RAG-mediated recombination is the predominant driver of oncogenic rearrangement in ETV6-RUNX1 acute...
13
© 2014 Nature America, Inc. All rights reserved. NATURE GENETICS ADVANCE ONLINE PUBLICATION ARTICLES Approximately 25% of B cell–precursor ALL cases are characterized by a balanced t(12;21) chromosomal translocation that creates the ETV6-RUNX1 fusion gene, conferring a favorable prognosis 1 . This particular disease has shaped understanding of the development of cancer well beyond leukemia, illuminating the long latency between initiating genetic lesion and clinically overt disease, the patterns of cooperativity among oncogenic mutations and the complex evo- lutionary trajectories a cancer can follow. Monozygotic twin stud- ies with concordant ALL and ‘backtracking’ studies using archived neonatal blood spots established that the translocation generating ETV6-RUNX1 is an initiating event occurring prenatally in a com- mitted B cell progenitor 2 . However, the fusion gene is not sufficient on its own to cause overt leukemia, and a number of studies have now provided strong evidence that additional mutations are essen- tial for the development of ALL 3 . Twin studies confirm that these additional events are most likely postnatal and secondary to the ETV6-RUNX1 fusion 4 . The genome of ETV6-RUNX1 ALL has been well characterized at the copy number and cytogenetic level. Array-based genome-wide profiling studies have shown copy number aberrations (CNAs) to be common, mostly comprising deletions and affecting genes involved in B-lymphocyte development and differentiation 5 , such as CDKN2A, PAX5, BTG1, TBL1XR1, RAG1, RAG2 and the wild-type copy of ETV6. The presence of V(D)J recombination sequence motifs close to these CNAs has suggested a role for aberrant RAG endonuclease targeting at these loci 6–10 , but these studies have been limited to the analysis of a small number of annotated breakpoints at specific genes. To obtain a detailed portrait of the composite genetic events that, in concert with the ETV6-RUNX1 fusion gene, drive this subtype of ALL, we carried out genomic analysis of diagnostic samples from RAG-mediated recombination is the predominant driver of oncogenic rearrangement in ETV6-RUNX1 acute lymphoblastic leukemia Elli Papaemmanuil 1 , Inmaculada Rapado 2 , Yilong Li 1 , Nicola E Potter 3 , David C Wedge 1 , Jose Tubio 1 , Ludmil B Alexandrov 1 , Peter Van Loo 1,4 , Susanna L Cooke 1 , John Marshall 1 , Inigo Martincorena 1 , Jonathan Hinton 1 , Gunes Gundem 1 , Frederik W van Delft 3,5 , Serena Nik-Zainal 1 , David R Jones 1 , Manasa Ramakrishna 1 , Ian Titley 3 , Lucy Stebbings 1 , Catherine Leroy 1 , Andrew Menzies 1 , John Gamble 1 , Ben Robinson 1 , Laura Mudie 1 , Keiran Raine 1 , Sarah O’Meara 1 , Jon W Teague 1 , Adam P Butler 1 , Giovanni Cazzaniga 6 , Andrea Biondi 6 , Jan Zuna 7 , Helena Kempski 8 , Markus Muschen 9 , Anthony M Ford 3 , Michael R Stratton 1 , Mel Greaves 3,12 & Peter J Campbell 1,10–12 The ETV6-RUNX1 fusion gene, found in 25% of childhood acute lymphoblastic leukemia (ALL) cases, is acquired in utero but requires additional somatic mutations for overt leukemia. We used exome and low-coverage whole-genome sequencing to characterize secondary events associated with leukemic transformation. RAG-mediated deletions emerge as the dominant mutational process, characterized by recombination signal sequence motifs near breakpoints, incorporation of non-templated sequence at junctions, ~30-fold enrichment at promoters and enhancers of genes actively transcribed in B cell development and an unexpectedly high ratio of recurrent to non-recurrent structural variants. Single-cell tracking shows that this mechanism is active throughout leukemic evolution, with evidence of localized clustering and reiterated deletions. Integration of data on point mutations and rearrangements identifies ATF7IP and MGA as two new tumor-suppressor genes in ALL. Thus, a remarkably parsimonious mutational process transforms ETV6-RUNX1–positive lymphoblasts, targeting the promoters, enhancers and first exons of genes that normally regulate B cell differentiation. 1 Cancer Genome Project, Wellcome Trust Sanger Institute, Hinxton, UK. 2 Hospital Universitario 12 de Octubre, Madrid, Spain. 3 Institute for Cancer Research, Sutton, London, UK. 4 Department of Human Genetics, VIB and University of Leuven, Leuven, Belgium. 5 Northern Institute for Cancer Research, University of Newcastle, Newcastle-upon-Tyne, UK. 6 Centro Ricerca Tettamanti, Hospital San Gerardo, Monza, Italy. 7 Department of Paediatric Haematology and Oncology, 2nd Faculty of Medicine, Charles University Prague and University Hospital Motol, Prague, Czech Republic. 8 Paediatric Malignancy Unit, Molecular Haematology & Cancer Biology Unit, Camelia Botnar Laboratories, Great Ormond Street Hospital for Children and University College London (UCL) Institute of Child Health, London, UK. 9 Department of Laboratory Medicine, University of California, San Francisco, San Francisco, California, USA. 10 Addenbrooke’s National Health Service (NHS) Foundation Trust, Cambridge, UK. 11 Department of Haematology, University of Cambridge, Cambridge, UK. 12 These authors jointly directed this work. Correspondence should be addressed to P.J.C. ([email protected]) or M.G. ([email protected]). Received 4 July 2013; accepted 13 December 2013; published online 12 January 2014; doi:10.1038/ng.2874
Transcript of RAG-mediated recombination is the predominant driver of oncogenic rearrangement in ETV6-RUNX1 acute...

©20
14 N
atu
re A
mer
ica,
Inc.
All
rig
hts
res
erve
d.
Nature GeNetics ADVANCE ONLINE PUBLICATION �
A rt i c l e s
Approximately 25% of B cell–precursor ALL cases are characterized by a balanced t(12;21) chromosomal translocation that creates the ETV6-RUNX1 fusion gene, conferring a favorable prognosis1. This particular disease has shaped understanding of the development of cancer well beyond leukemia, illuminating the long latency between initiating genetic lesion and clinically overt disease, the patterns of cooperativity among oncogenic mutations and the complex evo-lutionary trajectories a cancer can follow. Monozygotic twin stud-ies with concordant ALL and ‘backtracking’ studies using archived neonatal blood spots established that the translocation generating ETV6-RUNX1 is an initiating event occurring prenatally in a com-mitted B cell progenitor2. However, the fusion gene is not sufficient on its own to cause overt leukemia, and a number of studies have now provided strong evidence that additional mutations are essen-tial for the development of ALL3. Twin studies confirm that these
additional events are most likely postnatal and secondary to the ETV6-RUNX1 fusion4.
The genome of ETV6-RUNX1 ALL has been well characterized at the copy number and cytogenetic level. Array-based genome-wide profiling studies have shown copy number aberrations (CNAs) to be common, mostly comprising deletions and affecting genes involved in B-lymphocyte development and differentiation5, such as CDKN2A, PAX5, BTG1, TBL1XR1, RAG1, RAG2 and the wild-type copy of ETV6. The presence of V(D)J recombination sequence motifs close to these CNAs has suggested a role for aberrant RAG endonuclease targeting at these loci6–10, but these studies have been limited to the analysis of a small number of annotated breakpoints at specific genes.
To obtain a detailed portrait of the composite genetic events that, in concert with the ETV6-RUNX1 fusion gene, drive this subtype of ALL, we carried out genomic analysis of diagnostic samples from
RAG-mediated recombination is the predominant driver of oncogenic rearrangement in ETV6-RUNX1 acute lymphoblastic leukemiaElli Papaemmanuil1, Inmaculada Rapado2, Yilong Li1, Nicola E Potter3, David C Wedge1, Jose Tubio1, Ludmil B Alexandrov1, Peter Van Loo1,4, Susanna L Cooke1, John Marshall1, Inigo Martincorena1, Jonathan Hinton1, Gunes Gundem1, Frederik W van Delft3,5, Serena Nik-Zainal1, David R Jones1, Manasa Ramakrishna1, Ian Titley3, Lucy Stebbings1, Catherine Leroy1, Andrew Menzies1, John Gamble1, Ben Robinson1, Laura Mudie1, Keiran Raine1, Sarah O’Meara1, Jon W Teague1, Adam P Butler1, Giovanni Cazzaniga6, Andrea Biondi6, Jan Zuna7, Helena Kempski8, Markus Muschen9, Anthony M Ford3, Michael R Stratton1, Mel Greaves3,12 & Peter J Campbell1,10–12
The ETV6-RUNX1 fusion gene, found in 25% of childhood acute lymphoblastic leukemia (ALL) cases, is acquired in utero but requires additional somatic mutations for overt leukemia. We used exome and low-coverage whole-genome sequencing to characterize secondary events associated with leukemic transformation. RAG-mediated deletions emerge as the dominant mutational process, characterized by recombination signal sequence motifs near breakpoints, incorporation of non-templated sequence at junctions, ~30-fold enrichment at promoters and enhancers of genes actively transcribed in B cell development and an unexpectedly high ratio of recurrent to non-recurrent structural variants. Single-cell tracking shows that this mechanism is active throughout leukemic evolution, with evidence of localized clustering and reiterated deletions. Integration of data on point mutations and rearrangements identifies ATF7IP and MGA as two new tumor-suppressor genes in ALL. Thus, a remarkably parsimonious mutational process transforms ETV6-RUNX1–positive lymphoblasts, targeting the promoters, enhancers and first exons of genes that normally regulate B cell differentiation.
1Cancer Genome Project, Wellcome Trust Sanger Institute, Hinxton, UK. 2Hospital Universitario 12 de Octubre, Madrid, Spain. 3Institute for Cancer Research, Sutton, London, UK. 4Department of Human Genetics, VIB and University of Leuven, Leuven, Belgium. 5Northern Institute for Cancer Research, University of Newcastle, Newcastle-upon-Tyne, UK. 6Centro Ricerca Tettamanti, Hospital San Gerardo, Monza, Italy. 7Department of Paediatric Haematology and Oncology, 2nd Faculty of Medicine, Charles University Prague and University Hospital Motol, Prague, Czech Republic. 8Paediatric Malignancy Unit, Molecular Haematology & Cancer Biology Unit, Camelia Botnar Laboratories, Great Ormond Street Hospital for Children and University College London (UCL) Institute of Child Health, London, UK. 9Department of Laboratory Medicine, University of California, San Francisco, San Francisco, California, USA. 10Addenbrooke’s National Health Service (NHS) Foundation Trust, Cambridge, UK. 11Department of Haematology, University of Cambridge, Cambridge, UK. 12These authors jointly directed this work. Correspondence should be addressed to P.J.C. ([email protected]) or M.G. ([email protected]).
Received 4 July 2013; accepted 13 December 2013; published online 12 January 2014; doi:10.1038/ng.2874

©20
14 N
atu
re A
mer
ica,
Inc.
All
rig
hts
res
erve
d.
2 ADVANCE ONLINE PUBLICATION Nature GeNetics
A rt i c l e s
57 cases (Supplementary Table 1). We find that the critical second-ary events leading to leukemic transformation in ETV6-RUNX1 ALL are frequently driven by genomic rearrangement mediated by aberrant RAG recombinase activity and only infrequently by point mutations. The RAG-mediated signature is unparalleled among cancer-associated mutational processes for its specificity in inacti-vating the very genes that would usually promote normal cellular differentiation.
RESULTSStructural variation analysisWe performed whole-genome sequencing for structural variation analysis (average physical depth of 22×) on the leukemic samples of 51 cases (Supplementary Table 2). Structural variation analysis identified the ETV6-RUNX1 fusion gene in all 51 samples tested, demonstrating high sensitivity for structural variant detection (Supplementary Table 3). All structural variations reported in the present study were confirmed by break-point-specific PCR and shown to be somat-ically acquired (Supplementary Table 4). Mapping to base-pair resolution by capil-lary sequencing was obtained for 67.5% of breakpoints. For 50 of these cases and 5 additional cases, we sequenced the exomes of paired leukemic and remission specimens (Supplementary Table 5). We validated all putative coding mutations using either high-depth pyrosequencing or capillary sequenc-ing, and we report here only experimentally validated somatic variants (Supplementary Table 6). For one case, we also performed
whole-genome sequencing of both diagnostic and remission samples to 50× average sequence coverage. PCR for the IGH rearrangement showed that all samples in the study had rear-ranged V(D)J loci, with oligoclonality observed in most cases11 (Supplementary Table 1).
In addition to the fusion gene, we confirmed 523 structural varia-tions (average of 11 per case; range of 0–49) in 44 of the samples in the study (Fig. 1a): 417 were intrachromosomal, and 106 were interchro-mosomal (Supplementary Table 4), with 76% of intrachromosomal rearrangements being deletions. We identified 779 somatic substitu-tions and 16 indels across 715 protein-coding genes and 3 microRNAs (Fig. 1b and Supplementary Table 6). Each sample had on average 14 coding point mutations (range of 1–95), consistent with the low number of acquired somatic mutations reported in hematological cancers and childhood malignancies.
Invertedtranslocation
a
b
Num
ber
of a
cqui
red
mut
atio
ns in
exo
me
Num
ber
of a
cqui
red
stru
ctur
al r
earr
ange
men
ts
Deletion Tandemduplication
Interchromosomaltranslocation
50
45
0
40
10
35
30
25
20
15
5
Sample in study
c MHNTSBluntd
RS
S s
core
Per
cent
age
of r
esol
ved
brea
kpoi
nts
−20
−10
0
10
20
30
IndelSubstitution
Sample in study
DeletionInvertedtranslocation
Tandem duplicationInterchromosomaltranslocation
PD
3953
aP
D39
52a
PD
3953
aP
D39
54a
PD
3955
aP
D39
56a
PD
3957
aP
D39
58a
PD
3959
aP
D39
60a
PD
3961
aP
D39
62a
PD
3963
aP
D39
64a
PD
3965
aP
D39
66a
PD
3967
aP
D39
68a
PD
3969
aP
D39
70a
PD
3971
aP
D39
72a
PD
3974
aP
D39
75a
PD
3976
aP
D39
78a
PD
4008
aP
D40
09a
PD
4010
aP
D40
11a
PD
4012
aP
D40
13a
PD
4014
aP
D40
15a
PD
4016
aP
D40
17a
PD
4018
aP
D40
19a
PD
4020
aP
D40
21a
PD
4022
aP
D40
23a
PD
4024
aP
D40
25a
PD
4026
aP
D40
28a
PD
4029
aP
D40
30a
PD
4031
aP
D40
32a
PD
4033
aP
D40
34a
PD
4035
aP
D40
36a
PD
4037
aP
D40
38a
PD
4039
a
PD
3954
aP
D39
55a
PD
3956
aP
D39
57a
PD
3958
aP
D39
59a
PD
3960
aP
D39
61a
PD
3964
aP
D39
65a
PD
3966
aP
D39
68a
PD
3969
aP
D39
71a
PD
3973
aP
D39
76a
PD
4008
aP
D40
09a
PD
4010
aP
D40
11a
PD
4012
aP
D40
13a
PD
4014
aP
D40
15a
PD
4016
aP
D40
17a
PD
4018
aP
D40
19a
PD
4020
aP
D40
21a
PD
4022
aP
D40
25a
PD
4026
aP
D40
28a
PD
4030
aP
D40
31a
PD
4033
aP
D40
34a
PD
4035
aP
D40
36a
PD
4037
aP
D40
38a
PD
4039
a
100
90
80
70
60
50
40
30
20
10
0
V(D)J
ETV6
-RUNX1
Hypod
iploid ETP
Breas
t
Breas
t
Pancr
eas
Pancr
eas
Prosta
te
Prosta
teETP
ETV6
-RUNX1
100
90
80
70
60
50
40
30
20
10
0
Figure 1 Acquired mutations in ETV6-RUNX1 ALL. (a) Structural variation in ETV6-RUNX1 ALL. Bar plots show the distribution of genomic rearrangement events in 44 samples with confirmed somatic structural variations. All cases harbored the t(12;21) translocation, which is not included in the bar plots. (b) Distribution of coding mutations identified by exome sequencing across each case in the study. Each sample is represented by a bar, and the number of confirmed somatic substitutions and indels is represented by the height of each bar plot. (c) RAG recognition sequence score enrichment in ETV6-RUNX1 deletions. The RSS score is shown for each structural variation class at control V(D)J breakpoints and structural variants in ETV6-RUNX1 ALL, hypodiploid ALL, early T-progenitor (ETP) ALL, breast cancer, pancreatic cancer and prostate cancer. An RSS score of 8.55 corresponds to FDR < 0.01. The boxes denote the interquartile range; the whiskers denote the range up to 1.5 times the interquartile range; and isolated points mark outliers outside the whiskers. (d) Breakpoint resolution in ETV6-RUNX1 ALL. Bar plots show the proportion of resolved breakpoint sequences with NTS insertion at the breakpoint junction, evidence of microhomology (MH) between the two ends of the breakpoint or clean blunt ends at the breakpoint junctions in ETV6-RUNX1 ALL compared to the proportion of each breakpoint class in sets of confirmed rearrangements in ETP ALL and breast cancer, pancreatic cancer and prostate cancer.

©20
14 N
atu
re A
mer
ica,
Inc.
All
rig
hts
res
erve
d.
Nature GeNetics ADVANCE ONLINE PUBLICATION 3
A rt i c l e s
Structural variations bear the hallmarks of RAG activityDuring lymphocyte development, cells undergo somatic recombi-nation, also known as V(D)J recombination, at the variable immu-noglobulin and T cell receptor loci12. This process is primarily mediated by the RAG endonucleases RAG1 and RAG2, which are targeted to V(D)J sites by recombination signal sequence (RSS) motifs consisting of a highly conserved heptamer (CACAGTG) and a less conserved nonamer (ACAAAAACC) separated by a 12-bp or 23-bp sequence-independent spacer13. RAG endonucleases bind DNA at RSS motifs and cleave DNA at the boundary between the RSS and the flanking coding sequence, thereby generating two blunt and two hairpin ends that are held in close proximity to each other by the RAG complex13. Processing of these ends often involves the addi-tion of non-templated sequence (NTS) at the breakpoint by terminal deoxynucleotidyl transferase (TdT) in a process that results in fur-ther diversification of the V(D)J locus14. Functioning heptamers or nonamers outside the context of a conserved RSS, open chromatin state, trimethylation at histone H3 lysine 4 (H3K4me3), non-B DNA sequence and deaminated methyl CpGs are all genomic conforma-tions that have been associated with alternative mechanisms of RAG recruitment, targeting of DNA breaks, breakpoint localization and subsequent genomic rearrangement6,15,16.
Clustering of deletion breakpoints adjacent to RSS sites or motifs approximating the conserved RSS DNA sequence17 in lymphoid genes has provided some evidence of off-target RAG activity in leukemias6–10,18.
However, the association between breakpoints and RSS motifs has not been systematically evaluated on a genome-wide basis.
We resolved 354 of 523 structural variations to base-pair resolu-tion, generating the largest such data set in ALL by some margin (Supplementary Table 4), and searched for the conserved RSS motif (Supplementary Fig. 1), proposed AID recognition motifs16 and the presence of CpGs at breakpoint sites (Supplementary Fig. 2) using a bespoke algorithm. As a positive control, we used 26 structural rearrangements at the IGH and TCR loci, represent-ing canonical RAG sites (Fig. 1c, Supplementary Fig. 1a–c and Supplementary Table 7). To confirm that our findings were specific to ALL, we also evaluated two published ALL data sets (hypodip-loid ALL and early T-progenitor ALL)10,19 and made comparisons to published rearrangements from breast, pancreatic and prostate cancers (Fig. 1c,d)20–22.
Conserved RSS motifs were computationally detected (RSS score ≥ 8.55) in 23 of the 26 positive-control rearrangements (Fig. 2a and Supplementary Table 7) and 44 of the 354 somatic structural varia-tions outside of V(D)J sites (Fig. 2b, Supplementary Fig. 1d–f and Supplementary Table 4). As expected, canonical V(D)J RSS signals were characterized by deletions and inverted intrachromosomal rearrangements (Fig. 1c), and, in 92% (24/26), we observed NTS at the breakpoint junction (Supplementary Table 7). Enrichment for RSS motifs was particularly striking for genomic deletions in ETV6-RUNX1 ALL (Fig. 1c), including variants targeting known B-cell ALL
CACAGTG AAAAATGTTTTTG CAGTG TGTTTTT
CACAGT ACAAAACCCAC GT AAAAACA
CACAGTG ACAAAAA CCACAGTG ACAAAAACC
ACTGTG CAC TG CAAAAACCGTTTTTGT CACTGTG CACAGTG ACAAAAAC
CACAGTG ACAAAAA CCACAGTG ACAAAAACC
CACAGTG ACAAAAACACTGTG
AAAAACA
CAGTG TGTTTTT
GCTTTTGG CACTGTGCACTGTG CACAGTG ACAAAA CC
GCTTTTGGCACAGTG ACAAAA CC
ACAAAAA CACAGTGC GTG
CACAGT ACAAAAACGGTTTT CTGTG
ACAAAAA
CACAGTGCACAGTGCACAGT
C A CAGTGCACAGT
CACAGTGCACAGTG
CACAGCACAGTGCACAGTG
CACAGTCACAGTGCACAGT
CACAGTCACAGTG
CACAGTGCACAGTCACAGT
CACAGCACAGT
CACAGTCACAGTGCACAGTG
CACAGTGCACAGTG
CACAGTGACTCACAGTG
CACAGTGCACAGT
CACAGCACA TG
CACA TGCACAGTG
CACA TCACA TCACAGTG
CACACACA
CACACA C AC
a
b
Canonical V(D)J RSS
RSS approximation at SV breakpoints
(RSS score 17.0)
37429456GGTGGATCACGAGATCAGCAGGTTGAGACCATCCTAGCTAA AAACCCCATCTCTACT TACAACAACAACAAAAAAAGTCTTAGTTTTTGGAA TGACGGTGGGGATTTTA AAGTAGT TAGGGCCGAGGTTTGTTTGTTTTGTTT A
37465935GGTCAGATGATTGCCTCCTGTGCACACGTGTAGGAGACAGC ATATGCACAGCAGATA ACAGTAGTGACTGC AGAAGCTTTTTAAGATTTGTGTCCACTAATTAAT T ATTAC TGCAAGTTATAGGAGG CTCCAAAGTGATAGAGAGCTATCCT
(RSS score 14.0)
37637381 (RSS score 27.3) TACGTTTAATCTCCAGTCGTGTCCCTTGGCCGA AGGTGATC TTAACTTAATTACTTTCCCCTTA T TCTTTTCTTATTACTGTCAACAGTATTATAGTTTCCCTCC TTACACACCCGA CCCAGGGAAGCAGATGTGTAAGG
GACACC CC CTGCAGCTCTACTTCTGAGCAGCT ACTGAGGGAA AAAGCTCTGTAG ACTG GGGGATACG CTACAAAACCTACAGAGACCTGT TGC
37454666 (RSS score 19.2)
L5′H5′
L5′H5′
L5′H5′
L5′H5′
L3′H3′
L3′H3′
L3′H3′
L3′H3′
37452561AGAGGGTCCCGCACAGATTCTCCCATCC
CTTTGGGAATGGGGCTGTGT GGC ATAGCAGCTGGTACTACTACAATATCCT ACACGAGCCCCC T T
(RSS score 10.5) L3′H3′
L5′H5′
(RSS score 11.7)
(RSS score 11.8)
37487411GTTAAAACTT AGACTAAGTTTTCCCAAACACACT ACGCTGTCC ATAACGTTACTTACAATTAATCTAGTACTGGAATAATTCTGTAGGACACTTCATAGGGGTCAACC AGA TGA GTTCACTTGGGAGAAGCCTGAACAGCTCCTGACTGCTCAGTCCAATCCGC
37596962AGCTAGAGGCATCACATTACCCGGCTTAAAACTATACTACA GGAC AACTAAAACAACGTGGTACTGGT A
AGAGTGTTTTACAAA TTTTGCAAAATCTACTTATTGG GCCTCAAACAACATTATAAAGTGAAATAAAATAGAACAGAAA
L5′H5′
L5′H5′
L3′H3′
L3′H3′
c Heptamer at SV breakpoints
BreakpointBreakpoint
1 AAAGAGAGGC C AAG –1 CAAAGAGAGG C C AA –1 TACTACAGGA C AACT + 1 TGAACCTCC AATTG –1 CAAATCTGGG T GTCC –1 TCTGGGTGTC C CTT –1 TCTGGGTGTC C CTT –1 GAGGAACTAG A GTCC A + 1 AGGCAGGCTC C TTT –1 GGCGCCGGCC C CTC + 1 GGGTCCCAAG T TCC C + 1 GCAGGCGAGT C A AG –1 TGTGCATGGC C AAGT –1 TATTTCTCAA G GCA C + 1 TTCATCACGT T AA T + 1 TTCCTGGACC C GGA + 1 CAATGGTGAC C AC TT + 1 CGGGATTCCT C AAC A –1 TTTAAGGGGC C CCTCT + 1 TATTCCTCAC C ATAA –
1 ACTCAGGGAT C TTCC –1 ACCTCGAGCA G CTC –1 ATCCTAGCTA A AAA +1 CACAACATCT A ACC + 1 TAGAAGCAGA G TTG + 1 CTTGACCAGG G + 1 CTGCTTTGCA G AT T –1 GCAAACACTG G CTT –1 ATAAAGAGAA T ATAG –1 TTTGAGAGGA C A ACAT + 1 TACAAACACA T ATA C + 1 GCCGCCTTCT C C ATG + 1 CTCAAACCTA A GC T –1 CCTTATCCAC C T TCCA –1 ATCTAAGCAA T T C ATT –1 GGGCCTGGTC A CTA + 2 TCCACACATA G A TGCAT + 2 ATTATCCACA C ATAGA T + 2 TATCCACACA T AGA TGC + 2 TCCACCTA TGTGCACAC –
Motif Sequence Strand Motif SequenceP value Strand P value2.05 × 10–7
2.05 × 10⁻⁷
5.51 × 10⁻⁷
7.49 × 10⁻⁷
9.85 × 10⁻⁷
9.85 × 10⁻⁷
9.85× 10⁻⁷
9.85 × 10⁻⁷
1.31 × 10⁻⁶
1.73 × 10⁻⁶
2.78 × 10⁻⁶
3.52 × 10⁻⁶
6.76 × 10⁻⁶
6.76 × 10⁻⁶
1.47 × 10⁻⁵
1.76 × 10⁻⁵
2.49 × 10⁻⁵
2.49 × 10⁻⁵
2.94 × 10⁻⁵
2.94 × 10⁻⁵
4.05 × 10⁻⁵
4.72 × 10⁻⁵
4.72 × 10⁻⁵
1.10 × 10⁻⁴
1.10 × 10⁻⁴
2.56 × 10⁻⁴
2.85 × 10⁻⁴
3.92 × 10⁻⁴
5.27 × 10⁻⁴
6.97 × 10⁻⁴
8.32 × 10⁻⁴
9.06 × 10⁻⁴
1.07 × 10⁻³
1.26 × 10⁻³
1.58 × 10⁻³
1.58 × 10⁻³
9.24 × 10⁻¹⁰
9.24 × 10⁻¹⁰
9.24 × 10⁻¹⁰
1.54 × 10⁻⁸
TCAGAGAGAGATGAAGGGTCTTAC CCTGTT
G GTCTGGCCTGAGCCGCTGTGGGGATATTC
Figure 2 Evaluation of V(D)J recombination motifs. RSS heptamer and nonamer sequences are shown in red; spacing annotates the position of the breakpoint. Retained sequence flanking the breakpoint junction is shown in bold black text, with gray background shading and red borders. Genomic sequence is annotated 5′ to 3′ as presented in the reference genome plus strand. For each rearrangement, the first line indicates the sequence flanking the lower breakpoint (L), and the second line corresponds to the sequence flanking the higher breakpoint (H). The RSS score for each rearrangement is shown in parentheses. A dotted red line annotates the breakpoint junction. For more detailed annotation, see supplementary Figure 1. (a) Rearrangements at the V(D)J locus showing examples of canonical V(D)J recombination signal sequences in close proximity to the breakpoint junctions. (b) Close approximation to RSS motifs near the breakpoint junctions of confirmed structural variants (SVs) in ETV6-RUNX1 ALL. Represented are sequence motifs spanning the breakpoints for TBL1XR1 (RgID 37439593), FAF1 and CDKN2C (RgID 37429456), BTG1 (RgID 37487411) and RgID 37596962 showing chr. 1: 190,815,392–190,815,481 joining to chr. 1: 190,926,946–190,927,035. The RgID code refers to the specific rearrangement in supplementary table 4. (c) Heptamer sequences identified by agnostic motif search using MEME. A representation of 40 of the 164 breakpoints found to harbor heptamer-like motifs within 20 bp of breakpoint junctions is shown. Red denotes bases contributing to motif identification in the ETV6-RUNX1 ALL data set. Heptamer P values are annotated as calculated by MEME.

©20
14 N
atu
re A
mer
ica,
Inc.
All
rig
hts
res
erve
d.
� ADVANCE ONLINE PUBLICATION Nature GeNetics
A rt i c l e s
genes such as ETV6, BTG1, TBL1XR1, RAG2 and CDKN2A-CDKN2B (Supplementary Table 4). We did not find conserved RSS motifs near the breakpoints of the initiating ETV6-RUNX1 rearrangement itself, consistent with this rearrangement arising in a very early B-lineage progenitor2 via non-homologous end joining.
To explore the possibility of RAG targeting to non-canonical or cryptic RSS motifs, we next performed an agnostic motif search analy-sis23 on 354 resolved breakpoints, analyzing the 20 bp of sequence spanning each breakpoint junction. We discovered 2 significant motifs by this analysis: (i) the first 6 bases (underlined) of the per-fect heptamer sequence CACAGTG (E value = 9.9 × 10−81)23, identi-fied across 159 breakpoint junctions (Fig. 2c and Supplementary Fig. 1g–i), and (ii) the first 4 bases of the heptamer sequence, the CACA tetranucleotide (E value = 4.9 × 10⁻²) (Supplementary Table 8), identified adjacent to 5 rearrangements. As both of these motifs (CACAGT and CACA) correspond to the most conserved portion17 of the RSS heptamer sequence, all breakpoints reporting either of these motifs were annotated as ‘RSS-like’.
Overall, in 140 of 354 rearrangements (39.5%), we found convinc-ing signatures of RAG recognition sequence motifs at one or both ends (Supplementary Fig. 3) of the breakpoint junction. The overwhelm-ing majority of cases studied had at least one structural variation with an RSS or heptamer signal, and most had several such variants. An equivalent analysis of breakpoints from breast cancers20, pancreatic cancers21 and prostate cancers22 did not show any evidence of RSS motifs at breakpoint junctions (Fig. 1c), nor was the heptamer motif identified at junctions (Supplementary Table 8). We did not observe specific enrichment of CpGs or any of the proposed AID recognition motifs16 at breakpoint junctions in ETV6-RUNX1 ALL relative to other cancers (Supplementary Fig. 2 and Supplementary Table 9).
The other feature of canonical RAG-mediated V(D)J rearrangement is the inclusion of NTS at the breakpoint. All 44 rearrangements with a near-perfect RSS motif and 73 of the 96 rearrangements with a hep-tamer motif had novel sequence inserted at the breakpoints, suggestive of TdT activity during the formation of breakpoint junctions. Of the 354 resolved breakpoints overall, 248 (70%) had inserted NTS, 79 (22.4%) showed evidence of base-pair homology between the 2 breakpoints, and 27 (7.9%) involved blunt-end breakpoints (Supplementary Fig. 4). This data set shows a marked increase in breakpoints character-ized by the inclusion of NTS relative to breakpoints identified in breast cancer, pancreatic cancer and prostate cancer (with frequen-cies of NTS inclusion of 16.2% (n = 193), 19% (n = 36) and 6.7%
(n = 395), respectively; P < 2.2 × 10⁻¹⁶; Fig. 1d). Other mechanisms of genomic rearrangement were occasionally observed, including chro-mothripsis24 and chains of rearrangements similar to those reported in prostate cancer25 (Supplementary Fig. 5).
Chromatin signatures at structural variation sitesTo explore underlying genomic features that influence the distribu-tion of genomic rearrangements, we examined whether there was any enrichment of particular chromatin states at the 523 structural variations identified. For this analysis, we considered the 15 chroma-tin states defined by the Encyclopedia of DNA Elements (ENCODE) Project26. We found that structural variants in ETV6-RUNX1 ALL showed up to 14-fold enrichment of active promoter and enhancer regions relative to the other chromatin states (P < 2.2 × 10⁻¹⁶; Fig. 3a). This enrichment was particularly pronounced for struc-tural variations that had an RSS-like motif: for example, deletions with RSS-like sequences showed 33-fold enrichment of active promoter regions (P < 2.2 × 10⁻¹⁶; Fig. 3a). Overall, in our study, 30% of resolved rearrangements mapping in close proximity to an RSS-like motif occurred in promoter sites, 14% occurred in enhancer sites, and 13% occurred in sites of transcription (Supplementary Table 10).
The relationship between rearrangements and chromatin state observed in ETV6-RUNX1 genomes was significantly different (P < 2.2 × 10⁻¹⁶) from that expected by chance. Structural variations reported in a recent analysis of 40 individuals with hypodiploid ALL10 were also significantly different from the null distribution
176.
776
.876
.917
7.0
177.
117
7.2
37659389
37654561
37480670
37504040
37983197
37439593
TBL1XR1LINC00501
LINC00578
37657164
3q26.32
177.
3 Mb
c d
36.5
936
.60
36.6
136
.62
11p1237821575
37700046
37611808
37695195
37507037
RAG2RAG1
C11orf74
36.6
3 Mb
Deletion with RSS signatureDeletion without RSS signatureGene orientation
a All ETV6-RUNX1 SV Deletion Deletion with RSS No RSS Unresolved
Fol
d en
richm
ent
1. A
ctive
pro
mot
er
2. W
eak p
rom
oter
3. P
oised
pro
mot
er
4. S
trong
enh
ance
r
5. S
trong
enh
ance
r
6. W
eak e
nhan
cer
7. W
eak e
nhan
cer
8. In
sulat
or
9. T
rans
cript
ion
trans
ition
10. T
rans
cript
ion
elong
ation
11. W
eak
trans
cript
ion
12. R
epre
ssed
13. H
eter
ochr
omat
in/low
signa
l
14. R
epet
itive/
CNV
15. R
epet
itive/
CNV
35
30
25
20
15
10
5
0
b
21.9
00
21.9
50
22.0
00
9p21.3
*37691611
*37691686
37493699
^37449529
^37449516
CDKN2A
CDKN2BC9orf53
3799437537579743
21.8
75
21.9
25
21.9
75
22.0
25Mb
Chr. 9: 22,008,289
Chr. 9: 22,009,632 Chr. 9: 20009662 (+)
Chr. 9: 22,008,317 (+)
Figure 3 Chromatin segmentation of all somatic structural variations in ETV6-RUNX1 ALL. (a) Bar plot of structural variations identified in ETV6-RUNX1 ALL that map in 1 of the 15 chromatin states defined by the ENCODE Project using genome segmentation in lymphoblastoid cell line GIM12878. The heights of the bars reflect fold enrichment of each structural variation category for the 15 chromatin states (supplementary table 10). ETV6-RUNX1 ALL structural variations have a significantly different distribution than that expected by chance (goodness-of-fit test P < 2.2 × 10⁻¹⁶). (b–d) Clustering of deletion breakpoints (supplementary table 12). Red lines represent deletions with resolved breakpoints with either an RSS with a score of ≥8.55 or a heptamer motif within 20 bp of the breakpoint junction. Gray lines indicate deletions with resolved breakpoints without significant RSS motif scores at their breakpoint junctions. Dotted lines indicate the precise base pairs involved at breakpoint junctions. (b) Clustering of deletions at the CDKN2A locus (9p21.3) with evidence of reiterated deletions in two samples. Carats and asterisks indicate structural variations that were identified in the same sample (supplementary table 10). (c) Clustering of deletions at the TBL1XR1 locus (9p21.3). (d) Clustering of deletions at the RAG1-RAG2 locus (11p12).

©20
14 N
atu
re A
mer
ica,
Inc.
All
rig
hts
res
erve
d.
Nature GeNetics ADVANCE ONLINE PUBLICATION 5
A rt i c l e s
(P < 2.2 × 10⁻¹⁶; Supplementary Fig. 6), with structural variations mapping close to RSS-like sequences also showing a preponderance for promoter and enhancer sites (13-fold and 17-fold enrichment, respectively). In con-trast, breast cancer structural variations showed a rather uniform distribution across the 15 chromatin states, with modest but statistically significant enrichment in gene footprint regions (P < 2.2 × 10⁻¹⁶), as previously described27, but not in promoters or enhancers (Supplementary Fig. 6).
The inferred chromatin states in ENCODE data derive from a combinatorial code of individual histone modifications. We therefore explored whether specific histone marks or transcription factor bind-ing sites (Supplementary Table 11) were associated with genomic rearrangements in ETV6-RUNX1 ALL. We found significant correla-tion of rearrangement positions with peaks of H3K4me3, a marker of active promoters (q = 0.02; Supplementary Fig. 7). This finding is particularly notable because the PHD finger of the RAG2 protein has been shown to bind H3K4me3 (ref. 28), which would explain why this mutational process so precisely targets regions residing within active promoters and enhancers.
Localized clustering of deletions close to RSS-like motifsTight clustering of deletions next to RSS-like sequences9 as well as reiterated CNAs in diagnostic ALL samples29 has previously been reported. We identified 14 clusters of at least 2 deletions (range of 2–6) with breakpoints in close proximity to each other
as well as to the heptamer motif (Fig. 3b–d). For example, in four samples with deletions at 9p21.3, the deletion breakpoints were spaced 0 to 8 bp from each other and were in close proximity to an RSS-like sequence (Fig. 3b and Supplementary Table 12). Consistent with the preceding analysis, these breakpoint clusters frequently coin-cided with gene promoters (Fig. 3b–d and Supplementary Fig. 8). Within each locus, deletions that did not satisfy our criteria for anno-tation as having RSS-like sequences were observed to cluster with structural variations that did have a nearby RSS motif (Fig. 3d and Supplementary Table 12). Not unexpectedly, the genes disrupted in these clustered and reiterated deletions are among the most frequently targeted in ALL, including CDKN2A, BTG1, TBL1XR1, RAG1, RAG2 and BTLA8–10,19,29.
These data emphasize the targeted nature of the RAG-mediated mutational process. Not only is there enrichment of structural variants in active promoter and enhancer regions across the genome, but there is also a striking propensity for breakpoints to cluster within very specific ranges in individual promoter or enhancer elements.
a
bM
utat
ion-
adju
sted
cop
y nu
mbe
r st
ate
c
GPR156del 1q31
ARHGAP6C1orf101DNAH2
PD3958a
PD3971a
ETV6-RUNX1
A142%
del 12p13
A219%
A39%
CCDC110CYLC1SLC3A1
del 11p12
ETV6-RUNX1
B242%
B155%
B3%
del 21q22
del12q13
Birth
Birth
Sample in study
0
0.2
0.4
0.6
0.8
1.0
PD
3952
aP
D39
53a
PD
3954
aP
D39
55a
PD
3956
aP
D39
57a
PD
3958
aP
D39
59a
PD
3960
aP
D39
61a
PD
3962
aP
D39
63a
PD
3964
aP
D39
65a
PD
3966
aP
D39
67a
PD
3968
aP
D39
69a
PD
3970
aP
D39
71a
PD
3972
aP
D39
74a
PD
3975
aP
D39
76a
PD
3978
aP
D40
08a
PD
4009
aP
D40
10a
PD
4011
aP
D40
12a
PD
4013
aP
D40
14a
PD
4015
aP
D40
16a
PD
4017
aP
D40
18a
PD
4019
aP
D40
20a
PD
4021
aP
D40
22a
PD
4023
aP
D40
24a
PD
4025
aP
D40
26a
PD
4028
aP
D40
29a
PD
4030
aP
D40
31a
PD
4032
aP
D40
33a
PD
4034
aP
D40
35a
PD
4036
aP
D40
37a
PD
4038
aP
D40
39a
Figure 4 Clonal heterogeneity in ETV6-RUNX1 ALL. (a) The adjusted copy number of each mutation is shown, taking into account variant allele fraction and tumor cellularity. Gray circles represent acquired substitutions and indels identified from the exome study. Red circles represent previously characterized oncogenic mutations in cancer (supplementary table 6). (b) PD3958a clonal architecture. Acquired mutations are shown in blue, whereas structural variations with an RSS or RSS-like sequence at the breakpoint junction are shown in red. In single-cell analysis, 139 cells were positive for the ETV6-RUNX1 fusion gene and for the 3 missense mutations in CCDC110, CYLC1 and SLC3A1, as well as for the deletion at 11p12. The remaining two deletions at 12q13 and 21q22.12 were present in 55% and 42% of the cells, respectively, and were mutually exclusive. Both 11p12 and 21q22.12 deletions contained RSS motifs at the breakpoint junction. (c) Schematic of the clonal structure for PD3971a. Acquired mutations are shown in blue, and structural variations with an RSS or RSS-like sequence at the breakpoint junction are shown in red. ETV6-RUNX1 was present in all 130 cells, as were a heterozygous mutation in GPR156 and the deletion mapping to 1q31. Mutations in ARHGAP6, C1orf10 and DNAH2 co-occur within a distinct clonal branch (gray), representing 39% of the cells, whereas the 12p12-13 deletion, which affects ETV6, is present in 19% of cells, identifying a distinct subclone (red).

©20
14 N
atu
re A
mer
ica,
Inc.
All
rig
hts
res
erve
d.
� ADVANCE ONLINE PUBLICATION Nature GeNetics
A rt i c l e s
Clonal heterogeneity of RAG-mediated deletionsMassively parallel sequencing data enable estimation of the propor-tion of tumor cells carrying a mutation on the basis of the fraction of sequencing reads reporting a variant allele20. To study the clonal complexity of ETV6-RUNX1 ALL, we calculated variant allele fractions for all mutations identified by exome sequencing (Supplementary Table 6). We found extensive clonal heterogeneity across most cases in the study (Fig. 4a), confirming previous findings that multiple subclones coexist at presentation in individuals with ETV6-RUNX1 ALL7,29.
To assess the timing of aberrant RAG-mediated deletions, we used a single-cell genotyping protocol30 in two cases (Table 1 and Supplementary Fig. 9). For PD3958a, we interrogated 143 cells for the fusion gene, 3 genomic deletions and 3 acquired missense mutations (Fig. 4b and Supplementary Table 13). For PD3971a, we genotyped 159 cells for the fusion gene, deletions at 1q31 and 12p13.2-p12.3 and 4 point mutations (Fig. 4c and Supplementary Table 14). With the exception of the deletion at 12p13, all deletions studied carried an RSS signature.
Using the single-cell data, we reconstructed partial phylogenies of tumor evolution for the two cases (Fig. 4b,c). In these phylogenies, we found (i) that the ETV6-RUNX1 fusion gene was always in the trunk of the phylogenetic tree, as expected for an initiating lesion; (ii) that point mutations could be either clonal or subclonal, show-ing good correlation between the observed variant allele fraction in exome data and the fraction of single leukemia cells reporting the variant (Table 1); and (iii) that, in both cases, the RAG-mediated deletions were located in both the trunk of the phylogenetic tree and in subclonal branches.
These data suggest that RAG-mediated genomic instability in ETV6-RUNX1 ALL was an ongoing mutational process in these two cases. Intriguingly, the RAG1-RAG2 locus on chromosome 11p12 is itself a frequent target of deletion (Supplementary Table 4). NTS was present in four of the five resolved structural variations, and, in three, there was evidence of an RSS signature, suggesting that the RAG com-plex mediated its own deletion. Samples with 11p12 deletions did not differ in either the total number of observed structural variations or in the total number of RAG-mediated structural variations (Fig. 5a). The deletions we observed were heterozygous, and it is therefore
unclear what selective benefit, if any, might accrue to a clone from deleting this locus.
Structural variations show high fraction of recurrent eventsClassically, in cancer genomics, high rates of recurrence for a given event are used to distinguish mutations that are likely to be oncogenic from passenger variants. Restricting our analysis to deletions, we evaluated whether the consequence of each structural variation for gene copy number was recurrent in ALL or overlapped with genes showing recurrent copy number loss or inactivation by point mutation in other cancers (Supplementary Table 4). Overall, of 310 eligible deletions (Supplementary Table 4), 151 satisfied these criteria, accounting for 49% of deletions in the study. Each sample carried on average 3 (n = 3.4) CNAs that involved genes previously reported to be inactivated in cancer or recurrently affected by CNAs in ETV6-RUNX1 ALL (Fig. 5b,c and Supplementary Table 4). That half of deletions are recurrent is a rather remark-able figure.
This markedly non-random distribution of mutations has substan-tial implications for the identification of cancer-related genes in ALL. Typically, the background distribution of mutations is assumed to be uniform. With this RAG-mediated mechanism, however, passenger rearrangements would also cluster in actively transcribed genes and would consequently mimic true cancer-related genes. In this setting, the best approach to distinguish true cancer genes from genes affected by clustered passenger rearrangements would be to find enrichment of truncating point mutations in the same gene. This type of muta-tion has, for example, been observed in PAX5 and CDKN2A in ALL31. Thus, exome sequencing in ALL is an important confirmatory step in defining new cancer-relevant genes.
Integrative genome and exome analysis identifies new ALL genesIntegrative analysis of exome and whole-genome data identified 694 genes recurrently affected by CNAs, chromosomal rearrange-ments and/or acquired mutations (Supplementary Table 15). The most frequent and recurrent somatic alterations that we identi-fied in the present study involved deletion or mutation of ETV6, BTG1, TBL1XR1, PAX5, CDKN2A, NR3C2, RAG2 and BTLA, all loci previously described by cytogenetic or copy number profiling
table 1 single-cell genotyping of acquired mutations and deletions in PD3958a and PD3971a
Variation type Variant Chr. Position WT MutVariant allele fraction (%)
Copy number–adjusted estimated cell fraction (%)
Proportion of single cells with variant (%)
PD3958aDeletion del11p12a 100 (96.6–100)
Deletion del21q22a 41.7 (33.5–50.4)
Deletion del12q13 55.3 (46.7–63.7)
Substitution CCDC110 p.Gln432Glu 4 186380447 G C 45.3 76.1 (72.8–79.6) 100 (96.6–100)
Substitution CYLC1 p.Asn205Tyr X 83128329 A T 95.2 100 100 (96.6–100)
Substitution SLC3A1 p.Ser168Leu 2 44507927 C T 52.0 100 100 (96.6–100)
PD3971a
Deletion del1q31a 100 (96.4–100)
Deletion del12p13a 19.2 (13.0–27.3)
Substitution ARHGAP6 p.Met362Lys X 11204544 A T 12.7 29.2 (22.9–35.6) 39 (33–50.5)
Substitution C1orf101 p.Gly789Ser 1 244769058 G A 14.1 32 (19–47) 39 (33–50.5)
Substitution DNAH2 p.Arg1797* 17 7681635 C T 13.0 29.8 (24–35.8) 39 (33–50.5)
Substitution GPR156 p.Ser652Ala 3 119886370 A C 42.4 97.4 (87.1–100) 100 (96.4–100)
The variant allele fraction is reported for next-generation sequencing data. The adjusted estimate of the total cell fraction is reported for each variant using next-generation sequencing data copy number profiles and derived estimates of aberrant (normal) cell fraction. Single-cell data report the proportions and confidence intervals for single cells (ETV6-RUNX1 positive with normal cells excluded) with the variant of interest. All ETV6-RUNX1–negative cells were wild type for all remaining variants genotyped. Chr., chromosome; WT, wild type; Mut, mutant.aDeletions with an RSS signature. For structural variation coordinates, see supplementary table 4.

©20
14 N
atu
re A
mer
ica,
Inc.
All
rig
hts
res
erve
d.
Nature GeNetics ADVANCE ONLINE PUBLICATION �
A rt i c l e s
studies (Fig. 6a)5. Of these genes, ETV6, BTG1 and TBL1XR1 all had an inactivating point mutation (nonsense, frameshift or splice site), and such mutations have previously been found in PAX5, CDKN2A and ETV6, suggest-ing that they are bona fide ALL genes. We note that the majority of these inactivating point mutations and genomic rearrangements were heterozygous, suggesting that haploin-sufficiency of leukemia suppressor genes might frequently be operative in ETV6-RUNX1 ALL.
A systematic evaluation of all genes affected by both structural variation and mutation identified three previously unreported genes that would not have been highlighted by either data set alone. ATF7IP encodes a nuclear protein that, through interaction with MBD1 and SETDB1, mediates heterochroma-tin formation and transcriptional repression. ATF7IP maps to 12p13.1 and is located 2.7 Mb centromeric to ETV6, which is a target of frequent deletions32. In our study, eight of the nine cases with 12p13 deletions had concomitant deletions in both genes. One case, however, had a focal deletion at 12p13.1 targeting only ATF7IP (Fig. 6b). Furthermore, exome sequencing analysis iden-tified two additional samples with ATF7IP mutations, including one inactivating nonsense mutation (encoding p.Arg363*) and one missense mutation (encoding p.Arg571Gln) that alters the likely nuclear localization signal, maps within the SETDB1 interaction domain and is predicted to be deleterious (Supplementary Table 6). Additional evaluation of existing SNP6 array data from 21 ETV6-RUNX1 ALL cases at diagnosis and relapse33 identified 10 samples with deletions extending to both genes, 7 cases with ETV6-only dele-tions and 1 case with an independent ATF7IP deletion acquired at relapse (Supplementary Table 16). ETV6 and ATF7IP are two of the most commonly mutated genes in ETV6-RUNX1 ALL, and, although they are both deleted in ~67% of the 12p13 deletions, the present
study provides evidence of an independent role for ATF7IP mutations in ETV6-RUNX1 ALL pathogenesis.
MGA encodes a transcription factor that regulates the expression of Max network and T-box family target genes, including MYC34. We identified deletions mapping to 15q14-q15.2 resulting in loss of MGA in two cases (PD3971a and PD3951a). In addition, we identified a frameshift nonsense mutation (encoding p.Asp187fs*46) in PD4026a and a missense mutation (encoding p.Ser162Phe) in PD4010a map-ping within the DNA-binding domain. STAG2 is a component of the cohesin complex, which is often inactivated by mutations in myeloid leukemias35 and has recently been observed in chromosomal trans-locations in T-cell ALL36. In our study, STAG2 was mutated in five cases: three had interchromosomal rearrangements between Xq25 and chromosomes 6 and 9, and PD4018a and PD4031a harbored focal intronic deletions of unclear consequence. We also identified a STAG2 missense mutation (encoding p.Arg344Lys) in PD4022a. Furthermore,
aRSS-like Somatic, breakpoint not resolvedResolved
Num
ber
of S
Vs
in s
ampl
e
bSample in study
******
* Sample with RAG2 or RAG1 deletion
Deletion previously reported in ALL
Recurrent deletion in study
Deletion includes gene enriched for inactivating mutations in cancer
Non recurrent
c
50
45
40
35
30
25
20
15
10
5
0
PD
3953
aP
D39
54a
PD
3955
aP
D39
56a
PD
3957
aP
D39
58a
PD
3959
aP
D39
60a
PD
3961
aP
D39
64a
PD
3965
aP
D39
66a
PD
3968
aP
D39
69a
PD
3971
aP
D39
73a
PD
3976
aP
D40
08a
PD
4009
aP
D40
10a
PD
4011
aP
D40
12a
PD
4013
aP
D40
14a
PD
4015
aP
D40
16a
PD
4017
aP
D40
18a
PD
4019
aP
D40
20a
PD
4021
aP
D40
22a
PD
4025
aP
D40
26a
PD
4028
aP
D40
30a
PD
4031
aP
D40
33a
PD
4034
aP
D40
35a
PD
4036
aP
D40
37a
PD
4038
aP
D40
39a
51.20%
22.25%
22.90%
3.50%
Num
ber
of S
Vs
in s
ampl
e
Sample in study
PD
3953
aP
D39
54a
PD
3955
aP
D39
56a
PD
3957
aP
D39
58a
PD
3959
aP
D39
60a
PD
3961
aP
D39
64a
PD
3965
aP
D39
66a
PD
3968
aP
D39
69a
PD
3971
aP
D39
73a
PD
3976
aP
D40
08a
PD
4009
aP
D40
10a
PD
4011
aP
D40
12a
PD
4013
aP
D40
14a
PD
4015
aP
D40
16a
PD
4017
aP
D40
18a
PD
4019
aP
D40
20a
PD
4021
aP
D40
22a
PD
4025
aP
D40
26a
PD
4028
aP
D40
30a
PD
4031
aP
D40
33a
PD
4034
aP
D40
35a
PD
4036
aP
D40
37a
PD
4038
aP
D40
39a
18
16
14
12
10
8
6
4
2
0
Figure 5 Characterization of structural variation in ETV6-RUNX1 ALL. (a) Distribution of structural variant categories identified in each sample in the study. Red, structural variations with resolved breakpoints and evidence of an RSS or heptamer motif adjacent to the breakpoint junction (n = 140); light gray, structural variations with resolved breakpoint junctions that did not meet the criteria for RSS motif assignment (n = 214); dark gray, structural variations confirmed to be somatically acquired for which breakpoint junctions could not be resolved (n = 169). Asterisks indicate samples with confirmed deletions spanning the RAG locus. (b) Annotation of structural variations in ETV6-RUNX1 ALL including deletions that have previously been reported in ALL (n = 69; 22%), deletions that are recurrent in this study (n = 71; 23%) and deletions that include genes enriched for inactivating mutations in cancer (n = 11; 3.5%). Non-recurrent events are shown in light gray (n = 159; 51%). (c) Distribution of the structural variations in b by sample.

©20
14 N
atu
re A
mer
ica,
Inc.
All
rig
hts
res
erve
d.
� ADVANCE ONLINE PUBLICATION Nature GeNetics
A rt i c l e s
we identified a nonsense mutation in SMC1A and a missense mutation in SMC5, which encode two additional components of the cohesin complex (Fig. 6a).
Exome sequencing analysis identified 795 somatic mutations mapping to 719 genes, with 36 genes carrying recurrent non-silent muta-tions in at least 2 cases each. Of these genes, only three (KRAS, NRAS and SAE1) were mutated significantly more than expected by chance, as was recently reported for hotspot mutations in WHSC1 (NSD2) (Supplementary Table 6)37. Notably, 34 of the genes reported in the present study were enriched for inactivat-ing mutations across the 7,651 cancers (Supplementary Table 17). Of these, the most significant genes are well-recognized tumor sup-pressors such as CDKN2A, CDKN2B, NF1, KMT2D (MLL2), ARID2, TP53, RB1, APC, SETD2, KDM6A, CTCF, ARID1B, FBXW7 and BCOR. This heterogeneity underscores the biological complexity present even within a well-defined subtype of ALL.
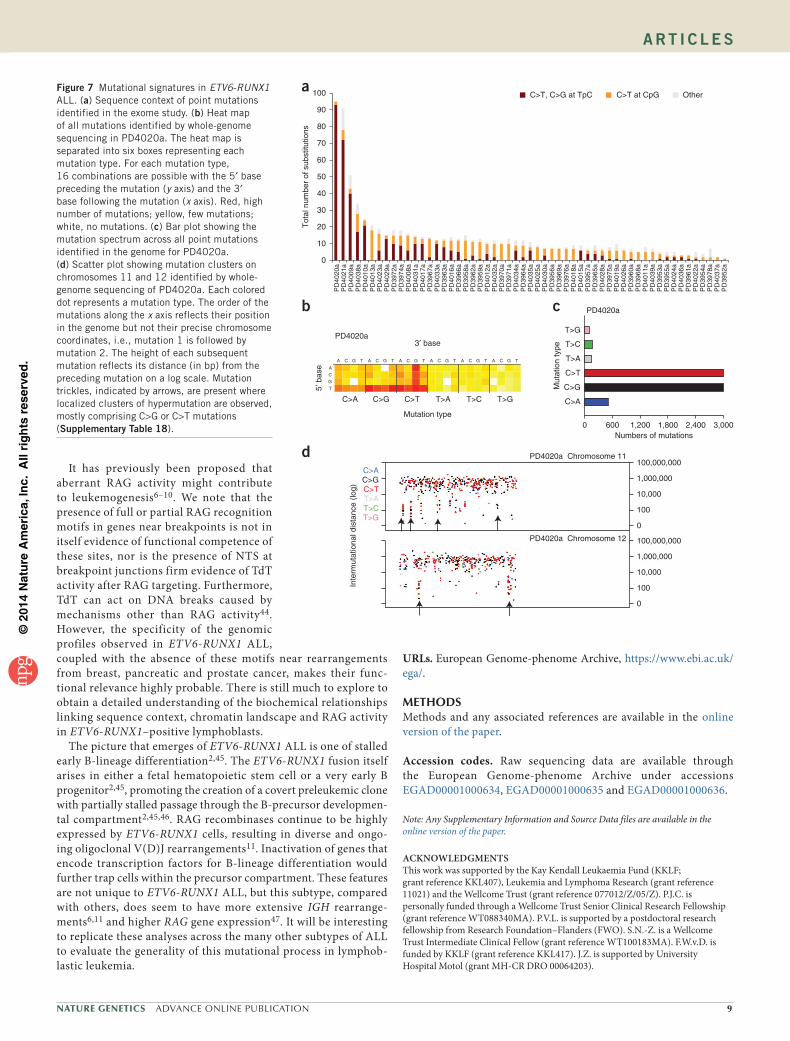
Mutational signatures in ETV6-RUNX1 ALLAnalysis of the nucleotide composition of each mutation and the sequence context in which it occurred identified two main mutational sig-natures: C>T transitions at CpGs and C>G and C>T mutations at TpCs, contributing 56% and 32% of all substitutions, respectively (Fig. 7a). The number of C>T mutations at CpGs significantly correlated with age at diagnosis (r2 = 0.62, P = 1.6 × 10⁻⁵), whereas C>T mutations at TpCs did not. C>T substitution at a methylated cytosine is the most widespread mutational process in genome evolution and cancer.
The second most frequent process involved transitions and trans-versions at cytosines in a TpC context. This process was observed in 36 of the samples sequenced (64%) and was the predominant signature in the 3 samples with the most acquired mutations (Fig. 7a). This signature is mostly represented by TpCpW sites (where W = A or T) (Supplementary Fig. 10) and is consistent with the reported preference of the APOBEC family of enzymes for cytosine deamina-tion to uracil38,39. This process has recently been proposed as a likely mechanism underlying clusters of localized somatic hypermutation (kataegis) in breast and other cancers20,40,41.
To explore this signature, we performed high-depth whole-genome sequencing in PD4020a. Whole-genome sequencing analysis identified
7,948 high-confidence substitutions and 122 indels (Supplementary Tables 18 and 19). Strikingly, 94% of the substitutions were C>G or C>T changes at TpC sites (Fig. 7b,c). We identified 19 clusters of 6 or more mutations present on the same strand40 (Fig. 7d, Supplementary Fig. 11 and Supplementary Table 18). Kataegis in breast cancer often colocalizes with structural rearrangement. However, such colocali-zation was not observed in PD4020a, where no structural variation mapped within 5 kb of any mutation cluster.
DISCUSSIONThe present study has provided a detailed characterization of the genomic architecture of 57 individuals with ETV6-RUNX1 ALL. We observe a paucity of recurrent coding-region mutations and a scarcity of the kinase mutations that are common in high-risk subtypes of ALL42. Genomic rearrangement emerges as the predominant driver of this disease. In a large proportion of the structural variations characterized, we identify RAG recognition sequences near the breakpoint junctions, evidence of TdT activity, and enrichment in active promoter and enhancer regions. Our data may underestimate the contribution of RAG-mediated recombina-tion to structural variation in ETV6-RUNX1 ALL. We find a large proportion of structural variations that do not satisfy our criteria for RSS annotation yet follow the same chromatin distribution as the RSS-like structural variations, with strong enrichment at pro-moters, and exhibit the inclusion of NTS at breakpoint junctions. A proportion of these variations may have been mediated by RSS motifs that were less conserved or more distant than those for which we screened6,43.
ATF7IP-only deletionb
Deletion
RB2
Nonsense or frameshift mutation
Missense mutation Essential splice-site variant
Structural variation
Compound event
Pre
dom
inan
tly r
earr
ange
d ge
nes
Pre
dom
inan
tly r
earr
ange
d ge
nes
Sample in studya
Exome
Rearragement
ETV6-RUNX1
PD
4013
a
PD
3971
aP
D40
14a
PD
4025
aP
D40
31a
PD
4037
aP
D40
15a
PD
3959
aP
D40
21a
PD
4028
a
PD
3972
aP
D39
57a
PD
3960
aP
D39
76a
PD
4035
aP
D40
36a
PD
3958
a
PD
3964
aP
D40
30a
PD
4023
a
PD
4022
aP
D39
54a
ETV6TBL1XR1PAX5ATF7IPBTG1RAG2BTLANR3C2
CDKN2A/BKRASSTAG2ZMYM2MGA
NSD2ABCC9SOX5NRASARID5BCTCFGNB1MYCNATM
NOTCH2DAXXEZH2KDM6ANSD1
POU2AF1PTPN11RB1
SETBP1SMC1ASMC5
PD
4038
aP
D40
39a
PD
3956
aP
D39
66a
PD
4009
aP
D40
10a
PD
4012
aP
D39
68a
PD
4019
aP
D40
34a
PD
4026
aP
D40
16a
PD
4017
aP
D39
65a
PD
3953
aP
D40
18a
PD
4008
aP
D39
52a
PD
3955
aP
D39
61a
PD
3962
aP
D39
63a
PD
3969
aP
D39
78a
PD
4011
aP
D40
20a
PD
4024
aP
D40
29a
PD
4032
aP
D40
33a
PD
3967
aP
D39
70a
PD
3974
aP
D39
75a
PD
3973
a
ETV6 BCL2L14 DUSP16 DDX47 GSG1 C12orf36 ATF7IP HIST4H4GRIN2B
Figure 6 Acquired somatic events in ETV6-RUNX1 ALL. (a) Each column represents a sample. The first row indicates samples with exome sequencing data, and the second row indicates samples with whole-genome sequencing data for rearrangements. In the ETV6-RUNX1 row, purple boxes indicate automated detection of the fusion gene in the samples on which whole-genome sequencing was performed. The top panel concentrates on genes that are predominantly affected by genomic rearrangement. The bottom panel annotates previously characterized cancer-related genes that are recurrently mutated in the present study. Mixed colors indicate the occurrence of more than one type of event in the same sample. (b) Independent deletion of ATF7IP. Copy number plot showing focal deletion of ATF7IP in PD4028a, RgID HS20_6248:31106.
©20
14 N
atu
re A
mer
ica,
Inc.
All
rig
hts
res
erve
d.
Nature GeNetics ADVANCE ONLINE PUBLICATION �
A rt i c l e s
It has previously been proposed that aberrant RAG activity might contribute to leukemogenesis6–10. We note that the presence of full or partial RAG recognition motifs in genes near breakpoints is not in itself evidence of functional competence of these sites, nor is the presence of NTS at breakpoint junctions firm evidence of TdT activity after RAG targeting. Furthermore, TdT can act on DNA breaks caused by mechanisms other than RAG activity44. However, the specificity of the genomic profiles observed in ETV6-RUNX1 ALL, coupled with the absence of these motifs near rearrangements from breast, pancreatic and prostate cancer, makes their func-tional relevance highly probable. There is still much to explore to obtain a detailed understanding of the biochemical relationships linking sequence context, chromatin landscape and RAG activity in ETV6-RUNX1–positive lymphoblasts.
The picture that emerges of ETV6-RUNX1 ALL is one of stalled early B-lineage differentiation2,45. The ETV6-RUNX1 fusion itself arises in either a fetal hematopoietic stem cell or a very early B progenitor2,45, promoting the creation of a covert preleukemic clone with partially stalled passage through the B-precursor developmen-tal compartment2,45,46. RAG recombinases continue to be highly expressed by ETV6-RUNX1 cells, resulting in diverse and ongo-ing oligoclonal V(D)J rearrangements11. Inactivation of genes that encode transcription factors for B-lineage differentiation would further trap cells within the precursor compartment. These features are not unique to ETV6-RUNX1 ALL, but this subtype, compared with others, does seem to have more extensive IGH rearrange-ments6,11 and higher RAG gene expression47. It will be interesting to replicate these analyses across the many other subtypes of ALL to evaluate the generality of this mutational process in lymphob-lastic leukemia.
URLs. European Genome-phenome Archive, https://www.ebi.ac.uk/ega/.
METhODSMethods and any associated references are available in the online version of the paper.
Accession codes. Raw sequencing data are available through the European Genome-phenome Archive under accessions EGAD00001000634, EGAD00001000635 and EGAD00001000636.
Note: Any Supplementary Information and Source Data files are available in the online version of the paper.
ACKNOWLEDGMENTSThis work was supported by the Kay Kendall Leukaemia Fund (KKLF; grant reference KKL407), Leukemia and Lymphoma Research (grant reference 11021) and the Wellcome Trust (grant reference 077012/Z/05/Z). P.J.C. is personally funded through a Wellcome Trust Senior Clinical Research Fellowship (grant reference WT088340MA). P.V.L. is supported by a postdoctoral research fellowship from Research Foundation–Flanders (FWO). S.N.-Z. is a Wellcome Trust Intermediate Clinical Fellow (grant reference WT100183MA). F.W.v.D. is funded by KKLF (grant reference KKL417). J.Z. is supported by University Hospital Motol (grant MH-CR DRO 00064203).
b
C>A C>G C>T T>A T>C T>G
Mutation type
3′ base
5′ b
ase
c
PD4020a
PD4020a
Mut
atio
n ty
pe
T>G
T>C
T>A
C>T
C>G
C>A
Tot
al n
umbe
r of
sub
stitu
tions
aC>T, C>G at TpC C>T at CpG Other100
90
80
70
60
50
40
30
20
10
0
PD
4020
aP
D40
21a
PD
4009
aP
D40
38a
PD
4010
aP
D40
13a
PD
4023
aP
D40
29a
PD
3972
aP
D39
74a
PD
4008
aP
D40
31a
PD
4017
a
PD
4033
aP
D39
63a
PD
3966
aP
D39
58a
PD
3962
aP
D39
59a
PD
4012
aP
D40
32a
PD
3970
aP
D39
71a
PD
4034
aP
D39
64a
PD
4035
aP
D40
25a
PD
4030
aP
D39
56a
PD
3969
aP
D39
76a
PD
4018
aP
D40
15a
PD
3957
aP
D39
65a
PD
4028
aP
D39
75a
PD
4019
aP
D40
26a
PD
3960
aP
D39
68a
PD
4011
aP
D40
39a
PD
3953
aP
D39
55a
PD
4024
aP
D40
36a
PD
3961
aP
D40
22a
PD
3954
aP
D39
78a
PD
4037
aP
D39
52a
PD
4016
a
PD
3967
a0 600 1,200
Numbers of mutations1,800 2,400 3,000
d PD4020a Chromosome 11
PD4020a Chromosome 12
Inte
rmut
atio
nal d
ista
nce
(log)
C>AC>GC>TT>AT>CT>G
100,000,000
1,000,000
10,000
100
0
100,000,000
1,000,000
10,000
100
0
Figure 7 Mutational signatures in ETV6-RUNX1 ALL. (a) Sequence context of point mutations identified in the exome study. (b) Heat map of all mutations identified by whole-genome sequencing in PD4020a. The heat map is separated into six boxes representing each mutation type. For each mutation type, 16 combinations are possible with the 5′ base preceding the mutation (y axis) and the 3′ base following the mutation (x axis). Red, high number of mutations; yellow, few mutations; white, no mutations. (c) Bar plot showing the mutation spectrum across all point mutations identified in the genome for PD4020a. (d) Scatter plot showing mutation clusters on chromosomes 11 and 12 identified by whole-genome sequencing of PD4020a. Each colored dot represents a mutation type. The order of the mutations along the x axis reflects their position in the genome but not their precise chromosome coordinates, i.e., mutation 1 is followed by mutation 2. The height of each subsequent mutation reflects its distance (in bp) from the preceding mutation on a log scale. Mutation trickles, indicated by arrows, are present where localized clusters of hypermutation are observed, mostly comprising C>G or C>T mutations (supplementary table 18).

©20
14 N
atu
re A
mer
ica,
Inc.
All
rig
hts
res
erve
d.
�0 ADVANCE ONLINE PUBLICATION Nature GeNetics
A rt i c l e s
AUTHOR CONTRIBUTIONSE.P., M.G. and P.J.C. designed the study and wrote the manuscript, with assistance from M.R.S. E.P. designed experiments, performed experiments, analyzed sequencing data and performed and reviewed bioinformatics and statistical analyses. I.R. performed sample preparation, validation experiments and evaluation of sequencing data. Y.L. performed bioinformatics and statistical analyses and wrote the manuscript. D.C.W., L.B.A., I.M. and P.V.L. performed statistical analysis. N.E.P., I.T., F.W.v.D. and A.M.F. performed experiments. G.G., J.T., C.L., S.L.C., J.M., J.H., A.M., K.R., S.N.-Z., M.R., L.S., D.R.J., A.P.B., J.G. and J.W.T. support variant calling algorithms and sequencing analysis platforms. L.M., B.R. and S.O. performed sample preparation and experiments. J.Z., H.K., G.C., M.M. and A.B. provided and prepared samples and experimental materials. All authors reviewed the manuscript during its preparation.
COMPETING FINANCIAL INTERESTSThe authors declare no competing financial interests.
Reprints and permissions information is available online at http://www.nature.com/reprints/index.html.
1. Bhojwani, D. et al. ETV6-RUNX1–positive childhood acute lymphoblastic leukemia: improved outcome with contemporary therapy. Leukemia 26, 265–270 (2012).
2. Greaves, M.F. & Wiemels, J. Origins of chromosome translocations in childhood leukaemia. Nat. Rev. Cancer 3, 639–649 (2003).
3. Mori, H. et al. Chromosome translocations and covert leukemic clones are generated during normal fetal development. Proc. Natl. Acad. Sci. USA 99, 8242–8247 (2002).
4. Bateman, C.M. et al. Acquisition of genome-wide copy number alterations in monozygotic twins with acute lymphoblastic leukemia. Blood 115, 3553–3558 (2010).
5. Mullighan, C.G. et al. Genome-wide analysis of genetic alterations in acute lymphoblastic leukaemia. Nature 446, 758–764 (2007).
6. Zhang, M. & Swanson, P.C. V(D)J recombinase binding and cleavage of cryptic recombination signal sequences identified from lymphoid malignancies. J. Biol. Chem. 283, 6717–6727 (2008).
7. Mullighan, C.G. et al. Genomic analysis of the clonal origins of relapsed acute lymphoblastic leukemia. Science 322, 1377–1380 (2008).
8. Raschke, S., Balz, V., Efferth, T., Schulz, W.A. & Florl, A.R. Homozygous deletions of CDKN2A caused by alternative mechanisms in various human cancer cell lines. Genes Chromosom. Cancer 42, 58–67 (2005).
9. Waanders, E. et al. The origin and nature of tightly clustered BTG1 deletions in precursor B-cell acute lymphoblastic leukemia support a model of multiclonal evolution. PLoS Genet. 8, e1002533 (2012).
10. Holmfeldt, L. et al. The genomic landscape of hypodiploid acute lymphoblastic leukemia. Nat. Genet. 45, 242–252 (2013).
11. Hübner, S. et al. High incidence and unique features of antigen receptor gene rearrangements in TEL-AML1–positive leukemias. Leukemia 18, 84–91 (2004).
12. Schatz, D.G. & Swanson, P.C. V(D)J recombination: mechanisms of initiation. Annu. Rev. Genet. 45, 167–202 (2011).
13. Fugmann, S.D., Lee, A.I., Shockett, P.E., Villey, I.J. & Schatz, D.G. The RAG proteins and V(D)J recombination: complexes, ends, and transposition. Annu. Rev. Immunol. 18, 495–527 (2000).
14. Komori, T., Okada, A., Stewart, V. & Alt, F.W. Lack of N regions in antigen receptor variable region genes of TdT-deficient lymphocytes. Science 261, 1171–1175 (1993).
15. Raghavan, S.C., Swanson, P.C., Ma, Y. & Lieber, M.R. Double-strand break formation by the RAG complex at the Bcl-2 major breakpoint region and at other non-B DNA structures in vitro. Mol. Cell. Biol. 25, 5904–5919 (2005).
16. Tsai, A.G. et al. Human chromosomal translocations at CpG sites and a theoretical basis for their lineage and stage specificity. Cell 135, 1130–1142 (2008).
17. Hesse, J.E., Lieber, M.R., Mizuuchi, K. & Gellert, M. V(D)J recombination: a functional definition of the joining signals. Genes Dev. 3, 1053–1061 (1989).
18. Mullighan, C.G. et al. BCR-ABL1 lymphoblastic leukaemia is characterized by the deletion of Ikaros. Nature 453, 110–114 (2008).
19. Zhang, J. et al. The genetic basis of early T-cell precursor acute lymphoblastic leukaemia. Nature 481, 157–163 (2012).
20. Nik-Zainal, S. et al. Mutational processes molding the genomes of 21 breast cancers. Cell 149, 979–993 (2012).
21. Campbell, P.J. et al. The patterns and dynamics of genomic instability in metastatic pancreatic cancer. Nature 467, 1109–1113 (2010).
22. Baca, S.C. et al. Punctuated evolution of prostate cancer genomes. Cell 153, 666–677 (2013).
23. Bailey, T.L., Williams, N., Misleh, C. & Li, W.W. MEME: discovering and analyzing DNA and protein sequence motifs. Nucleic Acids Res. 34, W369–W373 (2006).
24. Stephens, P.J. et al. Complex landscapes of somatic rearrangement in human breast cancer genomes. Nature 462, 1005–1010 (2009).
25. Berger, M.F. et al. The genomic complexity of primary human prostate cancer. Nature 470, 214–220 (2011).
26. ENCODE Project Consortium. An integrated encyclopedia of DNA elements in the human genome. Nature 489, 57–74 (2012).
27. Stephens, P.J. et al. Massive genomic rearrangement acquired in a single catastrophic event during cancer development. Cell 144, 27–40 (2011).
28. Shimazaki, N., Tsai, A.G. & Lieber, M.R. H3K4me3 stimulates the V(D)J RAG complex for both nicking and hairpinning in trans in addition to tethering in cis: implications for translocations. Mol. Cell 34, 535–544 (2009).
29. Anderson, K. et al. Genetic variegation of clonal architecture and propagating cells in leukaemia. Nature 469, 356–361 (2011).
30. Potter, N.E. et al. Single cell mutational profiling and clonal phylogeny in cancer. Genome Res. 23, 2115–2125 (2013).
31. Familiades, J. et al. PAX5 mutations occur frequently in adult B-cell progenitor acute lymphoblastic leukemia and PAX5 haploinsufficiency is associated with BCR-ABL1 and TCF3-PBX1 fusion genes: a GRAALL study. Leukemia 23, 1989–1998 (2009).
32. Kempski, H. et al. An investigation of the t(12;21) rearrangement in children with B-precursor acute lymphoblastic leukaemia using cytogenetic and molecular methods. Br. J. Haematol. 105, 684–689 (1999).
33. van Delft, F.W. et al. Clonal origins of relapse in ETV6-RUNX1 acute lymphoblastic leukemia. Blood 117, 6247–6254 (2011).
34. Hurlin, P.J., Steingrimsson, E., Copeland, N.G., Jenkins, N.A. & Eisenman, R.N. Mga, a dual-specificity transcription factor that interacts with Max and contains a T-domain DNA-binding motif. EMBO J. 18, 7019–7028 (1999).
35. Cancer Genome Atlas Research Network. Genomic and epigenomic landscapes of adult de novo acute myeloid leukemia. N. Engl. J. Med. 368, 2059–2074 (2013).
36. Chen, S. et al. Novel non-TCR chromosome translocations t(3;11)(q25;p13) and t(X;11)(q25;p13) activating LMO2 by juxtaposition with MBNL1 and STAG2. Leukemia 25, 1632–1635 (2011).
37. Jaffe, J.D. et al. Global chromatin profiling reveals NSD2 mutations in pediatric acute lymphoblastic leukemia. Nat. Genet. 45, 1386–1391 (2013).
38. Harris, R.S., Petersen-Mahrt, S.K. & Neuberger, M.S. RNA editing enzyme APOBEC1 and some of its homologs can act as DNA mutators. Mol. Cell 10, 1247–1253 (2002).
39. Neuberger, M.S. & Rada, C. Somatic hypermutation: activation-induced deaminase for C/G followed by polymerase eta for A/T. J. Exp. Med. 204, 7–10 (2007).
40. Alexandrov, L.B. et al. Signatures of mutational processes in human cancer. Nature 500, 415–421 (2013).
41. Roberts, S.A. et al. Clustered mutations in yeast and in human cancers can arise from damaged long single-strand DNA regions. Mol. Cell 46, 424–435 (2012).
42. Roberts, K.G. et al. Genetic alterations activating kinase and cytokine receptor signaling in high-risk acute lymphoblastic leukemia. Cancer Cell 22, 153–166 (2012).
43. Tsai, A.G. & Lieber, M.R. RAGs found “not guilty”: cleared by DNA evidence. Blood 111, 1750 (2008).
44. Boubakour-Azzouz, I., Bertrand, P., Claes, A., Lopez, B.S. & Rougeon, F. Terminal deoxynucleotidyl transferase requires KU80 and XRCC4 to promote N-addition at non-V(D)J chromosomal breaks in non-lymphoid cells. Nucleic Acids Res. 40, 8381–8391 (2012).
45. Hong, D. et al. Initiating and cancer-propagating cells in TEL-AML1–associated childhood leukemia. Science 319, 336–339 (2008).
46. Tsuzuki, S., Seto, M., Greaves, M. & Enver, T. Modeling first-hit functions of the t(12;21) TEL-AML1 translocation in mice. Proc. Natl. Acad. Sci. USA 101, 8443–8448 (2004).
47. Ross, M.E. et al. Classification of pediatric acute lymphoblastic leukemia by gene expression profiling. Blood 102, 2951–2959 (2003).

©20
14 N
atu
re A
mer
ica,
Inc.
All
rig
hts
res
erve
d.
Nature GeNeticsdoi:10.1038/ng.2874
ONLINE METhODSSamples. The patient samples studied in this investigation were collected from Italian or UK hospitals, with informed consent and local ethical review committee approval (CCR 2285, Royal Marsden Hospital NHS Foundation Trust). Collection and use of patient samples were approved by the appropriate institutional review board (IRB)of each institution. In addition, this study and usage of its collective materials had specific i approval.
Exome capture library construction and sequencing. Matched genomic DNA (3–5 µg) from leukemic samples and samples at full remission from 56 indi-viduals with childhood ALL was prepared for Illumina paired-end sequencing. Exome enrichment was performed using the Agilent SureSelect Human All Exon 50Mb kit (Agilent Technologies). Flow-cell preparation, cluster genera-tion and paired-end sequencing (75-bp reads) were performed according to the Illumina protocol guidelines on an Illumina Genome Analyzer IIx instru-ment. Target coverage per sample was for 70% of the captured regions at a minimum depth of 30× sequencing coverage. Detailed sequencing metrics are provided in Supplementary Table 5.
Low-depth whole-genome sequencing. Leukemic DNA (2–5 µg) for 51 cases was prepared for short-insert (300- to 400-bp) library construction flow-cell preparation and cluster formation using the Illumina no-PCR library proto-col48. We performed 50-base paired-end sequencing on an Illumina Genome Analyzer IIx instrument according to the manufacturer’s guidelines. Detailed sequencing metrics statistics are presented in Supplementary Table 3.
Variant detection (substitutions). Sequencing reads were aligned to the human genome (NCBI Build 37) using the Burrows-Wheeler Aligner (BWA) algorithm with default settings49. We used an in-house algorithm, CaVEMan (Cancer Variants through Expectation Maximization), to identify somatically acquired single-nucleotide substitutions. CaVEMan uses a naive Bayesian approach to estimate the posterior probability of each possible genotype (wild type, germline, somatic mutation) at each base given the reference base and the predefined copy number status and proportion of tumor cells in the sample sequenced. To increase variant specificity, several filters after processing as well as manual curation were applied to the initial set of CaVEMan mutation calls. Briefly, the spectrum of variant allele representation between forward and reverse reads and the range of positions in each read were evaluated as well as regions of low sequencing depth or poor sequence quality as previously described50. All substitutions were annotated to Ensembl version 58.
Variant detection (insertions, deletions and complex indels). To identify indels, we used a modified version of the Pindel51 algorithm allowing for map-ping of split reads using either one or both reads as an anchor and evaluating the second read through a series of split mappings. All putative indel calls were further filtered on the basis of coverage (minimum of three reads supporting a call), orientation (at least one read in each direction must report the call), local sequence context (variant length ≤ 4 within a sequence where the variant motif is repeated up to nine times) and with no more than 5% of normal reads reporting the indel variant. All indels were annotated to Ensembl version 58.
Variant detection (structural variations). Sequencing reads were mapped to the reference genome. Groups of at least two discordantly mapping paired-end reads by distance or orientation were identified using Brass (Breakpoint via Assembly)20. Putative structural variation was selected on the basis of the following criteria:
Groups of discordantly mapping paired-end reads supported by at least three discordant reads;Absence of discordant reads supporting the same variant in a panel of 45 in-house control genomes;Absence of discordantly mapping paired-end reads that showed at least 20% homology on either side of structural variant breakpoints identified in the 1,000 genomes sequenced by the 1000 Genome Project Consortium;Tandem duplications, intrachromosomal events and deletions greater than 1 kb in length;
•
•
•
•
Absence of an alternative best-mapping solution in the expected read-pair position called using less stringent alignment parameters;Absence of read clustering overlapping one of the paired-read ends in the group indicative of misalignment due to repetitive or recurrent genomic sequences;Groups of discordantly mapping paired-end reads that are supported by segmentation of GC-normalized copy number profiles.
Variant validation (substitutions). Primers were designed to amplify 300- to 500-bp fragments by conventional PCR for putative single-nucleotide substitutions identified by exome sequencing. PCR amplification was per-formed for both tumor and remission DNA pairs, and fragments were purified using SPRI bead clean up (Agencourt AMPure XP beads, Beckman Coulter). A sample-specific 8-bp index tag was incorporated during amplification to allow subsequent deconvolution of sample origin for all recurrent variants. Individual pools of normal and tumor samples were prepared and subjected to 454 pyrosequencing (Roche). Sequencing data were aligned as previously described, and targeted evaluation of sequence reads by chromosome, posi-tion and variant base was performed to confirm the somatic status of the reported variants.
Variant validation (indels). Primers were designed to amplify 300- to 500-bp fragments covering the genomic location of the identified indels. After purifi-cation, DNA fragments were sequenced twice using the ABI Dye Terminator Cycle Sequencing kit (Applied Biosystems).
Variant validation (structural variations). Primers mapping on either end of the reported structural variant in the appropriate orientation were designed and used for conventional PCR amplification on both tumor and remission DNA. PCR runs were performed in duplicate, and amplimers were separated by agarose gel electrophoresis. Conventional Sanger sequencing of amplimers unique to tumor samples enabled breakpoint resolution to the base-pair level. Sanger sequencing–derived sequences were mapped to the reference genome, and genomic breakpoint coordinates were characterized as well as annotated for the presence of microhomology, if homologous sequence was present in the respective 5′ and 3′ ends of the breakpoints, a NTS of one or more nucleotide bases was present in the breakpoint junction that did not map to the refer-ence genome or as clean blunt ends if the two breakpoints were continuous (Supplementary Fig. 3).
Copy number and loss-of-heterozygosity analysis. Copy number analysis was performed using ASCAT (version 2.2)52, taking into account non- neoplastic cell infiltration and tumor aneuploidy, and resulted in integral allele-specific copy number profiles for the tumor cells. Allele-specific copy number estimates for point mutations and indels were obtained by integrating copy number and sequencing data.
PD4020 variant annotation. For substitutions in subject PD4020a, we used CaVEMan parameters that showed a positive predictive value of 92.1% in a recent panel of 21 breast cancer genomes20. We further used a panel of DNA from 250 in-house unmatched normal samples to screen out variants in regions characterized by common sequencing artifacts. Variants present in five or more unmatched samples at a variant allele fraction greater than 5% were removed from the data set.
V(D)J score calculations. RSS motifs were scanned using a position-weight matrix (PWM) with weights taken from an RSS conservation table as reported17. Pseudocounts of 1 were used, and log2 likelihood scores for the PWM were calculated using the background model of a 20% background rate for C/G and a 30% rate for A/T. Spacer lengths were scored using log2 (relative affinity/optimal affinity), with the affinity values taken from Hesse et al.17. The experimental distribution of resection lengths (number of bases deleted before the final rearrangement join) were collated from real resection data from published studies9,16,18. Spacer lengths of 9–13 bp were allowed for 12-mer spacers and spacer lengths of 20–25 bp were allowed for the 23-mer spacers. Resection lengths of −1 to −50 were allowed, and, under the null
•
•
•

©20
14 N
atu
re A
mer
ica,
Inc.
All
rig
hts
res
erve
d.
Nature GeNetics doi:10.1038/ng.2874
model, all resection lengths were given the same weight. The resection likeli-hood score for a resection length of l was defined as log2 (relative observed resection length l frequency/null frequency). The PWM, spacer and resection log scores were treated as independent for each breakpoint, and both strands were searched for the best scoring motif defined as the sum of the three scores described above. To validate the RSS assignment, 26 structural variants map-ping to known targets of physiological V(D)J recombination were evaluated, successfully annotating the presence of a canonical RSS motif for 24 of the 26 variants (sensitivity = 92.3%). Furthermore, three sets of experimentally validated somatic rearrangements from a breast cancer study20, a pancreatic cancer study21 and a prostate cancer study22 were used as control data. RSS scores were calculated for these two data sets, and an FDR of >0.01 correspond-ing to an RSS score of 8.55 was used as a cutoff for calling RSS motifs from ALL rearrangements.
Motif search for CpGpC or CpG sequences or either of the proposed AID motifs16 (WRYC, RGYW or WGCW) was also performed in parallel for all resolved breakpoints. Agnostic repetitive ungapped motif analysis was per-formed using standard MEME23 parameters across 20-bp sequence fragments spanning the breakpoint junctions of all confirmed structural variants in the data set. The limit of output motifs was raised to 15, and the 3 most significant in each subset are presented. MEME analysis was also performed for the breast and pancreas data set as described.
Chromatin state annotation of ETV6-RUNX1 ALL structural variations. Chromatin segmentation profiles were generated using ENCODE annota-tion for GM12878. Each breakpoint junction was annotated for respective segmentation using the intersect and match functions of the R package G-Ranges. Appreciating that each joining end at a breakpoint junction is asso-ciated with an independent chromatin state, we annotated each breakpoints independently to 1 of the 15 chromatin states as defined by the ENCODE segmentation map.
Relative genomic segment representation was normalized to the propor-tion of each genomic segment in GM12878 by calculating the effect size of the number of structural variants in each chromatin segment over the total number of structural variants identified in the study to the proportion of each chromatin segment in the genome. The same calculations were performed for the control breast cancer and metastatic pancreatic cancer data sets using data for the HMMHMec epithelial cell line as provided by ENCODE.
Analysis of structural variation distribution by chromatin state. If struc-tural variation formation were random, one would expect the total number of structural variations in each chromatin state to be reflective of the relative length of that genome state. To derive values for the null hypothesis of a random distribution of structural variations across the genome, we calcu-lated the proportion of each chromatin state in the annotated genome. For example, in GM12878, 72.6% of the genome is annotated as heterochromatin, whereas active promoters occupy less than 1% of the genome (0.78%). To evaluate whether the overall distribution of structural variations in each study was different from what one would expect under a null model, we compared the proportion of structural variations mapping to each chromatin state to the relative proportion of the chromatin state in the tissue defined reference genome. These comparisons were performed for both the total structural variations in the present study as well as for the total structural variations within each class (structural variations with resolved breakpoints, structural variations with resolved breakpoints and an RSS signature, structural varia-tions with resolved breakpoints with no RSS signature) that maps within each chromatin state. We performed the same for the breast cancer and pancreatic cancer data set as well as for the hypodiploid ALL set. This analysis was not possible for prostate cancer owing to the unavailability of a chromatin segmentation map for prostate tissue.
To test whether the observed distribution of rearrangements was differ-ent from that expected by chance, we used Pearson’s goodness-of-fit tests. Essentially, the expected proportions of rearrangements falling in each chro-matin state under the null hypothesis were taken from the fraction of base pairs registered in each category from genome-wide ENCODE data for the matching normal cell type. All data were downloaded from the UCSC Genome Browser.
Biological relevance of identified mutations and structural rearrangements. Variants in known cancer genes were annotated according to an established reference of cancer genes from the Cancer Gene Census, known to be recur-rently mutated by base substitutions and indels and thought to contribute to cancer development. Variants that conformed to the well-recognized pat-terns of cancer-causing mutations for each cancer gene were annotated as ‘oncogenic’. For example, for recessive cancer genes or known tumor suppres-sors, truncating mutations and essential splice-site mutations were annotated as oncogenic. Missense mutations were included where they had been seen previously or conformed to the known pattern of missense mutation clusters previously reported for each gene in the Catalogue of Somatic Mutations in Cancer (COSMIC) database.
All structural variations in this study were cross-referenced with a table of common regions of loss of heterozygosity (LOH) as well as with fragile sites as defined by a meta-analysis of SNP array data derived from 2,218 primary tumors from 12 human cancers (J. Cheng, D.C.W., J.J. Pitt, H.G. Russnes, H.K.M. Vollan et al., unpublished data).
Deciphering signatures of mutational processes. Mutational signature analy-sis was performed using our previously developed theoretical model and its corresponding computational framework53. Briefly, we converted all mutation signature data from the exome data set into a matrix that is made up of 96 features comprising mutations counts for each mutation type (C>A, C>G, C>T, T>A, T>C, T>G) using each possible 5′ and 3′ context for all samples in the exome study. The algorithm deciphers the minimal set of mutational signatures that optimally explains the proportion of each mutation type and then estimates the contribution of each signature to each sample.
Significance of acquired somatic mutations. To evaluate at each gene whether the frequency of missense, nonsense and splice-site mutations was higher than expected by chance, we used an adaptation of a previously described method54. Briefly, the rate of mutation was modeled as a Poisson process, with the rate given by the product of the mutation rate and the impact of selection. In particular, we used 12 parameters to describe the different rates of the 12 possible single-nucleotide substitutions, 2 parameters to better account for the CpG effect on C>T transitions in each strand and 3 selection parameters to measure the observed-over-expected ratio of missense (wMIS), nonsense (wNON) and essential splice-site (wSPL) mutations. For example, the expected number of A>C missense mutations is modeled as ratemisA>C = (t) × (A>C) × (wMIS) × (LmisA>C), with LmisA>C being the number of sites that can suffer a missense A>C mutation (which is calculated for any particular sequence). t refers to the overall mutation rate or the density of mutations. The likelihood of observing nmisA>C missense A>C mutations given the expected ratemisA>C is then calculated as Likelihood = Poisson(nmisA>C | ratemisA>C). The likelihood of the entire model is the product of all individual likelihoods. This allowed us to quantify the strength of selection while avoiding the confounding effects of gene length, sequence composition and different rates for each substitution type. To obtain accurate estimates of the relative rates of each substitution type, the 14 rate parameters were estimated from the entire collection of mutations. These rates are shared by all genes, and maximum-likelihood estimates for wMIS, wNON and wSPLICE were obtained for each gene. Likelihood ratio tests were then used to test deviations from neutrality (wMIS = 1, wNON = 1 or wSPL = 1). Owing to the limited number of mutations, mutation rates were assumed to be constant among genes, but an additional likelihood ratio test was performed for each gene to detect violations of this assumption (compar-ing the observed number of synonymous mutations to the assumed mutation rate). No gene was found to deviate significantly from its estimated mutation rate in this data set (q > 0.05 for all genes). For indels, we tested for significant enrichment of indel recurrence within gene coding sequences compared to the expected background rate, under a uniform distribution model. Interactions between mutations were assessed to determine any codependence or mutual exclusivity using previously described methods54. Results for all validated substitutions are shown in Supplementary Table 6.
Chromatin-binding protein motif enrichment in ETV6-RUNX1 ALL rear-rangements. To control for the effect of differential rearrangement rates within varying chromatin states, the rearrangement rate per megabase, qi, was

©20
14 N
atu
re A
mer
ica,
Inc.
All
rig
hts
res
erve
d.
Nature GeNeticsdoi:10.1038/ng.2874
calculated as ni × 1,000,000/si, where ni and si are, respectively, the number of rearrangements that fall within a region with chromatin state i and the total number of base pairs throughout the genome in chromatin state i. For each of 75 chromatin-binding proteins (CBPs) or chromatin modifications, the expected number of rearrangement breakpoints that would fall within the binding sites of that CBP, E(rj), was then given by
E rs q
ji
i j i( )
, ,=
=∑ ,
1 000 0001
15
where si,j is the amount of DNA within the binding sites of chromatin- binding protein j identified by ENCODE as having chromatin state i. Assuming a Poisson distribution, the probability that the observed number of rearrange-ments within the binding sites of a CBP, rj,obs, was greater than expected by chance was then given by
P r E r P E r rj j j j( , ( )) ( ( )) ,obs > Poisson( obs)= >
Analysis was separately performed on all rearrangement breakpoints and on rearrangement breakpoints with a RAG signature. For CBPs with technical replicates, we evaluated each replicate individually as well as a more stringent subset comprising an intersect of the two technical replicates. FDRs were cal-culated using the Benjamini-Hochberg procedure55, after which H3K4me3 was the only CBP found to have an enrichment of rearrangements within its binding sites.
Single-cell labeling, flow sorting and analysis. Patient samples were thawed from liquid nitrogen–stored cryovials and stained using carboxyfluorescin diacetate, succinimidyl ester (CFSE). CFSE is a cell viability tracer that pas-sively diffuses into cells and only fluoresces once intracellular esterases cleave the acetyl groups from the compound. Single-cell sorting was performed on a BD FACSAria1–SORP instrument equipped with an automated cell deposition unit using the following settings: 100-micron nozzle, 1.4 bar sheath pressure, 32.6 kHz head drive and a flow rate that gave 1–200 events/s. Cell selection by forward-scattered light (FSC) and side-scattered light (SSC) accounted for cell size and internal complexity, allowing accurate selection of single cells and avoiding doublets and clumps. This novel approach for single-cell multiplex quantitative PCR (qPCR) analysis was followed according to a protocol
we developed30. Briefly, single cells were sorted directly into lysis buffer and were lysed. Specific (DNA) target amplification (STA) was then per-formed before qPCR. This multiplex STA reaction involves the simultaneous amplification of all target regions of interest using custom-designed TaqMan assays for case-specific mutations. Genotyping assays for the mutations of interest were custom designed according to the manufacturer’s guidelines. The STA product was then diluted before qPCR interrogation using the 96.96 dynamic microfluidic array and BioMark HD (Fluidigm) as recommended by the manufacturer.
V(D)J analysis. To determine the status of V(D)J recombination for the sam-ples in this study, we used the 21 BIOMED-2 primers56, and, for each sample in the study, we performed 20 independent PCRs. PCR analysis corresponding to the V(D)J segments with the brightest band were independently validated with a second PCR using the reaction conditions detailed in the BIOMED-2 protocol.
48. Kozarewa, I. et al. Amplification-free Illumina sequencing-library preparation facilitates improved mapping and assembly of (G+C)-biased genomes. Nat. Methods 6, 291–295 (2009).
49. Li, H. & Durbin, R. Fast and accurate long-read alignment with Burrows-Wheeler transform. Bioinformatics 26, 589–595 (2010).
50. Varela, I. et al. Exome sequencing identifies frequent mutation of the SWI/SNF complex gene PBRM1 in renal carcinoma. Nature 469, 539–542 (2011).
51. Ye, K., Schulz, M.H., Long, Q., Apweiler, R. & Ning, Z. Pindel: a pattern growth approach to detect break points of large deletions and medium sized insertions from paired-end short reads. Bioinformatics 25, 2865–2871 (2009).
52. Van Loo, P. et al. Allele-specific copy number analysis of tumors. Proc. Natl. Acad. Sci. USA 107, 16910–16915 (2010).
53. Alexandrov, L.B., Nik-Zainal, S., Wedge, D.C., Campbell, P.J. & Stratton, M.R. Deciphering signatures of mutational processes operative in human cancer. Cell Rep. 3, 246–259 (2013).
54. Greenman, C., Wooster, R., Futreal, P.A., Stratton, M.R. & Easton, D.F. Statistical analysis of pathogenicity of somatic mutations in cancer. Genetics 173, 2187–2198 (2006).
55. Klipper-Aurbach, Y. et al. Mathematical formulae for the prediction of the residual β cell function during the first two years of disease in children and adolescents with insulin-dependent diabetes mellitus. Med. Hypotheses 45, 486–490 (1995).
56. van Dongen, J.J. et al. Design and standardization of PCR primers and protocols for detection of clonal immunoglobulin and T-cell receptor gene recombinations in suspect lymphoproliferations: report of the BIOMED-2 Concerted Action BMH4-CT98-3936. Leukemia 17, 2257–2317 (2003).