Quantitative analysis of the shape of the corpus callosum in patients with autism and comparison...
17
http://aut.sagepub.com/ Autism http://aut.sagepub.com/content/early/2011/02/25/1362361310386506 The online version of this article can be found at: DOI: 10.1177/1362361310386506 published online 1 March 2011 Autism L. Williams, Nancy J. Minshew and Thomas E. Conturo Manuel F. Casanova, Ayman El-Baz, Ahmed Elnakib, Andrew E. Switala, Emily L. Williams, Diane and comparison individuals Quantitative analysis of the shape of the corpus callosum in patients with autism Published by: http://www.sagepublications.com On behalf of: The National Autistic Society can be found at: Autism Additional services and information for http://aut.sagepub.com/cgi/alerts Email Alerts: http://aut.sagepub.com/subscriptions Subscriptions: http://www.sagepub.com/journalsReprints.nav Reprints: http://www.sagepub.com/journalsPermissions.nav Permissions: at UNIVERSITY COLORADO on March 7, 2011 aut.sagepub.com Downloaded from
-
Upload
greenvillemed-sc -
Category
Documents
-
view
1 -
download
0
Transcript of Quantitative analysis of the shape of the corpus callosum in patients with autism and comparison...
http://aut.sagepub.com/Autism
http://aut.sagepub.com/content/early/2011/02/25/1362361310386506The online version of this article can be found at:
DOI: 10.1177/1362361310386506
published online 1 March 2011AutismL. Williams, Nancy J. Minshew and Thomas E. Conturo
Manuel F. Casanova, Ayman El-Baz, Ahmed Elnakib, Andrew E. Switala, Emily L. Williams, Dianeand comparison individuals
Quantitative analysis of the shape of the corpus callosum in patients with autism
Published by:
http://www.sagepublications.com
On behalf of:
The National Autistic Society
can be found at:AutismAdditional services and information for
http://aut.sagepub.com/cgi/alertsEmail Alerts:
http://aut.sagepub.com/subscriptionsSubscriptions:
http://www.sagepub.com/journalsReprints.navReprints:
http://www.sagepub.com/journalsPermissions.navPermissions:
at UNIVERSITY COLORADO on March 7, 2011aut.sagepub.comDownloaded from

autism © 2010SAGE Publicationsand The National
Autistic SocietyVol 15(2) 1–16; 386506
1362-3613(2010)
Quantitative analysis of theshape of the corpus callosumin patients with autism andcomparison individuals
M A N U E L F . C A S A N O VA University of Louisville, Kentucky, USA
A Y M A N E L - B A Z University of Louisville, Kentucky, USA
A H M E D E L N A K I B University of Louisville, Kentucky, USA
A N D R E W E . S W I TA L A University of Louisville, Kentucky, USA
E M I L Y L . W I L L I A M S University of Louisville, Kentucky, USA
D I A N E L . W I L L I A M S Duquesne University, Pittsburgh,Pennsylvania, USA
N A N C Y J . M I N S H E W University of Pittsburgh, Pittsburgh,Pennsylvania, USA
T H O M A S E . C O N T U R O Washington University, St. Louis,Missouri, USA
A B S T R A C T Multiple studies suggest that the corpus callosum inpatients with autism is reduced in size. This study attempts to elucidatethe nature of this morphometric abnormality by analyzing the shapeof this structure in 17 high-functioning patients with autism and anequal number of comparison participants matched for age, sex, IQ,and handedness.The corpus callosum was segmented from T1 weightedimages acquired with a Siemens 1.5 T scanner. Transformed coordi-nates of the curvilinear axis were aggregated into a parametric map andcompared across series to derive regions of statistical significance. Ourresults indicate that a reduction in size of the corpus callosum occursover all of its subdivisions (genu, body, splenium) in patients withautism. Since the commissural fibers that traverse the different anatom-ical compartments of the corpus callosum originate in disparate brainregions our results suggest the presence of widely distributed corticalabnormalities in people with autism.
A D D R E S S Correspondence should be addressed to: M A N U E L F. C A S A N OVA,Department of Psychiatry and Behavioral Sciences, University of Louisville, 500 S Preston StBldg 55A Rm 217,Louisville, Kentucky 40202,USA. e-mail:m0casa02@ louisville.edu
K E Y W O R D S
autisticdisorder;
cerebral cortexgrowth and
development;corpus
callosum;magneticresonanceimaging
1Copyright © The Author(s), 2010. Reprints and permissions:http://www.sagepub.co.uk/journalspermissions.navDOI: 10.1177/1362361310386506
at UNIVERSITY COLORADO on March 7, 2011aut.sagepub.comDownloaded from

There is at present a convergence of findings stemming from structuralneuroimaging studies indicating a reduction in size of the corpus callosumin patients with autism (Frazier and Hardan, 2009; Lainhart et al., 2005).This applies both to areal measurements (e.g. using one medial sagittalslice) and to volumetric assessments (Freitag et al., 2009; Hardan et al.,2009; Keary et al., 2009). Modeling of the corpus callosum using meta-analyses has shown medium effect size with area magnitude reductionsdecreasing along its caudal extent (i.e. genu → splenium) (Frazier andHardan, 2009). The fact that the corpus callosum is smaller in patients withautism is all the more striking when considering that, in this patientpopulation, total brain size apparently exhibits an age-dependent volu-metric increase (Hrdlicka, 2008).
The present study aims at elucidating the nature of the corpus callosumabnormality in patients with autism. It complements previous morpho-metric studies by quantifying the shape of the corpus callosum outlineacross series of individuals with autism and comparisons. Since commis-sural fibers bear a strict topographic relationship to originating/projectingcortical areas, focal shape abnormalities of the corpus callosum could helppinpoint which cortical region, or regions, are involved in the pathophys-iology of autism. In addition, focal abnormalities of the corpus callosumcould provide clues as to the timing and nature of a particular pathologi-cal change.
In this study we examine the outline of the corpus callosum in a seriesof patients with autism and age-matched comparisons. The morphometricmethod employed in our study provides a point by point descriptor ofcorpora callosa contours while being invariant to translation, rotation, andscaling. Inverse construction allowed for multidimensional representationsof the contours and anatomical depiction of the changes. The basic hypoth-esis of the study was that individuals with autism would exhibit a general-ized reduction in size of the corpus callosum. In other words, we expectedfor the corpus callosum of patients with autism to be conservative of shapebut to be otherwise reduced in size when compared to neurotypicals.
Method
The two groups of participants consisted of 17 high-functioning adoles-cents/adults diagnosed with autism (14 males, 3 females) and 17 matchedcomparisons (see Table 1). Participants in our comparison group werepaired with persons with autism on the basis of sex, age, ethnicity, hand-edness, and full scale IQ (Wechsler, 1999). All participants diagnosed withautism and most of the comparison participants were recruited from theUniversity of Pittsburgh’s Collaborative Program of Excellence in Autism
A U T I S M 15(2)
2
at UNIVERSITY COLORADO on March 7, 2011aut.sagepub.comDownloaded from

(CPEA). Written informed consent was obtained from all subjects followingexplanation of the procedures.
Participants diagnosed with autism were given the ADOS (Lord et al.,1989) and a parent/guardian or family member answered the ADI-R (Lordet al., 1994). Cutoff scores for ADOS were Communication: 3, Social: 6, andSocial/Communication Total: 10. Standard diagnostic cutoffs were utilizedwith the ADI-R. Participants diagnosed with autism did not have comorbidor causative conditions (chromosomal, neurologic, or infectious), had nohistory of seizures, perinatal brain injury, or head trauma, and were in goodgeneral medical health. The group of individuals with autism had bothverbal and full-scale IQ ≥ 80 to ensure adequate cooperation during proce-dures and testing, as well as to ensure good match to comparisons.
Candidates within the comparison group were screened for neurologic,psychiatric, and medical disorders, and their family history was screenedfor the same. Inclusion criteria for comparison individuals included: goodgeneral physical health, no regular use of psychotropic medications, goodperformance at school or on the job, and good peer relationships basedon self-report or staff observations during testing. Exclusion criteria forcomparison participants included: first-, second-, or third-degree relativediagnosed with ASD, personal and/or family history of psychiatric dis-orders, learning disability, perinatal brain injury, and head trauma. Bothgroups were screened for metal, claustrophobia, and body mass ≥ 114 kg,any of which would interfere with MRI scanning.
T1-weighted images were acquired with Siemens MAGNETOM Vision1.5 T scanners using an MPRAGE acquisition sequence. The two deviceswere located at University of Pittsburgh Medical Center (Shadyside) andWashington University School of Medicine. A single scanner operator em-ployed identical scanning protocols at both locations. Previously reportedDTT data from this equipment (Conturo et al., 2008) found that the twoscanners produce equivalent results. Each volume included 128 sagittalslices, comprising the entire head with a pixel size 1 mm2 and slice spacing1.25 mm.
Corpus callosum segmentation and mapping
Probabilistic model of the corpus callosum’s shapeMost of the recent literature on image segmentation employs level set-basedrepresentations of shape, in which a region’s boundary is the set of points{x: F(x) = k} for x = (x, y, z) a point in space, F a scalar function, and k aconstant. Without loss of generality one may always take k = 0. (Just letG(x) = F(x) – k; then the level set is {x: G(x) = 0}.) With k = 0, useful
I N T E R E S T- B A S E D L E A R N I N G
3
at UNIVERSITY COLORADO on March 7, 2011aut.sagepub.comDownloaded from

A U T I S M 15(2)
4
Tabl
e 1
Dem
ogra
phic
s o
f stu
dy p
arti
cipa
nts
Case
Age
Sex
Ethn
icity
Han
d.IQ
VIQ
PIQ
Med
icatio
ns
A1
22.2
MC
auca
sian
R10
810
710
8at
omox
eten
e(S
trat
tera
)C
124
.1M
Cau
casi
anR
115
111
116
none
A2
22.1
MC
auca
sian
R10
097
102
paro
xetin
eC
224
.8M
Cau
casi
anR
109
105
112
none
A3
25.7
MC
auca
sian
R11
811
611
6no
neC
323
.1M
Cau
casi
anR
111
107
114
met
hotr
exat
ea;c
hlor
oqui
nea ;
rani
tidin
eA
420
.0M
Cau
casi
anR
9595
95qu
etia
pine
(Ser
oque
l)C
420
.6M
Cau
casi
anR
103
102
103
none
A5
22.3
MC
auca
sian
R10
583
132
carb
amaz
epin
e;du
loxe
tine
(Cym
balta
)C
519
.8M
Cau
casi
anR
105
9311
7no
neA
621
.9F
Cau
casi
anR
101
9610
6fe
xofe
nadi
ne(A
llegr
a);c
etiri
zine
(Zyr
tec)
;lor
atad
ine
(Cla
ritin
);na
prox
enC
619
.4F
Cau
casi
anR
9295
109
none
A7
23.8
MC
auca
sian
R99
9310
5no
neC
723
.7M
Cau
casi
anR
9989
109
none
A8
32.9
MC
auca
sian
L11
010
411
6no
neC
832
.4M
Cau
casi
anL
105
9411
6no
neA
939
.6F
Cau
casi
anR
9410
980
none
C9
36.6
FC
auca
sian
R10
811
996
none
A10
53.4
FC
auca
sian
R11
011
010
7un
spec
ified
thy
roid
med
icat
ion
C10
50.9
FC
auca
sian
R11
611
511
2no
neA
1122
.5M
Cau
casi
anR
116
112
117
met
hylp
heni
date
;mirt
azap
ine
C11
22.6
MC
auca
sian
R11
711
611
4no
ne
Tabl
e co
ntin
ued
oppo
site
at UNIVERSITY COLORADO on March 7, 2011aut.sagepub.comDownloaded from

I N T E R E S T- B A S E D L E A R N I N G
5
Tabl
e 1
Dem
ogra
phic
s o
f stu
dy p
arti
cipa
nts
Case
Age
Sex
Ethn
icity
Han
d.IQ
VIQ
PIQ
Med
icatio
ns
A12
18.2
MC
auca
sian
R11
811
112
1no
neC
1219
.8M
Cau
casi
anR
113
105
120
none
A13
17.7
MC
auca
sian
R98
9510
1no
neC
1316
.5M
Cau
casi
anR
8688
88su
lface
tam
ide;
clin
dam
ycin
;taz
arot
ene;
azel
eic
acid
A14
49.2
MC
auca
sian
R96
8810
3no
neC
1451
.8M
Cau
casi
anR
9397
91no
neA
1522
.7M
Cau
casi
anR
9683
110
cital
opra
m;m
ultiv
itam
in;v
itam
in E
C15
21.7
MC
auca
sian
R10
196
106
min
ocyc
line
A16
19.2
MC
auca
sian
R99
109
88no
neC
1617
.2M
Cau
casi
anR
9996
102
none
A17
16.5
MA
sian
R11
210
411
9flu
oxet
ine
C17
18.5
MA
sian
R11
711
911
1no
ne
a.Ta
ken
for
arth
ritis
.N
ote.
See
also
Con
turo
et
al.(
2008
).A
n/C
n=
mat
ched
aut
ism
/com
pari
son
pair
n;A
ge =
yea
rs o
f age
at
time
of s
can;
Han
d.=
han
dedn
ess;
IQ =
full-
scal
e IQ
;V
IQ =
ver
bal I
Q;P
IQ =
per
form
ance
IQ;M
edic
atio
ns =
tak
en w
ithin
thr
ee y
ears
pri
or t
o M
RI s
can.
at UNIVERSITY COLORADO on March 7, 2011aut.sagepub.comDownloaded from

choices for F are signed metrics of displacement from the boundary; i.e.F < 0 inside the region, F > 0 outside the region, and |F| increases withdistance from the boundary. Then the region’s shape is approximated bythe closest linear combination of training shapes.The main drawback of thisrepresentation is that the space of signed distance functions is not closedwith respect to linear operations. Linear combinations of the distance func-tions may result in level sets with invalid or even physically impossibletopology, e.g. the approximation may be self-intersecting.
To circumvent this limitation, we represent the shape of the corpuscallosum having been learned from a training set of co-registered MRI witha ‘soft’ template, or probabilistic 3D model, s: R → [0,1], where s(x, y, z)is the empirical probability that the voxel (x, y, z) in anatomical space Rbelongs to the corpus callosum.The soft template is constructed as follows:
Co-align the training set of MRI using a rigid 3D registration with mutualinformation as a similarity measure (Viola and Wells, 1995).
Manually segment the corpus callosum from each MRI in the aligned set.
Estimate the voxel-wise probabilities s(x, y, z) as the fraction of aligned imageswhere voxel (x, y, z) was labeled as belonging to the corpus callosum.
Once constructed, s is used to facilitate segmentation of the corpuscallosum from an MRI. Let g denote a given grayscale MRI, and let mdenote the desired binary region map (i.e. m(x, y, z) = 1 for (x, y, z) insidethe corpus callosum, and m(x, y, z) = 0 otherwise). Proceed as follows:
Align g to a prototype selected from the training set for s, again using mutualinformation as a similarity measure.
Estimate the probability distribution of voxel values within the corpus callo-sum, P(g|m), by fitting a bimodal linear combination of discrete Gaussians.
From P(g|m) and the learned probabilistic shape model s, construct an initialregion map m.
Use the initial region map to update the conditional intensity P(g|m), anditerate. For details see El-Baz and Gimel’farb (2009).
MappingComparison of the corpus callosum between different subjects and groupsis facilitated by mapping their respective boundaries into a standardizedcoordinate system.We employed a pseudocylindrical system (ρ, ϕ, z) basedupon the medial axis of the corpus callosum extending from splenium togenu (Figure 1); i.e. the centerline. The mapping is defined as follows(Casanova et al., 2010): a given point on the boundary of the corpuscallosum lies in some plane intersecting the centerline at a right angle. The
A U T I S M 15(2)
6
at UNIVERSITY COLORADO on March 7, 2011aut.sagepub.comDownloaded from

arc length along the centerline from the splenium to the point of intersec-tion becomes the z coordinate. Then ϕ is the polar angle in the orthogonalplane measured clockwise from anatomical right, and ρ is the straight-line(Euclidean) distance from the boundary point to the point of intersection.
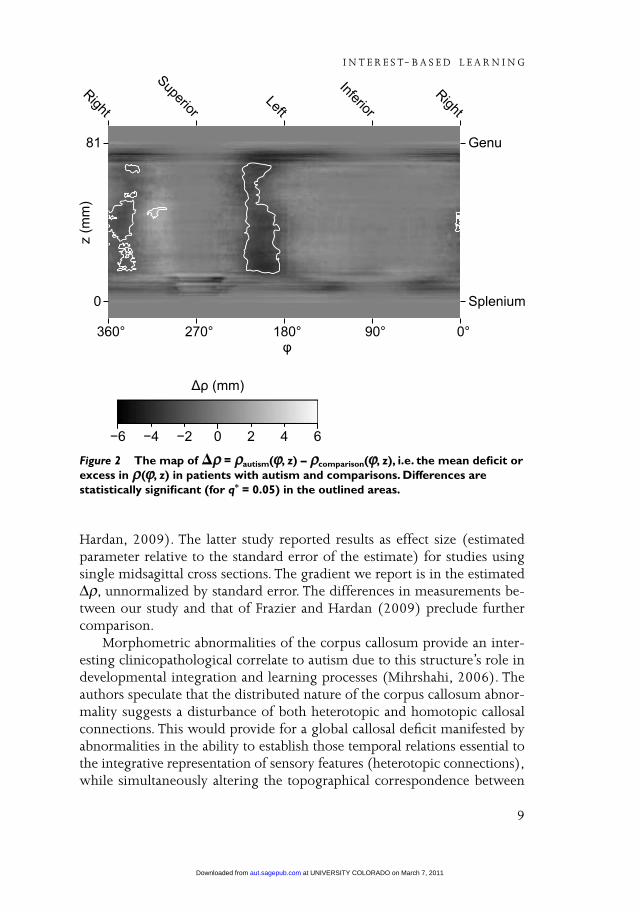
The construction is analogous to the cylindrical equal-area projectionsometimes used for maps of the Earth or other bodies. Of course themapping is not equal-area in the case of the corpus callosum, which is farfrom spherical in shape. It must not be presumed that each pixel in Figure2 represents a similarly sized patch of the CC boundary.
StatisticsThe boundary of each corpus callosum was treated as a two-dimensionalmap ρ(ϕ, z) providing the effective radius of the corpus callosum in a givendirection from a given point along the centerline. Each matched pair oftransformed surfaces was differenced pointwise, ∆ρ(ϕ, z) = ρautism(ϕ, z) –ρcomparisons(ϕ, z). The pairwise differences were aggregated pointwise toyield a statistical parametric map of t statistics with 16 degrees of freedom.Regions where ∆ρ was statistically significant – i.e. where we reject the nullhypothesis ∆ρ(ϕ, z) = 0 – were identified by thresholding the raw two-sided p values using the method of Benjamini and Hochberg (1995) witha false discovery rate q* = 0.05.
I N T E R E S T- B A S E D L E A R N I N G
7
Figure 1 Mapping the surface of the corpus callosum. In the pseudocylindricalcoordinate system, the z coordinate is the arc length along the centerline fromthe splenium (left). Radius and polar angle are then measured within the planeorthogonal to the centerline at z.
at UNIVERSITY COLORADO on March 7, 2011aut.sagepub.comDownloaded from
Results
Mean age of the participants with autism was 26.1 years (s.d. 10.8 years)at the time of MRI acquisition, while mean age of the comparison clientswas 26.5 years (s.d. 10.9 years). There was no significant difference be-tween groups in age (paired t = .78; 16 df.; p = .45), and no paired subjectsdiffered in age by more than three years. Mean IQ scores of those withautism were full-scale 105 (s.d. 9.4), verbal 103 (s.d. 10.3), and perfor-mance 108 (s.d. 9.2). Among the comparison clients mean IQ scores werefull-scale 104 (s.d. 8.3), verbal 101 (s.d. 10.3), and performance 107 (s.d.12.6). Again there was no significant difference between groups (paired t= –.48, –.97, –.26, respectively; 16 df.; p = .64, .35, .80, respectively).Paired subjects did not differ by more than 14 IQ points (full-scale), orby more than 15 and 16 points on the verbal and performance scales,respectively.
White matter in autism was reduced bilaterally along the body of thecorpus callosum, where ∆ρ took values as low as –4.3 mm (s.d. 2.3 mm)on the left side and –2.8 mm (s.d. 1.6 mm) on the right. There was apartfrom this an increase of up to ∆ρ = 2.3 mm (s.d. 2.4 mm) in the regionproximate to the right cingulate gyrus. There was also a reduction in thesplenium in autism, of up to ∆ρ = –5.1 mm, although it was not statisti-cally significant. There was otherwise no significant difference around themedial sagittal plane (Figure 2, Figure 3).
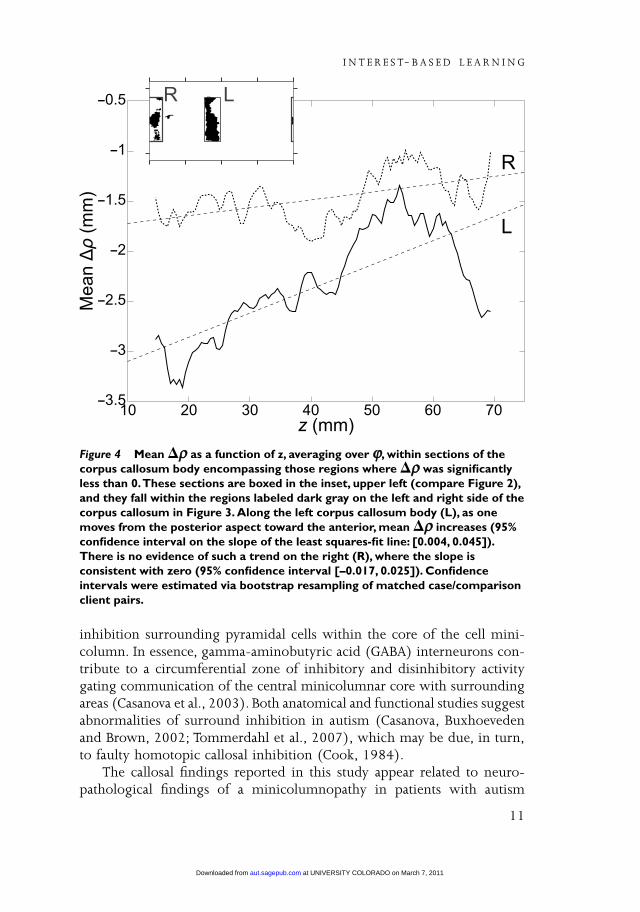
Where ∆ρ was significantly negative along the left side, there was aslight positive trend with increasing z. That is, ∆ρ was more negative onthe left posterior body of the CC than on the left anterior body (Figure 4).There was no significant evidence for a similar trend on the right CC body.
Discussion
The results of our study, in agreement with the previous literature, showeda smaller corpus callosum in patients with autism when examined againsta comparison group (Frazier and Hardan, 2009; Lainhart et al., 2005). Thecorpus callosum was significantly reduced in size throughout its extent(lengthwise), with the largest differences noted at the level of the splenium.Although we did not attempt to parcellate the corpus callosum, statisticalanalysis suggested a gradient of severity spanning the rostro-caudal axis ofthe corpus callosum. The significance of the finding is hard to interpret,being present on the left but absent on the right side (Figure 4). Thefindings could be due to the smaller left hemisphere planum temporalereported in autism (Rojas et al., 2002). A gradient of severity for the corpuscallosum in autism was also described in a meta-analysis (Frazier and
A U T I S M 15(2)
8
at UNIVERSITY COLORADO on March 7, 2011aut.sagepub.comDownloaded from
Hardan, 2009). The latter study reported results as effect size (estimatedparameter relative to the standard error of the estimate) for studies usingsingle midsagittal cross sections. The gradient we report is in the estimated∆ρ, unnormalized by standard error. The differences in measurements be-tween our study and that of Frazier and Hardan (2009) preclude furthercomparison.
Morphometric abnormalities of the corpus callosum provide an inter-esting clinicopathological correlate to autism due to this structure’s role indevelopmental integration and learning processes (Mihrshahi, 2006). Theauthors speculate that the distributed nature of the corpus callosum abnor-mality suggests a disturbance of both heterotopic and homotopic callosalconnections. This would provide for a global callosal deficit manifested byabnormalities in the ability to establish those temporal relations essential tothe integrative representation of sensory features (heterotopic connections),while simultaneously altering the topographical correspondence between
I N T E R E S T- B A S E D L E A R N I N G
9
Figure 2 The map of �ρρ = ρρautism(ϕϕ, z) – ρρcomparison(ϕϕ, z), i.e. the mean deficit orexcess in ρρ(ϕϕ, z) in patients with autism and comparisons. Differences arestatistically significant (for q* = 0.05) in the outlined areas.
at UNIVERSITY COLORADO on March 7, 2011aut.sagepub.comDownloaded from

right and left maps contributing to the generation of feature-selective recep-tive fields (homotopic connections) (Houzel and Milleret, 1999). Giventhe role of heterotopic and homotopic connections it is not surprising thatpatients with agenesis of the corpus callosum exhibit social and behavioralproblems associated with autism (Badaruddin et al., 2007).
According to the homotopic callosal inhibitory theory of Cook (1984),the process of activation of cortical columns in the left hemisphere duringverbal processing provides for surround inhibition, which in turn preventsactivation of neighboring columns with their contiguous cognitive content.The genesis of this surround inhibition rests within the peripheral neuropilspace wherein different anatomical elements provide a shower curtain of
A U T I S M 15(2)
10
Figure 3 Regions where the corpus callosum of individuals with autism andcomparisons appear to differ, as in Figure 2, mapped onto a reference surface(the average corpus callosum of the comparison group) and viewed from aboveand from below.The corpus callosum of an individual with autism would tend toenvelop the reference surface in the highlighted areas (�ρρ > 0). It would tendto lie entirely inside the reference surface in the darkened areas (�ρρ < 0). In themedium gray labeled area (�ρρ ≈≈ 0), it would not differ significantly from thereference.
at UNIVERSITY COLORADO on March 7, 2011aut.sagepub.comDownloaded from
inhibition surrounding pyramidal cells within the core of the cell mini-column. In essence, gamma-aminobutyric acid (GABA) interneurons con-tribute to a circumferential zone of inhibitory and disinhibitory activitygating communication of the central minicolumnar core with surroundingareas (Casanova et al., 2003). Both anatomical and functional studies suggestabnormalities of surround inhibition in autism (Casanova, Buxhoevedenand Brown, 2002; Tommerdahl et al., 2007), which may be due, in turn,to faulty homotopic callosal inhibition (Cook, 1984).
The callosal findings reported in this study appear related to neuro-pathological findings of a minicolumnopathy in patients with autism
I N T E R E S T- B A S E D L E A R N I N G
11
Figure 4 Mean �ρρ as a function of z, averaging over ϕϕ, within sections of thecorpus callosum body encompassing those regions where �ρρ was significantlyless than 0.These sections are boxed in the inset, upper left (compare Figure 2),and they fall within the regions labeled dark gray on the left and right side of thecorpus callosum in Figure 3. Along the left corpus callosum body (L), as onemoves from the posterior aspect toward the anterior, mean �ρρ increases (95%confidence interval on the slope of the least squares-fit line: [0.004, 0.045]).There is no evidence of such a trend on the right (R), where the slope isconsistent with zero (95% confidence interval [–0.017, 0.025]). Confidenceintervals were estimated via bootstrap resampling of matched case/comparisonclient pairs.
at UNIVERSITY COLORADO on March 7, 2011aut.sagepub.comDownloaded from

(Casanova, Buxhoeveden, Switala, et al., 2002; Casanova et al., 2006). Thecerebral cortex is composed of elementary processing units arranged incolumnar fashion (Hofman, 1985). Rakic has proposed that the size of theneocortex (i.e. the number of columnar arrangements) is the product ofsupernumerary mitotic activity within the germinal cells of the periventri-cular zone and their longevity during individual embryonic development(Rakic and Kornack, 2001). A series of asymmetrical divisions involvingthese cells provides for clones which migrate to the cortex under theguidance of a glial scaffolding (Casanova, El-Baz, Vanbogaert, et al., 2009).With each generated minicolumn there is an increased need for creatingsupporting interconnections. It has been calculated that each minicolumnis associated with approximately 103 other minicolumns (Casanova, 2004).The overall increase in minicolumns seen during corticalization thereforeprovides for bigger brains and a biased gray/white matter ratio (Casanova,Buxhoeveden and Brown, 2002). In essence, the bigger brains within anencephalization plot have more white matter than expected when consid-ering size alone (Hofman, 2001).
Since mean diameter of the longer projection fibers is essentially constantacross species (Olivares et al., 2001) average transmission times across com-misural pathways increase directly with size of the brain. This temporaldelay for interhemispheric communication is significant enough that thehuman brain has found it more efficient to emphasize an ‘intrahemisphericmodus operandi’ (Doty, 2007). In effect the white matter increase observedwith increasing encephalization is made primarily of short arcuate pro-jections at the expense of longer corticocortical connections including thecommisural tracks (Casanova, 2004). Across species, those with biggerbrains have smaller corpora callosa (Olivares et al., 2000; Rilling and Insel,1999). This finding is the putative mechanism underlying both cerebraldominance and the emergence of higher cognitive functions such aslanguage (Casanova and Tillquist, 2008). Many of the reported morpho-metric abnormalities in autism (e.g., bigger brains, overabundance ofarcuate fibers, smaller corpus callosum) may therefore be interdependent.In essence, abnormalities of both corpus callosum size and cerebral domi-nance have been implicated in psychiatric conditions, such as autism, thatare characterized by increased brain size and the presence of languagedisorder (Herbert et al., 2005; Johnson and Casanova, 2009; Williams andCasanova, 2010).
The findings of our study acquire relevance from the recent literaturein autism espousing a bias in connectivity favoring short connections (e.g.arcuate fibers) at the expense of longer corticocortical projections (e.g.commisural fibers). Hypotheses to this effect were postulated by Belmonteet al. (2004) and Mottron et al. (2006). Belmonte’s hypothesis was based
A U T I S M 15(2)
12
at UNIVERSITY COLORADO on March 7, 2011aut.sagepub.comDownloaded from

on clinical observations suggesting that patients with autism experience alack of ‘central coherence’ (Happé and Frith, 2006) and gamma frequencyabnormalities (Brock et al., 2002; Sokhadze et al., 2009). Mottron’s model,referred to as enhanced perceptual functioning, was based on enhancedlow-level operations. The latter author proposed atypical inhibition andfunctional autonomy of perceptual operations from top-down processinginfluences. Anatomical evidence in support of these hypotheses came fromparcellation studies of the white matter (Herbert et al., 2004), indicatingan enlarged outer radiate compartment (i.e. space occupied by arcuatefibers), smaller neurons (Casanova et al., 2006) favoring transmission alongshorter pathways, and structural imaging studies showing a reduction ofthe gyral window (Casanova, El-Baz, Mott, et al., 2009), which would serveto constrain the size of longer projection fibers in patients with autism.Functional neuroimaging studies have similarly shown a number of measuressuggesting underconnectivity among distant brain regions (Just et al., 2007).
Results from our study indicate a generalized reduction of the corporacallosa in those participants diagnosed with autism. Generalized findings,involving the rostro-caudal extent of the corpus callosum, is consistent witha mitotic event affecting periventricular germinal cells and the total numberof cortical minicolumns (i.e. the putative mechanism for encephalization).This suggests the presence of either a time window of vulnerability duringearly development as symmetrical divisions of periventricular germinal cellstake place (i.e. first forty days of gestation in primates) (Rakic and Kornack,2001), or a later acting exogenous influence capable of propitiating thismitotic process at an inopportune moment. Furthermore, since the com-misural fibers that transverse the different anatomical compartments of thecorpus callosum originate in disparate brain regions, our results suggestthe presence of widely distributed cortical abnormalities in people diag-nosed with autism.
It is worthwhile noticing that completely opposite morphometricfindings have now been reported in developmental dyslexia. Both dyslexiaand autism appear to fall at opposite ends of a minicolumnar spectrumwhich is manifested by divergent findings in regards to measurements fortotal brain volume, gyral window, white matter parcellation, and size ofthe corpus callosum (Williams and Casanova, 2010). Although a pervasivedisorder may affect, by definition, learning abilities, our findings and thosepreviously reported (e.g. white matter parcellation) suggest that the under-lying substratum for this deficit is different for both autism and develop-mental dyslexia.
I N T E R E S T- B A S E D L E A R N I N G
13
at UNIVERSITY COLORADO on March 7, 2011aut.sagepub.comDownloaded from

FundingThis work was supported primarily by the Nancy Lurie Marks Family Foun-dation; also by the National Institutes of Health (grant numbers ACE P50HD55748, CPEA U19 HD35469, K23 DC06691, R01 HD65279, R01MH86784, R01 NS39538, R01 NS52470, R21 MH90494); and AutismSpeaks (grant number AS03799).
ReferencesBadaruddin, D.H., Andrews, G.L., Bölte, S., Schilmoeller, K.J., Schilmoeller, G., Paul,
L.K. & Brown,W.S. (2007) ‘Social and Behavioral Problems of Children withAgenesis of the Corpus Callosum’, Child Psychiatry and Human Development 38:287–302.
Belmonte, M.K., Allen, G., Beckel-Mitchener, A., Boulanger, L.M., Carper, R.A. &Webb, S.J. (2004) ‘Autism and Abnormal Development of Brain Connectivity’,Journal of Neuroscience 24: 9228–31.
Benjamini,Y. & Hochberg,Y. (1995) ‘Controlling the False Discovery Rate: A Practicaland Powerful Approach to Multiple Testing’, Journal of the Royal Statistical Society B 57:289–300.
Brock, J., Brown, C.C., Boucher, J. & Rippon, G. (2002) ‘The Temporal Binding DeficitHypothesis of Autism’, Development and Psychopathology 14: 209–24.
Casanova, M.F. (2004) ‘White Matter Volume Increase and Minicolumns in Autism’,Annals of Neurology 56: 453.
Casanova, M.F., Buxhoeveden, D.P. & Brown, C. (2002) ‘Clinical and MacroscopicCorrelates of Minicolumnar Pathology in Autism’, Journal of Child Neurology 17: 692–5.
Casanova, M.F., Buxhoeveden, D.P., & Gomez, J. (2003) ‘Disruption in the InhibitoryArchitecture of the Cell Minicolumn: Implications for Autism’, The Neuroscientist 9:496–507.
Casanova, M.F., Buxhoeveden, D.P., Switala, A.E. & Roy, E. (2002) ‘MinicolumnarPathology in Autism’, Neurology 58: 428–32.
Casanova, M.F., El-Baz, A.S., Elnakib, A., Giedd, J.N., Rumsey, J.M.,Williams, E.L. &Switala, A.E. (2010) ‘Corpus Callosum Shape Analysis with Application toDyslexia’, Translational Neuroscience, 1(2): 124–130, 2010.
Casanova, M.F., El-Baz, A.S., Mott, M., Mannheim, G.B., Hassan, H., Fahmi, R., Giedd,J., Rumsey, J.M., Switala, A.E. & Farag, A.A. (2009) ‘Reduced Gyral Window andCorpus Callosum Size in Autism: Possible Macroscopic Correlates of aMinicolumnopathy’, Journal of Autism and Developmental Disorders 39: 751–64.
Casanova, M.F., El-Baz, A.S.,Vanbogaert, E., Narahari, P. & Trippe, J. (2009)‘Minicolumnar Width: Comparison between Supragranular and InfragranularLayers’, Journal of Neuroscience Methods 184: 19–24.
Casanova, M.F. & Tillquist, C. (2008) ‘Encephalization, Emergent Properties, andPsychiatry: A Minicolumnar Perspective’, The Neuroscientist 14: 101–18.
Casanova, M.F.,Van Kooten, I.A.J., Switala, A.E.,Van Engeland, H., Heinsen, H.,Steinbusch, H.W.M., Hof, P.R.,Trippe, J., Stone, J., & Schmitz, C. (2006)‘Minicolumnar Abnormalities in Autism’, Acta Neuropathologica 112: 287–303.
Conturo,T.E.,Williams, D.L., Smith, C.D., Gultepe, E., Akbudak, E. & Minshew, N.J.(2008) ‘Neuronal Fiber Pathway Abnormalities in Autism: An Initial MagneticResonance Imaging Diffusion Tensor Tracking Study of Hippocampo-Fusiform andAmygdalo-Fusiform Pathways’, Journal of the International Neuropsychological Society 14: 1–14.
A U T I S M 15(2)
14
at UNIVERSITY COLORADO on March 7, 2011aut.sagepub.comDownloaded from

Cook, N.D. (1984) ‘Homotopic Callosal Inhibition’, Brain and Language 23: 116–25.Doty, R.W. (2007) ‘Cortical Commissural Connections in Primates’, in T.M. Preuss &
J.H. Kaas (eds) The Evolution of Primate Nervous Systems, pp. 277–89. Oxford: Elsevier.El-Baz, A.S. & Gimel’farb, G. (2009) ‘Robust Medical Images Segmentation Using
Learned Shape and Appearance Models’, in Medical Image Computing and Computer-AssistedIntervention, pp. 281–8. Berlin: Springer.
Frazier,T.W. & Hardan, A.Y. (2009) ‘A Meta-Analysis of the Corpus Callosum inAutism’, Biological Psychiatry 66: 935–41.
Freitag, C.M., Luders, E., Hulst, H.E., Narr, K.L.,Thompson, P.M.,Toga, A.W., Krick, C.& Konrad, C. (2009) ‘Total Brain Volume and Corpus Callosum Size inMedication-Naïve Adolescents and Young Adults with Autism Spectrum Disorder’,Biological Psychiatry 66: 316–9.
Happé, F. & Frith, U. (2006) ‘The Weak Coherence Account: Detail-Focused CognitiveStyle in Autism Spectrum Disorders’, Journal of Autism and Developmental Disorders 36: 5–25.
Hardan, A.Y., Pabalan, M., Gupta, N., Bansal, R., Melhem, N.M., Fedorov, S., Keshavan,M.S. & Minshew, N.J. (2009) ‘Corpus Callosum Volume in Children with Autism’,Psychiatry Research: Neuroimaging 174: 57–61.
Herbert, M.R., Ziegler, D.A., Deutsch, C.K., O’Brien, L.M., Kennedy, D.N., Filipek, P.A.,Bakardjiev, A.I., Hodgson, J., Takeoka, M. & Caviness,V.S., Jr. (2005) ‘BrainAsymmetries in Autism and Developmental Language Disorder: A NestedWhole-Brain Analysis’, Brain 128: 213–26.
Herbert, M.R., Ziegler, D.A., Makris, N., Filipek, P.A., Kemper,T.L., Normandin, J.J.,Sanders, H.A., Kennedy, D.N., & Caviness,V.S., Jr. (2004) ‘Localization of WhiteMatter Volume Increase in Autism and Developmental Language Disorder’, Annals ofNeurology 55: 530–40.
Hofman, M.A. (1985) ‘Neuronal Correlates of Corticalization in Mammals: A Theory’,Journal of Theoretical Biology 112: 77–95.
Hofman, M.A. (2001) ‘Brain Evolution in Hominids: Are We at the End of the Road?’in D. Falk & K.R. Gibson (eds) Evolutionary Anatomy of the Primate Cerebral Cortex,pp. 113–27. Cambridge: Cambridge University Press.
Houzel, J.-C. & Milleret, C. (1999) ‘Visual Inter-Hemispheric Processing: Constraintsand Potentialities Set by Axonal Morphology’, Journal of Physiology 93: 271–84.
Hrdlicka, M. (2008) ‘Structural Neuroimaging in Autism’, Neuroendocrinology Letters 29:281–6.
Johnson, S.B. & Casanova, M.F. (2009) ‘Interhemispheric Connectivity: The Evolutionand Nature of the Corpus Callosum’, in T.B.Westland & R.N. Calton (eds) Handbookon White Matter: Structure, Function, and Changes, pp. 3–15. Hauppauge: Nova Science.
Just, M.A., Cherkassky,V.L., Keller, T.A., Kana, R.K. & Minshew, N.J. (2007) ‘Functionaland Anatomical Cortical Underconnectivity in Autism: Evidence from an fMRIStudy of an Executive Function Task and Corpus Callosum Morphometry’, CerebralCortex 17: 951–61.
Keary, C.J., Minshew, N.J., Bansal, R., Goradia, D., Fedorov, S., Keshavan, M.S., &Hardan, A.Y. (2009) ‘Corpus Callosum Volume and Neurocognition in Autism’,Journal of Autism and Developmental Disorders 39: 834–41.
Lainhart, J.E., Lazar, M., Bigler, E.D. & Alexander, A. (2005) ‘The Brain During Life inAutism: Advances in Neuroimaging Research’, in M.F. Casanova (ed) RecentDevelopments in Autism Research, pp. 57–108. New York: Nova Biomedical.
Lord, C., Rutter, M., Goode, S., Heemsbergen, J., Jordan, H., Mawhood, L. &Schopler, E. (1989) ‘Austism Diagnostic Observation Schedule: A Standardized
I N T E R E S T- B A S E D L E A R N I N G
15
at UNIVERSITY COLORADO on March 7, 2011aut.sagepub.comDownloaded from
Observation of Communicative and Social Behavior’, Journal of Autism and DevelopmentalDisorders 19: 185–212.
Lord, C., Rutter, M. & Le Couteur, A. (1994) ‘Autism Diagnostic Interview–Revised:A Revised Version of a Diagnostic Interview for Caregivers of Individuals withPossible Pervasive Developmental Disorders’, Journal of Autism and Developmental Disorders24: 659–85.
Mihrshahi, R. (2006) ‘The Corpus Callosum as an Evolutionary Innovation’, Journal ofExperimental Zoology 306B: 8–17.
Mottron, L., Dawson, M., Soulières, I., Hubert, B. & Burack, J. (2006) ‘EnhancedPerceptual Functioning in Autism: An Update, and Eight Principles of AutisticPerception’, Journal of Autism and Developmental Disorders 36: 27–43.
Olivares, R., Michalland, S. & Aboitiz, F. (2000) ‘Cross-Species and IntraspeciesMorphometric Analysis of the Corpus Callosum’, Brain, Behavior and Evolution 55:37–43.
Olivares, R., Montiel, J. & Aboitiz, F. (2001) ‘Species Differences and Similarities inthe Fine Structure of the Mammalian Corpus Callosum’, Brain, Behavior and Evolution57: 98–105.
Rakic, P. & Kornack, D. (2001) ‘Neocortical Expansion and Elaboration DuringPrimate Evolution: A View from Neuroembryology’, in D. Falk & K.R. Gibson (eds)Evolutionary Anatomy of the Primate Cerebral Cortex, pp. 30–56. Cambridge: CambridgeUniversity Press.
Rilling, J.K. & Insel,T.R. (1999) ‘The Primate Neocortex in Comparative PerspectiveUsing Magnetic Resonance Imaging’, Journal of Human Evolution 37: 191–223.
Rojas, D.C., Bawn, S.D., Benkers,T.L., Reite, M.L., & Rogers, S.J. (2002) ‘Smaller LeftHemisphere Planum Temporale in Adults with Autistic Disorder’, Neuroscience Letters328: 237–40.
Sokhadze, E.M., Singh, S., El-Baz, A.S., Baruth, J., Mathai, G., Sears, L., & Casanova,M.F. (2009) ‘Effect of a Low-Frequency Repetitive Transcranial MagneticStimulation (rTMS) on Induced Gamma Frequency Oscillations and Event-RelatedPotentials During Processing of Illusory Figures in Autism Spectrum Disorders’,Journal of Autism and Developmental Disorders, 39(4): 619–634, 2009.
Tommerdahl, M., Tannan,V., Cascio, C.J., Baranek, G.T. & Whitsel, B.L. (2007)‘Vibrotactile Adaptation Fails to Enhance Spatial Localization in Adults withAutism’, Brain Research 1154: 116–23.
Viola, P. & Wells,W.M., III. (1995) ‘Alignment by Maximization of MutualInformation’, Proceedings of the International Conference on Computer Vision 5: 20–3.
Wechsler, D. (1999) Wechsler Abbreviated Scale of Intelligence. San Antonio,TX:The Psychological Corporation.
Williams, E.L. & Casanova, M.F. (2010) ‘Autism and Dyslexia: A Spectrum of CognitiveStyles as Defined by Minicolumnar Morphometry’, Medical Hypotheses 74: 59–62.
A U T I S M 15(2)
16
at UNIVERSITY COLORADO on March 7, 2011aut.sagepub.comDownloaded from