Quality of life of older people in Karachi, Pakistan A thesis ...
444
1 Quality of life of older people in Karachi, Pakistan A thesis submitted for the Degrees of Doctor of Philosophy Institute for Health and Human development University of East London 2019
-
Upload
khangminh22 -
Category
Documents
-
view
6 -
download
0
Transcript of Quality of life of older people in Karachi, Pakistan A thesis ...

1
Quality of life of older people in Karachi, Pakistan
A thesis submitted for the Degrees of Doctor of Philosophy
Institute for Health and Human development
University of East London
2019

2
Abstract Introduction: There are several conceptualizations regarding the quality of life and what it means for
individuals. This thesis takes a specific approach to examine the quality of life by examining the
work of Maslow (1961), and Doyal, and Gough (1991), basic human needs. Doyal’s and
Gough’s (1991) work operationalized through CASP-19 (Control, Autonomy, Self-realization,
and Pleasure), a well-established and theoretically derived instrument to assess the quality of life
in older adults in Karachi, Pakistan.
Method: The cross-cultural survey was conducted to assess the quality of life of 50+ older adults in
Karachi, Pakistan. Nearly 100 participants from each low, middle, and high-income areas were
selected using cluster sampling. The rigorous method was used for cross-cultural adaptation of
CASP 19 in Pakistani population, which included (translated from English to Urdu, back
translation, pre-test the Urdu version).
Results: The pilot-testing explored the language, cultural and conceptual similarities of the tool to the
original version. Both focus groups confirmed that CASP-19 has conceptual relevance to
Pakistani culture. However confirmatory analysis results show that CASP13 had a good model
fit to use in Karachi, Pakistan. The regression analysis was used to model the association
between the various predictors of quality of life, for example, the socio-demographic variables
show that age does not show any effect on the quality of life, whereas gender inequality
decreases the quality of life. While financial constraints in later life decrease the quality of life in
Karachi, Pakistan.
Conclusion: This thesis indicates that after appropriate analysis, CASP13 is a valid and reliable tool to
assess the quality of life of 50+ older adults in Karachi. Moreover, study’s finding
recommended the importance of developing policies at the state level within the government.

3
Declaration I, Laila Surani Khalfan, declare that the work in the thesis is my own. Furthermore, the work has
not been submitted for any other professional qualification. The work that is submitted is my
own, except the work which had been used as a reference from other sources. Therefore, it had
been acknowledged while referencing correctly.

4
Table of Contents Abstract ....................................................................................................................................................... 2
Declaration.................................................................................................................................................. 3
List of figures .............................................................................................................................................. 8
List of Tables ............................................................................................................................................ 10
List of abbreviation .................................................................................................................................. 12
Acknowledgement .................................................................................................................................... 13
Chapter 1: Introduction .......................................................................................................................... 14
1.1Quality of life, and wellbeing ......................................................................................................... 14
1.2 Ageing globally ............................................................................................................................... 18
1.3 Ageing in Pakistan ......................................................................................................................... 20
1.4 Novelty of the study ....................................................................................................................... 26
1.5. Structure of the thesis chapters: .................................................................................................. 27
1.6. Conclusion: .................................................................................................................................... 28
Chapter 2: Literature review .................................................................................................................. 29
2.1 Introduction .................................................................................................................................... 29
2.2 What are ‘quality of life’ and ‘well-being’? ................................................................................. 29
2.3 Theoretical concept of Quality of life and Well-being ................................................................ 32
2.4 Measures of Quality of life and well-being in old age ................................................................. 43
2.4.1 Measures of quality of life used globally ............................................................................... 44
2.4.2 Measures used in Pakistan to assess the quality of life ........................................................ 47
2.5 CASP 19 the measure of the quality of life in old age ................................................................. 50
2.5.1 Comparing Confirmatory factor analysis of CASP19 from other studies ......................... 61
2.6 Predictors of quality of life ............................................................................................................ 64
2.6.1 Age, gender, and quality of life .............................................................................................. 65
2.6.2 -Socio-economic factors and quality of life ........................................................................... 68
2.6.3 Physical health and quality of life .......................................................................................... 71
2.6.4 Psycho-social factors and quality of life ................................................................................ 73
2.6.5 Life course and quality of life ................................................................................................. 77
2.7 Conclusion ...................................................................................................................................... 79
Chapter 3: Conceptual framework, Research questions Aims and Objectives .................................. 81
3.1 Introduction .................................................................................................................................... 81
3.2 Conceptual framework .................................................................................................................. 81
3.3. Aim ................................................................................................................................................. 82
3.3.1 General aim of the research ................................................................................................... 82
3.4 Conclusion ...................................................................................................................................... 84
Chapter 4: Methodology .......................................................................................................................... 85
4.1. Introduction ................................................................................................................................... 85
4.2 Research Methodology .................................................................................................................. 85
4.2.1 Quantitative method ............................................................................................................... 85
4.3 Research design .............................................................................................................................. 86
4.4 Research support in Pakistan ....................................................................................................... 88

5
4.5 Research sites ................................................................................................................................. 90
4.6 Sample ............................................................................................................................................. 91
4.7 Research Variables and scales ...................................................................................................... 92
4.7.1 Dependent variable CASP 19 ................................................................................................. 92
4.7.2 Socio-Demographic and socioeconomic variables ................................................................ 92
4.7.3 Health variables....................................................................................................................... 93
4.7.4 Psychosocial variables ............................................................................................................. 94
4.7.5 Life course variables ............................................................................................................... 99
4.8 Research process .......................................................................................................................... 100
4.8.1 Recruitment of data collectors ............................................................................................. 100
4.8.2 Translation of the questionnaire in the Urdu language ..................................................... 100
4.8.3 Pre-testing of the survey questionnaire ............................................................................... 100
4.8.4 Two days training programme ............................................................................................ 101
4.8.5 Development of data collection guide .................................................................................. 102
4.8.6 Inclusion and exclusion criteria ........................................................................................... 102
4.8.7. Data collection process ......................................................................................................... 102
4.9 Subjective data collection ............................................................................................................ 105
4.10. Data management Plan ............................................................................................................. 105
4.11 Data entry and data Analysis .................................................................................................... 106
4.11.1 Descriptive analysis ............................................................................................................. 107
4.11.2 Regression Analysis............................................................................................................. 107
4.11.3 Chi-square Analysis ............................................................................................................ 107
4.11.4 Psychometric evaluation of CASP ..................................................................................... 107
4.11.5 Assessing the degree of model fit ....................................................................................... 108
4.12. Quality assurance of the data ................................................................................................... 108
4.13. Ethical approval and Ethical consideration ........................................................................... 109
4.13.1 Ethics committee approval ................................................................................................. 109
4.13.2 Ethical consideration .......................................................................................................... 109
4.14 Potential risks ............................................................................................................................. 109
Chapter 5: First aspect of the Study; Cross cultural adaptation of CASP 19 measure of quality of life in 50+ older people in Karachi Pakistan........................................................................................ 111
5.1 Define Culture .............................................................................................................................. 111
5.2. Introduction to cross cultural adaptation of the tool ............................................................... 113
5.3 Process of Cross-cultural adaptation of the tool from English to the Urdu language ........... 115
5.3.1 Translation ............................................................................................................................. 115
5.3.2 Back-translation .................................................................................................................... 115
5.3.3 Selection of the best translation ........................................................................................... 116
5.3.4 Compilation of all 4-translated versions ............................................................................. 116
5.3.5 Pre-test CASP 19 in the Urdu Language ............................................................................ 116
5.4 Thematic analysis of the data ...................................................................................................... 118
5.5 Finding during the process of translation and back translation of the CASP ........................ 120
5.6 Focus groups Findings ................................................................................................................. 123
5.6.1 Linguistical equivalence of CASP 19 ................................................................................... 123

6
5.6.2 Financial needs ...................................................................................................................... 123
5.6.3 Social support ........................................................................................................................ 124
5.6.4 Cultural influence ................................................................................................................. 124
5.7. Discussion..................................................................................................................................... 125
5.7.1 Discussion of the translation process ................................................................................... 126
5.8. Psychometric evaluation of CASP 17 ........................................................................................ 131
5.9.1 Findings from the psychometric analysis of CASP-17 ....................................................... 132
5.10. Discussion on psychometric properties of CASP 17 .............................................................. 148
5.10.1 Self realization ..................................................................................................................... 152
5.10.2. Control ................................................................................................................................ 155
5.10.3 Autonomy/Agency ............................................................................................................... 156
5.10.4 Pleasure ................................................................................................................................ 157
5.11 General discussion on CASP ..................................................................................................... 159
5.12 Other cross-cultural factors ...................................................................................................... 164
5.12.1 Religion ................................................................................................................................ 164
5.13 Conceptual Model of Cross-cultural adaptation of CASP in Pakistan ................................. 171
5.1 Conclusion .................................................................................................................................... 173
Chapter 6: Second aspect of the study: Findings and Discussion on the predictors of quality of life ................................................................................................................................................................. 174
6.1 Introduction .................................................................................................................................. 174
6.2. Descriptive Findings ................................................................................................................... 174
6.2.3 Descriptive analysis of disease ............................................................................................. 182
6.3 Association between Socio-demographic variables and CASP13 (Bivariable Findings) ....... 184
6.4 Findings from Sociodemographic Multiple regression analysis .............................................. 189
6.5 Psychosocial descriptive findings ................................................................................................ 194
6.6 Association between Psychosocial variables with CASP 13 (Bi-Variable Findings) .............. 200
6.7. Psychosocial multiple regression analysis ................................................................................. 202
6.8 Life course determinants of quality of life: descriptive findings ............................................. 205
6.9 Bivariable Findings of life course variable ................................................................................ 214
6.10 Multiple regression on life course and current life situation ................................................. 216
4.14 Observational findings during data collection ........................................................................ 220
4.14.1 Observations ........................................................................................................................ 220
4.14.2 Questionnaire observations ................................................................................................ 223
6.11 Discussion on the findings of predictors of quality of life: ..................................................... 224
6. 11.1. Age ...................................................................................................................................... 225
6.11 2. Socio-economic impact on the quality of life ................................................................... 225
6.11.3 Socio-demographic impact on the quality of life .............................................................. 231
6.11.4 Social impact on the quality of life.................................................................................... 233
6.11.5 General health and quality of life ...................................................................................... 236
6.11.6 Psychological impact on the quality of life ........................................................................ 236
6.11.7 Life-course impact on the quality of life ........................................................................... 241
6.12 Conclusion .................................................................................................................................. 242
Chapter 7: Gender and Quality of life ................................................................................................ 244

7
7.1 Introduction .................................................................................................................................. 244
7.2 Findings from both qualitative and quantitative data .............................................................. 244
7.2.1 Gender-based Qualitative findings from a focus group .................................................... 244
7.2.2 Quantitative findings on gender differences in CASP ....................................................... 246
7.3 Discussion...................................................................................................................................... 252
7.4 Conclusion .................................................................................................................................... 254
Chapter 8: General discussion on research, conclusion, and implications ....................................... 256
8.1 Introduction .................................................................................................................................. 256
8.2 Summary of the Key Findings .................................................................................................... 256
8.3 Contribution of this study to existing research ......................................................................... 263
8.4 Strength and limitation of the study ........................................................................................... 264
8.4.1 Study Design .......................................................................................................................... 264
8.4.2 Sample and sampling strategy ............................................................................................. 265
8.4.3 Participants characteristic ................................................................................................... 266
8.4.4 Time management for data collection ................................................................................. 266
8.4.5 Strength and limitations of the scales .................................................................................. 266
8.5 Research Implication ................................................................................................................... 267
8.6 Recommendation for future research ........................................................................................ 270
8.7 Conclusion .................................................................................................................................... 271
References ............................................................................................................................................... 273
Annexure 1: Data collection Guide ....................................................................................................... 299
Annexure 2: information sheet for survey in English ......................................................................... 301
Annexure 3 Survey consent form in English ....................................................................................... 303
Annexure 4: Survey form English ........................................................................................................ 304
................................................................................................................................................................. 304
Annexure 5 Questionnaire in Urdu Language ......................................................................................... 358
Annexure 7: Consent form in Urdu for survey ................................................................................... 405
Annexure 8: Information sheet for focus groups in London .............................................................. 406
Annexure 9: Consent form for the focus groups ................................................................................. 409
Annexure 10: Thematic analysis of the focus group ........................................................................... 410
Annexure 11 : Compilation of CASP in Tree form ............................................................................. 428
Annexure 12 pictures from Survey in Pakistan .................................................................................. 439
Annexure 13: Ethics approval form I .................................................................................................. 441
Annexure 14: Ethics Approval form 2 ................................................................................................. 443
................................................................................................................................................................. 443

8
List of figures
Figure Figure name Page number
number 3.1 Conceptual framework 68
5.1 Translation process
100 5.2 Process of thematic analysis
117 5.3
Eigen value plot 132 5.4
Single factor model CASP 17 139
5.5
A first order model I for CASP-17 139
140
5.6 Second factor model CASP 17
5.7 Single order model CASP 13 141 5.8 First order model for CASP13 142
5.9 Second model factor CASP13 142
5.10 Second model factor CASP 13 (Constrained e6 and e7) 143
5.11 Second model factor CASP 13 (Constrained e6 and e7)
145 5.12 Conceptual model of cross-cultural adaptation
167 6.1 Interaction effect between strata and family type
171 6.2 Tenants by strata 172
6.3 Interaction effect between the strata and housing tenants
172
6.4 Transportation by strata
173
6.5 Interaction effect between transportation and strata 173
6.6
No relationship between age and quality of life 185

9
6.7 Age effect on quality of life
186 7.1 Interaction effect of gender and socio-economic groups 239
7.2 Education and Gender 240
7.3 Interaction effect of Gender and Education 240
7 4 Interaction effect between Gender and employment 241
7.5 Interaction effect between socio-economic groups and Gender
241 7.6
Interaction effects between: Gender and general health 242 7.7
Interaction effect between Gender and social support 243
7.8 Interaction effect between Gender and neighbourhood 243
7.9 Interaction effect between Gender and social participation 243
7.10 Interaction effect between Gender and social participation 243 7.11 Interaction effect between Gender and Depression 244
7.12 Interaction effect between Gender and Depression 244

10
List of Tables
Table Table name Page
number number 2.1 CASP summary used in different countries 55
2.2 Psychometric evaluation of CASP in different countries 59
5.1 Change of words in translation and back translation 119
5.2 CASP 17 Cronbach alpha for each item 131 5.3 Original CASP 19 132 5.4 Exploratory factor analysis: factors loading 133
5.5 Crohn back alpha for CASP 17 individual domain 136
5.6 Error Items 138
Cronbach alpha for all domains CASP 13 143
5.7 Confirmatory factor analysis 144
5.8 CASP 13 mean core 145
5.9 5.10 CASP 13 mean score strata 146 5.11 Four items deleted 148 165
5.12
Percentage of the participants attended religious services
5.13
Percentage of the participants attended religious services 165
Percentage of the participants belong to the Faith 166
5.14

11
5.15 Association among different faith groups 166
6.1 Socio-demographic (Descriptive) analysis) 174
6.2 Descriptive analysis of the Disease 178 6.3 Disease frequency by gender 180
6.4 Bivariable regression analyses with sociodemographic variables with quality of life 184
6.5 Sociodemographic Multiple regression analysis 187
6.6 Capability Coefficient 193
6.7 Descriptive statistics of psychosocial variables 194
6.8 Psychosocial bivariable analysis 197
6.9 Multiple regression psychosocial factors 199
6.10 Life course descriptive analyses 205
6.11 Bi-variable analysis of life course factors 211
6.12 Life course Multiple regression analysis 214 7.1 Differences in responses of both gender 239
7.2 Gender and Health 242
7.3 Gender wise capability scores 245
12
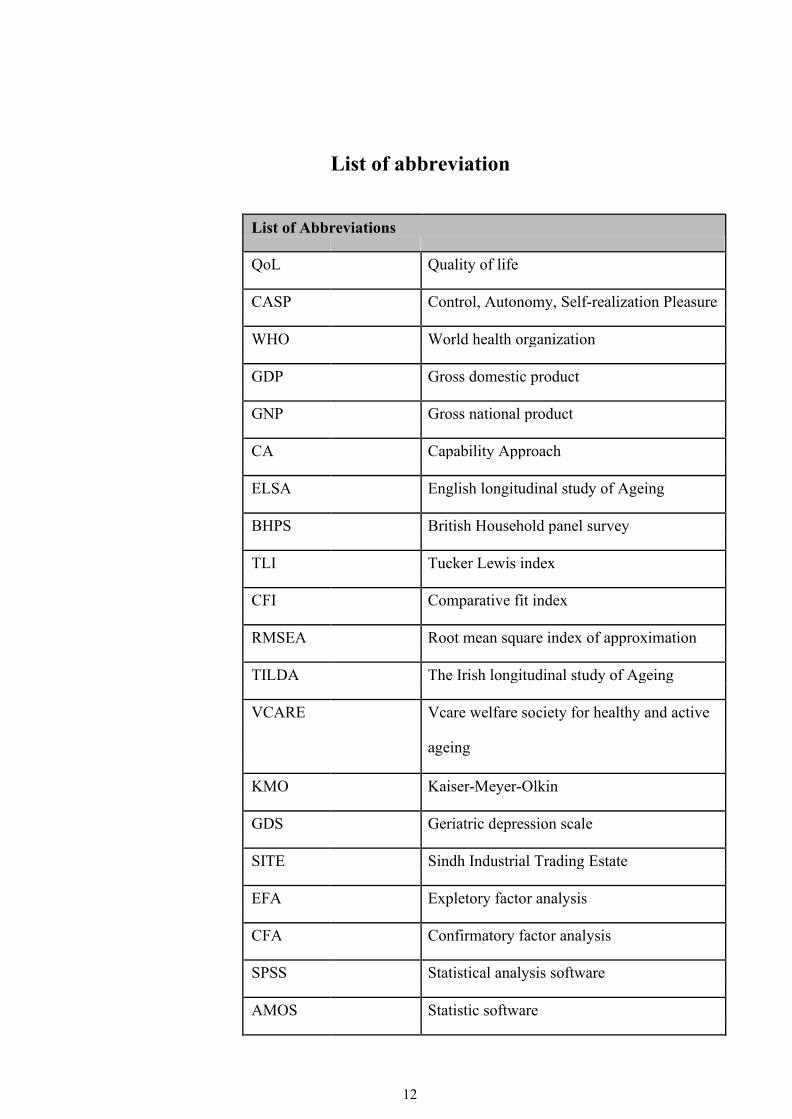
List of abbreviation
List of Abbreviations
QoL Quality of life CASP Control, Autonomy, Self-realization Pleasure
WHO World health organization
GDP Gross domestic product
GNP Gross national product
CA Capability Approach ELSA English longitudinal study of Ageing
BHPS British Household panel survey
TLI Tucker Lewis index
CFI Comparative fit index RMSEA Root mean square index of approximation
TILDA The Irish longitudinal study of Ageing
VCARE Vcare welfare society for healthy and active
ageing KMO Kaiser-Meyer-Olkin
GDS Geriatric depression scale
SITE Sindh Industrial Trading Estate
EFA Expletory factor analysis
CFA Confirmatory factor analysis
SPSS Statistical analysis software AMOS Statistic software

13
Acknowledgement
Firstly, I would like to express my sincere gratitude to my supervisors Professor Gopal Netuveli
and Dr Marcello Bertotti, for their continuous support in completing of my PhD. Moreover, for
assisting me throughout my PhD years, with their, professional approach and immense
knowledge. Their guidance had helped me throughout the period of my thesis, starting from
planning to the execution of the research and finally writing this thesis.
My special thanks to the organization VCARE social welfare society for active and healthy
ageing in Pakistan as well as for supporting me in collecting data in Karachi, Pakistan. My
humble thanks to Dr Rozina Mistry for being an international advisor during the data collection
of my research in Karachi, Pakistan.
Lastly, the completion of this thesis would not have been possible without the support of my
family. My special thanks to my husband and daughter for having endless patience and
supporting me to complete my PhD. I owe my special thanks to my parents and sisters, without
their support, prayers, and constant encouragement, it would not have been possible for me to
finish this PhD thesis.

14
Chapter 1: Introduction
This chapter will share the motivation behind conducting this study while focusing on
assessing the quality of life (QoL) of the ageing population in Karachi, Pakistan. The chapter
will also highlight the main aim of the research and outline of the overall structure of the thesis.
1.1Quality of life, and wellbeing
The meaning of life is difficult to understand. Most of the times, life takes a roller-coaster
ride, and sometimes it seems to be one disordered river in which a person is caught. Sometimes
it is about grasping every opportunity of life. At times, it is about achieving the purpose of life
(Ventegodt, Andersen and Merrick. 2003). However, many psychologists have approached it
from different perspectives: Antonovsky (1993) called it “coherence”. Maslow (1963) described
it as “transcendence”, and Frankl (1992) called it “meaning of life”. As humans, we call it
simply “being” (Ventegodt, Andersen and Merrick 2003). Therefore, with such a complex
meaning of life, what does the quality of life mean? It is not easy to understand.
There is no single definition of quality of life, as researchers from different fields from
philosophical, sociological, medical, and psychological sciences have different definitions.
According to World Health Organization (WHO 1997, pg 1), quality of life is defined as “the
perception of a person’s life in the context of culture and value system in his/her life.” Moreover,
Bells (2005) defined the quality of life as one’s life circumstances and satisfaction with it.
However, in some literature quality of life has also been used as a synonym of life
satisfaction though the meaning of Life satisfaction is a little different and challenging to define
as sometimes it had been "used interchangeably with happiness, however they are indeed two
separate concepts. Life satisfaction is the evaluation of one’s life, not simply one’s current level
of happiness" ( Park, and Peterson, 2010, p12). The researcher Ed Diener’s has explained life
satisfaction as “An overall assessment of feelings and attitudes about one’s life at a particular
point in time ranging from negative to positive” (Buetell, 2006). He also elaborated two-term
(Life satisfaction and quality of life) as “Life satisfaction is the degree to which a person

15
positively evaluates the overall quality of his/her life as-a-whole” (Diener, suh, lucas, & Smith
1999). The notion clearly shows that life satisfaction cannot be used alternatively with the term
quality of life.
Moreover, in earlier literature, quality of life has also used interchangeably with
subjective well-being (Dodge et., al 2012). “Subjective well-being (SWB) is the personal
perception and experience of positive and negative emotional responses and specific cognitive
evaluations of satisfaction with life” (Diener, Lucas, & Oishi, 2002, p. l63). So, in simple words,
SWB is the individual evaluation of the quality of life (QoL) and therefore unites with the
definition of QoL (Diener, Lucas, & Oishi, S. 2002).
However, in past, the well-being and quality of life both were used with the distinct
differences. If we look back almost 46 years, the study of Smith (1973) proposed that well-being
is different from the quality of life. Well-being referred to “evaluating the objective life
conditions of the population in general, whereas the quality of life was used to assess an
individual’s subjective assessments of their lives” (Carnwath 2015). However, due to the modern
researches, differences between the two-term had been lost. (De Leo et al., 1998).
Hence multiple concepts of quality of life have grown over the years (Beesley &
Russwurm, 1989), such as economic approaches being popular in the late 1960s and 1970s when
the quality of life/well-being was assessed by quantitative measures and unemployment rates
(Liu, 1976). In response to this quantitative approach to the subject, researchers began inquiring
into individuals’ subjective experiences of their lives in the belief that objective measures alone
were incomplete measures of ‘quality of life’ (Andrews & Withey, 1976; Campbell, Converse, &
Rogers, 1976).
Another reason for the loss of distinction between the terms is the acknowledgement that
quality of life/well-being has both “objective components – i.e., components external to an
individual and measurable by ‘others’ – and subjective components – i.e., personal assessments
of one’s own life or particular aspects of life using measures of satisfaction, happiness, or other
self-assessment scales (Campbell et al., 1976).

16
Moreover, in recent years, researchers have mainly discussed the two main approaches to
well-being: one hedonic, which means happiness, positive affect or less adverse effects and
satisfaction with life. The second is eudaimonic, which suggests, an individual who can achieve
the highest goal of life with positive functioning within their living environment (Dodge et., al
2012).
After reviewing some of the literature, it has been found that two-terms (Qol and Well-
being) could not be used interchangeably. Therefore, quality of life can be interpreted by looking
at one individual’s different aspects of well-being that how satisfied and happy one is with
dealing their everyday life circumstances (Mukherjee, 2003). According to Balan and Girija
(2015), quality of life is a general feeling of happiness, which is not a temporary experience but
a long-term sense of well-being.
The above discussion was on the perspective of western society how quality of life is
perceived. However, the eastern society especially Muslim society like Pakistan has a little
different perspective of the quality of life. Muslims have a significant impact of their religion
(Islam) on their “lifestyle and ways of thinking” Al-Aidaros, and Shamsudin, 2013). Abu-Raiya
and Pargament’s (2011) in his literature had suggested that while assessing “Muslims’ lives and
well-being, there is a need to understand the Islamic religion when dealing with Muslim
populations and not doing that could give an incomplete and one-sided picture of Muslim’s
understanding of quality of life’’ (Al-Aidaros. and Shamsudin, 2013).
For Muslims, the good life or quality of life is when one follows the ethics of Islam
(Rania 2006). Ogbonna and Ebimobowei (2011) stated "Ethics reflected in the principles that a
person uses in governing his/her actions and the personal standard by which a person
distinguishes the right from the wrong". Elegido (2000) described that ethics direct Muslims to
have a good life and live well (Al-Aidaros and Shamsudin, 2013). Furthermore, in Islamic
perspective “God is the only reality, and nothing else possesses authentic existence, ‘the full
realisation of this ultimate truth constitutes ‘loss’ of self in the One’’ (Renard 2009, p. 33).
Islamic thought directs to live a good life; one should have faith in Allah and practice of

17
principles of Islam as it covers all the aspects of life (spiritual, economic, social, political, and
the fmily) (Hamdan 2007; Joshanloo 2013; Pridmore and Pasha 2004). It is believed that only
having true faith in these beliefs and living a “life based on the ordinances of Islam in all aspects
(Quran 10:63–64) can lead to the satisfaction of the individual’s physical and spiritual needs, an
actualisation on of their potential”. Such a viewpoint could fit on the eudaimonistic view that
emphasises actualising human potentials and the satisfaction of true human needs” (Joshanloo
2013).
Furthermore, some of the Islamic literautre also “holds that Muslims should not pursue
hedonistic pleasures as the primary goal of their lives” (Joshanloo 2013). Although positive
emotions and pleasure are essential to Islam, they are viewed as secondary and are placed after
the eudaimonistic determined (Joshanloo 2013). Moreover, some of the Muslim writers
generally agree with the Aristotelian notion that to obtain happiness, one needs to know all
aspects of humankind, all its capacities and abilities, deficiencies, and needs (Husain 1998).
Therefore, the Islamic viewpoint of quality of life is when people follow the ethic of their
religion and trust God to achieve the best in life. However, a recent study in Karachi, Pakistan
also suggests that the quality of life is when older adults have opportunities to work in the age of
60 so they could not be dependent on anyone and live their life joyously with pleasure (Cassum
et al 2020).
After reviewing the quality of life and well-being, it is to conclude that there is a
distinction between the definitions of all three concepts, life satisfaction, well-being, and quality
of life. Life satisfaction is the individual’s evaluation of one’s life, while the quality of life refers
to the level of general well-being. The concept of quality of life is broad and depends on how an
individual’s measure the ‘goodness’ of multiple aspects of their life. "These evaluations include
one’s emotional reactions to life occurrences, disposition, sense of life fulfilment and
satisfaction, and satisfaction with work and personal relationships" (Diener, and Lucas, 2000).
Therefore, three of these terms cannot be the same entity or cannot be used interchangeably.

18
However, quality of life can vary from one culture to another. Therefore, it may be
misguided to generalise the definition of QoL cross-culturally (Bell 2005).
So far, the chapter has examined the brief concepts of quality of life and well-being generally.
The following sections will investigate ageing globally and specifically in Pakistan.
1.2 Ageing globally
The population will continue to age rapidly over the next few decades (Lutz, Sanderson,
and Scherbov, 2008) and there are severe economic and social implications of increasing
longevity and rapidly ageing population (Bloom, Canning, Fink 2010). Increased longevity is
noticeable in developed countries as compared to developing countries (Mathers et al. 2001).
The increase in longevity is one of the greatest achievements. Nevertheless, population ageing is
one of the most challenging demographic events in the 21st century and these challenges are not
only faced at the individual, family or community level but global level as well (Christensen,et al
2009). Therefore, to examine the quality of life in older age, it is essential to look at the key
factors that impact ageing well.
Due to socioeconomic and demographic factors, older adults are neglected in many ways
(Pritzker et al.; 2015). Lack of social security system in developing countries for older adults;
results in an increased cost of health, and social care expenses in later life (Christensen et al.
2009). However, the effect is different in developed countries. Developed countries have grown
to take the initiative like proper pension system to take care of older generations to have a better
life in their old age (Christensen, et al. 2009). It is also a blessing for the ageing population
living in these countries where public transport, social policies, shifting gender roles, and
improved living standards have been placed. As a result, people manage their daily activities
without depending on anyone (Christensen, et al. 2009). However, many of the developing
countries lack a publicly funded security system; this means that it is more challenging for older
adults to take care of themselves.
Furthermore, in many developing countries, many people work in informal settings or in
rural areas that offer very few or no benefits or worker protection of any kind; employees in

19
small companies with ten or fewer employees are often excluded from participation in social
security pension schemes" (Gillion. et al.; 2000). If we look around some of the developing
world regions, the pension system is fragile and poorly managed in Africa. Whereas pension
system in Asia has been weakened by the continent's weakened financial economy in the late
1990s (Gillion et al. 2000). Therefore, older adults will need financial support in these regions
(Sierra et al. 2009).
The second important factor that has an impact on ageing well is the country's cultural
environment. For example, in many eastern cultures, older adults also consider as a source of
wisdom and transformation of culture and traditions. The concept of wisdom has its roots in
religion and philosophy (Baltes, and Smith 1990). Vaillant (2002) considers "wisdom to be an
integral part of successful ageing", he also believed that one does not need to be old to acquire
wisdom. Blazer (2006) had proposed that promotion of wisdom should be an essential part of
facilitating successful ageing, although evidence-based techniques or tools to affect wisdom are
not available at this time (Blazer 2006).
According to Erick Erikson's (1964) "Psycho-social developmental stages, the last stage
of life called generativity and wisdom together are intertwined". Further research also confirmed
that wisdom is positively associated with life satisfaction (Ardelt, 2000; Baltes, Staudinger,
Maercker, & Smith, 1995). Other research also suggested that "Wisdom is more persistent
among the financially and interpersonally deprived respondents and individuals with low
perceived social support such as minorities, older adults, women, and individuals with illiterate
background" (Brugman, 2000). However, under the effect of globalisation, children are more
often living separately from their parents; they aspire to pursue a higher level of education
abroad or migration to pursue better opportunities for income, which affects the quality of life of
the older adults in developing countries. This changing family living pattern had resulted in
social isolation and loneliness and lack of sharing wisdom and tradition (Lowsky et al. 2014).
Thus, social isolation had unfavourable effects on health (Landeiro et al., 2017).
Cacioppo and Cacioppo (2014) had also identified that social isolation and loneliness affects the

20
physical and mental conditions that may result in having illnesses like, high blood pressure, heart
disease, obesity, anxiety, depression, cognitive decline, and Alzheimer's disease (Cacioppo and
Cacioppo 2014). And that could decrease the quality of life in older adults (Landeiro et al. 2017).
1.3 Ageing in Pakistan
The total population of Pakistan was estimated 193,203,000 (WHO 2016). During the
last half-century, public health and social conditions have contributed to a significant increase in
the country’s average lifespan (WHO 2016).
World Bank report had published the average life expectancy at birth in Pakistan from
2007 to 2017. In 2007 life expectancy was 63.55 for male and 65.37 for females. Which
increased in 2017, life expectancy at birth for women in Pakistan was 67.93 years, while men
were about 66.04 years. On an average, survival has improved across the lifespan, including in
the later ages; this means that more people in Pakistan survive to old age than ever
before. According to the United Nations (2013), 11.6 million over 60 years older adults live in
Pakistan, and it is predicted to reach 43 million by 2050 (United nation, 2013). Moreover,
according to Global Age Watch Index (2014), three countries had been marked as the worst
countries to grow old, and Pakistan is among these countries where 6.5 percent of the population
is over 60-years of age (Global Age Watch Index 2014). It is deplorable; with this growing
ageing population, Pakistan does not have welfare policies for its ageing population.
Furthermore, quality of life in the older adults depends on a range of factors, including
ageism, so in this section, the thesis will examine ageism. Ageist attitudes and stereotypes are
common in the family, community, workplace, and society. Moreover, this stereotype notion
could be seen differently in different cultures, social and economic contexts, but it is common
and often remains unknown and accepted. (Islam, 2014).
Moreover, stereotypes and discrimination against people based on a single attribute (their
older age) are referred to as ageism (Thornton, 2002). Ageism and discrimination in old age are
not just present in today's society, but they are rooted in pre-industrial societies. (i.e., they have
been around for a long time). However, it is a mixed picture that depends on the specific society

21
one lives in, their specific traditions, values, and culture. In the traditional culture of France, they
never respected their older adults; they saw old age as horror and annoyance (Stearns 1976 and
Ward 1984). The Fulani Society of Africa saw older adults as socially dead. (Leslie 1982 and
Schaefer 1983). Likewise, the society of Uganda wishes for the death of their older adults, as
older adults were unproductive to them. On the other hand, some pre-industrial societies like
ancient Israel, Rome, China, and the Inca society of Peru had great respect and honour for their
older adults.
In the post-industrial period, many societies presented mixed feelings about old age. On
the one hand, older people were given respect and love; on the other hand, older adults were
neglected from some societies after the retirement age, as it caused severe financial, social, and
psychological issues (Harris 1990). However, older adults can also be seen positively as the
source of wisdom, which has already been discussed earlier in this chapter.
A study conducted in Bangladesh suggested that ageism results from low economic
conditions, poverty, loss of work and authority, changes in social norms and values, and the joint
family system (where the family includes two or more generations) breaking up ( Islam, 2014).
Most of the studies in this area focus on the negative aspects of ageism. It further revealed that
older adults have become more isolated from their family and close relatives. They lose their
freedom and cannot express their choices in any matter, not even their choice of dress or food.
After retiring, they are more financially dependent on their family. Today's young generations
are not interested in spending time with the older adults in their families. Therefore, most older
people feel lonely and isolated due to age discrimination (Islam, 2014).
Another study was conducted in Britain 'to examine ethnic differences in the key
influences on quality of life for older people in the context of the increasing health and wealth of
British older people generally and the aging of the post-1945 migrants' (Bajekal, et al. 2004). It
is argued that after the second world war, the ethnic minority immigrants moving into retirement
may have faced hazards or threats. The finding showed that the quality of life of older people
varies significantly according to ethnicity. Indicators such as 'material circumstances,' 'health,'

22
'civic engagement through membership of community networks,' and 'physical environment
quality' showed that the Pakistani had the lowest rank in the quality of life; in contrast, the white
group had the highest rank, and the Indians and Caribbean groups ranked second and third.
(Bajekal, et al. 2004). This study took place in Britain, so it may not apply to Pakistan. However,
it is interesting to note that quality of life varies according to ethnicity. That may have
implications for the different groups of Pakistani living in Karachi and, therefore, will be
investigated in the thesis'.
Another study found out that people who migrated to the UK found stereotypes of
extended family in the ethnic minority. If older adults lived with 'their son or daughter (and
sometimes their son or daughter's children as well),' they repeatedly take on a 'parenting role that
mirrored the one that they had played when their children were younger, such as the
mother cooking and cleaning and the father chauffeuring.' Various reasons were identified for
the older adults to do so; living alone was not affordable for them, or they did not want to live
alone due to bad health. Moreover, the role that the family play as a parent or grandparent also
depended on gender. This meant that people living in multigenerational households’ men tend to
make decisions on behalf of the family. One of the Pakistani Punjabi men described himself as
the 'decision-maker and another who has 'control of all the household' (Grewal et al. 2004).
although these studies refer to Pakistani in the UK rather than Pakistani living in Karachi, they
are exciting and will be further investigated in the thesis to assess whether they apply to Pakistan
or not.
Another study conducted in Pakistan by Ahmed and Chaudhry (2015) had also explored
the perception of older adults about old age, and the study had identified that old age was
perceived as illness, disease, depression, stress, social isolation, ignorance, increased
dependency, socialization, having pleasure, freedom, and lack of social participation (Ahmed
and Chaudhry 2015). Similar findings have been identified in contemporary culture, particularly
North America, primarily negative stereotypes, 'depicting later life as a time of ill health,
loneliness, dependency, and poor physical and mental functioning' (Ory, et al., 2003).

23
Furthermore, another study was conducted through focus groups in 4 countries (Serbia,
Pakistan, Costa Rica, Gambia); to provide a platform to older adults to understand how aging
and ageism are experienced in their living contexts. The participants from Serbia reported that
they perceived a lack of respect from the society in which they lived, and they take old age as a
deficit and loss from the society. The participants highlighted that they were not respected, and
the family had expectations for unlimited support and care that included financial contribution.
Moreover, sometimes these expectations led to financial abuse and physical abuse too. Similar
findings were identified in the Gambia, where people reported that many participants experience
a lack of respect from the society in which they lived. Likewise, Serbia and Gambia participants
in Costa Rica shared their view about ageism, and they stated that ageism occurred 'within a
range of settings, including the family, health care, education, the workplace, and public
transport' it was identified by the older people that family expected grandparents to provide
unpaid care work. However, in Pakistani focus groups, male participants stated that respecting
older adults is a part of the culture; the participants also highlighted that changing traditions,
consequences of limited resources, and the feeling of vulnerability in older age resulted from
dependency less respect from the society. The women participants also shared feelings of being
ignored in society and disrespected in the family (Phoenix, 2020). This could also show that the
stereotype is also gendered based in Pakistan. Hence, views of old age and the perceptions of
older adults hold of themselves are 'complex, multidimensional, and dynamic' (Kornad, and
Rothermund, 2011).
Therefore, it concludes that ageism varies across different cultures, so older adults in one
culture may experience discrimination while others may be respected. However, there appears to
be a general trend of change from pre-industrial societies to modern societies. As explained
above, older adults face more discrimination in modern societies than previously, so their quality
of life is more likely to deteriorate. Pakistani societies are also affected by these cultural
changes, albeit at a slower pace. Older men still maintain authority over the extended family, and
older women still contribute disproportionately more to family life.

24
Furthermore, another big challenge for Pakistan is its weak pension system. The
retirement age in Pakistan is 60 and only people working for the government receive a pension,
which is only 2.3% of people aged 60 and over. Therefore, most old-age people rely on their
future generations to provide them with financial support in their retiring years (Sabzwari and
Azhar, 2010). According to Global age index (2014), 56% of people, aged 50+ were in
employment, and 60% were financially dependent on their family (Global Age Watch Index,
2014).
Moreover, older adults' family structures and living arrangements have changed
significantly in developing countries in the past few decades. (Zeng, 2006). Various studies have
documented the challenge of changing family household structures in Pakistan. Many of the
older adults are not supported by their families to meet their basic needs and facing hardships in
terms of no care, isolation, poor health, physical abuse (Afzal, 1999; Clark et al., 2002). Even
older adults do not get proper attention in a joint family due to large family size (Ali and Kiani,
2003). It implies that despite the availability of networks, particularly family members, many
older adults do not receive support from their families. Such a situation shows that an older
adult's quality of life in Pakistan is likely to deteriorate and raise the demand for social protection
for older adults in the coming years.
Afzal (1999) found that although many older adults lived with their children, many of
them were dependent on themselves to meet their basic needs; especially those who did not had
any savings or pensions for their old age (Jalal, and Younis, 2014). Thus, family dependency is
linked to income, with higher income families having the opportunity to pay for a carer for older
adults.
Therefore, the rising trends of poverty in Pakistan (Ali and Kiani, 2003) and “declining
share of the economically active population (Nasir, 2003) will not only affect the quality of life
of older people but also underscore the need for adequate provision of safety nets for older
people" (Ahmad, 2011).

25
The changing situation holds many challenges for older adults in many developing
countries, including Pakistan. Especially for those old age people who want to work after
retirement due to an inadequate pension or old-age benefits to improve their living standards.
However, one of the studies suggested that older adults could not find jobs due to their
inadequate education. Therefore, it is essential today for the population in their age 20s and 30s
to educate themselves, so they do not suffer from the same challenges in their old age. These
kinds of challenges would affect an individual's quality of life and society. (Cassum et al. 2020)

26
1.4 Novelty of the study The aims and objectives of this Ph.D. thesis have been described in Chapter 3. However, in
general, this research has assessed the quality of life in older adults in Karachi, Pakistan. There
are a couple of studies had been conducted in Pakistan, examined subjective and objective
indicators. The objective indicators included: education, gender, health, and living condition,
whereas the subjective indicators were collected, taking a perception of the population on
education, and public health safety (Haq 2009).
Moreover, some measures are used to assess the quality of life but mainly are health-
related; for example, a WHO scale was used to assess the health-related quality of life (HRQoL)
of people with hypertension (Saleem et al. 2014).
However, the novelty of this study is that the quality of life in older adults has been
assessed with a theoretical driven scale CASP-19. This scale includes both the eudemonic and
hedonic well-being characteristics (Control, Autonomy, Self-realisation, Pleasure) (Gale,2014).
This research has provided a better understanding of how well a CASP instrument had worked
in an entirely different cultural setting. Furthermore, the thesis also assesses other predictors that
may affect the quality of life in old age such as, sociodemographic variables, socioeconomic
variables, psychosocial and life-course variables.
In General, the thesis will answer the question, what is the quality of life of older adult
in Karachi, Pakistan?

27
1.5. Structure of the thesis chapters:
Chapter 2
Literature review- This chapter presents the review of the literature on the research area that is
quality of life and well-being of 50 +older population. It has provided a description, summary,
and critical evaluation. It has also included the historical background of well-being and its
theoretical analysis. This chapter also includes the literature on the scales to assess the quality of
life and other factors that influence the quality of life.
Chapter 3
Conceptual framework and research aim and objectives- This chapter will give an insight
into the conceptual framework of well-being and quality of life in old age. The conceptual
framework has been based on the theoretical analysis of the subject. This chapter also includes
aims, objectives and research questions.
Chapter 4
Research Methodology- This chapter explores the method and its justification for the
methodology. It also presents a research process that includes fieldwork and sample response
and ethical consideration. The statistical methods used to analyse the data are also described in
this chapter.
Chapter 5
First aspect of the study: Cross-cultural adaptation of CASP 19- This chapter discusses the
process of cross-cultural adaptation of CASP 19 a measure of the quality of life in 50+
population. This will further share the qualitative and quantitative finding of the CASP 19. It
will also discuss the findings, of cross culture adaptation of the CASP.
Chapter 6
Second aspect of the study: Predictors of quality of life – This chapter will have findings
from the research, including; sociodemographic, everyday life, capability, mental health, sense

28
of coherence, and life course. The chapter will discuss the findings of the predictors of quality
of life.
Chapter 7
Gender and quality of life: This chapter will have findings from the research, including;
sociodemographic, everyday life, capability, mental health, sense of coherence, and life course.
The chapter will discuss the findings of the predictors of quality of life.
Chapter 8.
General discussion, conclusion, and implication of the study: This chapter will include a
general discussion on both the aspects of the study that is a cross-cultural adaptation of the
CASP and predictors of quality of life. It will also share the emerging framework on the quality
of life of older adults in Karachi, Pakistan. Moreover, this chapter will also share the
contribution of this study to existing research and recommendation for future research. This
chapter will also share the strength and limitations of the study. Finally, the thesis will provide
the emerging conceptual framework on quality of life in old age for Pakistan. This chapter will
also have final recommendations on the findings.
1.6. Conclusion: As the world population is ageing, many of the world's developing countries face challenges to
address the issues of the ageing population in the entire sector of lives, which had been
discussed earlier. Moreover, these challenges will affect older adults' well-being and quality of
life, especially those living in developing countries such as Pakistan.
The thesis will now turn to chapter two, which examines the literature on quality of life, well-
being, CASP19 (measure to assess the quality of life of 50+ population), and the predictors of
quality of life.

29
Chapter 2: Literature review
2.1 Introduction
Ageing has become a global issue and will have a massive impact on all aspects of life
(Arokiasamy, et al 2015). World health organization (WHO) has also shown concern regarding
the health and well-being of millions of ageing community around the world (Shetty 2012).
Also, it has emphasized to improve the QoL of older adults, especially in low-income
countries. The WHO has also encouraged all the countries to work towards active and healthy
ageing to support older adults to live a dignified life (Shetty 2012).
This chapter examines the previous research and theoretical perspectives on quality of
life and well-being in the field of social sciences; it will also consider the measures developed
to assess QoL, with particular attention to CASP 19, a tool developed specifically to assess
the quality of life of people aged 50 and over. Lastly, the chapter will discuss QoL’s
predictors, which may affect the quality of life in later ages.
2.2 What are ‘quality of life’ and ‘well-being’?
In the previous chapter, it was already discussed that Quality of life and Subjective well-
being are not interchangeable terms as they have different concepts and theoretical backgrounds
(Brown., S 2015). This will be discussed in detail later part of this chapter. However, I will
further discuss the term happiness and its relation to well-being and quality of life in the
literature.
In general, the QoL term represents “either how well human needs are met or the extent
to which individuals or groups perceive satisfaction or dissatisfaction in various life domains”
(Costanza, et al. 2007). World Health Organization (WHO) defines quality of life as “An
individual’s perception of their position in life, in the context of the culture and value systems in
which they live, and about their goals, expectations, standards, and concerns. It is a broad-
ranging concept, affected in a complex way by the person’s physical health, psychological state,

30
level of independence, social relationships, and their relationship to salient features of their
environment” (WHOQOL Group, 1995: 1404).
The above description shows that the term quality of life is characteristically vague. It
can refer both to the experience an individual has of his/her own life; and the living conditions in
which individuals find themselves. Hence, the quality of life is highly subjective; where one
person may define the quality of life according to wealth or satisfaction with life, another person
may define having the ability to live a good life in terms of emotional, physical, material,
psychological, social, and subjective well-being (SWB) (Kinson, C 2020).
Whereas over the period, SWB had been used as “an umbrella term for different
valuations that people made regarding their lives, the events were happening to them, their
bodies and minds, and the circumstances in which they live” (Diener, 2006). Moreover, the
concept of subjective well-being falls as a person has a high level of satisfaction with their life
and who experiences a more significant positive effect, with little or less negative affect, and that
makes them happy (Diener, 2006).
However, the literature had also discussed that subjective well-being falls within the
‘hedonic’ perspective that defines subjective well-being maximizing pleasure and avoiding or
minimizing pain. Diener (2016) suggested that subjective well-wellbeing “is the scientific term
for happiness and life satisfaction” (Diener, 2016). In other words, happiness is the degree to
which a person evaluates the overall quality of his/her present life-as-a-whole positively
(Compton, and Hoffman 2019).
However, looking at the literature on happiness, it had referred to as “subjective well-
being (Hills, Argyle 2002), emotional well-being affect, and quality of life” (Ratzlaff et al.
2000); which suggested that the meaning of happiness may depend on the context and culture
person live in ( Carlquist et al. 2016). That indicated the close relationship between the
constructs of happiness, subjective well-being, quality of life, and life satisfaction (Medvedev,
and Landhuis, 2018).

31
However, interpretation of well-being and quality of life is a little different in the eastern
culture. The meaning of good life or quality of life in eastern philosophy has little different
features. In eastern culture, the concept of good life depends mostly on the religious definition
and ‘culture and value system’ prominence more on tolerance. That I had discussed in chapter 1
(Inglehart and Klingemann, 2000).
The eastern society mostly follows Confucianism, and it believes that a happy life is not
differentiated from a good or quality life (Zhang and Veenhoven 2008). The question of a good
life is usually understood in terms of what it means to be human (i.e., to be virtuous)
(Sundararajan 2005). In Confucianism, a high value is given to social relationships, particularly
family relationships. The harmony is a fundamental goal of personal and social life (Joshanloo,
2014). Hence, Confucianism emphasises the importance of balancing inner and outer selves
(Ching, 2003). “Unike the values of the western enlightenment, Confucian in Asian culture
values emphasise family and community over the individual, discipline and hierarchy over
freedom and equality, and consensus and harmony over diversity and conflict” (Tu 1999).
Public opinion surveys were conducted in Asia that confirmed that most people remain
attached to the Confucian “social values of collectivism and hierarchism” (Chu et al. 2008; Shin
2008). However, to date, no region-wide research effort had been made to assess the quality of
life that East Asians experience in their private and public lives (Shin 2008).
Furthermore, Confucianism insists that harmonious interpersonal relationship equals
well-being; it believes that well-being is spiritual comfort, joy, inner peace and harmony. It also
unanimously proposes to pursue well-being controlling and suppressing one’s material desires.
Besides that, Confucianism separates “happiness into two levels: one level where happiness is
derived from the satisfaction of basic needs in real life, and the other where rational happiness
comes from being kind to others and contributing to society at large” (Li, 2011 ).
Moreover, another main religion followed in Eastern society is Islam. According to
Islam, worshipping and serving Allah is humanity’s ultimate function, the fulfilment of which
establishes well-being and a good life. This view requires absolute submission to the ‘will’ of

32
Allah in every aspect of life, no matter how small. Moreover, Islam also represents diverse
schools of thought and sects. However, despite this diversity, agreement on fundamental beliefs
is relatively apparent in the Islamic world. The Quran is the holy book for Muslims and is the
authoritative text that contains all the central teachings about human life, good life and
happiness. Therefore, the core aspects of Islamic thought and guidance for well-being and
quality of life found in the Quran (Barakat 1993).
Furthermore, it would be right to say that subjective well-being and quality of life are
appraisals that people make about their lives in their own living culture (Diener, 2006; Diener,
Oishi and Lucas, 2003). Therefore, without knowing subjective well-being, one cannot evaluate
their quality of life. However, there have been studies examining subjective well-being and
quality of life independently (Diener,2006), yet few researches are focused on the connection
between these two domains (Camfield and Skevington, 2008). Furthermore, the subjective
nature of quality of life signifies that it can be conceptualised differently by different groups of
people, age, gender, health status, and cultural factors (Nilsson, Rana and Kabir 2006).
To conclude, the quality of life and subjective well-being, both interconnected but cannot
be used interchangeably. Culture plays a vital role in the conceptualisation and experience of the
quality of life (Shek, Chan, & Lee 2005). In western culture, communication and emotional
expressiveness are strongly emphasised; whereas, “roles, duties, and self-suppression
(particularly among the junior members in the family), and interpersonal harmony are virtues
upheld in eastern society”. Therefore, it is essential to conduct QoL studies in a culture like
Pakistan to understand the quality of life and its “manifestation in a cross-cultural context”
(Shek, 2010).
2.3 Theoretical concept of Quality of life and Well-being
In chapter one and earlier in this chapter, it had been discussed how the quality of life
and well-being are interrelated. It had also been described that many researchers had seen the
quality of life (QoL) and well-being differently. According to the different fields of interest,
such as sociology, psychology, social sciences, or philosophy had defined QoL differently.

33
Quality of life is also defined as how well a person had lived her/his life that included the
general well-being of people that included happiness, life satisfaction, fulfillment, comfort,
emotions, health that a person had experienced throughout the life (Carr, Gibson and Robinson
2001). Therefore, when one is assessing a person’s quality of life, it is essential to assess a
person’s general well-being to get the overall aspect of a person’s quality of life.
However, it is vital to understand both concepts of quality of life and well-being in
explaining older adults’ lives. Therefore, it is important to discuss both terms conceptually and
to understand their relationship. Now we will move on to the concepts of both well-being and
quality of life.
The earlier perspective of quality of life and well-being is back in 300 AC, when
philosopher Aristotle used the word good life, instead of well-being or quality of life. Aristotle
considered virtues as those qualities that enabled an individual to achieve the happiness that led
to a good life. However, he also believed that all human beings have some purpose in life, and
they required some actions to achieve that purpose. By not doing so, life was thought to have no
meaning, and one cannot have a good life (Haslip 2003). However, Nussbaum’s (1993) critiqued
on Aristotle’s point of an ethical approach based on virtues. According to her, the Aristotelian
virtue-based way lends support to relativism. She argued if the position of women is established
by local tradition in many parts of the world, it was to be improved, or if there was a racial
inequality, religious intolerance was to be criticised in the name of practical reason; then this
should be criticised from the utilitarian point of view, rather than Aristotelian approach
(Nassubum and Sen 1993). Also, utilitarian philosophers in the 17th and 18th century Jeremy
Bentham and John Stuart Mill, opposed the good life’s Aristotelian viewpoint. They believed
that the purpose of ethics “is to make life better by increasing the number of good things (such
as pleasure and happiness) and decreasing the amount of bad number (such as pain and
unhappiness)”, also flourishing purposeful life ‘eudaimonia’. After utilitarian philosophers,
many philosophers argued that people get a happy have good life when they have enough food
and money to live their lives (Ryan & Deci 2001). Over some time, the theory of utilitarianism

34
was changed where the classical utilitarian took happiness as a pleasure (absence of pain), and
modern utilitarian had changed the terminology using term welfare, and well-being which meant
“whatever makes life worth living” (Mulgan 2014).
Furthermore, well-being conceptions revolve around two different but related
philosophies: (1) hedonic and (2) eudaimonic. The hedonic approach defines well-being as
having more pleasure and no pain, and it also focuses more on human happiness and pleasure.
The hedonic approach has already seen in both Aristotle and Benthem’s philosophy of the good
life. Whereas the eudaimonic approach defines well-being as a person should fulfill their
ultimate goals with his/her capabilities (Richard and Edward 2001).
However, over the past quarter-century, psychologists have vigorously studied well-
being, especially Diener (1984), who focused on subjective well-being (SWB). From his
perspective, well-being is considered subjective because the idea is for people “to evaluate for
themselves, in a general way, the degree to which they experience a sense of wellness”. As an
operational definition, “SWB is most often interpreted to mean experiencing a high level of
positive affect, a low level of negative affect, and a high degree of satisfaction with’ one’s life”.
The concept of SWB also had frequently been used interchangeably with “happiness.”
Thus, maximising one’s well-being had been viewed as maximising one’s feelings of happiness.
Therefore SWB has been associated with the hedonistic approach to well-being (Ryff and Singer
2008) that focuses on factors that lead to SWB, including personal factors, social-environmental
factors, and cultural factors (Pinquart and Sörensen 2000).
However, SWB is not the only way to think about the general well-being of a person. A
second view is of Ryffs (1989) model and measure of psychological well-being, which fell
within the eudaimonic “tradition and was originally formulated to challenge the prevailing
hedonistic view of well-being within psychology”. In the current paper, Ryff and Singer
reviewed the work of theorists dating back to Aristotle. Aristotle’s view of the highest human
good involving virtue and the realisation of one’s potential had been presented by various
psychologists such as Maslow (1968), Allport (1961), and Rogers (1962). However, Ryffs

35
approach named six characteristics of psychological well-being: self-acceptance, personal
growth, relatedness, autonomy, relationships, environmental mastery, and purpose in life (Deci,
and Ryan 2008).
The psychological well-being perspective (PWB) focuses on eudaimonic well-being,
fulfilling human potential and meaningful life. At the same time, subjective well-being focuses
on the hedonic aspect of well-being, which is the pursuit of happiness and pleasant life.
Nevertheless, subjective well-being cannot capture all of the positive functioning; therefore, it is
being argued that subjective well-being is necessary but not sufficient to evaluate a good life.
Hence, both psychological and subjective well-being should be considered to know one’s quality
of life (Deci, & Ryan 2006). Hence, in recent years, both psychological and subjective well-
being involves evaluating the population’s quality of life (Ryff & Singer 2008).
Furthermore, it is also vital to understand the historical conception of quality of life.
Maslow in 1954 had given a different dimension of the quality of life as he examined human
needs in the form of “Hierarchy of Needs” which included five levels of “human maintenance
and existence” (Maslow 1968). He stated that people needed air, water, food, shelter, and safety
at the most basic level. Once people had achieved these, they needed to be loved, belong, have
personal self-respect, and ultimately achieve self-actualisation. However, according to Maslow,
not many people reach the highest level of need, that is, self-actualisation, because most fail to
have previous needs fulfilled. In later years, Maslow’s thought process did not account for the
idea that a person who had reached a need and goes on to the next may find it necessary to
relapse back to that need (Kenrick et al., 2010). Many psychologists had criticised Maslow’s
approach to the hierarchy of Basic needs. Bridwell (1976) reviewed Maslow’s theory of need in
detail; and recognised, human beings have many needs to get fulfilled, but the survival of a rigid
order of needs for every individual is different (Hofstede 1984). Built upon this evidence, stating
that the hierarchy developed on western ideology, human needs are individualists and differ
from the cultural needs of societies and individuals’ unique social and intellectual needs.
Hofstede (1984) further argued that individualistic societies reflect the needs of self-actualisation

36
and self-fulfillment, whereas a collectivist society is focused on community acceptance and
belonging to this structure (Hofstede 1984). Cianci (2003) had also criticised the Maslow’s
theory, as this could not be considered at a time, such as recession and war. Also, Tay and
Diener (2011) have established that the position of needs differs with age and does not appear to
be the same across all age groups. Alderfer (1969) further worked on the theory of need and
proposed the universality of needs. He simplified Maslow’s five Hierarchies of needs into three:
a) Physiological and safety needs, b) the need for relatedness, which includes love and esteem,
and c) the need for growth, which refers to self-actualisation. He had seen his three groups had a
continuity, rather than hierarchical construction. Therefore, anyone can experience some stages
at the same time, without forming changes in the hierarchy.
Max neef (1991) also critiqued Maslow’s hierarchy and suggested that human need is
interconnected and interrelated and had no hierarchies while describing human needs. According
to his theory, human needs must be fulfilled, but that could be satisfied by the people (Neef
1991). He further showed his concern for the people living in poor societies; people do not have
enough income, food, shelter, a better health care system, poor quality of education,
environment, and active participation in society (Max-Neef, 1991). Therefore, people living in a
poor society could more focus on fulfilling their basic needs and satisfying themselves, rather
than achieving the goals of their lives; described in Maslow’s work.
Moreover, theorists Doyal and Gough (1991) had argued that human beings have
universal and objective needs for health and autonomy and have an absolute right to fulfill those
needs and achieve their best satisfaction. In their theory Doyal and Gough (1991), highlighted
the relativist belief on the subjectivity of human needs. According to their theory, people know
about their feeling about what they need, but these needs are different in cultures over time.
They argued that assessing needs is based on what the person’s needs are and how capable it is
to achieve those needs. This is true that all human beings have different goals specific to their
culture, and to achieve those goals, people must act. However, there are specific requirements
for such action to be taken; that is, people must have the mental ability to choose and have

37
physical strength to follow their decisions (Doyal and Gough, 1991). Therefore, Doyal and
Gough concluded that survival and autonomy are basic human needs. And therefore, to achieve
the basic needs, it is also essential that people should have physical and mental freedom. Doyal
and Gough (1991) further discussed that the absence of autonomy brings adversities in society,
meaning that all individual learning may be stopped (Doyal and Gough 1991). Doyal and Gough
had also emphasised, that if one wants to satisfy their basic needs, cultural involvement would
be critical. Therefore, to use such a theory in eastern societies where autonomy is not seen much
would be interesting.
While Doyal and Gough (1991) presented a theory of need, at the same time, the
capability approach (CA) was proposed by Amartya Kumar Sen to state levels of well-being and
quality of life. Sen (1991) had highlighted many aspects of human needs in his Capability
approach, which Doyal and Gough (1991) had presented in their theory of need. Capability’s
concept was driven by the human development report presented in the united nation in 1991 by a
Pakistani economist Muhibul Haq (1991). According to him, the cause of human neglect is a
lack of financial resources and political commitment. Therefore, he presented a report on
financing human development. The report suggested that human development’s primary
objective is to expand the range of people’s choices and make development more participatory
and democratic.
Moreover, these choices should include access to income and employment opportunities,
education, health, and a clean physical environment. He also suggested that each soul have an
opportunity to participate in community decision and enjoy their surroundings and political
freedom (Mahbub ul Haq 1996). Haq (1991) had also talked about equality, that men, women,
and children should be given attention to development. The development must be participatory,
so all people should be allowed to invest in developing their capabilities in their health,
education, and training.
With the Human development report, Sen (1991) introduced the capability approach, a
framework to evaluate the individual well-being and social arrangements, to design policies and

38
proposals about social change in society. This approach’s main characteristic is its focus on what
people can do and to be within their capabilities to improve their quality of life (Mahbub ul Haq
1996). The capability approach is different from the other philosophical approaches; more
concentration is on “what people are effectively able to do and to be; that is, on their
capabilities” (Robeyns, 2005).
However, the glimpse of the capability approach could be seen in Aristotle, Adam Smith,
John Stuart Mill, and Karl Marx. In his theory, Sen (1991) argued that in social evaluations and
policy design, the focus should be on what people can do to improve their quality of life. He
suggested that it is essential for a human being to fight back with the challenges of life to live
their life as per their wish (Sen 1993). According to the capability approach, well-being should
be discussed in terms of people’s abilities to work or function, providing opportunities to
perform the activities they want to do and get satisfied (Robeyns, I., 2005).
So, that means that people have complete freedom to live their lives according to their
wish and can do what they can do and want to do to live a satisfied and happy life. Moreover,
Sen also suggested that well-being should be seen in a comprehensive and integrated manner,
like evaluating all aspects of well-being such as; material, mental, spiritual, social, economic,
political, and cultural dimensions of life (Robeyns 2005). Therefore, the capability approach had
also been used to assess the quality of life (Alkire 2008).
The capability approach argued that the quality of life should be considered and
measured directly in terms of ‘functioning and capabilities instead of resources or utility’ (Alkire
2008). Sen had “articulated the features, scope, advantages, and considerations of the capability
approach to measures quality life and living standard” (Alkire 2008). Sen also described the
essential feature of well-being that includes the ability to achieve valuable functioning. He also
argued that the need for identification and evaluation “of the vital functioning could not be
avoided by looking at something else, such as happiness, desire fulfilment, wealth, having
primary goods” (Alkire 2008).

39
As I am examining the quality of life conceptually, I will be examined to compare the
characteristic of both the basic needs approach and the capability approach.
The basic needs approach had a relatively long history, and it became widely discussed
and practised in the late 1970s. The philosophy behind the basic needs approach is that everyone
should be able to pursue well-being. The central notion of the basic needs approach is
fundamentally materialistic. It works by identifying a bundle of essential consumption and
assessing whether the population has adequate access. It has been generally accepted that the
package should cover supplies that are universally needed, such as shelter, sanitation, clean
water, and food. The strength of the basic needs approach is that it is easy to operationalise. At
the same time, Sen has stressed that the capability approach can be used for a wide range of
purposes (Sen 1993). The literature also had described that capability approach mainly focus on
getting the information that we need to know individual well-being, and social policies.
However, the central claim of the capability approach is that assessments of the person’s well-
being and quality of life all depend on the sufficient opportunities that people have to lead the
lives they have reason to value (Davies 2014).
As the passing time, quality of life theory had also included social cohesion due to
various aspects of economic and social change, which are currently considered to threaten the
social cohesion of societies, such as rising income inequality, poverty, unemployment, and
crime. A detailed review of the literature revealed (Schmitt and Regina 2000), the concept of
social cohesion incorporates mainly two dimensions of societal development. “The first-
dimension concerns are reducing disparities, inequalities, fragmentations, and cleavages, which
have also been denoted as ‘fault lines’ of societies. The second dimension embraces the forces
strengthening social relations, ties, and commitments to and within a community” (Schmitt and
Regina 2000). Although both dimensions emphasised within the social cohesion discourse are
supposed to represent significant components of individual and societal well-being, these aspects
are mainly neglected within the quality of life research.

40
Moreover, the literature on happiness, good life, well-being, and quality of life is more
focused on western culture and less focus on other cultures like (e.g., African and Middle
Eastern) given on rational psychology (Said 1979). Therefore, a good understanding of life,
happiness, and well-being in non-western culture need historical and current perspectives on
ethics, self, and how people define themselves and a quality of life (Abu-Raiya and Pargament,
2011).
The findings from western culture cannot be generalised to other cultures that need
empirical investigation. When the quality of life is assessed in a different culture, it is essential
to determine the meaning of quality of life in the cultural context. As discussed earlier, Pakistan
is an Islamic county and situated in south-east Asia. Therefore, it is essential to find out more
about the region’s literature on how that specific region sees the meaning of good life or quality
of life. In chapter one, I had already discussed some aspects of eastern society meant the quality
of life; I will further elaborate in this part of the chapter.
Islam and Confucianism believe to be two of the five greatest religions of the world
which have been practised in south-east Asia, and both religions have ethical characteristics.
However, Islam, “explicitly representing monotheistic characteristics, asks followers to commit
and virtuous to do the right things in life that are determined and governed by the ultimate
power, (Allah)”. Instead, Confucianism “basically does not talk about God as a concept, but
rather about Heaven, which is not a personal power; its followers must be righteous and
persistent in their life” (Cetinkaya and Imán 2011).
Moreover, both Confucius and Islam emphasise the importance of “virtues, ties, and
order in the family system”, as the male person is the head of the family and responsible for the
family’s existence and security. The male person also deserves more respect, and a younger
member of the family must respect and obey the older adults and vice versa. Both Confucianism
and Islam have great teaching that presents deep insights, virtues, rights, and family members
duties” (Abdullah 2011). Furthermore, literature on both religions also suggested that happiness

41
and a good life were socially constructed from culture and life experiences over a lifetime
(Seligman, 2011).
On contrary, Confucianism discourages the egocentric chase of individual happiness and
success because such a search could interrupt social structure and harmony. “Since the world is
uncontrollable and unpredictable from the individual’s perspective, belief in fatalism seems
inevitable” (Wong 2013). Fatalism identifies “limits of personal autonomy and self-
determination”. However, fatalism often also believes that humans can always have a better life
if they have good virtues, belief on God and freedom of choice, can spend a quality of life in the
future. Moreover, believing in fatalism makes people more patient to bear adversities of life. It
also allows to take control over one’s life and make the decision for oneself (Wong 2013).
When assessing the quality of life in Pakistani culture, which has religious influences,
there is a need to understand how people live in Muslim society believes good life and well-
being. Islam signifies different school of thought, all the primary teaching about human life,
well-being, good life, and happiness has been taught through it (Delle Fave et al., 2011). The
literature mentioned some differences in the “behavioural expression of happiness” in Islam. In
Islamic views, happiness and good life have their roots in the Quran, and the Prophet’s life and
all Muslims spent their lives within the perceived and correct interpretation of the Quran
(Joshanloo, 2013).
However, the modern Muslim scholars argued that Muslim understanding of life,
humankind, and happiness are strong influences by Islam (Husain, 1998). Muslim writers
further investigated that modern science and secular philosophies had failed to bring “happiness
and good life to humanity, due to a lack of a complete understanding of humankind and its
spiritual needs” (Musawi Lari 1997).
In Muslim ideology, God is the one who shows the way to happiness and a good life as
he had created the human being. However, the Muslim scholars believed that Aristotle list is
incomplete without adding religious faith, purification of the heart, worship, absolute submission
to God (Guessoum 2010).

42
The Islamic writers also assert that fulfillment of the wishes and dreams cannot only be
associated with happiness (hedonic), but they also need to supplicate themselves to God.
Therefore, it is believed that without strong and religious faith, a human being could not live a
healthy and quality life or contribute to society (1992). The Islamic writer is also steady with
Aristotle’s focus on eudaimonia’s social aspects that says, “we should devote ourselves to the
collective happiness of humanity to make our life better” (Joshanloo 2013).
For many years great thinkers across the culture had questioned about essential qualities
of a good society or good life. For example, “in Aristotle’s concept of eudaimonia, individuals
were called on to realise their full potentialities to achieve a “good life.” (Bynum, T.W., 2006).
However, according to the eastern philosophers, they stressed the virtue of limiting individual
desires and agreed on an ideology that encouraged an individual to achieve a good society and
good life by acting on their religion’s ethical values.
To conclude, quality of life is understood as a subjective understanding of well-being
while assessing an individual’s needs and understanding of a good life. In other words, quality of
life can be defined “as the satisfaction of a person with the current life situation. Also, quality of
life depends on the person’s value system and the cultural environment to which he/she belongs
to” (Susniene and Jurkauskas 2009). Therefore, one can say that quality of life comprises core
domains (emotional, personal, social, physical, and material psychology) that create personal
well-being (Schalock et al., 2016). Therefore, evaluating the quality of life, all the aspects of
well-being should be considered.
Moreover, the quality of life in Islamic culture reflects both hedonic and eudemonic
wellbeing in the Islamic context. However, none of the research had been conducted to evaluate
such complex phenomena in the fatalistic culture like Pakistan; therefore, this research will fill
the important gap in this research.

43
2.4 Measures of Quality of life and well-being in old age
In 1948, when Word Health organization defined health as "not only the absence of
infirmity and disease but also a state of complete physical, mental, and social well-being," the
physician thought that the patient's health is more than its physical health and it can be affected
by the social and environmental factors. However, the medical researcher was encouraged, but;
it changed the perception of the government strategies. A National Health Survey, created in
1957 in the USA, “to measure the quality of health of the American people, not just longevity,
and to determine the positive elements of good health rather than merely the absence of disease
and infirmity” the survey catered social aspects of health and personal impact of illness” (Linder
FE. 1966).
In (1963-1969), public agencies were advised and supported to develop more
quantifiable new measurements to evaluate national social programs to change society (Sheldon
and Parke 1975). This was the time when the social Indicators movement, led by psychologists
and sociologists, “began to advocate monitoring change in such areas of public life as education,
health, employment, crime victimization, political participation, and population growth and
measurement" (Vanhoutte, 2012).
Social indicators mainly have become more important since the population ageing
drastically around the world; therefore, it could be said that measuring the quality of life has
become more critical to assess and enhance a better life in the later years.
People are living longer and are spending a significant part of their later life in good
health. People do have many employment and childcare; they have a chance to possibly “fulfil
personal life goals and dreams, given good health and relative wealth” (Vanhoutte, 2012).
Therefore, any state or non-government organisations need to measure the population's quality
of life living in their third age. And, to assist them to fulfill their unmet goals or dreams.
Now I will be sharing some of the measures used to globally assess the quality of life,
particularly in Pakistan.

44
2.4.1 Measures of quality of life used globally
During the post-war years of rapid economic growth and social change, the more focus
was to measure the quality of life; for social research in both America and Europe (Abrams,
1973). So, the objective indicators were used to assess the quality of life of people. Objective
indicators were those measurable social statistics such as divorce or crime rates, or ownership of
purchased goods, the number of households with telephones, or several cars. In other words,
measures could be taken to show changes in the societal quality of life. Problems with these
measures lead to the birth of the subjective social indicator’s movement. It was argued that,
because people’s subjective responses are real, and people act based on them (Rapley 2003), one
should take account of these subjective responses when assessing the quality of life.
However, in the medical creation, quality of life was and still has been used to measure
disease type and treatment outcome (Farquhar, 1995). Many scales had been developed to
measure the quality of life. These differ extensively in concept, construction, and content.
Therefore, they could not always be compared directly with each other. There are hundreds of
measures that had been developed to assess the quality of life, and the majorities are health-
related (Burckhardt, and Anderson 2003). Now I will share some literature on the measures
developed to assess the quality of life worldwide.
A measure was developed to assess young people’s quality of life after one year of
having a Haemorrhagic stroke. This instrument had 65 items and considered general health,
relationship, emotional well-being. Moreover, the instrument was developed specifically for
young adults who had a risk of hemorrhagic stroke between 18 to 49 years hospitalised for a
primary, nontraumatic intracranial hemorrhage. Case subjects were excluded if they could not
communicate within 30 days of their stroke or had a history of prior stroke or other brain lesion
predisposing to hemorrhage. Though the instrument had construct validity, it did not evaluate the
subjective well-being of a person with the disease-related questions because the scale disease-
related could not evaluate the general well-being of the population (Hamedani et al., 2001).

45
Moreover, the Utian Quality of Life Scale (QoL) was developed to evaluate the women’s
QoL in Chinese women living in Hongkong within menopause. The study had an age group
between 40 to 52. The scale consisted of 4 domains (occupational, health, emotional, and
sexual). The scale-covered the domains which could affect woman peri or after menopause. The
telephonic interview was conducted; the article does not share whether the instrument was
translated into the Chinese language or was used in the English language. The scale was much
related to menopausal health and its effects on emotional well-being. Therefore, it cannot be
used to assess the general quality of life of the population or other aspects of well-being that
could include social and psychological aspects of well-being (Li and Sham., 2016).
Furthermore, an instrument was developed specifically to assess older adult’s quality of
life, named the Older People’s Quality of Life questionnaire (OPQOL-brief). The questionnaire
had 35 items with eight domains: life overall, health, social relationships and participation,
independence, control over life and freedom, home and neighbourhood, psychological and
emotional well-being, financial circumstances, culture, and religion. The tool was used in Iran
and was translated from English to Persian. The instrument had shown to use in healthy people
but can be used in “old patients with mild or moderate dementia”. This tool had been used in
various countries and had shown good psycho matric properties (Nikkhah et al. 2018). This tool
was also used on Italian outpatients to assess their quality of life and had shown 0.78 internal
consistency coefficients (Bilotta et al. 2011). Furthermore, Bowling et al (2011) found 0.9
Cronbach’s alpha coefficients in their research. The instrument had also been used to evaluate
the relationship between caregiver psychosocial factors and the quality of life of older adults at
home in Ghana, and the scale had 0.81 internal consistency (Bazaadut. 2014). Furthermore, the
same instrument in china had shown good internal consistency between 0.7–0.97 (Chen, Hicks ,
and While 2014). Though the instrument seemed to be reliable and good internal consistency in
a different part of the world, but cannot generalise the quality of life of healthy older adults as
this tool has the tendency to evaluate the quality of life of people who have dementia. Moreover,

46
the tool was not based on the theoretical ground, which represents the characteristic of the third
age population.
Another scale was developed named Quality of life scale (QOLS) with 15 items and had
five domains of QoL: “material and physical well-being, relationships with other people, social,
community and civic activities, personal development and fulfillment, and recreation” the
questioner was used to inquired person’s quality of life with chronic illness, later ‘the instrument
was expanded to include one more item: “Independence, the ability to do for yourself”. This
instrument was used for ages 30, 50, and 70. As this instrument was developed generally for all
the age groups, therefore, could not specifically share the quality of life of older adults. The
QOLS has also been used in studies of healthy adults and patients with “rheumatic diseases,
fibromyalgia, chronic obstructive pulmonary disease, gastrointestinal disorders, cardiac disease,
spinal cord injury, psoriasis, urinary stress incontinence, posttraumatic stress disorder, and
diabetes”. Therefore, this tool cannot be generalised to assess the quality of life of healthy older
people. The same QOLS tool was initially developed in the English language later it was
translated into various languages such as Arabic, Danish, Farsi, French, German, Greek,
Hebrew, Icelandic, Italian, Mandarin Chinese, Norwegian, Portuguese (Portugal and Brazil),
Spanish (Spain and Mexico), Swedish, Thai and Turkish. Though this scale was reliable and
validated to use to assess the quality of life, but it could have bias findings as people with
chronic illness might have different quality of life priorities or concerns (Burckhardt, and
Anderson, 2003 ).
Most scales on quality of life had been developed by professionals and are based on their
definitions and standards (Farquhar 1995). However, one of over 80 quality of life scales was
identified to evaluate people’s day-to-day lives, such as those with mental illness, chronic
psychiatric morbidity, physical disabilities, or infirmity due to old age (Cummins et al., 1994).
Also, Population-specific Quality of life instruments has been developed, such as evaluating an
adolescent’s quality of life with psychiatric issues (Ravens-Sieberer et al. 2014). Significantly
few old age-related measures have been developed, such as geriatric depression scale used to

47
assess depression in old age. Thus, the focus of much of the previous research into QoL in early
old age has been the extent of ill health among the population (Hyde et al., 2003).
2.4.2 Measures used in Pakistan to assess the quality of life
Earlier literature suggested that from the 1960s till 1980s, the following indicators were
used to assess the quality of life of the Pakistani population; “life expectancy at birth; health
facilities and level of nutrition; labour force participation; education facilities; and consumption
of durable goods and energy” (Jamal, and Malik, 1987). Since the 1990s, the Human
Development Index (HDI) was used to assess the country’s overall quality of life, which
measured the country’s economic and social dimensions (Sagar and Najam 1998). HDI was used
to assess the country’s level of quality of life. However, other instruments were used to measure
the quality of life of the population, which will be discussed now.
One study was conducted to assess the quality of life among the Pakistani population by
using the WHO generic quality of life scale, which was cross-culturally acceptable; it had both
validity and reliability to assess in Pakistani individuals. The scale was used in 18 + population;
the shorter version having 26 items were used compared to 100 items. The items were divided
into four domains: Physical (7 questions), Psychological (6 questions), Social relationship (3
questions), and Environmental health domain (8 questions). The WHOQOL-BREF questionnaire
was first translated into the Urdu language. The instrument was used in one of the region of
Pakistan named ‘Khyber Pakhtoon Khawa’; most people in this region speak the regional
language that is ‘Pashtu’, but the study did not mention whether the instrument was translated in
the regional language or the national language ‘Urdu’. The instrument had four dimensions
(Physical, Psychological, Environmental, and Relationship) that met the minimum reliability
standards of Cronbach’s alpha: 0.78, 0.71, 0.73, and 0.56. However, findings could not be
generalised for older adults as it was not age-specific, as the mean age of the study was 37 years
and was assessed in only one province of Pakistan (Lodhi et al. 2019).
Another study was conducted on 120 older adults; out of 60 older people were from
nursing homes, and 60 older people were from family set-up were selected through purposive

48
sampling. The study’s purpose was “to explore differences in depression, anxiety, coping and
quality of life between elderly residing in old age homes and within’ the family set-up. WHO
Quality of Life Questionnaire (WHO QOL-BREF) with 26 items was used to assess the quality
of life of 60 to 79 years of older adults. “The questionnaire showed discriminant validity, content
validity and test-retest reliability”. Participants with chronic illnesses such as; heart problems,
cancer and severe visual and hearing disability were not included in the study. WHO QOL
BREF was used to assess older adult’s quality of life with mental illness, which cannot
generalise the quality of life of Pakistan’s healthy older adults. Also, the number of participants
was minimal, where half of the participants were from the nursing home, where the living
standard and social conditions are different from the people living at home in the community
settings. Therefore, it could not generalize the findings of the older adult’s quality of life in
general (Parshad and Tufail 2014).
Another study was shown to examine women’s quality of life using microfinance in
urban Lahore in Pakistan. Quota sampling was used to interview 149 women users of
microfinance site office age between 20 to 59. The quality of life questionnaire was developed to
measure quality of life in four categories: economic, family, health, and decision-making ability.
Random samples were used to select five microfinance providers from the twenty‐one providers
for this study. Face to face interviews was conducted in the Urdu language. The study did not
share the process of translation. However, the researcher shared that the study’s limitation did
not have a standardised tool to measure microfinance women's quality of life (Jafree and Ahmed
2013).
The, study was also conducted to assess the predictive relationship of biopsychosocial
factors (health and lifestyle, self-esteem, self-efficacy, and social support) and quality of life
among older adults in Pakistan. The sample size for the study included 557 participants of age
60 years and above and was selected by using convenient sampling. Data were collected through
the WHOQOL-Brief questionnaire. Participants were recruited from cities and suburbs of all
provinces of Pakistan. The measure is standardised in Urdu (Lodhi et al., 2017). The study

49
reported acceptable psychometric properties, i.e., α = 0.88 to assess the QoL. Thus, measuring
QoL on these measures is comprehensive but exhaustive and covers a complete picture of
wellbeing in older people. However, the instrument was not specifically developed to assess
older adult’s quality of life; as WHOQOL has also been used in other age groups. Moreover, the
sample was not thorough in its extent and could not be generalised to many other older adults in
Pakistan (Tanveer and Batool 2019).
Another study was conducted to assess the quality of life of 60 plus population in
Pakistan. The participants were only males due to several constraints such as gender segregation,
socioeconomic disparities, and difficulties in retaining and recruiting older women in Pakhtun
society. The questionnaire was “consisted of two standardised inventories (Satisfaction with Life
Scale) constituted by Diener in 1985 (Diener et al. 1985) and Rosenberg Self-Esteem scale,
designed by Rosenberg in 1965 (Rosenberg 1965)”. To make sure the reliability of the
instruments, the pre-test of the questionnaire was performed. The content validity was ensured
by the consistency of the responses in pre-testing. The survey instruments were constructed in
both Urdu and English languages to make them more comprehensible to the older adults. The
internal consistency of the tool was 0.7 to 0.9. In the context of limitation, the study results were
not generalisable altogether since all the respondents were selected from only one metropolitan
city, i.e., Peshawar, and were gender biased. This made the result less generalisable to all the
older people who belong to the country’s other cities (Shah, 2019).
Moreover, a study was conducted to evaluate HRQOL in patients with Cirocis Liver
Disease in Pakistan. Two hundred seventy-three participants were part of the study, and the
mean age was 49 years. HRQOL is a subjective multidimensional concept that includes
functional status, emotional and social wellbeing, and general health. Because growing
awareness and understanding of health-related intervention on patients’ routine life. There is
rapid development in the concept of HRQOL. Therefore, HRQOL is vital in terms of physical
and psychosocial wellbeing for patients, suffering from chronic, devastating illnesses. The

50
measure could not generalise as it was particularly disease-related and was not age-related
(Parkash 2012).
To conclude, mainly in Pakistan, the quality of life had been assessed through a
WHOQOL developed scale mainly used to assess the quality of life in a variety of situations and
population groups. There are very few generic QoL scales used in an older population; most of
the researchers had used the Short-Form-36’ health status questionnaire as a proxy for QoL.
However, earlier research had suggested that older age groups had’ a higher rate of item
nonresponse than younger age groups with this instrument because they found several items
were not applicable to them. However, there are very few QoL measures that are truly
multidimensional (Bowling 2009). And one of them is CASP-19 (Control, Autonomy Self-
realization, and pleasure). The CASP-19 was based on needs satisfaction and self-actualisation
and aimed to measure Control, Autonomy, Self-realisation, and Pleasure and was developed for
the third age (Bowling, A., 2009). The next part of the chapter will focus on the CASP 19
measure of the quality of life.
2.5 CASP 19 the measure of the quality of life in old age
Quality of life has become an interest of many researchers and which has been discussed
earlier. Moreover, various scales developed to assess the quality of life in old age have been
discussed. The Quality of life measure for older adults was developed based on the 'need
satisfaction' theory of Maslow, which has been discussed earlier (Maslow, 1968) and Doyal and
Gough (1991), as previously discussed.
The theory argued that human beings need to have the liberty to be autonomous, practice
religion, and have political freedom (Higgs et al., 2003). In 'A fresh map of life,' Laslett (1996)
argued that older age should not be a remaining category of the life-course, whose populations
are more stressing about ill health and death. Instead, he argued that people live longer, healthier
lives with more non-refundable income in their retirement. Therefore, older age should be a
'crown of life,' where people are free to develop themselves and their interests (Hyde et al.,

51
2003). CASP is a measure that was theoretically driven and had four domains,
namely; Control, Autonomy, Pleasure, and Self-realisation, and it had 19 items.
The development of CASP is a useful scale for measuring the quality of life in old age
(Hyde et al., 2003). Control is "understood as the ability to intervene in one's environment
actively. Autonomy is defined as the right of an individual to be free from the unwanted
interference of others" (Hyde 2003). Laslett (1996) presented the theory of the Third age and
defined that the "older adults should be the 'crown of life' in which people are free to develop
themselves and their interests" (Laslett, 1996). Moreover, the increasing participation of older
adults in leisure activities and foreign trips showed that the older adults are keen to develop new
interests, and based on that, the other two domains, ' pleasure' and 'self-realisation,' were
developed. By including the other two domains, it showed that to have a good quality of life is
not adequate to be "free from undue interference nor simply to have the potential to be able to
intervene in one's environment," but that older adult should engage themselves "through those
activities that make them happy" (Hyde 2003).
Moreover, CASP had proved to be a "quick, effective, multidimensional instrument with
good psychometric properties" (Wiggins et al. 2008). Furthermore, CASP had also been
administered to see the relationship between the different predictors of quality of life. Table 2.1
describes the studies that performed the psychometric evaluation of CASP 19, which will be
discussed below in the chapter.
Now the chapter will discuss CASP studies with their characteristics. CASP-19 had been
extensively used in various studies with the large and small sample size to date such as; it had
been administered in large population-based samples English Longitudinal Study of Ageing
(ELSA) waves 1 to 5 (Marmot et al., 2003), the 2004 US Health and Retirement Study (Clarke,
2007); and the British Household Panel Study (BHPS) (Taylor, Brice, Buck, & Prentice-Lane,
2001). The psychometric properties of CASP 19 had been performed in a couple of studies;
specifically, in West European countries, primarily in the United Kingdom (Sim et al., 2011;
Wiggins et al., 2008) and Ireland (Sexton et al., 2013), but also in Taiwan (Wu et al., 2013) and

52
Brazil (Lima, F. M., et al. 2014). Initially, the CASP was developed with its 19 items. However,
later because of its psychometric properties, it had evolved with the CASP-12 questionnaire
(Siegrist, & Wahrendorf 2009). Hence, the scale developers recommended CASP-12 v.1, but
they also mentioned that CASP 12 V.1 has a ceiling effect, which was less of a problem with
CASP 19 (Howel 2012). The CASP-19 had shown a good to the BHPS and ELSA samples' data,
using the confirmatory factor analysis (CFA) approach. Also, the shortened three-factor CASP-
12v.2 proved slightly superior to the original 19-item scale. These findings had been confirmed
by Sim et al (2011); the authors assessed the psychometric properties of CASP-19 and CASP-
12v.2 on a sample of 120 British adults living in the retirement community. There was little
distinction between CASP 12 v 1. and v2. CASP. Both CASP 12 v1 and v2 has 12 items and had
a three-factor structure where items of control and autonomy domains were merged to form
single components while items related to pleasure and self-realisation represented different
dimensions.
CASP-12v.1 consisted of 12 items: C1, C2, C4, A5, A6, A9, P10, P11, P14, S15, S18,
and S19.CASP-12v.2 (Wiggins et al., 2008) was composed of C1, C2, C4, A5, A7, A9, P10,
P11, P12, S15, S18, and S19. Both CASPv1 and CASP v2 did not include C3, A8, P12, P13,
S16, and S17. The CASP 12 version 1 autonomy domain showed very low internal consistency.
Moreover, two of its indicators, items 6 ("family responsibilities") and 9 ("shortage of money"),
seemed to be bad indicators of the SHARE version of the CASP-12. On the other hand, CASP
12 v 2 Cronbach Alpha coefficient for the autonomy scale remained stubbornly low at around
0.45.
Sexton et al (2013) had also undertaken a detailed psychometric assessment of CASP-19 using
the Irish Longitudinal Study of Ageing (TILDA) (Kim et al., 2015). Their findings did not
support the validity of the established measurement models. The control and autonomy, self-
realisation, and pleasure factors were not sufficiently distinctive either empirically or
conceptually. Instead, they recommended using a revised 12-item scale with either a single-
factor or two-factor model (CASP-12v.3) when assessing overall QoL (Sexton et al., 2013). To
53
date, the psychometric properties of the proposed single- or two-factor CASP-12v.3 had not yet
been further investigated in other studies (Kim et al., 2015).
Moreover, the shorter three versions of the CASP 19, CASP (12 v1.2.3) and CASP 19
were also used in older adults from the HAPIEE (Health, Alcohol, and Psychosocial factors In
Eastern Europe) study. The same study found out that CASP-12v.3 is a reliable tool for
assessing QoL among adults aged 50 years or older in this population. This version of CASP is
recommended for future studies investigating QoL in the CEE (Countries in Eastern Europe)
populations (Kim et al. 2015). This was the first study that explored the psychometric properties
and validated a well-fitting three-factor structure proposed by Wiggins and colleagues (2008) for
the CASP-12 V.1 in a large population sample of older people from Spain. The study further
recommended that CASP12 V.1 could be used to assess the quality of life in the older population
(Pérez-Rojo 2018).
Several studies had tried to define the factor study CASP12 items through exploratory
and confirmatory methods (Kim et al., 2015; Sexton, King-Kallimanis, Conroy, & Hickey, 2013;
Pérez-Rojo, Martín, Noriega, & López, 2017; Towers, Yeung, Stevenson, Stephens, & Alpass,
2015), and it showed that 3 factors model of CASP is consistent in many studies. As the 2012
wave of the New Zealand Health, Work and Retirement Study, Towers et al (2015) determined
an 11-item, 3-factor solution which fit the data. Later the measure was called the NZCASP-
11(Allen., J 2018).
Moreover, a cross-sectional study was conducted on men and women aged 60 and older
living in Lithuania. The sample size was 132 out of 28 were male participants, and 103 were
women. The Lithuanian version of CASP-19 showed high internal consistency (Cronbach's
alpha 0.85); the psychometric properties had shown that the Lithuanian version of CASP-19 was
reliable and valid. Moreover, the inter-item correlations ranged from 0.65 to 0.56. However, the
weakest item was A6, "Family responsibilities prevent me from doing what I want to do." The
study aimed to provide a Lithuanian version of the questionnaire and test its psychometric

54
properties. The results of the Lithuanian version of the CASP-19 questionnaire were similar to
those found in other studies (Černovas et al., 2018).
Furthermore, one of the studies aimed to assess the psychometric properties of the
Persian version of quality of life (CASP- 19) in older people. The study included 200
participants. It was the first time when CASP was used in a middle eastern country to evaluate
the QoL. The reliability for CASP-19 was 0.97. The Farsi version of the CASP-19 for the
Iranian population found a reliable and valid tool to assess the Iranian population's quality of life
(Heravi-Karimooi et al., 2018).
The CASP19 English was translated into Bahasa Malaysia or the traditional Chinese
language. A total of 466 participants with a mean age of 73.1 years were included in the study.
The CASP-19 showed good test-retest reliability; the inter items had a good correlation with
each other. However, low inter-item correlations of below 0.2 were observed for A9, which
corresponded to the questions ‘shortage of money stops me from doing the things I want to do’.
Moreover, the best psychometric properties were observed when tested with the Taiwanese five
domain model. Overall Malaysian older adults appear to had better QoL. However, the
significant difference in the scoring based on ethnicity where the Malay population scored
highest, followed by Chinese, Indian, and others. However, the ethnic Malays who were
Muslims believe in fate; they believed that “any occurrence in life is to accept with grace as it is
a blessing of God. This naturally results in an accepting nature towards any circumstances within
the older Malays in Malaysia”. These fatalist views could be seen in a Muslim society
(Nalathamby et al., 2017).
Moreover, CASP 15 was also suggested by Vanhoutte (2012), where the four items were
removed because of having low factor loadings to the domain (i.e., shortage of money and
family responsibility, ‘my age prevents me from doing things, and my health stops me from
doing things’. The subsequent 15-item CASP scale reflects a three-factor solution where the
control and autonomy domains form one factor, and each domain includes five items (Jivraj et
al. 2014). There had been only limited use of the scale amongst non-European populations. The

55
CASP was used to assess the quality of life among the Israel immigrants, and the scale was
translated into Arabic and Hebrew languages. Moreover, the same study found out that CASP is
an excellent instrument to assess the quality of life in non-European populations (Lima et al.,
2014).
Moreover, the scale had also been adapted cross-culturally in a few countries. It was used
in Africa to study QoL amongst retired Nigerian, and results showed that the CASP-19 scale
performed relatively well (Ejechi, 2012). On the other hand, the scale was dropped from the first
wave of the Japanese Study of Ageing and Retirement (JSTAR) because; it was felt that some
items from the control and autonomy domains were too western that could not be appropriate to
assess the Qol in the Japanese culture (Ichimura, Hashimoto and Shimizutani 2009).
Besides, CASP-19 was also used in the Brazilian older population, which was used after
cross-culture adaptation. The CASP-16 Brazil demonstrated good psychometric properties and
internal consistency. Furthermore, the older respondents quickly understood the CASP-16 Brazil
questions. Overall, it was suggested that as it was developed within different cultural contexts,
the measure can use in a different culture and globalised society in a culturally appropriate
manner (Lima et al. 2014).
Another cross-cultural study on CASP 19 was conducted in Taiwan and used in a
Mandarin science community to assess quality of life. After the process of translation and back
translation, it was agreed by a research team that the final CASP 19 Chinese Taiwan versions
were conceptually and linguistically equivalent. The results showed that the tool had reliability
and good internal consistency. Older adults in Taiwan appeared to had lower CASP-19 scores
than Western society because of their cultural differences (Wu et al., 2013). Hence, the
reliability and quality of CASP 19 had allowed many researchers to assess the relationship
between CASP and various factors that affect quality of life (Blane, Netuveli, & Bartley 2007).
The growing ageing population is a concern for many; therefore, many previous studies
had also conducted using CASP 19 to see the relationship between the quality of life and socio-
economic position. The study revealed that social position did make a difference in an

56
individual's quality of life. Notably, an individual had a higher social position than the one who
had a lower position (Blane, Netuveli, & Bartley 2007). The CASP 19 had also used in a specific
population, such as assessing a people's quality of life with frailty. The study suggested that the
relationship between frailty and subjective well-being in the older population is about financial
resources. Therefore, people with adequate financial resources had better well-being and quality
of life in old age (Hubbard et al. 2014).
The CASP was also used to assess the quality of life of a retiring group of people in a
community; that showed good psychometric properties. When used in a defined population, a
concern with the instrument, such as (retirement), may show ceiling effects. Therefore, the study
identified that this group of people living in different environments had a different meaning of
autonomy (Sim et al., 2011).
CASP 19 had also been used to assess the effects of life course perspective in old age.
The study suggested that past life impacts the current situation and affects QoL (Wiggins et al.
2004). The further life-course study using CASP 19 was also used in a cohort study of middle
age in a retirement French men and women. Also, the data was collected from the National gas
and Electricity Company. The study suggested that the higher the occupational grades better the
quality of life is in the later years. However, it also depends on the person's new circumstances,
physical health, wealth, and other determinants; that affect the quality of life (Platts 2015).
Moreover, the CASP 19 analysis also revealed that the scale "can be used to investigate
differences in eudaimonic and hedonic subjective well-being across Europe" (Vanhoutte 2012).
Besides that, the study conducted using CASP in the British household suggested that better
QoL reduced death probability (Netuveli et al., 2012). Another study was conducted using
CASP to assess the association between the fertility histories of older British women and men
and their quality of life. The results suggested that participants who entered early parenthood had
a more mediocre quality of life. Moreover, other factors were associated with this: socio-
economic, social support, and health factors. Also, there is an association between fertility
history and quality of life (Read & Grundy 2011).

57
Moreover, CASP was based on the third age theory; it was also used in the study to
describe the quality of life of 80 years and older adults who lived independently in the
community. That revealed that the population scored well on the CASP scale and showed that
people had a better quality of life while living independently (Godwin et al., 2015). The study
was also conducted using CASP 19 in a different demographic and residential status besides the
original population where CASP was used. The study suggested that CASP 19 showed a good
psychometric property and internal consistency. However, the control and autonomy domains
were suspected and recommended that more modification of the scale be done while evaluating
the psychometric properties (Sim, 2011).
Furthermore, the study was conducted using the CASP 12 measure to investigate the
degree of socio-economic inequality, the quality of life of Europeans in early old age, and the
influence of the welfare regime type on these relationships. The result showed that individuals in
more generous welfare regimes experienced a higher quality of life and narrower socio-
economic inequalities in quality of life (Niedzwiedz, 2014).
The study was also conducted to compare different life domains' role in defining the
quality of life (QoL) in Ireland. The study illustrated that there was not one predictor that
explains the quality of life. However, mental health was only the domain that independently
examines the high proportion of variance in CASP 19 (Layte, 2013). Besides that, the CASP was
also used to assess the quality of life with occupation position, which results in people with high
management posts having the highest score on the quality of life (Netuveli et al. 2006).
Mainly the studies using CASP 19 to date have been used to investigate whether Age and
gender, longstanding illnesses, social context, and socio-economic circumstances predict the
quality of life or assess its psychometric properties in different cultures. Now the chapter will
look into the psychometric evaluation of the CASP 19.

58
Domains CASP 19 Items Original Various Eastern Europe and UK Brazil New Addis
UK Zealand Ababa
Ethiopia CASP19 CASP12v.1 CASP12v.2 CASP12v.3 CASP16 CASP 11 CASP11
Control C1 My age prevents me from X X X X X X X
doing the things I would like to
do
C2 I feel that what happens to X X X X X X X
me is out of my control C3 I feel free to plan for the X - - X X - X
future.
C4 I feel left out of things X X X X X X -
Autonomy A5 I can do the things that I X X X X X X
want to do.
A6 Family responsibilities X X - - - - -

59
prevent from doing what I want
to do.
A7 I feel that I can please X - X X X X X
myself what I can do.
A8 My health stops me from X - - X X - -
doing the things I want to do.
A9 Shortage of money stops me X X X X X - -
from doing the things I want to
do.
Pleasure P10 I look forward to each day X X X X X X X
P11 I feel that my life has X X X X X X X
meaning
P12 I enjoy the things that I do X - X - X X X
P13 I enjoy being in the X - - X - - -
company of others
P14 On balance I look back on X - - - X - -
my life with a sense of
happiness

60
Self- S15 I feel full of energy these X X X - X X X
realisation days
S16 I choose to do things I have X X - X X - -
never done before
S17 I feel satisfied with the way X - X - - - X
my life has turned out
S18 I feel that life is full of X X X X X X X
opportunities
S19 I feel that the future looks X X - - X X -
Table 2.1: CASP summary used in different countries

61
2.5.1 Comparing Confirmatory factor analysis of CASP19 from other studies
This part of the chapter will discuss the comparison of the confirmatory factor analysis of
CASP 19, used in different cultures. Though there are not many countries where the
psychometric properties of CASP 19 had been evaluated. However, the confirmatory factor
analysis comparison will allow evaluating the different model fits in different countries. Table
2.2 shows the CFA in the ELSA study, where original CASP-19 was used. ELSA wave 1 had a
total sample of 11,234; however, only 9300 data was considered for analysis. The main reason
for non-response was a refusal. The first-order model of the study showed a better model fit in
the observed data. Both the ‘single-factor model’ and the ‘second-order model’ did not fit the
data well (table).
Moreover, British Household Panel Survey (BHPS) study the sample was 7480 but 6471
cases were used for analysis due to missing data in the CASP model; only TLI indices
recommended that there was little to choose between the first and second-order models; as CFI
in both models were on the lower side. However, the RMSEA coefficient has better in BHPS
compared to the ELSA.
Another study conducted in the UK, in 120 residents of the retirement community, using
the CASP 19 was also evaluated to assess the best model fit. The study displayed that the first-
order factor fit better than the single and second-order factor; as the CFI and TLI both were in
the first order; the model was more significant than >0.90. The RMSEA score was higher than
its limit but better than the single and second model factor.
Also, psychometric analysis of CASP 19 was conducted in Ireland where 8,175, 50+
older adults participated in the study. However, the analysis was performed on 6,823 due to
incomplete forms; the finding of CFA indicated a flawed model fit to data. Therefore, CASP-12
V.2 was considered to use for the population. Moreover, the confirmatory factor analysis
showed that the ‘second-order factors’ displayed a better fit to the data.
The CASP 12 (v2) was also administered to 214 people aged 55 in African populations
living in Addis Ababa, Ethiopia. The confirmatory factor analysis suggested the best fit with 11

62
items, the four factors model (CFI, 0.954; RMSEA 0.075) (Hamren, Chungkham, & Hyde.
2015). The psychometric properties of the CASP 19 were also performed in the three countries
Czech Republic, Russia, and Poland in the Health, Alcohol, and Psychosocial factors In Eastern
Europe (HAPEE) study. The sample age was between 45 -70 years. The total sample recruited
was 28,945, and the response rate was 59%. The analytical sample consisted of 13,210
individuals (Czech Republic: N 3782; Russia: N 3802; Poland: N 5626). The confirmatory factor
analysis for CASP 19 demonstrated a poor model fit by the goodness of fit indices. Where
RMSEA was above 0.10, CFI and TLI were lower than 0.90. Therefore, the CASP 12 v3 was
used to assess the quality of life of the population. In all three countries, the ‘second-order
model’ of CASP 12 best fits the data. Though compared to both Russia and Poland, the Czech
Republic had the best second-order model fit indices where TLI was 0.97, CFI was 0.98, and
RMESA 0.05. The study suggested that it was difficult to compare results to other CEE
countries because of similar local studies. However, CFA’s result was in agreement with the
evidence from UK studies where ‘CASP-12v.2, goodness-of-fit indices of the latter two models
were of a similar magnitude as that found by Wiggins et al (2008). The study concluded that the
Russian data was less well-fit than the Czech and Polish data due to the cultural relevance of
certain CASP items (Gyu Ri Kim et al. 2015).
Hence, after looking at the studies conducted using on CFA, the reasons for the
difference in the CFA indices could be the sample size of the study, as the researcher had found
out that the RMSEA can elevate with small sample sizes (N ≤ 100). “As the model degrees of
freedom decreased, model rejection rates increased for the RMSEA, even with sample sizes as
large as 1000. The RMSEA decreased if there were more degrees of freedom and/or larger
sample size, keeping everything else constant” (Kline 2015). Hence, there was an “impact of
sample size on the fit indexes performance with models with small degrees of freedom”,
Several studies have shown the importance of sample size on the performance of fit indexes such
as the RMSEA (Chen et al. 2008).
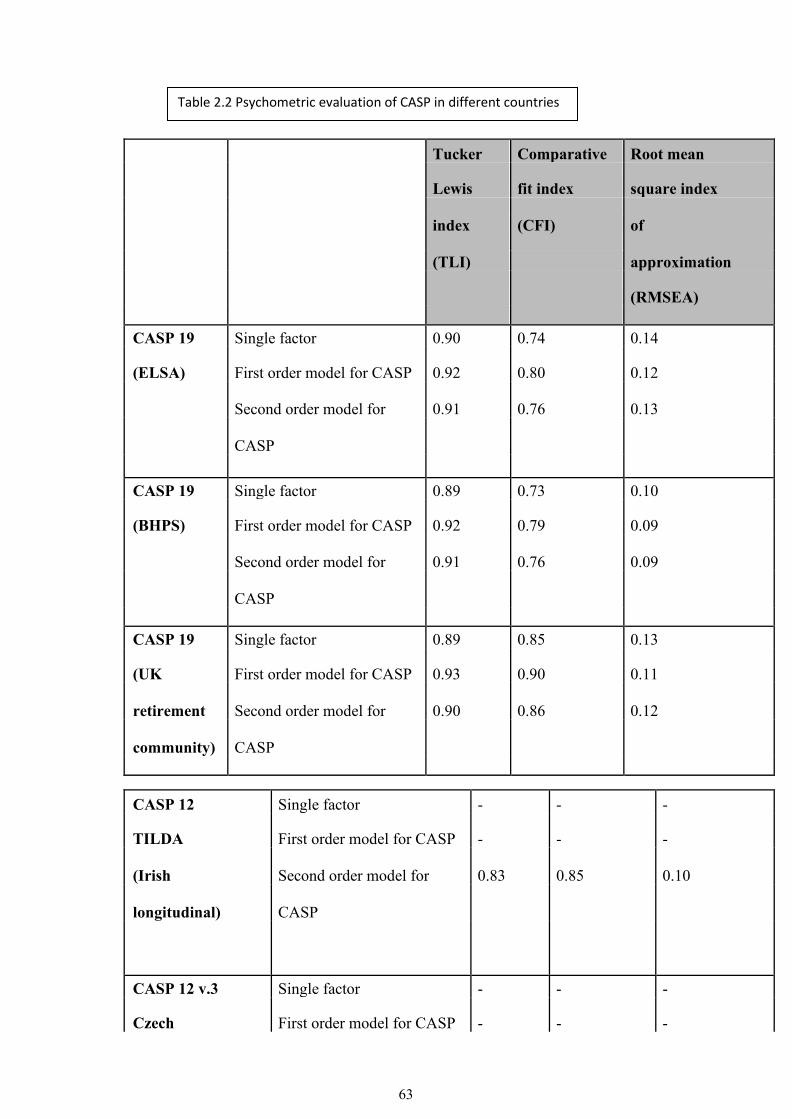
63
Tucker Comparative Root mean
Lewis fit index square index
index (CFI) of
(TLI)
approximation
(RMSEA)
CASP 19 Single factor 0.90 0.74 0.14
(ELSA) First order model for CASP 0.92 0.80 0.12
Second order model for 0.91 0.76 0.13
CASP
CASP 19 Single factor 0.89 0.73 0.10
(BHPS) First order model for CASP 0.92 0.79 0.09
Second order model for 0.91 0.76 0.09
CASP
CASP 19 Single factor 0.89 0.85 0.13
(UK First order model for CASP 0.93 0.90 0.11
retirement Second order model for 0.90 0.86 0.12
community) CASP
CASP 12 Single factor - - -
TILDA First order model for CASP - - -
(Irish Second order model for 0.83 0.85 0.10
longitudinal) CASP
CASP 12 v.3 Single factor - - -
Czech First order model for CASP - - -
Table 2.2 Psychometric evaluation of CASP in different countries

64
Republic Second order model for 0.97 0.98 0.05
CASP
CASP 12 v.3 Single factor - - -
Russia First order model for CASP - - -
Second order model for 0.90 0.93 0.07
CASP
CASP 12 v.3 Single factor - -
Poland First order model for CASP - -
Second order model for 0.94 0.96
CASP
2.6 Predictors of quality of life
Netuveli and Blane (2008), in one of their studies, did a narrative review of selected
literature to know older adults' perceptions regarding the quality of life. Most of the participants
shared some negative and positive views about the quality of life. Moreover, some of the factors
which participants had identified included social contacts with family and friends, dependency,
functional limitation, ill-health.
Furthermore, the national survey was conducted in England and Scotland with 999
individuals: by Bowling and colleagues on aged 65 +. The study found out that factors that
influenced on quality of life include social roles, health, psychological, home and
neighbourhood, financial circumstances, relationships with neighbours, accessible transport
facilities; psychological factors such as optimism and positive attitude, contentment, looking
forward to things, acceptance and other coping strategies. Their study identified that quality of

65
life goes beyond health, and therefore in my study, most of these factors had been used as a
predictor, including (Age and Gender), to assess the quality of life in older adults.
2.6.1 Age, gender, and quality of life
The well-being and quality of life, specifically in old age, can be affected by many
factors, such as relationships with children, relatives, communities, race, ethnicity,
socioeconomic status, physical and mental disabilities (Janardhan 2009). Also, cultural barriers
and gender inequality can impact older adult's well-being in society, especially in low-income
countries, as gender inequality does not allow them to live life fully (Janardhan 2009).
Gender inequality in low-income societies has been stressful, and a burden for women
expected to play an obedient wife or daughter in the family (Janardhan 2009). Women are
expected to take care of older adults, often at the expense of their physical, emotional, and
psychological well-being. This practice is also widespread in most developing countries,
including Pakistan, where family norms put more burden on women, decreasing women's quality
of life (Janardhan 2009).
Wiggins et al (2004) conducted a study to know whether a person's age and gender
impacted their quality of life. The CASP 19 was used to assess the quality of life in 284 sample
of the study. In the study, women's number of participants was slightly higher than the male
participants, and they were older as 61% of the women were age 70 or more years. Whereas
51% men were over 70 or more years. However, the participants were a 'nationally
representative sample of non-institutionalised adults living in England.' (Wiggins et al. 2004).
Overall, there was no statistical association between age and gender. one of the reasons for the
result could be the limitation of the study where the questionnaire was sent by post; therefore,
the response rate was 92%. Unlike an interview, if the respondent doesn't understand the
question or what needs to be answered, they could not discuss with the researcher and complete
it the way they have perceived. This may harm the validity of the answers as they may not
understand the question without prompts (Wiggins et al 2004).

66
However, the same study found out that there was a strong effect of age on CASP- 19, which
suggests that quality of life deteriorates with age (Wiggins et al. 2004).
Moreover, Blane et al. (2004) in one of their study shared a curvilinear relationship
between age and quality of life that showed 'older participants tend to experience greater rates of
decline in quality of life. (Blane et al. 2004). Though 'quality of life varies with age,' it does not
mean that older adults permanently have impaired quality of life. Individual life's circumstances
such as living standards, good psychosocial condition, socio-economic conditions, and good
health are evidence of having a better quality of life in 50 + older adults. (Bowling, 2009).
Moreover, Netuveli (2006) study using CASP in 50 + population from the first wave of
the ELSA. ELSA sample was ‘from three years (1998, 1999, and 2001) of health survey for
England (HSE). The issued sample for ELSA wave 1 was 18 813 and the achieved sample was
12 100. The main reason for non‐response was refusal’ The study revealed that as age increases,
the quality of life decreases. The study also found out that men had a better quality of life than
women. Women's QoL was reduced 'being a carer, being not in employment because of looking
after home and family and having increased contact with children and family. For men, all these
factors were not significant. However, women who lived alone had a better quality of life.
However, as the method was a self-completion of the questionnaire by the participants, there
was a large proportion of the missing data (Netuveli et al 2006).
Moreover, a study in Brazil using CASP in a sample of (n = 87), (52.9%) community-
dwelling older people in Recife, Brazil, reported that women had higher average QoL scores
than men though the difference was not statistically significant. However, the study doesn't share
the findings of the age effects, because of its small sample size (Lima et al. 2014). As the
purpose of the study was to translate CASP 19 into the Brazilian language and validate it, the
result could not be viewed as representative of the general Brazilian population. And the study
may not generalized because of its convenience sampling as there could be a chance of under-or
over-representation of the population (Lima et al. 2014).

67
Furthermore, CASP was also used to describe the quality of life of the 'population of
cognitively functioning seniors aged 80 years and older living independently in the community'
(Godwin et al., 2015). In Canada. The sample of the study was 236. The study suggested mean
scores for men were (44.4) and women (44.9), which did not show any statistically significant
difference, in both the gender. (Godwin et al., 2015). However, the study cannot generalize its
findings as the CASP was used on the 80 + population, though the CASP was initially developed
to assess the quality of life of the third age. Furthermore, it was only used one city of Canada'
which has culturally and genetically homogeneous population' (Godwin et al., 2015). Also, the
sample was randomly selected from the community, by the general physicians. Therefore, it
would be likely a selection bias as the 80+ population could not give age effects in the study
findings.
Moreover, the study was conducted in a large population sample of older adults from the
HAPIEE (Health, Alcohol, and Psychosocial factors In Eastern Europe). 'The aim was to assess
the reliability and validity of the quality of life (QoL) instrument CASP-19, and three shorter
versions of CASP-12 study'. The study found out that in the population samples of men and
women aged 45 and 70 years in Russia, Poland, and seven Czech towns, men scored
significantly higher on the CASP-19 than women in all countries. Polish men and women
reported the highest CASP-19 scores, whereas Russian men reported the lowest CASP-19
scores. The study findings showed the cultural influences on the results of CASP in all the
countries (Gyu Ri Kima et al. 2014). However, the findings could not be generalized because of
their methodological issues. It was a self-completed questionnaire; it may not allow participants
to respond accurately or honestly and had recall bias. Also 'respondents included in the study
may not represent the whole population.
Also, looking at the age effect on quality of life (Netuveli 2006) study was identified in
'secondary analysis of wave 1 of the English longitudinal study of aging ' that the quality of life
increases from 50 years (CASP‐19 score 44.4) to peak at 68 years (CASP‐19 score 47.7). It

68
gradually started to decline, reaching the same level as that of 50 years by 86 years. And by 100
years, the CASP‐19 score had declined to 37.3 (Netuveli, 2006).
Similarly, the study uses data from the first wave of the Irish Longitudinal Study of
Ageing (TILDA) was conducted, ‘comprising a random sample of community-dwelling
individuals aged 50 and over in the Republic of Ireland’. The 640 sampling geographical clusters
stratified by socio-economic group, followed by 40 households within each cluster. ‘A total of
8,175 home interviews were conducted between 2009 and 2011. Of these, 6,912 returned a self-
completion questionnaire including the CASP-19 scale’(Sexton et al. 2013). The study suggested
that the Mean CASP-19 score increased from age 50, reaching until 67, the quality of life started
decreasing until the age of 95 in the Irish population (Sexton et al. 2013).
Moreover, People in different cultures may hold different personal values that affect their
preferred course of action. Therefore, assessing the quality of life with the measure, CASP
could have a different impact on the predictors of the quality of life. For example, different
cultures perceive gender empowerment differently. Such as when CASP used in Canada, there
were no significant effects of quality of life in both the gender whereas when it was used in
Brazil women had a better quality of life than the man, it was not statistically significant.
2.6.2 -Socio-economic factors and quality of life
Well-being in later life is associated with higher socioeconomic status, financial security,
and better education (Pinquart and Sorensen 2000). Thus, both positive and negative association
between the quality of life and financial circumstances had been reported in various studies. In
terms of the perceived financial situation had a negative association (Blane et al., 2012; Netuveli
et al., 2006; Webb et al., 2011), the housing tenures had positive (Ross et al., 2008, p. 47),
inadequate pension arrangements of the country had negative (Wiggins et al., 2004), income had
positive (Netuveli et al., 2006; von dem Knesebeck et al., 2007), and wealth had a positive
(Zaninotto et al., 2009) impact on the quality of life..

69
Moreover ‘data from the English Longitudinal Study of Ageing for those completing
CASP-19 in both Wave 1 and Wave 2 (n = 6,482) to investigate how to interpret changes on the
CASP-19 quality of life scale for older people’. The Study collected data on many characteristics
such as socio-economic, health-related, and social circumstances from a nationally
representative sample of adults aged 50 years and over in England. The participants were asked
if they have a ‘limiting chronic illness, suffers from depression (CES-D 8 score>3, is often
troubled by pain, has difficulty walking ¼ mile, lives alone, is in employment and has access to
a car. A self-assessed socio-economic variable was also included, their ‘self-perceived social
status on a ladder’ (0–100 scale, 100) being highest status)’ 'Cross-sectional comparison of
CASP-19 scores found small differences in those who differed in indicators of socio-economic
position and larger differences in those with different health states' (Howel 2012).
Another study conducted using ELSA sample. In this study 9,300 people completed
CASP in Wave 1 and 6,820 in Wave 2. However the analyses was performed on 6,182
participants who completed CASP on both occasions. This allowed a clear comparison between
the cross-sectional and longitudinal differences. The 'Cross-sectional comparison of CASP-19
scores found small differences in those who differed in indicators of socioeconomic position and
larger differences in those with different health states' It was also identified that quality of life
was 22% higher in the population who were wealthier than the most impoverished population. as
the socioeconomic status could depend on the financial circumstances of an individual (Howel
2012). The difference between the two waves was not too long, and therefore, the
socioeconomic conditions in 2 years were not changed significantly than the health.
Baseline data from the 'Survey of Health, Ageing, and Retirement in Europe' (SHARE)
were obtained in 14 European countries to understand differences in quality of life in early old
age, 'associations between socioeconomic status, socially productive activities and well-being.'
The sample size was (n=8,896). The mean age of the population was between 64 and 75. The
data was taken from the first and second wave, and more than half of the population were male
participants. The finding displayed that almost half of the sample considered leaving their jobs

70
as early as possible, with a higher prevalence among participants who belonged to a lower
socioeconomic status and those with reduced quality of life. It was found out that low
socioeconomic status and reduced quality of life were strongly related to low quality of work.
There were two indicators of socioeconomic position were asked to the participants that were
'education and income' (Siegrist et al., 2007). The income information was based ‘on the total
annual household income composed by the sum of different income components which were
assessed in the questionnaire and Education was measured according to the International
Standard Classification of Educational Degrees(ISCED-97), categorized into ‘low education’
(pre-primary, primary or lower secondary education), ‘medium education’ (secondary or post-
secondary education), and ‘high education’ (first and second stage of tertiary
education)’(Siegrist et al., 2007). The study suggested that both the indicators could not be
appropriate for the people who were already retired and had no source of income.
Furthermore, the fourth and seventh waves of the English Longitudinal Study of Ageing
(ELSA) were conducted to know 'what extent, working beyond State pension age affects the
quality of life (QoL).' The sample population for men was aged (65-74) and for women aged
(60-69), the total sample size was (n=2502). To achieve the aim of the study The respondents
were asked ‘whether respondents were in paid work beyond SPA for financial reasons (i.e.
because they ‘could not afford to retire earlier’ or wanted to ‘improve their pension/financial
position’) or voluntarily (i.e. because they ‘enjoy working’ or to ‘keep active and fit’). And
Retirees were categorised into three main groups: ‘normal’ retirement (‘they reached SPA’);
‘involuntary’ retirement (due to their own or someone else’s ill health, or redundancy); and
‘voluntary’ retirement (including to ‘spend more time with family’ and because they ‘could
afford to retire’)’ (Di Gessa et al. 2018). The Study identified that 1 in 5 participants was in paid
work beyond their age .and it was found out that people who worked beyond their state pension
age had a lower quality of life than those who worked until the state pension age (Di Gessa et al.
2018). However, the Study fails to apprehend other vital factors related to work participants
were doing such as (e.g., working hours, physical demands of the job, whether respondents were

71
self-employed, or measures of occupational strain). The study also didn't show whether the
participants re-joined work after exiting the work after retirement and what circumstances made
them work after state pension (Di Gessa et al. 2018). And therefore, it cannot conclude that
financial constraints forces to work after retirement as it decreases the quality of life. Moreover,
the study cannot be generalized around the world as each country has their own retirement age.
Also, some countries do not have any pension system for the citizens after retirement (Ruth E.
Hubbard et al. 2014).
2.6.3 Physical health and quality of life
Health is the most crucial predictor of subjective wellbeing and quality of life in later life
(George, 2010). Physical health, functioning, and mental health have a significant influence on
the quality of life. A longstanding illness could reduce the quality of life (Netuveli 2006).
A study was conducted from a general Irish community-dwelling population aged 50+
years with a sample of ample (n = 4961). The sample was taken from the Irish Longitudinal
Study of Ageing (TILDA). The research aimed to see how chronic diseases affect QoL using
CASP 19. The ‘Chronic conditions were measured by number of self-reported doctor-diagnosed
physical chronic conditions’ (Sexton, 2014). Self-reported diagnosis may have information bias
as participant may misunderstood or does not have much knowledge about their illness.
Moreover, participants were asked the physical mobility questions using IADL and ADL
questionnaire. The study found out that there was a strong effect of the physical impairment on
the two domains of CASP (control/Autonomy) due to life circumstances, whereas (self-
realization/ Pleasure) had a lesser effect as it might be more influenced by psychological factors
such as mood. (Sexton, 2015) However, it is debatable as it could not be the same in other
cultures due to other predictors of life such as socioeconomic factors, as it is evident that past
socioeconomic circumstances are a primary determinant of current physical and mental health
(Sexton, 2014).

72
Similarly, a population-based study assessed the impact of a different chronic condition
on the quality of life using CASP 19, aged 50 years and older, ‘taking part in wave 1 of the
English Longitudinal Study of Ageing’. the chronic illnesses included (stroke, cancer and
diabetes, chronic lung illness, and server osteoporosis). ‘Presence of chronic illness was assessed
during the home interview, and participants responded to the following question, ‘Has a doctor
ever told you that you have (or have had) diabetes, chronic lung disease, asthma, cancer (or
history of cancer after age 40), osteoarthritis, rheumatoid arthritis, CHD, or stroke?’. The finding
showed that chronic illness is associated with the QOL.
However, ‘study was cross-sectional, so causal inferences cannot be drawn. Also,
identifying chronic medical conditions was based on self-report of having been told of the illness
by a doctor, which may not be as accurate as physician diagnoses. Also, the onset of illness and
time of collecting data may impact the quality of life. (Wi kman, Wardle, & Steptoe, 2011).
Moreover, a cross-sectional study in Taipei City, Taiwan, was conducted in 2010. The
sample was selected from the hospital that came for their free health examination. The
participants were asked about chronic disease and it was self-reported by the participants
This had been evident in Taiwan using CASP measure that chronic diseases were associated
with lower scale scores (Tai-Yin Wu et al. 2013).
Another study was conducted to investigate people with higher well-being have a lower
risk of developing arthritis. ‘participants were asked whether a doctor had ever told them that
they had ‘arthritis including osteoarthritis, or rheumatism’ (Okely et al., 2016). The finding
showed that People with higher CASP-12 scores had a significantly lower risk of incident
arthritis. However, the risk was higher in the younger age group. also, other factors were
associated with health, such as Socio-Economic condition, education, depressive symptoms, and
health behaviours (Okely et al., 2016).

73
2.6.4 Psycho-social factors and quality of life
The term 'psychosocial' has been extensively used in the literature of public health and
beyond. One of the most used definitions by the World Health Organization (WHO 2018) is "a
state of complete physical, mental, and social well-being and not merely the absence of disease
and infirmity." Also, psychosocial well-being depends on health, education, housing,
neighbourhoods, and the environment in which people live (Cohen, Doyle, and Baum 2006). It
was evident that social relationships, social coherence, and community support influenced the
health and quality of life (Berkman, 2000).
Furthermore, a study was conducted on people living in a household setting in Britain
aged 65 or more years. The study collected both quantitative and qualitative data. The 999
samples were collected answering semi-structured survey instruments. The 80 participants from
the study were followed up in greater depth one and two years after the baseline interview, And
the finding of the research shows that having good social relationships, help, and support; living
in a home and neighbourhood that is perceived to give pleasure, involving in the social activities
have a strong association with the quality of life. However, the follow-up of the participants was
less than a half population which was initially interviewed could not justify the results that after
a year or two, all 999 participants of the study would have the same thoughts about the social
connectivity (Bowling et al., 2002).
On the contrary, a study was conducted on 286 British people aged 65–75 years who
were members of the sample for the 1930s Boyd-Orr study of health and diet. The study aimed
to identify the life course and relative factors that influence the quality of life in early old age
using CASP 19. A postal questionnaire was sent to the participants. The variables in the
research included (social support and participation, the quality and quantity of social contact,
feelings of trust and reciprocity about the local neighbourhood, health, and financial security).
The social support and participation were measured both quality and quantity of social contacts,
‘for this purpose questions were adapted from the local area study carried out by the National
Centre for Social Research (Veenstra 2000)’.

74
And the finding suggested that “frequency of contacts with friends and family was
negatively associated with the perceived quality and density or closeness of these interactions.
Being in contact with friends and family does not guarantee an enhanced quality of life, and
some social contacts may be burdensome”. The study suggested that, ‘being in contact with
friends and family does not guarantee an enhanced quality of life' and contact socially with
people may be troublesome. Also, living in a deprived area, the quality of a person’s social
network may affect the quality of life (Wiggin 2004). ‘Veenstra’s (2000) finding of the negative
association between the frequency of social contacts with friends and family and health was
replicated, which leads to conclude that social contact per se should not always be beneficial.
Indeed, it may even be a source of conflict and stress for some people’ (Veenstra’s 2000).
However, this finding could not generalize around the world as in some culture and ethnicity
people live in close boundaries and loves to interact with family and friends.
Moreover, wave 1 of the English longitudinal study of aging was conducted to
investigate whether longstanding illnesses, social context, and current socioeconomic
circumstances predict the quality of life. The representative sample size was collected from
England (n = 11 234) using the CASP 19 scale. The questions on social network were asked
knowing the ‘quality (whether participants felt their relationships with children, family, and
friends were based on understanding, confidence, and support), frequency (how often a
participant met or contacted by phone or email children, family and friends), and the existence of
close or confiding relationships (a count of the number of children, family, and friends with
whom the participant had close relationships’. The findings had showed that the quality of life
decreases in people with depression, but the quality of life was improved by trusting
relationships with family and friends, frequent contacts with friends living in good
neighbourhood (Netuveli 2006).

75
A study was conducted in Taiwan, 699 older people using CASP 19 to understand the
relationship between psychological well-being and cognitive function. The result showed ‘In a
community-dwelling sample from Taiwan, participants living alone had a lower average quality
of life scores than other participants. And this could be because of the cultural difference in
Eastern and Western culture. As in Asian societies, more stress is given to living with the
families. and ‘Families are the principal social support network in old age in the Chinese
tradition.’ (Ng, Phillips, & Lee, 2002). The study had a limitation of its Selection bias as the
response rate of the face-to-face interview was about 70%. And the selection bias may affect the
internal validity of an analysis by leading to inaccurate estimation of relationships between
variables (Wu et al., 2013).
Another study was conducted in Ireland, where 8504 individuals from the household
participated in the study. The aim of the study was ‘to compare the role of different life domains
in determining the quality of life (QoL) in Ireland with international results. As it was a self-
completion questionnaire, the response rate was 62%. The following variables were used to
assess the quality of life with the CASP 19; (physical and mental health, social participation,
economic resources, and sociodemographic status). The social participation assessed asking the
frequency of ‘social contact {daily, weekly, monthly, less than monthly), active and social
leisure {dichotomised as < or > 1 per month), and formal organizational involvement outside
work (measured according to engagement in volunteer work > 1 per month)'. However, the
health variables such as having any illness or physical limitation were asked using single yes/no
answers. The study finding showed there is no single factor responsible for increasing and
decreasing quality of life as it suggests that ‘ Increasing longevity can be associated with
increasing QoL as long as it is accompanied by reasonable levels of mental and physical health,
high-quality relationships, and social participation. Even people with poor physical health have a
better quality of life if they have a means of enjoyment in another dimension of life (Layte et al.,
2013).

76
Another study was conducted to explore age-trajectories of quality of life (QoL) among
older adults living in England. The data was collected from the three waves of the English
Longitudinal Study of Ageing, aged 50 and over. ADL and IDAL questionnaire were used to
answer daily activities. to assess depression 8-item shortened version of the Centre for
Epidemiologic Study Depression Scale (CES-D) was used. ‘Social support and social network
were collected using a self-completion questionnaire. Respondents were asked about the
presence of positive support from their spouse, children, other relatives and friends (how much
they understand the way the respondent feels about things, how much they can be relied on if the
respondent has a serious problem and how much the respondent can open up to them to talk
about worries). Respondents were also asked to indicate the number of family members and
friends with whom they had a close relationship. From this question, a continuous variable was
derived that indicates the number of close friends/family in the respondent’s social network’
(Zaninotto et al., 2009). The finding had showed that the quality of life was bad in older adults
than the younger adults. The quality of life also declined for people having depression,
decreased the number of friends and low social support (Zaninotto et al., 2009). Moreover,
study was conducted to know whether a change in social, socio-economic and health
circumstances predict change in the quality of life. The sample was taken from waves 1 and 3 of
the English Longitudinal Study of Ageing. The social contacts and relationship questions were
asked knowing the frequency of the meeting with friends and family, number of people
participants think they had a trusting relationship. These questions were asked on ordinal scale.
The responses ordinal scale is often so narrow in relation to the question that might have
response bias. The findings of the study showed that quality of life decreased over the four years
because of depression, physical health, stable family relationships, and neighbourhood (Webb et
al., 2011). Similar findings in ELSA Netuveli (2003) also suggested that people with social
detachment having less emotional support and little contact with their friends and family had a
lower quality of life score measures on the CASP scale (Tomaszewski and Barnes, 2008).

77
Moreover, having more relationships with friends and family results in improved CASP 19
quality of life scores (Webb et al., 2011).
2.6.5 Life course and quality of life
Life-course refers to "a sequence of socially defined events and roles that the individual
enacts over time" (Giele and Elder 1998, p. 22). The life course perspective has been used to
understand the behavioural and social indicators separately in aging (Elder 1994). In 1983,
Fethterman well defined that aging is a process that starts at conception till death. A human must
face physical, psychological, and social changes and are influenced by how people live their
lives (Elder 1994). Therefore, various researchers and disciplines had investigated the life course
perspective differently. Mainly, the life-course researchers studied to understand the social
process and involvement in society.
Furthermore, the study was conducted in Britain on a 300-sample size to collect health
and life course information in the older adults age 50 + through the postal survey. The
participants of this study were unique. Which was taken from the Boyd Orr study, and the
sample was representative of the British population. Retrospective information about the
participant's lives since the '1937–1939 survey was collected by life grid (Berney & Blane,
1997), including the occupational, residential, and household histories from which lifetime
hazard exposures were calculated' (Holland et al.,2000). The study found that good quality of
life was related to material wealth, housing ownership, unemployment, or chronic disability
during the life course. However, the quality of life was mainly affected by the current contextual
factors such as 'material circumstances and severe health problem's (Berney & Blane, 1997).
Moreover, studies using a life course perspective suggested that childhood circumstances
influenced older adults' Quality of life (Holland et al., 2000). Blane et al. 2012, suggested a
positive association between life course circumstances and Quality of life (Blane et al., 2012).
GAZEL study was conducted to investigate that life-course events and present social,
psychological circumstances impact the Quality of life. The data was collected from the
administrative report and through a self-administered questionnaire. Mental health was assessed

78
using Short-Form 36 Health, physical functioning was assessed using French version of the SF-
36. Neighbourhood characteristics were asked using two questions ‘satisfaction with access to
(1) local shops and services and (2) leisure activities. Dissatisfaction with access to either set of
amenities was coded as 0, otherwise 1’. The social support was measures asking subjective
question whether participants had a close, confiding relationship. ‘Is there somebody with
whom you can discuss personal things or who can help you take an important decision?’
Negative responses were coded as 0, affirmative responses were coded as 1.’ Answer like yes/no
could restricts participants to share their experiences. The findings suggested that the past event
had both; negative and positive influences on the Quality of life that included owner-occupiers,
living in areas, social contacts, occupational exposures, and physical working conditions
(Wiggins et al. 2004). Another study had found out that physical working conditions have a
long-term impact on health and Quality of life in older ages. Improvements in physical working
conditions may improve one's Quality of life. (Platts et al., 2015).
The CASP 19 was also used to assess relationships between quality of life and various
lifetime social position measures. However, the study did not find any "associations between
manual or non-manual social class based on the last period of employment and CASP-19 quality
of life" (Blane et al., 2004). Nevertheless, some factors such as family, financial condition, and
place throughout the life course affect one's well-being and Quality of life (Blane, D et al. 2004).
Moreover, the British Boyd-Orr cohort study also suggested that father's social class, received a
meal at the age of 11 in school; experiencing financial difficulties and environmental hazards
(air pollution, residential damp, and inadequate nutrition) were all associated with lower Quality
of life scores (Blane et al., 2004).
The literature review on predictors of Quality of life had identified that CASP had been
used to recognize its predictors in old age. It has been found that variables like socioeconomic
status, social connections, physical health, mental health, and life course events are essential for
maintaining a sense of well-being in older ages. Moreover, People in different cultures may hold
different personal values that affect their preferred course of action. Therefore, assessing the

79
Quality of life with the measure, CASP could have a different impact on the predictors of the
Quality of life.
Nevertheless, there are minimal studies that have been conducted in the developing
country to see the effects of the different predictors on Quality of life, using CASP measures in a
different cultural context like Pakistan. As discussed earlier, the social realities about the
emerging older adults’ issues are changing due to urbanization, modernization, the
nuclearization of the family system, especially in urban cities of Pakistan. Therefore, it might
give a different picture of predictors of Quality of life in Pakistan.
2.7 Conclusion
The literature review does not show any agreement on the definition of quality of life and
well-being. However, based on various definitions coined by professionals of different fields,
various measures had been developed to assess the quality of life in the general population and
old age. CASP is one of the few theoretically informed tools to assess 50+ older adult's quality
of life. CASP 19 has proved to be a useful tool to measure the quality of life of 50+ older adults.
As described in the literature review, CASP had been used to identify the various predictors of
the quality of life, including social aspects, psychological aspects, physical and mental health,
essential for positive well-being in later life. The studies in the literature also described that
quality of life decreases with age. Besides, the studies that had performed psychometric
properties of CASP were mainly from Europe and the United Kingdom, where CASP was
initially developed. Very few studies using CASP were conducted in other parts of the world,
specifically in less advanced economies such as Pakistan, where the culture is different from the
western world. This research will add to the previous literature; the quality of life scores of 50+
Pakistani older adults living in Karachi Pakistan's urban city, and residing in fatalist society how
the older adults interpret the domains of CASP.
Some less advanced economies had used CASP 19 and found that it was reliable to use
in their specific population, following appropriate cultural adaptation. This study will be built on
this growing body of knowledge by adding the perspective from Karachi, Pakistan. In particular,

80
this research will be validating the psychometric properties of CASP 19 for use amongst older
adults living in Karachi and assess the predictors of the quality of life in old age.
However, before that, the study will describe the conceptual framework and the methodological
approach used to conduct this study.

81
Chapter 3: Conceptual framework, Research questions Aims and Objectives
3.1 Introduction
This chapter introduces the conceptual framework of the study. This will further
describe the overall aim of the thesis. It will also outline the questions and objectives of
the thesis based on the conceptual framework.
3.2 Conceptual framework
Diagram 3.1: a conceptual framework This study's conceptual framework assumed that the quality of life in old age predicts well-
being. Well-being is an amorphous term depending on who has used it and in what context. For
this research, the study has identified five factors that may define well-being (a constituent) and
create well-being (instrumental). This duality is well-known in the well-being literature, which
has already been discussed. I also assume that a sense of well-being can be gendered and be
under the influence of culture.
The conceptual framework highlights that life-course events affect the quality of life and
can positively and negatively affect the ageing process. Therefore, events that occur throughout

82
the life course influences the well-being and quality of life (Kuh et al., 2014). Hence, the
culmination of a positive life course trajectory is active and healthy ageing.
Thus, this study adopted a conceptual model, which defined quality of life as "Perception
of individuals to maintain the position in life, especially in the context of their own culture and
value system where an individual has their own goals, expectations, standards, and concerns. It
is a broad-ranging concept, incorporating the person's physical health, psychological state, and
level of independence, social relationships, personal beliefs, and relationship to salient features
in the environment" (Whoqol Group, 1998). So, people should attempt to achieve all the five
defined attributes (presented in diagram 3.1) of well-being in their entire life to get a better
quality of life.
The diagram shows there is no hierarchy to achieve a good life all well-being boxes have
two-sided arrows that shows interconnection. The life course box also shows two-sided arrows
which link to the boxes of wellbeing that indicates that the needs of an individual change
throughout the life course
The conceptual framework has been used to develop the research questions and
objectives of the study, presented below.
3.3. Aim 3.3.1 General aim of the research
This PhD's thesis aims to assess the quality of life and well-being of the 50+ older adult
population living in Karachi (Pakistan) using CASP 19. Moreover, this study has aimed to make
a more conceptual contribution by exploring possible predictors to pertained quality of life in a
less advanced economy. In particular, the study will examine an association between
sociodemographic, psychosocial, socioeconomic, life-course variables, and quality of life in 50 +
older adults age, assessed by the validated CASP scale in Karachi, Pakistan. Moreover, to
achieve the above mentioned broad aims, the following research questions and objectives will be
addressed in the thesis:
Research question 1:

83
1. What is the level of quality of life for older people in Karachi, Pakistan?
Objectives
1.1 To adapt CASP-19, a validated measure of the quality of life, in Urdu in a
culturally competent manner.
1.2 To survey a sample of older adults in Karachi from three strata of low, middle, and
high income.
Specific objectives for question 1
1.1.1 To translate and back translate CASP 19 into the Urdu language.
1.1.2. To pre-test the Urdu version of CASP 19 with the elderly in London.
1.1.3 To finalize CASP in the Urdu language for survey in Pakistan.
1.2.1 To survey three strata, 100 in each low, middle, and high - income areas of
Karachi, Pakistan.
Research question 2:
2 What are the determinants which provide a better quality of life for older adults in
Karachi?
Objectives
2.1 To measure and associate the material, the psychological and the social factors
with the quality of life of older adults in Karachi.
2.2 To measure and associate the life course determinants of older adults' quality of
life in Karachi.
Specific objectives for question 2
2.1.1 To develop a questionnaire with social, psychological, and life course factors
influencing the quality of life.
2.2.2. To adapt Boyd’s Orr life course questionnaire.
2.2.2. To translate the completed questionnaire into the Urdu language.

84
3.4 Conclusion
This chapter has described the conceptual framework of this research. Moreover, with
that understanding, the questions and objectives of the research were developed. The thesis will
then move onto the methodology chapter that will describe in debt methodology used to answer
the above research questions.

85
Chapter 4: Methodology
4.1. Introduction As given the conceptual framework, aims and research questions have been discussed
above in chapter 3; this chapter will discuss the methodology used to answer these research
questions. It also described the method used for the cross-cultural survey. The chapter will
discuss the research design, sampling, data collection, and data analysis. Moreover, it will
discuss ethical consideration. The chapter will end with the conclusion of the methodology.
4.2 Research Methodology The methodology which had mainly used in this research is quantitative. However, the
qualitative method (focus group) was also used in the cross-cultural study when the CASP 19
tool was adapted into the Urdu language to assess the quality of life where two focus groups
were conducted (one for males and one for females) to check the cultural, conceptual, and
content equivalence of the CASP 19. The responses of methodology had based upon the
research approach and the contextual lens through which analytical consideration occurred.
However, methodology underlined “general research strategy that outlined the way through
which models of research have taken into account.” Several methods had been performed,
which had been discussed in the relative chapter 5.
4.2.1 Quantitative method
The research method acts as a tool that can be used for the basis of the quantitative data
collection method that demonstrated to provide accuracy in techniques. However, the
quantitative research method is conducted when the research has aimed to test theories and
hypothesis to study the relationship between variables that are measure and collected,
numerically and analysed statistically (John et al., 2011). Quantitative data provided measurable
evidence that helped to show (possible) cause and effects. Further, quantitative research is
included in various methodologies, including surveys, observational studies, case-control
studies, and randomised controlled trials. This research's nature was quantitative, as a various
method of scale was quantitative such as CASP 19, geriatric depression scale, social coherence

86
scale, and optimism scale. And other quantitative indicators to assess the well-being and quality
of life.
4.3 Research design
This research aimed to assess the quality of life of 50+ older adults living in Karachi,
Pakistan. Therefore, the cross-sectional design was used to acquire information from three strata
at a single point in time. The survey is a standard research method in quantitative research. It is
"quick and an inexpensive method that allowed the collection of a significant amount of data
from a sizeable population" (Grey, 2009). A cross-sectional study is used when the researcher
wants to achieve detailed knowledge of the subject, and it is often done in the form of a survey.
Additionally, it does not have any hypothesis, but it described the outcome and risk factors of
the targeted population (Levin, 2006). Therefore, a structured survey interview was conducted
for effective results. It was also essential that the sample represents an entire population so that
the represented results can act as generalised (Lachlan. 2013). The most common way to sample
population includes random, stratified, purposive, convenience, cluster, and snowball.
Initially, a stratified random sampling method was identified for this study. In the
stratified random method, subjects would be recruited randomly for each stratum (low middle
and high income); the plan was to insert all the street names from the three strata in an excel
sheet and then select random street names for data collection. Later, all the households would be
approached for the targeted population. However, it was not possible in practice as low-income
target areas (Pahar Ganj), and middle-income targeted areas (Khudadad colony and Al-Noor
society) did not have any street names for random selection.
Besides, random sampling was not a realistic approach in this research for security and
political reasons, as many areas were not safe for visiting purpose. This issue was discussed with
the mentor based in Pakistan, Dr. Rozina Mistry, and the supervisor Professor Netuveli. Then
the cluster sampling was chosen for the study where all the households would be approached
from the targeted population. Clusters were selected from the areas where the VCARE welfare

87
society for active and healthy ageing (supported for research in Karachi) had provided their
services.
The cluster sampling was done in two stages;
Stage one: Is the identification of the population in each stratum (cluster)
Stage two: Identifying the sub-population in each stratum that happened to be purposive (rather
than random as initially planned).
The cluster sampling method is extremely cost-effective. It requires minimum efforts in
sample creation, fieldwork simplicity, and convenience of execution, especially in the area
where security is an issue. However, it also has its limitation and is prone to biases. “If the
clusters that represent the entire population were formed under a biased opinion, the inferences
about the entire population would be biased as well”. The other bias that could be crucial in
choosing cluster sampling is selection bias. The study participants were selected from specific
areas, and other areas were not represented in the sample. Moreover, the study participants were
recruited from a particular group; therefore, the sample could not represent the study's entire
population (Alatawi 2017).
Thus, there might have been limitations for generalisability of the findings across other
regions in Pakistan where social phenomena might differ due to many cultural groups across
geographic regions. Yet, a sample size calculation was used to improve the internal validity for
the sample population. To overcome cluster sampling challenges and improve the internal
validity, a randomised selection process was applied. For this, a list of the lanes of each area
were created; for example, in the low-income area, every 2nd lanes were selected. Data were
collected of all, To overcome cluster sampling challenges and improve the internal validity, a
randomised selection process was applied. For this, a list of the lanes of each area were created;
for example, in the low-income area, every 2nd lanes were selected. Data were collected of all
the households. “Although this method provides the benefits of randomness and unbiased
sampling by ensuring all clusters in the target population have an equal probability of being
selected” (Bluman, 2007). The possible implication of cluster sampling on the result could

88
estimates “standard errors that could be high as compared to other sampling designs with the
same sample size” (Ahmed, S., 2009). Even though the extent of the sampling error could not be
estimated, but bias might be present. Moreover, some measures were taken to ensure reliability
and validity, which are discussed in the latter part of the chapter (Polit et al. 2001).
In a cluster, purposive sampling was used. It is a non-probability sampling, which can be
very useful when reaching a targeted sample easily and quickly. It has both advantages and
disadvantages. The advantages of purposive sampling are that it is more convenient and
economical than other sampling methods (Brink, 1996:135). The researcher can choose
knowledgeable subjects about the research subject because of their own experience (Brink, 1996
pg 141). However, the disadvantage is that it limits the generalization of the findings. There is
also the possibility of sampling bias. However, to minimise sampling bias, the researcher
carefully followed the inclusion criteria (4.8.6) (Brink, 1996).
4.4 Research support in Pakistan
The NGO named VCARE social welfare Society for Active and Healthy Ageing
provided research support in Pakistan. The association with VCARE is not new; it had lasted for
about the last seven years from now onwards in volunteer consultant Public health and NGO
President. This organisation was founded by one of my family members. VCARE aimed to work
for the active and healthy ageing of the population in Karachi, Pakistan. The role of VCARE in
my research was to offer logistic support and supplying data collectors. However, it was my
responsibility to train and supervise all the data collectors.
Two-days training program for the data collectors were conducted. On the first day of
training, participants had briefed the purpose of the research, the role and responsibility of the
data collectors, and the research methodology. The research process was also shared with
participants, which included how the participants would approach to take part in the research.
Moreover, the questionnaire, consent form and information sheets were shared with the
participants. Participants were asked to go through all three forms and ask if they had any
questions. Later, the participants were given time to practice improving their interview skills,

89
including greeting the participant, introducing them, taking written consent, and going through
with the questionnaire. Data collectors were also provided feedback on their practice. The data
collector was also asked to notify timings of the interview. The day process allowed data
collectors to develop confidence in collecting data. On the second day of the training 50+ older
adults were invited, and each data collector administered a survey questionnaire on them. These
ten participants were not a part of the actual study. This allowed the participant to inquire about
their queries related to the questionnaire or any other general queries. The timings for the
training were from 10:00 am to 5:00 pm.
Moreover, the role and responsibility of the data collectors were also shared in the training,
which is as follow;
• To collect data through the research questionnaire daily.
• To keep a record of information or observations obtained during the research.
• To take written consent from the participants.
• To discuss any issues that arose during the data collection with the principal investigator.
• Contacting participants to discuss the survey, giving them an information sheet, and
taking consent
• To respond to the questions the participant may have about the survey.
• To schedule timing with participants to complete the survey questionnaire.
• To ensure that all data captured is always kept physically secure.
• To keep a logbook for everyday research. Keeping the logbook was to record
observations and subjective data shared by the participants during data collection and
record the household participating in the research.
Furthermore, no money was paid to the data collector. However, the university's participation
certificate was given to all the data collectors, recognising taking part in the research. Also, there
were no ethical issues raised regarding data collectors.
Moreover, both the organisation and researcher had a clear understanding which
highlighted research role. Therefore, there was no conflict of interest between organisations.
90
Additionally, to supervise, aspects within the fieldwork framework Dr Rozina Mistry, a senior
consultant of public health in Karachi, Pakistan, had accepted to assist me in my fieldwork.
4.5 Research sites
To select research sites for data collection; the researcher and the CEO of the VCARE
had visited various areas, where VCARE had served its targeted population to provide adequate
services. So, in a low-income area, data was collected from Pahar Ganj, in a middle-income
area, the data was collected from Karimabad, Al Noor, and Khudadad colony. Finally, in a high-
income area, the data was collected from North Nazimabad Block C, H, and Block L. The areas’
description is mentioned below;
Low-income area Pahar ganj
Pahar Ganj is based in the Karachi central; district of Karachi, Pakistan. Pahar means
(mountains) are small hills of that form. There are several ethnic groups in Pahar Ganj,
including Sindhi, Kashmiris, Pakhtuns, Balochis, Muhajirs, and Punjabi Christians.
People living in this area do not spend much on education. Neighbourhoods pool their resources
to lay sewage lines to the nearest disposal points, often natural storm drainage channels.
Katchiabadi residents establish piped water distribution networks tapping the municipal mains,
and where this is not possible, they construct community tanks and purchase water through
tankers (City population 2018).
Middle income Khudadad Colony, Al Noor colony, Karim Abad Colony
Three areas were targeted in middle-income areas, and the brief descriptions of the areas
are as follow;
Karimabad is a neighbourhood in the Central district of Karachi, Pakistan.
The population of this neighbourhood is predominantly Ismailis. People living here belong
mostly to the middle class. The area's pivotal place is Ismaili Jama'at Khana, which is one of the
largest in Pakistan. There are two colonies, commonly known as New Karimabad and Old
Karimabad. However, the data was collected from the new Karimabad (City population 2018).

91
Khudadad colony
It is situated in the east of Karachi and the people living here are mostly from the middle
class. Major ethnic groups in these areas are muhajir, memons, and marwaries (City population
2018).
Alnoor colony
Alnoor colony is in a neighbourhood in the north of North Nazimabad, in Karachi,
Pakistan. It is administered as a part of the Karachi Central district. There are several ethnic
groups: 96% Muhajirs, Sindhis, Kashmiris, Saraikis, Pakhtuns, Balochis, Memons, Bohras, and
Ismailis. Over 99% of the population is Muslim (City population 2018). Most of the middle-
class residents own some property, a motorcycle, or a car. Most of the children in middle-class
society go to private schools. They have telephones and cable network and avail private health
care and many consumer durables (City population 2018).
High Income North Nazimabad Block C, H and L
North Nazimabad Town lies in the northern part of the city named after the suburb
of North Nazimabad. The majority of the population is from the high-income group. And the
ethnic group includes Ismaili, boharas, muhajir, and pakhtoon (City population 2018). This area
is developing sports facilities, shopping centres, entertainment activities, libraries, and
educational institutions in its vicinity. Their residents now do not have to go out of their areas
except to work. Also, most houses have armed guards, and many are looked after by security
companies with computerised security arrangements
4.6 Sample Three hundred participants aged 50 or over were selected by purposive sampling, 100
each from low, middle, and high-income areas of Karachi, Pakistan. The sample was designed to
replicate in the original study where QoL was measured using CASP 19 (Hyde et al. 2003). To
identify a 3-unit’s difference in CASP-19 with a sample size of 75 people needed in each group

92
(calculated with STATA command samples). In the case of any drop-outs from the sample, the
sample size was inflated by 33%, so that there will be 100 people per strata. 4.7 Research Variables and scales
To see the variables and scales, the survey questionnaire both in English and Urdu is
provided in (Annexure 4 and 5).
4.7.1 Dependent variable CASP 19 The CASP-19 scale was used to assess the 50+ population in Karachi, Pakistan. It
consisted of 19 Likert scale items. It has four domains of quality of life (QoL),
including Control, Autonomy, Self-realisation, and Pleasure. CASP has items with both positive
and negative statements. The positive items were reverse coded so that higher scores equate with
higher QoL. Each item scores from 0 to 3, with the summed scale ranging from 0 to 57. The 0
number showed the lower score of the quality of life, and 57 had shown the higher side of
quality of life. The scale is rated from often to never. The participants were read out each item
and given an option from the Likert scale of the questionnaire. As the questionnaire was
administered in the Urdu language, which starts from the right-hand side, the Likert scale ‘often’
was given number 1, and ‘never’ was given 4. Therefore, before analysis, all the items were
recorded 0 to 3, and reverse coding applied to all the positive items. The validity and reliability
test of CASP 19 was performed. Further details about the process of CASP adaptation are
available in the next chapter 5.
4.7.2 Socio-Demographic and socioeconomic variables Although ‘age’ was administered as a continuous variable, all the other demographic and
profile variables (gender, Socioeconomic groups, place of birth, languages spoken, educational
status, marital status, family type, religion, housing tenure, sanitation, and water) were collected
on an ordinal scale (1 and above). Finally, other socio-demographic variables such as ‘having an
own car,’ and ‘work to earn money’ were collected on a nominal scale (i.e., Yes and No).
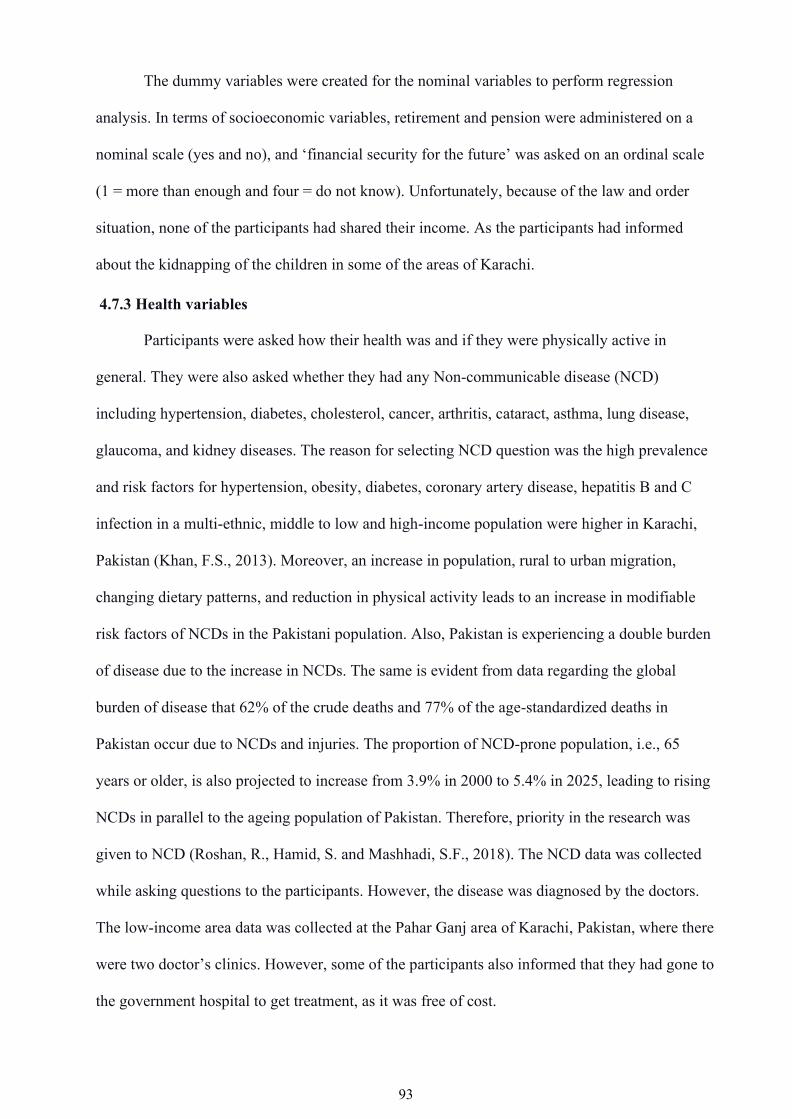
93
The dummy variables were created for the nominal variables to perform regression
analysis. In terms of socioeconomic variables, retirement and pension were administered on a
nominal scale (yes and no), and ‘financial security for the future’ was asked on an ordinal scale
(1 = more than enough and four = do not know). Unfortunately, because of the law and order
situation, none of the participants had shared their income. As the participants had informed
about the kidnapping of the children in some of the areas of Karachi.
4.7.3 Health variables Participants were asked how their health was and if they were physically active in
general. They were also asked whether they had any Non-communicable disease (NCD)
including hypertension, diabetes, cholesterol, cancer, arthritis, cataract, asthma, lung disease,
glaucoma, and kidney diseases. The reason for selecting NCD question was the high prevalence
and risk factors for hypertension, obesity, diabetes, coronary artery disease, hepatitis B and C
infection in a multi-ethnic, middle to low and high-income population were higher in Karachi,
Pakistan (Khan, F.S., 2013). Moreover, an increase in population, rural to urban migration,
changing dietary patterns, and reduction in physical activity leads to an increase in modifiable
risk factors of NCDs in the Pakistani population. Also, Pakistan is experiencing a double burden
of disease due to the increase in NCDs. The same is evident from data regarding the global
burden of disease that 62% of the crude deaths and 77% of the age-standardized deaths in
Pakistan occur due to NCDs and injuries. The proportion of NCD-prone population, i.e., 65
years or older, is also projected to increase from 3.9% in 2000 to 5.4% in 2025, leading to rising
NCDs in parallel to the ageing population of Pakistan. Therefore, priority in the research was
given to NCD (Roshan, R., Hamid, S. and Mashhadi, S.F., 2018). The NCD data was collected
while asking questions to the participants. However, the disease was diagnosed by the doctors.
The low-income area data was collected at the Pahar Ganj area of Karachi, Pakistan, where there
were two doctor’s clinics. However, some of the participants also informed that they had gone to
the government hospital to get treatment, as it was free of cost.

94
Also, a range of questions assessed limitations in individual activities such as bathing,
shower, dressing, eating, going to the toilet, using the phone, doing household chores, and
shopping. All questions in this section were asked on a nominal scale (Yes and No). The ADL,
IDAL scale was adapted from one of the studies conducted in Pakistan, in the Urdu language,
which was translated and back-translated in the English language (Bhamani, Karim and Moosa
2013). Therefore, it was not validated in my study.
4.7.4 Psychosocial variables
The psychosocial variables were assessed using various scales and subject to reliability
tests; the detailed information is provided below.
4.7.4.1 Scales reliability test All the scales which were used in the research were tested for their reliability. Reliability
‘refers to the degree to which the results obtained by measurement and procedure can be
replicated’ (Rothman, Greenland, and Lash, 2008). For some of the Scales, such as (social
support, social networking, and social coherence) factor analysis was also performed. The factor
analysis commonly “reduces many variables into a smaller set of variables (also referred to as
factors). Secondly, it establishes underlying dimensions between measured variables and latent
constructs, thereby allowing the formation and refinement of theory. Thirdly, it provides validity
evidence of self-reporting scales” (Williams 2012, pg. 2).
The reliability test and factor analysis were performed on all scales, except the
neighbourhood scale. All the details regarding the scales have been described below.
4.7.4.1.1 Social support scale The social support scale was adapted from the English Longitudinal Study of Ageing
(ELSA) and is made up of four items arranged on a Likert scale ranging from 1 (not true) to 3
(always true), which were coded from 0 to 2 for statistical analysis.
One of the purposes of this research was to translate and validate measures into Urdu, to
gain an understanding of the QoL of the sample population. The scales were validated and tested
for reliability within an urban sample population. However, it is important to note that, the

95
validation and reliability testing needs to be tested in each of the different cultural groups within
Pakistan. It was earlier mentioned in the literature that in recent times, the family system is
changing due to several factors influencing the way the structure and function of families are
evolving. Especially, in urban cities of Pakistan such as Karachi. More people live in a nuclear
system; therefore, the social support scale used in the ELSA study could be used in Karachi
(Itrat, A et al. 2008). However, in the rural areas of Pakistan where more people are living in the
extended family these scales would require further adaption and revalidation.
Moreover, the Construct and content validity of the complete Urdu questionnaire was
conducted in Pakistan by pre-testing the research questionnaire. Moreover, the content validity
showed that the questions were straightforward and easy to understand as well as covered all the
areas related to the quality of life (Tsang, Royse, and Terkawi 2017).
Before full analysis, a reliability test using Cronbach’s alpha was performed on the Urdu
version of the questionnaire. This showed that the scale had acceptable reliability and good
internal consistency, α = 0.82. Moreover, all the items were correlated to themselves. All four
items correlate well together with (> 0.40). The factor analysis showed that Kaiser-Meyer-Olkin
measure of sampling adequacy was 0.77, above the commonly recommended value of 0.6, and
Bartlett’s test of sphericity was significant (χ2: 446, df: 6, P-value .000). The result showed that
the factor had 1 Eigenvalue. The Eigenvalues measured the amount of variation in the total
sample accounted for each factor. Moreover, all four items of the scale were loaded on one
factor. Also, all the factors loaded were >0.30, which was a good result.
4.7.4.1.2 Neighbourhood scale
The neighbourhood scale was adapted from the study of ELSA and comprised of 13
items. The questionnaire was validated in Pakistan by pre-testing ten people aged 50 +. The
questionnaire included the scale of the neighbourhood. Moreover, the items included in the
neighbourhood scale were; (It is a safe place to live, There is much graffiti, I want to leave this
area, This is an affluent area, I have a lot of friendly neighbours, There is no sense of

96
community, Good community spirit, there is much crime in the area; there is a good mix of
people, It is not a safe place to live, This is a deprived area, People look out for each other, I
enjoy living here, People are unfriendly).
On the tool's validation, all the items in the neighbourhood scale were relevant and
meaningful to the research areas. Although the low-income areas where it was open sewage,
many people were less concerned about graffiti, with more pressing issues. However, the
research also took place in middle and high-income areas where people did not like graffiti.
However, new anti-graffiti law was introduced in the southern province of Sindh and covered
the whole province (of which Karachi is a part). “Scribblers caught defying the law by the cops,
or "nabbed," as they say here, could find themselves staring at a prison wall for six months and
paying 8000 rupees fine” (NPR newsletter, 2014). This legislation demonstrates that graffiti is
relevant in this population and geographic area.
Moreover, the participants were asked to say yes/or no about each item inquired which
was related to their neighbourhood. Moreover, the data collector ticked all boxes in front of
items. The data was then analysed categorically on the dichotomous scale where all the tick
marked considered 1, which meant (yes) and crossed marked considered 2, which meant (No).
Before conducting the analysis, variables were recorded from 0 and 1. Moreover; all the
negative items were reversed coded before performing the analysis. No reliability test was
performed on this scale because the reliability test cannot be performed dichotomous scale
(Louangrath, and Sutanapong 2018). The scale was translated from English to the Urdu language
from the original version.
4.7.4.1.3 Sense of coherence The sense of coherence scale was adapted from the well London research questionnaire.
The scale is made up of three items with a Likert scale ranging from 1 to 3. Before conducting
the analysis, the variables were coded from 0 to 2 for statistical analysis. The negatively worded
item was reversed coded. A reliability test using Cronbach alpha was performed on the Urdu
version of the questionnaire before full analysis. This showed that the scale did not have a good

97
internal consistency α 0.68. Furthermore, all the items were correlated to itself. However, all
three items correlate together with (> 0.37). The factor analysis showed that Kaiser-Meyer-Olkin
measure of sampling adequacy was 0.63, above the commonly recommended value of 0.6, and
Bartlett’s test of sphericity was significant (χ2 164, df: 3, P-value .000). The commonalities were
all above 0.3. The result showed that the factor had 1 Eigenvalue. All the three items of the scale
were loaded on one factor. All the factors loaded were >0.30. The Construct and content validity
of the complete Urdu questionnaire was conducted in Pakistan by pre-testing the research
questionnaire. Moreover, the content validity showed that the questions were straightforward
and easy to understand as well as covered all the areas related to the quality of life (Tsang,
Royse, and Terkawi 2017).
4.7.4.1.4 Capability scale
Sen (1991), introduced the human development index to measure the quality of life and
evaluate human wellbeing. Netuveli, Blane & Bartley (2007), operationalised capability as
activities (achieve Functioning), opportunity (set of all alternative Functioning) and satisfaction
(an evaluation of the individual life) (Netuveli, Blane, and Bartley 2007). The scale was also
used by Netuveli in Kerala's studies (Netuveli, G., Blane, Bartley, 2007). The capability scale is
made up of three items arranged on a Likert scale from 1 to 7, which are as follows, Functioning,
where ‘1’ indicated lower side of the scale, which means a participant (can do a few things) and
7 indicates the higher side of the scale which meant that the participant (can do everything as
they used to do 30 years back). Opportunities, (1 indicates there are few opportunities, and seven
indicates the opportunities are the same as 30 years back). Satisfaction, (1 indicates there is a
lack of satisfaction, and 7 indicate the same satisfaction as it used to be 30 years back). Before
full analysis, a reliability test using Cronbach’s alpha was performed on the Urdu version of the
questionnaire. This showed that the scale had good internal consistency, α = 0.82. Moreover, all
the items were correlated to themselves. Furthermore, all three items correlate well together with
(> 0.57). The factor analysis showed that Kaiser-Meyer-Olkin measure of sampling adequacy
was 0.76, above the commonly recommended value of 0.6, and Bartlett’s test of sphericity was

98
significant (χ2 317, df: 3, P-value .000). The result showed that the factor had 1 Eigenvalue. All
three items of the scale were loaded on one factor. Moreover, all the factors loaded were > 0.30.
The Construct and content validity of the complete Urdu questionnaire was conducted in
Pakistan by pre-testing the research questionnaire. Moreover, the content validity showed that
the questions were straightforward and easy to understand as well as covered all the areas related
to the quality of life (Tsang, Royse,and Terkawi, 2017).
4.7.4.1.5 Social networking The social networking scale was adapted from the study of ELSA. Moreover, the scale
had three items that included meeting family, speaking to family on phone, and meeting friends.
The scale had (1 to 5) Number 1 = once a week and Number 5= never.
The items were recorded from (0 to 4), where 0 indicated never, and four indicated once
a week. Moreover, later it was computed to one variable. The reliability test using Cronbach
alpha was performed on the Urdu version of the questionnaire. The scale was pretested in the ten
subjects before using it in the field. The scale had a weak internal consistency with α 0.54. The
factor analysis showed that all three items were loaded on one factor; all the factors loaded were
>0.30. Moreover, all the items were correlated to themselves. However, all three items correlate
poorly altogether with (> 0.29). The Construct and content validity of the complete Urdu
questionnaire was conducted in Pakistan by pre-testing the research questionnaire. Moreover, the
content validity showed that the questions were straightforward and easy to understand as well
as covered all the areas related to the quality of life (Tsang, Royse, and Terkawi, 2017).
4.7.4.1.6 Optimism scale The optimism scale was adapted from the study conducted in Pakistan in the Urdu
language, which was validated through a rigorous translation and back translation process and
finalised by an expert panel (Malik, 2010). Because the scale was validated in the Pakistani
population in the previous study; therefore, it was not validated in my study. The validated Urdu
version of the scale was used in my study. The scale had ten items in it—the Likert scale ranging
from 1 (wholly agreed) to 5 (not agreed). Before conducting analysis, the variables were

99
recorded from 1 to 5, to 0 to 4 were 0 (not agreed) and 4 (Completely agreed). There were three
items that were negatively asked in the questionnaire; therefore, it was reversed corded. The
optimism scale was not tested for its reliability because it was directly adapted in the Urdu
language and was validated by other researchers (Malik, 2010).
4.7.4.1.7 Depression scale The Geriatric depression scale was adapted from one of Pakistan's studies (Bhamani,
Karim and Moosa, 2013). The Geriatric depression scale was translated and validated in the
previous study by Mubeen, Henry, and Qureshi (2012), who had identified the prevalence of
depression and associated risk factors among community-dwelling older adults in Karachi,
Pakistan (Bhamani, Karim and Moosa, 2013). Therefore, the scale was not validated, and
reliability test was not performed in my study. Moreover, the scale was translated in Urdu, back-
translated into English, and checked for consistency with the help of subject experts in the
original study. Also, it was pretested. Older adults, scoring 5 and above on GDS were considered
to have depression; the cut-off was reported to have high sensitivity and specificity in previous
studies. Therefore, in my study, the cut-off point was the same as in the original study, which
was 5 and above (Bhamani, Karim, and Moosa, 2013).
4.7.5 Life course variables
The life course variables were adapted from the ELSA 3 wave study (Ward et al. 2009)
that included parent’s education, first five occupations of the life, occupational status (manual or
non-manual work), and occupational post (managerial and non-managerial), Physical,
occupational hazards (fume, dust, sand), practical problems (lifting, sweating, back injury). All
the above variables were measured on an ordinal scale (1 to 4). Moreover, the life course
variables also included the housing variables such as housing moved in the life, water and
sanitation, housing type, and housing tenure on the ordinal scale. The Construct and content
validity of the complete Urdu questionnaire was conducted in Pakistan by pre-testing the
research questionnaire. Moreover, the content validity showed that the questions were
straightforward and easy to understand as well as covered all the areas related to the quality of

100
life (Tsang, Royse, and Terkawi 2017).Moreover, the life course data were collected
retrospectively by asking the participants questions on an ordinal scale that I had already
mentioned earlier. No scale was used to assess the life course events therefore no reliability test
was performed. However, the life grid method was not used due to time restriction.
4.8 Research process 4.8.1 Recruitment of data collectors
VCARE assisted in recruiting data collectors. Most of the data collectors were
individuals who had worked in a voluntary capacity in many events at VCARE. However, few
data collectors were the employees of VCARE, who wanted to grow their skills in research. The
recruitment had taken place at the VCARE by the researchers. During the selection process, the
data collectors were also briefed about the research purpose, procedure and time commitment.
After interviewing ten candidates, three men and three women were recruited for the data
collection.
4.8.2 Translation of the questionnaire in the Urdu language
The translation of the research questionnaire from English to the Urdu language was
performed by one of the professional translators based in Karachi, Pakistan. Karachi is a very
multi-ethnic city therefore, many other languages are also spoken but because of financial and
time constraints I potentially had to recruit trained data collectors who could speak other
languages as the questionnaire was only translated into Urdu language (Annexure 5)
4.8.3 Pre-testing of the survey questionnaire
Pre-testing is one of the crucial aspects of the research as it addresses questionnaire
issues. For example, do the sections of the questionnaire, and the questions within sections
have a logical flow? Do the skip patterns make sense and are they correct? (Hilton, 2015).
Pre-testing is a method to check all questions work as planned and are understood by the
individuals who are likely to respond to them. Also, unexpected problems could be detected
earlier than later. Therefore, before conducting the training programme for the data collectors,
the survey questionnaire was pre-tested on (ten) participants. These participants were the regular

101
client of the VCARE, who were availing adult day-care services. Moreover, they had all the
characteristics required for inclusion in the sample. It was made sure that these participants did
not take part in the major research project. During the pre-testing of the research instrument, few
typing errors were identified and corrected later. Another issue, which was identified during the
pre-testing of the survey questionnaire, was the resilient scale. The resilient scale had 25 items
and participants felt that it was a repetitive question, asked during the depression and optimism
scale. Besides, each item of the resilience scale needed many clarifications. This issue was
discussed with the supervisor Professor Gopal Netuveli, and it was suggested to remove the
resilient scale from the questionnaire.
Moreover, items from the life course questionnaire included the nutritional status of the
participants; were also removed to reduce the time of administrating the questioner. Removing
these two parts from the questionnaire would not affect the measures, which were needed to be
considered within the respective in this study module. Moreover, during the pre-testing of the
research instrument, participants had also complained regarding the length of time had spent on
one person. As one participant was taking around 1 hour 50 minutes. However, after removing
two scales from the questionnaire, the final version of the questionnaire took around 40 to 50
minutes to answer all the questions.
4.8.4 Two days training programme
Training for the data collectors was conducted at the VCARE by the researcher. The
purpose of the training was, to familiarise and understand the research tools and procedure of
the data collection. It was also essential to give hands-on training to the data collectors to reduce
the chance of any error during the data collection. Another vital purpose of conducting training
was to have an accuracy of the tool, and to manage the time. Therefore, each data collector was
allowed practising the survey questionnaire. For that, six 50+ older adults were invited on the
second day of the training, and each data collector administered a survey questionnaire on them.
The timings for the training were from 10:00 am to 5:00 pm.

102
Moreover, the training was an incentive for all the volunteers. At the end of the training,
the participants were also given a certificate of participation. Besides that, they were not given
any other incentive in terms of money.
4.8.5 Development of data collection guide
The researcher needs to develop a brief data collection guide before collecting the data in
the field. Therefore, a brief data collection guide was developed and had given to all the data
collectors. The data collection guide explained general principles to be applied in dealing with
unforeseen problems. It also explains the general principles of data collection (Annexure 1).
4.8.6 Inclusion and exclusion criteria
Inclusion Criteria
Individuals who are 50+ speak and understand the Urdu language. Urdu is a
national language of Pakistan and mainly spoken and understood in all the cities of
Pakistan (All other data collectors are spoken, write and read the Urdu language).
Therefore, only those people were a part of the study who could speak and understand
the Urdu language. Individuals who can sign or thumb stamp on the consent form.
Exclusion Criteria
Individuals who are less than 50+ years old are vulnerable (having physical or
mental illness) and are not able to consent (By chance none of the participants had any
mental illness, however, one of the participants was paralysed and was not able to give
consent. Therefore, the participant was excluded from the study and the next
participant was selected).
4.8.7. Data collection process Overall, 317 people participated in the study out of them 18 discontinued in the middle of their
interview because of not having time.

103
The data collectors had started collecting data from the low-income area. On day one, two
data collectors, along with the researcher, had visited the research site, with one of the
members of VCARE, who had an idea about the place and the population. On the first day,
we identified ten houses where 50+ men or women were available.
Earlier it was shared the cluster quota sampling was used. There could be the implication
of quota sampling such as; in quota sampling, it is not possible to calculate the sampling error.
Also, the projection of the research findings to the total population could not be generalisable.
Selection bias could also have a problem. For example, it might avoid choosing people who live
further away or people in rough neighbourhoods. This may make the result unrepresentative of
the population (Saunders, Lewis, & Thornhill. 2012).
The formal process of the research was the data collector and researcher knocked on the
door and introduced ourselves to the person who opens the door. After the customary salutations
(Assalam-u-Aliqum), we informed them about the reason for our visit and asked the person if
he/she could answer for the household. If they could, there would be called the household
reference person. During the interaction, the researcher assessed, if this person was the right
household reference person. The criteria would be (above 18 years of age and able to make
decisions on behalf of the members of the household). If this person was not suitable, then the
researcher asked them to call someone who could speak for the household. At that time, the
researcher informed the main household person about the inclusion criteria, which was discussed
earlier. If the main household person had confirmed that they had someone living in the
household who fitted on that criteria, then asked permission to meet that individual. After
meeting with the target individual, the information sheet was shared regarding research purpose
and had taken the verbal consent. The information sheet (both in Urdu and English annexure 2
and 6) was given to the participants to keep; however, the written consent (both English and
Urdu annexure 3 and 7) was taken on the date of data collection. Moreover, if the targeted
subject was not available, researcher, along with data collector, moved on to the next door and
knocked on that door. On the next day, all six data collectors, including researcher, approached

104
the participants, who gave the verbal consent. The male data collectors interviewed the male,
and the female data collectors interviewed female. However, in some household’s people would
not mind interviewing either of the genders. The data collectors had administered a survey
questionnaire. An interview was administered in a provided room by the participant. The mean
time for data collection was 40 to 45 minutes. In very few houses, the wife/husband or
daughter/daughter in law accompanied the interviewees. Previous study suggested that the
presence of another person from home may bias the answers. Also, third parties were a common
enough, occurrence to potentially have a serious impact on responses if respondents provide
different answers when others are present during an interview. However past research on the
problems and biases created by third parties during an interview is somewhat limited (Smith,
T.W., 1997). Overall, in this research, the presence of the third persons on survey responses was
5 houses in the low-income area and 3 houses in the middle income areas. However, there could
be possible impact such as it might increase measurement error by reducing privacy. These
limitations were unavoidable in the study design and may have limited honest and full responses.
Yet, recruiting through locations where older adults gather, might improve this.
Before started interviewing, data collectors had informed all the participants about their
rights and maintaining their confidentiality. Once they were satisfied, their written consent was
then obtained. After an interview, the data collectors asked participants about whether they had
any questions regarding the research. Some of the people from low and middle income, asked if
we could help them in having electricity and water? Without making any false promises, we
restated the purpose of our research, and they got satisfied. However, few people from all the
three strata urged, if the issues like; electricity, water, transportation, unemployment, freedom
and security, would be shared with the government. Moreover, the data collectors had informed
those participants that the research findings would be disseminated through publications and
seminars. Lastly, data collectors thanked for their participation.
The research questionnaire was assessed every day by the researcher to check if any
items were left out from the questioner. If so, then the data collector, along with me went back
to fill the missing part of it. Sometimes, some household members were not comfortable in

105
answering the question such as about their income. Alternatively, in the life course section,
many of the participants did not remember their parent’s date of birth or their early profession.
In that case, it was written in the form that the participant was not willing to answer or did not
remember. Furthermore, at the end of each day, the data collectors and researcher took ten
more verbal consents for the next day to collect the data. The same process was taken place in
all the strata.
4.9 Subjective data collection
Subjective data is generally based on observations or emerged from the discussion
between the interviewer and the interviewee (Dilsizian, V. and Narula, J., 2009).
During the data collection, the subjective data were spontaneously shared by the study
participants in response to questions that were asked from the questionnaire. The subjective data
were not analysed. However, the subjective data was used with the research's relevant findings
identified after quantitative data analysis. The subjective data is mainly shared in the chapters 5
and 6.
4.10. Data management Plan
It is essential to have proper data management for research, as the sound data
management helps to avoid data loss, and a researcher can reuse the data in future as well.
In the ethics form, it was mentioned that survey interviews would be entered, and would
be saved on UEL drive and a password-protected laptop. The printed questionnaires would be
locked away in a cabinet at the organisation supporting me in Karachi, Pakistan.
However, due to the law and order situation, the data collection took much time; therefore, it
was not possible to enter data in Pakistan. Consequently, all forms were brought to the UK
and have kept in the Principal investigator’s locked room at UEL. The name from all the
forms was erased to anonymise the identity of the participants. 120 written consent forms
were brought back from Pakistan to the university in England. The remainder could not be
brought to the UK due to luggage restrictions. After discussion with the ethics committee, the

106
remainder were kept in a secure locked cupboard in the main study organisation in Karachi.
And this all information was informed to the ethics committee.
All the above-provided information was communicated to the University Research Ethics
Committee via Ms Catherine Fieulleteau, who is Research Integrity and Ethics Manager, at
UEL. An amended form was sent to an ethics committee. The regular back-ups of the data were
taken to protect in case of any accidental data loss such as; computer breakdown, hardware
failure, virus infection, power failure or human errors. The survey forms were also kept in a
locked room in order to save the intellectual property and to keep the sensitive pieces of
information safe. All the entered data were saved in a locked computer system with a password.
Data were anonymised by removing direct identifiers, e.g. name or address of the participants.
4.11 Data entry and data Analysis
The SPSS and AMOS software for data entry and its analysis was used for this research.
More than five hundred variables had been created. The nominal and categorical data was
examined by running frequency tables. Whereas, the descriptive analysis for the continuous data
was examined by mean ± standard division. To identify the association between the quality of
life and other demographic variables, cross-tabulation and chi-square test were performed for all
the categorical variables. ANOVA test was performed to see if the age distribution is different in
three socio-economic areas. Also, significant tests of gender and socio-economic groups had
been performed. Moreover, to look at different factors associated with the quality of life,
variable and multiple regressions analysis were performed. Moreover, different psychosocial
scales such as (neighbourhood scale, capability scale, sense of coherence scale, social support
and social networking scale) were tested for its reliability. Bi-variable and multiple regression
were also performed to assess the relationship between the variables. Amos was used to fitting
structural equation models (SEM). The confirmatory factor analysis was performed using
AMOS.

107
4.11.1 Descriptive analysis
Descriptive statistics summarise the data from the research and create a useful finding
that helps to understand the data more appropriately (Shahravan. Ghassemi and Baneshi.
2012). A descriptive analysis of the mean, standard deviation, frequency and the percentages
of all the variables for socio-demographic, psychosocial and life-course variables was
performed.
4.11.2 Regression Analysis
Regression analysis is an essential statistical method which allows the identification and
description of relationships between two variables or among multiple variables. Regression
analysis also helps to “predict future outcomes based on the predictor variables” (Schneider, et
al. 2010). In my data, I performed a simple linear regression to examine the relationship between
the quality of life and other independent variables. Then, I also performed a multiple regressions
analysis to observe the best model to predict the quality of life.
4.11.3 Chi-square Analysis
A chi-square test tells us if the two variables are related. In a more general sense, “it tests
to see whether the distributions of categorical variables differ from each other” (Diener-West,
2008). A minimal chi-square test reveals that the observed data fit the expected data
exceptionally well, and there is a relationship between the two variables. A large chi-square test
statistic tells that the data does not fit very well, and there is no relationship between the
variables. Therefore, the chi-square test was performed for all the categorical nominal variables
to see the relationship between the two variables.
4.11.4 Psychometric evaluation of CASP
The psychometric analysis of the CASP was performed using exploratory factor analysis
and confirmatory factor analysis. The internal consistency reliability and the factor analysis was
conducted while performing exploratory factor analysis. However, the confirmatory factor
analysis was performed competing for three models such as;

108
1) Single-factor model
2) First-order model
3) Second-order model. A single factor model where all the 17 and 13 items were
loaded onto one unobserved variable called QoL was tested. Then the first-order model
was tested where all the four domains of CASP were included. Finally, in the second-
order model, the CASP domains can be dependent upon a single underlying factor,
QoL.
4.11.5 Assessing the degree of model fit
Three goodness-of-fit indices were calculated to assess the overall fit of the data. These
indices include: Comparative fit index (CFI) (Bentler, 1990); Tucker Lewis index (TLI) (Tucker
and Lewis, 1973); and Root mean square error of approximation (RMSEA) (Steiger, 1989).
According to Hu and Bentler (1999), a CFI value of greater than 0.90 is an expected value for a
psychometrically fit to the data. RMSEA is another quantitative index which describes how well
the model fits the observed data. “As a rule of thumb, the value of RMSEA less than 0.05
indicates good fit, values between 0.05 to 0.08 suggest acceptable model fit, and values greater
than 0.10 suggest poor model fit.” For the CFI and TLI, values above 0.90 can be expected for a
reasonably good fitting model.
4.12. Quality assurance of the data
Quality control of data is an integral part of all research, and it took place at various
stages, during data collection, data entry, and data checking process.
During data collection, quality control measures were to follow the guidelines of the
data collection, capturing observations and recording forms with clear instructions.
Furthermore, the quality of data entry included; using data entry screens and code list.
Moreover, data checking included when data was edited, cleaned, verified, cross-checked and
validated. Therefore, to minimise the chances of errors; after entering 40 forms, 20 forms were

109
rented. This process checked if there are any discrepancies in two datasets. After completing
data entry, 30% of the random forms were rechecked; with a colleague’s (Michaela) help, to
see if any of the entry had been done incorrectly. Moreover, it was identified that there were
0% input error.
4.13. Ethical approval and Ethical consideration 4.13.1 Ethics committee approval
The two ethics approval for both studies in London and Pakistan was approved by the
University Research Ethics Committee at the University of East London (Annexure 14 and
15).
4.13.2 Ethical consideration
The participants were informed that participation in the proposed study was voluntary.
Moreover, participants were free to end their participation in the study at any time without
penalty. Furthermore, the participants were also informed that they would not have any harm if
they would leave the study. ‘Based on the right to privacy, the respondent had the right to
anonymity and the right to assume that the data collected would be kept confidential’ (Burns &
Grove 1993:343). Therefore, all the research participants were informed that their identity would
be kept anonymous and that the information collected would be kept confidential. A major
ethical issue in most researchers is the invasion of privacy. The interviews were conducted in the
provided room by the participants, where they were comfortable and was easy to maintain
privacy and confidentiality.
4.14 Potential risks
Earlier it was mentioned that the proposed study involves one to one interview and focus
groups discussion on the quality of life. Moreover, the participants were asked close-ended and
an open-ended question about the everyday living; which would not cause any emotional
disturbance, distress and/or potential hazards. However, as the starting of the interview

110
participants were also informed, that during the interview if participants faced any emotional
distress and they wanted to leave the discussion or interview, they would be allowed to leave.
However, none of the situations came across throughout the survey and focus group discussions.
Now the thesis will move on to chapter 5, to share the finding and discuss the cross-
cultural adaptation of CASP measure to assess the quality of life in Karachi Pakistan

111
Chapter 5: First aspect of the Study; Cross cultural adaptation of CASP 19 measure of quality of life in 50+ older people in Karachi Pakistan
This chapter describes the process, presents the findings, and discusses the cross-cultural
adaptation of CASP 19, a tool measuring the quality of life of 50+ older adults in Karachi,
Pakistan. In particular, the chapter discusses the translation process of the CASP 19 and its
psychometric properties and share the findings of the psychometric evaluation of the CASP. It
also discusses CASP in Pakistani context. Lastly, it presents a cross-cultural model derived
from the findings of the cross-cultural adaptation of CASP 19.
5.1 Define Culture
There are many definitions of culture, as scholars from different conceptual traditions
anthropologists and sociologist have studied the term for a long time (Spencer-Oatey 2012). One
of the most common definitions is as follows: "knowledge, belief, art, morals, law, custom, and
any other capabilities and habits acquired by man as a member of society" (Spencer-Oatey, &
Franklin, 2012). Culture is further defined as, "the derivatives of experience, organised, learned
or created by the individuals of a population, including those images and their interpretations
(meanings) transmitted from past generations, from contemporaries, or formed by one individual
themselves" (Spencer-Oatey, & Franklin, 2012). So, it is right to say, that culture is about all the
prevailing attitudes, values, beliefs, and behaviours shared by a group of people, and are passed
on, from one generation to another. Moreover, no human can live and grow in a specific group
with specific ideas, values, norms, beliefs, and ways of thinking. As a result, people living in
culture will behave and react differently than people living in another culture. Therefore, culture
influences people's way of thinking, way of acting and way of living. This may or may not affect
their quality of life (Spencer-Oatey & Franklin, 2012). Another component of culture is
“mutually negotiated by people in their relationships with others" (Wines, & Napier, 1992) and
internalise their culture so strongly that it would be difficult to separate their behaviours related
to their culture.

112
Therefore, it is essential to know the cultural difference between the two countries where
the research tool was developed and implemented. Culture matters to all the individual people
living in different societies as they have different experiences and perspectives that give new
insight into psychological processes (Oyserman and Lee 2008).
However, due to historical relationship between the United Kingdom and Pakistan, the
influence of British culture could be seen in Pakistan in particular areas such as “language,
public administration, education, architecture, communication, the political system, thinking,
and culture of the lands that Pakistan inherited” ( Islam 2004).
However, Pakistani culture is very diverse; its historical, geographical, and ethnic
diversity is influenced by Indian, Persian, Afghan, Central Asian, South Asian, and Western
Asian cultures. Because of this diversity, their way of conceiving life is different, and so their
response to the quality of life questions would also be different. This diversity does not include
westernised notions of culture.
Besides that, “the religious influence of Islam has also strongly shaped Pakistani culture.
Due to Islamic and tribal influences, non-urban regions of Pakistan have varying levels of
gender isolation” where women are not allowed to participate in decision-making (Kalra et al.,
2009). Whereas since 1950's Britain has experienced a period of accelerating social and cultural
change mainly the change was of the entry of women into the labour market and their increasing
independence has brought about fundamental changes to their position in society and their
relationship with their men (Bentley and O'Brien 2017).
Moreover, Pakistani society is not led by individualism but rather by interdependent self-
construal, where family and other relationships stand firm (Kalra et al., 2009). At the same time,
British culture is an individualist. Individualism is rooted in Adam Smith and Jeremy Bentham
utilitarianism, claiming that a free expression of individual will, and interests would provide
national harmony and maximal efficacy (Kagitcibasi 1997).
Therefore, with the difference in the culture where the tool is developed and adapted, it is
vital that scales are validated. As it had been developed keeping in mind Western populations of

113
who could score on levels individualism, whereas Eastern populations who score on collectivism
levels (Hofstede, 1980; Markus & Kitayama, 1991). Therefore, it is essential to evaluate the
conceptual and item equivalence in a different culture. As one statement could be interpreted
differently in a different culture for example, ‘family responsibility stops me doing things which
I want to do' was one of the items of CASP' this feeling might be intensely relevant to the
respondent of collectivist countries where people might think that it is a part of their life. In
contrast, in individualist countries, people might think that it is an extra responsibility on them.
Therefore, the interpretations of the items are highly influenced by cultural background, which
influences how one could think, perceive and react to situations. Therefore, while
acknowledging cultural influences on participants’ responses, a culturally fit instrument and an
understanding of cultural demands could help interpret results correctly (Halder et al. 2016).
Therefore, a measure like CASP 19, which had been developed in the United Kingdom,
needed in-depth adaptation process to assess the quality of life in an older adult in an entirely
different culture like Pakistan.
5.2. Introduction to cross cultural adaptation of the tool
The adaptation of the research instruments is complex and therefore, it is essential to use
accurate methodology. Most of the research questionnaires initially have been developed in
English and then have been adapted in many other languages, as it is more effective to adapt an
existing questionnaire than developing a new one. It is important to use validated and similar
research instruments which enabled comparison of results in different studies, whether done
nationally or internationally (Gjersing, et al. 2010). However, it is not compulsory that the
research questionnaires had always translated with a process the way it had been translated
earlier. However, before using in a different culture or linguistic settings, the instrument
necessarily needs to be validated in different culture, or context (Herdman, et al. 1998).
There is no universal agreement on how to adapt an instrument for use in another cultural
setting. However, there is an agreement that it is appropriate to translate and use a questionnaire
in another linguistic' and cultural context (Reichenheim and Moraes 2007).

114
Moreover, the instrument should be acceptable and practically perform in the same
way—the focus on cross-cultural and conceptual equivalence. Therefore, a well-established
method to achieve this goal should be used that is forward-translations and back-translations.
This method has been defined during several WHO studies (WHO, 2020). It is also essential to
know for the researchers that adapting any questionnaire cross-culturally, the focus should be on
the concepts, rather than on linguistic/literal equivalence of the questionnaire (WHO 2016).
On the contrary, if the questionnaire is well translated and has gone through with all the
phases of adaptation in the past, it still does not confirm the construct validity and reliability of
the tool with the present time. For example, a questionnaire that has asked about drinking tap
water, where people are drinking river water; this is not relevant in the setting. Therefore, it is
not always crucial that the instrument which had validated in the past would be valid to use
today. Thus, it is vital that an instrument should be culturally conceptually, linguistically, and
technically appropriate, to use in the target population.
Moreover, the questionnaire for most of the researches used in Pakistan was in the
English language, though it had developed in the West. Such as ‘Self-Reporting Questionnaire
(SRQ)’, a screening questionnaire for mental health developed by the World Health
Organisation (Rahman, 2003). Therefore, such measure needs to check for its validity and
reliability to be used in an entirely different culture. Therefore, the translation process should be
rigorous. Likewise, the CASP 19 a measure; to assess the quality of life of 50+ older adult was
also developed in a completely different culture. Therefore, to make CASP 19 culturally
appropriate the same process of WHO had used in this study.
The CASP 19 is a measure to assess the quality of life of 50+ years of the population. It
has four domains, namely; Control, Autonomy, Self-realization, and Pleasure. The CASP 19 had
been used in over 20 countries and had shown, having a good psychometric property (Lima et al,
2014). It had also used cross-culturally; with the appropriate process of translating from the
English language to the local language of the countries. To make culturally appropriate the

115
CASP 19 had translated into the Urdu language. The process of translating CASP 19 had defined
below.
5.3 Process of Cross-cultural adaptation of the tool from English to the Urdu language
To adapt CASP 19 measure, World Health Organization (WHO) recommended
methodology was used that included translation, forward/backward translation, selection of best
translation and pre-testing of the translation.
Diagram 5.1: Translation process 5.3.1 Translation
The CASP 19 tool was given to four people; who had a good command of English and
Urdu language, to translate the CASP 19 instrument. The translators had familiarity with the
target population as well. Four out of two translators were professionals pursuing their PhD from
different universities of the UK who came from Pakistan 3 or 4 years back, and two of them
were teachers in the school. Before starting the translation, the translators were briefed on the
objectives of the study.
5.3.2 Back-translation
Back-translation is very helpful; to know or understand the tool has been translated in a
culturally appropriate manner. The back translation would ensure the accuracy of the translated
version of the original tool (Beaton et al. 2000). Therefore, the four Urdu translated versions of
CASP 19 were given to another four people, to back-translate. Four out of two were
professionals pursuing their PhD from different universities of the UK who came from Pakistan
3 or 4 years back, and two back translators were housewives who moved from Pakistan to the

116
UK after getting married to British Pakistani nationals. Besides, that back translators never had
access to the original English language CASP 19. All these four translators also had good
command in both Urdu and English language.
5.3.3 Selection of the best translation
All the four back-translated versions were shared with the two natives separately. The
natives were the professionals who worked in the IHHD department and were born and bought
up in England.
The purpose of this exercise was to find out the best back-translated version, which was
close to the original CASP 19, for the adaptation. After the intense meeting with both people, the
2nd back-translated version was selected to pre-test for the adaptation.
5.3.4 Compilation of all 4-translated versions
All the four translated versions were compiled in the form of a tree (Annexure 12). The
tree showed how differently four different people had done all four translations. The best
selected back-translated version was the Urdu version two. That was later used in the Pakistani
population living in London, United Kingdom to pre-test the CASP19.
5.3.5 Pre-test CASP 19 in the Urdu Language
Most studies have been conducted to pre-test the instrument to use cross-culturally. Pre-
testing helps identify culture-specific concepts and unclear items, preventing errors (Fitzgerald
et al., 2011). Therefore, the translated version was pre-tested in the Pakistani community-based
in London; to understand the tool's language, cultural, and conceptual similarities.
Due to financial and time constraints, pre-testing of the measure was performed on the
Pakistani population based in London. Pakistani British Muslims had been massively influenced
by cultures and customs coming “from the subcontinent, which will continue to happen for
another generation or two” (Wang and Li 2019) Pakistani first-generation moved 40 years back
to Britain. And while living in England they still practised the same culture as of Pakistan. They
speak Urdu language, going to mosque listen and speak Urdu language, eating Pakistani food

117
and wearing Pakistani clothes, and follow Pakistani customs at weddings and other 'religious
ceremonies (Jacobson 1997.)
The first-generation migrant in Britain from Pakistan practices the same local culture and
religious norms. That also prohibit and discouraged them from performing certain health
behaviours. Due to cultural norms, the first-generation migrant is not an independent but a
family person who also can control the second generation (Wang and Li 2019). Even though
most Pakistani people hold British citizens “also navigate between their family's original culture
and that of British mainstream society” (Brown, Zagefka and Tip 2016).
Moreover, Britain culture emphasizes individualism, self-expression, and self-
actualization, whereas, first-generation British-Pakistani born and bought up in Pakistan, where
they socialized and lived their lives in the Islamic culture and value systems. Many British first-
generation immigrants, especially Pakistanis and Bangladeshis, live in urban ethnic enclaves.
They share the common values systems and cultural beliefs that prevent them from adopting
different and unhealthy lifestyles from the host society. Therefore, it was applicable to do a pre-
testing of the instrument in London with the first generation of British Pakistanis who were still
practising the same culture and norms line their home country (Wang and Li 2019).
Furthermore, the participants were asked to reflect on their culture rather than exercise
their culture. Even if their cultural views and behaviour may have changed by living in the UK,
their knowledge of cultural practices from their own country is likely to persist.
Moreover, the focus group discussion was selected to pre-test the measure. Though, both
cognitive interviews and focus groups are used to reveal issues and improve survey questions;
however, each method has strengths and limitations. Focus groups are a better method for
revealing how a group thinks about concepts collectively, with the opinions and ideas of one
respondent building on those of another to form a larger picture. Moreover, the focus group is
quicker, most cost-effective, and building consensus on the topic. However, less information is
gathered at the individual level.

118
Whereas, cognitive interviews are used to understand an individual's response to a survey
question. It is more time-consuming and costly but provides more information from the person,
who could uncover the problems with survey questions and topics (Meyers 2017).
I choose a focus group to pre-test the CASP questionnaire due to financial and time
constraint. It is evident that the focus group is the best method for determining: the respondents'
level of understanding of key terms and concepts. One other advantage of the focus group is that
participants may use other people's ideas and opinions to form their ideas. Moreover, a large
quantity of information can be collected from a 90-minute focus group. One of the drawbacks of
this method is that if one participant is more vocal, this did not allow other participants to share
their views (Babonea and Voicu 2011).
The two focus groups, one each for the male and female, were conducted; in support of
Pakistan Culture Society in Walthamstow, London. Each group had five to six participants.
Initially, the focus group participants signed the consent form. All the participants of the focus
group were between 55 to 68 years of age.
The participants were given 15 minutes to complete the questionnaire. All participants
were probed for their understanding and acceptability, to identify confusions among any item.
The discussion lasted for about 2 hours.
The recorded versions of the focus groups were transcribed immediately after the focus
groups and did the thematic analysis of the data.
5.4 Thematic analysis of the data
One of the research questions was 'What is the level of quality of life for older adult in
Karachi, Pakistan? And the objective for this question was; to adapt CASP-19, a validated
measure of the quality of life, to Urdu in a culturally competent manner. To achieve one of the
objectives of this question, the focus group was conducted. And to analyse Braun and Clarke’s
thematic approach was followed. The reason I chose this method was that “rigorous thematic
approach could produce an insightful analysis that answers particular research questions” (Braun
and Clarke, 2006).

119
Braun and Clarke (2006) identified the six-step approach to doing thematic analysis. The
steps are not linearly as the ‘researcher may need to move back and forth between the stages’
(Braun and Clarke 2006).
The steps I used in the thematic analysis are as follows:
First step: Braun and Clarke (2006) “recommended that researchers read through the entire data
set at least once before beginning coding, as ideas and identification of possible patterns may be
shaped as researchers become familiar with all aspects of their data”. Therefore, I familiarised
myself with the data by repeatedly reading the data and gaining a sense of familiarity with the
semantic meanings.
Second step: This phase involved the initial creation of codes from the data, “Qualitative coding
is a process of reflection and a way of interacting with and thinking about data. Coding allows to
simplify and focus on specific characteristics of the data” (Braun and Clarke 2006). Therefore, I
developed the codes to capture key analytic ideas within the data which may relate to the
research question. Transcripts were read line by line and extracts of meaningful text were
highlighted, and emerging codes were noted (Braun & Clarke, 2006). Some initial codes were
merged at this stage due to overlap with others. The developed codes (table 5.1) were then
compared against the research questions to confirm that only the codes meaningfully contributed
to the research. The emergent codes are as follow;
Emergent Codes Shortage of money, Living with a family Lack of resources interacting with friends Material needs Women responsibly to look after family Different words in Urdu Men bread earner Clarity of words Men Fulfil the needs of the family
Diagram 5.2: Process of thematic analysis
Table .5.1 Emergent codes

120
Third step: In this step data have been initially coded and gathered. I generated themes by
grouping codes that relate to a concept. The themes identified patterns of meaning across the
data. The themes were arranged according to the semantic content of the codes.
Braun and Clarke advise that “Data within themes should cohere together meaningfully, while
there should be clear and identifiable distinctions between themes.” (2006, p.91). Therefore,
coded extracts were then re-read in the context of the theme to consider whether a pattern
formed between the extracts. The themes were then defined and named. The following themes
emerged; “Financial needs, Social support, Cultural influence, Linguistic equivalence of CASP
19”.
Fourth step: During this phase, I reviewed the coded data extracts for each theme “to consider
whether they appear to form a coherent pattern”. The themes were reviewed concerning the
coded data and the data as a whole (Braun and Clarke 2006).
Fifth step: During this phase, I wrote analysis for each theme to understand how each “theme
fit into the overall story about the entire data; in relation to the research questions”. (Braun &
Clarke, 2006). Later the themes were defined and named.
Sixth step: The analysis is written up within a thesis.
5.5 Finding during the process of translation and back translation of the CASP
“English language is a fixed word order language and follows the SVO (Subject-Verb-
Object) structure; Urdu language is a free word-order language and allows many possible word
orderings but the most common sentence structure used by the native speakers is SOV” (Subject,
Object, Verb). Also, instead of English prepositions, Urdu nouns and verbs are followed by
postpositions (Jawaid, B. and Zeman, D., 2011). Urdu is not like English at all. English is
written in separate letters by putting them together from left to right. Urdu is written from right
Different meaning of words in Urdu language
Basic needs
Standard of living

121
to left, and in most cases, all letters of a word are joined, the middle letters in a word are written
partially. Vowels are a part of the alphabet in English, in Urdu, they are only diacritical marks
and most of the time they are not even written.
The only thing common between Urdu and English is that both languages have higher
level roots in the ancient Proto-Indo-European tongue. Many words in both languages are
therefore derived from the same old root. Nevertheless, that root is so far up in the family tree
that an ordinary speaker of either languages will find it challenging to identify.
Urdu is an Indo-Aryanean language of the Indo-Aryan family," which is spoken in South Asia. It
is a national language of Pakistan. In terms of vocabulary, it has a strong influence of Arabic and
Persian and some words from Turkish and English (Virk, S.M., Humayoun, M. and Ranta, A.,
2010, August).
Moreover, one English word gives several different translations in the Urdu language; for
example, “My age prevents me from doing the things I would like to do.”
The word “thing” has been translated as" Kaam" (work) in Urdu by 3 of the translators, and one
of the translators translated correctly things as “cheezain” in Urdu. So the back translation from
2 of the back translator translated like, “My age stops me from doing the work I am interested
in” and “My age restricts me to do such tasks that I want to do” so here the word “thing” in the
original CASP changed as “work” and “task.” Therefore, when all the back-translated versions
were taken to the native professionals, they gave mutual consent for the back-translated version's
closest meaning to use in Pakistan.
Moreover, as it has already been described in the discussion that one word of English
while translating in Urdu 2 to 3 words can be used, for example, the word “Health” has been
translated as “tabiyat” or “Sehat” both in back translating is the same meaning that is “health.”
Below is the list of words with two or more meanings to one English word while back
translating remains the same meaning and did not change the meaning of the original statement
of CASP 19.

122
Moreover, this happened in a couple of the CASP 19 sentence which are shown in table 5.2.
CASP statements Words used in CASP
Words translated in Urdu
Back translated in English
Shortage of money stops me from doing things I want to do
Money Paisa, Rupeeya Money
I feel that what happens to me is out of my control
control Kaboo , ikhtiyar Control
I look forward to each day
Look forward Agay dekhna, muntazir, intazar
Waiting, looking forward
I feel that my life has meaning
meaning Maqsad, maany
Purpose, Meaning
I enjoy the things that I do
Enjoy Khushi, maza, dilchaspi
Joy, happiness, delight interest
I enjoy being in the company of others
company sohabt mehfil
company
I feel full of energy these days
energy tar-o-taza tawanai tawanai
Energetic, refreshed, energy
I feel satisfied with the way my life has turned out
Turned out Badal gayee Turned out, changed
Moreover, the translation of statement 4 was entirely different in all four versions. The original
statement 4 in CASP was 'I feel left out of things' when it was back-translated from Urdu to the
English language it changed the meaning of the original and all four back-translated meant
differently such as 'I feel lonely' 'I feel that things have slipped from my hands,' 'I feel I have no
control over my desire,' 'I find myself left out on different things.’ When this was discussed with
the native professionals, one of the natives considered statement 'I find myself living out in
different things' which was nearer to the original statement in CASP. However, the other native
disagreed with it. Therefore, it was finally discussed with the supervisors' team, and eventually,
it was decided to remove this item from the CASP as it does not have a mutual consensus.
Furthermore, statement 14 of the CASP 19 'On balance, I look back on my life with a
sense of happiness’ the word 'on balance' was not at all translated in Urdu. As it did not change
Table 5.2 Change of words in translation and back translation

123
the meaning of the statement which was mutually agreed by the native. Rest of the statements of
CASP 19 were agreed by both the natives. Therefore, after the rigorous process, CASP 17 was
used to assess the quality of life in Karachi, Pakistan.
5.6 Focus groups Findings The following finding was identified after the thematic analysis of the two focus groups
conducted to adapt the CASP 19 measure to assess the quality of life.
5.6.1 Linguistical equivalence of CASP 19 It is essential to assess the linguistic or semantic equivalence of the tool. This aimed to retain a
similar meaning of a measure in the original and the translated version. The translated meaning
should remain as close as possible to the original meaning. One word in the English language
has two words in the Urdu language. For example, the word ‘meaning’ has two words in Urdu
like ‘maanay’ and ‘Baa maany’, so instead of using word ‘Maanay’ used ‘Baa maanay’ would
give more sense to the sentence. For example, one of the participants said;
“Statement number 11 ‘I feel that my life has a meaning’ ‘meri zindagi kay maenay hay’ is a bit confusing it should be It should be ‘ba maenay’ which can give sense to the sentence.”
Other participants also share his view regarding the word used in the translation he said.
“In statement 17 the word ‘mutmain’ is not appropriate it should be ‘itminaan’ (satisfied). So, it should be ‘main itminaan mehsoos karta hon jis tarha meri zindagi badal rahi hay”.
Such changes had been made in the instrument. It was identified that both male and female
participants to the focus group did not understand item number 4, ‘I feel left out of things’, this
item did not have content equivalence, and was poorly translated in the Urdu language, therefore
it was removed from the CASP 19.
5.6.2 Financial needs During the focus group discussion regarding CASP 19 items, Participants in both the groups had
identified that money had an essential factor in living better and quality life. Though they had
highlighted the other factors which influenced the quality of life such as health, the fulfilment of
basic needs. According to them, for the fulfilment of the basic needs, money is vital. In their

124
viewpoints, without money, no one can live a quality life. As one of the participants from the
focus group said;
“I had seven sisters and four brothers all died and now I am left alone, I am living alone at home and all the time I receive letters from the government, to pay money for different utilities, how can I pay? This is not a good quality of life.”
5.6.3 Social support
Another main finding that was identified during the focus group was about social
support. For some participants, the family was an essential aspect of life which provides
support. It was also identified that because of family support, a person can live a happy life.
According to participants, quality of life is, when people live with the family and have social
support in their old age. Participants also enforced the advantage of having social support and
mentioned that social support enhanced the quality of life whether it gets in terms of family,
neighbours or friends; it always helps in times of adversities. Moreover, it was also highlighted
that sometimes in financial crises, there are friends who assist them to improve their wellbeing.
One of the participants said.
“For me to live a happy life with the family is a good life. Money and health both are important but to live a life with the family and friends are also important.”
One of the participants from the male group said,
“All people present here have some social support. I always come to this centre (community centre for Pakistanis) to socialise and make myself happy. Many people I come across with in this centre say, that they are very happy with their lives and they say that we are still young”.
5.6.4 Cultural influence
Cross-cultural adaptation of any instruments needs to be culturally acceptable. Two
items of CASP 19, were identified by the male participants, which they found culturally
inappropriate those were; ‘Family responsibilities stop me doing things that I want to do.’
According to the male participants, the family is a priority in Pakistani culture. Moreover, to
fulfil family responsibility is a part of religion as well. As one of the men participants said

125
“Taking care of the family is the primary responsibility of the male person that never stops them from doing the things they want to do.”
On the contrary, female participants were quite happy with the same item, according to
the female participants, the family responsibility stops them from doing what they want to do.
One of the female participants said;
“In Pakistani culture females have been given all the responsibilities to carry out, and the male person of the house earns money and female has to work as a captain of the ship, if the captain is not there then, the ship will sink. It was just like, if a woman is not at home, how the home would be managed. The responsibilities start with all the home chores to taking care of kids and family. So, with so many responsibilities, women always leave their desires and wishes from getting fulfilled because those responsibilities never allow them to do the things they want to do.”
Moreover, item 19 from CASP was also identified as culturally inappropriate by both the
male and female participants. The CASP 19 item was, “I feel that the future looks good for me,”
according to the participants ‘I feel that the future looks good for me,’ is inappropriate
religiously because one cannot talk about the future. It is a culturally and religiously susceptible
item. The participants suggested, if the above mentioned CASP 19 items would add ‘agar Allah
nay chaha to main karon ga’ means ‘If Allah/God permits I will do this.’ Then it might not look
religiously sensitive.
To conclude the discussion of the focus group findings, it had been identified that CASP
19 had a conceptually accepted tool for the Pakistani population, except item 19. Moreover,
linguistically item 4, which was badly translated into Urdu language and was not understood by
any of the participants of the focus group. Therefore, this was later removed from the CASP and
after removing two items from the CASP 19 that is item 4 and 19; the CASP 17 was used to
assess the quality of life in Karachi, Pakistan.
5.7. Discussion
This part of the chapter will discuss the findings of, the process of cross-cultural
adaptation of the tool of CASP 17.

126
5.7.1 Discussion of the translation process
One of the aims of this study was to adapt the CASP 19 measure of the quality of life,
cross-culturally, from the English language and its associated cultural context to the Urdu
language in the Pakistani cultural context. The systematic approach followed to adapt the tool
cross-culturally allowed to check the content, conceptual, cultural, and language equivalencies
of the tool.
Many linguists have explored a relationship between language and culture. It has been
said that "Language and culture are two symbolic systems. Every language form we use has
meanings, carries meanings that are not in the same sense. Because it is associated with culture
and culture is more extensive than language" (Jiang, 2000, pg 3632). For some cultures, lunch
may mean having pizzas and fries, but for some culture, it must be curry and rice. Therefore, it
makes it more important when we use an instrument that has been developed in a country, which
has an entirely different culture and in different languages like Pakistan. When it comes to adapt
the tool in an 'Urdu' language which originally is being a mixture of many languages; like
'Sanskrit, Prakrit, Persian, and Arabic’. Therefore, we need to follow a rigorous process of
translation as some words may be translated or understood differently by different people.
Therefore, all the translated four versions from English to the Urdu language have a
difference in their translation. For example, the first statement of the CASP 19 is, 'My age
prevents me from doing the things I would like to do'; the word 'things' has been translated as
'cheezain' and 'Kaam' in Urdu. Moreover, when back-translated into the English language
'cheezain' translated as 'things' and 'Kaam' translated as 'work'. Both words' cheezain' and 'kaam'
use differently in the Urdu language. The word 'kaam' in English is not only used for 'work' but
also for an 'employment.' Whereas, the word 'cheezain' translates 'things' in the Urdu language,
which means any 'stuff'. So, the meaning of the CASP item "My age prevents me from doing the
things I would like to do” does not change its meaning in the Urdu language.
Moreover, the translated words could change the meaning of the sentence; therefore, the
closest to the back-translation items were taken in the final version of CASP 17. On the other

127
hand, the item number 1 of CASP, 'My age prevents me from doing the things which I want to
do'; when translated in Urdu, the two translators added two Urdu words; that is 'khuwaish’ (will
or desire.) and 'pasandida' (favourite). That could change the meaning of the sentence in a way,
that 'my age prevents me doing, my favourite things which I want to do' and 'my age prevents
me from doing things, which I have a will to do'. Therefore, the correct translation was selected
for the pre-testing.
Furthermore, item 4 'I feel left out of things' was translated very differently by all the 4
translators; that had changed the meaning of the original item. As it was translated as follows; 'I
feel lonely', 'I feel that things have slipped from my hands', 'I feel I have no control over my
desire', 'I find myself left out in different things'.
Likewise, in many items, translators had used different words in Urdu. The example of
that is item 2 'I feel that what happens to me is out of my control'. Though the back translation of
both the words is the same 'control.' However, word control has been translated differently by
two translators; 'kaboo' (control) and 'Ikhtiyar' (control). The semantic difference between the
two words is; ikhtiyar is a more polite way to say in the Urdu language; whereas kaboo is little
harsh way to use in the Urdu language (Urdu dictionary, 2020). Interestingly, in item 14 'On
balance, I look back on my life with a sense of happiness' the word 'on balance' was not
translated at all by four translators. However, not using the word 'on balance' did not change the
meaning of the sentence.
With all the above findings adapting a new instrument needs a rigorous process to avoid
any biases. As one word in English may have a different meaning in the other languages (Wild,
et al 2005). So, according to Guillemin (1993), the best way is back translations of the translated
version; when another bilingual translator independently translates the translation back into the
English (Guillemin, et al 1993). Also, then the back-translations are 'compared to the original
version for semantic and conceptual equivalence' (Brislin, 1970).

128
According to Van Winderfelt and colleagues (2005), a back translator should be the one
who knows the subject (Windenfelt,2005). However, Guillemin (1995) argues that back-
translations should be performed by the one who does not have any knowledge about the
subject. Therefore, this study had followed the method of back translation as Guillemin has
described. Because this study was to assess the quality of life of ordinary people, so it was
essential to get a back translation from the familiar people of the same culture; who speak and
share the same culture and values.
Likewise, in the different previous adaptation of CASP 19 in various countries like
Brazil, Taiwan, Israel, Nigeria, and Japan have followed the same process as Guillemin has
described in his literature. In Brazil, two Brazilian bilingual translators who had never seen the
CASP19 original version; they did the translation, and then another two persons did the back
translation of the tool, from Portuguese to English (Lima, et al 2014). However, the little
different process was carried out in Taiwan, the literate community- senior Taiwanese residents
were interviewed to check the language of the questionnaire. The corrections were made, and
later it was given to two bilingual medical doctors to back-translate the Chinese version (Wu, et
al 2013).
However, this study was a bit rigorous as described earlier; the study had used four
translators and four back translators, to get more tangible results. Overall, eight people took part
in the translation and back-translation process which had already been discussed earlier in this
chapter. Eight out of four people translated from English to the Urdu language. Then translated
versions were given to another four people to back translate into English.
Furthermore, some back translated items conceptually changed the meaning of the
original item such as; item number 3 'I feel free to plan for my future' was back-translated by one
of the translators was; 'I am free to think about my future.' This changes the meaning of the
sentence 'to plan' and 'to think' are different meanings in English. Moreover, the same item was
translated by another translator 'I can plan for the future without hesitation'; no word such as

129
hesitation was presented in the original item. However, item 4 'I feel left out of things', was
translated differently by all the translators, which did not have any conceptual equivalence and
linguistic equivalence.
In the third step, all the back-translated versions were taken to the two natives to select
the best version out of four, which could be the closest to the original one. Meetings with two
natives on individual bases were arranged, and each CASP back-translated versions were
discussed in detailed. According to both the natives, version II, of the back translation was very
closest to the original one. However, one of the natives did not agree with the back translation of
item number 4 'I feel left out of things.' According to him none of the back-translated version
was nearest to the original one. However, another native showed her agreement on version IV,
which was back-translated 'I find (feel is missing) myself left out in different things.' Finally,
both agreed to use translated version II to pre-test in Pakistani population living in London.
Pre-testing of the tool is an integral part of the adaptation as cultural knowledge and
differences have represented a significant focus of translation. The translation should not be
only related to language, but beyond that, it should have a cultural equivalent (Brislin,1970).
The concept which is meaningful in one culture not compulsorily be the same in another.
Different cultures may enforce different norms for responding to situations (e.g. the death of a
spouse or Grief and distress). In some cultures, people may feel free or even encouraged to
display their pain or distress openly, while in others, they might consider it a weakness of the
person (Durdureanu, 2011). The main finding of the focus group was on gender inequality
which I will discuss in chapter (7).
Another item which was not understood during the pre-testing was item 4. That had
already been highlighted earlier; which was translated differently by all the four translators.
Then, back-translated differently by all the back translators. However, item 4, which was the
closest one to the meaning of the original one used purposely, in the pre-testing of the tool; to
know the viewpoint of the participants. However, a similar problem was identified during the
focus groups. Both the groups did not understand the meaning of the item 'I feel left out of

130
things' as it did not make any sense to the participants. Also, because both the groups did not
understand this item, therefore, it was later removed from the CASP 19.
Another item highlighted by the male group was number 17, 'I feel satisfied with the way
my life has turned out.' In Urdu, there are two words for satisfaction one is 'mutmain' and the
other one is 'Itminan.' The word 'itminan' in the Urdu language is used humbly and politely
which meant an act of getting satusfaction, or the state of being satisfied, whereas, the word
'mutmain' is used free from emotional anxiety or nervous tension. However, it is also used for
Self-Satisfaction (Urdu point dictionary, 2020). Therefore, the group was concerned with the
word and grammar of the sentence. Therefore, instead of using the word 'mutmain,' it was
suggested that the use of 'Itminan' would be more appropriate for the final version to use in
Karachi, Pakistan.
There was another item 19 'I feel that the future looks good for me' which became very
argumentative. According to the participants, this item was not culturally appropriate. However,
it could raise the question then why participants did not raise a question for item three, which is
'I feel free to plan for future'. Item three was translated as 'I feel free to plan for my future' and
item 19 was translated as 'I feel that for my future looks good' so 'future looks good' was taken to
predict the future. As in a cultural context, a person can plan, but they cannot predict the future.
The translation of item 19, in Urdu, shows a prediction of the future. The participants of the
focus group disagreed and were unhappy with the statement. The teaching of Islam does not
allow anyone to predict about the future and it falls in kufr (disbelief) as prophet Mohamad had
said: "Whoever approaches an oracle or fortune-teller and believes in what he says, has
disbelieved in what was revealed to Muhammad." Both fortune-teller and the astrologists, who
claim to have knowledge of the future is haram in Islam and opposed to Tawheed (Islamic
Monotheism). Moreover, people who believe in prediction are called mushirk in Islam, because
Allah has clearly stated: "And with Him [i.e., Allah] are the keys of the unseen; none knows
them except Him." [Quran 6:59] As well as (what means): "Say (O Muhammad): “None in the
heavens and earth knows the unseen except Allah” [Quran: 27:65] (Pinault, D., 2008). The

131
group emphasized it to remove this item from the questionnaire; because of its sensitivity,
otherwise, this can create a conflict in the larger group. One of the Muslim scholars Khalid
Zaheer has also described these issues in one of his essays available at ('Khalid Zahir website)
that only God is the one who knows everything. Nobody must claim that he/she knows about the
future and if someone who says that he/she knows about the future, then it must be, A Demon
.(شیطان )
After the pre-testing of the instrument, removing items 4 and 19 were removed from the
CASP 19, which made a tool CASP 17 a measure of the quality of life, to use in Karachi,
Pakistan.
5.8. Psychometric evaluation of CASP 17
Psychometric properties of the instrument check the efficacy of the instrument
(Hunsley and Mash, 2008). Therefore, Psychometric testing was used to test the measurement
equivalence across cultural groups. To measure the psychometric properties of the
instruments, reliability and validity tests were conducted.
Reliability has defined as the “degree to which test scores are free from errors of
measurement” (American Psychological Association, 1985, p.19). It is essential that the
measurement has internal reliability and should be consistent over time. It estimates
Cronbach’s, to measure the internal consistency of the instrument. “Cronbach’s alpha is based
on the number of items in the scale and the similarity of the items.” If the Cronbach alpha is
0.00, that signifies the absence of reliability and a value of 1.00 shows perfect reliability. If
there is low reliability that means the measure is not consistent. According to Hunsley and Mash
(2008), a measure is considered to have excellent reliability; when Cronbach alphas are more
than 0.89 and the reliability of the measure is adequate; when it ranges from 0.70 to 0.79.
However, a measure has good reliability if it is between 0.80 and 0.89. However, the reliability
of the measure also depends on the sample where the measure has been used (Hunsley & Mash

132
2008). Therefore, a measure could be reliable in some places and unreliable at other places
(Hunsley & Mash, 2008).
Moreover, to check the content and construct validity of the instrument, factor analysis
was conducted. The factor analysis examines the construct validity of the scales (Reise, Waller
and Comrey, 2000). Construct validity answers the questions like, “Does the measure behave
like the theory says a measure of that construct should behave?” Moreover, to analyse the
importance of the items and the internal structure of the constructs that the instrument measures;
an exploratory factor analysis (EFA) was first conducted. EFA is a statistical method that
“increases the reliability of the scale by identifying inappropriate items that can then be
removed”. The EFA also analysis the relations between items and the factors (Slavec and
Drnovšek, 2012).
Moreover, the Confirmatory factor analysis was also performed to identify the “number
of factors required in the data and which measured variable is related to which latent variable”
(Statistics Solutions 2013). The quantitative data were entered in the SPSS to check the
psychometric properties of the measure CASP 17. Also, AMOS was used to perform the
confirmatory factor analysis. CASP 17 has a Likert scale item, numerically coded. 3 was coded
to the most positive answer, and 0 was coded most negative answer. The CASP 17 score was
ranging from 0 to 47. Higher the score better the quality of life; lower the score poor the quality
of life (Netuveli et al 2006).
5.9.1 Findings from the psychometric analysis of CASP-17 5.9.1.1 Exploratory factor analysis Exploratory Factor Analysis (EFA) had applied in the first phase; to explore the factors loading
on quality of life scale. In the later phase, the Confirmatory Factor Analysis (CFA) was
performed to test the fitness of the model identified by EFA.
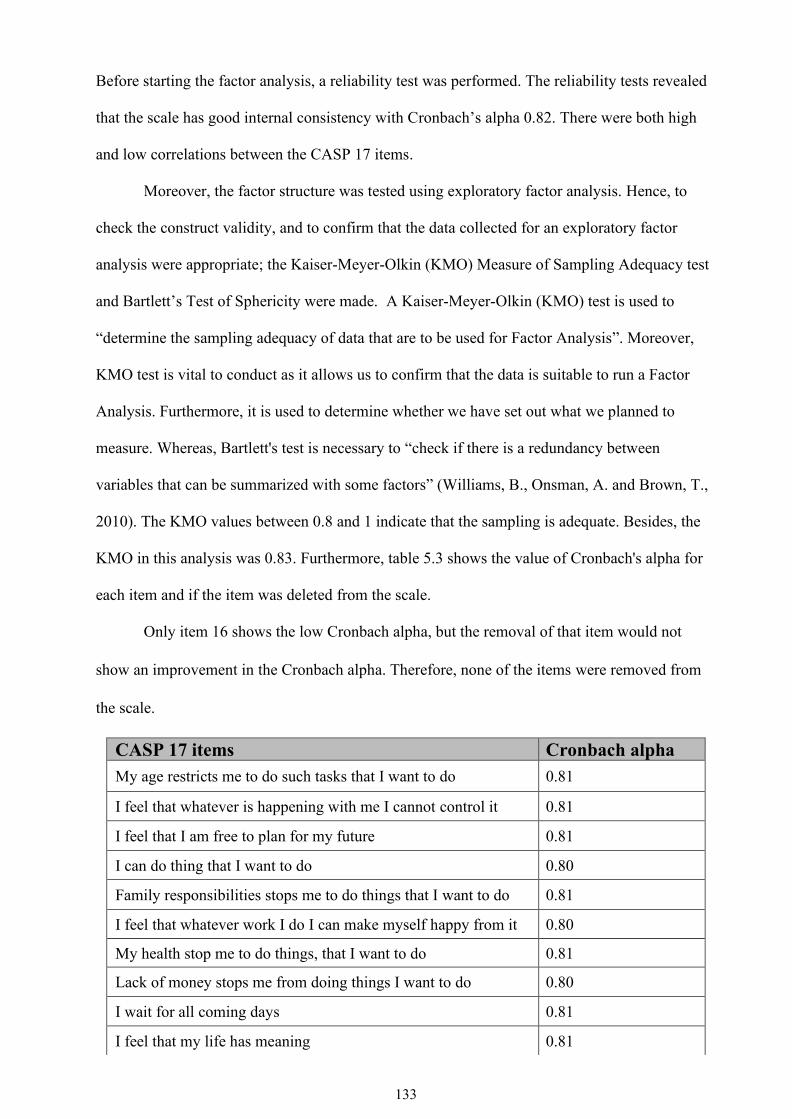
133
Before starting the factor analysis, a reliability test was performed. The reliability tests revealed
that the scale has good internal consistency with Cronbach’s alpha 0.82. There were both high
and low correlations between the CASP 17 items.
Moreover, the factor structure was tested using exploratory factor analysis. Hence, to
check the construct validity, and to confirm that the data collected for an exploratory factor
analysis were appropriate; the Kaiser-Meyer-Olkin (KMO) Measure of Sampling Adequacy test
and Bartlett’s Test of Sphericity were made. A Kaiser-Meyer-Olkin (KMO) test is used to
“determine the sampling adequacy of data that are to be used for Factor Analysis”. Moreover,
KMO test is vital to conduct as it allows us to confirm that the data is suitable to run a Factor
Analysis. Furthermore, it is used to determine whether we have set out what we planned to
measure. Whereas, Bartlett's test is necessary to “check if there is a redundancy between
variables that can be summarized with some factors” (Williams, B., Onsman, A. and Brown, T.,
2010). The KMO values between 0.8 and 1 indicate that the sampling is adequate. Besides, the
KMO in this analysis was 0.83. Furthermore, table 5.3 shows the value of Cronbach's alpha for
each item and if the item was deleted from the scale.
Only item 16 shows the low Cronbach alpha, but the removal of that item would not
show an improvement in the Cronbach alpha. Therefore, none of the items were removed from
the scale.
CASP 17 items Cronbach alpha My age restricts me to do such tasks that I want to do 0.81
I feel that whatever is happening with me I cannot control it 0.81
I feel that I am free to plan for my future 0.81
I can do thing that I want to do 0.80
Family responsibilities stops me to do things that I want to do 0.81
I feel that whatever work I do I can make myself happy from it 0.80
My health stop me to do things, that I want to do 0.81
Lack of money stops me from doing things I want to do 0.80
I wait for all coming days 0.81
I feel that my life has meaning 0.81

134
Table 5.3: CASP 17 Cronbach alpha for each item
Furthermore, the Eigenvalue measures evaluate how much of the variance of the observed
variables a factor can explain. Any factor with an Eigenvalue ≥1 explains more variance than a
single observed variable. The four factors analysed by this study presented an Eigenvalues just
over 1 as the screen plot in (Diagram 5.3) clearly illustrates.
The factor loading expresses the relationship of each variable to the underlying factor.
All the CASP 17 items were loaded on four factors (table 5.3). However, variables had been
loaded differently; as it was loaded in the original CASP 19 table: 5.3. Usually, a factor loading
>0.30 is recommended (Martinez-Vizcaino et al., 2010; Pillon, Laranjeira, & Dunn, 1998).
Moreover, in this research findings, all the factors loaded were >0.30.
Whatever work I do, I enjoy it 0.80
I enjoy other’s company 0.81
I look at my past happily 0.82
I feel energetic all the time 0.80
I select things that I have never done before 0.81
I feel satisfied with the way my life is changing 0.79
I feel that life is full of opportunities 0.80
Diagram 5.3: Eigen value plot

135
The analysis of CASP 17 shows that the quality of life in Karachi ranges from 3 to 47,
with an associated mean of 29.12 (that shows the average score of QOL) and Std. Deviation of
8.58. The standard deviations are not "good" or "bad." They are just indicators of how two
spread the data is. Table 5.5 shows the EFA results that have revealed the way factors have been
loaded differently than in the original CASP 19 (Table 5.4).
Original CASP 19 Domains Items Control C1 May age prevent me from doing the things in would like to do
C2 I feel that what happens to me is out of my control C3 I feel free to plan for the future C4 I feel left out of things
Autonomy A5 I can do the things that I want to do A6 Family responsibilities prevent from doing what I want to do A7 I feel that I can please myself what I can do A8 My health stops me from doing the things I want to do A9 Shortage of money stops me from doing the things I want to do
Pleasure P10 I look forward to each day P11 I feel that my life has meaning P12 I enjoy the things that I do P13 I enjoy being in the company of others P14 on balance I look back on my life with a sense of happiness
Self-realization S15 feel full of energy these days S16 choose to do things that I have never done before S17 feel satisfied with the way my life has turned out S18 feel that life is full of opportunities S19 feel that the future looks good for me
Below (table 5.6) shows the Domains and items loaded after the exploratory factor analysis.
And the names were given according to its loading.
Table 5.5: Exploratory factor analysis: factors loading
Old CASP 19 subdomains items
New CASP 17 subdomains items
CASP 17 items 1 2 3 4
C1 C1 My age prevents from doing the things I would like to do so
.761
C2 C2 I feel that what happens to me is out of my control
.655
Table 5.4: original CASP 19

136
C3 SR 1 I feel free to plan for the future
.543
A1 SR 2 I can do the things that I want to do
.604
A2 A1 Family responsibilities prevent me from doing the things I want to do
.589
A3 SR 3 I feel that I can please myself what I do
.712
A4 C3 My health stops me from doing the things, I want to do
.751
A5 A2 shortage of money stops me from doing things I want to do
.592
P1 P1 I look forward to each day .358
P2 P2 I feel that my life has meaning .745
P3 P3 I enjoy the things that I do
.444
P4 P4 I enjoy being in the company of others
.710
P5 A3 on balance I look back on my life with a sense of happiness
.739
SR1 SR 4 I feel full of energy these days .485
SR2 SR 5 I choose to do things that I have never done before
.500
SR3 SR 6 I feel satisfied with the way my life has turned out
.688
SR4 SR 7 I feel that life is full of opportunities
.723

137
Table 5.6: factors loading CASP 17
CASP 17 version factors loaded
Self realization I feel free to plan for the future
I can do the things that I want to do
I feel that I can please myself what i do
I feel full of energy these days
I choose to do things that I have never done before
I feel satisfied with the way my life has turned out
I feel that life is full of opportunities Control My age prevents from doing the things I would like to do so
I feel that what happens to me is out of my control
My health stops me from doing the things, I want to do Pleasure I look forward to each day
I feel that my life has meaning
I enjoy the things that i do
I enjoy being in the company of others Agency/Autonomy Family responsibilities prevent me from doing the things I want
to do
shortage of money stops me from doing things I want to do
on balance i look back on my life with a sense of happiness
Before commencing the CFA, the internal consistencies of the factors were checked.
The reliability scores for individual CASP components were moderate to high. For control and
self-realization (0.66 , 0.78) and the pleasure and agency/autonomy were moderate (0.60 ,0.50).
The moderate-scoring scales might have been lower due to the distribution of scores within these

138
scales being wider between sub population groups within the sample. However, the overall
CASP reliability was high.
The item correlations did not propose any perfection in removing the items from the
factors which have mentioned above. Therefore, it was decided to hold on to all the 17 items
for the structural equation model.
Domain CASP 17 Cronbach’s Alpha Self realization 0.78
Control 0.66
pleasure 0.60
Agency/Autonomy 0.50
Table 5.7 Crohn back alpha for CASP 17 individual domain 5.9.1.2 Psychometric findings of Confirmatory factor analysis
Confirmatory factor analysis (CFA) is used to validate the factor construction of a set of
observed variables. CFA also allows the researcher to test that a “relationship between observed
variables and their underlying latent constructs exists” (Suhr, 1999 pg 1). “CFA was conducted
to test the fitness of the obtained model. It examines the measurement model that supposes each
item is only loaded on its expected latent variable” (Thompson 2004). Three fit indices were
calculated to assess the measurement model validity; Comparative Fit Index (CFI), Tucker
Lewis index (TLI) and Root Mean square Error of Approximation (RMSEA).
In this study, the single factor model, the first order model and second order model
were assessed. In the single factor model, all 17 items are loaded onto one unobserved
variable known as QoL (figure 5.4). Moreover, the first order model in which all four
factors of CASP 17, with its items that are; Autonomy, Control, Self-realization and
Agency/Autonomy were added (figure 5.5). Also, the second order measurement model,

139
where all the CASP domains with 17 items were loaded on the single underlying factor,
QoL (figure 5.6).
As discussed earlier, to assess the model fit, three goodness of fit indices were
calculated. These include; CFI, TLI, and RMSEA. “The value of RMSEA <0.05 indicates
good fit, values between 0.05 and 0.08 suggest acceptable model fit, and values >0.10 suggest
poor model fit. For the CFI and TLI, values above 0.90 show a reasonably good fitting model”
(David A. Kenny 2015).
(Figure 5.4) demonstrates a measurement model for CASP-17; where all the 17 items
have been loaded on a single factor that is QoL. The single factor model of CASP 17 displays a
poor model fit as the results of the goodness of fit indices describes that TLI 0.674, CFI 0.714
which is relatively lower than the normal range and RMSEA 0.098, which is higher than its
required range. Because the single model seems the worst model fit for CASP 17 therefore, the
first order model was performed where the inter-relationship of all the four domains
(Autonomy/Agency, Control, Self-realization and Pleasure) was performed. The results of the
first-order model of CASP 17 with all four domains does not display a perfect model fit, as TLI
0.827, CFI 0.856 and RMSEA 0.071. As both the single model and the first model did not show
a better model fit, a third step was introduced involving the analysis of a second order model for
CASP 17. That included all the 17 items with its’ domains on one-factor latent variable ‘QoL’.
The results of the second order model analysis for CASP 17 showed that the values of TLI
0.674 and CFI 0.714 are very low (recommended value >0.90). Moreover, the value of 0.098 for
RMSEA was higher than its required range (recommended value <0.05). Thus, the second order
factor also does not demonstrate a good model fit between the model and the observed data for
CASP 17.
Moreover, the modification indices (MI) of covariance were observed. The MI indicated
a pair of correlated errors which reflect that the unnecessary items exist in the model. The MI
exhibited a high error measurement correlation between (e1, and e2,) that is: ‘I feel free to plan

140
for the future’, and ‘I can do the things that I want to do’. The MI value between the two items
(e1 and e2 ) was 20.99, which is considered high since it is greater than 15.0 and between (e12
and e9) that is; ‘I feel that what happens to me is out of my control’ and ‘I feel that my life has
meaning’ MI value 16.67 which was higher than 15 (Table 5.8). In order to achieve the best
model fit, which showed higher values on e1, e2, e12, e9 all four items were removed from the
analysis. Therefore, then the alternative 13-item four-factor model was tested for the population
of Karachi Pakistan.
Residuals Factors Items
E1 Self realization I feel free to plan for the future
E2 Self realization I can do the things that I want to do
E9 Control I feel that what happens to me is out of my control
E12 Pleasure I feel that my life has meaning
Table 5.8: error Items

141
Figure 5.4: Single factor model CASP 17
Figure 5.5: A first order model I for CASP-17
Self realization
Controle
Pleasure
Agency

142
Figure 5.6: Second factor model CASP 17
The CASP 13 was also evaluated for model fit through CFA. The single factor model of
CASP 13 showed the following values: TLI 0.709, CFI 0.757 and RMSEA 0.101 (Figure 5.7)
although these did not demonstrate perfect findings, they provided better model fit than
CASP17. The analysis for the first model fit showed the best model fit, with TLI 0.903, CFI
0.927 and RMSEA 0.058 (Figure 5.). The second model factor analysis for CASP 13 did not
exhibit a very good model fit (TLI 0.709, CFI 0.757 and RMSEA 0.101) (figure 5.9)
Finally, as for CASP 13, items redundancy was examined through inspecting the
Modification Indexes (MI). The correlated measurement error was between the item e6 and e7:
‘my age prevents me doing the things which I want to do’ and ‘my health stops me doing things
which I want to do’. The MI value between the two items was 64.463, which is considered high
since it is greater than 15.0. It was assumed, that the redundancies between the two items caused
the measurement model to record a poor fit. Therefore, these two correlated measurement errors
of redundant items were analysed as a “free parameter” and run the new measurement model II
for the second-factor model.
Self-realization
Ontrol17
Pleasure17
Agency/Autonomy

143
The CASP 13-second model fit (II) after unnecessary the two items, illustrated the
findings TLI 0.809, CFI 0.843 and RMSEA 0.082 (figure 5.10). The finding demonstrated that
fitness indexes have improved after the two redundant items which were constrained in the
model. The constrained was done while keeping the pair of the redundant item as ‘free
parameter estimate’. A free parameter is not pre-defined by the model; this can be chosen or
estimated based on theoretical ideas or experimental data. Moreover, “Free parameter is a value
estimated from data, usually in a modelling procedure such as structural equation modelling. A
free parameter differences with a fixed parameter, which is kept at a known, specific value; For
example, in confirmatory factor analysis, one-factor loading for each latent variable is usually a
fixed parameter of 1.0, and the other loadings are free parameters that are estimated” (Hoyle,
R.H. ed., 2012).
The overall CFA results propose that the ‘single-factor model’ and the ‘second factor
model’ for CASP 13 also does not provide an appropriate fit. However, the domain model,
which is the first factor model of CASP 13, is recommended as the best model fit to use in a
population of Karachi. Therefore, the shorter version of CASP13 was used to assess the quality
of life in Karachi, Pakistan.
Figure 5.7: single order model CASP 13

144
Figure 5.8 :first order model for CASP13
Figure 5.9: Second model factor CASP13
Self-realization
controle
Pleasure
Agency/ Autonomy
Self-realizatio
n
Control2
Pleasure
Agency2/ Autonom
y

145
Figure 5.10: Second model factor CASP 13 (Constrained e6 and e7)
Moreover, CASP 13 internal consistencies of the factors were also checked (Table 5.9).
Cronbach’s alpha values were 0.71 for self-realization, 0.68 for Control, and 0.58 for Pleasure
and 0.50 for Agency. The control domain showed an improvement in the CASP 13 than CASP
17 the rest of the domain has a very little but better difference in it.
Domain CASP 13 Cronbach’s Alpha
Self realization 0.71 Control 0.68
Pleasure 0.58 Agency/Autonomy 0.50
Table 5.9: Cronbach alpha for all domains CASP 13
Self-realization2
Control2
Pleasure2
Agency/ Autonomy
2

146
Tucker Lewis index (TLI)
Comparative fit index (CFI)
Root mean square index of approximation (RMSEA)
CASP 17 Single factor First order model for CASP 17 Second order model for CASP17
0.674 0.827 0.674
0.714 0.856 0.714
0.098 0.071 0.098
CASP 13 Single factor First order model for CASP13 Second order model 1 for CASP 13 Second order model 2 for CASP13 Constrained e6 and e7
0.709 0.903 0.709 0.809
0.757 0.927 0.757 0.843
0.101 0.058 0.101 0.082
5.9.1.3Quality of life CASP 13 scores
Each item in CASP 13 had scored on a four-point scale (‘Often’, ‘Sometimes’, ‘Not
often’ and ‘Never’), that could give a possible range of scores of 0–39, higher the score
represents a better quality of life (Sim., Bartlam, and Bernard 2011). The mean CASP 13 score
for the whole sample was 22.39 + 6.68 (table 5.11). the CASP 13 shows the lowest mean score
among the countries, where the CASP was used.
Moreover, the impact of financial resources on well-being had been observed in earlier
studies on CASP, where a higher socioeconomic status has common positive effects on the
quality of life (Hubbard, et al. 2014). Likewise, findings from this study also identified
differences in the score of quality of life in all three groups. Low Income Group (LIG) mean
CASP score was 17.4 + 6.6, middle income group (MIA) 22.8 + 4.9, and high-income group
Table 5.10 Confirmatory factor analysis

147
(HIA) 26.8 + 4.5 (Table 5.12). Moreover, the data in (diagram 5.11) shows that the sample
values it’s normally distributed, with a slight negative skew. However, there is a good
alignment with the bell curve, so can be deemed normally distributed.
Casp13score Std. 95% Confidence interval for mean
N Mean Deviation lower bond upper bond
299 22.39 6.68 21.63 23.13
Table 5.11. CASP 13 mean score
Diagram 5.11 CASP 13 distribution

148
Casp13 score Std. 95% CI for mean
N Mean Deviation Low bond Upper bond Low income 100 17.43 6.69 16.10 18.75
Middle income 99 22.87 4.90 21.89 23.85
high income 100 26.87 4.52 25.97 27.76
Table 5.12: CASP score in strata Now, the chapter will turn to discuss the findings of psychometric testing; considering the existing
literature on the subject.
5.10. Discussion on psychometric properties of CASP 17
This part of the chapter will be discussing the psychometric properties of CASP17.
CASP 19 has been used in many studies including an assessment of the quality of life in a
retirement community in the UK, (Sim, Bartlam, and Bernard, 2011), the life course influences
upon the quality of life in French men and women (Loretta et al. 2015). It was also used to
examine the correlation of religiosity and wellbeing in Jewish Israelis aged 50 (Litwin,
Schwartz, Avital, 2017). The CASP was also used to assess adverse effects of obesity on
psychological well‐being (Jackson, Beechen, and Wardle, 2015). However, very few of these
studies had conducted the psychometric testing of the CASP.
However, this study had performed the psychometric properties of the CASP 17 in
Karachi and it was found to be an appropriate tool to assess the quality of life. Moreover, it was
found easily understood by the targeted population. The CASP 17 showed good psychometric
properties and good internal consistency in the Pakistani population. It was also able to find out
common characteristic of growing older, which was mentioned in Hyde and colleges study
demonstrated the tool that would be used in the different culture, may able to find the most
common universal characteristics of growing older (Hyde et al, 2003). Besides the CASP 17 had

149
a good psychometric property; but, the modification indices (MI) of covariance were observed
when performed CFA. The MI indicated a pair of correlated errors which reflected that the
unnecessary items exist in the model. The MI exhibited a high error measurement correlation
between (e1 and e2): ‘I feel free to plan for the future’ and ‘I can do what I want to do’. The MI
value between the two items (e1 and e2 ) was 20.99, which is considered high since it is greater
than 15.0 and between (e12 and e9) that is; ‘I feel that what happens to me is out of my control’
and ‘I feel that my life has the meaning’ MI value 16.67 which was higher than 15 (Table 5.6).
To achieve the best model fit the four items which had showed higher values e1, e2, e12, e9,
were removed from the analysis.
Hence different countries have different psychometric properties of the CASP. When it
was used in the countries of Britain and Eastern Europe, both exploratory and confirmatory
analysis showed three factors with 12 items that best fit to the data (Kima et al, 2014).
Moreover, the CASP domains like Control and Autonomy seemed alike and therefore was
labelled as one domain ‘control and Autonomy’.
Moreover, the psychometric analysis of CASP 19 was also conducted in the Irish
population aged 50 years and above. In that study, the data did not support the four factors with
19 items, though; it was best fitted on two models with 12 items (Sexton, Kallimanis and, Ronan
2013). Similarly, when the validation study was conducted in Taiwan, the data revealed five
factors that are Control, Autonomy, self-realization, pleasure, and participation. Though the
items were reduced from the domain; Autonomy and Control, and the new factor ‘participation’
was added which had the mixture of both the items; from the autonomy and control of the
domains (Wu, et al, 2013). The Psychometric analyses in Brazil had also revealed that the
removal of two items improved the internal consistency of the Autonomy and Pleasure domains.
Confirmatory factor analysis suggested that a 16 item, four-factor, model best fits the data for
Brazilians (Lima et al, 2014).
In line with other psychometric studies of CASP (Lima., et al 2014, Sim , et al 2004,
Gyu Ri Kim et al 2015 , Tai-Yin Wua et al 2013, Wiggins et al 2007 ) this study in Karachi had
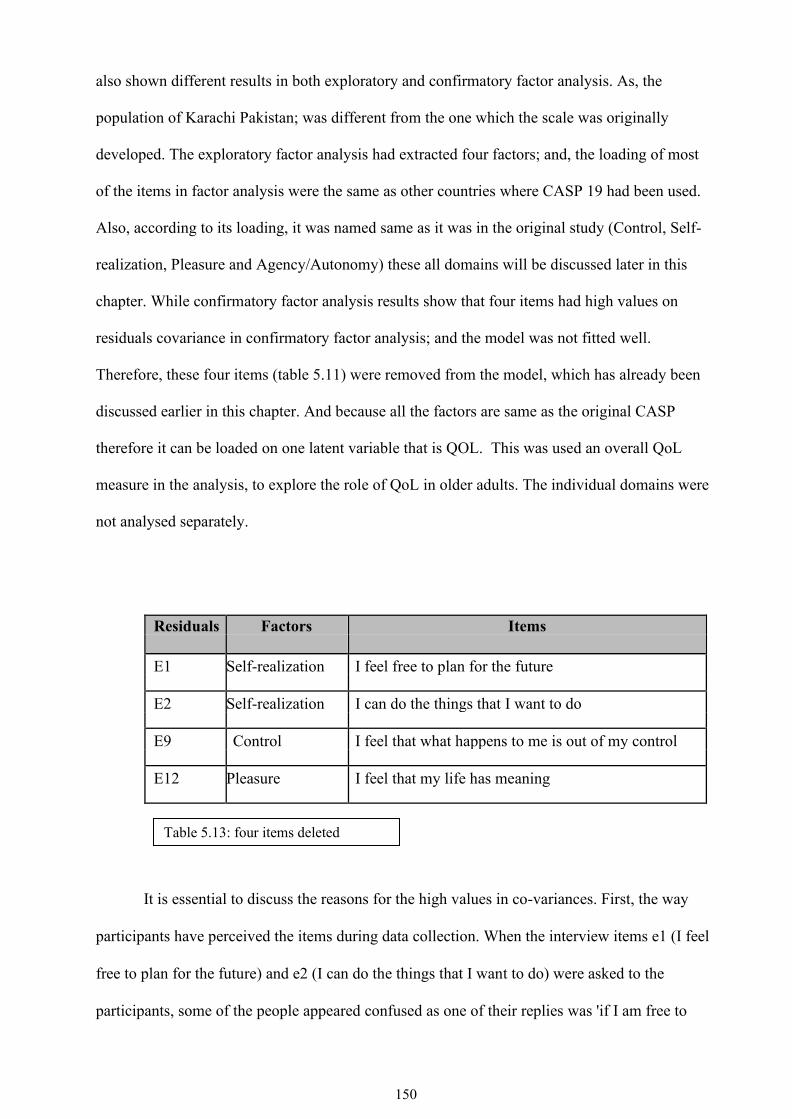
150
also shown different results in both exploratory and confirmatory factor analysis. As, the
population of Karachi Pakistan; was different from the one which the scale was originally
developed. The exploratory factor analysis had extracted four factors; and, the loading of most
of the items in factor analysis were the same as other countries where CASP 19 had been used.
Also, according to its loading, it was named same as it was in the original study (Control, Self-
realization, Pleasure and Agency/Autonomy) these all domains will be discussed later in this
chapter. While confirmatory factor analysis results show that four items had high values on
residuals covariance in confirmatory factor analysis; and the model was not fitted well.
Therefore, these four items (table 5.11) were removed from the model, which has already been
discussed earlier in this chapter. And because all the factors are same as the original CASP
therefore it can be loaded on one latent variable that is QOL. This was used an overall QoL
measure in the analysis, to explore the role of QoL in older adults. The individual domains were
not analysed separately.
Residuals Factors Items E1 Self-realization I feel free to plan for the future
E2 Self-realization I can do the things that I want to do
E9 Control I feel that what happens to me is out of my control
E12 Pleasure I feel that my life has meaning
It is essential to discuss the reasons for the high values in co-variances. First, the way
participants have perceived the items during data collection. When the interview items e1 (I feel
free to plan for the future) and e2 (I can do the things that I want to do) were asked to the
participants, some of the people appeared confused as one of their replies was 'if I am free to
Table 5.13: four items deleted

151
plan for my future, then I can do what I want to do'. This shows that the two items were similar
to each other.
Second, when asked e9 and e12 statements which say, "I feel that what happens to me is
out of my control', and 'I feel that my life has meaning". For these two statements, most of the
participants referred to God and said, 'if God has given us life, then there must be some meaning
to life'. Another participant added: "sometimes I get confused about life and do not understand
why it is happening to me, and those things are out of my control. So, I feel that it is God's
will". So, both the statements seem relatively the same and referred to God's will. Therefore,
participants may have perceived these items as similar.
Third, the CASP measure was developed on the theoretical model of Doyal, Gough,
Maslow and Lastlet. All the domains (control, autonomy, self-realization, and pleasure) were
introduced with the following description: 'Control was known as an ability to actively
intervene in one's environment' (Hyde, M et al., 2003). 'Autonomy is defined as the right of an
individual to be free from the unwanted interference of others' (Hyde, M et al., 2003). 'Self-
realization and pleasure capture the active and reflexive processes of being human' (Hyde, M
et al., 2003). Besides, according to the Lastlett, old age should not be frailty and thinking or
waiting for death. Lastlett argued that people should live a longer, healthier and joyful life.
Moreover, later years of life should be a crown of life, where they can develop themselves and
their interest (Lestlet, 1996). So, this dimension of lestlet leads to the further development of
CASP domains that is 'pleasure', and 'self-realization'. These domains reflect the “process of
self-realization through those activities that make them happy”. However, when it comes to
using such a measure in a different culture, the meanings and perceptions of these domains
may change because of their cultural values and beliefs. This is what happened with these
domains of CASP 17 when used in Karachi. For example, the item asked from the self-
realization domain ‘I feel satisfied with the way my life has turned out’ and some of the
participants referred to Allah as one of the participants said, ‘It is Allah’s will nothing is in our

152
hand’. But few of the participants also said “one wrong decision in life can change the life and
one is responsible for their own decisions so we cannot blame to anyone or Allah” so there
were distinct viewpoints of the participants.
Another example which showed how people had interpreted items according to their
cultural values, when asked an item from the pleasure domain ‘I feel that my life has meaning’
many people referred back to Allah and responded if Allah has sent to us in this world there
should be some meaning.
The next part of the chapter will discuss each domain of the CASP to show how people
have perceived domains in an entirely different culture. Moreover, it will also discuss the
meaning of each domain in the Urdu language and then the back-translated those words from
Urdu words into the English language. This will also discuss some of the subjective data shared
by the participants during the interview. The subjective data will enhance our understanding,
how different cultures comprehend, the CASP 13 domains. The subjective data will also allow,
to share the participant's perspective on domain in Pakistani culture.
5.10.1 Self realization
The first factor of CASP 13 had five items; 'I feel that I can please myself what I do', 'I
enjoy things that I do', 'I choose to do things that I have never done before', I feel satisfied with
the way my life has turned out and 'I feel that life is full of opportunities'. With items mentioned
above the first factor was named as self-realization. All the items were the same as they were in
the original measure of CASP 19
The dictionary meaning of self-realization is 'fulfilment of one's potential'. However, the
Urdu meaning of self-realization is 'takmil-e-zaat' and maarfatay zaat' when translated these
words again into the English language 'takmil-e-zaat' mean 'completion' and 'fulfilment of the
capacities'. Moreover, 'maarfatay zaat' means 'khud shanasi' means 'self-awareness'. Self-
realization is defined as the full development of self.

153
Initially, the Maslow's interpretation of self-realization was, whatever people know, and
the things make them happy they should perform to their ability in their life (Maslow, 1943). He
viewed life as an ongoing process of choices and described self-actualization as making the
"growth choice instead of the fear choice”. Moreover, with this concept of Maslow, the self-
realization became the part of CASP 19.
Moreover, in Eastern religions, self-realization signifies a state in which an individual
knows who they indeed are, what lasts they must achieve and way to fulfil it. Therefore, to some
culture, self-realization could be apparent itself and understand that “they are at one with the
omnipresence of God, or that the Divine is within them”. And for others, it is a “fulfilment of all
the possibilities of an individual's personality and character”. Consequently, the accomplishment
of self-realization may be a scientific and/or spiritual process (Fitzgerald, T., 2003). Though
spirituality has been seen differently by different scholars and people, for some, spirituality is to
feel confident that life is meaningful and spiritual person believes that life has a “meaning and
one's existence has a purpose” (Frank, 1984).
In a culture like Pakistan, some people understood, self-realization having a restful life
after struggling throughout the life course and to get pleasure in life and some perceived as a
spiritual accomplishment. Spiritual accomplishment in the Sufi thought has also “introduced
spiritual analysis as a science of self-realization” (Boni, 2005). Sufis are the one who has a
spiritual Islamic belief and practice in which Muslims' seek to find the truth of divine love of
God' (Baldick 2012). They are the one who achieves spiritual enlightenment through meditation,
prayers and by quitting worldly desires. Sufi can be both Sunni and Shia. However, Sunnis focus
on the teachings and Sunah of the holy Prophet, whereas Sufi follows basic and spiritual
practices. Moreover, Sunni and Sufi both follow Islam and have the same beliefs, but a Sunni is
more involved with worldly matters, whereas Sufi is more concerned with the world hereafter.
Sunni follows the code of life sent by God in the form of Sunah and Quran. Sunni Muslims
follow these codes and spend their lives accordingly to get to heaven as a reward for their
worldly noble deeds (Ahmed 2008).

154
When asked following items to the participants;' I feel satisfied with the way my life has
turned out' and 'I feel that life is full of opportunities'. Many participants from the study replied,
'jo Allah Karta hay wo acha kay liyee hi Karta hay'. Means' whatever Allah does for us it is good
for us. Moreover, some of the participants replied differently to the statement asked about the
'life is full or of opportunities' as it was said by one of the middle-income group “I retired in the
age of 60 from Muslim Commercial Bank' Now I am 62, and I want to work, but I am not
getting any. The government should increase the retirement age”. Moreover one of the
participants from Low-income replied to the statement when asked “I feel satisfied with the way
my life has turned out” and she replied that “I am happy the way we are now this is the time to
remember Allah as I have raised my kids they all are married and happy in their life”. The
subjective finding suggested that some people perceived self-realization differently.
Hence some of the subjective data also showed optimism and hope and these both factors
were an essential factor that accounts the religion involvement in some culture; as religion plays
a vital role in coping by inducing optimism and a sense of hope in adversity (Daniel, Enrique,
and Neblett, 2015). The positive psychology in Islamic spirituality is mostly based on; the
positive view of the human, believing in Divine kindness, gratitude, and universal man. In the
Islamic ideology, positive thinking is a crucial determinant for an individual; to think about past
events, interpretations of present events and future expectations (Mohammad Khodayarifard et
al. 2015). As in Quran Allah says, 'Oh Sons, go and inquire about Joseph and his brother, and
never give up hope in Allah's mercy, truly none despairs of Allah's spirit except those who have
no faith." Quran 12:87' this verse summarises the importance of optimism in Islam (Shedou,
2011).
Likewise, the Christian participants of the study also answered the items of self-
realization in a religious context as one of the participants from the low-income group said, “It is
a God's wish, whomever he wants to give, he will give we are no one to cry over. We can only
pray and stay hopeful”. So mainly it's about cultural and religious beliefs, that people living in
the same society have a robust religious belief system and social orientation, so these cultural

155
values produce spiritually based coping, and a more optimistic view of one's life (Shawn O.
Utsey et al. 2008).
Islam is indeed a fatalist religion that teaches that everything is determined in advance
and that man cannot do anything about it ( Pipes 2015) Nevertheless, Islam also teaches hope,
positive thinking, optimism and living life fullest and these elements are most important as they
relate to the prayers, supplications, and acts of worship, and this gives hope to a person in life
that whatever they want to achieve they can do it and have a happy life ( Pipes 2015).
5.10.2. Control
The dictionary meaning of control in the Urdu is kaboo and when back-translated it
remained same as 'control.' There were three items loaded on the second factor of CASP 17,
these were as follow; 'My age prevents from doing the things I would like to do so', 'I feel that
what happens to me is out of my control' and 'My health stops me from doing the things, I want
to do'. Moreover, these items were given the name of 'Control'.
However, when performing the CFA item, "I feel that what happens to me is out of my
control" had a high redundancy in modification indices; therefore, this item was deleted in model
fit. Besides that, each factor preferably should have at least three items (Hair et al, 2010).
However, high redundancy left the control domain remained with two items. Moreover, the
reason could be the statement be unclear to the participants, or a double meaning statement.
Also, it is evident, when this statement was asked to one of the participants she said, "What do
you mean by this, nothing is in my hand. God has control over our lives". The similar finding
was identified in a study among older Ethiopians population while assessing predictors of QoL.
The participants of the study felt the same for the item; “I feel that what happens to me is out of
my control". "Because the majority of Ethiopians are strong believers that whatever happens in
their life is God's will, and it is possible that they would answer the question that they do not
have control, which might be misleading" (Hamren, Chungkham, & Hyde, 2015).
Moreover, it is interesting to know that few participants took the meaning of two items
the same that is “My age prevents from doing the things I would like to do” and “My health

156
stops me from doing the things I want to do”. When asked to one participant about the “My
health stops me from doing the things, I want to do” and then “my health stops me from doing
the things I want to do”, he said: "you have already asked me this question. Why are you asking
me again? I already have told you, that my age does not allow me to do things. Because with the
growing age I got diabetes, blood pressure. Moreover, these diseases never allow me to do what
I want to do". That shows the perception of the person, who thinks that with age health
deteriorates, and therefore, the two items are the same.
5.10.3 Autonomy/Agency
The original CASP 19 had a domain named autonomy. The meaning of autonomy in
Urdu is 'Azadi ', and 'khud mukhtiyari' which translated in English again and the meaning is
'independence 'free from external control and constraint' and 'freedom'. The three items loaded in
the third factor in CASP 17 were 'Family responsibilities prevent me from doing the things I
want to do', 'shortage of money stops me from doing things I want to do' and 'on balance I look
back on my life with a sense of happiness'. Moreover, these all three items were the part of
autonomy domain in the original version of CASP 19; therefore, it was given the same name as
autonomy.
Autonomy has been discussed for last thirty years by the researchers, but in the recent
year, some cross-cultural theorists have suggested that autonomy is only a 'western cultural
ideal, and not a universal need' (Markus & Kitayama, 2003; Oishi, 2000; Oishi & Diener, 2001).
So, therefore, people who give more preferences to family, values, traditions, and norms can
never develop autonomy and seem to be more satisfied when living their will to their group's
will. However, autonomy is relevant to 'wellbeing (WB) in cultures that emphasize
individualism and independence, but less relevant to WB in cultures that emphasize collectivism
or interdependence' (Rudy et al., 2007). Therefore, it is right to say that people's well-being in
different cultures depends on the understanding and perception of autonomy.
South Asian region is known for the “inequalities in the autonomy and power of men and
women”. Furthermore, the researchers have proven that increased gender inequalities and

157
women's autonomy are strongly associated with social behaviour in South Asia (Sathar, and
Kazi, 2000). However, compared to the “Indian states of Kerala and Tamil Nadu and countries
like Sri Lanka with higher levels of women's autonomy” have demonstrated the better quality of
life than in the rest of South Asian regions (Sathar, and Kazi,2000). However, in Pakistani
society, autonomy has seen differently to different people; this will be discussed in the latter part
of this chapter. However, Women's autonomy has also been studied in Pakistan; where mothers
of adolescents were asked the meaning of "autonomy". The study identified that “mothers did
not spontaneously mention autonomy as a basic human need'. Hence some of the females of that
study described 'there is a restriction on women's autonomy”; in raising daughters, mothers
discouraged autonomy, emphasizing the central importance of marriage and the attendant
requirement of adjustment to in-laws (Stewart. Zaman. And Dar, 2006). However, in my study,
some subjective data were collected during the survey; showed that both man and woman had
the autonomy to live their life as they want. As one of the high-income group participants said
'family responsibility never stops me from doing what I want to do because all individual in our
family has right to do what they want to do so all are responsible for their own life'. On contrary
a woman from low income said ‘I cannot take decision as a woman my responsibility is to look
after children and take care of home and my husband is the one who takes all decision on behalf
of our family’. The subjective findings also show that the perception of autonomy is different in
different socio-economic group.
Hence it is right to say that people in a different culture like Pakistan apply their
autonomy in structural contexts, which include (religion, culture, values, and beliefs) that may
promote or restrict autonomous action. Autonomy will further be discussed in the later part of
this chapter. Also, gender-related autonomy will be discussed in the chapter (7).
5.10.4 Pleasure
Three items were loaded on the fourth domain these are 'I look forward to each day', I
enjoy the things that I do' and 'I enjoy being in the company of others' all items were loaded as it
was loaded in the original CASP 19. Therefore, the same name was given to it that is 'Pleasure'.

158
When translated 'Pleasure' into Urdu, it meant 'Khushi'. When back-translated word 'Khushi in
English it meant 'Happiness'.
Pakistan is a developing country and has economic and social problems. Besides that, the
latest World Happiness Report ranking, Pakistan placed at “81st among 158 world countries
with a happiness score of 5.2 on a scale from 0 to 10. This score is above the average score of all
158 countries, and higher than the score of neighbouring countries of Pakistan, i.e. China,
Bangladesh and India” (Jabeen and Khan 2016) the reason could be the perception and
understanding of happiness in the population.
From Islamic perspective, “the happiness is not merely a temporary state of joy and
delight; rather it's is a lifelong process aiming primarily at bringing eternal happiness, peace of
mind, the tranquillity of heart, contentment in this world” (Yazdi 2005). Islam is concerned
above all with the accomplishment of continuing happiness rather than with the more brief forms
of happiness (Nasr 2014).
However, when interviewing items from a pleasure domain like 'I feel that my life has
the meaning' most of the people commented that 'if Allah has sent us in this world so; there must
be some meaning and a reason and so far we do not have any regrets'. When asked another item;
'I look forward to each day; some of the participants said, 'inshallah yes' means 'if God's will,
yes' and some said 'na umeedi gunha hay is liyee anay walay din ka intazar kartay hay kay Allah
acha karay ga'. 'hopelessness is a sin. Therefore, we wait for the next day that Allah will do well
and we are happy whatever we have in our life'.
So, in whatever circumstance people had given the interview, they were aware and had
faith that things will change. As one of the participants said, 'hopelessness is not acceptable in
our religion, so we pray that the next day brings some change in our life'. While asked item from
pleasure domain, 'I enjoy the things that I do', most of the participants said they enjoy whatever
they do in their lives, whether it is looking after the family or doing household chores and we are
satisfied in our lives.

159
Thus, satisfaction is a part of happiness because satisfaction involves the fulfilment of
material and moral and spiritual needs. The concept of happiness in Islam is known as falah.
falah is pleasure and peace that can be enjoyed by any individuals in life and afterlife. Therefore,
most of the people responding to all the items of pleasure replied with full of satisfaction
(Amalia, Riani and Julia 2016).
5.11 General discussion on CASP
Pakistan is a fatalist country where people follow Islam as a religion. Fatalism can more
generally be defined as individuals or groups “tendency to believe that 'their 'destinies are ruled
by an unseen power or are played out inevitably rather than by their will”. The concept of
fatalism has been closely intertwined to the development of religious and philosophical thought.
Thus, it is not surprising that the precise meaning of the term fatalism changes across cultures'
over the period (Solomon 2003). However, the meaning of fatalism has changed by the scholar
of orientalism, where the Eastern world was defined by the western world, evaluating its social
and moral values and prospects. By the mid-19th century, the scholars represented East as
strange, exotic, dark, mysterious, and dangerous, society and has helped the West define itself
through this contrasting image. The stereotype notion of orientalism harms the psychological
and cultural part of the Eastern civilisation and dehumanises the people of the Eastern world
(Abu-Lughod 2001).
Assessing the quality of life using CASP measure in fatalist culture is appropriate.
Fatalism may be consistent with the belief that events are caused by a determining principle or
force in the universe, such as God. However, researchers have also found out that fatalistic
Individuals can still believe that some of their actions may change certain events (Belluomini,
2020). The domains like autonomy and control in CASP is also present in fatalist culture, which
is evident in my study. The participants of the study do believe that health and illness are from
God and they believe that they do not have control over it, but they also acknowledged that some
illnesses are due to one's behaviours and lifestyle choices as one of the participants of the study

160
said 'I had a major heart attack last year because I was a chain smoker. So, one needs to take care
of their health' one of the other participants also said that 'health is a blessing from God. We are
responsible for taking care of it'. Few of the participants of the study also highlighted that
whether the illness is physical or psychological, it is an affliction from GOD, but the illness can
come from culture as well such as eating food habit and behaviours plays a vital role in health
and illness'. Therefore, it is evident from their responses while they believed in fate; they also
believed in their ability to choose. One of the Quranic principles says to humanity that “you are
free to choose, and your decisions are based on your choices” (Kassem 2009). Participants of
the study also expressed their views about their life choices that have left them far behind. As
one of the participants said 'I was wealthy while living in a small town, I came to Karachi to earn
more money, and I spend all my money in investing business. Today I am not left with any
money. I do not blame Allah for it. This is because of my wrong decision that today I am living
in this small rented house'. Some of the participants realised the concept of free will, individual
choice and responsibility (Krause et al. 2016). This shows that autonomy and control exist in the
fatalistic culture. Also, the participants believe that everything is in God's hand, but people are
responsible for their behaviour and actions. God never give people what they cannot handle.
Thus, religious fatalism can provide individuals with “comprehensibility, manageability and
meaningfulness” (Hag and Daniel 2019).
Moreover, Pakistan's urban cities like Karachi make people more autonomous and have
control over their lives (Verkaaik 2009). A study conducted in Karachi Pakistan asking middle-
class women a perception of autonomy identified that older women are given more autonomy in
their lives, but autonomy is more common in men even if they are in their young age (Stewart,
Zaman and Dar 2006).
Furthermore, the study was conducted in Jamshoro urban city of Pakistan where the
interview was conducted to understand the concept of autonomy in women; the study identified
that women have autonomy even in fatalist culture, but it is categorised as “bounded autonomy
or limited autonomy” where women make independent decisions but thinking more about their

161
family than herself (Khatwani 2017). Moreover, one of the studies conducted in Karachi
Pakistan suggested that autonomy and independence are socially constructed, and the meaning
attached to them are deeply rooted in cultural specificity (Mumtaz and Salway 2009).
Furthermore, Karachi Pakistan's family system has made older adults empowered, self-
dependent, and autonomous while providing an opportunity to work (Cassum, et al. 2020).
Moreover, the literature also suggests that the socio-economic groups are also one of the
indicators that have impacts on autonomy and control. The people living in the low-income
group do not have much freedom to look after their health, have healthy food, and take
treatment. In my research, the subjective data shows that they were not able to go to the doctor
because of financial constraints. Moreover, getting sick was their choice; not God will.
Furthermore, even for that rather than accusing God, they accused Pakistan's policies as in
retirement, people who were working in private agencies do not have any pension system.
The t-test was also performed in my study to see the relationship between autonomy and
control with the socio economic group, and the results show that there is a significant (p <0.01)
correlation between autonomy and socio-economic group the same test was also performed to
assess the correlation between control and socio-economic group and finding shows significant
results (p<0.01).
Consequently, agency/ autonomy is also present in the fatalist culture; however, this has
been seen differently because of various factors (Khatwani 2017). Therefore, the underpinning
theory of developing of CASP domains relates to fatalist culture like Pakistan; as Islam allows
people to take control of their lives and have a freedom of choice. However, the interpretation of
people about religion and cultural norms restricts them to live an autonomous life.
Moreover, the CASP also aimed to show that in old age, people are engaged in a
reflexive process of self-realisation through those activities that make them happy (Hyde et al.
2003). However, in Pakistan, millions of older adults “live in poverty. Most Pakistanis rely on
agriculture and informal work throughout their lives. This leaves very few with pensions or a

162
reliable income when they reach older age, leaving them dependent on their families who often
struggle to provide for them” (Help age Pakistan). With this scenario, most older adults cannot
fulfill their wish or interest in the old age, but they stay happy and satisfied with what they have
in life.
On other hand people from high-income group shared ‘My husband had worked very
hard throughout his life and we have enough money; therefore, every year we go abroad for
vacation’. Therefore, the participants interpreted self-realisation and pleasure in the context of
their cultural norm, current circumstances, and religious practices.
Furthermore, if we look into the quality of life in the Islamic perspective, then Islam
considers the highest importance for human being’s quality of life. According to Islam, the
health and quality of human development environment should be a priority to human life; where
one can live their life fullest (Nezhadmohamad Nameghi, 2019). Esposito (1997) had reported
that poor understanding of Islamic theology and its principle beliefs, interpreting the Quran's
thoughts of fate, or qismat, as a matter of ongoing and continuous interaction between human
will and God's will. Acevedo (2008) argued that some interpretations of Islamic teachings might
not be adequately addressing the issue of personal responsibility in any given situation. The
wrong connection of life events with religion has also created uncertainty in people's perceptions
(Hamdy 2009). However, the Quran verdicts that every individual is free to choose his life in
social, economic and political spheres.
Further, the Quran stops its followers from challenging another person's freedom of
choice. Every individual is responsible for their own choices of their life. The Quran is most
definite about each person's freedom to choose their life course (Aslam, 2016). And, this choice
has been described as God's will. The following verse shows clearly how God's will acts. 'It acts
through human action and the choices human persons make. According to the Quran, it is God's
will for humans to hold divergent views' (2:253) (Aslam, 2016).

163
Quality of life is very individualistic, Netuveli (2008) had mentioned in his study that
'majority of the older adults evaluate their quality of life positively based on social contacts,
dependency, health, material, circumstances and social comparisons' (Netuveli, 2008). Similar
findings were identified in this research where most participants answered based on their current
life circumstances, positivity while considering their religious values and teaching.
Therefore, the concepts of autonomy, equality, independence and individuality
(specifically women's) must be considered within the context of collectivism, rather than
individualism. As the study conducted in Pakistan suggested that the notion of autonomy
“understood differently in Pakistan, as in other South Asian societies because an individual is
neither an independent, nor a self‐contained agent, but he or she establishes his or her
uniqueness in the context of a group (family and caste)”.(Khatwani 2017).
Moreover, this is also evident in the previous study conducted among 65+ older adults
where participants evaluated their quality of life positively based on their, social contacts,
especially with family and children, health, material circumstances and activities (Netuveli
2008). Therefore, it is not wrong to say that QoL is a vague concept that included many factors
such as; social, psychological, economic influences, and individuals' experiences, circumstances,
health, social well-being, values, and perceptions (Bowling, et al., 2003). Nevertheless, this
could be interpreted differently in a different culture based on their socio economic-status,
culture and religious ideology.
Furthermore, Gabriel and Bowling tried to develop a conceptual framework about the
quality of life using older people's views (Gabriel and Bowling 2004). They mentioned that the
factors that enhance the quality of life are; “having good social relationships with children,
family, friends and neighbours; having friendly and enjoyable neighbourhood, comfortable
houses and good public transport facilities, psychological factors such as; optimism and positive
attitude, contentment, looking forward to things, acceptance and other coping strategies; being
actively engaged in social activities such as attending educational classes and volunteering; good

164
health; financial security which brought enjoyment as well as empowerment and has not
depended on others” (Netuveli and Blane 2008).
Therefore, Quality of life is not consistent it could range from a need-based model of
Maslow’s (1954; 1968) hierarchy of human needs (deficiency needs: hunger, thirst, loneliness,
security; and growth needs: learning, mastery and self-actualisation to, life satisfaction
happiness, social interactions or the perception of life (Netuveli 2008). Consequently, there is
no consensus on what quality of life means to an older person in a different part of the world.
However, this study was conducted in Karachi city therefore the findings could not be
generalized for whole Pakistan, therefore using CASP in rural areas of Pakistan could give
different scenario of the fatalist culture of Pakistan, where autonomy and control could be seen
differently.
5.12 Other cross-cultural factors
Two main cross-cultural factors have been identified in the study that effects the quality
of life one is gender and second is religion. I will discuss gender in a chapter (7) whereas the
religion will be discussed now;
5.12.1 Religion
Religion is an integral part of the culture. Pakistan is a multicultural society, where
different faith has been practised. Though the main religion is Islam, people belong to a different
sect of Islam such as; (Sunni, Shia, Aga Khani, Jamat-e-Islami, isnaashri). The main participants
of the studies were Sunni Muslims and Ismaili Muslims (table:5.14). Therefore, I will give little
description on these both sect of Islam.
The Sunni and Shi'a Muslims believes on the basic principles of Islam that are believing
in one God, teaching of the prophets and the holy book of the Qur'an. The reason for their split
into different branches is differences in their belief about; who would be the successor of the
Prophet Muhammad as leader of the Muslim community after his death.
165
The Sunni Muslims believed that Abu-Bakr, the Prophet's closest companion would be
the first Caliph (deputy to God's Prophet'). However, Shia believed that Ali, the Prophet's son-in-
law, should lead the community as a Imam. Therefore, the main difference between Sunni and
Shi'a beliefs is Imamah (Kister 1994). The Shia sect also further divides into the two main
branches that are Ithna Ashari and Ismaili. Ismaili Shias accept the line of Imam they affirm the
Shahada, that there is only one God and that the Prophet Muhammad is His Messenger. Like
other Shia Muslims, the Ismailis hold that Ali, his cousin and son-in-law became the first Imam
(spiritual leader) of the Muslim community upon the Prophet's death. 'The Ismailis are the only
Shia Muslims to have a living, hereditary Imam' (Aga Khan) (Kadiwal, 2015).; it is the present
living Imam that makes the community different. The aga khan's role as an Ismaili imam is to
provide spiritual guidance and ensure the security and quality of life of Ismaili Muslim
communities.
Moreover, Shia Ismaili lives in the well-defined institutional framework through which
they have, under the leadership and guidance of the Imam, established schools, hospitals, health
centres, housing societies and a variety of social and economic development institutions for the
common good of all citizens regardless of their race or religion (Kadiwal, 2015).
All sect has different way of practising their faith. The females from the Sunni sect are
not allowed to go to the mosque for prayers. However, Aga Khani males and females both
practice their faith while attending jamatkhana (place of prayer) every day.
The participants were asked questions; do they participate in religious services? It was
identified that mostly 85.7% of males participated in religious services than the female 50.3%. It
was also identified that 39% of male participants perform their religious practices every day than
the female participants that are 34%.
ANOVA test was performed in this study to see the association among different faith
groups and quality of life. And the finding shows significant differences between group means
as determined by one-way ANOVA (df 1, 297 = 15.61, P <0.001) (Table 5.15).

166
A similar study was conducted in Ireland, which has found out that people who
participated in religious activity had a better quality of life in old age (Barrett et al, 2011). The
previous literature has also identified that People who attend religious services have a better
quality of life than the people who do not (Schneiders, 2003). Though, my study shows a
negative relationship between the religion and quality of life, but, whenever participants of the
study were asked the question from the CASP or the Optimism scale; they had always referred
back to God. For example; when participants were asked a question from CASP ‘my life has a
meaning’ a participant from the low income said, ‘if Allah has given life, then there should be
some meaning’.
Another male participant from low income said ‘Allah has not given us the luxurious
life, sometimes we are so frustrated that are basic needs are not fulfilled, but if he has sent in
this world there must be some reason and we thank him’. These subjective data showed that
people though tend to go for their religious practice but are still spiritual. As one of the men
from the high-income groups said ‘ I do not go to Jamat Khana every day, because I feel I am
more connected to my God while staying at home and remembering whenever I get time’. The
previous study on religion has also identified that people have justified their religious practices
as ‘I am a spiritual person, but I am not religious’ (Schneiders, 2003). That finding shows that
there is a difference in the concept of being religious and spiritual. Religion is more about the
practice of a faith person belongs to, such as; meditation or fasting, personal and communal
rituals (Schneiders, 2003). whereas, Spirituality has been variously defined by theorists as "the
human response to God's gracious call to a relationship with himself" (Kadar et al, 2015).
Furthermore, the terms spirituality and religiousness have been used interchangeably. To some,
religiousness meant going to church or mosque regular attendance, for some acts of humanity,
and for some, it might be performing religious rituals. As during the interview, one of the
women from the low-income group said ‘I pray five times, but still Allah does not listen to me.
In a very young age, my husband passed away and left behind, five little children. I bought up
them working day and night, and today they have left me alone’. Another woman from the low-
income group said ‘my husband is paralyzed for the last 2 years my younger son, who was only

167
17 died in an accident last year. I have 2 unmarried daughters and one married son. He supports
us financially, but still, there are lots of expenses, but its Allah’s will. I thank him whatever he
has given us. As nothing is in our hands’. These above subjective data show how people have
different views about their faith.
All religions highlight that spiritualism is a part of faith; one can be 'spiritual' without
being religious or a member of an organised religion' (Emmons, and Paloutzian 2003). Hence,
religion is a personal set or institutionalised system of religious attitudes, beliefs, and practices,
God's service and worship. At the same time, spirituality supports more toward self-referral or
the internalisation of one's awareness of the soul. 'Spirituality is an inward journey that involves
a shift in awareness rather than some form of external activity' (Granqvist,and Kirkpatrick 2013).
In this research it was identified that people who had attended and practised their faith regularly
were seemed dissatisfied with their life; One of the participants said 'I pray regularly I give
zakat and I do all good deeds, but Allah never listens to me and has made our life miserable'. On
the other hand, some participants confronted that they were not a regularly practising their faith
but are spiritually contacted with the God who made them satisfied in their life as one of the
participants had also said that 'I am going through a lot of financial crises I do not have work,
but I am hoping that sometime good days will come so I am relaxed'. Hence, the above
information shows that some people are religious and some are spiritual, but still, they are not
satisfied the way life is turning out.
It is an evident that relationship between religiosity and spirituality and QoL is poorly
understood. However, recent literature has shown evidence of positive links between
spirituality/religiosity and QoL (Abdala et al. 2016). QoL considers an “individual’s level of
function and value system, which may impact how an individual reacts to a loss of function”
(McDowell, 2006). A good QoL exists when the hopes of a person are fulfilled and achieved
through experience (Calman, 1984). Religiosity can be an essential component that influences
QoL and subjective wellbeing (Abdel-Khalek, 2010). According to a study of Muslim college
students, there is a strong positive correlation between religiosity and happiness when examining

168
life satisfaction (Abdel-Khalek 2010). A large European study also revealed a positive
relationship between life satisfaction and an individual’s commitment to frequent church
attendance (Greene and Yoon 2004).
Moreover, past research had also found a robust subjective relationship between
religiosity and wellbeing. Findings from 1400 survey responses revealed statistical associations
between religious individuals and levels of happiness. Religious individuals are generally
“happier and more satisfied than non-believers and atheists” (Vinson & Ericson, 2012, p. 7).
“Other studies had shown that individuals with a more elaborate and encompassing religious
orientation are likely to experience health benefits” (Hill & Pargament, 2003). Literature also
supports the existence of a positive relationship between spirituality and quality-of-life (Panzini,
2017). Another literature had found that spirituality was a positive factor for’ coping with
illness, preventing illness and aiding treatment’. Moreover, spiritual integrity, had a strong
significant relationship with overall QoL (Molzahn 2007). On other hand, it is also evident that
living a religious or spiritual lifestyle does not guarantee a smooth, struggle-free lifestyle and
better life. Even some of the world’s greatest religions like Buddha, Moses, Mohammed, and
Jesus Christ faced difficulty. Religious and spiritual struggles and trials are pivotal times
because they can lead the “individual on or off the path toward spiritual growth” (Kreitlow,
2015).
Participate in religious Male female
service Yes 85.7% 59.3%
No 13.3% 40.0%
Missing 1% 0%
Table 5.14: percentage of the participants attended religious services

169
How often participate in Male female
the relious practice everyday 39% 34%
Weekly 34.3% 20.1%
Monthly 15.2% 6.7% Yearly 11.4% 4.1%
Never 0% 35.1% Table 5.15: percentage of the participants attended religious services
5.12.1.1 Description of different Muslim sects
Sunni is one of the branches of Islam. The Sunnis have four Sunni schools of
religious law; Ḥanafī, Ḥanbalī, Mālikī, and Shāfiʿī. However, all four laws believe on one
principle of Islam: Allah is only one, prophet Mohamad is the last prophet of Allah, and the
Quran is the holy book. The Islamic law which Pakistan follow is Hanafi (Katz 2007). The
Hanafi school of law considered the most flexible and liberal in Islamic law. that works in the
“areas of criminal law, treatment of non-Muslims, individual freedoms, marriage and
guardianship, and ownership and use of the property” (Warren 2017).
Moreover, there are different Sunni castes, such as Sunni memon and Sunni lives in
Pakistan. The caste system is a social and religious hierarchy, created a few thousand years ago.
Marwari both castes follow Islamic legal system. Sunni Marwari ensures to work for their
community and maintain the harmony and help settle the disputes of their community. The
community do not allow girls and boys to get married outside the community, girls are not
allowed to study more than boys, and if boys pass their ten standards considered to be a
significant achievement (Timberg 2014). However, the Memons and Sunni Muslims live within
their community; they have welfare organization that supports their community members to
overcome their life problems and challenges. Memons are a highly endogenous community,
where marriages are arranged within their ethnic group (Saldanha-Shet, 2015). Therefore, it is

170
essential to assess the quality of life with different cultural norms and values (Skevington, Lotft,
and O'Connell 2004).
Faith participants belong to Male female Christian 4.8% 6.7%
Ismaili (follower of Aga Khan 43.8% 49.5%
Jamat-e-islami 1.0% 0%
Shia 1.0% 0.5%
Sunni 42.9% 34.5%
Sunni Marwari 1.9% 4.1%
Sunni Memon 1.0% 0.5%
Sunni Muhajir 0% 1.0% Not applicable 3.8% 3.1%
Table 5.16: Percentage of the participants belong to the Faith
ANOVA for religious belong
df Mean square F Sig
Between groups
1 664.753 15.614 .000
Within groups 297 42.574
Table 5.17 Association among different faith groups

171
5.13 Conceptual Model of Cross-cultural adaptation of CASP in Pakistan
The above (Diagram 5.12) conceptual model is based on the cross-cultural adaptation of
the CASP 17 in Karachi Pakistan. Moreover, this model can be applied to other parts of Pakistan
or any other developing countries with similar cultural values in the future while assessing the
quality of life. This conceptual model also concludes the chapter cross-cultural adaptation of
CASP 17 in Karachi Pakistan.
Gender
Religion/Spirituality
Quality of life in old age in
Karachi/Pakistan
Culture
Self-realization/Self awareness
Diagram 5.12: conceptual model of cross cultural adaptation

172
The first outer three layers denote culture, religion and gender. Although culture,
religion, and gender are foundational social constructs, and it cannot be placed separately and
equally at the same level ( Raday 2003).
Culture, along with the religion, are the sources of the gender construct. The diagram
shows that religion is derived from culture, and gender is, in turn, derived from both culture and
religion. Therefore, religion is an integral part of the culture. Moreover, gender is the social
construct that has been treated as part of cultural and religious identity. Alternatively, it is more
right to say that norms of behaviour are imposed on men and women by culture and religion. As
in Islamic culture, women are more excluded from public power and are more controlled by men
within the family (Jejeebhoy and Sathar 2001).
The fourth layer presents; control, agency, self-realization, optimism and capability,
which are the impacts of the culture, religion and gender that makes people live their lives within
it.
This study has revealed that religious customs and faith cultivates more optimistic and
resilient towards life situations. Also, belief and trust in God lead individuals to be more
satisfied and feel that life has a meaning and cherishes it. Furthermore, the CASP was developed
with the domain of Self-realization from Maslow's theory, which described self-realization as the
fulfilment of potential and meaning in life (Maslow 1962). However, because of the cultural
norms and beliefs, some participants considered self-realization differently.
The culture worldwide shows that religion “shares values, influences individual
behaviour, and helps sustain cultural identity” (Smithers, & Khorsandi, 2009). Looking at the
findings of this research, it has also confirmed that women are treated differently from the men
population; they lack control and agency. The previous study also revealed that women report
more negative emotions than men. The other study had also identified that women subjective
health in terms of life satisfaction is lower than the male (Tesch-Römer et al. 2008). Hence, this
study had also identified that most of the females had less freedom because of gender inequality
and were not allowed to do the things they want to do and had less control over their lives.

173
However, because of their faith in God, they become more optimistic in their lives. Moreover,
that optimistic approach helped them to stay calm in the time of adversities.
The overall model suggests that quality of life in old age in the urban Pakistani context is
revolved around culture, religion, gender, self-awareness, agency, capability, control and
optimistic approach towards life.
5.1 Conclusion
Cultural norms, values, and beliefs shape one’s life. And the cultural norms and values
pass from individuals and groups of people from generation to generation. And therefore, cross-
cultural studies have helped to find out differences among various cultural groups who have
more than the standard features among them.
In order to adapt any measure cross-culturally, it is essential to recognize its acceptance
as being a culture and its religion. As many respondents of this study had pointed to the
importance of their religion, and this considerably influenced the concepts underpinning CASP.
Moreover, the participants of this study had also indicated that the critical part or
component from the CASP 17 was missing from the tool, and that is religion. As it was
identified in Pakistani culture, that people were more positive; and their answers most of the
time was reflecting their faith on Allah or their religion. However, this would not be the same for
other cultures. Nevertheless, it is interesting to assess upon the quality of life in other countries
with a similar culture like Pakistan to get better understanding of CASP19 domains.
Furthermore, the assessment of the psychometric properties of the instrument is also vital
to confirm that the instrument is reliable and validated to use in the culture. Hence, the
confirmatory factor analysis revealed that the first and second-order four-factor model of the
CASP-17 does not provide a good fit to the data. However, the CASP-13 first order model in
Urdu proved to be an appropriate instrument to measure the quality of life in older people in
Karachi, Pakistan. Therefore, further research is needed to translate the instrument for use in
other cultures and languages to use in other parts of Pakistan. The next chapters will investigate
predictors of quality of life using CASP 13 in the population of Karachi, Pakistan.

174
Chapter 6: Second aspect of the study: Findings and Discussion on the predictors of quality of life
6.1 Introduction
This chapter discusses the findings related to the research questions that directed the
study – part two. The results include the description of socio-demographic, psychosocial
characteristics and the life course variables of the sample. The data analysis explores the
relationship between quality of life, socio-demographic, psychosocial and the life course
determinants. The chapter then presents multiple regression analysis models of the main socio-
demographic factors, psychosocial factors and life-course events that influence the quality of life
of respondents in Karachi, Pakistan. The chapter will conclude by discussing the findings of the
predictors of quality of life.
6.2. Descriptive Findings
The mean age for the surveyed population was 60.2 ±7.5 years. However, there
were differences in age among the three strata: LIA 58.8 ± 6.9, MIA 60.13 + 7.7, and HIA
61.81 + 7.5. The differences between the three strata were statistically significant (F: 4.20,
DF: 2, P-value: 0.016).
The study demonstrated that overall, 32.1% of the participants in the study were
employed. 45% percent of the population were from low income group, 29.3% were from the
middle-income group and 22 % were from the high-income group. Graph 6.5 illustrates that 55.2
% of male participants and 19.6% of female participants were in paid work. There was a non-
significant relationship between employment and quality of life (χ2 7.79, DF 6, p-value 0.25).
Moreover, in this study, 83.3% of participants from the overall sample were married, and
16.7% of the participants lived a single life. The analysis also shows there is a significant
association between marital status and quality of life (χ2: 23.21, DF: 9, P-value 0.006).

175
The study found that 51% of participants lived in an extended family compared to 47%
in a nuclear family, and only 8% study population lived alone. Mainly 66% of families in the
low-income group lived in an extended family (i.e., people living with two generations included
with parents, sisters, brothers, wife and children), then the middle-income group at 42.4% and
high-income group at 43%. There was a significant association between people living in an
extended or nuclear family system and quality of life (χ2: 19.24 DF: 3, P< 0.001). Moreover,
there is a significant interaction effect (p=0.002) between the family system and three strata
(low, middle and high). (Diagram 6.1).
The study also revealed that 82% of the overall sample was living in their residence
rather than in a rented property. Diagram 6.2 shows that 99% high-income group lived in their
own home compared to middle-income group 88%, and Low-income group 59%. Also, there
was a significant association between tenancy and quality of life (χ2: 19.24, DF: 3, P< 0.001).
However, there was a non-significant p<0.10 relationship between the housing tenancy
and strata that can be seen in diagram 6.3. Besides that, the living condition, source of water
and sanitation varied from place to place in Karachi. Some areas had a better sanitation system
than other areas, some households had adequate water, and some did not. The study
demonstrated a significant association between the source of water and quality of life (χ2:87.78,
Diagram 6.1 : interaction effect between strata and family type

176
Df: 18, p< 0.001) and also between the source of sanitation and quality of life (χ2: 73.97, df: 9,
p-value< 0.001). Moreover, the participants were also asked, how safe they feel walking alone
in the area near their home. The result illustrated that there is a non-significant relationship
between quality of life and walking alone in the area near their home (χ2:3.31, DF: 9, p-value=
0.95).
Diagram 6.2: tenants by strata
Diagram 6.3: Interaction effect between the strata and housing tenants

177
Furthermore, 64% of the sample in the study owned their own transportation, and 37% did
not (see Table 6.3). Also, there was a significant correlation between people having their own
transportation and quality of life (χ2: 40.55, DF: 3, P-value: <0.001). Diagram 6.4 displays that
only 33% in the low-income participants had their own transportation, then the middle-income
group had 57%, and 100% of the high-income group. Moreover, there was a significant interaction
effect between the income group and having their own transportation P <0.05.(diagram 6.5)
An overall 94% of the population in this study were Muslim, and 6% were Christian.
This 6% minority group belonged to the low-income group. Moreover, 69% of the population
attended religious practice and 31.1% did not attend any religious practice. There was a
significant association between attending religious practice and quality of life (χ2: 40.82, DF: 6
P<: 0.001).
Diagram 6.5: Interaction effect between transportation and strata
Diagram 6.4 transportation by strata

178
Variables All Lower Medium High income Test value and
income areas income areas significance
areas
Age (mean, SD) 60.24 58.78 60.13 61.81 F: 4.20 (df: 2)
(7.48) (6.93) (7.77) (7.47) P =0. 016
Gender: (N, %) X2: 11.68
Male 105 (35.0) 42 (42.0) 27 ( 27.3) 36 (36.0) df :3
Female 194 (65.0) 58 (58.0) 72 (72.7) 64 (64.0) P= 0.009
Educational
status:
(N, %)
Illiterate 106(36.0) 74 (74.0) 24(24.4) 8 (8.0) X2: 79.61
Up to 10 116(39.0) 21(21.0) 54(55.0) 41(41.0) df :9
years P< 0.001
10 years + 73 (24.4) 2(2.0) 20 (20.0) 51(51.0)
Missing 4(1.3) 3(3.0) 1(1.0) -
Table 6.1: Socio-demographic (Descriptive analysis)

179
Working to
earn: (N, %) X2: 7.79
Yes 96 (32.1) 5 (45.0) 29 (29.3) 22 (22.0) df :6
No 202 (68.0) 54 (54.0) 70 (70.7) 78 (78.0) P< 0.25
missing - - - -
Marital status X2: 23.21
(N, %) df :9
married 249 (83.3) 81 (81.0) 76 (76.8) 92 (92.0) P= 0.006
Single 50 (16.7) 19 (19.0) 23(23.2) 8 (8.0) Family type (N,
%) X2: 11.72
Extended 151(51.0) 66 (66.0) 42 (42.4) 43 (43.0) df :6
Nuclear 140 (47.0) 32( 32.0) 52 (53.0) 56 (56.0) P= 0.068
Alone 8 (3.0) 2 (2.0) 5 (5.1) 1 (1.0)
Tenants (N, %) X2: 19.24 Personal residence 245 (82.0) 59 (59.0) 87 (88.0) 99 (99.0) df :3
Rented
54 (18.1) 41 (41.0) 12 (12.0) 1 (1.0) P< 0.001

180
current
accommodation
adequate for
current needs X2: 49.17
(N, %) Df: 3
Yes 205 (68.6) 40 (40) 70 (70.7) 95 (95.0) P<0.001
No 94 (31.4) 60 (60) 29 (29.3) 5 (5.0) The current
source of
drinking water
piped water 212 (70.9) 47 (47.0) 74 (74.7) 91 (91.0) X2:87.78
hand pump 3 (1) 3 (3.0) - - Df: 18
water motor 35 (11.7) 2 (2.0) 24 (24.2) 9 (9.0) P<0.001
covered well 30 (10) 30 (30.0) - -
open well 17 (5.7) 17 (17.0) - -
other 1 (.3) 1 (1.0) - -
missing 1 (.3) - 1 (1.0) -
Current
sanitation
system X2:73.97
Underground drains 121(40.5) 9 (9.0) 48 (48.5) 64 (64.0) Df:9 P<0.001
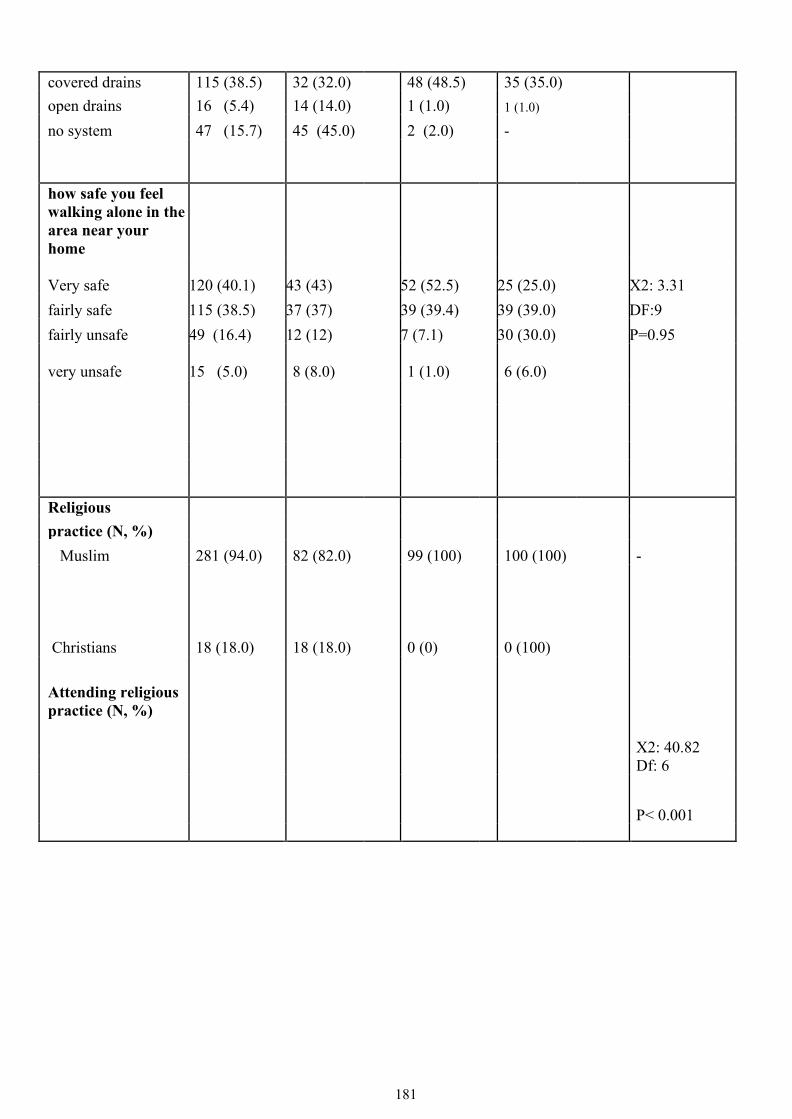
181
covered drains 115 (38.5) 32 (32.0) 48 (48.5) 35 (35.0) open drains 16 (5.4) 14 (14.0) 1 (1.0) 1 (1.0) no system 47 (15.7) 45 (45.0) 2 (2.0) -
how safe you feel walking alone in the area near your home Very safe 120 (40.1) 43 (43) 52 (52.5) 25 (25.0) X2: 3.31 fairly safe 115 (38.5) 37 (37) 39 (39.4) 39 (39.0) DF:9 fairly unsafe 49 (16.4) 12 (12) 7 (7.1) 30 (30.0) P=0.95
very unsafe
15 (5.0) 8 (8.0) 1 (1.0) 6 (6.0)
Religious practice (N, %)
Muslim 281 (94.0) 82 (82.0) 99 (100) 100 (100) -
Christians 18 (18.0)
(6.0) 18 (18.0) 0 (0) 0 (100)
Attending religious practice (N, %) X2: 40.82 Df: 6
P< 0.001

182
Attending 205 (69.0) 48(48.0) 64 (64.4) 93 (93.0) Not attending 93 (31.1) 51 (51.0) 35 (35.4) 7 (7.0)
missing 1 (3.0) 1 (1.0) - - Transportation to commute: (N, %)
X2: 40.55 Have transportation 190 (64.0) 33 (33.0) 57 (57.0) 100 (100) df : 3
P< 0.001
Don’t have transportation 109 (37.0) 67 (67.0) 42 (42.0) 0 (0)
6.2.3 Descriptive analysis of disease
The most common physical health disease in the sample was high blood
pressure 54.2%, followed by cholesterol 21.7%, diabetes 27.1%, arthritis 26.1%,
heart attack 11.4% and cataract 16.4% (Table 6.2). There were 0.7% who reported
having cancer. The analysis suggested that women had higher morbidity from non-
communicable diseases than men (Table 6.3).

183
Disease N (%) Yes No High blood pressure 162 (54.2) 137 (45.8)
Cholesterol 65 (21.7) 234 (78.3)
Diabetes 81 (27.1) 218 (72.9)
Cancer 2 (.7) 297 (99.3)
Stomach disease 17 (5.7) 282 (94.3) Arthritis 78 (26.1) 221 (73.9)
Asthma 11 (3.7) 288 (96.3)
Liver disease 10 (3.3) 289 (96.7)
Heart attach 34 (11.4) 265 (88.6)
Cataract 49 (16.4) 250 (83.0) glaucoma 2 (.7) 297 (99.3)
Kidney disease 10 (3.3) 289 (96.7)
Table 6.2: Descriptive analysis of the disease

184
Table 6.3: Disease frequency by gender
Disease n (%)
Male female Yes No Yes No High blood pressure 51(48.6) 54(51.4) 111(57.2) 83(42.8)
Cholesterol 19 (18.1) 86 (81.9) 46(23.7) 148(76.3) Diabetes 23 (21.9) 82 (78.1) 58 (29.9) 136(70.1)
cancer - - 2(1.0) 192 (99.0)
Stomach disease 2(1.9) 103(98.1) 15(7.7) 179 (92.3)
Arthritis 11(10.5) 94(89.5) 67(34.5) 127(65.5)
Asthma 8(7.6) 97(92.4) 3(1.5) 191(98.5) Liver disease 1(1.0) 104(99.0) 9(4.6) 185(95.4)
Heart attach 12(11.4) 93(88.6) 22(11.3) 172(88.7)
Cataract 12(11.4) 93(88.6) 37 (19.1) 157(80.9)
glaucoma - - 2(1.0) 192(99.0) Kidney disease 2 (1.9) 103(98.1) 8(4.1) 186(95.9)
6.3 Association between Socio-demographic variables and CASP13 (Bivariable Findings)
Linear regression was used to analyse the data. The regression assessed the relationship
between one dependent variable and one or more independent variables. The bivariable
regression analysis helps to study the relationship between a pair of variables (Campbell and
Campbell, 2008). Moreover, dichotomous and ordinal variables can be used in regression

185
analyses, but for the nominal variables, dummy variables were created. Each dummy variable
was compared with the reference group as ‘all other responses’.
The analysis showed that age had a non-significant negative association with quality of
life, as shown in (diagram 6.14), such that quality of life decreased when age increased (-0.056
95% CI -0.158, 0.046 P, 0.279).There was a significant relationship between quality of life and
gender (-1.848 95% CI-3.430, -0.266, P 0.022 ).
Furthermore, the positive significant association was found among the socioeconomic
groups and quality of life (4.720 95% CI 3.960, 5.480, P <0.001), people living in high income
areas had a better quality of life than the people living in low-income areas. There was a
significant positive association between educational status and quality of life (4.234, 95%CI
3.418, and 5.050, P=<0.001). There was a non-significant relationship between employment and
the quality of life (-0.001 95% CI -0.134, 0.136, P 0.991).
Using dummy variables to single out specific characteristics suggested that married
people had a significant positive relationship with the quality of life than the reference group
(4.673 95% CI 2.702, 6.643, P, <0.001). However, being widowed had a significant negative
relationship with quality of life ( -5.379 95%CI: -7.419, -3.338, P <0.001) compared to the
reference group. Furthermore, people who lived separately in their later life had significantly
higher quality of life. Interestingly, there was a significant negative association with the quality
of life and living with the extended family ( -2.610, CI 95% -4.105, -1.116, P <0.001). On the
other hand, people living in a nuclear family had a significantly higher quality of life (2.260, CI
95%: 0.755, 3.764, P <0.001).
Also, a dummy variable was created for the nominal variable ‘housing tenure’. People
living in any other residence was kept in the reference category. There was a significant positive
relationship between living in one’s own home and quality of life (4.410 95%CI 2.495, 6.325, P
<0.001). Moreover, people who lived in a rented home had significantly lower quality of life
(-4.410, 95%CI: -6.325, -2.495, P <0.001).

186
Moreover, there was a significant negative association with quality of life when
accommodation was reported as adequate for currents needs (-1.280 CI 95% -1.815, 0.744, P
<0.001). There was a significant negative association between the people having their own
transportation and the quality of life ( -5.207 CI 95% -6.674, -3.740, P <0.001).
In Pakistan, water and sanitation is a challenge as most households do not have access to
the adequate water supply. Likewise, many households also faced problems due to the
unavailability of the sanitation facilities. “Sanitation is one of the necessities, which contributes
to human dignity and quality of life” (Government of Pakistan, 2019).
To test this hypothesis of an association between sanitation and quality of life, the water
variable was used as a dummy variable. The finding shows that people using piped water had a
significant positive relationship with the quality of life than the reference category (4.718, CI
95% 3.130, 6.307, P <0.001). Whereas people using a hand pump to use water had a significant
negative relationship with the quality of life ( -7.803, CI 95%: -15.395, -0.211, P 0.044).
Moreover, there was non-significant relationship between using water from water motor and
quality of life (0.689, CI 95% -1.679, 3.058, P 0.567). However, people using water from a
covering well had significantly lower quality of life than the reference category (-5.289, CI 95%
-7.751, -2.826 P, <0.001). This indicates overall a significant association between water source
and quality of life in Karachi, Pakistan.
The sanitation system variable was also used as a dummy variable. Those with an
underground drain system had a significantly higher quality of life than others (4.202, CI 95%
2.725, 5.678, P<0.001) than the reference category. Whereas people using a covered draining
system did not have a significant association with the quality of life than others (0.692, CI 95%-
0.872, 2,256, P 0.384). Moreover, people who had an open drain had a lower quality of life
compared to the reference category (-1.536 CI 95% -4.917, 1.845, P 0.372).
Moreover, participants were also asked how safe they feel while walking alone in the
area near their home. There was a non-significant relationship between feelings of safety
walking alone near home and quality of life (0.063 CI 95% -0.819, 0.944, P 0.888).

187
However, when asked this question, some of the subjective data was recorded. As one of
the women from the low-income group reported, “We do not go out after 6:00 pm as it is not
safe to go outside alone in the dark. Moreover, we also do not allow our children to go out. If
they go and do not come after 7:00 pm, then we start calling them, and until they reach home
safely, I get anxious”. Other women from the middle-income area said, “We can go out to next
door alone but cannot go alone when it is dark, even near to the shop to buy milk it is not safe”.

188
Variables Test Values and significance
B CI(95%) LCL – HCL P-value
Age -0.056 (-0.158, 0.046) 0.279
Gender -1.848 (-3.430, -0.266) 0.022
Socio economic groups 4.720 (3.960, 5.480) <0.001
Education 4.234 (3.418, 5.050) <0.001
Employment (Do you work to earn yes and no 0.001 (-0.134, 0.136) 0.991
Marital status Married Widow Separation Unmarried (reference category)
4.673 (2.702, 6.643 ) <0.001 -5.379 (-7.419, -3.338) <0.001 3.404 (-3.216, 10.024) 0.312
Family Type Extended Nuclear Alone (reference category)
-2.610 (-4.105, -1.116) <0.001 2.260 (0.755, 3.764) 0.003
Housing tenures Personal residence Rented Any other residence (reference category )
4.410 (2.495, 6.325) <0.001 -4.410 (-6.325, -2.495) <0.001
Accommodation adequate for current needs (yes, no)
-1.280 (-1.815, -0.744) <0.001
Current source of Drinking water Piped water Hand pump Water moter Covered well Open well (reference category)
4.718 (3.130, 6.307) <0.001 -7.803 (-15.395, -0.211) 0.044 0.689 (-1.679, 3.058) 0.567 -5.289 (-7.751, -2.826) <0.001
Current sanitation system underground drains covered drains open drains no system (reference category)
4.202 (2.725, 5.678 ) <0.001 0.692 (-0.872, 2,256) 0.384 -1.536 (-4.917, 1.845) 0.372
Own a car (yes and No -5.207 (-6.674, -3.740) <0.001
How safe you feel walking alone in the area near the home
0.063 (-0.819, 0.944) 0.888
Table 6.4: Bivariable regression analyses with sociodemographic variables with quality of life

189
6.4 Findings from Sociodemographic Multiple regression analysis
Multiple linear regression models are used to study the linear relationship between a
dependent variable and several independent variables by fitting a linear equation to observe data
samples (Eregno, 2013). Multiple regression analyses were conducted to examine the
relationship between quality of life and various potential sociodemographic predictors. The first
regression model included age, age squared and Gender (Table 6.5). The findings from the first
models indicated that there was a non-significant association between age and quality of life.
The R2 in the first model that explains that there is a 0.014 or 1.4% of the variation in quality of
life with age differences.
However, when in model 2, the socioeconomic variables included social groups,
education, employment, housing tenure, car ownership, retirement, pension and financial
security for future. The R2 increased to 0.432 or 43.2% variation in quality of life. Also, the
social-economic variables including social groups (: 3.646, 95%CI: 2.283, 5.009), and
education (: 1.776, 95%CI: 0.097, 0.116) had a significant positive relationship with the
quality of life.
The third model included the first and second models alongside living status, marital
status, living arrangements, accommodation adequacy, and source of water, sanitation and
security. This explored how much quality of life changed with additional factors. In this model,
Diagram 6.6: No relationship between age and quality of life

190
there was a positive effect of age and a negative effect of age squared, suggesting that as people
aged, the effect of age was reduced; this will be discussed further later in this chapter (6). The
age effect graph is shown in (diagram 6.7).
Diagram 6.7: age effect on quality of life
The marital status in model III displayed a significant relationship with quality of life.
However, the model also indicated that the inadequacy of housing requirement significantly
decreased quality of life. Furthermore, the source of water indicated a nonsignificant relationship
with quality of life. More so, it was a weak sanitation system that was significantly associated
with a decrease in quality of life. Feeling safe walking alone near the home had a non-significant
relationship with the quality of life. Moreover, the R2 in the third model explained 0.452 or
45.2% of the variation in quality of life.

191
Model I Model 2 Model 3
Variables Coefficient (95% CI) Coefficient (95% CI) Coefficient (95%CI)
Standardized Beta
Age -0.047 (-1.835, 1.742) -0.116 (-1.488,1.256) 0.042 (-1.323, 1.407) 0.047
Age squared 0.000 (-0.015,0.014) 0.000 (-0.012, 0.011) -0.002 (-0.013, 0.010) -0.207
Gender -2.020 (-3.619,-0.420 )*** -2.269 (-3.521,-1.017)*** -1.600 (-2.921,-0.279) 0.114*** (Socio Economic Variables
Social groups
3.646 (2.283, 5.009)*** 2.461 (0.941, 3.981) 0.301***
education 1.776 (-0.097,0.116) 1.628 (0.732, 2.524) 0.196***
employment, 0.010 (-0.097,0.116) 0.006 (-0.100, 0.112) 0.005
housing tenure -0.650 (-2.399,1.098) -0.796 (-2.545,.953) -0.046
car ownership -1.280 (-2.786,0.225)*** -1.279 (-2.784,.225) -0.092***
Retirement 0.213 (-1.894, 2.319) 0.136 (-1.944, 2.217) 0.007
Pension -2.934 (-5.868,-0.001)*** -2.813 (-5.718,0.091) -0.098***
Financial security for 0.043 (-0.754, 0.839) -0.067 (-0.885,0.751) -0.011
future

192
(Socio-demographic
variables) Living status
Marital status -1.195 (-2.520, 0.131) -0.084***
Living arrangements 0.802 (-0.360, 1.964) 0.066
accommodation -1.244 (-2.726 ,0.238) -0.087
adequate for current
needs
The current source of 0.118 (-0.159, 0.395) 0.040
drinking water
Current sanitation -0.903 (-1.671, -0.136) -0.141***
system
How safe you feel
walking alone in the -0.517 (-1.239, 0.206) -0.066
area near the home

193
Table 6.5: Sociodemographic Multiple regression analysis Model 1(Age, Age squared and Gender), Model 2 (Model 1+Socio economic variables), Model 3 (Model 1 +Model 2 +living status)
P values = * p < 0.05. , ** p < 0.01., *** p < 0.001
Constant 29.384 31.742 32.423
R2
0.014 0.432 0.452

194
6.5 Psychosocial descriptive findings As described in the methodology chapter, this research study used many psychosocial variables
to assess the association with the quality of life. For descriptive analysis, the mean and the
standard deviation of the scales are presented in this section of the chapter.
The descriptive analysis (Table 6.7) for social support scale score ranges from 0 to 8, (0
is poor and 8 is the best) and the mean score for all samples was x̅ 4.62 + 2.11. Moreover, the
low-income group (LIG) mean score was 4.45 + 2.37, middle-income group (MIG) 4.72 + 2.10
and high-income Group (HIG) 4.69 + 1.84. Moreover, there was a non-significant difference in
the social support scores in all three strata (F: 0.50, DF: 2, P-value: 0.60). Besides that, the
neighbourhood scale score ranges from 0 to 13, (0 is bad and 13 is best) and the overall mean
score for the sample was 8.87+2.05. Also, the mean score from LIG was 7.01 +1.73, MIG mean
score was 9.41 +1.49 and HIG mean score was 10.22+1.36. Moreover, there was a significant
difference in the neighbourhood scores in all three strata (F: 117.17 DF: 2, P<: 0.001).
Moreover, 72% of the population identified as having good general health. The general health in
the LIG was the lowest at 53%, compared to the MIG at 76%, and the HIG at 86%. However,
when asked how physically active the participants were, analysis indicated that 74% of the
overall sample was physically active. However, differences can be seen in three strata; where
50% LIG participants reported that they were not physically active, compared to 79% of
participants from MIG who reported that they were physically active, and 93% of the HIG
participants were physically active. The mean score of depression was 7.58 + 2.04. The finding
was that people living in LIG had a higher depression mean score 8.90+1.84 than the other
socioeconomic groups, where the MIG mean score was 7.7 +1.85, and HIG mean score was 6.2
+ 1.44.
Additionally, the sense of coherence (SOC) “reflects a coping capacity of people to deal
with everyday life stressors and consists of three elements: comprehensibility, manageability and
meaningfulness” (Super et al. 2016). In this study, the three items were used to assess the sense of
coherence, which covers all three elements discussed earlier. The sense of coherence scale score

195
ranges from 0 to 6 (0 is bad and 6 is a good sense of coherence). The mean score for the overall
sample was 3.14 +1.69. However, the LIG mean score was 2.21+ 1.62 lower than the middle-income
group 3.57+ 1.51. However, in HIG, there was a slight difference in the mean score from the MIG
3.66+ 1.55. Moreover, there was significant difference in the sense of coherence scores in all three
strata (F: 26.92, DF: 2, P< 0.001).
In addition, the sense of coherence was perceived differently depending on the person's
environment and culture in how a person interpreted life in its three constructs: comprehensibility,
manageability, and meaning (Mittelmark & Bauer, 2017). In a culture like Pakistan, faith and
religion appeared to be central to how participants managed their lives and how they interpreted
circumstances in their lives. When the question from the sense of coherence asked the participants;
“Do you see a solution to problems and difficulties that other people find hopeless”?
Most of the participants responded, saying 'Inshallah' meaning 'Allah's will'. One participant of the
study who was facing hardships was optimistic that prayers and Allah's blessings would help them,
to face the challenges in their life. One of the participants also shared that, 'my prayers guide me to
find a solution for challenging circumstances'. However, some of the participants agreed that some of
the problems are because of taking wrong decisions and they were responsible for it. That shows that
some people believe that they have control over their own life whereas some people believes that
Allah control their lives. Another question asked 'does participant feel that their daily life is a source
of personal satisfaction? Most of them again were refereeing that Allah has given this life to us, so
we are satisfied. If some of them were not satisfied, they do not blame on God they blame on
themselves while taking wrong decisions. One of the questions in the SOC scale was 'do you feel
that the things that happen to you in your daily life are hard to understand'? On that, most of the
participants mentioned that Allah had created them, and he would take care of them, and he is in
control over their life.
In general, the sense of coherence scale showed that religious practices were significant
contributors and key constructs in how they handled life's stressors and remained satisfied. So, the
participants had a common belief that Allah is the controller of life. Therefore, one cannot predict
about life; but religion appeared to be a significant contributor in helping the participants to manage

196
daily life situations. Moreover, the items of SOC were connected to the CASP items when most of
the participants answered questions optimistically.
Moreover, the Capability scale ranges from 1 to 21 (1 meaning less and 21 meaning higher).
The mean score for capability was 9.05 +5.86. Because the capability approach is consisting of three
individual variables: functioning (such as work and what we are capable to do), opportunity, and
satisfaction - that had been discussed earlier in (chapter 4). The descriptive analysis was conducted
separately for each three of the variables. The score ranged from 1 to 7 for each. The mean score for
the overall sample who thought that they could work the same today the way they used to work 30
years back was 3.14 +2.35. Surprisingly the LIG participants had a better mean score of working the
same way they used to do 30 years ago was 3.88+2.52 than the MIG mean score 2.99+2.24 and HIG
mean score 2.56+2.10. Furthermore, the mean score for the opportunities people get the same they
used to get 30 years back; the mean score for the overall sample was 3.19+2.31. Once again, the LIG
mean score 3.81+2.50 suggested that this groups perceived themselves as having the same
opportunities as they had 30 years back. On the contrary, MIG mean score 2.93+2.05 and HIG
mean score 2.82+2.24 suggested that they found fewer opportunities for work than they had 30
years ago. Moreover, the mean score for satisfaction level in capability in the overall sample was
2.71+2.16. Furthermore, people in LIG had a higher satisfaction level indicated by the mean
score of 3.08+2.23, compared to the MIG mean score of 2.87 +2.18 and HIG 2.18+1.96.
2 Capability
The footnote shows how the three items of the capability scale is marked. Work (1 means cannot work the way used to work before and 7 means can do all work which used to do before) Opportunities (1 means have less opportunities and 7 means have a same opportunities) Satisfaction (1 means less satisfaction and 7 means have same satisfaction

197
Table 6.10 presents the bivariable analysis of all the three components of capability
(activity, opportunity and satisfaction). Overall, the activities, opportunities and satisfaction.
Beta Co-efficient (P-value)
Capabilities Whole sample
Activities 0.394 (0.062) Opportunities 0.520 (0.015)
Satisfaction 0.462 (0.045)
The participants were assessed for optimism towards their life in old age — the optimistic
scale which scores range from 0 to 40 (0 meaning less optimistic and 40 meaning more
optimistic). The mean score of the overall sample was 23.76+4.62. There was a significant
difference in optimism scores in all three strata (F: 3.46, df: 2, P-value: 0.032); the LIG mean
score was 22.99+4.22, the MIG mean score was 24.68+4.55, and HIG means the score was
23.62+4.96.
In the overall sample, only 12% of people had retired at the time of the research. Out of
LIG 9%, MIG 3% and HIG 23% had retired. From the participants who were retired, only 6%
were getting their pension from the overall sample. In which 8% of participants from LIG, 2%
of participants from MIG and 7% of participants from HIG received a pension. When
participants were asked if they had enough financial security for their future, only 29.1% of
participants said that they had more than enough money to meet their needs. However, 11.4%
of participants said that they had just about enough money to fulfil their needs. Moreover,
39.1% said that they had less than enough money to meet their needs in the future. The
Table 6.6: capability Coefficient

198
percentage was higher in LIG at 64% who felt that they do not have enough money for the
future to fulfil their needs than the MIG 52% and HIG 2%.
The participants were asked ‘if they had enough financial security for their future’
based on their current situation. People from the LIG most people said ‘we are earning
money which is hand to mouth, so we do not have any savings for the future’ and some
high-income participants said ‘ we have saved enough money for our family for the
future’. Thus, people are not predicting their future, but they had answered these questions
based on their current circumstances. Moreover, Islam also provides us with an ethics code
like all other religions; to lead a life that is in line with Islam. And there is a great deal of
evidence in the Qur’aan and Sunnah to save money for children to give them better life
(Khan, M.M., et al 2008).
Variables All Lower income Medium income High income
areas areas areas
Social support ( Mean, 4.62(2.11) 4.45 (2.37) 4.72 (2.10) 4.69 (1.84)
SD) Neighbourhood (Mean, 8.87(2.05) 7.01 (1.73) 9.41 (1.49) 10.22(1.36)
SD) General health (N, %)
Good 214 (72) 53 (53) 75(76) 86(86)
Not good 85 (28.4) 47 (47) 24 (24.2) 14(14) Physical active (N, %)
Active 221(74) 50(50) 78(79) 93(93)
Not active 78(26.1) 50(50) 21(21.2) 7(7)
Table 6.7: Descriptive statistics of psychosocial variables

199
Depression (Mean. SD) 7.58 (2.04) 8.90 (1.84) 7.7 (1.85) 6.2 (1.44)
Sense of coherence 3.14 (1.69) 2.21(1.62) 3.57 (1.51) 3.66(1.55)
(Mean, SD) Capability (Mean, SD)
Working 3.14(2.35) 3.88(2.52) 2.99(2.24) 2.56(2.10)
Opportunities 3.19(2.31) 3.81(2.50) 2.93(2.05) 2.82(2.24)
Satisfaction 2.71(2.16) 3.08(2.23) 2.87 (2.18) 2.18(1.96)
Capability in Total 9.05 (5.86) 10.77 (6.24) 8.82(5.69) 7.56(5.20)
Optimism (Mean, SD) 23.76(4.62) 22.99(4.22) 24.68(4.55) 23.62(4.96)
Retirement (N, %)
Retired 35(12.0) 9(9.0) 3 (3.0) 23 (23.0)
Not retired 264 (88.3) 91(91.0) 96 (96.0) 77(77.0) Pension (N, %)
Gets pension 17(6.0) 8(8.0) 2(2.0) 7(7.0)
Don’t get pensions 282(94.3.0) 92(92.0) 97(98.0) 93(93.0)
Financial security (N,
%)
More than enough to 87(29.1) 2 (2.0) 2(2.0) 83 (83.0)
meet my needs.
Just about enough to 34(11.4) 1(1.0) 23(23.0) 10(10.0)
meet my needs.
less than enough to 117(39.1) 64(64.0) 51(52.0) 2(2.0)

200
meet my needs
Don’t know 59(20.0) 33(33.0) 22(22.2) 4(4.0)
Missing 2(0.7) - 1(1.0) 1(1.0)
6.6 Association between Psychosocial variables with CASP 13 (Bi-Variable Findings)
A simple linear regression was carried out to identify the relationship between the two
continuous variables. There was a significant positive relationship between quality of life and
social support (0.846 95%CI: 0.498, 1.193, P <0.01) (Table 6.8). A positive neighbourhood
environment was associated with higher quality of life, (1.691 95%CI:1.375, 2.008, P<0.01).
Moreover, social participation had a negative relationship, such that those with lesser
social participation had significantly lower quality of life ( -0. 906, 95%CI: -1.375, -0.748, P
<0.01). Also, social networking had a significant positive relationship with quality of life
(1.157, 95%CI: 0.935, 1.379, P< 0.01). Those with higher general health at (6.546 CI 5.032,
8.061 P<0.01) and more physical activities at (6.704 CI,5.147, 8.261, P<0.001) had significantly
higher quality of life. Individuals having good health pertained to be physically active and have
a better quality of life. Furthermore, depression was significantly associated with lower quality
of life ( -3.641, 95%CI: -4.863, -2.418 P <0.001). Moreover, sense of coherence had a
significant positive relationship with the quality of life (2.099, 95%CI 1.718, 2.479, P <0.001).
The capability measured as CASP-19 also had a significant positive relationship with quality of
life of (0.159 CI 0.030, 0.288 P <0.001). Optimism had a significant positive relationship with
quality of life at (0.363 CI 0.204, 0.523 P<0.001).

201
Variable Test values and significance
B CI (95%) LCL -HCL P-value
Social support 0.846 (0.498, 1.193) <0.001
Neighbourhood 1.691 (1.375, 2.008) <0.001
Social participation -0.906 (-1.064, 0.748) <0.001
Social networking 1.157 (0.935, 1.379) <0.001
General health 6.546 (5.032, 8.061) <0.001
Physically Active activities of 6.704 (5.147, 8.261) <0.001 daily living (ADL/IDAL)
Depression -3.641 (-4.863, 2.418) <0.001
Sense of Coherence 2.099 (1.718, 2.479) <0.001
Capability 0.159 (0.030, 0.288) <0.001
Optimism 0.363 (0.204, 0.523) <0.001
Table 6.8: Psychosocial bivariable analysis

202
6.7. Psychosocial multiple regression analysis
A multiple linear regression analysis was carried out to examine the relationship between
psychosocial variables and quality of life. The first regression model included all the social
variables and socio-economic status (i.e., social support, neighbourhood and social
participation). The findings illustrated that socio-economic status, social support, neighbourhood
and social networking had a significant positive relationship with quality of life. However, the
lack of social participation may significantly decrease the quality of life in old age. The model
shown in (table 6.9) displays that social variables were related to a better quality of life.
However, the socio-economic status had significant relationships with quality of life. The R2 in
the first model explained 0.492, or 49.2% of the variation in the quality of life.
The second model consisted the first model with the addition of the health variables (i.e.,
general health, physically active and activities of daily living). Higher general health and being
physically active had a significant positive relationship with quality of life. The variable
activities of daily life had a non-significant positive relationship with quality of life. When the
health variables were added in the second model, R2 increased to 0.526, or 52.6% of the
variation in quality of life. In the final model with the addition of psychological variables,
depression had a non-significant relationship with quality of life. However, the sense of
coherence and capability had a significantly positive relationship with quality of life. Also,
optimism had a nonsignificant positive relationship with the quality of life. In the final model,
the variance reached 0.589, or 58.9%. However, lower lack of social participation and
depression was associated with lower quality of life. Higher socio-economic status, having
people around, social support, social networking, sense of coherence, capability (having more
work, opportunities and satisfaction) and good health were all associated with higher quality of
life in later life. This model supported that ‘social networks and social support have an impact on
a person’s physical and mental health (Bosworth et al., 2000 and Hinkikka et al., 2000).

203
Model I Model 2 Model 3
Variables Coefficient (95% CI) Coefficient (95% CI) Coefficient (95% CI ) B Standardized beta
Social Variables Socio economic status 1.788 (0.772, 2.803)** 1.640 (0.643, 2.638)** 1.794 (0,753, 2.835) 0.220***
Social support 0.582 (0.311, 0.852)*** 0.563 (0.301, 0.825)*** 0.266 (-0.004, 0.536) 0.084*
Neighbourhood 0.499 (0.144, 0.853)** 0.469 (0.125, 0.814)** 0.346 (0.015, 0.678) 0.107*
Social participation -0.432 (-0.609, -0.255)*** -0.349 (-0.524, -0.173)*** -0.322 (-0.489, -0.155) -0.194***
Social networking 0.450 (0.232, 0.668)*** 0.341 (0.124, 0.558)** 0.221 (0.016, 0.427) 0.098**
Health variables
General health 2.429 (1.017, 3.841)*** 1.474 (0.109, 2.838) 0.100**
Physically Active 1.334 (-0.202, 2.871)* 1.183 (-0.284, 2.650) 0,078
Activities of daily living -0.361 (-1.241, 0.520) -0.427 (-1.259, 0.405) -0.040
(ADL/IDAL)

204
Model 1: (social variables), Model 2: (Model 1 + health variables), Model 3: (model 1+ model 2 +psychological variables) P values = * p < 0.05., ** p < 0.01., *** p < 0.001.
Psychological Variables
Depression -0.122 (-0.416, 0.171) -0.037
Sense of coherence 0.884 (0.532, 1.237) 0.225***
Capability 0.174 (0.075, 0.273) 0.153***
Optimism 0.091 (-0.026, 0.207) 0.063
Constant 20.155 19.450 17.507
R2 0.492 0.526 0.589
Table 6.9: Multiple regression psychosocial factors

205
6.8 Life course determinants of quality of life: descriptive findings
Descriptive analysis of the overall sample, 99.3% of the participants reported that both of
their parents were illiterate. However, in the low-income group, 100% participants reported that
both the parents were illiterate. In the middle-income group, 99%, and in the high-income group,
98% of the participants reported that both parents were illiterate (Table 6.10).
The participants were asked about their first life occupation status until the fifth
occupation status, which included whether they worked manually with their hands or non-
manual work. It was identified that 52.8 % of the participants worked manually and 8% did a
non-manual work in their first life occupation and 62.1% were missing responses. However,
reaching towards the fifth occupation throughout the life course only 0.7% of participants
informed that they worked manually and 0% non-manually, out of which 99.3% data was
missing.
Moreover, the occupational status in three different strata, it had been identified that 68%
of the people worked manually than 44.4% in the middle-income group and 46% in a high-
income group. Some participants shared their views during the interview when asked the
question regarding manual and non-manual work. One of the participants from the low-income
area said that; 'hamaray zamany main koi machine nahin thin na computer that hum ko har cheez
haath se Karni parti this building banana kay liyee mati sar par utha kar le jatay they Aaj tho
machin agayee hay khud saman upar charha jaati hay' meaning; 'We used to work with there was
no machine, so we had to carry sand on our head to make a building’(male resident from LIG).
Today we have machines which do all the work'.
The participants were also asked if they had difficulty working at their worksite or had an
accident. It was identified during their first job overall, 8.4% of the participants had to lift heavy
things, 36.1% had sweat while working, and 0.7% of the participants complained that they had a
back injury caused by work. Most participants were from a low-income group who had to carry
heavy things during their first job, that is 15% than any other strata. However, in all three strata

206
participants complained of sweat at work: in low-income areas at 56%, middle income at
28.3% and high income at 24%. However, 1% of the participants from middle income and high
income complained of a back injury. The descriptive data shows that meanwhile, the participants
reach their fifth occupation in all samples; only 0.3% of the participant had complained of
sweating at work. Besides that, all the data was missing. The participant from the low-income
group said 'ab mazdori kartay hain tho pasina tho aye ga' mean' working as labour obviously will
sweat'. In descriptive analysis, participants in their life switched their jobs at a maximum of three
times in their life as one of the participants from the low-income area said during the interview'
main jab 16 saal ka tha tab se jamadar hon raasta saaf karta hon. Abhi 55 saal ka hon yehi kaam
kar Raha ho' means 'when I was 16 years I started sweeping streets, and till today I am doing the
same thing'. One of the participants from the middle income said 'hum Marwar se aye hay
Pakistan. Wahn hum karigari ka kaam kartay they bhari Samman utatay that ab bhi Yahi Kam
kartay hay ab ye kaam kartay howay 40 saal hogayee hamary bachay bhi yehi kartay hain' mean
'we have come from Marwar India there we used to work as a worker/labour carried heavy
things and the same things my children are doing '.
Participants were asked what control they had over their jobs. It was identified that
overall, in their first job, 49.8% of the participants said that they managed their work, with 57%
of the participant from low income expressed that they had control over their job. As one of the
participants said 'hum rikhsaw chaltay hain tho hum par hay kay Kabhi bhi jayee our kaam
khatam Karya 'means 'I drive auto, so it is up to me when I start my work and ends'.
Comparatively, 35.4% of the participant from the middle-income group said that they had
control over their work. Though, 57% of the participant said that they had control over their
work from the high-income group.
Moreover, 38.5% of the data was missing when asked about their occupational post.
Moreover, in the overall sample, 1% of the participants were in the position of the manager,
30.8% of the participants were an employee, and 29.8 % of the participants were self-employed.
Considering the data of all three strata, none of the participants was on the post of manager in

207
their first occupation, whereas 37% of the participants were an employee and 36% of the
participants were the self-employee. On the other hand, in middle-income group 1 % of the
participants were in the manager post, 24.2% of the participants were an employee and 25.3% of
the participants were a self-employee. While in the high-income group 2% of the participants
were on manager post, 31% were an employee, and 28% were a self-employee.
Participants were also asked about if their working areas had a piece of protective
equipment and the place was ventilated, where they could have worked efficiently. The overall
40.5% of the participants said that they had protective equipment and were working in ventilate
environment; whereas 20.7% replied that they did not have a protective environment to work
and did not have ventilation. Though the participants from the low income 38% said yes that
their first job was a ventilated. In middle income, 28.3% of the participants replied in yes, and in
the high income 55% of the participants said that their work environment was ventilated.
When asked question regarding housing tenants, it was identified that from the overall sample,
67.2% of participants had their own home, and only 32.8% were living in the rented homes. Out
of this group, 71% of the low-income group were living in their own homes.
During the interview, participants stated when they had migrated from other parts of Pakistan
and out of Pakistan like India and Bangladesh, they had settled in a piece of land where they
established their own houses and still living in the same house. One of the participants shared
that, 'main apni family kay Saath 40 saal pehelay Punjab se kaam ki talash main Aaya that ye
ilaka Pahari the paisa nahin that tho hum nay mati ka Ghar is Pahari par banaya phir aahisa
aahisa Aaj Dekho cement ka Ghar bana Liya hay' that means; 'I came with my family 40 years
back to eardid noty at that time didn't have money, so we settled on this mountain made the
house of sand and now see we have cemented house'. In the middle-income group, 73.7 % of the
people lived in their own house than 26.3% were living in a rented house. One of the participants
from this group shared ‘hum yahan kaafi khandan Marwar India se Pakistan aayee thay 1966
main Abhi jo AAP Ghar dekh reahay hay wo Ek khula maidan the hum yahan tent main rehtay
that Phir jab Kamana shoro Kia tho khud kay Ghar banatay chalay gayee tab use hunm yahan

208
reh rahay hain'. Meaning '; many of the family migrated from Marwar India came to Pakistan
and settled here at that time, this was an empty plot we lived in tents, and when we had money,
we started building our own homes, and since then we are living here'. Surprisingly from both
the low and middle-income strata, the high-income starta had the lesser percentage of owned
homes than the other two strata. 57% lived in their own homes, and 43% lived in the rented
home.
In the overall sample, the transition from one house tenure to another is significant as in
second housing tenure 49.8% of the participants lived in their own homes than 35.5% of the
participant lived in the rented home. The first housing type 24.1% of the participants lived in the
katcha house. Most participants lived in the flat 49.2%, and 26.8% of the participants lived in the
bungalow.
Mostly, participants had a source of drinking water from the pipe that was 49.5%., hand
pump 31.8%, covered well 5.7%, open well 3.3% and from river 7.4%. However, later in life,
thorough out the housing transition, 58.5 % of the overall sample population were getting water
from the pipe.
In terms of housing sanitation in the overall sample, 35.5% of houses had an
underground drain, 15.4% covered drain, 17.1% open drain. However, 32.1% of the participants
informed that there was no sanitation system. Nevertheless, moving to another housing 35.8%
participants said they had an underground drainage system, 9.7% had a covered drain, 15.1%
had an open drain, and 24.7% said they had no system. Mainly 66% of the participants from the
low-income group informed that they did not have any sanitation system while they were living
in their first housing. At the same time, 21.2% from middle income and 9% from the high
income informs that they did not have any sanitation system in their first house.

209
Variables All
Lower income areas
Medium income areas
High income areas
Father’s education (N and %) Illiterate Up to 10 years 10 years and above missing
297 (99.3) 0 0 2 (.7)
100 (100) 0 0 0
99 (99) 0 0 0
98 (98) 0 0 2 (2)
Mother Education (N and%) Illiterate Up to 10 years 10 years and above missing
297 (99.3) 0 0 2 (.7)
100 (100) 0 0 0
99 (99) 0 0 0
98 (98) 0 0 2 (2)
First Occupation (N and %) Manual Non-manual Missing Second Occupation (N and %) Manual Nonmanual Missing Third Occupation (N and %) Manual Non-Manual Missing Fourth Occupation (N and %) Manual Non-manual Missing Fifth Occupation (N and %) Manual Non-manual Missing
158 (52.8) 24 (8.0) 186 (62.1) 60 (20.1) 16 (5.4) 223 (74.6) 18 (6.0) 5 (1.7) 276 (92.3) 8 (2.7) 0 (0) 291 (97.3) 2 (.7) 0 (0) 297 (99.3)
68 (68.0) 5 (5.0) 27 (27.0) 24 (24.0) 1 (1.0) 75 (75.0) 5 (5.0) 1 (1.0) 94 (94.0) 2 (2.0) 0 (0) 98 (98) 1 (1.0) 0 (0) (99) (99.0)
44 (44.4) 6 (6.1) 49 (49.5) 19 (19.2) 5 (5.1) 75 (75.8) 7 (7.1) 1 (1.0) 91 (91.9) 4 (4.0) 0 (0) 99 (100) 0 (0) 0 (0) 99 (100)
46 (46.0) 13 (13.0) 41 (63.0) 17 (17.0) 10 (10.0) 73 (73.0) 6 (6.0) 3 (3.0) 91 (91.0) 2 (2.0) 0 ( 0) 98 (98.0) 1 (1.0) 0 ( 0) 99 (99.0)
First job Occupational Hazards Fume sand Dust Missing second job Occupational Hazards Fume Sand Dust Missing Third job Occupational Hazards Fume
28 (9.4) 42 (14.0) 23 (7.7) 206 (68.8) 10 (3.3) 16 (5.4) 13 (4.3) 260 (87.0) 4 (1.3) 4 (1.3) 1 (.3)
14 (14.0) 29 (29.0) 15 (15.0) 42 (42.0) 4 (4.0) 8 (8.0) 8 (8.0) 80 (80.0) 2 (2.0) 2 (2.0) 1 (1.0) 95 (95.0)
9 (9.1) 6 (6.1) 4 (4.0) 80 (80.8) 2 (2.0) 7 (7.1) 3 (3.0) 87 (87.9)
0 (0) 2 (2.0) 0 (0)
5 (5.0) 7 (7.0) 4 (4.0) 85 (84.0) 4 (4.0) 1 (1.0) 2 (2.0) 93 (93.0) 2 (2.0) 0 (2.0) 0 (2.0) 98 (98.0)

210
Sand Dust Missing Fourth job Occupational Hazards Fume Sand Dust Missing Fifth job Occupational Hazards Fume Sand Dust Missing
290 (97.0) 3 (1.0) 1 (.3) 1 (.3) 294 (98.3) 1 (.3) 0 (0) 0 (0) 298 (99.0)
1 (1.0) 1 (1.0) 0 (0) 98 (98.0) 1 (1) 0 (0) 0 (0) 99 (99.0)
97 (98.0) 2 (2.0) 1 (1.0) 0 (0) 96 (97.0) 0 (0) 0 (0) 0 (0) 99 (99)
0 (0) 0 (0) 0 (0) 100 100 0 (0) 0 (0) 0 (0) 100 (100)
Physically difficult work & accidents First job Lifting heavy things Sweating Back injuries Missing Second job Lifting heavy things Sweating Back injuries Missing Third job Lifting heavy things Sweating Back injuries Missing Fourth job Lifting heavy things Sweating Back injuries Missing Fifth job Lifting heavy things Sweating Back injuries Missing
25 (8.4) 108 (36.1) 2 (.7) 164 (54.9) 8 (2.7) 39 (13.0) 1 (.3) 251 (84)
1 (.3) 10 (3.3)
1 (.3) 279 (96.0) 1 (.3) 4 (1.3) - 294(98.3) - 1 (.3) - 298 (99.7)
14 (15.0) 56 (56.0) 0 (0) 30 (30.0) 5 (5.0) 19 (19.0) 0 (0) 76 (76.0) 1 (1.0) 5 (5.0) 0 (0) 94 (94.0) 1 (1.0) 1 (1.0) 0 (0) 98 (98.0) - 1 (1.0) - 99 (99.0)
4 (4.0) 28 (28.3) 1 (1.0) 66 (66.7) 0 (0) 13 (13.1) 1 (1.0)
85 (85.9) 0 (0) 2 (2.0) 1 (1.0) 96 (97.0) - 3 (3.0) - 96 (96.0) - - - 99 (99.0)
7 (7.0) 24 (24.0) 1 (1.0) 68 (68.0) 3 (3.0) 7 (7.0) 0 (0) 90 (90.0) - 3(3.0) - 97 (97.0) - - - - - - - -
Work control First job manages and foresee Yes No Missing Second job manage and foresee Yes No
149 (49.8) 32 (10.7) 118 (39.5) 65 (21.7) 11 (3.7) 223 (74.6)
57 (57.0) 14 (14.0) 29 (29.0) 20 (20.0) 5 (5.0) 75 (75.0)
35 (35.4) 14 (14.1) 50 (50.5) 20 (20.2) 4 (4.0) 75 (75.8)
57 (57.0) 4 (4.0) 39 (39.0) 25 (25.0) 2 (2.0) 73 (73.0)

211
Missing Thirds job manage and foresee Yes No Missing Fourth job manage and foresee Yes No Missing Fifth job manage and foresee Yes no missing occupation post first post manager employee self-employee missing second post manager employee self-employee missing third post manager employee self-employee missing fourth post manager employee self-employee missing fifth post manager employee self-employee missing protective -equipment and ventilation first job yes no missing second job yes no missing third job yes no missing
22 (7.4) 1(.3) 276 (92.3) 7 (2.3) 1 (.3) 291 (97.3) 2 (.7) - 297 (99.3) 3 (1.0) 92 (30.8) 89 (29.8) 115 (38.5) 1 (.3) 35 (11.7) 39 (13.0) 224(74.8) - 12(4) 11(3.7) 276(92.3) - 2(.7) 6 (2.0) 291(97.3) - - 2 (.7) 297 (99.3) 121 (40.5) 62 (20.7) 116 (38.6) 58 (19.4) 18 (6.0) 223 (74.6) 17 (5.7) 6 (2.0) 276 (92.3) 5 (1.7) 3(1.0) 291 (97.3)
5 (5.0) 1 (1.0)
94 (94.0) 2 (2.0)
- 98 (98.0)
1 (1) - 99 (99) - 37 (37.0) 36 (36.0) 27 (27.0) - 14 (14.0) 11 (11.0) 75 (75.0) - 5(5.0) 1(1.0) 94 (94.0) - - 2 (2.0) 98 (98.0) - - 1(1.0) 99(99.0) 38 (38.0) 35 (35.0) 73 (73.0) 15 (15.0) 10 (10.0) 75 (75.0) 3(3.0) 3(3.0) 94 (94.0) - 2 (2.0) 98 (98.0)
8 (8.1) - 91 (91.9) 3 (3.0) 1 (1.0)
95 (96.0) - - 99 (100) 1 (1.0) 24 (24.2) 25 (25.3) 49 (49.5) - 11 (11.1) 11 (12.1) 76 (76.8) - 3(3.0) 5 (5.1) 91(91.9) - 1 (1.0) 3 (3.0) 95(96.0) - - - 99(99.0) 28 (28.3) 21 (21.2) 50 (50.5) 16 (16.2) 8 (8.1) 75 (75.8) 6 (6.1) 2 (2.0) 91 (91.9)
3 (3.0) 1 (1.0) 96 (96.0)
9 (9.0) -
91 (91.0) 2 (2.0)
- 98 (98.0)
2 (2) - 98 (98) 2 (2.0) 31 (31.0) 28 (28.0) 39 (39.0) 1 (1.0) 10 (10.0) 16 (16.0) 73 (73.0) - 4 (4.0) 5 (5.0) 91 (91.0) - 1 (1.0) 1 (1.0) 98 (98.0) - - 1 (1.0) 99 (99.0) 55 (55.0) 6 (6.0) 39 (39.0) 27 (27.0) 0 (0) 73 (73) 8 (8.0) 1(1.0) 91 (91.0) 2(2.0) - 98(98)

212
fourth job yes no missing fifth job yes no missing
1(.3) 1(.3) 297(99.3)
- 1 (1.0) 99 (99.0)
- - 99(99.0)
1 (1.0) - 99(99.0)
Housing First housing tenure Owned Rented missing Second housing tenure Owned Rented Missing Third housing tenure Owned Rented missing Fourth Housing tenure Owned Rented missing Fifth housing tenure Owned Rented missing
201 (67.2) 98 (32.8) 0 (0) 149 (49.8) 106 (35.5) 44 (14.7) 95 (31.8) 35 (11.7) 169 (56.5) 43 (14.4) 6 (2.0) 250 (83.6) 10 (3.3) 1 (.3) 288 (96.3)
71 (71.0) 29 (29.0) 0 ( 0) 40 (40.0) 44 (44.0) 16 (16.0) 15 (15.0) 11 (11.0) 74 (74.0) 7 (7.0) 3 (3.0) 90 (90.0)
7 (1.0) 0 (0) 99 (99.0)
73 (73.7) 26 (26.3) 0 ( 0) 44 (44.4) 34 (34.3) 21 (21.2) 23 (23.2) 15 (15.2) 61 (61.6) 12 (12.1) 1 (1.0) 86 (86.9) 4 (4.0) 1 (1.0) 94 (94.9)
57 (57.0) 43 (43.0) 0 (0) 65 (65.0) 28 (28.0) 7 (7.0) 24 (24.0) 2 (2.0) 74 (74.0) 5 (5.0) 0 (0) 95 (95.0) 0 (0) 0 (0) 0 (0)
Housing type First home Katcha house Flat Bungloo missing second housing Katcha house Flat Bungloo missing third housing Katcha house Flat Bungloo missing fourth housing Katcha house Flat Bungloo missing fifth housing
72 (24.1) 147 (49.2) 80 (26.8) - 51 (17.1) 123 (41.1) 81 (27.1) 44 (14.7) 20 (6.7) 60 (20.1) 50 (16.7) 169 (56.5) 7 (2.3) 21 (7.0) 21 (7.0) 250 (83.6)
67 (67.0) 4 (4.0) 29 (29.0) - 50 (50.0) 6 (6.0) 28 (28.0) 16 (16.0) 20 (20.0) 4 (4.0) 2 (2.0) 74 (74.0) 7 (7.0) 2 (2.0) 1 (1.0) 90 (90.0)
5(5.1) 62 (62.6) 32 (32.3) 1 (1.0) 54 (54.5) 23 (23.2) 21 (21.2) - 30 (30.3) 8 (8.1) 61 (61.6) - 13 (13.1) - 86 (86.9)
- 81 (81.0) 19 (19.0) - 63 (63.0) 30 (30.0) 7 (7.0) - 26 (26.0) 40 (40.0) 34 (34.0) - 6 (6.0) 20 (20.0) 74 (74.0)

213
Katcha house Flat Bungloo missing
1 (.3) 5 (1.7) 5 (1.7) 288 (96.3)
1 (1.0) - - 99 (99.0)
- 5 (5.0) - 94 (94.9)
- - 5 (5.0) 95 (95.0)
Source of drinking water First home Pipe water Hand pump Water motor Covered well Open well River missing second home Pipe water Hand pump Water motor Covered well Open well River Missing Third home Pipe water Hand pump Water motor Covered well Open well River Missing Fourth home Pipe water Hand pump Water motor Covered well Open well River Missing Fifth home Pipe water Hand pump Water motor Covered well Open well River Missing
148 (49.5) 95 (31.8) 7 (2.3) 17 (5.7) 10 (3.3) 22 (7.4) - 175 (58.5) 24 (8.0) 5 (1.7) 29 (9.7) 19 (6.4) 3 (1.0) 44 (14.7) 109(36.5) 7 (2.3) 1 (.3) 11(3.7) 2 (.7) - 169 (56.5) 42 (14.0) 1 (.3) - 3 (1.0) 2 (.3) - 251 (83.9) 11 (3.7) - - - - - 288 (96.3)
29(29.0) 33(33.0) 1(1.0) 8 (8.0) 7 (7.0) 22(22.0) - 33 (33.0) 10 (10.0) 21 (21.0) 18 (18.0) 2 (2.0) 16 (16.0) - 10 (10.0) 3 (3.0) - 11(11.0) 2 (2.0) - 74 (74.0) 5 (5.0) - - 3 (3.0) 2 (2.0) - 90 (90.0) 1 (1.0) - - - - - 99 (99.0)
55(55.6) 30 (30.3) 6 (6.1) 5 (5.1) 3 (3.0) 0 55 (55.6) 9 (9.1) 5 (5.1) 7 (7.1) 1 (1.0) 1 (1.0) 21 (21.2) 36 (36.4) 1 (1.0) 1 (1.0) - - - 61 (61.6) 12 (12.1) 1 (1) - - - - 86 (86.9) 5 (5.0) - - - - - (94) (94.9)
64 (64.0) 32 (32.0) - 4 (4.0) - - 87 (87.0) 5 (5.0) - 1 (1.0) - - 7 (7.0) 63 (63.0) 3 (3.0) - - - - 34 (34.0) 25 (25.0) - - - - - 74 (74) 5 (5.0) - - - - - 95 (95.95)
Housing sanitation First home Underground drains Covered drain Open drain No system missing
106 (35.5) 46 (15.4)
51 17.1) 96 (32.1)
-
2 (2.0) 25 (25.0) 7 (7.0) 66(66.0) -
46 (46.5) 15 (15.2) 17 (17.2) 21 (21.2)
58 (58.0) 6 (6.0) 27 (27.0) 9 (9.0)

214
6.9 Bivariable Findings of life course variable
Bivariate associations are presented in (Table 6.11) that explore associations between
quality of life and the life course variables. There was a significant positive relationship
between both parent’s education and quality of life; father’s education (1.855 CI 0.603,
3.106, P 0.004) and mother’s education (1.406 CI -0.090, 2.901 P value 0.065).
Moreover, there was a non-significant relationship between the social class during the
life course (manual/non-manual) and quality of life ( -6.571 CI -25.607, 12.464, P 0.431).
Furthermore, having control in the occupation during the life course also did not have any
significant effects on quality of life (1.211, CI -4.779, 7.201, P 0.639). Additionally, people
designated on different work positions (i.e, manager, employee and self-employed) had a non-
significant positive relationship with quality of life (0.484, CI -0.396, 1.364, P 0.227 ).
Furthermore, occupational hazards such as fume, sand, or dust had a non-significant result on the
Second home Underground drains Covered drain Open drain No system missing Third home Underground drains Covered drain Open drain No system Missing Fourth home Underground drains Covered drain Open drain No system missing Fifth home Underground drains Covered drain Open drain No system missing
107(35.8) 29 (9.7) 45 (15.1) 74 (24.7) 44 (14.7) 74 (24.7) 14 (4.7) 21 (7.0) 21 (7.0) 169 (56.5) 31 (10.4) 4 (1.3) 8 (2.7) 6 (2.0) 250 (83.6) 8 (2.7) 1 (.3) 1 (.3) 1 (.3) 288 (96.3)
2 (2.0) 16 (16.0) 11 (11.05 (55.0) 16 (16.0) 2 (2.0) 5 (5.0) 3 (3.0) 16 (16.0) 74 (74.0) 2 (2.0) 2 (2.0) - 6(6.0) 90 (90.0) - - - 1 (1.0) 99 (99.0)
39 (39.4) 8 (8.1) 14 (14.1) 17 (17.2) 21 (21.2) 19 (19.2) 6 (6.1) 8 (8.1) 5 (5.1) 61 (61.6) 7 (7.1) 2 (2.0) 4 (4.0) - 86 (86.9) 3 (3.0) 1 (1.0) 1 (1.0) - 94 (94.9)
66 (66.0) 5 (5.0) 20 (20.0) 2 (2.0)
7 (7.0) 53 (53.0) 3 (3.0) 10 (10.0) - 34 (34.0) 22 (22.0) - 4 (4.0) - 74 (74.0) 5 (5.0) - - - 95 (95.0)
Table 6.10 Life course descriptive analyses

215
quality of life in the later years (0.465, CI -1.647, 2.576, P 0.610). In terms of physical
difficulties and work-related accidents, there was a non-significant effect on the quality of life
(0.254, CI -1.985, 2.493, P, 0.791). This study indicated that protective equipment and
ventilation at work had a non-significant relationship with quality of life (-2.111, CI -6.018,
1.795 P 0.234).
This study also shows that the housing tenure had a negative non-significant
relationship with the quality of life in the later years (0.650, CI -2.394, 1.095, P 0.458).
Besides, that, people living in housing types such as katcha house build of mud and sand, flat
and bungalow had a significant positive relationship with the quality of life (1.929, CI 1.041,
2.816, P <0.001). Additionally, the source of drinking water throughout life had a significant
negative correlation with the quality of life (1.254, CI -1.717, -0.790, P <0.001). Likewise,
housing sanitation has a significant negative correlation with the quality of life (0.870, CI -
1.277, -0.464, P <0.001)
Variables Test values and significance
B CI (95%) LCL - HCL P-value
Father’s education 1.855 (0.603, 3.106) 0.004
Mother’s education 1.406 (-0.090, 2.901) 0.065
Accumulated social class -6.571 (-25.607, 12.464) 0.431
Accumulated work control 1.211 (-4.779, 7.201) 0.639
Accumulated work designation 0.484 (-0.396, 1.364) 0.227
Accumulated occupational hazards 0.465 (-1.647, 2.576) 0.610
Accumulated physical difficulties at 0.254 (-1.985, 2.493) 0.791
workplace
Accumulated protective equipment -2.111 (-6.018, 1.795) 0.234
and ventilation

216
Accumulated housing tenure -0.650 (-2.394, 1.095) 0.458
Accumulated Housing type 1.929 (1.041, 2.816) <0.001
Accumulated source of drinking -1.254 (-1.717, -0.790) <0.001
water
Accumulated sanitation system -0.870 (-1.277, -0.464) <0.001
Table 6.11: Bi-variable analysis of life course factors
6.10 Multiple regression on life course and current life situation
Table 6.12 displays multiple regression models. There was a large proportion of missing
data in the housing variables. Thus, it was not included in the multiple regression analysis. The
linear regression only looks at linear relationships between dependent and independent variables,
so the housing data was deemed inappropriate.
The first regression model included number of years in the manual job and the
proportion of life spent in a manual job throughout life. The first regression model indicated
that there was a positive non-significant association between the year's people had done the
manual job in their life 0.035 CI (0.033, 0.103). However, the proportion of being in a manual
job throughout life had a significant negative relationship with quality of life at -6.661 CI (-
9.710, -3.611). The R2 interprets the amount of variance in the CASP 13 score, and the first
model explained 0.112 or 11.2% of the variation in the quality of life.
The second model included the first model variables and the education of both the
parents. There was a non-significant positive relationship between father’s 1.008(-1.049,
3.065) and mother’s education 0.398( -1.898, 2.684) education with the quality of life. The R2
interprets the amount of variance in CASP 13 score, and the second model had 0.115 or 11.5%
of the variation in quality of life.

217
A third model included the first and second model plus age, age squared, gender, current
sociological factors (i.e., social support, neighbourhood, social participation, social networking),
current health factors (i.e., general health, physically active, and activities of daily living) and
economic factors (i.e., employment, housing tenure, car ownership, retirement, pension and
financial security for future). There was no significant relationship of life-course events, age, age
squared and gender on the quality of life in the later years of life. However, there was a non-
significant positive effect of age 0.142 CI (-1.484, 1.768) and non-significant negative effect of
age squared -0.002 CI (-0.016, 0.011) and that the older a person was, the effect of age on
quality of life decreases. When including sociological factors with the life course factors, the
finding was that social support, neighbourhood and social participation had a significant effect
on the quality of life in older age. Moreover, higher general health and being physically active in
old age had a significant positive relationship with quality of life. Moreover, for the current
economic factors, not owning a personal vehicle had a significant negative relationship with the
quality of life at -1.670 CI (-3.375, 0.035).
Furthermore, financial security for the future had a significant negative relationship with
quality of life in the older age at 1.670 CI (-3.375, .035). The final model explained variance of
0.517 or 51.7% in the quality of life.

218
` Model I Model 2 Model 3 Variables Coefficient (95% CI) Coefficient (95% Coefficient (95% CI) Standardized beta
Occupation class
years in manual job 0.035 (0.033, 0.103) 0.048 (-0.022, 0.118) 0.016 (-0.51, 0.083) 0.044
proportion in manual job -6.661 (-9.710, -3.611) -6.866 (-9.936, -3.796) -1.602 (-4.380, 1.176) -0.098
Early life
Father’s education 1.008(-1.049, 3.065) -0.089 (-1.673, 1.494) -0.008
Mother’s education 0.398( -1.898, 2.684) 1.040 (-0.736, 2.815) 0.083
Age 0.142 (-1.484, 1.768)0.162
Age Squared -0.002 (-0.016, 0.011) -0.341
Gender -0.668 (-2.383, 1.047) -0.051
Current sociological factor
Social support 0.500 (0 .144, 0 .855) 0.157
Neighbourhood 0.690 (0.251, 1.128) 0.217
Social participation -0.315 (-0.566. -0.065)-0.190
Social networking 0.238 (-0.047, 0.523) 0.106

219
Current health
General health 1.890 (-0.107,3.887) 0.124
Physically Active 1.789 (-0.179,3.756) 0.119
Activities of daily living 0.003(-0.011, 0.018)0.025
(ADL/IDAL)
Current Economic variables
employment 0.002(-0.096, 0.101) 0.003
housing tenure
0.108 (-1.835, 2.052)0.007
car ownership
-1.670 (-3.375,0.035)-0.125
Retirement
-0.699 (-2.826,1.428)-0.042
Pension
-1.820(-4.670, 1.030)-0.079
Financial security for future
-0.719 (-1.572,0.133)-0.121
Constant 26.891 25.031 28.009
R2 0.112 0.115 0.517
Table 6.12 Life course Multiple regression analysis Model 1: (years in manual job + proportion in manual job), Model 2: (Model 1 + Early life), Model 3: (model 1+ model 2 +Age +Age squared+
Gender +current sociological factors +Current health +current economic variables)
P values = * p < 0.05. , ** p < 0.01., *** p < 0.001.

220
4.14 Observational findings during data collection
4.14.1 Observations
This PhD research had given me an opportunity, to learn more about different cultural
beliefs in a different religion, different Muslim sect and living in different socio-economic
classes of Karachi, Pakistan. Here i will share observational findings in all three strata (low,
middle and high income). Before sharing an observation, I also want to highlight the issues faced
while conducting this study. The issues are as follow; The main concern of conducting the
research was its method, as earlier, it was decided that the stratified random sampling would be
used, however, due to socio-political concerns; we had to change the research methodology and
use purposive sampling, which may reduce the generalizability of the data to non-participating
areas. Due to security issues, some participants refused to permit us to note down their contact
details in such cases, we respected their wishes, and it was noted on the form. Some households
did not want us to approach them. In one of the Pathan cast communities, strangers were not
welcomed. Additionally, some men were abusive, and the research team were asked to finish
work as soon as possible and leave.
Low-income areas (Pahar Ganj)
These developed on either convenience plots or the Hills' sharp vacant slopes, partly to
satisfy the demands for worker housing during the 1960s as the city was going through an
industrial boom. Labour colonies were first built as formal development for the nearby Sindh
Industrial Trading Estate (SITE), but later informal housing moved onto the hill known as Pahar
Ganj. The rural migrants who settled during that period later facilitated their fellow
villagers/tribesmen to settle in the city in this area (Ud Din Ahmed, 2016).
Pahar Ganj is one of the low socio-economic areas of Karachi (Ud Din, Ahmed, 2016).
Pahar Ganj is a muddy hill; the highest point of these hills in Karachi is about 528m in the
extreme north. People who had migrated made their own houses (Ud Din Ahmed, 2016). Pahar
Ganj was one of the study areas of my research. It was easy to enter that area because one of the

221
VCARE representatives assisted us in asking participants to participate in the research. Initially,
people were reluctant but when explained all the purpose of the research and their
confidentiality, they agreed to take part in this cause. After three days of the data collection in
this area, one of the community members, who was the teacher in a school and was on holidays,
came forward and offered his help. I welcomed him. The teacher worked as a gatekeeper and
was a well-trusted person. That person had assisted VCARE welfare society for active and
healthy ageing to organize their community events. When that person got to know that we were
with VCARE, he approached us to offer any assistance required in approaching people. The
person has been living in that area for 20 years and knew the best about the community;
therefore, he assisted us and guided us not to go in the section where drug mafia lived. As the
research plan, we had to take the participants' addresses, but because of the security reasons,
participants refused to write their addresses.
Therefore, no addresses were taken. Moreover, we had found three central communities
that had settled down at Pahar Ganj, namely, Pathan, Saraiki, and Christians. Pathan community
is extensive and has many castes. Members of one of the castes do not allow their women to talk
to anyone. They have a big purdah outside their homes, and this community warned us not to
enter in their boundaries. However, another caste of Pathan allows outsiders to speak with them,
but women can only speak to women and men would only speak to a man. Therefore, the male
data collector was collecting data from the male participants.
Moreover, if any women were present at home; then, the data collector was asked by the
participants, to collect the data outside the home. In such a situation, we respected their wish and
data was collected outside the home. However, for female participants, the data was collected
inside the home in a separate room. On the other hand, the Sariki community was welcoming
and allowed the researcher to collect the data but requested if a male data collector can only take
males' interviews, but a female data collector can interview both the gender. Most of the Saraiki
community women worked as maids in nearby houses, so they also requested if the researcher
could come for an interview after 3:00 pm. In that area, the third community was the Christian

222
community, who had their house boundaries between the Pathan communities. According to the
Christian community, Pathans are their enemies. They always wanted to keep a distance from
the Pathan community. However, the Christian community was very welcoming and agreed
either of the genders could collect the data. In terms of other observations, the community had
made a request, to not come on Wednesday, as they all were busy buying water for their home.
Moreover, the temperature in June and July was between 39c to 47c, scorching weather.
Moreover, in this hot weather, the electricity load shedding was 8 to 12 hours a day. Therefore,
few of the households refused to give an interview.
Most low-income community participants asked data collectors if we could tell the
government to give them water and electricity. In this situation, the data collectors restated the
data collection's purpose and did not make any false promises. One or two households in the
same area asked our data collectors if we would be paying them for their time. However, the
data collectors had informed the participants that their participation in the research is voluntary
and not forced to participate. However, later, the same participants took part in the data
collection.
Middle income
In the middle socio-economic group, most of the data were collected from the Khudadad
colony. However, after a week of collecting data, the community showed their lack of interest to
allow the data collectors to conduct an interview, due to high alert security reasons. Therefore,
the remaining data were collected from Al-Noor colony and Karim Abad colony. In Khudadad
colony, most of the people were Muslim Marwari. They had migrated from the Marwar (India)
and believed that they are from the Rajput family of India. The Marwari’s parents moved from
India to Pakistan between 1949 and 1950. The other community was the Muhajir community
who also migrated from India after the partition of India. Another community was Memon
community whose originate is from Pakistan.
Women from both Muhajir and Marwari communities do not work outside their home.
However, some Memon community women seem to allow working outside their home. As most

223
of the men had worked in the day, most of the participants from these communities were
women. However, some male participants were interested in taking part in the research, but they
wanted us to come at night-time, and that was not an appropriate and safe time for the data
collectors. So, I had to tell respectfully decline their wishes. All three communities that lived in
Khudadad colony were very positive and welcoming. They did not mind if male data collectors
were interviewing the female participants. According to the participants, all data collectors were
like their children. In this area, one of the women aged 60 offered her service as the volunteer to
introduce to the community.
Another targeted area in the middle socio-economic was Al Noor and Karim Abad
colony. Moreover, most of the people from this area belong to an Ismaili Aga khan Muslim
community. The community from where I belong to. However, these were the remote areas
where I live, so the residents did not know me. However, the VCARE representative knew about
the community structure, so she helped us enter the data collection colony.
High-income area
Initially, planning has made for the collection of data from Bahadurabad and Clifton
areas of Karachi. However, due to the law and order situation, we needed to change our area to
North Nazimabad. Here we also selected the areas, where Ismaili Muslim community resided. It
was the area where people live in big houses and have more than one car. Most of the houses
had guards outside of their home for the resident’s security. In this area, some households
refused to interview those data collectors who do not belong to the Ismaili community. Because
there were some questions about the monthly salary and source of income, the information they
did not feel comfortable in providing us, since they could not trust our intentions, so they refused
to participate in the study. Moreover, in this area, we found both husband and wife as our target
population; therefore, we interviewed both the husband and wife separately.
4.14.2 Questionnaire observations
The research questionnaire had some sensitive questions which could have caused any
emotional disturbance, distress or potential hazards for the participants. Therefore, it was made

224
sure if such an incident happens during the interview the data collectors, and I would
immediately stop taking the interview or focus group discussion. Also, I would help the
participant talk freely about any subject they might find helping and relaxing. Alternatively, if
the participant wanted to leave the discussion or interview, they would be allowed to leave. If
any participant express intention to harm themselves or others, then we would in the first
instance, recommend them to seek help from their doctor. However, if we thought that this was
insufficient, we would seek consent from the participant to contact their doctor on their behalf. If
this was declined and we felt that the situation was difficult enough, the interviewer would
consult with the Principal Investigator where possible. Only in extreme circumstances, we could
have broken the confidentiality and contact the personal doctor. Alternatively, and only if
proper, the participant would be taken to A&E.
Though, very few participants themselves shared their story; when the question was
asked about the number of children; some participants informed that they had five children and
now have four children. Then the participants shared the reason of the death of their child. The
data collectors heard their stories sympathetically. However, none of the emotional distress
incidents took place during the data collection.
Overall, three hundred and seventeen people participated in the study, out of eighteen
participants discontinued in the middle of their interview because of not having time.
In that situation, we valued the participants' time and asked if they wanted to drop the interview.
In that case, few participants discontinued, so the data collector cancelled the form and selected
another participant.
The questioner also had a question about the monthly income of the household. For
security reasons, some participants did not tell us their monthly income, so we respected that and
left that space with the comment on the questionnaire.
6.11 Discussion on the findings of predictors of quality of life:
As discussed in the literature review on the quality of life of older adults (Chapter 2) the
quality of life is a construct of well-being, including self-esteem and life satisfaction (Pinquart

225
& Sörensen, 2000). Other research has identified that life satisfaction is strongly related to
socio-demographic, socio-economic and psychosocial variables (Fernández-Ballesteros,
Zamarrón, & Ruiz, 2001). This research identified similar findings of a strong association
between the socio-demographic, socio-economic and psychosocial factors. This part of the
chapter will discuss the main findings of the determinants of quality of life, including socio-
demographic, socio economic, psyches social and life course and will compare these with the
existing literature. During the survey, participants had shared their views, and opinions about
their life events. These subjective data were recorded with the participants’ consent and are
discussed in this section.
6. 11.1. Age
One of the crucial predictors of quality of life is age. The English longitudinal study of
Ageing (ELSA) (Netuveli 2006) identified that quality of life declines from age 68 years and
then gradually drops until 100 years. However, this study indicated that age does not impose a
significant effect on the quality of life. This might be due to the minimum age of the participants
in this study, which was 50 years, and the maximum age of the participants which was around 75
years. Therefore, quality of life might decline after the age of 75, as reported in a previous study
that suggested the quality of life declines after the age of 75 and over (Brett, et al. 2019).
6.11 2. Socio-economic impact on the quality of life
The study indicated that there was a significant relationship between the socio-economic
factors and quality of life. However, some socio-economic variables had a significant positive
relationship, and some had a negative relationship, as discussed below.
6.11.2.1 Education
Education enhances people’s understanding of their surrounding world. Also, it plays a
vital role in the personal and social development. Pakistan is a Muslim country and follows
Islam as a religion. Islam follows the guidance of God given in the holy book of Quran; where
the importance of education is repeatedly emphasised like “God will exalt those of you who
believe and those who have the knowledge to high degrees” (58:11), “O my Lord! Increase me

226
in knowledge” (20:114), and “As God has taught him, so let him write” (2:282). The above
verses enforce the Muslim community to educate themselves (Javed, Javed, and Khan, 2016).
Though, this research has identified that 36% samples of this study were illiterate. Plus, there
were higher rates of illiteracy in the low-income areas at 74%, compared to the middle income
(24%) and high-income (8%) groups. There are likely to be various factors responsible for the
differences in educational levels within all the three strata of the study. For instance, poverty,
lack of resources and gender inequality as this study report that women pertained as more
illiterate compared to men. In all three strata, male participants had a better education than the
female participants.
The status of women in Pakistani society is very different from western societies.
Women are often considered weaker and vulnerable in terms of education, health,
employment and opportunities. The gender development index reports that Pakistan is the
poorest South Asian country (Chaudhry, 2007). Earlier studies have suggested that education
influences the quality of life in terms of access to paid work and employability. It also
improves well-being that leads to stable social relationships and increases social support
(Ross, & Van Willigen, 1997). Moreover, this study reports a significant positive association
between education and quality of life. This finding is corroborated by other studies, including
an earlier study using CASP (Netuveli, et al. 2006) where people with no educational
qualifications had a significantly lower quality of life than those with some qualification.
Moreover, another study using CASP found that low education in older adult decreases their
quality of life (Wahrendorf and Siegrist, 2010). Finally, Brazilian study using CASP 16 also
discovered that people with a higher level of education have a better quality of life in the old
age (Lima, et al. 2014).
During data collection, some female participants shared reasons for their lack of
education. One of the women from a low-income area said “We were 12 brothers and sisters and
my father was the only bread earner we used to live in the village where there were no schools.
When I was 14, we came to Karachi and settled here, and when I was 16, I got married, so I was

227
not able to get an education”. Other women from the middle income group shared ‘I am from a
Memon community, where women must get married at an early age. In the past, even girls were
not allowed to take education. Our brothers were encouraged to go to school but not us. Today,
we allow our girls to take education, but as soon as they are 18, we try to make them settled
while getting married (as a priority)’. These subjective accounts indicate a difference of views
about education in different ethnic groups of the Pakistani culture. Moreover, it was identified
during the interview when one of the low-income men said ‘I started earning from a very young
age. I think I was 13 years. I have not been allowed to get an education because of our financial
conditions’. The study has also identified that there is a difference in the education of both
gender; females are more illiterate than the male participants.
A woman from the low-income group said, ‘I was only 12 years old when I got married,
I was not allowed to see the world or understand because my parents were poor, and we were
seven sisters and one brother, so my parents were worried, we used to live in a small village
where girls have not been given respect or opportunities’. Previous research also identified that
women in Muslim countries have a low level of education and a broader gap in gender
education (Mcclendon et al, 2018). The research identified that people who left school during
earlier life have a risk of social exclusion and poverty, with fewer chances to take part in social
activities. Moreover, this could affect the future quality of life ( Javed and Khan 2016). There is
evidence that education has a significant association with self-rated life satisfaction (Javed, and
Khan, 2016). The same study identified that education improves well-being because it increases
the opportunities for paid work and the sense of control over life.
Another study predicted that education is an essential factor of good ‘physical and
cognitive functioning’ that affects the quality of life (María, Herrera, and Carmen, 2011).
Education influences life habits and income opportunities. The studies have reported that
education assists in dealing with everyday life situations. It identified that the higher education
of the elderly offers more emotional and financial support to the younger generation (María,
Herrera, and Carmen, 2011). In Eastern European and Mediterranean countries, a study

228
identified that higher education was associated with higher quality of life (Conde-Sala, et al.
2017). People with a higher level of education had a better quality of life (Fa, 2014).
6.11.2.2 Socio-economic groups
Poverty and low economic are worrying for those in older age as they have very ‘low
possibilities to recover from dropped income’ (Ali and Kiani, 2003). Research conducted in
Pakistan reveals that 33% of the Pakistani population is living below the poverty line, and this
affects the lives of the older population.
A similar finding was reported in this research that people living in low-income areas
had a lower quality of life than the people living in the middle and high socio-economic areas.
As the mean score of CASP in low income was 17.43, whereas middle income means the score
was 22.87 and the high-income area mean score was 26.87. Also, there was a significant
difference in the score of quality of life among the three groups. Moreover, the finding indicated
that there were significantly positive association between of people living in different socio-
economic areas and quality of life. Also, the previous study has revealed that there was a
positive and significant relationship between QoL and Social, economic status variables
(Keyvanara, et al. 2015). Similarly, another study conducted in Pakistan indicated that socio-
economic status impacted many aspects of people’s lives, including health and social activity
(Ahmad, & Hafeez, 2011).
The regression analysis using socio-economic variables indicated a significant positive
relationship between the socio-economic groups and quality of life. Earlier in this chapter as
this was informed that the subjective data were noted during the interview of the participants.
On the basis of those data there was a difference of opinion about the quality of life in all three
strata, as most of the people in low-income areas were concerned and worried about their day to
day, the fulfilment of their essential needs; such as unavailability of water, food, sanitation,
income. On the other hand, people in middle-income areas were more concerned about security
and income. Finally, most people living in high-income areas were more worried about living
alone and their health issues. One of the women from the high-income area said ‘My husband

229
died five years ago I have two sons who live in a different house, and my daughter is married
but she comes to meet me once in 15 days, and I am left alone in this big house, so I feel bored.
I spend my whole time with my servants’. The socio-economic finding also displays that quality
of life depends on the social situation of the person. Moreover, the quality of life is also a need-
based, and it varies from one stratum to another.
6.11.2.3 Financial status
A previous study suggested that poor financial stability harms the quality of life
(Netuveli et al, 2006). This thesis also identified a that lack of employment in later life can
decrease the quality of life. The other study has also acknowledged the similar findings that
employment is a crucial factor of QoL in old age (Walker, 2005). It further identified the
importance of work identity; employment, and a pension to increase the quality of life in old
age. This study reveals the similar findings that people who were not retired at the time of the
study had a better quality of life. It has also identified that lack of pension in old age has a
significant adverse effect on the quality of life in the old age. Another study had a similar
finding that pension inadequacy had a persistent effect on a person’s quality of life (Wiggins et
al. 2004). The pension system designed to provide support to the older adult after their
retirement or to the individuals who lost earning capacity during old age, the death of wage
earner in the family and any incident of disability. It is unfortunate that like other developed
countries where senior citizens are provided financial support in their old age, in Pakistan, only
government employee receive a pension or people who are working in a private organised
working sector (Sabzwari and Azhar, 2010). Also, this has been identified during the data
collection when one of the men from the middle-income group said, ‘I had worked in a factory
for 35 years. When I retired the company did not give me any money it was just my last salary in
my hand. Also, today, we are dependent on my son’. Arif and Ahmed have identified this that in
many industries in Pakistan, ‘older adult is working on a contract basis, and they are not entitled
to pension’ (Arif and Ahmed, 2010). With all the above financial challenges, participants in this
study were concerned about their future financial security. As this study identifies financial

230
security for future decreases, the quality of life as the older adults are more dependent on their
carer or their children.
One of the leading socio-economic indicators is the housing tenure in old age and its
relationship with the quality of life. Housing tenure is essential because of its links to housing
equity, and security (Gjonça, et al 2010). Earlier research has identified that owner-occupier
has a higher quality of life (Alan Walker, 2005). Also, this study revealed that housing tenure
has a significant negative association with the quality of life. However, people living in their
own houses have a better quality of life than the people who are living in rented houses. This
study also shared that people in low-income areas do not have their own houses than the
people living in middle income and high-income areas.
Besides, one of the problems faced by seniors of Pakistani citizens is transportation,
either people have no transportation facility, or they are too poor to pay. The public transport is
available, but it is expensive for them to pay for. Moreover, because of the unavailability of
transport facility, they are unable to get the medical facilities in time in case of emergency
(Salahuddin & Jalbani, 2006). Though in some cities of Pakistan, the local governments have
notified half fair for the older adults. However, the same could not be implemented yet (Alam,
Ibrar, and Khan, 2016).
As earlier studies have indicated, car ownership had linked to the quality of life
(Gilhooly, et al. 2002). Use of public transport is potentially vital in facilitating independence
to move around and go to the shops, leisure activities, health and other services and visiting
family or friends. It may be especially crucial for those who do not own a car or cannot drive,
for example, because of visual disability (Gjonça et al, 2010). A similar finding identified in
this study that people having personal transportation had a better quality of life. During the
interview, participants from low and middle income shared their experiences on transportation.
One of the women from low income said, “Transportation is costly, if I want to go to meet
someone or want to go to the hospital it costs me 10 rupees only one way, and I cannot think of

231
rickshaw it takes 100 rupees, so it is too much, and then we think rather than spending money
stay at home”.
Another woman from middle income said ‘The government has started chinkchi
(vehicle) in which 6 to 7 people can sit, but all males and females have to sit together and due to
the greediness of earning more money the driver allows 7 to 8 people to sit. Which is miserable
for a woman who does ‘pardha’ (explain what this means/gender …) like me’. These findings
show that facilities provided to the public in terms of transportation are also not culturally
appropriate.
6.11.3 Socio-demographic impact on the quality of life 6.11.3.1 Living arrangements
Living arrangements have linked to legal marital status. “Family ties, relationship and
support are thought to influence health and mortality, especially at older ages” (Grundy,
Bowling and Farquhar, 1993). Earlier research has found out that there is a positive effect of
family on the well-being of older adults. The living arrangement in this study included people
living in the nuclear or extended families and whether they were married, unmarried or single.
This study has identified that in the total sample, 51% of people lived in the extended family.
Moreover, overall, 83.3% of the participants were married. It was further identified that most of
people from the low-income group (66%) were living in an extended family than in the middle
and high-income group. As during the interview, one of the men from low income said “We are
15 members in a family living together. I have four boys and four girls, one girl is married, and
two boys are married and have their children. So, we are happy that our grandchildren surround
us as sometimes my daughters-in-law get a fight with my wife and they cook their food.
However, at the end of the day, everyone at night time comes to me and say Allah Hafiz
(goodnight)”. Though that statement shows that people living in an extended family sometimes
do not get financial support from the family, but in the end, it provides a sense of belonging in
the old age.” The multiple regression analysis indicated that family type and marital status had a
significant positive relationship with quality of life.

232
Another study conducted in Pakistan reported that the level of satisfaction is higher in
the people living in the extended family; and the reason was physical, financial and social
support (Itrat, et al. 2007). The same study identified that weakened family ties decrease the
quality of care for the elderly. However, this observed that the traditional extended family
system is declining because of the nuclear family system living a small number of people
together. Moreover, this trend has become more common in the South Asian population.
Besides, the study has also identified that people who were married and living with the partner
they have a better quality of life. Also, the similar findings were identified in another study that,
the living arrangement was a determinant of QoL among older people and the respondents who
lived alone experienced poor QoL than those who lived with spouse/children/others (Hellstrom
et al., 2004). Living alone is also associated with loneliness, poor psychological well-being and
depression (Fukunaga et al., 2012). A similar finding was identified using CASP 16 in Brazil,
that identified that socio-demographic characteristics influenced overall QoL (Fa’ bia Lima et al.
2014). The study also suggested that older adults who are unmarried and those who live alone
are more likely to report higher levels of QoL (Fa’ bia Lima et al. 2014). In most developed
countries, the proportion of older adults living alone has increased in recent years. Therefore,
studies have suggested that ‘living alone becomes more ‘normal’; its negative influence on
health and well-being may become less powerful’ (Banks, 2006).
6.11.3.2 Water and Sanitation
Availability of safe drinking water and basic sanitation relate to personal hygiene and
known as essential components for promoting healthy living. In Pakistan, sanitation facilities are
available to only about 42% of the population and improper sanitation cause to diseases
(Husnain Haider and Waris, 2009). This study reveals that the sanitation system has a negative
association with the quality of life. One of the participants of the study said, “Because of an
improper system of sanitation we usually get sick”. The inadequate water supply and poor
sanitation services lead to contamination of their water supply. It also leads to the input of
sewage water into the groundwater. The problem is severely acute in Karachi, the largest city in
233
Pakistan with a population of over 12 million and growing at 6 per cent (Rahman, 1997). ‘The
existing evidence also suggests that the low socio-economic groups would more prone to the
risks such as health behaviour hazards such as smoking, drinking, and eating habits (House, et
al. 1990).
Moreover, the study identified that the primary source of water in an urban city like
Karachi was that 70% of the participants from the sample gets water from the pipe. However, in
the low-income areas, 47% of the participants obtained water supply from the pipe and 30%
from the covered well. However, mostly in middle and high-income areas, people obtained
water from the pipe or the water motor. The study found a positive association between the
source of water and the quality of life. During the interviews, it was identified that the
participants in low-income area reported that they do not have water most of the time, as one of
the residents said, ‘we do not get water for a month we have to buy for 100 rupees and if my
husband is earning per day 50 rupees or sometimes 100 rupees, how can we survive’. The
unavailability of the water was not the issue of only low-income areas, but the same challenge
had identified in the middle-income area. As one of the participants said, ‘Sometimes we get
water twice a week five days a week and sometimes once in a week. If the basic need has not
fulfilled, then how one can survive’.
6.11.4 Social impact on the quality of life 6.11.4.1 Social support, social networking and social participation
Social support, whether from a family or neighbours, always have an influence in
people’s life. This study found that social support and better neighbourhood environment was
related to higher quality of life of older adults. A similar study was conducted using CASP 19,
which concluded that older people should ‘increase their network of friends and engage with the
wider community’ (Tampubolon, 2015). Another study also suggested that not getting positive
support from a family and friends can decrease the quality of life (Zaninotto, Falaschetti, &
Sacker, 2009). A similar finding by Webb E et al (2011) reported that the quality of relationships

234
with family and friends, the number of close relationships and the frequency of contact with
friends have a positive impact on the quality of life.
Another study reported that social life had a positive influence on the quality of life
(Zaninotto, Falaschetti, & Sacker, 2009). Studies using the CASP 19 to assess the quality of life
such as (TILDA) study, and Survey of Health, Ageing and Retirement in Europe (SHARE), have
also reported a significant association between social engagement and quality of life (Timonen,
Kamiya, & Maty, 2011). It has also identified that quality of life increases with greater social
integration (Sim, Bartlam, & Bernard, 2011).
However, in Pakistani society family structures and living arrangements of older adults
have changed over the past few decades (Zeng, 2006). Many of the older adults are not
supported by their families to meet their basic needs and facing hardships in terms of no respect,
no care, isolation, poor health, physical abuse (Afzal, 1999; Clark et al., 2002). A woman in this
study had also shared her views on social isolation from the high-income area; she mentioned,
‘This is my second marriage, and my husband passed away ten years back. Then I had to live
with my stepson and daughter in law as soon as my husband passed away. My stepson started
mentally torturing me. He gave me time for cooking and eating; after that, I am not allowed to
go into a kitchen. I am staying alone for the whole day. There is no one to talk. So, in 15 days, I
go to my brother’s house to spend 2 or 3 days. I am on antidepressant drugs as well’. However,
this was not only the case with the elderly living in a nuclear family, but another study identified
elderly living in a joint family set up also not been given proper family care (Ali and Kiani,
2003). Despite the availability of social networks, such as having family members, in Pakistan,
many older adults do not get support from their families and close ones. So that indicated the
quality of life of older people in Pakistan is possibly worse than previous years and increases the
‘demand for social protection networks for the older people in the coming years.
Moreover, this study found that a lack of social participation was related to lower quality
of life. Hence social networking is likely to increase quality of life. Women in the low-income
area of Karachi and from Pathan ethnic group also reported that “I have got married for the last

235
30 years and I have not been anywhere. Even I do not go to the doctor if I am sick, I use home
remedies. Because in our culture, women are not allowed to go out, and if we go out, then we
must cover ourselves completely, so I hardly go anywhere”.
Muhammad et al (2009) had conducted the study in Pakistan, also reported that people in
old age who still have a power and participate in the decision making have a better life.
However, people in old age who experience social isolation have adverse effects on their quality
of life, and this could be referred to the disengagement theory; (Muhammad, et al. 2009) which
highlights that older adults get disengaged from their social life in their later lives (Cumming, &
Henry, 1961).
Furthermore, previous studies have confirmed that there is a positive association between
social relationships and improved health conditions. It has also identified that the countries who
have a better social network have a lower mortality rate. Social network reduces stress, and the
availability of social support has an impact on well-being (Ponce. Lezaeta, & Lorca, 2011). The
study has also revealed that lack of social participation due to any of the reasons such as
retirement, reduce income, loss of the spouse, physical disability, and results in chronic illness.
However, the social participation of older adults in their life results in good health and improves
the quality of life. Various studies have also identified that social participation is an essential
element to address socio-economic and public health conditions of the ageing population
(Ahmad, & Hafeez, 2011).
On the contrary, the previous study has also identified that participation in social
activities decreases with age. A study was conducted in Lahore Pakistan, which identified that
older adults had a lack of social participation in their later years of life (Ahmad, K., & Hafeez,
M. 2011). The previous study also suggests that the quality of life and well-being in old age
depends on older individuals’ participation in social life (Ahmad, & Hafeez, 2011).
Moreover, a study using CASP 12 has also identified that both social networking and
social participation are strongly associated with ‘better cognitive abilities, higher subjective
well-being and less depression’ (Börsch-Supan, & Schuth, 2013).

236
6.11.5 General health and quality of life
This study identified that better general health and being physically active increase the
quality of life. Most of the people during the interview complained about their health issues.
One of the ladies who was 65 years of age from the low-income group said, ‘I have not gone to
a doctor in my. A month back I got sick, and my son took me to the doctor. He was very
costly, I took the medication, but I had promised myself that I would not go to the doctor
again’. Most of the people from low and middle income had an issue with the health facilities.
According to them, the government, hospitals are free, but the treatment is not proper, and the
private clinics are so expensive that people cannot afford, and they die’.
This study also identified that the lack of daily living activity reduces the quality of life.
However, it also revealed that mainly older people suffered from high blood pressure,
cholesterol, diabetes, and arthritis. The similar finding as identified in another indicates study
that the average old-age chronic condition is cardiovascular disease, diabetes and joint disorders.
Moreover, these conditions also impact the daily living of older adult (Walker, 2005). The
previous study has also identified that the limitation in physical activities and a longstanding
illness have a negative influence on the quality of life (Netuveli et al. 2006). However, this study
has identified that physically active and daily living activities have a positive association with
the quality of life. The earlier research has revealed that moderate physical activities can
increase the quality of life (Hubbard, R 2014). Another study also suggests that poor health is an
association with a lower quality of life (McGee, H.et al, 2011). In general, health influences the
quality of life in older adulst (Blane, Netuveli, & Montgomery, 2008).
6.11.6 Psychological impact on the quality of life 6.11.6.1 Depression
Depression is “associated with poor levels of cognitive function and increased levels of
age-related cognitive decline” (Llewellyn, et al. 2008). Depression has become a significant
public health issue, especially in the elderly. “Pakistan has 22.9% of the elderly population
facing depression” (Cassum, 2014). According to the World Health Organization (WHO), in

237
2020, depression will remain a significant cause of disability. The extent of depression among
the elderly in Pakistan is too much higher than what has been reported (Cassum, 2014).
A previous study using CASP 19 identified that depression has a negative association
with quality of life (Netuveli et al, 2006). Further, in another study, it has been identified that a
depressed person has a poor quality of life than a person who does not have depression
(Sivertsen, et al 2015). A similar finding identified in this thesis was that depression decreases
the quality of life of the older adult. Hence the cut-off point for the depression scale in this study
was score 5 or> 5. It was identified that all three strata included scores more than five. Also,
people living in low socio-economic areas had the highest mean score of depression than the
middle and high-income areas. This study was a cross-sectional study and the data was collected
at one point in time. Therefore, most of the time, the participants had replied based on the
current situation. Therefore, responding to any scale like depression could be affected by the
present situation. As one of the women from a low-income area of Karachi Pakistan mentioned
during the data collection; when asked “Do you feel satisfied with your life?’ and the lady
bluntly said, ‘without electricity, water, food and money can you have a happy life. So how can I
be satisfied”? Also, these situations had described in another study which revealed that poverty
and financial constraints lead to psychological issues like depression (Alam, Ibrar, and Khan,
2016). These are long-term circumstances and are likely to be static disturbances to mood.
Moreover, another study conducted in Pakistan reported that mental health problem
such as depression and anxiety impact the quality of life in the elderly and because of social
problems (Sabzwari, Saniya and Azhar Gohar 2010). A study conducted using CASP also
indicated that depression has a negative association with the quality of life (Netuveli and
Bartley, 2012).

238
6.11.6.2 Sense of coherence Antonovsky (1997) illustrated that ‘sense of coherence refers to an individual’s ability to
effectively cope with life stressors and the capability to raise the level of well-being’ (Nosheen,
Riaz, & Batool, 2014). The sense of coherence reduces the impact of stress and places a
remarkable mediation impact on well-being (Antonovsky, 1987), sense of coherence is a
theoretical construct that is used to explain why some individuals fall ill after the occurrence of
stressful situations, and some do not. Thus, Antonovsky (1987) gave his 1987 book the subtitle
“How people manage stress and stay well”. He felt dissatisfied with stress research, which
concentrates only on the potential harmful conditions of life (Antonovsky, 1974, 1979, 1987).
The same components of the sense of coherence were asked in the form of three questions to the
participants of this study, and it was identified that the sense of coherence had a positive effect
on the quality of life. The previous study assumed that SOC is an attitude of people who are well
educated, are in rather privileged societal positions, and with opportunities for decision-making
(Pallant, & Lae, 2002). And my study revealed that the sense of coherence was lower in the low
middle-income group than the middle and high-income group. Moreover, this can be assumed
that the low literacy level could be one of the reasons for the low score in the low-income group.
However, this study found that SOC had a positive association with the quality of life as it has
acknowledged as a way of viewing the world and one’s life.
Another study has also identified that the higher the SOC, the better was the health of the
respondents (Eriksson, Lindström, & Lilja, 2007). Moreover, another study finding shows that
the sense of coherence was higher in older adult than the younger people (Alex, Jonson,
Gustafson, 2005).
When the participant in this study was asked, ‘Do you feel that the things that happen to
you in your daily life are hard to understand?’ and while answering (yes), (no) or (sometimes)
most of the participants gave the subjective data which was noted during the interview. As one
of the participants said, ‘whatever happens with us is Allah’s will, so I do not think much about
it and leave everything on him’.

239
When participants from this study were asked if they feel that daily life is a source of
personal satisfaction, some of the participants from low income and middle income groups
answered, ‘With lack of resources how could one be satisfied with life’. On the other hand, it
was also observed that people living in the same circumstances were resilient to the situation and
rather than complaining, they were thanking God. As one of the women said, ‘God has given
life, and he has the right to run our lives according to his will, so we are no one to do anything’.
Baltes, Kuehl and Sowarka (1992) identified in their study that people continue to grow mature
in old age, both intellectually and with their skills. The previous study had suggested that the
sense of coherence develops from experiences during life (Antonowsky, 1987). Thus, it is likely
that a belief in God’s ‘will’ can further strengthen a sense of coherence with having an
additional explanation for life’s occurrences. Furthermore, it had also been identified that more
positive evaluation of one’s life history among older adults; have a stronger sense of coherence
(Alex, Jonsén, Gustafson, 2005).
To conclude SOC and God’s ‘will’ share one important aspect which is ‘predictability’.
By having faith in God’s will, people feel that life is predictable and that increases their SOC.
However, predictability does not suggest control.
6.11.6.3 Capability
Before presenting the capability approach by Sen (1991), a Pakistani economist presents
the capability in the form of human development report to the United Nations in 1990. That
describes a multifaceted concept of development, which focused on human well-being, and
“aimed at ensuring and enlarging human choices; which lead to equality of opportunities for all
people in society and empowerment of people so, that they participate in – and benefit from –
the development process” (Patrick, Edewor, 2014).
Sen’s (1991)’ capability approach is a moral framework’. This framework provides
ways to evaluate the ‘well-being and social arrangements’ and how to bring social change in
society. It also evaluates the freedom of people going to work (Alkire, Sabina, 2005).

240
Moreover, the capability approach describes three aspects in its theory that is, functioning,
opportunity and capability (Robeyns, 2006). This study has identified that human capability has
a positive association with the quality of life and having more opportunities and functioning can
increase the quality of life in old age. Surprisingly, this study had found out that the participants
from the LIG were more satisfied, had more opportunities to work than the MIG and HIG. The
previous study had found out that people living in the lower class are happier and more satisfied
and the reason could be more positive attitude towards life and having good family relationship
(Aburto, Rioseco,and Moyano-Díaz 2017). And one of the reasons for having a high capability
score of low-income group would be that mostly people in low-income group lived in an
extended family than the middle- and high-income group.
Furthermore, the findings also showed that the male participants had a negative non-
significant effect on the quality of life, whilst female human capability had significant positive
effects on the quality of life. Though there is only one study that has been conducted using
CASP with the three items questionnaire to evaluate the capability in Kerala, and the same study
found out that the women perceived more opportunities and men had a significant satisfaction
level (Netuveli, Blane & Bartley, 2007).
Hence, during the data collection when asked the question; can you do the things you
used to do 30 years back or you can do fewer things. So, one of the middle-income participants
said ‘I was working in a government firm, and I was given retirement at the age of 60 through
the retirement age is 65 they told me to take golden handshake, or we will terminate you. So, I
did not have the option I took the money and got retired. I would have loved working; I think I
can work until I die. Now sitting at home and doing nothing has made me sicker’.
Furthermore, when participants were asked if they have the same opportunities which
they had 30 years back, many of the participants said that after 60, no work has been given to
them. As one of the men from middle income said ‘I have worked in a bank as a cashier until I
was 59 years old survived an accident and was not able to work for a year then I was given a
retirement. Since then, I tried many places to get work, but every time I have been told that you

241
are too old to work. In my opinion, until we have life, we should be allowed to work because
that makes a person healthier than staying back home.’
6.11.6.4 Optimism
Optimism has been defined as the stable tendency to “believe that good rather than bad
things will happen” (Scheier, and Carver, 1985). It has been identified that optimism is shown to
contribute to an extended life (Netuveli, et al. 2012). This study has found out the optimism has
a positive association on the quality of life. Also, optimism can increase quality of life. As it was
also revealed during the interview that most of the time, people were hopef and positive while
expressing it by saying ‘inshallah’ which means God’s will. It seems that having whatever
circumstances or life event most of the people were optimistic, and this could be possible
because people have been more resilient to the life circumstance. As one of the studies have
identified that because of resilience, people were still happened to be positive (Netuveli, and
Blane, 2008). Though this study had identified, that religion variables had shown a negative
association with the quality of life, but when asked questions on optimism scale; most of the
people replied that “if Allah’s command says yes over some things then automatically things
turns out to get better”. Alternatively, “I am positive that Allah is always with me”. It also shows
a difference of opinion in one setting and could highlight the concept of religiosity and
spirituality, which has already been discussed in the cross-cultural study.
6.11.7 Life-course impact on the quality of life
Blane (2004) revealed that the life course events have an influence on later health and
wellbeing, especially if people have a low job profile or are associated with the low-grade
occupation along with the occupational hazards. Moreover, the same study identified that the
occupational hazards with household status can influence the quality of life in early old age
(Blane, et al. 2004). A further study suggests that previous life history may affect the quality
of life along with the individuals’ current situations, particularly ‘health, social support and -
socio-economic position’ (Blane et al., 2004).

242
However, bivariable analysis in this study do not show any significant association
between occupational hazards and work control. In one research, occupational social status in
mid-life made a direct positive contribution to the quality of life (Wildman, and Moffatt, 2018).
However, in this study, the occupational social class does not show any significant effect on the
quality of life. Moreover, both parents’ education shows a significant association with the
quality of life. Furthermore, the findings show a significant positive association with the housing
type. Moreover, during the life course, both the source of drinking water and sanitation shows a
significant negative association with life quality. The earlier study conducted in Pakistan
suggested that because of poor sanitation and improper water source deteriorates the health of
people, and that affects their quality of life (Daud et al. 2017). Though, multiple regression
analysis found that the proportion of the manual work from the overall working years of life had
a significant negative relationship with the quality of life.
This study also found that the life course events with the current sociological factors,
current health and economic conditions have an impact on the quality of life. When adding all
these variables in the life course factors in the multiple regression analysis, the amount of
variance in CASP 13 increased from 11.5% to 51.7%. That indicated that the social factors,
health and economic factors in later life with all the life course events are likely to improve the
quality of life in the later years. A previous study has also identified that current socio-
economic circumstances influence the quality of life in early old age; by current health
problems (Blane, 2004).
6.12 Conclusion
To conclude this chapter, there are not only one or two factors that influence the quality
of life in the old age. It also depends on one’s life circumstances. Some financial constraints
could be the reason for reduced quality of life; for some, it could be gender inequality. However,
study findings had identified some of the factors that decrease quality of life such as; gender
inequality and social participation. On the other hand, social support and social networking
could change the effects of ageing and improve the quality of life. Although the literature shows

243
that age is a predictor of QoL, this study did not find the same, most likely because of the limited
upper age limit i.e. 75 years old. Moreover, life course perspective suggests that individuals
experiences at one point in time can influence their lives at a much later point in time’
Population ageing is a global challenge that affects individuals, families, socio-economic
situation, care provisions and pension schemes. The finding shows that there are effects of life
course event in the later years. Including present financial status and social factors greatly
influence the quality of life in the later years. Finally, the factors described earlier in the thesis's
conceptual framework found out to have both positive and negative impact on the quality of life.
Moreover, the findings have several policy implications at both government and non-
government level, which will be discussed in chapter 8; where both cross-cultural and predictors
of life aspects of the studies have been concluded are provided as recommendations. The thesis
will then move on to chapter 7; where findings and discussions on gender and quality of life will
be presented.

244
Chapter 7: Gender and Quality of life 7.1 Introduction
Gender equality is a fundamental element for the development of any country. “Yet
Pakistan currently ranks the second lowest country in the world for gender equality, according to
the Global Gender Gap Index” (Leopold, T.A., Ratcheva, V. and Zahidi, S., 2016). Therefore, in
the cross-cultural adaption of any measurement instrument there is a need to consider gender
issues in the research.
This chapter aims to share the key findings of gender and quality of life from both the
quantitative and qualitative data of this research. The chapter is organized as follows; the first
part of the chapter will share findings from the qualitative data of the focus group and the second
part of the chapter will include quantitative findings of the research. Later the chapter will
discuss the key findings from both quantitative and qualitative data. The chapter will end with its
conclusion.
7.2 Findings from both qualitative and quantitative data 7.2.1 Gender-based Qualitative findings from a focus group
The qualitative findings were collected while conducting the focus group of cross-
cultural adaption of the CASP measuring control, autonomy/agency, self-realization and
pleasure. The findings of the focus group highlighted gender inequality in Pakistani culture. In
the Pakistani, culture discrimination starts when a child is born. In most families, a boy is given
priority over the girls. Where girls have been restricted to live their lives with the choices, they
mostly do not have the freedom to make decisions in their own lives (World economic forum
2017). Gender inequality was evident in this research; when item 3 from the CASP-19 was

245
posed to the participants; 'I feel free to plan for my future’ and discussed in both the male and
female groups. Men were confident that they could plan their future as their wish, but women
were more dependent on their husbands or the head of the family to plan for their future. It was
observed that in a Pakistani cultural context, gender plays an important role, where males are
dominant over women.
Moreover, item 6 of CASP 19: 'family responsibilities prevent me from doing what I
want to do' was susceptible to gender differences. Responses from women were different from
responses from men. The male group disagreed that family responsibility stops them from doing
anything they want to do. However, most of the participants from the women group very much
agreed, because of family responsibilities throughout their life, they never do what they want to
do. Ali et al (2011) identified a tradition that a ‘good woman’ in Pakistani culture is expected to
do all the household work, take care of children, husband, and the family.
Furthermore, good women compromise all life situations and sacrifice their dreams (Ali
et al. 2011). Item 6 was not excluded from the CASP. As based on four women’s point of view,
it would be judgemental to remove the item. Therefore, this item was retained in the CASP, to
give a better understanding of the cultural influence on gender differences on the quality of life
in later years.
Moreover, a previous study identified that the South Asian region is known for
'inequalities in men and women's autonomy and power' (Sathar, and Kazi, 2000). Moreover, this
was evident in this research, as it shows that for men, family responsibilities are their duties and
they never stop them from doing what they want to do. However, it is not the same for women.
As one of the women from the middle-income group said: “I am very good in stitching clothes
and always wanted to have a boutique to design clothes, but because of so much of family
responsibilities; I ended up taking care of my kids, my mother in law, father in law and my
husband. Now I am 57 and feel too old to do anything. As now I am a grandparent and have to

246
look after my grandchildren as well.” This provides evidence that culture influences on women’s
choices.
7.2.2 Quantitative findings on gender differences in CASP
The quantitative findings were taken from the survey conducted in Karachi, Pakistan.
Findings include the mean scores in all the subdomains of CASP 13 in gender segregation.
Furthermore, the findings included interaction effects of the independent variable with gender.
Table 7.1 displays the differences in responses of both genders for each CASP 13 domain. As it
shows that males had a higher mean score in each domain; control, autonomy/agency, pleasure,
and self-realization, compared to women.
Domains Males females
Mean Std. Deviation Mean Std. Deviation
Self- realization 9.38 2.78 8.07 3.62
Control 1.77 1.62 1.62 1.67
Pleasure 6.56 1.61 6.31 2.07
Autonomy/Agency 6.05 2.24 5.46 2.46
Moreover, the interaction effect of gender and socio-economic groups was highly
significantly related (<0.001) (table7.1). The main effect of gender was socio-economic groups.
Women in low socio-economic groups had a lower quality of life than women in a high socio-
Table 7.1 differences in responses of both gender
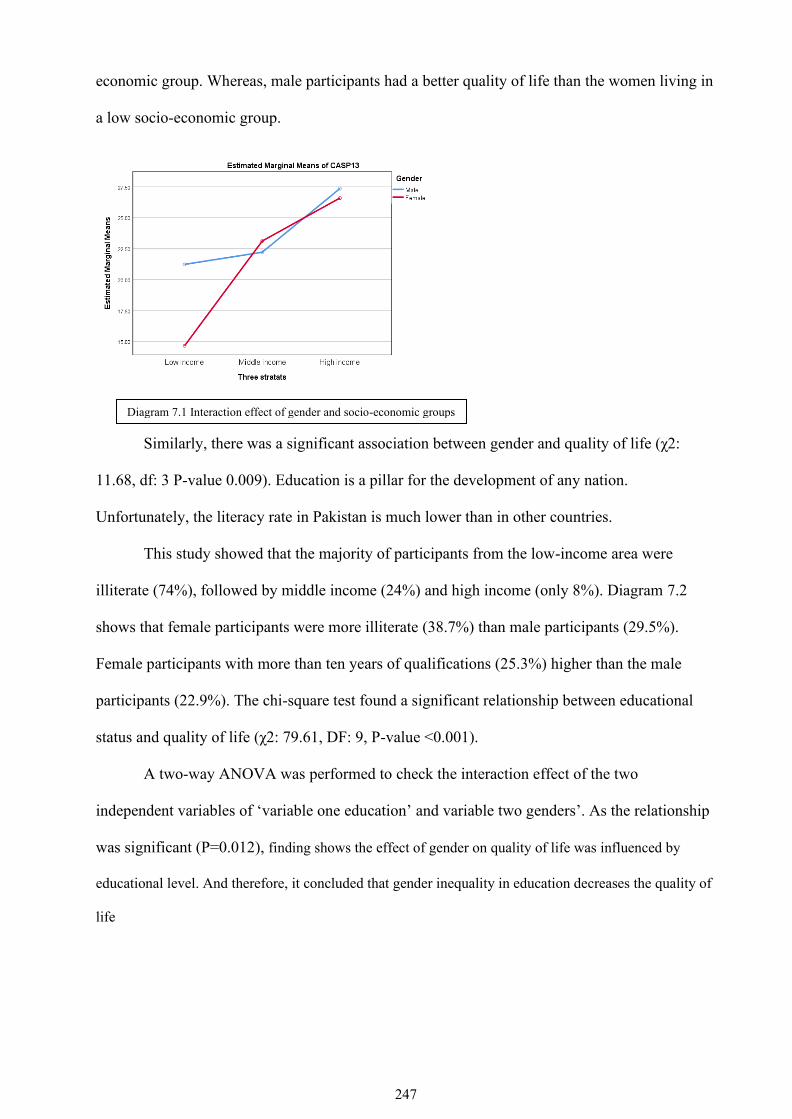
247
economic group. Whereas, male participants had a better quality of life than the women living in
a low socio-economic group.
Similarly, there was a significant association between gender and quality of life (χ2:
11.68, df: 3 P-value 0.009). Education is a pillar for the development of any nation.
Unfortunately, the literacy rate in Pakistan is much lower than in other countries.
This study showed that the majority of participants from the low-income area were
illiterate (74%), followed by middle income (24%) and high income (only 8%). Diagram 7.2
shows that female participants were more illiterate (38.7%) than male participants (29.5%).
Female participants with more than ten years of qualifications (25.3%) higher than the male
participants (22.9%). The chi-square test found a significant relationship between educational
status and quality of life (χ2: 79.61, DF: 9, P-value <0.001).
A two-way ANOVA was performed to check the interaction effect of the two
independent variables of ‘variable one education’ and variable two genders’. As the relationship
was significant (P=0.012), finding shows the effect of gender on quality of life was influenced by
educational level. And therefore, it concluded that gender inequality in education decreases the quality of
life
Diagram 7.1 Interaction effect of gender and socio-economic groups

248
For the interaction effects between the variables, people working to earn money and
gender were also performed. The main effect of gender was significant on employment
(P=0.004). Thus, the effect of gender on quality of life was influenced by employment
(Diagram 7.4).
Diagram 7.2 Education and Gender
Diagram 7.3 Interaction effect of Gender and Education

249
Furthermore, interaction effects between the variables, socio economic group and
gender were also performed. The main effect for gender was significant on socio economic
group (P=<0.001). Thus, the effect of gender on quality of life was influenced by socio
economic groups (diagram 7.5)
Furthermore, the descriptive analysis of gender regarding the general population health
indicated that the male participants' general health was better than the women. However, the
relationship between gender and general health of the population was nonsignificant (P=0.137).
Thus, the effect of gender on quality of life was not significantly influenced by general health
(Diagram 7.6). The graph also shows that both males and females had a low quality of life
without good general health.
General Health Male(%) Female (%)
Good 21.9 13.4
Fairly good 61 52.1
Not good 17.1 34.5
Diagram 7.4 Interaction effect between Gender and employment
Graph 7.5 interaction effect between socio-economic groups and Gender
Table 7.2 Gender and Health

250
Furthermore, the relationship between gender (male/female) and quality of life was
influenced by the social support system (P=0.004). The (Figure 7.7) displays that quality of life
increased when people had a good social support system. Furthermore, gender had a significant
relationship with having a good neighbourhood (P=0.055) (Figure 7.8).
Furthermore, gender had a non-significant relationship with social participation in the
society (P=0.342). It could be said that the effect of gender (male/female) on quality of life is not
influenced by social participation (figure 7.9). Also, the effect of gender was non-significant
with social networking in society (P=0.780) (figure 7.10).
Diagram 7.6 interaction effects between: Gender and general health
Diagram 7.7 Interaction effect between Gender and social support Diagram 7.8 Interaction effect between Gender and neighbourhood

251
Moreover, gender was not significantly related to depression (P=0.762) (diagrem 7.11).
Also, gender had a non-significant relationship with a sense of coherence (P=0.716); hence, a
better sense of coherence has a better quality of life (Diagram 7.12).
The participants were asked questions on the optimism scale, and the findings were that
gender had a non-significant relationship with the optimism (P=0.110) (Figure 7.13).
Diagram 7.9 Interaction effect between Gender and social participation
Diagram 7.10 Interaction effect between Gender and social networking
Diagram 7.11 Interaction effect between Gender and Depression
Diagram 7.12 Interaction effect between Gender and Sense of Coherence

252
Moreover, the table 7.2 displays the bivariable analysis for all three components of the
capability scale separately (activity, opportunity and satisfaction), comparing male and female
scores with the overall scores. Women had significantly higher scores in all three components
of capability and quality of life than males.
Beta Co-efficient (P-values)
Capabilities Males Female
Activities -0.332 (0.248) 0.670 (0.019) Opportunities -0.216 (0.467) 0.755 (0.010)
Satisfaction -0.074 (0.813) 0.647 (0.037)
Now the chapter will move on the discussion of the key findings.
7.3 Discussion
Gender differences are influenced by culture. Women are notably marginalized from
cultural life in Pakistan. They are prevented from contributing and participating equally in the
society. Gender inequality in many cultures can create a problem in many aspects of life (Kinias
and Kim, 2012). Gender inequality in Pakistan can be observed in several sectors, including
employment through segregation in labour markets, division of labour between paid and unpaid
work, distribution of resources within households, access to public services such as education
and health, and also within the power structure of the country (including the representation of
Diagram 7.13 Interaction effect between Gender and Optimism
Table 7.3 : Gender wise capability scores

253
women in policy-making).Women are the part of society that has contributed to life from
reproduction to socialization and looking after household responsibilities. However, the role of
women play is inferior to men (Sharma, 2017). This study has also identified that women were
not a part of the planning or decision making because of the status of women in Pakistan, as the
home is identified 'as a women legitimate ideological and physical space' where she has to
perform her duties as a mother, daughter and wife. Simultaneously, a man dominates the world
outside the home and performs his role as a breadwinner.
However, findings of this study show that there is an effect of gender on quality of life
influenced by socio economic groups. And this is evident in another study conducted in
Pakistan that women from urban cities and living in a high socio economic group are more
autonomous in the planning or making decisions for their own life (Ali and ul Haq 2006).
Also, this study reported a significant main effect of gender on employment. Pakistani
women have low labour force participation and low contribution to GDP. This is because a small
percentage of women are employed, as most men do not like their women to work outside of
their homes (Mehar 2020).
Pakistan also exhibits considerable gender inequality in education. This study found that
male members of the family are given better education opportunities than women, and primary
influence for gender was significantly related to educational level. It is right to say that there are
substantial gender disparities in educational attainment (Chaudhry and Rahman 2009).
Women in Pakistan 'also face a disproportionate burden of disease, with a high maternal
mortality rate' and the reason behind the high mortality is due to low social status and inequities
in access to primary health care, nutrition, and education( Moin, A., Fatima, H. and Qadir, T.F.,
2018). Though my research did not find any significant effect of gender on general health;
however, the descriptive finding shows that males had better health than females.
Moreover, social support directly and indirectly affects well-being (Gençöz, Özlale, and
Lennon, 2004). This study found that the effect of gender (male/female) on quality of life was
significantly influenced by the social support system. On the other hand, the study identified that

254
a good neighbour also increases the quality of life; and Females were more likely to report
having a good neighbour than males, suggesting that women seek positive relationships close to
home, more than men. There is also a non-significant effect of gender on social participation.
However, Pakistani women lack social participation due to their cultural and religious
restrictions (Pal 2000).
It was identified that quality of life was lower in the male participants when they did not
have work opportunities the same as they had 30 years previously. Therefore, they were less
satisfied than 30 years previously. In contrast, the quality of life improved for female
participants whose work opportunities had improved or had remained the same for 30 years
previously. However, Amartya and Martha Sen have discussed that 'gender inequalities may be
seen as multiple dis-functioning in a social space where men and women are differently
disadvantaged in access to resources, education, health, and control over their bodies and lives
and so on' (Addabbo, Lanzi and Picchio 2008).
Moreover, in this study, gender had a non-significant relationship with depression.
However, a previous study reported that women in Pakistan are vulnerable to poor mental health
due to 'marriage related issues, domestic violence, verbal or physical abuse by in-laws, stressful
life and poor social conditions' (Zahidie, and Jamali 2013).
7.4 Conclusion This study has demonstrated a glimpse of the societal status of women in Pakistan. Women in
Pakistani society are mainly involved in their family life, taking care of the home and bringing
up the children. Most of the time, they are not involved in decision making for their own lives.
Gender disparity was significantly observed in education and employment in this study.
Furthermore, gender discrimination may decrease the quality of life for women in later years.
However, there are differences in the autonomy of women from low income and high-income
groups.

255
The thesis will then move on to the last chapter, where the final discussion of the study
will be shared. That will include what this study adds to previous research, future research
direction, strength, and limitations of the study, implication and recommendations.

256
Chapter 8: General discussion on research, conclusion, and implications 8.1 Introduction
This chapter will discuss the key findings of the main primary two aspects of this study:
a cross-cultural adaptation of the CASP tool and the predictors of quality of life. The chapter
will also discuss the strength and limitation of the study, consider the future recommendation of
the study, and finally the conclusion and recommendation of the study.
8.2 Summary of the Key Findings
A cross-cultural survey of quality of life using CASP in Pakistani culture has provided a
picture of the multi-dimensional characteristics of quality of life and wellbeing in the Pakistani
population. Using CASP in an entirely different cultural context, the measure highlighted some
of the standard dimensions of being older across the culture in this globalised world. This study
further identified that the data for CASP 17 does not fit well to any model these are; the single-
factor model, first-factor model and second-factor model. However, the shortened 13 items
version was used to analyse the data to assess the quality of life and the first-order model best fit
to the data, which is recommended to use in a future study in Pakistan. However, CASP 13 is
not an only shorter version used to assess the quality of life, but there are other shorter versions
of CASP 12 v1, v2 and v3 that have also been used in other studies like Survey of Health,
Ageing and Retirement in Europe (Gyu, et al, 2015). As other shorter CASP versions, CASP 13
proved to be a useful tool to assess the quality of life in the Pakistani population. The domains
of CASP 13 had a same domain as it was in its original version CASP19 that shows that the
domains like autonomy and control can also work in fatalist culture like Pakistan especially
when CASP has been used to assess the quality of life of older adults in the urban city of
Pakistan.
According to Hyde et al (2003), the measures developed earlier on quality of life were
undertheorized and mainly based on the proxies such as health and some of the measure had
taken a necessary subjective wellbeing data such as life satisfaction, happiness in their measure

257
to assess the overall quality of life. However, the CASP was developed in the UK, where the
retirement arrangements had already been managed, and people were living a long life with good
health (Gilleard & Higgs, 2002).
Therefore, it is interesting to compare the CASP domain considering the study findings.
The theoretical background has already been discussed in chapter 2; here, the discussion will
focus on the theoretical implications of the findings from this research. CASP is based on
Maslow, Doyal and Gough (1991) theory who argued that fulfilment of once essential and
higher human needs results in a better quality of life. The domains of CASP were based on those
higher needs including Control, Autonomy, Self-realisation and Pleasure. Control is defined as
the ability to shape ’one’s own life situation and environment, while autonomy refers to an
absence of unwanted interference from others. According to Doyal and Gough (1991), there are
two basic human needs, autonomy and physical health. Based on this theory, one of the chosen
domains for CASP was autonomy. However, autonomy/agency is culturally sensitive in
Pakistani culture. Agency had been described by Sen (1999) ‘‘that person is free to do and
achieve in pursuit of whatever goals or values he or she regards as important.” (Sen, 1999). The
study finding also shows that autonomy was not considered as it meant, most of the participants
of the study did not have freedom of choice, mostly women. Still, the study also found out that
women living in a high-income group had an autonomy which has already been discussed in
chapter 5. However, women are underprivileged to get an education than men. It has already
been discussed in earlier chapter 5 that women wanted to get an education to make their life
better. Still, they were not allowed to pursue education because of cultural constraints.
Moreover, the domain Control was also interpreted the same as it was presented in the
original CASP. Where all three items loaded in the same factor. As three of the items; ‘‘my age
prevents from doing the things I would like to do so’’, ‘‘I feel that what happens to me is out of
my control’’ and ‘‘my health stops me from doing the things, I want to do’’ have perceived as it
had been perceived by a different culture where CASP had been used.

258
Other domains of CASP were self-realisation and pleasure, which were interpreted the
same as CASP 19 original version in Pakistani culture. Theoretically, both pleasure and self-
realisation from the original CASP meant that people in their old age perform all the activities
which makes them happy and achieve all goals in life which they intended to. Moreover, A fresh
map of life by Lastlet (1991) argued that a person should live their retired life as a crown of life
on which people are free to do whatever they want to do. Also, the theoretical ground of Maslow
discussed that Self-realisation refers to the need for personal growth and development
throughout ’one’s life. It is the highest level of ’Maslow’s hierarchy of needs, which shows that
the person is self-actualised, and have fulfilled all their potential as an individual. The same
concept was given by Lastlet (1991), in his third age theory, where he defined the third age
should be the age where an individual can achieve their goals and live a happy life. However,
this is only possible in a country where policies for the older adults have been in place and
people do not have many financial constraints. It had been identified in the study that the only
government employees had been given minimal amount as a pension to the retired employee in
Pakistan. And because of lack of financial stability, the quality of life decreases significantly.
Moreover, the theory of third age is based on the British society and could be used in a
country where the old age policies are in place, but this could not completely possible for the
developing world where the government is still struggling with poverty alleviation and the
creation of a strong welfare state. However, this study has found out that people living in high
socio-economic group live their life fullest and fulfil the criteria of third age.
Moreover, many people in Pakistani culture answered the items of self-realization in
religious context. where an individual had confidence that whatever God had given it to them is
of good characteristics and they were motivated that they would achieve or get things in life
what Allah sees a benefit to them. Moreover, keeping a strong belief in Allah, that He is solely
the one who can help them and makes their life happy. However, some study participants were
also convenience that they were free to fulfil their dreams and could had a happy life.

259
Furthermore, another essential aspect of culture which had an influence on the quality of
life is gender. Gender has a significant relationship with quality of life. The study has also found
out, that the religious values also influenced on quality of life, though there was no scale used to
assess the religiosity besides that, in all aspects of questions asked during the interview, the
’participant’s answers more reflected its religious values. Moreover, their belief in Allah in all
the life circumstances was positive that they could overcome with ’life’s challenges. However,
when asked question like, whether people attend religious services? Also, it was identified that
attending religious services shows a negative relationship with the quality of life. However,
during the interview, most of the participants reflect on their faith in Allah. The earlier study
had identified that ‘‘religiosity is associated with organised worship, whereas spirituality is
defined as the internalisation of positive ’values’ religion is more about worshipping and
practising faith in term of prayers and meditation. However, spirituality is a relationship and
faith in God (Mattis, 2000). And the study finding suggested that the study sample were more
spiritual than the religious. Besides, the cultural influences, older people also experience good
or bad life in their old age because of other influential factors such as (demographic
environment, social environment, physical and psychological health and life course events).
Moreover, the finding of the study suggested that quality of life varies from one
individual to an individual; it also varies from people living in one socio-economic group to
another socio-economic group. The study had found out that people living in the low socio-
economic strata had a lower quality of life score than the people who lived in high socio-
economic strata. People had autonomy in the high-income group than the low-income group.
Previous studies had also identified that the aforementioned conditions could affect the
quality of life through ’one’s influence upon ’individuals’ current circumstances, particularly
health, social support and socio-economic position (Blane et al., 2004; Read & Grundy, 2011).
One of the central issues of the older adult in Pakistan is poverty; as given the retirement
age, they are unable to work and even if they do have an insufficient state pension that does not
have enough to maintain human life. As the study has been identified that quality of life

260
decreases significantly because of a lack of country pension system. Economic insecurity is one
of the significant challenges in old age.
The previous study had suggested that in Pakistan to meet the needs of older people, they
are more dependent on individual social support system, that may include family, relatives,
friends and neighbours, as it is a traditional society (Ashiq, & Asad, 2017). Moreover, the
previous study also suggested that social position was associated with a better quality of life
following labour market exit and that more recent circumstances would account for these
differences, particularly health and financial characteristics. Furthermore, human wellbeing is an
essential aspect of ageing, and that includes life satisfaction, and opportunities, to have a better
life. The capability approach understands well-being in terms of functioning. These
’functioning’s are the states of being and doing those things that older people want to achieve. If
the older adult in Pakistan wants to achieve life in the third age or be self-actualised, then the
vital element to achieve is human capability. As this study had identified that capability had a
significant positive association with the quality of life. Also, there is a significant positive
relationship in all three aspects of capabilities such as activities which an individual performs,
opportunities and satisfaction. Many participants reported that they can do the same work they
used to do 30 years back but because lack of opportunities they are unable to do what they
wanted to do in their later life. Therefore, it is important for the state to increase the working
opportunities while increasing the retirement age of the state.
Furthermore, the optimism scale was also used to assess the relationship between
optimism and quality of life. It was identified that there is a significant positive association
between the quality of life and optimism. The socio-demographic characteristics of this study
were mostly the same as those studies where CASP-19 has been used, in Pakistan it is an evident
that family system has a significant positive association with the quality of life. The study has
found that overall (51%) of the population lived in an extended family, and more people (66%)
in the low-income group lived in an extended family than the middle- and high-income groups.
However, as discussed in the literature review, the family system changed in recent years due to

261
industrialisation and globalisation where more people live in a nuclear family than the extended
family system. Therefore, older adult has left alone behind. Since Pakistan is an Islamic country,
religion is firm where the family is responsible for looking after their older parents. It is a social
duty of children to look after their parents appropriately. However, my study had identified that
the quality of life decreases people living in an extended family system. On the contrary the
previous study suggested that older adults living alone had lower psychological well-being (Lim,
and Kua, 2011).
Moreover, the quality of life is a ‘‘multidimensional structure’’, which have constructed
‘‘both objective and subjective aspects of ’individual’ live’’ (Julius et al, 2011). This has also
been evident in this study, where objective indicators like; education, pension, and employment
have shown an impact on the quality of life. Whereas subjective indicators acted as; optimism,
sense of coherence, capability and depression had an also impact on the quality of life in the
older age. The study has also identified that education and socio-economic factors significantly
affect the quality of life. However, because of the cultural influence, women were less
opportunistic to have their education, whereas men are given a better education. Unfortunately,
over a period, Pakistan has made insufficient progress in decreasing the gender gap in education
to date.
Furthermore, there is no single key factor that affects the quality of life; the regression
model of this study showed that some variables have a statistically significant positive and
negative impact on the quality of life. The factors that positively impact are (socio-economic
groups, education, social support neighbourhood, social networking, general health sense of
coherence, capability, and ’father’s education). There are vital factors which have a statistically
significant negative impact on the quality of life such as (Gender, own transportation, pension,
marital status, social participation, and protective equipment and ventilation) beside that it has
also been identified that quality of life can be affected by ’one’s state of health, social support or
pension provision in later life (Blane, Netuveli, & Bartley, 2007). Moreover, the previous study
suggested that ‘‘Factors like perceived poor financial situation, depression, functional limitation

262
attributable to longstanding illness, and limitations in everyday activities can affect the quality of
life negatively’’ (Netuveli, et al, 2006). My study has also identified that social context in old
age has a significant relationship with the quality of life, including social support,
neighbourhood, social participation and social networking. Social support has a significant
positive association with the quality of life, and it has become the source of help in the old age.
This study has also identified a lack of social participation in the old age decreases the quality of
life. Similar findings have been identified in the earlier study, which shows that lack of social
support decreases the ‘life satisfaction and increases in depressive symptoms’ (Newsom, and
Schulz, 1996) in older adults.
My study had also found out that general health and physically active people had a
significantly better quality of life. However, limited functional activities of daily living did not
significantly impact the quality of life. Moreover, the typical illness in old age in the Pakistani
population was high blood pressure, diabetes and cholesterol. However, statistical analysis
found that depression was none significantly associated with quality of life, contrarily to other
studies. The study conducted by Netuveli (2006) found out that the impact of the depression was
the highest in reducing the quality of life (Netuveli, et al. 2006). Moreover, this study also had
identified that employment does not have any effect on the quality of life in the Pakistani
population; however, lack of pension and not having an owned car decreases the quality of life.
The similar study had also identified that financial circumstances to be unfortunate had a very
high effect on lowering the quality of life scores while owning cars and having good income
improve quality of life.
My study had also assessed the Life-course factors that play an essential role in assessing
the quality of life in the later years of life. Therefore, the study had evaluated life course factors
along with the present social factors, current health and current economic impact. It was
identified that there was no significant effect was identified in social class; however, source of
water and sanitation affects the quality of life in the later years. However, social support and

263
social networking in later years with the life course indicators had shown a significant positive
effect on the quality of life.
Therefore, improving social support, social networking and social participation during
the life course improves the quality of life in the later years. Thus, the previous study had also
suggested that facilitating older ’people’s participation in society can improve the quality of life
(Netuveli, et al. 2006).
8.3 Contribution of this study to existing research
It is well known that ageing decreases the quality of life (Netuveli and Blane, 2008) and
there could be limiting factors that could be associated with it; like socio-economic background,
or health. In Pakistan mainly, researches are focused on health-related quality of life on the
ageing population or the challenges of the ageing population. Therefore, this research has added
to that there is no single dominant which affects the quality of life in old age. But it is an
evidence that financial situation, opportunities, work satisfaction, not working in old age, lack
of social participation, social support, life-course events, health, depression, daily life activities,
sense of coherence and optimism are the factors which are positively or negatively associated
with quality of life in old age.
This research has added to the previous research that Autonomy and Control is present in
fatalist culture like urban city of (Karachi) Pakistan. Therefore, CASP can be measured to assess
quality of life in Pakistan.
The research also added that there is an inequality in different socio-economic groups in
all aspects of life. People in low-income groups who were counted themselves as weak for long
are still poor and living with low quality of life. It was evident during the interview, that
participants had described, how their lives had affected because of unavailability of their essential
needs such as; water, electricity and sanitation, which was described by the participants living in
low and middle-income areas. Moreover, this could be one of the reasons where the quality of life
scores was lower in the low socio-economic groups.

264
Moreover, the capability approach, which was a conceptual thought of the Pakistani
economist Muhubul Haq; was used in Pakistan to evaluate the wellbeing. The three items of
Capability were adapted from the study of Gopal Netuveli. Each item scored from 1 to 7, and
the mean score in all three items (working, opportunities and satisfaction) were better in the
low-income group than the middle income and high-income groups. The reason could be that
people in low-income groups look for more work, and opportunities to fulfil their basic needs.
My study has also added that the crucial aspect which was missing in the CASP is
religiosity and spirituality. It is fascinating to know that religiosity decreases the quality of life in
this sample. However, when asked questions in any scales like CASP or Optimism scale, most
of the participants answered in positivity and referred to Allah. For example, in CASP, when
asked ‘life has a meaning’ and the response was yes if Allah has given life, then there will be a
meaning of life’. This finding shows the difference in the perceptions of people and their
thoughts in between religiosity and spirituality.
Furthermore, the study also adds that human needs are different for all the three
strata. For the low income, they were worried about water, food sanitation and electricity.
For middle income, it was more about security and money, and for some social isolation,
moreover, for the high income living alone and health issues. Therefore, CASP can give a
different meaning to an individual.
8.4 Strength and limitation of the study
One of the key strengths of the study is that it is directly comparable to the study
conducted in the U.K. Quality of life at older ages: evidence from the English longitudinal study
of ageing (wave 1). Further study strength and limitations are discussed now.
8.4.1 Study Design To collect information at a single point of time is an excellent strategy to get a descriptive
finding off from the participants and to develop a future hypothesis. However, the cross-
sectional study makes it impossible to explore how people perceive their quality of life over
some time. Therefore, the longitudinal study is recommended because that will enable an assess

265
changes in quality of life over a period of time. More over the specific political situation in
Pakistan at the time of data collection (June 2016- August 2016) may represent a potential bias
on some of the data collected as security threats may have made participants more sensitive
about providing personal information to the data collectors. Moreover, the longitudinal study
has not been conducted in Pakistan yet. Therefore, the longitudinal study would give a better
picture of one’s quality of life over some time.
Another limitation of the study was when asked questions related to the life course
variables, there could be a possibility of having a recall bias, as the participants had to think
retrospectively and answer the question. Another limitation of the study was its length of the
questionnaire, by the time a participant had asked questions about life course events they could
get tired or they did not want to think about past; therefore, some of the participants did not give
answers, mainly in the life course questionnaire.
8.4.2 Sample and sampling strategy
The best way of collecting data is random sampling as it decreases the chanced of
sampling error and is the best way to give every individual chance in a population to take part
in the study. However, because of short time and resources, purposive sampling was selected to
collect the data (Meadows, 2003).
Another limitation of the study was that participants included in the study might not be
representative of the whole population, and the generalisation of our results may be limited. The
CASP 13 results can not represent the general population of Pakistan this only had covered one
of the cities of Pakistan. Different regions of Pakistan represented an entirely different culture
and norms. And when using CASP in other regions or rural areas of Pakistan the finding of
CASP might show different meaning to all the domains of CASP. Therefore, it is recommended
to conduct similar research in all the four regions of Pakistan, including urban and rural
communities.

266
8.4.3 Participants characteristic
All the participants of the study had similar characteristics which were set for the study
designed the minimum age of the participants were 50, and the maximum age was 75. Many of
the participants preferred to give an interview alone without the presence of anyone. Few
participants were accompanied by their family member. However, answers were given by the
participants. However, there could be a chance of response bias in the presence of another
person. Therefore, response bias may impact the results of the survey leading to over
satisfaction to all life circumstances in the participants’ population overall (Mazor, et al. 2002).
Moreover, participants refused to answer the question, regarding the amount they earn,
due to law and order situations of the country. Therefore, it was not possible to use the income
variable in the analysis to show the impact of income on one’s quality of life.
8.4.4 Time management for data collection
As earlier it was mentioned the data collection in the initial phase took a little longer
time. Therefore, it is suggested to reduce the number of scales while researching older adult
assessing their quality of life.
8.4.5 Strength and limitations of the scales
Few scales had administered in the study which had been discussed already in the
methodology chapter. However, there were some scales which had strength and limitation to
share.
8.4.5.1 CASP Scale
Besides, the validity and reliability of CASP, it had proved to be easy to understand
and to evaluate the quality of life among the Pakistani population. The CASP was
developed as a self-completion instrument to assess the quality of life; however,
administrating face to face interviews did not result in any challenge as it makes a person
understand each statement completely.
8.4.5.2 Activities of daily living and Instrumental Activities of Daily living

267
The usual version of Activities of daily living and Instrumental Activities of daily Living
has 15 items to assess the Functional status (ability to perform activities of daily living) The
ADL scale has ten questions related to non-instrumental and five questions related to
instrumental activities of daily living (IADL). However, in this study, nine items were used to
assess the ability of daily living four items for (ADL) and five items for (IADL) as this scale was
adapted from one of the studies and borrowed the translated and validated version in Urdu used
in Pakistan. Moreover, the translated version had nine questions. Therefore, the same version
was used to assess daily living. That included all the everyday daily living activity such as
(cooking, bathing, washing).
8.4.5.3 Life-course questionnaire
The limitation of the life course questionnaire was its length and its thoughtful answers.
However, it took time for participants to think and answer, and they left many of the questions
unanswered. Also, because this questionnaire was administered in the end, the participants were
tired or wanted to finish it quickly, therefore, refuse to answer questions. Especially when they
asked regarding all the jobs they had done throughout their life and houses moved throughout
their life. Therefore, the missing data in this questionnaire had created a problem in regression
analysis. As a life course is a vast concept, it is recommended to perform a life-course study
separately in order to obtain complete information.
8.4.5.4 Age effect
Furthermore, the previous study had evident that age had perceived to decrease quality of
life (Netuveli 2006). But the significant finding of the study had identified, that there were no
age effects on quality of life. Moreover, it had shown a non-significant association between the
age and quality of life. Moreover, the reason which can be assumed from the finding is that the
minimum age of the participants of this study was 50 years, and the maximum age was 75, and
the previous studies had suggested that age effect declines after the age of 68 years.
8.5 Research Implication

268
The main implication of this research is that government should work towards the
Healthy and Active ageing of the population. Active and Healthy ageing agenda was started by
the World Health Organization, the purpose was to empower people to live active and healthy
lives.
Therefore, it is a state responsibility to take forward the agenda of active and healthy
ageing to set a policy to promote the quality of life and wellbeing of individuals of all ages
(Eurostat, 2011; UNECE, 2012). The government should promote healthy and active ageing
while establishing age-friendly parks to allow older people to spend time in the fresh air and use
the park for walking and exercise.
The government and non-government organisations in collaboration should start active
ageing programs to promote a healthy lifestyle. Ageing is a process; therefore, the government
should also make a policy for healthy eating from the early ages so people can live a quality and
healthy life in their later life.
The government should also provide equal opportunities to both males and females to
establish culturally appropriate gyms and libraries where older people can spend the quality of
time in order to improve their social and physical health. The strategies should be developed in
order to change the attitude and behaviours of older adults. Also, create a social and supportive
environment to engage older adults to live an active and healthy life. Moreover, enable older
adults to live an independent life without any dependency on family (WHO 2015; Zaidi et al.
2016). Active ageing strategies should also include employment opportunities for older people to
get employment after their retirement life and give more opportunities to learn new skills in
order to live their life fullest.
The finding of this research suggests that a lack of social participation decreases quality
of life and better social networking and social support increase the quality of life in old age.
Therefore, the prescribing social agenda and policy implication at the government level will
improve the wellbeing in general but particularly psycho-social wellbeing and quality of life in
the old age. The government need to collaborate with the voluntary and non-government

269
organisations to initiate various activities such as; volunteering, art activities, group learning,
gardening, befriending, cookery, healthy eating advice and a range of sports. Earlier studies
suggested that social prescribing improves people’s health and wellbeing, especially for people
who are socially isolated and experience mental or physical ill-health (Wildman, & Moffatt,
2019).
Moreover, older people should be provided with a safer place to live. And provide a
platform to both men and women to interact and socialize on a daily basis. Strategies should be
developed to promote social participation and social networking at the community level. The
more community-level program could be organised at community levels by the non-government
organization (NGO). As the family system is changing the older parents left alone when children
migrate to another part of the world for better job opportunities, which left parents lonely and
isolated. The policy should be developed for all the non-government organisations to take a
responsibly to encourage older people to engage them in social and community activities.
It is also pivotal to empower older people to live a better life following retirement.
Therefore, it is essential to learn new skills after retirement such as vocational skills. It had
been identified in previous studies that approximately 80 per cent of older persons worldwide
do not have pensions, and it is crucial for developing countries like Pakistan to live a better life
after retirement, where only people working within government system gets pension
(International Labour Organization, 2002).
As the population is ageing, investment in maintaining a good quality of life for old
people is important so they make less use of health services. Preventative policies should be
introduced so that over time the cost to treat a patient is lower. This is particularly important for
that part of the Pakistani population that are poor and cannot afford private health. However,
government also needs to provide necessary finances for health care in old age so they can get
treated for the curable disease.
The government of Pakistan needs to have a policy for older persons to have a secure
income in terms of pension so they can live the later life according to their wish. Pension policy

270
should have equity and equality for all the social class. In developed countries, individuals with
higher socioeconomic status spend joyful and healthy life compared to the people having a
lower level of education, income and social status (United Nations, 2008). The policies on
transportation should be developed for older adults. There should be no fare on government
transportation. So, they can travel freely.
Furthermore, the government should provide more funds for research and development
to address the evidence-based challenges and problems of the older generation.
8.6 Recommendation for future research
The research is motivated by earlier findings of the quality of life of older people.
However, a longitudinal study on quality of life would always be a promising area for future
research. Because in cross-sectional studies, people answered with the situation, they are going
through at the time of data collection. For example, if there was no electricity in a house for 2
hours having 43 temperature. So, answers regarding the quality of life could have a biased
answered. Further, the study offers to see the relationship between resilience and quality of life.
Furthermore, Pakistan is a much-diversified country in terms of regions, ethnic background, and
demography. Therefore, it will be interesting to use CASP in different regions and in both urban
and rural settings to get a better understanding of the quality of life. It will also be interesting to
find out the association between Religiosity, spirituality and quality of life of older people; while
using the validated religious scale. Furthermore, as the study finding shows that social support
and neighbourhood increases the quality of life while a lack of social participation decreases the
quality of life. Therefore, it will be interesting to conduct the Randomized Control Trial studies
on social isolation in old age and its impact on the quality of life. Moreover, to add this, it will
be exciting to add social prescribing (Social prescribing is about recognising people’s health
primarily by a range of social, economic and environmental factors. Social prescribing addresses
people’s needs holistically) and to assess how this improves the quality of life in the old age.
Moreover, the life course is an emerging agenda for most of the developing countries,
and on another hand where the non-communicable disease is highly prevalent it will be

271
interesting to see the diet in the earlier age and its impact on today’s health and quality of life; in
all three strata. Also, it will assist public health professionals to develop their policies based on
the findings.
As more people are living in a nuclear family than the extended family and people are so
isolated with the social world, and people are more reluctant to come out of their shell.
Therefore, the concept of active ageing comes in. Active ageing is a recent evolving agenda of
WHO and after the summit in Madrid in 2014. Many of the countries are working towards the
agenda. “Active ageing is to enable people to realise their potential for physical, social and
mental wellbeing and to participate in social life also in the last stage of the life cycle” (Rossie G
et al. 2014). So, using the intergenerational approach in the trial study to assess its impact on the
quality of life of the older people will be exciting research.
8.7 Conclusion
The study is unique as it is the first study to investigate the subjective wellbeing and
quality of life of 50 + older adults in Pakistan. The first research aim was to assess the quality of
life of older adults in Karachi Pakistan using CASP. CASP has been chosen as the appropriate
instrument. A process of translation and back translation was conducted to assess the reliability
and validity of CASP in Pakistan. This PhD has also argued that there is a cultural influence on
the quality of life as the results if cross culture adaptation tool confirmed the validity and
reliability of CASP13 score as a good tool to assess the quality of life of 50+ older adult in
Karachi Pakistan. Moreover, various variables had been used to assess the quality of life in
Pakistan, such as (Age, Gender, and Education). And the key findings have shown the
following;
- The study had confirmed that there is a gender influence in the quality of life in the
Pakistani population. The study has further confirmed that CASP can be use in
fatalist culture, however social position did make a difference in an individual's
quality of life.

272
- Moreover, the study has also confirmed that age is only a number there is no age effect
on the quality of life in the Pakistani population.
- Furthermore, there is a positive significant association between education and quality of
life.
The second aim of the research was to explore the factors which influence quality of life in
old age. The research found that there is several factors that have had an impact on the lower
score of quality of life in the older adults lived in Karachi Pakistan. The study also revealed that
the main factors that significantly decrease quality of life in Karachi include gender, inadequate
pension in old age, lack of transportation facility, marital status, inadequate sanitation issues, and
lack of social participation. However, other factors can improve the quality of life significantly
in old age in Pakistani population, and that includes socioeconomic positions, education, social
support, pleasant neighbourhood surrounding, general health, sense of coherence, and human
capability. The study also added that life course events such as father’s education, present social
support, social networking, and owning a house during the life course significantly increase
quality of life. On the other hand, the lack of a protective workplace environment in previous
occupations, and lack of social participation in the later years significantly decreases quality of
life.
In summary, this study confirms that CASP is a good instrument to assess the quality of
life provided that the instrument is adjusted through a process that makes it sensitive to culture.
Furthermore, the results of this PhD thesis would be recommended the importance of
developing policies at the state level within government and non-governmental organisations.
273
References
Abrams, M.A. 1973 'Subjective Social Indictors', Social Trends, no. 4, HMSO, London. Abdala, G.A., Kimura, M., Koenig, H.G., Reinert, K.G. and Horton, K., 2015. Religiosity and quality of life in older adults: literature review. Life Style, 2(2), pp.25-51. Abdel-Khalek, A.M., 2010. Quality of life, subjective well-being, and religiosity in Muslim college students. Quality of life research, 19(8), pp.1133-1143. Ackrill, J. 1981. Aristotle the Philosopher. Oxford: Oxford University Press. URL available at; http://www.pursuit-of-happiness.org/history-of-happiness/aristotle/. Ahmad, K. 2011‘Older Adults’ Social Support and its Effect on Their Everyday Self-Maintenance Activities: Findings from the Household Survey of Urban Lahore-Pakistan’, South Asian Studies, 26(1), 37. Ahmad, K., & Hafeez, M. (2011). Factors affecting social participation of elderly people: a study in Lahore. J Anim Plant Sci, 21(2), 283e289. Ahmed, S., 2008, What is Sufism?. In Forum Philosophicum (Vol. 13, No. 2, pp. 229-246). Ahmed, S., 2009. Methods in sample surveys. Johns Hopkins Bloomberg School of Public Ahmed. A and Chaudhry, 2015 Ageing and ageing stereotypes: perception of older persons' of rawalpindi The Explorer: Journal of Social Sciences ISSN: 2411-0132, Vol-1, Issue (4):97-100 Alam., A, Ibrar., M. and Khan., P 2016 socio-Economic and Psychological Problems of the Senior Citizens of Pakistan Peshawar Journal of Psychology and Behavioral Sciences, Vol. 2, No. 2, 249-262 Alatawi, M.A., 2017. Overcoming the limitation of cluster samples with a simplified sampling method. international journal of research in management & social science, 10, p.7. Al-Aidaros, A.H. and Mohd Shamsudin, F., 2013. Ethics and ethical theories from an Islamic perspective. International Journal of Islamic Thought, 4, pp.1-13. Ali, M.A., Zengaro, F. and Zengaro, S.A., 2018. Spirituality and Sense of Coherence in Muslim Students: A Mixed Methods Study. Journal of Research Initiatives, 3(3), p.2. Alatartseva, E. and Barysheva, G., 2015. Well-being: subjective and objective aspects. Procedia-Social and Behavioral Sciences, 166, pp.36-42. Alderfer, C.P., 1969. An empirical test of a new theory of human needs. Organizational behavior and human performance, 4(2), pp.142-175. Alex, L., Jonsén ., E, Gustafson G 2005. Resilience, sense of coherence, purpose in life and self-transcendence in relation to perceived physical and mental health among the oldest old Aging and Mental Health 9(4):354-62 · Ali 2017. The rising epidemic of chronic diseases – Cardiovascular Disease Url available; http://blog.ringadoctor.com/the-rising-epidemic-of-chronic-diseases-cardiovascular-disease/

274
Ali, S.M. and ul Haq, R., 2006. Women's autonomy and happiness: the case of Pakistan. The Pakistan Development Review, pp.121-136. Ali M. Syed and Kiani F. Muhammad 2003. Ageing and Poverty in Pakistan. Islamabad: Pakistan Institute of Development Economics. Mimap Technical Paper Series No. 18 Ali T., Krantz G., Gul R., Asad N., Johansson E., and Mogren. I 2011. ‘Gender roles and their influence on life prospects for women in urban Karachi, Pakistan: a qualitative study’ Global Health Action doi: 10.3402/gha.v4i0.7448 Alkire, S, 2005 Why the Capability Approach?. Journal of Human Development, Volume 6, Issue 1, 2005, pages 115-135. Available at SSRN: https://ssrn.com/abstract=2118610 Amalia, I., Riani, W. and Julia, A., 2016. The influence of religiosity values on happiness with Islamic consuming ethics as moderator variable. Procedia-Social and Behavioral Sciences, 219, pp.76-83. Anand P, Hunter G, Smith R. 2005 Capabilities and well-being: evidence based on the Sen, Nussbaum approach to welfare. Social Indicators Research; 74(1):9-55. Ann lander (2011) availbale url: https://learningenglish.voanews.com/a/ann-landers-1918-2002-she-helped-millions-of-people-deal-with-their-problems-120541259/114416.html Anand, P., 2016. Happiness, well-being and human development: The case for subjective measures. Ardelt, M. 2000. Antecedents and effects of wisdom in old age: A longitudinal perspective on aging well. Research on Aging, 22, 360-394. Aristotle on the Good Life 2013 URL Availbale at; http://reasonandmeaning.com/2013/12/19/aristotle-on-the-good-and-meaningful-life/. Arokiasamy, P., Uttamacharya, U., Jain, K., Biritwum, R. B., Yawson, A. E., Wu, F., ... Afshar, S. 2015. The impact of multimorbidity on adult physical and mental health in low-and middle-income countries: what does the study on global ageing and adult health (SAGE) reveal?. BMC medicine, 13(1), 178.
Ashiq, U., & Asad, A. Z. 2017. The increasing old-age problem in Pakistan. Journal of the Research Society of Pakistan–Vol, 54(2). Asia’s ageing population available at; sites.asiasociety.org/asia21summit/wp.../Asias-Aging-Population-East-West-Center1.pdf Available at http://www.helpage.org/global-agewatch/reports/ Baltes, P.B. and Smith, J., 2003 New frontiers in the future of aging: From successful aging of the young old to the dilemmas of the fourth age. Gerontology, 49(2), pp.123-135.) Baltes, P. B., & Staudinger, U. M. 2000. Wisdom: A metaheuristic (pragmatic) to orchestrate mind and virtue toward excellence. American Psychologist, 55(1), 122-136.
Baldick, J., 2012. Mystical Islam: an introduction to Sufism. Bloomsbury Publishing.
Banks, J., Breeze, E., Lessof, C., & Nazroo, J. 2006. Retirement, health and relationships of the older population in England’: The 2004 English Longitudinal Study of Ageing (Wave 2).

275
Barrett, A., Burke, H., Cronin, H., Hickey, A., Kamiya, Y., Kenny, R. A. & Mosca, I. (2011).’ Fifty plus in Ireland 2011: first results from the Irish Longitudinal Study on Ageing (TILDA)’. Becker.M, Diamind R and Sain F 1983. Quality of life index for mental health. Bentley, R.A. and O'Brien, M.J., 2017 The acceleration of cultural change: from ancestors to algorithms. MIT Press. Berger-Schmitt, Regina 2000 Social Cohesion as an Aspect of the Quality of Societies: Concept and Measurement. EuReporting Working Paper No 14, Subproject “European System of Social Indicators”. Mannheim: Centre for Survey Research and Methodology (ZUMA), Social Indicators Department. Berney, L., Blane David, Smith,G. Gunnell,D Holland ., P, Montgomery., S 2001 ‘Socioeconomic measures in early old age as indicators of previous lifetime exposure to environmental health hazards’ |https://doi.org/10.1111/1467-9566.00212) Bhamani, M, Karim, M and Moosa,.M 2013 Depression in the elderly in Karachi, Pakistan: a cross sectional study BMC Psychiatry. 2013; 13: 181. Published online 2013 Jul 3. doi: [10.1186/1471-244X-13-181] Bluman, A. G. 2007. Elementary statistics: A step by step approach (6th ed.). New York, NY: McGraw Hill. Bigby, C., Knox, M., Beadle-Brown, J., & Bould, E. 2014. Identifying good group homes: Qualitative indicators using a quality of life framework. Intellectual and Developmental Disabilities, 52(5), 348–366. doi: 10.1352/1934- 9556-52.5.348 Blane, D. 2005. Cohort profile: the Boyd Orr lifegrid sub-sample—medical sociology study of life course influences on early old age. International journal of epidemiology, 34(4), 750-754. Blane, D., Higgs, P., Hyde, M. and Wiggins, R.D., 2004. Life course influences on quality of life in early old age. Social science & medicine, 58(11), pp.2171-2179. Blane, D., Netuveli, G., & Bartley, M. 2007. Does the quality of life at older ages vary with socio-economic position?. Sociology, 41(4), 717-726. Blane, D., Webb, E., Wahrendorf, M. and Netuveli, G., 2012. Life course influences on quality of life at age 50 years: evidence from the National Child Development Study (1958 British birth cohort study). Longitudinal and Life Course Studies’, 3(3), pp.346-358. Bluman, A. G. 2007. Elementary statistics: A step by step approach (6th ed.). New York, NY: McGraw Hill. Blazer DG Am 2006 Successful aging. J Geriatr Psychiatry. 14(1):2-5 Bloom D. E., Canning D., Fink G. 2010. The greying of the global population and its macroeconomic consequences. Twenty-First Century Soc. J. Acad. Soc. Sci. 5, 233–242.). Boni., L 2005 The sufi journey towards nondual self reliazation. URL available at; https://www.uleth.ca/dspace/bitstream/handle/10133/2528/boni,%20lauren.pdf?sequenc e=1&isAllowed=y

276
Borglin., G., Jakobsson., U., Hallberg., I 2006 Older people in Sweden with various degrees of present quality of life: their health, social support, everyday activities and sense of coherence https://doi.org/10.1111/j.1365-2524.2006.00603.x Borsboom, D., Mellenbergh, G. J., & van Heerden, J. 2004 The concept of validity. Psychological Review, 111, 1061-1072 Börsch-Supan, A., & Schuth, M. 2013. Early retirement, mental health and social networks. Active ageing and solidarity between generations in Europe: First results from SHARE after the economic crisis, 337. Boudiny, K. and Mortelmans, D., 2011. A critical perspective: towards a broader understanding of'active ageing. E-Journal of Applied Psychology, 7(1), pp.8-14. Bourassa, K. J., Knowles, L. M., Sbarra, D. A., & O’Connor, M. F. 2016. Absent but not gone: interdependence in couples quality of life persists after a partner’s death. Psychological science, 27(2), 270-281. Bowling, A., Hankins, M., Windle, G., Bilotta, C. and Grant, R., 2013. A short measure of quality of life in older age: The performance of the brief Older People's Quality of Life questionnaire (OPQOL-brief). Archives of gerontology and geriatrics, 56(1), pp.181-187. Brislin, R.W., 1970. Back-translation for cross-cultural research. Journal of cross-cultural psychology, 1(3), pp.185-216. Brown, I., Hatton, C., & Emerson, E. 2013. Quality of life indicators for individuals with intellectual disabilities: Extending current practice. Intellectual and Developmental Disabilities, 51, 316–332. doi: 10.1352/1934-9556-51. 5.316 Bryant, FB and Cvengros, JA. 2004. Distinguishing hope and optimism: Two sides of a coin, or two separate coins? Journal of Social and Clinical Psychology, 23: 273–302 Burckhardt C., and Anderson K., 2003. The Quality of Life Scale (QOLS): Reliability, Validity, and Utilization Health and Quality of Life Outcomes 20031:60 DOI: 10.1186/1477-7525-1-60 Brugman, G. M. 2000. Wisdom: Source of narrative coherence and eudaimonia. Delft, the Netherlands: Eburon. https://www.statista.com/statistics/971050/life-expectancy-at-birth-in-pakistan-by-gender/ Pakistan: Life expectancy at birth from 2007 to 2017, by gender 2020. Brown, R., Zagefka, H. and Tip, L., 2016. Acculturation in the United Kingdom. In The Cambridge handbook of acculturation psychology. Cambridge University Press. Caballero, C., Edwards, R. and Puthussery, S., 2008. Parenting'mixed'children: difference and belonging in mixed race and faith families. Joseph Rowntree Foundation. Camfield, L., Crivello, G. and Woodhead, M., 2009. Wellbeing research in developing countries: Reviewing the role of qualitative methods. Social Indicators Research, 90(1), p.5. Camfield, L., Streuli, N. & Woodhead, M. 2009. What’s the use of ‘well-being’ in contexts of child poverty? Approaches to research, monitoring and children’s participation. The International Journal of Children’s Rights, 17, Camfield, L., Skevington, M.S. 2008. On subjective well-being and quality of life. Journal of Health Psychology, 13(6), 764-775.

277
Campbell, A., Converse., P.E and Rogers.,W L 1976. The Quality of American Life: Perceptions, Evaluations and Satisfaction. New York: Russell-Sage. Campbell., S 2008. Introduction to Regression and Data Analysis. Campbell., D and Biggs, S., 1993. Understanding ageing: Images, attitudes and professional practice. Open Univ Pr. Carver, C. S. 2014. Optimism. Encyclopedia of quality of life and wellbeing research, 4500-4503. Carlquist E, Ulleberg P, Delle Fave A, Nafstad HE, Blakar RM. 2016. Everyday understandings of happiness, good life, and satisfaction: three different facets of well-being. Applied Research in Quality of Life 12(2):481-505Carlquist et al., 2016). Carter, S. 2016. Holding it together: an explanatory framework for maintaining subjective well-being (SWB) in principals. [Thesis (PhD/Research). Cassum A. Laila 2014. Elderly Depression in Pakistan: An Emerging Public Health Challenge. Karachi: International Journal of Innovative Research and development. Vol 3 Issue 5, p. p 698 Chaudhry, I. S., & Rahman, S. 2009. The impact of gender inequality in education on rural poverty in Pakistan: an empirical analysis. European Journal of Economics, Finance and Administrative Sciences, 15(1), 174-188.) Chaudhry., I 2007 Gender Inequality in Education and Economic Growth: Case Study of Pakistan Pakistan Horizon Vol. 60, No. 4, Chiu, Y.W., Moore, R.W., Hsu, C.E., Huang, C.T., Liu, H.W. and Chuang, H.Y., 2008. Factors influencing women's quality of life in the later half of life. Climacteric, 11(3), pp.201-211. Christensen,K Doblhammer, G and Vaupel, 2009 Ageing populations: the challenges ahead Lancet. 374(9696): 1196–1208.doi: 10.1016/S0140-6736(09)61460-4) Compton, W.C. and Hoffman, E., 2019. Positive psychology. SAGE Publications Colin Gillion, John Turner, Clive Bailey and Denis Latulippe 2000 Social Security Pensions: Development and reform, ISBN 92-2-110859-7. Conde-Sala, J. L., Portellano-Ortiz, C., Calvó-Perxas, L., & Garre-Olmo, J. 2017. Quality of life in people aged 65+ in Europe: associated factors and models of social welfare—analysis of data from the SHARE project (Wave 5). Quality of Life Research, 26(4), 1059-1070. Cumming, E., & Henry, W. E. 1961. Growing old, the process of disengagement, basic book Cummins, R. A., Mccabe, M. P., Romeo, Y., & Gullone, E. 1994. Validity studies the Comprehensive Quality of Life Scale (ComQol): Instrument development and psychometric evaluation on college staff and students, Educational and Psychological measurement, 54(2), 372-382.

278
Costanza, R., Fisher, B., Ali, S., Beer, C., Bond, L., Boumans, R., Danigelis, N.L., Dickinson, J., Elliott, C., Farley, J. and Gayer, D.E., 2007. Quality of life: An approach integrating opportunities, human needs, and subjective well-being. Ecological economics, 61(2-3), pp.267-276. Colin Gillion, John Turner, Clive Bailey and Denis Latulippe 2000 Social Security Pensions: Development and reform, ISBN 92-2-110859-7. Daud, M.K., Nafees, M., Ali, S., Rizwan, M., Bajwa, R.A., Shakoor, M.B., Arshad, M.U., Chatha, S.A.S., Deeba, F., Murad, W. and Malook, I., 2017. Drinking water quality status and contamination in Pakistan. BioMed research international. Davis, C., Lachlan.,K 2013 Straight Talk About Communication Research Methods 1st Edition 978-0-7575-7219-7 DeVellis R. 1991. Scale Development: Theory and Applications url available; http://blogs.mcgill.ca/crcfbrownbag/2014/05/10/devellis-r-1991-scale-development-theory-and-applications/ Deci, E.L. and Ryan, R.M., 2008. Hedonia, eudaimonia, and well-being: An introduction. Journal of happiness studies, 9(1), pp.1-11. Diener, E., Oishi, S. and Lucas, R.E., 2003. Personality, culture, and subjective well-being: Emotional and cognitive evaluations of life. Annual review of psychology, 54(1), pp.403-425. Diener, E. and Lucas, R.E., 2000. Explaining differences in societal levels of happiness: Relative standards, need fulfillment, culture, and evaluation theory. Journal of Happiness Studies, 1(1), pp.41-78.
Diener, E., Suh, E.M., Lucas, R.E. and Smith, H.L., 1999. Subjective well-being: Three decades of progress. Psychological bulletin, 125(2), p.276.
Diener, E. 2006. Guidelines for national indicators of subjective well-being and ill being. Applied Research in Quality of Life, 1, 151-157.
Diener, E., Scollon, C.N. and Lucas, R.E., 2009. The evolving concept of subjective well-being: The multifaceted nature of happiness. In Assessing well-being (pp. 67-100). Springer, Dordrecht. Diener, E., 2016. Happiness: The science of subjective well-being. Noba textbook series: Psychology. Champaign, IL: DEF publishers. DOI: https://doi. org/https://doi. org/nobaproject. com. Diener, E., Lucas, R. E., & Oishi, S. 2002. Subjective well-being: The science of happiness and life satisfaction. In C. R. Snyder & S. J. Lopez (Eds.), Handbook of positive psychology (pp. 63–73) Dijkers MP 2007. What’s in a name? The discriminating use of the “Quality of life” label, and the need to bring about clarity in conceptualizations. Int J Nurs Stud 44:153–155Dijkers 2005, 2007; Ferrans 1996; Meeberg 1993; Zhan 1992), Diener E, Wirtz D, Tov W, Kim-Prieto C, Choi D, Oishi S, Biswas-Diener R. 2010. New well-being measures: short scales to assess flourishing and positive and negative feelings. Social Indicators Research 97(2):143-156;

279
Diener, Ed 1984. Subjective well-being Psychological Bulletin. 95 (3): 542–575. PMID 6399758. doi:10.1037/0033-2909.95.3.542. Diener-West, M. (2008). ‘Use of the Chi-Square Statistic’. Baltimore, Maryland: School of. Dionigi., R 2015. ‘Stereotypes of Aging: Their Effects on the Health of Older Adults’ Journal of Geriatrics Volume 2015, Article ID 954027, 9 pages http://dx.doi.org/10.1155/2015/954027 Dodge, R., Daly, A., Huyton, J., & Sanders, L. 2012. The challenge of defining wellbeing. International Journal of Wellbeing’, 2(3), 222-235. doi:10.5502/ijw.v2i3.4
Doyal, L. and Gough, I., 1991. A theory of human need. Drinkwater, C., Wildman, J., & Moffatt, S. 2019. Social prescribing. BMJ, 364, l1285. Durdureanu I 2011.Translation of cultural terms: possible or impossible? Url Available on ;www.uab.ro/jolie/2011/4_durdureanu_irina.pdf Economic survey of Pakistan ( 2017) URL Avalaible; https://pakwired.com/economic-survey-pakistan-literacy-rate-decline-60-58-budget-17-18-series/ Eddington, N. and Shuman, R., 2005. Subjective well-being (happiness). Continuing psychology education, 6. Eithne Sexton.,Bellinda L. King-Kallimanis Ronan M. and ConroyAnne Hickey 2013 Psychometric evaluation of the CASP-19 quality of life scale in an older Irish cohort Quality of Life’ Research Volume 22, Issue 9, pp 2549–2559 Ejechi, E.O., 2012. The quality of life of retired reengaged academics in Nigeria. Educational Gerontology, 38(5), pp.328-337.) Elias, A , 2016 Positive thinking and optimism in Islam URL available at; https://abuaminaelias.com/positive-thinking-in-islam/ Elder Jr, G.H., 1994. Time, human agency, and social change: Perspectives on the life course. Social psychology quarterly, pp.4-15. Emmons, R.A. and Paloutzian, R.F., 2003. The psychology of religion. Annual review of psychology, 54(1), pp.377-402. Eregno., F 2013 Multiple Linear Regression Models for Estimating Microbial Load in the Drinking Water’ Source Case from Glomma River, Norway, 2013 Eriksson. M and Lindström., B 2007. Antonovsky's sense of coherence scale and its relation with quality of life: a systematic review J Epidemiol Community Health. 2007 Nov; 61(11): 938–944.doi: 10.1136/jech.2006.056028 Exline, J. J., & Rose, E. 2005. Religious and spiritual struggles. Handbook of the psychology of religion and spirituality, 2, 380-398.) Farquhar, M. 1995. Elderly people's definitions of quality of life’, Social Science & Medicine, 41(10), 1439-1446. Fernández-Ballesteros, R., 2008. Active aging: The contribution of psychology .Hogrefe Publishing.

280
Ferrari, M., Kahn, A., Benayon, M., & Nero, J. 2011. Phronesis, sophia, and hochma: Developing wisdom in Islam and Judaism. Research in Human Development, 8(2), 128-148. doi:10.1080/15427609.2011.56886
Fernández-Ballesteros, R., Zamarrón, M. D., & Ruiz, M. Á. 2001. The contribution of socio-demographic and psychosocial factors to life satisfaction’. Ageing & Society, 21(1), 25-43. Figueiredo Filho, D.B., Paranhos, R., Rocha, E.C.D., Batista, M., Silva Jr, J.A.D., Santos, M.L.W.D. and Marino, J.G., 2013. When is statistical significance not significant?. Brazilian Political Science Review, 7(1), pp.31-55.) Fitzgerald, R., Widdop, S., Gray, M. and Collins, D., 2011. Identifying sources of error in cross-national questionnaires: Application of an error source typology to cognitive interview data. Journal of Official Statistics, 27(4), pp.569-599. Galea, S. and Putnam, S., 2007. The role of macrosocial determinants in shaping the health of populations. Macrosocial determinants of population Health, pp.3-12. Gambrel, P.A. and Cianci, R., 2003. Maslow's hierarchy of needs: Does it apply in a collectivist culture. Journal of Applied Management and Entrepreneurship, 8(2), p.143. Gilhooly, M., Hamilton, K., O'Neill, M., Gow, J., Webster, N., Pike, F., & Bainbridge, D. 2002. Transport and ageing: extending the quality of life for older people via public and private transport. Gilleard, C.J. and Higgs, P., 2000. Cultures of ageing: Self, citizen, and the body. Pearson Education. Gjersing L., Caplehorn J., Clausen T., 2010. Cross-cultural adaptation of research instruments: language, setting, time and statistical considerations, BMC, 10:13 1471-2288/10/13 Gjonça, E., Stafford, M., Zaninotto, P., Nazroo, J., & Wood, N. (2010). ‘Health and social engagement among the oldest old. Financial circumstances, health and well-being of the older population in England’, 227. Global health and ageing 2016 Godwin, M., Gadag, V., Pike, A., Pitcher, H., Parsons, K., McCrate, F., ... & Miller, R. 2015. A randomized controlled trial of the effect of an intensive 1-year care management program on measures of health status in independent, community-living old elderly’: the Eldercare project. Family practice, 33(1), 37-41. Gouveia, O. M. R., Matos, A. D., & Schouten, M. J. 2016. Social networks and quality of life of elderly persons: a review and critical analysis of literature’. Revista Brasileira de Geriatria e Gerontologia, 19(6), 1030-1040. Govt of Pakistan 2019. Pakistan beurue of statistic’ Available at : http://www.pbs.gov.pk/sites/default/files/pslm/publications/pslm_prov_dist_2012-13/housing_water_supply.pdf Grey, D.E., 2009. Research ethics in doing research in the real world’. 2nd edn. Los Angeles: SAGE

281
Greene, K.V. and Yoon, B.J., 2004. Religiosity, economics and life satisfaction. Review of Social Economy, 62(2), pp.245-261. Granqvist, P. and Kirkpatrick, L.A., 2013. Religion, spirituality, and attachment. Giles, H., Noels, K.A., Williams, A., Ota, H., Lim, T.S., Ng, S.H., Ryan, E.B. and Somera, L., 2003. Intergenerational communication across cultures: Young people's perceptions of conversations with family elders, non-family elders and same-age peers. Journal of cross-cultural gerontology, 18(1), pp.1-32. Granqvist, P. and Kirkpatrick, L.A., 2013. Religion, spirituality, and attachment. Guillemin, F., Bombardier, C., & Beaton, D. 1993. Cross-cultural adaptation of health-related quality of life measures: literature review and proposed guidelines’. Journal of Clinical Epidemiology, 46, 1417-1432 Gyu Ri Kima, Gopalakrishnan Netuvelib, David Blanea, Anne Peaseya, Sofia Malyutinacd, Galina Simonovac, Ruzena Kubinovae, Andrzej Pajakf, Simone Croezenag, Martin Bobaka & Hynek Pikharta 2015 .Psychometric properties and confirmatory factor analysis of the CASP-19, a measure of quality of life in early old age: the HAPIEE study Aging & Mental Health’, 19:7, 595-609, DOI: 10.1080/13607863.2014.938605. Haider.H and Ali ., W 2009. Sustainability of Sanitation Systems in Pakistan. Hamedani, A.G., Wells, C.K., Brass, L.M., Kernan, W.N., Viscoli, C.M., Maraire, J.N., Awad, I.A. and Horwitz, R.I., 2001. A quality-of-life instrument for young hemorrhagic stroke patients’. Stroke, 32(3), pp.687-695. Hamren, K., Chungkham, H. S., & Hyde, M. (015. Religion, spirituality, social support and quality of life: measurement and predictors CASP-12 (v2) amongst older Ethiopians living in Addis Ababa’. Aging & mental health, 19(7), 610-621. Hasenfeld, Y. and Rafferty, J.A., (1989). ‘The determinants of public attitudes toward the welfare state’. Social Forces, 67(4), pp.1027-1048. Halder, M., Binder, J., Stiller, J. and Gregson, M., 2016. An overview of the Challenges faced during Cross-Cultural Research. Enquire,(8), pp.1-18. Hoyle, R.H. ed., 2012. Handbook of structural equation modeling. Guilford press. Hills P, Argyle M. 2002. The Oxford Happiness Questionnaire: a compact scale for the measurement of psychological well-being. Personality and Individual Differences 33(7):1073-1082), Horton, S., Baker, J. and Deakin, J.M., 2007. Stereotypes of aging: Their effects on the health of seniors in North American society. Educational Gerontology, 33(12), pp.1021-1035. Hassan., M 2014 The Purpose of Optimism URL available at; https://muslimyouthmusings.com/the-purpose-of-optimism/ Hasenfeld, Y. and Rafferty, J.A., (1989). ‘The determinants of public attitudes toward the welfare state’. Social Forces, 67(4), pp.1027-1048. Haslip., S (2003) ‘Aristotle's Theory of the Good Life: A Consideration of the Role of Luck in the Good Life and the Concept of Self-Sufficiency’ Quodlibet Journal: Volume 5 Number 1.

282
Herdman, M., Fox-Rushby, J. and Badia, X., 1998. A model of equivalence in the cultural adaptation of HRQoL instruments: the universalist approach. Quality of life Research, 7(4), pp.323-335. Hermalin, A. Ofstedal, M and Teskai,R. 2006. Future Characteristics of the Elderly in Developing Countries and Their Implications for Policy Population’ Available at; https://www.psc.isr.umich.edu/pubs/pdf/ea06-62.pdf. Higgs, P., Hyde, M., Wiggins, R., & Blane, D. 2003. Researching quality of life in early old age: the importance of the sociological dimension’, Social Policy & Administration, 37(3), 239-252. Hilton, C 2015. The importance of pretesting questionnaires: a field research example of cognitive pretesting the Exercise referral Quality of Life Scale’ (ER-QLS) International Journal of Social Research Methodology · DOI: 10.1080/13645579.2015.1091640 Hofstede, G., 1984. Cultural dimensions in management and planning. Asia Pacific journal of management, 1(2), pp.81-99. Holland, P., Berney, L., Blane, D. and Davey Smith, G., 2000. Life course influences on health in early old age.’ Health Variations Programme. House, J. S., Kessler, R. C., Herzog, A. R., Mero, R. P., Kinney, A. M., & Breslow, M. J. 1990. Age, socioeconomic status, and health. The Milbank Quarterly, 68(3), 383-411). Howel, D. 2012. Interpreting and evaluating the CASP-19 quality of life measure in older people. Age and ageing, 41(5), 612-617. https://www.nia.nih.gov/sites/default/files/2017-06/global_health_aging.pdf Hubbard, Hubbard, R.E., Goodwin, V.A., Llewellyn, D.J., Warmoth, K. and Lang, I.A., 2014. Frailty, financial resources and subjective well-being in later life. Archives of Gerontology and Geriatrics, 58(3), pp.364-369.
Hunsley, J., and Mash, E. J. 2008. Developing criteria for evidence-based assessment: An introduction to assessments that work. A guide to assessments that work’ (pp.3-14). New York: Oxford University Press. Husain, A. 2008. Horizons of Spiritual Psychology. New Delhi: Global Vision Publishing House. Hyde M, Wiggins RD, Higgs P, Blane DB 2003. A measure of the quality of life in early old age: the theory, development and properties of a needs satisfaction model (CASP-19)’. Aging & Mental Health, 7(3): 186–194 Hyde, M., Higgs, P., Wiggins, R. D., & Blane, D. 2015. A decade of research using the CASP scale: key findings and future directions. Ichimura, H., Hashimoto, H., & Shimizutani, S. 2009. Japanese study of aging and retirement’. RIETIDiscussion Paper Series. Islam, N., 2004. Sifarish, sycophants, power and collectivism: Administrative culture in Pakistan. International Review of Administrative Sciences, 70(2), pp.311-330.
283
ILO: 2011. Social security for social justice and a fair globalization Report VI, International Labour Conference, 100th Session, Geneva, 2011. Itrat, A., Taqui, A. M., Qazi, F., & Qidwai, W. 2007. Family systems: perceptions of elderly patients and their attendants’ presenting at a university hospital in Karachi, Pakistan. Journal of pakistan medical association, 57(2), 106.) Janardhan.N 2009 Population: Developing Countries Must Focus on 'Positive Ageing' URL available; http://www.ipsnews.net/2009/06/population-developing-countries-must-focus-on-positive-ageing/ Javed., S and Khan.,2016. An Effect of Education on quality of Life and Well Being. The International Journal of Indian Psychology ISSN 2348-5396 (e) | ISSN: 2349-3429 Volume 3, Issue 3, No. 58, DIP: 18.01.053/20160304 ISBN: 978-1-365-24976-1 Jejeebhoy, S.J. and Sathar, Z.A., 2001. Women's autonomy in India and Pakistan: the influence of religion and region. Population and development review, 27(4), pp.687-712. Jivraj, S., Nazroo, J., Vanhoutte, B., & Chandola, T. 2014. Aging and subjective well-being in later life. Journals of Gerontology Series B: Psychological Sciences and Social Sciences, 69(6), 930-941. John, W., Klassen, A., Clark, V., Smith, K., 2011. Best Practices for Mixed Methods Research in the Health’ Available at URL: https://scholar.google.co.uk/scholar?start=20&q=mixed+methods+research&hl=en&as_ sdt=0,5&as_vis=1 Joshanloo, M., 2013. A comparison of Western and Islamic conceptions of happiness. Journal of Happiness Studies, 14(6), pp.1857-1874.) Joshanloo, M., 2014. Eastern conceptualizations of happiness: Fundamental differences with western views. Journal of happiness studies, 15(2), pp.475-493. Jenaro, C., Verdugo, M. A., Caballo, C., Balboni, G., Lachapelle, Y., & Otrebski, W. 2005. Cross-cultural study of person-centered quality of life domains and indicators. Journal of Intellectual Disability Research, 49, 734–739. doi: https://doi.org/10.1111/j.1365-2788.2005.00742.x Jawaid, B. and Zeman, D., 2011. Word-order issues in english-to-urdu statistical machine translation. The Prague Bulletin of Mathematical Linguistics, 95(1), pp.87-106.) Jabeen, F. and Khan, F.A., 2016. An Empirical Analysis of Individual's Happiness in Pakistan. Putaj Humanities & Social Sciences, 23(2). Jacobson, J., 1997. Religion and ethnicity: dual and alternative sources of identity among young British Pakistanis. Ethnic and racial studies, 20(2), pp.238-256. Jalal, S. and Younis, M.Z., 2014. Aging and elderly in Pakistan. Ageing International, 39(1), pp.4-12. Jejeebhoy, S.J. and Sathar, Z.A., 2001. Women's autonomy in India and Pakistan: the influence of religion and region. Population and development review, 27(4), pp.687-712. Jenkinson;, C 2020 Quality of life.

284
Kadiwal, L., 2015. Religious pluralism in Ismaili Muslim religious education: from difference to diversity (Doctoral dissertation, University of Sussex. Kahneman, D., Diener, E. and Schwarz, N. eds., 1999. Well-being: Foundations of hedonic psychology.’ Russell Sage Foundation. Kadiwal, L., 2015. Religious pluralism in Ismaili Muslim religious education: from difference to diversity (Doctoral dissertation, University of Sussex). Kalachea A and Kickbusch I 1997. A global strategy for healthy ageing World Health. (4) July-August, 4-5 Karolia.,A 2003. To Know Yourself is to Know Allah Url Available at; http://www.beautifulislam.net/tasawwuf/know_yourself.htm) Katz, S. and Laliberte-Rudman, D. 2004. Exemplars of Retirement: Identity and agency between lifestyle and social movement.” In Tulle, E. (ed.) Old age and agency. New York, Nova Science. pp. 45–65. Katz, M.H., 2007. The birth of the prophet Muhammad: devotional piety in Sunni Islam. Routledge. Kalra, V.S. ed., 2009. Pakistani Diasporas: Culture, conflict, and change. Oxford: Oxford University Press Kagitcibasi, C., 1997. Individualism and collectivism. Handbook of cross-cultural psychology, 3, pp.1-49. Kenrick, D.T., Griskevicius, V., Neuberg, S.L. and Schaller, M.,2010. Renovating the pyramid of needs: Contemporary extensions built upon ancient foundations. Perspectives on psychological science, 5(3), pp.292-314. Keyvanara, M., Khasti, B. Y., Zadeh, M. R., & Modaber, F. 2015. Study of the relationship between quality of life and socioeconomic status in Isfahan in 2011. Journal of education and health promotion, 4. Khan, M.M., Bhatti, M.I., Haron, S. and Azmi, W.N.W., 2008. Determinants of Islamic and conventional deposits in the Malaysian banking system. Managerial Finance. Khan, F.S., Lotia-Farrukh, I., Khan, A.J., Siddiqui, S.T., Sajun, S.Z., Malik, A.A., Burfat, A., Arshad, M.H., Codlin, A.J., Reininger, B.M. and McCormick, J.B., 2013. The burden of non-communicable disease in transition communities in an Asian megacity: baseline findings from a cohort study in Karachi, Pakistan. PloS one, 8(2), p.e56008 Kister, M.J., 1994. Social and religious concepts of authority in Islam. Jerusalem Studies in Arabic and Islam, 18, pp.84-127. Kreitlow, A.A., 2015. Religiosity, spirituality, and quality of life among selected University Students. Kreitlow, A.A., 2015. Religiosity, spirituality, and quality of life among selected University Students.

285
Kim-Prieto, C., Diener, E., Tamir, M., Scollon, C. and Diener, M., 2005. Integrating the diverse definitions of happiness: A time-sequential framework of subjective well-being. Journal of happiness Studies, 6(3), pp.261-300 Kim, G. R., Netuveli, G., Blane, D., Peasey, A., Malyutina, S., Simonova, G., ... & Pikhart, H. (2015). ‘Psychometric properties and confirmatory factor analysis of the CASP-19, a measure of the quality of life in early old age: the HAPIEE study’. Aging & mental health, 19(7), 595-609. Kinias., Z and Kim., h 2012. Culture and gender inequality: Psychological consequences of perceiving gender inequality’ DOI: 10.1177/1368430211408940Zoe Kristjansson, E. A., Desrochers, A., & Zumbo, B. D. 2003. Translating and Adapting Measurement Instruments for Cross-Linguistic and Cross-Cultural Research’: A Guide for Practitioners. Canadian Journal of Nursing Research, vol. 35, pp. 127-142 Kuh, D., Ben-Shlomo, Y., Lynch, J., Hallqvist, J. and Power, C., 2003. Life course epidemiology’. Journal of Epidemiology & Community Health, 57(10), pp.778-783 Langlois., A and Anderson., D (=2002. Resolving the Quality of Life/Well-being Puzzle: Toward a New Mode. Canadian Journal of Regional Science/Revue canadienne des scienc es régio nales, X XV : 3501-512. Layte, R., Sexton, E., & Savva, G. 2013. Quality of life in older age: evidence from an Irish cohort study. Journal of the American Geriatrics Society, 61, S299-S305. Layard R: Happiness: lessons from a new science. London: Penguin; 2005.9. Larsen, R. J. & Eid, M. 2008. Ed Diener and the Science of SWB. In M. Eid &. R. J. Larsen (Eds.), Lee H and Shin. E 2016. The Influence Factors on Health-Related Quality of Life of Middle-Aged Working Women’ Indian Journal of Science and Technology, Vol 9(25), DOI: 10.17485/ijst/2016/v9i25/97190, July.
Leukkunen., K, and Johansson, S. 2015. Population ageing in a life course perspective: developing a conceptual framework Ageing and Society’ -DOI: 10.1017/S0144686X15000756 Levin, K. 2006. Dental Health Services Research’ 7, 24–25. doi: 10.1038/sj.ebd.6400375. Lima, F.M., Hyde, M., Chungkham, H.S., Correia, C., Campos, A.S., Campos, M., Novaes, M., Laks, J. and Petribu, K., 2014. Quality of life amongst older Brazilians: cross-cultural validation of the CASP-19 into Brazilian-Portuguese’. PloS one, 9(4), p.e94289. Linton M., Dieppe P., Lara A.,1 Linton M-J, 2016. Review of 99 self-report measures for assessing well-being in adults: exploring dimensions of well-being and developments over time’ BMJ Open doi:10.1136/bmjopen-2015-010641 Li, 2011 Li Wangang. 2011. On the life state of Confucius.Dong Yue Tribune, Vol.32 (1). Llewellyn, D. J., Lang, I. A., Langa, K. M., & Huppert, F. A. 2008. Cognitive function and psychological well-being: findings from a population-based cohort’. Age and Ageing, 37(6), 685-689.

286
Loretta G. Plattsa,, Elizabeth Webbb,c, Marie Zinsd,e, Marcel Goldbergd,e and Gopalakrishnan Netuvelib 2015. Mid-life occupational grade and quality of life following retirement: a 16-year follow-up of the French GAZEL study Aging & Mental Health, 2015’ Vol. 19, No. 7, 634646, http://dx.doi.org/10.1080/13607863.2014.955458 Lowsky DJ, Olshansky SJ, Bhattacharya J, Goldman DP 2014. Heterogeneity in healthy aging’. J Gerontol A Biol Sci Med Sci. 2014 Jun;69(6):640-9. Mahbub ul Haq Human Development Report (1996) URL available; http://hdr.undp.org/sites/default/files/reports/257/hdr_1996_en_complete_nostats.pdf Lutz W, Sanderson W, Scherbov S Nature. 2008 The coming acceleration of global population ageing 451(7179):716-9. Makai, P., Brouwer, W. B., Koopmanschap, M. A., Stolk, E. A., & Nieboer, A. P. 2014 .Quality of life instruments for economic evaluations in health and social care for older peopl’e: a systematic review. Social science & medicine, 102, 83-93. Malik., S 2010. Well being after natural disasters; resources, coping strategies and resilience URL Avaiblale; prr.hec.gov.pk/jspui/bitstream/123456789/1107/2/1134S.pdf. Marcus Aurelius URL Availbale at; https://en.wikiquote.org/wiki/Marcus_Aurelius. Mattis, J. S. 2000. African American women’s definitions of spirituality and religiosity. Journal of black psychology, 26(1), 101-122. Max-Neef, 1991. Human scale development: conception, application and further reflections.’ Mayer, K. 2002. The sociology of the life course and life span psychology – diverging or converging pathways? Understanding Human Development: Lifespan Psychology n Exchange with Other Disciplines. Dordrecht: Kluwer Academic Publishers. https://www.mpib- berlin.mpg.de/volltexte/institut/dok/full/Mayer/sociolog/Sociology_of_Life_Course.pdf Mazor, K. M., Clauser, B. E., Field, T., Yood, R. A., & Gurwitz, J. H. 2002. A demonstration of the impact of response bias on the results of patient satisfaction surveys’. Health services research, 37(5), 1403-1417.) Mcclendon. D, Hackett., C, Potančoková., M, and Stonawski., M 2018. Women's Education in the Muslim World Population and Development Review’ · DOI: 10.1111/padr.12142 Mckenna, h., Hasson, f., and keeney, s. 2010. Surveys. in: gerrish, k and lacey, a., ed, the research process in nursing. 6th edn. united kingdom’: wileybalckwell, pp. 216-226 McCallum, F. & Price, D. (Eds.) 2016. Nurturing wellbeing development in education: From little things, big things grow. New York, N.Y: Routledge.
Meadows, K.A., 2003. So you want to do research? 4: An introduction to quantitative methods. British Journal of Community Nursing’, 8(11), pp. 519-526. Mohammad Khodayarifard, Bagher Ghobari Bonab, Saeed Akbari Zardkhaneh, Sae Zandi, Enayatollah Zamanpour, Mariam Derakhshan 2015. Positive psychology from Islamic perspective’ Int J Behav Sci. 201 6 10 77 83 URL Available from

287
https://www.researchgate.net/publication/303999192_Positive_psychology_from_Islam ic_perspective Mathers CD, Sadana R, Salomon JA, Murray CJ, Lopez 2001. AD Lancet. 357(9269):1685-91. Meeks, T. W., & Jeste, D. V. 2009. Neurobiology of wisdom: A literature overview. Archives of General Psychiatry, 66(4), 355-365. Medvedev, O.N. and Landhuis, C.E., 2018. Exploring constructs of well-being, happiness and quality of life. PeerJ, 6, p.e4903 Michaelson, J., Mahony, S. and Schifferes, J., 2012. New Economic Foundation. Measuring well-being: a guide for practitioners. Michalos, A.C 2007. Education, happiness and wellbeing. Paper presented at the International Conference on ‘Is happiness measurable and what do those measures mean for public policy?’ Rome, Italy. Mulgan, T., 2014. Understanding utilitarianism. Routledge). Nadin, S., & Cassell, C. 2006. The use of a research diary as a tool for reflexive practice: Some reflections from management research’. Qualitative Research in Accounting & Management, 3(3), 208-217. Nasr, S.H., 2014. Happiness and the attainment of happiness: An Islamic perspective. JL & Religion, 29, p.76. National Statistics 2010: Spotlight on subjective well-being. Cardiff: Office for National Statistics; NPR news letter 2014 url available at https://www.npr.org/sections/parallels/2014/02/09/272470185/the-worlds-most-optimistic-law-banning-graffiti-in-karachi?t=1601465965313
Neculăesei., A 2015 Culture and gender role differences Cross-Cultural Management’ Journal Volume XVII, Issue 1 (7) Netuveli ., G and Bartley. M 2012 Perception is Reality: Effect of Subjective Versus Objective Socio-economic Position on Quality of Life’ Sociology 46(6) 1208 –1215) Netuveli, G., & Blane, D. 2008 Quality of life in older ages, British medical bulletin, 85(1), 113-126. Netuveli, G., Blane, D., & Bartley, M. 2007. Wellbeing and welfare state: Cross-national comparison of quality of life in market and transition economies’. Wellbeing in international development conference, University of Bath. Netuveli, G., Pikhart, H., Bobak, M., & Blane, D. 2012. Generic quality of life predicts all-cause mortality in the short term: evidence from the British Household Panel Survey’. J Epidemiol Community Health, 66(10), 962-966. Netuveli, G., Wiggins, R. D., Hildon, Z., Montgomery, S. M., & Blane, D. 2006. Quality of life at older ages: evidence from the English longitudinal study of aging (wave 1)’. Journal of Epidemiology & Community Health, 60(4), 357-363.

288
Nelson. T 2005 , “Ageism: prejudice against our feared future self,” Journal of Social Issues, vol. 61, no. 2, pp. 207–221, Niedzwiedz, C. L., Katikireddi, S. V., Pell, J. P., & Mitchell, R. 2014. Socioeconomic inequalities in the quality of life of older Europeans in different welfare regimes. The European Journal of Public Health, 24(3), 364-370. Nilsson, J., Rana, A.M. and Kabir, Z.N., 2006. Social capital and quality of life in old age: results from a cross-sectional study in rural Bangladesh. Journal of aging and Health, 18(3), pp.419-434. Nosheen, A., Riaz, M. N., & Batool, N. 2014. A cross-cultural study on social support, sense of coherence and outcomes in Pakistan and Germany’. Pakistan Journal of Commerce and Social Sciences (PJCSS), 8(2), 445-452. NPR news letter 2014 url available at https://www.npr.org/sections/parallels/2014/02/09/272470185/the-worlds-most-optimistic-law-banning-graffiti-in-karachi?t=1601465965313. Nussbaum, M.C., 2001. Women and human development: The capabilities approach’ (Vol. 3). Cambridge University Press. Nussbaum., M and Sen., A 1993. The quality of life pg 242. Ory, M., Hoffman, M.K., Hawkins, M., Sanner, B. and Mockenhaupt, R., 2003. Challenging aging stereotypes: Strategies for creating a more active society. American journal of preventive medicine, 25(3), pp.164-171.
Oyserman, D. and Lee, S.W., 2008. Does culture influence what and how we think? Effects of priming individualism and collectivism. Psychological bulletin, 134(2), p.311. Pallant, J. F., & Lae, L. 2002. Sense of coherence, well-being, coping and personality factors: further evaluation of the sense of coherence scale’. Personality and individual differences, 33(1), 39-48. Patrick A. Edewor (2014) ‘A Conceptual Exploration of the Human Development Paradigm’, Mediterranean Journal of Social Sciences Doi:10.5901/mjss.2014.v5n6p381 Park, N., Park, M. and Peterson, C., 2010. When is the search for meaning related to life satisfaction?. Applied Psychology: Health and Well‐Being, 2(1), pp.1-13. Pinault, D., 2008. Notes from the fortune-telling parrot: Islam and the struggle for religious pluralism in Pakistan. Equinox Publ. Pérez-Rojo, G., Martín, N., Noriega, C., & López, J. 2018. Psychometric properties of the CASP-12 in a Spanish older community dwelling sample’. Aging & mental health, 22(5), 700-708. Pinquart, M., & Sörensen, S. 2000. Influences of socioeconomic status, social network, and competence on subjective well-being in later life: A meta-analysis. Psychology and Aging’, 15(2), 187–224 Platts, L. G., Webb, E., Zins, M., Goldberg, M., & Netuveli, G. 2015. Mid-life occupational grade and quality of life following retirement: a 16-year follow-up of the French GAZEL study’. Aging & mental health, 19(7), 634-646.

289
Ponce., M. Lezaeta., C, & Lorca., M 2011. Predictors of Quality of Life in Old Age: A Multivariate Study in Chile Journal of Population Ageing ISSN 1874-7884 Population Ageing DOI 10.1007/ Ponomarenko, V, 2016. Cumulative disadvantages of non-employment and non-standard work for career patterns and subjective well-being in retirement ( Advances in Life Course Research volume 30, December 2016, Pages 133-148 Advances in Life Course Research Author links open overlay panel Url available at; https://doi.org/10.1016/j.alcr.2016.06.003. Pritzker.P, Bruce. H and Andrews 2015. An Aging World’ Available URL 2015 https://www.researchgate.net/publication/299528572_An_Aging_World_2015 Qidwai., W (2009) ‘Ageing Population: Status, Challenges and Opportunities for Health Care Providers in Pakistan’. Journal of the College of Physicians and Surgeons Pakistan 2009, Vol. 19 (7): 399-400. Roshan, R., Hamid, S. and Mashhadi, S.F., 2018. Non-communicable diseases in Pakistan; A health system perspective. Pakistan Armed Forces Medical Journal, (2), pp.394-399. Rahman, A., Lee, H. K., & Khan, M. A. 1997. Domestic water contamination in rapidly growing megacities of Asia: Case of Karachi, Pakistan’. Environmental Monitoring and Assessment, 44(1-3), 339-360. Rahn., M 2016. Factor Analysis: A Short Introduction’ urlavailable at; http://www.theanalysisfactor.com/factor-analysis-1-introduction/. Ramsing., R 2001. A Critique of Aristotelian Ethics of Happiness and Enlightenment Ethics’, Illuminare Volume 7 (1), 2001 11. Ravens-Sieberer, U., Karow, A., Barthel, D. and Klasen, F., (2014). ‘How to assess the quality of life in child and adolescent psychiatry’. Dialogues in clinical neuroscience, 16(2), p.147. Read, S., Grundy, E., & Foverskov, E. 2016. Socio-economic position and subjective health and well-being among older people in Europe: a systematic narrative review’. Aging & mental health, 20(5), 529-542. Roshan, R., Hamid, S. and Mashhadi, S.F., (2018) Non-communicable diseases in Pakistan; A health system perspective. Pakistan Armed Forces Medical Journal, (2), pp.394-399. Raday, F., 2003. Culture, religion, and gender. International Journal of Constitutional Law, 1(4), pp.663-715. Rojas M, Veenhoven R. 2013. Contentment and affect in the estimation of happiness. Social Indicators Research 110(2):415-431. Ratzlaff C, Matsumoto D, Kuznetzova N, Raroque J, Ray R. 2000. Culture and Subjective Well-Being. Boston: Massachusetts Institute of Technology. Reichenheim, M.E. and Moraes, C.L., 2007. Operationalizing the cross-cultural adaptation of epidemological measurement instruments. Revista de saúde pública, 41, pp.665-673. Ryff, C.D. and Singer, B.H., 2008. Know thyself and become what you are: A eudaimonic approach to psychological well-being. Journal of happiness studies, 9(1), pp.13-39.

290
Richard M. Ryan and Edward L 2001. Happiness and human potentials: A Review of Research on Hedonic and Eudaimonic Well-Being’. Annu. Rev. Psychol. 2001. 52:141–66.

291
Robeyns I., 2006. The Capability Approach in Practice* https://doi.org/10.1111/j.1467-9760.2006.00263.x Robeyns, I., 2003. Sen's capability approach and gender inequality: selecting relevant capabilities’. Feminist economics, 9(2-3), pp.61-92. Robeyns, I., 2005. The capability approach: a theoretical survey. Journal of human development, 6(1), pp.93-117. Ross, C. E., & Van Willigen, M. 1997. Education and the subjective quality of life’. Journal of health and social behavior, 38(3), 275. Rossi G, Boccacin L, Bramanti D Meda SG 2014. Active Ageing: Intergenerational Relationships and Social Generativity’. Stud Health Technol Inform. ;203:57-68. Rothman., KJ, Greenland., S, and Lash., TL. 2008. Modern Epidemiology. Philadelphia, USA: Lippincott William and Wilkins; p. 128-47. Rowe, J., & Kahn, R. 1998. Successful aging. New York: Pantheon Books. Rudy, D., Sheldon, K.M., Awong, T. and Tan, H.H., 2007. Autonomy, culture, and well-being: The benefits of inclusive autonomy’. Journal of Research in Personality, 41(5), pp.983-1007. Ryan, R.M. and Deci, E.L., 2001. On happiness and human potentials: A review of research on hedonic and eudaimonic well-being.’ Annual review of psychology, 52(1), pp.141-166. Ryff, C.D. and Keyes, C.L.M., 1995. The structure of psychological well-being revisited.’ Journal of personality and social psychology, 69(4), p.719. Ryff, C.D. and Singer, B., 1998. The contours of positive human health. Psychological inquiry’, 9(1), pp.1-28. Super M. A. E. Wagemakers H. S. J. Picavet K. T. Verkooijen M. A. Koelen 2016. Strengthening the sense of coherence: opportunities for theory building in health promotion’Health Promotion International, Volume 31, Issue 4, 1 December 2016, Pages 869–878, https://doi.org/10.1093/heapro/dav071 s12062-011-9043-7) Sabzwari, S and Azhar, G., 2011. Ageing in Pakistan—A New Challenge Ageing International 36(4):423-427 · DOI: 10.1007/s12126-010-9082- Sabzwari R. Saniya and Azhar Gohar 2010. Ageing in Pakistan—A New Challenge. Aging Int. Springer Science and Business Media. P. 3 Sabzwari, S. R., & Azhar, G. 2011. Ageing in Pakistan—a new challenge’, Ageing International, 36(4), 423-427. Salahuddin K and A.A Jalbani 2006. Senior Citizens: A Case Study of Pakistan. Karachi’: Journal of Independent Studies and Research (JISR) 4 (2): 26. Sander, M, Oxlund,B. Jespersen.A, Krasnik.A, Mortensen,A. 2015. The challenges of human population ageing Age and Ageing, Volume 44, Issue 2, 1 March, Pages 185–187, https://doi.org/10.1093/ageing/afu189.

292
Saunder.M; Philip.L; Adrian.T and Alexandra.B 2015. Understanding research philosophy and approaches to theory development’. .Research Methods for Business Students. Harlow: Pearson Education, pp. 122–161. Saunders, M., Lewis, P. & Thornhill, A. 2012. Research Methods for Business Students” 6th edition, Pearson Education Limited. Schalock, R.L., 2004. The concept of quality of life: what we know and do not know. Journal of intellectual disability research, 48(3), pp.203-216. Scheier, MF and Carver, CS. 1985. Optimism, coping, and health: Assessment and implications of generalized outcome expectancies’. Health Psychology, 4: 219–247. Schneider. Sehar., S 2016. Literature Reviews Socio-Economic Inequalities and their Impact on Health in Pakistan’ International Journal of Research in Nursing 2016, 7 (1): 12.18 DOI: 10.3844/ijrnsp.2016.12.18 Sen, A., 1993. Capability and Well-Being quality of life. Setia. M 2016. Methodology Series Module 3: Cross-sectional Studies Indian J Dermatol. 2016 May-Jun; 61(3): 261–264. doi: [10.4103/0019-5154.182410]. Sexton, E., King-Kallimanis, B. L., Conroy, R. M., & Hickey, A. 2013. Psychometric evaluation of the CASP-19 quality of life scale in an older Irish cohort. Quality of Life Research, 22(9), 2549-2559. Shahravan., A, Ghassemi., A, and Baneshi. M 2012. Statistics for dental researchers: descriptive statistics’, Summer & Autumn 2012; Vol. 1, No. 2 53Review Article Shakir.W (2017) 0.2 Million Affected By Alzheimer’s In Pakistan URL http://htv.com.pk/lifestyle/0-2-million-affected-by-alzheimers-in-pakistan. Sharma. S 2017. Relationship between Culture and Gender Inequality in India ‘IOSR Journal of Humanities and Social Science (IOSR-JHSS) Volume 22, Issue 10, Ver. VI) PP 30-35 e-ISSN: 2279-0837, p-ISSN: 2279-0845. www.iosrjournals.org. Shin.D and Johnson., M 1978. Avowed happiness as an overall assessment of the quality of life’ Social Indicators Research March 1978, Volume 5, Issue 1–4, pp 475– 492. Siegrist, J., & Wahrendorf, M. 2009. Participation in socially productive activities and quality of life in early old age: findings from SHARE. Journal of European Social Policy, 19(4), 317-326. Sim, J., Bartlam, B., & Bernard, M. 2011. The CASP-19 as a measure of the quality of life in old age: evaluation of its use in a retirement community. Quality of Life Research, 20(7), 997-1004. Smith, T.W., 1997. The Impact of the Presence of Others on a Respondent's Answers to Questions. International Journal of Public Opinion Research, 9(1), pp.33-47.
293
Sivertsen, H., Bjørkløf, G. H., Engedal, K., Selbæk, G., & Helvik, A. S. 2015. Depression and quality of life in older persons: a review. Dementia and geriatric cognitive disorders, 40(5-6), 311-339. Slavec., A and Drnovšek., M 2012. A perspective on scale development Economic and Business review vol. 14 No. 1 39–62 39 Smith, D.M. 1973. The Geography of Social Well-being in the United States: An Introduction to Territorial Social Indicators. New York: McG raw-H ill. Snyder, CR, Sympson, S, Michael, STand Cheavens, J. 2000. The optimism and hope constructs: Variants on a positive expectancy theme. In Optimism and pessimism, Edited by Chang, E. C.103–124. Washington, DC: American Psychological Association. Stephen., C 2010. Health and Ageing—Challenges for Health Psychology Research Journal of Health Psychology DOi 15(5) 643–648 DOI: 10.1177/1359105310368178 Saldanha, I J 2014. A symbol of Kutchi Memons (Bangalore). Deccan Herald. Retrieved 19 January 2015. Saunders, M., Lewis, P. & Thornhill, A. 2012. Research Methods for Business Students 6th edition, Pearson Education Limited. Smith, T.W., 1997. The Impact of the Presence of Others on a Respondent's Answers to Questions. International Journal of Public Opinion Research, 9(1), pp.33-47. Schalock, R.L., 2004. The concept of quality of life: what we know and do not know. Journal of intellectual disability research, 48(3), pp.203-216. Skevington, S.M., Lotfy, M. and O'Connell, K.A., 2004. The World Health Organization's WHOQOL-BREF quality of life assessment: psychometric properties and results of the international field trial. A report from the WHOQOL group. Quality of life Research, 13(2), pp.299-310.
Shah, H., & Marks, N. 2004. A well-being manifesto for a flourishing society. London, UK:The New Economics Foundation.
Schalock, R. L., & Verdugo, M. A. 2002. Handbook on quality of life for human service practitioners. Washington, DC: American Association on Mental Retardation Schoklitsch, A., & Baumann, U. 2011. Generativity and aging: A promising future research topic? Journal of Aging Studies, 26, 262-272. Saldanha-Shet, I J 2014. A symbol of Kutchi Memons (Bangalore). Deccan Herald. Retrieved 19 January 2015. Skevington, S.M., Lotfy, M. and O'Connell, K.A., 2004. The World Health Organization's WHOQOL-BREF quality of life assessment: psychometric properties and results of the international field trial. A report from the WHOQOL group. Quality of life Research, 13(2), pp.299-310.Sierra F, Hadley E, Suzman R, Hodes Prospects for life span extension R Annu Rev Med. 2009; 60():457-69.

294
Sung K. Elder respect: Exploration of ideals and forms in East Asia. 2001. Journal of Aging Studies. 2001;15:13–26. Slingerland, E. 2003. Confucius analects. Indianapolis: Hackett Publishing Company Shek, D.T., 2010. Introduction: quality of life of Chinese people in a changing world. Social Indicators Research, 95(3), pp.357-361.
Sierra F, Hadley E, Suzman R, Hodes Prospects for life span extension R Annu Rev Med. 2009. 60():457-69.). Sung K. Elder respect: Exploration of ideals and forms in East Asia 2001. Journal of Aging Studies. 2001;15:13–26. Tampubolon, G. 2015. Delineating the third age: joint models of older people's quality of life and attrition in Britain 2002–2010. Aging & mental health, 19(7), 576-583. Tsang, S., Royse, C.F. and Terkawi, A.S., 2017. Guidelines for developing, translating, and validating a questionnaire in perioperative and pain medicine. Saudi journal of anaesthesia, 11(Suppl 1), p.S80. Timberg, T.A., 2014. The Marwaris. Penguin Books. Tay, L., Kuykendall, L. and Diener, E., 2015. Satisfaction and happiness–the bright side of quality of life. In Global handbook of quality of life (pp. 839-853. Tsang, S., Royse, C.F. and Terkawi, A.S., 2017. Guidelines for developing, translating, and validating a questionnaire in perioperative and pain medicine. Saudi journal of anaesthesia, 11(Suppl 1), p.S80. Tiliouine, H. and Belgoumidi, A., 2009. An exploratory study of religiosity, meaning in life and subjective wellbeing in Muslim students from Algeria. Applied Research in Quality of Life, 4(1), pp.109-127 Tay, L. and Diener, E., 2011. Needs and subjective well-being around the world.’ Journal of personality and social psychology, 101(2), p.354. THEORY OF Self-realization steven s seller http://courses.aiu.edu/Models%20Techniques%20Stress%20Management/8/SESSION %208%20SELF%20REALIZATION%20pdf.pdf. Thompson, N., 1998. The ontology of ageing. The British Journal of Social Work, 28(5), pp.695-707. Timonen, V., Kamiya, Y., & Maty, S. 2011. Social engagement of older people. Fifty Plus in Ireland 2011, 51. Towers, A., Stevenson, B., Breheny, M., & Allen, J. 2015. Health, work, and retirement longitudinal study. Encyclopedia of geropsychology, 1-9. Towers, A., Yeung, P., Stevenson, B., Stephens, C., & Alpass, F. 2015. Quality of life in indigenous and non-indigenous older adults: assessing the CASP-12 factor structure and identifying a brief CASP-3’. Quality of Life Research, 24(1), 193-203.

295
Umaima A,. and Eatzaz A 2010. Pension System Reforms for Pakistan: Current Situation and Future Prospects’. Islamabad: Pakistan Institute of Development Economics. PIDE Monograph. P. 7 UNESCO 2010 .Why Gender Equality in Basic Education in Pakistan?’ Printed by Al-Noor Printers, 7B Azeem Mansion, Blue Area, Islamabad Pakistan/10/OS/002-E URL Available; http://unesdoc.unesco.org/images/0021/002151/215106e.pdf United nation (2013) World population ageing URL Available at; http://www.un.org/en/development/desa/population/publications/pdf/ageing/WorldPopu lationAgeing2013.pdf United nation 2015. World population agien URL http://www.un.org/en/development/desa/population/publications/pdf/ageing/WPA2015_ Report.pdf Usmani, M.T., 2009. The authority of sunnah. Kitab Bhavan Urdu point dictionary 2020 https://www.urdupoint.com/dictionary/urdu-to-english/ikhtiyar-meaning-in-english/95980.html. Utsey, S.O., Hook, J.N., Fischer, N. and Belvet, B., 2008. Cultural orientation, ego resilience, and optimism as predictors of subjective well-being in African Americans’. The Journal of Positive Psychology, 3(3), pp.202-210. Van Windenfelt, B. M., Treffers, P.D.A., de Beurs, E., Siebelink, B. M., & Koudijs, E. 2005. Translation and Cross-Cultural Adaptation of Assessment Instruments used in psychological research with children and families. Clinical Child and Family Psychology Review, 9(2), 135-147. Vanhoutte, B., & Nazroo, J. 2014. Cognitive, affective and eudemonic well-being in later life: Measurement equivalence over gender and life stage’. Sociological Research Online, 19(2), 1-14. Virk, S.M., Humayoun, M. and Ranta, A., 2010. August. An open source Urdu resource grammar. In Proceedings of the Eighth Workshop on Asian Language Resouces (pp. 153-160).
Vertejee., S and Karmali .,N 2014. Active ageing in Pakistan: challenges and opportunities’ Journal Of Pakistan Medical Association Pages with reference to book, From 5 To 7 url available http://jpma.org.pk/full_article_text.php?article_id=5757. Von Dem Knesebeck, O., Wahrendorf, M., Hyde, M. and Siegrist, J., 2007. Socio-economic position and quality of life among older people in 10 European countries: results of the SHARE study. Ageing & Society, 27(2), pp.269-284. Vaillant GE. 2002. Aging Well: surprising guideposts to a happier life from teh landmark Harvard study of adult development. Little, Brown and Company; Boston, MA: 2002. Does wisdom increase with age? pp. 249–257. Wahba, M.A. and Bridwell, L.G., 1976. Maslow reconsidered: A review of research on the need hierarchy theory’. Organizational behavior and human performance, 15(2), pp.212-240. Wahrendorf. M and Siegrist. J 2010. Are changes in productive activities of older people associated with changes in their well-being? Results of a longitudinal European study’ Eur J Ageing. 7(2): 59–68. doi: 10.1007/s10433-010-0154-4.

296
Walker, A., 2008. Commentary: The emergence and application of active aging in Europe.’ Journal of Aging & Social Policy, 21(1), pp.75-93. Walker. A 2005. Understanding quality of life in old age Url available: https://books.google.co.uk/books?hl=en&lr=&id=vimokg4mE4QC&oi=fnd&pg=PA27 &dq=casp+19+housing+tenure&ots=Qm0kxCD12g&sig=I70x3hvYznQ7Z8IvxlPWR5 Sr8oM#v=onepage&q=casp%2019%20housing%20tenure&f=false Wan He, Daniel Goodkind, and Paul Kowal 2015. An Aging World: URL Available: http://age-pride.org/wordpress/wp-content/uploads/2016/04/Global-aging-and-minority-populations-Healthcare-access-quality-of-care-and-use-of-services.pdf Watkins., R (2014) ‘ Family life in Pakistan’ URL Avaibalbe; https://prezi.com/v_dxf8rma9nl/family-life-in-pakistan/. Watson, D., Maître, B., Whelan, C.T. and Russell, H. 2016. Technical Paper on the Measurement of Multidimensional Quality of Life in Ireland, Social Inclusion’ Technical Paper No. 7, Dublin: Department of Social Protection. Webb, E., Blane, D., McMunn, A., & Netuveli, G. 2011. Proximal predictors of change in the quality of life at older ages. Journal of Epidemiology & Community Health, 65(6), 542-547. Weber, K., Canuto, A., Giannakopoulos, P., Mouchian, A., Meiler-Mititelu, C., Meiler, A & De Ribaupierre, A. 2015. Personality, psychosocial and health-related predictors of quality of life in old age. Aging & mental health, 19(2), 151-158. WHO 2011. global health and aging url Available; http://www.who.int/ageing/publications/global_health.pdf). WHO 2016. World report on ageing and health URL available; https://www.ifa-fiv.org/wp-content/uploads/2016/12/World-Report-on-Ageing-and-Health.pdf WHO. 2002. Active Aging: A Policy Framework. Geneva, Switzerland. Whoqol Group, 1998. Development of the World Health Organization WHOQOL-BREF quality of life assessment’. Psychological medicine, 28(3), pp.551-558. Why is the gender gap widening in Pakistan, 2016. url available; http://www.dw.com/en/why-is-the-gender-gap-widening-in-pakistan/a-36245560). Wiggins, R. D., Netuveli, G., Hyde, M., Higgs, P., & Blane, D. 2008. The evaluation of a self-enumerated scale of quality of life (CASP-19) in the context of research on ageing: A combination of exploratory and confirmatory approaches. Social Indicators Research, 89(1), 61-77. Wiggins, R.D., Higgs, P.F., Hyde, M. and Blane, D.B., 2004. Quality of life in the third age: key predictors of the CASP-19 measure. Ageing & Society, 24(5), pp.693-708. Wild, D., Grove, A., Martin, M., Eremenco, S., McElroy, S., Verjee-Lorenz, A., & Erikson, P. 2005. Principles of Good Practice for the Translation and Cultural Adaptation Process for Patient-Reported outcomes (PRO) Measures Report of the ISPOR Task Force for Translation and Cultural Adaptation. Value in Health, 8, 94-104 wikipideia (2018) url available https://en.wikipedia.org/wiki/List_of_Union_Councils_of_Karachi#North_Nazimabad_Town.

297
Webster, J. D., Westerhof, G. J., & Bohlmeijer, E. T. 2012. Wisdom and mental health across the lifespan. Journal of Gerontology, Series B: PsychologicalSciences and Social Sciences. doi:10.1093/geronb/gbs121.
Wang, M., Schalock, R. L., Verdugo, M. A., & Jenaro, C. 2010. Examining the factor structure and hierarchical nature of the quality of life construct. American Journal on Intellectual and Developmental Disabilities, 115, 218–233. doi: https://doi.org/10.1352/1944-7558-115.3.218 Warren, C.S., 2017. Constitutions and Islamic Law. In Oxford Research Encyclopedia of Religion. Webster, J. D., Westerhof, G. J., & Bohlmeijer, E. T. (2012). Wisdom and mental health across the lifespan. Journal of Gerontology, Series B: PsychologicalSciences and Social Sciences. doi:10.1093/geronb/gbs121 Williams, B., Onsman, A. and Brown, T., 2010. Exploratory factor analysis: A five-step guide for novices. Australasian journal of paramedicine, 8(3). Wikepedia 2020 . URL available at https://en.wikipedia.org/wiki/British_heritage_of_Pakistan) WHO 2020; URL available ; (https://www.who.int/substance_abuse/research_tools/translation/en/
Williams, B., Onsman, A. and Brown, T., 2010. Exploratory factor analysis: A five-step guide for novices. Australasian journal of paramedicine, 8(3). Warren, C.S., 2017. Constitutions and Islamic Law. In Oxford Research Encyclopedia of Religion. . wikipideia 2018. url available https://en.wikipedia.org/wiki/List_of_Union_Councils_of_Karachi#North_Nazimabad_Town) Webster, J. D., Westerhof, G. J., & Bohlmeijer, E. T. 2012. Wisdom and mental health across the lifespan. Journal of Gerontology, Series B: PsychologicalSciences and Social Sciences. doi:10.1093/geronb/gbs121. Wildman, J. and Moffatt,S. 2018. Quality of life at the retirement transition: Life course pathways in an early ‘baby boom’ birth cohort’. Social Science & Medicine Volume 207, June 2018, Pages 11-18 Social Science & Medicine Author links open overlay panel Mark Pearce how more ttps://doi.org/10.1016/j.socscimed.2018.04.011) Williams. B (2012) ‘Exploratory factor analysis: A five-step guide for novices’ Australasian Journal of ParamedicineVolume 8 | Issue 3 Article 1. World bank 2011. Socio Economic Conditions of Pakistan url available at; Socio Economic Conditions of Pakistan Only available on StudyMode Topic: Poverty, Sindh, World Bank Pages: 5 (1435 words ) Download(s): 1161 World economic forum 2017. Gender inequality in Pakistan Available at http://dailytimes.com.pk/editorial/27-Oct-16/gender-inequality-in-pakistan World report on Ageing and health Available at; apps.who.int/iris/bitstream/10665/186463/1/9789240694811_eng.pdf.

298
Wu, T. Y., Chie, W. C., Kuo, K. L., Wong, W. K., Liu, J. P., Chiu, S. T., ... & Blane, D. 2013. Quality of life (QOL) among community dwelling older people in Taiwan measured by the CASP-19, an index to capture QOL in old age. Archives of gerontology and geriatrics, 57(2), 143-150. Yazdi, A.M.T.M., 2005. The Human Sciences and Islamic Ideology and Culture. Zaheer K 2011. Available at; http://www.khalidzaheer.com/Posted by Mohamed Shedou on May 6th, 2011 in Beauty, Improving Lifehttp://muslim-mind.com/2011/05/optimism-and-the-law-of-attraction-in-islam/ Zaninotto, P., Falaschetti, E., & Sacker, A. 2009. Age trajectories of quality of life among older adults: results from the English Longitudinal Study of Ageing’. Quality of Life Research, 18(10), 1301-1309. Zain, O.F., 2010. South Asian Studies A Research Journal of South Asian Studies Vol. 25. Zhou,. 2005. A Review of the Research on the Relation between Subjective Well-being and Culture. Psychological Science, Vol. 3.). Zullig, K.J., Ward, R.M. and Horn, T., 2006. The association between perceived spirituality, religiosity, and life satisfaction: The mediating role of self-rated health. Social Indicators Research, 79(2), p.255.

299
Annexure 1: Data collection Guide
Interviewing Tips and Techniques:
- Establish a rapport with the person you are interviewing.
- Be courteous. Give your name.
- Thank him/her for agreeing to spend time with you.
- Explain the purpose of the interview.
- Take the written consent
- Tell him/her how much time you expect to need to complete the interview (e.g., “This will be a 45 -minute conversation”).
- Be patient.
- Listen to what the person says.
- Help him/her give you the correct answer, but do not make assumptions or answer for the person.
- Inform respondent when you move to another section (e.g., “We are now turning to the next section of the interview”).
- Control the conversation. A little small talk is okay, but do not let it go on for very long or the interview will take too much time.
- Stick to the questions in the data instrument. Answer interviewee questions, but try to stick to the topic.
Recruitment of the participants:
- The participants will be given a verbal consent a day before the interview but on the day if they refuse to take part in a data collector will inform the researcher and with the help of the researcher will select another participant.
- Don’t force participants to take part in the research.
Respond to the unusual situation in the field:
- Due to law and order situation these days in Karachi, any unusual event can happen such as firing, snatching etc. In that situation immediately inform the researcher and stop data collecting for that day.
- Incase in the field while you are introducing yourself and someone shuts the door on your face. Be polite don’t say anything or knock the door again immediately inform the researcher.
- If any participant has been rude to you or responding aggressively in a very polite manner ask him or her if they still want to be a part of this research if they say yes

300
continue and if they are not happy just say thank you and leave and inform the researcher.
- If any of the participant is not happy to reply any of the question which is a part of a survey don’t force them to reply just leave that part and write on the form whatever the participant has told you for example ‘participant is not willing to reply question 3 in section B).
- Walking through the streets especially in the low and middle -income area if people from these areas hold your way or stops you and ask you regarding the research and what you are doing in their area just explain the purpose of the research and if they get into in any arguments please call the researcher or send them to the researcher who will be presenting all the time with the data collectors in the area.
- Please Do not involve yourself in any political or religious arguments, if participants talk about it just listen and polity bring them to the research question.
- Any point of time during data collection, if you feel stressed, upset or depressed please stop your data collection immediately and inform the researcher.

301
Annexure 2: information sheet for survey in English
Information sheet
To assess quality of life
Researcher Principal investigator Laila Surani (PhD Student) Professor Gopal Netuveli Address: Address:
Institute for Health and Human Development Institute for Health and Human Development
Suite UH250 Suite UH250
University of East London University of East London Tel: 02082233000 020 8223 3000
Introduction
Quality of life (QOL), and life satisfaction has become an important theme in modern academic research on older people and has become priority agenda of public policy. (ALLISON, S 2004). According to Global Age watch index (2014), the age of 60 is set to rise from some 809 million today to more than two billion by 2050. Therefore, it has become the concern of the world to address the issues of early old age. Hence this will be possible when we will understand the both objective and subjective wellbeing of older people. Therefore, this study will assess the quality of life of older people living in Karachi, Pakistan.
Now we are interested in knowing your views on your daily living and how you feel about your life.
What will I have to do to take part?
• We are inviting participants aged 50 years or more from different areas of Karachi
• You will only need to be involved on one occasion.
• There will be a one to one interview conducted in Urdu language
• You will be asked several open ended and close ended questions regarding your daily living. • All the open-ended answers will be written on the form.
• The whole process will take 45 minutes

302
• All information will be dealt with in strict confidence
Are there any risks to taking part?
We are not giving you any medication or physically examining you in any way, so there are no physical risks. However, we will take your height and weight to know the BMI.
All information you share with us is confidential and will not be disclosed to anyone other than those involved in the study. All data will be stored on a secure computer. Data will be anonymised.
Do I have to take part?
No. Taking part is voluntary. If you do not want to take part, you do not have to give a reason. you can also withdraw from the study at any point of time without giving a reason. Furthermore, withdrawing yourself from the study will not affect the services which you are getting from the any organization in your area.
What will happen once research is done?
After the compilation of data, we will share report with you.
Where does this study will take place?
There will be home visits therefore it will take place at your home only so you don’t need to go anywhere.
Any concern about the conduct of investigator
if participants have any concerns about the conduct of the investigator, researcher(s) or any other aspect of this research project, they should contact
University Research Ethics Committee
If you have any queries regarding the conduct of the programme in which you are
being
asked to participate, please contact:
Catherine Fieulleteau, Research Integrity and Ethics Manager, Graduate School,
EB.1.43
University of East London, Docklands Campus, London E16 2RD
(Telephone: 020 8223 6683, Email: [email protected]).
What do I do now?
If you are willing to take part in the study, kindly give verbal consent and on the day of interview if any questions you may have can be answered, and you will be provided with a consent form to sign.
Thank you very much for taking part in our study. Your help is greatly appreciated

303
Annexure 3 Survey consent form in English
Consent form
Quality of life of older people in Karachi, Pakistan
I have the read the information leaflet relating to the above programme of research in
which I have been asked to participate and have been given a copy to keep. The nature
and purposes of the research have been explained to me, and I have had the opportunity
to discuss the details and ask questions about this information. I have understood the
process of the process of the questionnaire.
I understand that my involvement in this study, and data from this research, will remain
strictly confidential. Only the researchers involved in the study will have access to the
data. It has been explained to me what will happen once the programme has been
completed.
The study has been explained to me in full. I have read a copy of the information sheet
and I have no further questions that I would like answered. Therefore, I hereby freely
and fully consent to participate in the study.
Having given this consent, I understand that I have the right to withdraw from the study
at any time without disadvantage to myself and without being obliged to give any
reason.
Participant’s Name (BLOCK CAPITALS)
……………………………………………….
Participant’s Signature
……………………………………………………………………..
Investigator’s Name (BLOCK CAPITALS) ……………………………………………..
Investigator’s Signature ………………………………………………………
Date: ………………………….

304
Annexure 4: Survey form English
Quality of life in early old age in Karachi, Pakistan
Questionnaire
June 2016- Sep 2016

305
ID NO:
Thank you for agreeing to take part in our study. All the information that you give us in this questionnaire will remain confidential and, to all but us, anonymous. We expect the questionnaire to take you about 25 minutes to complete. Please take your time and read each question through carefully. Most of the questions can be answered by putting a tick in the box or boxes that describe your situation. Here are some examples.
Example:
Does your household have a private transportation that you can use when you need to?
Yes 1 No 2
Here are some statements that people have made about their neighbourhood.
It is a safe place to live 1 There is no sense of comm unity 3
2 4
There is a lot of graffiti Good community spirit
Sometimes, if you give us a particular answer, we would like to know more about it. Where you see an arrow next to the box that you have ticked please follow it to the other question and answer that as well. Example:
Do you usually By myself 1 If you manage to Very easy 1
manage to cut your cut
toenails yourself, or Your toenails by
does someone else Someone 2 Fairly easy
yourself, how easy
do it for you? else does it or difficult do you 2
for me
find it? Fairly difficult
Very difficult
3
4
Tick one box only Tick one box only
That is the end of the example .Now please continue on to the questions

306
Section A: General Information A1. What is your age in year?
Your Name?
A.2 What is your birth place? Karachi 1
Interior Sindh 2
Punjab 3
NWFP 4
Baluchistan 5
6
Kashmir
7
Tribal areas
Northern areas 8
India
9
Abroad (other than India)
10
A.3 Which language do you speak? Urdu

307
Sindhi
Kachi
Punjabi
Pashto
Balochi
gujrati
Any other
A.4 What is your Education level? Illiterate 1
Literate (no formal
2
schooling)
Upto 5th
3
Upto Matric
4
11-14 class
5
MA/MSc./MBBS/MBA
6
or above

308
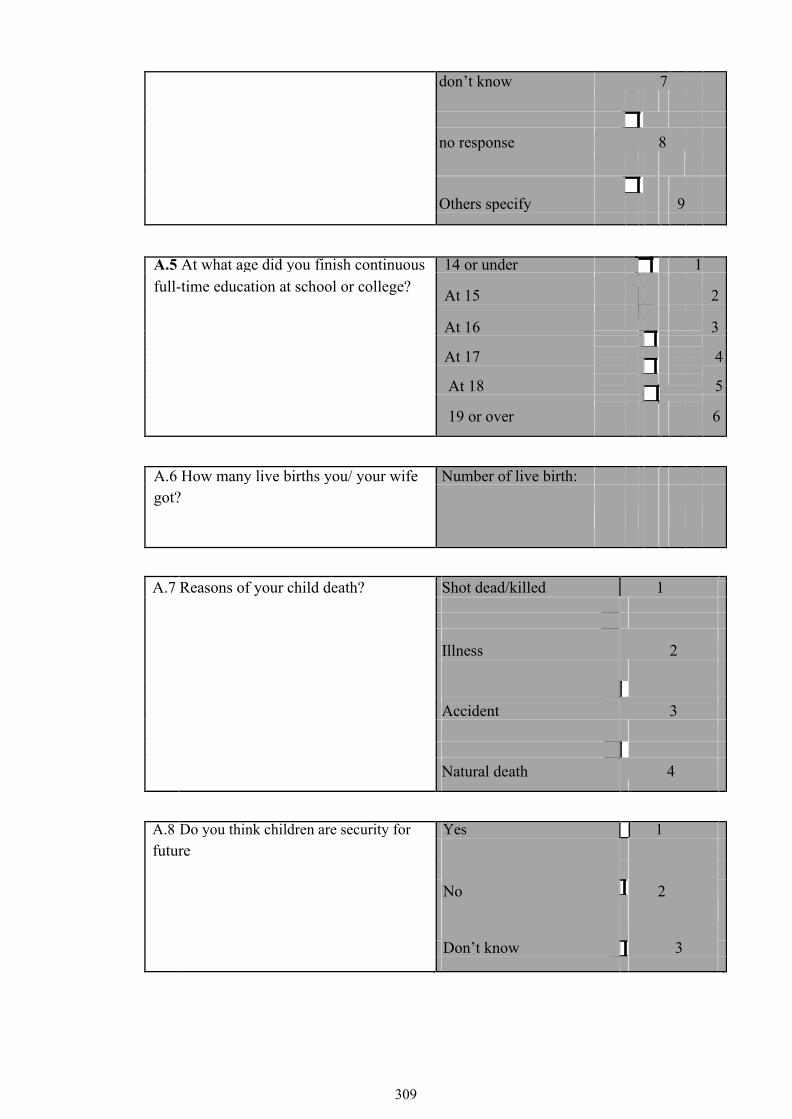
309
don’t know 7
no response 8
Others specify
9
A.5 At what age did you finish continuous 14 or under 1
full-time education at school or college? At 15 2
At 16 3
At 17
4
At 18
5
19 or over
6
A.6 How many live births you/ your wife Number of live birth:
got?
A.7 Reasons of your child death?
Shot dead/killed 1
Illness 2
Accident 3
Natural death 4
A.8 Do you think children are security for Yes 1
future
No
2
Don’t know
3

310
A.9 Do you work to earn money? Yes 1
2
No
No response 3
A.10 If working to earn, what is your Rupees 1
total monthly income from all Don’t know 2
sources? No response
3
A.11 If not working to earn, what is your Rupees 1
total monthly income from all sources?
(e.g.: pension, from children, home Don’t know 2
rentals, business income etc.) No response
3
A.12 What is your current Marital Status? Married 1
Widowed 2
Separated 3
Divorced 4
A.13 What is your Religion? Muslim 1
Hindu 2
Christian 3
Parsi 4
Other (specify )
5
14 Do you ever participate in religious Yes No
services?

311
Daily weekly month annualy 15 How often do you participate in religious services?
A.16Where do you go to practice your Mosque religion Church
Mandir Jamatkhana other
A17. What is the type of family you have? Extended
1
Nuclear
2
Alone
3
Others (specify)
4
A18 What is the residential status at present

312
Personal residence (Not Self Hired) 1 Personal residence ( Self Hired) 2 On Rent 3

313
On subsidized rent 4
without rent 5
A.19 For which of the following reasons , if any , have not bought your home?
I can not afford to buy I can not obtain a mortgage I think it is a bad time to buy There is a lack of available houseing to buy Some other reason
20 How suitable or unsuitable is your accommodation for your current needs
A.21 Please indicate how safe you feel walking alone in the area near your home
A.22 Please indicare how likely you belive it it be that you wull be assaulted in the futre

314
Very suitable fairly suitable fairly unsuitable very unsuitable Very safe fairly safe farily unsafe very unsafe Very likely likely ublikely very unlikely
A23 - Is your current accommodation adequate for your current needs A-24How many bedrooms do you have in your house---------------------------
A.25 Which material is used for roof

315
Yes No
1 2
RCC/RBC
1
Wood/Bamboo
2
Iron/Cement sheets
3
Garder\T-Iron
4
Other( please explain)
5

316
A26.What is main source for drinking Piped water
1
water?
Hand pump 2
Water motor\Tube well
3
Covered well 4
Open well
5
River, stream, pond etc.
6
Tanker truck, water bearer 7
Mineral Water
8
Filtration plant
9
A.27How many days you get water
Other
10
supply: ------------------------------
A.28 What kind of toilet facility does Facility not available
your household use? 1
Flush system (linked to sewerage)
2
Flush (linked to Septic tank)
3
Flush (connected to open drain)
4

317
Dry raised latrine
5
Pit latrine
6
A.29 What type of sanitation system you underground drains
have? 1
covered drains
2
open drains
3
no system
4
A.30 What is the main fuel used for Fire-wood
cooking 1
Gas
2
Kerosene oil
3
Dung cake
4
Electricity
5
Charcoal\Coal
6
A.31 What is main fuel used for lighting Electricity 1
Gas 2

318
Kerosene oil\Diesel\Petrol
3
Fire-wood
A.32 How many days you don’t have 4
Candle
electricity per week?
5
A.33 How many hours there is no
electricity in a day
-----------------------
A.34 What is the temporary source of light Generator
in the absence of electricity in your house?
UPS
1
2
Emergency light
3
Gas light
4
Lantern
5
Candle
6
Nothing
7
Others specify
8
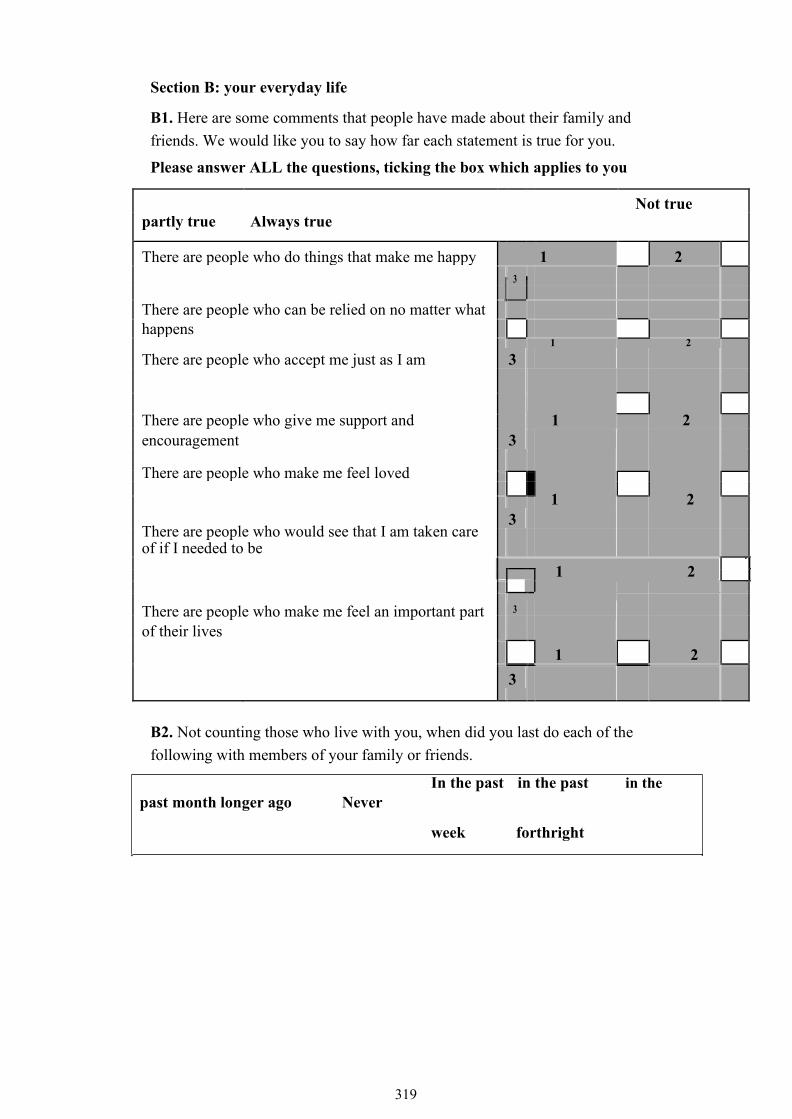
319
Section B: your everyday life
B1. Here are some comments that people have made about their family and friends. We would like you to say how far each statement is true for you.
Please answer ALL the questions, ticking the box which applies to you
partly true Always true Not true
There are people who do things that make me happy 1 2
There are people who can be relied on no matter what
3
happens
1 2
There are people who accept me just as I am 3
There are people who give me support and 3
1
2
encouragement
There are people who make me feel loved
1
2
There are people who would see that I am taken care 3
of if I needed to be
1 2
There are people who make me feel an important part 3
of their lives 1
2
3
B2. Not counting those who live with you, when did you last do each of the following with members of your family or friends.
In the past in the past in the
past month longer ago Never
week forthright

320
Met family members (include both arranged and chance meetings)
Spoke on the phone to family members
Met friends (include both arranged and chance meetings)
Spoke on the phone to friends

321
1 2 3
4 5
1 2 3
4 5
1
2
3
4 5
1 2 3 4 5
B3. Not counting the people that live with you, which of I have a close relationship the following statements best describes how many people you have a close relationship with
I have a close relationship with lots of people
1
I have a close relationship with some people
2
I have one or two close relationships
3
I don't have any close relationships
4
Tick one box only
B4. Some people need regular help with domestic tasks such as cleaning, doing the laundry, housework, shopping, etc. Tick all that apply to you.

322
I do not need regular help 1
I do not receive regular help even though I need it 2
I receive regular help from family, friends or neighbours 3
I receive regular help from someone I employ privately 4
Other (please say who):
B5. Does your household have a private transportation that you can use when Yes No
you need to? 1
2
Car
B6. Which of the following transportation you have? 1
Scooter
2
Bicycle
3
Horse cart
4
Any other
5
B7. Can you usually get a lift from someone when you want to go somewhere
that is too far to walk? Yes 1
No 2
Not applicable 3

323
B8 Here are some types of public transport. We would like to know if you use any of them and whether you think that they are affordable (even if you do not use them).
Do you regularly use one of Is this service affordable?
these? Yes No
Yes No
Bus
Taxi
Rickshaw
Mini bus
Chigchi 1 2 1 2
B9. Here are some statements that people have made about their neighbourhood.
Tick all that apply to where you live.
It is a safe place to live.
There is a lot of graffiti.
I want to leave this area.
This is an affluent area
I have a lot of friendly neighbours

324
1 There is no sense of community 8
2 Good community spirit 9
3 There is a lot of crime in the
10
area
4 There is a good mix of people
11
5 It is not a safe place to live
325
12
This is a deprived area 6
I enjoy living here
People look out for each other People are unfriendly 13
7 14

326
B10. Here is a list of places people may visit from time to time. In each row first tick a box to show whether you visit such a place and then tick to say if it is easy, a bit difficult or very difficult to visit (even if you do not visit one of these).
Do you ever How easy or difficult is it to visit?
visit? Easy A bit difficult Very
Yes NO
difficult
A bank or cash point 1 2
3
A Mosque 1 2
3
A cinema
1 2
A dentist 3
1 2
Your General Practitioner
3
1 2
A hairdresser 3
Your local corner shop
3
1
2
Nearest Government
1
2
3
hospital
An optician
3 1 2
An shopping centre/mall
1 2
3
A post office
3
1
2
A public park

327
A restaurant A hotel
A social club
A swimming pool A supermarket A Rastion shop

328
3
1
2
2
3
1
1
2
3
1
2
3
1 2
1 3
2
1
2
3
1 2
3
1 2 3
Have a personal computer in the household
Have a microwave cooker in the household
Have a refrigerator in the household

329
1 Voted in the last general election 11
2 Have a pet (cat, birds, dog, etc,.) 12
3 I generally read a daily national 13

330
newspaper'
Have a washing machine in the 4
household Sometimes I treat myself to 14
5 something I
Took a short break (one and three do not need'
nights) holiday in paid 15
Agree that I enjoy gardening
Took a holiday abroad last year 6
Have a mobile telephone
16
Last main holiday was a package
7
holiday
Use the Internet or email 17
Have interest-earning cheque or
8 18
savings account
9 Have ac /split at home Have personal health insurance 19
Existing kitchen refitted in the last
Have a video cassette player five years (in present or previous
home) 20
10
Have a compact disc player or tape Have cable TV (Sky, etc.,) 21
recorder
11 Have iron
B11 Please indicates how many of these statements apply to you. Tick all that apply to you
B12.. Do you regularly join in the activities of any of these types of organisation?
Tick all that apply to you
Political parties, trade unions, environmental groups 1
Tenants groups, residents' groups, Neighbourhood Watch 2
3
Mosque
4

331
Charitable organisations 5
Social clubs
6
Sports clubs (e.g. tennis, golf , bowls) or exercise classes
7
Other Groups or organisations
B13 Do you hold a position of responsibility (e.g. secretary, treasurer) Yes No
in any of these types of organisation?
1 2

332
Section C. CASP (Quality of life)
S.No CASP Often 1 Sometimes Not Never 4
2 often 3 1 My age restricts me to do such tasks that I
want to do 2 I feel that whatever is happening with me I
cannot control it 3 I feel that I am free to plan for my future 4 I can do thing that I want to do 5 Family responsibilities stops me to do things
that I want to do 6 I feel that whatever work I do I can make
myself happy from it 7 My health stop me to do things, that I want
to do 8 Lack of money stops me from doing things I
want to do 9 I wait for all coming days 10 I feel that my life has meaning 11 Whatever work I do , I enjoy in it 12 I enjoy other’s company 13 I look at my past happily 14 I feel energetic all the time 15 I select things that I have never done
before
16 I feel satisfied with the way my life is changing
17 I feel that life is full of opportunities

333
Section D: Health
D1 Would you say your health is? Good 1
Fairly good 2
Not good 3
D2 Are you physically …. very active 1
fairly active 2
not very active 3
not all active 4
D3. Do you have one of the following disabilities? Physical disabilities 1
Vision problem 2
Hearing problem 3
Hearing aids
1
D4 Do you use any of the instruments
Denture 2
Specs 3
D5 Have you been diagnosed with [conditions listed Hypertension 1
below, read one by one] by a doctor Cholesterol 2
Diabetes or high blood sugar 3
Cancer or malignant tumor 4
Chronic lung diseases
5
Liver disease
6
Heart attack, coronary heart disease,
7 angina, congestive heart failure
Stroke
8
Kidney disease
9
Stomach disease
10
Arthritis
11
Asthma
12
Cataract
13
Glaucoma
14
D 6 Do you have sleeping proble m Yes 1 No 2

334
D7 What do you do to overcome this issues
Relaxation Exercise
1
Religious intervention 2
Sleeping pills 3
Other
4
Health care
D 8 Where do you go to treat your illness? Hospital 1
General physician
2
Consultant 3
Homeopathic
4
Traditional healer 5
Others
D 9 Reason for going to above places for the Quality care 1
treatment? Affordable
2
Easy Access 3
Other reason----------------- 4

335
D 10 Depression scale
D10.1 Are you basically satisfied with your No =0
life? Yes =1
D10.2 Have you dropped many of your activities and interests? No =0
Yes =1
D10.3 Do you feel that your life is empty? No =0
Yes =1
D10.4 Do you often get bored? No =0
Yes =1
D10.5 Are you in good spirits most of the time? No =0
Yes =1
D10.6 Are you afraid that something bad is going to happen to No =0
you? Yes =1
D10.7 Do you feel happy most of the time No =0
Yes =1
D10.8 Do you often feel helpless? No =0
Yes =1
D10.9 Do you prefer to stay at home, rather than going out and No =0
doing new things? Yes =1
D10.10 Do you feel that you have more problems with memory than No =0
most? Yes =1
D10.11 Do you think it is wonderful to be alive now No =0
Yes =1
D10.12 Do you feel pretty worthless the way you are now? No =0
Yes =1
D10.13 Do you feel full of energy? No =0
Yes =1
D10.14 Do you feel that your situation is hopeless? No =0
Yes =1
D10.15 Do you think that most people are better off than you are? No =0
Yes =1
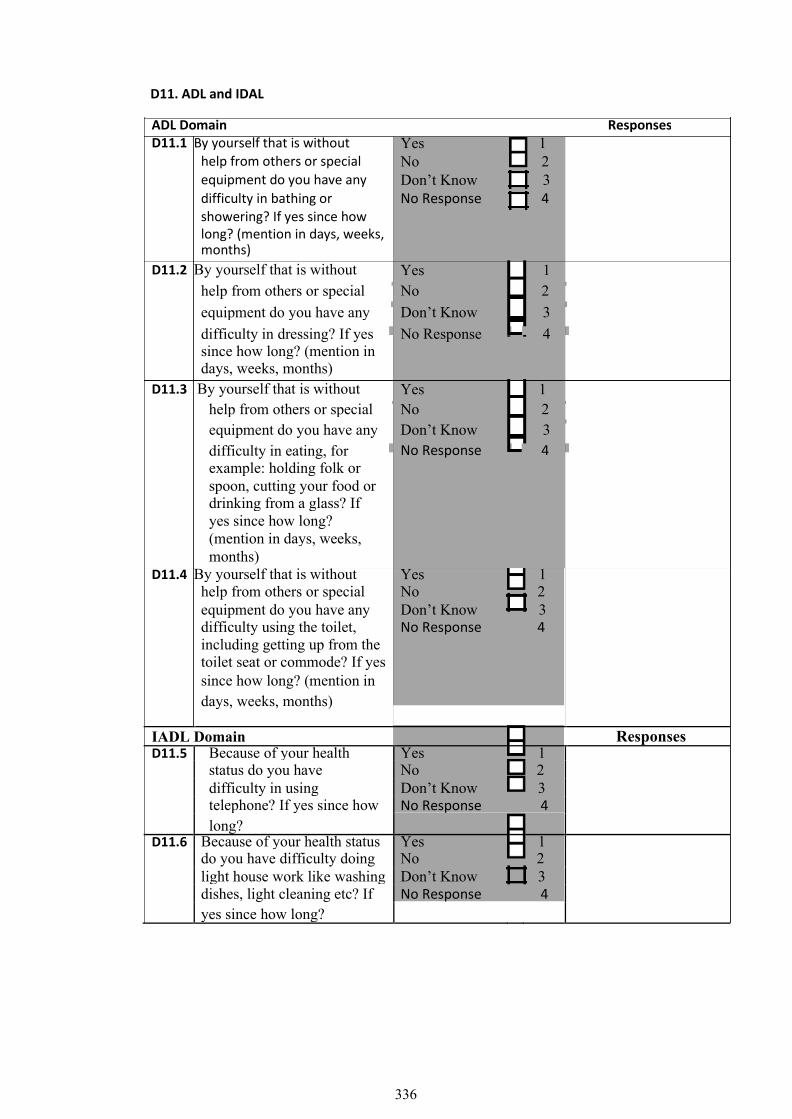
336
D11. ADL and IDAL
ADL Domain Responses
D11.1 By yourself that is without Yes 1
help from others or special No 2
equipment do you have any Don’t Know 3
difficulty in bathing or No Response 4
showering? If yes since how
long? (mention in days, weeks,
months) Yes 1
D11.2 By yourself that is without
help from others or special No 2
equipment do you have any Don’t Know 3
difficulty in dressing? If yes No Response 4
since how long? (mention in
days, weeks, months)
D11.3 By yourself that is without Yes 1
help from others or special No 2
equipment do you have any Don’t Know 3
difficulty in eating, for No Response 4
example: holding folk or
spoon, cutting your food or
drinking from a glass? If
yes since how long?
(mention in days, weeks,
months)
D11.4 By yourself that is without Yes 1
help from others or special No 2
equipment do you have any Don’t Know 3
difficulty using the toilet, No Response 4
including getting up from the
toilet seat or commode? If yes
since how long? (mention in
days, weeks, months)
IADL Domain Responses
D11.5 Because of your health Yes 1
status do you have No 2
difficulty in using Don’t Know 3
telephone? If yes since how No Response 4
long?
D11.6 Because of your health status Yes 1
do you have difficulty doing No 2
light house work like washing Don’t Know
3
dishes, light cleaning etc? If No Response 4
yes since how long?

337
D11.7 Because of your health Yes
1
status do you have No 2
difficulty doing heavy Don’t Know 3
household work like No Response 4
washing clothes or cleaning
floor etc? If yes since how
long?
D11.8 Do you have difficulty Yes 1
preparing your own meal? No
2
If yes since how long? Don’t Know
3
No Response 4
D11.9 Do you have difficulty if need Yes 1
to go for (going for) shopping No 2
for your personal items Don’t Know 3
including vegetables or
medicine etc? If yes since
how long?
D12. Thinking about the activities that
Yes
1
2 No
problems with, does anyone ever help
with above mentioned activities (including
partner or other people in household)?
D13 Who helps you to perform above Husband or wife
mentioned activities? 1 2
Son
Daughter
3
Daughter in Law
4
Sister in Law
5
Sister
6
Brother
7
Other relative
8
Privately paid help
9
Nurse
10
Friend or neighbor
11
Other person
12

338
Section E: Sense of coherence
Yes, usually 1 Yes, sometimes 2 No
E.1 Do you see a solution to problems and difficulties that other people find hopeless?
E.2 Do you feel that your daily life is a source of personal satisfaction?
E.3 Do you feel that the things that happen to you in your daily life are hard to understand?
Section F: Measure capability
mpared to when you were in your thirties, please tick the box that comes closest to describing you today:
1 2 3 4 5 6 7
I can do few of the things I used to
I can do everything I used to 1 2 3 4 5 6 7
I have fewer opportunities to do things
I have similar opportunities to do things 1 2 3 4 5 6 7
I have less satisfaction with what I do
I am as satisfied as I used to be
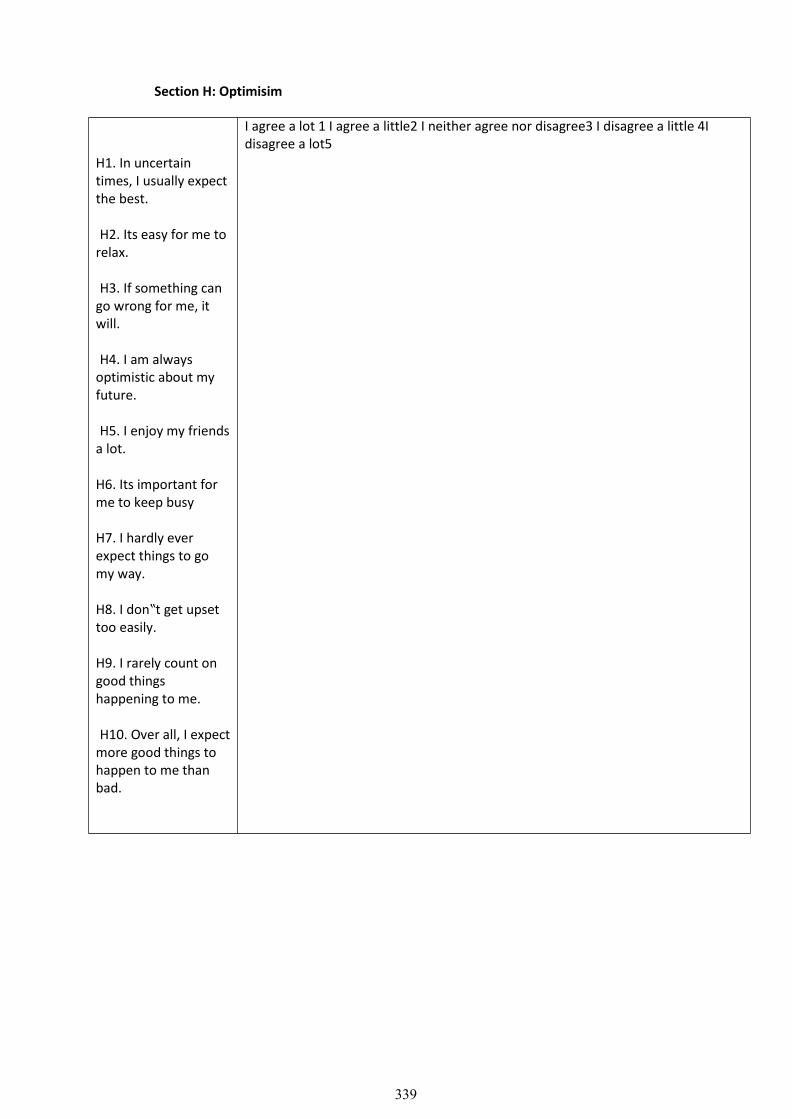
339
Section H: Optimisim
I agree a lot 1 I agree a little2 I neither agree nor disagree3 I disagree a little 4I disagree a lot5
H1. In uncertain times, I usually expect the best. H2. Its easy for me to
relax. H3. If something can
go wrong for me, it will. H4. I am always
optimistic about my future. H5. I enjoy my friends
a lot. H6. Its important for me to keep busy H7. I hardly ever expect things to go my way. H8. I don‟t get upset too easily. H9. I rarely count on good things happening to me. H10. Over all, I expect
more good things to happen to me than bad.

340
Section I. Retirement and Pensions
I1. At what age did you retire I retired at the age of …………..
I2 I am not yet retired 1
Other please say what? ..............................
I.3 . People retire for a variety of reasons and not everybody retires at the same time. Here are some reasons people give for retiring. Tick all that apply to you.
I retired at the state retired early to care 6
retirement age 1 for someone
I retired early due to 2
ill health I retired later than
the state retirement 7
I could not afford to 3 age to improve my
retire at the state
financial position
retirement age
I was offered a good I liked my job so 8
package to retire 4 much that I opted to
early stay on
I was persuaded by 5 for a while longer
my employer to stay
onafter the state
retirement age

341
I4.. Some people receive a pension from their employer when they retire as well as a state pension. Have you ever belonged to a pension scheme or superannuation scheme run by an employer (occupational pension scheme
I5. Looking to the future would you expect your income during retirement to be
Life course questionnaire
more than enough to meet 1
my needs
just about enough to
2
meet my needs
less than enough to meet
3
my needs
Don't know
4

342
Father Information
J1 Occupation - Main
J2. Periods of unemployment? (up to subject's 16th birthday)
J3 Date of birth: J4 Date of death:
K Mother Mothers information
K1 Occupation – Main ‘if housewife was there any paid work also
K2 Periods of unemployment? (up to subject's 16th birthday)
K3 Date of birth: K4 Date of death:
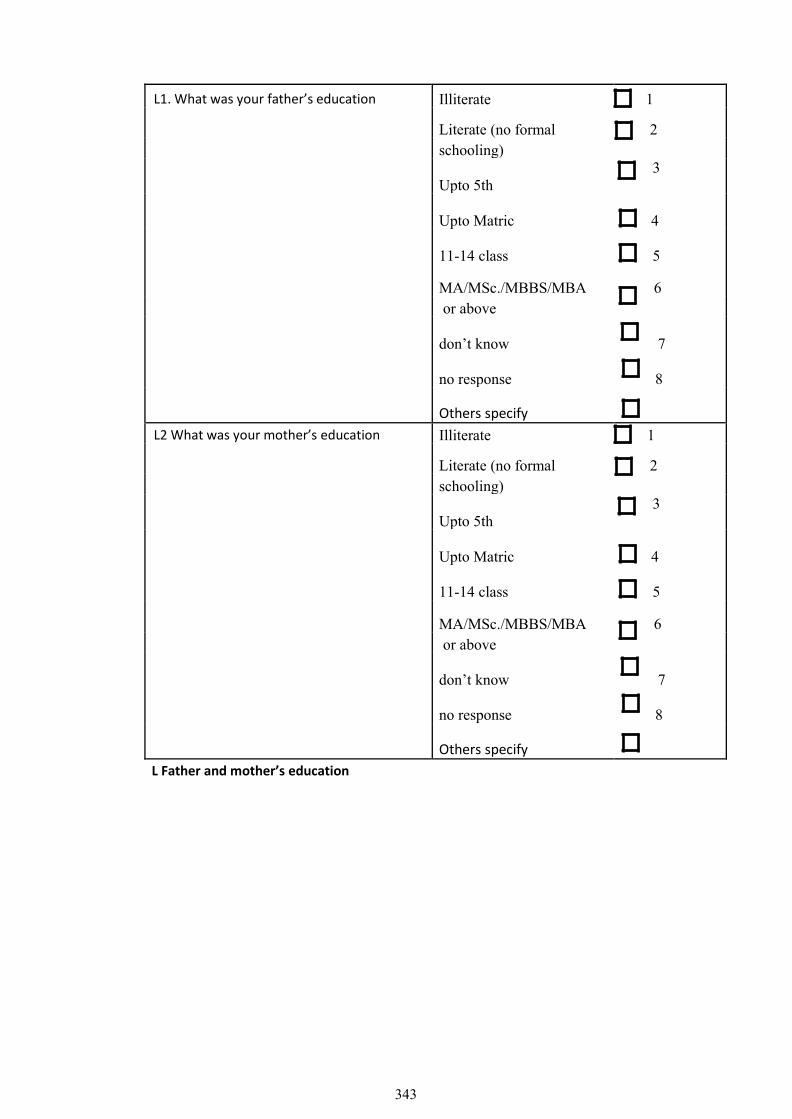
343
L1. What was your father’s education Illiterate 1
Literate (no formal 2
schooling) 3
Upto 5th
Upto Matric 4
11-14 class 5
MA/MSc./MBBS/MBA 6
or above
don’t know 7
no response 8
Others specify
L2 What was your mother’s education Illiterate 1
Literate (no formal 2
schooling) 3
Upto 5th
Upto Matric 4
11-14 class 5
MA/MSc./MBBS/MBA 6
or above
don’t know 7
no response 8
Others specify
L Father and mother’s education

344
M. Siblings
No 1.Name . Date of Date of Age left M5 Age M6 Occupation Birth death education left home before leaving home
M1.frist sib M2.sec sib M3 third M4 fourth M5 fifth M6 sixth M7 seventh
Are you married Yes 1 No 2
Date of marriage
N
1st spouse's occupation
At wedding PT/FT Main PT/FT At retirement PT/FT Year spouse retire :
Age of spouse:
2nd spouse's occupation
At wedding PT/FT Main PT/FT At retirement PT/FT Year spouse retire :
Age of spouse:

345
O .Children (including if step children)
NO Name Date Age left Age left home Do they still
of F/T live with birth education them Child 1
Child 2
Child 3
Child 4
Child 5
Child 6
Section P : Residence
. 1st residence
Address Period in year:
House type (if flat what floor) Years of residence
Tenuure (rented, private)
Number of rooms
What is main source for drinking water Piped water 1
Hand pump 2
Water motor\Tube well 3
Covered well 4
Open well 5
River, stream, pond etc. 6
Tanker truck, water bearer 7
Mineral Water 8
Filtration plant 9

346
Other 10
What kind of toilet facility does your household Facility not available 1
use? Flush system (linked to sewerage) 2
Flush (linked to Septic tank) 3
Flush (connected to open drain) 4
Dry raised latrine 5
Pit latrine 6
What type of sanitation system you have? underground drains 1
covered drains 2
open drains 3
no system 4
Which material is used for roof RCC/RBC 1
Wood/Bamboo 2
Iron/Cement sheets 3
Garder\T-Iron 4
Other( please explain) 5

347
2nd residence
Address Period in year:
House type (if flat what floor) Years of residence
Tenuure (rented, private)
Number of rooms
What is main source for drinking water Piped water 1
Hand pump 2
Water motor\Tube well 3
Covered well 4
Open well 5
River, stream, pond etc. 6
Tanker truck, water bearer 7
Mineral Water 8
Filtration plant 9
Other 10
What kind of toilet facility does your household Facility not available 1
use? Flush system (linked to sewerage) 2
Flush (linked to Septic tank) 3
Flush (connected to open drain) 4
Dry raised latrine 5
Pit latrine
6
What type of sanitation system you have? underground drains 1

348
covered drains 2
open drains 3
no system 4 Which material is used for roof RCC/RBC 1
Wood/Bamboo 2
Iron/Cement sheets 3
Garder\T-Iron 4
Other( please explain) 5
3rd residence
Address Period in year:
House type (if flat what floor) Years of residence
Tenuure (rented, private)
Number of rooms
What is main source for drinking water Piped water 1
Hand pump 2
Water motor\Tube well 3
Covered well 4
Open well 5
River, stream, pond etc. 6
Tanker truck, water bearer 7

349
Mineral Water 8
Filtration plant 9
Other 10
What kind of toilet facility does your household Facility not available 1
use? Flush system (linked to sewerage) 2
Flush (linked to Septic tank) 3
Flush (connected to open drain) 4
Dry raised latrine 5
Pit latrine 6
What type of sanitation system you have? underground drains 1
covered drains 2
open drains 3
no system 4
Which material is used for roof RCC/RBC 1
Wood/Bamboo 2
Iron/Cement sheets 3
Garder\T-Iron 4
Other( please explain) 5

350
4th residence
Address Period in year:
House type (if flat what floor) Years of residence
Tenuure (rented, private)
Number of rooms
What is main source for drinking water Piped water 1
Hand pump 2
Water motor\Tube well 3
Covered well 4
Open well 5
River, stream, pond etc. 6
Tanker truck, water bearer 7
Mineral Water 8
Filtration plant 9
Other 10
What kind of toilet facility does your household Facility not available 1
use? Flush system (linked to sewerage) 2
Flush (linked to Septic tank) 3
Flush (connected to open drain) 4

351
Dry raised latrine 5
Pit latrine 6 What type of sanitation system you have? underground drains 1
covered drains 2
open drains 3
no system 4 Which material is used for roof RCC/RBC 1
Wood/Bamboo 2
Iron/Cement sheets 3
Garder\T-Iron 4
Other( please explain) 5

352
5th residence
Address Period in year:
House type (if flat what floor) Years of residence
Tenuure (rented, private)
Number of rooms
What is main source for drinking water Piped water 1
Hand pump 2
Water motor\Tube well 3
Covered well 4
Open well 5
River, stream, pond etc. 6
Tanker truck, water bearer 7
Mineral Water 8
Filtration plant 9
Other 10
What kind of toilet facility does your household Facility not available 1
use? Flush system (linked to sewerage) 2
Flush (linked to Septic tank) 3
Flush (connected to open drain) 4
Dry raised latrine 5
Pit latrine
6
What type of sanitation system you have? underground drains 1

353
covered drains 2
open drains 3
no system 4 Which material is used for roof RCC/RBC 1
Wood/Bamboo 2
Iron/Cement sheets 3
Garder\T-Iron 4
Other( please explain) 5

354
Section Q: Occupation
1st occupation Name of Employer Period
Job Title: PT/FT
Years employed
Did the work entitle you working physically with your hand ? yes No
If yes
Did this work require skills and training ?
yes
No
What was your post? Manager
Employee
Self employee
Did you Manage /Forsee
E x p o s e d t o f u m e s / d u s t : ( t y p e / a m o u n t )
Protective equipment/ventilation:
Arduous (lifting/back injuries/sweating):
Description of workplace: small confined / large open other processes in vicinity of worker Working conditions: 1. opportunities to make decisions: Y/N
2. Varied or repetitive: Y/N 3. take breaks when wanted: Y/N
2nd occupation
Name of Employer Period
Job Title: PT/FT
Years employed
Did the work entitle you working physically with your hand ? yes No

355
If yes
Did this work require skills and training ? yes
No
What was your post? Manager
Employee Self employee
Did you Manage /Forsee
E x p o s e d t o f u m e s / d u s t : ( t y p e / a m o u n t )
Protective equipment/ventilation:
Arduous (lifting/back injuries/sweating):
Description of workplace: small confined / large open other processes in vicinity of worker Working conditions: 1. opportunities to make decisions: Y/N
2. Varied or repetitive: Y/N 3. take breaks when wanted: Y/N
3rd occupation
Name of Employer Period
Job Title: PT/FT
Years employed
Did the work entitle you working physically with your hand ? yes No
If yes
Did this work require skills and training ?
yes
No
What was your post? Manager
Employee
Self employee
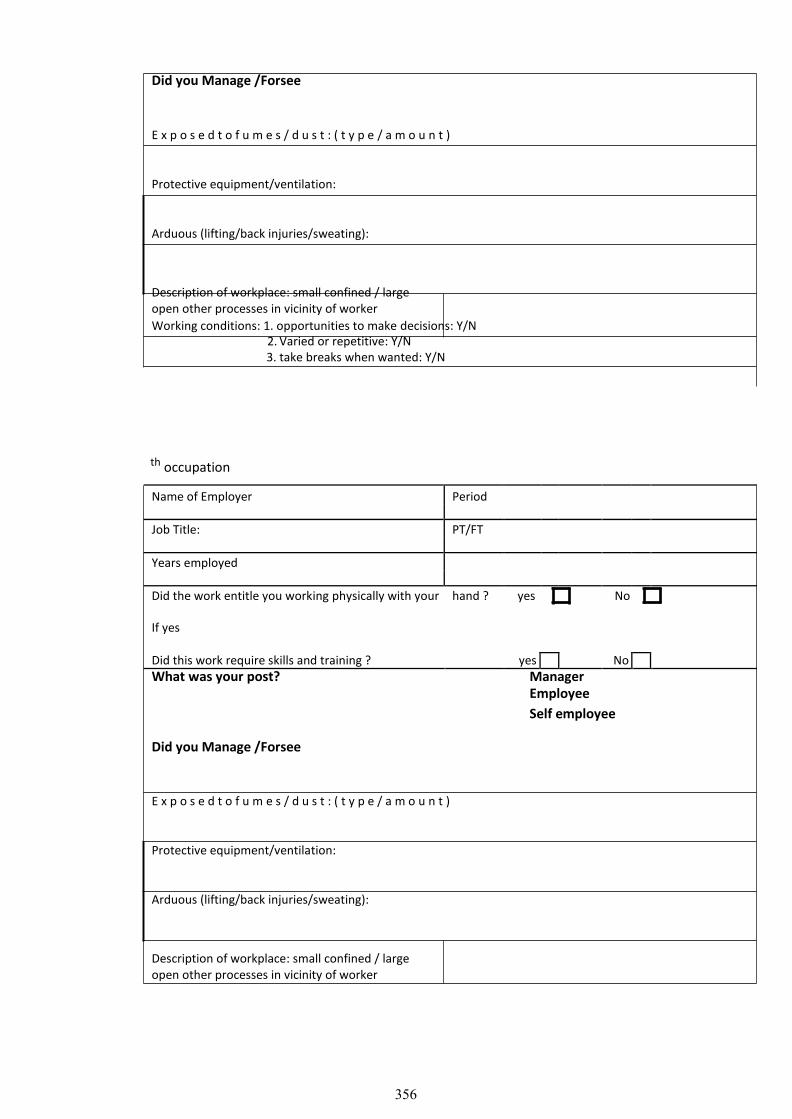
356
Did you Manage /Forsee
E x p o s e d t o f u m e s / d u s t : ( t y p e / a m o u n t )
Protective equipment/ventilation:
Arduous (lifting/back injuries/sweating):
Description of workplace: small confined / large open other processes in vicinity of worker Working conditions: 1. opportunities to make decisions: Y/N
2. Varied or repetitive: Y/N 3. take breaks when wanted: Y/N
th occupation
Name of Employer Period
Job Title: PT/FT
Years employed
Did the work entitle you working physically with your hand ? yes No
If yes
Did this work require skills and training ?
yes
No
What was your post? Manager
Employee
Self employee
Did you Manage /Forsee
E x p o s e d t o f u m e s / d u s t : ( t y p e / a m o u n t )
Protective equipment/ventilation:
Arduous (lifting/back injuries/sweating):
Description of workplace: small confined / large open other processes in vicinity of worker

357
Working conditions: 1. opportunities to make decisions: Y/N 2. Varied or repetitive: Y/N 3. take breaks when wanted: Y/N
5th occupation
Name of Employer Period
Job Title: PT/FT
Years employed
Did the work entitle you working physically with your hand ? yes No
If yes
Did this work require skills and training ?
yes
No
What was your post? Manager
Employee
Self employee
Did you Manage /Forsee
E x p o s e d t o f u m e s / d u s t : ( t y p e / a m o u n t )
Protective equipment/ventilation:
Arduous (lifting/back injuries/sweating):
Description of workplace: small confined / large open other processes in vicinity of worker Working conditions: 1. opportunities to make decisions: Y/N
2. Varied or repetitive: Y/N 3. take breaks when wanted: Y/N

358
Annexure 5 Questionnaire in Urdu Language

359

360

361

362

363

364

365

366

367

368

369

370

371

372

373

374

375

376

377

378

379

380

381

382

383

384

385

386

387

388

389

390

391

392

393

394

395

396

397

398

399

400

401

402

403
Annexure 6: Information sheet in Urdu for survey

404

405
Annexure 7: Consent form in Urdu for survey

406
Annexure 8: Information sheet for focus groups in London
Study Information sheet
Cross cultural adaptation of CASP 19 in Urdu language
Researcher Principal investigator
Laila Surani (PhD Student) Dr Gopal Netuveli
Address: Address:
Institute for Health and Human Development Institute for Health and Human Development
Suite UH250 Suite UH250
University of East London University of East London
Stratford Campus Stratford Campus
Water Lane Water Lane
London E15 4LZ London E15 4LZ
Tel:
Introduction
Quality of life (QOL), and life satisfaction has become an important theme in modern
academic research on older people and has become priority agenda of public policy.
(ALLISON, S 2004). It has become the concern of the world that how to take care of the
senior citizens and give QOL to our elderly, as people over the age of 60 is set to ascend
from some 809 million today to more than two billion by 2050. (Global age watch index,
2014). Hence to understand the subjective wellbeing of the elderly, it is important to
measure the quality of life with the much culturally adapted and validated measure of
QOL that is; CASP (control , Autonomy, Self-actualization Pleasure).

407
Therefore we have translated CASP 19 measure QOL from English to Urdu language for
the cross cultural adaptation of the tool in Pakistani older population.
We are interested in knowing your views on the language, content, and culturally sensitivity of
the statements provided in the CASP 19 measure. By understanding the way you view the
CASP 19 measure, we hope to be able to construct appropriate cross cultural adaptation of
CASP 19 measure in Pakistan.
What will I have to do to take part?
• We are inviting participants aged 50 years or more from Redbridge. • You will only need to be involved on one occasion. • There will be a focus group discussion conducting in Urdu language • You will be asked several questions regarding the instrument. • All the discussion will be recorded. • The whole process will take 3 hours. • All information will be dealt with in strict confidence
Are there any risks to taking part?
We are not giving you any medication or physically examining you in any way, so there are
no physical risks.
All information you share with us is absolutely confidential and will not be disclosed to anyone
other than those involved in the study. All the data and recorded cassettes will be stored in the
locker.
Do I have to take part?
No. Taking part is voluntary. If you do not want to take part you do not have to give a
reason. you can also withdraw from the study at any point of time.
What will happen once research is done?
After the compilation of data we will share report with you.
Where does this study will take place?
The study will take place in a room provided by Pakistan association in Redbridge.
Any concerned about the conduct of investigator
if participants have any concerns about the conduct of the investigator, researcher(s) or any
other aspect of this research project, they should contact Ms Laila Surani telephone number
What do I do now?
If you are willing to take part in the study, kindly give verbal consent and on the day of focus
group if any questions you may have can be answered, and you will be provided with a consent
form to sign.

408
Refreshment
Light refreshment will be served on the day of research.
Thank you very much for taking part in our study. Your help is greatly appreciated

409
Annexure 9: Consent form for the focus groups
Cross cultural adaptation of CASP 19 in Urdu language
Consent Form
I have the read the information leaflet relating to the above programme of research in which I
have been asked to participate and have been given a copy to keep. The nature and purposes
of the research have been explained to me, and I have had the opportunity to discuss the
details and ask questions about this information. I understand what it being proposed and the
procedures in which I will be involved have been explained to me.
I understand that my involvement in this study, and particular data from this research, will
remain strictly confidential. Only the researchers involved in the study will have access to the
data. It has been explained to me what will happen once the programme has been completed.
I hereby freely and fully consent to participate in the study which has been fully explained to
me and for the information obtained to be used in relevant research publications.
Having given this consent I understand that I have the right to withdraw from the study at any
time without disadvantage to myself and without being obliged to give any reason.
Participant’s Name (BLOCK CAPITALS) …………………………………………………………………….
Participant’s Signature ………………………………………………………………………………………..
Investigator’s Name (BLOCK CAPITALS) …………………………………………………………………..
Investigator’s Signature ………………………………………………………………………………………
Date: ………………………….

410
Annexure 10: Thematic analysis of the focus group
To perform the analysis of the two focus groups thematic analysis presented by (Barun,
V and Clarke, V 2006) was performed. The thematic analysis is particularly used for
identifying, analysing, and reporting (themes) within data. It assists in organising and
describing the data. However, ‘it also often goes further than this and interprets various
aspects of the research topic’ (Boyatzis, 1998). The following steps were used to
perform the thematic analysis.

411
Codes
-Shortage of money -Family responsibilities - Material needs
-Different words in Urdu -Clarity of words -Sentence structure
-Different meaning of opportunists in the context - Predicting about future
-Living with a family -Interacting and meeting with the friends .
-Women responsibly to look after family -Men bread earner -Fulfil the needs of the family -Not allowed education
-Qol is when basic needs are fulfilled, having Happiness -Opportunities to work -Have family
- having good health
Themes
Themes 1 Theme 2 :CASP Theme 3:CASP Theme 4 :Social Theme 5 : Cultural
Theme 6: Quality of life
Financial needs Language Concept support influence Participant’s
perspective
Gender wise Transcription Males Shortage of money Statement number In statement 18 quality of life is, ‘I have concern with
quality of life is, when
stops me from doing 11 ‘I feel that my when you say when you are living number 6 ‘khandaan ki
you are living nicely, your
things I want to do’ life has meaning’ ‘zindagi nicely, your family zemadari mujhay wo family life is good, you
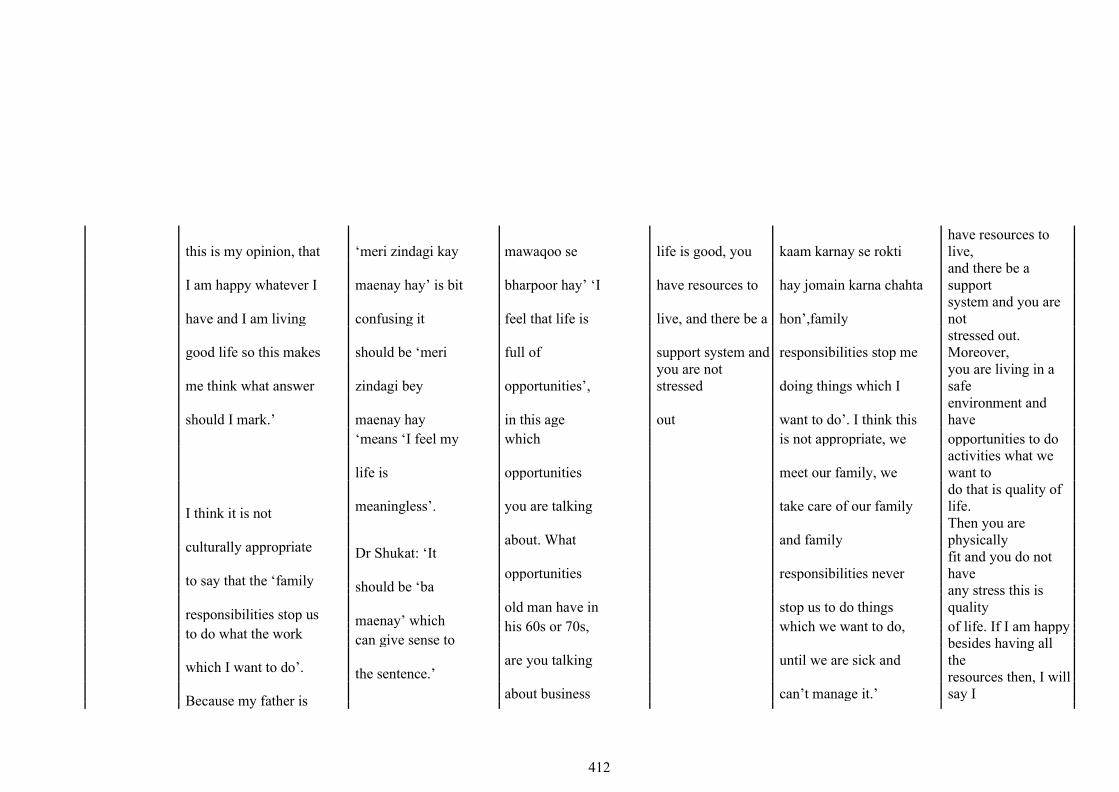
412
this is my opinion, that ‘meri zindagi kay mawaqoo se life is good, you kaam karnay se rokti have resources to live,
I am happy whatever I maenay hay’ is bit bharpoor hay’ ‘I have resources to hay jomain karna chahta and there be a support
have and I am living confusing it feel that life is live, and there be a hon’,family system and you are not
good life so this makes should be ‘meri full of support system and responsibilities stop me stressed out. Moreover,
me think what answer zindagi bey opportunities’, you are not stressed doing things which I
you are living in a safe
should I mark.’ maenay hay in this age out want to do’. I think this environment and have
‘means ‘I feel my which is not appropriate, we opportunities to do
life is opportunities meet our family, we activities what we want to
I think it is not meaningless’. you are talking take care of our family do that is quality of life.
about. What
and family Then you are physically
culturally appropriate Dr Shukat: ‘It
opportunities
responsibilities never fit and you do not have
to say that the ‘family
should be ‘ba
old man have in
stop us to do things any stress this is quality
responsibilities stop us
maenay’ which
his 60s or 70s,
which we want to do, of life. If I am happy
to do what the work
can give sense to
are you talking
until we are sick and besides having all the
which I want to do’.
the sentence.’
about business
can’t manage it.’ resources then, I will say I
Because my father is
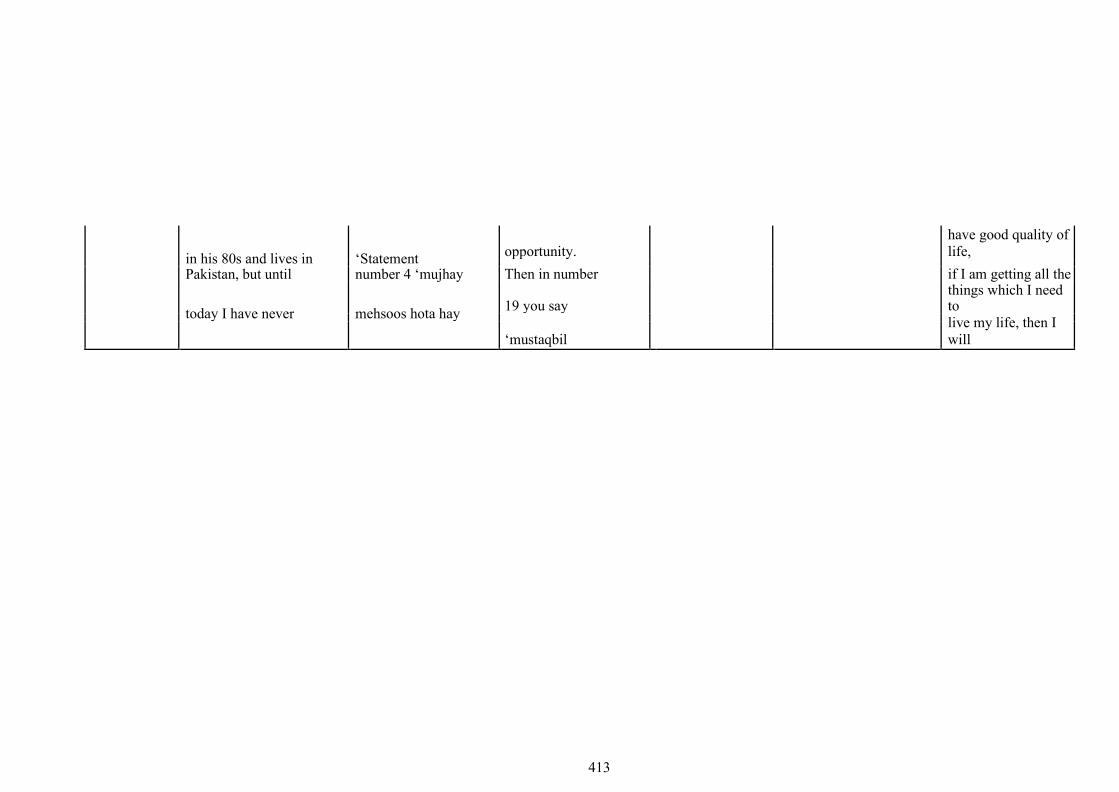
413
in his 80s and lives in ‘Statement opportunity.
have good quality of life,
Then in number
if I am getting all the
Pakistan, but until number 4 ‘mujhay
today I have never mehsoos hota hay 19 you say things which I need to
‘mustaqbil live my life, then I
will

414
ever taken a decision cheezian choot meray liyee say I have good quality of
without asking him. I rahi hay’, ‘I feel acha hay’ I feel life.’
am fulfilling all his left out of things’ that the future If person is happy, well I
needs and providing this sentence does looks good for
am not happy like people
all resources, which he not have any me’ then in
who have family support,
wants in his life. clarity, what do which context
they are happy, I don’t
Therefore, in our you mean by that? you are talking
have any support, I am
culture this statement The interpretation about.’
living alone. I am not
will not be of this sentence is
Moderator: Do
physically fit, see my
appropriate. However, not appropriate.
you mean that
hands are shacking and
if you really want to Do you want to
number 18 and
paining. I do not have
add this statements say things are left
19 is in
any one to look after me. I
then clear it that out physically,
inappropriate?
do not have any peace of
‘sometimes’ ‘baaz mentally or what?
mind. I am living alone so
uwqat’ it stops me So, this sentence Mohammad
you can think, what could
doing whatever I want does not make
aslam: ‘No
be my quality of life. I
to do.’ any sense.’
whatever you
had spent good life in the
are asking in 18
‘I think there is a past and I do not regret.
and 19 is right
problem with the My past was good but,
but our concern
grammar rather today I don’t have good
is that this is
than saying ‘main life and I have not left
irrelevant for
aanay walay din with anything to do in this
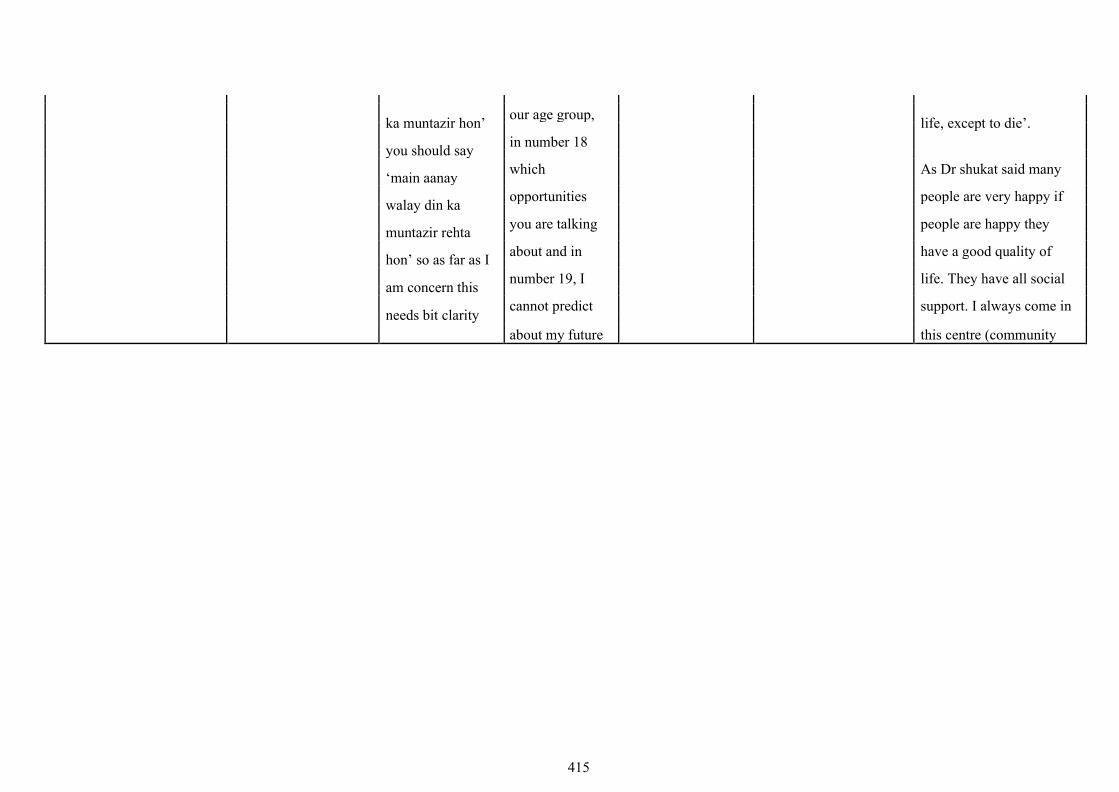
415
our age group,
ka muntazir hon’ life, except to die’.
in number 18
you should say
As Dr shukat said many
which
‘main aanay
opportunities
people are very happy if
walay din ka
you are talking
people are happy they
muntazir rehta
about and in
have a good quality of
hon’ so as far as I
number 19, I
life. They have all social
am concern this
cannot predict
support. I always come in
needs bit clarity
about my future
this centre (community

416
in grammar.’ whether it’s centre for Pakistanis) to
‘Even in
good of bad for get socialize and make
me. So, for the myself happy. Many
statement 11, if
old age these 2 people I come across in
we say ‘zindagi
statements are this centre they say, that
be maenay hay’, it
irrelevant.’ they are very happy with
will give you their lives and they say
negative meaning. Fazal karim: ‘I
we are still young’.
If you want to say am 75 now why
in a positive way should I look for Quality of life has 2
then you need to an opportunity, phases. One is when
say ‘app ki now I can only person has all the living
zindagi ka koi do ‘Allah, resources to survive and
maqsad hay’ ‘my Allah’. In this second, in the country,
life has some age, we wait for where the person is living
goals’. our time to die’. gets welfare. When they
Abdul Khaliq: If you can see
are in their retirement life,
they are all getting
‘This statement number 19
benefits for their living.
should be ‘main ‘mere mustaqbil
so that means do I have
aanay walay din meray lyee acha
enough resource to
ka achay kaam hay’ ‘I feel that
survive in my 50s or 60s
kay liyee the future looks
and when I am retired in
muntazir hon’ ,’ I good for me’. I
the age of 50s or 60s,
look forward to think it’s not an
does state have policy for
each day for good appropriate
the people to provide
work’. religiously,
them the resources and
because you
In statement 17
when all the needs are
cannot talk
met, then we can have a
the word
about future and
quality of life. For me the
‘mutmain’ is not
you can find a
basic need is that a person
appropriate it
group of people

417

418
should be 11 has his own place to live
‘itminaan’ will review on or the state has given
(satisfied). So it you or can shout place. The other thing is
should be ‘main at you, that how that the person above 50
itminaan mehsoos one can predict has given benefits for
karta hon jis tarha about future. In health care and has
meri zindagi our religion, you enough finance to live
badal rahi hay’. cannot predict better and quality life. As
Dr rashid: ‘Or
future. You need today there is a financial
to think about crisis therefore its state’s
you can say ‘I am
this as for responsibility to provide
satisfied’ ‘main
example you say resources to 50 or 60 plus
mutmain hon’ if
‘agar Allah nay people.’
you will say ‘I
chaha tho main
Mohammad aslam: ‘we
feel satisfied’ then
karon ga’ ‘If
you have to Allah permits I cannot always get
change the word
happiness even we have
will do this’.
‘mutmain’ to
money or we are very
‘itminan’ then Dr Rashid: rich, we cannot get
you can say ‘main ‘People can feel happiness if we don’t
itminan mehsoos anything but, have peace of mind. If the
karta hon’ ‘I feel when they will person is earning 200 or
satisfy’. discuss they will 300 pounds per week but
Dr rashid: ‘I am
say she has still he is not happy,
become mad, because his children and
also not very clear
talking about wife they are not
about the future, and supportive and don’t have
statement 15 ‘I
thinking that good relationship with
feel full of energy
he/she is a them. Then there is no use
these days’ this
GOD.’
of having money in the
need clarity. What
does it say, does it pocket.’

419
mean mental energy, physical energy.’
Dr Shuakat : ‘And the word ‘tawanai’ (energy) mostly is used in describing a form of electricity. The word energetic can be used which means ‘josheela’, ‘hoslay se’ ‘himat se’.
Moderator: Can you make it more clear, do you mean that the word ‘ tawanai’ is not appropriate in statement 17
Dr rashid : ‘What I have understood from number 17 is that ‘main mehsoos karta hon kay mujh aaj kaam karnay ki

420
Moderator: recapped all the points, which were shared by the participants on quality of life. Dr Rashid: ‘Education is also important to have a good quality of life. to understand quality of life it is important to look back in the past and to know, does a person has been given an opportunity to get an education? Then did he has a good job opportunity after completing his education and then did person have enough to fulfil all his lives necessitates and this can define quality of life.’ Abdul Khaliq: ‘Standard of living and quality of life is a relative term. There are factors, which affects the quality of life. The quality of life is different in London from back home and you cannot compare the life from here to there.

421
himat hay ‘‘I feel energetic these days’.so this needs some clarity both grammatically and conceptually.’
422
Quality of life includes political factors and how economic factors are distributed.’ Observation (he started speaking in English). Abdul Khaliq: ‘Just clear one thing to me, do we need to give answers while keeping this in mind that we are still Pakistani or a British national as we are now living in this country for last 40 years however, we have still had same feelings for our country.’ Moderator: you say whatever you feel and think about the subject. Abdul Khaliq: ‘For example my wife is handicap and I have to do all her work so sometimes that situation didn’t allow me to do things I really want to do

423
Females I did not I think item In my point of view
understand number 6 in the quality is life is when
statement 4 questionnaire is people have good health,
‘cheezain meray very true and then people should
haatho se choot statement, have money. A person’s
rahi hay’ what because in financial situation should
does that mean. Pakistani culture be very good so they can
B: Yes, this
mom or female fulfil their basic needs’.
has all family
statement is not
responsibilities.
even clear to me
A woman is like : ‘besides that people
this statement
a ship captain, if
should have respect in the
needs clarity
captain is not
society, then only they
their then ship
can have good life and
will sink. It has
person have life
just like that if a
satisfaction’.
woman is not at
home, and then B: ‘For me health is very
how home will important, financial
be managed situation should be good
women has a and people can avail
main role in a services.’
family. So
sometimes this
really stops us, For me quality of life is
if we want to go

424

425
somewhere or when you have a good
want to have our health. If person has good
own time, if I health, then he has
want to do some everything. If person is
course I cannot healthy, he can earn
do it. All the money for his living and
time woman can meet every one. His
must think what behaviour will be good;
to cook, should he will not be irritated all
pick daughter, the time. If person is
then drop unhealthy then he cannot
another do anything. For me
daughter. So, all health is everything. If
the time these person has lots of wealth
responsibilities but he is on bed then,
don’t allow us to what is the use of money?
do things which So therefore, health is
we really want wealth.’
to do.’ D: ‘for me to live happy
C: ‘yes she is
life with the family is
right women are good life. Money and
the key to home, health both are important
if someone died, to live a life, but health is
then that is a much important than the
woman money.’
responsibility to E: ‘For me all is
go for
important in life, money,
condolence,
health and family if you
man will say we
have all these things in
don’t have time
life then you have a good

426
427
we are working quality of life. It is
so you go.’ important that people
should live with the family happily and for me happiness is important.; but in this age I am so scared and think a lot that, what will happen in future if I would be on bed then what will happen. When I see disable people I get anxiety that what will happen if I will be disable in the future.’
F: ‘if person doesn’t have respect, love and family then they don’t have a good life.’

428
Annexure 11 : Compilation of CASP in Tree form
CASP 19 Stat 1
Wo(v1,v2)
Meri umar(v1, v2, v3, v4) mujay (v1,v2,v4) Cheezain (v1) karnay se rokti(v1, v2, v4) Ki waja se(v3) Kaam (V2, V3, V4) apni khuwaaish ke mutabiq (v3)
Pasandida (v4)
jo main karna chati hon (v1, v2)
nahin kar sakti hon (v3)
CASP 19 Stat 2
Ye(v3) Jo(v1)
Main (v1) 32
mehsoos (v1, v2,v3) karti hon(v1)
mujh par(v1) bitti hay(v1) wo(v1,v2)
Mujhay(v2, v3, v4) hota hay(v2,v3) meray sath(v2,v3,v4) hota hay(v2,v4) meray(v1,v2,v3,v4)
Lagta hay(v4) ke(v2)
jo kuch bhi(v4) horaha hay(v3)
Ikhtiyaar(v1,v2,v3) main nahi(v1,v3)
Kaboo(v4) se bahir hay (v2,v4)

429
CASP 19 Stat 3
Main apnay(v1,v3) hota hay(v2) kay baray main(v1) sochnay(v1) khud ko (v3)
Mujhay mehsoos(v2)
mustaqbil(v1, v2,v3,v4 ) ki mansoba bandi(v2,v4) karnay(v2)
Main bilajhijhak(v4) ke main apnay(v2) kay faislon(v3) kay liyee(v3)
Azaad hon (v1,v2)
Azaad mehsoos karti hon(v3)
CASP 19 Stat 4
Main (v1,v4) khud ko(v1,v4) ke ceezain (v2) akela(v1)
Mujhay (v2,v3) mehsoos hota hay(v2) choot (v2)
Cheeazin apnay(v3) Ikhtirar se baahir(v3)
mehsoos karti hon (v1,v4) rahi hay (v2)
mehsoos hoti hay (v3)

430
CASP 19 Stat 5
Main wo (v1,v2,v3,v4) cheezain (v1) kar sakti honn(v1,v2, v3,v4) jo main karna chahti hon (v1, v2, v4)
Kaam (v2,v3,v4) jo mujhay pasand hay (v3)
CASP 19 stat 6
Khandaan ki zimedaari (v1, v2, v3, v4) mujhay wo (v1,v2) karnay (v1) se rokti (v1,v2,v3,v4) hay jo(v1,v2,v3,v4)
Mujhay apni (v3) kaam karnay (v2,v3,v4)
Mujhay (v4)
main karna chahti hon (v1,v2,v4)

431
CASP 19 stat 7 kaamon(v3) ke jo(v2)
Mujhay (v1,v2) apnay (v1,v3) hota hay (v2)
kaam (v1,v2,v3,v4) se(v1)
Main(v3,v4) mehsoos (v2,v4) karti hon (v3,v4) kay mera(v4) main karti hon use se apnay aap ko (v2)
Main(v3)
Mujay(v4)
Khushi (v1, v3, v4) milti hay(v1)
Khush(v2) kar sakti hon (v2)
Mehsoos Karti hon (v3)
Deta hay (v4)

432
CASP 19 stat 8
Meri (v1, v2, v3, v4) tabiyat (v1) Nasaaz (v1) honay ki waja (v1) se main(1) wo nahinkar sakti jo main karna chahti hon (v1)
Sehat (v2, v3, v4)
wo kaam (v2)
se rokti hay (v2, v3)
Apni pasand kay kaam (v3, v4) rukaawat banti hay (v4)
CASP 19 stat 9 ki waja (v1, v3) se main (v1) wo(1) nahi kar sakti (v1)
Paiso (v1, v4) ki kami (v1,v2,v3,v4)
wo(v2)
kaam karnay se rokti(v2,v4)
Rupay (v2,v3)
mujhay (v2, v4) se main(v3) meri pasand(v4) ke (v3,v4) mutaabik kaam nahin kar sakti(v3)
Apni khuwaaish(v3)
Jo main karna chahti hon (v1,v2)

433
CASP 19 stat 10
Mujhay (v1) har din (v1, v3) ka(v1) khushi se(3) Intazaar(v1) rehata hay(v1)
Main(v2,v3,v4) Aanay walay din(v2) muntazir(v2) hon(v2)
Har roz (v4) ki(v2) Istaqbal(v3) karti hon(v3)
Tawaqa(v4) rakhti hon(v4)
CASP 19 stat 11 kay(v1,v2)
Mujhay (v1, v2) mehsoos(v1,v2,v4) hota hay (v1, v2) meri zindagi (v1,v2,v3,v4) ka(v1,v4)
Meri (v3)
aisay(2) karti hon (v4) kay(v2,v3)
Main (v4)
Koi maqsad hay (v1,v4)

434
CASP 19 stat 12
Mujhay (v1) meray (v1) kaam (v1, v2, v3, v4)
Main(v3,v4) apnay (v3) Jo(v2)
Hoti hay(v1) Ata hay (v2)
Leti hon (v3)
Hoti hon (v4)

435
main (v1, v2, v3) karti hon us main(2) Khushi(v1) se (v4) maza (v2)
dilchaspi (v3)
Lutf andooz (v4)

436
CASP 19 stat 13
Mujhay (v1, v2) Dosron (v1,v2) ki (v1, v2, v3)
Main (v4) logon (v3,v4) kay (v4)
Pasand hay (v1) Maza aata hay (v2)
Khushi mehsoos hoti hay (v3,v4)
CASP 19 stat 14
Mujhay apnay(v1,v2) maazi ko (v1, v2, v4) soch kar(v1)
Main apni (v3) guzray dino ko (v3) ki taraf (v3)
Tawazon kay saath(v4) ayaam (v4)
CASP 19 stat 15 Main khud(v1) ko(v1) tar-o-taaza(v1)
Aaj kal (v2,v3,v4)
mujhay (v2)
tawanai(v2,v3)
Main (v3,v4) purjosh(v4)
Puri tarha se(v2)
CASP 19 stat 16
Main (v1,v2,v3,v4) un(v2) cheezain (v2) ka(v2,v3) intakhaab(v2,v3)
Aisay(v3)
Wo(v4)
Kaam(v3,v4)
pasand( v4)
Wo sab kuch karna chahati hon jis ka kabhi(v1)

437
sohabat (v1,v3) main (v2) mehfil (v2) main rehna( v1) Saath (v4)
khushi(v1, v2, v3, v4) mehsoos karti hon(v1)
dekhti hon (v2,v3,v4)
mehsoos(v1,v2,v3,v4) karti hon (v1,v3,v4)
hoti hay (v2)
karti hoon (v2,v3,v4) moqa nahin mila(v1)
jo aaj se pehelay kabhi nahin kia(v2,v3,v4)

438
CASP 19 stat 17
Apni zindagi se(v1,v3) bohat khush aur (v1) hon(v1,v4) ne(v4) rukh mora hay (v4)
Main (v1,v2,v3,v4)
mutmain (v1,v2,v3,v4) mehsoos karti hon(v2)
badal rahi hay (v2)
Apni zindagi main (v1) se(v3) jis tarha meri zindagi(v2,v4)
CASP 19 stat 18
Mujhay(v2,v3) lagta hay (v3) zindagi (v1,v2,v3,v4) mawakon(v1,v2,v3,v4)
Main (v4) mehsoos hota hay/karti honv(v2,v4)
Se bharpur hay (v2,v3,v4)
Se Bhari hay (v1)
CASP 19 stat 19 Meray liyee
Main (v4) mehsoos hota hay /karti hon(v2,v4) mustaqbil(v1,v2,v3,v4) bohat
Mujhay (v2,v3)
Meri (v1)
Roshan hay (v1,v3)
Acha hay (v2,v4)

439
Annexure 12 pictures from Survey in Pakistan
Low income area

440
Middle income area
High income area
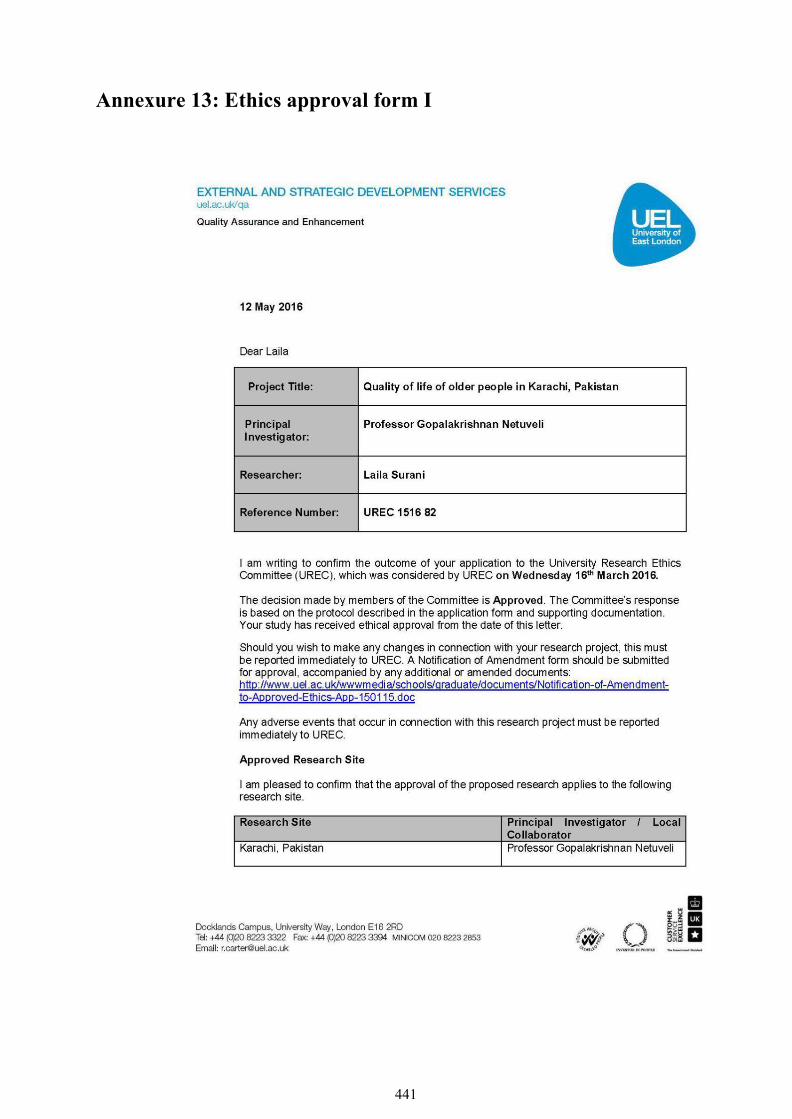
441
Annexure 13: Ethics approval form I

442

443
Annexure 14: Ethics Approval form 2

444


![Lessons and implications from a mass immunization campaign in squatter settlements of Karachi, Pakistan: an experience from a cluster-randomized double-blinded vaccine trial [NCT00125047]](https://static.fdokumen.com/doc/165x107/63370c0020d9c9602f0b205c/lessons-and-implications-from-a-mass-immunization-campaign-in-squatter-settlements.jpg)