
Quality Health Care in Private and Public Health Care Institutions
36
333 CHAPTER 13 Abstract Quality of care delivered by health care institutions is a mat- ter of public concern. Any differences in quality of services by ownership of health care institutions have significant pol- icy implications. Evidence from health-seeking behavior studies suggests that people who can afford to tend to use private health care institutions. It is assumed that the private health care institutions must be providing better quality of services. Otherwise, why would the rich and middle class access the private health care sector? Such an argument relies on the observed pattern of utilization as a proxy meas- ure of quality of care. Instead, it would be desirable to rely on more direct measures of quality of health care services. But the concept of quality health care tends to have different meanings depending on one’s viewpoint. This chapter first discusses the concept of quality in health care and presents a framework for assessing health care quality. Evidence is then presented on the quality of care in the private sector in India. Quality Health Care in Private and Public Health Care Institutions Prasanta Mahapatra, Institute of Health Systems Hyderabad, Andhra Pradesh, India 13_Yazbeck 8/6/03 3:24 PM Page 333
Transcript of Quality Health Care in Private and Public Health Care Institutions

333
CHAPTER 13
Abstract
Quality of care delivered by health care institutions is a mat-ter of public concern. Any differences in quality of servicesby ownership of health care institutions have significant pol-icy implications. Evidence from health-seeking behaviorstudies suggests that people who can afford to tend to useprivate health care institutions. It is assumed that the privatehealth care institutions must be providing better quality ofservices. Otherwise, why would the rich and middle classaccess the private health care sector? Such an argumentrelies on the observed pattern of utilization as a proxy meas-ure of quality of care. Instead, it would be desirable to relyon more direct measures of quality of health care services.But the concept of quality health care tends to have differentmeanings depending on one’s viewpoint. This chapter firstdiscusses the concept of quality in health care and presents aframework for assessing health care quality. Evidence is thenpresented on the quality of care in the private sector in India.
Quality Health Care in Private and PublicHealth Care InstitutionsPrasanta Mahapatra,
Institute of Health SystemsHyderabad, Andhra Pradesh, India
13_Yazbeck 8/6/03 3:24 PM Page 333

334 • Health Policy Research in South Asia
This is followed by findings about structural and processquality issues from a study in Andhra Pradesh to illustratethe structure and dynamics of the private health care sector.Finally, some opinions are presented about quality-of-caremeasures obtained from owner-managers of private healthcare institutions in Andhra Pradesh.
A Framework for Assessing Health Care Quality
Quality-of-health-care concepts emerge from our understanding ofgoals of health care. The World Health Organization (WHO)framework (table 13.1) for health system performance assessment(Murray and Frenk 2000; WHO 2000) provides one view of healthsystem goals and a measurement strategy. The defining goal of anyhealth care service is to improve the health of the recipient. Healthincludes survival and quality of life. Responsiveness is about theinterpersonal aspects of care. It refers to client orientation andrespect for persons. The health-enhancing aspects of care havebeen referred to as technical quality of health care, and the respon-siveness dimension has been referred to as interpersonal quality ofcare (Newbrander and Rosenthal 1997). Fairness of financial con-tribution refers to the equity aspect of the health system. Newbran-der and Rosenthal (1997) refer to these dimensions as the socialaspects of quality, efficiency, and access. I believe that quality ofcare is widely perceived to refer to the health-enhancing aspectsand responsiveness of the health care institution (HCI).
Table 13.1 Health System Goals According to a WHO Framework, 2000
GOAL LEVEL DISTRIBUTION
Health (survival + quality of life) ✓ ✓
Responsiveness ✓ ✓
Fairness of financial contribution ✓
Quality Equity
Source: Based on Murray and Frenk 2000.
13_Yazbeck 8/6/03 3:24 PM Page 334

Quality Health Care in Private and Public Health Care Institutions • 335
Quality of care is a multidimensional concept consisting of objec-tive and subjective elements. Hence, it is inferred from a variety ofsources. The “structure, process, and output” framework for assess-ment of quality of care originally recommended by Donabedian(1985) is widely followed (Acquilina 1992; Newbrander and Rosen-thal 1997). Structure refers to provider characteristics assumed to beprerequisites for good-quality medical care: credentials, accredita-tion, license to practice, and so on. The probability of good-qualitynursing care is assumed to be higher in an HCI that employs enoughnurses according to staffing norms compared with an HCI that doesnot have enough nurses. Similarly, between two HCIs employing asimilar number of nurses, the one employing only formally trainednurses is assumed more likely to provide better nursing care than theone employing untrained nurses. Standards determine what consti-tutes an adequate number of professionals and their qualifications.For example, in the United States, the Joint Commission on Accred-itation of Health Care Organizations ( JCAHO) develops and peri-odically revises standards of physical plant, staffing norms, healthcare professional selection procedures, and so on. The hospitallicensing boards of each state also prescribe structural standards,including, for example, building standards. Each structural charac-teristic of an HCI may also affect the interpersonal aspect of care.For example, the number of telephone lines will influence ease ofaccess to the health care facility. Provision of a waiting area and signpostings can smooth the process of outpatient consultation.
Process of care refers to what is done to the patient. Theseprocesses are usually achieved through protocols established by theHCI to deal with technical and interpersonal aspects of health care.Adherence to evidence-based protocols contributes to improvedpatient outcomes. For example, a study by Kahn and others (1990)developed explicit process criteria for patients hospitalized withcongestive heart failure, myocardial infarction, pneumonia, andcerebrovascular accident. A better process criterion was found tobe associated with lower mortality rates 30 days after admission.
For another example, the JCAHO accreditation requires thathealth care organizations follow certain minimum procedures to
13_Yazbeck 8/6/03 3:24 PM Page 335

336 • Health Policy Research in South Asia
ascertain the suitability of professional staff. The procedures aredesigned to reduce the chance of giving hospital privileges tophysicians with a known history of medical malpractice. Thisprocess is expected to improve the level of professional competenceamong physicians and thereby contribute to better patient out-comes. The JCAHO developed a set of Indicator MeasurementSystems (IMS) to improve objectivity in measuring health careprocess quality (Nadzam and others 1993). Practice guidelines areanother example of defining the process of care and hence arepotential tools for enhancing quality assurance (Woolf 1992). TheInstitute of Medicine (1990, p. 38) defines clinical practice guide-lines as “systematically developed statements to assist practitionerand patient decisions about appropriate health care for specificclinical circumstances.” Implementation of clinical practice guide-lines is an important tool for improving the technical quality ofhealth care. However, practice guidelines can be useful only ifthere is an environment for systematic development, implementa-tion, and evaluation of practice guidelines. For example, Lomasand others (1989) studied the knowledge, attitude, and practices ofobstetricians before and after release of a consensus statement rec-ommending a decrease in the use of cesarean sections. Theyobserved that clinical practice guidelines may predispose physiciansto consider changing their behavior, but actual change in physicianbehavior depends on the overall incentives system and practiceenvironment.
Outcome refers to the change in health status attributable to thehealth care in question. This is the most important indicator fromthe public health point of view. The American Medical Association(1986) defined high quality of care as “the care which consistentlycontributes to improvement or maintenance of the quality and/orduration of life.” In other words, patient outcome is viewed as theultimate measure of quality of medical care. Change in health sta-tus refers to improvement in survival as well as the quality of life.The Medical Outcomes Study (MOS) conducted in the UnitedStates sought to measure outcomes of medical care (Stewart 1992;Tarlov and others 1989). In this study, risk factors that may have an
13_Yazbeck 8/6/03 3:24 PM Page 336

Quality Health Care in Private and Public Health Care Institutions • 337
effect on patient outcome were measured at the time of patientintake and exit. Patient outcome was measured along multipledimensions of functioning and well-being. Patient outcomes fromdifferent health care institutions were compared after controllingfor the risk profile of patients at the time of intake. Note that sim-ple measures of patient outcomes such as hospital death rates werenot considered valid indicators of quality. Hospitals that providegood-quality and specialized care tend to attract more seriouscases. Thus the hospital death rates would be higher in such insti-tutions. To avoid this pitfall, the MOS controlled for risk factorswhile comparing patient outcomes. Another problem with usingsimple death rates is that it does not take into account the quality-of-life improvement resulting from good medical care. To accountfor quality-of-life improvements, the MOS measured functioningand well-being along multiple dimensions, including physical func-tioning, mobility, and role functioning.
Comparison of patient outcomes from different types of HCIs isresource intensive. While research studies have shown the feasibilityand usefulness of patient outcomes as a measure of quality of care,such approaches have yet to be adopted on a large scale in industrialcountries, much less in India or elsewhere in South Asia. A JCAHOarticle (Iezzoni and Greenberg 1994) reported that about 36 states inthe United States had some legislative mandate to examine hospital-ization outcomes, primarily mortality.
Outcome of the interpersonal aspects of care is usually assessedby measuring patient or client satisfaction. Interpersonal aspects ofcare are relatively easily recognized and readily assessed by thepatients and their attendants. A series of patient satisfaction ques-tionnaires (PSQs) were developed as a part of the Rand HealthInsurance Experiment (Newhouse 1993; Ware 1983) and devel-oped further through the MOS (Wilkin, Hallam, and Doggett1992). The National Committee for Quality Assurance (NCQA) inthe United States is a not-for-profit organization that seeks toimprove patient care in partnership with managed care plans (Cor-rigan and Nielsen 1993). In 1993, the NCQA released a core set ofhealth plan performance measures, titled the Health Plan and
13_Yazbeck 8/6/03 3:24 PM Page 337

338 • Health Policy Research in South Asia
Employer Data and Information Set, version 2.0 (HEDIS 2.0).HEDIS includes a section on patient satisfaction. In India, patientsatisfaction has been studied occasionally, either on its own or aspart of broader studies on hospital performance (Menon 1990;Sahu 1992). Recently the Andhra Pradesh Vaidya Vidhana Parishad(APVVP) has commissioned studies for systematic measurement ofpatient satisfaction at regular intervals of time to aid in manage-ment of public hospitals (IHS 1999; Mahapatra and others 2001).
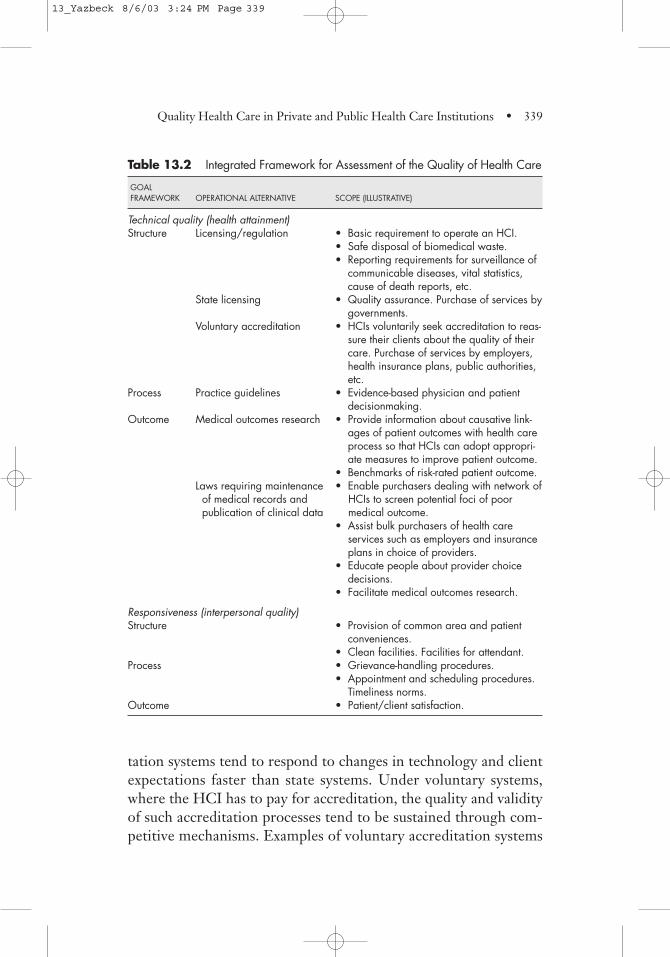
Using the WHO framework of health system goals related toquality of care and Donabedian’s framework for assessment of thequality of care, I propose an integrated framework for assessing thequality of health care, as shown in table 13.2. Each of the twointrinsic goals, namely an improvement of health and a satisfyinginterpersonal setting of care, can be assessed by looking at theenabling structural systems, the operating procedures and protocolsof care, and the actual outcomes realized by the patients receivingcare. Structural systems for achievement of health can exist at manylevels. At the least, the HCI should not hurt its patients and shouldnot be a source of risk to public health. For example, the state maycreate regulations to prevent exposure of patients, attendants, andneighbors to communicable disease attributable to unhealthy dis-posal of biomedical waste. The state would usually require everyhealth care institution to satisfy some reporting requirements forepidemiological surveillance. For example, the Andhra PradeshPublic Health Act (1939) requires HCIs to report all cases of notifi-able diseases they handle. Reporting vital events such as births,deaths, and causes of death may be mandatory. Satisfaction of theserequirements would not amount to any positive statement of qual-ity, but nonsatisfaction of such requirements may mean that theHCI could be a source of risk to the public health.
The state may accredit an HCI for purposes of purchasing ser-vices for its programs. While this is an improvement over minimal-ist licensing requirements, official accreditation processes tend toassume a ritualistic character and may lose some of their validity.Voluntary accreditation systems appear to be the best availableform of recognizing whether an HCI satisfies appropriate struc-tural and process norms for health care delivery. Voluntary accredi-
13_Yazbeck 8/6/03 3:24 PM Page 338
Quality Health Care in Private and Public Health Care Institutions • 339
Table 13.2 Integrated Framework for Assessment of the Quality of Health Care
GOAL FRAMEWORK OPERATIONAL ALTERNATIVE SCOPE (ILLUSTRATIVE)
Technical quality (health attainment)Structure Licensing/regulation • Basic requirement to operate an HCI.
• Safe disposal of biomedical waste.• Reporting requirements for surveillance of
communicable diseases, vital statistics,cause of death reports, etc.
State licensing • Quality assurance. Purchase of services bygovernments.
Voluntary accreditation • HCIs voluntarily seek accreditation to reas-sure their clients about the quality of theircare. Purchase of services by employers,health insurance plans, public authorities,etc.
Process Practice guidelines • Evidence-based physician and patientdecisionmaking.
Outcome Medical outcomes research • Provide information about causative link-ages of patient outcomes with health careprocess so that HCIs can adopt appropri-ate measures to improve patient outcome.
• Benchmarks of risk-rated patient outcome.Laws requiring maintenance • Enable purchasers dealing with network ofof medical records and HCIs to screen potential foci of poor publication of clinical data medical outcome.
• Assist bulk purchasers of health care services such as employers and insuranceplans in choice of providers.
• Educate people about provider choicedecisions.
• Facilitate medical outcomes research.
Responsiveness (interpersonal quality)Structure • Provision of common area and patient
conveniences.• Clean facilities. Facilities for attendant.
Process • Grievance-handling procedures.• Appointment and scheduling procedures.
Timeliness norms.Outcome • Patient/client satisfaction.
tation systems tend to respond to changes in technology and clientexpectations faster than state systems. Under voluntary systems,where the HCI has to pay for accreditation, the quality and validityof such accreditation processes tend to be sustained through com-petitive mechanisms. Examples of voluntary accreditation systems
13_Yazbeck 8/6/03 3:24 PM Page 339

340 • Health Policy Research in South Asia
in different countries include the JCAHO in the United States, theCanadian Council on Health Care Accreditation, and QualityHealth in New Zealand. Accreditation systems usually cover muchof the health care production processes in addition to the infrastruc-ture facilities. However, implementation of practice guidelines hasyet to form an integral part of the accreditation process. Adoptionof practice guidelines by individual physicians and HCIs requiresdevelopment of national infrastructure for development and dis-semination of practice guidelines. For example, the U.S. Agency forHealth Care Policy Research (AHCPR) develops practice guide-lines and disseminates them to HCIs and patients. The AHCPRwas set up by the U.S. Congress to support research, data develop-ment, and other activities that will “enhance the quality, appropri-ateness, and effectiveness of health care services.” The AHCPR ischarged with developing (a) practice guidelines, (b) medical reviewcriteria, (c) standards of quality, and (4) performance measures.
Use of a risk-rated medical outcomes profile of HCIs as a screen-ing device to identify potential focuses of poor-quality health carehas already been discussed. Interpersonal aspects of health care canalso be inferred by looking at enabling infrastructure and proce-dures established by the HCI for this purpose and by measuringpatient satisfaction. The infrastructure aspect is usually covered inthe conventional accreditation process. Some processes that have abearing on the interpersonal aspects of care may be covered by theaccreditation process, for example, grievance-handling proceduresand informed consent procedures. In addition, HCIs may have todevelop their own quality norms or look for generic customer satis-faction standards to demonstrate the interpersonal quality of theirservice. Patient or client satisfaction measurements indicate the out-come of the interpersonal aspects of health care.
Health Care Quality in Private and Public HCIs in India
The health care quality assessment framework allows us to assess theadequacy of quality subsystems in health care and comparative per-formance of different HCIs in the quality dimension. We need to
13_Yazbeck 8/6/03 3:24 PM Page 340

Quality Health Care in Private and Public Health Care Institutions • 341
view the findings about quality of care from this and other studies inIndia against the overall framework of quality assessment describedabove. We then discover that there is a lack of information about thequality of care in HCIs in India. There is hardly any regulatoryframework for quality assurance in the health sector (Bhat 1997).State or municipal laws for licensing of hospitals exist only in a fewstates. These are (a) the Bombay Nursing Home Registration Act,1949; (b) the Delhi Nursing Homes Registration Act, 1953; and (c)the Karnataka Private Nursing Homes Act, 1976. However, imple-mentation is lacking in most of these places (Nandraj 1998; Nandraj,Khot, and Menon 1999). The APVVP, which manages the firstreferral public hospitals in Andhra Pradesh, has developed quite afew standards and is making efforts to implement them (Srilatha1998). The Bureau of Indian Standards (BIS) generally deals withstandards and specifications of medical supplies and biomedicalequipment. Structural and process standards developed by the BISin the area of health care include the following:
• Classification and matrix for various categories of hospitals(IS12377-1988)
• Basic requirement for hospital planning (IS12433-1988)
• Quality management procedures for outpatient departments andother emergency services—guidelines (IS13808-1993)
• Quality management procedures for diagnostic and blood trans-fusion services—guidelines (IS13809-1993)
Some voluntary efforts have been made to develop structuralstandards for health care institutions. The Institute of Health Sys-tems (IHS) has been studying the need for accreditation systems(IHS 1996; Mahapatra and Sailaja 1994; Nandraj 1998) and hasdeveloped some standards for reproductive health care services(IHS 1998). The Centre for Enquiry into Health and AlliedThemes in Mumbai has been studying the need for accreditation(Nandraj, Khot, and Menon 1999) and has developed certain phys-ical standards for private health care institutions based on casestudies in Maharashtra (Nandraj and Duggal 1997).
13_Yazbeck 8/6/03 3:24 PM Page 341

342 • Health Policy Research in South Asia
The above efforts to establish standards and quality assurancesystems are positive developments. At least some capacity appearsto exist. But a sustained country- or statewide health care qualityassurance system is still to come. An encouraging development isthe rise in awareness about the need for state licensing and accredi-tation systems. For example, the Andhra Pradesh LegislativeAssembly House Committee on corporate hospitals recommendedstate licensing of private hospitals and nursing homes (Reddy andothers 1996). A consensus development workshop on the privatehealth sector in Andhra Pradesh, held in Hyderabad, was attendedby key persons from the private and public health sectors (Mahapa-tra and Nagarjuna 1998). There was a consensus among the work-shop participants about the need for a health care quality assurancesystem.
India has yet to develop any national program for developmentpractice guidelines, medical review criteria, and so on. Researchcapacity for measurement of medical outcomes and risk-rating ofpatients is also lacking. Most quality-of-care information in thecountry concerns the interpersonal aspects of care. Without theintegrated framework for assessing health care quality, the informa-tion on interpersonal aspects of care appears to be the only infor-mation on quality. So an important policy recommendationemerges, even without looking at the available information oninterpersonal quality of care. That is the need for systematic devel-opment of a quality-of-health-care assessment infrastructure in thecountry.
Evidence from various studies in India point out the poor qualityof care provided in the private sector (Nandraj 2001). TheNational Family Health Survey, 1998/99 (NFHS-2) asked womenwho had visited a health facility in the previous year questions toascertain their perceptions of the quality of care provided. Table13.3 shows the survey results for Andhra Pradesh and India. MostlyLikert-type category rating scales were used. Table 13.3 shows theperceptions of the ever-married women respondents about thequality of service received by them during their most recent visit toa private or public sector health facility. Almost all respondents
13_Yazbeck 8/6/03 3:24 PM Page 342

Quality Health Care in Private and Public Health Care Institutions • 343
received the care for which they had gone to the HCI, both in theprivate and public sectors. There was hardly any difference inmedian waiting time in private and public sector HCIs. Satisfactionwith the amount of time spent by the staff was generally high. Pri-vate sector HCIs did slightly better than the public sector in thematter of time spent by staff on the patient and also in respectingthe patient’s need for privacy. The experience of women regardingthe interpersonal communication (staff talked nicely) and cleanli-ness of the facility was much better in the private sector HCIs thanin the public sector HCIs.
Methods: Characteristics of Private and Public HCIs in Andhra Pradesh
Detailed methods for the study of the structure and dynamics of theprivate health sector in Andhra Pradesh are describe in the mainreport (IHS 2001). A random sample of private and public HCIswas made in three representative districts in the state and stratifiedinto outpatient clinics (primary health centers or PHCs), small hos-pitals, and large hospitals using the updated Andhra Pradesh HealthInstitutions Database (APHIDB) maintained at the IHS. Each ofthe owner-managers was interviewed at the selected facilities, and arandom sample of patients was selected for exit interviews.
Table 13.3 Quality of Care Received by Ever-Married Women during TheirMost Recent Visit to a Private or Public Sector Health Facility inIndia, 1998/99
ANDHRA PRADESH INDIA
QUALITY OF SERVICE INDICATOR PRIVATE PUBLIC PRIVATE PUBLIC
Received the required service (%) 99.6 98.1 99.7 98.9Median waiting time (minutes) 29.3 29.6 29.0 29.3Staff spent enough time (%) 97.9 93.2 97.5 90.3Staff talked nicely (%) 71.6 57.7 78.4 62.7Staff respected their need for privacy (%) 85.2 80.2 83.9 68.2The facility was very clean (%) 71.5 51.9 75.3 52.1
Source: IIPS 2000.
13_Yazbeck 8/6/03 3:24 PM Page 343

344 • Health Policy Research in South Asia
The inpatients selected for the exit interviews were people whohad been admitted for more than a week, that is, discharged afterone week of stay in the hospital. The sample size was 10 patientsfrom each institution. If 10 patients with a minimum stay of oneweek were not available, the norm was relaxed, so that patient withstays of three days were included in the interview. From clinics,outpatients were chosen for the exit interview.
The PSQ was based on the Client Satisfaction Questionnaire(CSQ) (Attkisson and Zwick 1982; Larsen and others 1979), asdescribed in Wilkin, Hallam, and Doggett (1992). The CSQ isdesigned to gather assessments by patients of specific health plansand programs. Here we wanted to measure client satisfaction withrespect to the immediately preceding encounter. Hence, wereworded the CSQ questions to refer to the encounter. Items thatdid not apply to the immediately preceding encounter weredropped. Some items from the Quality of Service in Texas (QOST)instruments were also included. To understand socioeconomic sta-tus of patients served by different types of HCIs, the instrumentincluded questions about household assets for computation of astandard of living index (SLI), as in the case of the NFHS house-hold questionnaire (IIPS 2000).
The questionnaire was divided into nine sections. Section 1recorded information about the interview. Section 2 recorded dataon the provider institution from which the patient was sampled.Section 3 recorded whether the respondent was the patient or anattendant and, if so, the relationship with the patient. Section 4identified and gathered demographic information about thepatient. Sections 5 and 6 collected socioeconomic data for compu-tation of the standard of living index and were based on the NFHS.In sections 7 to 9, the interviewer asked for the patient’s rating ofthe quality of services provided by the HCI. A five-point ratingscale (poor, fair, good, very good, and excellent) was used. TheCSQ mentioned above has four response categories. Attkisson andZwick (1982) deliberately did not use a middle category to avoidneutral responses. The fact that the patient chose the given HCIimplies some degree of confidence and preference for that health
13_Yazbeck 8/6/03 3:24 PM Page 344

Quality Health Care in Private and Public Health Care Institutions • 345
care provider. Hence, we included a middle category of “good.” Asthe same categories were used for both public and private HCIs,the choice of label for the middle category would equally affect theresponses from patients of both sectors. Arbitrary scores on anincreasing scale from 1 to 5 were given to each category ofresponse (5 = excellent, 1 = poor). To convert the questionnaireinto Telugu (the local language), the translation and retranslationprocedures described by Leplege and Verdier (1995) were used.The questionnaire in English was first translated into Telugu by ateam of IHS faculty who are conversant in both languages.Retranslation was done with the help of an external languageexpert conversant in Telugu and English. The retranslated instru-ment was compared with the original questionnaire. The Teluguversion was accepted for use, since the retranslated questionnaireclosely matched the original.
In the patient exit interview, the level of satisfaction was mea-sured by the sum of actual scores across all items in the scale (orsubscale) by an average respondent, expressed as a percentage ofthe maximum potential score. Since the least satisfaction category(poor) was assigned a value of 1, the minimum level of satisfactionin this scale would be 20 percent. The feasible range of the level ofsatisfaction measure is 20 to 100 percent. If all patients exitingfrom an HCI rate their satisfaction in respect of each of the 11items as poor, then the level of satisfaction will be 20 percent. Ifthey rate each of the 11 items as excellent, then the level of satis-faction will be 100 percent. We could have assigned a weight ofzero to the satisfaction category labeled as “poor” and four to thecategory labeled as “excellent,” which would have resulted in a satisfaction-level scale with a range of 0 to 100 percent. We didnot feel it necessary to adopt a different scale. Patient satisfactionis a relative measure of the gap between expectations and per-ceived fulfillment. Our purpose was to explore any gaps betweenexpectations and perceived realization between the private and thepublic sectors and between different categories of HCIs. Thesecomparisons remain unaffected between the two scaling alterna-tives discussed above.
13_Yazbeck 8/6/03 3:24 PM Page 345

346 • Health Policy Research in South Asia
The survey started in the first week of June 2000. The entire sur-vey took place between June and August. The surveyors consisted ofIHS faculty and research assistants who were trained in conductinginterviews. They visited the hospitals and explained the purpose oftheir visit to the concerned authorities. The surveyors interviewedthe patients or the attendants, depending upon availability. In thecase of minors, the attendants were interviewed. Data entry wasdone using an application specially developed by IHS for this pur-pose. The data were verified by making printouts of the filled-inquestionnaire and physically checking them with the original forms.The corrections were made on the questionnaire, and the correctedversion was updated in the database.
Results: Structure and Process Quality Characteristics in Andhra Pradesh
Premises and Floor Space
Table 13.4 provides some information about the premises in whichthe HCIs operate. Most large hospitals (100 percent of the publichospitals and 80 percent of the private hospitals) have their ownbuildings. The majority (about 75 percent) of small hospitals, bothprivate and public, operate in their own buildings. The majority ofPHCs and public dispensaries (72 percent) also operate in theirown buildings. Nearly half of private clinics operate in the propri-etor’s own building, and the other half rent space for the clinic.Those who rent space do so mostly from unrelated persons. Thepractice of renting space from promoters is not very prevalent. Itwould appear that where promoters locate the HCI in their ownbuilding, they reported the premises as the HCI’s own building.
Clearly, the HCIs in the public sector are better endowed withland and floor space. Two plausible explanations may apply. First,public sector HCIs may be overproviding floor space and land area.Second, private HCIs may be providing less than adequate spaceand land areas. Based on common experience and general knowl-edge of the situation, I conjecture that the public HCIs are usually
13_Yazbeck 8/6/03 3:24 PM Page 346

Quality Health Care in Private and Public Health Care Institutions • 347
Table 13.4 Premises Ownership and Scale of Accommodation of Private and Public HCIs
PRIVATE PUBLIC
DIAGNOSTICCLINIC SMALL H LARGE H CENTER PHC SMALL H LARGE H
PREMISES CHARACTERISTIC (71) (69) (10) (139) (53) (41) (12)
Located in own building (%) 52 71 80 27 68 90 100Rented fromPromoters (%) 3 3 0 14 2 0 0Unrelated persons (%) 44 25 20 58 19 10 0Other arrangements (%) 1 1 0 1 11 0 0
Floor space owned or rented (in square feet)
Mean fl. space/HCI 639 3,784 90,904 1,066 2,198 8,755 423,436Median fl. space/HCI 400 2,400 20,000 600 1,129 5,384 278,348Min. fl. space/HCI 60 110 4,000 1 1,000 1,089 15,662Max. fl. space/HCI 8,000 43,560 393,700 800 14,352 27,180 2,090,880Mean fl. space/bed 233 206 345 24 516 377 1,608Median fl. space/bed 120 150 95 4 514 300 771Min. fl. space/bed 40 3 33 1 176 47 157Max. fl. space/bed 1,333 1,452 1,312 150 1,320 1,117 4,966
Land (square yards) and FSI (floor space in sq. ft./land in sq. yd.)
Mean land area/HCI 402 1,348 6,816 355 3,543 11,613 123,908Median land area/HCI 300 600 4,920 210 1,000 4,840 41,140Min. land/HCI 33 100 2,420 1 34 150 7,260Max. land/HCI 2,420 24,200 24,200 2,400 19,360 217,800 774,400Median FSI of HCIs 1.25 3.13 2.35 3 1.67 1.22 8Min. FSI of HCIs 0.31 0.13 1.5 0 0.1 0.09 0.28Max. FSI of HCIs 16 30 81.34 13 112.85 34.79 54
Note: H = Hospital. FSI = Floor space index.
well endowed with land. In many cases, future requirements aretaken into account while allocating public land for HCIs. Mostlythese lands have been reclassified from existing public lands; hence,the immediate budgetary requirement to purchase land would notbe a constraint for public HCIs. Except for a few cases where con-cessional land grants have been given, most private sector HCIshave to provide capital and recurring budget for land and floorspace. This may explain the generally smaller floor space and landarea endowment of these HCIs. More detailed space audit andcomparisons with relevant physical standards will help clarify the
13_Yazbeck 8/6/03 3:24 PM Page 347

348 • Health Policy Research in South Asia
matter and provide some insights for policy interventions on thequestion of adequacy of floor space and land area of different typesof HCIs. For example, if HCI space audits were to consistentlyshow that public HCIs tend to have excessive floor space, then anappropriate policy response would be to identify the types of policydecisions contributing to excess provision of floor space and takeremedial measures. Another result from these studies may be ques-tions about the utilization of concessional land grants to privateHCIs and their impact on maintenance of floor space and land areastandards.
Let us examine the absolute figures of floor space availability.Data on floor space and land area are rough estimates. The surveydid not provide for measurement or expert assessment by an engi-neer or architect. These values are based on the inquiry and esti-mate by the generalist surveyor. Some HCIs did not provide anyhelp in estimating floor space and land area. Among those that didreport, the range of values included some that appear to be veryhigh. This could be a result of inaccurate guesses by the surveyoror erroneous information by the informants. Because estimation ofsmall premises is easier, the maximum end of the range of valuesmay be suspect. Hence, it is difficult to assign a level of confidenceto the mean and maximum values of floor space and land area.However, the median and minimum values are likely to be moreaccurate. Comparative study of minimum and median values offloor space and land area of private and public HCIs gives us someidea about the differences in premises between the two. We resur-veyed all the institutions where the values appeared unusually highor low. Although this process improved the validity of these esti-mates, all figures are rough estimates by generalist surveyors. Esti-mates from public HCIs are more accurate, as they are based onrecords maintained by an engineering department.
Instead of comparing the private and public sectors, we seekcomparison with some norm. The BIS has published a standard ofphysical requirements for a 30-bed community hospital (IS12433-1988), which may not be the most appropriate standard for com-parison of all categories of private and public hospitals. In fact
13_Yazbeck 8/6/03 3:24 PM Page 348

Quality Health Care in Private and Public Health Care Institutions • 349
there is some evidence that the space norms set by this standardtend toward overprovision (APVVP 1990). Nonetheless, this BISnorm is the only published source in India available to us for com-parison. This BIS norm suggests a floor space of 645 square feet(60 square meters) per bed. As seen from the mean and medianfloor space statistics, most private HCIs appear to fall short of thisnorm. Based on the maximum floor space data, some private hospi-tals do exceed this norm. In the public sector, PHCs and the largehospitals appear to be well endowed with floor space. Many of thesmall hospitals may suffer some shortage of floor space. The gapbetween the BIS floor space norm and mean or median floor spacein small public hospitals is considerably smaller than that in privatehospitals of comparable bed strength.
The land norm recommended by the BIS standard is 4,840square yards (one acre) for a 30-bed hospital. The median land areaof small public hospitals included in this study exactly matches thisnorm. The median land area of small private hospitals included inthis study was 600 square yards, much less than the norm. Com-pare the mean and median land area of private HCIs in all threecategories with the BIS norm. Clearly, the private HCIs are locatedin congested areas, with comparatively less land around them. Thisis consistent with our commonsense understanding of private HCIlocations and the motivations to minimize real estate costs.
Practice Guidelines and Medical Records
Adherence to practice guidelines and maintenance of medicalrecords are important quality-of-care attributes. Institutionalmechanisms for development and dissemination of practice guide-lines are not widely used in India. However, we included questionson practice guidelines and medical records to gauge the attitude ofhospital managers to quality-of-care issues. Table 13.5 shows theresponses to quality-of-medical-care issues. The question on med-ical audits was included in the owner-manager questionnaire,which was administered only to private sector HCIs. Hence, we donot have response to this question from the public sector.
13_Yazbeck 8/6/03 3:24 PM Page 349

350 • Health Policy Research in South Asia
All large hospitals in the private sector reported that they con-duct medical audits to review circumstances of deaths in the hospi-tal. None of the small hospitals reported such a practice. Only 20percent of clinics reported doing a medical audit in case of a deathin their care. Only 19 percent of private HCIs reported that theyuse written medical protocols. A little more than half (57 percent)of public HCIs reported that they use written medical protocols.Note that these are all unverified responses; actual practice maydiffer. However, we can rely on these responses to infer attitudes ofmanagers and medical personnel toward various quality-of-carepractices such as medical audit of deaths in hospital, use of writtenmedical protocols, and maintenance of medical records.
While 57 percent of public hospitals and only 19 percent of pri-vate HCIs reported that they use written medical protocols andtherapeutic guidelines, 50 percent of large hospitals in both theprivate and public sectors reported doing so. The difference in theextent of the practice in the private and public sectors appears,therefore, largely due to the private clinics and small hospitals.However, the study design did not seek to verify these reports, sothey are indeed perceptions of the respondents about their respec-
Table 13.5 Practice Guidelines, Medical Audits, and Medical Records in HCIs
PRIVATE PUBLIC
CLINIC SMALL H LARGE H ALL PHC SMALL H LARGE H ALLPRACTICE (71) (69) (10) (150) (53) (41) (12) (106)
Conduct medical audit to review circumstances of death (%) 20 0 100 40 n.a. n.a. n.a. n.a.
Use written medical protocols/therapeutic guidelines (%) 10 23 50 19 55 61 50 57
HCIs that maintain medical records (%) 44 84 80 65 92 95 100 94
HCIs that have kept medical records since inception (%) 13 23 20 18 40 44 33 41
Range retention period by those that do not keep forever (years) 1–20 0.5–10 5–10 0.5–20 0.5–10 1–10 5–20 0.5–20
n.a. = Not applicable.
13_Yazbeck 8/6/03 3:24 PM Page 350

Quality Health Care in Private and Public Health Care Institutions • 351
tive institutions. The perceptions, we assume, are based on theirbeliefs about their institution and actual experience.
We also asked about retention of medical records. Medicalrecords are basic to standards-based performance measurement.Medical records may also be required by the patient at a later dateto inform subsequent medical care. Hence, the maintenance ofmedical records is an important quality-of-care attribute. Almostall public sector HCIs (94 percent) reported that they keep med-ical records. Only about 80 percent of small and large private hos-pitals reported that they do so. Only about 44 precent of privateclinics reported maintaining medical records. Some private HCIssaid that they have maintained medical records from their incep-tion; most, however, reported retention periods ranging from 6months to 20 years. The retention periods reported by public hos-pitals were similar.
Results: Patient Satisfaction in Private and Public HCIs in Andhra Pradesh
All together 2,216 patients were surveyed (table 13.6), with 53 per-cent of the patients coming from the private sector and the rest fromthe public sector. The sample consisted of 53 percent females and 47percent males. The sex composition of the sample was the same inthe private and public sectors, but there were some differences in thecategories of hospitals. The patients sampled from small and largeprivate hospitals had more females (61–62 percent). The samplefrom large public hospitals had more males (62 percent), but thesmall public hospitals sample had more females (56 percent).
Socioeconomic status of patients served by the private and pub-lic sector HCIs can be assessed from the data on caste status andthe SLI. The share of scheduled castes (18 percent of patients) andscheduled tribes (15 percent of patients) was comparatively higherin the public sector than in the private sector (10 percent and 6percent, respectively). About 88 percent of patients in the publicsector institutions had a low SLI, compared with 51 percent in the
13_Yazbeck 8/6/03 3:24 PM Page 351

352 • Health Policy Research in South Asia
Table 13.6 Patient Exit Interview—Place of Interview and Respondent Characteristics
PRIVATE PUBLIC
ACTIVITY INDICATOR CLINIC SMALL H LARGE H ALL PHC SMALL H LARGE H ALL
Interviews 554 561 56 1,171 521 404 120 1,045Patient (%) 69 60 73 64 78 76 73 77Attendant (%) 31 40 27 36 22 24 27 23
Place of interviewAt home (%) 15 17 0 15 13 11 21 13In hospital (%) 85 83 100 85 87 89 79 87
Gender compositionMale (%) 51 38 39 44 46 44 62 47Female (%) 49 62 61 56 54 56 38 53
Age group (1991 census data in parentheses)0–4 years (11%) 10 5 5 7 8 5 0 65–14 years (25%) 7 6 4 7 14 11 1 1115–44 years (46%) 58 72 61 64 52 60 67 5745–59 years (11%) 18 10 21 15 18 14 12 1660+ years (7%) 7 7 9 7 8 10 20 10
Literacy and years of schoolingIlliterate (%) 40 36 27 37 64 58 44 591–4 years (%) 2 2 0 2 5 6 3 55–9 years (%) 15 18 22 16 18 15 16 1710–11 years (%) 21 19 21 20 10 15 18 1312+ years (%) 23 25 30 24 4 5 19 6
CasteScheduled caste (%) 11 9 11 10 20 16 16 18Scheduled tribe (%) 5 8 0 6 18 15 5 15Backward castes (%) 48 45 59 47 48 47 43 47Others (%) 36 38 30 37 14 22 37 20
State average low, medium, and high SLI households from the NFHS-2 for Andhra Pradeshgiven in parenthesesLow (state: 40.8%) 46% 54% 63% 51% 92% 88.4% 71% 88%Medium (state: 44.5%) 53.6% 44% 32% 48% 8% 11.4% 29% 11.9%High (state: 14.3%) 0.4% 2% 5% 1% 0% 0.2% 0% 0.1%
Source: State average SLIs from IIPS 2002.
private sector. The private sector had a larger share of persons withmedium and high SLIs. About 48 percent of private sector patientshad a medium SLI. A recent study by Mahal and others (2000) esti-mated that people belonging to higher expenditure quintiles con-
13_Yazbeck 8/6/03 3:24 PM Page 352

Quality Health Care in Private and Public Health Care Institutions • 353
sumed a disproportionate share of hospital-days at public facilities.Although the data from this study are not directly comparable, theyshow that for the types of HCIs surveyed, most of the patients hada lower standard of living.
Table 13.7 shows the level of patient satisfaction in various typesof HCIs. There is significant room for improvement in both theprivate and public sectors. Given the construction of the scale andthe scoring system followed, its is easy for many HCIs to show a 60percent level of satisfaction. If all patients rated their satisfactionwith respect to each item as “good,” the level of satisfaction wouldbe 60 percent. The measured level of satisfaction ranges from 46percent to 66 percent across all types of HCIs.
There was hardly any difference in level of patient satisfactionbetween the private and the public sectors. The composite satisfac-tion score for private HCIs was 58 percent of the maximum possiblescore, compared with 57 percent in public hospitals. The overalllevel of satisfaction in private clinics and the public sector healthcenters was similar. In large hospitals, the overall satisfaction levelalso was similar in the private and public sectors. Patients from smallhospitals in the private sector rated their satisfaction level a littlebetter than the small hospitals in the public sector (60 percent in pri-vate hospitals compared with 55 percent in the public hospitals).
Although the composite score of satisfaction was similar for boththe private and the public sectors, there were important differencesin the service characteristics. For example, patients from privateHCIs gave higher ratings to the access, availability, and convenienceaspects of the service. The level of satisfaction with access, availabil-ity, and convenience in the private sector was 57 percent, comparedwith 52 percent in the public sector. The difference in access, avail-ability, and convenience was further accentuated comparing privateclinics (59 percent) with the PHCs in the public sector (51 percent).This finding is consistent with the common understanding that pri-vate clinics offer better appointment scheduling and are generallymore accessible. The public sector HCIs received better ratings withrespect to technical skill and interpersonal aspects. The higher rat-ing of the public sector in interpersonal aspects is a little surprising.
13_Yazbeck 8/6/03 3:24 PM Page 353

Table
13.7
Patie
nt S
atisf
actio
n Le
vels
in P
rivat
e an
d Pu
blic
Hea
lth C
are
Insti
tutio
ns
POTE
NTI
AL
PRIV
ATE
(N=
1,17
1)PU
BLIC
(N=
1,04
5)
MIN
IMU
MM
AXI
MU
MIT
EMSa
SCO
RESC
ORE
ASP
ECT
OF
SERV
ICE
CLIN
ICSM
ALL
HLA
RGE
HA
LLPH
CSM
ALL
HLA
RGE
HA
LL
1212
60C
ompo
site
scor
e (%
)56
6057
5855
5558
57A
cces
s, a
vaila
bilit
y,
44
20an
d co
nven
ienc
e (%
)59
5650
5751
5256
523
315
Tech
nica
l ski
ll (%
)46
5961
5358
5860
583
315
Inte
rper
sona
l (%
)48
6063
5459
5960
601
15
Com
mun
icat
ion
(%)
6360
4861
5757
5757
11
5G
ener
al c
omfo
rt (%
)66
6461
6460
5957
59a I
tem
s ar
e nu
mbe
r of i
tem
s in
the
ques
tionn
aire
.
354
13_Yazbeck 8/6/03 3:24 PM Page 354

Quality Health Care in Private and Public Health Care Institutions • 355
We generally associate better interpersonal skills with the privatesector. In this case, the level of satisfaction with respect to interper-sonal aspects was 54 percent for the private sector and 60 percent forthe public sector HCIs. The private HCIs were rated better in com-munication and general comfort.
The differences between the private and the public sectorsbecome more visible if we examine responses to each item in theQOS scale. One advantage of examining the items singly is that wedo not have to worry about assigning arbitrary weights to differentresponse categories, because there is no need to aggregate theresponses across items. Instead, we can examine the frequency ofpositive satisfaction responses for each item. The frequency ofresponses to a single item is easier to understand and may providesome additional insights about possible interventions to improvepatient satisfaction. Table 13.8 shows the percentage of respon-dents who rated their satisfaction with respective items as “verygood” or “excellent.” These are the people who unequivocallyrated the performance of the HCI as positive. Recall that the mid-dle category of patient response was assigned a score of 3 for com-putation of the level of satisfaction in table 13.7. In table 13.8, theresponses in the middle category have been dropped. Thus, com-paring the satisfaction levels in tables 13.7 and 13.8 should give ussome idea about the intensity of patient satisfaction. Comparativelyhigher frequency of superlative assessment by patients without anydifference in the overall satisfaction level would mean that thehigher number of superlative assessments given to one category ofHCIs is compensated by more average assessments for the othercategory.
We find that the intensity of satisfaction is comparatively higherfor private HCIs. For example, 26 percent of patients from privateHCIs rated the overall experience of their visit as “very good” or“excellent,” compared with 14 percent in public HCIs. The differ-ence is not much with respect to convenience of location or manneror skill of other staff. Comparatively more private sector patientsrated their experience about the manner and skill of doctors, getting
13_Yazbeck 8/6/03 3:24 PM Page 355

356 • Health Policy Research in South Asia
an appointment, and waiting time as “very good” or “excellent.”Regarding manner and perceived technical skill of nurses, the inten-sity of patient satisfaction was slightly more in private hospitals thanin public hospitals. Private clinics did not do as well in patient ratingof nursing care. This is probably due to nonavailability of nurses inmost private clinics.
In table 13.9 we give frequency of “excellent” ratings to eachitem by hospital type. Differences between the responses in tables13.8 and 13.9 give yet more evidence about the intensity of patientfeelings with respect to various aspects of health care services.Clearly the frequency of “excellent” ratings received by public
Table 13.8 Frequency of “Excellent” or “Very Good” Rating by Patients forEach of the 11 Items in the Quality of Service Questionnaire
PRIVATE PUBLIC
ITEM CLINIC SMALL H LARGE H ALL PHC SMALL H LARGE H ALL
554 561 56 1,171 521 404 120 1,045
Getting through forappointment (%) 22 17 20 20 11 11 17 12
Waiting time for appointment (%) 19 11 0 14 6 7 15 7
Convenient location (%) 18 13 18 15 14 13 13 13
Waiting time for care (%) 19 12 0 15 6 6 16 7
Manner of the physician (%) 47 44 31 45 22 31 29 26
Technical skill of thephysician (%) 44 42 27 43 23 28 30 26
Manner of thenurse (%) 6 15 25 11 12 13 17 13
Technical skill ofthe nurse (%) 5 15 23 11 13 11 16 13
Manner of other staff (%) 11 12 23 12 10 9 14 10
Technical skill ofother staff (%) 12 12 20 12 10 9 14 10
Explanation abouttreatment (%) 20 14 2 16 11 10 10 11
Overall visit/stay (%) 29 23 29 26 13 15 16 14
13_Yazbeck 8/6/03 3:24 PM Page 356

Quality Health Care in Private and Public Health Care Institutions • 357
HCIs is much less (1 to 2 percent) than similar ratings received bythe private HCIs (3 to 8 percent). None of the small public hospi-tals and hardly any of the public sector clinics received an “excel-lent” rating in any of the items. The public sector clinics receivedsome “excellent” ratings in convenience of location and the overallvisit. However, most of the few “excellent” ratings received by thepublic sector HCIs were earned by the large hospitals with 100 ormore beds. Moreover, the public sector big hospitals clearlyreceived more “excellent” ratings than the private big hospitals.The nursing service was more likely to be rated “excellent” bypatients in large public hospitals than in the private HCIs. This
Table 13.9 Frequency of “Excellent” Rating by Patients for Each of the 11 Items in the Quality of Service Questionnaire
PRIVATE PUBLIC
ITEM CLINIC SMALL H LARGE H ALL PHC SMALL H LARGE H ALL
554 561 56 1,171 521 404 120 1,045
Getting through for appointment (%) 11 3 0 7 0 0 16 2
Waiting time for appointment (%) 10 3 0 6 0 0 12 1
Convenient location (%) 10 3 0 6 1 0 6 1
Waiting time for care (%) 10 3 0 6 0 0 8 1
Manner of the physician (%) 13 5 2 9 0 0 17 2
Technical skill of thephysician (%) 12 4 2 8 0 0 17 2
Manner of the nurse (%) 3 3 2 3 0 0 16 2
Technical skill of nurse (%) 3 3 2 3 0 0 15 2
Manner of other staff (%) 8 3 2 5 0 0 9 1
Technical skill of other staff (%) 8 3 2 5 0 0 9 1
Explanation about treatment (%) 8 3 0 5 0 0 7 1
Overall visit/stay (%) 9 3 2 6 1 0 8 1
13_Yazbeck 8/6/03 3:24 PM Page 357

358 • Health Policy Research in South Asia
finding is consistent with common knowledge that private hospitalsusually do not appoint adequately qualified nursing personnel. Thecomparative status of the private and the public sectors is reversedfor clinics and small hospitals. About 8 to 10 percent of privateclinic patients rated their satisfaction with various aspects of serviceas “excellent.”
Section 8 of the exit questionnaire asked patients to rate theirhospital or clinic on doctors, nurses, equipment, and general com-fort (table 13.10). The same rating scale was used. Assignment ofweights to various categories and computation of the level ofpatient satisfaction followed the same principles as used to analyzesection 7 data. The satisfaction levels ranged from 45 percent to 68percent, suggesting that there was much room in both sectors toimprove their performance. While overall nursing services in pub-lic HCIs were rated better than those in the private sector, this wasattributable to the PHCs, which usually have some nursing person-nel. Most private clinics (which also include nursing homes withfewer than 10 beds) usually do not have nurses; hence, they got acomparatively poorer rating. The actual level of satisfaction withnursing services was the same for small and large hospitals in boththe private and public sectors. The satisfaction level with respect todoctors, equipment, and general comfort was rated better by theprivate sector patients than by the public sector patients.
In section 9, some miscellaneous questions were posed to thepatient to help characterize the health care services provided byvarious types of HCIs. These questions, listed in table 13.11, were
Table 13.10 Level of Patient Satisfaction with Respect to Specific Facilities
PRIVATE (N = 1,171) PUBLIC (N = 1,045 )
FACILITY CLINIC SMALL H LARGE H ALL PHC SMALL H LARGE H ALL
Doctors (%) 70 67 65 68 61 63 64 62Nurses (%) 30 59 63 45 58 58 61 58Equipmenta (%) 55 58 57 57 50 53 60 52General comfort (%) 72 59 60 59 50 53 59 52aMedical, surgical, and diagnostic equipment.
13_Yazbeck 8/6/03 3:24 PM Page 358

Quality Health Care in Private and Public Health Care Institutions • 359
in yes-no format. Two of the questions allow us to deduce patientsatisfaction: if the patient will visit the hospital again, and if thepatient will recommend the hospital to others. Both public and pri-vate sector HCIs fared quite well. About 91 to 99 percent ofpatients said they will visit again and will recommend the HCI toothers. Public HCIs received slightly more favorable responses tothese questions. We asked if the doctor asked for a repeat visit.Answers to this questions helped us interpret responses to thequestion “Will you visit the hospital again?” If the doctor hadasked the patient to visit again, then an affirmative answer to the“visit again” question would not say much about the level of satis-faction. In this case, the frequency of positive responses to the“visit again” question was much higher than the frequency of doc-tor’s advice for a repeat visit. Sixty-seven percent of private HCIpatients reported that the doctor asked for a repeat visit, and 97percent said that they would visit the HCI again if there is a need.In the public sector, 59 percent of patients said that the doctorasked them for a repeat visit, and 99 percent said they would visitagain if there is a need.
Answers to the question “Were you told the diagnosis?” give ussome idea about the quality of communication and interpersonal
Table 13.11 Patients Responding “Yes” to Questions about Quality of Services by Respective HCIs (percent)
PRIVATE (N = 1,171) PUBLIC (N = 1,045 )
QUESTION CLINIC SMALL H LARGE H ALL PHC SMALL H LARGE H ALL
Were you told thediagnosis? 98 98 98 98 96 96 83 92
Did doctor ask fora repeat visit? 70 64 59 67 54 64 63 59
Will you visit the hospital again? 98 97 91 97 99 98 98 99
Will you recommend the hospital? 95 94 95 94 98 98 81 96
Was the billing fair? 92 90 70 90 n.a. n.a. n.a. n.a.
n.a. = Not applicable.
13_Yazbeck 8/6/03 3:24 PM Page 359

360 • Health Policy Research in South Asia
aspects of care in various types of HCI. Performance of private andpublic HCIs is close, with the private HCIs showing slightly betterratings. About 90 percent of the private sector patients perceivedthat the billing for services they received was fair. However, thisfigure drops to 70 percent for large private hospitals, suggestingthe need for greater transparency in billing practices by these hos-pitals. Lack of transparency in billing by private hospitals has alsobeen reported in other studies (Baru, Purohit, and Kumar 1999).
There is an impression that patient satisfaction is better in theprivate sector. Patient satisfaction is an indirect measure of qualityof care in various dimensions. There is increasing evidence to sug-gest that patient satisfaction is usually correlated with effectivenessof treatment (Wilkin, Hallam, and Doggett 1992). Cleary and oth-ers (1992) teased out data from a survey of 6,455 discharged adultpatients in the United States to assess the impact of different fac-tors on patients’ evaluations of hospital quality. They asked aboutwhat causes patient satisfaction, looking at both patient factors andthe type of care received. They found that the “patient’s evaluationof quality is more a function of what is done for the patient thanwhat kind of patient is being treated” (p. 59). Hence, a patient sat-isfaction survey can be used as a valid measure of quality, particu-larly of the interpersonal aspects of health care. Note, however,that people’s pattern of utilization of services at the time of ill-ness—that is, patients’ decisions about which health care institu-tion to go to—is another indicator of people’s preference. Variousfactors may contribute to the pattern of utilization. A patient exitinterview measures satisfaction by those who decide in the firstinstance to access services from that particular institution. That iswhy PSQs generally produce fairly high satisfaction scores, becausechoosing the institution for care implies that the patient had a posi-tive disposition (for whatever reasons) to that institution. Nonethe-less, patient satisfaction surveys allow us to compare the level ofsatisfaction between institutions and between groups of institu-tions. Certain aspects of hospital service, such as the amenities,hygiene, factors of hospital stay, important aspects of patient man-
13_Yazbeck 8/6/03 3:24 PM Page 360

Quality Health Care in Private and Public Health Care Institutions • 361
agement, and choice of therapeutic alternatives by the patient andhis or her attendants, can be better assessed by PSQs.
Results: Owner-Managers’ Opinions about Interventions for Improvement of Quality of Care in the Private Sector
We asked the owner-managers of private HCIs about possibleinterventions to improve the quality of health care services. Table13.12 shows their responses. There appears to be wide support formeasures such as registration of hospitals (licensing), registrationof doctors, voluntary accreditation, hospital quality assurance pro-cedures, and continuing education programs for doctors.
Summary of Evidence about Quality of Services
We have proposed a framework for assessment of health care qualityconsisting of achievement of health attainment goal (technical qual-ity) and responsiveness goal (interpersonal quality). Both technicalquality and responsiveness ought to be measured using structure,
Table 13.12 Recommendations to Improve Quality of Services in PrivateHCIs (percent of owner-managers reporting that they find theproposed measure useful or very useful)
CLINIC SMALL H LARGE H ALLPOSSIBLE QUALITY IMPROVEMENT MEASURE (67) (66) (8) (141)
Hospital registration 85 89 88 87Renewing hospital registration 83 73 88 79Registering doctors 91 92 88 91Renewing doctors’ registration 81 77 88 80Voluntary accreditation by independent NGO 60 61 71 61Compulsory accreditation of hospls by government 58 42 50 50Hospital quality assurance procedures 80 84 88 82Continuing education program for doctors 91 95 100 93
Note: NGO = Nongovernmental organization.
13_Yazbeck 8/6/03 3:24 PM Page 361

362 • Health Policy Research in South Asia
process, and outcome criteria. Unfortunately, assessment subsystemsfor the quality of health care have not yet been developed in India.There are hardly any licensing requirements for HCIs. Health careaccreditation systems are yet to be developed. India has no nationalprogram for development of practice guidelines, medical review cri-teria, and so on. Research capacity for measurement of medical out-comes and risk-rating of patients is lacking. Studies in India suggestthat technical quality of care may be slightly better in the public sec-tor and interpersonal quality may be slightly better in the privatesector. But the more important finding is the poorly developedhealth care quality practices in both the private and public sectors.
Only some rudimentary information on infrastructure andprocess of care could be collected in this study. Approximate data onpremises collected by this study show that public sector HCIs aregenerally better endowed with land and floor space. More publicHCIs, particularly PHCs and small hospitals, reported that they usewritten medical protocols and therapeutic guidelines. More than 90percent of public HCIs reported that they maintain medicalrecords, compared with only 65 percent of private HCIs. Resultsfrom the patient exit interviews showed that the level of patient sat-isfaction was generally low in both private and public HCIs, and theoverall level of patient satisfaction was similar in both sectors. How-ever, the private HCIs received better scores on access, availability,convenience, communication, and general comfort. On the otherhand, the public HCIs received better scores on the technical skilland interpersonal subscales. The private HCIs received significantlymore “very good” and “excellent” ratings on manner of physician,technical skill of physician, getting an appointment, and convenientlocation. Most of these ratings involve the interpersonal aspects ofcare. The limited data available from this study suggest that theinterpersonal quality of care in private HCIs is better than in publicHCIs, with slightly better ratings for infrastructure and technicalaspects of care. Most important, the level of patient satisfaction wasgenerally low in both private and public HCIs, suggesting an envi-ronment of poor client orientation in the health sector.
13_Yazbeck 8/6/03 3:24 PM Page 362

Quality Health Care in Private and Public Health Care Institutions • 363
References
Acquilina, David. 1992. “Alternative Approaches to Defining Quality in MedicalCare.” In Ranndi Schmidt, Judith Trumbo, and Ross Johnson, eds., QualityAssurance in Health Care Services. Milwaukee, Wisc.: ASQC Quality Press.
American Medical Association, Council on Medical Service. 1986. “Quality ofCare.” Journal of American Medical Association 256(8): 1032–34.
Andhra Pradesh (Andhra Area) Public Health Act. 1939. Hyderabad: Asia LawHouse, Opp High Court, AP500002.
APVVP (Andhra Pradesh Vaidya Vidhana Parishad). 1990. Development of SecondaryLevel Hospitals in Andhra Pradesh (India): Project Scheduling and Cost(1991–2000).
Attkisson, C. C., and R. Zwick. 1982. “The Client Satisfaction Questionnaire: Psy-chometric Properties and Correlations with Service Utilization and Psy-chotherapy Outcome.” Evaluation and Programme Planning 5: 233–37.
Baru, Rama V., B. Purohit, and Daniel Kumar. 1999. Efficacy of Private Hospitals andthe Central Government Health Scheme: Study of Hyderabad and Chennai. Hyder-abad: Administrative Staff College of India (ASCI).
Bhat, Ramesh. 1997. “Regulation of the Private Health Sector in India.” InWilliam Newbrander, ed., Private Health Sector Growth in Asia. Issues and Impli-cations. New York: John Wiley and Sons.
Cleary, Paul D., Susan Edgman-Levitan, William McMullen, and Thomas L. Del-banco. 1992. “The Relationship between Reported Problems and PatientSummary Evaluations of Hospital Care.” QRB 18(2): 53–59.
Corrigan, Janet M., and Don M. Nielsen. 1993. “Toward the Development of Uni-form Reporting Standards for Managed Care Organizations: The Health PlanEmployer Data and Information Set (version 2.0).” Journal of Quality Improve-ment 19(12): 566–75.
Donabedian A. 1985. Twenty Years of Research on the Quality of Medical Care:1964–1984. Eval Health Prof 8(3): 243–65.
Iezzoni, Lisa I., and Linda G. Greenberg. 1994. “Widespread Assessment of Risk-Adjusted Outcomes: Lessons from Local Initiatives.” Journal on QualityImprovement 20(6): 305–16.
13_Yazbeck 8/6/03 3:24 PM Page 363

364 • Health Policy Research in South Asia
IHS (Institute of Health Systems). 1996. “Andhra Pradesh Health InstitutionsDatabase (APHIDB): Private and Public. A Technical Note.” Institute ofHealth Systems Working Paper WP11/1996.
———. 1998. “Standards Document for Reproductive Health.” Institute of HealthSystems Working Paper WP 26/1998.
———. 1999. APVVP—Patient Satisfaction Survey. June. Institute of Health Sys-tems Report Series RP02/1999.
———. 2001. The Structure and Dynamics of Private Health Sector in Andhra Pradesh.Institute of Health Systems Report.
IIPS (International Institute for Population Sciences). 2000. National Family HealthSurvey, 1998/99 (NFHS-2). Mumbai: International Institute for PopulationSciences.
Institute of Medicine. 1990. Summary. Guidelines for Clinical Practice. From Develop-ment to Use. M. J. Field and K. N. Lohr, eds. Committee on Clinical PracticeGuidelines, Division of Health Care Services. Washington, D.C.: NationalAcademy Press.
Kahn, Katherine L., William H. Rogers, Lisa V. Rubenstein, Marjorie Sherwood,Ellen J. Reinisch, Emmet B. Keeler, David Draper, Jacqueline Kosecoff, andRobert H. Brook. 1990. “Measuring Quality of Care with Explicit ProcessCriteria before and after Implementation of the DRG-Based ProspectivePayment System.” Journal of American Medical Association 264(15): 1969–73.
Larsen, D. L., C. C. Attkisson, W. A. Hargreaves, and T. D. Nguyen. 1979.“Assessment of Client/Patient Satisfaction: Development of a General Scale.”Evaluation and Programme Planning 2: 197–207.
Leplege, A., and A. Verdier. 1995. “The Adaptation of Health Status Measures:Methodological Aspects of the Translation Procedure.” In Sally A. Shumakerand Richard A. Berzon, eds., The International Assessment of Health RelatedQuality of Life. Theory, Translation, Measurement and Analysis. Oxford, N.Y.:Rapid Communications.
Lomas J., G. M. Anderson, K. Domnick-Pierre, E. Vayda, M. W. Enkin, and W. J.Hannah. 1989. “Do Practice Guidelines Guide Practice? The Effect of a Con-sensus Statement on the Practice of Physicians.” New England Journal of Medi-cine 321: 1306–11.
Mahal, Ajay, Janmejaya Singh, Farzana Afridi, Vikram Lamba, Anil Gumber, and V.Selvaraju. 2000. Who Benefits from Public Health Spending in India? New Delhi:National Council of Applied Economic Research (NCAER).
13_Yazbeck 8/6/03 3:24 PM Page 364

Quality Health Care in Private and Public Health Care Institutions • 365
Mahapatra, Prasanta, and M. Nagarjuna, eds. 1998. The Private Health Sector inAndhra Pradesh. Institute of Health Systems Report Series RP01/1998. Hyder-abad: Institute of Health Systems.
Mahapatra, Prasanta, and Rajaratnam Sailaja. 1994. “Assessment of Demand forAccreditation Services in Hyderabad.” A pilot study. Institute of Health Sys-tems Working Paper WP 06/1994.
Mahapatra, Prasanta, Sivalenka Srilatha, Srinivasan Subhashree, and SreenivasaSarikonda. 2001. APVVP—Patient Satisfaction Survey. June. Institute ofHealth Systems Report Series RP 09/2001. Hyderabad: Institute of HealthSystems.
Menon, Manjul. 1990. A Study on Hospitalised Patient Satisfaction with PerceivedQuality of Care. Bangalore: Indian Institute of Management Bangalore.
Murray, Christopher J. L., and Julio Frenk. 2000. “A WHO Framework for HealthSystem Performance Assessment.” Bulletin of World Health Organization 78:717–31.
Nadzam, Deborah M., Robin Turpin, Linda S. Hanold, and Richard E. White.1993. “Data-Driven Performance Improvement in Health Care: The JointCommission’s Indicator Measurement System (IMS System).” Journal of Qual-ity Improvement 19(11): 492–500.
Nandraj, Sunil. 1998. “Situation Review and Analysis of Accreditation System inIndia.” Institute of Health Systems Working Paper WP 21/1998.
———. 2001. “Private Health Sector: Concerns, Challenges, and Options.” InSunil Nandraj, V. R. Muraleedharan, Rama V. Baru, Imrana Qadeer, and RituPriya, Collaborating Centre—Investigators, Private Health Sector in India.Review and Annotated Bibliography. Mumbai, Chennai, and Delhi: Centre forEnquiry into Health and Allied Themes (Mumbai), Foundation for Sustain-able Development IIT (Chennai), and Centre for Social Medicine and Com-munity Health (JNU Delhi).
Nandraj, Sunil, and Ravi Duggal. 1997. Physical Standards in the Private Health Sec-tor. A Case Study of Maharastra. Mumbai: Centre for Enquiry into Health andAllied Themes.
Nandraj, Sunil, Anagha Khot, and Sumita Menon. 1999. Accreditation of Hospitals.Breaking Boundaries in Health Care. Mumbai: Centre for Enquiry into Healthand Allied Themes.
Newbrander, William, and Gerald Rosenthal. 1997. “Quality of Care Issues inHealth Sector Reform.” In William Newbrander, ed., Private Health SectorGrowth in Asia. Issues and Implications. New York: John Wiley and Sons.
13_Yazbeck 8/6/03 3:24 PM Page 365

366 • Health Policy Research in South Asia
Newhouse, Joseph P. 1993. Free for All? Lessons from the Rand Health InsuranceExperiment. Cambridge, Mass.: Harvard University Press.
Reddy, N. 1996. Tenth Legislative Assembly. Andhra Pradesh Legislative Assembly,House Committee on Corporate Hospitals. Report, September 28.
Sahu, J. P. 1992. A Comparative Analysis of Organization of Health Care Machinery inHospitals. Bangalore: Indian Institute of Management Bangalore.
Srilatha, S. 1998. “Standards and Quality Control Measures in Andhra PradeshVaidya Vidhana Parishad (APVVP).” In Prasanta Mahapatra and M. Nagar-juna, eds., The Private Health Sector in Andhra Pradesh. Hyderabad: Institute ofHealth Systems Report Series RP 01/1998.
Stewart, Anita L. 1992. “The Medical Outcomes Study Frame Work of HealthIndicators.” In Anita L. Stewart and John E. Ware, Jr., eds., Measuring Func-tioning and Well-Being. Durham, N.C.: Duke University Press.
Tarlov, Alvin R., John E. Ware, Jr., Sheldon Greenfield, Eugene C. Nelson,Edward Perrin, and Michael Zubkoff. 1989. “The Medical Outcomes Study.An Application of Methods for Monitoring the Results of Medical Care.”Journal of American Medical Association 262: 925–30.
Ware, John E., Jr. 1983. “Defining and Measuring Patient Satisfaction with Med-ical Care.” Evaluation and Program Planning 6: 247–63.
WHO (World Health Organization). 2000. The World Health Report 2000. HealthSystems: Improving Performance. Geneva.
Wilkin, David, Lesley Hallam, and Marie-Anne Doggett. 1992. Measures of Need andOutcomes for Primary Health Care. New York: Oxford Medical Publications.
Woolf, S. H. 1992. “Practice Guidelines: A New Reality in Medicine. II. Methodsof Developing Guidelines.” Archives of Internal Medicine 152: 946–52.
13_Yazbeck 8/6/03 3:24 PM Page 366
Quality Health Care in Private and Public Health Care Institutions • 367
Acknowledgment
P. Sridhar and K. T. Rajshree were my associates for the Study onStructure and Dynamics of Private Health Sector in AndhraPradesh. The study on Structure and Dynamics of Private HealthSector in Andhra Pradesh was conducted at the Institute of HealthSystems, Hyderabad, and was funded by the World Bank. Thefindings of this study have been published under our joint author-ship. Dr. David Peters, who was then at the World Bank Delhioffice and responsible for funding of the study, has made importantcontributions in study design.
13_Yazbeck 8/6/03 3:24 PM Page 367

13_Yazbeck 8/6/03 3:24 PM Page 368