Purification and Characterization of Lignin Peroxidase from Pleurotus sajor caju MTCC–141
219
World Journal of Microbiology and Biotechnology Volume 21, Number 4, June 2005,pp 389-617 Production of rosmarinic acid byLavandula vera MM cell suspension in bioreactor: effect of dissolved oxygen concentration and agitation 10.1007/s11274-004-3982-6 Atanas I. Pavlov, Milen I. Georgiev and Mladenka P. Ilieva 389-392 Thailand habitats as sources of pullulan-producing strains of Aureobasidium pullulans 10.1007/s11274-004-2237-x S. Prasongsuk, R. F. Sullivan, M. Kuhirun, D. E. Eveleigh and H. Punnapayak 393-398 Optimization of medium constituents and fermentation conditions for the production of ethanol from palmyra jaggery using response surface methodology 10.1007/s11274-004-2461-4 B. V. V. Ratnam, S. Subba Rao, Damodara Rao Mendu, M. Narasimha Rao and C. Ayyanna 399-404 Dye decolorization by Trametes hirsuta immobilized into alginate beads 10.1007/s11274-004-1763-x Alberto Domínguez, Susana Rodríguez Couto and Mª Ángeles Sanromán 405-409 Stabilization of a truncated Bacillus sp. strain TS-23 α-amylase by replacing histidine-436 with aspartate 10.1007/s11274-004-1764-9 Huei-Fen Lo, Ya-Hui Chen, Nai-Wan Hsiao, Hsiang-Ling Chen, Hui-Yu Hu, Wen-Hwei Hsu and Long-Liu Lin 411-416 Development of diagnostic test methods for detecting key wildlife pathogens in bacteria-containing commercial biodegradation products 10.1007/s11274-004-1765-8 Jennifer A. Sibley, Rebecca H. Cross, Anita L. Quon, Kara Dutcyvich, Tomas A. Edge, Frederick A. Leighton and Greg D. Appleyard 417-423
-
Upload
independent -
Category
Documents
-
view
3 -
download
0
Transcript of Purification and Characterization of Lignin Peroxidase from Pleurotus sajor caju MTCC–141

World Journal of Microbiology and Biotechnology Volume 21, Number 4, June 2005,pp 389-617
Production of rosmarinic acid byLavandula vera MM cell suspension in bioreactor: effect of dissolved oxygen concentration and agitation 10.1007/s11274-004-3982-6 Atanas I. Pavlov, Milen I. Georgiev and Mladenka P. Ilieva
389-392 Thailand habitats as sources of pullulan-producing strains of Aureobasidium pullulans 10.1007/s11274-004-2237-x S. Prasongsuk, R. F. Sullivan, M. Kuhirun, D. E. Eveleigh and H. Punnapayak
393-398 Optimization of medium constituents and fermentation conditions for the production of ethanol from palmyra jaggery using response surface methodology 10.1007/s11274-004-2461-4 B. V. V. Ratnam, S. Subba Rao, Damodara Rao Mendu, M. Narasimha Rao and C. Ayyanna
399-404 Dye decolorization by Trametes hirsuta immobilized into alginate beads 10.1007/s11274-004-1763-x Alberto Domínguez, Susana Rodríguez Couto and Mª Ángeles Sanromán
405-409 Stabilization of a truncated Bacillus sp. strain TS-23 α-amylase by replacing histidine-436 with aspartate 10.1007/s11274-004-1764-9 Huei-Fen Lo, Ya-Hui Chen, Nai-Wan Hsiao, Hsiang-Ling Chen, Hui-Yu Hu, Wen-Hwei Hsu and Long-Liu Lin
411-416 Development of diagnostic test methods for detecting key wildlife pathogens in bacteria-containing commercial biodegradation products 10.1007/s11274-004-1765-8 Jennifer A. Sibley, Rebecca H. Cross, Anita L. Quon, Kara Dutcyvich, Tomas A. Edge, Frederick A. Leighton and Greg D. Appleyard
417-423

A study of polynucleotide phosphorylase production by Escherichia coli in a hollow fibre reactor 10.1007/s11274-004-1890-4 Shi-Jian Nie, Lin Ma, Lian-Xiang Du and Bei-Zhong Han
424-428 Optimization of carotenoid production by Rhodotorula glutinis using statistical experimental design 10.1007/s11274-004-1891-3 P. K. Park, D. H. Cho, E. Y. Kim and K. H. Chu
429-434 Purification and characterization of lignin peroxidases from Penicillium decumbens P6 10.1007/s11274-004-1876-2 JinShui Yang, HongLi Yuan, HeXiang Wang and WenXin Chen
435-440 Growth and survival potentials of immobilized diazotrophic cyanobacterial isolates exposed to common ricefield herbicides 10.1007/s11274-004-1877-1 Surendra Singh and Pallavi Datta
441-446 Characterization of a wine-like beverage obtained from sugarcane juice 10.1007/s11274-004-1878-0 Yadira Rivera-Espinoza, Elsa Valdez-López and Humberto Hernández-Sánchez
447-452 A novel Candida glycerinogenes mutant with high glycerol productivity in high phosphate concentration medium 10.1007/s11274-004-1879-z Bin Zhuge, Xue-Na Guo, Crispen Mawadza, Hui-Ying Fang, Xue-Ming Tang, Xi-Hong Zhang and Jiang Zhuge
453-456 Oxidation of carbonyl compounds by whole-cell biocatalyst 10.1007/s11274-004-2467-y K. R. Gawai, P. D. Lokhande, K. M. Kodam and I. Soojhawon
457-461 Regulation of synthesis of endo-xylanase and β-xylosidase in Cellulomonas flavigena: a kinetic study 10.1007/s11274-004-2396-9 M. Ibrahim. Rajoka
463-469 Improved productivity of β-fructofuranosidase by a derepressed mutant of Aspergillus niger from conventional and non-conventional substrates 10.1007/s11274-004-1995-9 M. I. Rajoka and Amber Yasmeen
471-478

Antimicrobial study of pyrazine, pyrazole and imidazole carboxylic acids and their hydrazinium salts 10.1007/s11274-004-2041-7 T. Premkumar and S. Govindarajan
479-480 Decolorization of azo dyes using Basidiomycete strain PV 002 10.1007/s11274-004-2047-1 Pradeep Verma and Datta Madamwar
481-485 Effect of cultivation conditions on invertase production by hyperproducing Saccharomyces cerevisiae isolates 10.1007/s11274-004-2612-7 Ikram-ul-Haq, Mirza Ahsen Baig and Sikander Ali
487-492 Antibiotic resistance and survival of faecal coliforms in activated sludge system in a semi-arid region (Beni Mellal, Morocco) 10.1007/s11274-004-2613-6 S. Fars, K. Oufdou, A. Nejmeddine, L. Hassani, A. Ait. Melloul, K. Bousselhaj, O. Amahmid, K. Bouhoum, H. Lakmichi and N. Mezrioui
493-500 Diphenolases from Anoxybacillus kestanbolensis strains K1 and K4 T 10.1007/s11274-004-2392-0 Melike Yildirim, Melek Col, Ahmet Colak, Saadettin Güner, Sabriye Dülger and Ali Osman Beldüz
501-507 Utilization of vegetable oil in the production of clavulanic acid by Streptomyces clavuligerusATCC 27064 10.1007/s11274-004-2393-z G. L. Maranesi, A. Baptista-Neto, C. O. Hokka and A. C. Badino
509-514 Cytogenetic analysis of metaphase chromosomes from pupal testes of four mosquito species using fluorescence in situ hybridization technique (FISH) 10.1007/s11274-004-2394-y Fatma A. E. Sallam and Refaat G. Abou El Ela
515-518 Evaluation of agro-food byproducts for gluconic acid production by Aspergillus niger ORS-4.410 10.1007/s11274-004-2395-x O. V. Singh, N. Kapur and R. P. Singh
519-524

A comparative evaluation of oxygen mass transfer and broth viscosity using Cephalosporin-C production as a case strategy 10.1007/s11274-004-3489-1 Punita Mishra, Pradeep Srivastava and Subir Kundu
525-530 Immobilized cells cultivated in semi-continuous mode in a fluidized bed reactor for xylitol production from sugarcane bagasse 10.1007/s11274-004-3490-8 J. C. Santos, S. S. Silva S. I. Mussatto, W. Carvalho and M. A. A. Cunha
531-535 Physiological responses of pressed baker’s yeast cells pre-treated with citric, malic and succinic acids 10.1007/s11274-004-3136-x Maristela F. S. Peres, Claudia R. C. S. Tininis, Crisla S. Souza, Graeme M. Walker and Cecilia Laluce
537-543 Enhancing biological nitrogen removal from tannery effluent by using the efficient Brachymonas denitrificans in pilot plant operations 10.1007/s11274-004-3272-3 Seyoum Leta, Fassil Assefa and Gunnel Dalhammar
545-552 Anti-Helicobacter pylori substances from endophytic fungal cultures 10.1007/s11274-004-3273-2 Y. Li, Y. C. Song, J. Y. Liu, Y. M. Ma and R. X. Tan
553-558 Preliminary research of the RAPD molecular marker-assisted breeding of the edible basidiomycete Stropharia rugoso-annulata 10.1007/s11274-004-3271-4 Pei-Sheng Yan and Jia-Hui Jiang
559-563 Determination of poly-β-hydroxybutyrate (PHB) production by some Bacillus spp. 10.1007/s11274-004-3274-1 Mirac Yilmaz, Haluk Soran and Yavuz Beyatli
565-566 Negative effects of oil spillage on beach microalgae in Nigeria 10.1007/s11274-004-3910-9 J. P. Essien and S. P. Antai
567-573 Production of alkali-tolerant cellulase-free xylanase by Pseudomonas sp. WLUN024 with wheat bran as the main substrate 10.1007/s11274-004-3491-7 Zheng-Hong Xu, Yun-Ling Bai, Xia Xu, Jing-Song Shi and Wen-Yi Tao
575-581

Studies on antagonistic marine actinomycetes from the Bay of Bengal 10.1007/s11274-004-3493-5 Sujatha Peela, VVSN Bapiraju Kurada and Ramana Terli
583-585 Protein fingerprinting profiles in different strains of Aeromonas hydrophila isolated from diseased freshwater fish 10.1007/s11274-004-3909-2 Basanta Kumar Das, Surya Kanta Samal, Biswa Ranjan Samantaray and Prem Kumar Meher
587-591 Application of response surface methodology in medium optimization for spore production of Coniothyrium minitans in solid-state fermentation 10.1007/s11274-004-3492-6 Xin Chen, Yin Li, Guocheng Du and Jian Chen
593-599 Cultivation of oyster mushrooms (Pleurotus spp.) on various lignocellulosic wastes 10.1007/s11274-004-3494-4 Q. A. Mandeel, A. A. Al-Laith and S. A. Mohamed
601-607 Production of tannase by Aspergillus niger HA37 growing on tannic acid and Olive Mill Waste Waters 10.1007/s11274-004-3554-9 H. Aissam, F. Errachidi, M. J. Penninckx, M. Merzouki and M. Benlemlih
609-614 The influence of tapioca on the growth, the activity of glucoamylase and pigment production of Monascus purpureus UKSW 40 in soybean-soaking wastewater 10.1007/s11274-004-1892-2 Kris H. Timotius
615-617

Production of rosmarinic acid by Lavandula vera MM cell suspension in bioreactor:
effect of dissolved oxygen concentration and agitation
Atanas I. Pavlov, Milen I. Georgiev and Mladenka P. Ilieva*Department of Microbial Biosynthesis and Biotechnologies – Laboratory in Plovdiv, Institute of Microbiology,Bulgarian Academy of Sciences, 26 Maritza Blvd., 4002 Plovdiv, Bulgaria*Author for correspondence: Tel.: +359-32-642-430, Fax: +359-2-8-700-109, E-mail: [email protected]
Keywords: Agitation, bioreactor, dissolved oxygen, Lavandula vera MM, rosmarinic acid
Summary
The relationship between dissolved oxygen (DO) concentration, agitation rate and growth of Lavandula vera MMand rosmarinic acid biosynthesis was investigated in 3 l laboratory bioreactor. Lavandula vera MM cell suspensionaccumulated the highest amounts of biomass (34.8 g/l) and rosmarinic acid (1870.6 mg/l) on day 12 of cultivation at50% dissolved oxygen and agitation speed 100 rpm and at 30% dissolved oxygen and agitation speed 300 rpm,respectively.
Introduction
The scaling up of plant cell suspensions to largeculture volumes, while keeping their biosyntheticpotential, represents a critical stage in the productionof secondary metabolites (Godoy-Hernandez et al.2000). The main problems that appeared after transferof plant cells from flasks to bioreactor include slowgrowth rate, physiological heterogeneity, genetic insta-bility, low metabolic content and product secretion(Zhong 2001). Dissolved oxygen (DO) concentrationand agitation speed are two of the most importantfactors for growth and accumulation of secondarymetabolites by plant cell cultures (Schlatmann et al.1995; Su et al. 1995; Huang et al. 2002; Luo et al.2002). The quantity of inlet air must be sufficient toprovide enough oxygen for the growth of the cells andthe production of secondary metabolites, but an over-supply of oxygen can repress cell growth and second-ary metabolite formation (Huang et al. 2002).However, oxygen consumption by different plant cellsin batch culture does not show a constant value(Doran 1993). The sufficient agitation is substantialfor ensuring the effective mass transfer in bioreactorwith respect to biomass and nutrient of medium(Zhong et al. 2002). The rotation speed of the impellermust be optimal for growth and secondary metaboliteproduction (Huang et al. 2002).The cell culture Lavandula vera MM is a promising
producer of rosmarinic acid (Ilieva & Pavlov 1997),which possess high antioxidant, antimicrobial andantiviral activity (Parnham & Kesselring 1985). As aresult of investigation of physiological peculiarities of
L. vera MM and further optimization of nutrientmedium, an amount of 1786.7 mg rosmarinic acid/lwas achieved under cultivation in flasks (Pavlov et al.2000). The aim of the present work is to investigatethe influence of DO concentration and agitation speedon growth and rosmarinic acid biosynthesis by L. veraMM in 3 l bioreactor.
Materials and methods
Plant cell culture and culture conditions
Lavandula vera MM callus culture was maintained in aLinsmayer–Skoog (LS) agar nutrient medium (Linsma-yer & Skoog 1965), supplemented with 30 g sucrose/land 0.2 mg 2,4-dichlorphenoxyacetic acid/l. The cellsuspension of L. vera MM was grown in LS medium ofthe same composition. The inoculum was obtained bycultivation of cell suspension for 7 days in conical flasks(500 ml) with 1/5 net volume, on a shaker (11.6 rad/s),in the dark, at 26 �C. The inoculation was performedwith 20% (v/v) cell suspension.
Bioreactor cultivation
A 3 l bioreactor (New Brunswick, BioFlo 110) with2.25 l working volume, supplied with propeller impellerand ‘Four-gas mix device’ (New Brunswick, M1273-0055) were used. Before cultivation, 1.80 l of LSmodified medium (Pavlov et al. 2000) was loaded intothe bioreactor vessel. Bioreactor experiments wereperformed under temperature 26 �C.
World Journal of Microbiology & Biotechnology (2005) 21:389–392 � Springer 2005
DOI 10.1007/s11274-004-3982-6

The effect of dissolved oxygenCultivations were performed at a constant impellerspeed (100 rpm) and concentrations of DO – 10, 30, 40and 50% of air saturation.
The effect of agitationExperimentswereperformedat a constantDO(30%ofairsaturation) and impeller speeds – 200, 300 and 400 rpm.
Analysis
Dry biomassThe growth of the L. vera MM cell suspension wasmonitored by measuring the dry biomass (Dixon 1985).Conductivity was measured by pH/cond meter (INO-
LAB, WTW, Germany).
Rosmarinic acid extraction and determinationThe rosmarinic acid was extracted from cell biomasswith 50% (v/v) ethanol (three times by 20 min) at 70 �C.The extract was evaporated to dryness; the dry residuewas dissolved in a small volume of 70% (v/v) ethanoland then was stored for 24 h at –10 �C. The obtainedprecipitate was separated by filtration and filtrate wasused for determination of RA. The determination wasperformed spectrophotometrically at 327 nm(Lopez-Arnaldos et al. 1995) using spectrophotometerShimadzu UV/VIS 1240.
Results and discussion
Effect of dissolved oxygen on growth and rosmarinic acidbiosynthesis by L. vera MM
Experiments were performed under the constantagitation speed of 100 rpm. The obtained data,
concerning effect of DO on the growth and RA byL. vera MM (Figure 1) shown that the highest amountof biomass (34.8 g/l) was achieved at 50% DOconcentration, while at 10, 30 and 40% DO biosyn-thesized biomasses were 12.7 g/l, 32.0 g/l and 31.8 g/l,respectively. The same dependence (an increase of drycell weight with increase of DO concentration) wasreported for another cell suspension cultures (Luoet al. 2002). However, the maximum amount ofbiomass was accumulated when the cultivation ofL. vera MM cell suspension was performed at 50%dissolved oxygen on day 12 of cultivation, while at30% and 40% DO, the maximum amounts ofbiomasses were achieved on day 10 of cultivation.The specific growth rate (l) and doubling time (td)were calculated (Table 1). As it can be seen the bestspecific growth rate and doubling time (l ¼ 0.0076 1/h; td ¼ 91 h) were observed for cultivation of L. veraMM at 30% DO.When the cultivation was performed at 30% DO, the
highest amount of rosmarinic acid was achieved on day11 (1073.0 mg/l) (Figure 1b). The produced amounts ofrosmarinic acid at DO levels 10, 40 and 50% of airsaturation were lower (Figure 1a, c and d). Low levels ofDO repressed secondary metabolite production, espe-cially rosmarinic acid production (Figure 1a) and on theother hand over-supply of oxygen suppressed RAproduction as well (Figure 1d). Kieran et al. (1997)summarized that for plant cell suspension culturescritical DO concentrations are generally assumed to bein the range 15–20% of air saturation. However, Suet al. (1995) established that the most appropriate DOconcentration for another producer of RA (Anchusaofficinalis) was also 30% of air saturation. So sufficientquantity of dissolved oxygen is essential for secondarymetabolite production, but it have to be specifying forevery cell culture.
Time (days)
0 2 4 6 8 10 12 14
Dry
wei
ght (
g/l)
0
5
10
15
20
25
30
35
40
Ros
mar
inic
aci
d (m
g/l)
0
200
400
600
800
1000
1200
Con
duct
ivity
(m
S/c
m)
0
1
2
3
4
5
6
7
Time (days)
0 2 4 6 8 10 12 14
Dry
wei
ght (
g/l)
0
5
10
15
20
25
30
35
40
Ros
mar
inic
aci
d (m
g/l)
0
200
400
600
800
1000
1200
Con
duct
ivity
(m
S/c
m)
0
1
2
3
4
5
6
7(a)
(c)
(b)
(d)
Time (days)
0 2 4 6 8 10 12 14
Dry
wei
ght (
g/l)
0
5
10
15
20
25
30
35
40
Ros
mar
inic
aci
d (m
g/l)
0
200
400
600
800
1000
1200
Con
duct
ivity
(m
S/c
m)
0
1
2
3
4
5
6
7
Time (days)
0 2 4 6 8 10 12 14
Dry
wei
ght (
g/l)
0
5
10
15
20
25
30
35
40
Ros
mar
inic
aci
d (m
g/l)
0
200
400
600
800
1000
1200
Con
duct
ivity
(m
S/c
m)
0
1
2
3
4
5
6
7
Figure 1. Time course of growth (s) of L. vera MM cell suspension, rosmarinic acid accumulation (d) and conductivity changes (() during the
cultivation with different dissolved oxygen (DO) concentration levels and constant impeller speed 100 rpm. A – 10% DO; B – 30% DO; C – 40%
DO; D – 50% DO. Bars represent standard deviation.
390 A.I. Pavlov et al.

Effect of agitation on growth and rosmarinic acidbiosynthesis by L. vera MM
For investigation of the influence of agitation, DO level– 30% of air saturation was chosen at which maximumamounts of RA were achieved.As shown in Figure 2 the maximum amount of
biomass was accumulated at an impeller speed200 rpm (32.2 g/l) and it was almost constant to300 rpm (31.8 g/l). When the impeller speed wasincreased (from 100 to 300 rpm) the amounts of RAwere increased as well (1870.6 mg/l on day 12 ofcultivation at 300 rpm). The specific growth rate anddoubling time are smaller from those calculated at 30%DO and 100 rpm agitation speed, which can beexplained with the mechanical stress and connectedwith this prolongation of lag-phase of growth (Fig-ure 2b). The calculated specific productivity was highest[155. 88 mg/(l. day)] when cultivation of L. vera MM
cell suspension was performed at 300 rpm agitation and30% DO (Table 1). The reason for this is the balancebetween hydrodynamic environment in the workingvolume of the bioreactor (connected with better ex-change of oxygen and nutrients between plant cell andculture medium) and the level of shear stress. Furtherenhancement from 300 to 400 rpm gave obviousreduction on cell growth (23.7 g/l), which probablydue to the higher shear stress. Obtained results showedthat the agitation rate is very important for both growthof the cells and rosmarinic acid accumulation. Its valuehas to be optimized: not to high, because of the shearstress, and in the same time not to low, because of themass transfer in the bioreactor.Based on experiences of microbial biotechnology
(especially bioreactor cultivation of bacteria, fungi andetc) the investigators controlled DO using inconstantagitation speeds (Su et al. 1995). However, the changesof agitation speed during cultivation could provokeenhancement of mechanical stress, which correspondswith decrease of cell viability and product biosynthesis.Our results clearly demonstrated that during cultivationof L. vera MM cell suspension DO and agitation speedhave to be optimized separately.
Conclusion
In conclusion it has been found that L. vera MM cellsuspension culture during its cultivation in bioreactor(impeller speed 300 rpm and DO 30% of air saturation)biosynthesized 1870.6 mg rosmarinic acid/l, which iscomparable to those reached in shake-flasks (1786.7 mgrosmarinic acid/l) (Pavlov et al. 2000). This is an
Table 1. Specific growth rate, doubling time and specific productivity
at the cultivation of L. vera MM plant cell culture in 3 l laboratory
bioreactor BioFlo 110 /New Brunswick/.
Specific growth
rate, 1/h
Doubling
time, h
Specific productivity,
mg/(l.day)
10% DOa 0.34 · 10–2 204 17.2
30% DOa 0.76 · 10–2 91 107.3
40% DOa 0.70 · 10–2 99 85.2
50% DOa 0.58 · 10–2 119 38.4
200 rpmb 0.66 · 10–2 105 122.2
300 rpmb 0.69 · 10–2 100 155.9
400 rpmb 0.47 · 10–2 147 52.2
a Impeller speed – 100 rpm.b Dissolved oxygen – 30%.
Time (days)
0 2 4 6 8 10 12 14 16
Dry
wei
ght (
g/l)
0
5
10
15
20
25
30
35
Ros
mar
inic
aci
d (m
g/l)
0200400600800100012001400160018002000
Con
duct
ivity
(m
S/c
m)
0
1
2
3
4
5
6
7(c)
Time (days)
0 2 4 6 8 10 12 14
Dry
wei
ght (
g/l)
0
5
10
15
20
25
30
35
Ros
mar
inic
aci
d (m
g/l)
0200400600800100012001400160018002000
Con
duct
ivity
(m
S/c
m)
0
1
2
3
4
5
6
7
Time (days)
0 2 4 6 8 10 12 14
Dry
wei
ght (
g/l)
0
5
10
15
20
25
30
35
Ros
mar
inic
aci
d(m
g/l)
0200400600800100012001400160018002000
Con
duct
ivity
(m
S/c
m)
0
1
2
3
4
5
6
7(a) (b)
Figure 2. Time course of growth (s) of L. vera MM cell suspension, rosmarinic acid accumulation (d) and conductivity changes (() during the
cultivation at different agitation speeds and constant dissolved oxygen concentration 30%. A – 200 rpm; B – 300 rpm; C – 400 rpm. Bars
represent standard deviation.
Production of rosmarinic acid by Lavandula vera MM in bioreactor 391

important result since many authors reported that thescale-up from flasks to bioreactor resulted in reducingproductivity of secondary metabolites (Schiel & Berlin1987; Scragg et al. 1987; Rodriguez-Monroy & Galindo1999; Zhong et al. 1999).
References
Dixon, R.A. 1985 Isolation and maintenance of callus and cell
suspension cultures. In Plant Cell Culture, a Practical Approach,
ed. Dixon, R.A. pp. 1–20. Oxford: Oxford University Press.
OX26DP. ISBN 0-947946-22-5.
Doran, P.M. 1993 Design of reactors for plant cells and organs. In
Advances in Biochemical Engineering/Biotechnology, vol. 48, ed.
Fiechter, A. pp. 117–168. Berlin, Heidelberg: Springer-Verlag,
ISBN 3-540-56315-6.
Godoy-Hernandez, G.C., Vazquez-Flota, F.A. & Loyola-Vargas, V.M.
2000 The exposure to trans-cinnamic acid of osmotically stressed
Catharanthus roseus cells cultures in 14-l bioreactor increases
alkaloid accumulation. Biotechnology Letters 22, 921–925.
Huang, S-Y., Shen, Y-W. & Chan, H-S. 2002 Development of a
bioreactor operation strategy for L-DOPA production using
Stizolobium hassjoo suspension culture. Enzyme and Microbial
Technology 30, 779–791.
Ilieva, M. & Pavlov, A. 1997 Rosmarinic acid production by
Lavandula vera MM cell-suspension culture. Applied Microbiology
and Biotechnology 47, 683–688.
Kieran, P.M., MacLoughlin, P.F. & Malone, D.M. 1997 Plant cell
suspension cultures: some engineering considerations. Journal of
Biotechnology 59, 39–52.
Linsmayer, E.M. & Skoog, F. 1965 Organic growth factor requirements
of tobacco tissue cultures. Physiology Plantarum 18, 100–127.
Lopez-Arnaldos, T., Lopez-Serrano, M., Ros Barcelo, A., Calderon,
A.A. & Zapata, J.M. 1995 Spectrophotometric determination of
rosmarinic acid in plant cell cultures by complexation with Fe2+
ions. Fresenius Journal of Analytical Chemistry 351, 311–314.
Luo, J., Mei, X.G., Liu, L. & Hu, D.W. 2002 Improved paclitaxel
production by fed-batch suspension cultures of Taxus chinensis in
bioreactors. Biotechnology Letters 24, 561–565.
Parnham, M.J. & Kesselring, K. 1985 Rosmarinic acid. Drugs of future
10, 756–757.
Pavlov, A.I., Ilieva, M.P. & Panchev, I.N. 2000 Nutrient medium
optimization for rosmarinic acid production by Lavandula vera
MM cell suspension. Biotechnology Progress 16, 668–670.
Rodriguez-Monroy, M. & Galindo, E. 1999 Broth rheology, growth
and metabolite production of Beta vulgaris suspension culture: a
copmarative study between cultures grown in shake flasks and in a
stirred tank. Enzyme and Microbial Technology 24, 687–693.
Schiel, O. & Berlin, J. 1987 Large scale fermentation and alkaloid
production of cell suspension cultures of Catharanthus roseus.
Plant Cell Tissue and Organ Culture 8, 153–161.
Schlatmann, J.E., Vinke, J.L., ten Hoopen, H.J.G. & Heijnen, J.J. 1995
Relation between dissolved oxygen concentration and ajmalicine
production rate in high density cultures of Catharanthus roseus.
Biotechnology and Bioengineering 45, 435–439.
Scragg, A.H., Morris, P., Allan, E.J., Bond, P. & Fowler, M.W. 1987
Effect of scale-up on serpentine formation by Catharanthus roseus
suspension cultures. Enzyme and Microbial Technology 9, 619–624.
Su, W.W., Lei, F. & Kao, N.P. 1995 High density cultivation of
Anchusa officinalis in a stirred-tank bioreactor with in situ
filtration. Applied Microbiology and Biotechnology 44, 293–299.
Zhong, J.J. 2001 Biochemical engineering of the production of plant-
specific secondary metabolites by cell suspension cultures. In
Advances in Biochemical Engineering/Biotechnology, Vol. 72, Plant
cells, eds. Scheper, T. & Zhong, J.J. pp. 1–26. Berlin, Heidelberg,
New York: Springer-Verlag, ISBN 3-540-41849-0.
Zhong, J.J., Chen, F. & Hu, W-W. 1999 High density cultivation of
Panax notoginseng in stirred bioreactors for the production of
ginseng biomass and ginseng saponin. Process Biochemistry 35,
491–496.
Zhong, J.J., Pan, Z-W., Wang, Z-Y., Wu, J., Chen, F., Takagi, M. &
Yoshida, T. 2002 Effect of mixing time on taxoid production
using suspension cultures of Taxus chinensis in a centrifugal
impeller bioreactor. Journal of Bioscience and Bioengineering 3,
244–250.
392 A.I. Pavlov et al.

Thailand habitats as sources of pullulan-producing strains of Aureobasidium pullulans
S. Prasongsuk1,2, R.F. Sullivan3, M. Kuhirun2, D.E. Eveleigh3 and H. Punnapayak2,*1Biological Science Ph.D. program, Faculty of Science, Chulalongkorn University, Bangkok, Thailand2Plant Biomass Utilization Research Unit, Department of Botany, Faculty of Science, Chulalongkorn University,Bangkok 10330, Thailand3Department of Biochemistry and Microbiology, Cook College, Rutgers University, NJ, USA*Author of correspondence: Tel.: +66-2-218-5477, Fax: +66-2-253-0337, E-mail: [email protected]
Keywords: Aureobasidium pullulans, exopolysaccharide, pullulan
Summary
A variety of habitats were sampled for the presence of Aureobasidium black yeasts with the attempt to findpullulan-producing strains. Habitats included leaves of mango (Mangifera indica Linn.), tamarind (Tamarindusindica Linn.), asoka (Saraca indica Linn.) and latex-painted and bathroom cement-wall surfaces. Parameters forthe identification of the isolates included morphology, nutritional parameters, exopolysaccharide (EPS)production, and rDNA internal transcribed spacer (ITS) sequencing. All isolates of black yeasts were polymorphicwith blastospores, hyphae, and chlamydospores. ITS analyses showed strong correlation with the GenBankA. pullulans sequences, with alignment using BLAST yielding greater than 95% similarity. All five isolates testedproduced pullulan as deduced from infrared spectra and sensitivity to pullulanase. None produced aubasidan asevidenced from their IR spectra. The current studies support the notion that the hot, humid environments facilitatethe development of A. pullulans and its tropical variants in diverse phylloplane and walls habitats, and meritsupport for further isolation and characterization of these black yeasts as a source of unique pullulan-producingstrains.
Introduction
Aureobasidium pullulans is a yeast-like fungus commonin a wide variety of environments from plant leaves todamp indoor surfaces. It is an ascomycetous yeast in theOrder Dothideales, Family Dothideaceae. This speciescomprises two varieties, var. pullulans and var. aubas-idani which are distinguished by molecular characteris-tics, nutritional assimilation patterns, andexopolysaccharide (EPS) structure (Yurlova & De Hoog1997). This fungus is useful in a range of applicationsincluding being a potential source of industrial enzymes(amylase, xylanase, and pectinase), single cell protein,and the polysaccharide gum, pullulan (Deshpande et al.1992; Leathers 2003). Pullulan, an extracellular linearhomopolysaccharide, is composed of repeating malto-triose subunits linked through a-1,6 glucosidic bonds.Pullulan is exploited in various industries includingpharmaceutical, food, electronic, and cosmetic compa-nies (Leathers 2003).A. pullulans is well recorded in the temperate-zones;
however, in the tropics (such as Thailand), reports arescarce. Tokomasu et al. (1997) found A. pullulans aspart of the fungal communities of pine-needle leaf litteron the pine forest of northern Thailand. Punnapayaket al. (2003) isolated airborne A. pullulans from various
locations in Thailand. These appear the only majorpublished reports of this black yeast found in Thailand.Moreover, though a phylloplane colonizer, there are noprevious reports on the isolation of A. pullulans fromfresh plant leaves or building surface environs inThailand.In this investigation, this fungus was isolated from
diverse phylloplane habitats in Thailand and identifiedusing morphology, nuclear ribosomal DNA internaltranscribed spacer (ITS) sequencing, nutritional physi-ology, and determination of their EPS.
Materials and methods
Isolation of fungi
Fresh plant leaves (Mangifera indica Linn., Tamarindusindica Linn., Hibiscus rosa-sinensis Linn., Ochna kirkiiOliv., Bougainvillea spectabilis Linn., Saraca indicaLinn., Cassia fistula Linn., Eugenia uniflora Linn.,Annona squamosa Linn. and Artocarpus heterophyllusLam.) were collected and disks (0.6 mm) were asepti-cally cut and placed on selective media plates-Corn MealAgar (CMA) and Malt Extract Agar (MEA)-halfstrength. Other fungal habitats sampled included
World Journal of Microbiology & Biotechnology (2005) 21:393–398 � Springer 2005
DOI 10.1007/s11274-004-2237-x

bathroom cement-walls and latex-painted surfaces.Sterile cotton swabs were used for collection and thisinoculum was smeared onto selective media plates intriplicate. All cultures were incubated at room temper-ature (30 �C). The initial yeast colonies were purifiedby using cross-streaking on Potato Dextrose Agar(PDA) and repeated until colony pure cultures wereobtained. CMA, MEA, and PDA were from Difco(Detroit, MI).
Fungal identification
Morphological observationSlide cultures were made using PDA, which were stainedwith lactophenol-cotton blue and observed by wetmounting using bright field microscopy. The colonycharacteristics were observed daily. The Aureobasidiumstrains were compared with the standard strains, A.pullulans ATCC 42023 and NRRL 6992, and thedescriptions of Aureobasidium by Barnett & Barry(1998), Domsch et al. (1993), and Hermanides-Nijhof(1977).
Nuclear ribosomal DNA internal transcribed spacer(ITS) SequencingFresh cells from the A. pullulans cultures were ground inliquid nitrogen and genomic DNA extracted using theDneasy Plant Protocol (Quiagen, Inc., Valencia, CA).The 5.8S rDNA and flanking ITS regions (ITS1&2) wereamplified from 2 ll of undiluted genomic DNA in a100 ll reaction using the primers ITS5 and ITS4 (Whiteet al. 1990). Each reaction contained 10 mM Tris–HCl(pH 8.3), 50 mM KCl, 2.5 mM MgCl2, 12.5 pmol eachdNTP, 50 pmol each primer, and 2 U Taq polymerase(Desai & Pfaffle 1995). PCR (25 cycles) was carried outusing a GeneAmp 9600 thermocycler (Perkin-ElmerCorporation, Foster City, CA) set to 95 �C for 10 s,56 �C for 30 s, and 72 �C for 1 min. Initial denaturationwas conducted at 95 �C for 1 min with a final extensionfor 10 min at 72 �C. Successful PCR products werecleaned of primers and salts, using the QIAquick PCRPurification Kit (Quiagen, Inc., Valencia, CA). ABIPRISM� BigDye Terminators v3.0 Cycle Sequencingreactions (Applied Biosystems, Foster City, CA) wereprepared according to the manufacturer’s protocol,using primers ITS5 and ITS4 and the PCR product astemplate (White et al. 1990). Reactions were analysedon an ABI PRISM� 3100 Automated DNA Sequencer(Applied Biosystems, FosterCity, CA).
Nutritional physiology testsCarbon and nitrogen assimilation were investigatedaccording to Barnett et al. (1990). Inocula were culti-vated in the Yeast Malt Broth (YMB) (Difco, Detroit,MI). The carbon (0.5 M, 0.5 ml) or nitrogen source(0.5 M, 0.5 ml) was added to 10� yeast nitrogen base(Difco, Detroit, MI) (0.5 ml) (Difco yeast carbonbase for nitrogen assimilation) plus 4 ml of sterile
distilled water. An inoculum (100 ll) of yeastculture (2.5 · 107 cell/ml) was added. Cultures wereincubated at 25 �C. Distilled water was used as acontrol. Growth was assessed by cell turbidity of thedispersed mycelium.
EPS production and analysisEPS was prepared by growing cultures in a productionmedium (PM) in shake flasks (100 ml/ 250-ml flask,150 rev/min, room temperature). PM contained glucose(5%); (NH4)2SO4 (0.06%); K2HPO4 (0.5%); MgSO4.7-H2O (0.04%); NaCl (0.1%); and yeast extract (0.04%),with the pH adjusted to 6.5. EPS was recovered after5 days by removing the yeast mycelium by centrifugation(10,000 · g, 15 min), and precipitating the EPS from theculture supernatant with 95% ethanol (2:1, etha-nol:supernatant). EPS was dried at 60 �C.The pullulan content was estimated by sensitivity to
pullulanase (EC 3.2.1.41) from Klebsiella pneumoniae(Sigma, St. Louis, MO) according to Leathers et al.(1988). The IR spectra were determined using thepotassium bromide (KBr) technique on an FTIRspectrometer (Perkin-Elmer, Norwalk, CT). Pullulan(Sigma) was used as the control standard.
Results and discussion
Aureobasidium spp. were isolated from different habitatsaround Thailand including a bathroom cement-wall(isolate BK4), a latex-painted surface (isolate BK6), andleaves of mango (Mangifera indica Linn.) (isolateNRM2), asoka (Saraca indica Linn.) (isolate LB3),and tamarind (Tamarindus indica Linn.) (isolate SK3).The isolates were generally recovered using MEA halfstrength. Isolate NRM2 were isolated using CMA halfstrength.Examination of the cell morphology of the isolates by
bright field light microscopy showed the classic A.pullulans polymorphology with blastospores, hyphae,and chlamydospores. The colonies grew rapidly, weresmooth, slimy, pale pink or cream and became blackwith time (Figure 1). Isolates NRM2 and SK3 produceda pink and a yellow pigment, respectively, characteristicof so-called ‘colour-variant’ strains (Wickerham &Kurtzman 1975). The colony sizes ranged between 2.86and 4.75 cm on the MEA after 7 days. Both morpho-logical and colony characteristics corresponded wellwith the A. pullulans descriptions by Barnett & Barry(1998), Domsch et al. (1993), and Hermanides-Nijhof(1977) and to features of standard strains, ATCC 42023and NRRL 6992.Sequences for isolates BK4, BK6, NRM2, and LB3
were identical to each other and identical to other A.pullulans sequences in GenBank, including the following:AF121284 (ATCC 42457), AY 139395 (CBS 110373), AY139393 (CBS 110376), AY 139392 (CBS 110375),AJ244236 (CBS 101160), AY 139391 (CBS 110377),
394 S. Prasongsuk et al.

AJ244269 (VKPM F-371), AJ276062 (MZ58) andAJ276061 (MZ65). The sequence for SK3 differed slightlyfrom the other four by a single T to A transversion in theITS1 and a single deletion (T) in the ITS2. Strain SK3wasmore similar to sequences for isolates BK4, BK6, NRM2and LB3 than to any other sequence in GenBank. Thesequences were submitted to GenBank with the followingaccession numbers AY225163, AY225164, AY225165,AY225166, AY225167, respectively for the isolates BK4,BK6, NRM2, SK3, and LB3.The carbon and nitrogen assimilation patterns of the
isolates correlated with the assimilation patterns of thecontrol strains (Tables 1 and 2). A diverse range ofcarbon sources was utilized including cellobiose, dulc-itol, fructose, galactose, glucose, glycerol, methyl-a-D-glucoside, raffinose, sucrose, xylitol, and xylose, whilecellulose, chitin, p-coumaric acid, sodium succinate, andsodium salicylate were not assimilated. Intra-specificvariation of Aureobasidium isolates and standard strainswas found in assimilation of dulcitol, glucosamine,sodium citrate (Table 1). Okagbue et al. (2001) reportedthat Zimbabwean isolates of A. pullulans (de Bary)Arnaud utilized a broad range of substrates includingcellobiose, glucose, glycerol, sucrose, xylan, and xylose.Other workers reported A. pullulans to utilize cellobiosebut not cellulose (Dennis & Buhagiar 1973; De Hoog &Yurlova 1994). Federici (1982) also noted a lack ofcellulase activity. Chitinase activity was not detectedfrom this fungus (Federici 1982; De Hoog & Yurlova
1994). The results are in agreement with previousreports in which A. pullulans was distinguished fromA. prunorum and Trichosporon pullulans by its ability toutilize glycerol and galactose (Dennis & Buhagiar 1973).De Hoog & Yurlova (1994) noted that A. pullulans couldutilize methyl-a-D-glucoside while Hormonema sp. couldnot. All isolates also utilized lactose and methyl-a- D-glucoside, in agreement with the data of A. pullulans var.pullulans (Yurlova & De Hoog 1997).Nitrogen sources that were utilized included
L-arginine, creatinine HCl, L-isoleucine, L-lysine, L-serine, sodium nitrate, sodium nitrite, and L-trypto-phane but not creatine monohydrate, and L-threonine.Cooke & Matsuura (1963) reported that while A.pullulans P-66 assimilated a range of nitrogen sourcesincluding amino acids, it could not assimilate L-lysine.In contrast, Cernakova et al. (1980) and De Hoog &Yurlova (1994) stated that many tested strains ofA. pullulans were able to utilize L-lysine. Generalutilization of amino acids is clear (Table 2), thoughthe inability of specific strains to use asparagine,alanine, glutamine, proline, leucine, phenylalanine,and glycine is evident.The EPS of all isolates showed sensitivities to pullu-
lanase between 56 and 97% (Table 3). An apparentcorrelation between greater pullulan production by thelesser pigmented isolates was observed. This possibilitywas found by the previous reports (Leathers et al. 1988;West & Reed-Hamer 1993; Punnapayak et al. 2003).
Figure 1. Colony and morphology of Aureobasidium isolates. (A) colony and hypha of isolate BK 4, (B) colony and conidial apparatus of isolate
BK6, (C) colony and chlamydospores of isolate NRM2, (D) colony and hypha with conidia of isolate LB3, (E) colony and blastospores of isolate
SK3.
Pullulan-producing strains of A. pullulans 395

Table 2. Nitrogen assimilation pattern of Aureobasidium isolates from Thailand.
Nitrogen substrates/Strains BK4 BK6 SK3 NRM2 LB3 NRRL Y-2311-1a NRRL Y-7469a
1. L-Aspartic acid + w + + + + +
2. L-Threonine ) ) ) ) ) ) )3. L-Asparagine ) ) ) + ) + +
4. Lysine + + + + + + +
5. L-Methionine w w + + + + +
6. Creatine monohydrate ) ) ) ) ) ) )7. L-Valine + + + w + + +
8. Sodium nitrite + + + + + + +
9. Sodium nitrate + + + + + + +
10. Creatinine + + + + + + +
11. L-Alanine w + + ) + + +
12. L-Arginine + + + + + + +
13. L-Serine + + + + + + +
14. L-Tryptophan + + + + + + +
15. L-Ornithine + w + + + + +
16. L-Glutamic acid + + + + + + +
17. L-Glutamine + w + ) + + +
18. L-Proline + + + ) ) + +
19. L-Leucine + + + + ) + +
20. L-Isoleucine + + + + + + +
21. L-Phenylalanine + + + ) ) + +
22. Glycine + + ) + + + +
23. L-Histidine w + + + + + +
a Standard strains, A. pullulans NRRL Y-2311-1 and A. pullulans NRRL Y-7469.
+ = assimilation, � = non assimilation, w = weak assimilation.
Table 1. Carbon assimilation pattern of Aureobasidium isolates from Thailand.
Carbon substrates/Strains BK4 BK6 SK3 NRM2 LB3 NRRL Y-2311-1a NRRL Y-7469a
1. Caffeic acid ) ) w ) ) ) -
2. D-Cellobiose + + + + + + +
3. Cellulose powder
(1% fibrous) ) ) ) ) ) ) )4. Chitin (colloidal) ) ) ) ) ) ) )5. p-Coumaric acid ) ) ) ) ) ) )6. D-Glucose + + + + + + +
7. Dulcitol + + + + + ) +
8. Fructose + + + + + + +
9. D-Galactose + + + + + + +
10. D-(+)-Glucosamine w w ) ) ) + )11. Glycerol + + w + + w w
12. Myo-inositol + + + + + + +
13. Lactose + + + + + + +
14. Mannitol + + + + + + +
15. Methyl-a- D-glucoside + + + + + + +
16. Maltose + + + + + + +
17. Quinic acid + + + + + + +
18. Raffinose + + + + + + +
19. Rhamnose + + ) + + + +
20. Ribose + + + + + + +
21. Sodium citrate ) ) ) ) + + +
22. D)Sorbitol + + + + + + +
23. Sodium succinate ) ) ) ) ) ) )24. Sodium acetate ) ) ) ) ) ) w
25. Sodium salicylate ) ) ) ) ) ) )26. Starch (soluble) + + + + + + +
27. Sucrose + + + + + + +
28. Salicin + + + + + + +
29. Trehalose + + + + + + +
30. D-Xylose + + + + + + +
31. D-Xylitol + + + + + + +
a Standard strains, A. pullulans NRRL Y-2311-1 and A. pullulans NRRL Y-7469.
+= assimilation, ) = non-assimilation, w = weak assimilation.
396 S. Prasongsuk et al.

Leathers et al. (1988) noted that melanin, which con-taminated pullulan, could be inhibitory to pullulanase.The IR spectra of EPS from all isolates were similar
to that of the pullulan standard (Figure 2), with apullulan-like peak at around k ¼ 850 cm)1 whichindicates the �-configuration within the EPS (Yurlova&DeHoog, 1997).Madi et al. (1997) also reported a peakat k ¼ 859.6 cm)1of EPS from A. pullulans (de Bary)Arnaud (IMI145194) which they interpreted as an �-configuration.In conclusion, A. pullulans was successfully isolated
from distinct habitats in Thailand. This furthers ourknowledge of the occurrence of this organism in tropicalclimates. The A. pullulans isolates were from verydifferent habitats from leaves to painted surfaces. Onthe basis of morphology, nutritional physiology, ribo-somal DNA ITS sequencing, and the types of EPS, allisolates were identified as A. pullulans var. pullulans.
Isolates included typical black colonies and colourvariants. Although Aureobasidium is ubiquitous, colourvariant strains have thus far only been isolated fromtropical or subtropical sites. Because of the polymor-phism of this fungus, morphological criteria are notsufficient for identification; however, molecular tech-niques (ITS sequencing) were also unable to resolve theisolates. Differences in nutritional physiology and EPScharacterization were useful to define the isolates. Allisolates produced a pullulan EPS, a commercial bio-polymer gum raising the concept that further Aureoba-sidium isolates from Thailand should be evaluated forpotential commercial exploitation.
Acknowledgement
The authors wish to thank The Royal Golden Jubilee(RGJ) Ph.D. grant 4.S.CU/42/Q1 contract numberPHD/0143/2542, The Thailand Research Fund andEveleigh-Fenton fund for the financial support. Wethank Cletus P. Kurtzman, Timothy D. Leathers(UDSA, Peoria, IL), James F. White Jr., MarshallBergen (Plant Pathology/Biology, Rutgers University)for helpful discussion. This research was also supportedby the establishment fund of the Plant Biomass Utili-zation Research Unit, Department of Botany, Facultyof Science, Chulalongkorn University, Bangkok, andthe Project for the Promotion of Efficiency and Capa-bility of the National Competition by the Ministry ofEducation, Thailand.
Table 3. Pullulan content and degree of pigmentation of the EPS.
Isolates Pullulan content (%)a Degree of pigmentationb
BK4 97 +
BK6 56 +++
NRM2 61 ++
LB3 80 +
SK3 90 +
a % Pullulan content was calculated from the amount of reducing
sugar (maltotriose equivalent) released from the reaction between
the EPS and pullulanase enzyme.b Degree of pigmentation was determined by visual observation.
Figure 2. Infrared (IR) spectra. (a) Pullulan standard (Sigma), (b) EPS from Aureobasidium sp. BK4, (c) EPS from Aureobasidium sp. BK6, (d)
EPS from Aureobasidium sp. NRM2, (e) EPS from Aureobasidium sp. LB3, (f) EPS from Aureobasidium sp. SK3.
Pullulan-producing strains of A. pullulans 397

References
Barnett, A.J., Payne, W.R. & Yarrow, R. 1990 Yeasts: Characteristics
and Identification. Cambridge: Cambridge University Press. ISBN
0521350565.
Barnett, H.L. & Barry, B.H. 1998 Illustrated Genera of Imperfect
Fungi. Minneapolis: The American Phytopathological Society
Press. ISBN 0890541922.
Cernakova, M., Kockova-Kratochvilova, A., Suty, L., Zemek, J. &
Kuniak, E 1980 Biochemical similarity among strains of Aureoba-
sidium pullulans (de Bary) Arnaud. Folia Microbiologica 25, 68–73.
Cooke, W.B. & Matsuura, G. 1963 Physiology studies in the black
yeasts. Mycopathologia et Mycologia Applicata 21, 225–271.
De Hoog, G.S. & Yurlova, N.A. 1994 Conidiogenesis, nutritional
physiology and taxonomy of Aureobasidium and Hormonema.
Antonie van Leeuwenhoek 65, 41–54.
Dennis, C. & Buhagiar, R.W.M. 1973 Comparative study of Aure-
obasidium pullulans, A. prunorum sp. nov. and Trichosporon
pullulans. Transaction of the British Mycological Society 60, 567–
575.
Deshpande, M.S., Rale, V.B. & Lynch, J.M. 1992 Aureobasidium
pullulans in applied microbiology: a status report. Enzyme and
Microbial Technology 14, 514–527.
Desai, U.J. & Pfaffle, P.K. 1995 Single-step purification of a
thermostable DNA polymerase expressed in Escherichia coli.
Biotechniques 19, 780–784.
Domsch, K.H., Gams, W. & Anderson, T. 1993 Compendium of Soil
Fungi. London: Academic Press. ISBN 3980308383.
Federici, F. 1982 Extracellular enzymatic activities in Aureobasidium
pullulans. Mycologia 74, 738–743.
Hermanides-Nijhof, E.J. 1977 Aureobasidium and allied genera.
Studies in Mycology 15, 141–166.
Leathers, T.D. 2003 Biotechnological production and applications of
pullulan. Applied Microbiology and Biotechnology 62, 468–473.
Leathers, T.D., Nofsinger, G.W., Kurtzman, C.P. & Bothast, R.J.
1988 Pullulan production by colour variants of Aureobasidium
pullulans. Journal of Industrial Microbiology 3, 231–239.
Madi, N.S., Harvey, L.M., Mehlert, A. & McNeil, B 1997 Synthesis
of two distinct exopolysaccharide fractions by cultures of the
polymorphic fungus Aureobasidium pullulans. Carbohydrate Poly-
mers 32, 307–314.
Okagbue, R.N., Mwenje, E., Kudanga, T., Siwela, M. & Sibanda,
T. 2001 Isolation of Aureobasidium pullulans from Zimbabwean
sources and glucosidase activities of selected isolates. South African
Journal of Botany 67, 157–160.
Punnapayak H., Sudhadham, M., Prasongsuk S. & Pichayangkura,
S. 2003 Characterization of Aureobasidium pullulans isolated from
airborne spores in Thailand. Journal of Industrial Microbiology and
Biotechnology 30, 89–94.
Tokumasu, S., Tubaki, K. & Manoch, L. 1997 Microfungal communi-
ties ondecayingpine needles inThailand. InTropicalMycology, edn.
Janardhanan, K.K., Rajendran, C., Natarajan, K. & Hawksworth,
D.L. pp. 93–106. Bangkok: Science Publishers. ISBN 1886106630.
West T.P. & Reed-Hamer, B. 1993 Polysaccharide production by a
reduced pigmentation mutant of the fungus Aureobasidium pullu-
lans. FEMS Microbiology Letters 113, 345–350.
White, T.J., Bruns, T., Lee, S. & Taylor, J. 1990 Amplification and
direct sequencing of fungal ribosomal RNA genes for
phylogenetics. In PCR Protocols: A Guide to Methods and
Applications, eds. Innis, M.A., Gelfand, D.H., Sninsky, J.J. &
White, T.J. pp. 315–322. New York: Academic Press. ISBN
0123721806.
Wickerham, L.J. & Kurtzman, C.P. 1975 Synergistic color variants of
Aureobasidium pullulans. Mycologia 67, 342–361.
Yurlova, N.A. & De Hoog, G.S. 1997 A new variety of Aureobasidium
pullulans characterized by exopolysaccharide structure, nutritional
physiology and molecular features. Antonie van Leeuwenhoek 72,
141–147.
398 S. Prasongsuk et al.

Optimization of medium constituents and fermentation conditions for the production
of ethanol from palmyra jaggery using response surface methodology
B.V.V. Ratnam1,*, S. Subba Rao3, M. Damodar Rao2, M. Narasimha Rao3 and C. Ayyanna31Department of Neurology, Johns Hopkins University School of Medicine, Pathology 233/Meyer 222, 600 NorthWolfe Street, Baltimore, MD 21287, USA2Department of Pediatrics, Division of Infectious Diseases, Johns Hopkins University School of Medicine, 720 RutlandAvenue, Ross 1135B, Baltimore, MD-21205, USA. Tel: 410 614 0058, Fax: 410 614 1315, e-mail: [email protected] for Biotechnology, Department of Chemical Engineering, College of Engineering, Andhra University,Visakhapatnam 530 003, India*Author for correspondence: E-mails: [email protected]/[email protected]
Keywords: Central composite design (CCD), ethanol, palmyra jaggery, response surface methodology (RSM),Saccharomyces cerevisiae
Summary
The quantitative effects of sugar concentration, nitrogen concentration, EDTA, temperature, pH and time offermentation on ethanol production were optimized using a Box-Wilson central composite design (CCD)experiment. It was found that palmyra jaggery (sugar syrup from the palmyra palm) is a suitable substrate for theproduction of high concentrations of ethanol using Saccharomyces cerevisiae NCIM 3090 by submergedfermentation. A maximum ethanol concentration of 129.4 g/l was obtained after optimizing media componentsand conditions of fermentation. The optimum values were a temperature of 26.2 �C, pH of 8.4, time of fermentationof 4.2 days with 398.5 g of substrate/l, 3.1 g of urea/l and 0.51 g of EDTA/l. Thus by using the CCD, it is possibleto determine the accurate values of the fermentation parameters where maximum production of ethanol occurs.
Introduction
Ethanol is one of the largest volume organic chemicalsthat are industrially produced. The study of ethanolfermentation has gained importance because of increas-ing demand for it in recent years as a motor fuelsupplement to gasoline. Rapid fermentation and highethanol levels are desirable to minimize capital costs anddistillation energy, while good yields are necessary forprocess economics. The substrate is the main costcomponent for industrial ethanol production and it isessential that ethanol production should be carried outwith cheap substrates (Lee & Woodward 1983; Elissonet al. 2001). Palmyra jaggery, sugar syrup from thepalmyra palm (Borassus flabellifer) is an agriculturalproduct abundantly available in the India, Peninsulaand the Northern of Sri Lanka and is an alternativesubstrate for producing ethanol.To develop a process for the maximum production of
ethanol, standardization of media and fermentationconditions is crucial. Medium optimization by theclassical method: a single – dimensional search involv-ing changing one variable while fixing the others at acertain level is laborious and time – consuming, espe-cially when the number of variables is large. Analternative and more efficient approach in microbialsystems is the use of statistical methods (Duff et al.
1973). Statistical inference techniques can be used toassess the importance of individual factors, the appro-priateness of this functional form and sensitivity of theresponse to each factor (Mason et al. 1989). Recentlymany statistical experimental design methods have beenemployed in bioprocess optimization. Among them,response surface methodology (RSM) is the one suitablemethod for identifying the effect of individual variablesand for seeking the optimum conditions for a multivar-iable system efficiently. This method has been success-fully applied to optimize alcoholic fermentation andother fermentation media (Maddox & Reichert 1977;Chen 1981, 1996; Zertuche & Zall 1985; Coteron et al.1993; Sunitha et al. 1998; Ambati & Ayyanna 2001;Ratnam 2001; Ratnam et al. 2003). A detailed accountof this technique has been outlined (Cochran & Cox1968). Basically, this optimization process involves threemajor steps: performing the statistically designed exper-iments, estimating the coefficient in a mathematicalmodel and predicting the response and checking theadequacy of the model.In this study, the RSM approach was adopted to
locate optimum levels of substrate concentration, ureaconcentration, EDTA concentration, temperature, pHand time of fermentation using palmyra jaggery as asubstrate, since these parameters play a key role in theenhancement of ethanol yield.
World Journal of Microbiology & Biotechnology (2005) 21:399–404 � Springer 2005
DOI 10.1007/s11274-004-2461-4

Materials and methods
Substrate
Palmyra jaggery is the dark solid obtained from thesweet today, which is collected from the palmyra tree(Borassus flabellifer) grown in West Godavari District,Andhra Pradesh, India.
Microorganism
Saccharomyces cerevisiae NCIM 3090 obtained fromNational Chemical Laboratory, Pune, India, was usedthroughout the study.
Growth medium and growth conditions
The culture was maintained on agar slants having thecomposition (%): malt extract 0.3, glucose 1.0, yeastextract 0.3, peptone 0.5 and agar agar 2.0. The pH of themedium was adjusted to 6.4–6.8 and cultures wereincubated at 30 �C for 48 h.
Production media and fermentation conditions
Palmyra jaggery with 70% sugars was used as the solecarbon source for the fermentation and the syrup containsa sugar concentration of 280 g/l. A weighed amount ofpalmyra jaggery was dissolved in water and sterilized at121 �C for 15 min. The fermentation was carried out in aBiostatM fermentor supplied by B. Braun Co., Germanywith all necessary controls. The reactorwas of 2 l capacityand working volume was 1 l. The operating conditionsweremaintained at a temperature of 30 �C, pH 5.0, stirrerspeed 200 rev/min and inoculum size 5% (v/v). Inoculumwas prepared in 500-ml flask containing 100-ml fermen-tation medium by incubating it at 30 �C for 48 h on arotary shaker. The reactor was maintained under anaer-obic conditions without aeration.
Analytical methods
Ethanol was estimated by GC in which a flameionization detector and stainless steel column (2.0 mlength, 3.0 mm i.d.) packed with Porapak-Q (50–
80 mesh, manufactured by Nucon Engineers, India)were used. The column oven was operated isother-mally at 150 �C and the detector and injection portswere kept at 170 �C. Nitrogen was used as carrier gasat a flow rate of 30 cm3/min and the combustion gaswas a mixture of hydrogen and air. Sugars weredetermined using Miller’s method (1959).
Experimental design and optimization
Central composite experimental design (CCD, Box andWilson 1951) was used in the optimization of ethanolproduction. Substrate (X1, g/l), urea (X2, g/l), EDTA(X3, g/l), temperature (X1, �C), pH (X2) and time offermentation (X3, days) were chosen as the independentvariables shown in Tables 1 and 2. Ethanol concentra-tion (Yi, g/l) was used as the dependent output variable.For statistical calculations the variables Xi were codedas xi according to Equation (1)
Xi ¼ Xi � �Xið Þ= DXj� �
ði ¼ 1; 2; 3; . . . ; kÞ ð1Þ
where, is the dimensionless value of an independentvariable, Xi the is real value of an independent variable,�xi; is the real value of the independent variable at thecenter point and DXj is step change.A 23-factorial CCD, with six axial points ða ¼
ffiffiffi3pÞ
and six replications at the center points (n0 ¼ 6)leading to a total number of 20 experiments wasemployed (Table 2) for the optimization of the con-stituents of fermentation. The second degree polyno-mials (Equation (2)) were calculated with thestatistical package (Stat-Ease Inc, Minneapolis, MN,USA) to estimate the response of the dependentvariable.
Yi ¼ b0 þ b1X1 þ b2X2 þ b3X3 þ b11X 21 þ b22X 2
2
þ b33X 23 þ b12X1X2 þ b23X2X3 þ b13X1X3 ð2Þ
where Yi is the predicted response, X1, X2, X3 areindependent variables, b0, is the offset term, b1, b2, b3 arelinear effects, b11, b22, b33 are squared effects and b12,b23, b13 are interaction terms.
Table 1. Independent variables in the experimental plan.
Variables Coded levels
)1.682 )1 0 1 1.682
Equation 3
Substrate (g/l), X1 316.9 350 400 450 484.1
Urea (g/l), X2 1.318 2 3 4 4.682
EDTA (g/l) , X3 0.3318 0.4 0.5 0.6 0.6682
Equation 4
Temperature (�C), X1 16.58 20 25 30 33.4
pH, X2 6.318 7 8 9 9.682
Time (days), X3 2.318 3 4 5 5.682
400 B.V.V. Ratnam et al.

Results and discussion
Optimization of medium constituents
RSM is a sequential procedure with an initial objectiveof leading the experimenter rapidly and efficiently to thegeneral vicinity of the optimum. Since the location of theoptimum is unknown prior to running RSM experi-ments, it makes sense to have a design that providesequal precision of estimation in all directions isemployed. The three factors which influence highly thefermentative production are substrate concentration,
urea concentration and EDTA concentration of ethanol.Hence these three factors are considered as majorconstituents of the medium to optimize by keeping themineral constituents of the medium constant.Using CCD, a total number of 20 experiments with
different combinations of substrate, urea, EDTA wereperformed (Tables 1 and 2). The response was taken atthe maximum ethanol production which was observed at4 days. The results were analysed using the analysis ofvariance (ANOVA) and v2 test as appropriate to theexperimental design being used. The calculated regres-sion equation for the optimization of medium constit-uents showed that the ethanol production (Yi, g/l) is afunction of the concentration of substrate (X1, g/l), urea(X2, g/l) and EDTA (X3, g/l). By applying multipleregression analysis on the experimental data, the fol-lowing second order polynomial equation was found torepresent the ethanol production adequately.
Yi ¼� 889:849þ 5:0625X1 � 17:642X2 þ 114:1887X3
� 0:0068X 21 � 3:1970X 2
2 � 188:886X 23
þ 0:0885X1X2 þ 4:3687X2X3 � 0:1619X1X3:
ð3Þ
The predicted levels of ethanol production frompalmyra jaggery medium using the above equationare given in Table 3 along with experimental data. ‘Thegoodness of the model can be checked by differentcriteria’. The coefficient of determination, R2 is 0.9788,implies that 97.88% of the sample variation in theethanol production is attributed to the independentvariables. The R2 value also indicates that the only 1%of the variation is not explained by the model. Thevalue of R is 0.9893. The corresponding analysis of
Table 2. The CCD matrix employed for three independent variables
(actual values are given in Table 1).
Run no. X1 X2 X3
1 )1 )1 )12 1 )1 1
3 )1 1 1
4 1 1 )15 0 0 0
6 0 0 0
7 )1 )1 1
8 1 )1 )19 )1 1 )110 1 1 1
11 0 0 0
12 0 0 0
13 )1.682 0 0
14 1.682 0 0
15 0 )1.682 0
16 0 1.682 0
17 0 0 )1.68218 0 0 1.682
19 0 0 0
20 0 0 0
Table 3. Experimental and predicted yields for ethanol.
X1 X2 X3 Ethanol yield (g/l)
Experimental Predicted
350 2 0.4 105.16 105.37
450 2 0.6 96.68 93.74
350 4 0.6 94.19 97.05
450 4 0.4 100.67 101.84
400 3 0.5 121.14 121.57
400 3 0.5 120.59 121.57
350 2 0.6 103.66 103.51
450 2 0.4 94.19 92.36
350 4 0.4 93.19 97.16
450 4 0.6 104.16 104.97
400 3 0.5 122.50 121.57
400 3 0.5 121.77 121.57
315.9 3 0.5 79.26 75.66
484.1 3 0.5 69.23 71.38
400 1.318 0.5 107.96 111.25
400 4.682 0.5 118.54 113.79
400 3 0.3318 117.29 115.69
400 3 0.6682 116.61 116.76
400 3 0.5 120.72 121.57
400 3 0.5 122.44 121.57
Ethanol production from palmyra jaggery 401

variance (ANOVA) is presented in Table 4. test wasalso carried out to check the best fit of the model. Themodel was a good fit. Since v2cal < v2tab, where v2catis 0.98and v2tab is 30.14. The predicted optimum levels ofsubstrate, urea and EDTA were obtained by applyingthe regression analysis to the Equation (3). Thepredicted and experimental ethanol production at theoptimum levels of medium constituents was alsodetermined by using Equation (3). Figures 1–3 repre-sent the response surface and contour plots for theoptimization of medium constituents of ethanol pro-duction. The optimum medium constituents for highermetabolic production can be attained at the concen-tration of 398.5 g of substrate/l, 3.1 g of urea/l and0.51 g of EDTA/l. At these optimum medium con-sentrations maximum ethanol production of 125.4 g/lwas obtained. Experimental and predicted ethanolproduction at the optimum levels of media constituentswere also determined (Table 7).
Optimization of fermentation conditions
The most important physical factors which affect thefermentative production of ethanol are the temperature,initial pH and time of fermentation. The suitable levelsfor these parameters were also determined using statis-
tical CCD. The experimental design matrix is given inTables 1 and 2. Twenty experiments were performedusing different combinations of the variables as per theCCD. Using the results of the experiments, the followingsecond order polynomial equation giving the ethanol asa function of temperature (X1, �C), pH (X2) and time offermentation (X3, days) was obtained.
Yi ¼� 1394:95þ 69:9918X1 þ 117:3672X2
þ 53:7724X3 � 1:0407X 21 � 4:2425X 2
2
� 6:8737X 23 � 1:8253X1X2 � 0:4824X2X3
� 0:0216X1X3 ð4Þ
Table 4. ANOVA for full quadratic model.
Source of
variation
Sum of
squares
(SS)
Degrees of
freedom
(DF)
Mean
squares
(MS)
F value Probe > F
Regression 4385.5 9 487.3
Residual 95.13 10 9.5 51.2 0
Total 4480.6 19
Figure 1. Response surface and contour plot of substrate concentra-
tion vs. urea concentration on ethanol production (EDTA was kept
constant at 0.5 g/l).
Figure 2. Response surface and contour plot of substrate concentra-
tion vs. EDTA concentration on ethanol production (urea was kept
constant at 3 g/l).
Figure 3. Response surface and contour plot of urea concentration vs.
EDTA concentration on ethanol production (substrate concentration
was kept constant at 400 g/l).
402 B.V.V. Ratnam et al.

The predicted production of ethanol using the aboveequation is given in Table 5 along with the experi-mental values. The coefficient of determination, R2 is0.9408, implies that the sample variation of 94.08%for ethanol production is attributed to the indepen-dent variables, viz., temperature, pH and fermentationtime. The R2 value also indicates that only 1% of thevariation is not explained by the model. The value ofR is 0.97. The corresponding analysis of variance(ANOVA) was presented in Table 6. v2 test shows
that the model is a good fit since v2cal < v2tab, where v2calis 15.77 and v2tab is 30.14. The predicted optimumlevels of temperature, initial pH and time of fermen-tation were obtained by applying the regressionanalysis to the Equation (4). The predicted andexperimental ethanol productions at the optimumlevels of fermentation conditions were also deter-mined. Figures 4–6 represent the isoresponse contourand surface plots for the optimization of fermentationconditions of ethanol production. The maximumethanol concentration of 129.4 g/l appeared at tem-perature, pH and time of fermentation of 26.2 �C, 8.4and 4.2 days respectively. The experimental and pre-dicted ethanol production at optimum conditions offermentation were also determined (Table 7).
Table 5. Experimental and predicted yields for ethanol.
X1 X2 X3 Ethanol yield (g/l)
Experimental Predicted
20 7 3 45.44 55.02
30 7 5 99.27 109.17
20 9 5 80.4 89.26
30 9 3 101.75 98.51
25 8 4 124.72 125.13
25 8 4 125.00 125.13
20 7 5 47.42 58.48
30 7 3 107.22 106.16
20 9 3 85.98 83.88
30 9 5 105.23 103.46
25 8 4 125.12 125.13
25 8 4 124.98 125.13
16.58 8 4 36.34 23.84
33.4 8 4 77.62 79.13
25 6.318 4 117.15 103.39
25 9.682 4 120.13 122.85
25 8 2.318 100.26 102.15
25 8 5.682 122.13 109.21
25 8 4 125.10 125.13
25 8 4 123.99 125.13
Table 6. ANOVA for full quadratic model.
Source of
variation
Sum of
squares
(SS)
Degrees of
freedom
(DF)
Mean
squares
(MS)
F value Probe > F
Regression 14904.6 9 1656.1
Residual 936.99 10 93.7 17.7 0
Total 15841.6 19
Figure 4. Response surface and contour plot of temperature vs. pH on
ethanol production (time was kept constant at 4 days).
Figure 5. Response surface and contour plot of temperature vs. time
on ethanol production (pH was kept constant at 8.0).
Table 7. Optimum values of media constituents, fermentation condi-
tions and the experimental and predicted yields for ethanol.
Variables Optimum
values
Optimum ethanol yield (g/l)
Experimental Predicted
Equation 3
Substrate (g/l), X1 398.5
Urea (g/l), X2 3.1 125.4 125.6
EDTA (g/l), X3 0.51
Equation 4
Temperature (�C), X1 26.2
pH, X2 8.4 129.4 129.8
Time (days), X3 4.2
Ethanol production from palmyra jaggery 403

Thus the present study using the technique of centralcomposite design enables to find the accurate values ofthe medium constituents and fermentation conditionsfor the maximum product concentration of ethanolusing Saccharomyces cerevisiae.
References
Ambati, P. & Ayyanna, C. 2001 Optimizing medium constituents and
fermentation conditions for citric acid production from palmyra
jaggery using response surface method. World Journal of Micro-
biology and Biotechnology 17, 331–335.
Box, G.E.P. & Wilson, K.B. 1951 On the experimental attainment of
optimum conditions. Journal of the Royal Statistical Society
(Series B) 13, 1–45.
Chen, S.L. 1981 Optimization of batch alcohol fermentation of
glucose syrup substrate. Biotechnology and Bioengineering 23,
1827–1836.
Chen, H.C. 1996 Optimizing the concentrations of carbon, nitrogen
and phosphorus in a citric acid fermentation with response surface
method. Food Biotechnology 10, 13–27.
Cochran, N.G. & Cox, G.M. 1968 Experimental Designs. John Wiley
and Sons Inc., p. 611.
Coteron, A., Sanchez, M., Martinez, M. & Aracil, J. 1993 Optimiza-
tion of the synthesis of an analogue of jojoba oil using fully central
composite design. Canadian Journal of Chemical Engineering 71,
485–488.
Duff, R.J., Defeo, J.A. & Robinson, R.A. 1973 Abstracts of Papers,
166th American Chemical Society National Meetings, Chicago,
Micro, 28.
Elisson, A., Hofmeyr, J.H.S., Pedler, S. & Hahn-Hagerdal, B. 2001
The xylose reductase/xylitol dehydrogenase/xylulokinase ratio
affects product formation in recombinant xylose-utilizing Sac-
charomyces cerevisiae. Enzyme and Microbial Technology 29,
288–297.
Lee, J.M. & Woodward, J. 1983 Properties and application of
immobilized b-D-glucoside coentrapped with Zymomonas mobilis
in calcium alginate Biotechnology and Bioengineering 25, 2441.
Maddox, I.S. & Reichert, S.H. 1977 Use of response surface
methodology for the rapid optimization of microbiological media.
Journal of Applied Bacteriology 43, 197–204.
Mason, R.L. Gunst, R.F. & Hers, J.L. 1989 Statistical Design and
Analysis of Experiments with Application to Engineering and
Science. New York: John Wiley & Sons. ISBN 0-471-85364-X.
Miller, G.L. 1959 Use of DNS reagent for determination of reducing
sugars. Analytical Chemistry 31, 426–428.
Ratnam, B.V.V. 2001 Studies on physico-chemical and nutritional
parametars for the production of ethanol from palmyra jaggery by
submerged fermentation using Saccharomyces cerevisiae. PhD
thesis, Andhra University, Visakhapatnam, AP, India.
Ratnam, B.V.V., Narasimha Rao, M., Damodara Rao, M., Subba
Rao, S. & Ayyanna, C. 2003 Optimization of fermentation
conditions for the production of ethanol from sago starch using
response methodology. World Journal of Microbiology and Bio-
technology 19, 523–526.
Sunitha, I., Subba Rao, M.V. & Ayyanna, C. 1998 Optimization of
medium constituents and fermentation conditions for the produc-
tion of L-glutamic acid by the coimmobilized whole cells of
Micrococus glutanicus and Pseudomonas reptilivora. Bioprocess
Engineering 18 , 353–359.
Zertuche, L. & Zall, R.R. 1985 Optimizing alcohol production from
whey using computer technology. Biotechnology and Bioengineer-
ing 27, 547–554.
Figure 6. Response surface and contour plot of pH vs. time on ethanol
production (temperature was kept constant at 25 �C).
404 B.V.V. Ratnam et al.

Dye decolorization by Trametes hirsuta immobilized into alginate beads
Alberto Domınguez, Susana Rodrıguez Couto and Mª Angeles Sanroman*Department of Chemical Engineering, University of Vigo, Campus Universitario As Lagoas–Marcosende,E-36200 Vigo, Spain*Author for correspondence: Tel.: +34-986-812383, Fax: +34-986-812380, E-mail: [email protected]
Keywords: Alginate, enzymes, immobilization, Trametes hirsuta, xenobiotics
Summary
The present paper studies the production of laccase by Trametes hirsuta immobilized into alginate beads in an airliftbioreactor. In order to enhance laccase production fresh ammonium chloride was added, which led to theproduction, of high laccase activities (around 1000 U l)1). The bioreactor operated for 40 days without operationalproblems and the bioparticles maintained their shape throughout fermentation. Dye decolorization was performedat bioreactor scale operating in the batch mode. High decolorization percentages were obtained in a short time(96% for indigo carmine and 69% for phenol red in 24 h), indicating the suitability of this process for application tosynthetic dye decolorization. On the other hand, in vitro decolorization of several industrial azo dyes by crudelaccase produced in the above bioreactor was also performed. It was found that some of the dyes needed theaddition of 1-hydroxybenzotriazole for their decolorization.
Introduction
Dyes are extensively used for several industrial applica-tions, and about 15% of them end up in industrialeffluents. Unfortunately, conventional wastewater treat-ments are ineffectual at removing dyes and involve highcost, formation of hazardous by-products and intensiveenergy requirements (Stolz 2001). Moreover, completedye removal is unfeasible. This has impelled researchinto alternative methods like biotechnological processes.The so-called ligninolytic fungi are particularly suitablefor the development of such processes, since theyproduce extracellular lignin-degrading enzymes. Themain components of their ligninolytic system are ligninperoxidases (LiPs), manganese peroxidases (MnPs) andlaccases, which degrade a wide range of organic pollu-tants including dyes and polyaromatic hydrocarbons(PAHs).Laccase (benzenediol: oxygen oxidoreductases; EC
1.10.3.2) contains four neighboring copper atoms, whichare distributed among different binding sites in themolecule and are differentiated by specific characteristicproperties allowing them to play an important role in itscatalytic mechanism (Shing & Kim, 1998; Xu 1999).This makes laccase an ideal candidate for the treatmentof wastewater from industrial effluents such as thosefrom textile factories.Trametes hirsuta has been selected to perform the
present study, since it has recently been described as agood producer of laccase and has been shown to have
potential in dye degradation (Abadulla et al. 2000,Campos et al. 2001).Dye decolorization on an industrial scale requires the
performance of continuous system technology, which isespecially complex when dealing with filamentous fungi.Processes using immobilized growing cells seem to bemore promising than traditional fermentation with freecells, since immobilization enables microbial cells to beused continuously (Zhou & Kiff 1991; Tieng & Sun2000). Basically, there are two types of cell immobiliza-tion: attachment and entrapment.Several studies have employed different materials for
the attachment procedure such as polyurethane foam(Nakamura et al. 1997; Mielgo et al. 2002), textile stripsand straw (Kaluskar et al. 1999), nylon cubes (Haapala& Linko 1993; Rodrıguez couto et al. 2000), polystyrenefoam (Ozturk & Kasikara 2005) and stainless steelsponge (Rodrıguez Couto et al. 2004). All these mate-rials were shown to be appropriate for the immobiliza-tion of white-rot fungi.On the other hand, relatively few studies have been
conducted with white-rot fungi immobilized on sodiumor calcium alginate (Livernoche et al. 1983; Pallerla &Chambers 1998; Yesilada et al. 1998). Cells entrapped innatural polymers (alginate, carrageenan, chitosan orcellulose derivatives) have been found to be morestable than free cells during continuous operation indifferent processes. This has stimulated interest in thedevelopment of systems with entrapped cells. Accord-ingly, calcium alginate was employed in this work. It
World Journal of Microbiology & Biotechnology (2005) 21:405–409 � Springer 2005
DOI 10.1007/s11274-004-1763-x

was preferred to other materials because it shows thefollowing advantages: biodegradability, hydrophilicity,presence of carboxylic groups, natural origin, lowdensity, mechanical stability and stability over anexperimental pH range of 3.0–8.0 (Arica et al. 2001).The purpose of this research was to obtain high
laccase activities by T. hirsuta immobilized by means ofan entrapment technique operating in an airlift biore-actor. The effect of fresh ammonium chloride additionto the culture medium was also assessed. In addition, thesystem was successfully applied for decolorization oftwo synthetic dyes. Taking into account the greatpotential of laccase in different areas, the applicationof this system to other bioprocesses could be feasible.
Materials and methods
Microorganism
T. hirsuta (BT 2566), obtained from Dr G.M. Gubitz(Institute for Environmental Biotechnology, Graz Uni-versity of Technology, Graz, Austria), was maintainedon potato dextrose agar (PDA) plates at 4 �C and sub-cultured every 3 months.
Alginate beads
T. hirsuta was entrapped in Ca-alginate polymer beadsat a concentration of alginate of 1.4% (w/v) dissolved inwater and sterilized at 120 �C. The alginate solution wasmixed with mycelial suspension, dropped into a calciumchloride solution 25 gl)1 and the beads formed weremaintained at 4 �C for 4 h. The ratio beads/culturemedium employed was 10% (w/w).
Bioreactor configuration and operation conditions
A Biostat B (B. Braun, Germany) airlift bioreactor(working volume of 2 l) was employed. The temperaturewas maintained at 30 �C by circulation of temperature-controlled water. Air was supplied to the bioreactor in acontinuous way at a rate of 1 l min)1 and the pH wasallowed to vary freely.The culture medium was prepared according to Tien &
Kirk (1984) with 10 g l)1 glucose as a carbon source,veratryl alcohol as an inducer (4 mM, final concentra-tion) and dimethyl succinate was replaced by 20 mMacetate buffer (pH 4.5).The bioreactor operated in batch. Samples were
collected twice a day, centrifuged (8000 · g, 10 min)and analyzed in triplicate. The values in the figurescorrespond to mean values of replicate experiments witha standard deviation less than 15%.
Analytical determinations
Laccase activity was determined spectrophotometricallyas described by Niku-Paavola et al. (1990) with ABTS
(2,2¢-azino-di-[3-ethyl-benzothiazoline-(6)-sulfonic acid],Roche) as a substrate. One unit was defined as theamount of enzyme that oxidized 1 lmol of ABTS perminute and the activities were expressed in U l)1.
Dye decolorization studies
DyestuffsThe dyes tested for the in vivo studies were indigocarmine (indigoid) CI 73015 and phenol red (sulfonaph-thalein). Both were purchased from Aldrich (St. Louis,MO, USA). The industrial dyes employed to performthe in vitro studies are indicated in Table 1. These dyeswere manufactured by Clariant Iberica S.A. (Spain) andthey are commonly employed to dye chromed leather.Their chemical structure has not been disclosed, since itbelongs to the company. A stock solution (0.5–0.25% inwater) was stored in the dark at room temperature.
In vivoDye concentration was selected in order to obtainaround 1.0 absorbance unit at their maximum visiblewavelength. Samples, taken every day from the outlet ofthe reactor, were centrifuged (8000 · g, 10 min) toeliminate suspended particles. The residual dye concen-tration was measured spectrophotometrically and asso-ciated with the decrease in the absorbance at the peak ofmaximum visible wavelength for each dye (610 nm forindigo carmine and 431 nm for phenol red).
In vitroCulture broth was collected at the maximum laccaseactivity (day 24), filtered, clarified by centrifugation at8000 · g for 15 min, frozen, defrosted and then filteredto remove the precipitated polysaccharides. The result-ing clear filtrate was concentrated with an Amiconmembrane with a molecular weight cut-off of 10 kDa. Invitro decolorization experiments were performed withthis concentrated clear filtrate.The reaction mixture for dye decolorization consisted
of an aqueous solution of dye (final concentrationsindicated in Table 1), crude laccase (500 U l)1, finalconcentration) in citrate phosphate buffer (pH 5.0) in afinal volume of 1.5 ml. In the experiments with redoxmediator, 1-hydroxybenzotriazole (HOBT) was alsoadded to a final concentration of 0.12%. The residualdye concentration was measured spectrophotometrically
Table 1. Industrial dyes employed in in vitro decolorization.
Dye Characteristics Concentration
(g l)1)
Derma Blue DBN Acid, azo, anionic 0.05
Derma Bordeaux V Acid, azo, anionic 0.07
Derma Carbon NBS Mixture of direct and
acid colorants, azo, anionic
0.13
Coracido Brown FG Azo, anionic 0.17
Derma Brown 5GL Acid, azo, metal
complex (Fe), anionic
0.08
406 A.Domınguez et al.

from 350 to 750 nm, calculated by measuring the areaunder the plot and expressed in terms of percentage. Acontrol test containing the same amount of a heat-denatured laccase was performed in parallel. The assayswere done twice, the experimental error being below3%.
Results and discussion
Laccase production
The rate, amount and quality of the laccase enzymeproduced is affected by diverse typical fermentationfactors such as medium composition, C/N ratio, pH,temperature, aeration rate, etc. Moreover, differentaromatic compounds have also been widely used tostimulate laccase production. Thus, Kaluskar et al.(1999) determined for fungi such as Agaricus sp. thatit is possible to increase laccase production by manip-ulating the growth medium composition and concludedthat the technology of immobilization could be prom-ising for future industrial development of this kind ofenzyme.In view of the results obtained in previous work,
experiments were performed supplementing the culturemedium with 4 mM veratryl alcohol (data not shown).As can be observed in Figure 1, firstly the culture profileshowed an initial lag phase, in which the fungus wasadapting to the environmental conditions. Glucose,measured as reducing sugars, remained at a valuearound 10 g l)1 from the beginning until day 6 andfrom there onwards it gradually decreased up to day 18,being consumed at a rate of 0.823 g l)1 day)1. As forammonium nitrogen, it was totally depleted in 4 daysafter the lag phase. Fresh medium was added on day 17to give a final concentration of ammonium nitrogen of175 mg l)1.Laccase activity appeared on day 6 and it sharply
increased, peaking on day 10 (585 U l)1). Afterwards, itabruptly decreased and from the addition of fresh
medium onwards the activity was recovered, showing amaximum value of 1043 U l)1on day 24. Moreover, amean value of about 900 U l)1 was maintained fromday 20 until the end of cultivation (Figure 2). It isremarkable that the highest laccase activities wereobtained when fresh ammonium chloride was added.This agrees with the investigations performed by Swamy& Ramsay (1999), who found that N-rich culturesproduced higher levels of laccase than N-limited ones insubmerged cultivation of T. versicolor. Moreover, inrecentwork byour research group (Rodrıguez et al. 2004)when T. hirsuta was grown immobilized into alginatebeads in a fixed-bed bioreactor in N-limited conditions,much lower laccase activity values were produced.It is noteworthy that the bioreactor design used in the
present study worked for 30 days without operationalproblems. In addition, the fungus was retained into thebeads and cell leakage from the polymeric matrix intothe medium was not observed. The bead size allowed themovement of air bubbles throughout the reactor bedgiving suitable aeration for the microorganism andavoiding clogging problems, which would hinder massand oxygen transfer rate. It indicates that this bioreactordesign minimizes the drawbacks frequently found inother bioreactor configurations. Altogether this makesthis support a very suitable material for the immobili-zation of filamentous fungi in airlift bioreactors.
Dye decolorization in vivo
The ability to degrade two structurally different dyes,indigo carmine (indigoid) and phenol red (sulfonaph-thalein), by T. hirsuta entrapped in alginate beads wasalso analyzed. The decolorization of model dyes is asimple method to assess the aromatic-degrading capa-bility of ligninolytic enzymes (Novotny et al. 2001).The reactor ran for 30 days and on day 32, when
laccase activity was about 800 U l)1, the dye indigocarmine was aseptically added as an aqueous solution toa final concentration of 150 lM. The dye was almosttotally decolorized in only 24 h (Figure 3). In a secondbatch, the dye phenol red was added on day 38 as anaqueous solution to a final concentration of 200 lM. Adegradation of about 50% was reached in 3 h. Afterthat, the decolorization rate was rather low reaching avalue of 69% in 24 h (Figure 3). This indicates thatphenol red is more resistant to degradation than indigocarmine. The easy degradation of indigoid dyes hasalready been reported by several authors (Wong & Yu1999; Abbadulla et al. 2000). In order to determine theadsorption of dyes on the alginate beads, the bioparti-cles were treated with an extracting agent such asethanol, measuring the possible residual dye concentra-tion resulting in the final solution. No residual dyeconcentration was found, indicating, therefore, that thedyes were not adsorbed onto the alginate beads. Thismeans that decolorization was only due to intra- andextracellular enzymes produced by the microorganismduring cultivation.
Time (days)0 5 10 15 20 25 30
Glu
cose
(g
l-1)
0
2
4
6
8
10
12
Am
mon
ium
(m
g l-1
)
0
40
80
120
160
200
Figure 1. Consumption of glucose (s) and ammonium (n), for the
experiments with T. hirsuta immobilized into alginate beads. Fresh
ammonium chloride was added on day 17.
Dye decolorization by immobilized Trametes hirsuta 407

To confirm that decolorization was due to the laccasesecreted by the fungus, in the following experiment theability of the extracellular liquid from the bioreactor
cultures with T. hirsuta immobilized on an alginate bedto degrade structurally different dyes with diversechromophoric groups of highly recalcitrant and non-biodegradable characteristics such as industrial azo dyeswas assessed. These results indicate the possibility ofusing this bioreactor to degrade other recalcitrantsubstances.
Dye decolorization in vitro
Figure 4 shows that the decolourization degree of thedyes indigo carmine and phenol red by the extracellularliquids reached similar profiles of decolorization percent-age determined in in vivo assays (Figure 3). For thisreason, in this section the ability of the crude laccaseproduced in the reactor to decolorize several industrialazo dyes was performed by an in vitro test. As seen inFigure 4, from 6 to 24 h decolorization obtained was thesame or increased very little (Figure 4), which could bedue to enzyme inhibition by some products generated inthe oxidation process. The dyes Coracido Brown andDerma Brown were decolorized to a very little extent,which indicates that they are not substrates for laccaseenzyme. Then, the well-known redox mediator HOBTwas added subsequently to the decolorizationmixture butno improvement was obtained. However, when thismediator was added at the beginning of the reaction thedecolorization rate considerably increased, in particular,for the dye Derma Brown (70% in 10 min) (Figure 4).These results show the efficiency of the extracellular liquidproduced for decolorization of complex azo dyes. Amoredetailed study of the effect of different redoxmediators onazo dye decolorization is underway in our laboratory.
Conclusions
According to the results obtained in the present work, itcan be concluded that the system employed here is verysuitable for use in dye decolorization, since it was able to
Time (days)
0 5 10 15 20 25 30
Lacc
ase
activ
ity (
U l-1
)
0
200
400
600
800
1000
1200
Figure 2. Laccase production in cultures of T. hirsuta immobilized
into alginate beads.
Time (min)
0 200 400 600 800 1000 1200 1400 1600 1800
Dec
olor
izat
ion
(%)
0
20
40
60
80
100
Figure 3. Profiles of indigo carmine (solid line) and phenol red (dotted
line) decolorization obtained in an airlift bioreactor with T. hirsuta
immobilized into alginate beads.
Carbon Derma
Burdeos Derma
Pardo Derma
Azul Derma
Pardo Coracido
Decolorization (%)
+ HBT (0.12%)4-6 h24 h
Phenol Red
Indigo Carmine
0 10 20 30 40 50 60 70 80 90 100
Figure 4. Decolorization percentages obtained for several industrial azo dyes by crude laccase produced in an airlift bioreactor with T. hirsuta
immobilized into alginate beads.
408 A.Domınguez et al.

operate with high efficiency, degrading different dyes insuccessive batches with no operational problems. Thisindicates the suitability of such a system for applicationto a continuous operation. In addition, it is alsopotentially very useful for laccase production for severalbiotechnological applications.
Acknowledgements
This work was financed by the Spanish Ministry ofScience and Technology and European FEDER (ProjectREN2003-01626/TECNO).
References
Abadulla, E., Tzanov, T., Costa, S., Robra, K.H., Cavaco-Paulo, A. &
Gubitz, G.M. 2000 Decolorization and detoxification of textile
dyes with a laccase from Trametes hirsuta. Applied and Environ-
mental Microbiology 66, 3357–3362.
Arica, M.Y., Kacar, Y. & Genc, O. 2001 Entrapment of white-rot
fungus Trametes versicolor in Ca-alginate beads: preparation and
biosorption kinetic analysis for cadmium removal from an aqueous
solution. Bioresource Technology 80, 121–129.
Campos, R., Kandelbauer, A., Robra, K.H., Cavaco-Paulo, A. &
Gubitz, G.M. 2001 Indigo degradation with purified laccases from
Trametes hirsuta and Sclerotium rolfsii. Journal of Biotechnology 8,
131–139.
Haapala, A. & Linko, S. 1993 Production of Phanerochaete chrysos-
porium lignin peroxidase under various culture conditions. Applied
Microbiology and Biotechnology 40, 494–498.
Kaluskar, V.M., Kapadnis, B.P., Jaspers, CH. & Penninckx, M.J. 1999
Production of laccase by immobilized cells of Agaricus sp.
Induction effect of xylan and lignin derivatives. Applied Biochem-
istry and Biotechnology 76, 161–170.
Livernoche, D., Jurasek, L., Desrochers, M. & Dorica, J. 1983
Removal of color from kraft mill waste waters with cultures of
white rot fungi and immobilized mycelium of Coriolus versicolor.
Biotechnology and Bioengineering 25, 2055–2065.
Mielgo, I.,Moreira,M.T., Feijoo,G.&Lema J.M. 2002Biodegradation
of a polymeric dye in a pulsed bed bioreactor by immobilised
Phanerochaete chrysosporium.Water Research 36, 1896–1901.
Nakamura, Y., Sawada, T., Sungusi, M.G., Kobayashi, F., Kuwahara,
M. & Ito, H. 1997 Lignin peroxidase production by Phanerochaete
chrysosporium. Journal of Chemical Engineering of Japan 30, 1–6.
Niku-Paavola, M.L., Raaska, L. & Itavaara, M. 1990 Detection of
white-rot fungi by a non-toxic stain. Mycological Research 94, 27–
31.
Novotny, C., Rawal, B., Bhatt, M., Patel, M., Sasek, V. &
Molotoris, H.P. 2001 Capacity of Irpex lacteus and Pleurotus
ostreatus for decolorization of chemically different dyes. Journal
of Biotechnology 89, 113–122.
Ozturk, U.R. & Kasikara P.N. 2005 Production and stimulation of
manganese peroxidase by immobilized Phanerochaete chrysospori-
um. Process Biochemistry 140, 83–87.
Pallerla, S. & Chambers, R.P. 1998 Reactor development for biodeg-
radation of pentachlorophenol. Catalysis Today 40, 103–111.
Rodrıguez Couto, S., Rivela, I., Munoz, M.R. & Sanroman, A. 2000
Ligninolytic enzyme production and the ability of decolourisation
of Poly R-478 in packed-bed bioreactors by Phanerochaete
chrysosporium. Bioprocess Engineering 23, 287–293.
Rodrıguez Couto, S., Sanroman, A., Hofer, D. & Gubitz, G.M. 2004
Stainless steel sponge: a novel carrier for the immobilisation of the
white-rot fungus Trametes hirsuta for decolourisation of textile
dyes. Bioresource Technology 95, 67–72.
Shing, K.-S. & Kim, C.-J. 1998 Decolorisation of artificial dyes by
peroxidase from the white-rot fungus Pleurotus ostreatus. Biotech-
nology Letters 20, 569–572.
Stolz, A. 2001 Basic and applied aspects in the microbial degradation
of azo dyes. Applied Microbiology and Biotechnology 56, 69–80.
Swamy, J. & Ramsay, J.A. 1999 The evaluation of white rot fungi in
the decoloration of textile dyes. Enzyme and Microbial Technology
24, 130–137.
Tien, M. & Kirk, T.K. 1984 Lignin-degrading enzyme from Phanero-
chaete chrysosporium: purification, characterization and catalytic
properties of an unique H2O2-requiring oxygenase. Proceedings of
the National Academy of Sciences of the United States of America
81, 2280–2284.
Tieng, Y.P. & Sun, G. 2000 Use of polyvinyl alcohol as a cell
entrapment matrix for copper biosorption by yeast cells. Journal of
Chemical Technology and Biotechnology 75, 541–546.
Wong, Y. & Yu, J. 1999 Laccase-catalysed decolorization of synthetic
dyes. Water Research 33, 3512–3520.
Xu, F. 1999 Laccase. In Encyclopedia of Bioprocess Technology:
Fermentation, Biocatalysis and Bioseparation, eds. Flickinger, M.C.
& Drew, S.W., Vol. 3, pp. 1545–1554. New York: John Wiley &
Sons, ISBN 0 471 16667 7.
Yesilada, O., Sik, S. & Sam, M. 1998 Biodegradation of olive mill
wastewaters by Coriolus versicolor and Funalia trogii: effects of
agitation, initial COD concentration, inoculum size and immobili-
zation.World Journal of Microbiology and Biotechnology 14, 37–42.
Zhou, J.L. & Kiff, R.J. 1991 The uptake of copper from aqueous
solution by immobilized fungal biomass. Journal of Chemical
Technology and Biotechnology 52, 317–330.
Dye decolorization by immobilized Trametes hirsuta 409

Stabilization of a truncated Bacillus sp. strain TS-23 a-amylase by replacing
histidine-436 with aspartate
Huei-Fen Lo1, Ya-Hui Chen1, Nai-Wan Hsiao2, Hsiang-Ling Chen,1 Hui-Yu Hu1, Wen-Hwei Hsu3
and Long-Liu Lin4,*1Department of Food and Nutrition, Hungkuang University, Taichung 433, Taiwan2Graduate Institute of Bioinformatics, Taichung Healthcare and Management University, Taichung, Taiwan3Institute of Molecular Biology, National Chung Hsing University, Taichung 402, Taiwan4Department of Applied Chemistry, National Chiayi University, Chiayi 60083, Taiwan*Author for correspondence: Fax: +886-5-2717901, E-mail: [email protected]
Keywords: Bacillus sp. strain TS-23, a-amylase, site-directed mutagenesis, histidine, thermostability
Summary
Histidine-436 of a truncated Bacillus sp. strain TS-23 a-amylase (His6-tagged DNC) has been known to beresponsible for thermostability of the enzyme. To understand further the structural role of this residue, site-directedmutagenesis was conducted to replace His-436 of His6-tagged DNC with aspartate, lysine, tyrosine or threonine.Starch-plate assay showed that all Escherichia coli M15 transformants conferring the mutated amylase genesretained the amylolytic activity. The over-expressed proteins have been purified to near homogeneity by nickel-chelate chromatography and the molecular mass of the purified enzymes was approximately 54 kDa. The specificactivity for H436T was decreased by more than 56%, while H436D, H436K, and H436Y showed a higher activity tothat of the wild-type enzyme. Although the mutations did not lead to a significant change in the Km value, morethan 66% increase in the value of catalytic efficiency (kcat/Km) was observed in H436D, H436K, and H436Y. At70 �C, H436D exhibited an increased half-life with respect to the wild-type enzyme.
Introduction
a-Amylases (a-1,4-glucan-4-glucanohydrolase, EC3.2.1.1) are ubiquitous enzymes that catalyze the hydro-lysis of the internal a-1,4 glucosidic bonds in starch andrelated poly- and oligosaccharides. These enzymes formone of the largest families within the sequence-basedclassification of glycosyl hydrolases (Henrissat & Bai-roch 1996; Henrissat & Davies 1997). As a consequenceof their widespread distribution in the three domains oflife, a-amylases display a high degree of sequencevariability that has been extensively analyzed in termsof evolutionary relationships (Janecek 1997; Janecek &Sevcik 1999).
a-Amylases have been used to produce glucose andfructose from starch, to improve texture, volume andflavour of bakery products, to remove starch fromtextiles, and as additives for detergents for both washingmachines and automated dish-washers (Vihinen &Mantsala 1989; Guzman-Maldonado & Paredes-Lopez1995; Ito et al. 1998). The conditions prevailing in thecommercial applications of these enzymes are ratherextreme, especially with respect to temperature and pH.Therefore, there is a continuing demand for stableenzymes to meet the requirements set by specificapplications. One approach would be to screen for
novel microorganisms from extreme environments suchas hydrothermal vents, salt and soda lakes, and brinepools (Sunna et al. 1997; Niehaus et al. 1999; Vieille &Zeikus 2001). Alternatively, more success has beenachieved by protein engineering of the commerciala-amylases (Nielsen & Borchert 2000). The design ofthermostable enzymes is among the most spectacularachievements of protein engineering. Since the pioneer-ing work of Perry & Wetzel (1984), the advent of site-directed mutagenesis methodology has yielded anincreasing number of proteins that have been thermo-stabilized through rational design or empirical means(Matthews 1995; Allen et al. 1998; Sakasegawa et al.2001, 2002; Nielsen & Borchert 2000). Thermostabilityof a protein is determined by many criteria such ashydrophobic interactions, loop stabilization, reducedentropy of unfolding, and electrostatic interaction(Vieille et al. 1996). Most natural proteins seem toachieve their individual stability by accumulation ofa large number of weakly stabilizing interactions(Demirjian et al. 2001). Accordingly, the characteriza-tion of several hundreds of Bacillus licheniformis a-amylase variants has identified protein regions andamino acid residues essential for thermostability of theenzyme (Declerck et al. 1990, 2000). In the study ofDeclerck et al. (2000), amino acid replacements at the
World Journal of Microbiology & Biotechnology (2005) 21:411–416 � Springer 2005
DOI 10.1007/s11274-004-1764-9

six histidine residues of B. licheniformis a-amylase revealthat His-133 is critical for its thermostability. Althoughno analogous histidine residue is present in therecombinant Bacillus sp. strain TS-23 a-amylase(AmyA) (Lin et al. 1997), His-436 of the N- andC-terminally truncated AmyA (His6-tagged DNC) hasbeen demonstrated to be important for thermostabilityof the enzyme (Chang et al. 2003). As reported by Loet al. (2001a), AmyA exhibits optimal activity at pH 9.0and 60 �C, respectively, and is stable at temperaturesbelow 50 �C. Under optimal conditions, the enzymehydrolyzes the a-1,4-linkages in soluble starch, amylose,amylopectin, and glycogen to produce maltopentoase asthe main end product. In this investigation, His-436 ofHis6-tagged DNC was substituted by four amino acidswith different side chains. Comparison of the wild typeand mutant enzymes shows that thermostability of thetruncated enzyme can be modulated by His-436 substi-tutions. In addition, the increased resistance of theenzyme towards higher temperature is not necessarilyaccompanied by a decrease in its catalytic activity.
Materials and methods
Materials, bacterial strains, plasmid, and growthconditions
Restriction and DNA modification enzymes wereacquired from Promega Life Sciences (Madison, WI,USA). Luria–Bertani (LB) media and Bacto agar forEscherichia coli cultivation were obtained from DifcoLaboratories (Detroit, MI, USA). The primers usedwere synthesized by Mission Biotechnology, Inc. (Tai-pei, Taiwan). Ni2+-nitrilotriacetate (Ni2+-NTA) resinwas purchased from Qiagen, Inc. (Valencia, CA, USA).Other chemicals were commercially products of analyt-ical grade or molecular biological grade.E. coli NovaBlue (Novagen, Inc., Madison, WI, USA)
was used as the host for routine plasmid propagationand DNA cloning procedure. E. coli XL1-Blue (Strat-agene, La Jolla, CA, USA) was used for site-directedmutagenesis. T5RNA polymerase-mediated gene expres-sion was performed in E. coli M15 (Qiagen). Theplasmids used were pQE-AMYDNC (Lo et al. 2001b)and pQE-AMYDNC436 (Chang et al. 2003). E. colistrains harbouring the recombinant plasmids weregrown aerobically at 28 or 37 �C in LB mediumsupplemented with 100 lg ampicillin/ml for NovaBlueand XL1-Blue strains or 100 lg ampicillin/ml and 25 lgkanamycin/ml for M15 strain. For starch-plate assay,the LB medium contained 1.5% (w/v) agar and theindicated antibiotics.
DNA manipulation
General DNA techniques were performed essentially asdescribed by Sambrook et al. (1989). Site-directedmutagenesis was performed on pQE-AMYDNC by a
QuickChange site-directed mutagenesis kit (Stratagene)according to the manufacturer’s protocol with a pair ofcomplementary primers (Table 1). DNA sequencingthen confirmed the presence of the desired mutation inthe selected transformants.
Expression and purification of wild type and mutantenzymes
Escherichia coli M15 harbouring pQE-AMYDNC andits mutated derivatives were grown at 37 �C in 100 ml ofLB medium supplemented with the above-mentionedantibiotics to an attenuance at 600 nm of approximately0.6. Isopropyl-b-D-thiogalactopyranoside (IPTG) wasthen added to a final concentration of 0.5 mM and thecultivation continued at 28 �C for 12 h. The cells wereharvested by centrifugation at 12,000 · g for 20 min at4 �C, resuspended in 3 ml of binding buffer (5 mMimidazole, 0.5 M NaCl, and 20 mM Tris–HCl; pH 7.9),and disrupted by sonication. The resulting extracts wereclarified by centrifugation at 12,000 · g for 20 min, andthe supernatants were then mixed with Ni2+-NTA resinpre-equilibrated with the binding buffer. After twovolume of washing buffer (50 mM imidazole, 0.5 MNaCl, and 20 mM Tris–HCl; pH 7.9), the His6-taggedenzymes were eluted from the resin by a buffer contain-ing 0.5 M imidazole, 0.5 M NaCl, and 20 mM Tris–HCl(pH 7.9).
Protein methods
SDS-PAGE was performed in a vertical mini-gel system(Mini Protean III system; Bio-Rad Laboratories, Rich-mond, CA, USA) with 4% polyacrylamide stacking and10% polyacrylamide separating gels. Before electropho-resis, the proteins were mixed with 2 · SDS-samplebuffer, heated at 100 �C for 5 min, and centrifuged at12,000 · g for 10 min. Electrophoresis was done atroom temperature and a constant voltage of 100 V. Foractivity staining, the gels were immediately immersedinto 1% soluble starch in 50 mM Tris–HCl buffer (pH8.0) and incubated at 50 �C for 1 h. The amylolytic
Table 1. Primers used for site-directed mutagenesis of Bacillus sp.
strain TS-23 a-amylase gene
Enzyme Nucleotide sequencea
H436D 50-CGTGATTACATTGACGAGCAAGACATTATTGb
50-CAATAATGTCTTGCTCGTCAATGTAATCACGc
H436K 50-CGTGATTACATTGACAAGCAAGACATTATTGb
50-CAATAATGTCTTGCTTGTCAATGTAATCACGc
H436T 50-CGTGATTACATTGACACTCAAGACATTATTGb
50-CAATAATGTCTTGAGTGTCAATGTAATCACGc
H436Y 50-CGTGATTACATTGACTATCAAGACATTATTGb
50-CAATAATGTCTTGATAGTCAATGTAATCACGc
a Nucleotides underlined represent the mutations that introduce the
desired amino acid substitutions.b Sequence for forward primers.c Sequence for reverse primers.
412 Huei-Fen et al.

band was visualized by soaking the gels into a solutionof 0.01 N I2–0.1 N KI. The same gels were subse-quently stained with 0.25% Coomassie Brilliant Bluedissolved in 50% methanol-10% acetic acid, anddestained in a solution of 30% methanol and 10%acetic acid. The protein size markers were phosphory-lase b (97.4 kDa), bovine serum albumin (66.3 kDa),ovalbumin (45.0 kDa), carbonic anhydrase (31.0 kDa),and trypsin inhibitor (21.5 kDa).Protein concentrations were determined by the Brad-
ford method with the Bio-Rad protein assay reagent,and bovine serum albumin was used as the standard.
Enzyme assay, kinetic characterization, andthermostability
Amylase activity was assayed in accordance with theprocedure described by Lin et al. (1994). One unit ofamylase activity is defined as the amount of enzyme thatreleases 1 lmol glucose equivalent per min from starch.The Km and kcat values were estimated by monitoring
the hydrolysis of soluble starch in the 0.5 ml reactionmixtures containing various concentrations of the sub-strate (0.2–4 mg/ml) in 50 mM Tris–HCl buffer (pH 8.0)and a suitable amount of enzyme. The reaction mixtureswere incubated at 50 �C for 10 min. Values of Km andkcat were calculated by fitting the initial rates as afunction of soluble starch concentration to the Micha-elis-Menten equation.To determine thermostability of wild type and mutant
enzymes, protein concentrations were adjusted to100 lg/ml with 50 mM Tris–HCl buffer (pH 8.0). Theenzyme solutions were incubated at 70 �C for designedtime periods. Aliquots (50 ll) of the enzyme solutionwere withdrawn to determine the residual activity underthe standard assay conditions.
Results and discussion
Expression of wild type and mutant enzymes
For structure-stabilization studies, His-436 on His6-tagged DNC was replaced by aspartate, threonine,tyrosine, and lysine, respectively. The resulting plasmidswere designed pQE-AMY436D/436T/436Y/436K. Afterconfirmation of the altered sequence, pQE-AMYDNC,pQE-AMYDNC436, and the mutated plasmids weretransformed into E. coli M15 for IPTG-induced geneexpression. As shown in Figure 1a, E. coli M15 (pQE-AMY436D/436Y/436K) hydrolyzed the starch in themedium comparable to the control. However, the resttwo transformants produced halos smaller than that ofthe host cell carrying pQE-AMYDNC. These resultsindicate that His-436 could be important for proteinstructure but is not essential for the catalytic reaction ofthe enzyme.A predominant protein band of approximately
54 kDa was observed in the total proteins from IPTG-
induced E. coli M15 transformants (data not shown).Activity staining showed that H436D and His6-taggedDNC had amylolytic activity, while a dramaticallydecrease in activity was observed in H436Y (Figure 1b).The heating step (100 �C for 5 min) before SDS-PAGEalso inactivated H436K and H436T, suggesting thatsubstitution of His-436 by Tyr, Arg or Thr has anegative effect on the enzyme stability.
Purification and kinetic characterizationof the recombinant proteins
To characterize each variant, the expressed proteinswere purified with chelate column chromatography tonear homogeneity (Figure 2). As compared with thewild type enzyme, the specific activity for threoninesubstitution was significantly decreased, while H436D,H436K, and H436Y showed a significant increase inenzyme activity (Table 2). To understand further thebasis for variations in specific activity, the kineticconstants, kcat and Km, were determined for wild typeand mutant enzymes. As shown in Table 2, H436T wasseverely compromised catalytically with more than 36%decrease in kcat, indicating that this substation signifi-cantly affects catalytic function of the enzyme. H436D,H436K, and H436Y exhibited a similar Km valuecoupled with an increased catalytic efficiency (kcat/Km)relative to the wild-type enzyme. A generally acceptedmechanism for the a-amylase family of enzymes is that itproceeds via an a-retaining double displacement proce-dure (Kuriki & Imanaka 1999). The mechanism involvestwo catalytic residues in which a glutamic acid acts asthe acid/base catalyst and an aspartate functions as thenucleophile. In the catalytic reaction, the critical histi-
Figure 1. Amylolytic activity of E. coli M15 transformants. (a) Starch-
plate assay. Transformants were cultivated on LB plate containing 1%
soluble starch, 0.1 mM IPTG and the indicated antibiotics for 24 h. A
clear zone around the colony indicates the expression of the amylase
gene. (b) SDS-PAGE analysis of the total cell proteins from E. coli
M15 transformants. The amylolytic activity is visualized by activity
staining. Numbers denote: 1, E. coli M15 (pQE-AMY436D);
2, E. coli M15 (pQE-AMY436K); 3, E. coli M15 (pQE-AMY436T);
4, E. coliM15 (pQE-AMY436Y); 5, E. coliM15 (pQE-AMYDNC436);
6, E. coli M15 (pQE-AMYDNC).
Stabilization of Bacillus sp. strain TS-23 a-amylase 413

dine residues of starch-degrading enzymes have beenproposed to be involved in the binding of substrate(Ishikawa et al. 1992, 1993; Nakamura et al. 1993;Takase 1994; Tseng et al. 1999). Three histidine residuesimplicated in the binding of substrate have generallybeen located in the highly homologous regions (Matsu-ura et al. 1984). In AmyA, these residues include His-137 (region I), His-269 (region II), and His-361 (regionIV) (Lin et al. 1997). Because His-436 of His6-taggedDNC falls outside the conserved regions, and substitu-tions at this position do not completely inactivate theenzyme, it is clear that this residue plays a role in theglobal structure of the enzyme.
Thermostability
Thermostabilities of His6-tagged DNC and His-436variants were compared. As shown in Figure 3, thewild-type enzyme exhibited a time-dependent decreasein amylolytic activity and had a half-life of 25 min at70 �C. H436Y, H436T, and H436K were more sensitivetoward the thermal inactivation to that of His6-taggedDNC. These results are consistent with the findingsfrom activity staining of the total proteins (Figure 1B).Interestingly, H436D retained 57% of the original activ-ity after incubating the enzyme at 70 �C for 30 min,indicating that substitution of His-436 by aspartategenerates a variant with enhanced thermostability. Inthe cyclodextrin glycosyltransferase (CGTase) fromThermoanaerobacterium thermosulfurigenes EM1, the
surface salt bridges have been proposed to contributeits relatively high thermostability (Knegtel et al. 1996).Based on the structural comparison of CGTases, a saltbridge was introduced into the Bacillus circulansenzyme to create a variant with improved thermosta-bility (Leemhuis et al. 2004). Several other exampleshave also demonstrated that salt bridges play a key rolein the maintenance of high enzyme stability (Auerbachet al. 1998; Sanz-Aparicio et al. 1998; Tahirov et al.1998; Hashimoto et al. 1999). However, computermodeling of three-dimensional structures of the wild-type enzyme and H436D using Bacillus stearothermo-philus a-amylase as the template structure (PDB entry1HVX) and the program CPH model 2.0 (http://www.cbs.dtu.dk/services/CPHmodels) revealed thatthe better thermostability observed in H436D is dueto the additional hydrogen bond in the vicinity of thesubstituted amino acid (Figure 4). Hsiao et al. (2004)demonstrated that thermostability of a protein could bequantified by the measurement of its Tm index. In ourcase, the Tm index of wild type enzyme and H436D are0.15 and 0.22, respectively. Based on the above facts, itis likely that the created hydrogen bond and larger Tmindex in the variant contribute to its higher thermosta-bility.
Conclusion
In this study, His-436 of the truncated Bacillus sp.strain TS-23 a-amylase was replaced with other aminoacids by site-directed mutagenesis. H436D showed notonly an increased catalytic efficiency but also anincreased resistance to thermal inactivation. SinceHis-436 is not essential for catalytic reaction of theenzyme, the increased kcat value in H436D could beattributed by the improved thermostability. In recentyears, many molecular and structural characteristics ofthe highly thermostable enzyme have been analyzed by
Figure 2. SDS-PAGE analysis of the purified His6-tagged DNC and
His-436 variants. Lanes: M, protein size marker; 1, H436D; 2, H436K;
3, H436T; 4, H436Y; 5, wild-type enzyme.
Table 2. Specific activities and kinetic parameters of wild type and
mutant enzymes
Enzyme Specific
activity
(U mg)1)
kcat(s)1)
Km
(mg ml)1)
kcat/ Km
(ml mg)1 s)1)
Wild type 170.2 ± 8.3 149.3 ± 2.7 2.8 ± 0.7 53.3
H436D 231.5 ± 8.9 295.5 ± 8.4 2.6 ± 0.5 113.6
H436K 240.2 ± 9.7 274.7 ± 7.9 2.9 ± 0.4 94.7
H436T 75.3 ± 3.1 98.4 ± 7.0 2.9 ± 0.5 33.9
H436Y 232.4 ± 5.6 212.5 ± 9.9 2.4 ± 0.3 88.5
0
0.5
1
1.5
2
0 10 20 30 40
Time (min)
Lo
g %
of
resi
du
al a
ctiv
ity
Figure 3. Thermostability of the purified His6-tagged DNC and His-
436 variants. These enzymes were incubated at 70 �C for the indicated
time prior to the determination of the residual activity. Symbols: �,
H436D; }, His6-tagged n, NC; j;, H436Y; m, H436T; d, H436K.
414 Huei-Fen et al.

pairwise comparisons on homologous proteins withdifferent thermal stabilities. As a result, several mech-anisms and factors have been found to be responsiblefor the higher thermostability, such as hydrophobicinteractions, salt bridges, hydrogen bonds, solventaccessible surface areas, etc (Matthews 1993; Vieille &Zeikus 2001). By computer modelling of Bacillus sp.strain TS-23 AmyA with B. stearothermophilus a-amylase, it is clear that the additional hydrogen bondand larger Tm index are responsible for the enhancedthermostability of H436D. The improved thermosta-bility makes H436D more valuable for industrialapplication.
Acknowledgement
The authors are grateful for the financial support (NSC-93-2313-B-241-005) by National Science Council of theRepublic of China.
References
Allen, M.J., Coutinho, P.M. & Ford, C.F. 1998 Stabilization of
Aspergillus awamori glucoamylase by proline substitution and
combining mutations. Protein Engineering 11, 783–788.
Auerbach, G., Ostendorp, R., Prade, L., Korndorfer, I., Dams, T.,
Huber, R. & Jaenicke, R. 1998 Lactate dehydrogenase from the
hyperthermophilic bacterium Thermotoga maritima: the crystal
structure at 2.1 A resolution reveals strategies for intrinsic protein
stabilization. Structure 6, 769–781.
Chang, C.T., Lo, H.F., Chi, M.C., Yao, C.Y., Hsu, W.H. & Lin, L.L.
2003 Identification of essential histidine residues in a recombinant
a-amylase of thermophilic and alkaliphilic Bacillus sp. strain TS-
23. Extremophiles 7, 505–509.
Declerck, N., Joyet, P., Gaillardin, C. & Masson, J.M. 1990 Use of
amber suppressors to investigate the thermostability of Bacillus
licheniformis a-amylase: amino acid replacement at 6 histidine
residues reveal a critical position at His-133. Journal of Biological
Chemistry 265, 15481–15488.
Declerck, N., Machius, M., Wiegand, G., Huber, R. & Gaillardin, C.
2000 Probing structural determinants specifying high thermosta-
bility in Bacillus licheniformis a-amylase. Journal of Molecular
Biology 301, 1041–1057.
Demirjian, D.C., Moris-Varas, F. & Cassidy, C.S. 2001 Enzymes for
extremophiles. Current Opinion in Chemical Biology 5, 144–151.
Guzman-Maldonado, H. & Paredes-Lopez, O. 1995 Amylolytic
enzymes and products derived from starch: a review. CRC Critical
Reviews in Food Science and Nutrition 35, 373–403.
Hashimoto, H., Inoue, T., Nishioka, M., Fujiwara, S., Takagi, M.,
Imanaka, T. &. Kai, Y. 1999 Hyperthermostable protein structure
maintained by intra and inter-helix ion-pairs in archaeal O6-
methylguanine-DNA methyltransferase. Journal of Molecular
Biology 292, 707–716.
Henrissat, B. & Bairoch, A. 1996 Updating the sequence-based
classification of glycosyl hydrolases. Biochemical Journal 316,
695–696.
Henrissat, B. & Davies, G. 1997 Structural and sequence-based
classification of glycosyl hydrolases. Current Opinion in Structural
Biology 7, 637–644.
Hsiao, N.W., Lu, P.Y., Wang, T.S., Lai, S.M., Cheng, C.S., Hwang,
J.K. & Lyu, P.C. 2004 Prediction of melting temperature directly
from protein sequences. In Abstract of the 9th Symposium on
Recent Advances in Biophysics held at Taipei, Taiwan, PC02.
Ishikawa, K., Matsui, I., Honda, K. & Nakatami, H. 1992 Multi-
functional roles of a histidine residue in human pancreatic a-amylase. Biochemical and Biophysical Research Communications
183, 286–291.
Figure 4. Diagram of hydrogen bond and hydrophobic interactions in the 436 residue of wild-type enzyme (a) and H436D (b). The ligand–ligand
interactions and hydrogen-bonding network in the 436 residue are represented schematically using the program LIGPLOT (Wallace et al. 1995).
Stabilization of Bacillus sp. strain TS-23 a-amylase 415

Ishikawa, K., Matsui, I., Kobayashi, S., Nakatani, H. & Honda, K.
1993 Substrate recognition at the binding site in mammalian
pancreatic a-amylase. Biochemistry 32, 6259–6265.
Ito, S., Kobayashi, T., Ara, K., Ozaki, K., Kawai, S. & Hatada, Y.
1998 Alkaline detergent enzymes from alkaliphiles: enzymatic
properties, genetic, and structures. Extremophiles 2, 185–190.
Janecek, S. 1997 a-Amylase family: molecular biology and evolution.
Progress in Biophysics and Molecular Biology 67, 67–97.
Janecek, S. & Seveik, J. 1999 The evolution of starch-binding domain.
FEBS Letters 456, 119–125.
Knegtel, R.M., Wind, R.D., Rozeboom, H.J., Kalk, K.H., Buitelaar,
R.M., Dijkhuizen, L. & Dijkstra B.W. 1996 Crystal structure at
2.3 A resolutionand revisednucleotide sequenceof the thermostable
cyclodextrin glycosyltransferase from Thermoanaerobacterium ther-
mosulfurigenes EM1. Journal of Molecular Biology 256, 611–622.
Kuriki, T. & Imanaka, T. 1999 The concept of the a-amylase family:
structural similarity and common catalytic mechanism. Journal of
Bioscience and Bioengineering 87, 557–565.
Leemhuis, H., Rozeboom, H.J., Dijkstra, B.W. & Dijkhuizen, L. 2004
Improved thermostability of Bacillus circulans cyclodextrin glyco-
syltransferase by the introduction of a salt bridge. Proteins 54,
128–134.
Lin, L.L., Hsu, W.H. & Chu, W.S. 1997 A gene encoding for an
a-amylase from thermophilic Bacillus sp. strain TS-23 and its
expression in Escherichia coli. Journal of Applied Microbiology 82,
325–334.
Lin, L.L., Tsau, M.R. & Chu, W.S. 1994 General characteristics of
thermostable amylopullulanases and amylases from alkaliphilic
Bacillus sp. TS-23. Applied Microbiology and Biotechnology 42,
51–56.
Lo, H.F., Lin, L.L., Chen, H.L., Hsu, W.H. & Chang, C.T. 2001a
Enzymic properties of a SDS-resistant Bacillus sp. TS-23 a-amylase
produced by recombinant Escherichia coli. Process Biochemistry
36, 743–750.
Lo, H.F., Lin, L.L., Li, C.C., Hsu, W.H. & Chang, C.T. 2001b The N-
terminal signal sequence and the last 98 amino acids are not
essential for the secretion of Bacillus sp. TS-23 a-amylase in
Escherichia coli. Current Microbiology 43, 170–175.
Matsuura, A., Kusunok, M., Harada, W. & Kakudo, M. 1984
Structure and possible catalytic residues of Taka-amylase. Journal
of Biochemistry (Tokyo) 95, 697–702.
Matthews, B.W. 1993 Structural and genetic analysis of protein
stability. Annual Reviews of Biochemistry 62, 139–160.
Matthews, B.W. 1995 Studies on protein stability with T4 lysozyme.
Advances in Protein Chemistry 46, 249–278.
Nakamura, A., Haga, K. & Yamane, K. 1993 Three histidine residues
in the active center of cyclodextrin gluconotransferase from
alkalophilic Bacillus sp. 1011: effects of replacement on pH
dependence and transition-state stabilization. Biochemistry 32,
6624–6631.
Niehaus, F., Bertoldo, C., Kahler, M. & Antranikian, G. 1999
Extremophiles as a source of novel enzymes for industrial
application. Applied Microbiology and Biotechnology 51, 711–
729.
Nielsen, J.E. & Borchert, T.V. 2000 Protein Engineering of bacterial a-amylases. Biochimica et Biophysica Acta 1543, 253–274.
Perry, L.J. & Wetzel, R. 1984 Disulfide bond engineered into T4
lysozyme: stabilization of the protein toward thermal inactivation.
Science 226, 555–557.
Sakasegawa, S., Takehara, H., Yoshioka, T., Takahashi, M., Kagim-
oto, Y., Misaki, H., Sakuraba, H. & Ohshima, T. 2001 Increasing
the thermostability of Flavobacterium meningosepticum glycerol
kinase by changing Ser329 to Asp in the subunit interface region.
Protein Engineering 14, 663–667.
Sakasegawa, S., Takehara, H., Yoshioka, I., Misaki, H., Sakuraba, H.
& Ohshima, T. 2002 Stabilization of Flavobacterium meningosept-
icum glycerol kinase by introduction of a hydrogen bond.
Bioscience, Biotechnology and Biochemistry 66, 1374–1377.
Sambrook, J., Fritsch, E.F. & Maniatis, T. 1989 Molecular Cloning: A
Laboratory Manual. pp. 17.2–17.44. New York: Cold Spring
Harbor Laboratory Press. ISSN 0-87969-309-6.
Sanz-Aparicio, J., Hermoso, J.A., Martinez-Ripoll, M., Gonzalez, B.,
Lopez-Camacho, C. & Polaina, J. 1998 Structural basis of
increased resistance to thermal denaturation induced by single
amino acid substitution in the sequence of b-glucosidase A from
Bacillus polymyxa. Proteins 33, 567–576.
Sunna, A., Moracci, M., Rossi, M. & Antranikian G. 1997 Glycosyl
hydrolases from hyperthermophiles. Extremophiles 1, 2–13.
Tahirov, T.H., Oki, H., Tsukihara, T., Ogasahara, K., Yutani, K.,
Ogata, K., Izu, Y., Tsunasawa, S. & Kato, I. 1998 Crystal
structure of methionine aminopeptidase from hyperthermophile,
Pyrococcus furiosus. Journal of Molecular Biology 284, 101–124.
Takase, K. 1994 Site-directed mutagenesis reveals critical importance
of the catalytic site in the binding of a-amylase by wheat
proteinaceous inhibitor. Biochemistry 33, 7925–7930.
Tseng, C.C., Miyamoto, M., Ramalingam, K.C., Hemavathy, K.C.,
Levine, M.J. & Ramasubbu, N. 1999 The roles of histidine residues
at the starch-binding site in streptococcal-binding activities of
human salivary amylase. Archives of Oral Biology 44, 119–127.
Vieille, C., Burdette, D.S. & Zeikus, J.G. 1996 Thermozymes.
Biotechnology Annual Review 2, 1–83.
Vieille, C. & Zeikus G.J. 2001 Hyperthermophilic enzymes: sources,
use, and molecular mechanism for thermostability. Microbiology
and Molecular Biology Reviews 65, 1–43.
Vihinen, M. & Mantsala, P. 1989 Microbial amylolytic enzymes. CRC
Critical Reviews in Biochemistry and Molecular Biology 24,
329–418.
Wallace, A.C., Laskowski, R.A. & Thornton, J.M. 1995 LIGPLOT: a
program to generate schematic diagrams of protein–ligand inter-
actions. Protein Engineering 8, 127–134.
416 Huei-Fen et al.

Development of diagnostic test methods for detecting key wildlife pathogens
in bacteria-containing commercial biodegradation products
Jennifer A. Sibley1, Rebecca H. Cross1, Anita L. Quon1, Kara Dutcyvich1, Tomas A. Edge2, Frederick A. Leighton1
and Greg D. Appleyard1,*1Department of Veterinary Pathology, University of Saskatchewan, 52 Campus Drive, Saskatoon, SK, CanadaSTN 5B42National Water Research Institute, Environment Canada, Burlington, Ontario, Canada.*Author for correspondence: Department of Veterinary Microbiology, University of Saskatchewan, 52 Campus Drive,Saskatoon, SK, Canada S7N 5B4. Tel.: +1-306-966-7213, Fax: +1-306-966-7244, E-mail: [email protected]
Keywords: Bacteria, biodegradation products, diagnostic methodology, polymerase chain reaction, pathogen
Summary
Bacteria-containing commercial products, sold to facilitate biodegradation of human and animal wastes, consistof complex mixtures of bacteria. These mixtures are often of undetermined composition and grown in batchcultures from diverse bacteria-rich inocula of proprietary origins. In order to provide a means of testing for thepresence of small numbers of microorganisms, pathogenic to terrestrial or avian wildlife, in bacteria-containingbiodegradation products, five DNA extraction protocols were tested for their ability to purify total genomicDNA from nine biodegradation products of different formulations. A diatomaceous earth and guanidinethiocyanate-based DNA extraction method was found to be the most reliable. Fourteen microorganism-specificpolymerase chain reaction (PCR)-based assays were developed. Each PCR assay was demonstrated to be specificusing DNA from 61 other species of microorganisms (105 different isolates). The mean detection limit for 10assays using cultured organisms spiked into biodegradation products was assessed. The mean was1 � 102.62 ± 1 � 101.58 c.f.u.g)1 (bacteria) and 1 � 103.88 ± 1�101.14 cells g)1 (protozoa). There were no targetwildlife pathogens detected by the 14 PCR assays in unspiked biodegradation products. This study hasdemonstrated that molecular diagnostic means can be used to detect small numbers of selected wildlife pathogensin complex biodegradation products.
Introduction
Bacteria-containing commercial products, sold to facil-itate biodegradation of human and animal wastes can bepurchased in commercial retail stores in a variety ofdifferent solid, liquid and powdered formulations. Theseproducts are marketed to household, farm and smallbusiness consumers, as safe, organic, natural waste-treatment products. Most products of this type are soldfor bio-remediation applications such as drain cleaning,enhancement of septic tank performance, pesticide spillclean-up, biofiltration of air emissions, livestock andpoultry waste treatment and reduction of farm andsewage odours for use in feed-lots, manure storage-lagoons, poultry barns, gutters and waste-holding tanks,septic tanks and waste-water drains in homes, cottagesand restaurants.Frequently, these bacteria-based biodegradation
products are consortia of bacteria and manufacturersmaintain their source as proprietary information. How-ever, one could speculate that sources rich in bacteriawith potentially biodegradative properties, such as
municipal wastewater and composted manure may havebeen used (Entry et al. 2002, Cotta et al. 2003, Lu et al.2003) where pathogenic bacteria can also be found (Luet al. 2003, Millner & Karns 2003). Use of theseproducts in close proximity to livestock as well asaquatic, terrestrial and avian wildlife has the potentialfor deleterious effects on wildlife health (Bryan et al.1994). Of particular concern is the risk that somebacteria-based products, derived from environmentalsources, such as municipal or livestock wastes, may alsocontain pathogenic organisms which have survived oreven proliferated in the manufacturing process. Any riskthat these products pose cannot be accurately assessedwithout reliable and specific diagnostic tests, suited tothe identification of small amounts of bacteria in avariety of product matrices.To address the need for valid microorganism detec-
tion assays with which to test these commercial bacteria-based biodegradation products, a molecular-diagnosticapproach was taken. This report describes the develop-ment of a DNA extraction protocol suitable for puri-fying DNA from many biodegradation products, as well
World Journal of Microbiology & Biotechnology (2005) 21:417–423 � Springer 2005
DOI 10.1007/s11274-004-1765-8

as the development of 14 polymerase chain reaction(PCR) protocols for the detection of selected animalpathogens.
Materials and methods
Experimental design
Fourteen pathogenic microorganisms (Campylobactersp., Clostridium piliforme, Clostridium botulinum TypeC, Cryptosporidium parvum, Francisella tularensis,Giardia lamblia, Mycobacterium avium, Mycobacteriumbovis, Mycoplasma gallisepticum, Mycoplasma syno-viae, Pasteurella multocida, Reimerella anatipestifer,Salmonella enterica and Toxoplasma gondii) werechosen as targets for diagnostic testing because theyrepresent a broad range of important animal patho-gens which can survive in synanthropic environmentsand be a health risk for livestock as well as aquatic,terrestrial and avian wildlife. Fifteen separate PCRprotocols were developed, one for each of the 14selected pathogens in the study and one additionalassay specific for Bacillus sp. (present in all thecommercial products tested) to be used only to assessthe utility of five extraction methods. The 14 patho-gen-specific assays were tested for microorganism-specificity using DNA extracted from 105 bacteriaisolates representing 61 different species. The lowestlimit of detection was obtained for 10 of these assaysby spiking the appropriate microorganism into sam-ples of the biodegradation products and testing byPCR. Detection limits for Clostridium piliforme, Clos-tridium botulinum, Toxoplasma gondii and Francisellatularensis were not determined for technical andbiosafety reasons.
Bacteria-based commercial products
Nine products (A, BioBrick, ZEP Manufacturing Com-pany, Carterville, GA, USA; B, AIRx32 Bio-enzymaticDrain Opener, Airx Laboratories, Folcroft, PA, USA.;C, Drain Guard Plus, ZEP Manufacturing Company,Carterville, GA, USA; D, Septic System & Cesspool,ZEP Manufacturing Company, Carterville, GA, USA.;E, Septonic, A.H.T. Field & Co. Ltd.; F, Septabs,Sanitation Equipment Limited, New Westminister, BC,Canada; G, Sani-zyme, ZEP Manufacturing Companyof Canada, Edmonton, AB, Canada; H, Kemsol’s Big‘‘G’’, Kemsol Products Limited, Saskatoon. SK, Can-ada; I, Kemsol’s Enzyme Blocks, Kemsol ProductsLimited, Saskatoon, SK, Canada) were selected basedon local availability and formulation styles; solid, liquidor powder. All products were identified on their label ascontaining bacteria. All products were shown to containbacterial DNA by a PCR assay which targeted the 16SrRNA gene of Bacillus species. Routine culture of allproducts revealed primarily Bacillus and Pseudomonasspecies in each.
Bacteria controls
One hundred and five isolates representing 61 species ofmicroorganisms used as specificity-controls in this studywere obtained from Dr M. Chirino-Trejo (VeterinaryMicrobiology, WCVM, University of Saskatchewan)and Dr M. Ngeleka (Prairie Diagnostic Services, Sas-katoon, Saskatchewan). For positive controls and assayoptimisation, Campylobacter sp., Clostridium piliforme,Clostridium botulinum Type C, Francisella tularensis,Pasteurella multocida and Salmonella sp. were obtainedfrom Dr M. Chirino-Trejo (Veterinary Microbiology,University of Saskatchewan). Mycobacterium avium andMycobacterium bovis were obtained from C. Turenne(National Reference Centre for Mycobacteriology).Cryptosporidium parvum was obtained from Dr BrentDixon (Bureau of Microbial Hazards, Health Canada)and Pleasant Hill Farms (Troy, Idaho). Reimerellaanatipestifer (ATCC 11845), Mycoplasma gallisepticum(ATCC 19610) and Toxoplasma gondii (ATCC 50851)were purchased from American Type Culture Collection(Manassas, Virginia). Giardia lamblia was obtained fromDr B. Dixon (Bureau of Microbial Hazards, HealthCanada). Campylobacter sp. was grown on Preston agar,Clostridium botulinum were grown on blood agar(anaerobic), Pasteurella multocida, Salmonella entericaand Reimerella anatipestifer was grown on blood agar.Mycoplasma gallisepticum was grown on Hay-Flickagar. Clostridium piliforme was obtained from forma-lin-fixed paraffin embedded animal tissue.
Isolation of DNA
Five different DNA extraction techniques (methods 1–5)were assessed for an ability to purify DNA from thebiodegradation products, in sufficient amount andquality, to support PCR amplification of the Bacillussp.16S rRNA gene. Results were scored as eitherpositive (supporting amplification) or negative (notsupporting amplification). This experiment was per-formed in duplicate.
Method 1. This method was adapted from Sambrooket al. (1989). Approximately 0.2 g samples, or pelletscentrifuged from 1 ml of liquid products, were homog-enized in 500 ll of lysis buffer (100 mM NaCl, 500 mMTris (pH 8.0), 10% sodium dodecylsulphate, 0.2 mgml)1 proteinase K), vortexed for 5 s and then incubatedfor 2 h at 65 �C. An equal volume of Tris-bufferedphenol–chloroform (1 : 1 v/v, pH 8.0) was added andthe mixture vortexed for 30 s and then centrifuged for5 min at 15,000 � g. The aqueous phase was removed toa clean tube and the phenol–chloroform extraction wasrepeated. Again the aqueous phase was removed to aclean tube and 2.5 volumes of ice-cold 95% ethanol(containing 0.3 M sodium acetate) was added, mixed bygentle inversions and incubated overnight at )20 �C.DNA was recovered by centrifugation for 15 min at4 �C and 15,000 � g. The ethanol was decanted and the
418 J.A. Sibley et al.

DNA pellet washed twice with 80% ethanol, dried undervacuum for 5–10 min and then dissolved in sterile water.
Method 2. Approximately 0.2 g samples, or pelletscentrifuged from 1 ml of liquid products, were addedto tubes containing 1 ml of 10 mM phosphate-bufferedsaline (8.4 g NaCl, 1.15 g Na2HPO4, 0.2 g KH2PO4,H2O to IL) to dissolve soluble components from thevarious products. The remaining solid material wasconcentrated by centrifugation for 30 s at 15,000 � g.This washing procedure was repeated twice and theremaining sample was processed as described in method1.
Method 3. This method was adapted from Pitcher et al.(1989). Approximately 0.2 g samples, or pellets centri-fuged from 1 ml of liquid products, were added to tubescontaining 400 ll D-Solution (4 M guanidine thiocya-nate, 25 mM sodium citrate (pH 8.0), 0.5% sarcosyl,0.1 M 2-mercaptoethanol) and vortexed for 30 s. Chlo-roform (200 ll) was added and the sample vortexedagain and then incubated for 10 min at )20 �C. Thesamples were centrifuged for 5 min at 4 �C and15,000 � g and the aqueous layer removed to a cleantube containing 200 ll of chloroform. The washing stepwas repeated and then the aqueous phase was removedto a clean tube containing 500 ll of 95% ethanol(containing 0.3 M sodium acetate). Samples were mixedgently and incubated for at least 1 h at )20 �C. DNAwas concentrated by centrifugation for 15 min at 4 �Cand 15,000 � g. The ethanol was decanted and theDNA pellet, washed twice with 80% ethanol, driedunder vacuum for 5–10 min and then dissolved in sterilewater.
Method 4. This method was adapted from McLauchlinet al. (1999). Approximately 0.2 g samples, or pelletscentrifuged from 1 ml of liquid products, were added totubes containing 200 ll of 0.1 mm diameter zirconia-silica beads (Biopsec Products Inc.), 900 ll GuSCN–Tris buffer (5.5 M guanidine thiocyanate, 0.05 M Tris–HCl (pH 6.4)) and 60 ll isoamyl alcohol. This mixturewas vortexed for 2 min and left to stand for 5 min atroom temperature. The sample was centrifuged for5 min at 15,000 � g and the supernatant transferred toclean tube containing 100 ll suspension of 20% w/vdiatomaceous earth (DE) in 0.17 M HCl. The samplewas incubated for 10 min at room temperature withgentle agitation and then centrifuged for 30 s at15,000 � g. The supernatant was discarded and theDE pellet was washed twice with 1 ml of GuSCN–Trisbuffer, once with 1 ml of 80% ethanol then once with1 ml of acetone. The final DE pellet was dried undervacuum for 5 min and DNA was eluted from the DEwith 100 ll of sterile water.
Method 5. This method was adapted from Cohen et al.(1996). Approximately 0.2 g of the solid or powderproducts were suspended in 1 ml of lysis buffer (5 M
guanidine thiocyanate, 22 mM EDTA, 0.05 M Tris–HCl (pH 6.4), 0.65% Triton X-100) and incubated atroom temperature for 1 h. Alternatively, 1 ml of a liquidproduct was centrifuged (15,000 � g, 5 min) and thenthe pellet was re-suspended in 1 ml of lysis buffer andincubated at room temperature for 1 h. Lysed sampleswere centrifuged (15,000 � g, 30 s) and the supernatanttransferred to a clean tube containing 100 ll of DEsuspension (20% DE in 0.17 M HCl). After vortexing10 s and centrifugation (15,000 � g, 30 s), the pellet waswashed twice with 1 ml GuSCN–Tris buffer (5.5 Mguanidine thiocyanate, 0.05 M Tris–HCl (pH 6.4)),washed twice with 80% ethanol (1 ml) and washed oncewith acetone (1 ml). The sample was vacuum dried andDNA was eluted from the DE with 100 ll of sterile,ultra-pure water.
Polymerase chain reaction
The primers and amplification conditions are listed inTable 1. All primer sets were designed specifically forthis project with the exception of the primer set forM. bovis (Miller et al. 1997), Cryptosporidium parvum(Lindergard et al. 2003) and Clostridium botulinum(Williamson et al. 1999).PCR reaction mixtures were prepared using sterile
water and reagents purchased from Fermentas Inc.(Burlington, Ontario, Canada). The 48 ll PCR reactionmixture contained 5 ll of 10� PCR buffer, 4 ll of25 mM MgCl2, 0.5 ll of 25 mM dNTP mixture, 2 ll ofeach primer (20 pmol ll)1), 0.25 ll of Taq polymeraseand 34.25 ll of sterile water. Twomicrolitres of the DNAsample was used in the PCR assay and the remainderstored at )70 �C. The reaction mixture was overlaid withone drop of mineral oil. The thermal cycler (PTC 200,MJResearch Inc., Waltham, MA) conditions began with aninitial denaturation at 94 �C for 3 min followed by40 cycles of, 94 �C for 30 s, an annealing temperature(see Table 1) for 60 s, and an extension at 72 �C for 60 s.Reactions finished with a final extension phase of 72 �Cfor 5 min. Amplified PCR products were analysed byelectrophoresis though a 1.5% agarose gel, staining withethidium bromide and visualizing with a UV transillu-minator. Positive controls consisted of DNA extractedfrom the appropriate cultured microorganism and neg-ative controls consisted of water instead of DNA.Extraction negative control was also performed.
PCR specificity and sensitivity
Serial dilutions in water or broth were made from afresh culture of each pathogen target and 10 ll of eachdilution was plated on appropriate nutrient agar. Inaddition, 10 ll of each dilution was also spiked into0.2 g samples, or into 1 ml of liquid products, of eachbiodegradation product. DNA was then extracted(method 5) from the product samples. Each dilutionexperiment was performed five times. Primer specificitywas determined using DNA (extraction method 1) from
PCR methods for use with biodegradation products 419

61 different bacterial species (Table 2) to identifypossible sources of PCR cross-reactions using the samePCR conditions as previously described.
Results
DNA extraction method 3 did not provide DNA thatcould support amplification. Methods 1, 2 and 4
provided amplifiable Bacillus sp. DNA from severalbut not all of the nine biodegradation products. Method5 provided Bacillus sp. amplifiable DNA from all ninebiodegradation products (Table 3). Given that DNAextraction method 5 worked best for all the products inthis study, this method was used to optimize the 15 PCRprotocols.None of the 14 target pathogens were detected in any
of the biodegradation products assayed, however, each
Table 1. PCR assay conditions, primers and sequence source.
Microorganism PCR assay conditions and primers Source
Bacillus sp. Ta = 60 �C Product size = 401 bp Accession AB055007
Bac-F CGTGGGGAGCGAACAGGATTAGAT
Bac-R TTGTCACCGGCAGTCACCTTAGAG
Campylobacter sp. Ta = 66 �C Product size = 709 bp Accession AF022768
Camp-F TACCAAGGCTATGACGCATAACTG
Camp-R GATATCAAGTCCGGGTAAGTTCT
Clostridium piliforme Ta = 55 �C Product size = 278 or 441 bp Accession S72349
Cpili-F CCTTCGGGGCAATGGAT (278 bp)
Cpili-F2 AACGCAATAAGCACTCCA (441 bp)
Cpili-R CCGAACTGGGACTACTTTTATG
Clostridium botulinum Type C Ta = 56 �C Product size = see below Williamson et al. (1999)
ToxC-384 AAACCTCCTCGAGTTACAAGCCC
ToxC-625 CTAGACAAGGTAACAACTGGGTTA
ToxC-850R GAAAATCTACCCTCTCCTACATCA
ToxC-1049R AATAAGGTCTATAGTTGGACCTCC
Primer set: 324 and 850R—526 bp
Primer set: 625 and 1049R—424 bp
Primer set: 625 and 850R—225 bp
Cryptosporidium parvum Ta = 53 �C, 56 �C (2�) Product size = 638 bp Lindergard et al. (2003)
SSU-1 GATTAAGCCATGCATGTCTAA (primary)
SSU-2 TTCCATGCTGGAGTATTCAAG (primary)
SSU-3 CAGTTATAGTTTACTTGATAATC (secondary)
SSU-4 CCTGCTTTAAGCACTCTAATTTTC (secondary)
Francisella tularensis Ta = 55 �C Product size = 459 bp Accession M93695
Ftu1-F GTGTTAGGGCATTTCGAGGAGTCT
Ftu1-R CTGGCCAGTTCTATCTTGAGG
Giardia lamblia Ta = 58 �C Product size = 480 bp Accession AB067649
Gia3-F TCTTCCCGGATTTTATGACG
Gia3-R AATCTCGCGCTCCTTGAA
Mycobacterium bovis Ta = 72 �C Product size = 123 bp Miller et al. (1997)
IS6110-F CTCGTCCAGCGCCGCTTCGG
IS6110-R CCTGCGAGCGTAGGCGTCGG
Mycobacterium avium Ta = 70 �C Product size = 473 bp Accession U43598
Mbav-F CGCGGCTTCGGGTGCTCATCCAGA
Mbav-R CGCGTCACCCACCACCGTCACCAC
Mycoplasma gallisepticum Ta = 52 �C Product size = 185 bp Accession AF214004
MpGal-F TTGCAGTGGGTGGTGTAAGTT
MpGal-R TCGGAGTAGAAGTTGGTTGTGGAT
Mycoplasma synoviae Ta = 55 �C Product size = 210 bp Lauerman et al. (1993)
MSL-F GAGAAGCAAAATAGTGATATCA
MSL-R CAGTCGTCTCCGAAGTTAACAA
Pasteurella multocida Ta = 67 �C Product size = 423 bp Accession AF411317
Pmult-R TCGCGTAGCATATGTGGTAGAT
Pmult-F AAGTATGGCGCGATTTTAGAT
Reimerella anatipestifer Ta = 67 �C Product size = 407 bp Accession AF104937
Reim2-F TAGCGAAAATAAACCATACACTCA
Reim2-R GGTCCTGCTACATCAACACAAG
Salmonella enterica Ta = 55 �C Product size = 423 bp Accession M18283
Salm-F CGCAGGTGCCTTTCTCCAT
Salm-R TCGCGCCTTTCCTTATCATCT
Toxoplasma gondii Ta = 64 �C Product size = 232 bp Accession L49390
TG-ITS1-F GAAGCGTGATAGTATCGAAA
TG-ITS1-R CACTCTCTCTCAAATGTTCCT
420 J.A. Sibley et al.

pathogen-specific PCR was able to detect bacterial orprotozoan genomic DNA from the correct microorgan-ism when a sufficient number of cells of that microor-ganism were spiked into bacteria-based biodegradationproducts. No PCR products were detected when path-ogen PCR primers were tested against DNA extractsfrom 61 other microorganisms.The detection limit (mean log10 c.f.u. and SD) of each
PCR assay is presented in Table 4. The mean detectionlimit for all assays using cultured organisms spiked intobiodegradation products was 1 � 102.62 ± 1 � 101.58
c.f.u.g)1 (bacteria) and 1 � 103.88 ± 1 � 101.14 organ-isms per gram (protozoa). The range in detection limitfor bacteria was 1–1 � 104.6 c.f.u.g)1 and for protozoa1 � 102.2–1 � 105.8. Values for detection limit sensitivity in each assay showed no deviation from a Gaussiandistribution using the Kolmogorov–Smirnov test(GraphPad Prism version 3.02 for Windows, GraphPadSoftware, San Diego, California, USA). There wasconsiderable variation between replicates. Two-wayanalysis of variance showed significant differences with-in both assay (P ¼ 0.0001) and product groups(P ¼ 0.0002).
Discussion
The focus of this study was on developing PCR-basedmolecular diagnostic assays to identify wildlife patho-gens in commercial preparations of live bacteria sold forthe purposes of biodegradation of biological wastes.Since domestic and wild animals and birds might beexposed to the introduced microorganisms in agricul-tural and other synanthropic environments, widespreaddistribution of such commercial preparations could leadto the inadvertent introduction of a pathogen insufficient quantity and result in the appearance of anew disease or outbreak. This may occur, for instance, ifa pathogen is introduced to a location beyond its normalgeographic range or to a population of previouslyunexposed individuals. In order to assess the safety ofthese products, there is a need for suitable diagnostictest procedures capable of detecting potentially smallnumbers of selected pathogenic bacteria contaminating
Table 2. Bacterial isolates (n=105) representing 61 species were assayed
by PCR to determine specificity of the 15 PCR assays developed for this
project.All isolateswere obtained from theWesternCollege ofVeterinary
Medicine, Department of Veterinary Microbiology. All assays were
negative except when testing with the appropriate PCR primer set.
Organism No. of strains
tested
PCR result
Actinobacillus equuli 1 Neg.
Actinobacillus lignieres 2 Neg.
Actinobacillus parasuis 1 Neg.
Actinobacillus pleuropneumoniae 2 Neg.
Actinobacillus suis 1 Neg.
Aeromonas hydrophilia 1 Neg.
Arcanobacterium pyogenes 1 Neg.
Bacillus sp. 17 Neg.
Bacillus subtilis 2 Neg.
Bordetella bronchiseptica 2 Neg.
Brucella suis 1 Neg.
Citrobacter freundii 1 Neg.
Clostridium perfringens 2 Neg.
Corynebacterium pseudotuberculosis 1 Neg.
Corynebacterium renale 1 Neg.
Enterobacter cloacae 1 Neg.
Enterobacter sp. 1 Neg.
Enterococcus faecalis 4 Neg.
Enterococcus sens 1 Neg.
Enterococcus sp. 1 Neg.
Erysipelothrix rhusiopathiae 1 Neg.
Escherichia coli 1 Neg.
Haemophilus parasuis 1 Neg.
Haemophilus somnus 1 Neg.
Haemophilus sp. 1 Neg.
Hafnia alvei 1 Neg.
Klebsiella oxytoca 1 Neg.
Klebsiella pneumoniae 1 Neg.
Listeria monocytogenes 1 Neg.
Micrococcus luteus 1 Neg.
Moraxella bovis 1 Neg.
Morganella morganii 1 Neg.
Mycoplasma arginini 1 Neg.
Mycoplasma bovis 2 Neg.
Mycoplasma canis 2 Neg.
Mycoplasma flocculare 2 Neg.
Mycoplasma hyopneumoniae 1 Neg.
Mycoplasma hyorhinis 2 Neg.
Ornithobacterium rhinotrachealis 1 Neg.
Pasteurella aerogenes 2 Neg.
Pasteurella canis 1 Neg.
Pasteurella gallinarum 1 Neg.
Pasteurella haemolytica (ATCC# 33365) 1 Neg.
Pasteurella multocida 9 Neg.
Pasteurella pneumotrophin 1 Neg.
Proteus mirabilis 2 Neg.
Proteus vulgaris 1 Neg.
Providencia stuartii 1 Neg.
Pseudomonas aeruginosa 4 Neg.
Pseudomonas sp. 1 Neg
Sacchromyces carlsburgensis 1 Neg.
Salmonella sp. 1 Neg.
Serratia marcescens 1 Neg.
Shigella sp. 1 Neg.
Staphylococcus aureus 1 Neg.
Staphylococcus epidermidis 1 Neg.
Staphylococcus hyicus 2 Neg.
Staphylococcus intermedius 3 Neg.
Staphylococcus sens 1 Neg.
Yersinia enterocolitica 1 Neg.
Yersinia pseudotuberculosis 1 Neg.
Table 3. Amplification of DNA extracted from biodegradation
products by different extraction methods (replicates = 2).
Product Method
1 2 3 4 5
A ) ) ) ) ) ) + + + +
B ) ) ) ) ) ) ) ) + +
C ) ) ) ) ) ) ) ) + +
D ) ) ) ) ) ) ) ) + +
E ) ) ) ) ) ) + + + +
F ) ) + + ) ) + + + +
G ) ) ) ) ) ) ) ) + +
H ) ) ) ) ) ) + + + +
I + + + + ) ) + + + +
PCR methods for use with biodegradation products 421

rich cultures of benign bacteria. Molecular methodswere developed and optimized to detect selected wildlifepathogens, first by examining five different DNAextraction protocols and then by demonstrating theefficiency of specific PCR protocols to detect pathogensspiked into nine different commercial products.Until recently microbiological culture of infectious
agents was accepted as a ‘‘gold standard’’ for infectiousdisease diagnosis. However, comparative studies havedemonstrated that PCR has a number of advantagescompared to microbiological culture methods. PCRassays can analyse minute samples with high specificity.The detection limit of PCR assays is often high enoughto detect 10–100 copies of a target region of DNA andtheoretically a single molecule of DNA can be detected.Microbiological culture often requires several days,
weeks or even months to obtain results. PCR resultscan be available in several hours. Isolation of manymicroorganisms is difficult, expensive or impossible(e.g., parasites and fastidious bacteria). With PCR,any microorganism can be detected regardless of itsability to be cultured in a laboratory. Culture requiresviable microorganisms to be present in the specimen.With PCR, both live and dead microorganisms may bedetected. For these reasons, PCR was selected as anappropriate approach to the detection of importantbacterial and protozoan pathogens in bacteria-basedbiodegradation products.Detection of amplifiable DNA is an evidence that an
extraction method produces both a suitable amount ofhigh quality DNA (not sheared), as well as DNA free ofTaq polymerase inhibitors. High quality DNA wasconsistently obtained from all nine products withextraction method 5. This method, which used DE tocapture DNA under conditions of high salt concentra-tions, has been used previously to successfully extractDNA from faecal samples which are known to containinhibitors of Taq polymerase (Argyros et al. 2000).As noted above, PCR is able to detect very small
numbers of microorganisms when DNA is extractedfrom fresh cultures that are free of inhibitors and otherDNA (Burtscher & Wuertz 2003). In this study, theaverage minimum detection limit for all 10 pathogen-specific assays was approximately 420 c.f.u. bacteria and7600 protozoan organisms, suggesting that inhibitors orother interfering components were still present, how-ever, bacteria and protozoa could still be detected whenpresent in relatively small numbers. A detection limit ofthis magnitude compares favourably with other extrac-tion protocols for microorganisms in problematic sub-strates such as faeces, soil and ground beef (Braid et al.2003; Cui et al. 2003; Trochimchuk et al. 2003). Giventhat these products reportedly contain greater than1 � 106 bacteria (c.f.u.g)1 or c.f.u. ml)1; manufacturer’sproduct literature), standard culturing techniques maynot be sufficiently sensitive or specific to detect smallamounts of some microorganisms among these prod-uct’s intended high bacteria contents. The molecularapproach allows for detection of small numbers ofpathogens contaminating concentrated bacterial prepa-rations.Significant differences in detection limit were observed
within assay or product groups. It is not surprising thatdifferent PCR assays have different detection limits,based on differences in sequence-specific primer-bindingcausing differences in reaction efficiency and frequencyof target copy number per microorganism. However,differences in detection limit between product groupssuggest that different products contain differentamounts or kinds of amplification inhibitors. Whilethe protocols developed in this study appear to workacross a variety of product manufacturers and formu-lations, the detection limit may not be predictable.The quantity of biodegradation products sold and
used around the world is not known, though it is likely
Table 4. Detection limit sensitivity (log10 c.f.u. ± SD), (repli-
cates = 5).
Product Campylobacter sp. Cryptosporidium sp. Giardia
A 3.8 ± 0.8 3.6 ± 0.5 3.8 ± 0.4
B 3.8 ± 0.8 2.6 ± 0.5 4.6 ± 0.5
C 3.8 ± 0.8 3.0 ± 0.7 3.2 ± 0.4
D 2.1 ± 1.4 4.6 ± 0.5 4.2 ± 0.4
E 3.8 ± 0.8 3.6 ± 0.9 4.8 ± 1.3
F 2.1 ± 1.4 5.4 ± 0.5 5.8 ± 0.4
G 2.3 ± 1.2 3.2 ± 0.8 4.0 ± 0.0
H 3.1 ± 1.6 2.2 ± 0.4 2.8 ± 0.8
I 3.8 ± 0.8 3.2 ± 0.4 5.2 ± 0.4
Product M. bovis Mycobacterium
avium
Mycoplasma
gallisepticum
A ND ND 2.7 ± 2.0
B ND ND 3.1 ± 2.0
C ND ND 2.7 ± 1.6
D 1.6 ± 2.2 3.4 ± 0.5 2.0 ± 1.4
E ND ND 3.5 ± 1.0
F 0.0 ± 0.0 2.4 ± 2.1 1.7 ± 1.0
G 0.0 ± 0.0 3.0 ± 1.7 2.5 ± 1.6
H ND ND 2.3 ± 1.3
I ND ND 3.1 ± 1.9
Product Mycoplasma
synoviae
Pasteurella
multocida
Reimerella
anatipestifer
A 3.9 ± 0.5 3.2 ± 1.0 3.2 ± 1.8
B 1.2 ± 0.6 2.0 ± 0.4 3.6 ± 1.2
C 2.6 ± 0.0 2.0 ± 1.6 2.4 ± 1.9
D 4.6 ± 1.2 1.6 ± 0.5 1.8 ± 1.7
E 1.2 ± 0.5 3.2 ± 1.0 3.0 ± 2.4
F 2.6 ± 1.2 2.9 ± 1.5 1.6 ± 1.3
G 2.0 ± 0.9 2.2 ± 1.3 0.7 ± 0.9
H 0.2 ± 1.3 1.8 ± 1.5 2.0 ± 2.7
I 2.9 ± 0.5 1.8 ± 1.5 2.7 ± 1.7
Product Salmonella sp.
A 3.9 ± 1.4
B 3.5 ± 1.0
C 3.9 ± 0.7
D 3.1 ± 1.0
E 3.9 ± 0.7
F 2.7 ± 1.7
G 3.1 ± 1.0
H 3.5 ± 1.2
I 2.9 ± 1.4
ND = not determined, test not conducted.
422 J.A. Sibley et al.

that their distribution is widespread. To our knowledge,no disease outbreak has been attributed to the use ofbiodegradation products, however, until studies havebeen conducted to demonstrate that the processes usedto manufacture bacteria-containing commercial prod-ucts does not permit the survival and growth ofpathogenic microorganisms, ongoing surveillance andquality assurance testing needs to be established. The listof microorganisms for which detection assays weredeveloped includes primarily, pathogens of terrestrial oravian wildlife. Similarly, assays to detect pathogens ofaquatic wildlife are also urgently required.
Acknowledgements
The authors thank Canada’s EMBRR Program forfinancial support of this project. We thank K. Marshall(National Wildlife Research Centre, Environment Can-ada) and members of the Canadian Cooperative WildlifeHealth Centre for important logistic and scientificsupport. We thank T. Bollinger (Western College ofVeterinary Medicine) for critical review of the manu-script. We are grateful to M. Chirino-Trejo (WesternCollege of Veterinary Medicine), B. Dixon (Bureau ofMicrobial Hazards, Health Canada) and M. Ngeleka(Prairie Diagnostic Services) for providing controlsamples. We received the generous cooperation of C.Turenne and A. Kabani at the National ReferenceCentre for Mycobacteriology, National MicrobiologyLaboratory, Health Canada, Winnipeg who allowed usto proceed with work on Mycobacterium avium andMycobacterium bovis from their collection and in theirlaboratory.
References
Argyros, F.C., Ghosh, M., Huang, L., Masubuchi, N., Cave, D.R. &
Grubel, P. 2000 Evaluation of a PCR primer based on the
isocitrate dehydrogenase gene for detection of Helicobacter pylori
in feces. Journal of Clinical Microbiology 38, 3755–3758.
Braid, M.D., Daniels, L.M. & Kitts, C.L. 2003 Removal of PCR
inhibitors from soil DNA by chemical flocculation. Journal of
Microbiological Methods 52, 389–393.
Bryan, R.T., Pinner, R.W. & Berkelman, R.L. 1994 Emerging
infectious disease in the United States. Annals of the New York
Academy of Science 740, 316–361.
Burtscher, C. & Wuertz, S. 2003 Evaluation of the use of PCR and
reverse-transcriptase PCR for the detection of pathogenic bacteria
in biosolids from anaerobic digestors and aerobic composters.
Applied and Environmental Microbiology 69, 4618–4627.
Cohen, N.D., Martin, L.J., Simpson, R.B., Wallis, D.E. & Neibergs,
H.L. 1996 Comparison of polymerase chain reaction and micro-
biological culture for detection of salmonellae in equine feces and
environmental samples. American Journal of Veterinary Research
57, 780–786.
Cotta, M.A., Whitehead, T.R. & Zeman, D. 2003 Isolation, charac-
terization and comparison of bacteria from swine faeces and
manure storage pits. Environmental Microbiology 5, 737–745.
Cui, S., Schroeder, C.M., Zhang, D.Y. & Meng, J. 2003 Rapid sample
preparation method for PCR-based detection of Escherichia coli
O157:H7 in ground beef. Journal of Applied Microbiology 95, 129–
134.
Entry, J.A., Sojka, R.E., Watwood, M. & Ross, C. 2002 Polyacryl-
amide preparations for protection of water quality threatened by
agricultural runoff contaminants. Environmental Pollution 120,
191–200.
Lauerman, L.H., Hoerr, F.J., Sharpton, A.R., Shah, S.M. & van
Santen, V.L. 1993 Development and application of a polymerase
chain reaction assay for Mycoplasma synoviae. Avian Diseases 37,
829–834.
Lindergard, G., Nydam, D.V., Wade, S.E., Schaaf, S.L. & Moham-
med, H.O. 2003 A novel multiplex polymerase chain reaction
approach for detection of four human infective Cryptosporidium
isolates: Cryptosporidium parvum, types H and C, Cryptosporidium
canis, and Cryptosporidium felis in fecal and soil samples. Journal
of Veterinary Diagnostic Investigations 15, 262–267.
Lu, J., Sanchez, S., Hofacre, C., Maurer, J.J., Harmon, B.G. & Lee,
M.D. 2003 Evaluation of broiler litter with reference to the
microbial composition as assessed by using 16S rRNA and
functional gene markers. Applied and Environmental Microbiology
69, 901–908.
McLauchlin, J., Pedraza-Dıaz, S., Amar-Hoetzeneder, C. & Nichols,
G.L. 1999 Genetic characterization of cryptosporidium strains from
218 patients with diarrhea diagnosed as having sporadic crypto-
sporidiosis. Journal of Clinical Microbiology 37, 3153–3158.
Millner, P. & Karns, J. 2003 Animal manure: bacterial pathogens and
disinfection technologies. EPA Report (in press).
Miller, J., Jenny, A., Rhyan, J., Saari, D. & Suarez, D. 1997 Detection
of Mycobacterium bovis in formalin-fixed, paraffin-embedded
tissues of cattle and elk by PCR amplification of an IS6110
sequence specific for Mycobacterium tuberculosis complex organ-
isms. Journal of Veterinary Diagnostic Investigations 9, 244–249.
Pitcher, D.G., Saunders, N.A. & Owen. R.J. 1989 Rapid extraction of
bacterial genomic DNA with guanidinium thiocyanate. Letters in
Applied Microbiology 8, 151–156.
Sambrook, J., Fritsch, E.F. & Maniatis, T. 1989 Molecular Cloning. A
Laboratory Manual. Cold Spring Harbor, NY: Cold Spring
Harbor Laboratory Press, ISBN 0 87969 309 6.
Trochimchuk, T., Fotheringham, J., Topp, E., Schraft, H. & Leung,
K.T. 2003 A comparison of DNA extraction and purification
methods to detect Escherichia coli O157:H7 in cattle manure.
Journal of Microbiological Methods 64, 165–175.
Williamson J.L., Rocke, T.E. & Aiken, J.M. 1999 In situ detection of
the Clostridium botulinum Type C1 toxin gene in wetland sediments
with a nested pcr assay. Applied and Environmental Microbiology
65, 3240–3243.
PCR methods for use with biodegradation products 423

A study of polynucleotide phosphorylase production by Escherichia coliin a hollow fibre reactor
Shi-Jian Nie1, Lin Ma2, Lian-Xiang Du1 and Bei-Zhong Han2,*1School of Food Science and Bioengineering, Tianjin University of Science and Technology, Tianjin 300222, China2College of Food Science and Nutritional Engineering, China Agricultural University, Beijing 100083, China*Author for correspondence: Tel.: +86-10-62395665, Fax: +86-10-82381443, E-mail: [email protected]
Keywords: Escherichia coli, fermentation, hollow fibre reactor, polynucleotide phosphorylase
Summary
A 30-l hollow fibre reactor with continuous fermentation for cell recycling of Escherichia coli AS 1.183 was used toremove the inhibitory effects on cell growth and extend the fast growth phase to increase the yield of polynucleotidephosphorylase (PNPase) in E. coli cells. When the dilution rate was 1.5 h)1, the cell concentration of E. coli reached235 g/l (wet wt, 70% moisture content), with PNPase activity above 90 u/g (wet wt). With the dilution rate is1.0 h)1, the fermentor volumetric productivity of PNPase in a hollow fiber reactor can reach 974 (u/h * l) comparedto 20 (u/h * l) in a conventional batch culture.
Introduction
Since its discovery by Ochoa et al. in 1955, polynucleo-tide phophorylase (PNPase) (EC 2.7.7.8) has been usedwidely in polynucleotide research (Marumo et al. 1993;Zhang & Yang 1984). PNPase is an intracellular enzymethat can be extracted from bacteria, yeast, eukaryotic,and higher animal and plant cells (Glazunov et al.1997). Escherichia coli (E. coli) cell has often been usedfor large-scale production of PNPase (Xie et al. 1988).However, metabolic inhibitors (mainly organic acids,and other low molecular chemicals) substantially limitsthe growth of E. coli, the cell concentration of E. coli canonly reach 8–15 g/l (wet wt, 70% moisture content) inbatch cultures (Zhang & Yang 1984). Industrial pro-duction requires a large fermentor to obtain commercialquantities of E. coli cells for extracting PNPase.PNPase’s extractive rate is relatively low because thecell’s PNPase accumulation in the harvest phase is nothigh, and PNPase activity is also affected by lengthydownstream treatments (Xie et al. 1988).The purpose of this paper is to investigate the
relationship between PNPase activity and the growthrate of E. coli. Potentially, the faster the growth, thehigher the PNPase activity in the cells, as PNPase plays akey role in the metabolism of RNAs in bacteria (Joneset al. 2003). The highest PNPase activity should occurduring the fast growth phase. Cell concentration in thefast growth phase, however, is usually too low as a resultof low PNPase productivity. To overcome these prob-lems, a cell recycling fermentor with a hollow fibremembrane filter was used to extend the fast growthphase, so that moreE. coli cells could be harvested during
latter stages of the fast growth phase while the activity ofPNPase in cells is still at a high level (Chang et al. 1994).
Materials and methods
Cell recycling system and its operation
The E. coli strain used in this study (AS 1.183) camefrom the Chinese Academy of Science. The experimentaldesign for the cell recycling membrane system is shownin Figure 1. A hollow fibre membrane filter cartridgewas attached to a 30-l fermentor (MD-300, L.E.MARUBISHI, Japan, working volume 20 l). Cell brothwas recirculated in the fermentor using a peristalticpump (7554-50 Cole Parmer Co. USA). A fresh mediumwas continuously supplied to the fermentor and theinhibitor removed by the membrane filter. To balanceoutlet flow, a peristaltic pump was used to adjust thefeed rate of the medium (Bibal et al. 1991; Piret &Cooney 1991). Cells were collected by continuouscentrifuge (CM-60RN, TOMY SEIKO Co. Japan) at12,000 · g and then preserved at )20 �C prior to furtheruse (Zhang & Yang 1984).
Filter membrane
The asymmetric hollow fibre membrane (Tianjin Insti-tute for Membrane, China) was made of polysulfone,with inner and outer diameters of 1.0 and 1.2 mm and amolecular cut-off of 100,000 Da (Kang et al. 1990;Uribelarrea et al. 1990). The total hollow fibre surfacearea was 2 m2. The filter system, sterilized with 5 mg/lsodium hypochlorite solution for 2 h and washed with
World Journal of Microbiology & Biotechnology (2005) 21:425–428 � Springer 2005
DOI 10.1007/s11274-004-1890-4

sterile distilled water, was connected to the fermentor(Bibal et al. 1991; Uribelarrea et al. 1997).
Culture and medium
The growth medium of glucose (20 g/l), yeast extract(10 g/l), Na2HPO4 (2 g/l), and K2HPO4 (2 g/l) wassterilized at 121 �C for 30 min. For the batch culture, E.coli AS 1.183 were grown aerobically in a 500-ml flaskwith a 100 ml growth medium in a rotary shakerincubator at 37 �C for 16 h. A 2-l inoculum was thenintroduced into a 30-l fermentor (Joao & Xivier 2000).The fermentation conditions were as follows: agitationrate 350 rev/min, pH 6.5–7.0, temperature 37 �C, anddissolved oxygen (DO) at 5 mg/l (Uribelarrea et al.1990). Oxygen-rich air was used to keep the DOconcentration above the 5 mg/l level during fermenta-tion. pH was maintained by automatic addition 10 g/lNaOH solution.For the continuously recycled culture, the inoculum
preparation and other controlling conditions were thesame as those for the batch culture. The cell recyclingsystem was not operated after inoculation. Cell recyclingbegan after 2 h. The dilution rate ranged from 0.25 to1.5 h)1 (Charley et al. 1983).
Analytical methods
Cell concentration was estimated by measuring opticaldensity (OD) at 570 nm during the E. coli fermentation(Zhang & Yang 1984). Data for cell concentrationestimation were standardized at 70% moisture using adry weight test and recalculation. The specific growthrate (l, h)1) was calculated according to:
l ¼ ð1=X Þ � ðdX=dtÞ
where X is cell concentration (g/l) and t is time (h)(Ohleyer et al. 1985; Chang et al. 1994; ).PNPase activity was measured using a 20 g (slurry) of
E. coli suspended in a 500 ml buffer (0.02 M Tris-0.001 M EDTA, pH 8.2–8.5). The cell walls were brokenusing an ultrasonic wave at 2–4 �C for 5 min. After thesuspension was centrifuged at 6,000 · g for 30 min at
2–4 �C, a supernatant as raw PNPase was obtained. Thereaction mixture contained 30 mg sodium cytidinediphosphate (CDP-Na), 5 lM MnCl2, 1 ml 0.2 MTris–HCl buffer (pH 9.0), 0.5 ml PNPase, and 0.5 mlwater. The mixture was incubated at 37 �C for 30 min,and the reaction stopped using 1 ml perchloric acid(100 g/l). After centrifuging at 6,000 · g for 30 min at2–4 �C, the precipitate was re-suspended in 3 ml of0.02 M Tris buffer (pH 8.0) and read with a OD257 (aunit of PNPase was defined as 1.0 OD257 under theconditions mentioned above) (Pupkova et al. 1983;Zhang & Yang 1984).
Productivity calculation
Productivity was determined as: medium (u/l) ¼ Aver-age PNPase activity (u/g) · Cell concentration (g/l) · Working volume (l)/Amount of medium (l)Volumetric productivity of the fermentor (u/
hl) ¼ Average PNPase activity (u/g) · Cell concentra-tion (g/l) · Working volume (l)/Fermentor volume(l) · Culture time (h)
Results and discussion
Batch culture of E. coli
The relationship between PNPase activity and E. coligrowth phase is presented in Figure 2. The resultsindicate that PNPase activity was related to the specificgrowth speed of the cells, reaching its highest value inthe growth phase, suggesting that cell collection shouldbe done in this phase or later. Unfortunately, the celldensity was very low during the growth phase in batchculture, that resulting in the following new method. ThePNPase productivity and growth rate were synchronous.
Continuous cell recycle culture of E. coli
Figure 3 shows the relationship between cell concentra-tion, specific growth rate, and PNPase activity in the
1 23
4 5
6 7
8
Figure 1. Hollow fibre reactor system: (1), fermentor; (2), hollow fibre
membrane filter; (3), medium tank; (4), 2 M NaOH solution; (5), pH
meter and controller; (6), pump; (7), value; (8), flowmeter.
0
5
10
15
20
0 2 4 8 10 12 14 16
Time (h)
Cel
l Con
cent
ratio
n (g
/l)
0
0.5
1
1.5
2
Spe
cific
Gro
wth
Rat
e (h
-1)
Cell ConcentrationPNPase ActivitySpecific Growth Rate
0
50
100
150
200
PN
Pas
e A
ctiv
ity (
u/g)
6
Figure 2. Cell concentration, PNPase activity and specific growth rate
in batch culture. Averages of triplicate experiments.
426 S.-J. Nie et al.

hollow fibre reactor when the dilution rate was at1.0 h)1. PNPase productivity and specific growth ratewere also synchronous in the continuous cell recyclingculture as they were in the batch culture. Cells numbersharvested in the continuous cell recycling culture weremuch higher than that in batch culture indicating thatthe low molecular chemical metabolite inhibitors in theculture were successfully removed and the higher pro-ductivity obtained.
Dilution rate and PNPase activity
The metabolite inhibitors of E. coli were continuouslyremoved from the culture system by hollow fibremembrane as fresh medium was continuously fed intofermentor. However, the dilution rate can affect therate of growth of cells as well as PNPase productivity.Table 1 shows that higher dilution rates can lead toincreases in E. coli cell concentration and morePNPase accumulation. Ultimately, the dilution ratewas finally limited by the capacity of filter membrane.As such, a dilution rate of 0.5, 1.0, 1.5 h)1 was used inthis study.
Comparison between batch and continuous recycledcell culture
Table 2 shows a comparison between the batch cultureand continuously recycled cell culture. The resultsindicate that the continuously recycled cell culture wasmore efficient than batch culture in producing PNPase(at dilution rate 1.0 h)1).Further, the results suggest that both PNPase and cell
concentration in a cell recycling fermentor were much
higher than that in a batch fermentor. Not only was theconcentration of E. coli higher (10 times) than that ofthe batch culture, but the fast growth phase was longer,making it possible to harvest more cells containing highactivity of PNPase.The fermentation productivity of PNPase was dra-
matically enhanced in this experiment, although thedilution rate, the amount of DO, and the supply ofnutrients affected the efficiency of cell recycle system.Filtration capacity appears to limits the dilution rate.In this study, the highest dilution rate was at 1.5 h)1; alimit imposed by the pressure capacity of the hollowfibre. The rate of cell growth was also affected by DOconcentration. When the concentration of cell washigh, oxygen-rich air had to be used to maintain theDO level above a prescribed minimum. Nutrient levelsof the medium and availability can also limit theefficiency of the cell recycling system. However, basedon the findings presented here, the cell recyclingfermentor appears to be suitable for producing mate-rial with high value.
References
Bibal, B., Vayssier, Y. & Goma, G. 1991 High-concentration cultiva-
tion of Lactococcus cremoris in a cell-recycle reactor. Biotechology
and Bioengineering 37, 746–754.
Chang, H.N., Yoo, I.-K. & Kim, B.S. 1994 High density cell culture by
membrane-based cell recycle. Biotechnology Advances 12, 467–487.
Charley, R.C., Fein, J.E., Lavers, B.H., Lawford, H.G. & Lawford,
G.R. 1983 Optimization of process design for continuous ethanol
production by Zymomonas mobilis ATCC 29191. Biotechnology
Letters 5, 169–174.
Glazunov, E.A., Surzhik, M.A. & Dyatlova, N.G. 1997 Specific
features of synthesis of the poly (C,U) copolymer by mesophilic
and thermophilic polynucleotide phosphorylases. Applied Bio-
chemistry and Microbiology 33, 349–352.
Joao, C. & Xavier, A.P. 2000 Model for micro/ultrafiltration cell
deactivation in cell-recycle reactors. Journal of Chemical Technol-
ogy and Biotechnology 75, 315–319.
Jones, G.H., Symmons, M.E., Hankins, J.S., & Mackiea, G.A. 2003
Overexpression and purification of untagged polynucleotide phos-
phorylases. Protein Expression and Purification 32, 202–209.
Kang, W., Shukla, R. & Sirkar, K. K. 1990 Ethanol production in a
microporous hollow-fiber based extractive fermentor with immo-
bilized yeast. Biotechology and Bioengineering 36, 826–833.
Marumo, G., Noguchi, T. & Midorikawa, Y. 1993 Efficient method
for the preparation of Escherichia coli polynucleotide
0
50
100
150
200
0 4 8 10 12 14 16
Time (h)
PN
Pas
e A
ctiv
ity (
u/g)
Cel
l Con
cent
ratio
n (g
/l)
0
0.5
1
1.5
2
Spe
cific
Gro
wth
Rat
e (h
-1)
Cell ConcentrationPNPase ActivitySpecific Growth Rate
2 6
Figure 3. Cell concentration, PNPase activity and specific growth rate
in hollow fiber reactor. Averages of triplicate experiments.
Table 1. PNPase activity and dilution rate.
Dilution rate (h)1) 0.5 1 1.5
Cell concentration (g/l) 58 ± 3a 148 ± 5 235 ± 5
PNPase activity (u/g) 61 ± 2 79 ± 8 94 ± 12
aAverages of triplicate ± standard deviations.
Table 2. Comparison between batch and continuous culture (Dilution
rate = 1.0 h)1).
Batch
culture
Continuous
culture
Culture time (h) 8 8
Working volume (l) 20 20
Amount of medium (l) 20 160
Cell concentration (g/l) 12 ± 2a 148 ± 5
Average PNPase activity (u/g) 20 ± 3 79 ± 8
Productivity based on medium (u/l) 240 1461
Volumetric productivity of fermentor (u/hl) 20 974
aAverages of triplicate ± standard deviations.
PNPase Production by E. coli 427

phosphorylase suitable for the synthesis of polynucleotides. Bio-
science, Biotechnology, and Biochemistry 57, 513–514.
Ohleyer, E., Blanch, H.W. & Wilke, C.R. 1985 Continuous production
of lactic acid in a cell recycle reactor. Applied Biochemistry and
Biotechnology 11, 317–332.
Piret, J.M. & Cooney, C.L. 1991Model of oxygen transport limitations in
hollow fiber bioreactors. Biotechology and Bioengineering 37, 80–92.
Pupkova, V.I. & Raspopina, G.I. 1983 Measurement of activity of
polynucleotide phosphorylase from E. coli. Prikladnaia Biokhimiia
Mikrobiologiya 19, 555–559.
Uribelarrea, J.L., Queiroz, J.H. & Pareileux, A. 1997 Growth of
Schizosaccharomyces pombe on glucose malate mixtures in
continuous cell recycle cultures. Applied Biochemistry and Biotech-
nology 66, 69–81.
Uribelarrea, J.L., Winter, J. & Goma, G. 1990 Determination of
maintenance coefficients of Saccharomyces cerevisiae cultures with
cell recycle by cross-flow membrane filtration. Biotechology and
Bioengineering 35, 201–206.
Xie, B.-T., Xu, J.-H., Shen, J., Zhang, L.-C., Chen, C. & Wu, F.-Q.
1988 Studies on microbial polynucleotide phosphorylase. Acta
Microbiologica Sinica 28, 149–154.
Zhang, S.Z. & Yang, K.Y. 1984 Polynucleotide Phosphorylase. In
Industrial Enzyme Part 21. ed. Wu, T.S. pp. 768–779. China:
Science Press. ISBN 7-03-001543-6/Q1228.
428 S.-J. Nie et al.

Optimization of carotenoid production by Rhodotorula glutinisusing statistical experimental design
P.K. Park1, D.H. Cho1, E.Y. Kim1,* and K.H. Chu21Department of Chemical Engineering, The University of Seoul, Seoul 130-743, Korea2Department of Chemical and Process Engineering, University of Canterbury, Private Bag 4800, Christchurch, NewZealand*Author for correspondence: Tel.: +82-2-2210-2530, Fax: +82-2-2216-0570, E-mail: [email protected]
Keywords: Carotenoids, factorial design, medium optimization, Rhodotorula glutinis
Summary
A two-step optimization strategy of statistical experimental design was employed to enhance carotenoid productionfrom sugar cane molasses (SCM) in the yeast Rhodotorula glutinis. In the first step, a fractional factorial design wasused to evaluate the impact of five fermentation factors (pH and concentrations of SCM, urea, KH2PO4, and NaCl).The results revealed that three factors (concentrations of SCM, urea, and KH2PO4) had a significant influence onbiomass and carotenoid production. A face-centered central composite design was then used in the second step tooptimize the three significant factors to further enhance the biomass yield and carotenoid production. Through thistwo-step optimization strategy, the carotenoid concentration could be increased from an average of 1.39 mg/l to anaverage of 3.46 mg/l, representing a 2.5-fold carotenoid production enhancement.
Introduction
Carotenoids are a group of natural pigments producedby a wide range of microorganisms and plants. They areused commercially as food colorants and as a source inpigmentation of fish and shellfish in aquaculture. Due tothe recent discovery of their anticancer and antioxidantproperties, wider use of carotenoids as pharmaceuticalsand nutraceuticals is expected. The worldwide demandfor carotenoids has been estimated at around US$ 1billion in 2005 (Lee & Schmidt-Dannert 2002). As aresult, microbial production of carotenoids has attractedconsiderable interest. Recent research efforts havefocused on the economic production of carotenoids inuseful quantities. One promising approach to reduce theproduction costs is to use low cost fermentation media.A number of studies have demonstrated the feasibility ofproducing carotenoids from low cost substrates such aswhey ultrafiltrate (Frengova et al. 1994), sugar canejuice (Florencio et al. 1998), corn starch hydrolysate(Siva Kesava et al. 1998), peat hydrolysate (Vazquez &Martin 1998), grape must (Buzzini 2000), corn syrup(Buzzini 2001), and sugar cane molasses (SCM)(Bhosale & Gadre 2001; Goksungur et al. 2002). InKorea, SCM is readily available and is considered a lowcost carbon substrate (10% of pure sugar cost) forfermentation. This work reports on the optimization ofcarotenoid production from SCM in the yeast Rhodo-torula glutinis. Yeasts are suitable for production-scale
fermentations due to their relatively high growth ratecompared to algae or fungi.The R. glutinis culture performance is affected by
numerous environmental and fermentation parameterssuch as aeration, agitation, temperature, pH, andconcentrations of the medium components. Optimiza-tion of the fermentation conditions is therefore veryimportant for maximizing the yield and productivityand minimizing the production costs. Most of therecent optimization efforts have relied on statisticalexperimental design and response surface analysis(Haaland 1989) and, to a lesser extent, artificialintelligence techniques such as genetic algorithms(Kennedy & Krouse 1999; Weuster-Botz 2000). Statis-tical design is a powerful tool that can be used toaccount for the main as well as interactive influences offermentation parameters on process performance. It isan efficient way to generate useful information withlimited experimentation, thereby cutting the processdevelopment time and cost (Myers & Montgomery2002). In this study, a two-step optimization strategy ofstatistical experimental design was employed to opti-mize carotenoid production from SCM in shake flasks.In the first step, a fractional factorial design was usedto evaluate the impact of five factors (pH andconcentrations of SCM, urea, KH2PO4, and NaCl)on cell mass yield and volumetric production ofcarotenoids. A face-centered central composite designwas then employed in the second step to optimize the
World Journal of Microbiology & Biotechnology (2005) 21:429–434 � Springer 2005
DOI 10.1007/s11274-004-1891-3

significant factors identified in the initial screening stepto further enhance the carotenoid production.
Materials and methods
Materials
SCM was obtained from Cheil Jedang Co., Korea. Acidhydrolysis of the SCM was carried out in an autoclave at120 �C for 15 min using 0.02 MH2SO4. This was followedbymembranefiltration to removeprecipitates.All solventsused for carotenoid extraction were of analytical grade.
Microorganism and culture conditions
The microorganism used was R. glutinis KCTC (KoreanCollection for Type Cultures) 7989 isolated from soiland identified by morphologic characteristics, biochem-ical properties, and carbon assimilation tests (Kim et al.1998). The cells were maintained on yeast malt agarplates at 4 �C and transferred monthly. The inoculum ofR. glutinis was grown in Erlenmeyer flasks at 22 �C for42 h containing 50 ml of a culture medium with thefollowing composition (in g/l): glucose 10, yeast extract3, and peptone 5. The basal medium used for carotenoidproduction had the following composition (in g/l):reducing sugars 20, urea 2, KH2PO4 1, and NaCl 0.1.The initial pH of the medium was adjusted to pH 5.5 byadding 2 M HCl or NaOH before autoclaving.Erlenmeyer flasks containing 100 ml of the basalmedium were inoculated with 5% of a preculture andincubated on a reciprocating shaker at 150 rpm and20 �C for 5 days. The culture conditions were variedaccording to the experimental design described below.All shake flask experiments were performed in duplicate.
Analytical methods
Cell density was determined by turbidity measurementsusing a spectrophotometer at 660 nm and correlated todry cell weight. The amount of reducing sugars in SCMwas determined after inversion of sucrose with 2 M HClby the dinitrosalicylic acid method (Miller 1959).Carotenoid extraction was carried out according to themethod of Park and Kim (2002). To extract carotenoids,cells were first harvested by centrifugation, washed twicewith distilled water, and frozen at )48 �C. The lyoph-ilized cells (0.1 g) were mixed with 1 ml each of DMSO(55 �C), acetone, petroleum ether, and 20% w/v NaClsolutions. The upper petroleum ether layer containingthe extracted carotenoids was collected and analyzed bythin layer chromatography.
Experimental design
A two-step optimization strategy was employed tooptimize carotenoid production from SCM in shakeflasks. In the first step, a fractional factorial design wasused to evaluate the effects of the following five factors:
(A) concentration of SCM, (B) concentration of urea,(C) concentration of KH2PO4, (D) concentration ofNaCl, and (E) pH on cell mass, carotenoid content, andcarotenoid production. Fractional factorial design iswell-suited for screening purposes because it allows forthe separation of the important influences from theunimportant ones at an early stage of experimentation.However, some information on higher order interac-tions among factors can be lost in a fractional designcompared to a full factorial design. In this study, a two-level fractional factorial design was selected whichrequired 16 experimental runs for five factors. Table 1shows the experimental ranges and levels of the fivefactors tested in the fractional factorial design ()for thelower level, + for the upper level, and 0 for the centerpoint level). Table 2 displays the design matrix andexperimental results (responses) after 5 days of culture.The carotenoid production was calculated from theexperimentally measured cell mass and carotenoidcontent. Note that four additional runs at the centerpoint level were included in the design matrix to checkreproducibility. The runs were conducted in randomizedorder to guard against systematic bias.The results of the fractional factorial design revealed
that three out of the five factors (SCM, urea, andKH2PO4) exerted significant effects on the responses(cell mass and carotenoid production). In the secondstep, a face-centered central composite design was usedto optimize the levels of the three factors. The selecteddesign matrix, shown in Table 3, consisted of nineexperimental runs and four additional runs at the centerpoint level to check reproducibility. Note that the SCMand urea factors have been combined to create a newfactor known as the carbon–nitrogen (C/N) ratio,reducing the number of factors from three to two. Inthe experimental design, the two factors are codedaccording to the following equation
xi ¼Xi � X0
DXð1Þ
where xi is the coded value of the ith factor (x1 ¼ C/Nratio and x2 ¼ KH2PO4), Xi is the natural value of theith factor, X0 is the factor’s natural value at the centerpoint level, and DX is the step change value. Twoexperimental responses (cell mass and carotenoid con-tent) and one calculated response (carotenoid produc-tion) are also listed in Table 3. Each response shownwas used to develop an empirical model of the response
Table 1. Experimental ranges and levels of the five factors tested in the
fractional factorial design.
Factor Symbol Ranges and levels
) 0 +
SCM (g/l) A 10 20 30
Urea (g/l) B 1 3 5
KH2PO4 (g/l) C 0 1.5 3
NaCl (g/l) D 0 1.5 3
pH E 4 5.5 7
430 P.K. Park et al.

surface in which each dependent variable was obtainedas the sum of the contributions of the two investigatedfactors through first-order, second-order, and interac-tion terms, according to the following quadraticpolynomial:
y ¼ b0 þ b1x1 þ b2x2 þ b11x21 þ b22x22 þ b12x21x22 ð2Þ
where y is the predicted response and b0, b1, b2, b11,b22, and b12 are the coefficients obtained by multipleregression of the experimental data. The commercialsoftware Design Expert v6.06 (STAT-EASE Inc.,Minneapolis, MN, USA) was used for statistical andregression analyses of the data obtained from thefractional factorial design and face-centered centralcomposite design.
Results and discussion
Fractional factorial design
A fractional factorial design was employed to evaluatethe influence of five fermentation factors on carotenoidproduction from SCM in shake flasks. The designmatrix and experimental responses are shown inTable 2. As can be seen from Table 2, significantlydifferent cell mass and carotenoid yields exist within the16 runs and that the highest values of cell mass,carotenoid content, and carotenoid production wereobtained in different runs: a maximum cell massconcentration of 11.9 g/l was observed in run 13, thecarotenoid content reached the highest value of 393 lg/g
Table 2. Experimental design matrix and experimental results for the fractional factorial design.
Run Design matrix Experimental results
A B C D E Cell mass (g/l) Carotenoid
content (lg/g)Carotenoid
production
(mg/l)
1 ) ) ) ) + 4.3 297 1.28
2 ) ) ) + ) 3.9 202 0.79
3 ) ) + ) ) 4.7 310 1.46
4 ) + ) ) ) 1.7 280 0.48
5 + ) ) ) ) 11.3 201 2.27
6 ) ) + + + 4.4 269 1.18
7 ) + ) + + 2.3 300 0.69
8 ) + + ) + 2.6 393 1.02
9 ) + + + ) 3.6 192 0.69
10 + + + ) ) 9.5 167 1.59
11 + + ) + ) 7.3 218 1.59
12 + + ) ) + 7.5 220 1.65
13 + ) + ) + 11.9 217 2.58
14 + ) + + ) 9.8 250 2.45
15 + ) ) + + 11.6 251 2.91
16 + + + + + 8.0 159 1.27
17 0 0 0 0 0 5.4 156 0.84
18 0 0 0 0 0 5.6 161 0.90
19 0 0 0 0 0 5.8 170 0.99
20 0 0 0 0 0 5.7 189 1.08
Table 3. Experimental design matrix and experimental results for the face-centered central composite design.
Run Design matrix a Experimental results
x1C=N ratio
x2KH2PO4
Cell mass (g/l) Carotenoid
content (lg/g)Carotenoid
production (mg/l)
1 ) ) 8.8 194 1.71
2 ) 0 11.1 101 1.12
3 ) + 12.3 85 1.05
4 0 ) 11.5 352 4.05
5 0 0 12.0 294 3.53
6 0 + 11.9 455 5.41
7 + ) 11.3 404 4.57
8 + 0 12.4 386 4.79
9 + + 11.8 379 4.47
10 0 0 12.0 294 3.53
11 0 0 12.2 300 3.66
12 0 0 11.9 297 3.53
13 0 0 12.5 290 3.63
a C/N ratio: )(4), 0(27), +(50); KH2PO4 : )(0), 0(1.5), +(3.0).
Carotenoid production by Rhodotorula glutinis 431

in run 8, and run 15 produced the highest carotenoidproduction of 2.91 mg/l. The mean cell mass concen-tration and carotenoid production, averaged over allruns, are 6.3 g/l and 1.39 mg/l, respectively.The results presented in Table 2 for cell mass and
carotenoid production were subjected to regressionanalysis and the analysis of variance (ANOVA). First-order models were fitted to the data to evaluate the maineffects of the five factors. The statistic test factor, F, wasused to evaluate the significance of the models andfactors at the 95% confidence level. If the calculatedvalue of F is greater than the tabular F at the specifiedprobability level, a statistically significant model orfactor is obtained. After applying the ANOVA statisti-cal test, it was found that the first-order models for cellmass and carotenoid concentrations were satisfactory.In addition, The SCM, urea, and KH2PO4 factors andthe SCM and urea factors showed significant effects onthe cell mass and carotenoid production, respectively.The NaCl and pH factors did not show a major impacton either the cell mass or carotenoid production withinthe ranges explored in our experiments. Consequently,these two factors were kept at the level of the centerpoint while carrying out the central composite designexperiments described below.The nature of the influence of the three significant
factors (SCM, urea, and KH2PO4) on cell mass andthe two significant factors (SCM and urea) on caroten-oid production may be deduced by examining the datatrends shown in Table 2. Notice that runs 5, 13, 14,and 15 in Table 2 are characterized by the high (+)level for SCM and the low ()) level for urea, i.e. highcarbon–nitrogen (C/N) ratios. The mean cell mass andcarotenoid concentrations for these runs are 11.2 g/l and2.55 mg/l, respectively. In contrast, runs 4, 7, 8, and 9are characterized by the low ()) level for SCM and thehigh (+) level for urea, i.e. low C/N ratios. The meancell mass and carotenoid concentrations for these runsare 2.6 g/l and 0.72 mg/l, respectively. It is evident thatthere is an alternating pattern of high and low cell massand carotenoid production which corresponds to thehigh/low variations of the C/N ratio. A direct correla-tion between the C/N ratio and cell mass and carotenoidconcentrations is obvious. Clearly, a higher C/N ratiowill lead to a higher cell mass and carotenoid produc-tion. However, the influence of KH2PO4 is not soconspicuous. Comparing the mean cell mass concentra-tion at the low level of KH2PO4 with the mean cell massconcentration at the high level in Table 2 indicates thatthe cell mass was somewhat positively affected byKH2PO4 (6.2 vs. 6.8 g/l), suggesting that KH2PO4 wasof secondary significance. Based on the results of thefractional factorial design, the levels of the significantfactors – SCM and urea (combined as one factor: theC/N ratio), and KH2PO4 – were further optimized usinga face-centered central composite design in the secondoptimization step. Higher C/N ratios were used in theseexperiments compared to those used in the fractional
factorial design since higher levels have been shown tofavor cell mass and carotenoid production.
Face-centered central composite design
A face-centered central composite design for the twofactors (C/N ratio and KH2PO4) was used foroptimizing cell mass and carotenoid production inshake flasks. Table 3 shows the design matrix andexperimental responses. The level of the C/N ratio wasvaried from 4 to 50 while the level of KH2PO4 wasvaried from 0 to 3.0 g/l. Note that the C/N ratio wasvaried by changing the urea concentration at a fixedSCM concentration. As can be seen from Table 3,these runs produced substantially improved results forthe cell mass and carotenoid production over thoseobtained in the fractional factorial design. The meancell mass and carotenoid concentrations, averagedover all runs, are 11.7 g/l and 3.46 mg/l, respectively.In comparison to the mean cell mass and carotenoidconcentrations in the fractional factorial design exper-iments, the mean cell mass concentration in thecentral composite design experiments is higher by afactor of 1.9, and the mean carotenoid concentrationis higher by a factor of 2.5, thus confirming thepositive effect of high C/N ratios observed in theprevious fractional factorial design.By using multiple regression analysis, the experimen-
tal responses shown in Table 3 were correlated with thetwo significant factors according to Equation (2):
½cell mass� ¼ 12:2þ 0:55x1 þ 0:728x2 � 0:492x21� 0:608x22 � 0:736x1x2 ð3Þ
½carotenoid production�¼ 3:74þ 1:66x1 þ 0:105x2
� 1:18x21 þ 0:59x22 þ 0:14x1x2 ð4Þ
The factors x1 and x2 are specified in their coded units.The goodness of fit of the quadratic polynomials isexpressed by the coefficient of determination, R2. Thecloser the value of R2 is to 1, the better is the correlationbetween the observed and predcited values. The R2
values for Equations (3) and (4) are 0.891 and 0.901,respectively, indicating that about 90% of the variationsin cell mass and carotenoid concentrations can beexplained by the quadratic polynomials. This meansthat Equations (3) and (4) are adequate for correlatingthe experimental results. The experimental cell mass andcarotenoid concentrations versus the correspondingvalues calculated by the regression models are shown inFigures 1 and 2, respectively. The line of perfect fit is alsoshown in these figures. These plots therefore visualize theperformance of the two quadratic models in an obviousway. The results in Figures 1 and 2 confirm that the tworegression models provide an accurate description of theexperimental data.
432 P.K. Park et al.

The regression models were used to construct theresponse surfaces and contour plots shown in Figures 3and 4. The measured values of cell mass and carotenoidconcentrations are also shown in these figures (solidcircles). Figure 3 depicts the interactive effect of the C/Nratio and KH2PO4 concentration on cell mass concen-tration. At low to moderate C/N ratios, increases inKH2PO4 led to increased production of cell mass. Athigh C/N ratios, the cell mass concentration increasedmarginally and then decreased with increasing KH2PO4.Similar trends were observed for cell mass concentrationas a function of the C/N ratio at fixed KH2PO4 levels. Atlow to moderate KH2PO4 levels, the cell mass concen-tration increased with increase in the C/N ratio. At highKH2PO4 levels, the cell mass showed no significantincrease with increase in the C/N ratio up to the centerpoint level and decreased thereafter. The contour plot inFigure 3 indicates that a local optimum exists in the areaexperimentally investigated; a set of values on the twofactors that leads to maximum cell mass production. Thelocation of this optimum can be obtained by differenti-ating Equation (3) with respect to x1 and x2 and solving
the resulting set of algebraic equations. According toEquation (3), the optimum point for maximum cell massproduction is located at a C/N ratio of 31.6 and aKH2PO4 concentration of 2.2 g/l.The effects of varying the C/N ratio and KH2PO4
concentration on carotenoid production are shown inFigure 4. The response surface indicates that the carot-enoid concentration was not significantly affected byKH2PO4 throughout the range of the C/N ratioemployed. This is not surprising as the fractionalfactorial design results have already indicated thatKH2PO4 was not a significant factor affecting caroten-oid production. However, it is interesting to note thatthe carotenoid production decreased and then increasedgradually with increasing KH2PO4. From the contourplot shown in Figure 4, it can be seen that a saddle pointexists in the region of high C/N ratios. By contrast,increases in the C/N ratio led to noticeable increases inthe carotenoid production irrespective of the KH2PO4
concentration. The increase in carotenoid productionwas marginal at high C/N ratios compared to the steepincrease at low C/N ratios. It can be seen that there is noclear optimum within the experimental area investigatedbecause the best carotenoid production lies at the upperbound of the KH2PO4 concentration range. Neverthe-less, the contour plot indicates that the best carotenoidproduction occurs at a C/N ratio of approximately 44.5when the KH2PO4 concentration is equal to 3 g/l. ThisC/N ratio for maximum carotenoid production differsfrom the C/N ratio of 31.6 which maximizes cell massyield. Also, the C/N ratio of 44.5 observed in this studyfor maximum carotenoid production differs from theresults of Somashekar and Joseph (2000). They inves-
0
2
4
6
8
0 2 4 6
Experimental carotenoid concentration (mg/l)
Cal
cula
ted
caro
teno
id c
once
ntra
tion
(mg/
l)
8
Figure 2. Carotenoid production calculated from second-order regres-
sion model (Equation (4)) vs. the corresponding experimentally
measured values.
4
27
50
0
1.5
3
9
10
11
12
13
C/N ratioKH2PO
4 (g/l)
Cel
l mas
s co
ncen
trat
ion
(g/l)
Figure 3. Response surface and contour plot obtained from Equation
(3) showing the effect of the C/N ratio, KH2PO4, and their mutual
interaction in natural units on cell mass concentration. Solid circles:
measured values of cell mass concentration.
8
8
10
12
14
10 12
Experimental cell mass concentration (g/l)
Cal
cula
ted
cell
mas
s co
ncen
trat
ion
(g/l)
14
Figure 1. Cell mass concentration calculated from second-order
regression model (Equation (3)) vs. the corresponding experimentally
measured values.
Carotenoid production by Rhodotorula glutinis 433

tigated carotenoid production from semi-defined mini-mal salts media with three different C/N ratios by theyeast R. gracilis, and found a C/N ratio of 10 favoredmaximum carotenoid production. Perhaps the differenceis due to the different types of medium and yeast strainused.
Conclusions
Using a sequential optimization strategy (fractionalfactorial design followed by central composite designcoupled with response surface analysis), the concentra-tions of SCM, urea, and KH2PO4, were shown to affectthe production of cell mass and carotenoids in the yeastR. glutinis. The two-step optimization strategy resultedin a 1.9-fold enhancement of the mean cell massconcentration and a 2.5-fold enhancement of the meancarotenoid concentration. Two of the three significantfactors, SCM and urea, were combined as a single factor(C/N ratio) in the central composite design experiments.The response surface analysis of the central compositedesign results indicates that the best cell mass yield andcarotenoid production within the experimental areainvestigated could be obtained at a C/N ratio of 31.6and a KH2PO4 concentration of 2.2 g/l and at a C/Nratio of 44.5 and a KH2PO4 concentration of 3 g/l,respectively.
References
Bhosale, P. & Gadre, R.V. 2001 b-Carotene production in sugarcane
molasses by a Rhodotorula glutinis mutant. Journal of Industrial
Microbiology and Biotechnology 26, 327–332.
Buzzini, P. 2000 An optimization study of carotenoid production by
Rhodotorula glutinis DBVPG 3853 from substrates containing
concentrated rectified grape must as the sole carbohydrate source.
Journal of Industrial Microbiology and Biotechnology 24, 41–45.
Buzzini, P. 2001 Batch and fed-batch carotenoid production by
Rhodotorula glutinis Debaryomyces castellii co-cultures in corn
syrup. Journal of Applied Microbiology 90, 843–847.
Florencio, J.A., Soccol, C.R., Furlanetto, L.F., Bonfim, T.M.B.,
Krieger, N., Baron, M. & Fontana, J.D. 1998 A factorial approach
for sugarcane juice-based low cost culture medium: increasing the
astaxanthin production by the red yeast Phaffia rhodozyma.
Bioprocess Engineering 19, 161–164.
Frengova, G., Simova, K., Pavlova, K., Beshkova, D. & Grigorova, D.
1994 Formation of carotenoids by Rhodotorula glutinis in whey
ultrafiltrate. Biotechnology and Bioengineering 44, 888–894.
Goksungur, Y., Mantzouridou, Y. & Roukas, T. 2002 Optimization of
the production of b-carotene from molasses by Blakeslea trispora:
a statistical approach. Journal of Chemical Technology and
Biotechnology 77, 933–943.
Haaland, P.D. 1989 Experimental Design in Biotechnology. New York:
Dekker.
Kennedy, M. & Krouse, D. 1999 Strategies for improving fermentation
medium performance: a review. Journal of Industrial Microbiology
and Biotechnology 23, 456–475.
Kim, E.Y., Park, P.K. & Chae, H.J. 1998 Optimization of culture
conditions for extracellular lipid production from Rhodotorula
glutinis K-501. Korean Journal of Biotechnology and Bioengineering
13, 58–64.
Lee, P.C. & Schmidt-Dannert, C. 2002 Metabolic engineering towards
biotechnological production of carotenoids in microorganisms.
Applied Microbiology and Biotechnology 60, 1–11.
Miller, G.L. 1959 Use of dinitrosalicylic acid reagent for determination
of reducing sugar. Analytical Chemistry 31, 426–429.
Myers, R.H. & Montgomery, D.C. 2002 Response Surface Methodol-
ogy: Process and Product Optimization Using Designed Experi-
ments, 2nd edn. New York: John Wiley & Sons.
Park, P.K. & Kim, E.Y. 2002 Extraction method of carotenoids from
Rhodotorula glutinis. Korean Journal of Biotechnology and Bioen-
gineering 17, 44–48.
Siva Kesava, S., An, G.-H., Kim, C.-H., Rhee, S.-K. & Choi, E.-S.
1998 An industrial medium for improved production of carote-
noids from a mutant strain of Phaffia rhodozyma. Bioprocess
Engineering 19, 165–170.
Somashekar, D. & Joseph, R. 2000 Inverse relationship between
carotenoid and lipid formation in Rhodotorula gracilis according to
the C/N ratio of the growth medium. World Journal of Microbi-
ology and Biotechnology 16, 491–493.
Vazquez, M. & Martin, A.M. 1998 Optimization of Phaffia rhodozyma
continuous culture through response surface methodology. Bio-
technology and Bioengineering 57, 314–320.
Weuster-Botz, D. 2000 Experimental design for fermentation media
development: statistical design or global random search? Journal of
Bioscience and Bioengineering 90, 473–473.
4
27
50
0
1.5
3
0
2
4
6
Car
oten
oid
conc
entr
atio
n (m
g/l)
C/N ratioKH2PO
4(g/l)
Figure 4. Response surface and contour plot obtained from Equation
(4) showing the effect of the C/N ratio, KH2PO4, and their mutual
interaction in natural units on carotenoid concentration. Solid circles:
measured values of carotenoid concentration.
434 P.K. Park et al.

Purification and characterization of lignin peroxidases
from Penicillium decumbens P6
JinShui Yang, HongLi Yuan*, HeXiang Wang and WenXin ChenKey Laboratory of Agro-Microbial Resource and Application, Ministry of Agriculture, College of Biological Science,China Agricultural University, Yuanmingyuan West Road 2, Haidian District, Beijing 100094, China*Author for correspondence: Tel.: +86-10-62893464, Fax: +86-10-62891332, E-mail: [email protected]
Keywords: lignin peroxidase, Penicillium decumbens, lignite, purification, characterization
Summary
Peroxidases are essential enzymes in biodegradation of lignin and lignite which have been investigated intensively inthe white-rot fungi. This is the first report of purification and characterization of lignin peroxidase from Penicilliumsp. P6 as lignite degradation fungus. The results indicated that the lignin peroxidase of Penicillium decumbens P6had physical and chemical properties and a N-terminal amino acid sequence different from the lignin peroxidases ofwhite-rot fungi. The lignin peroxidase was isolated from a liquid culture of P. decumbens P6. This enzyme had amolecular weight of 46.3 KDa in SDS-PAGE and exhibited greater activity, temperature stability and wider pHrange than those previously reported. The isolation procedure involved (NH4)2SO4 precipitation, ion-exchangechromatography on DEAE-cellulose and CM-cellulose, gel filtration on Sephadex G-100, and non-denaturing,discontinuous polyacrylamide gel electrophoresis. The Km and Vmax values of this enzyme using veratryl alcohol assubstrate were 0.565 mmol L)1 and 0.088 mmol (mg protein))1 min)1 respectively. The optimum pH of P6 ligninperoxidase was 4.0, and 70.6% of the relative activity was remained at pH 9.0. The optimum temperature of theenzyme was 45 �C.
Introduction
Lignin is a complex polymer consisting of phenylpro-pane units interconnected by a variety of carbon–carbonbonds and ether linkages (Adler 1977; Ramachandraet al. 1987). It is the main component of wood andlignite. In nature, lignin physically encrusts cellulose andis resistant to biodegradation (Kirk & Farrell 1987).Most active lignin degraders such as Phanerochaetechrysosporium, Phlebia radiata, Trametes versicolor,Bjerkandera adusta, Chrysonilia sitophila, Streptomycesbadius and Streptomyces flavovirens belong to thebasidiomycetes (Kirk & Farrell 1987; Blanchette 1991),though some of them are ascomycetes (Duran et al.1987) or actinomycetes (Crawford et al. 1983; Ramach-andra et al. 1988). In fungi, the biodegradation of ligninis an enzymatic procedure. The ligninolytic enzymesystem consists mainly of manganese peroxidase, ligninperoxidase and laccase. Some evidence has shown thatmany ligninolytic fungi use a combination of any twofrom these three enzymes (Kuwahara et al. 1984;Kantelinen et al. 1989).Lignin peroxidase (LiP; EC 1.11.1.14) is thoroughly
investigated ligninolytic enzyme that was first discoveredin the white-rot fungus P. chrysosporium (Glenn et al.1983). The biochemistry and molecular genetics under-lying the ligninolytic systems of P. chrysosporium are
quite complex. Various LiP isozymes have been found,and the genome of P. chrysosporium contains at least 10structurally related genes encoding LiP proteins, namedas lipA to lipJ respectively (Gaskell et al. 1994).About 940 million tons of lignite are produced
worldwide each year. In China, the conservativereserves of lignite are about 130.3 million tons,accounting for 13% of total coal resources. Convertingthis low grade coal to useful materials poses a signif-icant problem both in China and worldwide. Since thetypical structures of the original lignin are preserved incoal, some authors have designated lignite as demethy-lated and dehydrated lignin (Durie et al. 1960; Hayatsuet al. 1979; Hatcher 1990). Therefore, most of themain coal-biodegrading microorganisms are ligninolyticmicroorganisms.In previous work, we obtained a lignite degradation
fungus, Penicillium decumbens P6 (Yuan et al. 1999,2000). We found that extracellular enzymes played animportant role in lignite degradation (Yang et al. 2004),but the mechanism of degradation was not clear.Compared with the white-rot fungi, it is possible thatLiP also play an important role in the biodegradation oflignite. However, very few data exist on the productionand purification of lignin peroxidase or manganeseperoxidase in Penicillium sp. (Laborda et al. 1999;Kumari et al. 2002). The present paper deals with the
World Journal of Microbiology & Biotechnology (2005) 21:435–440 � Springer 2005
DOI 10.1007/s11274-004-1876-2

lignin peroxidase excreted by P. decumbens P6, includingthe purification and characterization of this enzymefrom liquid culture.
Materials and methods
Fungal strain and preparation of crude enzyme
P. decumbens P6 (CGMCCNo.0866) was maintainedon a yeast extract-malt agar (Lamar et al. 1990). Slantsinoculated with P6 were incubated at 28 �C for 1 weekand maintained at 4 �C. Spores from the slants weresuspended in sterilized water and inoculated at con-centration of 106 spores ml)1 into 500 ml flaskscontaining a 100 ml medium of 10 g glucose, 3 g maltextract, 3 g yeast extract, 2 g KH2PO4, 0.5 g MgSO4Æ7-H2O, and 0.2 g FeSO4ÆH2O in a litre of distilled waterwith pH 5.0 and sterilized at 115 �C for 30 min.Cultures were incubated with shaking at 28 �C for7 days at 150 rev/min. Then liquid fermentation cul-tures were filtered. The filtrate was precipitated with an80% saturated (NH4)2SO4 solution and centrifuged at10600 · g for 15 min at 4 �C. The precipitate wasdissolved in 100 ml distilled water and dialysed threetimes with 4 h in each time against 1000 ml 5 mMpotassium phosphate buffer, pH 7.2 (PB) at 4 �C usingdialysis tubing with a molecular weight cut off of about8000 Da.
Protein concentration
Protein concentrations were determined by using theBradford method and bovine serum albumin as thestandard. LiP concentration in the column effluents wasmonitored by measuring the absorbance at 409 nm(Farrell et al. 1989).
Detection of peroxidase activity in P. decumbens P6
Non-denaturing discontinuous PAGE was used toanalyse peroxidase enzymes (Ramachandra et al.1987). After electrophoresis, the gel was treated for10 min at 37 �C with a reaction mixture containing10 mM caffeic acid (Sigma), 0.05 mM aminoantipyrine(Sigma), 4.0 mM hydrogen peroxide, 0.1 M potassiumphosphate buffer (pH 7.0). Peroxidase bands stainedred. Reactions were stopped by placing the gel in asolution of ethanol-water (1:1).
Enzyme assay
LiP activity was determined by monitoring the conver-sion of veratryl alcohol to veratryl aldehyde at 25 �C byhydrogen peroxide at 310 nm as described by Tien &Kirk (1984). One unit of enzyme activity was defined asthe amount of enzyme that transformed 1 lmol ofsubstrate per min.
Ion-exchange chromatography
The first step in peroxidase purification involved aDEAE-cellulose (Sigma) column (2.5 · 18 cm), whichhad been equilibrated with 5 mM PB (pH 7.2). Follow-ing elution of unbound material with the same buffer,the column was washed stepwise with 50, 150, 300,500 mM and finally 1 M NaCl in 5 mM PB. The elutingsolution was collected in fraction of 5 ml. Proteinconcentration and LiP concentration were determinedrespectively for each fraction by the absorption at 280and 409 nm. Then the LiP activity was estimated asmentioned as above in each fraction with high absorp-tion at 280 and 409 nm.The active fractions were then loaded onto a CM-
cellulose (Sigma) column (2.5 · 18 cm) equilibratedwith 5 mM ammonium acetate buffer (pH 4.5). Afterthe unadsorbed materials had been eluted by 300 ml5 mM ammonium acetate buffer (pH 4.5), the adsorbedproteins were eluted with a linear gradient of 0–1 MNaCl in ammonium acetate buffer. Fractions of 5 mlwere collected. A409 and A280 were measured for eachfraction. LiP activity in each fraction with highest A409
and A280 was also assayed as mentioned above.
Gel filtration
The fraction on the CM-cellulose column with LiPactivity was concentrated into 3 ml using ultra-filtrationwith a molecular weight cut off of 1000 Da and dialysedfor 4 h against 500 ml 5 mM PB (pH 7.2) at 4 �C. Thenthe enzyme solution was supplied to a Sephadex G-100(Sigma) column (2.6 · 100 cm) pre-equilibrated with5 mM PB (pH 7.2) and eluted with the same buffer.Fractions of each 3 ml were collected. All the fractionswith high A409 were pooled and concentrated and LiPactivity was measured using non-denaturing, discontin-uous PAGE (10% polyacrylamide gel) as describedabove. The bands with LiP activity were cut outrespectively and the proteins recovered from the gelusing an elution buffer (1% Triton X-100, 50 mM Tris-HCl, pH 9.5), shaken gently for 10 min and centrifugedat 4942 · g at 4 �C. The supernatant was collected andconcentrated by lyophilization.
SDS-PAGE
The purity and subunit molecular weight of purifiedenzyme was checked using SDS-PAGE (12% polyacryl-amide gel). After electrophoresis, the protein bands werevisualized by silver staining (Guo 1991). The molecularweights of proteins were estimated according to molec-ular weight standards (Sigma).
Properties of the LiP
The Km and Vmax values for the enzyme, using veratrylalcohol as substrate, were determined by a Lineweaver-Burk plot. Also, LiP activity was measured at 25 �C in
436 JinShui Yang et al.

the pH range 3–9 (0.1 M NH4OAc buffer at pH valuesof 3, 4 and 5. A 0.1 M phosphate buffer was used toassess pH 6 and pH 7, and 0.1 M Tris-HCl buffer usedfor pH 8 and pH 9). The LiP activity was alsodetermined at various temperatures between 25 and65 �C at optimal pH.
Amino acid sequencing
The purified LiP protein was subjected to SDS-PAGEusing 12% separating gel. Proteins in the gel weretransferred onto a polyvinylidene fluoride membrane byblotting at 16 V for 30 min in a semi-dry transfer cell(Bio-Rad USA). After transfer, the membrane wasstained and then washed extensively with Milli-Q water.The protein band was cut out and air-dried. TheN-terminal amino acid sequencing was conducted usinga 491 Protein Sequencer (ABI USA). The sequence ofP. decumbens P6 LiP obtained was compared to otherfungal LiPs in the sequence database by BLAST search.
Results
Detection and purification of LiP in P. decumbens P6
The excretion of LiP in liquid culture of P. decumbensP6 was evidenced by the results of selective staining ofthe enzyme in PAGE. It showed that P. decumbens P6had two peroxidase isoenzymes, L1 and L2, in liquidculture (Fig. 1). The L1 isozyme was the major one.With the ion-exchange chromatography on DEAE-
cellulose, LiP activity was detected in 6 eluated fractionsby absorption at 409 nm. They were an unadsorbedpeak (D1) and five adsorbed peaks (D2–D6). Most ofthe lignin peroxidase activity was located in the twomajor protein peaks (D3 and D4) eluted with 150 and300 mMNaCl. The D3 peak exhibited more LiP activitythan the D4 peak.In further purification of the D3 peak on the CM-
cellulose column, the LiP activity was detected in twofractions: a small peak (C1) in the unadsorbed fraction
and a big peak (C2) in the fractions between the elutionvolumn of 360–600 ml. These two peaks correspondedto the main protein peaks.Fractions corresponding to the C2 peak were subse-
quently purified using a Sephadex G-100 column. Onemajor peak and several small peaks appeared. Themajor activity was found in the first peak (S1), but therewas an overlap zone between the peak S1 and the secondpeak (S2) while the collected S1 avoided S2.The yields and specific activities of the chromato-
graphic fractions are presented in Table 1. The purifi-cation efficiency of each method is shown in Fig 2. Afterpurification, the specific activity had increased from 0.05to 7.5 U/mg, demonstrating a 150.4-fold purification.The recovery of activity was 19.6%. The proteinpatterns in SDS-PAGE (Fig. 2) also showed that whilethe enzyme was getting purer, the number of proteinbands was decreasing with the degree of purification.The sample of combined peak S1 was purified finally
by PAGE. Selective staining for peroxidase showed onlyone band with a high level of peroxidase activity. A totalof 0.3 mg LiP was recovered from the gel.
Characterization of LiP in P. decumbens P6
Enzyme recovered from the PAGE gel possessed asubunit molecular weight of 46.3 KDa (Fig 3). In anal-ysis of veratryl alcohol oxidation at 25 �C, the Km of LiPfrom P. decumbens P6 was 0.565 mmol/l and the Vmax
was 0.088 mmol (mg protein) min)1, which was similarwith to the values for white-rot fungal LiPs (Farrell et al.1989; Glumoff et al. 1990; Rothschild et al. 2002). Theoptimum pH was 4 at 25 �C for the LiP of P. decumbensP6. At pH 9.0, 70.6% of the relative activity was stillretained. The optimum temperature was 45 �C at pH 4.Enzymatic activity declined with increase or decrease oftemperature. And LiP from P. decumbens P6 exhibitedrelatively high temperature tolerance, retaining 62.5% ofthe relative enzymatic activity at 55 �C.Ten amino acid residues in the N-terminus of the
46.3 KDa band of LiP were sequenced and comparedto other fungal peroxidase sequences (Table 2).P. decumbens P6 LiP had the conserve amino acid residuesVLL as in fungal MnP and other peroxidases, but noconservative amino acid residues with other fungal LiPs.
Discussion
To reduce environmental damage from weathering andcoal burning, biotechnological processes are needed toconvert hard coal or lignite to clean, cost-effectiveenergy sources or other useful materials. A microbial,enzymatic or enzyme-mimetic technology that can takeplace at moderate temperatures and pressures (Fakoussa1992) would have great advantages compared to thecurrent physical and chemical coal conversion technol-ogies. Biocatalytic particles are also smaller than con-ventional catalytic particles and thus more efficient.
Figure 1. PAGE analysis of P. decumbens P6 liquid culture showing
the existence of peroxidase activity. Seperation gel concentration was
10%. Enzyme were visualized by selective staining. The enzyme bands
were marked as L1 and L2 and L1 was major band.
Lignin peroxidases from Penicillium decumbens P6 437

The strain of P. decumbens P6 used in this study wasisolated from coalmine soil in InnerMongolia, China andcould completely degrade Chinese lignite in less than3 days in liquid culture or in 36 h on a plate colony. Theproducts of degradation were humic acids and fulvicacids, both had obvious biological effects (Yuan et al.1999, 2002). In addition, the characteristics of the
degradation products changed distinctly (Yuan et al.2000). Furthermore, P6 can excrete extracellular enzymesin the process of coal liquefaction (Yang et al. 2004).Compared with P. chrysosporium and other white-rot
fungi, P6 has obvious advantages in the biodegradationof lignite, such as being easy to grow and resistant tocontamination and so on. Laborda et al. (1999) reportedthat Penicillium sp. could excrete extracellular manga-nese peroxidase in the processes of liquefaction/solubi-lization of Spanish coals, but their study only focused onthe fundamental aspects of microbial coal liquefaction/solubilization involved in coal solubilization.P. decumbens P6 can excrete peroxidase isoenzymes
under liquid fermentation conditions. Peroxidase activ-ity was detected in PAGE by selective staining. Theoptical absorption spectra of enzyme showed that P6peroxidase had a Soret band (Yang 2004), which was thetypical adsorption spectra of peroxidase (Glumoff et al.1990). Furthermore, enzyme activity indicated that P6peroxidase was different from aryl alcohol oxidase,which could oxidase aryl alcohol to produce H2O2
(Guillen et al. 1992; Gutierrez et al. 1994). P6 LiP hadhigh veratryl alcohol activity, without MnP activity, andenzyme activity had to be activated by H2O2. Thecomparation of N-terminal amino acid residues of P6LiP with those of P. chrysosporium, Ceriporiopsissubvermispora, Armoracia rusticana and Arabidopsisthaliana peroxidase revealed that P6 LiP had theconserved peroxidase sequence VLL. All of these dataconfirmed that the purified enzyme from P. decumbensP6 was a peroxidase.LiPs are the most investigated ligninolytic enzymes in
white-rot fungi, but not in Penicillium sp. The subunitmolecular weight range of white-rot fungal LiP was 38–47 KDa and that of MnP was 38–50 KDa (Fakoussa &Hofrichter 1999). P6 LiP had a subunit molecularweight of 46.3 KDa, that was within this range. Itspure enzyme turnover number was 2.3)1 and activitywas 7.5 U/mg, 68.4 times than that of commercial LiPfrom whit-rot fungi (0.11 U/mg) (Fluka), indicating ithad production potential.Fakoussa & Hofrichter (1999) reported that the pH
range for LiP was between 2.0–5.0, with an optimumsomewhere between 2.5–3.0. The pH range for MnP wasbetween 2.0–6.0, with an optimum between 4.0–4.5. Inour case, the P6 LiP is different from other fungal LiPand similar to MnP, since the optimum pH of P6 LiPwas 4.0. However, the P6 LiP had a wider range of pH.
Table 1. Yields and specific activities during purification of extracellular lignin peroxidase from 10 L culture.
Fraction Protein
(mg)
Total activity
(U)
Specific activity
(U/mg)
Purification
fold
Recovery of
activity (%)
Culture filtrate 1287.6 60 0.05 1.0 100.0
(NH4)2SO4 precipitation 621.4 49.9 0.08 1.6 83.2
DEAE-cellulose (D3) 18.2 38.6 2.1 42.8 64.3
CM-cellulose (C2) 6.8 25.3 3.7 74.2 42.1
Sephadex G-100
(S1) 1.6 11.7 7.5 150.4 19.6
Figure 2. SDS- PAGE of proteins from P. decumbens P6 showing the
purification efficiency at different stages. Lane 1: molecular weight
standards; lane 2: crude enzyme; lane 3: D3 (from DEAE); lane 4: C2
(from CM); lane 5: S1 (from Sephadex G-100).
Figure 3. SDS-PAGE pattern of purified LiP 1. molecular weight
markers; 2. purified LiP.
438 JinShui Yang et al.

At pH 9.0, 70.6% of the relative activity was stillretained, coinciding with the lignite degradation phe-nomenon. P6 LiP also exhibited relatively high temper-ature tolerance, retaining 62.5% of the relativeenzymatic activity at 55 �C. The optimum temperatureof P6 LiP was 45 �C, higher than that reported for LiPin other researches (Fakoussa & Hofrichter 1999;Kumari et al. 2002).Conclusively, our results confirmed the excretion of
LiP by P. decumbens P6. The LiP we obtained fromP. decumbens P6 was different from those produced byother fungi in the amino acid sequence, optimum pHand optimum temperature. These findings offered basicinformation for the utilization of this strain in thebiodegradation of lignite.
Acknowledgements
This research was a part of project No. 30370040supported by the National Science Foundation of Chinaand No.2003AA241170 supported by the Ministry ofScience and Technology of China (863 program). Wethank Dr. EnTao Wang for his constructive review ofthe manuscript.
References
Adler, E. 1977 Lignin chemistry - past, present and future. Wood
Science and Technology 11, 69–218.
Blanchette, R.A. 1991 Delignification by wood decay fungi. Annual
Review of Phytopathology 29, 381–398.
Crawford, D.L., Pometto, A.L. III & Crawford, R.L. 1983 Lignin
degradation by Streptomyces viridosporous: isolation and charac-
terization of new polymeric lignin degradation intermediate.
Applied and Environmental Microbiology 45, 898–904.
Duran, N., Ferrer, I. & Rodriguez, J. 1987 Ligninases from Chrysonilia
sitophila (TFB-27441). Applied Biochemistry and Biotechnology
16, 157–167.
Durie, R.A., Lynch, B.M. & Strenhell, S. 1960 Comparative studies of
brown coal and lignin.Australian Journal of Chemistry 13, 156–168.
Fakoussa, R.M. 1992 Mikroorganismen erschlie b en Kohle-Ressour-
cen. Bioengineering 4, 21–28.
Fakoussa, R.M. & Hofrichter, M. 1999 Biotechnology and microbi-
ology of coal degradation. Applied Microbiology and Biotechnology
52, 25–40.
Farrell, R.L., Murtagh, K.E., Tien, M., Mozuch, M.D. & Kirk, T.K.
1989 Physical and enzymatic properties of lignin peroxidase
isoenzymes from Phanerochaete chrysosporoium. Enzyme and
Microbial Technology 11, 322–328.
Gaskell, J., Stewart,P.,Kersten,P.J.,Covert,S.F.,Reiser, J.&Cullen,D.
1994 Establishment of genetic linkage by allelc-specific polymerase
chain reaction: application to the lignin peroxidase gene family of
Phanerochaete chrysosporium. Biotechnology 12, 1372–1375.
Glenn, J.K., Morgan, M.A. & Mayfield, M.B. 1983 An extracellular
H2O2-requiring enzyme preparation involved in lignin biodegrada-
tion by the white-rot basidiomycete Phanerochaete chrysosporium.
Archives of Biochemistry and Biophysics 242, 329–341.
Glumoff, T., Harvey, P.J., Molinari, S., Goble, M., Frank, G., Palmer,
J.M. & Leisola, M.S.A. 1990 Lignin peroxidase from Phanerocha-
ete chrysosporium-molecular and kinetic characterizartion of
isozymes. European Journal of Biochemistry 187, 515–520.
Guillen, F., Martınez, A.T. & Martınez, M.J. 1992 Substrate specificity
and properties of the aryl-alcohol oxidase from the ligninolytic
fungus Pleurotus eryngii. European Journal of Biochemistry 209,
603–611.
Gutierrez, A., Caramelo, L., Prieto, A., Martınez, M.J. & Martınez,
A.T. 1994 Anisaldehyde production and aryl-alcohol oxidase and
dehydrogenase activities in ligninolytic fungi of the genus Pleur-
otus. Applied and Environmental Microbiology 60, 1783–1788.
Guo, Y.J. 1991 The progress of SDS electrophoresis technology.
Progress in Biochemistry and Biophysics 18, 32–37 (in Chinese ).
Hatcher, P.G. 1990 Chemical structural models for coalified wood
(vitrinite) in low rank coal. Organic and Geochemistry 16, 959–970.
Hayatsu, R., Winans, R.E., Mcbeth, R.L., Scott, R.G., Moore, L.P. &
Studier, M.H. 1979 Lignin-like polymers in coal. Nature 278,
41–43.
Kantelinen, A., Hatakka, A. & Viikari, A. 1989 Production of lignin
peroxidase and laccase by Phlebia radiate. Applied Microbioogy
andl Biotechnology 31, 234–239.
Kirk, T.K. & Farrell, R.L. 1987 Enzymatic combustion: the microbial
degradation of lignin. Annual Review of Microbiology 41, 465–505.
Kumari, M., Yadav, R.S. & Yadav, K.D. 2002 Secretion of lignin-
peroxidase by Penicillium citrinum, Fusarium oxysporum and
Aspergillus terreus. Indian Journal of Experimental Biology 40,
802–806.
Kuwahara, M., Glenn, J.K., Morgan, M.A. & Gold, M.H. 1984
Separation and characterization of two extracellular H2O2-depen-
dent oxidases from ligninolytic cultures of Phanerochaete chrysos-
porium. FEBS Letters 169, 247–250.
Laborda, F., Monistrol, I.F., Luna, N. & Fernandez, M. 1999
Processes of liquefaction/solubilization of Spanish coals by micro-
organisms. Applied Microbiology and Biotechnology 52, 49–56.
Lamar, R.T., Larsen, M.J., & Kirk, T.K. 1990 Sensitivity to and
degradation of pentachlorophenol by Phanerochaete sp. Applied
and Environmental Microbiology 56, 3519–3526.
Ramachandra, M., Crawford, D.L. & Hertel, G. 1988 Characteriza-
tion of an extracellular lignin peroxidase of the lignocellulolytic
Actinomycete Streptomyces Viridosporus. Applied and Environmen-
tal Microbiology 12, 3057–3063.
Ramachandra, M., Crawford, D.L. & Pometto, A.L III. 1987
Extracellular enzyme activities during lignocellulose degradation
by Streptomyces spp.: A comparative study of wild-type and
Table 2. Comparison of N-terminal amino acid sequences of Penicillium decumbens P6 and other fungal peroxidase sequences.
Accession
number
Strains origin and peroxidases N terminal amino acid sequences
Penicillium decumbens P6 LiP V L L P A D E K N A
Q02567 Phanerochaete chrysosporium MnP 1 V L L K G V G F P G
AAA62243 Phanerochaete chrysosporium MnP H3 V L L K G V G F P G
A32630 Phanerochaete chrysosporium MnP H4 V L L K G T G F P G
JC2579 Ceriporiopsis subvermispora MnP 1 V L L K G V G F P G
Q42517 Armoracia rusticana Peroxidase N V L L D G T N S E K
Q9SZH2 Arabidopsis thaliana Peroxidase 43 V L L S A A H T I G
Lignin peroxidases from Penicillium decumbens P6 439

genetically manipulated strains. Applied and Environmental Micro-
biology. 12, 2754–2760.
Rothschild, N., Novotny, C., Sasek, V. & Dosoretz, C.G. 2002
Ligninolytic enzymes of the fungus Irpex lacteus (Polyporus
tulipiferae) isolation and characterization of lignin peroxidase.
Enzyme and Microbial Technology 31, 627–633.
Tien, M. & Kirk, T.K. 1984 Lignin-degrading enzyme from Phanero-
chaete chrysosporium: purification, characterization, and catalytic
properties of a unique H2O2–requiring oxygenase. Proceedings of
the National Academy of Sciences, USA 81, 2280–2284.
Yang J.S. 2004 Purification and characterication of lignin peroxidases
from lignite degradation strain-Penicillium decumbens P6. Ph.D
Thesis, CAU, Beijing, China.
Yang, J.S., Yuan, H.L. & Chen, W.X. 2004 Studies on extracellular
enzyme of lignite degrading fungi-Penicillium sp. P6. China
Environmental Science 24, 24–27 (in Chinese).
Yuan, H.L., Cai, Y.Q., Zhou, X.G. & Chen, W.X. 1999 Breeding of
lignite degrading fungi and analysis of the degraded products.
Chinese Journal of Applied and Environmental Biology 5(Suppl),
21–24 (in Chinese).
Yuan, H.L., Cai, Y.Q., Zhou, X.G. & Chen, W.X. 2000 Study on
chemical properties of humic acid of microbial degraded lignite.
Environmental Chemistry 19, 240–243 (in Chinese ).
Yuan, H.L., Wang, F.Q., Li, B.Z. & Chen W.X. 2002 Biological
activation of humic acid derived from lignite degraded by micro-
organism. Acta Pedologica Sinica 39, 129–134 (in Chinese).
440 JinShui Yang et al.

Growth and survival potentials of immobilized diazotrophic cyanobacterial isolates
exposed to common ricefield herbicides
Surendra Singh and Pallavi Datta*Algal Biotechnology Laboratory, Department of Biological Science, Rani Durgavati University, Jabalpur 482001(M.P.), India*Author for correspondence: Tel.: +0761-2609519, Fax: +0761-2603752,E-mail: [email protected]
Keywords: Biofertilizers, cyanobacteria, herbicides, immobilization, survivability of immobilized cyanobacteria
Summary
The effect of graded concentrations of four common ricefield herbicides (Arozin, Butachlor, Alachlor, 2,4-D) ondiazotrophic growth, macromolecular contents, heterocyst frequency and tolerance potentials of Ca-alginateimmobilized diazotrophic cyanobacterial isolates Nostoc punctiforme, N. calcicola, Anabaena variabilis, Gloeocapsasp., Aphanocapsa sp. and laboratory strain N. muscorum ISU (Anabaena ATCC 27893) was studied and comparedwith free-living cultures. Cyanobacterial isolates showed progressive inhibition of growth with increasing dosage ofherbicides in both free and immobilized states. There were significant differences in the relative toxicity of the fourherbicides. Arozin proved to be more growth toxic in comparison to Alachlor, Butachlor and 2,4-D. Growthperformance of the immobilized cyanobacterial isolates under herbicide stress showed a similar diazotrophic growthpattern to free cells with no difference in lethal and sub-lethal dosages. However, at lethal concentrations ofherbicides, the immobilized cells exhibited prolonged survivability of 14–16 days as compared to their free-livingcounterparts (8–12 days). The decline in growth, macromolecular contents and heterocyst frequency was found tobe similar in both the states in graded dosages of herbicides. Of the test organisms, A. variabilis showed maximumnatural tolerance towards all the four herbicides tested. Evidently immobilization by Ca-alginate seems to provideprotection to the diazotrophic cyanobacterial inoculants to a certain extent against the growth-toxic action ofherbicides.
Introduction
Cyanobacteria are oxygenic, photosynthetic, prokary-otes that grow and multiply at the simple expense ofwater, light and air (Fay 1983). They are cosmopol-itan in distribution, capable of growth and multipli-cation in a wide range of ecological habitats (Whitton& Potts 2000). The dual capacity of fixing atmosphericcarbon and nitrogen makes them attractive as asource of nitrogenous biofertilizer in rice agriculture(Stewart et al. 1987). Extensive and regular use ofherbicides in modern rice agriculture is reported toadversely affect the diversity, biology or even sustain-ability of cyanobacteria often leading to their com-plete elimination from the field (Padhy 1985; Singhet al. 2003). Thus strategy is required to improve theecological viability of biofertilizer strains of cyano-bacteria under herbicide stress. Biological actions ofcommon ricefield herbicides particularly Arozin, 2,4-D,Butachlor and Alachlor on free-living diazotrophiccyanobacteria include inhibition of growth, macromo-
lecular synthesis, photosynthesis, nitrogenase and glu-tamine synthetase activity has been investigated (Singhet al. 1978; Singh & Tiwari 1988; Goyal et al. 1991;Leganes & Fernandez 1992; Fairchild et al. 1998). Butthe action of such herbicides on biofertilizer strains ofdiazotrophic cyanobacteria in an immobilized statehas not yet been investigated, despite the reported roleof immobilized N2-fixing cyanobacteria in increasingchlorophyll content, rice grain and straw yield ofpaddy crop (Kannaiyan et al. 1997). To furtherimprove cyanobacterial biofertilizer technology itwould be of great interest to investigate the perfor-mance of immobilized biofertilizer strains of diazo-trophic cyanobacteria in the presence of ricefieldherbicides. Therefore, the performance of certainnaturally occurring biofertilizer strains of diazotrophiccyanobacteria (N. muscorum ISU, N. punctiforme,N. calcicola, Anabaena variabilis, Aphanocapsa sp.and Gloeocapsa sp.) in an immobilized state exposedto four common ricefield herbicides (Arozin, 2,4-D,Butachlor and Alachlor) was examined.
World Journal of Microbiology & Biotechnology (2005) 21:441–446 � Springer 2005
DOI 10.1007/s11274-004-1877-1

Materials and methods
Source of organisms and growth conditions
The diazotrophic cyanobacteria Nostoc punctiforme,Nostoc calcicola, Anabaena variabilis, Gloeocapsa sp.and Aphanocapsa sp. used in the present investigationwere isolated from ricefields (Singh et al. 2000). Stan-dard laboratory strain Nostoc muscorum ISU (ATCC27893) was obtained from Prof. A.K. Kashyap, Depart-ment of Botany, Banaras Hindu University, Varanasi,India. Cultures were grown in BG11 medium (Rippkaet al. 1979) devoid of any combined nitrogen source(N2-medium). Cultures were incubated in an air-condi-tioned culture room maintained at 25 ± 1 �C andilluminated with cool day fluorescent lights. The photonflux density of light on the surface of the vessel was45 lE m2 s)1 for 18 h day)1.
Immobilization technique
The cells were immobilized by entrapment in sodiumalginate gel following the method of Codd (1987). Theimmobilized cells were freed for analytical purposewithout loss of viability by placing the washed Ca-alginate beads in 0.5 M trisodium citrate buffer for20 min.
Growth characterization, macromolecular synthesis andheterocyst differentiation of immobilized cyanobacterialisolates under graded concentrations of herbicides
The impact of increasing concentrations (0–100 mg l)1)of the herbicides Arozin, Alachlor, Butachlor and 2,4-Don the growth and survival of immobilized diazotrophiccyanobacterial isolates was determined in N2-mediumby monitoring variations in the concentrations ofchlorophyll a pigments (Mackinney 1941) at regularintervals of 24 h as a parameter of growth. For all theexperiments, exponentially growing cells (6 days old)were harvested by centrifugation (3000 · g, 5 min),washed three times with sterilized double distilled waterand divided into two equal parts. One half wasdispensed as such equally in assay flasks as free cellswhile the other half was used to obtain Ca-alginateimmobilized cells. The beads so obtained were washedwith sterile distilled water and dispensed in equalnumber in their respective assay flasks. The initialbiomass inoculated into each flask was equivalent to15 lg chlorophyll a. The cultures were incubated underphotoautotrophic growth conditions. The untreatedcultures were taken as control. All the experiments wererepeated three times. To test the correlation between thegraded concentration of herbicides and its effect ongrowth measured in terms of chlorophyll a, in free andimmobilized cells, the Spearman–Rank correlation coef-ficient (rs) was determined.The phycocyanin and phycoerythrin pigments were
determined using the method of Benett & Bogorad
(1973). Total cellular protein was estimated by theLowry method. The heterocyst frequency was deter-mined microscopically and expressed as the total num-ber of heterocysts occurring per 100 vegetative cells foreach cyanobacterial culture. The specific growth rateconstant was calculated by applying the method ofKratz & Myers (1955).Binomial tests were performed to examine whether the
proportion of free and immobilized cells under sub-lethal concentration of herbicides differs significantlyfrom the test proportion. The growth, macromolecularcontent and heterocyst frequency of free cells werecompared with immobilized cells under herbicide stressusing paired t-test in order to account for any significantdifference, using 0.05 level of significance as the criticalvalue for rejecting the null hypothesis.
Herbicides
All the herbicides used were of commercial grade,Arozin (30 EC): Trade name Arozin; Alachlor (45.1EC): Trade name – Lasso; Butachlor (93.34 EC): Tradename – Machete; 2,4-D Ethyl ester (38 EC): Tradename-Slash. Arozin was obtained from Agr. Evo. Ltd.(Ankleshwar, India), Alachlor and Butachlor from Evidand Co Pesticides Pvt. Ltd. (Ankleshwar, India) and2,4-D Ethyl ester from Monsanto Chemicals of IndiaLtd. (Mumbai, India). Different concentrations of therespective herbicides were prepared by appropriatedilution (according to EC) in precooled double distilledwater and were filter sterilized through a Milliporemembrane filter.
Results
The growth and survival potential of free and immo-bilized cyanobacterial isolates under herbicide(s) stresswas monitored by exposing N2-grown cultures tograded concentrations of herbicides. Free and immo-bilized cyanobacterial isolates showed gradual butsubstantial inhibition in growth, with increasing con-centration of herbicides (data not shown) showing astrong negative correlation exhibited by their rs (Spear-man–Rank correlation coefficient) values which laybetween )1 and )0.5. Growth kinetics of diazotrophiccultures in both free and immobilized states followedthe same pattern. Immobilized cells even under gradeddosage of herbicides followed similar growth kinetics tofree cells, as evident from their growth rates (Tables 1and 2). The complete lysis of the immobilized culturesoccurred at 10 mg l)1 (Aphanocapsa sp.), 15 mg l)1 (N.muscorum; Gloeocapsa sp.), 20 mg l)1 (N. punctiforme;N. calcicola), 25 mg l)1 (A. variabilis) of Arozin;20 mg l)1 (Aphanocapsa sp.; Gloeocapsa sp.; N. musco-rum), 25 mg l)1 (A. variabilis; N punctiforme; N.calcicola) of Alachlor; 20 mg l)1 (N. muscorum; Ap-hanocapsa sp.; N. calcicola), 25 mg l)1 (A. variabilis; N.punctiforme; Gloeocapsa sp.) of Butachlor; 15 mg l)1
442 S. Singh and P. Datta

(Aphanocapsa sp; N. muscorum), 20 mg l)1 (Gloeocapsasp.), 25 mg l)1 (N. punctiforme; N. calcicola; A. varia-bilis) of 2,4-D. These dosages were considered as thelethal dosages and the dosages viz. 5 mg l)1 (N.muscorum; N. calcicola; Aphanocapsa sp.; Gloeocapsasp.), 10 mg l)1 (N. punctiforme), 20 mg l)1 (A. variabi-lis) of Arozin; 15 mg l)1 (N. muscorum; Aphanocapsasp; Gloeocapsa sp.), 20 mg l)1 (A. variabilis; N puncti-forme; N. calcicola) of Alachlor; 10 mg l)1 (N. musco-rum); 15 mg l)1 (N. calcicola; Gloeocapsa sp.;Aphanocapsa sp.), 20 mg l)1 (A. variabilis) of Buta-chlor; 5 mg l)1 (Gloeocapsa sp.; Aphanocapsa sp.),10 mg l)1 (N. muscorum), 15 mg l)1 (N. calcicola),
20 mg l)1 (A. variabilis; N punctiforme) of 2,4-D wereconsidered as sub-lethal dosages for the isolates. Thecomplete lysis of the cultures at lethal dosages ofherbicides under immobilized conditions took place at14–16 days of incubation whereas in the free state thelysis was recorded at 8–12 days of incubation indifferent strains. Similarly under sub-lethal dosagesthe survivability of free cells was recorded up to20–25 days, whereas immobilized cells survived up to35–45 days of incubation.
Table 1. Effect of graded concentration of herbicides on growth rates
of free-living cyanobacterial isolates.
Herbicide (mg l)1) Butachlor Alachlor Arozin 2,4-D
Nostoc muscorum
0.0 1.1 1.1 1.1 1.1
2.0 1.0 1.1 1.5 1.1
5.0 0.6 0.6 0.4 0.5
10.0 0.4 0.3 0.1 0.4
15.0 NDa 0.1 ND ND
20.0 ND ND ND ND
25.0 ND ND ND ND
Nostoc punctiforme
0.0 1.0 1.0 1.0 1.0
2.0 1.0 1.0 1.0 1.0
5.0 1.0 1.0 0.6 0.6
10.0 0.7 0.6 0.4 0.6
15.0 0.6 0.6 ND 0.6
20.0 ND 0.4 ND 0.4
25.0 ND ND ND ND
Nostoc calcicola
0.0 0.9 0.9 0.9 0.9
2.0 0.9 0.9 0.9 1.0
5.0 0.6 0.7 0.4 0.6
10.0 0.3 0.6 0.2 0.5
15.0 0.1 0.6 0.1 0.3
20.0 ND 0.2 ND 0.1
25.0 ND ND ND ND
Anabaena variabilis
0.0 1.1 1.1 1.1 1.1
2.0 1.0 1.1 1.0 1.1
5.0 1.0 0.9 0.8 1.0
10.0 0.7 0.7 0.8 0.8
15.0 0.7 0.7 0.6 0.6
20.0 0.3 0.4 0.5 0.3
25.0 ND ND ND ND
Aphanocapsa sp.
0.0 0.9 0.9 0.9 0.9
2.0 0.9 0.9 0.9 0.1
5.0 0.5 0.5 ND ND
10.0 0.5 0.5 ND ND
15.0 0.3 0.3 ND ND
20.0 ND ND ND ND
25.0 ND ND ND ND
Gloeocapsa sp.
0.0 0.9 0.9 0.9 0.9
2.0 0.8 0.9 0.9 0.9
5.0 0.6 0.7 0.1 0.3
10.0 0.4 0.6 ND ND
15.0 ND 0.5 ND ND
20.0 ND 0.3 ND ND
25.0 ND ND ND ND
aNot detectable.
Table 2. Effect of graded concentration of herbicides on growth rates
of immobilized cyanobacterial isolates.
Herbicide (mg l)1) Butachlor Alachlor Arozin 2,4-D
Nostoc muscorum
0.0 1.0 1.0 1.0 1.0
2.0 1.0 1.0 1.0 1.0
5.0 0.7 1.0 0.4 0.5
10.0 0.4 0.9 0.1 0.4
15.0 NDa 0.6 ND ND
20.0 ND 0.5 ND ND
25.0 ND ND ND ND
Nostoc punctiforme
0.0 0.9 0.9 0.9 0.9
2.0 0.9 1.0 0.9 1.0
5.0 0.6 0.9 0.5 0.6
10.0 0.5 0.9 0.4 0.6
15.0 0.4 0.6 ND 0.5
20.0 ND 0.4 ND 0.2
25.0 ND ND ND ND
Nostoc calcicola
0.0 1.0 1.0 1.0 1.0
2.0 1.0 1.0 1.0 1.0
5.0 0.7 0.8 0.6 0.9
10.0 0.6 0.8 0.5 0.6
15.0 0.3 0.7 0.4 0.9
20.0 ND 0.6 ND 0.6
25.0 ND ND ND ND
Anabaena variabilis
0.0 1.0 1.0 1.0 1.0
2.0 1.0 1.0 1.0 1.0
5.0 0.9 1.0 0.8 1.0
10.0 0.7 0.8 0.7 0.8
15.0 0.7 0.8 0.5 0.6
20.0 0.4 0.5 0.4 0.4
25.0 ND ND ND ND
Aphanocapsa sp.
0.0 1.0 1.0 1.0 1.0
2.0 0.9 1.0 0.9 1.0
5.0 0.7 0.7 0.5 0.9
10.0 0.6 0.6 ND 0.6
15.0 0.5 0.5 ND 0.5
20.0 ND ND ND 0.2
25.0 ND ND ND ND
Gloeocapsa sp.
0.0 0.9 0.9 0.9 0.9
2.0 0.9 0.9 0.9 0.9
5.0 0.9 0.7 0.4 0.3
10.0 0.5 0.7 ND ND
15.0 0.4 0.6 ND ND
20.0 0.2 0.4 ND ND
25.0 ND ND ND ND
aNot detectable.
Immobilized cyanobacteria exposed to herbicides 443

Arozin as compared to 2,4-D, Alachlor and Butachlorhad shown most deleterious effect on growth of all thecyanobacterial isolates both in free and immobilizedstate (Table 3). As compared to other strains, thehighest inhibition in chlorophyll a content was observedin N. muscorum. The initial chlorophyll a (lg ml)1) of0.24 in free-living cells was increased to 1.61 in untreatedcontrol culture as compared to, 0.56 chlorophyll in cellstreated with sub-lethal dosages of Arozin on day 8 ofgrowth. Similarly 1.54 and 0.60 chlorophyll a contentwas found in control and treated culture of immobilizedN. muscorum with respect to the initial level of 0.2. Theprotein content and heterocyst frequency followed asimilar pattern of inhibition to chlorophyll a. Phycobi-lins were substantially reduced in free or immobilizedisolates as compared to chlorophyll a following treat-ment with Arozin (Tables 4 and 5).In 2,4-D -treated cultures the phycobilin pigments and
heterocyst frequency were more adversely affected thanchlorophyll a and protein both in free and immobilizedconditions (Tables 4, 5 and 7). On day 8 of growth,phycocyanin (lg ml)1) was significantly reduced to 0.45and 0.75 from an initial level of 1.40 in the free and 1.21in the immobilized state respectively. Likewise phycoer-ythrin (lg ml)1) was markedly reduced to 0.02 in thefree state and 0.07 in the immobilized state from aninitial level of 0.10 at a sub-lethal dosage in N.muscorum.
Microscopic examination of the cells revealed that theheterocyst frequency which was 2%–3% in the filamen-tous forms in both free and immobilized states inuntreated diazotrophic cultures had increased to 5–9%in the immobilized state at day 8 of growth, but only a4–6% increase was recorded in the free cultures. At sub-lethal dosages of herbicides, heterocyst frequency wasreduced to 16–37% from the initial frequency in freecultures. However, under immobilized conditions, nochange in heterocyst frequency was recorded in the testcyanobacterial strains from the initial frequency on day8 of growth (data not shown).Butachlor, an inhibitor of protein synthesis showed a
more marked inhibition of total protein content than ofchlorophyll a and heterocyst frequency (Table 6).Significant reduction in protein content (lg ml)1) wasrecorded at a sub-lethal dosage in N. muscorum andN. calcicola where the initial level of 12.0 and 11.2 wasreduced to 6.0 and 4.1 in free, and 9.5 and 7.5 inimmobilized conditions respectively by the end of day 8of growth. Phycobilin pigments followed a similar trendof inhibition (Tables 4 and 5).Alachlor, which is also an inhibitor of protein
synthesis exhibited marked inhibition in total proteincontent (Table 6). At sub-lethal concentrationsmaximum inhibition in protein content was observedin N. calcicola and Gloeocapsa sp. where the proteinlevel (lg ml)1) declined to 10.0 and 11.5 from initial
Table 3. Effect of sub-lethal dosages of herbicides on percent inhibition of chlorophyll a content of cyanobacterial isolates at the end of day 8 of
diazotrophic growth.
Cyanobacterial isolates Arozin Alachlor Butachlor 2,4-D
Fa Ib F I F I F I
N. muscorum ISU 65 61 ( p = 0.7)c 53 47 ( p = 0.5) 53 43 ( p = 0.3) 57 52 ( p = 0.6)
N. punctiforme 49 45 ( p = 0.7) 35 28 ( p = 0.4) 41 35 ( p = 0.5) 46 41 ( p = 0.6)
N. calcicola 44 37 ( p = 0.4) 39 30 ( p = 0.3) 34 27 ( p = 0.2) 36 30 ( p = 0.5)
A. variabilis 60 56 ( p = 0.7) 36 29 ( p = 0.4) 42 34 ( p = 0.3) 47 38 ( p = 0.3)
Aphanocapsa sp. 62 51 ( p = 0.3) 47 42 ( p = 0.6) 50 41 ( p = 0.3) 59 51 ( p = 0.4)
Gloeocapsa sp. 67 53 ( p = 0.2) 41 38 ( p = 0.7) 43 36 ( p = 0.4) 53 47 ( p = 0.5)
a Free cells.b Immobilized cells.c The p-values calculated from binomial test on the paired absolute data indicate that the proportion of free and immobilized cells does not
differ significantly from the test value (0.5).
Table 4. Effect of sublethal dosages of herbicides on percent inhibition of phycocyanin content of cyanobacterial isolates at the end of 8th day of
diazotrophic growth.
Cyanobacterial isolates Arozin Alachlor Butachlor 2,4-D
Fa Ib F I F I F I
N. muscorum ISU 77 71 ( p = 0.6)c 71 61 ( p = 0.4) 68 61 ( p = 0.5) 94 89 ( p = 0.7)
N. punctiforme 65 59 ( p = 0.6) 70 62 ( p = 0.5) 68 63 ( p = 0.7) 86 79 ( p = 0.6)
N. calcicola 57 53 ( p = 0.7) 74 67 ( p = 0.5) 49 42 ( p = 0.5) 85 78 ( p = 0.6)
A. variabilis 75 63 ( p = 0.3) 63 53 ( p = 0.3) 70 61 ( p = 0.4) 83 76 ( p = 0.6)
Aphanocapsa sp. 78 63 ( p = 0.2) 68 61 ( p = 0.5) 80 72 ( p = 0.5) 79 73 ( p = 0.6)
Gloeocapsa sp. 69 63 ( p = 0.6) 69 62 ( p = 0.5) 79 68 ( p = 0.4) 70 74 ( p = 0.7)
a Free cells.b Immobilized cells.c The p-values calculated from binomial test on the paired absolute data indicate that the proportion of free and immobilized cells does not
differ significantly from the test value (0.5).
444 S. Singh and P. Datta

levels of 11.2 and 12.2 respectively in free state. Underimmobilized conditions protein was reduced to 12.8 inN. calcicola from the initial level of 14.2 but no changewas recorded in case of Gloeocapsa sp. by the end of day8 of growth. A similar pattern of inhibition was observedin case of phycobilin pigments (Tables 4 and 5).
Discussion
The results of growth rates of free and immobilized cellsindicate that immobilization does not affect the multi-
plication of cells, even in the presence of herbicidessuggesting that immobilization had no modifying effecton the overall growth behaviour of cells. No differencein the lethal and sub-lethal dosages of herbicides wasrecorded for both the free and immobilized states,indicating that immobilization did not modify thesensitivity of cultures towards the herbicide toxicity.Nevertheless significant delay in lysis of the cultures atlethal and sub-lethal dosages of herbicides under theimmobilized state does suggest that immobilized cellsare somehow able to survive for longer periods of time.Immobilization-induced longevity of cultures does indi-
Table 5. Effect of sub-lethal dosages of herbicides on percent inhibition of phycoerythrin content of cyanobacterial isolates at the end of day 8 of
diazotrophic growth.
Cyanobacterial isolates Arozin Alachlor Butachlor 2,4-D
Fa Ib F I F I F I
N. muscorum ISU 89 83 ( p = 0.6)c 81 75 ( p = 0.6) 81 75 ( p = 0.6) 97 88 ( p = 0.5)
N. punctiforme 68 57 ( p = 0.3) 82 69 ( p = 0.3) 77 65 ( p = 0.3) 91 83 ( p = 0.5)
N. calcicola 70 65 ( p = 0.7) 80 70 ( p = 0.4) 69 60 ( p = 0.4) 70 63 ( p = 0.5)
A. variabilis 80 69 ( p = 0.4) 70 58 ( p = 0.2) 74 67 ( p = 0.5) 86 79 ( p = 0.6)
Aphanocapsa sp. 85 69 ( p = 0.2) 75 66 ( p = 0.4) 82 74 ( p = 0.2) 84 79 ( p = 0.7)
Gloeocapsa sp. 74 66 ( p = 0.5) 82 71 ( p = 0.4) 75 64 ( p = 0.7) 77 68 ( p = 0.4)
a Free cells.b Immobilized cells.c The p-values calculated from binomial test on the paired absolute data indicate that the proportion of free and immobilized cells does not
differ significantly from the test value (0.5).
Table 6. Effect of sub-lethal dosages of herbicides on percent inhibition of protein content of cyanobacterial isolates at the end of day 8 of
diazotrophic growth.
Cyanobacterial isolates Arozin Alachlor Butachlor 2,4-D
Fa Ib F I F I F I
N. muscorum ISU 47 42 ( p = 0.6)c 68 63 ( p = 0.7) 88 75 ( p = 0.3) 52 46 ( p = 0.5)
N. punctiforme 41 33 ( p = 0.3) 68 64 ( p = 0.7) 76 70 ( p = 0.6) 53 46 ( p = 0.5)
N. calcicola 50 43 ( p = 0.5) 75 68 ( p = 0.5) 90 81 ( p = 0.5) 40 33 ( p = 0.4)
A. variabilis 73 68 ( p = 0.7) 69 63 ( p = 0.6) 68 61 ( p = 0.5) 60 53 ( p = 0.5)
Aphanocapsa sp. 58 51 ( p = 0.5) 66 62 ( p = 0.7) 77 71 ( p = 0.6) 51 44 ( p = 0.5)
Gloeocapsa sp. 57 54 ( p = 0.8) 72 63 ( p = 0.4) 69 59 ( p = 0.4) 50 43 ( p = 0.5)
a Free cells.b Immobilized cells.c The p-values calculated from binomial test on the paired absolute data indicate that the proportion of free and immobilized cells does not
differ significantly from the test value (0.5).
Table 7. Effect of sub-lethal dosages of herbicides on percent inhibition of heterocyst frequency of cyanobacterial isolates at the end of day 8 of
diazotrophic growth.
Cyanobacterial isolates Arozin Alachlor Butachlor 2,4-D
Fa Ib F I F I F I
N. muscorum ISU 50 42 ( p = 0.4)c 50 38 ( p = 0.2) 50 40 ( p = 0.3) 75 64 ( p = 0.3)
N. punctiforme 52 45 ( p = 0.2) 52 42 ( p = 0.3) 52 44 ( p = 0.4) 76 73 ( p = 0.4)
N. calcicola 50 42 ( p = 0.4) 50 39 ( p = 0.2) 50 40 ( p = 0.3) 74 58 ( p = 0.2)
A. variabilis 68 59 ( p = 0.4) 45 38 ( p = 0.4) 44 39 ( p = 0.6) 74 67 ( p = 0.5)
a Free cells.b Immobilized cells.c The p-values calculated from binomial test on the paired absolute data indicate that the proportion of free and immobilized cells does not
differ significantly from the test value (0.5).
Immobilized cyanobacteria exposed to herbicides 445

cate that the Ca-alginate gel matrix possibly helps indelaying the acute toxicity of herbicides to the cyano-bacterial isolates as observed in bacterial cultures of E.coli, P. putida and S. aureus where immobilization inCa-alginate beads reduced the growth inhibition causedby bacteriostatic concentrations of phenol (Kewelohet al. 1989) indicating protection of bacterial cellsagainst the toxicity of phenol.The highest reduction of phycobilin pigments (a
nitrogen reserve) does suggest that under herbicide stressthere was a diversion to meet the nitrogen demand,possibly through the induction of proteolytic enzymes.Free-living herbicide-treated cultures exhibited a markedreduction in heterocyst frequency, while no such reduc-tion was noticed in immobilized cultures under similarset of conditions. It seems that immobilization protectsheterocyst differentiation to some extent. It is suggestedthat physical pressure of entrapment and low oxygenicconditions either induces heterocyst differentiation orrelieves heterocyst differentiation control mechanismsfrom cellular differentiation control mechanism (Mat-tiason & Hagerland 1982).It is clear from the foregoing discussion that cyano-
bacterial isolates have a higher frequency of heterocystsand prolonged survivability under the immobilized statethan their free-living counterparts under herbicidestress. This protective action could be due to a mechan-ical diffusion barrier provided by the alginate matrix upto a certain extent limiting the fast access of herbicidesto the cells present in the core of the beads, thusallowing certain cells to grow and multiply normally fora longer period of time, although statistical analysisdoes not suggest any significant variation in theresponses of free or immobilized cultures in sub-lethaldosages of herbicides.The sustained growth, heterocyst differentiation and
survival of immobilized diazotrophic cyanobacteriaunder graded dosages of common ricefield herbicidesdo suggest that N2-fixing cyanobacteria in the immobi-lized state could be used as better inocula deliverysystem for enhancing rice agriculture.
Acknowledgements
Thanks are due to Head, Department of BiologicalScience, R.D. University, Jabalpur (M.P.), India forfacilities and to C.S.I.R. and U.G.C., New Delhi forfinancial assistance.
References
Benett, A. &Bogorad, L. 1973Complementary chromatic adaptation in
filamentous blue green algae. Journal of Cell Biology 58, 419–435.
Codd, G.A. 1987 British Phycological Society. News Letter 24.
Fay, P. 1983 The Blue Greens (Cyanophyta - Cyanobacteria). Arnold-
Heinemann, London. ISBN 071312878X.
Fairchild, J.F., Ruessler, D.S. & Carlson, A.R. 1998 Comparative
sensitivity of five species of macrophytes and six species of algae to
atrazine, metribuzin, alachlor and metachlor. Environmental Tox-
icology and Chemistry 17, 1830–1834.
Goyal, D., Roy-Choudhury, P. & Kaushik, B.D. 1991 Effect of two
new herbicides on the growth and nitrogen fixation in Anabaena
and Tolypothrix. Acta Botanica Indica 19, 25–28.
Kannaiyan, S., Aruna, S.J., Merina-Prem Kumari, S. & Hall, D.O.
1997 Immobilized cyanobacteria as a biofertilizer for rice crops.
Journal of Applied Phycology 9, 167–174.
Keweloh, H., Heipieper, H.A. & Rehm, H.J. 1989 Protection of
bacteria against toxicity of phenol by immobilization in calcium
alginate. Biotechnology 31, 383–389.
Kratz, W.A. & Meyers J. 1955 Nutrition and growth of several blue
green algae. American Journal of Botany 42, 282–287.
Leganes F. & Fernandez-Valientl E. 1992 Effect of phenoxy acetic
herbicides on growth photosynthesis and nitrogenase activities in
cyanobacteria from ricefield. Archives of Environmental Contami-
nation and Toxicology 22, 130–134.
Mackinney, G. 1941 Absorption of light by chlorophyll solutions.
Journal of Biological Chemistry 140, 315–322.
Mattiason, B. & Hahn-Hagerland, B. 1982 Micro environmental
effects on metabolic behaviour of immobilized cells. A hypothesis.
European Journal of Applied Microbiology 16, 52–62.
Padhy, R.N. 1985 Cyanobacteria and pesticides. Residue Reviews 95,
1–44.
Rippka, R., Dereulles, J., Waterbury, J.B., Herdman, M. & Stanier,
R.V. 1979 Generic assignments, strain histories and properties of
pure cultures of cyanobacteria. Journal of General Microbiology
111, 1–61.
Singh, L.J. & Tiwari, D.N. 1988 Effect of selected rice field herbicides
on photosynthesis, respiration and nitrogen assimilating enzyme
system of paddy soil diazotrophic cyanobacteria. Pesticide Bio-
chemistry and Physiology 31, 120–128.
Singh, S., Datta, P. & Patel R. 2000 Cyanobacterial flora and
properties of ricefield soils of Jabalpur and Katni districts of
Madhya Pradesh. Phykos 39, 135–140.
Singh, S.,Datta, P.&Patel,R. 2003Survival and growthof diazotrophic
cyanobacterial isolates exposed to ricefield herbicides. Bulletin of
Environmental Contamination and Toxicology 70, 1052–1058.
Singh, V.P., Singh, B.D., Singh, R.B., Dhar, B., Singh, R.M. &
Shrivastava, J.S. 1978 Effect of herbicide Alachlor on growth and
nitrogen fixation in cyanobacteria and rhizobia. Indian Journal of
Experimental Biology 16, 1325–1327.
Stewart, W.D.P., Rowell, P., Kerby, N.W., Reed, R.H. & Machray,
G.C. 1987 N2-fixing cyanobacteria and their potential application.
Philosophical Transactions of the Royal Society of London 317,
245–258.
Whitton, B.A. & Potts, M. 2000 Introduction to the cyanobacteria. In
The Ecology of Cyanobacteria, eds. Whitton, B.A. & Potts, M.
Kluwer Academic Publishers. ISBN 071312878X.
446 S. Singh and P. Datta

Characterization of a wine-like beverage obtained from sugarcane juice
Yadira Rivera-Espinoza, Elsa Valdez-Lopez and Humberto Hernandez-Sanchez*Departamento de Graduados e Investigacion en Alimentos, Escuela Nacional de Ciencias Biologicas, InstitutoPolitecnico Nacional, Carpio y Plan de Ayala, C.P. 11340, Mexico, D.F., Mexico*Author for correspondence: Tel.: 5729-6000 ext. 62461, Fax: 5729-6000 ext. 62359, E-mail: [email protected]
Keywords: Alcoholic beverage, fermentation, sugarcane juice, wine, yeast
Summary
Two yeasts (Saccharomyces cerevisiae and Saccharomyces cerevisiae var. ellipsoideus) were tested for their ability toferment sugarcane (Saccharum officinarum) juice. In order to do this, time course studies of volatile, fixed, and totalacidity, pH, alcohol, total sugars and �Bx were performed and the presence of methanol was tested. Thefermentation studies were carried out at 25, 28 and 30 �C and the juice was inoculated with 1 and 5% (v/v)suspensions of both yeasts containing 1 · 108 cells ml)1. Time course studies indicated a similar fermentativepattern at the three temperatures evaluated, hence 25 �C was chosen as the cheapest alternative. The size of theinoculum made no difference in the fermentation. Analyses of the sugarcane juice wine showed the following results:pH, 3.2; alcohol, 10 �GL; total solids, 16.5 g l)1; ash, 1.4 g l)1; total acidity, 5.4 g l)1; volatile acidity, 0.12 g l)1;fixed acidity, 5.3 g l)1 and no methanol was detected. Two additional products were obtained after adding passionfruit juice and roselle (Hibiscus sabdarifa Linn) concentrates. The fruit-flavoured wines were significantly preferred(P £ 0.05) over the plain product. These results indicated that the elaboration of wine-like beverages is a goodalternative use for sugarcane.
Introduction
Sugarcane, Saccharum officinarum L. is one of the tallestmembers of the grass family with the potential to growup to 14 ft high under tropical conditions. It has beenthe subject of much recent genetic improvement toincrease its sugar content, or to give it disease resistance.The sugarcane industry is the principal agroindustry
in Latin America. Mexico has 650, 000 ha of landplanted with sugarcane. Over the years, sugarcane hasbeen used as a source of sucrose, however, due to theintroduction of high fructose corn syrup (HFCS), acheaper sweetener, a dramatic reduction in the use ofsucrose by the food industry has occurred (Tijerina &Crespo 1998). It is very important then, to findalternative uses for this crop.Sugarcane juice composition may vary according to
cane variety, geographical location, cultural practices,maturity at harvest and also mechanical treatmentduring harvesting and transportation. The principalconstituents of cane juice are sugars, salts, organic acidsand other organic non-sugars such as proteins (Poelet al. 1998).Fresh sugarcane juice has been used as a thirst-
quenching drink in some places such as South East Asia(Khor et al . 1990) and also in Mexico and some parts ofSouth America. In addition, the sugarcane juice is an
excellent medium for fermentation in order to elaboratealcoholic beverages. Rum is produced from molasses,the final by-product in the manufacture of raw sugarfrom sugarcane and fresh juice has also been used as asubstrate to make traditional beverages (Tanimura et al.1977). However, there are no reports about the kineticsof the fermentation of sugarcane juice in order toelaborate a wine. In the ordinary sense of the word, wineis a fermented beverage produced from grapes only.Otherwise, the wine is given the prefix of the fruit fromwhich it originates (Voguel 2003). For simplicity,however, in this study, the word ‘‘wine’’ will be usedto name the fermented, but not distilled, beveragesobtained from sugarcane juice.In the traditional wine-making process, fermentation
is usually achieved using the natural biota existing onthe grape skins (Ubeda & Briones 2000); however,selected yeasts are currently being used to ferment asweet juice to produce grape and fruit wines. A youngwine’s fruity aromas and flavours come mainly from thegrapes, though some of the aroma is also producedduring the fermentation. The majority of volatile com-pounds of the grape aroma are known to be constituentsof many other fruits as well (Mingorance-Cazorla et al .2003).For this reason, the aim of this work was to explore
the possibility of the elaboration of a fermented
World Journal of Microbiology & Biotechnology (2005) 21:447–452 � Springer 2005
DOI 10.1007/s11274-004-1878-0

beverage harbouring the sweet characteristics of thesugarcane juice. It is hoped that our analysis willprovide some incentive for an eventual commercialproduction of wine from sugarcane juice.
Materials and methods
Sugarcane juice (substrate)
The substrate used was obtained from washed andpeeled sugarcane. Sugarcane was squeezed through aroller mill to extract the juice. Then, the juice wasfiltered to remove solids, pasteurized for 15 min at15 lb in)2, and its physical and chemical characteristicswere measured.
Yeast strains
In order to find the best yeast to ferment the sugarcanejuice, Saccharomyces cerevisiae and Saccharomyces ce-revisiae var. ellipsoideus strains from the MicrobiologyLaboratory collection of the Escuela Nacional deCiencias Biologicas were used.The yeast inoculum was grown in sugarcane juice with
orbital shaking at 160 rev min)1 for 2 days. A loopful ofthis stock culture was plated on malt extract agar andincubated at 28 �C for 2 days.The number of viable yeast expressed as colony
forming units per millilitre (c.f.u. ml)1) was estimated.Serial dilutions (in 0.9% NaCl) of each sample wereplated in triplicate and the plates were incubated at28 �C until the appearance of the colonies. The water toprepare the agar was substituted by sugarcane juice forconditioning of the yeast strains. The absorbance at590 nm of the serial dilution was also measured.
Fermentation
The filtered and pasteurized sugarcane juice wasadjusted to a pH between 3.5 and 4 with citric acidand to 20 �Brix (soluble solids). The initial populationof the yeast used for fermenting the juice was 1%(0.9 · 108 for S. cerevisiae and 1 · 108 cells ml)1 forS. c. var. ellipsoideus). Fermentation was carried out,in duplicate, in capped sterile flasks containing4000 ml of unsterile sugarcane juice at 30 �C withoutshaking for 7 days. �Brix and ethanol contents weremonitored.After yeast selection, fresh juice was used to carry out
a new fermentation. A 5% inoculum (containing1 · 108 cells ml)1) of cells was used to inoculate thejuice whose pH and �Brix content were previouslyadjusted. The inoculated juice was incubated at differenttemperatures: 25, 28 and 30 �C while monitoring �Brix,ethanol, total acidity, volatile acidity, reducing sugarsand methanol. Samples were taken from the flasks every24 h for analyses until a constant �Brix concentrationwas obtained.
Clarification
After the fermentation stopped, the liquid was clarifiedby centrifugation at 10,000 · g for 30 min at 5 �C andthen stored for about 2 weeks at 4 �C.
Flavour addition
Two additional products were obtained after addingpassion fruit (Passiflora edulis) or roselle flower (Hibis-cus sabdariffa L.) extract to the fermented beverage toincrease the acceptance of the wine, using a concentrateto wine ratio of 1:10.
Analyses
Sugarcane juice was analysed to determine the followingparameters (AOAC 2003): �Brix (AOAC 2003): �Brix(AOAC procedure number 31.009), moisture (AOACprocedure number 31.006), ash (AOAC procedurenumber 31.012), nitrogen (AOAC procedure number31.019), invert sugar (AOAC procedure number 31.034),acidity (AOAC procedure number 31.202) and pH(AOAC procedure number 31.203).The following parameters were analysed in the final
products: total acidity (AOAC procedure number11.035), total volatile acidity (AOAC procedurenumber 11.036), volatile acidity (AOAC procedurenumber 11.039), fixed acidity (AOAC procedure num-ber 11.040), alcohol (AOAC procedure number11.003), extract (AOAC procedure number 11.012),ash (AOAC procedure number 11.017) and methanol(AOAC procedure number 9.086).Sensory evaluation of the wines was carried out by a
semi-trained panel of 40 potential consumers. A ratingtest with a five-point hedonic scale was used and thefinal score was the average of individual scores. A one-way analysis of variance was used for the statisticalanalysis.
Results and discussion
The characteristics of the sugarcane juice were: pH, 5.1;�Brix, 19.7; total sugars, 200 g l)1; total acidity (citricacid), 1.16 g l)1; nitrogen, 2.3 g l)1, ash, 0.28 g l)1.
Fermentation
Figure 1 shows the substrate consumption and ethanolproduction during sugarcane juice fermentation at30 �C using a 1% suspension of the yeast S. cerevisiaeor S. c. var. ellipsoideus containing 1 · 108 cells ml)1
over a period of 7 days.Approximately 85% of soluble solids were consumed
by S. c. var. ellipsoideus after 6 days of fermentation,whereas 10% of soluble solids in the juice inoculatedwith S. cerevisiae were consumed. In consequence, theethanol concentration was higher in the juice fermented
448 Y. Rivera-Espinoza et al.

with S. c. var. ellipsoideus than in the one fermentedwith S. cerevisiae (10% v/v and 1.6% v/v, respectively).In addition, S. c. var. ellipsoideus improved the fruitinessin the bouquet. The results were significatively different(P £ 0.05).The depletion of most of the sugar content during the
fermentative process showed that S. c. var. ellipsoideuswas better to ferment the sugarcane juice than S.cerevisiae. No change was detected in �Brix after 6 days.The results obtained with S. c. var. ellipsoideus are inagreement with Regodon et al . (1997), when they usedselected yeasts for wine-making and the traditionalspontaneous fermentation in grape juice. They reporteda decrease in soluble solids during the first 7 days of thealcoholic fermentation (25 �C). They used 11 yeaststrains, three microvinification trials and 21 grape juices(with 20 �Brix), and obtained, in all cases, wines of goodquality.It was observed that during the first 7 days of
fermentation, the wine had a nice fruity aroma, butafter this time, the product showed an undesirable tasteso it was decided to stop the fermentation after day 7.The sensory properties of wine were modified when thewine was left with the yeast longer than 7 days at 30 �C,probably due to autolysis of the yeast. This phenome-non has been observed also in grape wines (Martınez-Rodriguez & Polo 2000). In this process, the yeastconstituents (amino acids, proteins and polypeptides)are released into the medium (Perrot et al. 2002).
Effect of temperature on the fermentation
In the second stage of this study, S. c. var ellipsoideuswas used, due to its better ability to ferment thesugarcane juice. After adjusting the pH of the juice to3.5–4, the fermentation was carried out at 25, 28 and30 �C and increasing the yeast content to 5%(1 · 108 cells ml)1). The temperature had very little
effect on the rate of decrease of the soluble solidsmeasured as �Brix (Figure 2). The fermentation at 30 �Cwas apparently faster than at the other temperatures,however the analysis of variance did not show signifi-cant differences among temperatures. Temperature didnot show any significant effect (P £ 0.05) on ethanolproduction (Figure 3). The size of the inocula made nodifference in the characteristics of the product, but thetime of fermentation was shorter when the juice wasinoculated with 5% (v/v) of the yeast suspension.White grape juices are fermented at lower tempera-
tures than are red juices, often 15 �C or lower, to retainthe fruity character (Thornton & Rodriguez 1996). Insugarcane juice, the fermentation temperature did nothave a significant effect on the flavour of the wine. Afruity wine was obtained at the three temperatures used.Nitrogen compounds are important components of
the grape juice for wine production. Low levels ofassimilable nitrogen compounds for the yeast have beenrelated to lower fermentation rates, longer fermentation
0
5
10
15
20
25
0 2 3 5 7
Time (days)
Bri
x
Bx Saccharomycescerevisiae
Bx S. cerevisiae var. ellipsoideus
% Ethanol S. cerevisiae
% Ethanol .S cerevisiae var. ellipsoideus
1 4 6
Figure 1. Substrate consumption and ethanol production during sugarcane juice fermentation at 30 �C using a 1% inoculum of yeasts
Saccharomyces cerevisiae or S.c. var. ellipsoideus.
0
5
10
15
20
25
0 3Time (days)
Bri
x
°Bx a 25°C°Bx a 28°C°Bx a 30°C
1 2
Figure 2. Substrate consumption by S. cerevisiae var. ellipsoideus
during sugarcane fermentation at 25, 28 and 30 �C.
Sugarcane juice wine 449
times or stuck fermentations (Ferreira-Monteiro &Bisson 1992). S. cerevisiae does not have the ability tocarry out the fermentation in the sugarcane juice. Thefermentation could be stuck probably due to the fact thatnitrogen limits the rate of glycolysis. Many authors havedescribed differences in the amount of amino acidsconsumed by different yeast strains. In grape juice,ammonia is the preferred nitrogen source for the yeasts.Some studies have shown that amino acids increase thefermentation rate and decrease the fermentation time(Albers et al . 1996). Others have shown that a mixedsource (ammonia and amino acids) is more effective forpromoting yeast growth and fermentation rate (Ribe-reau-Gayon et al. 2000). In our results, unlike somereports, it was not necessary to add a nitrogen source.The fermentation time without nitrogen source wasshorter (7 days to consume all fermentable sugars) thanthe one reported by Torija et al. (2003) (8 days toconsume the fermentable sugars) when they used ammo-nium sulphate as a nitrogen source in a grape must.Figure 4 shows a small effect of temperature on the
formation of the volatile acidity at 25, 28 and 30 �C(0.12–0.28 g l)1), however all results are in agreementwith the values reported for white wines, also accordingto the procedures of the Official Mexican Standards
(maximum 1.12 acetic acid g l)1). Volatile acidity wasfound to be similar to the values obtained for grape wineby Regodon et al . (1997) (values between 0.42–0.8 g l)1)and Korkoutas et al . (2002) at 30–30 �C (values between0.7–0.13 g l)1). Also, the fermentation curves for thedecrease of �Brix (Figure 2) in sugarcane juice weresimilar to those shown for Garnacha Tintorera grapejuice not inoculated and inoculated with select yeaststrains in a grape must (Regodon et al .1997).The amount of total acidity in this experiment
appeared to be very similar to the values reported byother authors (Figure 5). Korkoutas et al. (2002) founda total acidity in the range of 3.3–6.6 g l)1 of tartaricacid at 15–30 �C and a value of 4.6 g l)1, at 25–30 �C,was obtained in this experiment after 7 days.
Wine analysis
The results of the sugarcane juice fermentation at thethree different temperatures and the values from theMexican Regulations for the grape wines are summa-rized in Table 1. According to the Mexican Regulations,all the parameters of the sugarcane wines are within thenormal ranges. Ethanol production measured at 15 �Crepresented approximately 10% v/v in the temperaturerange of 25–30 �C. Ash content was near the minimalrequirement. Total acidity was in the range 4.72–4.98 g l)1. Methanol was not detected in the course ofthe fermentation.
Sensory evaluation
Regodon et al. (1997) reported that the aroma andflavour of the resulting wines depend on the yeast strainused. This could be appreciated in the results of thisstudy, since the product obtained from sugarcane juicewas considered to have good quality according to thesensory evaluation test. It is very likely that somephenolic compounds and esters could be formed duringthe fermentation process and that they could greatlyinfluence the sensory attributes (Gil-Munoz et al. 1999;Plata et al . 2003).
0
2
4
6
8
10
12
0 2Time (days)
Eth
anol
(%
vol
)
25 °C28 °C30 °C
1 3
Figure 3. Ethanol production by S. cerevisiae var. ellipsoideus during
sugarcane fermentation at 25, 28 and 30 �C.
0
0.05
0.1
0.15
0.2
0.25
0.3
0.35
0Time (days)
Vol
atile
aci
dity
(g
l-1 ac
etic
aci
d)
25 ºC28 ºC30 ºC
1 2 3
Figure 4. Volatile acid production by S. cerevisiae var. ellipsoideus at
25, 28 and 30 �C.
0
1
2
3
4
5
6
0 1Time (days)
Tota
l aci
dity
(g
l-1 ta
rtar
ic a
cid)
25 ºC28 ºC30 ºC
2 3 4
Figure 5. Total acid production by S. cerevisiae var. ellipsoideus at 25,
28 and 30 �C.
450 Y. Rivera-Espinoza et al.

Forty panelists were chosen from the staff andstudents of the Escuela Nacional de Ciencias Biologicasand trained in their ability to describe the flavour of theproducts. The analyses were carried out with threedifferent products: plain, passion fruit- and roselle-flavoured wines. The judges considered that the flavourof the sugarcane wine was good; however the addition ofpassion fruit or roselle flavours increased even more theacceptance of the product. The results of the hedonictest (flavour acceptance) of the three different presenta-tions of sugarcane wine are shown in Table 2. Half ofthe panelists accepted the wine without flavour addition,60% accepted the passion fruit-flavoured wine and97.5% accepted the roselle-flavoured wine. The plainwine had 2�Brix and was definitely a dry wine. Thiscould have some influence in its acceptance. Theflavoured beverages had 6–7�Brix, and this could beessential for the acceptance by the people who do notusually drink wine. This sensory evaluation was usefulfor considering some of the factors that influenced theacceptance of the wine obtained from sugarcane. It wasclear that the offering of three different flavoursincreased the interest in this kind of wine. This wasimportant, since Mexico is a spirit and beer country andwine is the last choice among people who consumealcohol beverages.
Conclusions
Finally, it can be concluded that the elaboration of winewith acceptable characteristics, using sugarcane juice asa substrate, is technically feasible and a good alternativeuse for this raw material. It is our hope that this analysiscould be an incentive for an eventual commercialproduction of wines from sugarcane juice.
Acknowledgments
This study was supported by fellowships from COF-AA—IPN and a grant from CGPI—IPN. Author
Rivera-Espinoza received a scholarship from ConsejoNacional de Ciencia y Tecnologıa (CONACyT).
References
Albers, E., Larsson, C., Liden, G., Niklasson, C. & Gustafsson, L.
1996 Influence of the nitrogen source on Saccharomyces cerevisiae
anaerobic growth and product formation. Applied and Environ-
mental Microbiology 62, 3187–3195.
Association of Official Analytical Chemists (AOAC). 2003 Official
Methods of Analysis 17th edn., ed. Horwitz, W. Washington, DC.
20044, ISBN 0 93558 67 6.
Ferreira-Monteiro, F. & Bisson, L.F. 1992 Nitrogen supplementation
of grape juice. Effect on amino acid utilization during fermenta-
tion. American Journal of Enology and Viticulture 43, 1–10.
Gil-Munoz, R., Gomez-Plaza, E., Martınez, A. & Lopez-Roca, J.M.
1999 Evolution of phenolic compounds during wine fermentation:
influence of grape temperature. Journal of Food Composition and
Analysis 12, 259–272.
Khor, G.L., Tee, E.S. & Kandiah, M. 1990 Patterns of food
production and consumption in the ASEAN region. World
Reviews of Nutrition and Diet 61, 1–40.
Kourkoutas, Y., Koutinas, A.A., Kanellaki, M., Banat, I.M. &
Marchant, R. 2002 Continuous wine fermentation using a psy-
chrophilic yeast immobilized on apple cuts at different tempera-
tures. Food Microbiology 19, 127–134.
Martınez-Rodriguez, A. & Polo, M.C. 2000 Characterization of the
nitrogen compounds released during yeast autolysis in a model
wine system. Journal of Agricultural and Food Chemistry 48,
1081–1085.
Mingorance-Cazorla, L., Clemente-Jimenez, J.M., Martınez-Rodri-
guez, S. & Las Heras-Vasquez, F.J. 2003 Contribution of different
natural yeast to the aroma of two alcoholic beverages. World
Journal of Microbiology and Biotechnology 19, 297–304.
Perrot, L., Charpentier, M., Feuillat, M. & Chassagne, D. 2002 Yeast
adapted to wine: nitrogen compounds released during induced
autolysis in a model wine. Journal of Industrial Microbiology and
Biotechnology 29, 134–139.
Plata, C., Millan, C., Mauricio, J.C. & Ortega, J.M. 2003 Formation of
ethyl and isoamyl acetate by various species of wine yeasts. Food
Microbiology 20, 217–224.
Poel, van der P.W., Schiweck, H. & Schawartz, T. 1998 Sugar
Technology Beet and Cane Sugar Manufacture. Berlin, Germany:
Verlarg Dr. Albert Bartens KG. ISBN 3 87040 065 X.
Regodon, J.A., Perez, F., Valdes, M.E., de Miguel, C. & Ramirez, M.
1997 A simple and effective procedure for selection of wine yeast
strains. Food Microbiology 14, 247–254.
Table 1. Mexican Regulations for the grape wines and experimental results (average of three replicates) for the sugarcane juice wines.
Specifications Minimum Maximum 25 �C 28 �C 30 �C
Alcohol content (�GL at 15 �C) 9.5 14 10.1 10 9.8
Ash (g l)1) 1 0.96 0.94 0.96
Total acidity (as tartaric acid g l)1) 4.5 10 4.42 4.54 4.59
Volatile acidity (as acetic acid g l)1) 1.2 0.12 0.23 0.32
Fixed acidity (as tartaric acid g l)1) 4 4.30 4.31 4.27
Methanol (mg per 100 ml in 100% alcohol) 300 Negative Negative Negative
Table 2. Hedonic test for flavour acceptance of the sugarcane wine samples.
Sugarcane wine samples Like very much Like moderately Neither like nor dislike Dislike moderately Dislike very much Total
Natural flavour 0 14 6 17 3 40
Passion fruit flavour 14 4 6 5 1 40
Roselle flavour 14 22 3 1 0 40
Sugarcane juice wine 451

Ribereau-Gayon, P., Dubourdieu, D., Doneche, B. & Lonvaud, A.
2000 The microbiology of wine and vinifications. In Handbook of
Enology. Chichester, England: Wiley, ISBN 0 471 97362 9.
Tanimura, W., Sanchez, P.C. & Kosaki, M., 1977 Fermented foods of
the Philipphines. II. Basi (sugarcane wine). Journal of Agricultural
Science 22, 135–141.
Thornton, R.J. & Rodriguez, S.B. 1996 Deacidification of red and
white wines by a mutant of Schizosaccharomyces malidevorans
under commercial winemaking conditions. Food Microbiology 13,
475–482.
Tijerina, Ch. Z. & G. Crespo P. 1998 Analisis a nivel nacional de la
produccion de cana de azucar. Ed. INEGI. Mexico, ISBN 970 13
1179 5.
Torija, M.J, Beltran, G., Novo, M., Poblet, M., Rozes, N.,
Guillamon, J.M. & Mas, A. 2003 Effect of the nitrogen source
on the fatty acid composition of Saccharomyces cerevisiae. Food
Microbiology 20, 255–258.
Ubeda, J. & Briones, A. 2000 Characterization of differences in the
formation of volatiles during fermentation within synthetic and
grape must by wild Saccharomyces strains. Lebensmittelwissens-
chaft und -Technologie 33, 408–414.
Voguel, W. 2003 ¿Que es el vino? In Elaboracion casera de vinos. Vinos
de uvas, manzanas y bayas. Ed. Acribia, S.A. Zaragoza. pp. 4–7.
Spain, ISBN 84 200 1002 2.
452 Y. Rivera-Espinoza et al.

A novel Candida glycerinogenes mutant with high glycerol productivity in high
phosphate concentration medium
Bin Zhuge1, Xue-Na Guo1, Crispen Mawadza2, Hui-Ying Fang1, Xue-Ming Tang1, Xi-Hong Zhang1 and JiangZhuge1,*1School of Biotechnology and Key Laboratory of Industrial Biotechnology, Ministry of Education, Southern YangtzeUniversity, Huihe Road No.170, Wuxi, Jiangsu Province 214036, P. R. China2Department of Microbiology, University of Stellenbosch, Private Bag X1, Matieland 7602, South Africa*Author for correspondence: Fax:+86-510-588664, E-mail: [email protected]
Keywords: Candida glycerinogenes mutant, cytoplasmic glycerol-3-phosphate dehydrogenase (ctGPD), glycerol,phosphate
Summary
A novel Candida glycerinogenes mutant, which possesses high glycerol productivity in a high phosphateconcentration medium, was obtained by mutagenesis of an industrial glycerol producer. The mutant accumulated atotal biomass of 11.5 g l)1, which is less than the 15 g l)1 of the wild-type strain, but it consumed glucose faster thanthe wild-type strain did. The mutant reached its maximal glycerol concentration of 129 g l)1 in 84 h compared to96 h for the wild-type strain. High cytoplasmic glycerol-3-phosphate dehydrogenase activity of the mutant in theearly glycerol formation phase, leading to a rapid glycerol synthesis and accumulation, may be the main reason forthe short fermentation process.
Introduction
Glycerol, an important feedstock for the production ofvarious chemicals, can either be recovered as a by-product of soap manufacture from fats or produced bychemical synthesis from petrochemicals. As an alterna-tive route, glycerol production by fermentation has beenstudied since the First World War and has become morepopular recently. We isolated Candida glycerinogenes, anovel osmotolerant yeast, and succeeded in the indus-trialization of glycerol fermentation with the wild-typestrain (Wang et al. 2001; Zhuge et al. 2001).However, there is an urgent business need to shorten
the fermentation time for cost saving and productivityincrease. In a previous study (Guo et al. 2002), wereported that one of the main factors affecting theproduction of glycerol is the concentration of phosphatein the medium. The lower the phosphate concentration,the lower the biomass yield and the lower the rate ofglucose consumption. The fermentation time is thereforeprotracted giving a low glycerol concentration. Thoughhigh concentration of phosphate can shorten the fer-mentation time, the yield of glycerol from glucose by thewild-type strain is far from satisfactory.This paper describes the isolation of a C. glycerin-
ogenes mutant with high productivity and short fer-mentation time in high concentration phosphate
medium. The fermentation performances between themutant and wild-type strain are also comparativelyinvestigated.
Materials and methods
Microorganism and media
C. glycerinogenes, from the Research and Design Glyc-erol Fermentation Center, Southern Yangtze Univer-sity, was propagated in a seed culture mediumcontaining 100 g l)1 glucose, 2 g l)1 urea and 10 g l)1
corn steep liquor (CSL). The screening was carried outin a medium comprising different phosphate concentra-tions. (2 g CSL l)1 and potassium dihydrogen phosphate(KDP)) (Table 1), 250 g l)1 glucose, 2 g l)1 urea, pH5.5. The fermentation medium was composed of250 g l)1 glucose, 2 g l)1 urea and 10 g l)1 CSL(300 mg l)1 phosphate).
Mutation and screening of C. glycerinogenes mutants
The wild-type strain was cultivated in seed mediumdescribed above on a 110 rev min)1 reciprocatingshaker at 30 �C and the yeast cells were centrifugedfor 15 min at 3000 rev min)1 and collected. After
World Journal of Microbiology & Biotechnology (2005) 21:453–456 � Springer 2005
DOI 10.1007/s11274-004-1879-z

washing with 8 g l)1 NaCl solution, the cells werecentrifuged for 10 min at 3000 rev min)1 again. Then,the cells (107 cells ml)1) were added into a tube con-taining 40 mg l)1 NTG solution, shaken for about 30–40 min at 30 �C, and centrifuged again at 3000 revmin)1 for 10 min. Less than 20% of the cells survivedmutagenesis. Subsequently, the cells were cultured inseed medium again for 4 h, washed twice with 8 g )1
NaCl solution and spread on glucose–urea–agar med-ium after dilution. All the mutants obtained werescreened using the screening medium.
Fermentation
All shake-flask fermentations were carried out in 250-mlgauze-covered, conical flasks with a working volume of25 ml at 30 �C on a 110 rev min)1 reciprocating shaker.The medium was inoculated at 5% (v/v). For 5-l scaleexperiments, an automated magnetically stirred fermen-tor FK-5L (Korea Fermentor Co Ltd) was used with a3-l culture volume. The fermentor was agitated at450 rev min)1 and aerated at 2 l min)1.
Analytical methods
Glucose was determined by immobilized glucose oxidaseusing a glucose analyser. Glycerol was monitored by themethod of Zhuge et al. (2001) and the biomass concen-tration was determined after drying the cells at 80 �C for24 h. The activity of cytoplasmic glycerol-3-phosphatedehydrogenase (ctGPD) was determined by the methodof Blomberg & Adler (1989). One unit of ctGPD activitywas defined as the amount of enzyme that consumes1 lmol NADH per minute.
Results
Determination of phosphate concentration in the screeningmedium
The CSL that was used as the phosphate source hasmany other components. To avoid the effects of othercomponents, the CSL was added together with KDPinto the medium. The phosphate concentration in CSLwas 30 mg g)1. The quantity of CSL and KDP in themedium of different phosphate concentrations is shown
in Table 1. Experimental data shows that glycerol wasaccumulated at the highest level (129 mg l)1) when thephosphate concentration in the medium was 100 mg l)1
and fermentation time was 96 h. A further increase inthe phosphate concentration to 300, 400 and 500 mg l)1,the fermentation time was shortened to 85, 80 and 80 h,respectively, but the glycerol productivity declined to115.6, 109.1 and 73.1 g l)1, respectively. Therefore, bybalancing fermentation time and glycerol productivity, aphosphate concentration of 400 mg l)1 was employed inthe screening medium.
Choice of mutant for fermentation
In order to obtain a mutant that has a high rate offermentation and high productivity of glycerol at highphosphate concentration, we investigated the glucoseconsumption rate and glycerol productivity of mutantsin medium containing 400 mg l)1 phosphate. Afterscreening, a mutant that could reduce fermentation timeby about 12 h without an observed decrease in produc-tivity was obtained. The mutant was designated as C.glycerinogenes UN-1 and was used for further study.
Comparison of mutant with the wild-type strain
Fermentation experiments were done in order to identifydifferences in fermentation processes between themutant and wild-type strains. According to the exper-imental data, there were some differences in the rate ofglucose consumption, glycerol productivity, biomassand ctGPD activity. As shown in Figure 1a, b, theglucose consumption rate of the mutant was slightlyslower than that of the wild-type strain during the first48 h; later, the glucose consumption rate of the mutantevidently outstripped that of the wild-type one. Thesame phenomenon was observed for glycerol produc-tivity. During the first 48 h, the mutant gave a loweryield of glycerol than the original strain did, but themutant produced more glycerol from 44 to 96 h.Remarkably, the mutant strain reached its peak at84 h for glycerol production, compared to 96 h of thewild-type strain. Figure 1a shows that the mutant strainyielded a total biomass of 11.5 g l)1 in the mediumcontaining either 300 or 200 mg l)1 phosphate, but thewild-type strain in the medium containing 300 mg l)1
phosphate generated more biomass than in mediumcontaining 200 mg l)1 phosphate during the fermenta-tion process and reached more than 15 g l)1. ThectGPD activity of the mutant was higher than that ofthe wild-type strain over the period from 12 to 55 h(Figure 1b).
Fermentation characteristics of the C. glycerinogenes in a5-1 fermentor
The time courses of glycerol formation by the C.glycerinogenes mutant and wild-type in a 5-l fermentorare shown in Figure 2a and b, respectively. Both a and b
Table 1. The quantity of corn steep liquor (CSL) and potassium
dihydrogen phosphate (KDP) in different media.
Corn steep
liquor (CSL)
(g l)1)
Potassium dihydrogen
phosphate (KDP)
(g l)1)
Final phosphate
concentration
(mg l)1)
1.6667 0.0000 50
2.0000 0.0573 100
2.0000 0.2005 200
2.0000 0.3437 300
2.0000 0.4869 400
2.0000 0.6301 500
454 B. Zhuge et al.

show a sharp increase in the biomass and O2 consump-tion rate during the growth phase. Figure 2a shows thatthe mutant reached its biomass peak of 12 g l�1 after24 h. Thereafter, the glycerol increased and glucosedecreased gradually. When the glucose concentrationhad declined to 4 g l)1, glycerol reached 129 g l)1 in themedium. The oxygen consumption rate of the mutantdecreased gradually after the growth phase with a sharpdecrease from 48 to 57 h. The pH value fluctuatedbetween 2.5 and 4. The fermentation was complete in84 h. Compared with Figure 2a, Figure 2b shows thatthe wild-type strain formed more biomass and consumedmore oxygen than the mutant did. The fermentation timeof the wild-type was prolonged 12 h, with a maximalglycerol concentration of 114 g l)1 synthesized by wild-type strain versus 129 g l)1 synthesized by mutant.
Discussion
An insufficient O2 supply was the main reason for thelow yield of glycerol by the wild-type C. glycerinogenes
cultures in high-phosphate concentration medium. Aphosphate-rich medium can provide more phosphate forcell growth and generate more biomass in the mediumthat leads to an increased dissolved oxygen demand bythe yeast cells (Jin et al. 2003). With an insufficient O2
supply, the re-oxidation of NADH becomes restrictedand as the cell must maintain its redox balance (Mich-nick et al. 1997; Wang et al. 2001), some NADH is usedto reduce pyruvate or acetyl-CoA, thereby producingmore ethanol and lactic acid (Jin et al. 2003). Comparedto the wild-type strain, in high-phosphate concentrationmedium (300 mg l)1), the total biomass of the C.glycerinogenes mutant decreased significantly (Fig-ure 1a). This indicates that glycerol fermentation bythe mutant can be carried out in a wider phosphateconcentration range without an adequate O2 supply.ctGPD plays an important role in glycerol formation
(Chen et al. 1999). High ctGPD activity of the mutant inearly glycerol formation phase caused rapid glycerolsynthesis and accumulation (Figure 1b) and this is themain reason for the shorter fermentation process. It issuggested that a research should be aimed at enhancingthe expression of the gene encoding ctGPD in C. glycer-inogenes to further shorten the fermentation process.
Acknowledgements
This work was supported by Chinese Science andTechnology Development grant, 96c-03-03, to J. Zhuge.
Figure 1. (a) Comparison of the biomass and the glucose consumption
rate between the mutant and the wild-type strain in 250 ml conical
flasks. The volume of medium containing 200 mg l)1 phosphate was
25 ml. (·) the biomass of mutant, (m) the biomass of wild-type strain.
(n) the biomass of mutant in medium containing 300 mg l)1 phos-
phate, (r) wild-type strain in medium containing 300 mg l)1 phos-
phate, (d) the glucose consumption rate of mutant and (�) the glucoseconsumption rate of wild-type strain. (b) Comparison of the ctGPD
activity and the glycerol production between the mutant and the wild-
type strain in 250 ml conical flasks. The volume of medium containing
200 mg l)1 phosphate was 25 ml. (n) the ctGPD activity of mutant,
(r) the ctGPD activity of wild-type strain, (·) the glycerol productionof mutant and (m) the glycerol production of wild-type strain.
Figure 2. (a) The fermentation process of mutant in a 5-l fermentor at
30 �C. (b) The fermentation process of wild-type strain in a 5-l
fermentor at 30 �C. (·) Glucose, (m) biomass, (�) glycerol, pH and (n)
O2 consumption rate.
Candida glycerinogenes Mutant 455

References
Blomberg, A. & Adler, L. 1989 Roles of glycerol and glycerol-3-
phosphate dehydrogenase(NAD+) in acquired osmotolerance of
Saccharomyces cerevisiae. Journal of Bacteriology 171, 1087–1092.
Chen, J. & Zhuge, J. 1999 The role of cytoplasmic glycerol 3-phosphate
dehydrogenase of Canadida glycerolgenesis on its glycerol over-
producing. Journal of Wuxi University of Light Industry 18, 1–6.
Guo, X.N., Zhuge, B., Qiu, C.Y. & Zhuge, J. 2002 Screening Candida
glycerolgenes mutants with high productivity and fermentation
performance of the mutants. Journal of Wuxi University of Light
Industry 21, 336–339.
Jin, H.R., Fang, H.Y. & Zhuge, J. 2003 By-product formation
by a novel glycerol-producing yeast, Candida glycerinoge-
nes, with different O2 supplies. Biotechnology Letters 25, 311–
314.
Michnick, S., Roustan, I.L. & Dequin, S. 1997 Modulation of glycerol
and ethanol yield during alcoholic fermentation in Saccharomyces
cerevisiae strains over expressed or disrupted for GPD1 encoding
glycerol-3-phosphate dehydrogenase. Yeast 13, 783–797.
Wang, Z.X., Zhuge, J. & Prior, B.A. 2001 Glycerol production by
microbial fermentation: a review. Biotechnology Advances 19,
210–223.
Zhuge, J. & Fang, H.Y. 1994 Glycerol production by aerobic fermen-
tation. China Patent CN1110321A.
Zhuge, J., Fang, H.Y. & Wang, Z.X. 2001 Glycerol production by a
novel osmotolerant yeast Candida glycerinogenes. Applied Micro-
biology and Biotechnology 55, 686–692.
456 B. Zhuge et al.

Oxidation of carbonyl compounds by whole-cell biocatalyst
K.R. Gawai*, P.D. Lokhande, K.M. Kodam and I. SoojhawonBiochemistry Section, Department of Chemistry, University of Pune, Pune 411 007, India*Author for correspondence: Tel.: +91-20-25691728, Fax: +91-20-25691728, E-mail: [email protected]
Keywords: Acinetobacter junii, biocatalyst, biotransformation, cytochrome P-450
Summary
Acinetobacter junii was found to catalyse the oxidative biotransformation of benzaldehyde, 4-methoxybenzalde-hyde, vanillin, 3,4-dimethoxybenzaldehyde, 3-methoxybenzaldehyde and phthalaldehyde within 48 h of incubation.During this process, the activities of drug-metabolizing enzymes, such as cytochrome P-450 and acetanilidehydroxylase were found to be increased significantly. Such an increase in activity indicates their involvement in thebiotransformation processes. The purified biotransformed products of each carbonyl compound were characterizedby H1 NMR and IR spectroscopy, confirming that oxidation to the corresponding carboxylic acid had occurred.
Introduction
Several strategies have been employed for the biocon-versions of carbonyl compounds to acids, usingpurified enzymes, crude extracts or whole cells (Kar-ra-Chaabouni et al. 2003). Zigova et al. (2000) haveshown the strong oxidative biotranformation potentialof Acetobacter, Gluconobacter, Saccharomyces, Han-senula, Pichia, Candida and Kluyveromyces. Theenzyme system which catalyses the bioconversions isa three-component mixed function oxygenase, consist-ing of a cytochrome P-450 reductase, iron–sulphurferredoxin reductase and a terminal haemoproteinoxidoreductase. The whole system is known as cyto-chrome P-450.Cytochrome P-450 monoxygenases are a superfamily
of haem-containing proteins that universally exist inanimals, plants and microorganisms (Guengerich 1991;Maier et al. 2001). They catalyse a wide spectrum ofmetabolic reactions, such as oxidation, hydroxylation,epoxidation, dealkylation, deamination, sulphoxidationand dehalogenation (Sariaslani 1991; Coon 2003). Cyto-chrome P-450 proteins are well known to have com-mercial potential in biotransformation processes. Theycan be used to introduce functional groups into com-pounds that would be difficult to modify chemically(Guengerich 2002). The main features of these enzymeswhich makes them interesting for preparative organicchemistry are their tuneable, chemo-and regio-selectivityand stereo-selectivity. Moreover, the conditions ofenzyme-catalysed reactions are usually mild with rela-tively low energy consumption (Pachlatko 1999).Cytochrome P-450, produced in large quantities from
fungal or bacterial sources can also be applied for
degradation of environmentally unfriendly substances(Lee et al. 1998; Linko et al. 1998; Bramucci & Naga-rajan 2000; Miles et al. 2000; Shimada et al. 2002;Noworyta & Trusek-Holownia 2004).However, application of cytochromeP-450 enzymes on
an industrial scale is limited due to the following reasons.First, cytochrome P-450 proteins require an electrontransport chain that consists of two enzymes (a reductaseand ferredoxin) and reduced nicotinamide adenine dinu-cleotide (NADH). Second, unnatural substances that fitloosely in the active site are hydroxylatedwith poor regio-selectivity and require more than one equivalent ofNADH for each hydroxylation cycle. Whole cells areusually preferred at industrial scale in order to avoid theproblem of cofactor regeneration (Barbieri et al. 2001)and because of their rapid adaptability to the newenvironments (Handelsman & Lawrence 2002).Acinetobacter junii is widespread in nature and is
strictly aerobic. The nutritional properties of A. juniiand its ubiquitous occurrence in the soil allow it touse a variety of carbon sources for growth, which canbe natural or man-made. Much is known about theoxidative biotransformation of carbonyl compoundsby various strains of microorganisms. However, thedrawbacks associated with these microorganisms arethe inhibition of cell growth and the drug-metaboliz-ing enzyme activity by the acids formed (Zigova et al.2000). Potential improvements are expected fromgenetic engineering of microorganisms from naturalenvironments with increased ability for environmentaland industrial applications (Desouky 2003). Forexample, p-hydroxybenzoate synthesis is normallydone by a Pseudomonas putida mutant (Miller &Peretti 2002).
World Journal of Microbiology & Biotechnology (2005) 21:457–461 � Springer 2005
DOI 10.1007/s11274-004-2467-y

The aim of the present study was to observe thebiotransformation of some carbonyl compounds andtheir effect on drug-metabolizing enzymes like cyto-chrome P-450 and acetanilide hydroxylase which arekey enzymes in the biotransformation processes.
Materials and methods
Bacterial culture
Acinetobacter junii, obtained from the Department ofMicrobiology, University of Pune, Pune, India wascultured aerobically in nutrient broth medium (50 ml,pH 7.0) containing (g l)1): yeast extract, 5.0, peptone,5.0, along with mineral sources (mg l)1): KH2PO4,170.0, Na2HPO4, 980.0, (NH4)2SO4, 100.0, MgSO4,4.87, MgO, 0.1, FeSO4, 0.05, CaCO3, 0.20, ZnSO4, 0.08,CuSO4, 0.016, CoSO4, 0.015, H3BO3, 0.006, at 28 �C.
Substrates
Benzaldehyde, 4-methoxybenzaldehyde, vanillin, 3,4-dimethoxybenzaldehyde, 3-methoxybenzaldehyde andphthalaldehyde were purchased from Sisco ResearchLaboratories, India. All chemicals were of the highestpurity available.
Biotransformation of carbonyl compoundsby Acinetobacter junii
Biotransformation experiments were performed by add-ing 600 ll of benzaldehyde, 4-methoxybenzaldehyde,3-methoxybenzaldehyde and 100 mg of vanillin,3,4-dimethoxybenzaldehyde and phthalaldehyde to50 ml of the 24 h-grown bacterial culture (during thelog phase), respectively. The conical flasks were placedon a rotary platform incubator shaker at 200 rev min)1
at room temperature for further 48 h. The culturemedium of each flask was then centrifuged at 10000 · gfor 15 min in a refrigerated centrifuge (Dupont SorvallRC-5B) to separate the bacterial cell mass.
Preparation of cell extracts and enzyme assays
The bacterial cells were washed with saline and centri-fuged as described above. The microbial pellet wasweighed and sonicated in 50 mM Tris-HCl buffer (pH7.4). The cell extract was centrifuged again at 10000 · gfor 10 min at 4 �C and the cytosolic fraction was usedfor enzyme assays. The protein was measured by theLowry method. The measurement of cytochrome P-450was carried out using a Shimadzu UV–visible recordingspectrophotometer (UV-1601) as described by Omura& Sato (1964). Acetanilide hydroxylase activitywas assayed as described by Schenkman et al. (1967).p-Hydroxyacetanilide formed during the hydroxylationwas estimated by the procedure of Weisburger &Goodall (1968).
Extraction of biotransformed products
The supernatant containing the biotransformed prod-ucts were extracted with ethyl acetate and then driedover anhydrous magnesium sulphate. The solvent wasevaporated and the residue was then chromato-graphed on silica gel. The H1 NMR spectra of thepurified samples were determined on Varian Mercuryspectrometer (YH 300). The IR spectrum was deter-mined on a Shimadzu FTIR spectrophotometer(FTIR-8400).
Results and discussion
Effect of carbonyl compounds on protein content anddrug-metabolizing enzymes
Studies on the effect of these compounds on cellularprotein content of Acinetobacter junii showed thatvanillin caused a significant increase (74.6%) in proteincontent as compared to the control. Marginal increasesof 0.3, 7.9, 7.2, 10.7 and 14.5% was observed uponincubation of the culture with benzaldehyde, 4-meth-oxybenzaldehyde, 3,4-dimethoxybenzaldehyde, 3-meth-oxybenzaldehyde and phthalaldehyde, respectively.Incubation of the bacterial culture with known
concentration of carbonyl compounds, benzaldehyde,4-methoxybenzaldehyde, vanillin, 3,4-dimethoxybenzal-dehyde, 3-methoxybenzaldehyde and phthalaldehydecaused significant increase in the content of cytochromeP-450. The magnitude of increase was 21.4, 33.2, 69.8,29.5, 28.0, and 47.9% respectively as compared to thecontrol. A significant increase in acetanilide hydroxylaseactivity, 50.2, 38.4, 19.5, 28.8, 80.6, and 20.0%, was alsoobserved (Figure 1).
Characterization of biotransformation productsby spectroscopic methods
After 48 h of incubation, the biotransformation prod-ucts were extracted, purified and characterized byspectroscopic methods. The H1 NMR spectrum of theproduct from benzaldehyde indicated that it had beenbiotransformed to benzoic acid. The H1 NMR assign-ment of the product were as follows: 7.605 d (d, 2H, Ar–H), 7.629 d (s, 1H, Ar–H), 8.124 d (d, 2H, Ar–H), 9.418d (s, broad 1H, COOH, D2O exchangeable) (Figure 2).The IR spectrum having a peak at 3500 cm)1 indicates ahydroxyl group and a peak at 1689.5 cm)1 was of acarbonyl group (Figure 3).The H1 NMR assignment of the product from 4-
methoxybenzaldehyde was as follows: 7.003 d (d, 2H,Ar–H), 7.810 d (d, 2H, Ar–H), 9.861 d (s, 1H, COOH,D2O exchangeable), 3.800 d (s, 3H, –OCH3). The IRspectral study showed a broad peak at 3355.9 cm)1,indicating the presence of a hydroxyl group. A peak at1685.7 cm)1 indicated the presence of a carbonyl group.The product was identified as 4-methoxybenzoic acid.
458 K.R. Gawai et al.

0
20
40
60
80
100
120
140
160
180
200
% c
on
ten
t
ben
zald
ehyd
e
van
illin
3,4-
dim
eth
oxy
ben
zald
ehyd
e
3-m
eth
oxy
ben
zald
ehyd
e
ph
thal
ald
ehyd
e
carbonyl compounds
Protein content (Control =1.37mg/g cell mass = 100 %)
Cytochrome P-450 content(Control = 0.34 nmol/mg protein =100 %)
Acetanilide hydroxylase activity(Control = 27.09 nmol of p-hydroxy acetanilide liberated/ mgprotein/min = 100 %)
4-m
eth
oxy
ben
zald
ehyd
e
Figure 1. Effect of carbonyl compounds on protein and drug-metabolizing enzymes. (24 h grown culture of Acinetobacter junii was further
incubated with carbonyl compounds for 48 h at 28 �C. The cell mass was harvested and sonicated. Protein, cytochrome P-450 content and
acetanilide hydroxylase activity were determined from cytosol).
COOH
Figure 2. H1 NMR spectrum of biotransformed product of benzaldehyde (benzoic acid).
Oxidation of carbonyl compounds by whole-cell biocatalyst 459

The H1 NMR assignment of the biotransformedproduct of vanillin was as follows: 7.399 d (d, 2H, Ar–H) and 7.011 d (s, 1H, Ar–H), 9.796 d and 6.400 d (s, 1H,COOH,OH,D2O exchangeable), 3.946 d (s, 3H, –OCH3).The IR spectrum showed hydroxyl group peaks at 3440.8and 3764.8 cm)1. A peak at 1722.3 cm)1 indicated thepresence of a carbonyl group. From these data, thebiotransformed product was identified as vanillic acid.The spectroscopic analysis of the biotransformation of
3,4-dimethoxybenzaldehyde showed that it had beenconverted to 3,4-dimethoxybenzoic acid. The H1 NMRassignment of the product was as follows: 3.800–4.000 d(s, 6H, –OCH3 · 2), 4.650 d (s, 1H, COOH, D2Oexchangeable), 6.900 d (d, 2H, Ar–H), 7.300 d (s, 1H, Ar–H). The peaks at 3440.8 and 1737.7 cm)1 in IR spectrumconfirmed the presence of a hydroxyl group and acarbonyl group.The H1 NMR analysis of the product from 3-
methoxybenzaldehyde indicated that it had beenoxidized to 3-methoxybenzoic acid. The H1 NMRassignment of the product was as follows: 7.000–7.700d (m, 4H, Ar–H), 4.000 d (s, 3H, –OCH3), 9.933 d (s, 1H,COOH, D2O exchangeable). The IR spectral peak at3500 cm)1 indicated the presence of a hydroxyl groupand the peak at 1693.4 cm)1 showed the presence of acarbonyl group.The spectral analysis of the phthalaldehyde oxida-
tion product indicated that this compound had beenbiotransformed to phthalic acid. The H1 NMR datawere as follows: 6.947–7.857 d (m, 4H, Ar–H) and8.222 d (s, 1H, COOH, D2O exchangeable). The IRspectral studies showed a clear peak of a carbonylgroup at 1687 cm)1.Biological synthesis of aromatic compounds possessing
unique regio-or stereo-specific features has been shown tobe a realistic alternative to traditional chemical methods(Kieslich 1991;Miller & Peretti 2002). Biotransformationby whole cells involves oxygenases that incorporatemolecular oxygen directly into the aromatic ring with
high stereo- and regio-specificity; a reaction for whichthere is no traditional chemical equivalent.In the present studies, all the carbonyl compounds
were biotransformed to their corresponding acids within48 h of incubation with A. junii. These oxidationreactions were demonstrated by H1 NMR and IRstudies of the biotransformed product, indicating theinvolvement of bacterial monooxygenase systems. Thisis supported by the significant increase in the cyto-chrome P-450 content. The activity of acetanilidehydroxylase is an oxidative type of reaction, which isan activity of cytochrome P-450 monooxygenases.These carbonyl compounds are inducing hydroxylaseactivity, which confirms its involvement in oxidation ofthese aldehydes.The increase in cytochrome P-450 content is due to the
inductive effects of these carbonyl compounds on itssynthesis (Czekaj & Nowaczyk-Dura 1996, 1999). Theincrease in the activity of acetanilide hydroxylase isattributed to the induction of a specific isoenzyme ofcytochrome P-450 (Naessens & Vandamme 2003). Thus,the present study shows that there is induction of drug-metabolizing enzymes required for the biotransformationof carbonyl compounds by A. junii. In other microor-ganisms the oxidation products normally inhibit theseenzymes, which limits their use as biocatalyst. Moreover,itwasobserved thatmonooxygenation reactionbyA. juniiwas not altered by various substituents in the carbonylcompounds. All carbonyl compounds were oxidized toacids without inhibiting the drug-metabolizing enzymes.Our results indicate for the first time the presence ofmixedfunction oxidase systems in A. junii and its ability tobiotransform carbonyl compounds.
Acknowledgements
The authors would like to acknowledge the assistanceprovided by Smt. J.P. Choudhary and Mr. A.P. Gadgil.
Figure 3. IR spectrum of biotransformed product of benzaldehyde (benzoic acid).
460 K.R. Gawai et al.

References
Barbieri, C., Bossi, L., D’Arrigo, P., Fantoni, G. & Pedrocchi, S.S.
2001 Bioreduction of aromatic ketones: preparation of chiral
benzyl alcohols in both enantiomeric forms. Journal of Molecular
Catalysis B: Enzymatic 11, 415–421.
Bramucci, M.G. & Nagarajan, V. 2000 Industrial wastewater biorec-
tors: sources of novel microorganisms for biotechnology. Trends in
Biotechnology 18, 501–505.
Coon, M.J. 2003 Multiple oxidants and multiple mechanism in
cytochrome P-450 catalysis. Biochemical and Biophysical Research
Communications 312, 163–168.
Czekaj, P. & Nowaczyk-Dura, G. 1996 Effects of different synthetic
steroids combinations on the activity of mixed function oxidase
system and on the morphology of rat liver. Experimental and
Toxicologic Pathology 48, 82–87.
Czekaj, P. & Nowaczyk-Dura, G. 1999 Inhibiting effects of ethiny-
lestradiol/levonorgestrol combination on microsomal enzymatic
activities in rat and kidney. European Journal of Drug Metabolism
and Pharmacokinetics 24, 243–248.
Desouky, A. 2003 Acinetobacter: environmental and biotechnological
applications. African Journal of Biotechnology 2, 71–74.
Guengerich, F.P. 1991 Reactions and significance of cytochrome P-450
enzymes. Journal of Biological Chemistry 266, 10019–10022.
Guengerich, F.P. 2002 Cytochrome P-450 enzymes in the generation
of commercial products. Nature Reviews/Drug Discovery 1, 359–
366.
Handelsman, J.O. & Lawrence, P.W. 2002 Microbial diversity –
sustaining the earth and industry. Current Opinion in Microbiology
5, 237–239.
Karra-Chaabouni, M., Pulvin, S., Meziani, A., Thomas, D., Tou-
raud, D. & Kunz, W. 2003 Biooxidation of n-hexanol by alcohol
oxidase and catalase in biphasic and micellar systems without
solvent. Biotechnology and Bioengineering 81, 29–32.
Kieslich, K. 1991 Biotransformations of industrial use. Acta Biotech-
nologica 11, 559–570.
Lee, K.K.B., Poppenborg, L.H. & Stuckey, D.C. 1998 Terpene ester
production in a solvent phase using a reverse micelle-encapsulated
lipase. Enzyme and Microbial Technology 23, 253–260.
Linko. Y-Y., Lamsa, M., Wu, X., Uosukainen, E. & Seppala, J. 1998
Biodegradable products by lipase biocatalysis. Journal of Biotech-
nology 66, 41–50.
Maier, T., Hans-Heinrich, F., Asperger, O. & Ulrich, H. 2001
Molecular characterization of 56-Kda CYP153 from Acinetobacter
sp. EB104. Biochemical and Biophysical Research Communications
286, 652–658.
Miles, C.S., Ost, T.W., Noble, M.A., Munro, A.W. & Chapman, S.K.
2000 Protein engineering of cytochrome P-450. Biochimica et
Biophysica Acta: Protein structure and Molecular Enzymology
1543, 383–407.
Miller Jr. Edward, S. & Peretti, S.W. 2002 Toluene bioconversion to
p-hydroxybenzoate by fed-batch cultures of recombinant Pseudo-
monas putida. Biotechnology and Bioengineering 77, 340–351.
Naessens, M. & Vandamme, E.J. 2003 Multiple forms of microbial
enzymes. Biotechnology Letters 25, 1119–1124.
Noworyta, A. & Trusek-Holownia, A. 2004 Modeling of enzymatic
conversion in the catalytic gel layer located on a membrane
surface. Desalination 162, 327–334.
Omura, T. & Sato, R. 1964 The carbon monoxide-binding pigment of
liver microsomes. II. Solubilisation, purification and properties.
Journal of Biological Chemistry 239, 2379–2385.
Pachlatko, P.J. 1999 Industrial biocatalysis. Chimia 53, 577.
Sariaslani, S.F. 1991 Microbial cytochromes P-450 and xenobiotic
metabolism. Advances in Applied Microbiology 36, 133–177.
Schenkman, J.B., Remmer, H. & Estabrook, R.W. 1967 Spectral
studies of drug interaction with hepatic microsomal cytochrome P-
450. Molecular Pharmacology 3, 113–123.
Shimada, Y., Watanabe, Y., Sugihana A. & Tominaga Y. 2002
Enzymatic alcoholysis for biodiesel fuel production and applica-
tion of the reaction to oil processing. Journal of Molecular
Catalysis B: Enzymatic 17, 133–142.
Weisburger, J.H & Goodall, C.M. 1968 Stearic inhibition of enzyme
reaction. Lack of enzyme hydrolysis of 2,4,6-trimethylacetanilide.
Life Sciences 7, 263–267.
Zigova, J., Svitel, J. & Sturdık, E. 2000 Possibilities of butyric acid
production by butanol oxidation with Gluconobacter oxydans
coupled with extraction. Chemical and Biochemical Engineering
Quarterly 14, 95–100.
Oxidation of carbonyl compounds by whole-cell biocatalyst 461

Regulation of synthesis of endo-xylanase and b-xylosidase in Cellulomonas flavigena:a kinetic study
M. Ibrahim RajokaNational Institute for Biotechnology & Genetic Engineering, P.O. Box 577, Faisalabad, PakistanFax: +92-(41)-651472, E-mail: [email protected]
Keywords: Carbohydrates, Cellulomonas, induction, lignocellulose, production, regulation, xylanases
Summary
Regulation of xylanase, and b-xylosidase synthesis in Cellulomonas flavigena was studied by culturing non-inducedcells on mono-, oligo-, and poly-saccharides. The concomitant formation of these enzymes occurred onpolysaccharides having structural resemblances with lignocellulosics, namely, cellulose, cellodextrin and xylan.Among disaccharides, cellobiose was the best inducer for their synthesis. Increased levels of enzymes weresynthesized by the organism even under repressed conditions. Cell-free supernatants of the organism exhibitedgreater endo-xylanase than cell-associated b-xylosidase activity. Among inexpensive materials produced on salinelands, the salt tolerant grass Leptochloa fusca supported maximum xylanolytic activities followed by Sesbaniaaculeate (dhancha). The former could be effectively used for bulk production of xylanolytic enzymes by thisorganism.
Nomenclature
Qx rate of cell mass formation (g cells l)1 h)1)Qs rate of substrate consumption (g sub-
strate l)1 h)1)YX/S cell yield coefficient (g cells g substrate)1)qs specific rate of substrate consumption (g sub-
strate g cells)1 h)1)lmax maximum specific growth rate (h)1)QP rate of enzyme formation (IU l)1 h)1)qP specific rate of enzyme formation (IU g -
cells)1 h)1)YP/X specific yield of enzyme (IU g cells)1)QEP rate of extracellular protein formation
(mg l)1 h)1)QIP rate of intracellular protein formation
(mg l)1 h)1)CMC carboxymethylcelluloseS. starch soluble starch
Introduction
Lignocellulose, present in abundantly available renew-able biomass, consists of three major structural poly-mers, namely cellulose (a homopolymer of b-D-glucosylresidues), hemicellulose (a group of heteropolymers thatinclude xylans, arabinans, mannans, galactans), andlignin (a complex polyphenolic polymer). Lignocellulose
can be hydrolysed by cellulases, xylanases, arabinases,mannanases and galactanases (Rickard et al. 1981;Thomson 1993) and is a good inducer of these enzymes.Xylanases and cellulases are currently being applied in
nutritional improvement of lignocellulosic feedstockfor animal feed and food applications, the detergentindustry, alcoholic fermentation, and wastewater treat-ment (Li & Ljungdahl 1994). Cellulase-free xylanaseshave an important role in reducing consumption ofchlorine and chlorine dioxide in the paper and pulpindustry (Thomson 1993; Viikari et al. 1994; Nascimen-to et al. 2002).Bulk production of xylanases from microorganisms is
a prerequisite for their use in industrial processes.Gram-positive bacteria are effective secretors and pro-vide promising, industrially relevant alternatives tofungal systems because of high productivity and stabilityof enzymes (Lopez et al. 1998; Nascimento et al. 2002).Cellulomonas flavigena supports high endo-xylanaseproductivity (Vega-Estrada et al. 2002) and may fosterthe development of an efficacious and economicalenzyme system for commercial applications.The production of enzymes is influenced by a number
of factors, including the growth rate of the organism onsuitable substrates, uptake of the substrate, volumetricand specific substrate consumption rates, the inductionof the enzyme by a suitable substrate and cataboliterepression (Li & Ljungdahl 1994; Ruijter & Visser 1997;de Groot et al. 2003). Preliminary molecular studies
World Journal of Microbiology & Biotechnology (2005) 21:463–469 � Springer 2005
DOI 10.1007/s11274-004-2396-9

have indicated that induction of cellulase and xylanasegenes is delayed at the level of transcription (Ruijter &Visser 1997; Perez-Gonzalez et al. 1998). Cellobiose,and xylobiose, the primary products of lignocellulosehydrolysis, are believed to be strong inducers of thecellulase/hemicellulase complex as glucose and xyloseare liberated slowly (Hrmova et al. 1991) and may notsupport the formation of Crea A which inhibits tran-scription (Ruijter & Visser 1997). Information is avail-able about the molecular mechanisms on regulation ofxylanases in fungi (Ruijter & Visser 1997; de Vries et al.1999; de Groot et al. 2003) and bacteria (Spiridonov &Wilson 2000; Bohm & Boos 2004).Saline sodic soils in Pakistan have been effectively
utilized to raise salt tolerant grasses, such as Leptochloafusca (locally called kallar grass), Sesbania aculeata(dhancha), and Panicum maximum. The use of perennialbiomass produced on saline lands (Rajoka & Malik1997) for production of xylanolytic enzymes mayenhance the economic efficiency of the biomass produc-tion. Kallar grass can yield up to 50 metric ton drybiomass per ha per year (Rajoka & Malik 1997) andcould be used for bulk production of xylanases andcellulases. In the present investigation, regulation of thesynthesis of xylanolytic enzymes was studied usingmono- and di-saccharides, and lignocellulosic substrateswith reference to xylan, to establish a relationship ofsubstrate consumption and production of endo-b-xy-lanase (EC 3.2.1.8) and b-xylosidase (EC 3.2.1.37) byusing non-induced cultures of C. flavigena and to selectthe best carbon source for their production with thekinetics of their regulation.
Materials and methods
Sigmacell-100 (Avicel), carboxymethylcellulose sodiumsalt (CMC), cellulose, p-nitrophenyl b-D-xylopyranoside(p-NPX), xylose, glucose, galactose, sucrose, fructose,maltose, lactose, oat spelt xylan and cellobiose were
from Sigma Chemical Co, St. Louis, MO, USA. Allother chemicals were of analytical grade. Leptochloafusca (kallar grass), Panicum maximum and Sesbaniaaculeata (dhancha) were collected from the BiosalineResearch Substation of the Nuclear Institute for Agri-culture and Biology (NIAB), Faisalabad, Pakistan. Thedried powder of lignocellulosic biomass was steamalkali-treated as described earlier (Latif et al. 1988).
Micro-organism
The strain of Cellulomonas flavigena NIAB 441 wasobtained from the NIAB culture collection and wasmaintained on Dubos salt-Avicel plates and slants asdescribed previously (Rajoka & Malik 1997).
Enzyme production
The ability of the organism to utilize mono- and di-saccharides, lignocellulosic substrates and cellulose(Table 1) with reference to xylan was examined in basalDubos salts medium containing 0.2% yeast extract asdescribed earlier (Rajoka & Malik 1997). Carbonsources were added individually to batches of basalmedium to give a carbohydrate level of 10 g l)1.Monomeric and dimeric saccharides were added to theautoclaved medium after filter sterilization. All mediawere adjusted to pH 7.3 with 1 M NaOH or 1 M HCLand were dispensed in 180 ml aliquots into 1-l Erlen-meyer flasks in triplicate.The time course of production of endo-xylanase and
b-xylosidase in shake-flask batch cultures of above mediawas followed at 30 �C on a gyratory shaking incubator at150 rev/min. The amount of growth was measuredgravimetrically as dry cell mass. The enzyme activitypresent in the cell free supernatant (endo-xylanase) or cellextract (b-xylosidase) was assayed periodically as theinduction or repression indicator. When the organismwas grown on insoluble substrates, the fermentationbroth was centrifuged (4000 x g, 15 min) to remove
Table 1. Comparative fermentation kinetic parameters of C. flavigena for growth and substrate utilization following growth on different
substrates in Dubos salts medium (pH 7.3) at 30 �C in shake-flask cultures.
Carbon source Qx (g l)1 h)1) l max (h)1 ) qs (g g)1 h)1) QIP (mg l)1 h)1) QEP(mg l)1 h)1)
Arabinose 0.21a 0.28a 0.56a 14.1j 13.8e
Fructose 0.24a 0.17d 0.35d 13.5k 12.5i
Galactose 0.21a 0.19c 0.46b 16.1f 13.2h
Glucose 0.24a 0.23b 0. 48b 17.2d 14.7d
Xylose 0.25a 0 .14e 0.28e 18.5b 13.5f
Cellobiose 0.23a 0.19c 0.39c 18.1c 15.3c
Lactose 0.11b 0.12ef 0.25efg 151h 13.3g
Maltose 0.12b 0.13e 0.27ef 14.5l 12.1k
Sucrose 0.13b 0.14e 0.27ef 15.5g 12.4j
Dextrin 0.14b 0.12ef 0.24efg 16.5e 12.5i
S. starch* 0.14b 0.11f 0.23fg 15.5g 13.5f
CMC 0.15b 0.09g 0.21g 14.5l 11.5l
Cellulose 0.21b 0.11f 0.24efg 15.6g 15.5b
Xylan 0.36b 0.12ef 0.25efg 19.5a 16.6a
Each value is a mean of three replicates. Standard deviation among replicates varied between 3–4.5% of average values and has not been
presented. Values followed by different letters differ significantly at P £ 0.05.
464 M.I. Rajoka

particulate material. The substrate was washed twicewith saline and dried to assay unutilized substrate in theculture broth. Clear supernatant from culture broth(insoluble substrate free) was obtained by centrifugation(15,000 x g, 30 min at 4 �C). The cell pellet was used toextract cellular fractions using an ultrasonicator asdescribed previously (Rickard et al. 1981). An aliquotof 100 ml (after a low-speed centrifugation step) was alsocentrifuged (15,000 x g, 30 min). The cell free superna-tant was preserved for enzyme assays and the cell pelletwas washed twice with saline, suspended in 10 ml distilledwater and dried at 70 �C to constant mass.
Enzyme assays
Endo 1,4-b-D-xylanase activity was assayed according toBailey et al. (1992) by incubating the diluted enzymesolution at 40 �C for 5 min using 1% (w/v) crystallineoat spelt xylan in 50 mM sodium acetate buffer (pH 7.0).The reducing sugars were assayed by adding 3 ml of 3,5-dinitrosalicylic acid reagent, boiling for 5 min, cooling,and measuring the absorbance at 540 nm (Miller 1959)against xylose as standard. One IU was defined as theamount of enzyme releasing 1 lmol reducing sugarml)1 min)1 under the assay conditions.
b-Xylosidase was assayed using 1 mM p-nitrophenyl-b-D-xylopyranoside as substrate in 50 mM sodiumacetate buffer, pH 7.0. One millilitre of the properlydiluted enzyme sample was incubated with 1 ml substratesolution at 40 �C for 10 min. The reaction was stoppedby adding 1 M sodium carbonate (2 ml). The liberatedp-nitrophenol was measured at 400 nm with a spectro-photometer. The units are international units and weredefined as described previously (Rajoka et al. 1997).
Protein determination
The proteins were determined by the Lowry methodusing bovine serum albumin as the standard.
Saccharides determination
Glucose was periodically measured by commercial glu-cose kit. Polysaccharides were determined as describedby Miller (1959). Cellulose and hemicellulose weredetermined as described previously (Latif et al. 1988).
Determination of kinetic parameters
Kinetic parameters for batch fermentation process(Rajoka & Malik 1997) were determined as describedpreviously (Lawford & Rouseau 1993). Volumetric rateof substrate utilization (QS) , cell mass formation (QX)and enzyme production (QP), were maximum slopevalues of substrate (g l)1), cell mass (g l)1) and enzyme((IU l)1) vs. time of fermentation (h). Specific productformation rate (qP) was multiple of lmax and specificproduct yield (YP/X). Maximum specific growth (lmax)was calculated from the growth curve in the exponential
phase. Intracellular (QIP) or extracellular protein (QEP)productivity (mg protein l)1 h)1) was determined from aplot of intracellular or extracellular protein (mg l)1) vs.time (h).
Statistical analysis
Treatment effects were compared by the protected leastsignificant difference method. Significance of differencehas been presented as ANOVA –2 in the form ofprobability (P) values using MStatC software version3.1 (MStat Director, Crop and Soil Science Department,Michigan State University, Michigan, USA).
Results and discussion
Extensive screening of potential xylanase inducers(Table 1) showed that when non-induced cultures ofCellulomonas flavigena were grown on monosaccharides,the strain had a shorter lag period and higher maximumspecific growth rate than on disaccharides and polysac-charides. All monomeric saccharides induced the cells toproduce endo-xylanase and b-xylosidase significantly(P £ 0.05) lower than those cells induced with xylose.All saccharides induced b-xylosidase to a measurablelevel, otherwise, (in some cases) only a low level ofendo-xylanase or b-xylosidase (Table 2) was produced.This activity represents the basal level necessary forcellular metabolism.The cultures were grown in time course studies to
determine the minimum time for induction, other kineticparameters and biosynthesis of enzyme and cell mass;optimum time was 56–72 h while the lag phase was 4 hbefore the xylanase activities increased appreciably. Theorganism grown in Dubos salt medium for different timeintervals was processed for substrate, cell mass andassays of endo-xylanases and b-xylosidase (Tables 1–3).The enzyme was produced using 2% saccharides presentin the substrate or equivalent saccharides as described inMaterials and Methods. Enzyme production, cell massbiosynthesis and substrate utilization kinetics of repre-sentative substrates namely cellulose (a), cellobiose (b),xylose (c) and xylan (d) under the conditions of shake-flask cultures are shown in Figure 1. Maximum cellmass was supported by xylan. a-Cellulose as well asxylan were also easily degraded and supported higherintracellular (QIP) and extracellular (QEP) protein pro-ductivities (Table 1) and they were significantly(P £ 0.05) higher than from those on other carbonsources (Table 1). In general, monosaccharides werestrong repressors while disaccharides and polysaccha-rides acted as inducers. It has been observed by otherworkers (Li & Lujngdhl 1994) that during growth onmonosaccharides, a very low amount of mRNA forenzyme is produced. Other workers have found thatCreA modulates the expression of xylanases on xyloseor glucose in Aspergillus niger (de Vries et al. 1999). Theefficacy of inducers can be determined by both their
Induction of xylanases in a Cellulomonas sp. 465

actual concentration inside the cell and their bindingaffinity to regulatory macromolecules (Perez-Gonzalez1998; La Grange et al. 2000, 2001; de Groot et al. 2003;Bohm & Boos 2004). Specific enzyme yield (YP/X) was268 and 391 IU g cells)1 on xylose and cellobioserespectively, and only 1.0 IU g cells )1 (as basal enzymeactivity) on glucose (non-inducer). The induction ratio,defined as the ratio of activity in the presence of inducersto basal activity, was 4 to 1222. The higher the ratio,better was the carbon source to support enhanced endo-xylanase production.Best yield of b-xylosidase (Table 2) was obtained
when xylose was used as monomeric sugar in the Dubosmedium. Among disaccharides, cellobiose was the bestinducer of b-xylosidase. Among polymeric substances,xylan was the best substrate followed by cellulose. Theseresults are of considerable significance for the furtherdevelopment of suitable large-scale production processbased on selection of inducers for optimal production ofxylanase and b-xylosidase by C. flavigena.
Production of xylanase in different media containingvarious insoluble substrates
The use of commercial xylan as feedstock is uneconom-ical for large-scale production of endo-xylanase and
b-xylosidase, therefore, several renewable substratesraised on saline land (Table 3) were included in thesestudies. The potential of the C. flavigena strain toproduce xylanolytic enzymes and cell mass in shakenbatch culture was tested by growing non-induced cell onDubos-culture media containing lignocellulosic sub-strates, with reference to xylan (Table 3). Maximum cellmass formation (Table 4) rates on complex polysaccha-rides indicate the potential of the organism to degradecomplex substrates.C. flavigena exhibited 1.76- and 1.64-fold greaterQp following growth on kallar grass mediumthan that on dhancha or P. maximum medium. Maxi-mum YP/X, or QP of endo-xylanase (Table 3) wasseveral-fold improved over those from some otherbacterial cultures (Okeke & Paterson 1992) and fungalstrains (Milagres et al. 1993; Duenas et al. 1995; Kalog-eris et al. 2003; Kang et al. 2004), fungal mutant strainNTG-19 of Fusarium oxysporum mutant (296.7 IUl)1 h)1) (Singh et al. 1995) and compared favourablywith values from Cellulomonas CS1-1 and its mutantderivatives (Sinner & Preslmayer 1992), a hyperxylanase-producing mutant Trichoderma reesei QM 9414(436 IU l)1 h)1), Penicillium janthinellum (467.7 IUl)1 h)1) grown on xylan (Milagres et al. 1993), andA. nidulan recombinants harbouring xylanase genes fromA. niger (LaGrange et al. 2001). The possibility of using
Table 2. Production of endo-xylanase and b-xylosidase by C. flavigena measured as specific product yield (YP/X, IU g cells)1), and enzyme
productivity, Qp (IU l)1 h)1) following growth on different substrates in Dubos culture medium at 30 �C.
Growth substrate Parameters for xylanase Parameters for b-xylosidase
QP(IU l)1 h)1) YP/X(IU g cells)1) Titre(IU l)1) QP(IU l)1 h)1) YP/X(IU g cells)1) Titre(IU l)1)
Arabinose 13d 61fg 1250f 2.8fg 13.38h 275ef
Fructose 6d 24g 1250f 2.65f 11.0h 250ef
Galactose 4d 4g 1250f 0.49f 2.3.3i 38gh
Glucose 1d 1g 400f 0.4g 1.60i 25h
Xylose 67c 268e 6667de 3.10fg 13.5gh 213efg
Cellobiose 90b 391d 7500cd 5.21ef 29.65g 363e
Lactose 12d 105f 1250f 3.21fg 22.20fg 263ef
Maltose 12d 101f 1250f 2.10g 17.50gh 188efgh
Sucrose 2.3d 18g 250f 1.55g 11.92h 125fgh
Dextrin 97b 693b 9750b 8.57d 61.21d 650d
S. starch* 65c 464c 6000e 7.12de 50.86e 575d
CMC 70c 467c 8133c 12.3c 82.00c 1063c
-cellulose 108b 514c 9333b 26.6b 126.7b 2138b
Xylan 440a 1222a 33125a 63.0o 175.00a 4025a
Each value is a mean of three replicates. Standard deviation among replicates varied between 5–7.5% of average values and has not been
presented because of their very low values. Values followed by different letters differ significantly at P £ 0.05.
Table 3. Production of endo-xylanase and b-xylosidase by C. flavigena measured as specific product yield (YP/X, IU g cells)1), and enzyme
productivity, Qp (IUl)1h)1) following growth on different substrates in Dubos culture medium at 30 �C.
Growth substrate Parameters for xylanase Parameters for b-xylosidase
YP/X (IU g cells)1) QP(IUl)1h)1) Titre(IUl)1) YP/X(IU g cells)1) QP(IUl)1h)1) Titre(IUl)1)
Dhancha straw 1371 ± 140c 356 ± 17c 21300c 73 ± 80c 13 ± 0.7c 2679c
Kallar grass straw 1496 ± 154b 378 ± 18b 28300b 112 ± 13b 19 ± 1b 3576b
P. maximum 824 ± 63d 206 ± 11d 12800d 59 ± 4d 9.0 ± 1d 2357d
Xylan 2131 ± 215a 440 ± 22a 33130d 175 ± 18a 31 ± 2.5a 4025d
Values are means of three sets of replicates. Values with different letters differ significantly at P £ 0.05. The effect of treatments on all kinetic
parameters is highly significant as determined by DMRT using Duncan multiple range test in MstatC software.
466 M.I. Rajoka

locally available substrates (Table 3) for enzyme pro-duction was promising in that kallar grass and dhanchamedium induced the cells to yield xylanase to a level of0.7th and 0.64th of that induced by xylan.
Production of b-xylosidase from different media
Studies performed to measure the potential ofC. flavigena to produce b-xylosidase during growth onculture media containing different substrates (Table 4)indicated that xylan was a significantly (P £ 0.05) bettercarbon source, followed by kallar grass. During growthon xylan, the specific product yield (YP/X) and volumet-ric productivity are significantly higher than those of
Cellulomonas CS1-17 (Rickard et al. 1981), Bacillusstearothermophilus (Nanmori et al. 1990), fungal strains(Milagres et al.1993; Kang et al. 2004) and were com-parable with several Saccharomyces cerevisiae recomb-inants harbouring heterologous genes of b-xylosidasefrom Aspergillus niger (La Grange et al. 2000, 2001),A. nidulans and its recombinants harbouring bxl D gene(Perez-Gonzalez et al. 1998). During growth of theorganisms on different cellulosic and ligocellulosicsubstrates, reducing sugars accumulated slowly in thegrowth medium as unmetabolized substances (Table 4)and induced (probably due to inhibition of CreA proteinproduction; Ruijter &Visser 1997) both endo-xylanaseand b-xylosidase, but expression depended inversely ontheir concentration.
Figure 1. Kinetics of endo-xylanase and b-xylosidase production in shake flask fermentation of four representative substrates namely
(a) cellulose, (b) cellobiose, (c) xylose, and (d) xylan (each 1%) using Dubos optimized medium. The initial pH of the medium was 7.3, inoculum
size 10%, and temperature 30 �C: o = xylanase, D= b-xylosidase activity IU per 5 ml, = cell mass (g p)1 l) and �= [S] substrate (g p)1 l). Error
bars represent standard deviation among three replicates.
Table 4. Fermentation kinetic parameters of C. flavigena for substrate utilization and growth following growth on different substrates in Dubos
salts medium (pH 7.3) at 30 �C in shake-flask cultures.
C.source Qx(g l )1 h)1) R.S*(mg l)1 ) qS(g g )1h)1) QIP(mg l )1 h)1) QEP(mg l )1 h)1)
Cellobiose 0.231a 45d 0.39a 125b 112d
Dhancha 0.147c 82b 0.25c 103e 132g
K. grass 0.147c 78c 0.27b 116c 130c
P. maximum 0.143d 95a 0.27b 109d 109e
Xylan 0.178b 36e 0.12e 143a 156a
Each value is a mean of three replicates. Standard deviation among replicates varied between 3–4.5% of mean values. Values followed by
different letters differ significantly at P £ 0.05. *R.S. stands for reducing sugars in the fermentation medium.
Induction of xylanases in a Cellulomonas sp. 467

Effect of nitrogen sources on production of xylanases
In C. flavigena, the effect of nitrogen sources was testedby replacing NaNO3 in the medium with other com-pounds while maintaining equimolar amount of nitro-gen at 0.246 g l)1. The cultures were grown for 72 h,harvested and processed for enzyme assays. Readilyavailable nitrogen sources including NH4Cl, (NH4)2SO4, NH4H2PO4 were not good sources as they loweredthe terminal pH. Slowly available sources namely cornsteep liquor and urea supported lower synthesis of bothxylanases, though the terminal pH was neutral. NaNO3,KNO3 and NH4NO3 were the best nitrogen sources,because the terminal pH was 7.5–7.8. Thus in theabsence of pH regulation, NaNO3 and KNO3 were thebest nitrogen sources. This may have occurred due to
the regulatory effect of global nitrogen metabolismregulator, AreA (Lockington et al. 2004) on NO�3 orNHþ4 ions in the growth medium.
Effect of pH and temperature
The optimum pH for the production of both endo-xylanase and b-xylosidase was 7.3 (Figure 2) and was thethird factor which regulated the product formation andconfirmed the work of Orejas et al. (1999). Maximumvolumetric productivity (QP) of endo-xylanase and b-xylosidase occurred at fermentation temperature of30 �C (Figure 3). The optimum temperature was in goodagreement with the reported values forCellulomonas spp.(Rajoka et al. 1997; Rickard et al. 1981).
Conclusion
Xylan was the best carbon source followed by kallargrass but xylan is an expensive substrate, therefore,kallar grass could be used for commercial production ofendo-xylanase and b-xylosidase. The highest enzymeproduction level occurred at 30 �C, and pH 7.3. Themaximum volumetric productivities of xylanolyticenzymes were significantly higher than the valuesreported by some other workers. These values suggestthat this organism can serve as a good source ofxylanases, particularly when cultured on inexpensivesubstrates. We have recently isolated a deoxyglucose-and rifampicin-resistant mutant of C. biazotea (Rajokaet al. 1998) which hyper-produced xylanases. Thisorganism is amenable to mutagenesis as well. High-molecular weight oligomers that accumulate as productsof metabolic activity (Huang & Chou 1990) or hemicel-lulose hydrolysate of lignocellulosic biomass that accu-mulate as products of pretreatment act as inducersprobably by interfering with the CreA-DNA interactionas reported earlier (Ruijter & Visser 1997; de Vries et al.1999; Bohm & Boos 2004). It is concluded that thisorganism can be exploited for bulk production ofxylanases as reported by other workers (Vega-Estradaet al. 2002).
Acknowledgements
This work was supported by the Pakistan AtomicEnergy Commission. Some chemicals were purchasedfrom funds allocated by the United States Agency forInternational Development, Washington D.C., USAunder PSTC Proposal 6.163. Mr G. Rasul is thanked forassistance in computer graphics. The technical assis-tance of R. Shahid is gratefully appreciated.
References
Aiba, S., Humphrey, A.E. & Millis, N.F. 1973 Biochemical Engineer-
ing, 2nd Edn. New York: Academic Press. pp. 92–127. ISBN :
0-12-045052-6.
Figure 2. Effect of pH of the fermentation medium on maximum
volumetric productivity of endo-xylanase (o) and b-xylosidase (D)during growth of the organism on xylan (1%). The organism was
grown using Dubos optimized medium. The initial pH of the medium
was varied while fermentation temperature was regulated at 30 �C.
Figure 3. Effect of temperature on maximum volumetric productivity
of endo-xylanase (o) and b-xylosidase (D) during growth of the
organism on xylan (1%) medium (pH 7.3). The organism was grown in
optimized Dubos salt medium (initial pH 7.3) at different tempera-
tures.
468 M.I. Rajoka

Bailey, M.J., Biely, P. & Poutanen, K. 1992 Inter-laboratory testing of
methods for assay of xylanase activity. Journal of Biotechnology 23,
257–270.
Bailey, M.J. & Viikari, L. 1993 Production of xylanases by Aspergillus
fumigatus and Aspergillus oryzae on xylan based media. World
Journal of Microbiology and Biotechnology 9, 840–845.
Bohm, A. & Boos, W. 2004 Gene regulation in prokaryotes by sub
cellular relocalization of transcription factors. Current Opinion in
Microbiology 7, 151–156.
de Groot, M.J., van de Vondervoort, P.J., de Vries, R.P., van
Kuyk, P.A., Ruijter, G.J. & Visser, J. 2003 Isolation and
characterization of two specific regulatory Aspergillus niger
mutants shows antagonistic regulation of arabinan and xylan
metabolism. Microbiology 149, 1183–1191.
de Vries, R.P., Visser, J. & de Graaff, L.H. 1999 CreA modulates the
XlnR-induced expression on xylose of Aspergillus niger genes
involved in xylan degradation. Research in Microbiology 150,
281–285.
Duenas, R., Tengerdy, R.P. & Gutierrez-Corea, M. 1995 Cellulase
production by mixed fungi in solid-substrate fermentation of
bagasse. World Journal of Microbiology and Biotechnology 11,
333–337.
Hrmova, M., Petrakova, E. & Biely, P. 1991 Induction of cellulose-
and xylan-degrading enzyme systems in Aspergillus terreus by
homo- and hetero-disaccharides composed of glucose and xylose.
Journal of General Microbiology 137, 541–547.
Huang, S.Y., & Chou, M. S. 1990 Kinetic model for microbial uptake
of insoluble solid state substrate. Biotechnology and Bioengineering
35, 541–547.
Kalogeris, E., Iniotaki, F., Topakas, E., Christakopoulos, P., Kekos,
D. & Macris, B.J. 2003 Performance of an intermittent agitation
rotating drum type bioreactor for solid state fermentation of wheat
straw. Bioresource Technology 86, 207–213.
Kang, S.W., Park, Y.S., Lee, J.S., Hong, H.I. & Kim, S.W. 2004
Production of cellulases and hemicellulases by Aspergillus niger
KK2 from lignocellulosic biomass. Bioresource Technology 91,
153–156.
La Grange, D.C., Pretorius, I.S., Claeyssens, M. & van Zyl, W.H. 2001
Degradation of xylan to D-xylose by recombinant Saccharomyces
cerevisiae co-expressing the Aspergillus niger beta-xylosidase
(xlnD) and the Trichnoderma reesei xylanase ii (xyn2) genes.
Applied and Environmental Microbiology 67, 5512–5519.
Latif, F., Puls, J. & Malik, K.A. (1988) Effect of alkali pretreatment on
the enzymatic hydrolysis of plants grown in saline lands. Biomass
17, 105–114.
Lawford, H.G. & Rousseau, J.D. (1993) Mannose fermentation by
ethanologenic recombinants of Escherichia coli. Biotechnology
Letters 15, 615–620.
Li, X.-L. & Ljungdahl, L.G. (1994) Cloning, sequencing, and
regulation of a xylanase gene from the fungus Aureobasidium
pullulans Y-2311-1. Applied and Environmental Microbiology 60,
3160–3166.
Lopez, C., Blanko, A. & Pastor, F.I.J. 1998 Xylanase production by a
new alkali-tolerant isolate of Bacillus. Biotechnology Letters 20,
243–246.
Milagres, A.M.F., Lacis, L.S. & Prade, R.A. 1993 Characterization of
xylanase production by a local isolate of Penicillium janthinellum.
Enzyme and Microbial Technology 15, 248–253.
Miller, G.L. 1959 Use of dinitrosalicylic acid (DNS) for determination
of reducing sugars. Analytical Chemistry 31, 426–428.
Nanmori, T., Watanabe, T., Shinke, R., Kohno, A. & Kawamura, Y.
1990 Purification and properties of thermostable xylanase and
b-xylosidase produced by a newly isolated Bacillus
stearothermophillus strain. Journal of Bacteriology 172 , 6669–6672.
Nascimento, R.P., Coelho, R.R., Marques, S., Alves, L., Girio, F.M.,
Bon, E.P.S. & Amaral-Collaco, M.T. 2002 Production and partial
characterization of xylanase from Streptomyces sp. strain AMT-3
isolated from Brazilian cerrado soil. Enzyme and Microbial
Technology 31, 549–555.
Okeke, B.C. & Paterson, A. 1992 Simultaneous production and
induction of cellulolytic and xylanolytic enzymes in a Streptomyces
sp. World Journal of Microbiology and Biotechnology 8, 483–487.
Orejas, M., MacCabe, AP., Perez-Gonzalez, J.A., Kumar, S. &
Ramon, D. 1999 Carbon catabolite repression of the Aspergillus
nidulans xlnA gene. Molecular Microbiology 31, 177–184.
Perez-Gonazalez, J.A., van Peij, N.N., Bezoen, A., MacCabe, A.P.,
Ramon, D. & de Graff, L.H., 1998 Molecular cloning and
transcriptional regulation of the Aspergillus nidulans xynD gene
encoding a beta-xylosidase. Applied and Environmental Micro-
biology 64, 1412–1419.
Rajoka, M.I. & Malik, K.A. 1997 Cellulase production by Cellulo-
monas biazotea cultured in media containing different cellulosic
substrates. Bioresource Technology 59, 21–27.
Rajoka, M.I., Bashir, A., Hussain, M.-R.A. & Malik, K.A. 1998
Mutagenesis of Cellulomonas biazotea for improved production of
cellulases. Folia Microbiologica 43, 15–22.
Rickard, P.A.D., Ide, J.A. & Rajoka, M.I. 1981 Glycosidases of
Cellulomonas. Biotechnology Letters 3, 487–492.
Ruijter, G.J. & Visser, J. 1997 Carbon repression in aspergilli. FEMS
Microbiology Letters 151, 103–114.
Sinner, M. & Preslmayer, W. 1992 Chlorine is out, bring in enzymes.
PPI September 1992, 87–89.
Spiridonov, V.A. & Wilson, D.B. 2000 A CelR mutation affecting
transcription of cellulase genes in Thermobifida fusca. Journal of
Bacteriology 182, 252–257.
Thomson, J.A. 1993 Molecular biology of xylan degradation. FEMS
Microbiology Reviews 104, 65–82.
Vega-Estrada, J., Flores-Cotera, L.B., Santiago, A. & Magana-Plaza,
I. 2002 Draw-fill batch culture mode for the production of
xylanases by Cellulomonas flavigena on sugar cane bagasse. Applied
Microbiology and Biotechnology 58, 435–438.
Viikari, I., Kantelinen, A., Sundquist, J. & Linko, M. 1994 Xylanases
in bleaching: from an idea to the industry. FEMS Microbiology
Reviews 13, 335–350.
Induction of xylanases in a Cellulomonas sp. 469

Improved productivity of b-fructofuranosidase by a derepressed mutant of Aspergillusniger from conventional and non-conventional substrates
M.I. Rajoka* and Amber YasmeenNational Institute for Biotechnology and Genetic Engineering, P.O. Box 577, Jhang Road, Faisalabad, Pakistan*Author for correspondence: Tel.: +92-41-651475/550815, E-mail: [email protected]
Keywords: Aspergillus niger, derepressed mutant, enzyme, b-fructofuranosidase, kinetics, productivity
Summary
Wild-type cultures of Aspergillus niger produced a basal level of b-fructofuranosidase on glucose of 1 IU l)1 h)1. Incontrast, a catabolite-derepressed mutant strain of the same organism produced a markedly higher level(25 IU l)1 h)1) of this enzyme when grown on the same carbon source. Wheat bran induced both the wild type(252 IU l)1 h)1) and the mutant strain (516 IU l)1 h)1) to produce 252- to 516-fold higher levels of this enzyme thanwas observed with the wild-type grown on glucose and was the best carbon source. When corn steep liquor served asa nitrogen source, the wild-type organism showed a higher activity of enzyme on monosaccharides anddisaccharides comparable to that produced by corncobs in the basal medium and that mutant was a potentiallyimproved (>2-fold) organism for the production of b-fructofuranosidase on all carbon sources. Enhanced substrateconsumption and product formation kinetic parameters suggest that the mutant organism may be exploited for bulkproduction of this useful enzyme.
Nomenclature
l specific rate of growth (h)1)QX rate of cell mass formation (g cells l)1 h)1)QS rate of substrate consumption
(g substrate l)1 h)1)YX/S cell yield coefficient (g cells g)1 substrate)QP rate of enzyme formation (IU l)1 h)1)YP/X specific yield of enzyme (IU g)1 cells)YP/S product yield of enzyme (IU g)1 cells)CMC carboxymethylcellulose
Introduction
b-Fructofuranosidase or invertase (EC 3.2.1.26) cataly-ses the conversion of sucrose into fructose and glucoseby recognizing the fructose moiety of sucrose. It is beingextensively applied in the confectionery, food andpharmaceutical industries (Hayashi et al. 1992). Severalcultures possess the ability to produce intracellular/extracellular or mainly extracellular invertase (Hayashiet al. 1992; Roberfroid 1993; Muramatsu & Nakakuki1995; Euzenat et al. 1997; Yun 1998).For industrial production of b-fructofuranosidase, it
is imperative to screen organisms for invertase activityhigher than those reported. For this purpose it is alsonecessary to find cheaper inducers among the non-conventional substrates that potential producer
organisms can consume for growth, and to optimizecultural conditions for growth and enzyme production.Sucrose is the best inducer for invertase biosynthesis(Hayashi et al. 1992) but its production from agricul-tural and forest residues, municipal solid wastes, energycrops, or other forms of lignocellulosic biomass couldimprove the economics of b-fructofuranosidase (Ffase)production.The production of enzymes is influenced by induction
and catabolite repression (de Groot et al. 2003). Carboncatabolite repression alters transcription and is regu-lated by the CreA protein, a transcriptional repressor ofglucose-repressible genes involved in metabolic pro-cesses other than those involving glucose (de Vries et al.1999). Cellobiose, and xylobiose, the primary productsof lignocellulose (LC) hydrolysis, are believed to bestrong inducers of the hydrolases as glucose and xyloseare liberated slowly (Hrmova et al. 1991) and may notsupport the formation of CreA (de Vries et al. 1999).Information is available about the molecular mecha-nisms of regulation of hydrolases (xylanases) in fungi(de Vries et al. 1999; de Groot et al. 2003) and bacteria(Bohm & Boos 2004).Aspergillus niger produces extracellular b-fructofuran
osidase in both submerged and solid state fermentation(Yanai et al. 2001). It has been shown to undergocatabolite repression by monomeric carbohydrates(Hanif et al. 2004). Increases in Ffase expression andredirection of transport system in this organism will
World Journal of Microbiology & Biotechnology (2005) 21:471–478 � Springer 2005
DOI 10.1007/s11274-004-1995-9

enhance substrate utilization and product formation.Sucrose utilization requires a SUC locus and transcrip-tion of the structural genes for permeases which areinduced by sucrose and catabolite-repressed by glucose(Rincon et al. 2001). 2-Deoxy-D-glucose (DG), a toxicglucose analogue, has frequently been employed toisolate glucose-deregulated mutants (Rajoka et al. 1998;Haq et al. 2001). In this work we report the isolation ofa derepressed and aspartate-requiring mutant of thisorganism in which two-fold higher levels of Ffase wereachieved and to establish the optimal culture conditions.This mutant, deregulated for Ffase is not subject torecombinant DNA technology regulations, has beenstable for the last three years and ferments carbonsources faster than the wild type.
Materials and methods
Organism
Aspergillus niger NIAB 280 was maintained in ourculture collection and was used throughout these stud-ies. The strain was maintained on potato-dextrose agarplates and slants as described earlier (Siddiqui et al.1997).
Chemicals and growth media
All chemicals were purchased from Sigma Chemical Co.,Missouri, USA. Aspergillus niger was grown in glucose-salt medium supplemented with 0.2% yeast extract(Siddiqui et al. 1997) containing acid-washed glassbeads. The latter were added to achieve uniformturbidity. The initial pH of the medium was adjustedto 6.5 with 1 M HCl. For other growth studies, the seedculture developed on glucose was used as inoculum andwashed twice with sterile saline before use. This inoc-ulum was used to study the influence of other carbonsources, (mentioned in the text and in tables) oninvertase synthesis.
Substrates and their preparation
All lignocellulosic substrates were obtained from localsources. Their dry powder was alkali treated asdescribed earlier (Rajoka et al. 1998). The treatedbiomass of rice husk and corn cobs had 84 ± 1.2 and81 ± 1.5% total saccharides respectively, determinedusing standard methods (Latif et al. 1994).
Isolation of mutants
A. niger cells were cultured in Vogel-yeast extract-glucoseculturemedium at 30 �C for 20 h, centrifuged (15,000 · g,15 min), and suspended in 50 ml of biological salinecontaining 0.01% yeast extract. The cells of 3.0 attenu-ance (at 610 nm) were dispensed equally in 30 ml Mc-Cartney vials. The cells were exposed to different doses of
c-rays in a Co-60 irradiator. The exposure of cellsuspension (2 · 109 cells per ml) to c-irradiation of1200 Gy gave approximately a 3 log reduction in col-ony-forming units. The irradiated cells were allowed toexpress in the presence of 150 lg aspar-tate (asp) ml)1 + 0.6% deoxyglucose (DG) medium toisolate asp) and simultaneously derepressed mutants asdescribed earlier (Haq et al. 2001).The serial dilution of expressed cells were plated on
DYE-sucrose-DG-asp-oxgal (added to restrict growth)selection plates to give approximately 30 colonies perplate. Overall 3000 different colonies were screened formutant selection. The selected colonies were subsequentlyreplica-plated on sucrose + DG (0.6% w/v) + asp agarplates. The colonies were individually flooded withglucose oxidase reagent and colonies surrounded by apink halo were picked and screened by measuring thediameter of pink halo around each colony. One mutantstrain produced substantially higher Ffase and wasdesignated A. niger M125. The enzyme secretion wastested in the presence of increasing concentrations (2, 4, 5,6, 8, 10% w/v) of glycerol.
Batch-culture studies
The ability of the organism to utilize rice husk, corncobs, wheat bran, rice bran, monosaccharides anddisaccharides for improved production of Ffase withreference to sucrose was examined in basal Vogel salts’medium containing 0.2% yeast extract and 0.2% (v/v)Tween 80 as described earlier (Hanif et al. 2004).Carbon sources were added individually to batches ofbasal medium to give a saccharide level of 20 g)1 (foundto be optimum). All media were adjusted to pH 6.5 with1 M NaOH or 1 M HCl and were dispensed in 50 mlaliquots into 250-ml Erlenmeyer flasks in triplicate.The time course (Figure 1) of Ffase production in
shake-flask batch cultures was carried out at 30 �C in agyratory shaker (150 rev min)1). Sample flasks in tripli-cate were withdrawn after predetermined time intervals(h) and processed. The amount of growth, reducingsugars released from polysaccharides, protein productionand extracellular enzyme activities were assayed. Whenthe test organism was grown on insoluble substrates, theculture medium after growth was passed through twolayers of cheese cloth to remove substrate. The residuewas shaken vigorously with chilled water containing 1%(v/v) Tween 80 for 30 min at 4 �C. The washed substratewas oven-dried to constant weight for further processing.Clear supernatant was obtained by centrifugation (15,000� g, 15 min) of the above filtrate. The cell-free superna-tant was preserved for enzyme assays and cell pellets werewashed twice with saline, suspended in 10 ml distilledwater and dried at 70 �C to constant weight.
Enzyme assays
To 1 ml of 0.16 M sucrose and 1 ml McIlvaine buffer(0.15 M, pH 5.5) mixture, 100 ll of appropriately
472 M.I. Rajoka and A. Yasmeen

diluted invertase solution was added. The reactionmixture was agitated at 50 �C for 30 min in a shakingwater bath. The 50 ll reaction mixture was added to950 ll distilled water and boiled for 10 min to inactivatethe enzyme. The amount of glucose formed was deter-mined using glucose oxidase kit and reducing sugarswere assayed after Miller (1959) using 3,5-dinitrosali-cylic acid. One unit of enzyme activity is defined as theamount of enzyme which releases 1 lmol invert sugarper min.
Saccharide determination
In these tests, reducing sugars were estimatedcolorimetrically with 3,5-dinitrosalicylic acid afterMiller (1959) using glucose as standard. Glucose wasdetermined using Human (Germany) glucose kitfollowing instructions of the suppliers.
Protein determination
Protein was determined by the Lowry method usingbovine serum albumin as the standard. The proteincontent in the substrate and the spent dry matter wasdetermined by multiplying the nitrogen content deter-mined by Kjeldahl’s method by 6.25.
Effect of varying pH and temperature on enzymeproduction
The effect of initial pH of the fermentation medium onenzyme production parameters was studied in shakeflasks by varying the pH (5.0–9.0) and maintainingoptimum temperature and other growth-supportingconditions. For studying the effect of temperature, theexperiments were repeated in shake flasks (250 ml each)and incubated in an orbital shaker (150 rev min)1) ateither 20 to 38 �C for up to a period of 96 h. The enzymepreparations were analysed for enzyme activities asdescribed earlier.
Determination of kinetic parameters
Dry cell mass (g l)1) of A. niger, after growth ondifferent carbon sources, in time course study, wasdetermined on triplicate samples and each sample wasanalysed twice. Enzyme activities (IU ml)1) weredetermined as mentioned earlier in this section. Themaximum volumetric substrate uptake rate (QS), cellmass formation rate (QX) and enzyme production rate(QP), and other kinetic parameters were estimated asdescribed previously (Aiba et al. 1973) as maximumslope values of curves between substrate, cell mass andproduct in the fermentation mash versus time of
Figure 1. b-Fructofuranosidase (Ffase) (o), and cell mass (4) production kinetics of Aspergillus niger M125 in fermentation of cellobiose (a)
sucrose, (b) a-cellulose, (c) and wheat bran in shake-flask cultures (150 rev min)1) in Vogel’s medium (initial pH 6.5, temperature 30 �C)containing above substrates (?). Error bars show standard deviation among three replicates.
b-fructofuranosidase from different substrates 473

fermentation (h). Product yield coefficient (YP/S, productformed per g substrate consumed) was calculated byapplication of YP=S ¼ dP=dS.while specific product yieldwas calculated using YP=X ¼ dP=dX .
Results and discussion
Improvement in enzyme secretion by c-ray mutagenesiswas sought as described in Materials and methods.Eight mutant colonies with well-developed zones of pinkcolour on sucrose-agar plates were identified. Semi-quantitative plate studies revealed that one derivativecapable of producing the largest amount of invertasecould be isolated and designated. A. niger M125 forenzyme production studies in vitro. The organism wasrecovered from the replica plate and its Ffase activitieswere monitored in plate tests in the presence ofincreasing concentrations of glycerol. It was found thatthe secretion of this enzyme was least affected by thepresence of up to 5% glycerol in the medium.Different carbon sources (Tables 1 and 2) were
employed to study their effect on growth and productionof extracellular Ffase from Aspergillus niger and itsmutant in a time course study. The representative kineticsof product formation by the mutant culture from cello-biose (a), sucrose (b), a-cellulose (c) and wheat bran (d)(Figure 1) indicated that the activity in the case of themutant derivative reachedmaximum values after 80–96 hof fermentation in the log phase. This figure revealed thatproduction of Ffase was greatest on wheat bran. Thesecurves also indicated that production of Ffase wasapparently growth-associated. True time of inductioncould not be confirmed as the amount of enzyme formedup to 2 h of inoculation in the lag phase was below theaccuracy limit of enzyme assays. There were distinctvariations in the values of l, QS, YX/S and QX of theparental (Hanif et al. 2004) andmutant (Table 1) cultures
on different carbon sources (Table 1) and even largervariation of Ffase synthesis (Table 2) was noted. Thosesubstrates which were consumed faster (highQS) were therepressors. These studies indicated that glucose supportedonly a basal level of Ffase biosynthesis in the wild-typecells, while mutant cells were improved for productformation over the wild-type and that reported by Riconet al. (2001). Arabinose, fructose and xylose supported18- to 26-fold more synthesis of Ffase (than that onglucose), comparable with that achieved on CMC andthat mutant was improved up to >2-fold with respect tosynthesizing the enzyme.Normally, carbon sourceswhichfeed quickly into early steps of metabolic pathways causecatabolic repression, due to formation of the CreAprotein (Bohm & Boos 2004) and this is in goodagreement with the work reported by other workers (deGroot et al. 2003). In fact, the efficacy of inducers can bedetermined by both their actual concentration inside thecell and their binding affinity to regulatory macromole-cules (de Groot et al. 2003; Bohm & Boos 2004) tosynthesize more enzyme.The use of commercial sucrose as a substrate is
uneconomical for large-scale production of Ffase, there-fore, several renewable substrates (at 2% carbohydratelevel) were included in these studies. Out of all carbonsources employed, wheat bran (2%) w/v) gave optimalproductivity in the time course study (performed up to120 h) at 30 �C. It is important that for production ofFfase, wheat bran was superior to purified substrate(sucrose) which is prohibitively expensive, whereas arenewable substrate obtained from flour mills would bemore economical for large scale enzyme production.Among a-cellulose, rice husks, rice polishings, andcorncobs, the last one was the best stimulator of Ffase,followed by rice husk. Lignocellulosic substrates areutilized quite slowly, and glucose and xylose do notaccumulate to a level high enough to repress the FfasemRNA synthesis or formation of CreA protein as
Table 1. Comparative fermentation kinetic parameters of A. niger and its mutant derivative M125 for growth and substrate utilization on
different substrates in submerged fermentation.
Carbon source Qx (l)1 h)1) Yx/S (g gl)1) QS (l)1 h)1) RS* (h)1)
Arabinose 0.270 0.51 0.435 0.0 0.235
Fructose 0.390 0.49 0.452 0.0 0.284
Galactose 0.155 0.50 0.460 0.0 0.205
Glucose 0.420 0.50 0.512 0.0 0.301
Xylose 0.290 0.49 0.407 0.0 0.233
Lactose 0.109 0.52 0.290 0.0 0.246
Maltose 0.159 0.52 0.439 0.0 0.241
Sucrose 0.323 0.53 0.676 0.0 0.236
Cellodextrin 0.360 0.54 0.540 0.8 0.148
CMC 0.109 0.50 0.156 1.2 0.173
8-Cellulose 0.188 0.62 0.368 0.9 0.217
Corn cobs 0.216 0.56 0.412 0.5 0.190
Rice husk 0.210 0.54 0.451 0.6 0.150
Rice polishing 0.348 0.58 0.354 0.5 0.195
Wheat bran 1.498 0.66 0.680 0.4 0.198
Each value is a mean of three replicates. Standard deviation among replicates varied between 5–7.5% of mean values and has not been
presented. RS – reducing sugars in the fermentation mash.
474 M.I. Rajoka and A. Yasmeen

reported for the expression of xylanases on xylose orglucose in Aspgergillus spp. (de Vries et al. 1999).Carbohydrates present in the fermentation mash(Table 1) at the end of fermentation were different,therefore, all substrates varied with respect to inductiveeffect (Table 2). Those substrates which were rapidlyconsumed served as repressors but varied with respect to
their inductive effect which depended on substrateconsumption parameters. Among insoluble substrates,wheat bran which supplied a lower amount of reducingsugars was comparatively the best source. The specificyield of Ffase by A. niger and its mutant is several-foldhigher than the values reported by other workers onAspergillus spp. and their mutants or recombinants(Yanai et al. 2001; Ashokkumar & Gunasekaran 2002;Montiel-Gonzalez et al. 2002).Addition of glucose to the basal medium containing
wheat bran caused substantial catabolite repression inthe wild-type cultures and reduced QP to 153 IU l)1h)1
compared with 251 IU l)1h)1 in its absence. There wasan increase in the enzyme productivity (694 IU l)1h)1)even when glucose was being released from the substratein the presence of exogenously added glucose in mutatedcultures (Figure 2). This occurred because in the dere-pressed mutant, glucose might not trigger the formationof CreA protein to cause catabolite repression as hasbeen observed in the case of cellulases produced by amutant derivative of Cellulomonas biazotea (Rajokaet al. 1998).The possibility of using locally available substrates
(Table 2) for enzyme production was promising in thatinduction on corn cobs, rice husks, rice polishings andwheat bran medium yielded Ffase to a level greater than1.67–2.86-fold of that induced by sucrose. It wasnoteworthy that Ffase was also produced by culturesduring growth on pure cellulosic substrates. This may bedue to slow release of glucose, permitting poor bindingof glucose to regulatory macromolecules and allowingincreased synthesis of Ffase (de Groot et al. 2003).Alternatively, a common mechanism of induction forcellulases (Hanif et al. 2004) and Ffase may also induceFfase but its production from cellobiose, maltose andlactose (Table 2) indicated that it was produced consti-tutively as well.
Effect of nitrogen sources
Among the various nitrogen sources (ammoniumnitrate, ammonium sulphate, sodium glutamate, sodiumnitrate, urea, and corn steep liquor) added at equimolarconcentration to medium containing wheat bran (2%w/v) by replacing nitrogen sources in the basal medium,corn steep liquor (containing 50% protein on dry weightbasis) favoured maximum b-Ffase (315 and 671 IU l)1
h)1 in wild and mutant cultures respectively) produc-tion, followed by sodium glutamate, and ammoniumsulphate, while sodium nitrate and ammonium nitratewere the poorest sources of nitrogen in the absence ofpH control. Pandey et al. (1994) found that corn steepliquor increased the glucoamylase production while urea(0.25% w/v) favoured maximum pectinase productionin Streptomyces sp. RCK-SC (Kuhad et al. 2004). Whencultures were grown in the presence of corn steep liquor,even monosaccharides induced cells to produce elevatedlevels (Table 3) comparable to that on corncobs(Table 2). The molecular mechanism of this unusual
Table 2. Kinetic parameters of A. niger (P) and its mutant derivative
M125 (M) for b-fructo-furanosidase (Ffase) formation parameters
following growth on different substrates in submerged fermentation.
Carbon
source
QP
(IU l)1 h)1)
YP/S
(IU g substrate)1)
YP/X
(IU g cells)1)
Arabinose
P 20 100 201
M 45 211 423
Fructose
P 33 170 340
M 68 380 760
Galactose
P 26 114 228
M 55 255 510
Glucose
P 1 2 4
M 25 72 150
Xylose
P 18 132 264
M 40 285 572
Cellobiose
P 65 212 424
M 140 431 863
Lactose
P 33 180 360
M 69 362 725
Maltose
P 45 190 381
M 95 382 764
Sucrose
P 88 420 841
M 180 851 1702
Cellodextrin
P 97 255 510
M 200 626 1252
CMC
P 41 174 348
M 90 330 660
8-celluloseP 110 312 624
M 230 623 1246
Corn cobs
P 212 325 651
M 429 656 1212
Rice husk
P 154 300 600
M 309 675 1350
Rice polishing
P 147 300 600
M 300 615 1230
Wheat bran
P 252 675 1350
M 516 1355 2800
QP – Ffase formation rate (maximum slope of Ffase (IU l)1 ) vs.
time of fermentation, YP/S and YP/X were calculated as described in
Materials and methods. Each value is a mean of three replicates.
Standard deviation among replicates varied between 7.5\ and 10.0
% of mean values and has not been presented.
b-fructofuranosidase from different substrates 475

phenomenon is not known (and needs further study) butwas distinctly different from previous findings. This mayhave occurred due to the regulation of the globalnitrogen metabolism regulator, AreA (Lockington et al.2004) in corn steep liquor or ammonium sulphate in theculture medium.
Effect of pH and temperature on enzyme production
The influence of initial pH of the culture media on Ffaseproduction was studied in the range of pH 3.5–9.0.Maximum Ffase production occurred at pH 5.5–6.5(Figure 3); after pH 6.5, Ffase production slowlydeclined until it became zero at pH 9.5. These studiesindicated that in the absence of pH control, an initial pHof 6.5 may be regarded as optimal for Ffase production.The growth of the cultures namely A. niger and its
mutant derivative A. niger M125 is strongly affected bytemperature. The enzyme activity at 45 �C was very lowand the optimum temperature for biosynthesis of Ffaseactivity and cell mass formation was 30 �C (Figure 4).The enzyme activities of A. niger M125 were higher than
those of its parent at all temperatures, thus showing thatthe enzyme production process by the mutant is moreresistant to high temperature than that by its wild parent.Alteration in cell wall synthesis, protein synthesis or
cell membrane permeability is a common mechanism ofresistance to analogues (Rincon et al. 2001). Suchpermeability changes, may sometimes lead to increasedproduction, presumably through increased rate of prod-uct export from the cell. It is conceivable that like theparental strain, the mutant derivative can effectivelyutilize cellulosic and lignocellulosic substrates, continueto grow, and secrete b-fructofuranosidase in themedium. These results are in good agreement with thework reported by Allen & Roche (1989) but need furtherstudies for their confirmation.
Conclusion
Gamma ray-induced mutation has given a stable andviable mutant for hyperproduction of Ffase; the
Figure 2. Effect of addition of glucose to the wheat bran-Vogel’s medium (initial pH 6.5) on volumetric rate (Qp) (IU per l per h) of b-Ffaseformation during growth of Aspergillus niger (�), and its mutant M 125 (�) at 30 �C in shake flask culture studies.
476 M.I. Rajoka and A. Yasmeen

productivity is >2.0-fold improved over the wild-typeparental strain. This enhancement may have occurredas a result of either an increase in gene copy numberor an improvement in gene expression or both. Themechanism underlying this hypersecretion is of para-mount significance and needs further study. Themutant of A. niger has the obvious advantage ofhyperproduction of Ffase and may serve as a startingstrain for further genetic improvement. High-molecu-lar weight oligomers that accumulate as products ofmetabolic activity (Table 1) act as inducers, probablyby interfering with the CreA-DNA interaction asreported earlier (de Vries et al. 1999; Bohm & Boos2004). It is concluded that this organism may beexploited for bulk production of (Ffase) invertase
using inexpensive agro-industrial substrates abun-dantly available in many countries.
Acknowledgements
This work was supported by the Pakistan AtomicEnergy Commission. Some chemicals were purchasedfrom funds allocated by United States Agency forInternational Development, Washington, D.C, USAunder PSTC Proposal 6.163. The technical assistance ofR. Shahid is gratefully appreciated.
Table 3. Kinetic parameters of A. niger (P) and its mutant derivative
M125 (M) for product formation parameters following growth on
different substrates added to Vogel’s medium (pH 6.5) containing corn
steep liquor as a nitrogen source.
Carbon
source
QP
(IU l)1 h)1)
YP/S
(IU g substrate)1)
YP/X
(IU g cells)1)
Arabinose
P 174 321 640
M 360 644 1300
Fructose
P 200 332 760
M 412 663 1540
Galactose
P 195 325 652
M 400 654 1321
Glucose
P 112 224 490
M 230 451 990
Xylose
P 167 295 592
M 341 600 1202
Cellobiose
P 215 356 714
M 445 720 1450
Lactose
P 210 335 680
M 441 680 1400
Maltose
P 206 325 651
M 415 652 1300
Sucrose
P 245 420 841
M 500 851 1702
Cellodextrin
P 197 255 510
M 400 626 1252
CMC
P 141 174 348
M 290 330 660
8?-celluloseP 223 312 624
M 452 623 1246
QP – Ffase formation rate (maximum slope of Ffase (IU l)1) versus
time of fermentation, YP/S – and YP/X were calculated as described
in Materials and methods. Each value is a mean of three
independent readings. Standard deviation among replicates varied
between 5 – and 10% of mean values and has not been presented.
Figure 3. Effect of initial pHo of fermentation medium on volumetric
(Qp) (IU l)1 h)1)) of Ffase during growth of Aspergillus niger (�), andits mutant M125 (�) on wheat bran in Vogel’s medium at 30 �C. All
other variables were kept constant but initial pH of Vogel’s medium
was varied.
Figure 4. Effect of temperature on volumetric (Qp) productivity of
Ffase) during growth of A. niger (continuous line), and its mutant
M125 (broken line) on wheat bran in Vogel’s medium (initial pH 6.5)
at different temperatures. All other variables were kept constant while
fermentation temperature was varied.
b-fructofuranosidase from different substrates 477

References
Aiba, S., Humphrey, A.E. & Millis, N.F. 1973 Biochemical Engineer-
ing, 2nd edn. New York: Academic Press. pp. 92 – 127. ISBN 0-12-
045052-6.
Allen, A.L. & Roche, C.D. (1989). Effects of strain and fermentation
conditions on production of cellulases by Trichoderma reesei.
Biotechnology and Bioengineering 33, 650–656.
Ashokkumar B. & Gunasekaran P. 2002 Beta-fructofuranosidase
production by 2-deoxyglucose resistant mutants of Aspergillus
niger in submerged and solid-state fermentation. Indian Journal of
Experimental Biology 9, 1032–1037.
Bohm, A. & Boos, W. 2004 Gene regulation in prokaryotes by sub
cellular relocalization of transcription factors. Current Opinion in
Microbiology 7, 151–156.
de Groot, M. J., van de Vondervoort, P. J., de Vries, R. P., vanKuyk,
P. A., Ruijter, G. J. & Visser, J. 2003 Isolation and characteriza-
tion of two specific regulatory Aspergillus niger mutants show
antagonistic regulation of arabinan and xylan metabolism. Micro-
biology 149, 1183–1191.
de Vries, R.P., Visser, J. & de Graaff , L.H. 1999 CreA modulates
the XlnR-induced expression on xylose of Aspergillus niger genes
involved in xylan degradation. Research in Microbiology 150,
281–285.
Euzenat, O., Guibert, A. & Combes, D. 1997 Production of fructo-
oligosaccharides by levansucrase from Bacillus subtilis C4. Process
Biochemistry 32, 237–243.
Hanif, A., Yasmeen, A. & Rajoka, M.I. 2004 Induction, production,
repression, and de-repression of exoglucanase synthesis in Asper-
gillus niger. Bioresource Technology 94, 311–319.
Haq, I., Khurshid, S., Ali, S., Ashraf, A., Qadeer, M.A. & Rajoka, M.I.
2001 Mutation of Aspergillus niger for hyper-production of citric
acid following fermentation of blackstrap molasses. World Journal
of Microbiology and Biotechnology 17, 35–37.
Hayashi, A., Matsuzaki, K., Takasaki, Y., Ueno, H. & Imada, K. 1992
Production of b-fructofuranosidase by Aspergillus japonicus.World
Journal of Microbiology and Biotechnology 8, 155–159.
Hrmova, M., Petrakova, E. & Biely, P. 1991 Induction of cellulose-
and xylan-degrading enzyme systems in Aspergillus terreus by
homo- and hetero-disaccharides composed of glucose and xylose.
Journal of General Microbiology 137, 541–547.
Kuhad, R.C., Kapoor, M. & Rustagi, R. 2004 Enhanced production of
an alkaline pectinase from Streptomyces sp. RCK-SC by whole-cell
immobilization and solid-state cultivation. World Journal of
Microbiology and Biotechnology 20, 35–37.
Latif, F., Rajoka, M.I & Malik, K.A. 1994 Saccharification of
Leptochloa fusca (kallar grass straw) by thermostable cellulases.
Bioresouce Technology 50, 107–111.
Lockington, R.A., Rodbourn, L., Barnett, S., Carter, C.J. &Kelly, J.M.
2002 Regulation by carbon and nitrogen sources of a family of
cellulases in Aspergillus nidulans. Fungal Genetics and Biology 37,
190–196.
Miller, G.L. 1959 Use of dinitrosalisylic acid (DNS) for determination
of reducing sugars. Analytical Chemistry 31, 426–428.
Montiel-Gonalez, A.M., Fernandez, F.J., Viniegra-Gonalez, G. &
Loera, O. 2002 Invertase production on solid-state fermentation by
Aspergillus niger strains improved by parasexual recombination.
Applied Biochemistry and Biotechnology 102–103, 63–70.
Muramatsu, M. & Nakakuki, T. 1995 Enzymatic synthesis of novel
fructosyl and oligofructosyl trehaloses by Aspergillus sydowi b-fructofuranosidase. Bioscience Biotechnology and Biochemistry 59,
208–212.
Pandey, A., Askakumary, L., Selvakumar, P. & Vijayalaksmi, K. S.
1994 Influence of water activity on growth and activity of
Aspergillus niger for glycoamylase production in solid state
fermentation. World Journal of Microbiology and Biotechnology
10, 485–486.
Rajoka, M.I., Bashir, A., Hussain, M.R.A., Ghauri, M.T. &
Malik, K.A. 1998 Mutagenesis of Cellulomonas biazotea for
improved production of cellulases. Folia Microbiologica 43, 15–22.
Roberfroid, M. 1993 Dietary fiber, inulin, and oligofructose. A review
comparing their physiological effects. CRC Critical Reviews in
Food Science and Nutrition 33, 103–148.
Rincon, A.M., Codon, A.C., Castrejon, F. & Benitez, T. 2001
Improved properties of baker’s yeast mutant resistant to 2-
deoxy-D-glucose. Applied and Environmental Microbiology 67,
4279–4285.
Siddiqui, K. S. Azhar, M. J., Rashid, M. H. & Rajoka, M. I. 1997
Activity and thermostability of carboxymethyl celluslase from
Aspergillus niger is strongly influenced by noncovalently attached
polysaccharides. World Journal of Microbiology and Biotechnology
12, 213–216.
Tomomatau, H. 1994 Health effects of oligosaccharides. Food Tech-
nology 48, 61–65.
Yanai, K., Nakane, A., Hirayama, M. 2001 Molecular cloning and
characterization of the fructooligosaccharide-producing beta-fruc-
tofuranosidase gene from Aspergillus niger ATCC 20611. Biosci-
ence Biotechnology and Biochemistry 4, 766–773.
Yun, J.W. 1996 Fructooligosaccharides – occurence, preparation, and
application. Enzyme and Microbial Technology 19, 107–117.
478 M.I. Rajoka and A. Yasmeen

Antimicrobial study of pyrazine, pyrazole and imidazole carboxylic acids and their
hydrazinium salts
T. Premkumar and S. Govindarajan*Department of Chemistry, Bharathiar University, Coimbatore 641 046, India*Author for correspondence: Tel.: +91-422-2422222(344), Fax: +91-422-2422387, E-mail: [email protected]
Keywords: Hydrazinium salts, carboxylic acids, antibacterial activity
Summary
Some new hydrazinium salts of 2-pyrazinecarboxylate, 2,3-pyrazinedicarboxylate, 3,5-pyrazoledicarboxylate and4,5-imidazoledicarboxylate have been prepared. The in vitro antibacterial screening of the free acids and theirhydrazinium salts has been carried out against Escherichia coli, Salmonella typhii and Vibrio cholerae. Theantibacterial activities of the prepared hydrazinium salts show more promising activity than the corresponding freeacids and the standard positive control antibiotic, Co-trimoxazole.
Introduction
Dibasic acids are known to form N2H5HA, (N2H5)2Aand N2H5HA.H2A types of salts (H2A ¼ dibasic acid)with hydrazine. The preparation of hydrazinium saltshas become a subject of recent interest due to theirwide use as additives in propellants, explosives, and asdrugs to treat cancer and Hodgkin’s disease (Schmidt1984). The preparation and thermal behaviour ofsome of these salts have recently been reported fromour laboratory with a few aliphatic (Yasodhai &Govindarajan 1999) and aromatic ( Kuppusamy et al.1995) carboxylic acids. However, the antibacterialactivity of hydrazinium salts has not been studied todate. It was, therefore, considered interesting toprepare the hydrazinium salts of 2-pyrazinecarboxylicand 2,3-pyrazine-, 3,5-pyrazole- and 4,5-imidazoledi-carboxylic acids (Figure 1) and study their antibacte-rial activity.
Materials and methods
Microorganisms
Three pathogenic microorganisms were used to test thebiological potential of the free carboxylic acids and theirhydrazinium salts. They were (i) Escherichia coli, (ii)Salmonella typhi and (iii) Vibrio cholerae, obtained fromthe stock cultures of the Microbiology Laboratory ofthe Department of Environmental Sciences, BharathiarUniversity, Coimbatore, India.
Activity testing
The antibacterial activity of the compounds was deter-mined by the disc diffusion method (Cruickshank 1968).The bacteria were cultured in nutrient agar medium andused as inoculum for the study. Bacterial cells wereswabbed onto nutrient agar medium (prepared fromNaCl 5.0 g, peptone 5.0 g, beef extract powder 3.0 g,yeast extract powder 3.0 gagar 20.0 g in 1000 mldistilled H2O; pH ¼ 7.5 ± 0.2) in Petri dishes.The testsolutions were prepared in distilled water to a finalconcentrations of 1%, 2% and 4% and then applied tofilter paper discs (Whatmann No. 4, 5 mm dia).Thesediscs were placed on the already seeded plates andincubated at 35 ± 2 � C for 24 h. The zone of inhibitionaround the discs were measured after 24 h. Co-trimox-azole was used as a standard positive control.
Hydrazinium salts
The monohydrazinium salts such as N2H5pyzCOO, N2
H5pyzCOOÆH2O, N2H5Himdc, N2H5HimdcÆH2O, N2H5
Hpyz(COO)2 and N2H5 Hpz(COO), and dihydraziniumsalts, namely, (N2H5)2pyz(COO)2, (N2H5)2pyz(COO)2ÆH2O and (N2H5 )2pz(COO)2 and also the other kind ofacidic salts such as (N2H5)Hpyz(COO)2ÆH2 pyz(COO)2,(N2H5)Hpz(COO)2ÆH2pz(COO)2 and (N2H5)Hpz(COO)2Æ(H2pz(COO)2)3 have been prepared by neutral-ization of aqueous hydrazine hydrate with the respectiveacids in the appropriate molar ratios (Premkumar 2002;Premkumar & Govindarajan 2003).
World Journal of Microbiology & Biotechnology (2005) 21:479–480 � Springer 2005
DOI 10.1007/s11274-004-2041-7

Results
These are reported in Table 1. Antibacterial studies ofthe simple hydrazinium salts have not previously beencarried out. The results suggest that the antibacterialactivity of the prepared hydrazinium salts shows morepromising effects than the acid and the standardantibiotic, Co-trimoxazole.
Conclusions
It is worthwhile noting that the antibacterial activityincreases as the number of hydrazine moieties increases.Thus it is evident that the dihydrazinium salts showed agreater area of inhibition than those of monohydrazi-nium salts and free acids.
Acknowledgements
T. Premkumar thanks the Council of Scientific andIndustrial Research, NewDelhi, for the award of a SeniorResearch Fellowship. Also, the authors wish to thankProfessor P. Lakshmanaperumalsamy and his researchstudent Mr. P.M. Ayyasamy, Department of Environ-mental Sciences, Bharathiar University, Coimbatore,India for providing facilities to carry out the bacterialstudy.
References
Cruickshank, R. 1968 Medical Microbiology: A Guide to Diagnosis and
Control of Infection, 11th edn. Edinburgh and London: E & S
Livingstone Ltd.
Kuppusamy, K., Sivasankar, B.N. & Govindarajan, S. 1995 Prepara-
tion, characterization and thermal properties of some new hydra-
zinium carboxylates, Thermochimica Acta 259, 251–262.
Premkumar, T. 2002 Synthesis and structural, spectroscopic, and
thermal characterization of pyrazine, pyrazole and imidazole
carboxylates of metal with hydrazine, PhD thesis, Bharathiar
University, Coimbatore, India.
Premkumar, T. & Govindarajan, S. 2003 Preparation, spectral and
thermal studies of pyrazinecarboxylic acids and their hydrazinium
salts. Proceedings of the Indian Academy of Sciences (Chemical-
Sciences) 115, 103–111.
Schmidt, E.W. 1984 Hydrazine and its Derivatives: Preparation,
Properties and Applications. New York: Wiley Interscience, ISBN
0471891703.
Yasodhai, S. & Govindarajan, S. 1999 Preparation and thermal
behaviour of some hydrazinium dicarboxylates. Thermochimica
Acta, 338, 113–123.
2-pyrazinecarboxylic acid 2,3-pyrazinedicarboxylic acid
(HpyzCOO) (H2pyz(COO)2)
3,5-pyrazoledicarboxylic acid 4,5-imidazoledicarboxylic acid
(H2pz(COO)2) (H2imdc)
N
N
O
OHN
N
O
O
OH
OH
N
HN
OHO
HO O
NH
N
O
OH
OH
O
Figure 1. The structures of 2-pyrazinecarboxylic and 2,3-pyrazine-,
3,5-pyrazole- and 4,5-imidazoledicarboxylic acids.
Table 1. Antibacterial activity (the test solution was prepared in
distilled water).
Compound Diameter of inhibition zone (mm)
E.coli S.typhii V.Cholerae
1% 2% 4% 1% 2% 4% 1% 2% 4%
Hpyz(COO) – 9 11 – – 9 6 8 10
N2H5pyz(COO) 9 10 12 7 8 11 9 11 24
N2H5pyz(COO) Æ H2O 8 9 12 7 7 10 8 10 19
H2pyz(COO)2 – 9 11 9 9 12 9 11 14
N2H5Hpyz(COO)2 9 11 15 – 10 21 9 13 32
(N2H5)2pyz(COO)2 10 13 28 9 16 37 10 14 35
(N2H5)2pyz(COO)2 Æ H2O 10 13 29 9 17 36 11 13 34
N2H5Hpyz(COO)2 Æ H2pyz(COO)2 10 11 13 9 10 14 11 11 15
H2pz(COO)2 Æ H2O – 6 8 – 7 9 – 6 7
N2H5Hpz(COO)2 – 8 11 6 9 12 6 8 10
(N2H5)2pz(COO)2 9 16 25 10 16 34 10 17 32
N2H5Hpz(COO)2 Æ H2pz(COO)2 – 8 10 6 8 12 7 7 11
N2H5Hpz(COO)2 Æ (H2pz(COO)2)3 6 8 10 – 8 8 7 9 10
H2imdca – – – – – – – – –
N2H5Himdc 6 8 11 6 9 12 – 11 12
N2H5Himdc Æ H2O 6 8 11 6 8 11 – 11 12
Co-trimoxazole 6 7 10 6 9 11 7 8 10
Diameter of zone of inhibition is a mean of triplicates.a Insoluble.
–: no activity.
480 T. Premkumar and S. Govindarajan

Decolorization of azo dyes using Basidiomycete strain PV 002
Pradeep Verma*,� and Datta MadamwarPost Graduate Department of Biosciences, Sardar Patel University, Vallabh Vidyanagar, 388 120, Gujarat, India*Author for correspondence: E-mail: [email protected]�Present address: Center for Environmental Research Leipzig-Halle, Theodor Lieser Strasse. 4, 06120 Halle, Germany
Keywords: Azo dyes, basidiomycete, decolorization, laccase, ligninolytic enzyme, manganese peroxidase
Summary
Basidiomycete PV 002, a recently isolated white-rot strain from decomposed neem waste displayed highextracellular peroxidase and rapidly decolorized azo dyes. In this study, the optimal culture conditions for efficientproduction of ligninolytic enzymes were determined with respect to carbon and nitrogen. An additional objectivewas to determine the efficiency of PV 002 to degrade the azo dyes. White-rot strain PV 002 efficiently decolorizedRanocid Fast Blue (96%) and Acid Black 210 (70%) on day 5 and 9 respectively under static conditions. Thedegradation of azo dyes under different conditions was strongly correlated with the ligninolytic activity. Theoptimum growth temperature of strain PV 002 was 26 �C and pH 7.0.
Introduction
Azo dyes constitute the largest chemical class of dyesused regularly for textile dyeing color photography,paper printing and other industrial applications andabout 50% of the industrial colorants produced in theworld are azo dyes. Industrial effluents often containresidual dye, which affects water quality and maybecome a threat to public health (Capalash & Sharma1992). Certain azo dyes or their metabolites (e.g.aromatic amines such as benzidine) may be highly toxicand potentially carcinogenic (Rodriguez et al. 1999;Verma et al. 2003).The physicochemical methods available for the treat-
ment of synthetic dyestuffs such as flocculation, sorp-tion, electrochemical and oxidative degradation (Legriniet al. 1993; Arslan & Balcioglu 1999) are highly expen-sive and limited in their application. Decolorization ofsynthetic dyes using different microorganisms appears tobe a highly attractive option, a less expensive and moreenvironmentally friendly alternative to chemical decom-position (Moreira et al. 2000).The characteristic chemical structures of azo dyes (the
linkage and aromatic sulphonic groups) make themrecalcitrant to biological breakdown (Wang & Yu 1998).The white-rot fungi are the most extensive degraders oforganopollutants such as polycyclic aromatic hydrocar-bons (PAHs) and synthetic dyes. This capacity is due tothe extracellular system of ligninolytic enzymes includ-ing laccase, lignin peroxidase (LiP), manganese
peroxidase (MnP), and H2O2-generating oxidases. Dueto the non-specific character of the radical-mediatedreactions of ligninolytic enzymes, a wide variety ofrecalcitrant compounds is susceptible to attack by theseextracellular enzymes (Vyas & Molitoris 1995; Baldrian2004). So far, most of studies have been carried out withwell known white-rot fungi e.g., Phanerochaete chrysos-porium, Trametes versicolor and Pleurotus ostreatus(Paszczynski & Crawford 2000; Verma & Madamwar2002). Since each species differs in the composition of itsligninolytic machinery (Hatakka 1994), it is useful tostudy the production of enzymes in species with differentecological habitats. Therefore in the present investiga-tion, screening for new potential fungal cultures led tothe isolation of a Basidiomycete strain PV 002 thatefficiently transformed selected azo dyes.
Materials and methods
Chemicals
All chemicals used were of analytical grade. Bushnelland Haas (BH) medium was obtained from Hi Media,India. 2, 20-Azino-bis-3-ethylbenzthiazoline-6-sulphonicacid (ABTS) and veratryl alcohol were obtained fromSigma, USA. o-Dianisidine was purchased from ChittiChem, Baroda, India. Azo dyes, Ranocid Fast Blue(RFB) and Acid Black 210 (AB 210) were obtained fromlocal industries. Trival names are used for convenience.
World Journal of Microbiology & Biotechnology (2005) 21:481–485 � Springer 2005
DOI 10.1007/s11274-004-2047-1

Screening
Samples were collected from various sources includingdecaying wood, decomposed neem waste and variouscontaminated sites surrounding textile factories. Selec-tive screening procedures were used. Various dilutionswere made and spread on 1% (w/v) BH medium agarplates containing neem hull waste. The purity of eachculture was confirmed by colony, spore and cellularmorphology. The strains were grown on malt extractglucose medium (MEG) containing agar plates at 26 �Cand stored at 4 �C. The culture was sub-cultured once intwo months.
Decolorization of azo dyes on solid media
Decolorization of RFB and AB 210 was examined onagar plates containing dye (200 mg/l) in BH mediumsupplemented with 1.0 g yeast extract/l and 5.0 gglucose/l. The plates were inoculated with 5 � 5 mmpieces of agar from a 15-day-pregrown culture of theisolated basidiomycete and incubated at 26 ± 1 �C.
Decolorization of azo dyes and enzyme activity assays
The BH medium was used for dye decolorization andenzyme production. The flasks containing BH medium(50 ml containing 100 mg RFB/l [100 ppm] and 50 mgAB 210/l [50 ppm] final concentration) at pH 7.0 weresterilized by autoclaving. Inoculation was done with a15-days-pregrown culture of PV 002 (5 � 5 mm) andflasks were incubated at 26 ± 1 �C under static orshaking (80 strokes/cm.min) conditions. Adsorption ofthe dye to the mycelial biomass was analyzed usingmycelial biomass washed in distilled water. The concen-tration was determined at the absorbance maximum(kmax) of each dye. Uninoculated controls were also keptat the same temperature.Laccase activity was determined by oxidation of o-
dianisidine (Palmieri et al. 1993), MnP activity wasdetermined according to Katagiri et al. (1995), LiPactivity was assayed according to Tien & Kirk (1988)using veratryl alcohol as a substrate. Aryl alcohol oxidaseactivity was determined using veratryl alcohol as asubstrate without addition of H2O2 (Guillen et al. 1994).At regular intervals, 3 ml samples were withdrawn
from the flasks and centrifuged at 6000 � g for 20 minand the supernatant was analyzed for remaining dyecontent and enzyme activities. The decolorization wasmeasured as the decrease in absorbance maxima (kmax) ofRFB (536 nm) and AB 210 (604 nm) using a UV-visiblespectrophotometer (Hewlett-Packard 8452). Uninoculat-ed dye-containing media served as controls. All experi-ments were performed in triplicate.
Effect of carbon, nitrogen, temperature and pH
The effect of pH on the decolorization and enzymeactivities was studied. The pH was adjusted with 1 M
NaOH or HCl in the range 3.0–8.0. The effect oftemperature was studied by incubation at 26, 37 and45 �C. The effect of various carbon and nitrogen sourceson enzyme production was also studied. The concentra-tion of glucose varied from (0.1, 0.5, 1.0, 5.0 g/l) todetermine the effect on enzyme activity.
Chromatographic separation of the transformed dyeproducts by HPTLC
The transformation products were examined by highperformance thin layer chromatography (HPTLC), onprecoated Silica gel 60 F 254 (20�20) plated (E MerckKagaA Germany). About 10 ll samples were appliedbandwise with a Linomat IV Camag sampler, bandlength 8 mm, track distance 10 mm, distance from theside 20 mm, distance from lower edge 10 mm, deliveryspeed 15s/ll, temperature 25 �C. The plate was devel-oped in a presaturated (15 min) twin chamber contain-ing solvents of ammonia: propanol (1:2 v/v) for RFBand isoamyl alcohol-ethanol-water-ammonia (3.5: 5.0:1.5: 0.2 by vol) for AB 210 and the running distance was80 mm for the separation of transformation products.Spots were visualized under UV (254 nm) and visiblelight (540 nm).
Results and discussion
Among the 20 fungal isolates, 14 showed ligninolyticand cellulolytic activities. Seven fungal isolates wereAspergillus species, three isolates were Trichodermaspecies and four isolates were Basidiomycetes. Furtherstudies were carried out with Basidiomycete strain PV002 because of its rapid decolorization of the selectedazo dyes. RFB and AB 210 were selected for decolor-ization studies because of their wide use in textileindustries as well as their known structure (Verma &Madamwar 2003). Basidiomycete strain PV 002 com-pletely decolorized RFB and AB 210 agar plates on days12 and 17 respectively.
Dye decolorization and enzyme production byBasidiomycete starin PV 002
In the absence of dye, strain PV 002 showed highestproduction of laccase and MnP 4.7 and 28.5 U/ml ondays 4 and 7 respectively. In the presence of RFB, peaklaccase and MnP activities were reached (3.2 and24.4 U/ml) on days 3 and 5 of respectively. In thepresence of AB 210, peak laccase and MnP activitieswere reached (1.9 and 19.4 U/ml) on days 4 and 5respectively (Figure 1). More than 95% of RFB and70% of AB 210 decolorization was obtained on days 5and 9 respectively under static conditions. Adsorption ofdyes to mycelial biomass was not observed in the presentstudy. No LiP or veratryl alcohol oxidase activity wasdetected in the culture supernatant. The differences indecolorization can be attributed to AB 210 being a
482 P. Verma and D. Madamwar

triazo dye while RFB is a diazo dye and the structure ofAB 210 is more complex than RFB. It has been reportedthat the effectiveness of decolorization depends on thestructure and complexity of each dye and relativelysmall structural differences can markedly affect decol-orization. These differences are presumably due, at leastin part, to electron distribution and charge density,although steric factors may also contribute (Kim et al.1995).
Effect of agitation, pH and temperature on decolorization
Using agitation instead of static culture only 45% ofRFB and 35% of AB 210 decolorization was achieved.The optimum pH for strain PV 002 was 7.0, and RFBand AB 210 were rapidly decolorized at this pH.However, lower decolorization and enzyme activitieswere detected at pH 3.0. Media with initial pH valuesranging from pH 5.0–7.0 showed efficient decolorization(Figure 2). In the temperature range tested, 26 �C wasoptimum for decolorization and enzyme production. Nodecolorization and enzyme activities were detected aftergrowth at 45 �C (data not shown).
Effect of carbon, nitrogen source and dye concentration
In the presence of glucose, peak laccase (3.2 U/ml) andMnP (24.4 U/ml) activities were reached on days 3 and 5respectively and highest decolorization of RFB(100 ppm) and AB 210 (50 ppm) was observed on days5 and 9 respectively (Figure 3). In the presence offructose, only 1.2 and 5.6 U/ml laccase and MnPactivities were obtained respectively and more than60% decolorization was observed. At the same time, inthe presence of other carbon sources such as sucrose ormaltose, decolorization was not significant. This resultconfirms that glucose may be a suitable carbon sourcefor dye decolorization. The low laccase and MnP
production with other carbon sources might be attrib-uted to catabolite repression (Wood 1980; Sandhu &Arora 1985).High enzyme activity was detected at all glucose
concentrations examined (Figure 4). This indicates thatthe isolated fungus shows the enzyme activity expressedunder primary growth. After the depletion of glucose, theenzyme activities became steady up to day five and thendecreased rapidly. In most white-rot fungi, Lip and MnPproduction is induced under carbon-limiting conditions(Leatham 1986). By contrast, our isolated strain PV 002shows higher enzyme production in carbon-rich condi-tions. Thus, the physiology of our isolated strain is quitedifferent from that of the better-studiedP. chrysosporium.In P. chrysosporium, nutrient supplementation typicallyrepresses enzyme production (Leatham 1986). Underconditions of nutrient depletion, only a low biomass yieldis possible and also the ligninolytic enzymes can only beproduced in small quantities.Thus, our strain provides an
0
10
20
30
0 2 4 6 8 10 12
Days
Enz
yme
Act
ivity
(U
/ml)
0
25
50
75
100
Dec
olor
izat
ion
(%)
Figure 1. Decolorization and enzyme production by Basidiomycete
strain PV 002 in presence of RFB (100 ppm) and AB 210 (50 ppm).
(-j-) % decolorization of RFB, (-(-) decolorization of AB 210, (-�-)
laccase activity in RFB, (-d-) laccase activity in AB 210, (-4-) MnP
activity in RFB, (-m- ) MnP activity in AB 210.
0
25
50
75
100
3 3,5 4 4,5 5 5,5 6 6,5 7 7,5 8
pH
Dec
olor
izat
ion
(%)
Figure 2. Effect of initial medium pH on decolorization of RFB
(100 ppm) and AB 210 (50 ppm) by Basidiomycete strain PV 002 on
days 5 and 9 respectively. (-j-) RFB (-(-) AB 210.
0
25
50
75
100
Maltose Glucose Sucrose Fructose
Carbon sources
Dec
olor
izat
ion
(%)
Figure 3. Effect of various carbon sources on decolorization of RFB
(100 ppm) and AB 210 (50 ppm) by Basidiomycete strain PV 002 on
days 5 and 9 respectively. (-j-) RFB (-(-) AB 210.
Dye decolorization by Basidiomycete PV 002 483

attractive alternative given that cultivation in carbon-richmedium results in no observed repression of enzymeproduction, but rather in increased level of extracellularligninolytic enzyme production.The effect of a variety of inorganic and organic
nitrogen sources at 0.1 g/l on decolorization andenzyme activity was examined (Figure 5). The highestdecolorization of RFB and AB 210 was obtained in thepresence of yeast extract, however, 85 and 73% ofRFB and AB 210 decolorization were obtained on dayfive respectively in the presence of peptone. 80 and65% decolorization of RFB and AB 210 were observedon day nine when NH4Cl was used as inorganicnitrogen source. The Basidiomycete strain PV 002decolorized more than 75% of RFB at 250 ppm onday five while only 57% decolorization of AB 210 wasobtained at 150 ppm on day nine. However, duringfurther increase in concentration, no significant decol-orization was obtained.
Transformation studies by HPTLC
After transformation of RFB (Rf ¼ 0.71), four metab-olites (Rf ¼ 0.12, 0.45, 0.57, and 0.68) were detected.With AB 210 (Rf ¼ 0.85), metabolites Rf ¼ 0.39, 0.59,0.64 and 0.77 were detected. One metabolite of RFBtransformation might be metanilic acid with Rf ¼ 0.68.This was further supported by the presence of a peak inthe UV region. RFB is a coupled dye composed ofmetanilic acid, sulphanilic acid and N-phenyl peri acid(Verma & Madamwar 2002).The Basidiomycete strain PV 002 efficiently trans-
formed azo dyes. The dye decolorization was very fastcompared with well-known selected white-rot fungi.Since nutrient limitation is not required for ligninolyticactivity in Basidiomycete strain PV 002, further studiesshould attempt to increase degradation of the otherrecalcitrant compounds (e.g. PAH) by cheap organic-rich supplements, which are known to stimulate perox-idase production. Such a biological process could beadopted as a cost-effective, safer and efficient approachfor decolorization of effluents. Further work needs to beperformed using this fungal system with the objective ofreducing cost of the process significantly.
Acknowledgement
The work was supported by Department of Biotechnol-ogy, New Delhi, India.
References
Arslan, I. & Balcioglu, I.A. 1999 Degradation of commercial reactive
dyestuffs by heterogeneous and homogeneous advanced oxidation
process: a comparative study. Dyes and Pigment 43, 95–108.
Baldrian, P. 2004 Purification and characterization of laccase from
white-rot fungus Daedalea quercina and decolorization of synthetic
dyes by the enzymes. Applied Microbiology and Biotechnology 63,
560–563.
Capalash, N. & Sharma, P. 1992 Biodegradation of textile azo dyes by
Phanerochaete chrysosporium. World Journal of Microbiology and
Biotechnology 8, 309–312.
Guillen, F., Martinez, A.T., Martinez, M.J. & Evans, C.S. 1994
Hydrogen peroxide-producing system of Pleurous eryngii involving
the extracellular enzyme. aryl-alcohol oxidase. Applied Microbiol-
ogy and Biotechnology 41, 465–470.
Hatakka, A. 1994 Lignin modifying enzymes from selected white-rot
fungi: production and role of lignin degradation. FEMS Micro-
biology Reviews 13, 125–135.
Katagiri, N., Tsutsumi, Y. & Nishida, T. 1995 Correlation of
brightening with cumulative enzyme activity related to lignin
biodegradation during biobleaching of kraft pulp by white-rot
fungi in the solid-state fermentation system. Applied and Environ-
mental Microbiology 61, 617–627.
Kim, S.J., Ishikawa K., Hirai, M. & Shoda, M. 1995 Characteristics of
a newly isolated fungus, Geotrichum candidum December 1 which
decolorizes various dyes. Journal of Fermentation and Bioengineer-
ing 79, 601–607.
Leatham, G.F. 1986 The ligninolytic activities of Lentinus edodes and
Phanerochate chrysosporium. Applied Microbiology and Biotech-
nology 24, 51–58.
0
15
30
45
60
0,1 1,1 2,1 3,1 4,1 5,1Glucose Concentration (g/L)
Enz
yme
Act
ivity
(U
/ml)
Figure 4. Effect of glucose concentration on enzyme activity by
Basidiomycete strain PV 002 on days 4 and 7 respectively. (-d-)
Laccase, (-�-) MnP.
0
20
40
60
80
100
Amm. Sulphate Amm.Chloride Amm.Nitrate Yeast Ext. Peptone
Nitrogen Sources
Dec
olor
izat
ion
(%)
Figure 5. Effect of various nitrogen sources on decolorization of RFB
(100 ppm) and AB 210 (50 ppm) by Basidiomycete strain PV 002. (-j-)
RFB (-(-) AB 210.
484 P. Verma and D. Madamwar

Legrini, O., Oliveros, E. & Braun, A.M. 1993 Photochemical processes
for water treatment. Chemical Reviews 93, 671–698.
Moreira, M.T., Mielgo, I. & Feijoo Lena, J.M. 2000 Evaluation of
different fungal strains in decolorization of synthetic dyes. Bio-
technology Letters 22,1499–1503.
Palmieri, G., Giardina, P., Marzullo, L., Desiderio, B., Nitti, G.,
Cannio, R. & Sannia, G. 1993 Stability and activity of a phenol
oxidase from the ligninolytic fungus Pleurotus ostreatus. Applied
Microbiology and Biotechnology 39, 632–636.
Paszczynski, A. & Crawford, R.L. 2000 Recent advances in the use of
fungi in environmental remediation and biotechnology. Soil
Biochemistry 10, 379–422.
Rodriguez, E., Pickard, M.A. & Duhalt, R.V. 1999 Industrial dye
decolorization by laccases from lignolytic fungi. Current Microbi-
ology 38, 27–32.
Sandhu, D.K. & Arora, D.S. 1985 Laccase production by Polyporus
sanguineus under different nutritional and environmental condi-
tions. Experientia 41, 355–356.
Tien, M. & Kirk, T.K. 1988 Lignin peroxidase of Phanerochaete
chrysosporium. Methods in Enzymology 161, 238–243.
Verma, P. & Madamwar, D. 2002 Decolourisation of synthetic dyes by
lignin peroxidase of Phanerochaete chrysosporium. Folia Microbi-
ologica 47, 283–286.
Verma, P. & Madamwar, D. 2003 Decolorization of synthetic dyes by
a newly isolated strain of Serratia marcescens. World Journal of
Microbiology and Biotechnology 19, 615–618.
Verma, P., Baldrian, P. & Nerud, F. 2003 Decolorization of structur-
ally different synthetic dyes using cobalt(II)/ascorbic acid/hydro-
gen peroxide system. Chemosphere 50, 975–979.
Vyas, B.R. & Molitoris, H.P. 1995 Involvement of an extracellular
H2O2-dependent lignolytic activity of the white-rot fungus, Pleu-
rotus ostreatus in the decolorization of Remazol Brilliant Blue R.
Applied and Environmental Microbiology 61, 3919–3927.
Wang, Y. & Yu, J. 1998 Adsorption and degradation of synthetic dyes
on the mycelium of Trametes versicolor. Water Science and
Technology 38, 233–238.
Wood, D.A. 1980 Production, purification and properties of extracel-
lular laccase of Agaricus bisporus. Journal of General Microbiology
117, 327–338.
Dye decolorization by Basidiomycete PV 002 485

Effect of cultivation conditions on invertase production by hyperproducing
Saccharomyces cerevisiae isolates
Ikram-ul-Haq, Mirza Ahsen Baig* and Sikander AliBiotechnology Research Centre, Botany Department, Government College University, Lahore, Pakistan*Author for correspondence: Tel: +92-42-9211634, Fax: +92-42-7243198,E-mail: [email protected]
Keywords: Fermentation kinetics, invertase, nutrient media, process development, Saccharomyces cerevisiae, urea
Summary
Invertase (b-D-fructofuranoside fructohydrolase, EC 3.2.1.26) finds major uses in confectionery and in theproduction of invert syrup. In the present study, we report on invertase production by wild cultures ofSaccharomyces cerevisiae. The yeast strains were isolated from dates available in a local market. Fivehyperproducing yeast strains (>100- fold higher invertase activity) were kinetically analysed for invertaseproduction. Saccharomyces cerevisiae strain GCA-II was found to be a better invertase-yielding strain than all theother isolates. The values of Qp and Yp/s for GCA-II were economical as compared to other Saccharomyces cultures.The effect of sucrose concentration, rate of invertase synthesis, initial pH of fermentation medium and differentorganic nitrogen sources on the production of invertase under submerged culture conditions was investigated.Optimum concentrations of sucrose, urea and pH were 3, 0.2 (w/v), and 6 respectively. The increase in the enzymeyield obtained after optimization of the cultural conditions was 47.7%.
Introduction
Invertases (b-fructofuranosidases) are enzymes that cat-alyse hydrolysis of terminal non-reducing b-D-fructofur-anoside residues in b-D-fructofuranosides. Invertases areintracellular as well as extracellular (Nakano et al. 2000).The enzyme has wide range of commercial applicationse.g., the production of confectionery with liquid or softcentre. It also aids fermentation of cane molasses intoethanol. Microbial invertase activity is used for themanufacture of calf feed and food for honeybees (Weber& Roitsch 2000; Sanchez et al. 2001). Many organismssuch as Neurospora crassa, Candida utilis, Fusariumoxysporium, Phytophthora meganosperma, Aspergillusniger, Saccharomyces cerevisiae, Schizosaccharomycespombe, and Schwanniomyces occidentalis produce invert-ase (Silveira et al. 2000). Saccharomyces cerevisiae is theorganism of choice for invertase production because ofits characteristic high sucrose-fermenting ability.An appropriate incubation period is of critical impor-
tance for invertase synthesis, as longer incubation cancause feedback repression of the enzyme (Vrabel et al.1997; Gomez et al. 2000). In this manuscript, we reportthe isolation of Saccharomyces cerevisiae for the pro-duction of invertase and kinetic analysis of shake flaskfermentation. Five strains of Saccharomyces cerevisiaewere isolated from dates (Phoenix dactylifera) and tested
for invertase activity. The effect of sucrose concentra-tion, incubation period, initial pH and different nitrogensources was studied.
Materials and methods
Organism and culture maintenance
The strains of Saccharomyces cerevisiae were isolatedfrom dates (fruit of the date palm, Phoenix dactylifera),cultured and maintained on the medium containing (g/l)sucrose 20.0; agar 20.0; peptone 5.0 and yeast extract 3.0at pH 6.0 (Dworschack & Wickerham 1960). Thecultures were stored at 4 �C.
Vegetative inoculum
Cell suspension was prepared from 2 to 3-days-old slantcultures of Saccharomyces cerevisiae. Twenty-five ml ofseed medium was transferred to each 250 ml Erlenmeyerflask. The medium consisted of (g/l) sucrose 30.0;peptone 5.0 and yeast extract 3.0 at pH 6, unless statedotherwise. The flasks were cotton plugged and auto-claved at 103.5 Pa pressure (121 �C) for 15 min andcooled at room temperature. One ml of inoculum wastransferred to each flask under sterile conditions. Flasks
World Journal of Microbiology & Biotechnology (2005) 21:487–492 � Springer 2005
DOI 10.1007/s11274-004-2612-7

were then incubated in a rotary incubator shaker(SANYO Gallenkamp PLC, UK) at 30 �C for 24 h.Agitation rate was kept at 200 rev/min.
Fermentation technique
Production of invertase was carried out by the shakeflask technique using 250 ml Erlenmeyer flasks. Thesame medium composition was used for vegetativeinoculum preparation and for fermentation. Twenty-five millilitre of fermentation medium was transferred toeach Erlenmeyer flask. The cotton-plugged flasks wereautoclaved at 103.5 Pa pressure for 15 min and cooledat room temperature. One millilitre of vegetative inoc-ulum was aseptically transferred to each flask; dry cellmass content of vegetative inoculum was 0.45 g/l. Flaskswere then incubated in a rotary incubator shaker(SANYO Gallenkamp PLC, UK) at 30 �C for 48 h.The agitation rate was kept at 200 rev/min.
Analytical methods
Dry cell massDry cell mass of yeast was determined by centrifugationof fermented broth in centrifuge at 3000 g for 15 minusing weighed centrifuge tubes. The cells were washedthrice with distilled water and the tubes were oven driedat 105 �C for 2 h in an oven (Model: 1442A, Memmert,Germany).
Sugar estimationSucrose was hydrolysed by addition of 100 IU invertasein 10 ml of fermentation medium following incubationat 55 �C for 15 min. Sugar was then estimated by DNSmethod (Tasun et al. 1970) Transmittance was mea-sured at 546 nm using spectrophotometer.
Invertase activityEnzyme activity was determined according to themethod of Sumner & Howell (1935). ‘One invertase
unit was defined as the amount of enzyme, whichhydrolysed 1 lmol of sucrose per min at 20 �C, atpH 4.5’.
Kinetic parametric studies and statistical analysis
Kinetic parameters for batch fermentation process weredetermined after Pirt (1975). Treatment effects werecompared after Snedecor & Cochran (1980). Signifi-cance has been presented as Duncan’s multiple ranges inthe form of probability P values.
Results and discussion
Isolation and screening of organism
Five cultures of Saccharomyces cerevisiae (GCA-I,GCA-II, GCA-III, GCA-IV and GCA-V) were isolatedfrom five different samples of dates (Pakistani, Iranianand Arabian types obtained from different areas ofLahore). Isolates were identified on the basis of char-acteristic features (Alexopoulos et al. 1995). The strainswere screened for the production of invertase. Enzymeproduction ranged from 42.02 to 59.61 U/mg dry cellweight. Yeast strain GCA-II gave maximum produc-tion. This strain showed a low specific growth rate, but,a remarkable specific product rate was noted (Table 1)and was selected for the subsequent kinetic studies.
Sucrose concentration
The effect of sucrose concentration (20.0–40.0 g/l) oninvertase production by Saccharomyces cerevisiae GCA-II was studied (Figure 1). Maximum enzyme activity wasobtained at a sucrose concentration of 30.0 g/l. Sucroseconcentrations of more than 30.0 g/l caused an increasein sugar consumption and dry cell mass, however, therewas no increase in invertase production. The reason wasgeneration of a high concentration of inverted sugar in
Table 1. Kinetics of Saccharomyces cerevisiae strains for invertase biosynthesis.
Kinetic parameters Yeast strain
GCA-I GCA-II GCA-III GCA-IV GCA-V
Substrate consumption parameters
Yx/s(g cells/g) 0.097 ± 0.003 0.052 ± 0.002 0.056 ± 0.002 0.068 ± 0.002 0.077 ± 0.003
Qs (g/l h) 0.268 ± 0.001 0.411 ± 0.012 0.318 ± 0.003 0.305 ± 0.002 0.412 ± 0.002
qs (g/g cells h) 1.21 ± 0.04 2.42 ± 0.07 1.37 ± 0.04 1.30 ± 0.04 1.70 ± 0.005
lmax(h)1) 0.036 ± 0.001 0.021 ± 0.001 0.021 ± 0.001 0.032 ± 0.001 0.048 ± 0.002
Enzyme formation parameters
Qp (U/l h) 1583.0 ± 50 2274.5 ± 70 2010.1 ± 40 1728.2 ± 20 2047.1 ± 30
Yp/s(U/g) 5189.1 ± 4.2 5514.0 ± 5.2 4632.2 ± 5.1 4766.6 ± 6.0 4981.8 ± 4.1
Yp/x(U/mg cells) 60.6 ± 2.0 106.7 ± 0. 3 92.2 ± 0.3 82.9 ± 0.2 64.8 ± 0.2
qp (U/mg cells h) 6.26 ± 0.2 13.34 ± 0. 4 11.34 ± 0.3 9.73 ± 0.3 6.55 ± 0.2
Kinetic parameters: Qp = U of invertase produced/l h, Yp/s = U of invertase produced/g substrate consumed, Yp/s = U of invertase
produced/mg cells formed, qp = U of invertase produced/mg cells h, Yx/s = g cells/g substrate utilized,Qs = g substrate consumed/l h, qs = g
substrate consumed/g cells h, Qx = g cells formed/l h.
All the rates were calculated over intervals of 8 h and the maximum values are shown here, ± indicates standard deviation among three parallel
replicates.
488 Ikram-ul-Haq et al.

the medium resulting in glucose-induced repression ofinvertase (Elorza et al. 1977; Vitolo et al. 1995). Atconcentrations of sucrose less than 30.0 g/l, enzymeproduction was less than optimum. As sucrose was thecarbon source in the medium, lower concentrationslimited the proper growth of yeast, resulting in a loweryield of invertase (Myers et al. 1997).
Rate of invertase production
In batchwise fermentation, enzyme production startedafter a lag phase of 8 h and reached maximum at theonset of the stationary phase. Afterwards, enzymeactivity declined due to a decrease in nutrient availabil-ity in the medium, or carbon catabolite repression, asthe expression of invertase in Saccharomyces waschecked by the presence of monosaccharides like glucoseand fructose (Herwig et al. 2001). Thus proper incuba-
tion time was very important and critical for maximalenzyme production. Figure 2 shows the rate of invertaseproduction by Saccharomyces cerevisiae GCA-II. Totalincubation time was 72 h. Enzyme activity was esti-mated for different time intervals (8–72 h). Maximuminvertase production was observed at 48 h of incuba-tion. At 48 h incubation time, specific growth andproduct rates also supported the observed resultsindicating higher enzyme yield. Further increase inincubation period did not enhance invertase production.It might be due to a decrease in the amount of availablenitrogen in the fermentation medium, the age oforganism, the addition of inhibitors produced by yeastitself and the protease production characteristic ofdecline phase. Other workers have reported invertaseproduction by Saccharomyces cerevisiae in similar cul-ture medium incubated for 24–48 h (Dworschack &Wickerham 1960).
0
10
20
30
40
50
60
70
80
20 25 30 35 40Sucrose Concentration (g/l)
Inve
rtas
e A
ctiv
ity (
U/m
l).
0
5
10
15
20
25
30
Sug
ar c
onsu
mpt
ion,
Dry
cel
l mas
s (g
/l).
Invertase activity Dry Cell Mass Sugar Consumption
Figure 1. Effect of sucrose concentration on the production of invertase (incubation period 48 h, temperature 30 �C, initial pH 6.0, agitation rate
200 rev/min).
0
10
20
30
40
50
60
70
80
0 8 16 24 32 40 48 56 64 72
Time (h)
Inve
rtas
e ac
tivity
(U
/ml)
.
0
5
10
15
20
25
30
Suga
r co
nsum
ptio
n, D
ry c
ell m
ass
(g/l)
.
Invertase activity Dry cell mass Sugar consumption
Figure 2. Rate of invertase production by Saccharomyces cerevisiae (sucrose concentration 20.0 g/l, incubation period 48 h, temperature 30 �C,initial pH 6.0, agitation rate 200 rev/min).
Kinetics of invertase production 489

Initial pH
The effect of initial pH on invertase production bySaccharomyces cerevisiae GCA-II is shown in Figure 3.Maximum production of invertase was obtained whenthe initial pH of the fermentation medium was 6.0.Similarly, dry cell mass and sugar consumption weremaximal at pH 6.0 i.e., 1.05 and 25.53 g/l, respectively.The final pH of the medium was 6.7. Many workershave reported similar results (Vitolo et al. 1995; Her-wig et al. 2001, Belcarz et al. 2002). Higher growth ratewas observed at pH 5.5, however maximum productrate was noted at initial pH 6. This means thatalthough growth was more favoured at pH 5.5, as faras invertase production was concerned, pH 6 was best.It was noted that during submerged fermentation of S.cerevisiae, the final pH of the reaction mixture was
higher than the initial pH; and that the extent of theincrease in pH was proportional to the invertaseactivity.
Organic nitrogen sources
Nitrogen sources and their concentrations have amajor effect on enzyme yield because sucrose metab-olism shows a specific physiological response to thepresence of nitrogen source (Silveira et al. 2000). Theeffect of different organic nitrogen sources (nutrientbroth, peptone + yeast extract (control), urea + yeastextract and yeast extract only) on the production ofinvertase by Saccharomyces cerevisiae was studied(Figure 4). Application of an appropriate nitrogensource was very important for optimal production of
0
10
20
30
40
50
60
70
80
5 5.5 6 6.5 7
Initial pH
Inve
rtas
e ac
tivity
(U
/ml)
0
5
10
15
20
25
30
Dry
cel
l mas
s, S
ugar
con
sum
ptio
n (g
/l)
Invertase activity Dry cell mass Sugar consumption
Figure 3. Effect of initial pH on invertase production from Saccharomyces cerevisiae GCA-II (sucrose concentration 20.0 g/l, incubation period
48 h, temperature 30 �C, initial pH 6.0, agitation rate 200 rev/min).
0
10
20
30
40
50
60
70
80
control Nutrient broth Urea +yeast extract Yeast extract
Nitrogen Sources (5g/l)
Inve
rtas
e A
ctiv
ity (
U/m
l).
0
5
10
15
20
25
30
Dry
cel
l mas
s, S
ugar
con
sum
ptio
n(g
/l).
Invertase activity Dry Cell Mass Sugar Consumption
Figure 4. Effect of organic nitrogen sources on the production of invertase (sucrose concentration 20.0 g/l, incubation period 48 h, temperature
30 �C, initial pH 6.0, agitation rate 200 rev/min).
490 Ikram-ul-Haq et al.

invertase. In the following study, considerable invert-ase activity and dry cell mass was obtained whenpeptone + yeast extract was used as nitrogen source.Least dry cell mass was obtained when urea was usedin the medium (0.77 g/l) however enzyme productionwas maximum. The reason for the high enzyme yieldmight be the positive influence of urease and invertaseon each other’s secretion into the culture medium(Egorov et al. 2000).The effect of urea concentration in the fermentation
medium on the production of invertase by Saccharo-myces cerevisiae GCA-II was studied (Figure 5). Max-imum enzyme activity (88.03 U/ml) was observed aturea concentration of 0.2 g/l. Sugar consumption anddry cell mass were 24.72 and 1.02 g/l, respectively.Lower urea concentration was not enough to induceurease in amounts sufficient to promote invertaseproduction, and it did not fulfil the nitrogen require-
ment of the yeast, thus yielding less enzyme. Concen-trations of urea higher than the optimum alsoproduced less invertase, as it affected denaturation ofyeast cell membranes (Pitombo et al. 1994; Lopes &Sola-Penna 2001), this was also supported by the Qp
and Yx/s values (Figure 6), indicating reduction in cellmass with an increase in urea concentration. Otherworkers have reported maximum invertase activity ofwild and mutant yeasts and fungi in the range of 0.10–55.0 U/ml, which is at least 40% less than our strain(Dworschack & Wickerham 1960; Metzenberg et al.1962; Hill & Sussman 1964; Hang et al. 1973; Mor-meneo & Sentandreu 1982; Maheshwari et al. 1983;Carlson et al. 1984; Neigeborn & Carlson 1984;Sarokin & Carlson 1985; Perlman et al. 1986; Rou-wenhorst et al. 1991; Myers et al. 1997; Basha. &Palanivelu 1998; Chaudhuri et al. 1999; Ashokkumar& Gunasekaran 2002; Montiel-Gonzalez et al. 2002).
0
20
40
60
80
100
120
140
160
Control 0.1 0.2 0.3 0.4 0.5
Urea Concentration (g/l)
Inve
rtas
e A
ctiv
ity (
U/m
l).
0
5
10
15
20
25
30
Sug
ar c
onsu
mpt
ion,
Dry
cel
lm
ass
(g/l)
Fin
al p
H
Invertase activity Sugar Consumption Dry Cell Mass Final pH
Figure 5. Effect of urea concentration on the production of invertase (sucrose concentration 20.0 g/l, incubation period 48 h, temperature 30 �C,initial pH 6.0, agitation rate 200 rev/min).
0
0.5
1
1.5
2
2.5
3
3.5
4
4.5
5
Control 0.1 0.2 0.3 0.4 0.5
Urea concentration (g/l)
Qp
(U/m
lh).
0
0.01
0.02
0.03
0.04
0.05
0.06
0.07
Yx/
s (g
cel
ls/g
).
Qp Yx/s
Figure 6. Effect of urea concentration on the Qp (U of invertase produced/ml h) and Yx/s (g cells/g sugar consumed) (sucrose concentration
20.0 g/l, incubation period 48 h, temperature 30 �C, initial pH 6.0, agitation rate 200 rev/min).
Kinetics of invertase production 491

Conclusion
Invertase is an industrially important enzyme and itsdemand is increasing in line with the growing globalmarkets for processed food, especially the confectioneryindustry. The use of invertase is somewhat limited dueto its high price, thus optimization of the productionprocess is very important so as to make it moreeconomical and feasible. The present study contributedtoward the optimization of nutritional parameters andcultural conditions. Important findings included opti-mization of incubation period, pH, sucrose concentra-tion and use of urea as additional nitrogen source. It wasnoted that addition of 0.2 g/l of urea in the culturemedium resulted in a highly significant increase ininvertase production. This sharp increase might beattributed to the possibility that urease and invertasepositively influence each other’s secretion into theculture medium, and urea facilitates release of periplas-mic invertase by making yeast cell membranes morepermeable. The value of product yield coefficient wasvery high i.e., 9253 U/g.
References
Ashokkumar, B. & Gunasekaran, P. 2002 Beta-fructofuranosidase
production by 2-deoxyglucose resistant mutants of Aspergillus
niger in submerged and solid-state fermentation. Indian Journal of
Experimental Biology 40, 1032–1037.
Alexopoulos, C.J. Mims, C.W. & Blackwell M. 1995 Introductory
Mycology 4th edn. New York: John Wiley and Sons. ISBN
0471522295.
Basha, S.Y. & Palanivelu, P. 1998 Enhancement in activity of an
invertase from the thermophilic fungus Thermomyces lanuginosus
by exogenous proteins. World Journal of Microbiology and
Biotechnology 14, 603–605.
Belcarz, A., Ginalska, G., Lobarsewski, J. & Penel C. 2002 The novel
non-glycosylated invertase from Candida utilis (the properties and
the conditions of production and purification). Biochimica
et Biophysica Acta 1594, 40–53.
Carlson, M., Osmond, B.C., Neigeborn, L. & Botstein, D. 1984 A
suppressor of Snf1 mutations causes constitutive high-level invert-
ase synthesis in yeast. Genetics 107, 19–32.
Chaudhuri, A., Bharadwaj, G. & Maheshwari, R. 1999 An unusual
pattern of invertase activity development in the thermophilic
fungus Thermomyces lanuginosus. FEMSMicrobiology Letters 177,
39–45.
Dworschack, R.G. & Wickerham, L.J. 1960 Extracellular invertase by
sucrose-fermenting yeasts. U.S. Patent 2953500.
Egorov, S.N., Semenova, I.N. & Maksimov, V.N. 2000 Mutual effect
of invertase and acid phosphatase from the yeast Saccharomyces
cerevisiae on their secretion into culture media. Mikrobiologiia 69,
34–37.
Elorza, M., Villanuena, R. & Sentandreu, R. 1977 The mechanism of
catabolite inhibition of invertase by glucose in Saccharomyces
cerevisiae. Biochimica et Biophysica Acta 475, 103–112.
Gomez, S.J.R., Augur, C. & Viniegra-Gozalez, G. 2000 Invertase
production by Aspergillus niger in submerged and solid-state
fermentation. Biotechnology Letters 22, 1255–1258.
Hang, Y.D. Spliitstoesser, D.F. & Landschoot, R.L. 1973. Production
of yeast invertase from Sauerkraut waste. Applied Microbiology 25,
501–502.
Herwig, C. Doerries, C. Marison, I. & Stockar, U. 2001 Quantitative
analysis of the regulation scheme of invertase expression in
Saccharomyces cerevisiae. Biotechnology and Bioengineering 76,
247–58.
Hill, E.P. & Sussman, A.S. 1964Development of trehalase and invertase
activity in Neurospora. Journal of Bacteriology 88, 1556–1566.
Lopes, D.H.J. & Sola-Penna, M. 2001 Urea increases tolerance of
yeast inorganic pyrophosphatase activity to ethanol: the other side
of urea interaction with proteins. Archives of Biochemistry and
Biophysics 394, 61–66.
Maheshwari, R., Balasubramanyam, P.V. & Palanivelu, P. 1983
Distinctive behaviour of invertase in a thermophilic fungus,
Thermomyces lanuginosus. Archives of Microbiology 134, 255–260.
Metzenberg, R.L. 1962 A gene affecting the repression of invertase and
trehalase in Neurospora. Archives of Biochemistry and Biophysics
96, 468–474.
Montiel-Gonzalez, A.M., Fernandez, F.J., Viniegra-Gonzalez, G.&
Loera, O. 2002 Invertase production on solid-state fermentation by
Aspergillus niger strains improved by parasexual recombination.
Applied Biochemistry and Biotechnology 102–103, 63–70.
Mormeneo, S. & Sentandreu, R. 1982 Regulation of invertase
synthesis by glucose in Saccharomyces cerevisiae. Journal of
Bacteriology 152, 14–18.
Myers, D.K., Lawlor, D.T. & Attfield, P.V. 1997 Influence of invertase
activity and glycerol synthesis and retention on fermentation of
media with a high sugar concentration by Saccharomyces cerevi-
siae. Applied and Environmental Microbiology 63, 145–150.
Nakano, H., Murakami, H., Shizuma, M., Kiso, T., deAraujo T.L. &
Kitahata, S. 2000 Transfructosylation of thiol group by beta-
fructofuranosidases. Bioscience and Biotechnology 64, 1472–1476.
Neigeborn, L. & Carlson, M. 1984 genes affecting the regulation of
suc2 gene expression by glucose repression in Saccharomyces
cerevisiae. Genetics 108, 845–858.
Perlman, D., Raney, P. & Halvorson, H.O. 1986 Mutations affecting
the signal sequence alter synthesis and secretion of yeast invertase
(signal peptide/recombinant DNA/protein secretion/proteolytic
processing). Proceedings of the National Academy of Sciences
USA 83, 5033–5037.
Pirt, S.J. 1975 Principles of Microbe and Cell Cultivation. pp. 115–117.
London, UK: Blackwell Scientific. ISBN 0-63208150-3.
Pitombo, R.N.M., Spring, C., Passos, R.F., Tonato, M. & Vitole, M.
1994 Effect of moisture content on invertase activity of freeze-dried
Saccharomyces cerevisiae. Cytobiology 31, 383–392.
Rouwenhorst, R.J., Van Der Baan, A.A., Scheffers, W.A. & Van
Dijken, J.P. 1991 Production and localization of b-fructosidase in
asynchronous and synchronous chemostat cultures of yeasts.
Applied and Environmental Microbiology 57, 557–562.
Sanchez, M.P., Huidobro, J.F., Mato, I., Munigategui, S. & Sancho,
M.T. 2001 Evolution of invertase activity in honey over two years.
Journal of Agricultural and Food Chemistry 49, 416–422.
Sarokin, L. & Carlson, M. 1985 Upstream region of the suc2 gene
confers regulated expression to a heterologous gene in Saccharo-
myces cerevisiae. Molecular and Cellular Biology 5, 2521–2526.
Silveira, M.C., Oliveira, E.M., Carvajal, E. & Bon, E.P. 2000 Nitrogen
regulation of Saccharomyces cerevisiae invertase. Role of the URE2
gene. Applied Biochemistry and Biotechnology 84–86, 247–254.
Snedecor, G.W. & Cochran, W.G. 1980 Statistical Methods, 7th edn.
pp. 32–43. USA: Iowa State University., USA. ISBN 0-81381560-6.
Sumner, J.B. & Howell, S.F. 1935 A method for determination of
saccharase activity. Journal of Biological Chemistry 108, 51–54.
Tasun, K., Chose, P. & Ghen, K. 1970 Sugar determination of DNS
method. Biotechnology and Bioengineering 12, 921.
Vitolo, M., Duranti, M.A. & Pellegrim, M.B. 1995 Effect of pH,
aeration and sucrose feeding on invertase activity of intact
Saccharomyces cerevisiae cells grown in sugarcane black strap
molasses. Journal of Industrial Microbiology 15, 75–79.
Vrabel, P., Polakovic, M., Stefuca, V. & Bales, V. 1997 Analysis of
mechanisms and kinetics of thermal inactivation of enzymes:
evaluation of multi temperature data applied to inactivation of
yeast invertase. Enzyme and Microbial Technology 20, 348–354.
Weber, H. & Roitsch, T. 2000 Invertases and life beyond sucrose
cleavage. Trends in Plant Sciences 5, 47–48.
492 Ikram-ul-Haq et al.

Antibiotic resistance and survival of faecal coliforms in activated sludge system
in a semi-arid region (Beni Mellal, Morocco)
S. Fars1, K. Oufdou2,*, A. Nejmeddine3, L. Hassani2, A. Ait Melloul2, K. Bousselhaj1, O. Amahmid4,K. Bouhoum4, H. Lakmichi2 and N. Mezrioui21 Regie Autonome de Distribution d’Eau et d’Electricite du Tadla (R.A.D.E.E.T.), B.P. 174, Beni Mellal, Morocco2 Laboratoire de Microbiologie, Departement de Biologie, Faculte des Sciences-Semlalia, Universite Cadi Ayyad, B.P.2390 Marrakech 40000, Morocco3 Laboratoire d’Analyses et d’Ecotoxicologie, Departement de Biologie, Faculte des Sciences-Semlalia, Universite CadiAyyad, B.P. 2390 Marrakech 40000, Morocco4 Laboratoire de Parasitologie, Departement de Biologie, Faculte des Sciences-Semlalia, Universite Cadi Ayyad, B.P.2390 Marrakech, 40000 Morocco*Author for correspondence: Tel.: + 212-4443-4649, Fax: 212-4443-7412, E-mail: [email protected]
Keywords: Activated sludge, antibiotic resistance, drying bed, faecal coliforms, survival, wastewater
Summary
The activated sludge process is one of the biological treatment methods used in many countries to reduce the highlevels of organic and mineral pollutants and pathogenic micro-organisms present in wastewater. The present workwas undertaken to study the dynamic and antibiotic-resistance of faecal coliforms (FC) in the activated sludgesystem of Beni Mellal. This work has also as objective the study of the survival of FC, protozoan cysts, helmintheggs and FC antibiotic resistance in the sludge dehydrated in drying beds in order to know if the agricultural usageof sludge presents any problems to public health. The activated sludge treatment of Beni Mellal resulted in anaverage reduction of FC and faecal streptococci of 90.75 and 91.06%, respectively. The overall resistance (resistanceto at least one antibiotic) of 111 FC strains isolated from the system was 72.07%. This treatment system did notincrease the incidence of FC antibiotic resistance in treated wastewaters. The antibiotic resistance of FC was foundto be similar in both raw (71.05%) and treated sewage (77.77%). High levels of antibiotic resistance were towardsstreptomycin (54.05%), ampicillin (42.34%), amoxicillin (42.34%) and amoxicillin–clavulanic acid (31.53%). Thetreatment of sludge in drying beds appeared to be efficient in eliminating pathogenic micro-organisms: FC,protozoan cysts and helminth eggs. Moreover, the FC antibiotic resistance did not change over time in sludge-drying bed. According to the standard norms, agricultural utilization of this sludge cannot be excluded. However, itis important to study in the receptor environment the survival and the behaviour of antibiotic-resistant FC presentin sludge and water.
Introduction
The use of untreated wastewater for agricultural pur-poses involves serious health problems due to high levelsof organic pollutants (e.g. detergents, pesticides), min-eral pollutants (e.g. heavy metals), pathogenic bacteriaand other micro-organisms. Several treatment methodsare employed to reduce the organic and the bacterialload of wastewater. The activated sludge process is oneof the biological treatment systems used in manycountries where the amounts of sewage generated areincreasing.The activated sludge plant of Beni Mellal (Morocco)
has been underway since 1998. It may simultaneouslysolve the environmental and sanitary problems (protec-tion of the Oum Rbia river). It can also be economically
beneficial if the effluent is re-used for irrigation purposessuch as occurs in Beni Mellal. At the present time, theavailable data regarding bacterial dynamics, especiallybacteria of faecal origin: faecal coliforms and faecalstreptococci in activated sludge treatment plants arevery scarce. Therefore, it is important to determine theeffectiveness of this treatment method in semi-aridMediterranean climates similar to Beni Mellal area.The incidence of antibiotic-resistant bacteria in
aquatic environments has increased in the last decadesas a consequence of the large-scale use of antibiotics(Walker & Vennes 1985). Antibiotic-resistant bacteriamay be found in all aquatic ecosystems and under avariety of environmental conditions. Antibiotic resis-tance has been reported in organisms from surface waterand sediments (Saya et al. 1987; Susan et al. 1988), in
World Journal of Microbiology & Biotechnology (2005) 21:493–500 � Springer 2005
DOI 10.1007/s11274-004-2613-6

lakes (Jones et al. 1986), in rivers and coastal areas(Al-Jebouri & Al-Meshhadani 1985; Pathak et al.1993a), in drinking water (Bedard et al. 1982; Pathaket al. 1993b), in sewage-polluted seawater (Baya et al.1986) and in domestic sewage (Hassani et al. 1992;Mezrioui & Oufdou 1996; Oufdou et al. 1999).The occurrence of multiply antibiotic-resistant faecal
coliforms has been demonstrated in many studies (Wal-ter & Vennes 1985; Pathak et al. 1993a; Oufdou et al.1999) and is an important potential health problem.Antibiotic resistance in organisms which are not consid-ered primary pathogens is also important because of theability of these organisms to transmit resistance to otherorganisms mainly through R-plasmids (Niemi et al.1983; Breittmayer & Gauthier 1990). Several workershave suggested that the faecal coliforms (FC), which aregenerally more antibiotic-resistant than other coliforms,may have a survival advantage in natural and treatedwastewaters (Mezrioui & Baleux 1994).The aim of the present investigation is to study the
dynamic and antibiotic-resistance of FC during treat-ment by the activated sludge system of Beni Mellal inorder to discuss impacts of antibiotic resistance in thearea of the public health. To ascertain whether agricul-tural valorization of sludge presents some problems topublic health, this work has also as objective the studyof the survival of FC, protozoan cysts, helminth eggsand the antibiotic resistance of FC in the sludgedehydrated in drying beds.
Material and methods
Study site
The activated sludge plant of Beni Mellal (32 �210N,6 �230W, Morocco) covers 7 ha and receives sewage ofessentially domestic origin. The wastewater daily dis-charged is 11,000 m3 per day. It serves a population ofabout 150,000 habitants. Retention time in the ecosystemis approximately 56 h. The superficial area of water inthe system is 9700 m2. This system contains basins ofpre-treatment and biological treatment. The purpose ofthe pre-treatment is to remove large objects, sand and oil.The pre-treated wastewater is divided up into two
aeration tanks. The aeration is made with 10 turbines ineach basin. After aeration, two settling basins allowsludge sedimentation. The treatment of sludge is madein thickening tanks which assure the concentration ofsludge. The concentrated sludge is then pumped to thesludge-drying beds. There are 58 drying beds in whichthe sludge is sun-dried. The filtered water is taken to thehead of the station. The wastewater treated by thesystem is discharged into the Oum Rbia river.
Dynamics of faecal coliforms and faecal streptococci
The temporal evolution of FC and faecal streptococci(FS) were studied over 14 months (May 2001–June
2002) in the activated sludge plant of Beni Mellal.Samples were collected once a month from the inflowand the outflow of the system. To count FC and FS,0.1 ml of the sample or of its appropriate dilutions wasseeded respectively on TTC (2,3,5-triphenyl-tetrazoliumchloride)-Tergitol 7 agar (Pasteur Institute Production)incubated at 44.5 �C for 24 h and on bile-esculine agarincubated at 37 �C for 24 h. The enumeration of thesebacteria was done by indirect count of colony-formingunits (c.f.u.).
Determination of antibiotic resistance profiles
One hundred and eleven FC strains were sampledduring the period of study from the inflow, the outflowand the sludge of the system. These strains were storedbefore antibiotic resistance characterization in preserv-ing medium agar (Pasteur Institute Production).FC strains were tested for their resistance to 15
antibiotics currently used for the treatment of humaninfections. The antibiotics tested (concentrations givenin lg/ml) were: ampicillin (Amp: 20), amoxicillin (Amx:20), amoxicillin–Clavulanic acid (Amx-Clav: 40), strep-tomycin (Str: 20), kanamycin (Km: 20), gentamycin(Gm: 10), chloramphenicol (Chl: 30), tetracycline (TC:10), nalidixic acid (Na: 50), cephalothin (Cfl: 30),cefamandole (Cfm: 30), cefotaxim (Cfx: 30), trimetho-prim (Tpm: 5), sulphamethoxazole (Smx: 100) andtrimethoprim–Sulphamethoxazole (Tpm-Smx: 1.25/23.75).The resistance to antibiotics was determined by
multipoint inoculation on Mueller–Hinton agar (Bio-Merieux) containing the appropriate antibiotic (Calom-iris et al. 1984; Hassani et al. 1992; Oufdou et al. 1999).The plates were incubated at 37 �C for 24 h. A strainwas considered resistant to an antibiotic if its growth onthe medium containing the antibiotic was similar to thatobserved on a control plate. The control plate was theMueller–Hinton agar without antibiotic.Comparison was made between percentages of FC
antibiotic resistance at the inflow, the outflow and thesludge of the system. This comparison was performedusing the test of two proportions or frequenciesdescribed by Schwartz (1963).This test shows whether a difference between two
frequencies: f1 observed on n1 samples and f2 observedon n2 samples, is significant. It will determine:
t ¼ f 1� f 2ffiffiffiffiffiffiffiffiffiffiffiffiffiffiffiffiffiffiffiffiffiffiffiffiffiffiffiffiffiffiffiffiffiffiffiffiffiffiffiffiffiffiffiffiffiffif ð1� f Þð1=n1 þ 1=n2Þ
p with f ¼ n1f1 þ n2f2n1 þ n2
if jtj < 1:96: the difference between f1 and f2 was notsignificant (P > 0.05).if jtj � 1:96: the difference was significant (P £ 0.05).Among the 111 FC strains, 38 FC strains were
isolated from the inflow, 36 strains from the outflowand 37 strains were isolated from the sludge of thesystem. According to Bianchi & Bianchi (1982), samplesof 30 colonies were statistically significant to have a
494 S. Fars et al.

good idea of the qualitative composition of bacteria inthe medium.
Survival of pathogens and FC antibiotic resistancein sludge-drying bed
The sludge treated and concentrated in thickening tanksis spread on the drying beds. In order to study thesurvival of FC in the drying beds, we followed theirtemporal evolution in sludge over a 2-month period.The sampling was done at 0, 2, 4, 8, 14, 20, 26, 32, 38, 45and 60 days. Three repetitions were realized for eachsample which was done from the surface to the bottomof the sludge. The bed of sludge in the drying beds was20 cm deep.We also followed the temporal evolution of protozoan
cysts, helminth eggs and physico-chemical parameters(water-content of sludge, ambient temperature, evapo-ration and content of heavy metals). The count ofprotozoan cysts and helminth eggs was realized by thetechnique of Bailenger (1962). Microscopic observationwas done in a Thoma counting cell (Polylabo, 99530) at400· magnification for protozoan cysts and in a MacMaster counting cell (Polylabo, 99520) at 100· magni-fication for helminth eggs.The water-content of sludge samples was determined
according to the method described by the normA.F.N.O.R. ISO 11465 (A.F.N.O.R. 1999). Ambienttemperature and evaporation values were given by themeteorological station of ‘Hydraulic basin Oum RbiaAgency of Beni Mellal’. The temporal evolution of heavymetals was evaluated according to the following method:In brief, 500 mg of sludge were placed in a muffle oven at450 �C for 2 h. The sample was suspended in 10 ml ofhydrofluoric acid (HF: 50%) in a Teflon beaker anddried on a sand bath. The dissolution of the residue wasobtained by 2.5 ml of nitric acid (HNO3) and 6.5 ml ofhydrochloric acid (HCl) for 2 h while it was hot. Thefinal solution was adjusted to 10 ml by double-distilledwater. Heavy metal content was determined by a flameatomic absorption spectrophotometer (Unicam 929A.A.S.).The antibiotic resistance of FC in sludge-drying beds
was also studied. A comparison was made between theantibiotic resistance of FC strains isolated at T0 (initialtime) and those surviving after 2 months of exposure ofsludge in the drying beds.
Results
Dynamics of FC and FS
The evolution of FC and FS at the inflow and theoutflow of the activated sludge is illustrated in Figure 1.Temporal densities of these bacteria were relativelystable. High numbers of FC and FS were noted at theinflow point with respective numbers of 3.84 · 105 and2.44 · 104 c.f.u./ml, while at the outflow point, the
observed numbers were respectively 3.55 · 104 and2.18 · 103 c.f.u./ml. These numbers were significantlylower (P < 0.05; Wilcoxon signed rank non-parametrictest) compared to those noted in the inflow (Figure 1).The activated sludge rate efficiency in eliminating thesebacteria was respectively of 90.75 and 91.06% duringthe period of study.
Antibiotic resistance of FC
In order to evaluate the risk associated with antibioticresistance, 111 strains of FC were isolated over time atthe inflow, the outflow and the sludge of the system. Thesusceptibility patterns of FC strains to the 15 antibioticstested are shown in Table 1.The overall resistance (resistance to at least one
antibiotic) of FC strains was 72.07%. The mono-resistance (resistance to one antibiotic) of FC strainswas 18.91%, whereas the multi-resistance (resistance toat least two antibiotics) was 53.15%. The multi-resis-tance was significantly higher (P < 0.05; the test of twoproportions, Schwartz 1963) than that of mono-resis-tance.The highest levels of antibiotic resistance were
obtained for streptomycin (54.05%), ampicillin(42.34%), amoxicillin (42.34%) and amoxicillin–clavulanic acid (31.53%). The resistance rates tosulphamethoxazole, tetracycline, trimethoprim and tri-methoprim–sulphamethoxazole were relatively lower
0
1
2
3
4
5
6
7
May July Sept Nov Janv March May Months
Inflow Outflow
log 1
0 c.
f.u.
/ml
0
1
2
3
4
5
6
May July Sept Nov Janv March May
Months
Inflow Outflow
FS
log 1
0 c.
f.u.
/ml
FC
01 02
01 02
Figure 1. Temporal evolution of FC and FS at the inflow and the
outflow of the activated sludge.
Antibiotic resistance of FC in activated sludge 495

and reached 28.82, 21.62, 16.21 and 13.51%, respec-tively (Table 1). The resistance to kanamycin, chloram-phenicol, nalidixic acid, cephalothin, cefamandole didnot exceed 10%, whereas none of the strains examinedwas found to be resistant to gentamycin and cefotaxim.Mono-resistance occurred to streptomycin, tetracy-
cline, sulphamethoxazole and cephalothin. The maximalmono-resistance was to streptomycin (15 from 21 strainsresistant to one antibiotic: 71.42%). The dominantmulti-resistance profiles noted were to three antibiotics(13 from 59 strains resistant to at least two antibiotics:22.03%) and to six antibiotics (18.64%). The maximalmulti-resistance was to nine antibiotics with two pro-files: Amp, Amx, Amx-Clav, Str, Cfl, Cfm, TC, Tmp,Smx-Tpm and Amp, Amx, Amx-Clav, Str, Chl, TC,Smx, Tmp, Smx-Tpm.There was no significant difference (P > 0.05) be-
tween the level of antibiotic resistance of FC strainspresent in the raw (71.05%) and those present in thetreated effluents (77.77%). Similarly, the FC antibioticresistance in the sludge (67.56%) was not significantlydifferent than those noted in the inflow and the outflowof the system (Table 1).The results of this investigation indicate that approx-
imately 53.15% of FC found in raw, treated sewage and
sludge are multi-resistant to antibiotics commonly usedfor the treatment of bacterial infections in man andanimals.
Survival of pathogens and FC antibiotic resistance insludge-drying bed
In the sludge-drying bed, the survival of FC decreasedsignificantly over time (Figure 2). Densities of FCstrains were significantly higher (P < 0.05) at initialtime (3.9 · 105 c.f.u./ml) compared to their densitiesnoted after 2 months (only 30 c.f.u./ml). The elimina-tion rate of these bacteria is more than 99.99%equivalent to 4.114 logarithmic units.Protozoan cysts and helminth eggs were also elimi-
nated in the sludge-drying bed. At initial time (T0)protozoan cysts and helminth eggs were detected insludge. The concentrations of protozoan cysts were of76 cysts/g dry weight (d.w.) for Entamoeba histolytica,150 cysts/g d.w. for Giardia and 310 cysts/g for Ent-amoeba coli, whereas the concentrations of helmintheggs were of 6.8 eggs/g d.w. for Ascaris and 16.7 eggs/g d.w. for Trichuris (Table 2).After 4 days, the concentrations of protozoan cysts
and helminth eggs decreased rapidly (Table 2). After
Table 1. Antibiotic resistance among faecal coliforms strains isolated from the inflow, the outflow and the sludge of the system.
Inflow Outflow Sludge Total
No. of strains examined 38 36 37 111
No. of resistant strains (%) to
One antibiotic (mono-resistance) 6 (15.79) 8 (22.22) 7 (18.91) 21 (18.91)
Two antibiotics 4 (10.52) 3 (8.33) 1 (2.7) 8 (7.2)
Three antibiotics 5 (13.15) 5 (13.88) 3 (8.1) 13 (11.71)
Four antibiotics 3 (7.89) 3 (8.33) 1 (2.7) 7 (6.3)
Five antibiotics 3 (7.89) 3 (8.33) 1 (2.7) 7 (6.3)
Six antibiotics 2 (5.26) 4 (11.11) 5 (13.51) 11 (9.9)
Seven antibiotics 1 (2.63) 1 (2.77) 5 (13.51) 7 (6.3)
Eight antibiotics 2 (5.26) 0 (0) 2 (5.4) 4 (3.6)
Nine antibiotics 1 (2.63) 1 (2.77) 0 (0) 2 (1.8)
Multi-resistancea 21 (55.26) 20 (55.55) 18 (48.64) 59 (53.15)
Overall resistanceb 27 (71.05) 28 (77.77) 25 (67.56) 80 (72.07)
Percentages of strains resistant to
Amp 44.73 41.66 40.54 42.34
Amx 42.1 41.66 43.24 42.34
Amx-Clav 39.47 41.66 13.51 31.53
Str 44.73 58.33 59.45 54.05
Km 5.26 0 2.7 2.7
Gm 0 0 0 0
Chl 5.26 5.55 8.1 6.3
TC 21.05 13.88 29.72 21.62
Na 0 0 2.7 0.9
Cfl 5.26 8.33 2.7 5.4
Cfm 13.15 2.77 8.1 8.1
Cfx 0 0 0 0
Tpm 7.89 16.77 24.32 16.21
Smx 23.68 27.77 35.13 28.82
Tpm-Smx 10.52 8.33 21.62 13.51
a Multi-resistance: resistance to at least two antibiotics.b Overall resistance: resistance to at least one antibiotic.
Amp – ampicillin, Amx – amoxicillin, Amx-Clav – amoxicillin-Clavulanic acid, Str – streptomycin, Km – kanamycin, Gm – gentamycin, Chl –
chloramphenicol, TC – tetracycline, Na – nalidixic acid, Cfl – cephalothin, Cfm – cefamandole, Cfx – cefotaxim, Tpm – trimethoprim, Smx –
sulphamethoxazole, Tpm-Smx – trimethoprim-sulphamethoxazole.
496 S. Fars et al.

8 days no cysts of protozoan or eggs of Trichuris weredetected in the sludge. For Ascaris, the total removal(100%) of this helminth was obtained from 14 days.It appears that high temperatures are responsible for
the reduction of FC densities and the elimination ofprotozoan cysts and helminth eggs in the sludge-dryingbed. The present experience was conducted in summerperiod (May–July 2001). At 26 days, the recordedambient temperature was of 41 �C and the evaporationwas 7 l/m3 (Table 3).The dehydration in the drying bed appeared to be
efficient to eliminate these microbial pathogens. In fact,the water-content decreased rapidly over time and it wasonly of 3.55% at 20 days (Table 3).The analysis of heavy metals in the sludge-drying bed
revealed that the evolution of total concentration ofcopper, cadmium and lead remained relatively constantduring the period of dehydration of sludge in the dryingbed (Table 3). These heavy metals contents remainessentially under the standard norms recommended byA.F.N.O.R. 44-041 (A.F.N.O.R. 1998) (Table 4).On the other hand, the antibiotic resistance of FC
strains did not significantly change over time insludge-drying bed (Table 5). The overall resistance ofFC strains isolated at T0 (initial time) (67.56%) was notsignificantly (P > 0.05) different than that evaluatedafter 2 months (72.22%) of exposure of sludge to
sunlight in the drying bed (Table 5). Themono-resistanceand the multi-resistance of FC strains were not signifi-cantly different atT0 (respectively 18.91 and 48.64%) andafter 2 months (respectively 25 and 47.22%).The high levels of resistance at initial time and after
2 months, were to streptomycin (respectively 59.45 and47.22%), ampicillin (respectively 40.54 and 44.44%) andamoxicillin (respectively 43.24 and 52.77%) (Table 5).These percentages were comparable and were notsignificantly different (P > 0.05).
Discussion
The activated sludge treatment resulted in an averagereduction of faecal pollution bacteria; FC and FSrespectively of 90.75 and 91.06% during the period ofstudy equivalent to 1.034 and 1.05 logarithmic unit. Thesuperficial area of water in the system, which is 9700 m2,allowed only a weak reduction of faecal pollutionbacteria (Figure 1). The effectiveness in eliminatingthese bacteria was somewhat comparable to thatobtained by Mezrioui & Baleux (1994). These authorshave shown that the percentage reduction of FC was of91.30% in summer in the activated sludge of Montpel-lier (France) whereas in winter it was only 32%.The efficiency of the activated sludge plant appeared
to be lower in removing pollution faecal bacteria thanthe other biological treatment process such as thestabilization pond system. In fact, the Marrakechstabilization ponds resulted in a 97.97% average overallreduction of FC equivalent to 1.69 logarithmic units.
1
2
3
4
5
6
0 2 4 8 14 20 26 32 38 45 60
Time (days)
log 1
0 c.
f.u.
/ml
Figure 2. Temporal evolution of FC in sludge-drying bed (confidence
interval: 95%; n ¼ 3).
Table 3. Temporal evolution of water-content, ambient temperature, evaporation and heavy metals in the sludge-drying bed.
Time (days) Water-content
(%)
Temperature (�C)(l/m3)
Evaporation Copper Cadmium
(mg/kg d. w.)
Lead
T0 (0) 64.38 27 3.9 17.0 4.39 19.34
2 61.2 27 3.98 25.39 6.75 23.17
4 59 31 4 29.4 8.31 22.19
6 58.43 25 3 26.03 7.4 19.65
8 62.05 27 4 19.32 6.99 18.13
14 49.63 36 5.2 19.83 6.32 18.49
20 3.55 35 6 24.76 8.43 19.46
26 3.15 41 7 31.05 7.49 20.14
32 3.42 35 6.95 28.07 8.09 21.06
38 1.93 33 7.13 34.76 7.77 20.32
45 1.90 37 10.6 28.38 8.30 19.89
60 1.84 40 8 25.04 7.98 23.36
Table 2. Survival of protozoan cysts and helminth’s eggs in the sludge-
drying bed.
Protozoan (cysts/g) Helminths (eggs/g)
Ent. his. Giardi Ent. Coli Ascaris Trichuris
T0 (0) 76 150 310 6.8 16.7
4 32.6 64.3 205.3 4.3 7.6
8 – – – 2.4 –
14 – – – – –
Ent. his – Entamoeba histolytica, Ent. coli – Entamoeba coli.
Antibiotic resistance of FC in activated sludge 497

The reduction of FC reached 98.95% equivalent to 2logarithmic units in hot period (Mezrioui et al. 1995;Mezrioui & Oufdou 1996). The superficial area in thissystem which was only of 3800 m2, led to high reductionof FC. The aerobic lagoons of Meze (France) led toreduction of FC with rates of 99.99% in summer and99.38% in winter (Mezrioui & Baleux 1994).Determination of resistance patterns to 15 antibiotics
showed that among all FC strains isolated from BeniMellal activated sludge, 72.07% were resistant to one ormore antibiotics. The proportion of FC resistant to at
least one antibiotic ranged from 71.05% in the influentto 77.77% in treated sewage. This antibiotic resistancelevel was higher than that reported by Hassani et al.(1992) and Oufdou et al. (1999) in Marrakech sewagewaters. Hassani et al. (1992) showed that proportions ofEscherichia coli drug resistance was ranging onlybetween 21.5 and 34.1% in waste stabilization pondsof Marrakech. Oufdou et al. (1999) have also noted thatonly 27.5% of FC strains were resistant to one or moreantibiotics tested in Marrakech sewage water. However,the antibiotic resistance level evaluated in our study wassomewhat comparable to that obtained by some studies(Goyal et al. 1979; Al-Jebouri & Al-Meshhadani 1985).Goyal & Adams (1984) have reported that 80% of FCwere found to be resistant to one or more antibiotics.The percentage of multi-resistant strains (53.15%)
was significantly higher than that of mono-resistant ones(18.91%). Many studies have reported an increase ofmulti-resistant percentages among FC strains isolatedfrom various ecosystems (Walter & Vennes 1985;Pathak et al. 1993a; Oufdou et al. 1999).The most often encountered resistance of FC strains
was towards streptomycin (54.05%), ampicillin(42.34%), amoxicillin (42.34%) and amoxicillin–clavul-anic acid (31.53%). The abusive uses of these antibioticsin bacterial infections has probably led to selection ofresistant isolates (Levy 1983). All FC strains analysedwere susceptible to gentamycin. This antibiotic has oftenbeen described as an effective aminoglycoside towardsE. coli (Al-Jebouri & Al-Meshhadani 1985; Sokari et al.1988).The resistance level of FC to amoxicillin (42.34%) was
somewhat comparable to that observed for the associ-ation amoxicillin–clavulanic acid, even though, theclavulanic acid strongly inhibits b-lactamases. The mostlikely explanation was that the resistance to b-lactams isnot only achieved by the production of b-lactamases,but also by other ways like a reduced permeability ofmembranes to antibiotics as was seen in some bacteria(Urbaskova et al. 1993).The levels of antibiotic resistance of FC strains in the
sludge and in wastewater before and after treatment inthe activated sludge system were comparable. In viewof these results, it can be concluded that the activatedsludge, in which detention time was 56 h, does notpromote development of antibiotic resistance in thesame way as other biological treatment systems. Inwastewater stabilization ponds, the percentage ofantibiotic resistance at the outflow is often higher thanat the inflow. Hassani et al. (1992) have reported thatthe sewage stabilization ponds of Marrakech resultedin a significant increase of antibiotic resistance inEscherichia coli strains. Mezrioui & Echab (1995) havealso reported that this ecosystem increased significantlythe incidence of antibiotic resistance in Salmonellapopulations from the inflow (19%) of the system to itsoutflow (29%). Mezrioui & Baleux (1994) have notedthat the treatment of domestic sewage with activatedsludge did not increase resistance to antibiotics, as
Table 4. Concentrations of heavy metals in Beni Mellal sludge-drying
bed compared to the standards norms.
Heavy metals Concentrations in Beni
Mellal sludge-drying
bed (mg/kg dry weight)
Standards normsa
(mg/kg dry weight)
Copper 25.75 1000
Cadmium 7.35 20
Lead 20.43 800
a Standards norms recommended by A.F.N.O.R. 44-041
(A.F.N.O.R. 1998).
Table 5. Antibiotic resistance among FC strains isolated from sludge-
drying bed.
Initial time (T0) After 2 months
No. of strains examined 37 36
No. of resistant strains (%) to
One antibiotic
(mono-resistance)
7 (18.91) 9 (25)
Two antibiotics 1 (2.7) 3 (8.33)
Three antibiotics 3 (8.1) 5 (13.88)
Four antibiotics 1 (2.7) 5 (13.88)
Five antibiotics 1 (2.7) 1 (2.77)
Six antibiotics 5 (13.51) 2 (5.55)
Seven antibiotics 5 (13.51) 0 (0)
Eight antibiotics 2 (5.4) 1 (2.77)
Nine antibiotics 0 (0) 1 (2.77)
Multi-resistancea 18 (48.64) 17 (47.22)
Overall resistanceb 25 (67.56) 26 (72.22)
Percentages of strains
resistant to
Amp 40.54 44.44
Amx 43.24 52.77
Amx-Clav 13.51 38.88
Str 59.45 47.22
Km 2.7 5.55
Gm 0 0
Chl 8.1 2.77
TC 29.72 5.55
Na 2.7 0
Cfl 2.7 13.88
Cfm 8.1 0
Cfx 0 0
Tpm 24.32 5.55
Smx 35.13 8.33
Tpm-Smx 21.62 8.33
a Multi-resistance: resistance to at least two antibiotics.b Overall resistance: resistance to at least one antibiotic.
498 S. Fars et al.

observed in aerobic lagoons of Meze (France) whereresidence was much longer (40–70 days) than duringtreatment with activated sludge of Montpellier (France)(5–6 h).The survival of FC in the sludge-drying bed decreased
significantly during the time. The elimination rate ofthese bacteria after two months is more than 99.99%equivalent to 4.1 logarithmic units. The protozoan cystsand helminth eggs were completely eliminated after14 days in the sludge-drying bed.The treatment of sludge before reuse or disposal in the
drying bed by natural dehydration appeared to beefficient in removing pathogenic micro-organisms. Highvalues of temperatures and sunlight and low water-content could explain the significant reduction of FCdensities and the elimination of protozoan cysts andhelminth eggs. Troussellier et al. (1986), Mezrioui &Baleux (1992) and Mezrioui et al. (1995) have demon-strated the major effects of high temperature andsunlight on bacterial reduction. Ayres et al. (1993) havereported that high temperature affected eggs of Ascaris.The antibiotic resistance of FC strains did not
significantly change over time in sludge-drying bed.The overall resistance of FC strains isolated at T0 (initialtime) (67.56%) was not significantly different than thatnoted after 2 months (72.22%) of exposure of sludge tosunlight in drying bed.The conclusions to be drawn from this investigation
are that multiply antibiotic resistance FC occur insignificant numbers in both raw and treated wastewater.Even though it is better to have yielding effluents with2.76 · 104 c.f.u./ml FC antibiotic-resistant rather thanraw sewage without any treatment with2.73 · 105 c.f.u./ml FC antibiotic-resistant, the presentfindings support the view that wastewater should bepurified by more advanced methods prior to dischargeinto water destined for irrigation or recreation. Sincewater may play an important role in the spread ofresistant bacteria, routine surveillance of sewage atperiodic intervals for the detection of antibiotic-resistantbacteria is important.The treatment of sludge in drying beds appeared to be
effective to eliminate pathogenic micro-organisms.Moreover, the concentrations of heavy metals; copper,cadmium and lead remain broadly under the standardnorms. The agricultural valorization of this sludgecannot be excluded. However, it is important to studyin the receptor environment the survival and thebehaviour of antibiotic-resistant FC present in sludgeand water.
Acknowledgements
This study was supported by the International Founda-tion for Science (i.f.s.) (Project No. F/2826-2). Theauthors are grateful to the ‘Hydraulic basin Oum RbiaAgency of Beni Mellal’ for the data given of ambienttemperature and evaporation.
References
A.F.N.O.R. 1998 Association francaise de normalisation: Installations
classees pour la protection de l’environnement, Paris. ISBN 2-12-
214311-8.
A.F.N.O.R. 1999 Association francaise de normalisation: Qualite des
sols, Paris, vol. 2, 408 pp. ISBN 2-12-213141-1.
Al-Jebouri, M.M. & Al-Meshhadani, N.S. 1985 A note on antibiotic-
resistant Escherichia coli in adult man, raw sewage and sewage-
polluted river Tigris in Mosul, Nineva. Journal of Applied
Bacteriology 59, 513–518.
Ayres, R.M., Mara, D.D. & Silva, S.A. 1993 The accumulation,
distribution and viability of human parasitic nematode eggs in the
sludge of primary facultative waste stabilisation pond. Transac-
tions of the Royal Society of Tropical Medicine and Hygiene 87,
256–258.
Bailenger, J. 1962 Valeur comparee des methodes d’enrichissement en
coprologie parasitaire. Le Pharmacien Biologiste 3, 249–259.
Baya, A.M., Brayton, P.R., Brown, V.L., Grimes, D.J., Russek-
Cohen, E. & Colwell, R.R. 1986 Coincident plasmids and
antimicrobial resistance in marine bacteria isolated from polluted
and unpolluted atlantic ocean samples. Applied and Environmental
Microbiology 51, 1285–1292.
Bedard, L., Drapeau, A.J., Kasatiya, S.S. & Plante, R. 1982 Plasmides
de resistance aux antibiotiques chez les bacteries isolees d’eaux
potables. Eau de Quebec 15, 59–66.
Bianchi, M.A.G. & Bianchi, A.J.M. 1982 Statistical sampling of
bacterial strains and its use in bacterial diversity measurement.
Microbial Ecology 8, 61–69.
Breittmayer, V.A. & Gauthier, M.J. 1990 Influence of glycine betaine
on the transfer of plasmid RP4 between Escherichia coli strains in
marine sediments. Letters in Applied Bacteriology 10, 65–68.
Calomiris, J.J., Armstrong, J.L. & Seidler, J.C. 1984 Association of
metal tolerance with multiple antibiotic resistance of bacteria
isolated from drinking water. Applied and Environmental Microbi-
ology 47, 1238–1242.
Goyal, S.M. & Adams, W.N. 1984 Drug-resistant bacteria in conti-
nental shelf sediments. Applied and Environmental Microbiology 48,
861–862.
Goyal, S.M., Gerba, C.P. & Melnick, J.L. 1979 Transferable drug
resistance in bacteria of coastal canal water and sediment. Water
Research 13, 349–356.
Hassani, L., Imziln, B. & Gauthier, M.J. 1992 Antibiotic-resistant
Escherichia coli from wastewater before and after treatment in
stabilization ponds in the arid region of Marrakesh, Morocco.
Letters in Applied Microbiology 15, 228–231.
Jones, J.G., Gardener, S., Simon, B.M. & Pickup R.W. 1986
Antibiotic-resistant bacteria in Windermere and two remote
upland tarns in the English Lake District. Journal of Applied
Bacteriology 60, 443–453.
Levy, S.B. 1983 Antibiotic resistance. Infection Control 4, 195–197.
Mezrioui, N. & Baleux, B. 1992 Effets de la temperature, du pH et du
rayonnement solaire sur la survie de differentes bacteries d’interet
sanitaire dans une eau usee epuree par lagunage. Revue Sciences de
l’Eau 5, 575–593.
Mezrioui, N. & Baleux, B. 1994 Resistance patterns of E. coli strains
isolated from domestic sewage before and after treatment in both
aerobic lagoon and activated sludge.WaterResearch 28, 2399–2406.
Mezrioui, N. & Echab, K. 1995 Drug resistance in Salmonella strains
isolated from domestic wastewater before and after treatment in
stabilization ponds in an arid region (Marrakesh, Morocco).World
Journal of Microbiology and Biotechnology 11, 287–290.
Mezrioui, N. & Oufdou, K. 1996 Abundance and antibiotic resistance
of non-O1 Vibrio cholerae strains in domestic wastewater before
and after treatment in stabilization ponds in an arid region
(Marrakesh, Morocco). FEMS Microbiology Ecology 21, 277–284.
Mezrioui, N., Oudra, B., Oufdou, K., Hassani, L., Loudiki, M. &
Darley, J. 1994 Effect of microalgae growing on wastewater batch
culture on Escherichia coli and Vibrio cholerae survival. Water
Science and Technology 30, 295–302.
Antibiotic resistance of FC in activated sludge 499

Mezrioui, N., Oufdou, K. & Baleux, B. 1995 Dynamics of non-O1
Vibrio cholerae and fecal coliforms in experimental stabilization
ponds in the arid region of Marrakesh, Morocco, and the effect of
pH, temperature and sunlight on their experimental survival.
Canadian Journal of Microbiology 41, 489–498.
Niemi, M., Sibakov, M. & Niemala, S. 1983 Antibiotic resistance
among different species of fecal coliforms isolated from water
samples. Applied and Environmental Microbiology 45, 79–83.
Oufdou, K., Mezrioui, N., Ait Melloul, A., Barakate, M. & Ait Alla,
A. 1999 Effects of sunlight and Synechocystis sp. (picocyanobac-
terium) on the incidence of antibiotic resistance in wastewater
enteric bacteria. World Journal of Microbiology and Biotechnology
15, 553–559.
Pathak, S.P., Bhattacherjee, J.W. & Ray, P.K. 1993a Seasonal
variation in survival and antibiotic resistance among various
bacterial populations in a tropical river. Journal of General and
Applied Microbiology 39, 47–56.
Pathak, S.P., Gautam, A.R., Gaur, A., Gopal, K. & Ray, P.K. 1993b
Incidence of transferable antibiotic resistance among enterotoxi-
genic Escherichia coli in urban drinking water. Journal of Envi-
ronmental Science and Health A28, 1445–1455.
Saya, D.J., Ogunseitan, O., Sayler, G.S. & Miller R.V. 1987 Potential
for transduction of plasmids in a natural freshwater environment:
effect of plasmid donor concentration and natural microbial
community on transduction in Pseudomonas aeruginosa. Applied
and Environmental Microbiology 53, 987–995.
Schwartz, D. 1963 Methodes statistiques a l’usage des Medecins et des
Biologistes. 3eme edition. Paris: Flammarion Medecine-Sciences.
ISBN 2-257-10326-2.
Sokari, T.G., Ibiebele, D.D. & Ottih, R.M. 1988 Antibiotic resistance
among coliforms and Pseudomonas sp. from bodies of water
around Port Harcourt, Nigeria. Journal of Applied Bacteriology 64,
335–359.
Susan, B., Morchoe, O., Ogunseitan, O., Gary, S., Sayler, G.S. &
Miller, R.V. 1988 Conjugal transfer of R68.45 and FP8 5 between
Pseudomonas aeruginosa strains in a freshwater environment.
Applied and Environmental Microbiology 54, 1923–1929.
Troussellier, M., Legendre, P. & Baleux, B. 1986 Modeling of the
evolution of bacterial densities in an eutrophic ecosystem (sewage
lagoon). Microbial Ecology 12, 355–379.
Urbaskova, P., Schindler, J., Adolva, E. & Nemec, A. 1993 Antibiotic
susceptibility of mesophilic Aeromonads isolated in Czechoslova-
kia. Medical Microbiology Letters 2, 152–158.
Walter, M.V. & Vennes, J.W. 1985 Occurence of multiple-antibiotic-
resistant enteric bacteria in domestic sewage and oxidation
lagoons. Applied and Environmental Microbiology 50, 930–933.
500 S. Fars et al.

Diphenolases from Anoxybacillus kestanbolensis strains K1 and K4T
Melike Yildirim1,*, Melek Col1, Ahmet Colak1, Saadettin Guner�, Sabriye Dulger2 and Ali Osman Belduz21Departments of Chemistry, Karadeniz Technical University, 61080 Trabzon, Turkey2Department of Biology, Karadeniz Technical University. 61080 Trabzon, Turkey*Author for correspondence: E-mail: [email protected]
Keywords: Anoxybacillus, catecholase, diphenolase, thermophile, thermostability
Summary
Diphenolases from Anoxybacillus kestanbolensis strains K1 and K4T, highly active against 4-methylcatechol werecharacterized in terms of pH- and temperature-optima, pH- and temperature-stability, kinetic parameters, andinhibition/activation behaviour towards some general polyphenol oxidase (PPO) inhibitors and metal ions. Thetemperature-activity optima, for Anoxybacillus kestanbolensis K1 and K4T catecholases in the presence of4-methylcatechol, were 80 and 70 �C, respectively. Although catecholase from A. kestanbolensis K4T lost no activityafter a period of 1 h incubation at its optimum temperature, the enzyme from K1 was stimulated by keeping at80 �C. Both of the enzymes possessed pH optima at 9.5, and the pH-stability profiles showed that cathecholasesfrom both preparations retained their activities at alkaline pH values. Both A. kestanbolensis K1 and K4T
catecholase activities were totally inhibited by addition of 0.01 mM sodium metabisulphite, ascorbic acid andL-cysteine. 1 mM Mn2+ increased the activities of A. kestanbolensis K1 and K4T catecholases by 6.4- and 5.3-fold,respectively. These results indicate that both A. kestanbolensis K1 and K4T strains possess thermo- and alkalostablecatecholases.
Introduction
Polyphenol oxidases (PPO, EC 1.14.18.1) are a group ofcopper enzymes (Robb 1984) catalysing oxidation ofpolyphenolic compounds in the presence of molecularoxygen. They are widespread in the biosphere frommammals to bacteria (Burton 1994) and possess threedifferent related activities. Cathechol oxidase oro-diphenol:oxygen oxidoreductase (EC 1.10.3.1); laccaseor p-diphenol:oxygen oxidoreductase (EC 1.10.3.2) andcresolase or monophenol monooxygenase (EC1.18.14.1) (Sheptovitsky & Brudving 1996). PPOs cata-lyse two different types of reactions involved in thesethree activities. The first, and only specific reactioncatalysed by tyrosinase, is the hydroxylation of mon-ophenols to o-diphenols, a reaction that is usuallytermed as monophenolase activity. The second (diphe-nolase activity) consists of the oxidation of o-diphenolsto the corresponding o-quinones, which are highlyreactive molecules and polymerize to brown, red orblack pigments depending on the natural componentspresent in the material (Whitaker 1972; Friedman 1997;Gilabert et al. 2001).It has been known that PPOs are essential for
melanization (Mayer & Harel 1979). In mammals,melanins are mainly found in skin and hair, and they
have a protective function against UV radiation. Inlower organisms, melanins are also protective polymersthat constitute a primary response against chemicals,free radicals, toxic metal ions, etc. (Jacobson 2000). PPOactivity has also been found in plants and plays animportant role in plant metabolism, including therespiration system, intermediary metabolism, regulationof the oxidation–reduction potential, antibiotic effects,and the wound-healing system (Mayer 1987).Diphenolase activities of PPO have a great impor-
tance in medical diagnosis for the determination of thehormonally active catecholamines such as adrenaline,dopamine, isoprenaline and dihydroxyphenylalanine(DOPA) (Lisdat et al. 1997; Tu et al. 2001; Oldair et al.2003). PPOs also attract scientific interest for use in thesynthesis or modifications of high-value compoundssuch as coumestrol, known for oestrogenic activity, andL-DOPA, used for the treatment of Parkinson’s disease(Pandey et al. 1990; Ahmed & Vulphson 1994). PPOshave also been used in the synthesis of functionalpolymers of phenolic compounds difficult to synthesizeby conventional methods (Ikeda et al. 1996a, b; Uyama& Kobayashi 2002; Aktas & Tanyolac 2003). In thisrespect, a tyrosinase isolated from a thermophilicmicroorganism is advantageous over the mesophilicenzymes because of its thermal resistance and tolerancetowards the common denaturing agents (Kong et al.2000).� Dr. Saadettin Guner died on 7 January 2005.
World Journal of Microbiology & Biotechnology (2005) 21:501–507 � Springer 2005
DOI 10.1007/s11274-004-2392-0

Very recently, some novel hot spring thermophiles;two new species (Anoxybacillus kestanbolensis and A.gonensis) and two new strains (A. pushchinoensis A8 andSaccharococcus caldoxylolyticus TK4) have been isolat-ed from hot springs of Kestanbol and Gonen in Turkeyand characterized based on their biochemical, chemo-taxonomic and genetic properties in our laboratories(Belduz et al. 2003; Dulger et al. 2004). The presentstudy was aimed at screening their PPO potentials andevaluating the ability and biochemical characters ofthese thermophiles for oxidation of phenolic com-pounds.
Materials and methods
Chemicals
Substrates and 3-methyl-2-benzothiazolinone hydrazone(MBTH) were purchased from Sigma Chemical Co. (St.Louis, MO, USA) and the other reagents were ofanalytical grade and used as obtained.
Culture conditions
Supplemented Luria–Bertani (LB) broth was used forgrowth of all the thermophiles. The medium contained(g/l in distilled water) yeast extract 5.0, bactotryptone,10.0, NaCl; 5.0, and 40 lM CuSO4, pH 7.5.
Enzyme production and crude enzyme preparation
The bacteria were grown in LB broth medium at 60 �Cfor 12 h on a shaker operating at 200 rev/min. The cellswere harvested by centrifugation at 5000 rev/min for30 min and then suspended in 50 mM Tris–HCl buffer,pH 9.0. The suspended cells were subjected to liquidnitrogen for 2 min for three times and then disrupted bylysozyme. For this purpose, a 0.5 ml lysozyme solution(10 mg/ml) was added to a 10 ml of cell suspension andleft at room temperature for 30 min. The disrupted cellsuspension was centrifuged at 5000 rev/min for 30 min.The supernatant was used as crude enzyme extract andstored at 4 �C until use.
Screening of thermophiles for their polyphenol oxidasepotentials
Anoxybacillus species were screened for their PPOpotentials by the method reported previously (Espinet al. 1995; Dincer et al. 2002; Ozen et al. 2004; Colaket al. 2004) using an ATI Unicam UV2-100 doublebeam UV–Vis spectrophotometer (ATI Unicam, Cam-bridge, UK). The activity was determined by usingdifferent mono- or diphenolic compounds by measuringthe increase in absorbance at 494 nm for 4-methylcate-chol and 500 nm for all other substrates (Espin et al.1995). The enzymatic assay was carried out in air-saturated solutions. The assay mixture contained sub-
strates (stock 100 mM), an equal volume of MBTH(stock 10 mM), 20 ll dimethylformamide (DMF), andthe solution was diluted to 950 ll with buffer and 50 llenzyme extract was added. The reference cuvette in-cluded all the reactants except the crude enzyme. Underthe assay conditions, the oxidation of phenolic com-pounds in the reference mixture was negligible duringthe measurement time. One unit of catecholase activitywas defined as 1 lmol of product formed per min.Specific activity was defined as the units of enzymeactivity per mg of protein (Kong et al. 2000).
Protein determination
Protein quantity in the enzyme extracts was determinedaccording to the Lowry method with bovine serumalbumin as standard. The values were obtained bygraphic interpolation on a calibration curve at 650 nm.
Characteristics of the crude enzyme
Substrate specificityPPO activity was determined by using catechol,4-methylcatechol, L-3,4-dihydroxyphenylalanine (L-DOPA), 3-(3,4-dihydroxyphenyl) propionic acid(DHPPA), as diphenolic substrates and L-tyrosine as amonophenolic substrate with MBTH (Espin et al. 1995)in 50 mM phosphate buffer (pH 8.0).
Effect of pH on catecholase activity and pH stabilityThe effect of pH on the catecholase activity wasdetermined by using 4-methylcatechol as substrate withthe following buffers (50 mM) at the indicated pH.Glycine–HCl buffer, from pH 2.5 to 3.5; acetate buffer,from 4.0 to 5.5; phosphate buffer, from 6.0 to 8.0; Tris–HCl buffer, from 8.5 to 9.0; glycine–NaOH buffer, from9.5 to 10.0.The pH stability was determined by incubating the
enzyme extract in the above buffer for 48 h at 4 �C. Atthe end of the storage period, the activity was assayedunder standard conditions: 50 mM glycine–HCl, pH 3.5as buffer and 4-methylcatechol as substrate.
Effect of temperature on catecholase activityand thermal stabilityCatecholase activity was assayed at various tempera-tures over the range of 10–90 �C, using a circulationwater bath. The reaction mixture at pH 3.5 containingall the reagents except crude enzyme was incubated for5 min at various temperatures indicated above. After theenzyme was added, the relative activity was determinedspectrophotometrically at 494 nm as rapidly as possible.In order to determine the thermal stability of the
enzyme, the enzyme solutions in Eppendorf tubes wereincubated at their optimum temperatures for 20, 40 and60 min, rapidly cooled in an ice bath for 5 min, and thenbrought to 25 �C. After the mixture reached to roomtemperature, the enzyme activity was assayed under theassay conditions. The percentage residual catecholase
502 M. Yildirim et al.

activity was calculated by comparison with unincubatedenzyme (Dincer et al. 2002; Ozen et al. 2004).
Effect of substrate concentration on catecholase activityand enzyme kineticsTo study the effect of substrate concentration on theenzyme activity, a stock solution of 4-methylcatechol(100 mM) was used. The final reaction mixture con-tained equal volume of stock substrate solution andstock MBTH (10 mM). Twenty microlitres DMF wasadded and then the mixture was diluted to 950 ll withbuffer at pH 3.5. The rate of catecholase reaction wasmeasured spectrophometrically by adding 50 ll crudeenzyme (Colak et al. 2004).The Michaelis–Menten constant (Km) and maximum
velocity (Vmax) values were determined as the reciprocalabsolute values of the intercepts on the x- and y-axes,respectively, of the linear regression curve (Lineweaver& Burk 1934).
Effect of protein concentration on catecholase activityCatecholase activity, as a function of protein concen-tration, was determined in a protein concentration rangeof 0.05–0.36 mg/ml for Anoxybacillus kestanbolensis K1and 0.03–0.50 mg/ml for A. kestanbolensis K4T using4-methylcatechol as substrate. The activity was assayedunder standard conditions using various volumes of theenzyme extracts (Colak et al. 2004).
Effect of general PPO inhibitors on crude enzyme activityThe following compounds were evaluated for theireffectiveness as an inhibitor of catecholase activity using4-methylcatechol as substrate: benzoic acid, sodiummetabisulphite, ascorbic acid and L-cysteine. An aliquotof each inhibitor at various final concentrations wasadded to the standard reaction solution immediatelybefore the addition of 50 ll enzyme extract. Relativeenzymatic activity was calculated as a percentage of theactivity in the absence of inhibitor. The concentration ofinhibitor giving 50% inhibition (I50) was determinedfrom plot of residual activity against inhibitor concen-tration (Colak et al. 2004; Ozen et al. 2004).
Effect of metal ions on catecholase activityCo2+, Ca2+, K+, Mn2+, Cu2+, Zn2+, Ni2+, Al3+,Cd2+, and Cr3+ were used to study the effect of metalions on catecholase activity. After addition of eachmetal ion solution at 1 mM final concentration, theactivity was assayed using 4-methylcatechol as sub-strate. The percentage remaining activities wereexpressed by comparison with standard assay mixturewith no metal ion added.
Native polyacrylamide gel electrophoresisNative polyacrylamide gel electrophoresis was per-formed on a Hoeffer SE 600 Series Electrophoresis dualslab cell unit (California, USA), using preparative 8%polyacrylamide gels (Laemmli 1970) under native
conditions. After electrophoresis, the gel was stainedfor catecholase activity in 24 mM L-DOPA.
Results and discussion
The present study was aimed at screening PPOpotentials (Table 1) of seven Anoxybacillus (A. kestan-bolensis, A. gonensis or A. pushchinoensis) isolates andSaccharococcus caldoxylolyticus which were isolatedfrom Hot springs of Kestanbol and Gonen in Turkey(Belduz et al. 2003; Dulger et al. 2004). The screening ofPPO activities in the presence of catechol has shown thatthe two A. kestanbolensis strains (K1 and K4T) pos-sessed the greatest PPO activity (Table 1). Therefore, theability and biochemical characters of these thermophilesfor oxidation of phenolic compounds were investigated.The catecholases from A. kestanbolensis K1 and K4T
strains were characterized on crude enzyme prepara-tions. Native polyacrylamide gel electrophoresis oncrude enzymes stained with L-DOPA from both strainsindicated the presence of polyphenoloxidases havingmolecular weights of approximately 45 and 47 kDa,respectively. A lower molecular weight tyrosinase fromStreptomyces antibioticus (Streffer et al. 2001) and ahigher molecular weight tyrosinase from Thermomicro-bium roseum (Kong et al. 2000) were reported. PPO withsimilar molecular weights were also available for plantand fungal tyrosinases (Celia et al. 1997).The catecholase enzyme activities were found to be
protein concentration-dependent. For both catecholas-es, the plots of final protein concentration in the assaymixture versus specific catecholase activity in the pres-ence of 4-methylcatechol as a substrate exhibited hy-perbolic curves. Catecholase activities from A.kestanbolensis K1 and K4T increased until the finalprotein concentration at the standard assay conditionsreached 0.21 and 0.19 mg/ml, respectively and remainedconstant after these values for each.
Substrate specificity
Catechol, 4-methylcatechol, L-DOPA, DHPPA asdiphenolic substrates and L-tyrosine as a monophenolic
Table 1. Polyphenol oxidase potentials of the isolated thermophilic
strains in the presence of catechol as a substrate.
Isolate
number
Strain Specific activity
(U/mg protein)
A4 Anoxybacillus gonensis 0.007 ± 0.0002
A7 Anoxybacillus gonensis No activity
A9 Anoxybacillus gonensis No activity
A8 Anoxybacillus pushchinoensis No activity
G2Ta Anoxybacillus gonensis 0.03 ± 0.001
K1 Anoxybacillus kestanbolensis 0.05 ± 0.002
K4Ta Anoxybacillus kestanbolensis 0.07 ± 0.003
TK4 Saccharococcus caldoxylolyticus 0.03 ± 0.003
aSuperscript T means strain-type of any species.
Diphenolases from Anoxybacillus kestanbolensis 503

substrate were tested for substrate specificity of thepolyphenol oxidase. While catechol and 4-methylcate-chol were oxidized by crude A. kestanbolensis K1 andK4T polyphenol oxidases, there was no significantoxidation of L-DOPA and DHPPA. The enzymes didnot catalyse the oxidation of L-tyrosine as well(Table 2). Substrate specificities clearly show that theenzymes present in both A. kestanbolensis strains utilizeonly diphenols and possess catecholase activities. This isin good agreement with that monophenolase activities inmicroorganisms are generally very weak (Kong et al.2000; Ali & Haq 2001). The crude enzymes showed thegreatest catecholase activities towards 4-methylcatechol.The relative activities of the enzymes, based on thewavelength maximum of the product, were comparedwith the activities in the presence of 4-methylcatechol as100%.
Effect of pH on catecholase activity and stability
The effect of pH on the catecholase activities of bothenzyme preparations was determined by using 4-meth-ylcatechol as a substrate over the pH range from 2.5 to10.0. Both enzymes showed a pH optimum at 9.5(Figure 1). In addition, both enzyme preparationsshowed a second peak of activity at pH 3.5. This mightindicate different isoforms of the catecholases present inthe crude enzyme preparations or proteolysed butenzymatically active catecholases having similar molec-ular mass (Celia et al. 1997). It has been reported thatthe adduct occurring during the enzymatic assay wasunstable at alkaline pH values (Espin et al. 1997). Atyrosinase highly stable at neutral pH values wasreported from S. antibioticus (Streffer et al. 2001) Ithas been reported that T. roseum contains a tyrosinaseactive at pH 9.5 (Kong et al. 2000). The optimum pHvalues for PPO also differ among plant species depend-ing upon the substrate used for assay (Fraignier et al.1995; Arslan et al. 1998; Yang et al. 2000; Dincer et al.2002; Ozen et al. 2004).The residual percentage activities of the enzymes from
both A. kestanbolensis strains were determined after48 h of incubation at various pH values ranged from 2.5to 9.5 (Figure 2). The pH-stability profiles showed thatcatecholases from both preparations retained their
activities at alkaline pH values. Catecholase activitiesfrom A. kestanbolensis K4T seemed to be stable at pHvalues over 8.5 whereas the enzyme from K1 behaveddifferently, being stable at both pH 4.5 and 8.5 with 50and 100% of its original activity, respectively. It hasbeen reported that catecholase from T. roseum lost atleast 50% of its original activity out of its optimum pHvalue (Kong et al. 2000).
Effect of temperature on catecholase activity and stability
Thermal activity data for both catecholase activities arepresented in Figure 3. The optimum temperatures forcatecholase activities of A. kestanbolensis K1 and K4T
Table 2. Substrate specificities of Anoxybacillus kestanbolensis K1 and
K4T crude polyphenoloxidases.
Substrate Wavelength
(nm)aRelative activity (%)
A. kestanbolensis
K1
A. kestanbolensis
K4T
Catechol 500 28 ± 0.3 28 ± 0.1
4-Methylcatechol 494 100 ± 1.0 100 ± 1.0
L-DOPA 500 3 ± 0.1 2.0 ± 0.1
DHPPA 500 2 ± 0.1 1.0 ± 0.1
L-Tyrosine 500 No activity No activity
a Espin et al. (1995). 0
20
40
60
80
100
2.0 4.0 6.0 8.0 10.0pH
Rel
ativ
e ac
tivi
ty (
%)
A. kestanbolensis K1A. kestanbolensis K4T
Figure 1. pH-activity profiles for both Anoxybacillus kestanbolensis
K1 and K4T catecholases in 50 mM glycine–HCl buffer (pH 2.5–3.5),
in 50 mM acetate buffer (4.0–5.5), in 50 mM phosphate buffer (6.0–
8.0), in 50 mM Tris–HCl buffer (8.5–9.0) and in 50 mM glycine–
NaOH buffer (9.5–10.0). The reaction was carried out at room
temperature. Reaction mixture contained 4-methylcatechol (stock
100 mM), an equal volume of MBTH (stock 10 mM), 20 ll DMF,
and the solution was diluted to 950 ll with buffer and 50 ll enzyme
extract was added.
0
20
40
60
80
100
2 6 8 10Incubation pH
Res
idua
l Act
ivit
y (%
)
A. kestanbolensis K1A. kestanbolensis K4T
4
Figure 2. pH stabilities of both Anoxybacillus kestanbolensis K1 and
K4T catecholases. The pH-stability was determined by incubating the
enzyme extract in the different indicated buffers for 48 h at 4 �C. Theactivity was assayed under standard conditions; 50 mM glycine–HCl
buffer, pH 3.5 and 4-methylcatechol as a substrate.
504 M. Yildirim et al.

were 80 and 70 �C, respectively. It appears that thecatecholase activity from A. kestanbolensis K4T is moresensitive to higher temperatures over 70 �C. The ther-mostable catecholases from both strains were also activeat lower temperatures. A thermostable tyrosinase withan optimum temperature of 70 �C was also reported forT. roseum (Kong et al. 2000). The tyrosinase fromT. roseum has been reported to loose its originalacitivities rapidly at higher temperatures.Catecholases from both Anoxybacillus strains showed
different thermal stability profiles (Figure 4). Theenzymes were extremely stable over 1 h of incubationat their optimum temperatures. Although catecholasefrom A. kestanbolensis K4T retained all its original
activity for a period of 1 h incubation at its optimumtemperature, the enzyme from K1 was stimulated bykeeping at 80 �C. The thermostable tyrosinase from T.roseum was reported to be stable only 10 min at 70 �C(Kong et al. 2000). Therefore, both Anoxybacillus cat-echolases seemed to be highly thermostable at longerincubation times at 60–80 �C.
Effect of substrate concentration on catecholase activity
Substrate saturation curves in the presence of 4-meth-ylcatechol indicated that both Anoxybacilllus catecho-lases follow simple Michaelis–Menten kinetics.Lineweaver–Burk plots for the kinetic analysis of thereaction rates, at a series of concentrations for 4-meth-ylcatechol resulted in individual Vmax and Km values(Table 3). Catalytic efficiencies were very similar forboth catecholases. These results indicate that bothcatecholases efficiently use 4-methylcatechol as sub-strate. A similar result was also reported for a crudetyrosinase from T. roseum. (Kong et al. 2000).
Effect of inhibitors on catecholase activity
The behaviour of A. kestanbolensis K1 and K4T
catecholases for four general polyphenol oxidase inhib-itors was examined. Benzoic acid (0.01–5.00 mM),sodium metabisulphite (0.05–2.50 lM), ascorbic acid(0.05–10.00lM) and L-cysteine (0.05–4.00lM) wereused as inhibitors. All the compounds used in this studyinhibited the enzyme. Their potentials for the inhibitionof A. kestanbolensis K1 and K4T catecholase activitiesare presented as I50 values calculated from the plots ofinhibitor concentrations VS. percentage inhibition of 4-methylcatechol oxidation (Table 4). Both A. kestanbol-ensis K1 and K4T catecholase activities were fullyinhibited by addition of 0.01 mM sodium metabisulph-ite, ascorbic acid and L-cysteine. Inhibition assaysindicate that thiol compounds, such as cysteine andmetabisulphite with low I50 values, are potent inhibitorsof the A. kestanbolensis K1 and K4T catecholases,consistent with the earlier reports about plant PPOs(Ding et al. 1998; Duangmal & Owusu Apenten 1999;Yang et al. 2000; Dincer et al. 2002). It has been alsoreported that sulphur-containing compounds such as b-mercaptoethanol and diethyldithiocarbamate fully
0
20
40
60
80
100
0 20 40 60 80 100Temperature (°C)
Rel
ativ
e A
ctiv
ity
(%)
A. kestanbolensis K1A. kestanbolensis K4T
Figure 3. Temperature optima of both Anoxybacillus kestanbolensis
K1 and K4T catecholases for 4-methylcatechol as a substrate. The
reaction mixture at pH 3.5 containing all the reagents except crude
enzyme was incubated for 5 min at indicated temperatures. After the
enzyme was added, the relative activity was determined spectropho-
tometrically at 494 nm as rapidly as possible.
0
20
40
60
80
100
120
140
160
0 10 20 30 40 50 60
Incubation time (min)
Res
idua
l act
ivit
y (%
)
A. kestanbolensis K1A. kestanbolensis K4T
Figure 4. Thermal stabilities of both Anoxybacillus kestanbolensis K1
and K4T catecholases. The enzyme solutions were incubated at
temperatures of 80 and 70 �C, respectively for 20, 40 and 60 min,
rapidly cooled in an ice-bath for 5 min and then brought to 25 �C. Thepercentage residual catecholase activity was calculated by comparison
with unincubated enzyme.
Table 3. Biochemical characteristics of catecholases from Anoxybacil-
lus kestanbolensis K1 and K4T.
A. kestanbolensis
K1
A. kestanbolensis
K4T
Vmax (U/mg) 0.07 0.06
Km for
4-methylcatechol (mM)
2.0 2.0
Vmax/Km 0.035 0.030
pH optimum 9.5 9.5
Temperature
optimum (�C)80 70
Diphenolases from Anoxybacillus kestanbolensis 505

inhibited T. roseum tyrosinase activity at the concentra-tion of 1 mM (Kong et al. 2000).
Effect of metal ions on catecholase activity
The effect of various metal ions on the bothA. kestanbolensis K1 and K4T catecholase activities isshown in Table 5. The concentrations of metal ionstested were all at 1 mM and enzyme activity was assayedunder standard conditions. While Mn2+, Co2+ andCa2+ stimulated both catecholases for 4-methylcatecholoxidation, Cu2+, Zn2+, Ni2+, Al3+, Cd2+, and Cr3+
inhibited their activities. The most dramatic effect oncatecholases was seen in the presence of Mn2+. Thecatecholase activities increased 6.4- and 5.3-fold forA. kestanbolensis K1 and K4T enzymes, respectively, inthe presence of 1 mM Mn2+. Since metal ions may havedifferent coordination numbers, geometry in their coor-dination compounds, and potentials as Lewis acids, theymay behave differently towards proteins as ligands.These differences may also result in metal binding todifferent sites, and therefore, perturb the enzyme struc-ture in different ways (Bock et al. 1999; DiTusa et al.2001). It could be speculated that Mn(II) may activatecatecholase by binding to either an allosteric or a metalbinding site on the enzyme structure. How Mn(II)interact with A. kestanbolensis catecholases and itsstimulation of enzyme activity needs further investiga-tion.It can be concluded that the crude extracts prepared
from both A. kestanbolensis K1 and K4T possess
diphenolases having greatest substrate specificity to4-methylcatechol. These enzymes appear to share somebiochemical characteristics of several plant or microor-ganismal PPOs in terms of substrate specificity, pH andtemperature optima, stability and kinetic parameters.The catecholase activities from both strains were alsovery sensitive to some general PPO inhibitors especiallymetabisulphite and cysteine. Moreover, 1 mM Mn2+
stimulated catecholases from both strains by about6-fold when compared to other metal ions.
Acknowledgements
This work was financially supported by the KTU-BAP(Pr. Nr. 2003.111.002.3 to S.G., 1999.111.004.2 toA.O.B.) and The State Planning Organization of Turk-ish Government (DPT, Pr. Nr. 2001K12080010 toAOB).
References
Ahmed, G. & Vulphson, E.N. 1994 Facile synthesis of L- DOPA esters
by the combined use of tyrosinase and a-chymotrypsin. Biotech-
nology Letters 16, 367–372.
Aktas, N. & Tanyolac, A. 2003 Reaction conditions for laccase
catalyzed polymerization of catechol. Bioresource Technology 87,
209–214.
Ali, S. & Haq, I. 2001 Studies on the microbiological transformation of
L-tyrosine to L-DOPA (3,4-dihydroxyphenyl L-alanine) by mutant
strains of Aspergillus oryzae. Pakistan Journal of Plant Science 6,
97–113.
Arslan, O., Temur, A. & Tozlu, I. 1998 Polyphenol oxidase from
Malatya apricot (Prunus armeniaca L.). Journal of Agricultural and
Food Chemistry 46, 1239–1241.
Belduz, A.O., Dulger, S. & Demirbag, Z. 2003 Anoxybacillus gonensis
sp. nov., a moderately thermophilic, xylose-utilizing, endospore-
forming bacterium. International Journal of Systematic and Evo-
lutionary Microbiology 53, 1315–1320.
Bock, W.C., Katz, A.K., Markham, G.D. & Glusker, J.P. 1999
Manganese as a replacement for magnesium and zinc: functional
comparison of the divalent ions. Journal of the American Chemical
Society 121, 7360–7372.
Burton, S.G. 1994 Biocatalysis with polyphenoloxidase: a review.
Catalysis Today 22, 259–287.
Colak, A., Ozen, A., Dincer, B., Guner, S. & Ayaz, F.A. 2004
Diphenolases from two cultivars of cherry laurel (Laurocerasus
officinalis Roem.) fruits at early stage of maturation. Food
Chemistry (in press).
Dincer, B., Colak, A., Aydın, N., Kadioglu, A. & Guner, S. 2002
Characterization of polyphenol oxidase from medlar fruits (Mes-
pilus germanica L. Rosaceae). Food Chemistry 77, 1–7.
Ding, C.K., Chachin, K., Ueda, Y. & Imahori, Y. 1998 Purification
and properties of polyphenol oxidase from loquat fruit. Journal of
Agricultural and Food Chemistry 46, 4144–4149.
DiTusa, C.A., Christensen, T., McCall, K.A., Fierke, C.A. & Toone,
E.J. 2001 Thermodynamics of metal ion binding.1. Metal ion
binding by wild-type carbonic anhydrase. Biochemistry 40, 5338–
5344.
Duangmal, K. & Owusu Apenten, R.K. 1999 A comparative study of
polyphenoloxidases from taro (Colocasia esculenta) and potato
(Solanum tuberosum var. Romano). Food Chemistry 64, 351–359.
Dulger, S., Demirbag, Z. & Belduz, A.O. 2004 Anoxybacillus ayderensis
sp. nov. and Anoxybacillus kestanbolensis sp. nov. International
Journal of Systematic and Evolutionary Microbiology (in press).
Table 4. Inhibition of Anoxybacillus kestanbolensis K1 and K4T
catecholases by general polyphenoloxidase inhibitors.
Inhibitors (lM) I50
A. kestanbolensis K1 A. kestanbolensis K4T
Benzoic acid 600 470
Sodium metabisulphite 1.63 0.64
Ascorbic acid 6.40 1.37
L-Cysteine 1.35 3.30
Table 5. Effect of various metal ions on both Anoxybacillus kestanbo-
lensis K1 and K4T catecholase activities.
Metal ion (1 mM) Relative activity (%)
A. kestanbolensis K1 A. kestanbolensis K4T
None 100 ± 2 100 ± 2
Co2+ 153 ± 3 126 ± 2
Ca2+ 112 ± 2 103 ± 3
Mn2+ 641 ± 6 532 ± 5
Cu2 30 ± 2 27 ± 2
Zn2+ 22 ± 2 27 ± 2
Ni2+ 15 ± 1 13 ± 1
Al3+ 26 ± 1 11 ± 1
Cd2+ 45 ± 1 36 ± 1
Cr3+ 35 ± 1 26 ± 1
K+ 107 ± 2 92 ± 2
506 M. Yildirim et al.

Espin, J.C., Morales, M., Varon, R., Tudela, J. & Garcia-Canovas, F.
1995 A continuous spectrophotometric method for determining the
monophenolase and diphenolase activities of apple polyphenol
oxidase. Analytical Biochemistry 43, 2807–2812.
Espin, J.C., Trujano, M.F., Tudela, J. & Garcia-Canovas, F. 1997
Monophenolase activity of polyphenol oxidase fromHaas avocado.
Journal of Agricultural and Food Chemistry 45, 1091–1096.
Fraignier, M.P., Marques, L., Fleuriert, A. & Macheix, J.J. 1995
Biochemical and immunochemical characteristics of polyphenol
oxidases from different fruits of prunus. Journal of Agricultural and
Food Chemistry 43, 2375–2380.
Friedman, M. 1997 Chemistry, biochemistry, and dietary role of
potato polyphenols. Journal of Agricultural and Food Chemistry 45,
1523–1540.
Gilabert, M.P., Morte, A., Honrubia, M. & Carmona, F.G. 2001
Monophenolase activity of latent Terfezia claveryi tyrosinase:
characterization and histochemical localization. Physiologia Plan-
tarum 113, 203–209.
Ikeda, R., Sugihara, J. Uyama H. & Kobayashi S. 1996a Enzymatic
oxidative polymerization of 2,6-dimethylphenol. Macromolecules
29, 8702–8705.
Ikeda, R., Uyama, H. & Kobayashi, S. 1996b Novel synthetic
pathway to a poly(phenylene oxide). Laccase-catalyzed oxidative
polymerization of syringic acid. Macromolecules 29, 3053–3054.
Jacobson, E.S. 2000 Pathogenic roles of fungal melanins. Clinical
Microbiology Reviews 13, 708–717.
Kong, K.H., Hong, M.P., Choi, S.S., Kim, Y.T. & Cho, S.H. 2000
Purification and characterization of a highly stable tyrosinase from
Thermomicrobium roseum. Biotechnology and Applied Biochemistry
31, 113–118.
Laemmli, U.K. 1970 Cleavage of structural proteins during
the assembly of the head of bacteriophage T4. Nature 227, 680–
685.
Leite, O.D., Lupetti, K.O., Filho, O.F., Vieira, I.C. & Barbosa, A.M.
2003 Synergic effect studies of the bi-enzymatic system laccase-
peroxidase in a voltammetric biosensor for catecholamines.
Talanta 59, 889–896.
Lineweaver, H. & Burk, D. 1934 The determination of enzyme
dissociation constant. Journal of the American Chemical Society 56,
658–661.
Lisdat, F., Wollenberger, U., Makower, A., Hortnagl, H., Pfeiffer, D.
& Scheller, F.W. 1997 Catecholamine detection using enzymatic
amplification. Biosensors and Bioelectronics 12, 1199–1211.
Mayer, A.M. & Harel, E. 1979 Polyphenoloxidase in plants. Phyto-
chemistry 18, 193–215.
Mayer, A.M. 1987 Polyphenol oxidase in plants-recent progress.2.
Phytochemistry 26, 11–20.
Ozen, A., Colak, A., Dincer B. & Guner, S. 2004 A diphenolase from
persimmon fruits (Diospyros kaki L., Ebenaceae). Food Chemistry
85, 431–437.
Pandey, G., Muralikrishna, C. & Bhalerao, U.T. 1990 Mushroom
tyrosinase catalyzed coupling of hindered phenols-a novel-
approach for the synthesis of diphenoquionones and bisphenols.
Tetrahedron Letters 31, 3771–3774.
Robb, D.A. 1984 Tyrosinase. In Copper Proteins and Copper Enzymes,
ed. Lontie, R., vol. 2. Boca Raton, FL: CRC Press. ISBN 0-849-
36471-X.
Sheptovitsky, Y.G. & Brudving, G.W. 1996 Isolation and character-
ization of spinach photosystem II membrane-associated catalase
and polyphenol oxidase. Biochemistry 35, 16255–16263.
Streffer, K., Vijgenboom, E., Tepper, A.W.J.W., Makower, A.,
Scheller, F.W., Canters, G.W. & Wollenberger, U. 2001 Determi-
nation of phenolic compounds using recombinant tyrosinase from
Streptomyces antibioticus. Analytica Chimica Acta 427, 201–210.
Tu, Y.-F., Fu, Z.-Q. & Chen, H.Y. 2001 The fabrication and
optimization of the disposable amperometric biosensor. Sensors
and Activators B 80, 101–105.
Uyama H. & Kobayashi S. 2002 Enzyme-catalyzed polymerization to
functional polymers. Journal of Molecular Catalysis B: Enzymatic
19, 20, 117–127.
Van Gelder, C.W.G., Flurkey, W.H. & Wichers, H.J. 1997 Sequence
and structural features of plant and fungal tyrosinases. Phyto-
chemistry 45, 1309–1323.
Whitaker, J.R. 1972 Polyphenol oxidase. In Principles of Enzymology
for the Food Sciences, ed. Fennema, O.R. New York, USA: Marcel
Dekker, Inc. ISBN 0-824-71780-5
Yang, C.-P., Fujita, S., Ashrafuzzaman, M.D, Nakamura, N. &
Hayashi, N. 2000 Purification and characterization of polyphenol
oxidase from banana (Musa sapientum L.) pulp. Journal of
Agricultural and Food Chemistry 48, 2732–2735.
Diphenolases from Anoxybacillus kestanbolensis 507

Utilization of vegetable oil in the production of clavulanic acid by Streptomycesclavuligerus ATCC 27064
G.L. Maranesi, A. Baptista-Neto, C.O. Hokka and A.C. Badino*Department of Chemical Engineering, Universidade Federal de Sao Carlos, Cx. Postal 676, CEP 13565-905 SaoCarlos SP, Brazil*Author for Correspondence: Tel.: +55-16-3351-8001, Fax: +55-16-3351-8266, E-mail:[email protected]
Keywords: Beta-lactamase inhibitor, clavulanic acid, lipid as substrate, soybean oil, Streptomyces clavuligerus,vegetable oil
Summary
Production of clavulanic acid (CA) by Streptomyces clavuligerus ATCC 27064 in shake-flask culture (28 �C,250 rev min)1) was evaluated, with media containing different types and concentrations of edible vegetable oil.Firstly, four media based on those reported in the literature were examined. The medium containing soybean oil andstarch as carbon and energy source gave the best production results. This medium, with the starch replaced byglycerol, and with various soybean oil concentrations (16, 23 and 30 g l)1) was utilized to further investigate CAproduction. Medium containing 23 g l)1 led to the highest CA productivity (722 mg l)1 in 120 h) and that onecontaining 30 g l)1 gave the highest CA titre (753 mg l)1 in 130 h). Also, substitution of corn and sunflower edibleoils furnished similarly good results in terms of CA titre and productivity. It can be concluded that easily availablevegetable oil is a very promising substrate for CA production, since it is converted slowly to glycerol and fatty acids,which are the main carbon and energy source for the microorganism.
Introduction
The use of antibiotics to control infectious diseases isgreatly hindered by bacterial resistance. One of the mostimportant resistance mechanisms exhibited by a varietyof Gram-positive and Gram-negative bacteria is theirability to produce beta-lactamases, which inactivatepenicillins and cephalosporins by hydrolysing theirbeta-lactam ring. Clavulanic acid, (CA), is a beta-lactam antibiotic with a low antibacterial activity; it is,however, a potent inhibitor of the beta-lactamasesproduced by many pathogenic microorganisms resistantto beta-lactam antibiotics (Butterworth 1984). Thecombination of CA with amoxicillin is the mostsuccessful example of the use of a beta-lactam antibioticsensitive to beta-lactamase together with an inhibitor ofthese enzymes (Mayer & Deckwer 1996). CA is pro-duced industrially by strains of Streptomyces clavulige-rus (Butterworth 1984) in medium containing soybeanflour as nitrogen source and soluble starch together withglycerol as carbon and energy sources. S. clavuligeruswas first named and described as a new species byHiggens & Kastner (1971) from a Streptomycetes strainisolated from South American soil. These authorsperformed physiological tests and investigated carbon-utilization patterns and found that, among the 13
carbon sources tested, including glucose, sucrose andfructose, only one, maltose, showed positive utilization.Brown et al. (1976) reported the isolation of CA, andReading & Cole (1977) described the conditions for thecultivation of the organism and detection and isolationof this novel beta-lactamase inhibitor. Since then muchresearch has been published dealing with the biosyn-thetic pathway, molecular genetics, regulation andphysiology of CA production by S. clavuligerus. Ahar-onowitz & Demain (1978) found glycerol to be asubstrate for growth and antibiotic production. Theystudied the effect of increasing glycerol concentrationand observed that glycerol was the factor limitinggrowth in a medium containing L-asparagine as nitro-gen source. Based in this work, Garcia-Dominguezet al. (1989) suggested that S. clavuligerus cells areunable to carry out active transport of glucose. Glycerolhas been extensively utilized as the carbon source in thisprocess with CA titres up to 3.25 g l)1 being reported(Mayer & Deckwer 1996; Gouveia et al. 1999; Kimet al. 2001; Chen et al. 2002; Roubos et al. 2002). Therole of glycerol as a CA precursor and an inhibitor ofCA production rate has been speculated upon (Romeroet al. 1984; Chen et al. 2002). According to the reviewwork of Liras & Rodriguez-Garcia (2000), the pathwayof CA biosynthesis is now partially understood, with the
World Journal of Microbiology & Biotechnology (2005) 21:509–514 � Springer 2005
DOI 10.1007/s11274-004-2393-z

isolation of intermediates and labelling studies, comple-mented by the purification and characterization ofenzymes and genetic studies; labelled glycerol is incor-porated into carbons C-5 to C-7 of the CA moleculewhile arginine is incorporated into carbons C-2, C-3 andC-8 to C-10. Glyceraldehyde 3P appears to be theimmediate precursor of the C-3 unit. Indeed, Townsend(2002), in a review paper, states that ‘‘A battery ofwhole-cell incorporation and stereochemical experi-ments has already established the origin of these threecarbons as likely in a C3 carbohydrate related toglycolysis and lying between glycerol and phosphoenol-pyruvate’’. On the other hand, Perez-Redondo et al.(1999) show evidence for two different genes involved inthe formation of the C3 unit, suggesting that analternative gene product catalyses the incorporation ofglycerol into CA. Their finding was based on experi-ments with a pyc (for pyruvate-converting) replacementmutant which was unable to produce CA except inglycerol-containing medium. Furthermore, Melladoet al. (2002) have recently identified seven additionalgenes related to CA biosynthesis or regulation, butsuggest that further studies are necessary to elucidatetheir function. Apart from the actual role of glycerol, orany of the glycolytic pathway intermediates, in the rateof CA biosynthesis, glycerol is regarded as a rate-limiting substrate and a component of primary impor-tance in this process. Indeed, Romero et al. (1984)observed the dissociation of cephamycin and CAbiosynthesis by glycerol limitation; in the absence ofglycerol, no CA was formed and a maximal productionrate was found with 110 mM glycerol, reducing withfurther increase in glycerol concentration. During fer-mentation, high levels of CA, like other secondarymetabolites, are achieved after most of the growth hasoccurred (Martin & Demain 1980). Fed-batch culturewith a glycerol or complete medium feed is frequentlyproposed, to extend the CA production phase whileminimizing both the inhibitory effect of glycerol onproductivity and also the CA degradation rate (Mayer& Deckwer 1996; Roubos et al. 2002). An alternative tomaintaining the level of glycerol for long periods issubstituting lipids for glycerol, as suggested by Butter-worth (1984). So far only two pieces of work in theliterature deal with the use of lipids in the CAproduction process by S. clavuligerus (Lee & Ho 1996;Large et al. 1998). According to Large et al. (1998), theaddition of oil is preferred on an energy basis, as typicaloil contains around 2.4 times the energy of glucose. Itcan also act as antifoam and enhance secondarymetabolism. These authors report CA production inrelation to the viscosity of the medium. Their resultssuggest production of approximately 80 mg CA l)1,with a medium containing an unspecified lipid. Lee &Ho (1996), working with various carbon sources,including fatty acids and palm oil, obtained highertitres (ca. 5 mg l)1 CA) with palm oil. In the presentwork, the effect of various edible vegetable oils, addedto an inexpensive medium with soybean flour as the
nitrogen source, on CA production was investigatedand compared with results found in the literature.
Materials and methods
Microorganism and cultivation conditions
S. clavuligerus ATCC 27064 was used throughout thiswork. Vegetative cells were stored at )70 �C in cryotu-bes with 10% (v/v) glycerol.Seed medium contained (in g l)1 distilled water):
glycerol, 10; bacto peptone, 10; malt extract, 10; yeastextract, 1.0; K2HPO4, 2.5; MgSO4Æ7H2O, 0.75; MnCl2Æ4-H2O, 0.001; FeSO4Æ7H2O, 0.001; ZnSO4Æ7H2O, 0.001;the pH was adjusted to 6.8, prior to sterilization.Inoculum medium had the same composition as pro-duction medium, as described below.Four different production media, designated #1 to #4,
based respectively on those reported by Reading & Cole(1977), Mayer & Deckwer (1996), Large et al. (1998)and Laat & Kraben (2000) were tested. The media hadthe following compositions (in g l)1 distilled water).Medium #1: dextrin, 20; soybean flour, 10; malt extract,1.0; FeSO4Æ7H2O, 0.1; MOPS buffer, 21 (100 mM); pH7.0. Medium #2: glycerol, 15; bacto peptone, 10;soybean flour, 30; MOPS buffer, 21, pH 6.5. Medium#3: soluble starch, 10; soybean flour, 20; soybean oil, 23;K2HPO4, 1.2; MOPS buffer, 21; MnCl2Æ4H2O, 0.01;FeSO4Æ7H2O, 0.01; ZnSO4Æ7H2O, 0.01, pH 7.0. Medium#4: glycerol, 15; soybean flour, 20; Samprosoy 90NB(soybean protein hydrolyzate from Ceval AlimentosS.A., Esteio RS, Brazil), 2.5; K2HPO4, 0.80; MOPSbuffer, 21; MnCl2Æ4H2O, 0.001; FeSO4Æ7H2O, 0.001;ZnSO4Æ7H2O, 0.001; CaCl2, 0.001; pH 7.0.Subsequently, variants of medium #3 were tested, in
which, first, the carbon source was changed (glycerolinstead of starch) and, later, the concentration andorigin of vegetable oils.Cell suspensions (3.5 ml), with a concentration of ca.
5 g dry matter l)1 were inoculated into 50 ml seedmedium in a 500 ml Erlenmeyer flask and incubated at28 �C and shake at 250 rev min)1 for 24 h. Five ml of thecultivated seed broth was transferred to 45 ml ofinoculum medium and incubated at 28 �C, 250 -rev min)1 for 24 h in a 500 ml shake flask. The cultureobtained was then inoculated in a 3-l flask containing450 ml of production medium, and 50 ml of thisinoculated medium was transferred to each of several500 ml Erlenmeyer flask. Cultivations were performedin orbital shaker (New Brunswick Sci. Inc.) at 28 �C,250 rev min)1, for 120–160 h, and one flask was re-moved every 12 h for the determination of cell growthand substrate and product concentrations.
Analytical methods
Cell growth was determined indirectly by measuring thebroth rheological parameter K (consistency index) usinga Brookfield concentric-cylinders rheometer.
510 G.L. Maranesi et al.

Glycerol concentration was determined spectropho-tometrically by a chemical method proposed by Lam-bert & Neish (1950).CA concentration was determined by measuring
spectrophotometrically a derivative obtained by thereaction of CA with imidazole, as proposed by Birdet al. (1982). The assay results were checked by a high-performance liquid chromatography (HPLC) method,as described by Foulstone & Reading (1982) andbioassay with Klebsiella pneumoniae ATCC 29665 (Ro-mero et al. 1984). CA from DSM Gist Delft (potassiumclavulanate and silicon dioxide 1:1) was utilized asstandard.
Results
Initially, cultivations were carried out in the fourdifferent production media based on published ac-counts: media #1, #2, #3 and #4 described in Materialsand methods. Time courses of the consistency index ofthe broth, K, and the CA concentration are shown in
Figure 1. The rheological parameter in Figure 1a showsthat the best growth was accomplished with medium #3,in which soybean oil, together with soluble starch wereadded as carbon source. Also, for CA production, thehighest titre was achieved with this medium (Figure 1b).The authors referred to report CA titres with medium#1, #2, #3 and #4 of approximately 200, 300, 80 and300 mg l)1, respectively.Differences from our results can be explained by the
different strains utilized and also by different means ofpreservation and propagation of the microorganism(Sanchez &Brana 1996; Neves et al. 2001). The enhancedproduction achieved in the present work with medium #3containing soybean oil, similar to that utilized by Largeet al. (1999) with 10 g soluble starch l)1 and 23 g of a-n unspecified oil l)1 is worth mentioning. A maximumconcentration of 458 mg l)1 was obtained against ca.80 mg l)1 by Large et al. (1998). Soybean oil may havecontributed to the enhanced titre. Growth was evaluatedin terms of the rheological parameter K (consistencyindex), which is similar to that described by these authors,who calculated the apparent viscosity in order to followthe growth characteristics. It is observed that medium #3gave both the fastest growth rate and the highest cellconcentration.Since the best production was attained with medium
#3, containing starch and soybean oil, a new medium #5was prepared by replacing starch with more soybean oil,so that the initial oil concentration was 28 g l)1, to givethe same amount of carbon in both media. Figure 2shows the results obtained with the new medium and itcan be observed that a higher concentration of CA,478 mg l)1, was achieved. However, a longer time wasrequired (120 h) since the reduced availability ofglycerol resulted in slower growth, as indicated by thelow consistency index K.To improve the availability of carbon source during
the growth phase, media with glycerol (10 g l)1), insteadof the starch of medium #3, were prepared with three
0 20 40 60 80 100 1200
10
20
30
40
50
60
K (
dina
.cm
-2 .s
n )
Time (h)
Medium #1Medium #2Medium #3Medium #4
Medium #1Medium #2Medium #3Medium #4
0 20 40 60 80 100 1200
100
200
300
400
500
CC
A (m
g.L
-1)
Time (h)
(b)
(a)
Figure 1. Time course of (a) rheological parameter K (consistency
index) related to cell growth and (b)ClavulanicAcid concentration,CCA
from cultivation of S. clavuligerusATCC 27064 inMedium #1 (Reading
&Cole 1977),Medium #2 (Mayer &Deckwer 1996),Medium #3 (Large
et al. 1999), and Medium #4 (Laat & Krabben 2000).
0 20 40 60 80 100 120 1400
100
200
300
400
500
600
0
5
10
15
20
25
30
CC
A(m
g. L
-1)
Time (h)
CCA
K (
dina
.cm
-2 .s
n )
K
Figure 2. Time course of the rheological parameter K (consistency
index) related to cell growth and Clavulanic Acid concentration, CCA
from cultivation of S. clavuligerus ATCC 27064 in Medium #5,
containing 28 g of soybean oil l)1.
Vegetable oil in the production of clavulanic acid 511

levels of soybean oil: medium #6, medium #7 andmedium #8 with 16, 23 and 30 g l)1 of oil respectively.Figure 3 shows the time course of (a) glycerol consump-tion, (b) growth as indicated by changes in the consis-
tency index K, and (c) CA concentrations for the threemedia. It is observed that glycerol consumption wasfastest in medium containing 23 g oil l)1, and althoughin medium #6 a peak in the consistency index occurred,growth and oil content are apparently unrelated. How-ever, CA production rate was highest in the mediumcontaining 23 g l)1 of oil, while the greatest concentra-tion (753 mg l)1 in 130 h) was obtained with mediumcontaining 30 g l)1, against 722 mg l)1 at 120 h cultiva-tion time with medium #7 (23 g l)1).To investigate the effect of the origin of the oil on the
production of CA, two experiments were performedwith two media containing 23 g of another edible oil l)1
instead of the soybean oil of medium #7, one of themwith sunflower oil and the other with corn oil. Figure 4shows the time course of glycerol consumption, growthand CA production for each oil. It can be seen that thebehaviour was very similar to that found with medium#7. Maximal growth was achieved in ca. 60 h and CAtitres were around 700 mg l)1 in 120 h. Figure 4 showsthe results of these experiments.
Discussion
The results of the first group of experiments, in whichthe organism was cultivated in four different mediadescribed in the literature, showed a remarkable en-hancement, both in growth and CA titre, when soybeanoil (23 g l)1) together with soluble starch (10 g l)1) arethe carbon sources, in comparison with media contain-ing no lipid. It should be mentioned that the strain andexperimental apparatus and conditions were exactly thesame for all experiments. Furthermore, the results of theexperiment carried out with a modified form of thismedium, in which the soluble starch was replaced withmore soybean oil, show that production remained high.However, it was delayed, presumably due to the lowsolubility of oil and consequently lower availability ofcarbon source for growth (Figure 2). The slow forma-tion of glycerol, which is a product of the enzymatichydrolysis of lipid, was reflected in low growth, inferredfrom the low consistency index (K) attained.Results obtained in media containing glycerol and
three different quantities of soybean oil showed that,since glycerol is rapidly consumed for growth during thetrophophase and lipid is slowly metabolized to produceglycerol and fatty acids for cell maintenance during theidiophase, CA production is remarkably improved,indicating that glycerol plays an important part in thisprocess, being the preferred carbon source for growth,the precursor of the CA molecule and, when in excess,an inhibitor of the CA production. Roubos et al. (2001)take into account this last phenomenon in the develop-ment of a Semi-Stoichiometric Fed-Batch model. Theseauthors state, ‘‘It was decided to set the specific CAproduction rate to zero when the glycerol concentrationbecomes above 0.7 Cmol/L’’. Furthermore, accordingto Large et al. (1999), ‘‘once inside the cell, the fatty
0 10 20 30 40 500
2
4
6
8
10
12
14
16
18
CG
ly (g
.L-1
)
Time (h)
Time (h)
Time (h)
Medium #6Medium #7Medium #8
Medium #6Medium #7Medium #8
Medium #6Medium #7Medium #8
0
100
200
300
400
500
600
700
800
CC
A(m
g.L
-1)
0 20 40 60 80 100 120 140 160
0 20 40 60 80 100 120 140 160
0
10
20
30
40
50
60
K (
dina
.cm
-2 .s
n )
(a)
(b)
(c)
Figure 3. Time course of (a) the glycerol consumption, (b) rheological
parameter K (consistency index), related to cell growth and (c)
Clavulanic Acid concentration, CCA, in cultivations of S. clavuligerus
ATCC 27064 in Medium #6 (16 g of soybean oil l)1), Medium #7
(23 g l)1), Medium #8 (30 g l)1).
512 G.L. Maranesi et al.

acids enter the b-oxidation cycle to release acetyl orpropionyl coenzyme A, which are the precursors for theformation of many antibiotics’’. This may also accountfor the high CA titres obtained when lipids are utilized.From an economical point of view, a compromisebetween higher titre, at higher oil concentration
(30 g l)1), and faster production rate, at somewhatintermediate oil concentration (23 g l)1), should befound and established for this process. Certainly theresults obtained here in shake flasks can be improved inlarge-scale conventional fermentors.The results of the experiments with 23 g of edible -
corn and sunflower oil l)1 showed a very similar behav-iour to those obtained with soybean oil, suggesting thatany common easily available edible oil is perfectlyadequate for this process. The maximum CA concen-tration found in the cultivations performed in this workis much higher than those reported, so far, in theliterature with lipids as carbon source and even thanthose obtained with other types of media, analyticalprocedures and bacterial strain storage and preservationconditions. In the present work, the analytical methodperformed avoided overestimation since Bird’s methodexcludes interference from other substances, mainly CAdegradation products and medium components. More-over, the maximum concentrations found were checkedby HPLC (Foulstone & Reading 1982) and bioassayagainst Klebisella pneumoniae ATCC 29665. The HPLCpeaks were checked in a Photo Diode Array Detector(Waters PAD model 996) and the u.v. spectrum wasscanned and compared with that of the pure CA salt.Concerning the long-term preservation of the Strepto-mycete strain, lyophilized mycelium was prepared ac-cording to Sanchez & Brana (1996).From the results presented here, it can be concluded
that edible oil is a very promising substrate to be used inthe CA production process as its intrinsic characteristicsallow an adequate supply of glycerol and carbon source.
Acknowledgements
This work was supported by FAPESP (Grant Proc. 02/00189-1 and Proc. 03/11722-5) and CNPq, Grant Proc.523467/94-0.
References
Aharowitz, Y. & Demain, A.L. 1978 Carbon catabolite regulation of
cephalosporin production in Streptomyces clavuligerus. Antimicro-
bial Agents and Chemotherapy 14, 159)164.Bird, A.E., Bellis, J.M. & Gasson, B.C. 1982 Spectrophotometric assay
of CA by reaction with imidazole. Analyst 107, 1241–1245.
Brown, A.G., Butterworth, D., Cole, M., Hanscomb, G., Hood, J.D.,
Reading, C. & Roinson, G.N. 1976 Naturally occurring b-lactamase inhibitors with antibacterial activity. The Journal of
Antibiotics 29, 668–669.
Butterworth, D. 1984 CA: properties, biosynthesis and fermentation.
In Biotechnology of Industrial Antibiotics, ed. Vandamme, E.J.
New York: Marcel Dekker. ISBN 0824770560.
Chen, K.C., Lin, Y.H., Tsai, C.M., Hsieh, C.H. & Houng, J.Y. 2002
Optimization of glycerol feeding for CA production by Strepto-
myces clavuligerus with glycerol feeding. Biotechnology Letters 24,
455–458.
Foulstone, M. & Reading, C. 1982 Assay of amoxicillin and CA, the
components of Augmentin, in biological fluids with HPLC.
Antimicrobial Agents and Chemotherapy 22, 753–762.
0 10 20 30 40 50 60 700
2
4
6
8
10
12
14
16(a)
Time (h)
Time (h)
Time (h)
Medium #9Medium #10
Medium #9Medium #10
Medium #9Medium #10
0
10
20
30
40
50
60(b)
0 20 40 60 80 100 120 140
0 20 40 60 80 100 120 140
0
100
200
300
400
500
600
700
800(c)
CG
ly (g
.L-1
)K
(di
na.c
m-2
.sn )
CC
A (
mg.
L-1
)
Figure 4. Time course of (a) the glycerol consumption, (b) rheological
parameter K (consistency index) related to cell growth and (c) CA
concentration, CCA in cultivations of S. clavuligerus ATCC 27064 in
Medium #9 (23 g of corn oil l)1), Medium #10 (23 g of sunflower -
oil l)1).
Vegetable oil in the production of clavulanic acid 513

Garcia-Dominguez, M., Martin, J.F. & Liras, P. 1989 Characteriza-
tion of sugar uptake in wild-type Streptomyces clavuligerus, which
is impaired in glucose uptake, and in a glucose-utilizing mutant.
Journal of Bacteriology 171, 6808–6814.
Gouveia, E.R., Baptista-Neto, A., Azevedo, A.M., Badino, A.C., &
Hokka, C.O. 1999 Improvement of CA production by Streptomy-
ces clavuligerus in medium containing soybean derivatives. World
Journal of Microbiology and Biotechnology 15, 623–625.
Higgens, C.E. & Kastner, R.E. 1971 Streptomyces clavuligerus sp. nov.,
a b-lactam antibiotic producer. International Journal of Systematic
Bacteriology 21, 326–331.
Kim, I.C., Kim, C.H., Hong, S.I. & Kim, S.W. 2001 Fed-batch
cultivation for the production of CA by an immobilized Strepto-
myces clavuligerus mutant. World Journal of Microbiology and
Biotechnology 17, 869–872.
Laat, W.T.A.M. & Krabben, P. 2000 Fermentation process to produce
CA at low concentration of free aminoacids. Patent Number
WO0001840 A.
Lambert, M. & Neish, A.C. 1950 Rapid method for estimation of
glycerol in fermentation solutions. Canadian Journal of Research
28, 83–89.
Large, K.P., Ison, A.P. & Williams, D.J. 1998 The effect of agitation
rate on lipid utilization and CA production in Streptomyces
clavuligerus. Journal of Biotechnology 63, 111–119.
Large, K.P., Mirjalili, N., Osborne, M., Peacock, L.M., Zormpaidis,
V., Walsh, M., Cavanagh, M.E., Leadlay, P.F. & Ison, A.P. 1999
Lipase activity in Streptomycetes. Enzyme and Microbial Technol-
ogy 25, 569–575.
Lee, P.C. & Ho, C.C. 1996 Production of CA and cephamycin C by
Streptomyces clavuligerus. World Journal of Microbiology and
Biotechnology 12, 73–75.
Liras, P. & Rodriguez-Garcia, A. 2000 CA, a b-lactamase inhibitor:
biosynthesis and molecular genetics. Applied Microbiology and
Biotechnology 54, 467–475.
Martin, J.F. & Demain, A. 1980 Control of antibiotic biosynthesis.
Microbiological Reviews 44, 230–251.
Mayer, A.F. & Deckwer, W.D. 1996 Simultaneous production and
decomposition of CA during Streptomyces clavuligerus cultivation.
Applied Microbiology and Biotechnology 45, 41–46.
Mellado, E., Lorenzana, L.M., Rodriguez-Saiz, M., Diez, B., Liras, P.
& Barredo, J.L. 2002 The CA biosynthetic cluster of Streptomyces
clavuligerus: genetic organization of the region upstream of the car
gene. Microbiology 148, 1427–1438.
Neves, A.A., Vieira, L.M. & Menezes, J.C. 2001 Effects of preculture
variability on CA fermentation. Biotechnology and Bioengineering
72, 28–633.
Perez-Redondo, R., Rodriguez-Garcia, A., Martin, J.F. & Liras, P.
1999 Deletion of the pyc Gene blocks CA biosynthesis except in
glycerol-containing medium: evidence for two different genes in
formation of the C3 unit. Journal of Bacteriology 181, 6922–
6928.
Reading, C. & Cole, M. 1977 CA: a b-lactam from Streptomyces
clavuligerus. Antimicrobial Agents and Chemotherapy 11, 852–857.
Romero, J., Liras, P. & Martin, J.F. 1984 Dissociation of cephamycin
and CA biosynthesis in Streptomyces clavuligerus. Applied Micro-
biology and Biotechnology 20, 318–325.
Roubos, J.A.,Krabben, P., Luiten,R.G.M., Babuska,R.&Heijnen, J.J.
2001 A semi-stoichiometric model for a Streptomyces fed-batch
cultivation with multiple feeds. In Computer Applications in Bio-
technology 2001, Vol 8, eds. Dochain, D. & Perrier, M. Quebec City,
Canada: ISBN 0080436811.
Roubos, J.A., Krabben, P., Luiten, R.G.M., Laat, W.T.A.M.,
Babuska, R. & Heijnen, J.J. 2002 CA degradation in Streptomyces
clavuligerus fed-batch cultivations. Biotechnology Progress 18,
451–457.
Sanchez, L. & Brana, A.F. 1996 Cell density influences antibiotic
biosynthesis in Streptomyces clavuligerus. Microbiology 142, 1209–
1220.
Townsend, C.A. 2002 New reactions in CA biosynthesis. Current
Opinion in Chemical Biology 6, 583–589.
514 G.L. Maranesi et al.

Cytogenetic analysis of metaphase chromosomes from pupal testes of four
mosquito species using fluorescence in situ hybridization technique (FISH)q
Fatma A.E. Sallam1,* and Refaat G. Abou El Ela21Zoology Department, Faculty of Women for Arts, Science and Education, Ain Shams University, Cairo, Egypt2Entomology Department, Faculty of Science, Cairo University, Cairo, Egypt*Author for correspondence: Tel.: +202-010-5700416; Fax: +202-4857000, E-mail: [email protected]
Keywords: Aedes aegypti, Aedes albopictus, Aedes triseriatus, Culex pipiens, fluorescence in situ hybridization tags,metaphase chromosomes, pupal testes
Summary
The DNA probes, P1887, P2405, P2056 (being specific tags for Aedes aegypti genes coding for ribosomal RNA) anda centric heterochromatin probe, K20-1A5, were chosen to hybridize the metaphase chromosomes from the testes offour mosquito species, Culex pipiens, Aedes aegypti, Aedes albopictus and Aedes triseriatus. In addition, a singleplasmid, P2392, which contained the three probes, P1887, P2405 and P2056, was also used as chromosomelandmark in aedine species. Only the Aedes aegypti metaphase chromosome 1-specific tag, P1887, was conserved inAedes albopictus, Aedes triseriatus, and Culex pipiens metaphase chromosomes. Aedes triseriatus exhibited two geneloci, on chromosomes 1 and 3, coding for ribosomal RNA per haploid genome. When the specific probes forchromosomes 2 and 3, 2405 and 2056, were used in the fluorescence in situ hybridization technique against themetaphase chromosomes the fluorescent signals were not seen in Aedes albopictus, Aedes triseriatus or Culex pipiens.Also the centric heterochromatin probe, K20-1A5, exhibited strong fluorescent signals on chromosomes 1, 2 and 3of Aedes aegypti. These fluorescent signals were not observed in metaphase chromosomes derived from the otheraedine species, indicating that the centromere sequence can vary within the species.
Introduction
Malaria, filariasis and dengue fever are the three majorcauses of morbidity and mortality in developingcountries. Disease caused by arboviral, filarial andmalarial parasites are transmitted to humans bymosquitoes from the sub-families Culicinae and Anop-helinae. A great deal of information has accumulatedon chromosome numbers and heterochromatin distri-bution, as well as genomic size and organization, in themosquito family Culicidae, since the inheritance offilarial vector competence as a sex-linked recessive traitwas first demonstrated by MacDonald (1962a, b).Genera of Anophelinae have heteromorphic sex chro-mosomes, of small genomic size and repetitive ele-ments, which are distributed in a long-periodinterspersion pattern. In contrast, genera of Culicinae
have homomorphic sex chromosomes and repetitiveDNA organized in a short period interspersion pattern(Kumar & Rai 1990). Aedes aegypti and Anophelesgambiae are the two most studied mosquito species.Aedes belongs to the sub-family Culicinae and has agenomic organization more similar to human genomewhereas Anopheles belongs to the sub-family Anophe-linae and has a genomic organization similar toDrosophila (Knudson et al. 1996).Application of the fluorescence in situ hybridization
technique, FISH, in biological studies has expandedrapidly since the introduction of the technique byRudkin & Stollar (1977). This technique has severaladvantages over hybridization with isotopically labelledprobes, i.e. spatial resolution, speed and probe stability.A variety of probe-labelling schemes are available forsimultaneous detection of different chromosomal sub-regions in the same nucleus and in the entire chromo-somes. Chromosomal sub-regions can be specificallyhighlighted in different colours depending on the probesused. Probe-labelling and fluorescent reagents make theFISH procedure straightforward and reliable (Nederlofet al. 1990; Trask 1991). Standard FISH techniqueswere employed for visualizing the position of hybridized
qThis paper was presented at the Second Arab Conference on
Biotechnology and Genetic Engineering, held in the Kingdom of
Bahrain, 15–17 April, 2002 and is published here with the endorsement
of the Co-ordinator of the Scientific Committee, Professor Essam
H. Ghanem, University of Bahrain. Its publication has been delayed
because of the ill health of the senior author. Other papers from this
conference were published in the July 2003 issue (vol. 19, no. 5).
World Journal of Microbiology & Biotechnology (2005) 21:515–518 � Springer 2005
DOI 10.1007/s11274-004-2394-y

probes on the extended DNA strands through fluores-cence microscopes (Parra & Windle 1993).A genetic map for Anopheles gambiae was constructed
either by in situ hybridization of genetic markers topolytene chromosomes or by hybridization of geneticmarkers to polytene divisional pools (Zheng et al. 1993,1996; Dimopoulos et al. 1996). The physical map forAedes aegypti was difficult to generate because it did notyield usable polytene chromosomes. Brown & Knudson(1997) constructed a single landmark probe fromrepetitive DNA that uniquely marked each of the threechromosomes with paired signals and with distinctsignal intensity.The aim of the present work was to determine
whether, using the FISH technique, the specific tagsfor Aedes aegypti genes coding for ribosomal RNA andthe centric heterochromatin probe would be useful andapplicable as chromosome markers to other relatedmosquito species.
Materials and methods
Preparation of metaphase chromosomes
Metaphase chromosomes were prepared from pupaltestes of four mosquito species :Culex pipiens, Aedesaegypti, Aedes albopictus, and Aedes triseriatus usingstandard cytogenetic procedures of French et al. (1962),except that cholchicine treatment was omitted in thepresent work to avoid its toxicity.
In situ hybridization, microscopy and digital imaging
Laboratory protocols for in situ hybridization reactionshave been described in detail elsewhere (Ausubel et al.1998; Brown et al. 1995). Briefly, probes were labelledwith biotin-14-deoxyadenosine-5-triphosphate (biotin-14-dATP) using standard nick translation procedures.The labelled probes were sized to 100–500 bp (10 lg),precipitated denatured by boiling at 80 �C for 10 min,and allowed to reanneal at 37 �C for 30 min. Slidescontaining metaphase chromosomes were treated sepa-rately to denature the chromosomal DNA, the prean-nealed probe was added to the slide, and hybridizationoccurred overnight. The excess probe was removed fromthe slides by several washes. The slides were blocked
with 3% bovine serum albumin in 4· saline sodiumcitrate (SSC) (1:1, v/v) and the biotinylated probe wasdetected with FITC-conjugated avidin and any excesswas removed by a brief wash. The slides were counter-stained with 4-,6-diamidino-2-phenylinodle (DAPI ;0.2 lg ml)1) and stored at 4 �C until examined optically.To simplify orientation of the chromosomes and signalmeasurements, a single plasmid, P2392 containing thechromosomal landmarks (Brown & Knudson 1997) wasalso nick-translated with digoxigenin 11-deoxyuradine5-triphosphate (digoxigenin-11-dUTP), added to thepreannealed probe mix, and detected using rhodamine-conjugated anti-digoxigenin. Digital images were cap-tured of the DAPI, FITC, and rhodamine-stainedimages using a cooled-array charged coupled device(CCD) and they were processed as described previously(Brown et al. 1995; Brown & Knudson 1997). Non-overlapping chromosome spreads were examined for theposition and intensity of the landmark probe and testFISH signals. Measurements were made of the shortarm (p-arm), long arm (q-arm), and the total chromo-some length; the FISH signal position was expressed asa percentage of fractional length (% FL) from thesmaller arm or p-arm terminus (pter) relative to the totallength of the chromosome (% FLpter).
Results
The centromeric positions and lengths of the threechromosomes in the four mosquito species underinvestigation are given in Table 1.When the specific tag for genes coding for ribosomal
RNA (P1887) on chromosome 1 was used as a FISHprobe to metaphase chromosomes, the signals wereobserved as broad bands at 70, 71.4 and 69.5% FLpterof chromosome 1 of Aedes aegypti, Aedes albopictus andCulex pipiens, respectively (Figure 1a, b and d) (FLpteris the percentage of fractional length, %FL, from thesmaller arm or p-arm terminus, pter, relative to the totallength of the chromosome). In addition, Aedes triseri-atus had signals on chromosomes 1 and 3, indicatingthat two ribosomal RNA loci per haploid genome werepresent (Figure 1c). When the specific tag for chromo-some 2 genes, coding for ribosomal RNA, P2405, wasused, the FISH signals were found only on the threepairs of chromosomes of Aedes aegypti (Figure 1f).
Table 1. Chromsome measurements of mosquito species.
Species Chromosome 1 (Shortest) Chromosome 2 (Longest) Chromosome 3 (Intermediate)
Length (lm) Centromere
position
Length (lm) Centromere
position
Length (lm) Centromere
position
Aedes aegypti 9.4 Metacentric 12.6 Metacentric 11.5 Submetacentric
Aedes Albopictus 11.4 Submetacentric 17.7 Submetacentric 15.6 Metacentric
Aedes triseriatus 9.6 Slightly
submetacentric
11.4 Submetacentric 10.3 Submetacentric
Culex pipiens 6.2 Metacentric 10.0 Slightly
submetacentric
7.8 Metacentric
516 F.A.E. Sallam and R.G.A. El Ela

Also, when the specific tag for chromosome 3 genescoding for ribosomal RNA (P2056) was used, the FISHsignals were only located on chromosome 3 of Aedesaegypti (Figure 1g). On the other hand, when thelandmark probe, P2392, was used, a strong signal wasnoticed in chromosome 1. The next most intense signalwas on chromosome 2 and the weaker signal was onchromosome 3 of Aedes aegypti (Figure 1e–g). Also thecentric heterochromatin probe K20-1A5 exhibitedstrong signals on the three pairs of chromosomes ofAedes aegypti (Figure 1h). No signals were recorded inAedes albopictus, Aedes triseriatus and Culex pipiensmetaphase chromosomes when P2405, P2056, P2392and K20-1A5 were used as FISH tags (Figure 1b–d,i–k).
Discussion
The conservation of genes coding for ribosomal RNA inthe four mosquito species has been confirmed using theFISH probe, P1887. On the other hand, P2405 andP2056, used as specific probes of genes coding for
ribosomal RNA of chromosomes 2 and 3 in Aedesaegypti, showed no similarity with the sequences foundin Aedes albopictus, Aedes triseriatus and Culex pipiens.The three specific FISH tags for chromosomes 1, 2 and 3(P1887, P2405 and P2056) together form the cosmidP2392 that contains a repetitive sequence in Aedesaegypti (Brown & Knudson 1997). The results of thiswork showed that P2392-tagging reagent could be usedsuccessfully as a landmark FISH probe, which allowedthe chromosomes and the chromosomal arms to beidentified in such a way that determined the location ofthe genetic marker sequences accurately and quickly inAedes aegypti. On the other hand, this P2392-taggingreagent did not work as a chromosome marker in Aedesalbopictus, Aedes triseriatus and Culex pipiens.The results of this work agree with those of Kumar &
Rai (1990) who demonstrated two genes for ribosomalRNA in chromosomes 1 and 3 of 20 mosquito speciesbelonging to eight genera of sub-families Culicinae andAnophelinae. The conservation of the genes coding forribosomal RNA in mosquitoes has been confirmed usingFISH by Marchi & Pili (1994) and Ferguson et al.(1996). They demonstrated that those genes are localized
Figure 1. FISH landmark probes to Aedes aegypti, Aedes albopictus, Aedes triseriatus and Culex pipiens metaphase chromosome spreads. FISH
of the tagging clone P1887 is depicted in merged images that include FISH hybridization, using the P2392 probe. The digital images for
chromosome 1 are coloured and merged by software to yield the composite final images (a–d). FISH of the tagging clones, P1887, 2405 & 2056 are
depicted in merged images that include FISH hybridization using the P2392 probe. The digital images for Aedes aegypti chromosomes 1, 2 and 3
are coloured and merged by software to yield the composite final images (e–g). FISH of the K20-1A5 probe is depicted in merged images that
include FISH hybridization using the P2392 probe. The digital images for chromosome 1 are coloured and merged by software to yield the
composite final images (h–k).
Cytogenetic analysis of metaphase chromosomes 517

on the heterochromatic arm of both sex chromosomes inAnopheles genus and on the short arm of chromosome 1in a region proximal to the centromere in Culex pipiensand in the middle of chromosome 1 in Aedes aegypti.During the last 10 years, the FISH technique has beenused to localize genes coding for ribosomal RNA on thechromosomes of different insects belonging to orderDiptera (Marchi & Pili 1994; Brown & Knudson 1997;Willhoeft 1997; Nunamaker et al. 1999; Brown et al.2000).Eukaryotic chromosomes have organelles (telomeres
and centromeres) that ensure their independence duringmitosis and meiosis. In this work, the centromerestructure of four mosquito species was studied using acentric heterochromatic probe, K20-1A5. This probeexhibited strong FISH signals on chromosomes 1 and 3,while chromosome 2 had faint signal in Aedes aegypti.Such results indicated that the centromeres of chromo-some 1 and 3 are similar in sequences, while centromereof chromosome 2 exhibiting only a minor sequencesimilarity. Such FISH signals were not observed incentromeres of Aedes albopictus, Aedes triseriatus andCulex pipiens, indicating that those centromere se-quences were different from that of Aedes aegypti. Thisresults also showed that the centromere sequence canvary within the aedine species.
Acknowledgments
We would like to express our thanks to Prof.D.L. Knudson, Department of Bioagricultural Sciencesand Pest Management, College of Agricultural Sciences,Colorado State University, Fort Collins, USA, forproviding laboratory facilities needed for this work.
References
Ausubel, F.M., Brent, R., Kingston, R.E.,Moore, D.D., Seidman, J.G.,
Smith, J.A. & Struhl, K. 1998 Current Protocols in Molecular
Biology; pp. 33–42, eds. Seidman et al., New York: Green Publish-
ing Associates and Wiley-Interscience. ISBN 0-471-50338-X.
Brown, S.E., Menninger, J., Difillipantonis, M., Beaty, B.J., Ward,
D.C. & Knudson, D.L. 1995 Toward a physical map of Aedes
aegypti. Insect Molecular Biology 4, 161–167.
Brown, S.E. & Knudson, D.L. 1997 FISH landmarks for Aedes aegypti
chromosomes. Insect Molecular Biology 6, 197–202.
Brown, S.E., Severson, D.W., Smith, L.A. & Knudson, D.L. 2000
Integration of the Aedes aegypti mosquito genetic linkage and
physical maps. Genetics 157, 1299–1305.
Dimopoulos, G., Zheng, L., Kumar, V., Delta Torne, A. &
Kafatos, F.C. 1996 Integrated genetic map of Anopheles gambiae:
use of RAPD polymorphisms for genetic, cytogenetic and STS
landmarks. Genetics 143, 953–960.
Ferguson, M.L., Brown, S.E. & Knudson, D.L. 1996 FISH digital
imaging microscopy in mosquito genomics. Parasitology Today 12,
91–96.
French, W.L., Bakery, R.H. & Kitzmiller, H. 1962 Preparation of
mosquito chromosomes. Mosquito News 22, 377–383.
Knudson, D.L., Zheng, L., Gordon, S.W., Brown, S.E. &
Kafatos, F.C. 1996 Genome organization of vectors. In The
Biology of Disease Vectors, eds. Beaty, B.J & Marquardt, N.C.
pp. 175–214. Niwot, co: University Press of Colorado. ISBN
0870-814117.
Kumar, A. & Rai, K.S. 1990 Chromosomal localization & copy
number of 18S-28S ribosomal RNA genes in evolutionarily diverse
mosquitoes (Diptera, Culicidae). Heredity 113, 277–289.
MacDonald, W.W. 1962a The genetic basis of susceptibility to
infection with semi-periodic Brugia malayi in Aedes aegypti. Annals
of Tropical Medical Parasitology 52, 368–372.
MacDonald, W.W. 1962b The selection of a strain of Aedes aegypti
susceptible to infestation with semi-periodic Brugia malayi. Annals
of Tropical Medical Parasitology 56, 368–372.
Marchi, A. & Pili, E. 1994 Ribosomal RNA genes in mosquitoes:
localization by fluorescence in situ hybridization (FISH). Heredity
72, 599–605.
Nederlof, P.M., Van der Flier, S., Wiegant, J., Raap, A.K., Tanke, H.J.,
Ploem, J.S. & Van der Ploeg, M. 1990 Multiple fluorescence in situ
hybridization. Cytometry 11, 126–131.
Nunamaker, R.A., Brown, S.E. & Knudson, D.L. 1999 Fluorescence
in situ hybridization landmarks for chromosomes of Culicoides
variipennis (Diptera: Ceratopogonideae). Journal of Medical Ento-
mology 36, 171–175.
Parra, I. & Windle, B. 1993 High resolution visual mapping of
stretched DNA by fluorescent hybridization. Nature Genetics 5,
17–21.
Rudkin, G.T. & Stollar, B.D. 1977 High resolution of DNA-RNA
hybrids in situ by indirect immunofluorescence. Nature 265,
472–473.
Trask, B.J. 1991 Fluorescence in situ hybridization. Applications in
cytogenetics & gene mapping. Trends in Genetics 7, 149–154.
Willhoeft, U. 1997 Fluorescence in situ hybridization of ribosomal
DNA to mitotic chromosomes of tsetse flies (Diptera: Glossinidae:
Glossina). Chromosome Research 5, 262–267.
Zheng, L., Collins, F.H., Kumar, V. & Kafatos, F.C. 1993 A detailed
genetic map for the X chromosomes of the malaria vector,
Anopheles gambiae. Science 261, 605–608.
Zheng, L., Benedict,M.Q., Cornel, A.J., Collings, F.H. &Kafatos, F.C.
1996 An integrated map of the African human malaria vector
mosquito, Anopheles gambiae. Genetics 143, 941–952.
518 F.A.E. Sallam and R.G.A. El Ela

Evaluation of agro-food byproducts for gluconic acid production by Aspergillus nigerORS-4.410
O.V. Singh1,2, N. Kapur1 and R.P. Singh1,*1Department of Biotechnology, Indian Institute of Technology, Roorkee-247 667, India2Department of Pediatrics, Johns Hopkins School of Medicine, Baltimore, MD 21287, USA*Author for correspondence: Tel.: +91–1332-285792, Fax: +91–1332-273560, E-mail: [email protected]
Keywords: Aspergillus niger, banana-must, batch fermentation, gluconic acid, grape-must, molasses
Summary
Certain cost-effective carbohydrate sources in crude as well as after purification were utilized as the sole sourcesof carbon for gluconic acid production using Aspergillus niger ORS-4.410 under submerged fermentation. Crudegrape must (GM) and banana-must (BM) resulted into significant levels of gluconic acid production i.e. 62.6 and54.6 g/l, respectively. The purification of grape and banana-must led to a 20–21% increase in gluconic acid yield.Molasses as such did not favour gluconate production (12.0 g/l) but a significant increase in production (60.3 g/l)was observed following hexacyanoferrate (HCF) treatment of the molasses. Rectified grape must (RGM)appeared to be best suitable substrate which after 144 h resulted in 73.2 g of gluconic acid/l with 80.6% yieldfollowed by the yield obtained from the rectified banana must (RBM) (72.4%) and treated cane molasses (TM)(61.3%). Abundant growth of mould A. niger ORS-4.410 was observed with crude grape (0.131 g/l/h) and bananamust (0.132 g/l/h).
Introduction
Gluconic acid is regarded as a bulk chemical and is usedas an important product in the food, feed, beverage andtextile industries and for various clinical approaches.Due to the potential demand for it of about 50,000 to60,000 tons per annum, microbial fermentation isexclusively used for commercial scale production usingglucose as a major carbohydrate source (Roehr et al.1996; Roukas 2000). There are many reports on thefermentative production of gluconic acid and its salts byvarious bacterial and mould species. The commonlystudied bacterial species belong to Pseudomonas, Aceto-bacter, Gluconobacter, Zymomonas (Bekers et al. 2000;Chen & Liu 2000; Moonmangmee et al. 2000), while inmoulds, Penicillium, Aspergillus, Aureobasidium(Petruccioli 1994; Anastassiadis et al. 2003; Singh et al.2003) have been considered suitable strains for gluconicacid production. Refined glucose, glucose syrup andsucrose have been the main substrates for gluconic acidproduction (Ray & Banik 1999; Silveira et al. 1999;Bekers et al. 2000). The process could be furthereconomized by replacing conventional refined carbohy-drate materials with more economical substrates. Alarge quantity of raw fruit materials during storageundergo decomposition and generate a waste that maycause environmental pollution. Utilization of these
waste materials can be a part of environmental pollutioncontrol on one hand and production of value-addedproducts of commercial significance on the other, thuschanging their status from waste to potential provider.Agro-food byproducts such as grape-must, banana-must and sugarcane molasses contain high concentra-tions of sugars and can be considered as potentialsubstrates that are easily available and economical. Thepresent study is aimed at evaluating the economicalwaste carbohydrate sources grape-must, banana-mustand sugarcane molasses for gluconic acid production bya mutant Aspergillus niger strain ORS-4.410. Concen-trated purified grape-must, banana-must and treatedmolasses have also been evaluated for gluconic acidproduction.
Materials and methods
Microorganism
Aspergillus niger mutant ORS-4.410 (Singh et al. 2001a)derived from the wild type Aspergillus niger ORS-4(ITCC 5231) (Singh et al. 1999) after a two step u.v.irradiation, was used for this study. The strain wasmaintained on potato dextrose agar (PDA) slant byperiodical transfers; and was incubated following trans-fer for 72 h (30 �C) before storing at 4 �C.
World Journal of Microbiology & Biotechnology (2005) 21:519–524 � Springer 2005
DOI 10.1007/s11274-004-2395-x

Preparation and purification of grape-must
Grape juice has high sugar content (17% total sugar:50% glucose and 50% sucrose) and is acidic (up to 10 g/l tartaric acid). Market-refused red grapes of theConcord variety (100% ripened) that did not meet withthe quality norms were used in fermentation reaction forgluconic acid production. Clarification of grape-mustwas followed as described (Grassim & Fauquembergue1996) with slight modifications. Briefly, decomposed andmarket-refused grapes were collected (1 kg) and mixedwith 1 l double distilled water. These were then de-stemmed, crushed and heated at 80 �C for 30 min torelease the red colour from the grape skin and toinactivate the endogenous polyphenol oxidase. Materialthus obtained was filtered through muslin cloth and thejuice that emerged was considered as grape-must (GM),which was then diluted to give 10–12% sugar concen-tration and used for gluconic acid fermentation. Thisgrape-must was further clarified by addition of Cytolase(50 lg/g of original fruit mass) at room temperature for30 min. The resulted free run juice was subjected tovacuum filtration, cooled at 4 �C to prevent fermenta-tion and then depectinized with Klerzyme, (200 lM for2 weeks). The filtrate juice was referred as rectified grapemust (RGM) and diluted to 120 g glucose/l before beingused for fermentation.
Preparation and purification of banana-must
Market-rejected yellow rotten bananas that did not meetquality norms for consumption was utilized as thesubstrate for gluconic acid fermentation. Preparationand clarification of banana-must was followed asdescribed (Grassim & Fauquembergue 1996). Briefly,the rotten bananas (1 kg) were peeled, ground andblanched in 1 l double distilled water. The obtainedslurry was heated at 85 �C for 2–3 min to inhibitpolyphenol oxidase. Potassium metabisulphite (100 lM)was then added to prevent browning. The slurry wassubjected to vacuum filtration and the free run juice thuscollected was referred to as banana-must (BM). Further,banana-must was treated with Rapidase (75–100 lg/g offruit pulp for 1–2 h at 45 �C) and clarified by centrifu-gation (5000 · g, 30 min). Clarified supernatant juicewas referred as rectified banana-must (RBM) andfurther diluted to 120 g glucose/l of fermentationmedium prior to fermentation set-up.
Clarification of molasses
Crude molasses (CM) was found to contain highconcentrations of heavy metals and other compoundsthat inhibited gluconic acid fermentation, hence it wastreated with hexacyanoferrate (HCF) prior to use. Thecrude cane molasses (1 kg, obtained from a localsugarcane mill) was diluted 4–5 times with deionizedwater and passed through a bed of activated charcoalfor decolourization. HCF (3.8 mM) was added to the
decolorized molasses at pH 4.0–4.5, followed by heatingat 70–90 �C for 15 min. The precipitate formed con-taining metallic complex was removed by filtration, andthe filtrate was referred as treated cane molasses (TM).The pH of clarified molasses was adjusted to 4.5 beforeits use for gluconic acid fermentation.
Growth and fermentation condition
The spores (5 days-old) were suspended in 5 ml of sterile50 mM phosphate buffer (pH 6.8) containing 0.1% (v/v)Tween-80 (1010–1012 spores/ml) and used as inoculum(2–3%, v/v) for batch fermentation. The fermentationmedium contained: (NH4)2HPO4, 1.0 g/l; KH2PO4,0.5 g/l; MgSO4.7H2O, 0.15 g/l; CaCO3, 40 g/l (sterilizedseparately), medium was supplemented with 120 g/lglucose from previously diluted each substrate type i.e.grape-must (corresponding to �250 g t.r.c./l), RGM(corresponding to �250 g t.r.c./l); banana-must (corre-sponding to �240 g t.r.c./l), RBM (corresponding to�240 g t.r.c./l); crude hydrolysed molasses (correspond-ing to �285 g t.r.c./l) and HCF-treated molasses(corresponding to �285 g t.r.c./l) as the sole carbonsource in separate fermentation reactions. Initial pH was5.5 at 30 �C unless CaCO3 was added in the medium(pH 6.5±0.1). The submerged culture cultivation wascarried out in batches using Erlenmeyer flasks (500 ml),each containing 100 ml medium; flasks were incubatedat 30 �C in an Orbital shaker (Sanyo Gallenkamp,U.K.) at 150 rev/min for up to 8 days.
Determination of glucose and gluconic acid
Unfermented total residual sugar was determinedaccording to Miller (1959) and the total reducingcarbohydrate was estimated as described by Mann &Saunders (1960). The gluconic acid formed was quali-tatively analysed by HPLC (Waters, Milford, USA)using C18 ODS2 column. Elution was performed withan isocratic solvent (0.8 ml/min) using acetonitrile: H2O(3:7 v/v) and detected at 210 nm. A standard solution ofgluconic acid (Sigma) was prepared and eluted similarly.The elution times of peaks were compared to the elutiontime of a standard peak. Fermented broth containinggluconic acid was subjected to acid hydrolysis and theresulting gluconolactone was measured by a modifiedhydroxamate method (Lien 1959). Total yield of glu-conic acid was determined by measuring the dissolvedcalcium in the fermentation broth as described byLehman (1985). Briefly, 2 ml of supernatant (obtainedby centrifuging fermented broth) was diluted with 600ml of double distilled water. To this, 5 ml of concen-trated ammonia solution was added followed by a pinchof Eriochrome-red B powder. The sample thus preparedwas titrated with 0.1 M Titriplex solution until the colorchanged from yellow to green (1 ml Titriplex III=2.004g Ca/l broth; Total gluconic acid yield (%) = gluconicacid produced/ total sugar utilized · 100).
520 O.V. Singh et al.

Determination of dry cell mass
Culture fluid was filtered through Whatman No. 1paper. The filtered mycelia were washed with acidified(pH 2.5 with 4 M HCl) doubled distilled water toconvert the insoluble CaCO3 to soluble CaCl2. Theseparated mycelia were washed several times withdeionized water until pH of washing was 7.0; myceliawere then dried at 75 �C to constant weight afterrepeated weighing.
Reproducibility of results
All fermentation was carried out in triplicate and theexperimental results represent the mean of three iden-tical fermentations. Statistical analysis was performedusing ANOVA test software.
Results and Discussion
Utilization of grape-must and the banana-must forgluconic acid fermentation
Cheap carbohydrate sources such as GM, RGM, BMand RBM and cane molasses were evaluated forgluconic acid production by A. niger mutant ORS-4.410. Among all the substrates used, RGM appearedto be a potential substrate resulting into higher levelsof gluconic acid. An increase in the levels of gluconicacid produced with RGM was observed after 72 hfollowed by maximum production (73.2 g/l) after 144 h(Figure 1) with 80.6% yield, whereas, GM resulted into62.6 g gluconic acid/l, with 60.4% yield. Yield was
therefore 20% lower with GM as compared with thatof RGM as the substrate. ANOVA test for significantdifferences between gluconic acid production wasperformed at different time periods for both substrates(GM: F=103.4; d.f.=7, 16; P=0.000; RGM: F=135.4; d.f.=7,16; P=0.000). Kinetic analysis of thebioconversion also showed that the degree of conver-sion (0.611 g/g) and gluconic acid production rate(0.509 g/l/h) were higher with RGM as compared tothe GM (degree of conversion, 0.522 g/g; gluconic acidproduction rate, 0.435 g/l/h) (Table 1). A. niger mutantORS-4.410 yielded rapid growth on the crude sub-strates such as grape-must and banana-must and hadshown higher substrate utilization (Table 1) but hadlower gluconic acid productivity. Significant growth ofmould A. niger ORS-4.410 was observed during 24–96h of fermentation with GM having a specific biomassgrowth rate of 0.131 g/l/h whereas a lower growth rate(0.106 g/l/h) was observed with RGM (Table 1). High-er salt concentration in the crude substrates i.e. GMand BM (1.0 and 1.9 g total nitrogen/l, respectively)(Holland et al. 1997) may possibly favour biomassaccumulation than the gluconic acid accumulation(Buzzini et al. 1993; Ray & Banik 1999). Grape andbanana-must when rectified appeared to be the bettersubstrates that has improved gluconic acid yield 20–21% in fermentation medium. The biosynthetic activityof A. niger ORS-4.410 increased rapidly after a latentperiod of 24 h followed by the maximum productionafter 144 h, acid production activity of the mouldafterwards declined, probably due to the reducedamount of glucose in the fermentation medium.Another cheaper substrate i.e. RBM from market-
refused banana was evaluated for gluconic acid pro-duction. Use of banana-must as such led to 54.6 g/lgluconic acid, while RBM was found to result into a27% increase in acid production (Figure 2) withsignificant yield 72.4% as compared to crude banana-must (51.7%) (Table 1). A total of 79.6 and 88.0% ofthe glucose were utilized after single cycle of fermen-tation (144 h) from RBM and BM, respectively(Table 1). Significant differences in between gluconicacid production were found at different time intervalsusing RBM and BM as sole carbon sources infermentation medium (BM: F=76.64; d.f. =7, 16;P= 0.00; RBM: F=231.2, d.f. = 7, 16; P=0.000).
Utilization of sugarcane molasses for gluconic acidfermentation
Molasses resulted into lower levels of gluconic acidproduction (12.0 g/l), however a notable increase ingluconic acid production was observed with TM(60.3 g/l) when used as the substrate (Figure 3). Com-parison of gluconic acid yields as obtained from TM(61.3%) with that of rectified fruit wastes (RGM,80.6% and RBM, 72.4%) had indicated that TM hadyielded a comparatively lower amount of gluconic acid
0
10
20
30
40
50
60
70
80
90
0 24 48 72 96 120 144 168 192Time (h)
Glu
coni
c ac
id (
g/l)
0
20
40
60
80
100
120
140
Res
idua
l sug
ar (
g/l)
Figure 1. Utilization of grape-must (s, n) and rectified grape-must
(d, m) as a sole source of carbon for gluconic acid production (s, d)
and residual sugars (n, m) by Aspergillus niger ORS-4.410. The fungus
was grown in fermentation medium under submerged culture cultiva-
tion with an initial pH of 6.5 at 30 �C.
Gluconic acid fermentation 521

than the other two rectified fruit wastes used (Table 1).Statistically, significant differences were found inbetween gluconic acid production using crude andTM (CM: F=2.254; d. f. = 7, 16; P= 0.085; TM: F =125.8; d.f. = 7, 16; P = 0.000). The higher concen-trations of heavy metal ions not only hindered gluconicacid production but also sustained the cellular growthof the mould. The reduction in gluconic acid produc-tion may be due to the inactivation of intracellularglucose oxidase at higher metal ion concentration (Liuet al. 2001). Utilization of total reducing carbohydrateswas lower with CM when compared to the other twosubstrates GM and BM (Table 1).
It is therefore apparent that RGM was the bettercarbon source resulting in 6 and 22% higher productionof gluconic acid than RBM and treated molasses,respectively. The analysis of gluconic acid productionby A. niger mutant ORS-4.410 indicated that directfermentation of pure glucose resulted in 91.7 g gluconicacid/l, with 94.5% yield after 144 h of incubation (Singhet al. 2001b). Comparison of total gluconic acid pro-duction from RGM, RBM and TM with glucoseindicated that RGM, RBM and TM resulted in 80, 76and 66% gluconic acid production with respect to theproduction obtained with glucose. These observationstherefore substantiated that the rectified grape, banana-
Table 1. Evaluation of the kinetic parameters for gluconic acid production using cheap carbohydrate sources by Aspergillus niger ORS-4.410
Parametersaa GM RGM BM RBM CM TM
Gluconic acid yieldb (%) 60.4 80.6 51.7 72.4 15.3 61.3
Degree of conversionc (g/g) 0.522 (±0.241) 0.611 (±0.306) 0.455 (±0.211) 0.578 (±0.293) 0.100 (±0.098) 0.486 (±0.251)
Gluconic acid production
rated (g/l/ h)
0.435 (±0.219) 0.509 (±0.301) 0.379 (±0.127) 0.481 (±0.139) 0.083 (±0.021) 0.405 (±0.206)
Specific glucose uptake
rated (g/l/ h)
0.721 (±0.302) 0.631 (±0.264) 0.733 (±0.348) 0.115 (±0.095) 0.083 (±0.026) 0.118 (±0.094)
Glucose utilizatione (%) 86.5 75.8 88.0 79.6 65.3 79.3
t.r.c. utilization (%) 57.5 75.4 61.7 66.1 49.3 59.4
Specific biomass growth
rated (g/l/ h)
0.131 (±0.093) 0.106 (±0.084) 0.132 (±0.075) 0.115 (±0.094) 0.083 (±0.031) 0.118 (±0.071)
Biomass yieldd, f (g/g) 0.183 (±0.086) 0.168 (±0.076) 0.180 (±0.073) 0.174 (±0.085) 0.153 (±0.062) 0.178 (±0.079)
a Analyzed at 144 h of fermentation.b Calculated as per utilized glucose.c Degree of conversion (1=p/s), P, product; S, initial glucose concentration.d Mean of three replicates ± S.D.e Calculated as per utilized total reducing carbohydrate (t.r.c.).f Y(g/g), values calculated on the basis of biomass obtained and the substrate utilized.
0
10
20
30
40
50
60
70
80
0 24 48 72 96 120 144 168 192
Time (h)
Glu
coni
c ac
id (
g/l)
0
20
40
60
80
100
120
140
Res
idua
l Sug
ar (
g/l)
Figure 2. Utilization of banana-must (s, n) and rectified banana-
must (d, m) as a sole source of carbon for gluconic acid production
(s, d) and residual sugars (n, m) by Aspergillus niger ORS-4.410. The
fungus was grown in fermentation medium under submerged culture
cultivation with an initial pH of 6.5 at 30 �C.
0
10
20
30
40
50
60
70
80
0 24 48 72 96 120 144 168 192Time (h)
Glu
coni
c ac
id (
g/l)
0
20
40
60
80
100
120
140R
esid
ual s
ugar
(g/
l)
Figure 3. Production of gluconic acid (s, d) and recovery of residual
sugars (n, m) in fermentation medium using crude (s, n) and HCF
treated cane molasses (d, m) under submerged fermentation by fungus
Aspergillus niger ORS-4.410, grown in fermentation medium with an
initial pH 6.5 at 30 �C.
522 O.V. Singh et al.

must and the treated molasses are potential substratesfor gluconic acid production. Depending upon thesubstrate used, varying degree of the unfermentedsugars remained in the fermentation medium andconsisted mainly of complex carbohydrates, which werethe major carbohydrate residual material of each sub-strate. Earlier, attempts have been made to utilize thefig, grape-must and sugarcane molasses for gluconic acidproduction using Aspergillus niger and Penicilliumfuniculosum MN 238 strains (Kundu & Das 1984;Buzzini et al. 1993; Roukas 2000); however, A. nigerORS-4.410 appeared to have yielded higher productionlevels with RGM and treated cane molasses as com-pared to the earlier reports (Kundu & Das 1984; Buzziniet al. 1993). Analysis of kinetic parameters had alsoclearly demonstrated RGM followed by RBM are thepotential raw substrates for gluconic acid production(Table 1). Present study thus reveals that mutant A.niger ORS-4.410 can be an effective and promisingmould that could be utilized for gluconic acid produc-tion using horticultural and agricultural byproducts asthe cheaper carbohydrate substrates.Economics is of prime importance for any fermentation
industry to be viable and successful, and to a greaterextent depends on selection of the materials for theprocess. The choice is undoubtedly for the more econom-ical carbohydrate raw materials provided that the micro-organisms do not impose any special requirements for theparticular substrate. These specificities, therefore, led tothe search for significant carbohydrate materials contain-ing high sugar content and that are wastes with no furtherapplications. Fruit wastes are generated either as decom-posed fruit pulps during storage and processing of thefruit material in horticulture industries or as market-rejected fruit wastes from numerous regional markets.These wastes are easily available in market at substan-tially lower prices or at free of cost. Among the fruitwastes, grape-must and the banana-must appear to have ahigh sugar content. In addition, the molasses that aregenerated from the sugarcane processing industries dohave the high sugar content and are also low priced. Thesematerials, which are cost-effective and are easily avail-able, therefore, are promising substrates for economicalproduction of this industrially significant product.
Acknowledgments
We thank Mr. Amit Sharma for his excellent technicalassistance and help in preparation for this manuscript.This work was partially supported by grant 7759- 35 ofAll India Council for Technical Education (AICTE),New Delhi of the Government of India.
References
Anastassiadis, S., Aivasidis, A. & Wandrey, C. 2003 Continuous
gluconic acid production by isolated yeast-like mould strains of
Aureobasidium pullulans. Applied Microbiology Biotechnology 61,
110–117.
Bekers, M., Vigants, A., Laukevics, J., Toma, M., Rapoports, A. &
Zikmanis, P. 2000 The effect of osmo-induced stress on product
formation by Zymomonas mobilis on sucrose. International Journal
of Food Microbiology 55, 147–150.
Buzzini, P., Gobbetti, M., Rossi, J. & Ribaldi, M. 1993 Utilization of
grape-must and concentrated rectified grape-must to produce
gluconic acid by Aspergillus niger, in batch fermentation. Biotech-
nology Letters 15, 151–156.
Chen, C. & Liu, B.Y. 2000 Changes in major components of tea fungus
metabolites during prolonged fermentation. Journal of Applied
Microbiology 89, 834–839.
Grassim, C. & Fauquembergue, P. 1996 Fruit Juices. In Industrial
Enzymology. ed. Godfrey, T. & West, S.T. pp. 227–260. London,
Macmillan Press, ISBN 03–335-9464–9.
Holland, B., Welch, A.A., Unwin, I.D., Buss, D.H., Paul, A.A. &
Southgate, D.A.T. 1997 In The Composition of foods, 5th edn, pp.
852–971. ed. McCane & Widdowson’s, Royal Society of Chemis-
try, Cambridge, ISBN 0–854-04428–0.
Kundu, P. & Das, A. 1984 Utilization of cheap carbohydrate sources
for calcium gluconate production by Penicillium funiculosum
mutant MN 238. Indian Journal of Experimental Biology 22,
279–281.
Lehman, J.K. 1985 Comparative tests for fermentation. In Biotech-
nology. Vol. 2, ed. Rehm, H.J. & Reed, G. pp. 620–624, Weinheim:
VCH Publishers, ISBN 3–527-25764–0.
Lien, O.G. 1959 Determination of gluconolactone, galactonolactone
and their free acids by the hydroxamate method. Analytical
Chemistry 31, 1363–1366.
Liu, J.Z., Huang, Y.Y., Liu, J., Weng, L.P. & Ji, L.N. 2001 Effects of
metal ions on simultaneous production of glucose oxidase and
catalase by Aspergillus niger. Letters of Applied Microbiology 32,
16–19.
Mann, F.G. & Saunders, B.C. 1960 Practical Organic Chemistry. 4th
edn. pp. 458–461, London: Longman, ISBN 81-250-1380-6.
Miller, G. L. 1959 Use of dinitrosalicylic acid reagent for determina-
tion of reducing sugar. Analytical Chemistry 31, 426–428.
Moonmangmee, D., Adachi, O., Ano, Y., Shinagawa, E., Toyama, H.,
Theeragool, G., Lotong, N. & Matsushita, K. 2000 Isolation and
characterization of thermotolerant Gluconobacter strains catalyz-
ing oxidative fermentation at higher temperatures. Bioscience
Biotechnology and Biochemistry 64, 2306–2315.
Petruccioli, M., Piccioni, P., Fenice, M. & Federici, F. 1994 Glucose
oxidase, catalase and gluconic acid production by immobilized
mycelium of Penicillium variabile P16. Biotechnology Letters 16,
939–942.
Ray, S. & Banik, A.K. 1999 Effect of ammonium and nitrate ratio on
glucose oxidase activity during gluconic acid fermentation by a
mutant strain of Aspergillus niger. Indian Journal of Experimental
Biology 37, 391–395.
Roehr, M., Kubicek, C.P. & Kominek, J. 1996 Gluconic acid. In
Biotechnology, Products of Primary Metabolism. Vol. 6, ed. Rehm,
H.J. & Reed, G. pp. 347–362, Weinheim: VCH Publishers, ISBN
3–527-28316–1.
Roukas, T. 2000 Citric acid gluconic acid production from fig by
Aspergillus niger using solid-state fermentation. Journal of Indus-
trial Microbiology and Biotechnology 25, 298–304.
Silveira, M.M., Wisbeck, E., Lemmel, C., Erzinger, G., da Costa, J. P.,
Bertasso, M. & Jonas, R. 1999 Bioconversion of glucose and
fructose to sorbitol and gluconic acid by untreated cells of
Zymomonas mobilis. Journal of Biotechnology 75, 99–103.
Singh, O.V., Pereira, B.M.J. & Singh, R.P. 1999 Isolation and
characterization of a potent fungal strain Aspergillus niger ORS-
4 for gluconic acid production. Journal of Scientific and Industrial
Research 58, 594–600.
Singh, O.V., Sharma, A. & Singh, R.P. 2001a Mutagenesis and
production of gluconic acid by Aspergillus nigermutant ORS-4.410
in submerged and solid state surface cultivation. Indian Journal of
Experimental Biology 39, 691–696.
Gluconic acid fermentation 523

Singh, O.V., Sharma, A. & Singh, R.P. 2001b Optimization of
fermentation conditions for gluconic acid production by mutant
Aspergillus niger. Indian Journal of Experimental Biology 39, 1136–
1143.
Singh, O.V., Jain R.K. & Singh R.P. 2003 Gluconic acid production
under varying fermentation conditions by Aspergillus niger.
Journal of Chemical Technology and Biotechnology 78, (2–3),
208–212.
524 O.V. Singh et al.

A comparative evaluation of oxygen mass transfer and broth viscosity using
Cephalosporin-C production as a case strategy
Punita Mishra, Pradeep Srivastava* and Subir KunduSchool of Biochemical Engineering, Institute of Technology, Banaras Hindu University, Varanasi- 221005, India*Author for correspondence: E-mail: [email protected]
Keywords: Air lift reactor, Cephalosporin-C, consistency index, viscosity, volumetric gas–liquid mass transfercoefficient
Summary
The production of Cephalosporin-C (CPC) a secondary metabolite, using a mold Acremonium chrysogenum wasstudied in a lab scale Internal loop air lift reactor. Cephalosporin-C production process is a highly aerobicfermentation process. Volumetric gas–liquid mass transfer coefficient (kLa) and viscosity (g) were evaluated, duringthe growth and production phases of the microbial physiology. An attempt has been made to correlate the brothviscosity, g and volumetric oxygen transfer coefficient, kLa during the Cephalosporin-C production in an air liftreactor. The impact of biomass concentration and mycelial morphology on broth viscosity has been also evaluated.The broth exhibits a typical non-Newtonian fermentation broth. Rheology parameters like consistency index andfluidity index are also studied.
Nomenclature
a biomass exponentCPC cephalosporin-CCm biomass concentration as dry cell weight (g l)1)K consistency indexkLa volumetric gas–liquid mass
transfer coefficient (h)1)n fluidity index, flow behavior indexg viscosity (cp)c shear rate (s)1)USG superficial gas velocity (ms)1)
Introduction
The biosynthesis of Cephalosporin-C (CPC), an antibi-otic intermediate, is an aerobic fermentation process,using the filamentous microorganism Acremoniumchrysogenum. Antibiotics are the product of secondarymetabolism of microorganism which is produced afterthe active growth has declined. It has been observed thatthere are two phases during the growth of microorgan-ism producing antibiotics. The first phase is called theTrophophase (the balanced growth phase) characterizedby the intense accumulation of biomass, which is due tothe rapid utilization of the substrate and high rate ofoxygen utilization. Antibiotics are not normally formedduring this phase though occasionally small amounts are
formed. This is due to inhibition of the formation ofantibiotics during this balanced growth phase. Thesecond phase, the Idiophase (unbalanced growth phase),which follows the Trophophase, is the antibiotic pro-duction phase. The weight of the biomass increasesslowly or even decreases, during this phase because themain ingredient of the medium are already consumed bythe microorganism and the medium is enriched withsome metabolic products. During the aerobic fermenta-tion process, there is a wide variation of the oxygen masstransfer in the broth. Most of the antibiotic fermenta-tion processes which are of fungal origin exhibit non-Newtonian viscosity and are represented by the powerlaw model. Kawase & Young (1986) have measuredvolumetric mass transfer coefficient in somenon-Newtonian fluids. Several studies have been per-formed on the evaluation of CPC production process.Recently, some studies by Seidel et al. (2002a, b), toevaluate the Process Engineering aspects of CPC pro-duction using complex media in Stirred tank reactor,depict that at the end of the growth phase, the fractionof antibiotic increases to 55%. Also, some of the initialstudies by Weichang et al. (1992) on CPC production byCephalosporium acremonium evaluate the oxygen con-centration variation during the fermentation process.The CPC production has also been evaluated in stirredtank and air lift reactor to prove the utility of air liftreactor for its efficient production (Srivastava et al.1996). The earlier studies by authors, using immobilizedsystems for CPC production in air lift reactor has
World Journal of Microbiology & Biotechnology (2005) 21:525–530 � Springer 2005
DOI 10.1007/s11274-004-3489-1

depicted the role of broth morphology for controlledCPC production (Srivastava & Kundu 1998). However,an attempt is to be made to study and correlate thevariation of oxygen mass transfer and viscosity duringthe production cycle of CPC, along with the morpho-logical variations in the broth. The objectives of thesestudies include evaluation of broth viscosity in relationto morphological variation during the growth of theorganism Acremonium chrysogenum, the studies onoxygen mass transfer coefficient during the CPC pro-duction in the air lift reactor, and also the evaluation ofa correlation for the above mentioned parameters.
Materials and methods
Organism
Acremonium chrysogenum (a gift from J.K. Pharmaceu-ticals Limited, Cuddalore, Pondichery, India) was usedfor the production of CPC. Acremonium chrysogenumculture was maintained on potato dextrose agar (PDA)medium.
Medium
All analytical grade chemicals were used throughout thestudies. The growth and production medium used duringthe study were of, Kennel & Demain (1978), which usedsucrose as the carbon substrate. Requisite quantity ofsilicone oil was added as an antifoaming agent.
Methods
ExperimentalA 1.3 l air lift internal loop reactor (ALR) was indig-enously designed to study the highly aerobic CPCproduction process. The basic design of the lab scaleair lift reactor was determined from the earlier exper-iments (Srivastava 1998). Borosilicate glass was used forthe construction of ALR. The dimensions were re-stricted to ease the sterilization process in laboratoryautoclave. A constant air flow rate was maintainedthrough an air filter, and the flow rate was measuredwith a Rota meter. Dried air was passed at 28 �C. Allthe ports of ALR were aseptically sealed after inocula-tion. Batch CPC production was carried out in ALR.Sterile air was sparged co-currently through a singlesparger and air flow rate was maintained.
Analytical methods
Reducing sugar estimationSugar was estimated by dinitrosalicylic acid (DNS)reagent method described by Miller (1959).
Cephalosporin-C estimationCPC has been estimated by hydroxylamine method. Themethod is described by Boxer & Everet (1949).
Cell mass estimationThe cell mass produced was monitored by using Dry cellmethod (Srivastava 1998).
Broth rheologyThe physical properties of the CPC production brothwere studied using Brooke-field Viscometer (BV) (DialReading & Digital DV-I, Manual No. M/85-170-B,Brook-field Engineering Laboratories, Inc., 240 CushingStreet, Stoughton, MA 02072, USA). To examine theinfluence of biomass concentration on broth rheology,broth samples were taken throughout the time course ofseveral fermentation and reconstituted to the differingbiomass levels. Each sample was reconstituted as inTucker (1994) to form four or five subsamples ofidentical morphology but with biomass concentrationranging between 3 and 15 g l)1 dry cell weights. Fromthe rheological measurement on these subsamples,values of the biomass exponent, a at various time couldbe estimated.
a values, at any time were determined from the slopeof the logarithmically transferred plots of the Consis-tency Index vs. the subsample biomass concentration(Riley et al. 1999).
Volumetric mass transfer coefficientThe volumetric oxygen transfer coefficients, kLa, weredetermined using dynamic method of Ruchti et al.(1981).
Oxygen uptake rates (in vitro method)Oxygen uptake rate was determined by Gbewonoyo &Wang (1983) method.
Results and discussion
Visual observation of CPC broth
During the fermentation process, the CPC productionbroth was monitored and observed using a microscope(100· magnification). A notable change was observed inbroth characteristics. After 3–4 days CPC broth exhib-ited high viscosity and appeared pale yellow in color.The bubble size distribution in the riser of ALR was
also closely observed. Initially most of the bubbles werein the size of 2–3 mm diameter. However, as the biomassconcentration in the fermentation increased, the brothbecame more viscous and non-Newtonian. Also, theturbulence in the riser was observed to decrease consid-erably and the bubble size distribution changed. Thelarger size bubbles closely equal to the diameter of thedraft tube, rise rapidly through the riser and weredisengaged at the top of it, while the smaller bubblesremained trapped inside the fermentor. The broth in thedown comer appeared to be stagnant like a slug, in plugflow regime.It was also observed that clumps of mycelia were
formed in the late stages of fed batch fermentation.
526 P. Mishra et al.

Also, the percentage of clumps was around 40–50% ofthe sample. On microscopic observation, the biomasscould be divided into two morphological forms, freelydispersed mycelial forms with up to 2–3 hyphal mycelialeading to hyphal loops in the images and second theclumped form, which use these loops to define astructure. Further studies on image analysis of themycelia should be performed to evaluate compactnessand clump roughness parameters.
Broth density variation study
The importance of biomass concentration on the brothdensity was evaluated. An increase in the phase volume(volume of suspended material/volume of continuousphase) causes an increase in the apparent viscosity. Anincrease in the biomass concentration also causes anincrease in the phase volume. However, the brothviscosity remains nearly constant in the later part ofthe batch. The colloidal forces in between the mycelia aswell as the mycelial entanglement define the interactionsbetween the mycelia and hence affect the phase volume.Assuming mycelial interactions are important, henceparticle size might play an important role as well as theparticle size distribution, for the rheology of the broth.It has been observed that broth density varies with age
of CPC fermentation. In the early fermentation hours,the broth was of watery fluid in nature with densityapproximately 1.150 g l)1. It increased up to 1600 g l)1
at 60 h. However, with subsequent increase of time, nofurther increase in the broth density was observed, andfurther it decreases slightly. This decrease in the densityof the broth in the last phase of antibiotic productioncan be attributed to the arthrospore formation by themold (Matsumura et al. 1978).
Rheology of the fermentation broth
Elaborate viscosity measurements were performed usingCPC broth at various stages of the batch processes. Thebroth exhibits a typical non-Newtonian behavior, andfollows power law model. The viscosity of the brothincreases in the early hours of fermentation, which can beattributed to the growthphase of themicrobes. The rate ofgrowth of the microbes (dx/dt) was also observed toincrease during 0–60 h. Also the consistency index,K andfluidity index, nvarieswith time.Consistency index,Kwasobserved to be varying between 15 and 38 N m)1 from 24to 120 h. In later stages consistency index, K declined.Fluidity index shows also a change, and the details areexhibited in Figure 1a and Figure 1b, respectively. Thechange in the apparent viscosity of the broth withtime depicts the morphological differentiation of theAcremonium chrysogenum. However, in the later fermen-tation stages the formation of spherical arthrospore(Matsumuraet al.1978)reducedtheviscosityof thebroth.The correlation of the broth morphology with the
rheology in the growth phase of the microbes is anattractive proposition for the further study. A funda-
mental problem with developing correlations betweenmycelial broth rheology, biomass concentration andmorphology is the lack of understanding, how eachfactor affects the other. This area needs further research.However, preliminary investigations of the effect of
biomass concentration separately from that of myceliamorphology were also performed. It was observed thatrheological property can be correlated to the change inbiomass concentration and the correlation of Tucker(1994) holds true. This defines the correlate of rheolog-ical parameters to the biomass concentration with anempirical correlation constant a, as an exponent.It has also been assumed that the rheology of fungal
fermentation broth can be related to clump formationrather than to themorphology of freemycelia (Riley et al.1999). However, further correlation for clump morphol-ogy factors like compactness and roughness and thestatistical correlation analysis ( ƒ ) needs to be evaluated.
a value, determined for the correlation of the consis-tency index to biomass concentration is shown inFigure 2. For the present study in fed batch fermenta-tion in air lift reactor, a was observed to be 0.53, andwas calculated throughout the batch fermentation. Thestandard deviation and standard error for a value werealso evaluated (not shown). However, the variation in avalue (0.3–0.8), lies within the standard deviation of themean, hence justify the use of a. This deviation in avalue with the time of fermentation is due to the
0
5
10
15
20
25
30
35
40
0 50 100 150 200Time (h)
Con
sist
ency
Inde
x,k(
N/m
)
0
0.1
0.2
0.3
0.4
0.5
0.6
0.7
0 20 40 60 80 100 120 140 160Time (h)
Flu
idity
inde
x,n
(1/s
)
(a)
(b)
Figure 1. (a) Change in consistency index, K with the fermentation
time; (b) change in fluidity index, n with fermentation time.
Oxygen mass transfer and broth viscosity 527

uncharacterized degradation of the biomass. The myce-lial degradation might affect hyphal rigidity and clumpinteraction effecting a change in the exponent on thebiomass concentration (Allen & Robinson 1990).The consistency index divided by the square of
biomass concentration (K/Cm2), is plotted against fer-
mentation time and shown in Figure 3. The nature ofplot shows a steep decline in the early fermentationhours, followed by a low constant value, with littledeviation, which is quite similar to the earlier observa-tions of Riley et al. (1999). This plot illustrates thereason for the poor quality of correlation based purelyon biomass concentration. The plot clearly depicts thatthis is not possible, as K/Cm
a is equivalent to thisconstant and changes throughout the fermentation.Hence, it is imperative to develop a relationship betweenthe morphological factor and K/Cm
a.
Variation of oxygen mass transfer in the broth
The oxygen transport during the fermentation, from thegas phase through the liquid medium and then to the
microorganism, was studied and the results have beenshown in Figure 4. With the increasing biomass concen-tration, the solid sediment fraction and viscosity increasesfor the free cells and a sharp decrease in kLa is observeddue to spherical arthrospore formation by the mold andthe viscosity was effectively controlled.However, it was observed that further decrease in kLa
during the late exponential phase can be attributed tohigh oxygen demand during CPC formation, and thekLa could be only controlled at 15 h)1 at 60 h (Srivast-ava 1998).The high oxygen demand of the CPC production
processes may be attributed to its demand in thebiosynthetic pathway. The biosynthetic pathway ofCPC shows that there are three oxygen consuming stepsin the pathway:
(i) Cyclization of the tripeptide, a-aminoadipylcyste-nyl valine into isopenicillin N.
(ii) The ring expansion of penicillin N into deacetoxy-cephalosporin (CDAOC).
(iii) The hydroxylation of DAOC to give deacetyl CPC.
It has been observed in the study that with the declinein the oxygen availability in the broth, the product
2
2.2
2.4
2.6
2.8
3
3.2
3.4
3.6
3.8
2 2.5 3 3.5 4 4.5 5 5.5
ln T, Time
,k nledni ycnetsisno
C x
Figure 2. Logarithmic plot of time vs. consistency index for evaluation
of exponent of biomass (a value determination).
0
0.2
0.4
0.6
0.8
1
1.2
1.4
1.6
0 50 100 150 200
Time (h)
sam llec yrd fo erauq
S /xedni y cnetsisnoC
s
C/K(
m2 )
Figure 3. Time profile of the consistency index, K divided by the
squared biomass concentration as dry cell weight, Cm(K/Cm2) for
fermentation.
0
10
20
30
40
50
60
70
0 20 40 60 80 100 120 140
Time (h)
KLa
(h-1
)
Figure 4. Variation of volumetric mass transfer coefficient with time.
0
0.5
1
1.5
2
2.5
3
3.5
0 50 100 150 200
Time (h)
Cep
halo
spor
in-C
(g/
L)
Figure 5. The product concentration (CPC) with time.
528 P. Mishra et al.

concentration and its formation rate (dp/dt) decreasedat 120 h and above (Figure 5).
Correlation of broth properties and volumetric gas–liquidmass transfer coefficient
It is observed that an increase in pesudoplasticity of themedia causes a sharp decrease in the oxygen masstransfer coefficient, kLa. The increasing pseudoplasticityresults in a thick pulpy mass of the broth with pooroxygen transfer rate. The oxygen mass transfer studieswere performed in ALR during CPC fermentation, atshear rate of 175 and 100 S)1. It was observed that kLaincreases with shear rate. Furthermore, in non-Newto-nian broth, small rising bubbles coalesce and form largebubbles, which may possibly enhance axial mixing. Thisis in strong agreement with earlier results on homoge-nous viscous liquids. For example, based onc ¼ 5000USG.. Popovic & Robinson (1989) found thatkLa is proportional to g�0:89effective and Godbole et al. (1984),found that kLa is proportional to g�1:01effective. It has beenobserved that lower values of kLa coincide with anoticeable change in the bubble size distributiontowards larger spherical capped bubbles and resultingin the reduction of the specific interfacial area. Similar,observations has been made in the studies of interfacialarea with non-Newtonian homogenous fluids (Popovic& Robinson 1989). Very few studies however have beenattempted to evaluate quantitative correlation devel-oped for homogenous fluids to actual mycelial fermen-tation. Figure 6 shows the relationship between kLa andviscosity of the broth at two shear rate. During thepresent study it was observed that kLa is proportional tothe effective viscosity of the broth. This is different fromthe CMC homogenous solution studies for chemicalsystem. It can be attributed to the nature of Acremoniumchrysogenum broth which behaves as heterogeneous
slurry. The major resistance to oxygen transfer in afermentor is considered to occur in a thin film sur-rounding the air bubbles, the slip and bio-particles. ThekLa decreases with increasing cell mass concentration.This can be attributed to an interface blockage by cellswhich have lower oxygen permeability than the liquidmedia. However, there is no parameter to account forthe yield stress of the fluid, which exists in the broth. Thedependence of kLa with geffective was observed to beinversely related. For the present study, as shown inFigure 6, it was observed that kLa is proportional tog�0:7effective (calculated from the plot of K and n variationwith time). This is due to the nature of the microbialbroth. This observation of the dependence of kLa oneffective viscosity is quite similar to Aspergillus nigerbroth, as studied by Allen & Robinson (1989) whofound that kLa is proportional to g�0:89effective.
Conclusion
The importance of the biomass concentration in brothrheology has been evaluated. The increase in phaserheology causes an increase in apparent viscosity. Also,the consistency index is observed to strongly correlatewith biomass concentration. Studies on volumetric masstransfer coefficients and rheology correlation for CPCproduction were evaluated. It was observed that thevolumetric mass transfer coefficient decreased sharplywith increase in CPC broth viscosity. The decrease hasbeen explained by an interface blockage by cells, whichhave lower oxygen permeability than the liquid media.The dependence of kLa to the apparent broth viscosity,for microbial system has good similarity to the otherworks done earlier on carboxyl methyl cellulose solution.Oxygen transfer in the broth is a potential parameter forthe efficient design of a suitable air lift reactor for CPCproduction. The rheological studies using Acremoniumchrysogenum broth exhibit a typical fungal fermentationand follow power law model. However, the studyillustrates the problem of characterizing broth rheologyin terms of biomass concentration and the productformation. Also, a correlation of fluidity index to thebroth morphology needs to be explored. The studies onclump morphology factor like compactness and rough-ness and its statistical correlation analysis (ƒ) need to beevaluated and can be the part of further communication.However, with no basic understanding of the process andinteraction involved, the correlation cannot have a goodtheoretical basis.
Acknowledgment
The authors acknowledge the University Grants Com-mission, India for the financial assistance received asresearch Grant.
0
20
40
60
80
100
120
140
0 50 100 150
Apparent Viscosity (CP)
Vol
umet
ric o
xyge
n tr
ansf
er c
oeffi
cien
t (kL
a),h
-1
Figure 6. Variation of oxygen mass transfer coefficient with apparent
viscosity of broth. (c) changes at 100 S)1; (n) changes at 175 S)1.
Oxygen mass transfer and broth viscosity 529

References
Allen, D.G. & Robinson, C.W. 1989 Hydrodynamics and mass
transfer in Aspergillus niger fermentation in bubble column and
loop bioreactors. Biotechnology and Bioengineering 34, 731–740.
Allen, D.G. & Robinson, C.W. 1990 Measurement of rheological
properties of filamentous fermentation broth. Chemical Engineer-
ing Science Part I 45, 37–48.
Boxer, G.E. & Everet, P. 1949 Cephalosporin C estimation by
hydroxyl amine assay method. Analytical Chemistry 21, 670–678.
Gbewonoyo, K. & Wang, D.I.C. 1983 Confining mycelial growth to
porous microbeads: a novel technique to alter the morphology of
non-Newtonian mycelial cultures. Biotechnology and Bioengineer-
ing 25, 967–983.
Godbole, S.P., Schumpe, A., Shah, Y.T. & Carr, N.L. 1984 Hydro-
dynamics and mass transfer in non-Newtonian solutions in a
bubble column. Analytical Chemical Engineering 30, 213–220.
Kawase, Y. & Young, M. 1986 Mixing and mass transfer in concentric
tube airlift fermenters: Newtonian and non-Newtonian media.
Journal of Chemical Biotechnology 36, 527–536.
Kennel, Y.M. & Demain, A. 1978 Effect of carbon sources on b lactam
antibiotic formation by Cephalosporium acremonim. Experimental
Mycology 2, 234–238.
Matsumura, M., Imanaka, T., Yoshida, T. & Taguchi, H. 1978 Effect
of glucose and methionine consumption rates on cephalosporin-C
production by Cephalosporium acreomonium. Journal of Fermen-
tation Technology 56, 345–348.
Miller, G.L. 1959 Use of dintrosalicylic acid reagent for determining of
reducing sugar. Analytical Chemistry 31, 427–428.
Popovic, M. & Robinson, C.W. 1989 Mass transfer studies of external
loop air lifts and bubble column. Analytical Chemical Engineering
Journal 35, 393–405.
Riley, G.L., Tucker, K.G., Paul, G.C. & Thomas, C.R. 1999 Effect of
concentration and mycelial morphology on fermentation broth
rheology. Biotechnology and Bioengineering 68, 160–172.
Ruchti, G., Dunn, I.J. & Bourne, J.R. 1991 Comparison of dynamic
oxygen electrode method for the measurement of kLa. Biotechnol-
ogy and Bioengineering 23, 277–290.
Seidel, G., Tollnic, C., Beyer, M., Fahimi, Y. & Schugerl, K. 2002a
Process engineering aspects of the production of cephalosporin C
by Acremonium Chrysogenum Part Application of complex media.
Process Biochemistry 38, 229–239.
Seidel, G., Tollnic, C., Beyer, M., Fahimi, Y. & Schugerl, K. 2002b
Process engineering.aspects for the. production of cephalosporin C
by Acremonium Chrysogenum. Part II. Cultivation in diluted and
enriched complex media. Process Biochemistry 38, 241–248.
Srivastava, P. 1998 Studies onmicrobial production of cephalosporin-C
in air lift reactor. PhD thesis, Banaras Hindu University, Varanasi,
India.
Srivastava, P. & Kundu, S. 1995 A laboratory air lift reactor for
antibiotic production. Indian Journal of Chemical Engineering
37(4), 136–138.
Srivastava, P. & Kundu, S. 1998 A comparative evaluation of
cephalosporin C production using immobilization modes. Journal
of General and Applied Microbiology 44, 113–117.
Srivastava, P., Nigam, V. & Kundu, S. 1996 A comparative evaluation
of cephalosporin C production in air lift reactor and stirred tank
reactor. Indian Journal of Chemical Technology 3, 371–372.
Tucker, K.G. 1994 Relationship between mycelial morphology bio-
mass concentrations and broth rheology in submerged fermenta-
tion. PhD thesis, University of Birmingham, Birmingham, UK.
Weichang, Z., Rieger, K.H., Dors, M. & Schugerl, K. 1992 Influence
of dissolved oxygen concentration on the biosynthesis of cepha-
losporin C. Enzyme Microbial Technology 14, 848–854.
530 P. Mishra et al.

Immobilized cells cultivated in semi-continuous mode in a fluidized bed reactor for
xylitol production from sugarcane bagasse
J.C. Santos, S.S. Silva, S.I. Mussatto*, W. Carvalho and M.A.A. CunhaDepartment of Biotechnology, Faculty of Chemical Engineering of Lorena, Rod. Itajuba-Lorena km 74. 5, 12600-970,Lorena-SP, Brazil*Author for correspondence: Tel./Fax: +55-12-31533165, E-mail: [email protected]
Keywords: Candida guilliermondii, fluidized bed reactor, porous glass, sugarcane bagasse hydrolyzate, xylitol
Summary
Xylitol production from sugarcane bagasse hemicellulosic hydrolyzate was evaluated in a fluidized bed reactoroperated in semi-continuous mode, using cells immobilized on porous glass. The fermentative process wasperformed during five successive cycles of 72 h each one. The lowest xylitol production occurred in the first cycle,where a high cell concentration (12 g l)1) was observed. In the subsequent cycles the xylitol concentration was everincreasing due to the cells adaptation to the medium. In the last one, 18 g xylitol l)1 was obtained with a yield factorof 0.44 g g)1 and volumetric productivity of 0.32 g l)1 h)1.
Introduction
Xylitol is a pentahydroxy sugar-alcohol with sweeteningpower similar to sucrose and that presents importantphysicochemical and physiological properties, whichstands out it among other sweeteners. Xylitol promotestooth rehardening and remineralization, thereby pre-venting and reducing dental caries. Besides, this sweet-ener also prevents otitis, osteoporosis and inflammatoryprocesses, and has an insulin-independent metabolismthat permits its utilization by diabetics as a sugarsubstitute (Mussatto & Roberto 2002).Xylitol occurs widely in nature, in many fruits and
vegetables such as plums, strawberries, raspberries,grape, banana, lettuce and cauliflower (Parajo et al.1998). Nevertheless, its extraction from natural sourcesis not feasible because is a very expensive process. On anindustrial scale, xylitol is produced by chemical reduc-tion of D-xylose from hemicellulosic hydrolyzates(mainly wood hydrolyzates), a high-cost process thatuses elevated pressure and temperature, and requiresextensive xylose purification steps. For these reasons,several researchers are pursuing alternative ways toproduce xylitol, and the biotechnological pathway(using microorganisms and/or enzymes as catalysts)appear as an interesting alternative because it requiresthe use of mild conditions of pressure and temperature,and very little xylose purification (Winkelhausen &Kusmanova 1998), being thus more economical.Recently, many studies have been carried out aiming
to improve the performance of the biotechnologicalprocess, and the use of immobilization methods has
been proposed (Carvalho et al. 2002, 2003). Accordingto Webb & Atkinson (1992), immobilized cells aresheltered from inhibitor compounds present in thehydrolyzates and can be more easily separated fromthe culture medium, thus facilitating the reuse of thebiocatalyst for extended periods of time. The mainte-nance of cells into the reactor along the batches isinteresting, since the inoculation step can be eliminatedand the cells can be adapted to the culture medium,resulting in higher productivities and yields (Sene et al.1998; Carvalho et al. 2002).In the present study, the xylitol production from
sugarcane bagasse hemicellulosic hydrolyzate was inves-tigated in a fluidized bed reactor operated in semi-continuousmode, using cells immobilized in porous glass.
Materials and methods
Preparation and treatment of sugarcane bagassehemicellulosic hydrolyzate
A 350-l reactor was loaded with sugarcane bagasse andsulphuric acid solution (100 mg of acid per gram of drymatter) in a solid:liquid ratio of 1:10 (g:g). Reaction wasmaintained at 121 �C for 10 min. After this time, theresulting solid material was separated by centrifugationand the liquid fraction obtained (hemicellulosic hydro-lyzate) was concentrated under vacuum in a 4-l evap-orator, at 70 ± 5 �C.To minimize the concentration of the main fermenta-
tion inhibitors, the concentrated hydrolyzate was treated
World Journal of Microbiology & Biotechnology (2005) 21:531–535 � Springer 2005
DOI 10.1007/s11274-004-3490-8

according to the methodology established by Alves et al.(1998). After treated, the hydrolyzate presented thefollowing composition: 57.34 g xylose l)1, 1.97 g glucosel)1, 5.79 g arabinose l)1, and 4.33 g acetic acid l)1.
Microorganism, inoculum preparation and fermentationmedium
Cells of the yeast Candida guilliermondii FTI 20037,maintained at 4 �C on agar malt extract slants, weretransferred to 125 ml Erlenmeyer flasks containing50 ml of medium composed of (g l)1): xylose (30),ammonium sulphate (3.0), calcium chloride (0.1), and10% (v/v) rice bran extract. The flasks were maintainedon a rotatory shaker at 200 rev min)1, 30 �C, during24 h. Afterwards, the cells were collected by centrifuga-tion (2200 · g; 20 min) and rinsed twice with steriledistilled water to be added in the fermentation medium.Fermentation medium was composed by the treated
sugarcane bagasse hydrolyzate (autoclaved under man-ometric pressure of 0.5 atm for 15 min), supplementedwith ammonium sulphate (3.0 g l)1), calcium chloride(0.1 g l)1), and rice bran extract (10% v/v).
Fluidized bed reactor operation and cell immobilization
Fermentations were performed in a 1.7-l fluidized bedreactor (Bioengineering AG, Wald, Switzerland), thatconsisted in a 540 mm · 55 mm column containing avertical tube in the centre (9 mm inner diameter). Inorder to maintain the necessary fluidization of the bed,an external pump providing an inlet flow of about210 l h)1 was coupled with the column. The pumpedmedium returned from the top to the bottom of thereactor through the central tube. Steel spheres with adiameter of 2 mm (200 g) were placed at the bottom ofthe reactor to disperse air bubbles. The reactor wascoupled with sensors for measurement of dissolved O2
concentration, pH and temperature.The carrier employed consisted of porous glass
particles (Siran–Schott, Mainz, Germany) with 2.0–3.0 mm outer diameter and size of pores <300 lm.Before the first batch, the particles were boiled in a 2.5%HNO3 solution for 4 h, washed with distilled water anddried at 150 �C. Cells were immobilized in situ in thebioreactor by natural adsorption at the beginning offermentation.The process was started by loading the reactor with
1.6 l of fermentation medium, the inoculum suspensioncontaining 0.8 g DM of free cells, and 100 g of pretreatedcarrier. Fermentation was performed at 30 �C duringfive successive cycles of 72 h each one, using freshmedium in all of them. The aeration rate employed was50 ml min)1.
Analytical methods
Xylose, glucose, arabinose, acetic acid and xylitolconcentrations were determined by high-performance
liquid chromatography (HPLC) in a chromatographwith a Bio-Rad HPX-87H (300 · 7.8 mm) column and arefractive index (RI) detector, at 45 �C, using H2SO4
0.01 N as the eluent, at a flow rate of 0.6 ml min)1, andsample volume of 20 ll.Free cells concentration was determined by optical
density measurements at 600 nm.
Results and discussion
Xylose and arabinose consumption during the fermen-tative cycles is shown in Figure 1. As can be observed,the consumption of both sugars was favoured when thenumber of cycles was increased. In the first cycle,approximately 87% of the xylose and 35% of thearabinose present in the medium were consumed after72 h; while in the second cycle, the arabinose consump-tion was higher than 70% and 87% of the xylose wasconsumed after 48 h. The increase in xylose andarabinose consumption along the fermentative cyclescan be attributed to cells adaptation to the culturemedium. Procedures of cell adaptation such as the use ofa repeated–bath fermentation system have been de-scribed as an alternative to overcome the toxic effects ofthe inhibitors existent in the hemicellulosic hydrolyzates,improving the xylitol production (Sene et al. 1998;Carvalho et al. 2002).The glucose, another sugar normally present in
hemicellulosic hydrolyzates, was totally consumed inless than 24 h in all fermentative cycles. This isjustifiable since glucose is a preferential carbon sourceto microorganism, and was present in the hydrolyzate inlow concentration (about 2 g l)1).When comparing the fermentative cycles, a distinct
behaviour of the first one was observed when comparedwith the others. In this cycle occurred the lowest xyloseand arabinose consumption (Figure 1), however, theacetic acid consumption was the fastest and conse-quently caused the fastest pH variation (Figure 2). Thefast acetic acid consumption in this cycle (84% ofconsumption after 24 h) was a consequence of the highfree cells concentration obtained (about 12 g l)1 –Figure 3a). Is known that in fermentation media con-taining free and immobilized cells, the major quantity ofdissolved oxygen is available for free cells, and as higherthe oxygen availability to yeasts, as faster is the aceticacid consumption by these microorganisms.In the first cycle also was obtained the lowest xylitol
production (Figure 3b), and this probably occurred dueto the cells were not adapted to the medium. In thesubsequent cycles, the cells adaptation favoured xylitolproduction, and a progressive increase in the yield factor(YP/S) and xylitol volumetric productivity (QP) wasobserved when the number of cycles was increased(Figure 4). In the fifth batch, the product concentration,and YP/S and QP values after 48 h were approximately3.6, 2.6 and 5.4 times higher than at the end of the firstone, respectively.
532 J.C. Santos et al.

The cells adaptation to the medium can not be enoughto explain the large difference observed on xylitolproduction to the first and the second cycles. Figure 3b
shows that after 48 h of the second cycle the concen-tration of this compound was almost three times higherthan after 72 h of the first one. Domınguez (1998)
0
5
10
15
20
25
30
35
40
0 24 48 72 96 120 144 168 192 216 240 264 288 312 336 360
Fermentation time (h)
Xyl
ose
(g
l-1)
0
1
2
3
4
5
6
7
8
0 24 48 72 96 120 144 168 192 216 240 264 288 312 336 360
Fermentation time (h)
Ara
bin
ose
(g
l-1)
(a)
(b)
Figure 1. Xylose (a) and arabinose (b) concentrations during the fermentative cycles: (j) 1; (s) 2; (m) 3; (X) 4; (n) 5.
0
1
2
3
4
0 24 48 72 96 120 144 168 192 216 240 264 288 312 336 360
Fermentation time (h)
Ace
tic
acid
(g
l-1)
5
6
7
8
0 24 48 72 96 120 144 168 192 216 240 264 288 312 336 360
Fermentation time (h)
pH
(a)
(b)
Figure 2. Acetic acid concentration (a) and pH variation (b) during the fermentative cycles: (j) 1; (s) 2; (m) 3; (X) 4; (n) 5.
Xylitol production by immobilized cells 533

observed a similar result during the fermentation ofcommercial xylose by Debaryomyces hansenii immobi-lized in Ca–alginate (xylitol concentration in the secondfermentative cycle was two times higher than in the firstone), and attributed the large difference on xylitolproduction to the immobilization procedure. Accordingto this author, cells are under oxygen limited conditionswhen immobilized, and consequently their metabolism islow. For this reason, the cells would need a certain timeto grow inside the carrier, and only after this growth,xylitol production would start.The presence of free cells in the medium (that is
unavoidable when using immobilization by naturaladsorption) is another factor that probably contributed
to the difference in the results between the first and thesecond cycles, in the present work. As the oxygenavailability is higher to free than to immobilized cells,and in the first cycle there were more free cells than inthe others, the cell metabolism in this cycle was directedto biomass production instead of xylitol production.According to Carvalho et al. (2003), limited conditionsof oxygen are fundamental for the production of thispolyol, because in these conditions the NADH coen-zyme can not be completely re-oxidized to NAD+ bythe respiratory chain, and thus, the xylitol is excreted tooutside of cell. On the other hand, aerobic conditionsfavour the cell mass production in high quantity. In thepresent work, the cells population from the second cycle
0
2
4
6
8
10
12
14
0 24 48 72 96 120 144 168 192 216 240 264 288 312 336 360
Fermentation time (h)
Fre
e ce
lls (
g l-1
)
0
2
4
6
8
10
12
14
16
18
20
0 24 48 72 96 120 144 168 192 216 240 264 288 312 336 360
Fermentation time (h)
Xyl
ito
l (g
l-1)
(a)
(b)
Figure 3. Free cell (a) and xylitol concentration (b) during the fermentative cycles (j) 1; (s) 2; (m) 3; (X) 4; (n) 5.
0
Yp
/s (
g g
-1),
Qp
(g
l-1 h
-1)
1 2 5
Fermentative cycles
0.1
0.2
0.3
0.4
0.5
03 4
Figure 4. Xylitol yield factor (YP/Sj) and volumetric productivity (QPj) determined for each one of the fermentative cycles.
534 J.C. Santos et al.

was sufficiently high to limit the quantity of oxygenavailable to each cell, thus resulting in higher xylitolaccumulation.As mentioned before, xylitol concentration increased
when the number of cycles was increased, the highestxylitol production being attained at the end of the fifthbatch. These results are in disagreement with thoseobtained by Silva et al. (2003) employing a fluidized bedreactor operated in semi-continuous mode, with a fer-mentation medium elaborated with commercial xyloseand C. guilliermondii cells immobilized on porous glass.These authors attained the maximum QP and YP/S valuesat the first and second batches, and these values droppedin the subsequent cycles. Domınguez (1998) studying thexylitol production fromcommercial xylose basedmediumalso observed a drop on xylitol production when thenumber of fermentative cycles was increased. The differ-ence among the present results and the results obtained bythese authors suggests the importance of cells adaptationto the toxic compounds of themediumwhen hydrolyzatesare used as raw material in fermentations. When com-mercial xylose basedmedium is used, the effect of the highincrease in the cell population is more important, result-ing in nutritional limitations that negatively influence theprocess performance along the cycles.
Acknowledgments
The authors gratefully acknowledge the financial sup-port of FAPESP and CNPq.
References
Alves, L.A., Felipe, M.G.A., Silva, J.B.A., Silva, S.S. & Prata, A.M.R.
1998 Pretreatment of sugarcane bagasse hemicellulose hydrolyzate
for xylitol production by Candida guilliermondii. Applied Biochem-
istry and Biotechnology 70–72, 89–98.
Carvalho, W., Silva, S.S., Vitolo, M., Felipe, M.G.A. &Mancilha, I.M.
2002 Improvement in xylitol production from sugarcane bagasse
hydrolyzate achieved by the use of a repeated-batch immobilized cell
system. Zeitschrift fur Naturforschung C 57, 109–112.
Carvalho, W., Silva, S.S., Santos, J.C. & Converti, A. 2003 Xylitol
production by Ca–alginate entrapped cells: comparison of different
fermentation systems. Enzyme and Microbial Technology 32, 553–
559.
Domınguez, J.M. 1998 Xylitol production by free and immobilized
Debaryomyces hansenii. Biotechnology Letters 20, 53–56.
Mussatto, S.I. & Roberto, I.C. 2002 Xylitol: an edulcorant with
benefits for human health. Brazilian Journal of Pharmaceutical
Sciences 38, 401–413.
Parajo, J.C., Domınguez, H. & Domınguez, J.M. 1998 Biotechno-
logical production of xylitol. Part 1: Interest of xylitol and
fundamentals of its biosynthesis. Bioresource Technology 65, 191–
201.
Sene, L., Felipe, M.G.A., Vitolo, M., Silva, S.S. & Mancilha, I.M.
1998 Adaptation and reutilization of Candida guilliermondii cells
for xylitol production in bagasse hydrolyzate. Journal of Basic
Microbiology 38, 61–69.
Silva, S.S., Santos, J.C., Carvalho, W., Aracava, K.K. & Vitolo,
M. 2003 Use of fluidized bed reactor operated in semi–
continuous mode for xylose-to-xylitol conversion by Candida
guilliermondii immobilized on porous glass. Process Biochemistry
38, 903–907.
Webb, C. & Atkinson, B. 1992 The role of chemical engineering in
biotechnology. Chemical Engineering Journal 50, 9–16.
Winkelhausen, E. & Kusmanova, S. 1998 Microbial conversion of
D-xylose to xylitol. Journal of Fermentation and Bioengineering
86, 1–14.
Xylitol production by immobilized cells 535

Physiological responses of pressed baker’s yeast cells pre-treated with citric, malic
and succinic acids
Maristela F.S. Peres1, Claudia R.C.S. Tininis2, Crisla S. Souza3, Graeme M. Walker4 and Cecilia Laluce2,*1Programa de pos-graduacao em Quımica da Faculdade de Filosofia Ciencias e Letras de Ribeirao Preto,Av. Bandeirantes 3900, 14040-901/Ribeirao Preto, Brazil2Instituto de Quımica da UNESP, Departamento de Quımica e Tecnologia Quımica, Caixa postal 355, 14801-970/Araraquara, SP, Brazil3Programa de Pos-graduacao em Biotecnologia da USP, Av. Prof. Lineu Prestes, 1730, Ed. ICB IV, CidadeUniversitaria, Butanta, 05508-900/Sao Paulo, SP, Brazil4Division of Biotechnology and Forensic Science, University of Abertay Dundee, Dundee DD1 1HG Scotland, UK*Author for correspondence: Tel.: 055-16-201 6673, Fax: 055-16-222 3279, E-mail: [email protected]
Keywords: Bread dough fermentation, glycerol-3-phosphate dehydrogenase, maltase, total protein, trehalose, weakorganic acids
Summary
The dough-leavening power of baker’s yeast, Saccharomyces cerevisiae, is strongly influenced by conditions underwhich the pressed yeast is maintained prior to bread dough preparation. In this study, the influence of the yeast cell’spre-treatment with organic acids (malic, succinic, and citric acids) was investigated at a wide range of pH valueswhen the pressed yeast samples were exposed to 30 �C. Increased fermentative activity was observed immediatelyafter pre-treatment of the cells with organic acids. When the pH of the pressed yeast containing added citric acid wasraised from 3.5 to 7.5, increases in both fermentative and maltase activities were obtained. Improvements in viabilityand levels of total protein were also observed during storage in the presence of citric acid, notably at pH 7.5.Glycerol-3-phosphate dehydrogenase activity and levels of internal glycerol also increased in the presence of citrate.On the other hand, pressed yeast samples containing succinic acid at pH 7.5 showed decreased viability duringstorage despite the maintenance of high levels of fermentative activity, similar to pressed yeast containing malic acidat pH 4.5 and 7.5. Decreases in intracellular levels of trehalose were observed during storage in all cases. Overall, theresults of this study revealed the potential benefits of adding organic acids to pressed yeast preparations for bakingpurposes.
Introduction
Cells of pressed baker’s yeast, Saccharomyces cerevisiae,are in a non-proliferating state mainly due to nutrientdeprivation (Fuge & Werner-Washburne 1997). Suchcells are physiologically distinct from exponentially-dividing cells, especially regarding stress resistance(Werner-Washburne et al. 1993). These cells presenthigh levels of trehalose when nitrogen and carbonsources are exhausted from the medium (Parrou et al.1999). Although pressed yeast cells are capable ofmaintaining high viability for extended periods of timein the absence of nutrients, yeast activity in subsequentdough fermentation is strongly influenced by storageconditions, particularly temperature and humidity(Beudeker et al. 1990; Rose & Vijayalakshmi 1993).When pressed yeast is added to bread dough, thestarving cells are supplied with nutrients and fermenta-tion takes place under anaerobic conditions.
Organic acids have played important roles in foodsand beverages for thousands of years. In addition, citric,malic and tartaric acids have been found in wines(Stratford 1999), while citric acid has also been used inbaking powder formulations as an acidifying and/orantioxidizing agent (Spicher 1983). The classical ‘‘weakacid theory’’ proposes that undissociated forms oflipophilic acids dissolve in the plasma membrane andpass rapidly into the cell by simple diffusion (Stratford1999; Piper et al. 2001). Once inside the cytoplasm,undissociated forms of the organic acids dissociate,liberating protons. The lower internal pH prevents yeastgrowth (Krebs et al. 1983) and leads to other physio-logical alterations, which are: trehalose degradation(Valle et al. 1986), increases in the glycolytic flux(Verduyn et al. 1990; Larsson et al. 1997) and activationof the proton pumping H+-ATPase to restore theinternal pH homeostasis (Bracey et al. 1998; Piper et al.
World Journal of Microbiology & Biotechnology (2005) 21:537–543 � Springer 2005
DOI 10.1007/s11274-004-3136-x

2001). Under anaerobic conditions, the acidificationof the cytoplasm raises the levels of NADH, which isreoxidized via the glycerol pathway (Oura 1977; Bjorkq-vist et al. 1997). Nevertheless, ethanol is a major by-product, which accumulates in order to re-oxidize theNADH formed under anaerobic conditions. A plasmamembrane transporter (Pdr12) is also involved withadapting yeast cells to weak organic acids by extrudingionized forms of the intracellular acids (ATP-dependentprocess) to the cell exterior (Piper et al. 2001).The baker’s yeast is submitted to temperatures in the
range of 25–42 �C (Evans 1990; Rose & Vijayalakshmi1993) during dough preparation and proving. Thepresent study has been focused on variations in baker’syeast physiology occurring when yeast cells wereexposed to weak organic acids at 30 �C prior topreparation of the pressed yeast samples. The resultsdescribed here indicate that organic acids enhancepressed-yeast cell viability and fermentative activitydepending on the acid used, its concentration and pH.
Materials and methods
Pre-treatment, packing and storage of the pressedbaker’s yeast
Pieces of commercial pressed yeast (15 g wet weight,shelf life £2 weeks at 4 �C) supplied by Fleishmann &Royal Ltda (Brazil) were used. The yeast was resus-pended twice in 20 ml of water at room temperature andthe cell pellet separated by centrifuging (5 min at4000 g). The cells were then resuspended in 20 ml oforganic acid solution (previously sterilized) and sodiumhydroxide was added to raise the pH as required. Whenvariations in pH were no longer observed in the cellsuspension, cells were vacuum filtered (Whatmann No.41 filter paper) to give a pressed yeast sample containing73–74% moisture (on dry weight basis). A pH value of4.5 was obtained for cell suspensions in sterilized water.Pieces of pressed yeast cells (3–4 g) were wrapped in animpermeable 0.015 mm thick PVC film from Magipack(supplied by Minasa-TVP Alimentos e Proteına, Ara-raquara, SP, Brazil) and triplicate assays were carriedout before and after storage periods at 30 �C.
CO2 evolution from the bread dough
The modifications made in the procedure, previouslydescribed for the preparation of the bread dough(Murakami et al. 1996), were as follows: 10 g flour(bread flour Renata, supplied by Pastificio Selmi,Sumare, SP, Brazil), 0.2 g sodium chloride, 6.2 ml waterand 0.1 g pressed yeast. The entire process lasted about5 min. The bread dough was quickly transferred to agraduated centrifuge tube, which was carefully sealed bya rubber stopper. A glass tube passed though the rubberstopper to allow the outflow of gas (CO2) formed during
fermentation as described by Burrows and Harrison(1969). The gas formed forced a liquid to flow from a150 ml flask (filled with a saturated NaCl solution) to a50 ml graduated cylinder. The variations in the volumeof the salt solution within the graduated cylinder(proportional to the CO2 volume evolved from thedough) were measured and the fermentative activitywas expressed as milliliters of the salt solutiontransferred to the cylinder after 2 h per gram of yeastcells (ml/ 2 h)1 g�1cells).
Cell disruption and crude cell extract preparation
Pressedyeast cells (100 mg,dryweight)were re-suspendedin 1 ml buffer solution (prepared as described below) at4 �C and then separated by centrifugation (4000 g). Eachcell pelletwas then transferred toa5 mlflat-bottomscrew-capped test tube containing 1.5 g of glass beads (0.5 mmdiameter). The buffer solutions employed for the extrac-tions were: 0.20 M acetate buffer at pH 5.5, containing30 mM CaCl2 to obtain cell extracts for trehalose assays(Neves et al.1994); 10 mMTris/HClbuffer solutionatpH7.2 containing 10 mM sodium fluoride for the glycerol-3-phosphate dehydrogenase assays (Peres & Laluce 1998);50 mM Tris-HCl buffer at pH 7.4, containing 1 mMdithiothreitol and 20% glycerol (w/v) for the maltaseassays (Yao et al. 1994). Cells were disrupted in a vortexshaker for fourperiodsof30 swith1 mincooling intervalson ice. Duplicates of disrupted cells were quickly centri-fuged (3 min at 12,000 g) and the supernatants assayed asdescribed below.
Trehalose assay
Disrupted cells (100 mg, wet biomass) as describedabove were quickly transferred to a water bath at 100 �Cand the coagulated proteins separated by centrifugingfor 5 min. Trehalose was assayed in supernatants usinga trehalase preparation obtained from the conidia ofHumicula grisea (Neves et al. 1994). The reactionmixture were prepared as follows: 100 ll 0.20 M acetatebuffer (containing 30 mM CaCl2) at pH 5.5, 100 ll cellextract, and 200 ll of the enzyme preparation (treha-lase) to start the reaction. The mixture was incubated for60 min at 50 �C and the reaction stopped by immersingthe tubes in a boiling water bath for 5 min. The tubeswere cooled on ice bath and the glucose released duringtrehalose hydrolysis was determined in the protein-freesupernatants (100 ll) using an enzymatic kit based onthe glucose oxidade-peroxidase reaction (Labtest, Sist-emas para Diagnosticos Ltda, Belo Horizonte, Brazil).The trehalose was assayed in cell extracts and expressedas lmol)1 mg�1cells (dry weight).
GPDH (glycerol-3-phosphate dehydrogenase,EC. 1.1.1.8) activity assay
An enzymatic procedure, based on the u.v.-assay devel-oped for glycerol (Peres & Laluce 1998), was adapted to
538 M.F.S. Peres et al.

assay GPDH activity. The reaction mixture was pre-pared as follows: 42 mM NAD+, 13.6 mM glycerol-phosphate (substrate) and 10 mM manganese sulphatein glycine/NaOH buffer solution at pH 9.8 (containing1.09 M glycine and 2.25 M hydrazine added to deviatethe equilibrium toward glycerol phosphate oxidation).Fresh and diluted cell-free extracts were added to theassay mixture (3.3 ml final reaction volume) to startthe reaction. NADH formed was spectrophotometri-cally monitored at 340 nm every 15 s over the first 90 sof reaction time. Background reductions of NADHwere eliminated from the assay using a blank cuvettecontaining all the reagents except the substrate. Oneenzymatic unit (U) was defined as the amount of enzymeforming one lmol of NADH (e340 ¼ 6200 M)1cm)1) permilliliter and per min (lmol ml)1min)1). GPDH activitywas expressed as mUmg)1
cells (dry weight).
Maltase (EC. 3.2.1.20) activity assay
Maltase was assayed in extracts of pressed yeast using amethod based on PNPG (p-nitrophenol-a-D-glucopyr-anoside) hydrolysis (Yao et al. 1994). The reactionmixture (3.4 ml final volume) was prepared as follows:7.8 mM NaH2PO4(Na2HPO4)
)1 buffer at pH 6.8 (con-taining 0.16 mM b-mercaptoethanol and 0.16 M phe-nymethanesulphonyl fluoride or PMSF) and 0.18 mg/mlPNPG. The reaction started by adding 50 ll cell extractand was terminated by after 15 min incubation at 30 �Cby adding 1 ml of a 2.0 M Na2CO3 solution. Thesolutions were centrifuged and the absorbance moni-tored at A400 in the supernatants. One unit of maltaseactivity (U) was the amount of enzyme that released onelmol of p-nitrophenol per min (lmol ml)1 min)1).Maltase activity was expressed as U mg�1cells (dryweight).
Glycerol assay
Cell extracts (1.0 ml extract prepared as describedabove) were deproteinized by heating the tubes for5 min in boiling water bath. The supernatants (centri-fuging for 3 min at 4000 g) were assayed using theenzymatic kit supplied by Doles Reagentes e Equipa-mentos para Laboratorio Ltda (cat no. B-56, Goiania,Goias, Brazil) as follows: 0.36 ml supernatant plus3.0 ml colour reagent cocktail containing glycerol kinase(EC 2.7.1.30), glycerol phosphate oxidase (EC 1.1.3.21)and peroxidase (EC 1.11.1.7). The absorbance wasmonitored at A510nm and the amount of glycerol wasexpressed as lmol g�1cells (dry weight).
Protein assay
Total protein was assayed using a method based on theCoomassie Brilliant Blue G-250 reaction using bovineserum albumin as standard (Sedmak & Grossberg 1977).The total protein was expressed as mg mg�1cells (dryweight).
Viability
Cells suspensions were prepared in 50 mM phosphatebuffer (KH2PO4(K2HPO4)
)1) at pH 6.9 and 100–150cells (cell counts carried out in a Neubauer chamber)were plated on YPD medium. Colony counts werecarried out after three days growth at 30 �C and theviability (SD £ 10%) was expressed in relation to thecolony counts obtained before storage.
Biomass assays
The cell suspensions were vacuum filtered using 0.65 lmMillipore filters, then washed in water prior to drying toconstant weight at 106 �C (SD £ 2 mgcells ml)1culture inthree determinations).
Results and discussion
Although acids such as citric or succinic acid penetratethe yeast cells poorly and slowly (Stratford 1999),physiological alterations were observed in the pressedyeast cells as shown in the present study. As pressedbaker’s yeast is stored in the absence of nutrients andoxygen supply, the activities of the metabolic pathwaysare mainly altered at the expense of variations in thelevels of metabolites available in the cellular pool. Thesealterations were dependent on the added organic acid,its concentration and pH as described below. In thepresence of organic acids, increases in total protein(including maltase) were obtained by simply raising thepH of the pressed yeast to 7.5, while lesser drops infermentative activity were observed during storage at30 �C. Despite great decreases in trehalose levels duringstorage, increases in the levels of fermentation andmaltase activities, total protein and viability weredetected in the pressed yeast samples containing organicacids.
Bread dough fermentation and maltase activity of cellextracts
In Figure 1, organic acids and glycerol were added tothe solutions (0.3 M concentrations and pH adjusted to4.5 and 7.5) used in the pre-treatment of yeast cellsbefore filtering to obtain the pressed yeast samples.Particularly in the presence of succinic and citric acids atpH 4.5 (Figure 1a), increases in CO2 evolution wereobserved immediately after preparation of the pressedyeast. Nevertheless, decreases in the fermentation activ-ity were observed during the three days storage at pH4.5, minor variations being observed in the presence ofglycerol and malic acid. In previous work (Attfield et al.1997; Myers et al.), the pre-treatment of baker’s yeastcells with glycerol led to an improvement in thefermentative activity during storage of pressed yeast at4 �C. At pH 7.5 (Figure 1b), only a small variation wasobserved between the data obtained before and after
Weak Organic acids and pressed baker’s yeast 539

three days storage in all cases. This is supported by thefact that the external organic acids are predominantlydissociated at pH 7.5 reducing the need for protonextrusion during storage at this pH. The drops infermentative activity shown in Figure 1 were due to thedecreases in the activity of glycolytic pathway, initiallyactivated (before storage) by the presence of organicacids (Verduyn et al. 1990; Larsson et al. 1997; Braceyet al. 1998).The effects of increasing concentrations of citric acid
(up to 0.6 M) on the fermentative activity of the pressedyeast are shown in Figure 2. At pH 4.5 (Figure 2a),significant increases in the initial fermentative activity(before storage) were observed, while decreases occurredduring storage, particularly at concentrations ‡0.2 M.These increases in the fermentative activity are due to thecytoplasmic acidification, which is aggravated at decreas-ing values of pH. On the other hand, the decreases infermentative activityobservedduring storagewere greatlyreduced and less dependent on the presence of citrate atpH 7.5 (Figure 2b), possibly due to the increases inmaltase activity at this pHas shown inFigure 3.When thepHof thepressedyeastwas raised from3.5 to7.5, valuesofthe fermentative (Figure 3a) and maltase (Figure 3b)activities increased after three days storage independentlyof the presence of 0.3 M citric acid. Thus, raising the pHalso leads to increases in maltose degradation and doughfermentation activity. In liquid cultures, good values ofdough-rising power and high maltase activity wereobserved for the baker’s yeast cells harvested during thematuration stage when the pH was within the interval of6.0–7.0 (Angelov et al. 1997).
Total protein in cell extracts
Increases in synthesis of total protein have beenreported for yeast cells under conditions of nutritional
0
100
200
300
400 pH 4.5 (a)
(b)
Glycer
ol
Succin
ate
Malate
Citrat
e
Control
Fer
men
tatio
n (m
l CO
2/2 h
/g c
ells
)
0
100
200
300
400 pH 7.5
Figure 1. Effects of the organic acids (citric, malic, succinic acids) and
glycerol added to the pressed yeast samples (0.3 M concentrations in
all cases) at pH 4.5 (a) and 7.5 (b) on the variations in CO2 evolution
from the bread dough, when assayed before (filled columns) and after
(clear columns) three days storage at 30 �C.
0.0 0.2 0.4 0.60
160
200
240
280
320
360
400
0.0 0.2 0.4 0.6
[Citrate, M]
pH 4.5 (a) (b)
Fer
men
tatio
n (m
l CO
2/2 h
/g c
ells
) pH 7.5
Figure 2. Effects of the citric acid concentration present in the pressed
yeast at pH 4.5 (a) and 7.5 (b) on fermentation activity (CO2 evolved
from bread dough), when assayed before (n, initial) and after three
days storage (d) at 30 �C.
0
160
200
240
280
320
3 4 5 6 7 80.0
0.4
0.8
1.2
1.6
2.0
2.4
(a)
(b)
Ferm
enta
tion
(ml co
2/2 h
/g c
ells
)M
alta
se(U
/mg
cel
ls)
pH
Figure 3. Effects of the pH of the pre-treatment solutions containing
organic acids (n no additions; m, 0.3 M citric acid) on the fermentative
(a) and maltase activities (b) of the pressed yeast samples, when
assayed after three days at 30 �C.
540 M.F.S. Peres et al.

limitations (see review by Fuge & Werner-Washburne1997) and at increasing pH values (Madshus 1988).Increases in cellular protein were also observed in ananaerobic chemostat culture when S. cerevisiae wascultured under an acid stress caused by addition ofbenzoic acid (Larsson et al. 1997). In the present study,increases in the total protein occurred when the con-centrations of citric, malic and succinic acids were raisedin the pressed yeast at pH 7.5 (Figure 4b).The effects of citric acid’s chelation capacity on
growth (including protein synthesis required for growth)is supported by the finding that its inhibitory action ispH-dependent, thus increases were observed with risesin pH values and organic acid concentrations (Stratford1999). In the present work, the total protein was muchhigher at pH 7.5 than at pH 4.5 in all cases. Thisindicates that protein synthesis predominates overcellular proteolysis in pressed yeast cells at increasingexternal pH values. The increases in the proteolyticactivity observed in vacuoles of stationary phase cellshas been suggested previously (Fuge & Werner-Wash-burne 1997) as a way for the cells to reach a quickturnover of specific proteins when cell proliferationstarts.
Viability
In Figure 5, the effects of the pre-treatment of yeastcells with solutions containing increasing concentrations(0.01–0.3 M) of succinic, malic and citric acids onviability (colony growth on plates) were compared afterthree days storage at 30 �C. The cell counts obtainedbefore storage (100%) were not affected by the presenceof organic acids in all cases. After three days at pH 7.5(Figure 5b), high values of viability were obtained in thepresence of 0.05 M citric acid (99%) as well as in the
control experiment without additives (84%). On theother hand, increasing concentrations of both succinateand malate gradually suppressed colony growth onplates at pH 7.5 (equivalent to a 20% viability retainedafter three days at concentrations ‡0.1M). At pH 4.5(Figure 5a), viability was reduced to 52% after threedays in the control (without additives) while lesservariations were observed at increasing concentrations ofcitric and succinic acids (70-85% viability retention inrelation to the colony counts obtained before storage).However, great decreases in viability (viability retention£30%) were observed at increasing concentrations(‡0.05 M) of malic acid at pH 4.5. This shows thatdifferent acids lead to different effects on viabilitywithout causing a corresponding effect on the levels offermentative activity. Figure 1 shows small variations infermentative activity during storage at pH 7.5. Theresults shown here also suggest that cell division is notdirectly dependent on the activity of the glycolytic flux.As described above, succinic and malic acids pro-
moted significant decreases in viability when the pressedyeast was stored in these acids at pH 7.5 (Figure 5b).This was possibly due to the cell’s reduced capacity torestore internal pH homeostasis at increasing organicacid concentrations. During growth latency in anoctanoic acid-supplemented medium, an activation ofH+-ATPase of the plasma membrane in S. cerevisiaewas accompanied by decreases in both intracellular pHand cell viability (Viegas et al. 1998). In the presentwork, citric acid led to increases in cell counts on platesafter three days storage of the pressed yeast samples,and this occurred independently of the pH value.Actually, citric acid has peculiar effects on pressed yeastpossibly by exhibiting three values of pKa. It has a widerrange of buffering capacities compared to other acids,while its metal-chelating effect is greater at pH 7.5(Stratford 1999).
0.0 0.1 0.2 0.3
0
2
4
6
8
10
12
14
0.0 0.1 0.2 0.3
pH 4.5(a) (b)
Pro
tein
(mg
/mg
cel
ls)
x 10
-2
pH 7.5
[ Weak acid, M ]
Figure 4. Effects of the organic acid concentrations (citrate, m;
succinate, d; malate, n) present in the pre-treatment solutions at pH
4.5 (a) and 7.5 (b) on the total protein of pressed yeast samples, when
assayed after three days storage at 30 �C.
0.0 0.1 0.2 0.30
20
40
60
80
100
0.0 0.1 0.2 0.3
pH 4.5(a) (b)
[ Weak acid, M ]
Via
bili
ty (%
)
pH 7.5
Figure 5. Effects of the organic acid concentration (citrate, m;
succinate, d; malate, n) present in the pre-treatment solutions at pH
4.5 (a) and 7.5 (b) on the viability of pressed yeast samples, when
assayed after three days storage at 30 �C.
Weak Organic acids and pressed baker’s yeast 541

GPDH activity, levels of trehalose and internal glycerol
Increases in the cellular levels of GPDH activity havebeen described under stress conditions, notably underosmotic stress (Larson et al. 1997; Nevoigt & Stahl1997; Beales 2004). In the present work, variations inglycerol-3-phosphate dehydrogenase (GPDH) activitywere detected in cell extracts obtained after pre-treatment of the yeast cells with solutions containingincreasing concentrations (up to 0.3 M) of organicacid as shown in Figure 6. At pH 4.5 (Figure 6a),increases in activity were observed with citric andmalic acids, while small variations in activity wereobserved in the presence of succinic acid. At pH 7.5(Figure 6b), increases in activity were only obtainedwith citric acid after three days, while decreases wereobserved in the presence of malic and succinic acid.This suggests that the yeast cells are submitted todifferent stress conditions, depending on the acidused. After the addition of citric acid to thefermentation of barley shochu, an increase in theGPDH activity was also observed (Omori et al.1995).Despite the increasing external concentrations of the
citric acid used in the present work, variations in theinitial values of internal glycerol were not observedbefore storage (data not shown). However, the internalglycerol level increased during storage of the pressedyeast samples containing increasing concentrations ofcitric acid, notably at pH 4.5 (Figure 7). This is inagreement with the increases in GPDH activity de-scribed above (Figure 6). Possibly, the high levels ofintracellular glycerol obtained in the presence of addedcitric acid would protect the cells against death (seeFigure 5) when cellular trehalose declines to low levelsas described below.
In liquid cultures, high levels of trehalose accumulatetoward the final stages of the baker’s yeast propagation,but this reserve carbohydrate is quickly mobilized whenfermentation starts (Van Dijck et al. 1995). In thepresent work, the levels of the intracellular trehalose ofpressed yeast decreased during storage at 30 �C and thiswas independent of the presence of citric acid and itspH. Table 1 shows the variations in trehalose content ofthe pressed yeast at pH 4.5 while the same results wereobtained at pH 7.5 (data not shown). Under ourexperimental conditions, the variations in both thefermentative activity of the pressed yeast (shown inFigure 1) and its viability (shown in Figure 5) did notappear to be directly related to the cellular trehaloselevels. Actually, the presence of citrate did not preventtrehalose mobilization. A lack of correlation betweenthe trehalose levels and resistance to stress conditionshas been reported for yeast cells in liquid culture(Alexandre et al. 1998) while the results reported byother authors (Hounsa et al. 1998) indicate that treha-lose does not serve as a carbon source for glycerolformation under mild or severe osmotic stress. The factis that many questions regarding the control of reservecarbohydrates in yeasts remain to be clarified (Francois& Parrou 2001).
0.0 0.1 0.2 0.3
0.0
0.4
0.6
0.8
1.0
1.2
1.4
0.0 0.1 0.2 0.3[ Weak acid, M ]
GP
DH
(m
U/m
g c
ells
) x 1
0-1
pH 7.5pH 4.5 (a) (b)
Figure 6. Effects of the organic acid concentrations (citrate, m
succinate, d; malate, n) added to the pre-treatment solutions at pH
4.5 (a) and 7.5 (b) on the glycerol-3-phosphate dehydrogenase activity
(GPDH) of pressed yeast samples, when assayed after three days
storage at 30 �C.
0.0 0.1 0.2 0.3
0.0
0.2
0.4
0.6
0.8
1.0
1.2
Inte
rnal
gly
cero
l( µ
mo
l/g c
ells
)
[Citrate, M]
Figure 7. Effects of the citric acid concentrations present in the pressed
yeast samples at pH 4.5 (m) and 7.5 (r) on the intracellular glycerol
levels (lmol g�1cells) when assayed after three days storage of the pressed
yeast samples at 30 �C.
Table 1. Trehalose degradation at 30 �C during storage of the pressed
yeast cells pretreated with citric acid at pH 4.5.
Time (h) Trehalose (lmol mg�1cells) · 10)3
Control (no additives) Citric acid (0.3 M)
0 56 ± 5 58 ± 3
10 52 ± 4 48 ± 2
22 21 ± 2 22 ± 2
46 13 ± 2 14 ± 1
70 11 ± 1 12 ± 1
542 M.F.S. Peres et al.

Acknowledgements
This research was supported by a grant from FAPESP(no 98/04299-9). The authors would like to thankCAPES for the fellowship awarded to M.F.S. Peresand also thank the RHAE/CET/CNPq Program (proc.no 610.125/96-6) for the financial support for the visit ofG.M. Walker to our laboratory. The authors are alsograteful to Fernando Delfino for his valuable technicalassistance.
References
Alexandre, H., Plourde, L., Charpentier, C. & Francois, J. 1998 Lack
of correlation between trehalose accumulation, cell viability and
intracellular acidification as induced by various stresses in Sac-
charomyces cerevisiae. Microbiology 144, 1103–1111.
Angelov, A., Hristozova, T. & Roshkova, Z. 1997 Maltase activity
and dough rising ability of baker’s yeasts obtained at different
growth conditions during the maturation stage. Zeitschrift fur
Lebensmittel-Untersuchung und -Forschung A – Food research 205,
80–84.
Attfield, P.V., Myers, D.K., Pehm, S. & Joseph, V.M. May 1997
Improved yeast performance using compatible solutes/osmopro-
tectants. AU Patent WO 97/ 18295.
Beales, N. 2004 Adaptation of microorganisms to cold tempera-
tures, weak acid preservatives, low pH, and osmotic stress: a
review. Comprehensive Reviews in Food Science And Food Safety
3, 1–20.
Beudeker, R.F., van Dam, H.W., van der Plaat, J.B. & Vellenga, K.
1990 Developments in baker’s yeast production. In Yeast: Bio-
technology and Biocatalysis, Eds. Verachtert, H. & De Mot R. New
York: Marcel Dekker, Inc. ISBN 0-8247-8142-2.
Bjorkqvist, S., Ansell, R., Adler, L. & Liden, G. 1997 Physiological
response to anaerobicity of glycerol-3-phosphate dehydrogenase
mutants of Saccharomyces cerevisiae. Applied and Environmental
Microbiology 63, 128–132.
Bracey, D., Holyoak, C.D. & Coote, P.J. 1998 Comparison of the
inhibitory effect of sorbic acid and amphotericin B on Saccharo-
myces cerevisiae: is growth inhibition dependent on reduced
intracellular pH? Journal of Applied Microbiology 85, 1056–1066.
Burrows, S. & Harrison, J.S. 1959 Routine method for determination
of activity of baker’s yeast. The Journal of the Institute of Brewing
65, 39–45.
Evans, I.H. 1990 Yeast strains for baking: recent developments. In
Yeast Technology, Eds. Spencer, J.F.T. & Spencer, D.M. Berlin,
Heidelberg: Springer-Verlag. ISBN 3-540-50689-6.
Francois, J. & Parrou, J.I. 2001 Reserve carbohydrates metabolism in
the yeast Saccharomyces cerevisiae. FEMS Microbiology Reviews
25, 125–145.
Fuge, E.K. & Werner-Washburne, M. 1997 Stationary phase in the
yeast Saccharomyces cerevisiae In Yeast Stress Responses, Eds.
Hohmann, S., Mager, W.H. New York: Chapman & Hall. ISBN 0-
412-13251-6.
Hounsa, C.G., Brandt, E. V., Thevelein, J., Hohmann, S. & Prior, B.A.
1998 Role of trehalose in survival of Saccharomyces cerevisiae
under osmotic stress. Microbiology 144, 671–680.
Krebs, H.A., Wiggins, D., Stubbs, M., Sols, A. & Bedoya, F. 1983
Studies on the mechanism of the antifungal action of benzoate.
Biochemical Journal 214, 657–663.
Larsson, C., Nilsson, A., Blomberg, A. & Gustafsson, L. 1997
Glycolytic flux is conditionally correlated with ATP concentration
in Saccharomyces cerevisiae: a chemostat study under carbon- or
nitrogen-limiting conditions. Journal of Bacteriology 179, 7243–
7250.
Madshus, I.H. 1988 Regulation of intracellular pH in eukaryotic cells.
Biochemical Journal 250, 1–8.
Murakami, Y., Yokoigawa, K., Kawai, F. & Kawai, H. 1996 Lipid
composition of commercial bakers’ yeasts having different freeze-
tolerance in frozen dough. Bioscience Biotechnology and Biochem-
istry 60, 1874–1876.
Myers, D.K., Joseph, V.M., Pehm, S., Galvagno, M. & Attfield, P.V.
1998 Loading of Saccharomyces cerevisiae with glycerol leads to
enhanced fermentation in sweet bread doughs. Food Microbiology
15, 51–58.
Neves, M.J., Terenzi, H.F., Leone, F.A. & Jorge, J.A. 1994 Quanti-
fication of trehalose in biological samples with a conidial trehalase
from the thermophilic fungus Humicola grisea var. thermoidea.
World Journal of Microbiology and Biotechnology 10, 17–19.
Nevoigt, E. & Stahl, U. 1997 Osmoregulation and glycerol metabolism
in the yeast Saccharomyces cerevisiae. FEMS Microbiology
Reviews 21, 231–241.
Omori, T., Ogawa, K. & Shimoda, M. 1995 Breeding of high glycerol-
producing shochu yeast (Saccharomyces cerevisiae) with acquired
salt tolerance. Journal of Fermentation and Bioengineering 6,
560–565.
Oura, E. 1977 Reaction products of yeast fermentation. Process
Biochemistry 12, 19–21.
Parrou, J., Enjalbert, B., Plourde, L., Bauche, A., Gonzalez, B. &
Francois, J. 1999 Dynamic responses of reserve carbohydrate
metabolism under carbon and nitrogen limitations in Saccharo-
myces cerevisiae. Yeast 15, 191–203.
Peres, M.F.S. & Laluce, C. 1998 Ethanol tolerance of thermotolerant
yeasts cultivated on mixtures of sucrose and ethanol. Journal of
Fermentation and Bioengineering 85, 388–397.
Piper, P., Calderon, C.O., Hatzixanthis, K. & Mollapour, M. 2001
Weak acid adaptation: the stress response that confers yeasts with
resistance to organic acid food preservatives. Microbiology 147,
2635–2642.
Rose, A.H. & Vijayalakshmi, G. 1993 Baker’s yeasts. In The Yeasts,
2nd edn, Vol. 5, Eds. Rose, A.H. & Harrison, J.S. New York:
Academic Press. ISBN 0-12-596415-3.
Sedmak, J.J. & Grossberg, S.E. 1977 A rapid, sensitive, and versatile
assay for protein using coomassie brilliant blue G250. Analytical
Biochemistry 79, 544–552.
Spicher, G. 1983 Baked goods. In Biotechnology, Vol. 5, Eds. Rehm,
H.-J., Reed, G. Florida: Verlag Chemie. ISBN 0-89573-045-6.
Stratford, M. 1999 Traditional preservatives)organic acids. In Ency-
clopedia of Food Microbiology, Eds. Robinson, R.K., Batt, C.A.,
Patel, P.D. New York: Academic Press. ISBN 0-12-227070-3.
Valle, E., Bergillos, L., Gascon, S., Parra, F. & Ramos, S. 1986
Trehalase activation in yeasts is mediated by an internal acidifi-
cation. European Journal of Biochemistry 154, 247–251.
Van Dijck, P., Colavizza, D., Smet, P. & Thevelein, J.M. 1995
Differential importance of trehalose in stress resistance in fer-
menting and nonfermenting Saccharomyces cerevisiae cells. Applied
and Environmental Microbiology 61, 109–115.
Verduyn, C., Postma, E., Scheffers, W.A. & van Dijken, J.P. 1990
Physiology of Saccharomyces cerevisiae in anaerobic glucose –
limited chemostat cultures. Journal of General Microbiology 136,
395–403.
Viegas, C.A., Almeida, P.F., Cavaco, M. & Sa-Correia, I. 1998 The
H+ -ATPase in plasma membrane of Saccharomyces cerevisiae is
activated during growth latency in octanoic acid-supplemented
medium accompanying the decrease in intracellular pH and cell
viability. Applied and Environmental Microbiology 64, 779–783.
Werner-Washburne, M., Braun, E., Johnston, G.C. & Singer, R.A.
1993 Stationary phase in the yeast Saccharomyces cerevisiae.
Microbiological Reviews 57, 383–401.
Yao, B., Sollitti, P., Zhang, X. & Marmur, J. 1994 Shared control of
maltose induction and catabolite repression of the MAL structural
genes in Saccharomyces. Molecular and General Genetics 243,
622–630.
Weak Organic acids and pressed baker’s yeast 543

Enhancing biological nitrogen removal from tannery effluent by using the efficient
Brachymonas denitrificans in pilot plant operations
Seyoum Leta1,2,*, Fassil Assefa1 and Gunnel Dalhammar21Department of Biology, Addis Ababa University, P.O. Box 1176, Addis Ababa, Ethiopia2Department of Biotechnology, Royal Institute of Technology (KTH), S-106 91 Stockholm, Sweden*Author for correspondence: Tel.: +46-8-5537-8397, Fax: +46-8-5537-8483, E-mail: [email protected]
Keywords: Bio-augmentation, denitrifying bacteria, fluorescent in situ hybridization, nitrate uptake rate
Summary
Laboratory scale and pilot plant reactors were inoculated with an efficient denitrifier, Brachymonas denitrificans(CCUG 45880), in order to evaluate whether a bio-augmentation approach can be used to enhance biologicalnitrogen removal from tannery effluents. To determine the effectiveness of the introduced strain, denitrifying activityin the activated sludge was monitored by nitrate uptake rate (NUR) measurement of NO3-N. Fluorescent in situhybridization (FISH) technique was used to monitor the growth of the augmented species. The laboratory scalenitrate removal efficiency with the introduced B. denitrificans (3.7±0.6 mg NO3-N gVSS)1 h)1) was higher thanthat of the activated sludge without the addition of the bacteria (3.5±0.7 mg NO3-N gVSS)1 h)1); the NUR in thepilot plant after and before the introduction of the strain was also of the magnitude of 12.0±1.4 and10.6±1.4 mg NO3-N gVSS)1 day)1, respectively. In situ hybridization results revealed that the introduceddenitrifying bacteria significantly facilitated the development of a dense denitrifying bacterial population in theactivated sludge, which enhanced in situ denitrification activity. FISH data indicated that once introduced, B.denitrificans remained abundant throughout the experimental period. The ability to seed a bioreactor with bacterialstrain capable of removing target pollutants from tannery effluents in a mixed microbial community suggests thatthis approach could have commercial applications.
Introduction
Nitrogen pollution from Ethiopian tannery effluents isbecoming a more acute problem as effluent qualitystandards become more stringent (Government of Ethi-opia (GOE) 2002). Only very few of the existing tanningindustries treat their wastewater prior to discharge, andnot all of them meet the requirements for effluentquality standards (Environmental Protection Authority(EPA) 2003). The Ethiopian provisional standard fortannery effluent discharge for total N and nitrate N is 50and 10 mg l)1, respectively. Although biological deni-trification is a key process in the removal of nitrogenfrom tannery effluents, the process involved must notonly be technically efficient (i.e., more than 90%removal efficiencies) but it must also be able to meetthe effluent criteria in an economic manner. Biologicaldenitrification is recognized as being difficult to main-tain in practical tannery wastewater treatment plantsdue to the inherently toxic nature of the effluent streams(UNEP 1991; Leta et al. 2004).Bio-augmentation (introduction of specialized micro-
organisms into polluted sites and/or bioreactors) isrecognized as a promising and attractive operational
means of accelerating the removal of target pollutantsand improving wastewater treatment performance (Ritt-mann & Whiteman 1994; Meithling & Karlson 1996;Boon et al. 2000). The technique has been applied toenhance microbial nitrification (Satoh et al. 2003),biological phosphorus and nitrogen removal (Oertheret al. 1998; Paturea et al. 2001), and biodegradation ofchlorinated benzenes (Tchelet et al. 1999). However,bio-augmentation for wastewater treatment has notbeen practiced widely, mainly due to difficulty inevaluating its effectiveness in actual treatment plants.The effectiveness of bio-augmentation is dependent oneffective attachment, retention time and metabolicadaptation of the introduced strain in treatment sys-tems. The traditional monitoring techniques, such asmost probable number and selective plating are unreli-able for assessing the fate of the introduced microbialpopulation, because they lack sufficient sensitivity andselectivity to detect a specific denitrifying population ina mixed microbial community.Recently developed molecular tools such as
comparative sequence analysis of 16S rRNA genes andfluorescence in situ hybridization (FISH) with 16SrRNA-targeted oligonucleotide probes overcome these
World Journal of Microbiology & Biotechnology (2005) 21:545–552 � Springer 2005
DOI 10.1007/s11274-004-3272-3

problems of identification and monitoring of the specificmicroorganisms in complex microbial communities suchas biofilms and activated sludges (Amann 1995; Wagneret al. 1996; Mobarry et al. 1996; Juretschko et al. 2002).In addition, denitrifying activities of the introducedbacteria can be directly measured by nitrate uptake rate(NUR) measurements (Kristensen et al. 1992).The aim of this study was, therefore, to enhance
biological nitrogen removal from tannery effluent byintroducing the B. denitrificans species, and to monitorits efficiency, tolerance and abundance in laboratoryscale and pilot plant operations. The fate of B. denitrif-icans was monitored both by NUR measurements andFISH. The combination of these techniques providedreliable and direct evidence for the fate and in situmetabolic activity of the introduced species. These datawere used to evaluate the effectiveness of bio-augmen-tation strategy for the treatment of tannery effluents.
Materials and methods
Set-up of the pilot plant
The pilot plant consisted of a pre-denitrification reactorof 100 l, equipped with a vertical stirrer (RGL 2,Heidolph, Germany), an aerobic activated sludge unitof 200 l, and a 50 l sedimentation (clarifier) tank asshown in Figure 1. The influent wastewater was pumpedfrom the influent collection tank into a denitrificationtank at a flow rate of 5 l h)1 using a peristaltic pump(PD 5206, Heidolph, Germany) to maintain the nominalhydraulic residence time (HRT) of the anoxic andaerobic reactors at 20 and 40 h, respectively. The mixedliquor from the aerated tank and sludge from theeffluent were recycled to the head of the denitrificationreactor at rates of 100–200% and 100–150% by aperistaltic pump and airlift pump, respectively. The pilotplant was installed on the premises of the ScienceFaculty, Addis Ababa University, Ethiopia, and oper-ational parameters of the pilot plant for the study period(June–November, 2003) are given in Figure 2.
Bacterial strains
The strain used in this study was Brachymonas denitrif-icans (CCUG 45880), the efficient denitrifying bacteriumpreviously isolated and characterized from the activated
sludge of a tannery wastewater treatment plant inEthiopia. This bacterium was selected on the basis ofits remarkable denitrifying ability in the presence of suchtoxic substances as chromium and sulphide prevailing intannery effluents (Leta et al. 2004). In order to be sure ofthe result, B. denitrificans strains (CCUG 45880, 45881,45882, 45883, 45884 and 45885, respectively) wereevaluated with group- and species-specific 16S rRNA-targeted probes prior to in situ monitoring.
Fluorescent in situ hybridization (FISH)
FISH analysis was performed as described by Amann(1995). Aliquots of 1 ml overnight cultures of B. deni-trificans strains and sludge samples taken from the pilotplant, respectively, were centrifuged for 5 min at9000 · g and the pellets were washed in 1·PBS. The cellswere fixed in 4% paraformaldehyde fixative for 1.5 h at4 �C. Three ll of the fixed cell suspensions were immo-bilized by air-drying on 9 mm-diameter wells gelatine-coated slides. The cells were hybridized with probes asdescribed by Amann (1995) at 46 �C for 2 h in 7.8 ll ofhybridization buffer (1 M Tris–Cl pH 7.4, 0.5 M EDTA,5 M NaCl, and 10% SDS, formamide concentrations of25%) with 1.2 ll probe solution in a sealed moisturechamber. Subsequently, a stringent washing step wasperformed at 46 �C for 20 min in 50 ml of pre-warmedwashing buffer (1 M Tris–Cl pH 7.4, 0.5 M EDTA, 5 MNaCl, and 10% SDS). Slides were mounted with theantifade solution Citifluor glycerol/PBS (Citi Fluor, UK)and the hybridized cells were examined under an epiflu-orescencemicroscope (Olympus Bx51, Japan) attached toa CCD digital camera. AnalySIS� DOCU software(CC12 DOCU, Germany) was used for image acquisitionof hybridized cells.
Oligonucleotide probes
Probes BET42a, GAMA42a, ALF1b, and S-*-OTU6-0178-a-A-18 were used to evaluate B. denitrificansisolates prior to in situ detection of the species.Subsequently, the species-specific probe S-*-OTU6-
Figure 1. Process diagram of a pilot plant designed for biological
nitrogen removal from tannery effluent in Ethiopia.
Figure 2. Operational conditions of the pilot plant during the study
period.
546 S. Leta et al.

0178-a-A-18 was used in this study for in situmonitoringof the survival and growth of B. denitrificans specifically.The probes were supplied by Thermo Biosciences,GmBH (Germany) and the sequences and specificity ofthe probes are given in Table 1.
Laboratory scale NUR experiments
To determine the sludge activity of the system, NURbatch experiments were carried out following themethod described in Kristensen et al. (1992). Two 2-lcapacity laboratory scale reactors (R1 and R2) wereused for NUR studies where 1.5 l activated sludge takenfrom the anoxic tank of the pilot plant was added asinoculum in to each reactor. To both reactors NO3-N tobe removed was added at 60 mg l)1 and they wereoperated under anoxic conditions by flushing thereactors with N2 gas. Overnight cultures of B. denitrif-icans (CCUG 45880) cultivated on nutrient agar (Difco)were inoculated into a liquid nutrient broth medium(Difco) and was incubated on a rotary shaker underaerobic conditions at 30 �C for 24 h. The first reactor(R1) was seeded with the B. denitrificans enrichmentculture with respective cell densities of 2.5 · 106,1.5 · 107, 1.8 · 106 c.f.u. ml)1 for experiments I, IIand III, respectively, and NUR was determined asmg NO3-N g VSS)1 h)1. The second reactor (R2) wasoperated without the addition of the bacterium, whichwas used as a reference.
Pilot plant NUR measurements
In order to compare the removal capacity of theactivated sludge with that of the sludge with introduceddenitrifying population, NO3-N was added at 90 mg l)1
to the anoxic tank of the pilot plant prior to the additionof B. denitrificans. After 2 weeks, an enrichment cultureof B. denitrificans prepared as described above wasadded into the pilot plant with respective cell densities of6.7 · 108, 4.8 · 108, 5.8 · 108 c.f.u. ml)1 for experi-ments I, II and III, respectively. NO3-N was added at90 mg l)1 to the anoxic system of the pilot plant andNUR was monitored as mg NO3-N gVSS)1 day)1. Thedynamics of the introduced bacterium were monitoredby species-specific 16S rRNA-targeted probe.
Analyses
The influent and effluent wastewater samples wereanalysed for chemical oxygen demand (COD), Total N,
PO43), NH4
+-N, NO3-N and NO2-N using a spectro-photometer (DR/2010, Hach, USA) according to Hach(manufacturer) instructions. Biological oxygen demand(BOD5), mixed liquor suspended solids (MLSS) andmixed liquor volatile suspended solids (MLVSS) weredetermined using standard methods (APHA 1995).Dissolved oxygen (DO) was regularly monitored usinga DO probe (YSI 5905, USA). Temperature and pH werealso measured on a routine basis throughout the exper-imental period. The sludge volume index (SVI) wasdetermined using a 1-l measuring cylinder and 30 min ofsettling time.
Results and discussion
This study examined the treatment potential of the pilotprocess plant for biological nitrogen removal fromtannery effluent with and without bio-augmentation.
Performance of the pilot plant
The performance of the pilot plant treating tanneryeffluent was monitored from June to November 2003.The removal efficiencies of the pilot process plant for thestudy period are shown in Figure 3. The pilot processplant performed consistently well at organic loadingrates of 0.8–1.8 kg COD m)3 day)1. The removal effi-ciencies of total N and ammonium N varied between91–95% and 81–94%, respectively, for the study period.Before bio-augmentation (June–August) the removalefficiencies of the pilot process plant for total N and
Table 1. Oligonucleotide probes used for in situ detection of 16S rRNA sequences of target organism(s) in this study.
Probe Probe sequence from 5¢ to 3¢ Target organism(s) Reference
GAM42a GCCTTCCCACATCGTTT c-Proteobacteria Manz et al. (1992)
BETA42a GCCTTCCCACTTCGTTT b-Proteobacteria Manz et al. (1992)
ALF1b CGTTCGYTCTGAGCCAG a-Proteobacteria Manz et al. (1992)
S-*-OTU6-0178-a-A-18 TCAACCTCAGTTCTCATG B. denitrificans Juretschko et al. (2002)
Figure 3. Removal efficiencies of the pilot plant for the study period.
Enhancing biological nitrogen removal 547

ammonium N varied between 90–92% and 80–85% ascompared with 94–95% total N and 88–94% ammo-nium N removal efficiencies during the bio-augmenta-tion study period. Relatively, the lower ammonium Nremoval rate was due to higher influent organic loadingfluctuations, which may favour the growth of hetero-trophic organisms over that of aerobic nitrifiers (Gupta& Gupta 2001). Similarly, the COD and BOD5 removalefficiencies of the pilot process plant followed the sametrend indicating that the overall performance of thesystem was improving. This slight upward trend indi-cated that the introduction of the efficient bacterium andthe addition of nitrate might also have stimulated thedegradative capacity of the indigenous microorganisms.Reports show that bio-augmentation can sometimesstimulate the establishment of indigenous populationsthat also benefit wastewater treatment (Stephenson &Stephenson 1992; Massol-Deya et al. 1997; Wenderothet al. 2003).Moreover, the MLSS, MLVSS and SVI concentra-
tions varied between 3500–4200, 1500–3000 and 45–55 ml g)1 MLSS, respectively, indicating that theseparameters were in the normal range of operatingconditions in the system (Figure 2). Well settling acti-vated sludge has an SVI value of less than 100 ml g)1
MLSS whereas sludge with bulking problems usuallyhas an SVI value greater than 200 ml g)1 MLSS (Gupta& Sharma 1996; Cloete & Muyima 1997).
Evaluation of the efficient denitrifying isolates by FISHand in situ detection of B. denitrificans
In order to specifically monitor B. denitrificans in in situconditions, group- and species-specific DNA probes wereused to evaluate pure cultures of B. denitrificans strainsthat were isolated from tannery wastewaters in Ethiopia.All the examined strains were identified as B. denitrificansin the ß-subdivision of the Proteobactria (Table 2)consolidating the previous results (Leta et al. 2004).To investigate the effect of the addition of enrichment
culture of B. denitrificans on the denitrification rates ofthe sludge from the pilot plant, in situ hybridization witha species-specific probe was performed on the sludge
samples before introduction and at the time of NURmeasurements in the system. In situ hybridization withspecies-specific probe S*-*OTU6-0178-a-A-18 indicatedthat B. denitrificans was already present in the sludge ofthe pilot plant at low level. However, dense populationsof B. denitrificans were developed in the anoxic sludge ofthe pilot plant 4 days after introduction (Figure 4a).The cell densities were higher than those before theaddition of the bacterium. The abundance of the stainedcells was consistent after its introduction for the threeexperimental runs (Figure 4a–c). The cells appeared inmorphology small and rod-shaped, which are typicalcharacteristics of B. denitrificans strains (Leta et al.2004).
Laboratory scale and pilot plant NUR measurements
Nitrate removal by the system before and after theintroduction of B. denitrificans was monitored at differ-ent time intervals by measuring the residual NO3-N andin situ hybridization of the cells. In both the laboratoryscale and pilot process plant NUR experiments, theslightly increased rate of N removal was associated withthe efficiency of the introduced population of theefficient strain (Figure 5a, b). This can be seen by thereduction in the level of nitrate in the pilot plant systemfrom an initial 90 to 15.5 mg NO3-N l)1 within 24 h(Figure 5b). The nitrate removal ability of the systemhas increased by 12–20% with the addition of B.denitrificans. In terms of performance, the nitrogencontent in the effluent (7.5–15 mg NO3-N l)1) wasconsistent with the effluent quality standards set by theEPA (2003). It followed a similar trend in laboratoryscale NUR experiments (Figure 5a). No NO2-N accu-mulation was observed in both laboratory scale andpilot plant NUR experiments.The nitrate-nitrogen removal capacity of the sludge
with and without the addition of the efficient bacteriumdetermined in three laboratory scale experiments isgiven in Figure 6a. Figure 6b reports the in situ denitri-fication potential of the pilot process plant before andafter the introduction of B. denitrificans. Both labora-tory scale and in situ NUR measurements showed a high
Table 2. Evaluation of Brachymonas denitrificans isolates with group- and species-specific 16S rRNA probes.
Strains Group-specific Species-specific
BET42a GAM42a ALF1b S*-*OTU6-0178-a-A-18
B. denitrificans JCM9216a + ) ) +
B. denitrificans (CCUG 45880) + ) ) +
B. denitrificans (CCUG 45881) + ) ) +
B. denitrificans (CCUG 45882) + ) ) +
B. denitrificans (CCUG 45883) + ) ) +
B. denitrificans (CCUG 45884) + ) ) +
B. denitrificans (CCUG 45885) + ) ) +
Comamonas denitrificans + ) ) )
a Strain JCM 9216 was obtained from Japan culture collection and the six strains were isolated from tannery wastewater treatment plant in
Ethiopia. C. denitrificans was used as negative control for species-specific probe.
548 S. Leta et al.

denitrifying activity as compared with the NUR resultsbefore bio-augmentation with B. denitrificans (Fig-ure 6a, b). In all the laboratory scale experiments, thesludge augmented with B. denitrificans showed slightlyhigher denitrification (2.9±0.1–4.5±0.2 mg NO3-N gVSS)1 h)1) as compared with the sludge withoutthe addition of the bacterium (2.5±0.1–4.2±0.2 mg NO3-N gVSS)1 h)1) (Figure 6a). This leadto mean NUR values of 3.7±0.6 and 3.5±0.7 mg NO3-N gVSS)1 h)1 for augmented and non-augmented
sludges, respectively. Similarly, the in situ denitrifyingactivity of the sludge after the introduction of the activedenitrifying population was slightly higher (10.8±0.5–14.2±0.7 mg NO3-N gVSS)1 day)1) as compared withthe activated sludge before bio-augmentation (8.9±0.4–12.9±0.6 mg NO3-N gVSS)1 day)1) (Figure 6b). Themean NUR values with and without bio-augmentationwere 12.0±1.4 and 10.6±1.4 mg NO3-N gVSS)1day)1,respectively. Both experiments indicated that bio-aug-mentation using this denitrifying bacterium couldenhance the removal of nitrogen from tannery effluentscharacterized by high level of toxic substances.As can be seen from Figure 6a, b, the differences in
NUR before and after bio-augmentation with thebacterium are not significant. These small differencesperhaps can be attributed to the fact that the efficientbacterium, B. denitrificans, is already present in the pilotplant system before introduction. The addition of NO3-N can also stimulate the indigenous denitrifying organ-isms including B. denitrificans found in the system.Increasing cell densities of the inoculum might also havea greater effect on the observed N removal rate in bothconditions. The population size and activity of thedegradative bacteria play an important role in the
Figure 4. In situ detection of Brachymonas denitrificans in the pilot
plant by probe S*-*OTU6-0178-a-A-18 during nitrate removal activity
measurements, during three separate experiments I (a), II (b) and III
(c), respectively.
Figure 5. Nitrate reduction by the sludge under laboratory scale (a)
and pilot plant (b) with and without bio-augmentation. Data are
means of three measurements and their standard deviations.
Enhancing biological nitrogen removal 549

reduction of specific pollutants in wastewater treatment(Goldstein et al. 1985). In the present study, B. denitrif-icans was introduced into the pilot process plant at celldensities of 4.8x10⁸ – 6.7 · 108 c.f.u. ml)1 to enhance Nremoval from the system. It should also be noted thatthe system might have encouraged the growth of highconsortia of denitrifiers to attain high denitrificationefficiency. This can be seen from experiments II and Iwhere N removal rate was low as compared to exper-iment III in both cases. Hence bio-augmentation waslikely not to have had a greater effect than observed inthe present study.It is interesting to note that a denitrification potential
of up to 12.9±1.8 mg NO3-N gVSS)1 day)1 was mea-sured in run III in the activated sludge of the pilotprocess plant before bio-augmentation. When aug-mented with the active denitrifying population, thedenitrification rate was slightly increased to14.2±1.6 mg NO3-N gVSS)1 day)1 (Figure 6b) show-ing that bio-augmentation strategy can enhance theremoval of target pollutants from tannery effluents.Satoh et al. (2003) also observed that addition of
enrichment cultures of nitrifying bacteria into a biofilmreactor facilitated development of dense nitrifying bac-terial populations, which led to a rapid start-up of theprocess and enhancement of in situ nitrification activity.From FISH and NUR results, it can be seen that this
species could be an important member of the denitrify-ing population in this system. In a previous study, Letaet al. (2004) reported that B. denitrificans possess highdenitrifying capability in tannery wastewater activatedsludge systems laden with such toxic substances aschromium III and sulphide. The presence of this speciesin large quantities in the anoxic system of the pilot plantcould be explained by their versatile metabolism. Theincreases in the denitrification rates of the sludge wereconsistent with the increase in the B. denitrificanspopulation as determined by FISH.Since B. denitrificans was isolated from tannery
effluent, it should have the ability to tolerate differentkinds of stresses present in such an environment, e.g.high salinity, chromium and sulphide. The tanneryeffluent would also be expected to contain a consider-able amount of utilizable organic carbon, nitrogen andother nutrients that may support the growth of thisspecies in abundance in the system as determined by insitu hybridization technique. As was observed fromFISH, an increase in population size in both thelaboratory scale and pilot plant studies was accompa-nied by increased nitrate reduction (Figure 5a, b). Ahigher rate of in situ nitrate reduction in tanneryeffluent indicated an adaptation of the introducedBrachymonas denitrificans to environmental conditionsof tannery effluent.Bio-augmentation with microorganisms with desired
catabolic traits can be effective for biodegradation ofpollutants. The results described in this paper illustratethe importance of selecting bacterial inoculants withappropriate physiological characteristics for survivaland in situ activity in target ecosystems. The ability togrow in systems of a toxic nature might lead to thesuccessful establishment and activity of this species inthe system in addition to their peculiar performances insuch wastewater environments. Reports have showedthat the survival, activity and maintenance of intro-duced microorganisms are influenced by such factors asselection of suitable strains, effective attachment, devel-opment of active population of introduced bacteria andeffluent composition (McClure et al. 1991; Watanabeet al. 1998; Bouchez et al. 2000).Tannery wastewater usually contain mixtures of
chemicals, some of which are available as nutrientsources (carbon, nitrogen, etc.) and others that caninhibit bacterial growth at toxic levels (chromium,sulphide, etc.) (Leta et al. 2004). The fact that significantlevels of N depletion coupled with increased populationsize were observed in situ, after introduction of thisspecies into the system, indicated that the selectionstrategy we have used was valid. Bio-augmentationusing appropriate bacteria has also been shown toenhance biodegradation rates for persistent wastewater
Figure 6. Denitrification rates of the activated sludge with and without
Brachymonas denitrificans in lab scale (a) and pilot plant (b) opera-
tions. Data are means of three measurements and their standard
deviations.
550 S. Leta et al.

constituents from a mixed landfill leachate and chemicalindustry wastewater (Ying et al. 1986). However,because acclimatized sludge was used in this study,further research on the effect of bio-augmentation ofnon-acclimatized sludge for start-up of processes andduring process failures should be investigated for wideracceptance of bio-augmentation of this species inwastewater laden with toxic substances.Not only the population dynamics but also in situ
activities of the denitrifying bacteria added were mon-itored in this study. A clear correlation was observedbetween the in situ denitrifying activity measured byNUR, population dynamics of the introduced Brachy-monas denitrificans monitored by FISH and the pilotplant system performance, suggesting that the strategyof introducing this species for enhancing process per-formance is effective. The results of this report demon-strated enhanced nitrogen removal from tannerywastewater by introduced bacterial population and thepotential for removal of other pollutants from thiswastewater. The ability to seed a bioreactor withbacterial strains capable of removing target pollutantsfrom tannery wastewaters in a mixed microbial com-munity suggests that this approach could have commer-cial applications.
Acknowledgements
This work was supported by the Swedish InternationalDevelopment Cooperation Agency (Sida/SAREC)through the East African Regional Programme andResearch Network for Biotechnology, Biosafety andBiotechnology Policy Development (BIO-EARN).
References
Amann, R.I. 1995 In situ identification of microorganisms by whole
cell hybridization with rRNA targeted nucleic acid probes. In
Molecular Microbial Ecology Manual, eds. Akkerman, A.D., van
Elsas, L.J.D. & de Bruijn, F.J. pp. 1–15. Dordrecht, The
Netherlands: Kluwer Academic Publishers. ISBN 0792334116.
Amann, R.I., Binder, B.J., Olson, R.J., Chishom, S.W., Devereux, R.
& Stahl, D.A. 1990 Combination of 16S rRNA targeted oligonu-
cleotide probes with flow cytometry for analyzing mixed microbial
populations. Applied and Environmental Microbiology 56, 1919–
1925.
APHA 1995 Standard Methods for the Examination of Water and
Wastewater, 19th edn. Washington DC: American Public Health
Association. ISBN 0-87553-223-3.
Boon, N., Goris, J., De Vos, P., Verstraete, W. & Top, E.M. 2000 Bio-
augmentation of activated sludge by an indigenous 3-chloroani-
line-degrading Comamonas testosteroni strain, 12gfp. Applied and
Environmental Microbiology 66, 2906–2913.
Bouchez, T., Patureau, D., Dabert, P., Juretschko, S., Dore, J.,
Delgenes, J.P., Moletta, R. &Wagner, M. 2000 Ecological study of
a bioaugumentation failure. Environmnetal Microbiology 2, 179–
190.
Cloete, T.E. & Muyima, N.Y.O., eds. 1997 Microbial Community
Analysis: The Key to the Design of Biological Wastewater Treat-
ment Systems. IAWQ No. 5, London. ISBN 1-900222-02-7.
EPA 2003 Provisional standards for industrial pollution control in
Ethiopia. Prepared under the ecologically sustainable industrial
development (ESID) project-US/ETH/99/068/Ehiopia, EPA/
UNIDO, Addis Ababa.
GOE 2002 Environmental pollution control proclamation. Nagarit
Gazeta of the Federal Democratic Republic of Ethiopia, Procla-
mation No. 300/2002, Addis Ababa.
Goldstein, R.M., Mallory, L.M. & Alexander, M. 1985 Reasons for
possible failure of inoculation to enhance biodegradation. Applied
and Environmental Microbiology 63, 2802–2813.
Gupta, A.B. & Gupta, S.K. 2001 Simultaneous carbon and nitrogen
removal from high strength domestic wastewater in an aerobic
RBC biofilm. Water Research 7, 1714–1722.
Gupta, S.K. & Sharma, R. 1996 Biological oxidation of high strength
nitrogenous wastewater. Water Science and Technology 30,
593–600.
Juretschko, S., Loy, A., Lehner, A. & Wagner, M. 2002 The microbial
community composition of nitrifying and denitrifying activated
sludge from an industrial sewage treatment plant analysed by full-
cycle rRNA approach. Systematic and Applied Microbiology 25,
84–99.
Kristensen, H.G., Jorgensen, P.E. & Henze, M. 1992 Characterization
of functional microorganism groups and substrate in activated
sludge and wastewater by AUR, NUR and OUR. Water Science
and Technology 25, 43–57.
Leta, S., Gumaelius, L., Assefa, F. & Dalhammar, G. 2004 Identifi-
cation of efficient denitrifying bacteria from tannery wastewaters
in Ethiopia and a study of the effects of chromium III and sulphide
on their denitrification rate. World Journal of Microbiology and
Biotechnology 20, 405–411.
Meithling, R. & Karlson, U. 1996 Accelerated mineralization of
pentachlorophenol in soil upon inoculation with Mycobacterium
chlorophenolicum PCP1 and Sphingomonas chlorophenolica RA2.
Applied and Environmental Microbiology 62, 4361–4366.
McClure, N.C., Fry, J.C. & Weightman, A.J. 1991 Survival and
catabolic activity of natural and genetically engineered bacteria in
a laboratoryoratory-scale activated sludge unit. Applied and
Environmental Microbiology 57, 366–373.
Mobarry, B., Wagner, M., Urbain, V., Rittman, B.E. & Stahl, D. 1996
Phylogenetic probes for analyzing abundance and spatial organi-
zation of nitrifying bacteria. Applied and Environmental Microbi-
ology 62, 2156–2162.
Manz, W., Amann, R.I., Ludwig, W., Wagner, M & Scheifer, K.H.
1992 Phylogenetic oligodeoxynucleotide probes for the major
subclasses of Proteobacteria: problems and solutions. Systematic
and Applied Microbiology 15, 593–600.
Massol-Deya, A., Weeler, R., Rios-Hemandez, L., Zhous, J.Z.,
Hickey, R.F. & Tiedje, J.M. 1997 Succession and convergence of
biofilm communities in fixed film reactors treating aromatic
hydrocarbons in groundwater. Applied and Environmental Micro-
biology 63, 270–276.
Oerther, D.B., Danalewich, J., Dulekgurgen, E., Leveque, E., Freed-
man, D.L. & Raskin, L. 1998 Bioaugumentation of sequencing
batch reactors for biological phosphorus removal: comparative
rRNA sequence analysis and hybridization with oligonucleotide
probes. Water Science and Technology 37, 469–473.
Paturea, D., Helloin, E., Rustrian, E., Bouchez, T., Delgenes, J.P. &
Moletta, R. 2001 Combined phosphate and nitrogen removal in a
sequencing batch reactor using the aerobic denitrifier,Microvirgula
aerodenitrificans. Water Research 35, 189–197.
Rittman, B.E. & Whiteman, R. 1994 Bio-augmentation: a coming of
age. Biotechnology 1, 12–16.
Satoh, H., Okabe, S., Yamaguchi, Y. &Watanabe, Y. 2003 Evaluation
of the impact of bio-augmentation and bio-stimulation by in situ
hybridization and microelectrode. Water Research 37, 2206–2216.
Stephenson, D. & Stephenson, T. 1992 Bio-augmentation for enhanc-
ing biological wastewater treatment. Biotechnology Advances 10,
549–559.
Tchelet, R., Meckenstock, R., Steinle, P. & van der Meer, J.R. 1999
Population dynamics of an introduced bacterium degrading
Enhancing biological nitrogen removal 551

chlorinated benzenes in a soil column and in sewage sludge.
Biodegradation 10, 113–125.
UNEP 1991 Tannery and the Environment: A Technical Guide to
Reducing the Environmnetal Impact of Tannery Operations. Paris:
UNEP/IEO, UN Publication series III. ISBN 92-807-1276-4.
Wagner, M., Rath, G., Koops, H.P., Flood, J. & Amann, R. 1996 In
situ analysis of nitrifying bacteria in sewage treatment plants.
Water Science and Technology 34, 237–244.
Watanabe, K., Yamamoto, S., Hino, S. & Harayama, S. 1998
Population dynamics of phenol-degrading bacteria in activated
sludge determined by gyrB-targeted quantitative PCR. Applied and
Environmental Microbiology 64, 5000–5003.
Wenderoth, D.E., Rosenbrock, P., Abraham, W.-R., Pieper, D.H. &
Hofle, M.G. 2003 Bacterial community dynamics during bio-
stimulation and bio-augmentation experiments aiming at chloro-
benzene degradation in groundwater. Microbial Ecology 46, 161–
176.
Ying, W.C., Bonk, R.R., Lloyd, V.J. & Sojka, S.A. 1986 Biological
treatment of a landfill leachate in sequencing batch reactors.
Environmental Progress 5, 41–50.
552 S. Leta et al.

Anti-Helicobacter pylori substances from endophytic fungal cultures
Y. Li, Y.C. Song, J.Y. Liu, Y.M. Ma and R.X. Tan*Institute of Functional Biomolecules, State Key Laboratory of Pharmaceutical Biotechnology, Nanjing University,Nanjing 210093, People’s Republic of China*Author for correspondence: Tel.: +86-25-83592945, Fax: +86-25-83302728, E-mail: [email protected]
Keywords: Anti-Helicobacter pylori, Aspergillus sp. CY725, Cynodon dactylon, endophyte, helvolic acid
Summary
The human pathogenic bacterium Helicobacter pylori has been ascertained to be an aetiological agent for chronicactive gastritis and a significant determinant in peptic and duodenal ulcer diseases. Endophytic metabolites arebeing recognized as a versatile arsenal of antimicrobial agents, since some endophytes have been shown to possesssuperior biosynthetic capabilities owing to their presumable gene recombination with the host, while residing andreproducing inside the healthy plant tissues. A total of 32 endophytic fungi isolated from the medicinal herbCynodon dactylon (Poaceae) were grown in in vitro culture, and the ethyl acetate extracts of the cultures wereexamined in vitro for the anti-H. pylori activity. As a result, a total of 16 endophyte culture extracts were identifiedas having potent anti-H. pylori activities. Subsequently, a detailed bioassay-guided fractionation of the extract of themost active endophyte (strain number: CY725) identified as Aspergillus sp., was performed to afford eventually fouranti-H. pylori secondary metabolites. The four isolated compounds were identified through a combination ofspectral and chemical methods (IR, MS, 1H- and 13C-NMR) to be helvolic acid, monomethylsulochrin, ergosteroland 3b-hydroxy-5a,8a-epidioxy- ergosta-6,22-diene with corresponding MICs of 8.0, 10.0, 20.0 and 30.0 lg/ml,respectively. The MIC of ampicillin co-assayed as a reference drug against H. pylori was 2.0 lg/ml. Furthermore,preliminary examination of the antimicrobial spectrum of helvolic acid, the most active anti-H. pylori metabolitecharacterized from the endophyte culture, showed that it was inhibitory to the growth of Sarcina lutea,Staphylococcus aureus and Candida albicans with MICs of 15.0, 20.0 and 30.0 lg/ml, respectively.
Introduction
Helicobacter pylori, an aetiologic agent for chronicactive gastritis, has been recognized as a significantdeterminant in peptic and duodenal ulcer disease (Ge-bert et al. 2003). Sustained infection with this bacteriumcould lead to development of gastric cancer (Moran &Upton 1986). Unfortunately, H. pylori cannot be easilyeradicated after its invasion. In order to control theexpansion of its infection, combination therapy utilizingproton pump inhibitors and antibacterial agents has tobe applied (Bazzoli et al. 1994; Bayerdorffer et al. 1995;Bell et al. 1995), although an efficient single-agenttherapy is highly preferable for better patient compli-ances with weaker or negligible side effects (Grahamet al. 1992; Logan et al. 1994). Furthermore, H. pylori isapt to develop drug-resistance after a period of treat-ment (Sharara et al. 2002). Accordingly, it is imperativeto search for new anti-H. pylori agents.In view of the fact that endophytes, ubiquitous in
healthy tissues of almost all plants investigated so far,have been accepted as a rich source of bioactive metab-olites (Tan & Zou 2001), we screened for anti-H. pylori
substances the ethyl acetate extracts of cultures ofendophytic fungi harboured by Cynodon dactylon(Poaceae), a Chinese medicinal herb used locally fortreating hepatitis (Xie et al. 1996). In this paper, we wishto present the screening of the thirty-two endophyticfungal culture extracts, and a detailed fractionation offour anti-H. pylorimetabolites from the most active one.
Materials and methods
Isolation and identification of endophytes
Following the procedure detailed elsewhere (Lu et al.2000), a total of 32 cultivable endophytic fungal isolateswas obtained from the surface-sterilized fresh leaves ofC. dactylon within 3 h after its being collected in earlyNovember 2001 from the seashore with certain salinitynear Sheyang Port on the Yellow Sea. The endophyticfungus, strain CY725, whose extract afforded the mostactive anti-H. pylori effects, was then identified as anAspergillus sp. by Dr. Y.C. Song, through comparisonof the morphological characteristics and the ascertained
World Journal of Microbiology & Biotechnology (2005) 21:553–558 � Springer 2005
DOI 10.1007/s11274-004-3273-2

mechanism of sporulation, which are substantiallysimilar to those observed with other Aspergillus species(Frisvad & Samson 1990; Barnett & Hunter 1998).Finally, the endophytic nature of the strain was con-firmed by the vital test as described earlier (Lu et al.2000).
Test microorganisms
A reference strain of H. pylori (ATCC 43504) and fiveclinical isolates of the pathogen (obtained from antralbiopsies of child and adult patients) were used in thisstudy. Also used herein as test microorganisms for apreliminary investigation of the antimicrobial spectrumwere nine human microbial pathogens including fivebacteria: Bacillus subtilis, Pseudomonas fluorescens, Esc-herichia coli, Sarcina lutea and Staphylococcus aureus, aswell as three fungi: Aspergillus niger, Trichophytonrubrum and Candida albicans.
Antimicrobial screenings
The anti-H. pylori screening with the ethyl acetateextracts was performed by the disk diffusion method(DDM) (Zaika 1998). Briefly, a given volume (10 ll) ofeach of the 32 endophytic extract solutions at 1 mg/mlin dimethyl sulphoxide (DMSO) was dropped on astandard disk (u ¼ 5 mm) which was subsequentlyplaced on a Columbia agar plate pre-inoculated with0.1 ml H. pylori suspension in Brucella broth(1 · 108 c.f.u./ml). All test plates were then incubatedunder microaerophilic conditions for 72 h at 37 �C,followed by measurement of the diameters of theinhibition zone around each of the extract-carryingdisks. The procedure was repeated for the antimicrobialassay against the other test microbes except the incuba-tion for fungi were carried out at 28 �C for 96 h.
MIC measurements
The minimum inhibitory concentration (MIC) wasassessed with the agar dilution method (Megraud et al.1999). Briefly, 1 ml of each stock solutions in sterilewater at given concentrations of every isolated fungalmetabolite (possibly lower amounts of DMSO wereused for the desired intermiscibility) was separatelyadded into petri dishes containing 8 ml of unsolidifiedColumbia agar base supplemented with 1 ml of horseserum. Final concentrations of each compound in themedium were set to be 40.0, 35.0, 30.0, 25.0, 20.0, 15.0,10.0, 5.0 and 2.5 lg/ml with a DMSO concentrationlower than 1%. Different H. pylori strains taken fromthe seed cultures were immediately diluted withBrucella broth with the bacterial cells at approximately1 · 108 c.f.u./ml in the seed liquors. Subsequently,0.1 ml of each of seed liquors was inoculated ontothe surface of the sample-supplemented agar plates,followed by incubation at 37 �C for 72 h in ananaerobic jar (containing: 85% N2, 10% CO2 and 5%
O2). The MICs were defined as the lowest concentra-tion at which no microbial growth could be observed.The positive reference ampicillin (AMP) was co-assayedat concentrations of 0.125, 0.25, 0.5, 1.0, 2.0, 4.0 and8.0 lg/ml.The antibacterial and antifungal activities were
evaluated separately on LB (yeast extract 5, peptone10, NaCl 5 and agar 20 g/l, pH 7.0) and PDA platesseeded with the suspension of each test bacterium andfungus (all at a concentration of 106 cells and/or sporesper milliliter) followed by incubation at 37 �C forbacteria (48 h) and 28 �C for fungi (96 h), respectively.Each of the four metabolites was tested at concentra-tions 0 (blank control), 10, 20, 30 and 40 lg/ml,respectively, with MICs determined by judging visuallythe growth of every test microbe. For antifungalevaluations, ketoconazole (KCZ) was co-assessed aspositive control at concentrations of 0.1, 0.5, 1, 10, 20and 50 lg/ml. All experiments were conducted intriplicate.
Fermentation and preliminary screening
The inoculum was prepared by introducing the periph-ery of 7-day-old petri dish cultures of each of the 32endophytes into 500 ml flasks containing 200 ml of thebroth (potato: 200 g, dextrose: 20 g, H2O: 1000 ml),followed by shaking (150 rev/min) continuously for4 days at 28±1 �C. The follow-up culture was accom-plished by adding the inoculum (30 ml) into 1000 mlErlenmeyer flasks containing 500 ml of the same broth,and then shaking for 10 days in the same conditions.The fermentation broth of each endophyte was filtered,and the filtrate concentrated in vacuo into a smallervolume. The concentrated filtrates were extractedexhaustively with EtOAc, and the extracts obtainedwere tested at a concentration of 1 mg/ml (dry extract/medium) for the potential anti-H. pylori and otherantimicrobial activities as mentioned above.The culture liquor (20 ml) of the endophyte Aspergil-
lus sp. CY725, affording the most promising antibacte-rial action, was added to 250-ml Erlenmeyer flaskscontaining 15 g grain, 0.5 g yeast, 0.1 g sodium tartrate,0.01 g FeSO4Æ7H2O, 0.1 g sodium glutamate, 0.1 mlpure corn oil and 30 ml water. The fermentation,accomplished in a total of 400 Erlenmeyer flasks, wassubsequently progressed by standing for another30 days at 28±1 �C.
Extraction and fractionation
The fermentation broths of Aspergillus sp. CY725 werecombined and extracted three times with methanol. Invacuo evaporation of methanol from the extract gave abrown oily residue (314 g), which was suspended inwater and partitioned successively with ethyl acetate andn-butanol, respectively. The in vitro test showed that theactive compound(s) was (were) in the ethyl acetatefraction (153 g), which was therefore chromatographed
554 Y. Li et al.

on a silica gel column (1000 g, 200–300 mesh) elutingwith a CHCl3-MeOH gradient (1:0fi0:1, v/v) to give fivefractions (F-1, 103.5 g; F-2, 10.1 g; F-3, 12.8 g; F-4,10.5 g; F-5, 15.0 g), of which, F-2 and F-3 were furtherascertained to be bioactive. Subsequently, F-2 was re-chromatographed over silica gel (150 g, 200~300 mesh)using CHCl3-MeOH mixtures of a growing polarity(200:1fi10:1, v/v) to afford 3 (8 mg), 4 (11 mg) and amixture F-2-1 (5 g), from which 220 mg of 2 wereobtained upon further chromatography over a silica gelcolumn (150 g, 200�300 mesh) eluting with an isocraticsolvent mixture CHCl3-MeOH (10:1, v/v). Repeatedseparation of F-3 on silica gel column in the samemanner followed by gel filtration over Sephadex LH-20gave helvolic acid (1, 26 mg).
Examination of the sterile medium for presence ofcompounds 1-4
The sterile medium was extracted following exactlythe procedure as with that of the solid-substrateculture. The presumable presence of any of thefour isolates in the afforded extract was examinedby LC-MS comparisons.
Results and discussion
Some endophytes have been confirmed to be excellentproducers of bioactive substances such as plant growthregulators, antimicrobial agents and insecticides (Tan &Zou 2001; Carroll 1988). In our preliminary antimicro-bial screening of the ethyl acetate extracts originatingfrom thirty-two cultivable endophytes residing in healthyleaves of Cynodon dactylon, sixteen showed pronouncedantimicrobial activities against the test H. pylori strains,nineteen against B. subtilis, six against P. fluorescens, sixagainst E. coli, thirteen against T. rubrum, eight againstA. niger and twenty against C. albicans (Table 1). Thisfinding reinforced the assumption that endophytes couldbe a promising source of antimicrobial substances, thatmay play key and/or helpful roles in protecting the hostplants from various phytopathogenetic microbes (Tan &Zou 2001). In order to characterize the anti-H. pyloriconstituent(s) from the most bioactive culture extractderived from the endophytic fungus under the isolationnumber CY 725, the identification of the producingorganism and a scaled-up fermentation were performed.The endophytic fungal isolate (CY 725) was identified
as Aspergillus sp. according to the morphological
Table 1. Antimicrobial effects of ethyl acetate extracts of cultures of 32 endophytic fungi from Cynodon dactylona.
Strains Hp 43504b Hp 036 b Bs b Pf b Ec b Tr b An b Ca b
CY705b + + ++ +++ ) ) ) )CY705a ) ) + ++ ) ) ) )ZY802 ) ) ++ +++ ++ ) + +
CY 714a ) ) +++ + ) ) ) +
ZY 801-2 + + +++ +++ ) ) ) +
ZY 802b ) + + ) ) + + +
ZY 801a ) + ) ) ) ) ) )CY 703b ) ) + ) ) ) ) +
ZY 804-1 + + + ) ) ) ) +
CY 703-1 + + + ) +++ + ++ +++
ZY 804a + + + +++ + + ++ +
CY 702a’ ) ) ) ) ) ) ) )CY 701c + + ) ) + + ) +
CY 705a +++ ++ ) ) ) + ) )CY 704a’’ ) ) + ) ) ) ) +
CY 701-2 + + ) ) ) + ) +
ZY 801-3 ) ) ++ ) + ) ) )ZY 803a ) ) +++ ) ) ++ + +
CY 701a ) ) + ) ) ) ) )ZY 801a + + ++ ) ) ++ +++ ++
CY 703a ) ) ++ ) ) + + +
CY 701c + + ) ) ) + + )CY 704a’ + + ++ ) ) + ) +
CY 703b ) + + ) ) ) ) )CY 702b ++ ++ ) ) ) ) ) )CY 701a + ++ ) ) ) ) ) +
CY 703a ) ) ) ) ) ) ) )CY 704a’ ) ) ) ) ) + ) +
CY 7016 + ++ ) ) ) ) ) )CY 701-1 + ++ ) ) ) ) ) )CY 703-1 ) ) ) ) ) ) ) )CY 725 +++ +++ +++ ) ++ + ) +
a Inhibition expressed by the diameter of inhibition zones: ), no inhibition; +, < 10 mm; ++, 10–15 mm; +++, >15 mm. b Hp –
Helicobacter pylori; Bs – Bacillus subtilis; Pf – Pseudomonas fluorescens; Ec – Escherichia coli, Sa – Staphylococcus aureus; An – Aspergillus
niger; Tr – Trichophyton rubrum; Ca – Candida albicans.
Anti-H. pylori substances from endophytic fungus 555

characters below. The newly isolated mycelium grewwell on PDA to produce fruiting bodies easily. Colonieswith a regular margin attained 35–45 mm in diameterafter incubation on PDA at 28 �C for 4 days and tookon a weak green colour in PDA plates. Conidiophoreswere upright, simple, terminating in a globose swelling,bearing phialides at the apex; condia (phialospores)1-celled and globose. These morphological observations ofthe endophytic fungus were nearly identical with thosedescribed for other Aspergillus species (Frisvad &Samson 1990; Barnett & Hunter 1998). A living cultureis being maintained in our institute.Through a bioassay-guided fractionation of the ethyl
acetate extract of the endophytic culture, four main anti-H. pylori secondary metabolites (1–4) were obtained. Onthe basis of spectral and physical data, compounds 1–4were identified as helvolic acid (Oxley 1966; Okuda et al.1967), monomethylsulochrin (Turner 1965), ergosterol(Cushley & Filipenko 1976), 3b-hydroxy-5a,8a-epidi-oxy-ergosta- 6,22-diene (Ma et al. 1994), respectively(Figure 1). To exclude the possibility that any of thefour isolated metabolites might have originated from the
medium materials used in the study, an LC-MS exam-ination was therefore conducted with the ethyl acetateextract of the blank sterile medium treated identically towith fungal cultures. Howevert, none of the four fungalmetabolites (1–4) could be detected, indicating that allwere actually produced by the endophytic fungus.Concerning the results of antimicrobial assays, the
four identified metabolites 1–4 displayed significantgrowth inhibition against all the six strains of H. pyloriwith the MICs of 8.0, 10.0, 20.0 and 30.0 lg/ml,respectively (Table 2). For a preliminary understandingof the antimicrobial spectrum, the four compounds weretested additionally for the inhibitory effects on otherhuman pathogens including five bacteria: B. subtilis,P. fluorescens, E. coli, S. lutea and S. aureus, as well asthree fungi: T. rubrum, A. niger and C. albicans. Assummarized in Table 2, helvolic acid (1) was bacterio-static to S. lutea and S. aureus, and fungistatic toC. albicans whereas monomethylsulochrin (2) was bac-teriostatic to S. lutea only. However, ergosterol (3) and3b-hydroxy-5a, 8a-epidioxy-ergosta-6,22-diene (4) didnot show any discernible inhibitory effects on the six test
O COOMeOH
OMeOMeMe OH
H
HOOC Me
MeOAc
MeH
Me
O
O
Me
MeH
H
OAc
HO
1
3 5 7
910
11 13
15
17
18
19
20
21
2324
25
26
27
28
1
5
8
6
22
3
HO
OO
3
1
4
2
Figure 1. Structures of helvolic acid (1), monomethylsulochrin (2), ergosterol (3) and 3b-hydroxy-5a,8a- epidioxy-ergosta-6,22-diene (4).
Table 2. The MIC values (lg/ml) of compounds 1-4.
1 2 3 4 AMPa KCZa
H. pylori 43504 5.0 10.0 15.0 30.0 2.0
H. pylori 001 8.0 5.0 20.0 5.0 2.0
H. pylori 016 5.0 10.0 10.0 30.0 2.0
H. pylori 018 8.0 5.0 10.0 30.0 2.0
H. pylori 019 8.0 10.0 10.0 30.0 2.0
H. pylori 036 8.0 10.0 20.0 30.0 2.0
S. lutea 15.0 30.0 >100 >100 1.0
S. aureus 20.0 >100 >100 >100 2.0
C. albicans 30.0 >100 >100 >100 1.0
a AMP – ampicillin; KCZ – ketoconazole.
556 Y. Li et al.

microbes. The results observed with insusceptiblemicrobes are not tabulated. As to the magnitude ofthe antimicrobial action, the presently ascertained MICvalues of helvolic acid (1) (8.0 lg/ml) and monometh-ylsulochrin (2) (10.0 lg/ml) demonstrated that bothcompounds are fairly comparable to the promisinglypotent anti-H. pylori natural products reported previ-ously, such as alkaloids (Hamasaki et al. 2000), flavo-noids (Bae et al. 1999; Ohsaki et al. 1999), quinines(Dekker et al. 1998; Taniguchi et al. 2002), peptides(Iwahori et al. 1997) and rotenoid (Takashima et al.2002). Helvolic acid (1), characterized previously fromthe culture broth of Cephalosphorium caerulens, showsantibiotic activity against a wide range of microorgan-isms including Streptococcus (MIC 6.25 lg/ml), Salmo-nella typhi (MIC 100.0 lg/ml), Shigella lutea (MIC0.8 lg/ml) (Okuda 1967; Cole 1981). Furthermore,monomethylsulochrin (2), produced by the fungibelonging to the genera Aspergillus (Turner 1965;Inamori 1983), Penicillium (Mahmoodian 1964), Oos-pora (Curtis 1966) and Rhizoctonia (Ma et al. 2004), hasbeen shown to inhibit eosinophils (IC50 0.3 lM), whichmay play important roles in allergic diseases such asasthma and atopic dermatitis (Ohashi 1999). 3b-Hydro-xy-5a, 8a- epidioxy-ergosta-6,22-diene (4), widely dis-tributed in fungi and lichens, shows potent cytotoxity(LD50 11.7 lg/ml) against mouse lymphaemia L-1210/v/c strain, and to KB cell (LD50: 12.3 lg/ml) derived froma human epidermoid carcinoma of the mouth (Guna-tilaka 1981; Matsueda 1985). In conclusion, the first-time characterization of four anti-H. pylori metabolites,helvolic acid (1), monomethylsulochrin (2), ergosterol(3) and 3b-hydroxy-5a,8a-epidioxy- ergosta-6,22-diene(4) from a Cynodon dactylon endophyte culture high-lights the possibility that some endophytes in naturecould be efficient producers of anti-H. pylori and/orbacterial ulcer-treating compounds; the compounds mayhave clinical potential in the future.
Acknowledgements
The work was co-financed by grants for RXT from theNational Natural Science Foundation of China (No.30171104) and from the Ministry of Science & Technol-ogy-National Marine 863 projects (Nos. 2003AA624010and 2003AA 624110).
References
Bae, E.A., Han, M.J. & Kim, D.H. 1999 In vitro anti-Helicobacter
pylori activity of some flavonoids and their metabolites. Planta
Medica 65, 442–443.
Barnett, H.L. & Hunter, B.B. 1998 Illustrated Genera of Imperfect
Fungi, 4th edn. pp. 94–95. Minnesota: APS Press. ISBN 0-89054-
192-2.
Bayerdorffer, E., Miehlke, S., Mannes, G.A., Sommer, W., Hochter J.,
Weingart, W., Helewein, H., Klann, T., Simon, W., Schmitt, E.,
Bastlein, A., Eimiller, R., Hatz, N., Lehn, P., Dirschedl, P. &
Stolte, M. 1995 Double-blind trial of omeprazole and amoxicillin to
cure Helicobacter pylori infection in patients with duodenal ulcer.
Gastroenterology 108, 1412–1417.
Bazzoli, F., Zagari, R.M., Fossi, S., Pozzato, P., Alampi, G.,
Simoni, P., Sottili, S., Roda, A. & Roda, E. 1994 Short-term
low-dose triple therapy for the eradication of Helicobacter pylori
infection. European Journal of Gastroenterology and Hepatology
6, 773–777.
Bell, G.D., Powell, K.U., Burridge, S.M., Bowden, A.F., Atoyebi, W.
& Bolton, G.H. 1995 Rapid eradication of Helicobacter pylori
infection. Alimentary Pharmacology and Therapeutics 9, 41–46.
Carroll, G.C. 1988 Fungal endophytes in stems and leaves: from latent
pathogen to mutualistic symbiont. Ecology 69, 2–9.
Cole, R.J. & Cox, R.H. 1981 Handbook of Toxic Fungal Metabolites.
pp. 806–807. New York: Academic Press. ISBN 0121797600.
Curtis, R.F., Harries, P.C., Levi, J.D., & Phillips, D.M. 1966 The
biosynthesis of phenols. Part X. Mutation and radioactive tracer
studies relating to the biosynthesis of sulochrin. Journal of the
Chemical Society 168–174.
Cushley, R.J. & Filipenko, J.D. 1976 13C fourier transform N.M.R.
XIII-reassignment of the 13C spectrum of ergosterol. Organic
Magnetic Resonance 8, 308–309.
Dekker, K.A., Inagaki, T., Gootz, T.D., Huang, L.H., Kojima, Y.,
Kohlbrenner, W.E., Matsunaga, Y., Mcguirk, P.R., Nomura, E.,
Sakakibara, T., Sakemi, S., Suzuki, Y., Yamauchi, Y. & Kojima,
N. 1998 New quinolone compounds from Pseudonocardia sp. with
selective and potent anti-Helicobacter pylori activity: taxonomy of
producing strain, fermentation, isolation, structral elucidation and
biological activities. The Journal of Antibiotics 51, 145–152.
Frisvad, J.C. & Samson, R.A. 1990 Chemotaxonomy and morphology
of Aspergillus fumigatus and related taxa. In Samson RA, Pin J I.
Modern Concepts in Penicillum and Aspergillus Classification, eds.
Samson, R.A., Pin, J.I. pp. 201–208. New York: Plenum Press.
ISBN 0-306-43516-0.
Gebert, B., Fischer, W., Weiss, E., Hoffmann, R. & Haas, R. 2003
Helicobacter pylori vacuolating cytotoxin inhibits T lymphocyte
activation. Science 301, 1099–1102.
Graham, D.Y., Lew, G.M., Malaty, H.M., Evans, D.J., Klein, P.D.,
Alpert, L.C. & Genta, R.M. 1992 Factors influencing the eradi-
cation of Helicobacter pylori with triple therapy. Gastroenterology
102, 493–496.
Gunatilaka, A.A.L., Goplchand, Y., Schmitz, L. & Djerassi C. 1981
Minor and trace sterols in marine invertebrates. 26. Isolation and
stracture elucidation of nine new 5a,8a-epidioxy sterols from four
marine organisms. Journal of Organic Chemistry 46, 3860–3866
Hamasaki, N., Ishii, E., Tominaga, K., Tezuka, Y., Nakaoka, Y.,
Kadota, S., Kuroki, T. & Yano, I. 2000 Highly selective antibac-
terial activity of novel alkyl quinolone alkaloids from a Chinese
herbal medicine, gosyuyu (wu-chu-wu), against Helicobacter pylori
in vitro. Microbiology and Immunology 44, 9–15.
Inamori, Y., Kato, Y., Kubo, M., Kamiki, T. & Takemoto, T. 1983
Studies on metabolities produced by Aspergillus terreus var. aureus.
I. Chemical structures and antimicrobial activities of metabolites
isolated from culture broth. Chemical and Pharmaceutical Bulletin
31, 4543–4548.
Iwahori, A., Hirota, Y., Sampe, R., Miyano, S., Takahashi, N.,
Sasatsu, M., Kondo, I. & Numao, N. 1997 On the antibacterial
activity of normal and reversed magainin 2 analogs against
Helicobacter pylori. Biological and Pharmaceutical Bulletin 20,
805–808.
Logan, R.P.H., Gummett, P.A., Schaufelberger, H.D., Greaves,
R.R.F.H., Mendelson, G.M., Walker, M.M., Thomas, P.H.,
Baron, J.H. & Misiewicz, J.J. 1994 Eradication of Helicobacter
pylori with clarithromycin and omeprazole. Gut 35, 323–326.
Lu, H., Zou, W.X., Meng, J.C., Hu, J. & Tan, R.X. 2000 New
bioactive metabolites produced by Colletotrichum sp., an endo-
phytic fungus in Artemisia annua. Plant Science 151, 67–73.
Ma, W.G., Li, X.C., Wang, D.Z. & Yang, C.R. 1994 Ergosterol
peroxides from Cryptoporus volvatus. Acta Botanica Yunnanica 16,
196–200.
Anti-H. pylori substances from endophytic fungus 557
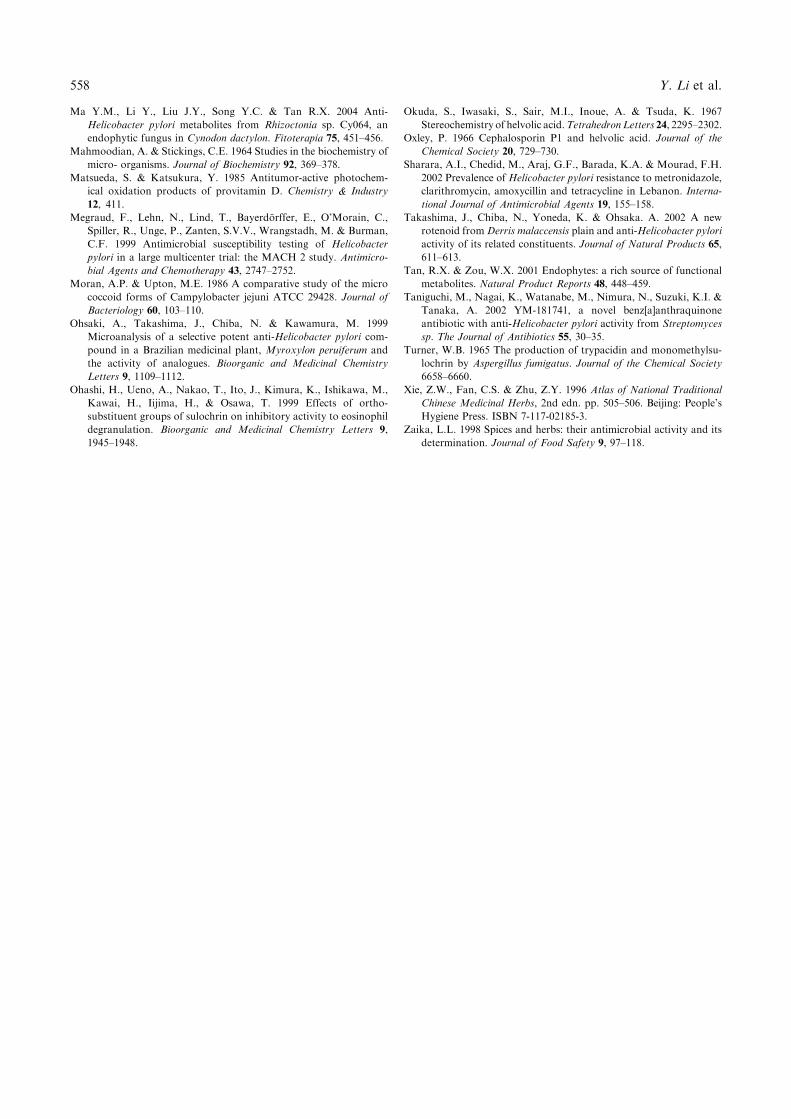
Ma Y.M., Li Y., Liu J.Y., Song Y.C. & Tan R.X. 2004 Anti-
Helicobacter pylori metabolites from Rhizoctonia sp. Cy064, an
endophytic fungus in Cynodon dactylon. Fitoterapia 75, 451–456.
Mahmoodian, A. & Stickings, C.E. 1964 Studies in the biochemistry of
micro- organisms. Journal of Biochemistry 92, 369–378.
Matsueda, S. & Katsukura, Y. 1985 Antitumor-active photochem-
ical oxidation products of provitamin D. Chemistry & Industry
12, 411.
Megraud, F., Lehn, N., Lind, T., Bayerdorffer, E., O’Morain, C.,
Spiller, R., Unge, P., Zanten, S.V.V., Wrangstadh, M. & Burman,
C.F. 1999 Antimicrobial susceptibility testing of Helicobacter
pylori in a large multicenter trial: the MACH 2 study. Antimicro-
bial Agents and Chemotherapy 43, 2747–2752.
Moran, A.P. & Upton, M.E. 1986 A comparative study of the micro
coccoid forms of Campylobacter jejuni ATCC 29428. Journal of
Bacteriology 60, 103–110.
Ohsaki, A., Takashima, J., Chiba, N. & Kawamura, M. 1999
Microanalysis of a selective potent anti-Helicobacter pylori com-
pound in a Brazilian medicinal plant, Myroxylon peruiferum and
the activity of analogues. Bioorganic and Medicinal Chemistry
Letters 9, 1109–1112.
Ohashi, H., Ueno, A., Nakao, T., Ito, J., Kimura, K., Ishikawa, M.,
Kawai, H., Iijima, H., & Osawa, T. 1999 Effects of ortho-
substituent groups of sulochrin on inhibitory activity to eosinophil
degranulation. Bioorganic and Medicinal Chemistry Letters 9,
1945–1948.
Okuda, S., Iwasaki, S., Sair, M.I., Inoue, A. & Tsuda, K. 1967
Stereochemistry of helvolic acid.TetrahedronLetters 24, 2295–2302.
Oxley, P. 1966 Cephalosporin P1 and helvolic acid. Journal of the
Chemical Society 20, 729–730.
Sharara, A.I., Chedid, M., Araj, G.F., Barada, K.A. & Mourad, F.H.
2002 Prevalence of Helicobacter pylori resistance to metronidazole,
clarithromycin, amoxycillin and tetracycline in Lebanon. Interna-
tional Journal of Antimicrobial Agents 19, 155–158.
Takashima, J., Chiba, N., Yoneda, K. & Ohsaka. A. 2002 A new
rotenoid from Derris malaccensis plain and anti-Helicobacter pylori
activity of its related constituents. Journal of Natural Products 65,
611–613.
Tan, R.X. & Zou, W.X. 2001 Endophytes: a rich source of functional
metabolites. Natural Product Reports 48, 448–459.
Taniguchi, M., Nagai, K., Watanabe, M., Nimura, N., Suzuki, K.I. &
Tanaka, A. 2002 YM-181741, a novel benz[a]anthraquinone
antibiotic with anti-Helicobacter pylori activity from Streptomyces
sp. The Journal of Antibiotics 55, 30–35.
Turner, W.B. 1965 The production of trypacidin and monomethylsu-
lochrin by Aspergillus fumigatus. Journal of the Chemical Society
6658–6660.
Xie, Z.W., Fan, C.S. & Zhu, Z.Y. 1996 Atlas of National Traditional
Chinese Medicinal Herbs, 2nd edn. pp. 505–506. Beijing: People’s
Hygiene Press. ISBN 7-117-02185-3.
Zaika, L.L. 1998 Spices and herbs: their antimicrobial activity and its
determination. Journal of Food Safety 9, 97–118.
558 Y. Li et al.

Preliminary research of the RAPD molecular marker-assisted breeding of the edible
basidiomycete Stropharia rugoso-annulata
Pei-Sheng Yan* and Jia-Hui JiangInstitute of Applied Mycology, Laiyang Agricultural University, Laiyang, Shandong 265200, China*Author for correspondence: E-mail: [email protected]
Keywords: Molecular breeding, monokaryotic parent, RAPD genetic distance, Stropharia rugoso-annulata
Summary
The average RAPD molecular genetic distance was proposed as a criterion in selecting monokaryotic parents forcross breeding and predicting the performance of hybrids of the mushroom Stropharia rugoso-annulata. Three groupsof cross pairs or hybrids were recognized based on the average RAPD genetic distance of the monokaryotic parentalpopulation. The RAPD-based molecular genetic distance significantly correlated with hybrid mycelial growth rateand mycelial growth heterosis, and their determination coefficients were 0.9237 and 0.8464 respectively. One of thehybrids in group I showed more vigorous mycelial growth in different pH conditions, incubation temperatures,carbon and nitrogen sources, and higher mushroom yield compared with its dikaryotic parent. These resultssuggested that RAPD-based molecular genetic distance of the monokaryotic parents might be a suitable criterion forselecting monokaryotic parents and predicting the performance of hybrids in mushroom cross breeding.
Introduction
Stropharia rugoso-annulata (King stropharia or Winecap) is a gorgeous, nutritional and functional mushroomwith a pleasant refreshing taste of delicate fragrance,crisp and slightly sweet. The mature mushroom cangrow to an enormous size, with the wine red cap of30 cm in diameter and a weight of five pounds andmore. However, the unveiled younger mushrooms arethe most desirable for human consumption. Kingstropharia is so prolific that its mycelia can grow onraw straw materials. Even at a high temperaturegrowing season, pasteurization of the materials forseveral hours is generally sufficient for successful pro-duction, which is unlike other mushrooms such as thebutton mushroom (Agaricus bisporus) or shiitake mush-room (Lentinula edodes) for which materials need to befermented for more than 2 weeks or sterilized byautoclaving. Obviously, the cultivation of Strophariarugoso-annulata will diversify world production ofmushrooms, which is now gaining more and moreimportance because of their nutritional and functionalproperties. This fungus can also be used in the bioreme-diation of contaminated explosives (such as TNT),chlorophenols and lignin (Scheibner et al. 1997; Schlos-ser et al. 2000; Steffen et al. 2000). Nowadays, Stropha-ria rugoso-annulata is already being cultivated in somecountries (Balazs 1978; Szudyga 1978; Huang 1995;Bonenfant-Magne et al. 1997, 2000; Yan & Li 2001).
However, the main problem faced by growers is the lowbiological efficiency.Cross breeding is routinely exploited in mushroom
strain improvement and crop variety selection. Tradi-tionally, it is thought that there is a relationship betweenyield or yield heterosis and genetic distance as measuredby geographical distance, morphological and physiolog-ical characters and isozyme markers. Although yield-predicting results based on these genetic distanceestimates are not always consistent, breeders continueto recognize the importance of genetic distance in hybriddevelopment programmes. Several reasons for theinconsistent association between genetic distance ofparents and hybrid yield have been given. Geneticdistance or diversity, as measured by geographicaldistance, physiological and biochemical markers, maynot contribute superior cross performance or may notbe linked to loci that contribute to heterosis. In addition,these markers represent only a small fraction of thegenotype, and thus might not adequately reflect geneticdiversity at the level required to predict performance(Smith et al. 1990). Molecular markers such as RFLPand RAPD have been used in crop cross breeding(Smith et al. 1990; Dudley et al. 1991). Smith’s results(1990) showed that genetic distance based on RFLPsaccounted for 87% of the variation in F1 grain yield and76% of the variation in grain yield heterosis, indicatinga strong relationship between RFLP-based geneticdistance and maize grain yield.
World Journal of Microbiology & Biotechnology (2005) 21:559–563 � Springer 2005
DOI 10.1007/s11274-004-3271-4

For mushroom cross breeding, there are two kinds ofparents, one is the dikaryotic parent which is like thediploid in plants, and the other is the monokaryoticparent which is like the haploid in plants. Unlike thehaploid (such as pollen) in plants, monokaryotic parentsof mushrooms can be artificially cultured and easilypreserved and recycled for future use. Therefore, theirgenetic diversity could be analysed before using in crossbreeding without losing the materials. In conventionalmushroom cross breeding, only the dikaryotic parentsare usually selected and evaluated by traditional meth-ods, such as the geographic origin, productivity, mor-phological and physiological characters. Nevertheless, itis the monokaryotic parents that are used directly incross breeding. The difference among dikaryotic parentsmight not accurately reflect the difference amongmonokaryotic parents, as genetic variability might occurduring the meiosis. Results have already confirmed thatgenetic variation had occurred in the single-sporeprogeny of wild Agaricus species, cultivated Agaricusbisporus and Stropharia rugoso-annulata by RAPD data(Khush et al. 1992; Calvo-Bado et al. 2000; Yan et al.2003). As the monokaryotic parents can grow onartificial medium and be preserved for future use, it willbe more accurate to use the genetic diversity or distanceof monokaryotic parents as a criterion to select theparents than that of dikaryotic parents in cross breed-ing. From this new standpoint, we utilized the RAPDmolecular genetic distance between monokaryotic par-ents of Stropharia rugoso-annulata as a criterion to selectthe monokaryotic parents for cross breeding, andinvestigated some biological characteristics of hybridand its dikaryotic parent at the same time, in order toprovide a simple but effective method to predict theheterosis and performance of hybrids in mushrooms.
Materials and methods
Fungal strains
Sixteen monokaryotic parents designated as A, B, C,…,P, which were the same population used in our previousresearch (Yan et al. 2003), were isolated from the dikary-otic parent of strainR0 (available from authors) by single-spore isolation method. PGP medium (potato 200 g,glucose 20 g, peptone 5 g, agar 20 g, distilled water1000 ml, pH 6.0) was used routinely for vegetative culturethroughout this study. Cultures were incubated on PGPmedium at 25 �C and maintained on PGP slant at 4 �C.
Calculation of RAPD molecular genetic distance andgrouping of hybrids
RAPD reactions and calculation of genetic similaritycoefficient (SC) between monokaryotic parents havebeen described previously (YAN et al. 2003). RAPDmolecular genetic distance (GD) was calculated accord-ing to the formula: GD ¼ 1) SC (Nei et al. 1979).
Measurement of mycelial growth rate, heterosis andmushroom yield
Mycelial growth rates of each hybrid of all three groupswere studied by using PGP agar plate (7 cm in diameter)as the culture medium. An agar disc (5 mm diameter)containing the young mycelium was inoculated in thecentre of the PGP agar plate. The inoculated plates wereincubated at 25 �C, and the mycelial growth wasmeasured as it reached the edge of the Petri dish. Threerepetitions were made for each hybrid. The mycelialgrowth heterosis of a hybrid was determined accordingto the formula H ¼ [(F1 ) CK)/ CK · 100], where Hwas heterosis, F1 was the mycelial growth rate of ahybrid, and CK was the mycelial growth rate of thedikaryotic parent.For determination of mushroom yield, the hybrid was
cultivated on wheat straw substrate treated by soakingin 1% lime solution for 24 h. The moisture content ofthe substrate was adjusted to ca. 65%. Two beds (0.4 m2
in size for each bed) were prepared for each strain, and10 kg of wheat straws (on dry base) that were inoculatedwith the corresponding spawn at a proportion of5% (w/w) was used for each bed. The spawn runtemperatures were maintained at 25 ± 1 �C. When thesubstrates were colonized completely by the mycelium,the substrates were then covered with a loam soil casinglayer to a depth of ca. 5 cm. The moisture content of thecasing layer was maintained at 35–40% by regular andlight watering. When mycelium was visible at the casingsurface, the air temperature and relative humidity weremaintained at 20–25 �C and 90–95% respectively forprimordia initiation and fruitbody development. Theyounger fruitbodies with unveiled caps were pickedevery day during fruiting and the fresh weight wasmeasured (Yan & Li 2001). The biological efficiency(BE) was determined as the ratio of harvested mush-room fresh weight to substrate dry weight and expressedas a percentage (%).
Biological characteristics
The following parameters were investigated for theireffects on mycelial growth of a hybrid and its dikaryoticparent R0: carbon sources, nitrogen sources, incubationtemperatures and initial pH value. The basal mediumwas sucrose 50 g, NH4NO3 3 g, MgSO4 Æ 7H2O 1 g,FeSO4 Æ 7H2O 0.1 g, agar 18 g, distilled water 1000 ml,pH 6.0. For the carbon sources tested, the sucrose in thebasal medium was substituted by the same amount ofglucose, fructose, maltose, lactose, semilactose andstarch respectively. For the nitrogen sources tested, theammonium nitrate in the basal medium was substitutedby the same amount of beef extract, peptone, yeastextract, wheat bran, soybean powder, NH4Cl,(NH4)2SO4 and (NH4)2CO3 respectively. PGP agarmedium was used in temperature and pH value exper-iments. Seven different incubation temperatures weretested, namely 5, 10, 15, 20, 25, 30 and 35 �C. Nine
560 P.-S. Yan and J.-H. Jiang

different pH values were tested, namely 4, 5, 6, 7, 8, 9,10, 11 and 12. Different pH values in PGP medium wereadjusted with 0.1 M HCl or 0.1 M NaOH beforeautoclaving. After autoclaving, the media were usedfor experiment directly. The inoculation method andmeasurement of mycelial growth were the same as abovedescribed. All the inoculated dishes were incubated at25 �C, except in the temperature experiment. Threereplicates were performed for each parameter level.
Results and discussion
Grouping of hybrids based on RAPD molecular geneticdistance
Genetic heterogeneity among single-spore isolates fromthe same fruitbodyofStropharia rugoso-annulatahasbeendetected by RAPD in our previous research [Yan et al.(2003), where the similarity values between single-sporeisolates had been presented (Table 1, p. 739)]. In order todevise a simplebut effectivemethod forbreeding, the samepopulation of single-spore isolates was used as themonokaryotic parents in cross breeding, and their RAPDmolecular genetic distances were chosen as a criterion formaking crosses and selecting hybrids (Table 1).According to the genetic distance between pairwisecrosses, three groups of hybrids were recognized. GroupI was the pairwise crosses or hybrids with RAPD geneticdistances significantly higher than the average RAPDgeneticdistanceof themonokaryoticparental population.Group II was the hybrids whose RAPD genetic distanceswere not significantly different from the average RAPDgenetic distance. Group III was the hybrids whose RAPDgenetic distanceswere significantly lower than the averageRAPD genetic distance. As Stropharia rugoso-annulata isa tetrapolar fungus, there are only 25% fertile crossingsamong siblingmonokaryotic parents.Therefore, 33 fertile
crossings or hybrids were obtained totally in our research.Out of these, 8 hybrids belonged to group I, 14 hybridsbelonged togroup II, and11hybridsbelonged togroupIII(Table 2).
Relationship of RAPD molecular genetic distance withmycelial growth heterosis of hybrids
Mycelial growth ability has been found to be positivelycorrelated with fruitbody yield and is an importantcharacteristic for selection in mushroom breeding pro-grammes (Furlan et al. 1997; Salmones et al. 1997;Larraya et al. 2002), therefore, 29 hybrids were sub-jected to measurement of their mycelial growth rates anddetermination of their heterosis. Results showed that thehyphae of all the hybrids in group I grew significantlyfaster than their dikaryotic parent R0 (0.368 cm/day),among which G–P cross showed the highest mycelial
Table 1. Matrix of RAPD genetic distance between monokaryotic parents of Stropharia rugoso-annulata.
A 0
B 0.429 0
C 0.167 0.429 0
D 0.579 0.333 0.474 0
E 0.444 0.200 0.333 0.120 0
F 0.529 0.158 0.529 0.250 0.130 0
G 0.231 0.200 0.385 0.500 0.368 0.333 0
H 0.556 0.400 0.444 0.360 0.333 0.391 0.474 0
I 0.286 0.250 0.286 0.333 0.200 0.263 0.333 0.400 0
J 0.286 0.375 0.286 0.429 0.400 0.474 0.333 0.300 0.250 0
K 0.333 0.294 0.333 0.273 0.143 0.200 0.500 0.429 0.176 0.412 0
L 0.467 0.294 0.467 0.455 0.333 0.300 0.375 0.238 0.294 0.412 0.333 0
M 0.200 0.294 0.333 0.455 0.333 0.400 0.250 0.429 0.294 0.412 0.333 0.333 0
N 0.500 0.222 0.500 0.391 0.364 0.333 0.412 0.182 0.333 0.222 0.368 0.263 0.368 0
O 0.375 0.333 0.375 0.391 0.364 0.429 0.412 0.182 0.222 0.222 0.368 0.263 0.263 0.200 0
P 0.412 0.368 0.294 0.250 0.217 0.364 0.556 0.391 0.263 0.368 0.200 0.500 0.400 0.333 0.333 0
A B C D E F G H I J K L M N N P
Note: D, E, I, P were different monokaryotic parents with A1B1 mating type; B, C, F, G, N, O were different monokaryotic strains with A2B2
mating type; J, K, M were different monokaryotic strains with A1B2 mating type; A, H, L were different monokaryotic strains with A2B1
mating type.
Table 2. Relationship of RAPD genetic distance with mycelial growth
rates and heterosis of different hybridsa.
Types of hybrids Group I Group IIb Group III
Number of hybrids 8 14 11
RAPD Genetic
distance
Mean 0.448 ± 0.058 0.349 ± 0.017 0.244 ± 0.052
Range 0.556 � 0.391 0.368 � 0.333 0.300 � 0.130
Mycelial growth
rates (cm/day)
Mean 0.462 ± 0.048 0.371 ± 0.016 0.279 ± 0.070
Range 0.522 � 0.406 0.397 � 0.346 0.342 � 0.100
Heterosis (%)
Mean 25.4 ± 12.9% 0.71 ± 4.42% )24.1 ± 19.1%
Range 41.8–10.3% 7.9 to )6.0% )7.1 to )72.8%
aMycelial growth rate of dikaryotic parent R0 was 0.368 cm/d.b In group II, four hybrids were contaminated during preservation,
therefore only 10 out of 14 hybrids were used in measurement of
mycelial growth.
Breeding of Stropharia rugoso-annulata 561

growth rate (0.522 cm/day, Table 2). In group II, fourhybrids were lost due to the contamination. Therefore,only 10 out of 14 hybrids were used in mycelial growthmeasurement. Results suggested that only the G–E crossshowed significantly faster growth rate than the dikary-otic parent R0, the others had no significantly differentmycelial growth rate. In contrast, in group III, all thehybrids showed significantly lower mycelial growth ratethan their dikaryotic parent R0, except for H–J, C–Pand C–I crosses, which had no significant differencesfrom their dikaryotic parent R0. Correlation analysisshowed that the correlation coefficients for RAPDmolecular genetic distance with mycelial growth rateand mycelial growth heterosis were 0.9611 and 0.9202respectively, and their determination coefficients were0.9237 and 0.8464 respectively, suggesting that RAPDmolecular genetic distance of monokaryotic strain is asuitable criterion for selecting cross parents and hybridsand predicting the performance of hybrids.
Biological characteristics and mushroom yield of hybrid
The G–P cross, which showed the fastest mycelialgrowth rate among all crosses, was chosen as anindicator to investigate the biological characteristics ofhybrids, and thereafter it was designated as hybrid no. 1.For the temperature experiment, the hyphae of hybridno. 1 grew faster than that of its dikaryotic parent R0 atall tested temperatures, especially for temperatures from15 to 20oC (Figure 1). However, both hybrid no. 1 andits parent R0 could not grow at 35 �C. The pHexperiment showed that hybrid no. 1 grew faster thanits parent R0 at pH 4–10, with no growth at pH 12 forhybrid no. 1 as well as its parent R0 (Figure 2). Hybridno. 1 showed a tendency of growing faster when organicnitrogen sources were used, whereas the parent R0
showed a tendency of growing faster when inorganicnitrogen sources were used (Figure 3). Both hybrid no. 1and its parent R0 could not grow when (NH4)2CO3
served as nitrogen source. There was no significantdifference for mycelial growth between hybrid no. 1 andits parent R0 when different carbohydrates served as
carbon sources, except for glucose on which parent R0
grew faster than hybrid no.1 (Figure 4).For the mushroom yield, the primary results showed
that hybrid no.1 yielded 0.68 kg mushroom/m2, and thebiological efficiency was 68.0%, which was significantlyhigher than that of the parent R0 (yield was 0.42 kgmushroom/m2, and BE was 42.0%). We are nowinvestigating in detail the mushroom qualities, such asthe cap diameter, thickness, firmness, the ratio of capdiameter to stipe length, and also investigating themushroom yield performance of the other hybrids weobtained in this research. Thereafter, we will evaluatethe yield heterosis performance of the hybrids selected,based on the RAPD molecular genetic distance of themonokaryotic parents.RAPD and RFLP markers have been widely applied
in plant breeding (Smith et al. 1990; Dudley et al. 1991;Garcia et al. 1998; Dubreuil & Charcosset 1999). In thisresearch, we primarily demonstrate the effectiveness ofthe RAPD marker-estimated genetic distance ininbreeding of Stropharia rugoso-annulata. Outbreedingamong unrelated monokaryotic strains is more popular
Figure 1. Mycelial growth of hybrid no. 1 and its parent R0 at different
incubation temperatures.
Figure 2. Mycelial growth of hybrid no. 1 and its parent R0 at different
pH value.
Figure 3. Effects of nitrogen sources on mycelial growth of hybrid no.
1 and its parent R0.
562 P.-S. Yan and J.-H. Jiang

than inbreeding among sibling monokaryotic strains forheterothallic mushrooms. As the dominant RAPDmarkers could provide more accurate information onpopulation genetic diversity than traditional methods,we anticipate that the RAPD molecular genetic distancebased on monokaryons derived from different dikary-otic parents should also be useful for predicting hybridperformance in outbreeding of Stropharia rugoso-annu-lata, and perhaps also for other mushrooms.
References
Balazs, S. 1978 Stropharia Growing Problems in Hungary. Report of
the Vegetable Crops Research Institute, Kecskemet, Hungary.
Bonenfant-Magne, M., Magne, C. & Lemoine, C. 1997 Characteriza-
tion of cultivated strains of a new edible mushroom: Stropharia
rugoso-annulata. II. Anatomy, mycelium development and fructi-
fication. Comptes Rendus de l’Academie des Sciences. Serie III,
Sciences de la Vie 320, 917–924.
Bonenfant-Magne, M., Magne, C. & Lemoine. C. 2000 Preparation
d’un substrat de culture pour le strophaire (Stropharia rugoso-
annulata) par trempage de residus ligno-cellulosiques agricoles.
Canadian Journal of Botany 78, 175–180.
Calvo-Bado, L., Noble, R., Challen, M., Dobrovin-Pennington, A. &
Elliott, T. 2000 Sexuality and genetic identity in theAgaricus section
Arvenses. Applied and Environmental Microbiology 66, 728–734.
Dubreuil, P. & Charcosset, A. 1999 Relationships among maize inbred
lines and populations from European and North-American origins
as estimated using RFLP markers. Theoretical and Applied
Genetics 99, 474–480.
Dudley, J.W., Saghai Maroof, M.A., & Rufener, G.K. 1991 Molecular
markers and grouping of parents in maize breeding programs.
Crop Science 31, 718–723.
Furlan, S.A., Virmond, L.J., Miers, D.A., Bonatti, M., Gern, R.M.M.
& Jonas, R. 1997 Mushroom strains able to grow at high
temperatures and low pH values. World Journal of Microbiology
and Biotechnology 13, 689–692.
Garcia, E., Jamilena, M., Alvarez, J.I., Arnedo, T., Oliver, J.L. &
Lozano, R. 1998 Genetic relationships among melon breeding lines
revealed by RAPD markers and agronomic traits. Theoretical and
Applied Genetics 96, 878–885.
Huang, N. 1995 Classification and characterization of Stropharia
rugoso-annulata. Edible Fungi 6, 11.
Khush, R.S., Becker, E. & Wach, M. 1992 DNA amplification
polymorphisms of the cultivated mushroom Agaricus bisporus.
Applied and Environmental Microbiology 58, 2971–2977.
Larraya, L. M., Idareta, E., Arana, D., Ritter, E., Pisabarro, A.G. &
Ramirez. L. 2002 Quantitative trait loci controlling vegetative
growth rate in the edible basidiomycete Pleurotus ostreatus.
Applied and Environmental Microbiology 68, 1109–1114.
Nei, M. & Li, W.H. 1979 Mathematic model for studying genetic
variation between species in terms of restriction endonuclease.
Proceedings of the National Academy of Sciences of the United
States of America 76, 5269–5273.
Salmones, D., Gaitan-Hernandez, R., Perez, R. & Guzman, G. 1997
Studies on genus Pleurotus. VIII. Interaction between mycelial
growth and yield. Revista Iberoamericana de Micologia 14, 173–
176.
Scheibner, K., Hofrichter, M., Herre, A. & Michels, J. 1997 Screening
for fungi intensively mineralizing 2,4,6-treinitrotoluene. Applied
Microbiology and Biotechnology 47, 452–457.
Schlosser, D., Grey, R., Hofer, C. & Fahr, K. 2000. Degradation of
chlorophenols by basidiomycetes. In Bioremediation of contami-
nated soils, eds. Wise, D.L., Trantolo, D.L., Cichon, E.J., Inyang,
H.I. & Stottmeister, U. pp. 393–408. New York: Marcel Dekker
Inc. ISBN 0824703332.
Smith, O.S., Smith, J.S.C., Bowen, S.L., Tenborg, R.A. & Wall, S.J.
1990 Similarities among a group of elite maize inbreds as measured
by pedigree, F1 grain yield, grain yield, heterosis and RFLPs.
Theoretical and Applied Genetics 80, 833–840.
Steffen, K.T., Hofrichter, M. & Hatakka, A. 2000 Mineralisation of14C-labelled synthetic lignin and ligninolytic enzyme activities of
litter-decomposing basidiomycetous fungi. Applied Microbiology
and Biotechnology 54, 819–825.
Szudyga, K. 1978 Stropharia rugoso-annulata. In The Biology and
Cultivation of Edible Mushrooms, eds. Chang, S.T. & Hayes, W.A.
pp. 559–571. New-York: Academic Press. ISBN 0-12-168050-9.
Yan, P.-S. & Li, G.-F. 2001 High yield cultivation of Stropharia
rugoso-annulata. Edible Fungi (extra issue), 19–20.
Yan, P.-S., Jiang, J.-H., Li, G.-F. & Deng, C.-L. 2003 Mating system
and DNA polymorphism of monokaryons with different mating
type of Stropharia rugoso-annulata. World Journal of Microbiology
and Biotechnology 19, 737–740.
Figure 4. Effects of carbon sources on mycelial growth of hybrid no. 1
and its parent R0.
Breeding of Stropharia rugoso-annulata 563

Determination of poly-b-hydroxybutyrate (PHB) production by some Bacillus spp.
Mirac Yilmaz1,*, Haluk Soran1, and Yavuz Beyatli21Hacettepe University, Faculty of Education, Department of Science and Mathematics Fields in Secondary Education,Ankara, Turkey2Department of Biology, Faculty of Science and Arts, Gazi University, Ankara, Turkey*Author for correspondence: Tel.: +90-312-297 86 00, Fax:+90-312-299 20 83. E-mail: [email protected]
Keywords: Bacillus, bioplastic, isolation, PHB, soil
Summary
In this study, 29 strains of the genus Bacillus were isolated from different soil samples which were taken fromgrasslands of Ankara, Turkey and were identified as B. brevis, B. sphaericus, B. cereus, B. megaterium, B. circulans,B. subtilis, B. licheniformis and B. coagulans. Two strains, B. sphaericusATCC 14577 and B. subtilisATCC 6633 werealso included in this study. Poly-b-hydroxybutyrate (PHB) production by these strains was determined by thespectrophotometric method, and it was found that PHB production ranged from 1.06–41.67% (w/v) depending on thedry cell weight. The highest PHB production and productivity percentage was found in B. brevis M6 (41.67% w/v).
PHB and its copolymers have been drawing considerableindustrial interest as biodegradable and/or biocompati-ble. They are used in packaging, medicine and agriculturefor a wide range of applications. PHB is accumulated asintracellular granules by many prokaryotic organisms(including Alcaligenes spp., Bacillus spp., Azotobacterspp., Pseudomonas spp.) as they enter the stationaryphase of growth, to be used later as an internal reserve ofcarbon and energy (Lee 1996, Braunegg et al. 1998). Theaim of the present work was selection of Bacillus spp.PHB producers. In this study, the Bacillus spp. from soilwere isolated and identified, and their PHB productionwas determined.About 15–20 g of soil samples scraped within 5–8 cm
depth with a sterile spatula were collected from nativegrass lands in eight areas of Ankara, Turkey. The sampleswere placed in sterile plastic bags and stored at 4 �C. Eachgram of the sample was suspended in 9 ml sterile distilledwater and shaken vigorously for 2 min. The samples wereheated at 60 �C for 60 min in water bath. Than the liquidwas serially diluted in sterile distilled water, and dilutionsfrom 10)1 to 10)7 were plated on nutrient agar medium.Plates were incubated at 30 �C for 24–48 h. In theidentification process, Bacillus species were initiallyselected based on the Gram reaction, spore morphologyand the catalase test. The isolates were then characterizedby their growth at various temperatures (5, 30, 40, and65 �C) and at different pH values (5.7, 6.8), tolerance ofdifferent salt levels (2, 4 and 10 g NaCl/100 ml), produc-tion of gas from glucose and reduction of nitrate. Inaddition esculin and starch hydrolysis, production of acidfrom D-glucose, D-mannitol, lactose, galactose, sucrose,
raffinose, D-xylose, L-arabinose, fructose and maltose(1 g/100 ml) were also examined. These results obtainedfrom the tests mentioned above were compared with thestandard taxonomic descriptions from Sneath (1986) andthe Bacillus species were identified. The bacterial strainswere cultivated in nutrient broth (NB) which contained(per l) 1 g lab-lemco powder, 2 g yeast extract, 5 gpeptone and 5 g NaCl. The pH was adjusted to 6.8 with0.01 M HCl and 0.01 M NaOH. Fermentations werecarried out in 250 mlErlenmeyer flasks containing 100 mlof culture medium. The temperature was maintained at30 �C, and the agitation was maintained at 100 rev/min.The cultures were inoculated with 2% (v/v) inocula.Determination of the amount of PHB was performed
chemically. Bacteria were grown on nutrient brothmedium at 30 �C for 48 h on a shaker. Suspensions ofcultures were centrifuged at 6000 · g for 30 min. Thenthe pellets were suspended in 5 ml of sterile water andhomogenized, using ultrasonic treatment (5 min.). To2 ml of the cell suspension was added 2 ml of 2 M HCland it was heated at boiling temperature for 2 h in awater bath and the tubes were centrifuged at 6000 · gfor 20 min. Five millilitre of chloroform were added tothe resulting precipitate. The test tubes were leftovernight at 28 �C on a shaker at 150 rev/min. Thenthe contents of the test tubes were centrifuged at6000 · g for 20 min, and extracted with 0.1 ml ofchloroform, and were dried at 40 �C. Five millilitre ofconcentrated sulphuric acid was added. The tubes wereheated at 100 �C in a water bath for 20 min. Aftercooling to 25 �C, the amount of PHB was determinedon a u.v. spectrophotometer, wavelength 235 nm
World Journal of Microbiology & Biotechnology (2005) 21:565–566 � Springer 2005
DOI 10.1007/s11274-004-3274-1

(Bonartseva & Myschkina 1985; Aslim et al. 1998). Inorder to compare the PHB amounts produced by ourisolates, two test bacteria were used (B. sphaericusATCC 14577 and B. subtilis ATCC 6633, AnkaraUniversity Department of Biology). The correlationbetween production of PHB and dry cell weight wasdetermined by Spearman’s q correlation coefficient test(Conover 1971).As a result of the identification tests, 29 Bacillus spp.
isolates were identified as 3 B. brevis, 1 B. sphaericus, 3B. cereus, 5 B. megaterium, 6 B. circulans, 4 B. subtilis, 4B. licheniformis and 3 B. coagulans. In this study, theproductions of PHB by 31 Bacillus strains rangedbetween 0.004–0.160 g/l with a productivity of 1.06–41.67% (w/v). The production of PHB by B. subtilisATCC 6633 (4.07%) and B. sphaericus ATCC 14577(6.37% w/v) used for comparison as the test bacteriawere similar with some of our isolates . The highest PHBproduction and productivity percentage were found inB. brevis M6 (41.67% w/v) (Table 1). It was investigatedwhether any relationship between the dry cell weight
and PHB production existed and the correlation wasfound q ¼ 0.397. When this value was compared withthe table value, it was seen that the relationship wassignificant (q ¼ 0.397>0.305).Some of the A. eutrophus strains used for commercial
PHB production have a PHB concentration which isapproximately 80% (w/w) of the dry cell weight (Lee1996). Chen et al. (1991), studied PHA in 11 differentBacillus spp. and found PHB consisting 50% (w/v) ofdry cell weight of the bacteria. Labuzek & Radecka(2001) similarly reported that PHB was 25% (w/v) ofdry cell weight for B. cereus UW85. Mercan & Beyatli(2001) reported about 32.5% (w/v) PHB in 10 B.sphaericus strains. Aslim et al. (2002) reported theproduction of PHB by 40 Bacillus spp. and found thehighest value of PHB was 48% (w/v) for dry cell weight.When compared to related literature, our results show ahigher PHB production.On the basis of data obtained in the present work, B.
brevis M6 strain capable of PHB accumulation up to41.67% (w/v) of dry cell weight was selected, and it maybe employed for industrial production after the optimi-zation of the conditions of PHB synthesis.
Acknowledgements
This research has been supported by Hacettepe Univer-sity BAB.
References
Aslim, B., Caliskan, F., Beyatli, Y. & Gunduz, U. 1998 Poly-b-hydroxybutyrate production by lactic acid bacteria. FEMS Micro-
biology Letters 159, 293–297.
Aslim, B., Yuksekdag, Z.N. & Beyatli, Y. 2002 Determination of PHB
growth quantities of certain Bacillus species isolated from soil.
Turkish Electronic Journal of Biotechnology Special Issue, 24–30.
Bonartseva, G.A. & Myskina, V.L. 1985 Fluorescence intensity of
strains of nodule Bacteria (Rhizobium melliloti, R. phaseoli)
differing in activity, grown in the presence of the lipophilic vital
stain phosphine 3R. Microbiology (Engl. Transl. of Mi-
krobiologiya) 54, 4, 535–541.
Braunegg, G., Lefebvre, G. & Genser, K.L. 1998 Polyhydroxyalkano-
ates, biopolyesters from renewable resources: Physiological and
engineering aspects. Journals of Biotechnology 65, 127–161.
Chen, G.Q., Konig, K.H. & Lafferty, R.M. 1991 Occurrence of poly-
D(-)-3- hydroxyalkanoates in the genus Bacillus. FEMS Microbi-
ology Letters 84, 174–176.
Conover, W.J. 1971 Practical Nonparametric Statistics. New York:
John Wiley and Son. Inc. ISBN 0471168521.
Labuzek, S., & Radecka, I. 2001 Biosynthesis of PHB tercopolymer by
Bacillus cereus UW85. Journal of Applied Microbiology 90, 353–
357.
Lee, S.Y. 1996 Bacterial polyhydroxyalkanoates. Biotechnology and
Bioengineering 49, 1–14.
Mercan, N. & Beyatli, Y. 2001 Production of poly-b-hydroxybutyrate(PHB) by Bacillus sphaericus strains. Journal of Biotechnology 25,
2, 1–7.
Sneath, P.H.A. 1986 Endospore-forming Gram-positive rods and
cocci, In Bergey’s Manual of Systematic Bacteriology. eds. Sneath,
P.H.A., Mair, N.S., Sharpe, M.E. & Holt, J.G. Vol.2. pp. 1104–
1139. Baltimore: Williams and Wilkins. ISBN 0-68307-893-3.
Table 1. PHB production by some Bacillus species in NB medium.
Bacillus species Dry cell
weight (g/l)*
PHBa (g/l)* Yield of
PHBb (%)
B. brevis M2 0.035 ± 0.005 0.005 ± 0.002 14.28
B. brevis M4 0.295 ± 0.055 0.059 ± 0.002 20.00
B. brevis M6 0.060 ± 0.010 0.025 ± 0.005 41.67**
B. sphaericus M3 0.305 ± 0.015 0.040 ± 0.005 13.11
B. sphaericus
ATCC 14577
0.690 ± 0.140 0.044 ± 0.003 6.37
B. cereus M5 0.345 ± 0.115 0.095 ± 0.430 27.53
B. cereus M10 1.535 ± 1.005 0.059 ± 0.010 3.84
B. cereus M15 0.580 ± 0.050 0.097 ± 0.031 16.72
B. coagulans M8 0.190 ± 0.010 0.046 ± 0.010 24.21
B. coagulans M25 0.370 ± 0.020 0.032 ± 0.004 8.90
B. coagulans M35 0.445 ± 0.065 0.064 ± 0.001 14.5
B. megaterium M14 1.195 ± 0.205 0.087 ± 0.006 7.28
B. megaterium M21 0.630 ± 0.000 0.078 ± 0.001 12.41
B. megaterium M22 0.430 ± 0.020 0.052 ± 0.004 12.31
B. megaterium M26 0.655 ± 0.265 0.036 ± 0.005 5.57
B. megaterium M28 0.425 ± 0.035 0.047 ± 0.019 11.14
B. circulans M16 0.460 ± 0.030 0.033 ± 0.013 7.35
B. circulans M18 0.375 ± 0.025 0.036 ± 0.015 9.61
B. circulans M23 1.000 ± 0.640 0.021 ± 0.000 2.12
B. circulans M31 0.435 ± 0.015 0.038 ± 0.015 8.88
B. circulans M32 0.450 ± 0.020 0.084 ± 0.021 18.83
B. circulans M34 0.535 ± 0.015 0.042 ± 0.001 7.95
B. subtilis M17 0.480 ± 0.050 0.066 ± 0.026 13.93
B. subtilis M24 0.845 ± 0.475 0.050 ± 0.008 6.01
B. subtilis M29 0.470 ± 0.070 0.032 ± 0.003 6.92
B. subtilis M33 0.535 ± 0.035 0.072 ± 0.026 13.47
B. subtilis ATCC 6633 0.415 ± 0.015 0.016 ± 0.006 4.07
B. licheniformis M19 1.010 ± 0.320 0.054 ± 0.006 5.37
B. licheniformis M20 1.310 ± 0.540 0.060 ± 0.025 4.64
B. licheniformis M27 0.410 ± 0.040 0.005 ± 0.000 1.26
B. licheniformis M30 0.445 ± 0.055 0.004 ± 0.000 1.06
* Values are the means ± standard deviations of duplicate
measurements.a Determined at dry cell weight. b According to dry cell weight.
** The highest PHB production.
566 M. Yilmaz et al.

Negative effects of oil spillage on beach microalgae in Nigeria
J.P. Essien* and S.P. AntaiEnvironmental Microbiology and Biotechnology Unit, Department of Microbiology, University of Calabar, P. M. B.1115, Calabar, Nigeria*Author for Correspondence: E-mail: [email protected]
Keywords: Beach, epipsammic microalgae indicator, oil spill
Summary
In a concerted effort to apply epipsammic microalgae indices as a biological indicator of crude oil pollution andnatural remediation in a tropical estuarine environment, the direct effect of a recent oil spill on the abundance ofmicroalgae in the coastal shore of the Qua Iboe Estuary was investigated. A significant negative effect ofcontamination on the salinity, acidity and nutritive salts (CO2�
3 , Cl), and SO2�4 ) levels of the sandy beach soil was
observed. The Biological Index of Pollution (BIP) of the beach soil was raised from the previous slightly pollutedlevel (18%) to 75, 88, 45 and 41% after contamination, at sampling distances of 5.5, 9.5, 11.5 and 15 m from thebarrier used for pollution control. These corresponded with increases in the density of microalgae with distancefrom the barrier. This implies that the effect of oil pollution was more severe on microalgal cells that are close to thebarrier. The overall effect was a distance-influenced reduction in the regeneration capabilities of the epipsammicmicroalgae. Some microalgal species, particularly the cyanobacterial species of Aphanizomenon flos-aquae, Lyngbyamajusculata, and a centric diatom Actinoptychus undulatus may have been exposed to contamination levelsexceeding normal homeostasis and compensation. They lost their existence in the sandy beach, and their absence isrecommended for use as an indicator of the short term effect of oil pollution in coastal sandy beaches in a tropicalestuarine environment.
Introduction
Microalgae are of great importance to coastal processesincluding nutrient and oxygen cycling, they are animportant component of the estuarine food web, fedupon by fish and birds. Recent researches have deter-mined that microalgae have a larger effect on estuarinefisheries than previously thought, juveniles of many fishspecies consume microalgae in tidally flooded marshes(Green et al. 1992; Galvao 1997). For several reasons,phytoplankton are good environmental indicators.Their relative immobility means they are continuouslyexposed to any pollutant bound to beach sediment andsand.Estuaries such as the Qua Iboe Estuary are complex
and constantly changing ecosystems. The main charac-teristic of estuarine zones is the high variability ofenvironmental factors (i.e high temperature, salinity,acidity and nutrients) affecting growth and survival oforganisms (Ukpong 1991, 1995; Peres-llorens et al.2003,) Thus organisms that inhabit the estuarine eco-system must have mechanisms to acclimate to, orotherwise survive, significant environmental stress.Recently Ubom & Essien (2003) have reported the
rich epipsammic microalgae (algae found in sandy
beaches) community of Ibeno beach located at themouth of the Qua Iboe Estuary. The response of themicroalgal community (predominated by pinnate dia-toms, and including cyanobacteria, chlorophyta, chrys-ophyta and few species of centric diatoms) found in thesandy beach of the estuary to a recent oil spill is asubject for investigation. The study here represents thefirst concerted attempt to apply epipsammic microalgaeindices as a biological indicator of oil pollution andnatural remediation in a tropical estuarine beach envi-ronment.
Material and methods
Study area
The area under investigation is a fine, sandy recreationalcoastal beach ridges covering about 560 km and locatedat Mkpanak in Ibeno, an oil-producing community ofthe Niger Delta Region of Nigeria. (Figure 1). Theregion has a humid tropical climate, the annual rainfallis 4021 mm with a peak (733 mm) in July–August. Leastrainfall occurs in December–February (39 mm). Anaverage relative humidity of 80% and mean minimum
World Journal of Microbiology & Biotechnology (2005) 21:567–573 � Springer 2005
DOI 10.1007/s11274-004-3910-9

and maximum temperatures of 22 and 30 �C, respec-tively, are often experienced in the zone (Ukpong 1995).The beach is situated at the mouth of a mesotidalestuary. Tidal currents which are strong at the mouth ofthe estuary but weak along its upper reaches and creeksplay an important role in biota distribution, includingthe distribution of microalgae in the coarse sandyrecreational beach.The beach recently experienced a third tier spillage,
which occurred on 22 November, 2003 from a leakage inthe facility of an oil company located close (about 40 m)to the ‘beach’ environment. A boom (oil pollutioncontrol barrier) was induced at the beach for the clean-up exercise, and this study was conducted around theboom (Figure 2).
Sample collection
Sampling was carried out, precisely 1 week after thespillage, in three transects (T1, T2 and T3) establishedoutwards from the boom, located at about 25 m fromthe low tide level. Eight beach soil samples wereobtained at boom site and at 2 m intervals per transectgiving a total of 24 samples. Also samples were obtainedfrom apparently flooded (as a result, of tidal currents)sections of the beach. The designated points of collec-
tion, A, B, C and D were 5.5, 9.5, 11.6 and 15 m,respectively, from the boom. Samples from the floodedsection were used for the determination of the biologicalindex of pollution (BIP). Beach soils were also obtainedfrom flooded and unflooded beach sites located at about100 km from the crude oil boom site to serve as control.During sampling the top sand layer 5 cm deep
containing the epipsammic algae was carefully scoopedusing a hand trowel from 5 cm · 5 cm area (at eachsampling point) into clean 100 ml beakers.
Physicochemical analysis of beach soil
Soil samples from the various sampling points weremixed (based on the distance of sampling points (e.g.2 m samples from T1 + T2 + T3) and the compositesoil samples from the three transects were analysed usingstandard procedures. Soil extracts were prepared byrotating upside down 100 g of the beach soil in 25 ml ofdeionized water for 30 min; followed by centrifuging at6000 · g for 10 min. The pH of the soil was measuredby a Beckman pH metre. From the soil extract theorganic carbon was determined by the Walkley Blackmethod and total nitrogen by the microkjeldahl method(AOAC 1975; Page et al 1982; Jakobsen 1992). Thesoil particle size distribution was determined by the
Figure 1. (a) Ibeno beach at the mouth of Qua Iboe Estuary, showing the sampling locality (XX); (b) The Niger Delta region of Nigeria showing
the location of the Qua Iboe Estuary.
568 J.P. Essien and S.P. Antai

hydrometer method using Calgon as the displacingagent (AOAC 1975; Juo 1979).The exchangeable bases were extracted with 1 M
ammonium acetate. Potassium and sodium in theextracts were determined by flame photometry, whilecalcium and magnesium were determined by an EDTAfiltration method (Black et al. 1965). The salinity of thesoil sample was determined from silver thiourea (AgTu)extracts and AgNO3 (0.1 M) titration using potassiumchromate as indicator and calculated as total solublesalts (chlorides + sulphates). The oil content of thebeach soil was determined by Soxhlet extraction (Pageet al. 1982; Essien & Udosen 2000). The nutrient salts(CO2�
3 ,Cl) and SO2�4 ) were determined according to the
procedures described elsewhere (APHA 1998).
Estimation of density of microalgae
Beach soil samples meant for plankton analysis were‘scooped’ into beakers containing 50 ml of physiologicalsaline to avoid desiccation and, then preserved with2.0 ml of 37% formaldehyde (Yakubu et al. 1998;Essien & Ubom 2003; Ubom & Essien 2003).This wasfollowed by the addition of three drops of Lugols iodinesolution and left to stand for 30 min which allowed thealgae to settle. The samples were then reduced to 10 mlbefore decanting the supernatant aliquot.The number of algae was estimated using a 1.0 ml
counting chamber filled with the concentrated phyto-planktonic sample and examined under a compoundmicroscope equipped with a haemocytometer. Theepipsammic algae observed were identified using theillustrations of freshwater (Woodhead & Tweed 1960;Han 1978; Carmichael 1981) and marine (Moore 1981a,b) algae. The average density per hectare of each species
of epipsammic alga was estimated per gram of the soilsample using the formula below:
D ¼ ma� 1000
where D, is the density of each species per hectare, a, isthe area of beach soil sample (5 cm · 5 cm) and m, isthe number of individual species under the microscope.The enumerations of microalgae in the contaminated
beach soil were repeated every 7 days (with samplesobtained at 2 m intervals from the boom) to assess theability of the microalgae to recover from the stress andregenerate. The percent regeneration rate of epipsammicmicroalgae was estimated using the formula:
regeneration rate (%) ¼ D1
D2� 100
where D1, is the density of microalgae in oil contami-nated beach soil (on day 28)
D2, is the density of microalgae in uncontami-nated (control) beach soil.
Calculation of BIP
The flooded beach soil samples obtained from points A,B, C, D of the clean-up site (Figure 2) and from thecontrol site were used to calculate the BIP resulting fromthe oil spill. The procedure recommended, by WHO(1971) for the examination of water quality wasadopted; but with modification. In the modified method50 g of flooded beach soil (soil plus water) was treatedwith 100 ml of physiological saline to avoid desiccationand immediately reduced to 20 ml before decanting the
Figure 2. A sketch of the oil boom site showing the sampling points at Ibeno Beach. T =transect, S ¼ sampling point, ABCD ¼ flooded sample
points.
Oil spillage effects on beach microalgal 569

supernatant aliquot. The number of chlorophyll-bearingplankton (microalgae) designated A - and non-chloro-phyll-bearing plankton (zooplankton) designated B wereenumerated as previously described. The pollution ofthe flooded beach soil was estimated using the formula:
BIP ¼ 3BAþ B
� 100
Using the following values the pollution level of thecrude oil contaminated beach was extrapolated.
Results and discussion
A previous study by Ubom & Essien (2003) revealedthat the epipsammic habitat of the Qua Iboe Estuary ischaracterized by sandy sized soil particles, and the pH,salinity, organic carbon and nutritive salts (CO2�
3 , Cl)and SO2�
4 ) values recorded for the different locations areusually close. The salinity of the beach soil is typical forthose of a brackish water ecosystem with a highconcentration of nutritive salts. However the amountof salts seems to be adequate for the growth ofmicroalgae. In the present study there is remarkablevariation in the physicochemical properties between theoil-polluted beach soil and soil from the ‘control’ site.Even at the polluted site, the beach soil exhibitednoticeable but insignificant variation in propertiesbetween sampling distance from the oil boom location
(Table 1). However the variation between soil parame-ters was significant at P ¼ 0.001. At P ¼ 0.01, the highlevels of oil content in polluted soil correlated positivelywith increase in the salinity, and nutritive salts (r ¼ 0.65for CO2�
3 , for Cl) and r ¼ 0.95 for SO2�4 ) levels of the
beach soil (Table 2). On the other hand a negativecorrelation (r ¼ )8.88) was established between the oilcontent and pH levels of the beach soil. This implies thatincrease in oil content resulted in a decrease in the pHvalue of the soil, meaning an increase in soil acidity. Thenitrogen and phosphorus levels of the contaminated soilwere comparatively very low. These are an indication ofan estuarine soil that is heavily contaminated withhydrocarbons. High levels of acidity and carbon con-centration are often associated with oil-contaminatedtropical soils (Odu 1981). Similarly, Rhykerd et at.(1995) noted that nitrogen and Phosphorus are inrelatively short supply in oil-contaminated soils andare needed to complement the carbon supply fordevelopment of microbial biomass (ljah & Antai 2003).Responses to stress in algae are often indicated at the
level of proteins. While stressful environmenta1 condi-tion can induce synthesis of specific proteins (Fitzgeraldet al. 1978) they can also affect protein stability andturnover by increasing the rate of proteolysis of specificproteins (Thiel 1990). For example in cyanobacteria,proteases have been implicated in the degradation ofphycobiliproteins during photoacclimation and nutrientstarvation, (Grossman 1993; Collier & Grossman 1994).The net effect is either a bloom or a reduction in densityas a result of plasmolysis.In response to the oil spill in the beach environment,
many microalgal species, particularly the cyanobacterialspecies of Aphanizomenon flos-aque, Lygnbya majuscula-ta, Microcystis sp, Nodularia spumigena, Oscillatioria
Table 1. Some physicochemical properties of the oil-polluted beach soil.
Parameters Sampling distance from boom
100 km
(control)
0 m
(boom)
2 m 4 m 6 m 8 m 10 m 12 m
pH 7.13 5.9 6.4 6.4 6.4 6.8 7.1 7.2
Organic Carbon (%) 0.19 21.12 22.1 20.10 13.42 10.3 8.10 6.12
Total nitrogen (%) 0.03 0.009 0.007 0.008 0.01 0.02 0.03 0.02
Available P (mg/kg) 3.98 1.03 1.28 1.49 2.11 2.18 3.10 3.21
Exchangeable Ca (mg/kg) 96.5 88.3 82.11 89.21 94.31 91.29 94.5 93.6
Mg 24.8 23.4 24.4 25.5 24.6 24.5 23.3 24.1
Na 8.11 11.31 9.88 10.11 10.41 9.77 8.22 8.66
K 12.81 11.41 12.01 11.71 10.91 12.61 13.01 12.91
Salinity (%) 3.6 10.4 8.6 7.3 6.8 6.6 5.4 5.2
Particle size distribution
Sand (%) 98.1 98.2 98.1 97.8 98.1 98.2 97.8 98.2
Silt (%) 1.04 1.04 1.05 1.10 1.05 1.06 1.22 1.03
Clay (%) 0.94 0.94 0.4 0.91 0.94 0.92 0.98 0.95
Nutritive salts (mg/kg)
Co2�3 0.28 13.21 9.62 11.21 10.21 8.31 6.12 11.28
Cl) 506 718 688 54.9 710 688 621 588
SO2�4 26.5 61.3 54.5 48.13 44.21 38.21 33.11 31.12
Oil content (%) 2.1 48 31 23 10.8 7.7 5.8 5.1
Note: Values are mean of duplicate determinations. No significant effect of distance on the physicochemical properties but significant effect
(P = 0.001) occurred amongst the parameters.
BIP value Interpretation
0–8 Clean
8–20 Slightly polluted
20–60 Polluted
60–100 Heavily polluted
570 J.P. Essien and S.P. Antai

nigroviridis and the usually predominant epipsammiccentric diatom Actinoptychus undulatus (Ubom & Essien2003) disappeared from the beach soil within the vicinity,up to’ 14 m away from the boom (Table 3). The pinnatediatoms, Cymbella lanceolata, Cymatopleura solea, Cocc-oneis pediculus, Navicula rhynocephala, N. radiosa andRhoicosphenia curvata, although also seriously affected,exhibited variable levels of incidence at 12 m from theboom. Also detected at 12 m from the oil boom were afew cells ofAstasia fustis and Euglena intermedia (both ofthe order Euglenales), and Chromulina globosa (Ochro-monadales). The density of the epipsammic algae incontaminated beach soil ranged from 1 to 3 organisms/haand 1 to 14 organisms/ha in sample collected at 12 and14 m, respectively from the boom. This is incomparableto 3–38 organisms/ha recorded for the control sampleobtained at 100 km from the boom. The reduction in thenumber epipsammic algae encountered in the polluted
beach is an indication that the pollution level exceededthe normal homeostasis and compensation required fortheir survival.The direct effects of chemical contamination were
observed to decrease with increase in distance ofsampling points from the oil boom. The implication isthat the density of the microalgae decreases withcloseness to the boom. The existence of non-diatomsat distances where the highly, fortified and protectivesiliceous-walled diatoms were detected is an indicationof the influence of factors other than distance from theboom, on the distribution of microalgae. This isattributable to the complex interplay of tidal currentsand other intrinsic uninvestigated parameters whichmay affect microalgal growth in the epipsammic habitat.The number of microalgae recorded in the oil-pollutedsandy beach is quite low compare to the numberrecorded by Yakubu et al. (1998) for the surface water
Table 2. Correlation between oil content and nutritive salts of crude oil-contaminated beach soil.
Parameters Oil content (%)
48 (0 m) 31 (2 m) 23 (4 m) 10.8 (4 m) 7.7 (8 m) 5.8 (10 m) 5.1 (12 m) r at P = 0.01
Co2�3 (mg/kg) 13.21 9.62 11.21 10.21 8.31 6.12 11.28 r = 0.65 ns
Cl)(mg/kg) 718 688 547 710 688 621 588 r = 0.35 ns
So2�4 (mg/kg) 61.3 45.5 48.13 44.4 38.21 38.21 13.12 r = 0.95 ns
pH 5.9 6.4 6.4 6.4 6.8 7.1 7.2 r = )0.88 ns
salinity (%) 10.4 8.6 7.3 6.8 6.6 5.4 5.2 r = 0.97 ns
Values in parenthesis are sampling distances at which the oil content levels were derived.
S – significant; ns – not significant.
Table 3. Distance influenced impact of oil spill on the density (organisms/ha) of epipsammic algae at lbeno beach. (samples collected 7 days after
spillage).
Microalgae Species Order Sampling Distance
0 m 2 m 4 m 6 m 8 m 10 m 12 m 14 m 100 km
(control)
Bacillariophyta
Actinoptychus undulatus Centrales 0 0 0 0 0 0 0 0 33
Cymbella lanceolata Pennales 0 0 0 0 0 0 3 8 17
Cymatopleura solea Pennales 0 0 0 0 0 0 2 2 16
Coceoneis pediculus Pennales 0 0 0 0 0 0 1 4 14
Navicula rhynocephala Pennales 0 0 0 0 0 0 1 5 21
Navicula radiosa Pennales 0 0 0 0 0 0 2 8 18
Rhoicosphenia curvata Pennales 0 0 0 0 0 0 1 5 21
Cyanobacteria
Aphanizomenon flos-aquae Blue–Green 0 0 0 0 0 0 0 0 9
Lyngbya majusculata Blue–Green 0 0 0 0 0 0 0 0 4
Microcystis sp Blue–Green 0 0 0 0 0 0 0 0 3
Nodularia spumigena Blue–Green 0 0 0 0 0 0 0 0 6
Oscillatoria nigroviridis Blue–Green 0 0 0 0 0 0 0 0 7
Chrysophyta
Chromulina globosa Ochromona-
dales
0 0 0 0 0 0 0 11 38
Chlorophyta
Astasis fustis Euglenales 0 0 0 0 0 0 0 14 38
Euglena intermedia Euglenales 0 0 0 0 0 0 0 1 43
Urceolus cyclostomus Euglenales 0 0 0 0 0 0 0 1 9
Total Abudance 0 0 0 0 0 0 10 59 297
Oil spillage effects on beach microalgal 571

of the lower reaches of the Nun river in Delta state, andmuch lower that values recorded by Ubom & Essien(2003) and Essien & Ubom (2003), respectively, for theepipsammic and epipellic habitats of the Qua IboeEstuary. The smaller number of epipsammic microalgaerecorded for the polluted beach may be ascribed to thenear terrestrial conditions of the sandy beach, compli-cated by crude oil-induced changes in the intrinsicgrowth parameters, particularly the acidity and salinitylevels of the epipsammic habitat.The BIP of the beach soils (Table 4) from the control
site indicate that the beach had been slighty polluted(18%), plausibly from previous incidents of contamina-tion (Asuquo 1991; Antia 1993). However, due to the oilspill, the index of pollution at the time of sampling wasraised to 75, 88, 45 and 41%, respectively in samplesobtained at 5.5, 9.5, 11.6 and 15 m from the boom. Thiscorresponded with the rates of microalgal regenerationover time. A slow microalgal regeneration rate wasobserved in soils close to the boom, while a much fasterregeneration rate was established in soil sample beyond12 m from the boom. This may be ascribed to reductionin the direct effect of the pollutant on the algae and thediluting influence of tidal currents. This notwithstand-ing, 97.4, 77.4, 79.6, 80.3, 65.9, 72.9, 71.3 and 55.2% lossin microalgae abundance were recorded for beach soilcollected respectively at boom site (0 m) and from 2, 4,6, 8, 10, 12 and 14 m sampling locations from the boom(Table 5).
Conclusion
A current limit of bioindicators or biomarkers concernsthe relations between individual response; and ecologicaleffect of a contaminant. This depends on whether or notthe organism has been exposed to contamination levelsexceeding their capacity to maintain community stabilityand integrity in a changing environment. In this investi-gation, cyanobacteria, specifically Aphanizomenonflos-aque, Lyngbya majusculatia, and a centric diatomActinoptychus undulatus, were the most directly affectedepipsammic microalgae by the crude oil pollution of theQua Iboe Estuary. These microalgae species are recom-mended for use as indicators of short term effect of oilpollution in coastal sandy beaches of an estuarineenvironment.
References
Antia, E.E. 1993 A morphodynamic model of sandy beach suscepti-
bility of tar pollution and self cleaning of the Nigerian coast.
Journal of Coastal Resources 9, 1065–1071.
AOAC 1975 Methods of Soil Analysis,12th edn. Washington, DC:
Association of Official Analytical Chemist.
APHA 1998 Standard Methods for the Examination of Water and
Waste Water? 20th edn. American Public Health Association.
ISBN 0-87553235-7.
Asuquo, F.E. 1991 Tarballs in Ibeno-Okposo beach of South Eastern
Nigeria. Marine Pollution Bulletin 22, 150–151.
Black, C.A., Evans, D.D., White, J.L., Ensminger, L.B. & Clerk, F.E.
1965. Methods of Soil Analysis, 2. Chemical and Microbiological
Properties, Madison: American Society of Agronomy.
Carmichael, W.W. 1981 The Water Environment:Algal Toxins and
Health.pp. 161–172.NewYork:PlenumPress. ISBN0-306-40756-6.
Collier, J.L. & Grossman, A.R. 1994 A small polypeptide triggers
complete degradation of light harvesting phycobiliproteins in
nutrient deprived cyanobacteria. EMBO Journal 13, 1039–1047.
Essien, J.P. & Ubom, R.M. 2003 Epipellic algae profile of the
mixohaline mangrove swamp of Qua Iboe River Esturay (Nigeria).
The Environmentalist 23, 323–328.
Essien, J.P. & Udosen, E.D. 2000 Distribution of actinomycetes in oil
contaminated ultisol of the Niger Delta (Nigeria). Journal of
Environmental Sciences 12, 296–302.
Fitzgerald, M.P., Husain, A. & Rogers, L.J. 1978 A constitutive
flavodoxin from a eukaryotic alga. Biochemical and Biophysiolog-
ical Research Communication 81, 630–635.
Galvao, H.M. 1997 Microbial Ecology of a Brackish Water System
(Western Baltic). Universidale to Algarve, Gambelas, 8000, Faro,
Portugal.
Green, A.M., Osborn, P., Chai, J., Lin, C., Loeffler, A., Morgan, P.
Rubec, S. Spanyers, A., Walton R.D., Slack, D., Gawlik, D.,
Harpole, J., Thomas, E., Schmidt, R., Zimmerman, D., Harper,
D., Hinkley, T. & Walton, A. 1992 Status and trends of selected
living resources in the Galveston Bay system. Galveston Bay
National Estuary Program Publication GBNEP-19 Webster, Texas.
Grossman. A.R., Schaetder, M.R., Cliang, G.G., Collier. J.L. 1993
The phycobilisome, a light-harvesting complex responsive to
environmental conditions. Microbiological Reviews 57, 725–749.
Han, M. 1978 Illustrations of Fresh Water Plankton, 85 pp. London:
Academic press. ISBN 13144-211.
Ijah, U.J.J. & Antai, S.P. 2003 The potential use of chicken-drop
microorganisms for oil spill remediation. The Environmentalist 23,
89–95.
Jakobsen, S.T. 1992 Chemical reaction and air change during the
decomposition of organic matter Resources Conservation and Re-
cycling 6, 529–399.
Table 4. Pollution level of the crude oil contaminated beach soil.
Point of
sampling
Distance from
oil boom
Phytoplankton
(A)
Zooplankton
(B)
BIP
A 5.5 m 3 1 75%
B 9.5 m 12 5 88%
C 11.5 m 34 6 45%
D 15 m 63 10 41.8%
Control 100 km 94 6 18%
Table 5. Regeneration rate (%) of epipsammic microalgae in oil
contaminated beach after 28 days of exposure.
Sampling
distance
Duration
(days)
Regeneration
rate (%)
Loss in micro
algae abudance
(%)
7 14 21 28
Om
(at the boom)
0 0 0 8 2.6% 97.4%
2 m 0 0 19 64 21.4% 77.4%
4 m 0 7 36 59 19.7% 79.6%
6 m 0 13 34 72 24.1% 80.3%
8 m 0 14 21 87 27.1% 85.9%
10 m 0 42 71 86 28.72% 72.9%
12 m 10 28 72 134 44.8% 71.39
14 m 60 78 120 193 64.5% 35.2
100 km
(control)
297 283 301 299 100% –
572 J.P. Essien and S.P. Antai

Juo, A.S.R. 1979 Selected Methods for Soil and Plant Analysis Manual
Series, 70 pp. Ibadan: International Institute of Tropical Agricul-
ture (IITA).
Moore, R.E. 1981a Toxins and marine blue-green algae. In The Water
Environment: Algal Toxins and Health. ed. Carmichael, W.W. pp:
15–23 New York: Plenum Press. ISBN 0-306-40756-6.
Moore, R.E. 1981b Constituents of blue green algae. InMarine Natural
Products: Chemical& Biological Perspectives. ed. Scheuer, P.J., vol.
4., pp.1–52. London: Academic press. ISBN 0-12-624003-5.
Page, A.L., Miller, R.H. & Keeney, D.R. 1982 Methods of Soil
Analysis. Part 2: Chemical and Microbiological Properties, 2nd edn.
p. 1159. ISBN 0-89118-072-9(Pt.2).
Perez-llorens, J.L., Benitez, E.,Vergara, J.J. & Beryes, J.A. 2003
Characterization of proteolytic enzyme activities in macroalgae.
European Journal of Phycology 38, 55–64.
Rhykerd,R.L.,Weaver,R.W.&Mclnnes,K.J. 1995 Influence of salinity
onbioremediationofoil in soil.EnvironmentalPollution90, 127–130.
Thiel, T. 1990 Protein turn over and heterocyst differentiation in the
cyanobacterium Anabaena variabilis. Journal of Phycology 26, 50–54.
Ubom, R.M & Essien, J.P. 2003 Distribution and significance
of epipsammic algae in the coastal shore (Ibeno Beach) of
Qua Iboe River Estuary, Nigeria. The Environmentalist 23, 109–
115.
Ukpong, I.E. 1991 The performance and distribution of species along
soil salinity gradients of mangrove swamps in Southeastern
Nigeria. Vegetatio 95, 63–70.
Ukpong, I.E. 1995 Vegetation and soil acidity of a mangrove swamp in
Southeastern Nigeria. Soil Use and Management 11, 141–144.
WHO 1971. International Standards for Drinking water. Geneva:
World Health Organisation.
Woodhead, N. & Tweed, R. 1960 A Second checklist of tropical
West African algae (fresh and brackish water) Hydrobiologia 15,
225–286.
Yakubu, A. F., Sikori, F.D. & Horesfall, M Jr. 1998 An Investiga-
tion into the physicochemical conditions and planktonic organ-
isms of the lower reaches of the Nun River, Nigeria. Journal
of Applied Science and Environmental Management 1, 38–
42.
Oil spillage effects on beach microalgal 573

Production of alkali-tolerant cellulase-free xylanase by Pseudomonas sp.WLUN024 with wheat bran as the main substrate
Zheng-Hong Xu1,2, Yun-Ling Bai1, Xia Xu1, Jing-Song Shi1 and Wen-Yi Tao1,2,*1School of Biotechnology, Southern Yangtze University, 170 Huihe Road, Wuxi 214036, P. R. China2The Key Laboratory of Industrial Biotechnology, Ministry of Education, Southern Yangtze University, 170 HuiheRoad, Wuxi, 214036, P.R. China*Author for correspondence: Tel.: +86-510-5862412, Fax: +86-510-5806493, E-mail: [email protected]
Keywords: Alkali-tolerant cellulase-free xylanase, fermentation conditions, Pseudomonas sp., wheat bran,xylo-oligosaccharides
Summary
An alkali-tolerant cellulase-free xylanase producer, WLI-11, was screened from soil samples collected from a pulpand paper mill in China. It was subsequently identified as a Pseudomonas sp. A mutant, WLUN024, was selected byconsecutive mutagenesis by u.v. irradiation and NTG treatment using Pseudomonas sp. WLI-11 as parent strain.Pseudomonas sp. WLUN024 produced xylanase when grown on xylosidic materials, such as hemicellulose, xylan,xylose, and wheat bran. Effects of various nutritional factors on xylanase production by Pseudomonas sp.WLUN024 with wheat bran as the main substrate were investigated. A batch culture of Pseudomonas sp.WLUN024 was conducted under suitable fermentation conditions, where the maximum activity of xylanase reached1245 U ml)1 after incubating at 37 �C for 24 h. Xylanase produced by Pseudomonas sp. WLUN024 was purifiedand the molecular weight was estimated as 25.4 kDa. Primary studies on the characteristics of the purified xylanaserevealed that this xylanase was alkali-tolerant (optimum pH 7.2–8.0) and cellulase-free. In addition, the xylanasewas also capable of producing high quality xylo-oligosaccharides, which indicated its application potential in notonly pulp bio-bleaching processes but also in the nutraceutical industry.
Introduction
Hemicellulolytic microorganisms play important rolesin nature by recycling hemicellulose, one of the keycomponents of plant polysaccharides and the secondmost abundant renewable resource in the world. Themajor group of hemicellulose is xylan, which has alinear backbone of b-1,4-linked xylopyranose residues(Whistler & Richards 1970). Xylan can be hydrolysedto xylo-oligosaccharides and xylose residues by xylan-ase (b-1,4-D-xylan xylanohydrolase, EC 3.2.1.8) pro-duced by hemicellulolytic microbes. Pre-treatment ofKraft pulp by xylanase prior to bleaching effectivelyminimizes the use of the conventional bleaching agent,chlorine (Kulkarni et al. 1999). Xylanase has been,since then, attracting worldwide research interests overthe past two decades due to its great potential inindustrial applications, especially in the pulp and paperindustries.Many microorganisms which produce xylanase simul-
taneously produce cellulase. The presence of minoractivity of cellulase in xylanase preparations coulddamage the cellulose fibre of pulp during bio-bleaching,making the pulp less suitable for paper industries. In
addition, the bleaching process is usually carried outunder alkaline conditions. Therefore, it is desirable toscreen for microorganisms capable of producing alka-line or alkali-tolerant cellulase-free xylanase. The impor-tance of such xylanases has been well documented(Subramaniyan & Prema 2000; Techapun et al. 2003).To date, the alkaline or alkali-tolerant and cellulase-freexylanase producers have mainly been found in thegenera Aspergillus, Penicillium, Streptomyces, Thermo-actinomyces, Clostridium, and Bacillus (Subramaniyan &Prema 2000; Duarte et al. 2003; Techapun et al. 2003).Here we report an alkali-tolerant cellulase-free xylanaseproducer, Pseudomonas sp., which was newly isolatedfrom the effluent of a pulp and paper mill in China. Toour knowledge, this is the first report describing theproduction of alkali-tolerant cellulase-free xylanase byPseudomonas sp. In addition, this xylanase was found tobe able to degrade xylan into xylo-oligosaccharideseffectively, 80% of which were xylobiose and xylotriose.As xylan can be prepared cost-effectively from agricul-tural by-products (i.e. wheat bran, bagasse, corn core)only by alkali hydrolysis, this xylanase also displays apotential to be used in the production of nutraceuticals,for example, oligosaccharides.
World Journal of Microbiology & Biotechnology (2005) 21:575–581 � Springer 2005
DOI 10.1007/s11274-004-3491-7

Materials and methods
Microorganisms and culture conditions
Pseudomonas sp. WLI-11 and its mutant WLUN024were screened and stored in our laboratory. Theenrichment medium contained: hemicellulose (10 g l)1),peptone (5 g l)1), NaCl (5 g l)1). Screening mediumcontained: hemicellulose (10 g l)1), KNO3 (1 g l)1),MgSO4 (0.5 g l)1), NaCl (5 g l)1), K2HPO4 (0.5 g l)1).Pre-culture medium contained: glucose (10 g l)1), pep-tone (5 g l)1), NaCl (5 g l)1). The basic culture mediumcontained: wheat bran (40 g l)1), peptone (5 g l)1),K2HPO4 (5 g l)1). The initial pH of all media wasadjusted to 8.5 before autoclave. Hemicellulose wasprepared from bagasse as described previously (Brecciaet al. 1995).
Screening for bacterial strains capable of producingalkali-tolerant xylanase
The soil samples were collected from the effluent of apulp and paper mill in China. One gram of each samplewas put in a 250 ml Erlenmeyer flask containing 30 mlenrichment medium and mixed well. The cultureswere incubated on a rotary shaker at 220 rev min)1
for 2–3 days. A portion (0.5 ml) of the enriched culturewas spread onto a screening medium agar plate, andincubated at 220 rev min)1 for 48 h. Those bacteria thatformed clear halos around their colonies were picked upand stored on pre-culture medium agar slants. Theculture from a slant was inoculated into a 250 mlErlenmeyer flask containing 30 ml screening medium,incubated at 220 rev min)1 for 48 h. The supernatant ofthe culture broth was used to measure xylanase activity,after which the best xylanase producing bacterium wasselected. All cultivations were conducted at 37 �C.
16S rDNA sequence amplification and sequencing
Genomic DNA of strain WLI-11 was isolated accord-ing to the standard method (Sambrook et al. 1989).Polymerase chain reaction (PCR) was performed in atotal volume of 50 ll. The final reaction mixturecontained 5 ll 10 · reaction buffer, 5 ll 20 mM MgCl2,5 ll 2 mM each of dNTP, 5 ll 2 lM of each primer,0.5 ll Taq polymerase (Takara, 5 U/ll), 50 ng ofgenomic DNA and sterile distilled water. Primers usedwere forward (1F; 5¢-AGAGTTTGATCCTGGCT-CAG-3¢) and reverse (2R; 5¢-GGTTACCTTGTTACG-ACTT-3¢). These are primers known to amplify 16SrDNA from a broad range of taxonomically differentbacterial strains (Suzuki & Giovannoni 1996). PCR wascarried out under the following conditions: (1) 94 �C,2 min; (2) 94 �C, 1 min; 55 �C, 1 min; 72 �C, 3 min;28 cycles; (3) 72 �C, 10 min. The PCR product waspurified and sequenced by the Shanghai Centre ofBiotechnology, China Academy of Science (Shanghai,China).
Determination of fermentation conditions for producingxylanase by mutant WLUN024
Pseudomonas sp. WLUN024 was derived from strainWLI-11 by mutagenesis using u.v. irradiation andNTG treatment (Zhuge & Wang 1994). The determi-nation of fermentation conditions for producing xy-lanase was performed based on the basic culturemedium. To investigate the effect of individual nutri-tional factors such as carbon source, the correspond-ing compound was replaced by a different one. Unlessindicated, batch fermentations were carried out in250 ml Erlenmeyer flasks containing 30 ml culturemedia, incubated on a rotary shaker at 220 rev min)1
at 37 �C for 24 h.
Determination of cell growth
Since wheat bran was used as the main substrate, theviable cell count method was used to measure thegrowth of bacteria. Samples were aseptically withdrawnfrom the fermentation broth, spread on pre-culturemedium plates (20 g l)1 agar) at different dilutions.Colony count results were expressed as means for threeplates incubated at 37 �C for 24 h.
Assay of xylanase activity
Fermented broth was centrifuged at 4000 · g, at 4 �Cfor 10 min and the supernatant was used for analysis orpreparation of crude enzyme (shown below). Xylanaseactivities were determined by measuring the reducingsugars liberated from 10 g oat spelt xylan (Sigma) l)1
suspended in 40 mM sodium barbitone buffer (pH 7.6)(Bailey et al. 1992). One unit (U) was defined as thequantity of enzyme required to liberate 1 lmol of xyloseequivalent per minute at 50 �C. The results were meansof duplicate determination on triple independent mea-surements.
Carboxymethylcellulase (CMCase) and FPase assays
CMCase and FPase of the supernatant were assayedunder the same conditions described above using car-boxymethylcellulose (CMC) and filter paper as sub-strates, respectively.
Purification of xylanase
Solid (NH4)2SO4 was gradually added to the culturesupernatant up to 60% saturation followed by a mildstir at 4 �C for 1 h. The solution was centrifuged at10,000 · g for 30 min and the supernatant was dis-carded. The precipitate was re-dissolved in distilledwater and dialysed against 40 mM sodium barbitonebuffer (pH 7.6), after which a crude enzyme solutionwas obtained. Crude enzyme was purified consecutivelyby chromatography on CM-Sephadex, SephadexG-100and SephadexG-75 to get a pure band on SDS-PAGE.
576 Z.-H. Xu et al.

Effect of pH on xylanase activity and stability
The purified xylanase was dissolved in different buffers(pH ranging from 3.3 to 12) to achieve an initial activityof 1000 U ml)1 and stored at 4 �C for 24 h, after whichthe residual activity was measured to assess the pHstability. The buffers used were citric acid–NaOH–HCl(pH 3.3, 4.3, and 5.3), sodium barbitone–HCl (pH 6.8,7.2, 7.6, 8.0, 8.8, and 9.6) and glycine–NaOH (pH 10.4and 12). To investigate the effect of different pH onxylanase activity, the protocol for measuring xylanaseactivity was followed except that sodium barbitonebuffer (pH 7.6) was replaced by other buffers withdifferent pH.
Effect of temperature on xylanase activity and stability
Purified xylanase was dissolved in 40 mM sodiumbarbitone buffer (pH 7.6) to achieve an initial activityof 1000 U ml)1. It was divided into four aliquots andtreated individually at 28, 37, 50 and 55 �C. Sampleswere removed periodically and the residual xylanaseactivity was measured as described in the standard assayto assess thermal-stability. To check the effect oftemperature on xylanase activity, the same proceduredescribed in studying the effect of pH was applied,except that different temperature was tested instead ofdifferent pH.
Procedure for preparing oligosaccharides
Crude xylanase produced by Pseudomonas sp. wasadded to a 40 mM sodium barbitone buffer (pH 7.6)containing 50 g xylan l)1 (Oat spelt, Sigma) with a ratioof 800 U xylanase per gram of xylan. The mixture wasincubated at 45 �C for 12 h with mild agitation. It wasthen boiled for 10 min to inactivate the xylanase. Aftercentrifuging at 10,000 · g for 10 min, the supernatantwas subjected to HPLC to analyse the concentrations ofxylobiose and xylotriose. Xylo-oligosaccharides weredetermined by using a Waters 600 HPLC equipped witha Waters 2410 differential refractive index detector. AHypersil NH2 column (5 lm) was used, with 75% (v/v)acetonitrile in water as the mobile phase. The columntemperature was kept at 30 �C and the injection volumewas 10 ll. The flow rate was maintained at 1 ml min)1.
Results
Screening, isolation and identification of bacteria
Fifteen soil samples collected from the effluent of a pulpand paper mill were enriched and screened. About 600bacterial strains, which formed clear halos around theircolonies on the screening plates, were picked up. Thesebacteria were grown on basic culture medium, and re-screened by measuring xylanase activity. A bacteriumstrain, which produced 170 U ml)1 of xylanase upon
24 h incubation, was selected and designated as WLI-11. The 1F and 2R primers were used to amplify apartial 16S rDNA sequence from strain WLI-11.Comparative analyses of the sequence obtained andthose available from GenBank showed strain WLI-11to be most closely related to the genus Pseudomonas.Together with its morphological properties and taxo-nomic characteristics, strain WLI-11 was identified asPseudomonas sp.
Mutagenesis of Pseudomonas sp. WLI-11
Strain WLI-11 was treated by u.v. irradiation for 60 swith a lethal rate of 80%. After u.v. mutagenesis, amutant WLUV-15 that produced 250 U ml)1 ofxylanase in basic culture medium was obtained. StrainWLUV-15 was further mutated by NTG treatment,after which an excellent xylanase-producing mutantWLUN024 was selected. This strain produced354 U ml)1 xylanase, it was therefore chosen as aworking strain in following studies.
Effect of carbon sources on xylanase production by strainWLUN024
The effect of different carbon sources on xylanaseproduction was shown in Table 1. Strain WLUN024grew well on all carbon sources except cellobiose (datanot shown), but the production of xylanase were ratherpoor when glucose, sucrose, starch and cellobiose wereused as a sole carbon source, respectively. High levels ofxylanase production were observed when xylosidicmaterials, such as xylan, hemicellulose and wheat bran,were used as carbon sources, suggesting that theproduction of xylanase could be induced by xylosidicmaterial. Since wheat bran is an abundant and verycheap agricultural residue, it was chosen as a solecarbon source for further study.To determine a suitable concentration of wheat bran,
the effect of various concentrations on xylanase pro-duction was investigated. Figure 1 shows that the yieldof xylanase increases enormously along with the increaseof wheat bran concentrations. The highest xylanase
Table 1. Effect of various carbon sources on xylanase production by
Pseudomonas sp. WLUN024.a
Carbon sources Enzyme activity (U ml)1)
Hemicellulose 118.7 ± 5.8 b
Xylan (Sigma) 190.2 ± 4.3
Xylose 32.2 ± 1.2
Wheat bran 31.2 ± 1.0
Starch 1.2 ± 0.3
Cellobiose 0.5 ± 0.3
Sucrose 1.4 ± 0.4
Glucose 2.0 ± 0.3
a The concentration of each carbon source is 10 g l)1.b Mean value ± standard deviation.
Alkali-tolerant cellulase-free xylanase 577

activity, 450 U ml)1, was achieved at a wheat branconcentration of 70 g l)1, which was approximately 15times higher than that of using 10 g wheat bran l)1.
Effect of nitrogen sources on xylanase production bystrain WLUN024
The effect of various nitrogen sources on xylanaseproduction was studied in the same way as describedabove. The production of xylanase by strainWLUN024 grown on inorganic nitrogen compoundswas better than that on organic nitrogen substances(data not shown), indicating this strain had strongcapability of assimilating inorganic nitrogen. Amongthe inorganic nitrogen sources tested, (NH4)2SO4 wasthe best candidate. Furthermore, the effect of variousconcentrations of (NH4)2SO4 on xylanase productionwas investigated (Figure 2). When the concentration of(NH4)2SO4 was increased from zero to 8 g l)1, theyield of xylanase increased by 20%. When the con-centration of (NH4)2SO4 was further increased from 8to 30 g l)1, the yield of xylanase kept at a relativelystable level. The yield of xylanase decreased, however,when the concentration of (NH4)2SO4 exceeded30 g l)1. The final pH of the fermentation brothdecreased continuously when increasing the concentra-tion of (NH4)2SO4, which could partly explain the
decrease of xylanase production in the presence ofexcessive amount of (NH4)2SO4. From the economicalpoint of view, 8 g l)1 of (NH4)2SO4 was chosen as theoptimal concentration of nitrogen source.
Effect of phosphorus concentration on xylanaseproduction by strain WLUN024
The effect of various concentrations of K2HPO4 onxylanase production was studied. Since no significanteffect was observed on xylanase production by strainWLUN024, 4 g K2HPO4 l)1 was chosen for furtherexperiments.
Effects of some other factors on xylanase production bystrain WLUN024
Metal ions were generally considered as importantfactors affecting microbial enzyme production. Eachmetal ion (5 mM) was added to the basic culturemedium prepared by distilled water, after which theeffect of metal ions on xylanase production by strainWLUN024 was investigated. It was found that severalmetal ions, such as Ca2+, Mg2+ and Ba2+, had no effector a little promotion effect on xylanase production,while the others (i.e. Zn2+, Co2+, Cu2+, Fe3+) inhib-ited xylanase production significantly.The effects of inoculum size and medium volume in
flask were also investigated. The results showed that theoptimal inoculum size and the optimal medium volumewere 5–10% (v/v) and 20 ml medium in 250 ml flask,respectively.
Batch production of xylanase by strain WLUN024 underoptimal conditions
An optimized medium for xylanase production, con-sisted of 70 g wheat bran, 8 g (NH4)2SO4 and 4 gK2HPO4 l)1, was developed based on the above inves-tigations. A batch fermentation process was carried outwith the optimized production conditions, where thehighest yield of xylanase reached 1245 U ml)1 at 24 h ofcultivation (Figure 3). Crude xylanase was extractedfrom the culture supernatant. Neither CMCase norFPase activity was detected in the crude xylanaseproduced by strain WLUN024. Furthermore, the crudexylanase was purified consecutively by chromatographyon CM-Sephadex, SephadexG-100 and SephadexG-75.The molecular weight of this xylanase was estimated as25.4 kDa (data not shown).
Effects of pH and temperature on the activity and stabilityof xylanase produced by strain WLUN024
The xylanase produced by strain WLUN024 was stablein the pH range of 5.3–10.4 when storing at 4 �C for24 h (Figure 4), while the optimum activity was ob-served in the pH range of pH 7.2–8.0 (Figure 5),
0
100
200
300
400
500
0 20 40 60 80 100
Wheat bran concentration (g l-1)
Xyl
anas
e ac
tivity
(U
ml-1
)
Figure 1. Effect of wheat bran concentration on xylanase production
by Pseudomonas sp. WLUN024.
0
100
200
300
400
500
600
0 10 20 30 40 50 60
(NH4)2SO4 concentration (g l-1
)
Xyl
anas
e ac
tivity
(U
ml-1
))
6
7
8
9
10
11
Fina
l pH
Figure 2. Effect of (NH4)2SO4 concentration on xylanase production
by Pseudomonas sp. WLUN024. Relative xylanase activity (n), final
pH (m).
578 Z.-H. Xu et al.

conceiving that this xylanase can be used to treatalkaline pulp.In addition, the maximum activity of xylanase from
strain WLUN024 was observed at 50 �C (Figure 6).Thermal-stability studies of this xylanase showed thatthe temperature of higher than 50 �C inactivated theenzyme quickly: the residual activity of xylanase incu-bated at 50 �C for 40 min was only 40% of that at 28 �C(Figure 7).
Preparation of xylo-oligosaccharides by crude xylanaseproduced by strain WLUN024
The alkali-tolerant cellulase-free xylanase producedby Pseudomonas sp. WLUN024 can also be usedto prepare high quality xylo-oligosaccharides from
0
200
400
600
800
1000
1200
1400
0 5 10 15 20 25 30 35 40
Time (h)
Xyl
anas
e ac
tivity
(U
ml-1
)
Red
ucin
g su
gar
conc
entr
atio
n (m
g l -1
)
1.0E+06
1.0E+07
1.0E+08
1.0E+09
1.0E+10
Col
ony
form
ing
per
unit
(ml-1
)
Figure 3. Time-course of xylanase production (s), reducing sugar concentrations (n) and viable cells (lgN, m) of Pseudomonas sp. WLUN024 in
flask culture. The inoculum size, the medium content and the initial pH were 5%, 20 ml medium in 250 ml flask and 8.5 (adjusted by NaOH
solution), respectively.
0
20
40
60
80
100
120
0 4 10 12
pH
Rel
ativ
e xy
lana
se a
ctiv
ity
(%)
2 6 8
Figure 4. Effect of pH on xylanase stability. Xylanase activity assay
was conducted at 50 �C.
0
20
40
60
80
100
120
3 6 10 11 12
pH
Rel
ativ
e xy
lana
se a
ctiv
ity (
%)
4 5 7 8 9
Figure 5. Effect of pH on xylanase activity. Xylanase activity assay
was conducted at 50 �C.
0
20
40
60
80
100
120
20 30 40 50 60 70 80
T (˚C)
Rel
ativ
e xy
lana
se a
ctiv
ity
(%)
Figure 6. Effect of temperature on xylanase activity. Xylanase activity
assay was conducted at pH 7.6.
0
20
40
60
80
100
120
0 20 40 60 80 100 120
Time (min)
Res
idua
l rel
ativ
e xy
lana
se a
ctiv
ity
(%)
Figure 7. Effect of temperature on xylanase stability. Xylanase activity
assay was conducted at pH 7.6. Symbols represent temperature: 28 �C(m), 37 �C (n), 50 �C (d), and 55 �C (s).
Alkali-tolerant cellulase-free xylanase 579

xylan, since 80% of the hydrolysates were xylobioseand xylotriose, while the content of xylose was lessthat 5%.
Discussion
In the present study, an alkali-tolerant cellulase-freexylanase producer Pseudomonas sp. WLUN024 wasscreened. Under a suitable fermentation conditions, ahigh level production of xylanase, 1245 U ml)1, wasachieved at 24 h of cultivation with wheat bran and(NH4)2SO4 as the sole carbon and nitrogen source,respectively (Figure 3). Preliminary studies on the puri-fied enzyme showed that this xylanase was alkali-tolerantand exhibited neither CMCase nor FPase activities. Allabove results demonstrated that Pseudomonas sp.WLUN024 was an alkali-tolerate cellulase-free xylanaseproducer compared to the other xylanase-producingstrains described previously (Subramaniyan & Prema2000; Beg et al. 2001).Xylan was found to be the best substrate for xylanase
production by Pseudomonas sp. WLUN024 (Table 1),which might be ascribed to xylan having a stronginducing effect for xylanase production, as reported inmany microorganisms (Sunna & Antranikian 1997).However, it is not practical to use pure xylan as asubstrate for xylanase production on an industrial scaledue to its high cost. Interestingly, similar levels ofxylanase activity were obtained on xylose and wheatbran. Xylose has been found to be an important inducerfor xylanase production by Bacillus sp. BP-7 (Lopezet al. 1998), but the use of wheat bran as a substrate forxylanase production by Pseudomonas sp. has never beenreported. Wheat bran contains many nutritional com-pounds, which not only provide carbon source and tracenutrition factors for cell growth, but also serve as aninducer for xylanase production due to its high xylancontent (up to 30%). Wheat bran might also have someunknown factors that enhanced the production ofxylanase by strain WLUN024. More importantly, wheatbran is an abundant and very cheap agricultural residue,which makes the development of a cost-effective mediumfor commercial production of xylanase possible.The production of xylanase by Pseudomonas sp.
WLUN024 was a partially growth-associated character-istic (Figure 3), suggesting that the xylanase fromPseudomonas sp. WLUN024 was produced in an induc-ible manner. Xylanase activity was very low at thebeginning of fermentation (0–10 h), which might be dueto that the xylan in wheat bran cannot be transportedinto the bacterial cell to induce the production ofxylanase. During this phase, however, the strain mightbe able to produce, constitutively, a minor amount ofxylanase to hydrolyse xylan into xylo-oligosaccharidesand xylose. These oligosaccharides would then besubsequently taken up by the bacteria to enhance cellgrowth and to induce xylanase production. Alongwith the production of xylanase, the amount of the
hydrolysed xylan increased continuously to providenutrition for cell growth and inducers for xylanaseproduction. This cycle would not stop until the forma-tion and the consumption of the hydrolysates catalysedby xylanase reached an equilibration. This hypotheticalmechanism could be partly supported by the evidencethat the concentration of the reducing sugar increased atthe beginning of fermentation, but then decreased andremained at a constant level afterwards (Figure 3).Similar regulation mechanisms for xylanase productionhave been reported previously (Bastawde 1992 Kulkarniet al. 1999).More importantly, the xylanase from Pseudomonas
sp. WLUN024 has a unique property of hydrolysingxylan mainly into xylo-oligosaccharides. Xylo-oligosac-charides, especially xylobiose and xylotriose, have beenfound to have a stimulatory and regulatory effect on theselective growth of human intestinal Bifidobacteria tomaintain a healthy microflora (Okazaki et al. 1990;Degnan & Macfarlane 1991; Vazquez et al. 2000).Although currently genetic engineering can be easilyused to increase xylanase activity, the traditional muta-genesis approach, which could increase the xylanaseactivity, is still powerful. This is because naturallyisolated or mutagenesis-derived xylanase producerswould be more favourable for nutraceutical productiondue to considerations of bio-safety.In conclusion, the discovery of Pseudomonas sp.
WLUN024 capable of producing xylanase expands thebiodiversity of xylanase producers. Furthermore, thealkali-tolerant cellulase-free characteristics and the capa-bility of preparing high quality xylo-oligosaccharidesindicate great potential of this xylanase in both the pulpbio-bleaching process and in the nutraceutical industry.
Acknowledgements
This work was supported by a Grant from the StateHigh Technology R&D Project (863) of China (No.2001AA214101), and a Grant from the National 10thFive Year Plan Special Research Programs of China(No. 2001BA708B04-02).
References
Bailey, M., Biely, P. & Poutanen, K. 1992 Interlaboratory testing of
methods for assay of xylanase activity. Journal of Biotechnology 23,
257–270.
Bastawde, K. 1992 Xylan structure, microbial xylanases, and their
mode of action. World Journal of Microbiology and Biotechnology
8, 353–368.
Beg, Q., Kapoor, M., Mahajan, L. & Hoondal, G. 2001 Microbial
xylanases and their industrial applications: a review. Applied
Microbiology and Biotechnology 56, 326–338.
Breccia, J., Castro, G., Baigori, M. & Sineriz, F. 1995 Screening of
xylanolytic bacteria using a colour plate method. Journal of
Applied Bacteriology 78, 469–472.
Degnan, B. & Macfarlane, G. 1991 Comparison of carbohydrate
substrate preferences in eight species of Bifidobacteria. FEMS
Microbiology Letters 68, 151–156.
580 Z.-H. Xu et al.

Duarte, M.C.T., da Silva, E.C., Gomes, I.M.D., Ponezi, A.N.,
Portugal, E.P., Vicente, J.R. & Davanzo, E. 2003 Xylan-hydroly-
sing enzyme system from Bacillus pumilus sp. CBMAI 0008 and its
effects on Eucalyptus grandis kraft pulp for pulp bleaching
improvement. Bioresource Technology 88, 9–15.
Kulkarni, N., Shendye, A. & Rao, M. 1999 Molecular and biotech-
nology aspects of xylanases. FEMS Microbiology Reviews 23, 411–
456.
Lopez, C., Balanco, A. & Pastor, F. 1998 Xylanase production by a
new alkali-tolerant isolate of Bacillus. Biotechnology Letters 20,
243–246.
Okazaki, M., Fujikawa, S. & Matsumoto, N. 1990 Effect of xylo-
oligosaccharides on growth of Bifidobacterium. Journal of Japanese
Society of Nutrition and Food Science 43, 395–401.
Sambrook, J., Fritsch, E.F. & Maniatis, T. 1989 Molecular Cloning: A
Laboratory Manual, 2nd edn. Cold Spring Harbor, NY: Cold
Spring Harbor Laboratory. ISBN 0-87969-309-6.
Subramaniyan, S. & Prema, P. 2000 Cellulase-free xylanases from
Bacillus and other microorganisms. FEMS Microbiology Letters
183, 1–7.
Sunna, A. & Antranikian, G. 1997 Xylanolytic enzymes from
fungi and bacteria. CRC Critical Reviews in Biotechnology 17,
39–67.
Suzuki, M.T. & Giovannoni, S.J. 1996 Bias caused by template
annealing in the amplification of mixtures of 16S rRNA genes by
PCR. Applied and Environmental Microbiology 62, 625–630.
Techapun, C., Poosaran, N., Watanabe, M. & Sasaki, K. 2003
Thermostable and alkaline-tolerant microbial cellulase free xylan-
ases produced from agricultural wastes and the properties required
for use in pulp bleaching bioprocess: a review. Process Biochem-
istry 38, 1327–1340.
Vazquez, M.J., Alonso, J.L., Domınguez, H. & Parajo, J.C. 2000
Xylooligosaccharides: manufacture and applications. Trends in
Food Science Technology 11, 387–393.
Whistler, R. & Richards, E. 1970 Hemicelluloses. In The Carbohy-
drates, ed. Pigman, W. & Horton, D. pp. 447–769 New York:
Academic Press. ISBN 0125563027.
Zhuge, J. & Wang, Z. 1994 Experimental Methods of Industrial
Microbiology (in Chinese). pp. 335–393. Beijing: China Light
Industry Press. ISBN 7-5019-1584-9/TSÆ1034.
Alkali-tolerant cellulase-free xylanase 581

Studies on antagonistic marine actinomycetes from the Bay of Bengal
Sujatha Peela*, VVSN Bapiraju Kurada and Ramana TerliDepartment of Biotechnology, College of Science and Technology, Andhra University, Visakhapatnam 530003, India*Author for correspondence: Tel.: +91-891-2734821, Fax: +91-891-2734821, E-mail:[email protected]
Keywords: Actinomycetes, antimicrobial activity, multi-drug resistant pathogens, pigmentation production,sporophore morphology, Streptomyces
Summary
Screening of 26 marine sediment samples near 9 islands of the Andaman Coast of the Bay of Bengal resulted in theisolation of 88 isolates of actinomycetes. On the basis of sporophore morphology and structure of the spore chain,64 isolates were assigned to the genus Streptomyces, 8 isolates to the genus Micromonospora, 5 to the genusNocardia, 7 to the genus Streptoverticilium and 4 to the genus Saccharopolyspora. Among 64 Streptomyces spp., 44isolates showed antibacterial activity and 17 isolates showed antifungal activity. Three isolates showed verypromising antagonistic activities against multi-drug resistant pathogens.
Introduction
The screening of microbial natural products continues torepresent an important route to the discovery of novelchemicals, for development of new therapeutic agents andfor evaluation of the potential of lesser-known and/ornew bacterial taxa (Kurtboke & Wildman 1998). It hasbeen estimated that approximately two-third of thethousands of naturally occurring antibiotics have beenisolated from actinomycetes (Takizawa et al. 1993).Indeed, the Streptomyces species produce about 75% ofcommercially and medically useful antibiotics (Miyadoh1993).In the present investigation an effort was made to
screen different marine sediments of the Andaman coastof the Bay of Bengal, India, which is large, diverse andlargely unscreened ecosystem, for the isolation of potentantibiotic-producing actinomycetes.
Materials and methods
Sampling procedure
In the course of screening for bioactive actinomycetes,altogether 26 marine sediment samples were collectedfrom a depth of 10–40 m in Bay of Bengal near 9 differentislands of Andaman coast using a core sampler.
Isolation of actinomycetes colonies from the marinesediments
Isolation and enumeration of actinomycetes were per-formed by the soil dilution plate technique (Ellaiah et al.
1996) using starch casein agar medium (g/l: starch 10,casein 0.3, KNO3 2, NaCl 2, K2HPO4 2, MgSO4�7H2O0.05, CaCO3 0.02, FeSO4�7H2O 0.01 and agar 18). Thestarch–casein agar medium containing 50% seawaterwas supplemented with rifampicin 2.5 lg/ml and fluco-nazole 75 lg/ml to inhibit bacterial and fungal contam-ination respectively.
Characterization of isolates from the Andaman Islands
Purified isolates of actinomycetes were identified up tothe genera level by comparing the morphology of spore-bearing hyphae with the entire spore chain and structureof the spore chain with the actinomycetes morphologiesas described by Bergey (1989). This was done by usingcover-slip method in which individual cultures weretransferred to the base of coverslips buried instarch–casein agar medium. Colours of spores werevisually estimated by using a colour chart.
Characterization of Streptomyces isolates
Streptomyces colonies were characterized morphologi-cally and physiologically following the methods given inthe International Streptomyces project (ISP) (Shirling &Gottlieb 1966). The micro-morphology of strains wasobserved by light microscopy after incubation at 28 �Cfor 2 weeks. The pigmentation of aerial mycelium andstructure of sporophores which are highly characteristicand useful in the classification of streptomycetes wereobserved by cultivating the strains on different ISPmedia (ISP-2, ISP-3, ISP-4 and ISP-5).
World Journal of Microbiology & Biotechnology (2005) 21:583–585 � Springer 2005
DOI 10.1007/s11274-004-3493-5

Screening of antibiotic-producing strains
Preliminary screening for antibiotic production was doneby the conventional cross-streak method. Subsequentscreening of promising isolates was done under sub-merged fermentation conditions.Mature slant cultures ofactinomycete strains were inoculated into 250 ml Erlen-meyer flasks, each containing 50 ml of the productionmedium having the composition (g/l): glucose 10, soya-bean meal 10, NaCl 10 and CaCO3 1. The cultures wereincubated on a rotary shaker (220 rev/min) at 27 �C for4 days and the clear supernatant broth samples weretested for their antimicrobial activities. Antimicrobialactivity was determined by the agar-diffusion method(Barry & Thornsberry 1985), employing nutrient agar forbacteria and yeast extract-malt extract agar for fungi andyeasts and expressed as diameter (mm) of the inhibitionzone. The antimicrobial activity was observed after 24 hincubation at 37 �C for bacteria and 48 h incubation at28 �C for fungi and yeast.Multi-drug resistant pathogenslike Staphylococcus aureus, Pseudomonas aeruginosa andCandida albicans were also used as test organisms.Staphylococcus aureus strain resistant to antibiotics likemethicillin, oxacillin, tetracycline and penicillin wasprocured from the American Type Culture Collection(ATCC 33591). Pseudomonas aeruginosa strain resistantto antibiotics like streptomycin, minocycline, gentamycinand ciprofloxacin was recovered from a clinical sampletaken from the intensive care burn unit of King GeorgeGovernment Hospital, Visakhapatnam, India and aCandida albicans strain resistant to antibiotics likefluconazole, nystatin and amphotericin B was recoveredfrom a clinical sample collected from medical ward ofKing George Government Hospital, Visakhapatnam,India. The antibiotic resistance of multi-drug resistantpathogenic strains was determined by the agar-diffusionmethod employing 50 ll (1 mg/ml concentration) ofrespective antibiotics.
Results and discussion
In the course of screening for novel antibiotics, 88actinomycete strains were isolated from marine
sediments, collected near nine islands of the Andamancoast of the Bay of Bengal. The occurrence anddistribution of different actinomycete genera in differentmarine sediment samples is shown in Table 1. Out of 88actinomycetes, 64 isolates were identified as belonging tothe genus Streptomyces, family Streptomycetaceae(spore chain with coiling and branching); 8 as Micro-monospora, family Micromonosporaceae (clusters ofspore chain, single conidia on substrate mycelia); 5 asNocardia (morphology ranging from fugacious substratemycelium only to Streptomyces-like); 4 as Saccharopo-lyspora (very long chains of conidia on the aerialmycelium) and 7 as Streptoverticilium (whorls of straightchain of conidia formed). In a similar study, Takizawaet al. (1993) demonstrated a diverse actinomycete com-munity in the Chesapeake Bay. Actinomycetes in marinesediments have not been extensively investigated,although their ubiquitous presence in the marine sedi-ments has been well documented (Jensen et al. 1991;Takizawa et al. 1993; Moran et al. 1995).The cultural characteristics (Pigment production),
morphological characteristics and antimicrobial activi-ties of the different Streptomyces isolates are presentedin Table 2. Out of 64 Streptomyces isolates, 29 producedmelanin, 18 showed distinctive reverse side pigment and11 produced soluble pigments. With reference to themorphology of spore-bearing hyphae, most isolates(47%) show spiral sporophores followed by straightsporophores (28%), flexous (17%) and retinaculumapertum (8%). Forty four percent of the isolates showedantibacterial activity and 17% isolates showed antifun-gal activity.The antimicrobial activity of the three most promising
isolates against multi-drug resistant pathogens is pre-sented in Table 3. As indicated in the table, Streptomycessp. BT 606 showed antimicrobial activity against all thethree multi-drug resistant pathogens, S. aureus, P. aeru-ginosa and C. albicans while Streptomyces sp. BT 624showed inhibitory activity against C. albicans and Strep-tomyces sp.BT 652 againstS. aureus andP. aeruginosa. Ina similar investigation, Thorne & Alder (2002) reportedthe in vitro antibacterial activity ofDaptomycin, a naturalproduct derived from the fermentation of S. roseosporusagainstmethicillin-resistantStaphylococcus aureus,meth-
Table 1. Occurrence and distribution of actinomycetes in different marine sediment samples.
Location No. of
actinomyctes
No. of
Streptomycetes
No. of rare actinomycetes isolated
isolated isolated Micromonospora Nocardia Saccharopolyspora Streptoverticilium
Ross island 22 16 3 1 0 2
Viper island 8 5 1 0 1 1
Cinque island I 11 8 1 1 0 1
Cinque island II 4 2 0 1 0 1
Red skin island 11 9 1 0 1 0
Jolly buoy island 7 4 0 1 1 1
Barren’s island 8 6 1 0 1 0
Haveloc island 7 5 0 1 0 1
Portblair island 10 9 1 0 0 0
Total 88 64 8 5 4 7
584 S. Peela et al.

icillin-resistant Staphylococcus epidermidis, vancomycin-resistant enterococci (VRE), and penicillin-resistantStreptococcus pneumoniae.
It is anticipated that the current effort for theisolation, characterization and the study on marineactinomycetes of Andaman coast of Bay of Bengal canbe a milestone for the discovery of novel antibioticseffective against multi-drug resistant pathogens.
Acknowledgement
Financial assistance from University Grants Commis-sion, New Delhi to P. Sujatha (JRF) is gratefullyacknowledged.
References
Barry, A.L. & Thornsberry, C. 1985 Susceptibility tests: diffusion test
procedure. In Manual of Clinical Microbiology, 4th edn., eds.
Ballows, E.A., Hawsler, W.J. Jr. & Shadomy, H.I. pp. 978–987.
Washington DC: American Society of Microbiology. ISBN 0-
914826-65-4.
Bergey, D.H. 1989 Bergey’s Manual of Systematic Bacteriology, Vol. 4.
Baltimore, USA: Williams & Wilkins Company. ISBN 0-683-
09061-5.
Ellaiah, P., Kalyan, D., Rao,V.S. & Rao, B.V. 1996 Isolation and
characterization of bioactive actinomycetes from marine sedi-
ments. Hindustan Antibiotics Bulletin 38, 48–52.
Jensen, P.R., Dwight, R. & Fenical, W. 1991 Distribution of
actinomycetes in near shore tropical marine sediments. Applied
and Environmental Microbiology 57, 1102–1108.
Kurtboke, D.J. & Wildman, H.G. 1998 Accessing Australian biodi-
versity towards an improved detection of actinomycetes – an
activity report. Actinomycetes 9, 1–2.
Miyadoh, S. 1993 Research on antibiotic screening in Japan over the
last decade: a producing microorganisms approach. Actinomyce-
tologica 9, 100–106.
Moran, M.A., Rutherford, L.T. & Hodson, R.E. 1995 Evidence for
indigenous Streptomyces populations in a marine environment
determined with a 16s rRNA probe. Applied and Environmental
Microbiology 61, 3694–3700.
Shirling, E.B. & Gottlieb, D. 1966 Methods for characterization of
Streptomyces species. International Journal of Systemic Bacteriol-
ogy 16, 313–340.
Takizawa, M., Colwell, R.R. & Hill, R.T. 1993 Isolation and diversity
of actinomycetes in the Chesapeake Bay. Applied and Environmen-
tal Microbiology 59, 997–1002.
Thorne, G.M. & Alder, J. 2002 Daptomycin: a novel lipopeptide
antibiotic. Clinical Microbiology Newsletter 24, 33–40.
Table 2. Sporophore morphology, pigment production and antimi-
crobial activity of Streptomyces isolates.
Character No. of isolates (%)
Sporophore morphology
Straight 18 (28)
Spiral 30 (47)
Flexous 11 (17)
Retinaculum apertum 5 (8)
Total (%) 64 (100)
Pigment production
Melanin 29 (45)
Reverse colour 18 (28)
Soluble colour 11 (17)
Isolates showing pigmentation 58 (91)
Total isolates (%) 64(100)
Antibacterial activity
Isolates 64 (100)
Active isolates 28 (44)
Staphylococcus aureus (ATCC 12600) 10 (16)
Bacillus subtilis (ATCC 6633) 15 (23)
Escherichia coli (ATCC 26) 9 (14)
Pseudomonas aeruginosa (ATCC 27853) 5 (8)
Antifungal activity
Isolates 64 (100)
Active isolates 11 (17)
Aspergillus niger (ATCC 9642) 5 (8)
Candida albicans (ATCC 10231) 4 (6)
Saccharomyces cerevisiae (ATCC 10275) 2 (3)
(): Percentage of isolates.
Table 3. Antimicrobial activity of selected Streptomyces isolates
against multi-drug resistant pathogens.
Streptomyces isolates Inhibition zone diameter (mm)
S. aureus P. aeruginosa C. albicans
Streptomyces sp. BT-606 18 15 12
Streptomyces sp. BT-624 – – 16
Streptomyces sp. BT-652 14 17 –
Studies on antagonistic actinomycetes 585

Protein fingerprinting profiles in different strains of Aeromonas hydrophila isolated
from diseased freshwater fish
Basanta Kumar Das*, Surya Kanta Samal, Biswa Ranjan Samantaray and Prem Kumar MeherCentral Institute of Freshwater Aquaculture (CIFA), P. O. Kausalyaganga, Bhubaneswar, 751002, Orissa, India*Author for correspondence: Tel.: 91+(0674) 2465446*228/235(O), 2350756 (R), Fax : 91+(0674) 2465407,E-mail: [email protected]
Keywords: Aeromonas hydrophila, molecular weight in kDa, SDS-PAGE, whole cell protein
Summary
Aeromonas hydrophila (Ah) strains isolated from diseased fish in India were studied for protein profiling using theSDS-PAGE protein fingerprinting profile pattern of whole cells of 12 local strains of A. hydrophila and one referencestrain (MTCC 646). Variability among the strains was observed. The average similarity between the 12 strains of A.hydrophila ranged from 0.272 to 0.916. Proteins with molecular mass of 55.6 and 14.67 kDa in Ah1, Ah2 and Ah3,28.5 and 27.9 kDa in Ah4, Ah5 and Ah6, 21.4 and 19.5 kDa in Ah7, Ah8, Ah9 and 72.9, 91.5 and 71.3 kDa inAh10, Ah11 and Ah12 were common. The protein polypeptide bands from 19.5 to 86.2 kDa were common in bothlocal strains and reference strain of A. hydrophila. The protein fingerprinting study showed that there is geneticsimilarity between strains of A. hydrophila and reference strain (MTCC 646). These protein markers may be usefulfor further strain differentiation in epidemiological study.
Introduction
Aeromonas bacteria are common Gram-negative, chem-organotrophic microorganisms widely distributedthroughout the world (Ho et al. 1990). A. hydrophila isconsidered to be one of the major fish pathogens andcauses mortalities to aquaculture system (Austin &Austin 1993; Angkra et al. 1995; Das & Mukherjee1997). It causes haemorrhagic septicaemia, epizooticulcerative syndrome (EUS) and abdominal dropsy tofishes (Frerichs 1989; Das 1991; Nayak 1993; Das &Mukherjee 1998).A. hydrophila has been reported to be associated with
epizootic ulcerative syndrome in South East Asiancountries (Roberts et al. 1986) and India (Karunasagaret al. 1986; Pal 1996; Das and Mukherjee 1997, 1998;Nayak et al. 1999). A wide variety of A. hydrophilastrains are available in India (Nayak et al. 1999). Theclassical identification relies mainly on morphological,biochemical and physiological criteria, but thisapproach is time-consuming and often gives ambiguousresults (Sorheim et al. 1989). Due to this fact, thedevelopment and use of new methods that improve theidentification and detection of these microbes is advis-able. Genotypic techniques including Ribotyping, Ran-domly amplified polymorphic DNA techniques andSDS-PAGE of cell free extracts (so called proteinfingerprinting techniques) are also used in microorgan-ism classification (DeParrasis & Roth 1990; Peter &
Bretz 1992; Hertel et al. 1993; Mc Dermott et al. 1994;Tsakolidou et al. 1994; Hartung 1998). However, nosuch protein based fingerprinting techniques are avail-able for A. hydrophila. The study was carried out for thefirst time among twelve strains of A. hydrophila isolatedfrom various disease conditions in order to standardizeand develop protein based markers for easy and quickdiagnosis of diseases due to this bacterium.
Materials and methods
The whole cell protein lysates of 12 strains of A.hydrophila isolated from skin lesion, liver, kidney andintestine of mrigal, cat fish, goldfish and murrels weretaken as materials for present study (Table 1). Theantigens (whole cell protein, WCP) of different strains ofA. hydrophila were prepared by the heat killed method.Mass cultures of A. hydrophila strains were done inbrain heart infusion broth (Himedia, India) for 24 h inan orbital shaking incubator (Remi, India) at 37 �C.Then, the cultures were centrifuged at 10,000 · g at 4 �Cfor 10 min and pellets were collected and washed threetimes with phosphate buffer saline (PBS: NaCl, 8 g;Na2HPO4, 1.15 g; KH2PO4, 0.2 g; KCl, 0.2 g; distilledwater to 1000 ml, pH 7.2). Finally, the pellets wereresuspended in PBS (2% of the initial volume) and heatkilled in a waterbath at 60 �C for 1.5 h. Samples werethen stored at )20 �C. The samples (WCP) of 12 strains
World Journal of Microbiology & Biotechnology (2005) 21:587–591 � Springer 2005
DOI 10.1007/s11274-004-3909-2

of A. hydrophila were subjected to SDS-PAGE (Lam-meli 1970) using 12% separating gel and 4% stackinggel and 1.5 mm thick slab gels with Tris/HCI buffer (pH8.3). Samples were diluted in an equal volume of samplebuffer (2% w/v SDS, 10% v/v, glycerol, 5% v/v, b-mercaptoethanol, 0.002% bromophenol blue, 0.02 MTris/HCl) and boiled for 5 min at 100 �C in water bathshaker (Remi, India). After electrophoresis (180 min,60 v) gels were stained with Coomassie brilliant blue (R-250). The different protein bands were compared withprotein standard markers (SM0431, MBI Fermentas),including b-galactosidase (116.0 kDa), bovine serumalbumin (66.2 kDa), ovalbumin (45.0 kDa), lactatedehydroginase (35.0 kDa), REB sp 981 (25.0 kDa), b-lactoglobulin (18.4 kDa) and lysozyme (14.4 kDa). Thebands were further characterized by designating them asDark (D) and Light (L) and their staining intensitieswere recorded by + sign, one + indicating one unit.The average similarities, S, between two strains wascalculated according to Lamont et al. (1986) as follows.
Average
similarityðSÞ ¼ Number of average bands�2
Total number of bands in both strains
Data analysis
Using similarity values, genetic distances between iso-lates were worked out and a distance matrix wascreated. Further cluster analysis was performed usingthis matrix in the SAS program to create a dendrogram.
Results and Discussion
On 12% SDS-PAGE electrophoresis, 12 strains of A.hydrophila (Ah1–Ah12) and the reference strain (MTCC646) yielded 6–13 polypeptide bands stained withCoomassie brilliant blue (R-250). The clear distinctbands as 16.2 and 14.67 kDa in Ah1; 27.9, 21.4 and15.2 kDa in Ah2; 32.4 and 14.67 kDa in Ah3; 28.5 and27.9 kDa in Ah4; 32.4 and 14.67 kDa in Ah5, 41.2 kDa
in Ah6; 86.2, 68.2 and 41.2 kDa in Ah7; 86.2, 55.6 and21.4 kDa in Ah8; 86.2, 68.2, 55.6 and 21.4 kDa in Ah9,72.9, 71.3, 47.6 and 23.5 kDa in Ah10; 91.5, 72.9, 71.3and 23.5 kDa in Ah11 and 91.5, 72.9, and 71.3 kDa inAh12, which were unique and different from each otherare tabulated (Table 2). Representative photographs ofeach strain of A. hydrophila, showing gel electrophoreticband profiles are also shown in Figures 1 and 2.A. hydrophila reference strain (MTCC 646) yielded 15
clear and distinct polypeptide bands of molecular weightranged from 19.5 to 99.2 kDa (Figure 3). Proteins ofmolecular mass 19.5, 23.5, 25.6, 32.4, 36.1, 41.2, 65.6,71.3, 72.9 and 86.2 kDa were common in both thereference strain and in the local strains of A. hydrophila.Proteins of molecular weight of 91.5, 72.9 and 71.3 kDawere common in Ah10, Ah11 and Ah12 and thisconfirmed that strains 10 to 12 are isolated from acommon species i.e. Channa species.The average similarity between Ah1 and Ah2 was
0.272, Ah2 and Ah3 was 0.375; Ah3 and Ah4 was 0.834;Ah4 and Ah5 was 0.916; Ah5 and Ah6 was 0.916; Ah7and Ah8 was 0.454; Ah8 and Ah9 was 0.445; Ah9 andAh10 was 0.476; Ah10 and Ah11 was 0.761 and Ah11and Ah12 was 0.667, respectively.From our observations, it appears that there are
minor variations in respect of the band numbers,intensity of bands and other properties of staining andelectrophoretic mobilities in the whole cell proteins ofthe different strains of A. hydrophila. Tabouret et al.(1992) concluded that 42 and 50 kDa bands appear tobe common to all species of Listeria monocytogenesduring SDS-PAGE of SDS extracted proteins ofL. monocytogenes. We conclude here that there are 6to 13 polypeptide bands in 12 strains of A. hydrophila.Out of them 55.6 and 14.07 kDa bands in Ah1, Ah2 andAh3; 28.5 and 27.9 kDa bands in Ah4, Ah5 and Ah6;21.4 and 19.5 kDa bands in Ah7, Ah8 and Ah9;91.5,72.9 and 71.3 kDa bands in Ah10, Ah11 andAh12 are common. Zarhowski et al. (2001) described,SDS-PAGE of all free protein extracts of differentstrains of Pseudomonas at similarity levels ranging from
Table 1. Isolation of Aeromonas hydrophila from different sources.
Sl.No. Isolate Code Fish/Prawn Organs Area of collection
1 30 Cirrhinus mrigala Skin lesion CIFA* Pond
2 31 Channa punctatus Skin lesion Commercial fish farm, Puri District,
India
3 32 Channa punctatus Skin lesion Commercial fish farm, Puri District,
india
4 33 Channa punctatus Liver CIFA wet laboratory
5 34 Channa punctatus Skin lesion CIFA wet laboratory
6 40 Catfish Skin lesion CIFA- catfish unit
7 42 Gold fish Kidney CIFA-Aquarium unit
8 43 Gold fish Intestine CIFA-Aquarium unit
9 46 Channa punctatus Kidney CIFA wet laboratory
10 51 Channa marulius Skin lesion Andhra Pradesh
11 53 Channa species Skin lesion CIFA wet laboratory
12 56 Channa marulius Skin lesion Andhra Pradesh
*CIFA –Central Institute of Freshwater Aquaculture.
588 B.K. Das et al.

18 to 100% of the maximum distance by computerassisted numerical processing of the patterns usingcluster analysis with Euclidean distances. We concludethat the average similarity between the strains of A.hydrophila ranges from 0.272–0.916. The average simi-larity between the strain Ah4, Ah5 and Ah6 wasmaximum 0.916 and between Ah1 and Ah2 was mini-mum 0.272. The clear and distinct bands such as 16.2,14.67, 15.2, 72.9, 71.3, 91.5, 68.2 and 47.6 kDa indifferent strains of A. hydrophila, which are unique anddiffer from each other may be suitable as molecularmarkers for identification and determination of molec-ular weight of the various polypeptide bands of different
Table 2. Showing the molecular weight of the various polypeptide bands of Aeromonas hydrophila strains (Ah1–Ah12) and RS (Ah13).
Sl No. 1 2 3 4 5 6 7 8 9 10 11 12 13 14 15
Ah1 MW in kDa 86.2 62.1 55.6 41.2 36.5 32.4 27.9 23.5 21.4 16.2 15.34 14.67
X L L+ L L L L+ L L+ L D+ L D
Ah2 MW in kDa 62.1 55.6 32.4 27.9 25.67 23.5 21.4 18.7 15.12 14.67
X L+ L L D+ L L+ D+ L D L
Ah3 MW in kDa 62.1 55.6 32.4 28.5 23.5 14.67
X L L D+ L+ L D
Ah4 MW in kDa 68.5 32.4 28.5 27.9 23.5 14.67
X L+ L L D+ L L+
Ah5 MW in kDa 62.1 32.4 28.5 27.9 23.5 14.67
X L L L+ L+ L D+
Ah6 MW in kDa 62.1 41.2 28.5 27.9 25.57 14.67
X L D+ L L+ L L+
Ah7 MW in kDa 97.1 86.2 68.2 55.6 48.32 41.2 36.1 32.4 28.5 27.9 23.5 21.4 19.5
X L+ D+ D L L D+ L L+ L L L L+ L
Ah8 MW in kDa 86.2 68.2 55.6 47.6 31.3 28.5 22.1 21.4 19.5
X D+ L D L+ L L+ L D+ L+
Ah9 MW in kDa 86.2 68.2 55.6 48.32 41.2 31.3 22.12 21.4 19.5
X D D+ D+ L L+ L L+ D L
Ah10 MW in kDa 91.5 72.9 71.3 53.5 48.32 47.6 41.2 38.7 31.3 28.5 23.5 16.2
X L D+ D L+ L D+ L L L+ L D L
Ah11 MW in kDa 91.5 72.9 71.3 48.32 43.51 31.3 27.9 23.5 16.2
X D D+ D L+ L+ L L D+ L
Ah12 MW in kDa 91.5 72.9 71.3 53.5 43.51 39.6 28.5 21.4 17.7
X D+ D D+ L L+ L L L+ L+
RS MW in kDa 99.2 86.2 72.9 71.3 70.2 69.7 55.6 44.3 41.2 36.1 34.1 32.4 25.6 23.5 19.5
Ah13 X L L D+ L L L+ D+ L L+ D+ D+ D D+ L+ L+
NB: MW, Molecular Weight; X, Characteristics of bands; Ah, Aeromonas hydrophila; RS, Reference Strain (MTCC 646).
Figure 1. SDS-PAGE analysis of whole cell lysates of A. hydrophila
strains. Lanes (R-L); M, molecular weight marker (14.4–116.0 kDa),
2–7, WCP of A. hydrophila strains (Ah1–Ah6).
Figure 2. SDS-PAGE analysis of whole cell lysates of A. hydrophila
strains. Lanes (R-L); M, molecular weight marker (14.4–116.0 kDa),
2–7, WCP of A. hydrophila strains (Ah7–Ah12).
Figure 3. SDS-PAGE analysis of whole cell lysates of A. hydrophila
reference strain (MTCC 646). Lanes (L-R); M, molecular weight
marker (14.4–116.0 kDa), 2–3, WCP of A. hydrophila reference strain
(MTCC 646).
Protein fingerprinting profiles in different strains of Aeromonas hydrophila 589

strains of A. hydrophila. A dendrogram of the clusteranalysis based on protein profiles of the 12 strains of A.hydrophila is shown in Figure 4. From, the dendrogramanalysis, it was concluded that Ah1 and Ah12 strains areclosely similar and isolated from the same source i.e.skin lesions of mrigal and Channa species. Ah12 andAh10 isolates of A. hydrophila are also very similar, asthese belong to same species of isolation (Channamarulius) and produce the same fingerprinting profile.Ah1, Ah9 and Ah10 strains are distantly related as thesestrains belong to different sources of isolation i.e. mrigaland different Channa species. Ah3 and Ah4 and Ah5strains are similar as they belong to the same Channapunctatus. Ah3, Ah4, Ah5, Ah12, Ah9 and Ah2 isolatesof A. hydrophila are distantly related as these strainsbelong to different sources of isolation i.e. Channapunctatus and Channa marulius. Ah7, Ah13 and Ah11strains are closely related as these isolates originatedfrom a different species i.e. gold fish and Channa species.Ah6, Ah7 and Ah8 strains were distantly related as theseisolates belong to different sources i.e. gold fish andcatfish as observed from the different polypeptide bandson SDS-PAGE. Ah6 and Ah11 strains are distantlyrelated as these strains were isolated from catfish andChanna species. Ah2, Ah9 and Ah13 isolates were notclosely related, as these belong to the different source ofisolation i.e. Channa punctatus and Channa marulius andhence the percentage of relatedness between these strainsvaries to a greater extent. Further work needs to bedone to study the characterization and immunogenicityof the above antigenic proteins of A. hydrophila.
Acknowledgements
This work was supported by Lal Bahadur ShastriYoung Scientist Award grant from the Indian Council
of Agricultural Research to the senior author. Acknowl-edgement is also due to Director, CIFA, and Bhubane-swar for providing all necessary facilities for conductingexperimental trials.
References
Angkra, S.L., Lam, T.J. & Sin, Y.M. 1995 Some virulence character-
istics of Aeromonas hydrophila walking cat fish (Clarias gariepinus).
Aquaculture 130, 103–112.
Austin, B. & Austin, D.A. 1993 Bacterial pathogens Diseases in Farmed
and Wild Fish. 2nd ed. Chichester. Ellis Horwood.
Das, B.K. 1991 Pathobiology studies in fry and fingerlings of rohu,
Labeo rohita (Ham). M. F. Sc. Dissertation, Orissa University of
Agriculture and Technology, Bhubaneswar.
Das, B.K. & Mukherjee, S.C. 1997 Pathology of Aeromonas infection
in rohu, Labeo rohita (Ham) fingerlings. Journal of Aquaculture 5,
89–94.
Das, B.K. & Mukherjee, S.C. 1998 Pathology of black Spot disease in
fry and fingerlings of rohu; Labeo rohita (Ham). Geobioscience 25,
102–104.
DeParrasis, J. & Roth, D.A. 1990 Nucleic acid probes for identifica-
tion of phytobacteria: Identification of genus-specific 16S RNA
sequences. Phytopathology 80, 618–621.
Frerichs, G.N. 1989 Bacterial diseases of marine fish. The Veterinary
Record 125, 315–318.
Hartung, J.S. 1998 Molecular probes and assays useful to identify
plant pathogenic fungi bacteria, and marked biocontrol agents. In
G.J. Boland, and L.D. Kuykeendall (ed), Plant Microbe Interac-
tions and Biological Control. Marcel Dekker Inc., New York, 393–
413 ISBN.
Hertel, C., Ludwig, W., Pot, B., Kerster, K. & Schleifer, K.H. 1993
Differentiation of lactobacilli occurring in fermented milk prod-
ucts by using oligonucleotide probes and electrophoretic protein
profiles. Systematic and Applied Microbiology 16, 463–467.
Ho, A., Mietzner, S.Y., Smith, A.J. & Scholnik, G.K. 1990 The pili of
Aeromonas hydrophila. Identification of an environmentally regu-
lated ‘‘mini pilin’’. Journal of Experimental Medicine 172, 795–806.
Karunasagar, I., Ali, P.K. M.M., Jeyasekaran, G. & Karuanasagar, I.
1986 Ulcerrative from A. hydrophila infection of Catla catla.
Current Science 1994–1995.
Laemmli, U.K. 1970 Nature 227, 680–685.
Figure 4. Dendrogram of the cluster analysis based on protein profiles of twelve strains of A. hydrophila (Ah1–Ah12) and reference strain (Ah13).
590 B.K. Das et al.

Lamont, R.J., Retire, D.T., Meluin, W.T. & Postlethwaite, R. 1986 An
investigation of the taxonomy of Listeria species in comparison of
electrophoretic patterns 1985–86, In Listeriose, Listeria, Listeriosis,
eds. Courtiuuie, A.L., Espaze, L. & Rehaud, A.E. Nantes:
Universite de Nantes. pp 41–46 ISBN.
McDermott, J.M., Brandle, U., Dutly, F., Haemmerli, U.A., Keller,
S., Muller, K.E. & Wolfe, M.S. 1994 Genetic variation in powdery
mildew of barley. Development of RAPD, SCAR, and VNTR
markers. Phytopathology 84, 1316–1321.
Nayak, K.K., Mukherjee, S.C. & Das, B.K. 1999 Observation on
different strains of Aeromonas hydrophila from various diseased
fishes. Indian Journal of Fisheries 46(3), 245–250.
Pal, J. 1996 The fish disease, Epizootic Ulcerative Syndrome. The
present state of research and its impact in North Bengal, In
Proceedings of the National Workshop on Fish and Prawn Diseases,
Epizootics and Quarantine Adoption in India. Central Inland
Capture Research Institute, Barrackpore. pp 95–98.
Peter, O. & Bretz, A.G. 1992 Polymorphism of outer surface proteins
of Borrelia burgdorferi as a tool for classification. Zentralblatt fur
Bakteriologie 277, 28–33.
Roberts, R.J., Macintosh, D.J., Tonguthai, K., Boonyaratpalin, S.,
Tayaputch, N. & Phillips, M.J. 1986 Field and Laboratory
investigations into Ulcerative fish diseases in the Asia-Pacific region.
Bangkok: F. A. O. ISBN-92-5-1044724.
Sorheim, R., Torsvik, V.L. & Goksoyr, J. 1989 Phenotypical diver-
gences between populations of soil bacteria isolated on different
media. Microbial Ecology 17, 181–192.
Tabouret, M., De Rycke, J. & Dubray, G. 1992 Analysis of surface
proteins of Listeria in relation to species, serovar and pathogenic-
ity. Journal of General Microbiology 138, 743–753.
Tsakolidou, E., Manopoulou, E., Kabaraki, E., Zoidou, E., Pot, B.,
Kersters, K. & Kalantzopoulos, G. 1994 The combined use of
whole cell protein extracts for the identification (SDS-PAGE)
and enzyme activity screening of lactic bacteria isolated from
traditional Greek diary products. Systematic and Applied Micro-
biology 17, 444–458.
Zarhowski, R., Eichel, J., Lewicka, T., Rozyoki, H. & Pietr, S.J.
2001 Protein fingerprinting as a complementary tool of Pseudo-
monas bacteria. Cell Molecular Biology Letter 6, 913–923.
Protein fingerprinting profiles in different strains of Aeromonas hydrophila 591

Application of response surface methodology in medium optimization for spore
production of Coniothyrium minitans in solid-state fermentation
Xin Chen1,*, Yin Li 1,2, Guocheng Du1 and Jian Chen1,2,*1 Laboratory of Environmental Biotechnology, School of Biotechnology, Southern Yangtze University, Wuxi 214036,P.R. China2Key Laboratory of Industrial Biotechnology, Ministry of Education, Southern Yangtze University, Wuxi 214036, P.R.China*Authors for correspondence: Tel./Fax: +86-510-5888301, E-mail: [email protected]
Keywords: Coniothyrium minitans, optimization, response surface methodology, solid-state fermentation, sporeproduction
Summary
Spore production of Coniothyrium minitans was optimized by using response surface methodology (RSM), which isa powerful mathematical approach widely applied in the optimization of fermentation process. In the first step ofoptimization, with Plackett–Burman design, soluble starch, urea and KH2PO4 were found to be the importantfactors affecting C. minitans spore production significantly. In the second step, a 23 full factorial central compositedesign and RSM were applied to determine the optimal concentration of each significant variable. A second-orderpolynomial was determined by the multiple regression analysis of the experimental data. The optimum values forthe critical components for the maximum were obtained as follows: soluble starch 0.643 (36.43 g. l)1), urea )0.544(3.91 g l)1) and KH2PO4 0.049 (1.02 g l)1) with a predicted value of maximum spore production of9.94 · 109 spores/g IDM. Under the optimal conditions, the practical spore production was 1.04 · 1010 spores/gIDM. The determination coefficient (R2) was 0.923, which ensure an adequate credibility of the model.
Introduction
In recent years, with the environmental contaminationcaused by the excessive use of chemical pesticidesbecoming worse and worse, substitution of biopesticidesfor chemical pesticides to control plant pests anddiseases has received increasing interest. The fungusConiothyrium minitans is a potential biopesticide againstSclerotinia sclerotiorum, a widespread soil-born plantpathogen affecting more than 360 plant species such asoilseed rape, celery, lettuce, beans and potatoes, etc.(Campbell 1947; Whipps et al. 1991; Whipps & Gerlagh1992; Boland & Hall 1994; Roger et al. 1998).For the commercial application of this biopesticide,
large numbers of spores or conidia are required, andsolid-state fermentation (SSF) is a cost-effective systemfor the sporulation of C. minitans (McQuilken &Whipps 1995; McQuilken et al. 1997; McQuilken &Whipps 1997). Several researches on spore productionof C. minitans by SSF have been carried out on definedculture media (Oostra et al. 1998; Ooijkas et al. 1998,1999). Although the use of defined media with an inertcarrier could give a good reproducibility, it was rela-tively expensive and very difficult to be scaled up in theway of SSF. In our research, wheat bran was chosen as a
cost-effective basal medium for the spore production.Although previous work has given satisfactory results,the effects of additional nutrients on the enhancement ofthe quantity of spores are not clear. Determination ofthe optimal cultivation conditions for the conidiaproduction of C. minitans is also very important forcommercial practice, especially for the decrease of massproduction cost.Conventionally, fermentation medium is optimized
with the one-variable-at-a-time method, in which allvariables but one is held at a constant level, and then theoptimum level of the testing variable is determined.Although this method is simple, it is laborious and time-consuming when there are many factors to be deter-mined. Moreover, it works if, and only if there is nointeraction between variables.Response surface methodology (RSM) is a powerful
and efficient mathematical approach widely applied inthe optimization of fermentation process, e.g. mediacomponents on enzyme production (Adinarayana &Ellaiah 2002; Park et al. 2002; Suamant et al. 2002),production of other metabolites (Zhang et al. 1996;Sunitha et al. 1998; Sadhukhan et al. 1999; Hujanenet al. 2001), spore production (Yu et al. 1997) andbiomass production optimization (Lhomme & Roux
World Journal of Microbiology & Biotechnology (2005) 21:593–599 � Springer 2005
DOI 10.1007/s11274-004-3492-6

1991). It can give information about the interactionbetween variables, provide information necessary fordesign and process optimization, and give multipleresponses at the same time.The present work was aimed at optimization of
medium components, which have been found to play avery important role in enhancing the sporulation offungus (Larroche 1996; Ooijkas et al. 1999), with the aidof RSM. In the preliminary step of optimization, sixcarbon sources, five inorganic nitrogen sources and sixorganic nitrogen sources were evaluated to determineoptimal carbon and nitrogen source. Then, a Plackett–Burman design was used to identify which componentsof the media had significant effects on spore production.Subsequently, a central composite design was employedto optimize the factors, which had significant influenceon spore production. The results were analyzed byresponse surface analysis.
Materials and methods
Microorganism and inoculum preparation
Coniothyrium minitans (CBS 14896) was used in thisstudy. A spore suspension was obtained as follows:C. minitans was grown on an isolated potato dextroseagar (PDA) in Petri dishes at 20 �C for 7 days. Theconidia were harvested from the surface by adding0.85% (w/v) sterile saline solution and scraping with asterile spatula. The spore suspension obtained wascounted by using a Neubauer counting chamber,adjusted to approximately 106 spores ml)1. The sporesuspension was used to inoculate the subsequent fer-mentation immediately. C. minitans was routinely main-tained on PDA slants at 4 �C by regular sub-cultivation(no longer than 3 months).
Solid-state fermentation
Wheat and wheat bran were purchased from localmarket and used as the solid substrates in the experi-ments. All fermentation substrates were autoclaved at121 �C for 20 min. The experiments were performed in250-ml Erlenmeyer flask with 5 g of autoclaved sub-strate, covered with a cotton plug. All fermentationswere carried out at 20 �C for 7 days under variousconditions as described in the following parts of thispaper. To protect the substrate from drying out, a metalplate filled with water was placed in the incubator tomaintain the relative humidity at ca. 0.98 inside theincubator.
Assessment of conidia yield
A 5-g sample was ground in a mortar and then mixedwith 100 ml distilled water containing 0.1% (v/v) Tween80 in a laboratory blender for 2 min at the maximumspeed to separate the spores from the substrate thor-
oughly. Spore suspension was obtained after this step,and the spore suspension was diluted appropriately to aproper density that could be identified under thecounting conditions. The spores were counted by usinga haemocytometer under 400 · magnification in a brightfield microscope. Spore yield was expressed as spores perg initial dry matter (IDM). The results were the meansof duplicate determination of two independent samples.
Experimental designs and data analysis
Determination of optimal carbon and nitrogen sourcesTo select the suitable carbon and nitrogen source, in thepreliminary step of optimization, six carbon sources(starch, dextrin, glucose, maltose, galactose and su-crose), six organic nitrogen sources (yeast extract, cornsteep liquor, beef extract, arginine, peptone and glycine)and five inorganic nitrogen sources (ammonium nitrate,ammonium chloride, urea, ammonium sulphate andsodium nitrate) were evaluated (Tables 1–3). Thesenutrients were respectively added into the flasks withwheat bran as basal medium. The initial moisturecontent of the media was adjusted to 40%. Aftersterilization and cooling to ambient temperature, 5 mlinoculum was inoculated in the flasks. The final mois-ture content then was maintained at 140%. The sporeproduction of C. minitans was calculated after 7 days ofincubation at 20 �C.
Plackett–Burman designIn many cases, there are a large number of factors,which needed to be identified for their importance to the
Table 1. Effect of supplementary carbon source on the spore produc-
tion of C. minitans in SSF.
Supplentary nutrients Concentration (w/v) Spore production
(*109/g IDM)
Starch 1% 8.50 ± 0.60
Dextrin 1% 8.01 ± 0.42
Glucose 1% 7.45 ± 0.30
Maltose 1% 7.49 ± 0.14
Galactose 1% 7.43 ± 0.21
Sucrose 1% 7.56 ± 0.29
Control – 6.50 ± 0.20
0.5 % (w/v) of urea was used as the nitrogen source.
Table 2. Effect of supplementary organic nitrogen source on the spore
production of C. minitans in SSF.
Supplentary nutrients Concentration (w/v) Spore production
(*109/g IDM)
Yeast extract 0.5% 6.45 ± 0.02
Corn steep liquor 0.5% 8.09 ± 0.44
Beaf extract 0.5% 6.17 ± 0.26
Arginine 0.5% 7.75 ± 0.13
Peptone 0.5% 6.33 ± 0.21
Glycine 0.5% 7.49 ± 0.08
1.0% (w/v) of soluble starch was used as the carbon source.
594 X. Chen et al.

dependent variable of interest. The most intuitiveapproach would be to vary those factors in a fullfactorial design, that is, to try all possible combinationsof settings. Full factorial designs require 2N (N denotesnumbers of factors) experiments. This would work fine,except that the number of necessary runs in theexperiment (observations) will increase geometrically.In our case, seven variables have to be examined, itrequires 27(128) experiments, which is a very largenumber and time-consuming.Plackett–Burman design is a very useful tool used to
screen ‘n’ variables in just ‘n+1’ number of experiments(Plackett & Burman 1946; Rama et al. 1999; Ghanemet al. 2000). There will be a tremendous decrease in totalexperiments. In this part, the selected carbon (solublestarch) and nitrogen sources (corn steep liquor and urea)were further optimized together with other four vari-ables: KH2PO4, CaCl2 Æ 2H2O, MgCl2 Æ 6H2O and traceelements. The design was shown in Table 4. The designmatrix (Table 4) was developed using an SAS package(version 8.01).Each variable was set at two levels, that is, high level
and low level. The high level of each variable was set farenough from the low level to identify which ingredientsof the media have significant influence on the sporeproduction. The trace elements stock solution consistedof (g l)1): EDTA 1, ZnSO4 Æ 7H2O 0.2, FeSO4 Æ 7H2O0.5, Na2MoO4 Æ 2H2O 0.02, CuSO4 Æ 5H2O 0.02, Co-Cl2 Æ 6H2O 0.04 and MnCl2 Æ 4H2O 0.1.
Central composite designThe CCD is one of response surface methodologies(Chakravarti & Sahia 2002). After the identification of
the components affecting the spore production signifi-cantly, a CCD was adopted to optimize the majorvariables (soluble starch, urea and KH2PO4), whichwere selected through Plackett–Burman design.A 23 full factorial central composite experimental
design with six star points (a ¼ 1.285), six replicates atthe centre points and resulting in a total of 20experiments was used to investigate the three chosenvariables of the medium for the spore production ofC. minitans by SSF. The experiment was designed byusing the SAS package, version 8.01. The centralcomposite design was presented in Table 5. The exper-iments were performed in duplicate and the mean valueswere taken for the analysis.A second order polynomial, Equation (1), which
includes all interaction terms, was used to calculate thepredicted response:
Y ¼ b0 þX
bixI þX
biix2i þ
Xbijxixj ð1Þ
Table 3. Effect of supplementary inorganic nitrogen source on the
spore production of C. minitans in SSF.
Supplentary nutrients Concentration (w /v) Spore production
(*109/g IDM)
NH4NO3 0.5% 7.63 ± 0.35
NH4Cl 0.5% 7.01 ± 0.04
Urea 0.5% 8.40 ± 0.50
(NH4)2SO4 0.5% 7.39 ± 0.57
NaNO3 0.5% 8.28 ± 0.72
1.0% (w/v) of soluble starch was used as the carbon source.
Table 4. Plackett–Burman design of seven variables.
Run I Variable Spore production
(ln Y)
Starch (g/l) Urea (g/l) Corn steep
liquor (ml/l)
KH2PO4 (g/l) CaCl2 Æ 2H2O
(g/l)
MgCl2 Æ 6H2O
(g/l)
Trace elements
(ml/l)
1 30 15 5 1 0.025 2.5 20 22.3707
2 30 5 15 1 0.1 10 5 22.5603
3 30 5 5 4 0.1 2.5 5 22.4149
4 10 15 15 1 0.1 2.5 5 22.3058
5 10 15 5 4 0.025 10 5 22.2996
6 10 5 15 4 0.025 2.5 20 22.3311
7 10 5 5 1 0.1 10 20 22.4121
8 30 15 15 4 0.1 10 20 22.3120
Table 5. CCD for three variables.
Run order Coded level Spore production
(lnY)
Soluble
starch (g/l)
Urea (g/l) KH2PO4
(g/l)
1 20 3 1.5 22.9876
2 40 3 0.5 22.7259
3 20 7 0.5 22.8100
4 40 7 1.5 22.8335
5 20 3 0.5 22.7700
6 40 3 1.5 22.9140
7 20 7 1.5 22.7043
8 40 7 0.5 22.8167
9 17.15 5 1 22.7596
10 42.85 5 1 22.9251
11 30 2.43 1 23.0465
12 30 7.57 1 22.8677
13 30 5 0.358 22.9260
14 30 5 1.643 22.9370
15 30 5 1 23.0171
16 30 5 1 23.0233
17 30 5 1 23.0171
18 30 5 1 23.0233
19 30 5 1 23.0171
20 30 5 1 23.0233
Coniothyrium minitans spore production 595

where Y represents response variable, b0 is the intercep-tion coefficient, bi, coefficient of the linear effect, bii, thecoefficient of quadratic effect and bij, the coefficient ofinteraction effect. Where xi and xj denote the codedlevels of variable Xi and Xj investigated in experiments.The variable Xi was coded as xi according to the
Equation (2):
xi ¼Xi � X0
DXið2Þ
where xi is (dimensionless) coded value of the variableXi, X0 is the real value of Xi at the center point (zero)level, and the DXi is the step change value.Media consisting of 5 g wheat bran as a basal medium
from the same batch, was dispensed into a 250-mlErlenmeyer flask and supplemented with the nutrientsfor optimization. The spore production of C.minitanswas expressed in natural logarithm value. An SASpackage, version 8.01, was used for multiple regressionanalysis of the experimental data obtained.The F-test was employed to evaluate the statistical
significance of the quadratic polynomial. The multiplecoefficients of correlation R and the determinationcoefficient of correlation R2 were calculated to evaluatethe performance of the regression equation.
Results and discussion
Determination of optimal carbon and nitrogen sources
In the preliminary step of optimization, the selectednutrients were added to wheat bran separately. Com-pared with the control, the supplementary nutrientcould really increase spore number of C. minitans(Tables 1–3).Soluble starch, dextrin, glucose, maltose, galactose,
and sucrose were examined to select a suitable carbonsource. As can be seen from Table 1, of the six carbonsources investigated, soluble starch and dextrin wererelatively favourable to the spore production of C.minitans. However, glucose gave the poorest result. Itmay be caused by hydrolysis of starch to glucose and therate is very slow compared with that of glucose uptake(Ooijkas et al. 1998). The influence of various nitrogensources on the spore production of C. minitans ispresented in Tables 2 and 3, corn steep liquor and ureawere found to be the best organic and inorganic nitrogensources. It has also been reported that urea was a kindof preferred inorganic nitrogen source for the sporula-tion of C. minitans.
Plackett–Burman design
A Plackett–Burman design was performed when thesuitable carbon and nitrogen source supplemented hadbeen determined. From Table 6, it can be seen that withthe increase in the concentration of soluble starch,
MgCl2 Æ 6H2O and corn steep liquor all have positiveeffects on spore production. An increase in the levels ofurea, KH2PO4, CaCl2 Æ 2H2O, or trace elements havenegative effects on spore production. With the help ofrelative ranking of Ex,i, soluble starch, urea andKH2PO4 within the tested limits were selected forfurther optimization, which had the most significanteffects on spore production.The positive effects of starch were, maybe, caused by
the requirement of a large quantity of substrate tosynthesize spores. Starch was a preferred substrate tosynthesize macromolecules (e.g. carbohydrates), whichwas related to sporulation and germination. Therefore,high starch concentrations would lead to higher sporeproduction, which agreed with the results of Ooijkaaset al. (1999).Urea at high concentration would negatively enhance
spore production of C. minitans. This result coincidedwith the cases of some other fungi (Smith & Galbraith1971). Low urea level was more advantageous than highurea level for spore production. McQuilken et al. (1997)reported that the sporulation of C. minitans is inhabitedat low initial pH. It is possible that the high concentra-tion of KH2PO4 could cause acidification of the culture,resulting in low spore production.The Plackett–Burman design was proved to be a
powerful tool to determine the effects of mediumconstituents on spore production of C. minitans rapidly.However the optimal concentrations of medium com-ponents that significantly affect spore production couldnot be obtained. Further work needed to be done to findout this information.
Central composite design
This is a very useful tool to determine the optimal levelof medium constituents and their interaction. Based onthe Plackett–Burman design, where soluble starch, ureaand KH2PO4 were selected for their significant effects onthe spore production, a central composite was used forfurther optimization. The concentrations of those majornutrients tested were presented in Table 5. Other nutri-ents concentrations were set at their centre point testedin the Plackett–Burman design. Spore count after 7 dayscultivation could reach 1.04 · 1010 spores per g IDM.Regression analysis of log-transformed experimental
data was performed by an SAS package to obtain the
Table 6. Ranking of the variables investigated in the Plackett–Burman
design.
Variable Component Ex,i Absolute
value of Ex,i
Ranking
A Starch 0.2228 0.2228 2
B Urea )0.3522 0.3522 1
C Corn steep liquor )0.0916 0.0916 4
D kh2PO4 )0.2041 0.2041 3
E CaCl2 Æ 2H2O )0.0178 0.0178 7
F MgCl2 Æ 6H2O 0.0697 0.0697 5
G Trace elements )0.0634 0.0634 6
596 X. Chen et al.

following second-order polynomial, which accounts forthe natural logarithm of the spore production.
Y ¼ 23:0503þ 0:02035X1� 0:0409X2þ 0:0293X3
� 0:1078X 21 � 0:0383X 2
2 � 0:0538X 23 þ 0:0317X1X2
� 0:0618X2X3þ 0:0116X1X3 ð3Þ
where Y is the response value, that is, the sporeproduction, and X1, X2 and X3 are the coded levels ofsoluble starch, urea and KH2PO4, respectively.The goodness of fit of the regression equation was
evaluated by the coefficient of correlation (R) and thedetermination coefficient (R2). In this case, the value ofR (0.9608) indicates a high agreement between theexperimental and predicted values. The value of deter-mination R2 (0.9232) indicates that the response modelcan explain 92.23% of the total variations. The value ofadjusted determination coefficient (R2
Adj ¼ 0:8540) wasalso high enough to indicate the significance of themodel.The corresponding analysis of variance (ANOVA) is
given in Table 7. The F value is a measure of thevariation of the data about the mean. Generally, thecalculated F value should be several times greater thanthe tabulated F value if the model is a good prediction ofthe experimental results and the estimated factor effectsare real. In this case, the ANOVA of the regressionmodel demonstrates that the model is highly significant,as is evident from the calculated F value (= 13.3447)and a very low probability value (P > F ¼ 0.00018).The computed F value (= 13.3447) is also much greaterthan the tabulated F value (F9,10 ¼ 4.94) at 0.01 level,which indicates that the second-order polynomial ishighly significant.The three dimensional response surfaces plots were
employed to determine the interaction of the mediumcomponents and the optimum levels of the componentssupplemented into the basal medium, which have signif-icant effects on the spore production of C. minitans.The response surface plots are shown in Figures 1–3,
which illustrate the relationship between response and theexperimental data. As can be seen from Figures 1 and 2,the spore production was predominantly affected by theurea concentration. With increase of the urea concentra-tion, the spore production was inhibited. This result quiteconformed to the information obtained from our Plack-ett–Burman design. Figure 3 showed the effects of starchconcentration and KH2PO4 concentration on spore
Table 7. Analysis of variance (ANOVA) for the three factorial design.
Source Sum of
squares
Degrees of
freedom
Mean
square
F-value P > F
Model 0.2248 9 0.0250 13.3477 0.00018
Error 0.0187 10 0.00187
Total 0.2435 19
Figure 1. Effects of starch (X1) and urea (X2) and their interactive effect
on the spore production (Y1) with other nutrient set at centre level.
Figure 2. Effects of urea (X2), KH2PO4 (X3) and their interactive effect
on the spore production (Y1) with other nutrients set at centre level.
Figure 3. Effects of starch (X1) and KH2PO4 (X3) and their interactive
effect on the spore production (Y1) with other nutrients set at centre
level.
Coniothyrium minitans spore production 597

production when urea was held at zero level. It can beobserved an increase of spore production with increasedstarch concentration vs. KH2PO4 concentration.The predicted optimum levels of the tested variables,
namely, soluble starch, urea and KH2PO4 were obtainedby applying regression analysis of Equation (3) usingSAS package software, version 8.01. The optimal levelswere as follows: X1 ¼ 0.643 (36.43: g l)1), X2 ¼ )0.544(3.91 g l)1), X3 ¼ 0.049 (1.02 g l)1) with the correspond-ing Y ¼ 23.020 (9.94 · 109 spores/g IDM). Verificationof the predicted values was conducted by using optimalconditions in inoculation experiments. The practicalcorresponding response was 1.04 · 1010 spores/g IDM.This result corroborated the validity and the effective-ness of this model. The spore production of 1.04 · 1010
spores/g IDM, compared with that reported in literature(Table 8) also justified our present work.
Conclusions
The RSM was performed to optimize the mediumcomponents for spore production of C. minitans. A highsignificant quadratic polynomial obtained by the centralcomposite design was very useful to determine theoptimal concentrations of constituents that have signif-icant effects on spore production.The optimal supplementary nutrient solution (per litre)
consisted of: soluble starch 36.43 g, urea 3.91 g, KH2PO4
1.02 g, Corn steep liquor 10.0 ml, CaCl2 Æ 2H2O 0.05 g,MgCl2 Æ 6H2O 5.0 g, and trace elements 10.0 ml. And itsfinal pHwas adjusted to 6.0.Under the optimal condition,9.94 · 109spores/g IDM could be produced in theory and1.04 · 1010 spores/g IDM in practical experiment.
References
Adinarayana, K. & Ellaiah, P. 2002 Response surface optimization of
the critical medium components for this production of alkaline
protease by a newly isolated Bacillus sp. Journal of Pharmacy and
Pharmaceutical Science 5, 272–227.
Boland, G.J. & Hall, R. 1994 Index of plant hosts of Sclerotinia
sclerotiorum. Canadian Journal of Plant Pathology 16, 93–108.
Campbell, W.A. 1947 A new species of Coniothyrium parasitic on
sclerotia. Mycologia 39, 190–195.
Chakravarti, R. & Sahai, V. 2002 Optimization of compactin
production in chemically defined production medium by Penicil-
lium citrinum using statistical methods. Process Biochemistry 38,
481–486.
Ghanem, N.B., Yusef, H.H. & Mahrouse, H.K. 2000 Production of
Aspergillus terreus xylanase in solid-state cultures: application of
the Plackett–Burman experimental design to evaluate nutritional
requirements. Bioresource Technology 73, 113–121.
Hujanen, M., Linko, S., Linko, Y.Y. & Leisola, M. 2001 Optimization
of media and cultivation conditions for L (+)(S)-lactic acid
production by Lactobacillus casei NRRL B-441. Applied Microbi-
ology and Biotechnology 56, 126–130.
Larroche, C. 1996 Microbial growth and sporulation behaviour in
solid-state fermentation. Journal of Scientific and Industrial
Research 55, 408–423.
Lhomme, B. & Roux, J.C. 1991 Utilization of experimental designs for
optimization of Rhizopus arrhizus culture. Bioresource Technology
35, 301–312.
McQuilken, M.P. & Whipps, J.M. 1995 Production, survival and
evaluation of solid-substrate inocula of Coniothyrium minitans
against Sclerotinia sclerotiorum. European Journal of Plant Pathol-
ogy 101, 101–110.
McQuilken, M.P., Budge, S.P. & Whipps, J.M. 1997 Effects of culture
media and environmental factors on conidial germination, pyc-
nidial production and hyphal extension of Coniothyrium minitans.
Mycological Research 101, 11–17.
McQuilken, M.P. & Whipps, J.M. 1997 Production, survival and
evaluation of liquid culture-produced inocula of Coniothyrium
minitans against Sclerotinia sclerotiorum. Biocontrol Science and
Technology 7, 23–26.
Oostra, J., Tramper, J. & Rinzema, A. 1998 Biomass estimation of
Coniothyrium minitans in solid-state fermentation. Enzyme and
Microbial Technology 22, 480–486.
Oostra, J., Tramper, J. & Rinzema, A. 2000 Model-based bioreactor
selection for large-scale solid-state cultivation of Coniothyrium
minitans spores on oats. Enzyme and Microbial Technology 27,
652–663.
Ooijkas, L.P., Chin-Joe, I., Tramper, J. & Buitelaar, R.M. 1998 Spore
production of Coniothyrium minitans on different nitrogen sources
with glucose or starch as carbon source. Biotechnology Letters 20,
785–788.
Ooijkas, L.P., Wilkinson, E.C., Tramper, J. & Buitelaar, R.M. 1999
Medium optimization for spore production of Coniothyrium
minitans using statistically based experimental designs. Biotechnol-
ogy and Bioengineering 64, 92–100.
Park, Y.S., Kang, S.W., Lee, J.S., Hong, S.I. & Kim, S.W. 2002
Xylanase production in solid state fermertation by Aspergillus
niger mutant using statistical experimental designs. Applied Micro-
biology and Biotechnology 58, 761–766.
Plackett, R.L. & Burman, J.P. 1946 The design of optimum multifac-
torial experiments. Biometrika 33, 305–325.
Rama Mohan Reddy, P., Reddy, G. & Seenayya, G. 1999
Production of thermostble b-amylase and pullulanase by Clos-
tridium thermosulfurogenes SV2 in solid-state fermentation:
Screening of nutrients using Plackett–Burman design. Bioprocess
Engineering 21, 175–179.
Roger, H., Willians, J.M. & Cooke, R.C. 1998 Role of soil mesofauna
in dispersal of Coniothyrium minitans: Transmission to sclerotia of
Sclerotinia sclerotiorum. Soil Biology and Biochemistry 30, 1929–
1935.
Sadhukhan, A.K., Ramana Murthy, M.V., Ajaya Kumar, R. Mohan,
E.V.S., Vandana, G., Bhar, C. & Venkateswara Rao, K. 1999
Optimization of mycophenolic acid production in solid-state
fermentation using response surface methodology. Journal of
Industrial Microbiology and Biotechnology 22, 33–38.
Table 8. Comparison of spore production of C. minitans of this paper with the same reported in literatures.
Substrate Harvest time Cultivation Spore
production (conidia/g IDM)
Source
Wheat bran 7–8 days Erlenmeyer flask, 250 ml, 1.04 · 1010 conidia/g IDM This paper
Dry oats 18–19 days Scraped-drum reactor, 1.6 l 5 · 109 conidia/g IDM Oostra et al. (2000)
Hemp impregnated with a
glucose/yeast extract solution
18 days Packed-bed reactor, 15 l 9 · 1014 conidia/m3 PBR J.Weber et al. (1999)
Chemically defined solid medium 31 days Petri dish (9 cm) 3 · 1010 conidia/ dish Ooijkaas et al. (1999)
598 X. Chen et al.

Smith, J.E.& Galbraith, J.C. 1971 Biochemical and physiological
aspects of differentiation in the fungi. Advances in Microbial
Physiology 5, 45–134.
Suamant, P., Qasim, K.B. & Rani, G. 2002 Optimization of alkaline
protease from Bacillus sp. by response surface methology. Current
Microbiology 44, 286–290.
Sunitha, I., Subba Rao, M.V. & Ayyanna, C. 1998 Optimization of
medium constituents and fermentation conditions for the produc-
tion of L-glutamic acid by the co-immobilized whole cells of
Micrococcus glutamicus and Pseudomonas reptilivora. Bioprocess
Engineering 18, 353–359.
Webber, F.J., Tramper, J. & Rinzema, A. 1999 A simplified material
and energy balance approach for process development and scale-
up of Coniothyrium minitans conidia production by solid-state
cultivation in a packed-bed reactor. Biotechnology and Bioengi-
neering 65, 447–458.
Whipps, J.M. & Gerlagh, M. 1992 Biology of Coniothyrium minitans
and its potential for use in disease biocontrol. Mycological
Research 96, 897–907.
Whipps, J.M., Grewal, S.K. & Van der Goes, P. 1991 Interactions
between Coniothyrium minitans and Sclerotia. Mycological Re-
search 95, 295–299.
Yu, X., Hallet, S.G., Sheppard, J. & Watson, A.K. 1997 Applica-
tion of the Plackett–Burman experimental design to evaluate
nutritional requirements for the production of Colletotrichum
coccodes spores. Applied Microbiology and Biotechnology 47,
301–305.
Zhang, J., Marcin, C., Shifflet, M.A., Salmon, P., Brix, T.,
Greasham, R., Buokland, B. & Chartrain, M. 1996 Development
of a defined medium fermentation process for physotigmine
production by Streptomyces griseofuscus. Applied Microbiology
and Biotechnology 44, 568–575.
Coniothyrium minitans spore production 599

Cultivation of oyster mushrooms (Pleurotus spp.) on various lignocellulosic wastes
Q.A. Mandeel*, A.A. Al-Laith and S.A. MohamedDepartment of Biology, College of Science, University of Bahrain, P.O. Box 32038, Isa Town Campus, Kingdom ofBahrain*Author for correspondence: Tel.: +973-876417, Fax: +973-876519, E-mail: [email protected]
Keywords: agriculture waste, bagging systems, fungi, lignocellulosic, oyster mushroom, Pleurotus, spawn
Summary
Cultivation of speciality mushrooms on lignocellulosic wastes represents one of the most economically and cost-effective organic recycling processes. Three species of Pleurotus, namely P. columbinus, P. sajor-caju and P. ostreatuswere experimentally evaluated on untreated organic wastes including chopped office papers, cardboard, sawdustand plant fibres. Production studies were carried out in polyethylene bags of about 1 kg wet weight with 5%spawning rates of substrate fresh weight in a custom-made growth room especially designed for spawn run andcropping. The conversion percentage from dry substrate weight to fresh mushroom weight (biological efficiency)was determined. The highest biological efficiency was noted with P. columbinus on cardboard (134.5%) and paper(100.8%), whereas P. ostreatus produced maximum yield on cardboard (117.5%) followed by paper (112.4%). Theoverall yield of P. sajor-caju was comparatively low (range 47–78.4%). The average number of sporophore flushingsranged between 5 and 6 times. The findings that P. columbinus and P. ostreatus are superior to P. sajor-caju areconsistent with previous reports elsewhere. Further evaluation of P. columbinus alone on different bagging systemscontaining partially pasteurized office papers as a growing substrate revealed that polyethylene bags resulted in109.4% biological efficiency in contrast to pottery (86%), plastic trays (72%) or polyester net (56%). The abovefindings reveal an opportunity for commercial implication of oyster mushroom especially P. columbinus forutilization of different feasible and cheap recyclable residues.
Introduction
Pleurotus species, commonly known as oyster mush-rooms, are edible fungi cultivated worldwide especially insouth east Asia, India, Europe and Africa. The genus ischaracterized by its high protein content (30–40% on dryweight basis) (Sharma &Madan 1993) and gourmet foodquality, thus surpassing many other foods. Medically,Pleurotus ostreatus is reported to decrease cholesterollevels in experimental animals (Bobek et al. 1995; Bobeket al. 1998; Hossain et al. 2003). Unlike other mushroomspecies, oyster mushrooms are the easiest, fastest andcheapest to grow, require less preparation time andproduction technology. Also, the first flush is usuallylarge, without the need for compost, manure, limestone,casing or temperature shocks. With more than 100%biological efficiency, coupled with its distinctive flavour,aroma and excellent drying and preservation qualities, itis assured a unique status as a delicacy.Bioconversion of lignocellulosic residues through cul-
tivation of Pleurotus species offers the opportunity toutilize renewable resources in the production of edible,protein-rich food that will sustain food security for peoplein developing countries (Sanchez et al. 2002). Cultivationof edible mushrooms is one of the most economically
viable processes for the bioconversion of lignocellulosicwastes (Bano et al. 1993; Cohen et al. 2002). The tech-nology can also limit air pollution associated withburning agriculture wastes as well as to decrease rodents,pests and deleterious fungal inoculum populations.Various agricultural by-products are being used as
substrates for the cultivation of the oyster mushroom.Some of these wastes include banana leaves, peanut hulland corn leaves, mango fruits and seeds, sugarcaneleaves, wheat and rice straw (Cangy & Peerally 1995).The widely used substrate for cultivation of the oystermushroom in Asia is rice straw (Thomas et al. 1998). Itis also considered the best substrate in terms of yield andhigh protein content. In Europe, wheat straw is used,while in South East Asian countries sawdust is morecommon. The majority of these substrates can be usedas animal feed. However, their low digestibility, lowprotein content and high lignin content render themunpopular and unacceptable. Moreover, due to anincreased demand on these substrates for biogas pro-duction, composting and non-availability in some areas,it becomes necessary to find cheap alternative sources.In Bahrain, cultivation of the date palm results in theaccumulation of large quantity of by-product leaveswhich are rich in lignin and cellulose and are available
World Journal of Microbiology & Biotechnology (2005) 21:601–607 � Springer 2005
DOI 10.1007/s11274-004-3494-4

without any cost throughout the year not only in farmsbut also in private gardens and homes. Groof is theflower spathe of the date palm. This part is locally usedto produce ‘Luqah water’, a popular and favourite localcold drink during the flowering season in spring. Solidwaste of Groof is produced as a result of simpledistillation process and finds no further use exceptdumping. Several distillation plants are seasonallyinvolved in this practice at a national level, but noavailable data is available with regards to the amount ofGroof waste produced annually. Saw chips from car-pentry factories and waste office papers are also avail-able free all the year round.The cultivation of Pleurotus spp. has been tested in
different bagging systems like trays, cylindrical contain-ers, wooden or polystyrene racks, blocks and plasticbags (Quimio et al. 1990). Cultivation in plastic bagswere reported to yield more harvest than other typeswith less contamination level (Zadrazil & Kurtzman1982). In Europe, growers uses mainly large blackperforated bags while in Asian countries they prefersmaller ones where inoculation and harvesting is man-aged at one end of the bag.The present investigation was undertaken with a view
to finding the feasibility of utilizing several locallyavailable lignocellulosic by-products as potential sub-strates for the cultivation of three species of oystermushrooms and determination of their optimum yield.
Materials and Methods
Strains and spawn
Stock cultures of three species of Pleurotus namelyP. columbinus (strain 250), P. sajor-caju (strain 290) andP. ostreatus (strain 200) on millet grains were obtainedfrom Comet Mushroom Service Co., Cairo, Egypt. Thespawn was kept at 5 �C until inoculation. Pure culturelines were maintained on potato dextrose agar (PDA,Difco Laboratories).The spawn used in this study were prepared on whole
grains of barely. One kilogram of grains were soakedovernight in water, rinsed three times in distilled waterand boiled for 25–30 min. The excess of water wasdrained off and 2% w/w CaCO3 + CaSO4 in additionto 5% dry oats (Quaker Oat Co., USA) were added. Theingredients were thoroughly mixed and distributedequally into 500-ml wide-neck autoclavable glass jarsat the rate of 250 g seeds per jar and sterilized at 15 psifor 45 min. Each of these jars was inoculated with oneagar plugs of 8-days-old mycelium and incubated in thedark for 20 days at 20 ± 2 �C until the substratebecame fully colonized.
Cultivation method
Four different waste materials, unsorted office paper,cardboard, plant fibres (Bromus fasciculatus, family;
Graminae) and white sawdust were used as substratesfor cultivation of Pleurotus spp. The papers andcardboard were shredded in an office-shreddingmachine, while plant fibres were chopped manually into3–5 cm in length with hand scissors. All air-driedsubstrates (337 g) were soaked in hot tap water(60 �C) overnight. The excess water was allowed todrain off through large-holed sieves. The wet substratewas mixed with a fresh supplement of chicken manure ata ratio of 5:1 on dry weight basis to provide a nitrogensource and 5 g dry oats. To maintain the pH, 2%CaCO3 + CaSO4 were added to the substrate. Threereplicates of each substrate per strain were prepared.The dry weights of these substrates were used tocalculate the biological efficiency. The substrate mixturewas properly mixed, moisture content adjusted to 65%,placed in 18 · 32.5 cm autoclavable polyethylene bags(75 lm thickness) and plugged with cotton wool. Bagsof substrate were placed in stainless steel baskets andautoclaved for 1 h at 15 psi at 121 �C and allowed tocool for 3 h to room temperature before asepticallyinoculated. A multilayered spawning method was fol-lowed using 5% wet spawn culture per bag. In thismethod, a layer of sterilized substrate was spread to aheight of about 5 cm at the bottom of the polyethylenebag. Later, a layer of spawn of about 10 cm was spreadon the substrate until the final consisted of spawn.About 25 holes measuring 3 mm in diameter were madeinto each bag for proper aeration. The spawned bagswere kept in a well ventilated room at a temperature of22 ± 2 �C in total darkness with >90% relativehumidity.
Spawn run
The spawn run and cropping were performed in acustom-made growth room of 6.6 m length · 3 mbreadth · 3 m height with waterproof gloss paint wallsand ceiling and ceramic tile-covered floor. A cool-airhumidifier was calibrated to provide 90% relativehumidity and a table fan allowed cross ventilation onall sides of the room. Cool fluorescent lights (20–50 lux)were adjusted to afford 12 h photoperiod daily. Thetemperature was centrally maintained at 21–22 �C. Priorto each experiment the room was disinfected with 10%formaldehyde. The incubated bags were placed ran-domly 20 cm apart on a aluminium shelf unit 1 m abovethe floor.
Cropping
After a complete spawn run, the bags were opened after2 weeks in case with paper and cardboard, 3 weeks forfibre and 4 weeks for sawdust, when the mycelium hadcompletely covered the substrate. The compact mass ofthe substrate and mycelium was watered daily withdistilled sterilized water from the second day of openingof the bags. Within 7–8 days of opening, pin headfruiting bodies (4–5 cm in diameter) appeared on all
602 Q.A. Mandeel et al.

sides of the bag. These young mushrooms attained thenormal size in about 2–3 days when the first crop washarvested from each of the bags. Mature fruiting bodieswere harvested at different periods and the fresh weightrecorded immediately after the harvest. The time takenfor the appearance of pin heads was also recorded.Biological efficiency (BE) was calculated as percentageyield of fresh mushroom fruiting bodies in relation todry weight of the substrate. It was necessary to calculatepercentage BE because certain substrates were denserthan others.
Effect of bagging system
Four different containers were used to evaluate the yieldof P. columbinus on paper byproducts. These consistedof polyethylene bags, plastic trays, pottery dishes andpolyester net bags. Polyethylene bags were 60 · 45 cm(75 lm thickness) transparent, heat-resistant, high-den-sity and perforated sacks with 15 holes of 2 cmdiameter. Plastic trays measured 34 cm length · 24 cmwidth · 4.5 cm height. Pottery dishes were 25 cm indiameter with 5.5 cm height custom-made containersmade up of local clay soil. Polyester net bags wereautoclavable custom-made similar in size to polyethyl-ene bags with 3 mm in diameter holes. All the foursubstrates were filled in their respective containers withshredded office paper, covered by sterilized polyethylenebags as above and partially pasteurized at 80 �C for 3 h.After cooling at room temperature, 1 kg of each of thesubstrates were inoculated with P. columbinus grainspawn at the rate of 5% per container type andincubated for 2 weeks at 22 �C and ambient relativehumidity at total darkness in a well ventilated room.The covering bags were opened and removed when themycelium had colonized the substrate to allow forfruiting to take place. The spawn run and cropping wereperformed as previously described.
Groof colonization
Groof was obtained either as a fresh material from localfarmers or after the distillation process as a wastenormally employed to produce Luqah water. Groofspathes were cut into small pieces (5–6 cm long · 2–3 cmwide). The by-products were soaked in fresh water for2 h after air-drying. Excess water was allowed to drainoff for 5 h. One kilogram of each substrate was placed inplastic trays, covered with two layers of aluminium foiland autoclaved for 45 min at 121 �C and 15 psi. Afterovernight cooling at room temperature, the substratewas inoculated with 2% inoculum of P. sajor-caju by amultilayered spawning method. The trays were kept inthe dark at room temperature (20 �C ) for 2 weeks. Later,aluminium foil were removed, exposing the surface area
of compact mass for fruit body development. In anexperiment designed to examine the effect of addition ofNH4Cl as an external source of nitrogen, three trays wereessentially prepared and treated as above. An amount of0.00, 0.265 and 2.650 g of NH4Cl were incorporated intoeach tray containing 1 kg of the substrate.
Chemical analysis
The moisture content was determined by drying thefruiting bodies to a constant weight in a conventional
oven at 105 �C for 24 h. Later, fruiting bodies werepowdered and analysed for organic constituents. Totalnitrogen content was determined by near infraredspectroscopy (Foss, Denmark). The factor 6.25 wasused to calculate the crude protein. Total carbohydrateswere estimated by the anthrone reaction. Three repli-cates were maintained for each treatment.
Results
Lignocellulosic residue colonization and yield
All the three Pleurotus spp. colonized the differentsubstrates within a period of 3 weeks of spawn run. Thecompact mass of whitish and cottony growth wasformed due to complete impregnation of mycelium intothe substrate. Mycelial ramification was comparativelymore condensed and vigorous in substrates colonized byP. columbinus followed by P. ostreatus compared toP. sajor-caju. Moreover, paper and cardboard wereheavily colonized in a short time as indicated by theirincubation time (Table 1), followed by fibre whereashyphal growth on sawdust was quite slow and lessprofuse than other substrates. The first pin heads(primordia) started appearing in all substrates withinabout 4–5 days after exposing the polyethylene bags tothe atmosphere. The first flush (mature fruiting bodies)was harvest on cardboard 18 days after incubation, and20 days on paper and fibre, whereas for sawdust it wasnot matured before 35 days. Consequent flushes wereusually intervened by 6–7 days, except for sawdust wasabout 10 days. The cardboard cultivated by P. sajor-caju and sawdust by P. ostreatus encountered the lowestnumber of flushes (Table 1). Overall, sporophores pro-duced on sawdust substrate were small, irregularlydistributed on bags and of inferior quality and lowyield per bag compared to the other substrates.The average yield (g) and biological efficiency (%) of
P. columbinus, P. ostreatus and P. sajor-caju cultivatedunder controlled condition on various lignocellulosicresidues using the polyethylene bag method is presentedin Table 1. The cultivation was continued for about
Biological efficiency% ¼Weight of fresh mushroom fruiting bodies
Weight of dry substrate� 100
Cultivation of Pleurotus spp. on waste 603

53–55 days, during which an average of 4–5 crops wereharvested. The maximum average yield of fruit bodies(>50%) was obtained in the first two flushes on all thesubstrates used under experimental conditions. Amongthe four substrates tested, maximum biological efficiencyof 134.5% was obtained on cardboard cultivated byP. columbinus per bag of »1000±12 g wet substrate in atotal of five flushes with an average yield of 90.6 g perflush. Consequently, a BE of 117.5% was yielded byP. ostreatus growing on cardboard in six harvests butwith much lower average of 66 g per flush. Shreddedoffice paper and plant fibres inoculated with P. ostreatusresulted in 112.4 and 95.3% BE in five and foursporophore harvest, respectively. Nonetheless, similarsubstrates colonized by P. columbinus had a BE of 100.8and 87.7% in six and five harvest, in that order. Theaverage BE of sawdust among all the oyster fungievaluated was only 57.7%. Comparatively, P. sajor-cajuattained a lower BE than the other fungi and rangedfrom as low as 47% in office paper to as high as 78% inplant fibres. The data clearly reveal that incubation timeis inversely correlated while harvest numbers are pro-portionally correlated with biological efficiency.
Effect of bagging system
The effect of four bagging systems on growth and yieldof P. columbinus on partially sterilized shredded papersubstrate at 5% spawning rate is presented in Table 2.The oyster mushroom P. columbinus was chosen on thebasis of its fast growth rate, short incubation time andBE on paper. Harvest yield and BE of mushroomproduction varied in different container type 2 weeksafter removal of the polyethylene bags. Shredded officepapers placed in polyethylene bags attained the highest
BE of 109.4% in four harvests with a total of 145 g freshedible biomass of mushroom. BE of the remainingsystems had only three cropping and can be arranged inthe magnitude of order into pottery, plastic and poly-ester net bags with 86.1, 71.9 and 56.1%, respectively.Moreover, bagging in polyethylene bags was superiorthan others in term of sporophore quality, total yield ofmushrooms per bag and reduced contamination level.
Protein and carbohydrates content
Protein and carbohydrate contents of mature sporo-phores of three Pleurotus spp. cultivated on differentlignocellulosic substrates are shown in Table 3. P. sajor-
Table 1. Comparative yield analysis of Pleurotus spp. on various lignocellulosic substrates.
Pleurotus spp. Substrate Mushroom yield
Incubation time
(weeks)
No. of flushing Biologicala Efficiency (%) Harvestbyeild (g)
P. columbinus Paper 2 6 ± 0.577 100.8 ± 12.982 339.6 ± 43.750a
Cardboard 2 5 ± 1.154 134.5 ± 10.793 453.4 ± 36.372b
fibre 3 5 ± 1.527 87.7 ± 15.253 295.4 ± 51.393c
Sawdust 4 3 ± 0.5773 66.4 ± 4.791 223.8 ± 16.145ac
ANOVA F ratio 18.085*
P. sajor-caju Paper 2 3 ± 0.5773 47.0 ± 6.549 158.4 ± 22.073a
Cardboard 2 2 ± 0.000 77.9 ± 13.509 262.7 ± 12.924b
fibre 3 3 ± 1.1547 78.4 ± 8.058 264.1 ± 27.157a
Sawdust 4 3 ± 1.1547 47.2 ± 12.253 158.9 ± 41.291b
ANOVA F ratio 4.274*
P. ostreatus Paper 2 5 ± 1.1647 112.4 ± 8.680 378.8 ± 29.269a
Cardboard 2 6 ± 1.000 117.5 ± 7.485 395.9 ± 25.225a
fibre 3 4 ± 0.5773 95.3 ± 8.365 321 ± 28.1901b
Sawdust 4 2 ± 0.000 59.6 ± 10.930 200.7 ± 36.835c
ANOVA F ratio 25.666*
a Dry weight (g) of the substrate is 337 g.b Means in column followed by the same superscripts are not statistically different at P< 0.05 according to Duncan’s multiple range test.
* Statistically significant at P< 0.05.
Table 2. Effect of bagging system on yield production by
P. columbinus on paper.
Container
type
Mushroom yield
Incubation
time
(weeks)
No. of
flushing
Biologicala
efficiency (%)
Harvestb
yield (g)
Polyethylene
bags
2 4 ± 2.081 109.4 ± 9.963 145 ± 13.099a
Plastic
trays
2 3 ± 1.527 71.9 ± 26.245 95.3 ± 34.77b
Pottery
trays
2 3 ± 0.577 86.1 ± 27.714 114 ± 36.726c
Polyster
net bags
2 3 ± 1.527 56.1 ± 38.095 74.4 ± 50.500d
ANOVA
F ratio
134.878*
a Dry weight (g) of the substrate is 132.5 g.b Means in column followed by the same superscripts are not
statistically different at P< 0.05 according to Duncan’s multiple
range test.
* Statistically significant at P< 0.05.
604 Q.A. Mandeel et al.

caju fruiting bodies produced on plant fibre possessedthe highest protein content of 29.4% on a dry weightbasis followed by cardboard with 27.8%. The averageprotein content of P. ostreatus is 21.3% with sporo-phores grown on cardboard being the highest (24.36%).Crude protein content of P. columbinus varied from23.7% in sporophores cultivated on plant fibre to19.46% in sawdust. Sawdust had always the lowestprotein content among all byproducts. The highest totalcarbohydrates were obtained on paper by P. ostreatus(47%) followed by P. columbinus (42.5%). Cardboardfollowed by plant fibre also yielded appreciable level ofcarbohydrates compared to sawdust. P. sajor-caju fru-iting bodies produced on different substrates generallywere less in carbohydrates content than other species.
Groof colonization
When P. sajor-caju was spawn in sterile Groof and keptin dark at room temperature, a normal white fluffyhyphal mat was observed. The hyphal filaments exten-sively colonized the stalk surface and filled the spacebetween the Groof stalks. At the end of this period (12–15 days), the entire surface was covered with themycelial mat, and the trays were exposed to a 12 hphotoperiod of white fluorescent light. Development offirst fruit bodies (sporophores) was detected after8 days. The fruiting bodies attained maximum size ofabout 7 cm in diameter and new harvests continued toappear for a period of about 12 days.
Effect of the addition of NH4Cl
Hyphal growth was normal and appeared earlier inculture containing no NH4Cl as a nitrogen source. Inculture incorporating 0.265 g/kg Groof, the rate of
hyphal growth was greatly reduced compared with theformer. More growth inhibition was observed in sub-strate containing 2.65 g/kg Groof. The latter was alsocharacterized by weak hyphal mat after almost 30 daysof incubation. Furthermore, when trays were exposed tolight, the first pin heads of sporophores appeared after4 days which became fully matured within 10 days incontrol treatments. However, in substrates containing0.265 g/kg Groof, the fruiting bodies started to appearafter 19 days of exposure to light and the number ofsporophores were considerably less. No fruiting bodiesappeared on substrates containing 2.65 g/kg Groof after20 days. The mycelial mat started to collapse within thisperiod. No difference in hyphal growth was observedbetween fresh or waste Groof byproduct.
Discussion
Commercial production of oyster mushrooms is largelydetermined by the availability and utilization of cheapmaterials of which agricultural lignocellulosic wastesrepresents the ideal and most promising substrates forcultivation. The by-products used in this study can beconsidered practical and economically feasible due totheir availability throughout the year at little or no costin large quantities. Office paper and cardboard arecurrently exported for recycling into low quality prod-ucts, while sawdust is used as floor bedding in poultryhouses. Utilization of these by-products for the produc-tion of oyster mushrooms could be more economicallyand ecologically practical.
Groof colonization
The chemical composition of Groof is not yet known.However, it is expected to show some similarity with
Table 3. Chemical contents of fruiting bodies of Pleurotus spp. cultivated on various lignocellulosic substrates.
Pleurotus spp. Substrate Moisture content (%) Chemical contentb
Crude Protein (%) Total Carbohydrate (%)
P. columbinus Paper 88.1 ± 0.984 21.13 ± 0.550 42.5 ± 2.471a
Cardboard 91.2 ± 0.814 15.70 ± 0.424 39.0 ± 1.896a
Fibre 90.2 ± 1.000 23.71 ± 2.920 31.5 ± 1.661b
Sawdust 89.5 ± 1.135 19.46 ± 2.311 28.5 ± 2.150b
ANOVA F ratio 3.773Ns 29.834*
P. sajor-caju Paper 86.3 ± 2.891 23.30 ± 3.421a 29.5 ± 2.541a
Cardboard 89.7 ± 1.571 27.80 ± 0.702b 36.0 ± 3.372b
Fibre 89.4 ± 1.386 29.40 ± 0.556b 27.5 ± 1.472ac
Sawdust 88.8 ± 2.302 18.03 ± 1.890c 23.5 ± 1.549c
ANOVA F ratio 19.469* 14.452*
P. ostreatus Paper 86.6 ± 2.302 22.13 ± 0.907 47.0 ± 1.755a
Cardboard 89.8 ± 1.167 24.36 ± 3.555 40.5 ± 2.726b
Fibre 87.9 ± 1.607 20.90 ± 2.961 36.0 ± 0.475c
Sawdust 87.9 ± 0.529 NDa 32.5 ± 0.756d
ANOVA F ratio 1.250Ns 41.885*
a ND is not determined.b Means in each column followed by the same superscripts are not statistically different at P< 0.05 according to Duncan’s multiple range test.
* Statistically significant at P< 0.05.; Ns, not significant.
Cultivation of Pleurotus spp. on waste 605

most agriculture wastes, and hence Groof may present apotential substrate for the cultivation of P. sajor-cajuand other species. Our preliminary studies revealed thatchopped Groof pieces can be efficiently colonized bythese fungi. During the incubation period, mycelialgrowth proceeded normally and upon exposure to theatmosphere, produced normal sporophores within theanticipated period of time. However, the maximal sizeattained was within the lower range of the expecteddiameter reported by other investigators (between 5 and15 cm) (Ahmed 1994). Allowing the sporophores togrow for longer duration did not improve the situation.With regard to the effect of NH4Cl addition, it was
clear that NH4Cl had an inhibitory effect on earlyhyphal colonization of the Groof. Increasing the con-centration of the NH4Cl to 0.265 g/kg resulted inremarkable decrease in the rate of hyphal growth(19 days compare to 4 days with control). Furtherincrease in NH4Cl to 2.65 g/kg have led to poormycelium ramification accompanied by an absolutesporophore repression. Substrate supplementation withan external source of nitrogen is recommended forenhancing the oyster mushroom yield of Pleurotus spp.(Azizi et al. 1990). According to Kurtzman (1994)Pleurotus spp. have a very low requirement for nitrogenin its initial substrate colonization. Ammonia andnitrates are toxic to sporophores developments andcontribute to low yield. The acceptable nitrogen is,however, always present in a bound form. Thus, it maybe useful if carbon sources are added to the substrateson which Pleurotus spp. grow without the addition ofnitrogen. Singh (1998) reported that supplementation ofstraw bed with extra nitrogen sources while spawningdid not have any favourable effect on growth and insome cases led to contamination. Thus, mushroom bedswere supplemented with nitrogen source after the spawnrun. Sharma & Madan (1993) found that nitrogen-fixingsubstrates (leguminous) were superior to non-legumi-nous in both yield performance and sporophore quality.
Lignocellulosic residue colonization and yield
Comparing the four lignocellulosic residues as sub-strates for the cultivation of Pleurotus spp. Shows thatshredded cardboard pieces and office paper supportedbest growth of P. columbinus and P. ostreatus asevidenced by complete and heavy colonization ofsubstrates forming a compact white mass of myceliumwithin 2 weeks of inoculation. Furthermore, the quan-tity of fresh edible sporophore (g/bag) harvest washigher in cardboard and paper than plant fibre andsawdust. The performance of the two substrates wasalso evident by their elevated biological efficiency valueswith 134.5% BE on cardboard by P. columbinus and117.5% by P. ostreatus whereas on paper the BE was112.4% by the latter fungus in 53–55 days of mushroomcropping (Table 1). The time required for sporophoreharvest on cardboard always preceded paper by 2 daysand the intervals between the appearance of flushes after
the first harvest is relatively short. The finding that P.columbinus and P. ostreatus are better than P. sajor-cajuare consistent with those reported by Cangy & Peerally(1995) while comparing the growth rate and yield ofdifferent Pleurotus spp. on sugar-cane bagasse. Theyalso showed that exposing P. columbinus, in particular,toa cool temperature regime resulted in higher average(23.9%) yield compared to P. sajor-caju (18.37%).P. ostreatus and P. columbinus require a low tempera-ture (18–20 �C) as compared to P. sajor-caju (23–25 �C).The overall low yield of P. sajor-caju could be attributedto the slightly low temperature (21–22 �C) during thespawning period. According to Zadrazil (1982), P. sajor-caju converts maximally 25% of the organic matter lostinto fruit bodies. P. ostreatus and P. columbinus pro-duces relatively higher economical yield of coefficient(yield of fruit bodies/loss of organic matter) than that ofP. sajor-caju (Sharma & Madan 1993).Reports on cultivation of the oyster mushroom on
similar by-products have manifested variable levels ofBE. These variations are mainly related to spawn rate,fungal species used and supplement added to thesubstrate. Remtulla (1993), for example, comparedvarious lignocellulosic residues such as wheat straw,mixed paper, newsprint, pulp sludge and wood chips forcultivation of P. sajor-caju and concluded that the latterresulted in 34% BE. Patil & Jadhav (1991) reportedfresh mushroom yield of 583 g per kg dry weight ofcoconut. Some of the elevated BE of Pleurotus spp. oncommonly used substrates varied from 58.9% in coco-nut palm leafstalk (Thomas et al. 1998), sugarcaneresidue 71.5% (Singh 1998), sugarcane bagasse 146.7%(Soto-Velazco & Alvarez 1995), rice straw 85.5%(Mehta et al. 1990), leguminous plants 103.8% (Sharma& Madan 1993) and shiitake spent 79% (Royse 1992).Our trial indicates that the bagging system has an
effect on the yield as well as on the quality and numberof the harvest (Table 2). Bagging in polyethylene bagsresulted in a maximal yield of 145 g per kg on wetsubstrate basis with four flushes during a croppingperiod of 30–34 days after removal of polyethylene bagsfollowed by 95.3 g using plastic trays with only threeflushes. Polyethylene bags retained higher water in thesubstrate, the contamination level was contained andsporophore quality were superior, due to the fullexpansion of the pileus.Pleurotus spp. are known to produce a wide range of
hydrolytic and oxidative enzymes that enable them tosuccessfully colonize, degrade and bioconvert manylignocellulosic substrates (Bano et al. 1993; Bajpai1997). Such degradation of lignocellulosic materialsresults from the concerted and synergistic action ofmany enzymes: endoglucanases, exoglucanases, lamina-rinases, b-glucosidases, xylanases, laccases and polyphe-nol oxidases (Saxena & Rai 1992; Buswell et al. 1996).Analysis of mushroom sporophores for protein and
carbohydrate content varied with the lignocellulosicresidue used (Table 3). Data, in general, revealed thatP. sajor-caju contain higher protein contents than
606 Q.A. Mandeel et al.

P. columbinus and P. ostreatus, especially on plant fibresand cardboard. These findings are consistent withstudies reported elsewhere (Remtulla 1993; Sharma &Madan 1993), but on different substrates. Sharma &Madan (1993) compared the protein contents of variouslignocellulosic residues and concluded that the nitrogencontent in fruit bodies was higher in leguminous plantsubstrates than non-leguminous ones. The proteincontent usually ranges between 30–40% on a dry weightbasis. Substrates rich in usable nitrogen after spawn runmay be a factor in enhancing the mushroom yield andquality, in addition to the mushroom species in biocon-version and bioaccumulation efficiency. In this study,the addition of fresh supplement of chicken manurecould, in part, accounted for the protein content.In conclusion, the results presented in this preliminary
study confirm the previous findings that P. columbinusand P. ostreatus are superior oyster mushrooms to P.sajor-caju as evidenced by their growth characteristicsand biological efficiency. Cultivation on shredded officepaper and cardboard by these fungi yielded more ediblesporophore biomass than other lignocellulosic residues.Also, bagging of shredded office paper colonized by P.columbinus in polyethylene bags resulted in a maximumof 109.4% BE compare to other container systems.Further work is in progress to improve growing condi-tions of spawning and increase the yield of P. columbinuson more feasible and cheap recyclable residue.
Acknowledgement
The authors are grateful to Deanship of ScientificResearch, University of Bahrain for funding the project.The authors would also like to thank Dr. Hashim Al-Sayed for his help in statistical analysis.
References
Ahmed, M.A. 1994 Cultivation of Oyster Mushroom, 1st ed. Cairo,
Egypt, Comet Co., 63
Azizi, K.A., Shamala, T.R. & Sreekantiah, K.R. 1990 Cultivation of
Pleurotus sajor-caju on certain agro-industrial wastes and utiliza-
tion of the residues for cellulose and D-xylanase production.
Mushroom Journal for the Tropics 10, 21–26.
Bajpai, P. 1997 Microbial xylanolytic enzyme system: properties and
applications. Advances in Applied Microbiology 43, 141–194.
Bano, Z., Shasirekha, M.N. & Rajarathnam, S. 1993 Improvement of
the bioconversion and biotransformation efficiencies of the oyster
mushroom (Pleurotus sajor-caju) by supplementation of its rice
straw with oil seed cakes. Enzyme and Microbial Technology 15,
985–989.
Bobek, P., Ozdin, O. & Mikus, M. 1995 Dietary oyster mushroom
(Pleurotus ostreatus) accelerates plasma cholesterol turnover in
hypercholesterolaemic rats. Physiological Research 44, 287–291.
Bobek, P., Ozdin, L. & Galbavy, S. 1998 Dose- and time-dependent
hypercholesterolaemic effect of oyster mushroom (Pleurotus
ostreatus) in rats. Nutrition 14, 282–286.
Buswell, J.A., Cai, Y.J., Chang, S.T., Peberdy, J.F., Fu, S.Y &Yu, H.S.
1996 Lignocellulolytic enzyme profiles of edible mushroom fungi.
World Journal of Microbiology and Biotechnology 12, 537–542.
Cangy, C. & Peerally, A. 1995 Studies of Pleurotus production on
sugarcane bagasse. African Journal of Mycology and Biotechnology
3, 67–79.
Cohen, R., Persky, L. & Hadar, Y. 2002 Biotechnological applications
and potential of wood degrading mushrooms of the genus
Pleurotus. Applied Microbiology and Biotechnology 58, 582–594.
Hossain, S., Hashimoto, M., Choudhury, E., Alam, N., Hussain, S.,
Hasan, M., Choudhury, S. & Mahmud, I. 2003 Dietary mushroom
(Pleurotus ostreatus) ameliorates atherogenic lipid in hypercholes-
terolaemic rats. Clinical and Experimental Pharmacology and
Physiology 30, 470.
Kurtzman, Jr. R.A. 1994 Nutritional needs of mushrooms and sub-
strates. In Advances in Mushroom Biotechnology, eds. Nair, M.C.,
Gopalapalan, G. & Lulu, D. pp. 106–110. Jodhpur, India: Scientific
Publishers. ISBN 8172330804.
Mehta, V., Gupta, J.K. & Kaushal, S.C. 1990 Cultivation of Pleurotus
florida mushroom on rice straw and biogas production from the
spent straw. World Journal of Microbiology and Biotechnology 6,
366–370.
Patil, B.D. & Jadhav, S.W. 1991 Yield performance of Pleurotus sajor-
caju on various substrates. In Indian Mushrooms. Proceedings of
National Symposium on Mushrooms. pp. 84–86.
Thiruvanathapuram, India: Kerala Agricultural University.
Quimio, T.H., Chang, S.T. & Royse, D.J. 1990 Technical guidelines
for mushroom growing in the tropics. F.A.O. Plant production and
Protection 106, 62–70.
Remtulla, A. 1993 Utilization of lignocellulosic residues for the
cultivation of Pleurotus sajor-caju. McIlvainea 11, 40–43.
Royse, D.J. 1992 Recycling of spent shiitake substrate for production
of the oyster mushroom Pleurotus sajor-caju. Applied Microbiology
and Biotechnology 38, 179–182.
Sanchez, A., Ysunza, F., Beltran-Gracia, M. & Esqueda, M. 2002
Biodegradation of viticulture wastes by Pleurotus: a source of
microbial and human food and its potential use in animal feeding.
Journal of Agricultural and Food Chemistry 50, 2537–2542.
Saxena, S. & Rai, R.D. 1992 Effect of nitrogen on production of
extracellular degradative enzymes by Pleurotus sajor-caju (Fr.)
Singer on wheat straw. Mushroom Research 1, 45–48.
Sharma, S. &Madan, M. 1993 Microbial protein from leguminous and
non-leguminous substrates. Acta Biotechnologica 13, 131–139.
Singh, A.K. 1998 Cultivation of oyster mushroom (Pleurotus spp.) on
sugarcane residues. Journal of Mycology and Plant Pathology 28,
24–245.
Soto-Velazco, C. & Alvarez, I. 1995 Fruit body production of Pleurotus
spp. on sugarcane bagasse after treatment with sodium hydroxide.
African Journal of Mycology and Biotechnology 3, 61–66.
Thomas, G.V., Prabhu, S.R., Reeny, M.Z. & Bopaiah, B.M. 1998
Evaluation of lignocellulosic biomass from coconut palm as
substrate for cultivation of Pleurotus sajor-caju (Fr.) Singer. World
Journal of Microbiology and Biotechnology 14, 879–882.
Zadrazil, F. & Kurtzman, Jr. R.H. 1982 The biology of Pleurotus
cultivation in the tropics. In Tropical Mushrooms, Biology, Nature
and Cultivation Methods, ed. Chang, S.T. & Quimio, T.H.
pp. 277–298. Hong Kong: The Chinese University Press. ISBN
9622012647.
Cultivation of Pleurotus spp. on waste 607

Production of tannase by Aspergillus niger HA37 growing on tannic acid and Olive
Mill Waste Waters
H. Aissam1, F. Errachidi1, M.J. Penninckx2,*, M. Merzouki1 and M. Benlemlih11Universite Sidi Mohamed Ben Abdellah, Laboratoire de Microbiologie de l’Environnement, Faculte des Sciences DharEl Mehraz B.P : 1796 Atlas-Fes, Maroc2Universite Libre de Bruxelles, Laboratoire de Physiologie et Ecologie Microbienne, Ecole Interfacultaire deBioingenieurs, c/o Institut Pasteur 642, Rue Engeland B-1180 Bruxelles, Belgium*Author for correspondence: Tel.: 32-2-3733303, Fax: 32-2-3733309, E-mail: [email protected]
Keywords: Aspergillus niger, Olive Mill Waste Waters, tannase, tannic acid
Summary
Production of tannase (tannin acyl hydrolase, EC 3.1.1.20) by Aspergillus nigerHA37 on a synthetic culture mediumcontaining tannic acid at different concentrations has been studied. Maximal enzymatic activity increased accordingto the initial concentration of tannic acid; respectively 0.6, 0.9 and 1.5 enzyme activity units (EU) ml)1 medium inthe presence of 0.2%, 0.5% and 1% of tannic acid. Tannase production by A. niger HA37 on fourfold diluted olivemill waste waters (OMWW) as substrate, was between 0.37 and 0.65 EU ml)1. Enzyme production on the dilutedOMWW remained globally stable during more than 30 h. Growth of A. niger HA37 on OMWW was correlatedwith about 70% degradation of phenolic compounds present in the waste. This strain has therefore the capacity todegrade complex wastewaters which cause environmental damage to aquatic streams.
Introduction
Olive Mill Waste Water (OMWW) is a major wasteproduced around the Mediterranean basin. OMWWcontains a large amount of hydrolysable tannins thatcan be degraded by tannase (tannin acyl hydrolase, EC3.1.1.20), an extracellular enzyme produced by bacteriaand fungi (Lane et al. 1997; Osawa et al. 2000; Mondalet al. 2001b; Bhardwaj et al. 2003; Nishitani et al. 2004;Saxena & Saxena 2004). This enzyme catalyses thehydrolysis of the ester link of the hydrolysable tannins(Lekha & Lonsane 1997; Kumar et al. 1999).Tannase has found application in various domains, for
example as inhibitor of foam in tea and as a clarifyingagent in the production of beer and fruits juices(Masschelein & Batum 1981; Cantarelli et al. 1989; Laneet al. 1997; Boadi & Neufeld 2001). It also plays animportant role in the pharmaceutical industry, especiallyin the manufacture of Trimethoprim, an antibioticderived from gallic acid (Bajpai & Patil 1997). Thisenzyme was also proposed for use in environmentalbiotechnology, as for example in the treatment of thetannery effluents (Suseela & Nandy 1985).Several micro-organisms are potential sources of
tannase (Bajpai & Patil 1997; Bradoo et al. 1997;Sharma et al. 1999; Mondal et al. 2001b; Bhardwajet al. 2003; Mukherjee & Banerjee 2004). Nevertheless inconsideration owing to obvious industrial potentialities
presented by this enzyme, in particular in remediation ofenvironmental pollution, a search for new competentmicro-organisms for production of tannase, capable ofchallenging drastic industrial conditions, is important(Ramirez-Coronel et al. 2003; Yu et al. 2004). Tanninscan be classified into two categories: hydrolysable andnon-hydrolysable (condensed). Tannic acid is an im-portant gallotannin belonging to the hydrolysable classand consist of esters of gallic acid and a polyol, usuallyglucose (Spencer et al. 1988; Kumar et al. 1999; Mondalet al. 2000).The strain Aspergillus niger HA37 was previously
isolated from OMWW, a substrate containing animportant amount of hydrolysable tannins acting asinducers for tannase production (Aissam et al. 2002).The present paper report on a study of the physiologicalparameters of tannase production and OMWW degra-dation by this strain. We conclude that A. niger HA37has the faculty to degrade complex wastewaters whichcause environmental damage to aquatic streams.
Materials and methods
Strain and culture conditions
Aspergillus niger HA37, isolated at the OMWWevaporation pond in Fez city (Morocco), was used inthe present study (Aissam et al. 2002). The strain was
World Journal of Microbiology & Biotechnology (2005) 21:609–614 � Springer 2005
DOI 10.1007/s11274-004-3554-9
maintained on malt extract agar slants, stored at 4 �Cand subcultured every month.Erlenmeyer flasks of 250 ml, containing 50 ml of the
basal AT medium (0.065% K2HPO4, 0.35% (NH4)2SO4
(w/v))were sterilized by autoclaving at 120 �C for 20 min.Tannic acid (Gallotannin: Farco Chemical Supplies)sterilized by filtration was added aseptically to the flasksat respective concentrations of 0.2%, 0.5%and 1% (w/v).The AT medium solidified by 2% (w/v) of agar, and
supplemented with 1% (w/v) of tannic acid (ATAmedium), was used for cultivation on Petri dishes.For growing on OMWW, 50 ml of fourfold water
diluted OMWW (v/v) was supplemented with 0.065% ofK2HPO4 and 0.35% of (NH4)2SO4 in Erlenmeyer’sflasks of 250 ml. The flasks were sterilized by autoclav-ing at 120�C during 20 min.The OMWW produced by an industrial mill unit
situated in the city of Fez was sampled during the 2001–2002 olive milling campaign. The main characteristics ofthe OMWWused in this study were pH 5.0 ± 0.2 ; COD82 ± 5 g l)1; phenolic content 3.2 ± 0.3 g l)1; sus-pended solids 2.8 ± 0.3 g l)1; total solids20 ± 3.2 g l)1 and volatile solids 18 ± 2.5 g l)1 (Ais-sam et al. 2002).Aspergillus niger HA37 was first cultivated at 30 �C
for 7 days on the solid ATA medium in order to inducesporulation. Fresh conidiospores were inoculated ineach Erlenmeyer flask to attain a final concentration of107 conidiospores · ml)1 (numbered with a Thoma cell).The liquid culture media were incubated at 30 �C on arotary shaker (120 rev min)1).One millilitre of supernatant samples were withdrawn
at intervals of 3 h and were used for the estimation oftannase and phenolic compounds. COD evolution of themedium of was measured out according to Knechtel(1978).The growth rate of the strain A. niger HA37 was
estimated by the measure of CO2 liberated from theculture medium according to the gravimetric method ofPochon & Tardieux (1962).
Tannic acid and phenolic compounds
Tannic acid and phenolic compounds were measuredaccording to Maestro-Duran et al. (1991).
Biomass estimation
Biomass produced during cultivation ofA. nigerHA37onthe OMWW media was estimated by filtration of theculture medium on glass microfibres (GF/A Whatman,Inc.). The retained biomass was washed twice with 5 mldistilledwateranddriedovernightat105 �C.Growthyieldwas expressed as gram of dry weight per litre of culture.
Estimation of tannase activity
Tannase was estimated by the spectrophotometric assayof Bajpai & Patil (1996). One unit of enzyme activity
(EU) was defined as the amount of enzyme catalysingthe hydrolysis of 1 lmol tannic acid per minute. Theresults are expressed in EU ml)1.
Chromatographic separation of phenolic compounds
Gel filtration Sephadex G-50 was used to analyse thephenolic compounds present in treated and untreatedOMWW.A volume of 200 ml of Sephadex G-50 gel was placed
in a quartz column (2.5 · 50 cm). After stabilizationand equilibration with the buffer (NaOH 0.05 M, LiCl0.025 M) 1 ml of the sample was layered on the top ofthe column and eluted at 0.6 ml min)1 by fraction of3 ml. The optical density of these fractions wasmonitored at k 280 nm.
Chemicals
Suppliers of chemicals and materials used in the presentstudy are identified in the text. All other items were ofhighest purity grade.
Data presentation
All the experiments were performed in triplicate. Dataare presented as means ± SEM (n ¼ 3).
Results and discussion
Tannase production by A. niger HA37 on tannic acid ascarbon and energy source
A previous study of the growth pattern of 11microbial strains isolated from OMWW revealed theefficiency of A. niger HA37 for tannic acid degradation(Aissam et al. 2002). Before considering OMWW as asubstrate we first used a defined medium containingtannic acid as single carbon and energy source to delimitthe basic physiological parameters of growth andenzyme production by A. niger HA37. This strain canapparently assimilate tannic acid at least up to 1%initial concentration in the growth medium (Figure 1a).Higher concentrations may cause growth inhibition ofA. niger HA37 (not shown). Gallotannin tolerance limitsfor A. niger, Aspergillus fischerii, Fusarium solani andTrichoderma viride, determined by progressively increas-ing the substrate concentration, were found to bearound 20%, 4%, 3% and 3% respectively (Bajpai &Patil 1997). As far as we know the mechanism of toxicityof tannins against fungal strains is not at this timeresolved. Yet, tannins were reported as antimicrobialagents that may induce membrane damage, complexa-tion with extracellular enzymes and/or metals ions, inparticular iron (Scalbert 1991; Chung et al. 1998).The extracellular tannase activity peaked during the
20 h latency phase (Figure 1b). This phase included aninitial 6–9 h period required for spores germination, asobserved by optical microscopy (not illustrated), and
610 H. Aissam et al.

was completed at the onset of growth (Figure 1a). Asimilar result was obtained by Suseela & Nandy (1985)with Penicillium chrysogenum. No detectable carbondioxide was released by A. niger HA37 within thelatency phase (Figure 1a). Therefore, the strain wasapparently not actively growing during that interval butproduced tannase. Yet, although RNA and proteinsynthesis are active during the latency phase, thetitration or the gravimetric procedures used here toestimate respiratory CO2 are not sufficiently sensitive to
measure any metabolic activity during this period(Sussman & Douthit 1973). In fine, a germination stepmost probably associated with tannase biosynthesisappears to prevail for A. niger HA37. Differentmechanisms of tannase production depending on strainmay however be operative. For example, Bacillus cereusa tannase-producing soil bacterium produced maximalenzyme activity during the stationary phase of growth(Mondal et al. 2001a). Moreover, Aspergillus aculeatusand Bacillus licheniformis also showed maximal tannaseproduction during the exponential phase (Mondal et al.2000; Banerjee et al. 2001).The mechanism of regulation of microbial tannase
production is currently not deciphered although theinducing effects of the gallic acid fraction of tannic acid(or a derivative) have been suggested (Bajpai & Patil1997). Production of tannase increased with the initialconcentration of the tannic acid (Figure 1b); maximalenzyme activities attaining 0.6, 0.9 and 1.5 EU ml)1 inthe culture medium containing, respectively, 0.2%,0.5% and 1% tannic acid. This suggest that theconcentration of the inducing fraction derived fromtannic acid (possibly gallic acid or a derivative)increased according the initial concentration of thesubstrate. A similar result has been observed withAspergillus japonicus where also strong end-productinhibition of tannase with gallic acid was shown(Bradoo et al. 1997).In AT medium containing 0.2% tannic acid, tannase
activity peaked after 9 h of incubation, whereas maximallevel was observed after 12 h in the AT culture mediacontaining, respectively, 0.5% and 1% of tannic acid(Figure 1b). Afterwards, the enzyme activity declinedgradually. This could be due to a combined effect ofcatabolite repression and enzyme inactivation or, en-zyme inactivation alone. Catabolite repression of tan-nase production, associated with the release of glucose inthe culture medium, has been suggested for Penicilliumchrysogenum (Suseela & Nandy 1985). On the otherhand, kinetic results indicated that low tannase activitytitres in submerged cultures of Aspergillus niger Aa-20could be associated with an enzyme degradation process,possibly mediated by proteolytic action (Aguilar et al.2001). Regulation of enzyme level by proteolysis hasbeen reported as a widespread mechanism among fungi,as for example for lignin peroxidase in the white-rotfungus Phanerochaete chrysosporium (Dass et al. 1995).Although tannase production peaked at about 9–12 h
(Figure 1b), tannic acid was apparently not utilized forabout 20 h (Figure 1a). The procedure used for estimat-ing tannic acid however quantifies only the totalphenolic content, including free gallic acid and alsogallic acid engaged in ester bonds with the polyolfraction of gallotannin. Therefore a plausible scenariowould be that most of tannic acid was hydrolysed intoits constituents during the latency phase and that gallicacid consumption started at the onset of growth. Thiswas supported by a gel chromatography experiment asreported in Figure 3.
0
2
4
6
8
10
12
0 3 6 9 12 15 18 21 24 27 30 33 36 39 41 44 47
Time (hours)
Tann
ic a
cid
(gl-1
)
0
0.5
1
1.5
2
2.5
3
3.5
4
4.5
5
CO
2 (g
l-1)
0
0.2
0.4
0.6
0.8
1
1.2
1.4
1.6
0 6 12 18 24 30 36 42 48 54Time (hours)
Tann
ase
(UE
ml-1
)
(a)
(b)
Figure 1. Growth pattern and tannase production by A. nigerHA37 at
different initial concentrations of tannic acid. (a) Variation of phenolic
content expressed in term of tannic acid (TA) concentration [ (n) 0.2%
TA; (d) 0.5% TA; (m) 1% initial TA concentration], and of CO2
liberated during growth [(h) 0.2% TA; (�) 0.5% TA; (n) 1% TA] . (b):
Tannase activity excreted by A. niger HA37 [(n) 0.2% TA; (d) 0.5%
TA; (m) 1% TA].
0
0.1
0.2
0.3
0.4
0.5
0.6
0.7
0.8
0.9
1
0 9 18 27 36 45 54 63 72 81 90Time (hours)
Phe
nolic
com
poun
ds (
g l-1
)
0
0.1
0.2
0.3
0.4
0.5
0.6
0.7
0.8
0.9
1
Tann
ase
(U m
l-1)
Figure 2. Variation of phenolic compounds (PC) content and tannase
activity produced by A. niger HA37 growing on OMWW [(d) PC
control in the absence of the strain; (m) PC treated; (n) tannase].
Tannase from A. niger growing on wastewater 611

Oxidases, in particular laccase for which gallic acid isa substrate (Faure et al. 1995), might be involved in themetabolism of this aromatic. It is noteworthy tomention that several fungal species including Aspergillusstrains are able to produce laccase (Bajpai & Patil 1996,1997; Scherer & Fischer 1998; Kiiskinen et al. 2004). Onthe other hand there are evidences that tannic acid isable to induce laccase activity in some basidiomycetesfungi (Carbajo et al. 2002), where a role for oxidativeligninolytic enzymes in the degradation of phenolicfraction of OMWW was proposed (Sayadi & Ellouz1995; Jaouani et al. 2003). Confirmation of the presenceof laccase in A. niger HA37 still awaits furtherinvestigation. A weak, but significant laccase activity,was however recently detected in ion-exchange chroma-tographic fractions of a culture supernatant of the straingrowing on tannic acid (Aissam et al. unpublished).Biomass produced by A. niger HA37 after 48 h of
cultivation was around 0.9 ± 0.07, 2 ± 0.2, and3.3 ± 0.3 g l)1 dry weight for respective 0.2%, 0.5%and 1% initial tannic acid concentration. The quantityof biomass produced by A. niger HA37 increased thusproportionally with the initial concentration of tannicacid, at least in this range, as was observed by Bradooet al. (1997) for Aspergillus japonicus.
Tannase production by A. niger HA37 growing onOMWW
Figure 2 shows the evolution of the content of phenoliccompounds and tannase produced during growth ofA. niger HA37 on fourfold-diluted OMWW. Growthand enzyme production on higher concentrations ofOMWW corresponding to a twofold or less dilution ofthe waste was seriously hampered (not shown). Degra-dation of the phenolic compounds, including tannins, byA. niger HA37 was preceded by a 24 h latency phasecorresponding to the time necessary for the germinationof spores (Figure 2). After this adaptation phase, thecontent in phenolic compounds decreased progressivelyfrom 0.9 ± 0.07 to 0.26 ± 0.03 g l)1 after 72 h ofincubation to remain steady at least until 96 h cultiva-tion. COD reduction was 71 ± 2% during that period
and was accompanied by a biomass production of5.3 ± 0.05 g l)1 dry weight.Therefore, the concentration of phenolic compounds
in fourfold-diluted OMWW did not apparently limit thecapacity of spore germination of A. niger HA37.However, as compared to cultures on tannic acid(Figure 1a) the latency phase on OMWW was slightlylonger, which could probably be assigned to the complexnature of the OMWW containing different organiccompound types (Balice & Cera 1984).Tannase production on OMWW started during the
first hour of incubation to culminate around 0.55–0.65 EU ml)1 between 8 and 28 h of cultivation(Figure 2). The enzyme level decreased subsequently tobecome non-detectable after 54 h of incubation, never-theless, the content of phenolic compounds keep ondecreasing for more 18 h. This could be explained by theinvolvement of other complementary enzymes in thedegradation process, as discussed above.As compared to the sharp peaks of tannase produc-
tion on tannic acid (Figure 1b), the enzyme productionon OMWW showed a plateau profile for about 20 h(Figure 2). This sustained production of tannase couldresult from the presence in OMWW of variouscompounds, all of them putative substrates of theenzyme, and acting as inducers. In contrast, in the ATmedium there is only one compound (tannic acid) andthis could be the reason of the sharp profile of tannaseproduction (Figure 1b).Taken together, these results suggest that tannins and
phenolic compounds present in OMWW induce theproduction of tannase. A similar conclusion could beprobably reached for the induction of the ligninolyticsystem in Phanerochaete chrysosporium, and otherfungal strains, in presence of OMWW (Sayadi et al.2000; Kissi et al. 2001; Jaouani et al. 2003). As anotherconsequence it can be reasonably assumed that A. nigerHA37 tannase is concerned with the process ofdegradation of phenolic compounds present inOMWW.The maximal tannase activity of 0.65 EU ml)1, ob-
tained on fourfold-diluted OMWW was comparable tothe value of 0.6 EU ml)1 found in the artificial mediumcontaining 0.2% of tannic acid (Figures 1b and 2).
Assessment of the treatment efficiency by gelchromatography of OMWW
Figure 3 show how a treatment with A. niger HA37 mayaffect the molecular mass distribution of polyphenoliccompounds including tannins. Before treatment, aOMWW elution chromatogram showed two mainpeaks, representing respectively aromatics of more than30 kDa and less 2 kDa. After 72 h incubation with thestrain, the amplitude of the first peak decreasedconsiderably whereas no more than 50% decrease wasshown for the low molecular weight (MW) peak. Thisresult is indicative of a depolymerization of high MWaromatics among which gallotannins, followed by
0
0.1
0.2
0.3
0.4
0.5
0.6
0 6 12 18 24 30 36 42 48 54 60
Fraction
Abs
orba
nce
(280
nm
)
Figure 3. Profile of elution of phenolic compounds of OMWW before
(m) and after (n) treatment by A. niger HA37. [(m) control; (n)
treated].
612 H. Aissam et al.

assimilation of low MW aromatics not entirely con-sumed at the end of the growth cycle.
Conclusion
Aspergillus niger HA37, a strain isolated fromOMWW produced tannase on an artificial laboratorymedium containing tannic acid as carbon and energysource, but also on OMWW. Most probably, tannaseparticipates in an initial hydrolytic step of tannins,liberating monomeric constituents entering further intothe metabolic network of the fungus. Yet, thissupposed hydrolytic activity remain to be strictlydemonstrated, for example with a purified enzymepreparation.The experiments reported in this paper were con-
ducted on fourfold diluted OMWW. In the perspectiveof a use in environmental pollution remediation, itwould be interesting to select new active strains able togrow on more concentrated OMWW or trying toacclimate existing strains including for example A. nigerHA37 to those conditions.
Acknowledgements
The authors wish to thank the Morocco Governmentand Walloon Region of Belgium for their support.
References
Aguilar, C.N., Augur, C., Favela-Torres, E. & Viniegra-Gonzalez, G.
2001 Production of tannase by Aspergillus niger Aa-20 in
submerged and solid-state fermentation: influence of glucose and
tannic acid. Journal of Industrial Microbiology and Biotechnology
26, 296–302.
Aissam, H., Errachidi, F., Merzouki, M. & Benlemlih, M. 2002
Identification des levures isolees des margines et etude de leur
activite catalase. Cahiers de l’Association Scientifique Europeenne
pour l’Eau et la Sante 7, 23–30.
Bajpai, B. & Patil, S. 1996 Tannin acyl hydrolase activity of
Aspergillus, Penicillium, Fusarium and Trichoderma. World Journal
of Microbiology and Biotechnology 12, 217–220.
Bajpai, B. & Patil, S. 1997 Induction of tannin acyl hydrolase (EC
3.1.1.20) activity in some members of fungi imperfecti. Enzyme and
Microbial Technology 20, 612–614.
Balice, V. & Cera, O. 1984 Acidic phenolic fraction of the olive
vegetation water determined by a gas chromatography method.
Grasas Y Aceites 35, 178–180.
Banerjee, D., Mondal, K.C. & Pati, B.R. 2001 Production and
characterization of extracellular and intracellular tannase from
newly isolated Aspergillus aculeatus DBF9 Journal of Basic
Microbiology 41, 313–318.
Bhardwaj, R., Singh, B. & Bhat, T.K. 2003 Purification and
characterization of tannin acyl hydrolase from Aspergillus niger
MTCC 2425. Journal of Basic Microbiology 43, 449–461.
Boadi, D.K. & Neufeld, R.J. 2001 Encapsulation of tannase for the
hydrolysis of tea tannins. Enzyme and Microbial Technology 28,
590–595.
Bradoo, S., Gupta, R. & Saxena, R.K. 1997 Parametric optimization
and biochemical regulation of extracellular tannase from Asper-
gillus Japonicus. Process Biochemistry 32, 135–139.
Cantarelli, C., Brenna, O., Giovanelli, G. & Rossi, M. 1989 Beverage
stabilization through enzymatic removal of phenolics. Food
Biotechnology 3, 203–213.
Carbajo, J.M., Junca, H., Terron, M.C., Gonzales, T., Yague, S.,
Zapico, E. & Gonzales, A.E. 2002 Tannic acid induces transcrip-
tion of laccase gene cglcc1 in the white rot fungus Coriolopsis
gallica. Canadian Journal of Microbiology 48, 1041–1047.
Chung, K.T., Wong, T.Y., Wei, C.I., Huang, Y.W. & Lin, Y. 1998
Tannins and human health: a review. CRC Critical Reviews in Food
Science and Nutrition 38, 421–464.
Dass, S.B., Dosoretz, C.G., Reddy, C.A. & Grethlein, H.E. 1995
Extracellular proteases produced by the wood-degrading fungus
Phanerochaete chrysosporium under lignolytic and non-lignolytic
conditions. Archives of Microbiology 163, 254–258.
Faure, D., Bouillant, M.L. & Bally, R. 1995 Comparative study of
substrates and inhibitors of Azospirillum lipoferum and Pyricularia
oryzae laccases. Applied and Environmental Microbiology 61, 144–
1146.
Jaouani, A., Sayadi, S., Vanthournhout, M. & Penninckx, M.J. 2003
Potent fungi for decolourisation of olive mill wastewaters. Enzyme
and Microbial Technology 33, 802–809.
Kiiskinen, L.L., Ratto, M. & Kruus, K. 2004 Screening for novel
laccase-producing microbes. Journal of Applied Microbiology 97,
640–646.
Kissi, M., Mountadar, M., Assobhei, O., Gargiulo, E., Palmieri, G.,
Giardina, P. & Sannia, G. 2001 Roles of two white-rot
basidiomycete fungi in decolorisation and detoxification of olive
mill waste water. Applied Microbiology and Biotechnology 57,
221–226.
Knechtel, R.J. 1978 A more economical method for the determination
of chemical oxygen demand. Water Pollution Control 25–29.
Kumar, R.A., Gunasekaran, P. & Lakshmanan, M. 1999 Biodegrada-
tion of tannic acid by Citrobacter freundii isolated from a tannery
effluent. Journal of Basic Microbiology 39, 161–168.
Lane, R.W., Yamakoshi, J., Kikuchi, M., Mizusawa, K., Henderson,
L. & Smith, M. 1997 Safety evaluation of tannase enzyme
preparation derived from Aspergillus oryzae. Food and Chemical
Toxicology 35, 207–212.
Lekha, P.K. & Lonsane, B.K. 1997 Production and application of
tannin acyl hydrolase: state of the art. Advances in Applied
Microbiology 44, 215–260.
Maestro-Duran, R., Borja, R., Martin, A., Fiestas Ros de Ursinos,
J.A. & Alba Mendoza, J. 1991 Biodegradacion de los
compuestos fenolicos presentes en el alpechin. Grasas Y Aceites
42, 271–276.
Masschelein, C.A. & Batum, M.S. 1981 Enzymic degradation and
participation of ester linked beer polyphenols in chill haze
formation. Proceedings of the Congress of the European Brewing
Convention 18th, Copenhagen, 359–370.
Mondal, K.C., Banerjee, R. & Pati, B.R. 2000 Tannase production by
Bacillus licheniformis. Biotechnology Letters 22, 767–769.
Mondal, K.C., Banerjee, D., Banerjee, R. & Pati, B.R. 2001a
Production and characterization of tannase from Bacillus cereus
KBR9. Journal of General and Applied Microbiology 47, 263–
267.
Mondal, K.C., Samanta, S., Giri, S. & Pati, B.R. 2001b Distribution of
tannic acid degrading microorganisms in the soil and comparative
study of tannase from two fungal strains. Acta Microbiologica
Polonica 50, 75–82.
Mukherjee, G. & Banerjee, R. 2004 Biosynthesis of tannase and
gallic acid from tannin rich substrates by Rhizopus oryzae
and Aspergillus foetidus. Journal of Basic Microbiology 44, 42–
48.
Nishitani, Y., Sasaki, E., Fujisawa, T. & Osawa, R. 2004 Genotypic
analyses of lactobacilli with a range of tannase activities isolated
from human feces and fermented foods. Systematic and Applied
Microbiology 27, 109–117.
Osawa, R., Kuroiso, K., Goto, S. & Shimizu, A. 2000 Isolation of
tannin-degrading lactobacilli from humans and fermented foods.
Applied and Environmental Microbiology 66, 3093–3097.
Tannase from A. niger growing on wastewater 613

Pochon, J.P. & Tardieux, C. 1962 Techniques d’analyse en
microbiologie du sol. p. 101 Collection Technique de base,
France.
Ramirez-Coronel, M.A., Viniegra-Gonzalez, G., Darvill, A. &
Augur, C. 2003 A novel tannase from Aspergillus niger with
beta-glucosidase activity. Microbiology 149, 2941–2946.
Saxena, S. & Saxena, R.K. 2004 Statistical optimization of tannase
production from Penicillium variable using fruits (chebulic
myrobalan) of Terminalia chebula. Biotechnology and Applied
Biochemistry 39, 99–106.
Sayadi, S. & Ellouz, R. 1995 Roles of lignin peroxidases and
manganese peroxidases from Phanerochaete chrysosporium in the
decolorization of olive mill wastewaters. Applied and Environ-
mental Microbiology 61, 1098–1103.
Sayadi, S., Allouche, N., Jaoua, M. & Aloui, F. 2000 Detrimental
effects of high molecular-mass polyphenols on olive mill waste-
water biotreatment. Process Biochemistry 35, 725–735.
Scalbert, A. 1991 Antimicrobial properties of tannins. Phytochemistry
30, 3875–3883.
Scherer, M. & Fischer, R. 1998 Purification and characterization
of laccase II of Aspergillus nidulans. Archives of Microbiology 170,
78–84.
Sharma, S., Bhat, T.K. & Dawra, R.K. 1999 Isolation, purification
and properties of tannase from Aspergillus niger van Tieghem.
World Journal of Microbiology and Biotechnology 15, 673–677.
Spencer, C.M., Cai, Y., Martin, J.D., Graffney, S.H., Goulding, P.N.,
Magnolato, D., Lilley, T.H. & Haslam, E. 1988 Polyphenol
complexation-some thoughts and observations. Phytochemistry 27,
2397–2409.
Suseela, R.G. & Nandy, S.C. 1985 Decomposition of tannic acid and
gallic acid by Penicillium chrysogenum. Leather Science 32, 278–
280.
Sussman, A.S. & Douthit, H.A. 1973 Dormancy in microbial spores.
Annual Review of Plant Physiology 24, 311–352.
Yu, X.W., Li, Y.Q., Wang, C.X. & Wu, D. 2004 Microencapsulation
of tannase by chitosan–alginate complex coacervate membrane:
synthesis of antioxidant propyl gallate in biphasic media. Journal
of Chemical Technology and Biotechnology 79, 475–479.
614 H. Aissam et al.

Short commmunication
The influence of tapioca on the growth, the activity of glucoamylase and pigment
production of Monascus purpureus UKSW 40 in soybean-soaking wastewater
Kris H. TimotiusSatya Wacana Christian University, Salatiga, Indonesia, Tel.: 0062-298-321212, Fax: 0062-298-321433, E-mail:[email protected]
Keywords: Food pigments, glucoamylase, Monascus purpureus, SSW, tapioca starch
Summary
The present study evaluates the usefulness of tapioca starch as additional carbon source for the growth ofMonascus purpureus in soybean-soaking wastewater (SSW). The result revealed that M. purpureus grown on 2.0%(w/v) tapioca starch in SSW produced significantly (P < 0.05) higher amounts of biomass and production of thepigments (OD400 and OD500) when compared to those grown on glucose-or maltose-containing media. However,the glucoamylase activity of M. purpureus grown on the tapioca-SSW medium was not significantly increased whencompared to those from the glucose-containing medium.
Introduction
Tapioca starch and soybean-soaking wastewater (SSW)are potentially cheap source of carbon and nitrogen forbioindustries in Java. These substrates are also availablein large amounts throughout the year in Java (Handay-ani & Timotius 1998; Yongsmith 1998). Combinatoryuse of these substrates as growth medium for M.purpureus has never been reported. It is for these reasonsthat the present project was conducted to evaluate theeffectiveness of this substrate on enzyme and pigmentproduction by M. purpureus.SSW from tempe industries is not yet used as substrate
for any kind of bio-based industry in Indonesia. Atpresent SSW is only discarded into the rivers. Further-more, on preliminary investigation has revealed thatsoybean waste has a high nutrient content. It isestimated that over 3000 l of SSW is produced per dayin Java. Thus, utilization of this substrate will reducedthe level of pollution created by these discharges(Timotius & Utomo 1997; Timotius 1998).M. purpureus is a mould usually isolated from
‘‘Angkak’’ which is traditionally used as a food colorantin Asian Countries. A lot of work has been done on thechemistry and production aspects on solid and liquidculturing of ‘‘Angkak’’. This mould produces six pig-ments along with other secondary metabolites. Itspigments show considerable potential as food colorants(Lee et al. 1995; Sheu et al. 2000).The present study investigates the possible use of
tapioca starch and SSW as substrates for the growth of
M. purpureus and its production of glucoamylase andpigments.
Materials and methods
Source and growth of M. purpureus
M. purpureus UKSW 40 was isolated from local‘‘Angkak’’ and maintained on malt extract agar(MEA) slopes.
Medium
SSW was obtained from local tempe producers, andcooked for 10 min at 120 �C and then filtered to separatethe insoluble materials before sterilization. The cookedand filtered SSW was diluted to 1.5% (v/v) Brix using aviscometer and adjusted to pH 6. The media was thensterilized by heating to 121 �C for 15 min.
Test substrate
Tapioca starch was obtained from the local manufac-turer (Salatiga). Glucose and maltose were obtainedfrom Merck Chemical Company.
Cultivation method
Inoculum was prepared by culturing the mould in MEA.The spores were then harvested in physiological saline
World Journal of Microbiology & Biotechnology (2005) 21:615–617 � Springer 2005
DOI 10.1007/s11274-004-1892-2

(NaCl, 9 g/l). The harvested spores in buffer wereshaken on an orbital shaker (150 rev/min) in 250 mlerlenmeyer flasks, containing 100 ml of medium for5 days. At the end of the incubation time, pigments,glucoamylase and biomass production were measured asexplained below. Growth experiments were performedusing a one-litre working volume airlift fermenter at550 ml air/min.
Analytical procedure
The harvested mycelium was placed in double volume ofabsolute methanol and the pigments extracted byshaking. After extraction of the pigments, the myceliumwas dried at 80 �C for 24 h and weighed to determinethe dry cell weight (DCW).The determination of soluble solids, free N-amino,
protein and total acid were done according to Sudar-madji et al. (1984). The concentrations of extracellularred and yellow pigments were determined using a
spectrophotometer measuring absorbance at 500 and400 nm, respectively, using a 1.0 cm light path. Theuninoculated medium was used as the blank. Glucoam-ylase activity was measured based on the amount ofreducing Sugar formed according to the method ofYangsmith et al. (2000).
Results and discussion
The nutrient profiles of SSW from tempe industriesvaries because of the lack of standard procedures. This
Table 1. Matrix of correlation coefficient among parameters of SSW.
Parameter Soluble
solid
Free
N-amino
Protein
content
Total
acid
pH
Viscosity 0.98 0.98 0.94 0.88 0.00
Free N-amino 0.96 0.91 0.94 0.02
Protein content 0.97 0.88 0.10
Total acid 0.84 0.01
pH 0.00
Figure 1. The influence of SSW viscosity on the production of biomass
(–h–), pigments OD400 (–d–); and OD500 (–n–) after 7 days incuba-
tion with 5.0% tapioca starch.
Figure 2. The comparison of biomass production (a), glucoamylase activity (b) and pigment production (c) and (d) with glucose (–d–); maltose
(–h–); or tapioca starch (–n–) after 7 days incubation.
616 K.H. Timotius

variability in nutrient quality is attributed to severalfactors, such as the soybean washing process, the ratioof soybean to water used in the washing process and thesteaming period or time.Except for pH, all parameters measured i.e. viscosity,
soluble solids, free N-amino, total protein and total acidvaried significantly. The viscosity of SSW varied 2–8%Brix. Its soluble solids, free N-amino, protein content,total acid, and pH were 17.2–65.0 mg/l, 0.76–2.52 g/l,0.029–0.178%, 0.44–2.16%, and 4.3–4.8%, respectively.From the data presented in Table 1, it is evident that thequality of SSW varies, however it would appear thatviscosity measured as % of Brix could be also usefulindicator for the levelling of soluble solids, free N-amino, protein content and total acid of the SSW. Thismeans that its level of viscosity is correlated with orinfluenced by soluble solids, free N-amino, proteincontent, and total acid. The correlation with pH wasvery low for all other parameters from the datapresented in Figure 1, the levels of biomass and pigmentproduction increased with increasing viscosity. Theseresults further indicate that maximum biomass occuredfrom 2.5 to 5.0% Brix and then reduced rapidly.Pigment production was higher at 2.5–3.0% witha valueof 7.0 g/l above 4.0% Brix the pigment concentrationreduced rapidly to 2.0 g/l.Further analyses of the data presented in Figure 1
revealed that above 6% Brix the pigment concentrationincreased to 7.0 g/l. This increase in pigment concentra-tion could be attributed to increasing lysis of the mycelialcell, which is reflected as a reduction in the biomass value.Careful analyses of the data presented in Figure 2
revealed that tapioca starch produced the higher levelsof biomass, glucoamylase activity and pigment produc-tion. The data also revealed that biomass productionand glucoamylase activity increased with increasingconcentration of tapioca starch, unlike maltose andglucose. The optimum concentration for pigment A400
and A500 were 2–4% for both pigments.From these experiments, it would appear that SSW
could be a useful substrate for biomass and pigmentproduction in M. purpureus. It is also interesting to notethat tapioca starch, which is a cheap source of carbon,also enhanced biomass and pigment production in amanner similar to glucose. The lower concentration of
pigment produced as compared to other publicationdata which used synthetic substrates will be exploredfurther since the growth conditions in this experimentwere not fully optimized.
Acknowledgements
The research was supported by the American Society forMicrobiology, Washington. I also expressed my grati-tude to Dr. Lawrent Williams from Jamaica for hiscomments.
References
Handayani, D. & Timotius, K.H. 1998 Pertumbuhan, produksi
pigmen dan aktivitas glukoamilase dari Monascus purpureus
UKSW 40 pacta berbagai medium pertumbuhan (The growth,
pigments production and glucoamylase activity of Monascus
purpureus on different growth media). Buletin Implementasi dan
Pemanfaatan Teknologi 4, 15–17.
Lee, Y.K., Chen, D.C., Lim, B.L., Tay, H.S. & Chua, J. 1995
Fermentative production of natural food colorants by the fungus
Monascus. Icheme Symposium Series 137, 19–23.
Sheu, F., Wang, C.L. & Shyu, Y.T. 2000 Fermentation of monascus
purpureus on bacterial cellulose-nata and the color stability of
Monascus-nata complex. Journal of Food Science 65, 342–345.
Sudarmadji, S., Haryono, B. & Suhardi. 1984 Prosedur Analisa Untuk
Bahan Makanan dan Pertanian (Analytical Procedure For Food and
Agriculture). pp.7–8; 10–13; 70–73; 85–86. Liberty: Yogyakarta.
ISBN 979-499-227-5.
Timotius, K.H. & Utomo, O.R. 1997 Pengaruh Zn terhadap pem-
bentukan biomass dan pigmen olehMonascus purpureusUKSW 40
pada medium yang mengandung air rendaman kedelai (The
influence of Zn on the biomass and pigments formation by
Monascus purpureus on soy-soaking). Buletin Teknologi dan
lndustri Pangan 2, 1–6.
Timotius, K.H. 1998 Production of Monascus pigments using soy-
soaking water as substrate. The symposium on Monascus culture
and application. Institut National des Sciences Appliquee de
Toulouse, Toulouse.
Yongsmith, B. 1998 Production of yellow pigments by Monascus
mutant growing on cassava. The symposium on Monascus culture
and application. Institute National de Sciences Appliquees de
Toulouse, Toulouse.
Yongsmith B., Kitprechavanich, V., Chitradon, L., Chaisrisook, C. &
Budda, N. 2000 Color mutants of Monascus sp. KB9 and their
comparative glucoamylases on rice solid culture. Journal of
Molecular Catalysis B: Enzymatic 10, 263–272.
Submerged production for Monascus pigments 617