Puntland State of Somalia
89
Puntland State of Somalia Education Statistics Yearbook 2013/2014 Ministry of Education and Higher Education Department of Policy and Planning EMIS unit March 2015 Garowe, Puntland State of Somalia Website: www.moepuntland.com
-
Upload
khangminh22 -
Category
Documents
-
view
3 -
download
0
Transcript of Puntland State of Somalia

Puntland State ofSomalia
Education StatisticsYearbook 2013/2014
Ministry of Education and Higher Education Department of Policy and Planning EMIS unit
March 2015 Garowe, Puntland State of Somalia
Website: www.moepuntland.com


i
Department of Policy and PlanningEducation Management Information System unitGarowe, Puntland State of SomaliaTel: +252 90-7793803Website: www.moepuntland.com Email: [email protected]
© Ministry of Education and Higher Education
This publication may be used in part or as a whole, provided that the EMIS is acknowledged as the
source of the information. Whilst the EMIS does all it can to accurately consolidate and integrate
Puntland education information, it cannot be held liable for incorrect data and for errors in
conclusions, opinions and interpretations emanating from the information. Furthermore, the EMIS
cannot be held misinterpretation of the statistical content of the publication.
This publication has been produced with financial support from the government of the
Netherlands through the Peace Building, Education and Advocacy (PBEA) programme and
technical assistance from UNICEF.
A complete set of the yearbook will be available at the following addresses:
• Department of Policy and Planning, EMIS Unit, MOEHE, Garowe, Puntland
• MOEHE’s website: www.moepuntland.com
For more inquiries or requests, please use the following contact information:
Mohamoud Abdisalan Ali, EMIS Focal Person, MOEHE Puntland, [email protected]

ii
Foreword

iii
Tables of Contents
ACRONYMS.......................................................................................................................................................VIII
1. INTRODUCTION.......................................................................................................................................... 1
1.1 ABOUT EMIS DATA ....................................................................................................................................... 1
1.2 HISTORY OF PUNTLAND EMIS ................................................................................................................ 2
1.3 ORGANOGRAM OF EMIS UNIT IN THE MINISTRY OF EDUCATION AND HIGHER EDUCATION .......................................................................................................................................................... 1
FIGURE 1.1 ORGANOGRAM OF EMIS IN THE MOEHE ......................................................................................................1
1.4 STRUCTURE OF THE PUNTLAND EDUCATION LADDER................................................................ 2
FIGURE 1.2 STRUCTURE OF PUNTLAND EDUCATION LADDER .........................................................................................2
2. SUMMARY OF EDUCATION DATA......................................................................................................... 3
2.1 SUMMARY OF BASIC EDUCATIONAL INDICATORS.......................................................................... 4
TABLE 2.1 BASIC INDICATORS OF PUNTLAND EDUCATION SYSTEM ...............................................................................4TABLE 2.1 BASIC INDICATORS OF PUNTLAND (CONT.…) ..................................................................................................5
2.2 ENROLMENT TRENDS................................................................................................................................. 6
TABLE 2.2 TOTAL ENROLMENT TRENDS OVER THE LAST THREE YEARS .........................................................................6CHART 2.1 TOTAL ENROLMENT TRENDS OVER THE LAST THREE YEARS ........................................................................6
2.3 TEACHERS TRENDS..................................................................................................................................... 7
TABLE 2.3 TOTAL TEACHERS TRENDS OVER THE LAST THREE YEARS ............................................................................7CHART 2.2 TOTAL TEACHERS TRENDS OVER THE LAST THREE YEARS ............................................................................7
2.4 SCHOOLS AND CLASSROOMS TRENDS................................................................................................. 8
TABLE 2.4 TOTAL SCHOOLS AND CLASSROOMS TRENDS OVER THE LAST THREE YEARS ..............................................8CHART 2.3 TOTAL SCHOOLS AND CLASSROOMS TRENDS OVER THE LAST THREE YEARS..............................................8
3. ANALYSIS OF EDUCATION INDICATORS........................................................................................... 9
A. PRE-PRIMARY EDUCATION.................................................................................................................. 10
B. PRIMARY EDUCATION ........................................................................................................................... 11
FORMAL PRIMARY INCLUDING IQS ENROLMENT ............................................................................................................11TABLE 3.1 FORMAL PRIMARY INCLUDING IQS ENROLMENT (2013/14) ........................................................................11CHART 3.1 FORMAL PRIMARY INCLUDING IQS ENROLMENT (2013/14) .......................................................................12ENROLMENT BY LOCALITY (URBAN VS. RURAL) ..............................................................................................................12TABLE 3.2 URBAN/RURAL ENROLMENT OF PRIMARY INCL. IQS EDUCATION (2013/14) ............................................12CHART 3.2 URBAN/RURAL ENROLMENT OF PRIMARY INCL. IQS EDUCATION (2013/14) ...........................................13ENROLMENT BY AUTHORITY (GOVERNMENT VS. NON-GOVERNMENT) .........................................................................13TABLE 3.3 PRIMARY INCL. IQS ENROLMENT BY OWNERSHIP (2013/14) ......................................................................13CHART 3.3 PRIMARY INCL. IQS ENROLMENT BY OWNERSHIP (2013/14)......................................................................14

iv
ACCESS (ADMISSION) TO PRIMARY EDUCATION ..............................................................................................................15GROSS INTAKE RATE (GIR) AND NET INTAKE RATE (NIR)............................................................................................15GROSS INTAKE RATE (GIR) ................................................................................................................................................15TABLE 3.4 APPARENT INTAKE RATE (AIR) FOR THE YEAR 2013/14 ..............................................................................15CHART 3.4 APPARENT INTAKE RATE (AIR) FOR THE YEAR 2013/14 .............................................................................16NET INTAKE RATE (NIR) ....................................................................................................................................................16TABLE 3.5 NET INTAKE RATE (NIR) FOR THE YEAR 2013/14 ........................................................................................16TABLE 3.5 NET INTAKE RATE (NIR) FOR THE YEAR 2013/14 ........................................................................................17COVERAGE TO PRIMARY EDUCATION ................................................................................................................................17GROSS ENROLMENT RATE (GER) AND NET ENROLMENT RATE (NER) .......................................................................17GROSS ENROLMENT RATE (GER) ......................................................................................................................................18TABLE 3.6 GROSS ENROLMENT RATE (GER) FOR THE YEAR 2013/14 ..........................................................................18CHART 3.6 GROSS ENROLMENT RATE (GER) FOR THE YEAR 2013/14..........................................................................18TABLE 3.7 GER, GG AND GPI TRENDS FROM 2011/12 - 2013/14 .................................................................................19CHART 3.7 GER TRENDS FROM 2011/12 - 2013/14 .........................................................................................................19NET ENROLMENT RATE (NER) ..........................................................................................................................................19TABLE 3.8 NET ENROLMENT RATE (NER) FOR THE YEAR 2013/14 ..............................................................................20CHART 3.8 NET ENROLMENT RATE (NER) FOR THE YEAR 2013/14..............................................................................20TABLE 3.9 NET ENROLMENT RATE (NER) TRENDS FROM 2011/12 - 2013/14.............................................................21CHART 3.9 NET ENROLMENT RATE (NER) TRENDS FROM 2011/12 - 2013/14 ............................................................21GENDER EQUITY IN THE PRIMARY EDUCATION ...............................................................................................................21INTERNAL EFFICIENCY OF PRIMARY EDUCATION ............................................................................................................22PROMOTION, REPETITION AND DROPOUT RATES ............................................................................................................22PROMOTION RATE (APPARENT) ..........................................................................................................................................22TABLE 3.10 PRIMARY INCL. IQS PROMOTION RATE (PR) FOR THE YEAR 2013/14......................................................22CHART 3.10 PRIMARY INCL. IQS PROMOTION RATE (PR) FOR THE YEAR 2013/14 .....................................................23REPETITION RATE ................................................................................................................................................................23TABLE 3.11 PRIMARY INCL. IQS REPETITION RATE (RR) FOR THE YEAR 2013/14 .....................................................23CHART 3.11 PRIMARY INCL. IQS REPETITION RATE (RR) FOR THE YEAR 2013/14.....................................................24DROPOUT RATE ....................................................................................................................................................................24TABLE 3.12 PRIMARY INCL. IQS DROPOUT RATE (DR) FOR THE YEAR 2013/14..........................................................24CHART 3.12 PRIMARY INCL. IQS DROPOUT RATE (DR) FOR THE YEAR 2013/14 .........................................................25SURVIVAL RATE TO GRADE 5 ..............................................................................................................................................25TABLE 3.13 SURVIVAL RATE TO GRADE 5 FOR THE YEAR 2013/14 ................................................................................26CHART 3.13 SURVIVAL RATE TO GRADE 5 FOR THE YEAR 2013/14 ...............................................................................26ENROLMENT OF CHILDREN WITH SPECIAL EDUCATIONAL NEEDS ...............................................................................26TABLE 3.14 ENROLMENT OF PRIMARY INCL. IQS CHILDREN WITH SPECIAL NEEDS (2013/14) ...............................27CHART 3.14 ENROLMENT OF PRIMARY INCL. IQS CHILDREN WITH SPECIAL NEEDS (2013/14) ...............................27QUALITY OF PRIMARY EDUCATION ....................................................................................................................................28FORMAL PRIMARY INCLUDING IQS TEACHERS ................................................................................................................28QUALIFIED AND CERTIFIED PRIMARY SCHOOL INCL. IQS TEACHERS ..........................................................................28TABLE 3.15 QUALIFIED AND CERTIFIED PRIMARY SCHOOL INCLUDING IQS TEACHERS (2013/14).........................29CHART 3.15 CERTIFIED PRIMARY SCHOOL INCLUDING IQS TEACHERS (2013/14).....................................................29TEACHERS SALARY PAYMENT ............................................................................................................................................29TABLE 3.16 PRIMARY INCL. IQS TEACHERS SALARY PAYERS (2013/14)......................................................................30
v
CHART 3.16 PERCENTAGE OF PRIMARY INCL. IQS TEACHERS SALARY PAYERS (2013/14) .......................................30PUPIL-TEACHER RATIO (PTR) ...........................................................................................................................................31TABLE 3.17 PRIMARY INCL. IQS PUPIL TEACHER RATIO (2013/14) .............................................................................31CHART 3.17 PRIMARY INCL. IQS PUPIL TEACHER RATIO (2013/14).............................................................................31FORMAL PRIMARY INCLUDING IQS SCHOOLS AND CLASSROOMS .................................................................................32FORMAL PRIMARY INCLUDING IQS SCHOOLS...................................................................................................................32TABLE 3.18 PRIMARY INCL. IQS SCHOOLS BY SHIFT (2013/14) .....................................................................................33CHART 3.18 PRIMARY INCL. IQS SCHOOLS BY SHIFT (2013/14).....................................................................................33TABLE 3.19 PRIMARY INCL. IQS SCHOOLS BY OWNERSHIP (2013/14) ..........................................................................33CHART 3.19 PRIMARY INCL. IQS SCHOOLS BY OWNERSHIP (2013/14) ..........................................................................34FORMAL PRIMARY INCLUDING IQS CLASSROOMS ...........................................................................................................34PUPIL CLASSROOM RATIO (PCR) .......................................................................................................................................34TABLE 3.20 PRIMARY INCL. IQS CLASSROOMS AND PUPIL CLASSROOM RATIO (2013/14) ........................................34CHART 3.20 PRIMARY INCL. IQS CLASSROOMS AND PUPIL CLASSROOM RATIO (2013/14) .......................................35FORMAL PRIMARY INCLUDING IQS TEXTBOOKS..............................................................................................................35PUPIL TEXTBOOK RATIO (PTBR) .......................................................................................................................................35TABLE 3.21 PRIMARY INCL. IQS SCHOOLS PTBR (2013/14) ..........................................................................................36CHART 3.21 PRIMARY INCL. IQS SCHOOLS PTBR (2013/14)..........................................................................................36TABLE 3.22 PRIMARY INCL. IQS SCHOOLS WITH AVAILABILITY AND TYPE OF WATER - 2013/14 ...............................37CHART 3.22 PRIMARY INCL. IQS SCHOOLS WITH AVAILABILITY AND TYPE OF WATER - 2013/14 ..............................37
C. ALTERNATIVE BASIC EDUCATION (ABE)........................................................................................ 38
ALTERNATIVE BASIC EDUCATION ENROLMENT...............................................................................................................38TABLE 3.23 ALTERNATIVE BASIC EDUCATION ENROLMENT FOR THE YEAR 2013/14.................................................38CHART 3.23 ALTERNATIVE BASIC EDUCATION ENROLMENT FOR THE YEAR 2013/14 ................................................38ALTERNATIVE BASIC EDUCATION TEACHERS ..................................................................................................................39TABLE 3.24 QUALIFIED AND CERTIFIED ALTERNATIVE BASIC EDUCATION TEACHERS (2013/14)...........................39CHART 3.24 CERTIFIED ALTERNATIVE BASIC EDUCATION TEACHERS (2013/14).......................................................39ALTERNATIVE BASIC EDUCATION TEACHERS SALARY PAYMENT..................................................................................40TABLE 3.25 ABE TEACHERS SALARY PAYERS (2013/14) ...............................................................................................40CHART 3.25 PERCENTAGE OF ABE TEACHERS SALARY PAYERS (2013/14) .................................................................40ALTERNATIVE BASIC EDUCATION SCHOOLS ....................................................................................................................41TABLE 3.26 ALTERNATIVE BASIC EDUCATION SCHOOLS (2013/14) .............................................................................41CHART 3.26 ALTERNATIVE BASIC EDUCATION SCHOOLS (2013/14) .............................................................................41
D. NON FORMAL EDUCATION (NFE)....................................................................................................... 42
NON FORMAL EDUCATION ENROLMENT...........................................................................................................................42TABLE 3.27 NON FORMAL EDUCATION (NFE) ENROLMENT (2013/14)........................................................................42TABLE 3.27 NON FORMAL EDUCATION (NFE) ENROLMENT (2013/14)........................................................................42NON FORMAL EDUCATION TEACHERS ..............................................................................................................................43TABLE 3.28 QUALIFIED AND CERTIFIED NON FORMAL EDUCATION TEACHERS (2013/14) .......................................43CHART 3.28 CERTIFIED NON FORMAL EDUCATION TEACHERS (2013/14) ...................................................................43NON FORMAL EDUCATION SCHOOLS.................................................................................................................................44TABLE 3.29 NON FORMAL EDUCATION SCHOOLS (2013/14)..........................................................................................44CHART 3.29 NON FORMAL EDUCATION SCHOOLS (2013/14) .........................................................................................44

vi
E. SECONDARY EDUCATION ..................................................................................................................... 45
SECONDARY ENROLMENT (FORMS 1-4).............................................................................................................................45TABLE 3.30 SECONDARY EDUCATION ENROLMENT (2013/14) .......................................................................................45CHART 3.30 SECONDARY EDUCATION ENROLMENT (2013/14) ......................................................................................45ENROLMENT BY LOCALITY (URBAN AND RURAL) ............................................................................................................46TABLE 3.31 URBAN/RURAL ENROLMENT OF SECONDARY EDUCATION (2013/14).......................................................46CHART 3.31 URBAN/RURAL ENROLMENT SECONDARY EDUCATION (2013/14)............................................................46ENROLMENT BY AUTHORITY (GOVERNMENT AND NON-GOVERNMENT) .......................................................................47TABLE 3.32 SECONDARY ENROLMENT BY OWNERSHIP (2013/14) .................................................................................47CHART 3.32 SECONDARY ENROLMENT BY OWNERSHIP (2013/14).................................................................................47SECONDARY GROSS ENROLMENT RATE (GER)................................................................................................................48TABLE 3.33 SECONDARY GER FOR THE YEAR 2013/14...................................................................................................48TABLE 3.33 SECONDARY GER FOR THE YEAR 2013/14...................................................................................................48TABLE 3.34 SECONDARY GER TRENDS (2012/13-2013/14) ...........................................................................................49CHART 3.34 SECONDARY GER TRENDS (2012/13-2013/14) ..........................................................................................49SECONDARY NET ENROLMENT RATE (NER)....................................................................................................................49TABLE 3.35 SECONDARY NER FOR THE YEAR 2013/14...................................................................................................49CHART 3.35 SECONDARY NER FOR THE YEAR 2013/14 ..................................................................................................50TABLE 3.36 SECONDARY NER TRENDS (2012/13 – 2013/14) ........................................................................................50CHART 3.36 SECONDARY NER TRENDS (2012/13 – 2013/14)........................................................................................50GENDER EQUITY IN THE SECONDARY EDUCATION..........................................................................................................51ENROLMENT OF CHILDREN WITH SPECIAL EDUCATIONAL NEEDS ...............................................................................51TABLE 3.37 ENROLMENT OF SECONDARY CHILDREN WITH SPECIAL NEEDS (2013/14) ............................................51CHART 3.37 ENROLMENT OF SECONDARY CHILDREN WITH SPECIAL NEEDS (2013/14)............................................52SECONDARY SCHOOL TEACHERS .......................................................................................................................................52QUALIFIED AND CERTIFIED SECONDARY SCHOOL TEACHERS .......................................................................................52TABLE 3.38 QUALIFIED AND CERTIFIED SECONDARY SCHOOL TEACHERS (2013/14) ................................................52CHART 3.38 CERTIFIED SECONDARY SCHOOL TEACHERS (2013/14) ............................................................................53TEACHERS SALARY PAYMENT ............................................................................................................................................53TABLE 3.39 SECONDARY TEACHERS SALARY PAYERS (2013/14)...................................................................................54CHART 3.39 PERCENTAGE OF SECONDARY TEACHERS SALARY PAYERS (2013/14) ....................................................54*BLANK (UNPAID): TEACHERS WHOSE SALARY PAYERS’ FIELD WERE BLANK IN THE QUESTIONNAIRE . ...................54PUPIL-TEACHER RATIO (PTR) ...........................................................................................................................................54TABLE 3.40 SECONDARY EDUCATION PUPIL TEACHER RATIO (2013/14) ....................................................................54CHART 3.40 SECONDARY EDUCATION PUPIL TEACHER RATIO (2013/14 .....................................................................55SECONDARY EDUCATION SCHOOLS AND CLASSROOMS...................................................................................................55SECONDARY EDUCATION SCHOOLS ....................................................................................................................................55TABLE 3.41 SECONDARY EDUCATION SCHOOLS BY SHIFT (2013/14) .............................................................................55CHART 3.41 SECONDARY EDUCATION SCHOOLS BY SHIFT (2013/14) ............................................................................56TABLE 3.42 SECONDARY EDUCATION SCHOOLS BY OWNERSHIP (2013/14)..................................................................56CHART 3.42 SECONDARY EDUCATION SCHOOLS BY OWNERSHIP (2013/14) .................................................................57SECONDARY SCHOOL CLASSROOMS...................................................................................................................................57PUPIL CLASSROOM RATIO (PCR) .......................................................................................................................................57TABLE 3.43 SECONDARY EDUCATION CLASSROOMS AND PUPIL CLASSROOM RATIO (2013/14)................................57

vii
CHART 3.43 SECONDARY EDUCATION CLASSROOMS AND PUPIL CLASSROOM RATIO (2013/14) ...............................58SECONDARY SCHOOL TEXTBOOKS......................................................................................................................................58SECONDARY EDUCATION PUPIL TEXTBOOK RATIO (PTBR) ...........................................................................................58TABLE 3.44 SECONDARY SCHOOLS PTBR (2013/14) .......................................................................................................58CHART 3.44 SECONDARY SCHOOLS PTBR (2013/14).......................................................................................................59TABLE 3.45 SECONDARY SCHOOLS WITH AVAILABILITY AND TYPE OF WATER - 2013/14 ............................................59CHART 3.45 SECONDARY WITH AVAILABILITY AND TYPE OF WATER - 2013/14 ............................................................60EXAMINATION RESULTS OF GRADES 8 AND FORM FOUR................................................................................................61I. GRADE 8 EXAM RESULTS.................................................................................................................................................61TABLE 3.46 GRADE 8 CANDIDATES WHO ARE PROMOTED IN THE YEAR 2013/14 .........................................................61CHART 3.46 GRADE 8 CANDIDATES WHO ARE PROMOTED IN THE YEAR 2013/14.........................................................61II. FORM FOUR EXAM RESULTS .........................................................................................................................................62TABLE 3.47 FORM FOUR CANDIDATES WHO PASSED EXAM IN THE YEAR 2013/14 ......................................................62CHART 3.47 FORM FOUR CANDIDATES WHO ARE PROMOTED IN THE YEAR 2013/14 ..................................................62
F. TECHNICAL AND VOCATIONAL EDUCATION AND TRAINING (TVET)................................... 63
TVET ENROLMENT..............................................................................................................................................................63TABLE 3.48 TVET ENROLMENT - 2013/14........................................................................................................................63TVET TEACHING STAFF .....................................................................................................................................................64TABLE 3.49 TVET TEACHING STAFF - 2013/14 ...............................................................................................................64TVET PUPIL TEACHER RATIO............................................................................................................................................65TABLE 3.50 TVET PUPIL TEACHER RATIO (PTR) - 2013/14 .........................................................................................65
G. HIGHER EUCATION................................................................................................................................. 66
ENROLMENT IN HIGHER EDUCATION................................................................................................................................66TABLE 3.51 UNIVERSITIES AND COLLEGES ENROLMENT - 2013/14 ..............................................................................66TEACHING STAFF IN HIGHER EDUCATION ........................................................................................................................67TABLE 3.52 UNIVERSITIES AND COLLEGES TEACHING STAFF - 2013/14 ......................................................................67PUPIL-TEACHER RATIO (PTR) IN HIGHER EDUCATION .................................................................................................67TABLE 3.53 UNIVERSITIES AND COLLEGES PTR - 2013/14............................................................................................68
4. ANNEXES..................................................................................................................................................... 69
4.1 SUMMARY INFORMATION BY DISTRICT LEVEL………...…….……………..……………….…………70
4.3 GLOSSARY….……….………………………………………………...….…………………………………………74
4.2 PRIMARY MISSING SCHOOLS………………………………….………......…………….……………………82

viii
ACRONYMS
AAGR Annual Average Growth Rate
ABE Alternative Basic Education
AIR Apparent Intake Rate
DEO District Education Officer/Office
EMIS Education Management Information System
ESC Education Sector Committee
ESSP Education Sector Strategic Plan
GER Gross Enrolment Ratio
GG Gender Gap
GPI Gender Parity Index
IQS Integrated Quranic School
M&E Monitoring and Evaluation
MA Masters of Art
MOEHE Ministry of Education and Higher education
NER Net Enrolment Ratio
NFE Non Formal Education
NGO Non-Governmental Organization
NIR Net Intake Rate
PCR Pupil Class Ratio
PESS Population Estimation Survey of Somalia
PLEMIS Puntland Education Management Information System
PS Primary School
PTbR Pupil Textbook Ratio
PTR Pupil Teacher Ratio
REO Regional Education Officer/Office
SS Secondary School
TVET Technical and Vocational Education and Training
TWG Technical Working Group
UNICEF United Nations Children’s Fund
UNDP United Nations Development Programme
UNFPA United Nations Population Fund, formerly the United Nations Fund for Population
Activities

ix

INTRODUCTION Puntland Education Statistics Yearbook 2013/14
1
1. INTRODUCTION1.1 About EMIS Data
This is the 2013/14 Education Statistics Annual Yearbook of Puntland in which annual
education data has been collected, processed and analyzed by the Ministry of Education
and higher education (MOEHE) for the third time.
The existing Annual School Census Surveys or questionnaires were modified for the year
2013/14 by the Puntland Ministry of Education and Higher Education, EMIS Unit and
sent to schools for data collection through the Regional Education Officers (REOs) and the
District Education Officers (DEOs). The completed survey data was collected from the
schools by the DEOs who checked the quality of the completed data and submitted to the
REOs and then the REOs to the EMIS unit of Ministry of Education and Higher
Education by checking the quality of the completed survey. The Ministry of Education and
Higher Education, EMIS unit encoded the raw data into the Pineapple software, verified it
and generated the required reports. It is only the formal primary, Integrated Quranic
Schools (IQS), Alternative Basic Education (ABE), Secondary education and Non Formal
Education data that have been captured by the pineapple software. The Technical and
Vocational Education and Training as well as Higher education data have been separately
processed on the MS Excel workbook.
The publication covers 2013/14 EMIS data and is a complete school census of Primary
education including Integrated Quranic Schools, Alternative Basic Education, Secondary
education, Non Formal Education, Technical and Vocational Education and Training as
well as Higher education. The main sources of data for the analysis and preparation of
educational indicators are the Annual School Census Surveys or questionnaires and also
the school age population of UNDP 2005 projected data. Our effort to get and use the
recent UNFPA Population Estimation Survey of Somalia (PESS) 2014 data for this
analysis was not successful as the Puntland Ministry of Planning and International

INTRODUCTION Puntland Education Statistics Yearbook 2013/14
2
Cooperation didn’t finalize it. UNDP 2005 projected data has been used as the sources of
school age population data in Puntland for yearbooks 2011/12 and 2012/13 especially at
the national level. No educational analysis has been done for those yearbooks at regional
and district levels as the UNDP 2005 population data has no school age population at
regional and district levels as well single age population data at national level.
The 2013/14 questionnaire has been well modified and shortened without limitation to the
very important data elements but the pineapple software has not been customized on time
accordingly. This has resulted in some data elements like classrooms, water supply,
sanitation, child protection, borders, feeding program, transport, etc. that have been
captured by the modified new survey couldn’t be encoded into the existing pineapple
software. But it has been tried to manually handle the classrooms, water supply and
sanitation data and analyze in this yearbook.
This publication contains analytical summaries of students, teachers, schools, learning
materials and facilities as well as examination results at grades 8 and 12. The data are
further disaggregated by region, gender, level of education, locality (urban vs. rural),
authority (MoEHE/Government vs. Non-Government).
Indicators and detailed analysis of indicators that are assumed to be most important for
the education system are presented. This analysis on students, teachers, schools, teaching
learning materials and facilities is used to produce conclusions and reports for
development partners, researchers, planners and decision makers.
1.2 History of Puntland EMIS
The Puntland EMIS Unit is established as one of the units in the department of Policy and
Planning, Ministry of Education and Higher Education. Data and Statistics section was
the first to manage EMIS data until it was transformed into EMIS unit in the early 2011.
Since 2011, the EMIS unit in the department of Policy and Planning has been managing

INTRODUCTION Puntland Education Statistics Yearbook 2013/14
3
and administering data collection, storage, processing, analyzing, utilization and
distribution of education information to planners, decision makers and other stakeholders.

INTRODUCTION Puntland Education Statistics Yearbook 2013/14
1.3 Organogram of EMIS Unit in the Ministry of Education and Higher Education
Figure 1.1 Organogram of EMIS in the MoEHE
Minister
Human Resources
Formal Education
Quality Assurance
Non Formal Education
Examination
Vice Minister
Director General
Admin & Finance
EMIS
Policy & Planning

INTRODUCTION Puntland Education Statistics Yearbook 2013/14
2
1.4 Structure of the Puntland Education Ladder
Figure 1.2 Structure of Puntland Education Ladder Year Age
19
Technical and Vocational
Education and Training
(includes Technical Secondary Education)
24
18 23
17 2216
University/College/
education
In-service teacher training
21
15 Pre-service teacher training
20
14 19
13 18
12
Secondary EducationForm 1 (F1) to Form 4 (F4)
17
11 16
10 15
9 14
8
Primary Education incl. IQS and ABE Formal Primary: P1 to P8 Integrated Quranic Schools (IQS): P1 to P8 Alternative Basic Education(ABE): L1 to L4
13
7 12
6 11
5 10
4 9
3 8
2 7
1 6
0
Early Childhood Education (ECE) Formal pre-primary Quranic Schools (QS)

SUMMARY TRENDS Puntland Education Statistics Yearbook 2013/14
3
2. SUMMARY OF EDUCATION
DATA

SUMMARY TRENDS Puntland Education Statistics Yearbook 2013/14
4
2.1 Summary of Basic Educational Indicators
Table 2.1 Basic Indicators of Puntland Education System
No Educational Indicators 2011/12 2012/13 2013/14 *AAGR
1 Access and Coverage Indicators
1.1 Primary (incl. IQS & ABE) Grade 1 Gross Intake Rate (GIR) 152.1
1.1.1 Male 154.5
1.1.2 Female 149.3
1.2 Primary (incl. IQS & ABE) Grade 1 Net Intake (NIR) 45.0
1.2.1 Male 45.1
1.2.2 Female 44.9
1.3 Primary (incl. IQS & ABE) Gross Enrolment Rate 41.0 46.8 55.6 16.5 1.3.1 Male 46.0 52.0 62.0 16.1 1.3.2 Female 37.0 41.7 49.0 15.11.4 Primary (incl. IQS & ABE) Net Enrolment Rate 37.0 37.5 47.8 13.7 1.4.1 Male 41.0 41.3 52.7 13.4 1.4.2 Female 33.0 33.8 42.9 14.01.5 Secondary Gross Enrolment Rate 9.4 12.6
1.5.1 Male 11.2 16.3
1.5.2 Female 7.4 8.8
1.6 Secondary Net Enrolment Rate 5.5 8.2
1.6.1 Male 6.5 10.1
1.6.2 Female 4.4 6.1
1.7 Enrolment in Non Formal Education (NFE) 14,444
1.7.1 Male 2,690
1.7.2 Female 11,754
1.8 Enrollment in TVET 4,213
1.8.1 Male 1,233
1.8.2 Female 3,017
1.9 Enrolment in Higher education 9,841
1.9.1 Male 6,013
1.9.2 Female 3,828
2 Quality Indicators2.1.1 Percentage of primary incl. IQS qualified teachers (secondary school completion and above) 62.1
2.1.2 Percentage of secondary qualified teachers (Diploma and above) 22.0
2.2.1 Percentage of primary incl. IQS certified teachers (Teaching certificate and above) 27.1
2.2.2 Percentage of secondary certified teachers (Teaching certificate and above)
61.2
2.3 Primary Pupil-Textbook Ratio [Mathematics] 37:10
2.4 Secondary Pupil-Textbook Ratio [Mathematics] 17:1
2.5 Primary Pupil-Teacher Ratio 33.0
2.6 Secondary Pupil-Teacher Ratio 26.4
2.7 Primary Pupil-Classroom Ratio 40.0
2.8 Secondary Pupil-Classroom Ratio 38.4

SUMMARY TRENDS Puntland Education Statistics Yearbook 2013/14
5
Table 2.1 Basic Indicators of Puntland (cont.…)
No Educational Indicators 2011/12 2012/13 2013/14 *AAGR
3 Efficiency Indicators
3.1 Primary (incl. IQS) Grade 1 dropout rate 20.0 11.1
3.1.1. Male 24.0 9.1
3.1.2 Female -4.0 13.3
3.2 Primary (incl. IQS) dropout rate 2.3
3.2.1 Male 1.1
3.2.2. Female 3.9
3.3 Primary (incl. IQS) repetition rate 3.5
3.3.1 Male 3.2
3.3.2 Female 3.8
3.4 Primary (incl. IQS) promotion rate 94.2
3.4.1 Male 95.7
3.4.2 Female 92.3
3.5 Primary (incl. IQS) survival rate to Grade 5 54.6
3.5.1 Male 56.2
3.5.2 Female 52.6
4 Gender Equity Indicators
4.1 GPI (Gender Parity Index) using GER
4.1.1 Primary (incl. IQS & ABE) 0.80 0.80 0.79 -0.6 4.1.2 Secondary 0.66 0.54
4.2 GG (Gender Gap)
4.2.1 Primary (incl. IQS & ABE) 9.0 10.3 13.0 20.2 4.2.2 Secondary 3.8 7.5
4.3 Percentage of female students
4.3.1 Primary (incl. IQS) 43.5 43.8 43.8 0.3 4.3.2 Secondary 38.0 33.5
4.4 Percentage of female teachers
4.4.1 Primary (incl. IQS) 12.3 11.3 13.0 2.8 4.4.2 Secondary 2.3 2.7
*AAGR is Annual Average Growth Rate, and more commonly known as the Compound Annual Growth Rate thatshows an average value for the annual rate of change over a period of time (typically several years) allowing for the compound effect of growth.
Table 2.1 above shows the main educational indicators of the Puntland education
system over the last three years. Particularly access, coverage, quality, internal
efficiency and gender equity indicators and their three years trends are shown for quick
reference. But it was not possible to get three years completed data/information for
most of the indicators, some have two years and others have only in the year 2013/14.
This indicates that the coverage and quality of EMIS data/information is increasing
from time to time for the last three years.

SUMMARY TRENDS Puntland Education Statistics Yearbook 2013/14
6
2.2 Enrolment Trends
Table 2.2 Total Enrolment Trends over the last three years
Education Level
2011/12 2012/13 2013/14 AAGR
Male Female Total Male Female Total Male Female Total Male Female Total
Primary Incl. IQS 56,938 43,765 100,703 59,553 46,425 105,978 70,903 55,250 126,153 11.6 12.4 11.9
ABE 3,694 3,510 7,204 1,395 2,122 3,517 4,048 3,620 7,668 4.7 1.6 3.2
NFE 2,690 11,754 14,444
Secondary 7,948 4,862 12,810 11,843 5,953 17,796 49.0 22.4 38.9
TVET 1,233 3,017 4,213
Higher Education 6,013 3,828 9,841
Total 60,632 47,275 107,907 68,896 53,409 122,305 96,730 83,422 180,115 40.4 56.2 47.3
Chart 2.1 Total Enrolment Trends over the last three years
Table 2.2 and chart 2.1 above show that enrolment has been increasing over the last
three years in the formal primary including Integrated Quranic Schools (IQS),
Alternative Basic Education (ABE) and Secondary education. The total increase is with
an annual average growth rate (AAGR) of 11.9% for formal primary including IQS,
3.2% for ABE and 38.9% for secondary education. It can also be seen that annual
average growth rate of girls is greater than boys in the primary education including
IQS while the reverse is true in the ABE and secondary education. Generally, this
indicates that the access and coverage to primary and secondary education is growing
rapidly for the last two to three years in Puntland.

SUMMARY TRENDS Puntland Education Statistics Yearbook 2013/14
7
2.3 Teachers Trends
Table 2.3 Total Teachers Trends over the last three years
Teachers2011/12 2012/13 2013/14 AAGR
Male Female Total Male Female Total Male Female Total Male Female Total
Primary Incl. IQS 2,763 350 3,113 3,328 498 3,826 20.4 42.3 22.9
ABE 63 30 93 95 29 124 50.8 -3.3 33.3
NFE 184 205 389
Secondary 513 12 525 655 18 673 27.7 50.0 28.2
TVET 72 50 122
Higher Education 535 36 571
Total 0 0 0 3,339 392 3,731 4,869 836 5,705 45.8 113.3 52.9
Chart 2.2 Total Teachers Trends over the last three years
Table 2.3 and chart 2.2 above show that numbers of teachers have been increasing over
the last two years in the formal primary including Integrated Quranic Schools (IQS),
Alternative Basic Education (ABE) and Secondary education. The increase is with an
annual average growth rate (AAGR) of 22.9% for formal primary including IQS, 33.3%
for ABE and 28.2% for secondary education. It can also be seen that annual average
growth rate of female teachers is greater than male teachers in the in the primary
including IQS and secondary education teachers while the growth rate of female
teachers has shown a decrease in the ABE teachers. Generally, this indicates that the
number of teachers in primary including IQS, ABE and secondary education is growing
rapidly for the last two years in Puntland.

SUMMARY TRENDS Puntland Education Statistics Yearbook 2013/14
8
2.4 Schools and Classrooms Trends
Table 2.4 Total Schools and Classrooms Trends over the last three years
Schools & Classrooms
Schools Classrooms AAGR
2011/12 2012/13 2013/14 2011/12 2012/13 2013/14 Schools Classrooms
Primary Incl. IQS 486 508 570 5,330 3,155 8.3 -40.8
ABE 51 23 58 6.6
NFE 108
Secondary 51 63 530 464 23.5 -12.5
TVET 16
Higher Education 10
Total 537 582 717 0 5,860 3,619 15.6 -38.2
Chart 2.3 Total Schools and Classrooms Trends over the last three years
Table 2.4 and chart 2.3 above show that numbers of schools have been increasing over
the last two to three years in the formal primary IQS, Alternative Basic Education
(ABE) and Secondary education. The increase is with an annual average growth rate
(AAGR) of 8.3% for formal primary education including IQS, 6.6% for ABE and 23.5%
for secondary education. There is no complete data/information trend on classrooms at
all levels and this should be give attention in the next consecutive years.

ANALYSIS Puntland Education Statistics Yearbook 2013/14
9
3. ANALYSIS OF EDUCATION
INDICATORS

ANALYSIS Puntland Education Statistics Yearbook 2013/14
10
A. PRE-PRIMARY EDUCATION
The pre-primary education includes kindergartens and other similar pre-primary
children programs. This level normally involves children of official school ages 3-5
enrolled in the pre-primary education. Kindergarten is mainly part of the pre-primary
education in which it has its own curriculum, trained teachers, administrative staff and
school compounds.
Educational researches show that students who have joined primary education without
exposure to pre-primary education have higher incidence of repeating and dropping out
at the primary level specially at grade 1 than the ones who have been exposed to pre-
primary education. The higher an African country’s pre-primary enrolment ratio, the
higher its primary school completion rate and the lower its primary school repetition
rate (Mingat and Jaramillo 2003, Arnold 2004). The impact of early childhood care and
education is stronger for children from poor families in terms of lower dropout and
repetition rates than those for more advantaged children (Arnold, 2004). Pre-primary
education is one and the first goal of the Education For All (EFA) goals.
Like in other African countries, pre-primary education especially kindergartens in
Puntland are predominantly operated by non-governmental institutions and
communities. But there is no data collected and analyzed on pre-primary education in
Puntland so that its accessibility and coverage is still unknown. The Ministry of
Education and Higher Education, EMIS unit and education development partners
should be organized and mobilized to collect, process, analyze and utilize the pre-
primary education data as part of the other education levels.

ANALYSIS Puntland Education Statistics Yearbook 2013/14
11
B. PRIMARY EDUCATION
Primary education is vital to development and the foundation for later on education
and economic growth. In Puntland, primary education is from grades/classes 1-8
divided into two as lower primary (primary 1-4) and upper primary (Primary 5-8). In
this yearbook, Integrated Quranic Schools (IQS) data is analyzed as part of formal
primary education and this is because formal primary and IQS use the same
curriculum, teachers and textbooks except that additional Quranic subject is taught in
the IQS. But Alternative Basic Education (ABE) uses its own curriculum and textbooks
plus may also use other non-formal teachers. Hence although Alternative Basic
Education is a complementary to primary education; it has been analyzed separately
because of some differences mentioned above except in the cases of access and coverage
indicators in which it has been analyzed together.
Formal Primary including IQS Enrolment
Primary education including IQS enrolment is the number of pupils of grades 1-8 of
formal primary and IQS who registered in the schools at the beginning of the
school/academic year. Classes/levels 1-4 are classified as lower primary while classes 5-
8 are upper primary.
Table 3.1 Formal Primary including IQS enrolment (2013/14)
RegionClass/Level 1-4 Class 5-8 Class/Level 1-8
Male Female Total Male Female Total Male Female Total
Ayn 2,644 1,651 4,295 891 453 1,344 3,535 2,104 5,639
Bari 12,054 9,728 21,782 6,084 4,242 10,326 18,138 13,970 32,108
Gardafuu 1,161 970 2,131 418 293 711 1,579 1,263 2,842
Hayland 1,566 1,234 2,800 840 589 1,429 2,406 1,823 4,229
Karkar 5,379 4,510 9,889 2,087 1,622 3,709 7,466 6,132 13,598
Mudug 7,935 6,623 14,558 5,177 3,860 9,037 13,112 10,483 23,595
Nugal 7,841 6,507 14,348 4,234 3,087 7,321 12,075 9,594 21,669
Sanag 3,370 2,702 6,072 1,202 858 2,060 4,572 3,560 8,132
Sool 5,392 4,415 9,807 2,628 1,906 4,534 8,020 6,321 14,341
Total 47,342 38,340 85,682 23,561 16,910 40,471 70,903 55,250 126,153
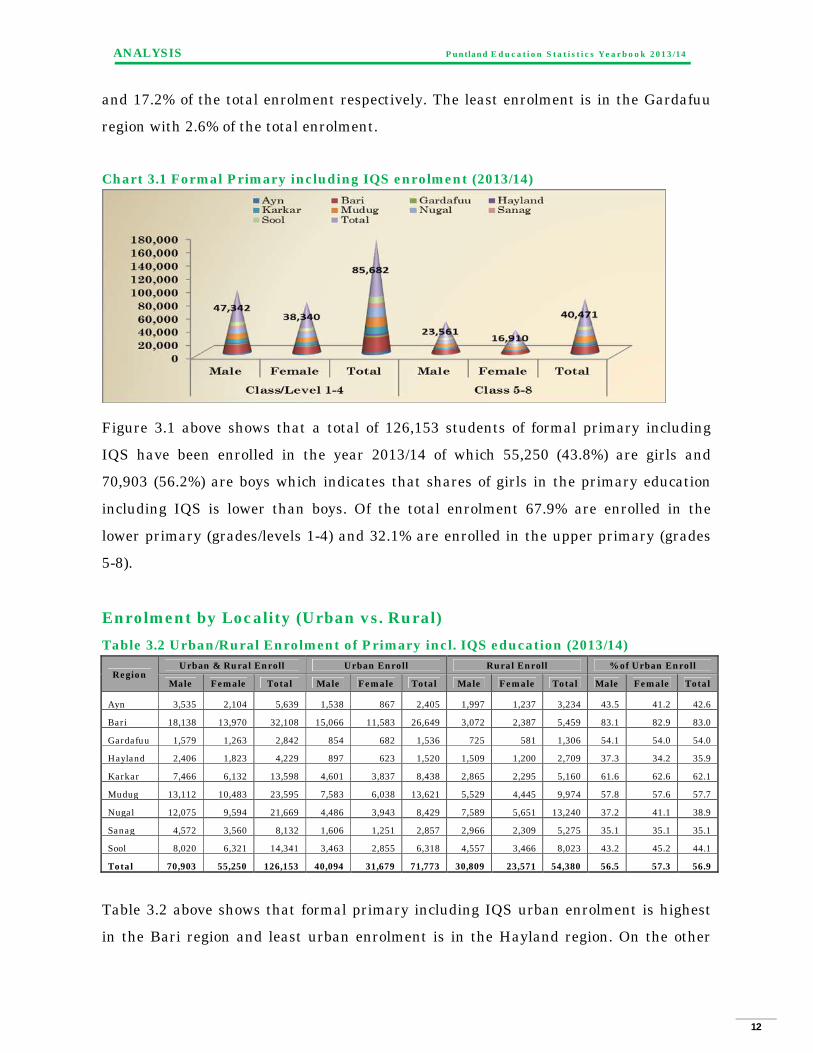
Table 3.1 above shows that formal primary including IQS enrolment is highest in the
Bari region followed by Mudug and Nugal regions with each constituting 25.5%, 18.7%
ANALYSIS Puntland Education Statistics Yearbook 2013/14
12
and 17.2% of the total enrolment respectively. The least enrolment is in the Gardafuu
region with 2.6% of the total enrolment.
Chart 3.1 Formal Primary including IQS enrolment (2013/14)
Figure 3.1 above shows that a total of 126,153 students of formal primary including
IQS have been enrolled in the year 2013/14 of which 55,250 (43.8%) are girls and
70,903 (56.2%) are boys which indicates that shares of girls in the primary education
including IQS is lower than boys. Of the total enrolment 67.9% are enrolled in the
lower primary (grades/levels 1-4) and 32.1% are enrolled in the upper primary (grades
5-8).
Enrolment by Locality (Urban vs. Rural)
Table 3.2 Urban/Rural Enrolment of Primary incl. IQS education (2013/14)
RegionUrban & Rural Enroll Urban Enroll Rural Enroll % of Urban Enroll
Male Female Total Male Female Total Male Female Total Male Female Total
Ayn 3,535 2,104 5,639 1,538 867 2,405 1,997 1,237 3,234 43.5 41.2 42.6
Bari 18,138 13,970 32,108 15,066 11,583 26,649 3,072 2,387 5,459 83.1 82.9 83.0
Gardafuu 1,579 1,263 2,842 854 682 1,536 725 581 1,306 54.1 54.0 54.0
Hayland 2,406 1,823 4,229 897 623 1,520 1,509 1,200 2,709 37.3 34.2 35.9
Karkar 7,466 6,132 13,598 4,601 3,837 8,438 2,865 2,295 5,160 61.6 62.6 62.1
Mudug 13,112 10,483 23,595 7,583 6,038 13,621 5,529 4,445 9,974 57.8 57.6 57.7
Nugal 12,075 9,594 21,669 4,486 3,943 8,429 7,589 5,651 13,240 37.2 41.1 38.9
Sanag 4,572 3,560 8,132 1,606 1,251 2,857 2,966 2,309 5,275 35.1 35.1 35.1
Sool 8,020 6,321 14,341 3,463 2,855 6,318 4,557 3,466 8,023 43.2 45.2 44.1
Total 70,903 55,250 126,153 40,094 31,679 71,773 30,809 23,571 54,380 56.5 57.3 56.9
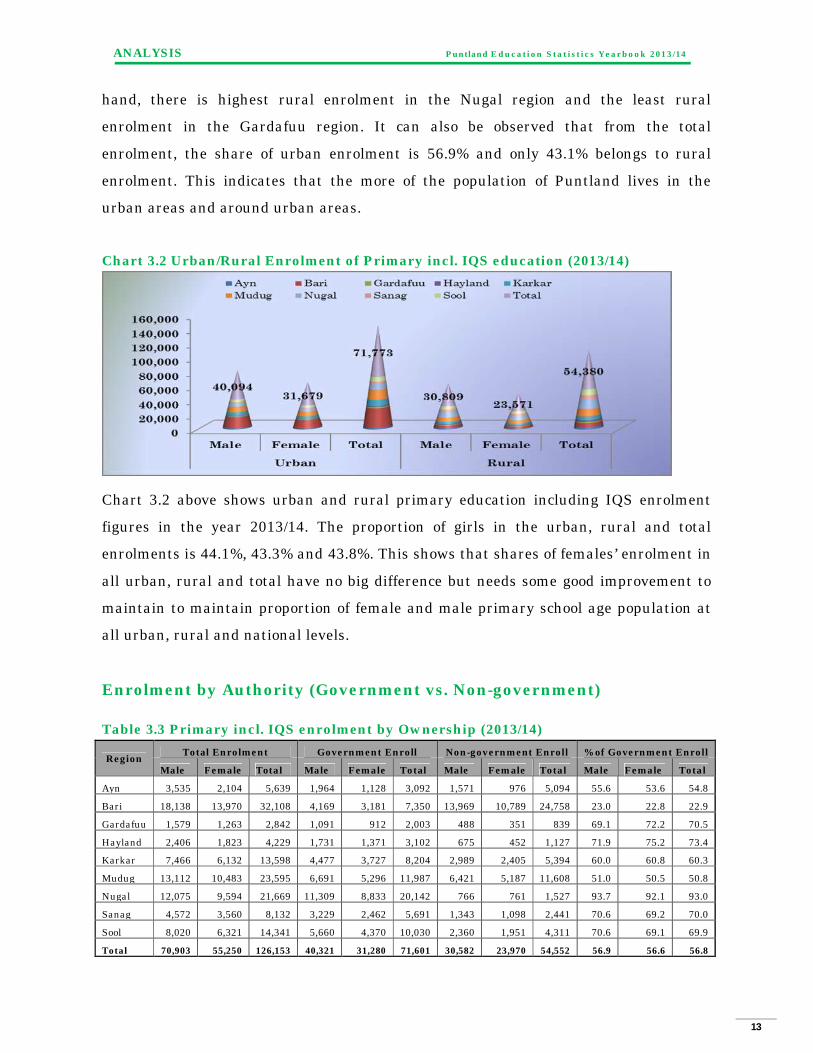
Table 3.2 above shows that formal primary including IQS urban enrolment is highest
in the Bari region and least urban enrolment is in the Hayland region. On the other
ANALYSIS Puntland Education Statistics Yearbook 2013/14
13
hand, there is highest rural enrolment in the Nugal region and the least rural
enrolment in the Gardafuu region. It can also be observed that from the total
enrolment, the share of urban enrolment is 56.9% and only 43.1% belongs to rural
enrolment. This indicates that the more of the population of Puntland lives in the
urban areas and around urban areas.
Chart 3.2 Urban/Rural Enrolment of Primary incl. IQS education (2013/14)
Chart 3.2 above shows urban and rural primary education including IQS enrolment
figures in the year 2013/14. The proportion of girls in the urban, rural and total
enrolments is 44.1%, 43.3% and 43.8%. This shows that shares of females’ enrolment in
all urban, rural and total have no big difference but needs some good improvement to
maintain to maintain proportion of female and male primary school age population at
all urban, rural and national levels.
Enrolment by Authority (Government vs. Non-government)
Table 3.3 Primary incl. IQS enrolment by Ownership (2013/14)
RegionTotal Enrolment Government Enroll Non-government Enroll % of Government Enroll
Male Female Total Male Female Total Male Female Total Male Female Total
Ayn 3,535 2,104 5,639 1,964 1,128 3,092 1,571 976 5,094 55.6 53.6 54.8
Bari 18,138 13,970 32,108 4,169 3,181 7,350 13,969 10,789 24,758 23.0 22.8 22.9
Gardafuu 1,579 1,263 2,842 1,091 912 2,003 488 351 839 69.1 72.2 70.5
Hayland 2,406 1,823 4,229 1,731 1,371 3,102 675 452 1,127 71.9 75.2 73.4
Karkar 7,466 6,132 13,598 4,477 3,727 8,204 2,989 2,405 5,394 60.0 60.8 60.3
Mudug 13,112 10,483 23,595 6,691 5,296 11,987 6,421 5,187 11,608 51.0 50.5 50.8
Nugal 12,075 9,594 21,669 11,309 8,833 20,142 766 761 1,527 93.7 92.1 93.0
Sanag 4,572 3,560 8,132 3,229 2,462 5,691 1,343 1,098 2,441 70.6 69.2 70.0
Sool 8,020 6,321 14,341 5,660 4,370 10,030 2,360 1,951 4,311 70.6 69.1 69.9
Total 70,903 55,250 126,153 40,321 31,280 71,601 30,582 23,970 54,552 56.9 56.6 56.8
ANALYSIS Puntland Education Statistics Yearbook 2013/14
14
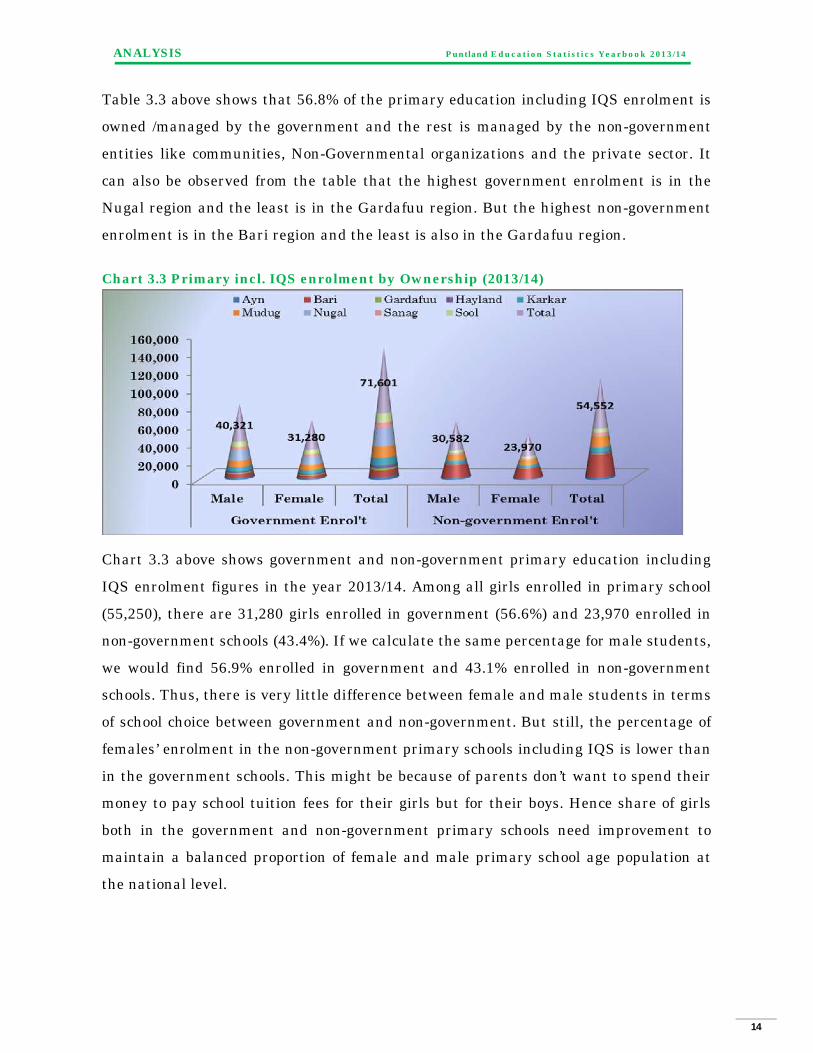
Table 3.3 above shows that 56.8% of the primary education including IQS enrolment is
owned /managed by the government and the rest is managed by the non-government
entities like communities, Non-Governmental organizations and the private sector. It
can also be observed from the table that the highest government enrolment is in the
Nugal region and the least is in the Gardafuu region. But the highest non-government
enrolment is in the Bari region and the least is also in the Gardafuu region.
Chart 3.3 Primary incl. IQS enrolment by Ownership (2013/14)
Chart 3.3 above shows government and non-government primary education including
IQS enrolment figures in the year 2013/14. Among all girls enrolled in primary school
(55,250), there are 31,280 girls enrolled in government (56.6%) and 23,970 enrolled in
non-government schools (43.4%). If we calculate the same percentage for male students,
we would find 56.9% enrolled in government and 43.1% enrolled in non-government
schools. Thus, there is very little difference between female and male students in terms
of school choice between government and non-government. But still, the percentage of
females’ enrolment in the non-government primary schools including IQS is lower than
in the government schools. This might be because of parents don’t want to spend their
money to pay school tuition fees for their girls but for their boys. Hence share of girls
both in the government and non-government primary schools need improvement to
maintain a balanced proportion of female and male primary school age population at
the national level.

ANALYSIS Puntland Education Statistics Yearbook 2013/14
15
Access (Admission) to Primary Education
Gross Intake Rate (GIR) and Net Intake Rate (NIR)
Gross Intake Rate (GIR) and Net Intake Rate (NIR) are measures of education access of
a nation to primary education. For the analysis of GIR and NIR for primary education,
we have used formal primary, Integrated Quranic School (IQS) and Alternative Basic
Education (ABE) as all show access to primary education.
Apparent Intake Rate and Net Intake Rate are used for the first time in Puntland
education system as an indicator of access (admission to class 1/level1) of primary
education and hence there is no trend analysis for AIR and NIR. And also due to lack of
school age population data at the regional and lower levels, there is no disaggregation
of intake rates at regional and district levels.
Gross Intake Rate (GIR) Gross Intake Rate (GIR) often called Apparent Intake Rate (AIR) is the percentage of
new entrants (irrespective of age) in the first class of primary (grade 1 or level), out of
the total number of children of the official primary admission age (age 6 for Puntland)
in a given academic year. Apparent Intake Rate shows how the education system is
accessible to all new entrants of official aged, over aged and under aged children. AIR
can be higher than 100% as it considers over aged and under aged children of class
1/level 1.
Table 3.4 Apparent Intake Rate (AIR) for the year 2013/14AIR Boys Girls Total
All new entrants to Class 1/Level 1 17,451 14,186 31,637
School age population (6 years) 11,293 9,502 20,795
Apparent Intake Rate (AIR) in % 154.5 149.3 152.1
Table 3.4 above shows that the total Apparent Intake Rate of Puntland is 152.1% of
which 154.5% is for boys and 149.3% is for girls in the year 2013/14. This means the
education system tends to include those students who may have not been enrolled in
school at their official school age, i.e. mostly over aged and to some extent under aged
children. Apparent Intake Rate greater than 100% indicates that there are overage and

ANALYSIS Puntland Education Statistics Yearbook 2013/14
16
under aged children entering primary school for the first time and more generally
higher achievement of creating access to primary education which needs to be
strengthened.
Chart 3.4 Apparent Intake Rate (AIR) for the year 2013/14
Chart 3.4 above shows the difference between the apparent intake rates of boys and
girls. This indicates that more boys are admitted to first class (class 1 or level 1 of
primary) school than girls and so access to primary education is greater for boys than
girls.
Net Intake Rate (NIR)Net Intake Rate (NIR) is the percentage of new entrants in the first grade of primary
(class 1/level 1) who are 6 years old, out of the total number of children who are of
official admission age (age 6 for Puntland) in a given year. Net Intake rate shows how
the education system is accessible to all new entrants of official aged children. NIR
cannot be over 100% and is usually lower than the AIR since it excludes over-aged and
under-aged children. Net Intake Rate will be 100% when all the children are admitted
to the first grade of primary school at their official school age, i.e. age 6 in the context of
Puntland.
Table 3.5 Net Intake Rate (NIR) for the year 2013/14NIR Boys Girls Total
All new entrants to Grade 1/Level 1 of age 6 5,090 4,270 9,360School age population (6 years) 11,293 9,502 20,795Net Intake Rate (NIR) in % 45.1 44.9 45.0

ANALYSIS Puntland Education Statistics Yearbook 2013/14
17
Table 3.5 above shows the total Net Intake Rate for Puntland is only 45.0% of which
45.1% for boys and 44.9% for girls in the year 2013/14. This means less than half of the
official school age children are coming to school and admitted to the first grade of
primary at the age of 6. This is a very low achievement and needs the attention of
education planners and policy makers to bring more children to school at their official
school age.
Table 3.5 Net Intake Rate (NIR) for the year 2013/14
Chart 3.5 above shows that only 9,360 out of 20,795 children of age 6 have joined the
first grade of primary education at their official school age. This indicates that most of
the children admitted to class 1 or level 1 are mostly over aged and in some cases under
aged children. The insignificant difference between the net intake rates of boys and
girls shows that there is good equity of boys and girls in going to school at their official
school age.
Coverage to Primary Education
Gross Enrolment Rate (GER) and Net Enrolment Rate (NER)
Gross Enrolment Rate (GER) and Net Enrolment Rate (NER) are measures of
education coverage of a nation at specific education level, here at primary level. For the
analysis of GER and NER for primary education, we have used formal primary,
Integrated Quranic School (IQS) and Alternative Basic Education (ABE) as all show
coverage to primary education. Due to lack of school age population data at the regional
ANALYSIS Puntland Education Statistics Yearbook 2013/14
18
and lower levels, there is no disaggregation of enrolment rates at regional and district
levels.
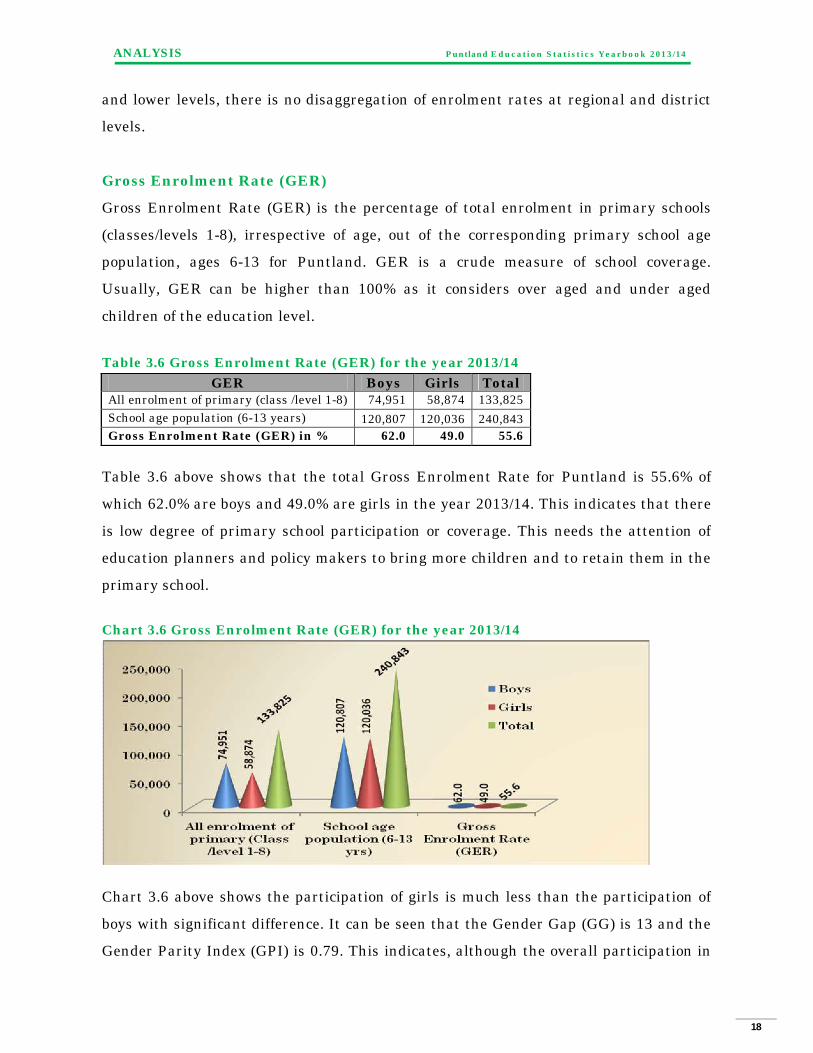
Gross Enrolment Rate (GER)
Gross Enrolment Rate (GER) is the percentage of total enrolment in primary schools
(classes/levels 1-8), irrespective of age, out of the corresponding primary school age
population, ages 6-13 for Puntland. GER is a crude measure of school coverage.
Usually, GER can be higher than 100% as it considers over aged and under aged
children of the education level.
Table 3.6 Gross Enrolment Rate (GER) for the year 2013/14
GER Boys Girls TotalAll enrolment of primary (class /level 1-8) 74,951 58,874 133,825School age population (6-13 years) 120,807 120,036 240,843Gross Enrolment Rate (GER) in % 62.0 49.0 55.6
Table 3.6 above shows that the total Gross Enrolment Rate for Puntland is 55.6% of
which 62.0% are boys and 49.0% are girls in the year 2013/14. This indicates that there
is low degree of primary school participation or coverage. This needs the attention of
education planners and policy makers to bring more children and to retain them in the
primary school.
Chart 3.6 Gross Enrolment Rate (GER) for the year 2013/14
Chart 3.6 above shows the participation of girls is much less than the participation of
boys with significant difference. It can be seen that the Gender Gap (GG) is 13 and the
Gender Parity Index (GPI) is 0.79. This indicates, although the overall participation in

ANALYSIS Puntland Education Statistics Yearbook 2013/14
19
the primary education is low, more boys are in the primary school system than girls.
This needs the attention of education planners and policy makers to bring and retain
more girls to the primary school.
Table 3.7 GER, GG and GPI Trends from 2011/12 - 2013/14
GER Trends Boys Girls Total GG GPI
2011/12 46.0 37.0 41.0 9.0 0.80
2012/13 52.0 41.7 46.8 10.3 0.80
2013/14 62.0 49.0 55.6 13.0 0.79
Chart 3.7 GER Trends from 2011/12 - 2013/14
Table 3.7 and chart 3.7 above show the trends in Gross Enrolment Rate (GER), Gender
Gap (GG) and Gender Parity Index (GPI) of Puntland primary education. GER has
increased from the total of 41.0% in the year 2011/12 to 55.6% in the year 2013/14
indicates that there is significant growth of children participation in the primary
schools.
Net Enrolment Rate (NER)
Net Enrolment Rate (NER) is the best way of measuring organized on-time school
participation. It is a more refined indicator of enrolment coverage and explains the
proportion of students enrolled in terms of official school age group. NER for primary is
calculated by dividing the number of official school aged primary students (for
Puntland ages 6-13) by the number of children of school ages (6-13) population. NER

ANALYSIS Puntland Education Statistics Yearbook 2013/14
20
cannot be over 100% and is usually lower than the GER since it excludes over-aged and
under-aged students.
Table 3.8 Net Enrolment Rate (NER) for the year 2013/14
NER Boys Girls Total
All enrolment of primary (class /level 1-8) of ages 6-13 63,612 51,532 115,144School age population (6-13 years) 120,807 120,036 240,843
Net Enrolment Rate (NER) in % 52.7 42.9 47.8
Chart 3.8 Net Enrolment Rate (NER) for the year 2013/14
Table 3.8 and Chart 3.8 above show the total Net Enrolment Rate for Puntland is
47.8% of which 52.7% are boys and 42.7% are girls. This is low achievement from the
Universal Primary Education (UPE) point of view. The difference between primary
gross enrolment rate and net enrolment rate, i.e., 7.8% shows the occurrence of over-
aged and under-aged children. The difference between the gross and net enrolments is
higher in boys than girls that shows there are more over-aged and under-aged boys
than girls in the primary education. The difference between 100% and NER (47.8%)
which is 52.2% of the children of ages 6-13 years old in Puntland are either not enrolled
or enrolled in the secondary education. But the incidence of children of ages 6-13 years
old enrolled in the secondary education is not significant and hence most are expected
to be out of school. Therefore, it is recommended to find the number of out of school
children in Puntland and design a strategy to bring those out of school children in the
primary school system so as to increase participation.

ANALYSIS Puntland Education Statistics Yearbook 2013/14
21
Table 3.9 Net Enrolment Rate (NER) Trends from 2011/12 - 2013/14NER Trends Boys Girls Total
2011/12 41.0 33.0 37.02012/13 41.3 33.8 37.52013/14 52.7 42.9 47.8
Table 3.9 above and chart 3.9 below show that net enrolment rate has been noticeably
increasing for the last three years (2011/12 – 2013/14) especially from 2012/13 to
2013/14. This indicates that there is better improvement of participation of children in
their primary official school ages.
Chart 3.9 Net Enrolment Rate (NER) Trends from 2011/12 - 2013/14
Gender Equity in the Primary Education
Equity of girls and boys can be measured using different indicators. One of the
indicators of gender equity is the Gender Parity Index (GPI), which is an important
indicator of gender equity that shows the status of the participation of girls. Although it
is possible to get GPI as the ratio of female to male indicators, GPI as ratio of Gross
Enrolment Rate (GER) is more acceptable and used in this publication. In situations
where the GPI is equal to 1, then equity between boys and girls is achieved. If the
gender parity index is greater than 1, then the system favors to girls more than boys
and if it is less than 1, the system favors to boys more than girls.
Another measurement of equity between girls and boys is Gender Gap (GG) which is
the difference between the male and female GER. In situations where the GG is equal
to 0 (zero), then equity between boys and girls is achieved.

ANALYSIS Puntland Education Statistics Yearbook 2013/14
22
The gender parity index in the Puntland primary schools has slightly decreased from
0.80 in the year 2011/12 to 0.79 in the year 2013/14 the gender gap has increased from
9.0 in 2011/12 to 13.0 in 2013/14 indicate that girls’ participation is slightly decreasing.
No nation has been able to achieve gender equity of basic education without programs
that assist girls. Hence to achieve gender equity in the Puntland primary education
system, education planners and policy makers should develop and/or sustain programs
that assist girls.
Internal Efficiency of Primary education
Promotion, Repetition and Dropout Rates
Promotion rate, repetition rate, dropout rate, survival rate, etc. are measures of
internal efficiency of the education system. These rates help to understand how the
education system utilizes the limited resources efficiently and timely. These rates are
commonly used to measure the efficiency of the education system in producing
graduates of a particular education level. A student has three paths in a particular
academic year, i.e. promotion, repetition and dropout. Repeating a class means using
more resources than allocated to a student; and leaving a school (dropping out of
school) before completing a particular level of education is also a waste of resources.
Higher promotion rates and lower repetition and lower dropout rates overall and at
each grade level are the indications of internal efficiency, i.e., improved utilization of
limited resources.
Promotion Rate (Apparent)
Promotion rate measures the proportion of students who have passed to the next
grade/class in the following year. It is an effective proportion of students enrolled in a
given grade/class that reach the next grade/class next year. A high level of effective
promotion rate indicates a high level of retention or survival rate.
Table 3.10 Primary incl. IQS Promotion Rate (PR) for the year 2013/14
GenderClass 1 to2
Class 2 to 3
Class 3 to 4
Class 4 to 5
Class5 to 6
Class6 to 7
Class 7 to 8
Class 8 to 9 Total
Male 86.0 96.9 96.6 99.5 101.2 106.0 93.9 96.2 95.7
Female 81.9 92.9 92.2 100.2 96.4 106.8 90.3 95.9 92.3
Total 84.1 95.0 94.6 99.8 99.2 106.3 92.5 96.1 94.2

ANALYSIS Puntland Education Statistics Yearbook 2013/14
23
Chart 3.10 Primary incl. IQS Promotion Rate (PR) for the year 2013/14
Table 3.10 and chart 3.10 above show that the total primary including IQS promotion
rate is 95.7% for boys, 92.3% for girls and 94.2% for both indicating that relatively good
internal efficiency and proper utilization of resources. Promotion rate is lower from
class/level 1 to 2 (84.1%) followed by class 7 to 8 (92.5%) but higher from class 6 to 7
(106.3%) followed by class/level 4 to 5 (99.2%). Logically, promotion rate cannot be
greater than 100% and over 100% promotion rate shows that data have been collected
on more number of schools in the year 2013/14 than in the year 2012/13. Generally,
more percentage of boys are promoted than girls except in classes of 4 to 5 and 6 to 7
where more percentage of girls are promoted than boys.
Repetition Rate
This indicator measures the proportion of students who have remained in the same
grade/class for two or more years by retaking the grade/class having either left the
grade prematurely or returning for a second or third time. Any repetition reduces the
efficiency of the education system and is also, at times, may imply of high pupil-teacher
ratio, lack of learning materials, etc.
Table 3.11 Primary incl. IQS Repetition Rate (RR) for the year 2013/14
Gender Class 1 Class 2 Class 3 Class 4 Class 5 Class 6 Class 7 Class 8 Total
Male 4.9 2.6 2.8 2.1 2.5 2.1 3.1 4.8 3.2
Female 4.8 3.0 3.3 2.5 2.8 6.6 3.9 5.1 3.8
Total 4.8 2.8 3.0 2.3 2.6 4.0 3.4 4.9 3.5

ANALYSIS Puntland Education Statistics Yearbook 2013/14
24
Chart 3.11 Primary incl. IQS Repetition Rate (RR) for the year 2013/14
Table 3.11 and chart 3.11 above show that girls’ repetition rate is higher than boys’. It
can also be observed that total repetition rate was lower for boys than girls and this
indicates that girls repeat the same class/level more than boys do. The highest
repetition rate is observed for girls at class/grade 6 and the lowest repetition for boys at
classes/grades 4 and 6. For both boys and girls, the repetition rate for classes/grades 1
and 8 are the highest. This might be because most students are joining class/level 1
without prior experience of pre-primary education and grade 8 is a bottleneck to pass to
the next level of education. Generally, it is recommended that girls should have given
more support than boys not to repeat the same class/level.
Dropout Rate
The dropout rate is a measure, typically by grade, of those who leave schooling. In most
cases it is calculated as the remainder after subtracting those who are promoted to the
next class/grade and those who repeat the same class/grade.
Table 3.12 Primary incl. IQS Dropout Rate (DR) for the year 2013/14
Gender Class 1 Class 2 Class 3 Class 4 Class 5 Class 6 Class 7 Class 8 Total
Male 9.1 0.5 0.7 -1.6 -3.7 -8.1 3.1 -1.0 1.1
Female 13.3 4.2 4.5 -2.7 0.9 -13.4 5.8 -1.0 3.9
Total 11.1 2.2 2.4 -2.1 -1.8 -10.3 4.2 -1.0 2.3

ANALYSIS Puntland Education Statistics Yearbook 2013/14
25
Chart 3.12 Primary incl. IQS Dropout Rate (DR) for the year 2013/14
Table 3.12 and chart 3.12 above show that the total dropout rate is 2.3% of which 1.1%
is for males and 3.9% is for females. The highest dropout rate (11.1%) is observed in
class/level 1 in which 9.1% is for males and 13.3% is for females. In all cases, girls have
higher dropout rates than boys. Logically, dropout rates cannot be less than zero or
negative and hence negative dropout rates show that there is data inconsistency in the
consecutive years. In our case, dropout rates for classes 4, 5, 6 and 8 show negative
values and that indicates the inconsistency of the data is specifically more feasible in
these grades. This data inconsistency is clearly identified that a large number of
schools that didn’t report their census data in the year 2012/13 have reported in the
year 2013/14. Therefore the Ministry of Education and Higher Education has to focus
on minimizing the number of girls that are dropping out schools and also should keep
the consistency of the EMIS data from one year to the next year.
Survival Rate to Grade 5
The survival rate to grade 5 is used to estimate the percentage of pupils who will
complete the lower primary education. The reliability of this indicator depends on the
consistency of data on enrolment and repeaters both in terms of coverage overtime and
across grades. There are different methods of calculating the survival rate such as the
synthetic cohort method, the transverse method, etc.
Here we will use the transverse method of calculating survival rate as the percentage of
a cohort of pupils enrolled in the first grade of a given level or cycle of education in a
given school year who are expected to reach each successive grade. In other words, it is

ANALYSIS Puntland Education Statistics Yearbook 2013/14
26
dividing new entrants of cohort at the last grade by new entrants of cohort at the first
grade of the education level or cycle and multiplying by 100.
Table 3.13 Survival Rate to Grade 5 for the year 2013/14Survival rate Boys Girls Total
New entrants of Grade 4/Level 4 8,739 6,679 15,418New entrants of Grade 1/Level 1 15,561 12,686 28,247Survival rate to Grade 5 56.2 52.6 54.6
Table 3.13 above and chart 3.13 below show that the survival rate to grade 5 of the year
2013/14 in Puntland. Survival rates will always be one year behind the current year’s
data since it requires measurement of enrolment and repetition from the following
year. The total survival rate to grade 5 for Puntland is 54.6% in which 56.2% is for
boys and 52.6% is for girls. This indicates that there is high rate of repetition of the
same class and/or dropping out of school in which more girls are repeating the same
class and dropping out of school than boys.
Chart 3.13 Survival Rate to Grade 5 for the year 2013/14
Survival rates approaching 100% indicate a high level of retention and low incidence of
dropouts. Therefore there is much more planning and implementation to bring survival
rate from the current 54.6% to 100%.
Enrolment of Children with Special Educational Needs
According to the data collected for the year 2013/14, the total number of primary school
including IQS children with special education needs is 1,939 of which 1,028 are male

ANALYSIS Puntland Education Statistics Yearbook 2013/14
27
and 911 are female children. This shows that the percentage of boys with special
education needs is greater than that of girls with 53% and 47% for boys and girls
respectively. A large number of these special needs children are enumerated in the
regions of Bari, Mudug and Nugal with a total of 509, 405 and 396 children
respectively.
Table 3.14 Enrolment of Primary incl. IQS Children with Special Needs (2013/14)
RegionHearing
DisabilityVisual
DisabilityLimb
(Movement)GrandTotal
Male Female Male Female Male Female Male Female TotalAyn 13 11 19 11 6 5 38 27 65Bari 60 48 193 201 4 3 257 252 509Gardafuu 7 3 12 9 2 3 21 15 36Hayland 4 5 17 9 9 4 30 18 48Karkar 29 38 70 53 12 7 111 98 209Mudug 59 47 132 119 26 22 217 188 405Nugal 70 65 99 92 43 27 212 184 396Sanag 20 20 53 63 16 18 89 101 190Sool 19 8 19 11 15 9 53 28 81Total 281 245 614 568 133 98 1,028 911 1,939
Chart 3.14 Enrolment of Primary incl. IQS Children with Special Needs (2013/14)
Table 3.14 and chart 3.14 above show that from the total children with special
education needs, 61.0% of them are visually disabled, 27.1% of them are hearing
disabled and the rest are limb (movement) disabled. Though there should be much
more attention to the visually disabled children, hearing disability and movement
disability should have significant attention in order to help the children, may be in the

ANALYSIS Puntland Education Statistics Yearbook 2013/14
28
curriculum, textbooks, construction of buildings, etc. Moreover, teaching and learning
materials and other supportive materials like Braille, wheel chair, etc. should be
accessible to help these children to cope up in the education system.
Quality of Primary Education
Formal Primary including IQS Teachers
Teachers are the very important components of any education system. The number of
teachers, the qualification and the certification of teachers combined together is the
basis for the quality of the education system.
Qualified and Certified Primary School incl. IQS Teachers
In addition to sufficient teachers, the level of certification is very important to the
education system. Although there is no documentation of minimum standard of
qualification and certification for primary education teachers, the Policy and planning
team agrees that minimum standard of qualification is secondary school completion
and of certification is teaching certificate for primary education.
Table 3.15 and chart 3.15 below indicate that the regional average proportions of
qualified primary school including IQS teachers in Puntland in the year 2013/14 are
63.1%, 55.8% and 62.1% for male, female and total teachers respectively. And also the
proportions of their certification are 27.3%, 25.5% and 27.1% for male, female and total
teachers respectively. At national level, there is no significant difference between the
certified male and female teachers but in general it shows that much more teachers
certification training is needed as the 72.9% of primary including IQS teachers teaching
in the year 2013/14 are not certified teachers.

ANALYSIS Puntland Education Statistics Yearbook 2013/14
29
Table 3.15 Qualified and Certified Primary School including IQS Teachers (2013/14)
RegionTotal Teachers % Qualified Teachers
% CertifiedTeachers
Male Female Total Male Female Total Male Female Total
Ayn 176 13 189 46.6 46.2 46.6 39.8 23.1 38.6Bari 877 101 978 59.1 62.4 59.4 35.8 25.7 34.8Gardafuu 83 8 91 43.4 62.5 45.1 54.2 25.0 51.6Hayland 117 17 134 72.6 76.5 73.1 17.9 11.8 17.2Karkar 410 61 471 69.5 39.3 65.6 12.2 19.7 13.2Mudug 581 82 663 65.2 62.2 64.9 27.9 26.8 27.8Nugal 465 130 595 66.0 52.3 63.0 23.4 33.8 25.7Sanag 245 37 282 71.0 56.8 69.1 18.8 18.9 18.8Sool 374 49 423 62.3 55.1 61.5 24.9 18.4 24.1Total 3,328 498 3,826 63.1 55.8 62.1 27.3 25.5 27.1
Chart 3.15 Certified Primary School including IQS Teachers (2013/14)
Gardafuu region has the highest percentage of certified primary school including IQS
teachers (51.6%) which needs more female teachers of the region should be trained
than male teachers. Hayland and Sanag regions have the least percentage of certified
primary school including IQS teachers with 17.2% and 18.8% respectively and this
shows that these regions need more attention for the certification training of their
primary teachers. In Nugal and Karkar region, more female primary school teachers
are found to be certified than their male counterparts in the year 2013/14.
Teachers Salary Payment
In Puntland, primary schools including IQS education teachers’ salary is paid by
communities, non-government organizations, private sector, Ministry of Education and
Higher Education and even some are blank (unpaid) at all.

ANALYSIS Puntland Education Statistics Yearbook 2013/14
Table 3.16 Primary incl. IQS Teachers Salary Payers (2013/14)
Region Community Ministry of EducationNon-Government
Organization Private Blank (Unpaid)* TotalM F T M F T M F T M F T M F T M F T
Ayn 16 2 18 78 3 81 6 6 17 4 21 59 4 63 176 13 189Bari 716 79 795 101 16 117 15 2 17 36 3 39 9 1 10 877 101 978Hayland 63 5 68 47 10 57 7 2 9 117 17 134Karkar 271 28 299 82 20 102 10 2 12 2 2 45 11 56 410 61 471Mudug 435 54 489 92 13 105 35 11 46 10 10 9 4 13 581 82 663Nugal 283 62 345 151 51 202 24 10 34 2 2 7 5 12 465 130 595Sanag 155 21 176 78 11 89 1 1 2 1 3 9 4 13 245 37 282Sool 243 21 264 41 1 42 6 6 9 3 12 75 24 99 374 49 423Gardafuu 37 4 41 40 2 42 1 1 5 2 7 83 8 91Total 2,219 276 2,495 710 127 837 97 25 122 77 13 90 225 57 282 3,328 498 3,826
*Blank (unpaid): teachers whose salary payers’ field were blank in the questionnaire.
Table 3.16 above and chart 3.16 below show the primary including IQS education teachers’ salary payers by region for of the
year 2013/14. In Puntland, 21.9% of the teachers’ salary is paid by the Ministry of Education and Higher Education and the
rest are paid by communities, non-government organizations, private owners and some are blank (unpaid) at all.
Chart 3.16 Percentage of Primary incl. IQS Teachers Salary Payers (2013/14)

ANALYSIS Puntland Education Statistics Yearbook 2013/14
31
Pupil-Teacher Ratio (PTR)
Pupil-Teacher Ratio (PTR) is one of the education indicators of quality and shows also
efficiency of the system. When the PTR is lower, it is better opportunity for contact
between the teacher and pupils and for the teacher to provide more support to students
individually, thereby improving the quality of education; but when PTR is very low,
however, may indicate under-utilization of teachers implies inefficiency. Therefore,
PTR alone does not explain the quality of education because quality of education
depends on other factors such as qualification of teachers, the supply of educational
materials, mode of delivery and other issues.
Table 3.17 Primary incl. IQS Pupil Teacher Ratio (2013/14)
RegionEnrolment Teachers PTR
Total Gov't Non-gov't Total Gov't Non-gov't Total Gov't Non-gov't
Ayn 5,639 3,092 2,547 189 112 77 29.8 16.4 33.1
Bari 32,108 7,350 24,758 978 240 738 32.8 7.5 33.5
Gardafuu 2,842 2,003 839 91 63 28 31.2 22.0 30.0
Hayland 4,229 3,102 1,127 134 91 43 31.6 23.1 26.2
Karkar 13,598 8,204 5,394 471 294 177 28.9 17.4 30.5
Mudug 23,595 11,987 11,608 663 314 349 35.6 18.1 33.3
Nugal 21,669 20,142 1,527 595 530 65 36.4 33.9 23.5
Sanag 8,132 5,691 2,441 282 205 77 28.8 20.2 31.7
Sool 14,341 10,030 4,311 423 268 155 33.9 23.7 27.8
Total 126,153 71,601 54,552 3,826 2,117 1,709 33.0 18.7 31.9
Chart 3.17 Primary incl. IQS Pupil Teacher Ratio (2013/14)
Table 3.17 and chart 3.17 above show the primary incl. IQS education PTR by region
for government and non-government enrolment of the year 2013/14. In Puntland, the

ANALYSIS Puntland Education Statistics Yearbook 2013/14
32
primary including IQS education Pupil Teacher Ratio (PTR) is 31.9 in the year 2013/14.
It can be also noted that PTR in the government schools is lower than the non-
government schools with 18.7 and 33.0 respectively. Although there is no
documentation for standard of PTR in the primary education of Puntland, it seems that
there is inefficiency of the system to use the available teachers especially in the
government managed schools.
Though the total PTR reflects the general direction, there is remarkable variation
among regions in both lower and upper primary education. PTR is above the national
average in the regions of Bari, Mudug and Ayn with 33.5%, 33.3% and 33.1%
respectively. Most regions do have a PTR of less than the national average.
Formal Primary including IQS Schools and Classrooms
Schools and classrooms are used to measure some of the quality of the education
system. It is noted by many educational researchers that the quality of education is
better in single shift schools than double shift schools. It is also expected that the lower
the pupil-classroom ratio the more the quality of education. But it should be noted that
single shift schools and lower pupil classroom ratio are not the only measures of quality
education.
Formal Primary including IQS schools
Schools can be disaggregated by authority/ownership, locality, type of shift, region and
district, etc. Here we will try to see formal primary schools including IQS by
disaggregation of shift type and authority/ownership.
Table 3.18 and chart 3.18 below show that the numbers of schools are observed highest
in the Bari region and lowest in the Hayland region. It can also be calculated that
43.2% of the primary schools including IQS are single shift and 56.8% of them are
double shift schools. Karkar region has the highest number of single shift schools and
Bari region has the highest number of double shift schools. It should be recommended
that the Ministry of Education and Higher Education should mobilize efforts to build

ANALYSIS Puntland Education Statistics Yearbook 2013/14
33
more schools and/or expand more classrooms in order to minimize the number of double
shift schools.
Table 3.18 Primary incl. IQS schools by shift (2013/14)
Region Single shift Double shift Total no. of Ayn 18 10 28Bari 36 89 125Gardafuu 7 15 22Hayland 7 11 18Karkar 61 36 97Mudug 25 59 84Nugal 43 46 89Sanag 17 25 42Sool 32 33 65Total 246 324 570
Chart 3.18 Primary incl. IQS schools by shift (2013/14)
Table 3.19 and chart 3.19 below show that the numbers of schools that are owned by
the Ministry of Education and Higher Education (Government) are higher than that of
the non-government owned ones. It can be calculated that 58.8% of the total primary
schools including IQS are managed and owned by the Ministry of Education and
Higher Education. Non-government schools here include community, non-government
organizations and the private sector.
Table 3.19 Primary incl. IQS schools by Ownership (2013/14)
Ministry of Education Non-Government TotalAyn 15 13 28Bari 41 84 125Gardafuu 16 6 22Hayland 13 5 18Karkar 58 39 97Mudug 41 43 84Nugal 78 11 89Sanag 30 12 42Sool 43 22 65Total 335 235 570

ANALYSIS Puntland Education Statistics Yearbook 2013/14
34
Chart 3.19 Primary incl. IQS schools by ownership (2013/14)
Formal Primary including IQS Classrooms
Classrooms are used to calculate Pupil Classroom Ratios of the particular education
level. But when there are schools of double and multiple shifts, classrooms could be
enumerated carefully not to mix up among the types of shifts. Classrooms can be
disaggregated by ownership, locality, type of shift, region and district, etc.
Pupil Classroom Ratio (PCR)
The Pupil Classroom Ratio (PCR) is generally shows the number of pupils in teaching
and learning classroom. In the case of Puntland, there are many double shift schools
and hence classrooms are shared. A higher PCR may mean many students
overcrowding in a class in which teachers cannot have chances to help each student
fully in that class. A lower ratio in comparison may mean underutilization of
resources.
Table 3.20 Primary incl. IQS Classrooms and Pupil Classroom Ratio (2013/14)
RegionEnrolment Classrooms PCR
Gov't Non-gov't Total Gov't Non-gov't Total Gov't Non-gov't Total Ayn 3,092 2,547 5,639 80 52 132 38.7 49.0 42.7Bari 7,350 24,758 32,108 187 687 874 39.3 36.0 36.7Gardafuu 2,003 839 2,842 58 18 76 34.5 46.6 37.4Hayland 3,102 1,127 4,229 94 34 128 33.0 33.1 33.0Karkaar 8,204 5,394 13,598 258 152 410 31.8 35.5 33.2Mudug 11,987 11,608 23,595 252 325 577 47.6 35.7 40.9Nugaal 20,142 1,527 21,669 388 52 440 51.9 29.4 49.2Sanaag 5,691 2,441 8,132 144 46 190 39.5 53.1 42.8Sool 10,030 4,311 14,341 146 182 328 68.7 23.7 43.7Total 71,601 54,552 126,153 1,607 1,548 3,155 44.6 35.2 40.0

ANALYSIS Puntland Education Statistics Yearbook 2013/14
35
Chart 3.20 Primary incl. IQS Classrooms and Pupil Classroom Ratio (2013/14)
Table 3.20 and chart 3.20 above show the primary incl. IQS education Pupil Classroom
Ratio (PCR) by region for government and non-government classrooms of the year
2013/14. In Puntland, the primary including IQS education Pupil Classroom Ratio
(PTR) is 40.0 in the year 2013/14. It can be also noted that PCR in the government
schools is higher than the non-government schools with 44.6 and 35.2 respectively.
Although there is no documentation for standard of PCR in the primary education of
Puntland, it can be seen that the PCR in the non-government classrooms is better than
in the government ones.
Formal Primary including IQS Textbooks
Number of available student textbooks is not the only but one of the indicators of
quality education. In line with this there should be quality curriculum and quality
textbooks in addition to the number of textbooks distributed to students.
Pupil Textbook Ratio (PTbR)
Pupil Textbook Ratio (PTbR) shows the number of pupils who have received or owned
textbooks by subject. It is expected that a pupil should have one book per subject and
the same in all the subjects. Mostly the number of subjects that the student studies are
large in number and in this cases, we will consider only some of the basic subject
textbook and if not Mathematics followed by English will be used as a measure of
PTbR. PTbR is mostly expressed as 1:1, 2:1, 3:1, etc. to mean 1 textbook to 1 pupil, 1
textbook to 2 pupils, 1 textbook to 3 pupils, etc. respectively.
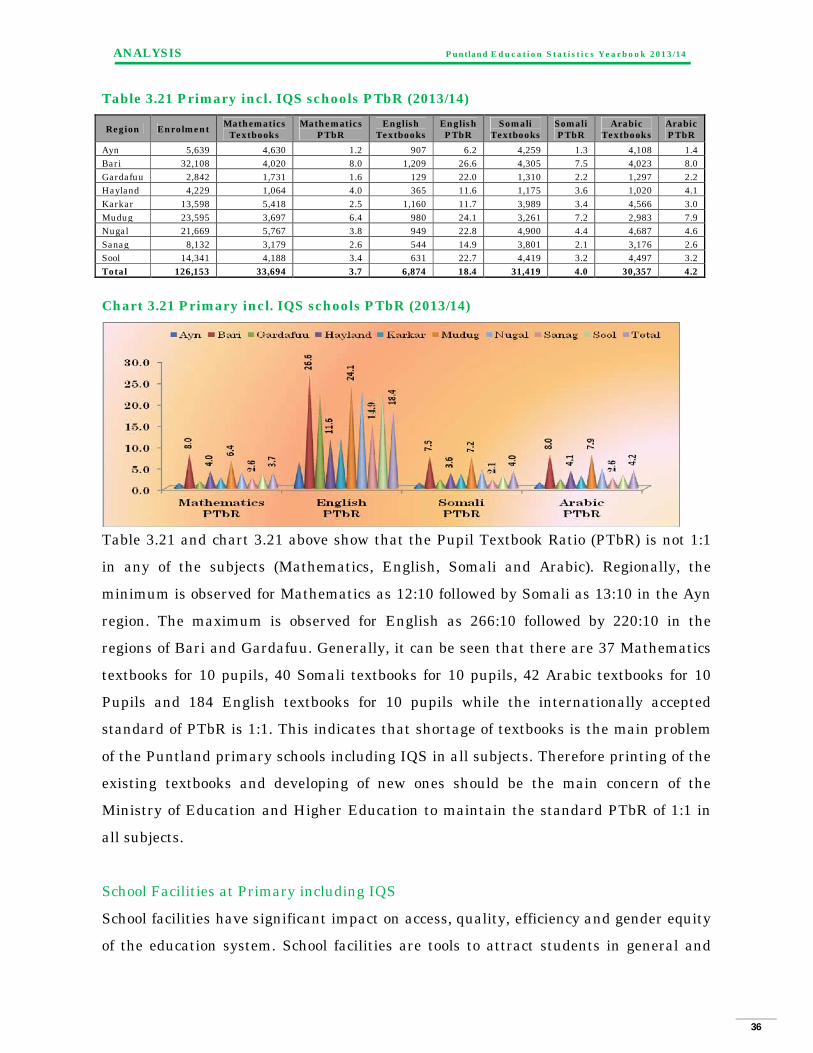
ANALYSIS Puntland Education Statistics Yearbook 2013/14
36
Table 3.21 Primary incl. IQS schools PTbR (2013/14)
Region EnrolmentMathematics
TextbooksMathematics
PTbREnglish
TextbooksEnglishPTbR
SomaliTextbooks
SomaliPTbR
ArabicTextbooks
ArabicPTbR
Ayn 5,639 4,630 1.2 907 6.2 4,259 1.3 4,108 1.4Bari 32,108 4,020 8.0 1,209 26.6 4,305 7.5 4,023 8.0Gardafuu 2,842 1,731 1.6 129 22.0 1,310 2.2 1,297 2.2Hayland 4,229 1,064 4.0 365 11.6 1,175 3.6 1,020 4.1Karkar 13,598 5,418 2.5 1,160 11.7 3,989 3.4 4,566 3.0Mudug 23,595 3,697 6.4 980 24.1 3,261 7.2 2,983 7.9Nugal 21,669 5,767 3.8 949 22.8 4,900 4.4 4,687 4.6Sanag 8,132 3,179 2.6 544 14.9 3,801 2.1 3,176 2.6Sool 14,341 4,188 3.4 631 22.7 4,419 3.2 4,497 3.2Total 126,153 33,694 3.7 6,874 18.4 31,419 4.0 30,357 4.2
Chart 3.21 Primary incl. IQS schools PTbR (2013/14)
Table 3.21 and chart 3.21 above show that the Pupil Textbook Ratio (PTbR) is not 1:1
in any of the subjects (Mathematics, English, Somali and Arabic). Regionally, the
minimum is observed for Mathematics as 12:10 followed by Somali as 13:10 in the Ayn
region. The maximum is observed for English as 266:10 followed by 220:10 in the
regions of Bari and Gardafuu. Generally, it can be seen that there are 37 Mathematics
textbooks for 10 pupils, 40 Somali textbooks for 10 pupils, 42 Arabic textbooks for 10
Pupils and 184 English textbooks for 10 pupils while the internationally accepted
standard of PTbR is 1:1. This indicates that shortage of textbooks is the main problem
of the Puntland primary schools including IQS in all subjects. Therefore printing of the
existing textbooks and developing of new ones should be the main concern of the
Ministry of Education and Higher Education to maintain the standard PTbR of 1:1 in
all subjects.
School Facilities at Primary including IQS
School facilities have significant impact on access, quality, efficiency and gender equity
of the education system. School facilities are tools to attract students in general and

ANALYSIS Puntland Education Statistics Yearbook 2013/14
37
girls in particular to the school system. The availability of water (drinking and/or
washing), latrines, laboratories, libraries and pedagogical centers in schools will attract
students and is means of increasing quality and efficiency of education.
Table 3.22 Primary incl. IQS schools with availability and type of water - 2013/14
Region No. of Schools
Source of Water Schools with drinkable
% of schools Piped Roof Tank Well Total
Ayn 28 2 4 1 7 7 25.0%Bari 125 44 9 9 62 43 49.6%Gardafuu 22 4 5 9 9 40.9%Hayland 18 2 7 9 9 50.0%Karkar 97 11 22 14 47 31 48.5%Mudug 84 0.0%Nugal 89 1 13 14 15.7%Sanag 42 1 16 5 22 11 52.4%Sool 65 1 1 13 15 15 23.1%Total 570 66 65 54 185 125 32.5%
Table 3.22 above shows only 32.5% of the Puntland primary schools including IQS
centers have access to water. Only 125 of 570 primary schools including IQS which is
21.9% have access to drinkable water. The sources of water are different and the
greatest source comes from piped water followed by roof tanks which are 35.7% and
35.1% respectively. No water availability is reported in the Mudug region.
Chart 3.22 Primary incl. IQS schools with availability and type of water - 2013/14
Chart 3.22 above shows piped water, roof tank and well are the main sources of water
for the Puntland primary schools including IQS centers. It can also be observed that
more piped water sources are found in the Bari region.

ANALYSIS Puntland Education Statistics Yearbook 2013/14
38
C. ALTERNATIVE BASIC EDUCATION (ABE)
Alternative Basic Education (ABE) is part of primary education but treated here
separately to monitor its contribution to the goal of providing universal access to
primary education. Most ABE teaching learning activities are accomplished in their
own established centers, and are designed to provide for the same age group as regular
primary education. ABE enrolments have been included in reports of the primary
access and coverage education analysis. Therefore AIR, NIR, GER and NER of primary
education include the contribution of ABE to primary education in Puntland.
Alternative Basic Education Enrolment
Table 3.23 Alternative Basic Education Enrolment for the year 2013/14
RegionLevel 1 Level 2 Level 3 Level 4 Level 5 Total
TotalM F M F M F M F M F M F
Bari 445 437 254 215 239 188 11 11 6 955 851 1,806
Hayland
78 86 128 118 206 204 410
Karkar 55 64 49 99 7 10 111 173 284
Mudug 531 520 239 221 157 124 8 935 865 1,800
Nugal 649 516 333 260 328 294 41 36 15 8 1,366 1,114 2,480
Sanag 200 180 186 116 3 7 389 303 692
Sool 61 89 20 10 5 15 86 114 200
Total
2,019
1,892
1,209
1,039
739
638
60
47
21
8
4,048
3,624
7,672
Chart 3.23 Alternative Basic Education Enrolment for the year 2013/14
Table 3.23 and chart 3.23 above show that the Alternative Basic Education (ABE)
enrolment for the year 2013/14. It can be seen that Nugal region has the highest ABE
enrolment followed by Bari and Mudug regions. Note that Ayn and Gardafuu regions

ANALYSIS Puntland Education Statistics Yearbook 2013/14
39
don’t have ABE enrolment at all in the year 2013/14. Sool region has the lowest ABE
enrolment followed by Karkar region. From the total primary education (Formal
primary, IQS and ABE) enrolment, ABE enrolment constitutes 5.7% of which males
constitute 6.9% and females constitute 4.8%. From the total ABE enrolment 47.2% are
females which shows that share of female students seems on the right track.
Alternative Basic Education Teachers
Table 3.24 Qualified and Certified Alternative Basic Education Teachers (2013/14)
Region
Total Teachers Qualified Teachers Certified Teachers
Male Female Total Male Female Total Male Female Total
Bari 32 8 40 21 5 26 10 2 12
Hayland 5 5 5 5 0 0
Karkar 9 2 11 6 2 8 3 0 3
Mudug 17 4 21 17 2 19 0 0 0
Nugal 16 7 23 11 2 13 1 1 2
Sanag 16 8 24 4 1 5 11 7 18
Total 95 29 124 64 12 76 25 10 35
Chart 3.24 Certified Alternative Basic Education Teachers (2013/14)
Table 3.24 above shows that Alternative Basic Education (ABE) qualified and certified
teachers and also chart 3.24 shows that the total and certified ABE teachers for the
year 2013/14. It can be seen that Bari region has the highest ABE teachers and
Hayland region has the least number of ABE teachers. It can also be noted that Ayn,
Gardafuu and Sool regions don’t have ABE teachers in the year 2013/14. From the total
ABE teachers only 23.4% are female teachers indicating that there is a need of
attention to increase the number of female teachers in the ABE schools. Moreover only

ANALYSIS Puntland Education Statistics Yearbook 2013/14
40
61.3% of ABE teachers are qualified and 28.2% of ABE teachers are certified and this
needs planning and implementation to certify more ABE teachers.
Alternative Basic Education Teachers Salary Payment
In Puntland, ABE teachers’ salary is paid by communities, non-government
organizations, private sector, Ministry of Education and Higher Education and even
some are unpaid at all.
Table 3.25 ABE Teachers Salary Payers (2013/14)
Region CommunityMinistry of Education
Non-GovernmentOrganization Private
Blank (Unpaid)* Grand Total
M F T M F T M F T M F T M F T M F T
Bari 3 2 5 23 6 29 6 6 32 8 40
Hayland 1 1 4 4 5 0 5
Karkar 3 1 4 3 1 4 1 1 2 2 9 2 11
Mudug 15 3 18 2 1 3 17 4 21
Nugal 16 7 23 16 7 23
Sanag 7 7 2 3 5 7 5 12 16 8 24
Total 3 2 5 65 17 82 13 5 18 1 0 1 13 5 18 95 29 124
*Blank (unpaid): teachers whose salary payers’ field were blank in the questionnaire.
Table 3.25 above and chart 3.25 below show the Alternative Basic Education teachers’
salary payers by region for of the year 2013/14. In Puntland, 66.1% of the teachers’
salary is paid by the Ministry of Education and Higher Education and the rest are paid
by communities, non-government organizations, private owners and some are blank
(unpaid) at all.
Chart 3.25 Percentage of ABE Teachers Salary Payers (2013/14)

ANALYSIS Puntland Education Statistics Yearbook 2013/14
41
Alternative Basic Education Schools
Table 3.26 Alternative Basic Education Schools (2013/14)Region Total Schools Single Shift Double ShiftBari 17 15 2Hayland 2 1 1Karkar 4 4Mudug 13 13Nugal 14 13 1Sanag 7 7Sool 1 1Total 58 54 4
Chart 3.26 Alternative Basic Education Schools (2013/14)
Table 3.26 and chart 3.26 above show that the Alternative Basic Education (ABE)
schools for the year 2013/14. It can be seen that Bari region has the highest ABE
schools followed by Nugal and Mudug regions. It can also be observed that Ayn and
Gardafuu regions don’t have ABE schools in the year 2013/14. Sool region has the
lowest ABE schools followed by Hayland region. From the total ABE schools 93.1% are
single shift schools and this will be a good example for the formal primary including
IQS schools in which the percentage of single shift schools is less than 50%.

ANALYSIS Puntland Education Statistics Yearbook 2013/14
42
D. NON FORMAL EDUCATION (NFE)
Non Formal Education (NFE) is education to address the primary education needs of adults and others who are substantially older than the traditional primary school ages.
Non Formal Education Enrolment
Table 3.27 Non Formal Education (NFE) Enrolment (2013/14)
RegionLevel 1 Level 2 Level 3 Level 4 Level 5 Total
TotalM F M F M F M F M F M F
Ayn 114
184
55
141
20
82
7
53
196
460
656
Bari 70
576
59
479
42
331
28
190
34
199
1,610
1,809
Hayland 14
54
22
39
10
42
14
20
60
155
215
Karkar 183
536
196
528
122
299
41
56
542
1,419
1,961
Mudug 288
814
256
655
102
307
3
44
1
650
1,820
2,470
Nugal 266
1,456
80
1,179
92
599
43
217
39
520
3,451
3,971
Sanag 60
179
49
125
2
99
3
50
2
16
116
469
585
Sool 212
1,329
118
652
53
332
23
57
1
407
2,370
2,777
Total 1,207
5,128
835
3,798
443
2,091
162
687
43
50
2,690
11,75
14,44
Table 3.27 Non Formal Education (NFE) Enrolment (2013/14)
Table 3.27 and chart 3.27 above show that the Non Formal Education (NFE) enrolment
for the year 2013/14. It can be seen that Bari region has the highest ABE teachers
followed by Nugal and Mudug regions. The highest NFE enrolment is observed in the
Nugal region followed by Sool and Mudug regions. The least NEF enrolment is the
Hayland region followed by Sanag and Ayn regions. From the total NFE enrolment
81.4% are female adult learners which seem that it is an education program for women.

ANALYSIS Puntland Education Statistics Yearbook 2013/14
43
It might be due to the fact that most Puntland women have not been part of the formal
education system.
Non Formal Education Teachers
Table 3.28 Qualified and Certified Non Formal Education Teachers (2013/14)
RegionTotal Teachers Qualified Teachers Certified Teachers
Male Female Male Female Male Female
Ayn 12 15 2 4 6 8
Bari 29 17 20 10 0 0
Hayland 3 4 3 2 0 0
Karkar 23 26 15 11 5 7
Mudug 30 17 26 9 2 4
Nugal 33 43 25 23 2 7
Sanag 13 23 12 15 1 6
Sool 41 60 25 16 9 8
Total 184 205 128 90 25 40
Chart 3.28 Certified Non Formal Education Teachers (2013/14)
Table 3.28 above show that the number of total, qualified and certified Non Formal
Education (NFE) teachers and chart 3.28 above show the comparison of total and
certified NFE teachers for the year 2013/14. It can be seen that Sool region has the
highest NFE teachers followed by Nugal region but Hayland region has the least
number of NFE teachers. It can also be noted that Gardafuu region doesn’t have NFE
teachers in the year 2013/14. From the total NFE teachers, only 52.7% are female
teachers indicating that share of NFE female teachers is over achieved. But generally
56.0% of NFE teachers are qualified and only 16.7% of are certified and this needs more

ANALYSIS Puntland Education Statistics Yearbook 2013/14
44
planning and implementation to certify and qualify more NFE teachers so that quality
of education will be achieved.
Non Formal Education Schools
Table 3.29 and chart 3.29 below show that the Non Formal Education (NFE) schools for
the year 2013/14. This indicates that Nugal region has the highest NFE teachers
followed by Sool, Mudug and Karkar regions.
Table 3.29 Non Formal Education Schools (2013/14)
Region Total Schools Single shifts Double shifts
Ayn 5 5
Bari 12 12
Hayland 1 1
Karkar 17 14 3
Mudug 19 19
Nugal 26 26
Sanag 5 5
Sool 23 23
Total 108 104 4
Chart 3.29 Non Formal Education Schools (2013/14)
It can also be observed that Gardafuu region don’t have NFE schools in the year
2013/14. Hayland region has the lowest NFE schools followed by Ayn and Sanag
regions. From the total NFE schools 96.3% are single shift schools and this will be
sustained.

ANALYSIS Puntland Education Statistics Yearbook 2013/14
45
E. SECONDARY EDUCATION
Secondary education in Puntland has four forms as Form 1, Form 2, Form 3 and Form
4. Entrance to secondary education is determined by the National Examinations at
class 8 (end of primary education).
Secondary Enrolment (Forms 1-4)
Secondary education enrolment is the number of pupils of Forms 1-4 of secondary
education who registered in the school at the beginning of the school/academic year. In
Puntland, a total of 17,796 students of secondary education have been enrolled in the
year 2013/14 of which 5,953 (33.5%) are girls and 11,843 (66.5%) are boys. This
indicates that the share of boys and girls is a problem and shows that only one third of
the girls are going to secondary schools. This needs some strategic planning to increase
the share of girls in secondary schools.
Table 3.30 Secondary Education enrolment (2013/14)
RegionForm 1 Form 2 Form 3 Form 4 Total
Male Female Male Female Male Female Male Female Male Female TotalAyn 43 27 46 31 38 21 35 10 162 89 251 Bari 940 496 920 416 784 303 695 248 3,339 1,463 4,802 Gardafuu 18 4 16 7 1 3 2 35 16 51 Hayland 111 61 102 40 69 23 69 17 351 141 492 Karkar 358 198 249 140 255 145 180 99 1,042 582 1,624 Mudug 906 541 759 377 715 266 425 181 2,805 1,365 4,170 Nugal 716 485 618 378 529 342 457 201 2,320 1,406 3,726 Sanag 216 128 159 92 105 47 65 34 545 301 846 Sool 390 229 370 162 227 102 257 97 1,244 590 1,834
Total 3,698 2,169 3,239 1,643 2,723 1,252 2,183 889 11,843 5,953 17,796
Chart 3.30 Secondary Education enrolment (2013/14)

ANALYSIS Puntland Education Statistics Yearbook 2013/14
46
Table 3.30 and chart 3.30 above show that enrolment of secondary education has
highest enrolment in Bari region followed by Mudug and Nugal regions. The least
enrolment is in the Gardafuu region.
Enrolment by Locality (Urban and Rural)
In Puntland, 82.5% of secondary education students are in the urban areas and 17.5%
of them are in the rural areas. Urban secondary enrolment is highest in Bari region
followed by Mudug and Nugal regions. Rural secondary enrolment is highest in the
Mudug region followed by Nugal. There is no urban enrolment in the Gardafuu region
and no rural enrolment in the Ayn region.
Table 3.31 Urban/Rural Enrolment of Secondary education (2013/14)
RegionUrban and Rural Enroll Urban Enroll Rural Enroll
Male Female Total Male Female Total Male Female Total
Ayn 162 89 251 162 89 251
Bari 3,339 1,463 4,802 3,174 1,416 4,590 165 47 212
Gardafuu 35 16 51 35 16 51
Hayland 351 141 492 155 58 213 196 83 279
Karkar 1,042 582 1,624 973 557 1,530 69 25 94
Mudug 2,805 1,365 4,170 2,192 1,024 3,216 613 341 954
Nugal 2,320 1,406 3,726 1,814 997 2,811 506 409 915
Sanag 545 301 846 336 195 531 209 106 315
Sool 1,244 590 1,834 1,040 495 1,535 204 95 299
Total 11,843 5,953 17,796 9,846 4,831 14,677 1,997 1,122 3,119
Chart 3.31 Urban/Rural Enrolment Secondary education (2013/14)
Table 3.31 and chart 3.31 show urban and rural secondary enrolment figures in the
year 2013/14. The percentage of girls in the urban enrolment is 32.9% and its

ANALYSIS Puntland Education Statistics Yearbook 2013/14
47
percentage in the rural enrolment is 36.0%. This indicates that the share of girls’ in the
rural areas is better than in the urban areas in the secondary schools.
Enrolment by Authority (Government and Non-government)In Puntland, 51.4% of the secondary education enrolment is authorized and managed
by the government (Ministry of Education and Higher Education) and the rest is
managed by the non-government entities like communities, Non-Governmental
organizations and the private sector.
Table 3.32 Secondary enrolment by Ownership (2013/14)
RegionTotal Gov't/MoEHE Non-gov't
Male Female Total Male Female Total Male Female Total
Ayn 162 89 251 162 89 251
Bari 3,339 1,463 4,802 849 164 1,013 2,490 1,299 3,789
Gardafuu 35 16 51 35 16 51
Hayland 351 141 492 155 58 213 196 83 279
Karkar 1,042 582 1,624 440 201 641 602 381 983
Mudug 2,805 1,365 4,170 2,313 1,105 3,418 492 260 752
Nugal 2,320 1,406 3,726 1,517 798 2,315 803 608 1,411
Sanag 545 301 846 131 49 180 414 252 666
Sool 1,244 590 1,834 812 298 1,110 432 292 724
Total 11,843 5,953 17,796 6,379 2,762 9,141 5,464 3,191 8,655
Chart 3.32 Secondary enrolment by Ownership (2013/14)

ANALYSIS Puntland Education Statistics Yearbook 2013/14
48
Table 3.32 and chart 3.32 above show that highest percentage of the Mudug and Nugal
regions secondary school students are in the Ministry of Education and Higher
Education/Government managed schools. Among all girls enrolled in secondary schools
(5,953), there are 2,762 girls enrolled in government (46.4%) and 3,191 enrolled in non-
government (53.6%) schools. If we calculate the same percentage for male students, we
would find 53.9.3% enrolled in government and 46.1% enrolled in non-government
schools. Thus, there is no significant difference between female and male students in
terms of school choice between government and non-government. But still, the
percentage of females’ enrolment in the non-government secondary schools including
IQS is higher than in the government schools. Hence share of girls in the non-
government secondary schools need only some improvement but in the government
schools need more improvement to maintain a balanced proportion of female and male
secondary school age population at the national level.
Secondary Gross Enrolment Rate (GER)
The secondary Gross Enrolment Ratio (GER) compares those students enrolled,
regardless of age, with the population of the appropriate age range. For Puntland, the
official school age for secondary education is 14-17.
Table 3.33 Secondary GER for the year 2013/14GER Boys Girls Total
All enrolment of secondary (Forms 1-4) 11,843 5,953 17,796
School age population (14-17 years) 72,863 67,884 140,747Gross Enrolment Rate (GER) in % 16.3 8.8 12.6
Table 3.33 Secondary GER for the year 2013/14

ANALYSIS Puntland Education Statistics Yearbook 2013/14
49
Table 3.33 and chart 3.33 above show secondary GER for the year 2013/14. It can be
seen from the table and chart that the Gross Enrolment Rate for boys is much greater
than the Gross Enrolment Rate for girls. This indicates there is a big gender gap of
students at the secondary school and gender equity is a problem. Totally 87.4% of the
secondary school age populations are either out of school or over-aged in the primary
schools.
Table 3.34 Secondary GER Trends (2012/13-2013/14)GER Trends Boys Girls Total GG GPI
2012/13 11.2 7.4 9.4 3.8 0.66
2013/14 16.3 8.8 12.6 7.5 0.54
Chart 3.34 Secondary GER Trends (2012/13-2013/14)
Table 3.34 and chart 3.34 above show that Secondary Gross Enrolment Rate (GER) has
increased from 9.4% to 12.6% from the year 2012/13 to the year 2013/14. But the
Gender gap has increased from 3.8 to 7.5 indicating that although students’ enrolment
is increasing the participation of girls is decreasing.
Secondary Net Enrolment Rate (NER)
The secondary Net Enrolment Rate (NER) measures the enrolment of children of the
appropriate school age (ages 14-17) divided by the population of the official school age.
Logically, NER cannot be greater than 100%.
Table 3.35 Secondary NER for the year 2013/14NER Boys Girls Total
All enrolment of secondary (Forms 1-4) of ages 14-17 7,345 4,133 11,478
School age population (14-17 years) 72,863 67,884 140,747Net Enrolment Rate (NER) in % 10.1 6.1 8.2

ANALYSIS Puntland Education Statistics Yearbook 2013/14
50
Chart 3.35 Secondary NER for the year 2013/14
Table 3.35 and chart 3.35 above show the secondary NER for the school year 2013/14.
The total secondary education NER in Puntland is only 8.2% which means less than
91.8% of the official secondary school age population are not in the secondary school
system rather they are in the primary school as over-aged or else they are out of school.
The Gender Gap is 4.0 indicating that there is significant disparity between the
secondary school boys and girls at their official school age.
Table 3.36 Secondary NER Trends (2012/13 – 2013/14)NER Trends Boys Girls Total
2012/13 6.5 4.4 5.5
2013/14 10.1 6.1 8.2
Chart 3.36 Secondary NER Trends (2012/13 – 2013/14)
Table 3.36 and chart 3.36 above show that secondary net enrolment rate has increased
for the last two years. It can be noted that the Gender Gap has increased from 2.1 to

ANALYSIS Puntland Education Statistics Yearbook 2013/14
51
4.0 and the Gender Parity Index has decreased from 0.68 to 0.60 all these indicate that
the significant growth of secondary NER is not due to increases in girls but increases in
boys. Therefore girls should be encouraged to join secondary schools at their official
school ages. This has to be developed at the primary school age so that it will be
foundation for the secondary school education.
Gender Equity in the Secondary Education
In this publication, Gender Parity Index (GPI) is calculated as the ratio of Gross
Enrolment Rate (GER) of females to males. The GPI of secondary education of
Puntland as indicated in the table 3.35 above has shown decreasing trend from 0.66 in
the year of 2012/13 to 0.54 in the year 2013/14. This indicates that gender equity in the
secondary school education is declining and needs immediate attention of the policy
and planning of the Ministry of Education and Higher Education.
Enrolment of Children with Special Educational Needs
In the year 2013/14, the total number of secondary school children with special
education needs is 458 of which 257 are male and 201 are female children. This shows
that the percentage of boys with special education needs is greater than that of girls
with 56.1% and 43.9% for boys and girls respectively. A large number of these special
needs children are enumerated in the regions of Mudug and Bari with a total of 181and
102 children respectively.
Table 3.37 Enrolment of Secondary Children with Special Needs (2013/14)
RegionHearing
DisabilityLimb
(Movement)Visual
Disability TotalMale Female Male Female Male Female Male Female Total
Ayn 1 1 1 2 2 4 3 7
Bari 13 7 44 38 57 45 102
Gardafuu 1 1 0 1
Hayland 1 1 1 2 3 2 5
Karkar 1 32 34 33 34 67
Mudug 5 6 94 76 99 82 181
Nugal 5 3 1 27 21 33 24 57
Sanag 1 1 1 2 2 4 3 7
Sool 7 2 8 8 6 23 8 31
Total 33 19 13 1 211 181 257 201 458

ANALYSIS Puntland Education Statistics Yearbook 2013/14
52
Chart 3.37 Enrolment of Secondary Children with Special Needs (2013/14)
Table 3.37 and chart 3.37 above show that of the total secondary children with special
education needs, 85.6% of them are visually disabled, 11.3% of them are hearing
disabled and the rest are limb (movement) disabled. This indicates that visual
disability is a problem among secondary school students and this should be further
investigated and in the meantime the use of Braille in the curriculum and inclusive
education are very important priority areas.
Secondary School Teachers
Qualified and Certified Secondary school Teachers
Although there is no documentation of minimum standard of qualification and
certification for secondary education teachers, the Policy and Planning team agrees
that minimum standard of qualification for secondary education is diploma and above
and also the minimum standard of certification requires teachers with a minimum of
teaching certificate.
Table 3.38 Qualified and Certified Secondary school Teachers (2013/14)
RegionTotal Teachers Qualified Teachers Certified Teachers
Male Female Total Male Female Total Male Female TotalAyn 15 15 2 2 2 2Bari 212 8 220 57 2 59 130 6 136Gardafuu 3 3 3 3Hayland 19 19 3 3 8 8Karkar 77 77 14 14 46 46Mudug 116 1 117 36 1 37 70 70Nugal 106 4 110 9 9 92 3 95Sanag 38 38 4 4 24 24Sool 69 5 74 19 1 20 26 2 28Total 655 18 673 144 4 148 401 11 412

ANALYSIS Puntland Education Statistics Yearbook 2013/14
53
Chart 3.38 Certified Secondary school Teachers (2013/14)
Table 3.38 show the total number of secondary school teachers, qualified and certified
teachers and chart 3.38 above show the total and number of certified teachers. At
national level, the proportion of secondary school certified teachers is 61.2%, 61.1% and
61.2% for male, female and both respectively whereas the proportion of qualified
teachers is 22.0%, 22.2% and 22.0% for male, female and both respectively in Puntland
in the year 2013/14. There is no significant difference between the percentages of
qualified male and female teachers but in general more secondary school teachers
qualification training is needed as 78.0% of secondary school teachers teaching in the
year 2013/14 are not qualified. The percentage of female teachers in the secondary
schools is 2.7% which is very small share of the total secondary school teachers. This
might be one of the reasons that girls’ participation of secondary schools is declining
down. Hence increasing the number of female teachers in the secondary schools will be
one of the strategies to increase girls’ participation in the secondary schools.
Teachers Salary Payment
In Puntland, secondary education teachers’ salary is paid by communities, non-
government organizations, private sector, Ministry of Education and Higher Education
and even some are blank (unpaid) at all.
Table 3.39 and chart 3.39 below show the secondary education teachers’ salary payers
by region for the year 2013/14. In Puntland, 21.9% of the teachers’ salary is paid by the

ANALYSIS Puntland Education Statistics Yearbook 2013/14
54
Ministry of Education and Higher Education and the rest are paid by communities,
non-government organizations, private owners and some are unpaid (blank).
Table 3.39 Secondary Teachers Salary Payers (2013/14)
Region CommunityMinistry of Education
Non-GovernmentOrganization Private
Unpaid(Blank)* Total
M F T M F T M F T M F T M F T M F T
Ayn 10 10 5 5 15 0 15
Bari 178 7 185 31 1 32 3 3 212 8 220
Hayland 8 8 5 5 1 1 5 5 19 0 19
Karkar 44 44 18 18 15 15 77 0 77
Mudug 59 59 57 1 58 116 1 117
Nugal 76 3 79 30 1 31 106 4 110
Sanag 31 31 7 7 38 0 38
Sool 38 3 41 24 2 26 7 7 69 5 74
Gardafuu 3 3 3 0 3
Total 437 13 450 182 5 187 4 0 4 20 0 20 12 0 12 655 18 673
Chart 3.39 Percentage of Secondary Teachers Salary Payers (2013/14)
*Blank (unpaid): teachers whose salary payers’ field were blank in the questionnaire .
Pupil-Teacher Ratio (PTR)
Table 3.40 Secondary Education Pupil Teacher Ratio (2013/14)
RegionEnrolment Teachers PTR
Total Gov't Non-gov't Total Gov't Non-gov't Total Gov't Non-gov'tAyn 251 251 - 15 15 16.7 16.7Bari 4,802 1013 3,789 220 40 180 21.8 25.3 21.1Gardafuu 51 51 3 3 17.0 17.0Hayland 492 213 279 19 8 11 25.9 26.6 25.4Karkar 1,624 641 983 77 37 40 21.1 17.3 24.6Mudug 4,170 3418 752 117 87 30 35.6 39.3 25.1Nugal 3,726 2315 1,411 110 58 52 33.9 39.9 27.1Sanag 846 180 666 38 9 29 22.3 20.0 23.0Sool 1,834 1110 724 74 44 30 24.8 25.2 24.1Total 17,796 9,141 8,655 673 298 375 26.4 30.7 23.1

ANALYSIS Puntland Education Statistics Yearbook 2013/14
55
Chart 3.40 Secondary Education Pupil Teacher Ratio (2013/14
Table 3.40 and chart 3.40 above show the secondary education Pupil Teacher Ratio
(PTR) disaggregated by ownership as government and non-government of the year
2013/14. The total secondary education Pupil Teacher Ratio (PTR) is 26.4 in the year
2013/14. The PTR in the government secondary schools is higher than the non-
government secondary schools with 30.7 and 23.1 respectively. Secondary education
PTR is above the national average in the regions of Mudug and Nugal with 35.6 and
33.9 respectively. All the rest, regions do have a PTR of less than the national average
in their secondary schools.
Secondary Education Schools and Classrooms
Secondary education schools
Secondary education schools disaggregated by shift type and ownership are presented
in this analysis.
Table 3.41 Secondary education schools by shift (2013/14)
Region Single shiftschools
Double Shiftschools
TotalAyn 2 2Bari 6 9 15Gardafuu 1 1Hayland 1 2 3Karkar 6 1 7Mudug 9 1 10Nugal 9 1 10Sanag 4 3 7Sool 8 8Total 46 17 63

ANALYSIS Puntland Education Statistics Yearbook 2013/14
56
Chart 3.41 Secondary education schools by shift (2013/14)
Table 3.41 and chart 3.41 above show that the numbers of secondary schools are
observed highest in the Bari region and least in the Gardafuu region. In Puntland,
73.0% of secondary schools are single shift and the rest are double shift indicates that
more secondary schools are single shift unlike primary schools. It is only in Bari and
Hayland regions that the number of double shift secondary schools is greater than the
number of single shift secondary schools.
Table 3.42 Secondary education schools by Ownership (2013/14)
RegionTotal
schoolsGov't/MoEHEschools
Non-gov'tschools
Ayn 2 2
Bari 15 3 12
Gardafuu 1 1
Hayland 3 1 2
Karkar 7 4 3
Mudug 10 6 4
Nugal 10 6 4
Sanag 7 2 5
Sool 8 5 3
Total 63 29 34

ANALYSIS Puntland Education Statistics Yearbook 2013/14
57
Chart 3.42 Secondary education schools by Ownership (2013/14)
Table 3.42 and chart 3.42 above show that the numbers of secondary schools that are
owned by the Ministry of Education and Higher Education (Government) are lower
than that of the non-governments. It can be calculated that 46.0% of the total
secondary schools are managed and owned by the Government/Ministry of Education
and Higher Education. Non-government secondary schools are comprised of
community, non-government organizations and the private sector schools.
Secondary School Classrooms
In the case of double shift schools, should be considered carefully. Classrooms can be
disaggregated by ownership, locality, type of shift, region and district, etc.
Pupil Classroom Ratio (PCR)
The PCR is shows the number of pupils in teaching and learning classroom.
Table 3.43 Secondary education Classrooms and Pupil Classroom Ratio (2013/14)
RegionEnrolment Classrooms PCR
Gov't Non-gov't Total Gov't Non-gov't Total Gov't Non-gov't TotalAyn 251 - 251 11 - 11 22.8 - 22.8
Bari 1,013 3,789 4,802 24 98 122 42.2 38.7 39.4
Gardafuu 51 51 4 0 4 - - 12.8
Hayland 213 279 492 4 14 18 53.3 19.9 27.3
Karkar 641 983 1,624 26 21 47 24.7 46.8 34.6
Mudug 3,418 752 4,170 54 33 87 63.3 22.8 47.9
Nugal 2,315 1,411 3,726 29 58 87 79.8 24.3 42.8
Sanag 180 666 846 10 23 33 18.0 29.0 25.6
Sool 1,110 724 1,834 19 36 55 58.4 20.1 33.3Total 9,141 8,655 17,796 181 283 464 50.5 30.6 38.4

ANALYSIS Puntland Education Statistics Yearbook 2013/14
58
Chart 3.43 Secondary education Classrooms and Pupil Classroom Ratio (2013/14)
Table 3.43 and chart 3.43 above show the secondary education Pupil Classroom Ratio
(PCR) by region for government and non-government classrooms of the year 2013/14.
In Puntland, the secondary education Pupil Classroom Ratio (PCR) is 38.6 in the year
2013/14. It can be also noted that PCR in the government schools is higher than the
non-government schools with 50.5 and 30.6 respectively. Though the total PCR reflects
the general direction, there is remarkable variation among regions. PCR is above the
national average in the regions of Mudug, Nugal and Bari regions with 47.9, 42.8 and
39.4 respectively.
Secondary school Textbooks
Secondary Education Pupil Textbook Ratio (PTbR)
Pupil Textbook Ratio (PTbR) shows the number of pupils who have received or owned
textbooks by subject. Here we have used Mathematics, English, Somali and Arabic as a
measure of secondary Pupil Textbook Ratio (PTbR).
Table 3.44 Secondary schools PTbR (2013/14)
Region EnrolmentArabic
TextbooksArabic PTbR
EnglishTextbooks
EnglishPTbR
MathematicsTextbooks
MathematicsPTbR
SomaliTextbooks
SomaliPTbR
Ayn 251 6 41.8 29 8.7 6 41.8 6 41.8
Bari 4,802 79 60.8 185 26.0 353 13.6 55 87.3
Gardafuu 51
Hayland 492 8 61.5 129 3.8 80 6.2 12 41.0
Karkar 1,624 44 36.9 163 10.0 162 10.0 31 52.4
Mudug 4,170 91 45.8 342 12.2 203 20.5 117 35.6
Nugal 3,726 79 47.2 133 28.0 191 19.5 54 69.0
Sanag 846 25 33.8 19 44.5 19 44.5 22 38.5
Sool 1,834 20 91.7 32 57.3 33 55.6 13 141.1
Total 17,796 352 50.6 1032 17.2 1047 17.0 310 57.4

ANALYSIS Puntland Education Statistics Yearbook 2013/14
59
Chart 3.44 Secondary schools PTbR (2013/14)
Table 3.44 and chart 3.44 above show that the Pupil Textbook Ratio (PTbR) is not 1:1
in any of the subjects (Mathematics, English, Somali and Arabic). Generally, it can be
seen that there are 170 Mathematics textbooks for 10 pupils, 172 English textbooks for
10 pupils, 506 Arabic textbooks for 10 Pupils and 574 Somali textbooks for 10 pupils.
This indicates that shortage of secondary textbooks in all the subjects is the main
problem of the Puntland secondary schools. Therefore printing of the existing textbooks
and developing of new textbooks by subject should be the main concern of the Ministry
of Education and Higher Education to maintain the standard PTbR of 1:1 in all
subjects.
School Facilities at Secondary schoolsSchool facilities have significant impact on access, quality, efficiency and gender equity
of the education system. The availability of water (drinking and/or washing), latrines,
laboratories, libraries and pedagogical centers in schools will attract students and is
means of increasing quality and efficiency of education.
Table 3.45 Secondary schools with availability and type of water - 2013/14
RegionTotal
schoolsType of water source Schools with
drinking water% of school with water Piped Roof Tank Well Total
Ayn 2 1 1 1 50.0%Bari 15 6 1 2 9 8 60.0%Gardafuu 1 0.0%Hayland 3 2 2 2 66.7%Karkar 7 3 1 2 6 6 85.7%Mudug 10 0.0%Nugal 10 0.0%Sanag 7 2 2 2 28.6%Sool 8 1 2 3 3 37.5%Total 63 9 3 11 23 22 36.5%

ANALYSIS Puntland Education Statistics Yearbook 2013/14
60
Chart 3.45 Secondary with availability and type of water - 2013/14
Table 3.45 and chart 3.45 above show that 36.5% of the Puntland secondary schools
have access to water and only 22 out of 63 which are 34.9% have access to drinkable
water. The sources of water are different and the greatest source comes from well
followed by piped water which are 47.8% and 39.1% respectively.

ANALYSIS Puntland Education Statistics Yearbook 2013/14
61
Examination Results of Grades 8 and Form Four
In Puntland, centrally administered standardized examinations will be given at the end of each school year to all students of Grade 8 and Form IV to certify completion of primary education and secondary education respectively.
I. Grade 8 Exam Results
Table 3.46 Grade 8 candidates who are promoted in the year 2013/14
RegionSat for Exam Promoted
Percentage Promoted
Male Female Total Male Female Total Male Female TotalBari 1,343 736 2,079 1,209 642 1,851 90.0 87.2 89.0Ayn 129 37 166 128 37 165 99.2 100.0 99.4Karkar 337 205 542 292 173 465 86.6 84.4 85.8Mudug 1,101 636 1,737 990 585 1,575 89.9 92.0 90.7Nugal 970 628 1,598 875 545 1,420 90.2 86.8 88.9Sanag 306 203 509 290 187 477 94.8 92.1 93.7Sool 52 28 80 39 15 54 75.0 53.6 67.5Total 4,238 2,473 6,711 3,823 2,184 6,007 90.2 88.3 89.5
Chart 3.46 Grade 8 candidates who are promoted in the year 2013/14
Table 3.46 and chart 3.46 above show that from the total number of students who
registered for the grade 8 examination, 89.5% of the students were promoted to the
next grade form four of which 90.2% are males and 88.3% are females. The highest
promotion to the next grade is observed in the Ayn (99.4%) and lowest in Sool (67.5%).
The promotion in Ayn, Sanag and Mudug is higher than the national average.

ANALYSIS Puntland Education Statistics Yearbook 2013/14
62
II. Form Four Exam Results
Table 3.47 Form Four Candidates who passed exam in the year 2013/14
RegionCandidates Promoted
Percentage Promoted
Male Female Total Male Female Total Male Female TotalBari 710 252 962 670 234 904 94.4 92.9 94.0Ayn 36 17 53 36 17 53 100.0 100.0 100.0Karkar 140 76 216 137 76 213 97.9 100.0 98.6Mudug 449 159 608 443 154 597 98.7 96.9 98.2Nugal 372 170 542 357 163 520 96.0 95.9 95.9Sanag 114 41 155 114 38 152 100.0 92.7 98.1Sool 20 4 24 18 1 19 90.0 25.0 79.2Total 1,841 719 2,560 1,775 683 2,458 96.4 95.0 96.0
Chart 3.47 Form Four Candidates who are promoted in the year 2013/14
Table 3.47 and chart 3.47 above show that from the total number of students who
registered for the form four examination, 96.0% of the students are promoted of which
96.4% are males and 95.0% are females. The highest promotion is observed in the Ayn
(100.0%) and lowest in Sool (79.2%). The promotion in Ayn, Karkar, Mudug and Sanag
is higher than the national average.

ANALYSIS Puntland Education Statistics Yearbook 2013/14
63
F. TECHNICAL and VOCATIONAL EDUCATION and TRAINING (TVET)
The Technical and Vocational Education and Training (TVET) data has been collected
and incorporated in this publication for the first time in the year 2013/14. The
Technical and Vocational Education and Training (TVET) data as part of this yearbook
contains students’ enrolled, Teaching staff and Pupil Teacher Ratio (PTR).
TVET Enrolment
Table 3.48 TVET enrolment - 2013/14
No Name of TVET Institution Region DistrictEnrollment
Male Female Total
Nugal region1 Garowe GVTC Nugaal Garowe 222 328 5502 Tabaruc EBTVET Nugaal Garowe 130 175 3053 Hanad Skills Centre Nugaal Dangorayo 20 65 854 Mustaqbal Centre Nugaal Garowe 120 210 3305 ACEED EBTVET Nugaal Dangorayo 40 70 1106 Samawade EBTVET Nugaal Garowe - 118 1187 Barwaqo Centre Nugaal Garowe - 85 858 Raja for Africa Nugaal Garowe 30 75 1059 Hawa Tako Skills College Nugaal Garowe - 655 655
Nugal total 562 1,781 2,343Karkar region
1 Qardho VTC Karkaar Qardho 65 174 2392 Garwo Net TVET Karkaar Qardho 107 398 505
Karkar total 172 572 744Mudug region
1 Bacadweyn VTC Mudug Galkaio 95 79 1742 Galkaio VTC Mudug Galkaio 292 380 672
Mudug total 387 459 846Bari region
1 Dan-Dor VTC Bari Bosaso 70 - 70Bari total 70 - 70Hayland region
1 Dan-Dor VTC Haylaan Dhahar 5 15 20Hayland total 5 15 20Sool region
1 Dhaqallaha Guriga Sool LasAno 37 - 372 LasAnod Skills College Sool LasAno - 190 190
Sool total 37 190 190Grand Total 1,233 3,017 4,213

ANALYSIS Puntland Education Statistics Yearbook 2013/14
64
Table 3.48 above shows that in the year 2013/14, a total of 4,213 TVET students have
been enrolled of which 71.6% are female students. This indicates the TVET program is
engrossing more women than men. TVET institutions exist and are functioning in six
regions of Puntland such as Nugal, Karkar, Mudug, Bari, Hayland and Sool. It can be
observed that TVET institutions are concentrated in the Nugal region, especially
Garowe district.
TVET Teaching Staff
Table 3.49 TVET Teaching staff - 2013/14
NoName of the TVET
institutionRegion District
TeachersMale Female Total
Nugal region1 Garowe GVTC Nugaal Garowe 13 1 142 Tabaruc EBTVET Nugaal Garowe 3 3 63 Hanad Skills Centre Nugaal Dangorayo 2 3 54 Mustaqbal Centre Nugaal Garowe 4 3 75 ACEED EBTVET Nugaal Dangorayo 6 1 76 Samawade EBTVET Nugaal Garowe 1 4 57 Barwaqo Centre Nugaal Garowe 3 3 68 Raja for Africa Nugaal Garowe 1 3 49 Hawa Tako Skills College Nugaal Garowe 3 3 6
Nugal total 36 24 60Karkar region
1 Qardho VTC Karkaar Qardho 10 1 112 Garwo Net TVET Karkaar Qardho 4 3 7
Karkar total 14 4 18Mudug region
1 Bacadweyn VTC Mudug Galkaio 3 2 52 Galkaio VTC Mudug Galkaio 9 6 15
Mudug total 12 8 20Bari region
1 Dan-Dor VTC Bari Bosaso 5 2 7Bari total 5 2 7Hayland region
1 Dan-Dor VTC Haylaan Dhahar 2 2 4Hayland total 2 2 4Sool region
1 Dhaqallaha Guriga Sool LasAno 2 7 92 LasAnod Skills College Sool LasAno 1 3 4
Sool total 3 10 13Grand Total 72 50 122
Table 3.49 above shows that there are 122 TVET teaching staffs of which 41.0% are
female teachers. Almost 50% of the TVET teachers are found concentrated in the Nugal
region.

ANALYSIS Puntland Education Statistics Yearbook 2013/14
65
TVET Pupil Teacher Ratio
Table 3.50 TVET Pupil Teacher Ratio (PTR) - 2013/14
NoName of the TVET
institutionRegion District PTR
Nugal region
1 Garowe GVTC Nugaal Garowe 39.32 Tabaruc EBTVET Nugaal Garowe 50.83 Hanad Skills Centre Nugaal Dangorayo 17.04 Mustaqbal Centre Nugaal Garowe 47.15 ACEED EBTVET Nugaal Dangorayo 15.76 Samawade EBTVET Nugaal Garowe 23.67 Barwaqo Centre Nugaal Garowe 14.28 Raja for Africa Nugaal Garowe 26.39 Hawa Tako Skills College Nugaal Garowe 109.2
Nugal total 39.1Karkar region
1 Qardho VTC Karkaar Qardho 21.72 Garwo Net TVET Karkaar Qardho 72.1
Karkar total 41.3Mudug region
1 Bacadweyn VTC Mudug Galkaio 34.82 Galkaio VTC Mudug Galkaio 44.8
Mudug total 42.3Bari region
1 Dan-Dor VTC Bari Bosaso 10.0Bari total 10.0Hayland region
1 Dan-Dor VTC Haylaan Dhahar 5.0Hayland total 5.0Sool region
1 Dhaqallaha Guriga Sool LasAno 4.12 LasAnod Skills College Sool LasAno 47.5
Sool total 14.6Grand Total 34.5
Table 3.50 above shows that in the year 2013/14 the total Pupil Teacher Ratio (PTR) in
TVET institutions is 34.5 of which the highest PTR is 109.2 for the Hawa Tako Skills
College and the least is 4.1 for the Dhaqallaha Guriga.

ANALYSIS Puntland Education Statistics Yearbook 2013/14
66
G. HIGHER EUCATION
Higher Education in Puntland includes universities and colleges. The higher education
data has been collected from ten universities and colleges for the first time in the year
2013/14. The higher education data as part of this yearbook contains students’ enrolled,
teaching staff and Pupil Teacher Ratio (PTR).
Enrolment in Higher Education
Table 3.51 Universities and Colleges enrolment - 2013/14
No Name of University/College Region DistrictEnrollment
M F T
1 East Africa University
Bari Bossaso 1,196 594 1,790Karkaar Gardo 106 70 176Mudug Galkayo 220 185 405Ayn Buhodle 79 38 117Mudug Galdogob 45 48 93Sanag Erigavo 128 79 207Nugal Garowe 260 163 423
2 Puntland State UniversityMudug Galkaio 174 99 273Bari Bosaso 115 62 177Nugal Garowe 845 650 1,495
3 University of BosasoBari Bosaso 641 474 1,115Nugal Garowe 173 157 330
4 Maakhir University Sanag Badhan 214 56 2705 PIDAM University Bari Bosaso 461 110 5716 University of Mogadishu Bari Bosaso 485 136 6217 University of Health Science Bari Bosaso 161 454 6158 Ilays International University Sool LasAno 80 18 989 Vision International College Bari Bosaso 302 183 485
10 Garowe Teachers' Education College Nugal Garowe 328 252 580Total 2,031 1,209 3,240
Table 3.51 above show that in the year 2013/14 the total higher education enrolment is
3,240 of which 1,209 are females which accounts for 37.3% of the total enrolment. It can
be observed that the higher education institutions are more concentrated in the Bari
region specially Bosaso district.

ANALYSIS Puntland Education Statistics Yearbook 2013/14
67
Teaching staff in Higher Education
Table 3.52 Universities and Colleges teaching staff - 2013/14
No Name of University/College Region DistrictTeaching staff
M F T
1 East Africa University
Bari Bossaso 100 4 104Karkaar Gardo 0Mudug Galkayo 48 4 52Ayn Buhodle 14 0 14Mudug Galdogob 9 0 9Sanag Erigavo 17 0 17Nugal Garowe 26 0 26
2 Puntland State UniversityMudug Galkaio 27 1 28Bari Bosaso 13 2 15Nugal Garowe 72 3 75
3 University of BosasoBari Bosaso 43 9 52Nugal Garowe 22 1 23
4 Maakhir University Sanag Badhan 10 0 105 PIDAM University Bari Bosaso 35 0 356 University of Mogadishu Bari Bosaso 37 4 417 University of Health Science Bari Bosaso 29 6 358 Ilays International University Sool LasAno 14 0 149 Vision International College Bari Bosaso 5 1 6
10 Garowe Teachers' Education College Nugal Garowe 14 1 15Total 535 36 571
Table 3.52 above shows that there are 571 higher education teaching staffs of which
6.3% are female teachers. This indicates that female teachers’ participation in the
higher education is very low.
Pupil-Teacher Ratio (PTR) In Higher Education
The Pupil Teacher Ratio (PTR) in higher education is difficult to calculate as there
might not be all students attend full-time and not all teachers employed full-time
teaching. Despite these problems, a rough comparison of Pupil Teacher Ratio (PTR)
can be shown in the following table.

ANALYSIS Puntland Education Statistics Yearbook 2013/14
68
Table 3.53 Universities and Colleges PTR - 2013/14
No Name of University/College Region District PTR
1 East Africa University
Bari Bossaso 17.2Karkaar Gardo -Mudug Galkayo 7.8Ayn Buhodle 8.4Mudug Galdogob 10.3Sanag Erigavo 12.2Nugal Garowe 16.3
2 Puntland State UniversityMudug Galkaio 9.8Bari Bosaso 11.8Nugal Garowe 19.9
3 University of BosasoBari Bosaso 21.4Nugal Garowe 14.3
4 Maakhir University Sanag Badhan 27.05 PIDAM University Bari Bosaso 16.36 University of Mogadishu Bari Bosaso 15.17 University of Health Science Bari Bosaso 17.68 Ilays International University Sool LasAno 7.09 Vision International College Bari Bosaso 80.8
10 Garowe Teachers' Education College Nugal Garowe 38.7Total 17.2
Table 3.53 above shows that in the year 2013/14 the total Pupil Teacher Ratio (PTR) in
higher education institutions is 17.2 of which the highest PTR is 80.8 for the Vision
International College and the least is 7.0 for the Ilays International University.
ANNEXES Puntland Education Statistics Yearbook 2013/14
69
4. ANNEXES

M F T M F T M F T M F T M F T- -
Buuhodle 2,066 1,164 3,230 1,205 666 1,871 861 498 1,359 528 297 825 1,538 867 2,405 Horufadhi 575 393 968 379 228 607 196 165 361 575 393 968 - - - Widh-Widh 894 547 1,441 380 234 614 514 313 827 894 547 1,441 - - -
3,535 2,104 5,639 1,964 1,128 3,092 1,571 976 2,547 1,997 1,237 3,234 1,538 867 2,405
- - - - - - - - - - - - Armo 520 486 1,006 118 111 229 402 375 777 212 231 443 308 255 563 Bosaso 15,699 12,105 27,804 3,078 2,244 5,322 12,621 9,861 22,482 718 517 1,235 14,981 11,588 26,569Iskushuban 569 459 1,028 230 197 427 339 262 601 569 459 1,028 - - - Qandala 1,511 1,085 2,596 684 564 1,248 827 521 1,348 989 740 1,729 522 345 867 Ufayn 794 686 1,480 205 176 381 589 510 1,099 794 686 1,480 - - -
19,093 14,821 33,914 4,315 3,292 7,607 14,778 11,529 26,307 3,282 2,633 5,915 15,811 12,188 27,999
- - - - - - - - - - - - Alula 760 624 1,384 533 476 1,009 227 148 375 352 302 654 408 322 730 Baargaal 819 639 1,458 558 436 994 261 203 464 373 279 652 446 360 806
1,579 1,263 2,842 1,091 912 2,003 488 351 839 725 581 1,306 854 682 1,536
- - - - - - - - - - - - Dhahar 1,497 1,107 2,604 719 553 1,272 778 554 1,332 394 280 674 1,103 827 1,930 Hingalol 1,115 920 2,035 1,115 920 2,035 - - - 1,115 920 2,035 - - -
2,612 2,027 4,639 1,834 1,473 3,307 778 554 1,332 1,509 1,200 2,709 1,103 827 1,930
- - - - - - - - - - - - Bayla 881 546 1,427 805 497 1,302 76 49 125 881 546 1,427 - - - Hafuun 245 299 544 208 248 456 37 51 88 245 299 544 - - - Qardho 5,292 4,365 9,657 3,381 2,898 6,279 1,911 1,467 3,378 783 610 1,393 4,509 3,755 8,264 Rako 494 462 956 - - 494 462 956 360 318 678 134 144 278 Waaciya 665 633 1,298 108 107 215 557 526 1,083 665 633 1,298 - - -
7,577 6,305 13,882 4,502 3,750 8,252 3,075 2,555 5,630 2,934 2,406 5,340 4,643 3,899 8,542
- - - - - - - - - - - - Galkacyo 10,575 8,692 19,267 4,725 3,812 8,537 5,850 4,880 10,730 2,525 2,194 4,719 8,050 6,498 14,548Goldogob 2,413 1,829 4,242 1,512 1,215 2,727 901 614 1,515 2,413 1,829 4,242 - - - Jariiban 1,059 827 1,886 976 782 1,758 83 45 128 1,059 827 1,886 - - -
14,047 11,348 25,395 7,213 5,809 13,022 6,834 5,539 12,373 5,997 4,850 10,847 8,050 6,498 14,548
- - - - - - - - - - - - Burtinle 2,816 2,234 5,050 2,731 2,168 4,899 85 66 151 2,816 2,234 5,050 - - - Dangorayo 1,621 1,039 2,660 1,621 1,039 2,660 - - - 1,621 1,039 2,660 - - - Eyl 2,220 1,440 3,660 2,220 1,440 3,660 - - - 2,220 1,440 3,660 - - - Garowe 6,021 5,365 11,386 5,292 4,629 9,921 729 736 1,465 885 841 1,726 5,136 4,524 9,660 Godobjiran 763 630 1,393 763 630 1,393 - - - 763 630 1,393 - - -
13,441 10,708 24,149 12,627 9,906 22,533 814 802 1,616 8,305 6,184 14,489 5,136 4,524 9,660
- - - - - - - - - - - - Baran 4,493 3,484 7,977 3,005 2,292 5,297 1,488 1,192 2,680 2,887 2,233 5,120 1,606 1,251 2,857 Fiqifuliye 236 193 429 236 193 429 - - - 236 193 429 - - - Lasqoray 232 186 418 232 186 418 - - - 232 186 418 - - -
4,961 3,863 8,824 3,473 2,671 6,144 1,488 1,192 2,680 3,355 2,612 5,967 1,606 1,251 2,857
- - - - - - - - - - - - Bo'ame 537 334 871 421 290 711 116 44 160 537 334 871 - - - Hudun 959 782 1,741 851 687 1,538 108 95 203 959 782 1,741 - - - Kalabayr 1,173 908 2,081 1,024 772 1,796 149 136 285 1,173 908 2,081 - - - Las'ano 4,766 3,910 8,676 2,856 2,218 5,074 1,910 1,692 3,602 1,217 941 2,158 3,549 2,969 6,518 Taleh 671 501 1,172 508 403 911 163 98 261 671 501 1,172 - - -
8,106 6,435 14,541 5,660 4,370 10,030 2,446 2,065 4,511 4,557 3,466 8,023 3,549 2,969 6,518
74,951 58,874 133,825 42,679 33,311 75,990 32,272 25,563 57,835 32,661 25,169 57,830 42,290 33,705 75,995
Sool Total
Grand Total
Total Enrolment
Ayn Total
Bari Total
Gardafuu Total
Hayland Total
Government Non-government Rural Urban
Enrolment by Ownesrship Enrolment by Locality
Sool
DistrictRegion
Ayn
Bari
Gardafuu
Karkar Total
Mudug Total
Nugal Total
Sanag Total
Hayland
Karkar
Mudug
Nugal
Sanag
70
4.1.1 Puntland Primary including IQS and ABE enrolment by District and different parameters (2013/14)

M F T M F T M F T M F T M F T M F T M F T
Buuhodle 95 8 103 27 27 68 8 76 30 30 65 8 73 42 5 47 53 3 56 69.3 17.9 27.5 32.9 31.4 Horufadhi 38 1 39 29 29 9 1 10 38 1 39 - - - 21 - 21 17 1 18 20.9 36.1 24.8 24.8 Widh-Widh 43 4 47 18 2 20 25 2 27 43 4 47 - - - 19 1 20 24 3 27 30.7 30.6 30.7 30.7
176 13 189 74 2 76 102 11 113 111 5 116 65 8 73 82 6 88 94 7 101 40.7 22.5 27.9 32.9 29.8 - - - - - - - - - - - - - - - - - - - - - - - - - -
Armo 26 1 27 3 3 23 1 24 10 10 16 1 17 14 - 14 12 1 13 76.3 32.4 44.3 33.1 37.3 Bosaso 729 92 821 12 2 14 717 90 807 40 4 44 689 88 777 481 62 543 248 30 278 380.1 27.9 28.1 34.2 33.9 Iskushuban 34 4 38 14 4 18 20 - 20 34 4 38 - - - 12 1 13 22 3 25 23.7 30.1 27.1 27.1 Qandala 81 12 93 46 6 52 35 6 41 64 9 73 17 3 20 21 5 26 60 7 67 24.0 32.9 23.7 43.4 27.9 Ufayn 39 39 9 9 30 - 30 39 39 - - - 11 11 28 - 28 42.3 36.6 37.9 37.9
909 109 1,018 84 12 96 825 97 922 187 17 204 722 92 814 539 68 607 370 41 411 79.2 28.5 29.0 34.4 33.3 - - - - - - - - - - - - - - - - - - - - - - - - - -
Alula 50 3 53 17 17 33 3 36 23 2 25 27 1 28 17 1 18 33 2 35 59.4 10.4 26.2 26.1 26.1 Baargaal 33 5 38 15 3 18 18 2 20 15 3 18 18 2 20 19 4 23 14 1 15 55.2 23.2 36.2 40.3 38.4
83 8 91 32 3 35 51 5 56 38 5 43 45 3 48 36 5 41 47 3 50 57.2 15.0 30.4 32.0 31.2 - - - - - - - - - - - - - - - - - - - - - - - - - -
Dhahar 74 9 83 12 6 18 62 3 65 24 7 31 50 2 52 52 6 58 22 3 25 70.7 20.5 21.7 37.1 31.4 Hingalol 48 8 56 48 8 56 - - - 48 8 56 - - - 38 7 45 10 1 11 36.3 - 36.3 36.3
122 17 139 60 14 74 62 3 65 72 15 87 50 2 52 90 13 103 32 4 36 44.7 20.5 31.1 37.1 33.4 - - - - - - - - - - - - - - - - - - - - - - - - - -
Bayla 39 11 50 34 11 45 5 - 5 39 11 50 - - - 25 4 29 14 7 21 28.9 25.0 28.5 28.5 Hafuun 14 6 20 12 4 16 2 2 4 14 6 20 - - - 1 - 1 13 6 19 28.5 22.0 27.2 27.2 Qardho 300 38 338 37 7 44 263 31 294 41 9 50 259 29 288 235 18 253 65 20 85 142.7 11.5 27.9 28.7 28.6 Rako 32 3 35 - 32 3 35 25 3 28 7 - 7 10 - 10 22 3 25 - 27.3 24.2 39.7 27.3 Waaciya 34 5 39 8 8 26 5 31 34 5 39 - - - 20 4 24 14 1 15 26.9 34.9 33.3 33.3
419 63 482 91 22 113 328 41 369 153 34 187 266 29 295 291 26 317 128 37 165 73.0 15.3 28.6 29.0 28.8 - - - - - - - - - - - - - - - - - - - - - - - - - -
Galkacyo 428 75 503 49 14 63 379 61 440 91 23 114 337 52 389 291 45 336 137 30 167 135.5 24.4 41.4 37.4 38.3 Goldogob 126 8 134 81 3 84 45 5 50 126 8 134 - - - 83 6 89 43 2 45 32.5 30.3 31.7 31.7 Jariiban 44 3 47 41 2 43 3 1 4 44 3 47 - - - 22 2 24 22 1 23 40.9 32.0 40.1 40.1
598 86 684 171 19 190 427 67 494 261 34 295 337 52 389 396 53 449 202 33 235 68.5 25.0 36.8 37.4 37.1 - - - - - - - - - - - - - - - - - - - - - - - - - -
Burtinle 108 21 129 101 20 121 7 1 8 108 21 129 - - - 79 12 91 29 9 38 40.5 18.9 39.1 39.1 Dangorayo 48 11 59 48 11 59 - - - 48 11 59 - - - 30 5 35 18 6 24 45.1 - 45.1 45.1 Eyl 65 18 83 65 18 83 - - - 65 18 83 - - - 43 7 50 22 11 33 44.1 - 44.1 44.1 Garowe 236 85 321 37 6 43 199 79 278 41 8 49 195 77 272 156 46 202 80 39 119 230.7 5.3 35.2 35.5 35.5 Godobjiran 24 2 26 24 2 26 - - - 24 2 26 - - - 10 - 10 14 2 16 53.6 - 53.6 53.6
481 137 618 275 57 332 206 80 286 286 60 346 195 77 272 318 70 388 163 67 230 67.9 5.7 41.9 35.5 39.1 - - - - - - - - - - - - - - - - - - - - - - - - - -
Baran 235 41 276 97 21 118 138 20 158 160 26 186 75 15 90 168 20 188 67 21 88 44.9 17.0 27.5 31.7 28.9 Fiqifuliye 13 1 14 13 1 14 - - - 13 1 14 - - - 9 1 10 4 - 4 30.6 - 30.6 30.6 Lasqoray 13 3 16 13 3 16 - - - 13 3 16 - - - 1 1 2 12 2 14 26.1 - 26.1 26.1
261 45 306 123 25 148 138 20 158 186 30 216 75 15 90 178 22 200 83 23 106 41.5 17.0 27.6 31.7 28.8 - - - - - - - - - - - - - - - - - - - - - - - - - -
Bo'ame 36 2 38 27 2 29 9 - 9 36 2 38 - - - 26 1 27 10 1 11 24.5 17.8 22.9 22.9 Hudun 49 5 54 37 3 40 12 2 14 49 5 54 - - - 28 4 32 21 1 22 38.5 14.5 32.2 32.2 Kalabayr 63 8 71 52 7 59 11 1 12 63 8 71 - - - 44 7 51 19 1 20 30.4 23.8 29.3 29.3 Las'ano 189 28 217 34 7 41 155 21 176 50 8 58 139 20 159 106 13 119 83 15 98 123.8 20.5 37.2 41.0 40.0 Taleh 37 6 43 25 5 30 12 1 13 37 6 43 - - - 29 2 31 8 4 12 30.4 20.1 27.3 27.3
374 49 423 175 24 199 199 25 224 235 29 264 139 20 159 233 27 260 141 22 163 50.4 20.1 30.4 41.0 34.4 - - - - - - - - - - - - -
3,423 527 3,950 1,085 178 1,263 2,338 349 2,687 1,529 229 1,758 1,894 298 2,192 2,163 290 2,453 1,260 237 1,497 60.2 21.5 32.9 34.7 33.9
No. of qualified No.of unqualified Government
Grand Total
Nugal
Nugal Total
Sanag
Sanag Total
Sool
Sool Total
Mudug Total
Ayn
Ayn Total
Bari
Bari Total
Gardafuu
Gardafuu Total
Hayland
Hayland Total
Karkar
Karkar Total
Mudug
Urban
Total
Pupil Teacher Ratio (PTR)Region District
Total TeachersTeachers by Qualification
Gov't Non-gov't
RuralRural Urban
Teachers by Locality
Non-government
Teachers by Ownership
71
4.1.2 Puntland Primary including IQS and ABE Teachers, their salary payers and PTR by District and different parameters (2013/14)

TotalSchools
Gov't Managed
Non-gov'tManaged
Rural Schools
UrbanSchools
Maths Textbooks
Maths PTbR
Gov'tNongov't
Total Gov'tNongov't
Total Rural Urban Total
Buuhodle 13 8 5 5 8 2,557 1.3 165 301 248Horufadhi 6 4 2 6 - 874 1.1 161 161Widh-Widh 9 3 6 9 - 1,199 1.2 160 160
28 15 13 20 8 4,630 1.2 80 52 132 23.4 26.1 24.5 162 301 201- - - -
Armo 8 2 6 5 3 270 3.7 89 188 126Bosaso 93 19 74 11 82 3,057 9.1 112 324 299Iskushuban 8 4 4 8 - 402 2.6 129 129Qandala 25 16 9 21 4 601 4.3 82 217 104Ufayn 8 2 6 8 - 74 20.0 185 185
142 43 99 53 89 4,404 7.7 187 687 874 40.7 38.3 38.8 112 315 239- - - -
Alula 14 11 3 8 6 349 4.0 82 122 99Baargaal 8 5 3 4 4 1,382 1.1 163 202 182
22 16 6 12 10 1,731 1.6 58 18 76 34.5 46.6 37.4 109 154 129- -
20 14 6 12 8 0 0 0Dhahar - - 419 6.2Hingalol - - 647 3.1
- - 1,066 4.4 94 34 128 35.2 39.2 36.2- - - -
Bayla 13 12 1 13 - 509 2.8 110 110Hafuun 7 5 2 7 - 379 1.4 78 78Qardho 64 39 25 17 47 1,905 5.1 82 176 151Rako 9 9 6 3 493 1.9 113 93 106Waaciya 8 3 5 8 - 2,517 0.5 162 162
101 59 42 51 50 5,803 2.4 258 152 410 32.0 37.0 33.9 105 171 137- - - -
Galkacyo 66 28 38 19 47 3,120 6.2 248 310 292Goldogob 21 13 8 21 - 529 8.0 202 202Jariiban 10 8 2 10 - 427 4.4 189 189
97 49 48 50 47 4,076 6.2 252 325 577 51.7 38.1 44.0 217 310 262- - - -
Burtinle 21 19 2 21 - 524 9.6 240 240Dangorayo 12 12 - 12 - 1,057 2.5 222 222Eyl 16 16 - 16 - 550 6.7 229 229Garowe 47 36 11 12 35 3,553 3.2 144 276 242Godobjiran 7 7 - 7 - 590 2.4 199 199
103 90 13 68 35 6,274 3.8 388 52 440 58.1 31.1 54.9 213 276 234- - - -
Baran 41 27 14 28 13 2,776 2.9 183 220 195Fiqifuliye 3 3 - 3 - 344 1.2 143 143Lasqoray 5 5 - 5 - 232 1.8 84 84
49 35 14 36 13 3,352 2.6 144 46 190 42.7 58.3 46.4 166 220 180- - - -
Bo'ame 7 5 2 7 - 686 1.3 124 124Hudun 9 7 2 9 - 373 4.7 193 193Kalabayr 13 9 4 13 - 1,476 1.4 160 160Las'ano 29 17 12 10 19 1,040 8.3 216 343 299Taleh 8 5 3 8 - 613 1.9 147 147
66 43 23 47 19 4,188 3.5 146 182 328 68.7 24.8 44.3 171 343 220- -
628 364 264 349 279 35,524 3.8 1,607 1,548 3,155 47.3 37.4 42.4 166 272 213
*No data on no. of classrooms by district and so presented by region
Sool Total
Grand Total
Hayland
Hayland Total
No. of Classrroms*
Mudug Total
Nugal
Nugal Total
Sanag
Sanag Total
Sool
Karkar
Karkar Total
Mudug
Ayn
Ayn Total
Bari
Bari Total
Gardafuu
Gardafuu Total
Average School Size
Region District
Schools by Locality
Mathematics Textbooks
Pupil Classroom Ratio (PCR)
School by Management/Ownership/
72
4.1.3 Puntland Primary including IQS and ABE Schools, Classrooms and PCR, Maths Textbooks and PTbR, etc by District (2013/14)

No Region School Name School type1 Bari Nuural cilmi PS2 Bari Sheekh Xamdaan PS3 Bari Halane 2 PS4 Bari Biyo Kule 2 PS5 Bari Grible IDP PS6 Bari Shabeele B IDP PS7 Bari Abow B IDP PS8 Bari Xaji Yasin IDP PS9 Bari Bosaso International PS
10 Bari Najax B PS11 Bari Omar ibnu A/zis PS12 Bari Iftiin PS13 Bari Darul cilmi IQS14 Bari Shiikh Hamdaan SS15 Mudug Shamsul Hudaa PS16 Sanag Shaafici IQS17 Nugaal Nugaal PS18 Nugaal Alwaha A PS19 Nugaal Darul Hidaya PS20 Nugaal Al xigma 2 PS21 Nugaal Albani IQS22 Nugaal Wabari ABE23 Nugaal Xasbahale SS24 Karkaar Hodman PS25 Karkaar Faduma Zahra PS26 Karkaar Al xaramayn PS27 Karkaar Siliga IQS
73
4.2 Missing Schools by Region in 2013/14

Apparent Intake Rate (AIR):
Apparent Intake Rate, sometimes called Gross Intake Rate is the percentage of new
entrants (irrespective of age) in grade 1 out of the total number of children of the
official admission age (age 6, for primary education, in the Puntland case) in a given
year.
Dropout Rate:
Dropout rate is the percentage of pupils who discontinue their learning from a given
grade compared to the previous year’s total enrolment in the same grade.
Gender Parity Index (GPI):
Gender Parity Index is the ratio of female to male indicators mostly we use Gross
Enrolment Rate (GER). A gender parity index of 1 indicates perfect equality between
males and females, while a GPI closer to zero indicates high disparity between the
participation of females compared to males.
Gross Enrollment Rate (GER):
Gross Enrollment Rate is the percentage of pupils (irrespective of age) at a particular
grade level compared to the corresponding school age population. For example,
Primary Gross Enrollment Rate for Puntland would be the total primary school
enrollment (lower and upper primary) divided by the population aged 6-13.
Net Enrolment Rate (NER):
Net Enrolment Rate is the percentage of pupils at a particular grade level, who are of
the official enrollment age for that level, compared to the corresponding school age
population. For example Primary NER for Puntland would be the primary school
enrollment of children aged 6-13 divided by the population aged 6-13.
74
4.3 Glossary

84
Net Intake Rate (NIR):
Net Intake Rate is the percentage of new entrants in grade 1 who are 6 years old, out of
the total number of children of official admission age (age 6 for Primary in Puntland) in
a given year.
Pupil Classroom Ratio (PCR):
Pupil Classroom Ratio is the average number of pupils, at a given educational level, in
a given classroom. It is calculated by dividing the total number of pupils at a given
level by the total number of classrooms available for that level.
Pupil Teacher Ratio (PTR):
Pupil Teacher Ratio is the average number of pupils at a given education level per
teacher at the same level. It is calculated by dividing the total number pupils at a
given level of education by the total number of teachers available at that level. PTR
becomes more complex when teachers are part-time, specialized and teaching only a
few classes, etc.
Repetition Rate:
Repetition Rate is the percentage of pupils repeating in a given grade out of the
previous year’s total enrolment in the same grade.
Rural Schools:
Rural schools are all schools located in areas that are not defined as urban.
Shifts:
Shifts are a second or third full school activity, in the same school building, at a
different time of the day. Because of limited school buildings, some schools operate a
Morning and Afternoon Shift as well as an Evening shift.
Urban Schools:
Urban schools are schools that are located in urban areas.
75
4.3 Glossary (cont...)