Publishing in the networked world: transforming the nature of ...
456
Publishing in the networked world: transforming the nature of communication 14 th International Conference on Electronic Publishing 16 - 18 June 2010, Helsinki, Finland http://www.elpub.net Edited by Turid Hedlund Hanken School of Economics, Helsinki, Finland Yasar Tonta Hacettepe University, Ankara, Turkey Helsinki 2010 Hanken School of Economics
-
Upload
khangminh22 -
Category
Documents
-
view
3 -
download
0
Transcript of Publishing in the networked world: transforming the nature of ...

Publishing in the networked world: transforming the nature ofcommunication
14th
International Conference on Electronic Publishing 16 - 18 June 2010,Helsinki, Finland
http://www.elpub.net
Edited by
Turid HedlundHanken School of Economics, Helsinki, Finland
Yasar TontaHacettepe University, Ankara, Turkey
Helsinki 2010Hanken School of Economics

Publishing in the networked world: transforming the nature of communication14th International Conference on Electronic Publishing 16-18 June 2010
Keywords: Electronic publishing, scholarly communication, social networks
© 2010 editors, authors
DisclaimerAny views or opinions expressed in any of the papers in this collection are those of theirrespective authors. They do not represent the view or opinion of the Hanken School ofEconomics, the Hacettepe University, the editors and members of the ProgrammeCommittee, nor of the publisher or conference sponsors.
Distributor:
LibraryHanken School of EconomicsP.O.Box 47900101 Helsinki, Finland
Telephone: +358-40-3521376, +358-40-3521265Fax: +358-40-3521425E-mail:[email protected]://www.hanken.fi
ISBN: 978-952-232-086-5
Edita Prima Ltd, Helsinki 2010

iii
Members of the 2010 Programme Committee
Baptista, Ana Alice University of Minho (Portugal)Björk Bo-Christer Hanken School of Economics (Finland)Borbinha, José INESC-ID / IST – Lisbon Technical University (Portugal)Chan, Leslie University of Toronto Scarborough (Canada)Costa, Sely M.S. University of Brasilia (Brazil)Delgado, Jaime Universitat Politècnica de Catalunya (Spain)Dobreva, Milena University of Strathclyde (Scotland) &IMI-BAS(Bulgaria)Engelen, Jan Katholieke Universiteit Leuven (Belgium)Gargiulo, Paola CASPUR (Italy)Gradmann, Stefan University of Hamburg (Germany)Güntner, Georg Salzburg Research (Austria)Halttunen Kai University of Tampere (Finland)Hedlund, Turid Hanken School of Economics (Finland)Hindersson-Söderholm Tua Hanken School of Economics (Finland)Horstmann, Wolfram University of Bielefeld (Germany)Iyengar, Arun IBM Research (USA)Jezek, Karel University of West Bohemia in Pilsen (Czech Republic)Kurbanoglu Serap Hacettepe University (Turkey)Linde, Peter Blekinge Institute of Technology (Sweden)Lioma,Christina Konstanz University, (Germany)Mac An Airchinnigh Micheal Trinity College Dublin (Ireland)Martens, Bob Vienna University of Technology (Austria)Mendéz, Eva Universidad Carlos III, Madrid (Spain)Mornati, Susanna CILEA (Italy)Morrison, Heather British Columbia Electronic Library Network (Canada)Nisheva-Pavlova, Maria Sofia University (Bulgaria)Opas-Hänninen, Lisa Lena University of Oulu (Finland)Roos Annikki University of Helsinki, (Finland)Smith, John University of Kent at Canterbury (UK)Tonta, Yasar Hacettepe University (Turkey)

iv

v
Preface
The title of the 14th International Conference on Electronic Publishing (ELPUB),“Publishing in the networked world: Transforming the nature ofcommunication”, is a timely one. Scholarly communication and scientificpublishing has recently been undergoing subtle changes. Published papers areno longer fixed physical objects, as they once were. The “convergence” ofinformation, communication, publishing and web technologies along with theemergence of Web 2.0 and social networks has completely transformed scholarlycommunication and scientific papers turned to living and changing entities in theonline world. The themes (electronic publishing and social networks; scholarlypublishing models; and technological convergence) selected for the conferenceare meant to address the issues involved in this transformation process. We arepleased to present the proceedings book with more than 30 papers and shortcommunications addressing these issues.
What you hold in your hands is a by-product and the culmination of almost aYear long work of many people including conference organizers, authors,reviewers, editors and print and online publishers. The ELPUB 2010 conferencewas organized and hosted by the Hanken School of Economics in Helsinki,Finland. Professors Turid Hedlund of Hanken School of Economics and Ya arTonta of Hacettepe University Department of Information Management (Ankara,Turkey) served as General Chair and Program Chair, respectively. We receivedmore than 50 submissions from several countries. All submissions were peer-reviewed by members of an international Program Committee whosecontributions proved most valuable and appreciated.
The 14th ELPUB conference carries on the tradition of previous conferences heldin the United Kingdom (1997 and 2001), Hungary (1998), Sweden (1999), Russia(2000), the Czech Republic (2002), Portugal (2003), Brazil (2004), Belgium (2005),Bulgaria (2006), Austria (2007), Canada (2008) and Italy (2009). The ELPUBDigital Library, http://elpub.scix.net serves as archive for the papers presentedat the ELPUB conferences through the years. The 15th ELPUB conference will beorganized by the Department of Information Management of HacettepeUniversity and will take place in Ankara, Turkey, from 14-16 June 2011. (Detailscan be found at the ELPUB web site as the conference date nears by.)
We thank Marcus Sandberg and Hannu Sääskilahti for copyediting, LibraryDirector Tua Hindersson – Söderholm for accepting to publish the online as well

vi
as the print version of the proceedings. Thanks also to Patrik Welling formaintaining the conference web site and Tanja Dahlgren for administrativesupport. We warmly acknowledge the support in organizing the conference tocolleagues at Hanken School of Economics and our sponsors.
Turid Hedlund Ya ar TontaGeneral Chair Program Chair

vii
Contents
Editorial ……………………………………………………………………V
Sessions: Thursday 17.6.2010
Business models for electronic open access journals and disciplinary differences:a proposal………………………………………………………………………………. 3Kathiúsia Araujo Guimiero, Sely Maria de Souza Costa
The impact factor of open access journals: data and trends.............................. 16Elena Giglia
Predictive validity of editorial decisions at an electronic open access journal…. 40Lutz Bornmann, Hans-Dieter Daniel
Search engine in the a class of academic digital libraries……………………….. 45Maria Nisheva-Pavlova, Pavel Pavlov
Reliable scholarly objects search and interchange framework………………….. 57Victor Torres, Ruben Tous, Jaime Delgado
A collaborative faceted categorization system – user interactions……………… 69Kurt Maly, Harris Wu, Muhammad Zubair
Towards an automatic multimedia indexing workflow for architectural 3D…….. 79models René Berndt, Ina Blümel, Raoul Wessel
What we blog: A qualitative analysis of researchers’ weblogs………………….. 89Helena Bukvova, Hendrik Kalb, Eric Schoop
Writeslike.us: Linking people through OAI metadata………………………………98Emma Tonkin
Authors’ publication strategies in scholarly publishing………………………….. 119Paola Dubini, Paola Galimberti, Maria Rita Micheli
The changing scholarly information landscape: reinventing information……… 142services to increase research impactLinda O’Brian
The PEG-BOARD project: A case study for BRIDGE…………………………... 167

viii
Gregory Tourte, Emma Tonkin, Paul Valdes
Motivations for image publishing and tagging on Flickr………………………… 189Emma Angus, Mike Thelwall
The HKU scholars hub; unlocking collective intelligence………………………. 205David T. Palmer
Social networks and the National Art Gallery (Dublin | … | Sofia)……………... 217Micheál Mac an Airchinnigh, Glenn Strong
The anatomy of an electronic discussion list for librarians, KUTUP-L………… 234Yasar Tonta, Do an Karabulut
Sessions: Friday 18.6.2010
Constituencies of use: Representative usage scenarios in digital library userstudies, a case study on Europeana……………………………………………… 245Duncan Birrell, Milena Dobreva, Yurdagül Ünal, Pierluigi Feliciati
Enhancing users’ experience: a content analysis of 12 university librariesFacebook profiles…………………………………………………………………… 258Licia Calvi, Maria Cassella, Koos Nuijten
Use and relevance of web 2.0 resources for researchers……………………… 271Ellen Collins, Branwen Hide
What are your information needs? Three user studies about research informationin the Netherlands, with an emphasis on the NARCIS portal………………….. 290Arjan Hogenaar, Marga van Meel, Elly Dijk
An effective and automated publishing process to improve user interface styleguides………………………………………………………………………………… 304Martin Lugmayr, Johann Schrammel, Cornelia Gerdenitsch, Manfred Tscheligi
Analysis of E-book use: the case of ebrary………………………………………..315Umut Al, Irem Soydal, Yasar Tonta
Digital content convergence: Intellectual property rights and the problem ofpreservation, a US perspective……………………………………………………. 330John N. Gathegi

ix
An adaptable domain-specific dissemination infrastructure for enhancing thevisibility of complementary and thematically related research information…… 338Engin Sagbas, York Sure
Translation of XML documents into logic programs…………………………….. 350Martin Zima, Karel Jezek
Geo information extraction and processing from travel narratives…………….. 362Rocio Abascal-Mena, Erick López-Ornelas
Semantic enrichment for 3D documents – Techniques and open problems…. 373Torsten Ullrich, Volker Settgast, René Berndt
Costs and benefits of alternative scholarly publishing models: Lessons anddevelopments……………………………………………………………………….. 384John W. Houghton
The open access landscape 2009………………………………………………… 403Bo-Christer Björk, Patrik Welling, Peter Majlender, Turid Hedlund, Mikael Laakso,Gudni Gudnasson
Mapping the structure and evolution of electronic publishing as a research fieldusing co-citation analysis…………………………………………………………... 406Yasar Tonta, Güleda Düzyol
Short papers
Electronically published scientific information in technical university libraries . 421Kate-Riin Kont
Exploratory study of quality control mechanisms for academic paper in theInternet era – a case study of science paper online in China………………….. 429Cantao Zhong, Meng Wan
Sophie 2.0 – a platform for reading and writing of interactive multimedia books ina networked environment………………………………………………………….. 436Kalin Georgiev, Miloslav Sredkov
E-books finallythere?................................................................................................................ 443Jan Engelen

x

3
BUSINESS MODELS FOR ELECTRONIC OPENACCESS JOURNALS AND DISCIPLINARY
DIFFERENCES: A PROPOSALKatiúcia Araujo Gumieiro1; Sely Maria de Souza Costa2
1 Deputies ChamberBrazil
e-mail: [email protected];2 University of Brasilia
Brazile-mail: [email protected]
AbstractReports results of a research that aimed at studying the use of businessmodels in the context of open access electronic scholarly journals publishing.Additionally, the work approaches disciplinary differences, particularly interms of three issues, namely required publication speed, funding andfeatures that involve the edition of a scholarly journal. In this context, thestudy aimed at proposing a model that allows identifying required elementsto design business models appropriated to open access scholarly journalspublishing. Along with identifying the elements, the study looked at therelationships between these elements and differences found betweenknowledge fields. Based on a bibliographic survey, the research adopted aqualitative approach that consisted of analysing the content of the literaturereviewed. As a result, a business model for the activity of open accesselectronic journal publishing has been proposed. Based on Stähler’sapproach, the model entails a set of four components, namely valueproposition, products and/or services, value architeture and source ofresources. Derived from this basic model, three other models are presented,each one representing particularities of the three major divisions ofknowledge, Sciences, Social & Human Sciences and Arts & Humanities. Asconclusion, features of business models for Sciences are considerablydifferent from the other two divisions. On the other hand, there are importantsimilarities between business models for the Social & Human Sciences and forArts & Humanities.
Keywords: Business models; Open access to scientific information;Scholarly communication; Disciplinary differences.

Business models for electronic open access journals and disciplinary differences:a proposal
4
1. Introduction
Science advancement occurs when knowledge is shared amongst members ofthe scientific world. Researchers discussions both promote and improvescience constructs, although barriers are constantly found within thescholarly communication system. High prices of scholarly journalssubscription, for instance, have made access to science findings unfeasible.Moreover, there is a high preoccupation amongst scholarly journal publishersregarding the protection of their rights.
Due to this fact, the movement of open access to scientificinformation is brought to light as a major initiative in favour of the wide andunrestricted dissemination of research results in electronic media. Both thegreen road (institutional repositories) and the gold road (open accessjournals) have become the two main ways of providing open access toscientific information. The present study focus on the later, taking intoaccount that it consists of a feasible alternative to the traditional scholarlyjournal publication model.
It seems natural to ask how to maintain the publication of an openaccess scholarly journal without having resources from subscription or accesscharges. The answer comes from the use of business models in a creativeway, as they constitute a method through which each publisher can build anduse its own resources in order to offer a better value than its competitors and,then, achieve a long-term sustainability [1]. Such method allows anentrepreneur to better understand his/her own business when outlining it in asimplified way. From the resulting models, it is feasible to organisebusinesses, besides increasing value appropriateness to a given business.
Taking account of the present time, in which economic environmentis highly uncertain, competitive and changing, business decisions becomedifficult and complex. In this sense, the use of such models is strategic to anykind of organisation, including open access scholarly journal publishers. Thisis because using these models facilitates analysing, understanding andexplaining empirical relationships found in this kind of businesses [2].
Van Der Beek et al. [3] emphasise that studies about business modelscan be grouped in two categories. The first one describes specific businessmodels. They consist of model taxonomies in which business modelspertaining to the same category share common features such as price policiesand clients relationship. The second one comprises studies that define andanalyse business models components. Within this later, Linder & Cantrell [4]explain that business models components are simply bits of a model, each ofthem representing a specific feature of a business. The present work adoptedthis later approach and it is justified by Mahadevan [5], who reports that

Business models for electronic open access journals and disciplinary differences:a proposal
5
studying only the models without looking at their components leads tofocusing on very specific features of how a sector makes business.
It is important to notice that apparently, there is no consensus onwhich components should comprise a business model. Hence, this researchobjective is, from the perspective of open access electronic scholarly journalpublishing, identify a set of components that better correspond to suchreality.
In the elaboration of a business model it is fundamental for a journalpublisher to consider, before any other thing, particularities concerning theknowledge field with which his/her journal is concerned. It is even moreimportant when these particularities involve disciplinary communicationpatterns. Meadows [6] explains that the nature and features of each filed ofknowledge lead to the adoption of different ways of carrying out research.Consequently, the way of communicating results is different, too. Therefore,publishers as intermediates in the scholarly communication process need tofocus on these patterns in order to produce and offer outputs that betterattend the needs of their clients. Because of being fairly recent as compared tothe existence of scholarly journals as a whole, the suitability of businessmodels for open access journals from different fields of knowledge becomes arelevant factor to the success of these journals.
2. Research methodology
The purpose of this study is both exploratory and descriptive. Exploratory,because in the literature reviewed no studies were found having the samefocus of this research, that is, to study the main components of businessmodels not limiting to that concerned with profits. Descriptive, to the extentthat there are, already, data respecting disciplinary differences in theliterature pertaining to this topic.
Additionally, the study adopted a methodology essentiallyqualitative, building itself on the interpretation of the literature. It isimportant to notice that the present research makes use, during the analysis,of the inductive reasoning, assuming that the model generated has thepotential to reflect itself on a broader reality. Conjointly, it availed itself ofanother kind of reasoning: the deductive. By studying business models in theelectronic environment, the researchers inferred deductively that thisknowledge is applicable to the activity of publishing scientific periodicals ofopen access, since it is produced in the electronic environment.
Bibliographic research was the technical procedure of choice. Inanalysing the texts, two approaches were used. The first one is thecodification and categorization method, proposed by. Kvale & Brinkman [7],who explain that this method attributes to one or more keywords the

Business models for electronic open access journals and disciplinary differences:a proposal
6
capability of identifying a communication appearing subsequently. The othermethod used was that of interpretation, whose key feature is to allow theinterpreter to move beyond what is actually said, bringing out structures andrelationships not apparent in the text.
3. Discussion
Based on the literature analysis, the present study discusses the use ofbusiness models in the context of open access scholarly journals. The studysought for knowledge on the business models theme in order to apply it tothe scientific publication activity. Therefore, business models componentsthat are feasible to open access electronic scholarly journal publishing havebeen looked at.
After a careful analysis of the literature, it has been decided to adoptStähler’s [8] approach, because it allows the analysis of key aspects involvingjournal publication. The author describe four components of a businessmodel:
Value proposition. It is concerned with the offer of differential values forusers, in view of the intense market competitiveness. Within the context ofjournal publishing, these values can be offered to business clients (readers,libraries), internal partners (reviewers, authors) and external partners(sponsors, publicity teams.Services and/or products. It consists of the description of services andproducts offered, taking careful account of their feasibility to user needs.In the present research, it was necessary to characterise journals in relationto writing style, presentation (text proportion, graphs, figures and tables),average number of pages per article, periodicity, minimum number ofarticles per year and average number of refused submissions.Value architeture. This component is strongly associated with intrinsicaspects of a specific enterprise, as it is the description of how it isorganised in order to offer values to its clients and partners. The presentresearch took into account specific aspects of a publisher in terms ofmarket design (target audience), as well as internal and externalarchiteture.Source of resources. It describes the way a business obtain resourcesneeded to is sustainability. These resources can come from three sources.The first concerns additional services (in the context of this research theycan consist of selling print copies, convenient forms of licenses, specificcharges for different types of distribution and so on). The second is relatedto external partners (sponsorship, publicity, expositions and conferenceco-work). Finally, there are contributions and funds from foundations,

Business models for electronic open access journals and disciplinary differences:a proposal
7
institutional subsidies, government agencies, voluntary contributions andso on [9].
These components are hereafter adopted in the proposition ofbusiness models for open access scholarly journals publishing. The firstmodel is generic and from this three more models have been proposed for thethree major divisions of knowledge.
3.1 Generic business model for open access scholarly journalspublishing
The relationship between these four components allowed the proposition of ageneric business model (Fig. 1) for open access scholarly journals. This modelshows how sources of revenue serve as input to the component ‘valuearchiteture’, which, in turn, drive other characteristics of the editorialbusiness, making it cyclical.
As can be observed, value architeture better organises the publisherbusiness, helping him/her to offer the correspondent value proposition to itsclients and partners. Clients are then attracted to have the journal, bringingabout a greater demand, which, in turn, calls the attention of sponsors andadvertisers, who financially invest in the business. The same happens toauthors and reviewers as partners. When a publisher offers services thatcorrespond to their yearnings, there is a tendency of getting a greater offer oftheir work, as well as an increase of better offerers’ work. This, in turn,attracts sponsors and advertisers.
In the context of disciplinary differences, particularities of the threemajor divisions of knowledge have been associated to each component of thegeneric model. Such association has allowed the proposition of threeadditional, specific models. The model for the Sciences (Fig 2) shows adistinct configuration from those for Social & Human Sciences (Fig. 3) andArts & Humanities (Fig. 4). An additional observation is the inference that theSciences business model should attract a greater number of clients andpartners than the other two divisions, because their authors make more use ofjournals than those from the others.
Business models for electronic open access journals and disciplinary differences:a proposal
8
Figure 1 – Business model for the activity of open access electronic scholarly journals publishing
3.2 Business model for open access scholarly journals in the Sciences
Each particularity of the Sciences, as compared to the other two divisions ofknowledge (Social & Human Sciences and Arts & Humanities) is reflected oncomponents of the business model, as shown below and depicted in figure 2.
Valueproposition
Immediate access to readers is more applicable toSciences than to the other two divisions. Publicationspeed is higher [10] and citations achieve the top faster[11]. Shorter time between submission and publicationbecause of its dynamic aspect, making time an importantvalue.The possibility authors have to deposit a preprintcorrespond to the needs of researchers from the Sciences[12]. There is actually a tendency of researchers from thisdivision to use less formal methods of disseminating theirresults [13].Authors from the Sciences write shorter sentences,
therefore, easier to be read [14].Literature review found mostly as footnotes [15].

Business models for electronic open access journals and disciplinary differences:a proposal
9
Productsand/orservices
Articles with more figures and equations [16], which maylead to higher editorial costs.Average number of pages is lower [16].Higher amount of articles [13], perhaps justifying moreoptions of titles available to publish in.Higher proportion of articles co-authored [10].Lower refusal rates [10].
Sources ofresources
Research in the Sciences requires greater support, makingcontributions and funding higher [10];Because of that, the “author pays” model is moreattractive, leading to a likely greater impact factor.
Figure 2 – Business model for the activity of open access electronic scholarly journals publishing inthe Sciences
3.3 Business model for open access scholarly journals in the Social &Human Sciences
With reference to Social & Human Sciences, because this divisionencompasses a variety of disciplines, there are also a variety ofcommunication patterns, ranging from the Humanities to the Sciences. So,grouping them in a unique set is a limitation of this study. However,according to what has been found in the literature, it was possible to obtain a

Business models for electronic open access journals and disciplinary differences:a proposal
10
list of interesting particularities for the proposition of a business model, asshown below and in figure 3.
Valueproposition
Publishing slowness [10] makes the possibility ofimmediate access to results non-attractive. However, anexception is found concerning disciplines withcommunication patterns close to the Sciences.A smaller period of time between submission andpublication is not an attractive issue, because of theslowness cited above [10]. For the same reason, thedelayed open access model becomes attractive.Depositing in preprint repositories is not a well-acceptedpraxis [12] and does not constitute a differential value.Although researchers from more flexible disciplines caninformally communicate their work in progress, they doprefer to publish results in more formal channels [13].Offering of low access cost journals does constitute adifferential value because research funding is smaller [10]as also is the number of researchers with access.
Productsand/orservices
Sentences are longer and more difficult of being read [14].Amongst empirical disciplines, literature review andmethodology are sections appearing in the beginning ofthe text and references at the end[15].Literature is purely in textual form with occasionaloccurrence of tables and illustrations [16].The average number of pages is greater [16].The amount of articles is higher[13].Co-authored articles are lower than in the Sciences andhigher than in the Humanities [10].
Sources ofresources
Research funding is smaller as is the number ofresearchers with access to it [10]. The author-pay modelis, therefore, not attractive either

Business models for electronic open access journals and disciplinary differences:a proposal
11
Figure 3 – Business model for the activity of open access electronic scholarly journals publishing inthe Social & Human Sciences
3.4 Business model for open access scholarly journals in Arts &Humanities
It is well known within the scholarly community that researchers from Artsand Humanities make more use of books than of journals [17]. However,journals have their proper importance in the division. Therefore, theproposition of a business model for the activity of open access scholarlyjournal in Arts & Humanities should take into account particularities shownbelow. Some peculiarities are presented in comparison with Sciences andSocial & Human Sciences.
Valueproposition
Immediate access to published work does not constitute adifferential; neither does the smaller period of timebetween submission and publication. This is becausespeed of publication is low [10]. Delayed access modelmight be feasible to the peculiarities of the area.Allowing researchers to deposit results in a digitalrepository is not a well-accepted praxis. Researchers frommore flexible disciplines may informally communicatetheir work in progress but do prefer formal channels totheir final results [13].

Business models for electronic open access journals and disciplinary differences:a proposal
12
Offering of low access cost journals does constitute adifferential value because research funding is smaller [10]as also is the number of researchers with access.
Productsand/orservices
Sentences are longer and more difficult of being read [14].Amongst some specialties, literature review andmethodology are sections appearing in the beginning ofthe text and references on footnotes [15].In some disciplines articles have less informative titlesthan the common praxis in other areas [10].Abstracts, though very usual in most areas, are rare [10].Literature is purely in textual form with occasionaloccurrence of tables and illustrations [16].o número médio de páginas de um artigo é maior nasHumanidades do que nas Ciências Naturais [16];The average number of pages is higher [13]. Researchescount on less journal alternatives to publish.Co-authored articles are lower than in the Sciences andhigher than in the Humanities [10].Refusal rates are much higher [10].
Sources ofresources
Research funding is smaller as is the number ofresearchers with access to it [10]. The author-pay modelis, therefore, not attractive either submissão de trabalhosnão é um diferencial nessa área.

Business models for electronic open access journals and disciplinary differences:a proposal
13
Figure 4 – Business model for the activity of open access electronic scholarly journals publishing inArts & Humanities
4. Conclusion
The results obtained and discussed in this research enable to conclude thatthe conception of a business model for the editorial milieu is stronglyassociated with two important conditions. On a macro level, it is associatedto the peculiarities of the different disciplinary areas. On a micro level, it isconcerned with the context of a given publisher. Specifically, regarding to thedisciplinary differences, the study showed that the configuration of businessmodels for the Sciences distinguishes itself markedly from the other areas.On the other hand, the business models for the Social Sciences andHumanities and the Arts and Humanities are similar.
Perhaps the most critical issue in planning is the process of choosingand integrating the different overtones of a business setting and to integratethem into a model. The manner a publisher selects, implements andcombines sundry components will reflect its idiosyncratic context—philosophical, cultural, technical and disciplinary. The business modelsproposed herein are just some amongst many resulting from the analysis ofthe publication context of open access scholarly journals. Therefore, it isbeyond the intent to consider the present model as a standard for the

Business models for electronic open access journals and disciplinary differences:a proposal
14
publication of scholarly journals; on the contrary, it intends to serve as aspawning ground for new and more perfected ideas.
References
[1] AFUAH, Allan; TUCCI, Christopher. Internet business models and strategies.New York: McGraw-Hill, 2001.[2] YUE, Gin Kwan. Modelo de negócio: uma proposta de visão integrada deprocessos logísticos em redes de restaurantes fast food. 2007. Thesis (PhD).University of São Paulo. Available athttp://www.teses.usp.br/teses/disponiveis/3/3136/tde-31032008-145820/ (May2009).[3] VAN DER BEEK, Kornelia; KRÜGER, Cornelia C.; SWATMAN, PaulaM.C. Business model formation within the on-line news market: the core +complement business Model Framework. In: BLED ELECTRONICCOMMERCE CONFERENCE, 16., 2003. Slovenia. Proceedings... Slovenia:IJEC, 9-11 June, 2003.[4] LINDER, Jane; CANTRELL, Susan. Changing business models: surveyingthe landscape. Carlsbad, U.S.A: Institute for Strategic Change, 2000. Availableat http://www.riccistreet.net/dwares/lane/mba600/linder.pdf (January 2009).[5] MAHADEVAN, B. Business models for internet-based e-commerce: ananatomy. California Management Review, v. 42, n. 4, p. 55-69, Summer 2000.[6] MEADOWS, A. J. Communicating research. San Diego: Academic Press,1998.[7] KVALE, Steinar; BRINKMANN, Svend. Interwiews: learning the craft ofqualitative research interviewing. 2. Ed. Los Angeles: Sage, 2009.[8] STÄHLER, Patrick. Business models as an unit of analysis for strategizing.2002. Available athttp://www.geschaeftsmodellinnovation.de/english/definitions.htm (May2009).[9] CROW, R.; GOLDSTEIN, H. Guide to Business Planning for Launching a NewOpen Access Journal. 2. Ed. Open Society Institute, 2003. Available athttp://www.soros.org/openaccess/oajguides/business_planning.pdf (March2009)[10] MEADOWS, A. J. A comunicação científica. Brasília: Briquet de Lemos,1999.[11] TESTA, James. A base de dados ISI e seu processo de seleção de revistas.Ciência da Informação, Brasília, v. 27, n. 2, p. 233-235, maio/ago. 1998. Availableat http://www.scielo.br/pdf/ci/v27n2/testa.pdf (April 2009)[12] CRONIN, B. Scholarly Communication and Epistemic Cultures. NewReview of Academic Librarianship, v.9, n. 1, p.1-24, Dec. 2003.

Business models for electronic open access journals and disciplinary differences:a proposal
15
[13] SPARKS, Sue. JISC Disciplinary Differences Report. 2005. Available athttp://www.jisc.ac.uk/media/documents/themes/infoenvironment/disciplinarydifferencesneeds.pdf (November 2008).[14] HARTLEY J.; SOTTO, E.; FOX, C. Clarity across the disciplines: ananalysis of texts in the Sciences, Social Sciences, and Arts and Humanities.Science Communication, v.26, n. 2, p. 188-210, Dec. 2004.[15] THODY, Angela. Writing and Presenting Research. London: SagePublications, 2006.[16] HAYASH, Takayuk; FUJIGAKI, Yuko. Differences in knowledgeproduction between disciplines based on analysis of paper styles and citationpatterns. Scientometrics, v. 46, n. 1, p. 73-86, 1999.[17] MOREIRA, A. C. S.; COSTA, S. M. S. Um modelo de comunicaçãoeletrônica para os cientistas sociais e humanistas. In: SIMPOSIOINTERNACIONAL DE BIBLIOTECAS DIGITAIS, 3, 2005, São Paulo.Proceedings... São Paulo: University of São Paulo: Universidade EstadualPaulista, 2005. 29 p. Available at http://bibliotecas-cruesp.usp.br/3sibd/docs/moreira165.pdf (March 2009).

16
The Impact Factor of Open Access journals: dataand trends
Elena Giglia 1
1 Sistema Bibliotecario di Ateneo,University of Turin,
via Verdi, 8e-mail: [email protected]
AbstractIn recent years, a large debate has arisen about the citation advantage of OpenAccess (OA). Many studies have been conducted on different datasets andaccording to different perspectives, which led to different and somehowcontradictory results depending on the considered disciplinary field, theresearchers’ attitude and citational behaviour, and the applied methodology.One of the bibliometric indicators most used worldwide to measure citationsis Impact Factor – not free from criticisms and reservations – but it has onlybeen tested on Open Access journals once, in 2004.
The aim of this preliminary work, focused on “Gold” Open Access, is totest the performance of Open Access journals with the most traditionalbibliometric indicator – Impact Factor, to verify the hypothesis thatunrestricted access might turn into more citations and therefore also goodImpact Factor indices. Other indicators, such as Immediacy Index and 5-yearImpact Factor, will be tested too.
The preliminary step of the work was fixing the list of Open Accessjournals tracked by Thomson Reuters in «Journal Citation Reports» (JCR). JCRwas compared to the Directory of Open Access Journals (DOAJ) as of 31December of the corresponding year.
As to coverage, Open Access journals in «Journal Citation Reports» arestill a small percentage, even though there has been a large increase since 2003in the Science edition (from 1.47% to 5.38%), less visible in the Social Scienceedition (from 1.05% to 1.52%, with a slight decrease from the 2007 1.71%).
In order to obtain comparable data, absolute Impact Factor or ImmediacyIndex values were not considered, but rather converted into percentiles foreach category. The rank of the Open Access journals was analyzed in each

The impact factor of open access journals: data and trends
17
single category. The titles were then clustered in disciplinary macro-areas,and data were aggregated.
Open Access journals in JCR 2008 Social Sciences edition rank in the topfifty percentiles (0-50) with a 54.5% share.
With substantial differences between macro-areas, in JCR 2008 Scienceedition Open Access journals rank in the top fifty percentiles (0-50) with a38.62% share when considering Impact Factor, and with a 37.68% sharereferring to Immediacy Index. When considering 5-year Impact Factor, theshare is 40.45%.
Open Access journals are relatively new actors in the publishing market,and gaining reputation and visibility is a complex challenge. Some of themshow impressive Impact Factor trends since their first year of tracking. Thecollected data show that the performance of Open Access journals, also testedwith the most traditional bibliometric indicator, is quite good in terms ofcitations.
Keywords: Open Access journals, Impact Factor, impact, scholarlycommunication, citations.
1. Impact, citations, Open Access, and Impact Factor
“Impact” in scientific communication is hard to define and moreover harderto measure. If we agree that «Science is a gift-based economy; value is definedas the degree to which one’s ideas have contributed to knowledge andimpacted the thinking of others» [1], we should also admit that citation countis only one of the possible impact indicators, a proxy measure referring onlyto the academic context. This concept is even more true in the digital era,where a great variety of new impact measures – based on social networkanalysis and usage log data – are under development or already in use [2].The notion of impact as a «multi-dimensional construct» and the suggestionthat usage measures actually better describe in their connections andcorrelations the complexity of “impact” in the scientific process [3, 4] cannotbe ignored, and we expect in a future further, new functional implications of

The impact factor of open access journals: data and trends
18
this approach [5]. The new “article level metrics” suggested by PLoS One goesstraight on this pathway [6].
However, “impact” has traditionally been expressed in terms ofquantitative indicators, among which Impact Factor can be considered astandard de facto: or, at least, it is in the Italian academic context. ImpactFactor has also gained a privileged position in the research evaluation system,with all its implications. But Impact Factor is only a proxy measure, and itshould be used with caution in evaluating a single article and a singleresearcher [7]; reasonable critics and reservations on Impact Factor have beenwidely discussed by different actors involved in scientific publishing, such asrecently summarized by Cope and Kalantzis and by Young et al [8]. Yet, focusof this work is to test an indicator and to present raw data; therefore it will notaddress the question and the related debate on the value of Impact Factor initself.
The author is interested in matching the most traditional quantitativeimpact indicator, Impact Factor, and «one of the most exciting and radicalevents in publishing in recent years» [9], i.e. Open Access. One of the mostdebated arguments between Open Access advocates and detractors is itsalleged citation advantage, which would stem by the « free, irrevocable,worldwide, right of access» stated by the Berlin Declaration [10]. Manystudies have been carried out to determine if there is an actual Open Accessadvantage in citations [11] and, once established, to measure its value andunderstand its causes. Alma Swan edited a sort of systematic review of thesestudies and discussed methodological and interpretive issues, starting fromthe point that «citability rests upon the quality, relevance, originality andinfluence of a piece of work» and stating that «that OA would produce anautomatic citation boost for every article was never the expectation» [12].Different selected datasets and control-cases, different measures, e.g. citationsor downloads, different time-spans led to different and somehowcontradictory results, depending on the considered disciplinary field, theresearchers’ attitude and citational behaviour, and the applied methodology[13]. Except for the two reports of Marie E. McVeigh of former ISI Thomson[14], since 2004 no more investigations have been conducted on the ImpactFactor value trends of Open Access journals. The author thought it could beinteresting to test again, after some years, the performance of Open Accessjournals in terms of citations, by applying the most commonly usedquantitative indicator, Impact Factor. The author does not intend to deal with

The impact factor of open access journals: data and trends
19
the debate about Impact Factor appropriateness or exhaustiveness, as juststated.
2. Do Open Access journals have good Impact Factorindices?
The 2009 RIN survey on Communicating knowledge: how and why researcherspublish and disseminate their findings, shows, in addition to other fundamentalfindings about researchers’ citing behaviour, that availability and easy accessare one of the key criteria in citing an article [15]. The hypothesis the authorintends to verify is that the “open” access, by raising the level of readership,might easily turn into more citations and therefore also good Impact Factorindices. Dealing with Impact Factor, this study forcedly addresses only OpenAccess journals – referred to as the “Gold Road” to Open Access. All the pre-prints and post-prints self-archived by authors in institutional or subject-based repositories have not been considered. They are referred to as the“Green Road”, a preferential channel in early and free dissemination ofresearch outputs, and they have been the object of recent bibliometric studies[16].
Sources of the work were:- Thomson Reuters «Journal Citation Reports» (JCR), published every
year in June, for the data about Journal Impact Factor, ImmediacyIndex and 5-year Impact Factor. It has a Science and a Social Sciencesedition. No coverage is provided for Humanities;
- Directory of Open Access Journals (DOAJ) edited by LundUniversity, as the most accredited list of Open Access journals [17].
In order to define the method and in setting the research criteria, theauthor would have tried when possible to follow the choices of McVeigh’s2004 analysis, but it wasn’t so easy partly because McVeigh, inside the formerISI, had had access to a great amount of complementary data, partly becauseMcVeigh’s sources at that time were different. In 2004 DOAJ was at thebeginning, so McVeigh had to consider also SCiELO, whose titles now appearin DOAJ, and J-Stage, which also includes journals that are free on the Web,but not strictly Open Access [18].
Although the same framework has been maintained (4 disciplinary macroareas, reduction in percentiles and so on), it is hard to make a direct

The impact factor of open access journals: data and trends
20
comparison because of the different list of titles examined and the adoptedprinciple of inclusion [19]. In the present work, only DOAJ has beenconsidered as a source, because with its 4,833 titles (as of March, 21st 2010) andits rigorous selection it is now supposed to be somehow an official register ofOpen Access journals.
3. Open Access journals coverage in Journal CitationReports
Fixing the list of Open Access journals included in Journal Citation Reportswas the first step of the work. There is no automatic filter to extract them, sothe author has to achieve them by comparison.
The Impact Factor of a journal is «the average number of times articlesfrom the journal published in the past two years have been cited in the JCRyear » and it is calculated «by dividing the number of citations in the JCR yearby the total number of articles published in the two previous years» [20]. JCR2008 edition, published in June 2009, contains data about 2007 and 2006articles’ citations in 2008 journals. The author then decided to compare thetitles present in DOAJ as of December, 31st of the corresponding JCR year, i.e.those on which Impact Factor has been calculated.
A query run by ISSN number gave a first automatic extraction. Then, amanual comparison drove to the inclusion of titles which for whatsoeverreason had different ISSN numbers in the two sources.
The same method has been applied both within the JCR Sciences and SocialSciences editions, considering the online original version as of June, 2009.Further inclusions in the 2009 Fall revision of JCR have not been considered,in order to set a definite edition for future comparisons.
In JCR 2008 Social Science edition resulted a list of 30 Open Access titles outof 3,801 (1.52%); in JCR 2008 Sciences edition resulted a list of 355 Open Accesstitles out of 6,598 (5.38%). The coverage in 2003-2008 is presented in Table 1(JCR Social Sciences edition) and 2 (JCR Sciences edition).
Year Titles inJCR
Titles in DOAJ31-12
OA titleswith IF
OA titles withIF (%)
2003 1714 602 18 1.05%2004 1712 1194 19 1.11%

The impact factor of open access journals: data and trends
21
2005 1747 1811 22 1.26%2006 1768 2357 24 1.36%2007 1866 2954 32 1.71%2008 1980 3801 30 1.52%
Tab. 1: Open Access titles in JCR – Social Sciences edition.
Year Titles inJCR
Titles in DOAJ31-12
OA titleswith IF
OA titles withIF (%)
2003 5907 602 87 1.47%2004 5968 1194 168 2.82%2005 6088 1811 218 3.58%2006 6164 2357 259 4.20%2007 6417 2954 315 4.91%2008 6598 3801 355 5.38%
Tab. 2: Open Access titles in JCR – Science edition
It is to be noticed that the lists of titles are not homogeneous. In JCR 2008Science edition 110 titles were excluded compared to the 2007 edition,including 6 Open Access titles; in JCR 2008 Social Sciences 23 titles wereexcluded, including 3 Open Access titles. In DOAJ, too, there have beenvariations, and 8 former Open Access titles listed in 2007 were not included asof December 2008.
In JCR 2008 Science edition 355 titles have been counted instead of 356because of the changing title of Acta Phytotaxonomica Sinica in Journal ofSystematics and Evolution. The journal maintained the same ISSN but has no2008 data. There are also two titles which were assigned to a differentcategory compared to 2007 (Interciencia and Journal of Research of the NationalInstitute of Standards and Technology).
These tables show the coverage of Open Access journals within JournalCitation Reports. While in the Science edition they are represented in a stillsmall but growing percentage, the small number and percentage of titlesincluded in the Social Sciences edition, 1.52%, representing a decrease from2007, has not been investigated in depth, as the numbers are not sufficient todraw any conclusions. In DOAJ as of December, 31st 2008, at least 533 titles

The impact factor of open access journals: data and trends
22
(14%) can be referred to the Social Sciences area. So we have to wait for theirinclusion in JCR in the future.
Some more comparisons can be added, in order to clarify the size of thesample: in Ulrichsweb, we find 26,710 active refereed academic/scholarlyjournals as of March 21st, 2010. Compared to this, the 4,833 Open Access titleslisted in DOAJ the same day represent a 18.09%.
4. Open Access journals in Journal Citation Reports:where do they come from?
Focusing on the Science edition, the author looked for the geographicaldistribution of the list of 355 Open Access journals, taking the publisher’scountry as the point of origin. The results are shown in Table 3.
Table 3: Geographical distribution of OA journals in JCR 2008 - Science ed.
Ratios generated in the comparison with the geographical distribution ofall 6,598 titles in JCR 2008 Science edition are shown in Table 4, in associationwith 2007 data (6,417 titles):

The impact factor of open access journals: data and trends
23
AreaJCR Science
TitlesOA titles %
2007 2008 2007 2008 2007 2008 Variat.
Africa 24 26 4 5 16.67% 19.23% +2.56%
Asia 547 567 74 88 13.53% 15.52% +1.99%
Australia –New Zealand
89 96 1 1 1.12% 1.04% -0.08%
Europe 3177 3264 118 141 3.71% 4.32% +0.61%
NorthAmerica
2529 2580 80 74 3.16% 2.87% -0.29%
South-CentralAmerica
51 65 38 46 74.51% 70.77% -3.74%
Tot. 6,417 6,598 315 355
Table 4: Percentages of OA titles by geographical distribution – JCR Science ed.
It’s important to notice that 70.77% (74.51% in 2007) of covered titles fromSouth-Central America are available as Open Access: this could be ademonstration of the international quality, visibility and reputation of thecited SCiELO platform. The Africa and Asia ratios are also interesting, with agood presence of Open Access journals and a growing trend, while NorthAmerica, Europe and Australia show lower percentages rates.

The impact factor of open access journals: data and trends
24
5. Open Access journals in Journal Citation Reports: whatdo they talk about?
Following Mc Veigh’s method, the 355 Open Access titles of JCR 2008 Scienceedition have been clustered in 4 disciplinary macro-areas, Chemistry [CH],Mathematics-Physics-Engineering [M-P-E], Life Sciences [LS], Medicine[MED], relating to the category assigned in JCR, as shown in Table 5. Titlesreferring to two or more categories have been duplicated, so the total amountcounted 479 items. In 2007, 315 titles had originated 422 items. The tableshows also the growing trend in inclusion of Open Access titles in eachmacro-area, with the caution, as we said above, that not all the 2007 OpenAccess titles are still represented in the 2008 edition.
Table 5: OA journals by macro disciplinary areas in JCR Science ed.
6. Open Access journals ranking in Journal CitationReports by Impact Factor
The author then ranked the Open Access titles by Impact Factor.Impact Factor’s values range is widely distributed among the categories: CA -A cancer journal for clinicians, an Open Access journal which runs first in its

The impact factor of open access journals: data and trends
25
category (Oncology) and which runs also first among all the 6,598 titles, has a74.575 index value as Impact Factor. Communications on pure and appliedmathematics, which runs as well first in its category (Mathematics), has a 3.806index value.
Therefore, in order to obtain comparable data, absolute Impact Factor wasnot considered. Impact Factor was converted to percentile rank as follows
pn100N (n 1
2)
where p is the percentile, N the number of items in a category and n the rankvalue of the title.
Percentiles 0-10 include the highest Impact Factor values, 91-100 the lowerones.
This is the only analysis carried out on JCR 2008 Social Science edition, tohave a preliminary benchmark result for future comparisons. There are 30Open Access titles which, once duplicated because of the pertaining category,generated 37 items. Due to the small size of the sample, no subdivision incategories was performed. Results are shown in synopsis in Table 6. OpenAccess titles rank in the top fifty percentiles (0-50) with a 54.05% share (20 outof 37).
Table 6: OA journals in JCR 2008 Social Sciences ed. ranking by Impact Factor (synopsis).

The impact factor of open access journals: data and trends
26
Referring to JCR 2008 Science edition, the author then analyzed the 479Open Access titles, duplicates included.
Percentile rank was first analyzed for each title in its assigned categorywithin JCR: Chemistry [CH]: 43 titles in 15 categories, Mathematics-Physics-Engineering [M-P-E]: 95 titles in 32 categories, Life Sciences [LS]: 222 titles in46 categories, Medicine [MED]: 119 titles in 31 categories.
Results were then aggregated by disciplinary macro-area, as shown inTables 7-10, in comparison with 2007 data.
Table 7 Impact Factor of OA journals Chemistry 2007/2008

The impact factor of open access journals: data and trends
27
Table 8 Impact Factor of OA journals Mathematics, Physics, Engineering 2007/2008
Table 9 Impact Factor of OA journals Life Sciences 2007/2008

The impact factor of open access journals: data and trends
28
Table 10 Impact Factor of OA journals Medicine 2007/2008
There are as expected strong differences among disciplinary areas. Whenconsidering the best performances, in Medicine there is a strong presence inthe top twenty (0-20) percentiles (15.96%); slightly lower in Life Sciences andin Mathematics-Physics-Engineering (respectively 14.42% and 12.63%),absolutely lower in Chemistry (4.66%). Data in synopsis are shown in Table11.
Table 11: OA journals in JCR 2008 Science ed. ranking by Impact Factor (synopsis).
In a global outlook, Open Access journals rank in the top fifty percentiles(0-50) with a 38.62% share (185 titles out of 479) when considering ImpactFactor, as shown in Table 12. The table also outlines the distribution in eachdisciplinary macro area: in Medicine, 42.02% titles rank in the top fiftypercentiles. 2007 values are included in the table in red.
Impact Factor of OA journals - synopsis
0
5
10
15
20
25
30
35
CH
M-P
-E LSM
ED CH
M-P
-E LSM
ED CH
M-P
-E LSM
ED CH
M-P
-E LSM
ED CH
M-P
-E LSM
ED CH
M-P
-E LSM
ED CH
M-P
-E LSM
ED CH
M-P
-E LSM
ED CH
M-P
-E LSM
ED CH
M-P
-E LSM
ED
1-10 11-20 21-30 31-40 41-50 51-60 61-70 71-80 81-90 91-100

The impact factor of open access journals: data and trends
29
Table 12: distribution top/bottom percentiles in JCR 2008 Science ed. (in red 2007 data)
In Fall, 2009, Thomson Reuters released a revised version of JCR 2008. Inthe Science edition, titles became 6,620 (+22). 10 titles out of these 22 are OpenAccess. Open Access titles moved from 355 to 365, and from 479 to 492duplicates included. In some cases, wrong assigned Impact Factor valueshave been rectified. Global data then moved from a 38.62% to a 39.43% shareranking in the top fifty (0-50) percentiles (194 titles out of 492), with a shiftfrom 30.23% to 31.11% in Chemistry, from 37.89% to 39.58% in Mathematic-Physics-Engineering, from 38.74% to 39.04% in Life Sciences, and from 42.02%to 43.09% in Medicine. However, according to the purpose of this study,aimed at future assessments, only the official June 2009 edition has to beconsidered.

The impact factor of open access journals: data and trends
30
Even though a direct comparison with McVeigh’s 2004 data is notpossible, as we said above, we can try at least to relate the final results.McVeigh’s global data showed in JCR 2002 edition a 34% share in the top fifty(which are 51-100, because she used a different formula) percentiles and a66% share in the bottom ones [21]. Six years later (according to JCR date ofpublication), the ratio is 38% [39% in Fall revised edition] against 62% [61%].It seems to be a little change. But it is to be noticed that the list of 355 titles inJCR 2008 Science edition is the whole sample of strictly Open Access journalswith Impact Factor, obtained by matching DOAJ and JCR. DOAJ has rigorousselection criteria in defining what an “Open Access journal” is. In 2004, McVeigh considered as a source also J-Stage, a Japan gateway which includessimply “free on web” journals [22]. So, McVeigh’s sample seems to have beenbuilt on wider inclusion criteria: therefore results might be overrated and theresulting gap with JCR 2008 data underestimated. A new study with the samemethodology and criteria of the analysis presented in these pages is going tobe carried on next JCR 2010 edition, in order to obtain comparable data to setup a trend.
5. Open Access journals ranking in Journal CitationReports by Immediacy Index
In order to test a potential early advantage, the author then ranked OpenAccess journals in JCR 2008 Science edition by Immediacy Index. ImmediacyIndex is calculated by dividing the number of citations to articles published ina given year by the number of articles published in the same year. Possiblebiases within this measure are that frequently issued journals, with articlespublished early in the year, had more chances of being cited and that largejournals have advantage over small ones: these are cautions notified in JCRitself [23].
Among the 355 Open Access titles, 33% are quarterly, 21% bimonthly, and17% monthly. 13% have no issues per year declared in JCR, comprising bothirregular and e-only titles. Only 3% have 20 or more issues per year.To obtain comparable data, also Immediacy Index was converted to percentilerank with the same formula: pn
100N (n 1
2) where p is the percentile, Nthe number of items in a category and n the rank value of the title.

The impact factor of open access journals: data and trends
31
According to the same methodology applied to Impact Factor values,percentile rank was first analyzed for each title in its assigned category withinJCR. Results were then aggregated by disciplinary macro-area.
Global results are shown in Table 13 in comparison with Impact Factordata.
Immediacy Index seems to be higher in the top thirty (0-30) percentiles. Ina global outlook, in JCR 2008 Science edition Open Access journals rank in thetop fifty (0-50) percentiles by Immediacy Index with a 37.16% share (178 titlesout of 479), slightly lower than the same year’s Impact Factor (-1.46%).
Table 13: Impact Factor compared to Immediacy Index – JCR 2008 Science ed.
In2007,thetrendwas

The impact factor of open access journals: data and trends
32
the opposite: they ranked in the top fifty (0-50) percentiles with a 40.05%share (169 titles out of 422) when considering Immediacy Index, a 2.37 %higher than Impact Factor (159 titles, 37.68%). Data are collected in Table 14.It is interesting to notice some cases of many titles which rank low by ImpactFactor but high by Immediacy Index. 225 titles out of 479 (47%) show a best
performance in Immediacy Index than in Impact Factor (56% in Chemistry 56%
in Mathematics-Physics-Engineering, 41% in Life Sciences and 49% in Medicine)
Table 14: Impact Factor to Immediacy Index – global data JCR Science ed. 2007/2008
The median value of the difference between the two values is 8, with 104titles under the median and 121 above. The peaks are represented by KyushuJournal of Mathematics (184th by Impact Factor and 36th by Immediacy Index),Abstract and Applied Analysis (116th and 9th), Boundary value problems (118th and14th), Revista Chilena de Historia Natural (96th and 8th).
6. A further analysis: 5-year Impact Factor
Considering that one of the most diffused criticisms against Impact Factor isits time span – two years is often a too narrow period to test the impact of aresearch article, especially in certain disciplines – a new indicator has beenprovided in JCR starting with the 2007 edition, 5-year Impact Factor. It iscalculated by dividing the number of citations in the JCR year by the totalnumber of articles published in the five previous years.
As with Impact Factor and with Immediacy Index, absolute values of 5-year Impact Factor were converted to percentile rank with the same formula:pn
100N (n 1
2) where p is the percentile, N the number of items in acategory and n the rank value of the title.
According to the same methodology applied to Impact Factor andImmediacy Index values, percentile rank was first analyzed for each title in itsassigned category within JCR. Results were then aggregated by disciplinarymacro-area.
In 2007 JCR Science edition 315 titles out of 422 (75% of the total) have a 5-year Impact Factor. They rank in the top fifty percentiles (0-50) with a 40%share (126 titles out of 315).
In 2008 JCR Science edition 356 titles out of 479 have a 5-year Impact Factor(74% of the total). They rank in the top fifty percentiles (0-50) with a 40.45%share (144 titles out of 356). Results are shown in Table 15.

The impact factor of open access journals: data and trends
33
Table 15: 5-year Impact Factor for OA journals JCR 2008 Science ed. (only for 356 titles).
7. Open Access journals in Journal Citation Reports:how old are they?
In the asymmetry of the inelastic scholarly communication market, there areprestigious titles with reputations acquired over a period of many years.
Therefore the journal age has been analyzed, in order to find if there mightbe any correlation between age and performance. Once obtained the splittinginto categories and percentiles for JCR 2008 Science edition titles, the authortried to collect data in Table 16. Only the first year of publication could havebeen considered; as known, some journals are Open Access-natives, other areOpen Access-converted, so these data are just relative. Although you canaccess a list of converted titles in Open Access Directory [24], informationdates back only to 2006, and the list is not exhaustive; in most cases, it is
5 year Impact Factor - OA journals in JCR 2008 Science ed (356 titles out of 479)
0
10
20
30
40
50
60
1-10 11-20 21-30 31-40 41-50 51-60 61-70 71-80 81-90 91-100

The impact factor of open access journals: data and trends
34
impossible to establish the year of conversion. However, the authorconsidered the median starting year of publication for journals within theirown percentile by Impact Factor rank. At the left and right side of the medianyear is the number of older and younger/equal titles respectively.Younger/equal titles are in majority.
Percentile CHEMISTRY MATH-PYS-ENG
LIFESCIENCES
MEDICINE
0-10 2001 1 4 1994 4 7 2003 11 5 1999 6
11-20 2001 1 2 1999 2 7 2001 7 3 2001 5
21-30 2 2000 2 1997 1 2 2001 10 3 2000 5
31-40 1 2003 1 5 1997 5 4 2000 8 4 2003 5
41-50 2 1990 3 6 1999 7 13 2000 17 6 2001 8
51-60 3 2000 5 5 1998 8 10 2000 15 4 2002 4
61-70 4 2000 5 5 1997 5 8 1999 13 5 2000 6
71-80 4 2002 5 4 1997 6 10 2000 19 7 1999 8
81-90 1 1998 1 9 1999 11 12 2000 17 6 2000 15
91-100 1 2004 1 3 2003 3 9 2001 23 6 2001 8
Table 16: Open Access journals in JCR 2008 Science ed.: median first year of publication.
Distribution is uneven, so that a direct causal relationship between ageand visibility and prestige in terms of citations cannot be straightforwardlyinferred.
At a glance, lower median years can be found in the top fifty (0-50)percentiles only in Mathematics-Physics-Engineering, where the lowestpercentile corresponds to the most recent median year. In Life Sciences, in thetop ten (0-10) percentiles, the median year is 2003, but seven titles were bornin 2005 (out of 18). In Medicine, in the top ten (0-10) percentiles there are a2003, a 2004 and a 2007 title. The last one is PLoS Neglected tropical diseases,which ranks first in its first year of tracking.
Thus, there seems to be no strong correlation between the age of a journaland its performance according to Impact Factor. There are some strikingexamples, such as the cited young PLoS journals which since their firsttracking year ranked in the first percentiles – PLoS Biology ranked first in itscategory in its first year, with an Impact Factor quite double over the secondin ranking – or such as BioMedCentral BMC Bioinformatics, or Atmospheric

The impact factor of open access journals: data and trends
35
Chemistry and Physics, with its innovative concept of peer-review, always inthe first positions of its category [25]. They could be a proof that the pre-reputation period – i.e. the time span requested for a journal to establish in thescholarly publications market – could result shortened in an Open Accessenvironment [26]. Otherwise, the great number of young Open Accessjournals ranking in the bottom fifty percentiles (51-100) could be a sign of thedifficulty of competing with traditional and established titles. More detailedanalyses and comparisons with non-Open Access titles trends are due toaddress the question.
8. Conclusions and further researches
Open Access journals presence in JCR 2008 Social Sciences edition (1.52%) is solow that claims, as to now, no more investigations than the simple trend inImpact factor value. These few Open Access journals rank in the top fifty (0-50) percentiles with a 54.05% share.
Open Access journals in JCR 2008 Science edition are still represented in asmall percentage, even though the large increase since 2003 (from 1.47% to5.38%).
As for Impact Factor performance, a 38.62% share [39.43% in Fall edition]in the top fifty (0-50) percentiles is a good although not striking result, such asa 37.16% share as for Immediacy Index and a 40.45% as for 5-year ImpactFactor (the latter only for 356 titles out of 479).
These results are not outstanding, but they represent only the first step ofan ongoing work. A fair discussion should require a comparison with JCR2010 data, to set a trend which is expected to be highly positive.
The preliminary data reported in this contribution might be useful tofurther comparisons, more elaborated reflections and in-depth analysis.Further researches might concern the Impact Factor values trend of OpenAccess journals over several years, in comparison with that of traditionaljournals, and the performance in terms of Impact Factor of Open Access andtraditional titles of the same age.
Open Access journals are relatively new actors in the scholarly publishingmarket; and gaining reputation and visibility is a complex challenge amongestablished titles. Our collected data, nevertheless, show that the performanceof Open Access journals, as tested with the most traditional bibliometric

The impact factor of open access journals: data and trends
36
indicator, Impact Factor, is quite good in terms of citations. They can competewith older actors; in other words, as Peter Suber puts it, quality can keep pacewith prestige and reputation [27].
AcknowledgementsI am deeply indebted to Marta Plebani (Thomson Reuters) who provided mewith 2007 raw data to work on; to Professor Giuseppe Migliaretti (Universityof Turin) for his statistic expertise; to Susanna Mornati (CILEA) for her initialmethodological suggestions; to Heather Morrison (Simon Fraser University)and Paola Gargiulo (CASPUR) for their comments.
Notes and References
[1] BOLLEN J; et al. A principal component analysis of 39 scientific impactmeasures. PLoS ONE 4 (6), 2009, e6022. Available athttp://www.plosone.org/article/info:doi%2F10.1371%2Fjournal.pone.0006022 (March 2010).
[2] BOLLEN J; et al. A principal component analysis of 39 scientific impactmeasures. PLoS ONE 4 (6), 2009, e6022. Available athttp://www.plosone.org/article/info:doi%2F10.1371%2Fjournal.pone.0006022 (March 2010). See also FRANCESCHET, M. Journal influence factors.Journal of Informetrics, 2010, in press. Available atdoi:10.1016/j.joi.2009.12.002 (March 2010).
[3] BOLLEN J; et al. A principal component analysis of 39 scientific impactmeasures. PLoS ONE 4 (6), 2009, e6022. Available athttp://www.plosone.org/article/info:doi%2F10.1371%2Fjournal.pone.0006022 (March 2010).
[4] BOLLEN J; et al. Clickstream Data Yields High-Resolution Maps ofScience. PLoS ONE 4 (3), 2009, e4803. Available athttp://www.plosone.org/article/info:doi/10.1371/journal.pone.0004803(March 2010).
[5] BOLLEN J. Studying scientific activity from large-scale usage data.Presentation. CERN workshop on innovations in scholarly communication -OAI 6, Geneva 17-19 June 2009. Available athttp://indico.cern.ch/contributionDisplay.py?contribId=22&sessionId=8&confId=48321 (March 2010). see also MESUR, Metrics from Scholarly Usageof Resources. Available at http://www.mesur.org/MESUR.html (March2010).

The impact factor of open access journals: data and trends
37
[6] BINFIELD P. PLoS One: background, future development, and article-levelmetrics. In MORNATI S; HEDLUND T. editors. Rethinking electronicpublishing, ELPUB 2009 proceedings. Milan: Nuova Cultura, 2009, pp. 69-86. Available athttp://conferences.aepic.it/index.php/elpub/elpub2009/paper/view/114/51(March 2010). See also PLoS One (2009) Article-level metrics. Available athttp://article-level-metrics.plos.org/ (March 2010).
[7] CAMPBELL P. Escape from the impact factor. ESEP 8, 2008, p. 5-7.Available at http://www.int-res.com/articles/esep2008/8/e008p005.pdf(March 2010). GARFIELD E. The Impact Factor and using it correctly. DerUnfallchirurg, 101(6), June 1998 p.413. English translation. Available athttp://garfield.library.upenn.edu/papers/derunfallchirurg_v101(6)p413y1998english.html (March 2010).
[8] COPE B; et al. Signs of epistemic disruption: Transformations in theknowledge system of the academic journal. First Monday, 14 (4) 6 April2009, Available athttp://firstmonday.org/htbin/cgiwrap/bin/ojs/index.php/fm/article/viewArticle/2309/2163 (March 2010).YOUNG NS; et al. Why Current Publication Practices May DistortScience. PLoS Med 5 (10), 2008, e201. Available athttp://www.plosmedicine.org/article/info:doi/10.1371/journal.pmed.0050201 (March 2010).
[9] MC VEIGH ME. Open Access journals in the ISI citation databases:analysis of Impact Factors and citation patterns. A citation study fromThomson Scientific, 2004. Available athttp://scientific.thomsonreuters.com/m/pdfs/openaccesscitations2.pdf(March 2010).
[10] Berlin Declaration on Open Access to Knowledge in the Sciences andHumanities (2003). Available at http://oa.mpg.de/openaccess-berlin/berlindeclaration.html (March 2010).
[11] The effect of open access and downloads ('hits') on citation impact: abibliography of studies (Op-Cit project). Available athttp://opcit.eprints.org/oacitation-biblio.html (March 2010). See alsoWAGNER, AB. Open Access Citation Advantage: An AnnotatedBibliography. Issues in Science and Technology Librarianship, 60. Winter

The impact factor of open access journals: data and trends
38
2010. Available at http://www.istl.org/10-winter/article2.html (March2010).
[12] SWAN, A. The Open Access citation advantage: Studies and results todate. Technical Report, 2010. Available athttp://eprints.ecs.soton.ac.uk/18516/ (March 2010).
[13] Stevan Harnad is as usual very sharp and meticulous in commenting andpointing out methodological questions about OA advantage. A thread ofhis exchanges with the authors of many studies could be followed on hisblog, Open Access Archivangelism (http://openaccess.eprints.org/)searching “OA advantage”. A collection of these contributions can also befound on Connotea, tag “OA advantage Harnad”.
[14] MC VEIGH ME. Open Access journals in the ISI citation databases:analysis of Impact Factors and citation patterns. A citation study fromThomson Scientific, 2004 Available athttp://scientific.thomsonreuters.com/m/pdfs/openaccesscitations2.pdf(March 2010). See also MC VEIGH ME. The Impact of Open Accessjournals. Report, 2004. Available athttp://thomsonscientific.jp/event/oal/impact-oa-journals.pdf (March2010).
[15] Research Information Network – RIN. Communicating knowledge: howand why researchers publish and disseminate their findings. Report,2009, p. 31. Available at http://www.rin.ac.uk/our-work/communicating-and-disseminating-research/communicating-knowledge-how-and-why-researchers-pu (March 2010).
[16] GARGOURI, Y; et al. Self-Selected or Mandated, Open Access IncreasesCitation Impact for Higher Quality Research. PLOS ONE, 2010.(Submitted). Available at http://eprints.ecs.soton.ac.uk/18493/ (March2010).GENTIL-BECCOT, A; et al. Citing and Reading Behaviours in High-Energy Physics. How a Community Stopped Worrying about Journalsand Learned to Love Repositories. arXiv.org, 30 Jun 2009. Available athttp://arxiv.org/ftp/arxiv/papers/0906/0906.5418.pdf (March 2010).GARGOURI, Y; et al. Logistic regression of potential explanatoryvariables on citation counts. Preprint 11 Apr. 2009. Available athttp://www.crsc.uqam.ca/yassine/SelfArchiving/LogisticRegression.htm(March 2010).

The impact factor of open access journals: data and trends
39
[17] DOAJ - Directory of Open Access Journals. Available athttp://www.doaj.org/ (March 2010). Journal Citation Reports is availableonly for subscribers.
[18] SciELO – Scientific Electronic Library Online. Available athttp://www.scielo.br/ (March 2010); J-Stage – Japan Science andTechnology Information Aggregator Electronic. Available athttp://www.jstage.jst.go.jp/browse/ (March 2010).
[19] MC VEIGH ME. Open Access journals in the ISI citation databases:analysis of Impact Factors and citation patterns. A citation study fromThomson Scientific, 2004. Available athttp://scientific.thomsonreuters.com/m/pdfs/openaccesscitations2.pdf(March 2010).
[20] JCR Help. Available for subscribers: http://admin-apps.isiknowledge.com/JCR/help/h_impfact.htm#impact_factor (March2010).
[21] MC VEIGH ME. The Impact of Open Access journals. Report, 2004.Available at http://thomsonscientific.jp/event/oal/impact-oa-journals.pdf(March 2010).
[22] J-Stage - Japan Science and Technology Information Aggregator,Electronic. Available at http://www.jstage.jst.go.jp/browse/ (March 2010).
[23] JCR Help. Available for subscribers: http://admin-apps.isiknowledge.com/JCR/help/h_impfact.htm#impact_factor (March2010).
[24] OAD - Open Access Directory. Available athttp://oad.simmons.edu/oadwiki/Journals_that_converted_from_TA_to_OA (March 2010).
[25] POESCHL, U. Open peer review and interactive open access publishing:the effectiveness of transparency and self-regulation in scientific qualityassurance. Presentation. CERN workshop on innovations in scholarlycommunication - OAI 6, Geneva 17-19 June 2009. Available athttp://indico.cern.ch/contributionDisplay.py?contribId=23&sessionId=8&confId=48321 (March 2010).
[26] WILLINSKI J. Open Access and academic reputation. Slaw.Ca, 16 Jan2009. Blog post. Available at http://www.slaw.ca/2009/01/16/open-access-and-academic-reputation/ (March 2010).
[27] SUBER, P. Thinking about prestige, quality and Open Access. SPARCOpen Access Newsletter, Sept. 2008. Available at

The impact factor of open access journals: data and trends
40
http://www.earlham.edu/~peters/fos/newsletter/09-02-08.htm (March2010).
40
Predictive validity of editorial decisions at an open access journal: A casestudy on Atmospheric Chemistry and Physics
Lutz Bornmann1; Hans-Dieter Daniel1,2
1 ETH Zurich, Professorship for Social Psychology and Research on Higher Education, Zähringerstr. 24,CH-8092 Zurich
[email protected];2 University of Zurich, Evaluation Office
Mühlegasse 21, CH-8001 [email protected]
AbstractIn this study we investigate the quality of the selection process of an open access (OA) journal, taking as anexample the journal Atmospheric Chemistry and Physics (ACP). ACP is working with a new system of public peerreview. We examined the predictive validity of the ACP peer review system – namely, whether the processselects the best of the manuscripts submitted. We have data for 1111 manuscripts that went through thecomplete ACP selection process in the years 2001 to 2006. The predictive validity was investigated on the basisof citation counts for the later published manuscripts. The results of the citation analysis confirm the predictivevalidity of the editorial decisions at ACP: They covary with citation counts for the published manuscripts.
Keywords: public peer review, open access, predictive validity
1. Introduction
More than 4500 open access (OA) journals have now become established in science that either still use thetraditional peer review system or have introduced the ‘new’ system of public peer review (seehttp://www.doaj.org/). “The difference compared to traditional. . .journals is that OA journals let authors retainthe copyright, and that they have a different business strategy: they are free of charge at the point of use. ..Many – but not all – of the OA publishers adopt the ‘author/institution pays’ policy, that is, paying once and inadvance and grant free access for everyone, worldwide” [1]. The greatest reservation about OA journals iswhether they achieve adequate quality control [2]. “In the open-access business model, it is widely acceptedthat authors (or their funding agencies or universities) pay. This means that the journals’ revenues dependdirectly on the number of articles published. Only fools would believe that editors wouldn’t then tend to accepta manuscript in the many borderline cases” [3].
Taking as an example the journal Atmospheric Chemistry and Physics (ACP), we present the – according toour literature search – first results of an evaluation study on the quality of the selection process of an electronicOA journal. The study examines whether the ACP peer review system actually does select the ‘best’manuscripts among those submitted. For that, the citation impact of papers is compared which, after a positiveevaluation either in ACP or if rejected after a negative evaluation, were submitted and published elsewhere. Asthe number of citations of a publication reflects the international impact of the reported research and in theabsence of other operationalizable indicators, it is a common approach in peer review research to evaluate thesuccess of a peer review process on the basis of the citation count of the reviewed manuscripts [4]. Accordingto Jennings [5] “the most important question is how accurately the peer review system predicts the longer-term

Predictive validity of editorial decisions at an open access journal: A case study on atmospheric chemistry and physics
41
judgements of the scientific community.” Scientific judgements on manuscripts are said to show predictivevalidity in peer review research if the citation counts of manuscripts receiving different decisions differ to astatistically significant degree.
2. Methodology
ACP was launched in September 2001. It is produced and published by the European Geosciences Union(EGU) (www.copernicus.org/EGU/EGU.html) and the Copernicus Society (www.copernicus.org). ACP is freelyaccessible via the Internet (www.atmos-chem-phys.org). ACP has a two-stage publication process, with a ‘new’peer review process consisting of a public peer review and interactive discussion [6, 7]. In the first stage,manuscripts that pass a rapid pre-screening process (access review) are immediately published as ‘discussionpapers’ on the journal’s Web site (as a result, they are published in Atmospheric Chemistry and PhysicsDiscussions, ACPD). After the end of the discussion phase, based on the revised manuscript and in the light ofthe access peer review and interactive public discussion, the editor accepts or rejects the revised manuscript forpublication in ACP.
For the investigation of peer review at ACP we had data for 1111 manuscripts that went through thecomplete ACP selection process in the years 2001 to 2006. These manuscripts reached one of the following finalstatuses: 958 (86%) were published in ACPD and ACP, 74 (7%) were published in ACPD but not in ACP (here,the editor rejected the revised manuscript), and 79 (7%) were not published in either ACPD or ACP (thesemanuscripts were rejected during the access review). Some of the manuscripts submitted to ACP but notpublished there (because they were rejected during the access review, for example) were submitted by theauthors, as described in the following, to another journal and published there. According to Schultz [8], thereare two reasons for the high publication rate of submissions to ACP [see also 9]: By using the public peerreview and interactive discussion, (1) ACP can expect a high average quality of submitted manuscripts, and (2)ACP works harder than journals working with the traditional peer review to keep and improve thesubmissions.
For manuscripts published in ACP, ACPD or elsewhere, we determined the number of citations for a fixedtime window of three years including the publication year. The citation analyses were based on the ScienceCitation Index (SCI, Thomson Reuters, Philadelphia, PA, USA), Chemical Abstracts (CA, Chemical AbstractsServices, Columbus, Ohio, USA) and Scopus (Elsevier, Amsterdam, The Netherlands).
3. Results
The search for the fate of the manuscripts that were not published in ACP (n=153) was conducted using tworesearch literature databases, Web of Science (WoS, Thomson Reuters) and CA. Two Ph.D. environmentalresearch scientists carried out the search. The results of the investigation revealed that of the 153 manuscripts,38 (25%) were published in other journals. No publication information was found for 115 (75%) manuscripts,whereby 70 of the 115 manuscripts (61%) were published in ACPD. Other studies on the fate of manuscriptsthat were rejected by a journal reported percentages ranging from 28% to nearly 85% for manuscripts laterpublished elsewhere [10], whereby the journals examined do not work with a two-stage publication process asdoes ACP. For manuscripts rejected by AC-IE at the beginning of the year 2000, Bornmann and Daniel [11]determined a percentage of 95%.
The 38 manuscripts that were published as contributions in other journals were published in 25 differentjournals within a time period of five years (that is, between 2005 and 2009). Six manuscripts were published in

Predictive validity of editorial decisions at an open access journal: A case study on atmospheric chemistry and physics
42
the Journal of Geophysical Research; three manuscripts were published in Geophysical Research Letters. The other 23journals each published one or two manuscripts.
Table 1 shows the mean number of citations found in CA, SCI and Scopus for manuscripts published inACP and ACPD (group 1), published in ACPD only or in ACPD and elsewhere (group 2), or published neitherin ACP nor in ACPD, but elsewhere (group 3). The medians are printed in bold in the table since the median –unlike the arithmetic mean – is not affected by outliers. The high standard deviations indicate that thedistributions of the citation counts are characterized by a multitude of outliers.
Table 1: Descriptive statistics about citation counts for manuscripts published in ACP and ACPD (group 1),published in ACPD only or in ACPD and elsewhere (group 2), or published neither in ACP nor in ACPD, but
elsewhere (group 3).
Group Statistic CA SCI ScopusGroup 1 n 958.00 958.00 951.00
mean 8.49 9.72 11.87sd 11.32 12.99 15.68
median 6.00* 6.00$ 7.00§
Group 2 n 74.00 74.00 51.00mean 1.76 2.04 3.82
sd 2.69 2.83 4.47median 1.00* 1.00$ 2.00§
Group 3 n 17.00 17.00 15.00mean 1.29 1.71 2.73
sd 2.20 2.37 2.74median 0.00* 1.00$ 2.00§
Notes: The citation counts were searched in the databases Chemical Abstracts (CA), Science Citation Index (SCI) andScopus for a fixed three-year citation window. Since citation counts could not be searched for all manuscripts in thedatabases, the number of manuscripts in the table differs from the number of manuscripts stated in the methodologysection.** 2 = 99.6, P < .001; $ 2 = 108.2, P < .001; § 2 = 56.7, P < .001.
As the results in Table 1 show, independently of the literature database in which the citation search wasconducted, manuscripts in group 1 are cited more frequently on average than those in group 3. For example,manuscripts that were published in ACP and ACPD (group 1) were cited, according to the SCI, on average 6times (median); manuscripts that were published neither in ACP nor in ACPD, but elsewhere (group 3) werecited on average once (median). It is also evident that manuscripts in group 1 are cited much more frequentlythan those published only in ACPD or in ACPD and elsewhere (group 2). In contrast, hardly any differencesare detectable between the median citation counts of group 2 and group 3 manuscripts. Regardless of thecitation database, the differences between the three groups in Table 1 are statistically significant.
4. Discussion
Many OA journals come into being in recent years. It is hoped that unrestricted access to scientific publicationswill have a positive effect on scientific progress: According to Borgman [12], “scholarship is a cumulativeprocess, and its success depends on wide and rapid dissemination of new knowledge so that findings can bediscarded if they are unreliable or built on if they are confirmed. Society overall benefits from the openexchange of ideas within the scholarly community” (p. 35). Some of the OA journals are using public or open

Predictive validity of editorial decisions at an open access journal: A case study on atmospheric chemistry and physics
43
peer review, for one, in the interest of higher quality submissions: “Open review has the advantage of speedingand democratizing reviewing, and could result in better manuscripts being submitted” [13]. Furthermore,“reviewers would be more tactful and constructive” [14]. And for another, “there is a widely held suspicion(certainly amongst commercial publishers and to a lesser extent amongst authors) that articles in … OAjournals are less well peer-reviewed than their counterparts in toll-access journals. This perception has tworoots; firstly, as … OA journals are new, they have not yet had a chance to attain high status, and secondly,there is a feeling that because income depends on the number of accepted articles, the editors will be underpressure to accept poor quality manuscripts to keep the income stream up” [15].
Contrary to those fears, the results of this study show – in agreement with the results on various closed peerreview systems of traditional journals [see an overview in 4] – that in the journal examined here, public peerreview is able to assess the quality of manuscripts ‘validly’ and to select the ‘best’ manuscripts among themanuscripts submitted. The results of the citation analysis confirm the predictive validity of the editorialdecisions: They correlate statistically significantly with citation counts. When interpreting these results,however, it should be taken into consideration that the ACP peer review system, through the high acceptancerate among submissions, in many cases exercises a different function that the peer review system at manytraditional journals, such as at AC-IE: It is more about improving manuscripts prior to publication than aboutselecting among submissions. In the words of Shashock [16], journals like Science, Nature, or the AC-IE skim offthe cream and discard everything else among the submissions. ACP, in contrast, in the first review step screensout unsuitable manuscripts only and eliminates them from the further selection process. Through the use ofpublic peer review in the second review step, a large part of the manuscripts that in the access review weredeemed potentially suitable for publication in ACP are published after varying degrees of revision.
5. Conclusions
For Anderson [17], open and closed peer review systems are each suitable for different publicationenvironments: “Closed peer review works best in scarce environments, where many papers fight for a fewcoveted journal slots. Open peer review works best in an abundant environment of online journals withunlimited space. In the scarce world of limited pages in top journals, prestige is earned through those journals’high standard and exclusivity. That comes, in part, from the process, which involves impressing the verydiscriminating combination of an editor and a few respected researchers.” Since the number of OA journals canbe expected to increase in coming years, future studies on predictive validity should examine in particular theirpeer review systems. Here, studies are needed that investigate not only the selection function, as in this study,but also the improvement function of peer review.
Acknowledgements
We would like to thank Dr. Hanna Joos (at the Institute for Atmospheric and Climate Science of the ETHZurich, Switzerland) and Dr. Hanna Herich (at EMPA – a research institution within the ETH Domain) for theinvestigation of the manuscripts rejected by Atmospheric Chemistry and Physics and published elsewhere. Wealso thank Dr. Werner Marx and Dr. Hermann Schier of the Central Information Service for the institutes of theChemical Physical Technical (CPT) Section of the Max Planck Society (located at the Max Planck Institute forSolid State Research in Stuttgart, Germany) for conducting the citation search for citations of the accepted andrejected (but published elsewhere) manuscripts in the literature database Chemical Abstracts (CA) and ScienceCitation Index (SCI).

Predictive validity of editorial decisions at an open access journal: A case study on atmospheric chemistry and physics
44
The research project, which is investigating quality assurance of interactive open access journals, issupported by a grant from the Max Planck Society (Munich, Germany). We thank Dr. Ulrich Pöschl, ChiefExecutive Editor of Atmospheric Chemistry and Physics, the Editorial Board of Atmospheric Chemistry and Physics,and Copernicus Publications (Katlenburg-Lindau, Germany) for permission to conduct the evaluation of theselection process of the journal, and thank the members of Copernicus Systems + Technology (Berlin,Germany) for their generous technical support during the carrying out of the study.
References
1 GIGLIA, E. Open Access in the biomedical field: a unique opportunity for researchers (and research itself).Europa Medicophyisica, 2007, vol. 43, no. 2, p. 203-213, p. 208.
2 JOINT INFORMATION SYSTEMS COMMITTEE Journal authors survey report. Truro, UK: Key Perspectives Ltd.,2004.
3 GÖLITZ, P. Twitter, Facebook, and Open Access ... Angewandte Chemie International Edition, 2010, vol. 49,no. 1, p. 4-6.
4 BORNMANN, L. Scientific peer review. Annual Review of Information Science and Technology, in press.5 JENNINGS, C.G. Quality and value: the true purpose of peer review. What you can’t measure, you can’t
manage: the need for quantitative indicators in peer review. 2006. Retrieved July 6, 2006, fromhttp://www.nature.com/nature/peerreview/debate/nature05032.html.
6 KOOP, T. AND PÖSCHL, U. Systems: an open, two-stage peer-review journal. The editors of AtmosphericChemistry and Physics explain their journal’s approach. 2006. Retrieved 26 June 2006, fromhttp://www.nature.com/nature/peerreview/debate/nature04988.html.
7 PÖSCHL, U. Interactive journal concept for improved scientific publishing and quality assurance. LearnedPublishing, 2004, vol. 17, no. 2, p. 105-113.
8 SCHULTZ, D.M. Rejection rates for journals publishing atmospheric science. Bulletin of the AmericanMeteorological Society, 2010, vol. 91, no. 2, p. 231-243.
9 PÖSCHL, U. Interactive Open Access publishing and peer review: the effectiveness and perspectives oftransparency and self-regulation in scientific communication and evaluation. LIBER Quarterly, submitted.
10 WELLER, A.C. Editorial peer review: its strengths and weaknesses. Medford, NJ, USA: Information Today, Inc.,2002.
11 BORNMANN, L. AND DANIEL, H.-D. The effectiveness of the peer review process: inter-referee agreementand predictive validity of manuscript refereeing at Angewandte Chemie. Angewandte Chemie InternationalEdition, 2008, vol. 47, no. 38, p. 7173-7178.
12 BORGMAN, C.L. Scholarship in the digital age. Information, infrastructure, and the Internet. Cambridge, MA, USA:MIT Press, 2007.
13 BORGMAN, p. 61.14 DECOURSEY, T. Perspective: The pros and cons of open peer review. Should authors be told who their
reviewers are? 2006. Retrieved June 20, 2006, fromhttp://www.nature.com/nature/peerreview/debate/nature04991.html.
15 OPPENHEIM, C. Electronic scholarly publishing and open access. Journal of Information Science, 2008, vol. 34,no. 4, p. 577-590, p. 582.,
16 SHASHOK, K. Standardization vs diversity: how can we push peer review research forward? MedscapeGeneral Medicine, 2005, vol. 7, no. 1, p. 11.
17 ANDERSON, C. Technical solutions: wisdom of the crowds. Scientific publishers should let their online readersbecome reviewers. 2006. Retrieved June 15, 2006, fromhttp://www.nature.com/nature/peerreview/debate/nature04992.html. para. 14, 15.

45
Search engine in a class of academic digitallibraries
Maria Nisheva-Pavlova, Pavel Pavlov
Faculty of Mathematics and Informatics, Sofia University5 James Bourchier Blvd., Sofia 1164, Bulgaria
{marian, pavlovp}@fmi.uni-sofia.bg
Abstract
The paper discusses some aspects of an ongoing project aimed at thedevelopment of a methodology and proper software tools for building andusage of academic digital libraries. A particular functional model of academicdigital library has been proposed and analyzed. The emphasis falls on somesolutions of the large set of problems concerning the development ofadequate mechanisms for semantics-oriented search in multilingual digitallibraries. An ontology-based approach is suggested in order to standardizethe semantic annotation of the library resources and to facilitate theimplementation of the functionality of the search engine. The main features ofa prototype of knowledge-based search engine for a multilingual academicdigital library with research and learning materials are discussed. This searchengine uses proper ontologies describing the conceptual knowledgeconsiderable for the chosen domains and in this way it is capable of retrievingand filtering documents by their semantic properties.
Keywords: Digital Library; Metadata; Semantic Annotation; Ontology;Search Engine
1. Introduction
Research and practical activities in the field of Digital Libraries during the lasttwo decades lead to significant results in the development and managementof digital collections, in the innovation in scholarly publishing and the long-term preservation of digital information. Many institutions are activelyinvolved in building suitable repositories of the institution's books, papers,theses, and other works which can be digitized or were “born digital”. In

Search engine in a class of academic digital libraries
46
particular, universities and other academic institutions participatesuccessfully in lots of projects directed to the development of different typesof academic digital libraries. Academic digital libraries are committed tomaintaining valuable collections of scholarly information. To this end,essential information resources should remain available and accessible intothe future – a real challenge in the cases of digital resources that areincreasingly transient and at risk.
The paper is aimed at the presentation of an ongoing project which isdirected to the development of a methodology and corresponding softwaretools for building academic digital libraries. A special attention has been paidto the elaboration of means for semantics-oriented search in multilingualdigital libraries. The study and the practical experiments are oriented to thedevelopment of DigLib-CI – a digital library with research and learningmaterials (articles, dissertations, monographs, lecture notes, textbooks,presentations, example program sources, data sets, quizzes, manuals etc.)created at the Department of Computer Informatics of the Faculty ofMathematics and Informatics (FMI), Sofia University, or especially selectedfrom among the scholarly materials freely available on the Web.
2. Related Work
Digital Libraries can mainly be characterized as a converging point wheredisparate communities have been meeting to address common issues relatedwith the creation, management and usage of digital information [1]. The goalof a digital library and especially of an academic library is to provide access toselected intellectual works. Moreover, academic digital libraries are usuallyaimed at some specific challenges like digital preservation of valuablescientific heritage collections and investigation of innovative methods forautomatic indexing, metadata extraction, document search and retrieval etc.In this sense, academic digital libraries are the front-rankers in the discussedarea.
The digital libraries of Cornell University [2], the University of Michigan[3] and Carnegie Mellon University [4] are considered as leaders in the field ofacademic digital library creation and management.
The Cornell University Library is the eleventh largest academic library inthe United States, ranked by number of volumes held. In 2005 it held 7.5million printed volumes in open stacks, 8.2 million microfilms andmicrofiches, and a total of 440,000 maps, motion pictures, DVDs, sound

Search engine in a class of academic digital libraries
47
recordings, and computer files in its collections, in addition to extensivedigital resources and the University Archives.
The Cornell Library Digital Collections Project integrates online collectionsof historical documents. Featured collections include the Database of African-American Poetry, the Historic Math Book Collection, the Samuel May Anti-Slavery Collection, the Witchcraft Collection, and the Donovan NurembergTrials Collection.
The University of Michigan Digital Library Project (UMDL) is based onthe traditional values of service, organization, and access that have madelibraries powerful intellectual institutions in combination with open,evolving, decentralized advantages of the web. The content of UMDL willemphasize a diverse collection, focused on earth and space sciences, whichcan satisfy the needs of many different types of users. The content will besupplied by publishers, although the project will eventually allow all users topublish their work.
The implementation of the current prototype of UMDL requires theintegration of numerous agent technologies for knowledge exchange,commerce, learning, and modelling. Recently, the efforts have beenconcentrated on developing technologies that, for example, manipulateontological descriptions of the elements of a digital library to help agents findservices and auctions for exchanging goods and services under variousconditions. These technologies allow flexibility in the UMDL configurationpolicies, extensibility and scalability by using demand as incentive forreplicating services.
Carnegie Mellon University Libraries became very popular with theMillion Book (or the Universal Library) project which was aimed to digitize amillion books by 2007. The activities within the project include scanningbooks in many languages, using OCR to enable full text searching, andproviding free-to-read access to the books on the web. As of 2007, they havecompleted the scanning of the planned number of books and have madeaccessible the corresponding database.
The research within the Million Book project includes developments inmachine translation, automatic summarization, image processing, large-scaledatabase management, user interface design, and strategies for acquiringcopyright permission at an affordable cost.
Compared to these well-known large scale initiatives, our project is of asignificantly smaller scale, but in contrast to all of them, it investigates the useof a set of subject ontologies to provide flexible, semantics-oriented access tothe library resources for users with different profiles and language skills.

Search engine in a class of academic digital libraries
48
3. Architecture of DigLib-CI
DigLib-CI is designed as a typical academic digital library. It has been underdevelopment at FMI in order to provide open access to various kinds ofscholarly and instructional content, mainly in a wide range of subfields ofComputer Science and Information Systems. The functional structure ofDigLib-CI is shown in Figure 1.
The content repositories include research and learning materials ofdifferent types (books, dissertations, periodicals and single articles, manuals,lecture notes, presentations, source code of computer programs, data sets,tests, quizzes etc.) in the areas of Computer Science and Information Systems.These library resources are available in various digital formats: pdf, html,plain text, doc, ppt, jpeg etc. Most of them are developed by faculty members,the others are especially selected from among the scholarly materials freelyavailable on the Web. The content repositories are stored in a small number oflocations. The materials in them are written in Bulgarian or in Englishlanguage.
The metadata catalogues are destined to facilitate the identification of theneeded research or learning materials by the search engine. They containdescriptive metadata stored in XML format and support the reusability of alllibrary resources and facilitate their interoperability.
Figure 1: Functional Model of DigLib-CI
ContentRepository
ContentRepository
ContentRepository
MetadataCatalogue
MetadataCatalogue
MetadataCatalogue
Search Engine
Library Functionality
GUI
. . .
Subject Ontologies and Index

Search engine in a class of academic digital libraries
49
The subject ontologies include large sets of concepts of the areas ofComputer Science and Information Systems, with description of theirproperties and different kinds of relationships among them. They play asignificant role in the implementation of the full functionality of the searchengine.
The purpose of the search engine is to provide adequate access to thecomplete palette of resources stored in DigLib-CI.
The library functionality and the user interface of DigLib-CI are designedin accordance with the expected needs and requirements of the basic types ofusers of the library. The interface module provides adequate online access tothe corresponding library resources and supporting software tools.
4. Catalogue Metadata
The library catalogues contain metadata which support the identification ofthe requested resources by the search engine. These metadata are stored inXML format and comply with the IEEE Standard for Learning ObjectMetadata [5].
Typical examples of relevant attributes of most kinds of research andlearning materials are: type of the material; author; title of the material;language(s) (human and/or programming one(s)); digital format; location;version; date of creation; completion status; restrictions on use; semanticannotation – list of concepts from a proper subject ontology describing theComputer Science or Information Systems subfields and/or concepts coveredor treated by the material. Learning materials have been characterized also bytheir educational level and the principal types of users for which thecorresponding material was designed; officially published research materialsand textbooks are supplied with the corresponding bibliographic metadata.
Each catalogue entry (i.e., each resource description) consists of twoequivalent parts in which the element values are texts in Bulgarian or Englishlanguage, respectively. The search engine examines the corresponding partsof the descriptions according to the language of the user query.
The elements <ontologyRefs> and <keywords> of the resource descriptionsplay the role of semantic annotations of the corresponding library materials.The values of the child elements of <ontologyRefs> are concepts of thesuitable subject ontologies (names of classes in these subject ontologies) whichpresent most precisely the content of the corresponding document.
The concepts of the subject ontologies are too general from the point ofview of the expectations of the typical users of DigLib-CI. For that reason one

Search engine in a class of academic digital libraries
50
can include in the resource descriptions additional lists of keywords whichdescribe the content of the corresponding documents at the necessary level ofabstraction. These keywords are set as values of the child elements of the<keywords> resource description elements.
The names of the respective subject areas and names of the files containingthe suitable subject ontologies have been assigned as values of the childelements of the catalogue description elements <subjects> and <ontologies>respectively.
5. Subject Ontologies
The subject ontologies include a large set of concepts in the fields ofComputer Science and Information Systems, with description of theirproperties and the different kinds of relationships among them. Two subjectontologies are included in the current version of DigLib-CI. The ComputerScience ontology is based on the Computer Science Curriculum 2008 of ACMand IEEE/CS [6]. Using the curriculum as a guideline, this ontology definesthe atomic knowledge units for the University courses and available researchmaterials in the field of Computer Science and makes them sharable andreusable. Its current version includes approximately 300 concepts with theirrelationships.
The Information Systems ontology has been under development using theModel Curriculum and Guidelines for Undergraduate Degree Programs inInformation Systems of ACM, AIS and AITP [7].
The subject ontologies are designed in order to play the role ofinformation sources describing the hierarchy and the other relationshipsbetween the main concepts in the discussed domains. A dictionary ofsynonyms has also been under development with the purpose of providingthe search engine with other viewpoints to the conceptual structure of theareas of Computer Science and Information Systems.
The body of knowledge in the areas of Computer Science and InformationSystems is formulated in the terms of a considerable number of commonconcepts, therefore the two subject ontologies discussed above contain manycommon classes (with equal or similar names and intersecting properties andrestrictions on them). Because of that our further plans include thedevelopment of an approach to the integration of domain ontologies relevantto the contents of multilingual academic digital libraries which will be basedon some of our former results [8].

Search engine in a class of academic digital libraries
51
6. User Interface
The library functionality and the user interface of DigLib-CI are designed inaccordance with the expected requirements of the basic types of users of thelibrary. The interface module provides adequate online access to thecorresponding library resources and supporting software tools.
The current version of the user interface allows one to formulate queries inBulgarian or English language. It is intended for four types of users:
FMI students – they may read/download textbooks, open lecture notesand presentations from all public sections of the library as well as allmanner of other kinds of materials (monographs, dissertations, articles,periodicals, degree theses, lecture notes, presentations, exercises,programs, data sets, quizzes, tests etc.) from fixed public librarysections;FMI lecturers and researchers – in addition to the students’ accessrights, they may upload materials to fixed public sections as well ascreate and update private sections and use materials in some of them;librarians (library administrators) – they have full access to all publicresources of the library (may download and upload materials destinedfor all public sections of the library);general citizen – they may read and download public materials of fixedtypes (e.g., dissertations, textbooks, open lecture notes andpresentations).
All types of users of DigLib-CI may use the standard input interface whichprovides convenient means for entering, editing and submitting queries forvarious kinds of document search and retrieval. FMI lecturers and researchersas well as the library administrators may play the role of authors of libraryresources and have an access to the author’s part of the user interface. Thispart of the user interface places at the authorized persons’ disposalappropriate forms enabling one to enter and edit catalogue descriptions of alltypes of library resources (Figure 2). More precisely, the user may enter thevalues of some of the elements or pick out the values of others frompreviously drawn lists. In particular, the available subject ontologies can beproperly visualized and the necessary concepts in them can be picked out asvalues of the child elements of the element <ontologyRefs>.

Search engine in a class of academic digital libraries
52
Figure 2: User interface of DigLib-CI (author’s view – form for enteringcatalogue metadata of periodicals)
7. Working Principles of the Search Engine
The purpose of the search engine is to provide adequate access to thecomplete palette of resources stored in DigLib-CI.
The search engine maintains several types of search and documentretrieval within DigLib-CI. The user queries define restrictions on the valuesof certain metadata attributes of the required research or learning materials.Generally, the search mechanism may be formulated as follows: the documentdescriptions included in all permissible user sections of the library areexamined one by one and these descriptions which have a specific element(determined by the type of the user query) with a value matching the userquery, are marked in order to form the search result. The matching process issuccessful if the value of the element or the value of one of its child elementsis equal to the user query. The documents pointed by the marked descriptionsare retrieved and the user is given an access to these documents and theircatalogue descriptions.
The current implementation of the search engine supports four types ofsearch and document retrieval:

Search engine in a class of academic digital libraries
53
full search – search and retrieval of all available library resources,ordered by title, by author, by category, by date of creation or by dateof inserting in the library;author search (search and retrieval of the documents created by a givenauthor) – the search is performed in the value of the element <authors>;ontological search – the search is performed in the value of the element<ontologyRefs>;keyword search – the search is performed in the value of the element<keywords>.
During the ontological search the user query is augmented with regard tothe concepts searched out in the semantic annotations of the required researchor learning materials. The more specific concepts from each of the subjectontologies indicated by the user are added to the original one in the resultingquery. Then the search engine retrieves all documents in the librarycontaining in their descriptions at least one component of the augmentedquery as the value of a child element of <ontologyRefs>. In this way theontological search enables one to find documents described by ontologyconcepts which are semantically related to the concept defining the userquery.
Till now, we have no disposal of an accomplished proper dictionary ofsynonyms of the concepts in the areas of Computer Science and InformationSystems neither in Bulgarian, nor in English, but our idea is to provide apossibility for two-stage augmentation of the user query. At the first stage therequest for ontological search will be extended with the more specificconcepts (its successors) from the indicated subject ontologies. At the secondstage the synonyms found in the dictionary will be added to the main (givenby the user) concept and its successors.
We allow in the current version of the implementation of the search engineonly “atomic” user queries that do not contain conjunctions or disjunctions ofwords or phrases. The next step will be to elaborate a sophisticated version ofthe search engine which will be capable to analyze and execute queries in theform of conjunctions or disjunctions of phrases of interest for the user. Someof our former ideas suggested in [9] will be used for the purpose.
The discussed working principles of the search engine of DigLib-CI aredesigned in order to support flexibility, interoperability and reusability. Theseprinciples could be applied in the implementation of the search engines of awhole class of academic digital libraries that provide semantics orientedaccess to their resources.

Search engine in a class of academic digital libraries
54
8. An Example of Ontological Search
Let us suppose for example that the user defines a request (a query) forontological search concerning the concept “fundamental constructs”. First anextension of this request will be generated. It will include all ontologicalconcepts which are special cases of the concept given by the user (with respectto the ontologies indicated by the user). For this purpose, breadth-first searchin the graphs that represent the ontologies will be performed, starting in eachone from the concept chosen by the user.
Assume that the Computer Science ontology is chosen by the user. In thiscase the extended request (the augmented query) will include the concepts“fundamental constructs”, “basic syntax and semantics”, “binding andscope”, “conditional structures”, “declarations”, “expressions”, “functionsand procedures”, … , “variables”, “bindings”, “blocks”, … , “simplevariables”.
Figure 3: Some search results for the query “fundamental constructs”
After that, a consecutive search in the catalogue descriptions follows. Inthis search all documents with descriptions that are juxtaposed with at leastone element of the extended request are extracted. In the currentimplementation each document appears as many times in the result list, asmany elements of the augmented query are juxtaposed with its description

Search engine in a class of academic digital libraries
55
(which means that the element <ontologyRefs> of the description includes asub-element that has value, coincident with an element of the augmentedquery).
Figure 3 shows a screenshot displaying part of the ontological searchresults for the query “fundamental constructs”.
If the user indicates more than one subject ontology (e.g., the ComputerScience ontology and the Information Systems ontology), the proceduredescribed above is repeated consecutively for each of these ontologies.
Our current activities are directed to the selection of a proper set ofrelationships between the ontology concepts that should be taken into accountin the process of ontological search along with the hierarchical ones. Weenvisage for the near future the development of a more flexible and user-friendly mechanism for ontological search which will not expect the user toindicate explicitly the subject ontologies appropriate for every particular case.
9. Conclusions
The most considerable results of the discussed project obtained so far may besummarized as follows:
A functional model of an academic digital library was proposed. Thismodel provides tools for semantics oriented access to learning andresearch materials in various digital formats written in differentlanguages;A prototype of DigLib-CI – an academic digital library with researchand learning materials in the areas of Computer Science andInformation Systems, was developed.
The main advantage of the suggested approach to building academicdigital libraries consists in the provided facilities for flexible and adequatesemantics-oriented access to the library resources for users with variousprofessional profiles and language skills.
The complete implementation of the project will help to enhance theresearch activities and the exchange of teaching innovation and thus willimprove the overall scholarly and teaching quality in Computer Science andInformation Systems at FMI. It will also contribute to the methodology ofdevelopment of innovative software systems maintaining the entire lifecycleof academic digital content.

Search engine in a class of academic digital libraries
56
Acknowledgements
This work has been partly funded by the Sofia University SRF within a projecttitled “Methods and Tools Supporting the Lifecycle of Rich Digital Content”.
References
[1] BORBINHA, J. The Age of the Digital Library. In: D. Castelli, E. Fox(Eds.), Pre-proceedings of the first International Workshop onFoundations of Digital Libraries, Vancouver, Canada, 2007, pp. 31-36.
[2] Cornell University Library Digital Collections. Available athttp://cdl.library.cornell.edu/ (March 2010).
[3] University of Michigan Digital Library. Available athttp://www.si.umich.edu/UMDL/ (March 2010).
[4] Carnegie Mellon University Libraries: Digital Collections. Available athttp://diva.library.cmu.edu/ (March 2010).
[5] IEEE Standard for Learning Object Metadata. Available athttp://ltsc.ieee.org/wg12/20020612-Final-LOM-Draft.html (March 2010).
[6] Association for Computing Machinery; IEEE Computer Society.Computer Science Curriculum 2008: An Interim Revision of CS 2001.Available at http://www.acm.org/education/curricula/ (March 2010).
[7] ACM; AIS; AITP. IS 2002: Model Curriculum and Guidelines forUndergraduate Degree Programs in Information Systems. Available athttp://www.acm.org/education/ (March 2010).
[8] ZLATAREVA, N; NISHEVA, M. Alignment of HeterogeneousOntologies: A Practical Approach to Testing for Similarities andDiscrepancies. In: D. Wilson, H. Chad Lane (Eds.), Proceedings of theTwenty-First International Florida Artificial Intelligence ResearchSociety Conference, AAAI Press, Menlo Park, CA, 2008, pp. 365-370.
[9] PAVLOV, P; NISHEVA-PAVLOVA, M. Knowledge-based Search inCollections of Digitized Manuscripts: First Results. In: Proceedings ofthe 10th ICCC International Conference on Electronic Publishing, FOI-Commerce, Sofia, 2006, pp. 27-35.

57
Reliable scholarly objects search and interchangeframework
Victor Torres1; Ruben Tous2; Jaime Delgado2
1 Departament de Tecnologies de la Informació i les Comunicacions,Universitat Pompeu Fabra (UPF)
Carrer Roc Boronat 128, 08018 Barcelona, [email protected];
2 Departament d'Arquitectura de Computadors,Universitat Politècnica de Catalunya (UPC)
Campus Nord. Carrer Jordi Girona 1-3, 08034 Barcelona, Spainrtous, jaime.delgado @ac.upc.edu
AbstractAuthors of scholarly objects might fear that there is a potential risk that theoriginal material they publish in online sites or that they submit forevaluation to scientific journals or conferences is used by others as their ownmaterial. In such cases, it would not be easy for the original authors to proveauthorship of the original contribution. In similar circumstances, it is verydifficult to prove the authorship or origin of some materials that are beingdistributed amongst social networks, private or institutional websites or anyother means through the Internet, namely documents, papers, images, data,etc. Those materials can be easily plagiarised (e.g. partially or totallytranslated) and redistributed without any control and with no means to proveauthorship. In this context, we propose an online framework for theregistration, search, interchange and trade of scholarly objects, which helps toovercome the potential drawbacks of online distribution and publishing. Thisframework acts as an intellectual property repository and sales point, wherepeople is able to register content and determine the way they want to trade it,while providing innovative search capabilities based on the MPEG QueryFormat standard [1]. Creative Commons (CC) [2] limitations are identifiedand overcome by means of a licensing approach that combines RightsExpression Languages and the MPEG-21 Media Value Chain Ontology [3].
Keywords: intellectual property rights; scholarly objects; creativecommons; multimedia information retrieval.

Reliable scholarly objects search and interchange framework
58
1. Introduction
In general, it is very difficult to prove the authorship or origin of somematerials that are being distributed amongst social networks, private orinstitutional websites or any other means through the Internet, namelydocuments, papers, images, data, etc.
Although there are some initiatives focused to detect plagiarism [4]regarding well-known contributions to literature, it is very difficult to proveauthorship for other minor or recent works that are not yet consolidated orpresent in global databases. Those materials can be easily plagiarised andredistributed without any control and even partially or totally translated.
In this paper, we analyse current approaches and initiatives that deal withintellectual property (IP) rights, determining up to which point they can beconsidered a secure means for protecting IP from the authors’ perspective.After this analysis, we describe the desirable features that an ideal systemwould have. This framework would act as an intellectual property repositoryand sales point, where people would be able to register content anddetermine the way they want to trade it, while providing innovative searchcapabilities based on the MPEG Query Format standard [1]. CreativeCommons (CC) [2] limitations will be identified in section 1.3 and overcomeby means of a licensing approach that combines the flexibility of rightsexpression languages and the MPEG-21 Media Value Chain Ontology [3].
2. Intellectual property, services and initiatives
Intellectual property rights is the set of rights that correspond to authors andother entities (artists, producers, broadcasters, companies, etc.) with respect toworks and other types of creations and inventions [5].
Copyright rights apply to literary and artistic works (e.g. writtencompositions, musical works, photographs, paintings, etc.) and they involveeconomic rights regarding the work reproduction, distribution, publicperformance, adaptation and translation and moral rights regarding the rightto claim authorship and the right of integrity [6].
2.1. Copyright protection
In general, in most countries, any document, work, or creative project isprotected by copyright by virtue of its creation from the date it is created. Theinclusion of the author's name, date of creation and a copyright statement or

Reliable scholarly objects search and interchange framework
59
the symbol "©" within or accompanying the work is a valid means fordeclaring copyright. However, the presence of this statement does not fullyprotect the author in case of litigation. Other types of qualified proofs such aswritten or documentary evidence of the date and time of registration areneeded to be sure that a work is safely protected.
2.2. Intellectual Property registry offices
Intellectual Property (IP) registry offices, which usually depend on nationalgovernments, provide a mechanism for registering and proving contentauthorship in both the analogue and digital world.
Although the inscription of content in such registries is not compulsory,they are useful to provide qualified proofs stating that copyright exists for awork and it belongs to someone. Some intellectual property registries alreadyoffer online registration facilities [7] [8], easing authors the tedious process ofthe traditional manual and on-site registration. However, those registries lackother functionalities than the mere registration, such as the interaction withother applications that build upon them via APIs, the possibility for authorsto determine other licensing schemes than the de facto “all rights reserved”,powerful searching facilities and even trading options.
2.3. Creative Commons licensing
Creative Commons (CC) [2] is a non-profit organisation that provides a set ofreference licensing models that can be used by authors which hold IP rights toenable people to easily change their copyright terms from the default of “allrights reserved” to “some rights reserved”, while being consistent with therules of copyright.
Following the CC approach, authors can mark their content with somespecific licenses that grant some permissions regarding copyright rights toanyone that accesses the content. It is relevant to remark the importance forcustomers of being capable to prove that they own the appropriate rights forusing a specific content.
We could imagine an editor that is used to work with images subject toany of the CC licensing models, which are used for illustrating their onlinenewspaper or blog with, let’s say, photographs obtained from the Flickr [9]site. It may happen that in a certain moment in time an image is licensedunder the CC Attribution (BY) model [10], which lets others copy, distribute,display, and perform the copyrighted work, and derivative works based uponit, but only if they give credit the way the author requests. Later in time, the

Reliable scholarly objects search and interchange framework
60
author of the image may decide to change the licensing model to the CCAttribution Non-Commercial (BY-NC) model [10], which lets others copy,distribute, display, and perform the work, and derivative works based uponit, but for non-commercial purposes only. What happens then? Which is thelicensing model that applies to the image? According to the CC model, itwould depend on the moment the content is accessed. That is, if the editoraccessed the content after the change in the licensing model, the Attributionmodel would apply. Moreover, as stated in the CC BY-NC license [10], thislicense would be royalty-free and perpetual (for the duration of the applicablecopyright). However, licensing in CC does not provide any proof on how orwhen content is accessed, since there is no link or association between contentand its licensing model, so it would be the editor’s responsibility to prove thatthe licensing model being offered in that moment was the appropriate one incase a legal dispute occurs. The main problems that arise from the usage ofCreative Commons licenses are, thus:
1) The lack of protection for content authors or rights holders regardingthe content commercial use. Enabling a commercial usage of content does notmean they resign a part of the income perceived by the party that exploits it.However, the possibilities for authors of perceiving any income are reduced,since CC licenses do not contemplate the possibility for stating suchcompensations. In general, content consumers do not have the initiative toreach an agreement with content authors. Thus, authors need to start a legaldispute, which is often a long, expensive and non-fruitful process.
2) The lack of protection for content authors or rights holders regardingthe license duration. CC licenses grant perpetual rights for those that canprove the content was accessed under that specific licensing model. Anychange in the licensing model being used for the content will not apply to theusers that accessed the content under the previous model.
3) The lack of protection for content consumers, since they need to provewhich is (or was) the licensing model applicable to the content they use incase of litigation.
Regarding the first problem, CC has defined the CCPlus (CC+) model [11],which enables authors to express where consumers can get rights beyondthose granted by the CC license, which is a non-commercial license (e.g. CCBY-NC). The CCPlus license can include a link to an external site or service,which can be a specialized commercial license broker as e.g. gettyimages [12],or even an email address to be contacted by the consumer. The CCPlusapproach is still not available at many sites.
Regarding the third problem, some initiatives already tackle it for specificfields. ImageStamper [13] is a free online tool that generates and keeps a

Reliable scholarly objects search and interchange framework
61
timestamp that includes the image, the license that applies and the date.However, it is only useful for images.
2.4. Safe Creative
SafeCreative [14] is a global, free, open and independent intellectual propertyregistry that allows creators and rights holders to register their works andobtain a valid proof suitable to be used on court hearings.
One of the main differences between SafeCreative and other registries isthe possibility to state the rights that apply to works by means of predefinedor customized licenses. CC and GNU [15] licenses are included between thetemplates offered to users, whereas, for other customized models, users needto provide their own specific text. The licensing model being applied can bechanged any time by the content author or rights holder.
SafeCreative also provides proofs for content consumers that can be usedto certify the licensing model being applied to the content when accessed. Inthat sense, SafeCreative solves the third issue identified previously, since itprovides proofs for content consumers, while keeping track of licensingchanges. In order to have reliable proofs, SafeCreative uses officiallyrecognised timestamping services and accepts some X.509 digital certificatesissued by trusted issuers. API interfaces are also provided to enable theintegration of their services in other web applications.
2.5. Copyright associations
The Writers’ Copyright Association (WCA), Webmaster's CopyrightAssociation (WMCA) and Musician's Copyright Association (MCA) [16] [17][18] are different associations that provide registration services for the type ofcontent they deal with. WCA accepts literary work for film and television,books, poems, artwork, lyrics, teleplays, game shows, storyboards,animations and cartoons, web pages etc. WMCA deals with websites, e.g.zipped entire sites, flash movies, custom java scripts, etc. Finally, MCAaccepts music files and documents containing scores.
They all function in the same manner. The user uploads a file, pays a feeand receives a registration number that should be applied to the front page ofthe author’s work. If necessary, a Registry employee may produce registrationinformation or material as evidence if legal or official guild action is initiated.The processing fees, which are common for the three associations areavailable at their sites. Although they provide a simple interface for authors,

Reliable scholarly objects search and interchange framework
62
they act as an unofficial intellectual property registry, while providing somebasic search functionalities to browse amongst their registry entries.
Some possible problems when relying on these 3 registries are related toits terms and conditions of use, available at their web sites: 1) any of the threeassociations provides a formal copyright; 2) they do not “verify the originalityor authenticity of the material, make comparisons of registration deposits,provide any statutory protections, nor give legal advice”; 3) “In the unlikelyevent that said file is lost, corrupted, damaged or destroyed due to the WCA'sfailure to maintain reasonable care or by any other cause whatsoever, it isagreed between both parties that the liquidated damages for the loss of themanuscript shall be £1.00”.
3. Proposed System
In order to deal with the potential drawbacks of online distribution andpublishing and respecting intellectual property rights, we propose an onlineframework for the registration, search and trade of scholarly objects.
A means to prove authorship is the first functionality needed for suchframework. Thus, it would act as an intellectual property repository wherepeople would be able to post their content prior to any other action they maywant to do with them, such as submitting a paper for evaluation orpublishing it elsewhere. Digital signatures applied to the XML [19]representation of works will be a reliable proof for authorship. Twoapproaches can be followed here. A digital signature from the framework willbe trustable as long as we trust in the framework management. A digitalsignature from the user will require the usage of a recognised X.509 certificateand private key from the user’s side and will be a more reliable proof ofregistration. The combination of both approaches would be the optimumsolution. We must say that even adopting these mechanisms, still some legaldisputes may arise regarding content ownership. However, the chances ofhappening so will be clearly reduced and limited to some active thefts.
Another desirable feature is the possibility to trade or share the registeredcontent. In this way, the proposed framework acts as a sales point, easing thedistribution and commercialisation of content, and always giving digitalevidence of all the transactions being executed in the system, not only forauthors but also for customers. The rights to be considered for being tradedare, on one hand, those involved in content creation and distribution, whichare defined in the MPEG-21 Media Value Chain Ontology (MVCO) [3]: makeadaptation, make instance and make copy (useful for determining the type of

Reliable scholarly objects search and interchange framework
63
works that can be derived), distribute, produce, public communication andsynchronization. On the other hand, we should consider those rights relatedto content consumption and fruition such as render/play, embed, extract,enlarge, diminish, enhance, etc., which are defined in the MPEG-21 RightsExpression Language (REL) [20]. With these two sets of rights we can refer toany action that can be exercised over the content both during creation anddistribution and its consumption by final users. Apart from rights, we need toconsider conditions, which restrict how rights can be exercised. MPEG-21 RELdefines different types of conditions, amongst which we find the following:temporal (e.g. from/to or time interval), payment (e.g. flat or per use fees to becleared), territorial (e.g. country or region) and the number of times the rightcan be exercised. Additionally, in order to cover a wider range of agreements,such as those offered in CC and others, some conditions should be added:attribution, exclusivity, non-territory. Finally, a new condition should beconsidered: the possibility to keep a percentage of the income generated byderived works.
Once authors can determine the rights they want to trade and theapplicable conditions, the same framework can act as a sales point whereother users (business or end users), to whom we call consumers, could getand clear licenses that grant them some rights or permissions under certainconditions. A license would, thus, formalise the ownership of rights by aconsumer and the related conditions. In that context, both authors andconsumers would need to be registered so as to be able to identify them andgenerate the corresponding licenses that act as proofs, since they areexpressed as digitally signed XML documents.
Once we have authors and consumers identified in the system, we can alsoprovide an advanced functionality that enables authors to trade content witheveryone or just with a limited and selected set of trusted users. We couldeven decide to offer different conditions for different sets of selected users,depending on our needs or will. In fact, this can be seen as a social networkfunctionality that empowers social relationships. It is important to remarkthat the author does not need for the permission of target users, since thesetargeted offers are not public and will be only accessible by target users whenaccessing that specific content in the framework or otherwise notified by theauthor, depending on the implementation. The only requirement is that theauthor is able to identify the target user by means of a nick-like identifier.
As we have seen with other initiatives, this framework can be managed byanyone, as long as security mechanisms are deployed so as to have a trustablesystem. In that sense, any of the following aspects will help: security audits,use of external timestamping services, use of digital signatures and

Reliable scholarly objects search and interchange framework
64
recognised X.509 certificates. The business model relying under theframework may be diverse, varying from the payment model to the freemodel. It is worth noting that the free model may be free for the generalpublic but not free for massive registration through applications that makeuse of a specific API. Other approaches may include the payment for somevalue-added services such as the usage of pseudonyms, advanced statistics,registration with more than one author, use of advanced and/or customisedlicensing models, preview images, etc., for which authors may appreciate areal and useful value so that they may be willing to pay.
In order to deal with the problems identified in section 2.3 for the CreativeCommons (CC) approach, the proposed framework separates licensing intotwo parts. First, authors decide how content is to be traded, by editing therights they offer and determining the conditions that apply to them. Thisedition is done through an intuitive and simple interface which hides thecomplexity of legal texts. Pre-defined templates are also available for commonlicenses. After selecting rights and conditions, an equivalent legal text isautomatically produced. Finally, any rights acquisition is formalized bymeans of a digitally signed license, expressed in a Rights ExpressionLanguage (REL) (e.g. MPEG-21 REL [20]), which links together consumeridentity, consumer rights and conditions and the content identification. Thus,a license acts as a proof for both the author and customer. Whenever thelicense does not state any temporal conditions, it will be forever. In general, alicense will apply as long as conditions are fulfilled. In this way, licensesequivalent to the CC models can be generated, but with the possibility ofadding new conditions such as those previously mentioned. On the otherhand, authors will still be able to modify the rights they offer from a givenmoment, but without affecting any licenses that might have been acquiredprior to the change. Another important feature proposed for the framework isthe possibility to search for content. Authors and consumers should be able toexpress complex conditions to filter the potentially huge amount ofdocuments. Current information retrieval technologies allow extending thetraditional search functionalities beyond the traditional keywords-based ormetadata-based querying. New approaches allow, for instance, searching forresearch papers containing potential image copyright infringements (throughcontent based image retrieval techniques). It would be desirable that both thetraditional and the advanced search functionalities would be providedthrough and open query interface for search, providing high expressivepower to allow users formulate sophisticated conditions over the scholarlyobjects’ metadata and contents (textual or audiovisual). We envisage that thisinterface is based on the MPEG Query Format (MPQF) [1]. MPQF is a recent

Reliable scholarly objects search and interchange framework
65
standard of the MPEG standardization committee (i.e. ISO/IEC JTC1SC29/WG11), which provides a standardized interface to multimediadocument repositories, including but not limited to multimedia databases,documental databases, digital libraries, spatio-temporal databases andgeographical information systems.
The MPEG Query Format offers a new and powerful alternative to thetraditional scholarly communication model. MPQF provides scholarlyrepositories with the ability to extend access to their metadata and contentsvia a standard query interface, in the same way as Z39.50 [21], but making useof the newest XML querying tools (based in XPath 2.0 [22] and XQuery 1.0[23]) in combination with a set of advanced multimedia information retrievalcapabilities defined within MPEG. This would allow, for example, queryingfor journal papers by specifying constraints over their related XML metadata(which is not restricted to a particular format) in combination with similaritysearch, relevance feedback, query-by-keywords, query-by-example media(using an example image for retrieving papers with similar ones), etc. MPQFhas been designed to unify the way digital material is searched and retrieved.This has important implications in the near future, when scholarly users’information needs will become more complex and will involve searchescombining (in the input and the output) documents from different nature (e-prints, still images, audio transcripts, video files, etc.).
4. Results
In this section we present the system we have developed, which tackles someof the problems identified in section 2.3, and which can be used not only fordealing with scholarly objects, but also for musical compositions, audiovisualworks and many other types of creations.
The Intellectual Property Operations System – Digital Shadow (IPOS-DS)[24] is a service-oriented architecture that consists of a main web application,accessible through a web browser, which interacts with different webservices. It also includes a user desktop application which deals with therendering of protected content. Figure 1 depicts the overall architecture.Further details can be found at [25] and [26].
IPOS-DS main features include: 1) Content registration and certification.The IPOS-DS system digitally signs an XML representation of any workregistered in the system including the identification of the work and author.Content ownership is ensured and content lineage can be traced thanks to thepresence of a reference to its ancestor (e.g. adaptation to work) in the

Reliable scholarly objects search and interchange framework
66
representation. 2) Content licensing according to MVCO and MPEG-21 RELcapabilities. Authors decide how they want to trade content and they canmodify it any time without affecting previous purchases. Conditions includenot only standard temporal limitations, territory restrictions, fees to be clearedand limited number of executions of the right, but also specific IPOS-DSconditions such as keeping percentage of the income generated by derivedcontent, and determining for whom rights will be available to be acquired.Customers formalise the rights’ acquisition through personal user-specificlicenses. 3) Content access and monitoring. Content is encrypted and can onlybe accessed by those who have purchased a license. For those users that areentitled to access content, it can be stored in clear so that they can use itwithout Digital Rights Management (DRM) restrictions. IPOS-DS keeps trackof the licenses being purchased and when content is accessed so that theauthors can have detailed usage information. 4) IPOS-DS provides searchinterfaces based on main content metadata fields.
Figure 1: The IPOS-DS System
IPOS-DS is still being improved in some aspects in order to fulfil all thefeatures proposed in section 3: 1) New conditions need to be added togenerate Creative Commons-equivalent licenses: exclusivity, attribution. 2) Athorough usability analysis is needed (e.g. use of license templates). 3)Provide better searching capabilities by adopting the MPQF approach. 4)

Reliable scholarly objects search and interchange framework
67
Interface with official IP registries or recognised timestamping services inorder to improve trust.
The IPOS-DS system was commissioned for development to the DMAG(Distributed Multimedia Applications Group) of the UPC (UniversitatPolitècnica de Catalunya) [27] by the company NetPortedItems S.L. (NPI) [24],which is responsible for its exploitation. It has been made accessible [24] forthe public in a pre-exploitation phase.
Regarding the business model, IPOS-DS can be exploited independentlyby a private company, or even adopted by collecting societies, as it providesmuch added value by offering their constituents and other users that latermay become members the benefit of their collective management services.
5. Conclusions
In this paper we have identified several initiatives that deal with theprotection and management of intellectual property rights, which can beapplied to scholarly objects.
After describing their main features and analysing their operation, wehave identified the drawbacks of current systems and proposed a set ofdesirable functionalities that an intellectual property registry should have.Our proposal has been made with the aim not only to give protection toauthors in terms of copyright but also to give them the freedom to trade theircontent and provide powerful and innovative searching capabilities in astandardised and automated manner.
Finally, we have also presented the IPOS-DS [24] system, which partiallyimplements the proposed features and which will be extended to fulfil them.
Acknowledgements
Part of this work has been supported by the Spanish administration:Multimedia Content Management Life Cycle project, TEC2008-06692-C02-01.
References
[1] ISO/IEC 15938-12:2008 “Information Technology -- Multimedia ContentDescription Interface -- Part 12: Query Format”.
[2] Creative Commons, http://creativecommons.org/.[3] ISO/IEC FDIS 21000-19. Information technology - Multimedia
framework (MPEG-21) - Part 19: Media Value Chain Ontology.

Reliable scholarly objects search and interchange framework
68
[4] Turnitin, http://turnitin.com/[5] World Intellectual Property Organization (WIPO). About Intellectual
Property, http://www.wipo.int/about-ip/en/[6] World Intellectual Property Organization (WIPO). Understanding
Copyright and Related Rights, http://www.wipo.int/freepublications/en/intproperty/909/wipo_pub_909.html
[7] Spanish Intellectual Property Registry,https://wwws.mcu.es/RPIntelectual
[8] US Intellectual Property Registry, http://www.copyright.gov/eco/[9] Flickr, http://www.flickr.com/[10] Creative Commons licenses, http://creativecommons.org/licenses/[11] CCPlus, http://wiki.creativecommons.org/CCPlus[12] gettyimages, http://www.gettyimages.com/[13] ImageStamper, http://www.imagestamper.com/[14] SafeCreative, http://www.safecreative.org/[15] GNU licenses, http://www.gnu.org/licenses/[16] Writers’ Copyright Association, http://www.wcauk.com/[17] Webmasters Copyright Association, http://www.wmcaglobal.org/[18] Musicians’ Copyright Association, http://www.mcaglobal.org/[19] XML-Signature Syntax and Processing W3C recommendation,
http://www.w3.org/TR/xmldsig-core/.[20] ISO/IEC, Information Technology – Multimedia framework (MPEG-21)
– Part 5: Rights Expression Language, ISO/IEC 21000-5:2004.[21] ISO 23950. Information Retrieval (Z39.50): Application Service
Definition and Protocol Specification.[22] XML Path Language (XPath) 2.0. W3C Recommendation. 23 January
2007, http://www.w3.org/TR/xpath20/.[23] XQuery 1.0: An XML Query Language. W3C Recommendation. 23
January 2007, http://www.w3.org/TR/xquery/.[24] IPOS-DS (Intellectual Property Operations System – Digital Shadow),
http://www.digitalmediavalues.com/.[25] TORRES, V.; DELGADO, J. et al. A web-based rights management
system for developing trusted value networks. Proc. of the 18thInternational World Wide Web Conference Developer’s Track, p. 57-59.
[26] TORRES, V.; DELGADO, J. et al. Enhancing rights management systemsthrough the development of trusted value networks. Proc. of the 7thInternational Workshop on Security in Information Systems, pp. 26-35.
[27] Distributed Multimedia Applications Group (DMAG),http://dmag.ac.upc.edu/.

69
A collaborative faceted categorization system –User interactions
Kurt Maly; Harris Wu; Mohammad Zubair
Old Dominion University, Norfolk, VA, USA
AbstractWe are building a system that improves browsing and searching access to alarge, growing collection by supporting users to build a faceted (multi-perspective) classification schema collaboratively. The system is targeted inparticular to collections of photographs and images that, in general, have fewtextual metadata. Our system allows users to build and maintain a facetedclassification schema collaboratively and have the system help to classifydocuments into the evolving facet schema automatically. This paper focuseson the evolution of faceted classification schema for a large growingcollection.
Keywords: collaborative faceted classification; schema enrichment;anomaly detection; user feedback; category ordering.
1. Introduction
We are building a system that improves browsing and searching access to alarge, growing collection by supporting users to build a faceted (multi-perspective) classification schema collaboratively [1,3].The system is targeted in particular to collections of photographs and imagesthat, in general, have few textual metadata. A facet is an attribute(dimension) of an item in a collection that gives one perspective of that item.For example, in a collection of wine, “color” could be one facet. Other facetscould be “origin”, “price”, etc. for the wine collection. This allows differentusers to navigate the collection using the facet of most interest to them. Whatis a good set of facets for a given collection is very much dependent on thegiven collection and the target users. Some example commercial sites that usefacet-based classification are Amazon and eBay. The facets can evolve withtime because of change in target users or change in interest of existing users in

A collaborative faceted categorization system – User interactions
70
how they want to navigate the collection. For example, after a given facetschema has stabilized there may be a need to add another facet, for example,“healthy ingredients” for the wine collection. Some example categories in thisfacet are resveratrol, flavonoids, and non-flavonoids. For collections that growin both volume and variety, a major challenge is to evolve the facet schema,and to reclassify existing objects into the modified facet schema. Centrallymanaged classification systems often find it difficult to adapt to evolvingcollections. It is hoped that through users’ collective efforts the facetedclassification schema will evolve along with the user interests and thus helpthem navigate through the collection quickly and intuitively. Our system (a)allows users to build and maintain a faceted classification collaboratively, (b)enriches the user-created facet schema systematically, and (c) classifiesdocuments into an evolving, user-managed facet schema automatically.Readers can explore the current system by browsing the African HistoryImage Collection on our website (http://facet.cs.odu.edu/), shown in Figure 1.In order for the faceted categorization to be effective in our system: (a) thereneeds to be a sufficient set of categories; (b) improper categories need to beremoved, and (c) the schema’s size needs to be regulated.
Figure 1: Screenshot of the system front page
In this paper, we focus on the enrichment and evolution of facetbased classification for a large growing collection. First, we review thebackground of tagging and classification. Then we present an approach onschema enrichment that utilizes a statistical co-occurrence algorithm toproduce possible new categories based on the existing metadata. In addition,we present an algorithm that harnesses the lexical power of WordNet in order

A collaborative faceted categorization system – User interactions
71
to detect possible anomalies in the evolving category schema. We also presenta statistical algorithm to visually rearrange the schema in the navigation panelof the user interface in order to minimize the time spent finding relevantitems. Finally, we discuss an approach to capture user feedback onclassifications produced by an automated process in order to control thequality of the overall classification.
2. Background
In this section we summarize previously reported related research [1].Categories represent a way content is organized into a structure that is bothmeaningful and traversable and which allows for objects to be easily retrievedfor later usage. Images, in particular, need such organization because animage itself is not easily searchable for any specific information that is usefulto the requestor. A commonly used approach is “tagging” images withkeywords which can later be searched for. However, tags do not fully allowfor browsing a collection by selecting and narrowing down collective criteria.It is categories that allow for multiple images that share common traits to bearranged together and, consequently, found together. Faceted categorizationis an extension to the common category structure. Facets allow for an image tobelong to more than one collective criterion (the facet). Within each facet, aregular, multi-tier category structure is developed. By allowing an image toposses several descriptive categorizations, browsing for specific needsbecomes much easier.
Traditionally, tagging and categorization in image classificationsystems have been the tasks of two dissimilar human groups. Tagging animage with keywords is generally the task of the users of the system. Itrepresents their ability to associate what they are seeing with an idea or anobject which they can easily recall later and search for. Very little input isneeded by an administrative entity to collect and support such metadata.Faceted categorization systems, on the other hand, are typically created andmaintained by a central entity. Facets and categories are created by theadministrator and, with the exception of occasional changes, remain verymuch the same. As a result, many users’ ideas of new classifications are notincluded in the schema which can potentially reduce the intuitiveness ofbrowsing the collection.
One major obstacle for a user-created facet schema is its initial qualitywhen compared to a centrally-compiled facet schema. Collaborative facet

A collaborative faceted categorization system – User interactions
72
schema building depends on users’ continuous improvement over time.Initially, a new facet may not contain all pertinent categories it shouldcontain. The categories may have mixed-level or misplacement problems. Forexample, a user may create a “Location” facet with US states and cities as twolevels of categories. Many states may be missing from the user-created facetinitially. Some cities may be listed at the same level as states are listed. Somecities may be under the wrong states. Such data quality problems in the facetschema will burden users’ classification efforts, and potentially lead tomisclassification problems.
Several researchers have attempted to build topical ontology usingmetadata such as tags from social tagging. Reference [4] built a hierarchy ofFlickr tags. Similarly, [5] built a concept hierarchy on the image collectionprovided by the ImageCLEF 2005 conference. Both studies adapted thesubsumption model [2], a simple statistical co-occurrence model thatidentifies parent-child relationships: X subsumes Y if: P(x|y >= 0.8) and P(y|x< 1). For example, suppose X = “glass”, and Y = “stained glass”. If mostdocuments tagged with “stained glass” are also tagged with “glass”, then“glass” subsumes “stained glass”. In [7] researchers built a hierarchy ofdel.icio.us tags using graph centrality analysis. In [8] a faceted classification ofconcepts was built using WordNet, a large lexical database of English [9].References [9] and [10] have induced ontology using statistical NLP (naturallanguage processing) techniques for textual documents.
Several research projects have also attempted to categorize items intoa pre-existing ontology utilizing tags from social tagging. In [11] researcherswere able to map about 75% of the tags from social tagging applications to theDublin Core metadata standard elements (subject, date, title, description,format, publisher, etc.), so that the tags could be used for semantic webapplications. The researchers also attempted to augment the Dublin Corestandard with several proposed new elements, such as Action, Utility,Category, Depth, Notes and User name, so that another 20% of the tags can bemapped to these new metadata elements. In [12], the researchers built animage repository based on the hierarchical structure provided by Wordnet,utilizing search engine and large-scale human labelling efforts. The projectused the service of Amazon Mechanical Turk, an online platform on whichone can put up tasks for users to complete and to get paid. As of 2009, therepository collected 3.2 million human-labelled images and consisted of 12subtrees (a small subset of Wordnet): mammal, bird, fish, reptile, amphibian,vehicle, furniture, musical instrument, geological formation, tool, flower, andfruit. Quintarelli et al’s Facetag project [13] first manually creates a facetedclassification schema. Then, their system guides users’ tagging by presenting

A collaborative faceted categorization system – User interactions
73
the facets to users. The system encourages users to use facets instead of free-form tags through a thoughtfully designed interface. If a user enters a tag, thecompletion tool suggests similar categories from the pertaining facet. Ourresearch is similar to these projects in that we try to utilize large-scale humanefforts. In contrast to these projects, the multi-faceted category schema in ourapproach is created and evolved by users.
3. Schema Evolution
Facet and Category EnrichmentAs a collection grows new categories (or even facets) need to be created toimprove the user browsing experience.
We designed an algorithm that adds categories utilizing the metadatapool and a statistical co-occurrence model. The model identifies parent-childrelationship between x and y if all documents tagged with y are also taggedwith x (so-called subsumption) [2]. For example, if all images labelled with“liberty bell” are also labelled with “independence”, where “independence” isan existing category, the algorithm will suggest “liberty bell” as a subcategoryunder the “independence” category. For an existing tagword t in the metadatapool, the algorithm identifies all documents with tag t. If these documentshave a common category c, the rule of subsumption implies that t is a possiblesubcategory of c. We adapted the tool to our system and ran it on an AfricanAmerican History image collection and found the results encouraging enoughto include this in future version. For example, the following suggestions weremade:
Category Suggested sub-categoryAmerican Civil War military lifeChina boxer rebellion
The suggestion feature will be added to the user interface in the future so thatany user who is in the process of modifying the schema can receive instantrecommendations for the particular facet or category she is modifying.
Schema CleansingIn a collaborative classification system, it is likely that categories are createdunder the wrong facet, or child categories might represent a broader conceptthan the parent category. –To detect such anomalies we utilize WordNet [4].

A collaborative faceted categorization system – User interactions
74
WordNet is a semantic lexicon, which stores hierarchical relationships amongwords. The example below shows a hierarchy in WordNet starting with thesearch term “dog”.
dog, domestic dog, Canis familiaris => canine, canid => carnivore => placental, placental mammal, eutherian, eutherian mammal => mammal => vertebrate, craniate => chordate => animal, animate being, beast, brute, creature, fauna => ...This example describes the relation hyponymy. It is commonly known as “isa” relationship (“dog is a mammal”). An anomaly detection algorithm detectsissues by running a number of administrator-defined rules against the facetschema. An example of real anomalies detected is:
Category Parent Cat Grandparent Category ProblemPresident Holiday Politics more closely related to grandparent than to parent
4. Ordering of Schema Display
In a collaborative classification system, it is possible that a significant numberof categories are created under a given facet (or another category), or largenumber of facets are created.
For usability the system displays only a limited number of childcategories under a parent. The number of visible children, v, can beconfigured through the administrative user interface. While the initial display(see Figure 2) is limited to the first v categories, a “More” link (Figure 3)expands all categories under a node. A proper display order is critical to theusability of the system. The simplest display order would be an alphabeticalone.

A collaborative faceted categorization system – User interactions
75
Figure 2: Limiting category display using the “more…” link
Our system orders the display by a popularity (P) measure, whichfavors the biggest, most used, and fastest growing facets and categories. Thetotal number of items in a category (including subcategories) PN determinesthe biggest category. The growth rate of a category is produced by thenumber of new (recent) items for a unit of time (PR). Finally, a popularcategory will see a larger number of browsing hits (number of clicks on thecategory link in the browsing menu) which are measured over a period oftime (PC). We combine the measure by adjustable weights and a normalizingfunction f:
P = 0.5*f(PN*PC)+ 0.5*PR (1)The retrieval effort against a category is –in proportion to their size and thenumber of times they were accessed. Therefore, the first part of the popularitymeasure is a product of the atomic popularity values for size and browsingclicks. The latter, representing the number of new items in a category,symbolizes the categorizing effort. We believe that retrieval and

A collaborative faceted categorization system – User interactions
76
categorization are two equally important user actions that consume roughlyequal user efforts. Therefore, they are assigned equal weights after thenormalizing function f is applied. The weights can be adjusted for differentenvironments where browsing and categorizing consume unequal amount ofuser efforts.
Figure 3: Expanding category display using the “more…” link
5. Quality Assessment through User Feedback
Our Faceted classification system uses user feedback to assess the quality of aclassification and to remove it if needed. It is collected in the form of “thumb-up” and “thumb-down” buttons available for every association (see Figure 4).Users can vote up or down for the association between an image and acategory on the basis of how relevant and accurate they think it is. The valueof this explicit feedback determines when a classification can be deleted or,conversely, when it becomes “hard”, i.e., it is confirmed. Each feedback action

A collaborative faceted categorization system – User interactions
77
will update the confidence value of an association by increasing or decreasingit by 0.05 based on whether a user believes it is a correct classification or not.If the confidence value reaches 1.00, it is hardened and essentially becomes auser-created classification. On the other hand, if users vote an associationdown below the threshold value, the system will allow them to delete it.
Figure 4: Feedback on category associations
6. Conclusions and Future Work
In an open community, management is needed to avoid problems created bythe multitude of diverse users. This paper has presented several algorithms inthe areas of schema enrichment, cleansing and ordering. With theseautomated algorithms, the burden on the administrator is reduced toresponding to alarms and suggestions rather than laborious manual efforts.Future improvements include recording actual administrator actions fortraining purposes.
Notes and References
[1] K. Maly, H. Wu, and M. Zubair, “Automated Support for a CollaborativeSystem to Organize a Collection using Facets”, proceedings, CD-ROM,ELPUB, Milan, June 2009

A collaborative faceted categorization system – User interactions
78
[2] M. Sanderson and B. Croft, "Deriving concept hierarchies from text," inProceedings of the 22nd annual international ACM SIGIR conference onResearch and Development in Information Retrieval, 1999, pp. 206-213.http://citeseerx.ist.psu.edu/viewdoc/summary?doi=10.1.1.44.3667
[3] H. Wu, M. Zubair, and K. Maly, "Collaborative classification of growingcollections with evolving facets," in HT '07: Proceedings of the 18thconference on Hypertext and hypermedia. New York, NY, USA: ACMPress, 2007, pp. 167-170. Available at:http://dx.doi.org/10.1145/1286240.1286289
[4] Schmitz and Patrick, Inducing Ontology from Flickr Tags. Workshop inCollaborative Web Tagging, 2006.
[5] Clough, P., H. Joho, and M. Sanderson, Automatically OrganisingImages using Concept Hierarchies. Proceedings of MultimediaInformation Retrieval 2005.
[7] Heymann, P. and Garcia-Molina, H., Collaborative Creation ofCommunal Hierarchical Taxonomies in Social Tagging Systems.Stanford Technical Report InfoLab 2006-10, 2006.
[8] Yee, K.P., et al., Faceted Metadata for image searching and browsing.Proceeding of CHI 2003, 2003.
[9] Hearst, M., Automatic Acquisition of Hyponyms from Large TextCorpora. Proc. of COLING 92", Nantes, 1992.
[10] Mani, I., et al., Automatically Inducing Ontologies from Corpora.Proceedings of CompuTerm2004: 3rd International Workshop onComputational Terminology, 2004.
[11] Maria Elisabete Catarino and Ana Alice Baptista. "Relating folksonomieswith Dublin Core", Proceedings of the 2008 International Conference onDublin Core and Metadata Application, Berlin, Germany, Pages: 14-22,2008.
[12] J. Deng, W. Dong, R. Socher, L.-J. Li, K. Li and L. Fei-Fei, ImageNet: ALarge-Scale Hierarchical Image Database. To Appear in IEEE ComputerVision and Pattern Recognition (CVPR), 2009.
[13] Quintarelli, E., L. Rosati, and Resmini, A. Facetag: Integrating Bottom-up and Top-down Classification in a Social Tagging System. EuroIA2006, Berlin.
[14] Harris Wu, Kurt Maly and Mohammad Zubair, Harvesting socialknowledge from folksonomies. ACM Hypertext 2006, Odense,Denmark.
[15] Wu, Zubair, and Maly, 2007.

79
PROBADO3D – Towards an automatic multimediaindexing workflow for architectural 3D models
René Berndt1; Ina Blümel2; Raoul Wessel3
1 Computer Science, Graz University of TechnologyInffeldgasse 16c, A-8010 Graz, Austria
[email protected];2 German National Library of Science and Technology TIB
D-30167 Hannover, [email protected]
3 Institute of Computer Science II Computer Graphics, University of BonnD-53117 Bonn, [email protected]
AbstractIn this paper, we describe a repository for architectural 3D-CAD modelswhich is currently set up at the German National Library of Science andTechnology (TIB), Hannover, as part of the larger German PROBADO digitallibrary initiative: The proposed PROBADO-framework is integrating differenttypes of multimedia content-repositories and adding features available intext-based digital libraries. A workflow for automated content-based dataanalysis and indexing is proposed.
Keywords: Digital libraries, multimedia indexing, content-based retrieval
1. Motivation
The amount of newly generated multimedia content increases year by yearand the use of this complex, non-textual data are becoming more and moreimportant. However, this data is not analyzed and indexed sufficiently withinthe workflow of today’s digital libraries, which are focusing on textualdocuments. Even though a lot of research has been done on how to manage,search, retrieve and present multimedia documents, there is still the need forintegrating multimedia documents in existing library workflows. User-friendly tools must be developed so that both the management of multimedia

Towards an automatic multimedia indexing workflow for architectural 3D models
80
documents for librarians and the user access to these documents (bothcontent-based and in the conventional way of searching metadata) becomepossible.
Manual indexing multimedia content with keywords often results in a lossof information. To give an example: if a complex 3D model of a roof is justmarked with the keyword "roof", it is not identifiable as a flat roof, a pitchedroof or a cupola. In current document interpreting processes two differentpersons have to use the same keywords to make the document detectable: theperson interpreting the document and, to detect the document, the personwho is searching. Another issue is that authors are not motivated to extendtheir documents with metadata, even in the presence of suitable tools.Furthermore, it is also nearly impossible to interpret all existing datamanually. The result is that in most cases multimedia documents are “blackboxes” whose content could not be made accessible individually.
2. Introduction
As a concrete step into this direction, the ongoing cooperative German digitallibrary project PROBADO [1] aims for setting up a framework for integratingrepositories containing multimedia documents. The project targets to developan integrated workflow for both document handling and cataloguingaccording to the classical library workflow and content-based documentprocessing, i.e., making the collection accessible through content-basedretrieval, the latter involving automatic content-based document analysis andindexing.
To achieve these goals, project partners from the University of Bonn andGraz University of Technology, each having expertise in distinct areas ofmultimedia document analysis and retrieval, are cooperating with partners oftwo large German libraries, the German National Library of Science andTechnology in Hannover (TIB) and the Bavarian State Library in Munich(BSB).
Rather than being a pure research project, it is a special focus ofPROBADO to achieve long-term usage of the developed systems andworkflows at the cooperating libraries.
Two multimedia repositories are currently set up: one for architectural 3Dmodels at the TIB and one for music at the BSB. As key contributions, we
• describe methods to support automatic processing of generaldocuments in the library processing chain of document acquisition,annotation, search, delivery, and storage,

Towards an automatic multimedia indexing workflow for architectural 3D models
81
• develop and implement a common PROBADO platform serving as aweb-based access point for searching and accessing general documenttypes stored in the connected repositories. A service-orientedframework allows easy integration of new multimedia typerepositories,
• develop and implement PROBADO-enabled multimedia repositorieswhich are located at particular libraries and that are suitable for bothconventional and content-based access.
3. Related Work
Within this field there are related scientific initiatives for 3D search engines.There are the Princeton Shape Retrieval [2] group with content-based searchengines and Aim@Shape [3] with content-based and metadata based searchengines.
And there exists the former EU-project MACE 1 , that aims to connectvarious repositories of architectural knowledge and enrich their contents withmetadata. Searching and browsing are very much based on architects needs,e.g. by conceptual connection, geography, language, competence. The searchengine is only able to process metadata. There are no 3D models integrated.
1 http:// http://portal.mace-project.eu/
Figure 1. Use-case for integrating 3D models into PROBADO3D

Towards an automatic multimedia indexing workflow for architectural 3D models
82
4. Use-case: Import of 3D models into PROBADO3D
A repository for architectural 3D models is currently set up at the TIB inHannover. As being the German National Library of Science and Technology,the TIB references relevant scientific material for superregional supply oftechnical literature and data.
Momentarily, the repository contains about 7,000 building, constructionunit and object models which are converted, indexed and described withmetadata as well as approximately 13,000 models that are to be analyzed andindexed.
The source 3D model can be categorized into two major groups:• Models which are hosted by the contributor itself (Type-A Model) –
usually provided by architectural practices• Models which cannot be accessed through the internet (Type-B Model)
– e.g. a submission from a student’s master thesis.Especially Type-A models can be subject to access restriction by the
contributor, e.g. pay-per-view or IP-based access for certain groups. Usuallythe contributor has already implemented the technical details for access orpayment.
In the paper we will present the integration workflow (see Figure 1) formodels of Type-A and Type-B in detail.
5. Processing Pipeline
One major goal of the PROBADO project is to minimize the manualcataloguing work and to automatically generate the appropriate metadatawherever possible. As a 3D model normally does not bring along anydescribing data (if it is not catalogued in a database beforehand), the mainsource for first metadata is the automatic deduction.
The following steps are a short excerpt of the different stages of theprocessing pipeline for the input data (see Figure 2):
Upload 3D Model and Metadata
Upload 3D Model +Metadata
MetadataProcessing
Conversion of theSource 3D Input
Extraction ofTechnicalMetadata
Content-basedIndexing
Figure 2. Schematic overview of the PROBAD3D processing pipeline

Towards an automatic multimedia indexing workflow for architectural 3D models
83
The first step in the processing pipeline is the upload of the original 3D modeland optional metadata by the contributor. This functionality is provided by aSOAP-based web service. The data is submitted as a single archive (seeFigure 3), containing one XML file (METADATA.XML) and the 3D model file(plus additional files e.g. materials, etc. belonging to the model).
The archive is then extracted to the file system for further processing.Beside the upload of new data the web service also supports modifying the3D model and/or metadata of already uploaded data.
Metadata ProcessingThe metadata provided by the contributor (METADATA.XML) are stored inthe metadata database of PROBADO3D. Since the PROBADO projectconcentrates on content-based indexing, the only required metadata isinformation about the contributor. An excerpt of the optional metadata islisted in Table 1.
Conversion of the Source 3D InputFor easier indexing, searching and viewing, a copy of each model isnormalized and automatically converted into a uniform format for indexingand different formats for preview and delivery.
Due to the number of input formats it is not feasible for the content-basedindexer to implement support for all these formats. The OBJ format fromAlias Wavefront was chosen as the uniform format for indexing. Forpreviewing, the PDF format from Adobe was selected, because of the widedistribution of the Adobe Reader.
Table 1. Optional information included in the contributors’ metadataName DescriptionEvent Contains data about events (e.g. competition, seminar,
presentation)Title The title of the 3D model (not the filename)
Archive
METADATA.XML MODEL3D.3ds...
(Additional Files/Directories)
Figure 3. Archive file structure for the SOAP-based web service

Towards an automatic multimedia indexing workflow for architectural 3D models
84
Description A textual description of the 3D modelSubject Keywords or classification of the 3D modelLocation A geographic reference to a real buildingObject A reference to a real buildingExternalInfo Contains additional information about external providers,
eventsRelation To define relations between models
Most of the tools used for this task during the design phase supportedonly semi-automatic conversion or had license restriction in terms of usage asa service. In order to provide a fully automatic conversion for the workflow,DeepServer from Right Hemisphere was chosen. The following requirementsfor the conversion module were verified:
Automatic conversion By using a watched folder DeepServer canexecute a custom defined workflow on adding files to this folder.For the evaluation the input formats were converted to OBJ, PDF,and PNG (thumbnail).Support of all input formats DeepServer supports a largenumber of input formats. Even proprietary formats like the MAXformat can be used if the appropriate software is installed.Licence The licence of DeepServer allows usage and deploymentas a service.
Extraction of Technical MetadataTechnical metadata of the 3D model are automatically extracted during theconversion process. These include number of vertices, polygons, textures, etc.which can provide an approximate estimate about the model complexity. Thistask is also performed by DeepServer (see Figure 4); the resulting technicalmetadata are stored in the metadata database of PROBADO3D.
<keyframeanimated>False</keyframeanimated>
<NumObjects>39</NumObjects>
<NumPolygon>17819</NumPolygon>
<NumTextures>2</NumTextures>
<SoftbodyAnimated>False</SoftbodyAnimated>
<AnimationLength>0</AnimationLength>
<NumVertices>10171</NumVertices>
<TextureLinks>True</TextureLinks>
<UVMapped>True</UVMapped>
<XMin>-434.3582</XMin>
<XMax>3345.902</XMax>
<YMin>-724.8393</YMin>
<YMax>2269.562</YMax>
<ZMin>-0.04620994</ZMin>
<ZMax>722.0472</ZMax>
Figure 4. Technical metadata of a 3D model extracted by DeepServer

Towards an automatic multimedia indexing workflow for architectural 3D models
85
Content-based IndexingIndexing of architectural 3D models is a prerequisite for content-based queryby example and document browsing. By creating a concise object description,the similarity between two 3D models can be computed. In the last years,automatic content-based indexing research resulted in the detection of manyindexing characteristics especially in the lower layers of semantic, i.e.characteristics relying on rather pure geometrical shape content. For adetailed overview of these algorithms we refer to [8]. We compute global andlocal low-level semantic features for characterizing architectural components.In a query-by-example scenario where the user either uploads an existing 3Dcomponent or uses a sketch-based PROBADO3D interface to generate one, thesearch for similar objects in the database is conducted using global shapefeatures based on spin-images [9] which are easy to compute and guaranteefast response times of the query engine. For browsing the PROBADO3Drepository based on shape similarity, we comprehensively characterize thecomponents using high quality local shape descriptors and special distancemeasures tailored to the requirements of architectural 3D models [6].
While low-level semantic features are an effective means to characterizethe geometric shape of an object, they are not well-suited to describe thestructure of building models which is mainly defined by the topology ofrooms and floors. To overcome this drawback, we introduced the concept ofRoom Connectivity Graphs [4]. These graphs are especially designed tocapture the topology of buildings. Rooms are represented by vertices, andconnections between rooms like doors, windows, stairs, etc. are representedby edges. The graph is additionally enriched by semantic attributes like thedimension of rooms or the type of the connection. By that, users can search forbuilding models that contain a certain spatial configuration of rooms. For thedefinition of such configurations we provide a graphical user interface.Additionally, the search can be further constrained regarding e.g. the area ofcertain rooms.
Content-based indexing of components using global and local low-levelfeatures works completely automatic and does not require manual dataprocessing. The extraction of Room Connectivity Graphs however requiresthe building models to be oriented in a consistent way, i.e. the object’spositive Z-axis must point towards the virtual sky. Additionally, the scale ofthe object must be known. In our experience so far it shows that thisrequirement does not lead to an increased amount of manual preprocessinginteraction. In many cases, the scale is contained as metadata in theunderlying 3D model data. Additionally, when presented a new charge of

Towards an automatic multimedia indexing workflow for architectural 3D models
86
models from a content-provider, orientation and scale is usually consistentwithin one batch and therefore only requires minimal manual interaction.
Generation of High-Level MetadataThe afore described indexing techniques involving local shape descriptorsand Room Connectivity Graphs serve as a starting point for fully automaticgeneration of high-level 3D object metadata. For predicting the objectcategory of architectural components, we developed a supervised learningframework [6]][5][7] that classifies components according to their associatedlocal shape descriptors. To this end it incorporates shape knowledge about alarge number of manually classified architectural components contained inthe Architecture Shape Benchmark [7]. The shape classification in thisbenchmark was created according to common architectural shape taxonomies.
The extracted Room Connectivity Graphs provide a large amount ofinformation about building models that is important to architects. Forexample, we automatically extract the number of building floors, room areas,gross floor area, window areas per room and per floor, number of rooms perfloor etc.
The resulting high-level metadata is finally stored in the PROBADO3Dmetadata database, allowing the user to textually search for components
Figure 5. Content-based indexing workflow

Towards an automatic multimedia indexing workflow for architectural 3D models
87
belonging to certain object categories as well as to search for building modelsfulfilling certain spatial specifications, e.g. concerning the number of floors orthe gross floor area.
6. Conclusion and Future Work
Most parts of the processing pipeline have already been implemented. Theintegration of DeepServer is planned for the next project phase. The proposedworkflow will then be established as a service at the German National Libraryof Science and Technology.
Future work will concentrate on improving the automatic classificationand processing of the 3D models. Similar to the above describedcategorization of components, we will additionally examine how buildingmodels can be automatically classified according to their Room ConnectivityGraph.
One additional content-based indexer using semantic enrichment methodsbased on procedural shape representations [10] is currently implemented andintegrated into the PROBADO3D system. By fitting a proceduraldescription to the target model the semantic information carried with thegenerative description can then also be applied to the target model (e.g.number of columns, stairs, etc).
AcknowledgmentsPROBADO is a joint research project supported by the German ResearchFoundation DFG under the LIS program. PROBADO started in February 2006with a tentative duration of five years. Partners are the University of Bonn,Technische Universitaet Darmstadt, Graz University of Technology, theGerman National Library of Science and Technology in Hannover, and theBavarian State Library in Munich.
The work presented in this paper was partially supported under grantsINST 9055/1-1, 1647/14-1, and 3299/1-1. For further information, please visitthe project website at http://www.probado.de/.
Towards an automatic multimedia indexing workflow for architectural 3D models
88
References
[1] BERNDT, R.; KROTTMAIER, H.; HAVEMANN, S. and SCHRECK, T.The PROBADO-Framework: Content-based Queries for Non-TextualDocuments. In Proceedings 12th International Conference on ElectronicPublishing (ELPUB 2009), 2009,pp. 485-500.
[2] SHILANE, P.; MIN, P.; KAZHDAN, M.; FUNKHOUSER, T. ThePrinceton Shape Benchmark. In Shape Modeling International (June 2004).
[3] FALCIDIENO, B. Aim@Shape Project Presentation. In Proceedings of Int.Conference on Shape Modeling and Applications, 2004, pp. 329.
[4] WESSEL, R.; BLÜMEL, I.; KLEIN, R. The Room Connectivity Graph: ShapeRetrieval in the Architectural Domain. In Proceedings of The 16-thInternational Conference in Central Europe on Computer Graphics,Visualization and Computer Vision'2008, UNION Agency-Science Press,February 2008.
[5] WESSEL, R.; KLEIN, R. Learning the Compositional Structure of Man-MadeObjects for 3D Shape Retrieval. To appear in Proceedings of 3rdEUROGRAPHICS Workshop on 3D Object Retrieval, May 2010.
[6] WESSEL, R.; BARANOWSKI, R.; KLEIN, R. Learning Distinctive LocalObject Characteristics for 3D Shape Retrieval In Proceedings of Vision,Modeling, and Visualization 2008 (VMV 2008), pp. 167-178,Akademische Verlagsgesellschaft Aka GmbH, Heidelberg, October2008.
[7] WESSEL, R.; BLÜMEL, I; KLEIN, R. A 3D Shape Benchmark for Retrievaland Automatic Classification of Architectural Data In Proceedings ofEurographics 2009 Workshop on 3D Object Retrieval, pp. 53-56, March2009.
[8] TANGELDER, J. W. H.; VELTKAMP, R.C. A survey of content based 3Dshape retrieval methods. Multimedia Tools and Applications, volume 39,2008, pp. 441-471.
[9] JOHNSON, A. Spin-Images: A Representation for 3-D Surface Matching.PhD thesis, Robotics Institute, Carnegie Mellon University, August,1997.
[10] ULLRICH, T.; SETTGAST, V. and FELLNER, D.W. Semantic Fitting andReconstruction. In: Journal on Computing and Cultural Heritage 2008(1),pp. 1201-1220.

89
WHAT WE BLOG?A QUALITATIVE ANALYSIS OF RESEARCHERS' WEBLOGS
Helena Bukvova; Hendrik Kalb; Eric Schoop
Chair of Business Informations, esp. Information Management,Faculty of Business and Economics,Dresden University of Technology
Dresden, Saxony, Germanye-mail: {helena.bukvova, hendrik.kalb, eric.schoop}@tu-dresden.de
AbstractTraditionally, academic researchers have been using platforms such as conferences, academic journals andbooks to present their findings and engage in academic discourse with their peers. The development ofInformation and Communication Technologies provides researchers not only with new tools, but also withnew means of interaction. Among the new platforms are also weblogs (blogs). Formerly defined as `onlinelogbooks', blogs can be used for a variety of purposes. A small but growing number of researchers writeresearch related blogs. In this paper we present a qualitative, explorative study, carried out with the aim ofdescribing and structuring information provided by academic researchers in their blogs. We describe aframework for categorising blogs and blog posts as well as patterns of blogging behaviour we have observed inresearch blogs.
Keywords: weblogs, blogs, research blogs, scientific blogging, scientific communication;
1. Introduction
Academic research as part of science has a long tradition. It has developed over centuries to gain today’s formand rules and it is being developed still. The contact to other researchers, the academic discourse, plays animportant role in academic research [1]. This exchange is often triggered by the publication of research results.By making their findings and their expertise public, academic researchers invite the opinions and criticisms oftheir peers. Through the issuing discussion, ideas and concepts can be refined and developed. Furthermore, theacademic discourse and the social exchange among the researchers influences personal development andcareer paths. The platform for the communication of scientific finding depends on the progress of the inquiry.Traditionally, researchers were using conferences, academic journals and books for their publishing. The recentdevelopment of Information and Communication Technologies provides researchers not only with new tools,but also with new means of interaction [2, 3]. How far does this change the established practices? How doresearchers use the new tools and platforms? In this article, we focus on the use of weblogs by academicresearchers.
The term ‘weblog‘ emerged in 1997/1998 and shortly afterwards it was abbreviated to blog [4, 5, 6]. Blogsare web pages with a list of dated entries that are typical displayed in a reverse chronological order [7]. Mostblogs combine text, images, and links to other blogs and web pages and allow the readers to comment blogpostings, generally in a mediated manner, where the blog host retains control [6]. Beside the reverse

What we blog? A qualitative analysis of researchers’ weblogs
90
chronological order, other typical features of blogs are an individual ownership, a hyperlinked post structure,and an archival of postings [8]. The aims and target groups of blogs can differ and the entries vary from shortopinions or references to large reports with citations. Herring [6] names as the purpose of blogs filters (withpostings about other web pages), personal journals (with the blogger’s thoughts and internal workings),knowledge logs (with relevant references about a particular knowledge domain), and mixed purposes. In thescientific world, blogs are well established for a fast dissemination of information. Portals like ScienceBlogs [9]or Scientificblogging [10] have evolved, which aggregate and organize scientific blogs about different subjects.
The use of blogs in science has already been a subject to some interest. The existing literature focuses on thepotentials and risks of blogs as well as the motives of bloggers [11, 12, 13]. Yet this field is comparatively newand blogging scientists still represent only a fragment of the scientific community. A systematic inquiry aboutthe use of blogs by researchers is therefore still missing. In this paper we present a qualitative, explorativestudy, carried out with the aim of describing and structuring information provided by academic researchers intheir blogs. Our findings show that other factors have to be considered when viewing research blogs besidesjust the type of produced content [6]. We also describe patterns observed in the studied sample that illustratethe blogging behaviour of the blog authors. Although still to be seen as a research in progress, our findings canoffer a new approach to analysing the role of blogs in scientific communication.
2. Method
This article describes an empirical study carried out to provide better understanding of the use of weblogs byresearchers. At the moment, blogging behaviour particularly in science and research is still unexplored. Wehave therefore carried out an explorative study analysing the information that researchers publish in blogs. Thestudy is a part of a larger research design, exploring what information researchers publish about themselves onthe Internet.
To focus our work, it was necessary to operationalise and further to define the facets of this topic. Firstly,when defining who will be seen as researcher, we chose to concentrate on academic researchers. Academicresearch (also scholarly research, scientific research) is a crucial part of science. Science uses research, a processof systematic inquiry, as means of gaining new knowledge [14, 15]. However, not all research takes place inscience. Academic research has to fulfil very specific criteria [16, 17], e.g. be public, replicable, unprejudiced,independent and it must advance the state of the art. Research outside these restrictions is non-scientific. Anacademic researcher, thus, is an individual professionally engaged in academic research. In the rst place, weconsidered individuals working at academic institutions (mainly universities) to be academic researchers. Asdescribed below, we have sampled German researchers. In Germany, the understanding of academia is verymuch influenced by the Humboldian ideal of unity of research and teaching [18]. Viewing German academicstaff as academic researchers thus appears appropriate. We have further viewed as academic researchersindividuals working at scientific institutes. Also, individuals engaged in academic qualification (dissertationand habilitation [19]) and affiliated to academic institutions were considered academic researchers. Secondly,we viewed only the activity in blogs directly connected to the researchers. These were those blogs, where theresearchers figured as authors or co-authors. Finally, we focused on research-related information and selectedthe blogs accordingly. Clearly private blogs (e.g. travel blogs, hobby blogs) were excluded from the study.Private information in blogs (e.g. blog post related to private interests or activities) were noted, but notanalysed. The study was based on the following research question:
What professional information do academic researchers publish in their blogs?

What we blog? A qualitative analysis of researchers’ weblogs
91
The research design method was derived mainly from the Grounded Theory Method, also using aspects ofanalytic induction [20] and matrix analysis [21]. The research was based on the constructivist understanding ofreality. We assume, that individuals create subjective reality in a process of construction [22]. Theunderstanding of the subjective reality of other individuals is limited and can take place only throughcommunication [23]. As researchers, we are thus not objective entities, but actively influence the findings byour interpretations. With regard to this position, we have based the exploration on the principles ofconstructivist grounded theory [24]. The Grounded Theory Method is “a systematic qualitative approach todata collection and analysis, that is concerned with generating theory” [25]. Key features of grounded theoryare a structured, but highly iterative procedure of simultaneous data collection and analysis, based on constantcomparison between already coded and new data samples [26].
Our study can be divided into two distinct though interconnected stages. In both stages, a sample ofresearchers was selected and analysed. In the first stage, a sample of n = 5 researchers has been purposivelyselected [27, 28]. Our aim was to find researchers, who not only had a research blog, but whom we alsoexpected to be actively engaged online. We therefore chose researchers, who also had a Twitter account. Weunderstood the engagement in both blogging and microblogging as an indicator of high level of onlineengagement. The Twitter streams were, however, not a part of our analysis. The researchers were all engagedat an academic institution in different positions (research assistants as well as professors). The sample includedboth male and female researchers, coming from three distinct areas: linguistics, literature, and cultural studies,social sciences, and natural sciences and mathematics. These areas were defined according to the GermanFederal Statistical Office. For each researcher, we viewed the blog and collected the last 15 blog posts andanalysed. We chose not to collect more, because we assumed that blogging behaviour develops and changesthrough time. For our study, we preferred to take a snapshot of blogging activities. This data was analysed andcoded using the qualitative-data-analysis software AtlasTI [29]. We started with in vivo coding (i.e. using termsor phrases used by the researchers) [30, 26], later developing further codes and categories. The analysis processwas highly iterative. The results of the analysis were two categories describing information in blogs based onthe researchers’ engagement in the virtual environment (see Results). At this point a second sample was drawnusing dimensional sampling [31]. Using the dimensions sex, academic position and area, we drew a sample ofn = 12 blogging researchers, each representing one combination of the considered factors. Again, we viewedtheir blogs and collected and analysed 15 last blog posts for each researcher, leaning on the identifiedcategories. As a result of this second stage, we have described five patterns of blogging behaviour.
When selecting the researchers for our analysis, we have also considered ethical issues. Although the datain the researchers’ blogs is publicly accessible and thus technically public, we consider it a private property ofthe authors. As such, it has been created with a certain purpose. Although research blogs are generallyaddressed to the broad public, the authors still may not be comfortable with the use of their blogs for researchpurposes [32]. Therefore, all selected researchers were contacted per e-mail, informed about the research andasked for permission to use the content of their blogs. Three researchers did not give their permission and twodid not reply. These were then removed from the samples and replaced, to gain the samples described above.Furthermore, to protect the researchers’ privacy, we have used a very broad classification of the consideredresearch areas and we refrained from using any direct quotes or material from their blogs.
3. Findings
The findings discussed here are a result of an integrative analysis of the first sample and the subsequentanalysis of the second sample with the developed categories. They are to be seen as preliminary results of aresearch still in progress (see Conclusions).

What we blog? A qualitative analysis of researchers’ weblogs
92
Before exploring the blog posts, we examined the blog itself, including static pages and widgets. Each blogincluded in the study was clearly attributed to an individual researcher. The researchers stated their names andnearly all of them also stated their affiliation to an academic institution or an institute. A photo was also mostlyincluded. More than a half of the researchers also provided links to other online profiles (web pages, socialnetworking profiles, Twitter and others). All researchers write their posts in the first person and address anaudience, more or less directly. This includes directly stating the audience in the blog description, ordering theposts according to the audience as well as addressing or questioning the audience in the posts. Whereresearchers stated the purpose of their blogs, they often noted the desire to share. Even for researchers who didnot make the purpose of their blogs explicit this desire was visible in their blog posts: to share knowledge,experience or simply interesting information.
In our analysis, we have recognised a key category, describing the researchers’ engagement in the virtualworld, in this case in their blogs. The engagement is defined by the type of the content the researchers produceand its verbosity. Content and verbosity can be each described by three subcategories.
Content. The content of the blog posts varied greatly not only among the blogs but also within each blog.We have isolated three types of content authored by the researchers: expertise, activity and identification.Expertise-related content provides information on particular topic. We have termed it ‘expertise’, assuming it istypically related to the author’s research area or area of interest. This assumption is in most cases confirmed bythe expression of the author within the blog post. Further, researchers often report about the activities theyengage in, both related to research and teaching. Very typical are reports from conferences and workshops.Finally, some content is apparently dedicated to describing the researcher as a person. These includedescriptions of interests, personal information or purely reflexive posts. Content of this type identifies theauthor as a ’real’ person, existing outside the virtual platform. Although the three content categories aresufficiently clear-cut, they are often combined in single blog posts. For example, an activity related contenttriggers a fluent shift towards an expert explanation of a particular topic. Similarly, a description of experiencecan lead the authors to reflect on themselves as individuals.
It was interesting to observe the role of external resources in blog posts. These are resources (content,media, events, people) outside the blog. Blog posts often contain links or references to external resources. Insome manner, this reminds us of the citation practice in scientific publication. However, in some posts, theexternal resource plays the chief role in shaping the content of the post. We have distinguished two cases:either the resource was the apparent trigger of the content (these are typically placed in the beginning of thepost) or it is used as a major illustration (appearing further on). In both cases, such posts appear to be writtenwith the purpose of presenting these resources. We have termed such crucial resources ‘Fundstücke’ (Germanfor finds). Connected to their use is typically an explicitly declared wish to share them. Often the authors notethat they have found them and wished to share them. A common note is also, that the authors had thisFundstück for some time and wished to show it to others. Fundstücke are very typical for expertise-typecontent and they appeared to play a major role in the blogs we have examined.
Verbosity. Besides viewing the content type, we have also recognised, that the researchers show differentforms and level of involvement. This verbosity of content can be viewed and measured with regard to threeareas: level of detail, personalisation, and interaction. Level of detail describes how much information do theresearchers provide about the particular topic. Personalisation measures how far the authors relate tothemselves (e.g. give their opinions, judgements). Interaction gives the intensity of the authors’ exchange withthe audience as well as the potential for such an exchange. None of these measures is simply quantitative. Eachform of verbosity leads to the production of more words and thus longer posts. A text analysis is necessary todescribe them in each post. The ‘measuring’ is thus subjective.
Patterns. Viewing the content and the verbosity, we have attempted to describe the distributions. Althoughthis was not very meaningful, given the limited size of our sample, by combining the dimensions content andverbosity, we were able to identify patterns. These patterns described the individual use of blogs byresearchers. Figure 1 illustrates these patterns within the content-verbosity portfolio. The content types are

What we blog? A qualitative analysis of researchers’ weblogs
93
given on the vertical axis and the verbosity on the horizontal axis. The width of the bars represents thefrequency of the content type and the colour intensity depicts the level of verbosity. Not all blog posts have tofollow the descriptions. The names of the patterns have a metaphoric meaning and should support quickassociation with the pattern description.
Presence. The first pattern is characterised through low levels of verbosity. The researchers (we found two inour sample) produced mainly expertise-type posts as well as some activity posts. These posts, although in onecase numerous, however contained a low amount of information. Most of them were based on externalresources and did hardly more than disseminate what was written elsewhere. Although the authors we presentin the blogosphere, they showed little engagement.
Knowledge base. This pattern was most common particularly among the researchers on the level of researchassistant as well as those coming from natural sciences. The posts are mainly expertise-oriented, with a highlevel of detail, but lower level of personalisation and interaction. The focus appears to be on the disseminationof information and the authors often mention the motive of sharing.
Expose. Particularly researchers on professorial level provided expertise- and activity-oriented posts,providing not only high level of detail, but also higher levels of personalisation. Researchers within this patternfocused not only on dissemination, but apparently also sharing their opinions and thoughts.

What we blog? A qualitative analysis of researchers’ weblogs
94
Figure 1: Blogging patterns
Visit card. Although we did not find this pattern in full, we have seen tendencies of development towardsthis pattern. A researcher writing a visit card blog would focus on activity and identification-oriented posts,with a high level of personalisation. Posts matching this pattern showed surprisingly low levels of detail - formore detail, the readers were supplied with links to external resources.
Communication platform. Again, we did not find a full demonstration of this pattern. However, someresearchers would very actively call for interaction and attempt to actively interact with their readers. A blog

What we blog? A qualitative analysis of researchers’ weblogs
95
that would fully follow this pattern would be expected to contain posts of different content, but highlypersonalised and interactive.
4. Conclusions
First, we have to point out, that given the nature of our sampling procedures, the data does not allow anyconclusions about the population of blogging academic researchers. Although some conclusions might bedrawn through analytical generalisation, we refrained from it in this article. The research presented here is tobe still seen as a research in progress. The small sample was acceptable in the described first stages of theresearch. It allowed a very detailed, iterative analysis, resulting in an analytical framework and a first typologyof blog and blog contents. However, it does not allow further verification of the results. To verify and furtherdevelop the findings, further research blogs and bloggers have to be included in the analysis. It is alsoinsufficient to include only German researchers. Only a fraction of German researchers uses either blogs orother Social Media and Web 2.0 applications [33]. We will therefore include international researchers in furtherresearch.
The purpose of our study was not to describe the blogging behaviour of the population of bloggingacademic researchers, but to explore the types of information that they provided in their blogs. In our study,we have viewed blog as a publication, possibly presentation platform of existing researchers. By seeing theauthor of the blog as a ‘real’ person engaged online, have been led to distinguish between the content and itsverbosity. This is a different approach from existing typologies, which focused mainly on content [6, 34]. Theverbosity can be interpreted as the authors’ engagement with the posts as well as the blog itself. The patternswe have derived rely strongly both on the content type and the verbosity, supporting the importance of bothfactors. The patterns we have observed, though they cannot be viewed as verified or generalisable, underlinethe focus on the individual bloggers an their blogs. This approach could be inappropriate in analysing privateblogs, because the offline identity of the authors is uncertain [35]. In case of research blogs, however, theauthors’ identity can be traced. Approaching blogs as platforms for presentation and not just for publishing offersnew views for discussing blogs in research.
Acknowledgements
The authors would like to thank all researchers, who have agreed to have their weblogs examined in thisstudy.
Notes and References
[1] P. A. DAVID, Patronage, reputation, and common agency contracting in the scientific revolution: Fromkeeping ’nature’s secrets’ to the institutionalization of ’open science’, SIEPR Policy paper No. 03-039,2004.
[2] H. KALB, H. BUKVOVA, E. SCHOOP, The digital researcher: Exploring the use of social software in theresearch process, Sprouts: Working Papers on Information Systems, vol. 9, no. 34, 2009.
[3] E. LEE, D. MCDONALD, N. ANDERSON, P. TARCZYHORNOCH, Incorporating collaboratory conceptsinto informatics in support of translational interdisciplinary biomedical research, International Journal ofMedical Informatics, vol. 78, pp. 10–21, January 2009.
What we blog? A qualitative analysis of researchers’ weblogs
96
[4] M. ALCOCK, Blogs - what are they and how do we use them?, Quill, vol. 103, no. 8, 2003.[5] R. BLOOD, Weblogs: a history and perspective, 2000.[6] S. C. HERRING, L. A. SCHEIDT, S. BONUS, E. WRIGHT, Bridging the gap: A genre analysis of weblogs,
in Proceedings of the 37th Hawaii International Conference on System Sciences - 2004, Jan 2004.[7] A. WILLIAMS, Internet-based tools for communication and collaboration in chemistry, Drug Discovery
Today, vol. 13, Jan 2008.[8] J. W. S. SIM, K. F. HEW, The use of weblogs in higher education settings: A review of empirical research,
Educational Research Review, Jan 2010.[9] http://scienceblogs.com/[10] http://www.scienti cblogging.com/[11] S. A. BATTS, N. J. ANTHIS, T. C. SMITH, Advancing science through conversations: bridging the gap
between blogs and the academy., PLoS biology, vol. 6, September 2008.[12] L. BONETTA, Scientists enter the blogosphere, Cell, vol. 129, pp. 443–445, May 2007.[13] J. WILKINS, The roles, reasons and restrictions of science blogs, Trends in Ecology & Evolution, vol. 23, pp.
411–413, August 2008.[14] K. BORDENS, B. B. ABBOTT, Research Design and Methods: A Process Approach. New York, NY, USA:
McGraw-Hill Humanities/Social Sciences/Languages, 7 ed., July 2007.[15] A. M. GRAZIANO, M. L. RAULIN, Research Methods: A Process of Inquiry. Boston, MS: Allyn & Bacon,
7 ed., February 2009.[16] L. J. HEINRICH, Wirtschaftsinformatik: Einführung und Grundlegung. München, Germany:
Oldenbourg, 1993.[17] S. M. SHUGAN, Consulting, research and consulting research, Marketing Science, vol. 23, no. 2, pp. 173–
179, 2004.[18] B. R. CLARK, The modern integration of research activities with teaching and learning, The Journal of
Higher Education, vol. 68, no. 3, pp. 241–255, 1997.[19] Habilitation is the highest academic quali cation available in Germany as well as in a number other
European countries, where this quali cation enables the individual to get a professorship. A habilitationcan be earned after obtaining a doctoral degree, i.e. dissertation. The habilitation process is similar to thedissertation, however the level of scholarship is expected to be much higher.
[20] J. LATHLEAN, Qualitative analysis, in The research process in nursing (K. Garrish and A. Lacey, eds.), pp.417–433, London, UK: Blackwell Publishing, 5 ed., 2006.
[21] M. B. MILES, A. M. HUBERMAN, Qualitative Data Analysis - An Expanded Sourcebook. London, UK:Sage, 2nd ed., 1994.
[22] E. VON GLASERSFELD, Thirty years constructivism, Constructivist Foundations, vol. 1, no. 1, pp. 9–12,2005.
[23] G. RUSCH, Understanding – the mutual regulation of cognition and culture, Constructivist Foundations,vol. 2, pp. 118–128, March 2007.
[24] J. MILLS, A. BONNER, K. FRANCIS, The development of constructivist grounded theory, InternationalJournal of Qualitative Methods, vol. 5, no. 1, 2006.
[25] I. HOLLOWAY, L. TODRES, Grounded theory, in The research process in nursing (K. Garrish and A. Lacey,eds.), pp. 192–207, London, UK: Blackwell Publishing, 5 ed., 2006.
[26] K. CHARMAZ, Constructing Grounded Theory - A practical Guide Through Qualitative Analysis.London, UK: Sage, 2006.
[27] J. M. MORSE, Sampling in grounded theory, in The SAGE Handbook of Grounded Theory (A. Bryant and K.Charmaz, eds.), pp. 229–244, London, UK: Sage, 2007.
[28] D. A. DE VAUS, Surveys in Social Research. London, UK: Routledge, 5 ed., 2002.[29] http://www.atlasti.com/

What we blog? A qualitative analysis of researchers’ weblogs
97
[30] K. CHARMAZ, Qualitative interviewing and grounded theory analysis, in Inside Interviewing: New Lenses,New Concerns (J. A. Holstein and J. F. Gubrium, eds.), pp. 311–330, Thousand oaks, CA, USA: Sage, 2003.
[31] L. COHEN, L. MANION, K. MORRISON, Research Methods in Education. Abigdon, UK: Routledge, 6thed., 2007.
[32] M. BAKARDJIEVA, A. FEENBERG, Involving the virtual subject, Ethics and Information Technology, vol. 2,pp. 233–240, December 2000.
[33] D. KOCH, J. MOSKALIUK, Onlinestudie: Wissenschaftliches arbeiten im web 2.0, 2009.[34] W. MACIAS, K. HILYARD, V. FREIMUTH, Blog functions as risk and crisis communication during
hurricane Katrina, Journal of Computer-Mediated Communication, vol. 15, no. 1, pp. 1–31, 2009.[35] N. HOOKWAY, ‘Entering the blogosphere’: some strategies for using blogs in social research, Qualitative
Research, vol. 8, pp. 91–113, February 2008.

98
Writeslike.us: Linking people through OAIMetadata
Emma Tonkin
UKOLN, University of Bath, Bath, United [email protected]
AbstractInformal scholarly communication is an important aspect of discourse bothwithin research communities and in dissemination and reuse of data andfindings. Various tools exist that are designed to facilitate informalcommunication between researchers, such as social networking software,including those dedicated specifically for academics. Others make use ofexisting information sources, in particular structured information such associal network data (e.g. FOAF) or bibliographic data, in order to identifylinks between individuals; co-authorship, membership of the sameorganisation, attendance at the same conferences, and so forth. Writeslike.usis a prototype designed to support the aim of establishing informal linksbetween researchers. It makes use of data harvested from OAI repositories asan initial resource. This raises problems less evident in the use of moreconsistently structured data. The information extracted is filtered using avariety of processes to identify and benefit from systematic features in thedata. Following this, the record is analysed for subject, author name, and fulltext link or source; this is spidered to extract full text, where available, towhich is applied a formal metadata extraction package, extracting severalrelevant features ranging from document format to author emailaddress/citations. The process is supported using data from Wikipedia. Onceavailable, this information may be explored using both graph and matrix-based approaches; we present a method based on spreading activationenergy, and a similar mechanism based on cosine similarity metrics. Anumber of prototype interfaces/data access methods are described, along withrelevant use cases, in this paper.
Keywords: formal metadata extraction; social network analysis; spreadingactivation energy; OAI-PMH metadata; informal scholarly communication

Writeslike.us: Linking people through OAI metadata
99
1. Introduction
Social network analysis is frequently applied to study 'community' structures.Web 2.0, with its social nature, is expected to contribute changes to scholarlycommunication. Community data mining, i.e., mining real world-data such asscholarly articles in order to characterize community structures, is considereda top data mining research issue [1]. Automated inference through miningnow represents a plausible approach to extracting candidate information fromdata that is already publicly and openly available in institutional repositories.
The Writeslike.us system was initially intended to support future workwith the University of Minho in establishing informal links betweenresearchers [2]. It also constitutes an exploration of a general area of interest,which is that of processing OAI metadata to extract author identity and tolink it with external data (as in Wikipedia) and linked data.
Understanding the relationship between individuals and theircommunities is a very old problem. Several excellent tools exist that attemptto support the exploration of community structures within researchpublication information; a prominent example is the application ofRKBExplorer [3] to support the exploration of OAI-PMH and DBLP metadata[4]. The problem has received widespread interest via bibliometrics and thepotential for their application in the area of impact assessment for academicpublications, as well as the widespread use of FOAF (Friend-of-a-Friend) toencode machine-readable information about individuals and theirrelationships.
One problem often encountered when making use of this sort of data is, inthe case of FOAF, that the data is too sparse to provide an overview of thecommunity as a whole; in the case of citation analysis, the information ismuch more exhaustive, but instead suffers from the difficulty that the data isnot sufficiently extensive or accurate to enable a clean graph to be drawn. Forexample, FOAF information is necessarily limited to the data provided byindividual users and their contacts on a given web site. Sometimes it is alsopossible to merge FOAF data from multiple web sites, but this is complicatedby the need to identify equivalence between users.
FOAF information is generated by direct input from users; for example,creating an account on LiveJournal or Facebook creates a new individualidentity. As the account holder seeks out individuals to add to their ‘friends’list, they create new links between themselves and others. Characterisingthose links is sometimes difficult; some systems therefore ask users to specifythe nature of the link. It is a simplification, based on the assumption thatindividuals play clearly definable roles in each others’ lives – but a social

Writeslike.us: Linking people through OAI metadata
100
graph can nonetheless be a useful resource. The problem, however, is that notall users make use of any given site, and a large percentage will make use ofnone at all. A recent report by Connell [5] offered a literature review ofseveral studies demonstrating user opinion to social networking sites; one,from 2005, showed that over 50% of study participants responded thatFacebook had no potential as an academic outreach tool, 12% said that it hadpotential, and the rest were unsure.
Reported demographics of use of social networks are largely consistentwith the popular image of a bias towards younger users, although the pictureis changing rapidly over time. A recent study [6] of the use of online socialnetworks demonstrated that younger users were associated with higher levelsof usage of Facebook, as well as a greater number of ‘friends’. The types of useof the site also vary greatly between user groups, and therefore all socialgraphs are not created equally (nor equally detailed). Finally, thecharacteristics of different social networks vary in that some social networkspredominantly reflect offline connections, whilst others are predominantlyplaces where people meet for the first time online. Facebook, according toRoss et al. [7], is ‘offline-to-online’ – that is, Facebook friends are mostly metoffline and then added at a later date to the online social network.
The outer edges of the Social Web
Citation analysis-based bibliometrics tends to privilege those papers thathave a large number of citations or are published in journals or proceedingsthat are indexed in large citation databases such as the domain-specificPubMed, DBLP or ACM, or journal-specific but widely accessible citationindexes. Indeed, Mimmo & McCallum [8] point out that it is ‘natural to askwhich authors are most influential in a given topic’. Because citation isessentially a ‘voting’ process, giving those who are better-known or moreinfluential or key to a given area of research a higher profile, less well-knownauthors and those who disseminate on a more local level will be almostinvisible by those metrics, unless indexes also explore user-drivenopportunities for deposit such as institutional repositories.
The majority of online bibliographic research tools, understandably, focuson establishing the primary figures within a field, and de-emphasiseencouragement of collaboration between the 'foot-soldiers' of the researchworld. Yet there are reasons to explore this territory. The aim of this project isnot to identify the most popular or well-cited individuals in a field, as thereare many existing methods that enable this to be done. Rather, we aim to

Writeslike.us: Linking people through OAI metadata
101
explore a mixture of factors; matching expertise and interest and enabling amultifaceted browse model for information about individuals.
We chose to make use of a mechanism that depends only on data that isalready publicly available, and as a consequence the startup cost was small.Additional data was extracted from publicly available sources, and is to berepublished for others to reuse in the same spirit of encouraging innovation.Service designA number of well-understood components are required in order to create asystem of this type. A data source and parser are required in order to extractthe essential information – for example, author names, institutions, and otherformal metadata. In the majority of cases citation analysis over a large corpusof electronic versions of papers is applied for this purpose, perhaps alongwith a formal metadata extraction system. We replace this step withextraction from OAI-PMH records.
Extracting strings from OAI-PMH records is extremely simple, but thedifficulty lies with their interpretation. A perfect example of this is the authorname disambiguation problem, which is to say, the question of identifying,from a pool of uses of a given string, which instances refer to a givenindividual.
The obvious conclusion when seeing five hundred papers by John Smith isthat John Smith is a prolific author. However, in reality there are in allprobability several John Smiths at work and writing peer-reviewed papers.The question becomes how to tell the works of a given individual from thoseof another individual with the same name. If there appears to be a Smithworking in ethnography with a second working in quantum physics, then weare perhaps fairly safe in assuming that they are different people – but it isnonetheless possible that a single individual named Smith has moved fromphysics to HCI in the last few years. If one Smith works for Harvard and theother works for MIT then it is reasonable to assume that they are differentpeople, but it is not by any means certain. Authors may be affiliated to severalinstitutions; they may have moved from one institution to another, or taken asabbatical to work in another and then returned to their parent institution.They may be working as a visiting fellow.
Author name disambiguation is a complex problem. Many unsupervisedmethods exist, such as calculating the distance between strings. We exploredthe use of several, including a vector-based cosine distance approachapplying similarity between authors' coauthor lists, institutions and subjects(calculated using simple text analysis to extract approximate ‘noun phrases’,and then reducing these further using Wikipedia as a text corpus).

Writeslike.us: Linking people through OAI metadata
102
The most promising methods, according to Laender et al. [9], are generallybased around supervised machine learning techniques, which require initialtraining. Examples of these include Naive Bayes [10], and support vectormachines (SVM) [11].
On et al. also describe various heuristics to be applied across the namesthemselves; spelling-based heuristics, based on name spellings, token-basedblocking, n-gram based blocking, and tokens similarity [11]. Laender et al. [9]describe a heuristic-based hierarchical clustering method that offerscomparable results. It has been applied for a wide number of purposes; onethat relates closely to our own is described by Minkov et al. [12], who appliedcontextual search and name disambiguation in order to relate name mentionsin emails to a given identity.Collecting relevant background informationDuring the development of the project identifying and utilising suitable datasources led to the need to make use of a whole variety of publicly availableresources, such as Wikipedia; this required enhancement for effective re-utilisation of the data.
Many of the possible functions of this prototype depend on having accessto appropriate datasets. For example, in order to improve the accuracy of aformal metadata extraction algorithm designed to identify the institution withwhich an author is affiliated, it is useful to have both a gazetteer of institutionnames and variant forms, and a list of the domains and sub-domainsassociated directly with that institution.
Again, this is greatly simplified when the data exists in a well-formatted,well-structured form, and to an extent this is true; for example, there existspartial data on DBPedia – a ‘community effort to extract structuredinformation from Wikipedia and to make this information available on theweb’ [13]. DBPedia is built up of the subset of information on Wikipedia thatis well-structured and well-formatted, which is to say, predominantlyinformation that is placed inside structured templates. However, althoughalready a useful resource, there is not enough information to cover all of ourrequirements. In terms of institutions, for example, only a small subset ofinstitutional Wikipedia pages contained a ‘legible’ dataset, and even in thesecases, the information did not – by design – cover any of the variant forms ofinstitutional name, identifier, domain, etc. that are useful for our purpose.
Therefore we chose to make a less subtle use of the Wikipedia resources,by spidering the pages directly, extracting relevant terms and URLs from thepage source, and attempting to characterise them by means of application of asmall set of heuristics. This was particularly difficult in shorter Wikipediaarticles, articles that contained information about institutions that were not,

Writeslike.us: Linking people through OAI metadata
103
themselves, present on the Web, and articles that were written in languagesother than English; however, we found that the simplest possible heuristicalone – that the top 1/3 of external links present on the Wikipedia page werelikely to represent the institution – was correct over 65% of the time. We choseto take a permissive approach to information collecting and to add aconfidence rating to each data point, reasoning that it is preferable to store toomuch data than too little at this early stage in the prototype’s development.Scenarios of useUsage scenarios are real-world examples of how people can interact with thesystem being designed, and are often collected as part of developmentprocesses, especially user-centred processes. In general, usage scenarios arewritten with specific user personas in mind; in this case, they have beengeneralised for publication. Initial usage scenarios were developed throughconsultation with the University of Minho and institutional repositorymanagers elsewhere. A shortened summary is included in this paper.Scenarios varied from supporting a student in seeking a supervisor workingin an area of interest, to exploring influences of relevance to the modern-dayconcept of the impact factor. Several example scenarios that informed thedesign of the writeslike.us prototype are given here.
Scenario 1: Classifying events and forums by listed participants
A researcher in the field of evolutionary linguistics has become increasinglyvery interested in possible mathematical mechanisms for describing thenature, growth and adaption of language, as he has heard that others havedone some very interesting and apparently relevant work in this area.Unfortunately, the researcher finds that some of the detail is hard to follow.He decides to seek out an appropriate event and/or online forum, and findssome people who might be interested in exploring links between his specialistarea and their own. He is concerned about the potential cost of attendingseveral events, so he chooses to look up possible events and web forums,intending to look through the participant lists for names that he recognises.This is greatly simplified by an automated system enabling him to identifypapers and authors that he considers most relevant; with this information it ispossible to parse through lists of participants in events or online communitiesin order to provide him with a rough classification of how relevant the groupis likely to be to his ideas.

Writeslike.us: Linking people through OAI metadata
104
Scenario 2: Building a ‘dance card’ for a Research Council event
One of the purposes of a Research Council event is to encourageserendipitous meetings. Rather than simply assuming that synchronicity atthe coffee-table will carry the day, the Research Council decides to produce a‘dance card’ that suggests several other individuals that you might like tomeet. Whilst elements of the composition of this ‘dance card’ are resultantfrom program managers’ knowledge of the individual’s interests andcharacter, a service that is able to identify, characterise and compareresearchers from their existing work and affiliations can be used to quicklybuild some interesting (and at times amusing) meeting suggestions, based onthe individuals’ papers and output, and/or on the names and ResearchCouncil-held descriptions of the projects on which the individuals work.
Scenario 3: Facilitating collaboration in a multidisciplinary researchenvironment
An anthropologist with a particular interest in the area of paleolithicarchaeology, who works in the Department of Humanities, is very interestedin exploring likely patterns of migration, and particularly in the idea that thisactivity may have been driven by climate change. However, the Departmentof Humanities has limited funding for the purpose of data collection andinterpretation regarding modeling of climate change, so it is not possible forhim to develop a paleoclimate simulation system. Therefore he decides that itis more appropriate for him to look for other people who have other reasonsto be interested in modeling of this kind, particularly during the time periodin which he is interested. This is not a trivial problem for several reasons;firstly, he does not usually publish in the same area as paleoclimatologistsand therefore is unlikely to make chance acquaintances. Secondly, he and theyhave very different ways of describing their areas of interest, and thereforethere is quite a lot of interpretation required in order to ascertain that thedatasets they require are (or are not) closely related. Successfully establishingthat these groups could usefully share data with each other is a non-trivialproblem. However, it is an important goal for all concerned, not only becauseit is likely to help the data consumer – the anthropologist – but also because thedata creator – the palaeoclimatologist – will benefit from wider impact andreach of their research.

Writeslike.us: Linking people through OAI metadata
105
Engineering from a series of scenarios
It is noticeable that the majority of the scenarios depend on information takenfrom several sources; much of the benefit of this system requires the dataextracted to be enriched with externally sourced information.
For example, geographical information is necessary in order tosuccessfully complete some of these tasks, such as finding local academicswith similar interests. In principle, this information can be found from severalsources, such as the address of the institution that the author places on his/herconference submissions. However, affiliation with an institution does notnecessarily require that the author spends a great deal of time physicallypresent at that institution. In practice, reliably eliciting a researcher’sworkplace or present location is difficult, requires considerable information tobe made available – such as calendar data, GPS, etc – and is not reallypractical without finding a solution for several major infrastructural andsocial issues.
This additionally marks an intersection with well-known research themesin the field of ubiquitous and pervasive computing, in particular the manyresearch projects that have sought to enhance social networking by means ofadditional information gleaned from context-sensitive mobile computing. Forexample, Kortuem and Segall [14] describe a system that supportsaugmentation of social networking through mobile computing. Informationsuch as the individuals with whom people have met and spoken can becollected and stored [14]; individuals can ‘pledge’ to work together towards agiven aim, and discovery of other individuals in the group can be managedaccordingly. This form of mobile computing requires devices that are alwayson and running (constant), aware of presence of nearby devices and people,able to communicate with other collocated devices (presumably aheterogeneous environment of devices), and proactive – operating withoutexplicit user interaction. All this goes to underline the point that, althoughthere is great potential in this sort of work, it is non-trivial as an engineeringproblem.
Because so much data is involved – or at any rate, sought – there is greatpotential for this sort of work to be implemented via the reuse of data fromseveral other sources, in what is sometimes known as a mash-up. That said,much of the data is not sufficiently cleanly formatted or complete to beaccessible as simply as well-formatted and structured FOAF, meaning that themajor challenge here is one of extracting as much as possible from theinformation available and storing it in a normalised form. The secondchallenge is to take the data and attempt to establish equivalence between

Writeslike.us: Linking people through OAI metadata
106
entities, which is to say, explore whether multiple mentions of the same namerefer to the same individual.
As a result, this problem can be seen as a useful step in the generalproblem of author name/identity disambiguation. Much of the data minedcould potentially be used to enrich formal data sources such as that offered bythe NAMES project [15].
2. Methodology
The writeslike.us project contained several specific stages; harvesting,analysis, user-level interface development and evaluation. . The project had asits final goal the development of a functional prototype intended to extract asmuch information as possible, making it accessible for further research in thearea.
Source data was retrieved from OAI-PMH metadata repositories, but wasexpected to require supplemental information from several sources;identification of appropriate sources was itself an aim of this work. As such,one focus of the project was to identify and use existing services whereverpossible. The quantity of data was also expected to give rise to a number ofdata management issues.
2.1 Data collectionThe dataset is harvested from OAI-PMH – the Open Archives InitiativeProtocol for Metadata Harvesting [16]. According to the Repositories SupportProject [17] about 75% of institutional repositories worldwide, and ~85% inthe UK, provide an OAI-PMH interface. The dataset is harvested viaUKOLN's OAI data harvesting service, RepUK, which performs regular UK-wide data harvests and stores the resulting information in an XML dump,available for reuse by other services and applications. The system currentlytakes in data from across the UK - a future evaluation methodology will be toexplore the applicability of the system at an international level. The data isinitially input into a database, from which it is processed in the followingmanner:

Writeslike.us: Linking people through OAI metadata
107
Figure 1: Published articles per year
2.2 Collecting information from the metadata recordThe metadata record itself is collected in oai-dc, which is to say that itcontains up to twelve elements, most of which are unlikely to be filled out.The actual placement of information within the record may vary a great dealdepending on the interface used to create the record and the design decisionsof its originators. Often the information will have initially been input asqualified Dublin Core rather than the simpler format, and as such there arelikely to be several instances of certain fields, containing different refinementsof a given field, but not marked as such. Hence, a useful initial step inanalysing this information is to attempt to characterise its qualifiedrepresentation.
This step can be achieved in a number of ways; for example, a simpleheuristic can often identify certain fields such as well-formatted dates (ie.validation against a schema, regular expressions capable of identifyingcommon citation formats, etc). Content-level feature analysis can also help toidentify certain common types. The result, however, will not be as clean ascollecting the qualified information directly in the occasions on which it isavailable.
2.3 Format normalisationKnowing what type of information is contained in a given field is only thebeginning. Following that, it becomes necessary to come to an understandingof the format of that information; for example, author names may be given inany one or more of a number of different formats:

Writeslike.us: Linking people through OAI metadata
108
Smith, John and Richard, PeterJ. Smith and P. RichardJohn Smith, Peter Richard.Smith, John and Peter RichardSMITH, J. ; RICHARD, P.…and so on.
It is unlikely that all of these can be convincingly, uniformly andaccurately parsed, especially since there are certain cases in which there is anessential ambiguity that would stop even a human user from having anycertainty of his or her conclusions – for example, Peter Richard and RichardPeter are both acceptable, valid names. A Bayes filter designed to make use ofa knowledge base of information regarding the prevalence of different firstnames and surnames would have a similar problem in this case; making useof the last published set of US census data, a classifier might make use ofTable 1 to find the following statistics:
Table 1: US Census data for surnames Richard and Peter
Name Rank in USApprox. number
in USFreq. of occurrence
per 100,000PETER 3758 8662 3.21
RICHARD 581 52138 19.33
True, ‘Peter Richard’ is a more statistically probable match than ‘RichardPeter’, but neither solution has an overwhelmingly convincing lead over theother.
Very similar problems exist with many other data formatting areas, forexample, dates; the well-known discrepancy between preferred forms of dateformatting in the United States versus the preferred mechanisms in use in theUnited Kingdom mean that:
10-11-200911-10-2009
may be very difficult to parse. Ideally, these formatting and encodingproblems would be avoided by appropriate choice of standard and strictadherence to that decision. As these issues do occur in practice, we are leftwith the requirement of developing a mechanism for solving such problemswith reasonable degrees of success. Fortunately, there are often simpleheuristics that can be applied. In both of the cases described here, there is a

Writeslike.us: Linking people through OAI metadata
109
solution to do with the observation that these variations are often regionaland often have a link to the choice of interface in use. If this is the case, thenthe convention is likely to be at least somewhat systematic. It then becomesdesirable to identify the convention in use within that context, the frequencywith which it applies and the likelihood that a similar pattern holds in ourparticular case.
2.4 Categorisation via text analysisThe means of categorisation was described briefly above as a method ofextracting noun phrases from text, followed by dimensional reduction usingWikipedia as a corpus. Here, we will explore how this works in more detail.
Noun phrases are defined by Wordnet as ‘a phrase that can function as thesubject or object of a verb’. We do not precisely look for ‘noun phrases’, butcontent ourselves by looking for a more loosely defined phrase that is either anoun phrase or a descriptive phrase of a somewhat similar nature. This isachieved by making use of a part of speech tagger to analyse the textualcontent that is available to us. This is naturally language-dependent, andmarks the point at which it is no longer possible to work in a language-agnostic manner. The particular tagger that we used is available in a numberof common European languages (English, French, German, Spanish,Portuguese).
This is a relatively processor-heavy and slow part of the analysis process.To complete a single run of data analysis on the full textual content of themetadata records alone takes over 24 hours – this is on UK content only,which is to say, a few hundred thousand records. To perform a similar task ona global scale would take weeks. To run a similar analysis on the full-text ofeach document spidered (see the following subsection) would take muchlonger. As such, it is important to consider both efficiency and the possibilityof caching results – if a piece of data has been processed once, thatinformation should be stored for the future.
In practice, the data set proved to be large enough to feed quite anextensive collection of terms, meaning that there was enough information touse this information for browsing purposes. Smaller datasets offer difficultiesboth to interface designers and for those intending to reuse the informationfor categorisation purposes, not least because there is not sufficientinformation regarding similarities between documents to enable an effectivecategorisation process to occur.
However, the data did suffer from excessive specificity; that is, there aresimilarities between the concepts underlying ‘superstring theory’ and ‘Higgsboson’, but it is not necessarily obvious from the content of the term or of

Writeslike.us: Linking people through OAI metadata
110
their application. This problem can be tackled in a number of ways. Onecommon solution is to make use of the LSI approach (latent semanticindexing) to reduce the dimensionality of the large matrix of terms, in thehope that the similarities between term domains would become evident.However, we chose to make use of Wikipedia as a ‘crowdsourced’ text corpuson which to look up and attempt to identify classifications for each of theterms that we had extracted. This meant that terms related to, for example,physics, would be clearly identified as such.
Once the popular phrases are extracted, they can also be used asnavigational elements supporting a subject-level browse mechanism. Thesame is true of dimensionally reduced categories, although in this case it maybe preferable to treat them as a simpler set of categories, graphicallypresented in a similar manner to a standard ‘breadcrumb trail’ navigationalelement.
2.5 Formal metadata extractionBefore formal metadata can be considered, it is necessary to identifyappropriate candidate data objects from which that metadata can be taken.For example, an OAI record may refer to a paper, a presentation (.ppt, etc) fileor a dataset contained within the institutional repository. These digital objectsmay not be accessible to the outside world – indeed it is not uncommon forrecords to be placed online without depositing a data object. Alternatively,the object(s) may be hidden for a limited time (embargoed).
Because direct links to digital objects are rarely given within an OAIrecord (only ~600 records contained actionable, externally accessible linksdirectly to digital objects), it is often necessary to use a web crawler (spider) toidentify candidate links to the fulltext record. About a quarter of the recordssurveyed contained a link to a page from which the originating record couldbe retrieved. To harvest digital objects effectively can be time-consuming andthe details are outside the scope of this paper, so we will merely commenthere that whilst there is considerable variation to be handled, handling themost common is easily achieved.
We found that on average just under half of the pages retrieved throughcrawling of links provided within DC records contained one or moreaccessible documents (Fig. 1). Around 15% of linked pages resolved to avariety of journal endpoints – ‘paywalls’ - (Ingenta, Taylor & Francis, Wiley,Sage, IOP, etc). These sometimes contain additional useful metadata about thedocument, but do not contain the document themselves. However, thecopyright ownership is in itself a useful data point. Around 40% ofinstitutional repository links were found to contain no accessible data.

Writeslike.us: Linking people through OAI metadata
111
A further finding from this work was the number of DOIs and handle.netpersistent links that were present in metadata records, including the
percentage that were broken. 240,000 records were harvested. Out of the62,000 records containing an actionable http dc:identifier, 35,000 contained ahandle.net (15,500) or dx.doi.org (20,000) actionable persistent identifier. DOIsand handles appear to have a similar prevalence in UK institutionalrepositories.
In principle, persistent actionable identifiers are useful in part becausethey permit URLs to be assigned, managed, and reassigned when somethingcauses that persistent identifier to break. In practice, we found that there wasa noticeable proportion of broken persistent identifiers. We found that out ofa test run of 20,000 URLs retrieved from URL records, almost 400 wereunresolvable DOIs or handle.net persistent identifiers – 2% of URLs wereinvalid persistent identifiers, of which two-thirds were DOIs.
Overall, harvested data is retrievable for about 1/8 of the indexed objects.Additional metadata (for example, details about a journal publication, author,affiliation, citations, and so on, that are not reflected in the metadata) maypotentially also be retrievable from journal item pages, so there is a case to bemade for this approach.
Figure 2: Findings from web crawl
The sorts of information that can usually be retrieved from this approachinclude, for eprints: title, author name, sometimes a date or range of dates,citations, format information, format metadata, software from which the
Fulltext available
Full text unavailable
Unresolvable persistentidentifier
Journal page
Other

Writeslike.us: Linking people through OAI metadata
112
document was created, and perhaps additional information such askeywords, abstracts, etc. This provides a useful check against the OAImetadata to ensure that the correct document has been retrieved. For mostdigital objects it is possible to retrieve some form of format informationand/or object-specific metadata. Object provenance information such assoftware used in its creation can say a great deal about author identity, asspecific authors may choose different routes to object creation.
2.6 Name disambiguation in metadata graphsThe result of the data collection process is to develop a set of relationsbetween entities, author-name strings and articles. Before the information canbe effectively used, the distinction between author name strings and identitymust be applied. Characteristics of authors for a given paper may often beextracted directly from the article text. These pieces of information may beadded to what we already know about a given set of instances of use of astring. Several name disambiguation approaches were explored using testdatasets taken from the real-world OAI-PMH dataset.
The information that is available to us can be displayed as a matrix ofterms; a given author-string a in authorlist A has created ia digital objects outof an overall set of objects I. Each object has a set of subject characteristics si, atitle ti, author affiliation information fi, provenance from repository ri, and soforth. So the problem becomes one of ascertaining the most likely number ofindividual authors identified by string a. These characteristics can be treatedeither as links within a graph, or a sparse matrix of characteristics; bothgraph-based approaches such as spreading activation energy and matrix-based methods such as cosine similarity metrics may be applied.
Table 2: Document object data in matrix form
I t f r s (a, b, c…)i2 t2 f2 r2 s2(a,b,c…)in tn fn rn sn(a,b,c.…)2.6.1 Relatedness metrics: Cosine similarityThe first metric explored was a very simple cosine similarity calculation. Thisis a measure returning the similarity between vectors of n dimensions, and isa staple of search engine design [18]. Cosine similarity states that twoidentical vectors are exactly identical (eg. Eq. 1 returns 1) or that they aredissimilar (Eq. 1 returns 0).

Writeslike.us: Linking people through OAI metadata
113
Equation 1: Cosine similarity
Cosine similarity can be applied to the document object characteristicsalmost directly, although there is a need to ‘unpack’ listed characteristics intoa simpler numeric form if they are to be treated as term frequencies. Applyingthis directly to information such as that provided in Table 2 returns amodified form of document object similarity, weighted with additional factorssuch as provenance metadata. To relate this to the author requires anassumption that there is a relationship between document object similarityand author identity. In principle this would seem to be a strong assumption, -authors primarily write about topics that they know well and seldom writeoutside their field. However, in practice this assumption may not hold upover time, as authors may change research groups, areas of interest, and evensubject areas. It may also presuppose a meaning to authorship that is notthere; for example, co-authorship of a paper may imply that the author hasproduced data that was used within the paper, but the paper itself may not bein the author’s core area of interest – a palaeoclimatologist may co-author apaper with an archaeologist, published in a journal with a focus onarchaeology and written for an audience consistent with the journal’s focus.Authorship represents contribution, which is traditionally expected to betextual, but often this may be an experimental collaboration, inspiration,supervision, perhaps even an administrative link.
This method provides a reasonable metric for comparison between items.There is, however, considerable computational overhead in calculating thisfor each document and metadata set, so this was done periodically inexploring the link between author name and unique identity - that is, thismethod provided one data point for the following question, essentially aclustering problem without the advantage of any definitive knowledge of thenumber of authors involved: given a set of objects created by a person orpeople with the author name a, how likely is it that objects i and j werecreated by the same author? Note, however, that grounding author identityas a subset of author name ignores a large number of complications, such asauthors who change their names or anglicise their names inconsistently.
The exploration of similarity provides an approximate notion of identity,which can also be represented as nodes in the graph – which, indeed,
similarity cos( ) A.BA B

Writeslike.us: Linking people through OAI metadata
114
supersede author name string similarity in calculating the relatednessbetween papers.
2.6.2 Relatedness metrics: Spreading activation energy
A search algorithm based on spreading activation energy over a contextualnetwork graph modelled over a series of timesteps [19] [20] was applied tosupport graph-based searching. This is not a pre-calculated method, but isrerun on each search. This method is appropriate where it is possible to searchfrom the starting point of a prechosen node – given a unique node id as asearch key, this algorithm could be seen as spilling a little ink on one node ofthe graph, which then spreads a predefined distance through the graph ofrelations between authors, objects, roughly calculated identities,classifications, and other metadata, in a manner defined by the way in whichthe implementation is tuned. The result is a ranked list of matching nodes andtheir types, which can then be presented to the user.
Modification of this approach can be used to reflect the relative relevanceof different types of connection or to tune a search to prioritise different typesof relation (eg. topicality, similar location of publication, similar physicallocation). The search may be weighted according to specific search types. Interms of efficiency, frequent calculation via a contextual network graphalgorithm is observed to be relatively inefficient on a dense graph, bycomparison to alternative methods (eg. latent semantic indexing); intuitively,this is reasonable, the number of links to process per timestep is related to thedensity of the graph. The decision of whether to use a contextual networkgraph/spreading activation energy method or whether to precalculate is alsolinked to the number of changes expected to be made to the graph – frequentchange and hence frequent recalculating negates any benefit to be gainedfrom what is essentially a caching mechanism. Furthermore, the contextualnetwork graph approach is memory-hungry [19]; in a productionenvironment it may be preferable to pre-process the data in a persistent(cached) form.
3. Evaluation
Initial qualitative and quantitative evaluation studies have been completed,and preliminary results are encouraging. In particular, there is significantdiversity between information and authors indexed into well-structureddatasets such as DBLP, ACM, and so forth, and the world as viewed through

Writeslike.us: Linking people through OAI metadata
115
OAI-PMH. From a random sample of authors, it is very visible that authorswith few publications have little visibility in the formal indexes. Figure 2contrasts authors who have published between six and twenty papers withthe indexing visibility of authors who have deposited five or fewerdocuments (see Figure 2).
Figure 2: Author appearance in popular indexes (average values)
One potential interpretation of this limited visibility is the following: itcould be taken to indicate that the data is relatively low-quality, as it containsso much information that was, for whatever reason, not published in apopularly indexed publication – and hence perhaps it is not published in apeer-reviewed form. However, for the purpose of encouraging informalcollaboration between researchers, this may not prove to be a significantimpediment.
Certain areas of functionality are key, in particular those areas concerningauthor identity, and it is clear that alternative methodologies, the use ofadditional data sources, and user-level amendment functionality couldimprove things greatly.
4. Discussion
During this work, we established a database extracted primarily frommetadata, a knowledge base derived from Wikipedia, a variety ofclassification information derived variously from part-of-speech tagging andthe use of Wikipedia as a classification dictionary. We used this in order toretrieve further information where available, and extract what metadata wasavailable from these sources. We then used simple mechanisms from textanalysis to classify and provide a mechanism for exploring this data.

Writeslike.us: Linking people through OAI metadata
116
The major difficulty in the project was simply one of interface design andaccess; it is one thing to develop a database, and quite another to create aninterface that supports the aim of encouraging informal collaboration – an aimthat depends a great deal on factors that are very difficult to identify orrepresent digitally, such as trust and organisational culture [21]. The problemis as much social as technical. We expect to release parts of the informationextracted as linked data for future reuse by ourselves and by others. Onelikely future avenue for reuse may be the application of this data insupplementing more formally generated information sets – ‘filling in thegaps’.
The course of this experimental development has been a journey ofdiscovery, and not least an opportunity to challenge our own assumptionsabout appropriate interpretation of apparently straightforward data, eventhose as simple as document creation and authorship.
5. Conclusion
OAI-PMH metadata alone provides sufficient information to collect basicinformation about authorship data. However, the quality and completeness ofthat data is greatly improved if the full-text document is also available andmay be analysed. Another means of supplementing basic data about authorsis to compare and contrast with information derived from networks ofcitations; for popularly-cited texts, this permits the retrieval of additionalinformation such as authors' full names, relevant dates and so forth. Theeffectiveness of this approach is dependent on the number, style and qualityof existing citations - so again, a synthesis of available approaches is likely toprovide the best overall result. Methods of disambiguating unique authoridentity vary greatly in effectiveness depending on the available data, as wellas factors such as resource type, format and language. Standardisedbenchmarking requires the establishment of and testing against a groundtruth. Bibliographic networks are often used to identify 'star' researchersworking in each field. The problem explored here is to enable the ability tobrowse for others (who may be at any of various stages in a research career)working on a given topic area.
In our future work, we intend to widen the availability of writeslike.us asa pilot service, to develop a clearer set of requirements for practical usage ofthe interface, API and data, and to explore questions such as automatedclassification of authors' likely primary occupations (eg. primary investigator,researcher, technical writer, student). We also intend to explore the

Writeslike.us: Linking people through OAI metadata
117
possibility of bringing in other sources of data – and publish relevantsegments of existing information for wider reuse, as a clearly and consistentlyformatted linked-data resource.
Acknowledgements
The author would like to acknowledge the input of Alexey Strelnikov, theprimary developer of the web interface and database, Andrew Hewson,database guru, and Wei Jiang, for his work in the area of identifying andtesting possible author name disambiguation methods.
Notes and References
[1] VARDE, A. Challenging Research Issues in Data Mining, Databasesand Information Retrieval. In ACM SIGKDD Explorations Journal,11(1) 2009, p. 49 - 52.
[2] BAPTISTA, A; FERREIRA, M. Tea for Two - Bringing InformalCommunication to Repositories. D- Lib 13 (5/6) (2007). Retrieved 10thJan, 2010, from www.dlib.org/dlib/may07/baptista/05baptista.html
[3] GLASER H; MILLARD I; JAFFRI A. RKBExplorer.com:A KnowledgeDriven Infrastructure for Linked Data Providers. In: EuropeanSemantic Web Conference, 1-5 June 2008, Tenerife, Spain. pp. 797-801.
[4] GLASER H; MILLARD I; CARR L. RKBExplorer: Repositories, LinkedData and Research Support. In: Eprints User Group, Open Repositories2009, 20/05/2009, Atlanta, GA, USA.
[5] CONNELL RS. Academic Libraries, Facebook and MySpace, andStudent Outreach: A Survey of Student Opinion. Portal: Libraries andthe Academy. Volume 9(1), January 2009. E-ISSN: 1530-7131
[6] JOINSON AN. ‘Looking at’, ‘Looking up’ or ‘Keeping up with’ People?Motives and Uses of Facebook CHI 2008, April 5–10, 2008, Florence,Italy.
[7] ROSS, C; ORR, ES; SISIC, M; ARSENEAULT, JM; SIMMERING, MG;ORR, RR. Personality and Motivations associated with Facebook use.Computers in Human Behaviour. Volume 25 (2), March 2009. Pp. 578-586.
[8] MIMNO, D; MCCALLUM A.s Mining a Digital Library for InfluentialAuthors. JCDL 2007.

Writeslike.us: Linking people through OAI metadata
118
[9] LAENDER AHF; GONCALVES MA; COTA RG; FERREIRA AA;SANTOS RLT; SILVA AJC. Keeping a Digital Library Clean: NewSolutions to Old Problems. DocEng '08.
[10] HAN H; GILES L; ZHA H; LI C; TSIOUTSIOULIKLIS K. TwoSupervised Learning Approaches for Name Disambiguation in AuthorCitations. JCDL 2004.
[11] ON, B-W; LEE, D; KANG, J; MITRA, P. Comparative Study of NameDisambiguation Problem using a Scalable Blocking-Based Framework.JCDL 2005.
[12] MINKOV E; COHEN WW; NG AY. Contextual Search and NameDisambiguation in Email Using Graphs. SigIR '06, Seattle, Washington,USA.
[13] JENTZSCH, A; et al. About DBPedia. Retrieved March 20, fromhttp://dbpedia.org/About
[14] KORTUEM G; SEGALL Z. Wearable Communities: Augmenting SocialNetworks with Wearable Computers. IEEE Pervasive Computing,volume 2(1) 2003, p. 71-81, ISSN: 1536-1268
[15] NAMES project introduction. Retrieved March 18 fromhttp://names.mimas.ac.uk
[16] LAGOZE C; VANDESOMPEL H. "The Open Archives Initiative:Building a Low-Barrier Interoperability Framework". Proceedings ofthe first ACM/IEEE-CS Joint Conference on Digital Libraries (JCDL'01).pp. 54–62.
[17] Introduction to the RSP project. Retrieved March 18 fromhttp://www.rsp.ac.uk/usage/harvesters
[18] TAN, P.-N; STEINBACH, M; KUMAR, V. Introduction to Data Mining.Addison-Wesley (2005), ISBN 0-321-32136-7, chapter 8; page 500
[19] CEGLOWSKI M; COBURN A; CUADRADO J. Semantic search ofunstructured data using contextual network graphs. 2003.
[20] BOLLEN, J; VANDESOMPEL, H; ROCHA LM. Mining associativerelations from website logs and their application to context-dependentretrieval using spreading activation. 1999.
[21] DODGSON, M. Organizational Learning: A Review of someLiteratures. Organization Studies, 14(3), 375-394 (1993). DOI:10.1177/017084069301400303

119
Authors publication strategies in scholarlypublishing
Paola Dubini1; Paola Galimberti2; Maria Rita Micheli1
1 Ask Research Center; Università BocconiVia Roentgen 1 20136 Milano Italy
paola.dubini, [email protected] Biblioteca di Scienze dell’antichità e Filologia moderna,
Università degli studi di MilanoVia Festa del Perdono 7 20121 Milano Italy
AbstractIn this exploratory study, we analyze publishing patterns of authors fromdifferent disciplines, as part of a broader analysis of the transformation of thescholarly publishing industry. Although a growing body of literatureanalyses the author’s role within the process of research production,validation, certification and dissemination, there is little systematic empiricalresearch on publishing patterns; little therefore can be said on relevant issueswithin the current debate on the future of scholarly publishing such asauthors’ responses to (or even awareness of) the growing array of publicationpossibilities or the speed of adaptation to the increasing series of incentives byfunding agencies or academic institutions. On the basis of the analysis of threeyears of publications gathered in the institutional repository of Universitàdegli Studi di Milano, we highlight trends of publication strategies anddifferent responses to incentive systems. Preliminary results indicate thatpublication outcomes and intensity differ across disciplines, while similaritiesoccur mainly in terms of choice of preferred outcomes by seniority. Openaccess is still uncommon among the authors in our sample and it is moreutilized by relatively senior authors and active authors.
Keywords: scholarly publishing; publishing strategies; industry changes;

Authors’ publication strategies in scholarly publishing
120
1. Introduction
The process of knowledge creation in the academic field follows a quiterigidly codified pattern. Academic and scholarly knowledge is in factsystematic, premeditated, reflective and continuously submitted to thescrutiny of a community of experts. 1 Creation is therefore a long, timeconsuming process for academic authors, and several steps have to beovercome, to reach the final moment of knowledge delivery to the audience[1].2 Publications as well as academic affiliation contribute to strengthenauthors’ reputation, which is a critical element for economic and socialprofessional growth in the academia. Over time, as scholars build theirreputation and become visible within their community, publication occurs onincreasingly more prestigious journals. As personal prestige increases,authors are likely to orient research trajectory development and to influencepublication patterns of younger colleagues.
The tangible starting point of academic knowledge creation isidentified in the existing body of scholarly literature, which constitutes thebackground of all academic scientific works [2],[3]. The central stage is themoment of design, in which the social process of knowledge becomes tangiblyrepresented. After the designing stage, concepts are integrated into aparticular body of knowledge, whose choice is influenced by several factors,with a special weight of the discipline of interest.
The choice of the body of knowledge to refer to in a particularresearch design coincides with the choice of the viable publication outcome,which is widely considered a determinant step for the evaluation of thescholarly work and the resulting academic assessment within academicinstitutions [4], [5].
Research patterns are influenced by the necessity to conform toreward mechanisms of institutions to obtain career advancements; authorsmay therefore choose where to publish on the basis of specific incentivestructures, deriving from national, institutional or community indications andexplicit or implicit incentives. In recent times academic institutions areprogressively increasing control mechanisms on faculty members in order toenhance a greater visibility and major prestige at the international level. Ascompetition for research funding becomes more intense, and institutions and
1 It is also necessary to underline that knowledge production activities in different areasentail different epistemic cultures (Knorr Cetina, 1999), and consequently different patternsof results delivery.
2 This conceptualization of science as a knowledge production system (Latour andWoolgar 1986) is functional for understanding the possibilities for the inclusion of newpublication channels in the editorial chain of scholarly publishing.

Authors’ publication strategies in scholarly publishing
121
funding agencies are increasingly interested in the visibility of the outcomesof the research process by authors associated with these institutions, attentionon what and where publication occurs becomes higher and possiblyinfluences authors’ behaviour.
Publication outcomes by academic authors is therefore a gooddependent variable of strategies put in place by authors to ensure maximumvisibility, reputation and personal achievement. In spite of a growing body ofliterature analysing the author’s role within the process of researchproduction, validation, certification and dissemination, there is littlesystematic empirical research on publishing patterns; little therefore can besaid on relevant issues within the current debate on the future of scholarlypublishing such as authors’ responses to (or even awareness of) the growingarray of publication possibilities or the speed of adaptation to the increasingseries of incentives by funding agencies or academic institutions.
In this exploratory paper, we are interested in analysing publishingpatterns by academic authors as part of a broader research project on theevolution of scholarly publishing. In recent years, digitization andtechnological advancements have indeed contributed to a structuralredefinition of the scholarly publishing industry and contributed to anincrease in publishing and diffusion of scholarly output. While traditionalpublishers have developed a digital strategy and upgraded their offering, avariety of digital only publishers and repositories have emerged with amultiplicity of innovative business models, covering all phases of thescholarly publishing process (from idea discussion to publishing to researchdissemination and communication), different revenues streams andintellectual property protection régimes. While publication tools areconstantly evolving, authors’ strategies remain sometimes unaffected [6], [7],reflecting the established norms of the traditional academic environment.
Based on the systematic analysis of three years of publications byauthors from different disciplines but from the same institution, we wish tohighlight to what extent recent publication patterns mirror the changesoccurring within the scholarly publishing industry and whether similaritiesand differences occur in publishing strategies across different disciplines.Although descriptive in nature, we think that our study contributes with factbased hints to the current debate on the assessment of the quality of researchactivity and on the future of scholarly publishing, while giving evidence to allparties involved on how academic authors from different disciplines buildtheir reputation and visibility, while strengthening that of their institution.

Authors’ publication strategies in scholarly publishing
122
2. Literature review
There is a growing body of literature describing why academic authorspublish and how they choose where to publish. Broadly speaking, literatureaddresses individual drivers to publication, the incentive system put in placeat the institutional level, the patterns of research diffusion and certificationacross different disciplines.
The willingness to contribute to science’s advancements isundoubtedly a leading motivation both to undertake the academic career andto publish [8], [9]; moreover, authors publish to be promoted and advance intheir institutions. [10], [11], [12], [13], [14] show a correlation between journalrankings and tenure and promotion decisions. Last but not least, authorspublish as part of their legitimization process: consensual evaluations ofpublication channels have the potential to impact on research qualityassessment and individuals’ promotion prospects and publishing strategies[15]. Recognition of personal contribution to journals’ articles can be used as acurrency to obtain reputation and being accredited by the scientificcommunity. In recent years international collaborative research projects haveincreased [16], as a consequence of the rising competition to publish in topquality journals. Collaborative research represents a way to improve dataavailability, and collaboration with foreign researchers is very attractive forthose who face difficulties in data collection when trying to conduct studiesacross countries [16]. Researchers are often invited by institutions tocollaborate, in order to include more features to the final paper and toincrease the probability of publication in high ranked journals. Althoughauthors tend to publish in the same channels their senior peers and theirscientific community deem appropriate, young researchers may benefit froma less conformist behaviour and the choice of more radical journals [17].
As competition for research funding increases, authors are pressuredon the one hand to accelerate publication of results and increase visibility andto publish on key refereed journals for purposes of promotion and tenures onthe other, respecting constraints and strict rules [6].
The choice of where to publish at the individual level parallels theeffort academic institutions are making to build their reputation at theinternational level and their degree of acceptance of new forms of publication.Attitudes of disciplines toward scholarly communication in general is affectedby the institutional setting of departments [18], [19], [20]; the use of newelectronic media is influenced by the academic field [21 [22], [23], [24], [25].Moreover, the reward in terms of reputation that authors from differentdisciplines achieve from the publication on specific channels varies andinfluences authors’ decision for results delivery [26], [27], [28].

Authors’ publication strategies in scholarly publishing
123
Web 2.0 tools are already considered as essential means for creatingusers community networks for commercial businesses 3 ; they are alsoincreasingly used to accelerate knowledge production and diffusion in thescientific fields[29], [30], [31], [32]. Scientists consider wikis and collaborativetools in general as a convenient place to post ideas and comments but not topublish freely, because of the possibility of being scooped and lose credit [29].The advocates of Science 2.0 affirm that Web technologies have to besustained in order to move researchers toward the kind of openness andcommunity that were supposed to be the hallmark of science in the first placeand these new interactive technological forms are conceived to supporttraditional research, with the aim of facilitating scientific communication.
In the meantime, economic constraints have made research fundingvery competitive, stimulating research and funding institutions to putpressure on the research community to be effective in the dissemination ofresearch results; therefore, several research institutions have put in placeincentive systems on research publication outcomes, whereas fundingagencies have been increasingly committed to maximise visibility and publicaccess of research outcomes financed with public resources [33], [34], [35],[36], [37], [38], [39].
Publication strategies are influenced by the specific research field[40]. Communication strategies and mechanisms for the creation of trustamong authors vary across disciplines [41], [42], [20], [43], [44], [45]. In 1999,Kling and McKim called for the need of systematic studies across disciplines,because past literature tended to homogenize publication strategies acrossdifferent disciplines, thus inevitably promoting quantitative studies andmethodologies associated with the most prolific disciplines in terms ofpublication, typically medicine and life sciences. In spite of a growing numberof studies comparing publications from different research fields, the topic isstill underexplored, particularly on the coexistence of traditional andalternative publishing tools. Many studies have looked at researchers indifferent fields, but without disaggregating results in a systematic way [46],[47], [48].
Of particular interest for the current debate of the future of scholarlypublishing is the attitude towards digital tools. Kling [23], analysed howauthors were facing the transition from paper to digital tools. Allen [49]focused on the differences among authors from humanistic disciplines interms of engagement in depositing in institutional repositories. Antelmann
3 E.g. see Vickery G., Wunsch-Vincent S, Participative web and user-created content: Web 2.0,
wikis and social networking, 2007, OECD Publisher, available at
http://www.oecd.org/document/40/0,3343,en_2649_34223_39428648_1_1_1_1,00.html (April
2010)

Authors’ publication strategies in scholarly publishing
124
[50], [51] focused instead on how authors from different disciplinesapproached technological tools; other studies addressed the degree ofacceptance of digital publications and new forms of publication and researchdiffusion, from open access journals to repositories [52], [53], [54]. Yet,publication strategies across disciplines as a response to institutionalpressures and differences in behaviour among more productive and lessproductive researchers are issues still largely unexplored.
3. Methodology
In this paper, we wish to describe publication strategies of authors withdifferent seniority and from different research fields; more specifically, we areinterested in their choices of publication outcomes, their attitude towards newforms of publication and diffusion of scientific results (such as open accessjournals and repositories), their response to institutional incentives topublication. We claim that most studies on scholarly publishing take a “onesize fits all” approach, in that they do not adequately consider differencesamong publications and differences among authors in terms of reputation andattitude to research. In any given academic institution, only a limited portionof faculty is devoted to research and only a limited portion of such faculty ishighly productive, visible and targeting to top tier journals. Moreover, it islikely that publication patterns change with seniority, as authors reach ahigher level of reputation and status on the one hand and are on the other lesspressured to publish. Moreover, it is still unclear how different disciplinesapproach the coexistence of traditional and digital channels for publishingtheir works and if differences are due to the presence of specific norms of thefield of belonging or to the different scientific framework in which authorswork.
In the next paragraphs we wish to answer to the following questions:- are there differences among authors in different disciplines as ofwhere to publish and how much to publish?- are these differences driven by discipline or by academic seniority?- to what extent open access journals are being exploited as a viablepublication channel? What drives their utilisation?We feel that answers to these questions, although still preliminary,
contribute to the current debate on the future of scholarly publishing as theystart systematically comparing outcomes from different academic disciplines.More specifically, they help understand the current acceptance of open accessjournals as viable alternatives to traditional journals and under whichconditions they are most appreciated.

Authors’ publication strategies in scholarly publishing
125
Our empirical base consists of the institutional repository ofUniversità degli Studi di Milano, for the years 2006-2009. The repository hasbeen active since 2005 and currently holds a stock of 43,264 publications by7,646 authors from 14 research areas.
The choice of this repository as the empirical base of our research isdriven not only by convenience and accessibility, but also by the fact that it isthe most complete institutional database in Italy, as the University made itmandatory to its faculty to archive scientific outputs since 2008 and themandate has been effectively enforced 4 , thus making the institutionalrepository a good reference to understand publication patterns acrossdisciplines for scholars of different seniority. Table 1 shows the percentage offaculty members complying with the repository; as part of the faculty is notinvolved in publishing activities (particularly at a very young age, as it is thecase with research assistants and first year PhD students), we feel that therepository is a good representation of the situation in this particularuniversity.
Table 1: Percentage of faculty in institutional repository.
Tenuredprofessors Full researchers
PhD andtemporaryresearchers
In repository 1,037 703 337Not in repository 339 (24.6%) 272 (27.9%) 332 (49.6%)Total faculty 1,376 975 669
Moreover, Italy is characterised by huge differences in reputationand scientific productivity of universities, and the debate on the evaluation ofscientific outcomes is very strong, as universities have to comply withnational standards in the evaluation of scholars for career advancements.5
Yet, the assessment of research outcomes6 does not take into considerationauthors’ performances.7 Milan University is a good starting point to addressopportunities and difficulties in evaluating authors’ performance, as it ischaracterised by big variety in terms of disciplines 8 , level of authors’
4 The IR has been defined primary source for every internal andexternal research assessment
5 For further details see Reale, E. (2007), La valutazione della ricercapubblica. Un’analisi della valutazione triennale della ricerca, Milano, FrancoAngeli.
6 E.g. see http://www.crui.it/valutazione/HomePage.aspx?ref=1176.7 Research assessments involve only institutions and departments.8 All disciplines except engineering are represented.

Authors’ publication strategies in scholarly publishing
126
productivity, international reputation of authors. More specifically, Medicinedepartments enjoy a long standing reputation at the national andinternational level for the quality of the research and education.
The repository archives publications authored by at least one facultymember; faculty was classified according to the following categories:
- tenured faculty (associate and full professors);- permanent researchers- temporary researchers (PhD students, research assistants…)Publications were classified in the following categories- books- chapters of books- journal articles- conference proceedings.The analysis was conducted in two steps. First an analysis of the
overall database was performed, in order to assess:- the percentage of faculty involved in research activity;- the number of published outcomes;- the number and type of published outcomes by seniority;- the relative importance of different publication outcomes;- the impact of career opportunities on research productivity;- the language used to publish.A subsequent analysis for a limited number of disciplines allows an
analysis by author, carried on to highlight specific publication strategies formore active authors in terms of attention to more recent forms of publications(namely open access), language used, types of publication outcomes. As wewere particularly interested in the penetration of open access, we chose tofocus on the following disciplines: computer science, medicine, humanities,chemistry and physics. Medicine was chosen as being traditionally importantand prestigious department within the university; the others were chosen asliterature on open access stresses the importance of new forms of publicationsin these disciplines. Data were analysed using SPSS.
4. Analysis of results
Table 2 shows the distribution of publications by faculty and by year; for eachfaculty, announcements of permanent positions available within theuniversity are highlighted.

Authors’ publication strategies in scholarly publishing
127
Table 2: Publications and announcements of tenured positions per year.2006 2007 2008 2009
Agriculture Publications 937 1225 1175 653Announcements 1 3 14 0
Pharmacy Publications 930 981 924 400Announcements 0 3 6 0
Law Publications 321 333 306 192Announcements 4 5 5 0
Letters Publications 597 694 645 450Announcements 0 8 19 0
Medicine Publications 3980 4433 4549 3719Announcements 11 15 15 0
Veterinary Publications 1333 1443 1405 635Announcements 4 3 6 0
Mathematics,NaturalSciences,Physics
Publications 2311 2612 2425 1368
Announcements 6 11 35 0
Sport Sciences Publications 162 140 124 81Announcements 0 1 7 0
PoliticalSciences
Publications 431 534 488 328Announcements 1 6 7 0
Table 2a shows the breakdown of the announcements by role.
Table 2a: Announcements for positions available at Università degli Studi diMilano.
2006 2007 2008Full professor 3 0 15Associate 0 0 55Researchers 24 55 49
In 2006, 27 new academic positions were announced; this is a smallnumber if compared with the 55 positions announced in 2007. We see ageneralized increase of publication records deposited for all the faculties,except for the Faculty of Sport Science, for which no positions wereannounced. In 2008, there has been an increase of positions announced, inparticular for the faculties of Physics, Mathematics and Natural Sciences andthe Faculty of Medicine for the role of researchers and associate professors. Ifwe look at publication patterns of the different roles, we see that there is anincrease of publication for researchers, even though, in general, there is adecrease in the total publication stock for 2008. In 2009, no positions havebeen announced and we see a consistent decrease of publications for all theroles.

Authors’ publication strategies in scholarly publishing
128
As it can be expected, there is an increase in the number ofpublications deposited over time, as the awareness about the repositoryincreases and enforcement policies for its use are more effective. Moreover,both in 2007 and 2008, the university opened several tenure track positions,which are not surprisingly correlated with an increase in publicationoutcomes for those years. Although it is not necessarily true that positionswill be occupied by the university faculty members (as these positions areopened at the national level), it is reasonable to expect that authors will try toput themselves in the position of becoming eligible candidates. For the Italiansystem, this is the highest incentive to publication; as positions are announcedby law, potential candidates normally get ready one year in advance byincreasing the number of their publications, so as to have higher chances to beadmitted to the evaluation procedures; this explains why there is a strongdrop in the publication rate between 2008 and 2009.
Table 3 shows the outcome of a cross tabulation analysis performedon the number of publications per faculty per year; the “expected count” rowfor each year shows the number of publications that one could expect in thehypothesis that there were no relationship between year and discipline.Broadly speaking, the table shows that Pharmacy, Law, Veterinary,Mathematics and Sport Sciences show a high publication activity in 2006;except Medicine, Law and Sport sciences all disciplines respond actively toincentives in 2007 in view of 2008 positions; Agriculture and Veterinary showactive publication rates in 2008. Medicine is the only discipline with higherthan expected publications in 2009. Apart from the opening of positions, alldisciplines show a cyclical publication pattern.
Table 3: Publication pattern per discipline per year

Authors’ publication strategies in scholarly publishing
129
Table 4 compares outcomes by faculty and by type of output; acrosstab analysis shows the expected distribution per row and per column,should the row and column variables independent of each other.
Table 4: publications patterns by faculty; different work types.
Article Book chapterConferenceProceedings Books
AGRICULTURE Count 1988 330 1551 121 3990Expected count 2233,9 314,5 1266,9 174,8 3990,0% Faculty 49,8% 8,3% 38,9% 3,0% 100,0%% work type 8,2% 9,7% 11,3% 6,4% 9,2%% total 4,6% ,8% 3,6% ,3% 9,2%
PHARMACY Count 2405 97 702 31 3235Expected count 1811,2 255,0 1027,2 141,7 3235,0% Faculty 74,3% 3,0% 21,7% 1,0% 100,0%% work type 9,9% 2,8% 5,1% 1,6% 7,5%% total 5,6% ,2% 1,6% ,1% 7,5%
LAW Count 453 337 99 263 1152Expected count 645,0 90,8 365,8 50,5 1152,0% Faculty 39,3% 29,3% 8,6% 22,8% 100,0%% work type 1,9% 9,9% ,7% 13,9% 2,7%% total 1,0% ,8% ,2% ,6% 2,7%
LETTERS Count 570 778 367 671 2386Expected count 1335,8 188,1 757,6 104,5 2386,0% Faculty 23,9% 32,6% 15,4% 28,1% 100,0%% work type 2,4% 22,8% 2,7% 35,4% 5,5%% total 1,3% 1,8% ,8% 1,6% 5,5%
MEDICINE Count 9962 576 5945 198 16681Expected count 9339,1 1314,8 5296,5 730,6 16681,0% Faculty 59,7% 3,5% 35,6% 1,2% 100,0%% work type 41,1% 16,9% 43,3% 10,4% 38,6%% total 23,0% 1,3% 13,7% ,5% 38,6%
VETERINARY Count 2654 98 2022 42 4816Expected count 2696,3 379,6 1529,2 210,9 4816,0% Faculty 55,1% 2,0% 42,0% ,9% 100,0%% work type 11,0% 2,9% 14,7% 2,2% 11,1%% total 6,1% ,2% 4,7% ,1% 11,1%
MATHEMATICS,PHYSICS, NATURALSCIENCES
Count 5325 567 2663 161 8716Expected count 4879,8 687,0 2767,5 381,8 8716,0% Faculty 61,1% 6,5% 30,6% 1,8% 100,0%% work type 22,0% 16,6% 19,4% 8,5% 20,1%% total 12,3% 1,3% 6,2% ,4% 20,1%
SPORT SCIENCES Count 270 8 220 9 507Expected count 283,9 40,0 161,0 22,2 507,0% Faculty 53,3% 1,6% 43,4% 1,8% 100,0%% work type 1,1% ,2% 1,6% ,5% 1,2%% total ,6% ,0% ,5% ,0% 1,2%
POLITICAL SCIENCES Count 595 619 168 399 1781Expected count 997,1 140,4 565,5 78,0 1781,0% Faculty 33,4% 34,8% 9,4% 22,4% 100,0%% work type 2,5% 18,2% 1,2% 21,1% 4,1%% total 1,4% 1,4% ,4% ,9% 4,1%
Total Count 24222 3410 13737 1895 43264Expected count 24222,0 3410,0 13737,0 1895,0 43264,0% Faculty 56,0% 7,9% 31,8% 4,4% 100,0%% work type 100,0% 100,0% 100,0% 100,0% 100,0%% total 56,0% 7,9% 31,8% 4,4% 100,0%

Authors’ publication strategies in scholarly publishing
130
If we look at the differences in terms of publication stocks fordifferent faculties, we see not surprisingly that the most productive faculty interms of publication stock is the Faculty of Medicine, with a stock of 16.681publications, accounting for 38% of the total references archived in AIR. If weadd Veterinary Medicine, the percentage rises to 48% (4.816 publications). Thesecond Faculty in term of publication stock is Physics, Mathematics andNatural Sciences, with 8.716 works archived. After Veterinary Medicine, wefind the Faculties of Agrarian Studies and Pharmacy. Faculty members ofHumanistic Faculties contribute for a minor part to the publication stock ofAIR. Letters, Law and Political Sciences represent together 12.3% of therepository. Sport Sciences Faculty, although cannot be classified withhumanistic faculties, follows the same path and accounts for 1.2%. On thewhole the least represented Faculty is Law (2.7% of the references in AIR).
Concerning the kinds of works published, an important distinctionemerged from data analysis is between faculties more used to write articlesand faculties more focused on book chapters publication.
The hard writers of articles are the members of scientific faculties,Medicine at the first place, representing more than 50% of the total articles(together with Veterinary Medicine) archived in AIR repository in the period2006 – 2009. Almost 60% of the works published by faculty members ofMedicine are articles. Also the faculty members of Physics, Mathematics andNatural Sciences write a consistent number of articles with respect to theircolleagues of other faculties. Their articles represent 22% of the total articlesarchived in AIR and 61.4% of their works are articles. The least productivefaculty in terms of articles is the Sport Science Faculty, which represents 1.1%of the total articles. A similar pattern is present for the faculties of Law,Letters and Political Sciences. Medicine and Physics, Mathematics andNatural Sciences have a consistent number of publications also for other kindsof works; in particular their works represent respectively 20% and 16.9% ofbook chapters in AIR. Concerning this kind of publication, the Faculty ofLetters is the most productive, representing almost 23% of the total of bookchapters. For this Faculty, even tough the publication of books chapters hashigher percentage respect to that of articles (32,6% vs. 23,9%), the differenceamong publication channels is less evident with respect to scientific faculties.
Contrary to common wisdom, the publication flow of faculty doesnot stop once tenure is attained. Quite the contrary, tenured faculty areresponsible for a high number of publications. For all the three categories(Researchers, PhD Students, Tenured Professors), journal articles representthe most used publication channel, representing almost half of the publicationstock of the three categories. Not surprisingly, tenured faculty tend to publishan increased number of books, while PhD students, tend to be

Authors’ publication strategies in scholarly publishing
131
overrepresented as far as the incidence of conference proceedings (41.3%) isconcerned.
Table 5 : distribution of outcomes per academic seniority
Finally, Table 6 analyses the internationalisation pattern of facultypublications.
Even in this case, there is a clear distinction between scientific andhumanistic disciplines. Faculty members from scientific disciplines are usedto publish in English. For the Faculty of Physics, mathematics and naturalsciences, as well as Pharmacy, the majority of contributions are written inEnglish. If we report the numbers of table 6 to the total publication stock, wesee that 61.4% of faculty members’ publications are in English and only 37.2%are in Italian. The rest is published in other languages. A similar situationcharacterises faculty members of Sport Sciences. For Medicine we find a majorbalance between English and Italian publications: 46.9% of publications are inEnglish and 40.6% are in Italian.

Authors’ publication strategies in scholarly publishing
132
Table 6: publications for different languages.
For humanistic disciplines, the majority of contributions is written in Italian(39%) and only a minor part in English (22.7%). What is interesting is thatfaculty members of Letters have a good number of publications in otherlanguages too, showing a remarkable international attitude. The leastinternational Faculty is that of Law, with almost 60% of contributions writtenin Italian.
Results so far confirm the existence of different publication patternsacross disciplines and different publication strategies related to seniority.Journal articles are increasingly becoming the most common publicationoutcome across disciplines, although books are more relevant in humanisticdisciplines and are generally published when faculty reach academicmaturity. Younger scholars start building their reputation throughparticipation to conferences across all disciplines and gradually publish onacademic journals and edited books. Medicine is the most prolific discipline interms of publication outputs, while Law (but also Veterinary and PoliticalSciences) is the least international. For hard sciences English is more commonthan Italian, while humanistic disciplines show a broader spectrum oflanguages covered.
The second step of our analysis looks at the acceptance of open accesspublications as viable alternatives to traditional journals for authors acrossdifferent disciplines. Due to the characteristics of the repository we could onlytrack gold open access journals and not other forms of open repositories.
We therefore identified five disciplines and tracked the evolution ofopen access publication between 2006 and 2009. The five disciplines arechemistry, physics, letters, medicine and computer science.

Authors’ publication strategies in scholarly publishing
133
Chemistry, like physics, is considered an advanced scientificdiscipline for the use of alternative publishing routes [23], whereas theopposite can be said for letters, whose authors are traditionally lessappreciative of the digital features of journals [52] and favour books to articlesin journals as the preferred mode of publication [40]. Medicine, and scientistsin general, are used to conduct systematic directed searches in aggregateddatabases on line to validate their findings and to look for early visibility fortheir works. Concerning Computer Sciences, faculty members are supposedto have the necessary skills to use IT tools and, for what concerns theirpublishing strategies, they are influentially driven by monetary return andthis fact could have deep influences on their approach to open access [40].
Four years is not a very long time span, but it allows looking at thegrowth in acceptance of Open Access across different disciplines. In order toanalyse authors’ publication strategies with respect to the introduction ofOpen Access, we looked at individual authors’ behaviour in five disciplinesover the time span analysed.
On the whole, open access publications represent 2.3% of the totalpublication records in AIR by the considered disciplines, which is quitemodest in absolute terms. If we look at the faculties who have the greatestpercentages of OA articles, Computer Science is the discipline with thehighest number of publications (3%), followed by Medicine (2,7%). This resultcan be explained by the international orientation of some of the faculty inthese disciplines and by the presence of high reputation open access journalsboth these disciplines have been early exposed to changes of scientificpublication tools and have developed an early aptitude to openness.
Chemistry follows the same pattern while, contrary to letters, physicsis underrepresented among open access journals in our sample. University ofMilano has opened several positions in physics for researchers and tenuredprofessors between 2006 and 2008. Given the fact that open access journals area relatively recent phenomenon, it may be that authors have preferred moretraditional publication outcomes so as to maximise their chances ofcomplying with the criteria set by evaluation committees.
Table 7: evolution of open access articles for the five disciplines consideredover the time span considered.
2006 2007 2008 2009Number ofOA articles
85 74 142 80
Number ofarticles
4,227 4,294 4,567 3,462

Authors’ publication strategies in scholarly publishing
134
If we focus on the number of Open Access publications deposited byscholars of different academic positions, we see that tenured faculty is morekeen to publish OA; their works represent 57,5% of the total OA publicationsin AIR by the considered disciplines. Researchers represent 39.4% and PhDstudents only 3.1%.
Table 8: number of open access articles.
This result is consistent with findings of past researches on this topic:younger faculty tend to prefer more established channels in order to getlegitimization; senior faculty, who has also access to higher funding, has more

Authors’ publication strategies in scholarly publishing
135
degrees of freedom and therefore can experiment with a wider range ofpublication activities.
Table 9: averages per discipline.
chemistry physics letters computersciences
medicine
Average number ofarticles per author
11,32 11,32 11,31 11,37 11,39
Average number ofpublications for thetop 20 of authors interms of articlespublished
31,05 33,3 18,45 15 100,15
% of OA articles 2% 0,5% 1,1% 3% 2,7%
Not surprisingly, OA publications tend to concentrate among authorswith the highest publication rate. We find a mild correlation between thenumber of publication and the number of OA publications. Yet, the numbersare too small for a generalisation.
Table 10: regression output.
5. Conclusions
In this paper, we were interested in exploring different publication strategiesput in place by authors from different disciplines and seniority, in order toidentify common trends and peculiarities within the same institutions; not

Authors’ publication strategies in scholarly publishing
136
surprisingly, the first result is that each discipline shows idiosyncraticpatterns, particularly as far as the preferred publication outcomes areconcerned: books are the preferred form of publication among scholars in thehumanities, whereas journal articles are preferred in science. Moreover,internationalisation patterns are quite different across disciplines, with some(namely physics) being a global academic field with English as the languageof reference, while others show the need to address both the local and theinternational audience; in the humanities, English is not a lingua franca,rather, other languages are also used to communicate scientific outcomes.
Yet, the analysis of results shows remarkably common patternsacross disciplines. Within the academia, only a limited number of facultymembers publish and an even smaller number of them publishes regularlyand a significant number of contributions per year; yet, those who publish arequite active even when they reach tenure, and this is true across disciplines.Incentives do play a role: opening of positions within the university iscorrelated to a sharp increase in the number of publications.
As publications alternatives multiply, it is becoming increasinglyimportant for the author to be aware of what rights, opportunities andlimitations are associated with different channels. At the same time, theincreased variety of juridical options associated with each of them makespublication decisions more complex than in the past. In this respect, authorsin our sample tend to follow a quite conservative approach in choosing whereto publish; younger faculty members tend to be more active in conferenceparticipation, while more senior faculty progressively publish journal articlesand books. Open access is still a very small percentage of outcomes and thereis a mild correlation between tendency towards open access and intensity ofpublications.
Incentives seem to be the most effective way to modify publicationstrategies: as scientific communities tend to be quite resilient, changes in thepatterns are likely to be introduced either by relatively senior and activeauthors or by specific policies put in place at the faculty level.
From this emerging perspective, new publication ways can beintegrated in the knowledge creation process of science and they can beconsidered important vectors for the final steps of diffusion, in parallel withtraditional channels. For some of these channels there is a lack of transparencyfor what concerns the consideration by academic communities and theevaluation for promotion and tenure decision within departments andUniversities. Current incentive mechanisms of universities can thereforerepresent an obstacle to a wider diffusion of new publication models [55],when they are not aligned with the trends of the scholarly publishing sector,reflecting the established norms of the traditional academic environment.

Authors’ publication strategies in scholarly publishing
137
Authors seem to be rational in their publication strategies: apart from theselected few who are systematic authors “no matter what”, academic authorsin our sample respond to career advancement opportunities and publish inestablished channels defined up by their departments / communities of peers.Although we could not measure it, impact factor most likely drives journalselection. New alternative models for early visibility or publication (such asrepositories like SSRN or PLoS) are clearly showing that it is possible to offeran alternative to traditional journals, provided that they are able to attractsignificant numbers of readers, offer high IF in addition to open access.Should they be able to comply with academic requirements, they willundoubtedly succeed in attracting to authors.
We do not have enough data to statistically verify this datum. Yet, itis likely that gold open access is more available to senior faculty, which islikely to have more access to financial resources. This needs to be taken intoconsideration in resource allocation, should the gold open access model beencouraged.
Notes and Bibliography
[1] Cope, B., and Kalantzis, M. (2000). Designs for social futures. In B. Cope,and K. Mary (editors). Multiliteracies: Literacy learning and the design ofsocial futures. London:Routledge, pp. 203–234.
[2] Cope B. and Kalantzis, M. (2009) Signs of epistemic disruption:transformation in the knowledge system of academic journals. FirstMonday, 14(4)http://firstmonday.org/htbin/cgiwrap/bin/ojs/index.php/fm/article/view/2309/2163 (April 2010)
[3] Kress, G. (2000). Design and transformation: New theories of meaning. In:B. Cope, and M. Kalantzis (editors). Multiliteracies: Literacy learning and thedesign of social futures.London: Routledge, pp. 153–161.
[4] Weiss, Y. , and Lillard, L. (1982). Output Variability, Academic LaborContracts, and Waiting Time for Promotion. Research in Labor Eco- nomics,5 : 157-188.
[5] O’ Neill G.P., and Sachis P.N. (1994). The importance of refereedpublications in tenure and promotion decisions: A Canadian study.Higher Education, 28(4 ): 472-435.
[6] Houghton, J. (2000). Economics of Scholarly Communication. Discussionpaper. Center for Strategic Economic Studies, VictoriaUniversity,available athttp://www.caul.edu.au/cisc/EconomicsScholarlyCommunication.pdf(April 2010)

Authors’ publication strategies in scholarly publishing
138
[7] Guedon J. C. (2001) In Oldenburg’s long shadow: Librarians, ResearchScientists, Publishers, and the Control of Scientific Publishing, ARL.Available at:http://www.arl.org/resources/pubs/mmproceedings/138guedon.shtml (April2010)
[8] Merton, R. (1973). The Sociology of Science: Theoretical and EmpiricalInvestigation. Chicago, University of Chicago Press.
[9] Dasgupta, P. and David, P.A. (1994). Towards a new economics of science.Policy Research, 23(5) 487–521. available athttp://ideas.repec.org/a/eee/respol/v23y1994i5p487-521.html (April 2010).
[10] Coe, R., & Weinstock, I. (1969). Evaluating journal publications:Perceptions versus reality. AACSB Bulletin, 1, 23-37
[11] MacMillan, I. C., and Stern I. (1987), Delineating a forum for businesspolicy scholars, Strategic Management Journal, 8: 183- 187.
[12] MacMillan, I. C. (1991).The emerging forum for business policy scholars,Journal of Business Venturing, 9(2): 85-89.
[13] Gordon, M. E., and Purvis, I.E. (1991). Journal publication records as ameasure of research performance in industrial relations. Industrial andLabor Relations Review, 45(1): 194-201
[14] Park, S. H., and Gordon, M.E. (1996).Publication records and tenuredecisions in the field of strategic management, Strategic ManagementJournal, 17(2): 109-128
[15] Lowe, A., and Locke, J. (2005), Perceptions of journal quality and researchparadigm: results of a web-based survey of British accounting academics,Accounting, Organizations and Society 30(1): 81–98.
[16] Baden-Fuller C., and Hwee Ang S. (2000). Building Reputations: The Roleof Alliances in the European Business School Scene, Long Range Planning34(6): 741–755
[17] Doran, J.S., and Wright, C. (2007). So You Discovered an Anomaly…Gonna Publish It? An investigation into the rationality of publishingmarket anomalies. Working Paper. Available at:http://papers.ssrn.com/sol3/papers.cfm?abstract_id=956105 (April 2010)
[18] Kling, R., and Iacono, S. (1989) The institutional character ofComputerized Information Systems. Office: Technologies and People 5 (1): 7-28.
[19] Kling, R., and McKim, G. (2000). Not just a matter of time: Fielddifferences and the shaping of electronic media in supporting scientificcommunication. Journal of the American Society for Information Science,51: 1306- 1320.
[20] Fry, J. (2006). Scholarly Research and Information practices: a domainanalytic approach. Information Processing and Management, 42: 299-316.

Authors’ publication strategies in scholarly publishing
139
[21] Curtis, K.L., Weller, A.C., & Hurd, J. (1997). Informationseekingbehaviour of health sciences faculty: The impact of new informationtechnologies. Bulletin of Medical Library Association, 85, 402-408.
[22] Rogers, E. M. (1995) Diffusion of Innovation. New York. Free Press.[23] Kling, R., and McKim, G. (2000). Not just a matter of time: Field
differences and the shaping of electronic media in supporting scientificcommunication. Journal of the American Society for Information Science,51: 1306- 1320.
[24] Foster, N.S., and Gibbons, S. (2005). Understanding Faculty to understandcontent Recruitment for Institutional Repositories. D-lib Magazine, 11(1).Available at http://www.dlib.org/dlib/january05/foster/01foster.html.(April 2010)
[25] Talja, S., Vakkari, P., Fry, J., and Wouters, P. (2007). Impact of ResearchCultures on the use of Digital Library Resources. Journal of the AmericanSociety for Information Science and Technology, 58(11): 1674-1685.
[26] Bauer, K., and Bakkalbasi, N. (2005). An Examination of Citation Countsin a New Scholarly Communication Environment. D-lib Magazine, 11(9).Available at http://www.dlib.org/dlib/september05/bauer/09bauer.html(April 2010)
[27] Clarke, R. (2005). A proposal for an open content licence for researchpaper (Pr)ePrints, First Monday, 10(8). Available athttp://firstmonday.org/htbin/cgiwrap/bin/ojs/index.php/fm/issue/view/187 (April 2010).
[28] Bar – Ilan, J. (2008). Which H-index? A comparison of Wos, Scopus andGoogle Scholar. Scientometrics, 74(2): 257-271.
[29] Waldrop, M. (2009). Science 2.0: Great Tool or great risk?, ScientificAmerican online. available athttp://www.sciam.com/article.cfm?id=science-2-point-0-great-newtool-or-great-risk&page=5 (April 2010)
[30] Harnad, S. (2003),Maximizing University research impact trough self-archiving.available at http://jcom.sissa.it/archive/02/04/A020401/ (April2010)
[31] Schneiderman, B. (2007), Science 2.0, Science, 319: 1349-1350[32] Hooker B. (2006). The future of Science is Open. available at
http://3quarksdaily.blogs.com/3quarksdaily/2006/10/the_future_of_s_1.html (April 2010)
[33] Katz, D. A. (1973). Faculty Salaries, Promotions, and Productivity at aLarge University. American Economic Review, 63(3) : 469-477.
[34] Weiss, Y. , and Lillard, L. (1982). Output Variability, Academic LaborContracts, and Waiting Time for Promotion. Research in LaborEconomics, 5 : 157-188.

Authors’ publication strategies in scholarly publishing
140
[35] MacMillan, I. C., and Stern I. (1987), Delineating a forum for businesspolicy scholars, Strategic Management Journal, 8: 183-187.
[36] Gordon, M. E., and Purvis, I.E. (1991). Journal publication records as ameasure of research performance in industrial relations. Industrial andLabor Relations Review, 45(1): 194-201.
[37] O’ Neill G.P., and Sachis P.N. (1994). The importance of refereedpublications in tenure and promotion decisions: A Canadian study.Higher Education, 28(4 ): 472-435.
[38] MacMillan, I. C. (1994).The emerging forum for business policy scholars,Journal of Business Venturing, 9(2): 85-89.
[39] Park, S. H., and Gordon, M.E. (1996).Publication records and tenuredecisions in the field of strategic management, Strategic ManagementJournal, 17(2): 109-128.
[40] Kingsley, D. A. (2008). PhD thesis. Australian National University.[41] Becher T. (1981). Towards a definition of disciplinary culture. Studies
6(2). 109-122.[42] Becher T. (1984). The significance of disciplinary differences. Studies in
higher education 19(2) 151-161.[43] Sparks S. (2005). JISC disciplinary differences. JISC Scholarly
Communication Group[44] Walsh J. P. and Bayma T (1996). Computer network and scientific work.
Social studies of Science 26(3), 661-703.[45] Whitley R. (1984) The intellectual and social organization of the Sciences.
Oxford University press[46] Bergstrom, T. (2007) and Lavaty R. . How often do economists self-
archive?, EScholarship Repository. Available athttp://repositories.cdlib.org/ucsbecon/bergstrom/2007a/ (April 2010).
[47] Cozzarelli, Nicholas R., Kenneth R. Fulton, and Diane M. Sullenberger.“Results of a PNAS Author Survey on an Open Access Option forPublication.” Proceedings of the National Academy of Sciences of theUnited States of America 101, no. 5 (2004): 1111.http://www.pnas.org/cgi/reprint/101/5/1111.pdf (April 2010)
[48] Gadd E. at al. (2003) Romeo Studies 2: Haw academics want to protecttheir open access research papers. Journal of information science 29(5)333-356.
[49] Allen J. Interdisciplinary attitudes towards deposit in institutionalrepositories http://eprints.rclis.org/archive/00005180/ (april 2010)
[50] Antelmann K. (2006) Self archiving practice and the influence ofpublisher policies in the Social Sciences. Learned publishing 19(2) 85-95.
[51] Talja S. Et al. (2004) Field differences in the use and perceived usefulnessof scholarly mailing lists. Information research 10(1).

Authors’ publication strategies in scholarly publishing
141
[52] Swan, A., and Brown, S. (1999) What Authors Want: the Motivations andConcerns of contributors to Learned Journals, Learned Publishing 12(3):170-172. Available at http://www.alpsp.org/ForceDownload.asp?id=142(April 2010)
[53] Swan, A., and Sheridan, B. (2005), Open Access and self – archiving: anauthor study. available at http://cogprints.org/4385/ (April 2010)
[54] Kennan, M.A. (2007), Academic authors, scholarly publishing and openaccess in Australia. Learned Publishing, 20(2): 138-146. Available athttp://docserver.ingentaconnect.com/deliver/connect/alpsp/09531513/v20n2/s7.pdf?expires=1245422858&id=50857584&titleid=885&accname=Guest+User&checksum=1638DD04FB019AFB8514FA48903C9B02 (April 2010)
[55] Dubini, P., and Giglia E. (2009), Economic Sustainability duringtransition: the case of scholarly publishing. available athttp://portale.unibocconi.it/wps/wcm/connect/resources/file/eb137a0a686d8e3/Dubini%20Giglia%20%20Economic%20sustainability%20during%20transition.pdf (April 2010)

142
The changing scholarly information landscape:Reinventing information services to increase
research impact
Linda O’Brien
Information Services, Griffith University, Queensland, [email protected]
AbstractIn an increasingly competitive global knowledge economy the role of theuniversity in a nation’s innovation agenda has taken on greater prominence.Innovation through knowledge creation and application is seen to be thedriver of long term national economic and social prosperity. With thisrecognition comes a growing interest by government in quality assuring andmeasuring the value of their universities. University league tables havebecome an accepted part of this landscape, as nations seek to positionthemselves in a globally competitive environment. A university’s researchimpact - the extent to which its research informs further research and practice- is a significant component of the innovation system, and of the league tablemeasures. Citation impact is often used as a proxy for research impact,though it only tells part of the story. Against this backdrop the researchlifecycle is being transformed by information and communicationtechnologies, fundamentally changing the scholarly information andcommunication landscape. What once appeared to be a linear process, fromresearch through to publication, has become more complex, morecollaborative, challenging the boundaries between disciplines, organisations,nations [1]. Emerging opportunities to leverage research data to increaseresearch impact have yet to be realised. Universities, as long lived institutions,must balance short term utilitarian demands driven by national innovationagendas and league table positioning, with their fundamental mission ofknowledge creation, synthesis, transmission and preservation. This is amission that aligns strongly with the traditional place of the library inproviding access to scholarship for current and future generation for all whowish to learn, a role that has been challenged by apparently ubiquitous accessto digital content. The complexity of the current environment offers newopportunities for a university’s information service providers to further the

The changing scholarly information landscape
143
university, and the nation’s aspirations – both short and long term.Information service providers are ideally positioned to navigate thecomplexity of the scholarly information landscape to achieve universityimperatives within a national context, through collaboration within andacross organisational boundaries; to achieve short term imperatives whilststaying true to the long term mission of universities in knowledge creation,dissemination and preservation for future generations of scholars andpractitioners. Griffith University, a research intensive, innovative universitysituated within the south east corner of Queensland, Australia enjoys thebenefit of an integrated information services division. Information Servicesbrings together library, information and IT professionals to provide theinformation leadership, services, systems and infrastructure which underpinthe University’s research, learning, teaching and administrative activity. Overthe last twelve months the division has built on its strengths to re-shape itsservices to tightly align them with University’s aspirations. A significant partof this re-shaping has been the implementation of new service models, newservices and systems, and strengthened partnerships, to increase theUniversity’s research impact. This initiative has been welcomed by theacademy. More complex measures will be required to indicate the success ofthis initiative over time.
Keywords: research impact; university information services;
1. Introduction
In an increasingly competitive global knowledge economy nations are lookingto their universities to drive the economy and prosperity. University leaguestables seem to now be a permanent part of the higher education landscape. Auniversity’s research impact - its impact on future research and practice - is akey driver of national innovation and a core component of the leagues tables.We are seeing profound change in the scholarly information andcommunication lifecycle as technology facilitates new ways of researching,communicating, collaborating, and sharing scholarly outcomes. It is stillunclear how this will evolve as conventional policies and practices arechallenged by the opportunities offered through technological innovation.Taken collectively these trends have a profound impact on the way in which auniversity can, or should, seek to increase its research impact.
This paper explores these issues, concluding by showing how oneAustralian university is seeking to increase research impact through the roleplayed by its information services. It begins by outlining Australia’s national

The changing scholarly information landscape
144
innovation agenda as it relates to universities, the research quality agendaand then explores how the scholarly information and communicationlandscape is changing. These observations are framed within the context ofbroader international trends. The concept of research impact is explored, aconcept which is used differently by different stakeholders. It concludes withan exploration of how a university’s information services can serve to increaseresearch impact, using Griffith University as a case study.
2. Universities and the innovation agenda
“Over the last decade or so there has been firmly established amonggovernments around the world the view that high quality, internationallycompetitive research and higher education, mostly contained withinuniversities, are prerequisites for long-term success in globalised knowledgeeconomies.”[2]
The generic social and economic benefits of universities – througheducating the population and generating knowledge - have long beenrecognised as an important source of industrial innovation [3]. More recently,in a world where knowledge and its application is seen as the key to globalcompetitiveness, the world’s developed and developing nations haverenewed their focus on knowledge innovation as a driver of nationalprosperity, advocating a central role for universities [4]. Australia is noexception, following in the path that the UK and others have alreadytravelled, though from a perspective relevant to the national context [5].
A logical consequence of governments’ viewing universities as sources ofhighly specific benefits, as drivers of innovation and national prosperity, is atendency to then regulate and stimulate to drive specific behaviours, and aconsequent desire to measure the success of these policy drivers. Thesignificant government investment in research infrastructure over the pastdecade, in e-science and cyber-infrastructure across North America, Europeand Australia; has been to stimulate national performance andcompetitiveness [6] - whilst the obsession with university research qualityassessment and rankings is a consequence of the desire to measureperformance (and often to provide a regulatory measure throughperformance driven funding).
The Australian Minister for Innovation, Industry, Science and Researchcommissioned a review of the national innovation system in 2008 [7] leadingto publication of a Government innovation strategy in 2009 [8]. The reviewexamined the way in which Australia’s national innovation system was

The changing scholarly information landscape
145
positioned in a globally competitive Internet-enabled world. Whilst Australiais small and geographically remote, with less than 1% of the global economy,we manage to produce 2% of the world’s scientific literature [9]. Australia hasmore Nobel prize winners per capita than any other nation [10]. Yet a rangeof indicators showed that we had slowed in terms of productivity growth,despite an enviable record. The review raised concern that investment levelsin research in Australian universities was low as compared to the OECD. Thescope of the review was broad ranging – looking at the three highlyinterdependent aspects of a national innovation system: the development ofnew knowledge and ideas, the deployment of those ideas in a real worldcontext and the diffusion and adoption of applied knowledge. The importantcontributions made by the social sciences and humanities to the health andprosperity of the nation were acknowledged- the review wasn’t purelyscience and technology focused.
The breadth of the review meant that universities featured prominently –being seen as the repositories of existing knowledge and the hub forgeneration and exchange of new knowledge [11]. There was recognition thatour understanding of innovation had changed – what is being referred to asthe concept of ‘open innovation’ [12]. Innovation increasingly relies ondistributed inter-organisational networks rather that innovation within anorganisation. Universities form part of multi-faceted social or informationchannels or mechanisms through which information, knowledge and otherresources are shared or co-produced- a much richer picture of universityengagement than that of the traditional university concept of knowledgetransfer [13]. The critical value of the nation’s information infrastructure tothe national innovation system was therefore central: from high speednetworks and collaboration tools, through to the value of unlocking publicinformation and content, the importance of the national collections held bylibraries, museums and other agencies. Specifically the review acknowledgedthe need for a high level of interaction between knowledge providers andknowledge users – particularly given that productivity growth in Australiawill require the capability to adopt and adapt the 98 percent of newknowledge which is generated by the rest of the world [14].
The subsequent national strategy: Powering Ideas adopts many of thereview’s recommendations. More than A$3.1 billion in funding is to be madeavailable through the strategy. Of particular relevance to this paper are thatover the next four years, there will be more than doubling of funding for theindirect costs of research, a A$1.1 billion investment in science infrastructurewith A$312 targeted at e-research infrastructure funding. This includes A$97million for data storage and collaboration tools through the AustralianResearch Collaboration Service (ARCS), A$48 million to establish a national

The changing scholarly information landscape
146
research data commons through the Australian National Data Service (ANDS)A$48 million, A$37 million to enhance the Australian Research Network,A$130 for national high performance computing initiatives and A$37 millionfor enhancement to the Australian research and education network [15].
Geoffrey Boulton and George Lucas critically examine the role ofuniversities, questioning the current obsession of governments withuniversities as drivers of innovation [16]. They clearly articulate why, in aworld of globalisation, universities are crucial national assets: “they researchinto the most theoretical and intractable uncertainties of knowledge yet alsoseek the practical application of discovery; they test, reinvigorate and carryforward the inherited knowledge of earlier generations; they seek to establishsound principles of reasoning and action which they teach to generations ofstudents” [17]. They regard a national innovation system as ecology, a set ofsystems, premising that the way in which universities contribute toinnovation varies according to the regional economy, the business sectorinvolved and the nature of the university. The definition of the utility ofuniversities is often too narrowly drawn from their perspective - the usefulknowledge and skills generated by universities are a derivative of a muchdeeper capability than that of driving innovation. “It is a capability deeplyembedded in the fundamental role that universities have in creating newknowledge and transmitting it to successive generations together with theknowledge which has been accumulated by predecessors and which in eachgeneration is subjected to renewed tests of verification.” [18]. Their paper is aplea for the autonomy and freedom of universities to “do what they do best”,without oppressive mechanisms which seek to drive short term utility. It isthe flexibility and adaptability of universities which enables them to stay trueto their core mission in pursuing and explaining knowledge whilst beingsensitive to the needs of the contemporary world. Courant, when consideringthe impact of disruptive technologies on universities, would concur,proposing that universities be both conservative and revolutionary:conservative in terms of mission and revolutionary in the way in which theyattain their mission [19].
3. Defining research impact
Together with the stimulation strategy there is the consequent regulationstrategy. Governments seek to measure the quality of their universities andthe contribution they make to the nation’s prosperity. The impact of auniversity’s research is a significant element of a university’s contribution.

The changing scholarly information landscape
147
They wish to maximise the economic and social returns from any publicinvestment in research. Within Australia the federal government is in themidst of rolling out a national research evaluation framework, the Excellencein Research for Australia, to measure research quality against internationalbenchmarks [20]. This is in keeping with overseas initiatives such as those inthe UK [21]. The measures will be used to inform funding decisions basedupon performance, though the detail of how this will be done is not yetknown [22].
The obsessive interest in university league tables is similarly asymbol of the international interest in measuring university quality andimpact. International league tables, such as the Shanghai Jiao Tong and Times,are now a permanent and significant feature of the higher educationlandscape. In a much more competitive global knowledge economy, with amore mobile, and valuable, international student market, universities arecompeting to attract the best students, the best teachers and researchers andthe best grants. Global rankings of universities are a familiar and increasinglyvisible part of the higher education landscape, as universities compete topromote their value, status and attractiveness.
Within Australia the Research Quality Framework (RQF) was introducedin 2005 to follow in the footsteps of other nation’s research qualityframeworks [23]. The RQF differed from existing international researchassessment exercises in that it sought to measure ‘research impact’. ‘Researchimpact’ was defined as “the beneficial application of research to achievesocial, economic, environmental and/or cultural outcomes.” [24]. Measures ofimpact included analyses of patents, cost-benefit assessments, social returnsand citations [25]. In its infancy the RQF was replaced by the Excellence inResearch for Australia (ERA) initiative, which no longer seeks to measureresearch impact in the same way, instead examining more quantifiablemeasures of citation impact and esteem.
Whilst the broader definition of research impact measurement has beendropped in the ERA process, the concept is still part of the national landscapein Australia. One aspect of the Australian national innovation system andresearch landscape are the Cooperative Research Centres (CRCs) [26]. Theyare funded by the Australian government to build critical mass in specificresearch ventures which link universities and industry. The governmentcommissioned Deloitte to develop a framework to evaluate the performanceof CRCs [27]. The framework was to help CRCs assess their outcomes throughexamining the impact chain from inputs, through to activity, outputs, usageand impact. They note that quantifying the final impact of research isnecessarily the most uncertain of the stages [28]. Impact types may include

The changing scholarly information landscape
148
productivity gains, industry development, environmental, health and socialbenefits which are not easy to quantify and which are highly contingent innature. This broad definition of research impact plays to the role ofuniversities in achieving the national innovation agenda in its most completesense.
In a knowledge economy it is the generation and exploitation ofknowledge that plays the predominant part in the creation of wealth.Scholarly publishing plays a key role in the effective dissemination anddiffusion of knowledge and research findings [29] and conventionalpublishing is still the main form of research dissemination [30]. It is thereforenot surprising that the more complex, difficult to measure, yet valuable,definition of research impact as outlined above is often abbreviated to ameasure of publishing quality as measured through journal ranking andcitation impact [31]. Butler reasons that research quality is best judged bypeers. Peer reviewed prestige publication is sill the route to academic success[32]. A stellar publication record and citation impact is integral to promotionand tenure. Hence the importance of a published research paper as judged byacademic peers through journal quality and citation has become an agreedquantitative measure of research quality [33] and of research impact. Missingfrom these measures is the evidence that the research has had a positiveeconomic or social impact.
4. The changing scholarly communication landscape
The mission of a university’s library is intertwined with that of the university– making the world’s knowledge accessible to current and future scholars[34]. Libraries have traditionally seen their role as providing free access to theworld’s scholarship. “This freedom gave us something real. It gave usfreedom to research, regardless of our wealth; the freedom to read, widelyand technically, beyond our means. It was a way to ensure that all of ourculture was available and readable” [35]. This role is now challenged by ascholarly information and communication landscape which has changedprofoundly and irrevocably.
The scholarly information lifecycle is transforming as advances ininformation and communication technologies enable new ways to create,contribute to, access and use scholarly outputs of all types. The creation of auniversity’s scholarly output, whether published works, research data,working papers, teaching materials or multimedia of a variety of kinds, isincreasingly digital. Scholarly books are published in digital form with some

The changing scholarly information landscape
149
predicting that virtually all new scholarly titles will be digital within 10 years[36]. More than 30% of Amazon’s titles are now sold in digital form [37].Scholarly information is published by individuals, institutions and largecorporations and delivered via a multitude of business models whichcontinue to evolve and change in unpredictable ways.
“The environment in which research is being conducted anddisseminated is undergoing profound change, with new technologies offeringnew opportunities, changing research practices demanding new capabilities,and increased focus on research performance.” [38]. As Borgman notes [39],every stage in the research lifecycle can be facilitated, or complicated bytechnology. Research practice is radically changing as large-scale, distributed,collaboration in research projects is facilitated through the capacity of digitaltechnologies, enabling the study of complex problems across organisationaland national boundaries [40]. Collaboration in the social sciences andhumanities is increasing as rich data sets and previously difficult to accesstexts and objects are made accessible through digitisation. Just as new contentis being created digitally, large collections of printed text and other objects arebeing made accessible globally and freely. Scholarly output now includes notonly the published works but the research data, tools and techniquesassociated with the research. Existing research data can be re-mined and re-used, research algorithms, tools and techniques can be easily shared, largedata sets can be visualised to render complex findings in useable ways.
An unknown amount of this research data will have value for the futureas an important part of scholarly output. A recent Intersect study of four NewSouth Wales universities found that more than 87% of researchers’ collect orcreate research data, more than 50% said their data was almost all digital anda further 23% said it was more than 60% digital [41]. Almost half therespondents allowed access to the data from outside their research team.Fewer than half the respondents believed they faced data management orpreservation issues and 20% weren’t sure. Yet with appropriate stewardshipresearch data has the potential to significantly increase research impact.
Australia has been well served by the Australian Partnership forSustainable Repositories (APSR) [42], the agency that has led nationalthinking on the research data issue. In 2006 APSR released a report onAustralian e-research sustainability. The report explores the issuessurrounding research data stewardship, the incentives and disincentives forappropriate stewardship of research data. There were clusters of issues, someof which are now being actively addressed at a national level. The reportsuggests that from a policy perspective the research funding bodies lackguidelines for clear administrative responsibility for data stewardship, yetthere is interest in maximising research outcomes from the public dollar. It

The changing scholarly information landscape
150
was not difficult, therefore, to convince funding agencies to encourage moreopen access to research data. The policy framework has now been changedwith the responsibility for research data access clearly resting with theuniversity as a long lived institution. This mirrors international trends.Though whilst agencies require data management plans and deposit,enforcement if often inconsistent [43]. Policy is necessary, but not sufficient,requiring the addition of “carrots and sticks” if behaviour is to change.
The APSR report also found that there are strong disincentives forresearchers to engage with long-term data management. They are funded todo the research, research groups come and go, there is no funding forstewardship, no rewards or recognition. Good research data stewardship willnot, at least in the immediate future, impact on their ranking in ERA, nor inleague table positioning. The universities themselves are one of the enduringfeatures of the research landscape and hence arguably a logical home for longterm commitment to data stewardship. But the report notes that whilstuniversities want an environment that maximises research outcomes, this iscurrently established by publishing and citation metrics – it is not in theuniversity’s interest to follow policy prescriptions if there are no rewardsand/or penalties [44]. One of the policy problems with data curation andpreservation is that the costs persist long after the project ends [45].Researchers may generate very long-lived and substantial financialresponsibilities for the institution.
Universities have invested significant sums of money in building andsustaining library collections for future generations of scholars. They havedone so based on a belief that the library plays a key role in supporting theirresearch and learning through preserving and making accessible scholarlyoutput- though arguably this is currently under challenge. Borgman notesthat whilst libraries are a logical steward for research data management,libraries are no better placed to take on an unfunded mandate [46]. Lynch alsonotes that ‘With data storage services, campus cyberinfrastructure design anddeployment begins to interconnect with fundamental campus policies andculture about the stewardship responsibilities of scholars, about contracts andgrants compliance issues, and about risk management” [47].
APSR also found that there was no systemic sustainable infrastructureavailable to broadly support research data management. It is in this area thatwe have seen significant national investment since the report, as noted in theearlier section of this paper. Australia has made a significant financialcommitment to development of a national research data fabric, data storage,high performance computing and networks.

The changing scholarly information landscape
151
5. New challenges and opportunities
Swan [48] questions whether we would invent our present system ofscholarly communication in our current context and decides not. If scholarlycommunication is to aid the progress of science, then, arguably, some of ourcurrent mechanisms act as barriers. Swan persuasively argues the case foropen access, showing that it increases citation impact, shortens the researchlifecycle, advances science by enabling use of new technologies to mine andmanage science and opens the way for greater collaboration across disciplineand geographic boundaries. Similarly Houghton and Sheehan [49] havesought to examine the economic benefit offered through increased access toresearch findings, afforded by new models of scholarly communication. Theyexplore different publication models, examining their potential for greaterresearch impact (as measured by citation). They analyse the literature andquantify the potentially measurable impacts of enhanced access to researchfindings, for researchers, government and the wider community, including:
more timely access to both accelerate and widen opportunities formore timely, collaborative research, and for adoption andcommercialisationgreater access leading to improved learning outcomes, a greateropportunity to inform professional practice, improve the capabilitiesof practitioners, future researchers and research usersthe potential to create more informed citizens and consumers withimplications for better use of health care, social benefits andeducation, and potentially improved productivity.
Their modelling shows significant economic benefit from open access topublicly funded research, with, for example, a 5% increase in access andefficiency in Germany worth USD 3 billion. This work was extended througha further study commissioned by JISC [50] to examine the economicimplications of alternative scholarly publishing models. This paper posits thatif the aim is to have the most cost-effective scholarly publishing system, thenboth costs and benefits must be quantified. All costs and benefits associatedwith the scholarly communication lifecycle are modelled in an attempt tounderstand the increasingly complex scholarly publishing landscape. Theydemonstrate that research and research communication are major activitieswith substantial costs and conclude that a preliminary analysis of thepotential benefits of more open access to research findings suggest that thereturns to research can be substantial. Different models for scholarlypublishing can make material differences to the returns realised and the costs

The changing scholarly information landscape
152
faced. Whilst the paper refers to the UK context (which produces 10% of theworld’s scientific papers [51]), the importance of promoting greater use ofopen access on an international scale is even more relevant to Australia if itmeans that the 98% of the world’s scholarly output produced elsewhere willbe more accessible.
A range of recommendations are made to overcome the barriers andrealise the benefits of more open access publishing. Among these are toensure that research evaluation is not a barrier to moving toward more cost-effective scholarly publishing models and that incentive and reward systemsare aligned. Arguably these barriers still exist.
In a highly competitive and complex environment a scholar’scompetitiveness is still judged by the quality of their publication and citationrecord. Whilst the scholarly communication and dissemination landscape ifchanging dramatically, it is within the context of relatively conservative valueand reward system for scholars, a system which has the practice of peerreview at their core [52]. A recent study by the Center for Studies in HigherEducation [53] found that from a researcher’s perspective one of the greatestchallenges for disseminating research is choosing where to publish. Scholarsare concerned with the stature and selectivity of the publication outlet butalso its appropriateness for the target audience. The study suggest that theprimary motivation of a scholar is to choose an outlet that will have thehighest visibility with the specific audience they want to reach, even if thataudience is small, preferring a prestigious commercial publisher over anopen access publication without a prestigious imprimatur. Interestingly arecent article on marketing publishing is Australia questions whether, in fact,scholars are publishing for other scholars at the expense of improvingprofessional practise [54]. The CSHE study found, perhaps unsurprisingly,that young scholars were particularly conservative in their researchdissemination behaviour whereas established scholars could afford to bemore innovative [55]. Scholars remain under pressure to publish in highimpact journals, many of which are still subscription access only, findingolder business models profitable in an environment where national researchquality schemes can serve to reinforce their market position.
Within ERA the concept of research impact is judged through citationimpact and esteem measures. In calculating these measures the AustralianResearch Council has worked with the academic community to rank journals,including Australian titles, based on their assessment of quality. Theserankings will inform the way in which publication quality is judged. This hasbeen a highly contentious, and arguably flawed, process [56]. Butler isconcerned that impact, as measured through publication quality and citations,

The changing scholarly information landscape
153
is becoming the proxy for research quality in total, rather than only oneaspect. She also expresses concern that a system which impacts on prestigeand/or funding (which ERA will do on both counts) will affect the behaviourof researchers and administrators. There is a risk of goal displacement, whereincreasing the measure becomes the imperative. Within the context of ERA,where the scholarly community has ranked journals for the purposes ofmeasuring research impact, it is already clear that there is now an unspokenimperative to seek to publish almost exclusively in journals ranked A and A*in order to drive ERA quality outcomes.
Arguably we are at risk of reducing our ability to achieve the moreaspirational notion of research impact, of contributing to national innovation,as universities, faculties and/or individual researchers seek to maximise ERAoutcomes at the expense of getting their research into the best place tomaximise its real social and economic impact.
6. Reinventing the role of information services
The changing scholarly communication landscape increases the potential toincrease research impact, and also increases the complexity. The onceapparently linear process of research, communication and application of theresults has become more much complex. Advances in information andcommunication technologies are disrupting the traditional models ofpublishing [57].
At all stages of the research lifecycle there are opportunities forinformation services providers to enhance their university’s research impact.
6.1 Information accessStudies have shown that increasingly researchers use Google for everything,that they are confident they can manage their information seeking, thoughmany are less certain that they are managing their research data well [58].Haglund [59], in a study of young university researchers at three universitiesin Sweden, found that Google was the first choice of information seeking,search methodologies were haphazard at best, yet researchers feel they arecompetent information searchers. Convenience was important – if an itemwasn’t “one click away” they didn’t bother seeking it, and they were receptiveto new technologies such as PDAs.
6.2 Becoming part of the research endeavour

The changing scholarly information landscape
154
Personal networks were important to researchers and collaboration waswidespread yet they appeared to have no working relationship with thelibrary. They rarely went to the library and did not see how the Library couldassist them with instruction or IT support. Haglund proposes that theparadigm shift, wrought through the Internet, digital publishing andreinvention of libraries as the “living room” for undergraduates, has served tomake libraries and librarians more removed from the world of theresearchers.
6.3 Research data services, generic and tailoredIn assessing the future of the scholarly communication landscape the recentCenter for Studies in Higher Education study [60] found that supportstructures and organisations available for the preservation and storage of aresearcher’s own data are uneven at best, with most institutions approachingthe issue in a piecemeal manner. They found five key areas that needimmediate attention:
More nuanced tenure and promotion practices that did not relyexclusively on publication and ‘easily gamed’ citation metricsA re-examination of peer review – meaning, timing, mechanisms,locusCompetitive high quality affordable publishing platformsNew models of publication with institutional assistance to managecopyrightSupport for managing and preserving new research methods andproducts- GIS, visualisation, complex distributed databases etc.
The study found that the scope of support needs by the differentdisciplines was starkly different, with scientists wanting bigger ‘pipes’, newways to store, manage, process and visualise large data sets and mechanismsto support ‘grand challenge’ research. Social scientists and humanists needswere more modest though they included interest in integrated complex datamining, computational analysis and visualisation. Arguably the differencesare of scope rather than of substance. All disciplines identified the problem ofdata storage and preservation (the authors noted that it appears that the EUhad prioritised this ahead of the US) [61].
The need for specialist support, particularly IT support, was prevalentthough the preference was for technology-savvy scholars who work incollaboration rather than a model of “academic computing services” who areunaware of the scholarly questions and methodologies that drive a discipline.In many cases the library was seen as the locus of support for archiving,curation and dissemination of scholarly output. They conclude by noting that

The changing scholarly information landscape
155
“although robust infrastructure are needed locally and beyond, the sheerdiversity of scholars’ needs across the disciplines and the rapid evolution ofthe technologies themselves means that one-size-fits-all solutions will almostalways fall short. As faculty continue to innovate and pursue new avenues intheir research, both the technical and human infrastructure will have toevolve with the ever-shifting needs of scholars. This infrastructure will, bynecessity, be built within the context of disciplinary conventions, rewardsystems, and the practice of peer review, all of which undergird the growthand evolution of superlative academic endeavours.“ [62]
6.4 Clear leadership in research information services, internallyand externally, with strong collaborative linksWithin the Australian context the Intersect study [63] found that the vastmajority of researchers had not heard of any of the major national bodiesinvolved in developing and providing research information infrastructureservices. When asked what support they most needed, scholars identifieddata management, expertise in data analysis, collaboration platforms, datamanagement and storage, access to research software and the need for moreIT personal.
APSR found that “the immediate critical issue for the stewardship ofresearch data in Australia is the lack of administrative responsibility for thetask” [64]. The report noted that “There are boundaries between researchgroups, data providers, repositories and data centres. These boundaries leadto duplication or capability gaps. It is important to identify responsibilitiesand opportunities across these groups where possible. Data managementrequires greater cooperation between the players” [65]. No administrativegroup has responsibility for research data sustainability – to create andmanage policies, understand cost benefit, accept funding and harvest thebenefits.
6.5 Publishing and curationThe Center for Studies in Higher Education study found that from aresearcher’s perspective one of the greatest challenges for disseminatingresearch is choosing where to publish. One response to this challenge hasbeen that of the University of New South Wales. It introduced RIMS, theresearch impact measurement service, in 2005 to realign its services to supportthe university’s goals [66]. Recognising the increasingly competitive nature ofthe research environment and a renewed emphasis by the University onresearch outcomes the Library provided a new bibliometric service providingcomparative publication and citation data to schools and faculties. Knowledge

The changing scholarly information landscape
156
gained through this process informed collection development, trainingopportunities for the academy on higher-impact publishing.
A 2010 study [67] showed that scholars across a broad range ofdisciplines had a growing interest in electronic publication and that scholarsembraced the potential of linking final publications directly to data setsand/or primary sources material. Though most of those interviewed believedthey didn’t have access to easy-to-use tools or to the expertise required.Publishing is seen as an emerging role for libraries as it becomes easier toimplement e-press services. Hahn [68] found that in most cases libraries wereassisting scholars to move existing journals into the digital world or into openaccess publishing; in some cases they were publishing new titles. The overlapof expertise and demands of publishing with the knowledge and skillsrequired by libraries made it a natural progression.
It is against this backdrop that scholarly information servicesproviders within the university context: libraries, information andcommunication technology units, must position themselves as valuedpartners in the scholarly and research endeavours of their universities. Lynch[69] questions how the cyber-infrastructure challenge differs for universitiesas compared with the national challenge. He believes there is a strongobligation and mandate for base level of universal service across allcampuses: all researchers need to be able to apply IT in their research, toaccess and build on cyber-infrastructure services including data management,data curation, to get help in learning how to use the services, particularlythose without specialist IT support. He notes that the campus perspective isconcerned with the ‘average’ rather than the ‘extreme’ scholar. “One of thekey challenges - politically, financially, and technically - is defining thedemarcation between free universal service and the more specialized packageof support services offered to extreme users, a package that may bepredicated on such users’ ability to obtain funds or other resource allocations“[70.] His recommendation – that campuses create a support organisation thatcan reach out to scholars early in the data lifecycle to assist with datamanagement and curation/preservation strategies, involving IT professionals,librarians and archivists and maintaining a close relationship with theresearch and grants office and that perhaps the Library take responsibility forthe long term curation of the data at an appropriate point in the lifecycle.
Borgman [71] suggest that data may become the new ‘special collections’for libraries. Noting that strategies for data curation will require involvementfrom academics, the campus research office, the library and instructional andinformation technology services.

The changing scholarly information landscape
157
7. A case study
Griffith University is a university of some 38,000 students from 124 countriesstudying at undergraduate through to doctoral level in one of four broadacademic groups: arts, education and law; business; science, engineering,environment and technology; and health. Griffith is a large multi-campusinstitution spanning Australia’s fastest growing corridor from Brisbane to theGold Coast in Queensland. Griffith’s strategic research investment strategypositions it to be a world leader in the fields of Asian politics, trade anddevelopment; climate change adaptation; criminology; drug discovery andinfectious disease; health; sustainable tourism; water science; music and thecreative arts.
Griffith is regarded as one of Australia's most innovative tertiaryinstitutions and one of the most influential universities in the Asia-Pacificregion. This innovation is carried through into the provision of informationservices, with e-learning, e-research, library, information and communicationtechnology services, systems and infrastructure offered through a singleintegrated division, Information Services. This provides a distinct advantageto the University in an increasingly complex scholarly information andcommunication environment.
In response to the University’s strategic intent to build its researchimpact, informed by the rapid changes to the scholarly information landscapeand the increased competitive nature of research measurement, InformationServices created a unique service portfolio, Scholarly Information andResearch (SIR), to provide an integrated end-to-end service, offering supportto researchers at all stages of the research cycle. Information services alreadyhad established relationships with the academic community, with academiclibrarians working closely with disciplines where the library is their “researchlaboratory” and research computing services well connected to specificresearchers and research groups. Research computing services initiallyfocused on the provision of high performance computing services andspecialist software development. More recently much of their work hadinvolved not only development of research portals and research analysis toolsbut assistance with research data management. This particular service hasgrown through fee for service work, often with work undertaken underservice level agreement, enabling us to recruit discipline specific specialists.We also had a thriving digital repositories team which had built a strongworking relationship with the office of research, working under service levelagreement to collect the data for all university publications for input into the

The changing scholarly information landscape
158
research quality assessment and funding process. Our academic librarians,whilst providing traditional library research support services, felt they couldbe doing more to support the University’s research mission. Across thedivision there was also a sense that no single Director provided leadership insupport the University’s research endeavours within Information Services.The creation SIR in 2009 brought together our academic librarians, digitalrepositories, acquisitions, cataloguing and metadata services and researchcomputing under a single leader, providing the catalyst for a renewed focuson research. Our aim was to focus on driving the University’s core researchmission through service innovation and collaboration.
7.1 Information accessWe are currently seeking more creative ways to expand access to scholarlycontent by adopting different purchasing models, fine tuning our selectionprocesses to acquire relevant content and by moving to an e-preferred format.A new library system will go live mid-year, increasing discoverability of ourcollections. Through our involvement in relevant state and national bodies wewill continue to be strong advocates for improved access to content ofrelevance to our scholars.
7.2 Becoming part of the research endeavourIn 2005 I noted that “we must bring our know-how forward and activelyengage in strengthening our partnerships with each other [library,information and IT professionals] and with the researchers within our owninstitutions if we are to continue to be a relevant and important part of theresearch endeavours of our institutions.” [72]. At Griffith we have createdcontact librarian roles as part of the new portfolio. Their role is to build andmaintain relationships with the academic community, referring them tospecialist librarians and IT professionals as required. They are required todevelop a clear understanding of the academics’ requirements, ensuring wedeliver services to meet academic needs and expectations and that wecontinue to evolve services over time to meet changing requirements.
All universities were awarded funding (scaled according to publicationrecord) to contribute to the Australia Research Data Commons, an initiativesponsored by the Australia National Data Service. The funding is to be usedto describe research data collections produced by, or relevant to, Australianresearchers, with the view of making research data more widely accessible.We used this opportunity to strengthen and build new relationships with theacademy through the contact librarians. They have been progressivelyvisiting every active researcher with a current national research grant, seeking

The changing scholarly information landscape
159
their assistance in identifying and describing any research data associatedwith Griffith research projects. Whilst ostensibly their visit is to elicit the datarequired to meet the criteria set by the Australia Research Data Commonsproject, they are using the opportunity to explore a broader range of questionsto better position our services to meet the researcher’s needs. Theirquestioning is free flowing, as the librarian seeks to understand theresearcher’s environment, their research practices, how they currently use ourservices and to suggest some services we could provide to gain their level ofinterest in these. This process will be complete in the coming months, atwhich time the remainder of the academy will be interviewed. The resultswill be invaluable in shaping our services to meet University requirements.
The contact librarians will remain an important part of our new strategyas we seek to build stronger relationships with the academy. Whilst academiclibrarians have traditionally been invited to academic boards, this role is nowstrengthened as they are able to represent the broad base of services weprovide to support the University’s research endeavour.
7.3 Research data services, generic and tailoredWe already have a good working model for tailoring services to specificresearchers or research group. The challenge now is to extend this service,building a baseline of service for all researchers whilst still meet specificresearch groups or researcher needs. We are seeking to learn from ourunderstanding of particular needs to build baseline university-wide servicesand infrastructure. Planned increases in federal research infrastructurefunding to universities over the coming years provide an opportunity to raisepolicy and funding questions at a University level. A paper on thedevelopment of a University research data management service will be anearly candidate for discussion.
From the work of the contact librarians we will know the types ofresearch data our academics produce, the kinds of storage practices used formaintaining research data, how the research data is managed, what accesspermissions are in place or are required any legal requirements in respect tothe data. This information will be used to develop a repository of metadataabout the University’s research data as part of the national data commons.
We are also working in collaboration with a partner university onanother federally funded project to build tools to harvest metadata fromcommonly used institutional repositories to populate the national datacommons.
Planning is underway for the development of a university researchdata management service. We plan to provide a baseline of service for allacademics - a service which leverages national data storage services whilst

The changing scholarly information landscape
160
providing complimentary local services - from policy, management andtechnical advice through to provision of infrastructure.
7.4 Clear leadership in research information services, internally and externally, with strong collaborationUnder the leadership of their Director, Scholarly Information and Research,information services staff: librarians, business analysts, information architects,programmers, advanced computing specialists; are developing intocontemporary information workers, strengthening their capabilities in theareas of content, technology and the disciplines to build support services toallow the researchers to thrive in this demanding, competitive and rapidlychanging environment. The gaps and overlaps that might occur withdistributed units can be managed internally- a full information serviceoffering can be provided akin to that proposed by Lynch [73]. The Universityhas welcomed the clarity of leadership around research from an InformationServices perspective. Building on the existing strong relationship with theOffice for Research, and building strong relationships with other Universityresearch leaders, is much simpler. Library and IT domains can be representedby a single role – it leverages relationships which each professional groupalready had, drawing on different strengths and different expertise. Thedivision now has a seat on the University’s main research committee –something that can be more difficult for a library or IT unit alone. Many of thepotential gaps and overlaps in supporting research are internalised within asingle organisational unit, allowing them to be managed, whilst also makingit easier to collaborate at a university level as fewer units must work together.
Another significant benefit is the ability to better manage the complexity,and leverage potential benefits, of the national and regional researchinformation environment to get the best outcome for the University. Having asingle division as the relationship manager on the University’s behalf makes iteasier to build to develop stronger and mutually beneficial relationships withthe state and federal bodies. It removes some of the complexity for theexternal agency when dealing with the University and the complexity for ouracademics who no longer need to navigate through a complex environment.
7.5 Publishing and curationThe academic community is increasingly time poor, with heavy teachingloads, reduced administrative support and increasing pressure to generatehigh quality research. Research success is increasingly ranked by complexmeasures created from within this rapidly changing scholarly informationlandscape, evolving into a new discipline of research management and

The changing scholarly information landscape
161
measurement. The new environment rewards researchers who profilethemselves and their work most effectively. We are building an integratedservice offering to facilitate effective research information management acrossthe institution with the specific goal of building the University’s researchimpact, balancing short term utility requirements with the long termrequirement to preserve the work of our scholars for future generations.
We are well positioned to assist researchers with their publishingdecisions, providing journal trend data and potentially high citingalternatives to traditional publishing. It is increasingly necessary forresearchers to consider a large range of factors when disseminating theirresearch outputs to ensure that their work gains the highest possible impact.To assist them with this we are providing seminars, workshops and/orpresentations to support researchers to manage their research for maximumimpact. This can include information on changing journal trends, publishingchoices, impact factors, research management, discoverability, research datamanagement, profile management and any legislative requirements forreporting research outputs. Bibliometric analysis will be used to identifyresearcher performance and to inform researchers of their personal, school,group or institutional publishing impact.
To complement our strong institutional repository which enables allacademics to deposit an open access copy of their work to increaseaccessibility and discoverability, an ePress service has been established. Thiswill further extend the reach and impact of the University’s research. TheePress provides a range of tools to manage author submissions through tomanaging peer-review and publication. It supports audio, video and imagecapabilities as well as text, enabling opportunities for deeper engagementwith journal content and the potential to link research data to publishedoutput. Journals published by the Griffith ePress are harvested by majorsearch engines, indices and citation services which will increase discoveryand dissemination of Griffith research.
Assistance can be given to ensure Griffith researchers grow their profileto attract partners of international standing both domestic and international.We are working in close collaboration with the University’s research office toreplace our existing research management system with one which integrateswith our digital repositories and other systems. This will provide anopportunity to more effectively profile Griffith’s researchers and theirscholarly output.

The changing scholarly information landscape
162
8. Conclusion
Universities are integral to a nation’s innovation agenda. The impact of theirresearch has the potential to significantly improve a nation’s economic andsocial outcomes. With this comes increased national interest in stimulatingand regulating universities to drive potentially utilitarian aims, and aninterest in measuring their quality. Universities must stay true to their coremission of knowledge creation, dissemination and preservation not just forcurrent, but for future generations. They cannot afford to adopt tacticalresponses to government imperatives or international league tables. As thescholarly information lifecycle transforms, the ability for a university toenhance its research impact is greater than ever, but it is also a much morecomplex environment. This complexity offers new opportunities for auniversity’s information service providers to further the university’s, and thenation’s, aspirations – both short and long term. Information serviceproviders are ideally positioned to navigate the complexity of the scholarlyinformation landscape to achieve university imperatives within a nationalcontext, through leadership and expertise and collaboration within and acrossorganisational boundaries; to achieve short term imperatives whilst stayingtrue to the long term mission of universities in knowledge creation,dissemination and preservation for future generations of scholars andpractitioners.
Acknowledgements
I would like to acknowledge the leadership, innovation and professionalismshown by the incoming Director, Information Services (Scholarly Informationand Research) Ms Lyn Bosanquet.
Notes and References[1] See for example OFFICE OF SPECIAL PROJECTS, NATIONAL
RESEARCH COUNCIL. Issues for Science and EngineeringResearchers in the Digital Age. Washington: National AcademiesPress, 2001 and MARKAUSKAITE, J; et al. Co-developing eResearchinfrastructure: technology enhanced research practices, attitudes andrequirements, Full technical report, Sydney: The University ofSydney & Intersect, 2009 which found that less than 23% of

The changing scholarly information landscape
163
researchers across 4 universities said nearly all their research isindividual and 53% with collaborated outside Australia.
[2] BOULTON, G; LUCAS, L. What are universities for? League ofEuropean Research Universities, September 2008. Available atwww.leru.org/file.php?type=download&id=1323 (March 2010)
[3] PERKMANN, M; WALSH, K. University-industry relationships andopen innovation: towards a research agenda. Loughborough:Wolfson School of Mechanical and Manufacturing EngineeringLoughborough University, 2007. Available athttp://ssrn.com/abstract=154532 (March 2010)
[4] See BOULTON and LUCAS and PERKMANN and WALSH[5] See for example PERKMANN and WALSH[6] LYNCH, C. The institutional challenges of cyberinfrastructure and e-
research. EDUCAUSE Review Nov/Dec 2008, pp.74-88[7] CUTLER, T. Venturous Australia: building strength through
innovation. 2008.http://www.innovation.gov.au/innovationreview/Documents/NIS_review_Web3.pdf (March 2010)
[8] Powering ideas: an innovation agenda for the 21st centuryhttp://www.innovation.gov.au/innovationreview/Documents/PoweringIdeas_fullreport.pdf (March 2010)
[9] DELOITTE – INSIGHT ECONOMICS. Impact monitoring and evaluationframework background and assessment approaches. CooperativeResearch Centres Association Inc. June 2007. p.4
[10] FINKEL, A. Innovation rests on simulating challenges. Focus no. 148February 2008, pp.11-12 http://www.atse.org.au (March 2010)
[11] See CUTLER p.67[12] See PERKMANN[13] See PERKMANN p.4[14] See CUTLER p.41[15] See Powering Ideas and
https://www.pfc.org.au/bin/view/Main/SuperScience[16] See BOULTON and LUCAS[17] See BOULTON and LUCAS p.4[18] See BOULTON and LUCAS p.8[19] COURANT, P. Scholarship: the wave of the future in a digital age.
Chapter in Katz, R (Ed.), The Tower and Cloud: Higher Education andInformation Technology (in press). Boulder, Colorado: EDUCAUSE,2007.
[20] http://www.arc.gov.au/era/default.htm

The changing scholarly information landscape
164
[21] BUTLER, L. Assessing university research: a plea for a balancedapproach. Science and Public Policy 34(8) Oct 2007 pp. 565-574
[22] See for example the speech made by the Minister at the AustralianTechnology Network of Universities Conference in Feb 2010http://minister.innovation.gov.au/Carr/Pages/AustralianTechnologyNetworkofUniversities.aspx (March 2010)
[23] See BUTLER[24] DURYEA, M; HOCHMAN, M; PARFITT, A. Measuring the impact of
research. Research Global Feb 2007 p. 8[25] JOHNSON, R. 1995 Research impact quantification. Scientometrics
34(3): p.415 [26] https://www.crc.gov.au/Information/default.aspx[27] See DELOITTE-INSIGHT ECONOMICS[28] See DELOITTE-INSIGHT ECONOMICS p.10[29] HOUGHTON, J. et al. Economic implications of alternative scholarly
publishing models: exploring costs and benefits, a report to the JointInformation Systems Committee. Jan 2009.http://www.jisc.ac.uk/media/documents/publications/rpteconomicoapublishing.pdf (March 2010)p.IX
[30] See MARKAUSKAITE[31] See for example BUTLER, HOUGHTON et al[32] HARLEY, D. et al. Assessing the future landscape of scholarly
communication: an exploration of faculty values and needs in sevendisciplines. UC Berkeley: Center for Studies in Higher Education, 2010available at http://escholarship.org/uc/sche_fsc (March 2010)
[33] See BOULTON p.569[34] See O’BRIEN, L. et al. Scholarly information in a digital age; choices for
the University of Melbourne, a consultation paper that invitesinvolvement and response. Melbourne: University of Melbourne, Feb2008. Available athttp://www.jisc.ac.uk/media/documents/publications/rpteconomicoapublishing.pdf
[35] LESSIG, L. For the love of culture. The New Republic Jan 26 2010.http://www.tnr.com/print/article/the-love-of-culture (March 2010), p.9
[36] BRINDLEY, L. Quoted in CHRISTENSEN, L. British Library predicts‘switch to digital by 2020.’ Media release. London: British Library, 2005.Available from www.bl.uk/news/2005/pressrelease20050629.html (Feb2008)
[37] http://www.digitaltrends.com/computing/amazon-sees-71-percent-profit-boost-from-holidays/

The changing scholarly information landscape
165
[38] HOUGHTON, J; SHEEHAN, P. The economic impact of enhancedaccess to research findings, CSES Working Paper no. 23, Melbourne:Centre for Strategic Studies, 2006. Available athttp://www.cfses.com/documents/wp23.pdf p.1
[39] BORGMAN, C. Scholarship in a digital age: information, infrastructure,and the Internet, London: MIT Press, 2007
[40] O’BRIEN, L. E-research: an imperative for strengthening institutionalpartnerships, EDUCAUSE Review Nov/Dec 2005, pp.65-76
[41] See MARKAUSKAITE[42] See http://www.apsr.edu.au[43] BORGMAN, C. Supporting the ‘scholarship’ in E-scholarship,
EDUCAUSE Review Nov/Dec 2008, pp.32-33[44] BUCHHORN, M; MCNAMARA, P. Sustainability issues for Australian
research data, http://www.apsr.edu.au (March 2010), p.45[45] See LYNCH[46] See BORGMAN (2007), p.247[47] See LYNCH, p.82[48] SWAN, A. Open access and the progress of science. American Scientist
vol 95 May-June 2007, pp.198-200[49] See HOUGHTON and SHEEHAN[50] See HOUGHTON et al[51] See HOUGHTON et al, p.233[52] See HARLEY[53] See HARLEY[54] See for example
http://www.campusreview.com.au/pages/section/article.php?s=Comment&idArticle=15060
[55] See HARLEY, p.12[56] See for example BUCKLE, S. Philosophy betrays its first principles, The
Australian, Wed March 31 2010, Higher Education, p.29[57] See HOUGHTON et al[58] See for example HAGLUND, L; OLSSON, P. The impact on university
libraries of changes in information behaviour among academicresearchers: a multiple case study, The Journal of AcademicLibrarianship vol. 34 no.1 pp. 52-59 and O’BRIEN et al
[59] See HAGLUND[60] See HARLEY[61] See HARLEY, pp..24-25[62] See HARLEY, p.26[63] See MARKAUSKAITE

The changing scholarly information landscape
166
[64] See BUCHHORN, p.1[65] See BUCHHORN, p.46[66] DRUMMOND, R; WARTHO, R. RIMS: the research impact
measurement service at RIMS the University of New South Wales,Australian Academic & Research Libraries vol.40 no.2 June2009, pp.76-87
[67] See HARLEY[68] HAHN, K. Publishing services: an emerging role for libraries,
EDUCAUSE Review Nov/Dec 2008, pp.16-17[69] See LYNCH[70] See LYNCH, p.78[71] See BORGMAN 2008[72] See O’BRIEN. p.68[73] See LYNCH[74] BOSANQUET, L. Building relevance in the content revolution, Library
Management vol 31, issue 3 2010, pp.133-144[75] BOSANQUET, L. Beyond digital repositories- a role for University
libraries, in press 2010.

The PEG-BOARD Project: a case study for BRIDGE
Gregory Tourte1; Emma Tonkin2; Paul Valdes1
1 School of Geographical Sciences.University of Bristol,
Bristol, United Kingdom{g.j.l.tourte,p.j.valdes}@bristol.ac.uk;
2 UKOLN,University of Bath,
Bath, United [email protected]
Abstract
With increasing public interest in the area of historical climate change and in models of climate change in general, comes a corresponding increase in the importance of maintaining open, accessible and usable research data reposit-ories. In this paper, we introduce an e-Science data repository containing ex-tensive research data from palæoclimatology. Initially designed to support in-ternal collaboration and organise data, the sharing of research outputs became an increasingly significant role for the service over several years of practical use. We report on a data preservation and interoperability assessment cur-rently under way. Finally, we discuss the ongoing significance of open re-search data and capacity for analysis in the area of climate research, with palæoclimatology as a case study.
Keywords: palæoclimate modelling; data management; data curation.
1. Introduction
The BRIDGE research group, or Bristol Research Initiative for the Dynamic Global Environment, focuses on the emerging area of ‘Earth System Science’ exploring the complex interactions between the Earth’s components: the oceans; atmosphere; ice sheets; biosphere; and the influence of human activity
167

Gregory Tourte, Emma Tonkin, Paul Valdes
on global change. This approach requires the input of multidisciplinary teams drawn from across Bristol University Glaciology, Hydrology, Biogeochemical Cycles, Chemistry, Earth Sciences, Mathematics, Engineering, Biological Sci-ences, Archæology, Personal Finance Research) and beyond (Hadley Centre, British Antarctic Survey, UK Met Office, DEFRA, Environment Agency, Centre for Global Atmospheric Modelling, Oil Industry).
Climate, ‘the synthesis of atmospheric conditions characteristic of a partic-ular place in the long term’, is ‘expressed by means of averages of the various elements of weather’; climatology, then, is the scientific study of climate [1]. The main research effort of the group is to improve the understanding of the causes of climate change, by testing the computer climate models used to pre-dict future climate change. Major themes include:
• quantifying environmental and climate change in the distant past through the combined use of data and models;
• evaluating climate models with accurate proxy climate records, espe-cially during periods of rapid climate change;
• improving climate models by incorporating additional components of the Earth System and detailed analysis of these processes for past, present and future change;
• assessing the impact of future climate change on spatial and temporal scales relevant to society and including timescales from decadal to millennial.
Many of these activities require―and produce―many terabytes of data. Making this data widely available is therefore a complicated and non-trivial process.
Researchers worldwide in both the sciences and humanities reuse BRIDGE data in their work. The project developed and applies de-facto preservation and data compression policies. Since the types of information required by users from areas as diverse as evolutionary biology, archæology and earth sci-ence very greatly, the project also developed an in-house interface designed to support tailored information extraction from climate model information.
Despite the complications associated with open access to large scientific datasets, openness in procedure and output is a priority for BRIDGE, and has been for many years. The importance of open data in climatology research in general has recently been highlighted, due to the high profile of the research area in the media and politics.
168

The PEG-BOARD Project: a case study for BRIDGE
1.1 Background
Sweet [2] divides climate modelling into theory, empirical work, and model-ling, and notes that modelling attracts the most attention since this area most directly assesses impact and produces predictions. It is expensive; simulations can take up to three months to run on high-performance computers (‘super-computer’ clusters) and can equate to up to a hundred thousand pounds worth of computer time, excluding the cost of storage. The existing archive of resulting data sets consists of over 2,000 simulations and represents several million pounds worth of CPU time. The cost of CPU time has reduced; how-ever, the scale of models has increased as a result. In terms of data require-ments, a single model simulation can produce up to 2 TiB of raw model out-put data. A smaller subset of 2 to 50 GiB per simulation is retained.
Adopting Sweet’s approach, we view the area as containing three areas of endeavour: empirical work, including data collection and preservation, the-ory, and modelling. In practice, these areas are difficult to divide; Edwards [3] qualifies the model/data relationship in climate science as ‘exceptionally com-plex’. The boundaries between a global climate model (GCM) and data are ‘fuzzy’, and the interaction between model and theory is supple and ongoing. A model inspired by theory may apply initial conditions taken from meas-ured data points. Data generated via a GCM may be compared with observed data points to evaluate the validity of the model. This demonstrates that model results agree with observations and that no detectable flaws exist, rather than that the GCM is essentially correct, but is nonetheless a significant step in es-tablishing realism.
e-Science has a strong tradition in climate science. In data collection, for example, Benford et al. [4] describe the use of a Grid-based networked device to enable remote monitoring of Antarctic freshwater lakes and explore the po-tential for distributed collaborative research based on the resulting dataset. Benford et al. [4] highlight Anderson and Lee’s [5] four phases of software fault tolerance as key to ensuring confidence in the resulting data: error detec-tion, damage confinement and assessment, error recovery and fault treatment. Data, then, is only part of the story; provenance and context are required to ensure confidence.
Climate modelling software, too, is increasingly designed in order to make use of e-Science concepts and facilities. The SciDAC-supported Earth System Grid Center for Enabling Technologies (ESG-CET), for example, enabled all of the simulation data from the IPCC’s AR4 to be made available to climate sci-entists worldwide [6]. The GENIE―Grid ENabled Integrated Earth modelling system―also applies a Grid-enabled architecture, in this case designed with the intent to ‘build simplified and faster-running models of the Earth’s cli-
169

Gregory Tourte, Emma Tonkin, Paul Valdes
mate system, and make them easier to use and more widely available to other people who want & need to use them’ [7] . GENIE is designed to facilitate cyc-lic improvement of models through comparison with available datasets; to improve traceable integration between various model types, and to integrate multiple representations of the natural Earth system. GENIE enables large en-semble studies on the Grid, supports complex workflows and provides Grid-based data handling and post-processing facilities [8]. In each of these applic-ations, as is generally true with Grid-based approaches [9], rich and descript-ive metadata, including extensive information about data provenance, is re-quired to enable effective use of available data.
The political significance of climate modelling as a research area is cur-rently such that openness is absolutely key. With publicly funded research, the ‘citizen scientist’ should be considered as a stakeholder, and ultimately this is dependent on working with the user community [10].
1.2 The case for open access to data
The importance of open data in climatology research in general has been highlighted in recent years, due to the high profile of the research area in the media and politics. Climate modelling, particularly in the area of climate pre-diction, is subject to a high level of scrutiny.
Consider for example a recent news article [11], discussing the open re-view of a recent report, the 4th Assessment Report or AR4, published by the Intergovernmental Panel on Climate Change (IPCC). The process described is a review conducted by ‘climate “sceptics”, […] busy searching the rest of the panel’s report for more mistakes’. One statement queried is described as ‘ba-sically correct but poorly written, and bizarrely referenced’; the process of es-tablishing accuracy has highlighted issues regarding appropriate referencing and clarification of the distinction between ‘grey’, or non-peer-reviewed, liter-ature, and peer-reviewed sources. Harrabin suggests ‘a need for much greater transparency’. A further famous example are the international repercussions (both political and scientific) surrounding the recent ‘leak’ of emails from the Climatic Research Unit at the University of East Anglia, dubbed ‘Climategate’ by many.
Access to data and modelling resources is variable. For example, the UM (Unified Model), the popular suite of atmospheric and oceanic numerical modelling software developed and used at the UK’s Met. Office has limited availability, being primarily available to UK academic researchers. Availabil-ity of the GENIE software is currently limited, as the software remains work-in-progress. A great deal of data is available, from sensor data released by the
170

The PEG-BOARD Project: a case study for BRIDGE
British Antarctic Survey, the Australian Antarctic Division and others to the OpenGeoscience service offered for non-commercial use by the British Geolo-gical Survey; a great deal of open-access data may be discovered via the NERC Data Services initiative (http://ndg.nerc.ac.uk/) that gathers together the NERC data centres. Data centres typically hold collections of empirical data (e.g. observations and measurements).
Open procedure and open access are priorities for BRIDGE, and a software platform has been developed over many years to support this aim, allowing modellers to publish datasets along with relevant experimental metadata. Al-though the present iteration of the software predates recent best practice in the area, the service has been widely used for those requiring secondary data, to the mutual benefit of BRIDGE and external users of the data.
1.3 The PEG-BOARD project: Palæoclimate & Environment data Generation – Building Open Access to Research Data
In response to the community’s need for openly accessible research data, we need to make sure that the data generated as part of our research remains ac-cessible and preserved for a certain amount of time after its creation and ori -ginal use.
However, preservation of digital information is a very complex subject. Su-Shing Chen in the Paradox of Digital Information [12] explains why it is difficult to come up with a simple definition of what ‘to preserve digital in-formation’ means. He says that ‘on the one hand we want to maintain digital information intact as it was created’ (one facet of preservation) ‘on the other, we want to access this information dynamically and with the most advanced tools’ (preserving access to the data).
This is extremely relevant to our data as the models used to generate it as well as the hardware architecture on which the models are run evolve and change over time. A particular experiment run five years ago may not run on current hardware or if it runs, may not produce the same results. We have seen recently that the implications of publications and data may be seen and questioned decades later. However, from a more pragmatic point of view, the benefit of keeping old data can easily be questioned. The cost of storing large dataset is very high, despite the raw cost of storage going down dramatically with time, archival enterprise grade storage is still very expensive and the long-term maintenance cost of keeping a storage system working and up--to-date may well be higher than the cost of re-running the experiment, espe-cially when computers speed is also increasing with time. Another point to consider is the fact that the science included in the models evolves as well.
171

Gregory Tourte, Emma Tonkin, Paul Valdes
With computers becoming more and more powerful, the complexity of the models have increased, adding CO2, NO2 and H2O exchanges to atmospheric models as well as vegetation over the last 15 years [13]. This means that old experiments will be inaccurate compared to our current understanding of the earth system and therefore may as well be re-simulated to get a result more in line with the current science.
With that in mind, the PEG-BOARD project has several aims, targeting every aspect of our data and our user base :
• assist the work of modellers by facilitating data processing, manipu-lation and analysis by the modellers and scientists who generate data as part of their research;
• facilitate data reuse by modellers and by any consumers of the data by providing methods to search and browse through the data;
• discover and characterise modes and means of data reuse, and identi-fy relevant user groups;
• identify current patterns of metadata use, the standards used and the extent to which they comply with relevant data types;
• describe current data retention policies and relevant standards;• provide clear guidelines to research groups and researchers to help
manage their data;• ensuring proper data retention and curation policies based on both
the research and the data life cycle;• disseminate documents and software to wider community to provide
better understanding and better accountability for the research com-munities to the wider public and stakeholders.
We are now in the requirements-analysis stage of a new project, PEG-BOARD, designed to support the curation of historical climate data within BRIDGE’s large global consortium of palæoclimate researchers, and to ensure ongoing availability of this data for reuse within research, teaching and the media. This work is carried out in the context of the UK e-Science infrastruc-ture [14]. The project focuses on providing the community with a better un-derstanding of the data and the limits of its validity, and defining a clear policy structure for palæoclimate data. An improved data management infra-structure is expected to improve availability and accessibility of data, as well as providing a stabler structure for collaborative reuse. Open availability of well-structured and documented research data is key, enabling open and easy creation of malleable prototypes, adaptable to relevant research or interest communities.
172
The PEG-BOARD Project: a case study for BRIDGE
2. Methodology
Due to the strong user-analysis component of these aims, we chose to begin with a phase of user analysis of the present system. Various mechanisms exist for exploring user requirements; indeed, the field of requirements engineering has over time attracted a large and very active research community. Require-ments engineering is described by Laplante [15] as ‘a subdiscipline of systems engineering and software engineering that is concerned with determining the goals, functions, and constraints of hardware and software systems’. Nu-seibeh & Easterbrook [16] describe requirements engineering as follows:
‘The primary measure of success of a software system is the degree to which it meets the purpose for which it was intended. Broadly speaking, soft-ware systems requirements engineering (RE) is the process of discovering that purpose, by identifying stakeholders and their needs, and documenting these in a form that is amenable to analysis, communication, and subsequent imple-mentation.’
RE is not a single operation but a sequence of operations. Stakeholder ana-lysis is a necessary precursor, a part of the process that in our case has been explored for previous developments in the BRIDGE area, but which due to the nature of the problem area is necessarily an ever-shifting target. Nuseibeh & Easterbrook describe the core areas of RE as: eliciting requirements, model-ling and analysing requirements, communicating requirements, agreeing require-ments and evolving requirements. The mechanisms used in the PEG-BOARD project thus far can be fitted into this overall model of the process of require-ments engineering, although some aspects were explored prior to the begin-ning of the project (stakeholder identification in particular).
The processes of eliciting, modelling and communicating requirements are all touched on in this paper. Requirements are elicited initially by the explora-tion of existing systems in use as part of the task decomposition process – via interface surveys (see Section 2.2), and then via the use of structured inter-views with selected users. This is completed in two areas; with users internal to the BRIDGE project, and with a case-study of an external consumption of BRIDGE data. ‘Data Sharing Verbs’ are used as part of the modelling and communication of requirements.
We chose to begin with a series of interviews, exploring a number of ‘char-acteristic’ individual users’ perceptions of their interactions with the BRIDGE services. The results of this process form part of the background material for the Results section of this paper (Section 3).
173

Gregory Tourte, Emma Tonkin, Paul Valdes
2.1 Exploring existing software development
We continued by exploring the current software system put in place to man-age palæoclimate research data as this system has been and continues to be extremely dynamic, in order to follow the science involved and the needs of the scientists who use it. This is therefore an extremely valuable source of in-formation on user requirements, technological requirements and preliminary insight into the de-facto research and data lifecycle evolution.
However, the system is currently very much designed to simplify the work of the climate modeller in that the interface really helps a scientist to
174
Figure 1: The BRIDGE Data Access Portal

The PEG-BOARD Project: a case study for BRIDGE
work on his/her own experiments: the metadata describing the experiments usually references other experiments on the system which were used to create it, as well as parameters used in the first place by the central UM interface. Within each experiment, the variables shown on the web interface are taken verbatim from annotations stored within the file itself, each of which follow the CF metadata standard.
There is currently no requirement for the modellers to describe their ex-periments in a way an external, non-modeller, user could understand, or for that matter a way a computer could interpret. The use of CF metadata is a very good start but it is embedded within the file and only describes that spe-cific file in which it is embedded with no references to the experiment to which it belongs. There is therefore a need to work on an experiment-level metadata schema that would describe the experiment as a whole and enable proper indexing on values that all users of the system could understand and not only the original modeller who created the data.
We have started looking at several metadata formats, such as the DIF (Dir-ectory Interchange Format) schema created by NASA [17] and the currently on-going work on the Scientific Data Application Profile [18].
2.2 Describing the Research Lifecycle
The process of creating, disseminating, storing and reusing research data is part of the overall research lifecycle. In order to come to an understanding of how this works, therefore, it is useful to characterise the research lifecycle that underlies it. There are considerable potential benefits to this process; if the process as it is today is well understood then it becomes possible to support the process as it stands, and potentially to find social, process-oriented and technical means to improve the speed, ease, and cost-effectiveness of that pro-cess further.
There are a number of models, mechanisms and proposed methods de-signed to support this process, a few of which we will briefly discuss here. Swann, for example, designed a model that was used for some time by the UKRDS (UK Research Data Service). This focused on separation of individu-als involved in the research lifecycle into a set of possible types, notably data creator, user and viewer [19]. This was useful as a method of decomposition, but focused on categorizing people into one of a number of types. It was later suggested that individuals might more usefully be seen as involved in a num-ber of different activities, and hence a later model focussed on individuals’ roles at given times within a give research workflow.
175

Gregory Tourte, Emma Tonkin, Paul Valdes
‘Data Sharing Verbs’ represent one such model, a mechanism described by the ANDS as a ‘structuring device’, to support discussion about the techno-logy and process of the data sharing aspect of the research lifecycle. The key insight underlying this is the assertion that thinking about the ‘what’ rather than the technical details of the system is useful ― that user experience can be described through a description of what is being done from the user perspect-ive. This mechanism is described by Burton & Treloar as ‘Data Sharing Verbs’ [20]; the candidate terms offered include Create, Store, Identify, Describe, Re-gister, Discover, Access and Exploit, although additional verbs are likely to be required for specific use cases and as time passes.
This approach can be effectively compared to relatively traditional meth-ods drawn from human-computer interaction and design methodologies, such as task analysis and decomposition. According to Kieras [21] task analys-is is the process of understanding the user’s task thoroughly enough to help design a system that will effectively support that user in doing the task. Task analysis aims to systematically analyse a task based on the knowledge and goals of the user, system, information and functionality (that is, social, organ-isational, technical factors). The ‘Data Sharing Verb’ idea could be described as a user-focused subset of this overall set of aims, specifically characterising an accessible researcher-level viewpoint on that overall area of endeavour. The fundamental aim of Data Sharing Verbs is as a structuring device, high-level architectural approach and descriptive mechanism [20]; they are de-scribed as ‘one way of thinking about the things that need to take place’, and it is noted that they ‘encourage a focus on the functionality [and] result’. They can therefore be seen as an approach to collaborative representation and design. However, little information is provided regarding the mechanisms by which they are assigned to a novel usage context, so that is an area of interest for our ongoing work.
The work reported here was achieved using methods derived primarily from classical task analysis, with modifications designed to take in the useful idea of accessible data sharing verbs. There are many formalized methods in existence for the purposes of requirements gathering and task analysis in par-ticular, but these do not in general provide a novel mechanism of analysing or understanding a task. In fact, much like the Data Sharing Verbs representa-tion described above, most formal methods are ways to represent the results of a task analysis [21].
According to Kieras [21] the process of task analysis itself is usually based around some or all of the following methods:
• observation of user behaviour – a thorough, systematic and docu-mented overview of observations with the aim of understanding the
176

The PEG-BOARD Project: a case study for BRIDGE
user’s task. This may use a think-aloud protocol (ie. the user is invited to vocalise his/her observations about a task while working through it).
• Review of critical incidents and major episodes – rather than discussing the full span of user experience, a subset of particularly informative case studies are discussed.
• Questionnaires: these often suffer from difficulties with accuracy lim-itations, but are economical to use and can collect some types of user and task data.
• Structured interviews: talking to users or domain experts about a task is a good way of gaining some idea of the basics, and a more struc-tured interview series at a later time can be an effective means of sys-tematically exploring the area.
• Interface surveys: exploring existing interfaces, scripts, and so on, can provide useful information about interface characteristics, explana-tions, interface issues as perceived and annotated by users, and so forth.
Due to the inevitable time constraints of a relatively short-term project we chose to limit the use of observational/ethnographic methods to the latter phases of exploration of our system. Instead we looked towards the use of, initially, unstructured interviews, supplemented by an intensive interface sur-vey series of the various visual and script-oriented interfaces that have been developed to serve the day-to-day needs of BRIDGE users of various types over the fifteen years of its operation. We then used this information to build a questionnaire, the results of which will be used to develop our initial find-ings as presented here into a second iteration.
We do, however, feel that ethnographic methods and think/talk-aloud workthroughs are likely to be of importance, particularly when exploring the cost-value propositions underlying our interface and those of other data pro-viders/data centres in which the data is deposited. For example, it is often the case that users perceive deposit processes in particular as excessively lengthy and something of a waste of time, and in some cases there are very different ways to present that task to alter the value proposition as presented to the user.
177

Gregory Tourte, Emma Tonkin, Paul Valdes
3. Results
We begin by describing what has been elicited so far regarding data genera-tion, storage, administrative and descriptive metadata, and reuse. We then present a candidate research data lifecycle model. Because the findings demonstrated emphatically that data consumption and reuse was a very sig-nificant part of the lifecycle, and indeed proved to represent the proximate cause of a great deal of the effort historically applied to this data collection, we found the need to place a far greater emphasis on it than was originally predicted.
BRIDGE data is generated via global climate models simulations (GCM), run on several national and international high performance computing (HCP) facilities. Our main tool is the Met Office Unified Model (UM) which runs a number of standard models such the Hadley Centre HADCM3 and HADGEM, or more recently FAMOUS, but we also use the European oceano-graphy model NEMO or GENIE (Grid ENabled Integrated Earth). The major-ity of our output comes from the UM which uses a proprietary output file format. However the industry standard for such large data sets is NetCDF.
NetCDF, currently maintained by University Corporation for Atmospheric Research (UCAR), is a widely used open standard. It is an extremely flexible format optimised to store large multidimensional arrays of numerical data such as those describing high resolution planet-wide data.
When the data is created, it is moved and converted to NetCDF to a stor-age and processing farm of server where the data is processed. Climatology involves running weather simulation and then averaging the output to obtain the climate information. There is a number of default processes that are al-ways running on the data to produce defaults sets of plots. It is then up to the modeller to add the specific output required for a specific project.
Due to the large amount of data created (around 2TB per day of raw out-put), it is not possible to store and keep everything, so raw output (from the UM) is discarded after conversion to NetCDF and calculation of intermediary averages generated from the converted files. Only the directly converted NetCDF files and the final averages and plots are kept. No expiration date is currently mandated for the data.
3.1 BRIDGE Service Design
The BRIDGE project at present has over 100 research groups spread over ap-proximately 10 countries―see stakeholder analysis, figure 2 and figure 3. The multidisciplinary reach of palæoclimatology data presents some unique chal-
178

The PEG-BOARD Project: a case study for BRIDGE
lenges in data dissemination. Historically, this diversity in user communities has meant that direct interaction with expert users of the BRIDGE environ-ment is a necessary component in enabling access to, and reuse of, research data. However, as the number and diversity of background of stakeholders has continued to widen, these manual processes have become increasingly unfeasible. Enabling computer-supported scientific collaboration is at the in-tersection of Computer Supported Cooperative Work (CSCW) and e-Science [22], and the specific problem of data curation is a recent addition to the area.
179
Figure 2: Stakeholder Analysis
Figure 3: Stakeholder Tasks Analysis

Gregory Tourte, Emma Tonkin, Paul Valdes
The first challenge for those working in interdisciplinary research is to loc-ate relevant data repositories and databases [23]. The second is to get ‘up to speed’ with the nature of the data and with its practical uses, metadata and it’s provenance.
3.2 BRIDGE Systems Architecture
The current BRIDGE infrastructure only supports UM data which constitutes 99% of the data utilised. Compatibility with non-UM data is under considera-tion.
The current BRIDGE facilities provide services for the groups of stake-holders described here as the research group and the data consumers. Data providers are accessed by the modellers independently as the sources provid-ing boundary conditions are rarely computer readable and usually come in the form of results published in scientific papers. These have to be ‘translated’ by the modeller before being added to the models.
In figure 4, we show the overall architecture of the services provided by the BRIDGE portal. Experiments are configured on a centralised national fa-cility provided by NCAS and run on national and institutional HPC facilities. In parallel, BRIDGE modellers need to initialise their experiments on the
Proceedings ELPUB2010 – Conference on Electronic Publishing 180
Figure 4: Architecture Diagram of the BRIDGE facilities

The PEG-BOARD Project: a case study for BRIDGE
BRIDGE facility by inputting details and metadata of the experiments. Once this is done, the modellers just have to let things run; the system is fully auto-mated (unless the experiment fails in some way).
In order to avoid straining the limited storage capacity of HPC facilities, generated data is pulled regularly by the post-processing servers which then check and convert it to NetCDF from the proprietary UM format. The original UM files are then discarded. This process runs during the entire time taken by the experiment to complete, which can be up to several months. On comple-tion, the modeller is given the choice to apply predefined averaging al-gorithms to the data, or define his own, in order to create an initial set of plots, maps and animations for a preliminary analysis of the data. The pre-defined algorithms are updated regularly by the research group to suit its evolving needs.Once the experiment is processed, most of the data is archived and only the post processed data, enough to generate most graphics is kept available and shared on the portal. From this point, the experiment is available to ‘data con-sumers’. The portal allows users to to view pre-generated graphics as well as creating new ones from the data, either to change the output format, to use different variables, or to combine multiple variables. The option is also given to compare the results of two experiments. This is made possible by the fact that extensive work has been done to make all graphics of the same type use the same colour scaling (visual conventions). All generated graphics outside the default predefined ones are cached for a limited time period so will not have to be re-generated at every access (a very time consuming and resource intensive process). Users also have access to post-processed data, either in NetCDF or converted into other formats such as CSV.
3.3 Case study: BRIDGE in Archæology
Archæology researchers at the University of Southampton make use of the BRIDGE software as part of their research. In this case study, their interest is in data regarding the climate in which a group of early Neanderthals lived. The specific information that can be provided as a result of BRIDGE palæocli-mate simulations includes wind speed, temperature, and rainfall. Palæoenvir-onmental information can help archæologists understand likely patterns of migration as well as providing contextual information surrounding artefacts, etc. In particular, palæoclimatology may be key to our understanding of the extinction of the Neanderthals [24].
Originally, very few NetCDF viewing applications existed for non-UNIX environments. Therefore, the use of BRIDGE resources was required. Even
181

Gregory Tourte, Emma Tonkin, Paul Valdes
now, the level of computer literacy required to analyse NetCDF data is very high. Our data uses meteorological units (temperature in Kelvin, precipitation in kg/m2/s and wind in m/s) whereas what is usually required is the more every day units (temperature in Celsius, precipitation in mm/day and wind in mph or kph.) Doing a single numerical unit conversion may not be a complex process, however, the overall process of extracting thousands of values from a number of files and then performing type-appropriate batch conversion is rel-atively challenging and time consuming. It was therefore decided to add data conversion and merging services to the BRIDGE service.
Another issue regarding the interdisciplinary use of climatology raw data-sets is the terminology used to describe the data variables contained in each files. This is even an issue for a glaciologist trying to use palæoclimate data-sets. The netcdf files are all CF compliant (Climate and Forecast Metadata convention, as required for data generated as part of NERC funded projects) which includes over 30 variables describing some sort of air temperature― eg. air_ temperature, air_ temperature_ at_ cloud_ top, surface_ temperature, surface_ temperature_ where_ land, surface_ temperature_ where_ open_ sea, …― as well as over 15 names describing types of air pressure (air_ pressure, air_ pressure_ at_ cloud_ base, air_ pressure_ at_ cloud_ top, air_ pressure_ at_ convective_ cloud_ base, air_ pressure_ at_ sea_ level, …). This multiplicity of terms which for some discip-lines would be described as air temperature and air pressure makes exchange and reuse of data particularly difficult without very close collaboration with a scientist. An individual acting as a ‘gateway’ between disciplines would or-dinarily be from the same field as the original data creator but who also un-derstands the requirements of the scientist who is trying to use the data.
Issues brought up during this work included the difficulty of discovering appropriate datasets―finding experiments that contained relevant data. This was solved by requesting that appropriate experiments were recommended by BRIDGE team members. This, coupled with the need to automate common tasks, meant that the collaboration had a significant cost in terms of time. Hence, changes made to the service at the time included a concept of ‘typed’ data―for example, precipitation―to which a number of standard conversions may be applied. The need for appropriate metadata is also very clear, but with a legacy of over a decade of datasets (over 2000 simulations), the prob-lem of introducing an improved standard includes the need to deal with a large amount of legacy content. Metadata applied to the data should also en-able the cross-disciplinary browsing, discovery and use of the data, by the use of some sort of description table or translation table to either provide this translation automatically or provide the user with a plain english description of the term to allow him or her to choose the right one.
182

The PEG-BOARD Project: a case study for BRIDGE
4. Discussion
The task analysis/preservation hybrid approach, making use of the ‘data shar-ing verbs’ to support discussion, has fitted well into our environment. Fur-thermore, it offers a strong theoretical basis in both preservation and HCI.
So far, we have successfully completed an investigation into the research lifecycle of research data from the BRIDGE project. We have built up an un-derstanding of the existing software and hardware infrastructure that has been built up to support this lifecycle, and explored the rules associated with data creation and reuse, both external and internal in nature. We have also ex-plored a case study of the reuse of palæoclimate data, in which archæology researchers at the University of Southampton make use of the BRIDGE soft-ware to access relevant datasets for the purpose of exploring patterns of mi-gration. From this case study, we note a need for clear and consistent metadata, as well as for metadata to be applied to existing and older datasets – and we note that such collaborations often have a significant cost in terms of time, which can be reduced by enabling the development of software that supports ongoing collaboration by accessing consistent and well-defined data-access services or APIs.
The next stage for us is to ground our existing work with further detailed analysis of:
• the path(s) to completion of common tasks; for example, the time taken to complete a task, technical and knowledge-organisational is-sues and dependencies.
• technical infrastructure/system• related infrastructural dependencies, such as the requirement to de-
posit information in data centres• patterns of reuse of the data; impact, review and overall benefit to the
community• the costs and benefits of each aspect of the system.
4.1. Updating BRIDGE
Initially, we chose to focus on data management requirements analysis, ex-ploring requirements for named stakeholders. Following the work described here, we have greatly improved our understanding of the broad technical and social processes that take part around the BRIDGE data. Now, however, we will need to identify appropriate methodologies for developing an improved understanding of the practical implications of the system as it is described here. For example, the time taken to complete any given process is very relev-
183

Gregory Tourte, Emma Tonkin, Paul Valdes
ant to the question of the total cost of that process. For example, the time taken to develop an archival copy of a dataset (depending on the definition of the term ‘archival’; this necessarily depends on the choice of archiving meth-od, so that the costs of putting data into a data repository and that of storing it locally are very different) may be measured.
We will also continue to explore the practical issues and opportunities sur-rounding the reuse of BRIDGE data both in local formats and in the data-centres’ preferred representations and formats.
4.2 Requirements analysis: Preservation, accessibility and metadata extraction
We intend to continue by consolidating our work with further questionnaires, observational studies and interviews. Tor this purpose, we have identified rel-evant components of the JISC Data Audit Framework (DAF) [25], DRAM-BORA [26], the Planets project-preservation planning workflow [27], and sim-ilar tools to help identify and develop a formal data management strategy for palæoclimate model data, taking into account the requirement that consist-ency with the NERC Data Grid is a critical factor.
This should enable us to analyse the workflow described above in more details. In particular, we are looking to gain further information about users’ (data creators and consumers alike) viewpoints and experiences with the data, its administration, access issues and potential enhancements. To this end, we have developed a questionnaire adapted from the Data Audit Framework, which is generally expected to be used primarily within an organisational context. The use of the DAF to explore data reuse externally constitutes a change from the usual way in which the framework is used, so it will also be an opportunity to explore and evaluate this approach.
In the following phase we expect to apply these components to the prob-lem area described in this paper.
4.3 Requirements analysis: Automated metadata extraction.
We expect to explore the use of relevant metadata standards―PREMIS [28], STFC, etc.―to enhance the structures currently in use, as well as exploring the use of metadata extraction in order to supplement the file-format specific metadata currently used as the primary data management tool. The scale of data generated in palæoclimate research means that, wherever possible, metadata will need to be automatically generated.
184

The PEG-BOARD Project: a case study for BRIDGE
Automated metadata extraction is the process of mechanically extracting metadata from a source document [29]. A completely automated process is unlikely to give perfect results; however, augmenting a manual metadata ex-traction process with an automated mechanism, even one that has an error rate of perhaps 10% to 20% of cases can nonetheless increase the speed and, potentially, the consistency of a metadata generation process. It can also in-crease user satisfaction with the interface; that the system has tried to support the user, even if it has not totally succeeded, can lead to a less frustrating user experience than a totally manual system.
In this instance, automated metadata extraction may explore the datasets and their associated files and format metadata as sources. Additionally, one may use the paper-based outputs of the research process as a source of in-formation about the simulations that took place. One particularly relevant point to this process is the problem of data citation; what should a data cita-tion look like, and what does it resemble at present? Informal exploration of the problem area has suggested that a co-author relationship is often used as an alternative to dataset citation, acknowledging the contributor of the re-search data in an implicit manner.
4.4 Supporting user reuse of data: Accessibility and visualisation
Exploration of the extent and diversity of the user community surrounding the BRIDGE dataset has demonstrated that data reuse is widespread and di-verse. Much of this is data reuse is formally uncharted, which is to say that al -though it appears in individual researchers’ records, often as citations, it is not always acknowledged as such. The nature of the data makes many different representations possible; as geographical data it can be directly explored us-ing software such as NASA’s WorldWind [30]. However, radically different representations may be appropriate for different user groups – so the collec-tion of end user requirements is key to scoping out relevant activities such as developing appropriate recommendations for APIs, services or policies relat-ing to preferred data storage formats.
A few specific cases that we expect to explore in the near future include the requirements for development of clear, high-quality visualisations, suited for high definition broadcasting in the media, and the requirements for the development of simulations that support haptic rendering, which is to say, that augment visual representations with tactile feedback. Provision of an ap-plication programming interface that can support this work is expected to fa-cilitate this sort of development in future, as it should reduce the cost, com-plexity and learning curve associated with making use of the dataset. Because
185

Gregory Tourte, Emma Tonkin, Paul Valdes
ongoing reuse of the data is an important part of this research data lifecycle, making it as easy as possible for developers to work with the information is likely to be an effective way of increasing the impact of research data publica-tion in the area.
4.5 Expectations
The key assertion underlying this project states that adoption of appropriate data management strategies, appropriate to partner institutions across the various research disciplines involved, will have several benefits. The most vis-ible initially is expected to be improved accessibility for potential users of the dataset. We additionally assert that the sustainability of a research data cura-tion programme is dependent on the existence of data management strategies with a robust approach to appraisal. Finally, a strong data management strategy should improve traceability, reducing the difficulty of answering questions such as data origin and confidence levels.
5. Conclusion
BRIDGE software is already being used to support a wide range of reuse pat-terns, including those described above. From exploring practical usage pat-terns, we have developed a number of updated requirements. The first is the need to provide high-quality metadata, enabling us to develop means for searching or browsing―exploring―the data, in an appropriate manner for specific end-user groups, be they archæologists, statisticians or biologists. It requires a viewpoint on metadata that is not excessively prescriptive or re-strictive in terms of form or interface, but that enables the base dataset to be presented to many different user groups, in their own terms. The current BRIDGE software review will take into account these disparate user require-ments in designing a flexible architecture that can support the generation of a wide variety of data representations.
Secondly, preservation is a key issue, along with provenance and the abil-ity to precisely cite a given data set. Climate science is not a subject in which the ‘fire and forget’ philosophy can be adopted. However, it is also an area of e-Science that generates very large quantities of data. Data curation and pre-servation in this area is reliant upon the development of appropriate data re-tention policies; as part of the PEG-BOARD project we will explore data man-
186

The PEG-BOARD Project: a case study for BRIDGE
agement requirements and develop appropriate policies along with any infra-structural dependencies.
Finally, better-quality visualisations and tools able to support accessible exploration of data are very important enablers for data reuse and widening the impact of completed research. This is a rich and open field for further re -search and development, particularly but not exclusively for educational pur-poses; high-quality visualisations are also sought after in many other fields, including audiovisual broadcast.
Notes and References
[1] LINACRE, E. Climate data and resources : a reference and guide. Routledge, 1992.
[2] SWEET, B. Three Cultures of Climate Science. IEEE SPECTRUM, 2010.[3] EDWARDS, PN. Global Climate Science, Uncertainty And Politics: Data-
Laden Models, Model-Filtered Data. Science as Culture, 8:437–472, 1999.[4] BENFORD, S. et al. e-Science from the Antarctic to the GRID. In 2nd UK e-
Science All Hands Meeting, 2003.[5] LEE, PA; ANDERSON, T. Fault Tolerance: Principles and Practice (Second
Revised Edition). Springer-Verlag, 1990.[6] ANANTHAKRISHNAN, R. et al. Building a global federation system for
climate change research: the earth system grid center for enabling technologies (ESG-CET). Journal of Physics: Conference Series, 78, 2007.
[7] Geniefy: Creating a grid enabled integrated earth system modelling framework for the community. http://www.genie.ac.uk/ GENIEfy/ , 2009.
[8] LENTON, TM; et al. Using GENIE to study a tipping point in the climate system. Phil. Trans. R. Soc. A, 367(1890):871–884, 2009.
[9] SIMMHAN, YL; B. PLALE, B; GANNON, D. A survey of data provenance in e-Science. SIGMOD Rec., 34(3):31–36, 2005.
[10] DE ROURE, D. e-Science and the Web. IEEE Computer, August 2009.[11] HARRABIN, R. Harrabin’s notes: IPCC under scrutiny. http://news. bbc.
co. uk/ 1/ hi/ sci/ tech/ 8488395.stm, 2010. Retrieved Jan 30, 2010.[12] SU-SHING, C. The Paradox of Digital Preservation, IEEE Computer, 34, p.
24–28, 2001.[13] MCGUFFIE, K; HENDERSON-SELLERS, A. A Climate Modelling
Primer, Third Edition, p. 47–79, 2005[14] LYON, L. Dealing with data: Roles, rights, responsibilities and relationships.
Technical report, UKOLN, Bath, UK, June 2007.
187

Gregory Tourte, Emma Tonkin, Paul Valdes
[15] LAPLANTE, P. Requirements Engineering for Software and Systems (1st ed.), CRC Press, 2009.
[16] NUSEIBEH, B; EATERBROOK, S. Requirements engineering: a roadmap, Proceedings of the Conference on The Future of Software Engineering, p.35-46, June 04-11, 2000, Limerick, Ireland
[17] OLSEN, L. A Short History of the Directory Interchange Format (DIF), http://gcmd.nasa.gov/User/difguide/whatisadif.html.
[18] BALL, A. Scientific Data Application Profile Scoping Study Report, http://www.ukoln.ac.uk/projects/sdapss/, June 2009
[19] SWAN, A; BROWN, S. The skills, role and career structure of data scientists and curators: An assessment of current practice and future needs, 2008.
[20] BURTON, A; TRELOAR, A. Designing for Discovery and Re-Use: the ?ANDS Data Sharing Verbs? Approach to Service Decomposition. International Journal of Digital Curation, 4(3), 2009.
[21] KIERAS, D. Task Analysis and the Design of Functionality, In CRC Handbook of Computer Science and Engineering, p. 1401–1423, CRC Press, 1996.
[22] KARASTI, H; BAKER, KS; HALKOLA, E. Enriching the Notion of Data Curation in E-Science: Data Managing and Information Infrastructuring in the Long Term Ecological Research (LTER). Network. Comput. Supported Coop. Work, 15(4):321–358, 2006.
[23] LUCE, R. Learning from e-databases in an e-data world. EDUCAUSE Review, 43(1):12–13, 2008.
[24] VAN ANDEL, TH; DAVIES, W; edts. Neanderthals and modern humans in the European landscape during the last glaciation. Cambridge: McDonald Institute for Archæological Research, 2004.
[25] JONES, S; BALL, A; EKMEKCIOGLU, Ç. The Data Audit Framework: A First Step in the Data Management Challenge. International Journal of Digital Curation, 3(2), 2008.
[26] MCHUGH, A; ROSS, S; RUUSALEEP, R; HOFMAN, H. The Digital Repository Audit Method Based on Risk Assessment (DRAMBORA). HATII, 2007.
[27] FARQUHAR, A; HOCKX-YU, H. Planets: Integrated Services for Digital Preservation. International Journal of Digital Curation, 2(2), 2008.
[28] PREservation Metadata: Implementation Strategies Working Group. PREMIS Data Dictionary, 2005.
[29] TONKIN, E; MULLER, H. Semi automated metadata extraction for preprints archives, JCDL ‘08: Proceedings of the 8th ACM/IEEE-CS joint conference on Digital libraries, p. 157–166, 2008.
[30] NASA World Wind Java SDK, http://worldwind.arc.nasa.gov/java/
188

189
MOTIVATIONS FOR IMAGE PUBLISHING ANDTAGGING ON FLICKR
Emma Angus1; Mike Thelwall2
School of Computing and Information Technology, University ofWolverhampton, Wulfruna Street, Wolverhampton, WV1 1LY, UK
1 e-mail: [email protected] e-mail: [email protected]
AbstractChanges in photographic and internet technology have revolutionised theway people create, process and share digital images. This paper investigatespeople’s motivations for image publishing and tagging on the web 2.0 siteFlickr. Using an online pilot survey, 33 participants answered questions abouttheir uploading and tagging practices, and whether or not they hope to makea commercial gain from their images. The results show that most people havetwo main motivational reasons both for using Flickr, and for the tagging oftheir images. However, whilst a person may be motivated to use Flickr forboth personal and social reasons, tagging motivation tends to focus moreexclusively on either one or the other of these two factors. Overall it wasfound that social organisation and social communication are the most popularmotivational factors for both using Flickr and for tagging images, suggestingthat Flickr is enjoyed for the community environment it provides rather thanas a place to store images. However despite people’s desire to share theirimages, most users are not hoping to make a commercial gain from the itemsthey upload.
Keywords: motivations; digital images; tagging; Flickr.
1. Introduction
Advancements in photographic technology have resulted in a renewedinterest in the role of the image in fields such as information and computerscience, anthropology, economics, sociology and visual studies. Increasingnumbers of individuals carry a camera with them every day: either a digital

Motivations for image publishing and tagging on Flickr
190
camera or a mobile phone with an inbuilt camera. Free from the limitations ofa 24/36 exposure film, people are now able to point and click almost endlessly.Coupled with this advancement in photographic technology, there aresignificant changes in the way the population is using internet technology; themain change being the web 2.0 pronounced emphasis on collaboration anduser contribution. Kirk et al. [1] point out that ‘the traditional role of the userfrom one as picture “taker”, into picture editor, developer and printer’ is alsocontributing to the pervasive photography landscape and this has beensupplemented with the development of web 2.0 image sites such as Flickr,PhotoBucket and Picasa. Such sites allow users to upload, store and shareimages either with selected friends and family or with the public at large.Images uploaded to such sites are generally annotated with ‘tags’, which arefreely chosen keywords [2], assigned by the user, ostensibly to aid withsubsequent search and retrieval.
These changes have had a dramatic effect on attitudes towards selfpresentation and publishing. The Web 2.0 revolution is ‘enabling Internetusers to author their own content….[a] technology platform [that] willradically democratize culture, build authentic community, [and] create citizenmedia.’ [3] As a result of this influx of user-generated content on the Web,there are some big businesses and organisations which are now looking totake advantage of this new model of creation and authoring. One suchexample is Getty Images, the world’s largest distributor of pictures andvideos. Getty joined forces with Flickr in July 2008 and their editors will nowbe regularly browsing through Flickr for images they like and invitingselected users to become paid contributors to their team of professionals.
However, does Getty’s new business model actually complement thedesires of Flickr users and their user-generated content? Why do peopleactually publish images on Flickr and what do they hope to achieve fromdoing so? This pilot study investigates what motivates individuals to publishtheir images, what motivates them to tag their images, and whether or notpeople are seeking to make a commercial gain from the images they publishon Flickr.
2. Related work
Digital images are at the core of Flickr’s existence (despite the fact that Flickr’screators originally intended it as an online game [4]). However, Flickr’sattraction now lies in its ability to act as both an image storage site and as a

Motivations for image publishing and tagging on Flickr
191
place for people to share images and cluster in communities of like-mindedpeople in order to converse, share tips and advice on photographic techniquesand to gain comments and feedback on photos which have been uploaded.Most of the work to date which has looked at Flickr describe it as a social siteand a place for sharing images rather than as a place for merely storing andbacking up collections of digital images [5, 6, 7, 8].
Reasons for taking and publishing images
Kindberg et al. [9] carried out an in-depth investigation into camera phone useand differentiated between social and individual intentions behind imagecapture. In their investigation they found that two thirds of all images takenon camera phones are captured with the intent to share (i.e., taken with socialintentions). Whilst the nature of taking pictures on a phone may be differentto that of using a standard digital camera due to the ease with which imagescan be sent simultaneously to contacts in the phone’s address book, Kindbergalso found that the subjects in their study only knew on average eight peoplewho had compatible camera phones who they could actually send images to.Subjects also expressed the intent to permanently save a selection of theirimages on either a PC, with the subsequent intention to perhaps share certainimages with friends via email or by posting onto a webpage.
The traditional reason for taking photographs on a standard camera(whether it be an instamatic, an SLR, or a digital camera) is to documentmemories and events and to store them so that family, friends and futuregenerations can look back on them. In an investigation into how peoplemanage their collections of photographs, Rodden and Wood [10] found thatthe organisation of traditional photos requires significant effort, and is notusually done to facilitate searching but to create an attractive ‘presentation’ ofphotos for keeping as part of a ‘family’ or ‘personal’ archive. Digitalorganisation on the other hand requires much less effort and is much morelikely to be carried out with the intent of sharing the photos and allowingothers to view them in the near future.
Cox et al. [8] carried out open-ended telephone interviews with 11Flickr users in an attempt to ‘explore the use of the system within the contextof the interviewees’ photographic practices.’ One of the questions which wasasked of participants was: ‘Why do you use Flickr?’ Overall, the intervieweesexpressed that they used Flickr as, ‘part of a wider nexus of self presentationor communication through the web’ and their collection of photos on Flickrwas, ‘usually a selection of the best or most appropriate to be shared.’ Flickritself was also found to be an important motivation for taking photos in thefirst place.

Motivations for image publishing and tagging on Flickr
192
Similarly, Van House et al. [11] in their interviews and observationswith 60 participants found that sharing is an important use of photos oncameraphones, and the authors argue that ‘cameraphones will soon be thedominant platform for low end consumer digital imaging.’
Reasons for tagging imagesOnce images have been placed on the Web, if they are in a Web 2.0 archivethen they may be tagged by the owner or others. Tagging is the process ofadding keywords to something as a form of metadata. There is much debateconcerning whether people tag their resources primarily for personalorganisation or to aid in sharing and discovery [5, 6, 12, 13, 14]. Althoughcategorised differently by authors and researchers, these tagging motivationscan be largely grouped together to form two distinct bodies of motivationalpractices: organisational, selfish, personal, intrinsic; and social, altruistic,public, extrinsic, evangelical - or put another way, information managementvs information sharing [15, 16].
Marlow et al. [6] claim that motivations to tag can be split into twohigh-level practices: organisational and social. Organisational motivations areassociated with users attempting to develop a personal digital filing system,whereas social motivations are associated with users attempting to expressthemselves with other users of the system. Hammond et al. [12] similarlydefine these two practices as selfish and altruistic.
Ames and Naaman [14] extend the notions of organisational and socialin an investigation which explored ‘the various factors that people considerwhen tagging their photos’ and the authors offer a taxonomy of taggingmotivations based along the two dimensions of: sociality and function. Theauthors conducted in-depth semi-structured interviews with 13 Flickr usersand they found that users generally had one or two primary motivations fortagging their images rather than solely one motivation, and that themotivations could be placed along the dimensions of sociality and function,rather than fitting into a mutually exclusive category (See Table 1.)
The sociality dimension relates to the tag’s intended audience (i.e., foroneself, or for others: friends/family/public). The function dimension relatesto the actual purpose of the tag (i.e., is it to aid in organisation: placing theimage into a category or classifying it somehow according to when/where itwas taken or perhaps grouping images into common themes. Or, is it to aid incommunication: providing context about the image content, or perhapstagging it as a way of drawing attention to it from other Flickr users).

Motivations for image publishing and tagging on Flickr
193
Table 1. A taxonomy of tagging motivations (Ames and Naaman [14])
FunctionOrganisation Communication
Soci
ality
Self
Retrieval,directorySearch
Context forselfMemory
Soci
alContribution,attentionAd hoc photopooling
ContentdescriptorsSocialsignalling
From their findings, the authors suggest that most of the participantswere motivated to tag by organisation for others (social organisation), withself organisation (adding tags for later retrieval) and social communication(adding context for friends, family and the public tied for second). This offersa more complex insight into motivation than previous research which hastended to crudely split tagging intention into either a manifestation oforganisation for the self, or having the intention to share with others. Thework of Ames and Naaman [14] proves that organisational tagging can oftenbe carried out more so for the benefit of others than for the self.
As part of the telephone interviews carried out by Cox et al. [8], theauthors also asked their participants, ‘how do you choose descriptions, tagsetc?’ They found that a key motivation for tagging was in order to increase theamount of people who could find and view the interviewee’s photos.
In a study which looked at whether users of social tagging systemsuse such platforms for the purposes of personal information management orfor information sharing [16], 48 Flickr participants were recruited from theMechanical Turk service. From qualitative judgements taken from free textcomments, these Flickr users showed a strong tendency towards informationsharing with friends and family, although personal information managementstill played a big factor in their motivations. Flickr users also perceived tags ashelpful for information retrieval and users often search through imagecollections other than their own.
In a study into the use of Flickr, Van House [5] interviewed 12 Flickrusers and found that most participants saw Flickr as, ‘a social site, a place forsharing images...and since they rarely searched back over their own images,tagging was almost exclusively for others.’
The findings of Nov et al. [7] and Ames and Naaman [14] indicatesthat social presence plays a role in tagging behaviour. It could behypothesised that if people are motivated to use and publish their images on

Motivations for image publishing and tagging on Flickr
194
Flickr in order to share them with others, then this ‘social presence’ shouldmotivate them to tag in a way which is socially orientated.
The previous research presented in this paper provides an excellentframework of motivational factors from which to base future studies on.However such research has either analysed Flickr image tags [17, 18, 19]; ormotivations to tag [5, 7, 14, 18] and these studies have tended to adopt either awholly quantitative (tag analysis) or qualitative (open ended in-depthinterviews) approach. An investigation combining both qualitative andquantitative methodologies may help us to better understand people’smotivations behind image publishing and image tagging, so that conclusionscan be drawn about the potential uses of web 2.0 image sites. To date therehas been no empirical research which has investigated if users of Flickr wishto make a commercial gain from the images they publish there.
3. Research questions
This pilot study which is part of a programme of research into tagging withFlickr aims to combine a qualitative and quantitative approach via the use of astructured online questionnaire and it aims to directly compare motivation touse Flickr with motivation to tag within Flickr.Using an information science and webometric approach this research paperaddresses the following questions:
What motivates people to publish their images on Flick?What are the key motivational factors for tagging images?Are people seeking to make a commercial gain from the images theypublish?
4. Methods
In order to investigate what motivates people to publish and tag their imageson Flickr, a pilot questionnaire was developed and administered on the Webto a sample of Flickr users utilising both a direct and indirect approach. Thiswill be followed-up with a larger sample in a future study.
Questionnaire DesignAs the target sample for the questionnaire was Flickr users, it was decidedthat an online questionnaire would be more appropriate than a paper based

Motivations for image publishing and tagging on Flickr
195
version. The questionnaire was designed using the online survey softwareand questionnaire tool, surveymonkey.com. Utilising the SurveyMonkeysoftware, a custom designed questionnaire could be created fairly quickly andassigned its own unique URL. In order to try to increase the response rate ofthe questionnaire and also to make the questionnaire as user friendly aspossible, a number of measures were taken:
The questionnaire was kept short and consisted of only 1 page ofquestions with minimal scrolling neededA clean, simple and uncluttered layout was used
The questionnaire was comprised of four main sections:A series of question statements relating to a respondent’s motivationsfor tagging their images (using a 5 point Likert scale)A free text box asking respondents to explain why they upload theirimages to FlickrA question asking if respondents hope that their images will bepicked up by a commercial stock photography organisation or themediaDemographic questions such as age, gender, and nationality
Question construction, wording and orderBased on the findings from the literature review, motivations for imagetagging seem to naturally align with the two dimensions as put forward byAmes and Naaman [14]; the first dimension being sociality (relating towhether the tag’s intended usage is by the individual or others i.e., self orsocial) and the second dimension being function (referring to a tag’s intendeduses of either facilitating later organisation and retrieval or to communicatesome additional context to viewers of the image). In light of these twoprominent dimensions, it was decided that the survey questions relating tomotivations for tagging would be based on these two constructs. Thereforefour questions were developed, one for each of the two main taggingmotivations within each of the two dimensions, thus creating four mainpossible reasons for tagging. In order to increase reliability, a further set offour questions were then developed which could be paired with the first set.Respondents were asked to express their level of agreement/disagreementwith these statements using a 5 point Likert scale.
It was decided that the demographic questions would be placed atthe end of the questionnaire as the respondents may be more likely to discloseinformation such as their age once they had already answered some questionsand felt a greater sense of involvement with the questionnaire as a whole.However whereas the motivational statement questions were a compulsory

Motivations for image publishing and tagging on Flickr
196
aspect of the questionnaire, the demographic questions were not, and arespondent could skip these questions if they felt uncomfortable disclosingsuch information. The researchers tried to ensure that all questions wereworded in a short and concise manner in order to reduce ambiguity
Data collectionIn order to try to increase the response rate of the questionnaire, both a directand an indirect method of data collection were utilised. For the directapproach, the URL of the questionnaire was posted to the discussion forumsof two public Flickr groups (Flickr Social and Surveys&Quizzes). The indirectapproach utilised advertising the questionnaire URL on the researchers’Facebook and Twitter profiles, and also on their personal web pages. In allinstances, the questionnaire URL was accompanied by a small paragraph ofexplanatory text, briefly stating the purpose of the questionnaire and advisingthat all responses would remain confidential and any published results wouldbe anonymised. A URL was also provided which linked to the first author’swebpage where further details on the questionnaire and the study as a wholecould be found. The questionnaire was available for a period of 3 weeksduring March 2010.
5. ResultsA total of 33 valid responses to the questionnaire were received. 51.5% of therespondents were female, and the mean average age of the respondent was 30years. The majority of the respondents originated from the UK and Denmark.See Figure 1 for a full breakdown of nationalities.
Figure 1. Respondent’s country of origin
0
2
4
6
8
10
12
14
16
Num
ber
of r
espo
nses

Motivations for image publishing and tagging on Flickr
197
Why people upload their images to FlickrParticipants were asked to briefly explain why they upload their images toFlickr. The responses were then broken down into the reasons stated andthese reasons were grouped together according to the motivational factors asput forward by Ames and Naaman [14] (i.e., social organisation, socialcommunication, self organisation, self communication).Most respondents (48%) reported two main reasons behind their use of Flickr,with the two most predominant reasons being to share images with friendsand family (social organisation), and to promote their work and connect withother people in the photography community (social communication).
P22: “I use Flickr to promote my creative work, get feedback, and share withfriends/family.”P31: “To keep a nicely presented, easily shared record of my photography andto get feedback, encouragement and advice from other users abouttechnique.”
45% of respondents reported that they had only one main motivation forusing Flickr, and 6.5% reported that they had three main reasons. Figure 2shows respondent’s overall preferences between each of the four mainmotivational factors.
Figure 2. Number of respondents who exhibited each of the fourmotivational practices
The results support the general consensus that people are drawn to Flickrbecause of the social aspects and the ‘community environment’ it provides,rather than using it solely as a place to store and archive images.
0
5
10
15
20
25SELF ORG
SELF COMM
SOCIAL ORG
SOCIAL COMM

Motivations for image publishing and tagging on Flickr
198
Do people hope to make a commercial gain from their images?Despite the fact that 51% of the respondents in this investigation specificallymentioned using Flickr as a way of promoting their work and receivingfeedback on their images, 75.8% of respondents said that they did not useFlickr with the hope that their images would be picked up by either acommercial stock photography organisation or by the media. So whilst the‘sociality’ element is a big factor for many Flickr users, people arepredominantly interested in having their images found so that they can gainfeedback and encouragement from other Flickr users, rather than hoping theirimages will be picked up by a commercial agency or the media.
What motivates people to tag their images?Motivation to tag images slightly differs from people’s motivations in usingFlickr to publish their images. Whereas people strongly state that socialorganisation is the main factor in using Flickr, social communication comesout slightly on top in terms of people’s motivations for tagging their images(see Figure 3). Social organisation and communication are the top twomotivational factors in both instances. This finding differs from the work ofAmes and Naaman [14] and Cox et al. [8] who found that social organisationwas the top motivating factor in tagging practices.
Figure 3. Motivations for tagging images
Similar to the finding which suggests that most people have two mainmotivations for using and publishing their images on Flickr, most peoplewere also found to have two main motivations for tagging their images(42.4% of respondents).
1
2
3
4
5
SELF ORG
SELF COMM
SOCIAL ORG
SOCIAL COMM
1 – strongly agree
5 – strongly disagree
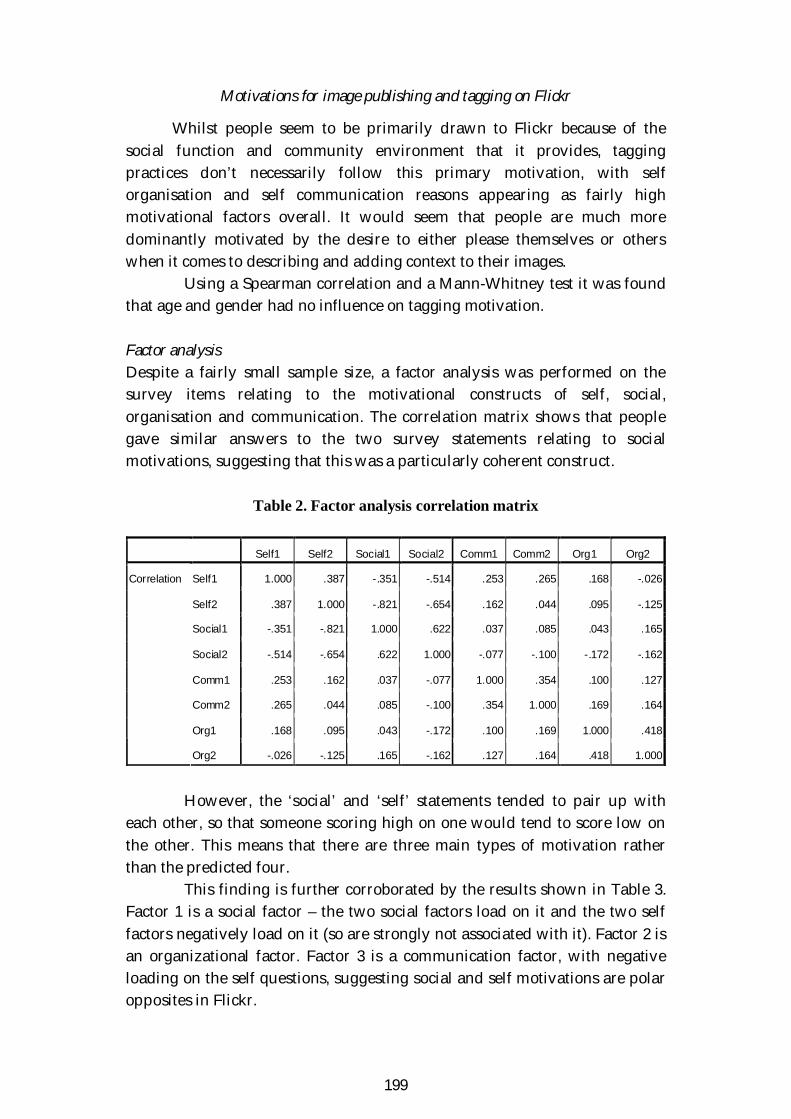
Motivations for image publishing and tagging on Flickr
199
Whilst people seem to be primarily drawn to Flickr because of thesocial function and community environment that it provides, taggingpractices don’t necessarily follow this primary motivation, with selforganisation and self communication reasons appearing as fairly highmotivational factors overall. It would seem that people are much moredominantly motivated by the desire to either please themselves or otherswhen it comes to describing and adding context to their images.
Using a Spearman correlation and a Mann-Whitney test it was foundthat age and gender had no influence on tagging motivation.
Factor analysisDespite a fairly small sample size, a factor analysis was performed on thesurvey items relating to the motivational constructs of self, social,organisation and communication. The correlation matrix shows that peoplegave similar answers to the two survey statements relating to socialmotivations, suggesting that this was a particularly coherent construct.
Table 2. Factor analysis correlation matrix
However, the ‘social’ and ‘self’ statements tended to pair up witheach other, so that someone scoring high on one would tend to score low onthe other. This means that there are three main types of motivation ratherthan the predicted four.
This finding is further corroborated by the results shown in Table 3.Factor 1 is a social factor – the two social factors load on it and the two selffactors negatively load on it (so are strongly not associated with it). Factor 2 isan organizational factor. Factor 3 is a communication factor, with negativeloading on the self questions, suggesting social and self motivations are polaropposites in Flickr.
Self1 Self2 Social1 Social2 Comm1 Comm2 Org1 Org2
Self1 1.000 .387 -.351 -.514 .253 .265 .168 -.026
Self2 .387 1.000 -.821 -.654 .162 .044 .095 -.125
Social1 -.351 -.821 1.000 .622 .037 .085 .043 .165
Social2 -.514 -.654 .622 1.000 -.077 -.100 -.172 -.162
Comm1 .253 .162 .037 -.077 1.000 .354 .100 .127
Comm2 .265 .044 .085 -.100 .354 1.000 .169 .164
Org1 .168 .095 .043 -.172 .100 .169 1.000 .418
Correlation
Org2 -.026 -.125 .165 -.162 .127 .164 .418 1.000

Motivations for image publishing and tagging on Flickr
200
In summary, the factor analysis suggests that sociality (self vs. social),organization and communication factors are the three main independenttypes of motivation.
Table 3. Rotated factor matrix
6. Discussion
The results from this investigation suggest that whilst it is possible to have anumber of different motivations for using Flickr, as well as a number ofdifferent motivations for tagging images, tagging motivation will tend to bedriven by only one direction of sociality (i.e., for oneself or for others) even ifa person states that their motivation for using Flickr in the first place is for amixture of self and social reasons. Tagging tends to be driven exclusively byeither self or social reasons, with the factors of organisation andcommunication being less exclusive and in many cases playing a dual role.
The results of this investigation give a valuable insight why peoplepublish and tag their images on Flickr, however the results cannot begeneralised too widely due to the small sample size. Whilst some literaturesuggests that it usually takes no more than 12-25 cases to reveal the majordifficulties and weaknesses in pre-test questionnaires [20] this is referringmore to the design of the questionnaire and the discovery of things such assuppositions, awkward wordings or missing categories. In order to test theunderlying assumptions of the information contained within the variablesbeing questioned, it is suggested that, ‘a minimum of five subjects per
Factor
1 2 3
Social1 .910
Self2 -.869
Social2 .765
Self1 -.469 .438
Org2 .848
Org1 .482
Comm2 .610
Comm1 .541

Motivations for image publishing and tagging on Flickr
201
variable is required for factor analysis.’ [21]. This investigation was thereforeseven subjects short of the 40 required in order to fully test the 8 statementsincluded in the factor analysis. However the results from the factor analysiswere clear and conclusive in suggesting that there were three main factorswhich made up the motivational statements rather than the predicted four.Therefore as a pilot investigation this proved to be a worthwhile finding,which could be further tested using a larger sample.
Despite the heavy bias towards UK and Danish participants, nonoticeable differences were found in the motivational intentions of these twonationalities, so the main factor is the European bias, which could be furtherinvestigated by having a larger sample from a more internationallyrepresentative set of countries.
As with all surveys there is the possibility that participants may havelied when answering questions. People often answer questions in the waythat they think they are expected to answer, and people also often answerquestions quickly, without giving much thought to their answers. In order totry to overcome this problem, the main motivational statement questionswere paired up, to test the assumption that people should answer similarly onthe pairs of questions.
As stated in the Results section of this paper, it is possible for someoneto have more than one main motivation to use Flickr, as well as more than onemain motivation for tagging their images. However, whilst motivations to useFlickr can be for a mixture of both self and social reasons (i.e., using Flickr as apersonal archive as well as using it to share images with friends and family),tagging motivation was found to be exclusively for either self or socialreasons. This is particularly interesting given that a number of participants inthis investigation specifically stated both self and social reasons for usingFlickr:
P17: “I use Flickr to archive for myself and also to promote my work.”P25: “to store my images and to share with friends.”P30: “as storage and for displaying my images to friends and family.”
These statements would suggest that perhaps people are not fullyaware of how much their tagging practices differ from their main motivationsfor using Flickr in the first place.

Motivations for image publishing and tagging on Flickr
202
7. Conclusion
Whilst motivations for using Flickr and uploading images can be for anumber of different reasons at the same time, motivations for tagging imagestends to have a more predominant role. People may use Flickr as both apersonal archive and as a place to share images with friends and family, buttheir reasons behind choice of tags will tend to be very distinctly either a ‘self’or a ‘social’ action, with less hesitation in the mind of the tagger as to who willultimately benefit from their choice of tag. People don’t appear to want to usea mixture of highly personal and social tags; they will adopt one strategy orthe other, regardless of if they are tagging for archive and storage orcommunicative purposes.
However in support of much of the previous work carried out onFlickr, the respondents who took part in this investigation seem to use Flickrfor the social aspects and the community environment which it provides withsocial organisation and social communication being the two most popularmotivational factors overall. Despite people’s desire to have their imagesfound and commented upon, as a general rule, people aren’t interested inmaking a commercial gain from the images they upload – the communityspirit of Flickr and its ability to connect people both known and unknown tothe image uploader is its most appealing feature.
The responses from the pilot questionnaire have given a valuable firstinsight into why people publish and tag their images on Flickr, and also intothe changing nature of self-publishing in the world of user-generated content.
Acknowledgements
The authors would like to thank Dr Ann O’Brien (Loughborough University)and David Goda (University of Wolverhampton) for their input and advice onthe development of the questionnaire. A big thank you also goes to all of theparticipants who took the time and effort to complete the questionnaire andfor providing such useful comments and feedback on their use of Flickr.
Notes and References
[1] KIRK, DS; SELLEN, A; ROTHER, C; and WOOD, K. UnderstandingPhotowork’, In Proceedings of CHI Conference on Human Factors in

Motivations for image publishing and tagging on Flickr
203
Computing Systems, 22-27 April 2006, ACM, Montreal: Canada p. 761-770.
[2] GUY, M; and TONKIN, E. Folksonomies: Tidying up Tags? D-LibMagazine, 12(1), 2006. Available athttp://www.dlib.org/dlib/january06/guy/01guy.html (March 2006).
[3] KEEN, A. The second generation of the Internet has arrived. It’s worsethan you think, The Weekly Standard, 15th Feb, 2006.
[4] FITZGERALD, M. How we did it: Stewart Butterfield and Caterina Fake,Co-founders, Flickr, December 2006. Available athttp://www.inc.com/magazine/20061201/hidi-butterfield-fake.html
[5] VAN HOUSE, N. Flickr and Public Image-Sharing: Distant Closenessand Photo Exhibition, CHI 2007 Proceedings, April 28 – May 3, 2007, SanJose, CA, USA.
[6] MARLOW, C; NAAMAN, M; BOYD, D; and DAVIS, M. PositionPaper, Tagging, Taxonomy, Flickr, Article, ToRead, Proceedings of the15th International World Wide Web Conference, (Collaborative Web TaggingWorkshop), May 22, 2006, Edinburgh, UK.
[7] NOV, O; NAAMAN, M; and YE, C. What Drives Content Tagging: TheCase of Photos on Flickr. Proceedings of the 26th annual SIGCHI conference onhuman factors in computing systems, 2008, p. 1097-1100.
[8] COX, A; CLOUGH, PD; and MARLOW, J. Flickr: a first look at userbehaviour in the context of photography as serious leisure, InformationResearch, 13(1), March 2008. Available at http://informationr.net/ir/13-1/paper336.html (May 2008).
[9] KINDBERG, T; SPASOJEVIC, M; FLECK, R; and SELLEN, A. TheUbiquitous Camera: An In-Depth Study of Camera Phone Use, IEEEPervasive Computing, 4(2), 2005, p. 42-50.
[10] RODDEN, K; and WOOD, KR. How do people manage their digitalphotographs?, ACM Conference on Human Factors in Computing Systems(ACM SIGCHI 2003) Fort Lauderdale, Florida, USA, April 2003, p. 409-416.
[11] VAN HOUSE, N; DAVIS, M; AMES, M; FINN, M; andVISWANATHAN, V. The Uses of Personal Networked DigitalImaging: An Empirical Study of Cameraphone Photos and Sharing,CHI 2005 Proceedings, April 2-7 2005, Portland, Oregon, USA.
[12] HAMMOND, T; HANNAY, T; LUND, B; and SCOTT, J. SocialBookmarking Tools (I): A General Review”, D-Lib Magazine, 11(4), 2005.Available athttp://www.dlib.org/dlib/april05/hammond/04hammond.html(October 2006).

Motivations for image publishing and tagging on Flickr
204
[13] GOLDER, SA; and HUBERMAN, A. Usage Patterns of CollaborativeTagging Systems, Journal of Information Science, 32(2), 2006, p. 198-208.
[14] AMES, M; and NAAMAN, M. Why We Tag: Motivations forAnnotation in Mobile and Online Media, CHI 2007 Proceedings, April 28– May 3, 2007, San Jose, CA, USA.
[15] THOM-SANTELLI, J; MULLER, M. J; and MILLEN, DR. Social taggingroles: publishers, evangelists, leaders. In Proceeding of the Twenty-SixthAnnual SIGCHI Conference on Human Factors in Computing Systems,Florence, Italy, April 05 - 10, 2008, ACM: New York. Available athttp://doi.acm.org/10.1145/1357054.1357215
[16] HECKNER, M; HEILEMANN, M; and WOLFF, C. Personal InformationManagement vs. Resource Sharing: Towards a Model of Information Behaviour inSocial Tagging Systems. May 2009, San Jose, California, USA.
[17] RAFFERTY, P; and HIDDERLEY, R. Flickr and Democratic Indexing:dialogic approaches to indexing, Aslib Proceedings: New InformationPerspectives, 59(4/5), 2007, p. 397-410.
[18] ZOLLERS, A. Emerging Motivations for Tagging: Expression,Performance and Activism, WWW 2007, May 8-12, 2007, Banff, Canada.
[19] ANGUS, E; THELWALL, M; and STUART, D. General patterns of tagusage among university groups in Flickr, Online Information Review,32(1), 2008, p. 89-101.
[20] SHEATSLEY, P. Questionnaire Construction and Item Writing. In“Handbook of Survey Research”, ed. Peter Rossi, James Wright, and AndyAnderson, 1983, p. 195–230. New York: Academic Press.
[21] COAKES, SJ; and STEED, LG. SPSS: analysis without anguish: version10.0 for Windows. Milton, Qld: John Wiley & Sons Australia, Ltd. 2001.

205
The HKU Scholars Hub: Unlocking collective intelligence
David T Palmer
University Libraries, The University of Hong Kong, Hong Kong SAR
AbstractIn 2009 The University of Hong Kong (HKU) wrote mission and vision statements, and strategicplans highlighting Knowledge Exchange (KE). The HKU Scholars Hub, the institutionalrepository of HKU, was chosen to be the chief vehicle to forge the necessary culture for KE withinHKU and engage staff in delivering the desired outcomes of KE. Development work to create thisvehicle serendipitously created other desired outcomes. Chief amongst these is a collectiveknowledge system, created from the interaction between machine and data, author and institution,and, local authority and remote indexing. The result is a bootstrapped “intelligence”, greater thanthe sum of its parts.
Keywords: institutional repository; The University of Hong Kong; knowledge transfer;knowledge exchange; Scopus; ResearcherID; ORCID; Collective Knowledge Systems; CollectiveIntelligence;
1. Introduction
The research funding body for Hong Kong academic research, The University Grants Committee(UGC), in 2009 charged and funded all of its eight tertiary education institutions to beginprogrammes for Knowledge Transfer (KT). Their definition of KT:
the systems and processes by which knowledge including technology, know-how,expertise and skills are transferred between higher education institutions and society,leading to innovative, profitable or economic or social improvements [1].
Upon receiving this UGC directive, The University of Hong Kong (HKU) set several initiativesin motion to uniquely do and show KT, with HKU characteristics. They re-articulated theirmission and vision statements, showing three themes; 1) research, 2) teaching and learning, and 3)knowledge exchange (KE) – HKU’s local interpretation of KT, emphasizing bilateral exchangebetween HKU and its community. They created a five year strategic plan [2, 3] based upon thesethree themes, showing strategic initiatives and operational priorities, two of which read:
… setting up a database to record knowledge exchange activities in the Universityand improving communication within and outside the University, we will facilitatedissemination of information and service as an exchange hub.… implementing a sustainable web-based expertise directory which draws uponresearch output, research grant records, contract research, media expertise andcommunity service databases, we will facilitate inbound enquires that seek toidentify expertise [4].
Finally, key indicators were assigned to determine the success of HKU’s KE initiative [5].These include:
Item count of HKU theses in open access (OA)Item count of HKU research in OA

206
Applications for patentsDownload counts of the aboveNumber of staff available for media contactNumber of collaborative researchesNumber of contract researchesNumber of consultancies, and income thereby generatedNumber of invited public lectures, symposia, exhibitions, performances & honorary degreespeechesNumber of University staff invited to be mentorsNumber of positive media impact related to knowledge transfer coverage, including print,online and electronic mediaNumber of appointments of external members to HKU advisory boards
The Hub. The HKU Scholars Hub [6] (The Hub) is the institutional repository (IR) of HKU. Itbegan in 2005 with a mission to collect, preserve, and provide OA to the intellectual output ofHKU. The HKU Knowledge Exchange Office (KEO) realized that the goal of The Hub -- OA onHKU research -- largely already aligned with that of KE, and with development could be used asthe key vehicle to enable, and show KE at HKU. The Hub could directly measure, and answerseveral of the key indicators above, and actively promote the increase of several others. The Hubwas therefore designated to be an “exchange hub” to make HKU research and expertise highlyvisible.
With encouragement from the KEO and others on campus, Hub administrators began toplan, how best to make The Hub,
An expert finder, showing many relevant particulars on each HKU scholar, enabling theirdiscovery by searchers in government, industry and academiaA supplier of metrics to evaluate these experts and their researchAn “exchange hub” to show and measure all relevant HKU KE activities
2. Methodology
Item-centric. Traditional IRs are item-centric, with metadata records for each separate item.Similar to IRs at other universities, we were collecting the published and grey literature of ouracademics, and the theses of our postgraduates. Because of a policy requiring thesis deposit, and aprogram of retrospective digitization, HKU was the first university in Asia to show online thesesfor all students – 17,000 theses in 2009. However the published and grey literature of ouracademics proved more difficult to collect – we were ingesting perhaps only 10% of the total.
Metrics in IRs will normally cumulate for each item. In this regard we used APIs fromScopus and Web of Science, to show citation metrics for each Hub item, if also available in Scopusor Web of Science. More article-level linking is planned, such as trackbacks, links tocorresponding entries in the blogosphere, etc [7].
Author-centric. Besides IR items in OA, the KE initiative also called for an online locus whereparticular details of one HKU author could be found. We therefore planned the creation ofResearcherPages (RPs) for each current HKU scholar with these particulars, and metrics that willcumulate to this individual scholar. To build these RPs, fortunately there were several data silosinternal to HKU and external, from which we could extract and quickly build a mash-up.
After tendering for this work to be done, we chose Cilea Consorzio Interuniversitario [7] asour partner in development. The first round of enhancements completed in 2009, with others stillin progress, and many others still in planning.

207
On Campus. HKU has long required authors to input data regarding their research output andprofessional activities; albeit in several disparate and often overlapping databases. Chief amongstthese is the Research Output System (ROS), which allows data input directly, but also receivesdata from the Academic Performance Appraisal (APA), used for performance appraisal, and theResearch Grants Committee Administration System (RGCAS), used for applying for, andreporting on, grants given by the Research Grants Committee (RGC) – the research arm of theaforementioned UGC.
We set up a process in 2007 to receive publication data for journal articles, conference papers,and books from ROS. ROS input screens ask for author permission to post to the Hub, and forattachment of the author’s manuscript. These items were posted to The Hub, only if publisher andauthor permission allowed. However with the KE initiative, we began to plan to import allrelevant data from ROS, to repost to The Hub. If relevant permissions cannot be obtained, citationdata only will be posted.
There are several other sources which we plan to harvest. The following chart shows data tobe obtained and from where.
Table 1: Data Elements & Sources (HKU)Data Element Source (HKU)Publications, awards, prizes, etc ROSContact details Communications DirectoryProfessional qualifications Central Personnel DatabaseSupervision of ResearchPostgraduate Students
Postgraduate Student Systems
Expertise / Research Interest APAPublic & Community Service APAResearch grants received & projectundertaken as principal or co-principal investigator
RCGAS
Patents applied for & granted Technology Transfer OfficePicture Departmental / personal web pagesSubjects for media comment Media Content Directory
KEO arranged permission for The Hub administrators to extract initially and then for weeklyupdates. In 2009 administrators set up unattended batch processes to extract data from the MediaContent Directory and Communications Directory, and to marshal into Excel files. Cilea created aprocedure that would load the data from these Excel files into The Hub. Future work will usesimilar processes to load data from the other sources.
External to HKU. Working with the various publication lists, it became apparent that sourceswithin HKU and externally all had different subsets of the total output for any one staff; thereasons for which are many and varied. Therefore, it is valuable to show all sources with theirdifferent publication lists and citation metrics. The two largest providers for paper counts andcitation metrics are Elsevier’s Scopus, and Thomson Reuters’ Web of Knowledge (TR WoK).Although for certain subjects, other sources are perhaps better, these two provide the widestcoverage across the most disciplines.
We have long used each of their APIs to show article level metrics on Hub items, andtherefore quickly thought of them to also provide author-cumulated metrics. Before we couldbegin however, there were several problems to overcome, chief of which is disambiguating namesvariants and like-named individuals.

208
Scopus. This database [9] provides a unique AuthorID and page for each author, on which papercounts and metrics will cumulate for this author. However these pages, which are created bymachine algorithm, are frequently in error, cumulating two or more like named individuals intoone AuthorID, or, creating two or more separate AuthorIDs for one individual when he or sheused two or more variants to publish. The affiliation information was frequently in error alsobecause, 1) most of the UGC universities in Hong Kong have very similar names, and, 2) secondand subsequent authors frequently showed erroneously, the affiliation of the first author.
Although authors themselves can request these changes, they rarely do. We therefore hiredresearch assistants to search out these problems, and report them to Elsevier. Elsevier hascommitted to fixing these reported errors and that changes once made will not need to be madeagain.
Figure 1. Example of Scopus AuthorID (April 2010)
ResearcherID. We could not find similar procedures to correct data in Web of Knowledge. Wethen happily learned of Thomson Reuters ResearcherID [10]. Although researchers themselvescould create these accounts, they rarely do. We therefore used XML files to create in batch mode,ResearcherID accounts for each of the approximately 1,500 HKU professional staff. We usedpublication data from the HKU ROS, placed into XML, and uploaded them to these accounts. Wethen gave the unique ResearcherID and password to each individual researcher, who can nowpersonally edit this information. If the data matched upon entries in WoK, citation metrics fromWoK will accrue in real-time to the entry in ResearcherID and cumulate to its author. UsingResearcherID, we generated an “R” badge and HTML code to place on each scholar’sResearcherPage. MouseOver on this badge will show the author’s top three cited articles.ResearcherID is public, needing no paid subscription to view.

209
Figure 2. Example of ResearcherID (April 2010)
With both AuthorID and ResearcherID ready for extraction, The Hub administrators usedVisual Basic Application (VBA) in Excel to build scripts to extract data from both repositories.Scopus AuthorID and ResearcherID were input into the Excel file, whose VBA script then returned15 fields of relevant data.
There are several other repositories from which we hope to do similar.BiomedExpertsMathSciNetMathematics Genealogy ProjectACM Digital LibrarySocial Sciences Research Network (SSRN)Research Papers in Economics (RePEc)Google ScholarAs Google Scholar does not provide an author page, or a way of cumulating citations to one
author, we must rely upon the authors themselves to run software such as Publish or Perish [11]on their Google Scholar data. We will build a function for them to input this data themselves, withan accompanying RIS file made from Publish or Perish, into The Hub.
Matching Publications with ResearcherPages. Cilea built procedures for cumulating authorname variants to one established name, or ResearcherPage. They then built procedures to makepreliminary matches between ResearcherPages and item records whose author names matched theestablished name heading or any of its cumulated variants. Hub administrators confirmed orrejected these preliminary matches. Authority control and preliminary matches now work on theDSpace Dublin Core element, “dc.contributor”, and any of its qualified variants;“dc.contributor.author”, dc.contributor.editor”, etc.

210
3. Results
In the initial 2009 round of developments, The Hub administrators, Cilea, and the data providersproduced these results,
TR ResearcherID accounts for each HKU scholar populated with their HKU researchpublication lists. Thomson Reuters will begin to use ResearcherID numbers in Web ofKnowledge entries later this year, to reduce search noise, and to create a more exact methodof author name searching. Some researchers use their publicly accessible accounts as onlineCVs. HKU uses them to harvest Web of Knowledge metrics and display in the Hub.
Figure 3. Example of a ResearcherPage (April 2010)
Clean AuthorID records in Scopus. Users of Scopus, search and retrieve on HKU authornames with greater accuracy. Government reports and university rankings using Scopusdata will show greater accuracy of HKU research output (described below). HKU canharvest cleaner and more accurate data, and display in the Hub.

211
Figure 4. Example of Authority Control. The “ ” denotes established heading.
HKU ResearcherPages with author-centric details and metrics, and linked publication listswith fulltext articles. Searchers in government, industry, the media, and academia useGoogle and other search engines to find HKU experts for media comment, contractedresearch, research collaboration, supervision of graduate students, speaking engagements,etc. RP owners use them for online CVs, publication lists validated by the institution,reputation management, publication list export (explained below), etc. The University usesthem to highlight its research talent, and for KE with its community.
Figure 5. Example of Edit Page for RP Owner
Authority control indexing to gather variant names together and disambiguate like-namedindividuals, in Roman scripts and in Chinese, Japanese, and Korean (CJK) scripts. Initiativessuch as the Bibliographic Knowledge Network use this HKU established authority control,along with the ResearcherID and Scopus AuthorID (manually matched by HKU staff) toascertain identity and link to corresponding records in other sources. Readers within HKUand externally, use them as a finding aid for further publications by the same author, pasthistory of the author, co-authors, etc.Individual login authentication using the HKU LDAP (CAS). RP owners login to edit oradd details, personalizing their individual RP. Data extracted from other sources – MediaContent Directory, Scopus, and ResearcherID – must be changed in the source silo, and notThe Hub.Unique author identifier, to further disambiguate each current HKU author. This numberappears in the ResearcherPage URL; for example, http://hub.hku.hk/rp/rp00060. Elsevierand Thomson Reuters in the future will allow this number to be written in the ScopusAuthorID and ResearcherID records, respectively, and thus increase the trust of all threesources of disambiguated identity.Procedure for matching Hub items with RPs. Hub administrators examine each potentialmatch before confirming.
High visibility of HKU research and authors in Google and other search engines.HKU administrators in KEO have lauded these developments and asked The Hub staff to
take a “road show” to each of the departments. Elsevier and Thomson Reuters have been

212
enthusiastic, and each claims that HKU is the first in the world to achieve these results. Scopusand ResearcherID add value to the Hub, and The Hub adds value to Scopus, and ResearcherID,driving traffic to both.
Individual scholars at HKU have, for the most part, also been enthusiastic. Upon seeingtheir results in The Hub, Scopus and ResearcherID, several have begun to take an active interest inshowing their metrics in the best possible light; adding missing citations, variant names used, andasking for corrections. Several have suggested other sources of data, especially good for theirdiscipline. This reputation management done by the individual also enhances the reputation ofthe institution.
Not all of the results are in. Development continues, and an authoritative survey has yet tobe done. However along the way, a few more purposes for this work have appeared.
RAE. The UK and Australia report that bibliometric data from Scopus, WoK, or both will be usedin their upcoming research assessment exercises (RAE): Research Excellent Framework (REF), andExcellence in Research for Australia (ERA), respectively. Hong Kong is heavily influenced byboth. A subgroup in the UGC is now considering whether bibliometrics will be used in HongKong’s own RAE, to be done in either 2011 or 2012.
Re-Positioning the Library. A recent report on research assessment in five countries by OCLChighlighted the role of libraries in this process. It noted that in those countries where bibliometricsare central to RAEs, academic libraries and librarians are often pivotal. The author writes:
,In terms of information infrastructure, the libraries that are playing a central role in theresearch assessment process – particularly Australia – are those which have been able toleverage the value of the institutional repository, which is typically managed andpopulated by librarians [12].He describes the role of librarians in each of the five countries surveyed. For Denmark,he observed:There is a general sense that the traditional library business of books on shelves is beingconsigned to the past and that librarians see their libraries as having an institutionalinformation infrastructure role within the universities [13].
A companion report to the above, gave seven recommendations on how libraries can, “provide aresearcher-centered view” [14]. Curating the institution’s research output and providing expertisein bibliometrics for RAEs and other purposes are clearly directions in which libraries can move, totheir benefit. This will increase their usefulness to researchers and the institution, andcorrespondingly align libraries with the mission and vision of the hosting institution.
University Rankings. Though many criticize these studies, they have taken on ever moreimportance in recent years. Parents use them to decide which school to choose for their child.Governments use them to distribute research and education funding, etc. Research metrics fromScopus, WoK, or both play a large part in these rankings. HKU is taking charge of its ownreputation, and applying resources to ensure proper accounting of its research output.
ORCID. A new worldwide initiative was announced in December 2009, the Open Researcher &Contributor ID (ORCID) [15]. Members include Elsevier, Thomson Reuters, major publishers, andlarge universities. The ORCID will be based upon, or perhaps use, the ResearcherID, and will beoperational in June 2010. Authors will use the ORCID when submitting articles to publishers.Publishers will record the ORCID in the metadata for each article, and pass to third parties such asScopus and WoK. Therefore institutions, publishers, and database managers will finally have away to disambiguate authors and assign unambiguous identity. At this time, HKU is the onlyinstitution in the world to have ResearcherIDs for all of its authors. In June 2010, we expect toannounce to our HKU authors, that they must begin using the ResearcherID / ORCID to submit

213
articles to publishers, record their publications in the HKU ROS, place in their CVs, etc. With eachmember already having a ResearcherID, we expect almost full, and immediate compliance. Thiswill finally consign problems of HKU author name ambiguity to history,.
Publicaton List Export. Although only minimal publication lists are now available in The Hub,authors still could envision and suggest to us, a use very relevant for them. We will build aprocedure for authors and their readers to select on publications, and export them in their desiredformat; RIS, EndNote, CSV, etc. HKU scholars are presented with dozens of requests forpublication lists during the year for various purposes; grant application, conference papers,postgraduate student supervision, etc. The present HKU Research & Scholarship pages do notallow this. In future work, publication lists in The Hub will be made complete with each scholar’sfull HKU record.
4. Discussion
Traditional IRs are item-centric, and done for the purpose of OA. Most suffer low populationrates. The Hub has luckily enjoyed the attention of HKU’s policy on Knowledge Exchange, whichhas meant a change in focus and alignment. The Hub has therefore grown beyond its initial scopeas an institutional repository. Besides cumulating data around the item, it now also does the samearound authors. It serves other purposes besides that of OA. Our primary goal is to create asystem that will forge the necessary culture for KE within HKU and engage staff in delivering thedesired outcomes of KE.
However, whether done for OA or for KE, the results are much the same in many cases [16].Work done for either OA or KE mutually contribute to each other. Recent months have seen thesedevelopments in OA at HKU:
The Vice-Chancellor of HKU signed the Berlin Declaration on Open Access in November2009 [17].With funding again from HKU KEO, HKU Libraries came to agreement in March 2010 withSpringer, to allow HKU faculty and students to publish using Springer’s Open Choice [18]option for one year. All such articles will be open access, and posted to SpringerLink, TheHub, and relevant ones to PubMed Central.In February 2010, HKU Libraries created a mandate for its staff to deposit authored items inThe Hub [19].
E-Science. “E-science” has been defined as, “shorthand for the set of tools and technologiesrequired to support collaborative, networked science” [20]. Although this was not a considerationin our initial planning, The Hub has indeed become, serendipitously, such a tool.
The Hub is now a unique locus for HKU researchers to interact with the web, and for remoteservices to interact with HKU researcher data. Initially the individual data was supplied fromvarious HKU and remote data silos. HKU researchers then edit, delete, or extend this data. Thisdata is then exposed to remote web services, which may also enhance this data, for greater valueto the individual and his or her institution. An example of a remote web service doing this, is theBibliographic Knowledge Network People (BKNpeople) hosted by UC Berkeley, and funded bythe (US) National Science Foundation (NSF) Cyber-enabled Discovery and Innovation (CDI)Program. Still in an experimental stage, BKNpeople displays HKU data, with links tocorresponding records held by other data suppliers, such as MatchSciNet and the MathematicsGenealogy Project [21].
Collective Intelligence. In The Hub paradigm, the institution loads relevant data to createResearcherPages, which RP owners can then edit and otherwise control for their own purposes.

214
This symbiosis between machine and data, author and his or her institution, local authority andremote indexing, creates a “collective knowledge system”. Tom Gruber’s well cited article onCollective Knowledge Systems, argues that these systems, “… unlock the ‘collective intelligence’of the Social Web with knowledge representation and reasoning techniques of the Semantic Web”[20]. Other descriptors for this process are “synergy”, and “bootstrapping”. Well knownexamples are of course, Wikipedia, Facebook, etc. An interesting observation by Chris Dixon ofHunch, writes, “I think you could make a strong argument that the most important technologiesdeveloped over the last decade are a set of systems that are sometimes called, ‘collectiveknowledge systems’” [23].
The last player in this symbiosis is Google, in which RPs are highly visible and discoverable.Searching on the interlinked documents of the planet, Google’s page ranking, “provide[s] a veryefficient system for surfacing the smartest thoughts on almost any topic from almost any person”[24]. Because of tagging done by machine loads, and manually by the RP owner, on any relevantGoogle search, RP pages are at, or near the top of the hit list.
Authority Control. An example of this symbiosis is the authority control in The Hub. Thetraditional paradigm has been a central or national library maintaining an authority file, to whichremote libraries can add; for example, the US Library of Congress and its member NACO libraries.However, The Hub has added a third, and perhaps more important player; the author who is thesubject of this authority work. The Hub begins with a full name, an academic shortened name,and a Chinese name extracted from the HKU Registry’s files. Variant names are loaded fromScopus. Hub administrators can edit or add more. Finally the owning author can also edit or addmore. Each of these parties has incentive to create and maintain an accurate record, with perhapsthe author holding the most incentive. Once this record of name, name variants, and publicationlist is created, it is valuable to many researchers and web services within HKU and beyond.
In this regard, a draft report by the Working Group on the Future of Bibliographic Controlto the Library of Congress, which included librarians and representatives from Google andMicrosoft stated:
The future of bibliographic control will be collaborative, decentralized, international inscope, and Web-based. Its realization will occur in cooperation with the private sector,and with the active collaboration of library users. Data will be gathered from multiplesources; change will happen quickly; and bibliographic control will be dynamic, notstatic [25].Indeed the authority control exhibited by The Hub on its limited data set of HKU authors,
appears to be in the vanguard of what the Bibliographic Knowledge Network project calls a,bibliographic revolution, whereby responsibility for bibliographic control (the organizingand cataloguing of metadata associated with publications) will shift from centralizedagents, such as the Library of Congress, OCLC and large abstracting and indexingservices, to an aggregation of many smaller [virtual organizations] which will contributediscipline-specific expertise on a collaborative basis [26].
Linked Data. Although we have seen many purposes in which The Hub can serve, there will bemany more, as yet unintended. In the concept of “linked data”, data once identified can be re-purposed by many other players. Data in The Hub now carries the imprimatur of HKU authority.This data can be used in many future mash-ups, at HKU and beyond, whose purpose is as yetunknown. Future Hub development will produce APIs or widgets for the purpose of extractingHub data.

215
5. Conclusion
The 2009 development to re-purpose The Hub into a vehicle for KE has produced favourableresults, and more besides; 1) infrastructure that can be used for RAE, ORCID, etc., 2) a method forthe Library to re-position itself with its institution, and 3) an e-science tool, or a collectiveknowledge system. This latter is slowly beginning to be understood, and used to unlock collectiveintelligence within HKU, and beyond. It presents a great challenge, and perhaps the area of mostreward; how best to extract from the several sources (author included) and structure it in a waythat invites interaction with all partners, for present purposes, and for those as yet unknown?
Notes and References
[1] University Grants Committee. “Knowledge Transfer”. Available athttp://www.ugc.edu.hk/eng/ugc/activity/kt/kt.htm (April 2010).
[2] The University of Hong Kong. “2009 – 2014 Strategic Development”. Available athttp://www3.hku.hk/strategic-development/eng/index.php ( March 2010)
[3] The University of Hong Kong. “Promoting Knowledge Exchange and DemonstratingLeadership in Communities across the Region”. Available at http://www3.hku.hk/strategic-development/eng/strategic-themes-for-09-14/promotion-knowledge-exchange-and-demonstrating-leadership.php (March 2010)
[4] Ibid.[5] Knowledge Exchange Office, The University of Hong Kong. “Recurrent Funding for
Knowledge Transfer Activities in the 2009/10 to 2011/12 Triennium, Initial Statement”, TheUniversity of Hong Kong, Hong Kong, June 2009.
[6] The University of Hong Kong Libraries. “The HKU Scholars Hub”. Available athttp://hub.hku.hk (April 2010).
[7] Binfield, P. “Plos One: Background, Future Development, and Article-Level Metrics”,Electronic Publishing 2009, Milan, 10-12 June 2009. Available athttp://conferences.aepic.it/index.php/elpub/elpub2009/paper/view/114 (April 2010).
[8] Cilea Consorzio Interuniversitario. Available at http://www.cilea.it/ (April 2010).[9] Elsevier. “Scopus”. Available at http://www.scopus.com (April 2010)[10] Thomson Reuters. “ResearcherID”. Available at http://www.researcherid.com (April 2010)[11] Publish or Perish. Available at http://www.harzing.com/index.htm (April 2010).[12] Key Perspectives Ltd. “A comparative Review of Research Assessment Regimes in Five
Countries and the Role of Libraries in the Research Assessment Process” (Reportcommissioned by OCLC Research), 2009. Available athttp://www.oclc.org/research/publications/library/2009/2009-09.pdf (April 2010).
[13] Ibid.[14] MacColl, J. “Research Assessment and the Role of the Library” (Report produced by OCLC
Research), 2010. Available at http://www.oclc.org/research/publications/library/2010/2010-01.pdf (April 2010).
[15] “Open Researcher & Contributor ID”. Available at http://www.orcid.org/ (April 2010).[16] The Canadian Institues of Health Research (CIHR) used their policy on “Knowledge
Translation”, similar to HKU’s KE, to create a mandate for OA deposit of their granteespublished literature into PubMed Central. “Knowledge Translation at CIHR”, 2007.Available at http://www.cihr-irsc.gc.ca/e/35412.html (April 2010). “Policy on Access toResearch Outputs”, 2007. Available at http://www.cihr-irsc.gc.ca/e/34846.html (April 2010).
[17] The Max Planck Society for the Advancement of Science”. “Berlin Declaration on OpenAccess, Signatories”, Available at http://oa.mpg.de/openaccess-berlin/signatories.html (April2010).

216
[18] Springer. “Springer Open Choice @ University of Hong Kong”. Available athttp://www.springer.com/HKUAuthors (April 2010).
[19] The University of Hong Kong Libraries. “The HKU Libraries Open Access Policy”.Available at http://hub.hku.hk/local/oaPolicy.jsp (April 2010)
[20] Hey T, Hey J. “E-science and its implications for the library community”, Library Hi Tech,2006; 24(4): 515–28. Available at http://conference.ub.uni-bielefeld.de/2006/proceedings/heyhey_final_web.pdf (April 2010).
[21] Bibliographic Knowledge Network. “BKNpeople”. http://people.bibkn.org/ (March 2010).[22] Gruber, T. “Collective Knowledge Systems: Where the Social Web meets the Semantic Web”,
Journal of Web Semantics, 2007. Available at http://tomgruber.org/writing/collective-knowledge-systems.htm (April 2010)
[23] “Chris Dixon’s Blog”. 17 January 2010. Available at http://cdixon.org/category/hunch/ (April2010).
[24] Ibid.[25] “Working Group on the Future of Bibliographic Control”. Draft Report to the Library of
Congress. November 30, 2007. Available at http://www.loc.gov/bibliographic-future/news/draft-report.html (April 2010).
[26] Pitman, J; et al. “Bibliographic Knowledge Network” (Proposal submitted to the NSF Cyber-enabled Discovery and Innovation Program), 2008. Available athttp://www.stat.berkeley.edu/users/pitman/bkn-proposal.pdf (April 2010).

217
Social networks and the national art gallery(Dublin |…|Sofia)
Mícheál Mac an Airchinnigh; Glenn Strong
School of Computer Science and StatisticsUniversity of Dublin, Trinity College. Dublin, Ireland
mmaa, Glenn.Strong @cs.tcd.ie
AbstractTo publish is to make public. And one sense of being public is surely to beaccessible? Today it is not only the writing and the images that are publishedformally, that is to say through official channels, but also the casual humanartefacts, the chat, the blog, the quick pic, the self-made music and dance andfilm, and all of the latter through the medium of the social network. In theWorld-Wide Web (WWW), to be published is to have a unique resourceidentifier (URI) and usually a unique resource locator (URL). But to be visiblypublished on the WWW one needs to be found (much in the same way thatone might be found say, 200 years ago, through the library catalogue). Henceat the very core of electronic publishing is to be found the metadata nucleus.In olden times the scholar/reader would have to travel to that place, theLibrary, if it were accessible, to read/study the work. Today, (s)he travelselectronically to those places which are accessible. E-publication does notnecessarily entail accessibility. For example, many scholarly works are behindpay walls, costs are borne by institutions of would-be accessors; someone hasto pay for maintenance, security, and accessibility. Works of art are in apeculiar and particular category. A work of art is considered to be unique, bywhich one understands that there is no other copy, properly understood.There may be thousands of prints of the unique piece authorised. But thedigitization of an artwork forces a categorical change. The digital artwork is,by nature different. It can be seen, not by reflected light but by transmittedsee-through light! In this specific regard it is completely other vis-à-vis thebook qua text. In this paper we consider the typical state of the “digital art” ase-publication and explore the extent to which such art is freely accessible tothe public, whether on social network or otherwise, with respect to fourchosen “National Art Galleries” on the circumference of the European Union.
Keywords: access; art gallery; augmented reality; el-pub; folksonomy.

Social networks and the national art gallery (Dublin|…|Sofia)
218
1. Introduction
Let us imagine a time of scarcity of trees, of materials that might be used tomake paper? Let us imagine a time in the not too distant future when allpublication is necessarily electronic? Let us imagine a time when greatpaintings will be electronically freed from their museums? Let us imagine… ?
«The world has changed recently, yet again, in January 2010. TheGuardian Newspaper [1], famous for its establishment of an onlinepresence [2], that was distinctly different from its physical newspaperprint presence, abandoned its Technology Insert that always appearedevery Thursday. There is, of course, the now much richer web presencethat provides the Technology News, all the time, around the clock,independently of the newsprint presses.Today, “Google puts off launch of mobile phone in China” [3], andyesterday, “Apple confirms date for its 'event': we know it's a tablet,but what else?” [4].At a slower pace one can read the Technology Editor’s blog [5]. Wantto keep up to date? Then get the tweets [6].mihalorela ElPub2010 has not yet happened; signed up to learn totweet for it before 16-18 June, Helsinki. Maybe will have iTablet withme... then? :)» [Mihal Orela 2010-01-19].
The foregoing extended block quotation is a conceived, imagined, mashup [7]of text from Charles Arthur, editor of the online Guardian Technology section,and a related tweet on the same date by a follower of Charles Arthurcommenting on the possibility that Apple’s January 2010 event might just berelated to the (un)expected iTablet aka iSlate. On the 19th of November 2009,Charles Arthur gave advance warning of this revolution in the making:
“What you are holding in your hands — assuming you’re reading thisin print form, which a substantial number of you are — is a collector’sitem. Guardian Technology, in its print incarnation, is to ceasepublication. The last edition will be on 17 December” [8].
Since the date of the mashup [7] one now knows that the mooted “Appledevice” for e-publications (such as newspapers) has the simple name of iPad.In this paper (destined in context to become an e-paper) we shall present stateof the art “electronic publication” with respect to the Fine Arts, usingillustrations/examples from a “National Art Gallery” (NAG) at the“extremities” of Europe: to the west, the National Gallery of Ireland (NGI),Dublin [9], to the east, “ ” (National ArtGallery), Sofia [10], to the north, Valtion Taidemuseo, (we focus on theAteneum), Helsinki [11], and to the south, Museo Nacional del Prado,

Social networks and the national art gallery (Dublin|…|Sofia)
219
Madrid [12], thus avoiding the “usual suspects” in Art discourse. Beforeproceeding let us mention our use of the buzz-word. For “electronicpublication” we will use the abbreviation el-pub (or elpub). Naturally itcorresponds with the name of the conference series. But more importantly, ithas significant ambiguity. In other words, el-pub is multi-referent on the Web.Specifically, due to the treatment of non-letters, el-pub may be interpreted as“el público” in Spanish; Pub in many languages is taken to be a drinkingestablishment, and extracted from the more formal English name “PublicHouse”. Similarly, we introduce here the abbreviation soc-net (socnet) forsocial network. A quick search will show just how “popular” and ambiguousthis buzz-word is.The deliberate focus in this paper, is Art in the classical and traditional sense.In particular, we include photos of paintings, sketches, drawings and photosof sculptures; we exclude photos per se. “Art is notoriously hard to talkabout” [13] and if it is hard to talk about it, or even to write about art, naïvely(i.e., not formal critical discourse), then we may pose a basic researchquestion. Is it harder or easier to ontologize the art rather than to talk about it?And having ontologized it, how easy or difficult is it for the machines to makesense of the ontologization? Let us make a first pass to test this hypothesis by1) restricting ourselves to the Dublin Core 15 tag elements [14] and2) exploiting folksomonic tagging such as used in Flickr. Furthermore let ususe a simple tool, DCdot [15], to extract the Dublin Core metadata andpresent it in a readable fashion. Our research will show just how little hasbeen accomplished in just over 15 years [16]. However, our main focus in thispaper will be elsewhere: on the electronic access to the Art, whether in situ oron the Web.
With respect to Art in situ, we note the potential for wireless devicesto be used to inform the “visitor” [17] to an art gallery/museum, whether thetechnology be classical RFID [18] or NFC [19]. An Art object appropriatelytagged in its immediate environment would become an entity within the“Internet of Things” [20]. By environment we mean primarily, for example,that for a painting in a given physical setting, there would be at least 4wireless tags on: the canvas, the frame, the wall labeling (etiquette), and thewall itself. Use of a wireless device such as a mobile phone would facilitatereading of the wall label in one’s own language, for example.
One year later after the formal submission on the “Internet ofThings” to an EU “request for response”, we found that there was a companycalled Plink [21] which released an Android app [22] called “PlinkArt” andwhich works just as we have theorized. They have a server-side database witharound 50,000 works and have plans to pilot the app as a replacement for the

Social networks and the national art gallery (Dublin|…|Sofia)
220
"clunky tape-recorder audio tours". They also have a developer API coming,they say, that allows other apps to link in to their server-based recognitionengine. Plink appears to be the output of the PhD thesis in machine vision ofthe two lead developers, Mark Cummins and James Philbin. A version ofPlinkArt for the iPhone is expected soon (perhaps in time for the Conferenceitself in June). And (perhaps no surprise) Google itself subsequently releaseda similar sort of app with the appealing title of “Google Goggles” [23] for theAndroid phone, which brings us right back to the issue of “Google and Chinaand the Google phone world” with which we started. Finally, a surprise, justas we went to press Nokia announced its own lookalike app by the name of“Augmented Reality” with features, in some respect, similar to those ofGoogle Goggles [24]. Let us now turn our attention to real electronicpublishing within the established formal Art world.
2. Methodology
How can one know something of the effectiveness of the use being made of anelectronic publication (el-pub) within a social network (soc-net)? And howmight one distinguish between effectiveness and simple popularity? Byeffectiveness we mean the taking root of the el-pub within the distributedcommunity. For example, the circulation within a soc-net to certain trustedWikipedia (WP) pages would be a strong indicator of effectiveness. Theprimary soc-net of Wikipedia itself consists of the registered editors. The firstauthor is a member of this WP soc-net and belongs to “Wikipedia languagecommunities” in English, Bulgarian, French, German, and Irish, meaning heedits pages in these languages.
Our research methodology is characterizedquite succinctly by the well-known phrase:
“By indirections find directions out” (Act II, Scene 1, Hamlet)This is a theatrical or artistic way of explaining that we belong to the greatmethodological school before the “time of the separation of the arts andsciences”[25]. Or… to put it differently we are here dedicated to reunite the“Sciences” with the human reality of the experience of most humans, thepeople, the non-digitally connected, the people who feel at home with the…arts, with the feelings of life.
Scenario: — In keeping with the general research strategy in the domain ofthe digital re-discovery of culture [26] ·(DrDC), one works outwards from agrounded scenario (a playlet, in other words) which consists of a short one

Social networks and the national art gallery (Dublin|…|Sofia)
221
page backstory… For example, one might first come across the art work ofHieronymus Bosch: “The Garden of Earthly Delights” as an illustration in anart book, such as “How to Read a Painting” [27], or on the Web throughWikipedia [28], or directly through the web presence of the holding gallery,“Museo Nacional del Prado” [12], or even courtesy of Google [29]. The visualimpact of the art work usually provokes a desire in the viewer to read up onthe background and to ask oneself fundamental questions: who is the artist?Why did (s)he paint it? When was it done? For whom was it done? Where is itnow? And so on. In the context of the art book cited above, many of thesequestions are answered. The backstory is given on two facing pages. In theEnglish version of the text (the original was Dutch) there are 4 key(words/phrases) marked out in bold font and which we list here in order topto bottom, left to right: “image of paradise or a world of debauchery”,“union of Adam and Eve”, “paradise”, “musical intruments”. These keyphrases or tags clearly belong to a folksonomy. They are formally recorded inthe Index of the book in order for the reader to see/lookup the “persons,themes, or motifs referred (or alluded) to in the titles of the illustratedworks” p.369.
One of the most significant features of the “old-fashioned” art book issimply that high quality images with accompanying erudite text opened adoor to another world. In the case of the text and example cited, there was theadded suprise of accounts of two more triptychs by the same painter: “TheTemptation of St Anthony” (key words/phrases: “Anthony”, “trio”,“kneeling hermit”, “naked woman”) p.96-7 and “The Haywain” (keywords/phrases: “Adam and Eve”, “central panel”, “on top of the cart”, “risenChrist”, “pilgrim”) p.99. Today, the art enthusiast of the works ofHieronymus Bosch will find a (complete?) list of his paintings onWikipedia [30]. In the context of the electronic publication of artworks andassociated commentary and folksonomy within the social networkcommunity in 2010 it will not be surprising that we rely on Wikipedia as asubstantive part of our research methodology.Wikipedia ·(EN and at least one other language): — Searching for and findingrelevant information is a difficult task in any medium. For books, the solutionwas/is the provision of an Index (in addition to any front matter such aschapter and/or section headings). For the Web (aka Internet) it is the chosensearch engine. Where once one relied on the encyclopedia (English, French,German,…) for terse erudite scholarly information, today one is more likely togo first to Wikipedia. The soundness or otherwise of Wikipedia is not theissue. In a Social Network context, it has proven itself to be an el-pub resourceconsulted by (very big number of?) people every day, and not only in English.

Social networks and the national art gallery (Dublin|…|Sofia)
222
For example, in our context of National Gallery [31], there is a page for theNational Gallery of Ireland (NGI), in English, as expected; nothing in Irish;the other languages, for which there is a description, are: Català (stub)Español, Esperanto (stub), Français (stub), Italiano (stub), Nederlands (stub),
. Those pages which are “inadequate” with respect to content aremarked here as (stub). Excluding stubs, we conclude that the NGI hassignificant presence in 2 languages other than English. There are certainmeasures available by which one might wish to judge the page. Details aregiven on Wikipedia. For comparison El Prado has a page in (roughly) 39languages.Dublin core metadata: — There are 15 key tags that one might want to use fore-publications, whatever the nature of these latter might be. Our research hasalready shown that in the category of Newspapers online, very few of thisbasic set of 15 metadata tags are ever used. Notice we speak of “newspapersonline” and not “online newspapers”. It seems to be the current paradigmthat newspapers “go online” while retaining their existing print productionform. It is our considered opinion that the burden to produce the Dublin Coremetadata for each section of each issue is too great either from a commercialor a practical point of view. An alternative hypothesis might be, simply, thatnothing out there makes use of such Dublin Core metadata when it comes tosearch, to access! The trend has been for news aggregators to come to the fore,the greatest of which is (still) Google.Folksonomy: — Instead of the exploitation of the use of formal metadata tags,such as is used in the Dublin Core, it appears to be the case that informalfolksy tagging has predominated. This is tagging by social networkers. Fromthe point of view of Art, the social networker’s folksy description of aparticular piece will be dramatically different from the description given bythat one with the “trained eye to see.” One of the key texts that developed this“Ways of Seeing” of Art was produced as a TV programme on the BBC [32],episodes of which are publicly available on YouTube [33].Augmented reality personal devices: — first was the iPhone which was not aphone at all! The basic character/nature/role of a “mobile phone” waschanged. There were earlier intimations of what was to come; one of the keyadditions was the camera. Who would have imagined a telephone that wouldtake pictures? And yet looking back at the initial beginnings of the mobilephone, we now realize that few if any predicted that the main purpose of thephone would be to use a certain redundancy in the mobile signalling, to witthe coming into being of “text messaging”. In 2010, another revolution istaking place — the camera on the phone is connecting with pictures of the

Social networks and the national art gallery (Dublin|…|Sofia)
223
world and augmenting the touch/display screen with another layer ofhypertext reality.
Given the nature of the iPhone (app) it is no longer surprising to notethe kinds of marriage between the el-pub and the soc-net. In the context ofElPub 2010 we note the ART app [34] which provides images of paintings inthe public domain and supplies corresponding biographies of artists,incorporating information from Wikipedia, using the Creative CommonsAttribution-shareAlike License. One has access, in the palm of one’s hand, tothe art of Vincent van Gogh, Hieronymous Bosch,… There are currently “204artists” represented. (To a certain extent it appears that one may remove oradd artists from the list at will). A closer examination shows that althoughMarc Chagall (1887-1985) is listed, there are no paintings in the gallery. One isinvited to “add them oneself” using “this button in browser to save images toyour gallery”, with suggested links to 1) Wikipedia.org, 2) Artst.org,3) ABCGallery.com, and 4) ShowMeArt.info. A good social network testmight be to obtain some “freely available” Chagall images of painting, addthem to one’s own gallery, and then see if they become available to otherswith the same app, either automatically or upon request.
3. The Experiments and the results
We now present some of the details of the 4 experiments that we carried out.Each experiment is introduced with a different type of backstory. For theNational Gallery of Ireland the backstory is built around a specific Exhibitionof Finnish art, deliberately chosen in order to ground the paper with respectto the location and culture of the hosting city of the ElPub 2010 conference—Helsinki. For the National Art Gallery in Sofia our backstory ties the Art of theSlav to the Language of the Slav, and so also to the tradition of the ByzantineArt. It seemed natural that Google Earth would play the major role in thebackstory for El Prado in Madrid. Lastly, to complete the “grand tour”, wereturn to the Ateneum Museum in Helsinki where we needed to construct abackstory that would provide closure for our work and at the same timeprovide breakout for further experimentation and research into the state ofthe other National Art Galleries (currently listed on Wikipedia in 2010).
Scenario 1: The National Gallery of Ireland (Dublin, Ireland).
Backstory: From 8th November 2008 until 1st February 2009, there was anexhibition of Finnish Art, organized in collaboration with the Ateneum Art

Social networks and the national art gallery (Dublin|…|Sofia)
224
Museum, Helsinki [11], entitled “Northern Stars and Southern Lights: TheGolden Age of Finnish Art 1870-1920” [35]. On p.53 of the publishedcatalogue one can see a photograph of the painting Virginie (1883) by AlbertEdelfelt, Cat. 28. The Catalogue number is an index to p.115 where furtherinformation on the painting may be read:
“Signed and dated: A. EDELFELT/PARIS 83;Oil on canvas, 73.5 x 92.5 cm;Joensuu Art Museum, Joensuu, JTM 71;Bequest 1962, Arla Cederberg collection.
A google search for “Albert Edelfelt” will lead to a brief biography [36, 37]and the art enthusiast will eventually obtain some idea of what the actualpainting looks like [38], in this case found on Flickr.
The story told is that of the classical tale in the context of Art.Specifically, physically presence, both of the painting and the observer, arerequired. This is the way it always has been. If the (modern) Art Gallery has“easy” access to “professional” publication facilities and sufficient resourcesthen a record, a book with full colour plates, can be produced and sold to theinterested art viewer. The National Gallery of Ireland excels in this way.
However, in the context of Social Networks, one now needs toexamine to what extent said Gallery and Collections have virtual presence. Inother words, what is the current state of its electronic publications? On a scale1 to 10, the Gallery gets 1. To “see” what images are available is practicallynon-existent at present. We are aware that extensive “computerization of theArt Work” is underway , since at least two years and it would not surprise uswere the job to be completed by the time ElPub 2010 unfolds in June. On theother hand the truly persistent Networker with a passion for art will note that“In September 2010, the National Gallery will present an exhibitioncelebrating the Dutch seventeenth-century artist Gabriel Metsu (1629-1667)and his exquisite scenes of daily life, which rank among the finest of theDutch Golden Age. It will bring together some 40 of his paintings anddrawings from public and private collections around the world. Anaccompanying catalogue will be published, edited by Dr Adriaan Waiboer,NGI curator of the exhibition and author of the catalogue raisonée on Metsu.Following its showing at the National Gallery of Ireland, the exhibition willtravel to the Rijksmuseum, Amsterdam and on to the National Gallery of Art,Washington.“
There are two thumbnail images given: 1) Man writing a Letter,c.1664-1666, 2) Woman reading a Letter, c.1664-1666. For the record (2010-04-08), Dublin Core subject metadata is “Press Release; Exhibitions; JohannZoffany (1733-1810; 13 MARCH - 25 JULY 2010; Taispeántais; Pierre Bonnard

Social networks and the national art gallery (Dublin|…|Sofia)
225
(1867-1947; FORTHCOMING EXHIBITIONS; Talks & Tours; Gabriel Metsu1629-1667 4 SEPTEMBER - 5 DECEMBER 2010; Acquisitions 2000-2010;Exhibition Catalogue; Roderic O’Conor (1860-1940; Taking Stock; GabrielMetsu (1629-1667”
The Social Networker will quickly find that there is a websitededicated to Gabriel Metsu [39] on which there are reasonably high-qualityimages of 33 of his paintings. It is from this website we learn that the twopaintings with thumbnails shown on the NGI site belong to the NGICollection. Now the issue for our e-times becomes the nature of the qualityand source of the “digital images” and their accessibility whether on a largehigh quality display computer or a small high quality mobile device.
Scenario 2: The National Art Gallery (Sofia, Bulgaria).
Backstory: “Orthodox painting has its own peculiar language… (today)impenetrable to the understanding of the worshipper as well as to thecommon spectator… this subordinate function of the landscape onlycharacterizes the starting of its understanding.” [40]
We would like to illustrate one aspect of this concept of the“landscape” in the Orthodox painting. We choose an icon from the late 16thcentury (originally from Nessebar) and now in “The Crypt” of the NationalArt Gallery Sofia [41]. A full color plate is available [40, 42 Icon 50]. Thelandscape aspect in question is the “architectural detail of Jerusalem.”Unfortunately, although there does not appear to be any picture of the Iconpublicly available, there is a photo of the said architectural detail [43].
A detailled analysis of the current Web site of the National ArtGallery, Sofia (NAGS) [44] will reveal a considerable amount of inconsistencybetween the pages in Bulgarian and the “corresponding” pages in English.Indeed it is only in the last six months or so that 65 images of paintings fromits collection became officially publicly available. These can now be seen alsoon the Social Network Flickr [45]. There is considerable difference betweenthe ways in which the paintings are presented on the official web site and onFlickr. In the latter, the image occurs once (uniquely) with information givenin both Bulgarian and English. In addition there is a link back to the twosources on the official site. In contrast, the official Web site is dividedlinguistically (Bulgarian and English), clearly a significant technologicalfailing. (At the time of writing (2010 April 8), the picture [46] is upside downat http://www.nationalartgallerybg.org/index.php?l=55&id=43 ).
On February 10, 2010 the Bulgarian Cabinet announced a major re-alignment of the “Art Museums” of Sofia: “Cabinet approved a proposal

Social networks and the national art gallery (Dublin|…|Sofia)
226
presented by the Culture Ministry for four metropolitan museums, a ministrymedia statement said on February 10 2010.” [47]. In the light of thisinformation, it is difficult to foresee and assess the nature of forthcomingNational Gallery el-pubs. On the other hand, the 65 images which are now onFlickr may give rise to interesting mashups of all kinds.
Scenario 3: Museo Nacional del Prado (Madrid, Spain)
Backstory: One of the most interesting surprises of 2009 was theannouncement that anyone could use Google Earth to travel to El Prado(There are two places in Google Earth with such a name.) and see 14 of itspaintings in exquisite detail [29]. This set of 14 was a subset of the 15 imagesalready available online [48]. The missing image is readily explained. It is aphotograph of a sculpture “Offering by Orestes and Pylades (San IldefonsoGroup)”, not a painting [49].
El Prado avails of the Social Networks: Facebook and Twitter [50]. Inother words, “Social Networks” is an official and explicit part of theMuseum’s presence online. The first author is signed up on both. Thelanguage is unsurprisingly, Spanish.
The DC data for the˜ sculpture page [49] is extensive.The DC Subject or keywords: Museo del Prado; Prado; Museo;
Madrid; España; Spain; Velázquez; Goya; Tiziano; Rubens; Juan de Flandes;El Greco; Ribera; Fra Angelico; Rafael; Tiepolo; van der Weyden; el Bosco;Meninas; la Crucifixión; el caballero de la mano en el pecho; el sueño de Jacob;el tres de mayo de 1808; el 3 de mayo de 1808; los fusilamientos en la montañadel Príncipe Pío; la Anunciación; el Cardenal; el emperador Carlos V a caballoen Mühlberg; Inmaculada Concepción; el Descendimiento; el Jardín de lasDelicias; las Tres Gracias; Artemisa; ofrenda de Orestes y Pílades; el arte deeducar; tienda prado; holandeses en el prado; la obra invitada; RichardHamilton; Las hijas de Edward Darley Boit; John Singer Sargent. Whether ornot this choice of DC Subject/keywords is appropriate for this page is a matterof judgment; our judgment is NO! In other words, it is clear to us that theDublin Core data used is generic! It is applicable to the entire web site; it isnot specific to the web page!
The DC Description data: ágina web oficial del Museo Nacional delPrado (Madrid, España). Información sobre visita al museo, obras maestras,colección, exposiciones, actividades, educación, investigación, enciclopedia, lainstitución, sala de prensa, acción corporativa, empleo, licitaciones
The DC Date: 2009-09-15Our judgment? This is a superb combination of Museum Art and

Social networks and the national art gallery (Dublin|…|Sofia)
227
Social Networking. It goes without saying that access to this great Art Galleryvia Google Earth is a first in World History? But, in reality, all that GoogleEarth gives to the experience is a virtual geographical surrounding… for theArt.
Scenario 4: The Ateneum Museum (Helsinki, Finland)
Backstory: “The exhibition focuses on the cultural life of young women in1910s Helsinki through the eyes of writer and critic L. Onerva (1882–1972)[51]. She studied art history at university, lived on her own, enjoyed thecultural scene of the city, had an active social life, got married, ran away, gotdivorced, and had a secret affair. She made her living and supported herwriter's career by teaching and translating, and above all by journalism andart reviews. In this exhibition, Onerva introduces us to her Helsinki: artgalleries, theatre premieres, films, cafés, restaurants, concerts, and other socialevents. She also reveals the flipside of an independent life: debts, limits to herfreedom, and moral judgment. The exhibition features plenty of art from theera, from Ateneum's own collections as well as other museums. Pioneers ofearly Finnish modernism, such as Helene Schjerfbeck, Sulho Sipilä and YrjöOllila, depicted modern man and the urban culture of the time. The curator ofthe exhibition is PhD Anna Kortelainen. In connection to the exhibition therewill also be a book coming out, published by Tammi.”
We will be at ElPub 2010 in Helsinki. We will be able to see theOnerva exhibition. We will be able to demonstrate “live” the interplay ofSocial Networks and the (Finnish) National Gallery, 16-18 June 2010. There isa Wikipedia article on L. Onerva and although it is currently available only inFinnish, accessing it through the Chrome browser permits instant translationinto English (and there are the usual sorts of blunders one expects from suchautomatic machine translation; but one can grasp the sense of the originalFinnish text).
In comparison with the National Gallery of Ireland, the FinnishNational Gallery is outstanding with respect to its e-presence [52].
4. Discussion and Conclusions
In the paper we have attempted to blend the static with the dynamic. We havesought to bring together the classical “this will appear in print” type ofmaterial (ordinary pub type)—dated instantly at the time of release, whetherin paper copy form or as an el-pub (just like ordinary pub type in modern

Social networks and the national art gallery (Dublin|…|Sofia)
228
medium). Such static forms then become a matter of public record—history.At the same time we wished to express the dynamic, to note that thetechnology unfolds continuously in our times. We wished to indicate thissense of the dynamic by the use of present and future tenses. The core of thatdynamic was grounded in the 4th Scenario above on the “Onerva Exhibition,”already opened in the Ateneum, Helsinki (2010 March 25) and with a promiseto illuminate this text in the ElPub conference in the same city two monthslater.
In a similar way we wish to make the current text “dynamic-like” byreferring back to the technological developments announced and unleashedcirca January 2010 and reported on in the introduction. We do not engage infuturology. Rather we wish to discuss the future of the Social Network andthe (National) Art Gallery within the context of the Art-sensitive mobiledevices.
Technology: The computer science and engineering
In many Art Galleries one is allowed to take photographs provided that the“Flash facility” is turned off. In such galleries individual art works might betagged by the “universal no photography allowed for this work” icon of acamera with a red X. In many Art Galleries photography is strictly prohibited.In most Art Galleries photographs may be permitted by application inadvance and the signing off of a memorandum of agreement.
But we are currently researching into the use of the camera phoneswhich “capture” the image of the picture, not as photograph as such, butrather as image to be recognized in order that it may be identified. This fallsinto the category of content-based image retrieval, a computer vision problemin which a program is given an input image of some subject and attempts tolocate further images of the same subject in a collection. The difficulty of thisproblem is clear; lighting conditions, camera angles and perspectives willlikely all be different in the images. Let us imagine 3 people with cameraphones standing side-by-side (with usual comfort zone separation betweenthem) in front of a picture, such as Carravagio’s “The Taking of Christ”(1602) [53] in the National Gallery of Ireland? The perspective view of eachwill be different. The computer vision technology must facilitate such“minor” differences in the view. Algorithms in this field usually rely onidentifying invariant elements (“interest points'”) in the image using a varietyof techniques [54-56]. A compounding difficulty in some domains is thereality that many images of different real-world scenes contain incidentalsimilarities due to repeated manufactured elements. Similar such elements are

Social networks and the national art gallery (Dublin|…|Sofia)
229
often a constituent part of Modern Art. For example, the works of BridgetRiley rely extensively on repeated elements [57].
This last point of repeated elements is a particular concern in the fieldof robot navigation; work by Cummins [58, 59] presents an improvedtechnique for allowing a robot navigation system to take observations(images) of the environment and assign probabilities that any two images hadbeen taken at the same location, and thus recognise its own location. Theauthor of this work noted that “Our model is also applicable to some types ofimage retrieval task.” [59] Indeed, “this author” is now the author of thePlinkArt application for Android-based mobile phones, which makes use ofthe camera on the mobile device to capture an image of an artwork. Theimage is then processed and uploaded to a remote server where imageretrieval is performed and attempts to identify the original artwork arecarried out. The mobile device can then display relevant information.
A similar approach is taken by the Google Goggles application (alsoavailable for the Android platform). This particular application is moregeneral in its reach. It also attempts to identify books and DVD's (by cover),landmarks, corporate logos, and a number of other elements. In thisapplication domain the presence of a large and well categorised corpus seemsto be critical to the success of the application [60, 61].
We conclude with a brief short story. The first author made anappointment with the Director of the National Gallery of Ireland in order todiscuss some of the technical details concerning the digitization of theGallery’s Collection, for this paper. The meeting was subsequently cancelled.Unfortunately, the Director had to go to Rome “with the Carravagio” — acolloquial name for famous painting “The Taking of Christ (1602)” for anexhibition. One deduces by the phrase “with the Carravagio” that theNational Gallery of Ireland has just the one work by him. It was the time, ifmemory serves well, when the Catholic Bishops of Ireland had beenassembled by the Pope to discuss the major problem of the handling ofclerical pedophiles in the country. The painting itself is very big. Fortunately adigital copy of the painting is available under Creative Commons Licence atWikimedia Commons. Consequently, the first author has a copy (as well as 54other digital images of Carravagio’s works) on the iPhone. These el-pubs ofArt are everywhere on the soc-nets. And now as we go to press (2010-04-13) ithas just been announced that Plink has been acquired by Google andconsequently PlinkArt will be absorbed by/within Google Goggles.

Social networks and the national art gallery (Dublin|…|Sofia)
230
Notes and References
1. guardian.co.uk. 2010 [cited 2010 January 19]; Available from:http://www.guardian.co.uk/.
2. The Guardian/Technology. 2010 [cited 2010 January 19]; Available from:http://www.guardian.co.uk/technology.
3. Arthur, C. Google puts off launch of mobile phone in China. 2010 [cited 2010January 19]; Available from:http://www.guardian.co.uk/technology/2010/jan/19/google-nexus-one-phone-china.
4. Arthur, C. Apple confirms date for its 'event': we know it's a tablet, but whatelse? 2010 [cited 2010 January 19]; Available from:http://www.guardian.co.uk/technology/blog/2010/jan/18/apple-tablet-date-confirmed.
5. Arthur, C. Charles on... anything that comes along. 2010 [cited 2010 January19]; Available from: http://www.charlesarthur.com/blog/.
6. Arthur, C. Charles Arthur (charlesarthur) on Twitter. 2010 [cited 2010January 19]; Available from: http://twitter.com/charlesarthur.
7. Wikipedia. Mashup (web application hybrid). [cited 2010 March 25];Available from:http://en.wikipedia.org/wiki/Mashup_(web_application_hybrid).
8. Arthur, C., Our technology coverage: what happens next, in TheGuardian/TechnologyGuardian. 2009. p. 2.
9. National Gallery of Ireland. 2010 [cited 2010 January 20]; Available from:http://www.nationalgallery.ie/.
10. National Art Gallery Sofia. 2008 [cited 2010 January 18]; Available from:http://www.nationalartgallerybg.org/.
11. Ateneum Art Museum. 2010 [cited 2010 January 20]; Available from:http://www.ateneum.fi/.
12. Museo Nacional del Prado. 2010 [cited 2010 January 21]; Available from:http://www.museodelprado.es/.
13. Geertz, C., Local Knowledge: Further Essays in Interpretive Anthropology.Third ed. 2000, 1983: Basic Books.
14. DCMI. Dublin Core Metadata Initiative. [cited 2009 June 26]; Availablefrom: http://dublincore.org/.
15. Powell, A. DC-dot. 2000 [cited 2009 June 26]; Available from:http://www.ukoln.ac.uk/metadata/dcdot/.
16. Dublin Core History. 2010 [cited 2010 January 21]; Available from:http://dublincore.org/about/history/.
17. Mac an Airchinnigh, M. Towards a vision of an Internet of Cultural Things.2009; Available from:http://ec.europa.eu/information_society/policy/rfid/library/index_en.htm#iotcons.
18. Wikipedia. Radio Frequency Identification. 2010 [cited 2010 January 21];Available from: http://en.wikipedia.org/wiki/RFID.

Social networks and the national art gallery (Dublin|…|Sofia)
231
19. Wikipedia. Near Field Communication. 2010 [cited 2010 January 21];Available from:http://en.wikipedia.org/wiki/Near_Field_Communication.
20. Wikipedia. Internet of Things. 2010 [cited 2008 November 14]; Availablefrom: http://en.wikipedia.org/wiki/Internet_of_Things.
21. Plink. PlinkArt. 2010 [cited 2010 January 20]; Available from:http://www.plinkart.com/.
22. Wikipedia. Android operating system. 2010 [cited 2010 January 21];Available from:http://en.wikipedia.org/wiki/Android_(operating_system).
23. Google. Google Goggles. 2010 [cited 2010 January 21]; Available from:http://www.google.com/mobile/goggles/#landmark.
24. Nokia. Augmentation Reality App: Point and Find. 2010 [cited 2010 January22]; Available from: http://pointandfind.nokia.com/.
25. Snow, C.P. The Two Cultures. 2010 [cited 2010 April 6]; Available from:http://en.wikipedia.org/wiki/The_Two_Cultures.
26. Mac an Airchinnigh, M., K. Sotirova, and Y. Tonta, Digital re-discovery ofculture game of inquiry & the physicality of soul. Review of the NationalCenter for Digitization, 2006. 2006(9): p. 19-37.
27. De Rynck, P., How to Read a Painting. 2004: Thames & Hudson.28. Wikipedia. The Garden of Earthly Delights. [cited 2010 March 21];
Available from:http://en.wikipedia.org/wiki/The_Garden_of_Earthly_Delights.
29. The Prado in Google Earth. [cited 2010 March 23]; Available from:http://www.google.com/intl/en/landing/prado/.
30. Wikipedia. List of paintings by Hieronymus Bosch. [cited 2010 April 1];Available from:http://en.wikipedia.org/wiki/List_of_paintings_by_Hieronymus_Bosch.
31. Wikipedia. National Gallery. 2010 [cited 2010 April 1]; Available from:http://en.wikipedia.org/wiki/National_gallery.
32. Berger, J., Ways of seeing : based on the BBC television series with John Berger.1972, London: British Broadcasting Corporation and Penguin. 166.
33. Berger, J. Ways of Seeing. 1972 [cited 2009 August 11]; Available from:http://www.youtube.com/watch?v=LnfB-pUm3eI.
34. ADS Software Group Inc., ART Version 4.4.35. Waiboer, A.E. and L. Ahtola-Moorhouse, Northern Stars and Southern
Lights: The Golden Age of Finnish Art, 1870-1920. 2008, Dublin: NationalGallery of Ireland.
36. Wikipedia. Albert Edelfelt. 2010 [cited 2010 January 20]; Available from:http://en.wikipedia.org/wiki/Albert_Edelfelt.
37. Wikipedia (Suomi). Albert Edelfelt. 2010 [cited 2010 January]; Availablefrom: http://fi.wikipedia.org/wiki/Albert_Edelfelt.
38. Edelfelt, A. Virginie. 1883; Available from:http://www.flickr.com/photos/floridagirl7/4180173503/.

Social networks and the national art gallery (Dublin|…|Sofia)
232
39. Metsu, G. [cited 2010 April 8]; Available from:http://www.gabrielmetsu.org/.
40. Gergova, I. and V. Rumenov, Landscape Images in Bulgarian Icon Painting.2007, Sofia: 41T Ltd. Publishers.
41. National Art Gallery Sofia. The Crypt. [cited 2010 April 8]; Availablefrom: http://www.nationalartgallerybg.org/index.php?l=46.
42. Paskaleva, K., Bulgarian Icons through the Centuries. 1987, Sofia: SvyatPublishers.
43. , . . 2010 [cited 2010 April 8]; Available from:http://www.flickr.com/photos/mihalorel/4503282602/.
44. Wikipedia. National Art Gallery (Bulgaria). 2010 [cited 2010 April 8];Available from:http://en.wikipedia.org/wiki/National_Art_Gallery_(Bulgaria).
45. , . „ -30- .“. [cited 2010 April 8]; Available from:http://www.flickr.com/photos/mihalorel/4268585971/.
46. , . „ , 1932“. [cited 2010 April 8]; Availablefrom: http://www.flickr.com/photos/mihalorel/4269291172/.
47. Beekman, R. Cabinet approves plan for four metropolitan museums. Availablefrom: http://sofiaecho.com/2010/02/11/856595_cabinet-approves-plan-for-four-metropolitan-museums.
48. Museo Nacional del Prado, Online Gallery. [cited 2010 March 23]; Availablefrom: http://www.museodelprado.es/en/the-collection/online-gallery/.
49. Unknown, Offering by Orestes and Pylades (San Ildefonso Group). Circa 10BCE (Before Current Era): Museo Nacional del Prado, Madrid.
50. Museo Nacional del Prado. Social Networks. 2010 [cited 2010 April 12];Available from: http://www.museodelprado.es/index.php?id=2778&L=5.
51. Wikipedia. L. Onerva. [cited 2010 April 10]; Available from:http://fi.wikipedia.org/wiki/L._Onerva.
52. Finnish National Gallery. The Art Collections. [cited 2010 April 11];Available from: http://kokoelmat.fng.fi/wandora/w?lang=en&action=gen.
53. Wikipedia. Caravaggio's "The Taking of Christ" (1602). [cited 2010 April13]; Available from:http://en.wikipedia.org/wiki/The_Taking_of_Christ_(Caravaggio).
54. Nist er, D. and H. Stewenius, Scalable recognition with a vocabulary tree, inConf. Computer Vision and Pattern Recognition. 2006. p. 2161–2168.
55. Sivic, J. and A. Zisserman, Video Google: A text retrieval approach to objectmatching in videos, in International Conference on Computer Vision. 2003:Nice, France.
56. Jégou, H., M. Douze, and C. Schmid, Hamming embedding and weakgeometric consistency for large scale image search., in European Conference onComputer Vision, A. Zisserman, D. Forsyth, and P. Torr, Editors. 2008,Springer. p. 304–317.
57. Bridget Riley Dialogues on Art, ed. R. Kudielka. 1995: Thames & Hudson.58. Cummins, M. and P. Newman, The International Journal of Robotics
Research. 2008. 27: p. 647.

Social networks and the national art gallery (Dublin|…|Sofia)
233
59. Cummins, M., Probabilistic Localization and Mapping in Appearance Space.2009, Balliol College, Oxford.
60. Droid News Net. App Review – PlinkArt (App, Free). [cited 2010 April 11];Available from: http://www.droidnews.net/2009/12/app-review-plinkart-app-free/.
61. Droid News Net. App Review – Google Goggles (App, Free). [cited 2010April 11]; Available from: http://www.droidnews.net/2009/12/app-review-google-goggles-app-free-2/.

234
The anatomy of an electronic discussion list forlibrarians, KUTUP-L: Bibliometric and content
analyses of postings
Ya ar Tonta1; Do an Karabulut2
1Department of Information Management, Faculty of Letters,Hacettepe University, 06800 Beytepe, Ankara, Turkey.
[email protected] Grand National Assembly Library,
06543 Bakanl klar, Ankara, [email protected]
AbstractElectronic discussion lists are widely used as a professional and scientificcommunication tool since late 1980s. Analysis of messages sent to discussionlists provides useful information on professional as well as scientificcommunication patterns. In this paper, we present the findings of abibliometric analysis of some 20,000 messages sent to KUTUP-L, an electronicdiscussion list for Turkish librarians, between 1994 and 2008. We test if thedistributions of messages and their authors conform to Pareto, Price andLotka laws. We then analyze the contents of 977 messages based on astratified sample. Findings indicate that the number of messages sent toKUTUP-L has increased over the years along with the number of authors.Two thirds (1,232) of about 1,900 list members posted at least one message tothe list while the rest preferred to be so called “lurkers”. Some 35 authorsposted almost half (49%) the messages while 20% of the authors posted 83%of all messages. The distribution of messages to authors conform to Price(“the square root of all authors would post half the messages”) and Paretolaws (so called “80/20 rule”), respectively. Of the 1,232 authors, one third (asopposed to 60% predicted by Lotka’s Law) sent only one message to the list.Results of content analysis show that 40% of messages sent to the list were off-topic. Issues about or related with information management services (32%),library and information science (23%) and professional and scientificcommunication (19%) were discussed more often in the list. The intentanalysis of the postings shows that three quarters of the messages wereinitiatory while the rest were reflexive. That’s to say that the majority ofmessages posted on KUTUP-L to initiate a discussion did not seem togenerate enough interest for others to reflect upon them by sending follow up

The anatomy of an electronic discussion list for librarians, KUTUP-L
235
messages, suggesting that professional and scientific communication takingplace on KUTUP-L on certain subjects can be characterized as more of a one-way communication than a participatory one.
Keywords: KUTUP-L; electronic discussion lists; electronic publishing;professional communication; scientific communication; bibliometricanalysis; content analysis
1. Introduction
The history of computer-based communication dates back to mid-1960s.Host-based mail systems were later replaced by the electronic mail (or e-mail)system of the ARPANET computer network in early 1970s. E-mail hasbecome a “killer app” on BITNET, the predecessor of the current day Internet.LISTSERV, an electronic discussion list management software, wasintroduced in early 1990s and e-mail based discussion lists such as PACS-L,LIBREF, PUBLIB and WEB4LIB proliferated thereafter. Messages posted tosuch discussion lists contain invaluable resources for historians, socialscientists, social network analysts, and bibliometricians, among others, andthey can be analyzed to study professional and scientific communicationpatterns along with the topics discussed and the productivity of authors.
KUTUP-L, an electronic discussion list for Turkish librarians, was set upin June 1991 to share information, exchange ideas and discuss professionalissues. It currently has some 1,900 registered members. Based on the analysisof messages in KUTUP-L archives, this paper aims to address the followingresearch questions:
Has the number of messages posted and the subjects discussedin KUTUP-L increased and proliferated over the years?Have professional and scientific communication patterns inKUTUP-L changed over the years in librarianship?Does the distribution of messages to authors (thus the authors’productivity) conform to Pareto, Price and Lotka laws?
Findings of this study will shed some light on the evolution ofKUTUP-L as an electronic discussion list for the last two decades. Intentand content analysis of KUTUP-L postings will provide bothquantitative and qualitative information about the level of activity aswell as the types of postings, their subjects and authors.

The anatomy of an electronic discussion list for librarians, KUTUP-L
236
2. Literature Review
Content analysis is a commonly used method of studying messages sent toelectronic discussion lists. Wildemuth et al. [1] used content analysis to study14 different library discussions lists and found that the relatively highpercentage of messages were intended to discuss certain issues.
Content analysis of 309 messages posted at PUBYAC, a discussion listcreated for public librarians working in children's and young adult services,shows that the majority of postings were of reference type, indicating that thelist took on the role of an information source for its subscribers [2]. PUBYACpostings were analyzed under six different categories in a different study:programs (27%), finding books (21%), collection (16%), library administrationand policy (9%), professional issues (9%), and announcements (7%). Half themessages were responses to earlier requests and (37%) were inquiries whilethe rest (13%) were announcements and general comments. Authors ofmessages were generally thankful and complimented the list and itssubscribers [3].
A survey of MEDLIB-L (Medical Library Association’s discussion list)users showed that about 90% of them read MEDLIB-L at work and spend lessthan three hours a week for this purpose. They used the list to comment onvarious issues and answer questions more often than to ask questions or startdiscussions [4]. The former types of messages are called “reflexive” oneswhile the latter are “initiatory” [5, 6]. Similarly, almost three quarters ofmessages sent to EVALTALK, a listserv for evaluation professionals, werecomments/responses on requests while the rest were questions or requests,indicating that subscribers used EVALTALK discussion list as aninformational tool [7]. We see the same pattern in the messages of thetrombone users’ discussion list, Trombone-L and a listserv used as a journal.Some 72% of the Trombone-L messages were comments/answers and 28%questions, although percentages varied by topics discussed (One-third of themessages were off-topic.) [8]. Reflexive messages constituted 65% of listservmessages while the rest were initiatory messages [9]. More than half (51%) themessages posted to HUMANIST discussion list were made up of responseswhile 25% questions, 19% announcements and 5% administrative ones [10].Some 56% of the messages sent to ABUSE-L, a discussion list on social work,were classified under “discussion” (i.e., reflexive messages) [11].
The communication patterns of authors posting at discussion lists tendto conform to some bibliometric laws such as Pareto (80% of messages getposted by 20% of all authors), Price (“the square root of all authors wouldpost half the messages”) and Lotka (60% of authors send one message to thelist while decreasing percentages of authors send more, i.e., 15% two, 6.6%three, 3.75% four and so on) [12,13,14,15]. Messages posted at two discussion
The anatomy of an electronic discussion list for librarians, KUTUP-L
237
lists (LINGUIST and HEL-L) seemed to conform to Lotka’s Law, although thecorrelation was not high [16].
3. Data and Method
To address research questions, we first obtained access to KUTUP-L logshosted by the Middle East Technical University in Ankara, Turkey. Logsarchived between June 1991 and September 1994 were not available due totechnical reasons. We imported the contents of all messages along withassociated metadata to a spreadsheet package and cleaned the data beforeanalysis. Descriptive statistics and bibliometric analysis are based on a totalof 19,827 messages posted on KUTUP-L between 1994 and 2008. We usedPareto, Price and Lotka’s laws to find out if the author productivity inKUTUP-L conforms to decreasing power laws. As given in the previoussection, the first two laws are relatively easy to explain. To test if data fitLotka’s Law, we used f(n) = C / n formula wherein f(n) is a function offrequency, C and are constants (C > 0 and 0). Thus, the number ofauthors posting n messages is proportional to decreasing power law [14].
We then selected a stratified sample of 977 messages for content analysis(sample size 5%). Using Bellack’s communication model, we classified eachmessage either as “initiatory” (i.e., asking a question or initiating a discussion)or “reflexive” (i.e., answering a question or commenting on an issue) [5,6].Based on Berman’s “intent analysis”, we also categorized each messageaccording to its purpose (or “intent”) under “information transfer” (IT),“information request” (IR) or “discussion of an issue” (IS) [11]. Next, wecarried out content analysis to identify the subject(s) of each message usingJarvelin and Vakkari’s subject classification [17, 18].
We presented the descriptive statistics and the results of bibliometric andcontent analysis using tables and figures. We grouped the findings of contentanalysis in five-year intervals to detect the changes of patterns in professionaland scientific communication over the years.
4. Findings and Discussion
A total of 19,827 messages were posted on KUTUP-L between 1994 and 2008,half of which belong to the last five years (2004-2008). The average number ofpostings per month in recent years is about 175. Findings indicate thatcommunication in the list has increased continuously over the years andKUTUP-L has become a major venue of communication and discussionamong library and information professionals (Figure 1). The heaviest

The anatomy of an electronic discussion list for librarians, KUTUP-L
238
message traffic was observed in March as the Turkish Library Week getscelebrated in the last week of March every year while the list was less busyduring summer months. About one third of 1,900 list members never posteda message on KUTUP-L. The gender of 1,232 unique authors contributing tothe list is evenly distributed (52% female, 48% male), although males postedmore (59%) messages than females.
The distribution of messages to authors conform to both Price and Pareto(80/20 rule) laws: Almost half (49%) the messages were posted by 35 out of1,232 authors while 20% of all authors posted 83% of all messages. One third(369) of all authors posted only one message, half the percentage predicted byLotka’s Law (60%) (Table 1). More than half the authors (52.60%) posted threemessages at most, constituting a mere 3% of all messages. The great majorityof authors contributed to the list very little, thereby making them primarily“lurkers”. Some 40% of all authors posted five or more messages to the list.
Figure 1: Average number of messages sent to KUTUP-L on a monthlybasis (1994-2008)
The authors’ productivity data for KUTUP-L posters seem to fit Paretoand Price laws fairly well. Yet, the distribution of messages to authors doesnot conform to Lotka’s Law, which is due to the fact that KUTUP-L has arelatively stable base of contributors (much more than what Lotka’s Lawpredicts) who send messages to the list from time to time. It could be that
1936
67
8897
124134 128
147133
142
172 168184
175
020406080
100120140160180200
1994
1995
1996
1997
1998
1999
2000
2001
2002
2003
2004
2005
2006
2007
2008
Num
ber of Messages
Years

The anatomy of an electronic discussion list for librarians, KUTUP-L
239
characteristics of authorship of a journal article differ from that of a post to adiscussion list such as KUTUP-L.
Table 1: Test of Lotka’s Law on KUTUP-L authorship data
# ofmessages
Expectedpercentage of
authorsaccording to
Lotka’s Law (%)
Expectednumber of
authorsaccording toLotka’s Law
Observedpercentage ofauthors (%)
Observednumber of
authors1 60.00 739 30.00 3692 15.00 184 14.40 1783 6.60 82 8.20 1014 3.75 46 7.47 925 2.40 30 4.71 586 1.60 20 3.33 417 1.20 15 3.08 38
8 or more 28.71 355Total 100.00 1,232 100.00 1,232
Note: Percentage and numbers of authors contributing more than 7 messages toKUTUP-L according to Lotka’s Law are not given in the table.
Intent analysis
Three quarters (76% to be exact) of all postings were “initiatory” (i.e., asking aquestion or initiating a discussion) while the rest were reflexive (i.e.,answering a question or commenting on earlier postings). Table 2 providesdescriptive statistics, at five-year intervals, about findings of intent analysisbased on a stratified sample of 977 KUTUP-L messages. The percentage ofreflexive messages tended to decrease over the years, suggesting that morelist members seemed to be indifferent towards KUTUP-L postings. Theintention was transferring information in two thirds (67%) of all messages,followed by starting a discussion (23%) and asking for information (10%).The percentage of postings aiming to transfer information increased over theyears while the percentage of postings with discussion topics decreased.Forwarded postings made up 16% of all messages, although the percentage isdecreasing. The percentage of postings containing links to other web sites ison the rise (20%).

The anatomy of an electronic discussion list for librarians, KUTUP-L
240
Table 2: Intent analysis of KUTUP-L postings
Note: Figures in brackets refer to percentages.
Content analysis
Content analysis of on-topic messages shows that about one third (32%) wererelated with information management services, 23% with library andinformation science, and 19% with professional and scientific communication(Table 3). (Each on-topic message was classified under the main topic). Topicsdiscussed on KUTUP-L varied over the years. For instance, postings oninformation management and professional/scientific communication issuesbecame more prominent in recent years while the percentage of postings oncataloging issues went down drastically (from 50% to 21%) over the years.
The percentages of reflexive postings were well over 50% for some topics(e.g., professional issues, professional training, library management andlibrary automation), indicating that some topics drew more attention andgenerated more discussion on KUTUP-L. The percentage of postingsintended to generate discussion has also increased and the topics of suchpostings were in line with those of reflexive ones, further reinforcing thewillingness of KUTUP-L members to make it a more dynamic electronicdiscussion list.
Out of 977 KUTUP-L messages in our stratified sample, 393 (or 40% of allmessages) were off-topic. Some of those messages were irrelevant whileothers consisted of postings of trial messages, virus warnings, announcementsof social activities, deaths, and so on. The percentage of off-topic messagesrose to 46% in recent years. Table 4 provides descriptive data on off-topicmessages. In general, more (53%) than half of off-topic messages wereirrelevant (i.e., unrelated with the purpose of the discussion list).Announcements of promotions (16%), deaths (9%), and job ads (9%) consistedof one-third of all off-topic messages.
YearsType ofmessages 1995-1999 2000-2004 2005-2008 TotalInitiatory 137 (63%) 279 (80%) 325 (79%) 741 (76)Reflexive 82 (37) 70 (20) 84 (21) 236 (24)Total 219 (100) 349 (100) 409 (100) 977 (100)

The anatomy of an electronic discussion list for librarians, KUTUP-L
241
Table 3: KUTUP-L messages by topicsSubjects Subject 1 Subject 2 Total %100 Professional issues 39 4 43 7101 Library Association’s activities 30 0 30 5
The Professions total (100) 69 4 73 12 300 Publishing 18 6 24 4 400 Education in LIS 12 2 14 2 600 Analysis of LIS 1 0 1 0 701 Inter-library loan activities 59 20 79 12 702 Collections 57 6 63 10 703 Information or Reference Services 2 0 2 0 704 User education 1 0 1 0 705 Library Buildings or Facilities 12 0 12 2 706 Library Administration or Planning 10 0 10 2 707 Library Automation 22 2 24 4 708 Other Library or Information Service 14 1 15 2
LIS Service Activities total (700) 177 29 206 32 801 Cataloguing 14 3 17 3 802 Classification or Indexing 3 1 4 1 803 Information Retrieval 4 5 9 1 804 Bibliographic Databases 5 1 6 1 805 Databases 9 2 11 2
Information Retrieval total (800) 35 12 47 7 901 Information Dissemination 7 1 8 1 905 Information Use 2 0 2 0 906 Information Management 4 0 4 1
Information Seeking total (900) 13 1 14 2 1001 Scientific or Professional Publishing 10 0 10 2 1003 Other Aspects of Scientific or Professional Communication 101 12 113 17
Scientific and Professional Communication total (1000) 111 12 123 19 1100 Other LIS Aspects 148 0 148 23 Total 584 66 650 100

The anatomy of an electronic discussion list for librarians, KUTUP-L
242
Table 4: Off-topic KUTUP-L messages
Note: Figures in brackets refer to percentages. Some totals are not equal to100% due to rounding errors.
We calculated the productivity of 34 authors in our sample who postedsix or more messages by dividing the number of off-topic messages by thetotal number of messages (both off- and on-topic) sent by each author. Theaverage productivity was 60%, perfectly in line with the percentage of on-topic messages.
5. Conclusion
As an unmoderated discussion list since its inception in 1991, KUTUP-Lseems to have an impact on professional lives of many Turkish librarians inthat they use it as a venue to ask questions, share news and information withtheir colleagues, follow up current developments and discuss professional aswell as social issues. The number of messages and unique authorscontributing to the list has increased considerably, indicating that KUTUP-Lhas become a popular and dynamic discussion list.
Although a wide variety of subjects have been discussed on KUTUP-L,the percentage of reflexive messages aimed at discussing a subject orcommenting on a professional issue is comparatively low (24%). A morecomprehensive study on the subjects of KUTUP-L postings is in order.However, the relatively high (40%) percentage of off-topic KUTUP-Lmessages might have discouraged its further use, as library and informationprofessionals may not wish to spend their precious time sifting throughirrelevant postings. Screening off-topic messages before distribution mayhelp in this respect but this would tax the list owner’s time and resourcesfurther.
Types of messages 1995-99 2000-04 2005-08 Total Avg (%)Irrelevant messages 47 (23) 78 (37) 84 (40) 209 (100) 53Announcements ofpromotions, congrats, etc. 6 (10) 18 (29) 39 (62) 63 (101) 16Announcements of deaths, etc. 0 (0) 9 (24) 28 (76) 37 (100) 9Job Ads 1 (3) 15 (44) 18 (53) 34 (100) 9Trial messages 3 (21) 6 (43) 5 (36) 14 (100) 4Messages on social activities 3 (21) 6 (43) 5 (36) 14 (100) 4KUTUP-L 5 (42) 6 (50) 1 (8) 12 (100) 3Virus warnings 2 (20) 7 (70) 1 (10) 10 (100) 3Total 67 145 181 393 101

The anatomy of an electronic discussion list for librarians, KUTUP-L
243
Most of the KUTUP-L postings were authored by a relatively few listmembers. KUTUP-L authors’ productivity data conform to Pareto and Pricelaws but not in accordance with Lotka’s Law. KUTUP-L has more listmembers contributing two or more messages to the list.
We hope that the results of bibliometric and content analysis of KUTUP-L postings will be helpful in studying professional and scientificcommunication patterns of library and information professionals in a largercontext.
References
[1] WILDEMUTH, B. et al. What's everybody talking about: messagefunctions and topics on electronic lists and newsgroups in informationand library science. Journal of Education for Library and Information Science, 38(2), 1997, p. 137-156.
[2] BAR-ILAN, J; ASSOULINE, B. A content analysis of PUBYAC- Apreliminary study. Information Technology and Libraries, 16, 1997, p.165-174.
[3] EDWARDS, MM. “A content analysis of the PUBYAC discussion list”.(Unpublished Master’s Thesis). University of North Carolina at ChapelHill, Chapel Hill, NC, 1999.
[4] SCHOCH, NA; SHOOSHAN, SE. Communication on a listserv for healthinformation professionals: uses and users of MEDLIB-L. Bulletin of theMedical Library Association, 85 (1), 1997, p. 23-32. Available at:http://www.ncbi.nlm.nih.gov/pmc/articles/PMC226219/ (April 2010).
[5] BELLACK, AA. et al. The language of the classroom. New York: TeachersCollege Press, 1966.
[6] BELLACK, AA. Methods for observing classroom behavior of teachersand students.Presented at a conference sponsored by PaedagogischesZentrum, Berlin, November 12-15, 1968.
[7] CHRISTIE, CA; AZZAM, T. What's all the talk about? ExaminingEVALTALK,an evaluation listserv. American Journal of Evaluation, 25(2), 2004, p. 219-234. Available at: doi: 10.1177/109821400402500206(April 2010).
[8] NICKLAS, EW. “The Trombone-L e-mail discussion list : an analysis ofits usersand Content.” (Unpublished PhD Thesis). The University OfMissouri, 2002.
[9] PIBURN, MD; MIDDLETON, JA. Listserv as journal: computer-basedreflectionin a program for pre-service mathematics and science teachers.Paper presented at the International Conference on Science, Mathematics andTechnology Education (Hanoi, Vietnam, January 6-9, 1997).

The anatomy of an electronic discussion list for librarians, KUTUP-L
244
[10] MAY, A. Automatic classification of e-mail messages by message type.Journal of the American Society for Information Science, 48, 1997, p. 32-39.
[11] BERMAN, Y. Discussion groups in the Internet as sources ofinformation: the case of social work. Aslib Proceedings, 48 (2), 1996, p. 31-36.Available at: http://www.aslib.co.uk/proceedings/1996/feb/1.html (April2010).
[12] TRUESWELL, RL. Some behavioral patterns of library users: the 80/20rule. Wilson Library Bulletin, 43, 1969, p. 458-461.
[13] DE SOLLA PRICE, D. A general theory of bibliometric and othercumulative advantage processes. Journal of the American Society forInformation Science, 27, 1976, p. 292-306.
[14] EGGHE, L. Power laws in the information production process: Lotkaianinformetrics. Amsterdam: Elsevier, 2005.
[15] EGGHE, L; ROUSSEAU, R. Introduction to informetrics: Quantitativemethods inlibrary, documentation and information science. Amsterdam:Elsevier Science Publishers, 1990. Available at: http://uhdspace.uhasselt.be/dspace/handle/1942/587 (April 2010).
[16] KUPERMAN, V. Productivity in the Internet mailing lists: Abibliometric analysis, Journal of the American Society for InformationScience and Technology, 57, 2006, p. 51-59.
[17] JARVELIN, K; Vakkari, P. Content analysis of research articles in libraryand information science., Library and Information Science Research, 12,1990, p. 395-421.
[18] JARVELIN, K; VAKKARI, P. Evolution of library and informationscience 1965-1985: Content analysis of journal articles. InformationProcessing Management, 29, 1993, p. 129-144.

245
Constituencies of use: Representative usagescenarios in international digital library user
studies, a case study on Europeana
Duncan Birrell1; Milena Dobreva1; Yurdagül Ünal2; Pierluigi Feliciati3
1 Centre for Digital Library Research (CDLR),Information Services Division (ISD), University of Strathclyde
Livingstone Tower, 26 Richmond Street, Glasgow, G1 1XH, UKduncan.birrell, [email protected]
2 Department of Information Management, Hacettepe University06800 Beytepe, Ankara, Turkey
[email protected] Department of Cultural Heritage, University of Macerata
via Brunforte, 63023 - Fermo, [email protected]
AbstractDigital libraries are still being developed independently of the extensiveinvolvement of end users, those who form their constituencies of use. Thetraditional approach to digital library development is to consult with expertsor communities of practice in a particular field and attempt to incorporaterecommendations into the interface functionality and service models, whilstuser needs are often not comprehensively scoped in advance, at thedevelopment stage, or regularly consulted for the purposes of formative andsummative evaluation. Recent developments in digital library designconcentrate effort on the use of innovative search and browse tools,streamlined techniques for navigation and display, and the provision ofpersonalised areas for search management and information sharing; suchdevelopments, however, remain unaligned to any thorough understanding ofexactly how user behaviour alters depending on scenario of use, and theproblems encountered by end users in task completion within differentcontexts. This paper reports on the deployment of usage scenarios to evaluatethe Europeana digital library v1.0 prototype.
Keywords: digital libraries, user studies, tasks

Constituencies of use: Representative usage scenarios in international digital libraryuser studies, a case study on Europeana
246
1. Introduction
Digital libraries are only as good as the uses to which we can put them. Whilstuser needs are signalled as a priority in the multitude of policy documentswhich shape online cultural heritage services, user needs are often notcomprehensively scoped in advance at the development stage, or regularlyconsulted for the purposes of formative and summative evaluation. Thetraditional approach to digital library development is to consult with expertsor communities of practice in a particular field, and incorporate advice andrecommendations into the service models. In a review of the use of digitisedarchival collections, for example, A. Sundqvist [1] noted that “the generalknowledge of user behaviour is a mixture of common sense, presumptionsand prejudices” (p. 624), whilst the Institute of Museum and Library Services(IMLS) reported that “The most frequently-used needs assessment methodsdo not directly involve the users” (p. 2) [2]. Z. Manžuch [3] in her survey onmonitoring digitisation (which summarises 11 user-related studies), showedthat the most popular method deployed was the analysis of usage statistics.Digital libraries are, therefore, still being developed independently of theextensive involvement of their constituencies of use.
An evidence-based approach to the information behaviour of users willhave tangible impact on the development of interface functionality, digitallibrary policy, data quality and potentially on the architecture of digitallibraries.1 Such studies need to address different user groups. For example,the younger users, often referred to as “digital natives”,2 are expected toprefer enhanced functionality which reflects the customisable, interactive,information experience found on popular search and social networking sites;whilst, by comparison, professional users seek authoritative and trustedinformation quality.
Recent developments in digital library design have concentrated effort onthe use of innovative search and browse tools, streamlined techniques fornavigation and display, and the provision of personalised areas for searchmanagement and information sharing. Hence, studying the use of such digitallibraries requires selecting suitable scenarios which will allow the users notonly to navigate and search for data, but also deploy a range of
1 Domains used as defined in the DELOS Digital Library Reference Model) [4]2 A term applied to the new generation of users who have grown up with ICT and
whose patterns of knowledge creation and information sharing are largely defined by webbased tools, virtual worlds and social media.

Constituencies of use: Representative usage scenarios in international digital libraryuser studies, a case study on Europeana
247
functionalities. This paper presents the experience of devising user-orientatedassignments for a study of Europeana3 undertaken in October-December 2009by the Centre for Digital Library Research (CDLR) at the University ofStrathclyde with the participation of the University of Macerata and GlasgowCaledonian University. The study aimed to gather feedback from members ofthe general public and younger users, since a previous web survey ofEuropeana users conducted in May 2009 identified these to be relatively lowuse consumers compared to professional in their 30s and early 40s [5].
2. Methodology and composition of the groups
Previous research on users of digital libraries has incorporated a range ofmethodologies including: interviews, focus groups, observations, usabilitytesting, transaction logging, user surveys, web-based questionnaires, thinkaloud protocols and video data [6, 7, 8, 9, 10]. Alongside usage scenarios, thestudy also utilised psychological testing techniques such as eye-tracking,which had been deployed in previous studies of information behaviour (cf.[11, 12,13]), but have not, before now, been applied to assess digital libraries.
The study needed to gather demographic data which would help toanalyse the profile of the participants and gather data on the tasks performed.Table 1 summarizes demographic data on the participants in the study.
The problem presented to the CDLR-led study was how to devise acohesive methodology for the user testing of a multilingual digital library,where focus group demonstration would take place across 4 Europeancountries with the resource being evaluated by a number of differentconstituencies of use i.e. groups composed of different cultures, linguisticcommunities, professions and ages. For example, 76% of study participantswere between the ages of 15 (or under) to 24 years and could be categorised asbelonging to the growing constituency of “digital natives”.
3 http://www.europeana.eu/portal/. A single access point for digitised cultural heritagematerials provided by various European libraries, museums, archives, galleries, andaudiovisual collections. At the time of the study it was offering access to 6 million digitalobjects. The interface is available in 26 languages and supports both simple and advancedsearch, and offers additional functionalities such as a timeline and date clouds.

Constituencies of use: Representative usage scenarios in international digital libraryuser studies, a case study on Europeana
248
Table 1: Demographic characteristics of the participants in the studyCountry
Bulgaria ItalyThe
Netherlands UK Total
N % N % N % N % N %Country 22 25 20 23 23 26 24 27 89 100Gender
Male 11 50 6 30 12 52 10 42 39 44Female 11 50 14 70 11 48 14 58 50 56
AgeUnder 15 2 9 - - - - - - 2 215-18 20 91 - - 21 91 - - 41 4619-24 - - 17 85 2 9 6 25 25 2825-34 - - - - - - 7 29 7 835-44 - - - - - - 3 13 3 345-54 - - 2 10 - - 5 21 7 855-64 - - 1 5 - - 3 13 4 5
ProfessionAt school 22 100 23 100 - - 45 51At College /University
- - 20 100 - - 5 21 25 28
Researcher - - - - - - 4 17 4 5Informationspecialist
- - - - - - 4 17 4 5
Manager /Administrator
- - - - - - 3 13 3 3
Lecturer - - - - - - 1 4 1 1Writer - - - - - - 1 4 1 1Other - - - - - - 6 25 6 7
A key issue in the design of user studies is the ‘hands-on’ experience ofusers physically interacting with the interface and the selection of tasks for thepurposes of testing and evaluation. During a study of information behaviour,users will normally have to answer specific questions, usually belonging totwo categories: navigational and informational [11, 13, 14]. The selection of taskshas a central role in the user studies as they constitute the very fabric of userexperience. In order to keep users engaged during the study, it is importantthat tasks should adequately address their likely interests. The selection oftasks is even more difficult when the study is international, addressesdivergent constituencies, and must produce comparable outputs from thevarious groups involved for the purposes of systematic evaluation. The

Constituencies of use: Representative usage scenarios in international digital libraryuser studies, a case study on Europeana
249
innovative solution for the CDLR was to devise an extended and iterativeassignment which could accommodate the interests and abilities of differentuser groups without compromising the basic thematic structure or upsettingthe essential navigational and informational elements of the tasks.
Our testing of Europeana, therefore, necessarily applied a uniformmethodology to all focus groups and media labs. A standard protocol wasestablished for the study including three questionnaires (demographic data;first impressions (since the participants were not familiar with Europeanabefore the study) and deeper/lasting impressions), as well as a series of keydiscussion points and an assignment. The thematic bond of the assignmentwas the creation of a virtual portrait of the city where each focus group washeld (with the exception of the group in Fermo where the assignment was tomake a virtual portrait of the city of Rome). This allowed the tasks to be bothlocally specific and easily translated across cultures and age groups.
The assignment requested participants to collate a PowerPointpresentation, from materials retrieved on Europeana, using a predefined setof slides which guided them to produce a virtual tour of their local city, andwhich also aimed to encourage use of Europeana’s innovative functionality.The assignment was designed to incorporate 8 different usage scenarios: 1)finding texts on a predefined topic; 2) finding images on a predefined topic; 3)finding audio and video materials on a predefined topic; 4) finding materialspresenting the same, predefined, object in different times (eg. how their cityhad changed over time); 5) finding materials on a specific predefined subject(like a landmark or an event or a person); 6) finding materials on a specifichistorical event; 7) a topic of the participants’ own choice within the context ofthe general theme; and finally, 8) identifying the providers of digital objectswho contributed the highest number of objects on a particular topic as ameans of encouraging consideration of the provenance of objects; this last alsoasked users to identify what they found to be most useful about Europeanaand to suggest areas where material may be lacking.
Deploying such scenarios requires users to formulate searches that target arange of metadata fields to retrieve a variety of material types. The approachmade it possible to assess which scenarios of use are easiest to satisfy and toidentify the stumbling blocks that users of the Europeana prototype might beencountering. The tasks were selected on an extended and iterative modelrepresentative of the key processes in the searching of digital libraries such as‘undirected searches’ and ‘monitoring a topic over time’ reported in Bryan-Kinns and Blandford [15] and noted the findings of Furnas and Rauch [16]

Constituencies of use: Representative usage scenarios in international digital libraryuser studies, a case study on Europeana
250
that ‘one-shot query’ of digital libraries, as with conventional ones, isrelatively rare.
The approach is also compatible with the TIME framework for evaluatingdigital libraries developed by Andrew Dillon [17]. The TIME frameworkfocuses on four elements: Task – what users want to do; Information model –what structures aid use; Manipulation of materials – how users access thecomponents of the document; and Ergonomics of visual displays – how theyaffect human perception of information. The 8 scenarios of the assignmentrepresent the Task; Europeana provides an environment in which the userscan try various searches, which maps to the TIME Information model.
Triangulation of the information gathered on search strategies, the datarecorded during eye-tracking sessions, and the combined responses todiscussion and questionnaires, enabled researchers to analyse: 1) the usersearches which show the queries used to search for objects; 2) the mostextensively and frequently used (and unused) components of the interface(based on the eye tracking data); and 3) users’ actual performance in relationto the specific scenarios (based on the content of presentations completed byparticipants).
3. ResultsTable 2 below shows the results sets (at the time of the study) for Text, Image,Video and Sound materials for a simple search using the name of each cityselected in the assignment (participants in Fermo chose to present a virtualportrait of Rome).
Table 2: Europeana “simple search” results for assignment citiesText Images Audio/Video
Sofia 35 668 34Amsterdam 3,653 69,440 381Glasgow 678 33,842 1,541Rome/Roma 1,509/1,604 27,007/ 13,853 534/213
An inevitable consequence of adopting such a thematic approach was amarked difference in levels of digital representation (the number of digitalobjects available in Europeana for each location) for different geographicregions; however, the repetition of a single generic and fixed assignment

Constituencies of use: Representative usage scenarios in international digital libraryuser studies, a case study on Europeana
251
throughout would have resulted in more problems, for example, with regardsto the language of retrieved objects in different cultural locations.
Table 3 gives the total number of presentations prepared by the variousgroups and the range of material types retrieved by participants in responseto the task. In some instances (as in the school groups), two participantsworked jointly on a single presentation, therefore, the number of completedpresentations is lower than the overall number of participants in these cases.The number of slides populated with text, image or audio/visual materials isalso lowest for Sofia which also reflects the relatively low ranking ofBulgarian institutions in the provision of digital collections to Europeana.
Table 3: Number of digital objects’ types retrieved during task by participantsCompleted
presentationsTextual
resourcesImagefiles
Audio/Videofiles
Sofia 15 0 0 3Amsterdam 19 6 10 7Glasgow 24 10 15 5Fermo 10 5 8 0
The 8 separate tasks of the assignment required users to formulatesearches that addressed differing levels of generality/specificity. From thepoint of view of the digital object model used in Europeana, the various tasksaddressed a range of metadata fields to retrieve a variety of material types;and also involved the necessary use of various functional components. As akey aim of the study was to discover areas of difficulty for current users of theEuropeana prototype, deploying a range of tasks which addressed matters ofboth content and functionality was deemed to be the most efficient approach.
The sample slide in Figure 1 illustrates the materials retrieved fromEuropeana by one Glasgow-based participant for Scenario 5: finding materialson a specific predefined subject, in this case the Mackintosh School of Art. Theslide is representative of the difficulties encountered by a number ofparticipants in completing the task for 3 reasons: 1) the low quality resolutionof the thumbnail demonstrates the difficulty of participants in retrievingpresentation quality images; 2) the insert of the Quicktime icon highlights thelack of direct access to (often subscription based) audio/visual resourcesexperienced by the groups, and 3) users commented on a lack of textualmaterial available to support findings.

Constituencies of use: Representative usage scenarios in international digital libraryuser studies, a case study on Europeana
252
Figure 1. Sample slide showing materials retrieved from Europeana by a FocusGroup participant relating to the Glasgow School of Art designed by Charles
Rennie Mackintosh
Table 4 below outlines the levels of performance and problemsencountered across the focus groups for all 8 usage scenarios deployed.
Table 4: The 8 Usage Scenarios used for the assignmentScenario 1 Finding texts on a predefined topicSlide title What do people write about the city of...
Sofia, Amsterdam, Rome, GlasgowGeneral description Participants working on assignments were tasked to identify and use
reliable text resources, copy them and supply a reference to sources.What problemswere experienced?
It was impossible to understand materials in foreign languages(experienced in Sofia, Fermo).Maps were received as text objects (Glasgow).In many cases texts were retrieved as digitised images and couldnot be used or copied easily.Few participants added references to indicate the sources ofdocuments.
Scenario 2 Finding images on a predefined topicSlide titles How do people see...Sofia, Amsterdam, Rome, Glasgow?General description Participants were tasked to identify and use relevant images, to copy
the image files to their presentations and supply a reference to their

Constituencies of use: Representative usage scenarios in international digital libraryuser studies, a case study on Europeana
253
source.What problemswere experienced?
Images were most easy to find.Concerns over image quality were raised, regarding the size andresolution of image files.
Scenario 3 Finding audio and/or video materials on a predefined topicSlide title What are the sounds of the city?General description Participants working on the assignment were asked to identify
sounds which might be either typical of or unique to their city. Theywere expected to be able to access audio/video files and insert theresource within their presentations whilst supplying a reference tothe source.
What problemswere experienced?
Big challenge to access video materials.Audio materials easier to find and useGenerally difficult to copy such objects into presentations.It would be helpful to have previews of material availablethrough subscription.
Scenario 4 Finding materials presenting the same object in different timesSlide title How has the city changed over time?General description Participants were asked to identify materials, images of landmarks
etc. which could be said to represent their city in different historicalperiods. They were expected to be able to access and use the resourcewithin their presentations and supply a reference to the source.
What problemswere experienced?
Users experienced difficulty in having to “guess” what digitalobjects were available on Europeana relating to their culturalheritage at different times – this would be made easier for usersif the range of resources related to the same object were linked.
Scenario 5 Finding materials on a specific subject (like a building, place orperson)
Slide titles Sofia as saint, princess & city; The Royal Palace on Dam Square; TheFontana dei Quattro Fiumi in Piazza Navona; The Glasgow Schoolof Art.
General description Participants were asked to identify materials related to a building orlandmark of popular/ iconic status within their respective cities. Theycould focus on its appearance or use in an historical period alongsidethe contemporary one. They were expected to be able to access anduse the materials in presentations whilst supplying references tosources.
What problemswere experienced?
Student in Bulgaria experienced problems with polysemy of theword “Sofia”.Although this appeared an easy task with specific objects tosearch for, it seems participants had difficulty in locating digitalobjects which matched their knowledge and expectations.

Constituencies of use: Representative usage scenarios in international digital libraryuser studies, a case study on Europeana
254
Scenario 6 Finding materials on a significant historical eventSlide titles What happened in 1853?; Roma during the Ventennio (1924-1945);
What happened in Glasgow’s George Square in 1919?General description Participants were asked to retrieve materials relevant to a specific
historic date or event. They were not restricted to what material theyselected to represent the event and were encouraged to seek primaryas well as secondary sources. They were expected to be able to accessthe materials for use in presentations and supply references.
What problemswere experienced?
A general observation is that participants did not use the timeline tosearch for answers of these questions but rather performed generalsearches combining the name of their city and the year in question.
Scenario 7 Finding materials on a topic of the participants’ choice within thecontext of the general theme
Slide title Use this slide for your own material…General description Participants were invited to present materials on a subject of their
own choosing. They were not restricted to what materials they couldselect (as long as the subject was in keeping with the thematic contextof the task) as long as reference to sources on Europeana were used.
What problemswere experienced?
This task redirected participants to browse mode; a low numberpopulated the slides due mainly to lack of time for completion.
Scenario 8 Identifying the providers of digital objects who contributed thehighest number of objects on a particular topic
Slide title Europeana and... Sofia, Amsterdam, Rome, GlasgowGeneral description Participants were requested to provide feedback on the institutions
and partners who had supplied the most materials on their city inEuropeana. Feedback was also gathered on what they considered tobe the most useful aspects of the site and their recommendations forits further development.
What problemswere experienced?
Generally participants did not look at the drill-down options of thesearch to provide the information but responses were based on theirimpressions of what types of materials they had retrieved during theassignment.
4. Discussion
The selection of tasks allowed for consideration of what specific difficultieswere experienced in various usage scenarios. Older (more professional users),for example, complained of not being able to complete tasks due to a lack ofgranularity encountered in the recording of some objects in Europeana (e.g.maps being classified as texts), and cases where textual materials could only

Constituencies of use: Representative usage scenarios in international digital libraryuser studies, a case study on Europeana
255
be retrieved as digitised images; whilst younger users, (who found imagesmost easy to find) complained of not being able to freely access audio/videocontent in order to complete tasks, or find contemporary materials to reflectchanges in their city over time. Generally, both constituencies of usersexpressed concerns over image quality, regarding the size and resolution ofimage files, stating also that it would be helpful to have previews of thematerials currently available only through subscription.
The tasks of the assignment were not purely navigational but included anumber of necessary navigational elements, such as use of the Europeanaadvanced search, time-line, results tabs and date-filters. Eye-tracking datarevealed, however, that participants did not fully investigate the various drill-down options available on the search interface, and analysis of search datarevealed that participants rarely used advanced search options or additionalfunctionality but rather performed variations upon general search themes.
5. Conclusion
The CDLR-led User and Functional Testing study demonstrates that it ispossible to develop large scale digital libraries, such as Europeana, with theextensive involvement of end users. In order to track the evolvingrequirements of both “digital natives” and other users, it is hoped that suchinnovative studies of digital libraries in the cultural heritage domain willcontinue to be conducted; a domain which is multi-cultural and multi-lingual,and whose constituencies of use seek better and more efficient forms of digitalrepresentation from their online cultural heritage institutions.
Acknowledgements
The authors would like to acknowledge the support of Emma McCullochfrom CDLR (University of Strathclyde), the EDL Foundation; Jill Cousins,Adeline van den Berg, Anne Marie van Gerwen and Milena Popova from theEuropeana Office. Discussions with Prof. Ian Ruthven (University ofStrathclyde) and Dr. Jonathan Sykes (Glasgow Caledonian University) wereparticularly helpful for the study.

Constituencies of use: Representative usage scenarios in international digital libraryuser studies, a case study on Europeana
256
Notes and References
[1] SUNDQVIST, A. The use of records – a literature review. Archives &Social Studies: A Journal of Interdisciplinary Research, 1(1), 2007, p. 623-653.
[2] IMLS. Assessment of End-User Needs in IMLS-Funded DigitizationProjects: Institute of Museum and Library Services, October 2003, p. 1-41.Available at http://www.imls.gov/pdf/userneedsassessment.pdf (2010).
[3] MANZUCH, Z. Monitoring digitisation: lessons from previousexperiences. Journal of Documentation, 65(5), 2009, p. 768-796.
[4] CANDELA, L; et al. The DELOS Digital Library Reference Model -Foundations for Digital Libraries. Version 0.98. February 2008.
[5] EUROPEANA Online Visitor Survey: Research Report, Version 3, 2009.[6] NORMORE, LF. Characterizing a Digital Library’s Users: Steps towards a
Nuanced View of the User. In: Proceedings of the American Society forInformation Science and Technology, 45(1), 2009, p.1-7.
[7] BISHOP, AP.; et al. Digital Libraries: Situating Use in ChangingInformation Infrastructure. Journal of the American Society forInformation Science and Technology, 51(4), 2000, p. 394-413.
[8] CHERRY, JM; DUFF, WM. Studying digital library users over time: afollow-up survey of Early Canadiana Online. Information Research 7(2),2002.
[9] BLANDFORD, A; STELMASZEWSKA, H; BRYAN-KINNS, N. Use ofMultiple Digital Libraries: A Case Study. In: Proceedings JCDL 2001. p.179-188. ACM Press.
[10] TENOPIR, C.; et al. Use of Electronic Science Journals in theUndergraduate Curriculum: An Observational Study. In Proceedings ofthe American Society for Information Science and Technology, 41(1) p.64-71, 2004.
[11] GRANKA, LA. Eye-R: Eye-Tracking Analysis of User Behavior in OnlineSearch. Masters Thesis, Cornell University Library Press, 2004.
[12] LORIGO, L; PAN, B; HEMBROOKE, H; JOACHIMS, T; GRANKA, L;GAY, G. The influence of task and gender on search and evaluationbehavior using Google. Information Processing & Management, 42, 2006,p. 1123—1131.
[13] PAN, B; HEMBROOKE, H; JOACHIMS, T; LORIGO, L.; GAY, G.;GRANKA, L. In Google we trust: Users' decisions on rank, position, andrelevance. Journal of Computer-Mediated Communication, 12(3), 2007.

Constituencies of use: Representative usage scenarios in international digital libraryuser studies, a case study on Europeana
257
[14] RELE, RS; DUCHOWSKI, AT. Using Eye Tracking to EvaluateAlternative Search Results Interfaces. In: Proceedings of the HumanFactors and Ergonomics Society, p.1459—1463. Orlando, Florida, 2005
[15] BRYAN-KINNS, N; BLANDFORD, A. A survey of user studies for digitallibraries, RIDL working paper, London, 2000.
[16] FURNAS, DW; RAUCH, SJ. Considerations for InformationEnvironments and the NaviQue Workspace. Proceedings of ACM DL ’98,pp. 79-88, 1998.
[17] DILLON, A. Evaluating on TIME: a framework for the expert evaluationof digital interface usability. International Journal on Digital Libraries, 2(2/3), 1999.

258
ENHANCING USERS’ EXPERIENCE:A CONTENT ANALYSIS OF 12 UNIVERSITY
LIBRARIES FACEBOOK PROFILES
Licia Calvi1; Maria Cassella2; Koos Nuijten1
1 NHTV University of Applied Science:Academy for Digital Entertainment
P.O. Box 391, 4800 DX Breda, The Netherlandse-mail: {calvi.l; nuijten.k}@nhtv.nl;
2 Università di TorinoVia Po, 17, 10124 Torino, Italye-mail: maria.cassella@unito
AbstractFacebook has become one of the most prominent tools for social networkingover the last few years. Since its establishing in 2004, more and more playershave made use of it: not just ordinary users willing to find their old friendsand to get back into contact with them, but also, for example, more and moreplayers from the cultural scene. These latter ones include cultural institutionswilling to experiment with new ways of getting in touch with their traditionalaudiences but also willing to attract new audiences (like a younger audience,who is supposed to be more present on such social media); artists, who use itto create a community to share information, to promote their own creationsbut, more recently, also to collaborate on common project; and finally alsolibraries.
This paper intends to explore the use of Facebook in university libraries bymaking an empirical analysis of current practices. In doing so, the paperbuilds on the knowledge gained in a previous study on the way in whichFlemish cultural institutions make use of the possibilities offered by socialmedia to communicate with their audiences and to promote themselves [2].The analysis on current uses we performed will help us sample existingpractices and help us derive some general ideas for future best practices. Andthis will help libraries to better profile themselves and communicate betterwith their old and new audiences.

Enhancing users’ experience: A content analysis of 12 university libraries Facebookprofiles
259
Keywords: academic libraries; social networking platforms; Facebook;Facebook academic library pages.
1. Introduction
As academic libraries strive to reposition themselves in the digitalenvironment and try to reconfigure their role, librarians experiment the use ofsocial tools of the Web 2.0 to advocate, promote, and raise awareness aboutlibrary collections and services.
One of the most popular social networking platforms is Facebook (FB [1]).Originally developed by Mark Zuckerberg, Dustin Moskovitz and ChrisHughes in 2004 at Harvard University in order to provide Harvard studentswith a place in which they could keep in contact with their classmates and,most importantly, could share study-related information, Facebook “burstbeyond its roots” by opening its membership to high school networks first, in2005, and to all the net users later, in 2007. In the last few years, Facebook hasglobally developed into one of the most prominent tools for social networkingaltogether.
Since its establishing in 2004, more and more players have made use ofFacebook: not just college students or ordinary users willing to find their oldfriends and to get back into contact with them, but also, for example, moreand more players from the cultural scene have started to use Facebook. Theselatter ones include cultural institutions willing to experiment with new waysof getting in touch with their traditional audiences but also willing to attractnew audiences (like a younger audience, who is supposed to be more presenton such social media [2]); artists, who use it to create a community to shareinformation, to promote their own creations but, more recently, also tocollaborate on common project [3]; and finally also libraries.
The use of Facebook in libraries is starting to be investigated (see in [4, 5,11, 14, 16, 17, 19]) as well as the use of other social media. Studies like the onesmentioned above focus on the tools and applications available in Facebook forlibrarians and make recommendations about the way libraries could benefitfrom using Facebook. Such applications include a Facebook Librarian [6], i.e.,a virtual librarian service providing links to books and other resources; BooksiRead [7], to share books with the friends in your own network; tools like theWorld Cat Search [8]), and several ad hoc Facebook groups [9].
This paper instead intends to explore the use of Facebook in universitylibraries by making an empirical analysis of current practices in 12 selected

Enhancing users’ experience: A content analysis of 12 university libraries Facebookprofiles
260
academic libraries. In doing so, the paper builds on the knowledge gained ina previous study on the way in which Flemish cultural institutions make useof the possibilities offered by social media to communicate with theiraudiences and to promote themselves [2]. For that analysis, a two-phase,empirical and qualitative evaluation of social media use was carried on. In afirst phase, a survey was conducted on as many cultural institutions aspossible in order to identify the role social media play in their currentcommunication practices. In a second phase, the focus was narrowed down toa very specific set of institutions selected on the basis of the previous analysisfor which the Facebook pages were analysed in terms of the content on eachpage, the updates, the degree of users' participation and the ways in whichthese institutions were handling users’ participation, and the fidelity issue,both as it is perceived by the cultural users and as it is handled by the culturalinstitutions.
The results of this study show that there is a very low degree ofpersonalisation among the cultural institutions that were analysed, althoughtheir focus and scope was intrinsically different. We noticed additionally thatFacebook itself was used rather poorly, i.e., mainly to promote events or toshow pictures of past events. But what was really interesting, was the fidelityissue associated with these institutions: the Facebook pages of the culturalinstitutions were visited by many serendipitous users, but there were veryfew regular and faithful ones.
With the present paper, we would like to further extend the resultscoming from this study and apply it to academic research libraries. Theanalysis on current uses we performed will help us sample existing practicesand help us derive some general ideas for future best practices. And this willhelp libraries to better profile themselves and communicate better with theirold and new audiences.
2. Facebook in academic libraries. Literature review
Since 2007, Facebook popularity is steadily advancing among colleges anduniversities students. Kerry estimates that 85% of undergraduates in USAhave a Facebook profile [9].
Academic libraries have since then started to explore how this technologycould be used in their libraries to contact and attract students, despite the factthat some very early reactions from students about the use of socialnetworking services were not that positive at the beginning.

Enhancing users’ experience: A content analysis of 12 university libraries Facebookprofiles
261
As a matter of fact, in an OCLC report from 2007, 6100 people aged 14-84and 382 US library directors did not see “a role for the libraries constructingsocial sites and would not be very likely to contribute content” [10]. In theliterature on FB in academic libraries, many librarians also express theirconcern about the use of social networking platforms in libraries. Charnigoand Barnett-Ellis [11], for example, found that librarians were wary about theacademic purpose of FB. 54% of 126 librarians surveyed by the authors statedthat it did not serve an academic purpose. 12% only was positive on this fact,and the rest were not sure. Marshall Breeding, the director of innovativetechnology at Vanderbilt University, wrote about the enormous opportunitiesof adopting Web 2.0 tools in academic libraries [12]. However, he recognized“that the very nature of Facebook works against this scenario. The naturalcircle of Friends centers on one's peers […] and it is unrealistic to think thatlarge numbers of undergraduate students would want to count librariansamong their FB Friends” [12].
In many instances academic librarians adopt FB pages for their librariesbut are worried about the best way to approach students. Miller and Jensen[13] advocate the aggressive “Friend and Feed” technique by which librarians“friend” as many students as possible, while Powers et al. [14} are morecautious about the practice of “friending” students. A better approach to themis to recommend mentioning one’s Facebook account in library instructionsessions and reference interviews and then letting the students find thataccount.
In a few articles we indeed found success stories of the use of socialnetworking platforms in academic libraries: Beth Evans [15], for example,created a “Brooklyn College MySpace page”. The library then used threeemployees to sift through MySpace profiles to find 4,000 Brooklyn Collegestudents, faculty, and graduates. Evans invited these affiliates to be thelibrary's friends and seven months later had approximately 2,350 friends.Evans did not mention any downsides to the Brooklyn College LibraryMySpace experiment and indicated that it had been well received by itsaudience [16]. Successful are also the results of the experiment led by Mack etal. [17], who promoted their FB library page profile for the reference service.During the fall of 2006, their librarians received 441 reference questions and126 of these were collected through Facebook, followed by e-mail (122) andin-person consultations (112).
Studies like those mentioned above focus on the librarians’ attitude andexperiences with the use of FB in academic libraries, while others investigate

Enhancing users’ experience: A content analysis of 12 university libraries Facebookprofiles
262
tools and applications available in Facebook for librarians and makerecommendations about the way libraries could benefit from using Facebook5]. In 2008, Ellissa Kroski listed in her blog iLibrarian the top ten Facebookapplications for libraries [18]: Books iRead to share books with the friends inyour own network, LibGuides Librarian, Librarian, University of Illinois atUrbana-Champaign (UIUC) Library Catalog, del.icio.us, JSTOR,MyWikipedia, LOLCats, Slideshare, and MyFlickr. Hendrix et al. [19] alsoprovided a different perspective to the studies of FB in academic libraries. Theauthors used a survey to investigate health libraries’ use of the popular socialnetwork. 72 librarians responded to the survey: 12,5% (9/72) maintained aFacebook page. Libraries used FB mainly “to market the library, push outannouncements to library users, post photos, provide chat reference, and havea presence in the social network” [19]. Librarians had a very positive attitudetowards the future of their FB pages although its use was currently ratherlow.
To date, the only study focused on actual Facebook library pages use andtheir content is the one from Jacobson [4]. The author investigated 12 FBacademic libraries using the Site Observation methodology. Results showedthat FB library pages are a useful tool to market the library “and it may bevalid to assert that this is currently the best use in the library realm. Whereasuses for communication from patrons or “fans”, communicating libraryneeds, and as a forum/discussion space for users may not be an ideal use” [4].
3. Scope and methodology of this study
The present paper investigated the level of use of Facebook in twelve UKresearch universities libraries. The scope of the authors in performing thisstudy was:
- to assess whether FB can be an effective new tool to communicate andpromote the academic library services, to outreach students, bothundergraduates and graduates, to fidelize them, or whether other solutionsshould be preferred (i.e. a personal librarian’s profile);
- to assess what the most used sections and services of a FB academic librarypage are;
- to highlight the potentiality of FB as a new channel to implement value-added services for students (i.e. asynchronuos reference, training courses andtutorials ….);

Enhancing users’ experience: A content analysis of 12 university libraries Facebookprofiles
263
- to verify whether there is any positive correlation between the use of FBlibrary pages and the number of FTE students enrolled in a university or anyother possible variables (i.e. a new library building, active libraries hostingmany events and exhibitions …..)
- to assess any differences in the use of FB central library pages and FB branchlibraries pages.
To this end, we selected 12 UK research university libraries and classifiedthem according to the following criteria:
1. libraries in universities with less than 10000 students2. libraries in universties with more than 10000 students3. branch university libraries.
This resulted in 4 libraries per category.
In order to perform some statistics (i.e., t-tests and some basic descriptives,see next section), we developed a coding instrument in line with the one usedby Jacobson [4] for her analysis. Coding focused on the FB page developed byeach library (number of pictures or videos, number of fans, links to socialsoftware), the kind of updates present (i.e., via blogs, newsfeeds or fansupdates), the possible use of the wall (by whom, and how frequently), thepresence of library applications or tools, the presence of information otherthan library-related one (i.e., links to external events or to possible sponsors),and whether the FB page is used for internal employees communication orannouncements.
We recorded data for each library for 8 days over a period of two weeks(from 29 March 2010 to 9 April 2010), once a day, at 23 hrs, to make sure thatall libraries would be already closed and that therefore no more updates fromthe library staff were possible.
4. Results
A quantitative analysis of the data collected with our coding instrument wasprocessed for some descriptive statistics and correlations. In this section, wereport some of the most prominent results.
First, we wanted to verify the frequency of wall use. Table 1 reports ourfindings: just less than 50% of the FB library pages use the wall.

Enhancing users’ experience: A content analysis of 12 university libraries Facebookprofiles
264
Table 1: The wall is used
Frequency Percent Validpercent
Cumulativepercent
Valid No 49 51,6 51,6 51,6Yes 46 48,4 48,4 100,0Total 95 100,0 100,0
Moreover, over half of the wall postings are about a year old or older. Thatseems to indicate that the activity on the wall is not very well kept up to dateor it means that the popularity of the platform for the library is alreadywearing out.
We looked at the time when postings are posted on the wall (Table 2).Table 2 shows that wall postings are usually updated by the end of the month(around 65% is done just around day 1, 2 or 30-31 of the month). Updates in-between are not really frequent.Posting wall updates at the end of the month seems to be an explicit decision:it is bigger and more active libraries that do post at the end of the month, as toindicate that there is a communication strategy behind this choice and that thelibrary has ad hoc staff in charge of it. Branch libraries just have postings atmonth edges.
Table 2: When postings are posted on the wall
Frequency Percent Validpercent
Cumulativepercent
Valid 1 8 17,4 17,4 17,42 2 4,3 4,3 21,76 6 13,0 13,0 34,87 2 4,3 4,3 39,18 5 10,9 10,9 50,09 3 6,5 6,5 56,530 1 2,2 2,2 58,731 19 41,3 41,3 100,0Total 46 100,0 100,0

Enhancing users’ experience: A content analysis of 12 university libraries Facebookprofiles
265
If we look at the number of pictures in the FB library pages, we found thatthat libraries publish between 0 and 49 pictures: it looks as if the profilesdiffer quite a lot in this respect. The average number of pictures does notseem to be quite a good indicator of library behaviour on FB. By selecting onlythe FB pages that carry at least two pictures, then almost half of the profilesfall away. However, it seems that the profiles that remain really use thosepictures (i.e., profiles seem to have either 0, 1 or 4 or more picturesincorporated). It seems that the FB profiles that carry more than two picturesreally use these pictures. For the others, it seems the pictures are just anoccasional and quite haphazard addition. The mean number of pictures forthe FB profiles that really and intentionally use pictures is almost 26.
As for videos, most libraries use videos very limitedly. But if they putmore than one video on their FB page, then they use them a lot (between 11and 22).
The number of fans ranges between 6 and 1004. Most libraries seem tohave 0 to 250 fans, and again, libraries that have a reasonable amount of fans(i.e., over 25), have very much fans (minimum 46, mean over 365). Becauseour data were dichotomous, it was not possible to measure the number of fanposts. Our data show that 71 out of 95 units contain updates: given the factthat not all libraries have a reasonable amount of fans, this value seems toindicate for the libraries that do have fans that these fans indeed also do posts.Although it was not possible to carry on specific demographics, it seems thereare more male fans than female fans. Librarian posts are quite common (81out of 95), instead.
As for the kind of library applications that are present on FB, we couldidentify that most libraries use either OPAC or database searches: it looks as ifOPAC or database searches are more or less comparable services. No otherapplications are as successful.
5. Discussion
If we combine the results described in the previous section with a qualitativeanalysis of the data collected with our coding instrument, the followingcharacteristics in the use of FB by academic libraries become more evident:

Enhancing users’ experience: A content analysis of 12 university libraries Facebookprofiles
266
Among the FB elements present on the library pages, the only onethat is truely active is the wall.Wall activity however differs depening on the library size andprofile: the bigger the library, the more active the wall. Branchlibraries also use the wall scarcely.Wall activity is nevertheless still limited to an average of a couple ofpostings per day, in the best cases. The wall is used to postinformation on new libraries activities, change in the opening hours,availability of learning rooms and in one instance to promote a newcollection. Very few are the postings by fans. Where the wall is activeis thanks to the librarians’ activity.Although it was almost impossible to derive some demographics ofthe fans for each library (since some have a high fan number), we hadthe impression that women are more active than men on the librarywalls (although in minority, see above). This statement (that can notbe proved from our data) is however confirmed by Schrock [20] whoclaims that women are more active in social networks tout court.Most FB library pages include some library applications (e.g., OPACor database search, JSTOR, book advice, etc.), but, again, the richestoffer of library tools applies to the bigger libraries.The FB pages of the libraries we analysed have vey few links to othersocial software: Flickr, YouTube or del.ic.ous. There are no links toother external sites.The FB pages are not used to promote external events and onlyscarcely for internal communication for employees.
Although we must admit that our conclusions are based on a very smallsample of FB academic libraries pages, our observations indicate that FBmight be a very powerful library communication and promotion tool but atthe moment its actual use is neither extensive nor advanced.
It is clear that the big libraries which are most active in cultural andlearning events are also more active on FB. It is also clear that it is a librarians’task to keep the FB pages alive and that this activity might be time-consuming. According to Hendrix [19] “the time spent maintaining andupdating a library Facebook page ranged “from no weekly maintenance to120 minutes a week”. Therefore, we suggest that librarians who wish to createa FB library page should consider carefully if they have enough time todedicate to its maintenance.
Librarians should consider if it is more effective to create a FB library pageor a personal librarians’ profile to outreach to students. For very proactive

Enhancing users’ experience: A content analysis of 12 university libraries Facebookprofiles
267
reference librarians, for example, this might be a better strategy as FB ismainly perceived by users as a virtual personal space.Generally speaking, for libraries to assess the best approach “to be where theusers are” qualitative pre-tests and post-tests performed both on usersvisiting the library and on remote users might be helpful.
From these findings we can conclude that two kinds of libraries can beidentified:
those with a very active FB profile and who invest on their FB pagesa lot. They have a higher number of fans, pictures and of videoswhich generate a higher return in terms of fans’ involvement andparticipation.Those who do little either because they do not seem to appreciate theadded value of having a FB page well enough or because of resourcelimitations.
6. Conclusions
These observations do not clear out how effective and efficient it is forlibraries to develop a page on FB and if a FB page helps them achieve theirgoals to outreach to students. Unfortunately, we could not match thesefindings with a survey whereby librarians would have explained what theirintentions were with opening a page on FB.
Although FB is a space made for people [10], something that our findingsconfirm by pointing out how the personal and the professional area seem toremain separate for FB users, we can positively conclude from theseobservations that FB pages help increase the communication with thestudents if librarians are proactive and keep the wall alive, but there is noevidence that at the moment content delivery or services delivery, i.e.,reference assistance have been improved in this way.However, the only way to profit from the added value provided by FB is toinvest in it and to be rich and active: the more active, the better and higherreturn on investment in terms of fans’ participation and involvement.
We nevertheless believe that in a few years’ time social networkingplatforms will become more effective for academic libraries to communicatewith students and to deliver them new types of services. As technologyevolves, social networking platforms become more and more diffuse,pervasive, and advanced and students get used to the idea that FB might alsohave an institutional function/goal.

Enhancing users’ experience: A content analysis of 12 university libraries Facebookprofiles
268
Notes and References
[1] www.facebook.com.[2] BOOST, A. Digitale culturele communicatie: de rol van sociale media
in de communicatie tussen culturele instellingen en hun doelpubliek(Digital cultural communication: the role of social media in thecommunication between cultural institutions and their audience). M.A.in Journalism, Lessius College, 2008/2009.
[3] Smith, S. The creative uses of Facebook as a tool for artisticcollaboration. In Proceedings of the Electronic Visualisation and the Arts(EVA) Conference. London, 2009. Available athttps://www.dora.dmu.ac.uk/handle/2086/2764?show=full (April2010)
[4] JACOBSON, TB. Facebook as a library tool: perceived vs actual use.To be published in College & Research Libraries, the journal of theAssociation of College and Research Libraries. Available as preprint athttp://www.ala.org/ala/mgrps/divs/acrl/publications/crljournal/preprints/crl-088.pdf (April 2010)
[5] SECKER, J. Case Study 5: Libraries and Facebook. London: London Schoolof Economics and Political Science, 2008
[6] http://www.facebook.com/apps/application.php?id=3135795462&b[7] http://www.facebook.com/apps/application.php?id=2406120893&b[8] http://apps.facebook.com/worldcat/[9] KERRY, B., Are you on Facebook? A comprehensive guide, presentation.
Available at http://www.slideshare.net/KerryFSU/facebook-and-academic-libraries-presentation (April 2010).
[10] OCLC. Sharing, privacy and trust in our networked world. [online] 2007.Available at http://www.oclc.org/reports/sharing/default.htm (April2010)
[11] CHARNIGO, L; BARNETT-ELLIS, P. Checking out Facebook.com: theimpact of a digital trend on academic libraries. InformationTechnology and Libraries, 26 (1), 2007, p. 23-34
[12] BREEDING, M. Librarians face online social networks. Computer inlibraries [online], 27 (8), 2007, p. 30-33. Available athttp://www.librarytechnology.org/ltg-displaytext.pl?RC=12735(April 2010)
[13] MILLER, SE; JENSEN, LA. Connecting and communicating withstudents on Facebook. Computers in libraries [online], 27 (8), 2007,p.18-29. Available athttp://www.infotoday.com/cilmag/sep07/index.shtml (April 2010)

Enhancing users’ experience: A content analysis of 12 university libraries Facebookprofiles
269
[14] POWERS, AC; SCHMIDT, J; HILL, C. Why can’t we be friends? TheMSU libraries find friends on Facebook. Mississipi Libraries. 72 (1),2008, p. 3-5.
[15] EVANS, B. Your Space or MySpace. Library Journal, 15 October 2006.Available at http://www.libraryjournal.com/article/CA6375465.html&(April 2010)
[16] CONNELL, RS. Academic libraries, Facebook and MySpace, andstudent outreach: a survey of student opinion. Portal: libraries and theacademy, 9 (1), 2009, p. 25-36 Available athttp://muse.jhu.edu/journals/portal_libraries_and_the_academy/v009/9.1.connell.html#f5#f5 (April 2010)
[17] MACK, D; BEHLER, A; ROBERTS, B; RIMLAND, E. Reaching studentswith Facebook: data and best practices. Electronic Journal ofAcademic and Special Librarianship [online], 2007. Available athttp://southernlibrarianship.icaap.org/content/v08n02/mack_d01.html(April 2010)
[18] http://oedb.org/blogs/ilibrarian/2007/top-ten-facebook-apps-for-librarians-part-one/
[19] HENDRIX, D; CHIARELLA, D; HASMAN, L; MURPHY, S; ZAFRON,ML. Use of Facebook in academic health libraries. Journal of medicallibrary association, 97 (1), 2009, p. 44-47. Available athttp://www.ncbi.nlm.nih.gov/pmc/articles/PMC2605034/ (April 2010)
[20] SCHROCK, A. Examinig social media usage: Technology clusters andsocial netwrok site membership. Available athttp://firstmonday.org/htbin/cgiwrap/bin/ojs/index.php/fm/article/view/2242/2066 (April 2010)

271
Use and relevance of Web 2.0 resources forresearchers
Ellen Collins; Branwen Hide
Research Information Network, 96 Euston Road, London, UKellen.collins, branwen.hide @rin.ac.uk
AbstractOne of the features of the growth of Web 2.0 resources and services in recentyears has been the rapid development of a range of web-based tools designedto allow researchers to generate, modify, share and redistribute information ininnovative ways. There has been much discussion about the benefits of usingsuch resources, often accompanied by an assumption, particularly fromoutside the academic research community, that most researchers willeventually use these tools, if they are not already doing so. However, it is notyet clear whether, why, or to what extent, researchers actually do use them.This work set out to examine the extent to which researchers use Web 2.0tools and resources. It also set out to identify the factors that influenceadoption in order to determine whether these resources are changingresearchers’ behaviours.
Keywords: Web 2.0, researchers, scholarly communication
1. IntroductionOver the past 15 years the World Wide Web has undergone a massivetransformation from a tool for scientist at CERN to a global informationsource for over a billion users. The web is constantly evolving and over thepast few years has entered a more social participatory phase in which theinformation users become the information provider by creating, sharing, andorganizing content [1, 2]. Coined ‘Web 2.0’ these tools and resources alsoencourage collaboration and re-purposing of content, as well as supportingusers to develop innovative ways to interact with and use these web-basedplatforms [3].
There is much discussion about the benefits of using these resourcesfor educational and research purposes, with a strong belief that Web 2.0 will

Use and relevance of Web 2.0 resources for researchers
272
enable researchers to create, annotate, review, reuse and repurposeinformation/data. It is also believed that Web 2.0 will promote new forms ofscholarly communications and drive innovation [4]. Thus, it is often assumed,particularly by those outside of the active research community, that a widemajority of researchers are using or will use these tools during the course oftheir research career. Currently, however, there is little evidence as to theextent to which researchers are using or intend to use these resources. Inaddition, there is little understanding of the factors influencing the adoptionof Web 2.0 tools and resources. The evidence that does exist highlights anumber of technical issues, such as the need for standardization, issuespertaining to intellectual property rights (IPR) and the problems that arisewhen coping with a large amount of information. In addition, some of thefactors influencing the adoption of these tools are related to researchersscholarly communications practices, particularly within sub-disciplines, aswell as to institutional and organizational issues such as funding and careerprogression mechanisms [2, 4].
Thus, this paper sets out to examine, in detail, the extent to whichresearchers at all stages of their career, use Web 2.0 tools and resources, thefactors which influence adoption and to determine if using these resources areinfluencing researchers’ behaviours. It also sets out to look at the implicationsfor research practices and policy. For the purposes of this study, and inagreement with previous definitions [1], Web 2.0 encompasses webapplications that facilitate interactive information sharing, interoperability,and user centred design as well as placing an increased emphasis on user-generated content. This definition is not limited to technologies, but alsoincludes the changing ways that individuals and groups produce andcommunicate information [2, 4]. Therefore, there are a large number of web-based tools and resources used by researchers that fall under the term ‘web2.0’. These include generic services produced by commercial providers whichare also widely used by the public at large, generic services targeted to thewider research community, services provided by publishers or librarians, andtools adapted or generated for specific research communities or worksites.During the course of this work we have categorized the Web 2.0 tools used byresearchers into four distinct but overlapping groups: (1) sites for networking(e.g ResearchGate or Nature Networks), (2) sites designed for sharinginformation directly related to research practices and methodologies (e.gmyExperiment or Methodspace), (3) resources for sharing and commentingon published outputs (e.g. Slideshare or Mendley), (4) tools for documentingand sharing experiences (e.g. blogs or wikis).

Use and relevance of Web 2.0 resources for researchers
273
2. Methods
Several methodological techniques were used to identify the attitudestowards and patterns of adoption, of Web 2.0 tools and resources byresearchers in the UK. Initially, a comprehensive survey was sent toresearchers, designed to gather basic demographic information, includingage, positions, gender, discipline, dissemination practices, extent to whichthey engage in research collaborations, use of Web 2.0 tools, and attitudestowards new technology. The survey was sent to 12,000 UK academic emailaddresses, with an over all response rate of 0.8%. The sample was deemed tobe representative of the overall UK research population as it agreed withcurrent Higher Education Statistics Agency [5] data on the UK researchpopulation. Researchers were not asked specifically about their use of ‘Web2.0’, since many are unfamiliar with this concept. Instead, they were askedabout existing scholarly communications practices and techniques, as well asattitudes towards and usage of more novel forms of scholarlycommunications. Focusing on specific techniques avoided problems arounddefinition and permitted a greater degree of flexibility in analysis of thesurvey responses. The survey results were cross tabulated and subjected toappropriate statistical tests (Chi-squared from non-ordinal variables,Cochran-Armitage Trend Test for combinations of non-ordinal and ordinalvariables and Spearman Rank Correlation for ordinal variables).
The second strand of the research used a series of semi-structuredinterviews (face to face and by telephone) with a stratified sample of 56survey respondents, selected as a representative sample of all respondents.The interviews set out to explore how the researchers were making use ofWeb 2.0 and their perceptions of barriers and drivers to adoption. Theseinterviews illuminated the findings of the quantitative research, andprompted further consideration of the causal relationships identified in theinitial survey.
Finally, five case studies examining Web 2.0 based services wereundertaken using semi-structured interviews with service developers andusers. These case studies were undertaken to further investigate the adoptionof web based resources and tools by researchers. The first two case studies,Nature Publishing Group (NPG) and Public Library of Science (PLoS), werechosen to illustrate how commercial and not-for-profit publishers arefacilitating and enhancing access to electronic research articles. They alsoprovide functionality for user-generated content. The third case study,Slideshare, was included to demonstrate the value of a community targetedcommercial tool. The fourth case study, myExperiment, was included as an

Use and relevance of Web 2.0 resources for researchers
274
example of a researcher-generated tool that has gained support within thewider research community. The fifth case study, arts-humanities.net,highlights the growing development of publicly funded sites which support aspecific research community, primarily within the UK. For each case study,several interviews were carried out with developers and users of the service.
3 Results
Use of web 2.0 tools
Table 1 presents respondents’ use of a very specific sub-set of Web 2.0 tools,which focus on information sharing, rather than networking or informationdiscovery). Respondents estimated their use of each tool separately, thereforethe table does not sum to the total number of responses received.
Table 1: Use of information-sharing Web 2.0 toolNon-user Occasional
userFrequent
userWrite a blog 1087 155 51
Comment on other peoples’ blogs 978 273 28Contribute to a private wiki 1066 191 58
Contribute to a public wiki (e.g.Wikipedia)
1072 215 15
Add comments to online journal articles 1023 267 16Post slides, texts, videos etc. publicly 820 382 80
The 1,282 valid responses where respondents had estimated their frequencyof use of each technology were cross tabulated to create a taxonomy of overallusage:• Frequent users (13% ;175 people) respondents, who do at least one of
the activities listed in Table 1 frequently• Occasional users (45%;589 people) individuals, who do at least one of
the activities in Table 1 occasionally• Non-users (39%;518 people) respondents who never engage in any of
the web based activities indicated in Table 1.According to this taxonomy, the majority of respondents use the specific webbased tools/resources listed in Table 1 at least occasionally. As the definitionof ‘frequent’ is weekly, which in the context of communication tools may notseem like habitual use, it is reasonable to suggest that overall use of

Use and relevance of Web 2.0 resources for researchers
275
information-sharing Web 2.0 tools is by no means intensive amongresearchers.
Table 2 shows usage of these tools, cross tabulated against‘stereotypical’ Web 2.0 behaviours by respondents. Respondents were askedabout their habits in relation to blogging, social networking and open science(sharing data and work in progress on public fora), and were determined tobe users if they engaged with the tool/resource at least once a week. Unlikethe frequency categorisations, the behaviours are not exclusive and it ispossible for a single respondent to be a blogger, social networker, and openscientist, or none of the above. This is why the table does not sum to the totalnumber of responses. Bloggers are a sub-set of the frequent user group, asblogging is one of the tools considered within the ranking of usage. However,not all frequent users are bloggers. Social networkers and open scientists existwithin all three categories, though they remain more concentrated amongusers.
Table 2: Web 2.0 behaviours and use of information-sharing web 2.0 toolsFrequent
usersOccasional
usersNon-users
Blogger 51 0 0Social networker 51 80 34
Open scientist 36 24 6
Demographic characteristics of users of Web 2.0 tools
Tables 3-5 show demographic characteristics (gender, age, and careerprogression) cross tabulated against frequency of use. In each case, thecharacteristics are represented as a percentage of all users in that category,with the total number of respondents in each category (Base) shown at thebottom of each table.
Table 3: Percentage of respondents using information-sharing Web 2.0 toolsby gender
Frequentusers
Occasionalusers
Non-users Allrespondents
Female 34% 41% 52% 44%Male 66% 59% 48% 56%
Missing 1% 0% 0% 0%Base 175 589 518 1282

Use and relevance of Web 2.0 resources for researchers
276
Table 4: Percentage of respondents using information-sharing Web 2.0 toolsby age
Frequentusers
Occasionalusers
Non-users Allrespondents
Under 25 2% 3% 5% 4%25-34 26% 25% 28% 26%35-44 34% 25% 23% 26%45-54 19% 25% 22% 23%55-64 16% 18% 16% 17%
Over 65 3% 4% 5% 4%Missing 1% 0% 0% 0%
Base 175 589 518 1282
Table 5: Use of information-sharing Web 2.0 tools by position
Table 3 shows a clear association between being male and level ofusage, which is confirmed using statistical tests (Z=5.52, p<0.001). Tests on thedata shown in Table 4 suggest that a greater degree of adoption is positivelyassociated with older age groups (rho=0.05, p=0.048). Tests on the data shownin Table 5 show that a greater degree of adoption is positively associated withmore senior positions (rho=0.14, p<0.001). However, since this analysis is notmultilinear, no statements can be made about the relative importance of eachdemographic factor. Furthermore, a relationship between variables, such asage and position, may underpin some of the observed correlations.
When considering the Web 2.0 behaviours, there are further cleardemographic distinctions. Being a blogger is associated with males (p=0.07)and discipline (p=0.004), with participation more likely by those in computer
Frequentusers
Occasionalusers
Non-users Allrespondents
Professor 20% 21% 20% 20%Reader 7% 9% 5% 7%
Senior lecturer 14% 18% 11% 15%Lecturer 13% 9% 12% 11%
Research fellow 12% 13% 11% 12%Research assistant 7% 4% 4% 4%
PhD student 19% 23% 32% 26%Missing 7% 3% 3% 4%
Base 175 589 516 1280

Use and relevance of Web 2.0 resources for researchers
277
science and mathematics as well as arts and humanities. Being a socialnetworker is associated with younger age groups (Z=5.42, p>0.001), morejunior positions (Z=4.64, p>0.001) and discipline (p<0.001), with participationmore likely again by those in computer science and mathematics, but also bythose in economics and social sciences. Being an open scientist is associatedwith older age groups (Z=1.70, p=0.0089), with males (P<0.001) and withdiscipline (p=0.009), with participation more likely by those in computersciences and mathematics as well as arts and humanities as was seen withblogging. However, participation in open science is highly unlikely by thosein the medical and physical sciences. As highlighted above in relation to thefrequency categorisations, this analysis is not multilinear and there may bemasking variables, such as a relationship between gender and discipline.
Attitude to Web 2.0
Table 6 cross tabulates level of usage against degree of encouragement thatresearchers received from various bodies, including their local researchgroup, their department, or institution, as well as library and informationservices, computer support services, research funders and conferenceorganisers. There appears to be a correlation between the level ofencouragement given and the degree of adoption of web 2.0 tools. Inparticular, non-users of Web 2.0 tools seem to have a very low perceived levelof encouragement from within their local research group. Statistical tests onthe survey data also suggest that the level of collaboration is associated withdegree of adoption (rho=0.26, p<0.001).
Table 6: Percentage of frequent, occasional and non-users who receiveencouragement to use Web 2.0 tools
Frequentusers
Occasionalusers
Non-users
Allrespondents
Local research groupencouragement
42% 23% 6% 19%
Other encouragement 31% 27% 24% 26%No encouragement 27% 50% 70% 55%
Base 175 589 518 1282
Findings from the qualitative interviews support this overallconclusion, suggesting that high levels of local support are crucial toencouraging adoption, and that an absence of these can prevent adoption. In

Use and relevance of Web 2.0 resources for researchers
278
some cases, this may be because the researcher has no interest in changingtheir working practices unless they can understand why it is useful to do so:
I do need people to recommend why I need to change to usesomething (Non-user)1
In other cases, the desire to do things differently is evident, but the researcheris unsure about how to proceed or needs encouragement to see these newpractices as a priority:
I’m enthusiastic in that I think there’s a lot of potential there, butpragmatically I think there are problems still because people don’thave the knowledge (…) to make use of it (Non-user)I can see other people using it and I'd like to be able [to] use it better.I really could do with having a tutorial or something, but I reallydon't have time to do all these things. (Occasional user)
Several respondents mentioned a lack of support from institutional IT servicesas a barrier to adoption.
HEIs put [a] lot of effort into supporting innovations in teaching butlittle effort into supporting innovations in research’ (Occasional user)‘The blog system is being run by people who we see as nottechnically competent enough to do it reliably (Frequent user)
Blogs were viewed by one survey respondent as a useful place to furtherexisting connections, via research groups or other networks as they can beprivate spaces:
Some of the discussions are sensitive and they want the peopleinvolved to be free to say what they want.Table 7 cross tabulates frequency of use by attitude towards Web 2.0
tools. Very few researchers in any category have a sceptical attitude to Web2.0, and even fewer are actively uninterested in it. However, frequent usersare noticeably much more enthusiastic about Web 2.0 than respondents inother categories.
Respondents were probed more deeply on their opinions about thefuture of scholarly communications and the role that Web 2.0 tools might takein this. In particular, they were asked to rate the likelihood of formal peerreview becoming increasingly complemented by reader-based ratings,annotations, downloads or citations and if either new types of onlinepublication or using new kinds of media formats and content will grow inimportance over the next five years. Table 8 cross tabulates frequency of use
1 All quotes are taken from the interviews and case studies.

Use and relevance of Web 2.0 resources for researchers
279
by rated likelihood of online supplements to peer review. Frequent users aremore likely than any other group to consider online supplements to peerreview to be likely. Non-users are less interested in the question, with more ofthem having no opinion than any other group. Overall, however, mostrespondents considered online supplements to peer review a likelydevelopment in their field.
Table 7: Percentage of frequent, occasional and non-users of Web 2.0 byattitude to Web 2.0
Frequentusers
Occasionalusers
Non-users Allrespondents
Sceptical 6% 8% 10% 9%Uninterested 1% 2% 4% 3%
Neutral 23% 49% 57% 49%Enthusiastic 68% 38% 26% 37%
Missing 3% 3% 3% 3%Base 175 589 518 1282
Table 8: Percentage of frequent, occasional and non-users of Web 2.0 byrated likelihood of supplement to peer review
Frequentusers
Occasionalusers
Non-usersAll
respondentsNo opinion 10 17 28 20
Unlikely 23 35 33 33Likely 65 48 38 46
Missing 2 1 1 1Base 175 589 518 1282
Findings from the qualitative survey, however, show that someresearchers remain suspicious about the value of this process:
Things like citation rates that come out of a formal process can betracked (…) but reader comments and ratings would be so open toabuse it’s hard to imagine that people would interpret it as valid ofthe paper’s worth (Non-user).Table 9 cross tabulates frequency of use with rated likelihood of new
types of online publication. All groups of users consider that new types ofonline publication will grow in importance in their field over the next fiveyears.

Use and relevance of Web 2.0 resources for researchers
280
Table 9: Percentage of frequent, occasional and non-users of Web 2.0 byrated likelihood of new types of online publication
Frequentusers
Occasionalusers Non-User
Allrespondents
No opinion 5 10 13 11Unlikely 13 12 13 13
Likely 81 77 73 76Missing 2 1 1 1
Base 175 589 518 1282
Information seeking practices in relation to Web 2.0
The survey data suggested that researchers continue to place considerableemphasis on traditional forms of scholarly communication. Subscriptionjournals, whether online or in print version, were considered the mostimportant source of research information across all disciplines. 91% ofrespondents rated online journals as average or high importance, while 89%rated print journals as average or high importance. Conference presentationswere also important (82% rated as average or high importance), as wereproceedings (71% rated as average or high importance). 65% of respondentsrated personal communications as average or high importance.
This finding is reflected in the survey interviews, where researchersplaced emphasis on personal networks, and suggested that Web 2.0 toolscould be valuable in enhancing their reach:
Certainly a lot of the articles that I pick up in journals are throughverbal face to face recommendations so I don’t see why I wouldn’talso take an online recommendation if someone in my area in anewsfeed I was to subscribe to would say that this article isimportant to our area, then I would take that on board and look at it(Non-user)
It is worth noting, however, that this comment is phrased as a possibilityrather than a report of existing practices, suggesting that researchers may notcurrently make extensive use of online research recommendations.
When seeking information, researchers value services such as GoogleScholar which increase the visibility of information. As one interviewee put it,the service is ‘particularly useful for looking up some papers that are onlinebut not published yet’. For most researchers, wikis and blogs were not used asa source of information, due to concerns about unreliability:

Use and relevance of Web 2.0 resources for researchers
281
[I] wouldn't use Wikipedia or anything like that, anything that isn'tpeer reviewed like that is worthless
One researcher suggested that even blogs associated with established journalswere viewed with some suspicion as a source of high-quality information:
[blogs are] not taken very seriously, even blogs based on Nature[colleagues] find it time consuming and not very credible, interesting,yes, but it’s almost regarded as a piece of entertainment first andpotentially useful almost serendipitously.’
However, another researcher suggested that Nature blogs had helped him tobuild connections within the discipline. He used the blogs:
for searching for and about information regarding our research, withour collaborators (…) it’s very useful because you get to know whatother people are doing, getting to know [a] network of people. Once Isaw a relevant paper written by a person in Canada, so I wrote tohim to send me some of the things he was using, and within twodays he sent me everything, you know. So, out of this system we areable to collaborate too, getting to know other people’s work and ifthey are doing similar things to us, we can get in touch with themand ask questions and share ideas.This interview data suggests that where blogs are used it is not
necessarily to find information per se, but rather to connect with people ororganisations that might inform a researcher’s work. Web 2.0 resources, evenwhen associated with a trusted source, have a credibility problem whichprevents their widespread use as a source of research information: they havemore value as a tool to increase discoverability.
Information dissemination practices in relation to web 2.0
The survey showed that, when rating methods of research dissemination,respondents continue to place considerable emphasis on traditional, peer-reviewed outputs. The exact form of these varied between disciplines, withconference proceedings rated highly in some disciplines and monographsconsidered more important in others. An interesting disparity arose betweenonline and print journals: print publications were rated as very important by70% of respondents, while only 56% rated online-only journals as veryimportant. This may suggest that non-peer reviewed online resources such asblogs and wikis will struggle to be accepted as long as established and peerreviewed online-only journals are valued so much less than their printcounterparts.

Use and relevance of Web 2.0 resources for researchers
282
However, interview data suggests that researchers’ concerns aboutdisseminating information via web 2.0 tools were not linked to the credibilityof these new media, but rather their likely impact. One non-user describednovel forms of scholarly communications as a 'waste of time', and anothersaid that 'I'd rather spend the time thinking about what I'm going to do nextrather than spend it telling others what I'm doing'. Even frequent users didnot necessarily begin from the assumption that the tools they were using wereuseful:
People are very keen to have unconventional dissemination practices,but I think it all boils down to whether they will be valued.
In some instances, this attitude was the product of previous, unsuccessful,attempts to use Web 2.0 tools:
The institute had a blog for two years, but we actually gave it up,because it wasn’t the interactive service we thought it should be (…)nobody really commented. (Non-user)
However, frequent and occasional users did value the visibility that blogsbring to their authors.
If it increases your profile and more people were aware of the workyou did, that would be a benefit (Occasional User)There are career benefits too. Those working in the media field whoare actively using these materials and are perceived to be on the‘cutting edge’ are often very successful. (Frequent user)
This visibility was considered particularly useful in cases where it helped tobuild collaborations, share preliminary findings and increase the speed withwhich other researchers could see work. This reflects the use of blogs andsocial networks for information seeking, as outlined in the previous section.
It is of big value to be able to communicate with academics from allover the world (Frequent User)It almost offers you a halfway house in that you can be less formal,you don't have to have completed your research project, you can talkabout your research findings, as it were, and it's kind of put out therein the public space, and people can comment or interact withouthaving to wait until your final output is a journal article that willappear in print. (Frequent User)
Within this consideration of information dissemination and Web 2.0, it isworth turning a more focused attention to the practice of open science. Openscientists formed a very small minority in the research sample, but they areparticularly strong proponents of web 2.0 as a way to improve the practice ofscience:

Use and relevance of Web 2.0 resources for researchers
283
You can have a ‘conversation’ of more than just two-way. Otherpeople can be watching the conversation. That’s quite useful. Theycan contribute if they want and you can always make it private.(Open Scientist)Ultimately, it will change how people do research (…) It is aboutaccelerating the research cycle for small pieces of research that areeasily distributed. (Open Scientist)
Outside the open scientist group, some respondents were broadly supportiveof the concept, without entirely understanding what it meant:
I presume it’s concerned with the production of papers and researchmaterials that placed in some publicly accessible place. I support it,yes. (Occasional user)
However, many were concerned that the practice of open science wouldinterfere with the established procedures which make up the so-called‘minutes of science’, thereby leading to confusion:
I do not support open science and I do not see any benefits for me. Ihave a negative attitude to use blogs and videos in research. Once it’sfinished it should be published otherwise it will be anarchy inscience. (Occasional user)In our university we have a certain guideline what may or may notbe put onto the blog. I have to agree that something needs to besaved and I don’t want people to say: we just discovered X.(Occasional user)
This consideration of the very specific behaviour of open science reflects theoverall shape of researchers’ attitudes to disseminating information via Web2.0. A small minority are actively engaging with these new publicationtechniques, using them to share information and hold conversations. Manyare not yet engaged with the tools, and view them with some suspicion. Andindeed, even the most enthusiastic proponents do not see online publicationas an alternative to established peer reviewed journals.
Development and delivery of Web 2.0 services
The case studies were undertaken in order to understand more about theways in which Web 2.0 services are developed and delivered, and users’perceptions of these services. The five case study organisations were selectedto represent a range of tools, business models and disciplinary focuses.
The need to respond to a perceived gap in existing services was astimulus for the development of many Web 2.0 tools. myExperiment, forexample, was established as a tool to encourage and support scientists to

Use and relevance of Web 2.0 resources for researchers
284
share their methods as well as their data and research findings: this was felt tobe an unusual practice for scientists. Similarly, SlideShare was establishedbecause the developers felt that there was no straightforward way for those inbusiness or academia to share their presentations online. Developers seem towork in a process of continual innovation, seeking out new gaps to be filled astheir service grows. In 2009, for example, Public Library of Science (PLoS)designed a strategy to explore article-level metrics of impact, in response tothe perceived failings of journal impact factors. This was a logicaldevelopment from its original purpose as a publisher, and later repository, foracademic articles. Similarly, Nature Blogs was developed by NaturePublishing Group (NPG) in response to the observation that, while their owncommenting facility for articles was not well-used, conversations about thosearticles were taking place elsewhere in the blogosphere.
As suggested by this latter example, innovations can also result fromdevelopments in other areas of online communication. NPG developed socialbookmarking system Connotea as a scholarly version of the existing tooldel.icio.us. PLoS worked in partnership with a new Google tool to developtheir pre-publication service, PLoS Currents. Such innovations have varyingdegrees of success: Connotea, for example, is not the market leader and hasnot been heavily invested in. Nonetheless, NPG is investigating the ways inwhich it could provide useful data on the use of the tool and journal in orderto inform the Group’s wider management decisions. This repurposing of a‘failed’ experiment illustrates the constant innovation practiced by many web2.0 service providers.
Such innovation is often driven by developers’ notions of whatresearchers might find useful, as with NPG’s development of Connotea andNature Blogs. However, it is sometimes undertaken through direct contactwith researchers, talking to them to discover what they want from a socialnetworking tool and using this information to build new platforms andservices. Some products use relatively light touch forms of user feedback toinform their development. SlideShare, for example, places considerable valueon user feedback communicated via emails and blog posts, and finds this farsuperior to more formal market research exercises. NPG gathers feedbackfrom users directly via blogs, mailing lists and fora.
Others, however, use a much more intensive process whendeveloping their services. myExperiment is an excellent example of this.During the development process, software developers were embedded in thelab with scientists so that they could understand exactly how researchersapproached and carried out their work. Throughout the development stages,researchers worked with focus groups and other feedback mechanisms to

Use and relevance of Web 2.0 resources for researchers
285
regularly test their ideas, ensuring that scientists’ views were taken on board.Developers were also present at introductory sessions for the scientists new tothe service, who went on to become strong advocates to encourage wideradoption. This illustrates the benefits of user-centred research anddevelopment, which can ensure that the end result meets practitioners’ needs.
Producing a service that researchers actually need is an importantpart of ensuring usage. However, as myExperiment demonstrates, it is alsoimportant to actively engage with the proposed user community, to ensurethat they understand what they can gain from novel tools. SlideShare ascribessome of its success to ongoing work with other services: it has created plug-ins for Facebook, LinkedIn and PowerPoint to make its product more easilyaccessible. The capacity to embed presentations in a blog post has also beenan important factor in SlideShare’s success, as it encourages bloggers to usethe service and thereby raise awareness of the service among their readers.arts-humanities.net noticed a relatively large increase in membership of theirsite following a concerted publicity effort involving emails, announcementsand conferences within the community. Feedback suggests that onceunengaged researchers are informed about the site they become veryenthusiastic. This could mean that for some tools an important barrier toadoption may simply be lack of awareness.
In other instances, however, there are more complicated barriers towidespread adoption of Web 2.0 services. SlideShare users cited concernsabout intellectual property rights, privacy and data protection, and hadreservations about entrusting their valuable content to externally-hostedsystems. This concern had been identified as a possible barrier to adoption bymyExperiment, and so their service offers different levels of sharing.However, they felt that potential users needed better education about the highlevels of security offered by the site, as fears about loss of intellectual propertypersisted. NPG noticed that their initial facility for commenting on articleswas less successful than some of their competitors, such as the British MedicalJournal (BMJ). They suggested that this could have been because comments atthe BMJ are a formal extension of the letters to the editor, with a D.O.I.allocated to the contribution, thereby ‘rewarding’ the commenter.
Another barrier to widespread adoption is the number of Web 2.0services available to researchers. Several users cited this as an issue,highlighting the amount of time required to sign up to and experiment withnew technologies, and even the number of usernames and passwords thatmust be remembered. Another issue was the specificity of many of these web2.0 tools, either in terms of the services they offer or their subject remit. Oneinterviewee commented that ‘Nature is very focused on certain parts of

Use and relevance of Web 2.0 resources for researchers
286
research, so doesn’t allow me to follow other kinds of research’. It is not clearthat individual services can do a great deal to overcome this particularbarrier.
In terms of adoption, many of the case study services highlighted thedifferent levels of engagement by researchers. SlideShare, for example, usesan ‘influence pyramid’ to describe its user groups: a small segment at the topwho actually upload information, a larger segment who increase the visibilityand usefulness of this content by commenting on it or tagging it, and the vastmajority who just watch or download presentations. arts-humanities.net notesa similar hierarchy in relation to its users: it has 1,200 registered members butattracts between 6,000-7,000 unique visitors each month. Several of the casestudy organisations are actively targeting high-profile researchers toencourage them to use their services, in the hope that they will generateincreased usage within their communities.
4. Discussion
The data collected through the survey, interviews and case studies presents arelatively detailed picture of researchers’ usage of Web 2.0. Overall, it seemsthat researchers are not overtly hostile to new forms of scholarlycommunication, and that some are experimenting with these techniques.However, routine use of Web 2.0 tools does not seem to be widespread.
The cross tabulation between frequency of use of certain tools andWeb 2.0 behaviour, shown in Table 2, presents some interesting results. Inparticular, there are a small number of open scientists sharing their data andwork in progress on a regular basis, but not using blogs, wikis, comments onjournal articles or slide, text and video sharing on a regular basis, prompting aquestion about how they are sharing this information. There is a furthergroup, small but not insignificant, of open scientists who undertake theseactivities only occasionally. This suggests that the Web 2.0 tools underinvestigation may be seen as a convenient way to communicate whenoccasion demands, but not a regular and routine part of working practice.This reaffirms that it is difficult to consider researchers’ use of ‘Web 2.0’ as asingle phenomenon, since it is perfectly possible for people to be using someaspects of it frequently, while ignoring other aspects or using it only when itmeets their needs.
The associations between demographic variables and frequency andtype of use must be treated with a degree of caution, but remain valuable.Social networking, in comparison to blogging and open science, seems to be

Use and relevance of Web 2.0 resources for researchers
287
more important for younger and more junior researchers. This may reflect thefact that younger researchers are exploring new ways to establish theirprofessional networks, while older and more experienced researchers havealready created theirs without virtual aids. It may also be that youngerresearchers are more likely to use social networking tools in their personallives, and are therefore more familiar with them and potentially more awareof their potential value in a professional context. The positive relationshipbetween professional level and engagement with web 2.0 techniques is alsointeresting. This could well be prompted by a concern on behalf of morejunior researchers to focus on established communication channels such aspeer reviewed journals, which will have the most impact on their career andpromotion prospects. More senior researchers, with an establishedprofessional reputation, may be freer to experiment with novel ways ofcommunicating their research.
Researchers appear to be strongly influenced by their widerprofessional environment in their use of web 2.0 tools. The associationbetween level of collaborative working and uptake of web 2.0 tools could bedue to researchers adopting new tools and technologies to further existingcollaborations. However, it is also possible that being part of a collaborativenetwork helps researchers to discover, use and advocate new ways ofworking. In terms of the future of scholarly communications, researchers inall categories considered an increasing importance of new types of onlinepublication in their field within the next five years to be likely. This isparticularly interesting in light of the relatively low levels of usage of existingtypes of online publication such as blogs, wikis and file sharing. Researchersexpect a future scenario where online publication is more important, but arenot engaging with tools which could perhaps be the precursor to these newmedia.
Researchers’ attitudes to Web 2.0 tools as a way of discovering andpublishing information are decidedly mixed. The survey showed that mostresearchers are engaging on at least an occasional basis with Web 2.0 tools.However, the qualitative interviews suggest that only a few are using them ina systematic way as part of their investigative work. Both information seekingand dissemination are thought to benefit from Web 2.0 tools, as they improvediscoverability of information and help researchers hold more effectiveconversations. These may be with existing members of the research team, orwith other researchers in the field; sometimes the researcher would not havebecome aware of these people without the intervention of Web 2.0 tools.However, it is clear that online tools are valued only as a route to access highquality, trusted information: they are not seen as a source for such

Use and relevance of Web 2.0 resources for researchers
288
information. Researchers have strong reservations about the accuracy ofinformation online. They are also dubious about the impact of Web 2.0 tools,recognising that a specific tool needs to be relatively widely used andaccepted if information published on it is to have any value. Some researchersalso expressed concerns that informal web-based dissemination ofinformation could have a negative impact upon the published record ofscience, and felt that this could retard scientific discovery.
The case studies show that a researcher’s Web 2.0 environment issomewhat complex, with a wide range of tools to choose from. Serviceproviders are constant innovators, and often recognise the importance ofengaging with researchers in order to create services that are useful. Usage ofservices is varied, but where services are not successful they are quicklydropped or re-purposed to better meet researchers’ needs, as happened withNPG’s commenting features. However, many services acknowledge that theiruser base is very diverse, and that it is challenging to create tools which willmeet the needs of everyone. Researchers themselves do engage with theseservices, but retain some reservations, the principal of which is aroundintellectual property rights. It will be a challenge for individual serviceproviders to overcome this concern, as evidenced by myExperiment’sattempts to show researchers that their work is protected on the site.
5. Conclusion
Overall, it appears that researchers are not engaging systematically with Web2.0 tools. They are broadly interested, and many are infrequent users of thesetools. However, they do not form a core part of most researchers’ workingpractices. Researchers value the increased visibility that Web 2.0 tools cangive to research findings, but they do not hold information published via theweb in equal esteem with peer reviewed journals. And while many believethat online publication tools will be increasingly important in future,relatively few are engaging with existing options such as blogs, wikis and filesharing. Web 2.0 services are rapidly evolving to attempt to meet researchers’needs, but are aware that their user base is very diverse and overwhelmedwith a range of possible technological solutions to research problems.
This project suggests that any systematic changes to researchers’ useof Web 2.0 tools will need to be supported by various bodies with a role in theresearch process, but in particular by local research groups. Web 2.0 servicedevelopers are seeking to engage high-level academics to encourage wideruptake within specific fields; there may be some virtue in examining the

Use and relevance of Web 2.0 resources for researchers
289
potential of this model more widely to encourage researchers to engage withgeneric Web 2.0 tools such as blogs. There are also some significant barriersto overcome. In particular, the issue of intellectual property rights andownership of data, methods and tools must be resolved, and researchers mustreceive enough information to feel secure that their work is protected. Thereis also a credibility issue to be addressed, as researchers continue to besuspicious of information published using Web 2.0 tools, even whenassociated with reputable and established sources.
Future research could usefully undertake more complex multivariateanalysis on the data to establish the relationship between possible causalfactors for level of Web 2.0 usage. It would also be interesting to considerwhy, given that most researchers believe online communications will becomeincreasingly important in future, so few of them are choosing to engage withthese techniques while they are still at a relatively formative stage.
Acknowledgement
We wish to acknowledge Rob Procter from the Manchester eResearch Centre,University of Manchester, as well as Robin Williams and James Stewart fromthe Institute for Study of Science, Technology and Innovation, The Universityof Edinburgh who undertook this work on our behalf.
Notes and References
1 ANDERSON, P. What is Web 2.0? Ideas, technologies and implications foreducation. Available athttp://www.jisc.ac.uk/media/documents/techwatch/tsw0701b.pdf.
2 RIN. Use and relevance of web 2.0 resources for researchers. to be publishedMay 2010, Submitted, Available at http://www.rin.ac.uk/our-work/communicating-and-disseminating-research/use-and-relevance-web-20-researchers.
3 WARE, M. Web 2.0 and Scholarly Communication. Available athttp://mrkwr.files.wordpress.com/2009/05/ware-web-2-0-and-scholarly-communication-preprint.pdf.
4 PROCTER, R; et al. Adoption and Use of web 2.0 in scholarly communications.Philosophical Transactions of the Royal Society A, Submitted
5 HESA Available at http://www.hesa.ac.uk/index.php/content/view/600/239/

290
What are your information needs?Three user studies about research information in
the Netherlands, with an emphasis on the NARCISportal
Arjan Hogenaar; Marga van Meel; Elly Dijk
Royal Netherlands Academy of Arts and Sciences, Research Information,P.O. Box 19121, 1000 GC Amsterdam, The Netherlands
AbstractThe NARCIS portal (www.narcis.info) provides access to science information(information about research, researchers and research institutions) andscientific information (full-text) publications and datasets. The portal is verypopular, with 1.2 million users annually. NARCIS is also an importantsupplier of information to international services such as Google/GoogleScholar, WorldWideScience.org and DRIVER. In 2009, the KNAW conducteda three-part user survey, with two online surveys and a series of semi-structured interviews. The aim was to learn more about the people who usethe portal, why they use it and their ideas and wishes for improvements tothe portal. Another purpose of the survey was to identify changes that couldbe made to improve the match between the services provided by NARCISand the needs of existing and potential users. Surveys showed that more thanhalf the users of NARCIS are from universities, research institutions oruniversities of applied science. Most searches conducted on NARCIS are fordissertations. The existence of a single gateway to different types ofinformation is regarded as very useful. The most frequently mentionedimprovement in the service would be to provide access to information fromother countries as well. Respondents also mentioned the provision of tools forperforming complex analyses of the information available via NARCIS as aworthwhile option for enhancing the service. The interviews revealed, amongother things, the need for the presentation of information in context and thatsenior officials are often confronted with information overload. The usersurvey has led to a series of proposals for modifications or improvements in

What are your information needs?
291
the service; some of them may be implemented immediately, while otherswill require consultation at national or international level.
Key words: user survey; questionnaires; portal; evaluation of integratedservices
1. Introduction
The most important task of the Research Information (KNAW-OI)department of the Royal Netherlands Academy of Arts and Sciences (KNAW)is to help national and international users to find information about research,researchers (and their expertise), research institutions and the results ofresearch (publications and datasets) in the Netherlands.
The Dutch Research Database (NOD)1 is a service provided by KNAW-OIand forms the basis for its role as the national focal point for researchinformation. Before 2005, the KNAW was involved in the development ofDAREnet (network for Dutch Academic REpositories) [1], at the time thecentral portal for access to publications in the repositories of researchinstitutions. Since then, KNAW-OI has been developing the national focalpoint for research information and research results at European level. Thefinal result is NARCIS (National Academic Research and CollaborationsInformation System) [2].
NARCIS now plays a central role in searching all research-relatedinformation in the Netherlands and serves as the national showcase forresearchers working in the Netherlands. Via NARCIS users have access toboth the information from the Current Research Information Systems (CRISs)and the information from the Open Access Repositories (OARs).
A problem is that in the Netherlands the (OARs) and the CRISs generallyfall under different organisational units of the universities: the libraries or theresearch administration departments. The datasets, if they are kept at all, arestored in the DANS2 system. With all these different systems, it is inevitablethat variant versions of the names of authors and researchers are incirculation. To cross-reference the different information types, unique DigitalAuthor Identifiers (DAIs) are used. Every author or researcher is assigned apersonal DAI, which creates the Academic Information Domain [3], thedomain where all information relating to research is collected. Thanks to the
1 www.researchinformation.nl2 Data Archiving and Networked Services (www.dans.knaw.nl)

What are your information needs?
292
DAI, a personal page can be compiled in NARCIS for every researcher,containing a complete overview of his or her research, publications anddatasets in context, as illustrated by the example for Professor W.H.J. Meeus.3
NARCIS already offers users many useful functionalities such as RSSfeeds, the Zotero4 reference tool and personal pages for researchers. Theportal is visited 1,200,000 times a year by researchers, policy makers, peoplein the media and members of the general public. The proportion of OpenAccess publications available is rising steadily, as Peter Suber has observed[4]. Thanks to NARCIS, these Open Access publications can be traced quicklyand easily.
It is easy to discover how often NARCIS is used from the log data. Inkeeping with the department’s tradition of conducting regular surveys,KNAW-OI conducted a user survey in 2009 to identify who the users are,where they come from and what they use NARCIS for.
2. Methodology
2.1 Analysis of IP addresses
The simplest way of discovering who is using the NARCIS portal is to checkthe users’ IP addresses. 5 We identified the IP addresses of the 400 mostfrequent users (in terms of the number of NARCIS views) in January 2010(through AW-stats6).
Those IP addresses were then linked to the names of institutions using IPlocators Topwebhosts 7 , Geobytes 8 and ip2locations. 9 In Table 1 thoseinstitutions are broken down into the following categories: University,Research institution, University of Applied Sciences, Government, Not-for-profit sector, Hospital, Business, Media and Provider.
Table 1: Share of users in each category
Category Share of NARCIS use
3 http://www.narcis.info/person/RecordID/PRS12373694 http://www.zotero.org5 For reasons of privacy, no attempt has been made to connect IP addresses to individual users.6 http://www.ubiquityhosting.com/web-hosting/service/awstats7 http://www.topwebhosts.org/8 http://www.geobytes.com/ipLocator.htm9 http://www.cqcounter.com/whois/domain/ip2locations.com.html

What are your information needs?
293
University 36%Research institution 4%University of Applied Sciences 8%Government 6%Not for profit 2%Hospital 1%Business 11%Media 1%Provider 32%
The last category, ‘provider’, is a very special one: many users accessNARCIS via a provider. This means that the KNAW can see which providerswere used, but naturally cannot identify the individual or organisation thatvisited NARCIS via those providers.
2.2 Online surveys
In addition to this analysis of users on the basis of IP addresses, we alsoconducted two online surveys to discover more about the work environmentand the professions of the users. The surveys were also designed to learnmore about the types of information the users were searching for, how theyrated the different functionalities in NARCIS and what developments theywould like to see in the system. The two online surveys were compiled byusing SurveyMonkey.10
The first survey was held in June 2009. It could be completed only via theNARCIS website (www.narcis.info), so that only actual portal users wereaware of the survey’s existence. In view of NARCIS’s international character,the survey was presented in both Dutch and English. The participants wereasked whether they would also be willing to take part in a follow-up survey.The survey was deliberately kept short and confined to just six questions.
The Dutch-speaking respondents who had said they were willing toparticipate in a follow-up study were asked to take part in another study,again compiled in SurveyMonkey, in December 2009.
As already mentioned, the two surveys were completed only by actualusers of NARCIS. They left two questions unanswered:
10 www.surveymonkey.com

What are your information needs?
294
To what extent does the target group for whom NARCIS may berelevant actually use the service? Can any conclusions be drawnabout non-users?To what extent could NARCIS be useful for non-users, given theirinformation behaviour?
2.3 Interviews
To answer these questions, semi-structured interviews were held with 17individuals in the final quarter of 2009. It was not known in advance whetheror not they used NARCIS, but it was known that they all held seniorpositions in which they handled a lot of information.
The point of departure for the interviews was to identify the informationecology [5] of the interviewees, in other words what technologies they use tosearch for and process information.
These 17 individuals represented NARCIS’s various target groups: nineresearchers [humanities (3), natural sciences (3) and social sciences (3)], fourpolicy makers, two information specialists and two journalists. This methodcorresponded with that used in a previous survey of needs in 2002 [6],although that earlier study related exclusively to the Dutch ResearchDatabase (NOD).
A script was written in advance to ensure that at least the followingsubjects were discussed with the interviewees:
What sources of information do they use?How do they search for information?What problems do they encounter in searching for information?
Although the interviews related to the respondents’ general informationneeds and information behaviour – in other words, their informationlandscape – the interviewers focused mainly on NARCIS’s potential role in it.
Each interview lasted one hour. The interviews were all recorded and areport summary of each interview was produced according to a fixed format.The reports were all approved by the interviewees.
3. Results
3.1 Surveys

What are your information needs?
295
There were 434 respondents in the first survey, of whom 268 completed thefull questionnaire; 61 respondents completed it in English.
Of the respondents, 59% were from universities, universities of appliedscience or research institutions. Another 15% were from the businesscommunity and 15% were from the not-for-profit or public and semi-publicsector (see Figure 1).
Figure 1: Distribution of fields of activity
As mentioned, it was already possible to gain an impression of the fieldsof activity of the users of NARCIS by identifying the names of the institutionscorresponding with the IP addresses of the 400 most frequent users inJanuary 2010. That analysis showed that at least 48% of the users were fromuniversities, universities of applied science or research institutions, a figurethat corresponds closely with findings from the survey, especially bearing inmind that quite a number of those who visit NARCIS via a provider have aposition at one of those research institutions.
Thirty-six percent of the respondents described themselves as researchersand 21% as information specialists. Few described themselves as members ofthe other professions (e.g., policy assistant, journalist). Many respondentsanswered the question concerning their profession in their own words.Analysis of the information they provided suggests that almost half of thosesurveyed can be described as academics.
During a six-month period, 21% of the respondents use NARCIS morethan 10 times, 18% use NARCIS between four and 10 times and 60% use itbetween one and three times. Relatively speaking, information specialists use
00.10.20.30.40.50.60.7
Distribution of Fields of Activity

What are your information needs?
296
NARCIS most frequently (58% use NARCIS four times or more in a six-month period).
NARCIS users search mainly for dissertations, other types of publicationand information about researchers. The number of searches for datasets isremarkably small (7%).
Being able to download full-text publications was mentioned as the mostimportant feature of NARCIS by 78% of the respondents, while 60% regardthe links to additional information (for example, from the description of aperson to his/her publications) as important. Other important features arebeing able to search simultaneously in different information types as well asthe presentation of an individual’s entry in combination with all the relevantinformation about him or her.
Asked to say what they felt the most interesting development would befor NARCIS, 57% of the respondents mentioned the presentation of similarinformation from other countries. Other frequently mentioned suggestionsfor upgrading NARCIS were to make improvements in its functionality (forexample, the possibility to browse) and to offer tools for complex analyses.
The follow-up survey was held among a sub-population of therespondents in the first survey, but with a similar composition. The purposeof this survey was to find out how the respondents rated the functionalitiesand content offered by NARCIS. For 95% of the respondents, having a singlegateway to different types of information was felt to be useful or very useful.
The respondents were impressed with the option of searching on (full-text) publications and on current research. However, also this group ofrespondents – who search in NARCIS more frequently than the wider groupof participants in the first survey – does not perform many searches ondatasets.
Although the search options are highly rated (79% of respondents weresatisfied or very satisfied), the respondents were not always aware of all thesearch functionalities in NARCIS (combining search terms; tailored RSSfeeds). The respondents were most impressed by the large number of OpenAccess publications available through NARCIS and the overview of experts.They were also pleased with the response time.
3.2 Interviews
The interviews gave an impression of how the interviewees are usinginformation and of what could be the potential importance of NARCIS for

What are your information needs?
297
them. The demand for the information in NARCIS differed from oneinterviewee to another, so it is impossible to draw any general conclusionsfrom the interviews. Nevertheless, a certain trend could be discerned in theinterviews. The various information types to be found in NARCIS are brieflydescribed below.
Information about individuals, organisations and current research
Information about individuals and organisations is occasionally important forresearchers and non-researchers alike. Researchers use this information asbackground material to help them assess the value of a particular individualor organisation’s publications. Non-researchers are often searching forexperts in a particular field in order to gather more information.
The interviewees often have their own network and do not need toconsult a database, unless they want to explore a new area or needinformation about less well-known individuals.
Information about current research is important to gain an earlyimpression of work being done new fields of research.
Information sources
The interviewees use a variety of channels to gather information. The sourcesmentioned include those available via the Digital Library of the respondent’sown university, preprints, search engines (Google, Google Scholar), personalcontacts and participation at conferences and workshops in the Netherlandsand elsewhere. Blogs and Twitter were also mentioned as a source of veryup-to-date and opinion-forming information.
Dissertations and datasets are especially important for researchers;dissertations are a particularly valuable source of information outside thenatural science sector. The same applies for other types of publication of amonographic nature. While many dissertations are nowadays available inelectronic form, this is unfortunately not true of monographs in general.Nevertheless, it is shown that there is a growing demand for digitalmonographs [7].
In the Science-Technology-Medicine (STM) sector, the interviewees weremore interested in journal articles (which also are the main elements of thedissertations in this sector).
Policy makers seek inspiration from the results of research to formulateand roll out new policy, while journalists report on that research. At most,dissertations and other scientific publications are useful to them asbackground information.

What are your information needs?
298
Most researchers and non-researchers subscribe to services alerting themto new information. One disadvantage of this method that was mentionedwas that it causes information overload.
A noteworthy finding was the importance the interviewees attached topersonal networks, including online networks. Some have created their ownnetworks and they often also establish special interest groups on networkssuch as LinkedIn.11 Scientific information is quickly disseminated in thesenetworks. Trust is important in this context, which is why the digitalnetworks are built on existing networks in real life.
Datasets
Datasets are mainly important for researchers. These datasets may consist ofstatistics but may in a broader sense also include, for instance, audio andvideo recordings. There is a certain tension between, on the one hand, thedesire to write publications based on one’s own raw material first, andsharing and re-analysing this material on the other.
At most, non-researchers need pre-packaged statistical information.
Context
Many researchers refer to the importance of the context of the informationthey find. This relates to a functionality such as links (for example from theraw data to the related publications), on the one hand, and the presentation ofbackground information (about the author, the organisation or the researchprogramme) relating to the information that has been found, on the other. Inthis way, the user can assess the merits of a particular source.
Problems in searching for and selecting information
Examples mentioned by the researchers include:Quality: it is not always easy to distinguish between information of ahigh quality and less valuable information.Accessibility: publications are not always available under OpenAccess.Coverage: a lot of material that is relevant for research and educationis not available.
11 http://www.linkedin.com

What are your information needs?
299
Context: search engines like Google provide no information about thecontext. Information overload: search and alert systems are not intelligentenough, which results in a surplus of information or in irrelevantinformation.Persistence: researchers and documents are difficult to tracepermanently on the Internet. Assigning Digital Author Identifiersand persistent identifiers to documents could solve this problem.
The non-researchers report the following problems:Absence of very concise abstracts of scientific publicationsNo free access to some textsDifficulty in finding experts (who are needed to assess the content of newsitems)
Suggestions for improving the NARCIS service were made in both thesurveys and the interviews. Some of the suggestions may be put into effectimmediately, but some call for national or international consultation. Some ofthe most imaginative suggestions were:
Intelligent search and alert systems; text mining; internationalisation;permanent storage of new information types such as blogs; access to enrichedpublications [8, 9].
4. Discussion
The surveys have shown that a significant number of NARCIS users comefrom universities, research institutions or universities of applied science.They are the portal’s principal target group. At the same time, it becameapparent that NARCIS users are often unaware of the possibilities of theportal. For example, they are not all aware of the possibility of combiningterms in a search command and do not all take advantage of the benefits ofthe customised RSS feeds. It is very important to display these options moreclearly in NARCIS.
The interviews revealed that the interviewees first consult Google(Scholar) when searching for information. Only the biomedical specialistsamong them also use PubMed.
However, these interviewees are also aware of the limitations of the giantGoogle, the most prominent being information overload and the uncertaintyabout the quality of the information that is found.

What are your information needs?
300
The information overload can be eased by introducing the option ofpersonalising the presentation of information in the NARCIS system bygiving the greatest prominence to the information types that are mostrelevant to him or her.
Although search engines, and particularly Google, are popular, theinterviewees did say that they would like information to be presented bysubject. To present information by subject (for example, on the topic ofhistorical sciences), a service depends on the metadata that is supplied.
Past experiments by the KNAW with tools for automatic categorisationsuggest that it does not lead to acceptable results in a multidisciplinarydatabase. Thematic presentation might be possible with Web 2.0 facilities(along the lines of Flickr), with users applying their own tags to informationobjects.
The NARCIS information is already highly accessible in Google. Googleoften shows users information from NARCIS without their realising it.Google can therefore be regarded as a supplementary source of access toNARCIS. The benefit for the user of searching directly in NARCIS is theavailability of additional functionalities that Google does not offer. A publicrelations effort is needed to inform users of these extra options in NARCIS.
This user survey was confined to the reaction of human users. However, aservice like NARCIS is also for non-human users. For example, NARCISprovides crucial information to services that operate at European and globallevel (DRIVER 12 ; Scientific Commons 13 ; Google (Scholar);WorldWideScience.org14 ). It is clear, for example, that the co-ordinationbetween NARCIS and Google works well from the fact that the websitewww.narcis.info has the high page ranking of ‘8’15, a scale that is awardedonly to one percent of the websites displayed by Google.
According to the interviews, NARCIS is not adequately promoted orpublicised. None of the senior officials interviewed use the service, which isnot surprising since until 2010 there had never been a publicity campaign forNARCIS. The launch of a new version of NARCIS in March 2010 is now beingused to bring NARCIS to the attention of a wider public.
The campaign will stress the key role that NARCIS plays in the Dutchnational information landscape. By using Digital Author Identifiers (DAIs)and showing relationships between types of information, NARCIS is theleading site for searching for and finding scientific information in context.
12 http://search.driver.research-infrastructures.eu/13 http://www.scientificcommons.org/14 http://www.Worldwidescience.org/15 http://www.thegooglepagerank.com

What are your information needs?
301
However, broader applications of identifiers are possible, particularlyidentifiers for persons, who may act as a researcher, as an author or even asthe subject of a study. A number of interviewees suggested enriching theidentifiers with a definition of the various roles as a way of improving thesystem.
The NARCIS concept is unique in the Netherlands, and even in Europe.There are no other services that provide a combination of scientificinformation (publications and datasets) and science information (informationabout researchers, research, research institutions).
The integrated supply of so many types of information automaticallycreates a desire for more complex text-mining tools, which can displayclusters of researchers or publications. Naturally, that implies that users mustbe able to visualise the results of these analyses.
5. Conclusions
The user survey in 2009 proved very useful. The surveys gave an impressionof the backgrounds of the NARCIS users, of the NARCIS functionalities theyappreciated and of possible improvements. The interviews provided anunderstanding of the information needs of persons who use information a lotbut are not yet familiar with NARCIS.
The surveys reveal that more than half of the NARCIS users come fromuniversities, scientific institutions or universities of applied science. Mostsearches in NARCIS are for dissertations.
The most valuable functionalities are the option of downloadingpublications, the links from individuals to publications and the ability tosearch simultaneously for different information types. The existence of asingle gateway to different types of information is regarded as very useful.
The possible upgrade that was most frequently mentioned is access toinformation from other countries. Providing tools to perform complexanalyses on the material accessed via NARCIS was also mentioned as aworthwhile option. The conclusion to be drawn from these responses is thatthere is room for a service like NARCIS alongside a ‘one size fits all’ searchengine like Google. NARCIS can already largely meet the wishes of theinterviewees in its current form. With just a few minor modifications – suchas the introduction of the possibility of browsing through the information –NARCIS will also be far better equipped to their needs.

What are your information needs?
302
The value of NARCIS can be further increased by intensifying thepublicity about the portal and by continuing to improve the service.
Acknowledgements
KNAW-OI is very grateful to Repke de Vries and Henk Voorbij for theirassistance in preparing and carrying out the user survey and processing theresults.
Notes and References
[1] WAAIJERS, L. The DARE Chronicle: Open Access to Research Resultsand Teaching Materials in the Netherlands. Ariadne 53, October 2007.Available at: http://www.ariadne.ac.uk/issue53/waaijers/ (March 2010).
[2] DIJK, E; BAARS, CHR.; HOGENAAR, A.; MEEL, M. VAN. NARCIS:The Gateway to Dutch Scientific Information. Paper presented atELPUB Conference 2006, Bansko, Bulgaria. Available at:http://elpub.scix.net/cgi-bin/works/Show?233_elpub2006 (March 2010).
[3] BAARS, CHR; DIJK, E; HOGENAAR,A; Meel, M. VAN. Creating anAcademic Information Domain: a Dutch example. Paper presented atEuroCRIS 2008, Maribor, Slovenia, 2008. pp. 77-78. Available at:http://www.eurocris.org/fileadmin/Upload/Events/Conferences/CRIS2008/Papers/cris2008_Baars_Dijk.pdf (March 2010).
[4] SUBER, P. Open Access in 2009. SPARC Open Access Newsletter, issue#141, 2010. Available at:http://www.earlham.edu/~peters/fos/newsletter/01-02-10.htm#2009(March 2010).
[5] NARDI, B.O.; O’DAY,V.L. Information Ecology : Using Technologywith Heart. First Monday, 4(5), May 1999. Available at:http://firstmonday.org/htbin/cgiwrap/bin/ojs/index.php/fm/article/view/672/582 (March 2010).
[6] KOOPMANS, N.I. ‘What is your question? The need for researchinformation from the perspective of different user groups’ in W.Adamczak and A. Nase (eds). Gaining Insight from Research Information:Proceedings of the 6th International Conference on Current ResearchInformation Systems, University of Kassel, August 29-31, 2002 (Kassel) pp.

What are your information needs?
303
183-192, 2002. Available at: http://www.upress.uni-kassel.de/online/frei/978-3-933146-84-7.volltext.frei.pdf
[7] ADEMA, J; RUTTEN, P. Digital Monographs in the Humanities andSocial Sciences: Report on User Needs. OAPEN report 2010. Availableat:http://www.oapen.org/images/D315%20User%20Needs%20Report.pdf.
[8] Enriched publications consist of a traditional publication, linked toinformation that is used in the writing of the publication (a dataset, forexample) and to related information that has appeared since thepublication (citations; publications based on it; commentary).
[9] HOGENAAR, A. Enhancing Scientific Communication throughAggregated Publications Environments. Ariadne 61, October 2009.Available at: http://www.ariadne.ac.uk/issue61/hogenaar/ (March 2010).

304
An effective and automated publishing process toimprove user interface style guides
Martin Lugmayr; Johann Schrammel; Cornelia Gerdenitsch; Manfred Tscheligi
CURE – Center for Usability Research and Engineering Modecenterstrasse 17/Objekt 2, Vienna, Austria
lugmayr, schrammel, gerdenitsch, tscheligi @cure.at
AbstractStyle guides have become an important and common way to improve andstandardise development of user interfaces. However, there are several well-known problems on using style guides. Having these problems in mind wepresent an effective and automated publishing process. First we willintroduce a role-based approach to model style guides. After that we willfocus on the steps of the publishing process and describe them in detail withtheir outputs. By that we want to focus on the practical and theoreticaladvantages of our methodology and their limitations. In summary, this paperwill describe in detail how mentioned techniques and components worktogether and how we build up a useful publishing process for adaptable andusable style guides.
Keywords: user interface style guide; DITA maps; user centred design;usability
1. Introduction
User interface style guides are a central and important element for developinggraphical user interfaces (GUIs). With their aid it is possible to guaranteeconsistency (e.g. menu guidance, Look and Feel) between differentapplications [2], to provide a high quality human-computer interaction [5]and to simplify interdisciplinary and multinational collaboration indeveloping GUIs [4].
There are several typical problems that occur in developing,implementing and using style guides that are related to the commonly usedtraditional publishing process. Scientific literature and practical experiences

An effective and automated publishing process to improve user interface style guides
305
illustrate that the reason for many problems is related to the preparation andrepresentation of information in a style guide. Wilson [6] reports issues onupdating, bad usability, insufficient indexes and others. Similar problems areformulated by [4] and affect for example style of preparing materials, media(paper-based vs. online) and the complexity in practice of style guides. Thoseauthors also pointed out that people who use style guides want to get theinformation they look for structured and fast.
Reasons for those problems that exist in using style guides are e.g.formulated by [6]. The author lists thirteen reasons that can cause problems inusing style guides. Five main reasons concerning the design andimplementation of the style guide are formulated as follows:
- Extent of the style guide: Although guides should be very easy tounderstand, complete style guides became very big.
- Possibilities of updating: The question is how to distribute updates tothe style guide. Some try to put the guide online, but in this case youstill need to alert people to do changes.
- Bad usability: Users often do not understand the guides and alsohave to look for the information they need very long.
- Insufficient indexing: There are not enough index terms (which areadditionally not sufficient) and there is also a poor use of cross-referencing.
- Too much formulated text: There is too much formulated text insteadof integrating screenshots or bullet points.
Other problematic areas are the complexity of the style guide and that styleguides are laborious to use [4].
In this paper we want to present a new style guide approach that givesa solution for many of those problems. We present style guides based onDITA maps. First we want to describe the role-based approach, the publishingprocess and the technical implementation of the guide. Afterwards weprovide a demonstration of our methodology. In the discussion section wework out positive and negative aspects of our work.
2. Methodology
Taking above mentioned problems into account, the aim of our research wasto establish a new method to develop, publish and maintain style guides.
To achieve our goals we use two different approaches. First we want toreduce complexity of the style guide by introducing role-based style guides.

An effective and automated publishing process to improve user interface style guides
306
Second, our aim was to improve and automate the update process by usingDITA.
Within our publishing methodology typical problems can be avoided,and as a consequence we expect an increase in the acceptance of style guidesin the practical context.
The next step is to evaluate our approach in user trials and interviewswith real users of the developed style guide.
2.1. The role-based approach
The main idea of the role-based approach is to split up the information intosmall logical units that are maintained centrally, to determine the relevance ofthese information units for the different user groups and output formats andto produce tailored documents automatically. Based on the modelled scaffoldand with the help of automated transformation processes, specific documentsfor specific users and publication formats are generated. Consequently we canmake sure that different user groups get just the information they need andwe can avoid providing irrelevant and unnecessary content.
Regarding the implementation of our particular style guide, thefollowing three roles were defined to cover the different needs andrequirements of the different user groups:
1. User Interface Designer2. Developer3. Library-Developer
Corresponding to these three roles we split up the content of the whole styleguide and assigned each logical unit to at least one role. Due to the fact thatwe designed the roles according to an extensive analysis of internal processesand division of work of our project partner, other roles will probably be morefeasible for other applications.
Using the tagged content for each role, a tailored style guide can begenerated automatically. Thus, each user will get the required information forhis/her role. Nevertheless, each user is given a chance to explore the wholestyle guide and not only the filtered parts. This will provide an overview ofall topics additionally.

An effective and automated publishing process to improve user interface style guides
307
2.2. The publishing process
In addition to the aim of reducing complexity of the style guide, our secondapproach is to avoid the mentioned typical problems that occur when using aconventional production and publishing process for style guides. Thetechnical implementation focuses especially on an efficient publishingprocess, which supports the user in getting the required information.
Contrary to conventional style guides which are monolithic systems,we used a modular concept. Therefore, we split the style guide and extractedhundreds of small topics from chapters, sections and subsections.Consequently, a topic is our basic information unit.
2.3. Technical Implementation
According to our idea of structured content, we required technology whichprovides both a reliable and automated publishing process and the ability tohandle tagged content units.
DITA (Darwin Information Typing Architecture) achieves theserequirements. Embedded Ant and Batch scripts for automation as well as atopic-based structure provide the required functionality. Thus, we designedthe publishing process of our style guide based on DITA specifications.
The mentioned topics are stored in XML-files and build the basis forfurther data processing in DITA. DITA Open Toolkit 1 is an open sourceimplementation of DITA and thus the main component of our publishingprocess. DITA Open Toolkit – an XML based framework – is used forgenerating, distributing and reusing technical information and we will showhow the capabilities of DITA Open Toolkit fit for our aims of structure,changeability and automated publishing process.
1 http://dita-ot.sourceforge.net/

An effective and automated publishing process to improve user interface style guides
308
Figure 1: Schematic representation of the automated publishing process
DITA maps are a main concept in DITA and are mainly used to define thestructure of a style guide document. In DITA maps all necessary topics arelisted hierarchically by using a reference to the corresponding XML files, asshown in Figure 1. According to the structure in the DITA map, DITA OpenToolkit creates table of contents and structured documents automatically.
As DITA Open Toolkit implements the DITA specifications, we adoptall the useful characteristics of DITA like various output formats (HTML,PDF, MS HTML Help) from a single XML repository.
Due to the fact that DITA Open Toolkit is based on Java, XML andXSLT, we got platform-independency on the top.
The role-based approach is managed in DITA Open Toolkit by usingXML attributes. Basically, each topic is labelled by an XML attribute thatdefines for which role it is important. On using different values for differentroles it is possible to filter out the unnecessary topics. Having integrated thisfunctionality in our publishing process, we make sure that each user gets theinformation s/he needs, according to the role-based approach.
Corresponding to the aim of an automated publishing process we usedAnt and Batch scripts for automation. At this point of process it is definedwhich output formats should be created. In the background, DITA OpenToolkit uses different XSL transformations for different output formats (e.g.HTML, PDF, MS HTML Help Files, RTF). Ant scripts enable an easy and fastpublishing process, which means that it is possible to build all defined outputformats for all defined roles just by a double click.

An effective and automated publishing process to improve user interface style guides
309
A WYSIWIG XML Editor is also an essential part of our publishingprocess. So, defined administrators get the possibility to apply necessarychanges to the style guide. Providing such update mechanisms is veryimportant for acceptance of style guides 6 . According to this, we alsointroduced a SVN (Subversion 2 ) repository for interoperability andtraceability of changes.
2.3.1. Steps of the publishing process
To give an overview of how the publishing process is used, we describe it inthe following step by step. Central aim was also to keep the update process assimple as possible.
1) Check content out of version control (Subversion): At first it isnecessary to fetch the content from a central version controlrepository, due to tracking and security considerations.
2) Changing content in WYSIWIG XML Editor: Defined “contentadministrators” can insert, update or delete content. They have toassign the topics to one or more roles. That means they have to befamiliar with underlying role approach and have to decide whichcontent relates to whom.
3) Check content in to version control: Changed topics have to bestored back to version control repository, so, more than one personcan administer the content of the style guide.
4) Start batch process: Re-building of the style guide and its variousfiles can be done regularly or – if required – by executing a batch file.
5) HTML, PDF, Help file for defined roles will be createdautomatically: The user can always work with latest version of thestyle guide.
3. Live demonstration
In the following we present some output examples and details of the styleguide we developed to demonstrate the advantages of our approach of thepublishing process.
2 http://subversion.tigris.org/

An effective and automated publishing process to improve user interface style guides
310
As discussed before, we implemented an automated publishingprocess which allows content distribution to various output formats fordifferent user groups (roles). Figure 2 shows at the left side a snippet of thesection overview of the PDF style guide and at the right side the HTMLequivalent. As you can see, there is no difference in content. Just theappearance differs slightly due to technology constraints.
Figure 2: Section overview of content in PDF (left) and HTML (right)
Of course, not only the structure but also the content has to be the same indifferent output formats. Figure 3 and Figure 4 demonstrate the advantage ofstoring information in XML. Due to this, it is possible to generate variousdifferent output formats automatically without additional efforts. As a result,we can provide the same content for the same role in e.g. HTML, PDF, MSHTML Help. Thus, users of the style guide can switch between e.g. HTMLand PDF without loss of orientation.

An effective and automated publishing process to improve user interface style guides
311
Figure 3: Content presented in PDF
Figure 4: Content presented in HTML
According to the role-based approach we modelled the information about e.g.“Buttons” differently for the role “library developer” and “developer”. Asyou can see in Figure 5, “library developer” will get information about the“Behavior and States”, because this role is responsible to implement newbuttons (or other user interface elements) in a consistent way.

An effective and automated publishing process to improve user interface style guides
312
Figure 5: Section “Button” for role “library developer”
As shown in Figure 6, we defined the role “developer” as not in need of thesubsection “Fonts” and “Behavior and States” of buttons. The reason for thisis that it’s not relevant for a developer how the button will appear, becauses/he has just to use it and implement the functionality. Due to this thedeveloper gets information about “Usage Guidelines” and “Examples”.
Figure 6: Section “Button” for role “developer”
4. Discussion
Developing and implementing a style guide based on DITA maps will lead toseveral advantages.
- Firs, it is possible to actively integrate the user in the developmentprocess of the style guide, which will consequently lead to a moreflexible and easier service of the style guide.
- Second, the consistency of the style guide will be increased and forthat it is much easier to compare different style guides or versions ofstyle guides.
- Third, we want to argue that through the integration of DITA mapsregular services will be done easily and fast, because it is possible toquickly react on new requirements and update styles. DITA mapsallow a direct connection on online-publishing channels and for thatchanges came fast to the specific user and without expensivedistribution costs.
Summarizing our arguments, using DITA maps can deal with traditionalproblems in implementing style guides.
As mentioned before, DITA maps allow integrating the user in thedeveloping process and increasing the commitment of the end-user. Forfurther development we suggest specifying the introduced DITA maps in a

An effective and automated publishing process to improve user interface style guides
313
more individual way and adapt them to specific user groups. For that wesuggest formulating a scaffold, where it is possible to use it for contents ofspecific issues (e.g. developing an e-commerce portal). We assume toindividualize the style guides as much as possible to provide the appropriateinformation.
We suggest integrating users in the development process as they cangive valuable feedback and stimulations in developing the styles (e.g. throughdiscussion boards). This will lead to a higher commitment on the style guideand allows adaptive improvements of the style guide within the developmentcircle.
Further research and development should also concentrate on theoutput format of the DITA Open Toolkit. An opportunity in this contextwould be to provide code snippets as well as to formulate existing patternsand design. We want to point out that this will lead to an optimized designingprocess of the user interface.
5. Conclusions
Finally, development and initial setup of a style guide using both the role-based approach and the automated publishing process with DITA are moretime-consuming than writing a common style guide. But in the long run thereare several advantages which have to be taken into account also.
The most important advantage is the updating process of thisapproach, as changing content doesn’t lead to extensive re-design andexpensive distribution costs. Thus, the content of the style guide can be heldup-to-date easily and the user gets more current information.
In addition, the role-based approach provides more relevantinformation to the user, because just the content that is most informative anduseful for a particular role is presented. But, of course, the quality of relevanceof content depends on an extensive analysis of required roles at the beginningof the style guide development process.
Both together improve style guides essentially and avoid thecommon problems like too large style guides and missing updatingpossibilities.

An effective and automated publishing process to improve user interface style guides
314
Notes and References
[1] Gale, S. A Collaborative Approach to Developing Style Guides.Conference proceedings on Human factors in Computing Systems, April13 - 18, 1996, Vancouver Canada. ACM Press, pp. 362-367. 1996
[2] Henninger, S. Creating organization-specific usability guidelines. In CHI'97 Extended Abstracts on Human Factors in Computing Systems:Looking To the Future, Atlanta, Georgia, March 22 – 27. 1997
[3] Quesenbery, W. Building a better style guide. Proceedings of UPA 2001.[4] Schemenauer, P.J., Pawlick, C. Evaluating Guidelines for Writing User
Interface Text. SIGDOC’07, October 22-24. 2007[5] Willems, P., Verlinden, J., Troost, P.J. Towards a Framework of Methods
on UI Style Guides. CHI 2000, 1-6 April, p.131. 2000[6] Wilson, C. E., STC Usability SIG Newsletter: Usability Interface, Vol 7,
No. 4, April 2001 (http://www.stcsig.org/usability/newsletter/0104-style.html) (January 2010).

315
Analysis of e-book use: The case of ebrary
Umut Al; rem Soydal; Ya ar Tonta
Department of Information Management, Faculty of Letters,Hacettepe University, 06800 Beytepe, Ankara, Turkey
{umutal, soydal, tonta}@hacettepe.edu.tr
AbstractThe interest in the use of electronic media in scholarly communication isgrowing. Nowadays, libraries reserve much larger budgets for electronicinformation sources as users tend to get access to the full-texts of journalarticles and books online. The effective management of library collections isonly possible through studies identifying user needs as well as studies ofusage analysis showing how much of what is being used in these collections.Although e-books are a significant part of library collections, studies on e-book use are scarce. In this paper, we have analyzed about half a million usedata of ebrary e-book database by the users of Hacettepe University Librarieswithin a four-year period (2006-2009). We obtained COUNTER-compliantuse data identifying, among other things, book title, publisher, andpublication year for each transaction to analyze the use. We identified themost frequently used e-book titles by Hacettepe University ebrary users ineach Library of Congress (LC) subject class. E-books on Medicine (R) wereused most often, followed by books on Education (L) and Language andliterature (P). A small number of e-books in each subject class satisfied halfthe demand, while an overwhelming majority of e-book titles were neverused. Findings of this study can be used to develop an e-book collectionmanagement policy and understand its implications for consortial licensing ofe-book packages.
Keywords: e-book use; collection management; collection development;ebrary; Hacettepe University Libraries

Analysis of e-book use: The case of ebrary
316
1. Introduction
Libraries continue to develop their own collection management policies thatsuit their users’ information needs. Limited library budgets put theconsortium-type collaboration efforts on the agenda. Therefore, librariesmust not only understand the needs of their potential users but also be awareof the needs of the users of other consortium members. Developing effectivecollection management policies and executing them in a consortialenvironment requires careful work as well as polished negotiation skills.
Databases provide instant access to information. Full-text databases aremore intensely used than bibliographic ones as they provide direct access tothe sources. Full-text electronic books (e-books) are now available via severaldatabase vendors or aggregators, and they are becoming an important part oflibrary collections. The increase in the variety of e-book packages forceslibraries to be selective as their diminishing budgets are not enough to copewith the growth of databases. Libraries have to investigate the trends andchoices of their users to be able to build an effective policy for collectiondevelopment and management. Therefore, it is important to address thefollowing questions: Who are the actual users of these databases? Dotendencies on using e-books differ across the subjects? Are current e-booksrequested more often by the users?
This paper addresses some of these questions by analyzing the usage of e-book titles in the ebrary database by the users of Hacettepe UniversityLibraries. It identifies the most frequently used e-book titles and tries to shedsome light on the non-use of titles in some subjects. Findings can be used toimprove the micro-management of e-books collections and understand itsimplications on a wider scale for library consortia.
2. Literature Review
Generally, an “e-book” is defined as a digital version of a traditional printbook designed to be read on a personal computer or an e-book reader [1].Related studies explain some advantages of e-books such as adjustable fontsize and font face, easy access to the content, multimedia display capabilities,no cost for paper, ink, binding, wrapping, postage, or transport, no physicalspace requirements, on-demand availability, and searchability within a book[2, 3, 4]. Typically, e-books are cheaper than hard copy versions.

Analysis of e-book use: The case of ebrary
317
Despite the many advantages of e-books, some studies showed that theirusage can be very low [5, 6, 7, 8]. Most users are unaware of the existence ofe-books in library collections. Although they are willing to discover and usee-books more effectively, user unfriendly interfaces or usability problemstend to hinder their further use. Some studies comparing usage statistics of e-books to that of their print counterparts concluded that e-books are used moreoften [9] while others did just the opposite [10]. Usage patterns should betaken into consideration in interpreting these somewhat conflicting findings.
E-book use is hard to measure when compared to printed ones. Forinstance, the use of printed books can be measured by the number of loans orin-library use whereas e-book use can only be measured by access statistics.Access to e-books, on the other hand, can be defined in different ways such asprint, view or download. Access statistics provided by e-book vendors differin this respect. Hence, a standard presentation of parameters is not availablefor e-books. It can be difficult to compare e-book usage across differentpackages since there is almost no consistency in usage statistics betweenvendors [11]. Therefore, most of the e-book usage studies in the literaturefocused on e-books provided by the same vendor rather than makingcomparisons across different vendors [12]. COUNTER (Counting OnlineUsage of Networked Electronic Information Resources) is an internationalinitiative to set practical world-wide standards for the recording andreporting of vendor-generated usage statistics in a consistent and compatibleway [13, 14].
Libraries benefit from usage statistics of e-books in collection developmentdespite the lack of standardized reports. Statistics of e-book use show thedemand for e-books as well as give some important clues about the mostpopular subject categories for e-books. For instance, according to the usagestatistics of the netLibrary, e-books on computer science and engineering(39%), business, economics, and management (17%), arts and humanities(14%), and natural sciences and mathematics (13%) were the most demandedones [11]. Safley [11] emphasized in the same study that the use of ebrary hasincreased 190%. In a different study almost 19% of the library’s e-book titleshad been accessed at least once [12]. The results of the Springer’s e-book usestudy showed that chapters from e-books on chemistry and materials sciencewere downloaded most often [15]. The study also pointed out that thegrowth of sales of Springer’s printed books is commensurate with the increasein Springer’s e-book usage, and that the use of Springer’s e-books hasincreased 60% in Turkey between 2007 and 2008. The study concludes thatthe e-book use was on the rise and printed books were not being

Analysis of e-book use: The case of ebrary
318
“cannibalized” by e-books. E-books were even driving print book salesespecially in the countries which have a large e-book penetration [15].
There are many surveys on who use e-books, how and why they use them.For instance, more than 60% of netLibrary users in a university library saidthey preferred print books over electronic ones [16]. They generally read achapter or a few pages instead of reading the whole e-book. In a differentstudy, special libraries were the largest users of e-books (15% to 60%)compared to academic (5%) and public (2%) libraries [17]. Users of speciallibraries appreciated the remote use and they preferred the convenience of e-books. Academic librarians thought that e-book usage was better forbrowsing and reference work [17]. Studies also show that users are unawareof the existence of e-books. More than 70% of students of an academic librarywere familiar with the term “e-book”, yet almost 60% of them did not use e-books and did not know that e-books were available in their university library[18]. (See also [19].)
3. Method
This study analyzes nearly half a million e-book “sections” (a section isdefined as a chapter or an entry [20]) requested from ebrary, an e-bookdatabase, by the users of Hacettepe University Libraries within a four-yearperiod (2006-2009). Hacettepe University has currently some 28,000 studentsand 3,500 academic staff and Hacettepe University Libraries offer a richcollection of both printed and electronic sources of information to its usersincluding more than 70 databases [21, 22]. The University added ebrarydatabase to its collection in 2006 as a member of the Consortium of AnatolianUniversity Libraries (ANKOS). ebrary has been Hacettepe’s most frequentlyused and the largest e-book database containing more than 45,000 e-booktitles in several disciplines. We obtained COUNTER-compliant use statisticsof Hacettepe University Libraries from ebrary. We then looked into the usageof e-books classified under different Library of Congress (LC) ClassificationSystem subjects. The term “usage” in this study is defined as the number oftimes each e-book is requested from the ebrary e-book database.
This paper addresses the following research questions:Which e-books are requested most frequently from the ebrarycollection?What are the subjects of the most frequently requested e-books?Does the usage of e-books differ across the subjects?

Analysis of e-book use: The case of ebrary
319
Does the usage of e-books change by year?Finding answers to these research questions would empower Hacettepe
University Libraries to better manage its precious resources, negotiate betterdeals with e-book database vendors and aggregators, and align its collectionmanagement policy with that of the Consortium.
4. Findings and Discussion
The total number of books in ebrary database is 45,147. Users of HacettepeUniversity Libraries requested a total of 499,841 sections from 12,826 differentbooks in ebrary collection between the years 2006 and 2009, indicating thatjust over a quarter (28%) of the overall ebrary collection was used. Figure 1provides the number of unique book titles requested from ebrary collectionbetween 2006 and 2009 (4,213, 4,548, 4,343, 5,072, respectively), which at anygiven year constitutes only a fraction (about 10%) of the total number of booksavailable in the ebrary collection (45,147). Although the number of requestedbooks has increased in 2009, the number of sections requested by the users ofHacettepe University has been decreasing in the last three years.
Figure 1: Number of unique e-books used and sections requestedtherefrom (2006-2009)
The distribution of 43,422 e-books and sections requested therefrom underLC Classes is given in Table 1 (no LC subject classification information was
4.2134.548 4.343
5.072
106.709
126.767130.968 135.397
0
1.000
2.000
3.000
4.000
5.000
6.000
2006 2007 2008 20090
20.000
40.000
60.000
80.000
100.000
120.000
140.000
160.000
number of unique e-books used number of sections requested

Analysis of e-book use: The case of ebrary
320
available for 1,725 titles). The number of e-books under each LC class rangesbetween 40 (A: General works) and 10,021 (H: Social sciences), median being1,142. Books classified under Social Sciences constitute 23% of all books in theebrary e-book database, followed by Language and literature (P) (12%) andScience (Q) (11%) (column 3 of Table 1). Books classified under Generalworks, Naval science (V), Library science (Z), on the other hand, make up lessthan 1% of the overall ebrary collection.
Of 43,422 of e-book titles available in the ebrary database, 12,826 (or 29.5%)were used at least once. The number and percentage of e-book titles usedunder each LC subject classification (excluding 1,484 titles with no LC Classnumbers) is given in columns 4 and 5 of Table 1. On the average, 74% of43,422 e-book titles were not used at all. The proportion of use of e-booksunder each LC subject varied, although none was over 40%. For instance,only 39.8% of e-book titles on Medicine (R) were ever consulted, followed bye-books on Education (L), General works and Library science (circa 35% each).About 90% of e-book titles on American history, Military science (U) andNaval science were not used at all. The use of e-books seems to be closelyrelated with the disciplines studied at Hacettepe University, which has one ofthe top medical schools in the country along with a Faculty of Education, buthas no military/naval school or a department on American history (F).
The total number of sections requested from 12,826 e-books was 499,841.The distribution of 429,049 sections under each LC subject (as frequencies andpercentages) is given in columns 6 and 7 of Table 1 (no LC subjectclassification information was available for 70,792 sections). The number ofsections requested from e-books under each LC subject ranges between 90(Naval science) and 78,157 (Medicine), median being 3,841. More than 51% ofall sections requested came from e-books on Medicine (18.2%), Social sciences(16.8%) and Language (16.5%). E-books under 11 LC subjects satisfied lessthan 5% of all requests. Sections from e-books on Medicine, Education,Language and literature and Science have been requested more heavily. Forinstance, the number of e-books available on Medicine and Philosophy,psychology, religion (B) are almost the same (each constitutes 8.4% of all e-books). Yet, more than twice as many sections were requested from books onMedicine (18% of all section requests) compared to that of Philosophy,psychology, religion. The number of sections requested from all but foursubjects (Medicine, Education, Language and literature and Science) was notcommensurate with the number of e-books available under those LC subjectclasses.

321
Table 1: Number of books and sections requested from ebrary database (under Library of Congress subject classes)
LC Class
# ofbooks
(a)*% of total books
(43,422) (b)
# ofrequestedbooks (c)
**% of booksrequested (c /
a)# of sections
requested (d)
***% of allsections requested
(d / 429,049) d / cGeneral works (A) 40 0.1 14 35.0 269 0.1 19.2Philosophy, psycho., religion (B) 3,667 8.4 866 23.6 36,051 8.4 41.6Auxiliary sciences of history (C) 161 0.4 53 32.9 998 0.2 18.8History (D) 2,319 5.3 507 21.9 17,297 4.0 34.1American history (E) 1,101 2.5 123 11.2 3,288 0.8 26.7American history (F) 614 1.4 52 8.5 684 0.2 13.2Geography, anthro., recreation (G) 1,142 2.6 324 28.4 11,296 2.6 34.9Social sciences (H) 10,021 23.1 2,271 22.7 72,162 16.8 31.8Political science (J) 1,639 3.8 379 23.1 10,844 2.5 28.6Law (K) 1,195 2.8 151 12.6 2,161 0.5 14.3Education (L) 1,727 4.0 612 35.4 24,383 5.7 39.8Music (M) 659 1.5 147 22.3 3,581 0.8 24.4Fine arts (N) 405 0.9 105 25.9 3,159 0.7 30.1Language and literature (P) 5,393 12.4 1,819 33.7 70,615 16.5 38.8Science (Q) 4,962 11.4 1,472 29.7 59,032 13.8 40.1Medicine (R) 3,675 8.5 1,461 39.8 78,157 18.2 53.5Agriculture (S) 557 1.3 110 19.7 3,841 0.9 34.9Technology (T) 3,391 7.8 744 21.9 28,752 6.7 38.6Military science (U) 467 1.1 49 10.5 985 0.2 20.1Naval science (V) 71 0.2 8 11.3 90 0.0 11.3Library science (Z) 216 0.5 75 34.7 1,404 0.3 18.7Total/Average 43,422 100.0 11,342 26.1 429,049 ****99.9 37.8
*Ratio of the # of books in LC classes to the total # of books **Ratio of the # of requested books to the total # of books under corresponding LC Class

Analysis of e-book use: The case of ebrary
322
***Ratio of the # of requested sections under corresponding LC class to the total # of requested sections ****Percentages may not equal 100% due to rounding

Al; Soydal; Tonta
323
The last column of Table 1 provides the average number of sectionsrequested from books under each LC subject. Medicine came first with anaverage of 54 sections per e-book used, followed by Philosophy, psychology,religion (42 sections), Language and literature, and Education (40 sectionseach). Users studying Medicine seem to attach greater importance toelectronic information sources [23]. Monographs in electronic form appear tobe in high demand in Language and literature as well as in Education [24]. E-books used in Naval science, American history and Law (K) were consultedmuch less often (average of 11, 13 and 14 sections per book, respectively). E-books under these LC classes can be considered as prime candidates to beexcluded from the collection.
Figure 2 shows the cumulative percentage of 12,826 e-books in the ebrarydatabase satisfying Hacettepe users’ demand. About 10% of books satisfied63% of the total requests and 20% did 78% of all requests, conforming toTrueswell's well-known 80/20 rule [25]. When the entire collection of ebrarydatabase with 45,147 books is taken into account, the concentration ofrequests on a relatively few e-books is even more remarkable: 10% of bookssatisfied 90% of the total demand.
Figure 2: Usage of e-books in ebrary database
We obtained similar results for e-books used under each LC subject. Asmall number of books in each LC subject class consistently satisfied one thirdor half of all requests (Table 2). For instance, in Social sciences, a subject withthe highest number of books (10,021), 60 books satisfied 33% of all requestswhile 142 books did 50%. Similarly, 7 books each in General works andAmerican history, 8 books each in Auxiliary sciences of history (C), American
0
20
40
60
80
100
0 20 40 60 80 100
cum
ulat
ive
perc
enta
ge o
f boo
kus
e
cumulative percentage of books

Analysis of e-book use: The case of ebrary
324
history (E) and Fine arts (N), 6 books in Agriculture (S), 2 books in Militaryscience, and 5 books in Naval science satisfied half the demand. In general, afew books satisfied the overwhelming majority of demand while the greatmajority of books were not used at all. It should be kept in mind that theproportion of books satisfying 33%, 50%, 67% and 100% of the demand ineach LC subject would be much lower if we used the total number of booksavailable under each LC subject instead of total number of books used (as wedid in Table 2). For instance, 5% of out of all e-books used to satisfy 40% of thetotal demand in Language and literature subject class constitute only 1% of alle-books available under that class.
Table 2: Number of books satisfying demand
LC Class 33% 50% 67% 100% # of booksA 5 7 10 14 40B 20 44 95 866 3,667C 5 8 12 53 161D 16 36 68 507 2,319E 3 8 17 123 1101F 4 7 12 52 614G 9 19 37 324 1,142H 60 142 287 2,271 10,021J 10 22 47 379 1,639K 8 16 30 151 1,195L 21 49 97 612 1,727M 48 76 102 147 659N 3 8 20 105 405P 30 84 197 1,819 5,393Q 34 81 182 1,472 4,962R 48 105 197 1,461 3,675S 3 6 11 110 557T 17 38 81 744 3,391U 2 2 5 49 467V 3 5 6 8 71Z 5 12 20 75 216
No discernable pattern of yearly variations was detected in the use of e-books under different LC subject classes, although this may change in thelong run. Subjects of e-books requested in different years were similar.
We also tested if the distribution of books to requests under each LCsubject fits the Price Law, which states that the square root of all books would

Analysis of e-book use: The case of ebrary
325
satisfy half the demand [26]. Books classified under General works andLibrary science were in accordance with the Price Law to some extent. Therest did not fit the Price Law. For LC subject classes of Social sciences,Education, Music (M), Language and literature, Science and Medicine, thenumber of books that satisfied 50% of all requests in respective fields werehigher than that predicted by Price Law whereas the number of bookssatisfying half the demand for subject classes of Philosophy, psychology,religion, Auxiliary sciences of history, History (D), American history (E & F),Geography, anthropology, recreation (G), Political science (J), Law, Fine arts,Agriculture, Technology (T), Military science, and Naval science were lowerthan that predicted by Price Law. It could be that relatively small number ofrequests for e-books under most LC subject classes was not enough to test thevalidity of a power law such as Price Law.
Table 3: The most frequently used 20 ebrary books
Book LC NInternational Encyclopedia of Ergonomics and Human Factors* T 2,1945 Steps to a 5 on the Advanced Placement Examinations: Calculus Q 2,147Beginner's Guide to Structural Equation Modeling* Q 1,436Beginning Programming Q 1,411Character Strengths and Virtues: A Handbook and Classification B 1,372Routledge Critical Dictionary of Semiotics and Linguistics P 1,346Psychology of Humor: A Reference Guide & Annotated Bibliography P 1,308On That Point! An Introduction to Parliamentary Debate P 1,246Harrison's Manual of Medicine (16th Edition) R 1,224Jacques Derrida and the Humanities: A Critical Reader B 1,202Speaking, Listening and Understanding: Debate for Non-NativeEnglish Speakers P 1,186Talking Gender and Sexuality P 1,170Routledge Reader in Politics and Performance J 1,169Speech Acts in Literature P 1,164Provocations to Reading: J. Hillis Miller and the Democracy to Come P 1,150Argument and Audience P 1,106Advanced Mathematical Thinking Q 1,094Theoretical Aspects of Heterogeneous Catalysis Q 1,080Discourse P 1,067SPSS for Intermediate Statistics: Use and Interpretation* H 1,032Total 26,104Note: Titles with asterisks (*) did not have LC subject classes assigned to them. Theywere classified by the authors.

Analysis of e-book use: The case of ebrary
326
The most frequently requested 20 e-book titles satisfied 5% of the totalrequests (Table 3). Almost half (9) of 20 book titles came from Language andliterature, 5 from Science, 2 from Philosophy, psychology, religion, and 1 eachfrom Political science, Medicine, Technology, and Social sciences.
5. Conclusion
ebrary has been the most heavily used e-book database at HacettepeUniversity Libraries since 2006. Although the number of subscribed books inebrary database was increasing since then, the number of sections requestedhas been decreasing in recent years.
The use of e-books under different LC subject classes differstremendously. There was almost 20-fold difference between the averagenumber of total requests in Medicine and that in American history. Booksclassified under Naval science, Law and Military science were used veryinfrequently. Relatively lower rates of use of e-books in these subjects areprobably due to the fact that Hacettepe has no military and naval schools andthe Faculty of Law has recently been founded. Hence, a few Hacetteperesearchers appear to study in these fields. Hacettepe University Librarieshave to promote e-books more intensely to increase their use.
The use of e-books exhibits a Bradfordian distribution in that relativelyfew titles satisfied the majority of the requests, perfectly in line with thefindings of similar studies. The fact that the majority of e-book titles in somesubject areas were not used at all suggests that libraries should review theircollection management policies. It could be that a potential user base for e-books in certain subjects may be lacking. Or, the existence of licensed e-bookpackages such as ebrary may need further promotion within the campus toincrease the awareness. In any case, the unit cost of using a title from alicensed e-book database could be quite expensive if such e-book packages arenot carefully selected according to collection development policies and userneeds of respective libraries. The lack of consortial collection developmentand management policies complicates the issue of cost further.
The following recommendations can be offered:The usage levels of e-book databases licensed by universitiesthrough consortia have to be measured.Findings of in-depth usage analysis studies should be taken intoaccount when negotiating deals with e-book suppliers for licenseagreements or renewals thereof.

Analysis of e-book use: The case of ebrary
327
In addition to usage statistics, feedback should be gathered fromusers through questionnaires and interviews to find out why theyuse or do not use e-books.The percentage of non-used e-book titles should be figured intothe license renewal terms to get discounts or additional titles.
Findings of this study can be used by libraries to improve their e-bookcollection management policies. Further studies on cost-benefit analysis of e-book use, comparison of e-book use in different libraries and its impact onlibrary consortia are needed.
Acknowledgements
We are grateful to Ms. Ay en Küyük, Director of Hacettepe UniversityLibraries, for making their ebrary usage data available to us for analysis anduse.
Notes and References
[1] REITZ, JM. ODLIS: online dictionary for library and information science.2007. Available at http://lu.com/odlis/odlis_e.cfm (4 April 2010).
[2] BROWN, GJ. Beyond print: reading digitally. Library Hi Tech, 19(4),2001, p. 390-399.
[3] GUNTER, B. Electronic books: a survey of users in the UK. AslibProceedings: New Information Perspectives, 57(6), 2005, p. 513-522.
[4] RAO, SS. Electronic books: a review and evaluation. Library Hi Tech,21(1), 2003, p. 85-93.
[5] ABDULLAH, N; GIBB, F. A survey of e-book awareness and usageamongst students in an academic library. In: Proceedings of InternationalConference of Multidisciplinary Information Sciences and Technologies,Merida, 25-28 October, 2006. Available athttp://strathprints.strath.ac.uk/2280/1/strathprints002280.pdf (4 April2010).
[6] ANURADHA, KT; USHA, HS. Use of e-books in an academic andresearch environment: A case study from the Indian Institute of Science.Program: electronic library and information systems, 40(1), 2006, p. 48-62.

Analysis of e-book use: The case of ebrary
328
[7] BENNETT, L; LANDONI, M. E-books in academic libraries. TheElectronic Library, 23(1), 2005, p. 9-16.
[8] ISMAIL, R; ZAINAB, AN. The pattern of e-book use amongstundergraduates in Malaysia: a case of to know is to use. MalaysianJournal of Library & Information Science, 10(2), 2005, p. 1-23.
[9] LITTMAN, J; CONNAWAY, LS. A circulation analysis of print booksand e-books in an academic research library. Library Resources &Technical Services, 48(4), 2004, p. 256-262.
[10] CHRISTIANSON, M; AUCOIN, M. Electronic or print books: Which areused? Library Collections, Acquisitions, & Technical Services, 29(1),2005, p. 71-81.
[11] SAFLEY, E. Demand for e-books in an academic library. Journal ofLibrary Administration, 45(3-4), 2006, p. 445-457.
[12] SPRAGUE, N; HUNTER, B. Assessing e-books: Taking a closer look at e-book statistics. Library Collections, Acquisitions, & Technical Services,32(3-4), 2009, p. 150-157.
[13] COUNTER. About COUNTER. 2009. Available athttp://www.projectcounter.org/about.html (4 April 2010).
[14] SHEPHERD, PT. COUNTER: towards reliable vendor usage statistics.VINE: The Journal of Information and Knowledge ManagementSystems, 34(4), 2004, p. 184-189.
[15] VAN DER VELDE, W; ERNST, O. The future of eBooks? Will printdisappear? An end-user perspective. Library Hi Tech, 27(4), 2009, p.570-593.
[16] LEVINE-CLARK, M. Electronic book usage: A survey at the Universityof Denver. portal: Libraries and the Academy, 6(3), 2006, p. 285–299.
[17] BLUMMER, B. E-books revisited. Internet Reference Services Quarterly,11(2), 2006, p. 1-13
[18] ABDULLAH, N; GIBB, F. Students’ attitudes towards e-books in aScottish higher education institute: part 1. Library Review, 57(8), 2008, p.593-605.
[19] GREGORY, CL. “But I Want a Real Book” an investigation ofundergraduates’ usage and attitudes toward electronic books. Reference& User Services Quarterly, 47(3), 2008, p. 266–273.
[20] CONYERS, A. Usage statistics and online behaviour. In The E-resourcesmanagement handbook, v.1, 2006, p.17-27. Available athttp://uksg.metapress.com/media/5g048jxytg5xxxxtwc2l/contributions/5/5/0/u/550u5m1aku3aqjvk.pdf (4 April 2010).

Analysis of e-book use: The case of ebrary
329
[21] HACETTEPE UNIVERSITY. General overview. 2010. Available athttp://www.hacettepe.edu.tr/english/ortak/universite/genel.php (4 April2010).
[22] HACETTEPE UNIVERSITY LIBRARIES. Hacettepe University Libraries.2009. Available at http://www.library.hacettepe.edu.tr (4 April 2010).
[23] TENOPIR, C. Library resources: An overview and analysis of recent researchstudies. Washington, D.C.: Council on Library and InformationResources. 2003. Available athttp://www.clir.org/pubs/reports/pub120/pub120.pdf (4 April 2010).
[24] THOMPSON, JW. The death of the scholarly monograph in thehumanities? Citation patterns in literary scholarship. Libri, 52(3), 2002,p. 121-136.
[25] TRUESWELL, RL. Some behavioral patterns of library users: The 80/20rule. Wilson Library Bulletin, 43 (5), 1969, p. 458–461.
[26] EGGHE, L; ROUSSEAU, R. Introduction to informetrics: Quantitativemethods in library, documentation and information science. Amsterdam:Elsevier. 1990. Available at http://hdl.handle.net/1942/587 (4 April 2010).

329
Digital content convergence: Intellectual propertyrights and the problems of preservation:
A US perspective
John N. Gathegi
School of Library and Information Science, University of South Florida4202 E. Fowler Ave, CIS1040, Tampa, FL 33620
AbstractOne of the issues that this conference explores is the continuing phenomenonof convergence of communication, caused in part by the convergence ofmedia and digital content. In this paper, we will review some of theintellectual property challenges that loom in this environment, with anemphasis on the situation in the Unites States. We shall discuss some of thepeculiar features inherent in digital content that exacerbate the intellectualproperty problem, such as non-permanence, multiple, heterogeneous. Weshall examine a couple of cases that illustrate some of the problems in thisarea. We shall then conclude with the problem of intellectual property and themultiple goals of digital content collections.
Keywords: digital rights, intellectual property, digital content
1. Introduction
The literature continues to indicate a continuing phenomenon of convergenceof communication, caused in part by the convergence of media and digitalcontent. We will review in this paper some of the intellectual propertychallenges that loom in this environment, with an emphasis on the situationin the Unites States. Some of the peculiar features inherent in digital contentthat exacerbate the intellectual property problem, such as non-permanence,multiple, and heterogeneous media, will be discussed. We shall examine acouple of cases that illustrate some of the problems in this area. We shall thenconclude with the problem of intellectual property and the multiple goals ofdigital content collections.

Digital content convergence: Intellectual property rights and the problems ofpreservation: A US perspective
330
2. The problem of non-permanency of dynamic content
Digital content has, unlike its print counterpart, some unique features thatpresent challenges in both development and management, especially from alegal perspective. We shall examine three such features in this paper, theproposition that digital content (1) is dynamic, (2) may suffer issues of non-permanence, and (3) may have more than one media format.
Digital content is dynamic. As the need arises, items are constantlyadded and corrections and modifications made to specific files and databases.This means that a file may change from day to day. The problem thenemerges on how to preserve digital content and vouch for its integrity.
Preservation efforts face many legal problems. The primary problemis how to ensure the non-infringement of copyright, by avoidingunauthorized exercise of the authors’ exclusive rights, as well as determiningwhat content is protected by copyright, to facilitate access to content as wellas consent from copyright holders. A persistent question is whether thedigital content manager still has the necessary rights in the e-content. Also,issues of privacy and confidentiality may be raised by the dynamism andnon-permanence of digital content, as may ethical issues in health andpersonal data [1].
Despite perceptions to the contrary, “digital information is in factfragile and at risk.” Changes in technology can render some digital filescorrupt and unreadable [2]. The longer the time frame required for futureaccess, the more the uncertainty with information preservation. Challengesinclude changes in format, data definitions, and metadata content [1]. Theformat problem is exacerbated by the fact that many formats are proprietaryand continue to evolve into more complex versions with newer features andfunctions, sometimes ‘orphaning’ earlier versions [3]. Legal access problemscan occur when a proprietary owner contractually limits access or goes out ofbusiness [4].
One way of handling format changes in digital preservation ismigration of data, both in terms of software and hardware. This willsometimes involve re-arranging structural and data elements sequence [3].Two copyright problems arise. First, the act of migration usually will involvecopying of the information, which may be an infringement of the author’sexclusive reproduction right. Also, the re-arrangement of the structural anddata elements may trigger the trampling of another right: the author’sexclusive right to make derivative copies. Permission to migrate may have tobe sought from the copyright holder. Other issues include, in the case of the

Digital content convergence: Intellectual property rights and the problems ofpreservation: A US perspective
331
United States, whether a file conversion would be a violation of the DigitalMillennium Copyright Act, and whether, for evidentiary purposes, amigrated file is the same as the original file.
3. Multi-media content and its complexity
As well as being dynamic and raising the problem of non-permanency, digitalcontent may also contain a mixture of different media formats, including text,sound, graphics, video, and a variety of other file formats.
Good examples of multimedia digital content are electronic books, ore-books. An e-book could have, for example, an article about a country, avideo about parts of the country, and a sound file of examples of music fromthe country.
E-books are usually in proprietary devices, but may also be accessiblethrough a central server. An owner of an e-book collection has many of thesimilar features to a publisher of any other digital content in terms of thesusceptibility of the content to be easily copied. Digital rights managementtechnology is used to control access to e-book content that is copyrightprotected, to preserve the copyright owner’s exclusive rights. There are,however, e-books available free of copyright protection that a digital contentmanager can link to from the digital collection [5]. E-book aggregators, suchas netLibrary (a division of OCLC), provide access to a digital library’s e-content on a 24/7 basis by negotiating intellectual property rights withpublishers to provide access to content hosted on their servers. Aggregatorsusually provide their own digital rights management technology, thus easinglegal issues for the digital content manager [6].
“Stocking” or publishing e-books in a digital collection requires thatthe digital collection manager understand the access limitations that comewith the digital rights management, and the different pricing models. Thesemodels can range from outright purchases (much like print versions) tolimited time and number of persons per access, and may also come with userestrictions that define practices such as printing, downloads, and amount ofcontent that can be accessed.
Legal issues in this area are complicated by the fact that some mediaformats are covered by rules specific to the media (e.g. sound files). Also,conversion of media from one format to another may trigger copyrightinfringement (e.g. conversion of text into audio formats). More so than textworks, dates on which a sound recording was first fixed determine the natureof the legal protection available in the United States. For example, no federal

Digital content convergence: Intellectual property rights and the problems ofpreservation: A US perspective
332
copyright protection was available to sound recordings prior to February 15,1972, but the Sound Recording Amendment Act of 1971, rectified the situationby providing federal copyright protection to works recorded or fixed afterthat date [7]. Pre-1972 works, however, may be protected by state criminallaw statutes or common law, against unfair competition or misappropriation,until February 15, 2067 [8].
Page thumbnails and document iconsOther newer versions of familiar formats, such as document icons and pagethumbnails, present new legal issues.
Document icons are small visual representations of documents [9].Icons can include information about a document format or genre (e.g., pdfdocument, web page or folder). Page thumbnails, on the other hand, are smallimages of a page usually in reduced resolution, that can be enlarged by areader for viewing.
In discussing thumbnails, two rights that are exclusive to thecopyright holder are implicated. Because they make copies of the images theycrawl, search engines may violate the author’s exclusive right to makereproductions of a work [10]. Also, because the thumbnails are shown to theusers, search engines may also violate the author’s exclusive right to publicdisplay [10]. However, the use of thumbnails may rely, as we see in the Kellyv. Arriba [11] and Perfect 10 cases below, on one of the exemptions to theauthor’s exclusive rights: fair use.
In Kelly v. Arriba Soft Corp., a photographer whose copyrightedimages were displayed by a visual search engine operator on the operator’sweb site and those that it had licensed sued the operator. The operator hadbuilt its database by copying images from web sites and reducing theseimages into “thumbnails” that could be enlarged by clicking on thethumbnail. The lower court ruled the operator’s use of the thumbnails fairuse, as the character and purpose of its use was “significantly transformativeand the use did not harm the market for or value of [the photographer’s]works” [11]. The 9th Circuit affirmed the lower court’s ruling that the displayof thumbnails was fair use.
In Perfect 10 v. Google [12] it was a website operator’s turn to sueInternet search engines. Perfect 10 published adult photographs in both amagazine and a web site, and had expended considerable resources to thedevelopment of the brand name for the magazine and web site. Google andAmazon, search engine operators, have an image search function thatretrieves thumbnail images in response to a textual search string query. Someof the images so retrieved came from Perfect 10’s website, and it sued both

Digital content convergence: Intellectual property rights and the problems ofpreservation: A US perspective
333
Google and Amazon. The district judge, when considering plaintiff Perfect10’s motion for an injunction against Google, put the issue in a perfect context:
The principal two-part issue in this case arises out of theincreasingly recurring conflict between intellectual propertyrights on the one hand and the dazzling capacity of internettechnology to assemble, organize, store, access, and displayintellectual property “content” on the other hand. That issue, in anutshell, is: does a search engine infringe copyrighted imageswhen it displays them on an “image search” function in the formof “thumbnails…?” [12]The district court was of the view that Perfect 10 was likely to
succeed in its claim that the display of thumbnails was a direct infringementby Google of its copyrighted images, and issued a preliminary injunctionfrom creating and displaying Perfect 10’s images. The district courtdistinguished Arriba’s use of thumbnails in Kelly, in that Perfect 10’s marketfor downloading reduced-size adult thumbnails into cell-phones wassuperseded by Google’s use of Perfect 10’s thumbnails. However, the 9th
Circuit later ruled that the thumbnails were fair use because they did notdetract from the economic value of the images, and thus Google couldcontinue displaying Perfect 10 thumbnails that came up following a search[13].
4. Multiple, heterogeneous content: the legal complexities
A related feature to the complexity of digital content discussed above is themultiple, heterogeneous nature of digital collections. This feature can usefullybe analyzed in two parts: the different types of digital collections, and thedifferent goals of digital collections. Digital collections often have content ofdifferent types designed to meet a variety of goals.
The Internet, for example, can be viewed as one giant digitalcollection; a sort of a “meta-collection.” Individuals, libraries, and otherorganizations often take subsets of the Internet to form specific collections.This is generally done through book-marking and linking. While there havebeen no legal challenges yet to bookmarking, linking has generated somelegal issues, less so in the United States than in some European countries.
Likewise, libraries and other organizations may have, as part of theirdigital collections, commercial databases. The major issues here involvecopyright protection and licensing issues. Data sets, on the other hand, may

Digital content convergence: Intellectual property rights and the problems ofpreservation: A US perspective
334
be viewed in the same category as commercial databases, with less emphasison copyright and more emphasis on licensing issues.
One type of content, collective works and compilations requires amore extended discussion here. Section 101 of the U.S. copyright code definesa compilation as “a work formed by the collection and assembling ofpreexisting materials or of data that are selected, coordinated, or arranged insuch a way that the resulting work as a whole constitutes an original work ofauthorship. The term “compilation” includes collective works.” [14].
Just to make sure it is understood that compilations fall under thesubject matter of copyright specified in section 102, section 103 explicitlydeclares that compilations are indeed included, but points out that protectionextends only to what the author has contributed, and not to the underlying orpre-existing material. Nor does it extend to preexisting material that has beenused unlawfully [15].
Collective works and compilations may or may not have commoncharacteristics. In a collective work, individual components are generallyindependent copyrightable works, while compilations may include materialthat is not necessarily copyrightable [16]. Separate contributions to a collectivework can have copyright protection that is distinct from copyright in thecollective work as a whole. Owning a copyright in a collective work entitlesthe copyright owner to “only the privilege of reproducing and distributingthe contribution as part of that particular collective work, any revision of thatcollective work, and any later collective work in the same series” [17]. Thecourt in New York Times Co., Inc. v. Tasini [18] explored the question ofwhether a copyright owner in a collective work who republished all or a partof the compilation in an electronic database could prevail against an assertionof copyright infringement from the author of a contribution in thecompilation. The case involved freelance writers who had sued a newspaperpublisher for making their articles available in electronic databases. Thenewspaper asserted a privilege offered by section 201(c) of Title 17. Undersection 201(c):
Copyright in each separate contribution to a collective work isdistinct from copyright in the collective work as a whole, andvests initially in the author of the contribution. In the absence ofan express transfer of the copyright or of any rights under it, theowner of copyright in the collective work is presumed to haveacquired only the privilege of reproducing and distributing thecontribution as part of that particular collective work, anyrevision of that collective work, and any later collective work inthe same series. [17]

Digital content convergence: Intellectual property rights and the problems ofpreservation: A US perspective
335
The Supreme Court focused on the perception of a user of the articlesas presented in the database, and rejected the newspaper’s reliance on thesection 201(c) privilege. The privilege, however, continues to be availablegiven the right circumstances. A second circuit court, for example, affirmedthe granting of summary judgment to the National Geographic publisher whohad made a searchable digital collection of past issues of the magazine(dubbing it the Complete National Geographic), against freelance authors andphotographers who had sued the magazine for the use of their work in thisnew medium [19]. The Court relied on its holding the fact that the originalcontext of the magazine was present in the new Complete NationalGeographic, and that the digital work was a new version of the NationalGeographic Magazine. The database at issue in Tasini, on the other hand, didnot allow users to view the underlying works in their original context.
Divergent goalsAs well as being heterogeneous and having multiple formats, digitalcollections also have different goals. One of the goals of digitization, asmentioned above, is preservation. Some institutions have a legal privilege topreserve. Section 108 of the U.S. Copyright Code, for example, addresses theneed for preservation and conservation [20]. Legal issues that are likely toarise here not only include copyright, but also evidence.
The issue of non-permanence that we discussed above acquirescritical importance when it comes to maintaining documents for legalevidentiary purposes. In December 2006, changes were put into effect in theU.S. Federal Rules of Civil Procedure that institute a new category ofevidence: the Electronically Stored Information (ESI), which is designed towork within the existing rules of production of “documents.” Under the rules,a party must provide to other parties: “a copy--or a description by categoryand location--of all documents, electronically stored information, and tangiblethings that the disclosing party has in its possession, custody, or control andmay use to support its claims or defenses…” [21]. While the rule does notspecify the version of the electronically stored information that should beproduced, Rule 26(f) does oblige the parties to conference and “…discuss anyissues about preserving discoverable information” as well as “any issuesabout disclosure or discovery of electronically stored information, includingthe form or forms in which it should be produced.”
A closely related issue to non-permanence for evidence isauthenticity. Digital information can be vulnerable to tampering orcorruption. Depending on the nature of the collection, authentication methodssuch as digital signatures, version control, and encryption may be necessary[22].

Digital content convergence: Intellectual property rights and the problems ofpreservation: A US perspective
336
Finally, we cannot conclude without mentioning something aboutaccess. Access and preservation are much intertwined. There could be anynumber of reasons for seeking access, including for entertainment, research,or safeguarding culture. Copyright is always an issue, as, for example, not allcopyrightable works have the same protection duration. Differentpublications are covered under different copyright protection terms,depending on when they were created or published. However, the issuesmost likely to rise are those of licensing for access. By access, we are also herereferring to use. Unfortunately, this issue is for the moment outside the scopeof this paper.
Notes and References
[1] ANDERSON, WL. Some Challenges and Issues in Managing, andPreserving Access to, Long-Lived Collections of Digital Scientific andTechnical Data. Data Science Journal 3, 2004, p. 191-201. Available athttp://www.jstage.jst.go.jp/article/dsj/3/0/191/_pdf (June 29, 2009).
[2] ADAMS, G. Partners Go Dutch to Preserve the Minutes of Science.Research Information, September/October, 2004. Available athttp://www.researchinformation.info/risepoct04archiving.html(March 10, 2010).
[3] ARMS, CR. Keeping Memory Alive: Practices for Preserving DigitalContent at the National Digital Library Program of the Library ofCongress, RLG DigiNews, 4(3) 2000, Available athttp://www.rlg.org/preserv/diginews/diginews4-3.html#feature1
[4] BARNES, I. The Preservation of Word Processing Documents. Canberra:Australian Partnership for Sustainable Repositories, 2006. Availableathttp://www.apsr.edu.au/publications/word_processing_preservation.pdf (June 29, 2009).
[5] ESPOSITO, J. The Processed Book, First Monday, 8 (3) 2003 (Updated2005). Available athttp://firstmonday.org/htbin/cgiwrap/bin/ojs/index.php/fm/article/view/1038/959 (March 25, 2010)
[6] GARROD, P. Ebooks in UK Libraries: Where Are We Now? Ariadne,no. 37 (2003). Available at http://www.ariadne.ac.uk/issue37/garrod/
[7] BESEK, J.M. Copyright Issues Relevant to Digital Preservation andDissemination of Pre-1972 Commercial Sound Recordings. Washington,

Digital content convergence: Intellectual property rights and the problems ofpreservation: A US perspective
337
DC: Council on Library and Information Resources and Library ofCongress, 2005. p. 16-17.
[8] 17 USC 301(c) provides: “With respect to sound recordings fixedbefore February 15, 1972, any rights or remedies under the commonlaw or statutes of any State shall not be annulled or limited by [Title17] until February 15, 2067.”
[9] JANSSEN, WC. Document Icons and Page Thumbnails: Issues inConstruction of Document Thumbnails for Page-Image Digital Libraries.Palo Alto, CA: Palo Alto Research Center, 2004
[10] 17 USC 107[11] 280 F.3d 934 (9th Cir. 2002)[12] 416 F. Supp. 2d 828 (C.D. Cal. 2006)[13] PERFECT 10, Inc. v. Amazon.com, Inc., 508 F.3d 1146 (9th Cir. 2007).[14] 17 USC 101[15] 17 USC 102, 103[16] ROY Export Co. Establishment of Vaduz, Liechtenstein, Black Inc., A.
G. v. Columbia Broadcasting System, Inc., 503 F. Supp. 1137 (S.D.N.Y. 1980), judgment aff'd, 672 F.2d 1095 (2d Cir. 1982)
[17] 17 USC 201(c)[18] NEW York Times Co., Inc. v. Tasini, 533 U.S. 483[19] FAULKNER v. National Geographic Enterprises Inc., 409 F.3d 26 (2d
Cir. 2005)[20] 17 USC 108[21] FEDERAL Rules of Civil Procedure 26(a)(1)(A)(ii)[22] GERMAIN, CM. Legal Information Management in a Global and
Digital Age: Revolution and Tradition, International Journal of LegalInformation, 35 (1) 2007. p.134-163, 156-157

338
An adaptable domain-specific disseminationinfrastructure for enhancing the visibility of
complementary and thematically related researchinformation
Engin Sagbas;1 York Sure1, 2
1 GESIS – Leibniz Institute for the Social Sciences, InformationProcesses in the Social Sciences (IPS), Bonn, Germany
2 University of Koblenz-Landau, Institute for Computer Science,Information Systems and Semantic Web (ISWeb), Koblenz, Germany
{engin.sagbas, york.sure}@gesis.org
AbstractWe introduce an adaptable domain-specific infrastructure for disseminationof heterogeneous outcomes (e.g. publications) from thematic complementaryand related projects. Our aim is to enhance the visibility of thematicallyrelated research information and to face obstacles from both sides: needs frominformation users and information providers. Users are confronted withfinding sources for relevant information, handling with heterogeneousinformation display, varying information granularity on different sources,extracting and compiling the information found whereas informationproviders have costs for implementing and maintaining such aninfrastructure from scratch, limit or omit coupling with different relatedsources and offer information partly in an interconnected manner. Thecontributions of this paper include a model closely related to the CERIFstandard and a technical infrastructure ready to reuse to set up a researchinformation system for a new research topic. We created a reference portal onthe topic “Governance in the EU”.
Keywords: dissemination infrastructure; information retrieval; researchinformation; CERIF

An adaptable domain-specific dissemination infrastructure
339
1. Introduction
Information visibility of complementary and related information on the webis an important claim from a user’s perspective. For example, collaborativeresearch in large projects and complementary research by other relatedprojects across national and international research institutes have the problemnot to be adequately visible for those who are not familiar with the relatedprojects. Transparency is hampered, e.g. about the produced outcomes in aresearch field, established research structures and connections to other relatedprojects. Furthermore, there are different target groups with differentinformation needs like researchers seeking new, relevant papers; projectcoordinators and managers looking for project specific documents; and thegeneral public interested in new developments in specific research topics.Users with these different needs usually start finding the relevant informationby using different search engines or available specific project informationsystems. It is a very tedious and time consuming task for a user to find anduse several relevant information systems and websites. The success of findingthe requested information across several sources is uncertain. In addition, theresults found are heterogeneous, i.e. they mostly have a different kind ofinformation display and granularity. Besides, if the information is not directlyinterconnected to related sources, the access to relevant complementaryresources is hampered. For the information provider there is a challenge tobuild such a project dissemination infrastructure usually from scratch thatgathers these information needs from the user.
2. Challenges
We identify challenges from two sides: On the one side, the informationconsumer needs, and, on the other side, the information provider needs. Theinformation consumer side usually consists of individuals participating in theprojects, users of the projects’ results like external researchers, policy makers,and the interested public. They are confronted with the following obstacles:
In project information systems like CORDIS (EuropeanCommission’s Research Information System) [1], information iscurrently available at the level of the individual research projects.Persons interested in individual project outcomes like conferencesand publications are required to visit the websites of all projectsdealing with the topic of interest. The visibility of the projects and oftheir collective contribution to the realization of the Framework

An adaptable domain-specific dissemination infrastructure
340
Programme priorities and European Research Area [2] is thereforerather limited.Users who will not know in advance which type of information orservice is to be expected from each project website, are forced to findand visit all project websites including those not relevant to them.Due to the lack of interconnections to complementary and relatedinformation across project boundaries, users will usually have to visitmultiple websites for further information needs.By visiting each website, users have to learn the sites’ structure, howto find and access relevant information on each project website, andfinally compile themselves the heterogeneous materials with varyingqualities found on different sites [3]. Mostly, it is a time consumingand inconvenient task for users.Biased by the above problems, users miss the big picture for relevantand related information.
In contrast, the information provider needs are characterized with thefollowing common situations:
Spending time and financial resources for implementing the projectdissemination activities for each project resulting in several websiteswith similar infrastructures which are usually project-specific andisolated. Therefore, they are not coupled with the complementaryinformation from other information providers.Across all projects, different dissemination and sustainabilitystrategies beyond the projects’ duration will make it difficult toensure the availability of project results in the long run yieldinginformation websites that are not maintained or no more visible [4].The lack of a topic-oriented research infrastructure for disseminationof complementary project outcomes can lead to an unnecessaryduplication of work on the provider side, and an increased effort forfinding and accessing relevant information on the user side.
3. Approach
Our contributions are making thematically connected research activitiesvisible at a single place together with their results, giving users integratedaccess to currently distributed resources at a common level of quality ofservice; to provide an adaptable technical infrastructure for informationproviders facilitating dissemination of heterogeneous outcomes from thematiccomplementary projects targeted to different audiences; to integrate and

An adaptable domain-specific dissemination infrastructure
341
compile heterogeneous data from different sources providing quality data forthe purpose of analyzing, visualizing and reusing by other services; toprovide a collaborative infrastructure connecting interested and activeresearchers; to reuse the complete information infrastructure for a newdomain reducing costs for acquisition and implementing; and to facilitatesustainability of project outcomes after the project’s end.
The main pillar of work carried out focused on the development of atechnical dissemination infrastructure which covers all entities relevant in thecontext of research information (i.e. actors, activities and results) at a verydetailed level and at the same time interconnected them both within thecontext of an individual project and across project boundaries.
3.1 The Conceptual ModelIn the first phase of the EU project IConnectEU [5], the different outcomesproduced by eight complementary projects and the target audience of theseoutcomes were analyzed and a core model was defined for documentingthese outcomes together with information about participating institutes andpersons at a very detailed level. The core model is closely related to theCommon European Research Information Format (CERIF), which was fundedby the European Commission and is maintained by euroCRIS [6], aprofessional organization dedicated to improvement of research informationavailability since the release of CERIF2000 [7]. Compatibility to CERIF, inspecific to its exchange format CERIF-XML [8], supports reusing researchinformation across institutional and geographic boundaries.
The CERIF model is built around three core entities of researchinformation and three result entities. Core entities are project, person andorganizational unit. The result entities consist of publication, patent, andproduct. These entities are connected with typed links which represent thesemantic relationships between these entities expressing, e.g. the members ofa project, the affiliation of a person, project outcomes, authors of publications,and persons with specific project roles like coordinator, to name a fewexamples.
These entities are reflected in the information architecture, where semanticannotations, i.e. attributes, were used to describe these entities. They havebeen partly expanded in regard to the attribute set defined in CERIF. This notonly includes additional information on e.g. project work packages, datacollections or scientific methods, but also includes geographic locationand coverage of all entities, target groups of activities and results.
We specified the basic requirements in a core model that includes allrelevant entities, with their describing attributes and the relationships

An adaptable domain-specific dissemination infrastructure
342
between them. We modeled the research information context comprising ofthe following core entities: project, institute (institutional participantsinvolved in a research project), person (doing research and affiliated with aninstitute), and research results (including project research outcomes likepublications, events, research data or other produced results).
Figure 1 depicts the conceptual model. Each of these entities (displayed inoval form) has its own set of mandatory and optional attributes, whichadequately describe the single entity. Attributes are grouped in formalattributes, specific attributes, attributes for content describing and indexing,and finally, semantic relations for interconnecting entities.
For example, attributes for describing projects are divided in:formal attributes: title, acronym, begin, end, funding, URL etc.,specific attributes: funding agency, thematic priority, instrument etc.,content describing attributes: summary, research area, objectives,work packages etc.,content indexing attributes: geographic coverage, thesauruskeywords, free keywords etc., andsemantic relations: linking semantically the project entities toinstitutes, persons, and results and interconnecting all entities in thecore model to express relationships between two entities, e.g. “Mike”(person) is involved in “Apollo” (project). Other relation typeattributes can be defined and used like “coordinator of”, “author of”,or “cooperate with”.
The result entity is subdivided in different research outcome entitiesproduced by all projects. Especially publications are the most prominentexample for representing research outcomes. Events like conferences orworkshops, produced results like research data, and other generated projectresources are also covered project outcomes. Each result entity has its owndescribing attribute set and is interconnected within the research context.

An adaptable domain-specific dissemination infrastructure
343
Project Layer
Actors & Participant Layer
Result Layer
Semantic Layer
Figure 1: Conceptual model in the context of research information
Project
Result
Project
Project
PersonInstitute
Institute
Institute
Person
Person
Result
Result
Result
Result
SemanticRelationtypes
SemanticRelations
SemanticAnnotations

An adaptable domain-specific dissemination infrastructure
344
3.2 The Architecture ModelThe overall architecture model is shown in Figure 2. The model considers thedifferent information needs and implements the conceptual model describedin the last section. The middleware consists of two main parts. A contentmanagement system manages the editorial static contents. The dynamicalcontents representing the conceptual model in Figure 1 are realized by acataloguing system. This combination allows exploiting the synergy effects ofboth specialized systems so that information providers can both buildcomplex portal structures combined with functionality of a cataloguingsystem providing dynamic contents.
We use for the technical infrastructure of the IConnectEU reference portalas cataloguing system DBClear [9], which is developed in a project fundedby the German Research Foundation (DFG). Due to its flexibility, DBClear hassuccessfully been adapted to several use cases where a web-based cataloguingsystem was needed to collect and map information, e.g. in the FP5 project“MORESS - Mapping of Research in European Social Sciences andHumanities”, in around 10 Digital Libraries in Germany, and recently in“SSOAR – Social Science Open Access Repository”[10], which was alsofunded by the DFG. As content management system we adopted Typo3 [11].Both software packages are open source.
Our infrastructure is flexible in regard to adapting it to a new domain.Since the conceptual model developed is generic for research information, it isnot restricted to a particular research discipline. All kinds of research topics indifferent research domains can in principle be covered by the model, e.g.research topics in social sciences, life sciences, or natural sciences. Reusing theconceptual model can significantly reduce the effort to set up a specific topic-oriented research information system.
Customizing and extensions might be useful to adapt the model to newemerging needs, e.g. for particular requirements of a new domain. DBClearhas two main strengths. The flexibility both in defining and editing semanticannotations and flexibility in adapting the information display view for theuser interface, both feasible during and after system implementation. Forexample, we could define a new relation type called “cooperate-with” andthen annotate persons who cooperate with each other (semantic relations).This would represent a cooperation network of persons. There are nolimitations, i.e. we can add or adapt all semantic annotations and semanticrelation types for the given entities in Figure 1.

An adaptable domain-specific dissemination infrastructure
345
Enduser added value services
Middleware
Data storage
Data entry
Figure 2: Overall architecture model
CMS storage
CMS foreditorial contents
Catalogue System fordynamical contents
by instituteBrowsing
by project
by authorby role…
by country
by geographic coverage
Customizing and Extensions
semantic annotations semantic relationtypes
designusability
functionality
Catalogue System storage
RDF …
Export
CERIF BibTex
XML
discussionCollaboration
sharingpeople
Web 2.0 CERIF/XML Import
Editorialnews
editorial texts
multimedia
Map
Explore
Timeline
Tag Clouds …
ChartsNetwork Graph
Searching
by subject by keyword
by entitytype …

An adaptable domain-specific dissemination infrastructure
346
3.3 Enduser added value servicesBuilding a useful research information system from a user’s perspectiverequires attention for different user needs. Especially, added value servicescould be a crucial incentive using it. Figure 2 lists a few valuable services. Forexample, browsing frequently requested research information in predefinedcategorized views facilitates quick access to the requested information, e.g.persons can be browsed by project members, by institute members, by projectroles, by authors or by another person view adopting a relation type to aperson. Further services like new visualization types (e.g. map, charts) oruseful export formats for publications like BibTex can be realized.
3.4 Data entry and Data gatheringEach information system with its varying functionality and services rely onthe availability of quality and up-to-date data. Thus, an issue is where to getthese data. There are approaches for automatically harvesting and collectingrelevant data, e.g. by web mining, but we focus here on the idea of Web 2.0.This has the advantage that a human collaboration led to better results ofgathering quality data by exploiting the social intelligence [12]. We focus onresearchers who would provide their own data and integrate it with theothers. Another associated issue is, how we can get the user’s data withoutforcing them to use multiple places for data entering. In this case, we can usestandards for reusing research data. The CERIF standard adopting byresearch information systems (CRIS) makes research information acrossdifferent systems available using the CERIF exchange format. Export formatsfrom proprietary systems are imported by using XML and CSV formats. Theflexibility of DBClear to define new mapping templates for different dataexport formats by using XSLT makes large amounts of data reusable fromother quality controlled systems.
4. Related Work
The IConnectEU model is closely related to the CERIF model which isregularly updated. The current release is CERIF 2008 [13]. IConnectEU isconsistently structured according to the CERIF core entities: project, institute,person, and results. There is a mapping defined for the intersection betweenthe IConnectEU and the CERIF entities. Due to the specific use case ofIConnectEU, not all entities from CERIF are relevant or used. Otherwise thereare some entities and attributes defined in IConnectEU but not present in

An adaptable domain-specific dissemination infrastructure
347
CERIF. If required, the conceptual model can be evolved or adapted to thespecific discipline or emerging new requirements.
Relying on the CERIF standard ensures that the data can be reused byother third-party research information systems. For example, the IST Worldproject [14] adopts the CERIF standard so that the IConnectEU data can befurther reused, e.g. to apply advanced technologies for visualization like acompetence diagram. The IST World project complements IConnectEU sinceits focus is on analyzing research competencies across European countries[15]. IConnectEU’s primary focus is to provide a complete model for coveringtypically research information combined with a ready for reuse softwareinfrastructure applicable for any research topic.
There are other portals like sowiport.de [16] (one of the largestinformation portals for the social sciences in Germany) or vascoda.de [17] (aninterdisciplinary portal for scientific information in Germany) which providea broad range of information from multiple integrated databases. Sciencegateways like WorldWideScience.org [18] enable federated searching ofnational and international scientific databases and portals. In contrast to theseportals, IConnectEU has a narrow thematic focus on a research topic within adiscipline connecting only thematically related projects, e.g. projects withresearch on the topic “EU Governance”. In this sense, it is a lightweightthematically focused information system not intended to be a literaturedatabase with millions of entries from different areas. Especially, IConnectEUcovers the project context with research information (e.g. persons, institutes,results) in a semantically interconnected manner which is not or partlyprovided in this form by the mentioned portals. To sum up, IConnectEU cancontribute topic oriented research information and data to larger (multi-)disciplinary portals and profit from accessibility from those portals gainingnew users who have a special research focus.
Search engines like Google might be useful but their retrieval effectiveness[19] is limited in the context of finding complementary research information.Due to the fact that IConnectEU is thematically focused and the data ishandpicked and quality controlled by the partners, all search results arethematically relevant and related, which result in a high retrieval quality.
5. Conclusion and future work
We addressed common needs of both information users and informationproviders. From the user’s perspective there are obstacles to find and retrieverelevant and related research information on the web. These include finding

An adaptable domain-specific dissemination infrastructure
348
the relevant websites and sources, confronting with the heterogeneity ondifferent sources like different information display and granularity, andextracting as well as compiling the collected information from the web. Incontrast, obstacles for information providers are costs for implementing andmaintaining a complex dissemination infrastructure, coupling with otherrelated sources, and providing interconnected information to thematicallyrelated information. Another issue is sustainability of information beyond theprojects’ duration.
We introduced the benefits of the IConnectEU infrastructure allowingtopic-oriented organization of complementary research information andoutcomes. The typical research information, e.g. from projects, institutes andpersons to publications, conferences and other results are covered andinterlinked semantically. Research networks can be represented, i.e. linkingresearchers and institutes across projects and countries. Besides, detailedinformation and extensive metadata for a large number of information entitiesare provided. The data is compatible with the CERIF standard for researchinformation promoted by the European Commission. Reusing data by otherservices for the purpose of analyzing and visualizing adds several newdimensions to geographical analysis, e.g. mobility of researchers,development of collaboration networks, and inclusion of regions in Europeanfunded research.
IConnectEU strengths are based on an adaptable infrastructure. Using itfor dissemination in other research topics will significantly reduce theprovider’s costs. The software developed in IConnectEU is made freelyavailable as open source software to third parties.
Future work includes the Web 2.0 approach to get research information forthe data entry process directly from the involved persons. This requires acollaborative infrastructure that eases the data gathering process sinceeveryone would be responsible for maintaining his/her own part ofcontribution. Our approach for dealing with the issue will include:
Providing an incentive by establishing new added value services likenew visualization and exploration services for data, e.g. mapvisualizations allowing geographical analysis.Bridging to social networks for special target groups like researchersusing XING, and making an incentive to join the platform [20].
We will extent the current dissemination platform to a collaborativeinfrastructure where users maintain their own data and collaborate together,e.g. discussions on a topic. Further, we prove use cases for connecting tosocial network users by using the open social standard [21], which is also partof future work.

An adaptable domain-specific dissemination infrastructure
349
Notes and References
[1] CORDIS: http://cordis.europa.eu/[2] European Commission Research http://ec.europa.eu/research/[3] P. Oliveira, F. Rodrigues, P. Henriques, und H. Galhardas, A taxonomy
of data quality problems, Proceedings of 2nd International Workshop onData and Information Quality, 2005, p. 219-233.
[4] K.H. Lee, O. Slattery, R. Lu, X. Tang, und V. McCrary, The state of theart and practice in digital preservation, Journal of Research-NationalInstitute of Standards and Technology, vol. 107, 2002, p. 93-106.
[5] IConnectEU: http://www.iconnecteu.org/[6] euroCRIS: http://www.eurocris.org/[7] A. Asserson, K.G. Jeffery, und A. Lopatenko, CERIF: Past, Present and
Future: an Overview. Gaining Insight from Research Information, 6thInternational Conference on Current Reseach Information Systems, 2002, p.29-31.
[8] B. Jörg, O. Krast, K.G. Jeffery, und G. van Grootel, CERIF 2008–1.1 XML:Data Exchange Format Specification. euroCRIS, March, 2010.
[9] H. Hellweg, B. Hermes, M. Stempfhuber, W. Enderle, und T. Fischer,DBClear: A Generic System for Clearinghouses, Gaining Insight fromResearch Information, 2002, p. 131.
[10] SSOAR: http://www.ssoar.info/en/[11] Typo3: http://typo3.org/[12] J.F. Jensen, User-generated Content – a Mega-trend in the New Media
Landscape, Interactive TV: Shared Experience, TICSP Adjunct Proceedingsof EuroITV2007, 2007, p. 29–30.
[13] B. Jörg, K.G. Jeffery, A. Asserson, und G. van Grootel, CERIF 2008–1.1Full Data Model: Introduction and Specification. euroCRIS, March, 2010.
[14] IST World: http://www.ist-world.org/[15] B. Jörg, J. Ferle, H. Uszkoreit, und M. Jermol, Analyzing European
Research Competencies in IST: Results from a European SSA Project,Bošnjak&Stempfhuber, 2008.
[16] Sowiport: http://sowiport.de/[17] Vascoda: http://vascoda.de/[18] WorldWideScience: http://worldwidescience.org/[19] D. Lewandowski, The retrieval effectiveness of web search engines:
considering results descriptions, Journal of Documentation, vol. 64, 2008,s. 915-937.
[20] L. Leung, User-Generated Content on the Internet: An Examination ofGratifications, Civic Engagement, and Psychological Empowerment,New Media & Society, 2009.
[21] OpenSocial: http://www.opensocial.org/

350
Translation of XML documents into logic programs
Martin Zima; Karel Jezek
Department of Computer Science & EngineeringUniversity of West Bohemia in Pilsen
Universitni 8, 306 14 Pilsen, Czech Republiczima, jezek_ka @kiv.zcu.cz
AbstractThe semantic web is supposed to become a characteristic phenomenon of theworldwide web in the next decade. One of the basic semantic web tools is theXML language. The aim of this paper is to provide information on how webdocuments written in the XML language can be rewritten into logic formsexpressed as Prolog/Datalog programs. The XML language constitutes thebasis of many semantic web languages and information in XML documents isusually retrieved with the help of procedural language called XQuery.Retrieving based on logic formulas gives us the chance to take advantage ofdeduction and this way to gain new, originally hidden information.
Keywords: semantic web; logic programming; XML; Datalog language.
1. Introduction
An interesting and topical research issue is the use of logic rules (logicprogram) to evaluate a query about XML documents [1]. It provides an optionto combine XML technology with the inference capabilities of logicprogramming. Logic programming allows us to evaluate the queries thatrequire computation of a transitive closure of relations. This means that wecan query such information that is not explicitly included in the documents.In other words, we are able to draw deductive conclusions concerning thefacts contained in the documents and in this way to find new, but originallyhidden facts. Suppose, for example, that we have an XML collection ofscientific articles. The logic program allows a query such as: find the names ofall co-authors of the given author, including co-authors of found co-authors, etc. Itmeans this query evaluates the transitive closure of the relation co-author.There are many similar tasks having something to do with transitivity of

Translation of XML documents into logic programs
351
relations, e.g. looking for a path from one place to some destination, searchingfor owners of a given company (as frequently real final owners are hiddenbehind the companies that transitively own other companies), etc. Allcompound queries have the form of logic formulas. Therefore it is natural touse the logic query languages and, consequently, transform XML documentsinto expressions written in the logic language. This task is particularlyinteresting for us, as a few years ago we implemented an experimentaldeductive system [2], translating the Datalog language into the PL/SQLprocedural language [3], which is used in the DBMS Oracle.
The use of Datalog instead of Prolog has some pragmatic reasons too. Adatabase-oriented system with a professional database management system isable to process large data collections within a reasonable time. This isparticularly important in the case of web documents processing.
2. Logic programming and Datalog
To be able to explain the method of translation, let us briefly introduce someprinciples of logic programming and its form used in the language Datalog[4]. Datalog is a slightly modified version of the primary logic languageProlog [5] and is tailored to database processing.
The logic program consists of a set of facts, a set of logic rules and a query.On the basis of the logic program execution, a set of new facts can be inferredand delivered as the query result. Every logic program can contain constantsand variables. The names of variables begin with upper case letters. Theexceptions are anonymous variables, i.e. variables whose values we are notinterested in. They are marked with an underscore. Names of predicatesbegin with lower case letters and predicates are distinguished by the numberof their arguments as well. Facts have the common form
predicate_name(list of constant arguments).Rules have the common form head :- body. The symbol “:-” means
“if” and expresses an implication between the truth of the body and headpredicates. The head is a predicate name, the arguments of which are mostlyvariables. Such variables are evaluated during the program execution and incase the head predicate is TRUE, they are returned as the result of the ruleprocessing. The rule body consists of predicates whose arguments have tocontain all variables from the rule head. The head predicate becomes TRUE ifthere exist such values of variables in the logic program that the values of allpredicates in the rule body are TRUE too. If such values of variables do not

Translation of XML documents into logic programs
352
exist, the rule is evaluated as FALSE. The query consists of a predicate whosearguments are variables or constants. The deductive system tries to findvalues of query variables which are derivable from existing program factswith the possible use of program rules. The query succeeds if such valuesexist, otherwise, the query predicate has the value FALSE and the queryanswer is NO.
Our experimental deductive system implements an extended version ofthe Datalog language. The current extensions include relational operators,assignment and not operation for negation.
3. Translation of XML documents
Advantage of logic programming for XML documents querying andprocessing has inspired other researchers too. To our knowledge, a similarissue was described by Jesús M. Almendros-Jiménez [6]. He proposed apossible solution to the problem of converting XML documents to a logicprogram written in Prolog. His solution uses a list structure which describesdata of the XML document and represents the result of the XPath query [7].The rules of the logic program define the structure of the XML document (theway the elements are nested within other elements). He introduces specificfunctions with a different number of arguments to specify the XMLdocuments structure, but the process of functions evaluations is missing. Theresulting logic program contains all data of the input XML document in a setof facts. The structure of the XML document is fixed in logical rules. Thismeans that each XML document is transformed into a different set of rules.
On the contrary the method proposed by us generates a logic programwhich consists of universal rules. That is, two different logic programs(results of the transformation of two different XML documents) contain thesame logic rules. Differences between the structures of various XMLdocuments are captured by the facts. This technique also eliminates the needto work with lists that our implementation of Datalog still lacks.
3.1. Construction of the set of facts
To show our method of generating a set of logic facts, we need to choose someexample of an input XML document. Such suitable candidate is e.g.books.xml, a modified XML document describing a library content, which

Translation of XML documents into logic programs
353
was adopted from [6]. The text of the XML document, accompanied by anumber of lines, is shown in Fig. 1.
As [6] shows, the information “Buneman is the author of the first book”describe this fact:
author( Buneman , [2, 1, 1], 3, books.xml ).
- The first argument is the value of the element <author>.- The second argument defines the XML document structure: Number 2
means: the element is the second one inside another element. The first 1means that the element <book> is the first one inside another element<bookshelf>. The second 1 stands for the element <bookshelf> whichis the root element of the document.
- The remaining arguments do not require further explanation.
Before explaining the above-presented transformations, let us modify thesample XML document so it is consistent with the standards of the SemanticWeb. An adapted version of the XML document is shown in Fig. 2. Theabove-mentioned information "Buneman is the author of the first book“, will bewritten into a triple of auxiliary logic facts that define the predicate xml. Inthis way we simultaneously eliminate the need to use the data structure list.
xml(5, dc:creator , 2, 3).xml(5, bk:book , 1, 2).
1 <?xml version="1.0" ?> 2 <bookshelf> 3 <book year="2003"> 4 <author>Abiteboul</author> 5 <author>Buneman</author> 6 <author>Suciu</author> 7 <title>Data on the Web</title> 8 <review>A fine book.</review> 9 </book>10 <book year="2002">11 <author>Buneman</author>12 <title>XML in Scotland</title>13 <review>The best ever!</review>14 </book>15 </bookshelf>
Figure 1: XML document books.xml

Translation of XML documents into logic programs
354
xml(5, bk:bookshelf , 1, 1).
The predicate xml mostly shows only the structure of the document. Thefirst argument of the xml predicate holds the row number of the input XMLdocument. This value will be the same for all logic facts defining the predicatexml, i.e. facts which describe a specific occurrence of the element written in agiven row of the XML document. The other three arguments define the pathin the XML document, i.e. the path from the given element to the root elementof the document. To be specific, on line 5 there is recorded the element<dc:creator>, whose parental element is <bk:book>. The element<bk:book> contains a total of 5 children, of which the second child elementis <dc:creator> located on line 5. The element <bk:book> has a parentalelement <bk:bookshelf>. This element contains 2 children (books). Theelement <dc:creator> from line 5 is contained in the first element<bk:book>. The last of the three facts says that the described<bk:bookshelf> element is the root element of the document.
1 <?xml version="1.0" ?> 2 <bk:bookshelf xmlns:rdf="http://www.w3.org/1999/02/22-rdf-syntax-ns#" xmlns:dc="http://purl.org/dc/elements/1.1/" xmlns:bk="http://example.org/books/"> 3 <bk:book year="2003"> 4 <dc:creator>Abiteboul</dc:creator> 5 <dc:creator>Buneman</dc:creator> 6 <dc:creator>Suciu</dc:creator> 7 <dc:title>Data on the Web</dc:title> 8 <bk:review>A fine book.</bk:review> 9 </bk:book>10 <bk:book year="2002">11 <dc:creator>Buneman</dc:creator>12 <dc:title>XML in Scotland</dc:title>13 <bk:review>The best ever!</bk:review>14 </bk:book>
Figure 2: Adapted XML document

Translation of XML documents into logic programs
355
The data itself (names and attributes of elements, text content, etc.) has tobe saved through other predicates. Let us introduce for this purpose a piece ofpredicate data which will contain the line number, the element name thatcontains the relevant text information and the value, i.e. the text content ofthis element. The fact that “Buneman is the author of the first book” is expressedas follows:
xml(2, 'bk:bookshelf', 1, 1).xml(3, 'bk:book', 1, 2).xml(3, 'bk:bookshelf', 1, 1).xml(4, 'dc:creator', 1, 3).xml(4, 'bk:book', 1, 2).xml(4, 'bk:bookshelf', 1, 1).xml(5, 'dc:creator', 2, 3).xml(5, 'bk:book', 1, 2).xml(5, 'bk:bookshelf', 1, 1).xml(6, 'dc:creator', 3, 3).xml(6, 'bk:book', 1, 2).xml(6, 'bk:bookshelf', 1, 1).xml(7, 'dc:title', 4, 3).xml(7, 'bk:book', 1, 2).xml(7, 'bk:bookshelf', 1, 1).xml(8, 'bk:review', 5, 3).xml(8, 'bk:book', 1, 2).xml(8, 'bk:bookshelf', 1, 1).xml(10, 'bk:book', 2, 2).xml(10, 'bk:bookshelf', 1, 1).xml(11, 'dc:creator', 1, 3).xml(11, 'bk:book', 2, 2).xml(11, 'bk:bookshelf', 1, 1).xml(12, 'dc:title', 4, 3).xml(12, 'bk:book', 2, 2).xml(12, 'bk:bookshelf', 1, 1).xml(13, 'bk:review', 5, 3).xml(13, 'bk:book', 2, 2).xml(13, 'bk:bookshelf', 1, 1).
data(4, 'dc:creator', 'Abiteboul').data(5, 'dc:creator', 'Buneman').data(6, 'dc:creator', 'Suciu').data(7, 'dc:title', 'Data on the Web').data(8, 'bk:review', 'A fine book.').data(11, 'dc:creator', 'Buneman').data(12, 'dc:title', 'XML in Scotland').data(13, 'bk:review', 'The best ever!').
attribute(3, 'bk:book', 'year', '2003').attribute(10, 'bk:book', 'year', '2002').
Figure 3: Generated facts

Translation of XML documents into logic programs
356
data(5, dc:creator , Buneman ).
Attributes and values will also be recorded in the form of facts. We canintroduce the predicate attribute containing the line number, the elementname by which an attribute is defined, the attribute name and finally itsvalue. For example, as our document defines only one attribute year withinthe element <bk:book>, the corresponding fact will have the form:
attribute(3, bk:book , year , 2003 ).
Fig. 3 shows the full set of facts defining the predicates xml, data andattribute, which were obtained by translation from the XML document inFig. 2.
3.2. Universal rules
The logic facts defining the predicate xml hold the structure of the input XMLdocument. Therefore, it is possible to determine which element is a part(descendant) of another element. As this process is recursive we can define anauxiliary predicate intersection. This predicate is defined by two rules,which look for the intersection of sets of facts determining the predicate xml.Each set describes an element from one line of the XML document. The set oflogic facts from Fig. 3 defines 11 various sets in total. To demonstrate, weselected two sets which describe the elements listed in lines 3 and 6.
xml(3, 'bk:book', 1, 2).xml(3, 'bk:bookshelf', 1, 1).
xml(6, 'dc:creator', 3, 3).xml(6, 'bk:book', 1, 2).xml(6, 'bk:bookshelf', 1, 1).
At first sight it is clear that both sets have three common arguments:'bk:bookshelf', 1, 1. They describe the root element of the XMLdocument, which must be specified in any set of facts defining the predicatexml. The form of rules defining the predicate intersection is as follows:

Translation of XML documents into logic programs
357
intersection(Line1, Line2, Element, N, 1) :- xml(Line1, Element, N, 1), xml(Line2, Element, N, 1), Line1 < Line2.
The above-mentioned sets also have another three common arguments:'bk:book', 1, 2. The value 2 defines the level of nesting of the element,the value 1 indicates the root element. To ensure that these two facts will alsobe included in the intersection, the intersection must include the fact definedat a lower level. This results in the following recursive rule:
intersection(Line1, Line2, Element, N, P2) :- xml(Line1, Element, N, P2), xml(Line2, Element, N, P2), P1 := P2 – 1, intersection(Line1, Line2, _, _, P1).
The pairs of line numbers, which are the results of an evaluation of thepredicate intersection, do not guarantee so far that on these XML linesthere are written two immediately nesting elements, e.g., that on Line2 thereis written such element, whose parent is written on Line1. This conditionapplies only in the following case. With Line1 there is associated such a setwhich is identical to the intersection of both sets and the second set,associated with Line2, contains one more fact. This condition is true forelements on lines 3 and 6 of the XML document, but it is false in the case ofelements on line 4 and 7. The following rule describes this condition.
child_lines(Line1, Line2) :- intersection(Line1, Line2, _, _, P1), P2 := P1 + 1, not xml(Line1, _, _, P2), xml(Line2, _, _, P2), P3 := P2 + 1, not xml(Line2, _, _, P3).
XML documents often contain deeply nested elements. We call nestedelements the descendants of a surrounding element. The nesting has to beverified. The following recursive predicate will do this activity.

Translation of XML documents into logic programs
358
descendant_lines(Line1, Line2) :- child_lines(Line1, Line2).
descendant_lines(Line1, Line3) :- child_lines(Line1, Line2), descendant(Line2, Line3).
To make our list of universal rules complete, we have to add a ruledetecting which element is on the specified line. This rule must be used incase of elements without any attributes, e.g. the element <bookshelf> (seeFig. 1). The rule element_line looks for the specified number of such lineelement (in the set of predicates xml) which has the greatest value of the lastargument, i.e. the level of nesting.
element_line(Line, Element) :- xml(Line, Element, _, P1), P2 := P1 + 1, not xml(Line, _, _, P2).
All listed and described logic rules are universal. If we use the proposedtransformation on two different XML documents, the resulting logicprograms will contain different set of facts, but the logic rules will be thesame.
4. Queries
The logic program is complete if it contains a query we want to evaluate.Datalog has the basic form of a query:
?- predicate(list of arguments).
For the formulation of a query, it is usually necessary to define additionalpredicates in the form of one or more logic rules. This approach is used for allqueries listed below.
The first query looks for the names of all authors participating in bookspublished in 2003. The rule defining the predicate authors_2003 and itscorresponding query are as follows:

Translation of XML documents into logic programs
359
authors_2003(Author) :- attribute(Line1, 'bk:book', 'bk:year', '2003'), data(Line2, 'dc:creator', Author), descendant_lines(Line1, Line2).
?- authors(Author).
The rule looks for all lines (see variable Line1) where books issued in2003 are recorded and all lines (see variable Line2) where all authors existingin the relevant facts of the predicate data are recorded. The predicatedescendant_lines searches only pairs values of variables Line1 andLine2, which satisfy the condition that the element written on Line2 is adescendant of the element written on Line1. So the predicate searches onlyfor the names of the authors of those books that were issued in 2003.
The last query is more complicated, working with several auxiliary rules.It searches for all co-authors of a given author (e.g. Abiteboul), including allco-authors of the searched co-authors, etc. This means it is looking for thetransitive closure of a co-authorship relation (for the connected component ofthe co-authorship graph). The core of the recursive evaluation is given in asimplified form:
coauthors(New_coauthor) :- coauthors(Coauthor), search_book(Coauthor, Book), serarch_new_coautor(Book, New_coauthor).
?- coauthors(Coauthor).
The predicate coauthors will bind the variable Coauthor to the name ofthe previously found co-author. The predicate search_books finds out suchbooks in which the Coauthor participated with other co-authors. Thepredicate search_new_coauthor evaluates the names of these co-authors(the value of the variable New_coauthor). This recursive evaluation stopswhen no other co-authors are found.

Translation of XML documents into logic programs
360
5. Conclusions
This paper shows one possible transformation of an arbitrary XML documentinto a logic program. The advantage of our transformation is the use ofuniversal rules. These rules are the same in all generated logic programs. Theprograms differ only in facts.
The shortcoming of the proposed procedure is the assumption that theelements in XML documents will not have mixed content. This means that theelement will contain either text or other nested elements. For example, theelement <review>A <em>fine</em> book.</review> has a mixedcontent. It contains both text as well as a nested element <em>. Suchinformation cannot be recorded into facts. If the proposed proceduretransforms the RDF, RDFS or OWL document written in XML syntax, theelements with mixed content are not occurred.
In the future, we suppose to extend the set of universal rules and add ruleswhich simplify the queries formulation.
Acknowledgements
This work was partly supported by Ministry of Education, Youth and Sportsof the Czech Republic – the project 2C06009 Knowledge base tools for naturallanguage communication with semantic web.
Notes and References
[1] W3 CONSORTIUM. Extensible Markup Language (XML) 1.0 (FifthEdition), November 2008, http://www.w3.org/TR/xml/.
[2] ZIMA, M. Experimental Deductive Database System with Uncertainty [inCzech], Ph.D. Thesis, University of West Bohemia in Pilsen, 2002.
[3] ORACLE CORPORATION. Oracle Database PL/SQL User’s Guide andReference 10g Release 2 (10.2), June 2005, Available athttp://www.oracle.com/.
[4] CERI, S; GOTTLOB, G; TANCA, T. What you always wanted to knowabout Datalog (and never dared to ask), IEEE Transactions on Knowledgeand Data Engineering 1(1), March 1989, p. 146-66.

Translation of XML documents into logic programs
361
[5] STERLING, L; SAPIRO, E. The Art of Prolog, Second Edition: AdvancedProgramming Techniques (Logic Programming), The MIT Press, March1994.
[6] ALMENDROS-JIMENEZ, J.M. An RDF Query Language based on LogicProgramming, Electronic Notes in Theoretical Science, 200, 2008, p. 67-85.
[7] W3 CONSORTIUM. XML Path Language (XPath) 2.0, January 2007,http://www.w3.org/TR/xpath20/.
[8] W3 CONSORTIUM. RDF/XML Syntax Specification (Revisited), February2004, http://www.w3.org/TR/rdf-syntax-grammar/.

362
Geo information extraction and processing fromtravel narratives
Rocío Abascal-Mena; Erick López-Ornelas
Universidad Autónoma Metropolitana – CuajimalpaDepartamento de Tecnologías de la Información
Avenida Constituyentes 1054, 4° piso, Col. Lomas Altas,Delegación Miguel Hidalgo, C.P. 11950, México, D.F., México
mabascal, [email protected]
AbstractTravel narratives published in electronic formats can be very importantespecially to the tourism community because of the great amount ofknowledge that can be extracted. However, the low exploitation of thesedocuments opens a new area of opportunity to the computing community. Inthis way, this article explores new ways to visualize travel narratives in a mapin order to take advantage of experiences of individuals to recommend anddescribe travel places. Our approach is based on the use of a Geoparsing WebService to extract geographic coordinates from travel narratives. Oncegeographic coordinates are extracted by using eXtensible Markup Language(XML) we draw the geo-positions and link the documents into a map imagein order to visualize textual information.
Keywords: electronic publishing; knowledge representation; mappingservices; Geoparsing Web Service; social network.
1. Introduction
The growing predominance of adding information in social web sites presentsnew challenges to the computing community in terms of thinking of newways to extract, analyze and process the information contained. Nowadays,there are interesting works around the capacity to extract and map geotaggedphotos [1], coming from social web sites like Flickr, but there is a lack in theextraction of geographic concepts coming from unstructured text documents[2].

Geo information extraction and processing from travel narratives
363
The text documents that we will use in this paper are the travel narratives.These documents represent the observations and experiences of individualswho visited foreign countries or places and constitute a special category ofprimary source for people who want to visit these places.
These narratives provide information about a foreign society or culturethat the traveller guides do not provide. This way, we have realized thatinformation coming from travel narratives as opposed to travel guides, allow,from a personal point of view, the exchange of experiences, andrecommendations by way of letters, diaries or chronicles. These narratives canbe used to know, for example, what museums have to be visited in adetermined place and what are the most interesting things to do inside (fromthe point of view of the writer). So, in our work we decided to investigatehow to link, automatically, travel narratives containing personal descriptionsof visited places on a map and to explore the different web mapping servicesexisting in this specific application.
Web mapping services applications like Google Maps, Google Earth,NASA World Wind or Flickr Map are a new way to organize the world’sinformation geographically. Mapping services have been used in many areasincluding weather forecast, tourism and asset management. They providegeospatial visualization of information so the users can analyze, plan and takedecisions based on geographic location. They help users understand therelationship between data and geographic location. All mapping applicationsprovide an intuitive mapping interface with detailed street and aerial imagerydata embedded. In addition, map controls can be embedded in the product togive users full control over map navigation. The primary goal behind its rapidacceptance as an Internet mapping viewer is the ability to customize the mapto fit application-specific needs.
The article is structured as follows. Some background of Geoparsing WebServices (GWS) is provided in Section 2. Section 3 describes the methodologyfollowed to identify visual elements in travel stories. Experimental results aredescribed in Section 4 while some conclusions and further work are shown inSection 5.
2. Geoparsing Web Services background
Traditional Information Extraction (IE) has involved manual processing in theform of rules or tagging training examples where the user is required tospecify the potential relationships of interest [3].

Geo information extraction and processing from travel narratives
364
Geoparsing is the process of recognizing geographic context [4]. The firststep involves extracting geographic entities from texts and distinguishingthem from other entities such as names of people or organizations, andevents. In natural language processing this is referred to as Named EntityRecognition (NER) and is central to other text processing applications such asinformation extraction (IE) and information retrieval (IR).
Geoparsing is most frequently used to automatically analyze collections oftext documents. There are a number of commercial products with ageoparsing capability. Companies like MetaCarta1 extract information aboutplace and time, while others like Digital Reasoning2 (GeoLocator), LockheedMartin (AeroText) 3 , and SRA (NetOwl) 4 extract places along with otherentities, such as persons, organizations, time, money, etc. To process the largevolumes of data, these systems rely on automated techniques optimized forspeed.
These geoparsing systems are not perfect. Identifying and disambiguatingplace names in text are difficult and vulnerable to the vagaries of language.Just identifying which words are associated with place names can be achallenge. The geoparsing software must not only understand the words, butwhether the words that form a name actually refer to a place. The softwaremust understand that “Paris” in “Paris, France” refers to an urban area; in“Paris Creek” refers to a stream; in “Paris Hilton” refers to a person or to ahotel; and in “Paris Match” refers to a magazine name.
Once a place name has been identified, disambiguation remains achallenge. For example, there are over 2,100 names in the NationalGeospatial-Intelligence Agency which exactly match San Antonio. Sometimes,without being the author of a document, it is simply not possible to identify,with any confidence, the place to which a name refers.
Given these difficulties, it is understandable that automated geoparsingsoftware will miss some place names, identify non-place text as place names,and sometimes identify the location of place incorrectly if multiple choices arepossible.
Rather than focus on analyzing collections of documents, some otherapproaches focuses on the individual document, allowing authors toefficiently ensure that the place names are identified correctly and arediscoverable by other users. Just as map documents go through a review and
1 http://www.metacarta.com/2 http://www.digitalreasoning.com/3 http://www.lockheedmartin.com/products/AeroText/index.html4 http://www.sra.com/netowl/

Geo information extraction and processing from travel narratives
365
validation process, this approach allows authors to confirm that the places intheir documents are correctly identified and located at the time of writing.One example is GeoDoc5 where the user has to identify and tag the placenames manually, the application starts by automatically extracting placenames and highlighting them on the display.
Current work on query processing for retrieving geographic informationon the Web has also been done by Chen et al [5]. Their approach requires acombination of text and spatial data techniques for usage in geographic websearch engines. A query to such an engine consists of keywords and thegeographic area the user is interested in (i.e., query footprint).
2.1 The Yahoo! Placemaker Web ServiceYahoo! Placemaker6 is a geotagging web service that provides third-partydevelopers the means to enrich their applications or Web sites withgeographic information. The service is able to identify, disambiguate, andextract place names from unstructured and semi-structured documents. It isalso capable of using the place references in a document, together with a pre-determined set of rules, to discover the geographic scope that bestencompasses its contents. Thus, given a textual document, Yahoo! Placemakerreturns unique Where-on-Earth Identifiers (WOEIDs) for each of the namedplaces and scopes. Through these identifiers, one can use the Yahoo!GeoPlanet7 Web service to access hierarchical information (i.e., containingregions) or spatial information (i.e. centroids and bounding boxes).
There are two flavours of document scopes in Placemaker, namely thegeographic scope and the administrative scope. The geographic scope is theplace that best describes the document. The administrative scope is also theplace that best describes the document, but is of an administrative type (i.e.,Continent, Country, State, County, Local Administrative Area, Town, orSuburb). Since the reference document collection that we used for ourexperiments only contains documents assigned to administrative regions, welimited our cross-method comparison to using Placemaker's administrativescopes.
Placemaker is a commercial product and not many details are availableregarding its functioning. However, some information about the service isavailable in the Web site, together with its documentation. For instance, the
5 http://geodoc.stottlerhenke.com/geodoc/6 http://developer.yahoo.com/geo/placemaker/7 http://developer.yahoo.com/geo/geoplanet/

Geo information extraction and processing from travel narratives
366
Web site claims that when the service encounters a structured address, it willnot perform street level geocoding but will instead disambiguate the referenceto the smallest bounding named place known, frequently a postal code orneighbourhood. The Web site also claims that besides place names, the servicealso understands geography-rich tags, such as the W3C Basic Geo Vocabularyand HTML micro-formats. However, no details about the rules that are usedin the scope assignment process are given in the documentation for theservice.
The Placemaker Web service accepts plain text as input, returning aneXtensible Markup Language (XML) document with the results. The servicehas an input parameter that allows users to provide the title of the documentseparately from the rest of the textual contents, weighting the title text asmore representative. In our experiments we used the Web service as a black-box to assign scopes to the Web documents, using the option that weights thetitle text as more important than the rest.
3. Methodology
Our approach is based on the use of a Geoparsing Web Service (GWS) whichenriches content with geographic metadata by extracting places fromunstructured texts, the travel narratives. Geoparsing offers the ability to turntext documents into geospatial databases. This process is done in two steps: 1)entity extraction and 2) disambiguation, which is also known as grounding orgeotagging. Geospatial entity extraction uses natural language processing toidentify place names in text, while disambiguation associates a name with itscorrect location.
In order to access the GWS we have used the Yahoo! Placemaker, which isa GWS that provides third-party developers the means to geo-enrich contentat scale. The service identifies, disambiguates, and extracts places fromunstructured and structured textual content: web pages, RSS (and Atom)feeds, news articles, blog posts, etc. It is an open API that assists developers increating local and location-aware applications and datasets. Placemaker is ageo-enrichment service that assists developers in determining the wherenessof unstructured and atomic content, making the Internet more location-aware.
To access the GWS we have used the Yahoo Query Language (YQL) whichis a query influenced by the Structured Query Language (SQL) but divergesfrom it as it provides specialized methods to query, filter, and join data acrossweb services. The process is shown in figure 1.

Geo information extraction and processing from travel narratives
367
Figure 1. Geoparsing and visualization process.
4. Experimental results
On the web we find many websites containing travel stories. But, to presentour experimental results we have chosen, in an aleatory way, only one ofthese sites. We selected “The Adventure Prone Site”(http://www.adventureprone.com/). From this site, we have extracted all theURLs containing travel narratives by using the web spider called Robot V1(http://www.semantic-knowledge.com/). This spider is designed to collectwebsites and extract texts from Internet, following the links from a startingWeb page to other pages, until the process is finished. Thus, we have obtainedpages coming from this site. To analyze and extract the geographic aspects ofthese pages we have implemented a system able to communicate to the GWSby using YQL. For each URL extracted we have obtained the geographiccoordinates. But, in order to present our results in ELPUB conference, wedecided to choose only one travel story: “A Tale of Ten Cities”(http://www.adventureprone.com/travel/stories/cities.html). Analyzing thispage, we have obtained 48 places with the next geographic elements (name,latitude, longitude):
1. Budapest, Budapest, HU (47.5062, 19.0648)2. San Francisco, CA, US (37.7792, -122.42)3. France (46.7107, 1.71819)4. Silicon Valley, CA, US (37.3953, -122.053)5. Italian Town, AL, US (33.1183, -87.1)6. Danube, HU (46.3298, 18.9073)7. Poland (51.9189, 19.1343)8. Naples, Campania, IT (40.8399, 14.2519)9. Gary, Midi-Pyrénées, FR (43.6959, 1.91942)10. Greece (39.0724, 21.8456)

Geo information extraction and processing from travel narratives
368
11. Prague, Hlavni mesto Praha, CZ (50.0791, 14.4332)12. Armenia (40.0662, 45.0399)13. Acropolis, Athens, Attiki, GR (37.9714, 23.7238)14. England, GB (52.8836, -1.97406)15. Mont Blanc, Bossons, Rhône-Alpes, FR (45.8359, 6.86211)16. Berlin, Bundesland Berlin, DE (52.5161, 13.377)17. Pantheon, Rome, Lazio, IT (41.8987, 12.4769)18. Colosseum, Rome, Lazio, IT (41.8902, 12.4929)19. Montpellier, Languedoc-Roussillon, FR (43.6109, 3.87609)20. Rome, Lazio, IT (41.9031, 12.4958)21. Italy (42.5038, 12.5735)22. Spain (39.895, -2.98868)23. Venice, Veneto, IT (45.4383, 12.3185)24. Bolivia (-16.2883, -63.5494)25. Manarola, Liguria, IT (44.1075, 9.73006)26. Chamonix-Mont-Blanc, Rhône-Alpes, FR (45.9249, 6.87193)27. Florence, Tuscany, IT (43.7824, 11.255)28. Pisa, Toscana, IT (43.71, 10.3995)29. London, England, GB (51.5063, -0.12714)30. Vesuvius, Torre del Greco, Campania, IT (40.8, 14.4)31. Newquay, England, GB (50.4158, -5.07558)32. Monastiraki, Athens, Attiki, GR (37.9782, 23.7268)33. St Peter's Basilica, Vatican City, VA (41.9022, 12.4547)34. Vatican Museums, Vatican City, VA (41.9069, 12.454)35. St Peter's Square, Vatican City, VA (41.9023, 12.4576)36. Athens, Attiki, GR (37.9762, 23.7364)37. United Kingdom (54.3141, -2.23001)38. St. Columb Major, England, GB (50.4325, -4.93688)39. Vatican City (41.9038, 12.4525)40. Morocco (31.8154, -7.067)41. Buda, Budapest, Budapest, HU (47.5131, 19.0241)42. Africa (2.07079, 15.8005)43. Trevi Fountain, Rome, Lazio, IT (41.9009, 12.4833)44. Cairo, Al Qahirah, EG (30.0837, 31.2554)45. Olympia, Olimbia, Dytiki Ellada, GR (37.6405, 21.6281)46. Europe (52.9762, 7.85784)47. London Stansted International Airport, Takeley, England, GB
51.8894, 0.26256)48. Delphi, Dhelfoi, Sterea Ellada, GR (38.472, 22.4746)

Geo information extraction and processing from travel narratives
369
In the previous results presented we find places like “San Francisco, CA,US” which is compared in the story even if it is not part of the trip: “We wouldgo out to dinner every night, and seeing as things were so "cheap" compared to SanFrancisco, spend US$50/head on a fantastic meal with great wines which would havecost twice as much at home.” This is an example of further work that must bedone in order to extract only the pertinent places according to the context.
With the geographic coordinates obtained we display each position on anEquirectangular projection of the Earth. For example, for the 48 coordinatesextracted we have obtained the projection show in Figure 2.
Figure 2: Representation of 48 coordinates extracted from a previous travelnarrative analyzed
To present in a clear way the results obtained, we have selected only thecoordinates belonging to Europe to show them in an Equirectangular Europeprojection. In this way, Figure 3 presents the places visited in Europe duringthe tour written in the analyzed travel story.

Geo information extraction and processing from travel narratives
370
Figure 3: Representation of extracted cities corresponding to Europe
Each of the places linked to the map contains its respective paragraphwhere the place is mentioned.
5. Conclusions and further work
This article explores the possibilities given by a Geoparsing Web Service inorder to extract and contextualize unstructured text documents. Our workpresents a first exploration of travel narratives in order to map them into anEarth projection and visualize personal descriptions of the marked places.Further work will be in the next axes:
(1) Identify other non-structured documents to verify and check theGeoparsing extraction like news, historical documents or collectionsof documents like Wikipedia [6].
(2) Compare different Geoparsing methods (Metacarta, NetOWL,GeoLocator) in order to identify the best extraction process with thedifferent applications.
(3) Having the extracted spatial position of the travel narrative we willhave to find new ways of extracting some spatial knowledge likeGeoProfiling and find new geo-visualization tools.
(4) The contextualization and disambiguation of the places named ineach travel narrative sometimes is not very clear, so a work tocontextualize and extract pertinent information of the originaldocument with the use of ontologies is required [7]. Also, the use of
Geo information extraction and processing from travel narratives
371
information extracted from a large encyclopedic collection and theWeb could be a solution to explore [8].
(5) Compare concepts, coming from different documents, such as thehierarchical nature of geographic space and the topologicalrelationships between geographic objects in order to representrelationships between different documents [9].
(6) Geo-temporal criteria are important for filtering, grouping andprioritizing information resources [10]. In this way, the capacity toautomatically link travel stories on a time scale like the proposaldone in articles of the Wikipedia shown by Bhole et al. [11] is anapproach to be explored.
(7) Classify documents according to their implicit location relevance [12].Results presented here show that it is possible to automatically extract
places from unstructured texts in order to visualize them and provide otherkind of services to the users. In this way, we are working in order to provideto the users with the capability to manipulate textual travel narratives byclicking places of interest or even having the capacity to visualize visitedplaces according to time.
References
[1] CRANDALL, D; et al. Mapping the World’s Photos. WWW 2009 Madrid.Track: Social Networks and Web 2.0. 2009. Available athttp://citeseerx.ist.psu.edu/viewdoc/download?doi=10.1.1.147.1382&rep=rep1&type=pdf (April 2010).
[2] ABASCAL-MENA, R; LÓPEZ-ORNELAS, E. Structured Data Analysisof Travel Narratives by Using a Natural Language Processing Tool.IADIS International Conference WWW/Internet 2009, Rome, Italy. pp. 242-246. 2009.
[3] BANKO, M; CAFARELLA, M.J; SODERLAND, S; BROADHEAD, M;ETZIONI, O. Open Information Extraction from the Web. ProceedingsTwentieth International Joint Conference on Artificial Intelligence 2007, pp.2670–2676. 2007.
[4] LARSON, R.R. Geographic Information Retrieval and Spatial Browsing.Smith, L., Gluck, M. (eds.) University of Illinois GIS and Libraries: Patrons,Maps and Spatial Information, pp. 81–124, 1996.
[5] CHEN, Y; SUEL, T; MARKOWETZ, A. Efficient Query Processing inGeographic Web Search Engines. Proceedings SIGMOD 2006, pp. 277–

Geo information extraction and processing from travel narratives
372
288. 2006. Available at http://portal.acm.org/citation.cfm?id=1142505(April 2010).
[6] WITMER, J; KALITA, J. Extracting Geospatial Entities from Wikipedia.IEEE International Conference on Semantic Computing. 2009. Available athttp://www.computer.org/portal/web/csdl/doi/10.1109/ICSC.2009.62(April 2010).
[7] ZUBIZARRETA, A; FUENTE, P; CANTERA, J. M; ARIAS, M;CABRERO, J; GARCÍA, G; LLAMAS, C; VEGAS, J. ExtractingGeographic Context from the Web: GeoReferencing in MyMoSe.Proceedings of the 31th European Conference on IR Research on Advances ininformation Retrieval. 2009. Available athttp://www.springerlink.com/content/u364332137807568/ (April 2010).
[8] CUCERZAN, S. Large-scale named entity disambiguation based onWikipedia data. Proceedings of the 2007 Joint Conference on EmpiricalMethods in Natural Language Processing and Computational NaturalLanguage Learning. pp. 708-716. Prague, June 2007. Available athttp://acl.ldc.upenn.edu/D/D07/D07-1074.pdf (April 2010).
[9] BRISABOA, N. R; LUACES, M. R; PLACES, Á. S; SECO, D. Exploitinggeographic references of documents in a geographical informationretrieval system using an ontology-based index. Geoinformatica 14, 3 (Jul.2010), pp. 307-331. 2010. Available athttp://www.springerlink.com/content/2553w445515231q1/ (April 2010).
[10] MARTINS, B; MANGUINHAS, H; BORBINHA, J. Extracting andExploring the Geo-Temporal Semantics of Textual Resources. IEEEICSC, pp. 1–9. 2008. Available athttp://www.computer.org/portal/web/csdl/doi/10.1109/ICSC.2008.86(April 2010).
[11] BHOLE, A; FORTUNA, B; GROBELNIK, M; MLADENIC, D. ExtractingNamed Entities and Relating Them over Time Based on Wikipedia.Informática, 31(2007) pp. 463-468. 2007. Available athttp://www.informatica.si/PDF/31-4/12_Bhole-Extracting%20Names.pdf(April 2010).
[12] ANASTACIO, I; MARTINS, B; CALADO, P. Classifying DocumentsAccording to Location Relevance. Proceedings of the 14th PortugueseConference on Artificial intelligence: Progress in Artificial intelligence.Lecture Notes in Computer Science. pp. 598-609. 2009. Available athttp://www.springerlink.com/content/d551604105m05g07/ (April 2010).

373
Semantic enrichment for 3D documents:Techniques and open problems
Torsten Ullrich1; Volker Settgast1; René Berndt2
1 Fraunhofer Austria Research GmbH, Visual ComputingInffeldgasse 16c, A-8010 Graz, Austria,
torsten.ullrich, volker.settgast @fraunhofer.at2 Institut f. ComputerGraphik und WissensVisualisierung,
Technische Universität Graz, Inffeldgasse 16, A-8010 Graz, Austria,[email protected]
AbstractWith increasing knowledge the process of knowledge management andengineering becomes more and more important. Enriching documents byusing markup techniques and by supporting semantic annotations is a majortechnique for knowledge management. This invaluable information is ofextreme importance in the context of civil engineering, product life cyclemanagement, virtual archival storage, and preservation. In these fields ofapplications annotation techniques for 3D documents are a vital part. Theyprovide semantic information that makes up the basis for digital libraryservices: retrieval, indexing, archival, and searching. Furthermore, metadataare of significant importance as they set the stage for data re-use and theyprovide documentation of data sources and quality, which is vital for everyengineering department. Using metadata helps the user to understand data.Additional information allows focusing on key elements of data that help todetermine the data's fitness for a particular use and may provide consistencyin terminology. In this paper we give an overview on state-of-the-artannotation techniques focussed on 3D data.
Keywords: annotation techniques; semantic enrichment; geometryprocessing

Semantic enrichment for 3D documents – Techniques and open problems
374
1. Introduction
In 1998 William J. Clinton announced at the 150th Anniversary of theAmerican Association for the Advancement of Science that “the store ofhuman knowledge doubles every five years”. With increasing knowledge theprocess of knowledge management and engineering becomes more and moreimportant. Enriching documents by using markup techniques and bysupporting semantic annotations is a major technique for knowledgemanagement. It allows an expert to establish an interrelationship between adocument, its content and its context.
Annotations made by groups or individuals in the context of teamwork orindividual work allow to capture contextual information, which can improveand support cooperative knowledge management policies; i.e. annotationscan be considered under the perspective of documentation. In fact, trackingthe changes and focal points of annotations implies tracing the underlyingreasoning process.
This invaluable information is of extreme importance in the context of civilengineering, product life cycle management, virtual archival storage, andpreservation. In these fields of applications annotation techniques for 3Ddocuments are a vital part. In this paper we give an overview on state-of-the-art annotation techniques focussed on 3D data.
2. Terms and Definitions
Different documentation standards and annotation processes are used invarious fields of applications. Unfortunately, each branch of science hasslightly different definitions of bibliographical terms. To clarify these termsand to avoid misunderstandings and misconceptions we present the relevantdefinitions of terms used in this article.
A document is any object, “preserved or recorded, intended to represent,to reconstruct, or to demonstrate a physical or conceptual phenomenon”. Thisdefinition has first been verbalized by Suzanne Briet in her manifesto on thenature of Documentation: Qu’est-ce que la documentation? [1]. In Michael K.Buckland’s article “What is a document?” various document definitions aregiven and compared to each other [2]. As we will concentrate on 3D data sets,the “physical or conceptual phenomenon” will always be a three-dimensionalphenomenon.

Semantic enrichment for 3D documents – Techniques and open problems
375
A distinct, separate subpart of a document is called entity. Other authorsrefer to a subpart as segment. Metadata about documents or parts ofdocuments are defined as “structured, encoded data that describecharacteristics of information-bearing entities to aid in the identification,discovery, assessment, and management of the described entities.” TheAmerican Library Association formalized this definition in its Task Force onMetadata Summary Report [3]. According to this definition metadata isalways structured. Unstructured, encoded data, such as comments and freetexts, are hereinafter called annotations. As metadata is always structured, itcan be specified in a formal, explicit way: an ontology is a “formal, explicitspecification of a shared conceptualisation”. It provides a shared vocabulary,which can be used to model a domain; i.e. the type of objects and/or conceptsthat exist, and their properties and relations. Tom Gruber established thisdefinition in his article “A translation approach to portable ontologyspecifications” [4]. The connections between a document and its metadata orannotations are called markup instructions. They provide local or globalreference points in a document.
In the context of computer-aided design, reconstruction, and archivalstorage, a document is very often the result of a process chain. Datadescribing a single processing step or a document’s process chain is termedparadata.
3. Classification
Metadata and annotations – semantic information in general – can beclassified in several ways. Depending on the field of application, they can beclassified according to the following criteria.
3.1 Document data typeSemantic information enriches a document. As documents can be groupedaccording to their type, these categories can be transferred to metadata andannotations as well. We concentrate on 3D data in this article, which can besubdivided further into different kinds of 3D representations.
Boundary Representation. Boundary and surface representations are themost common kind of data representations in computer graphics. Theserepresentations comprehend lists of triangles, polygonal meshes, splinesurfaces, and subdivision surfaces, etc. to name a few. Several annotationsystems allow users to leave text messages on the surface of a 3D model [5] or

Semantic enrichment for 3D documents – Techniques and open problems
376
to draw annotations on the surface and in free space of a virtual scene [6]. Themain field of applications is architectural model annotation. Adobe embeds3D models into PDF documents [7] and combines this technique with itsannotation system.Point Clouds. In a digital documentation process, the input data set is veryoften a simple point cloud – measured points in space without any additionalstructure – recorded by e.g. a laser scanner. Although many tools exist (forexample: geomagic1, Leica Cyclone2) to annotate and markup point clouds,the automatic documentation of the recording process has many gaps.Volume Data. Computer tomography and similar acquisition techniquesgenerate volumes of measured points consisting of many layers of high-resolution 2D images. This is the predominant acquisition technique inbiomedical sciences, in which documentation, markup and annotation hasalways been put into practice. Consequently, many established annotationand markup systems exist; for example the volume data annotation tool calledVANO by Peng et al. [8] and the Annot3D Project by Balling et al. [9].Miscellaneous. Besides these “main data types” numerous datarepresentations specialized in its field of application are available. Asannotation is a key activity of data analysis, many visualization systems offerannotation capabilities [10], [11].
3.2 Scale of Semantic InformationSemantic information can be added for the entire data set or only for afragment of the object. For some metadata like “author” it can be sufficient tomark the entire document. But 3D data creation is often a collaborative taskwith many people working on one complex object. For comments anddetailed descriptions a specific place within the 3D data set is needed. Also tocommunicate suggestions for improvement during an evaluation process it isnecessary to make comments on some parts of an object but independentfrom the entities of the object. This can be done by defining an anchor, like apoint, a surface or a volume in addition to the actual data set. It is essentialthat an anchor can be defined independently from the object. In this way it isalso possible to annotate something which is missing in a specific place. Oftenalso the viewer’s parameters are stored together with the added informationto make it easier to read.
1 http://www.geomagic.com2 http://leica.loyola.com

Semantic enrichment for 3D documents – Techniques and open problems
377
3.3 Type of Semantic InformationThe “Metadata Encoding & Transmission Standard”3 defines the followingtypes of metadata and annotation:Descriptive Information. Descriptive information describe the content of anobject and comprehend amongst others the Dublin Core metadata set [12].Administrative Metadata. Administrative metadata provide informationregarding how a document was created and stored, as well as intellectualproperty rights, information regarding the provenance of a document,transformation/conversion information, etc.Structural Metadata. A structural map and structural links outline ahierarchical structure for a digital library object and embed a document into acontext.
3.4 Type of creationThe creation of semantic enrichment of 3D documents fall basically in twocategories: manual or automatic. Most of the metadata (especiallyadministrative and descriptive metadata) can be generated automatically, butdepending on the domain certain fields need support from an expert.Especially categorizing 3D models can be a difficult task for automaticindexing, e.g. classify buildings according to architectural theory or genres(e.g. the Getty Art & Architecture Thesaurus (AAT)).
Annotations, in terms of free text like comments and remarks, are usuallyentered manually (the translation of a comment using an automatictranslation service would be an example for automatic created annotations).While the manual processing of structured metadata is done by experts,comments or remarks can also come from non-expert users. This method(social tagging) has become very popular within Web 2.0.
3.5 Data organizationThe data organization is an important aspect thinking of the sustainability ofthe annotation. There are two basic concepts how programs can storeannotations.The truth is in the file. The metadata and annotations are stored within theoriginal documents. EXIF or XMP are good examples for that strategy. Themain drawback is that the file format must support the possibility to add sucharbitrary data. While modern 3D formats like Collada offer this functionality(e.g. the extra tag), others do not. For these a sidecar file can be an appropriatelocation for storing the annotation. Putting the original document and thesidecar file(s) in a container (portmanteau) is a very popular technique. In
3 http://www.loc.gov/standards/mets/

Semantic enrichment for 3D documents – Techniques and open problems
378
most cases the container is a simple zip archive, but with a different andunique extension (examples are the Open Document Format (ODF) orMicrosoft Office Open XML).The truth is in the database. In this concept the metadata and annotations arestored within a database system. This guarantees that the user will access up-to-date data, but he needs to retrieve the associated annotations separately. Inaddition the application must be able to access the database.
3.6 Information comprehensivenessSemantic enrichment can be further classified by the comprehensiveness ofthe information. The amount of comprehensiveness can vary from low to highin any gradation. An example for a low comprehensiveness would be theDublin Core metadata set [13]. It allows 15 properties to be added as semanticinformation. In contrast, for example the CIDOC Conceptual Reference Model(CRM) is a scheme with a high comprehensiveness. It is a framework for thedefinition of relationship networks of semantic information in the context ofcultural heritage [14]. CIDOC CRM offers a formal ontology with 90 objectclasses and 148 properties (in version 5.0.1) to describe all possible kinds ofrelations between objects.
4. Standards and File Formats
An important aspect of semantic enrichment is to agree on standards. Forsemantic information it is more a question of organizing documents in astandardized way. In the area of 3D data representations an important aspectis the file format and its ability to support semantic enrichment. Manyconcepts for encoding semantic information can be applied to 3D data butonly a few 3D data formats support semantic markup.
4.1 Semantic InformationThe definition and storage of semantic information develops mainly aroundtextual documents. Established standard schemes like Dublin Core andCIDOC CRM (see Section 3) can also be used for 3D content. The MovingPicture Experts Group (MPEG) defined a standard for the annotation ofmedia resources. MPEG-7 is a scheme to describe metadata for audio andvisual contents. 3D models however are not part of the scheme. In [15] Bilscoet al. propose an extension to the standard for 3D data.

Semantic enrichment for 3D documents – Techniques and open problems
379
4.2 Three-Dimensional ContentFor 3D data there is not one single standard format like for example JPEG canbe seen as standard for digital photos. Many different formats with a largevariation of shape descriptions and features are in practical use. For semanticinformation on 3D data it is even harder to identify one or a few standardformats because most of the commonly used 3D formats do rarely supportsemantic enrichment.
On the one hand it is possible to extend existing 3D file formats to supportmetadata and annotations. Especially XML based formats are well suited to beextended while still being readable by existing applications. Some extensionshave been proposed for Extensible 3D (X3D) and for Collada. On the otherhand there are document formats which have been extended to support 3Dcontent, like PDF 3D.Collada. The XML-based Collada format was initiated by Sony Entertainmentmainly to establish a standard way of data exchange between differentcreation tools for 3D content. It is hosted by the Khronos group as an openstandard. The Collada description allows storing metadata like title, author,revision etc. not only on a global scale but also for parts of the scene likenodes and geometry. Custom extensions to the format are possible as part ofthe XML scheme. The Collada format can be found in Google Warehouse andthe Google Earth application. Metadata like the location of the 3D data on thevirtual earth however is stored in separate files.PDF 3D. Since version 1.6 the Adobe PDF format supports the inclusion of 3Dcontent. For presentations the complete set of data can be exported to PDF 3D.3D data has to be converted to the Universal 3D (U3D) format or to theProduct Representation Compact (PRC) format to be used inside a PDF file.PDF 3D allows to store annotations (logically) separated from the 3D data ofthe annotated object. Typically the exported 3D data is modified to get asmaller file size. But only if the model is stored without lossy compression itis possible to extract the original data and use the PDF 3D as an exchangeformat. The PRC format supports product manufacturing information andallows to use the geometry data to be used as input for computer aidedmanufacturing. U3D is mainly used as a visualization and publication format.Also the PDF format allows adding additional annotations to the model andeven annotating the annotations. 3D PDF has the potential to become astandard for 3D models with annotations. The viewer application is widelyspread and PDF documents are the quasi standard for textual documents.
The export of 3D content containing metadata or annotations to anotherfile format often leads to information loss. To minimize data loss somesemantics, for example labels and measurements, can be integrated into the

Semantic enrichment for 3D documents – Techniques and open problems
380
3D data as geometry. But afterwards depending on the format it may behardly possible to distinguish between the metadata and the geometry.
Some software companies offer solutions for their own product lines. Forexamples Dassault Systems introduced an XML-based format called 3D XML.It is supported by all of their applications as an exchange format. There aremany of those solutions but none of them is a standard.
5. Examples
To illustrate semantic information processing, we present results from threeon-going research projects: CityFIT, PROBADO and 3D-COFORM4.
Currently the state-of-the-art for automatically generated city models arebasically just extruded ground polygons with roofs. Still missing are detailed3D models of facades. The goal of the CityFIT project is to reconstruct thesefacades automatically using the example of Graz, Austria. The main idea ofCityFIT [16] is to turn the general implicit architectural knowledge aboutfacades into explicit knowledge, based on both architectural theory andempirical evidence. To achieve this, it combines inductive reasoning withstatistical inference. In this example semantic knowledge is encoded in afacade library in form of algorithms. Each execution of such an algorithmgenerates a (part of) 3D model. During the reconstruction process, thetextured point cloud is matched by algorithm instances of the facade libraryand its instantiation parameters are added as metadata to the point cloud.Therefore, this reconstruction process identifies architectural patterns andenriches the data set semantically.
This metadata is essential in digital libraries. Hence, considering content-based retrieval tasks, multimedia documents are not analyzed and indexedsufficiently. To facilitate content-based retrieval and browsing, it is necessaryto introduce recent techniques for multimedia document processing into theworkflow of nowadays digital libraries. The PROBADO-framework willintegrate different types of content-repositories – each one specialized for aspecific multimedia domain – into one seamless system, and will add featuresavailable in text-based digital libraries (such as automatic annotation, full-textretrieval, or recommender services) to non-textual documents [17].
4 http://www.3d-coform.eu/

Semantic enrichment for 3D documents – Techniques and open problems
381
The third example is a project in the context of cultural heritage (CH). Thecontext of cultural heritage distinguishes itself by model complexity(“masterpiece of human creative genius” 5 ), model size (archaeologicalexcavation on the scale of kilometers with a richness of detail on the scale ofmillimeters), and imperfection (natural wear and tear effects). In this context,the interplay of content and metadata as well as paradata is extremelycomplex and difficult to model. The aim of the 3D-COFORM project is toestablish 3D documentation as an affordable, practical and effectivemechanism for long term documentation of tangible cultural heritage. Inorder to make this happen the consortium is highly conscious that both thestate of the art in 3D digitization and the practical aspects of deployment inthe sector must be addressed.
6. Recommendations and Open Problems
In this section we discuss some good practices (and also problems) forhandling semantic information. Special attention is drawn to aspects whichinfluence the sustainability of the semantic information (e.g. integrity ofinformation, long-term preservation).
Techniques as presented in [18] offer a great flexibility in terms ofannotating 3D formats which do not offer a built-in mechanism. One problemof this approach is that modifying the model afterwards can break theintegrity of the semantic information. Any 3D authoring operation mightchange the geometry in a way that the referenced part of the model either nolonger exists or has changed its meaning. A possible solution to detect suchconflicts is to add a checksum to the annotations. But without deepknowledge of the semantic data structure it is impossible to preserve thesemantic information through a processing pipeline. While for specialdomains a number of complex and expensive product lifecycle management(PLM) solutions exists, other domains, e.g. cultural heritage still lack such acommon infrastructure.
For the issue of long-term preservation the use of open standards is a veryessential point. This addresses both the 3D file format and the format for thesemantic information (if not already included in the 3D format). Especially thenext version of Adobe’s PDF standard for long-term archiving (PDF/A-2) willplay a major role. PDF/A-2 as PDF/A-1[19] will use the ”truth is in the file”
5 http://whc.unesco.org/en/criteria

Semantic enrichment for 3D documents – Techniques and open problems
382
strategy. This guaranties that all information will be available even in anoffline scenario. One drawback is that PDF 3D relies on either U3D or PRC.This requires in most cases a conversion step, which inevitably leads to loss ofinformation. Because of the wide distribution of the Adobe Reader, more andmore domains start to use PDF 3D as a format for their visualizations. Someexamples are described in [20].
Which approach fits best depends on the project constraints. In many casesthe 3D file format cannot easily be replaced by another; even worse, mosttools still build on their own proprietary formats.
References
[1] S. Briet, Qu’est-ce que la documentation? EDIT -´editions documentairesindustrielles et techniques, 1951.
[2] M.K. Buckland, “What is a “document”?,” Journal of American Societyof Information Science, vol. 48, no. 9, pp. 804–809, 1997.
[3] ALCTS Committee on Cataloging: Description and Access. “Task Forceon Metadata -Summary Report,” American Library Association, vol. 4,pp. 1–16, 1999.
[4] T.R. Gruber, “A translation approach to portable ontologyspecifications,” Knowledge Acquisition -Special issue: Current issues inknowledge modeling, vol. 5, no. 2, pp. 199–220, 1993.
[5] T. Jung, M.D. Gross, and E. Y.-L. Do, “Annotating and Sketching on 3DWeb models,” Proceedings of the International Conference onIntelligent User Interfaces, vol. 7, pp. 95–102, 2002.
[6] K. Osman, F. Malric, and S. Shirmohammadi, “A 3D AnnotationInterface Using DIVINE Visual Display,” Proceeding of the IEEEInternational Workshop on Haptic Audio Visual Environments andtheir Applications, vol. 5, pp. 5–9, 2006.
[7] I. Adobe Systems, “3D Annotations Tutorial,” Adobe SolutionsNetwork, vol. 7, pp. 1–16, 2005.
[8] H. Peng, F. Long, and E. W. Myers, “VANO: a volume-object imageannotation system,” Bioinformatics, vol. 25, no. 5, pp. 695–697, 2009.
[9] J. S. Balling, “Visualization, Annotation, and Exploration of ThreeDimensional Datasets Using an Existing 3D Rendering System,”BioEngineering Senior Design, vol. 1, pp. 1–6, 2004.

Semantic enrichment for 3D documents – Techniques and open problems
383
[10] M. M. Loughlin and J. F. Hughes, “An annotation system for 3D uidflow visualization,” Proceedings of the IEEE Conference onVisualization, vol. 5, pp. 273 – 279, 94.
[11] L. Offen and D. W. Fellner, “BioBrowser – Visualization of and Accessto Macro-Molecular Structures,” Mathematics and Visualization –Visualization in Medicine and Life Sciences, vol. 5, pp. 257–273, 2008.
[12] S. Sugimoto, T. Baker, and S. L. Weibel, “Dublin Core: Process andPrinciples,” Lecture Notes in Computer Science – Digital Libraries:People, Knowledge, and Technology, vol. 2555/2010, pp. 25–35, 2002.
[13] “Dublin Core Metadata Initiative.” http://dublincore.org/, 1995.[14] C. C. S. I. Group, Definition of the CIDOC Conceptual Reference Model.
ICOM/CIDOC Documentation Standards Group, 2003.[15] I. M. Bilasco, J. Gensel, M. Villanove-Oliver, and H. Martin, “An MPEG-
7 framework enhancing the reuse of 3D models,” Proceedings of theInternational Conference on 3D web technology, vol. 11, pp. 65–74, 2006.
[16] B. Hohmann, U. Krispel, S. Havemann, and D. W. Fellner, “Cityfit:High-Quality Urban Reconstructions by Fitting Shape Grammars toImages and Derived Textured Point Clouds,” Proceedings of the ISPRSInternational Workshop 3D-ARCH, vol. 3, pp. 61–68, 2009.
[17] R. Berndt, H. Krottmaier, S. Havemann, and T. Schreck, “ThePROBADO-Framework: Content-Based Queries for non-textualDocuments,” Proceeding of the Conference on Electronic Publishing(ELPUB), vol. 13, pp. 485–500, 2009.
[18] S. Havemann, V. Settgast, R. Berndt, and Ø. Eide, “The Arrigo ShowcaseReloaded – towards a sustainable link between 3D and semantics,”Proceedings of the 9th International Symposium on Virtual Reality,Archaeology and Cultural Heritage (VAST), vol. 9, pp. 125–132, 2008.
[19] International Organization for Standardization (ISO), “ISO 19005-1:2005(Document management – Electronic document file format for long-term preservation),” 2005.
[20] M. Strobl, R. Berndt, V. Settgast, S. Havemann, and D. W. Fellner,“Publishing 3D Content as PDF in Cultural Heritage,” Proceedings ofthe 10th International Symposium on Virtual Reality, Archaeology andIntelligent Cultural Heritage (VAST), vol. 6, pp. 117–124, 2009.

384
Costs and benefits of alternative scholarlypublishing models: Lessons and developments
John W. Houghton
Centre for Strategic Economic Studies, Victoria UniversityMelbourne, Australia
E-mail: [email protected]
AbstractThe JISC study Economic implications of alternative scholarly publishing models:Exploring the costs and benefits, released early in 2009, focused on threealternative models for scholarly publishing: subscription or toll accesspublishing, open access publishing using the author-pays model, and self-archiving. The research approach involved a combination of processmapping, activity costing and macro-economic modelling. Since its release,there have been six follow-on studies applying elements of the same basicmethodology. This paper describes the research approach and explores someof the major issues arising and lessons learned from this ongoing research.Drawing on experience from a number of studies and countries, it attempts todistil and summarise the key research issues and policy messages arising.
Keywords: Scholarly publishing; economics of publishing; cost-benefitanalysis; open access.
1. Introduction
The JISC report Economic implications of alternative scholarly publishing models:Exploring the costs and benefits[1] was greeted with praise in some quarters andopposition from others. During 2009, there were a number of follow-onstudies. These included national studies in The Netherlands and Denmark,and a three-country comparison that explored the impacts of alternativescholarly publishing models for one of the larger (United Kingdom), a mid-sized (Netherlands) and one of the smaller European countries (Denmark).During the first half of 2010, there have been three further projects, two ofwhich are still underway. The first focuses on Germany, and brings the

Costs and benefits of alternative scholarly publishing models:Lessons and developments
385
German National Licensing Program (NLP) into the mix of alternativescholarly communication models. The second, conducted by Alma Swan ofKey Perspectives, focuses on the United Kingdom, using the JISC EI-ASPMon-line cost model to examine the cost implications of alternative scholarlypublishing models for a sample of UK universities.[2] The third significantlyextends one aspect of the underlying method used in the original study toexplore the possible return on investment implications of the proposed FederalPublic Research Access Act (FRPAA) in the United States. This paper exploressome of the major issues arising and lessons learned from this ongoingresearch. Drawing on experience from a number of studies and countries, itattempts to distil and summarise the key research issues and policy messagesarising.
2. The JISC EI-ASPM study
The JISC study Economic implications of alternative scholarly publishing models:Exploring the costs and benefits[3] focused on three alternative models forscholarly publishing: subscription or toll access publishing, open accesspublishing using the author-pays model, and self-archiving. Because self-archiving, of itself, does not constitute formal publication, analysis focused ontwo publishing models in which self-archiving is supplemented by the peerreview and production activities necessary for formal publishing, namely:‘Green OA’ self-archiving operating in parallel with subscription publishing,and the ‘deconstructed’ or ‘overlay journals’ model in which self-archivingprovides the foundation for overlay journals and services.[4] Hence, each ofthe publishing models explored includes all of the key functions of formalscholarly publishing, including peer review and quality control.
The approach taken to the JISC EI-ASPM study involved a combinationof process mapping, activity costing and macro-economic modelling, and theresearch process involved four main steps.
Process mapping
Björk (2007) developed a formal model of the scholarly communicationlifecycle, based on the IDEF0 process modelling method which is often usedin business process re-engineering.[5] Björk’s central focus was the singlepublication (primarily the journal article), how it is written, edited, printed,distributed, archived, retrieved and read, and how eventually its reading mayaffect practice. To provide a solid foundation for our analysis, we developed

Costs and benefits of alternative scholarly publishing models:Lessons and developments
386
and extended Björk’s model to include five core scholarly communicationlifecycle activities, namely: (i) fund research and research communication; (ii)perform research and communicate the results; (iii) publish scientific andscholarly works; (iv) facilitate dissemination, retrieval and preservation; and(v) study publications and apply the knowledge. Each of these activities isfurther subdivided into a detailed description of the activities, inputs,outputs, controls and supporting mechanisms involved, creating a lifecycleprocess model with some 53 diagrams and 190 activities.[6]
Activity costing
This formal process model provided the foundation for detailed activitycosting, using a spreadsheet-based cost model that included all of theelements in the lifecycle model, as well as the base data necessary for thestudy (i.e. relating to the UK and UK higher education). The costings reliedprimarily on existing sources, and collating activity cost information from awide-ranging literature on scholarly communication and publishing.[7]Where necessary, these sources were supplemented by informal consultationwith experts in the field. For the UK national and higher education data, werelied on national and international sources on R&D expenditure andpersonnel by activity and sector, expenditure and employment trends.Detailed data on higher education were sourced from such agencies asSCONUL and HESA. The resulting activity cost model included more thantwo thousand data elements.
Macro-economic modelling
To capture the impacts of alternative scholarly publishing models on returnsto R&D expenditure, we developed a modified Solow-Swan model. Thestandard Solow-Swan approach makes some key simplifying assumptions,including that: all R&D generates knowledge that is useful in economic orsocial terms (the efficiency of R&D); and that all knowledge is equally accessibleto all entities that could make productive use of it (the accessibility ofknowledge). Addressing the fact that these assumptions are not realistic weintroduced accessibility and efficiency into the standard model as negative orfriction variables, to reflect the fact that there are limits and barriers to accessand to the efficiency of production and usefulness of knowledge. Then weexplored the impact on returns to R&D of changes in accessibility andefficiency.[8]

Costs and benefits of alternative scholarly publishing models:Lessons and developments
387
A stepwise approach
There were four main steps in the research process. In the first, we produced adetailed costing of all of the activities identified in the scholarlycommunication lifecycle model, focusing on areas where there were likely tobe activity and, therefore, cost differences between the alternative publishingmodels. In the second, we summed the costs of the three publishing modelsthrough the main phases of the scholarly communication lifecycle, so wecould explore potential system-wide cost differences between the alternativepublishing models. In the third of the three major research steps, we used themodified Solow-Swan model to estimate the impact of changes in accessibilityand efficiency on returns to R&D. The final step was to compare costs andbenefits, for which we used the three elements outlined: (i) the direct costsassociated with each of the models, (ii) the associated indirect system-widecosts and cost savings, and (iii) the benefits accruing from increases in returnsto R&D resulting from increases in accessibility and efficiency. Because thereturns to R&D lag expenditure and accrue over a number of years, the cost-benefit comparisons were made over a 20 year transitional period.
Findings and conclusions
Our analysis of the potential benefits of more open access to research findingssuggested that open access could have substantial net benefits in the longerterm, and while net benefits may be lower during a transitional period, theyare likely to be positive for both open access publishing and overlayalternatives (Gold OA) and for parallel subscription publishing and self-archiving (Green OA).
For example, during a transitional period of 20 years we estimated that,in an all open access world:
The combined cost savings and benefits from increased returns toR&D resulting from open access publishing all journal articlesproduced in the UK’s universities using an author-pays system(Gold OA) might be around 3 times the costs;The combined cost savings and benefits from open access self-archiving in parallel with subscription publishing (Green OA) mightbe around 7 times the costs; andThe combined cost savings and benefits from an alternative openaccess self-archiving system with overlay production and reviewservices (overlay journals) might be around 4 times the costs.

Costs and benefits of alternative scholarly publishing models:Lessons and developments
388
While the benefits from unilateral national adoption of open accessalternatives would be lower, they would be substantial – ranging from 2 to 4times the costs.
3. Responses to the JISC EI-APSM study
Responses to the JISC report have been polarised. While recognising theinherent limitations in such modelling, academic and professionalcommentary has been generally positive. A detailed peer review of the reportundertaken by Professor Danny Quah, Head of Economics at The LondonSchool of Economics, provides an example of the academic and professionalreception of the work. He concluded:
The report addresses an important and difficult problem, and is clearly theresult of a lot of very careful thinking about the issues. The methodology issound and the analysis is extremely detailed and transparent. The multi-stage model of production that is used is complex, and does requirecalibration according to a large number of parameters, many of which arenecessarily estimates, where possible taken from published sources or thewider literature. If demonstrably better estimates become available then thesecould improve that calibration still further. The report represents the bestevidence so far on the questions it addresses.[9]Initial comments from some publishers’ representatives, including
The Publishers’ Association, the Association of Learned and ProfessionalSociety Publishers and the International Association of stm Publishers,focused on the modelling assumptions and calibration, while implicitlyaccepting the methodology and underlying analysis. Ware and Mabe (2009)summarised the critique, noting that:
“[The Houghton Report] underestimated the efficiencies of the currentsubscription system and the levels of access enjoyed by UK researchers.Many of the savings hypothesized would depend on the rest of the worldadopting author-pays or self-archiving models. The calculated savings wouldremain hypothetical unless translated into job losses… Critics also arguethat Houghton et al. underestimated the costs of switching to an author-pays model because they underestimated the true costs of publishing anarticle only, and because additional costs such as the infrastructure requiredto manage the many small publication charges were not included.”[10]Although referring to critics, Ware and Mabe (2009) failed to cite a
single source. Nevertheless, JISC (2009) released a response addressing the

Costs and benefits of alternative scholarly publishing models:Lessons and developments
389
criticisms soon after the release of the report and a response to Ware andMabe was posted on the Liblicense-L list.[11]
Later in 2009, the International Association of stm Publisherscommissioned Steven Hall to provide a critique of the JISC report, whichresulted in a paper and presentation at the Berlin7 Conference. Hall’s analysisrested on such claims as:
“The fact is, researchers today have immediate access to the vast majority ofthe scientific articles that they could need for their research.”“The fact is, the report’s authors have failed to show that there is any realgap between the access that researchers have today to the scientific literaturethat they need and that which they might have under an open accessmodel.”[12]Unfortunately, of course, the fact is that there is widespread evidence
that such claims are baseless. Much of the evidence is cited in the JISC report,although some important studies have been published since which confirm,yet again, that access gaps remain a major concern. Ware (2009) reported that73% of UK small firms experienced difficulties accessing articles and just 2%reported having all the access they needed.[13] As the Research InformationNetwork recently noted:
“…access to research information content issues must be addressed if theUK research community is to operate effectively, producing high-qualityresearch that has a wider social and economic impact.”[14]
A response to Hall’s critique is available from the Berlin7 Conferencewebsite.[15]
Much of the critique rests on the assertion that one should choosedifferent variables. However, the project website has included an on-lineversion of the underlying cost model since the report’s release, which allowsanyone to experiment with alternative values for the major parameters(http://www.cfses.com/EI-ASPM/). Consequently, the critique rather missesthe mark, as anyone could test different parameters and publish the resultsalong with their evidence for the choice of alternative values. Moreover, ourown sensitivity testing suggested that the bottom-line answer does not changefor any plausible values that we have tried.
In the absence of any serious critique of the approach, subsequentstudies have focused on its further development, refinement and application.

Costs and benefits of alternative scholarly publishing models:Lessons and developments
390
4. The three-country studies: a comparison
During 2009, the same basic approach as that used in the JISC study wasapplied in the Netherlands[16] and Denmark[17] with a view to exploring thepotential impacts of alternative publishing models in a mid-sized and asmaller European country, as well as one of the larger European countries.For the purposes of presenting a summary of the three country studies inBrussels, Knowledge Exchange facilitated a workshop and released summaryreport.[18]
In exploring the potential impacts of alternative publishing models inthe three countries, differences in the modelling per se were kept to aminimum, although some minor adjustment of the basic model to fit differentnational circumstances was necessary. Nevertheless, there are a number offactors that can affect the benefit/cost estimates for different countries. Asmodelled, these included such things as: the number and size of universitiesand research institutions; the implied number of institutional and otherrepositories, each with substantial fixed costs and relatively low variablecosts; the ratios of publicly funded and higher education research spending togross national expenditure on R&D; historical and projected rates of growthof R&D spending by sector; relative national and sectoral publicationproductivity; historical and projected growth in publication output; and themix of publication types.
There are also inherent data limitations that varied somewhatbetween the countries. For example, in addition to cost differences betweenthe countries, there were minor differences in the methods used to estimatefull cost for researcher activities. In the UK, we used the official highereducation costing methodology for full economic costing of research (TRACfEC), for the Netherlands we used an averaged GERD/FTE researcherstriangulating with a variation of a full cost model from the University ofAmsterdam, and in Denmark we used a simple HERD/FTE researcherscalculation. Minor differences between these methods relate primarily to theinclusion (exclusion) of the technicians counted among research personnelinto (from) overheads. In addition, some UK R&D data related to 2006,whereas data for the Netherlands and Denmark were all from 2007.
Despite these influences, the different national studies produced verysimilar results and exhibited broadly similar patterns within the results. Thecost-benefits of the open access ‘author-pays’ publishing model were similaracross the three countries. In terms of estimated cost-benefits over atransitional period of 20 years – open access publishing all articles produced

Costs and benefits of alternative scholarly publishing models:Lessons and developments
391
in universities in 2007 would have produced benefits of 2 to 3 times the costsin all cases, but showed benefits of 5 to 6 times costs in the simulatedalternative ‘steady state’ model for unilateral national open access, andbenefits of around 7 times the costs in an all open access world.
One observable difference related to scale and the impacts ofunilateral national adoption of open access, with the benefits of worldwideadoption being relatively larger for smaller countries as they produce asmaller share of the world’s journal articles. However, the most obviousdifference between the results related to the ‘Green OA’ self-archiving andrepositories model, which did not look quite as good in the Netherlands as inthe UK and nothing like as good as it did in Denmark. This is due to theimplied number of repositories, each with operational overheads. Asmodelled, the number of institutional repositories required in each countryrelated to the number of institutions and their operational overheads wereshared across the number of articles produced and archived. For example,under the modelled assumptions, for 2007 outputs, the Netherlands’ 86 highereducation institutional repositories might have housed around 26,000 articles(an average of 302 each from that year), the UK’s 168 higher educationinstitutional repositories might have housed around 100,000 articles (anaverage of 595 each from that year), and Denmark’s 8 universities’repositories might have housed around 14,000 articles (an average of 1,750each from that year). As modelled, these differences materially affected theimplied per article cost of self-archiving. Of course, had we used a averagedper article lifecycle costing, these differences would not have been apparent.
Notwithstanding these differences, the modelling suggested thatopen access alternatives would be likely to be more cost-effective in a widerange of countries (large and small), with ‘Gold OA’ or author-payspublishing, the deconstructed or overlay journals model of self-archiving withoverlay production and review services, and ‘Green OA’ self-archiving inparallel with subscription publishing progressively more cost-effective.
5. Germany: incorporating the NLP
As a part of a much larger ongoing project, funded by DfG in Germany, wehave been working with colleagues at Goethe Universität in Frankfurt on astudy that brings the German National Licensing Program (NLP) into the mixof alternative models, and compares the NLP with the subscription and openaccess alternatives.

Costs and benefits of alternative scholarly publishing models:Lessons and developments
392
The German NLP provides enhanced access for researchers inGermany through an extended form of consortial purchasing and licensing.While it centralises a number of activities in the lifecycle process relating tofacilitating dissemination, retrieval and preservation (e.g. negotiation andlicensing), the NLP does not fundamentally change the activities performed.Since the scholarly communication lifecycle process model focuses onactivities without pre-judging which actors undertake them, incorporating theNLP has not necessitated changes to the underlying process model.
Nevertheless, the German NLP does impact a number of the five mainactivity areas in the scholarly communication lifecycle.
Fund research and research communication: The NLP has little orno impact on the activities performed by research funders, with theexception of DfG which funds it, so no impacts were included in themodelling.Perform research and communicate the results: With the exceptionof time saving related to permissions and research reporting, theNLP facilitates much the same potential time saving as open accessalternatives for German researchers, but scaled to the share ofworldwide journal articles/titles that are encompassed by the NLP.Publish scientific and scholarly works: While it could be seen as anew sales strategy for publishers, the NLP has little or no impact onpublisher costs except for possible minor savings on marketing, theoperation of servers and user support. As these activities are stillperformed for content lying outside the NLP and the rest of theworld outside Germany these impacts were excluded.Facilitate dissemination, retrieval and preservation: The NLP leadsto research library savings in handling, support and purchasing andnegotiation activities, scaled to the number of titles in the NLP. Thecounter-factual to the NLP is not readily knowable as we cannotknow if the NLP content would have been subscribed to withoutthe NLP. Hence we explored per title impacts, then multiplied bythe number of titles accessible through subscriptions and throughthe NLP (combined). It is assumed that the NLP reduces non-negotiation and licensing subscription-related library activities by50% (i.e. 50% of the non-negotiation and licensing subscription-related activity is handled centrally under the NLP and 50% is stilldone by the institutional research library).Study publications and apply the knowledge: The impacts of theNLP on accessibility and efficiency were modelled as follows:

Costs and benefits of alternative scholarly publishing models:Lessons and developments
393
o In relation to accessibility, the NLP leads to (i) a marginalincrease in returns to German R&D through an increase inGerman access, which would be very small and was notincluded; and (ii) no increase in access to German researchoutside Germany, as it is published in the same way; and
o In relation to efficiency, the NLP’s impacts are less thanthose of open access as it has no impact on the speed ofpublication and facilitates domestic collaboration only.Hence the efficiency impacts were scaled.
There is one important difference between the comparisonsundertaken in the German study and those that preceded it. Subscription andopen access publishing perform very different roles. To the limits ofaffordability, subscription access seeks to provide an institution’s or country’sresearchers with access to the worldwide research literature; whereas openaccess seeks to provide worldwide access to an institution’s or country’sresearch output. These are very different things, but to compare cost-effectiveness it is necessary to compare like with like. Consequently, the JISCEI-ASPM study compared the costs associated with publishing, handling andaccessing UK article output under different models. In contrast, the Germanstudy compares the costs of operating within alternative models. This doesnot compare the cost of using alternative models to achieve a comparabletask, rather it compares the cost implications of the alternative models for aparticular actor or actors (in this case for Germany).
Modelling the impacts of an increase in accessibility and efficiencyresulting from more open access on returns to R&D over a 20 year period andthen comparing costs and benefits, we found that the benefits of open accesspublishing models were likely to substantially outweigh the costs. TheGerman National Licensing Program (NLP) returned the highest benefit/costratio during a transitional period and the second highest (to ‘Green OA’ self-archiving) in a simulated steady state alternative scenario. Whether ‘GreenOA’ self-archiving in parallel with subscriptions is a sustainable model overthe longer term is uncertain. So too is the potential for developments in openaccess or other scholarly publishing business models to significantly changethe relative cost-benefit of the NLP over time.
Currently, the project focus is on ascertaining what impact the NLPmay have on: (i) the take up of open access alternatives in Germany (e.g. byimproving access for German researchers, does it reduce awareness of andpressures for open access, or does it enhance awareness of the importance ofaccess?), and (ii) levels and patterns of use of the content available (e.g. does

Costs and benefits of alternative scholarly publishing models:Lessons and developments
394
the NLP materially affect usage patterns, perhaps increasing usage, and, if so,how does usage under the NLP compare with that under open access?).
6. Impacts on UK universities
Alma Swan, of Key Perspectives, has recently completed another follow-onstudy for JISC in which she applied the on-line cost model produced as a partof the original JISC EI-ASPM study to an examination of the cost and benefitimplications of alternative publishing models for a small sample of UKuniversities.[19] As in the German study, Swan compared the costs ofoperating within alternative models, in this case for a sample of universities,by setting the cost of publishing UK articles under alternative publishingmodels against the costs of subscription to that share of worldwide articlescurrently subscribed to. Again, this does not compare the cost of usingalternative models to achieve a comparable task, rather it compares the costimplications of the alternative models for a particular actor or actors (in thiscase a sample of UK universities).
Swan found that:There are potential economic savings for universities from openaccess. Economic savings accrue to universities according to thedetail of how each operates its library services and its repository,and the level of research intensiveness of the institution.Moving to open access as the basis for disseminating researchoutputs can bring economic and academic benefits for alluniversities, though the most research-intensive universities mayface additional costs under some conditions.If universities continue to pay for subscription-based journals whilesimultaneously making their outputs freely available through theirrepositories, as they currently do, they are likely to make savings.Savings accrue from increased efficiencies in the research andlibrary handling processes.If universities switch from the current subscription-based system topublishing all their articles in open access journals that charge anarticle-processing fee, there would be savings for all universitieswith the article-processing fee at GBP 700 per article or less.
Swan showed how universities can compare the impacts of alternativepublishing models for themselves, and that by looking at whole-of-systemcosts we can start to question the simplistic arguments that suggest that inresearch-intensive universities author-pays fees may be higher than current

Costs and benefits of alternative scholarly publishing models:Lessons and developments
395
subscription expenditures. While that may be true in some cases, it isapparent from this study that the potential savings in research time, libraryhandling costs, etc. that could arise from more open access would also begreatest in the more research-intensive universities.
7. The United States: incorporating the FRPAA
Early in 2010, the Scholarly Publishing and Academic Resources Coalition(SPARC) supported a feasibility study that sought to outline one possibleapproach to measuring the impacts of the proposed US Federal Research PublicAccess Act (FRPAA) on returns to public investment in R&D.[20] The aim ofthe study was to define and scope the data collection requirements andfurther model developments necessary for a robust estimate of the likelyimpacts of the proposed FRPAA archiving mandate.
The project involved a major shift from previous studies in that itsfocus was on the modified Solow-Swan model, rather than the scholarlycommunication lifecycle model or the associated activity cost model. Thatfocus enabled further development and refinement of the modified model,particularly in relation to the most appropriate lag and distribution over timeof returns to R&D, the most appropriate depreciation rate for the underlyingstock of R&D knowledge arising from federally funded R&D, and metrics tomeasure potential changes in accessibility and efficiency.
As noted, the standard approach makes some key simplifyingassumptions, including that all R&D generates knowledge that is useful ineconomic or social terms (the efficiency of R&D), and that all knowledge isequally accessible to all entities that could make productive use of it (theaccessibility of knowledge). These assumptions are not realistic. In the realworld, there are limits and barriers to access and limits to the usefulness ofknowledge. So, we introduced accessibility and efficiency into the standardmodel as negative or friction variables, and then looked at the impact onreturns to R&D of reducing the friction by increasing accessibility andefficiency.
To operationalise the model it was necessary to establish values forthe accessibility and efficiency parameters, as well as a number of otherparameters, such as rates of return to R&D and of depreciation of theunderlying stock of research knowledge. To establish plausible base casevalues for these parameters we drew on the extensive literature on returns toR&D.[21]

Costs and benefits of alternative scholarly publishing models:Lessons and developments
396
The other piece of the puzzle is the input data required for themodelling. These include the implied archiving costs, the volume of federallyfunded research outputs (journal articles), and the levels of federal researchfunding and expenditure trends. For the purposes of preliminary analysis weused publicly available sources and published estimates. Data relating tofederal research funding, activities and outputs were taken from the NationalScience Board Science and Engineering Indicators 2010,[22] and we exploredthree sources for archiving costs: the LIFE2 Project lifecycle costs,[23] andsubmission equivalent costings from arXiv[24] and NIH.[25] In order toenable anyone to use alternative values for the various parameters, testsensitivities and explore the issues for themselves, we created a simplifiedmodel in MS Excel format.[26]
Preliminary modelling suggests that over a transitional period of 30years, the potential incremental benefits of the proposed FRPAA archivingmandate for all federally funded R&D might be worth around 3 times theestimated cost using the higher end LIFE2 lifecycle costing, 6 times the costusing the NIH costing and 17 times the cost using the arXiv costing. Perhapstwo-thirds of these benefits would accrue within the US, with the remainderspilling over to other countries. Hence, the US national benefits might be ofthe order of 2 to 11 times the costs.
Exploring sensitivities in the model in order to identify majorsensitivities and, thereby, prioritise areas for further data collection andmodel development, we found that the benefits exceed the costs over a widerange of values. Indeed, it is difficult to imagine any plausible values for theinput data and model parameters that would lead to a fundamentallydifferent answer.
8. Summary and conclusions
With the exception of the US project, the studies have combined three mainapproaches: a scholarly communication lifecycle or process re-engineeringmodel; a spreadsheet-based activity cost model; and a modified macro-economic model into which we introduced accessibility and efficiency asnegative variables. The studies sought to map activities throughout thescholarly communication lifecycle, then attach costs to each of the activities toexplore the direct activity cost differences and indirect system-wide costdifferences between publishing models. The modified Solow-Swan modelwas used to explore the impact of increased accessibility on returns to R&D.In the final step, the costs are set against system-wide cost savings and

Costs and benefits of alternative scholarly publishing models:Lessons and developments
397
benefits in the form of increases in returns to R&D to estimate cost-benefits.While there are many limitations to such modeling, the results were notparticularly sensitive. We found that the benefits of more open accessexceeded the costs across a wide range of values, and it is difficult to imagineany plausible values for the main variables that would result in afundamentally different answer.
Given the sometimes heated debate on open access and the detail andcomplexity of the research methods used, it is perhaps not surprising thatreactions have been polarized and somewhat piecemeal. While recognisingthe inherent limitations in such modelling, academic and professionalcommentary has been generally positive. Comments from some publishers’representatives have been critical, focusing on the details of the modellingassumptions and calibration. Much of the critical comment has been based onunsubstantiated claims, misunderstandings and falsehoods, and we haveprovided a response to each of the commentators. We have also provided on-line versions of the models to enable anyone to explore the impacts of usingtheir own preferred values for the main variables.
Given that there has been no substantive critique of the work andthat the results appear to hold across a wide range of values and a range ofcountries, the evidence would seem to suggest that more open access couldhave substantial net benefits in the longer term, and while net benefits may besmaller during a transitional period, they are likely to be positive for bothopen access publishing and overlay alternatives (Gold OA) and for parallelsubscription publishing and self-archiving (Green OA). At the institutionallevel, Swan (2010) has shown that the benefits would be likely to outweighthe costs for all but the most research-intensive of universities.[27]
Given the capacity to enhance access at very little cost, self-archivingalternatives appear to be the more cost-effective – although whether self-archiving in parallel with subscriptions is a sustainable model over the longerterm is debateable. Similarly, the German NLP provides enhanced access forresearchers in Germany through an extended form of consortial purchasingand licensing, which by centralising certain library subscription-relatedactivities is effectively negative cost (i.e. the centralised costs are less than thede-centralised cost savings). Hence, it too provides a highly cost-effectiveavenue for enhanced access. The downside risks of such a program includethe potential for developments in open access or other scholarly publishingbusiness models to significantly erode the relative cost-benefit of the NLPover time, and the potential impact the NLP may have on slowing the take upof open access alternatives in Germany (e.g. by improving access for German

Costs and benefits of alternative scholarly publishing models:Lessons and developments
398
researchers, does it reduce awareness of and pressures for open access, ordoes it enhance awareness of the importance of access?).
Nevertheless, the evidence would suggest that archiving policies andmandates, be they at the national, sectoral, funder or institutional levels, canenhance accessibility and improve efficiency at relatively little cost and withno immediate disruptive change to scholarly publishing practices andtraditions. As such, archiving mandates provide an obvious focus for policyand implementation activities in the immediate term, while morefundamental changes to scholarly communication practices evolve over time.
Notes and References[1] HOUGHTON, J.W., RASMUSSEN, B., SHEEHAN, P.J., and
OPPENHEIM, C., MORRIS, A., CREASER, C., GREENWOOD, H.,SUMMERS, M. and GOURLAY, A. Economic Implications of AlternativeScholarly Publishing Models: Exploring the Costs and Benefits, Bristol andLondon: The Joint Information Systems Committee (JISC), 2009.Availablehttp://www.jisc.ac.uk/publications/publications/economicpublishingmodelsfinalreport (December 2009).
[2] SWAN, A. Modelling scholarly communication options: costs and benefits foruniversities, Bristol and London: The Joint Information SystemsCommittee (JISC), 2010. Available http://ie-repository.jisc.ac.uk/442/(February 2010).
[3] HOUGHTON, J.W., RASMUSSEN, B., SHEEHAN, P.J., andOPPENHEIM, C., MORRIS, A., CREASER, C., GREENWOOD, H.,SUMMERS, M. and GOURLAY, A. Economic Implications of AlternativeScholarly Publishing Models: Exploring the Costs and Benefits, Bristol andLondon: The Joint Information Systems Committee (JISC), 2009.Availablehttp://www.jisc.ac.uk/publications/publications/economicpublishingmodelsfinalreport (December 2009).
[4] SMITH, J.W.T. ‘The Deconstructed Journal, a new model for AcademicPublishing,’ Learned Publishing 12(2), 1999, pp79-91.; SMITH, J.W.T.Open Access Publishing Models: Reinventing Journal Publishing,Research Information, May-June 2005.; VAN DE SOMPEL, H. et al.‘Rethinking Scholarly Communication: Building the system thatscholars deserve,’ D-Lib Magazine 10(9) September 2004.; SIMBOLI, B.Subscription subsidized open access and the crisis in scholarlycommunication, Lehigh University, 2005.; HOUGHTON, J.W.

Costs and benefits of alternative scholarly publishing models:Lessons and developments
399
‘Economics of Publishing and the Future of Scholarly Communication’in Eds. GORMAN, G.E. & ROWLAND, F. International Year Book ofLibrary and Information Management 2004-2005: Scholarly Publishing in anElectronic Era, London: Facet Publishing, 2005.
[5] BJÖRK, B-C. ‘A model of scientific communication as a globaldistributed information system,’ Information Research 12(2) paper 307,2007.
[6] Details of the entire model in ‘browseable’ form can be found athttp://www.cfses.com/EI-ASPM/SCLCM-V7/
[7] TENOPIR, C. and KING, D.W. Towards Electronic Journals: Realities forScientists, Librarians and Publishers, Washington D.C.: Special LibrariesAssociation, 2000.; TENOPIR, C. and KING, D.W. ‘Reading behaviorand electronic journals,’ Learned Publishing 15(4), 2002, pp259-265.;TENOPIR, C. and KING, D.W. ‘Perceptions of value and value beyondperceptions: measuring the quality and value of journal articlereadings,’ Serials 20(3), 2007, pp199-207. Availablehttp://www.uksg.org/serials (March 2009).; KING, D.W. The cost ofjournal publishing: a literature review and commentary, LearnedPublishing 20(2), April 2007, pp. 85-106.; HALLIDAY, L. andOPPENHEIM, C. Economic Models of the Digital Library, eLib, UnitedKingdom Office of Library and Information Networking, 1999.;FRIEDLANDER, A. and BESSETTE, R.S. The Implications of InformationTechnology for Scientific Journal Publishing: A Literature Review,Washington DC: National Science Foundation, 2003.; OECD. DigitalBroadband Content: Scientific Publishing, Paris: OECD, 2005. Availablehttp://www.oecd.org/dataoecd/42/12/35393145.pdf (February 2010);EUROPEAN COMMISSION. Study on the economic and technicalevolution of the scientific publication markets in Europe, Brussels: EuropeanCommission, 2006.; EPS, et al. UK scholarly journals: 2006 baseline report –An evidence-based analysis of data concerning scholarly journal publishing,London: Research Information Network, Research Councils UK andDepartment of Trade and Industry, 2006. Available athttp://www.rin.ac.uk/data-scholarly-journals (December 2009).;BJÖRK, B-C. ‘A model of scientific communication as a globaldistributed information system,’ Information Research 12(2) paper 307,2007.; CEPA. Activities, costs and funding flows in the scholarlycommunications system in the UK, London: Research InformationNetwork (RIN), 2008.; CLARKE, R. ‘The cost profiles of alternativeapproaches to journal publishing,’ First Monday 12(12), December 2007.

Costs and benefits of alternative scholarly publishing models:Lessons and developments
400
[8] HOUGHTON, J.W. and SHEEHAN, P. ‘Estimating the potentialimpacts of open access to research findings,’ Economic Analysis andPolicy 39(1), 2009. Available http://eap-journal.com/ (January 2010).;HOUGHTON, J.W., RASMUSSEN, B., SHEEHAN, P.J., andOPPENHEIM, C., MORRIS, A., CREASER, C., GREENWOOD, H.,SUMMERS, M. and GOURLAY, A. Economic Implications of AlternativeScholarly Publishing Models: Exploring the Costs and Benefits, Bristol andLondon: The Joint Information Systems Committee (JISC), 2009.Availablehttp://www.jisc.ac.uk/publications/publications/economicpublishingmodelsfinalreport (December 2009).
[9] JISC. JISC’s response to comments from publishers’ representative groups,2009. Availablehttp://www.jisc.ac.uk/media/documents/publications/responseoneiaspmreport.pdf (March 2010).
[10] WARE, M. and MABE, M. The STM Report: An overview of scientific andscholarly journal publishing, Oxford: STM Publishers Association, 2009.Available http://www.stm-assoc.org/news.php?id=255&PHPSESSID=3c5575d0663c0e04a4600d7f04afe91f (December 2009).
[11] JISC. JISC’s response to comments from publishers’ representative groups,2009. Availablehttp://www.jisc.ac.uk/media/documents/publications/responseoneiaspmreport.pdf (March 2010).; Houghton, J.W. Re: Growth for STMpublishers in 2008, 2010. Availablehttp://www.library.yale.edu/~llicense/ListArchives/0910/msg00056.html (March 2010).
[12] HALL, S. ‘Widening access to research information: collaborativeefforts towards transitions in scholarly communications’, Paperpresented at The Berlin7 Conference, Paris, December 2009. Availablehttp://www.berlin7.org/IMG/pdf/hall.pdf (February 2010).
[13] WARE, M. Access by UK small and medium-sized enterprises to professionaland academic literature, Bristol: Publishing Research Consortium, 2009.Available http://www.publishingresearch.net/SMEaccess.htm(December 2009).
[14] RIN. Overcoming barriers: access to research information content, London:Research Information Network, 2009. Availablehttp://www.rin.ac.uk/system/files/attachments/Sarah/Overcoming-barriers-report-Dec09_0.pdf (December 2009).

Costs and benefits of alternative scholarly publishing models:Lessons and developments
401
[15] HOUGHTON, J.W. and OPPENHEIM, C. Widening access to researchinformation: A response, The Berlin7 Conference, Paris, 2010. Availablehttp://www.berlin7.org/spip.php?article57 (February 2010).
[16] HOUGHTON, J.W., DE JONGE, J. and VAN OPLOO, M. Costs andBenefits of Research Communication: The Dutch Situation, Utrecht:SURFfoudation, 2009. Availablehttp://www.surffoundation.nl/wiki/display/economicstudyOA/Home(December 2009).
[17] HOUGHTON, J.W. Costs and Benefits of Alternative Publishing Models:Denmark, Copenhagen: DEFF, 2009. Available http://www.knowledge-exchange.info/Admin/Public/DWSDownload.aspx?File=%2fFiles%2fFiler%2fdownloads%2fDK_Costs_and_benefits_of_alternative_publishing_models.pdf (December 2009).
[18] HOUGHTON, J.W. Open Access: What are the economic benefits? Acomparison of the United Kingdom, Netherlands and Denmark, Brussels:Knowledge Exchange, 2009. Available http://knowledge-exchange.info/Default.aspx?ID=316 (December 2009).
[19] SWAN, A. Modelling scholarly communication options: costs and benefits foruniversities, Bristol and London: The Joint Information SystemsCommittee (JISC), 2010. Available http://ie-repository.jisc.ac.uk/442/(February 2010).
[20] HOUGHTON, J.W., RASMUSSEN, B. and SHEEHAN, P.J. Economicand Social Returns on Investment in Open Archiving Publicly FundedResearch Outputs, Washington DC: SPARC, 2010 (Forthcoming).
[21] SALTER, A.J. and MARTIN, B.R. ‘The economic benefits of publiclyfunded basic research: a critical review,’ Research Policy 30(3), 2001,pp509-532.; MARTIN, B.R. and TANG, P. The benefits of publicly fundedresearch, SWEPS Paper No. 161, Brighton: Science Policy Research Unit,2007. Available http://www.sussex.ac.uk/spru (December 2009).;SVEIKAUSKAS, L. R&D and Productivity Growth: A Review of theLiterature, US Washington DC.: Bureau of Labor Statistics WorkingPaper 408, BLS, 2007. Available www.bls.gov/osmr/pdf/ec070070.pdf(February 2010).; HALL, B.H., MAIRESSE, J. and MOHNEN, P.Measuring the returns to R&D, NBER Working Paper 15622, CambridgeMA: NBER, 2009.
[22] NATIONAL SCIENCE BOARD (NSB). Science and EngineeringIndicators 2010, Arlington, VA.: National Science Foundation (NSB 10-01), 2010. Available http://www.nsf.gov/statistics/ (January 2010).

Costs and benefits of alternative scholarly publishing models:Lessons and developments
402
[23] AYRIS, P. et al. The LIFE2 Final Report, London & Bristol: The JointInformation System Committee (JISC), 2008. Availablehttp://www.life.ac.uk/2/documentation.shtml (January 2010).
[24] ARXIV.ORG. arXiv Business Model White Paper, Cornell University,2010. Available http://arxiv.org/help/support/whitepaper (January2010).
[25] NATIONAL INSTITUTES OF HEALTH (NIH). Analysis of Commentsand Implementation of the NIH public access policy, Washington DC.: NIH,2008. Availablehttp://publicaccess.nih.gov/analysis_of_comments_nih_public_access_policy.pdf (February 2010).
[26] See http://www.cfses.com/SPARC-FRPAA/.[27] SWAN, A. Modelling scholarly communication options: costs and benefits for
universities, Bristol and London: The Joint Information SystemsCommittee (JISC), 2010. Available http://ie-repository.jisc.ac.uk/442/(February 2010).

403
The Open Access Landscape 2009Bo-Christer Björk1, Patrik Welling1, Peter Majlender1, Turid Hedlund1, MikaelLaakso1, Gudni Gudnasson2.
1 HANKEN School of Economics, Helsinki, Finland2 Innovation Center Iceland, Reykjavik, Iceland
AbstractThe Internet has technically facilitated making scientific results available to amuch wider readership than ever before, both via electronic subscriptions butalso for free in the spirit of Open Source licensing of software and theknowledge sharing of Wikipedia. This emerging openness has importantimplications for better impact of published research in general and forbridging the digital divide between the researchers of the leading universitiesand the developing nations.
A central question many policymakers ask is how common Open Access istoday and how fast the share of OA is increasing. What proportion of journalarticles are OA and to what extent do researchers post OA copies inrepositories? Accurate answers to such questions would be very valuable forinstance for research funders and for university administrators. The purposeof the study reported on in this paper is to provide answers to this type ofquestions.
Keywords: Open access publishing, prevalence of open access articles
1. Earlier studies
Although some estimates of OA prevalence have been published over the lastfew year there is a clear need for rigorously conducted studies. Also the shareis constantly changing and thus studies need to be up-to-date. So far thevolume of OA has been studied for instance in the following ways.

Open access landscape 2009
404
For gold OA publishing it has been easy to compare the number ofOA journals listed in the DOAJ index to the total number of activepeer reviewed scholarly journals listed in the Ulrich’s periodicalsdirectory.For green OA there are directories listing repositories and statistics ofhow many documents these contain.For particular limited disciplines it is possible to take the content in afew leading journals and check the availability of OA copies viagooglingFor larger masses of articles the availability of full text versions OAcan be checked by web crawling robots (cf. ex, 1 ) that are fed byarticle titles from indexing services such as Web of Science.
All these methods suffer from limitations. On average OA journalspublish far fewer articles per annum than subscription based one 2 and thusthe share of OA articles in the total global article volume is much lower thanthe share of titles. Secondly the criteria for inclusion in DOAJ and Ullrich’smight differ, so that the number of journals may not be directly comparable.
Counting the number of documents in repositories may tell a lot aboutthe growth of the repositories, but the numbers cannot usually easilydistinguish between copies of articles published elsewhere and a wide rangeof other materials (thesis, working papers, research data, teaching materialetc).
2. Research methods and Results
The proportion of all peer reviewed scholarly journal articles, which areavailable openly on the web without any restrictions (Open Access), wasempirically studied. A sample was constructed using articles from 2008obtained from a citation indexing service (Scopus) which coveredapproximately 1,2 million articles, estimated to represent around 80 % of thewhole peer reviewed article stock of that year. The sample, which all in allincluded 1773 titles, was stratified over 9 disciplines so that roughly equal

Open access landscape 2009
405
numbers of titles were included in each of the sub-samples. The researchmethod consisted of using a web search engine in order to find free full textcopies of the articles. A team of researchers shared the workload, aided by aspreadsheet tool linked to the search engine.
The detailed results will be presented at the conference itself. Wehave submitted manuscripts to journals, which prohibit publishing them inthe conference proceedings (which are openly available) at this stage. Readersof this abstract can check for the results later by googling using the authors’names.
References
[1] Hajjem, C., Harnad, S., Gingras, Y. (2005). Ten-Year Cross-DisciplinaryComparison of the Growth of Open Access and How it Increases ResearchCitation Impact. IEEE Data Engineering Bulletin, 28(4): 39-47. Available at:http://eprints.ecs.soton.ac.uk/11688/
[2] Björk, Bo-Christer, Roos, Annikki, Lauri, Mari 2009 Scientific journalpublishing – yearly volume and open access availability, InformationResearch, 14(1) paper 391. http://InformationR.net/ir/14-1/paper391.html]

406
Mapping the structure and evolution of electronicpublishing as a research field using co-citation
analysis
Ya ar Tonta; Güleda Düzyol
Department of Information Management, Faculty of Letters,Hacettepe University06800, Beytepe, Ankara, Turkey
{tonta, gduzyol}@hacettepe.edu.tr
AbstractElectronic publishing can be defined as making full-texts of journal articlesand books available through the network. Although e-publishing has been inexistence for over 30 years in various forms such as CD-ROMs, it owes muchof its current level of development to the Internet and the Web. This paperattempts to chart the evolution of e-publishing as a research field over the last31 years using CiteSpace, an information visualization tool. It maps theintellectual structure of e-publishing based on 493 articles that appeared inprofessional literature on the subject between 1979 and 2009. Document co-citation and author co-citation patterns and patterns of noun phrases andkeywords of papers on e-publishing are visualized through a number of co-citation maps. Maps show the major research strands and hot topics in e-publishing such as “open access” and would improve our understanding ofthe e-publishing as a research field.
Keywords: electronic publishing; information visualization; CiteSpace
1. Introduction
Scientific papers and publications reflect the rapid growth of humanknowledge. Studying citations in research papers describes the developmentof science and explains the starting point and intellectual bases of thescientific research [1]. Bibliometrics uses citation data to trace the growth ofpublished literature and study the patterns of publications and specificscientific developments within a field [1, 2]. Co-citation analysis can be usedto study various aspects of scientific networks and to map structures ofscholarly research in a certain field [2, 3, 4]. It identifies how often “two

Mapping the structure and evolution of electronic publishing: a co-citation analysis
407
documents are . . . co-cited when they both appear in the reference list of athird document” [5]. Author co-citation analysis (ACA) is used to find out thenumber of times “that selected author pairs are cited together in articles,regardless of which of their works are cited” and it tries to “identifyinfluential authors and display their interrelationships from the citationrecord” [6]. Co-word analysis, on the other hand, is based on the co-occurrence frequency of pairs of words or phrases” and “used to discoverlinkages among subjects in a research field and thus to trace thedevelopment of science” [7]. “Åström found a good correspondencebetween maps based on author-co-citation analysis and on co-occurrence ofdescriptors” [8]. Such relationships between citations and words revealnetworks of documents, authors and words, respectively [9, 10, 11].
Studying networks has been an established research topic in informationscience and other disciplines. A network consists of nodes (i.e., articles,words or authors) and links (to other articles, words or authors). “Each nodein the network represents a reference cited by records in the retrieveddataset” [12]. The size of a node and its label is proportional to the frequencyof citations. Colors on a node (so called “rings”) correspond to the time slicein which citations were made. The thicker the ring for a certain color, themore citations the paper received from that time slice [13]. The lines betweenthese circles represent co-citations. The width and length of links areproportional to the co-citation coefficient. Colors of links indicate the firstappearance of those links [4]. Thicker lines and closer nodes indicate that thepairs are co-cited more frequently and thus more similar [2].
Social network analysis (SNA) used in creating co-citation maps is basedon graph theory. SNA offers several measures such as density and centralityto study the characteristics of a network and conceptualize it [14]. The“density” of a network is defined as the number of actual links between nodesdivided by the number of possible links and represents the connectedness ofthe graph [15]. The “centrality” of a network, on the other hand, measuresrelationships between nodes in terms of degree, closeness and betweenness.Central nodes are more important in a network [16]. Degree centrality is thenumber of direct relationships that a node has. Betweenness centrality is anindicator of a node’s ability to make connections to other nodes in a networkwhile closeness centrality measures how quickly a node can access morenodes in a network [17].
Highly cited, and thus important, articles in a co-citation network form“landmark” nodes. Articles that have many connections to other articles arecalled “hubs”. The “pivot” nodes, on the other hand, connect different sub-networks in a co-citation network through playing a brokerage role [18].Scientific networks tend to change over time in various ways. Moderate aswell as dramatic changes may be observed [4]. As a scientific field matures,

Mapping the structure and evolution of electronic publishing: a co-citation analysis
408
new nodes and links get added to the network while some of the existing onesget merged with other nodes or would disappear altogether.
This paper aims to assess the evolution of e-publishing as a research fieldusing scientific visualization techniques. Tracing its historical developmentbetween 1979 and 2009, we carried out a domain analysis of the e-publishingfield so as to see how it is that the intellectual structure of e-publishing haschanged over time. In addition to providing descriptive statistics on e-publishing, we addressed the following research questions:
What are the prominent articles in the field of e-publishing?What major areas of e-publishing exist and how are they interlinked?Which authors are major knowledge producers?Is there an evolving area in e-publishing as a research field?
We used the CiteSpace software (http://cluster.ischool.drexel.edu/~cchen/citespace/) to explore the research fronts in e-publishing field and addressedthe research questions by means of co-citation analysis and scientificinformation visualization tools.
2. Methodology
We performed a topical search on Thomson Reuters’ Web of Science (WoS)online database to identify papers on e-publishing that appeared in theliterature between 1979 and 2009 [19]. We used the terms “electronicpublishing”, “e-publishing” and “digital publishing” for topical searches. Atotal of 1,182 papers were identified. Some 689 contributions other thanjournal articles (book reviews, editorials and other document types) wereexcluded. The full bibliographic records (including authors, titles, abstractsand reference lists) of the remaining 493 journal articles were downloadedalong with a total of 1,895 citations that they received.
We used CiteSpace to analyze and visualize co-citation networks.Developed by Dr. Chaomi Chen, CiteSpace facilitates the analysis of emergingtrends in a knowledge domain [4]. CiteSpace is part of the developing field of“knowledge domain visualization” aimed at creating a picture of how sciencegrows and evolves over time [18]. “Compared with earlier visualizations, thenew methods in CiteSpace have improved the clarity and interpretability ofvisualizations” [16]. CiteSpace supports collaboration networks of co-authors,institutions and countries, document co-citation networks, concept networksof noun phrases and keywords, and hybrid networks that consist of multipletypes of nodes and links [9]. CiteSpace reduces the number of links that mustbe shown and weights the remaining ones, thereby preserving the network’sbasic structure.

Mapping the structure and evolution of electronic publishing: a co-citation analysis
409
We analyzed the data using two-year time slices, making altogether 16slices for the entire period of 1979-2009. In each time slice, a co-citationnetwork was constructed based on the co-citation instances made by the top30 most cited records published in the corresponding time interval and thethreshold values.
3. Findings and Discussion
Table 1 provides descriptive statistics on papers on electronic publishing thatappeared in professional literature between 1979 and 2009. During thisperiod, a total of 493 papers with “electronic publishing” or “e-publishing” or“digital publishing” in their topics were published and they were cited 1,895times. On the average, 16 papers appeared on electronic publishing annually(SD = 11) and they received 61 citations (SD = 72).
Table 1: Number of articles and citations on electronic publishing (1979-2009)
Year # ofarticles
# of timescited Year # of
articles# of times
cited1979 1 12 1995 32 2381980 0 0 1996 30 1111981 0 0 1997 34 621982 4 0 1998 36 881983 4 2 1999 29 2161984 7 43 2000 42 2201985 11 26 2001 28 941986 9 13 2002 21 1271987 11 11 2003 22 1451988 5 10 2004 16 501989 10 11 2005 15 451990 5 0 2006 17 371991 12 11 2007 15 121992 14 189 2008 21 251993 9 14 2009 10 41994 23 79Total Total 493 1,895
While the number of papers and citations thereto were not high between1979 and 1993 (average of 7 papers and 23 citations per year), they haveincreased considerably between 1994 and 2000 (average of 32 papers and 145

Mapping the structure and evolution of electronic publishing: a co-citation analysis
410
citations per year). This is probably due to the fact that the number ofInternet and Web users proliferated in early 1990s when the Internet becameavailable outside the academia, thereby increasing both the number of e-publishing activities and papers engendered therefrom. The increase hasslowed down after the year 2000 (average of 18 papers and 60 citations peryear), which can perhaps be explained by the appearance of more specificpapers on e-publishing indexed under more specific keywords.
Fig. 1: A document co-citation network of electronic publishing (1979-2009)
Figure 1 shows a document co-citation network derived from the citingbehavior of authors writing on e-publishing. This network is the result ofmerging 15 two-year and 1 one-year (2009) document co-citation networksgenerated by the WoS dataset (1979-2009). It consists of 409 papers that havebeen cited by two or more e-publishing articles and 1,096 co-citation links.Each co-citation link represents at least three co-citations. Citations made inearlier years are shown in blue links, mid-range years in green and yellow,and recent years in orange. The colors of co-citation links depict the earliestyear in which the connection between two documents was made for the firsttime. For example it is quite possible that papers published in the 1980s werenot co-cited until 1990s [20].
Structurally strategic nodes can easily be identified in Figure 1 [21]. Tenopirand King’s book (2000) on electronic journals appears to be the mostprominent source as it was cited the most. Journal articles on e-publishing byHarnad (“Scholarly skywriting”, 1990), Schauder (“Electronic publishing ofprofessional articles”, 1994) and Ginsparg (“First steps towards electronic

Mapping the structure and evolution of electronic publishing: a co-citation analysis
411
research communication”, 1994) were the second most highly cited articles inthe network. These four sources started to get cited soon after publication andstill continue to be cited today, as the outer orange rings indicate.
In Figure 1, we see three distinct clusters in the network. (These threeclusters are shown in detail in Figures 2, 3 and 4). We have already pointedout the strategic nodes of Tenopir-2000, Harnad-1990, Schauder-1994 andGinsparg-1994 at the middle of the network. Figure 2 shows the middle andupper left-hand cluster in Figure 1 in more detail. Figure 2 comprises paperswith mainly green links, indicating that this cluster was formed between 1991and 2002. Papers in this cluster (e.g., Tenopir-2000, Harnad-1990, Schauder-1994, Ginsparg-1994) have also been cited after 2002. Rawlins-1993, Turoff-1982, and Lancaster-1978 have not been cited after 2003. Tenopir-2000,Harnad-1990 and Ginsparg-1994 provide connection with the recently formedupper right-hand part of the network (see Fig. 3). To put it differently, theywere cited by papers in this cluster whose centroid is represented byLawrence’s seminal letter (“Online or Invisible?”) that appeared in the journalNature in 2001. The linkage between the two clusters was formed in 2001-2002time slice, which roughly corresponds to the rise of open access debate inearly 2000s. The debate was (and, to some extent, still is) centred on thepotential impact of e-publishing through open access e-journals in terms ofuse and citations exemplified in Antelman-2004 (“Do open access articleshave a greater research impact?”) and Kurtz-2005 (“The effect of use andaccess on citations”), for example.
Fig. 2: The middle and upper left-hand part of network in Figure 1 in detail

Mapping the structure and evolution of electronic publishing: a co-citation analysis
412
The cluster in the upper right-hand part of the network seems to havebeen formed recently, as the prevalent orange and red rings indicate. Thispart shows the most recent active area of e-publishing field. Sources in thatcluster were cited mostly after 2005. This part of the network shown in detailin Figure 3 represents an evolving thread and contains highly cited articles byLawrence-2001, Antelman-2004, Kurtz-2005, Miller-2004, Odlyzko-2002,Swan-2005, and Jones-2006. The first paper published by Lawrence-2001, wasfirst cited in 2001 and heavily cited after 2005, whereas the Kurtz-2005 paperwas not cited between 2007 and 2009.
Figure 3: The upper right-hand part of the network in Figure 1 in detail.
Figure 4 shows the lower part of the network that was formed startingfrom 1988. Note that the seminal article by Vannevar Bush (“As we maythink”, 1945) is one of the nodes connecting two clusters in the network andcontinued to be cited until 2006. Also, papers by Odlyzko and Negropontehave been cited up until recent years. We can see a dense cluster in yellow onthe left-hand side next to the Bush’s 1945 paper. This cluster was formed in2003-2004 time slice and contains papers by Negroponte-1995, Ormes-2001,Crawford-2000, Hawkins-2000, and Sottong-2001.
We also carried out a network analysis of authors contributing to e-publishing literature (author co-citation analysis) (Fig. 5). The networkcontains 340 authors cited by the e-publishing dataset and 1091 co-citationlinks. The largest connected component of this network is densely connectedand therefore it is difficult to identify sub-networks, even if they exist. (SeeFig. 6 for the blow up of the densest part of Fig. 5.) Increasing the thresholdvalue does not help much in this respect, as “meaningful pairwiseassociations are broken” and related authors “appear in differentcomponents“ [5].

Mapping the structure and evolution of electronic publishing: a co-citation analysis
413
Figure 4: The lower part of the network in Figure 1 in detail
Figure 5: An author co-citation network (1979-2009), including 340 citedauthors and 1091 co-citation links.
The size of a node is proportional to the number of e-publishing articlesone has published. The colors of tree-rings indicate the temporal patterns ofan author. For example, Harnad has the largest citation circle. On the otherhand, the author co-citation map conveys additional information about howthese authors have been cited. The nodes of Harnad and Lancaster have

Mapping the structure and evolution of electronic publishing: a co-citation analysis
414
purple rings, indicating that they are pivotal nodes in the network with thehighest betweenness centrality. In other words, they are strategicallyimportant in pulling other nodes together [20]. The same can be said, to alesser extent, for the nodes of Garfield and King. The citation tree-ring ofHarnad shows thick layers of green-orange rings, indicating that the majorityof citations to Harnad were received in recent years (e.g., 2000s). The openaccess expert Stefan Harnad, the founder of arXiv Paul Ginsparg and AnnOkerson of Yale University Libraries are usually co-cited.
The prominent nodes are dominated by green citation rings (see Fig. 6).This pattern suggests that these authors frequently published e-publishingpapers in the green time slices, which corresponds to the 1990s and first yearsof 2000s. The outermost authorship tree-rings of most of the authors areorange, suggesting that many of these authors continue to publish papers thatcontinue to be cited. The names of those authors can be seen in Figure 7 alongwith linkages among them.
Fig. 6: The densest part of the author co-citation network (1979-2009) in Fig. 5.

Mapping the structure and evolution of electronic publishing: a co-citation analysis
415
Fig. 7: The largest connected component of the e-publishing authorship network
Fig. 8: A hybrid networks of keywords (shown as circles with black labels)and noun phrases (shown as triangles with dark red labels) (1979-2009)
Figure 8 shows a hybrid network of keywords as circles and noun phrasesas triangles, extracted from titles and abstracts of papers. A noun phraseconsists of a noun and adjective(s). Pivotal nodes are shown with purple rings(e.g., electronic publishing, internet).
Figure 9 draws a minimum spanning tree using the hybrid network ofkeywords and noun phrases in Figure 8. Keywords represent more generaltopics whereas noun phrases represent microscopic analysis. So, the hybridmap of keywords and noun phrases is expected to reveal concrete connectionsat different granularity levels [20]. The inclusion of the map is to provide anoverall orientation of the conceptual structure of papers on e-publishing.
This map includes hubs of electronic publishing, internet and researchfunding. Internet and research funding are interconnected with electronicpublishing. The hub of electronic publishing is connected to other keywordsor noun phrases such as open access, copyright and electronic books; the hubof internet is connected to electronic books, information, information retrieval,information technology and so on. Concept maps can be useful to identifyspecific terms that are closely related with the field of e-publishing [20].

Mapping the structure and evolution of electronic publishing: a co-citation analysis
416
Fig. 9: A concept map of keywords assigned by authors to their own papersand noun phrases extracted from titles and abstracts of papers. Citespace
thresholds: 3,3,15; 3,3,20; 3,3,20
4. Conclusion
We have analyzed the structure and evolution of electronic publishing fieldthrough articles published between 1979 and 2009 using co-citation networksderived from CiteSpace. Findings of our study show that e-publishing is anemerging research field. The three most prominent sources in e-publishingfield are Tenopir and King’s book (“Towards Electronic Journals: Realities forScientists, Librarians, and Publishers”, 2000), Harnad’s article (“Scholarlyskywriting and the prepublication continuum of scientific inquiry”, 1990) andSchauder’s article (“Electronic Publishing of Professional Articles: Attitudes ofAcademics and Implications for the Scholarly Communication Industry”,1994). There is a recently formed part of the network that represents “openaccess”. The open access evangelist Stefan Harnad seems to be the mostinfluential author. Open access, e-journals, e-books, digital libraries areamong the major research tracks in e-publishing as indicated in the hybridmap of keywords and noun phrases. Findings of this study can be used toidentify landmark papers along with their impact in terms of providingdifferent perspectives and engendering new research areas.

Mapping the structure and evolution of electronic publishing: a co-citation analysis
417
Notes and References
[1] JIANHUA, H; et al. The information visualization analysis of the studyin international S&T policy. Proceedings of the Fourth InternationalConference on Webometrics, Informetrics and Scientometrics & NinthCOLLNET Meeting, Berlin, 2008. Available athttp://www.collnet.de/Berlin-2008/HouJianhuaWIS2008iva.pdf(January 2010)
[2] ESTABROOKS, CA; et al. The intellectual structure and substance ofknowledge utilization field: A longitudinal author co-citations analysis,1945 to 2004. Implementation Science, 3, 2008, p. 49. Available athttp://www.implementationscience.com/content/3/1/49 (January 2010)
[3] MOED, HF. Citation analysis in research evaluation. Netherlands:Springer, 2005
[4] CHEN, C. Searching for intellectual turning points: Progressiveknowledge domain visualization. Proceedings of the NationalAcademy of Sciences of the USA (PNAS), 101 (Suppl.(1)), 2004, p. 5303-5310. Available athttp://www.pnas.org.content/101/suppl.1/ 5303.full.pdf (January 2010).
[5] EGGHE, L; ROUSSEAU, R. Introduction to informetrics: Quantitativemethods in library, documentation and information science. Amsterdam:Elsevier Science Publishers, 1990. p. 239. Available athttp://uhdspace.uhasselt.be/dspace/handle/1942/587 (April 2010).
[6] WHITE, HD; MCCAIN, KW. Visualizing a discipline: An author co-citation analysis of information science, 1972-1995. Journal of theAmerican Society for Information Science, 49, 1998, p. 327-355. p. 327.
[7] HE, Q. Knowledge discovery through co-word analysis. LibraryTrends, 48 (1): 133-159, 1999. p. 133.
[8] ÅSTRÖM, F. Visualizing Library and Information Science conceptspaces through keyword and citation based maps and clusters. In:Bruce, Fidel, Ingwersen & Vakkari (Eds). Emerging frameworks andmethods: Proceedings of the fourth international conference onconceptions of Library and Information Science (CoLIS4), 2002, p. 185-197. Greenwood Village: Libraries Unlimited. (as cited inhttp://www.db.dk/bh/Core%20Concepts%20in%20LIS/articles%20a-z/coword_analysis.htm).
[9] CHEN, C; et al. Visual analysis of scientific discoveries and knowledgediffusion. Proceedings of the 12th International Conference on

Mapping the structure and evolution of electronic publishing: a co-citation analysis
418
Scientometrics and Informetrics (ISSI 2009). July 14-17, 2009. Rio deJaneiro, Brazil. Available athttp://cluster.cis.drexel.edu/~cchen/papers/2009/issi2009/issi2009.pdf(January 2010).
[10] PETERSON, I. Mapping scientific frontiers. Science News Online, 165(11), 2004. Available athttp://cluster.cis.drexel.edu/~cchen/citespace/doc/mathtrek.pdf(January 2010).
[11] CHEN, C; et al. Making sense of the evolution of a scientific domain: Avisual analytic study of the Sloan Digital Sky Survey research.Scientometrics, in press (DOI 10.1007/s11192-009-0123-x). Available athttp://www.springerlink.com/content/46661328402643l0/fulltext.pdf(April 2010).
[12] CHEN, C; et al. Towards an explanatory and computational theory ofscientifiv discovery. Journal of Informetrics, 3 (3), 2009, p. 191-209.Available at http://arxiv.org/ftp/arxiv/papers/0904/0904.1439.pdf (April2010).
[13] CHEN, C; et al. The structure and dynamics of co-citation clusters: Amultiple-perspective co-citation analysis. Journal of the AmericanSociety for Information Science and Technology, in press (DOI:10.1002/asi.21309). Available athttp://www3.interscience.wiley.com/cgi-bin/fulltext/123324662/PDFSTART (April 2010).
[14] OTTE, E; ROUSSEAU, R. Social network analysis: A powerful strategy,also for the information sciences. Journal of Information Science, 28,2002, p. 443–455.
[15] SCOTT, J. Social network analysis: A handbook (second ed.). ThousandOaks, CA: Sage Publications, 2000.
[16] CHEN, C. CiteSpace II: Detecting and visualizing emerging trends andtransient patterns in scientific literature. Journal of the AmericanSociety for Information Science and Technology, 57 (3), 2006, p. 359-377. Available athttp://cluster.cis.drexel.edu/~cchen/citespace/doc/jasist2006.pdf(January 2010).
[17] Sentinel Visualizer. Social network analysis (SNA), 2009. Available athttp://www.fmsasg.com/SocialNetworkAnalysis/ (January 2010).
[18] DELL, H. Mapping intellectual milestones. BioMedNet: Special Report.Available at:http://cluster.cis.drexel.edu/~cchen/citespace/doc/biomednet.pdf(January 2010)

Mapping the structure and evolution of electronic publishing: a co-citation analysis
419
[19] One of the reviewers commented that papers published in proceedingsof ELPUB conferences should be included in our sample. However,this was not possible in that metadata, references and citations ofELPUB papers were not readily available and they would have to bepre-processed in order for them to be entered into CiteSpace software.
[20] CHEN, C; et al. The thematic and citation landscape of Data andKnowledge Engineering (1985-2007). Data and KnowledgeEngineering, 67, 2008, p. 234-259.
[21] Details for all papers in Figures 1-4 are given in Appendix.
Appendix: Papers depicted in the network clusters andmentioned in the text
Antelman, K. (2004). Do open access articles have a greater research impact?College and Research Libraries, 65 (5): 372-382.
Bush, V. (1945). As we may think. The Atlantic Monthly, 176 (1): 101-108.Crawford, W. (2000). Nine Models, One Name: Untangling the e-book Muddle.
American Libraries, 31, 56-9.Harnad, S. (1990) . Scholarly skywriting and the prepublication continuum of
scientific inquiry. Psychological Science, 1, 342–344.Jones, R., Andrew, T., & MacColl, J. (2006). The Institutional Repository. Oxford:
Chandos.Ginsparg, P. (1994). First Steps Towards Electronic Research Communication.
Computers in Physics, 8 (4): 390-396.Hawkins, D.T. (2000). Electronic books: a major publishing revolution (part 1).
Online, 24 (4): 14-28.Kurtz, M.J..et al. (2005). The effect of use and access on citations. Information
Processing & Management, 41, 1395-1402.Lancaster, F.W. (1978). Toward Paperless Information Systems. Orlando, FL:
Academic Press.Lawrence, S. (2001). Online or invisible? Nature, 411 (6837): 521.Miller C.T., & Harris, J. C. (2004). Scholarly Journal Publication: Conflicting
Agendas for Scholars, Publishers, and Institutions. Journal of ScholarlyPublishing, 35 (2): 73-91.
Negroponte, N. (1995). Being Digital. New York: Alfred A. Knopf.Odlyzko, A.M. (1995). Tragic loss or good riddance? The impending demise of
traditional scholarly journals. International Journal of Human-ComputerStudies, 42, 71–122.
Ormes, S. (2001). An e-book primer, available at:www.ukoln.ac.uk/public/earl/issuepapers/ebook.htm

Mapping the structure and evolution of electronic publishing: a co-citation analysis
420
Rawlins, G.J.E. (1993). Publishing over the Next Decade. Journal of the AmericanSociety for Information Science, 44 (8): 474-479.
Schauder, D. (1994). Electronic Publishing of Professional Articles: Attitudes ofAcademics and Implications for the Scholarly Communication Industry.Journal of the American Society for Information Science, 45, 73-100.
Sottong, S. (2001). E-book technology: Waiting for the false pretender. InformationTechnology and Libraries, 20 (2): 72-80.
Swan, A. (2005) Open access self-archiving: An Introduction. Technical ReportUNSPECIFIED, JISC, HEFCE.
Tenopir, C., & King, D.W. (2000). Towards Electronic Journals: Realities for Scientists,Librarians, and Publishers. Washington, D.C.: Special Libraries Association.
Turoff, M., & Hiltz, S.R. (1982). The Electronic Journal: A Progress Report. Journalof the American Society for Information Science, 33 (4): 195-202.

421
Electronically published scientific information intechnical university libraries
Kate-Riin Kont
Tallinn University of Technology Library: Acquisitions DepartmentAkadeemia 1, 12618 Tallinn, Estonia
AbstractThe use of electronic information resources is growing rapidly. The actualscience information is electronic as a rule - practically all the journals ofengineering and natural science have electronic versions and a certainnumber of them are available only electronically. Electronic scientificinformation in technical universities is the basis for research anddevelopment, degree study and professional specialty, to a certain extent. It iswidely agreed by producers and purchasers of information that the use ofelectronic resources should be measured in a more consistent way. Librarianswant to understand better how the information they buy from a variety ofsources is being used; publishers want to know how the information productsthey disseminate are being accessed. Findigs of this study suggest that thefinancial opportunities of technical university libraries in the four neighboringcountries - Swedish Royal Institute of Technology, Helsinki University ofTechnology, Tallinn University of Technology Library, and Scientific Libraryof Riga Technical University (henceforth referred to as KTHL, HUTL, TUTLand RTUL respectively) - to spend resources on electronic publications arevery different.
Keywords: university libraries; digital libraries; electronic scholarlycommunication; library services; performance measurement.
1. Introduction
Libraries in the Nordic European countries (Denmark, Finland, Iceland,Norway and Sweden) began the process of digital library building in 1980swith the implementation of computerized library catalogues [1]. The mainpurpose of the Nordic Council for Scientific Information and Research Libraries

Electronically published scientific information in technical university libraries
422
(NORDINFO), founded in 1977 (closed in 2004) was to promote Nordiccooperation within the field of scientific information and documentation,principally in connection with the research library systems.
The Nordic Electronic Research Library is a concept which is based onnational developments within the research library sector in each of the fiveNordic countries. The goals of the Nordic Electronic Research Library are tomake scientific and technical information easily available in all the Nordicregion [2].
In contrast to the situation in the Nordic countries, the development of theinformation system of Eastern Europe libraries is weakly included in thenational program for the development of the information society. Accordingto Virkus [3], academic libraries in the former communist countries of Balticstates have experienced a period of rapid and profound change during thelast decade, in connection with the transformation in the political andeconomic structures, changes in territorial and administrative situations, aswell as with the rapid development of information and communicationtechnologies.
The purpose of the present poster is to analyze the essential data, details ofthe use of e-resources and the cost of electronic scientific information as wellas the cost of the most important performance indicators related to theincreasing usage and acquisition of electronic scientific information of theleading technical university libraries in Sweden, Finland, Estonia and Latvia.These university libraries are also members of the IATUL (InternationalAssociation of Scientific and Technological University Libraries). The choiceof the period 2004-2008 is justified by the fact that during that time thelibraries underwent a substantial increase in e-services as well as inexpenditures on electronic scientific information.
2. Methodology
The data used in this paper is based on the analysis of relevant literature. Thedetails of the size, cost and usage of the collections of university libraries,based on the annual reports of these libraries (in the case of the HUTL andTUTL) as well as on the questionnaires sent to directors of libraries (in case ofthe KTHL and RTUL), are analyzed.

Electronically published scientific information in technical university libraries
423
3. Findings
The numbers in Figure 1 indicate that students constitute only one part of thereadership of the technical university libraries, while a considerable part ofthe readership (for example ca 30% in TUTL) is formed by other target groups(lecturers, scientists and other interested groups). Therefore, the role oftechnical university libraries is much broader, offering services to differentusers.
Figure 1: The number of students FTE/the number of registered users
Data given in Figure 2 shows that the number of licensed databases hasgrown during the last three years in all libraries. Since 2006, HUTL began todistinguish between 66 separate CSA (Cambridge Scientific Abstracs)database, hence the sudden increase in the number of databases. The numberof licensed databases in RTUL was not calculated until 2006, but the numberof databases is still extremely small compared to other libraries.
2004 2005 2006 2007 2008
14 251 14 428 13 537 13 361 13 73715 192 15 166 15 131 15 201 14 96310 064 10 700 11 300 11 700 13 26316 513 16 746 16 520 17 665 16 508
17 00018 855 18 190 17 969 17 74517 82319 042 19 167 19 229 19 25119 31513 067 15 561 18 231 18 38219 330
RTUL: numberof usersTUTL: numberof usersHUTL: numberof usersKTHL: numberof users*RTU: number ofstudents FTETUT: number ofstudents FTE

Electronically published scientific information in technical university libraries
424
Figure 2: Electronic collection: number of licensed databases
Table 1 lists the comparison of collections on physical carriers (includes forexample books and periodicals on paper, but also CDs, VHSs, DVDs etc.) andelectronic collections (number of the titles of e-books and e-periodicals) oftechnical university libraries. These data are collected according to thestandard the ISO 2798:2006 [4]. In 2004-2008, the number of collections onphysical carriers was stable in all libraries. Of the considerably increasednumber of e-publications in HUT Library in 2006, around 240,000 are variousdigitized historical books from different disciplines published in the UK andUS in the 15th to18th centuries and made available via different databases.Unfortunately it is not possible to compare side by side the number ofelectronic collections between libraries in 2004-2008. The reason for this is thatRTUL does not reflect these numbers in statistics.
Table 1. Collections on physical carriers / electronic collection: the numberof e-publication titles (e-books + e-periodicals)
Library 2004 2005 2006 2007 2008KTHL 864 661/
626 274865 723/633 412
877 572/638 348
833 379/638 667
837 770/665 392
HUTL 237 087/10 999
241 104/13 068
240 800/260 228
240 875/311 547
234 894/326 151
TUTL 718 536/31 000
723 136/37 800
723 906/43 800
733 4867/55 000
723 630/69 474
RTUL 2 333 910/* 2 301 858/* 2 205 044/* 2 084 972/* 1 961 419/**Records were not considered
70 70 7171 74
42 44
125
185
214
2335
72
76 80
11 11 10
2004 2005 2006 2007 2008
KTHL HUTL TUTL RTUL

Electronically published scientific information in technical university libraries
425
Table 2 compares traditional loans and downloaded electronic content unitsin the technical university libraries. Home lending, on-site-loans, loansthrough the self-rental machine and renewals (but not in-house usage) aretaken into consideration in the case of traditional library loans. Contentdownloaded is defined as content unit (full-text article or abstract), that issuccessfully requested from a database, electronic serial or library digitalcollection.
Table 2. The usage of the collections: traditional library usage: loans/electronic library usage: content units downloaded
Library 2004 2005 2006 2007 2008KTHL 107 563/
482 729105 953/728 787
96 305/720 443
84 031/772 317
82 140/914 318
HUTL 181 557/245 046
253 264/255 642
271 545/264 895
256 447/291 849
241 760/353 627
TUTL 183 246/136 244
193 497/418 538
193 518/545 804
193 960/684 623
193 545/436 788
RTUL 752 243/* 756 730/* 670 780/95 000
630 261/74 213
352 680/229 754
*Records were not considered
Figure 2 indicates a big difference in the acquisitions costs of the libraries, dueto which the libraries have very different financial means to spend onelectronic publications, unfortunately to the disadvantage of TUTL andRTUL. The proportion of the expense of e-documents in the acquisition costs isconsidered an important performance indicator, which is included in officialstatistics since 2006, but has been recorded by libraries even earlier. Thespending on electronic collections – purchased access to databases andacquired licenses – has been the largest in KTHL - 69% of acquisition costs in2004, 73% in 2005, 72% in 2006, 78% in 2007 and 89% in 2008, followed byHUTL - 80% of acquisition costs in 2004, 84% in 2005, 87% in 2006, 88% in2007 and 90% in 2008. In TUTL, the spending on electronic collectionsincreased from 32% of acquisition costs in 2004, to 36% in 2005, 39% in 2006,54% in 2007 and dropped to 36% in 2008, while in RTUL the spending onelectronic collections has not increased, being 15% of acquisition costs in 2004,6% in 2005, 17% in 2006, 14% in 2007 and 13% in 2008.

Electronically published scientific information in technical university libraries
426
Figure 2. Acquisition costs: expenditure on print materials / expenditure onelectronic materials (EEK) [1 EUR=15,6466 EEK]
The two most interested stakeholder groups in the case of university librariesare the population the library is set up to serve and the institution to which itbelongs. The institution, especially if it provides funding, will see universitylibrary quality on another scale i.e., the library is good if it helps to shortenstudying time, produces graduates that quickly find a job, supports researchin an effective way, helps to raise the image of the institution, and if it is cost-effective overall. The last issue will often be the most important whenresources are scarce [5]. To measure this, university libraries are using aperformance indicator given in Table 4 – acquisition costs per student.
Table 4. Acquisition costs per student: expenditure on print materials/expenditure on purchased access to databases, e-publications (EEK).
Library 2004 2005 2006 2007 2008
KTHL 640/1420 568/1521 696/1815 555/1978 295/2309HUTL 29/1079 175/942 182/1255 192/1317 154/1401TUTL 637/297 625/375 624/402 488/611 659/376RTUL 88/13 96/57 108/18 126/18 121/16Note: The values are calculated as follows: expenditure on print materials, expenditure onpurchase of e-documents, databases / number of students.
Acquisition costs of electronic publications per student have steadilyincreased in KTHL and HUTL since 2006. In TUTL this cost was the highest in2006 (402 EEK) and in 2007 (611 EEK). Acquisition costs of electronicpublications per student in RTUL have been very low as well as acquisitioncosts of print materials per student per year.
9 115 50020 239 5004 419 99516 400 1376 414 8502 985 1501 460 054221 928
8 188 50021 939 000
2 648 86714 308 2676 688 7424 011 2581 614 317315 639
9 424 50024 565 500
2 749 94018 987 5167 178 5194 621 4811 791 338298 593
7 419 09026 431 860
2 925 58420 016 3975 704 9007 153 8002 230 398322 417
4 058 71531 720 3952 306 68720 964 7018 745 7004 989 0001 997 287258 084
2004 2005 2006 2007 2008

Electronically published scientific information in technical university libraries
427
A number of cost indicators in library work are based on the relationshipbetween a certain statistical indicator and the operating expenditures of thelibrary [6].
Table 5. Cost per loan and cost per contents downloadedLibrary 2004 2005 2006 2007 2008KTHL 932/
208919/134
1017/136
1064/116
1075/94
HUTL 376/279
256/253
260/267
296/260
330/226
TUTL 93/131
101/47
114/41
138/39
150/67
RTUL 9/* 12/* 16/110
26/218
58/89
*Number of content units downloaded was not recorded. The values are calculated asfollows: operating expenditure/number of loans, number of contents unit downloaded
The objective of the indicator of the cost per traditional loan is to establish arelation between the number of loans and the cost of providing all services ofthe library, based on this can be estimated the overall efficiency of the service,especially in the university libraries, where loans are the dominant service.The objective of the indicator cost per content unit downloaded is to assessthe contractual cost of an electronic resource related to the number of contentunits downloaded. A lower value indicates cost efficiency for electronicresources [5]. In addition, the cost indicators of regular loans have becomeconsiderably more expensive throughout years when compared to the usageof the electronic library.
4. Conclusions and Discussion
Since Estonia and Latvia joined the EU in May 1, 2004 – all foreign electronicpublishers changed their pricing policy towards our countries. The Balticregion is no longer a region of transition and therefore many current benefits(for example discounts preferences for developing countries) havedisappeared. The usage license fees for electronic resources and prices ofprinted books and journals continue to rise. However, expanding the choice ofelectronic scientific information in the Baltic countries cannot be done withoutadditional financing at the national level.

Electronically published scientific information in technical university libraries
428
The analysis of the most important cost indicators shows that the main costindicator of the electronic library - the cost of the downloaded e-content unit–has become cheaper than traditional loans to the library, which affirms thatthe costs on the electronic library of the university library –e-resources, arewell worth making due to smaller cost indicators. Perhaps a future suggestion would be the establishment of a consortium ofthe libraries of universities of technology in the Nordic and Baltic countries.The need for certain specific and expensive databases would well justify thatwish.
Acknowledgements
This study was supported by European Social Fund’s Doctoral Studies andInternationalisation Programme DoRa.
References
[1] FENDIN, M-L. Digital libraries in the Nordic countries: with practicalexamples for the creation and development of ‘libraries without walls’from the Nordic Africa Institute Library and other libraries within theNordic countries. Paper presented in Conference of ElectronicPublishing and Dissemination, from 1st to 2nd September in Africa,Senegal, 2004. Available at:http://www.codesria.org/Links/conferences/el_publ/fendin.pdf[December 2009].
[2] HANNESDOTTIR, S.K. The Nordic Electronic Research Library indifferent dimensions. Library Consortium Management: An InternationalJournal. Vol. 2, no.5/6, 2001, p. 122-131.
[3] VIRKUS, S. Academic Libraries in Eastern Europe. In: Encyclopedia ofLibrary and Information Science. London: Taylor & Francis, 2005, p. 11-21.
[4] ISO 2789:2006 Information and documentation. International librarystatistics. International Organization for Standardization.
[5] POLL, R. Performance, Processes and Costs: Managing Service Qualitywith the Balanced Scorecard. Library Trends, 2001, Vol. 49, no. 4, p. 709-717.
[6] ISO 11620:2008 Information and documentation. Library performanceindicators. International Organization for Standardization.

429
Exploratory study of quality control mechanism foracademic papers in the Internet era: A case study of
Sciencepaper Online in China
Cantao Zhong 1; Meng Wan 2
1 Institute of Advanced Technology, Peking UniversityBeijing, 100871, [email protected];
2 Centre for Sci-tech Development of the Ministry of EducationBeijing, 100080, China
AbstractInformation and communication technologies such as the Internet can bothchallenge traditional ways and open opportunities for solving existentproblems of present academic quality assurance system. Sciencepaper Onlinein China (CSPO) has adopted a sophisticated mechanism for qualitycontrolling, which can be represented by “Publish Online First, AuthorSelected Peer-Review Later”. Using a five-star rating system for qualitylabelling, each reviewed paper will be assigned a one to five star grade label,corresponding with Poor, Fair, Good, Very Good, and Excellent. With thissystem, CSPO innovatively solves the conflict between rapid publication andquality assurance. This paper investigates this unique quality mechanismwith the aim to understand its operation more thoroughly and evaluate itsvalue to the scientific communication community.
Keywords: Sciencepaper Online; quality labelling; quality control;academic paper
1. General Background
New technologies such as the Internet enable new publication models foracademic papers. The ways scientists share and use research results are

Exploratory study of quality control mechanism for academic papers in Internet era
430
changing rapidly, fundamentally and irreversibly [1]. Information andcommunication technologies can both challenge traditional ways and openremedies for existent problems of present academic quality assurance system.New forms of ex-ante and of ex-post quality control may partly replace andpartly amend peer review. Open peer review, online commenting, rating,access counts and use tracking are also potential contributors [2].
Current development of ’open’ movements, including Open-access, Open-data, and Open-science has evolved from only coping with the serials crisisinto reflection and re-engineering of the entire scholarly communicationprocesses. Scholarly publishing mainly comprises four functions: registrationto establish intellectual priority, certification to certify the quality/validity ofthe research, awareness to assure accessibility of research and archiving topreserve research for future use. Convergence of technologies enables newbusiness models for scholarly communication. A variety of business modelscan be explored with the four core functions disentangled or recombined [3].
Traditional academic journals are switching or have switched to Internetplatforms to facilitate the reviewing and editing process, thus to shorten thetime for papers to reach their readers. But, fundamentally, most onlinejournals are simply digital editions of their print analogs [1]. They still use thetraditional subscription-based business model without overcoming all theinherent access-limiting drawbacks of traditional journals.
Golden OA journals eliminate the access barrier. But most of them still usetraditional forms of peer review. Some have begun to use innovative newforms that take advantage of the new medium and the interactive networkjoining scholars to one another. One example is PLoS’s light-touch peerreview. The truly radical thing about PLoS ONE is that it has redefined thenature of peer review. Using this ‘light touch’ refereeing process, the onlycriterion for publication is that a paper is methodologically sound. So the timefor a paper to appear on the web or PubMed repositories will be shortenedinto two to four weeks. Although there are many debates about this light-touch refereeing method, PLoS ONE has made a success with this disruptivebusiness model. Peter Suber said that ‘removing access barriers and reformingpeer review are independent projects’ [4], which is right in concept level.However, the case of PLoS ONE indicates that they can be combined to bringmore benefits to the academic arena. Leo Waaijers even suggests in Ariadnethat funders should fund research on alternative "non-proprietary peerreview" services [5].

Exploratory study of quality control mechanism for academic papers in Internet era
431
2. Introduction of Sciencepaper Online
There are also pioneers in the scientific communication area in China, andSciencepaper Online (CSPO) is the most aggressive one, which integrates theconcepts and implementations of preprint repository, open access journals,and coalition of institutional repositories into one platform. CSPO issponsored and operated by the Center for Science and TechnologyDevelopment (CSTD) of the Ministry of Education (MOE) with strongfinancial support from the government.
CSPO offers an online publication platform for new and innovative ideasto the academic community with the aim to facilitate fast exchanges andinstant adoption of new academic achievements. It also serves as animportant platform for the optimization of academic environments and forthe improvement of academic behaviors [6].
CSPO will accept and publish any papers that meet its basic formatrequirements for online publication in one week after the submission, nopublishing fee needed. It bypasses traditional publication procedures such asex-ante peer reviews, revisions, editing and printing. CSPO does not hold anycopyright of any paper, the copyright still belongs to the author, and it allowsand encourages authors to submit the paper to other professional journals.
CSPO has begun operation formally since August, 2003. By the end ofMarch 2010, it has more than 200,000 registered (which is free) users, withdaily IP visits about 10,000. The number of total papers published is about41,000, and this number increases steadily about 1,000 per month. (See Fig. 1)
The operator, CSTD, also plays as a funder and a government agency,which greatly helps the operation of CSPO. For example, it requires that allprojects funded by the Doctoral Program of MOE must publish 1-2 originalpapers on Sciencepaper Online. In addition, as a funder and governmentagency, it has an expert database, including all the doctoral advisors in China.This provides strong support for its peer review and quality control system.

Exploratory study of quality control mechanism for academic papers in Internet era
432
Figure 1: Annual published articles on Sciencepaper Online
3. Unique quality mechanism
Sciencepaper Online offers a fast and real-time platform for exchanging newacademic ideas and disseminating new academic achievements. In this aspect,Sciencepaper Online acts much like a preprint repository, or archive. Inaddition, CSPO also provides an opportunity to publish scientific content thatwould not be accepted in a traditional journal.
However, quality control mechanism is essential for academic papers tohave real value to the scientific community. So CSPO adopts a sophisticatedmechanism for quality controlling, which can be represented by “PublishOnline First, Author Selected Peer-Review Later” since Oct. 2005.
When a paper is submitted to the site, its author can select whether theywant formal peer review services (free). The paper, waiting for peer reviewupon its author’s request, will appear first on the site with a “waiting forreview label” along its side. Reviewers will evaluate the paper around severalaspects, including Title, Chinese and English abstracts, scientific innovativityand originality, rationality of the research plan, methodology of dataprocessing and bibliometric references (See Table 1).
0
2000
4000
6000
8000
10000
12000
2004 2005 2006 2007 2008 2009
Num
ber
of a
rtic
les
Year

Exploratory study of quality control mechanism for academic papers in Internet era
433
Table 1: Review CriteriaCriteria Options Note
TitleVeryGood
Good Fair Poor Appropriate with content
Abstract (Chinese)VeryGood
Good Fair Poor Terse and Concise
Abstract (English)VeryGood
Good Fair Poor Terse and Concise
ScientificInnovativitiy
VeryHigh
High Some NoFor review articles, thiswill be academic value.
Research PlanVeryGood
Good Fair PoorFor review articles, thiswill be coverage ofreferences.
Data processingand Reasoning
VeryGood
Good Fair PoorFor review articles, thiswill be logic deductionand proof.
Written expressionVeryGood
Good Fair Poor Clear and formal
ReferencesVeryGood
Good Fair PoorComprehensive andconcise
Overall ReviewSuggestion
Suggestto pub.withpriority
Agreeto pub.
Needminormod.
Muchmod.needed
Not pub.
Specificsuggestions
(No less than 50 words)
mod. = modification pub.=publish
CSPO uses a five-star rating system for quality labelling. According thefinal comprehensive peer evaluation results generated from the reviewingprocess, each reviewed paper will be assigned a one to five star grade label,corresponding to Poor, Fair, Good, Very Good, and Excellent, respectively.The final reviewing commentary will also appear alongside the paper withoutthe name of the reviewer to ensure that reviewers can criticize openly withoutthe danger that the author would know the originator and be resentful [2].Furthermore, CSPO also permits registered users to comment on all publishedpapers, encouraging academic criticism and discussion with the aim toevaluate the real academic value of a paper more objectively.

Exploratory study of quality control mechanism for academic papers in Internet era
434
4. Data analysis and discussion
The “Author-selected peer-review after publishing online” method startedfrom October 2005 as an effort to make papers published on CSPO to beaccepted by the academic community. Appropriately-arranged peer-reviewcan encourage academic communication, including critics and discussionsaround sumitted papers. By the end of March 2010, CSPO has publishedabout 41,000 originated articles, among which about 88 percent has selectedpeer-review. The high ratio reflects the fact that most authors are seriouswhen submitting their articles to CSPO. They want to demonstrate academicvalues of their articles.
For all peer-reviewed articles, the proportion of different star levels, are 13,34, 19, 18, and 16 percent for one to five stars, respectively. Because onlyarticles with 3 stars or higher level have the the opportunity to be recognizedas eligible academic papers, so we can consider the rejection rate of CSPO isabout 36 percent, which is not very high. Now, only 35 universities and/orresearch institutes consider papers published on CSPO as eligible academicpapers for tenure, promotion, and/or graduation purpose. So, only a littlefraction of high-rating papers can be formally treated and brought actualimpact to their authors.
CSTD, the operator of CSPO, started to publish a traditional journalSciencepaper Online (ISSN 1673-7180) since August 2006. The SciencepaperOnline journal is different from CSPO, but those best articles on CSPO, will bearranged to be re-published in this journal with priority. Since last year,CSTD started another journal, the Sciencepaper Online Collections, which onlyselects excellent articles from CSPO.
Due to time and other constraints, complete citation data for CSPO is notobtained. However, we found citation data for Sciencepaper Online journalfrom one of the most widely used database –China National KnowledgeInfrastructure (CNKI). There are only 74 articles with non-zero citations forthis journal, and the largest number of citations for a single article is only 5.
These data indicate that the quality of articles published on SciencepaperOnline journal and on CSPO site need to be improved. Of course, the lack ofan OAI-compliant interface may also be one of the reasons for its low impact,because readers or academics can’t use popular search engines, i.e., GoogleScholar, to find most articles on CSPO.
As said above, China Sciencepaper Online is sponsored and operated by agovernment affiliate, the Center for Science and Technology Development(CSTD) of the Ministry of Education (MOE). Because its inherent non-commercial and non-profit nature, CSPO does not charge authors for

Exploratory study of quality control mechanism for academic papers in Internet era
435
publishing, and even pay a little fee to reviewers. This makes it very differentfrom other new publishers in the western world, such as PLoS. For example,PLoS ONE uses light-touch peer-review, mainly to cope with its sustainabilityproblem, in other words, to attract more authors to publish in it and earnmore author-paid fees.
Another reason for its low impact may arise from its wide disciplinecoverage. Academics usually read a few journals focusing on their disciplines,or use search engines for initial literature investigation in their study.Coverage being too-wide and the lack of indexing by search engines meansfewer readers and users, resulting in low academic impact.
5. Conclusion
Through its “Publish Online First, Author Selected Peer-Review Later”method and five-star quality labelling system, Sciencepaper Onlineinnovatively solves the conflict between rapid publication and qualityassurance. Since quality control is so important for academic papers, furtherin-depth investigation about this unique quality mechanism and its long-termimpact will tell more about the nature and changes of scientificcommunication in the Internet era.
Notes and References
[1] R. K. Johnson, "Will Research Sharing Keep Pace with the Internet?," J.Neurosci., vol. 26, 2006, pp. 9349-9351, September 13.
[2] M. Nentwich, "Quality control in academic publishing: challenges in theage of cyberscience," Poiesis & Praxis: International Journal of TechnologyAssessment and Ethics of Science, vol. 3, 2005, pp. 181-198.
[3] R. Crow, "The Case for Institutional Repositories: A SPARC PositionPaper," ed. Washington, D.C.: Scholarly Publication and AcademicResources Coalition, 2006.
[4] P. Suber. (2007, 1-28). Open Access Overview. Available:http://www.earlham.edu/~peters/fos/overview.htm (March 2010)
[5] L. Waaijers, "Publish and cherish with non-proprietary peer reviewSystems," Ariadne, no. 59, 2009. Available:http://www.ariadne.ac.uk/issue59/waaijers/ (April 2010)
[6] Sciencepaper Online. (2003, 1-28). Introduction about Sciencepaper Online.Available: http://www.paper.edu.cn/en/aboutus_zaixian.php (March2010)

436
Sophie 2.0 - a platform for reading and writing ofinteractive multimedia books in a networked
environment
Kalin Georgiev1; Miloslav Sredkov2
1 Faculty of Mathematics and Informatics, Sofia University,5 J. Boucher str., Sofia, Bulgaria
[email protected] Astea Solutios AD, 20 Lozentz str., Sofia, Bulgaria
AbstractSophie is software for reading and writing networked multimedia electronicbooks. It has been designed to let those without professional design skillscreate and distribute complex documents that take full advantage of newmedia and the Internet. Sophie brings together all of the pieces of media-richwriting. In addition, Sophie fosters collaboration, allows instant readerfeedback, and encourages interactivity. Sophie lets users create communitiesaround projects; with Sophie, “books” become “places” where people meet. Inaddition to its powerful capabilities for combining various media formats andinteractivity, Sophie Server, a significant part of the Sophie platform, allowsauthors to collaborate – working on the same content simultaneously in realtime or offline, and later integrate their changes with the work of others whenan Internet connection becomes available. Sophie also offers integrated readercommunication capabilities allowing readers to ask questions and commenton specific sections of the book.
Keywords: e-book; e-publishing; collaboration; Sophie; rich media;
1. Introduction
The digital, networked nature of the World Wide Web provides significantopportunities for the dissemination of electronic content, opportunities notavailable for conventional printed content. There are several widely usedtechnologies that today facilitate the delivery of media intensive, interactivecontent over the Web. These technologies include Flash, HTML, and PDF [1].

Sophie 2.0 - a platform for reading and writing of interactive multimedia books in anetworked environment
437
Collectively, current digital content 'carriers' offer the following features,providing the fundamental advantages that are propelling the acceptance ofelectronic content:
- Support for various asset types (text, images, audio, video, andothers) [2]
- Support for interactive features and scripting- Advanced layout of content organized as building blocksThe widespread availability and features of existing software tools for
writing and publishing is also a major factor for many authors. Every modernauthoring tool provides at least some of the following advantages:
- Ability to author, manage, and publish rich multimedia books withoutprior technical training (ease of use)
- Availability of facilities for the publishing and review process- Support for author collaboration and reader feedback [3]- Low price (or free)There are certainly other criteria that make one authoring tool preferable
over another. However, we have limited our list to the set of factors that theproject team has identified as those authors take into consideration whenchoosing an authoring tool.
Each technology taken alone will provide many of the desired capabilities,but none of them provides all of them in a single package. For example, Flashsupports various asset types and text flow (using the recently developed TextLayout Framework [4]). However, it requires technical training. It is notintended to make content per se, but rather animations and applications. Thereare many easy to use authoring tools for HTML, and it does support videoassets [5]. However, advanced text flows around other assets are notsupported, nor are some matrix transformations over media (rotation ofimages, for example).
We will not continue comparing existing technologies that enableauthoring of electronic content since a detailed list is not the purpose of thispaper. Rather, it is to make several simple points:
- There are too many authoring tools and the choice authors have tomake is not trivial. Often, by choosing a particular technology, authorssacrifice the ability to make use of some of the potential capabilities ofelectronic content because of technology limitations
- There are too many competing concepts in the world of authoringelectronic content. For example, there is a conceptual abyss betweenmaking Flash content and making HTML 5 content
- Creating quality interactivity elements in electronic content requiresprofessional experience, tools and training

Sophie 2.0 - a platform for reading and writing of interactive multimedia books in anetworked environment
438
- Integration of multiple sources of content and reuse of content createdwith different technologies is complicated and often impossible
- Free and easy to use tools for building advanced, rich content are rare- Publishing, author collaboration, and reader feedback facilities are
often beyond the reach of technically untrained authors.
2. What is Sophie?
Sophie is a software package for writing and reading interactive books in anetwork environment. Its aim is to support authors of all levels in the worldof electronic content by addressing the challenges discussed above. Inaddition, Sophie makes several new conceptual approaches possible forcreating interactive content without prior technical training. Sophie alsoprovides a platform for real time author collaboration and gathering readerfeedback.
3. Static Sophie Content
Sophie content incorporates a wide variety of asset types such as text, images,sound, videos, and more. Sophie goes even further by enabling theincorporation of PDF documents, Flash, and, more exotically, HTML content.In addition to reusing existing documents and assets in other formats, Sophiebooks are embeddable one into the other, allowing the authoring process tobe decomposed by creating smaller, reusable content components.
Text is of special importance for Sophie as Sophie is software for creatingbooks. In addition to most of the text styling features authors have come toexpect in rich text editors, Sophie provides dynamic text flow. Text wrapsaround other shapes in the document (images, videos, and other text areas,for instance) and is flowed into a sequence of independent rectangular shapescalled a text chain. Manual chaining of text blocks allows authors to buildvarious types of standard layouts like the simple book layout, or the multi-column layout with images that is the standard for newspapers. Turning theautomatic chaining option on makes Sophie automatically generate newpages whenever typed or pasted text exceeds the limits of the manuallycreated text chain.

Sophie 2.0 - a platform for reading and writing of interactive multimedia books in anetworked environment
439
Figure 1: Halo buttons and HUDs conceptualize available settings and tools
Supporting a wide variety of asset formats is a significant advantage;however, in most software tools, this often leads to bloating of the userinterface. Many different asset types usually mean many different tools andproperties, accessible through many different palettes, dialog boxes, andinspectors. Sophie addresses these challenges by proposing an innovativeuniversal approach to the user interface for manipulating any content type.Sophie introduces halo buttons and HUDs (Head-up Displays) whichcontextualize the access to available operations over the specific assets.
4. Dynamic Features for Sophie Content
Content displayed on a computer not only allows incorporation of predefineddynamic behavior (such as effects, transitions, and time-based behavior), butalso enables interactivity. Sophie's timeline feature allows authors tosynchronize dynamically changing properties of page elements in a Sophiebook with time. Effects such as "start the video at the n-th second, while at thesame time making the page title turn white" are achieved by simply clickingthe desired moment on the timeline and setting the attributes of the elements

Sophie 2.0 - a platform for reading and writing of interactive multimedia books in anetworked environment
440
to be changed. Further, the time line allows synchronization of audio, video,images, and transcripts through the same intuitive interface.
Sophie provides a set of triggers that fire when a certain event occurswithin page elements, when an element is clicked, for example. Authors canassociate triggers with an action from a predefined set, such as hide or showan asset, play or stop a video. Advanced links can be built by definingdynamic behavior of content elements to be triggered by user input. Possibleactions include changing the current page to any other page, which makespossible the implementation of non linear reading.
Sophie's scripting system lets authors write JavaScript code that accessesthe Book's DOM model to implement complex interactivity or batchoperations.
5. Publishing with Sophie
No matter how impressive the content itself is, publishing and distribution ofinteractive, rich media content is commonly problematic to authors. Electroniccontent is, for example, often published on web sites in PDF format.
Sophie 2.0 consists of three building blocks - the Sophie Author, the SophieReader and the Sophie Server. Sophie Author seamlessly connects to SophieServer, allowing authors to publish their books on the Server with a singleclick. Books become accessible to readers through the Sophie Server's webinterface. Readers read books using Sophie Reader. Sophie Reader is capableof running in a web page (as an applet), which allows Readers to read withoutinstalling any software on their computers and authors to integrate Sophiebooks into web pages. Additionally, Sophie Server supports the full history ofbook editions.
Sophie introduces the concept of 'book extras', additions to the main bookcontent. An example of a book extra is the use of Sophie annotations thatallow authors and readers to create additional notes to book sections,paragraphs, or individual assets. The novel aspect of Sophie's book extras isthat they can be distributed separately from the book. In this way there maybe several differing sets of book annotations made available to different targetgroups of readers.

Sophie 2.0 - a platform for reading and writing of interactive multimedia books in anetworked environment
441
6. Collaboration and Feedback
Sophie Server provides real time collaboration features for authors connectedto the server. If multiple authors are connected to Sophie Server and workingon the same book, changes made by any author are reflected to the localcopies of all other authors. Authors will also be able to work offline, without aconnection to Sophie Server, and their work will be automatically integratedwith the work of others when a connection becomes available.
Through the use of a Sophie Feature called “comment frames”, authors arecapable of requesting live feedback from readers. When reading a book,readers are able to input their comments or suggestions in the commentframes making their input available to other readers and the author in realtime. Comment frames can be associated with specific book segments, whichallow focusing on gathered feedback on specific parts of the book.
7. Sophie as a Platform
In addition to being open source, Sophie 2.0 is being developed withextensibility in mind. Java is chosen for implementing most of Sophie 2.0because of its high popularity and rich availability of tools. Sophie 2.0 runs onJava SE 5 and higher. Modularization support is built on top of OSGi. Each ofthe products (Author, Reader, and Server) is implemented as subsets of themodules of the platform. Extension points for additional content types,additional user interface elements, and others are defined to allow extrafeatures to be added without the need of modifying the existing source code.Third party module developers can take advantage of the underlyingimplementations for resources, text layout, graphic scenes, collaboration andother fundamental Sophie libraries. The file formats are open, documentedand XML based. The source code is documented and follows strictconventions.
8. Applications and target users
Sophie 2.0 has been developed by academics and focused at academia. Sophieis being evaluated by professors creating content to be used for their classesand other academic activities. However, the broad set of capabilities Sophieprovides opens it to various other target groups, such as self publishingauthors, traditional publishers, artists, designers, and others. Sophie is under

Sophie 2.0 - a platform for reading and writing of interactive multimedia books in anetworked environment
442
continuous development, and new features and improvements are beingintroduced that enhance Sophie's publishing capabilities as well as its contentauthoring features.
Acknowledgments
Sophie 2.0 is a project developed by the University of Southern California'sSchool of Multimedia Literacy and Astea Solutions AD of Sofia, Bulgaria,under a grant from The Andrew W. Mellon Foundation. Sophie 2.0 isdistributed under the Educational Community License (ECL). The project is acontinuation of the work on Sophie 1.0, initiated in 2006 by Robert Stein,founder of the Institute for the Future of the Book. Software development hasbeen done in close collaboration with the Laboratory of InteractiveMultimedia at the Faculty of Mathematics and Informatics of SofiaUniversity.
This report is supported by the SmartBook project, subsidized by theBulgarian National Science Fund, under Grant D002-111/15.12.2008 and theEC FP7 SISTER Project, Grant Agreement Number 205030.
Notes and References
[1] WIKIPEDIA. Comparison of e-book formats. Available athttp://en.wikipedia.org/wiki/Comparison_of_e-book_formats
[2] WIKIPEDIA. Multimedia. Available at.http://en.wikipedia.org/wiki/Multimedia
[3] NEW MEDIA CONSORTINUM AND THE EDUCAUSE LEARNING INTIATIVE. The 2010 Horizon Report. Available at
http://wp.nmc.org/horizon2010/ [4] ADOBE LABS. The Text Layout Framework. Available at
http://labs.adobe.com/technologies/textlayout/ [5] W3C. HTML 5 reference. Available at http://dev.w3.org/html5/html-
author/

443
E-books: Finally there?
Jan Engelen
Katholieke Universiteit Leuven, ESAT-SCDocarchKasteelpark Arenberg 10 box 2442, B-3001 Leuven (Belgium)
AbstractWidespread distribution of electronic book readers, commonly called “e-readers” seems to have taken off seriously over the last year. Although thefirst e-readers popped up almost twenty years ago, last year’s marketappearance of a completely reworked Amazon Kindle 2, a new series of SonyPRS readers and several Bookeen & Cybook devices made e-books quitepopular. All of them can store thousands of books, are extremely light weightand very mince. However, many of them present problems for persons withlow vision or blindness. We will discuss briefly the situation and possiblesolutions.
Keywords: electronic books, e-books, Kindle, print impaired persons
1. Introduction
One of the major recent e-book reader improvements is linked to the displaytechnology: so called e-ink pages [1] are using battery power only during atext change; in between, their consumption is almost nil. Battery life for thesedevices now routinely extends to one or two weeks. However, e-ink screensdo not produce light: one needs ambient lighting on the screen to see the text.
E-books (as opposed to e-book readers) have yet to gain globaldistribution. Amazon provides a huge amount of e-books, but only in theirown (Kindle) format and up to now only in English. Publishers in otherlanguages often prefer the more open ePub format (e.g. BE & NL).
Furthermore, not all authors have endorsed the concept of electronicpublishing. J.K Rowling, author of the Harry Potter series, has stated thatthere will be no e-versions of her books . . . [2]
E-books can easily be obtained from many internet bookstores. Twobottlenecks do remain, however: their price (still often at almost the same

E-books: finally there?
444
level as printed copies) and a copyright protection mechanism that hinderschanging the electronic format of a book (e.g. when a person buys anotherbrand of e-reader, previously bought e-books become unusable).
E-books and audiobooks have been discussed at previous ELPUBconferences [3]. Therefore this contribution focuses on recent developmentsonly.
The International Digital Publishing Forum (IDPF) providesimpressive statistics on the booming US e-book industry (cf. Fig. 1). [4]
Figure 1. US book industry (2002-2009)
2. E-book formats
Current e-books are made to several different standards with their ownadvantages and disadvantages, which will briefly be described below.
Besides popular formats such as HTML, RTF and PDF that can beread by all e-book readers, following major e-book standards are commonlyused [5]:
Amazon Kindle has his own format, loosely based on an older FrenchMobipocket formatSony uses the ePub format (Open standard for e-books)the Cybooks use an Adobe protected PDF format
Except for public domain books an encryption feature (Digital rightsmanagement) is used on all e-books.

E-books: finally there?
445
3. E-book distribution
Evidently most e-books simply can be downloaded from the Internet.As Internet was not yet routinely available when travelling (and
therefore buying books on the move was not possible), Amazon decided todistribute the Kindle books through Whispernet which is based on mobilenetwork technology (3G, EDGE…). The cost of the data connection is coveredby Amazon (and constitutes part of the e-book price). Up till last year it wasimpossible to download books within Europe where Amazon’s Whispernetwas not available. Since then agreements with EU mobile providers have beenmade.
4. Using e-book readers as audiobook or talking bookdevices
Starting with the Kindle-2 [6] in 2009 a text-to-speech module has beenincorporated in an e-reader device. This feature permitted to listen to the textand was very much appreciated by print impaired persons (persons with lowvision, blindness, dyslexia or a severe motor handicap). Unfortunately thispossibility was turned off soon after by Amazon unless the author hadexplicitly agreed with it or if public domain books (=old) are read. In practicethe ban on text-to-speech output was almost general.
This led to several US cases in court (e.g. National Federation of the Blindvs the Arizona State University that planned to provide university coursematerial in Kindle format only).
Another bottleneck is commanding the e-reader itself. Up to now noauditive feedback was produced when choosing commands on the device.But at the end of 2010 a new Kindle will become available in which the speechoutput can be used for accessing the menu functions and an extra large fontwill be added so that the device is more usable for persons with low vision.However nothing apparently will change for the text-to-speech locking formost books…
5. Daisy format e-books (and audio-books)
For use within the community of print impaired persons an e-book andaudiobook standard has been developed almost 15 years ago. The Daisy

E-books: finally there?
446
format not only links the text to the audio version of the same book butpermits also an extensive tree-like navigation through the document. Thisresults in easy jumping to parts of the book, including up to the sixth level ina table of contents. Furthermore Daisy permits to produce several kinds of e-books such as text-only, audio-only, text & audio, text & images etc [7]..
Daisy is promoted by the Daisy consortium and their standards arenowadays recognised by international bodies [8].
Daisy books technically consist of a collection of computer files thatcan be stored on a CD (very popular as it can be read with a portable CDplayer) but also on any other computer medium including SD-cards (popularfor pocket size readers) and simply via the internet.
Despite a decennium of efforts the Daisy standard is still not in useoutside the field of print impaired users. To make it more popular severalopen-source software solutions have been developed. So it is possible toproduce a Daisy talking book directly from within Microsoft Word [9]. Withinthe European Aegis project three add-ons for OpenOffice.org (file extension:*.odt) have been developed at K.U.Leuven [10]:
an odt to Daisy convertoran odt to Daisy talking book convertoran odt to Braille convertor – still under development
The Daisy Consortium itself focuses onDAISY Online Delivery Protocol: this is basically a definition ofSOAP messages permitting easy web-based content provision [11]Daisy version 4.0: this standard will permit an easier transfer of e-books and talking books to the ePub format (mentioned in section 2)copyright protection for Daisy books.Up to now such protection was deemed unnecessary as specialequipment or software was needed to read a Daisy book.
6. Conclusions
It can be stated that the market of e-books and e-readers finally has taken off.Although the phenomenon in general terms still remains a byproduct ofstandard and traditional book publishing, new applications e.g. for printimpaired persons seem to be growing. But a tough copyright hurdle is still tobe taken before e-books routinely also will become audio or talking books.

E-books: finally there?
447
Acknowledgements
The author would like to acknowledge the help of the Aegis and Kamelegoprojects in preparing this contribution. Furthermore the support of the Kath.Univ. Leuven is highly appreciated.
Notes and References
[1] Details at: http://en.wikipedia.org/wiki/E_Ink[2] This statement is based on fear for piracy. Ironically enough, all Harry
Potter books have been turned (illegally) into e-books within hours ofthe release of the printed version. More on:http://www.bradsreader.com/2009/01/jk-rowling-harry-potter-ebooks-and-the-definition-of-irony/
[3] ENGELEN, J. Marketing Issues related to Commercial and SpecialisedAudiobooks, including Digital Daily Newspapers, ELPUB2009.Rethinking Electronic Publishing: Innovation in Communication Paradigmsand Technologies - Proceedings of the 13th International Conference onElectronic Publishing held in Milano, Italy 10-12 June 2009 / Edited by:Susanna Mornati and Turid Hedlund. ISBN 978-88-6134-326-6, 2009, pp.621-624; ENGELEN, J. A Rapidly Growing Electronic Publishing Trend:Audiobooks for Leisure and Education, (Electronic Publishingconference - ELPUB-2008, Toronto, June 26-27, 2008), published in OpenScholarship: Authority, Community and Sustainability in the Age of Web 2.0,Edited by Leslie Chan & Susana Mornati, ISBN 978-0-7727-6315-0.Both papers are available electronically from elpub.scix.net.
[4] More trend figures and numbers can be found at:http://www.idpf.org/doc_library/industrystats.htm
[5] http://en.wikipedia.org/wiki/Comparison_of_e-book_formats[6] Details at: http://en.wikipedia.org/wiki/Amazon_Kindle[7] http://www.daisy.org/daisy-technology[8] Daisy 3.0 is in fact an ANSI standard, "ANSI/NISO Z39.86 Specifications
for the Digital Talking Book"[9] Details on: http://www.daisy.org/project/save-as-daisy-microsoft[10] Details on: http://www.daisy.org/project/save-as-daisy-openoffice.org[11] Details on: http://www.daisy.org/projects/daisy-online-
delivery/drafts/20100402/do-spec-20100402.html