Public investment, the Stability Pact and the ‘golden rule
23
Fiscal Studies (2000) vol. 21, no. 2, pp. 207–229 © Institute for Fiscal Studies, 2000 Public Investment, the Stability Pact and the ‘Golden Rule’ FABRIZIO BALASSONE and DANIELE FRANCO * Abstract The fiscal rules set in the Treaty of Maastricht and in the Stability and Growth Pact have sometimes been criticised as an excessively binding constraint for appropriate counter-cyclical action. The risk that the rules may permanently reduce the public sector’s contribution to capital accumulation has also been pointed out. In this framework, the adoption of a ‘golden rule’ has been suggested. Starting from the recent debate, this paper tackles two questions: (a) the implications of the Pact for public investment and (b) the pros and cons of introducing a golden rule in EMU’s fiscal framework, given the objectives of low public debts and adequate margins for a stabilising budgetary policy. The analysis suggests that the rules set in the Treaty and in the Pact may negatively influence public investment spending. However, the golden rule, although intuitively appealing, does not seem to be an appropriate solution to the problem. JEL classification: H54, H6, E61. I. INTRODUCTION The slowdown in growth in 1998 and its possible implications for the level of unemployment raised worries and doubts concerning the fiscal rules set in the Treaty of Maastricht and in the Stability and Growth Pact. It has been argued that these rules may represent an excessively binding constraint for appropriate counter-cyclical action and that the attempt to reach rapidly a budget position ‘close to balance or in surplus’ may worsen the slowdown. The risk that the rules * Research Department, Banca d’Italia. The views expressed in this paper are those of the authors and do not commit the Banca d’Italia. The authors wish to thank Marc Robinson and two anonymous referees for helpful comments and for suggesting improvements. All remaining mistakes are their own.
-
Upload
independent -
Category
Documents
-
view
1 -
download
0
Transcript of Public investment, the Stability Pact and the ‘golden rule

Fiscal Studies (2000) vol. 21, no. 2, pp. 207–229
© Institute for Fiscal Studies, 2000
Public Investment, the Stability Pactand the ‘Golden Rule’
FABRIZIO BALASSONE and DANIELE FRANCO*
Abstract
The fiscal rules set in the Treaty of Maastricht and in the Stability and Growth Pact have sometimesbeen criticised as an excessively binding constraint for appropriate counter-cyclical action. The riskthat the rules may permanently reduce the public sector’s contribution to capital accumulation hasalso been pointed out. In this framework, the adoption of a ‘golden rule’ has been suggested.Starting from the recent debate, this paper tackles two questions: (a) the implications of the Pact forpublic investment and (b) the pros and cons of introducing a golden rule in EMU’s fiscalframework, given the objectives of low public debts and adequate margins for a stabilisingbudgetary policy. The analysis suggests that the rules set in the Treaty and in the Pact maynegatively influence public investment spending. However, the golden rule, although intuitivelyappealing, does not seem to be an appropriate solution to the problem.
JEL classification: H54, H6, E61.
I. INTRODUCTION
The slowdown in growth in 1998 and its possible implications for the level ofunemployment raised worries and doubts concerning the fiscal rules set in theTreaty of Maastricht and in the Stability and Growth Pact. It has been arguedthat these rules may represent an excessively binding constraint for appropriatecounter-cyclical action and that the attempt to reach rapidly a budget position‘close to balance or in surplus’ may worsen the slowdown. The risk that the rules
*Research Department, Banca d’Italia.The views expressed in this paper are those of the authors and do not commit the Banca d’Italia. The authorswish to thank Marc Robinson and two anonymous referees for helpful comments and for suggestingimprovements. All remaining mistakes are their own.

Fiscal Studies
208
may permanently reduce the public sector’s contribution to capital accumulationhas also been pointed out.
In this framework, the adoption of a ‘golden rule’ has been suggested. Therule would exclude investment spending from the computation of the fiscalparameters relevant to the Excessive Deficits Procedure.1 In the opinion of thosesupporting the amendment, this would allow EU Member States to loosen theirfiscal stance while positively affecting long-run growth: debt finance would thusnot harm future generations.
Underlying the debate, there are several issues. It is important to separateproblems concerning the current economic situation from those concerning thedesign of the EMU’s fiscal constitution per se. The solution to the potentialconflict between the objective of moving towards a close-to-balance position andthe need to avoid a worsening of short-term economic prospects may not requirechanges to the rules set in the Treaty and in the Pact. Furthermore, the risk that arevision of the rules could harm the credibility of the commitment to fiscalsustainability, which in turn may prevent the adoption of the appropriate policymix, must be taken into account.
Also, the need to allow more room for counter-cyclical budgetary action andthe need to increase public investment should be dealt with separately. As to thepublic sector’s contribution to capital accumulation, one cannot simply assumethat an increase in public investment spending is always superior to a cut intaxes, an increase in outlays for human capital formation or a reduction in thedeficit.
Finally, it is necessary to evaluate whether the golden rule is consistent withthe objectives underlying present European fiscal rules.2 These rules aim toreduce the risk that unbalanced budgets in some Member States may harm othermembers of the Union, and even endanger EMU, through financial instabilityand inflationary pressures. The rules also aim to allow countries to adopt theappropriate policy mix when dealing with both symmetric and asymmetricshocks. The reduction of deficits and debts, necessary for reaching bothobjectives, may find an obstacle in the golden rule, depending on the way therule is implemented.
Starting from the recent debate, this paper tackles two issues: (a) theimplications of the Pact for public investment and (b) the pros and cons ofintroducing a golden rule in EMU’s fiscal framework, given the objectives oflow public debts and adequate margins for stabilisation policy. The analysissuggests that the rules set in the Treaty and in the Pact may negatively influence 1This point of view is taken by Modigliani et al. (1998). Opinions in favour of some kind of golden rule havealso been expressed by European Commissioner Mario Monti. It should be noted that, when defining an‘excessive deficit’, the Treaty does not discriminate between current and capital outlays; however, it providesfor the Commission’s Report on Excessive Deficits to take into account a list of relevant factors and, amongthose, ‘whether government deficit exceeds government investment expenditure’ (article 104c(3)).2See, for example, European Commission (1997).

Public Investment, the Stability Pact and the ‘Golden Rule’
209
public investment. However, the golden rule, although intuitively appealing,does not seem to be an appropriate solution to the problem.
The paper is organised as follows. Section II examines the implications of abalanced budget for public investment both in the long run, when the debtreaches the new equilibrium level, and during the transition towards suchequilibrium. Section III reviews the empirical evidence on the link between fiscalconsolidations and reductions in public investment. Section IV reviews theliterature on the effects of public investment on growth in order to assess thepossible consequences of a reduction in investment spending. Section Vhighlights the difficulty in reconciling different specifications of the golden rulewith EMU’s fiscal framework. Section VI summarises the main conclusions.
II. THE STABILITY AND GROWTH PACTAND PUBLIC INVESTMENT
The achievement of budget positions ‘close to balance or in surplus’ implies thatmost capital expenditure will have to be funded from current revenues. Hence itwill no longer be possible to spread the cost of an investment project over all thegenerations of taxpayers who benefit from it. This has two main implicationswhich are analysed below:
• there is a disincentive to undertake large projects producing deferred benefitsand entailing a significant gap between current revenues and currentexpenditures;
• the disincentive will be stronger while the deficit is being reduced:3 theabove-mentioned gap will grow if the flow of investment stays unchanged;the gap will remain larger than the initial level until the decline in interestexpenditure induced by the reduction of the debt equals the decline in thedeficit.
Concerning the first consequence, in Balassone and Franco (1999), we showhow the introduction of a deficit ceiling can imply a reduction in investment in atwo-period model where a policymaker with a finite horizon maximisesdisposable income and the latter is positively affected by investment with a lag.The finite horizon suggests a political economy interpretation of the result.Without a ceiling, the policymaker, who cares about economic performance onlywhen he or she is in power, can run deficits and invest in the first period withoutreducing disposable income. With a ceiling, investment will reduce disposableincome in the first period, and the policymaker invests less. 3The idea that investment is reduced more than other items during fiscal consolidations is largely shared in theliterature. For example, Oxley and Martin (1991) point to ‘the political reality that it is easier to cut back orpostpone investment spending than it is to cut current expenditure’ (p. 161); De Haan, Sturm and Sikken(1996) argue that investment ‘[is] the least rigid component of expenditure’ (p. 108).

Fiscal Studies
210
However, the introduction of a ceiling implies a reduction of investment alsoin the case of a benevolent planner aiming to maximise social welfare. In Barro(1979), given an expenditure profile, the efficiency loss caused by distortionarytaxation is minimised if the tax rate is constant (tax-smoothing). If a budgetconstraint is introduced, indivisible investment projects may have welfare costs(the tax profile is no longer smooth); if the expenditure profile is not given, thesecosts may induce a reduction in investment.
Finally, since investments produce deferred benefits, the means of financingthem (tax rather than debt) also affect intergenerational equity. Tax financingimplies a welfare loss for the current generation and favours future ones: theformer fully pays for a project whose benefits will partly accrue to the latter.When a budget constraint is introduced, it is then possible that voters will prefera reduction in capital expenditure to an increase in taxes or a reduction in currentoutlays (from which they fully benefit).
The disincentive would mainly apply to projects with very uneven costdistributions. With a homogeneous expenditure flow, the difference between taxand debt financing is limited:4 only those generations living when the earliestprojects are undertaken suffer a loss under tax finance; future generations willhave to pay more or less the same, be it to finance interest on past debt (whilenew projects are financed via new debts) or to finance new projects (while pastones have already been paid for by past generations).
The transition to a lower deficit level is equivalent to an expenditure peak. Ifthe flow of investment is unchanged, current generations will have to pay part ofthe new projects (the whole if the budget is balanced) while also paying intereston debts: taxes will have to be raised or current expenditures cut. For thesegenerations, the transition would be less burdensome if the level of investment(producing deferred benefits) were reduced, so that a smaller tax increase (orcurrent outlays reduction) would be needed.5
The problem can easily be seen with reference to the budget constraint:
(1) T + B = G = Cp + I(D) + K ⇒ T – Cp = K + I(D) – B
where T is taxes, B the deficit, G overall outlays (made up by interest I, othercurrent outlays Cp and investment K). The burden for current generations is 4Let us express all variables in real terms and assume that the deficit is equal to investment expenditure (I) andconstant as a ratio to GDP (Y): It/Yt = it = i ∀ t. If i is such that the debt (D) to GDP ratio converges (i.e. if i ={g/(1+g)}d, where d = dt = Dt/Yt ∀ t and g is the growth rate of GDP), then since taxes (T) must equal interestoutlays (rDt–1, where r is the interest rate) plus primary current expenditure (C), we have Tt/Yt = rDt–1/Yt + Ct/Yt= rDt–1/{(1+g)Yt–1} + Ct/Yt = {r/(1+g)}d + ct ∀ t, where ct = Ct/Yt. If the same level of i were to be financed bytaxes, we would have Tt/Yt = i + ct = {g/(1+g)}d + ct. The difference between the two cases once the debt ratiois stable would then be negligible if r ≅ g (i.e. if the real interest rate were close to the real GDP growth).5See Kitterer (1994) for an analysis based on an overlapping-generations general-equilibrium model. TheCentral Planning Bureau of the Netherlands estimates that the shift from deficit to tax finance would entail awelfare loss for current generations equal to 34 per cent of GDP (van Ewijk, 1997).

Public Investment, the Stability Pact and the ‘Golden Rule’
211
T–Cp, since they give up resources (T) in excess of the transfers and services thatthey receive (Cp). This burden is compensated by the flow of services producedby investment projects that were undertaken in the past and financed by deficit.The burden is a positive function of interest payments (and hence of past debt,D) and of present investment spending; it is reduced by the deficit, so that thetransition to a lower deficit implies an increase in the burden, which is higher thehigher are K and D; ceteris paribus, it will be higher in those countries wheredeficit finance has also been used to pay for current expenditures.
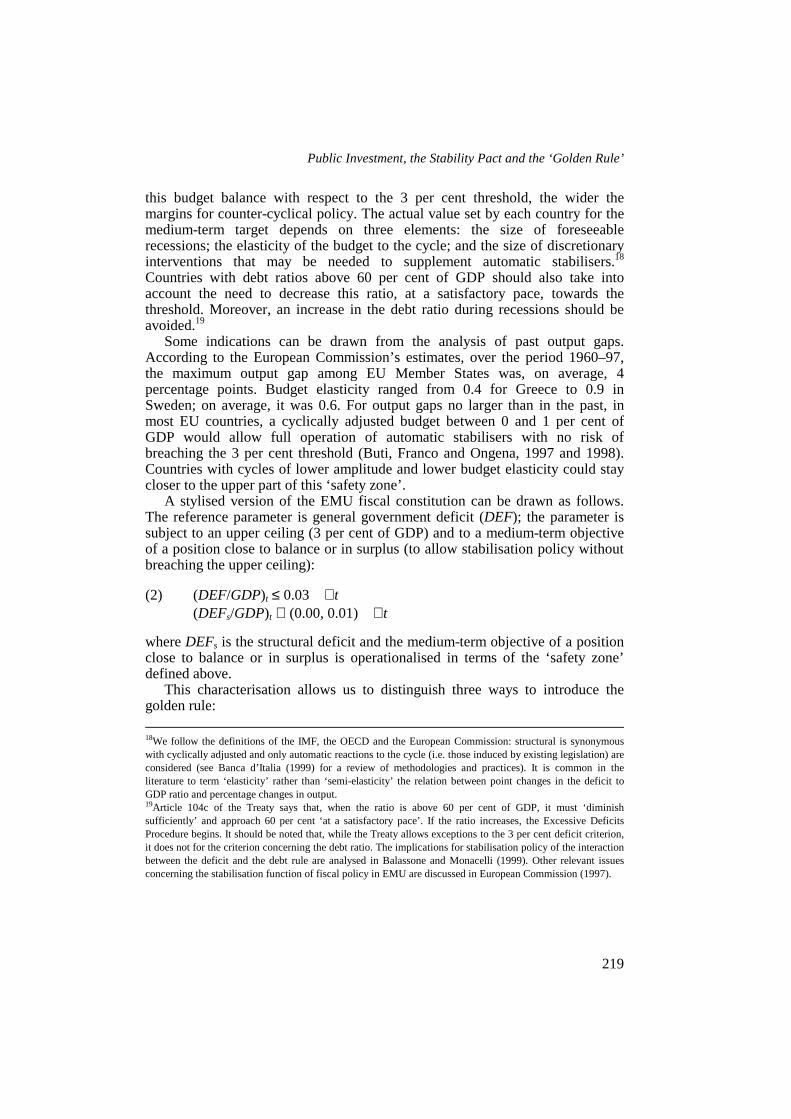
The double burden issue is exemplified in Figure 1, which is drawn assumingboth nominal GDP growth rate and nominal interest rate at 5 per cent, and aninitial debt to GDP ratio at 60 per cent of GDP. The initial deficit ratio is 3 percent of GDP; thereafter, a balanced budget is attained. Three phases can beidentified:
1. The first, labelled ‘steady state before the Pact’, is a situation in which theoverall deficit is constant at 3 per cent of GDP; this implies a balancedprimary budget and a constant debt to GDP ratio. The primary balance isassumed to result from a 40 per cent revenue to GDP ratio, a 37 per centcurrent primary expenditure ratio and a 3 per cent capital expenditure ratio.There is a 3 per cent of GDP gap between revenues and current primaryexpenditures (the light-shaded area), which is assumed to be balanced by theflow of services produced by past public investments.
FIGURE 1The Burden of Transition
60
0
40
37
03
Phase I:steady state
before the Pact
Deficit
Current primary outlays
Phase II:transition
Phase III:steady stateafter the Pact
Interest
Total revenue
Debt
Investment
Per
cen
tP
er c
ent

Fiscal Studies
212
2. The second phase (‘transition’) opens with the abrupt reduction of the deficitto zero. This is obtained via an increase of 3 percentage points of GDP in therevenue ratio (a reduction in current primary outlays would have the sameeffect6). The gap between revenues and current primary outlays doubles. Asthe debt ratio gradually declines, so do interest expenditures, and the revenueratio can slowly move back to 40 per cent. The additional burden induced bythe reduction of the deficit during the transition phase corresponds to thedark-shaded triangle.
3. The third phase (‘steady state after the Pact’) begins when the debt ratio andinterest expenditures are nil. The gap between revenues and current primaryoutlays is again at 3 per cent, balanced again by the flow of services producedby past investments.
The problems involved in the transition from deficit to tax financing of publicinvestment are similar to those involved in the transition from a pay-as-you-go toa funded pension scheme.7 In both cases, the burden on current generationsdepends on the speed of the transition and on the stock of debt. In countrieswhere a shift to funded schemes is under way, the burdens determined by the twotransitions will be summed.
III. FISCAL CONSOLIDATION AND INVESTMENT REDUCTION:THE EMPIRICAL EVIDENCE
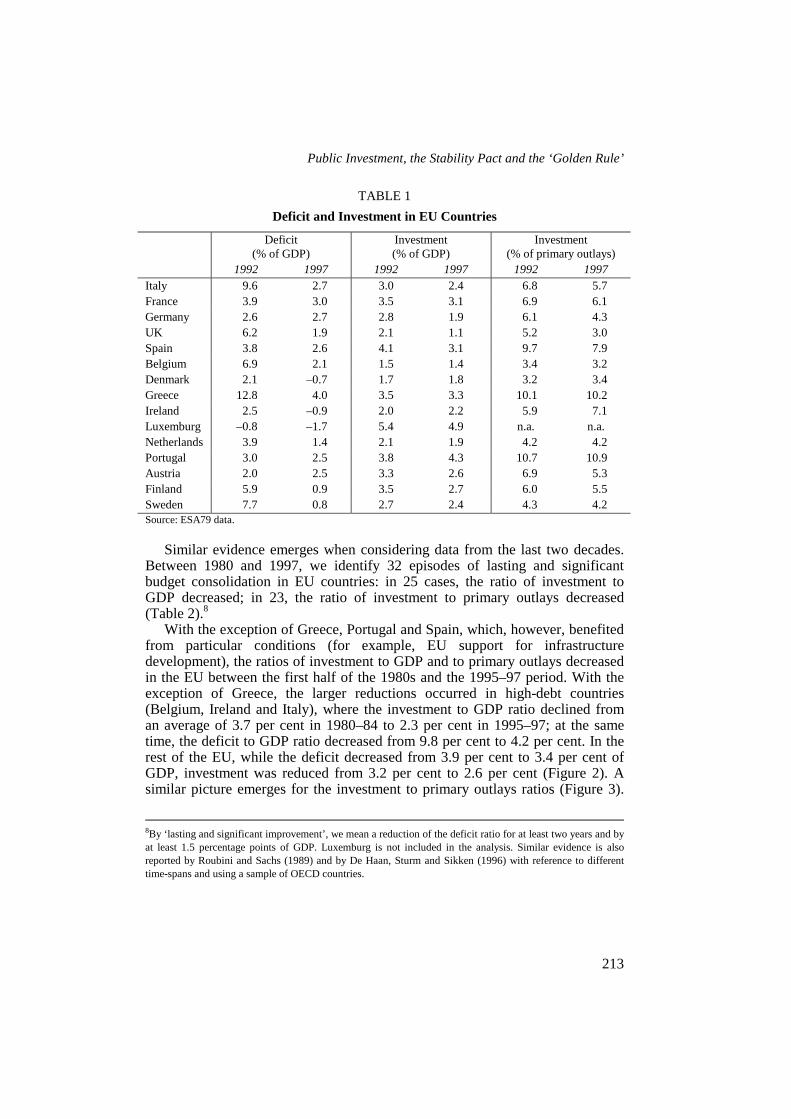
The link between fiscal consolidation and cuts in capital spending is confirmedby the experience of EU countries. In 1992, the year of the Treaty, the deficitratio exceeded 3 per cent in nine countries. In 1997, for all these countries butGreece the ratio was at or below the threshold; all had reduced the investment toGDP ratio; all but Greece and the Netherlands had lowered the investment toprimary outlays ratio (Table 1). Over the same period, investment ratiosincreased in three of the six countries that met the deficit criterion in 1992.
In some countries, the reduction of investment may reflect the privatisationprocess or changes in the classification of public utilities and other units (fromgeneral government to the private sector); for Austria, the latter factor accountsfor half of the reduction between 1993 and 1997. In the UK, the use of ‘publicfinance initiatives’ (involving private capital in the realisation of projects ofpublic interest) may explain about one-third of the reduction in publicinvestment expenditure between 1993 and 1997. The contribution from sales ofpublic real estate, which are recorded as negative investment outlays by generalgovernment, appears less relevant.
6If capital expenditures were reduced, the burden of transition would be shifted on to future generations whowould suffer from the lower accumulated stock of public capital.7Budgetary problems involved in this second transition are analysed in Holzmann (1997).
Public Investment, the Stability Pact and the ‘Golden Rule’
213
TABLE 1Deficit and Investment in EU Countries
Deficit(% of GDP)
Investment(% of GDP)
Investment(% of primary outlays)
1992 1997 1992 1997 1992 1997Italy 9.6 2.7 3.0 2.4 6.8 5.7France 3.9 3.0 3.5 3.1 6.9 6.1Germany 2.6 2.7 2.8 1.9 6.1 4.3UK 6.2 1.9 2.1 1.1 5.2 3.0Spain 3.8 2.6 4.1 3.1 9.7 7.9Belgium 6.9 2.1 1.5 1.4 3.4 3.2Denmark 2.1 –0.7 1.7 1.8 3.2 3.4Greece 12.8 4.0 3.5 3.3 10.1 10.2Ireland 2.5 –0.9 2.0 2.2 5.9 7.1Luxemburg –0.8 –1.7 5.4 4.9 n.a. n.a.Netherlands 3.9 1.4 2.1 1.9 4.2 4.2Portugal 3.0 2.5 3.8 4.3 10.7 10.9Austria 2.0 2.5 3.3 2.6 6.9 5.3Finland 5.9 0.9 3.5 2.7 6.0 5.5Sweden 7.7 0.8 2.7 2.4 4.3 4.2Source: ESA79 data.
Similar evidence emerges when considering data from the last two decades.Between 1980 and 1997, we identify 32 episodes of lasting and significantbudget consolidation in EU countries: in 25 cases, the ratio of investment toGDP decreased; in 23, the ratio of investment to primary outlays decreased(Table 2).8
With the exception of Greece, Portugal and Spain, which, however, benefitedfrom particular conditions (for example, EU support for infrastructuredevelopment), the ratios of investment to GDP and to primary outlays decreasedin the EU between the first half of the 1980s and the 1995–97 period. With theexception of Greece, the larger reductions occurred in high-debt countries(Belgium, Ireland and Italy), where the investment to GDP ratio declined froman average of 3.7 per cent in 1980–84 to 2.3 per cent in 1995–97; at the sametime, the deficit to GDP ratio decreased from 9.8 per cent to 4.2 per cent. In therest of the EU, while the deficit decreased from 3.9 per cent to 3.4 per cent ofGDP, investment was reduced from 3.2 per cent to 2.6 per cent (Figure 2). Asimilar picture emerges for the investment to primary outlays ratios (Figure 3).
8By ‘lasting and significant improvement’, we mean a reduction of the deficit ratio for at least two years and byat least 1.5 percentage points of GDP. Luxemburg is not included in the analysis. Similar evidence is alsoreported by Roubini and Sachs (1989) and by De Haan, Sturm and Sikken (1996) with reference to differenttime-spans and using a sample of OECD countries.

Fiscal Studies
214
The growth of deficit and investment in low-debt countries in the first half of the1990s may reflect expansionary policies implemented in response to a cyclicaldownswing: this opportunity was not available to countries where fiscalconsolidation was still under way. During the 1990s, the investment to GDP ratiowas significantly lower in high-debt countries than in low-debt countries.
TABLE 2Deficit Reduction and Changes in Investment in EU Countries, 1980–97
Period Deficitimprovement
Change in ratioof investment to
GDP
Change in ratioof investment toprimary outlays
Italy 1985–891990–97
2.58.4
–0.4–0.9
–0.9–1.7
France 1985–891994–97
1.72.8
0.2–0.1
0.8–0.1
Germany 1981–85 2.5 –0.6 –1.4UK 1984–89
1993–974.96.0
–0.3–0.8
0.0–1.7
Spain 1985–871995–97
3.84.7
–0.3–0.7
–0.4–1.2
Belgium 1983–851986–901993–97
2.63.75.0
–0.8–1.0–0.2
–1.2–1.7–0.4
Denmark 1982–861994–97
12.53.5
–0.80.0
–1.70.3
Greece 1985–871995–97
2.06.3
–1.00.0
–2.40.7
Ireland 1982–841985–891995–97
3.88.93.1
–1.2–2.0
0.0
–2.4–3.5
0.4Netherlands 1982–85
1995–973.02.6
–0.6–0.1
–0.80.0
Portugal 1985–891993–97
4.13.6
0.60.3
1.80.3
Austria 1983–851987–901995–97
1.51.82.7
–0.2–0.2–0.2
–0.6–0.1–0.2
Finland 1983–861987–891993–97
2.45.37.1
–0.5–0.7–0.1
–1.6–1.1
0.6Sweden 1982–84
1985–871993–97
4.18.0
11.4
–0.5–0.5
1.3
–1.0–0.1–0.9
Source: ESA79 data.

Public Investment, the Stability Pact and the ‘Golden Rule’
215
FIGURE 2Investment and Deficit as Percentages of GDP: EU Countries
12
8
4
0
Investment(% of GDP)
Def
icit
(% o
f GD
P)
3.83.63.43.23.02.82.62.42.22.0
1980–841990–94
1995–97
1985–89
1995–97
1990–94
1985–89
1980–84
Average, high-debt countries (Belgium, Greece, Ireland and Italy)
Average, other EU countries
Source: ESA79 data.FIGURE 3
Deficit as a Percentage of GDP and Investment as a Percentage of Primary Outlays:EU Countries
12
8
4
0
Investment(% of primary outlays)
Def
icit
(% o
f GD
P)
9.59.08.58.07.57.06.56.05.55.0
1980–841990–94
1995–97
1985–89
1995–97
1990–94
1985–891980–84
Average, high-debt countries (Belgium, Greece, Ireland and Italy)
Average, other EU countries
Source: ESA79 data.

Fiscal Studies
216
IV. THE EFFECTS OF A REDUCTION IN PUBLIC INVESTMENTEXPENDITURE
The reduction in public investment is a problem if, as implicitly assumed in theprevious sections, it reduces the productive and growth potential of the economy.However, the empirical evidence on the effects of public investment is notunequivocal.9
Various techniques have been used to measure the impact of public capital.Direct estimation of a production function dates back to Mera (1973) and Ratner(1983).10 Using this approach, Aschauer (1989) revived the debate. He foundthat non-military public capital is a significant input to a national productionfunction for the US and that the implied marginal product of public capital ishigh; he argued that the slowdown in public capital growth in the US during the1970s and 1980s explains the decline in productivity growth that occurred overthe same period. Aschauer’s work spurred a literature aimed at refining hismethod and results (see the reviews in Eberts (1990), Munnel (1992) andGramlich (1994)). Many studies initially confirmed (in sign if not in value)Aschauer’s results also using US state-level panel data. However, subsequentefforts have found that, when controlling for state fixed effects, the positiveinfrastructure–output link found in OLS and random effects models disappears(Holtz-Eakin, 1994; Garcia-Milà, McGuire and Porter, 1996; Kelejian andRobinson, 1997); similar results have been obtained by Evans and Karras (1994)using a panel of seven OECD countries.11
The statistical measurement of the effect of public capital on privateproduction encounters several problems: the causality direction is difficult toassess, there is potential endogeneity of inputs and outputs, time-series may not
9The implications of deficit financing of public investment also raise doubts from a theoretical point of view.Among the relevant issues, the possibility of crowding-out should be mentioned. A review of the theory isprovided by Dalamagas (1995).10Cost function estimations have also been used (see the references in Dalenberg, Partridge and Rickman(1998)). In Dalenberg et al. (1998), the analysis focuses on the relationship between public infrastructure andprivate employment using a labour demand function: ‘public highway capital is significantly related to stateemployment growth in all specifications’ (p. 46). Also, the effects of public investment on private investmenthave been investigated: Erenburg (1993) finds a significant positive relationship between the two variables atstate level for the US. Overall, the results are ambiguous.11The production function method is based on an aggregate production function where public capital (G) is afactor of production (Q) together with private capital (K) and labour (L):
Q = MFP × f(K,L,G)where MFP (multifactor productivity) is the residual after subtracting from the growth in total output the directcontributions from capital and labour. Subsequent to the specification of the function (usually a Cobb–Douglas) and of the error term (a typical structure for a panel would be εit = fi+gt+mit where f is a country-specific effect, g is a time-specific component and m is an identically and independently distributed error), aregression analysis is conducted to check whether the coefficient of G is positive and significant. The literatureshows that the results of the analysis are strongly dependent upon the assumptions concerning f and g;specifically, the presence of significant productivity effects from public capital seems to depend on thehypothesis that f = 0 ∀ i.

Public Investment, the Stability Pact and the ‘Golden Rule’
217
be stationary, the proper treatment of fixed and random effects is an unsettledissue, and the measurement of the stock of public capital or of the net addition tothe stock generated by the annual flow of public investment is often inadequate(see the review in Hurst (1994)).
To this effect, the Italian experience clearly indicates that the ratio ofinvestment to GDP is not a good indicator of variations in the stock of publiccapital: the Italian ratio has long been among the highest in western countrieswithout improving Italy’s relative position in terms of infrastructures.12 Besidesthe obvious issue of amortisation, the result may also reflect impropermanagement or any other source of inefficiency. Furthermore, a large part of theinfrastructures presumably affecting productivity and growth is not includedamong general government investment as the institutions responsible for suchinfrastructures are not part of general government (this is frequently the case forenergy, telecommunications and railways).
Hence, while there is a consensus that private sector production of goods andservices depends crucially upon an adequate infrastructure of roads, electricity,telecommunications, water and other similar facilities, the public investment toGDP ratio cannot be the sole indicator of year-to-year changes in the stock ofpublic capital.
The problem of efficiency of public investment is also stressed by Girard,Gruber and Hurst (1994 and 1995), who argue that ‘the different quality ofinvestment has played a significant role in the different economic growthexperiences of the EU, Japan and USA’ (1995, p. 731) and by Girard and Hurst(1994), who argue that a suboptimal public capital stock is consistent with a too-high rate of public capital accumulation, i.e. ‘that there is some maximum rate atwhich viable projects can be prepared’ (p. 53).13
V. WHICH ‘GOLDEN RULE’ FOR THE MONETARY UNION?
The usefulness of a dual budget has been long debated, since the 1930s, when adual budget was proposed in order to foster the acceptance of using public debtto finance investment. It is still an unsettled issue, which has been tackled indifferent ways in different countries and at different times.14 Sweden, forexample, introduced the dual budget in 1937 and suppressed it in 1980.
12Comparative analyses show that the stock of infrastructure in Italy is currently 10 per cent lower than the EUaverage; a similar gap was estimated for the mid-1980s. See, for example, Pontolillo (1998).13De la Fuente (1997), using a sample of OECD countries, finds that the elasticity of GDP with respect toinvestment expenditure decreases rapidly as outlays increase and can even assume negative values as aconsequence of distortions and crowding-out induced by public intervention.14Proposals to exclude capital outlays from the operating budget and to include depreciation of governmentcapital stock date back at least to Musgrave (1939). The issue is reviewed, for example, in Goode andBirnbaum (1955), Steve (1972), Premchand (1983), Poterba (1995) and Robinson (1998 and 1999).

Fiscal Studies
218
The separation of current and capital operations is attractive in variousrespects. One of its main advantages is the possibility of spreading the costs ofdurables over the years during which they will be used. However, it has beennoted that it is necessary to be careful about which expenditures should beincluded in the capital account, otherwise the dual budget would result ‘... in apreference for expenditures on physical assets rather than greater spending forintangibles such as health or education’ (Colm and Wagner, 1963, p. 125).Clearly, there are current expenditures, such as those increasing human capital,that can give a relevant contribution to growth.15 Moreover, the possibility ofborrowing, without strict limits, in order to finance investments can lower theattention paid when evaluating the costs and benefits of each project. Contrary towhat happens in the private sector, there would be no mechanism to penalisepublic institutions investing in low-revenue projects.
Besides taking into account the above-mentioned aspects, the proposal tointroduce such a rule in EMU’s fiscal framework must be evaluated with regardto its consistency with the objectives of EMU’s fiscal rules and to its impactupon the effectiveness of the surveillance procedure set to safeguard theirenforcement.
The reference values and the targets defined in the Maastricht Treaty and inthe Stability and Growth Pact do not distinguish between current and capitaloutlays. The latter are only mentioned among the other relevant factors forevaluating excessive deficits (article 104c(3)); investment expenditure must bespecified in the Convergence Programmes that each Member State will submitannually to the Council and the European Commission.
The objectives of the Treaty and the Pact are a sound fiscal stance (to thisend, quantitative limits are set for the deficit and the debt to GDP ratios) andsufficient room for counter-cyclical action (to this end, given the above-mentioned limits, a medium-term target of a budget position close to balance orin surplus is set).16
The Ecofin Council has subsequently made clear that the medium-term targetis to be obtained ‘over the cycle’; in other words, it may be thought of asapplying to structural budgets, around which automatic stabilisers will beoperating and, if necessary, discretionary interventions will be made.17 The lower 15The inclusion in the capital account (which can be debt-financed) of all expenditures contributing to humancapital accumulation would imply high levels of deficits and pose serious classification problems. One shouldalso take into account that part of expenditures replaces existing capital. Modigliani and Padoa SchioppaKostoris (1998) estimate that, in Italy, gross public expenditure for ‘development’ amounts to 15 per cent ofGDP; the corresponding net figure would be 5 per cent.16For a review of the justifications put forward for the Pact and for an analysis of its potential macroeconomicimplications, see European Commission (1997), Artis and Winkler (1997) and Eichengreen and Wyplosz(1998).17This interpretation is supported by the Council Resolution of 16–17 June 1997, by the Council Regulation no.1466/97 of 7 July 1997 and by the Opinion of the Monetary Committee of 12 October 1998 as endorsed by theCouncil.
Public Investment, the Stability Pact and the ‘Golden Rule’
219
this budget balance with respect to the 3 per cent threshold, the wider themargins for counter-cyclical policy. The actual value set by each country for themedium-term target depends on three elements: the size of foreseeablerecessions; the elasticity of the budget to the cycle; and the size of discretionaryinterventions that may be needed to supplement automatic stabilisers.18
Countries with debt ratios above 60 per cent of GDP should also take intoaccount the need to decrease this ratio, at a satisfactory pace, towards thethreshold. Moreover, an increase in the debt ratio during recessions should beavoided.19
Some indications can be drawn from the analysis of past output gaps.According to the European Commission’s estimates, over the period 1960–97,the maximum output gap among EU Member States was, on average, 4percentage points. Budget elasticity ranged from 0.4 for Greece to 0.9 inSweden; on average, it was 0.6. For output gaps no larger than in the past, inmost EU countries, a cyclically adjusted budget between 0 and 1 per cent ofGDP would allow full operation of automatic stabilisers with no risk ofbreaching the 3 per cent threshold (Buti, Franco and Ongena, 1997 and 1998).Countries with cycles of lower amplitude and lower budget elasticity could staycloser to the upper part of this ‘safety zone’.
A stylised version of the EMU fiscal constitution can be drawn as follows.The reference parameter is general government deficit (DEF); the parameter issubject to an upper ceiling (3 per cent of GDP) and to a medium-term objectiveof a position close to balance or in surplus (to allow stabilisation policy withoutbreaching the upper ceiling):
(2) (DEF/GDP)t ≤ 0.03 ∀ t(DEFs/GDP)t ∈ (0.00, 0.01) ∀ t
where DEFs is the structural deficit and the medium-term objective of a positionclose to balance or in surplus is operationalised in terms of the ‘safety zone’defined above.
This characterisation allows us to distinguish three ways to introduce thegolden rule: 18We follow the definitions of the IMF, the OECD and the European Commission: structural is synonymouswith cyclically adjusted and only automatic reactions to the cycle (i.e. those induced by existing legislation) areconsidered (see Banca d’Italia (1999) for a review of methodologies and practices). It is common in theliterature to term ‘elasticity’ rather than ‘semi-elasticity’ the relation between point changes in the deficit toGDP ratio and percentage changes in output.19Article 104c of the Treaty says that, when the ratio is above 60 per cent of GDP, it must ‘diminishsufficiently’ and approach 60 per cent ‘at a satisfactory pace’. If the ratio increases, the Excessive DeficitsProcedure begins. It should be noted that, while the Treaty allows exceptions to the 3 per cent deficit criterion,it does not for the criterion concerning the debt ratio. The implications for stabilisation policy of the interactionbetween the deficit and the debt rule are analysed in Balassone and Monacelli (1999). Other relevant issuesconcerning the stabilisation function of fiscal policy in EMU are discussed in European Commission (1997).

Fiscal Studies
220
• changing the reference parameter;• changing the upper limit;• changing the medium-term objective.
For each option, both the kind of investment outlays considered and the time-span to which one refers need to be specified.
The implications of the three types of reform can be explained by looking atsolutions already adopted in some countries or proposed in the debate:
• The proposal made by Modigliani et al. (1998), suggesting the use of a deficitnet of net investment, represents a reform of the first type.
• In Germany (article 115 of the Constitution), yearly deficits are allowed up tothe level of gross investment in the federal budget (this includes items thatdiffer from those considered in the National Accounts20); the adoption of thissolution at EMU level would represent a reform of the second type.
• In the UK, public borrowing cannot exceed the level of net investment overthe cycle (HM Treasury, 1997); the adoption of this solution for EMUmember countries would represent a reform of the third type.
To evaluate the consistency of each solution with the objectives of the Treatyand the Pact, it is useful to refer to Figure 4, where the effects of each proposalon the structural deficit and on the margins for stabilisation policy are stylised.The curves show the level of the balance; they are traced assuming a 4 per centof GDP difference between the position at the top of the upswing and theposition at the bottom of the downswing (this is assumed to be sufficient forstabilisation purposes). The straight lines show the limits set to the deficit.Figure 4(a) depicts the present situation. The two curves refer to a balancedstructural budget and a 1 per cent structural deficit. To simplify the analysis inthe following subsections, reference is made only to the latter situation.
1. Proposal of Modigliani et al.Changing the reference parameter as proposed by Modigliani et al., theconditions in (2) would change to
(3) { [DEF – (INV–AMM)]/GDP} t ≤ 0.03 ∀ t{ [DEFs – (INV–AMM)]/GDP} t = 0.01 ∀ t
where INV and AMM are gross investment and amortisation respectively. Theseconditions amount to an increase in the upper limit and the medium-term
20‘Borrowing cannot exceed the total investment expenditure in the budget; exceptions are only allowed toavoid disturbances to the overall economic equilibrium’.

Public Investment, the Stability Pact and the ‘Golden Rule’
221
FIGURE 4(a) The Stability Pact
3
0
Structural deficit = 1%Structural deficit = 0%
Per
cen
t
(b) Excluding Gross Investment
6.6
4.9
0
Gross investment +3%: UK (average 1980–97)
Gross investment +3%: Spain (average 1980–97)
Per
cen
t
(c) Golden Rule: The German Model
Gross investment: UK (average 1980–97)
3.6
0
SpainUK Gross investment: Spain (average 1980–97)
1.9
Per
cen
t
(d) Golden Rule: The UK Model
Net investment = 1%
3
0
Per
cen
t

Fiscal Studies
222
objective presently set for the overall deficit. The increase depends on thecountry’s level of net investment. In fact, (3) can be rewritten as
(3′) (DEF/GDP)t ≤ 0.03 + [(INV–AMM)/GDP]t ∀ t(DEFs/GDP)t = 0.01 + [(INV–AMM)/GDP]t ∀ t.
The margins for counter-cyclical action are unchanged with respect to (2).However, this proposal would determine an increase in the structural deficitwhich, for high-enough values of net investment, may be incompatible with thereduction of debt.
Reference to net investment is what a proper application of the dual budgetrequires. It has the merit of making the deficit level conditional upon the level ofthat part of expenditures that actually can increase a country’s productivepotential.21 However, it also poses some problems for evaluation: (a)amortisation would have to be evaluated item by item, with high administrativecosts, and (b) this would be complicated by the fact that public infrastructureshave multiple functions and no market value. Furthermore, the margins foropportunistic behaviour may widen.22 These problems are all the more relevantfor the multilateral surveillance procedure.
The use of gross investment would not be in line with the correct applicationof a dual budget but would avoid the above-mentioned difficulties. The elementsfor the computation of the modified reference parameter (overall deficit andgross investment) are already available and communicated to the EU by MemberStates within the Excessive Deficits Procedure.23 There would not be extraadministrative costs and the leeway for opportunistic behaviour would be lesspronounced.24 However, the monitoring of results during the year would becomemore difficult.25
The constraints in (3′) would change to
(3″) (DEF/GDP)t ≤ 0.03 + (INV/GDP)t ∀ t(DEFs/GDP)t = 0.01 + (INV/GDP)t ∀ t.
In this case, if gross investment remained at the levels recorded on average overthe last two decades, the resulting structural deficit would not be consistent withthe objective of a sound fiscal stance. In Figure 4(b), two lines are traced 21On this, see HM Treasury (1998).22For example, how would one distinguish between maintenance and new investment?23In the procedure, investment is defined as ‘gross fixed capital formation’.24It would be different if all capital expenditure were excluded from the deficit. Among these expenditures,payments aimed at covering current deficits of public enterprises or at settling past debts would be included.25In several countries, general government accounts are only available on a yearly basis. Monitoring of overallbalances is often based on more readily available financial data (for example, borrowing requirement), whichdo not provide indications concerning the composition of balances and, more specifically, investmentexpenditure.

Public Investment, the Stability Pact and the ‘Golden Rule’
223
corresponding to the limits to the overall deficit resulting from the minimum andmaximum value of the gross investment to GDP ratio recorded on average in the1980–97 period in EU countries (1.9 per cent in the UK and 3.6 per cent inSpain). The structural deficit would lie between 1.9 and 4.6 per cent of GDP(considering fluctuation margins respectively equal to 3 and 2 percentagepoints).26 Such values, given the present low-inflation environment, would onlybe consistent with the limit set for the debt ratio (60 per cent of GDP) undersustained real growth rates; for a country with a structural deficit of 3 per centand a debt ratio of 60 per cent, growth rates higher than 5 per cent would berequired. For Italy, a nominal growth rate of 4.5 per cent and structural deficit of3 per cent would imply a debt ratio still at 100 per cent in the year 2010.
2. The German ModelThe German model would meet difficulties similar to those mentioned abovefrom the point of view of multilateral surveillance (again, gross investment isused). The constraints in (2) would change to
(4) (DEF/GDP)t ≤ (INV/GDP)t ∀ t(DEFs/GDP)t = (INV/GDP)t – 0.02 ∀ t
where, as in (3′), it is assumed that the change in the upper ceiling of thereference parameter also determines a change in the medium-term objectiveallowing stabilisation policy without breaching the upper limit (the margins areleft unaltered at 2 per cent).
As for the consistency with the objectives of the Treaty and the Pact, if thesame level of expenditure experienced in the past were to prevail in the future,this solution would not imply a significant change with respect to the presentsituation for most EU Member States. On average between 1980 and 1997, theratio of gross investment to GDP in EU countries was slightly below 3 per cent;only in a few countries and for very limited periods of time did it go above 4 percent; so, in order to have sufficient margins for counter-cyclical action, mostcountries would have to target a structural balance between 0 and 1 per cent ofGDP. In Figure 4(c), two examples are depicted concerning the countries withthe lowest and the highest gross investment to GDP ratio in the EU (again, thefluctuation margins are set to 2 per cent of GDP).
3. The UK ModelThe UK model refers to results over the cycle; thus it appears to be better suitedto be consistent with the objectives of soundness and flexibility of the budget.Adopting this model in EMU would imply the following constraints:
26In Figure 4(b), fluctuation margins are always equal to 2 percentage points of GDP.

Fiscal Studies
224
(5) (DEF/GDP)t ≤ [(INV–AMM)/GDP]a + 0.02 ∀ t(DEFs/GDP)t ≤ [(INV–AMM)/GDP]a ∀ t
where the upper ceiling on the reference parameter has been defined so as toleave the fluctuation margins for the budget unaltered and [(INV–AMM)/GDP]ais the average level of the net investment to GDP ratio over the cycle.
The actual determination of the reference period (the length of the cycle) mayencounter some difficulties both on theoretical and on practical grounds. It alsoadds to the complexity of the multilateral surveillance process. As alreadymentioned, additional problems stem from the reference to net investment.
Depending on the level of net investment, the medium-term target consistentwith the UK model may or may not fall in the ‘safety zone’.27 In the first case,the UK model would only differ from the present situation in that a structuraldeficit could only be incurred if net investment were under way; it would leaveunaltered both the margins for stabilisation policy and the safeguard of astructural budget consistent with a sustainable debt level. In the second case,both objectives could be compromised. Considering the investment undertakenby EU countries between 1980 and 1997, the structural deficit would lie between(1.9–x) and (3.6–x), where x = AMM/GDP; these levels are lower than thoseallowed by the proposal in Modigliani et al. (1.9–x; 4.6–x), but they could still beinconsistent with a reduction of the debt ratio.28 Furthermore, if the 3 per centthreshold for the overall deficit is kept (Figure 4(d)), net investment larger than 1per cent would imply shrinking margins for stabilisation policy.
In conclusion, the adoption of the golden rule cannot significantly change thepolicy options open to EU countries without conflicting with the objective of asound fiscal stance and without making the multilateral surveillance processmore complex.29
VI. CONCLUSION
The Maastricht Treaty defines the soundness of public finances as a necessarycondition for the success of EMU and sets quantitative limits to deficit and debtin EU member countries. The centralisation of monetary policy and theimpossibility of using the exchange rate as a policy instrument make fiscalpolicy all the more important. Indeed, fiscal policy together with structuralpolicy becomes the main instrument of national economic policy. Fiscal policy 27In the UK, net investment to GDP is likely to be below 1 per cent (the gross ratio is just above 1 per cent).28In HM Treasury (1997), a safeguard clause is included for the stability of the debt to GDP ratio over theeconomic cycle.29These problems become more relevant when referring to the overall contribution of public sector outlays tohuman and physical capital accumulation. Estimates by Modigliani and Padoa Schioppa Kostoris (1998)clearly show how high the deficit could reach (see footnote 15) and the complexity of evaluating thatcontribution; the latter would be further compounded at the EU level.

Public Investment, the Stability Pact and the ‘Golden Rule’
225
must deal with asymmetric shocks and with situations in which the nationalcycle diverges from that of the Union as a whole. This requires sufficientmargins of fluctuation for the budget. In order to avoid flexibility conflictingwith soundness, a structural budget close to balance is called for.
This arrangement is not without problems: (a) the transition to a balancedbudget can have negative effects on conjunctural developments;30 (b) the longprocess of debt reduction brings significant costs in terms of primary surplusesto current generations; and (c) there is limited scope for using debt in order tofinance investment and this in turn can determine a reduction in investment.
The first problem is undoubtedly relevant. In the event of extremelyunfavourable conjunctural developments, a prudent tuning of the transition maybe considered. However, a large part of the needed adjustment has already beencompleted: in 1999, the average deficit in EU countries was 0.6 per cent of GDP,compared with the 6.2 per cent peak in 1993. It should also be noted that, inseveral countries, the interest to GDP ratio tends to decrease as the reduction ininterest rates affects the average cost of debt and as the debt ratio itself declines,making the needed effort in terms of primary surplus less demanding.
The effect of the transition to a balanced budget could be lessened byincreasing the degrees of competition and flexibility in product and factormarkets. A loosening of the rules designed to govern budgetary policy after thetransition does not seem necessary; it may damage the credibility of thecommitment to sustainable public finances; monetary policy may be called totake a restrictive stance. Moreover, the golden rule does not help duringdownswings: investment decisions only translate into actual expenditure with asignificant delay.
The second problem cannot be avoided. The burden in terms of primarysurplus is the price to pay for gaining budget flexibility and soundness. In somecountries, the reduction of the debt can break the vicious cycle between highdebt and high interest rates which has conditioned economic policy in recentyears (for Italy, see Sartor (1998)). Furthermore, it allows margins for counter-cyclical action, avoiding the risk that an expansionary policy be perceived as athreat to sustainability.31 Finally, it permits tackling, from a sounder financialposition, the coming phase of intense ageing and compensating with lowerinterest payments the ensuing increase in expenditure (see, for example, Francoand Munzi (1997)). If the introduction of the golden rule implied a reduction inprimary surpluses, it could endanger the objectives of soundness and flexibilityset for government budgets.
30According to the Ecofin decision on 12 October 1998, the objective should be attained by 2002.31It has been suggested that the effects of expansionary policies diminish with the level of debt and that anincrease in deficit may even have restrictive effects. See, for example, Bertola and Drazen (1993) and Giavazziand Pagano (1990 and 1996).

Fiscal Studies
226
Previous sections have explained how the third problem evolves: a broadlybalanced budget reduces the possibility of spreading investment costs over thegenerations benefiting from investment and can negatively affect the investmentlevel. This effect can be especially relevant during the transition to the low debtlevels consistent with the chosen structural balance. The reduction in deficitrecorded in EU countries in recent years benefited from cuts in investmentspending; in relative terms, these cuts have often been higher than thecorresponding cuts in other items. The problem may be more serious forcountries and regions with a lower stock of public capital. However, a reductionin investment as measured in the general government accounts should not be tooworrisome since this is not the most appropriate measure of change in publiccapital.
Should a golden rule be introduced into the EMU fiscal framework to avoidthe reduction in investment? The analysis above points to a negative answer.Some of the solutions proposed may be an obstacle to deficit and debt reduction;others meet practical difficulties, such as the evaluation of amortisation.Generally, leeway for opportunistic behaviour would increase and thesurveillance of outcomes and trends would be more complex.
Perhaps it is better to search for different solutions. While an exhaustive listis certainly not the aim of this paper, some ideas can be put forward. At thenational level, one may consider safeguard clauses to avoid fiscal consolidationefforts translating into investment cuts. The adoption of the UK model at thenational level may be a useful self-discipline mechanism warranting a minimumlevel of investment; if the mechanism has no relevance at EU level, nosurveillance problem will arise. In adopting this model, the actual use of themargins for a structural deficit allowed by the EU fiscal constitution will becomeconditional on the realisation of infrastructure. As noted in Section V, in order toavoid an excessive reduction of the margins for counter-cyclical action and tomake sure that EU fiscal rules are not breached, the structural deficit should notbe above 1 per cent of GDP; this is a modest amount, which should also limit therelevance of the conceptual problems posed by the dual budget system.
In order to ensure a larger flow of resources available for public investment,other measures are necessary. For example, especially for smaller projects, thedecentralisation of investment decisions and financing may help to reduce thedisincentive for projects with deferred benefits. At the local community level,intergenerational altruism may be stronger and people may be more willing tobear a larger gap between taxes and immediate benefits. More generally, privatecapital will have to be involved in funding projects of public interest. Mostinfrastructure networks are already the responsibility of institutions and firmsoutside general government.
Public Investment, the Stability Pact and the ‘Golden Rule’
227
REFERENCES
Artis, M. J. and Winkler, B. (1997), ‘The Stability Pact: safeguarding the credibility of theEuropean Central Bank’, Centre for Economic Policy Research, Discussion Paper no. 1688.
Aschauer, D. A. (1989), ‘Is public expenditure productive?’, Journal of Monetary Economics, vol.23, pp. 177–200.
Balassone, F. and Franco, D. (1999), ‘Public investment in the Stability Pact framework’, in M.Bordignon and D. Da Empoli (eds), Concorrenza fiscale in un’economia internazionaleintegrata, Milano: Franco Angeli.
— and Monacelli, D. (1999), ‘Politiche di stabilizzazione: quali margini nelle regole fiscali dellaUE?’, Politica Economica, vol. 15, pp. 309–28.
Banca d’Italia (1999), Indicators of Structural Budget Balances, Roma.Barro, R. J. (1979), ‘On the determination of public debt’, Journal of Political Economy, vol. 87,
pp. 940–71.Bertola, G. and Drazen, A. (1993), ‘Trigger points and budgetary cuts: explaining the effects of
fiscal austerity’, American Economic Review, vol. 38, pp. 11–26.Buti, M., Franco, D. and Ongena, H. (1997), ‘Budgetary policies during recessions: retrospective
application of the “Stability and Growth Pact” to the post-war period’, RecherchesEconomiques de Louvain, vol. 63, pp. 321–66.
—, — and — (1998), ‘Fiscal discipline and flexibility in EMU: the implementation of the Stabilityand Growth Pact’, Oxford Review of Economic Policy, vol. 14, no. 3, pp. 81–97.
Colm, G. and Wagner, P. (1963), ‘Some observation on the budget concept’, Review of EconomicStudies, vol. 45, pp. 122–6.
Dalamagas, B. (1995), ‘Growth, public investment and deficit financing’, Australian EconomicPapers, vol. 65, pp. 244–62.
Dalenberg, D. R., Partridge, M. D. and Rickman, D. S. (1998), ‘Public infrastructure: pork or jobscreator?’, Public Finance Review, vol. 1, pp. 24–52.
De Haan, J., Sturm, J. E. and Sikken, B. J. (1996), ‘Government capital formation: explaining thedecline’, Review of World Economics, vol. 132, pp. 55–74.
de la Fuente, A. (1997), ‘Fiscal policy and growth in the OECD’, Centre for Economic PolicyResearch, Discussion Paper no. 1755.
Eberts, R. (1990), ‘Public infrastructure and regional economic development’, Economic Review ofthe Federal Reserve Bank of Cleveland, vol. 26, pp. 15–28.
Eichengreen, B. and Wyplosz, C. (1998), ‘Stability Pact: more than a minor nuisance?’, EconomicPolicy, vol. 26, pp. 67–104.
Erenburg, S. J. (1993), ‘The real effects of public investment on private investment’, AppliedEconomics, vol. 25, pp. 831–7.
European Commission (1997), ‘Economic policy in EMU’, Economic Papers, issues 124–5.Evans, P. and Karras, G. (1994), ‘Is government capital productive? Evidence from a panel of
seven countries’, Journal of Macroeconomics, vol. 16, pp. 271–9.Franco, D. and Munzi, M. T. (1997), ‘Ageing and fiscal policies in the European Union’, in
European Commission, ‘The welfare state in Europe: challenges and reforms’, EuropeanEconomy: Reports and Studies, vol. 7, pp. 239–388.
Garcia-Milà, T., McGuire, T. J. and Porter, R. H. (1996), ‘The effect of public capital in state-levelproduction functions reconsidered’, Review of Economics and Statistics, vol. 78, pp. 177–80.
Giavazzi, F. and Pagano, M. (1990), ‘Can severe fiscal contractions be expansionary? Tales of twosmall European countries’, Centre for Economic Policy Research, Discussion Paper no. 417.

Fiscal Studies
228
— and — (1996), ‘Non-Keynesian effects of fiscal policy change: international evidence and theSwedish experience’, Swedish Economic Policy Review, vol. 3, pp. 67–105.
Girard, J., Gruber, H. and Hurst, C. (1994), ‘A discussion of the role of public investment ineconomic growth’, Cahiers BEI-EIB Papers, no. 23, pp. 13–19.
—, — and — (1995), ‘Increasing public investment in Europe: some practical consideration’,European Economic Review, vol. 39, pp. 731–8.
— and Hurst, C. (1994), ‘Investment and growth: quality versus quantity’, Cahiers BEI-EIBPapers, no. 23, pp. 39–55.
Goode, R. and Birnbaum, E. A. (1955), Government Capital Budgets, Washington, DC:International Monetary Fund.
Gramlich, E. M. (1994), ‘Infrastructure investment: a review essay’, Journal of EconomicLiterature, vol. 32, pp. 1147–75.
HM Treasury (1997), A Code for Fiscal Stability, London.— (1998), The Public Sector Balance Sheet, London.Holtz-Eakin, D. (1994), ‘Public sector capital and the productivity puzzle’, Review of Economics
and Statistics, vol. 76, pp. 12–21.Holzmann, R. (1997), ‘On economic benefits and fiscal requirements of moving from unfunded to
funded pensions’, European Economy, vol. 4, pp. 121–66.Hurst, C. (1994), ‘Infrastructure and growth: a literature review’, Cahiers BEI-EIB Papers, no. 23,
pp. 57–76.Kelejian, H. H. and Robinson, D. P. (1997), ‘Infrastructure productivity estimation and its
underlying econometric specification: a sensitivity analysis’, Papers in Regional Science, vol.72, pp. 297–312.
Kitterer, W. (1994), ‘Tax- versus debt-financing of public investment: a dynamic simulationanalysis’, Kredit und Kapital, vol. 2, pp. 163–87.
Mera, K. (1973), ‘Production functions and social overhead capital: an analysis of the Japanesecase’, Regional and Urban Economics, vol. 3, pp. 297–312.
Modigliani, F., Fitoussi, J. P., Moro, B., Snower, D., Solow, R., Steinherr, A. and Sylos Labini, P.(1998), ‘Manifesto contro la disoccupazione nell’Unione Europea’, Moneta e Credito, vol. 51,pp. 375–412.
— and Padoa Schioppa Kostoris, F. (1998), Sostenibilità e solvibilità del debito pubblico in Italia,Bologna: Il Mulino.
Munnel, A. H. (1992), ‘Infrastructure investment and economic growth’, Journal of EconomicPerspectives, vol. 6, pp. 189–98.
Musgrave, R. A. (1939), ‘The nature of budgetary balance and the case for a capital budget’,American Economic Review, vol. 29, pp. 260–71.
Oxley, H. and Martin, J. P. (1991), ‘Controlling government spending and deficits: trends in the80s and prospects for the 90s’, OECD Economic Studies, vol. 17, pp. 145–89.
Pontolillo, V. (1998), ‘Aspetti economico-istituzionali del project financing: problematiche edesperienze in Italia’, Banca d’Italia, Documenti, no. 589.
Poterba, J. M. (1995), ‘Capital budgets, borrowing rules and state capital spending’, Journal ofPublic Economics, vol. 56, pp. 165–87.
Premchand, A. (1983), Government Budgeting and Expenditure Controls: Theory and Practice,Washington, DC: International Monetary Fund.
Ratner, J. B. (1983), ‘Government capital and the production function for U.S. private output’,Economics Letters, vol. 13, pp. 213–17.

Public Investment, the Stability Pact and the ‘Golden Rule’
229
Robinson, M. (1998), ‘Measuring compliance with the golden rule’, Fiscal Studies, vol. 19, pp.447–62.
— (1999), ‘The role and nature of public sector balance sheets’, Queensland University ofTechnology, Discussion Papers in Economics, Finance and International Competitiveness no.49.
Roubini, N. and Sachs, J. D. (1989), ‘Government spending and budget deficits in the industrialcountries’, Economic Policy, vol. 8, pp. 99–132.
Sartor, N. (ed.) (1998), Il risanamento mancato — La politica di bilancio italiana: 1986–90,Roma: Carocci.
Steve, S. (1972), Lezioni di scienza delle finanze, Padova: Cedam.van Ewijk, C. (1997), ‘Infrastructure, intergenerational conflict and the golden rule of finance’, De
Economist, vol. 145, pp. 447–60.