PS 007 123 Interim Evaluation of the National Follow Through ...
417
DOCUMENT RESUME ED 086 371 PS 007 123 AUTHOR TITLE INSTITUTION SPONS AGENCY REPORT HO PUB DATE CONTRACT NOTE EDRS PRICE DESCRIPTORS IDENTIFIERS Emrick, John A.; And Others Interim Evaluation of the National Follow Through Program 1969-1911. A Technical Report. Stanford',Research Inst., Menlo Park, Calif. Bureau of Elementary and Secondary Education (DHE , Washington, D.C. W/06 SRI-URU-7370 Feb 73 OPC-0-8-522480-4633(100) 416p. MF-$0.65 HC-$16.45 Academic Achievement; Achievement Tests; Affective Behavior; Cognitive Processes; *Disadvantaged Youth; Language Skills; *Longitudinal Studies; *Preschool Children; *Preschool Curriculum; *Program Evaluation *Planned Variations Program; Project Follow Through; Stanford Research Institute ABSTRACT \ Results of an interim evaluation of selected aspects of the Follow Through Program are described. Analyses `re described for two cohorts: children entering the program in 1969 (2 year's data) and those entering -In 1970 (1 year's data) . Measures on program impact on the children included achievement, quantitative skill, langue arts, cognitive processes, affect, and attendance. Various measures of program impact on the parents were also taken. Overall interim results, for the most part, favor the Follow Through children. Caution is advised in interpreting results of this interim evaluation. (CS)
-
Upload
khangminh22 -
Category
Documents
-
view
0 -
download
0
Transcript of PS 007 123 Interim Evaluation of the National Follow Through ...
DOCUMENT RESUME
ED 086 371 PS 007 123
AUTHORTITLE
INSTITUTIONSPONS AGENCY
REPORT HOPUB DATECONTRACTNOTE
EDRS PRICEDESCRIPTORS
IDENTIFIERS
Emrick, John A.; And OthersInterim Evaluation of the National Follow ThroughProgram 1969-1911. A Technical Report.Stanford',Research Inst., Menlo Park, Calif.Bureau of Elementary and Secondary Education(DHE , Washington, D.C.W/06SRI-URU-7370Feb 73OPC-0-8-522480-4633(100)416p.
MF-$0.65 HC-$16.45Academic Achievement; Achievement Tests; AffectiveBehavior; Cognitive Processes; *Disadvantaged Youth;Language Skills; *Longitudinal Studies; *PreschoolChildren; *Preschool Curriculum; *ProgramEvaluation*Planned Variations Program; Project Follow Through;Stanford Research Institute
ABSTRACT \
Results of an interim evaluation of selected aspectsof the Follow Through Program are described. Analyses `re describedfor two cohorts: children entering the program in 1969 (2 year'sdata) and those entering -In 1970 (1 year's data) . Measures on programimpact on the children included achievement, quantitative skill,langue arts, cognitive processes, affect, and attendance. Variousmeasures of program impact on the parents were also taken. Overallinterim results, for the most part, favor the Follow Throughchildren. Caution is advised in interpreting results of this interimevaluation. (CS)
FILMED FROM BEST AVAILABLE COPY
I k "S . 0
US JCP.RTmENT OF HEALTHEJOCATION ,AELFARENATIONAL INSTITUTE OF
EDUCATIONTHIS DOCUMENT HAS PEEN REPROOWED t %ACTLY AS RECEIVED FROMTMC PERSON ORIGINATING IT POI OF VI..W OR OPW IUNSST TED DO N T NECESSARILY REPRESEIT OFFICIAL NATIONAL INSTITUTE 01EDOCTION POSITION OR OLICY
February 1973
INTERIM EVALUATION OF THE NATIONALFOLLOW THROUGH PROGRAM 1969-1171
A Technical Report
By: JOHN A. EMRICK, PHILIP H. SORENSEN, and MARIAN S. STEARNSwith assistance from the professional project staff
Prepared for:
BUREAU OF ELEMENTARY AND SECONDARY EDUCATIONU.S. OFFICE OF EDUCATIONDEPARTMENT OF HEALTH, EDUCATION, AND WELFAREWASHINGTON, D.C.
CONTRACT OEC-0-8-522480-4633(100)
SRI Project URU-7370
The conclusions and recommendations in this report are those of the Contractor and do not 'necessarilyreflect the views of the U.S. Department of Health, Education, and WelfdrP or any other agency ofgovernment.

CONTENTS
LIST OF ILLUSTRATIONS
LIST OF TABLES
ACKNOUEDGMENTS
EXECUTIVE SUMMARY
I INTRODUCTION
ix
xi
xxi
XXV
1
Follow Through as an Experiment 4
Follow Through as Policy Research 6
Stakeholder Interests in the Evaluation 9
Problems of Design 11
Evaluation of the Planned Variations 12
Overall FT/NET Evaluatirn 14
II DESIGN AND SAMPLE 17
The Follow Through Evaluation Design
The Sample Subset for Assessment of Interim Impacts
The Project Sampling Scheme
Cohort I Sample (Fall, 1969)
Cohort II Sample (Fall, 1970)
III METHODOLOGY
Introduction
Instrumentation and Data Collection
The Classroom Roster and Related Information Form
The FollOw Through Test Battery
The Parent Interview
Teacher and Aide Questionnaire
The Classroom Observation Instrument
Project Descriptors
Procedures
Rostering Procedure
FT Testing Procedure
Parent Interview Procedure
Teacher and Aide Survey Procedure
Classroom Observation Procedure
jiii
19
22
24
. 25
27
31
33
33
34
34
39
41
43
46
47
48
48
51
52
52

III MEMODOLOGY (Continued)
Project Descriptor Procedures 53
Community Studies, 1970-71 55
Definition and Development of Evaluation Variables . .56
Basic Variable by Category Matrix for Evaluation
Data 57
Variables at the Child Level 58
Variables at the Parent Level
Variables at the Teacher Level 69
Project Variables 65
Process Variables 67
Summary of Variability by Level-of Evaluation-Focus 72
Analysis Methodology 74
Basic Evaluation Hypotheses 74
ANCOVA: The Method of Analysis 76
Guide to Interpretation of Results 81
Explanation of Entries in the Project Data Tables 82
IV RESULTS 91
Introduction 93
Part 1-- Results for Each Project by Sponsor 95
Responsive Educational Program, FarWest Laboratory
for Educational Research and Development 97
Sponsor's Intended Approach 97
Individual Project Results 98
Summary 110
Tucson Early Education Model (TEEM), University
of Arizona 115
Sponsor's Intended Approach 115
Individual Project Results 116
Summary 126
Bank Street College of Education Approach, Bank
Street College 133
Sponsor's Intended Approach 133
Individual Project Results 134
Summary 147
Mathemagenic Activities Program (MAP), boiversity
of Geor;ia 151
Sponsor's Intended Approach 151
Individual Project Results 152
Summary 154
iv
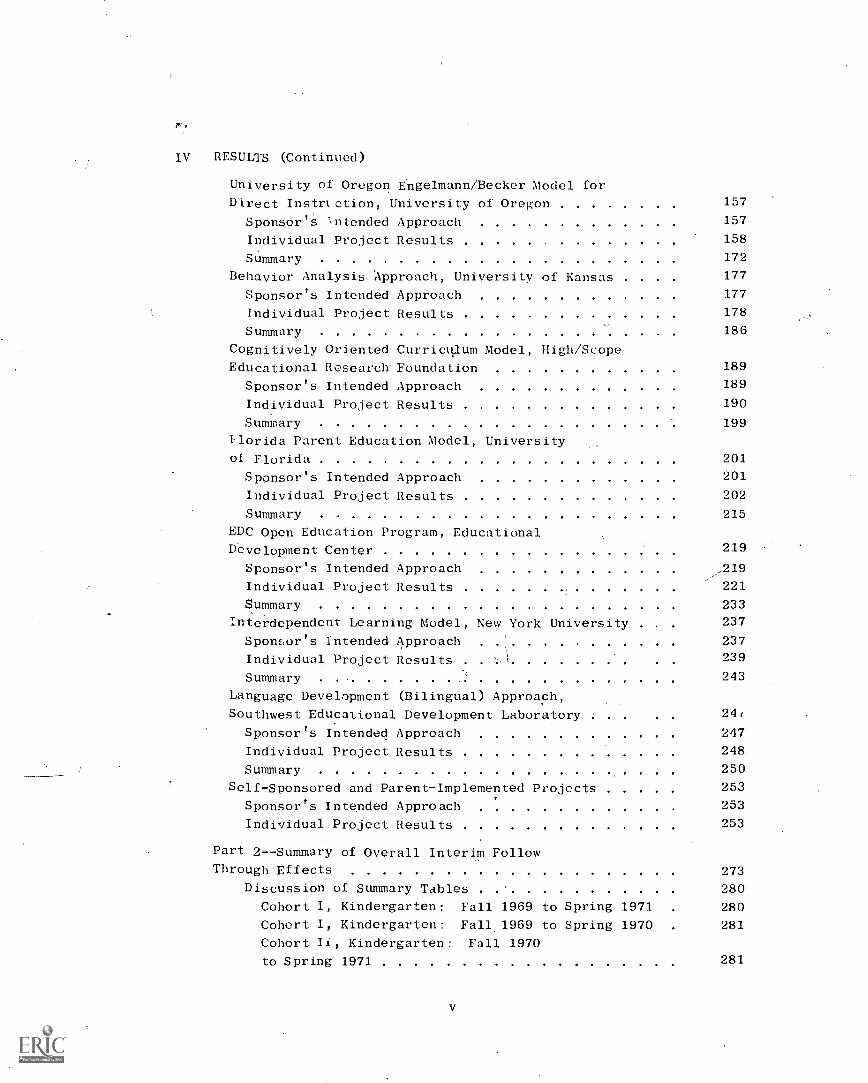
IV RESULTS (Continued)
University of Oregon Engelmann/Becker Model for
Direct Instrtction, University of Oregon 157
Sponsor's ntended Approach 157
Individual Project Results 158
Summary 172
Behavior Analysis Approach, University of Kansas .177
Sponsor's Intended Approach 177
Individual Project Results 178
Summary 186
Cognitively Oriented Curriculum Model, High/Scope
Educational Research Foundation 189
Sponsor's Intended Approach 189
Individual Project Results 190
Summary 199
Florida Parent Education Model, University
of Florid. 201
Sponsor's Intended Approach 201
Individual Project Results 202
Summary 215
EDC Open Education Program, Educational
Development Center 219
Sponsor's Intended Approach _219
Individual Project Results 221
Summary 233
Interdependent. Learning Model, New York University .237
Sponsor's Intended Approach 237
Individual Project Results 239
Summary 243
Language Development (Bilingual) Approach,
Southwest Educational Development Laboratory .24/
Sponsor's Intended Approach 247
Individual Project Results 248
Summary 250
Self-Sponsored and Parent-Implemented Projects 253
Sponsor's Intended Approach 253
Individual Project Results 253
Part 2--Summary of Overall Interim FollowThrough Effects 273
Discussion of Summary Tables 280
Cohort I, Kindergarten: Fall 1969 to Spring 1971 280
Cohort I, Kindergarten: Fall 1969 to Spring 1970 281
Cohort II, Kindergarten: Fall 1970
to Spring 1971 281

IV RESULTS (Continued)
Cohort I, Entering First: Fall 1969
to Spring 1971
Cohort I, Entering Firg-17--Fa1l
to Spring 1970 283
Cohort II, Entering First: Fall 1970
to Spring 1971 283
The Parent Image Variable 284
Discussion of Sample Matching, 284
282
Part 3 Observational Evidence of Planned Variations 295
Background 297
Evidence of Differential Treatments 298
V DISCUSSION AND RECOMMENDATIONS 309
Discussion of the Interim.Results and Recommendations
for Improving the Evaluation ,f FolloW Through 311
The Need for More Precise '1,:eatment Definitions and
Descriptions 315
Competing Goals of Follow Through 316
Problems in Measurement 318
Attrition and Its Implications 320
Summary of Recommendations for the Continuing
FTEvaluation 321
Recommendations Coneorning.Evaluations of Future
Education and Social Action Programs 323
The Need for Planning the Evaluation ..... 323
Critical DiMensions for Evaluation Planning .324
ReCommendation for Specific Policy Decisions
Regarding Compensatory Education Programs 326
Sponsor Programs 326
The Overall Evaluation 328
Project Lex,el Factors 328
ANNEX A
ISSUES IN THE ANALYSIS OF THE DATA
Part I: The Use of C-DA-8-8rOom-Level Data as a Basis
for Analysis of Program Effects
Locus of Treatment
The Nested Design and Confounding at Different
Levels of Nesting
Variations in Levels of Measurement
Problems of Program Attrition and Incomplete and
Missing Data
vi
A-1
A-3
A-3
A-4
A-6
A-7
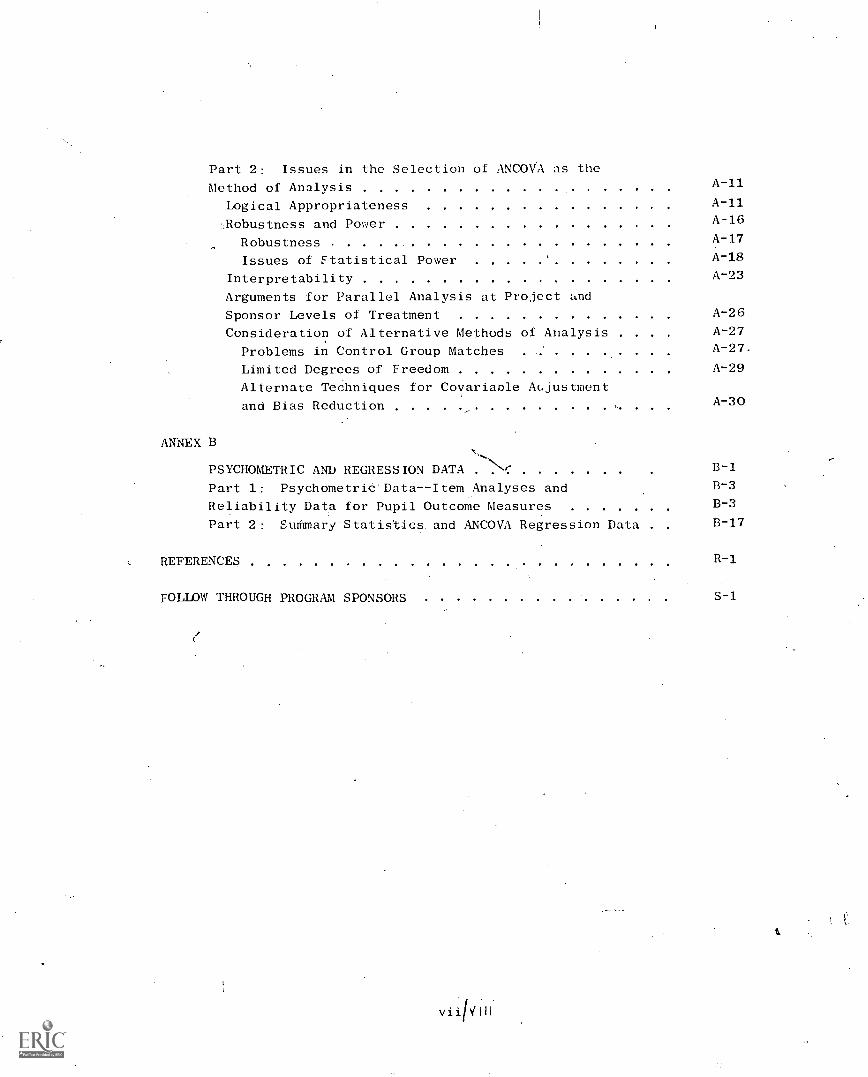
Part 2: Issues in the Selection of ANCOVA as the
Method of Analysis A-11
Logical Appropriateness A-11
;Robustness and Power A-16
Robustness A-17
Issues of Statistical Power A-18
Interpretability A-23
Arguments for Parallel Analysis at Project and
Sponsor Levels of Treatment A-26
Consideration of Alternative Methods of Analysis . . A-27
Problems in Control Group Matches A-27.
Limited Degrees of Freedom A-29
Alternate Techniques for Covariaole Acjustment
and Bias Reduction A-30
ANNEX B
PSYCHOMETRIC AND REGRESSION DATA
Part 1: Psychometrie'Data--Item Analyses and
Reliability Data for Pupil Outcome Measures
Part 2: Summary Statistics and ANCOVA Regression Data
B-1
B-3
B-3
B-17
REFERENCES R-1
FOLLOW THROUGH PROGRAM SPONSORS S-1
vii
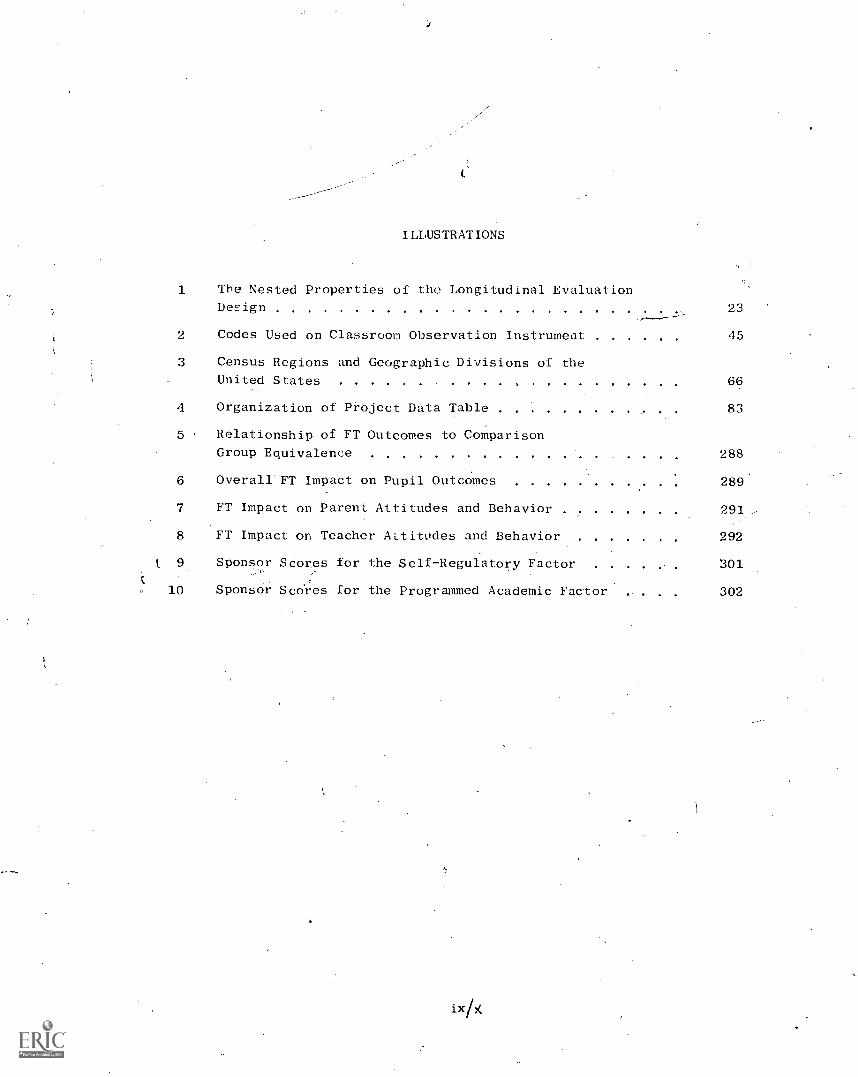
ILLUSTRATIONS
1 The Nested Properties of the Longitudinal Evaluation
Design 23
2 Codes Used on Classroom Observation Instrument 45
3 Census Regions and Geographic Divisions of the
United States 66
4 Organization of Project Data Table 83
5 Relationship of FT Outcomes to Comparison
Group Equivalence 288
6 Overall FT Impact on Pupil Outcomes 289
7 FT Impact on Parent Attitudes and Behavior 291
8 FT Impact on Teacher Attitudes and Behavior 292
Sponsor Scores for the Self-Regulatory Factor 301
10 Sponsor. Scores for the Programmed Academic Factor 302
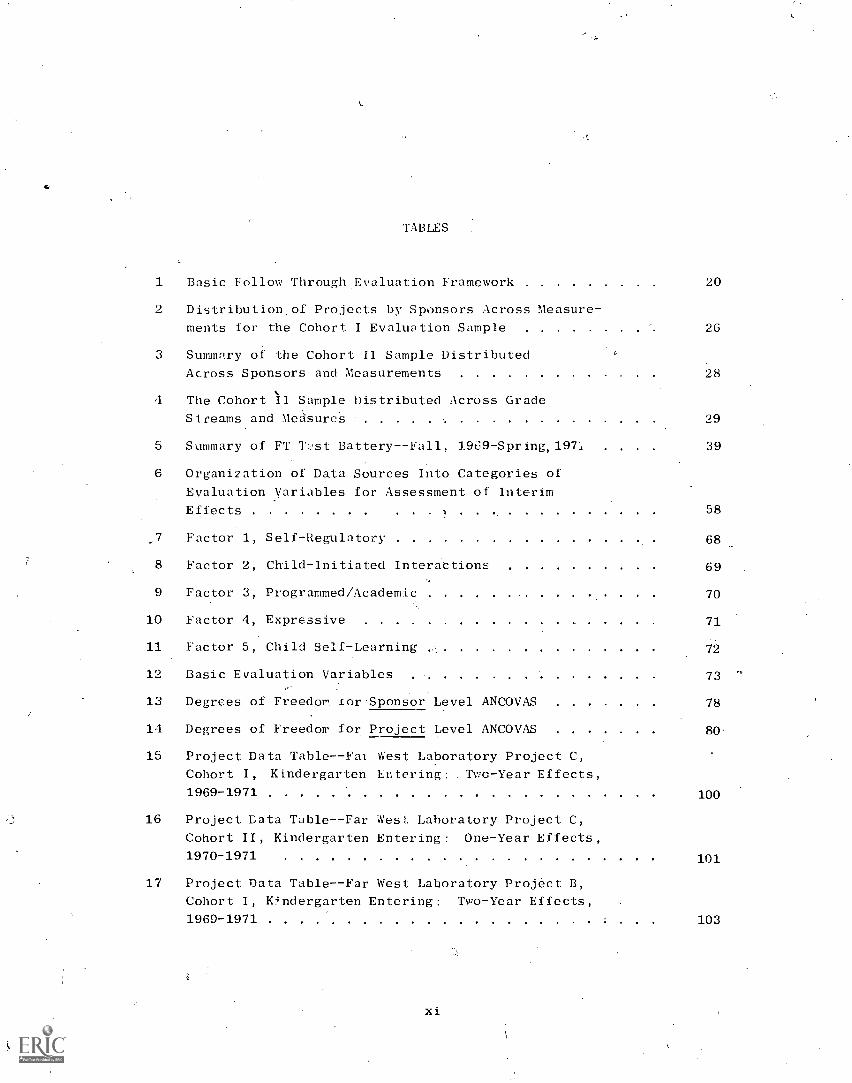
TABLES
1 Basic Follow Through Evaluation Framework 20
2 Distribution, of Projects by Sponsors Across Measure-
ments for the Cohort I Evaluation Sample 26
3 Summary of the Cohort II Sample Distributed
Across Sponsors and Measurements 28
4 The Cohort II Sample Distributed Across Grade
Streams and MeA"sureS 29
5 Summary of FT Test Battery--Fall, 1969-Spring,197i 39
6 Organization of Data Sources Into Categories of
Evaluation Variables for Assessment of Interim
Effects 58
7 Factor 1, Self-Regulatory 68
8 Factor 2, Child Initiated Interactions 69
9 Factor 3, Programmed/Academic 70
10 Factor 4, Expressive 71
11 Factor 5, Child Self-Learning
12 Basic Evaluation Variables 73
13 Degrees of Freedor Jar Sponsor Level ANCOVAS 78
14 Degrees of Freedom for Project Level ANCOVAS 80
15 Project Data Table--Fai West Laboratory Project C,
Cohort I, Kindergarten Entering: Two-Year Effects,
1969-1971 100
16 Project Data Table--Far West. Laboratory Project C,
Cohort II, Kindergarten Entering: One-Year Effects,
1970-1971
17 Project Data Table--Far West Laboratory Project B,
Cohort I, Kindergarten Entering: Two-Year Effects,
1969-1971
xi
101
103
18 Project Data Table--Far West LAoratory Project B,
Cohort I, Kindergarten Entering: One-Year Effects,
1969-1070. 105
19 Project Data Table- -Far West Laboratory Project B,
Cohort II, Kindergarten Entering: One-Year Effects,
1970-1971 106
20 Project Data Table--Far West Laboratory Project A,
Cohort I,. Kindergarten Entering: Two-Year Effects,
1969-1971 108
21 Project Data Table-Far West Laboratory Project A,
Cohort II, Kindergarten Entering: One -Year Effects,
1970-1971 109
22 Far West Laboratory Summary, Cohort I, Kindergarten
Entering Projects: Two-Year Effects, 1969-1971 112
23 Far West Laboratory SumMaryi Cohort II, Kindergarten
Entering Projects: One-Year Effects, 1970-1971 . 113
24 Project Data Table--University of Arizona Project D,
Cohort I, Kindergarten Entering: Two-Year Effects,
1969-1971 118
25 Project Data TableUniversity of Arizona Project D,
Cohort L, Kindergarten Entering: One-Year Effects,
1969-1970 120
26 Project Data Table--University of Arizona Project A,
,Cohort I, Kindergarten Entering: Two-Year Effects,
1969-1971 121
27 Project Data Table--University of Arizona Project B,
Cohort I, Entering First Grade: Two-Year Effects,
1969-1971 123
28 Proje t Data Table--University of Arizona Project C,
Cohort I, Entering First Grade: Two-Year Effects,
1969-1971
29 Project Data Table--University of Arizona Project C,
Cohort I, Entering First Grade: One-Year Effects,
1969-1970
30 Ptoject Data Table--University of Arizona Project C,
Cohort II, Entering First Grade: One-Year Effects,
1970-1971
xii
125
127
128
.31 University of Arizona Summary, Cohort I, Kir6ergarten
Entering Projects: Two-Year Effects, 1°';9-1971 131
32 University of Arizona Summary, Col Jet I) Enteric
First Grade Projects: Two-Ye-_ Effects, 1)69-1971 . 132
33 Project Data Table--Banl otreet College Pr( ject B,
Cohort J, Kindergait-.1 Entering: Two-Year Effects,
1969-1971 13G
24 Project Da+ Table--Bank Street College Project E,
Cohort ', Kindergarten Entering: Two-Year Effects,
1969-1971 137
35 Project Data Table--Bank Street College Project A,
Cohort I, Kindergarten Entering: Two -Year Effects,
1969-1971 139
36 Project Data Table--Bank Street College Project C,
Cohort I, Kindergarten Entering: Two-Year Effects,
1969-1971 141
37 Project Pata Table -Bank. Street College Project C,
Cohort If, Kixdergarten Entering: One-Year Effects,
1970-1971 143
38 Project Data Table -Bank Street College Project D,
Cohort I, Entering First Grade: Two-Year Effects,
1969-1971 144
39 Project Data Table--Bank Street College Project D,
Cohort I, 'Entering First Grade: One-Year Effects,
1969-1970 145
40 Project Data Table- -Bank Street College Project D,
Cohort II, Entering First Grade:- One-Year Effects,
1970-1971 148
41 Bank Street College Summary, Cohort I, Kindergarten
Entering Projects: Two-Year Effects, 1969-1971 . . 150
42 Project Data Table--University of Geocgio. Project,
Cohort I, Entering First Grade: Two-Year Effects,
1969-1971
43 Project Data Table--University of Oregon Project C,
Cohort I, Kindergarten Entering, Two-Year Effects,
1969-1971
153
161

Project Data TableUniversity of Oregon Project B,
Cohort I, Kindergarten Entering: Two-Year Effects,
1969-1971 4 162
45 Project Data Table University of Oregon Project A,
Cohort I, Kindergarten Entering: Two-Year Effects,
1969-1971 163
46 Project Data Table--University of Oregon Project A,
Cohort II,.Kindergarten Entering: One-Year Effects,
1970-1971
47 Project Data TableUniversity of Oregon Project E,
Cohort I, Entering First Grade : Two-Year Effects,
1969-1971
165
167
48 Project Data Table University of Oregon Project/D,r
Cohort I, Entering First Grade: Two-Year Effects,
1969 -1971 169
49 Project Data Table--University ,of Oregon Project D,
Cohort I, Entering First Grade: One-Year Effects,
1969 -1970 170
50 Project Data Table University of Oregon Project I),
Cohort II, Entering First Grade: One-Year Effects,
1970-1971 171
51 University of Oregon Summary, Cohort I, Kindetgarten
Entering Projects: Two-Year EffectS, 1969-1971 . 173
52 University of Oregon Summary, Cohort I, Entering
First Grade Projects: Two-Year Effects, 1969-1971 . 174
53 Project Data Table--University of Kansas Project A,
Cohort I, Kindergarten Entering: Two-Year Effects,
1969-1971 179
54 Project Data Table--University of Kansas Project B,
Cohort I, Kindergarten Entering: Two-Year Effects,
1969-1971 181
55 Project Data Table--University of Kansas Project R,
Cohort I, Kindergarten Entering: One-Year Effects, ,
1969-1970 182
xiv

$
ri6 Project Data Table--University of Kansas Project C,
Cohort I, Kindergarten Entering: Two-Year Effects,
1969-1971
Project Data TableUniversity of Kansas Project C,
Cohort I, Kindergarten Entering: One-Year Effects,
1969-1970
ate University of Kansas Summary; Cohort I, Kindergarten
Entering Projects: Two-Year Effects, 1969-1971
184
185
,,187
9 Project:Data TableHigh/Scope Project C, Cohort I,
Kindergarten Entering: Two-Year Effects, 1969-1971 . .
60 Project Data Table -=High /Scope Project B, Cohort I,
_Entering First Grade: Two-Year Effects, 1969-1971 . . 194
61 Project. Data TableHigh/Scope Project B, Cohort
Entering First Grade: One-Year Effects, 1969-1970 . 195
k32 Project. Data TableHigh/Scope Project A, Cohort I,
Entering First Grade: TWo-Year Effects, 1969-1971 197
63 Project Data Table- -High /Scope Project A, Cohort I,
Entering. First Grade: One-Year Effects, 1969-1970 .
61 Project. Data Table -- University of Florida Project A,
Cohort I, Kindergarten Entering: Two-Year EffeCts,
1969-1971 204
198
65 Project Data Table--University of Florida Project A.,
Cohort II, Kindergarten Entering: One-Year Effects,
1970-1971. 206
66 Project Data 'fabler- University of Florida Project C,
Cohort I, Kindergarten Entering: Two-Year Effects,
1969-1971 209
67 Project Data Table -- University of Florida Project C,
Cohort I, Kindergarten Entering: One-Year Effects,
1969 -1970 210
68 Project Data Table -- University of Florida Project B,
Cohort I, Entering First Grade: Two-Year Effects,
1969-1971 212
69. Project Data TableUniversity of Florida Project B,
Cohort IT, Entering First. Grade: One-Year Effects,
1070-1971
xv
214
70 University of Florida Summary, Cohort I,
Kindergarten Entering Projects: Two-Year
Effects, 1969-1971
71 Project Data Table--Educational DoVelopment Center
Project C, Cohort I,, Kindergarten Entering: Two-Year
Effects, 1969 -1971
217
222
72 Project Data Table--Educational Development Center
Project C, Cohort I, Kindergarten Entering: One-Year
Effects, 1969-1970 224
73 Project Data Table--Educationa Development Center
. Project B, Cohort I, Kindergart n Entering: Two-Year
Effects, 1969-1971
74 Project Data Table--Educational Development Center
Project B, Cohort I, Kindergarten Entering: One-Year
Effects, 1969-1970
75 Project Data Table--Educational Development Center
Project B,.Cohort II, Kindergarten Entering: One-Year
Effects, 1970-1971
76 Project Data Table--Educational Development Center
Project A, Cohort I, Entering First Grade: Two-Year
Effects, 1969-1971
77 Project Data Table--Educational Development Center
- Project A, Cohort I, Entering First Grade: One-Year
Effects,'1969-1970
78 EduCational Development Center Summary, Cohort I,
'Kindergarten Entering Projects: Two-Year Effects,
1969-1971 234
226
228
229
231
232
79 Project Data Table - -New York University Project A,
Cohort I, Kindergarten Entering: Two-Year Effects,
1969-1971 240
80 Project Data Table--New York University Project A,
Cohort II, Kindergarten Entering: One-Year Effects,
1970-1971 242
81 Project Data Table--New York University Project B,
Cohort I, Kindergarten, Entering: Two-Year Effects,
1969-1971 244
82 New York University Summary, Cohort I, Kindergarten
Entering Projects: Two-Year Effects, 1969-1971 . . .
xvi
246

83 Project Data Table--Southwest Educational Development
Laboratory Project, Cohort I, Kindergarten Entering:
Two -Year Effects, 1969-1971 249
84 Project Data Table- -Self Sponsored Project A, Cohort I,
Entering First Grade: Two-Year Effects; 1969-1971 . . . 255
85 Project Data Table--Self Sponsored Project A, Cohort I,Entering First Grade: One-Year Effects, 1969-1970 . . .
86 Project Data TableSelf Sponsored Project B, Cohort I,Kindergarten Entering: Two-Year Effects, 1969-1971 . . . 258
87 Project Data Table--Self ponsored Project B, Cohort I,
Kindergarten Entering: On -Year Effects, 1969-1970 . . . 260
257
88 Project Data Table7-Self SpOnsored Project C, Cohort I,
Kindergarten Entering: Two -Fear Effects, 1969-1971 . . . 261
89 Project Data Table--Self SponSored Project C, Cohort I,
Kindergarten Entering: One-Year Effects, 1969-1970 . . . .263
90 Project Data Table--Self Sponsored Pr ect D, Cohort I,
Kindergarten Entering: Two-Year Effects, 969-1971 . . .264
91 Project Data Table--Self Sponsored Project D, sort I,
Kindergarten Entering: One-Year Effects, 1969-19. . . 266
92 Project Data Table-7Self Sponsored Project E, Cohort I,
Kindergarten Entering: Two-Year Effects, 1969-1971 . . . 267
93 Project Data Table--Self Sponsored Project E, Cohort I,
Kindergarten Entering: One-Year Effects, 1969-1970 . . . 268
94 Project Data Table--Parent Implemented Project, Cohort I,
Kindergarten Entering: Two-Year Effects, 1969-1971 . . . .270
95 Project Data Table--Parent Implemented Project, Cohort I,
Kindergarten: One-Year Effects, 1969-1970 . . ...... 272
96 Summary of Interim Effects for Cohort I, Kindergarten . 276
97 Summary of Interim Effects for Cohort II, Kindergarten
(One-Year Outcomes) 277
98 Summary of Interim Effects for Cohort I, Entering First .\ 278
99 Summary of Interim Effects for Cohort II, Entering
First (One-Year Outcomes) 279
100 Frequency of "Good," "moderate," and "Poor" FT/NET
Matches, Based on Baseline Differences for the Seven
Match Variables 285
xvii
101 Frequency an( Proportion of FT-Favoring Outcomes for
the Cohort Samples as a Function of FT/NFT Match
Quality 286
102 T)istribution of Classrooms in the C'ssroom
Observation Sample 298
103 Interproject Differences Within Sponsor Categories
for Factor Scores 300
104 Proccss Variables that Differentiate Between FT
and NFT Classrooms 301
105 Observed Sponsor Differences for Certain Classroom
Process Variables 306
A-1 Classroom Means Obtained for Pre-Post Identic Subgroups
Versus Total classroom Populations on Baseline and
Outcome Measures A-9
A-2 Percent of Missing Data for Each Class of Variables
A-3
for Each of the Analysis Groupings
Average Power Values for Planned Comparisons with
Various Dependent Variables
1 -10
A-21
A-4 Adjusted Parent Outcomes Obtained by Means of ANCOVA
Versus Indirect Standardization Procedures: Cohort
Kindergarten
I,
A-31
A-5 Adjusted Parent Outcomes Obtained by Means of ANCOVA
Versus Indirect Standardization Procedures: Cohort
Enterinc, First
I,
A-32
A-6 Adjusted Parent Outcomes Obtained by Means of ANCOVA
Versus Indirect Standardization Procedures: Cohort
Kindergarten
II,
A-33
A-7 Adjusted Parent Outcomes Obtained by Means of ANCOVA
Versus Indirect Standardization Procedures: Cohort
Entering First
II,
A-33
B-1 Test Statistics and Reliability Data for Dependent
Variables and Components in the Follow Through
Cognitive Test Battery B-4
B-2 Item Analysis (Difficulty and Variance) for Contents
of the 1971 Follow Through Pupil Test Battery:
Cognitive Variables B-7

B-3 Cohort I, Kindergarten, Regression on Control Variables:
Pupil Outcomes for Project Analyses (N = 330, Residual
df = 258)
B-4 Cohort I, Kindergarten, Regression on Control Variables:
Disaggregatcd Achievement Pupil Outcomes for Project
Analyses (N = 330, Residual df = 258)
B-5 Cohort I, Kindergarten, Regression on Control Variables:
PIrent Outcomes for Project Analyses (N = 296, Residual
di = 236)
B-18
B-19
B-20
B-6 Cohort I, Kindergarten, Regression on Control Variables:
Teacher Outcomes for Project Analyses (N = 195,
Residual df = 146) B-21
B-7 Cohort I, Entering First, Regression on Control
Variables: Pupil Outcomes for Project Analyses
(N = 123, Residual df = 50) 13-22
3-8 Cohort I, 7,ntering First, Regression on Control
Variables: Disaggregated Achievement Pupil Outcomes
for Project Analyses (N = 123, Residual df = 85) B-23
B-9 Cohort I, Entering First, Regression on Control
Variables: Parent Outcomes for Project Analyses
= 105, Residual df = 77) 13-24
B-10 Cohort I, Entering First, Regression on Control
Variables: Teacher Outcomes for Project Analyses
(N = 63, Residual df = 41) B-25
B-11 Cohort II, Kindergarten, Regression on Control
Variables: Pupil Outcomes for Project Analyses
(N = 51, Residual df = 19) B-26
B-12 Cohort II, Kindergarten, Regression on Control
Variables: Disaggregated Achievement Pupil Outcomes
for Project Analyses (N = 51, Residual df = 19) B-27
B-13 Cohort II, Kindergarten, Regression on Control
Variables: Parent Outcomes for Project Analyses
(N =-46, Residual df = 24) B-28
B-14 Cohort II, Kindergarten, Regression on Control
Variables: Teacher Outcomes for Project Analyses
(N = 19, Residual df = 4)
xix
B-29

B-15 Cohort II, Entering First, Regression on Control
Variables: Pupil Outcomes for Project Analyses
= 31, Residual df = 8) 13-30
B-16 Cohort II, Entering First, Regression on Control
Variables: Disaggregated Achievement Pupfl. Outcomes
for Project Analyses (N = 31, Residual df = 8) B-31
B-17 Cohort II, Entering First, Regression on Control.
Variables: Parent Outcomes for Project Analyses
(N = 24, Residual df = 10) B-32
B-18 Cohort II, Entering First, Regression on Control
Variables: Teacher Outcomes for Project Analyses
= 27, Residual df = 12) B-33
xx
ACKNOWLEDGMENTS
A program of the scope and complexity of Follow Through is critically
dependent on the cooperative efforts of a vast number of people. We wish
we could appropriately acknowledge the contributions of each such indivi-
dual, but because of space limitations we cannot. We do, however, wish
to acknowledge the following individuals and groups who have contributed
to the Follow Through program and its evaluation.
First, we extend our sincere gratitude to the piipils and parents,
whose cooperation has been vital in collection of evaluation data. Special
thanks are also due to local Policy Advisory Committee members and chair-
men, to Follow Through directors, and to teac:Iers and other staff--both
Follow Through and non-Follow Through--whose assistance made possible the
collection of data. Moreover, the Follow Through sponsors and their staffs.
warrant special thanks for their cooperation and counsel.
We cannot name all the staff associated with the FolloW Through pro-
gram in the Office of Education who have been responsible for planning
and managing Follow Through as a national program. We are grateful toMr. Richard Fairley, Director of Compensatory Education, Ms. Rosemary
Wilson, Director of Follow Through, and especially to Dr. Garry McDaniels,
Chief of Research and Evaluation for Follow Through, under whose management
and/support this report was prepared. We also recognize and are apprecia-
tiVe of the contributions and assistance provided by members of Dr. Mc-
Daniels' staff in resolving the complex and manifold administrative prob-
lems encountered in this project.
Special recognition is due Dr. Robert Egbert, previous director of
Follow Through (through June, 1971) and Dr.- Richard Snyder, Chief of Re-
search and Evaluation, who originally established the research potential
of Follow Through.
We also wish to acknowledge the advice and assistance of technical
consultants to the Follow Through evaluation staff. These consultants
included Dr, Marshall Smith, Dr. Sheldon White, and Ms. Jane David of the
Huron Institute, Dr. Andrew Porter of Michigan State University and
Dr. Gilbert Krulee of Northwestern University.
xxi
Many persons have served as consultants to SRI throughout the period .
covered by this report. We are particularly grateful fo:. the advice and
assistance provided by Dr. Leon Festinger, Dr. Robert Hess, Dr. Eleanor
Maceoby, and Dr. Merle Wittrock. W,: are particularly grateful for the
advice and assistance provided by Dr,. David E. Wiley regarding the sta-
tistical analysis of These interim data. Further special gratitude is
extended to Dr. Ralph Hakstian, 1)r. S. Jay Samuels, and Dr. James M.
Royer, each of whom contributed in crucial ways to the interpretation of
results and overall organization of this report.
The Follow Through evaluation project is under the administrative
supervision of Mr. Harvey Dixon, Executive Director of the Urban and
So-j,a1 Systems Division. Dr. Philip Sorensen, Director of Education
Res .arch, and Dr. William Madow, Director of Mathematical Statistics,
col:Jporated as project leaders until recently; Mr. Richard Marciano,
AssiL-tant Director of Education Research, serves currently as project
leader.
Although the SRI Follow Through Evaluation represents the consoli-
dated efforts of a very large professional, technical and clerical staff,
certain key members assumed major responsibilities in completing the re-
search for this report. Very snecial recognition and gratitude is due
Dr. W. Lee Ruggles for his invaluable assistance in developing and imple-
menting the interim data analyses. Gratitude is also expressed to
Mr. Michel Rogson and his programming staff for their assistance in
executing the complex data preparations and computer processing. Ap-
preciation is extended to Dr. Jane-Stallings and her staff for developing
the classroom process variables, to Mr. S. Stephen Oura for desielOping,
project descriptor information, and to Mr. C. David Beers for developing
the descriptions of the sponsor approaches. Finally, sincere thanks to
Ms. Susan Peterson, and Ms. Dorothy Stewart for their diligent research
assistance in the preparation, revisions and completion of this report,
and to Ms. Trudy Hammerling for her excellent secretarial assistance.
Listed below are SRI professional staff who devoted full time, or
nearly so, to tr Follow Througl, project during'all or part of the period
from July 196'_ through June 1971 or, if they were not part of the staff
during that period, contributed to the analyses presented in this report.
Leland Anderson, M.S. Sylvia Jeans, M.A. Stephen Dora, M.A.
Arthur Atkinson-Hager, B.A. Yolanda Jenkins, M.A. Gertrude Peterson,
Philip Baker M.A. Kenneth Jonec., M.A. Susan Peterson, D.A. j4
Elouise Banks, M.A. Peter Karzmark, M.A. George Posey, B.A.
DaVid Beers, M.A. David Kaskowitz, M.A. Kathryn Preecs, B.A.
Robert Bergquist, B.A. Diana Kirk, B.A. Ray Rhine, Ph.D.
Dorothy Booth, M.A. Andrew Kolstad, M.A. Michel Rogson, M.S.
John Bosley, Ph.D. Karen Lee, M.A. Lee Rugtels, Ph.D.
Alan Bridges, M.A. Joan Lewis, B.A. Vivian Sherman, Ph.D.
Robert Campana, B.A. ) Irene Longwell, D.S Glenn Sherwood, A.A.
Margaret Carrpll, B.A:' Jean Lotridge, B.A. Philip Sorensen, Ph.D.
Stanley Crockett, Ph.D. Alan Lunemann, D.A. Jane Stallings, Ph.D.
Jay Cross, M.A. Charles McCarty, M.D.A. Marian Stearns, Ph.D.
Lorraine Cruz. A.A. Alix McClary, B.A. Gerald Steinmetz, M.A.
Daryl Dell, Ed.D. William Madow, Ph.D. Dorothy Stewart, B.S.
Harvey Dixon, M.S. Richard Marcinno, A)11, Fredric Sykes, D.A.
John Dohme, Ph.D. Gary Glen Vaughan, B.A.
John Emrick, Ph.D. Gloria Marshall, M.A. Jane White, B.A.
Phillip Giesen, M.A. Elijah Mason, B.A. Virginia Wiegand, Ph,D.
Patricia Gillespie, B.A. Marsha Moseley, M.A. Mary Wilcox, Ph.D.
Georgia Gillis, B.A. Jeanne Moulton, B.A. Allan Williams, M.S.
Martin Gorfinkel, M.S. Margaret Needels, 3.A., Elizabeth Willis, B.A.
Dominic Guidici, B.S.M.E, Carl Negus, B.A. Anise Wright, M.A.
Phyllis Hamilton, B.A. Charles Norwood, M.A.,M.S. Grace Wright, B.A.
Edward Jackson, M.A. Ellen Ohmer, B.A.
EXECUTIVE' SUMMARY
The current report describes the results of an interim evaluation of
selected aspects of the Follow Through program. Congress authorized Follow
Through in 1967 under an amendment to the Economic Opportunity Act to pro-
vide comprehensive health, social, and educational services for poor chil-
dren in primary grades who had experienced Head Start or an equivalent
preschool program. The enabling legislation anticipated a large-scale
service program, bu appropriations did not match this'vision. Accord-
ingly, soon after its creation, Follow Through became a socio-educational
experiment, employing educationai innovators to act as. sponsors of. their
own intervention programs in different school districts throughout theUnited States. This concept of ,different educational improvement models
being tried in various situations was called "planned variation."
The evaluation of Follow Through is the evaluation of the effective-
ness of the sponsored educational models as they are implemented in variousschool districts. School districts are recommended for partioipation by
state education officials and are awarded grants by the U.S. Office of
clucation.- School communities choose a model from among those'offered bysponsors. These sponsored educational prziagrams represent the only dis-
tinct part of the experimental treatment. Parent advisory committees and
nutrition, medical, dental, and social service components must be present
in every Follow Through program, but they are not specified by type.
Evaluation of the Follow Through program consists primarily of determining
which approaches are effective in achieving a specified set of educational
objectives for children and a variety of changes in parent-school relations.
The SRI evaluation of the impact and effectiveness of Follow Through,
both as an overall program and as a collection of diverse "treatments" with
varying goals and emphases, has been approached at a number of levels. In
part, the evaluation was designed to answer policy relevant questions,
such as the following:
Are any approaches having positive impact on children, parents,
school, and community?
Which approaches appear most effective and under what condi-,
tions?
XXV
At another level, the evaluation seeks to discover in what ways and to
what extent planned variations in approaches are occurring. At
another level, the evaluation seeks to develop useful data and to advarf-e
the state of the art regarding research on large-scale, nonexperimental
social intervention programs, such as Follow Through.
Design of the Evaluation
The basic design for longitudinal evaluation of Follow Through, on
which this interim report is based, is summarized as follows:
(1) A set of projects that have had at leaSt one year's experi-
ence with a sponsored Follow Through approach are sampled
for participation in the national evaluation. This sam-
pling process is based on criteria such as participation
in Head Start.planned variation, ethnic or minority group
representation, representation of different sponsor
approaches, and regional and community characteristics.
(2) For each school participating in the Follow Through experi-
ment, a comparable school in the same district that is not
receiving a Follow Through grant is recruited to serve as
the non-Follow Through comparison group. A Follow Through
(FT) school, or group of classrooms, operating in accor-
dance with a sponsor's "model" and the non-Follow Through
(NFT) comparison classrooms define a Follow Through project.
Within each project, five'categories of mearements'areobtained: pupil classroom dejnographies; cognitive and
noncognitive pupil measures; parent interviews; teacher
responses to questionnaires; and project and communitydescriptors. An additional category of measures--classroom
observation processes--are collected on a limited number
of Follow Through and non-Follow Through classrooms.
(4) The original SRI evaluation plan called for collection of
all maior categories of measures durifig the beginning
period for each annual group of participants--or cohort- -
and-at specified successive time points, generally at the
end of each grade year.
Due to administrative difficulties, collection of baseline measure-ments for Cohort I samples was not completed until. December 1969, creating
xxvi
serious analysis problems for evaluation of program impacts on this co-
hort. Cohort II ineasures, however, were gathered well within the intended
baseline interval (second to fourth week following commencement of school).
Parent interviews were to be limited to two times--once in the initial
year and again at the end of Third Grade. Since the Follow Through ex-
periment provided for four years of "treatment" for kindergarten cohorts
(three years for children entering at the first grade), .and since there
were to be four successive cohorts-, a total of 16 evaluation points
existed In this plan. Subsequent modifications required reducing the
size of the evaluation samples that were included in intermediate testing,
although the total plan includes 16 evaluation points.
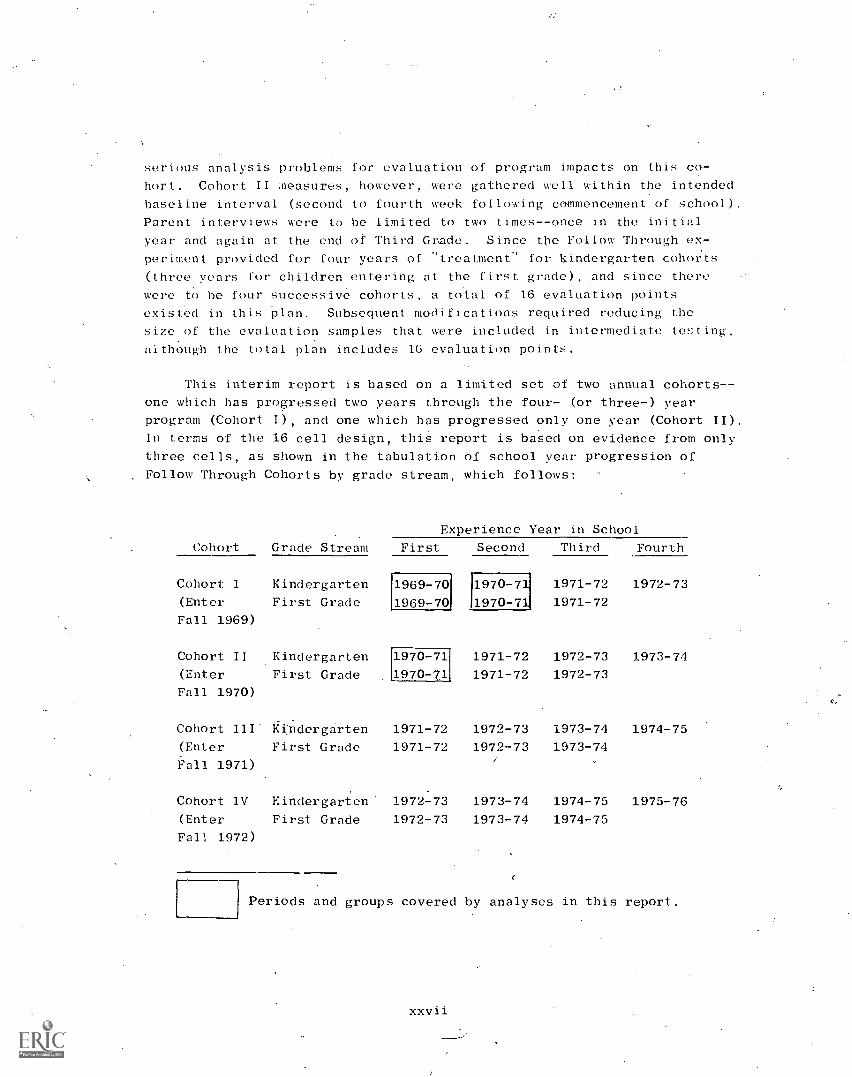
This interim report is based on a limited set of two annual cohorts- -
one which has progressed two years through the four- (or three-) year
program (Cohort I), and one which has progressed only one year (Cohort II).
In terms of the 16 cell design, this report is based on evidence from only
three cells, as shown in the tabulation of school year progression of
Follow Through Cohorts by grade
Cohort Grade Stream
stream, which follows:
Experience Year in School
First Second Third Fourth
Cohort I Kindergarten 1971-72 1972-731969-70 1970-71(Enter First Grade 1969-70 1970-71 1971-72
Fall 1969)
Cohort II Kindergarten 1970-71 1971-72 1972-73 1973-74
(Enter First Grade 1970-71 1971-72 1972-73
Fall 1970)
Cohort III. Kindergarten 1971-72 1972-73 1973-74 1974-75
(Enter First Grade 1971-72 1972- -73 1973-74
Fall 1971)
Cohort IV Kindergarten 1972-73 1973-74 1974-75 1975-76
(Enter First Grade 1972-73 1973-74 1974-75
Fall 1972)
Periods and groups covered by analyses in this report.
The evidence of program impact was 'developed from systematic organi-
zation:of baseline measurements (taken at entrance to the program) and
progress measurements (taken 2t the end of each school year) into out-
come, process, and control variables. Three classes of outcome measures
or evaluation foci were generated: child, parent, and teacher.
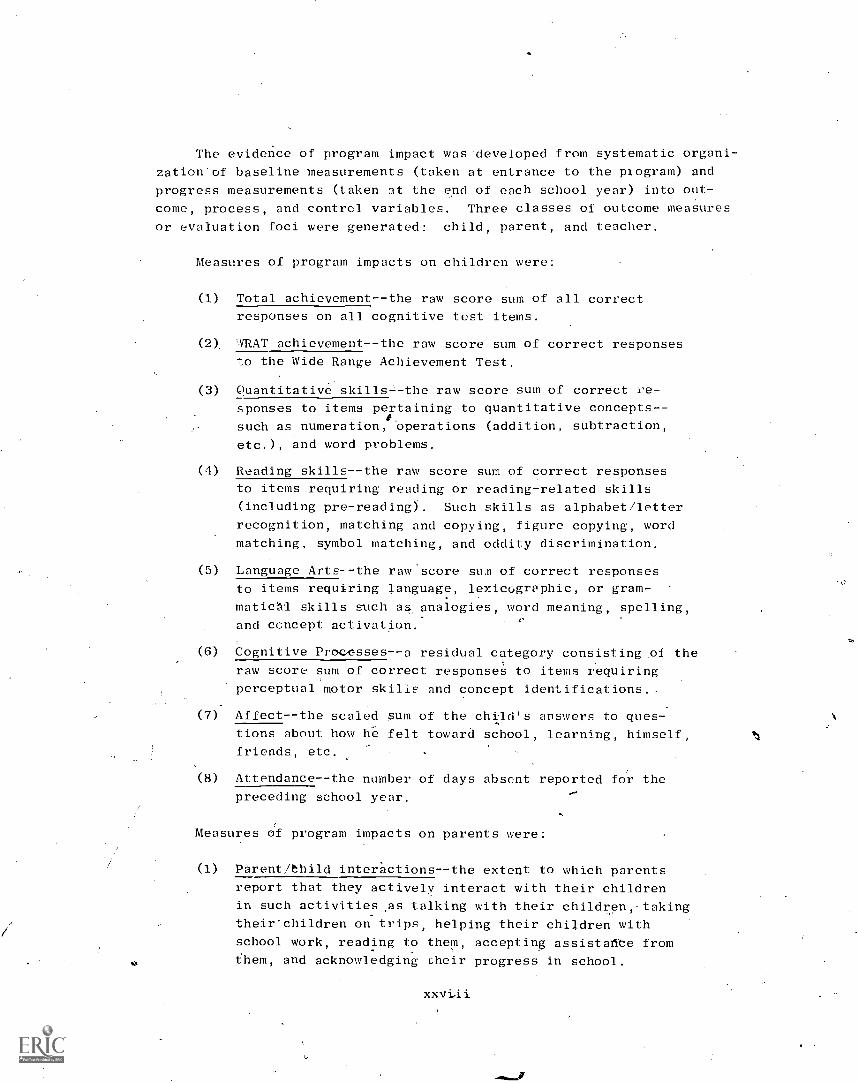
Measures of program impacts on children were:
(1) Total achievement--the raw score sum of all correct
responses on all cognitive test items.
(2) WRAT achievement--the raw score sum of correct responses
to the Wide Range Achievement Test.
(3) Quantitative skills-the raw score sum of correct re-
sponses to items pertaining to quantitative concepts- -
such as numeration, operations (addition, subtraction,
etc.), and word problems.
(4) Reading skills--the raw score sum of correct responses
to items requiring reading or reading-related skills
(including pre-reading). Such skills as alphabet/letter
recognition, matching and copying, figure copying, word
matching, symbol matching, and oddity discrimination.
(5) Language Arts-,-the raw score sum of correct responses
to items requiring language, lexicogryphic, or gram-
matiOil skills such as analogies, word meaning, spelling,
and ccncept activation.
(6) Cognitive Processes - -a residual category consisting of the7
raw score sum of correct responses to items requiring
perceptual motor skills and concept identifications.
(7) Affect--the scaled sum of the child's answers to ques-
tions about how he felt toward school, learning, himself,
friends, etc,
(8) Attendance--the number of days absent reported for the
preceding school year.
Measures of program impacts on parents were:
(1) Parent/thild interactions--the extent to which parents
report that they actively interact with their children
in such activities as talking with their children,- taking
their'children on trips, helping their children with
school work, reading to them, accepting assistafte from
them, and acknowledging cheir progress in school.
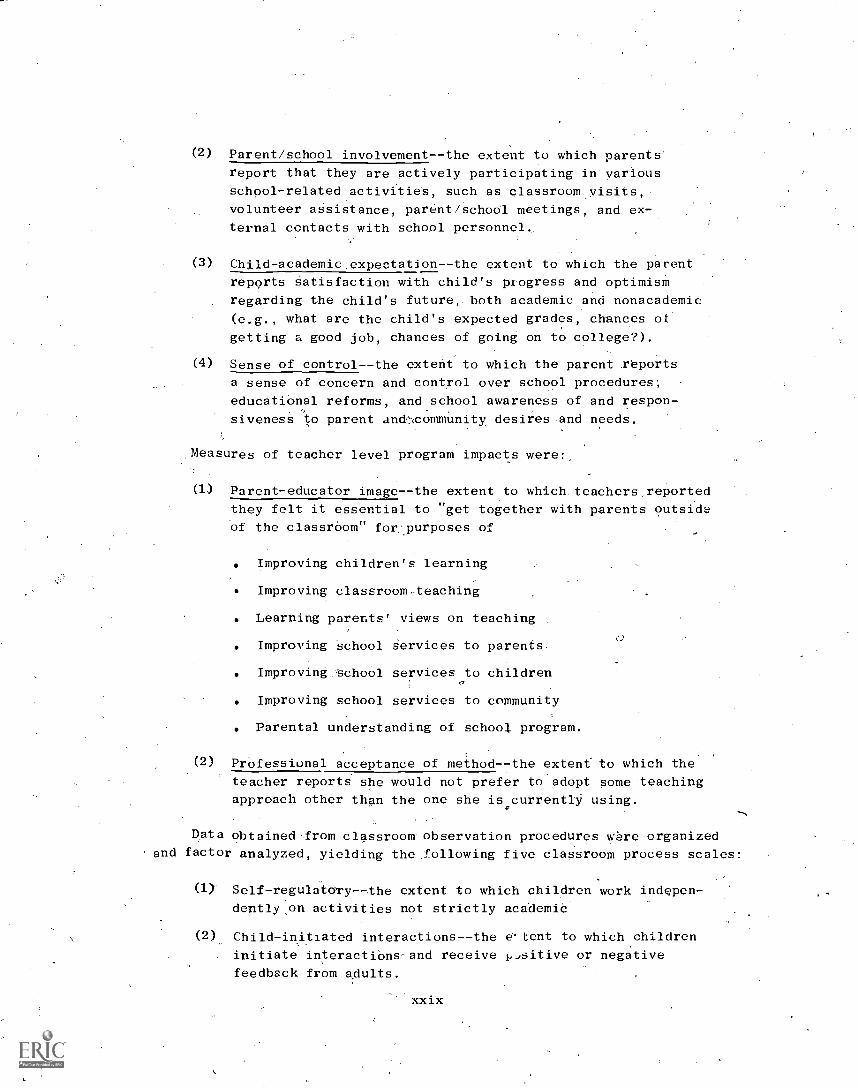
(2) Parent/school involvement--the extent to which parents'
report that they are actively participating in'various
school-related activities, such as classroom visits,
volunteer assistance, parent/school meetings, and ex-
ternal contacts with school personnel.
(3) Child-academic.expectation--the extent to which the parent
reports satisfaction with child's progress and optimism
regarding the child's future,. both academic and nonacademic
(e.g., what are the child's expected grades, chances of
getting a good job, chances of going on to college?).
(4) Sense of control--the extent to which the parent reports
a sense of concern and control over school procedures;
educational reforms, and school awareness of and respon-.
siveness to parent and4:,community desires and needs.
Measures of teacher level program impacts were:,
(1) Parent-educator image--the extent to which teachers,reported
they felt it essential to "get together with parents outside
of the classroom" for. purposes of
Improving children's learning
Improving classroom-teaching
teaching
to parents.
to children
to community
Parental understanding of school program.
Learning parents' views on
Improving school services
Improving school services
Improving school services
C.)
(2) Professional acceptance of method--the extent to which the
teacher reports she would not prefer to adopt some teaching
approach other than the one she is currently using.
Data obtained from classroom observation procedures ware organized
and factor analyzed, yielding the following five classroom process scales:
(1) Self-regulatory--the extent to which children work indepen-
dently,on activities not strictly academia
(2) Child- initiated interactions--the extent to which children
initiate interactions-and receive 1.-,sitive or negative
feedback from adults.

(3) Programmed academicthe extent to which adults teachsmall. groups of children by highly structured question-
response-reinforcement interactions.
(4) Expressive--the extent to which positive and negative
affect was expressed by both children and adults.
(5) Child self-learning--the extent to which children workalone with books or seat-work materials.
Hypothes,-Js regarding program impacts on each of these evaluation
foci were formulated at several levels: overall and by individual
approaches in terms of duration of treatment (one year or two years) and
in terms of successive cohort experiences (C-I. or 0-II). Classroomsdefined the units of analysis for assessment of effects and hypotheses
tests, and classroom scores were composed of the scores of only thosepupils for whom both pre- and post-measurement data were
Parent data from classroom grouped pupils were similarly grouped, Wherenecessary, certain missing values were imputed from school and project
means,
Four basic analysis gr6ups were created, corresponding to cohorts
and entrance points withinzohorts. These groups-are Cohort I-K (kinder-garteners entering FT in Fall, 1969), Cohort I-EF (first graders, in
schools without kindergarten, entering FT in Fall, 1969), Cohort II-K
(kindergarteners entering FT in Fall, 1970), and Cohort II-EF (first
graders in schools without kindergarten entering FT in Fall, 1970).
%.".'* Cohort I data were further organized into. oone-year effects (1969-1970)
and two -year effects (1969-1971) subsets.
The basic statistical procedure for analysis og program effects was
fixed effect's one -way analysis of covariance (ANCOVh), with planned.vari-
ations defining the treatment"variable. Separate but parallel ANCOVAS
were performed on project level and sponsor level treatment groupings.
These analyses were conducted separately on each data grouping (cohort
and grade stream) and for each set of outcomes Ipupil, parent, and
teacher). Individual project results were obtained by means of planned
comparisons (linear contrasts) of corresponding FT with NFT,subgroups.
Summar' of Significant Prb ram Impacts
Significant FT-favoring results of the analyses conducted on'these
interim data are summarized separately for each sponsOr. That is, inthis summary, only the significant (p4(.05)_ results in favor.of the Follow
Through group-are reported. The complete results,, as presented in the
xxx

text, are far too complex and extensive to report adequately in this
summary. We have concentrated on presenting FT-favoring findings be-
cause we assumed they would be of principal interest.
The results of pupil outcomes are reported separately for the analy-
sis of two-year and one-year data. Since parent impacts are measured
during the first year of the child's participation in the program and
since teacher impacts are the results of the most recent teacher survey,
these results are not .3ummarized separately by cohorts.
The Far West Model (FW): The Responsive Educational Program
Seven project samples were included in the analysis of interim effectsfor the Far West Laboratory approach. Analyses of two-year data showsignificant FT-favoring pupil differences on the quantitative skills
measure; analyses of one-year data show FT-favoring pupil differences on
the cognitive processes measure. Significant parent impacts were noted
on the parent/child and parent/school interaction measures. No signifi-
cant FT-favoring teacher impacts were noted.
The University of Arizona Model (UA): The Tucson Early Education
Model
Five project samples were included in the analyses of interim effects
for the University of Arizona approach. Analyses of one7year data show
FT-favoring pupil dif)ferences bn,the affect measure only. Significant
parent impacts were noted on the parent/school involvement measure, and
significant teacher impacts were noted on the acceptance of method measure.
Bank Street Model (BC): The Bank Street College of EducationApproach /
Seven project samples were included in the analyses of interim effects
for the Bank Street approach. Analyses of two-year data show significant
FT-favoring pupil differences on the quantitative skills and cognitive
processes measure. Analyses of one-year data show FT-favoring pupil dif-
ferences on overall achievement, on the WRAT measure, and on the reading
and language/arts subscores. Significant parent impacts were voted on
the parent/child interaction measure, and significant teacher impacts were
noted on the acceptance of method measure.

The University of Georgia (UG): The Mathemagenic Activities
Program
A single project sample for the University of Georgia was included
in the analyses. No FT-favoring significant differences were noted on
outcome measures, but since this project was in its initial implementa-
tion year (first year of affiliation) with the model, no evaluation con-
clusions are appropriate.
The University of Oregon Model (U0): The University of Oregon
Engelmann/Becker Model for Direct Instruction
Seven project samples were included in the analysis of interim
effects of the University of Oregon approach. Analyses of two-year data
show significant FT-favoring pupil differences on the attendance measure.
Significant one-year effects were noted on the overall a hievement mea-
sure, attendance measure, and the WRAT measure. Significant parent im-
pacts were noted ')11 the parent/child interaction measure, and significant
teacher impacts were noted on the acceptance measure. Substantial analysis
problems were encountered with these project data due to non-equivalence
of treatment and comparison groups.
The University of Kansas (UK): The Behavior Analysis Approach
Three projects were included for analyses of interim effects from
the University of Kansas approach. Analyses of one-year data show sig-
nificant FT-favoring pupil differences on the achievement and WRAT mea-
sures and on the quantitative and reading skills measures. No other FT-
favoring differences reach significance for this model. Substantial
analysis problems were encountered with these project data due to non-
equivalence of treatment and comparison groups.
"High/Scope (HS): The Cognitively Oriented Curriculum Model
A total of three project samples were included in the analyses of
interim effects for this model. Analyses of two-year data show signifi-
cant FT-favoring pupil differences en 'affect and attendance. Analyses
of one-year data showFT-favoring differences on affect only. Significant
parent impacts were noted in the parent/child, parent/school, and parent
Pxpectation measures. No significant FT-favoring teacher impacts were
noted. Substantial analysis problems were encountered withkthese project
data due to non-equivalence of treatment and comparison groups.
University of Florida (UF): The Florida Parent Education Model
Five project samples were included in the interim evaluation of the
University of Florida approach. Analyses of the two-year data show sig-
nificant FT-favoring pupil differences only on attendance. Analyses of
one-year data show FT-favoring pupil differences on the achievement mea-
sure, the WRAT measures, the affect measure, the quantitative skills
measure, the reading skills measure, and the language arts measure.
Significant parent impacts were noted on the parent/school interaction
measure, and significant teacher impacts were noted on the acceptance of
method measure.
The EDC Model (ED): The EDC Open Education Program
Four project samples were included in the interim evaluation of the
EDC model. Analyses of two-year data show significant FT-favoring pupil
differences on the quantitative skills measure. Analyses of one-year
data show significant FT-favoring pupil differences on attendance and on
cognitive processes. Significant parent impacts were noted on the parent/
school involvement measure, and significant teacher impacts were noted
on the parent image measure.
The NYU Model (NY): The Interdependent Learning Model
Three project samples were included in the interim evaluation of the
NYU model. Analyses of two-year data show significant FT-favoring pupil
differences on attendance and on the quantitative skills measure. Sig-
nificant FT-favoring one-year effects failed to occur. Significant
teacher impacts were noted on the acceptance of method. Significant
parent impacts failed to occur in these projects.
The Southwest Educational Development Model (SW): Language
Development (Bilingual) Approach
A single project was included in the evalua÷ion of the Southwest
model. Analyses of the two-year data showed significant FT-favoring,
pupil differences on the achievement measures, on the quantitative skills
measure, and on the reading skills measure. Significant parent or teacher
impacts failed to occur, although parents were significantly more satis-
fied with their child's progress.
Self-spor.:oied Models
In addition t2, sponsored projects, there are six projects from the
early group of-pilotreceding the planned variation phase of FollowThrough who elected to remain unsponsored (the only projects included in
this interim evaluation which exercised this option). They are classified..
as self-sponsored or parent-implemented and have instituted programs they
themselves have developed. Analyses of two-year data show FT-favoring
pupil differences on the achievement and WRAT measures, on attendance, on
quantitative skills, and on reading skills. Significant one-year effects
Were observed on affect, on achievement, on quantitative skills, and on
language arts. Significant parent impacts were noted on the parent/child
interaction patterns and on parent/school involvement. Significant teacher
impacts were noted on the acceptance of method measure.
Again, the reader is cautioned that the above paragraphs summarize
only the significant FT-favoring results. A more complete presentation of
findings and fileir interpretations can be found in the text of this report
Process Indicators of Follow Through Treatments
The five classroom process scales (factor scores) were qualitatively
'analyzed in conjunction with project impact data. These analyses tended
to show (a) FT classroom activities do tend to correspond with sponsor
emphases, (b) clear distinctions between FT and NFT classroom activities
occur, and (c) patterns of activities (factor score profiles) are reason-
ably consistent among project employing the same models. These inter-,
pretatiens, however, are based only on qualitative analyses of process
score profiles.
More detailed and rigorous analyses conducted on the discrete vari-
ables generated from the observation instruments displayed reliable Otrer-
all FT/NFT differences primarily on components related to the presence of
several adults in the classroom. This result is important, since a favr-
able adult/child ratio is a necessary condition for the implementation of
many critical features of the planned variations (or critical components\
of the treatments). Additional analyses showed, to some extent, predict-'
able rank ordering of the planned variatiomi on many of the discrete
observation variables.-
This evidence, talc, a together, suggests the following interpretations.
(1) Sponsored approaches do differ discernibly from one another
on many process variables.
(2) Processes characteristic of various Follow Through approaches
predictably depart from characteristics observed in non
Follow Through classrooms on many process variables.
(3) Analysis of factor scores and of discrete variable scores
presents strong evidence of instructional activities and
components that correspond well with, descriptions of in-
.tended approaches, thus_ validating in part the concept of
planned variations in FT treatments.
Overall Results
Overall interim results were analyzed both in terms of average proj-
ect results by grade stream within cohort and in terms of percentage and
frequency of FT-favoring outcomes in relation to the quality of comparisongroup match. Average project results are slightly in favor of Follow-
Through for Cohort I-K, two-year pupil outcomes, and comparison of one-
and two-year results show two-year effects as systematically greater.
Cohort I-EF on the other hand, displays a slight NFT-favoring trend on the
two-year pupil outcomes, and comparison of o 'he- and two-year results showssecond year deficits for FT. Cohort II average effects all tend to favor
Follow Through, although the differences are greater for the enteringfirst grade group than for the kindergarten group.
With the exception of the child academic expectation and parent image
measures results on parent and teacher measures tended to show positive FT
impacts regardless of cohort. The image and expectation measures tended.to indicate negative impacts, Further investigation is needed to uncoverreasons for these reversals.
Analyses of the frequency and proportion of FT-favoring results in
relation to the quality of the FT/NFT baseline match (good, moderate, or
poor, based on seven pupil/parent indicators) show a strong relationship
of outcomes to quality of match, particularly for Cohort-I data. Where
FT and NFT were well matched, results tend to show FTfavoring results.
Where the samples were poorly matched, results were generally NFT-favoring
(primarily beoause the initial mismatch is strongly biased - against the
FT group). Further, comparison of Cohort I results with Cohort II showS
program impact as systematically strong for the latter, suggesting a pro-gram maturation or improved implementation effect.
When these interim results were reviewed within the perspectiye of
the overall evaluation design, the likelihood of obtaining FT-favoring
pupil, parent, or teacher results appears to be associated with severalrather crucial evaluation parameters. In particular, the magnitude and
frequency of FT-favoring pdpil results appears related to:
xxxv
The relative comparability of families in the FT and NFT samples
within a project (quality of match). That is, as the quality of
the match improves, the frequency and proportion of FT-favoring
results also tend to improve. That bad matches tended to yield
NFT-favoring results is primarily because the initial biases were
extreme in favor of NFT, often suggesting that two separate popula-
tions were being compared.
The severity of impoverishment and disadvantagement relative to
the main-stream social structure. Projects in the most impoverished
communities showed some of the most dramatic gains, but these were
sometimes statistically unreliable and often confounded with com-
parison group problems. This trend may indicate the presence of
a type of floor effect, but more likely it is associated with major
differences in the social complexities of rural and urban com-
munities.
The amount of time the sponsor has had to refine and improve im-
plementation of his treatment. In general, first-year impacts
for 1970 samples (C-II) were stronger than for 1969 samples (C-I).
Although this trend is confounded by certain measurement difficul-
ties associated with the first-year, Cohort I data, the differences
appear large enough to support our interpretation.
The grade level of the pupils and the amount of time they spent
in the program. This interpretation is suggested by the fairly
regular cumulative trend observed for the Cohort I-K samples
(second-year effects were almost always stronger than first-year
effects). Also, the effects on Cohort II-EF samples (pupils in the
first grade) tended to ie larger than those on Cohort II-K samples.
These trends do not obtain for Cohort I-EF samples probably becausethe proportion of "good" matches in these samples was very low
(i.e., 14 percent for Cohort I-E versus 50 percent for Cohort 1-K).
When the four trends evident at this interim point are combined, it
appears'that Follow Through has most often been successful in projects
located in truly disadvantaged communities when there has been enough time
to implement the mgdel properly. In addition, the effects appear cul.aa-
tive, and impacts appear stronger at higher age levels.
Some Caveats
We wish to underscore the need for caution in generalizing the inter-
pretations of the results we have detected to date. Some major reasons
for this caution are as follows:
The samples on which these interim results are based are small,
certainly too small to allow us to isolate approaches that "work"
and approaches that do not. We can conclude that some changes
are taking place, but we do not yet know precisely what they are
or why they are occurring. At a more general level, the parent,
teacher, classroom observation. and community data indicate that
Follow Through is succeeding in measurably altering adult attitudes
and behaviors in the home, the srthool, and the community. Evidence
that these changes in adults are having impact on the children
is less marked and more variable, but results tend to indicate
positive effects on IT pupils. It is likely that in future analyses
In larger and more representative samples, evidence of program
impacts on pupil attitudes and achievements will be considerably
more marked.
In addition to the limitations impoSed by the relatively small
interim evaluation samples, we encountered complex problems of
missing data. These resulted from high attrition and, particu-
larly for Coilort I, inadequate baseline data. The magnitude of
these problems was greater than originally anticipated becauseof the unprecedented nature and scope of this research program.
And, although we now know how to cope with them, they restrict
our ability to generalize about findings for Cohort I samples,
and to a lesser extent about findings for Cohort II samples.
Since Follow Through is a quasi-experiment, the allocation of
treatments to projects and the allocation of units to treatment
or control conditions within projects were nonrandom. One con-
sequence of this nonrandbmness was that biases were introduced
into the design. The bias associated with the allocation of
treatments to projects may not be very serious. But the nonran-
doffiness within projects (i.e., systematic differences between FT
and NIT samples) occasionally has serious consequences. For
example, in some *projects, treatment and comparison groups were
very d fferent. Although such differences, are bound to occur in
quasi - Experiments for which control grotips are assembled post hoc,
they pisent serious obstacles to the interpretation of outcomes.
And whe:.-e comparison group biases are severe, we suspect they
invalidzte the results of analyses for the projects affected.
These problems (missing data, difference's between comparison:and
treatment groups, and too few classrooms per project) combine to
produce relatively ].ow statistical power in our analyses for'ef-
fects. To some extent this outcome was expected, since the U.S.
Office of Education made a conscious decision to concentrate data
collectiol: efforts at the entry grade (K or EF) and at the exit
grade (3) nd to devote less effort at the intermediate grades.

Nevertheless, we are quite likely failing to detect many
important program impacts at this interim point.
. As suggested above, a substantial number of program impacts are
evident in our analyses of interim data. Furthermore, we believe
that the true magnitude of the effects is probably somewhat greater
than detected by our analyses. But it is impyrtant to recognize
that even if the number of significant effects were strikingly
greater, we would still have difficulty interpreting how or why
such results occurred because, at present, our current knowledge
of the treatment is confined almost exclusively t9 the sponsors'
descriptions of them. We do have evidence from limited subsamples
on some of the characteristics of some proCesses. This qualitative
evidence indicates that classroom processes conform to these treat-ment descriptions. To interpret how and why results occur, we
now need clear operational statements of what a sponsor does when
he is installing and maintaining a ,project and how he does it,
. Finally, because of the complexity and_variety of the intervention.
approaches, or treatments, in the FT experiments, it is very likely
that many of the evaluation measures used were not uniformly ap-
propriate, sensitive, or relevant to varied objectives. Many
program objectives were probably overlooked in our asSessments.
The technology for evaluating large scale social programs is inits infancy. We believe that we have contributed substantially
to the advancement of this technology through our successful'and
unsuccessful experiences with evaluation instruments andTwocedures.Yet there remains much more tote learned.,
Section I
INTRODUCTION

Section I
INTRODUCTION
As originally authorized in the Economic Opportunity Act amendments
of 1967 (P.L. 90-22, Section 222), Follow Through (FT) was a program of
comprehensive services-including dental, medical, 'and nutritional ser-
vices; an instructional program;:and psychological counseling, all with
parental and community participation--for disadvantaged children in the
primary grades of schools throughout the nation. As part of the war on
poverty, Follow Through was conceived as an extension of Head Start when
that preschool program, by itself, did not seem to promote enduring de-
velopmental gains (Wolff and Stein, 1966). In contrast to the notion
that intervention programs should begin with Still younger children (a
notion that led to the development of the Parent Child Centers), Follow
Through was based on the assumption that a sustained, multifaceted inter-,
vention that demands participation from the parents and community as well
as the child7, throughout the child's primary years, would contribute most
to breaking the "cycle of poverty."
Underlying all of the complementary programs (i.e., Parent Child
Center, Head Start, Follow Through, and other poverty and compensatory
education programs) were some major theoretical shifts in view toward
social serv4ces. One was the change from viewing poor persons and minor-
ity persons as inferior individuals responsible for their own position
to viewing tnem as victims of a system and blaming environmental factors,
the subculture, or the-societal institutions for failing to provide equal
opportunities', for success. Giving poor communities and minority groups
more real power to control their own environment (by changing institutions
such as the elementary school, the welfare departments, and the medical
profession) rather than giving direct charity to individuals was optimis-
tically viewed as the solution to many social probleMs. While the Head
Start and Follow Through programs still represent somewhat ambiguous views
toward the poor and minorities,* the pervading philosophy does differ from
See Hess' article,(1969) on four different explanatory models for lower
intellectual attainment by low-income and minority groups. See, also
S. Baratz and J. Baratz (1970) in which the authors argue that social
scientists have merely changed from blaming the children's inferior
inheritance for their .intellectual performance to blaming the children"s
inferior cultural milieu.
3
old modes of social service and is aimed at preventing, rather than
remediating, social and economic problems.
A.second theoretical notion on which high expectations were based
was that regarding the great plasticity and responsiveness to environ-
mental stimulation of the human intellect in the early years of life
(Hunt, 1961; Bloom, 1964). While this "critical period hypothesis was
no longer held in its strong form after a few years of experience with
the .Heau Start and other preschool programs, there was still .reason to
believe (e.g., the studies of SL'els, 1966) that a sustained, enriched
eLvironment would bring lasting advantages--would allow children to obtain
the basic skills and motivation needed to learn, to succeed in school,
and then to obtain satisfying productive employment as adults and raise
a new generation outside of the poverty mold.
Follow Through as an Experiment
Before the Follow Through program could be launched on a sale com-
parable to the Head Start program, which has now reached over 5 million
preschoolers, events occurred that radically changed its form and its
raison d'etre. Much less money was appropriated than was expected. It
was deci.'ed to use the period until more funds were made available to
learn mole about compensatory education by conceiving of Follow Thrqugh
as a research and development effort. The U.S. Office of Education (USOE)
sought advice from the research community and found a number of educators
willing to try out their methods or programs on a larger scale in actualschool sitiations.
Eventually the program, still funded at levels substantially below
original expectationS, was changed into an experiment for purposes of
social policy guidance.
The Office of Education, which administers Follow Through,
prepared a menu of project-types from which applicants would
select the one most suitable to their circumstances, and an
evaluation plan that would use common measures to assess all
projects (Timpane, 1970, p. 557).
Individual decisions too numerous to mention were involved in the
evolution of the final set of goalS arid,evaluation plan imposed on theFollow Through program. But several histbrical trends underlay the de-
1cisions to shape the Follow Through prograi'into a kind of large-scalesocial experiment. Most important among such trends were the following:
4
(1) Disillusion with present understanding of social problems and
their cures made it imperative to find out more before invest-
ing heavily.
(2) Growing pressure for public accountability and knowledgeable
program planning and policy-making in the government, as evi-
denced by the installation of Program Planning Budgeting System
(PPBS) in government departments and by Congressional mandates
(e.g., Title I of ESEA 1965, Section 402 of the Civil Rights
Act of 1964), demanded that programs be evaluated.
(3) Earlier piecemeal evaluations of educational changes (docu-
mented by Hawkridge et'al., 1968, and Averch et al., 1971)and Head Start programs, where information on success orfailure of individual centers was often confounded with the
center's location, yielded no policy-relevant information
and, thus, indicated that more comprehensive research was
necessary.
(4) Large-scale evaluations of program effectiveness and sugges-
tions for such .other new concepts as experimental schools were
being advanced by influential commissions and study groups
(e.g., President's Science Advisory ComMittee, Progress Report
of the Panel of Educational Research and Development, 1964).
(5)' The growing realization in Congress and among the public (Com-
mittee for Economic Development, 1968) that directly applying
great amounts of money (e.g., in Title I and Head Start) wasnot alleviating social and educational problems; the wisdom
of allocating funds for another comprehensive proverty pro-
gram without further knowledge was tnus made questionable.
(6) Finally, several discernibly different and promising early
education programs developed with government and foundation
support were available and ready for widespread field testing.
Although remaining a social experiment, Follow Through inevitably
became'oriented more toward education than community action, since re-
Cr 4 sponsibility for the prbgram was delegated to the U.S. Office of Education
by the Office of Economic Opportunity and since the social services in-
eluded in, the program were coordinated through the framework of the
* public, school system.
By.the 1967-68 School Year, when USOEfunded 45 planning or pilot
(7)programs, the notion had already develbped that Follow Through should be
recast as a research and development program to refine methods of deliver-
0 ing educational and supporting services to young children. Then, by the
5

1968-69'School Year, the guidelineS developed by the Office of Education
came to emphasize national evaluation and specified a 'planned variation"
'approach, under which a number of different early childhood instructional
programs would be implemented, each in a number of communities throughout
the United States. Individuals and educational organizations involved
in research and development on educational curricula were identified andwere asked to present their instructional approaches to members of com-
munities receiving Follow Through grants. The individuals and educational
organizations were designated "program sponsors." Their intervention
approaches were called "models."
Communities receiving Follow Through grants wen- .obliged to choose
one of the available sponsors' models.*
A sponsor any' a school aistrict
contracted to work together to implement i-:,!tructional or parent
education approach and to integrate it with other supporting services
as part of their comprehensive Follow Through program. Variations in
the educational components of the Follow Through program were "planned"
variations only insofar as there was a limited number of sponsors to
choose from--14 originally and 22 at present. The objectives of the
evaluation changed along with the conception of the Follow Through pro-
gram 'and eventuated in policy guidance objectives.
Follow Through as Policy Research
As a social experiment for pOlicy guidance, the Follow Through program
built on the eialuation,efforts of the recent past and'managed to set prec-
edents for'social experiments to follow. Continued funding for Follow
Through as an experiment and for the evaluation effort indicated a wil-
lingness'on the part of legislators and administrators to defer judgment
before proceeding to fund massive social action programs, since. the effects
of such programs cannot be accurately predicted. Although tremendous
pressures remain to use resources for spreading services to all who have
need and for satisfying the demands of certain constituencies, there is
at least a recognition that it may be wiser to test- the efficacy of pro-,
grams aimed at mass behavioral change before applying them generally.
Follow Through, although a compromise-between servi,ce, and experi-
mental purposes, is far less confused than the action'reSearCh" projectsof the late\1950s and early 1960s (e.g., Mobilization for Youth, the Ford
Foundation's "Grey Areas" project) in which researchers and program
_CommunitieS that lead pilot projeats in 1967-68 were allowed the choice .
of remaining-self-sponsored, since they had a year of-program develop-
ment on their own:
directors were often ,the same people. In these early projects, formative
and summative functions for research were not distinguiShed, and conflicts
between service and research regarding changes in program goals were re-
solved in favor of providing more service. These confusions permitted
few reliable findings about projects and allowed no generalizations about'
program success in various settings.
The FT experiment makes it theoretidally possible to make discoveries
not permitted by a survey of status design, such as the Equal Educational
Opportunity Survey (Coleman et al., 1966). The Coleman Report did not
evaluate a particular program, but it has been reeognizzd as having ad-
vanced the state of the art of policy - relevant research. It not only
measured' the available school resources, or 'inputs' to the educational
institutions, thought to be important to equality of opportunity but also,
for the first time, surveyed the outputs of the schools--the performance
of the students. The relationships discovered from these outputs were
startling:
. Schools are remarkably similar in t. he way they relate to, the
* Achievement of their pupils when sc(!io-economic factors bear -a
strong relation to academic achievelkent. When socio-economic
factors are statistically controlleC however, it appears that
differences between schools account for only a small fraction of
differences in pupil achievement (Cc4;eman et al., 1966, p. 21).
School, facilities for children of difVerent races were not
especially unequal, and where differeilees did exist they were
not necessarily in the presumed direction. In any event, it
did not appear that school facilities had any great influence
on educational achievement,,which seemed mostly to derive from
the family background of the child and the social class of his
schoolmates (Moynihan, 1969).
From the Coleman survey, however, we are neither able to estimate our
confidence in causal inferences nor to obtain information about the'effect
of school programs on children over.a pariod of time.
Singe Follow Through is en intervention program, the evaluation need
not be deply a status survey but can be designed-to assess changes in
.schoo/ programs; e.g., using a longitudinal evaluation design, it is pos-
sible to take measurements before, during, and after several waves of
children experience the .program.
7
The Westingn use/Ohio University study of Head Start (Cicerelli
et al., 1969), lile the Coleman study, involved sampling on a national
scale to take into account regional variations and, in addition, was an
evaluation of a pi-)gram of intervention. It was a bold attempt to as-
sess the overall irpact (3P-the Head Start program on the achievement and
attitudes of the participating children. Because of the time schedule
on which it;was conlucted, a post hoc evaluation deSign was employed.
Insofar as possible subjects with an without the special intervention
had to be equated on entering abilities at the one final measurement
point. Inferences Ebout effects of the program over time had to be
made on the basis of groups of children who had entered Head Start in
different years.*
The Westinghouse, study revealed some relatively small (rarely sta-
tistically significan) differences between Head Start and control groups
the, attitude and achievement tests. However, its design did not permit
much further inquiry ato explanations for this main finding; it especially
did not provide clue; or program iMprovement.In terms of policy, at bestit might have aided de isions of the !I go/no-go" type, but could not provide
guidance regarding ha" arograms might be improved.
The "planned Vaii design'for evaluating the Follow Through
and the Head Start proLiams originated partly in response to the absence
iii earlier evaluations Df information on the'differential effectiveness
of various educational approaches. Ideally, under this design, system-
atically different strategies can be tested and compared so that more and
less effective techniques can be cited for attaining various goals in sub-
groups with varying characteristicS.' When the "planned variations" idea
was combined with the notion of measurement e several points in time(before, during, and after primary school), on several successive waves
of children, in the several special programs as well as in comparison
school programs, the evaluation design, in conception, began to take on
the agpects of an experiment.
Thus, when understa-id in terms of its potential advancement over
past efforts, the concept of the Follow Through experiment is quite sophis-
ticated. As actualized, it demonstrates that the state of the art of im-
plementing and evaluating large-scale social 'action programs is just being
developed.
It is important to understand that unlike Follow Through, the Head
Start program is for-the most part a one-summer or one-year experience
so that measurement in the Westinghouse/Ohio study occurred for some
children as long as 2 years after the end of the intervention period,
rather than during the intervention period.
8
Stakeholder Interests in the Evaluation
The lack of elegance in the FT evaluation desigi is perfectly under-
standable when the demands that circumstances made or the evaluation are
considered. There is, first, the enormous scope and ven contradiction
among the goals held for the Follow Through program 131 people at many
different levels. The goals range from long -term, abE'ract, social goals,
such as reducing poverty and racial discimination, to immediate, concrete,
and specific goals, such as imp!'oving fly- ability of a child to express
himself verbally. The pressure for evali-Ative information regarding at-
tainment of each of the objectilias is gret. Each is i aortant\to a group
of people on whom the program depends for .its existence.
Members of Congress and adminj_straton in the Executve Office of thePresident want to know if the Follow Throug program over;11 enhances the
"life chances of children" or makes poverty families more "self-s4ficient."
Their decisions on continued stipport for the comprehensive services and
on allocation of f Inds seem to require information abouttaleragelper pupil
costs, genern1 participant satisfaction, and benefits deriled by) children
and their families participating in programs supported under the FollowThrough authorization. Such information is needed yearly, because appro-
priations for the Economic Opportunity Act are authorized annually. These
stakeholders will find this document of some use,
State and Federal administrators want to know which educational pro-
grams work best with disadvantaged children and can be implemented in a
.variety of settings. Both also want to know the comparative costs of the
programs. While the two groups may vie over the authority to determine
allocations and to make the decisions, they both want the information assoon as possible to select programs that "work." A recent Federal-State
"5-year plan" for uisseminating the most promising Follow Through program
models to local education' agencies increases the pressure for ift..Tma'tion
on the effectiveness of "ready-made" program alternatives. It is policy-
makers at the State and Feueral levels to-whom this report is primarily
directed.
Local education officials and local service agencies have goals in
mind that dictate different foci for evaluation. They want to know which
program will work for their particular population of children and how to
implement it. Those local people actually involved in implementing Follow
Through models in communities throughout the country have still other'
These goals are stated in the Economic Opportunity Act.
9
concerns. Evaluation for their )wn'formative purposes might be appre-
ciated, but this is rarely offercd. Delayed summative assessment of their
progress would more likely reflect the effects of satisfactorily imple-
mented programs and .thus wodld be Desiree over immediate assessment by
Federally sponsored evaluators. nce the data in the present volume are
analyzed in a manner appropriate to the broader policy questions, the
local polic -maker likely will fin] that the present report does not
serve his pu,Toses.
The goa.3 of the teachers in the Follow Through classrooms and parents
of participat:ng children are more specific to their particular groups of
children and even to individual children. An evaluation designed to an-
swer some of tneir questions would be entirely different from an evaluation
aimed at broader policy questions.
Finally, sTonsorE who are working to implement their ideas in the
natural laboratory of the public school have somewh:.t different objectives.
They have several entirely different theories of education and very dif-
ferent notions about the appropriate agents of intervention and their
roles (parents making curriculum decisions, teachers becoming experi-
menters dr technicians, teachers becoming staff planners, parents rein-
forcing school objectives). Mostare also interested in experimentation
as a way of testing hypotheses about intervention techniques and abbut
children's learning from which better education theory could be built.
Many are themselves engaged in formative evaluation as an aid in refining
their methods. Some would like analysis and documentatfon of implementation
procedures, descriptions of problems involved in working simultaneously
wit'd a school district, a group of parents, Federal program officers, and
their own staffs to get a- Follow Through program to children }n school.
Unfortunately, none of these purposes is well served by the presentpolicy study.
The concept of the evaluation as assessing alternatives may seem
straightforward, but.it obscures fundamental value differences that sep-
arate those with various interests in Follow Through. These basic dif-
ferences reside in the question that is implied, but not answered, by
the assertion that Follow Through is a comparative study of alternative
approaches; the unasked and unanswered question is "approach to what ?`'
Some feel that Follow Through should be used as a vehicle by which the
educational system itself may be changed in basic ways to be more adapt-
able to the diverse needs and desires of the children it serves and the
adults who comprise its political constituency. A more common view is
that the fundamental purpose of an educational system, including Follow
Through, is to bring about desirable changes in people.
10
Although these two views are not necessarily incompatible, t'ey imply
that different kinds of c.iteria be used to judge the effectiveness of tne
program. For example, if one holds that the essential purpose of Follow
-Through is to change the system, then the indicators of program success
that are given most weight will be ones tbat attend to the behavior and
beliefs of parents vis -a -vis tne school and the actions and attitudes
of administrators and teachers who are charged with the school's operation.
On the Jther hand, for those who view the school as an institution to
bring about desired changes in children, the criteria of effectiveness
or program success will center primarily on the changes that childrendisplay. This simplistic distinction still overlooks additional iiq3ortant
considerations about when changes might realistically be expected and what
constitute "desirable changes" in children. Changes may range from grow-
ing effectiveness in the use of sucn cognitive tools as reading and mas-
tery of quantitative concepts to growth in psychological and social di-
mensions such as increased self-esteem, selfconfidence, or socialsensitivity.
Although it is clear that the general purpose of the evaluation of
Follow Through is to assess the effectiveness of alternative approaches,
there is far from unanimity of opinion regarding the particular goals
that the - ""approaches should seek. Thus, a fundamental issue in the eval-
uation design has been from the outset how to accommodate to the multi-
plicity of criteria by which program effectiveness is judged. The de-
cision to select a faffly broad set of measurable behaviors against which
to measure every program makes it possible to compare programs on that
set of behaviors. What is relinquished is the ability to determine, for
each sponsored model, if it accomplished its own aims.
Unrealistic expectations (e.g., measurable changes in "self-
sufficiency" of poverty families attributable to short-term partici-
pation in a school-based Follow Through program), contradictory expecta-
tions (e.g., immediate feedback versus summative pre-post Follow Through
evaluation), and changing expectations (e.g., finding improved ways of
educating disadvantaged children versus finding out if Follow Through,
on the average, improves disadvantaged children's education) for the
program made the selection of the most appropriate objectives for the
evaluation problematic.
Problems of Design
Besides the problem of priorities posed to evaluation design by
disparate goals, there'is the paucity of measurement technology in the
entire area of social action evaluation. The underdeveloped state of
11
measures of personal growth and development in children is already well
documented. Even less well explored are techniques for obtaining infor-
mation on the extent. or quality of program implementation, institutional
responsiveness, or community change. Certainly techniques for measuring
educational product and social c st/benefit analyses are still totally
inadequate. Finally, the purely logistical demands of an evaluation of
a program the size of Follow Through are prodigious.
The quasi-experimental form the evaluation design has assumed results
from administrative decisions made in implementing the FT program. Some
of these practical constraints have been mentioned already. Each of''
160 school districts in various regions of the country has its unique
group of community officials, parents, school principals, and teachers
who coordinate the services and work with the chosen sponsor in a unique
way. While continual modification is necessary in each setting to ensure
that the boot possible practices are implemented, it makes description
of the experimental "Lyeatihrnt" to be evaluated very difficult.
School districts are recommended for participation by state educa-
tion officials and are awarded grants by the U.S. Office of Education on
the basis of political and administrative criteria unrelated to evalua-
tion. School communities naturally choose a model from among those offered
by sponsors for reasons of their own, without regard to experimental design.
These sponsored programs, which represent the only distinct part of the
Follow Through "treatment" (since nutrition, medical, and other service
components must be present in every program but are not otherwise specified
by type), differ from one another in an unsystematic manner.
Thus, it was clear by the time the evaluation began that the possi-
bility of randomization in the assignment of students, teachers, class-
rooms, schools, or projects was superseded by administrative decisions.
Data collection procedures could follow planned schedules, but no exper-
imental control over the specification and scheduling of experimental
"treatments" was possible; that is, treatments were defined by persons
other than the experimenters, self - selection of treatments occurred, and
conditions of experimental independence were often violated. In addition,
intensive efforts made to involve those families,"most in need" posed a
problem for the composition of adequate comparison groups.
Evaluation of the Planned Variations
The innovative "planned variations"'idea is the unique aspect of
the FT experiment and the key to understanding the plan for assessment.
The fundamental purpose of the Follow Through experiment is to find
12

educational strategies that might be used to improve the effectiveness
of the American primary schools for.disadvantaged .children. Thus we have
evaluations of alternative early education models that differ from one
another and from the alternative offered by the primary grades-of the
present school systems.
Each sponsor has designed a program of education or intervention for
disadvantaged children or a way of changing the 'significant others" in
their environments.* Each sponsor has somewhat different immediate and
intermediate objectives and different theories about child development,
educational disadvantages, and education in general. Each also has dif-
ferent methods of implementing the program that he believes will enhance
the school performance and presumably the "life chances' of poor or dis-
advantaged children. The Follow Through evaluation provides the oppor-
tunity for assessing these approaches only against a single set of criteria.
Evaluation of the national FT program then consists primarily of
determining which approaches are effective in achieving a specified set
of developmental or educational objectives for children and a variety of
changes in parent - community- school relations.
The specified set of objectives for children are the primary criterj
for the evaluation of effectiveness. But the evaluation also gives con-
sideration to elements in the children's environment that influence
development--family, neighborhood, and community setting as well as the
school. Although the Follow Through program was initiated with the pur-
pose of increasing the "life chances" of the children, it is only possible
to evaluate performance on objectives presumed to be intermediate to that
final goal. Objectives on which the sponsored educational alternatives
can be compared are, broadly speaking, those that are held for all chil-
dren at the end of the third grade. These are that children (1) be excited
about learning, (2) feel good about themselves and their own competence,
and (3) have mastered basic reading, language, and arithmetic skills that
will help them to proceed successfully in the rest of their school ex-
perience,
The Follow Through evaluation lends itself primarily to policy deci-
sions that deal with selecting nationally robust models for improving
existing instructional programs for disadvantaged children. Federal
education officials will presumably determine the most appropriate
*The programs of some sponsors are'not directly concerned with instruc-
tion of children, but attempt to change school and community interac-
tions.
13
educational models to offer in their compensatory education programs.
Thus, administrators eagerly await information about which educational
models raise achievement of disadvantaged youngsters in academic skills
areas and which educational models create positive attitudes toward school
on the part of poor parents and their children. The results of the eval-
uation will be pertinent to such decisions when data from a large enough
sample of children who have completed the educational programs associated
with the several sponsors become available.
Since it is possible that sponsored programs will not be equally
effective in all situations (ranging from inner-city ghetto to rural
Appalachia, from highly unionized to nonorganized teaching staffs), it
will be important to establish evidence of relative effectiveness of
programs on a project by project basis. An evaluation performed at this
level (which must await the development of a far greater and more repre-
sentative data base than is currently available) will provide a basis for
decisions at local levels about which programs appear to be most appro-
priate to particular situations.
Overall FT/NFT Evaluation
Follow Through as a service program was designed to continuepro-'
viding comprehensive services throughout the primary grades to children
who began receiving such a program in Head Start, the preprimary program.
It attempted to ensure continuity between preschool and elementary school
programs in terms of the 'full range of "life support" services children
required as well as the educational-program. While the evaluation of
Follow Through is primarily focused on identifying effective educational
strategies, it should make it possible to determine whether children in
Follow Through have an advantage over those without a Follow Through pro-
gram. The answer to this broad question would have a bearing on policydecisions, such as whether to increase or decrease support for compre-
hensive compensatory education programs in general.* Earlier reports(SRI,1971, 1972a) dealt with these questions more directly, but the cur
rent Follow Through interim evaluation permits the question of overall
impact to be addressed.
*Naturally, answers to policy questions such as "On the average is it
'worth it to continue to ingest in comprehensive compensatory programs
for disadvantaged children and their families?" are not resolved by
research evidence but depend on the valuational criteria held and the
frame of reference from which the facts are viewed.
14

One must remember that the only things common to Follow Through
treatments are that some (unspecified) set of nutritional, medical, and
other services supplemented some (at least nominally differentiated)
experimental educational programs. In addition, it should be pointed 'Out-
that when the "treatment "'` is defined this loosely it is diffit141CG:
distinguish "treated" groups from comparison groups. Poor children who
are compared with Follow Through children are likely to have had a pri-
mary grade supplemented by services under another name (Title I or
Title III ESEA, hot lunch programs, etc). Under these circumstances,
differential effects of Follow Through and Non-Follow Through "treatments"
would be extremely difficult to detect.

Section II
DESIGN AND SAMPLE
1

Section II
DESIGN AND SAMPLE
The Follow Through Evaluation Design
The basic research design for evaluating the impacts of FT planned
variations is a series of replications of longitudinal comparisons of
treatments versus comparisons. This design essentially corresponds to
Campbell and Stanley's (1963) design 10, or "The (Pretest-Posttest) non-
equivalent control group design." There are, however, a number of features.
that complicate the Follow Through evaluation design and that make
straightforward analyses and interpretation complex and difficult.
Within a given replication of the basic evaluation design, measures
are gathered on pupils as they enter school, Follow Through, and the
evaluation; and subsequent measures are gathered at the end of successiveexperience years in school and FT. Measures are also gathered at selected
times on the families, teachers, classrooms and communities with which
the pupils within a replication, are associated. The data elements of
each such replication define a cohort in the evaluation. Those pupils
in the evaluation who entered primary school in the Fall of 1969 consti-
tute Cohort I, those who entered school in the Fall of 1970 constituteCohort II, and so on.
The Follow Through program is administered throughout the primary
school grades, that is, from kindergarten through third grade. As such,
Cohort I represents a 4-year experiment commencing in Fall, 1969, andterminating in Spring, 1973. Similarly, the 'Cohort II replication com-
menced in Fall, 1970, with a new sample of participants and is scheduled
to terminate in Spring,1974. The design is complicated, however, by the
fact that many of the participants within each cohort begin formal educa-
tion not at t-indergarten but at the first grade. Thus, two subgroups-
or "grade streams"--exist within each cohort--the Kindergarten subgroup
and the Entering First Grade (i.e., those participants in schools that
do not offer kindergarten) subgroup.. Throughout this report, we willrefer to these two separate subgroups within cohorts by their respective
19

grade levels at entrance to the cohort--Kindergarten (K) and Entering
First (EF).*
The basic longitudinal evaluation design is summarized in fable 1.This representation displays the relationship of evaluation cohort to year
of entrance into the evaluation and successive experience years within
the evaluation. The shaded area represents that portion of the total de-
sign on which this report is based. Although four cohorts are indicated
in Table 1, it should be noted that the basic design allows for an in-
definite number of successive additional cohorts.
TABLE 1
Basic Follow Through Evaluation Framework
CohortEnterYear
I 1969
II 1970
III 1971
IV 1972
Year of Follow Through ExperienceFirst Second Third. Fourth
Note that these definitions serve to distinguish two groups of partic-
ipants having different, yet "normal" (for the school district), en-
trance points into the experiment.' These should not be confused with
subgroups of pupils which "migrate" into a program at some point after
these normal entrance points, e.g., pupils who transfer into or "enter"
a kindergarten cohort at some point after kindergarten. These latter
subgroups are not officially part of the-evaluation design.
20

Each cohort is composed of a number of "projects," or sponsored
Follow Through programs. A project consists of one or more schools inwhich a particular program of services is being implemented. A givenprogram of services includes as a main feature one of 22 sponsored models,
or treatments, designed to improve the life chances of poor children.
Each project resides within a single school district, although occasion-ally more than one project resides within a single district.
For each project participating in the evaluation, a non-project
,comparison -or control group--is selected and recruited for participation
in the evaluation. Therefore, each cohort in the evaluation consists of
a collection of treatment and, comparison groups. The,collection of these
treatments comprise what is described as "planned variation," and this
planned variation dimension constitutes the treatment variable in the
overall evaluation design.
Attempts are made to obtain comparison groups that have salient
population characteristics reasonably similar to those of the project or
treatment groups and that are within the same or proximate district
boundaries. That is, to the extent possible, comparison schools are
selected because of similarity with FT school characteristics, such as
ethnic composition, general level of poverty of pupil families and type
of neighborhood. The purpose for obtaining these matched compariSon
groups is to provide a basis for validly assessing the,FT program impacts-
by contrasting measures obtained from comparison groups with those obtained ,
from FT groups. Thus, ifmlafching is successful, the only relevant vari-
able'on which the two groups differ is FT, and differences on measures
would Oe valid indicators of FT's effects. But comparison group schools
participated on a voluntary basis and since these comparson groups are
constituted after a FT project is implemented and designated for inclu-
sion in the evaluation, such matching was accomplished .with a highly
'ariaLJ.e degree,of success. However, the important point from a design
consideration is that neither the assignment of treatments to projects
nor the assignment of schools to treatment or comparison groups is random.
Arni-1g the implications of this non-random assignment,of treatments
to projeCts is the'/resultant imbalance of treatments across locations.
That is, since projects are neither systematically nor randomly assigned.
to treatments, no national or regional representativeness is assured.
In actual fact,.the imbalance of treatments across locations in the
samples included in this interim evaluation shows. projects as essentially
nested within treatments. This nesting relationship is displayed in!Figure 1, which shows both the longitudinal anl hierarchical propprties
of the evaluation design. ence, a given observation Xij.4.kl represents
21

3 0
the. value of X associated with the, ithplanned variation approach (Ai,
A2, ...An) implemented in the ,jth location :(Li, L2, ...Ln),during the kth
experience year (Yi, Y2, ...Yn) of the lth cohort (di, .d2, en).
The design logic for assessing the. impact of thee planned Variations
is throUgh pre-post ^,omParisons 'of each treatme4 against its control.
,If sufficient coverage of the population distributions of disadvantaged
.children, their families, and Communities is represented for, treatments
within cohorts, then further inter - approach: comparisons .become,peSsible.
That is, the overall, relative impactC=be.evaluated for those modelsimplemented in comparable sites and with other things essentially equal
(or equalized) . Also, the .longitudinal property of, the design enables
'Assessment of Changes over time while cohort replications. .enable assess-
-ment of changes in quality of implementation and associated effects.
The Sample Subset for Assessment.of Interim Impacts
The portion of the overall -design:that constitutes the basis for
tpis interim report extends frOm the 1969-70 through the 1970-71 school
year, or the first two rows in Table 1. As such, the' first -two years
of impact are being assessed fot Cohriyt I (Fall, 1969; to Spring, 1971),
and the first year of impact' is being' assessed for Cohort II -(Fal 1,_'1970,
to Spring, 197.1).
.According to the pre-post design, premeasures are gathered on,all
members of a cohprt--treatment and comparison--at the time they enter the
evaluation. Subsequent postmeasures .are gathered on selected subsets s)o
of these cohorts at varioti§ later times.
Since intermediate "pdsttesting," or data gathering, is not conducted
on the total cohort sample, the interim assessment is restribted to those
components and participants that have been measured. The decisions asto which and how many subsets wot3ld participate,. in interim'.measurement
were 'based on a variety of administrative and financial 'considerations
(SRI, 1972b)° and effectively ,dictate the and generality .
interim assessments. That;is, the sampling and measurement - design for
assessment of interim .effects does not.mateh, "the scope, and mggnitude Of.
the overall evaluation design- as schematized in Figure, 1 . The net con:-
sequence of these *reductions in interim data.will- be 4 corresponding re-duction in the interprets.' ility. and generality of interim findings.
a
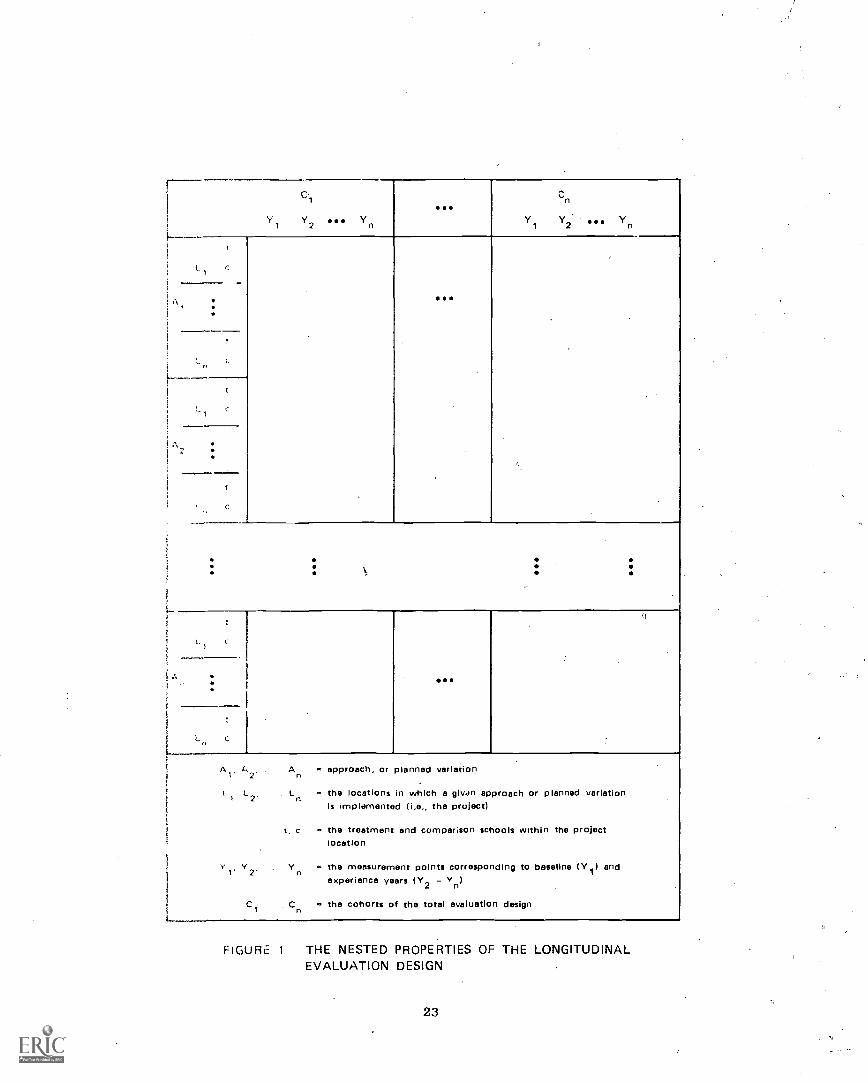
I
1
1'
Cl
1Y2 Yn
On
"1 Yn
LI ,
, A.
I
r.
t
A2
..--t
c
.
1
I
----,..
'.c I
A .c...2
.
Y
C1
An
. In
t. c
Cn
-
==
approach, or planned variation
the locations in which a ()Ivan approach or planned variationIs implemented (i.e., the project)
the treatment and comparison schools within the projectlocation
the measurement points corresponding to baseline (Y1) andexperience years (Y2 vn)
the cohorts of the total evaluation design
FIGURE 1 THE NESTED PROPERTIES OF THE LONGITUDINALEVALUATION DESIGN
23
The Project Sampling Scheme
Selection of projects for inclusion in the evaluation sample required
judgments and decisions by the planned variation sponsors, USOE/FT, andSRI. In the initial phases of the evaluation (1968), the planned varia-
tion sponsors were permitted and encouraged to designate projects for
both certain inclusion and certain exclusion from the evaluation sample.
The primary criterion for sponsors' judgments was the state of model imple-
mentation as it could be estimated at that point. In general, sponsors
requested inclusion of projects in which implementation appeared to them
to be progressing well and requested exclusion of projects in which imple-
mentation difficulties were being encountered. USOE/FT also influenced
the composition of the _.valuation sample by designating various projects
for certain inclusion or certain exclusion in addition to those so desig-
nated by the sponsors.
Finally, SRI selected additional projects from among the residual,
following inclusion and exclusion specifications by sponsors and USOE/FT.
The principal sampling criteria employed by SRI were:
(1) To obtain at least five projects (if available) for each
planned variation
(2) To maintain the 3:1 distribution of K to EF projects repre-
sented in the total FT program.
(3) To obtain representative geographic and urban/rural balance.
(4) To avoid impractical situations, such as locations where
comparisons were unobtainable.
In June, 19',u, an additional sampling constraint was placed on
project selection; namely, any project would be excluded from the evalua-
tion sample during its first implementation year with a given sponsor.
This rule had retrospective consequences on data collected before its
formulation, as is noted below.
A complete description of the implementation of, this sampling year
requires reference to 1968-69, during which many of the above criteria
were initially employed in selecting projects for participation in the
evaluation. In particular, 1968 was the first year of sponsor partici-
pation in Follow Through. From the total of 106 projects in Follow Through
at the beginning of the 1968-69 year, sponsors designated nine projects
for certain inclusion; these were projects in which the sponsors felt that
implementation was proceeding well 'and which should be included in theevaluation. Sponsors also designated 17 projects for certain exclusion
in 1968-69 since difficulties of various kinds were being encountered
24

in implementing the Follow Through program or the specific model. In
'addition to the 26 projects specified for either inclusion or exclusion
by the sponsors, USOE/FT designated .5 projects for certain inclusion
and 10 projects for certain exclusion. From the remaining 65 projects
(i.e., ones neither specified for inclusion nor exclusion), SRI selected
35 to satisfy the remaining sampling criteria of frequency and balance
across sponsors, regions, and grade streams. The total sample included
49 projects in 1968-69.
Because 1968-69 was subsequently designated as an "Implementation'
Year," data collected on these A9 projects during that year were excluded
from evaluation. All but two of these projects were, however, part of
the subsequent Cohort I (Fall, 1969) 'sample.
Cohort I Sample (Fa-141-4969)
saTbeobaseline sample for Cohort I consisted of 90 projectsthat were
seleA'ed in Fall, 1969. At that time, all entering pupils were tested.*
Of, hese 90 projects, 47 were sampled because they had been tested in 1968,
d 42 were selected on the basis of the other sample inclusion rules.
is resultant sample contained 61. K projects, 28 EF projects.and one
project classified as both K and EF. However, on,the basis of the eligi-
bility policy formalized in June, 1970, 38 of these 90 projects became
ineligible for inclusion in the Cohort I evaluation savle. This post
hoc reduction impaired the balance of the sampling design implemented in
selecting the original 90 Cohort I projects.
overall pattern is displayed in Table 2, which shows the dis-
tribution of project sampie3 by sponsor for each of three measurement
periods--baseline (Fall, 1969), first year (Spring, 1970) and second year
(Spring, 1971). Entries for Spring, 1971 are further subcategorized to
show those Cohort I projects for which both first- and second-year mea-
surements were collected, and those for which only second-year measureswere obtained.
*It should be noted that the Fall, 1969, data collection included tests
of entering (K, EF) and of intermediate (1st, 2nd, 3rd and 4th) grade
pupils. As such, the Cohort I baseline sample reflects only a subset
of the overall activity.
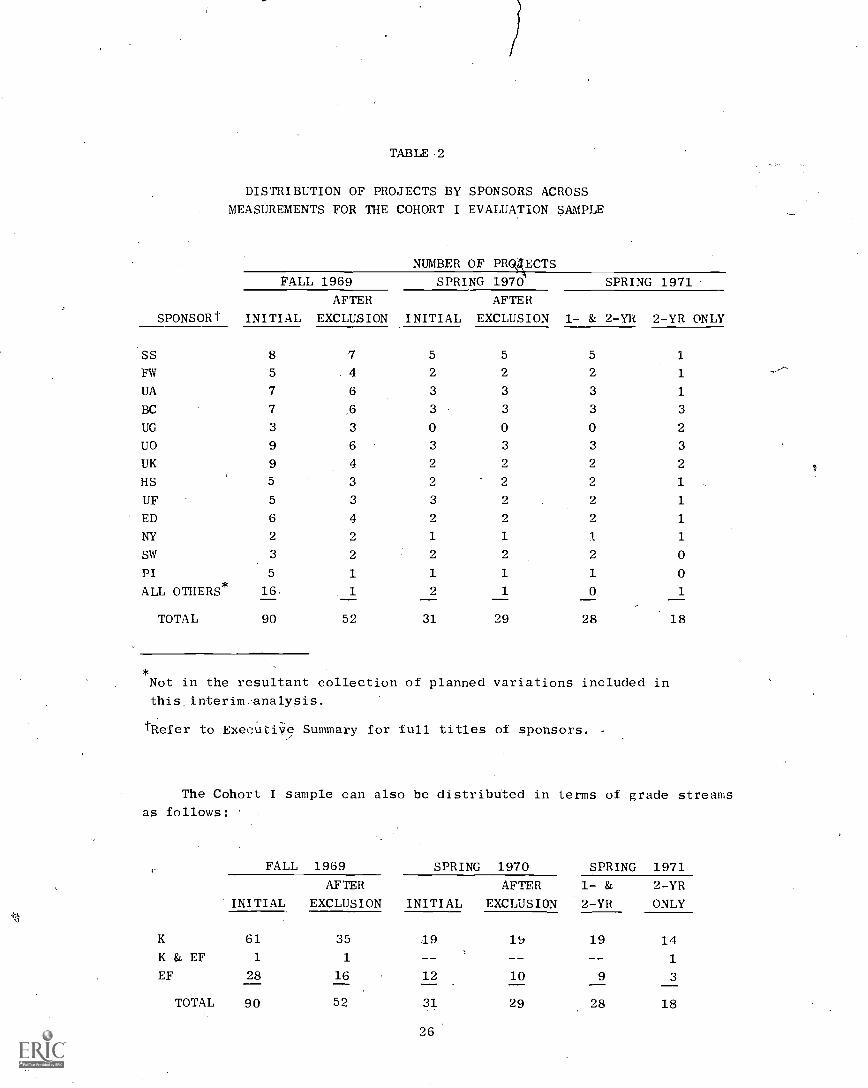
TABLE 2
DISTRIBUTION OF PROJECTS BY SPONSORS ACROSS
MEASUREMENTS FOR THE COHORT I EVALUATION SAMPLE
NUMBER OF PRQ4ECTS
FALL 1969 SPRING 1970 SPRING 1971
AFTER AFTER
SPONSORt INITIAL EXCLUSION INITIAL EXCLUSION 1- & 2-YR 2-YR ONLY
SS 8 7 5 5 5 1
FW 5 4 2 2 2 1
UA 7 6 3 3 3 1
BC 7 _6 3 3 3 3
UG 3 3 0 0 0 2
UO 9 6 3 3 3 3
UK 9 4 2 2 2 2
HS 5 3 2 2 2 1
OF 5 3 3 2 2 1
ED 6 4 2 2 2 1
NY 2 2 1 1 1 1
SW 3 2 2 2 2 0
PI 5 1 1 1 1 0
ALL OTHERS*
16 2 1 0 1
TOTAL 90 52 31 29 28 18
*Not in the resultant collection of planned variations included in
this,interimanalysis.
tRefer to Executive Summary for full titles of sponsors. -
The Cohort I sample can also be distributed in terms of grade streams
as follows:
FALL 1969 SPRING 1970 SPRING 1971
AFTER AFTER 1- & 2-YR
'INITIAL EXCLUSION INITIAL EXCLUSION 2-YR ONLY
K 61 35 19 19 19 14
K & EF 1 1 1
EF 28 16 12 10 9 3
TOTAL 90 52 31 29 28 18
26
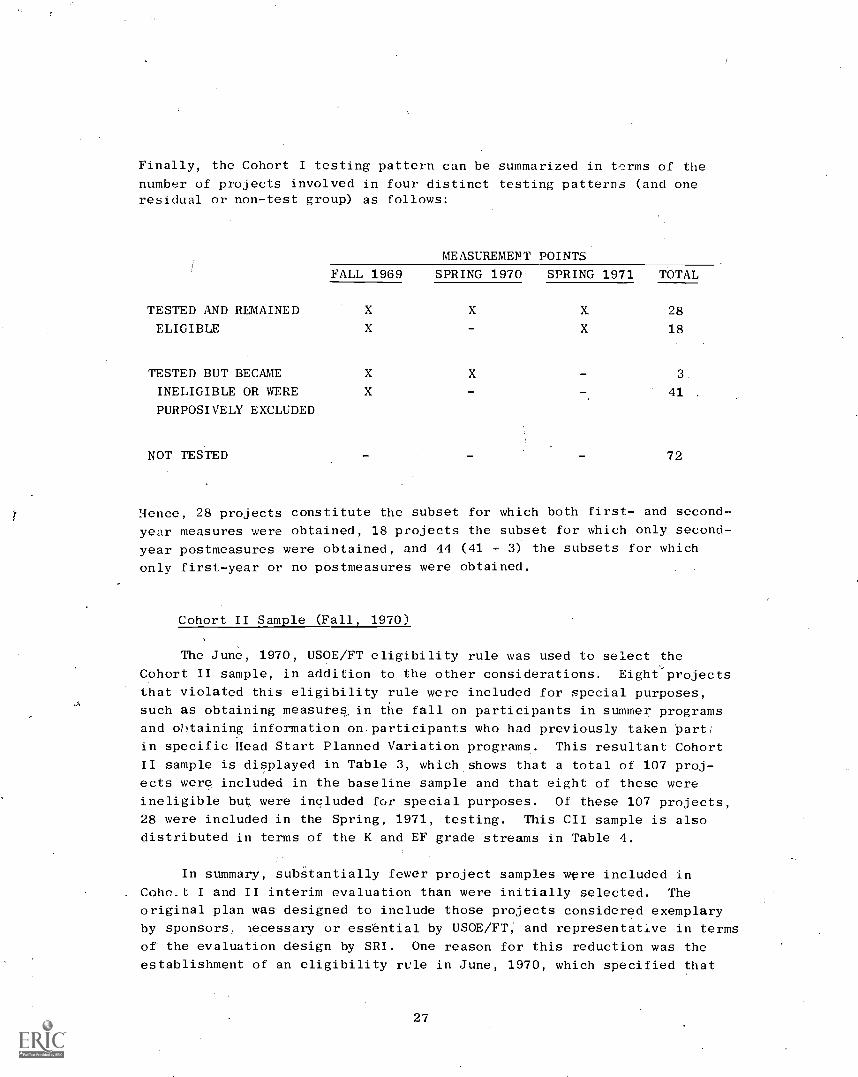
Finally, the Cohort I testing pattern can be summarized in terms of the
number of projects involved in four distinct testing patterns (and oneresidual or non-test group) as follows:
MEASUREMENT POINTS
FALL 1969 SPRING 1970 SPRING 1971 TOTAL
TESTED AND REMAINED X X X 28
ELIGIBLE X X . 18
TESTED BUT BECAME X X - 3.
INELIGIBLE OR WERE X - - 41 .
PURPOSIVELY EXCLUDED
NOT TESTED 72
Hence, 28 projects constitute the subset for which both first- and second-
year measures were obtained, 18 projects the subset for which only second-
year postmeasures were obtained, and 44 (41 + 3) the subsets for which
only first-year or no postmeasures were obtained.
Cohort II Sample (Fall, 1970)
The June, 1970, USOE/FT eligibility rule was used to select the
Cohort II sample, in addition to the other considerations. Eight projects
that violated this eligibility rule were included for special purposes,
such as obtaining measures. in the fall on participants in summer programs
and obtaining information on participants who had previously taken part'
in specific Head Start Planned Variation programs. This resultant Cohort
II sample is displayed in Table 3, which shows that a total of 107 proj-
ects were included in the baseline sample and that eight of these were
ineligible but were included for special purposes. Of these 107 projects,
28 were included in the Spring, 1971, testing. This CII sample is also
distributed in terms of the K and EF grade streams in Table 4.
In summary, subStantially fewer project samples were included in
Cohort I and II interim evaluation than were initially selected. The
original plan was designed to include those projects considered exemplary
by sponsors, iecessary or essential by USOE/FT; and representative in terms
of the evaluation design by SRI. One reason for this reduction was the
establishment of an eligibility rule in June, 1970, which specified that
27

TABLE 3
SUMMARY OF THE COHORT II SAMPLE DISTRIBUTED
ACROSS SPONSORS AND MEASUREMENTS
SPONSORt
FALL 1970 SPRING 1971
ELIGIBLE
AND TESTED
ELIGIBLE
AND TESTED
TUTED BUTNOT ELIG.* TOTAL
SS 7 1 8 1
FW 9 9 3
UA 8 8 3
BC 10 10 5
UG 3 3 0
U0 9 9 4
UK 9 9 3
HS 5 3 8 2
UP 7 7 3
ED 8 8 2
NY 2 2 2
SW 3 3 0
PI 3 1 4 0
OTHERS* 16 3 19 0
TOTAL 99 8 107 28
*These projects (tested but not eligible for evaluation) were in-
cluded in the test sample for special purposes such as assessment
of summer effects, Head Start Planned Variation and so on.
tRefer to Executive Summary for full titles of sponsors.
28
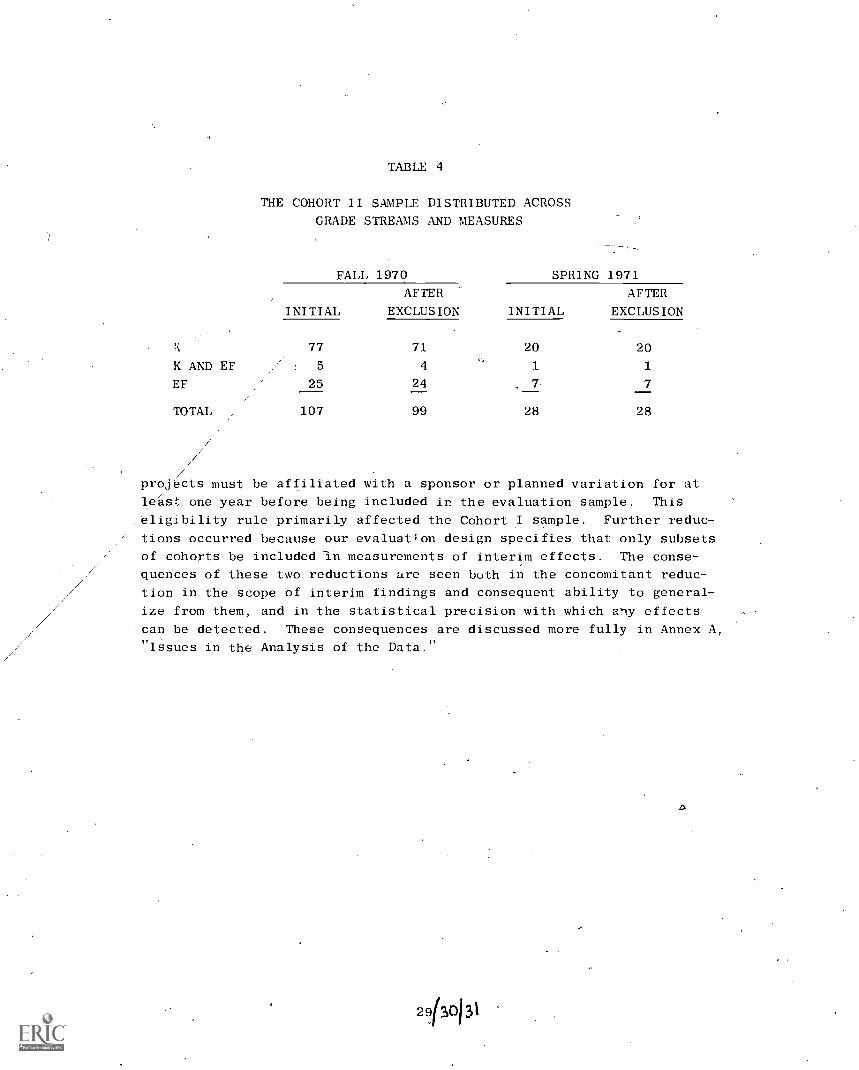
TABLE 4
THE COHORT II SAMPLE DISTRIBUTED ACROSS
GRADE STREAMS AND MEASURES
FALL 1970 SPRING 1971
AFTER AFTER
INITIAL EXCLUSION INITIAL EXCLUSION
,.,, 77 71 20 20
K AND EF 5 4 1 1
EF 25 24 . 7, 7
TOTAL 107 99 28 28
projects must be affiliated with a sponsor or planned variation for at
lest one year before being included in the evaluation sample. This
,eligibility rule primarily affected the Cohort I sample. Further reduc-
tions occurred because our evaluation design specifies that only subsets
of cohorts be included in measurements of interim effects. The conse-
quences of these two reductions are seen both in the concomitant reduc-
tion in the scope of interim findings and consequent ability to general-
ize from them, and in the statistical precision with which any effects
can be detected. These consequences are discussed more fully in Annex A,
"Issues in the Analysis of the Data."
Section III
METHODOLOGY
le
F
Section III
METHODOLOGY
Introduction
In this section we will describe the general and specific featuresof the evaluation, instrumentation, and collection of data, construction
of variables, and methods of data analysis. Where appropriate, we will
distinguish between specific methodologies that were implemented in this
1969-1971 interim evaluation and the general methodologies.
This section is organized into the following four subsections:
(1) Instrumentation and data collection
(2) Procedures
(3) 'Definition and development of evaluation variables
(4) AnalysiS methodology.
Instrumentation and Data Collection
Follow Through is a complex, broad-scale educational experiment.
As such,a great variety of its qualitative and quantitative components
are of interest. It was clear early in the planAing and preliminary
evaluation activities that for FT to be evaluated as a total program,
more must be measured than the participating child's academic progress.
Furthermore, since evaluation interest would be focused on identification
of "components" of "sdccessful' programs, attention would need to be
given to evaluating the process as well as the outcome. ,-Also, of course,
some minimum level of descriptive data would be essential.
Six basic sources of data, each of which corresponds with separate
instrumentation and data collection procedures, were employed in develop-
ing this evaluation evidence. They are the following:
33

Classroom roster
Follow Through test battery
Parent interview
Teacher and aide questionnaire
Classroom observation procedure
Project descriptor inventory.
Much of the basic evaluation effort was spent on developing and refining
such instruments and procedures. Their purpose and contents are briefly
described in the paragraphs to follow. The nature of the, evaluative
questions and the focus on children's progress as the principal measure
of effectiveness determined the nature of the instruments used to collect
data. Clearly, this set-of instruments does not begin to exhaust the
types or composition of instruments that could be employed in an evalua-
tion of all the aspects of Follow Through.
The Classroom Roster and Related Information Form
The classroom roster provides a straightforward and relatively
reliable source"of several categories of information about the pupils,
serves as a cross reference for certain data that are collected through
Other sources, and provides a basis for determining program census,
migration, and attrition throughout the evaluation. Specifically, this
instrument is a.listing of the classroom, pupils byname, age, sex, ethnic
group, language spoken at home, preschool experience, and amount of FT
services received, if any. Other items of information available from
each properly completed roster are classroom identifiers (room number,
.principal, school, address, district), classroom staff (teachers, aides,
volunteers) and evaluation design information (cohort, grade stream,
grade ?.evel, and condition -FT versus NFT).
The roster form remained substantially unchanged from year to year
throughout the.,evaluation, although several minor changes were made to
facilitate its completion and to improve the clarity of data obtained.
The Follow Through Test Battery
The principal source of evidence for program impact on Pupils is
the Follow Through Test_ Battery. This battery is administered twice
each year--in the fall to obtain baseline information on children enter-
ing the program, and again in the spring to obtain progress and/or
34

outcome information on children progressing through or exiting from the
program. The same test instruments are administered to both FT and com-
parison classrooms within each grade level,
The contents 'of the FT battery have been changed from year to year
of administration, and, of course, differ across grade levels within
each year of administration. Nonetheless, the cognitive and non-
cognitive domains for which the instruments ,:ere selected are consistent
both within and across years. Changes in the battery primarily reflect
attempts at improved measurement, both in terms of reliability and
validity of data.
Cognitive Measures--The instruments, that were included at one or
more levels of the test battery and that provided measures of perfor-
mance within the cognitive domain are described in the following paragraphs.
The Wide Range Achievement Test (WRAT) is a multi-level achievement
test designed for individual administration to younger pupils (those
attending kindergartens and first grades) and possible group administra-
tion to older pupils (th se attending second And third grades). Essen-
tially, the WRAT provides a means of using a. single instrument for pre-
post achievement assessment,,although it is unlikely_that certain items
appropriate for kindergarten would also be administered to third grade
pupils.
The WRAT was designed to provide'measures of achievement in three
basic skill areas -- reading, spelling, and arithmetic. Although the 1965
version of the test is, standardized and Wormed, it contains several
relatively unconventional features. First, the test is interactive;
that is, the set of questions the student is asked depends on how he
performs on certain items. Second, the test is of variable length for
each pupil; testing is .continued until particUlar error runs occur.
Third, normative conversions are supplied :for separate subtests but not
for a total score. Finally, the appropriateness of these norms for the
Follow Through Evaluation Sample was questioned since they were basedon a norm sample of less than 2000 pupils for the age range participating
(five to eight years) and, according to the technical manual, No attemptwas made to obtain a representative national sampling." (Jastak and
Jastak, 1965, p. 9).
Because of the need to establish and follow uniform, rigorous, and
replicable testing procedures and because of concern over certain mea-
surement and evaluation issues (such as, the need for 12 successive errors
as a criterion run,'-the adequacy and appropriateness of the norm conver-
sions, and administrative problems of implementing.the_quasi-branch
35
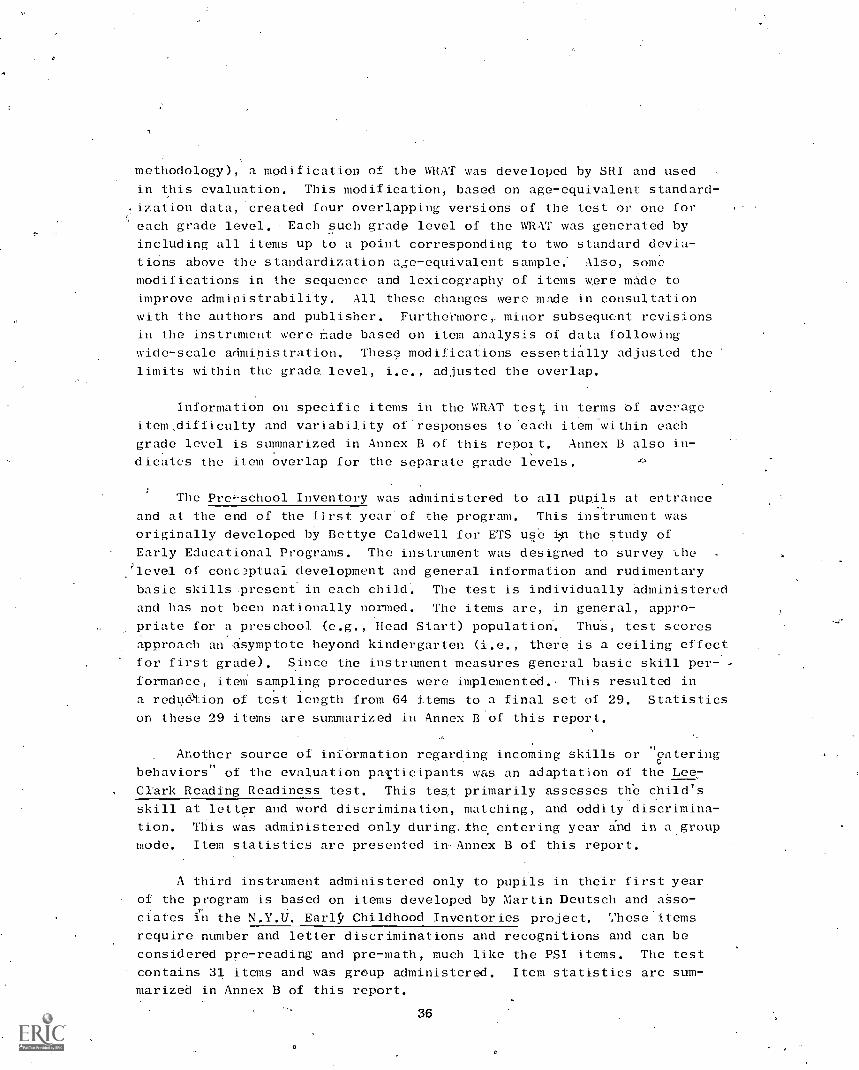
methodology), a modification of the WRAT was developed by SRI and used
in this evaluation. This modification, based- on age-equivalent standard-
ization data, created four overlapping versions of the test or one for
each grade level. Each such grade level of the WRAT was generated by
including all items up to a point corresponding to two standard devia-
tions above the standardization age-equivalent sample: Also, some
modifications in the sequence and lexicography of items were made to
improve administrability. All these changes were made in consultation
with the authors and publisher. Furthermore, minor subsequent revisions
in the instrument were made based on item analysis of data following
wide-scale administration. These modifications essentially adjusted the
limits within the grade level, i.e., adjusted the overlap.
Information on specific items in the WRAT tes in terms of average
item, difficulty and variability of responses to 'each item within each
grade level is summarized in Annex B of this report. Annex B also in-
dicates the item overlap for the:separate grade levels.
The Pre- school Inventory was administered to all pupils at entrance
and at the end of the first year of the program. This instrument was
originally developed by Bettye Caldwell for ETS use ix-1 the study of
Early Educational Programs. The instrument was designed to survey the
leval of conc3ptual development and general information and rudimentary
basic skills_present in each child. The test is individually administered
and has not been nationally normed. The items are, in general, appro-
priate for a preschool (e.g., Head Start) population. ThuS, test scores
approach an asymptote beyond kindergarten (i.e., there is a ceiling effect
for first grade). Since the instrument measures general basic skill per-
formance, item sampling procedures were implemented.. This resulted in
a redu&tion of test length from 64 items to a final set of 29. Statistics
on these 29 items are summarized in Annex B of this report.
Another source of infOrmation regarding incoming skills or "entering
behaviors" of the evaluation patticipants was an adaptation of the Lee-
Clark Reading Readiness test. This test primarily assesses th'e child's_ .
skill at letter and word discrimination, matching, and oddity discrimina-
tion. This was administered only during. the entering year and in a group
mode. Item statistics are presented inAnnex B of this report.
A third instrument administered only to pupils in their first year
of the program is based on items developed by Martin Deutsch and asso-
ciates in the N.Y.U. EarlST Childhood Inventories project. '<liese.items
require number and letter discriminations and recognitions and can be
considered pre-reading and pre-math, much like the PSI items. The test
contains 31 items and was group administered. Item statistics are sum-
marized in Annex B of this report.
36

A total of six subtests contained in the 1965 version of the
dotrepolitan Readiness Test were administered torpupils in their second
year of program (i.e., non-entering first grdders and second graders
in 1970-71). These subtests include measures of word-meaning, listen-
ing, matching, alphabet identificatin, numeration, and symbol copying.
This test was group administered and consists of 38 work items and ap-
propriate practice items. Item statistics are summarized in Annex B of
this report.
In addition to the Metropolitan Readiness items, selected Stanford
Achievement Test items .(1964 revision) and Metropolitan Achievement Test
items (1958 revision) were administered to PUpilsin their second year of
the program. This SAT-MAT subtest consists of 20 word reading items ,
and 20 arithmetic computation items. The test was group administered
and allowed 'eight minutes for word reading and seven minutes for arith-
metic. Item statistics are summarizedAn1 Annex B of this report: Also
included in Annex B are summary statistics describing the measurement
properties of theseAnstruments when aggregated into specific variables..
Sponsor Contributed ItemS--To guard against the FT TeSt Battery's
failing to cover items relevant to sponsors' objectives, attempts were
made to solicit sponsor-contributed test items and to incorporate them
into the upper grade levels of the battery (first grade and beyond). ,
These items are labeled sponsor items and vary from imbedded figures
tests to measures of word reading, numeration, concept identification,. alphabet skills, language/reading skills, set operations, straight
arithmetic abilities, verbal anaogies, and so on. These tests were
individually administered. Item difficulty and response variability
are'suMmarized in Annex B of this .report.
Noncognitie Measures-7A substantial interest in the collection and
analysis of noncognitive -or-affective indices of program impact was
expressed early in the evaluation planning,, However, several difficulties
soon became apparent. First; unlike cognitive measures (i.e., achieve-
ment, intelligence, aptitude, readiness,' ctc.), noncognitive instruments..
have not emerged An widely accepted or standardized forms. Whether thi5
is due to inherent difficulties in developing such instruments or in the
lack of prior focus on the domain is irrelevant; the fact remains that
no instrument comparable to the WRAT exists for noncognitive assessment.
Rather than abandon the domain as currently unmeasurable, limited
noncognitive instrumentation'was included in the battery, and a research
program for the identification and evaluation of alternative noncognitive
37

measures as instituted (SRI, 1970, 1972c, 1972d). The results of all such
instrument evaluation studies to date are generally discobraging, suggest-
ing thct although the limited Astrumentation initially incorporated in
the battery is far from sufficient as a valid and reliable measure of
affect, no better methods or instiuments short of a clinical interview
are currently available.4
tz,
The limited noncogriitive instrumentation included in the battery is
called the "Faces" Attitude Inventory. It consists of a series of self-
report questions, in which the. pupil is asked.to indicate how he feels/
about himself, ottrers, school, and learning, and how others feel towaEd
him, i.e., his' peer group status, and so on. To provide each:pupil: even
an entering kindergartner, with a relatively unequivocal means of indicat-
ing his feelings to eath such item, the tester asks each student to mark
a face (smile, so-so, frown) that corresponds to this feeling. This test
was group adminibtered to pupils in theT1969-1971 assessment period.*
The same instrument was administered to all grade and experience year
levels.
The contents of.the overall Follow Through Test Battery as adminis-
tered over the.perdod of Fall, 1969,' through Spring, 1971, are summarized
016
in Table 5.4
This table lists the test. contents in terms of item sources
for each le el relevant to this interiM evaluation. AfSo displayed in
Table 5 are the maximul scores obtainable for each item source. Changes
in these maximum sc '-res reflect longitudinal (year to year) as well as
grade level difference's dm the overall,batterv.:jt should be mentioned
that auring theyall 1969-Spring 1970 test interval pupils at grade
levels besides kindergarten and entering first were being tested. The
scope of the testing effort extelhded to first, second, chrd, and fourthgrade perils in groups latetexcluded from the evaluation sample. A
description of the entire data collection effort is beyond the scope of../'
this report and is mentioned here only to provide a.context for the
Cohort I testing.1
A
'wised on subsequently developed research evidence, this and similar
noncognitive instrument... were individually administered to all kinder
garten-and 'first grade pupils from Pall,.1971, onward.
38
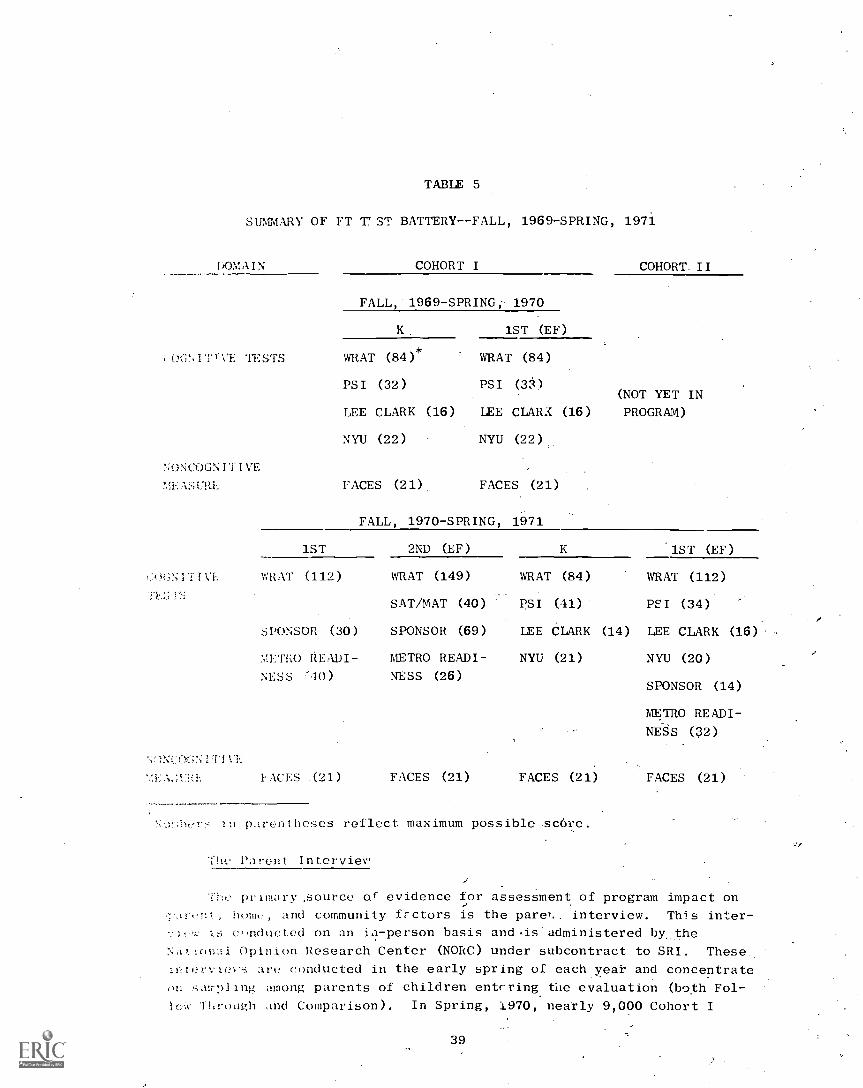
TABLE 5
SUIVARY OF FT 7 ST BATTERY--FALL, 1969-SPRING, 1971
DOMAIN
;.)G;IT.i.'E 'JESTS
NONCOGNITIVE
4EASURE
cr.,NCOWCITIVE
COHORT I COHORT. II
FALL, 1969-SPRING, 1970
1ST (EF)
WRAT (84)* WRAT (84)
PSI (32) PSI (33)(NOT YET IN
LEE CLARK (16) LEE CLAM (16) PROGRAM)
NYU (22) NYU (22),
FACES (21) FACES (21)
FALL, 1970-SPRING, 1971
1ST 2ND (EF) K 1ST (EF)
WRAT (112) WRAT (149) WRAT (84) WRAT (112)
SAT/MAT (40) PSI (41) PSI (34)
SPONSOR (30) SPONSOR (69) LEE CLARK (14) LEE CLARK (16)
METRO READI- METRO READI- NYU (21) NYU (20)
NESS '10) NESS (26)SPONSOR (14)
FACES (21) FACES (21)
METRO READI-
NESS (32)
FACES (21) FACES (21)
In parentheses reflect maximum possible score.
he Parent Interview
ThL. primary .source of evidence for assessment of program impact on
ry1:1, home, and community frctors is the parei.._ interview. This inter-is cflnducted on an ia-person basis and'ds administered by_the
Ntonal Opinion Research Center (NORC) under subcontract to SRI. These.
Intervies are conducted in the early spring of each year and concentrate
o4 yalr:)ling among parents of children entcring the evaluation (both Fol-
l*:N Through and Comparison). In Spring, 1970, nearly 9,000 Cohort I
39

interviews were conducted,* and in Spring, 1971, nearly 15,000 parents
were interviewed, a subset of whom had children in Cohort II.
Within the overall Follow Through evaluation the interviews with
parents' of Follow Through children and non-Follow Through children serve
four main purposes:
(1) Provide information .from which to estimate the initial
comparability of Follow Through and non-Follow Through
children and families according to socioeconomic, ethnic,
and other demographic characteristics, and to adjust sta-
tistically for noncomparability since random assignment was
not possible.
(2) Provide information for sorting respondents into subgroups
so that possible interactions between treatment and parent
characteristicS can be examined.
(3) Develop indicators of parental beliefs, expectations, and
practicesthat characterize family life styles which may
be influenced by or may mediate the effects of Follow Through
prograM participation. Some Follow Through programs are
specifically designed to bring about a considerable degree of
parent involvement and parent education while others empha-
size these goals only minimally.
(4) Ascertain the parent's knowledge of, participation in, and
satisfaction with school programs in general and Follow
Through in particular.
SRI, OE, and consultants selected a set of questions that, in their
judgment and with the constraints operating at the time, best served these
purposes. These items made,up the first Parent Interview (Spring, 1970).
The first Parent Interview, items provided data in the following ten areas:
Demographic data
Interest and knowledge about FT
Participation in making policy with respect to educational
programs
*During Spring, 1970, over 14,000 interviews were conducted. Decisions
subsequent to iata collection delimited the sample of interest.
40
Contact with the school and teacher.
Feelings about ability to control one's life
Support and guidance of child with respect to educational
programs
Extent of educationally relevant stimulation in the home
environment
Number of types of programs available to child in community
Aspirations.
In the second Parent Interview, used as a source of data for this
analysis (Spring, 1971), the following 11 content areas were used
Demographic data
Awareness of what is going on in child's classroom
Participation in policy making with respect to educa-
tional programs
Parental involVement with educational components of
planned variation
Feelings of being-able to control one's life
Support and guidance of child with respect to educational
items, and extent of relevant stimulation in the hote
environment
Satisfaction of parent with school
Satisfaction of child with school
Expectations/anticipations/goals of the parents
Feelings of efficacy in relation to the school
Social life style.
Teacher and Aide Questionnaire
The Teacher and Aide Questionnaires were developed to complementand support data gathered through other measurement instruments of theFollow Through evaluation and to learn whether teachers in the FollowThrough program were changing. First, the questionnaires were designedto provide profiles of the teachers in terms of demographic characteris-tick, the training and support they received, and the'goals and attitudesthey held. Second, the questionnaires could provide information about
41

the different effects of different Follow Through sponsors' programs.
As such, surveys were made of teacher practices and attitudes during
both Cie Springs of 1970 and 1971 using a teacher questionnaire that
included questions in the following areas:
Demographic information and background
Classroom practices
Availability and use of equipment and materials
Educational goals for children
Information and attitudes about home visits and parent
participation in the classroom
Knowledge about Follow Through, manner of involvement with
the program, and opinions about its effectiveness
General assessment of pupil progress.
Some instrument revision occurred between the 1970 and 1971 adminis-
trations, and only data for the 1971 administration are included in this
interim analysis. The nature of the 1971 revision reflected an increased
interest in teacher characteristics and practices, and in-dclassroom
composition.
For example, portions of the instrument dealing with teacher char-
acteristics included item& designed to assess:
Educational background
Teaching experience
Educational goals
Motivation
Training prior to current school year
Training during school year
Suggestions for improving training
Help provided by sponsor
What teachers know about Follow Through
Discussion of Follow Through with others.
42
Classroom characteristics were assessed through items dealing with:
Length of class day
Number of children at present and all year
Languages spoken by the children at hOme and in the clasSroom
Teaching approaches and techniques
Field trips taken.
Specific questions about parent involvement included:
Parent participation in classroom
Number of teacher visits to parent and reasons for them
. Number of parent visits to school and reasons for them
Teachers' feelings about the importance of getting together
with parents outside' school.
Finally, questions about the progress of children included teachers'
estimates of the progress of children in their classes on various cogni-
tive and noncognitive characteristics. However, teachers were not ques-
tioned about individual children.
The Classroom Observation Instrument
The SRI Classroom Observation Instrument (COI) is an elaborate
event recording procedure by means of which a trained observer in aclassroom records interactions among teachers, aides, and children, and
also records setting, kinds of activities, and groupings within the
classrpom. The instrument was developed to,be appropriately sensitive
to a broad range of activities characterizing the programs of a subset
of Follow Through sponsors,* while retaining adequate reliability.
*Sponsors included in the 1970-71 sample for classroom observations were
Bank Street College, University of Kansas, Univergity of Oregon, Uni-
versity of Florida, Educational Development Center, New York Univer-
sity, Far West Laboratory for Educational Research and Development,
High/Scope Educational Research Foundation, and the University of
Arizona. 4
43
The SRI Classroom Observation Instrument has three major parts--an
Observation Summary Form_(0SF) for describing the physical environment,
a Classroom Check List (CCL), and a Five-Minute Observation (FMO) form.
The CCL, sometimes referred to as the "snapshot," attempts to record
relatively static pictures (four an hour), of the dis- tribution of adults
and children among activities in the classroom. Essentially, the CCL
assesses (1) activities occurring, (2) materials used in activities,
(3) grouping patterns (4) teacher and aide responsibilities, and (5) chil-
dren working independently."
The FMO record of interactions is completed four times an hour (i.e.,
following each CCL). It requires a symbol to be marked for (1) who does
the action, (2) to whom it is done, (3) what is done, and (4) how it is
done. A complete unit of interaction is described when the coded cate-
gories are strung into a sentence structure format or frame. This frame
is a sequence of "parts of spe&ch" or subject, object, verb, and adverb.
The "Who" and "To Whom" codes make it possible to designate the person
or group of persons initiating or receiving an action.
The 12 "What" codes refer to categories (e.g., question, response,
instruct) that survived several iterations of instrument review with
consultants and sponsors' representatives to ensure that it captured
classroom .interactions -considered educationally significant.
The first four items in the 'How" code refer to the affective as-
pects of an interaction between people or with materials. The next six
items refer generally to strategies the teacher may use to control be-
havior in her classroom. The last two "How" items--"concrete objects"
and"symbolic objects"--were added' to capture an important distinction
among instructional strategies made by certain sponsors who believe chil-
dren must learn first from experOnces with concrete objects before
proceeding to experiences with symbols (ideas).
The FMO frame, then, is to record an interaction as a "sentence" in-
cluding "Who, To Whom, What, and How." Figure 2 shows the numeric and
alphabetic symbols, or codes, and theo brief definitions. Operational
definitions and examples are contained in the complete Training Manual.
Figure '2 also shows two sample frames recording teacher-pupil interac-
tions.
Coding a frame l'equires the observer to make adot with a felt-
tipped_marker pen on the appropriate symbol. Special mark-sense forms
were developed and adapted to the procedure to facilitate accuracy and
reliability of the observation/recording process.
44
ir
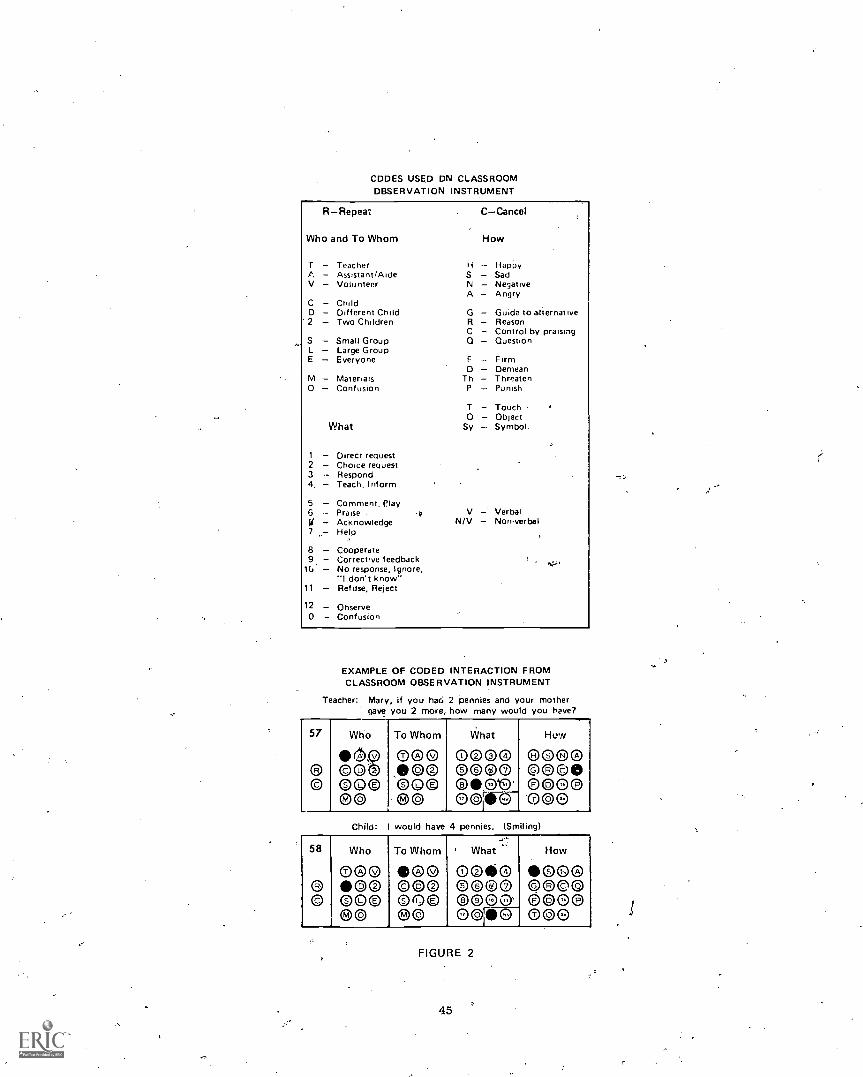
CDDES USED DN CLASSROOMOBSERVATION INSTRUMENT
RRepeat
Who and To Whom
CCancel
How
T Teacher H HappyP. Assistant/Aide S SadV Volunteer N Negative
A AngryC ChildD Different Child G Guide to alternative2 Two Children R Reason
C Control by praisingS Small Group QuestionL Large GroupE Everyone F Firm
D DemeanM Materials Th Threaten0 Confusion P Punish
T Touch0 Object
What Sy Symbol.
1 Direct request2 Choice request3 Respond4. Teach, Inform
5 Comment, Play6 Praise V Verbal
Acknowledge N/V Non-verbal7 Help
8 Cooperate9 Corrective feedback
11a No response, Ignore,"I don't know"
11 Refuse, Reject
12 Observe0 Confusion
EXAMPLE OF CODED INTERACTION FROMCLASSROOM OBSERVATION INSTRUMENT
Teacher: Mary, if you had 2 pennies and your mothergave you 2 more, how many would you have?
57
®©
Who
06,©© 0ocoa00
To Whom
(Deoea®©coo0@
What
(Doe®=DoGoan.O@;
Hew
()Goooeee000000e
Child: I would have '4 pennies. (Smiling)
58
0©
Who
00000000000
To Whom
00@@@00000
' What
000000000000'
How
000000@(§)000000000[0G
FIGURE 2
45
Project Descriptors
cy
A variety of categories of data descriptive of communities, school
systems and projects were collected and assembled for inclusion in the 0
interim evaluation.
The main sources of descriptive data for the projects included in
this interim analysis were the Census, Consolidated Program Information
Report (CPIR) and Elementary and Secondary General Information Survey
(ELSEGIS) systems, NCES documents, individual Follow Through projects'
annual applications, progress and interim reports, and data already
available in the SRI Follow Through data bank.
Data from the 1970 Census were available as published documents and
on magnetic data tapes. However, because of difficulties with system
compatibility and software, only published census reports were utilized.
These included the following final Census reports:
PC(1)--A-Number of Inhabitants
HC(1)--A-General Housing Characteristics
PC(1)--B-General Population Characteristics
Similarly, anticipated software and system compatibility problems
precluded use of CPIR'and ELSEGIS data tapes. As such, validated list-
crilks of all/ELSEGIS and CPIR data obtained for school systems and
individual schools in the interim sample were used. These validated
listings of data are essentially data (rave) tables in a format similar
to that of the original instrument, but which have been subjected to
editing and verification.
CPIR collects and enumerates statistical information aggregated atthe school district level for all Federal title expenditures on the fol.:-
lowing(quoted from Federal State Task Force ..., 20):
(1) Number of children ani number of schools in'the district
by pupil popuiationgroups, grade levels, and services andactivities provided;
(2)' Number of staff members by activity and pupil populations
served, number of staff members participating in Federal
programs, and Federal dollars expended on in-service
training by source of funds;
(3) Dollars expended, by source of funds,-pupil population
groups, services and activities provided, and dollars byage/grade level;
46
ta.
(4) Supplemental information appropriate to specific programs,
such as the ESEA Title III.0-0
,On the other hand, the ELSEGIS system is primarily designed to col-
lect data on the individual school system and analyze these data by
enrollmeht, metropolitan-stat,is, and geographic region. ELSEGIS, Parts
A, B, and C, are surveys conducted biennially. Collectively, they cover
staff, finances, public school organization, and pupils. Parts A and B
give data aggregated at the school district level; for Part C, the unit
is thc individual school.
Procedures
The data gathered for the Evaluation of Follow Through were-obtained
through two general procedures:' (1) direct assessment in the .schools and
communities as with the FT test battery, parent interview, teacher and
aide survey, and community studies and (2) the use of nonreactive mea-
sures and secondary data sources, such as the FT classroom roster, class-
room observation, and project descriptor data sources (e.g., Census,
CPIR, ELSEGIS, etc.). Since Follow Through is a very large and complex
program, correspondingly elaborate, yet systematic and detailed, data
collection procedures were developed for all direct assessments. These
included the establishment of:
Instrumentation and materials development, logistics, and
receipt control prOcedures
Data collection training, scheduling, supervision' and
management procedures.
Instrumerit administration, $coring, and processing procedures
Quality control, error resolution, and data storage and
retrieval systems.
Specific,data collection prpced.ures varied' according to requirements
of the separate instruments. s-Pupfl data (roster and test battery) were
obtained through the SRI field operations procedure. Parent interview
data were obtained through in-person interview by NORC. Teacher and aide
questionnaire data were obtained.by mail-survey methods. Classroom
process data were obtained through the classroom observation procedure.
Project descriptor data were acquired from secondary sources. Community
studies data were obtained on a case study basis. Each of these proce-
dures is described in the following paragraphs. ,Where appropriate, they
are discu'sed 'in terms of development, training, administration, and
processing components.
47
Rostering Procedure
Roster data were a basic source of relevant descriptivb information
on pupils and classrooms and thus were essential for the interpretation
of test scores and for the organization and management of all subsequent
longitudinal data. The initial procedure for collecting roster data in
vOlved reliance on site pe-rsonnel and Classroom teachers. Specifically,
rosters were distributed at the end of the school year to classroom and
school personnel via FT Directors. These local personnel were to complete
c the rosters and return them to SRI, also via the FT Directors. However,
over the course of the evaluation, procedures employed to gather these
roster data were revised because feedback indicated that problems were
encountered in this initial procedure. This revision involved the follow-
ing two major changes, which were implemented in the 1970-71 rostering
procedure:
Jl) Rostering of all classrooms scheduled for any testing (either
Fall or Spring` was completed twice during the school year;
at the time o1 fall testing and at the time of spring testing.
(2) Responsibility for accuracy and completeness of rosters was
assumed by SRI field staff (described below) who worked with
local school personnel and teachers in_obtaining and validating
roster data,
These revisions greatly improved the quality and completeness of roster
information, which was, of course, essential, since rosters provide the
major basis for linking up longitudinal data; for tracking control school.c,
classes, and pupils; for organizing all pupil, classroom, and teacher data
into appropriate subgroups (e.g., FT/NFT); for defining the parent inter-
view sample; and for organizing the data storage and retrieval system.
FT Testing Procedure
As described in the instrumentation section, the FT battery consisted
of several grade-specific and several grade-overlapping test instruments,.
Moreover, some changes in the grade-specific contents of the battery were
made from Fall, 1969, to Spring, 1971, (the duration of this interim
evaluation). These Modifications generally reflect subtle changes in
evaluation focus over the interim period as well as instrument refine-__ment based on item analyses of preceding administrations:

Parallel to the instrument refinement, substantial development and
modification of training and administration procedures occurred. Speci-
f,cally, the.training and test administration procedures for Fall, 1969,
data collection employed 36 SRI/FT "regional representatives," whose
responsibility it was to recruit, train, and supervise test administra-
tors and'Coordinate the collection of data from over 35,000 pupils in
90 projects. (The,Fal], 1969, Cohort I sample). These regional repre-
sentatives generally were university faculty (most from .schools of educa-
tion) and' were recruited as consultants to SRI. These representatives
attended a single, 'central training session conducted by SRI project
Staff. The training included testing procedures, test receipt control,
shipping and documentation procedures, and various scheduling and admin-
istrative details. Each representative was responsible for hiring his
' own testing staff and for-conducting his own local training session in
accordance with guidelines established by SRI. (SRI, 1969). Each regional
representative was assigned between two and four projects and supervised ti
an average of 10 testers.
Several features distinguishing the Fall, 1969, test effort were,
the use of superVlsing, assistant,;and;aide testers at the classroom
level; attempts at the use of systematic scheduling for test administra-
tion (with pupils assigned to schedules at random); and the use of multi-
level management procedures to establish uniform supervision and control
over the brief but wide -scale test program. All pupil 'tes'ts were to be
administered within a two=week period, hopefully between the sixth and
eighth week folloWing the commencement of school and again between three
and six weeks prior to completion of the school year. Within these test-
ing intervals, attempts were made'to test FT'and NFT classrooms simulta-
neously, alternating testers between FT and NFT classrooms at random.
Regional representatives served as test coordinators, field supervisors,staff trainers, and.SRI-project
Experience gained in the preliminary data collection activities in
1968-69-indicated that these procedures should be adequate, especially since
'the time available in which to develop and implement any procedure follow-
ing specification of the battery and approVal of the sample was extremelyShort. Recall that Cohort I K and EF samples were only a subset of theFall, 1969, sample. 'Data were alSo collected on continuing first, second,third, and fourth grade pupils at these sites. Also, because of the scope-and magnitude of the Fall, 1969i effort, and because of delays in negotia-
ting the content of the test Thttery;,completion of Cohort I taseline test-
ing often occurred as late as December, 1969, nearly half-way into theschool year. This unavoidable delay in the Cohort I baseline testing; has
unfortunate-consequences on the validity and utility of resultant data,particularly for those programs designed t!-),produce-large early impacts.For example, if a program had a large effect on improving performance of
49,
FT pupils during the interval between commencement of school and bqqc=1-inc
testing, these FT pupils will invalidly appear as able" at baseline.
If"this difference is considered 'or adjusted for in an analysis of FT/NFT
outcomes, the net effect will be that of "adjusting put" the impact of the
programmaking the statistical test biased against finding an FT programeffect.
Nevertheless, the detentra.lized nature of this operational plan led
to variation in the quality and completeness of data collected. That is,consultants differed in their approaches to training, scheduling, and
documentation such that occasionally irreplaceable gaps in baseline data
(both rosters and test battery) resulted. These data problems werelargely eliminated in subsequent data collection when it became possible
to (1) establish permanent centralized data collection managers who were
called "field Supervisors," (2) replace regional representatives" with
locally recruited 'Tsite coordinators," and (3) establish uniform regional
training programs, which were attended by site coordinators and super-
vising testers. These changes amounted to centralizing data collection
'management at SRI (as implemented by the field supervisors), and further
standardizing the training and administration procedures (senior testers
attended regional training). By the Spring, 1971, testing periOd, these
procedural revisions were sufficiently refined that the quality and quan-
tity of relevant data were clearly superior to those obtained in Fa11,1969.
Under this improved standardized testing procedure, classroom testing
vas conducted by a,test team consisting of a supervising tester, an assis-
tant. tester, and two or more aides. Several such teams worked at each
site. The supervising testers within a testing site-reported to the site
coordinator, who in turn was responsible to a designated field supervisor.
Regional training was conducted by SRI training experts and field''
stipe4Visors. All site coordinators and fiead supervisors were required
to demonstrate understanding and competence in the admidistration of, all
tests and in the completion of all control and data forms. These regional
trainees, in turn, conducted local training for test assiStants and aides
(project hires) Under the superVision of the field Superviser.
Testing was accomplished within the second to fourth week after
commencement and before completion of the school year' Again testers
were randomly balanced across FT and NFT classes. Up n compI,etion of
testing,, test booklets and data forms were shipped to SRI for. and-pro-
cessing. formThe processing of test data into machine readable was
accomplished with very high precision by means of two coding verification
steps (100 percent aid variable'sample) and through comprehensive editing
and: i'esolution ,,rocedures In the FT data storage, system. RdSter and test
data were linked in this storage pfocedure.
.50

Parent Interview Procedure
.The administration of the parent interview (PI) survey was subcon-
tracted to National Opinion Research Center (NORC). However, SRI was
responsible for developing and'revising the instrument, for selecting
projects and specifying the parents to be interviewed, and'for scheduling
the survey and follow-up activities. In close collaboration with SRI,
NORC was responsible for the recruitment, training, and supervision of
all interviewers. In general, NORC attempted to recruit local (40 sites)
interviewers through the assistance, of the FT directors and PAC chairmen.
The respondent to the PI was the mother or the mother surrogate when
avatlable; in the majority of cases, the respondent was the mother. If
neither the mother nor a mother surrogate was a member of the household,
the father was sought as respondent; if he too was unavailable, a respon-
sible adult in the household was interviewed.
The designation of participants for each PI interview sample was
based on the corresponding year's pupil test sample. For both the 1970
and 1971 administrations of the PI, the following criteria\were employed:
(1) At sites where 110 or fewer entering pupils were tested,
all corresponding households were scheduled for inter-.
views. ,
(2) At sites where, the number of pupils"tested exceeded 110,
random selection of 110 households defined the interview
sample. Thus, up to, but not more than, 110 interview's
were administered at each site, each year.
The FolloW Through sponsors provided NORC with lists of households
to contact. In Spring, 1970, a 96.5 percent net response rate was obtained
from an original assignment of 14,800 cases In Spring, 1971, of the 15,17
possible respondents,.all'but 397 were interviewed, giving a net response
rate of 97.5 percent. These approximately 15,000 interviews per year
represent the total survey effort. As has been noted.earlier, relevant
Cohort I and Cohort II samples are only subsets of these efforts. Never-
theless, we feel it is reasonable to assume that the.same return rates
prevailed for these subsamples.4,
As a control on quality, NORC checked between 15 percent and 25 per-
cent of the respondents by phone or mail to assure that the'interview had
taken place. Except for the first few interviews at each site, interviews
E,were selected for-validation of random.. In addition to verifying the
original,interview and the answers to a few '.ey NORC asked
respondents questions about their reaction to the interview itself. The
51
validation forms were transmitted to SRI. Whenever a,resPondent refused
the -first 'attempt to interview, another interviewer (often the supervisor)
recontacted ,thc respondent and either obtained the interview'or learned
more about the reason for the refusal. The overall direct refus:_i rate
was 'Well under 1 percent.
Teacher and Aide Survey Procedure
-"Survey data for teachers and aides for this interim evaluation are
based on self-reports of respondents to the Teacher Questionnaire and theAide Questionnaire. These questionnaires:did not entail'any in-person
interviewing, nor were any. torced compliance procedures employed.
During the last two weeks of April, 1971, questionnaires were mailed
to al]. Follow Through.coordindtors, to be distributed to both Follow Through
and non-Follow Through teapherswhose classes had been tested in the,Fall,
1970. During the last week of May, an additional 200 questionnaires were
sent out to'Foilow Through coordinators for teachers whose classes were
tested in the Spring but not in the Fall. Each Follow Through teacher
received one aide questionnaire-for a regular classroom aide to fill out.
If morg than one aide worked in the classroom, the teachers were. instructed
to alphabetiZe the aides by the lia.E,T name and give the questionnaire to
the second tone on the list. There were 1,774 teacher questionnaires and
933, aide questionnaires sent out. Of the teachers, 993 were Follow Through
and 781 were non-Follow Through.I
Of the 1,774 teacher (993 Follow Through and 781 non-Follow Through)
questionnaires sent out, 1,462 vere completed and returned for a response
rate of 82 percent, and of the 993 aide questionnaires sent out, 804 were
completed and returned for a response rate of 80 percent. At present, nodata are available on determinants of refusal'.
Completed questionnaires were processed by a team of three coders,
one checker, and one supervisor. For the aide questionnaire, two coders,
one checker, and one supervisor were used. Each booklet was coded and
checked for errors and open ended responses. The supervisor verified
.processing of every fifth questionnaire. A twostep verification of key-punt. was' employed- -100 Percent verificatiaa.and 5 percent verification.
Classroom Observation Procedure
Observers completed a programmed home study course in,which they
were acquainted with the Classroom Observation Instrument and learned
the definitionS of the coding symbols. They then attended a four-day
52

Intensive training session with an instructor for every four trainees.
This session dealt with standard prOcedures for the conduct of all
actual observations..,; After passing a final coding criterion test, observ-
ers went to their designated-fielddsites.
rt.
In Spring1971, each classroom in the Classroom Observation sub-.
sample was observed for two consecutive days. An Observation Summary
Form, mainly identifying the. classroom and noting number of children,
walt tilled in once. The Classroom Check List and the Five-Minute Ob-.
servation of interactions were completed at the rate of approximately
four poi' hour, or approximatelY 16 per day (fewer for most kindergartens,
which were half-day sessions). One completed CCL aria FMO constituted a
unit called Classroom Observation Period (COP). Observers were instructed
to include:one of each Kind of.adult/child grouping and one or:each major
type'of activity as the focus of their-five-minute observations. -A COP
conSiituted the unit on which the frequenciof the process variable was
bused.
Reliability checks were made by on -site simultaneous coding by ob-
server and SRI Classroom Observation trainer for two hours in the same
classroom (eight five-minule observations). .
Observations were'conductecyJy the same observers in both Follow
Through 4nd non- Follow Through classrooms at the same site.
Project DescriploK_Procedures
For the project descriptors study approxiMately 1,500 individual
`pieces o' data were collected for each of the 45 projects, in the sample.
In 411, more than 75,000 pieces of data were collected and processed.
Genera1ly, data collection involved a heavily concentrated effort be-
cause of the time limitations. Data Sources, are indlimted below, along
'1,644-estimates if how much of the data we actually :stave been able to
collIct fromeach source.
The high return rates indicated above may be omesdiat misleading. for
two reasons. Frrat, the percentages given abovo represent the proportion
of the trJtal sample (% = 45) for which we have data For some sources
some 6, the sample projects were not included in the original data gather-
ing,. Hence for the ELSEGIS data a 100 percent completion rate is unob-
tal::abl! because one of our projects was not surveyed by ELSEGIS. On theother hied, is a significant number of cases, portion's of the information
abstained in a given source are either iccomplete or apparently inaccurate.
Lack of conptheness has been a particularly difficult problem sdth the.
project Applications. Copies of Individual project applications were
33

4
requested directly from the 45 sample projects. These applications were
received over a period of several months, extending into Spring, 1972,
well into the data prOCessing stage of our study.
Percentage of Projects for Which,
Secondary 'Source Source has been Obtained
Census
NCES and State Educdtion Agency
publications
CPIR data
ELSEGIS ,
Part A--Staff
Part B--Finances.
Part C--Individual schools
Local Fellow Through project (annual).,
applications to USOE
SRI Follow Through Data Bank
. 'Child Roster data.
Teacher/Aide Questionnaire data
Purent Interview data
Personnel Roster data
100%
75
91
95
97
90
100
lop
loo
- 64
84
Because of the pressing need to begin the data processing stage of
our investigation, the codes had to be lormUlated before a fully repre-
sentative set of proposals,had been made available to SRI. Thus the ",
cOdes, although they do provide for a wide variety of responses, do not
cover every contingency ,and are more suitable for some projects than for
others. For example, proposals from New York City and Philadelphia were
not received until after the codes had been constructed. Certain distinc-
tive features of both sets of projects could only be approximitedby the,3
codes available. This phase of our study has produced codebooks for the
various source documents and an elaborate set of coding instructions for
. the project applications.
Given these constraints, the reliability and validity of the resul-
tant data, although high, could be improved. Attempts were made to im-
prove the accuracy of project data through phone calls to the projects,
examination of the project master files maintained At the U.S. Office of
,Education,.Follow Through Bra6Ch, and discussion with the SRI field staff.
Also, among the techniques used to assess or improve the reliaLl_sty of
descriptor data were:
(1) Use of multiple sources to check for inter-source consistency
(2) ,Estimation of internal consistency within a given source
54
' (3) Checks for reasonable consistency across time when appropriate
data were available.
'Community Studies, 1970-71
Community studies conducted during the evaluation year 1970-71-are
part of a Series of developmental. studies'aimed at identifying the pat-
terns of institutional change--both those taking place within the school
and those involving relationships..between the school and the larger com-
munity- -emerging within Follow Through.
The 1970 -71 phase of the studies was designed to fteht tLe viability
ofiatentative model of Institutional' change that had been developed -from
case studies conducted between 1968 and 1970. This model suggested that
the-1e941 of parental involvement in tpe local, projects was a critical
factor in the process of institutional change. It further identified
certaiwdeterminants of the level of parent'involvement'in Follow Through.
These.factas include'organizational characteristics of the project and
its Parent Advisory Committee (PAC), social-psychoreecal attributes.of
the parents (roleexpectatipns, conflict, etc.),, and resources. .
'The 1970-71 effort was conceived as aprelimiAary investigation into
the re:ationship between certain.psychosocial and organizational _variables
and the level of parental involvement in Follow prough prolects. Nine
projects were purposively selected to comprise the sample fr ple explora-
tory study.. Because of the sampleeP small size and judgmental nature, no
generalizations7especially Conclusions regarding differences among sponsor'
approaches, projects, or geographic regionsare warranted,
The study consisted of two parts. For the part concerned with the
relationship between organizational aspects of individual projects and
the overall level of parental participation, unobtrusive techniques were
utilized to gather information on individual projects. Annual project
applications and interim and progress reports were obtained and scruti-
nized. USOE/Follow Through master files, contaiqing reportivon individual
projects prepared by General Consultants and Specialists, were consulted.
Demographic and population data describing the Community and the Local
Education Agency were obtained from sources at the Bureau of.the Census
and at National Center for Educational. Statistics (particularly ELSEGIS
and CPIR), respectively.
Both the qualitative and quantitive data obtained from these secon
dary sources were used to develop a descriptive profile for each project,
whiCh focused mainly on the school ys.cr 1970 -7l but did not necessarily
excldde evolutionary and developmental factiirs extending back to prior
years. The profiles were reviewed by project directors, PAC chairmen at
55
the respective projects,and project officers. This revie wets undertaken
not only to establish the factual accuracy of the data but also, and
equally importantly, to determine whether the "gestalt" of n tdven'pro-
'file coincided with the views of persons familiar with that project.
The profiles were then synthesized and analyzed.
For the phase of the study concerned with social-psychological
factors underlying parental involvement, semi- structured interviews
were employed. Respondents were purposively selected samples-of parents
and teachers in the nine projects. Although general guides were used in
conducting the interViews, respondents were allowed and even encouraged
to narrate their perceptions of their own and others' roles and role
relationships. No attempt was. made to prevent respondents from offering-
personal -, subjective descriptions of causal patterns that they believed
linked various role performances to variations in mode of involvement or
to variations of activities.
ThiS technique was selected with the aim of ascertaining a range
of expec-&tions, attitudes,- norms, and patterns of behavior for parents
and teachers. Although no two respondents received exactly the same
interview treatment, questions pertaining to expectations and behaviors
were structured and similar for all respondents. Follow Through parents
(including PAC chairmen) and teachers. were asked about the attributes,
broadly de4ned, that they perceived as most essential for determininglegitimacy and probabinty.of their participation in the program.
Since these studies were conducted on only 7 of the projects included
in this evaluation, their results are not included in this report. The
interested reader is referred to, the Draft report (SRI, 1972b, Appendix E)
and to a forthcoming revision scheduled for publication in Spring 1973.
Definition and Development of EValuatfon Variables ,
Before we describe the procedure for defining and deVeloping evalua-
tion variables from instruments and data collected, it mii,ut be useful
to review briefly tta general model for evaluating the overall FT. program
and its planned variations. In its simplest form, the model assesses the.
differences between participants and nonparticipants in Follow Through on .
measures and variables of interest. These measures or variables are
referred to as "outcomes," and differences in outcomes are defined as
"impacts." ,Before any such assessed differences may be attributed toprogram participation (i.e., before impact may be ascribed to the program),
it is necessary to establish that participants and nonparticipants werecomparable (i.e., establish some degree of ceteris paribUs)before imple-
mentation of the program. These measures of comparability are defined=
56
as control variables or "inputs" inlkhe evaluation model.' Finally, after
comparability of inputs has been established (i.e., input differences have
been controlled), impacts, can be interpreted in'terms of a third class of
variables namely, process or treatment variables and components. Thus
there are three classes of variables in our evaluation model: (1) input
or control; (2) process or treatment, and (3) impact or outcome.
When we apply this model to the Follow Through experiment, we see
that it applies at three interrelated levels--or impact foci--each,roughly
corresponding to a general objective held for the .Follow Thy ough program
by at least one stakeholder group. The first level--and the one central
to this report--is the child. What are the overall and differential im-
pacts of Follow Through:on the educational, psychological, and social
growth and development of children? The second level--obviously inter-
related with the first--is the parent/home and community. What are the
relative overall and differential impacts of Follow Through on parent,parent-chile, parent-school, and, parent-community-factors? The thirdlevel also interrelated with the first and sec...Indis the eacher, class-room, and school. What, for example, are the overall and relative impacts
of Follow Through on teacher attitudes and behavior; classroOm practices;
curriculuM reforms; and school funding, staffing and service policies?
For each of'the. above levels, the evaluationgliestion was pcsedin
two forms: what,: if any; are the general or overall iMpacts;'ani what,
if any, are the differential (i.e., input or prodess specific) impacts
of Follow Through?, The first form of the question is designed to assess
and evaluate Follow Through as a national program. The second form is
appropriate for assessing and evaluating planned variations of Follow
Through. We believe that limitations in the scope, representativeness,
and duration of "treatments" of the programs included in ttis interim
report, zi.s. well as a number of data and analysis problems discussed below,
severely restrict ansWer9 to such evaluation questions at this time.
Nevertheless, the soundness.. of this evaluation approach should be evident
and, as applied to these interim data, could reveal emerging program
effects.'
Basic Variable by Category Matrix for Evaluation Data
Table 6 presents a summary of the organization of data sources and
instruments into appropriate evaluation variables in terms of the basic
evaluation model. This table shows the separation as well as the overlap0 of the various instruments in terms of how eackcontributed to evaluation
variables. In the following paragraphs, we describe our method and pro-
cedure for organizing our data into apprepriate evaluation variables and
refor to relevant operational definitions..
'57
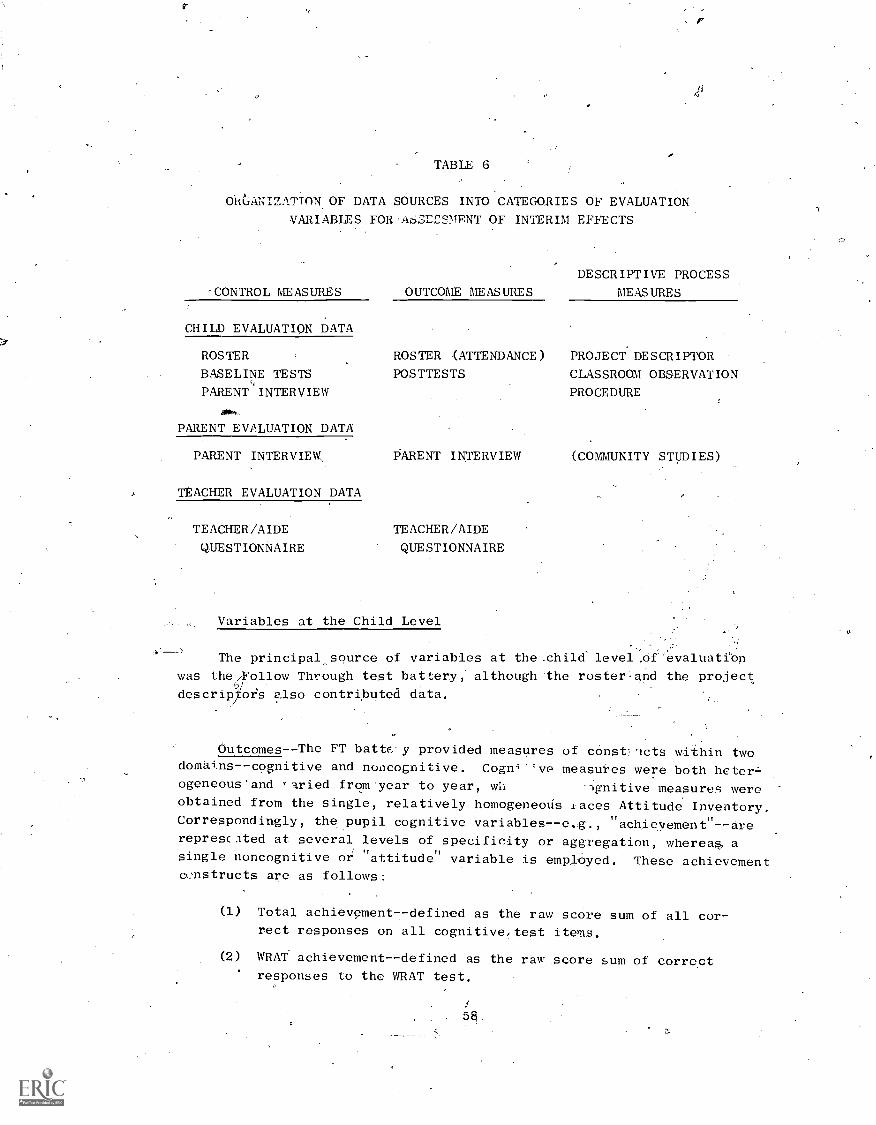
r
TABLE 6
ORCANIZATTON OF DATA SOURCES INTO CATEGORIES OF EVALUATION
VARIABLES FOR-A6ZECSENT OF INTERIM EFFECTS
DESCRIPTIVE PROCESS
CONTROL MEASURES OUTCOME MEASURES MEASURES
CHILD EVALUATION DATA
ROSTER ROSTER (ATTENDANCE) PROJECT DESCRIPTOR
BASELINE TESTS POSTTESTS CLASSROOM OBSERVATION
PARENT INTERVIEW PROCEDURE
PARENT EVALUATION DATA
PARENT INTERVIEW PARENT INTERVIEW (COMMUNITY STUDIES)
TEACHER EVALUATION DATA
TEACHER/AIDE TEACHER/AIDE
QUESTIONNAIRE QUESTIONNAIRE
Variables at the Child Level
The principalsource of variables at the-.child level .Of evaluatibp
was the Follow Through test battery, although Ahe roster and the project,
descrip ois also contributed data.
OutcomesThe FT batte.y provided measures of cOnst:*Icts iAhin twodomains--cognitive and noncognitive. Cognil've measures were both heterogeneous'and varied from year to year, wh -1gnitive measures wereobtained from the single, relatively homogeneods maces Attitude Inventory.Correspondingly, the pupil cognitive variablese.g., "achievement"arerepresc.ited at several levels of specificity or aggregation, whereas, asingle noncognitive or attitude
!I
variable is empl6yed. These achievementconstructs are as follows:
(1) Total achievement--defined as the raw score sum of all cor-rect responses on all cognitive, test items.
(2) WRAT achievement--defined as the raw score sum of correctresponses to the WRAT test.
8.

(3) Quantitative skills -- defined as the raw score sum of correct-
s items pertaining to quantitative concepts--such as numeration,
operations, (addition, subtraction, etc.), and word prOblems.
(4) Reading skills--defined as the raw score sum of correct re-.
sponses to items requiring reading or.reading-related skills
(including pre-reading), such skills as alphabet/letter
recognition, matching and copying, figure copying, word
matching, symbol matching, oddity di'crimination.
(5) Language Artsdefined as the raw score sum of correct
responses to items requiring language, lexicographic, or
grammatical skills, such as analogieS, word meaning, spelling,
and concept activation.
(6) Cognitive Processes--a residual category consisting of the
raw score sum of correct responses to items requiring per-
ceptual-motor skills. and concept identifications;
It should be,noted that in this organization of instruments into
variableS, the quantitative, reading, language, and cognitive process
variabl 3 consist of mutually exclusive subsets of the total achievement
variable. The WRAT achievement variable, on the other hand, .-werlaps
with both the total achievement variable and the quantitative, reading,
and language variables. A reliability analysis of these outcome measures
is presented in Annex B of this report.
The attitude measure initially comprised two components: psycholog-
ical--or feelings toward self, otherS, school and learning - -and socio-
logical - -or perceived peer acceptance, social distance, and associated
sociograms. These latter measures were abandoned because of lack of
reliability and validAy, yielding a single measure for the noncognitive
or attitude -- variable. This measure is defined as the scaled sum of self
reports of feelings (sad = 1, _so-so = 2, happy = 3) toward a series of
standard situations.
Finally, a nonreactive measure of interest was obtained from the
classroom roster'for use as a child outcome. This- measure, attendance,
was sir*y the number.of days absent in the preceding academic year,;.up
to -Chi, time.of rostering.
Controls--A preliminary inspection of test, roster, and descriptor
data indicated that although the FT and comparison (NFT) school pupils
were similar in many -if not most--respects, important initial differ-,
ences existed, particularly on measures assumed (or demonstrated) to be
59
related to outcomes, such as baseline test scores. Consequently, three
categories of control (input) variables were defined and subsequently .
I I
utilized to generateI
comparabilityI
,in the analysis for program effects.
These categories of control variables were":
(1) Baseline differencesdefined a5 the entering scores on,
each of the above defined outcome variables (i.e., acnieve-
mcnt, WRAT, quantitative,. language; reading, cognitive
process, and affect).
(2) Environmental differences -- defined as home, school, and
comthunity demographics and SES factors, such as parents'
education, occupation, race, income, sex and employment
of head of household -(HH), urbanization of the community,
the pupil/teacher ratio and average per pupil expenditures'
of the school. So that these measures could be aggregated
Within an analysis, education was dichotomized at high,school
diploma, race as Black. versus non-Black, income as poverty
eligible versus noneligible,*- and eMployment.of household
head (HH) as working versus seeking employment.
(3) Individual/experiential differences -- defined as average
pupil age, sex, race, and preschool experience. Pupil
"age was calculated in tenths at the time of baselinetesting. 'Se.: is representec as the percent .male
race as the percent black, l.i.nguage as the percept Of ..
pupils for whom English is tie first language, and pre-
, school is either (a) actual months of Head Start'or eqpi-
valent preschool experience, or (b)percent of pupils%
having some Head Start or equivalent education.
Variablesat the Parent Level
Parent involvement in their child's learning and parent participa-
tion in school activities (at least at the level of awareness of or
knowledge about the school program) are considered important or'even
crucial in the various Follow Through models. In some, such as the
Parent Implemented Models, parents are as much or more the objects, of
program influence as their children. Other models (e.g., the Florida
Parent Education Model) seek to influence child deVelopment through the
metiiation of parent behavior and direct tneir efforts to parent education.
*See the explanation of the 0E0 poverty-guidelines.for interpretationkf
eligibility on page 84 of this report.
60
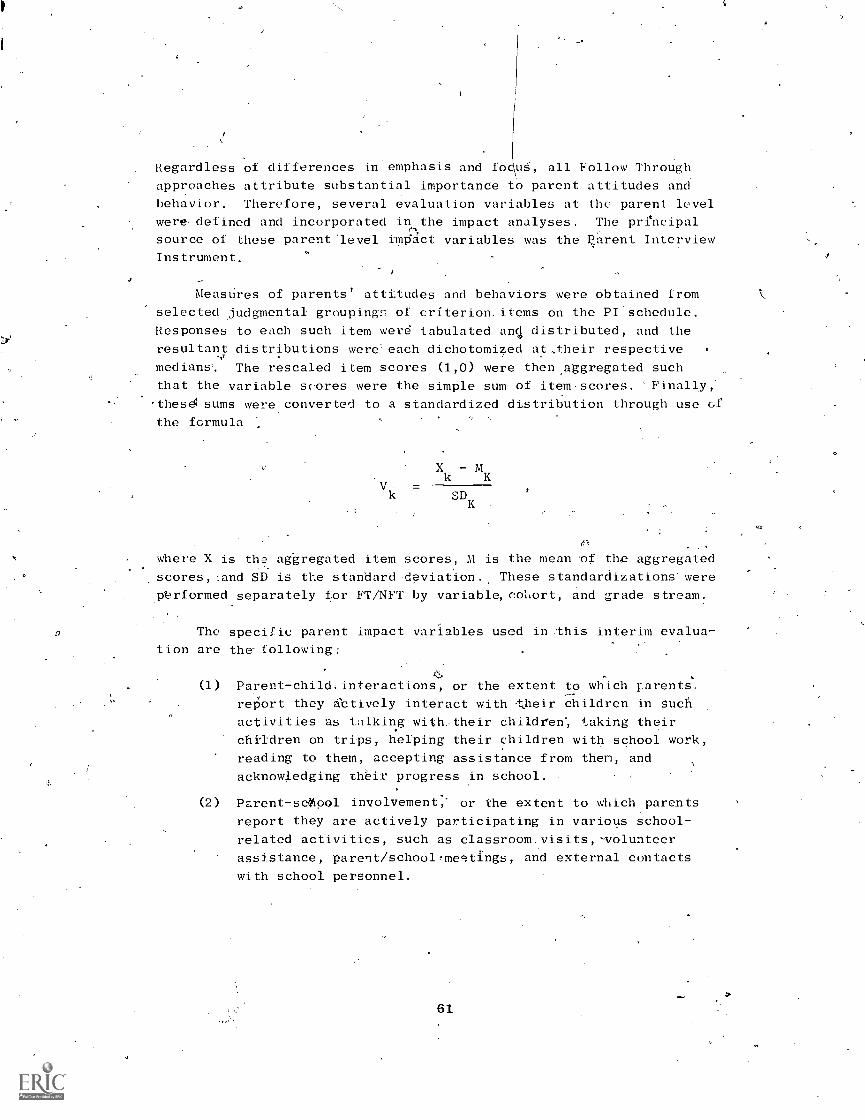
Regardless of differences in emphasis and fo uS, all Follow Through
approaches attribute substantial importance to parent attitudes and
behavior. Therefore, several evaluation variables at the parent level
were defined and incorporated in the impact analyses. The principal
source of these parent level impact variables was the parent Interview
Instrument.
Measures of parents' attitudes and behaviors were obtained from
selected judgmental groupings of criterion.items on the PI schedule.
Responses to each such item were tabulated anq distributed, and the
resultant distributions were each dichotomized at,their respective .
medians. The resealed item scores (1,0) were then aggregated such
that-the variable scores were the simple sum of item scores.
-thesd sums were converted to a standardized distribution through use of
the formula ;
Vk
X Mk K
SDK
where X is the aggregated item scores, M is the mean of the aggregated.
scores, and SD is the standard .deviation.: These standardizations were
ybrformed separately for FT/NFT by variable,collort, and grade stream.
The specific parent impact variables used in Ahis interim evalua-
tion are the following:
(1) Parent -child interactions, or the extent to which ilarents,
report they actively interact with ,their children in Such
activities as talking with...their children; taking their
children on trips, helping their children with school work,
reading to them, accepting assistance from them, and
acknowledging their progress in school.
(2) Parent-soKool involvement; or the extent to which parents
report they are actively participating in various school-
related activities, such as classroom.visits,-volunteer
assistance, parent/school,megtings, and external contacts
with school personnel.
61

(3) Child acP(..mic expectations; or the extent to' which the
parent reports satisfaction with the child's progress and
optimism re.:;arding the child's future, both academic and non-
academic. (E'.g, what are the Child's expected grades, chances
of_getting'a good ,job, chances of going on to college ?)
(4) Sense of control, or the extent to which the parent
1?ePorts a sense of concern and control over school pl'oce-
du'res, educational reforms, and school awareness of and
. responsiveness t{6., arent and community desires and needs.
Other parent measures th t were similarly scaled but that were not
included in this interim analysis (generally because of an excessive
amount of missing data or inadequateresponse variability) were:
'(5) Parent-social interactions, or the extent to which parents
actively interacted Tith otheA in the communLty-(e.g.,
visit with friends, visited by .friends, club membership:,
etc.).
(6) Parent locus of control, or the extent the parent reports
a sense of control over his/her Sate and life chances, as
well as those of others.
(7) Parent participation in PAC, or the extent to which LlYe
parent reports awareness of and/or. participation i7.,the
Policy Advisory Committee (note: variable has meaning onlyfor parents).
Since .the. same inr traproject variability.(FT/NFT) noted for child
outcome measures would be present and potentially bias estimates of
program impact on parent outcomes; it was necessary to develop and em-
ploy a set of-variableg to control for initial or unintended differences
in the parent sample. Many of these control Variables are identical to
those developed for child level analyses to control for effects of en-
vironmental differences.
Variablesat the Teacher Level
Outcomes--To assess the relative impactof Follow Through on teacher
attitudes and behavior, information obtained from teacher and aide reL
sponses to the questionnaires administered in 1969 and 1970 was assem-
bled into outcome measures of interest. The procedure adopted fordeveloping' these measures was essentially the same scaling method as that
62
r-
used to develop parent outcome and control-measures. Items were asseMbred
into logical and,judgmental groupings, responses were resealed after
dichotomizing the distribution for each item at or_nearest the median;
the resealed item scores. were then aggregated into a grouping'Or variable.
score. These scaled variable scores were finally transformed into a
standardized metric with Mean = 0, SD =
The specific teacher outcome variables prepared for analysis of
program impact are asfollows:
(1) Parent-educator image, or the extent. to which teachers
reported they felt it essential to "get together with
parents outside of the classroom" for purposes of
Improving children's learning
Improving classroom teaching.
Learning parents' views on teaching,
Tmproving school Services to parents
Improving school services to children
Improving school services to community
Parental understanCna of school program.
The- logic of this measure or index of teacher._attitude
toward parents is that rf parents are being brought more
inter the mainstream of their children's education through
the FT programs and if.theiy.participation is being viewed
as helpful by teachers;* these effects should be reflected
in differences between TT and NFT teacherS on s. ees for
the above variabre.
(2) Professional acceptance of method, or the extent to which
the teacher reports she would not prefer to adopt some
teaching approach other than the one she is.- currently.
Tite logic for. use of this variable as a measure oC
impact is that if teachers perceive their current method
as appropriate and effectiveto the nerds of the children,
they should express less interest in alternative methods.
Essentially, this measure provides an indirect assessment
of teacher ,satisfaCtion with her current approach.
63
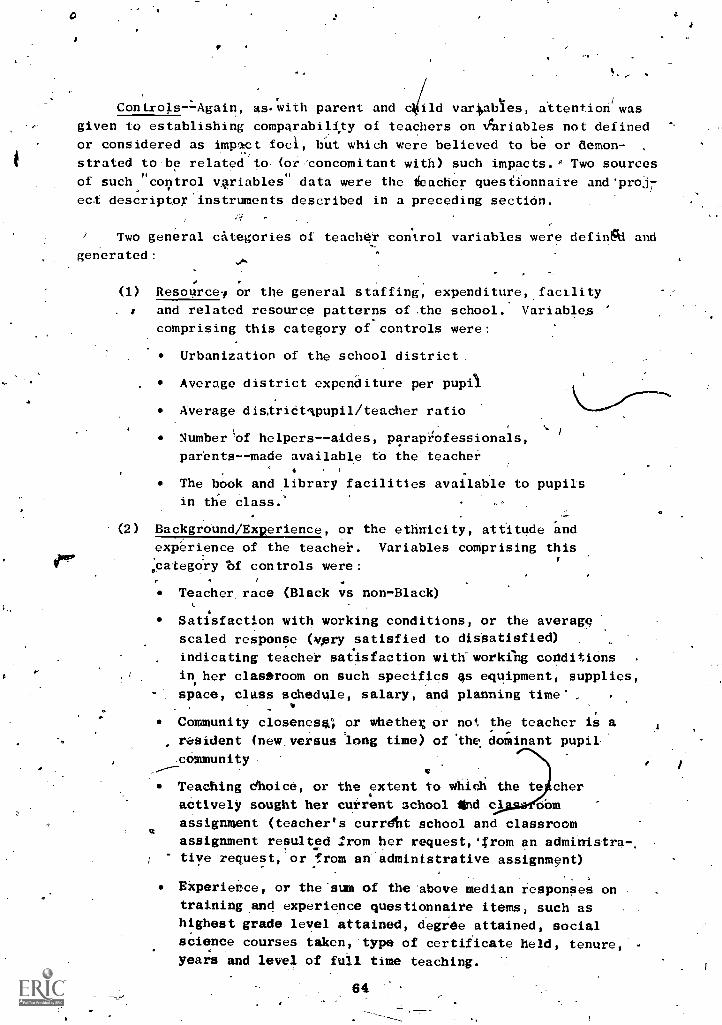
0
r
4/I
ControlsAgain, as. with parent and c ild variables, attention was
given to establishing comparability of teachers on lAriables not defined °.
or considered as impact foci, hut which were believed to be or demon- .,..
strated to be related to (or/concomitant with) such impacts .g Two sources
of such "control v4riables" data were the tkacher questionnaire and'pro:j7
ect descriptoy instruments described in a preceding section.
4
Two general categories of teacher control variables were defin6ii and
generated:
(1) Resource or the general staffing, expenditure, facility
and related resource patterns of the school. Variables
comprising this category of controls were:
Urbanization of the school district
Average district expenditure per pupil
Average distridtlpupil/teacher ratio
Number 'of helpers -- aides, parapAdessionals,
parents- -made available to the teacher
The book and library facilities available to pupils
in the class.'
(2) Background/ExRerience, or the ethnicity, attitude and
experience of the teacher. Variables comprising this
,;categdry bf controls were:
Teacher. race (Black vs non-Black)
Satisfaction with working conditions, or the average
scaled response (very satisfied to disSatisfied)
indicating teacher satisfaction with working conditions
in her classroom on such specifics qs equipment, supplies,
space, class schedule, salary, and planning time
Community closenesa°, or whetheg or not the teacher is a
resident (new versus long time) of the. dominant pupil
.community
Teaching ehoice, or the extent to which the to cher
actively sought her current school Akid .c1 oom
assignment (teacher's current school and classroom
assignment resulted prom her request,'from an administra-.tiye request,'or from an'admintstrative assignment)
Ekperience, or the-sum of the above median responses on
training and experience questionnaire items, such as
highest grade level attained, degree attained, social
science courses taken,-type of certificate held, tenure,
years and level of full time teaching.
64
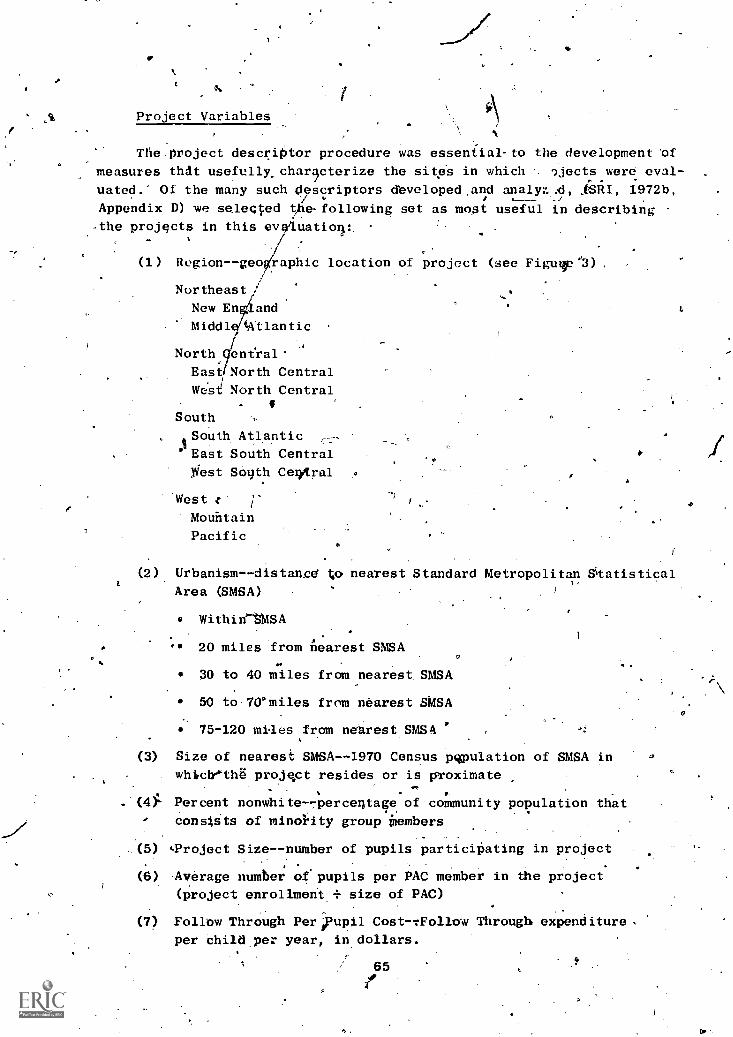
Project Variables
The.project descriptor procedure was essential-to the development of
measures that usefully,char4cterize the sites in which ejects were eval-
uated.' Of the many such descriptors developedand analyzA, 1972b,
Appendix D) we selected tAefollowing set as most useful in describing
the projects in this evaluatiolp r.
/j
(1) Region--geoiraphic location of project (see Figuloc.3)
Northeast
New En and
Middl 411tlantic
North
East North Central
West North Central
South
*South Atlantic
East South Central
West Soyth Cei$ral
West c
Mountain
Pacific
(2) Urbanism--distance to nearest Standard Metropolitan Statistical
Area (SMSA)
Within'MSA
20 miles from nearest SMSA
30 to 40 miles from nearest. SMSA
50 to.70Bmiles from nearest SMSA
75-120 miles from nearest SMSA
(3) Size of nearest SMSA--1970 Census poulation of SMSA in
whiclthg project resides or is proximate
. (4)1 Percent nonwhite percentage of community population that
consists of minority group ilembers
(5) 'Project Size--number of pupils participating in project
(6) Average number opupils per PAC member in the project(project enrollment + size of PAC)
(7) Follow Through Per pupil Cost-vFollow Through expenditure
per child.per year, in dollars.
65
0
c.

194
..0
°
4."P
"TN
DA
N'
Nee
l Eng
land
.Ja
ws
,sw
'
MIN
KI.
MI
°PE
G; 1
in,.
s
wes
i,
Nor
th C
entia
l' 'sj
iNIA
NE
E/
CO
LO
NA
iS
Mou
ntai
n.
-_
-f
C1.
!P3.
21)0
....,,
10o
EN
S.
NIC
K
CE
NT
RA
L
OA
LA TE
X
Wes
t Sou
th c
entr
al
NO
RT
H
owl°
Eas
t NO
rtht
entr
alIII
Qw
wA
MIS
.
CD
La
kAit-
Sou
th""
Cen
tral
MIS
S u) T
r'
100
799
..,(S
cA
11-1
1
MT
EA
ST
Mid
dle
col3
,0
Atla
ntit
),.
PS
ON
Sou
thA
tlant
icS
C
Tt.A
.
C
U.S
. DE
PAR
TM
EN
T O
f C
OM
ME
RC
EiU
till O
FT
HE
CE
NS
US
FIG
UR
E 3
CE
NS
US
RE
GIO
NS
AN
D G
EO
GR
AP
HIC
DIV
ISIO
NS
OF
TH
E U
NIT
ED
ST
AT
ES
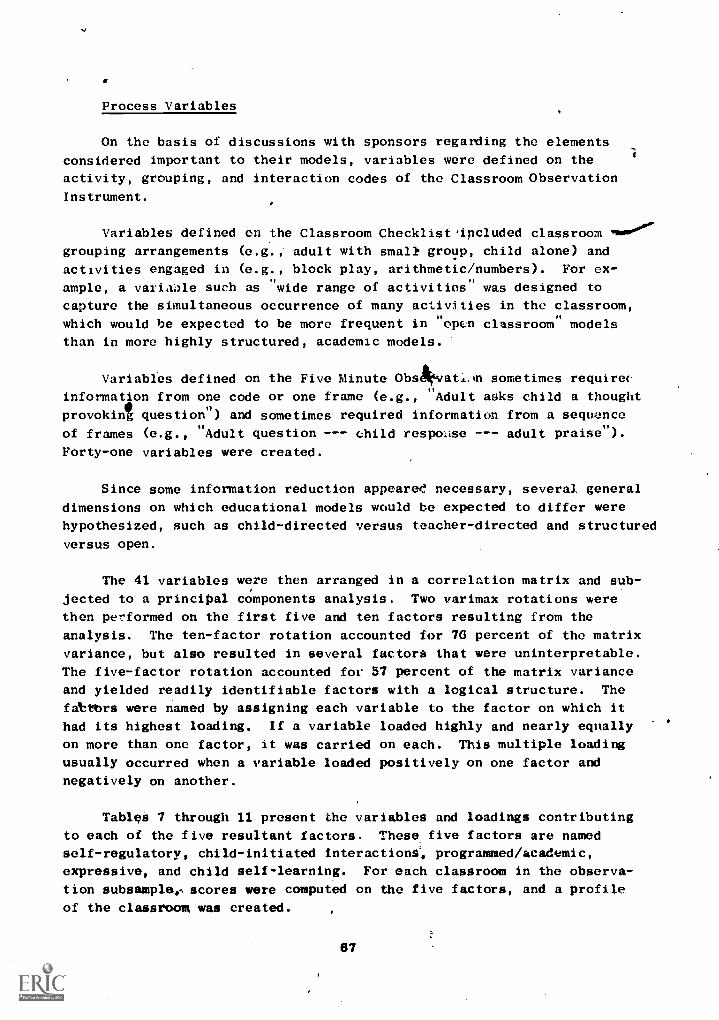
Process Variables
On the basis of discussions with sponsors regarding the elements
considered important to their models, variables were defined on the
activity, grouping, and interaction codes of the Classroom Observation
Instrument.
Variables defined on the Classroom Checklist'included classroom soe"...
grouping arrangements (e.g.,' adult with smalk group, child alone) and
activities engaged in (e.g., block play, arithmetic/numbers). For ex-
ample, a variable such as wide range of activities" was designed to
capture the simultaneous occurrence of many activities in the classroom,
which would be expected to be more frequent in "open classroom" models
than in more highly structured, academic models.
Variables defined on the Five Minute Obskvati.,In sometimes requireu
information from one code or one frame (e.g., "Adult asks child a thought
provokint question") and sometimes required information from a sequence
of frames (e.g., "Adult question --- child response --- adult praise").
Forty-one variables were created.
Since some information reduction appeared' necessary, several general
dimensions on which educational models would be expected to differ were
hypothesized, such as child-directed versus teacher-directed and structured
versus open.
The 41 variables were then arranged in a correlation matrix and sub-
jected to a principal components analysis. Two varimax rotations were
then performed on the first five and ten factors resulting from the
analysis. The ten-factor rotation accounted for 70 percent of the matrix
variance, but also resulted in several factors that were uninterpretable.
The five-factor rotation accounted for 57 percent of the matrix variance
and yielded readily identifiable factors with a logical structure. The
fattOrs were named by assigning each variable to the factor on which it
had its highest loading. If a variable loaded highly and nearly equally
on more than one factor, it was carried on each. This multiple loading
usually occurred when a variable loaded positively on one factor and
negatively on another.
Tables 7 through 11 present the variables and loadings contributing
to each of the five resultant factors. These five factors are named
self-regulatory, child-initiated Interactions', programmed/academic,
expressive, and child self-learning. For each classroom in the observa-
tion subsample,- scores were computed on the five factors, and a profile
of the classroom was created.
67

TABLE 7
FACTOR 1, SELF-REGULATORY
VARIABLE DESCRIPTION LOADING
INDEPENDENT CHILD ACTIVITIES
WIDE VARIETY OF ACTIVITIES
CHILD SELF-EXPRESSION
+.87
+.87
+.72
CHILD INFORMING SELF WITH OBJECTS +.60
G-- BLACKS, TRUCKS, DOLLS, DRESS-UP +.58
F--ARTS, CRAFTS, SEWING, COOKING, POUNDING, SAWING +.4e
ADULT WITH ONE OR TWO CHILDREN IN ALL ACTIVITIES +.45
ADULT NEGATIVE AFFECT -.38
ADULT ASKING CHILD DIRECT QUESTION -.37
C--ARITHMETIC, NUMBERS, MATHEMATICS, -.36
ALPHABET, READING, LANGUAGE DEVELOPMENT
F--GAMES, PUZZLES +.35
DIRECT QUESTION FOLLOWED BY CHILD RESPONSE -.35
CHILD QUESTIONING ADULT +.34
TOGETHER THESE VARIABLES INDICATE A PATTERN OF CHILDREN
WORKING BY THEMSELVES AND IN CONTROL OF WHAT THEY ARE DOING
AT THE MOMENT.
68
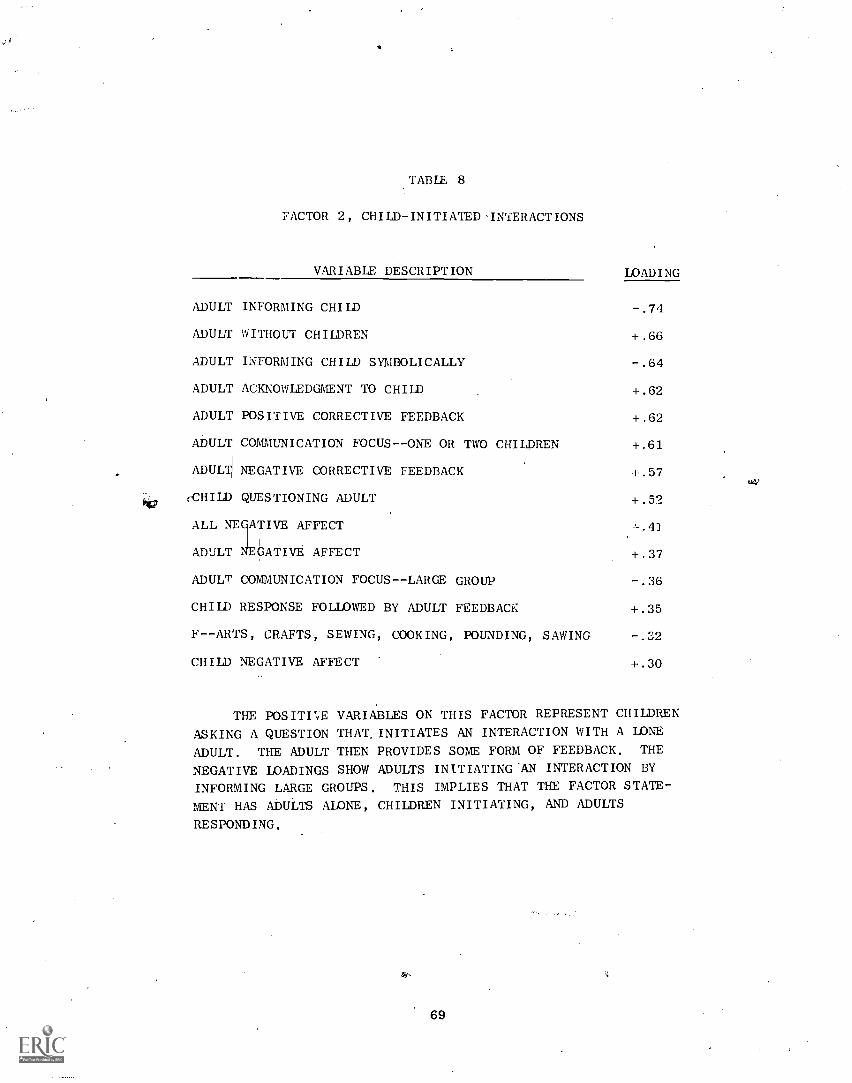
TABLE 8
FACTOR 2, CHILD-INITIATEDINTERACTIONS
VARIABLE DESCRIPTION LOADING
ADULT INFORMING CHILD -.74
ADULT WITHOUT CHILDREN +.66
ADULT INFORMING CHILD SYMBOLICALLY -.64
ADULT ACKNOWLEDGMENT TO CHILD +.62
ADULT POSITIVE CORRECTIVE FEEDBACK +.62
ADULT COMMUNICATION FOCUS--ONE OR TWO CHILDREN +.61
ADULT NEGATIVE CORRECTIVE FEEDBACK +.57
(CHILD QUESTIONING ADULT +.52
ALL AFFECT
ADULT pATIVE AFFECT +.37
ADULT COMMUNICATION FOCUS- -LARGE GROUP -.36
CHILD RESPONSE FOLLOWED BY ADULT FEEDBACK +.35
F--ARTS, CRAFTS, SEWING, COOKING, POUNDING, SAWING -.32
CHILD NEGATIVE AFFECT +.30
THE POSITI;E, VARIABLES ON THIS FACTOR REPRESENT CHILDREN
ASKING A QUESTION THAT, INITIATES AN INTERACTION WITH A LONE
ADULT. THE ADULT THEN PROVIDES SOME FORM OF FEEDBACK. THE
NEGATIVE LOADINGS SHOW ADULTS INITIATING AN INTERACTION BY
INFORMING LARGE GROUPS. THIS IMPLIES THAT THE FACTOR STATE-
MENT HAS ADULTS ALONE, CHILDREN INITIATING, AND ADULTS
RESPONDING.
69
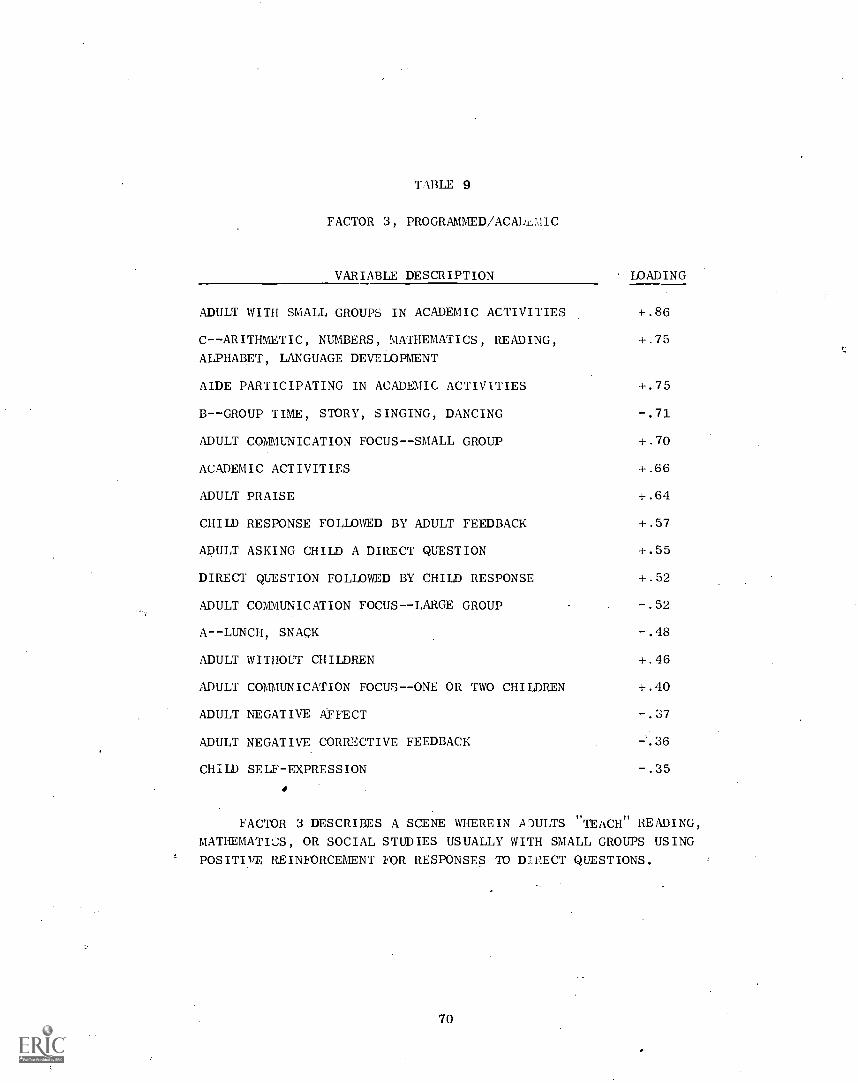
TABLE 9
FACTOR 3, PROGRAMMED/ACALEMIC
VARIABLE DESCRIPTION LOADING
ADULT WITH SMALL GROUPS IN ACADEMIC ACTIVITIES
C--ARITHMETIC, NUMBERS, MATHEMATICS, READING,
ALPHABET, LANGUAGE DEVELOPMENT
+.86
+.75
AIDE PARTICIPATING IN ACADEMIC ACTIVITIES +.75
B--GROUP TIME, STORY, SINGING, DANCING -.71
ADULT COMMUNICATION FOCUS--SMALL GROUP +.70
ACADEMIC ACTIVITIES +.66
ADULT PRAISE +.64
CHILD RESPONSE FOLLOWED BY ADULT FEEDBACK +.57
ADULT ASKING CHILD A DIRECT QUESTION +.55
DIRECT QUESTION FOLLOWED BY CHILD RESPONSE +.52
ADULT COMMUNICATION FOCUS--LARGE GROUP -.52
A--LUNCH, SNACK -.48
ADULT WITHOUT CHILDREN +.46
ADULT COMMUNICATION FOCUS--ONE OR TWO CHILDREN +.40
ADULT NEGATIVE AFFECT -.37
ADULT NEGATIVE CORRECTIVE FEEDBACK
CHILD SELF-EXPRESSION -.35
FACTOR 3 DESCRIBES A SCENE WHEREIN ADULTS "TEACH" READING,
MATHEMATICS, OR SOCIAL STUDIES USUALLY WITH SMALL GROUPS USING
POSITIVE REINFORCEMENT FOR RESPONSES TO D'PECT QUESTIONS.
70

TABLE 10
FACTOR 4, EXPRESSIVE
VARIABLE DESCRIPTION LOADING
CHILD TO ADULT POSITIVE AFFECT
ALL NEGATIVE AFFECT
CHILD NEGATIVE AFFECT
+.81
+.7C
+.69
CHILD POSITIVE AFFECT +.65
ADULT TO CHILD POSITIVE AFFECT +.63
ALL POSITIVE AFFECT +.61
DIRECT QUESTION FOLLOWED BY CHILD RESPONSE -.57
ADULT ASKING CHILD A DIRECT QUESTION -.57
ADULT ASKING CHILD THOUGHT PROVOKING QUESTIONS +.49
CHILD INFORMING ANOTHER CHILD +.47
ADULT NEGATIVE AFFECT +.41
CHILD RESPONSE FOLLOWED BY ADULT FEEDBACK -.37
ADULT INFORMING CHILD WITH CONCRETE OBJECTS +.34
CHILD QUESTIONING ADULT +.32
FACTOR 4 IS CALLED "EXPRESSIVE" AND REFLECTS BOTH POSITIVE
AND NEGATIVE OVERT EXPRESSIVENESS ON THE PART OF ADULTS AND
CHILDREN, EXPRESSIVENESS IS NEGATIVELY RELATED TO AN ADULT'S
'DIRECT QUESTIONING AND CHILDREN RESPONDING TO ADULT'S DIRECTQUESTIONS.
71
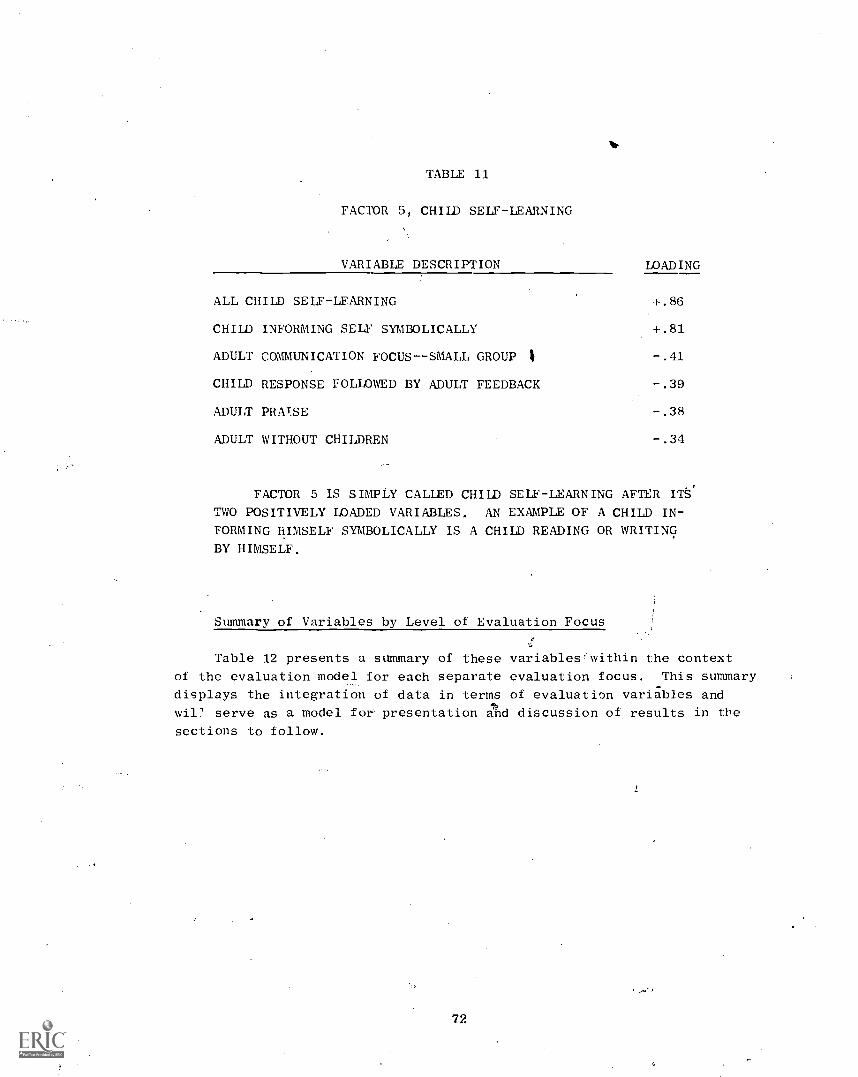
TABLE 11
FACTOR 5, CHILD SELF-LEARNING
VARIABLE DESCRIPTION WADING
ALL CHILD SELF-LEARNING +.86
CHILD INFORMING SELF SYMBOLICALLY +.81
ADULT COMMUNICATION FOCUS--SMALL GROUP 4 -.41
CHILD RESPONSE FOLLOWED BY ADULT FEEDBACK -.39
ADULT PRATSE -.38
ADULT WITHOUT CHILDREN -.34
FACTOR 5 IS SIMPLY CALLED CHILD SELF-LEARNING AFTER Pit'
TWO POSITIVELY LOADED VARIABLES, AN EXAMPLE OF A CHILD IN-
FORMING HIMSELF SYMBOLICALLY IS A CHILD READING OR WRITING
BY HIMSELF.
Summary of Variables by Level of Evaluation Focus
Table 12 presents a summary of these variables within the context
of the evaluation model for each separate evaluation focus. This summary
displays the integration of data in terms of evaluation variables and
wil' serve as a model for presentation and discussion of results in the
sections to follow.
72

INPUT AND CONTROL VARIABLES
TABLE 12
BASIC EVALUATION VARIABLES
OUTCOME VARIABLES
PART I CHILD EVALUATION DATA
NO, OF CLASSROOMS
AVERAGE PUPILS/CLASSROOM
QUANT, PRESCORE
COG. PROCESS PRESCORE
READING PRESCORE
LANGUAGE PRESCORE
AFFECT PRESCORE
AGE (JUNE'71)
% CLASSROOM MALE
% CLASSROOM BLACK
% PRESCHOOL (OR NO. MOS.)
% PARENTS W/O HS DIPL.
% PARENTS W SKILLED OCCUP.
% PARENTS BLACK
% PARENTS POVERTY E.,IGIBLE
% HEAD HOUSEHOLD EMPLOYED
% HEAD HOUSEHOLD MALE
OVERALL ACHIEVEMENT
AFFECT
ATTENDANCE
WRAT TOTAL
QUANTITATIVE SKILL
COGNITIVE PROCESSES
READING SKILLS
LANGUAGE ARTS
PART II PARENT EVALUATION DATA
NO, CLASSROOM GROUPS
AV, PARENTS/CLASSROOM GRP-
% W/O HIGH SCHOOL DIPLOMA
% W SKILLED OCCUP.
% POS,EVAL OF CHILD LRNG
% BLACK
% REPORTING USE OF PRESCHOOL
% POVERTY ELIGIBLE
% HEAD HOUSEHOLD EMPLOYED
% HEAD HOUSEHOLD MALE
PARENT-CHILD INTERACTION
PARENT-SCHOOL INVOLVEMENT
CHILD-ACADEMIC EXPECTATION
SENSE OF CONTROL
PART III TEACHER EVALUATION DATA
NO, OF CLASSROOMS
JOB SATISF, RATING
BOOK RESOURCE SCALE
RACE (BLACK/NONBLACK)
IDENT. W. COMMUNITY
NO, OF HELPERS
ABLE TO CHOOSE ASSIGNMENTTRAINING AND TEACHER EXPERIENCE
PARENT-EDUCATOR IMAGE
PROFESSIONAL ACCEPTANCE
OF METHOD
73
PROJECT AND PROCESS VARIABLES
PROJECT DESCRIPTORS
REGION
DISTANCE TO NEAREST SMSA
SIZE OF NEAREST SMSA
PERCENT NONWHITE
PROJECT SIZE (PUPILS)
NO. PUPILS/PAC MEMBER
FT PER-PUPIL EXPENDITURE
CLASSROOM OBSERVATION
FACTOR SCORES
SELF REGULATORY
CHILD- INITIATED
INTERACTIONS
PROGRAMMED ACADEMIC
EXPRESSIVE
CHILD SELF-LEARNING
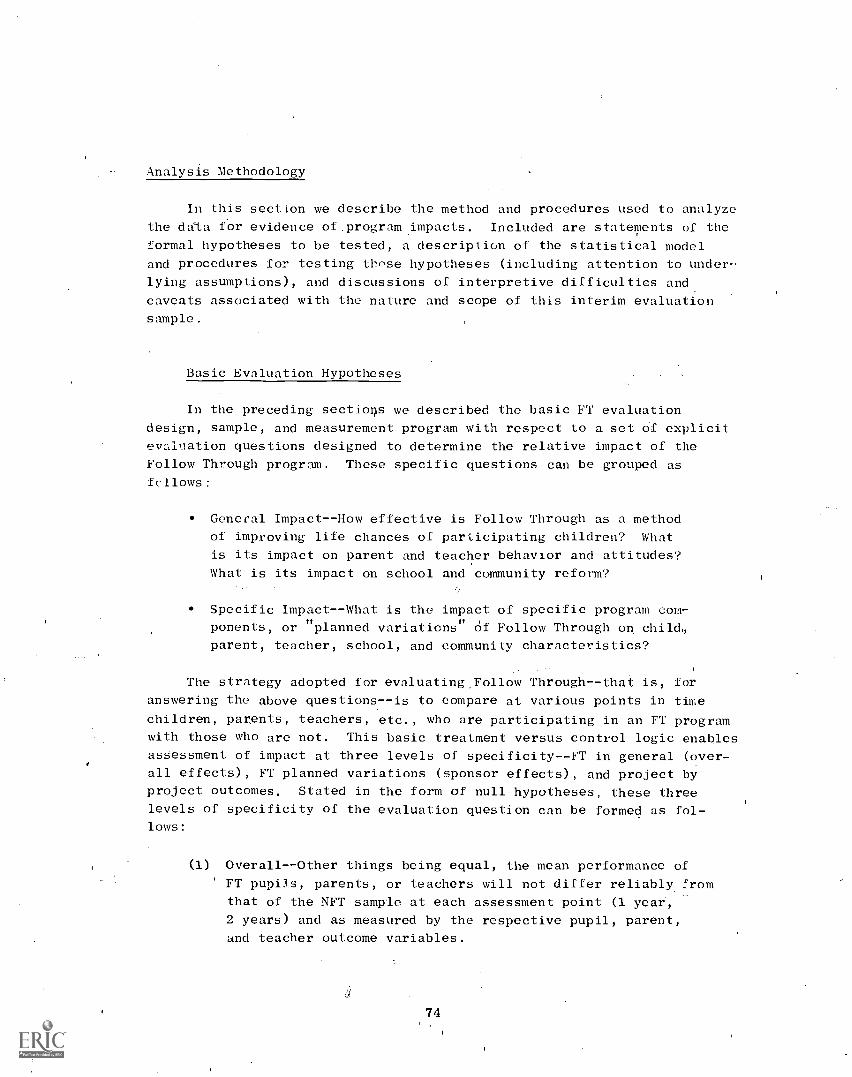
Analysis Methodology
In this section we describe the method and procedures used to analyze
the data for evidence of.program impacts. Included are statements of the
formal hypotheses to be tested, a description of the statistical model
and procedures for testing those hypotheses (including attention to under-
lying assumptions), and discussions of interpretive difficulties and
caveats associated with the nature and scope of this interim evaluation
sample.
Basic Evaluation Hypotheses
In the preceding sections we described the basic FT evaluation
design, sample, and measurement program with respect to a set of explicit
evaluation questions designed to determine the relative impact of the
Follow Through program. These specific questions can be grouped as
fellows:-
General Impact--How effective is Follow Through as a method
of improving life chances of participating children? What
is its impact on parent and teacher behavior and attitudes?
What is its impact on school and community reform?
Specific Impact--What is the impact of specific program com-
'ponents, or "planned variations" Of Follow Through on child,
parent, teacher, school, and community characteristics?
The strategy adopted for evaluating, Follow Through--that is, for
answering the above questions - -is to compare at various points in time
children, parents, teachers, etc., who are participating in an FT programwith those who are not. This basic treatment versus control logic enables
assessment of impact at three levels of specificity--FT in general (over-
all effects), FT planned variations (sponsor effects), and project byproject outcomes. Stated in the form of null hypotheses, these three
levels of specificity of the evaluation question can be formed as fol-lows:
(1) Overall--Other things being equal, the mean performance of
' FT pupils, parents, or teachers will not differ reliably from
that of the NFT sample at each assessment point (1 year,
2 years) and as measured by the respective pupil, parent,
and teacher outcome variables.
74
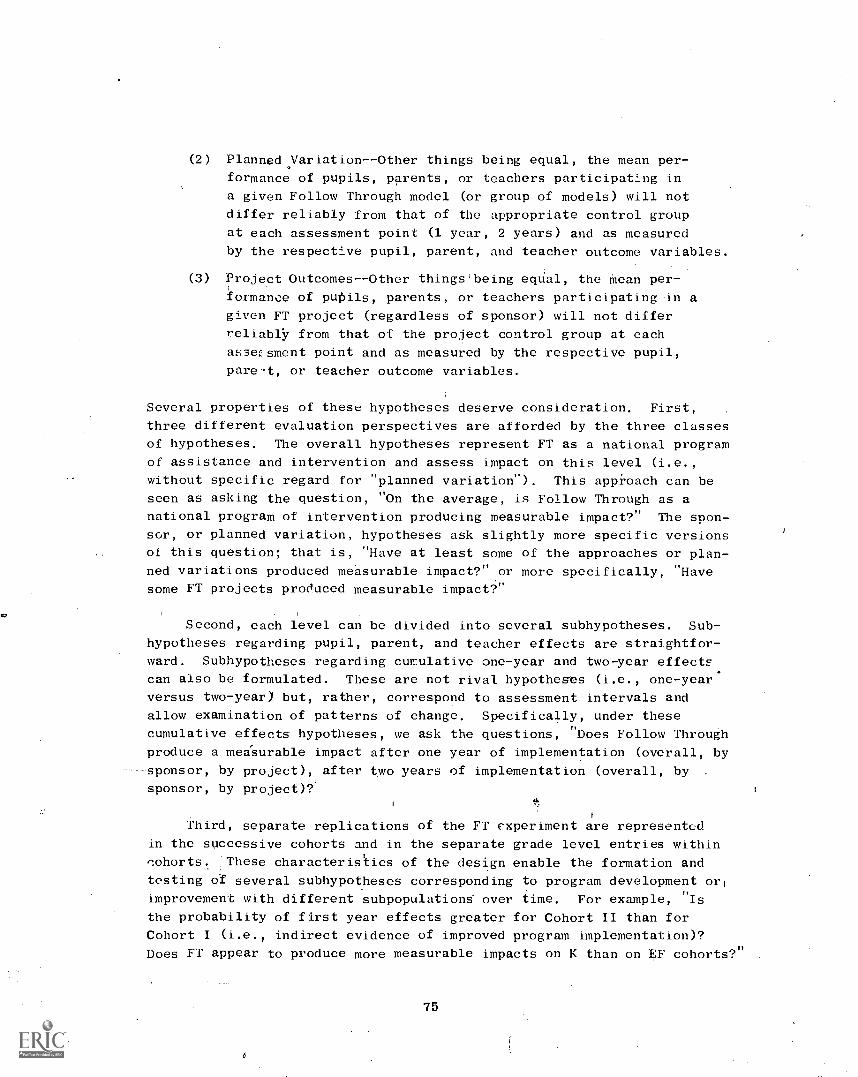
(2) Planned Variation - -Other things being equal, the mean per-
formance of pupils, parents, or teachers participating in
a given Follow Through model (or group of models) will not
differ reliably from that of the appropriate control group
at each assessment point (1 year, 2 years) and as measured
by the respective pupil, parent, and teacher outcome variables.
(3) Project Outcomes--Other things'being equal, the Mean per-'
formance of pupils, parents, or teachers participating in a
given FT project (regardless of sponsor) will not differ
reliably from that of the project control group at each
a:;.sersment point and as measured by the respective pupil,
pare-t, or teacher outcome variables.
Several properties of these hypotheses deserve consideration. First,
three different evaluation perspectives are afforded by the three classes
of hypotheses. The overall hypotheses represent FT as a national program
of assistance and intervention and assess impact on this level (i.e.,
without specific regard for "planned variation"). This appi-oach can be
seen as asking the question, "On the average, is Follow Through as a
national program of intervention producing measurable impact?" The spon-
sor, or planned variation, hypotheses ask slightly more specific versions
of this question; that is, "Have at least some of the approaches or plan-
ned variations produced measurable impact?" or more specifically, "Have
some FT projects produced measurable impact?"
Second, each level can be divided into several subhypotheses. Sub-
hypotheses regarding pupil, parent, and teacher effects are straightfor-
ward. Subhypotheses regarding cumulative one-year and two-year effects
can also be formulated. These are not rival hypotheses (i.e., one-year*
versus two-year) but, rather, correspond to assessment intervals and
allow examination of patterns of change. Specifically, under these
cumulative effects hypotheses, we ask the questions, "Does Follow Through
produce a measurable impact after one year of implementation (overall, by
sponsor, by project), after two years of implementation (overall, by
sponsor, by project)?
Third, separate replications of the FT experiment are represented
in the successive cohorts and in the separate grade level entries within
cohorts. These characteristics of the design enable the formation and
testing of several subhypotheses corresponding to program development orp
improvement with different subpopulations over time. For example, "Is
the probability of first year effects greater for Cohort II than for
Cohort I (i.e., indirect evidence of improved program implementation)?
Does FT appear to produce more measurable impacts on K than on EF cohorts?"
75
Arg
And finally, contrasting first year effects ol Cohort II-EF against
second year effects for Cohort I-K constitutes a test of differential
cumulative impact with developmental age held constant. In this interim
analysis, this test can be applied only to pupils in the first grade and
equivalent to asking the qUestion "Does FT have a greater impact on
first grade pupils after two years (Cohort I-K sample) than after one
year (Cohort II-EF sample) of participation and services?"
In summary the evaluation design, including the sampling plan and
assessment schedule, provides a basis for analysis of Follow Through
effects in a large variety of contexts. Comparison can be made at the
overall, sponsor, and project'levels; within cohort samples at varying
grade levels and years of experience; and across cohort samples in terms
of experience year, grade level, and both.
ANCOVA: The Method of Analysis
Analysis of covariance (ANCOVA) was the method chosen for integrat-
ing data from the various sources and performing tests of the major and
subhypotheses. The specific ANCOVA model employed is a fixed effects,
one-way design in which. approaches (planned variations) are arranged as
the treatment variables, and control variables are used as covariates.
Furthermore, within each treatment group in the one-way design, the FT
project samples and the corresponding NFT control groupshare nested.
This analysis design was implemented separately for pupil, parent, and
teacher variables and for each cohort sample, grade stream, and assess-
ment interval. Thus, 3 (pupil, parent, teacher) X 2 (Cohort I, II)
X 2 (K, EF), or 12 independent analyses were performed on 1971 data,
and 2 additional analyses were performed on the 1970 K and EF pupil data.*
Analysis of teacher and parent variables was not performed on the 1970Cohort I subset.
The units chosen for these ANCOVAS were classroom aggregated vari-
ables. Parallel analyses were also conducted on these classroom units
in terms of sponsor and project level definitions of the treatment
*We recognize that the 1970 and the 1971 analyses on Cohort I data are not
independent, since the measurement units of the 1970 analyses were a
subset of those for 1971. 'Towever, a more complex repeated measures
analysis was considered inappropriate because measures and classroom
groupings changed from 1970 to 1971.
76
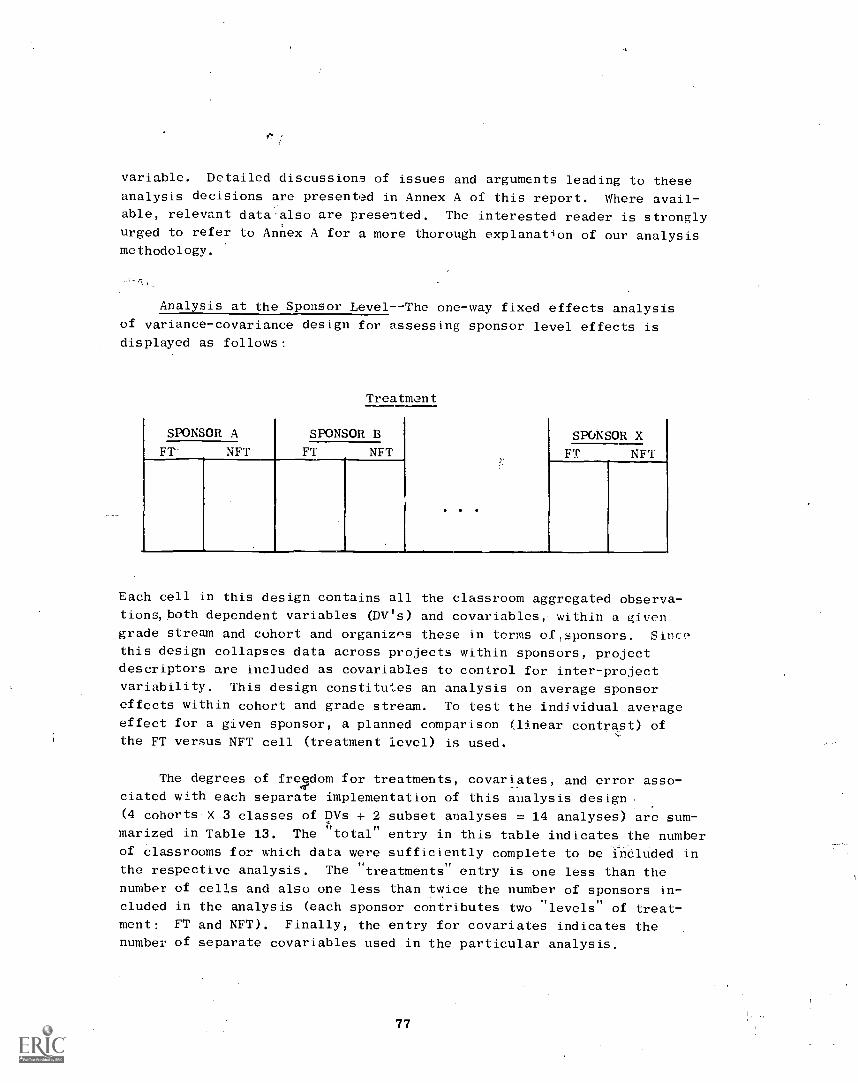
variable. Detailed discussions of issues and arguments leading to these
analysis decisions are presented in Annex A of this report. Where avail-able, relevant data also are presented. The interested reader is stronglyurged to refer to Annex A for a more thorough explanation of our analysismethodology.
Analysis at the Sponsor Level--The one-way fixed effects analysis
of variance-covariance design for assessing sponsor level effects isdisplayed as follows:
SPONSOR A
FT NFT
Treatment
SPONSOR B
FT NFTSPONSOR X
FT NFT
Each cell in this design contains all the classroom aggregated observa-
tions,both dependent variables (N's) and covariables, within a given
grade stream and cohort and organizes these in terms of,sponsors. Sincethis design collapses data across projects within sponsors, project
descriptors are included as covariables to control for inter-projectvariability. This design constitutes an analysis on average sponsor
effects within cohort and grade stream. To test the individual average
effect for a given sponsor, a planned comparison (linear contrast) of
the FT versus NFT cell (treatment level) is used.
The degrees of freedom for treatments, covariates, and error asso-
ciated with each separate implementation of this analysis design.
(4 cohorts X 3 classes of DVs + 2 subset analyses = 14 analyses) are sum-marized in Table 13. The "total" entry in this table indicates the number
of classrooms for which data were sufficiently complete to be included in
the respective analysis. The "treatments" entry is one less than thenumber of cells and also one less than twice the number of sponsors in-
cluded in the analysis (each sponsor contributes two "levels" of treat-ment: FT and NFT). Finally, the entry for covariates indicates the
number of separate covariables used in the particular analysis.
77

TABLE 13
DEGREES OF FREEDOM FOR SPONSOR LEVEL ANCOVAS
SOURCE OF VARIANCE
PUPIL
VARIABLES
PARENT
VARIABLES
TEACHER
VARIABLES
COHORT I -K , 2-YR
TREATMENTS
COVAR I ATE S
ERROR
TOTAL
23
19
313
23
8
297
21
10
221
356 329 253
COHORT I -E , 2-YR
TREATMENTS 15 15 13
CO VAR I ATE S 18 8 10
ERROR 94 85 50
TOTAL 128 109 74
COHORT I I -K , 1-YR
TRE ATMENTS 13 11 7
COVAR I ATE S 19 8 7
ERROR 44 52 4
TOTAL 77 72 19
COHORT I I -E , 1- YR
THE ATIVIE NTS 7 5 7
CO VARIANTS 15 8 7
ERROR 8 10 12
TOTAL 31 24 27
COHORT 1 -K, L-YR
TREATMENTS 19
CO VAR I ATE S 19
ERROR 168
TOTAL 207
COHORT I -E , -1-YR
TREATMENTS 11
CO VAR I ATE S 17
ERROR 47
TOTAL 76
78
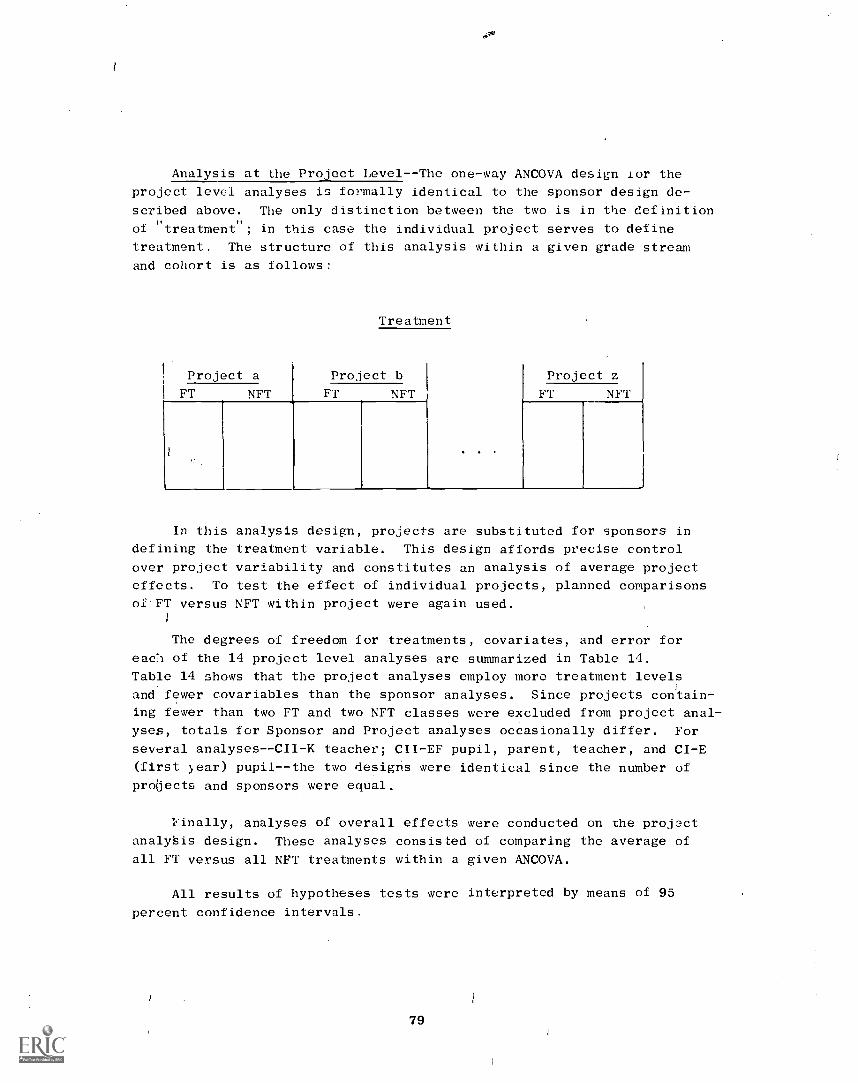
Analysis at the Project Level--The one-way ANCOVA design ior the
project level analyses is formally identical to the sponsor design de-
scribed above. The only distinction between the two is in the definition
of "treatment"; in this case the individual project serves to define
treatment. The structure of this analysis within a given grade stream
and cohort is as follows:
Project a
FT NFT
Treatment
Project b
FT NFT
Project z
FT NFT
In this analysis design, projects are substituted for sponsors in
defining the treatment variable. This design affords precise control
over project variability and constitutes an analysis of average project
effects. To test the effect of individual projects, planned comparisons
oi FT versus NFT within project were again used.1
The degrees of freedom for treatments, covariates, and error for
ean of the 14 project level analyses are summarized in Table 14.
Table 14 shows that the project analyses employ more treatment levels
and fewer covariables than the sponsor analyses. Since projects contain-
ing fewer than two FT and two NFT classes were excluded from project anal-
yses, totals for Sponsor and Project analyses occasionally differ. For
several analyses--CI1-K teacher; CII-EF pupil, parent, teacher, and CI-E
(first year) pupil--the two designs were identical since the number of
protjects and sponsors were equal.
Finally, analyses of overall effects were conducted on the project
analygis design. These analyses consisted of comparing the average of
all FT versus all NFT treatments within a given ANCOVA.
All results of hypotheses tests were interpreted by means of 95
percent confidence intervals.
79

TABLE 14
DEGREES OF FREEDOM FOR PROJECT LEVEL ANCOVAS
SOURCE OF VARIANCE
PUPIL
VARIABLES
PARENT
VARIABLES
TEACHER
VARIABLES
COHORT I-K, 2-YR
TREATMENTS
COVARIATES
ERROR
TOTAL
55
16
258
51
8
236
41
7
146
330 296 195
COHORT I-E, 2-YR
TREATMENTS 21 19 15
COVARIATES 16 8 7
ERROR 85 77 41
TOTAL 123 105 64
COHORT II-K, 1-YR
TREATMENTS 15 13 7
COVARIATES 16 a 7
ERROR 19 24 4
TOTAL 51 46 19
COHORT II-E, 1-YR
TREATMENTS 7 5. 7
COVARIATES 15 8 7
ERROR 8 10 12i
TOTAL 31 24 27
COHORT I-K, 1-YR
TREATMENTS 23
COVARIATES 15
ERROR 113
TOTAL 152
COHORT I-E, 1-YR
TREATMENTS 13
COVARIATES 15
ERROR 47
TOTAL 76
80
Guide to Interpretation of Results
Data tables that display input/control and outcome values in accor-
dance with the analysis procedures'described in the preceding sections
are presented in the "Results" section. These tables were prepared by
combining relevant data from separate analyses (pupil, parent, teacher)
into single displays organized in terms of tne planned comparisons pre-
viously describecL
The individual project is the basic organizational unit for presen-
tation of results. Separate results tables were prepared for each set
of data analyzed. If more than one set of data was analyzed for a par-
ticular project (e.g., CI-K and CII-K) each is presented and discussed
within the context of the project. Therefore, more than one data table
is presented for some projects.
There are three categories of entries on individual project data
tables--input/control variables, outcome variables, and project /process
descriptors. Both input/control and outcome measures are summarized at
the appropriate evaluation levelpupil (classroom averaged), parent
(pupil-classroom averaged), and teacher. Depending on the measure, pupil
and parent covariates are displayed as raw score averages or as percent
averages. Teacher covariates are raw score averages on the respective
variables.
Pupil outcomes are all presented as raw score averages. Parent and
teacher outcomes are all presented as scale score averages, where the
scale has a mean of 0,0 and a standard deviation of 1.0.
Project descriptors are presented once for each project, as raw
scores on the respective variables. Classroom observation scores are
presented as average factor scores for each of the five process dimen-
sions,
Within each evaluation level (pupil, parent, and teacher), average
values for the FT and NFT classes and the average FT/NFT differences are
entered for each variable. These entries display the baseline, unadjusted
outcome, and adjusted outcome subgroup averages and differences for each
pr ,sect sample. Standard errors for adjusted FT/NFT mean differences are
also presented.
Significance tests for outcomes are presented in the form of 95 per-
cent confidence intervals for the adjusted mean FT/NFT differences. Con-
fidence intervals which do not show Lign changes (+ to -) across the
interval indicate significance. These intervals can be read ds follows:
81
"with 95 percent probability, the true mean difference between FT and
NFT on X measure is between (lower boundary) and (upper boundary) units."
In general, if the algebraic sign preceding both confidence interval
boundaries is positive, then the resultS shows significance in favor of
FT. If both signs are negative, then the difference is significantly in
favor of NFT. The exception is the attendance measure, which shows the
average days absent during the preceding school year. Here negative dif-
ferences favor FT (less absence).
Explanation of Entries in the Project ');,ita Tables
Figure 4 shows the organization of the project level evaluation
data as summarized in the project data tables. A complete project data
table contains eight groups of entries. These groups, which are cor-
respondingly numbered 1-8 in Figure 4 are the following:
*(1) Pupil baseline/control measures
(2) Parent control measures
(3) Teacher input/control measures
(4) Pupil outcomes*
(5) Parent outcomes
(6) Teacher outcomes
(7) Project descriptors
(8) Classroom observation factor scores.
The entries in the area of Figure 4 designated as "1:' provide data
on child baseline controls. The following are detailed descriptions of
individual entries;
No. of classrooms--the number of classroom' level aggregations
of pupils for which data a:'e sufficiently
complete 90 percent) for analysis.
Average pupils/classroom--the average number of pupils who met
the completeness of data requirement.
Average classroom size represents the
average frequency for which data on all
measures are available. Frequencies
vary considerably from measure to measure.
*Refer to Table 5 or Annex B (Table B-2) for maximum scores on baseline
and outcome measures at various grade levels and assessmemt points.
82
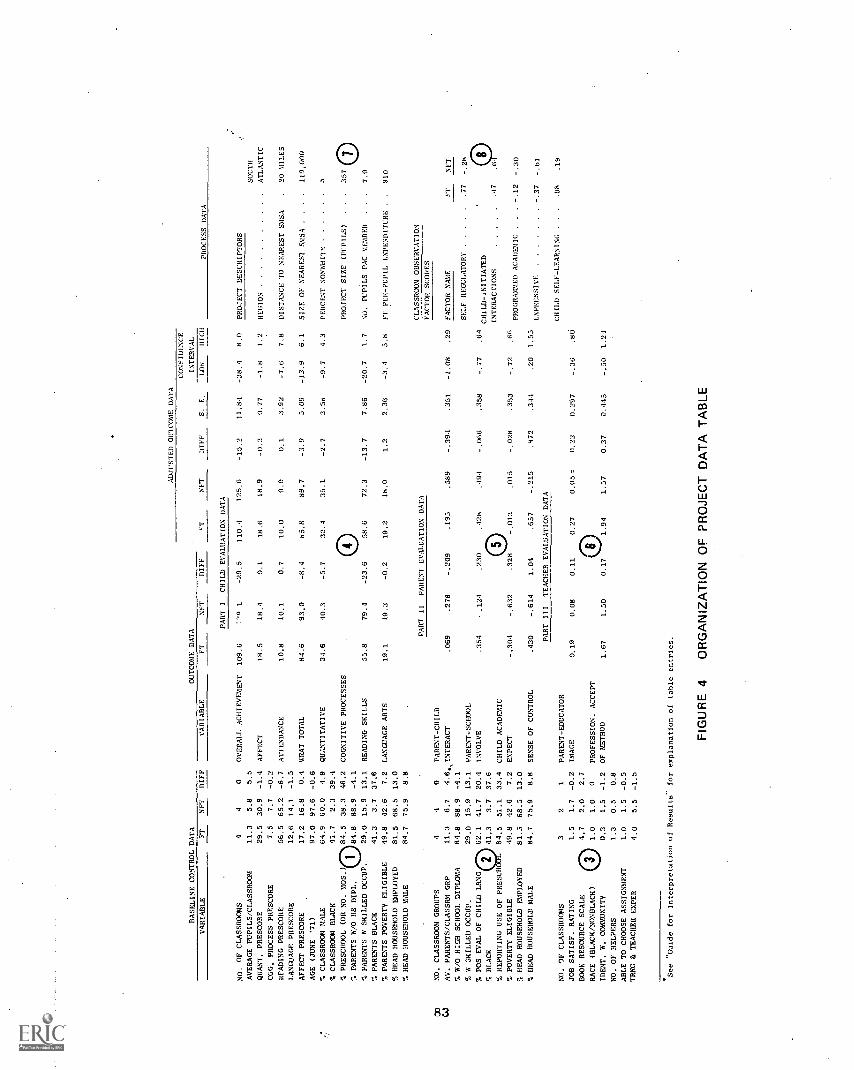
BASELINE CONTROL DATA
OUTCOME DATA
VARIABLE
PT
NFT
DIFF
VARIABLE
FT
NET
PART I
NO. OF CLASSROOMS
44
0OVERALL ACHIEVEMENT
109.6
1'4 1
AVERAGE PUPILS/CLASSROOM
11.3
5.8
5.5
QUART. PRESCORE
29.5
30.9
-1.4
AFFECT
18.5
18.4
COG. PROCESS PRESCORE
7,5
7.7
-0.2
READING PRESCORE
56.5
65.2
-8.7
ATTENDANCE
10.8
10.1
LANGUAGE PRESCORE
12.6
14.1
-1.5
AFFECT PRESCORE
17.2
16.8
0.4
{PRAT TOTAL
84.6
93.0
AGE (JUNE '71)
97.0
97.6
-0.6
CLASSROOM MALE
64.9
60.0
4.9
QUANTITATIVE
34.6
40.3
% CLASSROOM BLACK
41.7
2,3
39.4
% PRESCHOOL (OR NO. MOS.)
84.5
38.3
46.2
COGNITIVE PROCESSES
PARENTS 8/0 HS DIPL.
84.8
88.9
-4.1
% PARENTS W SKILLED OCCUP.
29.0
15.9
13.1
READING SKILLS
55.8
79.4
% PARENTS BLACK
41.3
3.7
37.6
% PARENTS POVERTY ELIGIBLE
49.8
42.6
7.2
LANGUAGE ARTS
19.1
19.3
% HEAD HOUSEHOLD EMPLOYED
81.5
68.5
13.0
% HEAD HOUSEHOLD MALE
84.7
75.9
8.8
ADJUSTED OUTCOME DATA
DIFF
'T
NET
CHILD EVALUATION DATA
-29.5
110.4
125.6
0.1
18.6
18.9
0.7
10.0
9.9
85.8
89.7
-5.7
32.4
35.1
0-23.6
58.6
72.3
-0.2
19.2
18.0
00
NO. CLASSROOM GROUPS
44
0PARENT-CHILD
PART
II
PARENT EVALUATION DATA
CO
AV. PARENTS/CLASSRM GRP
11.3
6.7
4.6k
INTERACT
.069
.278
-.209
.195
.589
% 8/0 H:GH SCHOOL DIPLOMA
84.8
88.9
-4.1
%SKILLED OCCUP.
29.0
15.9
13.1
PARENT-SCHOOL
% POS EVAL OF CHILD LRNG
62,1
41.7
20.4
INVOLVE
.354
.124
.230
.428
.494
% BLACK
41.3
3.7
37.6
% REPORTING USE OF PRESCH
84.5
51.1
33.4
CHILD ACADEMIC
% POVERTY ELIGIBLE
49.8
42.6
7.2
EXPECT
-.304
-.632
.328
-.013
.015
% HEAD HOUSEHOLD EMPLOYED
81.5
68.5
13.0
% HEAD HOUSEHOLD MALE
84.7
75.9
8.8
SENSE OF CONTROL
.430
-.614
1.04
.657
-.215
PART
III
TEACHER EVALUATION DATA
NO. OF CLASSROOMS
32
1PARENT-EDUCATOR
JOB SATISF. RATING
1.5
1.7
-0.2
IMAGE
0.19
0.08
0.11
0.27
0.05,
BOOK RESOURCE SCALE
4.7
2.0
2.7
RACE (BLACK/NONBLACK)
1.0
1.0
0PROFESSION. ACCEPT
IDENT. W. COMMUNITY
0.3
1.5
-1.2
OF METHOD
1.67
1.50
0.17
1.94
1.57
NO. OF HELPERS
1.3
0.5
0.8
ABLE TO CHOOSE ASSIGNMENT
1.0
1.5
-0.5
TRNG & TEACHER EXPER
4.0
5.5
-1.5
*See "Guide for Interpretation of Results" for explanation of table entries.
CONFIDENCE
INTERVAL
DIFF
5.
E.
LOW
HIGH
PROCESS DATA
-15.2
11.84
-38.4
8.0
PROJECT DESCRIPTORS
SOUTH
-0.3
0.77
-1.8
1.2
REGION
ATLANTIC
0.1
3.92
-7.6
7.8
DISTANCE TO NEAREST SMSA
.20 MILES
-3.9
5.09
-13.9
6.1
SIZE OF NEARFT S1IS4
119,000
3.56
-9.7
4.3
PERCENT NONWHITE
5
PROJECT SIZE (PUPILS)
..
.
357 (T)
-13.7
7.86
-20.7
1.7
NO. PUPILS'PAC MEMBER
..
7.9
1.2
2.36
-3.4
5.8
FT PER-PUPIL EXPENDITURE
..
910
CLASSROOM OBSERVATION
FACTOR SCORES
-.394
.351
-1.08
.29
FACTOR NAME
FT
NIT
SELF REGULATORY
.77
-.28
-.066
.358
-.77
'64
CHILD-1NITIATED
INTERACTIONS
.47
.(12)
-.028
.353
-.72
.66
PROGRAMMED ACADEMIC
..
.-.12
-.30
.472
.341
.20
1.55
EXPRESSIVE
-.37
-.61
CHILD SELF-LEARNING
..
.98
.1.9
0.22
0.297
-.36
0.37
0.445
-.50
1.24
FIG
UR
E 4
OR
GA
NIZ
AT
ION
OF
PR
OJE
CT
DA
TA
TA
BLE

Quant. prescore--the raw score (numbnr correct) on the baseline
test (maximum varies ti -Toss cohorts and grade
streams) .
Cog. Process prescore--the raw cognitive process prescore.
Reading prescore--the raw reading prescore.
Language prescore--the raw language prescore.
Affect prescore--the raw affect prescore.
Age (June "71)--the average age in months of
pupils as of June, 1971.
%Classroommalethe percentage of boys in the classroom,
averaged across classrooms.
% Classroom Black--the percentage of Blacks in the classroom,
averaged across classrooms.
Preschool--either: (a) the average percentage of pupils who
had at least some preschool (CI only) or (b) the
average number of months of preschool (CII only).
Parents w/o HS diploma--the percentage of parents of pupils in
the class who DO NOT have high school
diplomas, averaged across classrooms.
% Parents w skilled occup.--the average percentage of parents of
pupils in the class who have occupa-
tions classified as "skilled"--i.e.,
professional, clerical, manager, sales,
craft, etc., but NOT service, laborer,
operative, housewife, etc.
POVERTY DEFINITIONS
DOLLAR
INCOME
NON-FARM FAMILY SIZE FARM FAMILY SIZE
CERT.
POOR
POSS.
POOR
NOT
POOR
CERT.
POOR
POSS.
POOR
NOT
POOR
1,00 >_1 .1
1,000-2,999 .._3 2 1 ....4 2-3 1
3,000-4,999 7 3-6 1-2 ._ 8 4-7 1-3
5,000-7,499 .1.1 7-10 1-6 .1.3 '8-12 1-7
7,500-9,999 X15 11-14 1-10 .?_1.7 13-16 1 -12
10,000+ ..1.9 15-18 1-14 .._21 17-20 1-16
84
% Parents Black--average percentage of pupil parents who are Black:
% Poverty eligible--average percentage meeting 0E0 poverty guide-
lines as shown in the preceding (page 84)
tabulation.
% Head of household employed--the average percentag3 of heads of
households who report they are cur-
rently employed (parent interview
responses).
% Head household male--the average percentage of heads of house-
holds who are male.
The entries in the area of Figure 4 designated as "2" present con-trol data on parents. The following are detailed descriptions of indi-vidual entries:
No. classroom units--number of parent groups of data, aggregated
in terms of the corresponding pupils' class-
rooms.
Av. parents/classroom grp--average number of parents per unit
meeting the completeness of data re-
quirement. Average classroom group
size represents the average frequency
for which data on all:measures areavailable. Frequencies vary consider-
ably from_measure to measure.
o w/o high school diploma--see child definitions.
% w skilled occup.--see child definitions.
°' Pos. eval. of child lrng--satisfaction rating of parent ( "very"
to "not") with child's progress in
school; percentage of "very satisfied"
responses.
% Black--see child definition.
% Repor÷ing use of preschool--percentage stating their FT/NFT
child participated in some pre-
school program.
% Poverty eligible--see child definition.
% Head household employed- see child definition.
% Head household male--see child definition.
85
The entries in the area of Figure 4 designated as "3" display input
data on teachers. The following are detailed descriptions of individual
entries:
No. of classrooms--number of classrooms for which data on teacher
variables are sufficiently complete.
Job satisf. rating--the average scaled satisfaction response
(3 = very satisfied, 2 = satisfied, 1 = dis-
satisfied) regarding working conditions, i.e.,
equipment, supplies, classroom space, schedule,
salary, and planning time.
Book Resource scale--the number of book and library facilities
available to the students--classroom, take
home, central library, etc. (maximum score
= 6).
Race (Black/non-Black)--Black = 1; non-Black = O.*
Ident. w community--the extent to which the teacher is both a
longtime member of the community and a
resident of a neighborhood similar to that
of the pupils (maximum score = 2).
No. of helpers--the minimum number of helpers (aides or volun-
teers) utilized in the class.
Able to choose assignment--the extent to which the teacher was
able to choose her current school and
classroom teaching assignment (2 =
teacher's own choice; 1 = at request
of other; 0 = assigned, no choice- -
each for school and classroom assign-
ment).
Trng & teacher experience--an aggregate training and experience
variable indicating the extent of for-
mal education, degrees held, specific
course completions, certification, years
of experience, grade levels taught, and
tenure of the teacher (maximum score = 12
points).
The entries in the area of Figure 4 designated as "4" display outcomedata on pupils. The following are detailed descriptions of individual
entries:
Cohort II teacher ethnicity coding is reversed: Black = 0, non-Black = 1.
86
Overall achievementthe raw score sum of correct responses toall cognitive test battery items.
Affect--the scald sum of seven responses to the attitude inven-
tory (3 = happy, 1 = sad; min. = 7, max. = 21).
Attendance--the average number of days absent from class in the
1970-1971 school year.
WRAT--the raw score sum of correct responses to th.e. WRAT.
Quantitative--the raw score sum of correct responses.
Cognitive processes --the raw score sum of correct responses.
Reading skills--the raw score sum of correct responses.
Language arts- -the raw score sum of correct responses.
Two entries are made for the subgroups on each measure. The out-
come entry shows the actual or unadjusted posttest averages for FT and
NFT subgroups on each measure. The adjusted outcome entries show these
values after regression for differences on covariables (i.e., differences
on baseline/control averages).
The entries in the area of.Figure 4 are designated as "5" present
outcome data on parents. Tb.: !ollowing are detailed descriptions of
individual entries:
Parent/child interact - -the extent to which parents report they
actively interact with their children in
such activities as talking with their child-
ren, taking their children on trips, helping
their children With school work,' reading to
them, accepting assistance frcm them, and
acknowledging their progress in school.
Parent/school involve--the extent to which parents report they
are actively participating in'various
school-related activities, such as class-
room visits, volunteer assistance, parent/
school meetings, external contacts with
school personnel.
Child academic expect--the extent to which the parent reports
satisfaction with child's progress and
optimism regarding th3 child's future,
both academic and nonacademic (e.g., what
are the child's expected grades, chances of
getting a good job, chances of going on to
college?).
87
Sense of control--the extent to which the parent reports a sense
of concern and control over school procedures,
educational reforms, and school awareness of
and responsiveness to parent and community
desires and needs.
These entries are all expressed as standardized (M = 0, SD = 1) scale
values and are displayed in unadjusted and adjusted forms.
The entries in the area of Figure 4 designated as "6" present out-
come data on teachers. The following are detailed descriptions of in-
dividual entries:
Parent-educator image--the extent to which teachers reported they
felt it essential to "get together with
parents outside of the classroom" for pur-
poses of:
Improving children's learning
Improving classroom teaching
Learning parent's views on teaching
Improving school services to parents
Improving school services to children
Improving school services to community
Parental understanding of school program.
Professional accept of method--the extent to which the teacher
reports she would not prefer to adopt
some teaching approach other than the
one she is currently using.
Like the parent outcomes, teacher outcomes are expressed as standardized
scale scores and are shown in adjusted and unadjusted forms.
The entries in the area of Figure 4 designated as "7" describe the
project. The following are detailed descriptions of individual entries.
Region--geographic location of project
Distance to nearest SMSA--within SMSA; 20 miles from nearest
SMSA; 30 to 40 miles from nearest SMSA;
50-70 miles from nearest SMSA; or 75 to
120 miles from nearest SMSA.
38
Size of nearest SMSA--1970 population of nearest SMSA for those
communities not within a SMSA.
Percent nonwhitepercent-of community population that consists
of minority group members.
Project size (pupils)--number of participating pupils as projected
in the 1970-71 project application.
No. pupils/PAC member--projected 1970-71 enrollment divided by the
size of PAC as reported in 1970-71 membership
listing.
FT per pupil expenditure--total anticipated funds supplementing
district maintenance of effort (sometimes
includes Title I funding) divided by
projected enrollment.
The entrieslin the area of Figure 4 designated as "8" give classroom
observation factor scores. The following are detailed descriptions of
individual entries:
Self-regulatory--children working independently on activities
rot strictly academic.
Child-initiated interactions--children initiating interactions
and receiving positive or negative
feedback from adults.
Programmed academic--adults teaching small groups of children by
highly structured question-response-reinforcement
interactions.
Expressive--positive and negative affect expre;sed by both children
and adults.
Child self-learning--children working alone with books or seat-
work materials.
891%19/

1
Section IV
RESULTS
1
Section IV
RESULTS
Introduction
This section is divided into the following three parts:
(1) Evidence of results at the project 'level presented on a sponsor
by sponsor basis
I
(2) Overall results presented on a cohort basis
(3) Independent evidence of FT planned variations.
Part 1 presents the results and interpretations of individual project
outcomes, both CI and CII. Because of the quantity and complexity of
these results, several steps are followed to organize and simplify the
presentation.
ao
First, all results are organized in terms of individual projects as
in the interpretive guide. These projectlevel results are further groupedby sponsor. The reasons for this organization of the interim results arethe following:
The objective of this interim evaluation is not to contrast each
approach or planned variation to others, but to assess the impact
of each app-roach on pupils, parents, and teachers by comparing
their development with the development of NFT comparison.
Organization of impact evidence on the basis of planned variations
allows comprehensive evaluation of how outcomes compare with the
goals of the specific approach and how they are related to the
characteristics of that approach.
The presentation of the results at the project level is organizedas follows:
(1) A comprehensive description of the planned variation or approach,
which was produced by SRI in collaboration with the sponsors,
is presented. This description of the approach presents the
sponsor's intende6 goals; it does not necessarily describe whatactually happened.
93
(2) The results of individual CI and CII projects that employed this
approach and for-which interim data have been analyzed are pre-
sented. In general, the sequence of presentation is from Cohort I
to Cohort II samples (i.e., two-year results to one-year-results).
Also, first-year (Spring 1970) results of Cohort I are compared
with the corresponding second-year results (Spring 1971) when
both are available and, with Cohort II first-year results, when
they are available.
(3) A summary of results is presented for the sponsor. This summary
includes an outline of Alhat we believe to be the salient features
of the planned variation (objectives, curriculum emphases,
parent component). The resultsi
of sponsol level analyses are
included only if two or more projects at a particular cohort and
grade stream are present. Separate sponsor-level analyses for
individual projects are redundant and, therefore, are not included
in the summary.
Part 2 of this section presents summary tables and discussions of
evidence of overall effects at the cohort level. In this presentation,
we attempt to show how results are related to the quality of the matching
of comparison groups with FT groups. These interpretations and evaluations
are informal and descriptive.
Part 3 documents the extent to which FT planned variations currently
exist. These evaluations are based directly on analysis of classroom
observation variables and factors across projects and, cohorts.
94

3
Part 1
RESULTS FOR EACH PROJECT
BY SPONSOR
RESPONSIVE EDUCATIONAL PROGRAM
Far West Laboratory for Educational Research and Development
Sponsor's Intended ApproaJh
Learning activities that are self-rewarding (autotelic) and an environ-
ment structured to be responsive to the individual child's needs, culture,
and interests a2e the main principles in this model.. The autotelic prin-ciple states that the best way for a child to learn is for him to be in
an environment in which he can try things out, risk, guess, ask qUestions,
and make discoveries without serious psychological consequences. Autotelic
activities include learning activities that help the child develop a skill,
lean a concept, or:acquire an attitude that can be usefully applied insome other endeavor.
This sponsor believes that relkards are intrinsic within an activity
and that the child gets feedback from physical materials as well ar, human
interactions. Thus, he need not depend solely on the authority of the
teacher for rewards, punishments, or feedback. The child becomes self-directed and develops inner controls.
The goals of the model are for the child to develop his intellectual
abilities and to develop a healthy self-concept. A healthy self-concept
allows the child to accept himself and his culture, to make realistic
estimates of his own abilities and limitations, and to have confidence
in 14s own capacity to succeed. Such a child is willink to take risks,
learns from his mistakes, and feels safe in expressing his feelings.
He learns to apply all his resources--emotional, physical and intellec-
tual--to the process of solving problems within his environment.
In the Responsive Model classroom the child is free to explore within
a carefully controlled environment containing learning centers and a
variety of games and activities. There is freedom to choose activities
within already established limits. What he chooses to do is more likely
to become important to him, to stimulate affective involvement, and to
pose real problems. The child searches for solutions to'problems in his
own way using a variety of resources, both physical and human. The teachers
guide his discovery of solutions. The child finds out if his solutions
work. Solutions he discovers often fit together and lead to other dis-
coveries, The child's reward is what he gains from the entire experience.
%/97
Learning sequences have been developed for the model, but each child
may work at his own pace. There are no constraints to master given lessoncontent by a given time. It is assumed in the model that no single theory
of learning can account for all the ways in which children learn. What
is considered essential is that a variety of educational alternatives be
available to build on whatever background, cultural influence, or lifestyle the child brings to school.
The sponsor of this model trains a person from the local community
to act as Program Advisor. The Program Advisor conducts inservice train-
ing for all staff and parent groups and is responsible for carrying the
model's program into the classroom. One aspect of the training includes
developing career-directed jobs for parents as teacher assistants, typing
booth attendants, and the like. The training program is the first concern
in evaluating the model overall. An attempt is made to determine how ef-
fective the training program is in producing the changes in teacher behavior
roquiredto i7)lement the model and whether the changed behavior indeed
affects the growth of children toward the self-concept and intellectual
objectives of the program.
Since the approach taken by the Responsive Model places equal respon-
sibility for the child's education on the home, particularly heavy emphasis
is placed on parent involvement. Parents are offered training during which
they are familiarized with the program and trained to pursue its objectivesin the home. A game and toy library is available for parent use, and it
includes filmstrips and audio tapes that demonstrate how the toys and games
should be used. The sponsor also offers a course to teacher-librarians
so they can further assist parents in the application of program materials.
In addition to the parents trained specifically for employment in the
project, parents in general are invited to participate in classroom activ-
ity on a volunteer basis. This gives them the opportunity to become aware
of the kinds of adult-child interactions that contribUte to the child's
success in school and to become familiar with the principles and the
activities of the program. The purpose of the carefully planned parentinvolvement demonstrated by this model is to train parents for the leader-
ship and policy-making roles the sponsor feels they should assume in the
education of their children.
Individual Project Results
Seven samples from three different projects sponsored by Far-West
Laboratory for Educational Research and Development (FW) were included
in the analysis of the interim effects. The distribution of these evalua-
tion samples in terms of cohort, outcome, and project is as follows:
98
Cohorc First-year Effects ° Second-year Effects
IK (project b) (projects a, b, & c)IIK (projects a, b, & c)
Project FW(c)
Project FW(c) is a relatively small, nearly all white project,
located some distance from a relatively small (95,000% N-aw England city.The anticipated per pupil Follow Through expenditure in this project was
$634, and there was one PAC member, on the average, fur each 13.7 pupils.
Two separate samples. were analyzed for this project, a Cohort I-K second-7
year sample and a Cohort II-K, one-year sample.
The results of the Cohort I, two-year analysis are presented in Table15. This analysis was based on a sample of four Follow Through and threenon-Follow Through classrooms.
These sets of classrooms were only moderately similar. NFT class-rooms averaged consistently higher than FT classrooms on the baseline
measures and were more than 10 points above the FT classrooms on thereading prescore. As usual, the Follow Through classrooms had a higher
proportion of preschool experience but appeared to have families quitedifferent from those of the non-Follow Through pupils. Specifically,
FT parents tended to have substantially less education, were more likely
to be unemployed, were in lower occupational categories, were poverty
eligible, and had fewer male heads of household than NFT families.
Teachers, on the other hand, appeared somewhat better matched on the inputvariables. For example, the FT and NFT samples differ only in the numberof helpers and the relative experience of teachers.
The analysis of covariance on pupil outcomes showed a.significant
difference in favor of Follow Through on the quantitative skills measure.
Other test measures failed to reveal significance, but generally showed
differences in favor of the Follow Through sample. The parent outcomesand teacher outcomes presented in Table 15 indicate that no other resultsreach significance for this sample.
The Cohort II first-year results for this project are summarized in'table 16. The baseline averages for these three FT and two NFT classrooms
indicate that the comparison group match is only slighly better that that ofthe Cohort I sample in Project FW(c). The preschool averages for the two
groups were approximately the same except for "affect," in which FT was sub-
stantially higher than NFT. However, in the NFT classrooms there were con-
siderably more boys than girls, whereas in the FT classroom there were about
99

/."
TABLE 15
PROJECT DATA TABLE--FAR WEST LABORATORY PROJECT C, COHORT I, KINDERGARTEN ENTERING:
TWO-YEAR EFFECTS,
1969-1971
ADJUSTED OUTCOME DATA
CONFIDENCE
BASELINE CONTROL DATA
OUTCOME DATA
INTERVAL
VARIABLE
FT
NFT
DIFF
VARIABLE.
FT
NFT
DIFF
FT
NFT
DIFF
S.
E,
LOW
HIGH
PROCESS DATA
PART I
CHILD EVALUATION DATA
NO. OF CLASSROOMS
13
1OVERALL ACHIEVEMENT
139.1
149.3
-10.2
128.1
118.6
9,8
10.04
-9.9
29.5
PROJECT DESCRIPTORS
AVERAGE PUPILS/CLASSROOM
9.8
5.7
4.1
QUART, PRESCORE
21.7
27.1
AFFECT
18.5
0.5
18.8
17.6
1.2
1.06
-.9
3.3
REGION.
NEW ENGLAND
COG. PROCESS PRESCORE
6.0
7.9
-1.9
READING PRESCORE
40.1
50.2
-10.1
ATTENDANCE
13.1
1::.1
10.5
10.8
-0.3
3.29
-6.7
6.1
DISTANCE TO NEAREST SMSA
..50-70 MILES
LANGUAGE PRESCORE
11.6
13.7
-2.1
AFFECT PRESCORE
15.8
16.5
-0.7
WRAT TOTAL
79.6
85.0
-5.4
76.7
72.8
3.9
5.42
-6.7
14.5
SIZE OF NEAREST SMSA
95 000
AGE (JUNE '71)
86.8
86.1
0.7
1 CLASSROOM MALE
47.3
40.5
6.8
QUANTITATIVE
42.8
42.6
0,2
38.7
22.2
6.5
3.22
.2
12.8
PERCENT NONWHITE
1
1 CLASSROOM BLACK
00
0
1 PRESCHOOL (OR NO. MOS.)
87.5
56.2
31.3
COGNITIVE PROCESSES
7.7
8.1
7.0
6.9
0.1
0.60
-1.1
1.3
PROJECT SIZE (PUPILS)
..276
% PARENTS W/0 HS DIPL.
54.9
22.6
32.3
'1 PARENTS W SKILLED OCCUP.
40,5
76.6
-36.1
READING SKILLS
56.5
64.6
-8.1
53.3
53.3
4.98
-9.8
9.8
NO. PUPILSTAC MEMBili
..13.7
% PARENTS BLACK
00
0
'N PARENTS POVERTY ELIGIBLE
43.8
9.1
34.3
LANGUAGE ARTS
?2.1
34.0
-1.9
29.4
26.1
3.3
2.76
-2.1
8.7
FT PER - PUPIL. EXPENDITURE
.634
5 HEAD HOUSEHOLD EMPLOfED
89.5
95.3
-5.8
'4 HEAD HOUSEHOLD MALE
74.6
100.0
-25.4
CLASSROOM DATA NOT AVAILABLE FOR THIS
PART II
PARENT EVALUATION DATA
PROJECT
NO. CLASSROOM GROUPS
43
1PARENT-CHILD
AV. PARENTS/CLASSRM GRP
10.0
5.7
4.3
INTERACT
-,064
.484
-.548
.063
.350
-.287
.331
-.94
.36
WO HIGH SCHOOL DIPLOMA
51.9
22.6
32.3
W SKILLED OCCUP.
40.5
76.6
-36.1
PARENT-SCHOOL
POS EVAL OF CHILD LRNG
70.8
58.3
12.5
INVOLVE
.127
.224
-.097
.253
.344
-.091
.448
-.97
.79
'4 BLACK
00
0
REPOnTIN'' '.T17 OF PRESCHOOL
87.5
56.8
30.7
CHILD ACADEMIC
1 POVERTY ELIGIBLE
43.8
9.5
34.3
EXPECT
-.440
.041
-.481
-.989
-.189
-.800
.465
-1.71
.11
HEAD HOUSEHOLD EMPLOYED
89.5
95.3
5.8
1 HEAD HOUSEHOLD MALE
74.6
100.0
-25.4
SENSE OF CONTROL,
.295
.029
,266
.511
.396
.115
.440
-.75
.98
PART III
TEACHER EVALUATION
DATA
NO. OF CLASSROOMS
32
1PARENT-EDUCATOR
JOB SATISF. RATING
1.7
2.0
-0.3
IMAGE
0.29
0.43
-0.14
0.27
0.50
-0.23
0.232
-.68
.22
BOOK RESOURCE SCALE
4.0
1.5
-0.5
RACE (BLACK'NONBLACK)
1.0
1.0
0PROFESSION. ACCEPT
IDENT. W. COMMUNITY
0.7
0.5
0.2
OF METHOD
1.67
1.50
0.17
1.83
1.45
0.38
0.324
-.26
1.02
NO, OF HELPERS
1.7
0.5
1.2
ABLE TO CHOOSE ASSIGNMENT
2.0
1.5
0.5
TRNG & TEACHER EXPER
5.0
6.0
-1.0
"Guide for Interpretation of Results- for explanation of table entries.
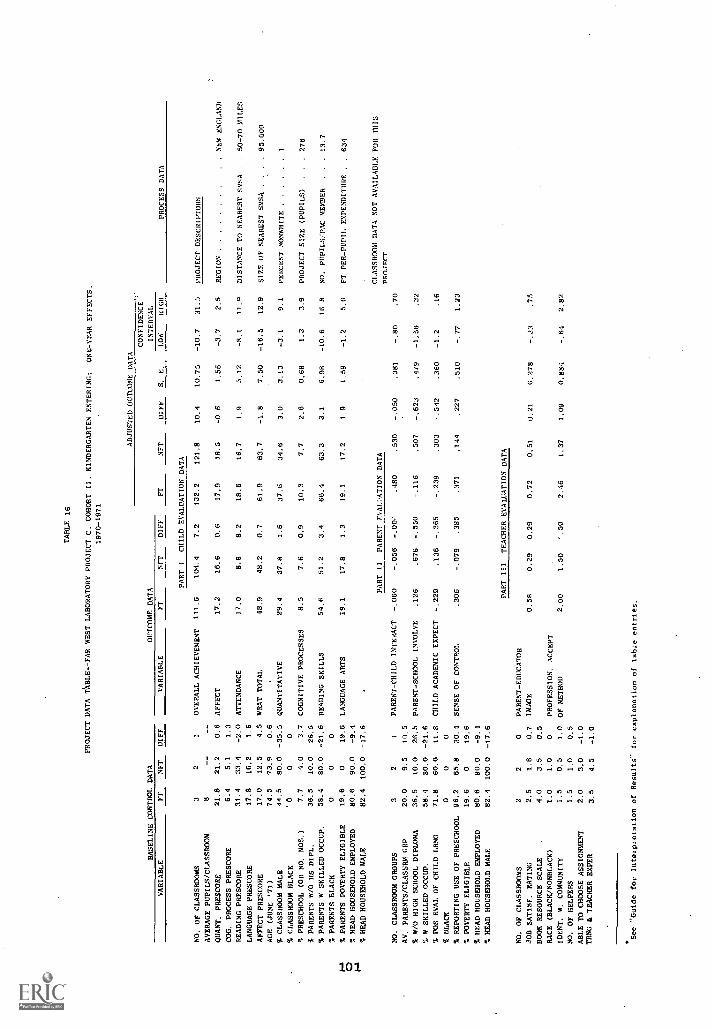
TA
BL
E 1
6
PROJECT DATA TABLE-FAR WEST LABORATORY PROJECT C. COHORT II. KINDERGARTEN ENTERING:
ONE-YEAR EFFECTS,
1970-1971
BASELINE CONTROL DATA
VARIABLE
FT
NFT
DIFF
ADJUSTED OUTCOME DATA
CONFIDENCE
OUTCOME DATA
INTERVAL
VARIABLE
FT
NFT
DIFF
FT
NFT
DIFF
S.
E.
LOW
HIGH
PROCESS DATA
PART I
CHILD EVALUATION DATA
NO, OF CLASSROOMS
32
1OVERALL ACHIEVEMENT
111.6
104.4
7.2
132.2
121.8
10.4
10.75
-10.7
31.5
PROJECT DESCRIPTORS
AVERAGE PUPILS/CLASSROOM
8--
--
QUART. PRESCORE
21.8
21.2
0.6
AFFECT
17,2
16.6
0.6
17,9
18.5
-0.6
1.56
-3.7
2,5
REGIO'
NEW' ENGLAND
COG. PROCESS PRESCORE
6.4
5.1
1.3
READING PRESCORE
31.4
33.4
-2.0
ATTENDANCE
17.0
8.8
8.2
18.6
16.7
1.9
5,12
-R.1
11,9
DISTANCE TO NEAREST SMSA
..50-70 MILES
LANGUAGE PRESCORE
17.8
16,2
1.6
AFFECT PRESCORE
17.0
12.5
4.5
WRAT TOTAL
48.9
48.2
0.7
61.9
63.7
-1.8
7.50
-16.5
12.9
SIZE OF NEAREST SMSA
..
.95,000
AGE (JUNE '71)
74.5
73,9
0.6
,
% CLASSROOM MALE
44.5
80.0
-35.5
QUANTITATIVE
29.4
27.8
1.6
37.6
34.6
3.0
3.13
-3.1
9.1
PERCENT NONWHITE
% CLASSROOM BLACK
' 0
00
% PRESCHOOL (OR NO. MOS.)
7.7
4.0
3.7
COGNITIVE PROCESSES
8.5
7.6
0.9
10.3
7.7
2.6
0,68
1.3
3.9
PROJECT SIZE (PUPILS)
..
.276
A PARENTS W/O HS DIPL.
36.5
10.0
26.5
% PARENTS W SKILLED OCCUP.
58.4
80.0
-21.6
READING SKILLS
54.6
51.2
3.4
66.4
63.3
3.1
6,98
-10.6
16.8
NO. PUPILS:PAC MEMBER
..
.13.7
% PARENTS BLACK
00
0
% PARENTS POVERTY ELIGIBLE
19.6
019.6
LANGUAGE ARTS
19.1
17.8
1.3
19.1
17.2
1.9
1.59
-1.2
5.0
FT PER-PUPIL EXPENDITURE
..634
% HEAD HOUSEHOLD EMPLOYED
80.6
90.0
-9.4
% HEAD HOUSEHOLD MALE
82.4
100.0
-17.6
PART
II
PARENT EVALUATION
DATA
CLASSROOM DATA NOT AVAILABLE FOR nits
NO. CLASSROOM GROUPS
32
PARENT-CHILD INTERACT
-.060
-.056
-.00.,
.480
.530
-.050
,381
-.80
.70
PRO
JEC
T
AV, PARENTS/CLASSRM GRP
20.0
9.5
10.5
% W/O HIGH SCHOOL DIPLOMA
36.5
10.0
26.5
PARENT-SCHOOL INVOLVE
.126
.676
-.550
-.116
.507
-.623
,79
-1.56
.32
% W SKILLED OCCUP.
58.4
80.0
-21.6
% POS EVAL OF CHILD LRNG
71.8
60.0
11.8
CHILD ACADEMIC EXPECT
-.229
.136
-.365
-.239
.303
-.512
,360
-1.2
.16
% BLACK
00
0
% REPORTING USE OF PRESCHOOL
96.2
65.8
30.4
SENSE OF CONTROL
.306
-.079
.385
.371
.144
.227
.510
-.77
1.23
% POVERTY ELIGIBLE
19.6
019.6
% HEAD HOUSEHOLD EMPLOYED
80.6
90.0
-9.4
% HEAD HOUSEHOLD MALE
82.4
100.0
-17.6
PART
III
TEACHER EVALUATION DATA
NO. OF CLASSROOMS
22
0PARENT-EDUCATOR
JOB SATISF. RATING
2.5
1.8
0.7
IMAGE
0.58
0.29
0.29
0.72
0.51
0.21
0.278
-.33
75
BOOK RESOURCE SCALE
4.0
3.5
0.5
RACE (BLACK/NONBLACK)
1.0
1.0
0PROFESSION. ACCEPT
IDENT. W. COMMUNITY
1.5
0.5
1.0
OF METHOD
2.00
1.50
'.50
2.46
1.37
1,09
0.894
-.64
2,82
NO. OF HELPERS
1.5
1.0
0.5
ABLE TO CHOOSE ASSIGNMENT
2.0
3.0
-1.0
TRNG & TEACHER EXPER
3.5
4.5
-1.0
See 'Guide for Interpretation of Results- for explanation of table entries.
the same number of boys and girls. In addition, the FT parents were less
likely to have a high school education or be employed in a skilled occupa-
tion. The head of a FT household was less apt to be employed and less
apt to be malp than the head of an NFT household. Nearly 20 percent of
the FT families were poverty eligible under the 0E0 criteria, whereas
none of the NFT families were. Teachers in the two samples were moderately
comparable. FT teachers appeared more satisfied with their jobs, had
more book resources, were better integrated in the communities in which
they taught, and had more helpers than NFT teachers. However, FT teachers
reported less freedom in choosing assignments and were less experienced
than NFT teachers.
Analysis of pupil outcome measures in terms of these background differ-
ences revealed a significant FT superiority only in measures of cognitive
processes. Outcomes of parent and teacher measures failed to show signifi-
cant differences between FT and NFT groups.
In summary, the only significant differences between FT and NFT groups
in Project FW(c) were the superiority in quantitative skills of the FT
group in the Cohort I, second-year sample and the superiority in cognitive
processes of the FT group in the Cohort II, first-year sample.
Project FW(b)
Project FW(b) is a moderately large project of 720 pupils, primarily
white, located within a city of 138,000 in the west north central region.
The anticipated per pupil expenditure in this project was $606, and, on
the average, there were 19 pupils per PAC member.
Analyses were performed on three sets of data for Project FW(b),
a Cohort I-K, second-year effects analysis, a Cohort I-K, first-year effects
subset, and a Cohort II-K, first-year effects analysis. Both the Cohort
I and the Cohort II classrooms were included in the classroom observation
sample.
The results of the two-year effects analysis for Project FW(b) are
summarized in Table 17. The six FT and the six NFT classrooms participating
in this analysis were fairly well matched on pupil and parent variables.
Substantial differences between FT and NFT groups were noted only in pre-
school experience and parents' evaluation of the pupils' academic progress.
Parents in both samples were moderately well educated and were employed at
skilled occupations; less than half the families are poverty eligible,
and more than three quarters of the family heads are males or employed
or both. The teachers were also relatively well matched, differing notice-
ably only in number of helpers and relative training and experience.
102
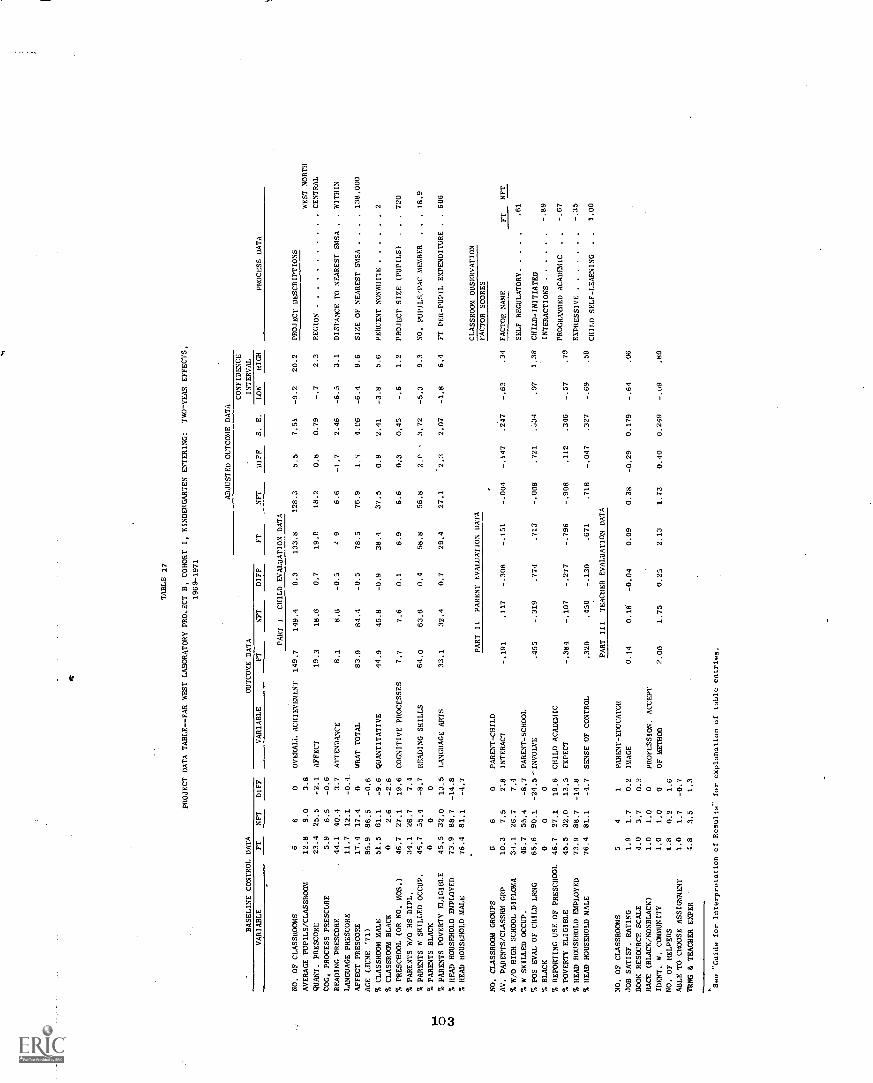
TABLE 17
PROJECT DATA TABLE--FAR WEST LABORATORY PRO.2CT B, COHORT I, KINDERGARTEN ENTERING:
TWO-YEAR EFFECTS,
1969-1971
ADJUSTED OUTCOME DATA
BASELINE CONTROL DATA
OUTCOME DATA
FT
NET
DIFF
S. E.
CONFIDENCE
INTERVAL
PROCESS DATA
VARIABLE
FT
NFT
DIFF
VARIABLE
FT
NFT
DIFF
LOW
HIGH
PART I
CHILD EVALUATION DATA
NO. OF CLASSROOMS
66
0OVERALL ACHIEVEMENT
149.7
149.4
0.3
133.8
128.3
5.5
7.51
-9.2
20.2
PROJECT DESCRIPTIONS
AVERAGE PUPILS/CLASSROOM
12.8
9.0
3.8
WEST NORTH
QUART. PRESCORE
23.4
25.5
-2.1
AFFECT
19.3
18.6
0.7
19.0
18.2
0.8
0.79
2.3
REGION
CENTRAL
COG, PROCESS PRESCORE
5.9
6.5
-0.6
READING PRESCORE
44.1
40.4
3.7
ATTENDANCE
8.1
8.6
-0.5
49
6.6
-1.7
2.46
-6.5
3.1
DISTANCE TO NEAREST SMSA
..WITHIN
LANGUAGE PRESCORE
11.7
12.1
AFFECT PRESCORE
17.4
17.4
0WRAT TOTAL
83.9
84.4
-0.5
78.5
76.9
1.'5
4.C6
-6.4
9.6
SIZE OF NEAREST SSA
138,000
AGE (JUNE '71)
85.9
86.5
-0.6
% CLASSROOM MALE
51.5
61.1
-9.6
QUANTITATIVE
44.9
45.8
-0.9
38.4
37.5
0.9
2.41
-3.8
5.6
PERCENT NONWHITE
2
CLASSROOM BLACK
02.6
-2.6
% PRESCHOOL (OR NO. MOS.)
46.7
27.1
19.6
COGNITIVE PROCESSES
7.7
7.6
0.1
6.9
6.6
0.3
0.45
1.2
PROJECT SIZE (PUPILS)
..
.720
% PARENTS W/O HS DIPL.
34.1
26.7
7.4
% PARENTS W SKILLED OCCUP.
45.7
55.4
-8.7
READING SKILLS
64.0
63.6
0.4
58.8
56.8
2.0
3.72
-5.3
9.3
NO. PUPILS/PAC MEMBER
..
.18.9
F"
% PARENTS BLACK
00
0
CD
% PARENTS POVERTY ELIGIBLE
45.5
32.0
13.5
LANGUAGE ARTS
33.1
32.4
0.7
29.4
27.1
2.3
2.07
-1.8
6.4
FT PER-PUPIL EXPENDITURE
..606
CO
% HEAD HOUSEHOLD EMPLOYED
73.9
88.7
-14.8
% HEAD HOUSEHOLD MALE
76.4
81.1
-4.7
PART II
PARENT EVALUATION DATA
CLASSROOM OBSERVATION
FACTOR SCORES
NO. CLASSROOM GROUPS
66
0PARENT-CHILD
AV. PARENTS/CLASSRM GRP
10.3
7.5
2-.8
INTERACT
-.191
.117
-.308
-.151
-.004
-.147
.247
-.63
.34
FACTOR NAME
FT
NFT
% W/O HIGH SCHOOL DIPLOMA
34.1
26.7
7.4
% W SKILLED OCCUP.
46.7
55.4
-8.7
PARENT-SCHOOL
SELF REGULATORY
61
% POS EVAL OF CHILD LANG
65.6
90.1
-24.5 "INVOLVE
.455
-.319
.774
.713
-.008
.721
..;34
.07
1:38
CHILD- INITIATED
% BLACK
00
0INTERACTIONS
-.89
% REPORTING USE OF PRESCHOOL
46.7
27.1
19.6
CHILD ACADEMIC
% POVERTY ELIGIBLE
45.5
32.0
13.5
EXPECT
-.384
-.107
-.277
-.796
-.908
.112
.346
-.57
.79
PROGRAMMED ACADEMIC
-.67
% HEAD HOUSEHOLD EMPLOYED
73.9
88.7
-14.8
EXPRESSIVE
- 35
% HEAD HOUSEHOLD MALE
76.4
81.1
-4.7
SENSE OF CONTROL
-.130
.718
-.047
-.69
.59
.320
.450
.671
.327
CHILD SELF-LEARNING
1.00
PART
III
TEACHER EVALUATION DATA
NO. OF CLASSROOMS
54
1PARENT-EDUCATOR
JOB SATISF. RATING
1.9
1.7
0.2
IMAGE
0.14
0.18
-0.04
0.09
0.38
-0.29
0.179
-.64
.06
BOOK RESOURCE SCALE
4.0
3.7
0.3
RACE (BLACK/NONBLACK)
1.0
1.0
0PROFESSION. ACCEPT
IDENT. W. COMMUNITY
1.0
1.0
0OF METHOD
2.00
1.75
0.25
2.13
1.73
0.40
0.249
-.u9
.89
NO. OF HELPERS
1.8
0.2
1.6
ABLE TO CHOOSE ASSIGNMENT
1.0
1.7
-0.7
TANG & TEACHER EXPER
4.8
3.5
1.3
See "Guide for Interpretation of Results" for explanation of table entries.

The analysis of pupil measures failed to display any significant
differences between the FT and NFT samples, although means for the FT
sample were slightly higher in each instance, an outcome that may indicate
that FT had a small effect.
FT parents showed significantly greater involvement in school activi-
ties than NFT parents, a result that indicates that the program did have
some impact on parents. However, no other outcome for either parents or
teachers reached significance.
The classroom process data, however, does indicate that the sponsor's
program is being implemented. The above average score on self-regulatory
and child self-learning factors and the below average score on the pro-
grammed/academic factor are consistent with sponsor goals. Only FT class-
rooms were included in the sample, so contrasts between FT and NFT cannot
be drawn.
The first year effects for the Project FW(b), Cohort I sample are
summarized in Table 18. The results indicate that none of the test score
differences reach significance. A comparison of the net scores (adjusted
outcomes) shown in Tables 17 and 18 gives some evidence of a cumulative
effect in that the second-year differences are more positive than those
of the first year. This interpretation receives further support from
data presented in Table 19, which displays the background properties and
first-year effects for a Cohort II-K sample in Project FW (b). The
baseline variables for the pupils indicate that the four FT and two NFT
classrooms are reasonably well matched on pretests and family character-
istics. Teachers, on the other hand, appear somewhat different in that
NFT teachers tended to have more book resources and freedom to choose
assignments, whereas FT teachers had more classroom helpers and, in
general, higher levels of training and experience.
Analysis of the FT/NFT differences on each outcome measure revealed
that only for parent/child interactions were the differences significant.
More interactions were reported by FT parents, a result that is consistent
with the model's goals, one of which is to encourage parents to participate
directly with their own children inside and outside the classroom. None of
the pupil or teacher measures reached significance. The results for Cohort
II, first-year pupils and those for Cohort I, first-year pupils tend to
favor NFT. This evidence may indicate that the model implemented in
Project FW(b) has an initial disruptive effect. This finding coupled
with some more positive Cohort I results obtained at the end of the
second year suggests that the project effects measured by these outcome
variables are not likely to be immediate or positive. This conclusion
is supported to some extent by the process data for the two separate
104

TABLE 18
PROJECT DATA TABLE--FAR WEST LABORATORY PROJECT B, COHORT I, KINDERGARTEN ENTERING:
ONE-YEAR EFFECTS,
1969-1970
ADJUSTED OUTCOME DATA
CONFIDENCE
BASELINE/CONTROL DATA
OUTCOME DATA
INTERVAL
VARIABLE
FT
NFT
DIFF
VARIABLE
FT
NFT
DIFF
FT
NFT
DIFF
S. E.
LOW
HIGH
CHILD EVALUATION DATA
NO. OF CLASSROOMS
66
0OVERALL ACHIEVEMENT
108.1
111.-9
-3.8
92.6
94.0
-1.4
5.11
-11.4
8.6
QUANT. PRESCORE
23.4
25.6
42.2
COG. PROCESS PRESCORE
5.9
6.5
AFFECT
18.4
17.8
.6
16.8
15.4
1.4
1.16
-1.1
3.7
0I-&
READING PRESCORE
44.1
40.4
3.7
cnLANGUAGE PRESCORE
11..7
12.1
-.4
ATTENDANCE
8.1
8.7
-.6
15.3
18.2
-2.9
3.38
-9.5
3.7
AFFECT PRESCORE
17.4
17.4
0.
AGE (JUNE '71)
85.9
86.5
-.6
WRAT TOTAL
49.4
50.7
-1.3
41.0
42.2
-1.2
2.91
-6.9
4.5
% CLASSROOM MALE
51.4
61
-9.6
% CLASSROOM BLACK
02.6
-2.6
QUANTITATIVE
31.3
31.9
-.6
27.9
26.7
1.2
1.48
-1.7
4.1
% PRESCHOOL (OR NO. MOS.)
46.7
27.1
19.6
% PARENTS W/O HS DIPL.
34.1
26.7
7.4
COGNITIVE PROCESSES
8.2
8.6
-.4
6.8
6.8
0.49
-1.0
1.0
% PARENTS W/SKILLED OCCUP.
46.7
55.4
-8.7
% PARENTS BLACK
00
0READING SKILLS
54.6
57.4
-2.8
44.5
48.1
-3.6
3.49
-10.4
3.2
% PARENTS POVERTY ELIGIBLE
45.5
31.9
13.6
% HEAD HOUSEHOLD EMPLOYED
73.9
88.7
-14.8
LANGUAGE ARTS
13.7
14
-.3
12.5
11.9
.6
.75
-.9
2.1
% HEAD HOUSEHOLD MALE
76.5
81.2
-4.7
See
uuide for Interpretation of Results" for explanation of table entries.

TABLE 19
PROJECT DATA TABLE--FAR WEST LABORATORY PROJECT B, COHORT II, KINDERGARTEN ENTERING:
ONE-YEAR EFFECTS,
1970-1971
lASELINE CONTROL DATA
VARIABLE
FT
NFT
DIFF
OUTCOME DATA
VARIABLE
FT
NFT
DIFF'
FT
ADJUSTED OUTCOME DATACONFIDENCE
INTERVAL
NFT
DIFF
S. E.
LOW
HIGH
PART I
CHILD EVALUATION DATA
PROCESS DATA
NO. OF CLASSROOMS
42
2OVERALL ACHIEVEMENT
116.4
113.7
2.7
127.4
132.5
-5.1
9.20
-23.1
12.9
PROJECT DESCRIPTORS
AVERAGE PDPIIS/CLASSROOM
14.0
14.0
0
QUANT. PRESCORE
24.6
24.3
0.3
AFFECT
18.5
18.6
-0.1
18.7
19.9
-1.2
1.34
-3.8
1.4
WEST NORTH
COG. PROCESS PRESCORE
6.9
7.0
-0.1
REGION
CENTRAL
READING PRESCORE
37.3_
32.4
4.9
ATTENDANCE
7.2
9.0
-1.8
11.6
14.5
-2.9
4.37
-11.5
5.7
LANGUAGE PRESCORE
17.0
17.6
-0.6
DISTANCE TO NEAREST SMSA
WITHIN
AFFECT PRESCORE
17.4
16.0
1.4
WRAT TOTAL
51.1
49.2
1.9
58.7
62.9
-4.2
6.41
-16.8
8.4
AGE (JUNE 'ii)
74.0
75.1
-1.1
SIZE OF NEAREST SMSA
.138,000
% CLASSROOM MALE
55.5
51.9
3.6
QUANTITATIVE
31.6
31.3
0.3
36.6
38.4
-1.8
2.67
-7.0
3.4
% CLASSROOM BLACK
00
0PERCENT NONWHITE
2
% PRESCHOOL (OR NO. MOS.)
4.7
2.5
2.2
COGNITIVE PROCESSES
9.3
9.1
0.2
10.3
10.3
00.58
-1.1
1.1
% PARENTS W/O HS DIPL.
34.7
49.6
-14.9
PROJECT SIZE (PUPILS)
72C
% PARENTS W SKILLED OCCUP.
49.4
55.8
-6.4
READING SKILLS
56.9
53.6
2.3
62.6
65.8
-3.2
5.96
-14.9
8.5
% PARENTS BLACK
00
NO. PUPILS/PAC MEMBER
18.9
% PARENTS POVERTY ELIGIBLE
27.7
10.5
17.2
LANGUAGE ARTS
19.6
19.6
018.8
19.1
-0.3
1.36
-3.0
2.4
% HEAD HOUSEHOLD EMPLOYED
81.8
84.8
-3.0
FT PER-PUPIL EXPENDITURE
606
% HEAD HOUSEHOLD MALE
78.5
86.0
-7.5
PART II
PARENT EVALUATION DATA
CLASSROOM OBSERVATION
NO. CLASSROOM GROUPS
42
2PARENT-CHILD
FACTOR SCORES
AV. PARENTS /CIASSRM GRP
14.5
16.0
-1.5
INTERACT
-.003
-.624
.621
.534
-.263
.797
.364
.08
1.51
% W/O HIGH SCHOOL DIPLOMA
34.7
49.6
-14.9
FACTOR NAME
FT
NFT
% W SKILLED OCCUP.
49.4
55.8
-6.4
PARENT-SCHOOL
POS EVAL OF CHILD LRNG
82.0
58.1
23.9
INVOLVE
.278
.021
.257
.248
-.470
.718
.457
-.18
1.61
SELF REGULATORY
3.10
.53
% BLACK
00
0CHILD-INITIATED
% REPORTING USE OF PRESCHOOL
37.5
37.3
0.2
CHILD ACADEMIC
INTERACTIONS
-.40
-.72
% POVERTY ELIGIBLE
27.7
10.5
17.2
EXPECT
.006
-.519
.527
-.210
-.329
.119
.343
-.55
.79
% HEAD HOUSEHOLD EMPLOYED
81.8
84.8
-3.0
% HEAD HOUSEHOLD MALE
78.5
86.0
-7.5
SENSE OF CONTROL
.634
.268
.366
.967
.556
.411
.487
-.54
1.37
PROGRAMMED ACADEMIC
.-.10
-1.26
PART III
TEACHER EVALUATION DATA
EXPRESSIVE
.02
-.69
NO. OF CLASSROOMS
42
2PARENT-EDUCATOR
CHILD SELF-LEARNING
..
.-.27
.24
JOB SATISF. RATING
1.8
1.3
0.5
IMAGE
0.75
0.43
0.32
0.49
0.85
-0.36
0.463
-1.27
.55
BOOK RESOURCE SCALE
2.0
3.0
-1.0
RACE (BLACK/NONBLACK)
1.0
1.0
0PROFESSION. ACCEPT
IDENT. W. COMMUNITY -
0.5
00.5
OF IMTIOD
2.00
2.00
02.33
1.25
1.08
1.472
-1.81
3.97
NO. OF HELPERS
2.0
02.0
ABLE TO CHOOSE ASSIGNMENT
1.0
4.0
-3.0
TRNG St TEACHER Ek.PER
7.7
5.0
2.7
"Guide for Interpretation of Results" for explanation of table entries.

samples, which interestingly show the same general pattern of the factor
scores. However, Cohort II is much higher on the self-regulatory factor
than Cohort I, while Cohort I is much higher on the self-learning factor.
Both factors are representative of Far West's goals.
Project FW(a)
Sponsor FW evaluation data were also collected and analyzed for Cohort
I and Cohort II in Project FW(a). Project FW(a) is a relatively large
project, located within a very large urban area (3 million people) in
the Pacific region. The anticipated per pupil expenditure was $653, and
there were slightly more than 21 pupils per PAC member in an average
classroom.
Table 20 summarizes the results of the analysis. The Cohort I sample
for Project FW(a) consisted of nine FT and four NFT classes. NFT classes
were fairly well matched to FT classes on baseline test scores but were
clearly different in e,.hnic composition, FT classrooms being predominantly
Black and NFT classrooms predominantly non-Black. However, except forthis difference in racial make-up and the usual greater preschool participa-
tion of FT pupils, the two samples appear quite c8mparable. Teacher
analyses were not performed because of insufficient data.
The only pupil variable that differed significantly between the two
groups was attendance which was higher for the NFT sample. The only
parent variable that differed significantly was sense of control; the NFT
parents reported a greater sense of control than FT parents (the 95 percent
confidence interval favored NFT by .34 to 1.190 scale units). The classroom
process characteristics summarized in Table! 20 suggest a pattern somewhat
different from the patterns of other samples of this model. These class-
rooms appear not only quite high on the self-regulatory factor, which is
characteristic of the model, but also above average on the programmed/
academic factor, The programmed/academic factor represents an educational
format not usually associated with this sponsor's goals.
The remaining analysis of Project FW(a) is of Cohort II.first-year
data, which are summarized in Table 21. The baseline values for thissample show that six FT and two NFT classrooms are well matched. However,
a problem with the preschool data from the pupil rosters precluded inclusion
of preschool experience for this sample. This omission accounts for the
discrepancy between the average preschool values reported for the pupilsand those reported by the parents. Again, teacher data were insufficient
to enable analysis for this sample.
107
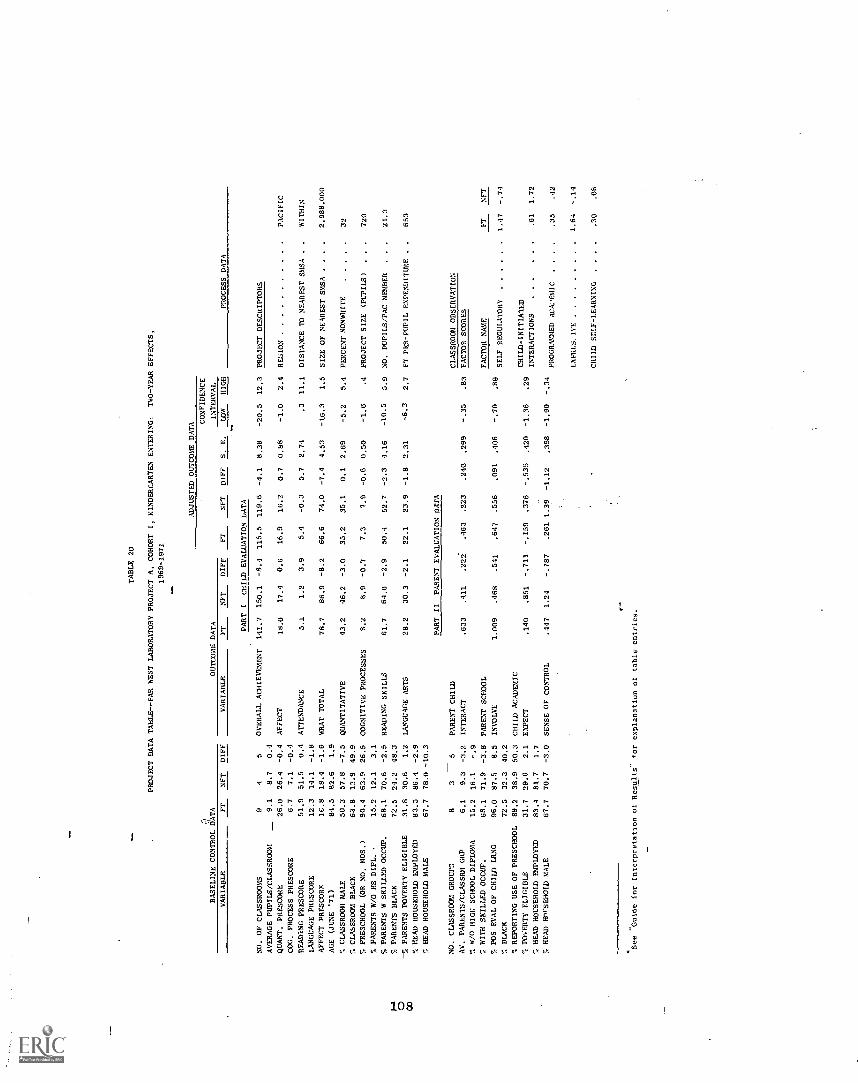
TABLE 20
PROJECT DATA TABLE - -FAR WEST LABORATORY PROJECT A, COHORT I, KINDERGARTEN ENTERING:
TWO-YEAR EFFECTS,
1969-1971
ADJUSTED OUTCOME DATA CONFIDENCE
BASELINE CONTROL DATA
OUTCOME DATA
INTERVAL
VARIABLE
FT
NIT
DIFF
VARIABLE
FT
NFT
DIFF
FT
NFT
DIFF
S. E.
LOW
HIGH
PROCESS DATA
PART I
CHILD EVALUATION DATA
.1.
NO. OF CLASSROOMS
94
5OVERALL ACHIEVEMENT
141.7
150.1
-8.4
115.5
119.6
-4.1
8.38
-20.5
12.3
PROJECT DESCRIPTORS
AVERAGE PUPILS /CLASSROOM
9.1
8.7
0.4
QUANT. PRESCORE
26.0
26.4
-0.4
AFFECT
18.0
17.4
0.6
16.9
16.2
0.7
0.88
-1.0
2.4
RESION
PACIFIC
COG. PROCESS PRESCORE
6.7
7.1
-0.4
READING PRESCORE
51.9
51.5
0.4
ATTENDANCE
5.1
1.2
3.9
5.4
-0.3
5.7
2,74
.3
11.1
DISTANCE TO NEAREST SMSA .
.WITHIN
LANGUAGE PRESCORE
12.3
14.1
-1.8
AFFECT PRESCORE
16.8
18.4
-1.6
%RAT TOTAL
78.7
86.9
-8.2
66.6
7.1.0
-7.4
4.53
-16.3
1.5
SIZE OF NEAREST SMSA
..
..
2,988,000
AGE (JUNE '71)
84.5
82.6
1.9
% CLASSROOM MALE
50.3
57.8
-7.5
QUANTITATIVE
43.2
46.2
-3.0
35.2
35.1
0.1
2.69
-5.2
5.4
PERCENT NONWHITE
32
7E CLASSROOM BLACK
63.8
13.9
49.9
7, PRESCHOOL (OR NO. MOS.)
90.4
63.9
26.5
COGNITIVE PROCESSES
8.2
8.9
-0.7
7.3
7.9
-0.6
0.50
-1.6
.4
PROJECT SIZE (PUPILS)
..
.720
PARENTS W/0 HS DIPL.
15.2
12.1
3.1
PARENTS W SKILLED OCCUP.
68.1
70.6
-2.5
READING SKILLS
61.7
64.6
-2.9
50.4
52.7
-2.3
4.16
-10.5
5.9
NO. PUPILS/PAC MEMBER
..
.21.3
1.4
a PARENTS BLACK
72.5
24.2
48.3
CD
-7, PARENTS POVERTY ELIGIBLE
31.6
30.6
1.2
LANGUAGE ARTS
28.2
30.3
-2.1
22.1
23.9
-1.8
2.31
-6.3
2.7
FT PER-PUPIL EXPENDITURE
653
CO
HEAD HOUSEHOLD EMPLOYED
83.3
86.4
-2.9
..
fi HEAD HOUSEHOLD MALE
67.7
78.0
-10.3
PART
II
PARENT EVALUATION DATA
NO. CLASSROOM GROUT::
83
5PARENT CHILD
CLASSROOM OBSERVATION
AV. PARENTS/CLASSRM GRP
6.1
9.3
-3.2
INTERACT
.633
,411
.222
.463
.223
.240
.299
-.35
.83
FACTOR SCORES
W/0 RIG!: SCHOOL DIPLOMA
15.2
16.1
-.9
WITH SKILLED OCCUP.
68.1
71.9
-3.8
PARENT SCHOOL
FACTOR NAME.
FT
NFT
POS EVAL OF CHILD LRNG
96.0
87.5
8.5
INVOLVE
1.009
.468
.541
.647
.556
-.70
BLACK
72.5
32.3
40.2
.091
.406
.89
SELF REGULATORY
1 47
-.74
REPORTING USE OF PRESCHOOL
89.2
38.9
50.3
CHILD ACADEMIC
q POVERTY ELIGIBLE
31.7
29.6
2.1
EXPECT
.140
.851
-.711
-.159
.376
-.535
-1.36
CHILD - INITIALED
7, HEAD HOUSEHOLD EMPLOYED
83.4
81.7
1.7
.420
.29
INTERACTIONS
..
..
..61
1.72
HEAD HOUSEHOLD MALE
67.7
70.7
-3.0
SENSE OF CONTROL
.447
1.24
-.787
.261 1.39
-1.12
-1.90
-.34
.398
PROGRAMMED ACA,TMIC
..
..
.35
.42
EXPRES.:IVE
1 64
-.14
CHILD SELF-LEARNING
..
..
.30
.08
*See "Guide for Interpretation of Results" for explanation of table entries.
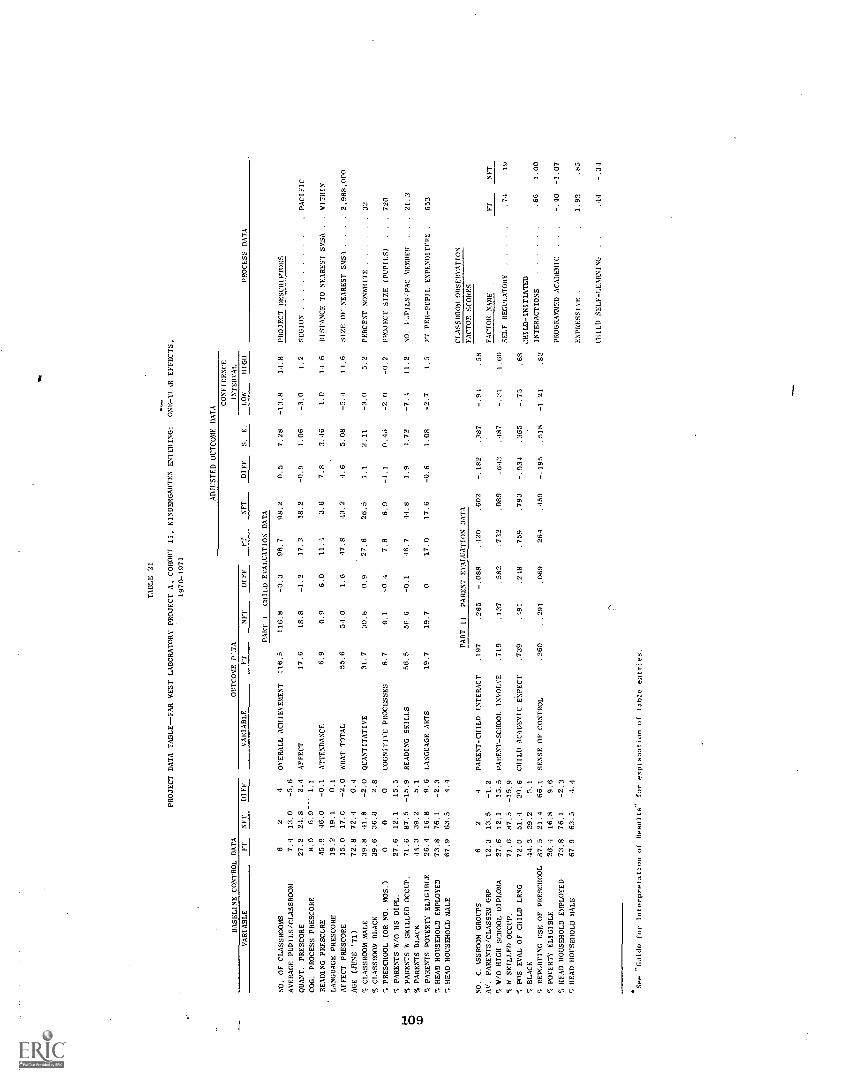
TABLE 21
---
PROJECT DATA TABLE--FAR WEST LABORATORY PROJECT A, COHORT II, KINDERGARTEN ENTERING:
ONE-ITAR EFFECTS,
1970-1971
ADJUSTED OUTCOME DATA
CONFIDENCE
BASELINE CONTROL DATA
OUTCOME 0.,TA
INTERVAL.
VARIABLE
FT
NFT
RIFF
VARIABLE
FT
NFT
DIFF
FT
NFT
DIFF
S.
E.
LOW
HIGH
PROCESS DATA
PART I
CHILD EVALUATION DATA
NO, OF CLASSROOMS
62
4OVERALL ACHIEVEMENT
116.5
116.8
-0.3
98.7
98.2
0.5
7.28
-13.8
14.8
PROJECT DESCRIPTORS
AVERAGE PUPILS/CLASSROOM
7.4
13.0
-5,6
QUANT. PRESCORE
27.2
24.8
2,4
AFFECT
17.6
18.8
-1.2
17.3
18.2
-0.9
1.06
-3.0
1.2
REGION
PACIFIC
COG. PROCESS PRESCORE
8.0
6.9- 1.1
READING PRESCORE
45.9
46.0
-0.1
ATTENDANCE
6.9
0.9
6.0
11.4
3.6
7.8
3.46
1.0
14.6
DISTANCE TO NEAREST SMSA
..WITHIN
LANGUAGE PRESCORE
19.2
19.1
0.1
AFFECT PRESCORE
15.0
17.0
-2,0
WRAT TOTAL
55.6
5.1.0
1.6
47.8
43.2
1.6
5.08
11.6
SIZE OF NEAREST SMSA
2,988,000
AGE (JUNE '71)
72.8
72.4
0.4
% CLASSROOM MALE
39.8
41.8
-2.0
QUANTITATIVE
31.7
30.8
0.9
27.6
26.5
1.1
2.11
-3.0
5.2
PERCENT NONWHITE
32
% CLASSROOM BLACK
39.6
36.0
2.8
% PRESCHOOL (OR NO. MOS.)
00
0COGNITIVE PROCESSES
8.7
9.1
7.8
8.9
-1.1
0.46
-2.0
-0.2
PROJECT SIZE (PUPILS)
..720
% PARENTS W/0 HS DIPL.
27.6
12.1
15.5
% PARENTS W SKILLED OCCUP.
71.6
87.5
-15.9
READING SKILLS
56.5
56.6
-0.1
46.7
44.8
1.9
4.72
-7.1
11.2
NO.
PriPILS/PAC MEMBER
..
21.3
% PARENTS BLACK
44.3
39.2
5.1
% PARENTS POVERTY ELIGIBLE
26.4
16.8
9.6
LANGUAGE ARTS
19.7
19.7
017.0
17.6
-0.6
1.08
1.5
FT PER-PUPIL EXPENDITURE
.653
% HEAD HOUSEHOLD EMPLOYED
73.8
76.1
-2.3
HEAD HOUSEHOLD MALE
67.9
63.5
4.4
PART II
PARENT EVALUATION DATA
CLASSROOM OBSERVATION
FACTOR SCORES
.197
.285
-.088
.420
.602
NO.
C. ISSROOM GROUPS
62
4PARENT - CHILD INTERACT
-.182
.387
.58
Al'. PARENTSICLASSRM GRP
12.3
13.5
-1.2
FACTOR NAME
FT
NFT
% 8/0 HIGH SCHOOL DIPLOMA
27.6
12.1
15.5
PARENT-SCHOOL INVOLVE
.719
.137
.582
.732
.089
.643
.187
-.31
1.60
9 W SKILLED OCCUP.
72.6
87.5
-15.9
SELF REGULATORY
.74
.19
% POS EVAL OF CHILD LRNG
72.0
51.4
20.6
CHILD ACADEMIC EXPECT
.739
.491
.248
.759
.793
-.034
.365
-.75
.68
% BLACK
44.3
39.2
5.1
CHILD-INITIATED
% REPORTING USE OF PRESCHOOL
87.5
21.4
66.1
SENSE OF CONTROL
.360
..291
.069
.264
.459
-.195
.518
-1.21
.82
INTERACTIONS
.66
1.00
% POVERTY ELIGIBLE
26.4
16.8
9.6
% HEAD HOUSEHOLD EMPLOYED
73.8
76.1
-2.3
PROGRAMMED ACADEMIC
-.40
-1.07
% HEAD HOUSEHOLD MALE
67.9
63.3
4.4
EXPRESSIVE
1.92
.85
CHILD SELF-LEARNING
'See "Guide for Interpretation of Results" for explanation of table entries.
First-year impact results show that the NFT sample significantly
exceeds the FT classrooms on the cognitive measure and on daily attendance.
No other measures, either pupil or parent, show significant FT/NFT differ-
ences.
The process scores for this sample indicate a pattern consistent with
the sponsor's model. Specifically, the FT classrooms are above average
Ion the self-regulatory factor and below average on the programmed/academic
factor. Like Cohort I, this samrle is especially high on the expressive
factor. The explanation oz the child outcomes does not appear to lie in
la lack of implementation of t''.e model.
Summary
The salient features of the Sponsor FW model can be outlined as
follows:
Focus and Objectives--emphasizes long range program objecti.ves
Child
Cognitive
Develop problem solving ability
Affective
Develop self-direction
Increase ability to take risks, learn from mistakes, and fee]
safe in expressing feelings
Develop a healthy self-concept
Parent
Develop parent's ability to teach his children
Curricular Approach
Teacher's role that of facilitator
Intrinsic reinforcement from activities
Individual child free to choose among self-rewarding activities
within structured environment
Wide variety of activities available
Type of Parent Involvement
Heavy emphasis on training parents for employment in projects
as teacher assistants
Two separate impact analyses were conducted at the sponsor level.
The first analysis was conducted on the Cohort I, second-year data, the
second on Cohort II first-year data. These results are summarized in
Tables 22 and 23, respectively. Th results summarized in these tables
indicate that interim evidence at the sponsor level is inconclusive
although not particularly favorabl-. In particular, no pupil level re-
sults are indicated in either the Cohort I or Cohort II analyses. How-
ever, the model shows significant impacts on parents in each case. In
Cohort I, the parent school interaction variable is significantly higher
for FT parents, an in Cohort II, the parent/child interaction variable
is significantly higher in the FT group. Finally, although project level
analyses were not possible for teacher data, aggregation to sponsor level
did enable an analysis of the Cohort I data. However, the results which
are displayed on Table 22, show that the effects failed to reach signifi-
cance.
In total, the interim statistical evidence on the effects of the Far
West Laboratory's program is not particularly favorable. It may be that
the FT battery, which measures more or less traditional academic be-
haviors, is not particularly well suited to many of the objectives
stressed by this sponsor's model, particularly at the kindergarten and
first grade level. Nevertheless, given the emphasis this model places
on parental involvement, it is difficult to understand the lack of con-
sistent evidence of positive impact on the parental outcome measures.
Quite likely a program of this complexity (its primary focus is that of
changing process) require, more time to reveal dts true impact.
111
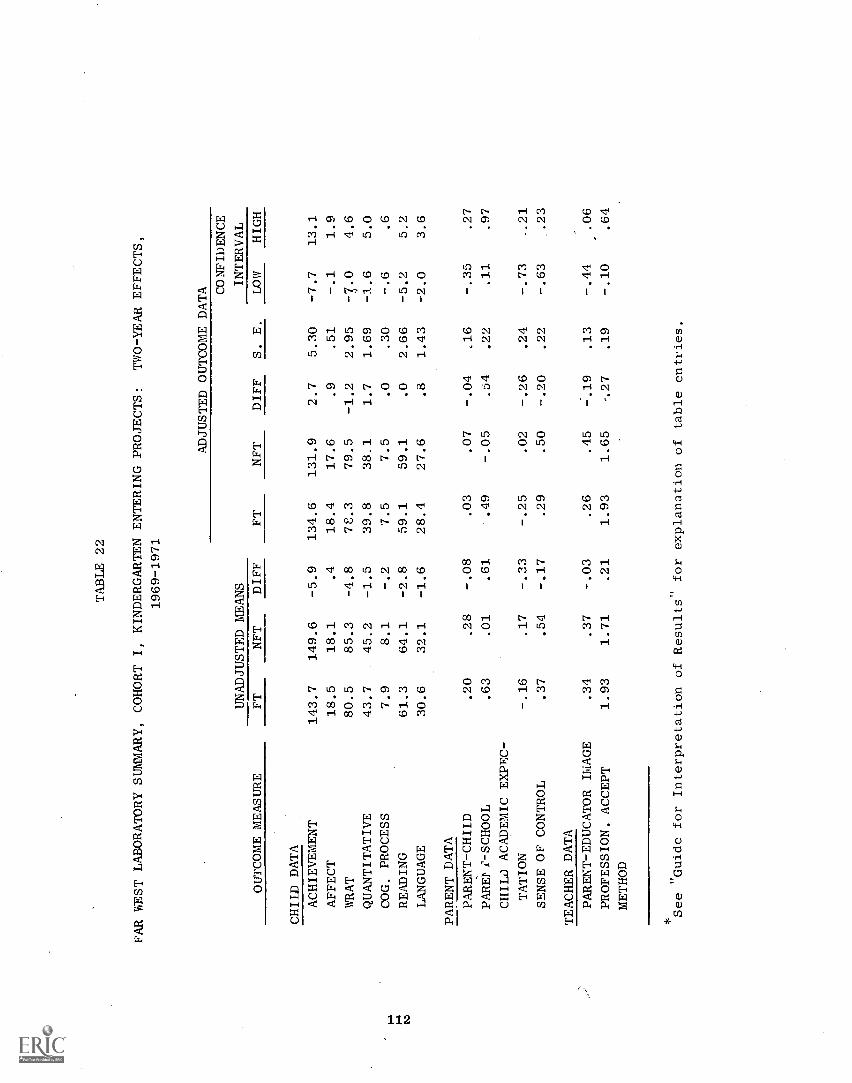
TABLE 22
FAR WEST LABORATORY SUMMARY, COHORT I, KINDERGARTEN ENTERING PROJECTS:
TWO-YEAR EFFECTS,
1969-1971
ADJUSTED OUTCOME DATA
OUTCOME MEASURE
UNADJUSTED MEANS
FT
NFT
DIFF
S. E.
CONFIDENCE
INTERVAL
FT
NFT
DIFF
LOW
HIGH
CHILD DATA
ACHIEVEMENT
143.7
149.6
-5.9
134.6
131.9
2.7
5.30
-7.7
13.1
AFFECT
18.5
18.1
.4
18.4
17.6
.9
.51
-.1
1.9
WRAT
80.5
85.3
-4.8
7E.3
79.5
-1.2
2.95
-7.0
4.6
QUANTITATIVE
43.7
45.2
-1.5
39.8
38.1
1.7
1.69
-1.6
5.0
iA
COG. PROCESS
7.9
8.1
-.2
7.5
7.5
.0
.30
-.6
.6
i-A
ts)
READING
61.3
64.1
-2.8
59.1
59.1
.0
2.66
-5.2
5.2
LANGUAGE
30.6
32.1
-1.6
28.4
27.6
.8
1.43
-2.0
3.6
PARENT DATA
PARENT-CHILD
.20
.28
-.08
.03
.07
-.04
,16
-.35
.27
PAREP.2-SCHOOL
.63
.01
.61
.49
-.05
.64
.22
.11
.97
CHILD ACADEMIC EXPEC-
TATION
-.16
.17
-.33
-.25
.02
-.26
.24
-.73
_21
SENSE OF CONTROL
.37
.54
-.17
.29
.50
-.20
.22
-.63
.23
TEACHER DATA
PARENT-EDUCATOR IMAGE
.34
.37
-.03
.26
.45
-.19
.13
-.44
..06
PROFESSION. ACCEPT
1.93
1.71
.21
1.93
1.65
-.27
.19
-.10
.64
METHOD
See "Guide for Interpretation of Results" for explanation of table entries.
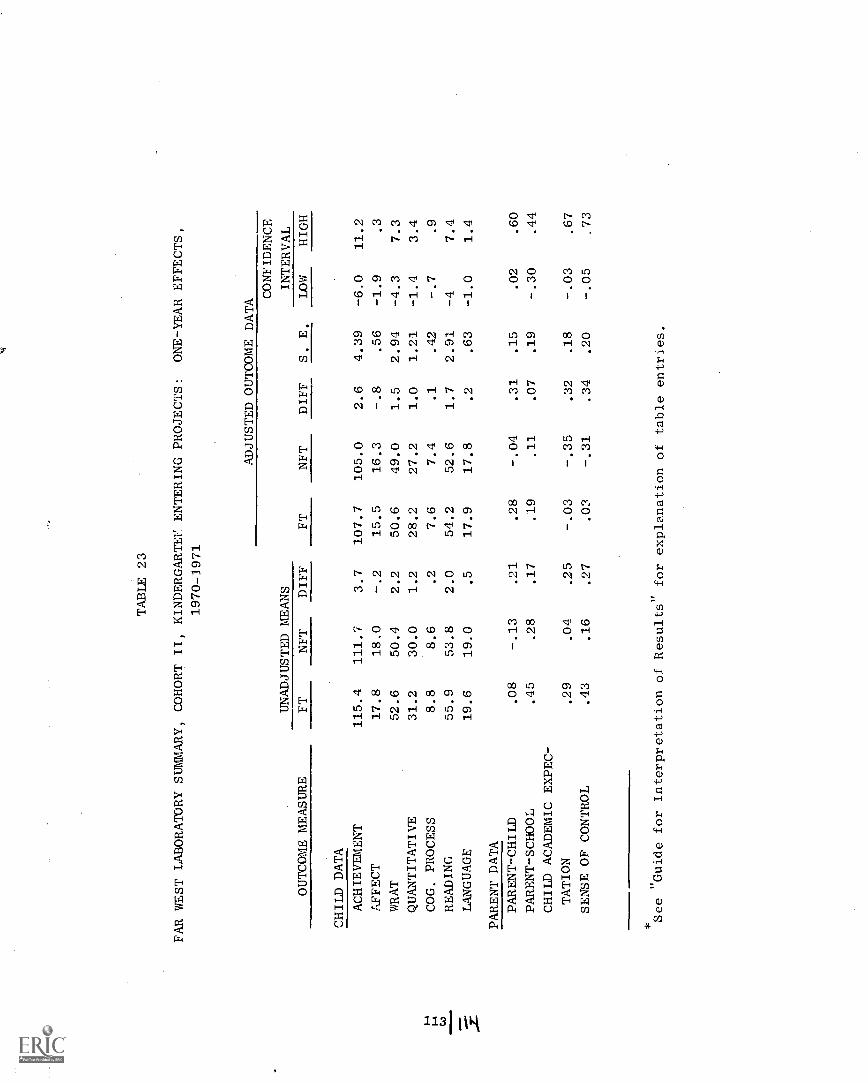
TABLE 23
FAR WEST LABORATORY SUMMARY, COHORT II, KINDERGARTEY ENTERING PROJECTS:
ONE-YEAR EFFECTS,
1970-1971
OUTCOME MEASURE
UNADJUSTED MEANS
ADJUSTED OUTCOME DATA
FT
NFT
DIFF
S. E.
CONFIDENCE
INTERVAL
FT
NFT
DIFF
LOW
HIGH
CHILD DATA
ACHIEVEMENT
115.4
111.7
3.7
107.7
105.0
2.6
4.39
-6.0
11.2
AFFECT
17.8
18,0
-.2
15.5
16.3
-.8
.56
-1.9
.3
WRAT
52.6
50.4
2.2
50.6
49.0
1.5
2.94
-4.3
7.3
QUANTITATIVE
31.2
30.0
1.2
28.2
27.2
1.0
1.21
-1.4
3.4
'-'
1-/
COG. PROCESS
8.8
8.6
.2
7.6
7.4
.1
.42
-.7
.9
wREADING
55.9
53.8
2.0
54.2
52.6
1.7
2.91
-4
7.4
--
.11E
LANGUAGE
19.6
19.0
.5
17.9
17.8
.2
.63
-1.0
1.4
PARENT DATA
PARENT-CHILD
.08
-.13
.21
.28
-.04
.31
.15
.02
.60
PARENT-SCHOOL
.45
.28
.17
.19
.11
.07
.19
-.30
.44
CHILD ACADEMIC EXPEC-
TATION
.29
.04
.25
-.03
-.35
.32
.18
-.03
.67
SENSE OF CONTROL
.43
.16
.27
.03
-.31
.34
.20
-.05
.73
See "Guide for Interpretation of Results" for explanation of table entries.
TUCSON EARLY EDUCATION MODEL (TEEM)
Univesityof Arizona
Sponsor's Intended Approach
Participation in contemporary society requires skills and abilities
missing in the behavioral repertoires of many individuals because theirbackground does not provide an adequate foundation. The TEEM model at-
tempts to solve this problem by providing children with educational ex-
periences appropriate tc developing such skill-S- and abilities--beginning
with the behavior characteristics and level:oi development with which the
child enters school and working from there. The model calls on teachersto individualize their teaching and emphasizes persistent adult-child in-
teraction on a one-to-one basis. To meet the needs and learning rates
of individual children, the model provides a great variety of behavioral
options, including both self-selected and structured activities.
The curriculum for the model focuses on four general areas of develop-
ment: language competence, development of an intellectual base, develop-
ment of a motivational base, and societal arts and skills. An intellectual
base includes skills assumed to be necessary to the process of learning
(e.g., ability to attend, recall, organize behavior toward goals, and
evaluate alternatives). A motivational base includes attitudes and be-
havior related to productive involvement, such as liking school and learn-
ing, task persistence, and expectation of success. Societal arts andskill acquisition include reading, writing, and math skills, combined
with social skills of cooperation, planning, and the like.
In this model a skill is always taught in a functional setting, and
concepts are illustrated by a variety of examples across content areas
both within and outside the classroom. Field trips, walks, and visits
to the children's homes help the child generalize new skills to his ownenvironment. The technique of simultaneously attending to developing
language, intellectual, motivational, and societal skills in a meaning-
ful setting is defined in the model as "orchestration."
The TEEM classroom is organized into behavioral settings and interestcenters for small groups to encourage interactions among the child, his
environment, and others. Pupil groups are purposely heterogeneous so that
children of different ability levels will learn from peer models and workindependently with available materials. Imitation, a formal part of
115
classroom practice, is viewed as an especially important process in
language acquisition. Social reinforcement techniques, such as praise,
attention, and affection, are liberally applied, and materials are chosen
and arranged for their reinforcing value. Every effort is made to ensure
that the child will come to regard school as significant and rewarding.
In the open-ended context of this model, lessons and learning ex-
perience are given definite structure and direction through careful plan-
ning by the staff. Adults working in the classroom are trained to use
the experiential background of pupils to further instructional objectives,
and the home and the neighborhood are treated as instructional resources.
The delivery system for the TEEM model includes programs and services
developed to provide continuous input, demonstration, and evaluation to
the community, the classroom instructional staff, and to parent liaisonpersonnel. Field representatives visit sites to provide guidance and
communicate questions and problems back to the TEEM center. School psy-chologists serve as consultants to teach project staff to apply psycho-
logical techniques in defining and solving educational problems. Evalua-
tion services include a new program that clearly sets out objectives of
the program and ways for the community to evaluate how well they are met.
The model establishes positive and frequent contact between schools
and parents to acquaint parents with the instructional program and to in-
fluence them to participate in school-related activities, work with the
Policy Advisory Committee, serve as classroom volunteers, and train for
new careers. An attempt is made to provide parents desiring to have a
more direct influence on educational policy with increased knowledge
about the school system and the political influences that play a role
in policy making.
Individual Project Results
Seven samples from four different projects sponsored by the University
of Arizona (UA) were included in the analysis of interim effects. The
distribution of these evaluation samples in terms of cohort, outcome, and
project is as follows:
Cohort First-Year Effects Second-Year Effects
IK (project d) (projects a & d)
IEF (project c) (projects b & c)
IIEF (project c)
116
Project UA(d)
Table 24 presents the analysis data and results for Project UA(d).
This project is located in a non-urban area in the mid-Atlantic region.Nine FT and five NFT classrooms were included in the analyses. These
FT-NFT classrooms were quite dissimilar; FT classes had a more even
distribution of boys and girls, a higher proportion of Blacks, a largerproportion of pupils with preschool experience, more poverty eligible
families, and fewer employed parents and heads of households than NFT
classes. Moreover, the FT classroom averages were below the NFT class-
room averages on all cognitive baseline tests. The baseline data on
parents differs similarly.
Covariable data for the teacher analyses (nine FT classes, threeNFT), show that FT teachers reported more book resources, more helpers,
and more years of experience +ban the NFT teachers. NFT teachers, how-
ever, appeared more closely tied with the school community.
Analysis of covariance on outcomes at the child level failed to
reveal any statistically significant effects. Although the adjustments
for covariable bias were pronounced (Compare unadjusted and adjusted
results), all confidence intervals cross zero (change signs), indicat-
ing nonsignificance. This project showed the least progress of any on
language and reading measures, both on unadjusted and adjusted prepost
comparisons.
Of the four outcome variables at the parent level, only the parent/
school interaction measure shows significance. The 95 percent confidence
interval for the mean difference (adjusted) between FT and NFT on the
parent/school interaction scale is between .05 and 1.3 units in favor
of FT parents. This result is interesting since pareiltal involvement was
below average in this project--one PAC member per 20.4 pupils.
Teacher results failed to reach significance. Since the project
was not included in the classroom observation sample, little beyond the
differences noted on input measures can be said at the teacher level.
The impact of FT in this project appears negligible at the end of the
second year of implementation.
This project was among the CI subset for which first-year impact
data were also available and analyzed. The results of this analysis
117
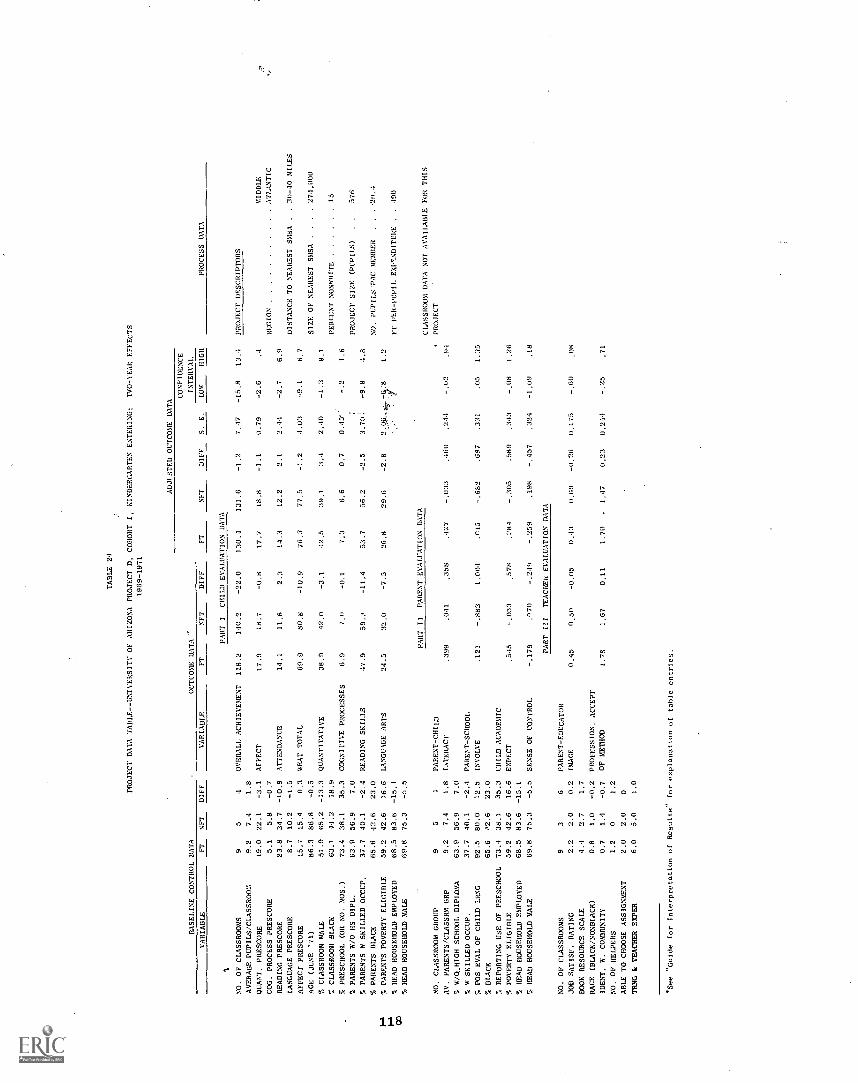
BASELINE CONTROL DATA
TABLE 2.1
PROJECT DATA TABLE--UNIVERSITV OF ARIZONA PROJECT D, COHORT I, KINDERGARTEN ENTERING:
TWO -YEAR EFFECTS
1969-1971
OUTCOME DATA '-
ADJI STED OUTCOME DATA
CONFIDENCE
INTERVAL
VARIABLE
FT
NFT
95
RIFF
VARIABLE
FT
NFT
DIFF
FT
NFT
01FF
-1.2
S. E.
LOW
HIGH
13.4
PROCESS DATA
ti
NO. OF CLASSROOMS
4OVERALL ACHIEVEMENT
PART
ICHILD EVALUATION DATA
7.47
-15.8
PROJECT DESCRIPTORS
118.2
140.2
-22.0
130.4
131.6
AVERAGE PUPILS/CLASSROOM
9.2
7.
1.8
QUANT. PRESCORE
19.0
22.1
-3.1
AFFECT
17.9
18.7
-0.8
17.7
18.8
-1.1
0.79
-2.6
.4
MIDDLE
COG. PROCESS PRESCORE
5.1
5.8
-0.7
REGION
ATLANTIC
READING PRESCORE
23.8
34,7
-10,9
ATTENDANCE
14,1
11,8
2.3
14.3
12.2
2.1
2.44
-2.7
6.9
LANGUAGE PRESCORE
8.7
10.2
-1.5
DISTANCE TO NEAREST SMSA
.30-40 MILES
AFFECT PRESCORE
15.7
15.4
0.3
WHAT TOTAL
69.9
80.8
-10,9
76.3
77.5
1.03
-9.1
6.7
AGE (JUNE '71)
86.3
86.8
-0.5
SIZE OF NEAREST SMSA
..
.274,000
% CLASSROOM MALE
51.9
65.2
-13.3
QUANTITATIVE
38.9
42,0
-3.1
42,5
39,1
3.4
2.0
-1.3
8.1
% CLASSROOM BLACK
63.1
44.2
18.9
PERCENT NONWHITE
15
% PRESCHOOL (OR NO. MOS.)
73.
38.1
35.3
COGNITIVE PROCESSES
6.9
7,11
-0.1
7.3
6.6
0,7
0.45
1.6
% PARENTS W/O HS DIPL.
63.9
56.9
7.0
PROJECT SIZE (PUPILS)
576
% PARENTS W SKILLED OCCUP.
37.7
40.1
-2.4
READING SKILLS
7.9
59.3
-11.4
53.7
56.2
-2.5
3.7();
-9.8
.8
% PARENTS BLACK
65.6
42.6
23.0
NO. PUPILS PAC MEMBER
20.4
% PARENTS POVERTY ELIGIBLE
59.2
42.6
16.6
LINGU\GE ARTS
24.5
32.0
-7.5
26,8
29.6
-2.8
81.2
% HEAD HOUSEHOLD EMPLOYED
68.5
83.6
-15.1
FT PER-PUPIL EXPENDITURE
.490
% HEAD HOUSEHOLD MALE
69.8
75.3
-5.5
PART
Il
PARENT EVALUATION DATA
CLASSROOM DATA NOT AVAILABLE FOR THIS
NO. CLASSROOM GROUP
95
4PARENT-CHILD
PROJECT
AV, PARENTS/CLASSRM GRP
9.2
7.4
1,8
INTERACT
.399
.0.11
,358
,427
-.033
.460
.244
-,02
.94
% W/Q_HIGH SCHOOL DIPLOMA
63.9
56.9
7.0
% W SKILLED OCCUP.
37.7
40.1
PARENT-SCHOOL
% POS EVAL OF CHILD LRNG
92.5
80.0
12.5
INVOLVE
.121
-.883
1.004
.P15
-,682
.697
.331
.05
1.35
% BLACK
65.6
23.0
S REPORTING USE OF PRESCHOOL
73.4
38.1
35.3
CHILD ACADEMIC
% POVERTY ELIGIBLE
59.2 2.6
16.6
EXPECT
.545
-,033
,578
.28.1
-,305
.589
,343
-.08
1.26
% HEAD HOUSEHOLD EMPLOYED
68.5
83.6
-15.1
% HEAD HOUSEHOLD MALE
69.8
75.3
-5.5
SENSE OF CONTROL
-.179
.070
-.246
-.259
.198
-.457
.324
-1,09
.18
PART
III
TEACHER EVALUATION DATA
NO. OF CLASSROOMS
93
6PARENT-EDUCATOR
JOB SATISF. RATING
2.2
2.0
0.2
IMAGE
0.5
0,50
-0.05
0.43
0.69
-0.26
0.175
-.60
.08
BOOK RESOURCE SCALE
4.4
2.7
1,7
RACE (BLACK/NONBLACK)
0.8
1.0
-0.2
PROFESSION. ACCEPT
WENT, W. COMMUNITY
0.7
1,4
-0.7
OF METHOD
1.79
1.67
0,11
1.70
-1,47
0.23
0.244
-.25
.71
NO. OF HELPERS
1.2
01.2
ABLE TO CHOOSE ASSIGNMENT
2.0
2.0
0
TANG & TEACHER EXPER
6.0
5.0
1.0
*See "Guide for Interpretation
of Results"
for explanation of table
entries.
are summarized in Table 25. These results show that none of the pupil
outcomes reached significance. However, a decline between first-year
and second-year results is evident. Whereas FT students showed a con-
sistent, though nonsignificant, advantage at the end of the first year,
the opposite was true at the end of the second year. This trend suggests
that the program is not having the desired impact on pupil performance.
Project UA(a)
The evaluation data for project UA(a) also a Cohort I-K project,
are summarized in Table 26. This project is located in a large city
(population 1.5 million) in the south Atlantic region. The project is
predominantly black, made up of underemployed, very poor families with
few years of formal education. The background characteristics of the
five FT and the seven NFT classrooms are highly comparable. Baseline
test averages of the two groups were nearly identical and, except that
more of the FT pupils had had preschool experience, the groups appear
quite similar on all child variables.
Parents and teachers seem reasonably well matched on most variables.
One exception is that a higher proportion of FT parents favorably evaluatedtheir child's academic progress. FT teachers reported having more books
and more classroom helpers, more freedom to choose teaching assignment,
and more teaching experience than NFT teachers.
Outcome analyses for pupil measures fail to reveal significant pro-
gram impacts. Moreover, the relative differences in the pretest and post-
test scores, both adjusted and unadjusted, are nearly identical on every
outcome measure. Thus, there is virtually no evidence of differential
effect due to the FT program. Similarly, analysis of pari'nt variables
failed to display any significant FT/NFT differences, though all measured
differences favored the FT group.
The one significant outcome for this project was the impact of the
program on teacher approval of classroom procedures similar to those used
in the FT classrooms. FT teachers showed more approval than IsTeT teachersat the 95 percent confidence level. Adequate interpretation of this
result would require detailed process descriptions which are unavailable
since classroom observations were not made in this project.
119
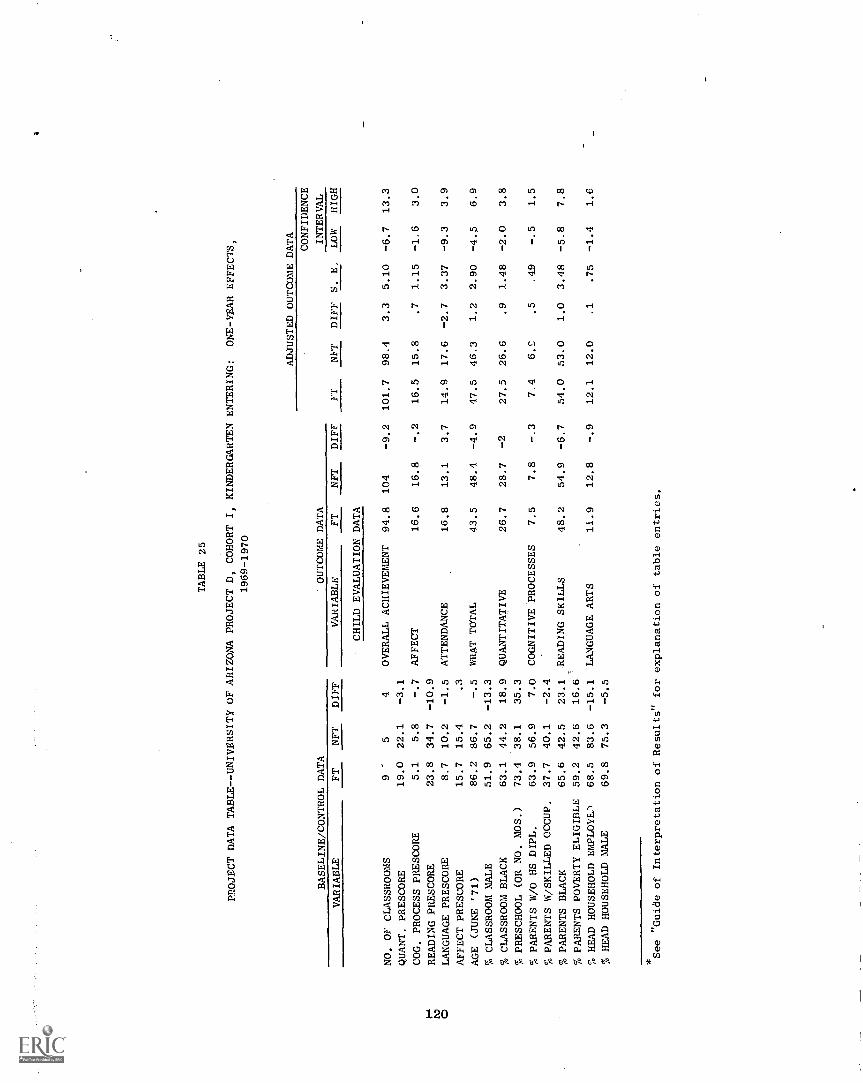
TABLE 25
PROJECT DATA TABLE -- UNIVERSITY OF ARIZONA PROJECT D, COHORT I, KINDERGARTEN ENTERING:
ONE-YEAR EFFECTS,
1969-1970
BASELINE/CONTROL DATA
OUTCOME DATA
ADJUSTED OUTCOME DATA
CONFIDENCE
INTERVAL
VARIABLE
FT
NFT
DIFF
VARIABLE
FT
NFT
DIFF
FT
NFT
DIFF
S. E,
LOW
HIGH
CHILD EVALUATION DATA
NO. OF CLASSROOMS
9 -
54
OVERALL ACHIEVEMENT
94.8
104
-9.2
101.7
98.4
3.3
5.10
-6.7
13.3
QUANT. PRESCORE
19.0
22.1
-3.1
COG. PROCESS PRESCORE
5.1
5.8
-.7
AFFECT
16.6
16.8
-.2
16.5
15.8
.7
1.15
-1.6
3.0
IV
READING PRESCORE
23.8
34.7
-10.9
OLANGUAGE PRESCORE
8.7
10.2
-1.5
ATTENDANCE
16.8
13.1
3.7
14.9
17.6
-2,7
3.37
-9.3
3.9
AFFECT PRESCORE
15.7
15.4
.3
AGE (JUNE '71)
86.2
86.7
-.5
WRAT TOTAL
43.5
48.4
-4.9
47.5
46.3
1.2
2.90
-4.5
6.9
% CLASSROOM MALE
51.9
65.2
-13.3
% CLASSROOM BLACK
63.1
44.2
18.9
QUANTITATIVE
26.7
28.7
-2
27.5
26.6
.9
1.48
-2.0
3.8
% PRESCHOOL (OR NO. MOS.)
73.4
38.1
35.3
% PARENTS W/0 HS DIPL.
63.9
56.9
7.0
COGNITIVE PROCESSES
7.5
7.8
-.3
7.4
6.1,
.5
.49
-.5
1.5
% PARENTS W/SKILLED OCCUP.
37.7
40.1
-2.4
% PARENTS BLACK
65.6
42.5
23.1
READING SKILLS
48.2
54.9
-6.7
54.0
53.0
1.0
3.48
-5.8
7.8
% PARENTS POVERTY ELIGIBLE
59.2
42.6
16.61
% HEAD HOUSEHOLD EMPLOYE
68.5
83.6
-15.1
LANGUAGE ARTS
11.9
12.8
-.9
12.1
12.0
.1
.75
-1.4
1.6
% HEAD HOUSEHOLD MALE
69.8
75.3
-5.5
See "Guile of Interpretation of Results" for explanation of table entries.
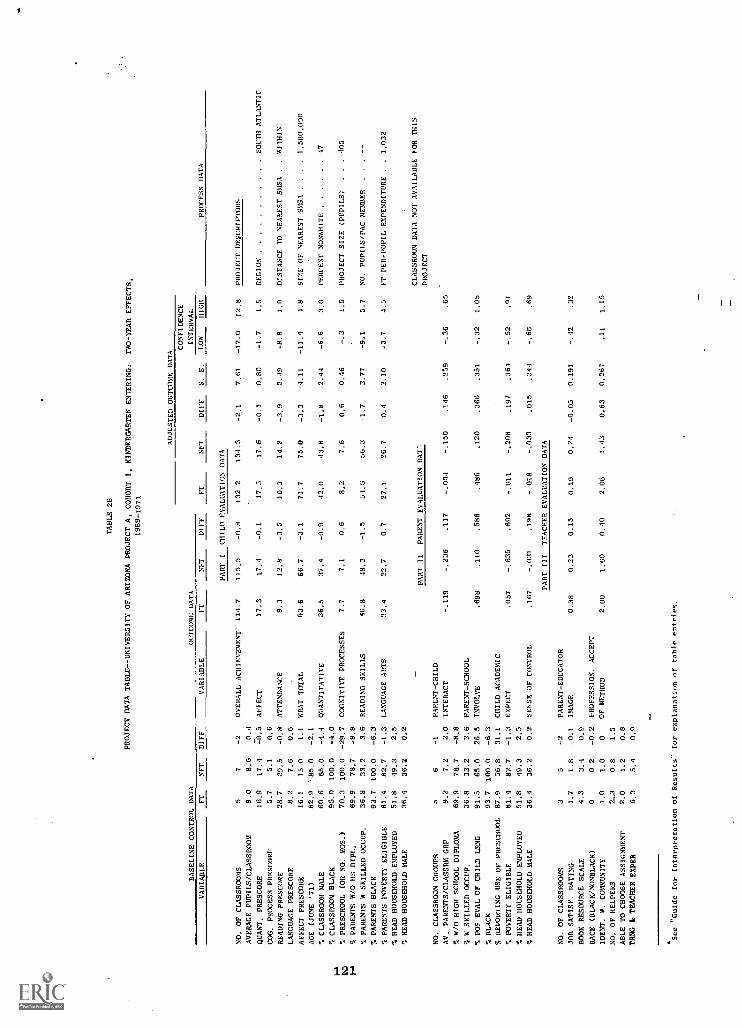
TABLE 26
PROJECT DATA TABLE - -UNIVERSITY OF ARIZONA PROJECT A, COHORT 1, KINDERGARTEN ENTERING;
TWO-YEAR EFFECTS,
1969-1971
ADJUSTED OUTCOME DATA
CONFIDENCE
BASELINE CONTROL DATA
OUTCOME DATA
INTERVAL
VARIABLE
FT
NFT
DIFF
VARIABLE
FT
NET
DIFF
FT
NET
DIFF
S.
E.
LOW
HIGH
PROCESS DATA
PART I
CHILD EVALUATION DATA
NO, OF CLASSROOMS
57
-2
OVERALL ACHIEVEMENT
114.7
115.5
-0.8
132.2
134.3
-2.1
7.61
-17.0
12.8
PROJECT DESCRIPTORS
AVERAGE PUPILS/CLASSROOM
9.0
8.6
0.4
QUANT, PRESCORE
16.9
17.1
-0.5
AFFECT
17.3
17.4
-0.1
17.5
17.6
-0.1
0,80
-1.7
1.5
REGION
SOUTH ATLANTIC
COG. PROCESS PRESCORE
5.7
5,1
0.6
READING PRESCORE
28.7
29.5
-0,8
ATTENDANCE
9.3
12.8
-3.5
10.3
14.2
-3,9
2.49
-8.8
1.0
DISTANCE TO NEAREST SMSA
..WITHIN
LANGUAGE PRESCORE
8.2
7.6
0,6
AFFECT PRESCORE
16,1
15.0
1.1
WRAT TOTAL
63.6
66,7
-3.1
71.7
75.0
-3.3
4.11
-11.1
4,8
SIZE OF NEAREST SMSA
1,580,090
AGE (JUNE '71)
82.9
85.0
-2.1
% CLASSROOM MALE
60.6
65.0
QUANTITATIVE
36.5
37.4
-0.9
42.0
43.8
-1.8
2.44
-6.6
3,0
PERCENT NONWHITE
17
i."
% CLASSROOM BLACK
96.0
100.0
-4,0
NS PRESCHOOL (OR NO. MOS.)
70,3
100.0
-29.7
COGNITIVE PROCESSES
7.7
7.1
0.6
8,2
7.6
0.6
0,46
1.5
PROJECT SIZE (PUPILS)
..
.405
F-,
% PARENTS 8/0 HS DIPL,
69.9
78.7
-8.8
SPARENTS W
SKILLED OCCUP.
36.8
33.2
3.6
READING SKILLS
46.8
48,3
-1.5
54.5
56.3
-1.7
3.77
-9.1
5,7
NO. PUPILS /PAC MEMBER
..
.--
S PARENTS BLACK
93.7
100.0
-6.3
% PARENTS POVERTY ELIGIBLE
81.4
82.7
-1.3
LANGUAGE ARTS
23.4
22.7
0.7
27.1
26.7
0.4
2.10
-3.7
4.5
FT PER-PUPIL EXPENDITURE .
,1,032
% HEAD HOUSEHOLD EMPLOYED
51.8
49.3
2.5
% HEAD HOUSEHOLD MALE
36.4
36.2
0.2
CLASSROOM DATA NOT AVAILABLE FOR 11115
PART II
PARENT EVALUATION DAT:.
PROJECT
NO, CLASSROOM GROUPS
56
-1
PARENT-CHILD
AV. PARENTS/CLASSRM GRP
9.2
7,2
2.0
INTERACT
-.119
-.236
.117
-.004
-.150
.146
.259
-.36
.65
%HIGH SCHOOL DIPLOMA
69.9
78.7
-8.8
% W SKILLED OCCUP.
36.8
33,2
3,6
PARENT-SCHOOL
% POS EVAL OF CHILD LRNG
91.5
65.0
26,5
INVOLVE
.698
.110
.588
.486
.120
.366
.351
-.32
1.05
% BLACK
93.7
100.0
-6.3
REPORTING USE OF PRESCHOOL
87.9
56,8
31.1
CHILD ACADEMIC
% POVERTY ELIGIBLE
81.4
82,7
-1.3
EXPECT
.057
-.635
.692
-.011
-.208
.197
.361
-.52
.91
S HEAD HOUSEHOLD EMPLOYED
51.8
49.3
2.5
% HEAD HOUSEHOLD MALE
36.4
36.2
0.2
SENSE OF CONTROL
.167
-.031
.198
-.018
-.033
.015
.344
-.66
.69
PART III
TEACHER EVALUATION DATA
NO, OF CLASSROOMS
35
-2
PARENT-EDUCATOR
JOB SATISF. RATING
1.7
1.8
-0.1
IMAGE
0.38
0.23
0.15
0.19
0.24
-0.05
0,191
.32
BOOK RESOURCE SCALE
4.3
3.4
0.9
RACE (BLACK/NONBLACK)
00.2
-0.2
PROFESSION. ACCEPT
IDENT. W. COMMUNITY
1,0
1.0
0OF METHOD
2.00
1,60
0.40
2.06
1.43
0.63
0,267
.11
1.15
NO. OF HELPERS
2-3
0,8
1.5
ABLE TO CHOOSE ASSIGNMENT
2.0
1.2
0.8
TRNG & TEACHER EXPER
6,3
5,4
0,9
*See "Guide for Interpretation of Results" for explanation of table entries.
Project UA(b)
The results for Project UA(b), an entering first grade project, are
displayed in Table 27. This very large project ,(1050 pupils) is located
in a major urban area in a west-south central state. Eighty percent of the
families participating in the FT classes were Black. Evidence regarding
the similarity of the comparison group is mixed. NFT classes had a higher
percentage of boys than FT classes, whereas FT parents tended to have less
education, lower occupational levels, less current employment, lower in-
comes, and fewer male heads of household than NFT parents. The FT group
had only slightly higher preschool participation rates than the NFT group.
FT teachers were slightly less satisfied with their jobs, more likely to
be Black, less likely to be resident within the school community, and more
likely to have an assistant or classroom helper than NFT teachers.
No pupil outcome measures showed significant program impact. However,
all FT/NFT adjusted differences indicated a modest positive FT program in-
crement. (Note that the attendance measure is actually an absence rate;
thus a lower value is favorable.) Since sponsor level averages were used
to estimate classroom data, analysis of effects actually represents the
regressed estimate of the model's impact on a sample displaying these popu-
lation characteristics. * Thus, it is estimated that this FT program, which
was anticipated to cost an average of $996 per pupil, would produce small,
statistically nonsignificant gains over a comparable sample of pupils with-
out the program. The strongest gain would be in reading skills.
Parent impact data also failed to reach significance for this project.
The one difference that approached significance (95 percent confidence
interval = -.09 to 1.13 units) was for parent/school interactions. Also,
the pupil/PAC ratio of 15.9 suggests that, on the average, slightly more
than one parent per classroom participated in PAC.
FT teachers responded significantly more favorably to FT-like pro-
cedures (i.e., gave a positive evaluation to classroom practices) than
NFT teachers. The confidence interval indicates a .95 probability that
this true effect is somewhere between .07 and 1.37 scale units. Since
classroom observation data were available for several classrooms in this
project, averages on Factor Scores are presented. These averages show
.eT as most different from NFT on the expressive and the self-regulatory
factors. These factors best describe the Arizona model and suggest im-
plementation is taking place according to sponsor goals. While FT classes
*Because of a redefinition of K and EF distinctions, this project sample
Ithad been administered an inappropriate level of the test battery, re-
sulting in exclusion of the data from analysis.
122

TABLE 27
PROJECT DATA TABLE - -ONIVERSIT1' OF ARIZONA PROJECT 8, COHORT
I, ENTERING FIRST GRADE:
TWO YEAR EFFECTS,
1969-1971
BASELINE CONTROL DATA
OUTCOME DATA
VARIABLE
ADJUSTED OUTCOME DATA
CONFIDENCE
INTERVAL
FT
NF7
D1F1'
VARIABLE.
FT
NFT
DIFF
FT
NET
DIFF
S. E.
LOW
HIGH
PART I
CHILD EVALUATION DATA
PROCESS DATA
NO. OF CLASSROOM?
62
OVERALL ACHIEVEMENT
138.3
138.3
0152.3
135.7
16.6
10.21
-3.4
36.6
PROJECT DESCRIPTORS
AVERAGE PUPILS / CLASSROOM
--
--
WEST SOUTH
QUART. PRESCORE
28.8
28.8
0AFFECT
18.5
18.5
018.7
17.9
0.8
0.66
-.5
2.1
REGION
CENTRAL
COG. PROCESS PRESCORE
6.7
6.7
0
READING PRESCORE
57.3
57.3
0ATTENDANCE
10.3
.10.2
0.1
10.0
13.2
-3.2
3,38
-9.8
3.
DISTANCE TO NEAREST SMSA
..WITHIN
LANGUAGE PRESCORE
12.5
12.5
0
AFFECT PRESCORE
16.5
16.1
0.4
WRAT TOTAL
98.0
98.0
0103.2
97.2
6.0
.39
-2.6
1 -1.6
SIZE OF NEAREST SMSA
..
,677,000
AGE (JUNE '71)
99.8
104.8
-5.0
% CLASSROOM MALE
47.4
66.8
-19.4
QUANTITATIVE
38.7
36.7
040.5
39.1
1.4
3.07
-4.6
7.4
PERCENT NONWHITE
21
% CLASSROOM BLACK
78.2
81.1
-5.9
% PRESCHOOL (OR NO. MOS.)
82.3
71.9
10.4
READINS SKILLS
76.6
76.6
085,7
73.0
12.7
6.78
-.6
26.0
PROJECT SIZE (PUPILS)
..
..1,050
% PARENTS W/0 HS DIPL.
75.7
66.6
'1,1
% PARENTS W SKILLED OCCUP.
14.7
26.2
-11.9
LANGUAGE ARTS
22.8
22.8
026.2
23.6
2.6
2.03
-1,i
6.6
NO. PUPILS PAC MEMBER
..
..15.9
I"
% PARENTS BLACK
77.3
81.2
-3.9
bo
7. PARENTS POVERTY ELIGIBLE
94.8
-19.2
45,6
FT PER-PUPIL EXPENDITURE
.996
C.11,
% HEAD HOUSEHOLD EMPLOYED
65.5
92.5
-27.0
% HEAD HOUSEHOLD MALE
58.7
75.0
-16.3
PART
II
PARENT EVALUATION DATA
CLASSROOM OBSERVATION
FACTOR SCORES
NO. CLASSROOM GROUPS
86
2PARENT-CHILD
AV. PARENTS/CLASSRM GRP
11.0
5.8
5.2
INTERACT
-.099
-.001
-.098
.018
-.261
.279
.305
-.32
.88
FACTOR NAME
FT
NET
W/O HIGH SCHOOL DIPLOMA
75.7
66.6
9.1
% W SKILLED OCCUP.
14.3
26.2
-11.9
PARENT-SCHCOL
SELF REGULATORY ....
.85,
-1.31
POS EVAL OF CHILD LRNG
83.9
57.6
26.3
INVOLVE
.389
-.323
.712
.126
-.400
.516
.311
-.09
1.13
BLACK
77.3
81.2
-3.9
CHILD-INITIATED
% REPORTING USE OF PRESCHOOL
82.3
66.3
16.0
CHILD ACADEMIC
INTERACTIONS
00
-.54
% POVERTY ELIGIBLE
94.8
49.2
45.6
EXPECT
.416
.153
.293
-.144
.301
-.447
.307
-1.05
% HEAD HOUSEHOLD EMPLOYED
65.5
92.5
-27.0
PROGRAMMED ACADEMIC
..27
-.69
% HEAD HOUSEHOLD MALE
58.7
75,0
-16.3
SENSE OF CONTROL
.257
.269
-.012
.192
.398
-.206
.299
-.79
.38
EXPRESSIVE
1.07
-.17
PART
III
TEACHER EVALUATION DATA
W. OF CLASSROOMS
84
4PARENT-EDUCATOR
CHILD SELF-LEARNING
..
..
29
-.07
'JOB SATISF. RATING
2.0
2.9
-0.9
IMAGE
0.06
0.50
-0.44
9,01
0.47
-0.43
0.223
-.87
.01
BOOK RESOURCE SCALE
3.4
3.3
0.1
RACE (BLACK/NONBLACK)
0.5
00.5
PROFESSION. ACCEPT
/DENT_ W. COMMUNITY
0.7
1.2
-0.5
OF METHOD
1.88
2.00
-0.12
1.76
1.01
0.72
0.334
.07
1.37
NO. OF HELPEPS
1.0
01.0
ABLE TO CHOOSE ASSIGNMENT
1.1
1.5
-0.1
TEC & TEACHER EXPER
5.6
5.4
0.2
See "Guide for Interpretation of Results" for explanation of table enities.

are higher than NFT classes on the programmed academic dimension, they
appear to have little more than the average amount of programmed academic
activity. This may, in part, account for the lack of strong results inthe traditional academic achievement variables and further suggests that
these tests do not adequately evaluate this model.
Project UA(c)
The remaining University of Arizona project included in this interim
evaluation is UA(c). This project, for entering first grade pupils, has
data for analysis of first- and second-year effects in Cohort I and for
first-year effects in Cohort II.
Project UA(c) is characterized as predominantly white, moderate in
size, and located within 20 miles of a SMSA of 120,000 residents inithe
south Atlantic region. The anticipated per pupil expenditure of $910 is
slightly above average, and he pupil/PAC ratio of 7.9 is well above
average. Classroom observation data were colleq)ted for classrooms in
both the C" and CII samples.
The results of the analysis of CI-EF two-year program effects are
presented in Table 28. These results are based on four FT and four NFT
classrooms. The quality of the FT/NFT match on this project is considered
poor. FT classes were below NFT on all cognitive baseline measures. In
addition, the FT classes comprised higher proportions of black pupils and
greater percentages of pupils with preschool experience. But with the ex-
ception of the ethnic and preschool variables, the FT and NFT families
appeared relatively comparable. That is, parents were nearly proportion-
ally equivalent on education (low), skilled occupations (low), employment'(relatively high), impoverishment (relatively low), and male heads of
household (high). FT parents also tended to respond more favorably to
the child's academic progress than did NFT parents.
FT teachers and NFT teachers were quite dissimilar. FT teachers
reported over twice the resources (books and helpers) as NFT, but NFT
teachers were more integral to the communities, more experienced, and
reported more flexibility in choosing assignments than FT teachers.
Analysis of outcomes failed to reveal any significant program im-
pacts in any of the pupil outcome variables. Moreover, relatively large
deficits in achievements (reading, in particular) were evident and ap-
proach significance. Parent impact analyses show a significant differenceon sense of control; scores of FT parents are from .2 to 1.55 scale units
above scores of NFT parents at the 95 percent confidence level. Teacher
outcome differences fail even to approach significance.
124
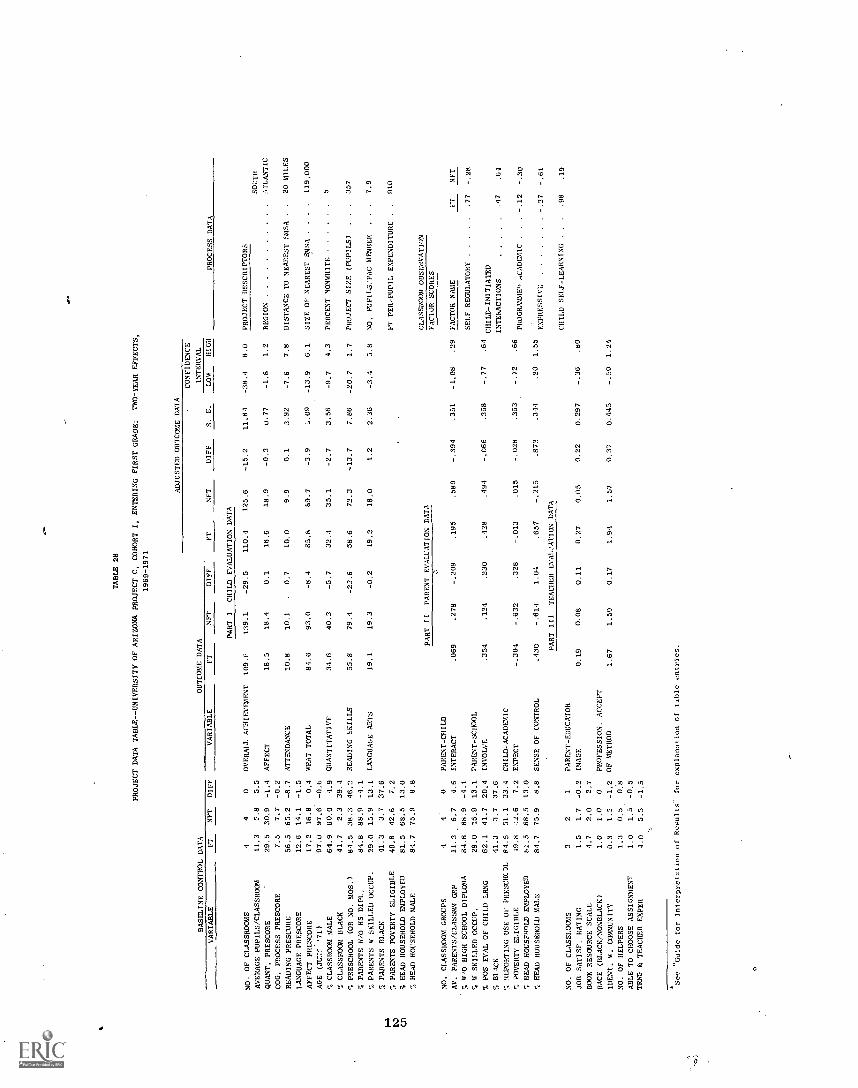
BASELINE CONTROL DATA
TABLE 28
PROJECT DATA TABLE--UNIVERSITY OF ARIZONA PROJECT C, COHORT I, ENTERING FIRST GRADE:
TWO-YEAR EFFECTS,
1969-1971
OUTCOME DATA
ADJUSTED OUTCOME DATA
CONFIDENCE
INTERVAL
VARIABLE
FT
NFT
DIFF
VARIABLE
FT
NFT
DIFF
FT
NFT
DIFF
S. E.
LOW
HIGH
PROCESS DATA
PART I
CHILD F/ALUATION DATA
NO. OF CLASSROOMS
44
0OVERALL ACHIEVEMENT
109.6
139.1
-29.5
110.4
125.6
-15.2
11.81
-38.4
8.0
PROJECT DESCRIPTORS
AVERAGE PUPILS/CLASSROOM
11.3
5.8
5.5
SOUTH
QUART. PRESCORE
29.5
30.9
-1.4
AFFECT
18.5
18.4
0.1
18.6
18.9
-0.3
0.77
-1.8
1.2
REGION
TLANTIC
COG. PROCESS PRESCORE
7.5
7.7
-0.2
READING PRESCORE
56.5
65.2
-8.7
ATTENDANCE
10.8
10.1
0.7
10.0
9.9
0.1
3.92
-7.6
7.8
DISTANCE TO NEAREST SMSA
..
20 MILES
LANGUAGE PRESCORE
12.6
14.1
-1.5
AFFECT PRESCORE
17.2
16.8
0.4
WHAT TOTAL
84.6
93.0
-8.4
85.8
89,7
-3.9
,.09
-13.9
6.1
SIZE OF NEAREST SMSA
..
..
119,000
AGE (J1= '71)
97.0
97.6
-0.6
% CLASSROOM MALE
64.9
60.0
4.9
QUANTITATIVE
34.6
40.3
-5.7
32.4
35.1
-2.7
3.56
-9.7
4.3
PERCENT NONWHITE
5
CLASSROOM BLACK
41.7
2.3
39.4
PRESCHOOL (OR NO. MOS.)
84.5
38.3
46.2
READING SKILLS
55.8
79.4
-23.6
58.6
72.3
-13.7
7.86
-20.7
1.7
PROJECT SIZE (PUPILS)
..
.357
.1 PARENTS W/O HS DIPL.
84.8
88.9
% PARENTS F SKILLED OCCUP.
29.0
15.9
13.1
LANGUAGE ARTS
19.1
19.3
-0.2
19.2
18.0
1.2
2.36
-3.4
3.8
NO, PUPILS/PAC MEMBER
..
7.9
1 PARENTS BLACK
41,3
3.7
37.6
% PARENTS POVERTY ELIGIBLE
49.8
42.6
7.2
FT PER-PUPIL EXPENDITURE
..
910
% HEAD HOUSEHOLD EMPLOYED
81.5
68.5
13.0
1 HEAD HOUSEHOLD MALE
81.7
75.9
8.8
CLASSROOM OBSEnVATION
PART
II
PARENT EVALUATION DATA
FACTOR SCORES
NO. CLASSROOM GROUPS
44
0PARENT-CHILD
AV. PARENTS/CLASSRM GRP
11.3
6.7
4.6
INTERACT
.069
.278
-.209
.195
.589
-.394
.351
-1.08
.29
FACTOR NAME
FT
RFT
W/O HIGH SCHOOL DIPLOMA
84.8
88.9
-4.1
SELF REGULATORY
.77
-.28
% W SKILLED OCCUP.
29.0
15.9
13.1
PARENT-SCHOOL
% POS EVAL OF CHILD LRNG
62.1
41.7
20.4
INVOLVE
.354
.124
.230
.128
.494
-.066
.358
-.77
.64
CHILD-INITIATED
1. BLACK
41.3
3.7
37.6
INTERACTIONS
.47
.64
% REPORTING USE OF PRESCHC)I.
84.5
51.1
33.4
CHILD-ACADEMIC
% POVERTY ELIGIBLE
19.8
:2.6
7.2
EXPECT
-.304
-.632
.328
.015
-.028
.353
-.72
.66
PROGRAMMEn ACADEMIC
-.12
-.30
HEAD HOUSF0oLD EMPLOYED
81.5
68.5
13.0
% HEAD HOUSEHOLD MALE
84.7
75.9
8,8
SENSE OF CONTROL
.430
-.614
1.04
.657
-.215
.872
.344
.20
1.55
EXPRESSIVL
-.37
-.61
PART III
TEACHER
EVALZ.'ATION DATA
CHILD SELF-LEARNING
..
.98
.19
NO. OF CLASSLOOMS
32
IPARENT-EDUCATOR
JOB SATISF. RATING
1.5
1.7
-0.2
IMAGE
0.19
0.08
0.11
0.27
0.05
0.22
0.297
-.36
.80
BOOK RESOURCE SCALE
4.7
2.0
2.7
RACE (BLACK/NONBLACK)
1.0
1.0
0PROFESSION. ACCEPT
IDENT. W. COMMUNITY
0.3
1.5
-1.2
OF METHOD
1.67
1.50
0.17
1.94
1.57
0.37
0.445
-.50
1.24
NO. OF HELPERS
1.3
0.5
0.8
ABLE TO CHOOSE ASSIGNMENT
1.0
1.5
-0.5
TANG & TEACHER EXPER
4.0
5.5
-1.5
"Guide for Interpretation of Results" for explanation of table entries.
However, classroom observation factors indicate that the sponsor's
model is being implemented in part. Like project UA(b) we find this proj-
ect considerably above average on the self-regulatory factor. In addition
the child self-learning factor score appears well above average. This
factor also reflects sponsor goals. The Arizona model encourages children
to become more self sufficient, evaluate problems, and express themselves.
Again it seems that standard achievement tests do not adequately evaluate
interim changes in children in these models.
Comparison of these second-year results with CI-EF first-year data
(Table 29) for the same pupils show that, if anything, performance decre-
ments increased from 1970 to 1971. For all achievement measures except
language skills, the two-year trend favors the NFT pupils. Also, the one-year difference in affect (95 percent confidence interval = .8 to 5 8 units)
did not recur in the two -year data.
The Cohort II, one-year sample (Table 30) appears to be well matched
with the NFT comparison group on all variables except baseline test scores,where FT consistently averaged above NFT. An inspection of the table re-
veals that there were no FT/NFT differences on pupil outcome measures, ex-
cept for the significantly beter affect scores noted for the FT classes.
Neither parent nor teacher results reach significance. This lack of
significance may be related to somewhat limited implementation, as shown
in classroom observation data. Tile profile of factors scores for Cohort II
FT classrooms is similar to that for the NFT comparison group, and scoreson factors consistent with the sponsortis model (in particular, self-
regulatory and self-learning) are generally below scores of other FTclassrooms implementing the same model.
Summary
Separate summary analyses on University of Arizona data are reported
only for Cohort I-K and Cohort I-E, two -year results, for each of which
two or more project samples were included. Sponsor summaries based on
single projects are not r'7eated in this section.
The salient features of this FT approach are suriharizect Lelow:
126
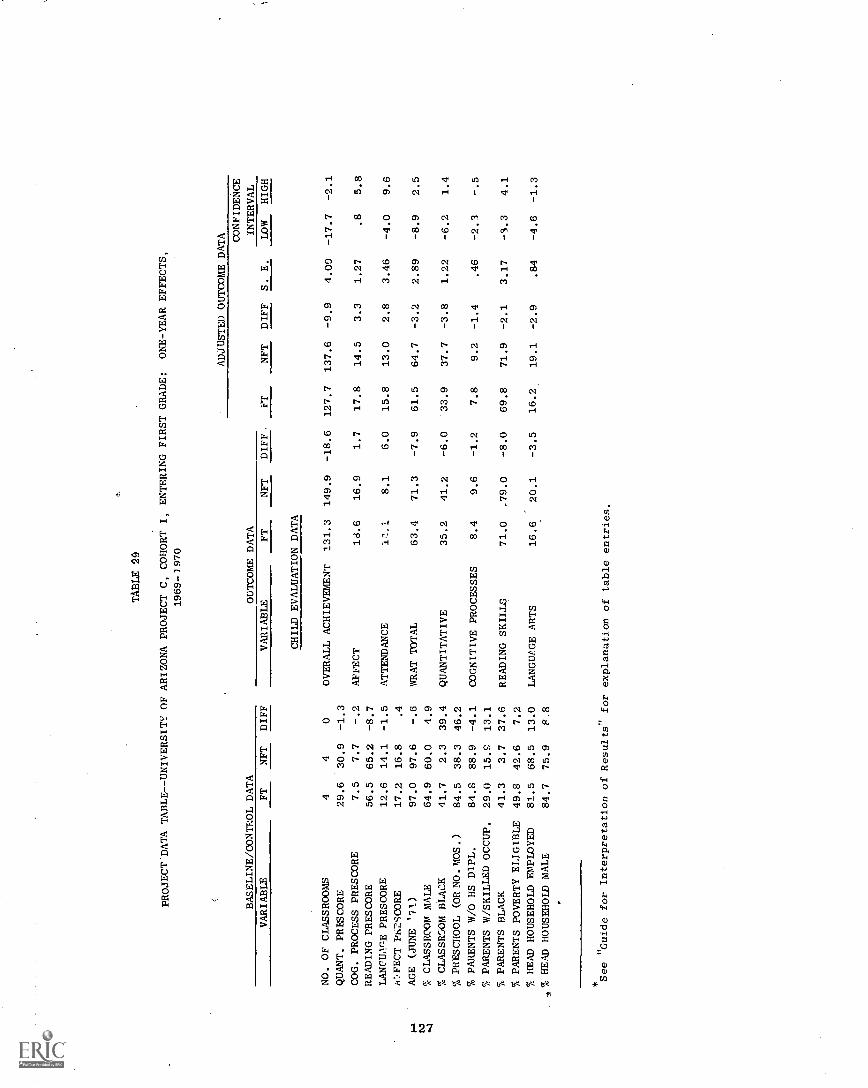
TABLE 20
PROJECT DATA TABLE--UNIVERSITY OF ARIZONA PROJECT C, COHORT I, ENTERING FIRST GRADE:
ONE-YEAR EFFECTS,
1969-7970
ADJUSTED OUTCOME DATA CONFIDENCE
BASELINE/CONTROL DATA
OUTCOME DATA
INTERVAL
VARIABLE
FT
NFT
DIFF
VARIABLE
FT
NFT
DIFF
FT
NFT
DIFF
S. E.
LOW
HIGH
CHILD EVALUATION DATA
NO. OF CLASSROOMS
44
0OVERALL ACHIEVEMENT
131.3
149.9
-18.6
127.7
137.6
-9.9
4.00
-17.7
-2.1
QUANT. PRESCORE
29.6
30.9
-1.3
COG. PROCESS PRESCORE
7.5
7.7
-.2
AFFECT
ld.6
16.9
1.7
17.8
14.5
3.3
1.27
.8
5.8
READING PRESCORE
56.5
65.2
-8.7
LANCUAnE PRESCORE
12.6
14.1
-1.5
ATTENDANCE
11.1
8.1
6.0
15.8
13.0
2.8
3.46
-4.0
9.6
ii'2FECT Ph2SCORE
17.2
16.8
.4
I-A
Iv
AGE (JUNE '71)
97.0
97.6
-.6
WRAT TOTAL
63.4
71.3
-7.9
61.5
64.7
-3.2
2.89
-8.9
2.5
-.I
% CLASSROOM MALE
64.9
60.0
4.9
% CLASSWAM BLACK
41.7
2.3
39.4
QUANTITATIVE
35.2
41.2
-6.0
33.9
37.7
-3.8
1.22
-6.2
1.4
% PRESCHOOL (ORNO.MOS.)
84.5
38.3
46.2
% PARENTS W/O HS DIPL.
84.8
88.9
-4.1
COGNITIVE PROCESSES
8.4
9.6
-1.2
7.8
9.2
-1.4
.46
-2.3
-.5
% PARENTS W/SKILLED OCCUP.
29.0
15.E
13.1
% PARENTS BLACK
41.3
3.7
37.6
READING SKILLS
71.0
.79.0
-8.0
69.8
71.9
-2.1
3.17
-3.3
4.1
% PARENTS POVERTY ELIGIBLE
49.8
42.6
7.2
% HEAD HOUSEHOLD EMPLOYED
81.5
68.5
13.0
LANGUPGE ARTS
16.6
20.1
-3.5
16.2
19.1
-2.9
.84
-4.6
-1.3
4% HEAD HOUSEHOLD MALE
84.7
75.9
F.8
See "Guide for Interpretation of Results" for explanation of table
entries.
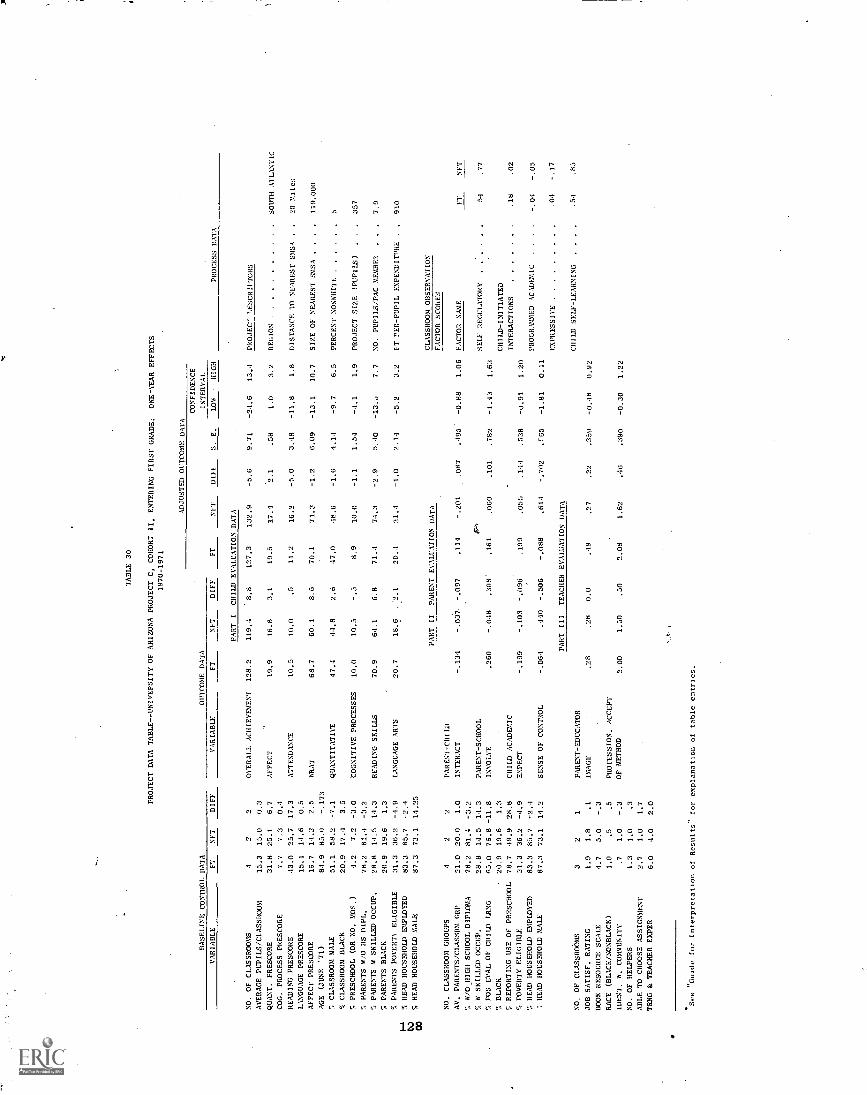
TABLE 30
PROJECT DATA TABLE - -UNIVEPSITY OF ARIZONA PROJECT C, COHORT II, ENTERING FIRST GRADE;
ONE-YEAR EFFECTS
1970-1971
BASELINE CONTROL DATA
ADJUSTED OUTCOME DATA
CONFIDENCE
OUTCOME DATA
INTERVAL
VARIABLE
FT
EFT
DIFF
VARIABLE
FT
NFT
DIFF
FT
NFT
DIFF
S.
E.
IOW
HIGH
PROCESS DATA
PART I
CHILD EVALUATION DATA
NO. OF CLASSROOMS
42
2OVERALL ACHIEVEMENT
128.2
119.4
8.8
127.3
132.9
-5.6
9.71
-24.6
13.1
PROJEC" (,ESCRIPTORS
AVERAGE PUPILS/CLASSROOM
15.3
15.0
0.3
QUANT, PRESCORE
31.8
25.1
6.7
AFFECT
19.9
16.8
3.1
19.5
17.4
2.1
.58
1.0
3.2
REGION
SOUTH ATLANTIC
COG, PROCESS PRESCORE
7.7
7,3
0.4
READING PRESCORE
43.0
25.7
17.3
ATTENDANCE
10.5
10.0
.5
11.2
16.2
-5.0
3.18
-11.8
1.8
DISTANCE TO NEAREST SMSA
..
20 Miles
LANGUAGE PRESCORE
15.1
14.6
0.5
AFFECT PRESCORE
16.7
14.2
2.5
WHAT
68.7
60.1
8.6
70.1
71.3
6.09
-13.1
10.7
SIZE OF NEAREST SMSA
..
..
119,000
AGE (JUNE '71)
84.9
85.0
-.173
7, CLASSROOM MALE
51.1
58.2
-7.1
QUANTITATIVE
47.4
44.8
2.6
47.0
48.6
-1.6
4.14
-9.7
6.5
PERCENT NONWHITE
5% CLASSROOM BLACK
20.9
17.1
3.5
5., PRESCHOOL (OR NO. MOS.)
4.2
7.2
-3.0
'COGNITIVE PROCESSES
10.0
10.5
8.9
10.0
-1.1
1.54
1.9
PROJECT SIZE (PUPILS)
..
357
7 PARENTS W/O HS DIPL,
78.2
81.4
-3.2
PARENTS W SKILLED OCCUP.
28.8
14.5
14.3
READING SKILLS
70.9
64.1
6.8
71.1
74.3
5.40
-13.0
7.7
NO. PUPILS/PAC MEMBER
..
.7.9
% PARENTS BLACK
20.9
19.6
1.3
% PARENTS POVERTS ELIGIBLE
31.3
36.2
LANGUAGE ARTS
20.7
18.6
.2.1
20.4
21.4
-1.0
2.14
3.2
FT PER-PUPIL EXPENDIT'HE
..
910
N % HEAD HOUSEHOLD EMPLOYED
83.3
85.7
% HEAD HOUSEHOLD MALE
Uu
87.3
73.1
14.25
PART II
PARENT EVALUATION DATA
CLASSROOM OBSERVATION
FACTOR SCORES
NO. CLASSROOM GROUPS
42
2PARENT-CHILD
AV. PARENTS /CLASSRM GRP
21.0
20.0
1.0
INTERACT
-.134
-.037,
-.097
.111
-.201
.087
.190
-0.88
1.06
FACTOR NAME
FT
NFT
7, 8/041IGH SCHOOL DIPLOMA
78.2
81.1
W SKILLED OCCUP,
28.8
14.5
1.1.3
PARENT-SCHOOL
1r,,,
SELF REGULATORY
54
.77
(1 POS EVAL OF CHILD LRNG
65.0
76.8
-11.8
INVOLVE
.260
-.048
.308'
.161
.060
.101
.782
-1.43
1.63
BLACK
20.9
19.6
1.3
CHILD-INITIATED
T, REPORTING USE OF PRESCHOOL
78.7
49.9
28.8
CHILD ACADEMIC
INTERACTIONS
.18
.02
7, POVERTY ELIGIBLE
31.3
36.2
EXPECT
-.199
-.103
-.096
.199
.055
.144
.538
-0.91
1.20
7, HEAD HOUSEHOLD EMPLOYED
83.3
85.7
PROGRAAMED ACADEMIC
q HEAD HOUSEHOLD MALE
87.3
73.1
14.2
SENSE OF CONTROL
-.064
.440
-.506
-.088
.611
-.702
.765
-1.81
0.11
EXPRESSIVE
.04
-.17
PART III
TEACHER
EVALUATION DATA
CHILD SELF-LEARNING
.54
NO. OF CLASSROOMS
32
1PARENT-EDUCATOR
..
..
.85
JOB SATISF, RATING
1.9
1.8
.1
IMAGE
.28
.28
0.0
.49
.27
.22
.359
-0.48
0.92
BOOK RESOURCE SCALE
4.7
5.0
RACE (BLACK/NONBLACK)
1.0
.5
.5
PROFESSION. ACCEPT
IDENT. W. COMMUNITY
.7
1.0
OF METHOD
2.00
1.50
.50
2.08
1.62
.46
.390
-0.30
1.22
NO, OF HELPERS
1.3
1.0
.3
ABLE TO CHOOSE ASSIGNMENT
2.7
1.0
1.7
TANG & TEACHER EXPER
6.0
4.0
2.0
See "Guide for Interpretation
of Results" for explanation of table entries.

Focus & Objectives--emphasizes intermediate objectives
Child
Cognitive
Develop language competence
Develop skills underlying all academic performance,
such as the ability to:
Attend
Recall
Organize behavior toward goals
Evaluate alternatives
Develop reading, writing, and math skills
Affective
Develop positive attitude toward school and learning
Increase expectation of success
Develop social skills of cooperation and planning
Curricular Approach
Teacher's role that of director
Reinforcement primarily from teacher
Emphasizes persistent adult-child interaction on 1-to-1 basis
in small heterogenous groups
Provides variety of behavioral settings, including both self-
selected and structured activities
Type of Parent Invovlement
Inform parents about program
Encourage parents to work in classroom as volunteers
Encourage parents to work with PAC
129
Results of analyses of the second-year, Kindergarten entrance samples
are presented in Table 31 and second-year first grade entrance samples inTable 32. These results show that the University of Arizona model has not
produced identifiable impact on pupil outcomes after two years. Similar
results were noted for first-year data (both K and EF, CI and CII) except
that FT pupils seemed to show greater positive affect following one year
in the program. It thus appears :hat the model has not attained many of
its cognitive objectives. However, it has met with partial success in
attaining noncognitive objectives.
Analsis of parent outcomes present a somewhat more favorable evalua-
tion for the impact of this model. In the Kindergarten projects, signif-
icant effects occur on both the parent/school and academic expectation
measures. In the entering first-grade samples, results of parent out-
come analyses show that FT parents are significantly more involved andhave a stronger sense of control over educational activities than NFT
parents. Also, this sponsor level analysis (entering first grade) shows
FT teachers as significantly more approving of their methods than NFT
teachers.
Apparently then, this model has been reasonably well implemented in
at least some projects, is having its intended impact in generating parentinvolvements in schooling, and is producing occasional evidence of other
desirable impacts, such as teacher approval and parental confidence. At
this interim point, it appears lacking primarily in strong evidence of
positive impacts on the child.
130
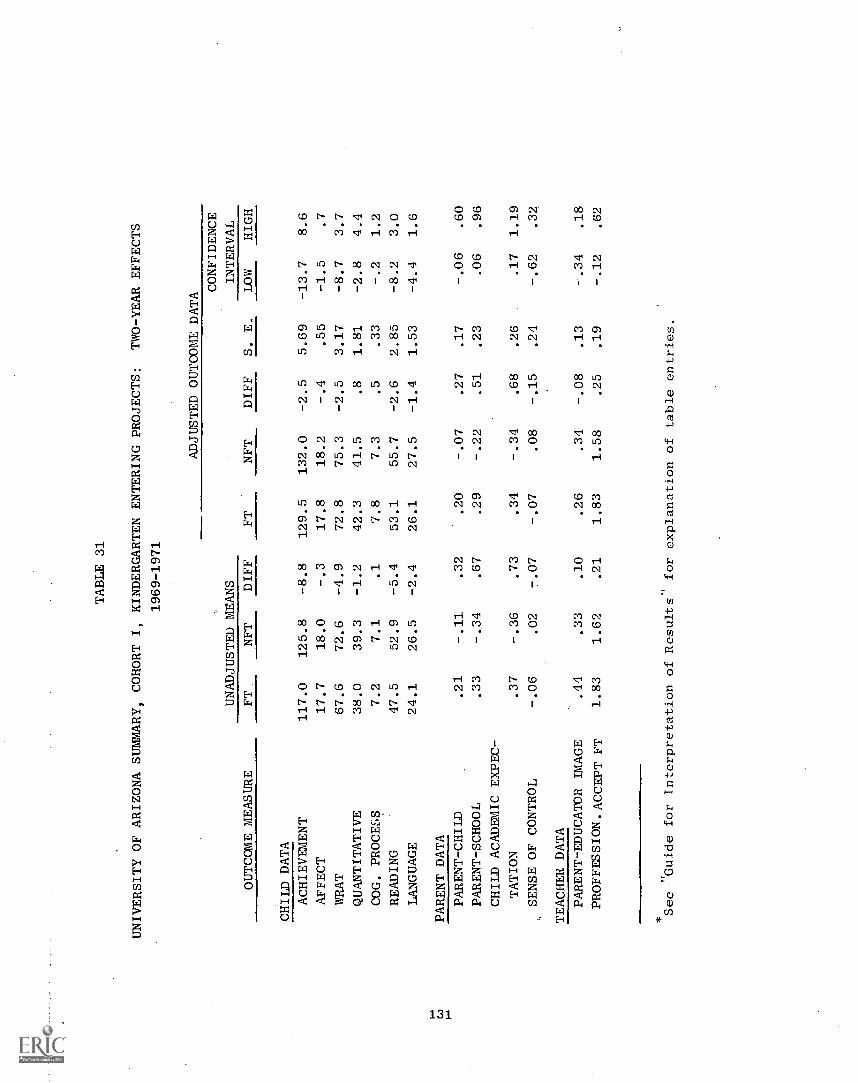
TABLE 31
UNIVERSITY OF ARIZONA SUMMARY, COHORT I, KINDERGARTEN ENTERING PROJECTS:
TWO-YEAR EFFECTS
1969-1971
ADJUSTED OUTCOME DATA
OUTCOME MEASURE
UNADJUSTED MEANS
FT
NFT
DIFF
S. E.
CONFIDENCE
INTERVAL
FT
NFT
DIFF
LOW
HIGH
CHILD DATA
ACHIEVEMENT
117.0
125.8
--8.8
129.5
132.0
-2.5
5.69
-13.7
8.6
AFFECT
17.7
18.0
-.3
17.8
18.2
-.4
.55
-1.5
.7
WRAT
67.6
72.6
-4.9
72.8
75.3
-2.5
3.17
-8.7
3.7
QUANTITATIVE
38.0
39.3
-1.2
42.3
41.5
.8
1.81
-2.8
4.4
COG. PROCESS
7.2
7.1
.1
7.8
7.3
.5
.33
-.2
1.2
READING
47.5
52.9
-5.4
53.1
55.7
-2.6
2.85
-8.2
3.0
LANGUAGE
24.1
26.5
-2.4
26.1
27.5
-1.4
1.53
-4.4
1.6
1-, w 1
-,
PARENT DATA
PARENT-CHILD
.21
-.11
.32
.20
-.07
.27
.17
-.06
.60
PARENT-SCHOOL
.33
-.34
.67
.29
-.22
.51
.23
.06
.96
CHILD ACADEMIC EXPEC-
TATION
.37
-.36
.73
.34
-.34
.68
.26
.17
1.19
SENSE OF CONTROL
-.06
.02
-.07
-.07
.08
-.15
.24
-.62
.32
TEACHER DATA
PARENT-EDUCATOR IMAGE
.44
.33
.10
.26
.34
-.08
.13
-.34
.18
PROFFESSION. ACCEPT FT
1.83
1.62
.21
1.83
1.58
.25
.19
-.12
.62
See "Guide for Interpretation of Results" for explanation of table entries.
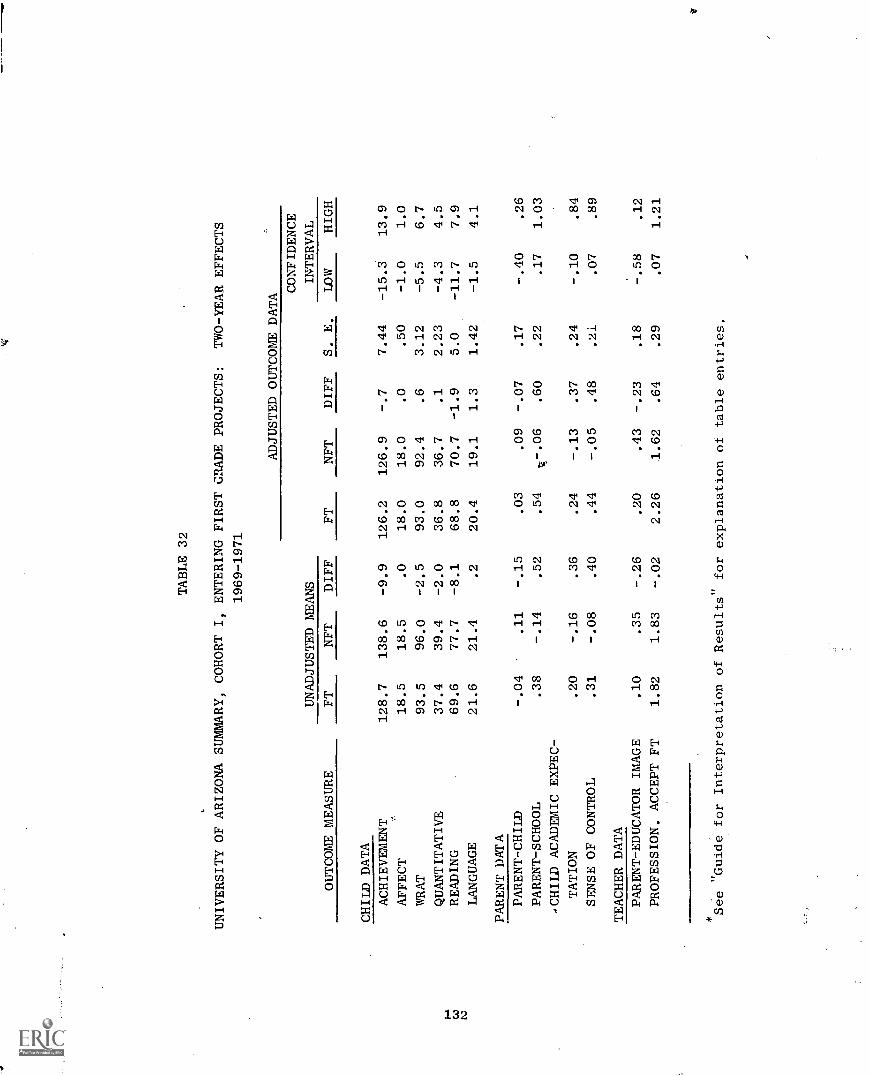
TABLE 32
UNIVERSITY OF ARIZONA SUMMARY, COHORT I, ENTERING FIRST GRADE PROJECTS:
TWO-YEAR EFFECTS
1969-1971
OUTCOME MEASURE
UNADJUSTED MEANS
ADJUSTED OUTCOME DATA
FT
NFT
DIFF
S. E.
CONFIDENCE
INTERVAL
FT
NFT
DIFF
DOW
HIGH
CHILD DATA
ACHIEVEMENT
128.7
138.6
-9.9
126.2
126.9
-.7
7.44
-15.3
13.9
AFFECT
18.5
18.5
.0
18.0
18.0
.0
.50
-1.0
1.0
WRAT
93.5
96.0
-2.5
93.0
92.4
.6
3.12
-5.5
6.7
QUANTITATIVE
37.4
39.4
-2.0
36.8
36.7
.1
2.23
-4.3
4.5
READING
69.6
77.7
-8.1
68.8
70.7
-1.9
5.0
-11.7
7.9
LANGUAGE
21.6
21.4
.2
20.4
19.1
1.3
1.42
-1.5
4.1
PARENT DATA
PARENT-CHILD
-.04
.11
-.15
.03
.09
-.07
.17
-.40
.26
PARENT-SCHOOL
.38
-.14
.52
.54
47.06
.60
.22
.17
1.03
eCHILD ACADEMIC EXPEC-
TATION
.20
-.16
.36
.24
-.13
.37
.24
-.10
.84
SENSE OF CONTROL
.31
-.08
.40
.44
-.05
.48
.21
.07
.89
TEACHER DATA
PARENT-EDUCATOR IMAGE
.10
.35
-.26
.20
.43
-.23
.18
-.58
.12
PROFESSION. ACCEPT FT
1.82
1.83
-.02
2.26
1.62
.64
.29
.07
1.21
*See
Guide for Interpretation of Results" for explanation of table entries.

BANK STREET COLLEGE OF EDUCATION APPROACH
Bank Street College
Sponsor's Intended Approach
Basic to the Bank Street approach is a rational, democratic life
situation in the classroom. The child participates actively in his own
learning and the adults support his autonomy while extending his world
and sensitizing him to the meanings of his experiences. The teaching
is diagnostic with individualized follo.vup. There is constant restruc-
turing of the learning environment to adapt it to the special needs and
emerging interests of the children, particularly their need for a positivesense of themselves.
In this model academic skills are acquired within a broad context
of planned activities that provide appropriate ways of expressing and
organizing children's interests in the themes of home and school, and
gradually extend these interests to the larger community. The classroomis organized into work areas filled with stimulating materials that allow
a wide variety of motor and sensory experiences, as well as opportunities
for independent investigation in cognitive areas and for interpreting ex-perience through creative media such as dramatic play, music, and art. The
cognitive areas of primary concern are the capacity to probe, to reason,
and to solve problems. Teachers and paraprofessionals working as a team
surround the children with language that they learn as a useful, pleasurable
tool. Math, too, is highly functional and pervades the curriculum. The
focus is on tasks that are satisfying in terms of the child's own goals
and productive for his cognitive and affective development.
Bank Street supports parent involvement in each community by pro-
viding materials interpreting the progam and special consultants, as
well as by joint planning for home-school interaction. Parents partic-
ipate in the classroom, in social and community activities related to
the school, and as members of the local Policy Advisory Committee.
Parents may receive career development training with either graduate or
undergraduate credit. Parents and teachers pool their understanding of
each child's interests, strengths, and needs as they plan his educational
experiences in and out of school.
Staff development is an ever-evolving process for administrators,
teachers, paraprofessionals, and local supportive and sponsor staff. It
133
is conducted both on site and at the College. Programs are geared to
the specific needs of each project and are guided by a sponsor field
representative familiar with the history and dynamics of a given community
in cooperation with local staff. Self-analysis is stressed in both the
teaching and administrative areas. Bank Street's 50 years of experimen-
tation as a multidisciplinary education center has demonstrated that a
flexible, child-oriented program requires more, not less, planning and
study. Staff development aims at providing a repertoire of teaching
strategies from which to choose on the basis of the adult's increased
understanding of individual children.
In moving from the broad, conceptual framework to the specifics of
implementation, Bank Street supplies diagnostic tools for assessing child
behavior, child-adult interaction, the physical and social milieu of the
classroom, and the totality of model implementation. These instruments
are used by trained observers and in self-analysis to increase model ef-
fectiveness and stimulate joint planning of changes needed in the class-
room and in teaching behavior, community relations, parent involvement,
and administrative practices.
In addition to continuing services on site, Bank Street develops
slides, films, video tapes, and other materials for adult education.
These supplement the materials developed for use in the classroom, such
as the Bank Street Basal Readers and Language Stimulation Materials.
Field representatives, resource persons, program analysts, and materials
specialists meet weekly with the Director of the Bank Street program to
share experiences, continue conceptual development of the sponsor's role,
and to plan institutes and workshops differentiated on the basis of re-
quirements of specific communities and participants.
Individual Project Results
Eight samples from five different projects of Bank Street College (BC)
were included in the analysis of interim effects. The distribution of
these evaluation samples in terms of cohort, outcome, and project is as
follows:
Cohort First-Year Effects Second-Year Effects
IK
IEF (project d)
IIK (project c)
IIEF (project d)
134
(projects a, b, c, and e)
(project d)
Project BC(b)
Table 33 presents the analysis data for Project BC(b)--a Cohort I-K,
two year effects sample. This project is located in a mixed ethnic com-
munity (25 percent Black) within a large eastern megalopolis (population
SMSA = 16,207,000). It was moderately small (500 pupils) with an antici-
nated per pupil expenditure of $808 and about one PAC member per 20 pupils.
On the basis of the control variables, the seven FT and six NFT class-
rooms appear reasonably well matched. They are nearly equivalent on base-
line measures, and the FT families appear only slightly more disadvantaged
than NFT. Also, teachers in the two samples appear comparable except on
experience, aid, and autonomy.
Outcome analyses show NFT significa-tly above FT on the affect mea-
sure (95 percent confidence interval = 1.1 to 4.1 units), WRAT score
(95 percent confidence interval = .6 to 16.2 points), and reading skills
(95 percent confidence level = .5 to 14.7 points). Other measures also
favor NFT but do not reach significance. Differences in parent outcomes
were not significant. NFT teachers scored significantly higher on parent
image than did FT teachers.
The net consensus of evidence for Project BC(b) is unfavorable to the
model. On all measures, NFT groups scored either significantly better or
slightly better than FT groups. However, both FT and NFT averages in
general appear higher than other Bank Street Cohort I-K projects in this
interim sample. No classroom observation data are available to provide
clues regarding whether or not the model was well implemented. Since the
FT and NFT samples appear reasonably well matched and since some FT-
favoring covariable adjusting does occur, these outcomes must be considered
as reflecting poorly on the impact of FT as implemented in this project.
Project BC(e)
Table 34 presents the analysis data for Project BC(e), which is also
a CI-K, two-year effects sample. Located within a moderately small SMSA
(371,000) in the south Atlantic region, the project is within a racially
mixed community (44 percent nonwhite), is moderately large, and had al
rather high anticipated per pupil expenditure of $1140. On the average,
there was one'PAC member per 16 pupils.
The six FT and six NFT classes are moderately well matched in terms
of pupil baseline test scores and classroom composition, but the groups
differ widely on preschool experience (FT = 94 percent, NFT = 0 percent).
135
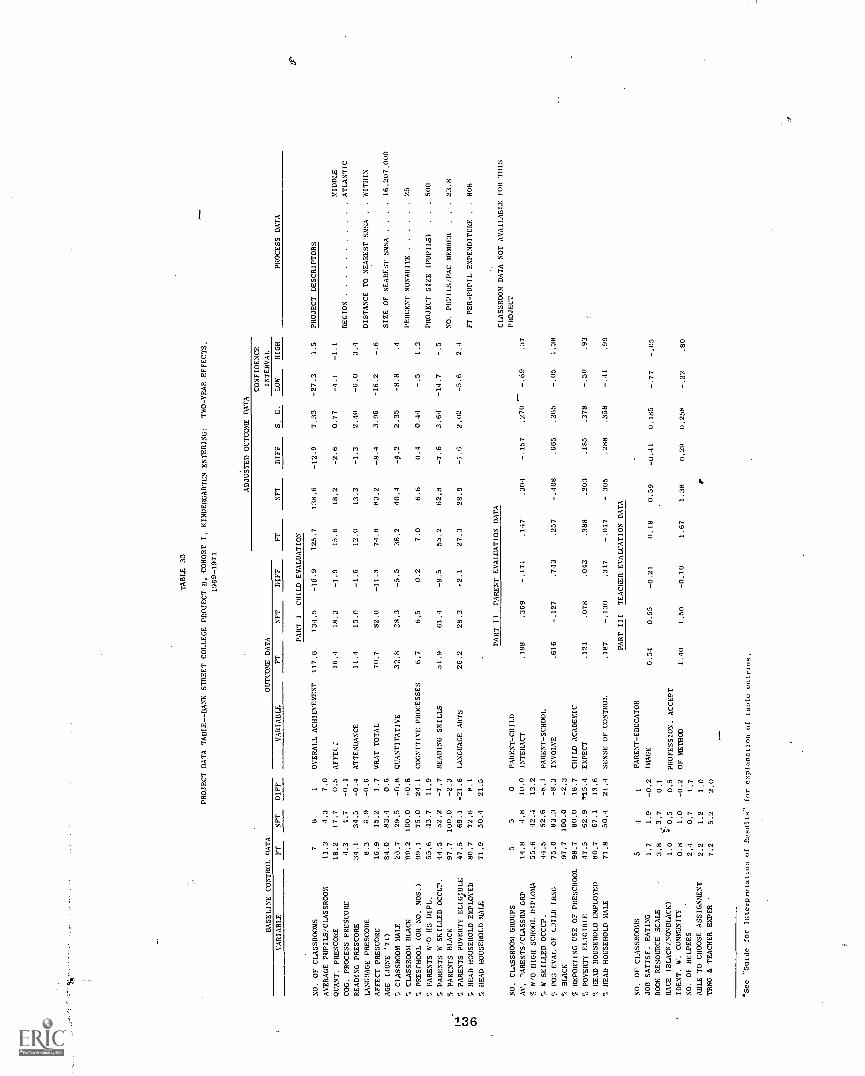
TABLE 33
PROJECT DATA TABLE-BANK STREET COLLEGE PROJECT 8, COHORT I, KINDERGARTEN ENTERING:
TWO-YEAR EFFECTS,
1369-1971
ADJUSTED OUTCOME DATA . CONFIDENCE
BASELINE CONTROL DATA
OUTCOME DATA
FT
NET
DIFF
S. E.
INTERVAL
PROCESS DATA
VARIABLE
FT
NFT
DIFF
VARIABLE
FT
NFT
DIFF
LOW
HIGH
PART I
CHILD EVALUATION
NO, OF CLASSROOMS
76
1OVERALL ACHIEVEMENT
117,6
134.5
-16.9
125.7
138.6
-12.9
7.33
-27.3
1.5
PROJECT DESCRIPTORS
AVERAGE PUPILS/CLASSROOM
11.3
4.3
7.0
QUANT, PRESCORE
18.2
17.7
0.5
AFFEC:
16.4
18.3
-1,9
15.6
18.2
-2.6
0.77
-1.1
MIDDLE
COG, PROCESS PRESCORE
4.3
1.7
-0.4
REGION
ATLANTIC
READING PRESCORE
34.1
34.5
-0.4
ATTENDANCE
11.4
13.0
-1.6
12.0
13.3
-1.3
2,40
-6.0
3.4
LANGUAGE PRESCORE
8.3
S.9
-0,6
DISTANCE TO NEAREST SMSA
WITHIN
AFFECT PRESCORE
16.9
15.2
1.7
WRAT TOTAL
70.7
82.0
-11.3
74.8
83.2
-8.4
3.96
-16.2
AGE (JUNE '71)
84.0
83.4
0.6
SIZE OF NEAREST SMSA
.16,207,000
5 CLASSROOM MALE
29.5
-0,8
QUANTITATIVE
32.8
38,3
-5.5
36.2
40.4
-I.2
2.35
-8.8
.4
5 CLASSROOM BLACK
99.2
100.0
-0,8
PERCENT NONWHITE
25
o PRESCHOOL (OR NO, MOS.)
99.1
75.0
24.1
COGNITIVE PROCESSES
6.7
6.5
0.2
7.0
6,6
0.4
0.44
1.3
S PARENTS W 0 HS DIPL.
55.6
43.7
11.9
PROJECT SIZE (PUPILS)
500
5 PARENTS W SKILLED OCCUP.
44.5
52.2
-7.7
READING SKILLS
51.9
61.4
-9.5
55.2
62,8
-7.6
3.64
-14.7
5 PARENTS BLACK
97.7
100.0
-2.3
NO. PUPILS/PAC MEMBER
23.8
PARENTS POVERTY ELIGIBLE
47.5
69.1
-21.6
LANGUAGE ARTS
26.2
28.3
-2.1
27.3
28.9
-1.6
2.02
-5.6
2.4
5 HEAD HOUSEHOLD EMPLOYED
80.7
72.6
8.1
FT PER-PUPIL EXPENDITURE
808
5 HEAD HOUSEHOLD MALE
71.9
50.4
21.5
PART II
PARENT EVALUATION DATA
CLASSROOM DATA NOT AVAIIABIE FOR THIS
NO. CLASSROOM GROUPS
55
0PARENT-CHILD
PROJECT
Al', "ARENTS/CLASSRM GRP
14.8
4.8
10,0
INTERACT
.198
.369
-.171
.147
.304
-.157
.270
-.69
.37
5 8/0 HIGH SCHOOL DIPLOMA
55.6
-12.4
13.2
W SKILLED OCCUP.
44.5
52.6
-8.1
PARENT-SCHOOL
5 POS EVAL OF LSILD LANG
75.0
83.3
-8.3
INVOLVE
.616
-.127
.7.13
.257
-.408
.665
.365
-.05
1.38
5 BLACK
97,7
100.0
-2.3
S REPORTING USE OF PRESCHOOL
98.7
80.0
18.7
CHILD ACADEMIC
5 POVERTY ELIGIBLE
47.5
62.9
.15.4
EXPECT
.121
.078
.043
.388
.203
.185
.378
-.50
.93
5 HEAD HOUSEHOLD EMPLOYED
80.7
67.1
13.6
5 HEAD HOUSEHOLD MALE
71.8
50.4
21.4
SENSE OF CONTROL.
.187
-.130
,317
-.017
- 305
.288
.358
.99
PART
III
TEACHER EVALUATION DATA
NO. OF CLASSROOMS
54
1PARENT-EDUCATOR
JOB SATISF. RATING
1,7
1.9
-0.2
IMAGE
0.34
0.55
-0.21
0.18
0.59
-0.41
0.185
-.77
-.05
BOOK RESOURCE SCALE
3.8
.3.7
0.1
RACE (BLACK/NONBIACK)
1.0
0.5
0.5
PROFESSION. ACCEPT
IDENT. W. COMMUNITY
0.8
1.0
-0.2
OF METHOD
1.40
1.50
-0.10
1.67
1.38
0.29
0.258
-.22
.80
NO. OF HELPERS
2,4
0.7
1.7
ABLE TO CHOOSE ASSIGNMENT
2.2
1.2
1.0
TANG & TEACHER EXPER '
7.2
5.2
2.0
*See "Guide for Interpretation
of Results- for explanation of table entries.
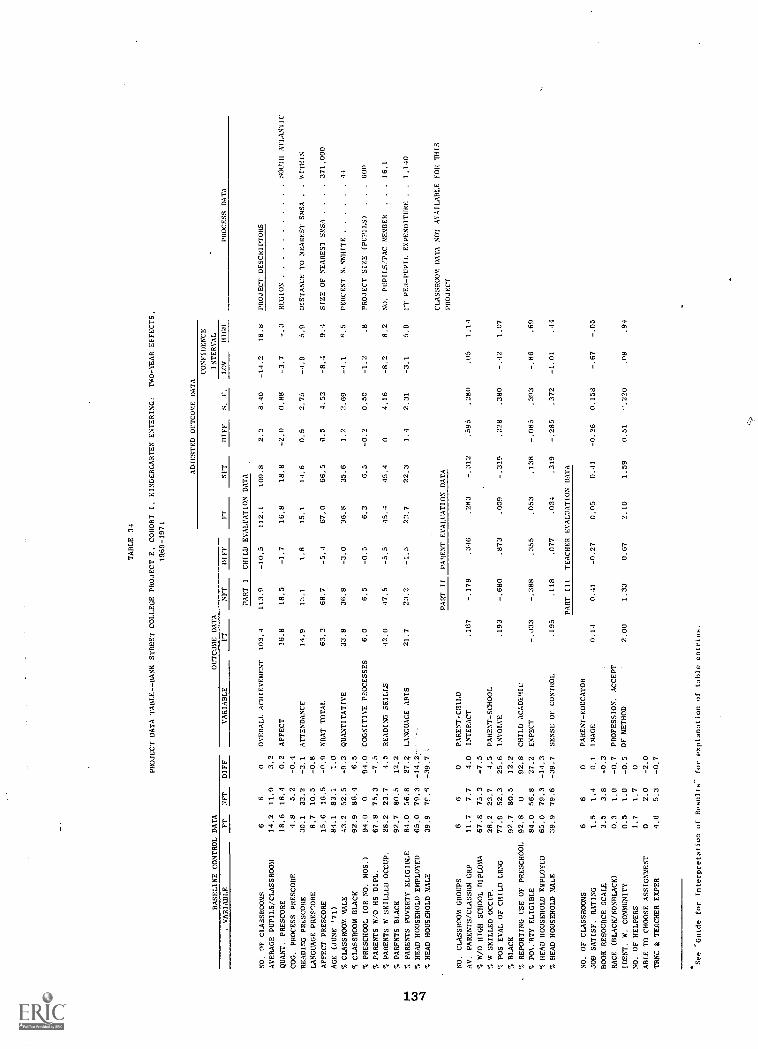
TABLE 34
PROJECT DATA TABLE--BANK STREET COLLEGE PROJECT E, COHORT I, KINDERGARTEN ENTERING,
TWO-YEAR EFFECTS,
1969-1971
ADJUSTED OUTCOME DATA
CONFIDENCE
BASELINE CONTROL DATA
OUTCOME DATA
INTERVAL
VARIABLE
FT
NET
DIFF
VARIABLE
FT
NFT
DIFF
FT
NET
DIFF
S.
E.
LOW
HIGH
PROCESS DATA
?ART I
CHILD EVALUATION DATA
NO.
'IF CLASSROOMS
66
0OVERALL ACHIEVEMENT
103.4
113.9
-10,5
112.1
109.8
2.3
8.40
-14.2
18.8
PROJECT DESCRIPTORS
AVERAGE PUPILS/CLASSROOM
14.2
11.0
3.2
QUANT. PRESCORE
18.6
18.4
0.2
AFFECT
16.8
18,5
-1.7
16.8
18,8
-2.0
0,88
-3.7
-.3
REGION
SOUTH ATLANTIC
COG. PROCESS PRESCORE
4.8
5.2
-0.4
READING PRESCORE
30.1
33.2
-3.1
ATTENDANCE
14.9
13.1
1.8
15.1
14,6
0.5
2.75
5.9
DISTANCE. TO NEAREST SMSA
..WITHIN
LANGUAGE PRES'.ORE
8.7
10.5
-0.8
AFFECT PRESCORE
15.6
16.5
-9.9
WRAT TOTAL
63.3
68.7
67,0
66,5
0.5
4.53
9,4
SIZE OF NEAREST SISA
71,000
AGE (JUNE '71)
84.1
83.1
1.0
% CLASSROOM MALE
43.2
52,5
-9.3
QUANTITATIVE
33.8
36.8
-3.0
36.8
35.6
1.2
2.69
S,5
PERCENT N,NWHITE
11
% CLASSROOM BLACK
92.9
86.4
6.5
% PRESCHOOL (OR NO. MOS.)
94.0
094.0
COGNITIVE PROCESSES
6.0
6.5
-0.5
6.3
6,5
-0.2
0,50
-1.2
.8
PROJECT SIZE (PUPILS)
..
.800
% PARENTS W/O HS DIPL.
67.8
75.3
-7.5
% PARENTS W SKILLED OCCUP,
28.2
23.7
4,5
READING SKILLS
42,0
47,5
-5,5
45.4
45,4
04,16
-8.2
8.2
NO. PUPILS/PAC MEMBER
..
.16.1
% PARENTS BLACK
92.7
80,5
12.2
1.4
% PARENTS POVERTY ELIGIBLE
84.0
56.8
27.4
LANGUAGE ARTS
21.7
23.2
-1.5
23.7
22,3
1.4
2,31
-3.1
5.9
FT PER-PUPIL EXPENDITURE
,.1,140
CO
S HEAD HOUSEHOLD EMPLOYED
65.0
79.3
-14.2:
---
% HEAD HOUSEHOLD MALE
39.9
71-.9
-39.7
CLASSROOM DATA NOT AVAILABLE FOR THIS
PART II
PARENT EVALUATION DATA
PROJECT
NO, CLASSROOM GROUPS
66
0PARENT -CHILD
AV. PARENTS/CLASSRM GRP
11.7
7.7
4.0
INTERACT
.167
-.179
.316
.283
-.312
.595
.280
,05
1.14
% W/O HIGH SCHOOL DIPLOMA
67,8
75,3
-7,5
S W SKILLED OCCUP.
28,2
23.7
4.5
PARENT-SCHOOL
S POS EVAL OF CHILD LRNG
77.9
52.3
25.6
INVOLVE
.193
-.680
.873
.009
-.319
.328
.380
-.42
1.07
% BLACK
92.7
80.5
12,2
.% REPORTING USE OF PRESCHOOL
92.8
092.8
CHILD AcADEMIc
% P01..BTY ELIGIBLE
84.0
56.8
27.2
EXPECT
-,J33
-.388
.355
.053
.138
-.085
.393
-.86
.69
% HEAD HOUSEHOLD EMPLOYED
65.0
79.3
-14.3
% HEAD HOUSEHOLD MALE
39.9
79.6
-39.7
SENSE OF CONTROL
.195
.118
.077
.034
.319
-.285
.372
-1.01
.44
PART III
TEACHER
EVALUATION DATA
NO, OF CLASSROOMS
66
0PARENT-EDUCATOR
JOB SATISF. RATING
1,5
1,4
0.1
IMAGE
0.14
0.41
-0.27
0.05
0.41
-0.26
0.158
-.67
-.05
BOOK RESOURCE SCALE
3.5
3.8
-0.3
RACE (BLACK/NONBLACK)
0.3
1.0
-0.7
PROFESSION. ACCEPT
IDENT. W. COMMUNITY
0.5
1.0
-0.5
OF METHOD
2.00
1.33
0,67
2,10
1.59
0.51
".220
.08
.94
NO. OF HELPERS
1.7
1.7
0
ABLE TO CHOOSE ASSIGNMENT
02.0
-2.0
TRNC & TEACHER EXPER
4.6
5,3
-0.7
"Guide for Interpretation of Results- for explanation of table entries.
Also, as was often the case, FT families are more disadvantaged than
NFT families. Teachers, however, appear quite closely matched on all
measures except choice of assignment, where, in contrast to most projects,
NFT teachers report more autonomy.
Results of outcome analyses (Table 34) show NFT pupils significantly
above FT pupils on the affect measure with no other pupil differences
approaching significance. The difference on the parent child interaction
measure is significant in favor of FT parents. Also, FT teachers show
significantly more approval and acceptance of their methods than NFTteachers.
These Project BC(e) results are mixed and perplexing. Since this
project was not included in the classrocm observation sample, descriptions
of processes are not available to assist in interpretation. However, it
does seem clear that this project is failing to attain at least one major
goal of the model--that of developing positive pupil affect. On the
other hand, the parent and teacher goals are being attained to some ex-
tent, as evidenced by the significant results in these areas.
Project BC(a)
Data for Project BC(a), a Cohort I-K sample, are summarized in
Table 35. Even though this project only marginally qualifies for inclu-
sion in the analysis and evaluation, we are including the findings for
purposes of completeness.
The project is small (240 pupils) and suburban to a relatively small
SMSA (63,000) in the New England region. The community is 99 percent
white, the projected FT expenditure was $862 per pupil, and the PAC
ratio was one member per 10 pupils.
The FT and NFT groups badly matched; pupils in the three
FT classes average about nine mc_Iths older than those in the two NFT
classes. Nevertheless, the FT group scored only slightly better than
the NFT group on baseline tests. the NFT classes are nearly 75 percent
girls, whereas the FT classes are about 50 percent female. Although
data problems prevented parent and teacher analyses, parent data are
summarized for the pupils. As can be seen, FT families are substantially
more disadvantaged than NFT families (less education, lower occupational
levels, lower income, less employment, and fewer male heads of household).
Results of the outcome analyses for this project show that FT scored
significantly higher than the NFT pupils on the cognitive process
138
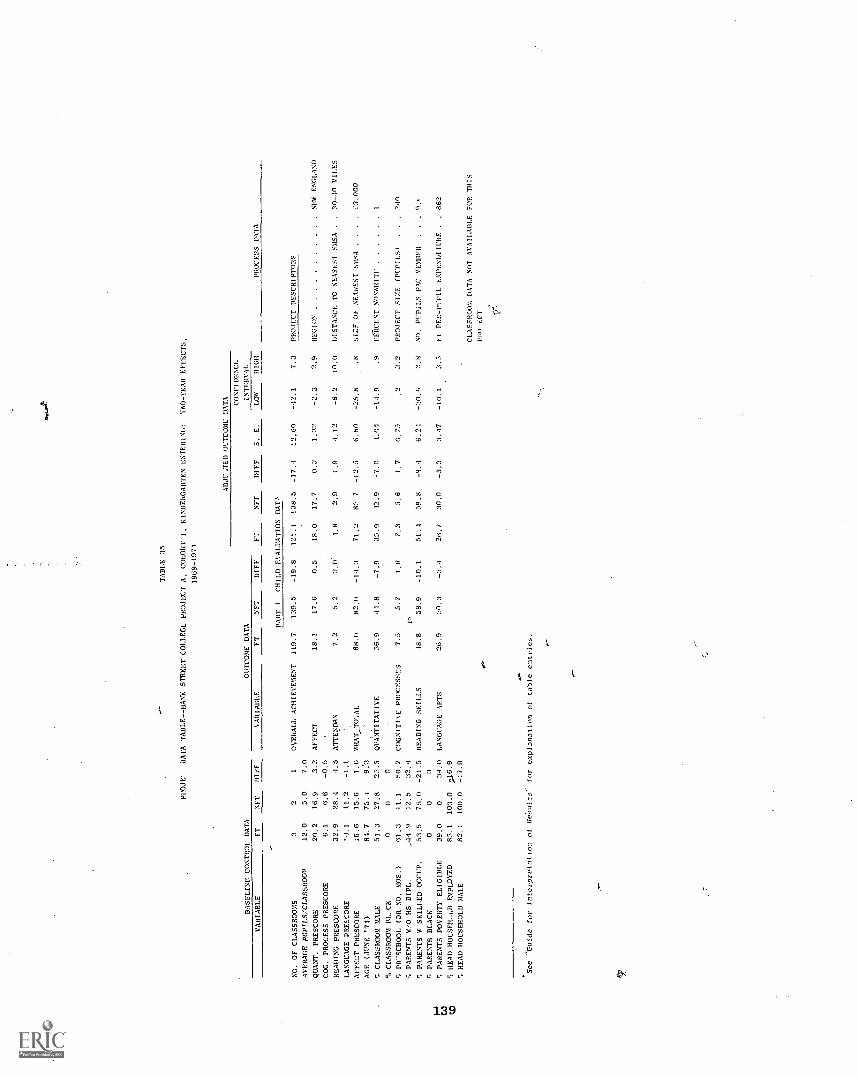
BASELINE CONTROL DATA
TABLE 35
PROJE!
DATA TABLE--BANK STREET COLLEGE PROJECT A, COHORT 1, KINDERGARTEN ENTERING:
TWO-YEAR EFFECTS,
1969-1971
ADJU,TED OUTCOME DATA CONFIDENCE
OUTCOME DATA
INTERVAL
VARIABLE
FT
SET
DliF
VARIABLE
FT
NFT
RIFF
FT
NFT
DIFF
S.
E,
LOW
HIGH
PROCESS DATA
PART I
CHILD EVALUATION
DAT,
NO, OF CLASSROOMS
32
1OVERALL ACHIEVEMENT
119.7
139.5
-19.8
121.1
138.5
-17.4
12,60
-42.1
7.3
PROJECT DESCRIPTORS
AVERAGE PUPILS /CLASSROOM
12.0
5.0
7.0
QUART. PRESCORE
20.2
16,9
3.3
AFFECT
18.1
17,6
0.5
18.0
17.7
0.3
1.32
2.9
REGION
NEW ENGLAND
COG, PROCESS PRESCORE
6,1
6,6
-0.5
READING PRESCORE
32.9
28.4
4.5
ATTENDAN
7.2
5.2
2.0
4.8
2.9
1.9
4.12
-6.2
10.0
DISTANCE TO NEAREST SM.SA
..30-40 MILES
LANGUAGE PRESCORE
11.2
-1.1
AFFECT PRESCORE
16.6
15.6
1.0
WRATTOTAL
68.0
82,0
-14.0
71.2
81' 7
-12.5
6.80
-25.8
.8
SIZ.17 OF NEAREST 5M,
..:3.000
AGE (JUNE '71)
84.7
75,4
9.3
7, CLASSROOM MALE
51.3
27.8
23,5
QUANTITATIVE
36.9
44.8
-7,9
35.9
42.9
-7.0
1.04
-14.9
.9
FetCENT NONWHITE
1
% CLASSROOM 111,..CK
00
0
q PR-SCHOOL (OR NO, MOS.)
61,3
11.1
50.2
COGNIT1E PROCESSES
7.5
5.7
1,8
7.3
5,6
1.7
0.75
.2
3.2
PROJECT SIZE (PUPILS)
..
.240
% PARENTS 6/0 HS DIPL.
,44 9
12.5
32.1
Cs
PARENTS W SKILLED OCCUP.
53.5
75.0
-21,5
READING SKILLS
48.8
58.9
-10.1
51.4
59.8
-8.1
6,21
-20.6
3.8
NO. PUP1LS'PAC MEMBER
..
.9.t.
... PARENTS BLACK
00
0I"
q PARENTS POVERTY ELIGIBLE
39.0
039.0
LANGUAGE ARTS
26.9
30.3
26.7
30.0
-3.3
3.47
-10.1
3.5
FT PER-PUPIL EXPENDITURE
862
GO
..
CO
q HEAD HOUSEHOLD EMPLOYED
83.1
100.0
:,,..16,9
7. HEAD HOUSEHOLD MALE
82.1
100.0
-17.9
41,
..-
.See -Guide for Interpretatio:i of Re'snits- for explanation of table entries,
CLASSROOM DATA SOT AVAILABLE FOR THIS
PRo ACT
measure (95 percent confidence interval = .2 to 3.2 points). Although
no other differences reached significance, a large NFT-favoring difference
on the WRAT approached the 5 percent confidence level. The evidence of
positive effects of this FT project is considered marginal.
Project BC(c)
Project BC(c) is a relatively small project (292 pupils) located
within a moderate sized SMSA (601,000) in the mid-Atlantic region. The
anticipated FT expenditure is relatively high, averaging $1,250 per pupil,
with a pupil/PAC ratio of 8.6. Two cohort samples were gathered from
this project--I-K (two year) and II-K (one-year). Both of these samples
were included in the classrobm observation activities.
The analysis data for the Cohort I, two-year effects sample are
summarized in Table 6. These data show that the five FT and four NFT
classrooms were reasonably comparable on baseline test scores, but not
on classroom compositions. FT classes had higher proportlions of male
pupils, lower proportions of Blacks, and a much higher proportion of
pupils with preschool experience than the NFT classes. The families,
however, were moderately similar except that the FT families tended to
be somewhat more disadvantaged (lower relative educational level, income,
occupational level, and employment, and fewer male heads of households).
.Teachers of the two groups were also moderately alike on inputs although
FT teachers were less satisfied with their working conditions, had fewer
book resources, less training and experience, less choice of assignment,
and fewer helpers than NFT teachers. This profile is quite unusual,
since in other projects FT teachers tend to exceed NFT teachers on many
or all of these variables.
In the outcome analysis, FT pupils scored significantly better in
quantitative skills (95 percent confidence interval = 3.6 to 15.0 points).
No other pupil results reached significance, although the FT pupils
tended to do better.
None of the results for parents or teachers were statistically
significant. On classroom observation 'factors, FT andkNFT share similar
patterns of scores, but FT is consistently higher than NFT, especially
on the self-regulatory factor, which is emphasized in the model. The
pattern would correspond better with the Bank Street model if thedifferences on the self-regulatory and expressive factors were even
more pronounced. But the five factors are not as salient for 'ais
model as they are for most other models (cf. SRI, 1972b, Appendix B).
Selected variables from several factors, such as small groups, wide
140
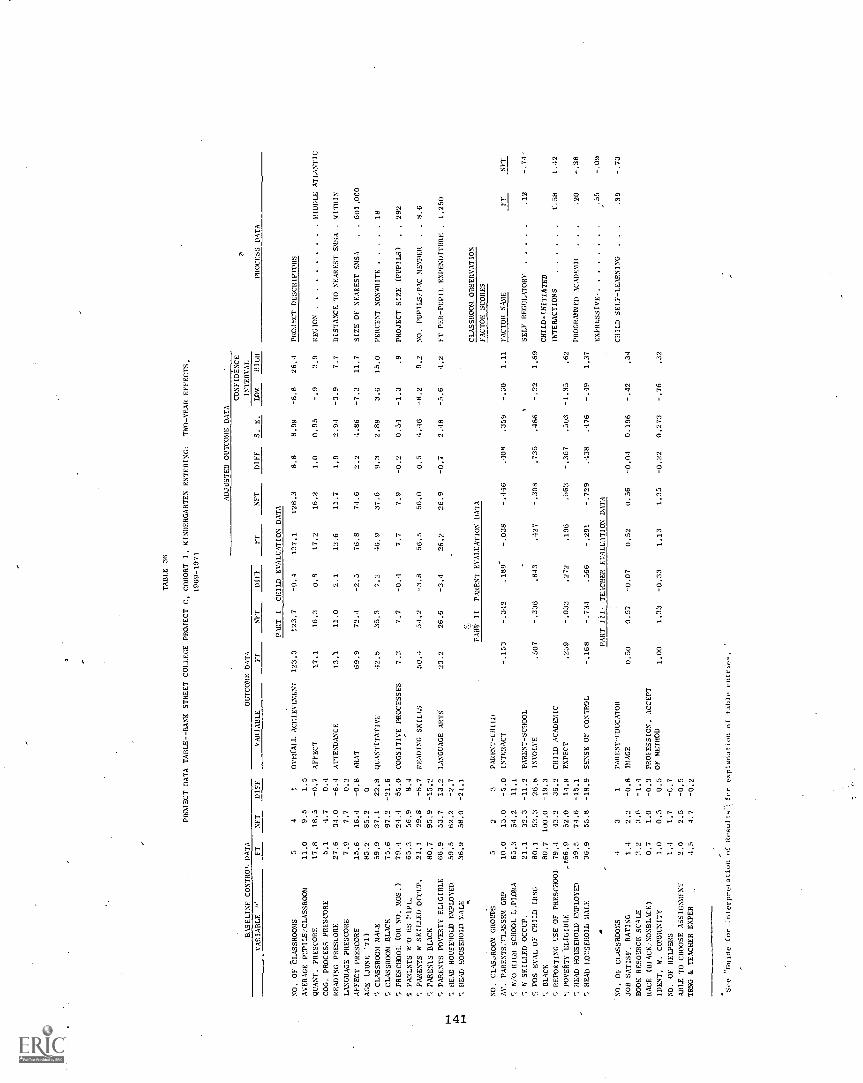
TABLE 36
PROJECT DATA TABLE-RAMC STREET COLLEGE PROJECT C, COHORT I, KINDERGARTEN ENTERING:
TWO -YEAR EFFECTS,
1969-1971
ADJUSTED OUTCOME DATA
CONFIDENCE
BASELINE CONTROL DATA
OUTCOME DATA
INTERVAL
VARIABLE v
FT
NFT
D1FF
VARIABLE
FT
NFT
MIFF
FT
NFT
DIFF
S. E.
IOW'
HIGH
PART I
CHILD EVALUATION DATA
PROCESS DATA
SO. OF 'CLASSROOMS
54
1OVERALL ACHIEVEMENT
123.3
123.7
1137.1
128.3
8.8
8.99
-8.8
26.4
PROJECT DESCRIPTORS
AVERAGE PUPILS/CLASSROOM
11.0
9.5
1.5
QUART. PRESCORE
17.8
18.5
-0.7
AFFECT
17.1
16.3
0.8
17.2
16.2
1.0
0.95
2.9
REGION
MIDDLE ATLANTIC
COG, PROCESS PRESCORE
5.1
4.7
0.4
READING PRESLORE
27.6
34.0
-6.4
ATTENDANCE
13..
11.0
2.1
13.6
11.7
1.9
2.94
-3.9
7.7
DISTANCE TO NEAREST SMSA
.WITHIN
LANGUAGE PRESCORE
7.9
7.7
0.2
AFFECT PRESCORE
15.6
16.4
-0.8
WHAT
69.9
72.4
-2.5
76.8
74.6
2.2
4.86
-7.3
11.7
SIZE OF NEAREST SMSA
,. 601,000
AGE (JUNE '71)
85.2
85.2
0
CLASSROOM MALE
59.9
37.1
22.8
QUANTITATIVE
42.5
35.3
7.2
46.9
37.6
9.3
2.89
3.6
15.0
PERCENT NONWHITE
18
7c CLASSROOM BLACK
75.6
97.2
-21.6
7c PRESCHOOL (OR NO. MOS.)
79.4
24.4
55.0
COGNITIVE PROCESSES
7.3
7.7
7.7
7.9
0.54
-1.3
.9
PROJECT SIZE (PUPILS)
.,292
PARLNTS W'0 HS PIPL.
65.3
56.9
8.4
PARENTS W SKILLED OCCUP.
21.1
29.8
-8.7
READING SKILLS
50.4
54.2
-3.8
56.5
56.0
0.5
4.46
-8.2
9.2
NO. PUPILS/PAC MEMBER
..8.6
PARENTS BLACK
80.7
95.9
-15.2
7c PARENTS POVERTY ELIGIBLE
66.9
53.7
13.2
LANGUAGE ARTS
23.2
26.6
26.2
26.9
-0.7
2.48
-5.6
4.2
FT PER-PUPIL EXPENDITURE
.1,250
'7; HEAD HOUSEHOLD EMPLOYED
59.5
62.2
-2.7
". HEAD HOUSEHOLD MALE
36.9
58.0
-21.1
CLASSROOM OBSERVATION
PAR 4' II
PARENT EVALUATION DATA
FACTOR SCORES
NO. CLAS,ROOM GROUPS
52
3PAREST-CHILD
Al'. PARENTS/CIASSRM GRP
10.0
15.0
-5.0
INTERACT
-.153
-.342
.189
-.446
.408
.359
-.30
1.11
FACTOR NAME
1-f
NFT
'-.1170 HIGH SCHOOL L.PLOMA
65.3
54.2
11.1
'-,S SKILLED OCCUP.
21.1
32.3
-11.2
PARENT-SCHOOL
ISELF REGULATORY
.12
7c POS EVAL OF CHILD LRNG
80.1
53.3
26.8
INVOLVE
.507
-.336
.843
.127
-.308
.735
.486
-.22
1.69
'-.BLACK
80.7
100.0
-19.3
CHILD-TRITIATED
`-.REPORTING USE OF PRESCHOOL
79.4
43.2
36.2
CHILD ACADEMIC
INTERACTIONS
1.58
1.42
POVERTY ELIGIBLE
.166.9
52.0
11.9
EXPECT
.2j9
-.033
.272
.196
.563
-.3G7
.503
-1.35
.62
7c HEAD HOUSEHOLD EMPLOYED
59.5
74.6
-15.1
PROGRAMMED AcADEmi,
.20
-.38
HEAD HOUSEHOLD MALE
36.9
55.8
-18.9
SENSE OF CONTROL
-.168
-.734
.566
-.291
-.729
.438
.476
1.37
EXPRESSIVE-
55
-.09
PART III;
TEACHER EVALUATION DATA
NO. OF CLASSROOMS
43
1PARENT-EDUCATOR
CHILD SELF-LEARNING
..
.-.39
-.73
JOB SATISF. RATING
1.4
2.2
-0.8
IMAGE
0.50
0.57
-0.07
0.52
0.56
-0.04
0.196
-.42
.34
BOOK RESOURCE SCALE
3.6
RACE (BIACK;SONBLACK)
0.7
1.0
-0.3
PROFESSION. ACCEPT
IDENT, W, COMINITY
1.0
0.5
0.5
OF METHOD
1.00
1.33
-0.33
1.13
1.35
-0.22
0.273
-.76
.32
NO. OF HELPERS
1.4
1.7
-C.7
ABLE TO CHOOSE ASSIGNMENT
2,0
2.5
-0.5
TANG & TEACHER EXPER
4.5
4.7
-0.2
See
Guide for Interpretation of Resultsfer explanation of table entries.

variety of activities, reinforcement, use of objects, independence, and
self-expression, would more nearly describe the Bank Street program. In
any case, the pattern of process factors does not provide assistance in
the interpretation of the single instance of FT superiority on the quan-
titative outcome measure.
Project data from the Cohort II sample in Project BC(c) provide
additional evidence of FT/NFT lack of comparability. These data, pre-
sented in Table 37 shOw that the four FT and three NFT classes are poorly
matched on ethnic composition. Moreover, NFT families appeared more
disadvantaged than FT families as defined by the conventional indi-
cators of education, occupation, and poverty level, although the heads
of household were more often male and more often employed than the FT
heads of household. Insufficient teacher data prevented analyses of
teacher effects, but process data were available since the classrooms
were included in the CO sample.
Analysis of one-year effects for this sample failed to reveal sig-
nificant FT/NFT differences on any of the pupil or parent outcomes. How-
ever; the FT pupils did somewhat, better on all tests (adjusted scores),
and on the quantitative measure, the difference between their scores and
those of the NFT group approaches statistical significance. Process
factor score averages show FT above NFT on the self-regulatory and child
self-learning factors but close to NFT on the expressive dimension. The
low expressive factor score for FT and the lower score for FT than NFT on
the programmed academic dimension give a mixed picture of implementation
of the model. The classroom observation scores do not serve to clarify
our understanding of the pupil tE ,t scores for this cohort.
Project BC(d)
The remaining Bank Street project supplied evaluative data for
analysis of three groups--a Cohort I, second-year, a Cohort I, first-
year subset, and a Cohort II, first year. This fairly large project
(892 pupils) consists of entering first grade pupils in a predominantly
nonwhite community in a small east-south central community. None of the
'classrooms participating in this analysis were included in the classroom
observation sample; thus; no process data are available.
The data for the Cohort I sample are summarized in Table 38 for the
two-year effects and in Table 39 for the one-year subset. A total of .
nine FT and 'our NFT classes were tested and appear highly comparable
both on baseline test scores and classroom composition (with the excep-
t tion of preschool experience, which was much more prevalent among
142

TABLE 37
PROJECT DATA TABLE--BANK STREET COLLEGE PROJECT C, COHORT II, KINDERGARTEN ENTERING:
ONE-YEAR WECTS.
1970-1971
BASELINE CONTROL DATA
VARIABLE
FT
NET
DIFF
OUTCOME DATA
VARIABLE
FT
ADJUSTED OUTCOME DATA
CONFIDENCE
INTERVAL.
NET
DIFF
FT
NET
DIFF
S. E.
LOW
HIGH
PART I
CHILD EVALUATION DATA
PROCESS DATA
NO. OF CLASSROOMS
43
1OVERALL ACHIEVEMENT
103.5
101.5
-1.0
107.7
98.2
9.5
10.86
-11.8
30.8
PROJECT DESCRIPTORS
AVERAGE PUPILS/CLASSROOM
14.8
5,0
9.8
QUANT. PRESCORE
15.0
13.4
AFFECT
16.0
16.4
16.0
15.8
0.2
1.58
3.3
REGION
MIDDLY ATLANTIC
COG. PROCESS PRESCORE
4.8
4.8
0
READING PRESCORE
21.1
25.6
ATTENDANCE
21.8
16.4
21.3
13.3
8.0
5.17
18.1
DISTANCE TO NEAREST SMSA
WITHIN
LANGUAGE PRESCORE
12.3
12.8
-0.5
AFFECT PRESCORE
15.G
16.6
-1.0
WRAT TOTAL
47.5
17.1
0.4
48.6
41.0
7.6
7.57
22.4
SIZE OF NEAREST SMSA
..
.601.000
AGE (JUNE '71)
74.3
73.1
1.2
7, CLASSROOM MALE
52.9
49.6
3.3
Qt:ANTITATIVE
29.1
27.4
1.7
29.3
24.9
3.16
-1.8
10.6
PERCENT NONWHITE
18
7, CLASSROOM BLACK
75.7
100.0
-24.3
PRESCHOOL (OR NO. 1105.)
7.3
0.2
7.1
COGNITIVE PROCESSES
7.5
6.8
0.7
7.7
6.7
1.0
0.69
2.4
PROJECT SIZE (PUPILS)
..
.292
PARENTS W/O HS DIPL.
67.3
79.3
-12.0
PARENTS W SKILLED OCCUP.
28.8
9.1
19.7
READING SKILLS
49.1
53.2
52.0
48.3
3.7
7.04
-10.1
17.5
NO. PUPILS,PAC MEMBER
..
.8.6
7, PARENTS BLACK
75.7
98.1
-22.1
7, PARENTS POVERTY ELIGIBLE
48.4
56.2
-7.8
LANGUAGE ARTS
17.9
17.2
0.7
18.6
17.8
0.8
1.61
4.0
FT PER-PUPIL EXPENDITURE
.1,250
HEAD HOUSEHOLS EMPLOYED
19.3
55.7
-6.4
HEAD HOUSEHOLD MALE
46.0
55.0
-9.0
PART II
PARENT EVALUATION
DATA
CLASSROOM OBSERVATION
FACTOR SCORES
NO. CLASSROOM GROUPS
43
PARENT-CHILD
AV. PARENTS,CLASSRM GRP
11.8
11.0
3.8
IMAGE
-.122
-.017
-.105
-.433
-.583
.150
.328
.70
FACTOR NAME
VT
NET.
W/O HIGH SCHOOL DIPLOMA
67.3
79.3
-12.0
W SKP.LED OCCUP.
28.8
9.1
19.7
PARENT-SCHOOL
SELF REGULATORY
.38
-.20
POS REAL OF CHILD LRNG
75.1
87. -I
-12.3
INVOLVE
.286
.067
.219
.153
.117
.036
.113
.85
BLACK
75.7
98.1
CHILD-INITIATED
REPORTING USE OF PRESCHOOL
95.7
83.4
12.3
CHILD ACADEMIC
INTERACTIONS
1.02
2.04
7, POVERTY ELIGIBLE
48.1
56.2
-7.8
EXPECT
.043
.125
-.082
.11.
-.003
..123
.310
.73
7, HEAD HOUSEHOLD EMPLOYED
19.3
55.7
PROGRAMMED ACADEMIC
.-.77
-.28
7 HEAD HOUSEHOLD MALE
46.0
55.0
-9.0
SENSE OF CONTROL
-.099
-.422
.323
-.287
-.559
.272
.440
-.59
1.13
EXPRESSIVE
-.39
CHILD SELF LEARNING
..
..
-.66
-1.87
See
,InIde for Interpretation of St-sults
for c.xplanation of tablc. entrius.
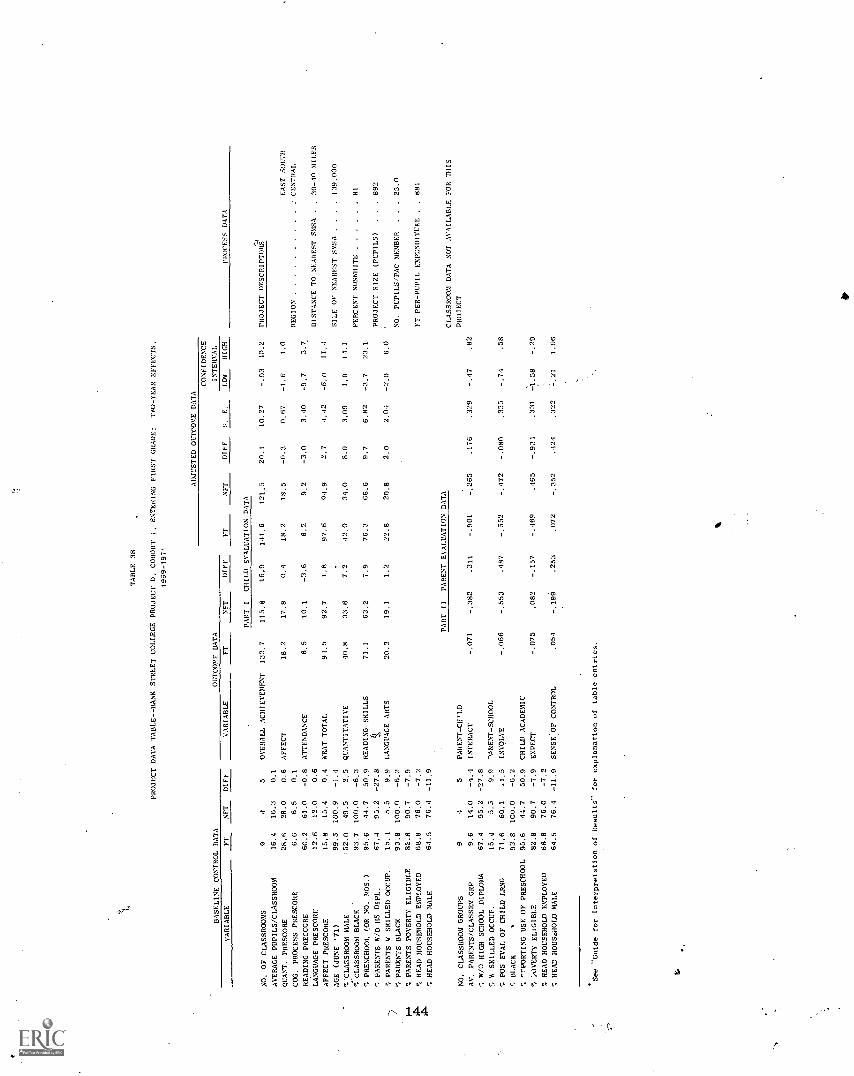
IA
ti
BASELINE CONTROL DATA
TABLE 38
PROJECT DATA TABLE-BANK STREET COLLEGE PROJECT 0, COHORT I, ENTERING FIRST GRADE:
THO-YEAR EFFECTS,
1969-1971
OUTCOME DATA
ADJUSTED OUTCOME DATA
CONFIDENCE
iSTERM
VARIABLE
FT
NFT
DIFF
VARIABLE
FT
NFT
DIFF
FT
NET
DIFF
S.
E.
LOW
HIGH
PROCESS DATA
PART I
CHILD EVALUATION
DATA
NO. OF CLASSROOMS
94
5OVERALL ACHIEVEMENT
132.7
115.8
16.9
141.6
121,5
20.1
10.27
-.03
40.2
PROJECT DESCRIPTORSi
AVERAGE PUPILS /CLASSROOM
16.4
16.3
0.1
QUANT, PRESCORE
28.6
28.0
0.6
AFFECT
18.2
17.8
0.4
18.2
18.5
-0.3
0.67
-1,6
1.0
EAST SOUTH
COG. PROCESS PRESCORE
6.6
6.5
0.1
REGION
CENTRAL
READING PRESCCRE
60.2
61.0
-0.8
ATTENDANCE
6.5
10.1
-3.6
6.2
9.2
-3,0
3.40
-9,7
3.7
LANGUAGE PRESCORE
12.6
12.0
0.6
DISTANCE TO NEAREST SMSA
30-10 MILES
AFFECT PRESCORE
15.8
15.4
0.4
WRAT TOTAL
94.5
92.7
1.8
97.6
94.9
2.7
4.42
-6.0
11.4
AGE (JUNE '71)
99.5
100.9
SIZE OF NEAREST SMSA
..
.139.000
'N CLASSROOM MALE
'52.0
49.5
2.5
QUANTITATIVE
40.8
33.6
7.2
12.0
31.0
8.0
3.09
1,9
11.1
.', CLASSROOM BLACK
93.7
100.0
-6.3
PERCENT NONWHITE
81
'1 PRESCHOOL (OR NO. MOS.)
95.6
44.7
50.9
READING SKILLS
71.1
63.2
7.9
76.3
66.6
9.7
6.82
-3.7
23.1
PARENTS W/O HS DIPL.
67.4
95.2
-27.8
PROJECT SIZE (PUPILS)
..
892
PARENTS N SKILLED OCCUP.
15.1
5.5
9.9
LANGUAGE ARTS
20.3
19.1
1.2
22.8
20.8
2.0
2.04
-2.0
6.0
7, PARENTS BLACK
93.8
100.0
-6.2
NO. PUPILS/PAC MEMBER
..
.25.0
!7; PARENTS POVERTY ELIGIBLE
82.8
90.7
-7.9
HEAD HOUSEHOLD EMPLOYED
68.8
76.0
-7.2
FT PER-PUPIL EXM:NDITURE
..881
q HEAD HOUSEHOLD MALE
64.5
76.4
-11.9
PART II
PARENT EVALUATION DATA
CLASSROOM DATA NOT AVAILABLE FOR THIS
NO. CLASSROOM GROUPS
94
5PARENT - CHILD
PROJECT
AV. PARENTS/CLASSRM CRP
9.6
14.0
INTERACT
-.071
-.382
.311
-.901
-.265
.176
.329
-.47
.82
W/0 HIGH SCHOOL DIPLOMA
67.4
95.2
-27.8
7, IS SKILLED OCCUP.
15.4
5.5
9.9
^ARENT-SCHOOL
POS EVAL OF CHILD LRNG
71.6
60.1
.1.5
INVOLVE
-.066
-.553
.487
-.552
-.472
-.080
.335
-.74
.58
BLACK
93.8
1C0.0
-6.2
""PORTING USE OF PRESCHOOL
95.6
44.7
50.9
CHILD ACADEMIC
:OVERTY ELIGIBLE
82.8
90.7
-7.9
EXPECT
-.075
.082
-.157
-.469
.465
-.934
.331
-1.58
-.29
HEAD HOUSEHOLD EMPLOYED
68.8
76.0
-7.2
HEAD HOUSthIOLD MALE
64.5
76.4
-11.9
SENSE OF CONTROL
.051
-.199
.253
.072
-.352
.124
.322
7.21
1.06
*See "Guide for Interpretation of Results' for explanation of table entries.

TABLE 39
PROJECT DATA TABLE--BANK STREET COLLEGE PROJECT D, COHORT I, ENTERING FIRST GRADE:
1969-1970
ONE-YEAR EFFECTS,
ADJUSTED OUTCOME DATA
CONFIDENCE
BASELINE/CONTROL DATA
OUTCOME DATA
INTERVAL
VARIABLE
FT
NFT
DIFF
VARIABLE
FT
NFT
DIFF
FT
NFT
DIFF
S. E.
LOW
HIGH
CHILD EVALUATION DATA
NO. OF CLASSROOMS
94
OVERALL ACHIEVEMENT
131.8
129.6
2.2
132.2
131.4
.8
3.60
-6.3
7.9
QUANT. PRESCORE
28.6
28.0
6
COG. PROCESS PRESCORE
6.6
6.5
AFFECT
16.9
16.6
.3
!15.1
13.4
1.7
1.14
-.5
3.9
READING PRESCORE
60.2
61.0
-
-.8
v
r tA c.n
LANGUAGE PRESCORE
AFFECT PRESCORE
12.6
15.8
12.0
15.4
.6
.4
ATTENDANCE
8.6
9.0
-.4
9.2
15.0
-5.8
3.12
-11.9
.3
AGE (JUNE '71)
99.5
100.9
-1.4
WRAT TOTAL
64.1
63.5
.6
65.4
64.9
.5
2.61
-4.6
5.6
.% CLASSROOM MALE
'::
52.0
49.5
2.5
% CLASSROOM BLACK
93.7
100.
-6.3
QUANTITATIVE
35.1
33.7
1.4
34.8
34.4
.4
1.10
-1.8
2.6
.% PRESCHOOL (OR NO. MOS.)
95.6
44.7
- 50.9
% PARENTS W/O HS DIPL.
67.4
95.2
-27.8
COGNITIVE PROCESSES
8.1
7.8
.3
7.8
8.2
-.4
.41
-1.2
.4
% PARENTS W/SKILLED OCCUP.
15.4
5.5
9.9
% PARENTS BLACK
93.8
100.
-6.2
READING SKILLS
71.6
72.5
-.9
72.3
71.9
.4
2.86
-5.2
6.0
% PARENTS POVERTY ELIGIBLE
82.8
90.7
-7.9
% HEAD HOUSEHOLD EMPLOYED
68.8
76.1
-7.2
LANGUAGE ARTS
17.0
15.5
1.5
17.5
16.9
.6
-.76
-.9
2.1
% HEAD HOUSEHOLD MALE
64.5
76.4
-11.9
See
Guide for Interpretation of Results
for explanation of table entries.
1

FT pupils). Covariable data indicate that both FT and NFT families in this
project were severely disadvantaged. The NFT parents reported less educa-
tion, lower occupational status, and higher poverty eligibility than the
FT group, although more NFT families had male heads of household and over-
all employment of head of household was higher for NFT. Because of insuffi-
cient data, teacher analyses were not performed on this sample.
Analysis of FT/NFT differences on pupil measures indicates that the
program had a significant effect on quantitative skills. The 95 percent
confidence interval for this result shows from 1.9 to 14.1 score points
in favor of FT. Other differences failed to reach significance but the
outcome on achievement came close enough (-.03 to 40.2 points) to warrant
attention.
Parent results showed that FT parents have a lower appraisal of
their children's success opportunities than do NFT parents. Since the
Bank Street model attempts to involve parents in both classroom and
PAC activities, this result is unexpected. Perhaps the FT parents are
appraising their children more realistically, or perhaps their goals are
higher than those of NFT parents. Prev..ous studies of community involve-
ment (Zurcher, 1970; Gurin & Gurin, 1970) make these explanations plaus-
ible. In any event, the outcome needs further study.
That the impact of this project is increasing becomes apparent
when first year results are compared with second year results for the
same children. This analysis (Table 39) shows virtually no difference
between FT and NFT groups on all test measures, and a near-significant,
FT-favoring difference on attendance at the end of one year of FT. After
two years, however, tests of these same FT and comparison group pupils
show that FT pupils are stronger on cognitive variables (quantitative
difference reaching significance) and, again, on attendance.
This pattern of results can be explained at least two different
ways. Eithey the model's effects gradually accumulate over time or the
structure and implementation of the Bank Street program substantially
improved between 1970 and 1971. Since Cohort II samples were measured
in this project, we can determine which of these explanations seems most
likely; if Cohort II, first year effects are stronger than Cohort I, first
year effects, the improved implementation explanation would see.., more
plausible.
The Cohort II-EF results for Project BC(d) are summarized in Table 40.
The baseline data indicate a moderately good match between FT and NFT class-
rooms on pupil scores, classroom composition, and family characteristics.
The notable exceptions are the reading test score (NFT higher), preschool
participation (FT much higher), and family leadership and employment
(NFT more male household heads and higher proportion employed). Teacher
146
characteristics were also quite similar with the only notable difference
being the greater number of helpers for FT teachers.
Results are very strongly in favor of FT for this one-year sample.
Significant differences appear on overall achievement, on WRAT,on reading,
and on language skills. Differences on affect and quantitative skills
also approach significance in favor of FT.
No parent effects reached significance, but teacher acceptance of
FT approached significance at the 95 percent confidence interval (-.05
to 1.91). Hence, the principal impact of this program appears concen-
trated on pupil outcomes.
Since the outcomes for the Cohort II, one-year group are much stronger
than the outcomes for the Cohort I, one-year group--in fact, resemble more
closely the results for the Cohort I, two-year group - -we prefer the inter-
pretation that the project was better implemented in 1971 than it was in
1970.
Summary
The salient features of the Bank Street College approach can be
summarized as follows:
Focus and Objectives--emphasizes long range objectives via child
self-development
Child
Cognitive
Develop competence in basic skills
Develop ability to probe, to reason, to solve problems
Affective
Develop capacity for enjoyment
Develop positive self-image
Develop self-direction
Develop expressiveness
Curricular Approach
Teachr's role that of facilitatorReinforcement primarily from teachers and aides
Individual and small group focus
Wide variety of activities provided
Heavy emphasis on child self-expression and self-regulatory
activity
147
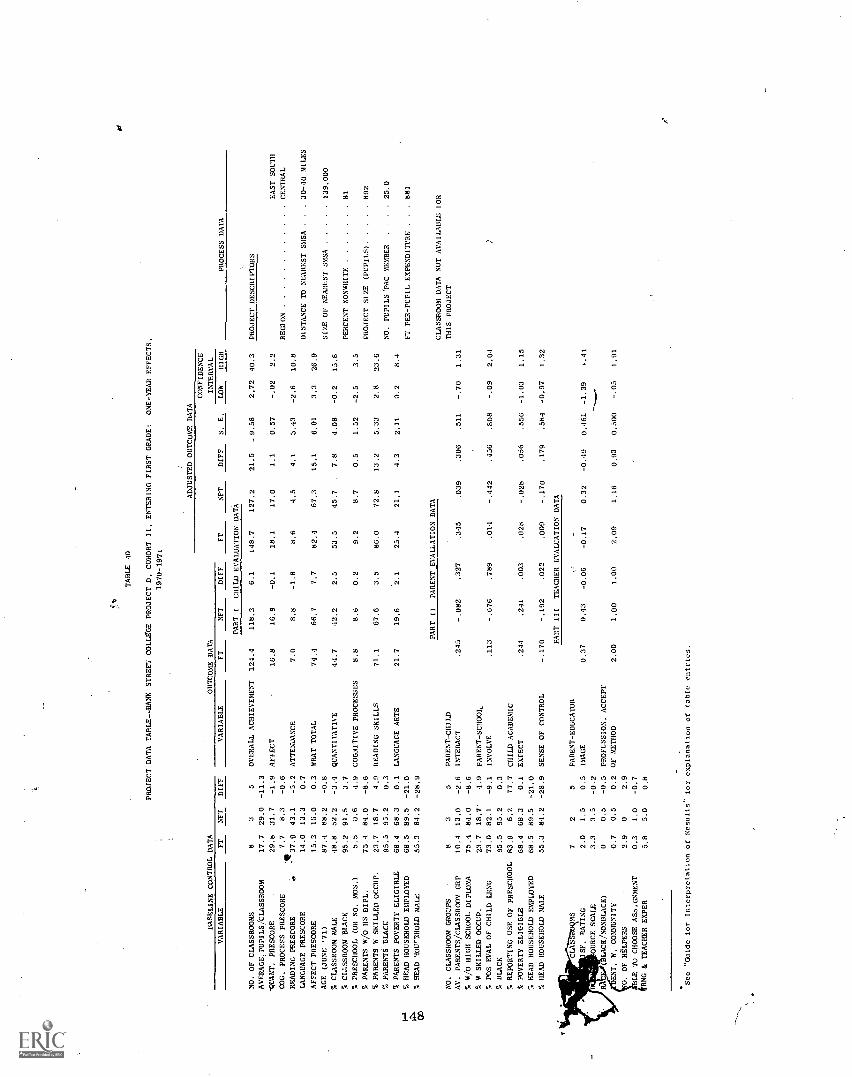
-
TABLE 40
PROJECT DATA TABLE-BANK STREET COLLEGE PROJECT D, COHORT II, ENTERING FIRST GRADE:
ONE-YEAR EFFECTS,
1970-1971
ADJUSTED OUTCOME DATA
BASELINE CONTROL DATA
OUTCOME DATA
FT
NET
OUT
S. E.
CONFIDENCE
INTERVAL
PROCESS DATA
VARIABLE
FT
RFT
DIFF
VARIABLE
FT
NFT
DIFF
LOW
HIGH
PART I
CHILD EVALUATION DATA
NO. OF CLASSROOMS
83
5OVERALL ACHIEVEMENT
124.4
118,3
6.1
148.7
127.2
21.5
- 9.58
2.72
40.3
PROJECT DESCRIPTORS
AVERAGE,PUPILS/CLASSROOM
17.7
29.0
-11.3
-QUANT. PRESCORE
29.8
31.7
-1.9
AFFECT
16.8
16.9
-0.1
18.1
17.0
1.1
0.57
-.02
2.2
EAST SOUTH
COG, PROCESS PRESCORE
7.7
8.3
-0.6
REGION
CENTRAL
READING PRESCORE
37.9
43.1
-5.2
ATTENDANCE
7.0
8.8
-1.8
8.6
4.5
4.1
3.43
-2.6
10.8
LANGUAGE PRESCORE
14.0
13.3
0.7
DISTANCE TO NEAREST SMSA
..30-40 MILES
AFFECT PRESCORE
15.3
15.0
0.3
WRAT TOTAL
74,4
66.7
7.7
82.4
67.3
15.1
6.01
3.3
26.9
AGE (JUNE '71)
87.4
88.2
-0.8
SIZE OF NEAREST SMSA
139.000
% CLASSROOM MALE
48.8
52.2
-3.4
QUANTITATIVE
44.7
42.2
2.5
53.5
45.7
7.8
4.08
-0.2
15.8
% CLASSROOM BLACK
95.2
91.5
3.7
PERCENT NONWHITE
81
% PRESCHOOL (OR NO. MOS.)
5.5
0.6
4.9
COGNITIVE PROCESSES
8.8
8.6
0.2
9.2
8.7
0.5
1.52
-2.5
3.5
% PARENTS W/O HS DIPL.
75.4
84.0
-8.6
PROJECT SIZE (PUPILS)
892
% PARENTS W SKILLED OCCUP.
23.7
18.7
4.9
READING SKILLS
71.1
67.6
3.5
86.0
72.8
13.2
5.33
2.8
23.6
% PARENTS BLACK
95.5
95.2
0.3
NO. PUPILS 'PAC MEMBER
.25.0
% PARENTS POVERTY ELIGIBLE
68.4
68.3
0.1
LANGUAGE ARTS
21.7
19.6
2.1
25.4
21.1
4.3
2.11
0.2
8.4
% HEAD HOUSEHOLD EMPLOYED
68.5
89.5
-21.0
FT PER-PUPIL EXPENDITURE
..881
% HEAD HOIY'THOLD MALE
55.3
84.2
-28.9
PART II
PARENT EVALUATION DATA
CLASSROOM DATA NOT AVAILABLE FOR
NO. CLASSROOM GROUPS
83
5PARENT-CHILD
THIS PROJECT
AV. PARENTS/CLASSROOM GRP
10.4
13.0
-2.6
INTERACT
.245
-.082
.327
.345
.039
.306
.511
-.70
1.31
% W/O HIGH SCHOOL DIPLOMA
75.4
84.0
-8.6
% W SKILLED OCCUP.
23.7
18.7
4.9
PARENT-SCHOOL
% POS EVAL OF CHILD LANG
73.0
82.1
-9.1
INVOLVE
.113
-.676
.789
.014
-.442
.456
.808
-.09
2.04
% BLACK
95.5
95.2
0.3
% REPORTING USE OF PRESCHOOL
83.9
6.2
77.7
CHILD ACADEMIC
% POVERTY ELIGIBLE
68.4
68.3
0.1
EXPECT
.244
.241
.003
-.028
.056
.556
-1.03
1.15
% HEAD HOUSEHOLD EMPLOYED
68.5
89.5
-21.0
% HEAD HOUSEHOLD MALE
55.3
84.2
-28.9
SENSE OF CONTROL
-.170
-.192
.022
.009
-.170
.179
.584
-0.97
1.32
PART
III
TEACHER EVALUATION DATA
72
5PARENT-EDUCATOR
SF. RATING
2.0
1.5
0.5
IMAGE
0.37
0.43
-0.06
-0.17
0.32
-0.49
0,461
-1.39
-.41
'=.7'';
:.URCE SCALE
3.3
3.5
-0.2
RAIN ilACK/NONBLACK)
00.5
-0.5
PROFESSION. ACCEPT
ENT. W. COMMUNITY
0.7
0.5
0.2
OF METHOD
2.00
1.00
1.00
2.09
1.16
0.93
0.500
-.05
1.91
'O. OF HELPERS
2.9
02.9
LE TO CHOOSE ASa.GNMENT
0.3
1.0
-0.7
G & TEACHER EXPER
5.8
5.0
0.8
See "Guide for Interpretation of Results- for explanation of table entries.

Type of Parent Involvement
Inform parents about program
Parents participate in classrooms, PAC
Parents used as resource for teachers in planning educational
experience of child
Evidence that the model is achieving its objectives is mixed from project
to project, but some encouraging results were noted. These encouraging
results include significant achieveMent gains in reading and language
skills for entering first grade samples in Cohort II. Also, for the Co-
hort I, entering first grade sample a significant FT-favoring difference
on quantitative skills occurred. However, these results are apparent
primarily at the project level, since only for Cohort I, two-year data
(kindergarten stream) is an across project summary analysis for this
sponsor possible. The results of this analysis are summarized in Table 41
and show overall significant differences favoring the model on cognitive
processes and on parent-school involvement measures. Teacher differences
approached significance on professional acceptance of FT, and reached
significance (NFT favoring) on the parent image measure. These findings
indicate that for the Coh rt I sample, the Bank Street College model has
met with reasonable success in attaining its objectives of pupil gains
and parent involvement. FT teachers, however, apparently hold less favor-
able attitudes regarding parent participation than do NFT teachers.
Process data, which describe activities, i.e., the way the model
was implemented, varied from project to project, indicating a high degree
of variability in the fidelity with which the approach was implemented.
Because of this variability, it is very difficult to formulate a complete
evaluation of the interim success of this approach. As mentioned earlier,
we can state that the results appear encouraging.
149

TABLE 41
BANK. STREET COLLEGE SUMMARY, COHORT I, KINDERGARTEN ENTERING PROJECTS:
TWO YEAR EFFECTS,
1969-1971
ADJUSTED OUTCOME DATA
OUTCOME MEASURE
UNADJUSTED MEANS
FT
NFT
DIFF
S. E.
CONFIDENCE
INTERVAL
FT
NFT
DIFF
LOW
HIGH
CHILD DATA
ACHIEVEMENT
120.2,
125.8
-5.6
126.9
123.7
3.3
4.46
-5.4
12.0
AFFECT
17.6
17.8
-.2
17.6
18.0
-.4
.43
-1.2
.4
WRAT
71.2
75.4
-4.2
74.6
74.2
.4
2.48
-4.5
5.3
QUANTITATIVE
37.6
37.8
-.2
39.7
37.7
2.0
1.42
-.8
4.8
COG. PROCESS
7.0
6.7
.3
7.2
6.6
.5
.25
.0
1.0
READING
50.4
54.9
-4.5
53.3
53.8
-.4
2.23
-4.8
4.0
LANGUAGE
25.3
26.4
-1.1
26.8
25.7
1.1
1.20
-1.2
3.4
PARENT DATA
PARENT-CHILD
.04
.04
.0
.01
-.01
.02
.13
-.24
.28
PARENT-SCHOOL
.43
-.37
.80
.37
-.37
.74
.19
.37
1.11
CHILD ACADEMIC EXPEC-
TATION
-.04
-.16
.13
-.01
-.10
.09
.21
-.32
.50
SENSE OF CONTROL
-.01
-.12
.10
-.03
-.09
.06
.19
-.31
.43
TEACHER DATA
PARENT-EDUCATOR IMAGE
.38
.51
-.12
.28
.53
-.25
.09
-.43
-.07
PROFESSION. ACCEPT FT
1.62
1.43
.20
1.72
1.49
--;24
.14
-.03
.53
See "Guide for Interpretation of Results" for explanation of table entries.

MATHEMAGENIC ACTIVITIES PROGYAM (MAP)
University of Georgia
Sponsor's Intended Approach
The MAP model emphasizes a scientific approach to learning based on
teaching the child to make a coherent interpretation of reality. It ad-
heres to the Piagetian perspective that cognitive and affective develop-
ment are products of interactions between the child and the environment.
It is not sufficient that the child merely Copy his environment; he must
be allowed to make his own interpretations in terms of his own level of
development.
An activity-based curriculum is essential to this model since it
postulates active manipulation and interaction with the environment as
the basis for learning. Individual and group tasks are structured to
allow each child to involve himself in them at physical and social as
well as intellectual levels of his being. Concrete materials are pre-
sented in a manner that permits him to experiment and discover problem
solutions in a variety of ways. The sponsor contends true learning
cannot occur when tasks that exceed a child's level of development are
forced on him. On the other hand, a child is attracted and challenged
to learn by tasks representing the next step beyond his current expe-
rience and knowledge level. Beth teaching techniques and curriculum
materials empha&tze sequential arrangement of tasks in small steps to
create a stimulating discrepancy or "mismatch."
Thus, the mathemagenic classroom stresses learning by doing as well
as individual initiative and decision-making on the part of the child.
AD attempt is made to maintain a careful balance between highly structured
and relatively unstructured learning situations and between the level of
conceptual material and the capability of individual children; small group
instruction by teacher and aides is emphasized but with specific provisions
for individual activity. This results in a great variy in the media em-
ployed, the activities available to the chilkardric the social situations
the child encounters. ;
The classroom is arranged to allow several groups of children to be
engaged simultaneously in similar or different activities. Teachers'
mantals including both. - recommended teaching procedure and detailed lesson
151
plTs for eight curriculum areas (K-3) are provided in the model. Learn-
ing materials'also include educational games children can use without
supervision in small groups or by themselves. Art, music, and physical
education are considered mathemagenic activities of equal importance to
- 'language, mathematics, science, and social' studies. Feelings of self-
confidence and motivation to learn are viewed as natural consequences of
the mathemagenic approach to learning.
Sponsor assistance to projects includes assignment of curri.uluM
specialists to spend some time each month in continuous inservice teacher-
ttrLining and a Project Advisor to coordinate the model with the other
aspects of the Follow Through project, such as the Policy Advisory Com-
mittee, supporting services, and home-school activities. Preservice work-
shcps are held during which teachers and teacher-aides gain experience
using the curriculum materials and learn how to implement MAP principles.
Second-year teachers and aides are expected to asstOck leadership roles in
these training workshops, and parents and the Policy Advisory Committee
are invited to all sessions. Parents and Follow Through staff work to-
gether during the year in the overall efforts in home-school coordination
and in encouraging the.local community to participate in the program.
Evaluation is a continual process. Project staff participate jointly
in evaluating the effectiveness of various aspects of the program and in
recommending improvements. Evaluative information is used in program
development and for specifying, in observable terms, important dimensions
of the program.
Individual Project Results
Only one project, which became an MAP project in 1969-70, was avail-able for analysis of effects. This project sample consists of enteringfirst grade pupils in Cohor.VI. The project is relatively small (397
pupils), in a predominantly white (3 percent nonwhite) community located
30 to 40 miles from a lage urban SMSA in the south. Atlantic region.
The data for the analysis of this project are summarized in Table 42.
Baseline values on pupils, parents, and teacher:- indicate substantial lack
of comparability between FT and NFT samples on many variables. Specif-
ically, FT classes averaged below NFT classes on nearly all baseline tests.
FT pupils also averaged several months older than the NFT pupils and, as
istypical in this experiment, were more likely to have had preschool
experience. The FT families tended to be more disadvantaged than UT.
Fewer FT heads of household had skilled occupations and werefully
152
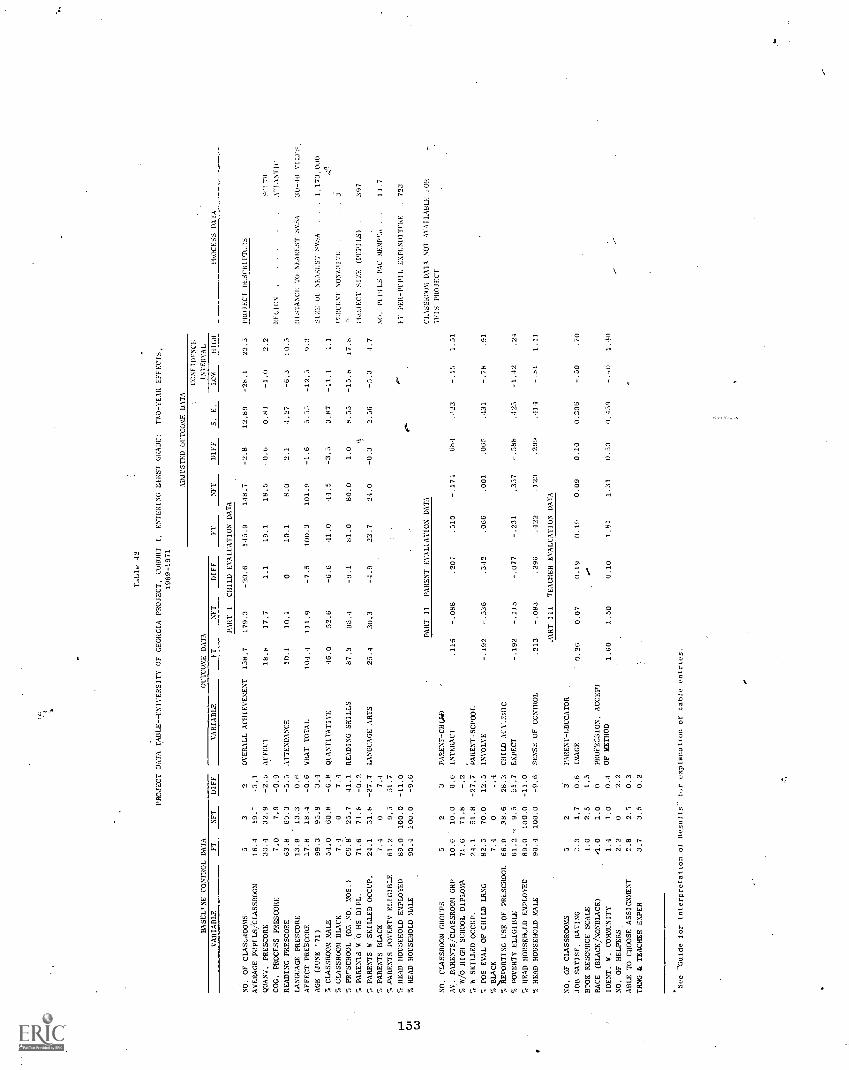
Table 42
PROJECT DATA TABLE -- UNIVERSITY OF GEORGIA PROJECT, COHORT I,
ENTERING FIRST GRADE:
TWO-YEAR EFFECTS,
1969-1971
BASEL'NE CONTROL DATA
OUTCOME DATA
ADJUSTED OUTCOME. DATA
CONFIDENCE
INTERUL
VARIABLE.
FT
NFT
DIFF
VARIABLE.
FT
NET
DIFF
FT
NFT
DIFF
S.
E.
LOW
HIGH
PROCESS DATA
PART I
CHILD EVALUATION DATA
NO. OF CLAS..ROOMS
53
2OVERALL ACHIEVEMENT
158.7
179.3
-20.6
145.9
148.7
12.89
-28.1
22.5
PROJECT 0F.5cRIPTI.:!S
AVERAGE PUPILS/CLASSROOM
16.4
19.7
-3.1
QUANT. PRESCORE
30.4
32.9
-2.5
AFFECT
18.8
17.7
1.1
19.1
18.5
.0.6
0.81
-1.0
2.2
sG!T0
COG. PROCESS PRESCORE
7.0
7.9
-0.9
REGION
. \TL1NT IC
READING PRESCORE
63.8
69.3
ATTENDANCE
10.1
10,1
010.1
8.0
2.1
4.27
-6.3
10.5
LANGUAGE PRESCORE
13.9
13.3
0.6
DISTANCE TO NEAREST SMSA.
30-40 MILES.
AFFECT PRESCORE
17.8
18.4
-0,6
%MAT TOTAL
104.4
111.9
-7.5
100.3
101.9
-1.6
5.5:,
-12.5
9.3
AGE (JUNE '71)
99.3
95.9
3.4
SIZE 01 NEAREST SMSA
.1.173.000
% CLASSROOM MALE
54.0
60.8
-6.8
QUANTITATIVE
46.0
52.6
-6.6
41.0
44.5
-3.3
3.87
-11.1
4.1
..^
5 CLASSROOM BLACK
7.4
07.4
pERCENT NoNwNITE
,
S PRESCHOOL (0I: SO. MOS.)
C6.8
25.7
41.1
READING SKILLS
87.3
95.4
-0.1
61.0
80.0
1.0
8.33
-15.8
17.8
5 PARENTS 5'/0 HS DIPL,
71.6
71.5
-0.2
PROJECT SIZE (PUPIIS)
.397
5 PARENTS W SKILLED OCCUP,
24.1
51.8
-27.7
LANGUAGE ARTS
25.4
30,3
23.7
24.0
-0.3
2.56
-5.3
1.7
5 PARENTS BLACK
7.4
07.4
NO. PUPILS PAC HEMP':,
..
11.7
5 PARENTS POVERTY ELIGIBLE
61.2
9.3
51.7
S"
5 HEAD HOUSEHOLD EMPLOYED
89.0
100.0
-11.0
s=
IT PER-PUPIL EXPENDITURE
723
(7n
7. HEAD HOUSEHOLD MALE
00.4
100.0
-9.6
e.
PART II
PARENT EVALUATION DATA
CLASSROOM DATA NOT AVAILABLE
ifilS PROJECT
10(1
NO. CLASSROOM GROUPS
52
3PARENT-MAD
AV. PARENTS/CLASSROOM GRP
10.6
10.0
0.6
INTERACT
.116
-.088
.204
.310
-.174
.694
23
-.15
1.51
5 8/0 HIGH SCHOOL DIPLOSLA
71.6
71.8
,
5 W SKILLED OCCUP.
24.1
51.8
-27.7
PARENT-SCPOOL
5 POS EVAL OF CHILD LANG
82.5
70.0
12.5
INVOLVE
-.192
-.536
.342
.066
.001
.431
-.79
.91
5 BLACK
7.4
0..4
%'AEPORTING USE OF PRESCHOOL
66.9
38.6
28.3
CHILD ACAIMIC
% POVERTY ELIGIBLE
61.2
':
9.5
:1.7
EXPECT
-.192
-.115
-.077
-.231
.357
-.588
.423
-1.42
.24
5 HEAD HOUSEHOLD EMPLOYED
89.0
100.0
-11.0
5 HEAD HOUSEHOLD MALE
90.4
100.0
-9.6
SENSE OF CONTROL
.213
-.083
.296
.422
.123
.299
.414
1.11
:ART III
TEACHER EVALUATION DATA
NO, OF CLASSROOMS
52
3PARENT-EDUCATOR
JOB SATISF. RATING
Z.3
1.7
0.6
IMAGE
0.26
0.07
0.19
0.19
0.09
0.10
0.306
-.50
.70
13')OK RESOURCE SCALE
4.0
2.5
1.5
RACE (BLACK/NONBLACK)
4.0
1.0
0PROFESSION, ACCEPT
IDENT.
COMMUNITY
1.4
1.0
p,4
OF METHOD
1.60
1.50
0.10
1.81
1.31
0.50
0.459
-.10
1.40
NO, OF HELPERS
2.2
02.2
ABLE TO CHOOSE ASSIGNMENT
2.8
2.5
0.3
TANG & TEACHER EXPER
3.7
3.5
0.2
See "Guide for Interpretation of Results" for explanation of table entries.
employed, and thus FT families were more likely to be impoverished by
0E0 standards. However, the actual employment rates and the proportion
of famili,, with male heads was quite high.
FT teachers and NFT teachers were reasonably comparable on most
variables. Only on book resources and number of helpers did notable
differences occur, showing FT higher on each.
Analysis of outcomes failed to reveal significant FT/NFT differences
for any measure, pupil, parent, or teacher. Since classroom observation
data were not collected for this sample, description of process components
and differences are unavailable.
Summary
Since data from only a single project sample were available for
interim evaluation of sponsor effects,' risk of faulty interpretations
is considered very high. It does appear that there is no clear evidence
of a two-year program impact on this EF sample. However, review of the
salient features of the model suggeSts that these results could be ex-
pected.,. These features are:
Focus and Objectives--long range program objectives
Child
Cognitive
Develop academic competence in many different areas
Affective
Promote feelings of self-confidence and motivation to learn
Curricular Approach
Teacher's role that of facilitatn.
Reinforcement from teacher and activities
Small group focus with provision for individual activiyBalances highly structured and relatively unstructured activities.
Emphasizes se4uential arrangement, of tasks in small steps
Type of Parent Involvement
Minimal during period covered by report.
154

The model does not stress immediate academic impacts or extensive
parent involvement asdo'many of the alternate approaches. The model
places the teacher in a guidance role and appears to incorporate a
Montessori-like concept of the child's learning from structured expe-
riences. In this perspective, it is altogether possible that large dif-
feences on pupil measures would not emerge early in the child's FT
experiences. Rather, effects of this model should occur on such non-
cognitive factors as motivation, curiosity, exploratory behavior, and
the like. Unfortunately, adequate measures of these traits do not cur-
rently exist for use in large-scale evaluations. Further, this model
was not implemented in this project until 1969-70, and hence by theeligibility definition of project inclusion (see p. 24) should not have
been included in the evaluation sample in the first place. Thus, we must
conclude that the evidence necessary to evaluate the University of Georgia
model on its own terms is not available in these interim data.
155 1510
UNIVERSITY OF OREGON ENGEL,MANN/BECKER MODEL FOR DIRECT INSTRUCTION
University of Oregon
Sponsor's Intended Approach
The sponsors of this model insist that a child who fails is a child
who has net been properly taught and that the remedy lies in teaching theskills that have not been mastered. The model attempts to bring disadvan-
taged children up to the "normal" level of achievement of their middle-
class peers by building on whatever skills children bring to school and
to do so at an accelerated pace.
Using programmed reading, arithmetic, language, art, and music mater-
ials and behavior modification principles, the model employs straigies
to teach concepts and skills required to master subsequent tasks oriented
toward a growing level of competence. Emphasis is placed on learning the
general case, i.e., developing intelligent behavior, rather than on rotebehavior. Desired behaviors are systematically reinforced by praise and
pleasurable activities, and unproductive or antisocial behavior is ignored.
In the classroom there are three adults for every 25 to 30 children:
a regu.'.ar teacher and two full-time aides recruited from the Follow Through
parent nomm,inity. Working very closly with a group of 5 or 6 pupils ata time, each teacher and aide employs the programmed materials in combina-
tion with frequent and persistent reinforcing responses, applying remedial
measures where necessary and proceeding only when the success of each child
with a given instructional unit is demonstrated. At the same time, the
teacher aides are working with other small groups throughout the classroom
in a sim..1.7.r manner. Training in implementing the model ,includes local
summer workshops for all teachers and teacher aides and inservice trainingduring the school year.
Family workers, who are usually parents themselves, personnally con-
tact all project parents to acquaint them with the program and teaching
materials; inform them about their children's progress; and encourage them
to attend Policy Advisory Committee meetings, visit school, and partici-
pate in training leading to work in the school. Parent workers also in-
struct parents in the use of materials to supplement the school program
in the home and attempt to organize parents experiencing specia_ dif-
ficulties into problem solving groups. On occasion, they contact local
social service agencies where spec,ialskstance is needed by individual
families.
157
p
Evaluation is an ongoing part of the program. Tests arc administered
at the beginning and throughout the year to determine if children are being
taught the skills required by the model and at what rate. The tests are
administered by parents especially trained for the job. Continous test
data provide a positive gauge of teacher performance and allow for timely
remedial action when the program appears to be implemented improperly or
students appear to be falling behind. Video tapes of teachers and aides
executing training tasks are used both to determine and to correct specific
difficulties. Bi-monthly reports are issued to teachers reporting the
progress of individual children and classroom summaries.
The parent Policy Action Committee participates actively in the model,
focusing attention on the needs and interests of parents, recruiting parent
aides, and assisting in writing the Follow Through proposal,. 'he model is
firmly committed to support a parent-community-school iKartnershi in themr:.
operation of its program.' The sponsor feels project parent's must have the
right to judge the effects of the program for themselves, both to provide
criteria of program success and to guide efforts at program improvement.
*el
Individual Project Results
Eight samples from five different projects sponsored by the University
of Oregon (UO) were included in the analysis of interim effects. The dis-tribution of these evaluation samples in terms of cohort, utcome andproject is as follows:
Cohort 1st -year Effects 2nd-year Effects
TK (projects a, b, and c)
IEF (project d) (projects d and e)
IIK (project a)
IIEF (project d)
Project UO(c)
Project UO(c) is located within a racially mixed but predominantly
white community within a small east north central urban area. The project
is moderate in size (480 pupils) with an anticipated per-pupil expenditure
of $694 and an unusually high PAC participation rate of one member for
roughly every four and one-half pupils.
158

The Cohort I-K, two year data gathered on this project sample
(Table 43) show that FT and NFT classrooms were reasonably comparable
at baseline, with the FT group showing a slight advantage. FT pupils
tended to average higher on pretest measures; recalling that baseline
testing occurred very late in Fall, 1969, this result may be due to in-
itial program impacts in this project. The FT and NFT samples were es-
sentially equivalent in--terms of classroom composition and family char-,
acteristics. Specifically, most classroom samples were nearly evenly
split between Black and non-Black pupils; and the few small differences
between the groups on Parent education, occupation, and employment are
cunsidered negligible.
Comparison of adjusted outcomes for these pupils shows that differ-
ences between FT and NFT pupils fail to reach significance on any of the
evaluation variables.' A trend toward positive pupil impacts is suggested
by FT-favoring differences on the cognitive measures, but inspection of
confidence intervals indicates that conclusions cannot be justified at
this point. None of the differences on parent measures reach significance,
although the parent school involvement and expectations measures show
differences in the desired direction.
The teacher data for this project show that FT and NFT teachers were
reasonably comparable in their satisfaction with their job, the amount of
book resources, race, and closeness to the community. FT teachers, on
the other hand, appeared to have more training and more classroom helpersthan NFT teachers, but reported less freedom to choose their assignment.
A:ialysis of program effects on teachers, which controlled for these dif-
ferences, failed to reveal any significant outcome on-the evaluation
variables.
Project U0(b)
The data for the Project U0(b) Cohort I-K, two-year sample are pre-
sented in Table 44. This project is relatively small (225 pupils),
located within a school district in a large eastern urban population
center. The anticipated per-pupil expenditure for this project was $902
and there was one PAC member for each 6.6 pupils, or roughly three PAC
members per classroom.
The pupil baseline test, classr&w._ composition, and family 'date for
the three FT and four NFT classrooms indicate a fair'. cPrious problem
in noncomparability for 4Ais project sample. Specii - NFT pupils
systemat.:.cally scored above the FT pupils on all baseline measures, and
the FT classrooms were predominantly, if not completely, Black, whereas
159

NFT classrooms were almost totally non-Black. Furthermore, although the
FT parents tended to be better educated, fewer were employed and fewer
had male heads of household than the parents of children in NFT classrooms.
We believe that the bias introduced by this type of mismatch of controland treatment group seriously impairs the interpretability of any subse-
quent results. That is, even though our statistical procedures are de-
signed to adjust for differences in certain baseline properties, substan-
tial population, differences between the two sub samples increase the
probability of differential regressions. Since this mismatch exists for
both pupil md parent variables, we feel a more appropriate procedure is
to avoid interpretation of results for this project.
The teacher characteristics for the FT'and NFT samples show that the
teachers were reasonably comparable on most of the variables except those
measuring number of book,resourcesand number of helpers available for
classroom assistance. On the whole, the FT teachers appear to be less
well suited to the task than the NFT teachers; they report less satisfac-
tion and fewer resources, they are less close to the community, and they
have slightly less training and experience. With adjustments for these
differences, analysis of the teacher outcome variables reveals that FT
teachers are significantly more approving of their method than are NFT
teachers, a variable that assumes great importance to those who believe
that the enthusiasm and sense of commitment maintained by the teacher
will ultimately relate to the success of the program. This finding may
also be taken as indirect evidence that the program is reasonably well
implemented.
Project U01.)
Project U0(a) comprises a Cohort I-K second-year sample and a
Cohort II-K, first-year sample. This project is moderately large and is
located within an urban area within the east north central region. The
project average was one PAC member for approximately 28 pupils and in-
volved an anticipated par-pupil expenditure of just over $1000.
The evaluation data for the Cohort I-K sample are presented in
Table 45. Values for the ten FT and six NFT classrooms on the control
variables show FT pupils are systematically above NFT on the pretest '-
measures and percentage with preschool experience. The FT classrooms have
a better ethnic balance in this sample (NFT is nearly all Black), but the
FT families appear to be more disadvantaged than the NFT families. Thus,
overall, the two subgroups appear only moderately comparable in terms of
these baseline measures.
160
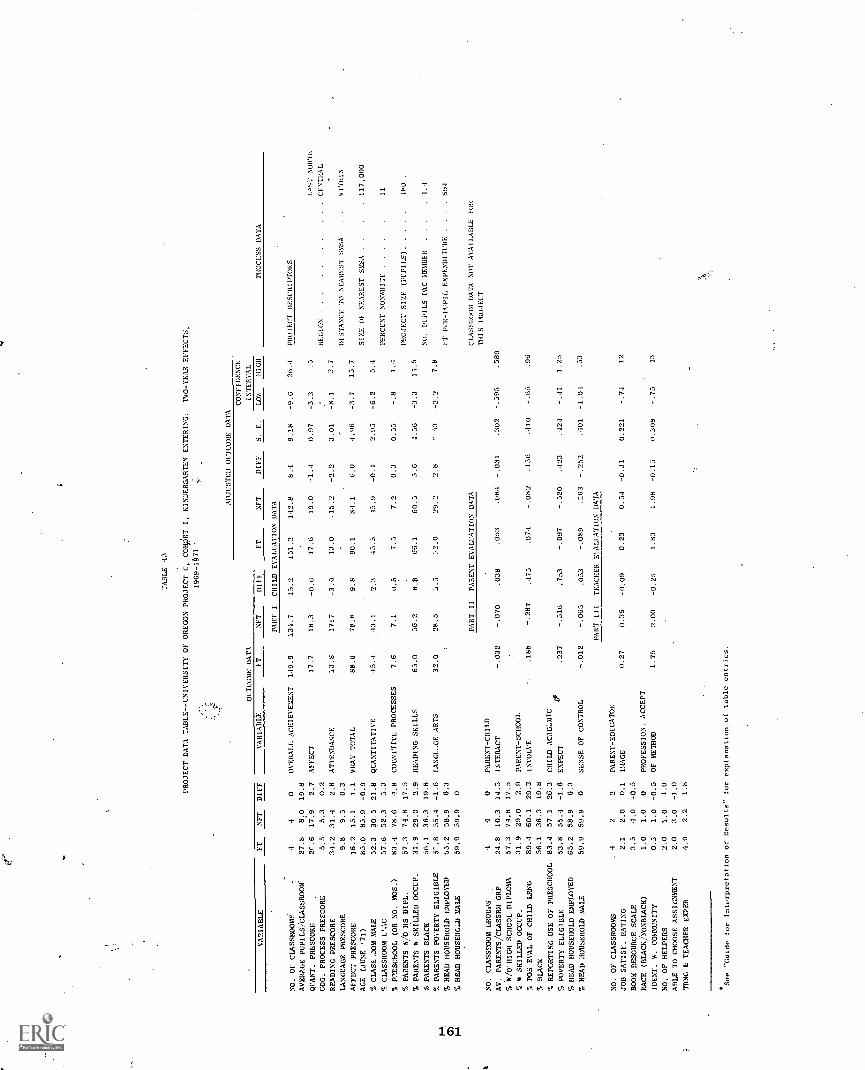
TABLE 43
PROJECT DATA TABLE -- UNIVERSITY OF OREGON PROJECT C, COOT I, KINDERGARTEN ENTERING:
TWO-YEAR EFFECTS,
1969-101
'
OUTCOME DATA
ADJUSTED OUTCOME DATA
PROCESS DATA
DIFF
S. E.
CONFIDENCE
INTERVAL
VARIABLE
FT
NFT
DIFF
VARIABLE
FT
NFT
DIFF
FT
NFT
LOW
MGR
PART I
CHILD EVALUATION DATA
NO. OF CLASSROOMF
44
0OVERALL ACHIEVEMENT
149.9
134.7
15.2
151.2
142.8
8.4
9.18
-9.6
26.1
PROJECT DESCRIPTORS
AVERAGE PUPILS/CLASSROOM
27.8
8.0
19.8
QUART. PRESCORE
2r .6
17.9
2.7
AFFECT
17.7
18.3
-0.6
17.6
19.0
-1.1
0.97
-3.3
.5
FIST NORTH
COG. PROCESS PRESCORE
5.5
5.3
0.2
REGION
..
,CENTRAL
READING PRESCORE
3.1.2
31.4
2.8
ATTENDANCE
13.8
17:7
-3.9
13.0
-15.2
-2.2
3.01
-8.1
3.7
-
LANGUAGE PRESCORE
9.8
9.5
0.3
DISTANCE TO NEAREST SMSA
WITHIN
AFFECT PRESCORE
16.2
15.1
1.1
WRAT TOTAL
88.6
78.8
9.8
90.1
84.1
6.0
.96
-3.7
15.7
AGE (JUNE '71)
85.0
85.9
-0.9
SIZE OF NEAREST SMSA
..117,000
A CLASS-.30M MALE
52.3
30.5
21.8
QUANTITATIVE
45.4
43.1
2.3
45.5
45.9
-0.4
2.95
-6.2
5.4
A CLASSROOM L'.'4C
57.6
52.3
5.3
PERCENT NONWHITE
11
A P:1ESChOOL (OR NO. MOS.)
83.4
78.6
4.8
COGNITIVE PROCESSES
7.6
7.1
0.5
7.5
7.2
0.3
0.55
1.4
A PAPENTS 8/0 HS DIPL.
57.3
74.8
17.5
PROJECT SIZE (PUPILS)
180
.
% PARENTS W SKILLED OCCUP.
31.9
29.0
2.9
READING SKILLS
65.0
56.2
8.R
66.1
60.5
5.6
4.56
-3.3
11.5
A PARENTS BLACK
56.1
36.3
19.8
NO. PUPILS PAC MEMBER
% PARENTS POVERTY ELIGIBLE
5 78
55.4
-1.6
LINGL_GE ARTS
32.0
28.5
11.5
72.0
29.2
2.8
- 13
-2.2
7.8
CD
% HEAD HOUSEHOLD EMPLOYED
55.2
58.9
6.3
FT PER-PUPIL EXPENDITURE
..694
i"A HEAD HOUSERGIL MALE
59.9
59.9
0
PART II
PARENT' EVALUATION DATA
CLASSROOM DATA NOT AVAILABLE
1(1R
THIS PROJECT
NO. CLASSROOM GROWS
44
0PARENT-CHILD
AV. PARENTS/CLASSRM GRP
24.8
10.3
14.5
INTERACT
-.032
-.070
.038
.053
.084
-.031
.302
-.595
.589
A WO'HIGH SCHOOL DIPLOMA
57.3
7.1.8
17.5
70 W SKILLED OCCUP.
31.9
29.0
2.9
PARENT-SCHOOL
% POS EVAL OF CHILD LANG
89.4
60.1
29.3
INVOLVE
.188
-.287
.475
.074
-.082
.156
.410
-.65
.96
A BLACK
56.1
36.3
19.8
% REPORTING USE OF PRESCHOOL
83.4
57.1
26.3
CHILD ACABLMIC
A POVERTY ELIGIBLE
53.8
55.4
-1.6
EXPECT
.0'
.237
-.516
.753
-.097
-.520
.423
.424
-.41
1.25
A HEAD HOUSEHOLD EMPLOYED
65.2
58.9
6.3
7, HEAD HOUSEHOLD MALE
59,9
59.9
0SENSE OF CONTROL
-.012
-.065
.053
-.089
.163
-.252
.401
-1.04
.53
PART III
TEACHER EVALUATION DATA
NO. OF CLASSROOMS
22
PARENT-EDUCATOR
JOB SATISF RATING
2.1
2.0
0.1
IMAGE
0.27
0.36
-0.09
0.23
0.51
-0.31
0.221
-.7 -1
.12
BOOK RESOURCE SCALE
3.5
4.0
-0.5
RACE (BLACK/NONBLACK)
1.0
1.0
0PROFESSION. ACCEPT
IDENT. W. COMMUNITY
0.5
1.0
-0.5
OF METHOD
1.75
2.00
-0.25
1.83
1.98
-0.15
0.308
-.75
.13
NO. OF HELPERS
2.0
1.0
1.0
ABLE TO CHOOSE ASSIGNMENT
2.0
3.0
-1.0
TRNG & TEACHER EXPER
4.0
2.2
1.8
See -Guide for Interpretation of Results- for explanation of table entries.
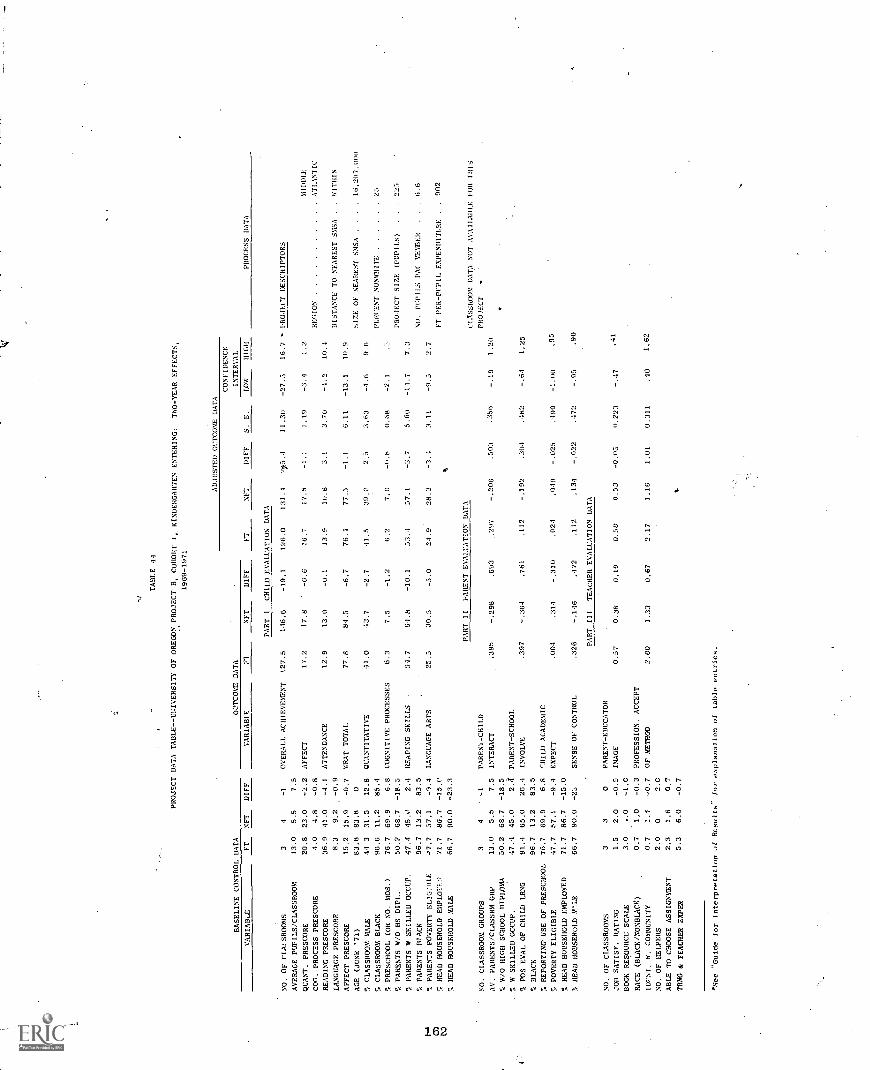
TABLE 44
PROJECT DATA TABLE-UNIVERSITY OF OREGON PROJECT B, COHORT I, KINDERGARTEN ENTERING:
TWO-YEAR EFFECTS,
1969-1971
ADJUSTED OUTCOME DATA
CONFIDENCE
BASELINE CONTROL DATA
OUTCOME DATA
INTERVAL
VA
RIA
BL
EFT
NFT
DIFF
VARIABLE
FT
NFT
DIFF
FT
NET
DIFF
S. E.
DOW
HIGH
PROCESS DATA
PART I
CHILD EVALUATION DATA
NO. OF CLAISROOMS
34
-1
OVERALL ACHIEVEMENT
127.5
116,6
-19.1
126.0
131.4
v$5.4
11.30
-27.5
16.7 .
PROJECT DESCRIPTORS
AVERAGE PUPILS/CLASSROOM
13.0
5.5
7.5
QUANT. PRESCORE
20.8
23.0
-2,2
AFFECT
17.2
17.8
.
-0.6
16.7
17.8
-1.1
1.19
1.2
MIDDLE
COG. PROCESS PRESCORE
4.0
4.8
-0.8
REGION
ATIANTIC
READING PRESCORE
36.9
41.0
-4.1
ATTENDANCE
12.9
13.0
-0.1
13.9
10.8
3.1
3.70
10.4
LANGUAGE PRESCORE
8.3
9.2
DISTANCE TO NEAREST SMSA
.WITHIN
AFFECT PRESCORE
15.2
15.9
-0.7
WRAT TOTAL
77.8
81.5
-6.7
76.1
77.5
-1.1
6.11
-13.1
10.9
AGE (JUNE '71)
83.8
83.8
0SIZE OF NEAREST SMSA
,.
.16,207.000
S CLASSROOM MALE
41 3
31.5
12.8
QUANTITATIVE
41.0
43.7
-2.7
41.5
39.0
2.5
3.63
9.6
5 CLASSROOM BLACK
96.6
11.2
85.4
PERCENT NONWHITE
25
PRESCHOOL (OH NO. MOS.)
76.7
69.9
6.8
COGNITIVE PROCESSES
6.3
7.5
-1.2
6.2
7,0
-0.8
0.68
-2.1
S PARENTS 8/0 HS DIPL.
50.2
68.7
-18.5
PROJECT SIZE (PUPILS)
..
.225
5 PARENTS 8 SKILLED OCCUP.
47.4
45.0
2.1
READING SKILLS
54.7
64.8
-10.1
53.4
57.1
-3.7
5.60
-14.7
7.3
% PARENTS MACK
96.7
13.2
83.5
NO. PUPILS PA(' MEMBER
..
.6 6
S PARENTS POVERTY ELIG:BLE
"7.7
57.1
-9.4
LANGUAGE ARTS
25.5
30.5
-5.0
24.9
28.3
:1.11
-9.5
2.7
CD
5 HEAD HOUSEHOLD EMPLOYE0
71.7
86.7
-15.
1'FT
PER-PUPIL EXPEND1TLRE
..902
N)
S HEAD HOUSEHOLD MALE
66.7
90.0
-23.3
PART II
PARENT EVALUATION DATA
CIASSROOM DATA NOT AVAIIADIE FOR THIS
NO. CLASSROOM GROUPS
34
-1
PARENT- CHILD
PROJECT
AV. PARENTS/CLASSRM GRP
13.0
5.5
7.5
INTERACT
.395
-.298
.693
_.297
-.206
.503
.356
-.19
1.20
8/0 HIGH SCHOOL DIPLOMA
50.2
68.7
-18.5
W SKILLED OCCUP.
47.4
45.0
2.'1
PARENT-SCHOOL
POS EVAL OF CHILD LRNG
91.4
65.0
26.4
INVOLVE
.397
-.364
.761
.112
-.192
.30.1
.482
-.64
1.25
S BLACK
96.7
13.2
83.5
S REPORTING- USE OF PRESCHOOL
76.7
69.9
6.8
,11ILD ACADEMIC
S POVERTY ELIGIBLE
47.7
57.1
-9.4
EXPECT
.004
.314
-.310
.024
.049
-.025
.499
-1.00
.95
S HEAD HOUSEHOLD EMPLOYED
71.7
86.7
-15.0
U HEAD HOUSEHOLD MALE
66.7
90.0
-25
SENSE OF CONTROL
.326
-.146
.472
.112
.134
-.022
.472
-.95
.90
PART III
TEACHER EVALUATION DATA
NO. OF CLASSROOMS
33
0PARENT-EDUCATOR
JOB SATISF. RATING
1.5
2.0
-0.5
IMAGE
0.57
0.38
0,19
0.30
0.53
-0.03
0.223
-.47
.41
BOOK RESOURCE SCALE
3.0
..O
-1.0
RACE (BLACK/NONBLACK)
0.7
1,0
-0.3
PROFESSION. ACCEPT
ID1'NT. W. COMMUNITY
0.7
1.4
-0.7
OF METHOD
2.00
1.33
0.67
2.17
1.16
1.01
0.311
.40
1,62
NO. OF HELPERS
2.0
02.0
ABLE TO CHOOSE ASSIGNMENT
2.3
1.6
0.7
TRNG & TEACHER EXPER
5.3
6.0
-0.7
'See "Guide for Interpretation
of Results"
for explanation of table entries.

TABLE 45
PROJECT DATA TABLE--UNIVERSITY OF OREGON PROJECT A, COHORT I, KINDERGARTEN ENTERING:
TWO-YEAR EFFECTS,
1969-1971
BASELINE CONTROL DATA
OUTCOME DATA
ADJUSTED OUTCOME DATA
CONFIDENCE
INTERVAL
VARIABLE
PT
NET
DIFF
VARIABLE
FT
NFT
DIFF
FT
NFT
DIET
S. E.
LOW
HIGH
PROCESS DATA
PART I
CHILD EVALUATION DATA
NO. OF CLASSROOMS
10
61
OVERALL ACNIEVEMENT
135.8
129.5
6.3
130.0
124.9
17.06
-8,7
18.9
PROJECT DESCRIPTORS
AVERAGE PUPI-S/CLASSROOM
13,1
8.0
5.1
QUANT, PRESCORE
23,4
21,0
2.4
AFFECT
17.7
16.6
1.1
17.9
16.8
1.1
0.74
2.6
EAST Nom
COG. PROCESS PRESCORE
6,3
5.5
0.8
REGION
CENTRAL
"EADING PRESCORE
38,7
35.0
3.7
ATTENDANCE
5.4
13.0
-7.6
4,1
14.6
-10,5
2.31
-15,0
-6.0
LANGUAGE PRESCORE
10,7
9.4
1,3
DISTANCE TO NEAREST SMSA
.WITHIN
AFFECT PRESCORE
16,0
15.3
0.7
WRIT TOTAL
80.7
74,7
6.0
77.9
72.0
5.9
3.81
-1.6
13,-1-
AGE (JUNE '71)
.84,9
84.2
0.7
SIZE OF NEAREST SMSA ...
353,000
9 CLASSROOM MALE
46,9
56.3
QUANTITATIVE
12.6
11.6
1.0
40.4
10.6
-0,2
2.27
4,2
7, CLASSROOM BLACK
67,8
90.3
-22.5
PERCENT NONWHITE
12
7,- PRESCHOOL (OR NO. MOS.)
88.4
56.2
32,2
COGNITIVE PROCESSES
6.1
6,9
6.3
6.8
-0.5
0.42
-1.3
,3
9 PARENTS W/O HS DIPL.
78.1
60.7
17.4
PROJECT SIZE (P('PILS)
..
750
'7, PARENTS W SKILL7D OCCLP.
17.2
22.0
READING SKILLS
59.3
54,9
57.2
52.1
4,8
3.50
-2,1
11.7
q PARENTS BLACK
61.8
90.0
NO. PUPILS/PAC MEMBER
..
28.6
I"
C PARENTS POVERTY ELIGIBLE
84.9
60.5
24.1
LANGUAGE ARTS
27.4
26.1
1,3
26.1
25.1
1.0
1.94
4.8
GO
9 HEAD HOUSEHOLD EMPLOYED
51,0
78.2
-27,2
FT PER-PUPIL EXPENDITURE
.1,003
c HEAD HOUSEHOLD MALE
1.0
65,5
-24.5
PART II
PARENT EVALUATION DATA
CLASSROOM DATA NOT AVAILABLE FOR IIIIS
NO, CLASSROOM GROUPS
10
55
PARENT-CHILD
PROJECT
AV. PARENTS/CLASSRM GRP
7.7
6.4
1.3
INTERACT
-.190
,249
-.139
.042
.234
-.192
.254
-.69
.31
9- W/O HIGH SCHOOL DIPLOMA
78.1
60.7
17.4
7. N SKILLED OCCUP.
17,2
22,0
PARENT-SCHOOL
C POS EVAL OF CHILD LRNG
91.5
39.6
51.9
INVOLVE
-
-.076
-.485
.409
-.152
-.455
.303
.345
-.37
,98
9- BLACK
65.8
90.0
C REPORTING USE OF PRESCHOOL
88.5
56.8
31.7
CHILD ACADEMIC
POVERTY ELIGIBLE
84.9
60.5
24.4
EXPECT
.193
-.293
.186
-.130
.430
-.510
.257
-:,t6
.11
9, HEAD HOUSEHOLD EMPLOYER
51.0
78.2
-27.2
HEAD HOUSEHOLD MALE
11.0
65.5
-24.5
SENSE OF CONTROL
.100
-.234
.334
-.007
-.167
.160
.338
-.50
.82
FART III
TEACHES EVALUATION DATA
NO. OF CLASSROOMS
24
-2
PARENT-EDUCATOR
SATISF. RATING
1..2
1.7
0.5
IMAGE
0.50
0.61
-0.11
0.37
0,60
-0,23
0.225
-.67
.21
BOOK RESOURCE SCALE
1.5
3.0
-1.5
RACE (BLACK/NOSBLACK)
0.5
0,7
PR,'ESSION. ACCEPT
IDENT. W. COMMUNITY
00.7
-0,7
OF METHOD
2.0(
1.00
',CIO
1,91
1.03
0.88
0,314
.26
1,50
NO, OF HELPERS
1,0
1,0
1,0
ABLE TO CHOOSE ASSIGNMENT
0.7
0.2
0.5
TRNG & TEACHER EXPER
5.2 ,-1.0
*See "Guide for Interpretation
of
Results-
for explanation of table entries.
Outcome differences adjusted for these baseline. biases show sig-
nificance only for the attendance measure. FT pupils have lower absence
rates tan NFT pupils. In addition, FT pupils scored higher on four of
the six cognitive outcome variables. However, none of these differences
reach significance and thus, we must interpret the outcomes as showing
no substantial project effect on the pupils.
Parent outcome measures indicate a similar lack Of effect. In no
instance do the adjusted FT/NFT differences reach significance.
Comparison of averages,on the teacher variables show that the FT
teachers reported a higher degree of job satisfaction but had fewer book
resources than the NFT teachers. Furthermore, the FT teachers had more
classroom help and more freedoM to choose their assignments but were some-
what less experienced than the NFT teachers. The outcome measures for
teachers show that FT teachers are significantly more accepting of their
teaching methods than are NFT teachers. We should again note that this
difference is important to the extent that the teacher's approval of the
teaching method influences the success of the program.
The evaluation data for the Cohort II, one-year sample in this project
are summarized in Table 46. Some very serious problems regarding the com-
parability of the FT and NFT samples within this cohort project are ap-
parent from this table. For example, the FT classes systemati.cally aver-
aged above the NFT classes. Furthermore, the data on classroom composition
are highly suspicious, particularly for the preschool experience of NFT
rapils, which does not correspond to that reported by the parents. F4-ally,
NFT values on many of the parent background and poverty variables wereimputed* for this sample. This imputation most likely seriously under-
estimated the comparison group values, which would result in underadjust-
ment or even adjustment in the wrong direction for FT/NFT differences.Because of this fairly strong evidence of data problems and the comparison
group's severe lack of comparability with the FT group, we feel that inter-
pretation of these parent and pupil outcome data would lead to unwarranted
( nclusions. Any analysis and corresponding interpretation must be based
on a more complete and verified data set.
A discussion of imputation (i.e., estimation) problems can be found in
Annex A, Detailed rules for imputing scores for each variable in cases
where data were missing are too extensive to be incorporated in this
report, but they are part of the formal documentation for the analysis.
164
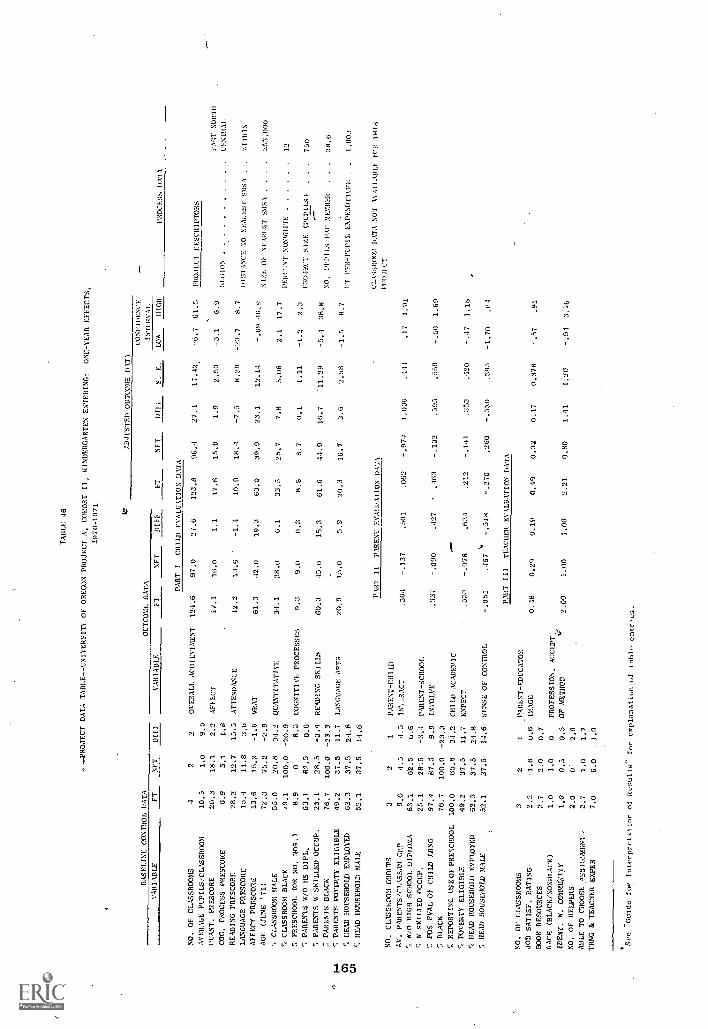
BASELINE CONTROL DATA
TABLE 46
_.._PROJECT DATA TABLE-- CNIVERSITI OF OREGON PROJECT A, COHORT 11, KINDERGARTEN ENTERING:
ONE-YEAR EFFECTS,
1970-1971
ID
ADJUSTED OUTCOME DATA
CONFIDENCE
OUTCOME DATA
INTERVAL.
.AMIABLE
FT
NFT
DIFE
VARIABLE
FT
NFT
DIFF
FT
NFT
DDT'
S. K.
COW
RICH
P1107156 DATA
PART !
CHILD EVALUATION DATA
NO. OF CLASSROOMS
42
2OVERALL. ACHIEVEMENT
124.6
97.0
27.6
123.8
96.4
27.4
17.42.
-6.7
61.7
PROJECT DESCRIPTORS
AVERAGE PUPILS/CLASSROOM
10.5
1.0
9.5
cUANT. PRESCORE
20.3
18.1
2.2
AFFECT
11.1
16.0
1.1
17.8
15.9
1.9
2.53
-3.1
6.9
EAST NORTH
COG, PROCESS PRESCORE
6.9
5.1
1.8
LEGION
CENTRAL
READING PRESCORE
28.2
12.7
15.5
ATTENDANCE
12.2
13.6
.
-1.4
10.9
18.4
-7.5
8.29
-23.7
8.7
pinTNcr 10 NEA:Esr sVsA
mITH1N
LANGUAGE PRESCORE
15,4
11.E
3.6
..
AFFECT PRESCORZ
13.6
15.2
-1.6
WRAT
61.3
42.0
19.3
63.0
39.9
23.1
12,14
-.69
46.S
s12E of NrAREsT smsA
351,090
AGE (JUNE '71)
72.3
75.2
'I CLASSROOM MALE
55.0
20.8
34.2
QUASTITATI1T
31.1
28.0
6.1
33,5
25.7
7.8
5.06
-2.1
17.7
CLASSROOM BLACK
,9,1
100,0
-20.9
PERCENT NoNRIIITF
12
'A PRESCHOOL (OR No. MoS.)
8.9
08.D
COGNITIVE PROCESSES
9.3
9.0
0.3
8.8
8.7
0.1
1.11
-1.2
2.3
pRoJEcT 5121: (PCPILs)
.750
PARENTS 11/0 HS DIPL,
63,1
62.5
0.6
.
,-
.
7, PARENTS W SKILLED OCCUP.
25.1
28.5
-3.4
READING SKILLS
60.3
45,0
12.3
61.6
44.9
16.7
11.29
-5.1
311,8
7, PARENTS BLACK
76,7
100.0
-23.3
No. PUPILs,1)Ac mENHIER
,28.6
'7 PARENTS POVERTY ELIGIBLE
49.2
37.5
11.7
LANGUAGE ARTS
20.5
1.5.0
5.9
20.3
16.7
3.0
2.28
-1.2
8.7
Cr)
HEAD HOUSEHOLD EMPLOYED
62.3
37.5
24.8
1J DER-PUPIL EXPEND1TLEE
,.
1,003
cn
HEAD HOUSEHOLD MALE
52.1
37.5
14.6
CLASsRcK,:., DATA NOT Avx11,11,E) >EH 'IRIS
PART
II
PARENT EVALUATION DATA
Pit0.1EcT
NO. CLASSROOM GROUPS
32
1PARENT -CHILD
AV. PARENTS/CIASsAM C2P
9,0
4.5
4.5
INI_IlAcT
.36.1
-.137
.501
.062
-.974
1.036
.111
.17
1.91
7,w/o HIGH SCHOOL. DIPLOMA
63.1
62.5
0.6
SKILLED OCCL'P.
25.1
2EJ:5
PARENT-SCHOOL
FOS EVAL OF CHILD LRNG
97,4
87.5
9.9
INVOLVE
.337
-.090
.427
'
.463
-.132
.595
.559
-.50
1.69
7, BLACK
76.7
100.0
-23.3
REPORTING USE0FPREsCH001.
100.0
65.8
34.2
CHILD ACADEMIC
7, POVERTY ELIGIBLE
49.2
37.5
11.7
ENPECT
.527
.-.076
.634
.212
-.1.11
.353
,120
-.47
1.18
HEAD HOUSEHOLD EMPLOYED
62,3
37.5
24.8
HEAD HOUSEHOLD NJ1LE
52.1
37.5
14.6
SENSE OF CONTROL
-.051
.467
s.
-.518
-.270
.260
-.530
.595
-1,70
.64
PART III
TEACHER EVALUATION DATA
NO. OF CLASsROOMs
32
1PARENT- EDUCATOR
JOB sATISF. RATING
2.2
-1.6
0.6
IMAGE
0.48
0.29
0.19
0.49
0.32
0.17
0.378
-.57
.91
BOOK RESOURCES
2.7
2.0
0.7
RACE (BLAcK/NONBLAcK)
1.0
1.0
0PROFESSION. AcCEPT,..
MEW.
COMMWTY
1,0
0.5
0.5
OF METHOD
2.00
1.00
1.00
2.21
0.80
1.41
1.20
-.91
3.76
NO. OF HELPERS
2.0
02.0
ABLE TO CHOOSESSIG:440NT..
2.7
1.0
1,7
TRNG & TEACHER EXPER
7.0
6.0
1.0
See
Guide for Interpretatior of Ru5ults" for explanation of table entries.
Tie teacher data obtained for this project do appear to be accurw;e.
The specific values on the teacher variables indicate that the FT teachers
were somewhat more satisfied with their job conditions, had more book
resources, were somewhat more closely tied to the communities in which
they taught, had more helpers, had had more freedom to choose their assign-
rents, and were slightly better qualified than the NFT teachers. Analysis
of outcomes indicates that neither of the outcome measures show signifi
cant FT/NFT differences.
Project U0(e)
The data -for Project U0(e) are summarized in Table 47. This moderate
sized project is located more than 75 miles from the nearest SMSA in the
west south central region of the United States, had a low PAC membership
of one PAC for each 42 pupils, and anticipated a near average FT expendi-
ture of $757 per pupil.
The pupil baseline variables show that the spyen-FT classrooms and
the two NFT classrooms were far from comparable on prescores. ,FT pupils
averaged below NFT pupils on nearly all measures and were 15 points below
on the reading scores. However, the two samples do appear reasonably
well matched on classroom composition variables.
Parent variables were not available far control as covariables; their
absence severely limited the interpretability of the outcomes of our
analyr s. As we have repeatedly noted, FT families tend to be more
severely disadvantaged than comparison group families. Siace indices of
disadvantagement relate strongly to outcomes, they are essential for
appropriate adjustment and inerpretation of the FT/NFT differences.
We do not attempt to interpret the results of an inappropriate
analysis of pupil outcome data. We choose instead to limit our discus-
sion to classroom observation data. All of the factors appear to be
quite salient for describing classroom processes in this project. The
factor score averages reveal a pattern consistefitith the model. In
particular, the high score on the progral,imed academic factor would be
expected. It appears that the FT and NFT classes differ con3iderably Ana
that the model has been implemented in this project.
Project U0(d)
Project U0(d) is located fairly far from the nearest SMSA in the'cast south central region. It is a moderately large project in a ra-cially mixed but predominantly white -community. Since the public school:;
.166
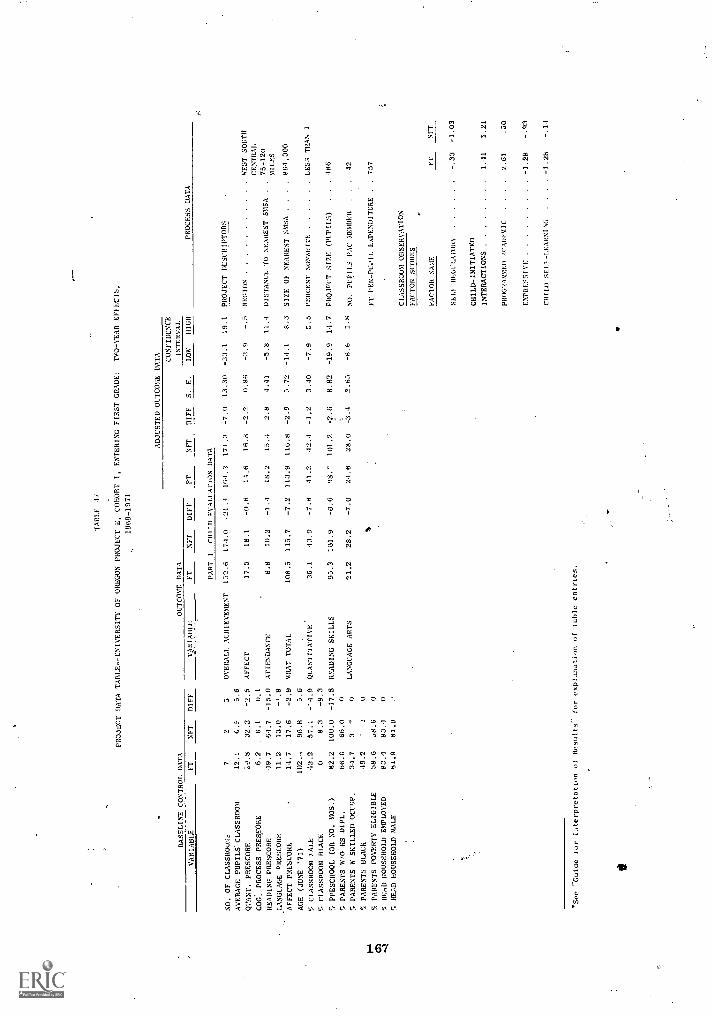
TABLE .1./
PROJECT DATA TABLE -- UNIVERSITY OF OREGON PROJECT
E, COHORT I, ENTERING FIRST GRADE:
TWO-YEAR EFFECTS,
1969-1971
ADJUSTED OUTCOME DATA
CONFIDENCE
BASELINE CONTROL DATA
OUTCOME
DATA
INTERVAL
VARIABLE.
FT
NFT
OWE
1.1,1111ABIE
FT
NFT
DIFF
FT
NFT
DIFF
S. F.
IOW
HIGH
PROCESS DATA
PART
ICHILD EVALUATION DATA
NO. OF CLASSROIX:0
72
5OVERALL. ACHIEVEMENT
132.6
171,0
-21.4
104.3
171.3
-7.0
13,30
-33.1
19.1
PROJECT DESCRIPTORS
AVERAGE PUPILS CLASSROOM
12.1
0.5
5.6
WANT, PRESCORE
I5.8
32.3
-2.5
AFFECT
17.5
18.1
-0.6
11.6
16.8
-2.2
0.86
-3,9
REGION
WEST SOUTH
COG. PROCESS PRESCORE
6.2
6.1
0,1
CENTRAL
READING PRESCORE
49.7
64.7
-15.0
ATTENDANCE
8.8
10.2
18.2
15.4
2.8
4.41
-5.8
11.1
DISTANCE TO NEAREST SMSA
.
75-120
MILES
LANGUAGE PRESCORE
11.2
..
13.0
AFFECT PRESCORE
14,7
17,6
-2,9
WHAT TOTAL
108.5
115.7
-7,2
113.9
116.8
-2.9
5.72
-14.1
8.3
SIZE OF NEAREST SMSX
864,000
AGE (JUNE '71)
102..,
06.8
5.6
7,' C
LA
SSR
OO
M )
AL
E2.2
57.1
QUANTITATIVE
36.1
13.9
-7.8
41.2
-1.2
3.40
-7.9
5.5
PERCENT
NO
NW
HI'T
'ELESS THAN 1
5 CLASSROOM BLACK
08.3
-8.3
U PRESCHOOL (OR NO. MOS.)
82.2
100,0
-17.8
READING SKILLS
95.3
101.9
-6.6
98.-
101,2
-2.6
8.82
-19.9
14.7
PROJECT SIZE (PUPILS)
..
.486
7, PARENTS W,0 HS DIPL.
66.0
66.0
0
7. PARENTS W SKILLED OCCUP.
31.7
3'
0LANGUAGE ARTS
21.2
28.2
-7.0
21.6
28.0
2.65
-8.6
1.8
NO. PCp1LS PACMEMRER
..
.42
U PARENTS BLACK
49.2
'
2.
0
F4
Cr)
S PARENTS POVERTY ELIGIBLE
58.6
./8.6
0FT PER-PCPIL EXPENDITURE
..757
45 HEAD HOUSEHOLD EMPLOYED
83.4
83.1
0
!-< HEAD HOUSEHOLD MALE
81.9
81.9
CLASSROOM OBSERVATION
FACTO!! SCORES
FACTOR NAME
FTO
rr
SELF REGULATORY
- 33
-1.03
CHILD - INITIATED
INTERACTIONS
1 41
1.21
PROGRAMMED .,.CADEMIC
.50
EXPRESSIVE
-1 28
-.93
CHILD SELF-LEARNING
..
..-1.26
-.14
'See "Guise ior laterpretation of Results'
for explanation of table entries.
I
do not offer kindergarten, the groups in this project are classified as
entering first grade cohort samples. The project had an average of 18.2
pupils per PAC member and an anticipated per-pupil expenditure of $735.
Three sets of data were analyzed for this project--a Cohort I, two-
year effects sample, a one-year effects subset for this same sample, and
a Cohort II, one-year effects sample. The data for the two-year effects
sample are presented in Table 48, and the data for the first-year subset
of this sample, in Table 49. Finally, the data for the Cohort II, first-
year sample are presented in Table 50.
The baseline data for each of these samples indicate a serious mis-
match of the FT and NFT pupil samples. FT pupils were below the NFT
comparison pupils on entering abilities. Most of the FT were Black and
came from very impoverished Biack famili2s; whereas most of the NFT pupils
were non-Black, and very few came from families that met the poverty
criteria. Because the samples are very different, we believe that the
probability of inappropriate covariable adjusting is extreme. In fact,
the two samples can be characterized as belonging to two different popu-
lations on all covariables of interest. Consequently, we believe that
any interpretation of the results of pupil and parent outcome analyses
for this project would be invalid at this time. We present the project
data for descriptive purposes only.
Teacher and classroom observation data were also obtained for these
two samples (the Cohort I, two-year and the Cohort II, one-year samples).
They point up additional differences between the two groups. The Follow
Through teachers apparently have fewer book resources and less freedom
tcj choose their assignments than the Nil' teachers; on thp other hand,
mAe classroom helpers are used in FT classrooms than in NFT classrooms.
Measures of teac_ar attitudes toward parents and toward their teaching
methods show that FT teacher; for the Cohort I sample are significantly
more accepting of their methods than are the NFT teachers. This result
did not recur in the Cohort II sample.
The factors scores associated with the respective classrooms for
these two samples reveal an interesting and repeated pattern. As would
be expected from the sponsor's model, the FT classrooms are strongly
characterized by a high programmed academic factor. The NFT classrooms,
on the other hand, can be characterized by very low frequency of self-
regulatory and child self-learning activities. The sponsor appears to
have affected classroom processes; they are quite different from the
processes occtrring in NFT clasj3rooms.
168
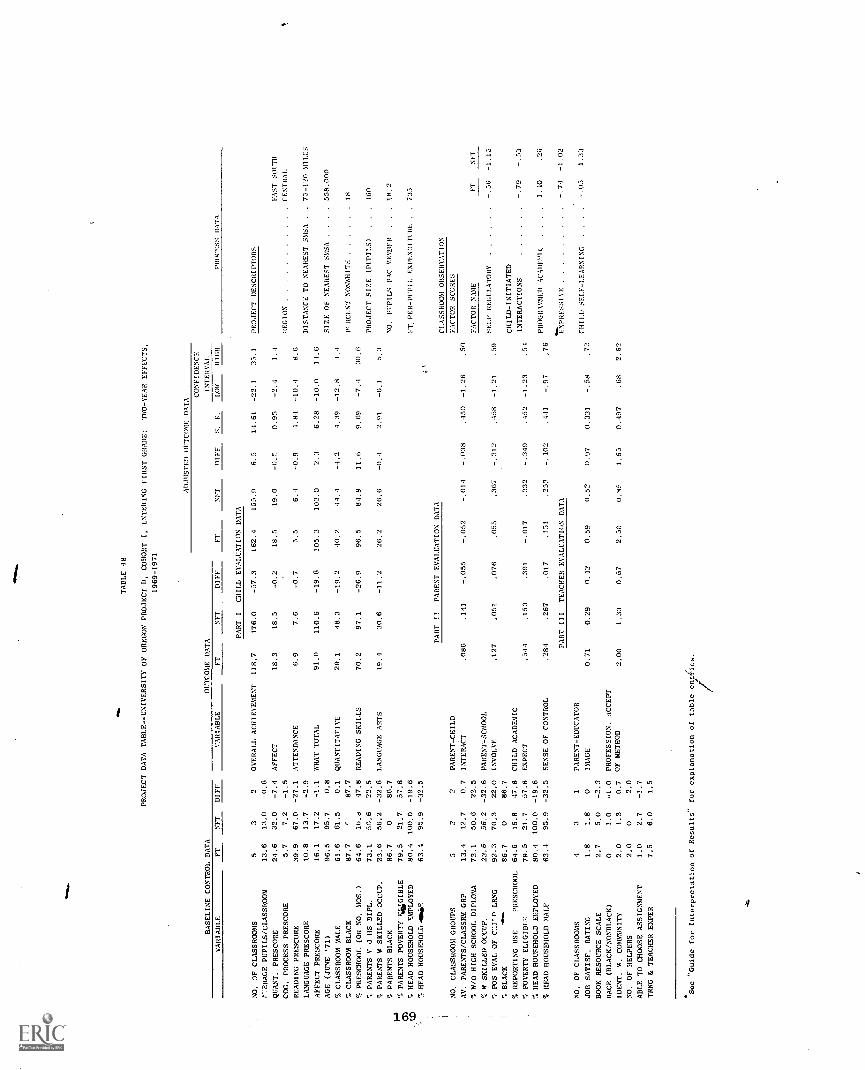
TABLE 48
PROJECT DATA TABLE -- UNIVERSITY OF OREGON PROJECT D, COHORT 1, ENTERING FIRST GRADE:
TWO-YEAR EFFECTS,
1969-1971
BASELINE CONTROL DATA
VARIABLE
FT
NFT
DIFF
OUTCOME DATA
VARIABLE
FT
ADJUSTED OUTCOME DATA
NET
DIFF
FT
CONFIDENCE
INTERVAL.
NET
DIFF
S.
E.
LOW
HIGH
PART I
CHILL EV'ALU'ATION DATA
PIS.)CESS DATA
NO. OF CLASSROOMS
53
2OVERALL ACHIEVEMENT
118.7
176.0
-57.3
162,4
155.9
6.5
14.61
-22,1
35.1
PROJECT DESCRIPTORS
P-TRAGE PUPILS/CLASSROOM
13.6
13.0
0.6
QUANT. PRESCORE
24.6
32.0
-7.4
AFFECT
18.3
18.5
18.5
19,0
-0.E
0.95
-2.4
1.4
EAST SOUTH
COG. PROCESS PRESCORE
5.7
7.2
-1.5
REGION
CENTRAL
READING PRESCORE
39.9
67.0
-27.1
ATTENDANCE
6,9
7,6
-0,7
5.5
6.4
-0.9
4.84
-10.4
8.6
LANGUAGE PRESCORE
10.8
13.7
-2.9
DISTANCE TO NEAREST SMSA
.73-120 MILLs
AFFECT PRESCORE
16.1
17.2
-1.1
WRAT TOTAL
91.0
110,6
-19,6
105.3
103,0
2,3
6,28
-10.0
14.6
AGE (JUNE '71)
96.5
95.7
0.8
SIZE OF NEAREST ROSA
558.000
% CLASSROOM MALE
61.6
61.5
0.1
QUANTITATIVE
29,1
18.3
-19,2
40.2
44.4
4,39
-12,8
1.4
% CLASSROOM BLACK
87.7
r87.7
KRCENT NONWHIT'
18
% PRESCHOOL (OR NO. MOS.)
64.6
lb.d
47.8
READING SKILLS
70,2
97,1
-26,9
96,5
84.9
11.6
9.69
30.6
"1 PARENTS
0 HS DIPL.
73.1
50.6
22.5
PROJECT SIZE (PUPILS)
,160
% PARENTS W SKILLED OCCUP.
23.6
56.2
-32.6
LANGUAGE ARTS
19.4
30.6
-11.2
26,2
26,6
-0,1
2.91
-6.1
5.3
% PARENTS BLACK
86.7
086.7
NO. PUPILS PAC MEMBER
.18.2
% PARENTS POVERTY WGIBLE
79.5
21.7
57,8
% HEAD HOUSEHOLD EMPLOYED
80.4
100.0
-19.6
FT, PER-PUPIL EXPENDITURE
..735
% HEAD HOUSEHOLL Alex;
63.4
95.9
-32,5
PART
II
PARENT EVALUATION DATA
CLASSROOM OBSERVATION
NO, CLASSROOM GROUPS
53
2PARENT-CHILD
FACTOR SCORES
AV. PARENTS/CLASSRM GRP
13.1
12.7
0,7
INTERACT
.086
.141
-.055
-.052
-.014
-.038
.450
-1.26
.50
% W/O HIGH SCHOOL DIPLOMA
73.1
50.6
22.5
FACTOR NAME
FT
NIT
% W SKILLED OCCUP.
23.6
56.2
-32,6
PARENT-SCHOOL
% POS EVAL OF
LRNG
92.3
70.3
22.0
INVOLVE
.127
.051
.076
.055
.367
-.312
.458
-1.21
.59
SELF REGULATORY
- 56
-1.13
+do
.% BLACK
86.7
086.7
% REPORTING USE
PRESCHOOL
64.6
16.8
47.8
CHILD ACADEMIC
CHILD-INITIATED
INTERACTIONS
-.79
-.53
% POVERTY ELIGIBLE
79.5
21.7
57.8
EXPECT
.544
.153
.391
-.017
.332
-.349
.452
-1,23
% HEAD HOUSEHOLD EMPLOYED
80.4
100.0
-19.6
% HEAD HOUSEHOLD MALE
63.4
95.9
-32.5
SENSE OF CONTROL
.284
.267
.017
.151
.257
-.102
.441
-.97
,76
PROGRAMMED ACADEMIC
1.40
26
PART III
TEACHER EVALUATION
DATA
EXPRESSIVE
-.74
-1.02
NO. OF CLASSROOMS
43
1PARENT-EDUCATOR
JOB SATISF. RATING
1.8
1.8
0IMAGE
0.71
0.29
0,42
0,59
0,52
0.07
0.331
-.58
.72
CHILD SELF - LEARNING
-.03
1.33
BOOK RESOURCE SCALE
2.7
5.0
-2.3
RACE (BLACK /NONBLACK)
01.0
-1.0
PROFESSION. ACCEPT
IDENT. W. COMMUNITY
2.0
1.3
0,7
OF METHOD
2.00
1.33
0,67
2,50
0,45
1,65
0.497
.68
2.62
NO. OF HELPERS
2.0
02.0
ABLE TO CHOOSE ASSIGNMENT
1.0
2.7
-1.7
TANG & TEACHER EXPER
7.5
6.0
1.5
-Guide for Interpretation of Results- for explanation of table eny(qes.
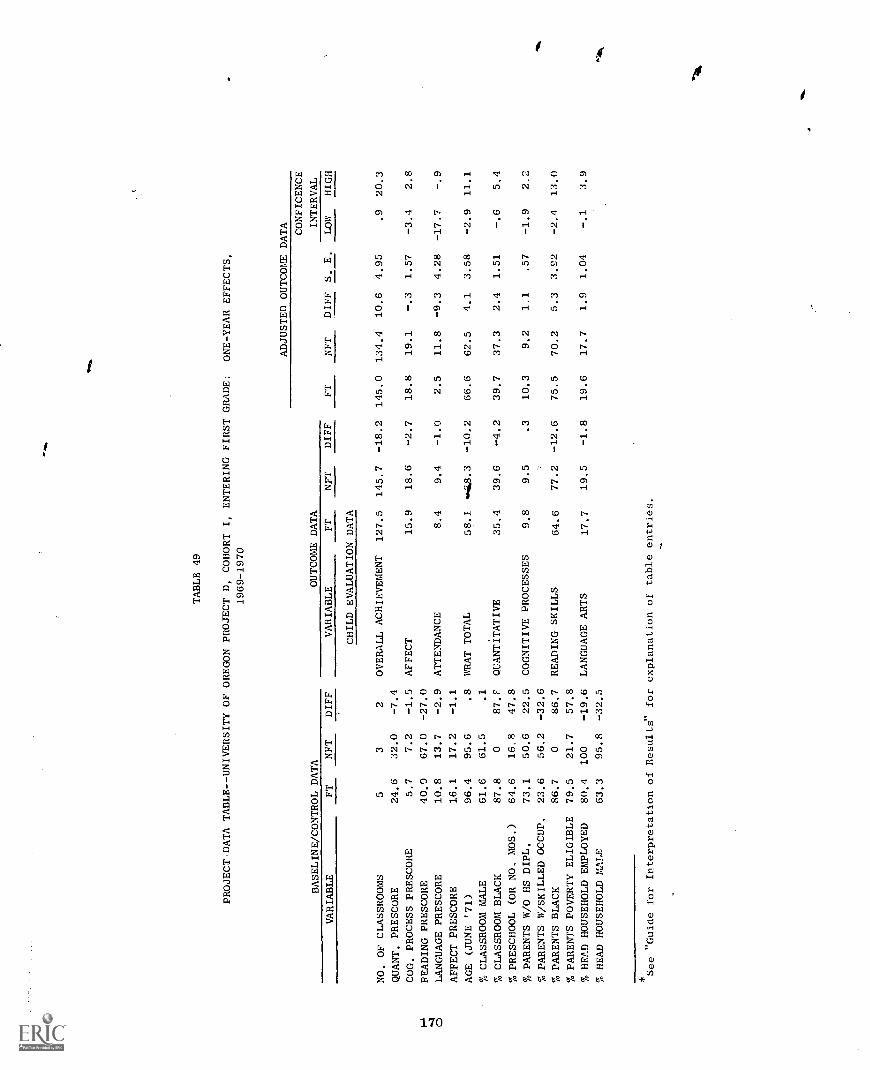
TABLE 49
PROJECT DATA TABLE -- UNIVERSITY OF OREGON PROJECT D, COHORT I, ENTERING FIRST GRADE:
ONE-YEAR EFFECTS,
1969-1970
BASELINE/CONTROL DATA
OUTCOME DATA
ADJUSTED OUTCOME DATA
FT
NFT
DIFF
S. E.
CONFICENCE
INTERVAL
VARIABLE
FT
NFT
DIFF
VARIABLE
FT
NFT
DIFF
LOW
HIGH
CHILD EVALUATION DATA
NO. OF CLASSROOMS
53
2OVERALL ACHIEVEMENT
127.5
145.7
-18.2
145.0
134.4
10.6
4.95
.9
20.3
QUANT. PRESCORE
24.6
32.0
-7.4
COG. PROCESS PRESCORE
5.7
7.2
-1.5
AFFECT
15.9
18.6
-2.7
18.8
19.1
-.3
1.57
-3.4
2.8
I-&
--I
READING PRESCORE
40.0
67.0
-27.0
0LANGUAGE PRESCORE
10.8
13.7
-2.9
ATTENDANCE
8.4
9.4
-1.0
2.5
11.8
-9.3
4.28
-17.7
-.9
AFFECT PRESCORE
16.1
17.2
-1.1
AGE (JUNE '71)
96.4
95.6
.8
WRAT TOTAL
58.1
.ftli.8.3
-10.2
66.6
62.5
4.1
3.58
-2.9
11.1
% CLASSROOM MALE
61.6
61.5
.1
% CLASSROOM BLACK
87.8
087.F
QUANTITATIVE
35.4
39.6
-4.2
39.7
37.3
2.4
1.51
-.6
5.4
% PRESCHOOL (OR NO, MOS.)
64.6
16,8
47.8
% PARENTS W/O HS DIPL.
73.1
50.6
22.5
COGNITIVE PROCESSES
9.8
9.5
.3
10.3
9.2
1.1
.57
-1.9
2.2
% PARENTS W/SKILLED OCCUP.
23.6
56.2
-32.6
% PARENTS BLACK
86.7
086.7
READING SKILLS
64.6
77.2
-12.6
75.5
70.2
5.3
3.2
-2.4
13.0
% PARENTS POVERTY ELIGIBLE
79.5
21.7
57.8
% HEAD HOUSEHOLD EMPLOYED
80.4
100
-19.6
LANGUAGE ARTS
17.7
19.5
-1.8
19.6
17.7
1.9
1.04
-.1
3.9
% HEAD HOUSEHOLD MALE
63.3
95.8
-32.5
See "Guide for Interpretation of Results" for explanation of table entries.

TABLE 50
PROJECT DATA TABLE -- UNIVERSITY OF OREGON PROJECT D, COHORT II, ENTERING FIRST GRADE:
ONE-YEAR EFFECTS,
1970-1971
ADJUSTED OUTCOME DATA
CONFIDENCE
BASELINE CONTROL DATA
OUTCOME DATA
FT
NFT
DIFF
S. E.
INTERVAL
PROCESS DATA
VARIABLE
FT
NFT
DIFF
VARIABLE
FT
NET
DIFF
IOW
HIGH
PART I
CHILD EVALUATION DATA
NO. OF CLASSROOMS
43
1OVERALL ACHIEVEMENT
111.6
122.0
-10.4
154.7
102.4
52.3
28.86
-4.3
108.9
PROJECT DESCRIPTORS
AVERAGE PUPILS/CLASSROOM
10.3
9.0
1.3
EAST SOUTH
QUART. PRESCORE
27.5
27.2
0.3
AFFECT
15.5
16.7
-1.2
18.3
16.4
1.9
1.72
-1.5
5.3
REGION
CENTRAL
COG. PROCESS PRESCORE
5.9
7.2
-1.3
READING PRFSCORE
31.2
38.0
-6.8
ATTENDANCE
8.4
4.4
4.0
5,4
5.8
10.34
-20.7
19.9
DISTANCE TO NEAREE1 SMSA
.75-120 miles
LANGUAGE PRESCORE
13.2
16.1
-2.9
AFFECT PRESCORE
16.0
15.1
0.9
WRAT TOTAL
65.0
70.3
-5.3
87.1
44.2
42.9
18.11
7.4
78.4
SIZE. GI' Y'-JREST SMSA .
..
558,000
AGE (JUNE '71)
84.8
86.4
-1.6
I CLASSROOM MALE
55.6
29.1
26.5
QUANTITATIVE
40.2
40.4
-0.2
55.6
'
33.5
22.1
12.29
-2.0
46.2
PERCENT NONWHITE
.41,
18
I CLASSROOM BLACK
84.1
084.1
I PRESCHOOL (OR NO. MOS.)
5.8
05.8
COGNITIVE PROCESSES
8.6
9.9
-1.3
10.3
-9.8
0.5
4.57
-8.5
9.5
PROJECT SIZE (PUPILS)
..
460
9 PP1lZNTS W/O HS D1PL.
86.4
42.4
44.0
9 PARENTS W SKILLED OCCUP.
15.1
59.5-44.4
READING SKILLS
62.8
71.7
-8.9
88.8
59.2
29.6
16.06
-1.D
61.1
NO. PITILS/PAC MEMBER
..
18.2
I PARENTS BLACK
87.7
087.7
I PARENTS POVERTY ELIGIBLE
70.8
21.7
49.6
LANGUAGE ARTS
19.0
21.0
=1..0
28.5
16.8
11.7
6.35
-0.7
24.1
FT PER-PUPIL EXPENDITURE
.735
1-4
% HEAD HOUSEHOLD EMPLOYED
84.5
74.6
9.9
I-4
I HEAD HOUSEHOLD MALE
57.3
79.0
-21.7
PART. II
PARENT EVALUATION DATA
CLASSROOM OBSERVATION
FACTOR -CURES
NO. CLASSROOM GROUPS
43
1PARENT-CHILD
AV. PARENTS/CLASSRM GRP
16.8
8.7
8.1
INTFRACT
-.252
-.031
-.221
-.279
-.083
-.196
.934
-2.03
1.63
FACTOR NAME
FT
NET
W/O HIGH SCHOOL DIPLOMA
86.4
42.4
44.0
I W SKILLED OCCUP.
15.1
59.5
-44.4
PARENT-SCHOOL
SELF REGULATORY
- 22
-1.06
I POS EVAL OF CHILD LRNG
91.4
32.6
58.8
INVOLVE
-.263
.229
-.312
-.589
.277
1.477
-2.62
3.17
% BLACK
87.7
087.7
CHILD-INITIATED
REPORTING USE OF PRESCHOOL
72.5
072.5
CHILD ACADEMIC
INTERACTIONS
-.59
-.94
POVERTY ELIGIBLE
70.8
21.2
49.6
EXPECT
.301
-.472
.773
-.170
-.070
-.100
1.017
-2.09
1.89
HEAD HOUSEHOLD EMPLOYED
84.5
74.6
9.9
PROGRAMMED ACADEMIC
1.7 -1
.08
HEAD HOUSEHOLD MALE
57.3
79.0
-21.7
SENSE OF CONTROL
.160
-.110
.270
.634
-.933
1.57
1.068
-.52
,3.65
oEXPRESSIVE
- J7
-.97
JART III
TEACHER EVALUATION DATA
CHILD SE11,-LEARNING
-.22
1.30
NO. OF CLASSROOMS
33
0PARENT-EDUCATOR
JOB SATISF. RATING
1.8
2._
-0.4
IMAGE
0,42
0.79
0.13
0.09
0.55
-0.46
0.503
-1.45
.53
BOOK RESOURCE SCALE
2.3
3.3
-1.0
RACE (BLACK/NONBLACK)
0.3
1.0
-0.7
PROFESSION. ACCEPT
IDENT. Ni. COMMUNITY
1.0
1.7
-0.7
OF METHOD
1.67
2.00
-1.33
1.61
1.64
-0.03
0.546
-..1.10
1.04
NO. OF HELPERS
2.0
02.0
ABLE TO CHOOSE ASSIGNMENT
0.3
3.0
-2.7
TRNG & TEACHER EXPER
5.6
4.7
0.9
"Guide for Interpretation
of Results" for
explanation of table entries.
Summary
The salient features of the University of Oregon model are summarized
below:
Focus and Objectives--emphasizes short range program objectives
Child
Cognitive (major emphasis)
Develop competence in reading,- math, language, art, and music
Curricular Approach
Teacher's role is that of director
Desired behaviors are systematically reinforced by praise and
pleasurable activities
Teacher and two aides each work closely with small groups
Highly programmed materials and structured environment
Structured responsiveness expected on part of child)
Type of Parent Involvement
Family workers personally contact all parents to acquaint them
with program and child's progress
Parent workers instruct parents in use of materials to supple-
ment school program
Encourage parents to participate in PAC and to volunteer in
classroom.
In many ways, this model can be considered the most structured and
well defined of all the FT approaches. It is unfortunate that the FT
and NFT samples for the Cohort I and II projects in this evaluation were
so badly matched. The results of sponsor level analyses for Cohort I-K
and I-EF are summarized in Tables 51 and 52. As discussed in the inter-
pretation of project data, these FT and NFT samples represented distinct
population subgroups. Hence, the results of significance tests on pupil
outcomes are likely invalid, particularly in the analysis of the groups
where the matching problem is acute. That is, the FT samples were char-
acterized by Black children from poor families with low baseline scores,
whereas the NFT groups were characterized by non-Black children with
higher baseline scores from familes that can scarcely be characterized
as disadvantaged.
172

TABLE 51
UNIVERSITY OF OREGON SUMMARY, COHORT I, KINDERGARTEN ENTERING PROJECTS:
TWO-YEAR EFFECTS,
1969-1971
ADJUSTED OUTCOME DATA
OUTCOME MEASURE
UNADJUSTED MEANS
FT
NFT
"
DIFF
S. E.
CONFIDENCE
INTERVAL
FT
NET
DIFF
LOW
HIGH
CHILD DATA
ACHIEVEMENT
137.6
135.9
1.7
133.4
132.3
1.2
5.31
-9.2
11.6
AFFECT
17.6
17.4
.2
17.6
17.8
-.1
'
.51
-1.1
.9
WRAT
82.0
78.7
3.3
80.6
77.6
3.0
2.96
-2.8
8.8
QUANTITATIVE
43.0
42.6
.4
41.2
41.8
-.6
1.69
-3.9
2.7
i-L w
COG. PROCESS
READING
6.7
59.9
7.1
58.1
-.4
1.7
6.5
58.5
6.9
56.6
-.4
2.0
.30
2.66
-1.0
-3.2
.2,
7.2
LANGUAGE
28.1
28.0
.1
27.2
27.2
.0
1.43
-2.8
2.8
PARENT DATA
PARENT-CHILD
-.05
-.02
-.03
.01
.01
.0
.15
- -.29
.29
PARENT-SCHOOL
.07
-.39
.46
.06
-.37
.43
.21
.02
.84
CHILD ACADEMIC EXPEC-
TATION
.17
-.17
.34
.21
-.23
.44
.24
-.03
.91
SENSE OF CONTROL
.11
-.15
.27
.09
-.16
.25
.22
-.18
.68
TEACHER DATA
PARENT-EDUCATOR IMAGE
.42
.48
-.06
.38
1.97
-.19
.1.3
-.44
.06
PROFESSION. ACCEPT FT
1.89
1.33
.56
.58
1.33
.64
.19
.27
1.01
See "Guide for Interpretation of Results" for
explanation of table entries.

4
Table 52
UNIVERSITY OF OREGON SUMMARY, COHORT I, ENTERING FIRST GRADE PROJECTS:
TWO-YEAR EFFECTS,
1969-1971
OUTCOME MEASURE
UNADJUSTED MEANS
ADJUSTED OUTCOME DATA
FT
NFT
DIFF
S. E.
CONFIDENCE
INTERVAL
FT
NFT
DIFF
LOW
HIGH
CHILD DATA
ACHIEVEMENT
140.0
175.2
-35.2
168.7
162.9
5.8
9.63
-13.1
24.7
AFFECT
18.0
18.3
-.3
17.6
18.7
-1.1
.65
-2.4
.2
WRAT
101.4
112.6
-11.2
109.5
108.2
1.3
4.04
-6.6
9.2
QUANTITATI"E
33.6
46.5
-12.9
42.4
42.2
.2
2.89
-5.5
5.9
READING
85.3
99.1
-13.8
99.4
92.1
7.3
6.47
-5.4
20.0
LANGUAGE
21.1
29.7
-8.6
27.3
28.8
-1.5
1.84
-5.1
2.1
PARENT DATA
PARENT-CHILD
.09
.14
-.06
.11
-.10
.21
.29
-.36
.78
PARENT-SCHOOL
.13
.05
.08
.23
-.19
.42
.37
-.30
1.14
CHILD ACADEMIC EXPEC-
TATION
.54
.15
.39
.50
.06
.43
.42
-.39
1.25
SENSE OF CONTROL
.28
.27
.02
.37
.13
.24
.36
-.47
.95
TEACHER DATA
PARENT-EDUCATOR IMAGE
.56
'
.28
.28
.A9
.56
-.08
.31
-.69
.53
PROFESSION. ACCEPT FT
1.83
1.33
.50
2.46
1.16
1.29
.48
.35
2.2a
See "Guide for Interpretation of Results" for explanation of table entries.
These comparison group problems notwithstanding, these analyses do
show evidence of greater parental involvement (K stream) and greater
teacher acceptance of FT methods (K and EF streams). Also, the class-
room observations conducted within these projects show evidence of a
high degree of correspondence between the observed teacher processes and
those specified by the model, suggesting that the pogram is being appro-
priately implemented. If, in subsequent cohorts or in subsequent measure-
ments within these cohorts, a more acceptable degree of control group
comparability can be established, thenthe impact and effects of thif:
model on pupil gains can be properly,assessed.
175111(0
BEHAVIOR ANALYSIS APPROACH
University of Kansas
Sponsor's Intended Approach
The behavior analysis model is based on the experimental analysis of
behavior, which uses a token exchange system..to provide precise, positive
reinforcement of desired behavior. The tokens provide an immediate re-
ward to the child for successfully completing a learning task. He can
later exchange these tokens for an activity he particularly values, such
as playing with blocks or listening to stories. Initial emphasis in the
behavioral analysis classroom is on developing social and classroom skills,
followed by increasing emphasis on the core subjects of reading, mathe-
matics, and handwriting. The goal is to achieve a standard but still flex-
ible pattern of instruction and learning that is both rapid and pleasurable.
The model calls for careful and accurate definitions of instructional
objectives, whether they have to do with social skills or with academic
skills. Curriculum materials used describe the behavior a child will be
capable of at the end of a learning sequence and clearly state criteria
for judging a response as "correct." They also require the teacher to
make frequent reinforcing responses to the child's behavior and permit the
child to progress through learning tasks at his own pace. The child earns
more tokens during the initial stages of learning a task and progressively
fewer as he approaches mastery, the object being 'co move from external
rewards to self-motivatel behavior. Since a child with few tokens to ex-
change for preferred accLvity is likely to be a child needing more atten-
tion, the system guides the teacher in evaluating her own performance.
In the behavior analysis classroom, four adults work together as an
instructional team. This includes a teacher who leads the team and assumesresponsibility for the reading program, a full-time aide who concentrates
ou small group math instruction, and two project parent aides who attend
to spelling, handwriting, and individual tutoring. Parent aides are em-ployed on a rotating basis with other parents. They first serve as class-
room trainees for a period of several weeks; some of these parents, in
turn, become aides for a full semester. Full-time teacher aides are
emieloyed from the latter group. The short trainee cycle allows a great
number of parents to become directly involved in the program. They thencarry its main features into the home situation.
Careful staff planning is an integral part of the behavior analysis
daily schedule. Each day includes planning sessions, periods of formal
177
instruction, and special activity periods during which the children ex-
change their tokens for an activity they choose. Instruction and special
activity periods alternate throughout the day, with the amount of time for
instruct:on increasing as the amount of reinforcement required to sustain
.motivatirn decreases.OP
Evaluation of the model begins with an entry behavior inventory and
diagnostic tests that determine where each child should begin a sequence
of instruction and that also help to monitor his progress through the
sequence, The curriculum materials usedalso provide for periodic testingand monitoring of achievement gains, Throughout the school year a com-
puterized record-keeping system issues to the teacher aweekly progress
report on each child and also reports progress for the class as a whole.
Generally, implementation of the'behavior 'Analysis model proceeds in
three phases. In the first, the sponsor supplies substantial advisory
support and training in, the procedures and techniques of the program. In
the second, local leadership takes over and local staff training coordi-
nators assume more and more of the training and support responsibility.
Finally, only periodic consulting with the sponsor is needed.
Individual Project Results
Five samples from three different projects sponsored by the University
of Kansas (UK) were included in the analysis of interim effects. The dis-
tribution of these evaluation samples in terms of cohort, outcome, and
project is as follows:
Cohort First-year Effects Second-year Effects
IK
Project UK(a)
(projects b & c) (projects a, b, & c)
Two-year evaluation data for Project UK(a) are summarized in Table 53.
This relatively small project is located within the large Eastern popu-
lation center. The anticipated FT expenditure was $763 per pupil, and the
pupilfrAC member ratio was 9.6.
178
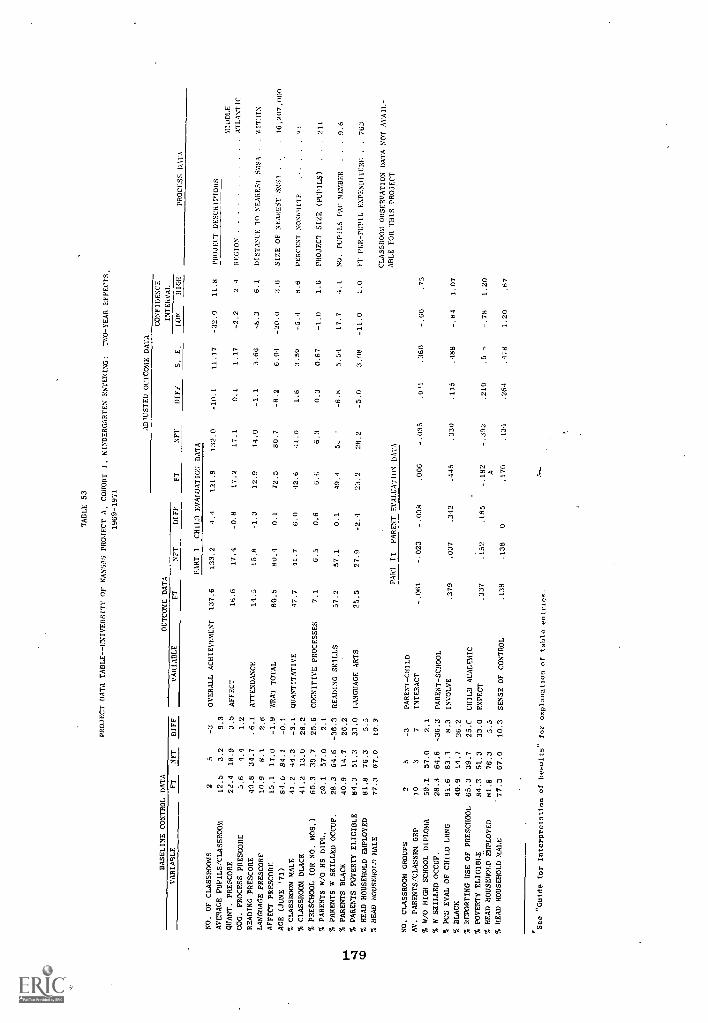
TABLE 53
PROJECT DATA TABLE -- UNIVERSITY OF KANSAS PROJECT A, COHORT I, KINDERGARTEN' ENTERING:
TWO-YEAR EFFECTS,
1969-1971
BASELINE CONTROL
DATA
OUTCOME DATA
AD'USTED OUTCOME DATA
PROCESS DATA
FT
NF7
D1FF
S. E.
CONFIDENCE
INTERVAL
VARIABLE
FT
NFT
DUE.
VARIABLE
FT
NFT
D1FF
DOW
HIGH
PART I
CHILD EVALUATION DATA
NO. OF CLASSROOMS
25
-3
OVERALL ACHIEVEMENT
137.6
133.2
4.4
121.9
132.0
-10.1
11.17
-32.0
11.8
PROJECT DEscHivroRs
AVERAGE PUPILS/CLASSROOM
12.5
3.2
9.3
M10D1.E
QUAINT. PRESCORE
22.4
18.9
3.5
AFFECT
16.6
17.4
-0.8
17.2
17.1
0.1
1.17
-2.2
2.4
REGION
ATLANTIC
COG. PROCESS PRESCORE
5.6
4.4
1.2
READING PRESCORE
40.8
34.7
.6.1
ATTENDANCE
14.5
15.8
-1.3
12.9
14,0
-1.1
3.66
-8.3
6.1
DISTANCE TO NEAREST SMSA
..WITHIN
LANGUAGE PRESCORE
10.9
8.1
2.8
AFFECT PRESCORE
15.1
17.0
-1.9
WRAT TOTAL
80.5
80.1
0.1
72.5
80.7
-8.2
6.04
-20.0
3.6
SIZE OF NEAREST SMS1
..
16,207,000
AGE (JUNE '71)
84.0
84.1
-0.1
% CLASSROOM MALE
41.2
44.3
-3.1
QUANTITATIVE
47.7
41.7
6.0
42.6
11.0
1.6
3.59
8.6
PERCEN1 NoN1,011T
24
% CLASSROOM BLACK
41.2
13.0
28.2
% PRESCHOOL (OR NO. MOS.)
65.3
39.7
25.6
COGNITIVE PROCESSES
7.1
6.5
0.6
6.6
6.3
0.3
0.67
-1.0
1.6
PROJECT SIZE (PUPILS)
..211
% PARENTS w/0 HS DIPL.
59.1
57.0
2.1
% PARENTS W SKILLED OCCUP.
28.3
64.6
-36.3
READING SKILLS
57.2
57.1
0.1
49.4
-6.8
5,54
-17.7
4.1
NO. PUPILS PAC MEMBER
..9.6
1"
% PARENTS BLACK
40.9
14.7
26.2
..4
% PARENTS POVERTY ELIGIBLE
84.3
51,3
33.0
LANGUAGE. ARTS
25.5
27.9
-2.4
23.2
28.2
-5.0
3.08
-11.0
1.0
FT PER -PUPIL EXPENDITURE
..763
U.D.
S HEAD HOUSEHOLD EMPLOYED
81.8
76.3
5.5
% READ HOUSEHOLD MALE
77.3
67.0
10.3
CLASSROOM OBSERVATION DATA NOT AVAIL-
ABLE FOR THIS PROJECT
PART II
PARENT EVALUATION DATA
NO. CLASSROOM GROUPS
25
-3
PARENT-CHILD
AV. PARENTS/CLASSRM GRP
10
37
INTERACT
-.061
-.023
-.038
.006
-.035
.0t1
.360
-.66
.75
% 8/0 HIGH SCHOOL DIPLOMA
59.1
57.0
2.1
% W SKILLED OCCUP.
28.3
64.6
-36.3
PARENT-SCHOOL
% PCS EVAL OF CHILD LRNG
91,6
83.1
8.3
INVOLVE
.379
.037
.342
.415
.330
.115
.488
-.84
1.07
% BLACK
40.9
14.7
26.2
% REPORTING USE OF PRESCHOOL
65.3
39,7
25.0
CHILD ACADEMIC
% POVERTY ELIGIBLE
84.3
51.3
33.0
EXPECT
.337
.152
.185
-.182
-.392
.210
.5 7
-.78
1.20
% READ HOUSEHOLD EmPLoyEn
81.8
76.3
5.5
A% HEAD HOUSEHOLD MALE
'77.3
67.0
10.3
SENSE OF CONTROL
.138
.138
0.170
.434
-.261
.158
-1.20
.67
"Guide for Interpretation of Results
for explanation of table entries.
Baseline data indicate the two FT and five NFT classrooms were mod-
erately comparable, but that more FT pupils came from poor Black families.
Interestingly, the FT pupils averaged higher than the NFT pupils on most
of the baseline measures. After adjustments for these baseline differ-
ences, outcome data failed to indicate any significant FT/NFT differences
on either pupil or parent variables. Since process data were not gathered
for this project, no further interpretations are possible.
Project UK(b)
The second-year pupil data in Project UK(b) are summarized in
Table 54, and evaluation data for the first-year subset are zummarized in
Table 55. This project is also located within a large metropolitan area
in the Middle Atlantic region. Project UK(b) was large (1,240 pupils),
anticipated spending $832 per pupil and averaged one PAC member for each
9.6 pupils. Because of the size of this project, total PAC membership
was extensive (i.e., 129 members).
The baseline data for this project indicate that FT and NFT pupils
had similar entering scores. Al$ were Black, and classroom compositions
were reasonably equivalent. However, serious problems emerge in the
paren data. The FT parents averaged below the NFT parentson educational,
employment, and occupational leve]s, yet all NFT families were rated as
poverty eligible. This phenomenon dramatically illustrates the missing
data problem referred to earlier. In this project, poverty data were
available only for those NFT families who were, in fact, poverty eligible.
Therefore, no data on those NFT families who were not poverty eligible
were included. Since poverty is highly related to outcomes, we feel it
should be included as a covariable. But restricting the data to subsets
of complete data would eliminate one of the two NFT classrooms, hence
precluding ana]ysis. Thus again we are faced with a sample of data that
cannot be adequately analyzed because of comparison-group problems. Our
feeling regarding estimation of effects for this specific project is that
outcomes are in favor of FT. Unfortunately, we cannot attach a signifi-
cance level tc this interpretation, since the covariable valUes have pro-
duced distortions in analysis.
Classroom observation factor scores, which were available only for
the FT classes, reveal that the instructional process corresponds closely
to that intended by the sponsor. The strongest curriculum component, and
the only one that is above average, is the programmed academic factor;
the weakest are the child-initiated interactions cnd the self-regulatory
factors
180
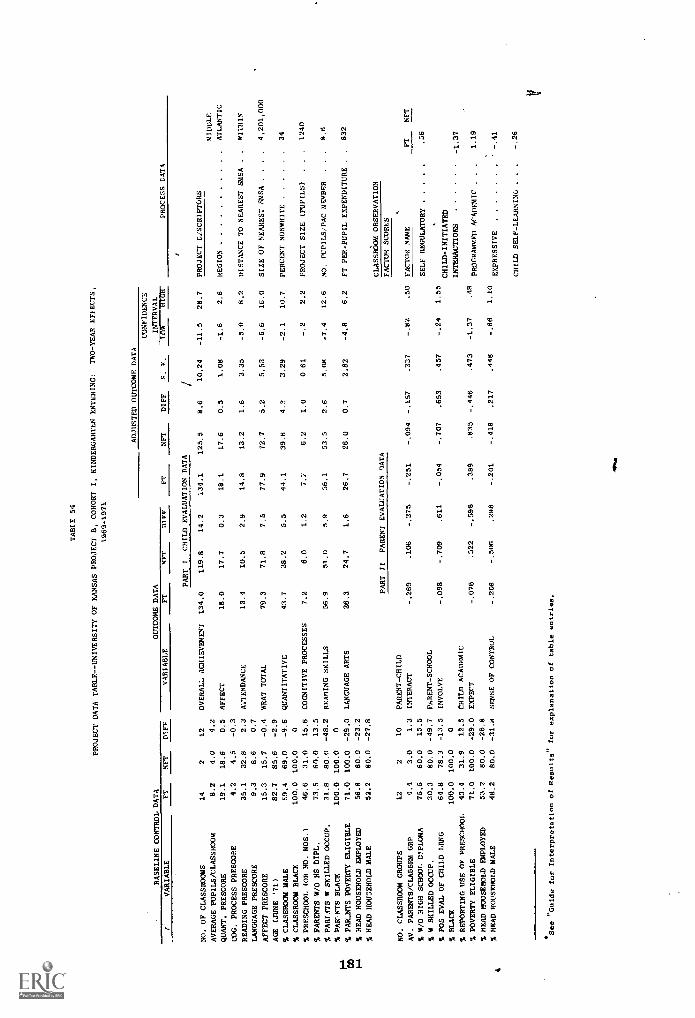
BASELINE CONTROL DATA
TABLE 54
PROJECT DATA TABLE -- UNIVERSITY OF KANSAS PROJECT B, COHORT I, KINDERGARTEN ENTERING:
TWO-YEAR EFFECTS,
1969-1971
OUTCOME DATA
ADJUSTED OUTCOME DATA
CONFIDENCE
INTERVAL
VARIABLE
FT
RFT
DIFF
VARIABLE
FT
NFT
DIFF
FT
NFT
DIFF
S. E.
LOW
HIGH
PROCESS GATA
PART I
CHILD EVALUATION DATA
I
NO. OF CLASSROOMS
14
212
°FERAL"- ACHIEVEMENT
134.0
119.8
14.2
134.1
125.5
8.6
10.24
-11.5
28.7
PROJECT CiSCRIPT0RS
AVERAGE PUPILS/CLASSROOM
8.2
4.0
4.2
MIDDLE
QUART. PRESCORE
19.1
18.6
0.5
AFFECT
18.0
17.7
0.3
18.1
17.6
0.5
1.08
-1.6
2.6
REGION
ATLANTIC
COG. PROCESS PRESCORE
4.2
4.5
-0.3
READING PRESCORE
35.1
32.8
2.3
ATTENDANCE
13.4
10.5
2.9
14.8
13.2
1.6
3.35
-5.0
8.2
DISTANCE TO NEAREST SMSA
..
WITHIN
LANGUAGE PRESCORE
9.3
8.6
0.7
AFFECT PRESCORE
15.3
15.7
-0.4
WRAT TOTAL
79.3
71.8
7.5
77.9
72.7
5.2
5.53
-5.6
16.0
SIZE OF NEAREST SMSA
..
..
4,201,000
AGE (JUNE '71)
82.7
85.6
-2.9
% CLASSROOM MALE
59.4
69.0
-9.6
QUANTITATIVE
43.7
38.2
5.5
44.1
39.8
4.3
3.29
-2.1
10.7
PERCENT NONWHITE
34
% CLASSROOM BLACK
100.0
100.0
0
% PRESCHOOL (OR NO. MOS.)
46.6
31.0
15.6
COGNITIVE PROCESSES
7.2
6.0
1.2
7.2
6.2
1.0
0.61
2.2
PROJECT SIZE (PUPILS)
..
.1240
% PARENTS E/0 HS DIPL.
73.5
60.0
13.5
% PARTATS W SKILLED OCCUP.
31.8
80.0
-48.2
READING SKILLS
56.9
51.0
5.9
56.1
53.5
2.6
5.08
_7.4
12.6
NO. PUPILS /PAC MEMBER
.9.6
% PAR:NTS BLACK
100.0
100.0
0
% PARENTS POVERTY ELIGIBLE
71.0
100.0
-29.0
LANGUAGE ARTS
26.3
24.7
1.6
26.7
26.0
0.7
2.82
-4.8
6.2
FT PER-PUPIL EXPENDITURE .
.832
% HEAD HOUSEHOLD EMPLOYED
56.8
80.0
-23.2
% HEAD HOUSEHOLD MALE
52.2
80.0
-27.8
CLASSROOM OBSERVATION
PART
II
PARENT EVALUATION DATA
FACTOR SCORES
NO. CLASSROOM GROUPS
12
210
PARENT-CHILD
AV. PARENTS/CLASSRM GRP
4.4
3.0
1.3
INTERACT
-.269
.106
-.375
-.251
-.094
-.157
.337
-.82
.50
FACTOR NAME
FT
NFT
% W/O HIGH SCHOOL. DIPLOMA
75.5
60.0
15.5
SELF REGULATORY
-.56
% W SKILLED OCCUP.
30.3
80.0
-49.7
PARENT-SCHOOL
% PDS EVAL OF CHILD LANG
64.8
78.3
-13.5
INVOLVE
-.098
-.709
.611
-.054
-.707
.653
.457
-.24
1.55
CHILD-INITIATED
% BLACK
100.0
100.0
0INTERACTIONS
-1.37
% REPORTING USE OF PRESCHOOL
43.4
31.9
12.5
CHILD ACADEMIC
% POVERTY ELIGIBLE
71.0
100.0
-29.0
EXPECT
-.076
.522
-.598
.389
.835
-.446
.473
-1.37
.411
PROGRAMMED ACADEMIC
..
.1.19
% HEAD HOUSEHOLD EMPLOYED
53.2
80.0
-26.8
% HEAD HOUSEHOLD MALE
48.2
80.0
-31.8
SENSE OF CONTROL
-.208
-.506
.298
-.201
-.418
.217
.448
-.66
1.10
EXPRESSIVE
-.41
CHILD SELF-LEARNINL,
..
.-.26
See "Guide for Interpretation of Results" for explanation of table entries.
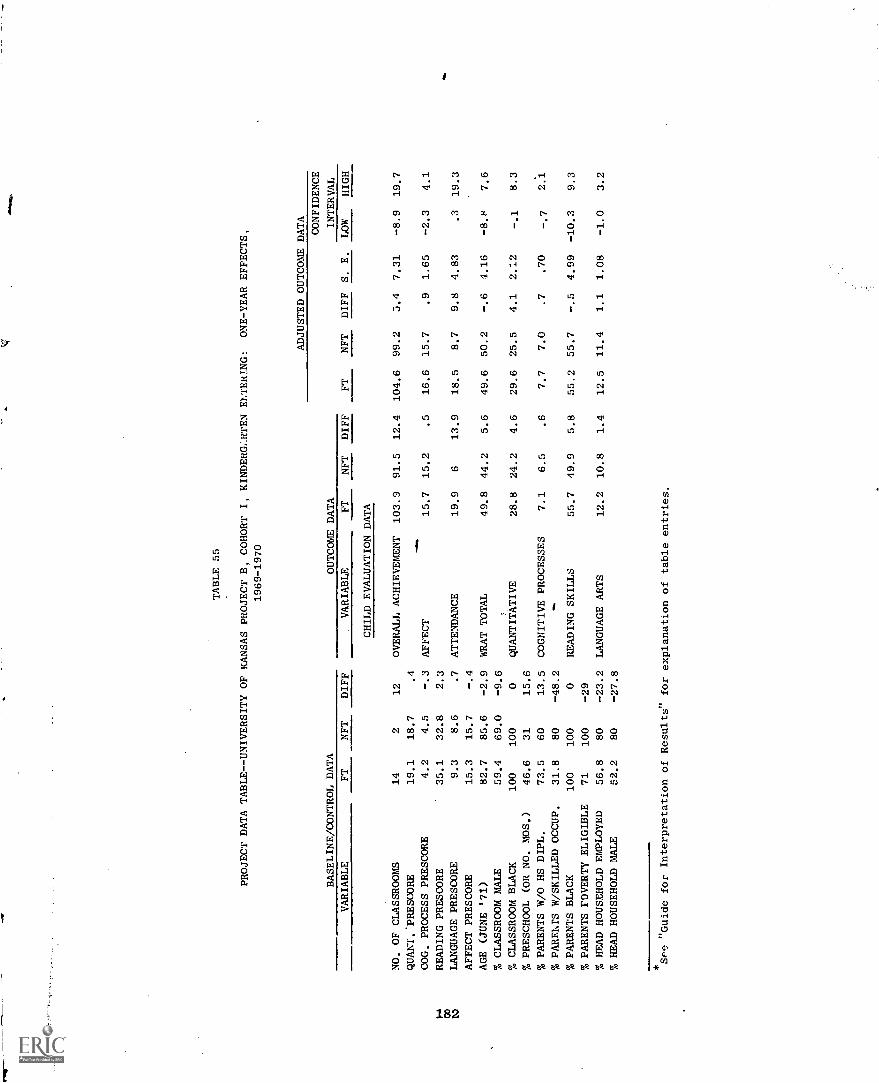
TABLE 55
PROJECT DATA TABLE--UNIVERSITY OF KANSAS PROJECT B, COHORT I, KINDERGARTEN EP.TERING:
ONE-YEAR EFFECTS,
1969-1970
ADJUSTED OUTCOME DATA
BASELINE/CONTROL DATA
OUTCOME DATA
FT
NFT
DIFF
S. E.
CONFIDENCE
INTERVAL
VARIABLE
FT
NFT
DIFF
VARIABLE
FT
NFT
DIFF
LOW
HIGH
CHILD EVALUATION DATA
NO. OF CLASSROOMS
14
212
OVERALL ACHIEVEMENT
103.9
91.5
12.4
104.6
99.2
3.4
7.31
-8.9
19.7
QUANT.-PRESCORE
19.1
18.7
.4
-...
COG. PROCESS PRESCORE
4.2
4.5
-.3
AFFECT
15.7
15.2
.5
16.6
15.7
.9
1.65
-2.3
4.1
I-L
READING PRESCORE
35.1
32.8
2.3
CO N
LANGUAGE PRESCORE
9.3
8.6
.7
ATTENDANCE
19.9
613.9
18.5
8.7
9.8
4.83
.3
19.3
AFFECT PRESCORE
15.3
15.7
-.4
AGE (JUNE '71)
82.7
85.6
-2.9
WRAT TOTAL
49.8
44.2
5.6
49.6
50.2
-.6
4.16
-8.8
7.6
% CLASSROOM MALE
59.4
69.0
-9.6
% CLASSROOM BLACK
100
100
0QUANTITATIVE
23.8
24.2
4.6
29.6
25.5
4.1
2.12
-.1
8.3
% PRESCHOOL (OR NO. MOS.)
46.6
31
15.6
% PARENTS W/O HS DIPL.
73.5
60
13.5
COGNITIVE PROCESSES
7.1
6.5
.6
7.7
7.0
.7
.70
-.7
2.1
% PAREhTS W/SKILLED OCCUP.
31.8
80
-48.2
..-
% PARENTS BLACK
100
100
0READING SKILLS
55.7
49.9
5.8
55.2
55.7
-.5
4.99
-10.3
9.3
% PARENTS POVERTY ELIGIBLE
71
100
-29
% HEAD HOUSEHOLD EMPLOYED
56.8
80
-23.2
LANGUAGE ARTS
12.2
10.8
1.4
12.5
11.4
1.1
1.08
-1.0
3.2
% HEAD HOUSEHOLD MALE
52.2
80
-27.8
SPe "Guide for Interpretation of Results" for explanation of table entries.
Differences between one- and two-year data (I-K2 versus IK1) tn the
unadjusted outcomes on pupil variables also show encouraging evidence of
impact. That is, the two-year results show larger differences than the
one-year results on every cognitive measure. Since these two groups were
nearly equivalent at the baseline, the probability that this event would
happen by chance alone is small enough (less than 2 percent for each set
of outcomes) that we arc reasonably certain the program in this project
is producing its intended impact on pupil growth.
Project UK(c)
The remaining University of Kansas project, located over 75 miles
from a west north central urban area, was also moderately small (277
pupils) with an average of 10 pupils per PAC member and an anticipated
per-pupil FT expenditure of $773. Twc data samples were analyzed forthis project: a second-year group and a first-year subset. These data
are presented in Tables 56 and 57, respectively.
The control variable data for the four FT and five NFT samples show
a very good match. FT groups are nearly equivalent to NFT groups on pre-
scores, classroom compositions, and all parent measures. In fact, the FT
group appears only negligibly more disadvantaged than NFT.
Differences in FT/NFT pupil measures fail to show any significant
two-year program effects. Parent differences also fail to reach signifi-
cance. Classroom observation data were not available to aid in inter-
preting these results.
Analysis of the one-year subset reveals that, at the end of one year
of the program, significant FT-favoring differences existed on achieve-
ment, WRAT, quantitative, and reading measures. Just why these differ-
ences disappear in the two-year effects data is far from clear. One
possibility is that NFT teachers are adopting the FT methods. Ai,other
possible explanation is that FT teachers altered their procedures or
levels of effort. But since teacher data were unavailable for this sample,
any such explanation is speculative and unsupportable at this point in the
evaluation.
183
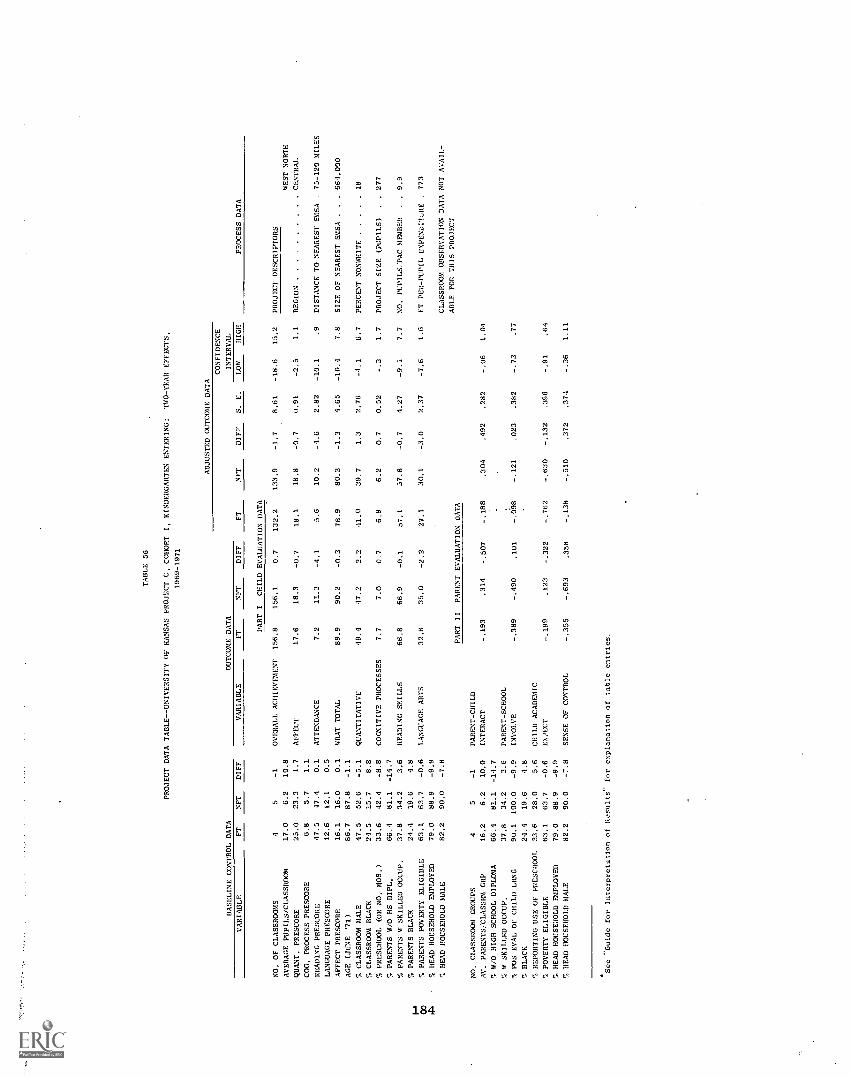
TABLE 56
PROJECT DATA TABLE--UNIVERSITY OF KANSAS PROJECT C, COHORT I, KINDERGARTEN ENTERING:
TWO-YEAR EFFECTS,
1969-1971
ADJUSTED OUTCOME DATA
CONFIDENCE
BASELINE CONTROL DATA
OUTCOME DATA
INTERVAL
VARIABLE
FT
NET
DIFF
VARIABLE
FT
NFT
DIFF
FT
NET
DIFF
S.
E.
LOW
HIGH
PROCESS DATA
PART
ICHILD EVALUATION DATA
NO. OF CLASSROOMS
45
-1
OVERALL ACHIEVEMENT
156.8
156.1
0.7
132.2
133.9
-1.7
8.61
-18.6
15.2
PROJECT DESCRIPTORS
AVERAGE PUPILS/CLASSROOM
17.0
6.2
10.8
WEST NORTH
QUART. PRESCORE
25.0
23.3
1.7
AFFECT
17.6
18.3
-0.7
18.1
18.8
-0.7
0.91
-2.5
1.1
REGION
CENTRAL
COG. PROCESS PRESCORE
6.8
5.7
1.1
READING PRESCORE
47.5
47.4
0.1
ATTENDANCE
7.2
11.3
-4.1
5.6
10.2
2.82
-10.1
.9
DISTANCE TO NEAREST SMSA
.75-120 MILES
LANGUAGE PRESCORE
12.6
12.1
0.5
AFFECT PRESCORE
16.1
16.0
0.1
WHAT TOTAL
89.9
90.2
-0.3
78.9
80.2
-1.3
4.65
-10.4
7.8
SIZE OF NEAREST SMSA .
..664.000
AGE (JUNE '71)
86.7
87.8
-1.1
CLASSROOM MALE
47.5
52.6
-5.1
QUANTITATIVE
49,4
47.2
2.2
41.0
39.7
1.3
2.76
-4.1
6.7
PERCENT NONWHITF
18
% CLASSROOM BLACK
24.5
15.7
8.8
% PRESCHOOL (OR NO. MOS.)
33.6
42.4
-8.8
COGNITIVE PROCESSES
7.7
7.0
C.7
6.9
6.2
0.7
0.52
1.7
PROJECT SIZE (PUPILS)
..277
PARENTS W/O HS DIPL.
66.4
81.1
-14.7
PARENTS 8 SKILLED OCCUP.
37.8
34.2
3.6
READING SKILLS
66.8
66.9
-0.1
57,1
57.8
4.27
-9.1
7.7
NO. PUPILS/PAC MEMBER
..9.9
I"
% PARENTS BLACK
24.4
19.6
4.8
00
% PARENTS POVERTY ELIGIBLE
63.1
63.7
-0.6
LANGUAGE ARTS
32.8
35.0
-2.2
27.1
30.1
-3.0
2.37
-7.6
1.6
FT PER-PUPIL EXPENDITJRE
.773
ki=,
% HEAD HOUSEHOLD EMPLOYED
79.0
88.9
-9.9
HEAD HOUSEHOLD MALE
82.2
90.0
-7.8
CLASSROOM OBSERVATION DATA NOT AVAIL-
ABLE. FOR THIS PROJECT
PART II
PARENT EVALUATION DATA
NO. CLASSROOM GROUPS
45
-1
PARENT-CHILD
AV. PARENTS/CLASSRM GRP
16.2
6.2
10.0
INTERACT
-.193
.314
-.507
-.188
.304
.492
.282
_.06
1.04
% 8/0 HIGH SCHOOL DIPLOMA
66.4
81.1
-14.7
% 8 SKILLED OCCUP.
37.8
34.2
3.6
PARENT-SCHOOL
% POS EVAL OF CHILD LRNG
9U.1
100.0
-9.9
INVOLVE
-.389
-.490
.101
-.098
-.121
.023
.382
-.73
.77
% BLACK
24.4
19.6
4.8
% REPORTING USE OF PRESCHOOL
33.6
28.0
5.6
CHILD ACADEMIC
POVERTY ELIGIBLE
63.1
63.7
-0.6
EX.-,ECT
-.199
.123
-.322
-.762
-.630
-.132
.396
-.91
.64
HEAD HOUSEHOLD EMPLOYED
79.0
88.9
-9.9
HEAD HOUSEHOLD MALE
82.2
90.0
-'.8
SENSE OF CONTROL
-.355
-.693
.358
-.138
-.510
.372
.374
-.36
1.11
*See
Guide for Interpretation of Rosults" for explanation of table entries.
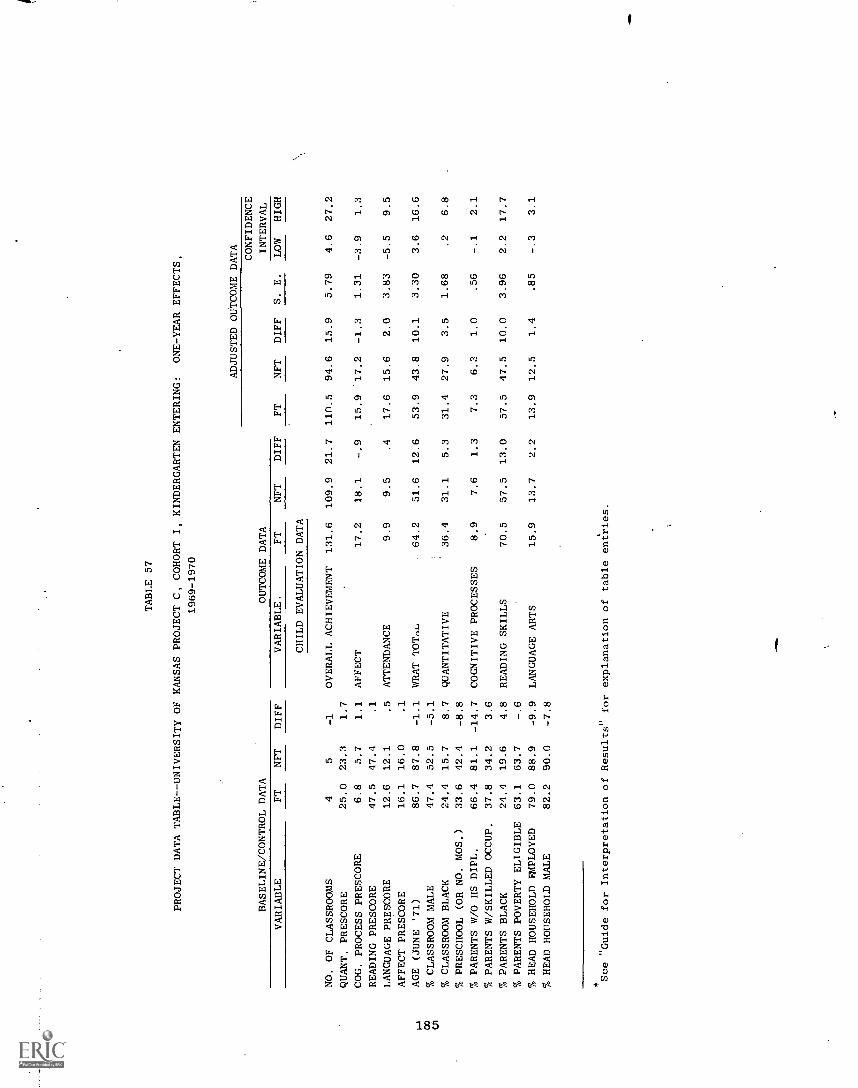
TABLE 57
PROJECT DATA TABLE--UNIVERSITY OF KANSAS PROJECT C, COHORT I, KINDERGARTEN ENTERING:
ONE-YEAR EFFECTS,
1969-1970
ADJUSTED OUTCOME DATA
CONFIDENCE
BASELINE/CONTROL DATA
OUTCOME DATA
INTERVAL
VARIABLE
FT
NFT
DIFF
VARIABLE.
FT
NFT
DIFF
FT
NFT
DIFF
S. E.
LOW
HIGH
CHILD EVALUATION DATA
NO. OF CLASSROOMS
45
-1
OVERALL ACHIEVEMENT
131.6
109.9
21.7
110.5
94.6
15.9
5.79
4.6
27.2
QUANT. PRESCORE
25.0
23.3
1.7
COG. PROCESS PRESCORE
6.8
5.7
1.1
AFFECT
17.2
18.1
-.9
15.9
17.2
-1.3
1.31
-3.9
1.3
READING PRESCORE
47.5
47.4
.1
LANGUAGE PRESCORE
12.6
12.1
.5
ATTENDANCE
9.9
9.5
.4
17.6
15.6
2.0
3.83
-5.5
9.5
AFFECT PRESCORE
16.1
16.0
.1
IAGE (JUNE '71)
86.7
87.8
-1.1
WRAT TOT,-.L.
64.2
51.6
12.6
53.9
43.8
10.1
3.30
3.6
16.6
CO cn
% CLASSROOM MALE
47.4
52.5
-5.1
% CLASSROOM BLACK
24.4
15.7
8.7
QUANTITATIVE
'
36.4
31.1
5.3
31.4
27.9
3.5
1.68
.2
6.8
% PRESCHOOL (OR NO. MOS.)
33.6
42.4
-8.8
% PARENTS W/O HS DIPL.
66.4
81.1
-14.7
COGNITIVE PROCESSES
8.9
7.6
1.3
7.3
6.3
1.0
.56
-.1
2.1
% PARENTS W/SKILLED OCCUP.
37.8
34.2
3.6
% PARENTS BLACK
24.4
19.6
4.8
READING SKILLS
70.5
57.5
13.0
57.5
47.5
10.0
3.96
2.2
17.7
% PARENTS POVERTY ELIGIBLE
63.1
63.7
-.6
% HEAD HOUSEHOLD EMPLOYED
79.0
88.9
-9.9
LANGUAGE ARTS
15.9
13.7
2.2
13.9
12.5
1.4
.85
-.3
3.1
% HEAD HOUSEHOLD MALE
82.2
90.0
-7.8
See "Guide for Interpretation of Results" for explanation of table entries.
Summary
The salient features of this approach can be outlined as follows:
Focus and Objectivqs--emphasizes short range program objectives
Child
Cognitive (major focus)
Increase academic achievement in basic skills
Affective
Develop social skills
Curricular Approach
Teacher's role that of director
Desired behavior is reinforced with tokens, which are later
exchanged for activity of child's choice
Individual focus with child proceeding at own rate
Highly structured curriculum, plus free play time
Structured responsiveness expected on part of child
Type of Parent Involvement
Train parents for direct involvement in classrooms as parent
aides.
Advise parents about how to continue education of child at home.
The project by project evidence for the interim impact of this
approach is mixed and, because of data problems, often uninterpretable.
The one-year subset data appeared to indicate that significant academic
progress was resulting from the program, but such evidence was not repli-
cated in the two-year data. Results of the sponsor level analysis on the
Cohort I-K projects are presented in Table 58. They suggest that the
model has produced significant pupil gains on the cognitive process mea-
sures. The results also show that NFT samples averaged significantly
higher on the parent-child interaction measure. Because of missing data
and the lack of comparability of the comparison groups, these results are
probably invalid. Thus, we cannot confidently make statements regarding
the relative impacts of this model at this time.
186
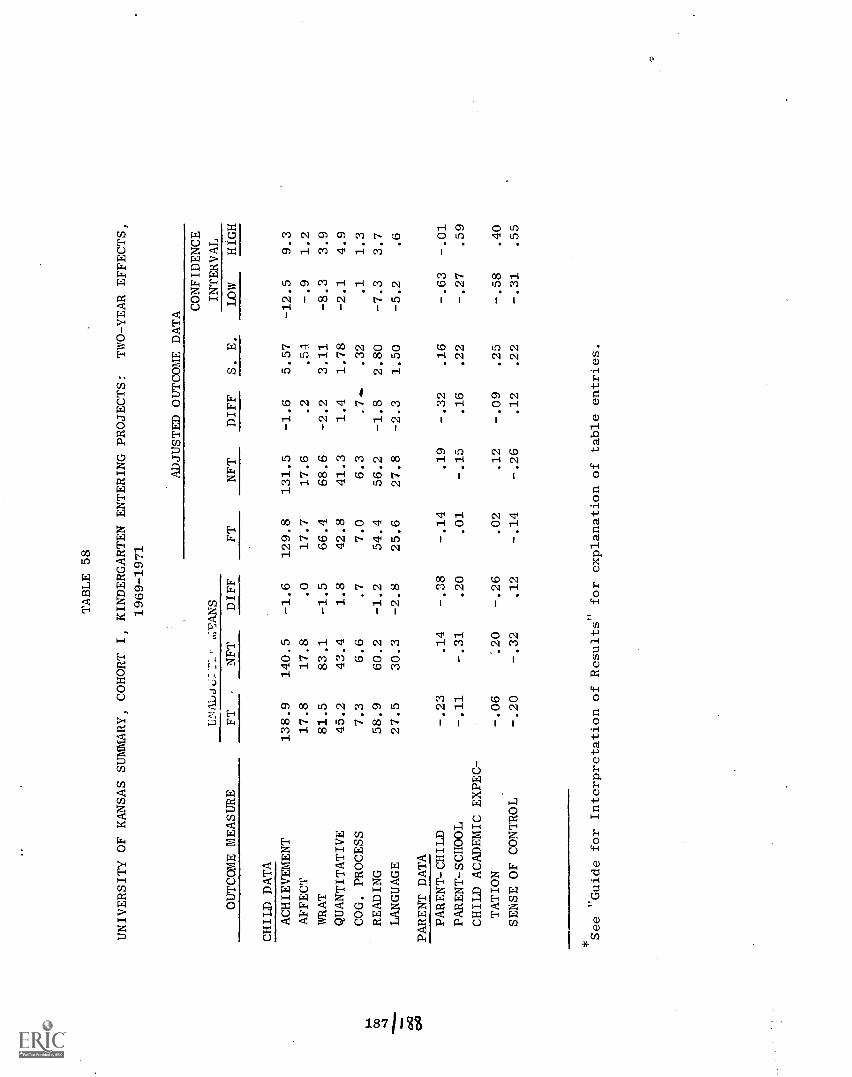
TABLE 58
UNIVERSITY OF KANSAS SUMMARY, COHORT I, KINDERGARTEN ENTERING PROJECTS:
TWO-YEAR EFFECTS,
1969-1971
OUTCOME MEASURE
..FANS
ADJUSTED OUTCOME DATA
FT
NFT
DIFF
S. E.
CONFIDENCE
INTERVAL
FT
NFT
DIFF
LOW
HIGH
CHILD DATA
ACHIEVEMENT
138.9
140.5
-1.6
129.8
131.5
-1.6
5.57
-12.5
9.3
AFFECT
17.8
17.8
.0
17.7
17.6
.2
.54
-.9
1.2
WRAT
81.5
83.1
-1.5
66.4
68.6
-2.2
3.11
-8.3
3.9
QUANTITATIVE
45.2
43.4
1.8
42.8
41.3
1.4
1.78
-2.1
4.9
COG. PROCESS
7.3
6.6
.7
7.0
6.3
.7+
.32
.1
1.3
READING
58.9
60.2
-1.2
54.4
56.2
-1.8
2.80
-7.3
3.7
LANGUAGE
27.5
30.3
-2.8
25.6
27.8
-2.3
1.50
-5.2
.6
PARENT DATA
PARENT-CHILD
-.23
.14
-.38
-.14
.19
-.32
.16
-.63
-.01
PARENT-SCHOOL
-.11
-.31
.20
.01
-.15
.16
.22
-.27
.59
CHILD ACADEMIC EXPEC-
TATION
-.06
'.20
-.26
.02
.12
-.09
.25
-.58
.40
SENSE OF CONTROL
-.20
-.32
.12
-.14
-.26
.12
.22
-.31
.55
See "Guide for Interpretation of Results" for explanation of table entries.
COGNITIVELY ORIENTED CURRICULUM MODEL
High/Scope Educational Research Foundation
Sponsor's Intended Approach
The High/Scope Educational Research foundation model represents a
synthesis of research in preschool and early elementary education. The
program recommends an "open framework" classroom that combines emphasis
on active experience and involvement of the child; a systematic, consis-
tent, and thoroughly planned approach to child development and instruc-
tion by the teacher; and continuous assessment of each child's level of
development so that appropriate materials and activities can be provided.
This approach is based on the conviction that telling and showing do not
teach, but that active experience with real objects does.
This approach uses a cognitively oriented curriculum, which takes
into account the very real difference between the way children "think"
and the way adults do. The model's aim is to nurture in children the
thinking skills they will need throughout their school years and adult
lives, as well as the academic subject competencies traditionally taught
in the early elementary grades. It emphasizes and is designed to support
the process of learning rather than particular subject matter. It is
central to High/Scope's program that learning should be active, that it
occurs through the child's action on the environment and his resultant
discoveries.
Each month one or more sponsor 'taff members spend up to a week at
each project site. Field Consultants assist with issues relating to theinstructional model: room arrangement, scheduling, teaching methods,
planning, learning centers, and the like. Program Specialists deal with
specific academic areas--math, science, social studies, and communication- -
and with the curriculum materials, both commercially developed and those
prepared by the sponsor. Curriculum Developers and administrative per-
sonnel also travel to projects as often as is necessary and feasible.
High/Scope Foundation staff present three major training and planning
workshops at the FOundation during the year--in the spring, summer, and
winter. In the fall, they conduct individual workshops at each project,
primarily for teaching staff. In addition, High/Scope Foundation oper-
ates laboratory classrooms to increase the scope and versatility of
training and curriculum development activities.
18.9
Staff at projects inc_tude a project director, curriculum assistants,
classroom staff, parent program staff, and home visitors. Each classroom
has two teadaers and an aide, or a single teacher with two aides, who
operate as a teaching team. The instructional staff is supervised by
and receives continuing inservice training and program monitoring from
the local Curriculum Assistant (CA). The CAs therefore receive the most
extensive training by Foundation staff. CAs bear prime responsibility
for planning, demonstrating, and evaluating activities in the six to
eight classrooms under their supervision and, in general, for ensuring
smooth implementation of the High/Scope model at each field site.
The parent program and home visit staff vary according to local
needs and objectives. Each local project essentially designs and imple-
ments its own parent program, with general guidelines and consultation
from High/Scope Foundation staff.
The home teaching component of the program consists of planned visits
to the home by classroom teachers or individuals hired specifically as
home visitors. The child, a parent, and the home visitor work together
during the visit, focusing on current and past activities at school and
on supportive activities that may be carried out at home.
Individual Project Results
Five samples from three different projects sponsored by High/Scope
Educational Research Foundation were included in the analysis of interim
effects. The distribution of these evaluation samples in terms of cohort,
outcome, and project is as follows:
Cohort First-year Effects Second-year Effects
IK (Project c)
IEF (Projects a & b) (Projects a & b)
Project HS(c)
The evaluation data for Project HS(c) are presented in Table 59.
This is a relatively small kindergarten entrance project located in a
large, racially mixed urban mid-Atlantic population center. The project
anticipated near average per pupil expenditures and maintained a lower
than average PAC/pupil ratio of approximately one PAC member for every
30 pupils.
190
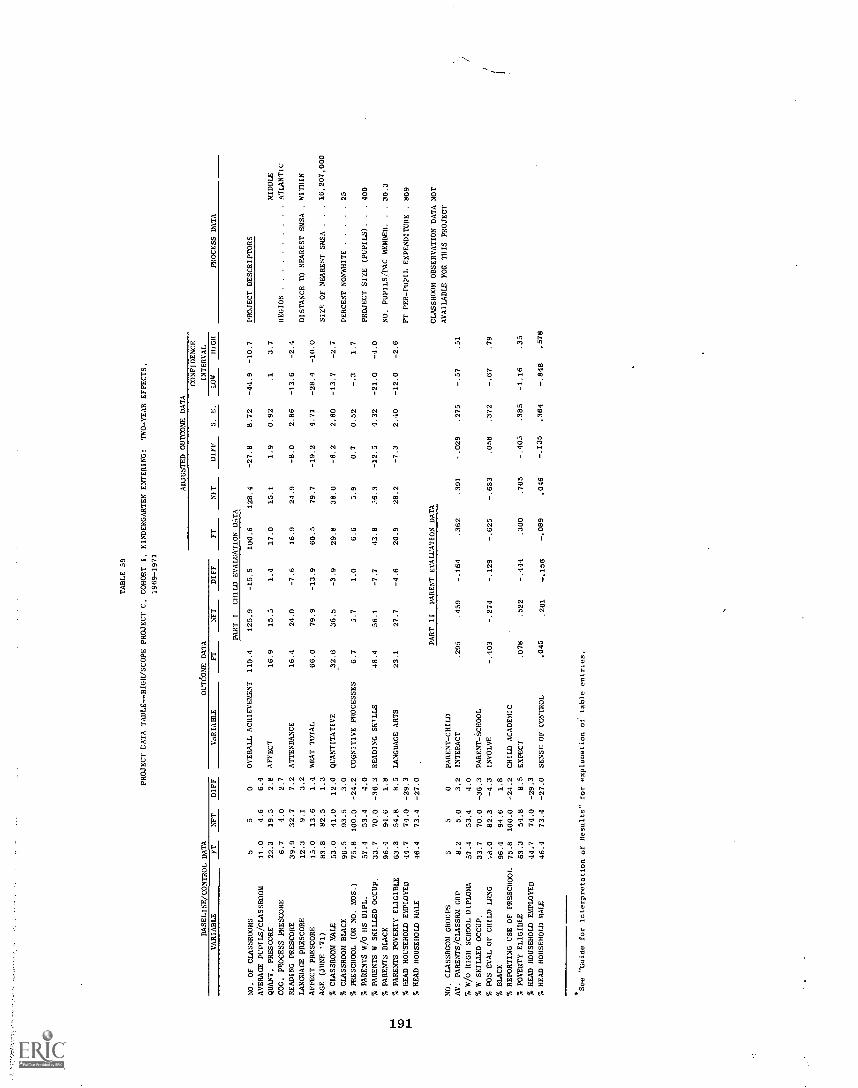
TABLE 59
PROJECT CATA TABLE - -HIGH/SCOPE PROJECT C, COHORT I. KINDERGARTEN ENTERING:
TWO-YEAR EFFECTS,
1969-1971
BASELINE/CONTROL DATA
VARIABLE
FT
NFT
DIFF
OUTCOME DATA
VARIABLE
FT
NFT
DIFF
ADJUSTED OUTCOME DATA
FT
CONFIDENCE
INTERVAL
NFT
DIFF
S.
E.
LOW
HIGH
PART I
CHILD EVALUATION DATA
PROCESS DATA
NO. OF CLASSROOMS
55
0OVERALL ACHIEVEMENT
110.4
125.9
-15.5
100.6
128.4
-27.8
8.72
-44.9
-10.7
PROJECT DESCRIPTORS
AVERAGE PUPI LS/CLASSROOM
11.0
4.6
6.4
QUANT, PRESCORE
22.3
19.5
2.8
AFFECT
16.9
15.5
1.4
17.0
15.1
1.9
0.92
.1
3.7
MIDDLE
COG. PROCESS PRESCORE
6.7
4.0
2.7
REGION
ATLANTIC
READING PRESCORE
39.9
32.7
7.2
ATTENDANCE
16.4
24.0
-7.6
16.9
24.9
-8.0
2.86
-13.6
-2.4
LANGUAGE PRESCORE
12.3
9.1
3.2
DISTANCE TO NEAREST SMSA
.WITHIN
AFFECT PRESCORE
15.0
13.6
1.4
WRAT TOTAL
66.0
79.9
-13.9
60.5
79.7
-19.2
4.71
-28.4
-10.0
AGE (JUNE '71)
83.8
82.5
1.3
SIn OF NEAREST SMSA
..
.16,207,000
% CLASSROOM MALE
53.0
41.0
12.0
QUANTITATIVE
32.6
36.5
-3.9
29.8
38.0
-8.2
2.80
-13.7
-2.7
% CLASSROOM BLACK
96.5
93.5
3.0
PERCENT NONWHITE
25
% PRESCHOOL (OR NO. MOS.)
75.8
100.0
-24.2
COGNITIVE PROCESSES
6.7
5.7
1.0
6.6
5.9
0.7
0.52
1.7
% PARENTS W/O HS DIPL.
57.4
53.4
4.0
PROJECT SIZE (PUPILS).
..400
% PARENTS W SKILLED OCCUP.
33.7
70.0
-36.3
READING SKlLLS
48.4
56.1
-7.7
43.8
56.3
-12.5
4.32
-21.0
-4.0
% PARENTS BLACK
96.4
94.6
1.8
NO. PUPILS/PAC MEMBER.
..30.3
% PARENTS POVERTY ELIGIBLE
63.3
54.8
8.5
LANGUAGE ARTS
23.1
27.7
-4.6
20.9
28.2
-7.3
2.40
-12.0
-2.6
% HEAD HOUSEHOLD EMPLOYED
44.7
74.0
-29.3
FT PER-PUPIL EXPENDITURE
.809
% HEAD HOUSEHOLD MALE
46.4
73.4
-27.0
PART II
PARENT EVALUATION DATA
CLASSROOM OBSERVATION DATA NOT
NO. CLASSROOM GROUPS
55
0PARENT-CHILD
AVAILABLE FOR THIS PROJECT
AV. PARENTS/CLASSRM GRP
8.2
5.0
3.2
INTERACT
.295
.459
-.164
.362
.391
-.029
.275
.51
% W/O HIGH SCHOOL DIPLOMA
57.4
53.4
4.0
% W SKILLED OCCUP.
33.7
70.0
-36.3
PARENT-SCHOOL
% POS EVAL OF CHILD LANG
82.3
-4.3
INVOLVE
-.403
-.27.1
-.129
-.625
-.683
.058
.372
-.67
.79
% BLACK
96.4
94.6
1.8
% REPORTING USE OF PRESCHOOL
75.8
100.0
-24.2
CHILD ACADEMIC
% POVERTY ELIGIBLE
63.3
54.8
8.5
EXPECT
.078
.522
-.444
.300
.705
-.405
.385
-1.16
.35
% HEAD HOUSEHOLD EMPLOYED
44.7
74.0
-29.3
% HEAD HOUSEHOLD MALE
46.4
73.4
-27.0
SENSE OF CONTROL
.045
.201
-.156
-.089
.046
-.135
.364
-.848
.578
"Guide for Interpretation of Results" for explanation of table entries.

The baseline data for this project show some highly unusual patterns,
which suggest to us that the prescores on the tests may be invalid. Spe-
cifically, the families constituting this cohort sample are poor, Black,
and below average in educational and employment levels. Also, these FT
families display the commonly noted pattern of being more disadvantaged
than their comparison groups. However, the baseline test scores show IT
pupils consistently (and significantly at the .05 level) above NFT pupils
on all measures. This difference in scores is in sharp contrast to the
characteristic and understandable pattern noted in all other projects in
this evaluation: namely, the direct relationship between prescores and
poverty indicators. Furthermore, this prescore bias cannot be attributed
to preschool experience since the FT pupils had proportionately less such
experience than the NFT pupils.
If (as we strongly suspect but are unable to confirm*) the prescores
were inflated in favor of FT, the covariance adjustments would cause the
resultant FT/NFT contrast to be seriously biased against FT. Since nearly
all cognitive test variables show significant differences in favor of NFT,
we suspect that such biasing occurred. The exceptions are the cognitive
process measure, the affect measure (significantly in favor of FT) and
the attendance measure (also significantly in favor of FT). None of the
parent measures showed significant program effects.
We are faced with two alternatives. Either we (a) accept the project
data at face value and interpret the pupil results as showing the FT' '
group as well above NFT on pretest measures but well below NFT on post-
test measures, thus producing evidence that the FT program hindered pupil
development, or (b) consider the pretest data as invalid and exclude the
project data from our interpretation of the effects of this model. Al-
though we can find no independent evidence to support the interpretation
that baseline data are invalid, we believe that the circumstantial evi-
dence is sufficiently compelling to make exclusion of this project from
the evaluation of this sponsor's effects the more prudent course of
action.
*Fall 1969 baseline data were collected under the decentralized field
operations procedure. Information regarding procedures used in specific
sites was available only through records provided by site personnel.
192

Project HS(b)
The evaluative data for the Project HS(b) sample, a Cohort I, Enter-
ing First Grade sample, are summarized in Table 60 for the second-year
effects, and in Table 61 for the first-year subset. This moderately
sized project is located in a primarily white rural community in the
south Atlantic region. The anticipated per-pupil expenditure of $928 is
slightly above the overall average, and the rate of one PAC member per
20 pupils is about average.
Baseline averages for the four FT and six NFT classrooms included
in this project sample show that the two groups lack comparability on
nearly all indicators. The FT classes systematically (and significantly)
scored lower on all baseline measures. FT pupils were primarily Black,
whereas NFT pupils were primarily non-Black. FT pupils came from substan-
tially more disadvantaged home environments than NFT pupils (their parents
were poorer, ethnically different, less skilled, and less well educated).
Teachers of the two groups were relatively comparable, although NFT teachers
were better integrated into their pupils' communities than were FT teachers.
Results of analysis show that NFT pupils scored significantly higher
than FT pupils on the affect measure and that NFT parents felt a signifi-cantly greater sense of control than FT parents did. All other results
failed to reach significance; in general, FT groups scored lower than NFT
groups. First-year data for these same pupils show similar results. Com-
parison of first- and second-year effects suggests that the program is
failing to produce the targeted improvements on pupil, parent, and teacher
outcome variables. However, the evidence of control group bias is so
pronounced as to suggest that the groups in our sample are drawn from two
initially distinct populations. If they are, then the probability of
inappropriate comparisons and differential regression on covariables is
increased and serious questions are raised about the validity of this
project analysis. We believe the risk of faulty interpretation resulting
from essentially invalid comparisons is sufficiently great in this case
to warrant exclusion of this project from the interim evaluation.
193
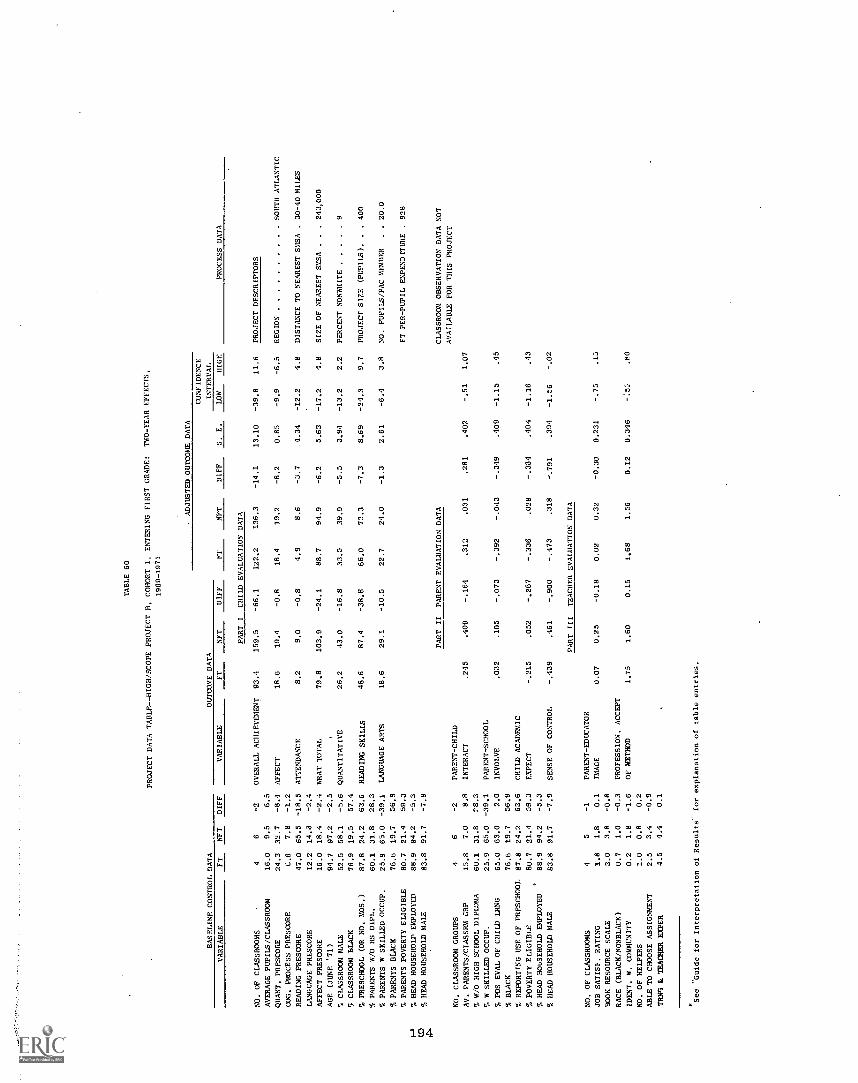
CO
TABLE 60
PROJECT DATA TABLE--HIGH/SCOPE PROJECT B, COHORT I, ENTERING FIRST GRADE:
TWO-YEAR EFFECTS,
1969-1971
ADJUSTED OUTCOME DATA
CONFIDENCE
BASELINE CONTROL DATA
OUTCOME DATA
INTERVAL
VARIABLE
FT
NFT
DIFF
VARIABLE
FT
NFT
DIFF
FT
NFT
DIFF
S. E.
LOW
HIGE
PROCESS DATA
PART I
CHILD EVALUATION DATA
NO. OF CLASSROOMS
46
-2
OVERALL ACHIEVEMENT
93.4
159.5
-66.1
122.2
136.3
-14.1
13.10
-39.8
11.6
PROJECT DESCRIPTORS
AVERAGE PUPILS/CLASSROOM
16.0
9.5
6.5
QUART. PRESCORE
24.3
32.7
-8.4
AFFECT
18.6
19.4
-0.8
18.4
19.2
-8.2
0.85
-9.9
-6.5
REGION
SOUTH ATLANTIC
COG. PROCESS PRESCORE
C.6
7.8
-1.2
READING PRESCORE
47.0
65.5
-18.5
ATTENDANCE
8.2
9.0
-0.8
4.9
8.6
-3.7
4.34
-12.2
4.8
DISTANCE TO NEAREST SMSA
.30-40 MILES
LANGUAGE PRESCORE
12.2
14.3
-2.4
AFFECT PRESCORE
16.0
18.4
-2.4
WRAT TOTAL
79.8
103.9
-24.1
88.7
94.9
-6.2
5.63
-17.2
4.8
SIZE OF NEAREST SMSA
..
.243,000
AGE (JUNE '71)
94.7
97.2
-2.5
% CLASSROOM MALE
52.5
58.1
-5.6
QUANTITATIVE
26.2
43.0
-16.8
33.5
39.0
-5.5
3.94
-13.2
2.2
PERCENT NONWHITE
9
¶CLASSROOM BLACK
76.9
19.5
57.4
% PRESCHOOL (OR NO. MOS.)
87.8
24.2
63.6
READING SKILLS
48.6
87.4
-38.8
66.0
73.3
-7.3
8.69
-24.3
9.7
PROJECT SIZE (PUPILS).
..400
% PARENTS W/O HS DIPL.
60.1
31.8
28.3
% PARENTS W SKILLED OCCUP.
25.9
65.0
-39.1
LANGUAGE ARTS
18.6
29.1
-10.5
22.7
24.0
-1.3
2.61
-6.4
3.8
NO. PUPILS/PAC MEMBER
..20.0
% PARENTS BLACK
76.6
19.7
56.9
% PARENTS POVERTY ELIGIBLE
80.7
21.4
59.3
FT PER-PUPIL EXPENDITURE
928
% HEAD HOUSEHOLD EMPLOYED
88.9
94.2
-5.3
% HEAD HOUSEHOLD MALE
83.8
91.7
-7.9
PART II
PARENT EVALUATION DATA
CLASSROOM OBSERVATION DATA NOT
AVAILABLE FOR THIS PROJECT
NO. CLASSROOM GROUPS
46
-2
PARENT-CHILD
AV. PARENTS/CLASSRM GRP
15.8
7.0
8.8
INTERACT
.245
.409
-.164
.312
.031
.281
.402
-.51
1.07
% W/O HIGH SCHOOL DIPLOMA
60.1
31.8
28.3
W SKILLED OCCUP.
25.9
65.0
-39.1
PARENT-SCHOOL
% POS EVAL OF CHILD IRNG
65.0
63.0
2.0
INVOLVE
.032
.105
-.073
-.392
-.043
-.349
.409
-1.15
.45
% BLACK
76.6
19.7
56.9
% REPORTING USE OF PRESCHOOL
87.8
24.2
63.6
CHILD ACADEMIC
POVERTY ELIGIBLE
80.7
21.4
59.3
EXPECT
-.215
.052
-.267
-.336
.028
-.364
.404
-1.16
.43
HEAD HOUSEHOLD EMPLOYED
88.9
94.2
-5.3
% HEAD HOUSEHOLD MALE
83.8
91.7
-7.9
SENSE OF CONTROL
-.439
.461
-.900
-.473
.318
-.791
.394
-1.56
-.02
PART III
TEACHER EVALUATION DATA
NO. OF CLASSROOMS
45
-1
PARENT-EDUCATOR
JOB SATISF. RATING
1.8
1.8
0.1
IMAGE
0.07
0.25
-0.18
0.02
0.32
-0.30
0.231
-.75
.15
BOOK RESOURCE SCALE
3.0
3.8
-0.8
RACE (BLACK /NONBLACK)
0.7
1.0
-0.3
PROFESSION. ACCEPT
IDENT. W. COMMUNITY
0.2
1.8
-1.6
OF METHOD
1.75
1.60
0.15
1.68
1.56
0.12
0.346
.80
NO. OF HELPERS
1.0
0.8
0.2
ABLE TO CHOOSE ASSIGNMENT
2.5
3.4
-0.9
TRW; & TEACHER EXPER
4.5
4.4
0.1
See "Guide for Interpretation of Results" for explanation of table entries.
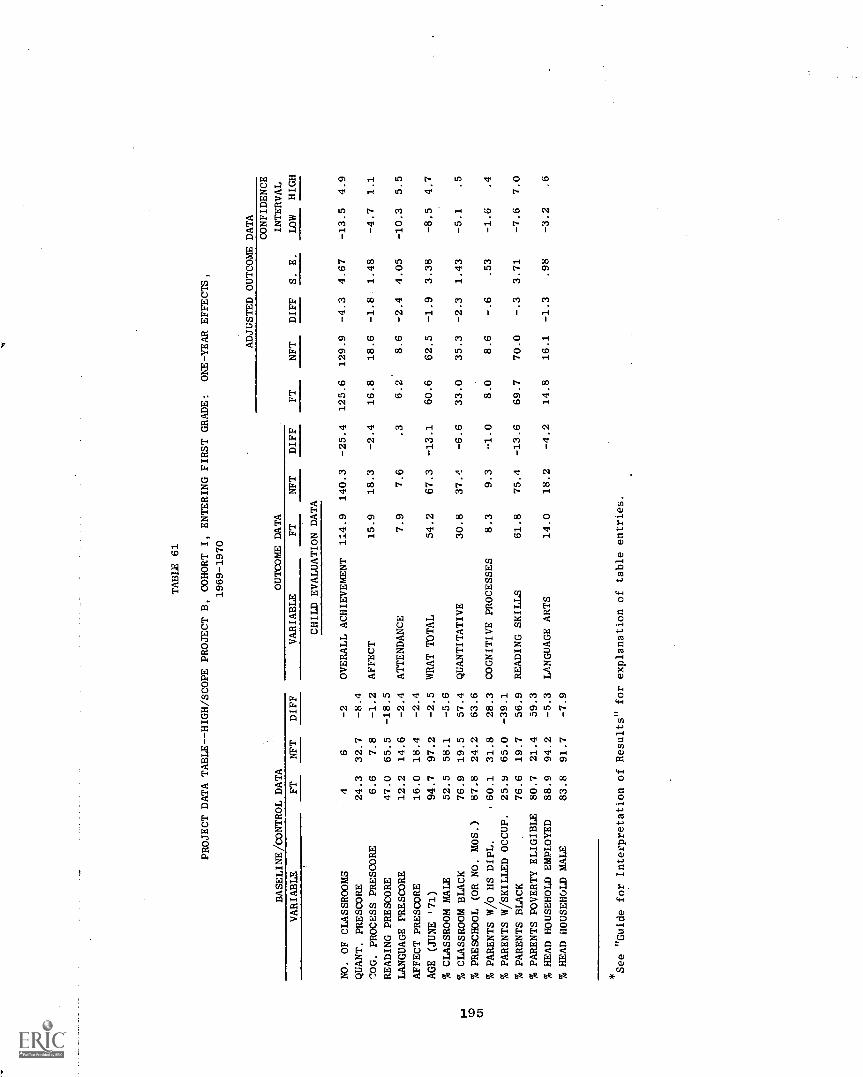
TABLE 61
PROJECT DATA TABLE -- HIGH /SCOPE PROJECT B, COHORT I, ENTERING FIRST GRADE:
ONE-YEAR EFFECTS,
1969-1970
BASELINE/CONTROL DATA
OUTCOME DATA
ADJUSTED OUTCOME DATA
FT
NFT
DIFF
S. E.
CONFIDENCE
INTERVAL
LOW
HIGH
VARIABLE
FT
NFT
DIFF
VARIABLE
FT
NFT
DIFF
CHILD EVALUATION DATA
NO. OF CLASSROOMS
46
-2
OVERALL ACHIEVEMENT
114.9
140.3
-25.4
125.6
129.9
-4.3
4.67
-13.5
4.9
QUANT. PRESCORE
24.3
32.7
-8.4
MG. PROCESS PRESCORE
6.6
7.8
-1.2
AFFECT
15.9
18.3
-2.4
16.8
18.6
-1.8
1.48
-4.7
1.1
READING PRESCORE
47.0
65.5
-18.5
LANGUAGE PRESCORE
12.2
14.6
-2.4
ATTENDANCE
7.9
7.6
.3
6.2
8.6
-2.4
4.05
-10.3
5.5
AFFECT PRESCORE
16.0
18.4
-2.4
AGE (JUNE '71)
94.7
97.2
-2.5
WRAT TOTAL
67.3
-13.1
60.6
62.5
-1.9
3.38
-8.5
4.7
% CLASSROOM MALE
52.5
58.1
-5.6
% CLASSROOM BLACK
76.9
19.5
57.4
QUANTITATIVE
30.8
37.4
-6.6
33.0
35.3
-2.3
1.43
-5.1
.5
TS)
at
% PRESCHOOL (OR NO. MOS.)
87.8
24.2
63.6
% PARENTS W/0 HS DIPL.
60.1
31.8
28.3
COGNITIVE PROCESSES
8.3
9.3
-1.0
8.0
8.6
-.6
.53
-1.6
.4
% PARENTS W/SKILLED OCCUP.
25.9
65.0
-39.1
% PARENTS BLACK
76.6
19.7
56.9
READING SKILLS
61.8
75.4
-13.6
69.7
70.0
-.3
3.71
-7.6
7.0
% PARENTS POVERTY ELIGIBLE
80.7
21.4
59.3
% HEAD HOUSEHOLD EMPLOYED
88.9
94.2
-5.3
LANGUAGE ARTS
14.0
18.2
-4.2
14.8
16.1
-1.3
.98
-3.2
.6
% HEAD HOUSEHOLD MALE
83.8
91.7
-7.9
See "Guide for Interpretation of Results" for explanation of table entries.
Project H.Sia)
The evaluation data for project IIS(a), also a CI-EF sample, are
presented in Table 62 for the two-year effects, and in Table 63 for the
one-year effects. This project is located in a rural community in the
east south central porticn of the United States. The project is moderate
in size (450 pupils) and primarily Black in ethnic composition. It antic-
ipated spending approximately $940 per pupil and had an average of one
PAC me.aber for each 32 pupils.
The four FT an the five NFT classes were reasonably comparable on
baseline ability measures, but differed in classroom composition (NFT
classes had proportionally more males and Blacks* and more preschool ex-
perience than FT classes). FT families differed from NFT families in
only two respects. The FT heads of household were more likely to be male
and currently working than were the NFT heads of households. It should
be noted that both FT and NFT families were severely impoverished, with
very few parents having high school educations or skilled occupatiolns
rnd nearly all families meeting the 0E0 poverty crikeria. Data on teachers
were inadequate for analysis.
Results of analyses of these second-year data display significant
FT-favoring differences only on days absent (95 percent confidence
in = 3.2 to 19.2 days). But on the WRAT and reading outcomes,
FT pupils showed significantly less gain than NFT pupils. Analysis of
first-year results for these pupils (Table 63) indicate that the FT def-
icits are cumulative. For both first- and second-year measurel..ents, the
results favor NFT, and by the second year some of the differences become
significant. However, the FT-favoring affect difference remains signif-
icant across both analyses, so apparently FT pupils have more positive
attitudes and are learning the mea'ured academic skills at a slower rate
than NFT pupils in this projec....
That this program had substantial impact on parents is evident from
the analysis of parent data. The FT parents significantly differ from
the NFT parents on the parent/child interaction scale, the parent/school
involvement scale, and the parent expectation scale. These outcomes sug-
gest that the model's emphasis on parental participation did succeed.
Table 62 shows FT classrooms sampled averaging 82 percent Black and the
parent interview sample as 72 percent Black. Yet according to the sponsor,
all participants at this site (both FT and NFT) were Black. This conflict
reflects further on data reliability problems.
196
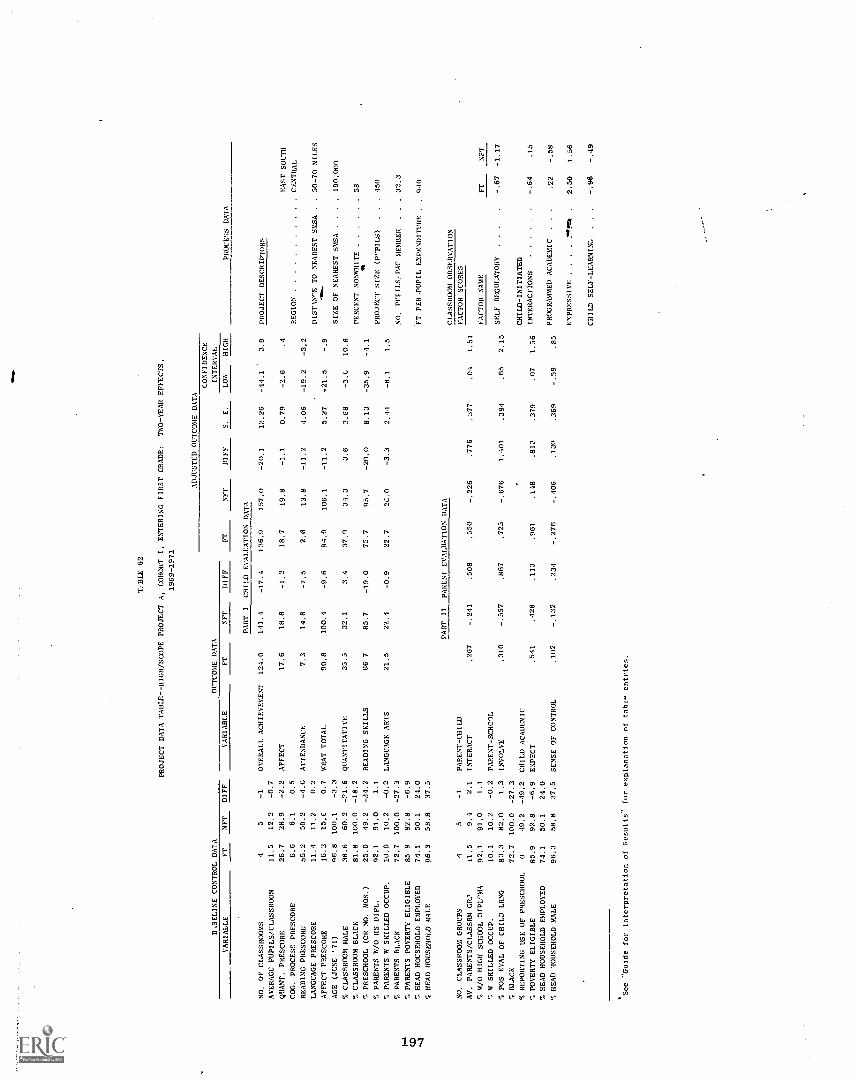
BiSELINE CONTROL DA1A
TrBIE 62
PROJECT DATA TABLE--HIGH/SCOPE PROJECT A, COHORT I, ENTERING FIRST GRADE,
TWO-YEAR EFFECTS,
1969-1971
OUTCOME DATA
ADJUSTED OUTCOME DATA
CONFIDENCE
INTERVAL
VARIALLE
FT
NFT
DIFF
VARIABLE
FT
NFT
DIFF
FT
NFT
DIFF
S.
E.
LOW
HIGH
PROCESS DATA
PART I
CHILD EVALUATION DATA
NO. OF CLASSROOMS
45
-1
OVERALL ACHIEVEMENT
124.0
141.4
-17.4
136.9
157.0
-20.1
12.26
-44.1
3.9
PROJECT DESCRIPTORS
AVERAGE PUPILS/CLASSROOM
11.5
12.2
-0.7
QUART, PRESCORE
26.7
28.9
-2.2
AFFECT
17.6
18.8
-1.2
18.7
19.8
-1.1
0.79
,4
EAST SOUTH
COG. PROCESS PRESCORE
6.6
6.1
0.5
REGION
CENTILU
READING PRESCORE
55.2
59.2
ATTENDANCE
7.3
14.8
2.6
13.8
-11.2
4.06
-19.2
-3.2
LANGUAGE PRESCORE
11.4
11.2
0.2
DIST1N,E TO NEAREST SMSA
.50-70 MILES
AFFECT PRESCORE
16.3
15,E
0.7
WRAT TOTAL
90.8
100.4
-9.6
94.9
106.1
-11.2
5.27
-21.5
AGE (JUNE '71)
06,8
100,1
-3.3
SIZE OF NEAREST SMSA
.190.000
1 CLASSROOM MALE
38.6
60.2
-71.6
QUANTITATIVE
35.5
32.1
3,1
37.9
34.3
3.6
3.68
-3,1
10,8
7, CLASSROOM BLACK
81.8
100.0
-18.2
PERCENT NONWHITE
58
1 PRESCHOOL (OR NO. MOS.)
25.0
49.2
-24.2
READING SKILLS
66 7
85.7
-19.0
75.7
95.7
-20.0
8.13
-35.9
1
PARENTS W/0 HS DIPL.
92.1
91.0
1.1
PROJECT SIZE ( PUPILS)
450
PARENTS W SKILLED OCCUP.
10.0
10.2
-0.2
LANGUAGE ARTS
21,5
22.4
-0.9
22.7
26.0
-3.3
2.44
-8.1
1.5
1 PARENTS BLACK
72.7
100.0
-27.3
NO, PUFILS/PAC MEMBER
32.3
PARENTS POVERTY ELIGIBLE
85 9
92.8
-6.9
HEAD HOUSEHOLD EMPLOYED
74,1
50.1
24.0
FT PER.PUPIL EXPENDITURE
,940
T HEAD HOUSEHOLD MALE
96.3
58.8
37.5
PART II
PARENT EVALUATION DATA
CLASSROOM OBSERVATION
NO. CLASSROOM GROUPS
45
-1
PARENT-CHILD
FACTOR SCORES
AV, PARENTS/CLASSRM GB?
11.5
9.4
2.1
INTERACT
,267
-.241
.508
.550
-.226
.776
.377
.04
1.51
8/0 HIGH SCHOOL DIPL7MA
92.1
91.0
1.1
FACTOR NAME
FT
NET
W SKILLED OCCUP,
1 POS EVAL OF CHILD LRNG
10.1
83.3
10.2
82.0
-0.2
1.3
PARENT-SCHOOL
INVOLVE
.310
-.557
.867
.725
-.676
1,401
.384
.65
2.15
SELF REGULATORY
.-.67
-1.17
BLACK
72.7
100.0
-27.3
'N REPORTING USE OF PRESCHOOL
049,2
-49.2
CHILD ACADEMIC
CHILD-INITIATED
1 POVERTY ELIGIBLE
85.9
92.8
-6.9
EXPECT
.541
.428
,113
.961
.148
.813
.379
.07
1.56
INTERACTIONS
.64
.15
1 HEAD HOUSEHOLD EMPLOYED
74.1
50.1
24.0
1 HEAD 40USEHOLD MALE
96.3
58.8
37.5
SENSE OF CONTROL
.102
-.132
,234
-.276
-.406
.130
,369
-.59
.85
PROGRAMMED ACADEMIC
.22
-.58
EXPRESSIVE
..gra
m2.50
1.56
CHILD SELF-LEARNIN:,
"Guide for Interpretation of Results
for explanation of tab1
entries.
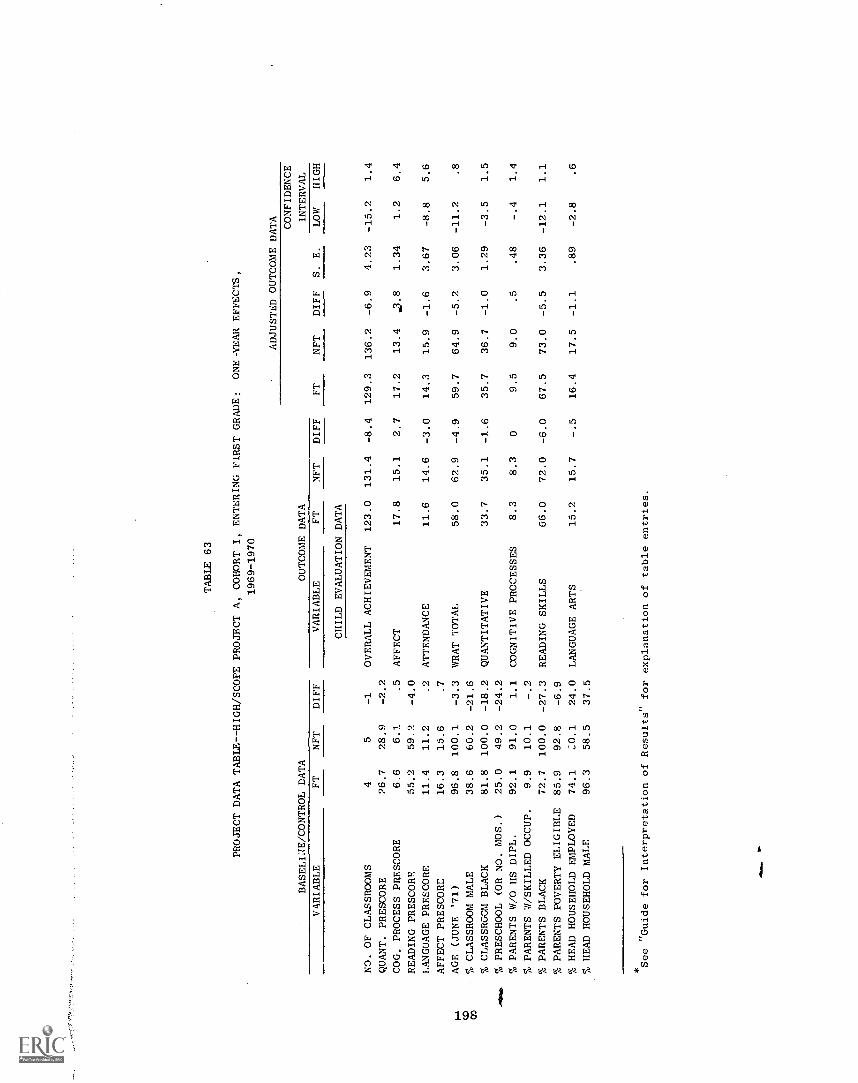
TABLE 63
PROJECT DATA TABLE--HIGH/SCOPE PROJECT A, COHORT I, ENTERING FIRST GRADE:
ONE-YEAR EFFECTS,
1969-1970
BASELLZE/CONTROL DATA
OUTCOME DATA
ADJUSTED OUTCOME DATA
FT
NFT
DIFF
S. E.
CONFIDENCE
INTERVAL
VARIABLE
FT
NFT
DIFF
VARIABLE
FT
NFT
DIFF
LOW
HIGH
CHILD EVALUATION DATA
NO. OF CLASSROOMS
45
-1
OVERALL ACHIEVEMENT
123.0
131.4
-8.4
129.3
136.2
-6.9
4.23
-15.2
1.4
QUANT. PRESCORE
26.7
28.9
-2.2
COG. PROCESS PRESCORE
6.6
6.1
.5
AFFECT
17.8
15.1
2.7
17.2
13.4
,0.8
1.34
1.2
6.4
READING PRESCORE
55.2
59.2
-4.0
LANGUAGE PRESCORE
11.4
11.2
.2
ATTENDANCE
11.6
14.6
-3.0
14.3
15.9
-1.6
3.67
-8.8
5.6
AFFECT PRESCORE
16.3
15.6
.7
I-I
AGE (JUNE '71)
96.8
100.1
-3.3
WRAT TOTAL
58.0
62.9
-4.9
59.7
64.9
-5.2
3.06
-11.2
.8
CS)
co% CLASSROOM MALE
38.6
60.2
-21.6
% CLASSROOM BLACK
81.8
100.0
-18.2
QUANTITATIVE
33.7
35.1
-1.6
35.7
36.7
-1.0
1.29
-3.5
1.5
Sao
% PRESCHOOL (OR NO. MOS.)
25.0
49.2
-24.2
% PARENTS W/O HS DIPL.
92.1
91.0
1.1
COGNITIVE PROCESSES
8.3
8.3
09.5
9.0
.5
.48
-.4
1.4
% PARENTS W/SKILLED OCCUP.
9.9
10.1
-.2
% PARENTS BLACK
72.7
100.0
-27.3
READING SKILLS
66.0
72.0
-6.0
67.5
73.0
-5.5
3.36
-12.1
1.1
% PARENTS POVERTY ELIGIBLE
85.9
92.8
-6.9
% HEAD HOUSEHOLD EMPLOYED
74.1
:0.1
24.0
LANGUAGE ARTS
15.2
15.7
-.5
16.4
17.5
-1.1
.89
-2.8
.6
% HEAD HOUSEHOLD MALE
96.3
58.5
37.5
See "Guide for Interpretation of Results" for explanation of table entries.
Factor score profiles obtained from classroom observation data sug-
gest that the FT classrooms were not really all that different from the
NFT classrooms. Only slight differences on most of the process components
are noted. The FT classrooms can be best characterized by the expressive-
ness factor (as can NFT), and both appear low on the isolatory components
(self-learning and self-regulatory). An identifiable salient process
corresponding to this model is not evident in these data.*
Summary
The salient features of the cognitively oriented curriculum model
are outlined as follows:
Focus and Objectives--emphasizes long range program objectives
Child
Cognitive (major emphasis)
Develop thinking skills
Develop competence in basic skills
Curricular Approach
Teacher's role that of facilitator
Reinforcement primarily from activities
Individual child's development continuously assessed,
and appropriate materials are provided
Group session (whole class situation) used to plan and
revise daily activities; otherwise three adults work
within open classroom framework
Type of Parent Involvement
Home visitors work with parents to plan child's
activities at home.
0
Since the serious comparison group and data collection problems noted
or suspected for two of the three samples lead to our recommendation that
these samples not be included as evaluative evidence regarding the model's
effects to date, our judgments and comments must be based on analysis of
a single project.
*Clear evidence that classroom processes in FT classrooms differ from
those in NFT classrooms fails to occur in other High/Scope projects, as
documented in the SRI FT Classroom Observation Study, 1972(b).
199
Data on this project indicate that the program has not yet produced evi-
dence of positive impact on the development of competence in certain aca-
demic skills greater than that displayed by the NFT pupils. In fact, on
the WRAT and reading measures, NFT pupils average significantly above FT.
It is possible that the current evaluation variables are not appropriately
sensitive to many of the cognitive behaviors that the model purports to
develop. Also, since process factors showed high FT/NI7 similarity, it
may be that the model was not well implemented in the FT school. Nonethe-
less, the data show FT pupils are clearly behind NFT in the learning of
certain basic skills as measured by the FT battery.
The parent results do indicate the model has been successful in de-
veloping parent/child interactions, more involveme%t in school, and more
positive expectations for their children's success.
200

FLORIDA PARENT EDUCATION MODELUniversity of Florida
Sponsor's Intended Approach
As the name of this model implies, its primary focus rests on educat-
ing parents to participate directly in the education of their children and
motivating them to build a home environment that furthers better perfor-
mance on the part of the child both in school and in life. Basic to tLe
model is recognition of the fact that parents are a key factor in the
emotional and intellectual growth of their children and that they are
uniquely qualified to guide and participate in their children's education.
The Florida model is designed to work directly in the home. It is
not classroom oriented in the traditional sense of having a preset cur-
riculum or prescribed teaching strategies. It is developmental in its
approach, changing classroom organization, teaching patterns, and the
curriculum as needed to integrate learning activity in the school with
that in the home. Learning tasks are developed that allow the home and
the school to work as instructional partners. Thus, responsibility for
curriculum development resides in the community, and the curriculum isthe product cf parent and school staff cooperation.
Paraprofessionals play an especially significant role in this model,
working in the home and in the classroom. Mothers of project children
are trained as both teacher auxiliaries and as educators of other parents
and are assigned two to a classroom. They work half-time assisting the
teacher and the rest of the time making home visits, demonstrating and
teaching other mothers learning tasks developed to increase the child's
intellectual competence and personal and social development. While in
the home the parent educator also actively solicits ideas and information
on which strategies are working from the parents.
In addition to her instructional role, the parent educator acts as
liaison between the project overall and the home, serving as a referral
agent for medical, dental, psychological, or social services. She in-
forms the parents about Policy Advisory Committee meetings and other
school/community functions in which they should become involved. Her
experience with the children in the classroom setting as a teaching assis-
tant enables her to keep individual parents up to date on their child's
201

specific needs. This highly active role of the paraprofessional is cru-
cial to the operation of the Florida model.
The teacher supervises t'.e classroom activity of the parent educator
and assists her in planning and carrying out her assignments in the home.
Conversely, the teacher modifies her own activity on the basis of knowl-
edge obtained from the parent educator's reports on the home. Parents
are invited into the classroom not as passive observers but to partici-
pate actively in the instruction. Through such persistent contact the
teacher learns and grows along with the parent and obtains a sound basis
from which to guide preparation of learning tasks.
Recognizing the role of the Policy Advisory Committee is basic to
the program, each school develops a "mini-PAC" that participates in the
activity of the larger Follow Through PAC. The larger PAC group is in-
volved in staff selection, budgets, working with project professionals
on development of home learning tasks, and in strengthening all compo-
nents of the program.
Both preservice and inservice training are provided by the sponsor
in implementing the model. A workshop at the University of Florida
trains a cadre of teachers and parent educators along with such other key
personnel as Follow Through representatives, principals, and PAC chair-
men. People attendjng this workshop, in turn, conduct workshops at the
project site. Video tapes made in the classroom and in the home guide
the sponsor in addressing problems pertinent to model implementation and
development. Projects also provide the sponsor with copies of their home-
learning tasks, weekly observation reports, and replies to attitude ,ques-
tionnaires. All such information is collected subject to review and ap-
proval by the PAC. The flow of information among the sponsor, the local
education agency, and the parent community reflects the team partnership
emphasis of the model and gives the education of individual children its
direction and shape.
Individual Project Results
Six samples from three different projects sponsored by the University
of Florida (UF) were included in the analysis of interim effects. The
distribution of these evaluation samples in terms of cohort, outcome, and
project is as follows:
202
Cohort First-year Effects Second-year Effects
IK (project c)
IEF
IlK (project a)
IIEF (project b)
Project UF(a)
(projects a&c)
(project b)
This project is located in a south Atlantic city of approximately
500,000 residents, nearli one fourth of whom are Black. The project an-
ticipated an above average per-pupil expenditure of $1,023 and had a very
high PAC participation of one member for each 5.5 pupils. Two sets of
data are examined below--second-year outcomes for Cohort I and first-year
outcomes for Cohort II.
Cohort I data are presented it Table 64. Baseline data indicate that
children in the four FT and ten NFT classrooms included in the analysis
scored fairly comparably on test:, taken as they entered school. Although
more of the FT children had attended preschool, a substantial percentage
of NFT children (56 percent) also had preschool experience.
All FT children were Black, and rosters indicate that 28 percent of
the NFT pupils were non-Black. However, this information is inconsistent
with the data on families obtained by interview. All of the parents inter-
viewed, both FT and NFT, were Black. FT parents were more likely to be
high school educated and slightly more likely to have a skilled occupation
and to be employed. They are also described as slightly more likely to
meet poverty eligibility requirements, which is somewhat inconsistent withthe general trends in these interim data.
Teacher data show that both FT and NFT teachers were fairly well
trained, with FT teachers having more experience than NFT. Although NFTteachers reported slightly higher job satisfaction, most of them had
apparently been assigned to the school and classroom in which they taught.
FT teachers, on the other hand, indicated a fairly high level of freedomto choose teaching assignments. Although NFT teachers reported more bookresources, they did not report more classroom helpers.
Child outcomes on both overall cognitive measures (WHAT total and
overall achievement) show that NFT children improved significantly morethan FT children. Among the cognitive skills, the only significant dif-ference was in language arts; again NFT pupils showed more improvement.
203
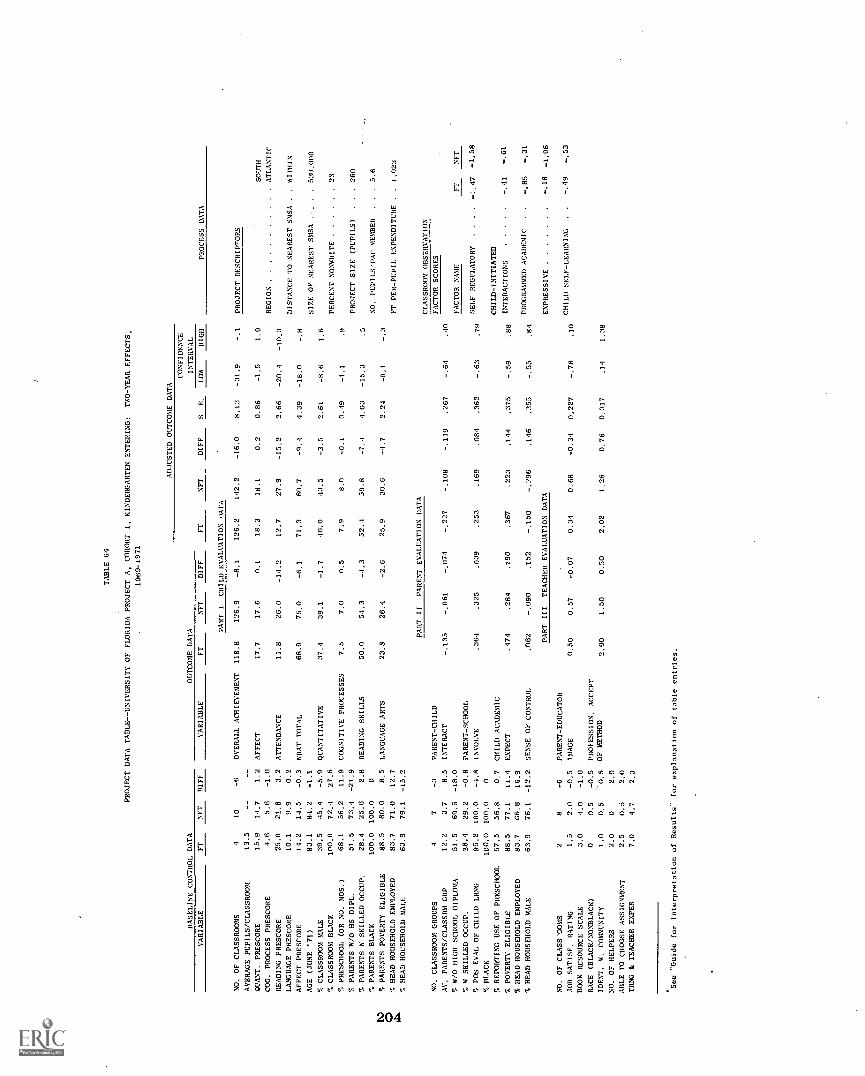
TABLE 64
PROJECT DATA TABLE--UNIVERSITY OF FLORIDA PROJECT A, COHORT I, KINDERGARTEN ENTERING,
TWO-YEAR EFFECTS,
1969-1971
BASELINE CONTROL DATA
ADJUSTED OUTCOME DATA
CONFIDENCE
OUTCOME DATA
INTERVAL
VARIABLE
FT
NFT
DIFF
VARIABLE
FT
NET
DIFF
FT
NFT
DIFF
S.
E.
LOW
HIGH
PROCESS DATA
PART I
CHILD EVALUATION 0ATA
NO. OF CLASSROOMS
410
-6
OVERALL ACHIEVEMENT
118.8
126.9
-8.1
126.2
142.2
-16.0
8.13
-31.9
-.1
PROJECT DESCRIPTORS
AVERAGE PUPILS/CLASSROOM
13.5
--
__
QUANT. PRESCORE
15.9
14.7
1.2
AFFECT
17.7
17.6
0.1
18.3
18.1
0.2
0.86
-1.5
1.9
SOUTH
COG. PROCESS PRESCORE
4.6
5.6
-1.0
REGION
ATLANTIC
READING PRESCORE
25.0
21.8
3.2
ATTENDANCE
11.8
26.0
-14.2
12.7
27.9
-15.2
2.66
-20. -I
-10.0
LANGUAGE PRESCORE
10.1
9.9
0.2
DISTANCE TO NEAREST SMSA
.,
WITHIN
AFFECT PRESCORE
14.2
14.5
-0.3
WRAT TOTAL
68.9
75.0
-6.1
71.3
80.7
.1.39
-18.0
AGE (JUNE '71)
83.1
84,2
-1.1
SIZE OF NEAREST SMSA
530 000
1 CLASSROOM MALE
39.5
45.4
-5.9
QUANTITATIVE
37.4
39.1
-1.7
43,5
-3.5
2.61
-8.6
1.6
1 CLASSROOM BLACK
100.0
72.4
27.6
PERCENT NONWHITE
23
1 PRESCHOOL (OR NO. MOS.)
68.1
56.2
11,9
COGNITIVE PROCESSES
7.5
7.0
0.5
7.9
8.0
-0.1
0.49
-1.1
.9
1 PARENTS 1170 HS DIPL,
51.5
73.4
-21,9
PROJECT SIZE (PUPILS)
.260
S PARENTS N SKILLED OCCUP.
28.4
25.6
2.8
READING SKILLS
50,0
54.3
-4.3
52.4
59.8
4.03
-15.3
.5
1 PARENTS BLACK
100.0
100,0
0NO, PUPILS/PAC MEMBER
.5.6
ba1 PARENTS POVERTY ELIGIBLE
88.5
80.0
8.5
LANGUAGE ARTS
23,8
26.4
-2.6
25.9
30.6
2,24
-9.1
01 HEAD HOUSEHOLD EMPLOYED
83.7
71.0
12.7
FP
1 HEAD HOUSEHOLD MALE
63.9
79.1
-15.2
FT PER - PUPIL, EXPENDITURE
..1.023
PART
IT
PARENT EVALUATION DATA
CLASSROOM OBSERVATION
NO. CLASSROOM GROUPS
47
-3
PARENT-CHILD
FACTOR SCORES
AV. PARENTS/CLASSRM GRP
12.2
3.7
8.5
INTERACT
-.135
-.061
-.074
-.227
-.108
-.119
,267
.40
% W/O HIGH SCHOOL DIPLOMA
51.5
69.5
-18.0
FACTOR NAME
FT
NFT
B SKILLED OCCUP.
28.4
29.2
-0.8
PARENT-SCHOOL
---
% POS EVAL OF CHILD LRNG
95.2
100.0
INVOLVE
.364
.325
.039
.253
.169
.084
.362
-.63
.79
SELF REGULATORY
..
..
-1.58
BLACK
100.0
100.0
0
% REPORTING USE OF PRESCHOOL
57.5
56.8
0.7
CHILD ACADEMIC
CHILD-INITIATED
% POVERTY ELIGIBLE
88.5
77.1
11.4
EXPECT
.474
.284
.190
.367
.223
.144
.375
-.59
.88
INTERACTIONS
- 41
-.61
S HEAD HOUSEHOLD EMPLOYED
83.7
66.8
16.9
S HEAD HOUSEHOLD MALE
63.9
76.1
-12.2
SENSE OF CONTROL.
.062
-.090
.152
-.150
-.796
.146
.355
-.55
.84
PROGRAMMED ACADEMIC
.-.85
-.31
PART
III
TEACHER EVALUATION DATA
EXPRESSIVE
18
-1.06
NO, OF CLASS 0011S
28
-6
PARENT-EDUCATOR
JOB SATISF, RATING
1.5
2.0
-0.5
IMAGE
0.50
0.57
-0.07
0.34
0.68
-0.34
0.227
-.78
.10
CHILD SELF-LEARNING
..
-.49
-.53
BOOK RESOURCE SCALE
3.0
4.0
-1.0
RACE (BLACK/NONBLACK)
00.5
-0.5
PROFESSION. ACCEPT
IDENT. N, COMMUNITY
1.0
0.5
0.5
OF METHOD
2.00
1.50
0.50
2.02
1.26
0.76
0.317
.14
1.38
NO. OF HELPERS
2.0
02,0
ABLE TO CHOOSE ASSIGNMENT
2.5
0,5
2.0
TRNG & TEACHER EXPER
7.0
4.7
2.3
'See
Guide for Interpretation of Results- for explanation of table entries.

Although the slightly higher FT scores on affect measures do not reach
significance, the attendance measure favors FT significantly (95 percent
confidence interval of -20.4 to -10.0, with negative scores indicating
lower absence rates).
Classroom observations of FT and NFT classrooms in Project UF(a) with
Cohort I pupils in their second year of school (first graders) showed that
the two sets of classrooms were similar in many respects. For example,
both FT and NFT classrooms were low (relative to all classrooms observed)and similar to one another on the self-regulatory factor. They were alsosomewhat below overall averages and similar to one another on the child-
initiated interaction and the child self-learning factors. Their greatestrelative differences were on the programmed academic and the expressivefactors. On both these factors, FT and NFT classrooms were below the
overall means for all classrooms observed. However, the relative dif-ferences between FT and NFT groups were substantial; the NFT group was
relatively higher on the programmed academic factor, and the FT group
was relatively higher on the expressive factor. This difference in em-phasis may help account for NFT superiority on the achievement measures
and FT superiority (or equality) on the attendance and attitude measures.
The model had some positive impact on the FT teachers. They reported
a significantly higher acceptance of FT and its innovations than NFT
teachers reported of their methods. But on the parent image variable FT
and NFT did not differ significantly. Since the University of Florida
employs parents as paraprofessional home-school coordinators, it is pos-
sible that teachers felt it was not essential for them to contact parents
personally outside of the classroom. However, the complexity of the
parent imago variable does not exclude alternative interpretations.
Data for Cohort II are presented in Table 65. Pupil data are based
on three FT classrooms and two NFT classrooms. FT and NFT children appear
to have been comparable in ethnicity (all are Black) and education of their
parents (64 percent without high school diplomas). However, more of the
FT children are male (58.6 percent, compared with only 39.7 percent of the
NFT children), a higher percentage of FT children came from homes meeting
poverty criteria and in which the head of household was not employed.
205

TABLE 65
PROJECT DATA TABLE -- UNIVERSITY OF FLORIDA PROJECT A, COHORT II, KINDERGARTEN ENTERING,
ONE-YEAR EFFECTS,
1970-1971
ADJUSTED OUTCOME DATA
CONFIDENCE
BASELINE CONTROL DATA
OUTCOME DATA
INTERVAL
VARIABLE.
FT
NET
DIFF
VARIABLE
FT
NET
PART I
DIFF
FT
NIT
DIFF
S. E.
LOW
HIGH
PROCESS DATA
CHILD EVALUATION DATA
NO. OF CLASSROOMS
32
1OVERALL ACHIEVEMENT
107.7
89.6
18.1
107.9
76.5
31.4
10.28
11.3
51.5
PROJECT DESCRIPTORS
AVERAGE PUPILS/CLASSROOM
7.3
19.0
-11.7
QUART. PRESCORE
14.8
15.6
-0.8
AFFECT
17.9
16.1
1.8
16.8
15.4
1.4
1.49
-1.5
4.3
REGION
SOUTH ATLANTIC
COG. PROCESS PRESCORE
4.8
5.2
-0.4
READING PRESCORE
21.7
23.8
-2.1
ATTENDANCE
12.4
10.4
2.0
4.1
5.5
-1.4
4.89
-11.0
8.2
DISTANCE TO NEAREST SMSA .
WITHIN
LANGUAGE PRESCORE
13.2
12.7
0.5
AFFECT PRESCORE
16.4
14.9
1.5
PRAT TOTAL
7.7
36.4
11.3
46.9
26.1
20.8
7.16
6.8
34.8
SIZE OF NEAREST SMSA .
..530,000
AGE (JUNE '71)
72.0
71.8
0.2
7, CLASSROOM MALE
58.6
39.7
18.9
QUANTITATIVE
28.0
23.7
4.3
27.3
20.2
7.1
2.99
1.2
13.0
PERCENT NONWHITE
23
7. CLASSROOM BLACK
100.0
100.0
0
% PRESCHOOL (OR NO. MOS.)
9.5
09.5
COGNITIVE PROCESSES
8.7
8.1
0.6
8.2
7.4
0.8
0.65
2.1
PROJECT SIZE (PUPILS)
..260
7, PARENTS W/O HS DIPL.
64.0
64.0
0
51 PARENTS W SKILLED OCCUP.
19.2
20.3
-1.1
READING SKILLS
51.3
0.4
10.9
51.7
31.1
20.6
6.66
7.5
33.7
NO. PUPILS/PAC M.)BER
..5.6
7, PARENTS BLACK
100.0
98.2
1.8
P PARENTS POVERTY ELIGIBLE
83.0
69.1
13.
LANGUAGE ARTS
19.6
17.3
2.3
20.2
17.2
3.0
1.52
.02
6.0
FT PER -PUPIL EXPENDITURE
.1,023
Otv
P HEAD HOUSEHOLD EMPLOYED
7, HEAD HOUSEHOLD MALE
60.9
52.3
75.7
59.1
-14.8
-6.8
PART II
PARENT EVALUATION DATA
CLASSROOM OBSERVATION
FACTOR SCORES
NO. CLASSROOM GROUPS
32
1PARENT-CHILD
AV. PARENTS/CLASSRM GRP
22.7
25.5
-2.8
INTERACT
.063
.052
.011
-.008
-.075
.067
.310
-.54
.67
FACTOR NAME
IT
NIT
7t. W/O HIGH SCHOOL DIPLOMA
64.0
64.0
0
7. W SKILLED OCCUP.
19.2
20.3
-1.1
PARENT-SCHOOL
SELF REGULATORY
-.72
-.80
`k POS EVAL OF CHILD LRNG
90.2
88.6
1.6
INVOLVE
.099
-.161
.260
.569
.217
.352
.390
-.41
1.12
7, BLACK
100.0
98.2
1.8
CHILD-INITIATED
REPORTING USE OF PRESCHOOL
100.0
100.0
0CHILD ACADEMIC
INTERACTIONS
-.54
-.75
7, POVERTY ELIGIBLE
83.0
69.1
13.9
EXPECT
.353
.197
.156
1.30
-.063
.193
.293
-.38
.77
HEAD HOUSEHOLD EMPLOYED
60.9
75.7
-14.8
PROGRU,GAED ACADEMIC
-.84
-1.74
P HEAD HOUSEHOLD MALE
52.3
59.1
-6.8
SENSE OF CONTROL
.228
-117
.345
.088
-.291
.379
.416
1.19,
EXPRESSIVE
.04
...86
CHILD SELF-LEARNING
-.75
-.43
PART
III
TEACHER EVALUATION DATA
NO. OF CLASSROOMS
22
0PARENT-EDUCATOR
JOB SATISF. RATING
1.9
1.8
0.1
IMAGE
0.14
0.21
-0.07
-0.30
0.08
-0.38
0.22
-.81
.05
BOOK RESOURCE SCALE
1.5
2.0
-0.5
RACE (BLACK/NONBLACK)
0.5
0.5
0'
PROFESSION. ACCEPT
IDENT. W. COMMUNITY
1.0
1.0
0OF METHOD
1.50
2.00
-0.50
1.73
1.84
-0.11
0.69
-1.46
1.24
NO, OF HELPERS
2.0
1.0
1.0
ABLE TO CHOOSE ASSIGNMENT
01.0
-1.0
TRNG & TEACHER EXPER
5.5
3.5
2.0
-Guide for Interpretation of Results" for explanation of table entries.
Nevertheless, FT and NFT scores on baseline tests are relatively comparable,
except on reading, where the FT children are two points behind the NFT
children.*
Teacher covariable data indicate that FT and NFT teachers were com-
parable in terms of job satisfaction and community membership. Whereas
Cohort II, FT teachers were more experienced than /.2T teachers, both groups
had somewhat less experience than did teachers in the Cohort I sample.
Also, Cohort I, FT teachers reported a fair amount of freedom to choose
the school and classroom in which they worked, while Cohort II, FT teachers
were apparently assigned, and NFT teachers chose their assignments.
Outcome data for the children in Cohort II are favorable to the model.FT children score above NFT children (at a 95 percent level of confidence)
on all achievement outcomes except cognitive processes, where the differ-
ence favors FT but does not reach significance. These FT-favoring differ-
ences represent a sharp contrast to the effects observed for Cohort I.
Indeed, comparison of Cohort T to Cohort II results strongly suggests an
improved implementation effect.
That is, although outcome measures for parents all fail to display
significant differences, the parent data show a small but consistent ten-
dency to favor FT. FT teachers, on the other hand, responded essentially
no differently than NFT teachers regarding parent image and acceptability
of method, and given the parent role emphasis of this model, the Project
UF(a) pupil results seem to indicate that the effectiveness of this in-
volvement is improving with successive samples of parents and pupils.
Classroom observation data for Cohort II indicate that the FT classes
were below the overall average (as were the NFT classes) in the scaled
process dimensions. The FT classes can be characterize:f. as more expressive
and less structured than NFT. This pattern is not inconsistent with the
Data on the preschool experience of NFT children in this cohort present
a problem. Data from rosters indicate that NFT children did not have pre-
school experience, while data collected from parents indicate that they
did. In this case, the latter set of data is more likely correct, since
rostering problems were encountered for this set of pupils. Thus, the
child covariable data are slightly biased in favor of NFT outcomes. But
since the observed differences are, in general, large and in favor of FT,
the probability that the interpretation would change because of this bias
is considered remote.
207
emphasis of the model that parents should facilitate the classroom process
and assume more of a direct role as the principal educators of their
children,
Project UF(c)
This project is located within a large city in the middle Atlantic
region. Slightly more than one third of the 4 million residents are non-
white. The anticipated per pupil expenditure was $826, and the pupil/PAC
ratio was 6,8, which suggests above-average parent involvement on the PAC.
Baseline data describing second-year effects on children in the five
FT and four NFT, Cohort I-K classrooms (Table 66) included in the analysis
consistently show FT children with higher scores, in some cases substan-
tially higher, than the comparison group. Although the two groups were
similar in ethnic composition (almost totally Black) and had approximately
the same employment rate for heads of household (about 50 percent), the
parents differ considerably in terms of percentage with high school edu-cation and skilled occupation. FT children scored consistently higher on
pretests with the largest differences (8.6 points) occurring on the read-ing measure.
FT classes averaged higher on all pupil outcomes than NFT classes,
but none of these differences is significant.
One-year data for Cohort I children are presented in Table 67. As
was the case for the second-year data, none of the child outcome measures
reached significance at a 95 percent level of confidence. However com-
parison of differences between the first- and second-year results shows
a trend toward increasingly positive impacts on FT children.
None of the parent outcomes reached significance, but the high degree
of parent participation in the PAC group is encouraging.
It is interesting that FT and NFT teachers display similar job satis-
faction ratings, since NFT teachers have a great many resources available
to them and more freedom to choose assigaments than FT teachers.
The ethnic difference between NFT teachers and their students is
especially interesting iu view of the teachers' evaluations sf the impor-
tance of pa:ents to education. NTT teachers viewed parents as being an
integral part of the educational system outside of school time more fre-
quently than did FT teachers.
208
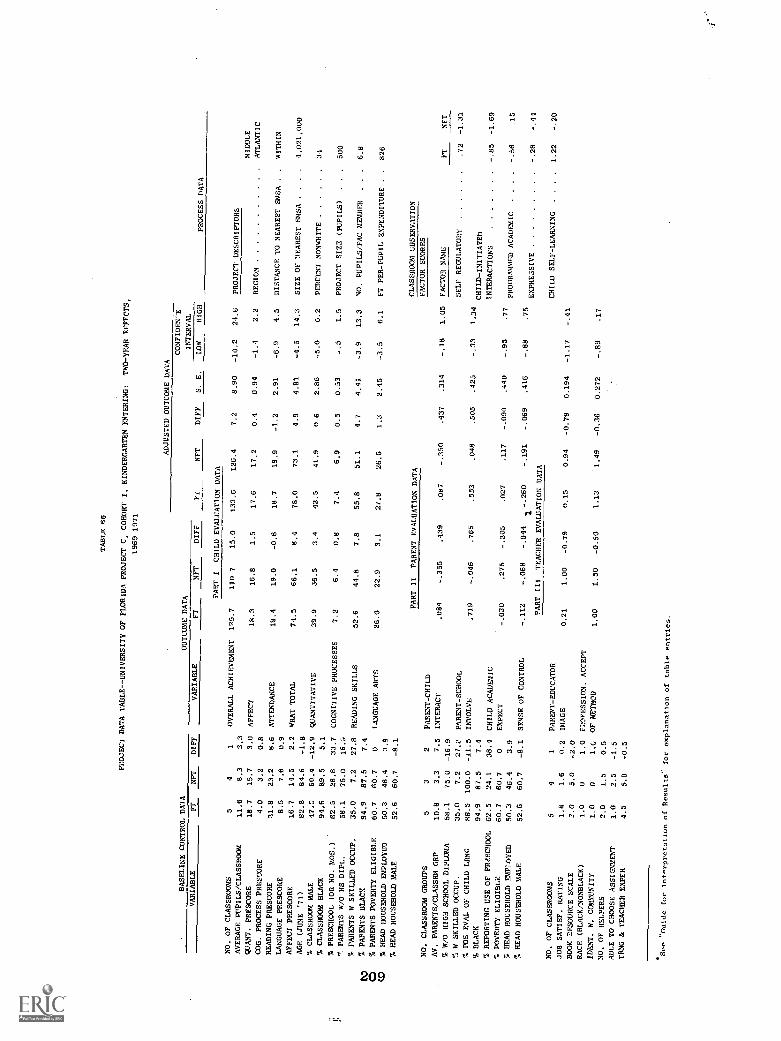
TABLE 66
PROJECT DATA TABLE--UNIVERSITY OF FLORIDA PROJECT C, COHORT I, KINDERGARTEN ENTERING:
TWO-YEAR EFFECTS,
1969-1971
ADJUSTED OUTCOME DATA
CONFIDEN'T
BASELINE CONTROL DATA
OUTCOME DATA
INTERVAL
VARIABLE
FT
NFT
DIFF
VARIABLE
FT
NFT
DIFF
Fi
RFT
DIFF
S. E.
DOW
HIGH
PROCESS DATA
PART I
CHILD EVALUATION DATA
NO. OF CLASSROOMS
54
1OVERALL ACHIEVEMENT
125.7
110.7
15.0
133.6
126.4
7.2
8.90
-10.2
24.6
PROJECT DESCRIPTORS
AVERAGE PUPILS/CLASSROOM
11.6
8.3
3.3
MIDDLE
QUANT. PRESCORE
18.7
15.7
3.0
AFFECT
18.2
16.8
1.5
17.6
17.2
0.4
0.94
-1.4
2.2
REGION
ATLANTIC
COG. PROCESS PREECORE
4.0
3.2
0.8
READING PRESCORE
31.8
23.2
8.6
ATTENDANCE
18.4
19.0
-0.6
18,7
19,9
-1,2
2.91
-6.9
4.5
DISTANCE TO NEAREST SMSA
..
WITHIN
LANGUAGE PRESCORE
8.5
7.6
0.9
AFFECT PRESCORE
16.7
14.5
2.2
WRAT TOTAL
74.5
66.1
8,4
78.0
73.1
4,9
4.81
-4.5
14.3
SIZE OF NEAREST SMSA
..
4.021,000
AGE (JUNE '71)
82.8
84.6
-1.8
% CLASSROOM MALE
47.5
60.4
-12.9
QUANTITATIVE
39.9
36.5
3.4
42.5
41.9
0_6
2.86
6.2
PERCENT NONWHITE
34
% CLASSROOM BLACK
94.6
89.5
5.1
% PRESCHOOL (OR NO. MOS.)
62.5
28.8
33.7
COGNITIVE PROCESSES
7,2
6.4
0.8
7.4
6.9
0.5
0.53
-.5
1.5
PROJECT SIZE (PUPILS)
..
500
" PARENTS W/O HS DIPL.
58.1
75.0
16.5
% PARENTS W SKILLED OCCUP,
35.0
7.2
27.8
READING SKILLS
52.6
44.8
7.8
55.8
51.1
4.7
4.41
-3.9
13,3
NO. PUPILS/PAC MEMBER
..
6.8
% 'MEWS BLACX
94.9
87.5
7.4
% PARENTS POVERTY ELIGIBLE
60.7
60.7
0LANGUAGE ARTS
26.0
22.9
3.1
27.8
26.5
1.3
2.45
-3.5
6.1
FT PER-PUPIL EXPENDITURE
.826
% HEAD HOUSEHOLD EMPLOYED
50.3
46.4
2.9
% HEAD HOUSEHOLD MALE
52.6
60.7
-8.1
PART
II
PARENT EVALUATION DATA
CLASSROOM UBSERVATION
FACTOR SCORES
NO. CLASSROOM GROUPS
53
2PARENT-CHILD
AV. PARENTS/CLASSRM GRP
10.8
3.3
7.5
INTERACT
.084
-.355
.439
.087
-.250
.437
.314
-.18
1.05
FACTOR NAME
FT
NFT
% W/O HIGH SCHOOL DIPLOMA
58,1
75.0
-16.9
W SKILLED OCCUP.
35.0
7.2
27.2
PARENT-SCHOOL
SELF REGULATORY
- 72
-1.31
% PDS EVAL OF CHILD LRNG
88.5
100.0
-11.5
INVOLVE
.710
-.046
.765
.553
.048
.505
.425
-.33
1.34
% BLACK
94.9
87.5
7.4
CHILD-INITIATED
% REPORTING USE OF PRESCHOOL
62.5
24.1
38.4
crimp ACADEMIC
INTERACTIONS
- 85
-1.69
% POVERTY ELIGIBLE
60.7
60.7
0EXPECT
-.030
.275
-.305
.027
.117
-.090
.440
-.95
.77
% HEAD HOUSEHOLD EMP;OYED
50.3
46.4
3.9
PROGRAMMED ACADEMIC
-.56
.15
% HEAD HOUSEHOLD MALE
52.G
60.7
-8.1
SENSE OF CONTROL
-.112
-.068
-.044
-.191
-.069
.416
-.88
.75
1-.260
EXPRESSIVE
28
-.44
PART III
TEACHER EVALUATION DATA
CHILD SELF-LEARNING
.1.22
-.20
NO. OF CLASSROOMS
54
1PARENT-EDUCATOR
JOB SATISF. RATING
1.8
1.6
0.2
IMAGE
0.21
1.00
-0.79
0.15
0.94
-0.79
0.194
-1.17
-.41
BOOK RESOURCE SCALE
2.0
5.0
-2.0
RACE (BLACK/NONBLACK)
1.0
01.0
PROFESSION. ACCEPT
IDENT. W. COMMUNITY
1.0
01.0
OF METHOD
1.00
1.50
-0.50
1.13
1,49
-0.36
0,272
-.89
.17
NO. OF HELPERS
2,0
1.5
0.5
ABLE TO CHOOSE ASSIGNMENT
1.0
2.5
-1.5
TRNG & TEACHER EXPER
4.5
5.0
-0.5
"Guide for Interpretation of Results" for
explanation of table entries.
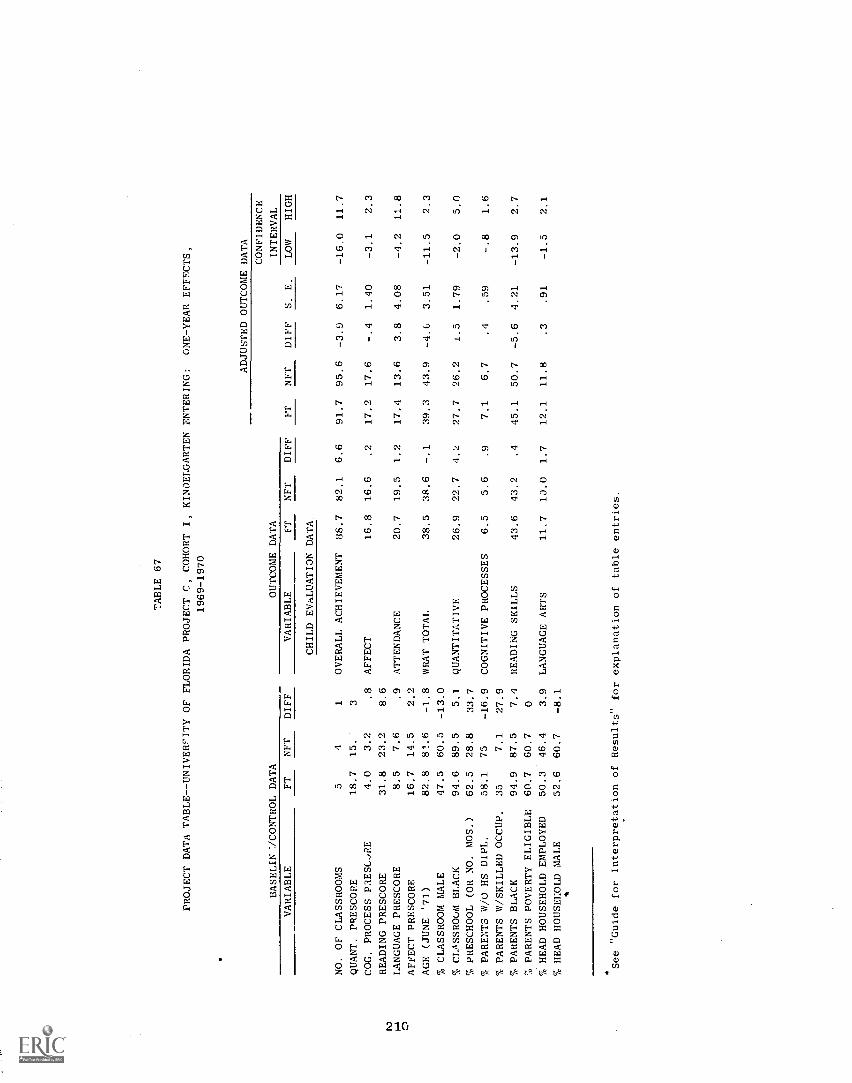
TABLE 67
PROJECT DATA TABLE--UNIVERPITY OF FLORIDA PROJECT C, COHORT I, KINDEnGARTEN ENTERING:
ONE-YEAR EFFECTS,
1969-1970
BASELIN 7CONTROL DATA
OUTCOME DATA
ADJUSTED OUTCOME DATA
FT
NFT
DIFF
S.
E.
CONFIDENCE
INTERVAL
VARIABLE
FT
NFT
DIFF
VARIABLE
FT
NFT
DIFF
LOW
HIGH
CHILD EVhLUATION DATA
NO. OF CLASSROOMS
54
1OVERALL ACHIEVEMENT
88.7
82.1
6.6
91.7
95.6
-3.9
6.17
-16,0
11.7
QUANT. PRESCORE
18.7
15.
3
COG. PROCESS PaESCJRE
4.0
3.2
.8
AFFECT
16.8
16.6
.2
17.2
17.6
-.4
1.40
-3.1
2.3
READING PRESCORE
31.8
23.2
8.6
N 1-/
LANGUAGE PRESCORE
8.5
7.6
.9
ATTENDANCE
20.7
19.5
1.2
17.4
13.6
3.8
4.08
-4.2
11.8
AFFECT PRESCORE
16.7
14.5
2.2
AGE (JUNE '71)
82.8
81.6
-1.8
WHAT TOTAL
38.5
38.6
-.1
39.3
43.9
-4.6
3.51
-11.5
2.3
% CLASSROOM MALE
47.5
60.5
-13.0
% CLASSROUM BLACK
94.6
89.5
5.1
QUANTITATIVE
26.9
22.7
4.2
27.7
26.2
1.5
1.79
-2.0
5.0
% PRESCHOOL (OR NO. MOS.)
62.5
28.8
33.7
% PARENTS W/O HS DIPL.
58.1
75
-16.9
COGNITIVE PROCESSES
6.5
5.6
.9
7.1
6.7
.4
.59
-.8
1.6
% PARENTS W/SKILLED OCCUP.
35
7.1
27.9
% PARENTS BLACK
94.9
87.5
7.4
READING SKILLS
43.6
43.2
.4
45.1
50.7
-5.6
4.21
-13.9
2.7
% PARENTS POVERTY ELIGIBLE
60.7
60.7
0
% HEAD HOUSEHOLD EMPLOYED
50.3
46.4
3.9
LANGUAGE ARTS
11.7
10.0
1.7
12.1
11.8
.3
.91
-1.5
2.1
% HEAD HOUSEHOLD MALE
52.6
60.7
-8.1
A
See "Guide for Interpretation of Results" for explanation of table entries.
The process profiles obtained through classroom observation for FT
and NFT pupils Cohort I in Project UF(c) were fairly similar. Both showedlow scores (relative to the overall average) or the child-initiated inter-
action and the self-regulatory factor and both were moderatley low onthe expressive factor. FT and NFT classes were most different on thechild self-learning and the programmed academic factors. On the childself-learning factor, FT classes were very much higher than NFT classes
and sustallIA,wily above the mean for all classrooms. On the programmedacademic factor, FT classes were lower than NFT classes although neither
deviated radically from the overall average.
These pattern differences in process may have been related to the
favorable differences on achievement, affect, and attendance outcome
measures, although the magnitude of these outcome differences is not
statistically significant.
Project UF(b)
This project, located in the west south central region, is far from
the nearest SMSA, which is of moderate size (664,000). The community'spopulation is only 6 percent Black. The proportion of Black children inthe two FT samples was about 15 percent. This project anticipated a verylow per-pupil expenditure of $516. 7Jata on this entering first grade
project are available for second-year effects on Cohort I and first-yeareffects on Cohort
Data on Cohort I are summarized in Table 68. Baseline data showthat the si:; FT and three NFT classrooms were moderately comparable onthe prescore measures, although FT children tended to average below NFTchildren. The families are also moderately comparable, although again
PT families appear more disadvantaged than NFT families on all demographicindicators (education, occupation, income, etc.). The high employmentrates displayed by both samples suggests farm-worker families in the ruralsouth.
Analyses of the pupil outcome variables failed to reveal any signif-icant two-year FT impacts for this project. Analysis of parent outcomes,
however, showed a significant FT-favoring difference on the parent-schoolinvolvement variable. This outcome is compatible with the model's major
emphasis on parental involvement in the education of their children.
Teacher data for this sample show FT teachers as somewhat more satis-
fied with their working conditions and more likely t, have classroom help-ers than NFT teachers. On the other hand, NFT teachers reported more book
211
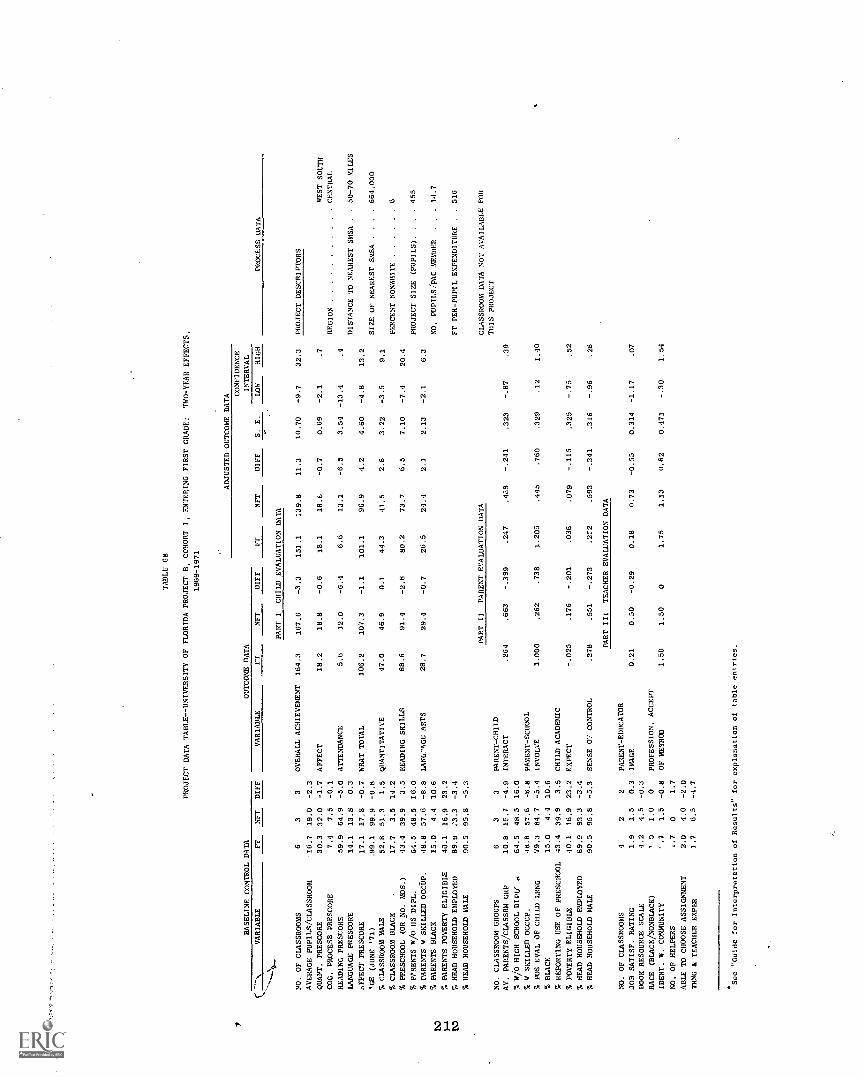
TABLE 68
PROJECT DATA TABLE--UNIVERSITY OF FLORIDA PROJECT B, COHORT I, ENTERING FIRST GRADE,
TWO-YEAR EFFECTS,
1969-1971
BASELINE CONTROL DATA
VARIABLE
FT
NFT
DIFF
OUTCOME DATA
VARIABLE
ADJUSTED OUTCOME DATA
FT
NFT
DIFF
FT
CONFIDENCE
INTERVAL
NFT
DIFF
S. E.
LOW
HIGH
PART I
CHILD EVALUATION DATA
PROCESS DATA
NO. OF CLASSROOMS
63
3OVERALL ACHIEVEMENT
164.3
167.6
-3.3
151.1
:39.8
11.3
10.70
-9.7
32.3
PROJECT DESCRIPTORS
AVERAGE PUPILS/CLASSROOM
16.7
19.0
-2.3
QUANT. PRESCORE
30.3
32.0
-1.7
AFFECT
18.2
18.8
-0.6
18.1
18.6
-0.7
0.69
-2.1
.7
WEST SOUTH
COG. PROCESS PRESCORE
7.4
7.5
-0.1
REGION
CENTRAL
READING PRESCORE
59.9
64.9
-5.0
ATTENDANCE
5.6
12.0
-6.4
6.6
13.1
-6.5
3.54
-13.4
.4
LANGUAGE PRESCORE
14.1
13.8
0.3
DISTANCE TO NEAREST SMSA
50-70 MILES
,FFECT PRESCORE
17.1
17.8
-0.7
WRAT TOTAL
106.2
107.3
-1.1
101.1
96.9
4.2
4.60
-4.8
13.2
".GE (JUNE '71)
.99.1
99.9
-0.8
SIZE OF NEAREST SMSA
..
.664,000
% CLASSROOM MALE
52.8
51.3
1.5
QUANTITATIVE
47.0
46.9
0.1
44.3
41.5
2.8
3.22
-3.5
9.1
% CLASSROOM BLACK
17.7
3.5
14.2
PERCENT NONWHITE
6
% PRESCHOOL (OR NO. MOS.)
43.4
39.9
3.5
READING SKILLS
88.6
91.4
-2.8
80.2
73.7
6.5
7.10
-7.4
20.4
% PARENTS W/O HS DIPL.
64.5
48.5
16.0
PROJECT SIZE (PUPILS).
.455
% PARENTS W SKILLED OCCUP.
48.8
57.6
-8.8
LANS:'AGE ARTS
28.7
29.4
-0.7
26.5
24.4
2.1
2.13
-2.1
6.3
% PARENTS BLACK
15.0
4.4
10.6
NO. PUPILS/PAC MEMBER
.14.7
% PARENTS POVERTY ELIGIBLE
40.1
16.9
23.2
% HEAD HOUSEHOLD EMPLOYED
89.9
-3.4
FT PER-PUPIL EXPENDITURE
.516
% HEAD HOUSEHOLD MALE
90.5
95.8
-5.3
PART II
PARENT EVALUATION DATA
CLASSROOM DATA NOT AVAILABLE FOR
THIS PROJECT
NO. CLASSROOM GROUPS
63
3PARENT-CHILD
AV. PARENTS /CIASSRM GRP
10.8
15.7
-4.9
INTERACT
.264
.663
-.399
.247
.4E8
-.211
.323
-.87
.39
% 8/0 HIGH SCHOOL DIPLG
64.5
48.5
16.0
% W SKILLED OCCUP.
48.8
57.6
-8.8
PARENT-SCHOOL
% PDS EVAL OF CHILD LANG
79.3
84.7
-5.4
INVOLVE
1.000
.262
.738
1.205
.445
.760
.329
.12
1.40
% BLACK
15.0
4.4
10.6
% REPORTING USE OF PRESCHOOL
43.4
39.9
3.5
CHILD ACADEMIC
% POVERTY ELIGIBLE
40.1
16.9
23.2
EXPECT
-.025
.176
-.201
.036
.079
-.115
.325
-.75
.52
% HEAD HOUSEHOLD EMPLOYED
89.9
93.3
-3.4
% HEAD HOUSEHOLD MALE
90.5
95.8
-5.3
SENSE 07 CONTROL
.278
.551
-.273
.222
.593
-.341
.316
-.96
.28
PART
III
TEACHER EVALUATION DATA
NO. OF CLASSROOMS
42
2PARENT-EDUCATOR
JOB SATISF. RATING
1.9
1.5
0.3
IMAGE
0.21
0.50
-0.29
0.18
0.73
-0.55
0.314
-1.17
.07
BOOK RESOURCE SCALE
4.2
4.5
-0.3
RACE (BLACK/NONBLACK)
10
1.0
0PROFESSION. ACCEPT
IDENT. W. COMMUNITY
'.7
1.5
-0.8
OF METHOD
1.50
1.50
01.75
1.13
0.62
0.471
-.30
1.54
NO. OF HELPERS
L.7
01.7
ABLE TO CHOOSE ASSIGNMENT
2.0
4.0
-2.0
TANG & TEACHER EXPER
1.7
6.5
-4.7
"Guide for Interpretation of Results" for explanation of table entries.
resources, were more closely tied to the neighborhoods of their pupils,
were freer to choose assignments, and appeared far more experienced than
FT teachers. Analysis of teacher outcomes in terms of these differences
failed to reveal significant FT/NFT differences. However, the magnitude
and nature of this overall pattern of differences certainly suggested
substantial lack of comparability between these two samples.
Covariable data on families for Cohort II children (see Table 69)
display the same tendencies as the data for Cohort I, although the FT/NFT
differences are more pronounced for Cohort II in every case. FT families
in Cohort II were less well educated, less well employed, and more often
classified as poverty eligible than both their NFT comparison and theirCohort I, FT counterparts. FT and NFT pupils had had similar preschool
experience. The NFT group scored slightly higher on all baseline test
measures except reading. The two groups also lacked comparability in
classroom composition, the FT class containing slightly more girls than
boys, while the NFT group was almost all male.
Like the Cohort II data for Project UF(a), child outcome data sig-
nificantly and consistently favor FT over NFT. These gains are indeedimpressive, since they are reflected on overall cognitive outcomes (achieve-
ment and WRAT), specific skills (reading, language, and quantitative skills),
and affect measures.
Covariable teacher data indicate that the FT teachers in Cohort II
classrooms were considerably more experienced than those in Cohort I class-
rooms; they were also more experienced than the NFT teachers with whom
they were 'ompared. They identified somewhat more strongly with the com-
munitl and reportfad_slightly higher book resources and more classroom help-ers than NFT teachers. Perhaps partly because of the presence of addi-
tional resources and helpers, FT teachers indicated greater job satisfac-
tion. Although the adjusted outcomes still favor the FT group, neitheris significant.
Data on parent impacts were not available for this cohort.
213
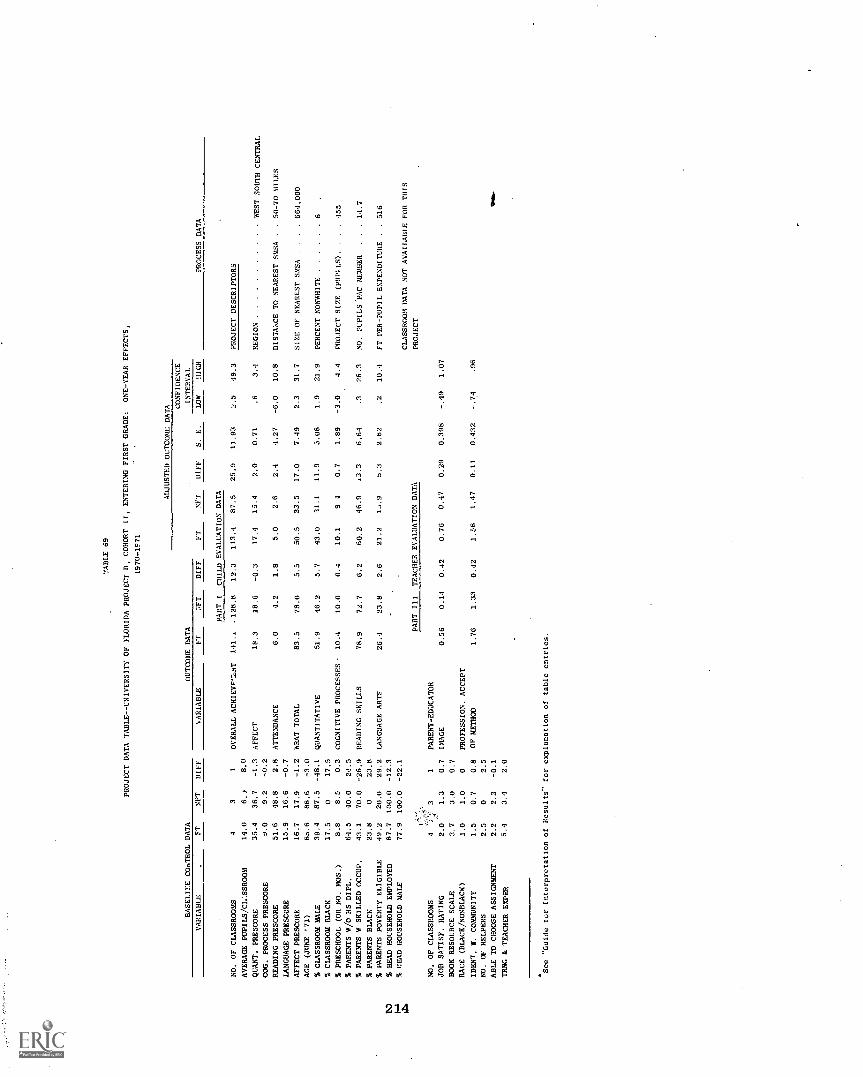
TABLE 69
PROJECT DATA TABLE--UNIVERSITY OF FLORIDA PROJECT B, COHORT II, ENTERING FIRST GRADE:
ONE-YEAR EFFECTS,
1970-1F71
BASELIFE COnTROL DATA
OUTCOME DATA
ADJUSTED OUTCOME DATA
PROCESS DATA
FT
NFT
DIFF
S. E.
CONFIDENCE
INTERVAL
VARIABLE
FT
YET
DIFF
VARIABLE
FT
NFT
DIFF
LOW
HIGH
PART I
CHILD EVALUATION DATA
NO. OF CLASSROOMS
43
1OVERALL ACHIEVF.11JIT
141_,
.128.8
12.3
113.4
87.5
25.9
11.93
2.5
49.3
PROJECT DESCRIPTORS
AVERAGE PUPILS /CI..SSROOM
14.0
6.7
8.0
QUANT. PRESCORE
35.4
36.7
-1.3
AFFECT
18.3
18.6
-0.3
17.4
15.4
2.0
0.71
.6
3.4
REGION
WEST SOUTH CENTRAL
COG. PROCESS PRESCORE
a.O
9.2
-0.2
READING PRESCORE
51.6
48.8
2.8
ATTENDANCE
6.0
4.2
1.8
5.0
2.6
2.4
4.27
-6.0
10.8
DISTANCE TO NEAREST SMSA
.50-70 MILES
LANGUAGE PRESCORE
15.9
16.6
-0.7
AFFECT PRESCORE
16.7
17.9
-1.2
WRAT TOTAL
83.5
78.0
5.5
50.5
33.5
17.0
7.49
2.3
31.7
SIZE OF NEAREST SMSA
..664,000
AGE (JUNE '71)
8,.6
88.6
-3.0
% CLASSROOM MALE
39.4
87.5
-48.1
QUANTITATIVE
51.9
46.2
5.7
43.0
31.1
11.9
5.08
1.9
21.9
PERCENT NONWHITE
6
% CLASSROOM BLACK
17.5
017.5
% PRESCHOOL (OR NO. MOS.)
8.8
8.5
0.3
COGNITIVE PROCESSES-
10.4
10.0
0.4
10.1
9 4
0.7
1.89
-3.0
4.4
PROJECT SIZE (PUPILS).
..455
% PARENTS W/O HS DIPL,
64.5
40.0
24.5
% PARENTS W SKILLED OCCUP.
43.1
70.0
-26.9
READING SKILLS
78.9
72.7
6.2
60.2
46.9
13.3
6.64
.3
26.3
NO
PUPILS PAC MEMBER
..14.7
% PARENTS BLACK
23.8
023.8
% PARENTS POVERTY ELIGIBLE
49.2
20.0
29.2
LANGUAGE ARTS
26.4
23.8
2.6
21.2
1j.9
5.3
2.62
.2
10.4
FT PER-PUPIL EXPENDITURE
.516
% HEAD HOUSEHOLD EMPLOYED
87.7
100.0
-12.3
% HEAD HOUSEHOLD MALE
77.9
100.0
-22.1
CLASSROOM DATA NOT AVAILABLE FOR THIS
PART III
TEACHER EVALUATION DATA
PROJECT
NO. OF CLASSROOMS
31
PARENT-EDUCATOR
JOB SATISF. RATING
2.0
1.3
0.7
IMAGE
0.56
0.14
0.42
0.76
0.47
0.29
0.398
-.49
1.07
BOOK RESOURCE SCALE
3.7
3.0
0.7
RACE (BLACK/NOSBLACK)
1.0
1.0
0PROFESSION. ACCEPT
'DENT. W. COMMUNITY
1.5
0.7
0.8
OF
ME
MO
1.76
1.33
0.42
1.58
1.47
0.11
0.432
-.74
.96
NO. OF HELPERS
2.5
02.5
ABLE TO CHOOSE ASSIGNMENT
2.2
2.3
-0.1
OM
.
TRNG & TEACHER EXPER
5.4
3.4
2.0
"Guide tor Interpretation of Results" for explanation of table entries.
Summary
The salient features of.the University of Florida approach can be
summarized as follows:
Focus and Objectives--emphasizes long range objectives
Parent
To educate parents for direct participation in the education
cf their children
To motivate parents to build a home environment conducive
to learning
Child
Increase intellectual competence
Promote personal and social development
Curricular Approach
Parent educators divide time between assisting teacher in
classroom and making home visits to demonstrate learning
tasks to parents
Parents also participate actively in the classroom quite
often
Type of Parent Involvement
Direct both at home and at school.
The primary concern of this model is to increase the amount of paren-
tal involvement in the educational process. The goal is to accomplish
this by educating parents for direct participation in the education of
their children and by motivating parents to build a home environment
conducive to learning.
In summarizing the results of the interim analyses, it appears that
the Florida approach has met with mixed one and two year success on
Cohort I project samples. The sponsor level analysis (Table 70) on
Cohort I-K projects fails to reveal any significamt overall parent or
pupil impacts. This absence of results, particularly for parent/school
involvement, is possibly due to implementation problems associated with
these samples or, equally likely, to data problems. That is, as has
been noted for other approaches, Cohort I data often yield conflicting
results.
215

The analyses of teacher and parent outcome variables generally show
greater acceptance of Follow-Through by FT teachers and greater parental
involvement for FT parents. This pattern is interpreted as positive evi-
dence of attainment of some basic objective of this model. The overall
finding (see Table 70) that Cohort I FT teachers held a significantly less
positive parent educator image may, in part, reflect implementation diffi-
culties. An alternative explanation may lie within the mechanics of the
Florida model itself, making this finding wholly acc-ptable, if not antic-
ipated. Specifically, in this model contacts with the parents are gen-
erally initiated by the classroom paraprofessionals (parent educators)
rather than by the teachers. The finding that NFT teachers consider con-
tacts with parents outside the classroom more essential than do FT teachers
may, then, be explained by the Florida's model's delegation of this re-
sponsibility to the parent educator.
In general, the Cohort II samples produce much stronger and more
promising evidence of the efficacy of the Florida approach. Since
Cohort II samples contain far fewer data problems, and since improved
outcomes may reflect improved implementation of the model, we feel that
these latter data should be stressed.
(
216

TABLE 70
UNIVERSITY OF FLORIDA SUMMARY, COHORT I, KINDERGARTEN ENTERING PROJECTS:
TWO-YEAR EFFECTS,
1969-1971
ADJUSTED OUTCOME DATA
OUTCOME MEASURE
UNADJUSTED MEANS
FT
NFT
DIFF
S. E.
CONFIDENCE
INTERVAL
FT
NFT
DIFF
LOW
HIGH
CHILD DATA
ACHIEVEMENT
122.6
122.3
.4
123.4
128.4
-5.0
6.51
-17.8
7.8
AFFECT
18.0
17.4
.7
17.3
16.6
.7
.63
-.5
1.9
WRAT
72.0
72.5
-.4
72.6
75.3
-2.8
3.63
-9.9
4.3
QUANTITATIVE
38.8
38.4
.4
39.7
40.6
-.9
2.08
-5.0
3.2
NI
1-L
-4
COG. PROCESS
READING
7.3
51.5
6.8
51.6
.5
-.1
7.3
51.1
7.1
52.9
.2
-1.8
.37
3.27
-.5
-8.2
.9
4.6
NI
LANGUAGE
25.0
25.4
-.4
25.0
27.3
-2.3
1.75
-5.7
1.1
CP
PARENT DATA
PARENT-CHILD
-.01
-.15
.14
.0
.08
-.08
.19
-.45
.29
PARENT-SCHOOL
.56
.21
.35
.49
.38
.10
.27
-.43
.63
CHILD ACADEMIC EXPEC-
TATION
.19
.28
-.09
.21
.50
-.29
.30
-.88
.30
SENSE OF CONTROL
-.03
-.08
.05
-.07
-.01
-.06
.27
-.59
.47
TEACHER DATA
PARENT-EDUCATOR IMAGE
.30
.71
-.42
.32
.95
-.63
.14
-.90
-.36
PROFESSION. ACCEPT FT
1.28
1.50
-.21
1.30
1.22
.08
.21
-.33
.49
See "Guide for Interpretation of Results" for explanation of table entries.

EDC OPEN EDUCATION PROGRAM
Educational Development Center
Sponsor's Intended Approach
The EDC Follow Through approach is a program for helping communitic3.
generate the resources to implement open education. It is not specifi-
cally a program in compensatory education because it is based on princi-
ples EDC considers relevant for the education of all children. The
approach is derived in part from ideas and practices evolved over many
years in British infant and primary schools. It also draws heavily on
knowledge of child development gained during the last 50 years and on
EDC experience in curriculum and school reform. EDC believes that learn-
ing is facilitated by a child's active participation in the learning
process, that it takes place best in a setting where there is a range
of materials and problems to investigate, and that children learn in
many different ways and thus should be provided with many different
opportunities and experiences. In other words, the ability to learn de-
pends in part on the chances to learn provided by the educational setting.
The classrooms are "open," and the children usually choose their
activities, drawing on a great variety of materials in the room. The
room is often divided into several interest areas for activities in making
things, science, social studies, reading, math, art, and music. Small
groups of children use any or all of these interest areas during the day.
In addition, traditional subjects may be combined with any one interest
area. Whether or not interest areas are physically set out, the open
classroom is characterized by an interaction of subject matter and by
purposeful mobility and choice of activities on the part of the children.
The child's experience is one of the starting points for teaching
in an open classroom; the teacher's input is another. The role of the
teacher is an active one. Teachers lead children to extend their own
projects, through thoughtful responses and suggestions. The classroom
is carefully supplied with materials that are likely to deepen children's
involvement. The teacher occasionally works with the entire class but
more often with a small group or an individual child. Aides and other
adults also participate in teaching roles.
219
Traditional academic skills are important in the open classroom and
children have many opportunities to develop them in flexible, self-directed
ways that allow learning to become a part of their life style outside as
well as in the classroom. EDC believes that if children are going to
live fully in the modern world, the schools must embrace objectives that
go far beyond literacy training, the dissemination of information, and
the acquisition of concepts. This approach is concerned with children's
growth in problem-solving skills, their ability to express themselves
both creatively and functionally, their social and emotional development,
and their ability to take responsibility for their own learning. Accumu-
lated experience in early childhood education in this country and overseas
suggests that these larger aims must be taken seriously from the very
outset of formal schooling, and that the environment that provides for
them also provides a sure foundation for academic learning.
An EDC advisory team makes monthly visits to the community to assist
the schools in making the changes needed to develop open education. EDC
policy is to work in places with individuals who are ready for change,
who have a sense of the directions in which they want to move, and who
need and request advisory help.
The advisory team does not attempt to impose specific ideas or methodsbut tries to extend what individuals are capable of doing. The team helps
by suggesting appropriate next steps and provides continuing support to
teachers and aides. It conducts workshops for teachers, aides, parents,
and adminir:tratois, works with teachers and aides in the classroom; pro-
vides appropriate books and materials; helps teachers and aides develop
their own instructional equipment; and assists school administrators with
problems related to classroom change.
EDC is convinced of the important role parents can play in the edu-
cation of their children. Parents have a right and a responsibility to
be involved in all decisions affecting their children. In addition, the
teacher's effectiveness is greatly increased by his knowledge rf a child's
life outside of school. The EDC advisory team helps teachers, aides, and
administrators work with parents to make them better informed about the
open education program, to use parents as an important resource for
knowledge about the children, and to involve parents in decisions con-
cerning the education of their children.
220
Individual Project Results
Seven samples from three different projects sponsored by the Educa-
tional Development Center (ED) were included in the analysis of interimeffects. The distribution of these evaluation samples in terms of cohort,
outcome and project is as follows:
Cohort First-year Effects Second-year Effects
IK (projects b & c) (projects b & c)IE (project a) (project a)
IIK (project b)
Project ED(c)
Data describing two-year impacts on Cohort I-K are presented inTable 71. This rather small project (300 pupils) is located within a
major urban area in the south Atlantic region. The FT children for whom
data were included were all Black; in contrast, only 72 percent of the NFTchildren were Black.
There is evidence that the FT and NFT samples were not well matchedon several variables. For example, the NFT sample reported a higher
percentage of skilled employment and a substantially higher level of headof household employment than did the FT sample. As might be expected,th3 FT sample more frequently met poverty level guidelines than did the
NFT sample.
The lack of comparability of the two groups is also reflected in the
child baseline variables. More of the NFT children had had preschool
experience, and the NFT group almost uniformly outperformed FT children
on baseline test measures. The FT deficiency was especially severe in
reading.
Because of data problems with the NFT sample, analysis of parent
impacts was not possible for this project. The teacher data show that
FT teachers were less satisfied with their jobs, had fewer book resources,
and had less teaching experience than NFT teachers. FT teachers reported
more freedom to choose their assignments than did NFT teachers. The two
groups were virtually identical on the closeness to the community and the
number of helpers in the classroom variables.
221
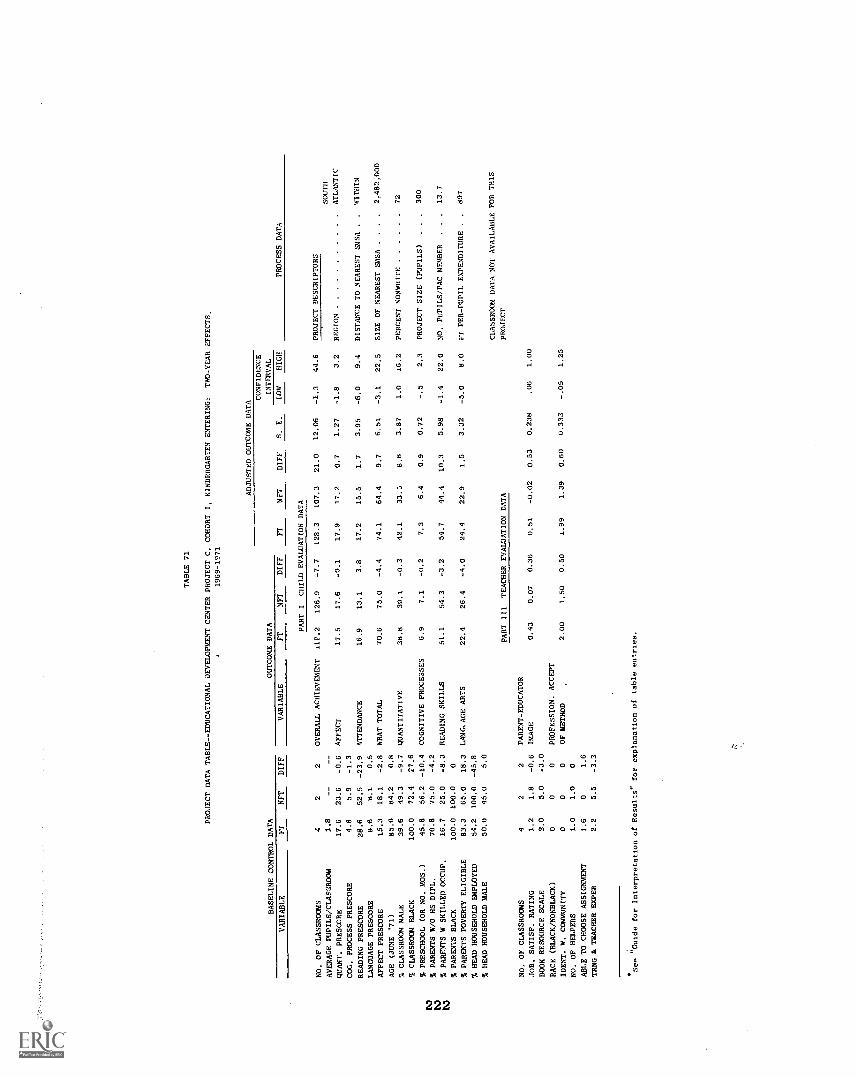
TABLE 71
PROJECT DATA TABLE--EDUCATIONAL DEVELOPMENT CENTER PROJECT C, COHORT I, KINDERGARTEN ENTERING:
TWO-YEAR EFFECTS,
1969-1971
BASELINE CONTROL DATA
VARIABLE
FT
NFT
DIFF
OUTCOME DATA
VARIABLE
ADJUSTED OUTCOME DATACONFIDENCE
INTERVAL
FT
NFT
DIFF
FT
NFT
DIFF
S. E.
LOW
HIGH
PART I
CHILD EVALUATION DATA
PROCESS DATA
NO. OF CLASSROOMS
42
2OVERALL ACHIEVEMENT
11S.2
126.9
-7.7
128.3
107.3
21.0
12.06
-1.3
44.6
PROJECT DESCRIPTORS
AVERAGE PUPILS/CLASSROOM
1.8
--
SOUTH
QUANT. PRESCORE
17.6
23.6
-0.6
AFFECT
17.5
17.6
-0.1
17.9
17.2
0.7
1.27
-1.8
3.2
REGION
ATLANTIC
COG. PROCESS PRESCORE
4.6
5.9
-1.3
READING PRESCORE
28.6
52.5
-23.9
ATTENDANCE
16.9
13.1
3.8
17.2
15.5
1.7
3.95
-6.0
9.4
DISTANCE TO NEAREST SMSA
..
WITHIN
LANGUAGE PRESCORE
8.6
8.1
0.5
AFFECT PRESCORE
15.3
18.1
-2.8
WHAT TOTAL
70.6
75.0
-4.4
74.1
64.4
9.7
6.51
-3.1
22.5
SIZE OF NEAREST RASA
..
..
2,482,000
AGE (JUNE '71)
85.0
84.2
0.8
% CLASSROOM MALE
39.6
49.3
-9.7
QUANTITATIVE
38.8
39.1
-0.3
42.1
33.5
8.6
3.87
1.0
16.2
PERCENT NONWHITE
72
% CLASSROOM BLACK
100.0
72.4
27.6
% PRESCHOOL (OR NO. MOS.)
45.8
56.2
-10.4
COGNITIVE PROCESSES
6.9
7.1
-0.2
7.3
6.4
0.9
0.72
2.3
PROJECT SIZE (PUPILS)
.300
% PARENTS vo HS DIPL.
70.8
75.0
-4.2
% PARENTS W SKILLED OCCUP.
16.7
25.0
-8.3
READING SKILLS
51.1
54.3
-3.2
54.7
44.4
10.3
5.98
-1.4
22.0
NO. PUPILS/PAC MEMBER
..
.13.7
% PARENTS BLACK
100.0
100.0
0
% PARENTS POVERTY ELIGIBLE
83.3
65.0
18.3
LANGUAGE ARTS
22.4
26.4
-4.0
24.4
22.9
1.5
3.32
-5.0
8.0
FT PER-PUPIL EXPENDITURE
.,
897
% HEAD HOUSEHOLD EMPLOYED
54.2
100.0
-45.8
% HEAD HOUSEHOLD MALE
50.0
45.0
5.0
CLASSROOM DATA NO7 AVAILABLE FOR THIS
PART III
TEACHER EVALUATION DATA
PROJECT
NO. OF CLASSROOMS
42
2PARENT-EDUCATOR
JOB. SATISF. RATING
1.2
1.8
-0.6
IMAGE
0.43
0.07
0.36
0.51
-0.02
0.53
0.238
.06
1.00
BOOK RESOURCE SCALE
2.0
5.0
-3.0
RACE (BLACK/NONBLACK)
00
0PROFESSION. ACCEPT
IDENT. W. COMMUNITY
00
0OF METHOD
2.00
1.50
0.50
1.99
1.39
0.60
0.333
-.05
1.25
NO. OF HELPERS
1.0
1.0
0
ABLE TO CHOOSE ASSIGNMENT
1.6
01.6
TANG & TEACHER EXPER
2.2
5.5
-3.3
"Guide for Interpretation of Results" for explanation of table entries.
Pupil outcomes show FT-favoring trends on all test variables, with
the difference reaching significance on the quantitative skills measure.
The teacher outcomes favor FT on both the acceptance of methods and image
of parents variables, with the latter effect reaching significance. Since
the FT-favoring difference on acceptance of method approached significance,
we interpret these results as consistent with the goals of the model.
Since this project both incorporated the EDC model and operated as a
parent-implemented, self-sponsored project, one would expect a high degree
of autonomy and teacher assistance to prevail.
The overall picture presented by the two-year data for Cohort I shows
modest, but encouraging, impacts on the children. The positive impacts on
teachers may help to sustain and improve impacts on children in subsequent
cohort groups. The lack of parent and classroom observation data for this
project is unfortunate. It would be interesting to relate these measures
to the teacher and pupil outcome variables.
First-year data are also available for Cohort I-K, kindergarten childrenin this project (see Table 72). This group of children was slightly dif-
ferent from the second-year group, both racially and in amount of pre-
school experience. The majority of the FT children in the one-year group
were non-Black, while the NFT group had a slight Black majority. The FTgroup also had a higher incidence of preschool experience than their NFTcomparisons.
The two groups distinctly lack comparability on demographic and
baseline test data. On parental employment and the presence of a male
head of household, the FT groups averaged well below the NFT group. How-
ever, the samples were virtually identical on poverty eligibility. Also,
FT children averaged well below NFT children on all baseline tests.
The adjusted outcome measures for the first-year data reveal no
significant differences between the FT and NFT samples. A comparisonof adjusted differences for the one- and two-year child outcome data
suggests improvements during the second year in every outcome but
attendance. While only one measure reaches significance after the second
year, two-year outcomes consistently display FT-favoring trends. Thesetrends should, however, be interpreted with caution. The large baseline
differences that existed between FT and NFT samples restrict considerably
the confidence with which we can interpret these data.
223

TABLE 72
PROJECT DATA TABLE--EDUCATIONAL DEVELOPMENT CENTER PROJECT C, COHORT I, KINDERGARTEN ENTERING:
ONE-YEAR EFFECTS,
1969-1970
ADJUSTED OUTCOME DATA
CONFIDENCE
BASELINE /CONTROL DATA
OUTCOME DATA
INTERVAL
VARIABLE
FT
NFT
DIFF
VARIABLE
FT
NFT
DIFF
FT
NFT
DIFF
S. E.
LOW
HIGH
CHILD EVALUATION DATA
NO. OF CLASSROOMS
74
3OVERALL ACHIEVEMENT
72.5
95.0
-22.5
93.9
86.1
7.8
6.47
-4.9
20.5
QUANT. PRESCORE
12.3
20.8
-8.5
COG. PROCESS PRESCORE
2.1
6.2
-4.1
AFFECT
14.1
17.0
-2.9
15.3
16.7
-1.4
1.46
-4.1
1.5
READING PRESCORE
20.4
37.4
-17
LANGUAGE PRESCORE
5.4
9.9
-4.5
ATTENDANCE
23.4
16.3
7.1
14.0
18.9
-4.9
4.28
-13.3
3.5
AFFECT PRESCORE
16.9
16.0
.9
AGE (JUNE '71)
83.1
84.1
-1
WRAT TOTAL
34./
44.7
-10
42.5
40.8
1.7
3.68
-5.5
8.9
% CLASSROOM MALE
47
45.7
1.3
% CLASSROOM BLACK
36.4
64.7
-28.3
QUANTITATIVE
20.4
26.9
-6.5
27.2
25.2
2.0
1.87
-1.7
5.7
% PRESCHOOL (OR NO. MOS.)
51.9
19.6
32.3
% PARENTS W/0 HS DIPL.
58.8
60.4
-1.6
COGNITIVE PROCESSES
5.3
7-1.7
6,8
6.5
.3
.62
-.9
1.5
% PARENTS W/SKILLED OCCUP. 12
25.8
-13.8
% PARENTS BLACK
47.8
69.1
-21.3
READING SKILLS
48.9
-9.6
48.7
42.8
5.9
4.42
-2.8
14.7
% PARENTS POVER
ELIGIBLE 85.8
86
-.2
% HEAD HOUSEHOLD EMPLOYED
30.2
62.2
-32
LANGUAGE ARTS
8.6
12.1
-3.5
11.8
11.6
.2
.95
-1.7
2.1
% HEAD HOUSEHOLD MALE
39.1
53.3
-14.2
See "Guide for Interpretation of Results" for explanation of table entries.
Project ED(b)
With more than 1,100 pupils, thi's project is one of the largest
included in the interim evaluation. The project is located in a large
middle Atlantic city (more than 4 million residents) with a substantial
minority population (about one third of the inhabitants are nonwhite).
Children in this project enter school in kindergarten. Data are available
on both Cohort I-K (first- and second-year effects) and Cohort II-K (first-
year effects). The Cohort I, two-year data, presented in Table 73, willbe considered first.
Covariable data indicate that children in the nine FT and five NFT
classrooms that were included in analysis of child outcomes were well
matched, both on backgrowri data and on tests taken shortly after they
entered kindergarten, The two groups display little difference in terms
of age, race (almost all children were Black), or percentages of boys and
girls in the samples. Differences in demographic variables were also
relatively small. About half of the parents in both groups lacked high
school diplomas, and employment of head of house was indicated for be-
tween two thirds and three fourths of the cases, with slightly more than
25 percent of both samples employed in skilled jobs. Male heads of house -
nold were present in about 65 percent of both samples, and the poverty
level for FT was slightly higher than that for NFf (61 percent, compared to
55 percent). A difference in the amount of preschool experience was
evident, however; 54 percent of the FT sample reported preschool ex-
periences, while only 17 percent of the NFT sample did. The FT and NFT
scores on pupil baseline tests were very similar.
The baseline data on the teacher variables suggest that the two
teacher groups were fairly comparable. NFT teachers were more likely to
resemble their students ethnically and were closer to the community than
teachers. They also resported slightly more training and experience.
FT teachers, however, had greater freedom to choose teaching assignments
and had more aides in the classroom, whereas NFT teachers had somewhat
more book resources available. Strong satisfaction with working conditions
was not noted for either group.
Because of the reasonably good FT/NFT match, adjustments to child
outcome measures had only minor impacts on FT/NFT unadjusted differences.
An inspection of Table 73 reveals that none of the pupil outcome variables
differed reliably from chance expectation. A similar conclusion is
apparent in the parent and teacher outcome variables. Neither of these
analyses indicated significant differences between the FT and NFT samples.
225
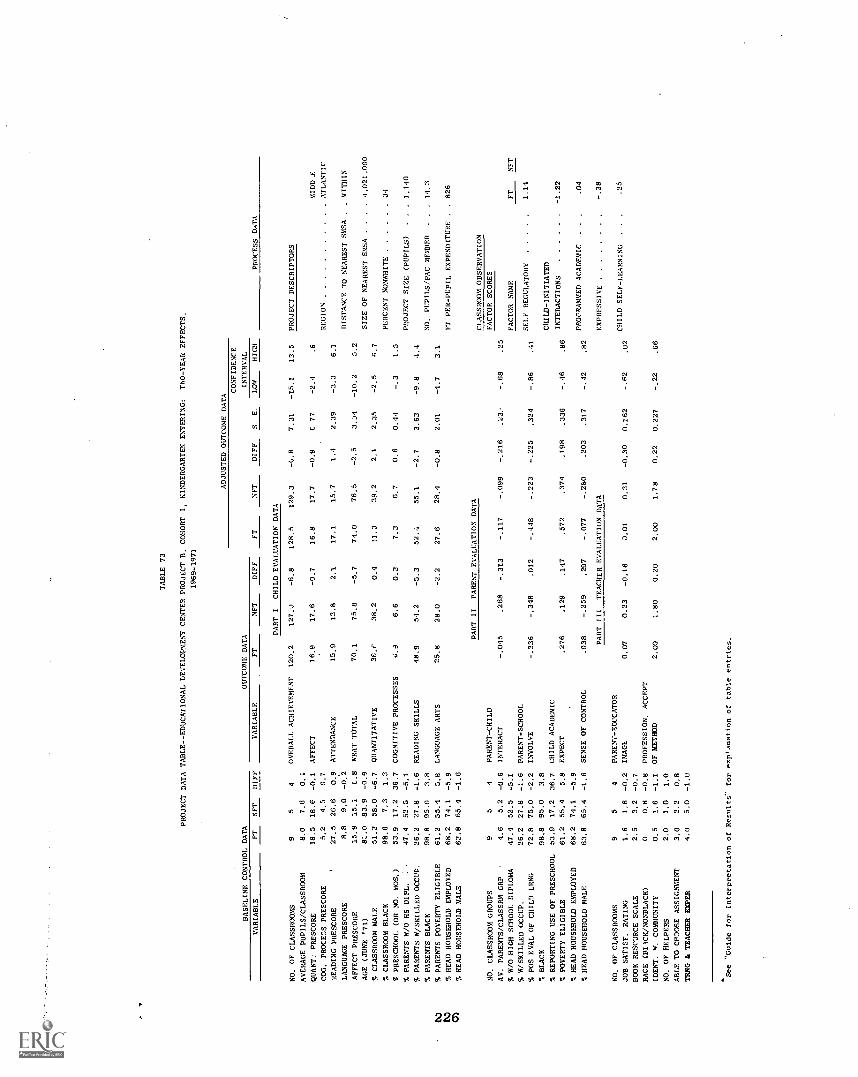
'1
TABLE 73
PROJECT DATA TABLE--EDUCATIONAL DEVELOPMENT CENTER PROJECT B, COHORT I, KINDERGARTEN ENTERING:
ThO-YEAR EFFECTS,
1969-1971
BASELINE CONTROL DATA
OUTCOME DATA
ADJUSTED OUTCOME DATA
PROCESS DATA
FT
NFT
DIFF
S.
E.
CONFIDENCE
INTERVAL
VARIABLE
FT
NFT
DIFF
VARIABLE
FT
NFT
DIFF
LOW
HIGH
PART I
CHILD EVALUATION DATA
NO. OF CLASSROOMS
95
4OVERALL ACHIEVEMENT
120,2
127.0
-6.8
128.5
129.3
-0.8
7,31
-15,1
13.5
PROJECT DESCRIPTORS
AVERAGE PUPILS/CLASSROOM
8.0
7.6
0.1
QUANT: PRESCORE
18.5
18.6
-0.1
AFFECT
16.9
17.6
-0.7
16.8
17.7
-0.9
C 77
-2.4
.6
MIDDE
COG. PROCECS PRESCORE
5.2
4.5
0.7
REGION
ATLANTIC
READING PRESCORE
27.5
26.6
0.9
ATTENDANCE
15,9
13.8
2.1
17.1
15.7
1.4
2.39
-3.3
6.1
LANGUAGE PRESCORE
8.8
9.0
DISTANCE TO NEAREST SMSA
,WITHIN
AFFECT PRESCORE
15.9
15.1
C.8
WRAT TOTAL
70,1
75.8
-5.7
74.0
76.5
-2.5
3.D4
-10.2
5.2
AGE (JUNE '71)
8I.0
83.9
-0,9
SIZE OF NEAREST SMSA
..
4,021.000
% CLASSROOM MALE
51.3
58.0
-6,7
QUANTITATIVE
3E.f
38.2
0.4
11.3
39.2
2.1
2.35
-2.5
6.7
% CLASSROOM BLACK
98.6
7.3
1.3
PERCENT NONWHITE
14
% PRESCHOOL (OR NO. MOS.)
53.9
17.2
36.7
COGNITIVE PROCESSES
6.9
6.6
0.3
7,3
6.7
0.6
0.44
1.5
% PARENTS W/O HS DIPL.
.47.4
52.5
-5.1
PROJECT SIZE (PUPILS)
1,140
% PARENTS W/SKILLED OCCUP.
26.2
27.8
-1.6
READING SKILLS
48,9
54.2
-5.3
52.4
55.1
-2.7
3.63
-9.8
% PARENTS BLACK
98.8
95.0
3.8
NO. PUPILS/PAC MEMBER
14,3
% PARENTS POVERTY ELIGIBLE
61.2
55.4
5.8
LANGUAGE ARTS
25,8
28.0
-2.2
27.6
28,4
-0.8
2.01
3.1
% HEAD HOUSEHOLD EMPLOYED
68.2
74.1
-5.9
FT PER-PUPIL EXPENDITURE
.826
% HEAD HOUSEHOLD MALE
63,8
65.4
-1.6
PART
II
PARENT EVALUATION DATA
CLASSROOM OBSERVATION
NO. CLASSROOM GROUPS
95
4PARENT-CHILD
FACTOR SCORES
AV. PARENTS/CLASSRM GRP
4.6
5.2
-0.6
INTERACT
-.045
.268
-.313
-.117
-.099
-.216
.23,.
-.68
.25
% 8/0 HIGH SCHOOL DIPLOMA
47.4
52.5
-5.1
FACTOR NAME
FT
NET
% W/SKILLED OCCUP.
26.2
27.8
-1.6
PARENT-SCHOOL
% POS EVAL OF CHILD LRNG
72.8
75.0
-2.2
INVOLVE
-.336
-.348
.012
-.223
-.225
.324
-.86
.41
SELF REGULATORY
1.14
% BLACK
98,8
95.0
3.8
% REPORTING USE OF PRESCHOOL
53.9
17.2
36.7
CHILD ACADEMIC
CHILD-INITIATED
% POVERTY ELIGIBLE
61.2
55.4
5.8
EXPECT
.276
.129
.147
.572
.374
,198
.336
-.46
.86
INTERACTIONS
-1.22
% HEAD HOUSEHOLD EMPLOYED
68.2
74.1
-5.9
% HEAD HOUSEHOLD MALE
63.8
65.4
-1.6
SENSE OF CONTROL
.038
-.259
.297
-.077
-.280
.203
.317
PROCRAMMED ACADEMIC
..
.04
PART
III
TEACHER EVALUATION DATA
EXPRESSIVE
-.38
NO. OF CLASSROOMS
95
4PARENT-EDUCATOR
JOB SATISF. RATING
1.6
1.8
-0.2
IMAGE
0,07
0.23
-0.16
0.01
0.31
-0.30
0.162
-.62
CHILD SELF-LEARNING
..
.25
BOOK RESOURCE SCALE
2.5
3.2
-0.7
RACE (131ACK/NONBLACK)
O0.8
-0.8
PROFESSION. ACCEPT
IDENT. W. COMMUNITY
0.5
1.6
-1.1
OF METHOD
2.00
1.80
0.20
2.00
1,78
0.22
0.227
-.22
.66
NO. OF HELPERS
2.0
1.0
1.0
ABLE TO CHOOSE ASSIGNMENT
3.0
2.2
0.8
TANG & TEACHER EXPER
4.0
5.0
-1.0
See "Guide for Interpretation of Results" for exp,anation of table entries.
Classroom observation data, collected during the second year, showFT classrooms scoring very high on the self-regulatory factor. This isconsistent with the model. The average or low scones on the otherfl.ctors make plausible the lack of striking findings on child outcomes,
although no data on NFT classroom processes are available for comparison.
First-year effects for Cohort are summarized in Table 74. Theoutcomes for this analysis reveal a single significant difference. NFTstudents had a significantly lower level absenteeism than did FTstudents.
Child covariable and outcome data for Cohort II are included in
Table 75. The FT and NFT samples for Cohort II-K are slightly less com-
parable than the samples for Cohort I-K, Although the proportion ofparents reporting high school educations is somewhat higher for FT than
for NFT, more FT families were poverty eligible (38 percent FT, 28 percent
NFT), The higher poverty level in the FT group is consistent with the
greater absence of male heads of household and the higher unemploymentand unskilled employment noted in this sample. FT children also had, on
the average, slightly (half a month) less preschool than their NFT counter-parts. These differences in the demographic variables were not reflected
in pupil baseline measures; the FT children performed about as well on
baseline tests as did the NFT children, In fact, their scores were
slightly higher on most baseline measures. On the language variable,
however, the average FT score was 2,3 points below the average NFT score.
All of the adjusted FT/NFT outcome measures favored NFT except at-
tendance, which shows less absenteeism for FT, The only measure showingsignificant differences was quantitative skills.
The classroom observation data, available for FT classes only, showa pattern similar to the one for Cohort I-K, although even more pronk-nced,
That is, consistent with the model, the self-regulatory factor score is
very high and the scores on the other factors, particularly chila-initiated
interactions and self-learning (both connoting a classroom in which adultsdo not initiate contacts with children) are low,
Project ED(a)
This project is located 50 to 70 miles from a south Atlantic SMSAwith a population of half a million. The population is about 20 percentnonwhite. Included is the interim evaluation are one- and two-yearresults fOr children in Cohort I-EF. First grade is the entering year inthis rural community,
227

TABLE 74
PROJECT DATA TABLE--EDUCATIONAL DEVELOPMENT CENTER PROJECT B, COHORT I, KINDERGARTEN ENTERING:
ONE-YEAR EFFECTS,
1969-1970
BASELINE/CONTROL DATA
OUTCOME DATA
ADJUSTED OUTCOME DATA
FT
NFT
DIFF
S. E.
CONFIDENCE
INTERVAL
VARIABLE
FT
NFT
DIFF
VARIABLE
FT
NFT
DIFF
LOW
HIGH
CHILD EVALUATION DATA
NO. OF CLASSROOMS
75
2OVERALL ACHIEVEMENT
95.4
100
-4.6
98.8
103.7
-4.9
5.21
-15.1
5.3
QUANT. PRESCORE
18.5
18.6
-.1
COG. PROCESS PRESCORE
5.2
4.5
-.7
AFFECT
15.4
16.6
-1.2
15.7
16.9
-1.2
1.18
-3.5
1.1
READING PRESCORE
25.3
26.6
-1.3
IVtO
LANGUAGE PRESCORE
8.8
9.0
-.2
ATTENDANCE
22.7
10.9
11.8
21.7
10.5
11.2
3.44
4.5
17.9
GO
AFFECT PRESCORE
15.5
15.1
.4
AGE (JUNE '71)
82.8
83.9
-1.1
WRAT TOTAL
44
44.8
-.6
46.7
47.1
-.4
2.96
-6.2
5.4
% CLASSROOM MALE
54.6
58
-3.4
% CLASSROOM BLACK
98.2
97.3
.9
QUANTITATIVE
27.1
27.4
-.3
27.3
27.6
-.3
1.51
-3.3
2.7
% PRESCHOOL (OR NO. MOS.)
56
17.2
38.8
% PARENTS W/O HS DIPL.
43.8
52.5
-8.7
COGNITIVE PROCESSES
76.7
.3
7.2
7.0
.2
.50
-.8
1.2
% PARENTS W/SKILLED OCCUP.
24.3
27.9
-3.6
% PARENTS BLACK
98.4
95
3.4
READING SKILLS
48.8
53.3
-4.5
52.2
56.9
-4.7
3.56
-11.7
2.3
% PARENTS POVERTY ELIGIBLE
59.6
55.4
4.2
% HEAD HOUSEHOLD EMPLOYED
71.5
74.1
-2.6
LANGUAGE ARTS
12.3
12.6
-.3
12.3
12.8
-.5
.77
-2.0
1.0
% HEAD HOUSEHOLD MALE
61.1
65.4
-4.3
See "Guide for Interpretation of Results" for explanation of table entries.
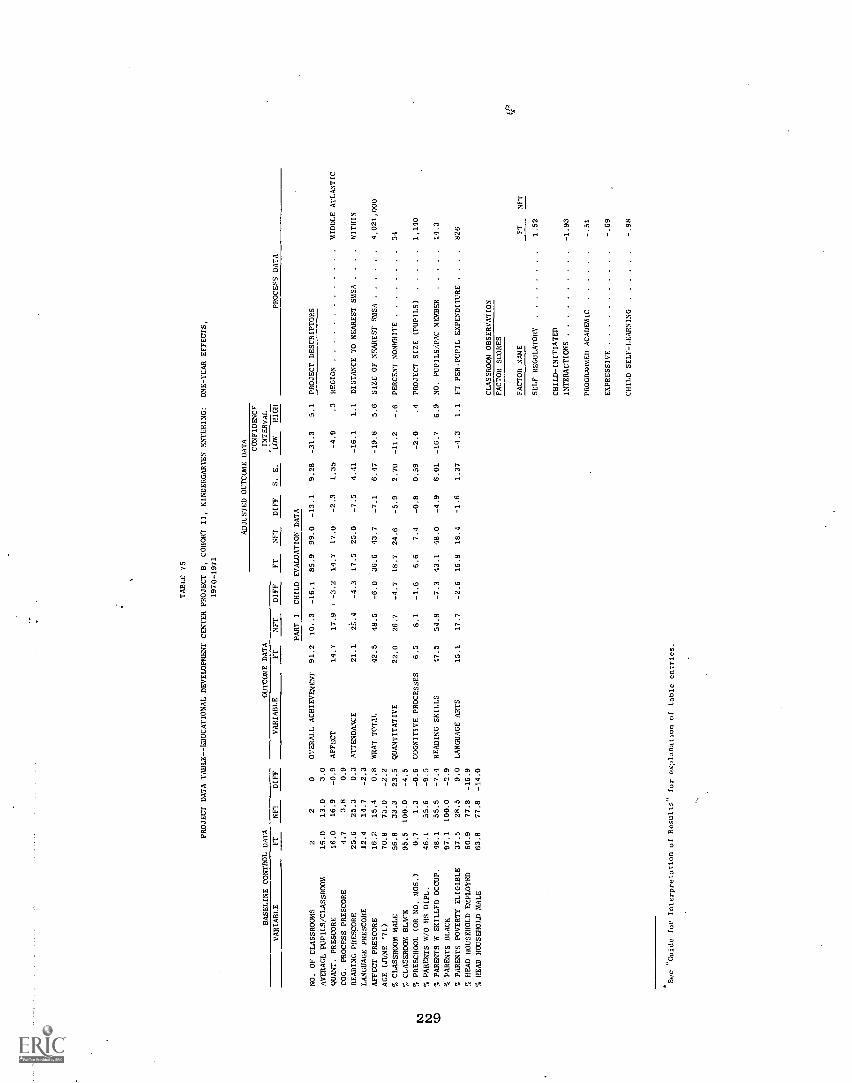
TABLE 75
PROJECT DATA TABLE--EDUCATIONAL DEVELOPMENT CENTER PROJECT B, COHORT II, KINDERGARTEN ENTERING:
ONE-YEAR EFFECTS,
1970-1971
BASELINE CONTROL DATA
OUTCOME DATA
ADJUSTED OUTCOME DATA
CONFIDENCF
INTERVAL
VARIABLE
FT
NF1
DIFF
VARIABLE
FT
NFT
DIFF
FT
NFT
EVALUATION DATADIFF
S. E.
LOW
HIGH
PROCESS DATA
PART I
CHILD
NO. OF CLASSROOMS
22
0OVERALL ACHIEVEMENT
91.2
111,.3
-16.1
85.9
99.0
-13.1
9.28
-31.3
5.1
PROJECT DESCRIPTORS
AVERAGE PUPILS/CLASSROOM
16.0
13.0
3.0
QUANT. PRESCORE
16.0
16.9
-0.9
AFFECT
14.7
17.9
-3.2
14.7
17.0
-2.3
1.35
-4.9
.3
REGION
MIDDLE ATLANTIC
COG. PROCESS PRESCORE
4.7
3.8
0.9
READING PRESCORE
25.6
25.3
0.3
ATTENDANCE
21.1
25.4
-4.3
17.5
25.0
-7.5
4.41
-16.1
1.1
DISTANCE TO NEAREST SMSA
..
..
WITHIN
LANGUAGE PRESCORE
12.4
14.7
-2.3
AFFECT PRESCORE
16.2
15.4
0.8
WRAT TOTAL
42.5
48.5
-6.0
36.6
43.7
-7.1
6.47
-19.8
5.6
SIZE OF NEAREST SMSA
4,021,000
AGE (JUNE '71)
70.8
73.0
-2.2
% CLASSROOM MALE
56.8
33.3
23.5
QUANTITATIVE
22.0
26.7
-4.7
18.7
24.6
-5.9
2.70
-11.2
-.6
PERCENT NONWHITE
34
CLASSROOM BLACK
95.5
100.0
-4.5
% PRESCHOOL (OR NO. MOS.)
0.7
1.3
-0.6
COGNITIVE PROCESSES
6.5
8.1
-1.6
6.6
7.4
-0.8
0.59
-2.0
.4
PROJECT SIZE (PUPILS)
1,140
% PARENTS W/O HS DIPL.
46.1
55.6
-9.5
% PARENTS F SKILLFD OCCUP.
48.1
55.5
-7.4
READING SKILLS
47.5
54.8
-7.3
43.1
48.0
-4.9
6.01
-16.7
6.9
NO. PUP1LSAPAC MEMBER
14.3
% PARENTS BLACK
97.1
100.0
-2.9
% PARENTS POVERTY ELIGIBLE
37.5
28.5
9.0
LANGUAGE ARTS
15.1
17.7
-2.6
16.8
18.4
-1.6
1.37
-4.3
1.1
FT PER-PUPIL EXPENDITURE .
..
.826
% HEAD HOUSEHOLD EMPLOYED
60.9
77.8
-16.9
% HEAD HOUSEHOLD MALE
63.8
77.8
-14.0
CLASSROOM OBSERVATION
FACTOR SCORES
FACTOR NAME
FTN
ET
SELF REGULATORY
1.52
CHILD-INITIATED
INTERACTIONS
-1.93
PROGRAMMED ACADEMIC
-.51
EXPRESSIVE
-.69
CHILD SELF - LEARNING
-.98
*See "Guide for Interpretation of Results" for explanation of table entries.
Co variable data describing the children in Cohort I-EF, presented in
Table 76, indicate a fairly severe mismatch between the FT and NFT groups.
On demographic variables, FT children appear less disadvantaged than
project children at some other sites, but much more disadvantaged than
the NFT children who made up the comparison group. The typical family
in both groups included an employed male head of house. However, about
half the FT parents lacked high school diplomas, while the majority
(about 80 percent) of the NFT parents had completed high school. Level
of employment was high for both groups, but more skilled occupations were
associated with NFT families (75 percent versus 55 percent). FT children
were more often Black and more frequently came from poverty-eligible homes.
The majority of both samples reported preschool experience, with a slightly
higher experience rate in the FT sample. On baseline test measures, NFT
children performed consistently better than FT children, with the most
striking differences in the areas of reading, language, and affect.
The baseline data for the six FT and six NFT teachers show that FT
teachers had less experience, less freedom to choose their teaching
assignment, and, surprisingly, fewer classroom helpers than NFT teachers.
FT teachers did report more book resources and slightly more satisfaction
with working conditions.
There were no significant differences between FT and NFT children on
any of the pupil outcome variables. The slight differences consistently
favored NFT on all of the test variables, but attendance favored FT.
The parent outcome analysis yielded one significant difference. FT
parents reported significantly more involvement in school than NFT parents.
No other differences on parent or teacher outcomes reached significance.
The significant parent/school involvement outcome is consistent with
the high degree of parental involvement suggested by the large PAC for
this project during the 1970-71 school year.
One-year data on these Cohort I-EF children are presented in Table
77. The adjusted pupil outcome measures generally reveal minimal differ-
ences between FT and NFT pupils,. The one exception is the significant
advantage noted for the FT children on the cognitive processes measure.
In summary, it appears that this program has had minimal impact on
pupil and teacher outcomes in this project. The lack of classroom
observation data at this site makes interpretation difficult. Data
collected from parents, on the other hand, are encouraging.
230

TABLE 76
PROJECT DATA TABLE--EDUCATIONAL DEVELOPMENT CENThR PROJECT A, COHORT I, ENTERING FIRST GRADE:
TWO-YEAR EFFECTS,
1969-1971
BASELINE CONTROL DATA
VARIABLE
FT
NFT
DIFF
OUTCOME DATA
VARIABLE
FT
NFT
DIFF
ADJUSTED OUTCOME DATA
CONFIDENCE
INTERVAL
FT
NFT
DIFF
S. E.
LOW
HIGH
PART I
CHILD EVALUATION DATA
PROCESS DATA
NO. OF CLASSROOMS
68
-2
OVERALL ACHIEVEMENT
157.7
191.0
33.3
138.8
144.3
-5.5
9.74
-21.6
13.6
PROJECT DESCRIPTORS
AVERAGE PUPILS/CLASSROOM
24.3
4.6
19.7
QUART. PRESCORE
34.8
35.8
-1.0
AFFECT
19.2
19.5
-0.3
18.4
18.7
-0.3
0.63
-1.5
.9
SOUTH
COG. PROCESS PRESCORE
7.5
8.1
-0.6
REGION
ATLANTIC
READING PRESCORE
64.8
75.9
-11.1
ATTENDANCE
10.1
-3.1
10.1
12.4
-2.3
3.23
-8.6
4.0
LANGUAGE PRESCORE
14.4
17.1
-2.7
DISTANCE TO NEAREST SMSA'.
.50-70 MILES
AFFECT PRESCORE
17.4
19.5
-2.1
WRAT TOTAL
105.1
118.7
-13.6
98.7
102.1
-3.4
4.19
-11.6
4.8
AGE (JUNE '21)
97.0
96.1
0.8
SIZE OF NEAREST !NSA
..
..
500,000
% CLASSROOM MALE
51.1
41.9
9.2
QUANTITATIVE
45.4
50.8
-5.4
39.8
40.4
0.6
2.93
-6.3
5.1
% CLASSROOM BLACK
25.5
4,9
20.6
PERCENT NONWHITE
19
% PRESCHOOL (OR NO. MOS.)
91.4
79.8
11.7
READING SKILLS
84.9
106.7
-21.8
74.6
79.1
-4.5
6.46
-17.2
8.2
% PARENTS W/O HS DIPL.
51.4
22.9
28.5
PROJECT SIZE (PUPILS)
..
.582
% PARENTS W SKILLED OCCUP.
54.9
75.8
-20.9
LANGUAGE ARTS
27.4
33.4
-6.0
24.4
24.8
-0.4
1.94
-4.2
3.4
% PARENTS BLACK
22.6
4.6
18.0
NO. PUPILS/PAC MEMBER
..
.6.1
ba
% PARENTS POVERTY ELIGIBLE
29.8
5.6
24.2
CO
% HEAD HOUSEHOLD EMPLOYED
95.2
95.0
0.2
FT PER-PUPIL EXPENDITUE
.404
% HEAD HOUSEHOLD MALE
89.3
97.5
-8.2
PART II
PARENT EVALUATION DATA
CLASSROOM DATA NOT AVAILABLE FOR THIS
NO. OF CLASSROOM GROUPS
67
-1
PARENT-CHILD
PROJECT
AV. PARENTS/CLASSRM GRP
15.3
4.7
10.6
INTERACT
.520
.528
-.008
.384
.147
.237
.282
-.32
.79
% W/O HIGH SCHOOL DIPLOMA
51.4
19.0
32.4
% W SKILLED OCCUP.
54.9
79.5
-24.6
PARENT-SCHOOL
% POS EVAL OF CHILD LRNG
73.7
58.3
15.4
INVOLVE
.030
-.375
.405
-.153
-.960
,807
.287
.24
1.37
% BLACK
22.6
5.3
17.3
% REPORTING USE OF PRESCHOOL
91.4
81.6
9.3
CHILD ACADEMIC
% POVERTY ELIGIBLE
29.8
6.4
23.4
EXPECT
-.123
.107
-.230
-.316
-.091
-.227
.284
-.78
.33
% HEAD HOUSEHOLD EMPLOYED
95.2
94.3
0.9
% HEAD HOUSEHOLD MALE
89.3
97.1
-7.8
SENSE OF CONTROL
.289
.090
.199
.480
.174
.306
.276
-.23
.b5
PART
III
TEACHER EVALUATION DATA
NO. OF CLASSROOMS
66
0PARENT-EDUCATOR
JOB SATISF. RATING
1.9
1.6
0.3
IMAGE
0.31
0.38
-0.07
0.39
0.42
-0.03
0.179
-.38
.32
BOOK RESOURCE SCALE
4,7
3.7
1.0
RACE (BLACK /NONBLACK)
0.8
1.0
-0.2
PROFESSION. ACCEPT
IDENT. W. COMMUNITY
1.3
1.5
-0.2
OF METHOD
_2A00
1.67
0.33
2.00
1.96
0.04
0.269
-.49
.57
NO. OF HELPERS
1.0
1.3
-0.3
ABLE TO CHOOSE ASSIGNMENT
1.5
2.0
-0.5
TRNG & TEACHER EXPER
3.1
5.1
-2.0
.See "Guide for Interpretation
of Results"
for explanation of table entries.
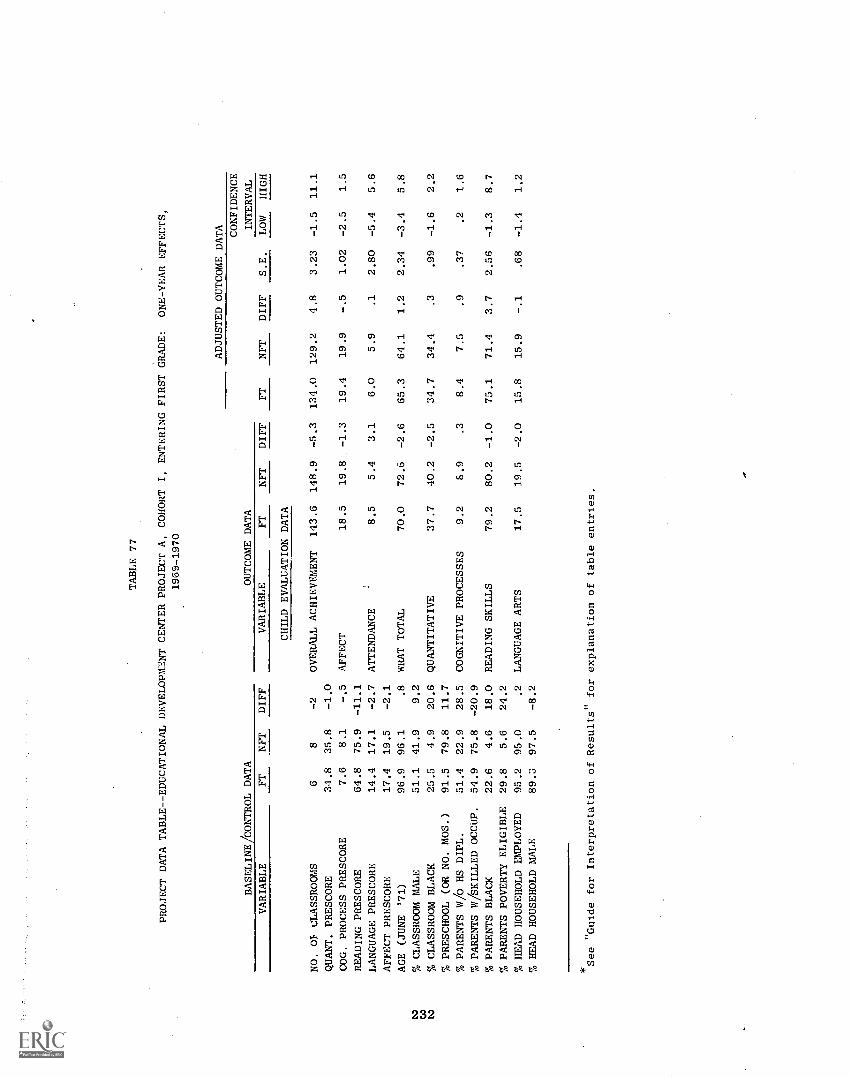
TABLE 77
PROJECT DATA TABLE--EDUCATIONAL DEVELOPMENT CENTER PROJECT A, COHORT I, ENTERING FIRST GRADE:
ONE-YEAR EFFECTS,
1969-1970
ADJUSTED OUTCOME DATA
CONFIDENCE
BASELINE /CONTROL DATA
OUTCOME DATA
INTERVAL
VARIABLE
FT
NFT
DIFF
VARIABLE
FT
NFT
DIFF
FT
NFT
DIFF
S.E.
LOW
HIGH
CHILD EVALUATION DATA
NO. OI CLASSROOMS
68
-2
OVERALL ACHIEVEMENT
143.6
148.9
-5.3
134.0
129.2
4.8
3.23
-1.5
11.1
QUANT. PRESCORE
34.8
35.8
-1.0
COG. PROCESS PRESCORE
7.6
8.1
-.5
AFFECT
18.5
19.8
-1.3
19.4
19.9
-.5
1.02
-2.5
1.5
READING PRESCORE
64.8
75.9
-11.1
LANGUAGE PRESCORE
14.4
17.1
-2.7
ATTENDANCE
8.5
5.4
3.1
6.0
5.9
.1
2.80
-5.4
5.6
AFFECT PRESCORE
17.4
19.5
-2.1
AGE (JUNE '71)
96.9
96.1
.8
WRAT TOTAL
70.0
72.6
-2.6
65.3
64.1
1.2
2.34
-3.4
5.8
ND
% CLASSROOM MALE
51.1
41.9
9.2
CA
ND
% CLASSROOM BLACK
25.5
4.9
20.6
QUANTITATIVE
37.7
40.2
-2.5
34.7
34.4
.3
.99
-1.6
2.2
% PRESCHOOL (OR NO. MOS.)
91.5
79.8
11.7
% PARENTS W/0 HS DIPL.
51.4
22.9
28.5
COGNITIVE PROCESSES
9.2
8.9
.3
8.4
7.5
.9
.37
.2
1.6
% PARENTS W/SKILLED OCCUP.
54.9
75.8
-20.9
% PARENTS BLACK
22.6
4.6
18.0
READING SKILLS
79.2
80.2
-1.0
75.1
71.4
3.7
2.56
-1.3
8.7
% PARENTS POVERTY ELIGIBLE
29.8
5.6
24.2
% HEAD HOUSEHOLD EMPLOYED
95.2
95.0
.2
LANGUAGE ARTS
17.5
19.5
-2.0
15.8
15.9
-.1
.68
-1.4
1.2
% HEAD HOUSEHOLD MALE
89.3
97.5
-8.2
See "Guide for Interpretation of Results" for explanation of table entries.
Summary
Separate summary analyses on the EDC Open Education Program are
reported only for Cohort I-K, twoyear groups, which include two project
samples. Sponsor summaries based on a single project are not repeated
in this section.
The salient features of this FT approach are summarized below:
Focus and Objectives--long range program objectives.
Child
Cognitive
Develop competence in basic skills
Promote problem solving skills
Affective
Develop ability in self-expression
Develop self-direction
Curricular Approach
Teacher's role that of facilitator
Reinforcement primarily from activities
Child generally free to choose among wide variety of activities
Individual/small group focus
Type of Parent Involvement
Inform parents about program
Teachers use parents as resource in planning child's education
Some form of decision making
The results of the outcome analysis are presented in Table 78. Aninspection of the table indicates that the program produced no significant
FT-favoring results on the child outcome measures. The FT group performed
slightly better on four individual variables, the NFT group, on three
variables. Results of parent outcome analyses show NFT parents reported
interacting with their children to a significantly greater extent than
did FT parents. No other parent outcome differences reached significance.
The analysis of teacher outcome variables at the sponsor level suggests
that there were no reliable differences between FT and NFT teachers. How-
ever, classroom observation process data indicate that the model is being
implemented according to its specified goals.
233
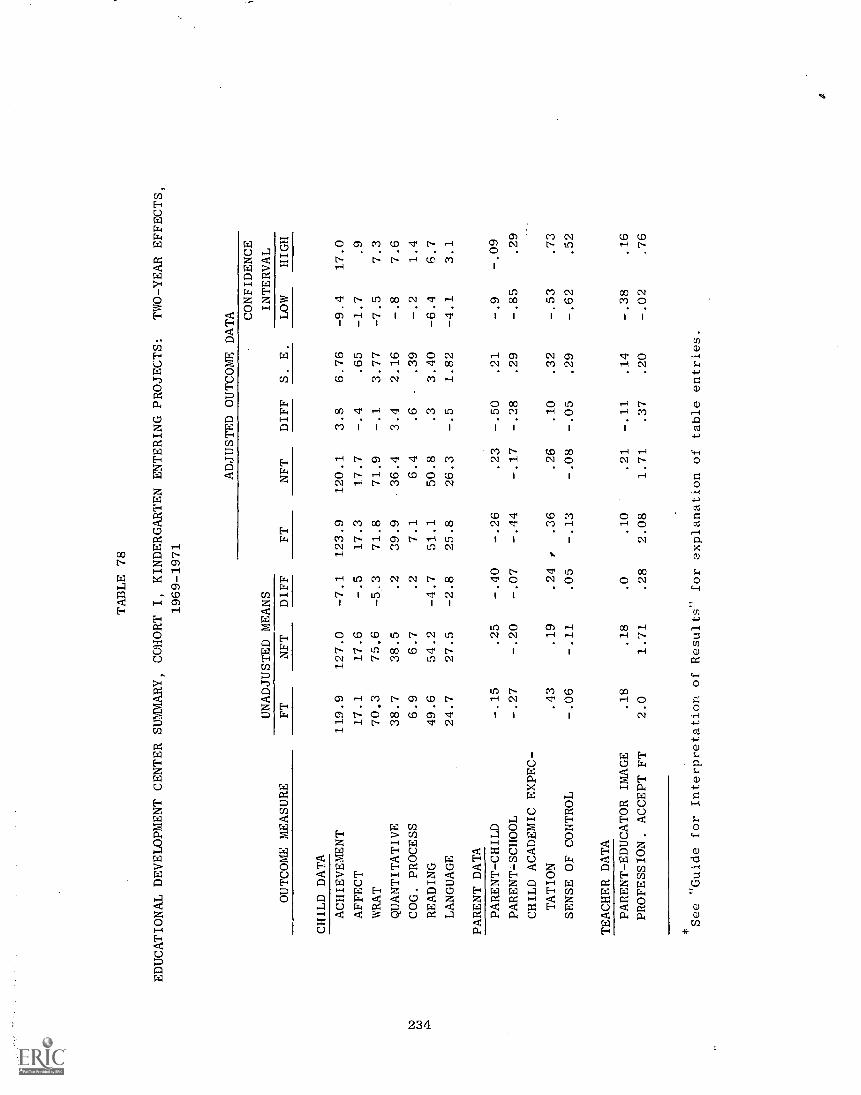
TABLE 78
EDUCATIONAL DEVELOPMENT CENTER SUMMARY, COHORT I, KINDERGARTEN ENTERING PROJECTS:
TWO-YEAR EFFECTS,
1969-1971
ADJUSTED OUTCOME DATA
OUTCOME MEASURE
UNADJUSTED MEANS
FT
NFT
DIFF
S. E.
CONFIDENCE
INTERVAL
FT
NFT
DIFF
LOW
HIGH
CHILD DATA
ACHIEVEMENT
119.9
127.0
-7.1
123.9
120.1
3.8
6.76
-9.4
17.0
AFFECT
17.1
17.6
-.5
17.3
17.7
-.4
.65
-1.7
.9
WRAT
70.3
75,6
-5.3
71.8
71.9
-.1
3.77
-7.5
7.3
QUANTITATIVE
38.7
38.5
.2
39.9
36.4
3.4
2.16
-.8
7.6
w wCOG. PROCESS
6.9
6.7
.2
7.1
6.4
.6
.39
-.2
1.4
AREADING
49.6
54.2
-4.7
51.1
50.8
.3
3.40
-6.4
6.7
LANGUAGE
24.7
27.5
-2.8
25.8
26.3
-.5
1.82
-4.1
3.1
PARENT DATA
PARENT-CHILD
-.15
.25
-.40
-.26
.23
-.50
.21
-.9
-.09
PARENT-SCHOOL
-.27
-.20
-.07
-.44
-.17
-.28
.29
-.85
.29
CHILD ACADEMIC EXPEC-
TATION
.43
.19
.24
.36
.26
.10
.32
-.53
.73
SENSE OF CONTROL
-.06
-.11
.05
-.13
-.08
-.05
.29
-.62
.52
TEACHER DATA
PARENT-EDUCATOR IMAGE
.18
.18
.0
.10
.21
-.11
.14
-.38
.16
PROFESSION. ACCEPT FT
2.0
1.71
.28
2.08
1.71
.37
.20
-.02
.76
See "Guide for Interpretation of Results" for explanation of table entries.

Interpretation and evaluation of this general lack of impact evidence
for this sponsor, and for the individual projects, must include considera-
tion of the occasionally severe lack of comparability of these FT and NFT
samples, which, we suspect, seriously confounds the analysis of effects.
Hence, it is possible that many results were undetected or are grossly
underestimated on the basis of these data.
2351236
INTERDEPENDENT LEARNING MODEL
New York University
Sponsor's Intended Approach
The Interdependent Learning Model (ILM) is a transactional approach
to education that focuses on the learner as an individual and on the so-
cial interactional context within which learning occurs. It contains
elements of both the open classroom and individualized program approaches,
but is distinguished by its strong focus on small group interaction as
the basic structure out of which learning emerges. This derives from the
conviction that a child gains most of his knowledge from interaction withinhis family and with his peers rather than while sitting at 2 desk. If
education is truly preparation for life, the theory goes, it needs to be
more life-like in its structure.
,M, for example, advocates an emergent approach to language develop-
ment in which communication rather than language per se is stressed. A
child develops language proficiency by being presented with situations of
increasing complexity that motivate him to express himself verbally. Lan-
guage emerges from situations rather than being prescribed. Games And
game-like activities play a majOr role in bringing this about.
Games are a central feature of the ILM model, often being used in
combination with certain aspects of programmed instruction to achieve
instructional and social objectives. Since the focus is on "learning to
learn," curriculum content is not specific, although suggested games deal-
ing with specific content areas, such as language, are being developed..
In introducing new games the teacher typically follows a strategy of teach-
ing from within; she demonstrates how to play by actually playing the game
with a group, verbalizing what is being done and why and serving as a model
rather than actually teaching; ultimately she transfers much of the control
to the game rules, encouraging the children to direct their own learning.
The advantages seen in games further defines the philosophy of this
approach. They can be played by individuals with different levels of
competence, with the more advanced helping the others. They provide feed-
back to the child both by way of the game materials themselves and from
the other participants; the child monitors the "correctness" of his own
response as well as that of others. Games can approximate evei.ts in"real
life" minus the risk factor. Starting with the benefit of game rules,
237
groups can be quickly formed and sustained with minimal adult direction.
Thus, children can be led to assume increasing responsibility for making
choices and managing their own behavior.
The small group approach is considered just as appropriate for de-
veloping the teaching role as the lear%ing role in this model. Theadultsin the classroom are consizlerPu to be a team participating equally in
decision-making and teaching functions. They are expected to meet with
other teams to pool ideas, share materials, and provide mutual support.
The team implements the model gradually, introducing changes in the class-
room only as the team becomes relatively comfortable with them.
Joint participation between sponsor and the local project governs
model implementation overall. The sponsor helps the local site develop
its program according to its own needs and objectives through a coordinator
serving as chief liaison between the site and the sponsor's staff. In
training sessions, local staff work as apprentices to sponsor consultants
at the beginning of workshops and take over training sessions by the end
of the training period. As part of the training, local staff also design
preservice workshops for their own sites. Responsibility for training
and implementation is steadily delegated to local staff until the model
finally functions autonomously.
ILM considers parents an integral part of the educational teams and
urges schools to invite them into the classroom to play a real role in
the educational process and to participate in model improvement. The
game approach allows parents to play leadership roles in the classroom,
even though their own formal education may be limited. Parents unable
to participate direct:_ in the classroom are encouraged through workshops
and home visits to learn the instructional games their children are play-
ing and to play the games with them at home.
238
Individual Project Results
Three samples from two different projects sponsored by New York
University (NY) were included in the analysis of interim effects. The
distribution of these evaluation samples in terms of cohort, outcome, and
project is as follows:
Cohort First-year Effects Second-year Effects
IK (projects a&b)
IIK (project a)
Project NY(a)
Project NY(a) is a very large kindergarten entrance project (1,109
pupils) implemented in a racially mixed community (52 percent nonwhite)
in a large south Atlantic urban area (SMSA = 1,173,000). A Cohort I and
Cohort II sample are included in this project. Second-year data for the
Cohort I sample are presented in Table 79. Baseline averages for the ten
FT and twelve NFT classes are quite comparable. In fact, of the many
projects included in this interim evaluation analysis, Project NY(a) has
one of the best matches of FT and NFT groups. There is one moderately
serious problem with these project data. Pupil baseline averages show both
FT and NFT groups as averaging 0 percent on p":.eschool experience, an in-
accurate statistic caused by incomplete roster data obtained in Fall 1969.
Parent reports show that the 56.8 percent of the FT children and none
of the NFT children had preschool experience. Although these data are
also incorrect, it seems more likely that they represent true differences
in preschool experience. These two errors, however, result in inappropriate
covariance adjustments in the outcome data. In the case of pupil scores,
the likely effect is an under-adjustment. In the case of the parent out-
comes, over-adjusting likely resulted. Poblems such as these seriously
complicate the task of interpreting analysis results.
Nevertheless, significant FT/NFT differences can be noted on the
quantitative measure and on attendance. Both of these r,?3ults are FT-
favoring and suggest that FT pupils may be more interested in school and
learning more than :omparable NFT'pup'ls.
239

TABLE 79
PROJECT DATA TABLE - -NEW YORK UNIVERSITY PROJECT A, COHORT I, KINDERGARTEN ENTERING,
TWO-YEAR EFFECTS,
1969-1971
BASELINE CONTROL DATA
OUTCOME DATA
ADJUSTED OUTCOME DATA
PROCESS DATA
FT
NFT
D1FF
S, E,
CONFIDENCE
INTERVAL
VARIABLE
FT
'IT
RIFF
VARIAI
FT
NFT
DIFF
LOW
HIGH
PAST 1
CHILD EVALUATION DATA
NO, OF CLASSROOMS
10
12
-2
OVEhALL ACHIEVEMENT
117.3
104.7
12,6
115.9
107.8
8.1
5.77
-3.2
19.4
PROJECT DESCRIPTORS
AVERAGE PUPILS/CLASSROOM
7.1
4.7
2.1
QUANT, PRESCORE
16.7
17.6
-0.9
AFFECT
17.1
17.7
-0.6
18.1
17.8
O.%
0.61
1.5
REGION
SOUTH ATLANTIC
COG, PROCESS PRESCORE
4.9
-0.2
READING PRESCORE
34.1
29.9
4.2
ATTENDANCE
11.7
18.5
-6.8
12.3
19.8
-7.3
1.89
-11.2
-3.8
DISTANCE TO NEAREST SMSA
.WITHIN
LANGUAGE PRESCORE
9.0
9.3
-0.7
AFFECT PRESCORE
11.9
17.7
-2.8
NEAT TOTAL
68.6
63.1
5.5
67.0
64.
2.6
3.12
-3.3
8.7
SIZE OF NEAREST SMSA
..
.1,173,000
AGE (JUNE '71)
83.2
83.1
0.7.
% CLASSROOM MALE
- 13.0
53.6
-10.6
QUANTITATIVE
35.8
30.3
5.5
36.2
31.0
3.2
1.85
1.6
8.8
PERCENT NONWHITE
"2
5 CLASSROOM BLACK
89.7
91.8
-2.1
% PRESCHOOL (OR NO, MOS.)
00
0COGNITIVE PROCESSES
7.1
7.2
-0.3
6.9
7.4
-0,5
0.35
-1.2
.2
PROJECT SIZE (PUPILS)
..1,10k
% PARENTS W/O HS DIPL.
71.2
72.4
-1.2
% PARENTS K SKILLED OCCUP.
22.3
22.0
0.3
READING SKILLS
50.1
44.5
5.6
48.8
16.2
2.6
2.87
-3.0
8.2
NO, PUPILS/PAC MEMBER
..19.6
% PARENTS BLACK
82.7
90.1
% PARENTS POVERTY ELIGIBLE
78.1
-6.2
1.9
LANGUAGE ARTS
24.2
22.6
1,6
24.1
23.3
0.8
1.59
-2.3
3.9
FT PER-PUPIL EXPENDITURE
812
1NO
% HEAD HOUSEHOLD EMPLOYED
68.7
69.9
-1.2
A. 0
7, HEAD HOUSEHOLD MALE
49.2
6.5
2.7
CLASSROOM OBSERVATION
PART II
PARENT EVALUATION DATA
FACTOR SCORES
NO. CLASSIE3M GROUPS
10
11
-1
PARENT-CHILD
AV. PARENTS/CLASSRM GRP
6.
3 6
2.7
INTERACT
-.121
.013
-.164
-.083
-.072
-.011
.200
.38
FACTOR NAME
IT
NFT
% W/O HIGH SCHOOL DIPLOMA
71.2
69.9
1.3
SF'1-- REGULATORY
.59
-.71
% W SKILLED OCCUP.
22.3
24.0
-1.7
PARENT-SCHOOL
% POS :NAL OF CHILD LRNG
86.1
75.0
11,1
INVOLVE
.137
-.347
.84
.17.1
0.174
.271
-.36
.71
CHILD- INITIATED
% BLACK
82.7
89.2
-6.5
INTERACTIONS
.58
.8'
% REPORTING USE OF PRESCHOOL
56.8
056.8
CHILD ACADEMIC
% POVERTY ELIGIBLE
78.1
74.1
.0
SCHOOL
.134
.270
-.136
.037
.32
-.395
.280
PROGR,AMMED ACADEMIC
..
.
% HEAD HOUSEHOLD EMPLOYED
-68.7
71.7
-3.0
% HEAD HOUSEHOLD MALE
49.2
50.8
-1.6
SENSE OF CONTROL
.135
-,369
.50.1
.046
-.195
.341
.265
-,13
.86
EXPRESSIVE
-.70
-.83
PART III
TEACHER EVALUATION DATA
CHILD SELF-LEARNING
..57
-.65
NO. OF CLASSROOMS
10
12
-2
PARENT-EDUCATOR
JOB SATISF. RATING
1.6
2.0
0.4
IMAGE
0.32
0.60
-0.25
0.33
0.9
-0.16
0.123
.08
BOOK RESOURCE SCALE
2.5
4.4
-1.9
RACE (BLACK/NONBLACK)
0.2
00.2
PROFESSION. ACCEPT
IDENT, W, CONBWNITY
0.5
0.6
-0.1
OF METHOD
1.75
1.20
0.55
1.64
1.04
0.60
0.172
.26
.94
NO. OF HELPERS
0.7
1.2
-0.5
,%.BLE TO CHOOSE ASSIGNMENT
2.0
0.4
1.6
TRNG & TEACHER EXPER
6.0
6.0
0
*Soc. "Guidr for Interpretation of Results" for explanation of table entries.

Parent measures fail to display significant FT/NFT differences.
However, FT teachers reported significantly greater approval of their
methods than did NFT teachers. This result is mildly surprising, since
these same FT teachers appeared less pleased with their general working
conditions and resources and reported fewer helpers than the NFT teachers.
Perhaps the-) preceive the appropriateness of their procedures, but feel
that circumstances still could be better.
On classroom observation data, FT classes differ from NFT classes
on the self-regulatory and child self-learning factors. Since both factors
include independent activity by the children, these scores are in accord
with the sponsor's advocacy of game materials in tiie curricuim and the
model's focus on the learner and his interactions with peers. The class-
room averages are not dramatically different from zero on any of the
factors, however, and do not by themselves assist our understanding of
the FT child outcome data.
Data for the Cohort II, one-year sample from Project NY(a) are pre-
sented in Table 80. FT and NFT groups in this sample, consisting of eight
FT and two NFT classes, were moderately comparable on baseline measures.
Some discrepancies appear on parent educational and occupational levels,
with FT being higher than NFT. Also, it should be noted that not quite
as many FT families had male heads of household, and many of the mothers
reported they were currently working.
In this case, the adjustments for lack of comparability between the
FT and NFT groups on family-social variables reduced the apparent size
of FT-favoring differences on pupil outcomes.' This adjustment differs
from the more common one, which increases FT-favoring differences, because,
in this project, unlike most, FT parents were less disadvantaged than NFT
parents. We present these comments only to allay concern that "true"
differences are being obscured by the analysis. We do not believe that
they are; there just do not appear to be any significant results--either
pupil or parent--for the one-year, Cohort II outcomes in this project.
The classroom observation factors scores do not give us a consistent
picture of implementation nor do they illuminate the lack of differences
between child outcome scores for the two groups. While the FT spore on the
programmed academic factor was higher than the extremely low NFT score, FT
classes were lower on that factor than FT classes in most other projects.
Consistent with the model, FT classes differed considerably from compari-
son classes on the sell-regulatory and child self-learning factors, but
on the latter the average FT score was below the general mean and well
below the mean of Cohort I classrooms in the same project.
241

TABLE 80
PROJECT DATA TABLE - -NEW YORK UNIVERSITY PROJECT A, COHORT II, KINDERGARTEN ENTERING:
ONE-YEAR EFFECTS,
1970-1971
BASELINE CONTROL DATA
VARIABLE
FT
.NFT
DIFF
OUTCOME DATA
VARIABLE
FT
NFT
ADJUSTED OUTCOME DATA
DIFF
FT
CONFIDENCE
INTERVAL
NET
DIFF
S. E.
LOW
HIGH
PART I
CHILD EVALUATION DATA
PROCESS DATA
NO. OF CLASSROOMS
82
6OVERALL ACHIEVEMENT
91.3
76.1
15.2
87.2
78.7
8.5
8.19
-7.6
24.G
PROJECT DESCRIPTORS
AVERAGE PUPILS/CLASSROOM
18.9
10.0
8.9
SOUTH
QUART. PRESCCRE
13.3
13.5
-0.2
AFFECT
15.6
15.1
0.5
15.4
15.1
0.3
1.19
-2.0
2.6
REGION
ATLANTIC
COG. PROCESS PRESCORE
3.7
3.5
0.2
READING PRESCORE
20.1
19.0
1.1
ATTENDANCE
17.9
23.8
-5.7
13.5
18.7
-5.2
3.90
-12.8
2.4
DISTANCE TO NEAREST SMSA
..WITHIN
LANGUAGE PRESCORE
11.8
11.3
0.5
AFFECT PRESCORE
15.0
16.2
-1.2
WRAT TOTAL
40.6
32.5
8.1
36.3
32.5
3.8
5.71
-7.4
15.0
SIZE OF NEAREST SMSA
..
..
1,173,000
AGE (JUNE '71,
71.7
71.0
0.7
% CLASSROOM MALE
51.8
49.5
2.3
QUANTITATIVE
23.7
19.2
4.5
21.3
18.5
2.8
2.38
-1.9
7.5
PERCENT NONWHITE
52
% CLASSROOM BLACK
98.8
100.0
-1.2
% PRESCHOOL (OR NO. MOS.)
1.1
0.5
0.6
COGNITIVE PROCESSES
6.3
5.5
0.8
5.9
5.3
0.6
0.52
1.6
PROJECT SIZE (PUPILS)
..
.1,109
% PARENTS W/O HS DIPL.
66.8
87.5
-20.7
% PARENTS W SKILLED OCCUP.
28.5
12.5
16.0
READING SKILLS
45,6
38.4
7.2
43.2
40.2
3.0
5.31
-7.4
13.4
NO. PUPILS/PAC MEMBER
..
.19.6
% PARENTS BLACK
99.0
100.0
-1.0
% PARENTS POVERTY ELIGIBLE
70.4
81.2
-10.8
LANGUAGE ARTS
15.7
13.1
2.6
16.1
14.0
2.1
1.21
4.5
FT PER-PUPIL EXPENDITURE
..812
% HEAD HOUSEHOLD EIPLOYED
64.7
54.2
10.5
% HEAD HOUSEHOLD MALE
37.9
41.7
-3.8
CLASSROOM OBSERVATION
PART
II
PARENT EVALUATION DATA
FACTOR SCORES
NO. CLASSROOM GROUPS
82
6PARENT-CHILD
FACTOR NAME
FT
NFT
AV. PARENTS/CLASSRM GRP
9.9
8.0
1.9
INTERACT
-.073
-.382
.310
-.245
-.554
.309
.346
-.37
.99
SELF REGULATORY
.55
-.51
% W/O HIGH SCHOOL DIPLOMA
66.8
87.5
-20.7
% W SKILLED OCCUP.
28.5
12.5
16.0
PARENT-SCHOOL
% POS EVAN OF CHILD LANG
67.6
50.0
17.6
INVOLVE
-.073
-.096
.023
.I10
-.158
.268
.435
-.58
1.12
CHILD-INITIATED
% BLACK
99.0
100.0
-1.0
INTERACTIONS
.72
.77
% REPORTING USE OF 1-AESCHOOL
31.9
50.0
-18.1
CHILD ACADEMIC
% POVERTY ELIGIBLE
70.4
81.2
-10.8
EXPECT
-.288
-.348
.059
-.220
.080
-.230
.327
-.87
.41
PROGRAMED ACADEMIC
..
..-.67
-2.03
% HEAD HOUSEHOLD EMPLOYED
64.7
54.2
10.5
% HEAD HOUSEHOLD MALE
37.9
41.7
-3.8
SENSE OF CONTROL
.233
-.151
.385
.261
-.096
.357
.464
-.55
1.27
EXPRESSIVE
-.74
-.89
CHILD SELF-LEARNING
..
..-.33
-1.10
"Guide for Interpretation of Results" for explanation of table entries.

Project NY(b)
Project NY(b) is a "big city" project located in the huge mid-
Atlantic population center. The project is moderately small with near
adverage PAC size and anticipated perpupil expenditure. Nearly all
pupils for whom data were analyzed were Black.
The evaluation sample from NY(b) consists of second-year data for
Cohort I pupils. These data are presented in Table 81. The FT and NFT
groups are moderately comparable. Again, FT pupils are superior on
baseline tests and their families were less disadvantaged than the NFT
families.
Pupil measures show that NFT pupils had significantly better attendance
than FT pupils. No other pupil differences reach significance. In addition,
none of the parent measures reveal significant FT effects. This result
suggests that the parents of this project sample may rot have reached the
level of involvement and participation emphasized by the model at the
time data were gathered. FT teachers, however, displayed evidence of
significantly greater approval and acceptance of their methous (presumably
the model's approach) than the NFT teachers, and since it seems likely
that the long-range success of this kind of program is highly dependent
on positive teacher regard and compliance, we interpret this teacher
outcome as encouraging for the model.
Summary
The salient features of the New York University approach to Follow
Through can be outlined as follows:
Focus and Objectives--emphasizes long term program objectives
Child
Cognitive
Develop problem solving ability
Develop language competence
Affective
Develop self-direction
Develop cooperative uehavior
243
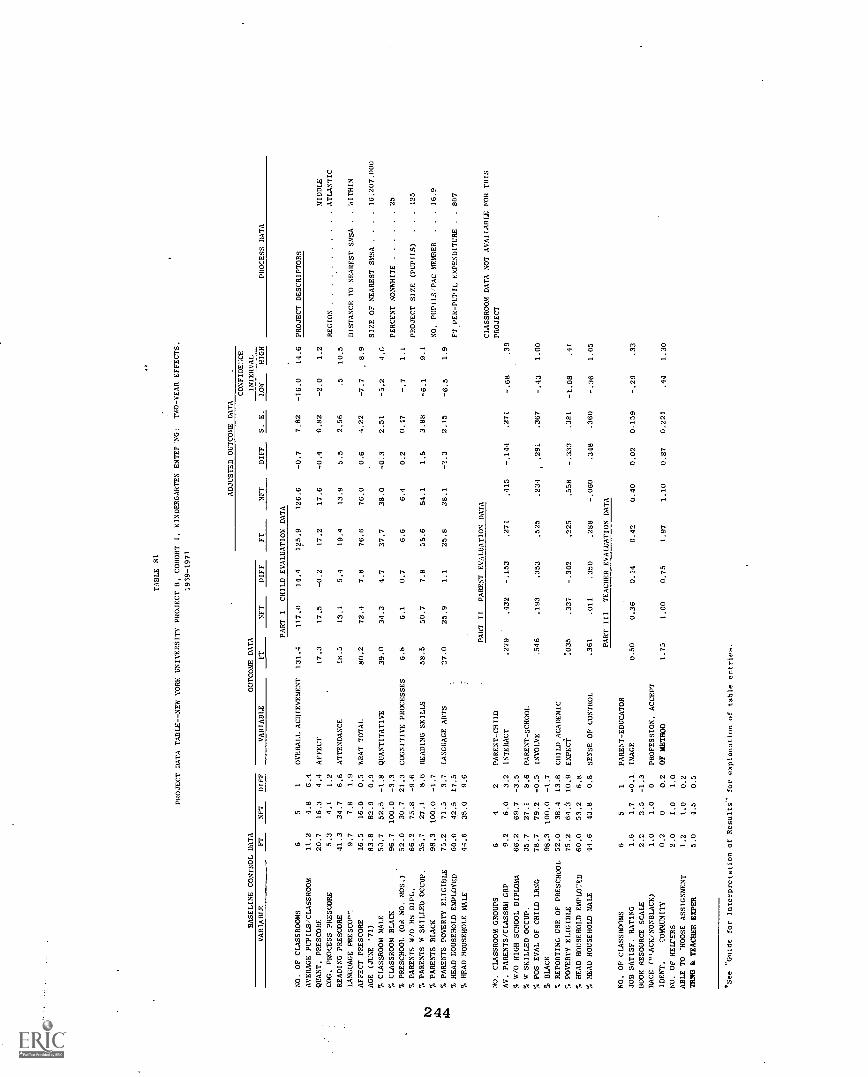
BASELINE CONTROL DATA
TABLE 81
PROJECT DATA TABLE--NEW YORK UNIVERSITY PROJECT B, COHORT I, KINDERGARTEN ENTEP 'NG:
TWO-YEAR EFFECTS,
1959-1971
OUTCOME DATA
ADJUSTED OUTCOME DATA
CONFIDECE
INTERVAL
VARIABLE
FT
NFT
D1FF
VARIABLE
FT
NFT
DIFF
FT
NFT
DIFF
S. E.
LOW
HIGH
PROCESS DATA
PART I
CHILD EVALUATION DATA
NO, OF CLASSROOMS
65
1OVERALL ACHIEVEMENT
131.4
117.0
14.4
125.9
126.6
-0.7
7.82
-16.0
14.6
PROJECT DESCRIPTORS
AVERAGE PUPILS/CLASSROOM
11.2
4.8
6.4
QUART. PRESCORE
20.7
16.3
4.4
AFFECT
17.3
17.5
-0.2
17.2
17.6
-0.4
0.82
-2.0
1.2
MIDDLE
COG. PROCESS PRESCORE
5.3
4.1
1.2
REGION
ATLANTIC
READING PRESCORE
41.3
34.7
6.6
ATTENDANCE
18.5
13.1
5.4
19.4
13.9
5.5
2.56
.5
10.5
LANGUAGE pREsco.n
9.7
7.8
1.9
DISTANCE TO NEAREST SMSA
.WITHIN
AFFECT PRESCORE
16.5
16.0
0.5
WRAT TOTAL
80.2
72.4
7.8
76.6
76.0
0.6
4.22
-7.7
8.9
AGE (JUNE '71)
83.8
82.9
0.9
SIZE OF NEAREST SMSA
.16,207.000
% CLASSROOM MALE
53,7
52.5
-1.8
QUANTITATIVE
39.0
34.3
4.7
37.7
38.0
-0.3
2.51
-5.2
4.G
% CLASSROOM BLACK
96.7
100.0
-3.3
PERCENT NONWHITE
25
% PRESCHOOL (OR NO. MOS.)
52.0
30.7
21.3
COGNITIVE PROCESSES
6.8
6.1
0.7
6.6
6.4
0.2
0.47
1.1
% PARENTS W/O 118 DIPL.
66.2
75.8
-9.6
PROJECT SIZE (PUPILS)
125
% PARENTS N SKILLED OCCUP.
35.7
27.1
8.6
READING SKILLS
58.5
50.7
7.8
55.6
54.1
1.5
3.88
-6,1
9.1
% PARENTS BLACK
98.3
100.0
-1.7
NO. PUPILS-PAC MEMBER
16.9
% PARENTS POVERTY ELIGIBLE
75.2
71.5
3.7
LANGUAGE ARTS
27.0
25.9
1.1
25.8
28.1
-2.3
2.15
-6.5
1.9
% HEAD GOUSEHOLD EMPLOYED
60.0
42.5
17.5
FT PER-PUPIL EXPENDITURE
.807
% HEAD HOUSEHOLE MALE
44.6
35.0
9.6
PART
II
PARENT EVALUATION DATA
CLASSROOM DATA NOT AVAILABLE FOR THIS
NO. CLASSROOM GROUPS
64
2PARENT-CHILD
PROJECT
AV. PARENTS/CIASSRM GRP
9.2
6.0
3.2
INTERACT
.279
.432
-.153
,271
.415
-.144
.271
-.68
.39
% W/O HIGH SCHOOL DIPLOMA
66.2
69.7
-3.5
% W SKILLED OCCUP.
35.7
27.1
8.6
PARENT-SCHOOL
% POS EVAL OF CHILD LRNG
78.7
79.2
-0.5
INVOLVE
.546
.193
.353
.525
.234
,291
.367
-.43
1.00
% BLACK
98.3
100.0
-1.7
% REPORTING USE OF PRESCHOOL
52.0
38.4
13.6
CHILD ACADEMIC
% POVERTY ELIGIBLE
75.2
64.3
10.9
EXPECT
:035
.337
-.302
.225
.558
-.333
.381
-1.08
.41
% HEAD HOUSEHOLD EMPLO7ED
60.0
53.2
6.8
% HEAD HOUSEHOLD MALE
44.6
43.8
0.8
SENSE OF CONTROL
.361
.011
.350
.288
-.060
.348
.360
-.36
1.05
PART
III
TEACHER EVALUATION DATA
NO. OF CLASSROOMS
65
1PARENT-EDUCATOR
JOB SATISF. RATING
1.6
1.7
-0.1
IMAGE
0.50
0.36
0.14
0.42
0.40
0.02
0.159
-.29
.33
BOOK RESOURCE SCALE
2.2
3.5
-1.3
RACE (.IACK/NONBLACK)
1.0
1.0
0PROFESSION. ACCEPT
IDENT.
COMMUNITY
0.2
00.2
OF METHOD
1.75
1.00
0.75
1.97
1.10
0,87
0.221
.44
1.30
NO. OF HELPERS
2.0
1.0
1.0
ABLE TO 7HOOSE ASSIGNMENT
1.2
1.0
0.2
TRNG & TEACHER EXPER
5.0
4.5
0.5
*See "Guide for Interpretation of Results
for explanation of table entries.
Curricular Approach
Teacher's role that of facilitator
Reinforcement primarily from activities
Combines programmed instruction elements with central use of games
Teacher demonstrates games, then gradually withdpws, encouragingchildren to direct their own learning
Stresses small group interaction of children
Type of Parent Involvment
Encourages parents to participate in the classroom
Provides home visits and workshops so that parents can learn
instructional games and play them at home with children
Since Cohort II evidence is based on a single project, summary analysis
data are reported only for the Cohort I samples for this sponsor. These
results, as presented in Table 82 show significant differences on quanti-
tative skills, parent/school involvement, parent sense of control, and
teacher acceptance of the method. The pupil achievement outcome is con-sistent with the model's emphasis on the development of problem-solving
ability, but there is no evidence indicating attainment of the language
objectives.
We interpret these Cohort I and Cohort II results for this project
as noncontradictory and, perhaps, even compatible. It is wholly possible
that the bases for academic and social growth are being developed during
the first year od.' two, and that, consistent with the goals of the model,
large performance differences would be expected to accrue only in advanced
primary grades.
The parent result is consistent with the model's emphasis on parent
participation in the classroom. The teacher approval outcome does suggest
that the model is viable and, presumably, fairly well implemented )n the
projects studied. Overall, these results are favorable, and we interpret
them as positive evidence that the approach is meeting many of its ob-
jectives. The difficulty with this interpretation is that it is based on
evidence from only two projects in the Cohort I-K sample and, hence, cannot
be considered conclusive at this point in the evaluation.
245
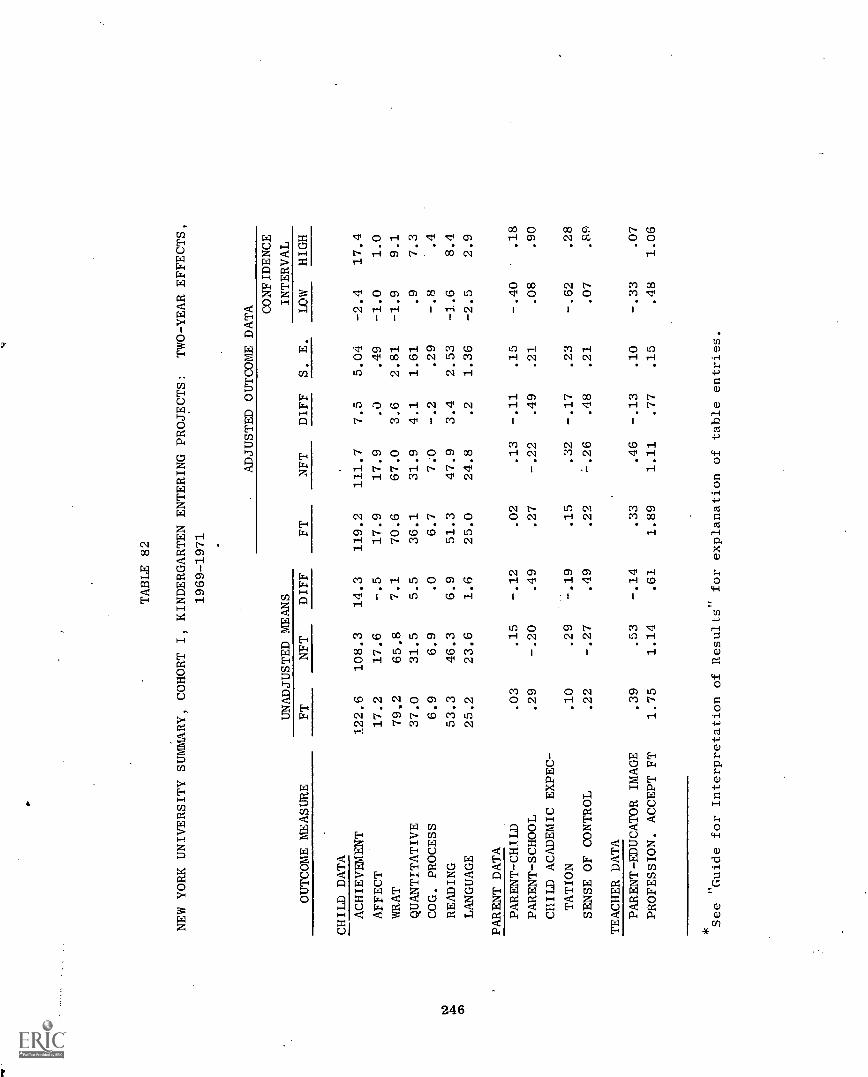
,P.
TABLE 82
NEW YORK UNIVERSITY SUMMARY, COHORT I, KINDERGARTEN ENTERING PROJECTS:
TWO-YEAR EFFECTS,
1969-1971
ADJUSTED OUTCOME DATA
OUTCOME MEASURE
UNADJUSTED MEANS
FT
NFT
DIFF
S. E.
CONFIDENCE
INTERVAL
FT
NFT
DIFF
LOW
HIGH
CHILD DATA
ACHIEVEMENT
122.6
108.3
14.3
119.2
111.7
7.5
5.04
-2.4
17.4
AFFECT
17.2
17.6
-.5
17.9
17.9
.0
.49
-1.0
1.0
WRAT
79,2
65.8
7.1
70.6
67.0
3.6
2.81
-1.9
9.1
QUANTITATIVE
37.0
31.5
5.5
36.1
31.9
4.1
1.61
.9
7.3
COG. PROCESS
6.9
6.9
.0
6.7
7.0
-.2
.29
-.8
.4
READING
53.3
46.3
6.9
51.3
47.9
3.4
2.53
-1.6
8.4
LANGUAGE
25.2
23.6
1.6
25.0
24.8
.2
1.36
-2.5
2.9
PARENT DATA
PARENT-CHILD
.03
.15
-.12
.02
.13
-.11
.15
-.40
'
.18
PARENT-SCHOOL
.29
-.20
.49
.27
-.22
.49
.21
.08
.90
CHILD ACADEMIC EXPEC-
TATION
.10
.29
-.19
.15
.32
-.17
.23
-.62
.28
SENSE OF CONTROL
.22
-.27
.49
.22
-.26
.48
.21
.07
.89
TEACHER DATA
PARENT-EDUCATOR IMAGE
.39
.53
-.14
.33
.46
-.13
.10
-.33
.07
PROFESSION. ACCEPT FT
1.75
1.14
.61
1.89
1.11
.77
.15
.48
1.06
ItSee
Guide for Interpretation of Results
for explanation of table entries.

LANGUAGE DEVELOPMENT (BILINGUAL) APPROACH
Southwest Educational Development Laboratory
Sponsor's Intended Approach
The Southwest Educational Development Laboratory model is a bilingual
approach first developed for classrooms in which 75 percent of the pupils
are Spanish-speaking, but it can be adapted by local school staffs for
other population mixes. In all cases the model emphasizes language as
the main tool for dealing with environment, expressing feelings, and ac-quiring skills, including nonlinguistic skills. Pride in cultural back-
ground, facility and literacy in both the native language and English,
and a high frequency of "success" experiences are all central objectives.
The theory applied by the model is that learning in a second language
is easier and more effective if the child first learns concepts in his
native language. Step-by-step sequential procedures are followed in teach-
ing language patterns, and both teaching techniques and materials are de-
signed to develop a hierarchy of thinking processes, specific terminology,
and symbols. Drills, games, and exercises are used to overcome individual
linguistic problems.
Focusing on content in teaching language, all clasSroom activities
reinforce language development. The Kindergarten program concentrates on
the following skill areas: visual, auditory, motor, thinking and reasoning,
discovering and exploring, and English language structures. Oral com-
munication precedes reading and writing in the First and Second Grades.
The responsibility for instruction is on the teacher rather than on spec-ified texts. The Third Grade component of the model serves as a transi-
tion, guiding the teacher to adapt standard curricula to the unique needs
of the bilingual children, thus preparing them to function effectively in
a traditional Fourth Grade.
The model stresses a high degree of adult-child contact. Teachersand aides are constant language models, assuring the child he can succeed
and reinforcing him with recognition and praise. Kindergarten classesare usually divided into three or four groups, with the teacher and aideworking with one group while the other groups work independently. Allgroups cover the same material, but those progressing more rapidly aregiven expanded materials. In the First and Second Grade classes, the
247

teacher presents a lesson to the whole group with visual aids and books,
and then the children work in small groups or as individuals with enrich-
ment materials based on the lesson.
Optimal staffing includes a bilingual teacher skilled in the method-
ology of second-language teaching and a bilingual aide in each classroom.
Staff development coordination and evaluation activities are also required
of local project staff. Staff development aimed at continuous professionaJ
development of district teachers and administrators is a supporting com-
ponent of the model. Summer training workshops for local Staff Develop-
ment Coordinators result in ongoing training and assistance at the project
site. The Southwest Educational Development Laboratory has designed a
series of training modules that include manuals, video tapes, and film-
strips to help teachers implement curriculum materials in a way consis-
tent with the cultural and linguistic needs of the child.
The model seeks to accelerate the child's success at school by en-
couraging a positive expectation of achievement in the parent, and parents
are invited to take part in classroom activities. Parent involvement is
regarded as essential, and special materials are available fox the parent
to use at home to reinforce the child's Kindergarten experience.
During the past three years, the model has been modified and improved
on the basis of pupil progress reports, teacher feedback, and other forma-
tive evaluation data.
Individual Project Results
Only one project sample for Southwest Educational Development Labora-
tory (SW) was included in the interim analysis data base. Two-year effects
data for this Cohort I project are summarized in Table 83. This moder-
ately large project (854 pupils) is in a large mid-Atlantic urban region
(SMSA = 4,021,000). The anticipated per-pupil FT expenditure for this
project of $752 is slightly below the overall average, and the pupil/PAC
ratio of about 18 to 1 is near average.
Comparison of the eight FT and four NFT classes included in this pro-
ject analysis shows that the grcups lack comparability on baseline scores,
ethnic composition, preschool experience for the classrooms, and mostparent-level variables. FT pupils averaged substantially below NFT pupils
on cognitive process, reading, and language measures. NFT classrooms had
higher proportions of Black pupils and lower proportions of preschool ex-perienced pupils. The, general pattern of greater disadvantage for FT
families also prevailed in this project sample. Indeed, the particular
248
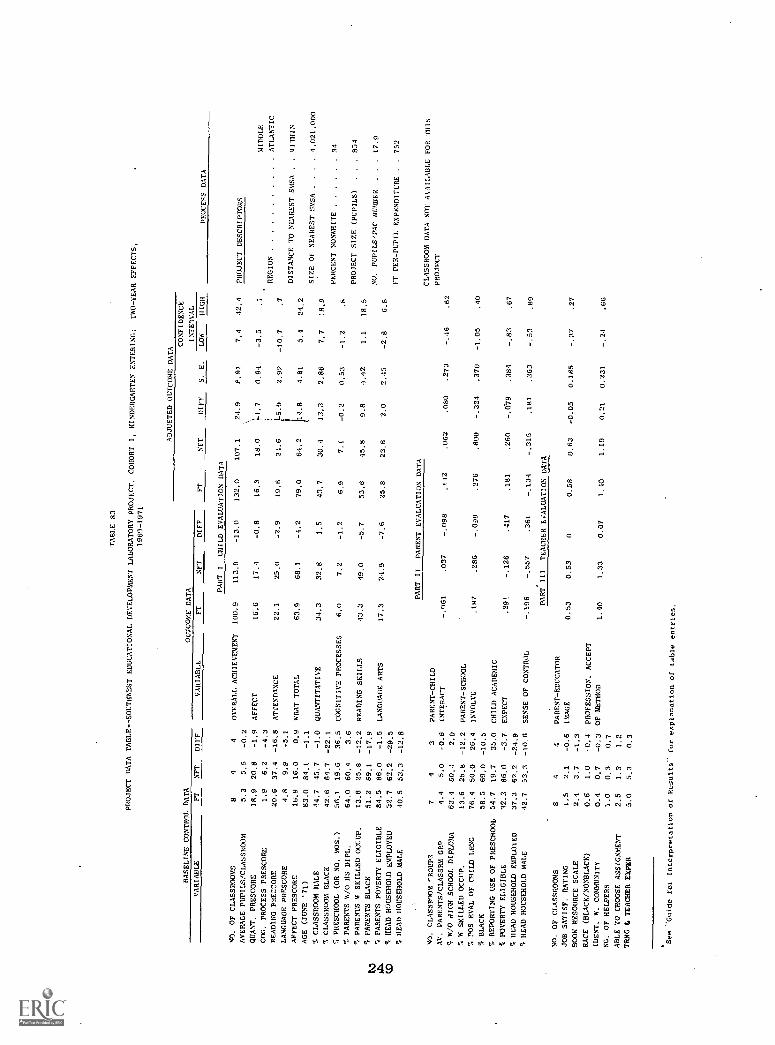
TABLE 83
PROJECT DATA TABLE -- SOUTHWEST EDUCATIONAL DEVELOPMENT LABORATORY PROJECT, COHORTI, KINDERGARTEN ENTERING:
TWO-YEAR EFFECTS,
1969-1971
BASELINE CONTROL DATA
OUTCOME DATA
ADJUSTED OUTCOME DATA
CONFIDENCE
INTERVAL
VARIABLE
FT
NFT
DIFF
VARIABLE
FT
NFT
DIFF
FT
NFT
DIFF
S.
E.
LON'
HIGH
PROCESS DATA
PART I
CHILD EVALUATION DATA
NO, OF CLASSROOMS
84
4OVERALL. ACHIEVEMENT
100,9
113.9
-13.0
132,0
107.1
24.9
8.91
7,4
42.4
PROJECT DESCRIPTORS
OVERAGE PUPILS/CLASSROOM
5.3
5.5
-0.2
QUANT. PRESCORE
18.9
20.8
-1.9
AFFECT
16.6
17.4
-0.8
16.3
18.0
0,7
0,94
-2.5
.1
MIDDLE
COG, PROCESS PRESCORE
1.9
6.2
-4.3
REGION
ATLANTIC
READING PRE= ORE
20.6
37.4
-16,8
ATTENDANCE
22.1
25.0
-2.9
19.6
2.1.6
1-5.0
2.92
-10.7
,7
LANGUAGE PRESCORE
4.8
9,9
-5.1
DISTANCE TO NEAREST SHIA
,WITHIN
AFFECT PRESCORE
16.9
16.0
0,9
NEAT TOTAL
63.9
68.1
-4.2
79.0
64,2
4.8
4.81
5,4
24,2
AGE (JUNE '71)
83.0
84.1
-1.1
SIZE OF NEAREST SMSA
..
.4,021.000
% CLASSROOM MALE
44,7
45.7
-1.0
QUANTITATIVE
34,3
32.8
1,5
43,7
30.4
13,3
2.86
7,7
18.9
CLASSROOM BLACK
42.6
64.7
-22,1
PERCENT NONWHITE
34
PRESCHOOL (OR NO. MOS.)
56.1
19,6
26.5
COGNITIVE PROCESSES
6.0
7.2
-1.2
6,9
7.1
0.53
-1.2
.8
% PARENTS W/O HS DIPL.
64.0
60.4
3,6
PROJECT SIZE (PUPILS)
..
854
PARENTS W SKILLED OCCUP.
13.6
25,8
-12,2
READING SKILLS
43.3
49.0
-5.7
55,6
15.8
9.8
4.42
1.1
18.5
1. PARENTS BLACK
51.2
69.1
-17,9
NO. PUPILS/PAC MEMBER
..
17.9
ti PARENTS POVERTY ELIGIBLE
84.5
86.0
-1.5
LANGUAGE ARTS
17.3
24.9
-7.6
25,8
23.8
2.0
2.45
-2.6
6.8
HEAD HOUSEHOLD EMPLOYED
32,7
62.2
-29.5
FT PER-PUPIL EXPENDITURE
.752
q. HEAD HOUSEHOLD MALE
40.5
53,3
-12.8
PART
IF
PARENT EVALUATION DATA
CLASSROOM DATA NOT AVAILABLE FOR THIS
MO. CLASSROOM rROUPS
71
3PARENT-CHILD
PROJECT
AV. PARENTS/CLASSRM GR,
8/0 dIGH SCHOOL DIPLOMA
1.4
62.4
5,0
60.4
-0.6
2.0
INTERACT
-.061
.037
-.098
.142
.062
.080
.273
.62
W SKILLED OCCUP.
13.6
25.8
-12.2
PARENT-SCHOOL
NOS EVAL OF CHILD LRNG
76.4
50.0
26.4
INVOLVE
.187
.286
-.059
.276
.600
-.324
.370
-1,05
.40
% BLACK
58.5
69.0
-10.5
REPORTING USE OF PRESCHOOL
54.7
19.7
35,0
CHILD ACADEMIC
% POVERTY ELIGIBLE
32.3
86.0
-3.7
EXPECT
.29?
-.126
.417
.181
.260
-.079
.284
-.83
.67
% HEAD HOUSEHOLD EMPLOYED
37.3
62.2
-24.9
7i HEAD HOUSEHOLD MALE
42,7
53.3
-10.6
SENSE OF CONTROL
-.196
-.557
.361
-.134
-.315
.181
.363
-.53
.89
PART
III
TEACHER
DATA
NO, OF CLASSROOMS
84
4PARENT-EDUCATOR
JOB SAT1SF. RATING
1.5
2.1
-0.6
IMAGE
0.53
0.53
00.58
0.63
-0.05
0.165
-.37
.27
BOOK RESOURCE SCALE
2.4
3,7
-1.3
RACE (BLACK/NONBLACK)
0.6
1.0
-0.4
PROFESSION. ACCEPT
'DENT. W. COMMUNITY
0.4
0,7
-0.3
OF METHOD
1.40
1.33
0.07
1.40
1.19
0.21
0.231
.66
NG, OF HELPERS
1.0
0.3
0.7
ABLE TO CHOOSE ASSIGNMENT
2.5
1.3
1.2
TRNG & TEACHER EXFER
5.0
5.2
0.3
*See "Guide fol
Interpretation of Results" for explanation of table entries.

values for these parent variables (low income, education, and or:cupational
levels, and high proportions of unemployed and female heads of household)
indicate that the sample included a large number of broken or father-
absent homes. Nevertheless, these FT families rate their child's progress
substantially more favorably than do NFT families.
Comparison of means for teacher variables show the FT teachers re-
ported fewer book resources but more helpers, and they apparently had
greater freedom to choose assignments than did NFT teachers. The groups
were moderately well matched on the training and experience scale.
Results of analysis of pupil outcomes show significant FT-favoring
differences on overall achievement and the WRAT total score. The .95 con-
fidence intervals were 7.4 to 42.4 and 5.4 to 24.2 points, respectively.
The specific academic. areas where these differences appear concentrated
are quantitative and reading skills. Neither parent nor teacher program
effects reached significance, and since this project was not included in
the classroom observation sample, process data are not available to aidin interpreting these results.
Summary
The salient features of the Southwest Educational Development Labora-
tory (SW) model are summarized as follows:
Focus and Objectives--emphasizes intermediate program objectives
Child
Cognitive
Develop bilingual competence
Affective
Increase self-expression
Develop positive expectation of success
Curricular Apprcach
Teacher's role that of facilitator
Teachers offer reinforcement and do so frequently with recog-
nition and praise
Small group focus
Programmed materials used
Emphasis on high degree of adult-child contact
Type of Parent Involvement
Urge parents to have expectation 'of success (achievement)
for child
Parents participate in classroom activities
Provide special materials for parent use.
250

These objectives and methods characterize the approach as nontradi-
tional, yet, interestingly enough, the significant results in favor of
the model's effectiveness in the single project evaluated are in tradi-
tional academic areas of reading and mathematics achievement. There is
no independent eviqence that the model was implemented as planned, but
the model's emphasis on th,=, use of programmed materials, teacher rein-
forcement, small group insLruction and high adult-child interactions
appears effective in promoting positive academic growth with these inner-
city poor children. On the other hand, these results show that the model's
emphasis on parental enthusiasm and involvement appears not to have met
with success in this project. Moreover, noncognitive objectives involv-
ing development of attitudes and aspirations within the children are not
evident in these data. One could further argue that teachers do not
exhibit strong preferences for this approach. They also do not reflect
a particularly positive image of the parents' role in extramural educa-
tional activities, as evidenced by the responses to teacher questionnaire
variables. This last finding may, in part, be due to the relatively low
number of helpers and resources in this project.
Since all the above inferences are based on data from a single sample
within a single project, we feel no conclusions can be justified at this
time. At best, the model as implemented in this sample project seems to
be producing positive achievement gains for pupilS.
2 5 1 / 2,5 2,
r,
4c2

SELF-SPONSORED AND PARENT-IMPLEMENTED PROJECTS
Sponsor's Intended Approach
Six of the early group of pilot projects that preceded the planned
variation phase of Follow Through elected to remain unsponsored. They
were the only projects included in this evaluation given this option.
They are classified as "self-sponsored" or "parent-implemented" models
and have instituted programs that they themselves have developed. Since
a variety of different models exist, it is inappropriate to analyze these
projects at the sponsor level. Therefore, only project results are pre-
sented. Even at this level, interpretation is complicated by a lack of
stated objectives. Where significant results have occurred, there is no
way to determine whether they are desired results.
Individual Project Results
Twelve samples from six different self-sponsored (SS) or parent-
implemented (PI) projects were included in the analysis of interim effects.
Of these, five are self-sponsored, and one is parent-implemented. The
distribution of these evaluation samples in terms of cohort, outcome,
and project is as follows:
Cohort 1st -year Effects 2nd-year Effects
IK (projects b, c, d, e, and PI) (projects b, c, d, e, and PI)
IE (project a) (project a)
Project SS(a)
Located within an SMSA of 1.2 million people in the south Atlantic
region, Project SS(a) is predominantly white and_slightly larger than
average. The anticipated FT per-pupil expenditure of $732 is slightly
below average, and the pupil/PAC ratio was 27.8 to one. As is the case
with all other self-sponsored projects, classroom observation data were
not collected.
253
Table 84 presents the two-year impact data and results for Project
SS(a), Cohort I-EF. These results are based on five FT and sixteen NFT
classrooms. Although FT and NFT pupils had comparable scores on baseline
tests, the large difference in the number of classrooms of each type crcates
a poor base for comparison. More significantly, the NFT classes were
predominantly Black, while FT classes were predominantly non-Black. Also,
NFT classes had a higher proportion of boys, and more FT pupils had hasi
preschool experience.
FT and NFT families were more comparable on some socioeconomic vari-
ables. Both FT and NFT parents showed low educational attainment, employ-
ment in unskilled occupations, high percentages of poverty eligibility,
and high percentages 01 male heads of household. Nevertheless, more NFT
parents were employed in skilled occupations than were FT parents, and
more NFT heads of household were employed. Both groups responded favor-
ably to the child's academic progress in nearly equal proportions. As
noted in the child sample discrepancies, preschool and ethnicity variables
differed greatly. FT parents were predominantly white and reported more
preschool for their children. Conversely, NFT parents were predominantly
Black and reported less preschool. Investigations revealed that the FT
families were primarily Spanish speaking (likely Cubans or Puerto Ricans),
indicating an additional cultural bias between the two subgroups. How-
ever, these differences do not appear to have affected the language per-
formance of the children, since the two groups are nearly equal on langu-
age prescore averages.
FT and NFT teachers (four FT, two NFT) were nearly equivalent on
Arariables such as job satisfaction, resources (books and helpers), and
experience. However, more FT teachers were Black, fewer lived within
the school community, and fewer were allowed to choose their assignments
than NFT teachers.
Analysis of covariance on child level outcomes showed a significant
difference only for the quantitative meas,Jre. The confidence interval
indicates a 95 percent probability that the true difference is somewhere
between 1.2 and 13.2 units in favor of FT pupils. Alt :Jugh other measures
teni to favor FT, none of the differences are significant.
Parent variables indicate a trend that favors the FT group. Differ-
ences on the parent/child and parent/school interaction variables reach
significance (95 percent confidence interval = .14-1.31 and .23-1.43
respectively). In light of the high number of pupils (27.8) per PAC
member, such results are interesting.
254
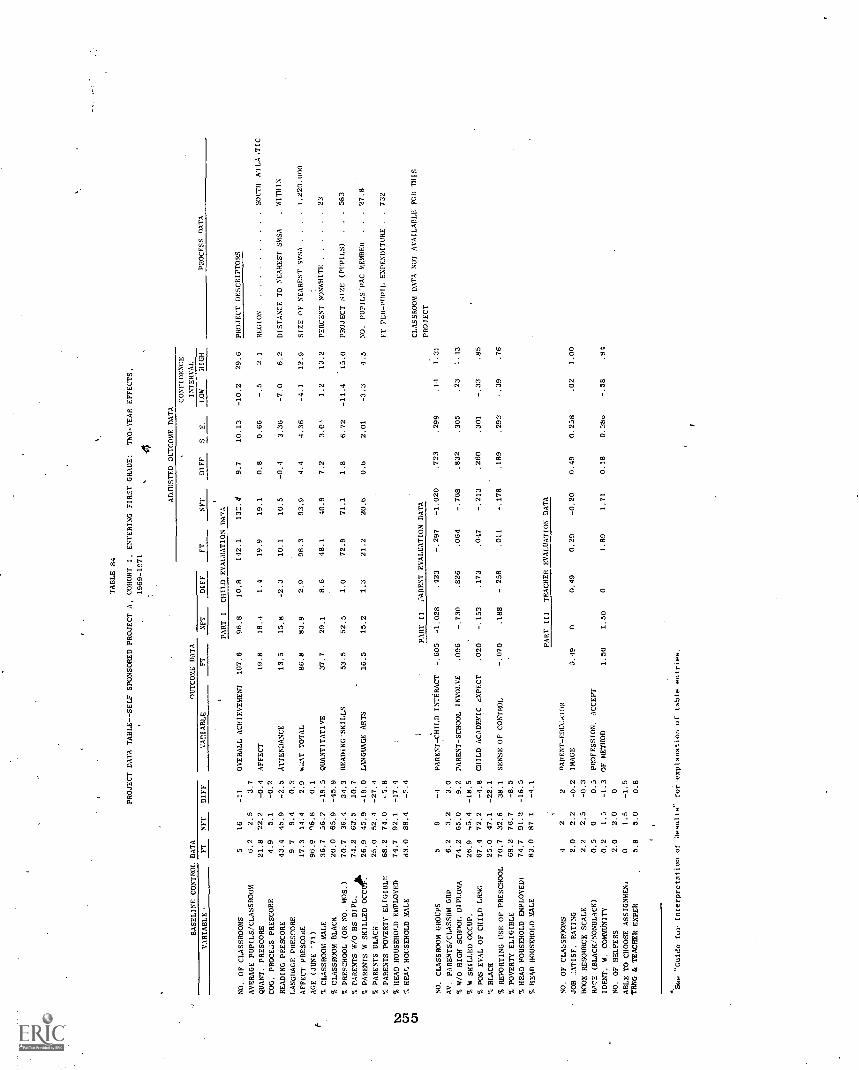
TABLE 84
PROJECT DATA TABLE - -SELF SPONSORED PROJECT A, COHORT 1, ENTERING FIRST GRADE:
TWO-YEAR EFFECTS,
1969 -1f71
4ADJUSTED OUTCOME DATA
CONFIDENCE
BASELINE CONTROL DATA
OUTCOME DATA
INTERVAL
VARIABLE.
FT
NFT
DIFF
VARIABLE
FT
NFT
DIFF
FT
NET
DIFF
SE.
LOW
HIGH
PROCESS DATA
PART I
CHILD EVALUATION nATA
NO, OF CLASSROOMS
516
-11
OVERALL ACHIEVEMENT
107.6
96.8
10.8
142,1
13ZA
9.7
10.13
-10.2
29.6
PROJECT DESCRIPTORS
AVERAGE PUPILS/CLASSROOM
6.2
2.5
3.7
QUART. PRESCORE
21.8
22.2
-0.4
AFFECT
19.8
18.4
1.4
19.9
19.1
0.8
0.66
2.1
REGION
SOUTH ATLA,TIc
COG. PROCE..;S PRESCORE
4.9
5.1
-0.2
READING PRESCORE
43.4
45.9
-2.5
ATTENDANCE
13.5
15.8
-2.3
10.1
10.5
-0.4
3,36
-7.0
6.2
DISTANCE TO NEAREST SMSA
.WITHIN
LANGUAGE PRESCORE
9.7
9.4
0.3
AFFECT PRESCORE
17.3
14.4
2.9
HZAT TOTAL
86.8
83.9
2.9
98.3
93.9
4.4
4,36
-4.1
12.9
SIZE OF NEAREST SMSA
..
..
1,220.000
AGE (JUNE '71)
96.9
96.8
0.1
% CLASSROOM MALE
36.7
56.2
-19.5
QUANTITATIVE
37.7
29.1
8.6
48,1
40.9
7.2
3.0'
1.2
13.2
PERCENT NOSWHITF
23
% CLASSROOM BLACK
20.0
65.9
-45.9
-
% PRESCHOOL (OR NO. MOS.)
70.7
36.4
34,3
READING-SKILLS
53.5
52.5
1.0
72.9
71.1
1.8
6.72
-11.4
15.0
PROJECT STZE (PUPILS)
..
.583
% PARENTS W/O HS DIPL.
74.2
63.5
10.7
% PARENTS W SKILLED
OCC100,
26.9
45.9
-19.0
LANGUAGE ARTS
16.5
15.2
1.3
21.2
20.6
0.6
2.01
-3.3
4.5
NO. PUPILS/PAC MEMBER
..
.27.8
% PARENTS BLAC
25,0
52.4
-27.4
% PARENTS POVERTY ELIGIBLE
68.2
74.0
5.8
FT PER-PUPIL EXPENDITURE
,.732
% HEAD HOUSEHOLD EMPLOYED
74.7
92.1
-17.4
% HEAL HOUSEHOLD MALE
d3.0
88.4
-5.4
1PART
II
1-ARENT EVALUATION DATA
CLASSROOM DATA NOT AVAILABLE FOR 11IIS
PROJECT
-.605
-1.028
.423
-.297
-1.020
NO, CLASSROOM GROUPS
59
-4
PARENT -CHILD INTERACT
.723
.299
.14
1.31
AV, PARENTS/CLASSRM GRP
6.2
3.2
3.0
% W/O HIGH SCHOOL. DIPLOMA
74.2
65.0
9.2
PARENT-SCHOOL INVOLVE
,096
-.730
.826
.064
-.768
.832
.305
.23
1.43
% W SKILLED OCCUP.
26,9
45.4
-18.5
% POS EVAL OF CHILD LRNG
67.4
72.2
-4,8
CHILD ACADEMIC HXPECT
.020
-.153
.173
.047
-.213
.260
.301
-.33
.85
% BLACK
25.0
47.1
-22.1
% REPORTING USE OF PRESCHOOL
70.7
32.6
38.1
SENSE OF CONTROL
-.070
.188
- 258
.011
-.178
.189
.293
-.39
.76
% POVERTY ELIGIBLE
68.2
76.7
-8.5
% HEAD HOUSEHOLD EMPLOYEDI
74,7
91.2
-16.5
% HEAD HOUSEHOLD MALE
83.0
87 1
-4.1
PART III
TEACHER EVALUATION DATA
NO, OF CLASSROOMS
42
2.ARENT-EDUCslOR
JOB JATISF. RATING
2.0
2.2
-0.2
IMAGE
0.49
00.49
0.29
-0.20
0.49
0.258
-.02
1.00
BOOK RESOURCE SCALE
2.2
2.5
-0.3
RACE (BLACK/NONBLACK)
0.5
00,5
PROFESSION. ACCEPT
IDENT. W. COMMINITY
0.2
1.5
-1.3
OF METHOD
1.50
1.50
01.89
1.71
0.18
0.315o
-.58
.94
NO, OF HELPERS
2.0
2.0
0
ABLE TO CHOOSE ASSIGNMENT
01.5
-1.5
TRNG & TEACHER EXPER
5.8
5.0
0.8
See "Guide for Interpretation of Results" for explanation of table entries.

Neither teacher result reached significance on this project. Since
no classroom observation data are available, little can be stated beyond
the previously noted control variable pattern at the teacher level. FT
teachers scored higher than NFT teachers on both measures. The difference
approaches, but does not reach, significance on the parent image variable.
Without knowing the specific objectives of the model, we can only
note that two years of implementation show gain feu. the Follow Through
group in child quantitative ability and parent interactions with the
child and the school. Such results show that the FT program had some
impact. Additional information is needed if this impact is to be further
assessed.
The results of the analysis of first-year effects on children in
Cohort I-EF are summarized in Table 85. Comparison of the first- and
second-year results shows that 'he FT pupils did make greater gains in
Spring, 1971, than in Spring, 1970. All differences favored FT in Spring,
1971, while most differences favored NFT in Spring 1970 (although no
Spring 1970 difference reached significance).
Project SS(b)
Project SS(b) is of moderate size and is located within a large urban
area in the east north central regien. The anticipated FT per-p.pil
expenditure of $1,183 is well above average, and the project had a lower
than average number of pupils (11.4) per PAC member.
Table 86 summarizes the two-year impact- data and results for Project
SS(b), Cohort I-K. These results are based on four Fl and nine NFT class-
rooms. Aside from a slightly higher proportion of males in the FT child
sample and a much higher proportion of FT preschool experience (100 percent),
the samples represeu' a good FT/NFT match. 11.seline test measures are
nearly equivalent, z.nd children in both groups were predominantly Black.
Values on parent and teacher control variables also suggest a reason-
ably good FT/NFT match for this project. Pare.it samples are fairly com-
parable on percentage with high school diplomas (low), percentage with
skilled occupations (low), percentage who were poverty eligibile (high),
and percentage with head of household employed (low). The parents were
predominantly Black, and most households did not have male heads. Few dif-
ferences between the two groups of teachers are evident. The FT teachers
did have more book resources- and were less integrated into their pupils'
communities than NFT teachers.
256
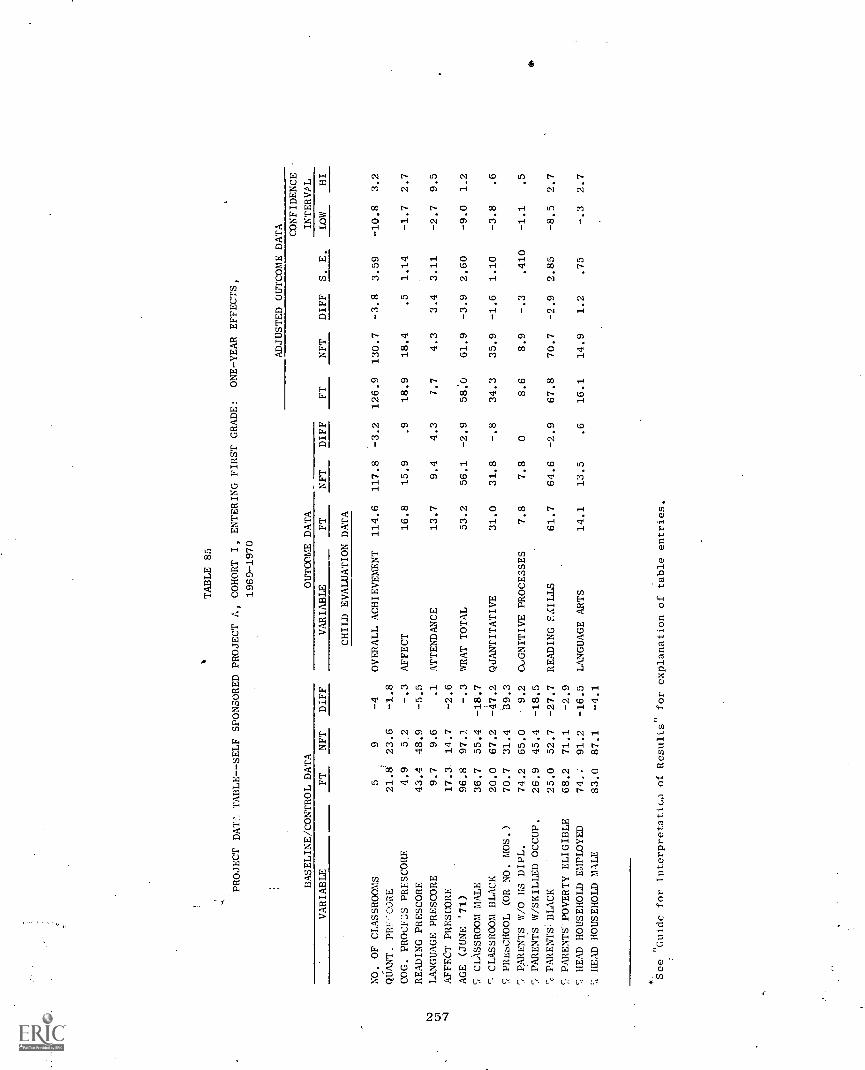
TABLE 85
PROJECT DKr. TABLE--SELF SPONSORED PROJECT A, COHORT I, ENTERING FIRST GRADE:
ONE-YEAR EFFECTS,
1969-1970
ADJUSTED OUTCOME DATA CONFIDENCE
BASELINE/CONTROL DATA
OUTCOME DATA
INTERVAL
VARIABLE
FT
NFT
DIFF
VARIABLE
FT
NFT
DIFF
FT
NFT
DIFF
S. E.
LOW
HI
CHILD EVALUATION DATA
NO. OF CLASSROOMS
59
-4
OVERALL ACHIEVEMENT
114.6
117.8
-3.2
126.9
130.7
-3.8
3.59
-10.8
3.2
QUANT. PRI -cc.IE
21.8
23.6
-1.8
COG. PROCESS PRESCORE
4.9
5.2
-.3
AFFECT
16.8
15.9
.9
18.9
18.4
.5
1.14
-1.7
2.7
READING PRESCORE
43.4
48.9
-5.5
N Co
LANGUAGE PRESCORE
9.7
9.6
.1
ATTENDANCE
13.7
9.4
4.3
7.7
4.3
3.4
3.11
-2.7
9.5
-4
AFFECT PRESCORE
17.3.
14.7
-2.6
AGE (JUNE '71)
96.8
97.1
-.3
WRAT TOTAL
53.2
56.1
-2.9
58.0
61.9
-3.9
2.60
-9.0
1,2
CLASSROOM MALE
36.7
55.4
-18.7
'-- CLASSROOM BLACK
20.0
67.2
-47.2
QUANTITATIVE
31.0
31.8
-.8
34.3
35.9
-1.6
1.10
-3.8
.6
PRESCHOOL (OR NO. MOS.)
70.7
31.4
39.3
'-.PARENTS W/O HS DIPL.
74.2
65.0
9.2
CvGNITIVE PROCESSES
7.8
7.8
08.6
8.9
-.3
.410
-1.1
.5
PARENTS W/SKILLED OCCUP.
26.9
45.4
-18.5
`, PARENTS BLACK
25.0
52.7
-27.7
READING F,tILIS
61.7
64.6
-2.9
67.8
70.7
-2.9
2.85
-8.5
2.7
PARENTS POVERTY ELIGIBLE
68.2
71.1
-2.9
HEAD HOUSEHOLD EMPLOYED
74..
91.2
-16.5
LANGUAGE ARTS
14.1
13.5
.6
16.1
14.9
1.2
.75
-.3
2.7
`; HEAD HOUSEHOLD MALE
83.0
87.1
-4.1
*
See
Guide for Interpretatiw of Results" for explanation of table entries.
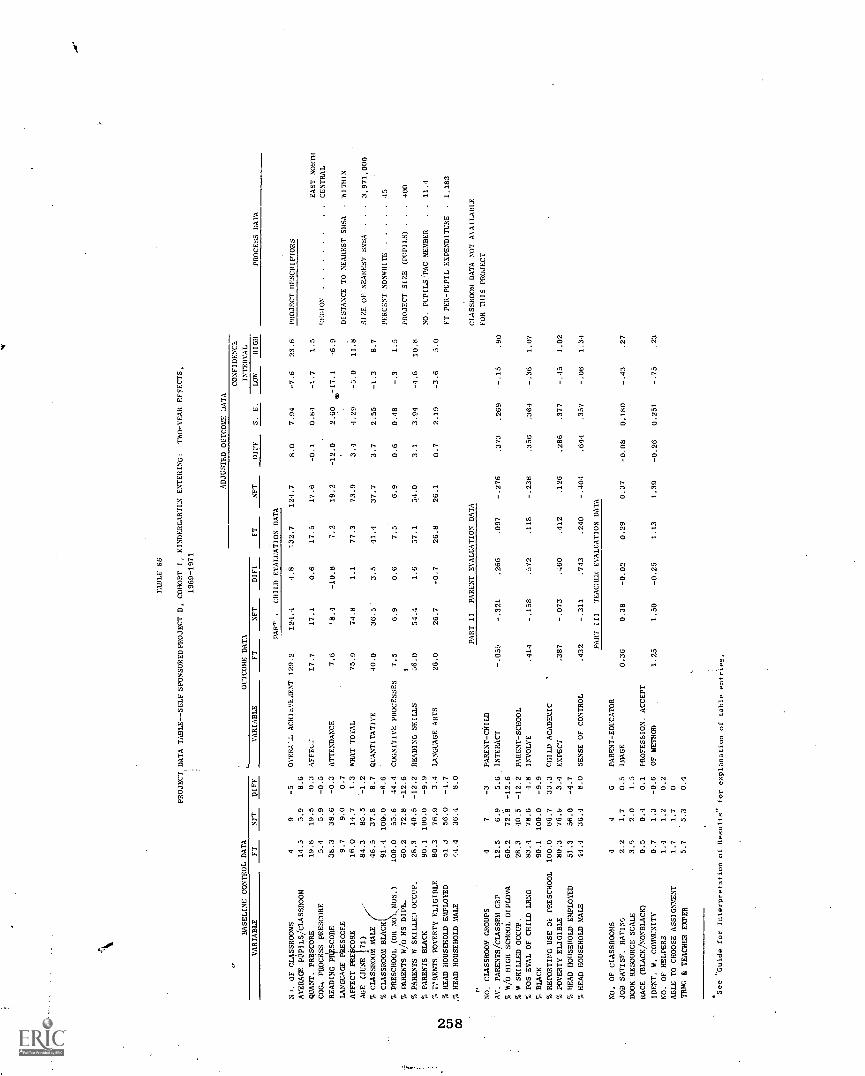
TABLE 86
PROJECT DATA TABLE- -SELF SPONSORED PROJECT B, COHORT I, KINDERGARTEN ENTERING:
TWO-YEAR EFFECTS,
1969-1971
ADJUSTED OUTCOME DATA
CONFIDENCE
BASELINE CONTROL DATA
OUTCOME DATA
INTERVAL
VARIABLE
FT
NFT
DIFF
VARIABLE
FT
NFT
DIFF
FT
SFT
DIFF
S. E.
LOW
HIGH
PROCESS DATA
PAR' .
CHILD EVALUATION DATA
N r. OF CLASSROOMS
49
-5
OVER?'.:. ACHItVE0IENT
129.2
12.1.4
4.8
132.7
12.1.7
8.0
7.94
-7.6
23.6
PROJECT DESCRIPTORS
AVERAGE PUPILS/CLASSROOM
14.5
5.9
8.6
WANT. PRBSCORE
19.8
19.5
0.3
AFFEL.2
17.7
17.1
0.6
17,5
17.6
-0.1
0.84
-1.7
1.5
EAST NORTH
COGS PROCESS PRESCORE
5.4
5.9
-0.5
REGION
CENTRAL
READING PRESCORE
38.3
38.6
-0.3
ATTENDANCE
7.6
N8.
-10.8
7.2
19.2
-12.0
2.60
,-17.1
-6.9
LANGUAGE PRESCORE
9.7
9.0
0.7
DISTANCE TO NEAREST SMSA
WITHIN
AFFECT PRESCORE
16.0
14.7
1.3
WRAT TOTAL
75.9
74.8
1.1
77.3
73.9
3.4
4.29
-5.0
11.8
AGE (JUNE !71)
84.3
85.5
SIZE. OF NEAREST SMSA
..
3,971,000
% CLASSROOM MALE
46.5
37.8
8.7
QUANTITATIVE
40.0
36.5
3.5
41.4
37.7
3.7
2.55
-1.3
8.7
% CLASSROOM BLACK
91.4
100.0
-8.6
PERCENT NONWHITE
45
% PRESCHOOL (OR NO. MOS.)
100.0
55.6
44.4
COGNITIVE PROCESSES
7.5
6.9
0.6
7.5
6.9
0.6
0.8
1.5
% PARENTS 8/0 HS DIPL.
60.2
72.8
-12.6
1PROJECT SIZE (PUPILS)
400
% PARENTS 8 SKILLED OCCUP.
28.3
40.5
-12.2
READING SKILLS
56.0
54.4
1.6
57.1
54.0
3.1
3.94
10.8
% PARENTS BLACK
90.1
100.0
-9.9
NO. PUPILS:PAC MEMBER
.11.4
7, TnENTS POVERTY ELIGIBLE
80.3
76.9
3.4
LANGUAGE ARTS
26.0
26.7
-0.7
26.8
26.1
0.7
2.19
-3.6
5.0
[NO
51
56.0
CA
70 HEAD HOUSEHOLD EMPLOYED
J-4.7
FT PER-PUPIL EXPENDITURE
1,183
00
.7. HEAD HOUSEHOLD MALE
,4.4
36.4
8.0
i
rPART II
PARENT EVALUATION DATA
CLASSROOM DATA NOT AVAILABLE
NO. CLASSROOM GROUPS
47
-3
PARENT-CHILD
FOR 'Fill PROJECT
AV. PARENTS/CLASSRM GRP
12.5
6.9
5.6
INTERACT
-.055
-.321
.266
.097
-.276
.373
.269
-.15
.90
NI W/O HIGH SCHOOL DIPLOMA
60.2
72.8
-12.6
% W SKILLED OCCUP.
28.3
40.5
-12.2
PARENT- SCHOOL
To POS EVAL OF CHILD LRNG
83.4
78.6
4.8
INVOLVE
.414
-.158
.572
.118
-.238
.356
.364
-.36
1.07
% BLACK
90.1
100.0
-9.9
% REPORTING USE OF PRESCHOOL
100.0
66.7
33.3
CHILD ACADEMIC
% POVERTY ELIGIBLE
80.3
76.5
3.4
EXPECT
.387
-.073
.460
.412
.126
.286
.377
-.45
1.02
% HEAD HOUSEHOLD EMPLOYED
51.3
56.0
-4.7
% HEAD HOUSEHOLD MALE
44.4
36.4
8.0
SENSE OF CONTROL
.432
-.311
.743
.240
-.404
.644
.357
-.06
1.3.1
PART III
TEACHER EVALUATION DATA
NO, OF CLASSROOMS
44
GPARENT-EDUCATOR
JOB SATISF. RATING
2.2
1.7
0.5
IMAGE
0.36
0.38
-0.02
0.29
0.37
-0.08
0.180
.27
BOOK RESOURCE SCALE
3.5
2.0
1.5
RACE (BLACK/NONBLACK)
0.5
0.4
0.1
PROFESSION. ACCEPT
'DENT. W. COMMUNITY
0.7
1.3
-0.6
OF METHOD
1.25
1.50
-0.25
1.13
1.39
-0.26
0.251
-.75
.23
NO. OF HELPERS
1.4
1.2
0.2
ABLE TO CHOOSE ASSIGNMENT
1.7
1.7
0
TRFG & TEACHER EXPER
5.7
5.3
0.4
"Guide for Interpretation of Results' for explanation of table entries.

Outcome analyses for pupil measures reveal significance only for
attendance, which is FT-favoring. Although FT classes tended to scorehigher than NFT classes on basic skill measures, none of these differences
reached significance. Moreover, none of the variables on either the parent
or the teacher impact analyses reached significance. This lack of clear
evidence of impact suggests that this project was not very effective, in
spite of its high expenditures and large PAC.
Table 87 presents the results of the one-year effects analysis on
children in Cohort I, At the end of one year of FT experience, signifi-
cant FT-favoring differences were found on measures of achievement, affect,
quantitative, and language. The 95 percent confidence interval for achieve-
ment ranges from .8 to 22.4 units; for affect, from .5 to 5.4;for quanti-
tative, from .2 to 6.4; and, for language, from .4 to 3.6 units. Just
why this sample failed to maintain its growth rate is far from clear.
Perhaps changes took place within the project, or perhaps the methods
employed produce only short-term gains. Without additional data, only
speculative explanations can be offered.
Project SS(c)
Project SS(c) is a very large FT program located in a large city(population 4 million) in the middle Atlantic region. The an'icipated FT
per-pupil expenditure of $631'is below average, and there was a slightly
below-average number of pupils (12.2) per PAC member.
Table 88 summarizes the two-year results for Cohort I-K. These
results are based on twelve FT and seven NFT classrooms. Although FT
classes are slightly higher than NFT classes on baseline test averages
and preschool experience, the groups are highly comparable on all othervariables. The two samples have approximately the same distribution of
boys and girls. Children in the groups were about the same age and were
predominantly Black.
Both parent groups were predominantly Black and few parents in either
group had high school diplomas. Most parents in both groups listed un-
skilled occupations, and a high proportion of both were poverty eligible.
Although a slightly higher percentage of Flow Through parents had high
school diplomas and a smaller percentage were poverty eligible, FT parents
were more likely to be employed than NFT parents, but NFT parents were
more likely to have a skilled occupation. In addition, a higher percent-
age of FT households had male heads. Although those differences that do
exist favor FT, the groups were socioeconomically similar enough to in-
dicate'comparability. Teacher data for this project were insufficient
for analysis.
259
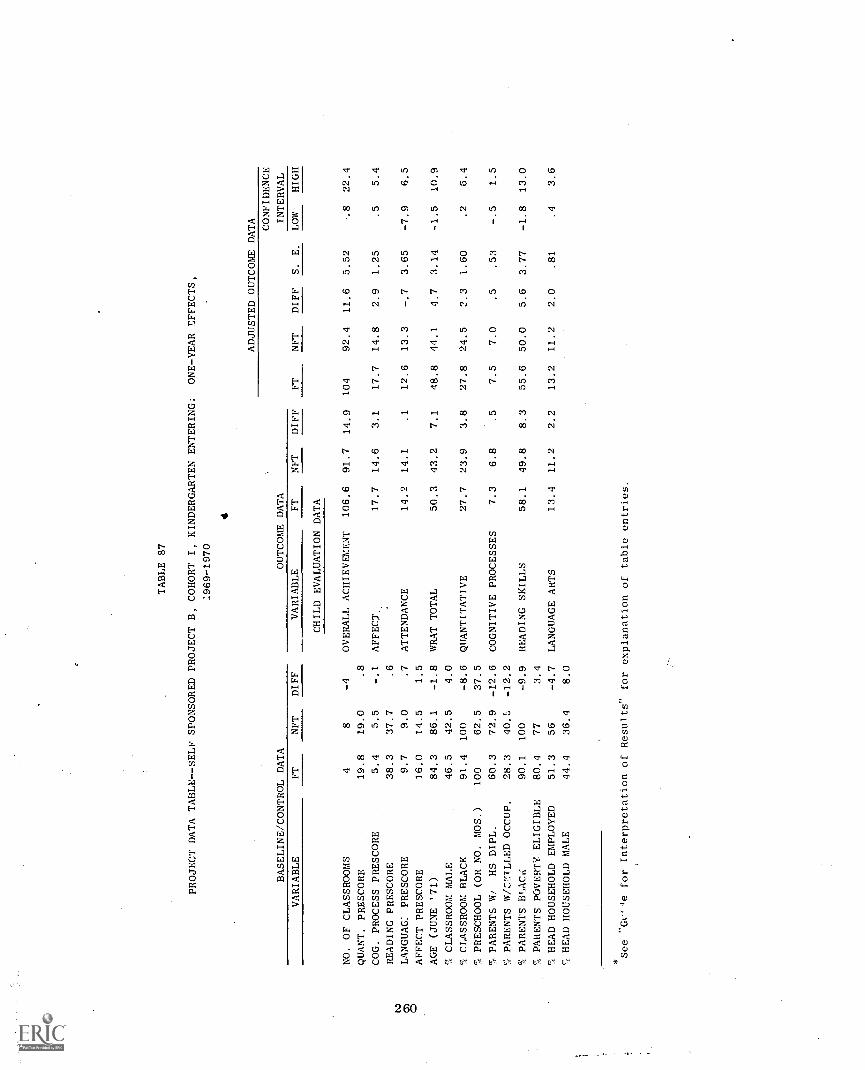
TABLE 87
PROJECT DATA TABLE--SELF SPONSORED PROJECT B, COHORT I, KINDERGARTEN ENTERING:
ONE-YEAR EFFECTS,
.969 -1970
BASELINE/CONTROL DATA
4
OUTCOME DATA
ADJUSTED OUTCOME DATA
FT
NFT
DIFF
S.
E.
CONFIDENCE
INTERVAL
VARIABLE
FT
NFT
DIFF
VARIABLE
FT
NFT
DIFF
LOW
HIGH
CHILD EVALUATION DATA
NO. OF CLASSROOMS
48
-4
OVERALL ACHIEVEMENT
106.6
91.7
14.9
104
92.4
11.6
5.52
.8
22.4
QUANT. PRESCORE
19.8
19.0
.8
COG. PROCESS PRESCORE
5.4
5.5
-.1
AFFECT,
17.7
14.6
3.1
17.7
14.8
2.9
1.25
.5
5.4
READING PRESCORE
38.3
37.7
.6
LANGUAG: PRESCORE
9.7
9.0
.7
ATTENDANCE
14.2
14.1
.1
12.6
13.3
-.7
3.65
-7.9
6.5
AFFECT PRESCORE
16.0
14.5
1.5
AGE (JUNE '71)
84.3
86.1
-1.8
WRAT TOTAL
50.3
43.2
7.1
48.8
44.1
4.7
3.14
-1.5
10.9
CLASSROOM MALE
46.5
42.5
4.0
CLASSROOM BLACK
91.4
100
-8.6
QUANTITATIVE
27.7
23.9
3.8
27.8
24.5
3.3
1.60
.2
6.4
PRESCHOOL (OR NO. MOS.)
100
62.5
37.5
PARENTS W/
HS DIPL.
60.3
72.9
-12.6
COGNITIVE PROCESSES
7.3
6.8
.5
7.5
7.0
.5
.53
-.5
1.5
PARENTS W /C!TLLED OCCUP.
28.3
40.5
-12.2
PARENTS BLACK
90.1
100
-9.9
READING SKILLS
58.1
49.8
8.3
55.6
50.0
5.6
3.77
-1.8
13.0
PARENTS POVERTY ELIGIBLE
80.4
77
3.4
HEAD HOUSEHOLD EMPLOYED
51.3
56
-4.7
LANGUAGE ARTS
13.4
11.2
2.2
13.2
11.2
2.0
.81
.4
3.6
HEAD HOUSEHOLD MALE
44.4
36.4
8.0
See "G-le for Interpretation of Results" for explanation of table entries.

TABLE 88
PROJECT DATA TARL7--SELF SPONSORED PROJECT C, COHORT I, KINDERGARTEN ENTERING.
TWO -YEAR EFFECTS.
1969-1971
BASELINE. CONTROL DATA
OUTCOME DATA
ADJUSTED OUTCOME DATA
CONFIDENCE
INTERVAL
VARIABLE
FT
NET
DIFF
VARIABLE
FT
NFT
DIFF
FT
NFT
DIFF
S.
E.
LOW
HIGH
PROCESS DATA
PART
ICHILD EVALUATION DATA
NO. OF CLASSROOMS
12
75
OVERALL ACHIEVEMENT
133.0
116.8
16.2
146.5
132.2
14.3
6.47
1.6
27.0
PROJECT DESCRIPTORS
AVERAGE PUPILS/CLASSROOM
10.8
8.2
2.0
WANT. PRESCORE
17.4
16.7
0.7
AFFECT
17.2
16.6
0,6
17.1
16.6
0.5
0.68
1.8
MIDDLE
COG, PROCESS PRESCORE
5.0
3.1
1.9
RECTox
ATLANTIC
READING PRESCORE
26.0
25.6
0.4
ATTENDANCE
9.9
11.3
-4.4
11.0
14.8
-3.8
2.12
-8.0
,4
LANGUAGE PRESCORE
8.2
7.4
0.8
DISTANCE TO NEAREST SMSA
..81THIN
AFFECT PRESCOPL
16.3
14,1
1.9
WHAT TOTAL
80.4
71.3
9.1
86,5
76.9
9.6
3,50
2.7
16,5
AGE (JUNE '71)
82.4
82.9
-0.5
SIZE OF NEAREST SMSA
..
..1,021,000
11 CLASSROOM MALE
48,5
4^.6
0.9
QUANTITATIVE
39.5
36.2
3.3
42.7
41.3
2.4
2.08
-1.7
6,5
7, CLASSROOM BLACK
100.0
99.0
1.0
PERCENT NONWHITE
'14
% PRESCHOOL (OR NO. MOS.)
50,S
45.3
5.5
COGNITIVE PROCESSES
7,3
7.0
0.3
7.7
7.6
0.1
0,39
.9
'A PARENTS W/O HS I,IPL.
61.5
76,4
-14.9
PROJECT SIZE (PUPILS)
1.110
3 PARENTS A/SKILLED OCCUP.
33.0
48,5
-15.5
READING SKILLS
58.7
49.7
9.0
64.6
55.8
8.8
3.21
2.5
15.]
'1; PARENTS BLACK
98.8
100,0
-1.21
NO. PUPILS /PAC MEMBER
PARENTS POVERTY ELIGIBLE
67.1
82.2
-15.1
LANGU.',GE ARTS
27.6
23.9
3,7
30.1
27.5
2.9
1,78
6.4
7 HEAD HOUSEHOLD EMPLOYED
63.8
41,0
22.8
ET PER -PUPIL EXPENDITURE .
.631
% HEAD HOUSEHOLD MALE
52.4
11.9
7,5
PART
II
PARENT EVALUATION DATA
CLASSROOM DATA NOT AVAILABLE FOR THIS
NO, CLASSROOM GROUPS
12
75
FARENT-CHILD
PROJECT
AV. PARENTS/CLASSRM GRP
8.5
6.9
1.6
INTERACT
-.019
-,057
.038
-.069
-.029
-.038
.205
-.41
.36
rfo HIGH SCHOCI, DIPLOMA
61,5
76,4
-11.9-
,, A/SKILLED OCCUP,
33.0
48.5
-15.5
PARENT- SCHOOL
7,- POS EVAN, OF CHILD LRN5
84.3
82.7
1.6
INVOLVE
-.411
-.255
-.156
-.280
-.188
.277
-.73
,35
q BLACK
98.8
100,0
-1.2
'I REPORTING USE OF PRESCHOOL
50,8
45.3
5.5
CRIED ACADEMIC
fl, POVERTY ELIGIBLE
67.1
1.2,2
-15.1
EXPECT
.094
-.039
.133
.208
.189
.019
.287
-.54
.58
T, HEAD HOUSEHOLD EMPLOYED
63.8
41,0
22.8
HEAD HOUSEHOLD MALE
,22.1
41.9
7.5
SENSE OF CONTROL
-.053
.209
-.262
-.175
.193
-.368
.272
-.90
.17
-Guide for Interpretation of Results- for explanation of table entries.
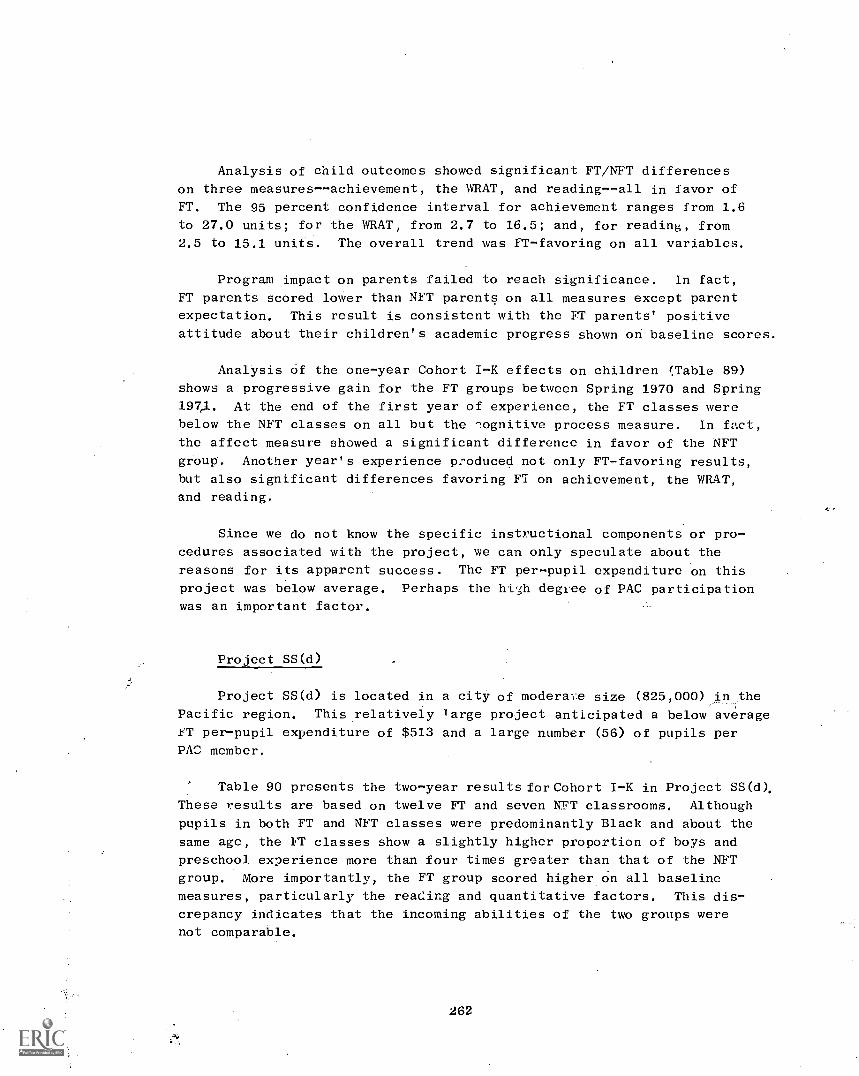
Analysis of child outcomes showed significant FT/NFT differences
on three measures--achievement, the WRAT, and reading--all in favor of
FT. The 95 percent confidence interval for achievement ranges from 1.6
to 27.0 units; for the WRAT, from 2.7 to 16.5; and, for reading, from
2.5 to 15.1 units. The overall trend was FT-favoring on all variables.
Program impact on parents failed to reach significance. In fact,
FT parents scored lower than NFT parents on all measures except parent
expectation. This result is consistent with the FT parents' positive
attitude about their children's academic progress shown on baseline scores.
Analysis of the one-year Cohort I-K effects on children (Table 89)
shows a progressive gain for the FT groups between Spring 1970 and Spring
197I. At the end of the first year of experience, the FT classes were
below the NFT classes on all but the -..ognitive process measure. In fact,
the affect measure showed a significant difference in favor of the NFT
group. Another year's experience produced not only FT-favoring results,
but also significant differences favoring FT on achievement, the WRAT,
and reading.
Since we do not know the specific instructional components or pro-
cedures associated with the project, we can only speculate about the
reasons for its apparent success. The FT per-pupil expenditure on this
project was below average. Perhaps the high degree of PAC participation
was an important factor.
Project SS(d)
Project SS(d) is located in a city of moderate size (825,000) in the
Pacific region. This relatively large project anticipated a below average
FT per-pupil expenditure of $513 and a large number (56) of pupils per
PAC member.
Table 90 presents the two-year results forCohort I-K in Project SS(d),
These results are based on twelve FT and seven NFT classrooms. Although
pupils in both FT and NFT classes were predominantly Black and about the
same age, the FT classes show a slightly higher proportion of boys and
preschool experience more than four times greater than that of the NFT
group. More importantly, the FT group scored higher on all baseline
measures, particularly the reading and quantitative factors. This dis-
crepancy indicates that the incoming abilities of the two groups were
not comparable.
262
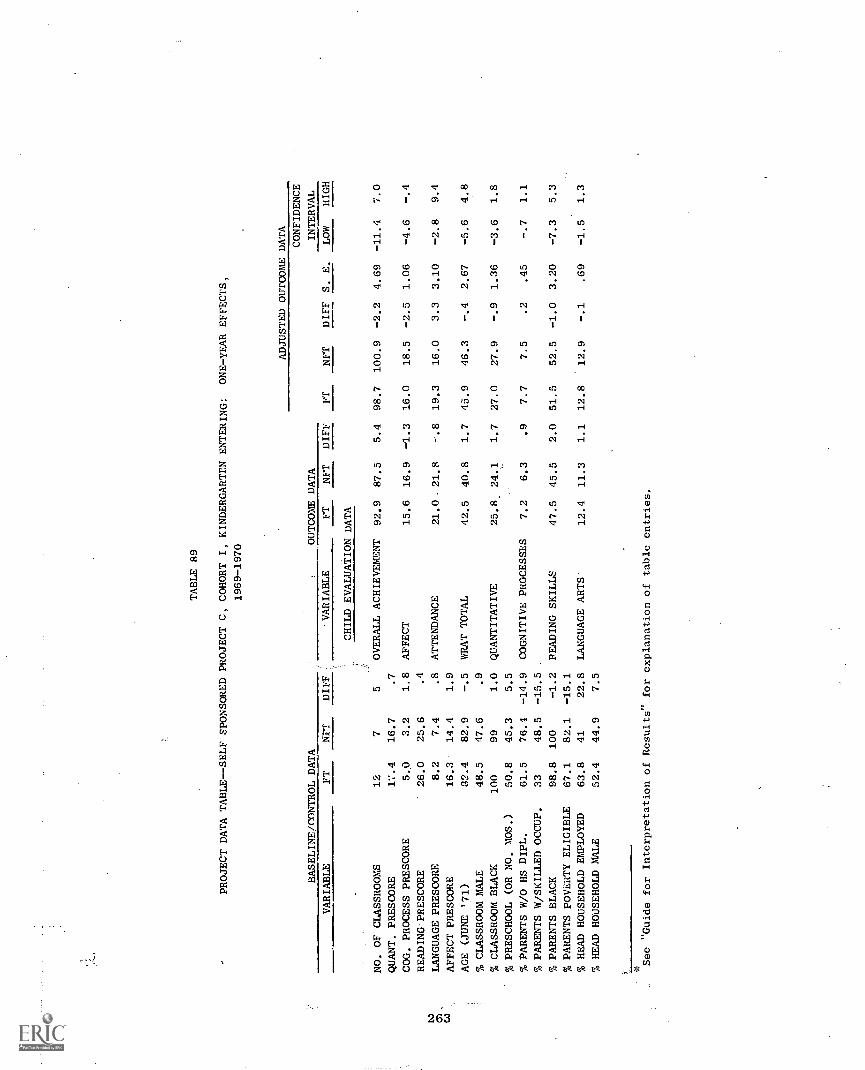
TABLE 89
PROJECT DATA TABLE--SELF SPONSORED PROJECT C, COHORT I, KINDERGARTEN ENTERING:
ONE-YEAR EFFECTS,
1969-1970
ADJUSTED OUTCOME DATA
CONFIDENCE
BASELINE/CONTROL DATA
OUTCOME DATA
FT
NFT
DIFF
S. E.
INTERVAL
VARIABLE
FT
NFT
DIFF
VARIABLE
FT
NFT
DIFF
LOW
HIGH
CHILD EVALUATION DATA
NO. OF CLASSROOMS
12
75
OVERALL ACHIEVEMENT
92.9
87.5
5.4
98.7
100.9
-2.2
4.69
-11.4
7.0
QUANT. PRESCORE
17.4
16.7
.7
COG. PROCESS PRESCORE
5.0
3.2
1.8
AFFECT
15.6
16.9
-1.3
16.0
18.5
-2.5
1.06
-4.6
-.4
READING'PRESCORE
26.0
25.6
.4
a) ,
LANGUAGE PRESCORE
8.2
7.4
.8
ATTENDANCE
21.0,.21.8
-.8
19.3
16.0
3.3
3.10
-2.8
9.4
C4
AFFECT PRESCORE
16.3
14.4
1.9
AGE (JUNE '71)
82.4
82.9
-.5
WRAT TOTAL
42.5
40.8
1.7
45.9
46.3
-.4
2.67
-5.6
4.8
% CLASSROOM MALE
48.5
47.6
.9
% CLASSROOM BLACK
100
99
1.0
QUANTITATIVE
25.8
24.1
1.7
27.0
27.9
-.9
1.36
-3.6
1.8
% PRESCHOOL (OR NO. MOS.)
50.8
45.3
5.5
% PARENTS W/O HS DIPL.
61.5
76.1
-14.9
COGNITIVE PROCESSES
7.2
6.3
.9
7.7
7.5
.2
.45
-.7
1.1
% PARENTS W/SKILLED OCCUP.
33
48.5
-15.5
% PARENTS BLACK
98.8
100
-1.2
READING SKILLS
47.5
45.5
2.0
51.5
52.5
-1.0
3.20
-7.3
5.3
% PARENTS POVERTY ELIGIBLE
67.1
82.1
-15.1
% HEAD HOUSEHOLD EMPLOYED
63.8
41
22.8
LANGUAGE ARTS'
12.4
11.3
1.1
12.8
12.9
-.1
.69
-1.5
1.3
% HEAD HOUSEHOLD MALE
52.4
44.9
7.5
See "Guide for Interpretation of Results" for explanation of table entries.
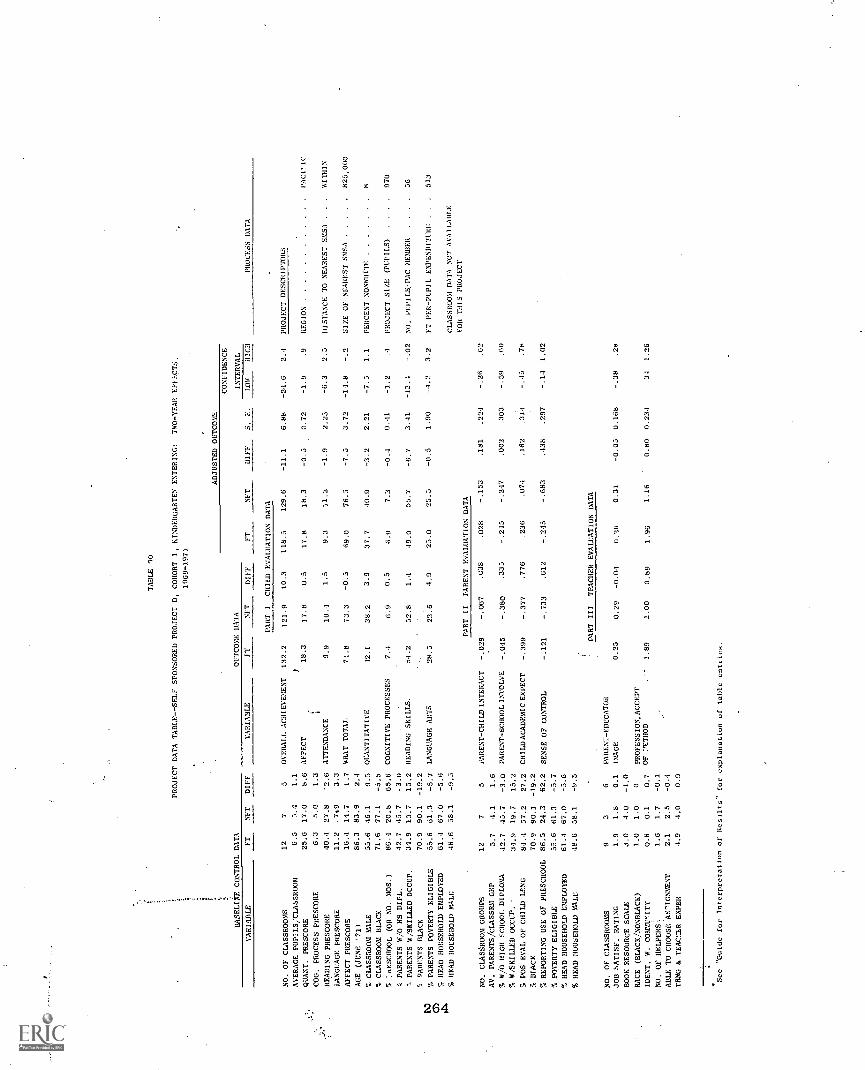
t\D
TABLE 90
PROJECT DATA TABLE--SELF SPONSORED PROJECT D, COHORT I, KINDERGARTEN ENTERING:
TWO-YEAR EFFECTS.
1969-1971
BASELINE CONTROL DATA
OUTCOME DATA
ADJUSTED OUTCOME
PROCESS DATA
FT
NET
DIFF
S.F.
CONFIDENCE
INTERVAL
VARIABLE.
FT
NFT
DIFF
VARIABLE
FT
NFT
D1FF
LOW
HIGH
PART I
CHILD EVALUATION DATA
NO. OF CLASSROOMS
12
75
OVERALL ACHIEVEMENT
132.2
121.9
10.3
118.5
129.6
-11.1
6.88
-24.6
2.4
PROJECT DESCRIPTORS
AVERAGE PUPILS/CLASSROOM
6.5
5.4
1.1
)
QUASI. PRESCORE
25.6
17.0
8.6
AFFECT
18.3
17.8
0.5
17.8
18.3
-0.5
0.72
-1.9
.9
REGION
PACffIC
COG. PROCESS PRESCORE
6.3
5.0
1.3
i
READING PRESCORE
40.4
27.8
'2.6
ATTENDANCE
9.9
10.4
1.5
9.3
11.2
-1.9
2.25
-6.3
2.5
DISTANCE TO NEAREST SMSA
..
.wynlis
LANGUAGE PRESCORE
11.2
.7.9
3.3
AFFECT PRESCORE
16.
14.7
1.7
WRAT TOTAL
74.8
73.3
-0.5
69.0
76.5
-7.5
3.72
-14.8
SIZE OF NEAREST SMS1
825,000
AGE (JUNE '71)
86.3
83.9
2.4
% CLASSROOM MALE
55.6
46.1
9.5
QUANTITATIVE
42.1
38.2
3.9
37.7
40.9
-3.2
2.21
-7.5
1.1
PERCENT NONWHITE
8
% CLASSROOM BLACK
71.6
77.1
-5.5
7 :nESCHOOL (OR NO. MOS.)
86.4
20.8
65.6
COGNITIVE PROCESSES
7.4
6.9
0.5
6.9
7.3
0.1
-1.2
PROJECT SIZE (PUPILS)
..
..
970
PARENTS W/O HS DIPL.
42.7
45.7
-3.0
PARENTS W/SKILLED OCCUP.
34.9
13.7
15.2
READING SKILLS.
54.2
52.8
1.4
49.0
55.7
-6.7
3.41
-13.4
-.02
NO. PUPILS/PAC MEMBER
..
..
56
'. PARENTS BLACK
70.9
90.1
-19.2
% PARENTS POVERTY ELIGIBLE
55.6
61.3
-5.7
LANGUAGE ARTS
28.3
23.6
4.9
23.0
25.5
-0.5
1.90
3.2
FT PER-PUPIL EXPENDITURE
..
.513
';; HEAD HOUSEHOLD. EMPLOYED
61.4
67.0
-5.6
% HEAD HOUSEHOLD MALE
8.6
58.1
-9.5
CLASSROOM DATA NOT AVAILABLE
FOR THIS PROJECT
PART II
PARENT EVALUATION DATA
NO. CLASSROOM GROUPS
12
75
PARENT -CHILD INTERACT
-.029
-.067
.638
.028
-.153
.181
.224
-.26
.62
AV. PARENTS/CLASSRM GRP
5.7
4.1
1.6
% W/0 HIGH SCHOOL DIPLOMA
42.7
45.7
-3.0
PARENT - SCHOOL INVOLVE
-.045
-.380
.335
-.245
-.247
.002
.303
-.59
.110
% W/SKILLED OCCUP.
34.9
19.7
15.2
% POS EVAL OF CHILD LRNG
84.4
57.2
27.2
CHILDACADEMIC EXPECT
-.399
-.377
.776
.236
.074
.162
.314
-.43
.78
% BLACK
70.9
90.1
-19.2
% REPORTING USE OF PRESCHOOL
86.5
24.3
62.2
SENSE OF CONTROL
-.121
-.733
.612
-.683
.438
.297
-.1.1
1.02
% POVERTY ELIGIBLE
55.6
61.3
-5.7
% HEAD HOUSEHOLD EMPLOYED
61.
67.0
-5.6
% HEAD HOUSEHOLD MALE
8.6
58.1
-9.5
PART
III
TEACHER EVALUATION DATA
NO. OF CLASSROOMS
93
6PARENT-EDUCATOR
JOB SATISF. RATING
1.9
1.8
0.1
IMAGE
0.25
0.29
-0.04
0.26
0.31
-0.05
0.168
-.38
.28
BOOK RESOURCE SCALE
3.0
4.0
-1.0
RACE (BLACK/NONBLACK)
1.0
1.0
0PROFESS ION. ACCEPT
IDENI. W. COMME'.ITY
0.8
0.1
0.7
OF :ETHOD
.'"
1.89
1.00
0.89
1.96
1.16
0.80
0.234
.34
1.26
NO. OF HELPERS
1.6
1.7
-0.1
ABLE TO CHOOSE AS7IGNMENT
2.1
2.5
TRNG & TEAC!:ER EXPER
4.9
4.0
0.9
Sec "Guide for Interpretation of Resllts" for explanation of table entiies.
T!ese groups were somewhat more comparable on parent factors. Both
were primarily Black with unskilled occupations, fairly low educational
attainment, moderately high poverty eligibility, and high unemployment.
The NFT sample contained a higher percentage of Black parents. The groups
also differed on presence of a male as head of household; there was a
higher percentage in the NFT families.
FT and NFT teachers were nearly equal on rated job satisfaction,
amount of resources (books and helpers), residence outside the schoOl
community, freedom to choose assignment, and number of years of combined
training and teaching experience.
Outcome analyses for pupil measures reveal significant differences
on the WHAT and reading scores in favor of NFT. The 95 percent confidence
interval for the WHAT ranges from -14.8 to -.2 units, and for reading,
from -13.4 to -.02 units. In light of the baseline bias in favor of FT,
such results are more than indicative of lack of program impact at the
end of the two-year experience. The low FT per-pupil expenditure could
be associated with this result.
Analyses of parent and teacher data indicate FT-favoring trends.However, the only measure showing significant difference was acceptance
of method, which showed that the FT teachers were more approving of their
methods than were NFT teachers. This result is somewhat confusing, since
r.vidence that these methods had impact on FT pupils is lacking.
Analysis of the one -year, Cohort I-K child data (Table 91) shows
evidence of a progressive ueficit for the FT group between Spring 1970,
and Spring 1971. In the first year, FT pupils scored lower than NFT
pupils only on the affect and language measures. Since process data were
not collected Jn this sample, we are unable to offer reasons for this
reversal of outcomes over the two-year period.
Project SS(e)
Project SS(e) is a large project in a large West Coast city. The
projected per-pupil expenditure of $698 and PAC involvement (1 per 27
pupils) are consid.-:red below average.
Table 92 summarizes the two -yeas results for the eight FT and the
six NFT classrooms included in the project sample. Table 93 summarizes
irst-year results. Except that more than four times as many FT pupils
had preschdol experience as NFT pupils, the groups are moderately comp-r-
able. Baseline test scores were nearly equivalent, and classroom composi-
tiers were similar.
265

TABLE pi.
I-ROJCT DATA TABLE--SELF SPONSORED PROJECT D, COHORT I, KINDERGARTEN ENTERING:
ONE-YEAR EFFECTS,
1969-1970
ADJUSTED OUTCOME DATA
CONFIDENCE
BASELINE/CONTROL DATA
OUTCOME DATA
INTERVAL
VARIABLE
FT
NFT
DIFF
VARIABLE
iFT
NFT
DIFF
FT
NFT
DIFF
S. E.
LOW
HIGH
CHILD EVALUATION DATA
NO. OF CLASSROOMS
12
75
OVERALL ACHIEVEMENT
114.4
90.8
23.6
99.9
94.7
5.2
4.99
-4.6
15.0
QUANT. PRESCORE
25.7
17
8.7
COG. PROCESS PRESCORE
6.3
5.0
1.3
AFFECT
16.8
15.1
1.7
15.J
16.0
-.7
1.13
-2.9
1.5
READING PRESCORE
40.4
27.8
12.6
LANGUAGE PRESCORE
11.2
7.9
3.3
ATTENDANCE
16.8
26.5
09.7
18.4
25.9
-7.5
3.30
-14.0
'1.0
AFFECT PRESCORE
16.4
14.7
1.7
N3
AGE (JUNE '71)
86.3
83.9
2.4
WRAT TOTAL
51.7
40.5
11.2
45.1
43.3
1.8
2.84
-3.8
7.4
0)
0)
% CLASSROOM MALE
55.6
46.1
9.5
% CLASSROOM BLACK
71.6
77.1
-5.5
QUANTITATIVE
32.6
25.3
7.3
28.2
26.3
1.9
1.45
-.9
4.7
% PRESCHOOL (OR NO. MOS.)
86.4
20.8
65.6
% PARENTS W/O HS DIPL.
42.7
45.7
-3.0
COGNITIVE PROCESSES
8.5
71.5
7.4
7.0
.4
.48
-.5
1.3
% PARENTS W /SKILLED OCCUP.
34 9
19.7
15."
% PARENTS BLACK
70.9
90.1
-19.2
READING SKILLS
59.6
-1','.2
12.4
52.4
49.7
2.7
3.41
-4.0
9.4
% PARENTS PROVERTY ELIGIBLE
55.6
61.3
-5.7
% HEAD HOUSEHOLD EMPLOYED
61.4
67
-5.6
LANGUA6E-ARTS
13.7
11.7
2.0
11.7
12.3
-.6
.74
-2.1
.9
% HEAD HOUSEHOLD MALE
4R.6
58.1
-9.5
-
See "Guide for Intrepretation of Results" for explanation of table entries.
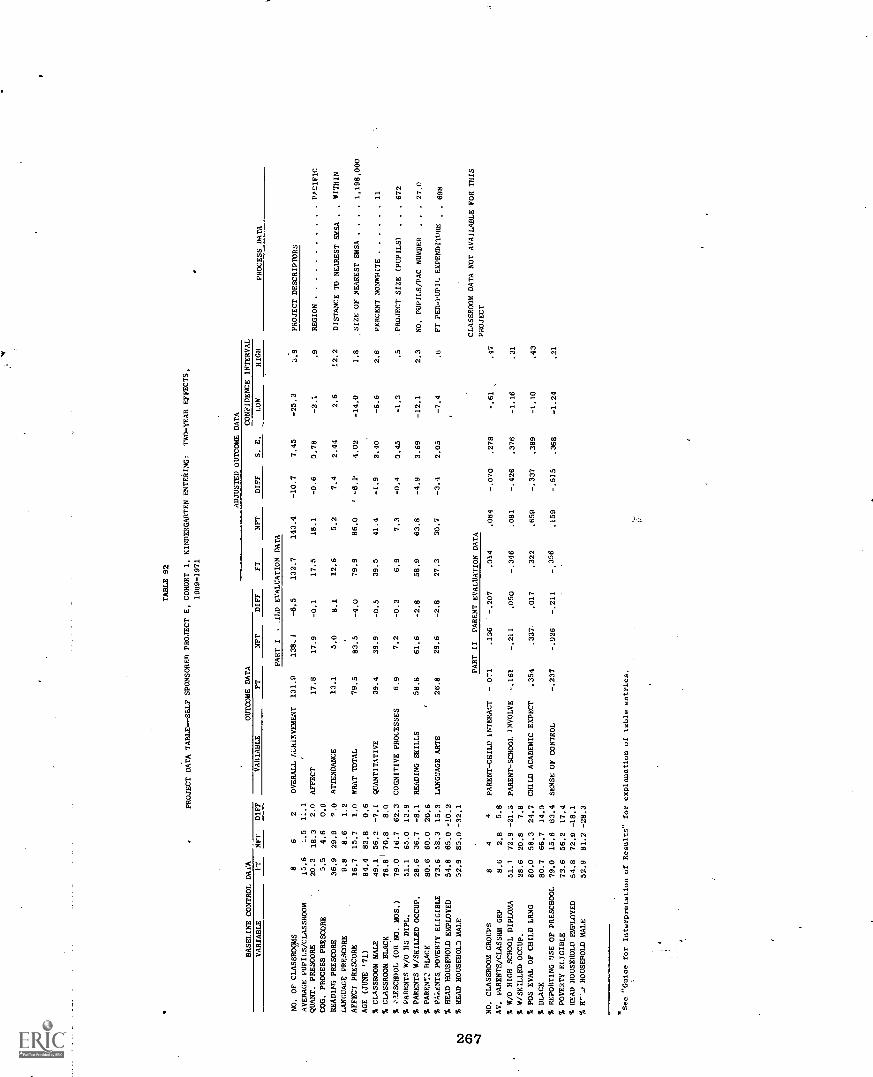
TABLE 92
PROJECT DATA TABLE -SELF SPONSORED PROJECT E, COHORT I, KINDERGARTEN ENTERING:
TWO-YEAR EFFECTS,
1969-1971
BASELINE CONTROL DATA
ADJUSTED OUTCOME DATA
OUTCOME DATA
CON1,IDENCE INTERVAL
VARIABLE
FT
NFT
DIFF
VARIABLE
FT
NFT
DIFF
FT
NFT
DIFF
S. E.
LOW
HIGH
PROCESS DATA
PART I
,.LLD EVALUATION DATA
NO. OF CLASSROOMS
86
2OVERALL ALBIEVEMENT
131.9
138,4
-6,5
132.7
143.4
-10.7
7.45
-25.3
3:9
PROJECT DESCRIPTORS
AVERAGE PUPILS/CLASSROOM
15.6
1:.1
QUART. PRESCORE
20.3
18.3
2.0
AFFECT
17.8
17.9
-0.1
17.5
18.1
-0.6
0.78
-2.1
.9
REGION
PACIFIC
COG. PROCESS PRESCORE
5.5
4.6
0.9
READING PRESCORE
36.9
29.9
1.0
ATTENDANCE
13.1
5.0
8.1
12,6
5.2
7.4
2.44
2.6
12.2
DISTANCE TO NEAREST SMSA
..WITHIN
LANGUAGE PRESCORE
9.8
8.6
1.2
AFFECT PRESCORE
16.7
15.7
1.0
WRAT TOTAL
79.5
83.5
-4.0
79.9
86.0
' -8.1
4.02
-14,0
1.8
.SIZE OF NEAREST SMSA
..
..1,198,000
AGE (JUNE '71)
84,4
83.8
0.6
% CLASSROOM MALE
49.1
56.2
-7.1
QUANTITATIVE
39.4
39.9
-0.5
39.5
41.4
-1.9
2.40
-6.6
2.8
PERCENT NONWHITE
11
% CLASSROOM BLACK
78.81
70.8
8.0
% PAESCHOOL (OR NO. MOS.)
79.0
16.7
62.3
COGNITIVE PROCESSES
6.9
7.2
-0.3
6.9
7.3
-0.4
0.45
-1.3
.5
PROJECT SIZE (PUPILS)
..
.672
% PARENTS W/O HS DIPL.
51.1
65.0
13.9
% PARENTS W/SKILLED OCCUP.
28.6
36.7
-8.1
READING SKILLS
58.8
61.6
-2.8
58.9
63.8
-4.9
3.69
-12.1
2.3
NO. PUPILS/PAC NUMBER
.27.0
% PARENT2 BLACK
80.6
60.0
20.6
% PAkENTS, POVERTY ELIGIBLE
73.6
58.3
15.3
LANGUAGE ARTS
26.8
29.6
-2.8
27.3
30.7
-3.4
2.05
-7.4
.6
FT PER-PUPIL EXPENDITURE
698
% HEAD HOUSEHOLD EMPLOYED
54,8
65.0
-10.2
N.D
% HEAD HOUSEHOLD MALE
52.9
85.0
-32.1
CD
..4
PART II
PARENT EVALUATION DATA
CLASSROOM DATA NOT AVAILABLE FOR THIS
NO. CLASSROOM GROUPS
84
4PARENT-CHILD INTERACT
-.071
.136
-.207
.014
.084
-.070
.278
.47
PROJECT
AV. PARENTS/CLASSRM GRP
8.6
2.8
5.8
% W/O HIGH SCHOOL DIPLOMA
51.1
72.9
-21.3
PARENT-SCHOOL INVOLVE
-.161
-.211
.050
-.346
.081
-.426
.376
-1.16
.31
% W/SK1LLED OCCUP.
28.6
20.8
7.8
% POS EVAL OF CHILD LRNG
80.0
58.3
24.7
CHILD ACADEMIC EXPECT
.354
.337
.017
.322
.659
-.337
.389
-1.10
.43
% BLACK
80.7
66.7
14.0
% REPORTING USE OF PRESCHOOL
79.0
15.6
63.4
SENSE OF CONTROL
-.237
-.026
-.211
-,356
.159
-.515
.368
-1.24
.21
% POVERTY ELIGIBLE
73.6
56.2
17.4
4 HEAD HOUSEHOLD EMPLOYED
54.8
72.9
-18.1
% H'..., HOUSEHOLD MALE
52.9
81.2
-28.3
*See "Guise for Interpretation of Results" for explanation of table entries.
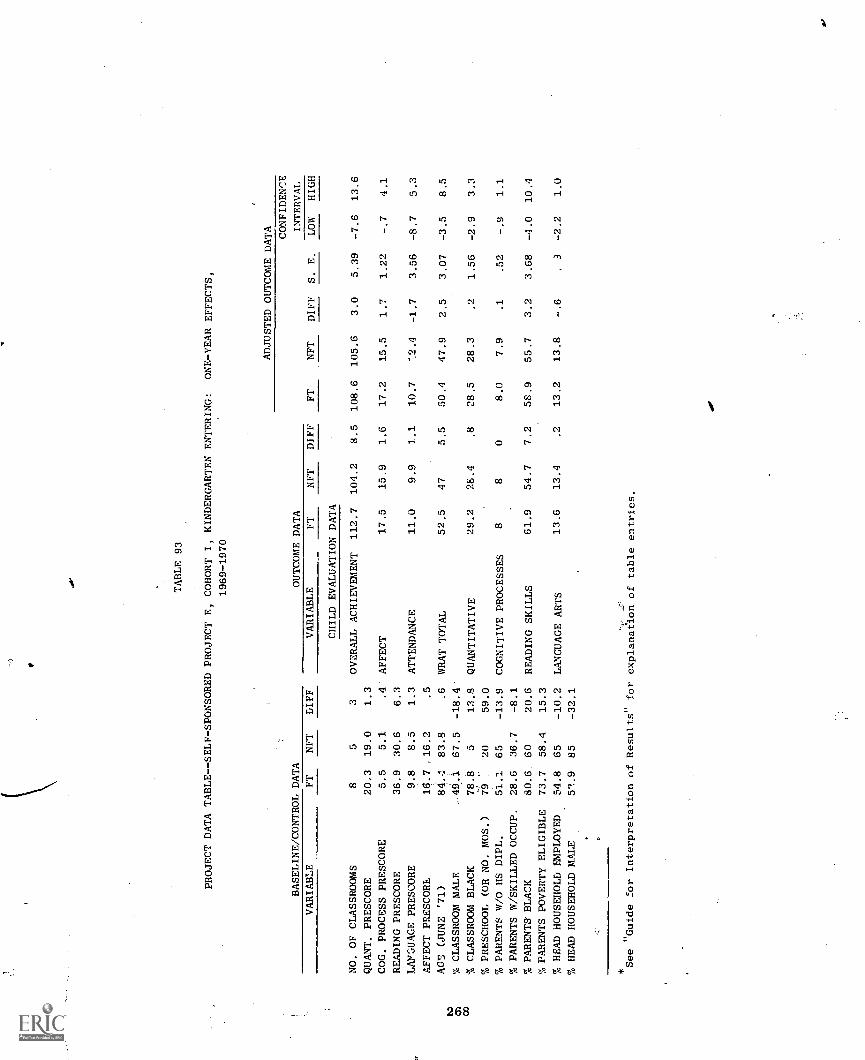
a**
TABLE 93
PROJECT DATA TABLE -- SELF - SPONSORED PROJECT E, COHORT I, KINDERGARTEN ENTERING:
ONE-YEAR EFFECTS,
1969-1970
BASELINE/CONTROL DATA
OUTCOME DATA
ADJUSTED OUTCOME DATA
CONFIDENCE
INTERVAL
VARIABLE
FT
NFT
DIFF
VARIABLE
FT
NFT
DIFF
FT
NFT
DIFF
S. E.
LOW
HIGH
CHILD EVALUATION DATA
NO. OF CLASSROOMS
85
3OVERALL ACHIEVEMENT
112.7
104.2
8.5
108.6
105.6
3.0
5.39
-7.6
13.6
QUANT. PRESCORE
20.3
19.0
1.3
COG. PROCESS PRESCORE
5.5
5.1
.4
AFFECT
17.5
15.9
1.6
17.2
15.5
1.7
1.22
-.7
4.1
READING PRESCORE
36.9
30.6
6.3
LANGUAGE PRESCORE
9.8
8.5
1.3
ATTENDANCE
11.0
9.9
1.1
10.7
12.4
-1.7
3.56
-8.7
5.3
AFFECT PRESCORE
16.7
,16.2
.5
ts2
AG'S (JUNE '71)
84.-1
83.8
.6
WRAT TOTAL
52.5
47
5.5
50.4
47.9
2.5
3.07
-3.5
8.5
CS)
% CLASSROOM MALE
- 49.1
67.5
-18.4'
00
% CLASSROOM BLACK
78.8
513.8
QUANTITATIVE
29.2
26.4
.8
28.5
28.3
.2
1.56
-2.9
3.3
% PRESCHOOL (OR NO. MOS.)
79
20
59.0
% PARENTS W/O HS DIPL.
54.1
65
-13.9
COGNITIVE PROCESSES
88
08.0
7.9
.1
.52
-.9
1.1
% PARENTS W/SKILLED OCCUP.
28.6
36.7
-8.1
% PARENTS BLACK
80.6
60
20.6
READING SKILLS
61.9
54.7
7.2
58.9
55.7
3.2
3.68
-4.0
10.4
%PARENTS POVERTY ELIGIBLE
73.7
58.4
15.3
% HEAD HOUSEHOLD EMPLOYED.
54.8
65
-10.2
LANGUAGE ARTS
13.6
13.4
.2
13.2
13.8
-.6
.9
-2.2
1.0
% HEAD HOUSEHOLD MALE
59.9
85
-32.1
See "Guide for Interpretation of Results" for explanation of table entries.
The samples are somewhat less comparable in terms of family variables.
FT parents were more likely to have a high school education, list unskilled
occupations, be unemployed, and be poverty eligible than were NFT parents.
While both FT and NFT households were characterized by male heads, the
proportion was much higher for NFT households.
First-year results reveal no significant differences in child outcome
measures. The only significant difference in the second-year outcomes
for the two groups of children was in attendance. Unlike the primarily
FT-favoring differences in the first-year results this attendance differ-
ence and differences in all other second-year child outcome measures
favored the NFT sample. Teacher data were insufficient to support analysesfor this project. No parent outcomes reached significance.
This project failed to demonstrate positive FT impact. Since process
data are unavailable, any interpretation would be merely speculative.
Project PI
This prdject is the only parent-implemented project included in this
.,lterim report. It is a small project located in a large urban setting
(population 4 million) in the middle Atlantic region. The anticipated FT
per-pupil expenditure is below average and the pupil/PAC ratio of 15 is
near average.
jTwo-year data for the Cohort I-K group in this project are summarized
in Table 94. These four FT and three NFT classrooms appear comparable
on the basis of pupil measures and classroom composition.
Although neither FT nor NFT parents were highly educated and both
gro .ps were underemployed, the NFT parents appear to be at a much lower
so' _oeconomie level than the FT parents. Almost twice as many NFT parentswer_3 poverty eligible. In addition, NFT parents were much more likely to
be inemployed, and a much higher percentage of NFT households lackedm[1, heads.
On the other hand, teacher data show FT/NFT similarities in terms
of job satisfaction, ethnicity, residence outside the school community,
freedom to choose assignment, and training and experience. However,
while FT teachers tended to have more helpers in their classrooms, NFT
teachers tended to have more book resources available.
AnalySis of pupil outcomes fails to indicate significant FT/NFT
differences, but all differences favor the FT classes. Analyses of parent
269
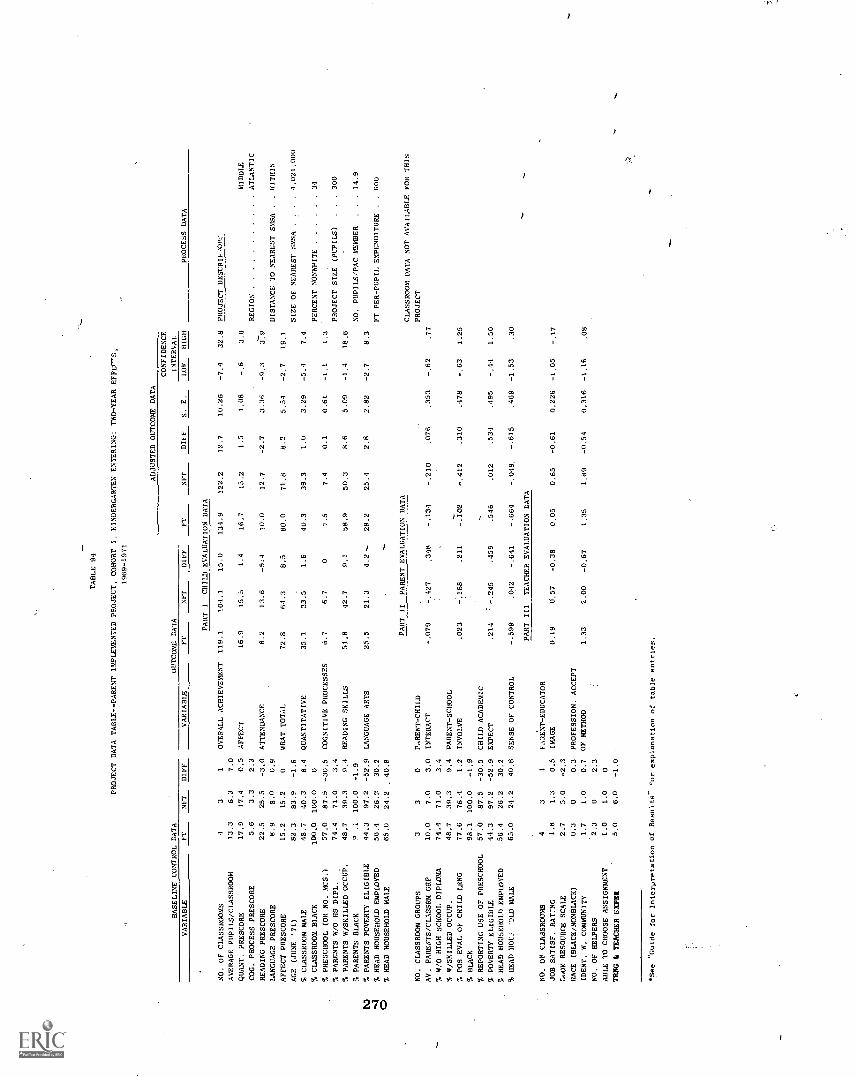
TABLE 94
PROJECT DATA TABLE--PARENT IMPLEMENTED PROJECT, COHORT I. KINDERGARTEN ENTERING: TWO-YEAR EFFE(-"S,
1969-1971
BASELINE CONTROL DATA
VARIABLE
FT
NFT
DIFF
NO. OF CLASSROOMS
43
1
AVERAGE PUPILS/CLASSROOM
13.3
6.3
7.0
QUANT. PRESCORE
17.9
17.4
0.5
COG. PROCESS PRESCORE
5.6
3.3
2.3
READING PRESCORE
22.5
25.5
-3.0
LANGUAGE PRESCORE
8.9
8.0
0.9
AFFECT PRESCORE
15.2
15.2
0
AGE (JUNE '71)
82.3
83.9
-1.6
% CLASSROOM MALE
48,7
40.3
8.4
% CLASSROOM BLACK
100.0
100.0
0
% PRESCHOOL (OR NO. MCS.)
57.0
87.5
-30.5
% PARENTS W/O HS DIPL.
74.4
71.0
3.4
PARENTS W/SKILLED OCCUP.
48.7
39.3
9,4
% PARENTS BLACK
9.1
100.0
-1.9
ND
% PARENTS POVERTY ELIGIBLE
44.3
97.2
-52.9
4% HEAD HOUSEHOLD EMPLOYED
56.4
26.2
30.2
CD
% HEAD HOUSEHOLD MALE
65.0
24.2
40.8
NO. CLASSROOM GROUPS
33
0
AV. PARENTS/CLASSRM GRP
10.0
7.0
3.0
% 8/0 HIGH SCHOOL DIPLOMA
74.4
71.0
3.4
% WiSKILLED OCCUP.
48.7
39.3
9.4
POS EVAL OF CHILD LRNG
77.6
76.4
1.2
BLACK
98.1
100.0
-1.9
REPORTING USE OF PRESCHOOL
57.0
87.5
-30.5
POVERTY ELIGIBLE
44.3
97.2
-52.9
HEAD HOUSEHOLD EMPLOYED
56.4
26.2
30.2
HEAD HODS
'OLD MALE
65.0
24.2
40.8
NO. OF CLASSROOMS
43
1
JOB SATISF. RATTNG
1.8
1.3
0.5
LuOK RESOURCE SCALE
2.7
5.0
-2.3
RACE (BLACK/NONBLACK)
0.3
00.3
IDENT. W. COMMUNITY
1.7
1.0
0.7
NO. OF HELPERS
2.3
02.3
ABLE TO CHOOSE ASSIGNMENT
1.0
1.0
0
TRAO 4 TEACHER ENFER
5.0
6.0
-1.0
ADJUSTED OUTCOME DATA
CONFIDENCE
OUTCOME DATA
INTERVAL
VARIABLE
FT
NFT
DIFF
FT
NFT
DIFF
S. E.
LOW
HIGH
PART I
CHILD EVALUATION DATA
OVERALL ACHIEVEMENT
119.1
104.1
15.0
134.9
122.2
12.7
10.26
-7.4
32.8
AFFECT
16.9
15.5
1.4
16.7
15.2
1.5
1.08
3.6
ATTENDANCE
8.2
13.6
-5:4
10.0
12.7
-2.7
3.36
-9.3
379
WRAT TOTAL
72.8
64.3
8.5
80.0
71.8
8.2
5.54
-2.7
19.1
QUANTITATIVE
35.1
33.5
1.6
40.3
39.3
1.0
3,29
-5.4
7.4
COGNITIVE PROCESSES
6.7
6.7
07.5
7.4
0.1
0.61
-1.1
1.3
READING SKILLS
51.8
42.7
9.1
58.9
50.3
8.6
5.09
-1.4
18,6
LANGUAGE ARTS
25.5
21.3
4.2--
28.2
25.4
2.8
2.82
-2.7
8.3
__
PART
II
PARENT EVALUATION DATA
PARENT-CHILD
INTERACT
-.079
-.427
.348
-.134
-.210
.076
.353
-.62
.77
PARENT-SCHOOL
INVOLVE
.023
-.188
.211
-.102
-.412
.310
.78
-.63
1.25
CHILD ACADEMIC
EXPECT
.214
-.245
.459
.546
.012
.534
.495
-,44
1.50
SENSE OF CONTROL
-.599
.042
-.641
-.664
-.049.
-.615
.469
-1.53
.30
PART
III
TEACHER EVALUATION DATA
PARENT-EDUCATOR
IMAGE
0.19
0.57
-0.38
0.05
0.65
-0.61
0.226
-1,05
-.17
PROFESSION. ACCEPT
OF METHOD
1.33
2,00
-0.67
1.35
1.89
-0.54
0.316
-1.16
.08
See "Guide for Interpretation of Results"
or explanation of table entries.
PROCESS DATA
PROJECT DESCRIFXDIR::
RECION
DISTANCE TO NEAREST SMSA
MIDDLE
ATLANTIC
WITHIN
SIZE OF NEAREST SMSA
..
4,021,000
PERCENT NONWHITE
34
PROJECT SIZE (PUPILS)
.300
NO. PUPILS/PAC MEMBER
..14.9
FT PER-PUPIL EXPENDITURE
600
CLASSROOM DATA NOT AVAILABLE FOR THIS
PROJECT
and teacher variables do not add to the negligible evidence that this
project had impact. FT parents scored higher than NFT parents on all
variables except sense of control, but none of the differences is statistL-
cally significant. Furthermore, NFT teachers scored significantly higher
than FT teachers in their ratings of how essential they considered contact
with the parents outside the classroom.
Overall, there is little,evidenee of FT impact in this project. Pupil
and teacher outcomes show negligible, or unfavorable differences. Since
this project is parent-implemented, the absence of clear parent impacts
suggests that the project is meeting with little success.
Analysis of the one-year effects on children in Cohort I-K (seeTable 95) indicates that FT pupils did improve somewhat from Spring 1970
to Spring 1971. At the end of the first year, the FT children were higher
than the NFT children only on the language variable and equal only on the
cognitive process variable. At the end of two years, the FT group scored
higher than the NFT group on all variables. However, additional data are
needed to determine whether significant program impacts are emerging.
271
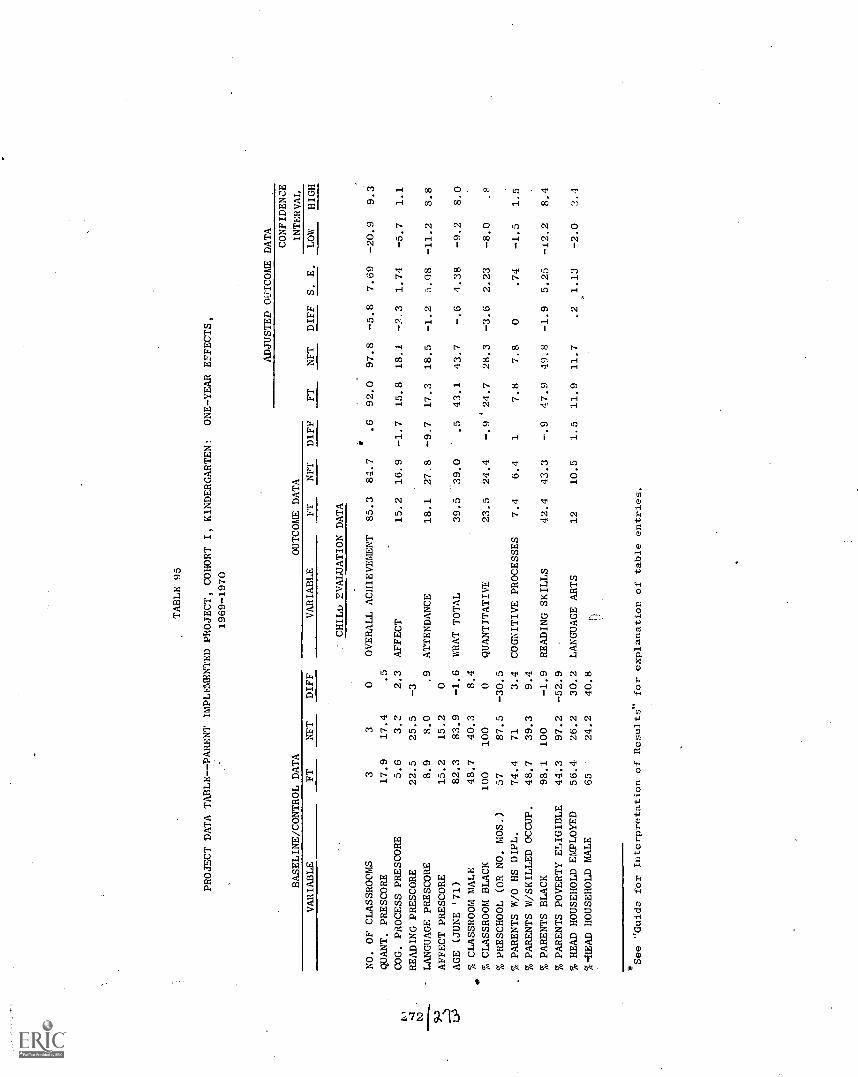
TABLE 95
PROJECT DATA TABLE--PARENT IMPLEMENTED PROJECT, COHORT I, KINDERGARTEN:
ONE-YEAR EFFECTS,
1969-1970
ADJUSTED OUTCOME DATA
CONFIDENCE
BASELINE/CONTROL DATA
OUTCOME DATA
INTERVAL
VARIABLE
FT
NFT
DIFF
VARIABLE
FT
DATA
NFT
DIFF
FT
NFT
DIFF
S. E.
LOW
HIGH
: CHILD EVALUATION
NO. OF CLASSROOMS
33
0OVERALL ACHIEVEMENT
85.3
84.7
.6
92.0
97.8
-5.8
7.69
-20.9
9.3
QUANT. PRESCORE
17.9
17.4
.5
t1
COG. PROCESS PRESCORE
5.6
3.0
2.3
AFFECT
15.2
16.9
-1.7
15.8
18.1
-7,3
1.74
-5.7
1.1
READING PRESCORE
22.5
25.5
-3
LANGUAGE PRESCORE
8.9
8.0
.9
ATTENDANCE
18.1
27.8
-9.7
17.3
18.5
-1.2
5.08
-11.2
8.8
..--)
50
AFFECT PRESCORE
15.2
15.2
0
Las
AGE (JUNE '71)
82.3
83.9
-1.6
BRAT TOTAL
39.5
39.0
.5
43.1
43.7
-.6
4.38
-9,2
8.0
s% CLASSROOM MALE
48.7
40.3
8.4
% CLASSROOM BLACK
100
100
0QUANTITATIVE
23.5
24.4
-.9424.7
28.3
-3.6
2.23
-8.0
.8
% PRESCHOOL (OR NO. MOS.)
57
87.5
-30.5
% PARENTS W/0 HS DIPL.
74.4
71
3.4
COGNITIVE PROCESSES
7.4
6.4
17.8
7.8
0.74
-1.5
1.5
% PARENTS W/SKILLED OCCUP.
48.7
39.3
9.4
% PARENTS BLACK
98.1
100
-1.9
READING SKILLS
42.4
43.3
-.9
47.9
49.8
-1.9
5.25
-12.2
8.4
% PARENTS POVERTY ELIGIBLE
44.3
97.2
-52.9
% HEAD HOUSEHOLD EMPLOYED
56.4
26.2
30.2
LANGUAGE ARTS
12
10.5
1.5
11.9
11.7
.2
1.13
-2.0
2.4
%-.HEAD HOUSEHOLD MALE
65
24.2
40.8
r)
See "Guide for Interpretation of Results" for explanation of table entries.
Part-2
SUMMARY OF OVERALL INTERIM FOLLOW THROUGH EFFECTS
Part 2: SUMMARY OF OVERALL INTERIM FOLLOW THROUGH EFFECTS
The interim FT/NFT effects obtained frpm the separate cohort analyses
are summarized in Tables 96 through 99. These tables present adjustedFT/NFT differences on all pupil, parent, and teacher outcomes. They alsoinclude entries for parent satisfaction, teacher job satisfaction, andnumber of classroom helpers. These last three variables are included inthe tables because they reflect valid program objectives over and above
differences possibly associated with comparison group problems. Note,
however, that these "effects" are unadjusted, and that they are used as
input controls (covariates) in tWe analysig-of the other program outcomes.
Table entries with a positive sign indicate differences favoring FT;
those with negative signs show differences favoring NFT.* Those differences
reaching significance (p < .05) are flagged with an asterisk. Overall cohort
averages (computed by summing across projects) are presented at the bottomof each table. These overall, or "average," cohort values represent themean FT/NFT difference for each outcome. The row marked "Percent FT
Favoring" at the bottom of each table shows the percentage of projects
reporting FTfavoring differences for each outcome variable.
Because the interpretation of outcome effects is moderated by the
comparability of FT and NFT samples, the tables include a designation for
each FT/NFT comparison as a "good," "moderate," or "poor" match. These
designations were derived by inspecting seven of the demographic baseline
variables:
(1) Percentage of students with preschool experience.
(2) Percentage of parents without high school diplomas.
(3) Percentage of parents in skilled occupations.
(4) Percentage of Black parents.
(5) Percentage of parents who are poverty eligible.
(6) Percentage of heads of household currently employed.
(7) Percentage of heads of household who are male.
*The exception to this rule is the attendance variable; fewer absences
for FT is represented by a minus sign.
275

6
9
w
N1,1 1 ID , O O 0 I IS.00 00t.rn MgN N 0 1 0 N
I * 0 I 1 C O ( " 1 CI ION, .CO i0 I I I I 1'0 N O N ^NHoll cl N 0/ NOM°, 1 1 I 1 N ID 00 N C1 N
7EcT,`,12c7,..1 I 1 1;',`,-'222192'2.......' ' '
N r uJ If1 . . 0. 0 CI . N N Cl In 1.!;
r. 0 .4 a . a ' .4 ,s .; a 4 .4 N 1 W n cr7INNLINN .4111,1 N
111 1 F.:, c:*; `,7,"
.1 1 1 1 1 I 1 1 11 I 1
1
F' P 7" 2.0I
FI tC
rW
'28' R 03 NC CF1 Ei1 1 I 1 I 1 1 I I I I 1 I 1
It2gC3,g`f:r2,22,°,?,I,Tr, 1 gE4g,',.91.- C In ID W r M cl M n r1 ID 0 0 0 N N N CI M N W
I
g8N n o,vo, SN 0,00 ONC 7 7 O. . . . . . .
I II I t.1
M M. V M. 'D. ° 7 M °. M CG. M. ° S' '4 CI "" " 7 ";7T 77
, i'A 1-- 0 0 0 o <I' 10 0 cc r La co La r c 4 r r co ,1:, 7) GO cP , becl 07 LOPNNO,NCO, On...MOWN. Nt-,1,40C4,,nce3 I V.
I 1 1 1111 ,1 I , I 1 ,
0
1-4. .NI I I ,LO 0 trr) 0 ID r C. 01 0
I I
LC, .0 , ,PNN.0 CO CI CI 0 r r n 1.11 W 01 1n N N, N N P n N N O P N M P IR
ts N Qt n T LO W 1. 0 N M N N N ,a I0 CnN N ID .01 Cl
N 7.,4 ,..4 ,7 GC
11 n
CI 11 CA CV N cn o La cu sG. i G-7 : 4 o; n I eV
p W VI ...I P N Q1 M N N v. NOO,ONNN 01 0 1-- ID W GO N M EP r V. CO 0 01 N 1.0 N W P r W Ne,1, CI CI N CO N W tD W 11 Q1 CC P N Q1 N P
P CO . N 1..97.'1.'4 I ;121 1 I 1 1 1 I I 1 1 I
g0
0 W co 4 r r M Q1 n al M Q1 O if) n N n W W O 46e4 N P r N N 0 r CO ty rs M N ts. CO rGo O W ru cn Nn i , 7 O c i , 7 .4 G O L r ; , 7 ,7 L r ; r n i ci - in, I 1 1 I I I 1 1 1 I 1 I I 1111 . 0
1 1
Vm .0 N ID 1.- 00 N , , CI*LIO 0 0 I, , P. LII , IT N P CA , CI , -. 10 rI g
C A ' ' ' . N NN N N
. P: `-'.8 °alr
I I ,4 I 1-.1 C4 r4 ni ,; g ....; 1 .4 , I G.: ,: . o: 1 1 II 1 `4 7 '" 7 '777 ''
0..:,
0m , , .4 0 GO , 01 cti 01 CO cl I- Cr P. I ..0 1-..CO 0 N 00 0 , 1--.01 -. 0:1 8 ,D N CV 0 V CI P. In en en co oo Go 1, .. 7 fei EI
Go 4 ,4 c 4 Lri a; eV G.: r.: eV GO a; ..fi u4 ad , ..c. G.7 r. c; r.: GA' GO ,' 4 G.; Locc
1 I I N ,-4 1-1 I, N VI CI , CI .0 NC 7 T, illi N ,r1 , 4 d
1 1 1
, 1 0 ,1 i 1
I of
4.2 wE-
0ODiiiiiiihilighiiiiiiiiiiigi 2 hiligilligi P -2
... 2,D6 v,
a o ...c
o n.O
c?..
8 f.
8 8:-."'
W
O 8o o x
2, 0 9 0 0 .0 0 01 9 o f .. u a, of .0 u of 2 u 0 ea u .. L1 of .0'4
x 4- 4- 4- 4- 4- - 4- 4- 4-t 4-
g4 C1 7 0 +4 7 +4 'Z; 2 T n 28'.....f,. f,. f,... og co cac c c occoolLuic R. cn 12. 0 tn ;a , ig 14 P. 0 I 1iq PE17.45_499t. qco co co co x x a a COG.) G.) Q U000 X X w co 4. mpg ,,-,
o F cd 440. O.
276

TABLE 97
SUMMARY OF INTERIM EFFECTS FOR COHORT II, KINDERGARTEN
g(ONE-YEAR OUTCOMES)
CHILD MEASURES
PARENT MEASURES
TEACHER MEASURES
PARENT-
PARENT-
SCHOOL
CHILD
ACADEMIC
SENSE
POS. EVAI.
PARENT-
PROF.
JOB
ACHIEVE-
AWEN-
QUANTI-
COG.
LAN-
CHILD
INVOLVE-
EXPEC-
OF
OF CHILD
EDUCATOR
ACCEPT.
SATIS-
NO. OF
PROJECT CODE
MATCH
MENT
AFFECT
DANCE
WRAT
TATIVE
PROCESS
READING
GUAGE
INTERACT,
MENT
TATION
CONTROL
LEARNING
IMAGED
FT
FACTION
HELPERS
FW(a)
GOOD
.5
7.8*
4.6
1,1
-1.1.
1,9
-.182
,643
-.034
-.195
20.6
FW(b)
GOOD
-5.1
-1.2
-2.9
-4,2
-1.8
0-3,2
.718
.119
.411
23.9'
-.36
1.08
2.0*
FW(c)
MOD
10.4
1,9
-1.8
3,0
2,6*
3,1
1.9
-.050
-,623
-.512
,227
11.8
.21
1.09
.7
.5
,..
BC(C)
GOOD
9,5
.2
8.0
7.6
4.4
1.0
3.7
.8
.150
.036
.120
.272
-12.7
bas4
110(w)
MOD
27.4
1.9
-7,5
23.1
7,8
16.7
3,6
1.036*
,595
,353
-,530
9.9
.17
1.41
.6
2.0*
s4
UF
(a)
GO
OD
31.4
"1.
4-1
.420
.87,
1*.8
20.6
*3.
0.0
67.3
52.193
.379
1.6
-.38
-.11
.1
1.0
ED(b)
GO
OD
-13.1
-2,3
-7.5
-7.1
-5 9*
-4.9
-1,6
NY(a)
MO
D8.
5.3
-5.2
3.8
2.8
3.0
2,1
.309
.268
-.230
.357
17.6
OVERALL
8.7
-.15
5.8
1.3
5.1
1.1
.304
,284
-.003
.132
10.4
-.09
.87
.5
1.4
PERCENT FT FAVORING
7511;
50"I
62'1
62'1
7511,
620
757.
620
710
86',
57'1
710
86%
50%
750
1000
1000
p < .05.

TABLE 98
SUMMARY OF INTERIM EFFECTS FOR COHORT I, ENTERING FIRST
PARENT MEASURES
PARENT-
CHILD
TEACHER MEASURE.;
CHILD MEASURES
PARENT-
SCHOOL
ACADEMIC
SENSE
POS. EVAL
PARENT-
PROF.
JOB
ACHIEVE-
ATTEN-
QUANTI-
COG.
LAN-
CHILD
INVOLVE-
EXPEC-
OF
OF CHILD
EDUCVICR
ACCEPT.
SATIS-
NO. OF
PROJECT CODE
MATCH
MENT
AFFECT
DANCE
WHAT
TATIVE
PROCESS
READING
GUAGE
INTERACT.
MENT
TATION
CONTROL
LEA2NING
IMAGE
FT
FACTION
HELPERS
TWO-YEAR OUTCOMES
SS(a)t
MOD
9.7
.8
4.4
7.2'
1.8
.6
.723*
.832*
.260
_.189
-4.8
.49
.18
0
UA(b)
MOD
16.6
.8
-3.2
6.0
1.4
12.7
2.6
.279
.516
-.447
-.2t6
26.3*
-.43
.72*
-.9*
1.0*
T.JA(0
MOD
-15.2
.1
-3.9
-2.7
-13.7
1.2
-.394
-.066
-.028
.872*
20.4
.22
.37
.FP
SC(d)t
GOOD
20.1
-3.0
2.7
8.0t
9.7
2.0
.176
-.080
-.934*
.424
11.5
--
--
--
DO
MOD
-2.8
.6
2.1
-1.-6
-3.5
1.0
.684
.065
-.588
.299
12.5
.10
.50
.6
272*
UO(d)t
POOR
6.5
-.5
2.3
-4.2
11.6
-.4
-.038
-.312
-.349
-.102
22.0
.07
1.65*
02.0*
130(
e)POOR
-7.0
-2.2*__
2.8
-2.9
-1.2
-2.6
-3.4
--
--
--
--
--
--
--
--
--
.HS(a)T
MOD
-20.1
-1.1
-11.2*
-1l.2*
3.6
-20.J*
-3.3
.776*
1.401*
.813*
.130
1.3
--
--
HS(b)T
MOD
-14.1
-8.2*
-3.7
-6.2
-5.5
-7.3
-1.3
.281
-.349
-.36.1
-.791*
2.0
-.30
.12
.1
.2
UF(b)
GOOD
11.3
-6.5
4.2
2.8
6.5
2.1
-.7.11
.760*
-.115
-.341
-.55
.62
.3
1.7*
ED(a)t
MOD
-5.5
-2.3
-3.4
-.6
-4.5
.237
.807*
-.227
.306
15.4
-.03
.04
.3
-.3
OVERALL
-O
-1.0
-2.4
.5
-.1
.248
.357
-.197
.078
10.1
-.05
.52
01.0
ND L
PERCENT FT FAVORING
ONE -YEAR OUTCOMES
45%
27%
73 %
45%
45%
55%
45%
70%
60% -
20%
-
60%
80%
50%
100%
50%
88C,
SP(a)
MOD
-3.8
.5
'3.4
-3.9
-1.6
-2.9
1.2
UA(c)
MOD
-9.9*
3.3*
2.8
-3.2
-3.8
-1.4'
-2.1
-2.9*
SC(d)
GOOD
.8
1.7
-5.E
.5
.4.4
U0(d)
POOR
10.6*
-9.3'
4.1
2.4
1.1
5.3
1.9
HS(a)
MOD
-6.9
3.8'
-1.6
-5.2
-1.0
.5
-5.5
HS(b)
MOD
-4.3
-1.8
-2.4
-1.9
-2.3
-1.3
ED(a)
MOD
4.8
-.5
.1
1.2
.3
.9'
3.7
-.1
OVERALL'
1.2
1.0
-1.8
-1.2
-.8
-O
PERCENT FT FAVORING
43%
57%
57%
43%
43%
43%
43%
43%
TWO-YEAR OUTCOMES FOR
PROJECTS WITH ONE-YEAR DATA
-2.7
-1.4
-3.1
-2.2
.8
-3.2
PERCENT FT FAVORIN5
43%
14%
86%
43%
43%
43%
43%
p < .05.
*Projects for which one-year ,,utcomes are also giwen.
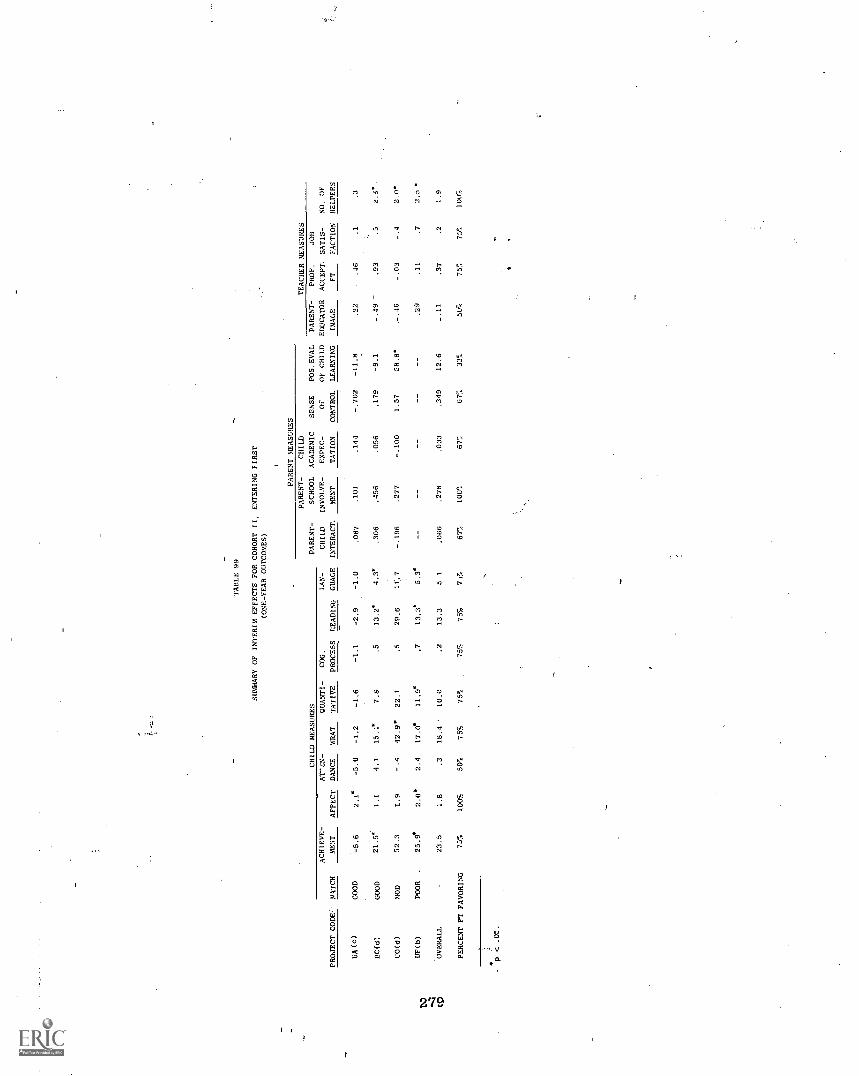
TABLE 99
SUMMARY OF INTERIM EFFECTS FOR COHORT II, ENTERING FIRST
(ONE-YEAR OUTCOMES)
PARENT MEASURES
PARENT-
CHILD
TEACHER MEASURES
CHILD MEASURES
PARENT-
SCHOOL ACADEMIC
SENSE
POS. EVAL
PARENT-
PROF.
JOB
ACHIEVE-
AT7EN-
QUANTI-
COG.
LAN-
CHILD
INVOLVE-
EXPEC-
OF
OF CHILD
EDUCATOR
ACCEPT. SATIS-
NO. OF
PROJECT CODE'-' MATCH
MELT
AFFECT
DANCE
WRAT
TATIVE
PROCESS
READING
GUAGE
INTERACT.
SCENT
TATION
CONTROL
LEARNING
IMAGE
FT
FACTION
HELPERS
UA(C)
GOOD
-5.6
2.1*
-5.0
-1.2
-1.6
-1.1
-2.9
-1.0
.087
.101
.144
-.702
-11.8
.22
..46
.1
.3
PC(d)
GOOD
21.5
1.1
4.1
15.1*
7.8
.5
13.2*
4.3*
.306
.456
.056
.179
-9.1
.93
.5
2.F.-*
U0(d)
MOD
52.3
1.9
-.4
42.9*
22.1
.5
29.6
11:.7
-.196
.277
-.100
1.57
58.8.
-.46
-.03
2.0
NUF(b)
POOR
-25.9*
2.0*
2.4
17.0*
11.9*
.7
13.3*
5.3*
.29
.11
.7
2.5 .
VD
OVERALL
23.5
1.8
.3
18.4
'
10.0
.2
13.3
5.1
.066
.278
.033
.349
12.6
-.11
.37
.2
1.9
PERCENT FT FAVORING
75%
100%
50%
75%
75%
75%
75%
71%
67%
100%
67%
67%
33%
50%
75%
75%
100%
s-
p < .05.
For each project, the number of these variables showing a FT FT differ-
ence of 10 Percentage points or more was tabulated.,- Three or less:discrep-
ancies of 10 percent or more resulted in the claSSification of an-FT/NFT
comparison as a "good" match. Four or five discrepancies of 10 percent
or more resulted in a "moderate" match classification, and six or seven
discrepancies of 10 percent resulted in a classification of "poor."
'Since these labels are somewhat arbitrary, they should not be taken
literally. One could reasonably argue that a good match is one in which
FT and NFT differ on none of the demographic variables by more than 10 per-
cent, but such a condition is virtually nonexistent in the pres,-At compari-
b00. However, our classification scheme does provide useful information,
and it is discussed later in this section.
Discussion of Summary Tables
Cohort I, Kindergarten: Fall 1^':,9 to Spring 1971
The second-year outcomes for Cohort I-K are summarized in Table 96.
These results are mixed, with little consistent evidence of 'FT impact on
the child outcome variables. Inspection of the average FT/NFT difference
summed across projects shows FT-favoring differences on the achievement
measure, the attendance measure (negative signs indicate less absentee-
ism), and the quantitative and cognitive processes measures. The remain-
ing measures favor NFT All of these differences are small and not
especially noteworthy.
The parent outcome measures are also not especially noteworthy, ex-
cept for the parent/school involvement variable, for which 81 percent of
the projects display FT-favoring results. This suggests that FT is having
an impact on the degree to which parents become involved in school-related
activities. (One must keep in mind that these measures are obtained
during the child's first year of FT participation. Thus, parent outcomes
are first-year outcomes, regardless of the cohort or grade stream).
For Cohort I teacher results, three of the four measures display
strong results.* Seventy -five percent of the projects display FT-favoring
differeAces for both the teacher acceptance of methods and the number of
*The teacher satisfaction variable and the number of classroom helpers
variable are represented by unadjusted (i.e., not subject to covariable
adjustment) outcome measures.
280
classroom helpers available to the teacher. On the other hand, only 10
percent of the projects display FT-favoring differences for the teacher's
image of the parent as an educator (i.e., in 90 percent of the projects,
NFT teachers considered at least some kinds of involvement with parents
in the educational process more 'essential" than did the FT teachers).
This outcome is difficult to interpret without more information. At
first, it suggests that for this cohort., a high degree of parental-involve-
ment has not been favorably received by many FT teachers. It may also
mean that FT teachers, having had extensive contact with parents, view
the parental role as supportive rather than essential.
Cohort I, Kindergarten: Fall 1969 to Spring 1970
The one-year effects for Cohort I-K are also summarized in Table 95.
The evidence of program impact is slightly more encouraging in these data.
FT-favoring outcomes are noted in 75 percent of the projects for the
quantitative measure and in 63 percent of the projects for the cognitive
processes variable. However, the average FT-favoring difference per proj-
ect for these variables is relatively small. The results for the remain-
ing variables are not particularly noteworthy.
Table 96 also permits comparison of one-year and two-year summary
effects of Cohort I-K. The data row labeled "Two-Year Outcomes for Proj-
ects with One-Year Data" presents the average FT/NFT second -year difference
scores for the projects included in the first-year sample (i.e., these proj-
ects represent a subset df-the Cohort I-K two-year effects sample). These
comparisons suggest some longitudinal impact for FT projects, since the
percentage of FT-favoring outcomes is generally higher in the second year
than it is in the first. This trend is also apparent in the average FT
effect across projects. This indicates that, with the exception of the
cognitive processes variable and the language variable, FT children show
a greater advantage over their NFT counterparts after two years than they
do after one year.
Cohort II, Kindergarten: Fall 1970 to Spring 1971
The summary data for Cohort II-K are presented in Table 97. An
examination of the child outcome variables is moderately encouraging in
that all of the variables except affect show average differences in favor
of FT. This pattern is also reflected in the percentage of projects re-
porting FT-favoring outcomes; the percentages range from a low of 50 (for
the affect variable) to a high of 75 (for the achievement, quantitative,
and reading variables).
281
Encouraging effects are also present for the parent outcome variables,
where four of the five measures show overall Ffavoring differences (theparent expectation variable is the exception). For all variables, the
majority of the projects showed FT-favoring results.
Teacher outcome data for Cohort II-K were available for only four
projects. Although the small number of projects precludes interpreting
the data with 'confidence, the summary outcomes are generally FT favoring.
Cohort I, Entering First: Fall 1969 to Spring 1971
The second-year summary for Cohort I-EF is presented in Table 98.
The results for the child outcome variables in this table are considerably
less encouraging than those for Cohort I-K projects. In particular, the
affect, WRAT, reading, and language measures display average outcomes
favoring the NFT sample. The only overall outcomes in favor of FT were
those for the attendance and quantitative variables. This pattern is
also displayed by the percentage of FT-favoring results. Only the attend-
ance and reading variables show a higher number of FT-favoring differences.
The parent outcome results for this cohort sample show a provocative
and somewhat paradoxical pattern. Overall results showed FT-favoring
differences (both average project effects and percentage of FT-favoring
differences) for the parent-child interactions, the parent-school involve-
ment. and the sense of control variables. The average project effect was
NFT favoring for parent expectations; in only 20 percent of the projects
did FT parents report higher expectations for their child's success than
did NFT parents. But, ironically, 80 percent of these same projects
showed higher proportions of FT parents reporting they were satisfied
with their child's current progress. This might indicate that FT parents
in these predominantly Southern rural projects simply have lower overall
aspirations for their children and, hence, appear satisfied with their
children's current progress. But this interpretation is hard to reconcile
with the more positive FT results for the school involvement and sense
of control measures, unless these parents are responding to the expecta-
tion measures on the basis of a larger socio-cultural context. (Many of
these projects involved very poor Black Fir families and less poor non-Black
NFT families).
The teacher results for this cohort sample are also difficult to
interpret straightforwardly. The average project differences show vir-
tually no FT effects on the teacher's image of the parents, and FT teachers
appear, on the average, no more or less satisfied with their working con-
ditions than do NFT teachers. But literally ev,ry project shows FT
282

teachers axe more approving of their methods than NFT teachers, and in
only ore project did NFT teachers report more classroom helpers than didFT teachers. This pattern of outcomes suggests FT is well regarded by
these teachers, perhaps because they receive more classroom assistance.
The interesting result is that these FT teachers are apparently less
negative (compared with NFT teachers) in their view of the parent as an
educator than were the FT teachers in the Cohort I-K and II-K samples.
Whether this reflects better parent-teacher relationships, indifference,
or something else is unclear at this point in the evaluation.
4 Cohort I, Entering First: Fall 1969 to Spring 1970
The available first-year child outcome data for Cohort I-EF, also
presented in Table 98, car be directly compared with second-year data.
The number of projects for which both one- and two-year results exist is
small (seven in all), which necessarily limits the confidence that can
be placed on the interpretation. The pattern of first-year results is
essentially the same as that noted for the second-year data. Most of the
variables display NFT-favoring trends (the exceptions are the attendance
and affective measures) for both the average difference measure and the
percentage o' FT-favoring projects measure.
The comparison of these Cohort I-EF first-year and second-year effects
reveals some interesting differences over those displayed by the CohortI-K sample. Specificall3), second-year effects for Cohort I-K were morefavorable than first-year effects, suggesting a cumulative positives impact
for FT. The opposite is true for the present Cohort I-EF projects, where
there is evidence of a progressive dr:rement; second-year outcomes more
frequently reflect NFT-favoring trends than do the results for these same
children after their first ,ear in the program. But since the NFT samplesrepresent a different population than the FT samples in many instances,
this result is likely due to inappropriate comparisons and thus is not
interpretable.
Cohort II, Entering First: Fall 1970 to Spring 1971
The results for the Cohort II-EF projects are summarized in Table
99. Since only four projects are included in this sample, summary sta-
tistics are likely to be unreliable. The results presented indicate afavorable impact for the FT program. With the exception of the attend-
ance ;variable, all of the child outcome variables show FT-favoring dif-
ferences. A similar pattern is observed for the parent outcome variables,
where FT-favoring trends are present for all variables. The teacher out-
come variables also display favorable trends, with the exception of the
parent image measure.
283
The Parent Image Variable
The overall trend toward negative FT results for the teacher's image
of parents as educators deserves some special attention. NFT teachers
who have not had mu,..th interaction with parents may have an exaggerated
notion of the importance of such contacts, and FT teichers may be making
more informed judgments. Perhaps contact with parents ontside of the
school context is less important to FT teachers because they have more
in- school interaction and because they feel that further contact with
parents is unnecessary. Or perhaps FT parent-teacher interactions have,
in fact, engendered resentments. The difficulty is that we do. not know
at present why the teachers responded the way they did to the items as
presented on the questionnaire, and thus, we prefer not to draw inter-
pretative conclusions at this point in the study. Nevertheless, the pat-
tern is .clear and consistent; NFT teachers reliably tended to rate parents
and parent contacts outside of class as more essential to the child's
education than did FT teachers.
Discussion of Sample Matching
The classification scheme used to index sample comparability was
devised to assist interpretation of the outcomes associated with the FT
projects. As described earlier, this scheme provides a basis for class-
ifying each FT/NFT comparison within projects as a "good;' "moderate,"
or "poor" match. The frequencies with which projects were classified
into "good," "moderate," and "poor" match categories relative to each
set of outcome analyses aresummarized in Table 100. This table shows
that of 28 Cohort I-K projects for which two-year child outcomes were
analyzed, 12 were classified as having reasonably "good" baseline com-
parability, 12 as "moderate" and 4 as "poor." Similarly, for the 26 Co-
hort I-K projects for which parent outcomes were analyzed, 11 had "good"
matches, 12 had "moderate," and 3 had "poor."
Using this classification scheme and summing across all such entries,
roughly 41 percent of the outcome analyses involved "good" FT/NFT matches,
48 percent involved "moderate" matches, and 11 percent involved "poor"
matches. But two important features of this procedure need to be stressed.
First, t!r: classification scheme is arbitrary, although we believe it is
reasonal.e and objective. Second, classroom composition and pupil famil-
ies are the match variables, whereas the match classification is applied
to pupil, parent, and teacher outcome analyses, Hence, it would not be
unusual if teacher outcomes were unrelated to the quality of pupil/parent
matches.
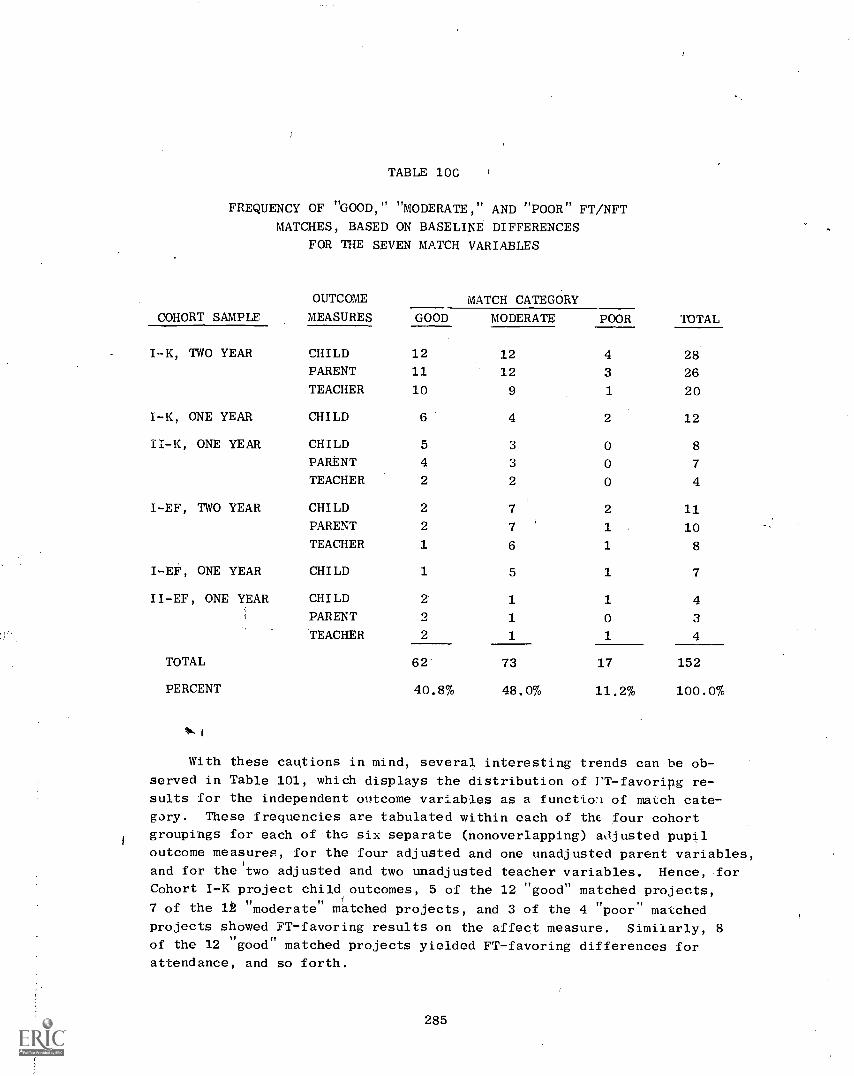
TABLE 10C
FREQUENCY OF "GOOD,"
MATCHES, BASED
FOR THE SEVEN
OUTCOME
"MODERATE," AND "POOR" FT/NFT
ON BASELINE DIFFERENCES
MATCH VARIABLES
MATCH CATEGORY
COHORT SAMPLE MEASURES GOOD MODERATE POOR TOTAL
I--K, TWO YEAR CHILD 12 12 4 28
PARENT 11 12 3 26
TEACHER 10 9 1 20
I-K, ONE YEAR CHILD 6 4 2 12
II-K, ONE YEAR CHILD 5 3 0 8
PARENT 4 3 0 7
TEACHER 2 2 0 4
I-EF, TWO YEAR CHILD 2 7 2 11
PARENT 2 7 1 10
TEACHER 1 6 1 8
I-EF, ONE YEAR CHILD 1 5 1 7
II-EF, ONE YEAR CHILD a 1 1 4
PARENT 2 1 0 3
TEACHER 2 1 1 4
TOTAL 62 73 17 152
PERCENT
to.1
40.8% 48,0% 11.2% 100.0%
With these cautions in mind, several interesting trends can be ob-
served in Table 101, which displays the distribution of FT-favoripg re-
sults for the independent outcome variables as a function of match cate-
gory. These frequencies are tabulated within each of the four cohortgroupings for each of the six separate (nonoverlapping) a0justed pupil
outcome measures, for the four adjusted and one unadjusted parent variables,
and for the'two adjusted and two unadjusted teacher variables. Hence, forCohort I-K project child
i
outcomes, 5 of the 12 "good" matched projects,
7 of the lb "moderate" matched projects, and 3 of the 4 "poor" matched
projects showed FT-favoring results on the affect measure. Similarly, 8of the 12 "good" matched projects yielded FT-favoring differences for
attendance, and so forth.
285
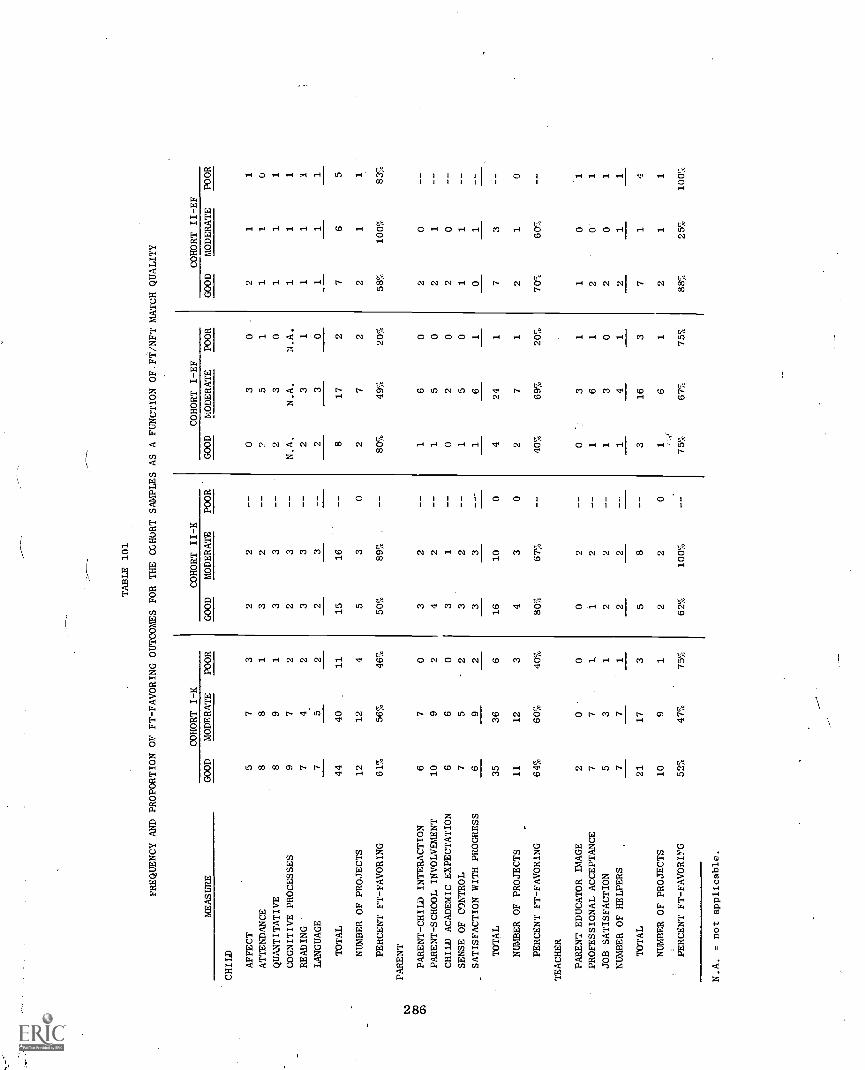
TABLE 101
FREQUENCY AND PROPORTION OF FT-FAVORING OUTCOMES FOR THE COHORT SAMPLES AS A FUNCTION OF.FT/NFT MATCH QUALITY
MEASURE
COHORT I -K
COHORT II -K
COHORT I -EF
COHORT II -EF
GOOD
MODERATE
POOR
GOOD
MODERATE
POOR
GOOD
MODERATE
POOR
GOOD
MODERATE
POOR
CHILD
AFFECT
57
32
20
30
21
1
ATTENDANCE
88
13
29
51
11
0
QUANTITATIVE
89
13
32
30
11
1
COGNITIVE PROCESSES
97
22
3N.A.
N.A.
N.A.
11
1
READING
'
74
23
32
31
11
1
LANGUAGE
75
22
32
30
11
1
TOTAL
44
40
11
15
16
817
27
65
NUMBER OF PROJECTS
12
12
45
30
27
22
11
PERCENT FT-FAVORING
61%
56%
46%
50%
89%
.80%
49%
20%
58%
100%
83
PARENT
PARENT-CHILD INTERACTION
67
03
21
60
20
PARENT-SCHOOL INVOLVEMENT
10
92
42
15
02
1
CHILD ACADEMIC EXPECTATION
66
03
10
20
20
SENSE OF CONTROL
75
-2
32
15
01
1
SATISFACTION WITH PROGRESS
69
23
31
61
01
TOTAL
35
36
616
10
04
24
17
3
NUMBER OF PROJECTS
11
12
34
30
27
12
10
PERCENT FT-FAVORING
64%
60%
40%
80%
675
40%
69%
20%
70%
60%
TEACHER
PARENT EDUCATOR IMAGE
20
00
20
31
10
PROFESSIONAL ACCEPTANCE
77
11
21
61
20
1
JOB SATISFACTION
53
12
21
30
20
1
NUMBER OF HELPERS
77
12
21
41
21
1
TOTAL
21
17
35
83
16
37
14
NUMBER OF PROJECTS
10
91
22
01
61
21
1
PERCENT FT- FAVORING
52%
47%
757
62%
100%
757
67%
75%
88%
25%
1005
N.A. = not applicable.
The entries at the bottom of each measurement o.tegory in Table 101show the overall frequency and percent ofFT-favoring results for each sepa-
rate match classification. Thus, for Cohort I-K, 61 percent of the indepen-
dent child outcomes among "good" matched projects favored I 56percent of
the "moderate" matches favored FT, and 46 percent of the "poor" matches
favored FT. This trend is even more pronounced for Cohort I-EF, when°
the values are 80, 49, and 20 percent, respectively. The trend is less
clear for Cohort II-K and II-EF, although interpretation is difficult be-
cause there mere no "poor" match classifications for Cohort II-K and be-
cause only four projects were analyzed for Cohort II-EF. Yet the Cohort I
pattern does appear to suggest that outcomes favor FT more strongly when
comparability is good. Recall that FT populations tend to be more dis-
advantaged than comparison popta-allonS. Thus, when the FT/NFT comparisons
are made between similar populations, FT-favoring pupil outcomes are likely.
The relationship of outcomes to quality of match becomes even morepronounced with parent data. This result is important because six of the
seven match variables are parent characteristics. Although this evidence
of a strong relationship between the proportion of FT-favoring results
and the comparability of FT/NFT families is probably due to the inappropri-
ateness of the covariance model (or any analysis model) when bias becomes
great, it is not immediately clear why NFT is favored. A furth,..1 break-
down of the nature of these extreme biases in the match between FT and
NFT suggests an answer. In some three-fourths (76 percent) of the in-
stances of extreme noncomparability (i.e., poor matches between FT andNFT), NFT was markedly less disadvantaged than FT. In contrast, barely
more than half (56 percent) of the' moderate mismatches between FT and NFT
showed FT to be more disadvantaged than NFT. Hence, it is clear that these
results are seriously dependent on both the magnitude and direction of
initial biases and that covariance adjustments are insufficient to over-
come these biases with these interim child and parent data._ .
We feel this result is very important, since it typifies the extra-
ordinarily complex problem of obtaining valid assessments of individual
project results. Figure 5 graphically displays the relationship of the
pupil outcome trends to the degree of initial bias in the FT and comparison
samples. These patterns are displayed separately for the K entrance (Part
A) and First Grade entrance (Part B) project samples. Several features of
the interim pupil results become evident in this display. First, the
relationship between outcomes and match bias is unmistakable, even though
the match variables were included as covariates in the analyses of the
data. Second, this relationship appears more pronounced for EF than for
K samples, which corresponds to our previously noted observation that
match problems tend to be more severe for EF than K projects. Third,
these match bias problems notwithstanding, the frequency of results reach-
ing significance is clearly in favor cf FT, whereas the rate of significant
287
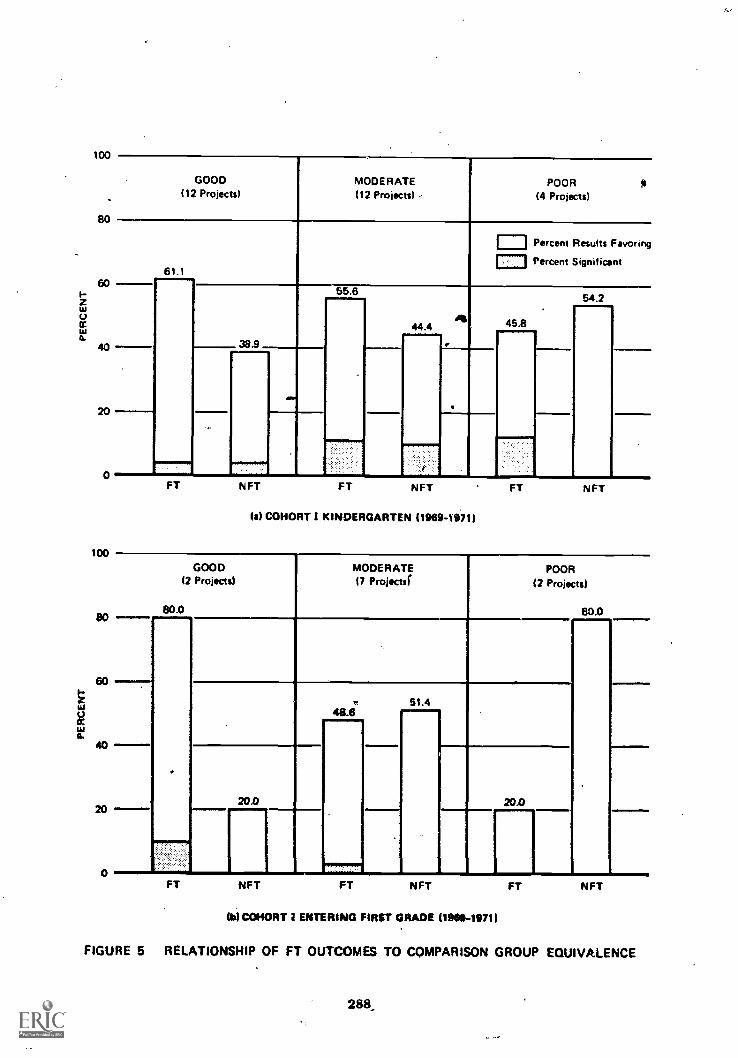
a
100
80
60
40
20
0
100
80
60
40
20
0
GOOD(12 Projects)
MODERATE(12 Projects) -
POOR 9(4 Projects)
61.1
Percent Results Favoring
Percent Significantinal
38 9
55.6
44.4 445.8
54.2
S
FT NFT FT NFT
(a) COHORT I KINDERGARTEN (19694971)
FT N FT
GOOD(2 Projects)
80.0
MODERATE(7 Projectir
POOR(2 Projects)
80.0
si
48.651.4...........
20D Ir ....Ip qmomommw20.0
loomowommr
FT NFT FT N FT
tbl COHORT 1 ENTERING FIRST GRADE 1180-19711
FT NFT
FIGURE 5 RELATIONSHIP OF FT OUTCOMES TO COMPARISON GROUP EQUIVALENCE
288.

differences for the NFT groups is generally at or below the "experiment-
wise" error rate (i.e., the overall alpha level). Finally in our judgment
these trends provide sufficient evidence for deleting project samples
judged as poorly matched with their comparisons from our summary assess-
ments of interim program impacts on pupil and parent measures, since in
these cases the initial mismatch apparently dominates the data.
Restricting our tabulations of outcomes (Table 101) to those project
samples judged either well or moderately matched on the seven match vari-
ables (classroom composition and family characteristics) several interest-
ing trends emerge. Figure 6 shows that for the 33 Cohort I (good and
moderate matched) projects about 58% of the adjusted mean differences on
pupil variables showed FT as having a positive impact, whereas for the11 Cohort II projects, 67% of the outcomes were FT favoring. This upward
trend in the proportion of FT favoring results (especially the proportion
100
(a) COHORT I (1969-1971)2 Year (p3 Projects)
80
lb) COHORT II (1970-1971)1 Year (11 Projects)
60 57.7
66.7
wUCCwa.
42.3
4033.3
20
FT NFT FT NFT
Percent Results Favoring
Percent Significant
FIGURE 6 OVERALL FT IMPACT ON PUPIL OUTCOMES
289
of differences reaching significance) from Cohort I to Cohort II demon-
strates an apparent program maturation phenomenon. That is, the impact
of the program on successive cohorts appears to be getting stronger.
This could mean that as sponsors, teachers, and other Wtakeholders gain
experieflce with FT-like procedures, they become more effective imple-
menters of the program. Also involved in this apparent effect, however,
are improvements in evaluation methodology. Cohort II baseline measures
were gathered substantially closer to the commencement of school and data
collection procedures were more systematic, complete, and error-free than
was the cost for Cohort I.*
However, the interpretation of a FT maturation or implementation
effect is further supported upon comparison of program impact on successive
cohort parent and teacher samples. Cohort I to Cohort II outcome (FT-NFT
difference) trends on the five parent measures (reported child interac-
tions, school involvement, satisfaction with progress, future expecta-
tions, and sense of control) are summarized in Figure 7. These re-
sults again summate results across only those projects for which NFT
matches were categorized as good or moderate. Thus, of the 32 Cohort I
projects, nearly 61% of the results showed positive FT impact, whereas
for the 10 Cohort II projects, 72% of the results were FT favoring. This
trend is further supported by a parallel trend in the proportion of dif-
ferences reaching significance.
Teacher outcome dataf(Figure 8) show even stronger implementation or
program maturational trends. These results which are summed across all
projectst show the proportion.iif FT or NFT favoring (and proportion-
significant) differences on the four teacher variables: Parent educator
image, professional acceptance of method, job satisfaction and adult
assistance. For the 28 Cohort I teacher samples, approximately 60% of
all adjusted mean differences on these measures were FT favoring, whereas
for the 8 projects represented by the Cohort II teacher data, over 78%
of all differences favored FT. Thus it is difficult to escape the
Recall, Cohort I baseline pupil data were collected as late as December,1969, whereas Cohort II pretest measures were gathered in September andOctober, 1970. And since baseline differences were included as covariates,
CI FT programs which produced impacts in the first fear months of school
would be (invalidly) penalized, or at least underestiMated.$Since match categories were constructed independent of teacher consid-
eration, there is no a priori basis for excluding teacher comparisOn
data on projects mismatched with respect to pupil/family characteristics.
In fact, the overall FT favoring outcome rates were 70%, 60%, 83% forgood, moderate and poor matches, respectively.
290
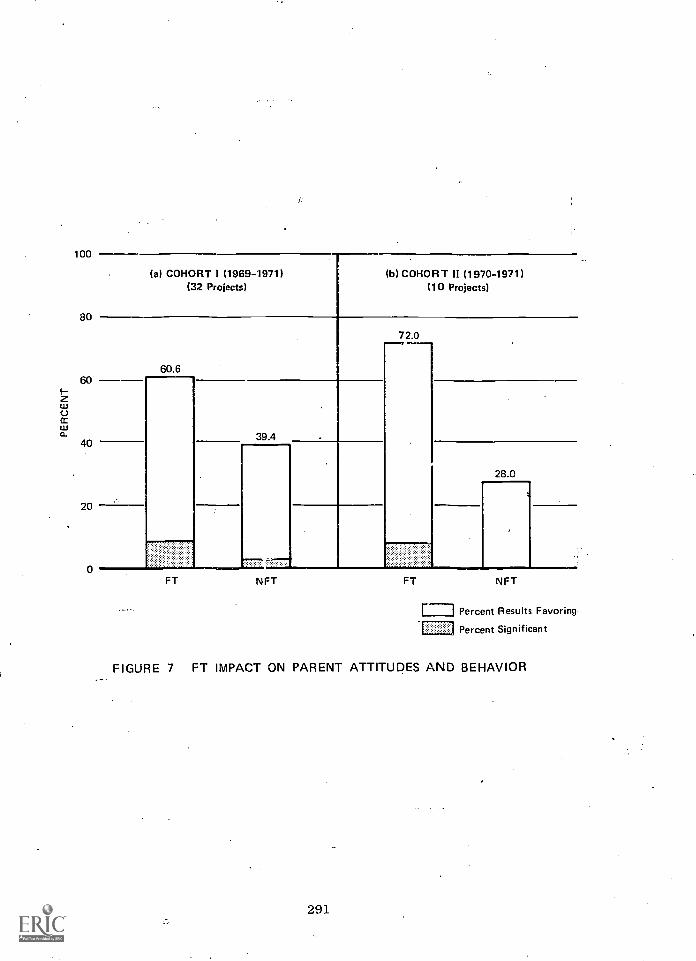
100
(a) COHORT I (1969-1971)(32 Projects)
(b) COHORT 11 (1970-1971)(10 Projects)
80
60.6
72.0
60
w
wa. 39.4
40
28.0
20
0FT NFT FT NFT
Percent Results Favoring
Percent Significant
FIGURE 7 FT IMPACT ON PARENT ATTITUDES AND BEHAVIOR
291

100
(a) COHORT 1 (1969-1971)(28 Projects)
80
IbICOHORT 11 (1970-1971)(8 Projects)
78.1
59.860
2wccwo_ 40.1
40
22.9
20
FT NFT FT NFT
EiPercent Results Favoring[:=1 Percent Significant
FIGURE 8, FT IMPACT ON TEACHER ATTITUDES AND BEHAVIOR
292
interpretation that FT is having a stronger and more positive impact on
successive samples of parents and teachers, as measured by the current
evaluation variables.
In summary, given the provocative relationships of outcomes to initial
FT/comparison group equivalence as demonstrated above, added to the multi-
plicity of design and methodological factors which combine to produce ex-
tremely low statistical power for detection of differences as significant,
it seems preferable to interpret these data patterns in the context of
the overall, as opposed to "significant only" results, noting carefully
each of the major caveats associated with interpretations at this time.
We feel there is evidence of an emerging program impact, which is increas-
ing in magnitude as the program matures. These trends are revealed by
inspection of pupil, parent, and teacher outcomes for successive cohort
samples, controlling for FT/NFT comparability. The extent of project and
sponsor variation in conjunction with problems of sample size, measurement
validity, and comparison group bias makes these conclusions highly
speculative. HoWever, one could expect little more from only a glimpse
of emerging effects representing a limited sample of observations made
less than one-fourth of the way through a planned national longitudinal
experiment. To try to infer or conclude more than this now would be
equivalent to attempting to describe the results of a race based on the
relative positions of jUst a few participants at a point less than one-
quarter of the distance to the goal. Such conjecture is neither respon-
sible nor in the interest of the evaluation.
293LVII jags

PART 3
OBSERVATIONAL EVIDENCE OF PLANNED VARIATIONS
1

PART 3: OBSERVATIONAL EVIDENCE OF PLANNED VARIATIONS
Background
A central purpose of the national Follow ThroughProgram was to
encourage the development and refinement of improved approaches to early
education.I Each of the sponsored Follow Through approaches is intended
to offer an alternative to the kinds of school experiences traditionally
encountered by poor children during their primary school years.
In the interim evaluation, this concept of "planned variation" rep-
resents the "treatment" whose impacts are being evaluated. As shown in
preceding sections, some sponsors emphasize changes in parent-school
communication patterns, others concentrate on influencing parent-child
interactions, and nearly all attempt to affect teacher-child interactions
in the classroom. The parent and teacher outcome measures obtained during
the first year of the children's FT experience can be considered as evi-
dence of the implementation of treatment. A separate study of community
factors is designed to assess changes in parent-school relations, which
can, in turn, be considered as important mediators of child outcomes.
This interim evaluation does not purport to test a definitive model
of factors causally related to child achievement and affect. Moreover,
an assessment of all possible determinants of child outcomes is beyond
4 the scope of this evaluation. In fact, many such possible determinants
may still be latent now, and their detection will be dependent on sub-
sequent assessments.
To the extent that we can observe reliable components that system-
atically occur in classrooms within a planned variation, we have some
evidence as to what comprises these treatments. Moreover, it is through
these claAsroom observation data that we have our best evidence that
treatments, as such, even existed. The existence of evidence of imple-
mentation of the various FT treatments contrasts with a lack of documen-
tation of treatment in several other compensatory education programs
(Wargo, 1972). We present here evidence that FT sponsors have, in fact,
implemented treatments at the classroom level (as administered by
teachers) that are discernibly different from activities observed in
comparison schools or in other FT-sponsored schools.
297
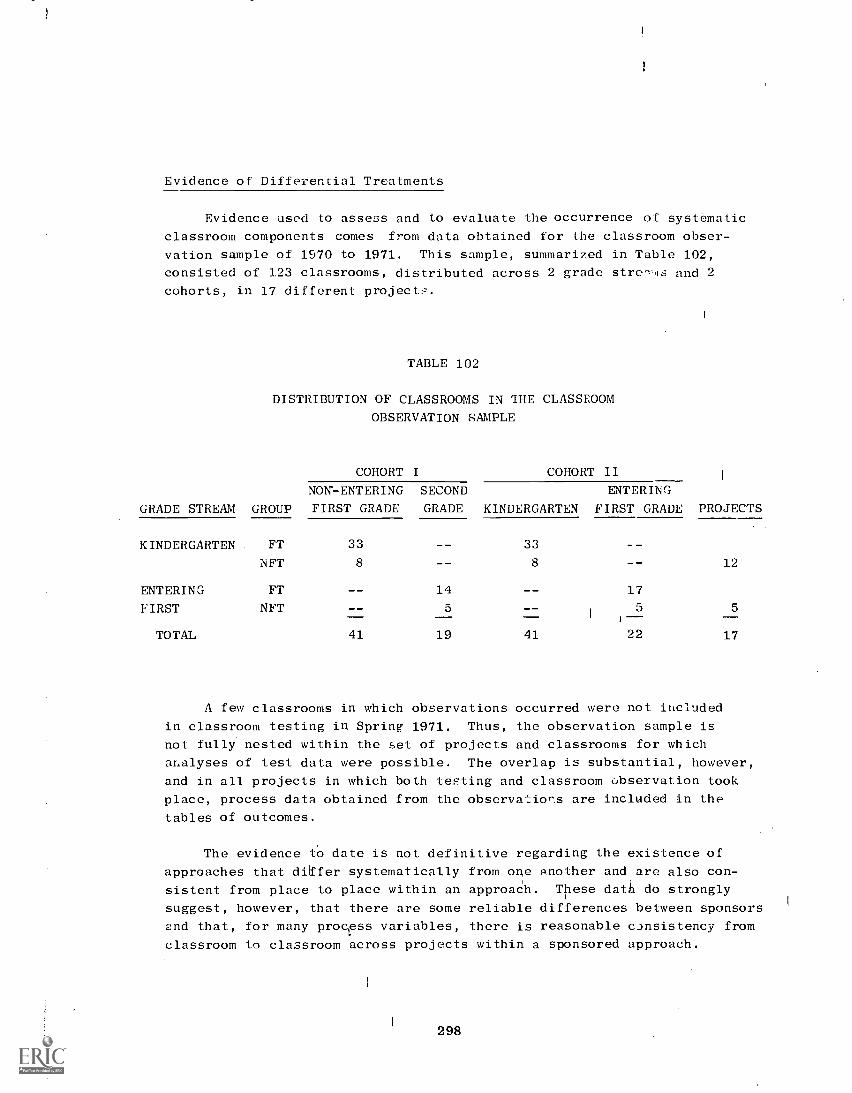
Evidence of Differential Treatments
Evidence used to assess and to evaluate the occurrence of systematic
classroom components comes from data obtained for the classroom obser-
vation sample of 1970 to 1971. This sample, summarized in Table 102,
consisted of 123 classrooms, distributed across 2 grade stre-ts and 2
cohorts, in 17 different projects.
TABLE 102
DISTRIBUTION OF CLASSROOMS IN THE CLASSROOM
OBSERVATION SAMPLE
COHORT I COHORT II1
NON-ENTERING SECOND ENTERING
GRADE STREAM GROUP FIRST GRADE GRADE KINDERGARTEN FIRST GRADE PROJECTS
KINDERGARTEN FT 33 33
NFT 8 8 12
ENTERING FT 14 17
FIRST NFT 5 51--
5
TOTAL 41 19 41 22 17
A few classrooms in which observations occurred were not included
in classroom testing in Spring 1971. Thus, the observation sample is
not fully nested within the set of projects and classrooms for which
analyses of test data were possible. The overlap is substantial, however,
and in all projects in which both testing and classroom observation took
place, process data obtained from the observatior.s are included in the
tables of outcomes.
The evidence to date is not definitive regarding the existence of
approaches that differ systematically from otle another and are also con-
sistent from place to place within an approach. These dath do strongly
suggest, however, that there are some reliable differences between sponsors
cnd that, for many procpss variables, there is reasonable c)nsistency from
classroom to classroom across projects within a sponsored approach.
298

To summarize the outcome tables, we have displayed factor scores
derived from the observations. These factor scores provide a qualitative
indication of process characteristics within those projects where obser-
vations were conducted. Informal analyses of factor score profiles sug-
gest substantial homogeneity across classrooms within sponsor categories
for some factors and considerable heterogeneity across classrooms within
sponsor categories for other factors.
For seven of the nine sponsors included in the sample, observations
occurred in two different projects, thus enabling analysis of interproject
process consistency. Before summarizing this examination, it is important
to emphasize that sponsor and district or project influences are confounded;
i.e., to the extent that process regularities occurring in observed class-
rooms are more a function of district influences than sponsor influences,
our interpretations of these regularities as treatments will be in error.
Despite these interpretive caveats, visual examination of the factor
profiles supports two interpretations:
(1) Reasonable similarity exists between projecth within sponsor
categories on some factors.
(2) The two factors for which there is the least apparent inter-
site difference within sponsors are also the factors that
reveal the most consistent intersponsor differences.
Table 103 summarizes the results of judgmental interpretation of fac-
tor scores across classrooms within and between projects for each of the
seven sponsor categories in which observation occurred in two different
projects. This table shows that for the self-regulatory and programmed
academic factors, apparent differences between groups of classrooms in two
different projects were small for nearly all sponsors. In contrast, most
of the seven sponsors show higher variability across two groups of class-
rooms for the remaining three factors. The sponsors differed somewhat on
their apparent consistency for certain factors. For example, while the
self-re;ulatory and programmed academic factors appeared to differentiate
reasonably well among the set of seven sponsors, additional factors may
also be characteristic of a particular sponsor. For example, FW projects
showed reasonable similarity between two project locations on the self-
regulatory factor, the programmed academic factor, and the child self-
learning factor; and UA projects showed reasonable similarity on the
self-regulatory factor, the child-initiated interaction factor, and the
programmed academic factor.
299
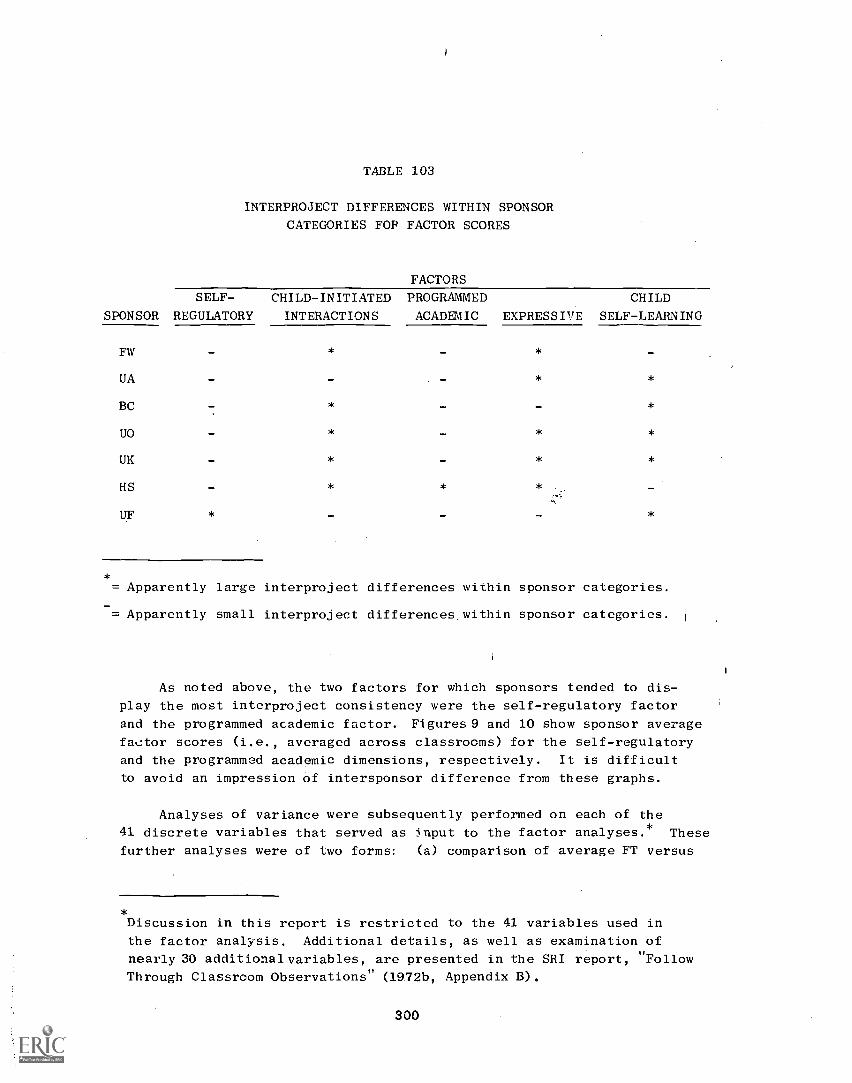
TABLE 103
INTERPROJECT DIFFERENCES WITHIN SPONSOR
CATEGORIES FOP FACTOR SCORES
SPONSOR
FACTORS
SELF-
REGULATORY
CHILD-INITIATED
INTERACTIONS
PROGRAMMED
ACADEMIC EXPRESSIVE
CHILD
SELF- LEARNING
FW
UA
-
-
*
-
- *
*
-
*
BC - * - - *
UO - * - * *
UK - * - * *
HS - * * * -
OF * - - - *
= Apparently large interproject differences within sponsor categories.
= Apparently small interproject differences. within sponsor categories. i
As noted above, the two factors for which sponsors tended to dis-
play the most interproject consistency were the self-regulatory factor
and the programmed academic factor. Figures 9 and 10 show sponsor average
factor scores (i.e., averaged across classrooms) for the self-regulatory
and the programmed academic dimensions, respectively. It is difficult
to avoid an impression of intersponsor difference from these graphs.
Analyses of variance were subsequently performed on each of the
41 discrete variables that served as jnput to the factor analyses.* These
further analyses were of two forms: (a) comparison of average FT versus
*Discussion in this report is restricted to the 41 variables used in
the factor analysis. Additional details, as well as examination of
nearly 30 additional variables, are presented in the SRI report, "Follow
Through Classroom Observations" (1972b, Appendix B).
300
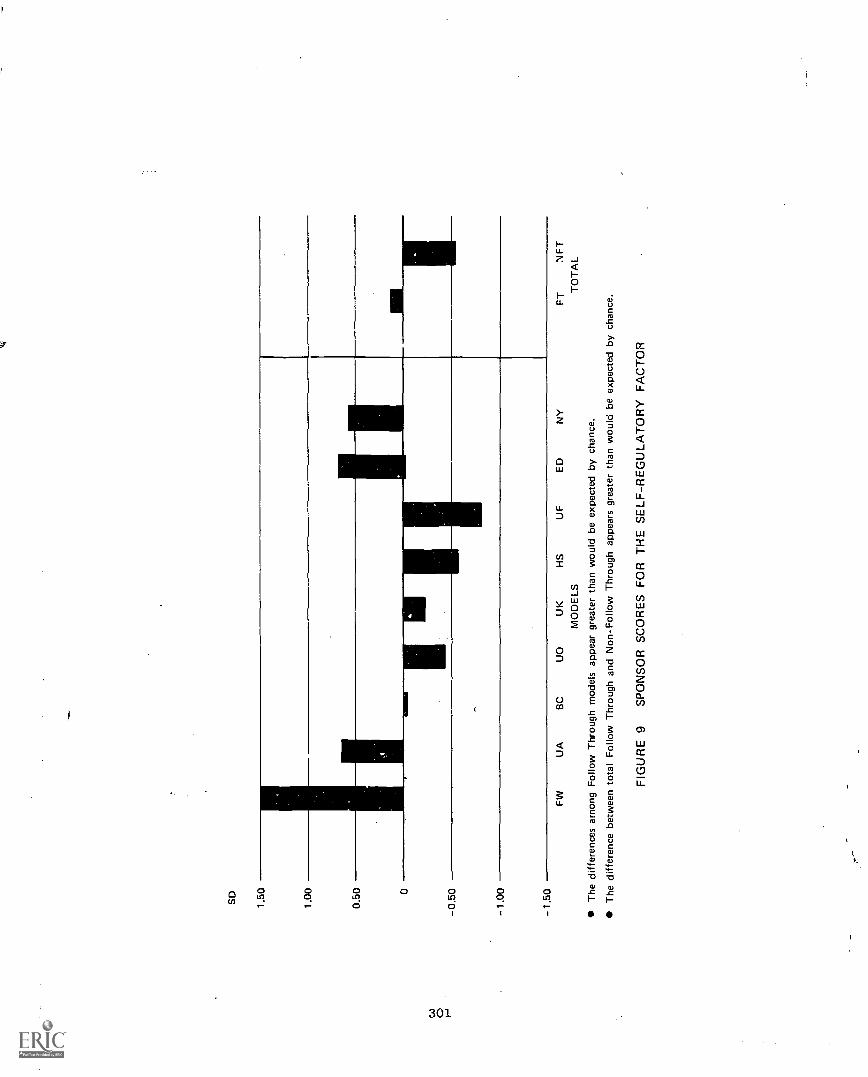
vi
FW
UA
BC
UO
UK
HS
OF
ED
NY
MO
DE
LS
The
diff
eren
ces
amon
g F
ollo
w T
hrou
gh m
odel
s ap
pear
gre
ater
than
wou
ld b
e ex
pect
ed b
y ch
ance
.
The
diff
eren
ce b
etw
een
tota
l Fol
low
Thr
ough
and
Non
--F
ollo
w T
hrou
gh a
ppea
rs g
reat
er th
an w
ould
be
expe
cted
by
chan
ce.
FT
NF
TT
OT
AL
FIG
UR
E 9
SP
ON
SO
R S
CO
RE
S F
OR
TH
E S
ELF
-RE
GU
LAT
OR
Y F
AC
TO
R
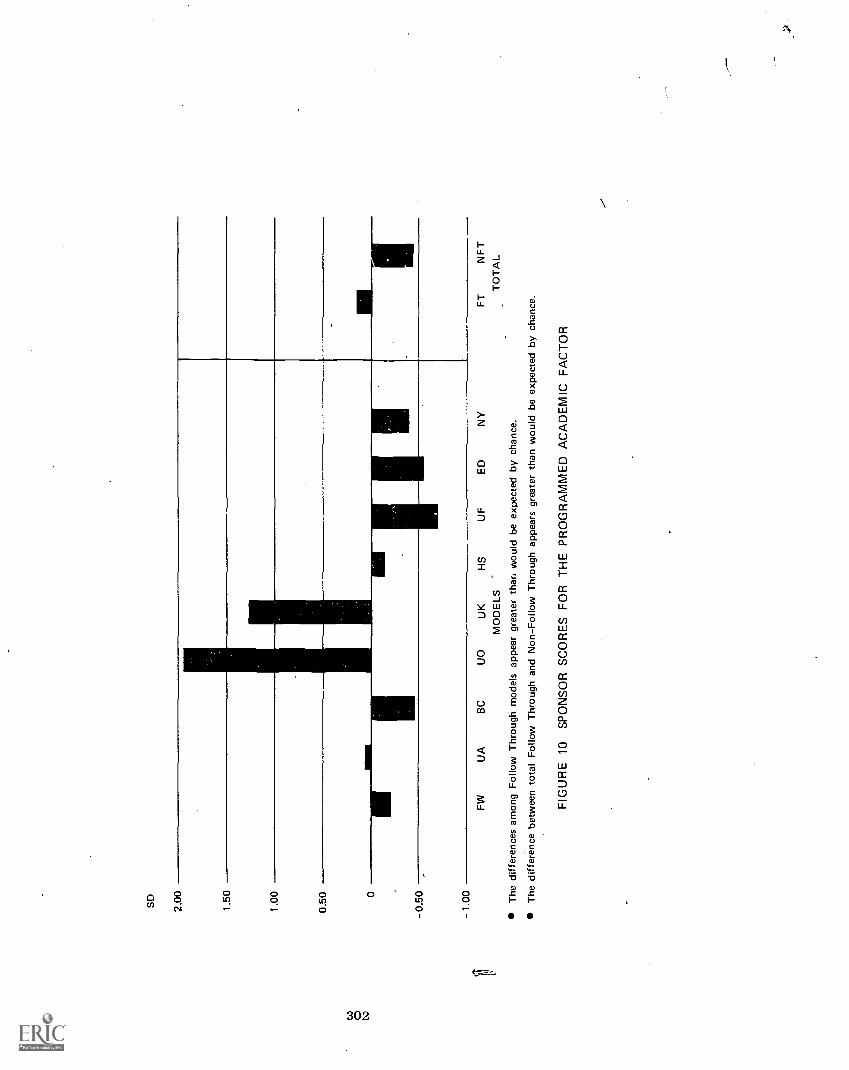
SD
2.00
1.50
1.00
0.50 0
- 0.
50
- 1.
00
FW
UA
BC
UO
UK
HS
OF
ED
NY
FT
NF
TM
OD
ELS
TO
TA
L_
The
diff
eren
ces
amon
g F
ollo
w T
hrou
gh m
odel
s ap
pear
gre
ater
than
wou
ldex
pect
ed b
y ch
ance
.
The
diff
eren
ce b
etw
een
tota
l Fol
low
Thr
ough
and
Non
-Fol
low
Thr
ough
app
ears
gre
ater
than
wou
ld b
e ex
pect
ed b
y ch
ance
.
FIG
UR
E 1
0 S
PO
NS
OR
SC
OR
ES
FO
R T
HE
PR
OG
RA
MM
ED
AC
AD
EM
IC F
AC
TO
R
NFT values averaged across all FT/NFT classrooms, and (b) intersponsor
comparisons of means. The first analysis served to point up process
components that differentiate FT from NFT. The latter analyses provide
a basis for qualitative validation of planned variations on a variable-
by-variable basis.
Results of the across-sponsor comparisons reveal consistent and
significant FT/NFT differences for all process variables directly related
to the number of adults involved in classroom activities and for a number
of other variables that are probably (but not certainly) related to adult-
child ratios. Only one process variable that may be independent of adult-
child ratios displayed significant FT/NFT differences. This pattern of
results is shown in Table 104.
In Table 104, variables that significantly differentiate between
FT and NFT classrooms are grouped in terms of apparent relationship to
the number of adults in the classroom. These variables are listed in
terms of the direction (FT or NFT) of the difference.
Since the evidence clearly indicates that FT/NFT treatment differences
are strongly dependent on adult participation in the classroom, a tabu-
lation of adult-pupil ratios observed in these classrooms was made. The
results of this tabulation, displayed below, show how different the two
groups really are on
Ratio
this variable.
Follow Through
(N = 97)
Non-Follow Through
(N = 26)
Maximum 1 to 3 1 to 7
Average 1 to 6.8 1 to 12.8
Minimum 1 to 14 1 to 33
We feel that this result is important because a favorable adult-child
ratio is a necessary condition for the implementation of many critical
features (or treatment components) of the planned variations. Evidence
for the implementation of planned variations at a more detailed level thansheer adult-child ratio is available. Sponsors report preservice and
inservice training for aides as well as for teachers. Observation data
reported more fully elsewhere indicate that not only are there more aides
in FT, but also that they function differently in the academic program
in the classroom than do NFT aides.
303

Table 104
PROCESS VARIABLES THAT DIFFERENTIATE* BETWEEN FT
AND NFT CLASSROOMS
Relation of Process
to Adult-to-Child Ratio
in the Classroom
Almost certainly directly
related to number of
adults
Probably related to num-
ber of adults
May not be related to
number of adults
Characteristic Processes
Follow Through
Adult with one or two
children in academic
activities
Adult with small
groups of children in
academic activities
Aides participating in
academic activities
Adult communication
focus on small groups
of children
Arts, crafts, sewing,
cooking, pounding ac-
tivities
Blocks, trucks, dolls,
dress-up activities
Guessing games, table
games, puzzles
Independent child ac-
tivities
Snacks, lunch, group
time
Wide variety of ac-
tivities
Academic activities
Non-Follow Through
Adult communication focus
on large groups of chil-
dren
Adult informing children
*Differences between FT classrooms (N = 97) and NFT classrooms (N = 26) were
statistically significant (p < .05).
304
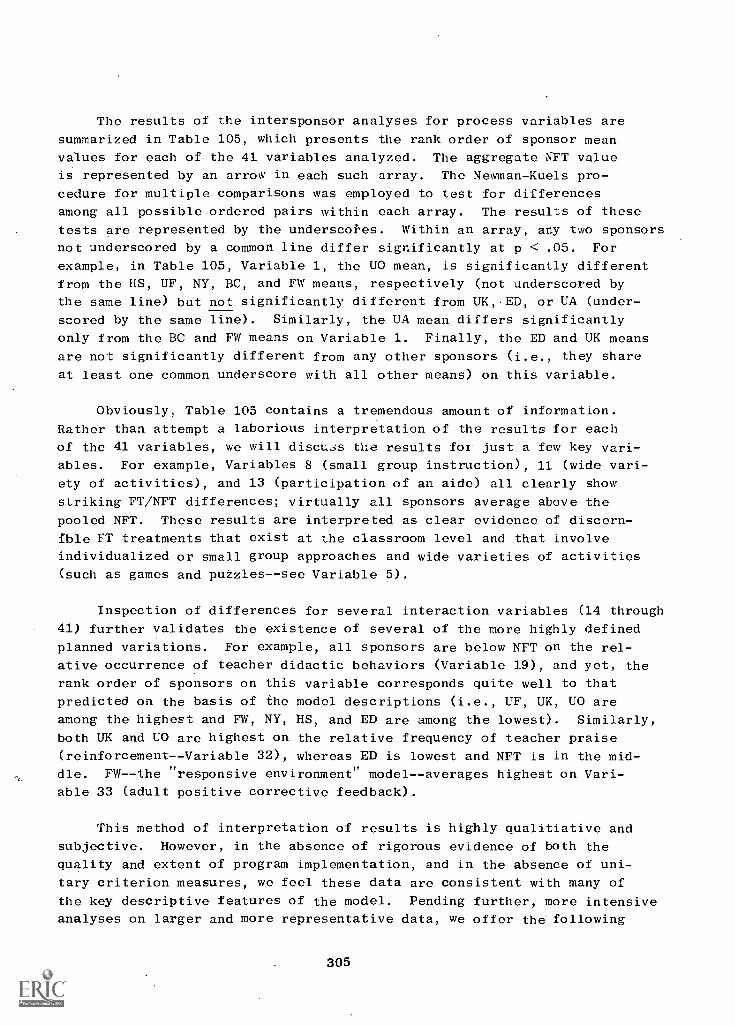
The results of the intersponsor analyses for process variables are
summarized in Table 105, which presents the rank order of sponsor mean
values for each of the 41 variables analyzed. The aggregate NFT value
is represented by an arrow in each such array. The Newman-Kuels pro-
cedure for multiple comparisons was employed to test for differences
among all possible ordered pairs within each array. The results of these
tests are represented by the underscotes. Within an array, any two sponsors
not underscored by a common line differ significantly at p < .05. For
example, in Table 105, Variable 1, the UO mean, is significantly different
from the HS, UF, NY, BC, and FW means, respectively (not underscored by
the same line) but not significantly different from UK,ED, or UA (under-
scored by the same line). Similarly, the UA mean differs significantly
only from the BC and FW means on Variable 1. Finally, the ED and UK means
are not significantly different from any other sponsors (i.e., they share
at least one common underscore with all other means) on this variable.
Obviously, Table 105 contains a tremendous amount of information.
Rather than attempt a laborious interpretation of the results for each
of the 41 variables, we will discus the results for just a few key vari-
ables. For example, Variables 8 (small group instruction), 11 (wide vari-
ety of activities), and 13 (participation of an aide) all clearly show
striking FT/NFT differences; virtually all sponsors average above the
pooled NFT. These results are interpreted as clear evidence of discern-
ible FT treatments that exist at the classroom level and that involve
individualized or small group approaches and wide varieties of activities
(such as games and puzzles--see Variable 5).
Inspection of differences for several interaction variables (14 through
41) further validates the existence of several of the more highly defined
planned variations. For example, all sponsors are below NFT on the rel-
ative occurrence of teacher didactic behaviors (Variable 19), and yet, the
rank order of sponsors on this variable corresponds quite well to that
predicted on the basis of the model descriptions (i.e., UF, UK, UO are
among the highest and FW, NY, HS, and ED are among the lowest). Similarly,
both UK and UO are highest on the relative frequency of teacher praise
(reinforcement--Variable 32), whereas ED is lowest and NFT is in the mid-
dle. FW--the "responsive environment" model--averages highest on Vari-
able 33 (adult positive corrective feedback).
This method of interpretation of results is highly qualitiative and
subjective. However, in the absence of rigorous evidence of both the
quality and extent of program implementation, and in the absence of uni-
tary criterion measures, we feel these data are consistent with many of
the key descriptive features of the model. Pending further, more intensive
analyses on larger and more representative data, we offer the following
305

TABLE 105
OBSERVED SPONSOR DIFFERENCES FOR CERTAIN
CLASSROOM PROCESS VARIABLES
PROCESS VARIABLES
Activities (CCL)
1. A-Lunch, snack
SPONSOR MEAN*
LOW HIGH
2. B-Group time, story, singing,dancing UO,UK,NY,UF,BC,HS,UA,FW ED
3. C-Arithmetic, numbers, math.,reading, alphabet, languagedevelopment
4. D-Social studies, geography,science, natural world
5. E-Games, puzzles
6. F-Arts, crafts, sewing,cooking, pounding, sawing
7. G-Blocks, trucks, dolls,dress-up
B. Adult with small groups inacademic activities
9. Academic activities
10. Independent child activities
11. Wide variety of activities
12. Adult with one or twochildren in all activities
13. Aide participating inacademic activities
Interactions (FMO)
14. Adult informing childsymbolically
15. Adult asking child a directquestion
16. Direct question followed bychild response
17. Adult praise and correctivefeedback
18. Child response followed byadult feedback
19. Adult informing child
20. Adult asking child thought-provoking questions
ED,UF,BC,HS,FW,NY,UA,UK,U0
UO,UF,UK,NY,LCUA,FW,HS ED
UF,UK,NY,UO,HS,BC,FW UA ED
UO,UF,NY,UK,HS,UA,FW,BC,ED
ED,UF,FW,BC,NY,BS,UA,UK U0
UF4BO,NY,BC,HS,UK,UA,FW ED
HS,NY,UO,UF,UA,UK,BC FW ED
ED1NY,BC,HS,UF,FW,UA,U0 UK
NY,UA,UO,HS,FW,UF,BC,UK,ED
FW,UF,BC,UK,ED,HS,NY,UA,UO
f
FW,UF,BC,UK,ED,H7Y,VA,U0
UF,ED,UA,FW,NY4BC,HS,UK,U0
ED,UK,UA FW,NY,BCF,HS,U0
FW,NY,HS,ED,BC,UA,UF,UK,U0
f= Mean for aggregate of NFT classrooms observed (N = 26).
Sponsor means on each variable are ordered in increasing magnitude.
Underlining indicates subsets of no significant difference (p <.05)
between sponsors, as determined by the multiple range test, Newman-Kuels method.
306
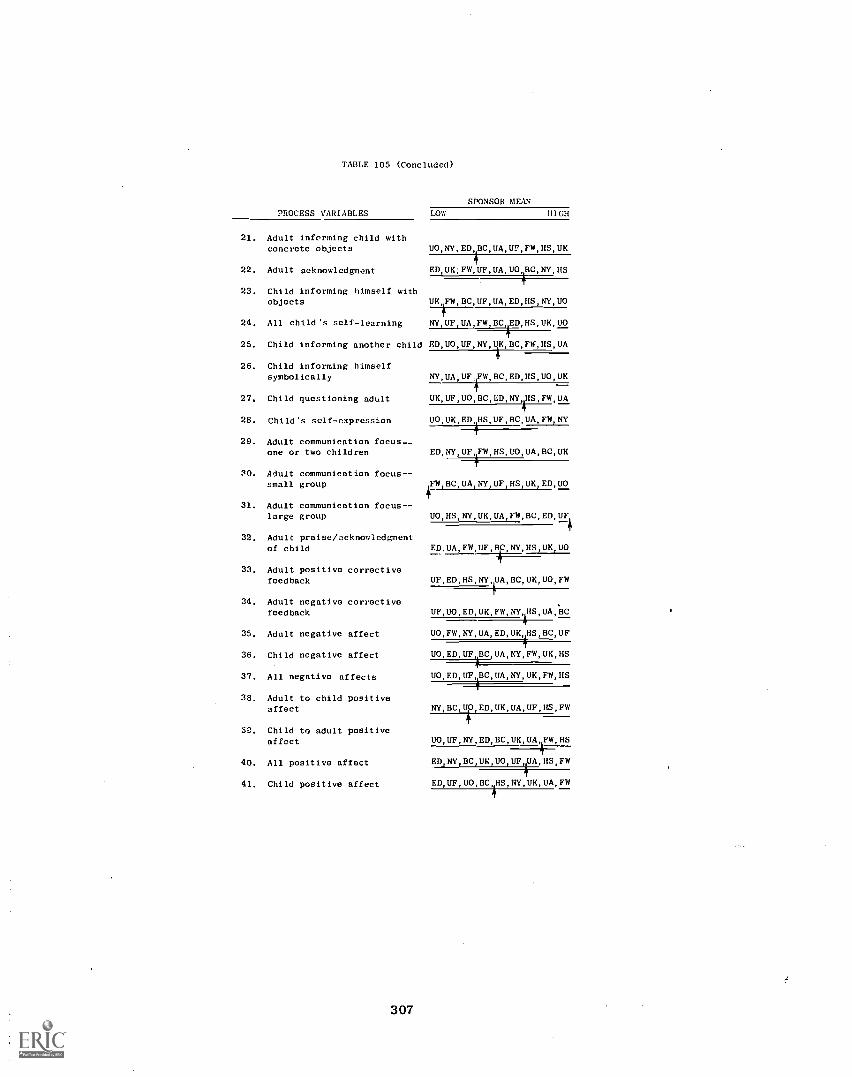
TABLE 105 (Concluded)
PROCESS VARIABLES
SPONSOR MEAN
LOW HIGH
21. Adult informing child withconcrete objects
22. Adult acknowledgment ED,UK;FW,UF,UA,UO,BC,NY,HS
23. Child informing himself withobjects UK,FW,BC,UF,UA,ED,HS,NY,U0
24, All child's self-learning NY,UF,UA,FW,BC,ED,HS,UK,U0
25. Child informing another child ED,UO,UF,NY,UK,BC,FW,HS,UA
26. Child informing himselfsymbolically NY,UA UF,FW,BC,ED,HS,UO,UK
27. Child questioning adult UK,UF,UO,BC,ED,NY,HS,FW,UA
28. Child's self-expression NY
29. Adult communication focus--one or two children
30. Adult communication focus- -small group IFW,BC,UA,NY,UF,HS,UK,ED,U0
32. Adult communication focus- -large group
32. Adult praise/acknowledgmentof child ED,UA,FW,UF,BC,NY,HS UK UO
33. Adult positive correctivefeedback.
34. Adult negative correctivefeedback
35. Adult negative affect
36. Child negative affect
37. All negative nffects
38. Adult to child positiveaffect
39. Child to adult positiveaffect
40. All positive affect
41. Child positive affect
307
UF,UO,ED,UK,FW,NY4HS,UA2BC
UO,FW,NY,UA,ED,UKOS,BC,UF
UO,ED,UF4BC,UA,NY,FW,UK,IIS
UO,ED,UF,BC,UA,NY,UK,FW,HS
NY,BC,Up,ED,UK,UA,UF,HS,FW
UO,UF,NY,ED,BC,UK,UA,FW,HS
ED,NY,BC,UK,UO,UF,UA,HS,FW
ED,UF,UO,BC,HS,NY,UK,UA,FW
evaluation of FT treatments, based on classroom observation evidence:
(1) Sponsored approaches do discernibly differ from one another
for many process variables.
(2) Processes characteristic of various FT approaches predict-
ably depart from characl.clistics observed in NFT classrooms
for many process variables.
(3) Analysis of factor scores and discrete variable scores
presents strong evidence of instructional activities and
components that correspond well with descriptions of
intended approaCaes, thus validating in part the concept
of planned variations in FT treatments.
3oE(3o?
Section V
DISCUSSION AND RECOMMENDATIONS
Section V
DISCUSSION AND RECOMMENDATIONS
The discussions and recommendations presented in this section are
based on our experiences in dealing with the intricate and often difficult
problems encountered in this massive and unprecedented evaluation of a
nationwide intervention program. We have attempted to focus these dis-
cussions on issues pertinent to an evaluation of programs like Follow
Through and have tried to remain objective throughout. The section isdivided into the following three parts:
(1) Discussion of the interim results and recommendations for
improving the evaluation of Follow Through
(2) Recommendations concerning evaluations of future educationand social action programs
(3) Recommendations for specific policy decisions regarding
compensatory education programs.
Discussion of the Interim Results and Recommendations
for Improving the Evaluation of Follow Through
The results described in the preceding section present a complexpicture of findings. We would like to be able to present a simple and
concise statement of interim effects, but feel that we cannot do so atthis time. Many of our interpretive difficulties are due to the problemsdescribed in the following paragraphs. We feel that any conclusions drawnfrom this interim evaluation must be considered in light of these problems.
The samples on which these interim results are based are small,
certainly too small to allow as to isolate approaches that "work" and
approaches that do not. We can conclude that some changes are taking
place, but we do not yet know precisely what they are or why they areoccurring. At a more general level, the parent, teacher, classroom ob-
servation, and community data indicate that Follow Through is succeeding
in measurably altering adult attitudes and behaiviors in the home, the
school, and the community. Evidence that these changes in adults arehaving impact on the children is less marked and more variable, but re-sults tend to indicate positive effects on FT pupils. It is likely thatin future analyses on larger and more representative samples, evidence
311

of program impacts on pupil attitudes and achievements will be considerably
more marked.
In addition to the limitations imposed by the relatively small in-
terim evaluation samples, we encountered complex problems of missing data.
These resulted from high attrition and, occasionally, inadequate baseline
data. The magnitude of these problems was greater than anticipated at
the beginning because of the unprecedented nature and scope of this re-
search program. And, although we now know how to cope with them, they
restrict our ability to generalize about findings for Cohort I samples,
and to a lesser extent about findings for Cohort II samples.
Since Follow Through is a quasi-experiment, the allocation of treat-
ments to projects and the allocation of units to treatment or control
conditions within projects were nonrandom. One consequence of this non-
randomness was that biases were introduced into the design. The bias
associated with the allocation of treatments to projects may not be very
serious. But the nonrandomness within projects (i.e., systematic dif-
ferences between FT and NFT samples) occasionally has sericus consequences.
For example, in some projects, treatment and comparison groups were very
different. Although such differences are bound to occur in pseudo-
experiments for which controllgroups are assembled post hoc, they present
serious obstacles to the interpretation of outcomes. And where comparison
group biases are severe, weisuspect they invalidate the result:, of analyses
for the projects affected)
These problems (missing data, differences between comparison and
treatment groups, and too few classrooms per project) combine to produce
relatively low statistical power in our analyses for effects. To some
extent this outcome was expected, since Office of Education and SRI made
conscious decisions to Concentrate data collection efforts at the entry
grade (K or EF) an at the exit grade (3) and to devote less effort at
the intermediate grades. Nevertheless, we are quite likely failing to
decect many important program impacts at this interim point.
As suggested above, a substantial number of program impacts are
evident in our analyses of interim data. Furthermore, we believe that
the true magnitude of the effects is probably somewhat greater than de-
tected by our analyses. But it is important to recivize that even if
the number of significant effects were strikingly greater, we would still
have difficulty interpreting how or why such results occurred because,
at present, our current knowledge of the treatments is confined almost
exclusively to the sponsors' descriptions of them. We do have evidence
from limited subsamples on some of the characteristics of some processes.
This qualitative evidence indicates that classroom processes conform to
312
these treatment descriptions. To interpret how and why results occur,
we now need clear operatiodal statements of what a sponsor does when he
is installing and maintaining a project and how he does it.
Finally, because of the complexity and variety of the jmtervention
approaches, or treatments, in the FT experiments, it is very likely that
many of the evaluation measures used were not uniformly appropriate,
sensitive, or relevant to varied objectives. Many program objectives were
probably overlooked in our assessments. The technology for evaivating
large scale social programs is in its infancy. We believe that we have
contributed substantially to the advancement of this technology through
our successful and unsuccessful experiences with evaluation instruments
and procedures. Yet there remains much more to be learned.
In sum, the data available for this interim evaluation were sampled
from a limited set of projects and are not adequate for comparing the
effectiveness of different program approaches. Some rather serious prob-
lems with baseline data, comparability of FT and NFT groups, and general
attrition further hampered analyses. That quite a few significant effects
emerged (beyond an "experiment-wise" error rate) in spite of these data
analysis problems is certainly noteworthy.
When the pupil results are reviewed within the perspective of the
overall evaluation design, the likelihood of obtaining a significant
effect appears to be associated with several rather crucial evaluation
parameters. In particular, the magnitude and frequency of FT-favoring
pupil results appear related to:
The relative comparability of families in the FT arm NFT
samples within a project (quality of match). That is, as
the quality of the match improves, the frequency and pro-
portion of FT-favoring results also tend to improve. That
bad matches tended result in NFT-favoring results is
drimarily because the initial biases were extreme in favor
of NFT, often suggesting that two separate populations were
being compared.1
The severity of impoverishment and disadvantagement relative
to the main-stream social structure. Projects in the most
impoverish d communities showed some of the most dramatic
gains, but these were sometimes statistically unreliable and
often confounded with comparison group problems. This trend
may indicate the presence of a t-:pe of floor effect, but
more likely it is associated with major differences in the
social complexities of rural and urban communities.
313
rt

The amount of time the sponsor has had to refine and improve
implementation of his treatment. In general, first-year
impacts for 1970 samples (C-II) were stronger tnan for 1969
samples (C-I). Although this trend is confounded by certain
measurement difficulties associated with the first-year,
Cohort I data, the differences appear large enough to supportour interpretation.
The grade level of the pupil3 and the amount of time they
spent in the program. This interpretation is suggested by
the fairly regular cumulative trend observed for the Cohort I-K
samples (second-year effects were almost always stronger than
first -year effects). Also, the effects on Cohort II-EF samples
(pupils in the first grade) tended to be larger than those on
Cohort II-K samples. Thes trends do not obtain for Cohort I-EF
samples probably because of the proportion of "good" matches
in these samples was very low (i.e., 14 percent for Cohort I-E
versus 50 percent for Cohort I-K).
When the four trends evident at this interim point are combined, it
appears that Follow Through has most often been successful in projects
located in truly disadvantaged communities when there has been enough time
to implement the model properly. In addition, the effects appear cumulative,
and impacts appear stronger at higher age levels.
Admittedly, we may be stretching the available evidence to generate
these specific interpretations. But it is definitely no exaggeration to
conclude there is evidence of impact. Furthermore, given all the uncon-
trolled variation and lack of rigor represented in this "pseudo-experiment,"
it would not have been surprising if such evidence were altogether absent.
This point deserves further clarification. At the outset of the
Follow Through experiment some planners apparently expected that the im-
pact of Follow Through on poor children would be so dramatic that it would
be clearly evident, independent of sophisticated inferential statistical
methods. That this expectation was overly optimistic probably should have
been anticipated, since, in many instances, laooratory and field experi-
mental data have yielded only moderate-sized effects under highly con-
trolled conditions. In Follow Through, the treatments are administered
by teachers and parents, nrst by trained experimenters. Furthermore, we
must assume (although we do not know) that some changes or losses occur
because of imperfect implementation of the models; perfect implementation
could hardly be expected. And, since degree of impoverishment is a
dominwit eligibility component for obtaining an FT rant, understandably
the truly poor schools within districts were quickly absorbed into the
treatment. This made the task of finding comparable NFT schools and
314
families difficult, and occasionally impossible. Lack of comparability
often meant that, to be clearly detected, a FT impact must emerge over
and above a whole host of competing factors and extraneous sources of
variance, many of which recently have been demonstrated as determining the
great majority of pupil outcomes (see Coleman et al., 1966; Jencks et al.,
1972; Mosteller & Moynihan, 1972). In many laboratory and field experi-ments on educational treatments the results have been modest, often show-
ing effects of a standard deviation or less even when competing factors
and extraneous sources of variance are controlled or held at a minimum
(Gray & Klaus, 1965; Hodges, McCandless & Spicker, 1967; Passow, in press).
It is an understa'ement to argue that treatments developed in the
laboratory would be suboptimal in a natural setting. Hence we must ask
the question, "How large do we expect the impacts of the various FT ap-
proaches to be after one year? After two years?" For some of the models
represented as treatments in this evaluaticn, results from laboratory and
field experiments suggest an answer. But for the majority of the models,
there is no way of even guessing. For those treatments that have been
validated experimentally, the effects detected were generally approxi-
mately one standard deviation--under highly controlled conditions (i.e., the
mean of the treatment was not greater than two standard deviations from the
mean of the control). Without these controlled conditions, as in the FT
program, the effects most likely decrease in apparent magnitude, and cor-
respondingly their detection becomes less likely.
The Need for More Precise Treatment Definitions
and Descriptions
We view the absence of careful and precise definitions of FT treat-
ments and their associated delivery systems as one of the more serious gaps
in the total Follow Through evaluation. By a definition of treatment, we
mean operational statements of the specific manipulations the sponsor in-
tends to implement within the project. By delivery system, we mean the
actual materials and procedures he employs to affect this implementation.
One basic reason for the Follow Through experiment is to provide a testing
ground for the wide variety of both implicit and explicit hypotheses and
theories that have been advanced to explain why disadvantaged pupils per-
form poorly. These implicit or explicit theories presumably served as
the bases for the intervention treatments, the effects of which are the
subject of this evaluation. But in the current situation when we encounter
program failures or negative results, we have no way of knowing, or some-
times even guessing, why. It could be because the theory is wrong or
because some or all of the treatment was not properly implemented.
315
The necessary linkage between the specification of treatment and
evidence of impact is missing because at present we do not know the
literal materials and procedures that a given sponsor employs in setting
up his model in a particular project. It is true that the evidence ob-
tained from the classroom observation procedures indicates that FT teachers
tended to exhibit behaviors that, more often than not, were consistent
with the relevant features of their respective models. But this evidence
is insufficient for several reasons. First, this classroom observation
evidence indicates the extent to which certain implementations are occur-
ring; it does not tell us specifically how implementation was originally
accomplished o): specifically how it is maintained. Second, we currently
have no rigorous independent evidence of the extent to which the presence
of the observer influenced the behaviors of the teacher (pseudo-treatments),
or the extent to which observer bias existed. Third, only a subset of
models attempt to operate directly on the teacher and classroom process.
For several approaches, the parent, home, and community are the vehicles
by which the model becomes implemented.*
Thus, if the longer-range evaluation of Follow Through is have
any payoffs in terms of the identification of "significant" treatments
or treatment components (i.e., those treatment components to which signif-
icant outcomes have been or can be attributed), necessary descriptions of
treatments and delivery systems must be collected and classified for ap-
propriate future analyses. Without these data, it is very unlikely we
will ever understand the reasons that certain programs worked, and even
more unlikely that we will be able to describe how to "export" successful
approaches -co other contexts or situations.
competing Goals of Follow Through
It is apparent that considerable confusion and ambiguity exists con-
cerning the goals of FT and its concomitant evaluation. The same array
of stakeholders are present as were present when the program began, and
a few others have joined. The major bifurcation is between those, on the
one hand, who (consistent with the intent of the original legislation)
believe that the Follow Through program was designed to enable low-income
These comments are not intended to detract from our previously stated
confidence in the reliability of classroom observation findings. Indeed,
our observed patterns were anecdotally corroborated by sponsors and other
observers, and the agreements among raters appeared reasonably high, sug-
gesting that observer bias is not a major factor.
316
families to participate in the administration of comprehensive services
being provided to their children through the school and those, on the
other hand, who wish to find out the ways in which 20 or so edileacional
innovators with different educational philosophies and techniques can
improve the leve14of achievement and enhance the self concepts of poverty
children.
The former group, which includes not only most parents but also some
cf the Local Education Agencies and even a sizaOle group of Federal program
officers, appears positive toward Follow Through and seems convinced that
the programs are accomplishing the goals. Our own data show that FTfamilies become involved in their child's education and regard the program
positively. The interim results do not yet allow us to say whether early
results on parental variables reflect a general phenomenon like the "Haw-
thorne effect.' Parents certainly appear pleased that, something is being
done for their children even when they are unsure of the nature of the
programs. It may be that parents' responses indicate that they are aware
of effects on their children that have not yet been detected by the evalu-
ation data.
In any case, evaluative evidence is not of crucial relevance to
this group. They feel Follow Through is a demonstration of what can be
done when everyone works to improve conditions. Understandably, to these
.stakeholders, the requirements of experimental rigor must appear irrelevant
and superfluous. These attitudes, though beneficial to the program in
many ways, become deleterious when we seek to establish comparison groups
whose performance we contrast with that of FT groups as a measure of pro-
gram effectiveness.
This interim evaluation has shown that for several projects the
comparison group samples consist of pupils and families not at all likethe FT project samples. We know that reasonable effort was extended in
attempting to obtain proper matches for experimental purposes. But notonly are truly poor families within a project disproportionately repre-
sented in the FT groups(since they compose the subgroup for which the
program was intended), but also it is difficult to see how similar and
eligible families within the same district could long be prevented from
either (a) enrolling their children in FT schools or (b) encouraging
their own schools to adopt FT-like methods. Both of these actions are
natural, even desirable, but they have negative consequences on the
longitudinal evaluation design. In fact, a serious question arises as
to whether or not we should continue the expense of data collection for
projects where attrition and matching problems are severe.
317
Most compromised by the program-versus-research dilemma are the
sponsors. On the one hand the sponsors are advocating intervention models
and providing delivery systems, so they have a definite stake 'in a good
evaluation. They would want the evaluation design to have as many safe-
guards as possible to avoid biased or invalid assessments of their effec-
tiveness. Most are also interested in reliable and useful feedback
information on outcomes so that they can improve their approaches. On
the other hand, they are sensitive to the importance of participant "good
will" to make their approach successful,or, in some cases, to make its
implementation even possible. In this sense, the sponsor must consider
his every action in terms of its consequences not only on the overall
evaluation of his model, but also on how it affects relationships with
the parents who have served as classroom aides and who, as PAC members,
have shaped the programs to fit the community and vice versa and who,
the sponsor may believe, are crucial to the effectiveness of his model.
Problems in Measurement
Another serious impediment to clarity of evaluation results appears
to be in the very nature of the kinds of results many of us are looking
for. For example, the simplest way to increase the apparent clarity of
results is to utilize measures that are both reliable in themselves and
externally valid (sensitive to treatment effects). Achievement measures
are generally reliable and face-valid, but they are differentially rele-
vant to various program objectives. That is, nearly all models purport
to have impacts on pupil achievements, but descriptions vary as to how
and when these impacts will emerge. Similarly, in all FT models, the
development of positive affect in one form or another is considered a
goal. In some FT approaches, the emergence of this positive affect is
considered necessary for meaningful learning to occur. In other approaches,
a positive self-image is considered a consequence of successful academic
achievement. Unfortunately, regardless of one's theoretical predisposition
toward the construct, currently available measures of pupil affect show
poor--almost unacceptable--reliability (as do most noncognitive measures).
Since validity is dependent on reliability, these measures are not highly
useful in their current state of development.
Another strategy might be to compile separate assessment batteries
tailored to the goals and objectives of each model. This strategy would
certainly enhance the validity of conclusions in the evaluations of in-
dividual approaches, but would seriously impair, if not preclude, one's
ability to draw inter-approach conclusions. In fact, early attempts to
construct a comprehensive evaluation battery made extensive use of
318
sponsor-contributed items, but in the long run this procedure satisfied
no one and, by 1971-72, was abandoned in favor of standardized or "off
the shelf" instruments.*
Establishing the temporal relevance of evaluation measures to the
long-range goals of the program presents still another problem. The
general objectives of improving the life chances of poor children suggest
that what are needed are sets of measures that validly predict (or diag-
nose) the long term life chances of such children. In addition, these
measures would have to be appropriately sensitive to the effects of
specific treatments. The only set of measures that even comes close to
meeting these requirements in the current interim data are the achievement
scores. But current research (Jencks et al., 1972) has called even these
measures into question in terms of their predictive validity and utility.
We feel that this problem of predictive validity of the evaluation
measures will probably not be resolved in the near future. What seems
more likely is that appropriate developments and advancements in theories
of instruction should lead to the specification of criterion skills and
behaviors, the attainments of which will belboth testable and useful as
ends in themselves. Similarly, we expect that the ambiguity currently
associated with noncognitive objectives will be resolved either by speci-
fying theoretically relevant criterion behaviors or by abandoning the
domain as impractical.
Another related measurement issue is the need for clarification of
certain paradoxical or equivocal response patterns obtained from our
survey instruments. The most striking example comes from teachers'
responses. FT teachers tended to indicate that they approved of their
current teaching methods and procedures; that is, they were less inter-
ested in alternatives than were NFT teachers. Yet FT teachers also tended
to answer that meeting with parents was less essential than the NFT teachers
believed it was. Almost without exception, FT methods prescribed greater
adult participation in the classroom. If we are to assume these measures
are reliable and valid, then at least three interpretations can be advanced:
FT teachers are pleased with parent assistance, but they do not
feel parents should be directly involved in educational activ-
ities.
*The current (1972-73) battery consists of the Metropolitan Achievement
Test (1970 edition), the Progressive Matrices Test (problem-solving), and
selected noncognitive instruments (the I.A.R., Gumpgookies, Locus of Con-
trol, and Coopersmith Self-Esteem).
319
FT teachers are pleased with parent assistance and since they
are in classroom contact with them, the teachers see less need
for outside contacts.
FT teachers are not pleased with parent participation and are
responding to other factors on the "professional acceptance"
measure.
Our problem is that, based on the current data, we have no way of
choosing which of these (or possibly other) interpretations is correct.
But since the measures often reliably differentiated between FT and NFT
teachers, it would be unfortunate if at least some follow-up activities
were not instituted to resolve these ambiguities.
A similar example from the parent interview variables is found in the
"satisfied with progress" and "academic expectations" measures. On these
measures, FT parents more often indicated satisfaction with their children's
progress than did NFT parents. On the other hand, NFT parents tended to
have higher overall academic expectations for their children than did FT
parents. If we accept these results as valid, then FT parents definitely
have lower aspirations for their children (i.e., they tend to be more
satisfied with less progress and are less optimistic about future growth).
On the other hand, FT parents may be more realistically appraising the
educational situation of their children, whereas NFT parents are less
realistic. Again, additional information would be useful for resolving
this interpretive problem.
Attrition and Its Implications
Some preliminary evidence suggests that some rather serious problems
will likely be encountered in the final stages of this longitudinal evalu-
ation because of apparent patterns of differential FT/NFT attrition.
Our current tracking data show that theihalf-life of the comparison sam-
ples is about two years. (That is, the size of the comparison sample
reduces by one half every two years, on the average). Thus, by the end
of four years in this longitudinal study, only about one-fourth of the
original comparison group is expected to be available for assessments.
Although the attrition rate is considerably smaller for FT (half-life of
about three years), it will be very difficult to draw valid inferences of
effects, given what is likely to be a nonrepresentative residual of an
already biased comparison sample.
It might well be prudent to begin considering alternative strategies,
one of which might involve a shift to crossrsectional matched sampling,for the outcome data collection among exiting cohorts. This shift in
320
strategy would, of course, mean that the longitudinal nature of the ex-
periment would be replaced, in some (or, possibly, all) projects, by a
broader based, cross-sectional model. Moreover, our regression analyses
have shown that over 60 percent of the variance accounted for by all co-
variables can be attributed to parent/home/environment indexes. Thus,
if careful matching is implemented, a cross-sectional design might restore
most of the power initially represented in the longitudinal design but
lost because of attrition.
Summary of Recommendations for the Continuing FT Evaluation
On the basis of evidence and discussion presented in the body of this
report, we advance the following recommendations, which we feel will en-
hance the quality and utility of the final FT evaluation.
(1) 'Clear and precise operational definitions of sponsor "treat-
ments" and equally precise descriptions of their delivery systems
are needed to improve understanding of how and why these treat-
ments are or are not effective. This information should be ob-
tained as soon as possible, since it will be relevant to the
evaluation 'of currently exiting cohorts, and essential if the
findings are to be applicable to new situations.
(2) Analysis of statistical power for detection of treatment effects
at the project level indicates that the number of classrooms per
project is insufficient for the detection of moderate or small
effects. If possible, the number of classrooms (FT and NFT) per
project should be increased.'
(3) For many projects, NFT comparison groups were not considered suf-
ficiently similar to FT groups to enable a valid analysis of
program impacts. Unless comparability of these comparisons can
be improved by means of alternative designs (e.g., matched pairs,
cross-sectional), we recommend that these "mismatched" projects
be deleted from subsequent data collections.
(4) The magnitude of the attrition problem appears to be far greater
than initially estimated, particularly for the NFT sample. It
appears that over a four-year duration, NFT pupil attritions range
as high as 80 percent of the baseline sample. We strongly recom-
mend alternative evaluation designs be studied for possible
adoption in the near future. One highly feasible alternative
appears to be a matched pairs, cross-sectional design.
321
(5) Although we believe that the current (1972-73) evaluation bat-
tery is adequate in many respects, the possibility of gathering
sponsor-specific measures should be reconsidered. Given the
divergent goals of the different approaches, such measures would
provide alternative bases on which to assess impacts.
(6) Alternatives to the current noncognitive measures should be
considered. One such alternative might be the use of classroom
observation data to index patterns of personal and social growth
and development.
(7) The classroom description component (CCL) of the classroom ob-
servation should be utilized more frequently and extensively in
subsequent data collections to better characterize overall class-
room practices and emphases. The possibility of continuous sam-
pling on case study bases should be considered.
(8) Further investigation of teacher and parent attitudes and be-haviors is needed to resolve ambiguities in a number of important
effects noted in these interim data.
322
Recommendations Concerning Evaluations of Future Education
and Social Action Programs
The Need for Planning the Evaluation
Evaluation of Follow Through has demonstrated to us that it is essen-
tial to have a formative period bekore a summative evaluation of any
social action program is begun. The-formative stage is required to clarify
the purposes of the evaluation. It is also needed for defining evaluation
questions and hypotheses, clarifying and understanding the nature of the
alternate treatments or procedures that will be assessed, and assembling
and sharpening the tools of measurement. Hopefully, in addition, some of
the conflicts common to all social experiments can be explicitly recognized
and reconciled during the period.
One issue that demands attention during the planning stage is the
state of the art in both measurement and statistical analySes. The temp-
tation in undertaking an evaluation is to assume that procedures can be
rapidly developed or that ways to deal with problems of measurement and
analysis will emerge. There is, however, great danger in basing one's
plans on the assumption that such developments will occur. A simple
example can be cited from Follow Through. While the importance of measures
in the noncognitive domain was clearly recognized, neither the limita-
tions in existing instruments for use in large-scale measurement appli-
cations nor the difficulties inherent in effecting new developments were
equally clearly recognized, and certainly not on a schedule that would
be useful to the evaluation. Evaluation planning, in short, should be
limited to the state of the art as known or best estimated at the time
the evaluation begins so that unrealistic expectations about new develop-
ments can be avoided. If it is decided that development efforts and
evaluation activities should be undertaken simultaneously, these activi-
ties should not_be made time-dependent on one another. The evaluation
can be used as a vehicle for development, but the pace of development
should not be tied to the evaluation schedule, and the evaluation should
not depend on products from the development activities.
A major lesson in evaluation, learned from Follow Through, stems
from the di:ference between controlled experiments and naturalistic
studies in the "assignment" of subjects to treatments. The wrong decisions
about the communities to receive treatments, the school teachers and pupils
within these communities to participate, and the mechanism by which pro-
grams are effected can complicate or seriously jeopardize the quality of
an evaluation. There are ways to improve the design of social experiments
similar to Follow Through, and thereby strengthen the power of the study,
without doing disservice to poor children. Even when no options in the
323
selection of participating communities are available, it should be possi-
ble to shape the procedure by which program and district affiliations are
determined so that each type of program would be balanced in its project
representation according to geographical location, type of community, or
other relevant dimensions. Within each project location, it would be
possible to establish both experimental and control groups sin,altaneously
rather than leaving the problem of controls to be resolved later. In
addition, it might be possible, within a large-scale program, to require
that all programs that are to be evaluated be adopted by a certain minimal
number of sites or groups and also that all sites wishing to receive grants
choose a program from among the several to be evaluated.
There is great value in a stable external panel of advisers to pro-
vide continuity and counsel. Such a panel need not be fixed in its mem-
bership; panel members can be replaced from time to time to avoid some
of the dangers of proprietorship or parochialism. The important con-
sideration is that of an advisory body to help both the sponsoring agency
and its contractors recognize and reconcile problems of planning, oper-
ations, analyses, interpretation, and reporting. To the extent that such
consulting bodies can be influenced to accept accountability for the re-
search products, their utility will be enhanced.
The Follow Through evaluation to date has ignored costs as an evalua-
tion variable to be considered systematically in analyses. The implica-
tions of program costs for policy decisions are too great to ignore; any
social experiment should incorporate studies of cost/effectiveness and
cost/benefit analyses as part of their plan from the outset.
One aspect of project costs that concerns evaluation efforts is thepossible need for a quid pro quo account in the budget. Such funds
would be drawn upon when the evaluation design requires the cooperation,
for control purposes, of groups that do not receive program grants. Risk
beyond what is necessary is entertained if one must rely solely on persua-
sion and diplomacy to win participation from groups that do not recetve
any project funds.
Critical Dimensions :'.or Evaluation Planning
The alternate positions on dimensions such as those listed in the
following paragraphs should be clearly stated and the implications of
alternatives for policy-making should be understood in detail before an
evaluation design is even attempted. The evaluator must recognize that
for any position chosen he either sacrifices at one end of the dimension
to realize gains at the other or he must expand the purposes of the study
324

and allocate additional resources to cover separate efforts.
The Service Orientation versus the Research Orientation--For example,
a service orientation toward Follow Through would dictate assuring that
only the most needy were participants in the program. In contrast, an
experimental orientation would either assure equal neediness for partici-
pants and nonparticipants or would permit variations on the impoverishment
scale so that a "treatment by poverty" interaction might be identified.
A service orientation would also argue for a standard presentation of
services to all who qualify, whereas an experimental orientation ruld
encourage a greater variety of services. Finally, evaluating a program
under a service orientation would require some pre-defined standards
against which program success could be measured, In contrast, an experi-
mental orientation would more likely ask whether inter-treatment differ-
ences existed, and if so, where, to what degree, and so on.
The Policy Orientation versus the Theory Orientation--For purposes
of deciding on continuation or termination a policy-maker might ask,
"Does the program work?" A theoretician is more likely to be concerned
with the conditions, including treatment variations, under which particular
effects are observed. An investigator with a policy orientation would
suggest contrasting input levels with output levels without necessarily
trying to ascertain what happens during the process. The theorist, while
not uninterested in input-output di:,:ferences, is particularly concerned
with the mediating processes. A policy-maker is also more likely to ask
cost effectiveness and cost benefit questions about the data, whereas a
theorist may, in many cases, ignore the cost variable.
The Formative Orientation versus the Summative Orientation--If one
decides that formative assessment is most important, he is by that choice
encouraging the program to change as it grows in response to frequent and
fairly rapid feedback. Summative assessment, on the other hand, is more
congenial to a stable treatment observed over a sufficiently long period
to permit conclusions to be drawn about the whole program or the relative
strength of fixed alternatives. Formativetassessm,Jut is most appropriate
for those conditions that exist when designing a syjtem is the primary
objective, and summative assessment is most appropriate to conditiOns
where the objective is to test the worth of a c -ribable system.
325

General versus Specific Criteria of Success--The dichotomy between
general and specific criteria might be referred to as abstract versus
concrete results, or less measurable versus more measurable,outeoms,
or broad versus narrow criteria, or aggregated and gross outcome measures
versus disaggegated measures of individual outcomes. in other words, if
one wishes to know whether experimental approaches are effective in reach-
ing their own goals, one chooses different sets of criteria in different
time frames than if one wishes to assess all approaches on a single set
of effectiveness criteria.
Frequent Reporting versus Deferred Reporting--The Question of frequent
versus deferred reporting is related to two questions discussed earlier--
formative versus summative assessment and policy versus theoretical orienta-
tion. ff findings are reported freqliently, then the risk of premature
conclusions is increased. On the other hand, if reports are deferred too
long or excessively qualified when issued, their utility for the policy
maker may be lost entirely. Perhaps the balance can be struck by acknow-
ledging the legitiam. y of each class of report, for different uses. In
addition, thoughtful consideration tic) time constraints must be given very
early, if the information provided to decision-makers is to be useful.
Recomme.ndation for Specific Policy Decisions Regarding Compensatory
Education Programs
Sponsor Programs
The primary focus of this evaluation of Follow Through is the assess-
ment of the effectiveness of the sponsored programs. The most general
finding is that, on the measures obtained over the mere two years of the
evaluation (mostly with kindergartners and first graders), there is not
yet evidence that one or several sponsors' programs stand out as consis-
tently superior to the comparison program. Arguments have been advanced
that the expectation of finding such a result at this time is probably
premature and overly 'ptimistic because of the amount of uncontrolled
variation, difficulties in implementation, and problems in obtaining
adequate comparison groups.
To speculate about eventual outcomes, let us imagine for a moment
that the planned evaluation is complete and that a good match was achieved
in several projects for each sponsored program. On the basis of present
trends, the most reasonable guess is that, for example,., outcomes for
third-grade, Cohort III participants would still reveal that no sponsor
was effective in all projects. Sponsors with highly academically struc-
tured classrooms would more often reveal superiority on tests of achievement,
326

but it is likely that in some projects, the NFT classrooms would equal
or exceed the FT classroes on mean achievement. Child-centered classes
with more self-regulatory activities might prove superior to their com-
parison groups on some measures of problem-solving ability and locus of
control, but their performance on overall achievement tests such as the
WRAT would probably vary considerably. We would probably also find some
reversals such that NFT groups exceeded FT groups, even in those areas
where the models were well implemented.
Even if such projected results occur in a
could still probably identify some sponsored p
stantial impacts on relevant variables across
decision would then be justified? Some polyy,
uation, one
t produced sub-
wo sites. What
assume that if
such successful approaches co aid bejdrntlTied, the'A'inding would provide
a direct guide to action. But-finding that a sponsor, a community, and
a school district can work together effe:tively is not the same as dis-
covering the precise conditions that enabled their joint success. True,
a sponsor who has been associated with several sites producing good results
is likely to be doing something right. But without a more comprehensive
catalog of the variables included in the treatment, and the identification
of these variables in action across sites, no one could say what was right.
So ,,rescriptions for compensatory education programs other than Follow
Through itself are difficult to derive.
If the following expectations are held by policy makers, they shouldbe discarded as unrealistic:
The sponsor has a "package"--a clearly delineated set of training
manuals, administrative procedures, curriculum materials, and
accountability mechanisms--which can simply be applied again to
another school district to bring the same results.
The sponsor has identified the crucial variables of his model and
can share all the essentials with others, and thus, the "package"
can be applied by people other than the sponsor himself.
It is the sponsor and his model that contain the key variables
determining success and failure. Furthermore, we already know
certain factors to be unimportant.
By laying stress on the model and its transferability these viewpoints
ignore the possibliity that, for example, the nature of the Federal-local
funding relationship and the nature of the school district-sponsor court-
ship are potent determiners of success or failure. Effects of societal
events surrounding the schools (growth of Chicano, Indian, and Blaci:
pride; teacher underereloyment; teacher unions, school finance inequality
controversies) are also not yet adequately considered as crucial factors.
327

For those sponsored programs that repeatedly fail to produce evidence
of impacts across sites, we must explore the reasons for these failures.
We should establish, to the extent possible within evaluations like Follow
Through, what contributions are required from teachers, parents, and school
administrators, what amounts and types of federal-state-local interactions
are necessary, and how much funding it takes to achieve the desired out-
comes.
What of other compensatory education programs, those that are cur-
rently being planned by federal or state education agencies? Have we pro-
vided any guidance at this interim stage? At this point, several of the
FT projects might be looked on as successful demonstrations. Since it
is not clear which are the crucial and which the superfluous factors,
however, the new program could only attempt to incorporate as many aspects
of the "successful" projects as can be identified. These common elements
might include the same sponsor (or some similar third-party change agent),
who had been: a) successful with a similar population, b) invited by
school district officials in consultation with parents, c) accountable
to the funding agency as well as to the local district, d) funded at the
same overall level, and e) provided with the necessary and sufficiently
committed support staff. If these conditions cannot be established,
no prescription of the treatment seems justified.
The Overall Evaluation
While no direct process comparisons were made between FT and NFT
classrooms, project by project, we have determined that, on the average,
sponsorea classrooms differ from comparison classrooms on several process,
dimensions. Parent and teacher data, and community studies as well,
give us strong reason to believe that something potentially powerful is
happening. On the question of overall impact of Follow Through, however,
we have as yet only a little positive evidence that the effects are cumu-
lative. Although a "go/no-go" decision on the FT experiment is not known
to be pending, the evidence so far would favor continuation of the project,
even though the current lack of comparability of experimental and control
groups and the lack of treatmen4- specification argue for substantial
changes in the evaluation design.
Project Level Factors
Any action taken on the basis of present evidence to extend, modify,
or terminate projects on the basis of interim outcomes (aside from im-
proving matches with the comparison groups) could have a dramatic effect
328
on the outcome of the overall program and, thus, on its future evaluation.
We have assumed that the internal (e.g., curriculum, personnel) components
were key treatment variables, but factors such as the locus of decision-
making power in a project may be even more influential. It seems clear
from the evidence in the Community Studies report (SRI, 1972b, Appendix E)
and observation of parent groups in action that parents are quite sensitive
to the possibility of arbitrary decision-making. Changes in unwritten
social contracts without parents' participation may violently shift parents'
roles in Follow Through. The change in parents' attitudes that would
occur if projects were dropped on the basis of. an evaluation they do not
consider valid might radically affect the impact of the program in the
sites remaining.
329(336

Annex A
ISSUES IN THE ANALYSIS OF THE DATA
Arnex A
ISSUES IN THE ANALYSIS OF THE DATA
This annex presents data and discussions on two fundamental analy-
sis issues:
The unit for analysis
The method of analysis.
Part 1 discusses the use of classroom data as a basis for analysis of
program effects. Part 2 discusses issues in the selection of ANCOVA as
the method of analysis. We have attempted to present these issues and
arguments in a manner that' does not require advanced knowledge or expe-
rience on the part of the reader or appreciation or understanding.
Part 1: The Use of Classroom-Level Data as a Basis for Analysis
of Program Effects
The unit of analysis chosen for estimating interim program effects
was the classroom. For our current evaluation purposes, the classroom
is the most appropriate unit because of the locus of treatment, the
nested design and confounding of different levels of nesting, the levels
of measurement, and the problems of missing data and program attrition.
Where appropriate and practical, we discuss below the advantages and
difficulties associated with alternative procedures for dealing with
these problems.
Locus of Treatment
The locus of treatment in Follow Through is the classroom. Although
the program is targeted for poor children, it is implemented and admin-
istered on the classroom level (or some equivalent administrative group-
ing). We recognize that teachers and aides respond differentially to
pupil needs and characteristics, and thus, the "treatment" may be quite
different from one pupil to another. But since we have no systematic or

reliable way of defining or classifying such treatment variations, we
must assume that they are independently distribUted.
The Nested Design and Confounding at Different Levels
of Nesting
A very important consideration is the relative independence of
differential treatment effects within classrooms compared to those across
classrooms. We believe it is reasonable to assume that treatment effects
are correlated to a much greater degree within classrooms than across
classrooms; that is, what the teacher does with individual pupils or
groups of pupils in a given classroom will have some impact on all pupils
in that classroom but will not necessarily be expected to have any impact
on pupils in different classrooms. This means we cannot legitimately
pool pupils across classrooms without first estimating (and partitioning)
this classroom effect. This problem can be dealt with in at least three
different ways:
By organizing the data into a hierarchical design with
classrooms, and perhaps schools, as design variables.
By considering each classroom as a separate treatment
and pupils as units in a one-way design.
By assuming within-classroom error variance as normally
and independenl-ly distributed (NID), and aggregating
pupil data to the classroom level, so that each class-
room represPrts an independent estimate of program effect.
Each of the above three alternatives presents advantages and dis-
advantages. The first, hierarchical design, allows for separate esti-
mation and partitioning of effects at each level of .testing. Statisti-
cally, it can be considered the most appropriate. However, this model
requires balanced frequencies at each successive level, which our data
do not satisfy. Moreover, unweighted means solutions (Winer, 1962,
Searle, 1971) are appropriate for dealing with only slight imbalances,
whereas in our case the problem is acute. Thus, we concluded that this
alternative (hierarchical design, unweighted means solution) offered no
real advantages over simple aggregation to the classroom level (which
is a special case of unweighted means),
The second alternative, considering the classroom as the experiment
with pupils as the units, was rejected as inconsistent with the evalu-
ation design and objectives. Follow Through is designed as both a school
and community level program. The fact that the educational component is
A-4

implemented at the classroom level is incidental to the program; it is
more a function of the administrative structure of elementary education.
Moreover, the concept of planned variation requires that we assume (or
test for) some regularity in treatment properties from classroom to
classroom within projects.
The third alternative, aggregating pupil level data to the classroom
level under the assumption of uncorrelated and normally distributed"errors,"
has it3 own advantages and disadvantages. The most obvious disadvantages
are intuitive ami interpretive. On the intuitive level, such a procedure
appears to shift evaluation focus from the individual child to the class-
room, and to reduce statistical power and precision by decreasing obser-
vations (there are certainly more children than classrooms).
The first of these concerns can be met with the observation that
Follow Through was not designed as a clinical program whose success would
be based on case studies. Instead, FT is designed to assist poor or dis-
advantaged children to attain basic skills and attitudes necessary for sub-
sequent academic and social growth, and we are evaluating the program
in terms of these children (and their parents and teachers) as a group.
Moreover, our measures of outcomes, such as standardized achievement
tests, are primarily appropriate for group-level decisions. We admit
that evaluation based on zriteria of individual successes would be more
desirable, and we anxiously await the development of such methodology
for large-scale research,
Thr. second disadvantage, red:..:otion of statistical power and preci-
sion due to reduced observations, is relevant to the extent that we haverelatively few classrooms with which to start. The reduction in obser-
vations associated with the aggregation of pupil measures to classroom
levels is somewhat offset by the corresponding reduction in variance
presumed to exist at the classroom level, which, in the pupil level
analysis, would appear as error variance. Also, classroom level vari-
ables enable precise estimation of fallible data for use as covariables.
(Under the assumptions of classical reliability theory, the point esti-
mate confidence intervals reduce as the VR or the class size. Hence,
classroom-level data are more appropriate for covariance adjustments.)
In other words, assuming substantial variance can be attributed to class-
room differences (over and above program effects), the net effect of the
two approaches (classroom analysis and pupil analysis) should yield equiv-
alent statistical power and precision provided sufficient classrooms are
available for estimation of variance components.
A--5
The same reasoning that leads to the aggregation of measures from
pupils to classrooms applies equally to all higher levels at which we
suspect that effects other than those due to treatment may exist. For
example, we could continue the aggregation of scores from pupils within
classrooms on up to classrooms within schools, and finally, to schools
within projects. However, each such aggregation carries with it all pre-
ceding assumptions and the corresponding additional assumptions at the
level involved. Moreover, the effects of such higher level aggregation
on power and precision become so dramatic that a random effects model is
required for aggregation beyond the classroom.* But since district and
project nearly perfectly covary, the only advantage that such higher ag-
gregation would offer is that of removing school variance from treatment
variance. And since we believe schools within projects or districts are
reasonably well matched, we prefer to assume school variance is dominated
by classroom/teacher variance. Hence, the classroom appears to be the
most appropriate analysis unit.
Variations in Levels of Measurement
In the previous sections on instrumentation and variable definition,
we presented categories of measures obtained at child, parent, teacher,
and community levels. Aggregation to classroom-level representation
adjusts child and parent variables to the same level as teacher variables.
This result is important for purposes of comparability of analysis and
interpretation of results, and it enables integration of variables across
categories for control purposes. We are still unable to integrate
community-level measures with the pupil/parent/teacher, but in project
by project analyses, these variables remain fixed and, thus, are not of
concern.
*A random effects model requires that we assume units were drawn at
random from a larger population about which we wish to generalize
and draw conclusions. A case can be made for employing random effects
analyses with projects as the unit if we wish only to test national-
level hypocheses concerning FT as a single treatment (i.e., FT versus
NFT overall).
A.-6
Problems of Program Attrition and Incomplete
and Missing Data
One of the most difficult--often disastrous--problems occurring in
large-scale research programs is that of data loss. Our experience in
Follow Through, where a large number of measures are repeatedly gathered
for large groups of respondents, is no exception. The fact is that every
data point lost becaUse of incomplete measurement or subject mortality
(attrition) actually alters the basic research design (i.e., changes the
experiment in essentially unpredictable ways). If we were to restrict
our interim analysis to those cases for which all data on all measures
are present and presumed valid, we would most certainly be faced with
a greatly reduced and most likely nonrepresentative subset of cases in
terms of our original samples.
To the exteAt that missing or incomplete data are random events- -
both within and across measures--our procedure of aggregation to classroom
level data represents a partial solution to this problem. Likewise, if
program attrition is randomly distributed across subgroups (FT/NFT) within
projects, aggregation to classrooms will tend to reducethe apparent im-
pact of this attrition; i.e., even though some or most pupil data within
a classroom are lost to attrition, under the assumption that the attrition
is random, an unbiased mean can still be estimated for the classroom from
the remaining pupil data.
Still another aspect of concern in aggregating data within classrooms
is the general migration patterns of pupils from year to year across class-
rooms and teachers. For the interim analysis, this becomes an issue only
for Cohort I data, in which pupils are in their second experience year in
Follow Through. Moreover, the problem is considered more crucial for the
NFT classes, where redistribution of pupils across classes from year to
year is likely to be more pronounced than in FT schools, where pupils tend
to progress in relatively intact classroom groupings.
Each of these data aspects received considerable attention in the
preparation of data for analysis. The procedures used for handling missing
data and for examining effects of classroom migration and attrition are
presented below. However, since attrition and associated effects are
currently being examined in depth in a separate study, only preliminary
consideration will be given in this report.
Of the general methods for handling missing data problems (dis-
regarding it, statistically adjusting for it, and supplying it) we chose
direct imputation as the most expedient method for this interim evaluation.
A systematic step-by-step procedure was followed in constructing the data
matrices, beginning with the construction of pupil-, parent-, and teacher-
level variables. Specifically, pupil-level data were restricted to those
cases for which baseline data were present (roster and test battery) and
for which WRAT and Affect posttests were administered. Data for these
cases were combined into appropriate dependent and control variables
according to the definitions described earlier (see Definition and Develop-
ment of Variables). Variables werc computed only for those cases where
90 percent or more of the component data (e.g., item scores) were present.
All data were then aggregated on a variable-by-variable basis to the class-
room level (with the exception of the teacher variables, which already
existed at the classroom level), where classroom was defined in terms of
the Spring 1971 Rosters.*
The next step was to examine the relative completeness of the
classroom-level data. Two aspects of this examination were:
Assessment of the relative comparability of classroom-
level scores obtained for the identic subset (those
members of a given classroom for which both pretest
and posttest data were "complete") and the total
classroom average.
Assessment of the proportions of missing data on a
variable-by-variable basis across classrooms.
The results of the part-whole comparisons for classroom-level
values of the pupil outcome variables are summarized in Table A-1. These
results indicate the magnitude (in items) and significance level of the
average differences between the classroom means of those pupils having
both pretest and posttest data and the means of all pupils in the class-
room. These comparisons reveal that, for the baseline data (f..2etests),
Note that in terms of baseline data, classroom grouping is wholly
artificial, since these measure are gathered prior, or close to, the
commencement of formal instruction and treatment administration. How-
ever, classroom grouping for the second experience year of Cohort I
(Spring 1971) does ignore the grouping for their first experience year
(Spring 1970), which may involve carry-over consequences.
A-8

Table A-1
CLASSROOM MEANS OBTAINED FOR PRE-POST IDENTIC SUBGROUPS VERSUS
TOTAL CLASSROOM POPULATIONS ON BASELINE AND OUTCOME MEASURES
GROUP VARIABLE WRAT QUANT PROC READ LANG AFFECT
COHORT I-K PRE A x -.05-.
-.02 -.02 -.08 -.01 -.03
(N = 337) ± -.42 -.30 -1.31 -.63 -.36 -1.09
POST A x -1.07 -.66 -.06 -1.09 -.57 -.08
t -4.95t -4.45t -2.51* -5.30t -4.62t -2.05*
COHORT I-EF PRE A x -.05 -.03 NA -.01 -.02 .02
(N = 118) t -.86 -.99 NA -.24 -1.02 1.57
POST A x -.30 -.21 NA -.61 -.16 -.07
t -1.26 -.95 NA -1.26 -.97 -1.38
COHORT II-K PRE A x .26 .05 -.03 -.01 -.30 .11
(N = 93) t 1.29 .38 -.39 -.02 -1.83 .29
POST A x -.04 -.20 -.13 -.55 -.31 -.58
t -1.25 -4.47t -4.80t -3.80t -4.08t -3.94t
COHORT II-EF PRE t x .14 .27 .13 .91 .55 .66
(N = 34) t .84 1.57 .76 .59 .71 .61
POST A x -.01 -.42 -.05 -.41 -.28 -.49
t -.22 -4.96t -1.58 -3.21t -2.66* -3.78t
NA = not applicable.*
Entries represent the mean difference of total minus identic scores.
Thus, a minus sign indicates the identic means are great3r than thetotal class means.
tp < .01.
P < .05.
means computed from id9ntic and total classroom samples are not signif-icantly different. This is important because it establishes to someextent the lack of a systematic bias in the nonattrited pupil sample
in terms of baseline or incoming characteristics.
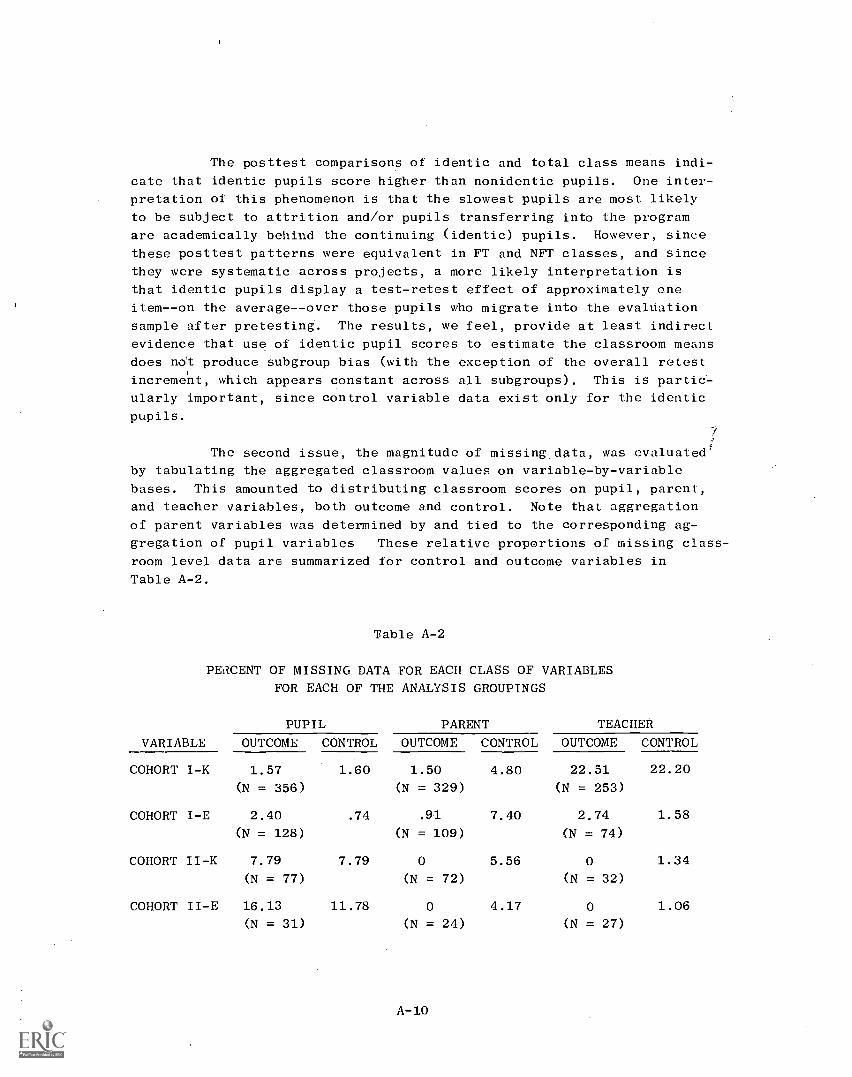
The posttest comparisons of identic and total class means indi-
cate that identic pupils score higher than nonidentic pupils. One inter-
pretation of this phenomenon is that the slowest pupils are most likely
to be subject to attrition and/or pupils transferring into the program
are academically behind the continuing (identic) pupils. However, since
these posttest patterns were equivalent in FT and NFT classes, and since
they were systematic across projects, a more likely interpretation is
that identic pupils display a test-retest effect of approximately one
item--on the average--over those pupils who migrate into the evalUation
sample after pretesting. The results, we feel, provide at least indirect
evidence that use of identic pupil scores to estimate the classroom means
does not produce subgroup bias (with the exception of the overall retest
increment, which appears constant across all subgroups). This is partie-
ularly important, since control variable data exist only for the identic
pupils.
The second issue, the magnitude of missing data, was evaluated'
by tabulating the aggregated classroom values on variable-by-variable
bases. This amounted to distributing classroom scores on pupil, parent,
and teacher variables, both outcome and control. Note that aggregation
of parent variables was determined by and tied to the corresponding ag-
gregation of pupil variables These relative proportions of missing class-
room level data are summarized for control and outcome variables in
Table A-2.
Table A-2
PERCENT OF MISSING DATA FOR EACH CLASS OF VARIABLES
FOR EACH OF THE ANALYSIS GROUPINGS
VARIABLE
PUPIL PARENT TEACHER
OUTCOME CONTROL OUTCOME CONTROL OUTCOME CONTROL
COHORT I -K 1.57 1.60 1.50 4.80 22.51 22.20
(N = 356) (N = 329) (N = 253)
COHORT I-E 2.40 .74 .91 7.40 2.74 1.58
(N = 128) (N = 109) (N = 74)
COHORT II-K 7.79 7.79 0 5.56. 0 1.34
(N = 77) (N = 72) (N = 32)
COHORT II-E 16.13 11.78 0 4.17 0 1.06
(N = 31) (N = 24) (N = 27)
As can be seen from Table A-2, the relative extent of missing
or incomplete data was not severe, except for Cohort I-K teacher variables.
Since we felt this overall result was acceptable for the purposes of our
interim analysis, we proceeded to impute missing classroom-level values
according to the following algorithm:
Data missing at the classroom level way ilflputed from the
mean of the school at the appropriate subgroup classifi-
cation (i.e., grade level by cohort by treatment condition).
If imputation within the school was unsuccessful, the next
level of nesting--the district--was used to impute the
missing values.
If imputation failed at the district level, then the over-
all subgroup mean was used to supply missing data values.
It.should be noted that only rarely was it necessary to proceed
beyond the school level, and almost never beyond the district level, in
the imputation procedure. As such, we feel the likely bias (most probably
reduced variance and increase in Type I error rates) introduced by this
procedure is small relative to its advantages of maintaining sufficient
cases so that analyses could be performed.
Part 2: Issues in the Selection of ANCOVA as the Methodof Analysis
The selection of one-way analysis of covariance as the principal
statistical method for evaluating interim FT impacts was based on con-
siderations of logical appropriateness, robustness, and power and inter-
pretability. Each of these considerations is discussed in detail in the
following sections. Arguments for the-parallel analysis of project and
sponsor treatment groupings are also discussed. Finally, considerations
of alternative methods of analyses and of alternative techniques of co-
variable adjustments are presented. Where possible, relevant data are
provided to support our arguments.
4,
Logical Appropriateness
In terms of logical appropriateness, the principal issues were the
structure of the treatment variables, the use of control groups, and the
definition of replication samples. To consider variations of FT treatment
on any other than a one-way continuum would require not only the specifi-
cation of the additional continuums but also rather precise quantification
A-11
of treatment variables on each such continuum. The objective of such
quantification would presumably be to establish a basis for organizing
treatments into a factorial or partially crossed structure for analysis
of main effects and interactions among "planned variatios." However,
we now have only qualitative distinctions, corresponding to sponsor
descriptions of their respective models, and no assurance that variabil-
ity in treatment is any less across projects within a given sponsor than
across projects between sponsors. Thus, although it is more convenient
for purposes of interpretation to group projects within sponsors and,
perhaps, to cluster sponsors in terms of meta-models or theoretical con-
structs (e.g., psychological growth versus parent involvement approaches),
we feel it is more defensible on both rational and statistical bases to
consider each project as a relativuly independent treatment in a large
pseudo- (or quasi-) experiment, and to organize the collection of these
treatments into a one-way analysis of variance design.
The purpose of within- project control groups was to provide a basis
for separating district variance (variability in scores observed from
one district to another) from program variance (variability in scores
attributable to FT programs). The issue of how to handle these control
groups within the one-way analysis design was resolved by treating them
as nested within each project. We rejected the alternative of represent-
ing the FT/NFT distinction as crossed with treatments, since such a treat-
ment by levels (FT/NFT) analysis design requires that we be able to esti-
mate treatment effects at the NFT level, which of course cannot be done.
Also, when crossed analyses of variance design are unbalanced with respect
to cell frequencies (as is the case with FT data), resultant hypotheses
tests are biased in potentially complex ways, making interpretation very
difficult. We reasoned that through use of planned comparisons (i.e., lin-
ear contrasts of elements in the one-way design), tests of all major hy-
potheses of interest could be accomplished while problems associated with
the crossed design were avoided.
A second issue concerning the use of contio,o1 groups in the analysis
of covariance design pertains to the eqvivalance or comparability of
subgroups (FT/NFT) within projects on relevant covariables (baseline and
background variables). Substantial noncomparability can present serious
and perhaps unresolvable analysis problems. Inspection of these covari-
ables in preliminary descriptive analyses did reveal moderate and occa-
sionally substantial latex of FT/NFT covariable comparability within pro-
jects. (These covariable values are summarized in project data tables
in the section on results.) These biases are viewed as a direct consequence
of the lack of randomization in sampling and assignment to experimental
groups in the quasi-experimental evaluation design. A variety of methods
for dealing with this control group problem has recently been suggested,
A-12
including the analysis of pre-post difference scores, regre.ssed gain scores,
repeated measures, indirect standardization, treatment-effect correlation,
and analysis of covariance ( Campbell, 1971; Campbell and Erlebacher, 1970;
Harris, 1967; Hsia, 1971; O'Connor, 1972; Porter, 1972; Wiley"j(in press);
Whitla, 1968). We rejected the gain score methods because of noncom-
parability of pre- to post-measures (tests change from kindergarten to
second grade) and treatment-effect correlation methods because of in-
sufficient project data points. And since indirect standardizatio-
[comparing groups on the basis of residual outcomes derived from multiple
regression of the entire sampl 's outcome scores with relevant control
variables (see Shaycoft et al., 1972)] is a special cr.se of classicalanalysis covari2nce, the latter app2ared more direct and appropriatefor our analysis purposes.
To proceed with analysis of covariance, the foPowing assumptions
are required:
1. The samples were drawn from a common population.
2. The subgroups (FT/NFT) are experimentally independent.
3. Experimental 'errors" are independently (and less
importantly, normally and homogeneously) distributed.
4. Covariables are uncorrelated with treatment, measured
w.chout error, and homogeneously distributed.
The descriptive analyses provided some support for Assumption 1;
specifically, FT and NFT samples were predominantly composed of below-
average families in terms of generally accepted SES indicators (e.g., in-
come, education, occupation), and thus, all appeared to be drawn from the
disadvantaged population. Also, sir-e FT and NFT pupils are generally in
separate schoo Assumption 2 seems plausible.
/.,4" \Assumption 3 4s fundamental to the fixed effects ANCOVA model. In-+.
halidation of this assumption would seriously affect the validity of the
analysis, particularly the hypothesis t'.sts. However, Glass et al. (1972)
have shown that nonindependence of errors produces far more serious con-
sequences than does nonnormality of errors.
In the Follr'w Through experiment, pupils are generally grouped into
self-contained classrooms. Since each such classroom represents a homo-
geneous unit (common teacher, location, facilities, aiik) interactions among
comp-nents) possible nonrandomness of error among pupils .Athin classrooms
can be argued. However, classrooms can be viewed as experimentally inde-
pendent, and we telieve tney constitute an appropriate unit for analysis
A-13
in terms of Assumption 3. Additional considerations for the use of
classi)om-level data in our analysis of effects are discussed in the
preceding section.
Relevant to Assumption 4 is the observation that often the FT sample
within a project appears somewhat "more disadvantaged" than its corre-
sponding NFT sample. This may indicate the existence of a biased selection
or assignment process; e.g., the poorest families are recruited. for FT
programs, or only the poorest schools (ad hoc) are awarded FT grants.
However, this bias becomes troublesome only if we postulate anticipated
fnteractions among these and other control variables that will affe(et the
program, thus violating Assumption 4. For example, children from extremely
impoverished families may have suffered organic damage from extended mal-
nutiition and consequently would not be expected to show any improvement,
whereas children from moderately impoverished,families might be very re-
sponsive to the same program. If the poorest' families were dispropor-
tionately allocated to FT, the above described interaction would strongly
affect results of FT/NFT comparisons. More subtle examples of these
disruptive interactions occur with respect to measurement instruments in
the form of floor and ceiling effects.
Two general methods of dealing with this post hoc nonrandom covari-
able interaction problem are polynomial regression and blocking. In poly-
nomial regression, the exact nature of the suspected interaction is modeled
and statistically controlled by means of polynomials of appropriate degrees.
This requires farily elaborate and precise theories and a total absence of
error in the covariates.* Although this approach is currently popular in
econometrics, it far exceeds the current precision and robustness of theo-
ries and measures in educational evaluation. The second alternative- -
blocking--is generally more appropriate, we believe, to our current state
of evaluation technology. But this method imposes the same requirements
as the factorial design in terms of balanced cell frequenciesFurther-
more, it assumes blocks were defined end units were randomly assigned
across conditions within blodks prior to the administration of the treat-
ment. Since the FT data satisfy none of these conditions, we rejected
this nethod. Due to regional and sampling variability, there are virtu-
ally no control variables for which blocking strata of criticalJor theo-
retical interest could be established to achieve a balanced design. Even
if such strata could be established, they would be post hoc, which would
*The absence of error assumption is required for literally any adjust-
ment on control variables.
A-14
seriously affect probability statements on any hypothesis tests. Con-
sequently, we implemented standard classical analysis of covariance to
reduce experimental error.
To safeguard our analyses from obvious violation of Assumption 4,
we performed a series of preliminary screening analyses on potential
covariables by examining overall covariable-dependent variable corre-
lation matrices and by examining individual bivariate scatter plots of
covariables with treatment and dependent variables. The purpose of this
procedureovas to ensure that covariables were both uncorrelated with
treatment (FT/NFT) and were reasonably and linearly correlated with out-
comes. Although this procedure does not ensure within-subgroup homo-
geneity of covariables (as we shall demonstrate later), the within-cell
frequencies were too small to enable a test of this assumption. But
Glass et al. (1972) reported, "...the empirical sampling distribution of
the F-statistics differed little from the theoretical sampling distri-
bution unless the departure from homogeneous slopes was extreme" (p. 277).
Thus, the procedure does provide at least limited protection against these
violations of the model (covariable interactions an-, correlations with
treatment variables).
The remaining logical issue in the choice of analysis procedures was
the definition of replication samples. We rejected a single analysis
pooled over all data because of known and assumed systematic inequalities
on both dependent and independent variables among the subsamples. For
example, the EF samples were systematically one year older than the cor-
responding K samples within cohQrts. This meant the subgroups were non-
comparable in terms of Joth underlying developmental/maturational vari-
ables and test battery Content. Slmilarly, we rejected pooling across
cohorts within age levels, since both treatment and test variables under-
went considerable transformation from one year to the next. Consequently,
we reasoned that the most appropriate analysis would be one that is per-
formed separately on each of four independent replication samples: CI-K,
CI-EF, CII-K, CII-EF.
Within these replication samples, several additional analysis alter-
natives were considered. One was that of conducting separate ANCOVAS on
project-by-project bases. Another was conducting repeated-measures ANCOVAS
on Cohort I first and second year data. Both of these alternatives were
rejected for reasons described below. Project-by-project analyses were
considered because sponsors are not well distributed across school dis-
tricts--or, for that matter, across geographic regions. Indecj, nearly
a one-to-one correspondence exists between project and district, and,
with few exceptions, district variations are almost totally nested within
sponsors. Since there was sample evidence of a strong district variance
A-15

component, the danger of serious confounding of district and sponsor
sources of variance exists. Although within-district control groups
(the FT/NFT dimension) provide a basis of separating these sources of
variance, performing separate analyses on a project-by-project basis
within each replication sample would be even better. The problem with
this method is that when classroom-level variables are used as analysis
units, we simply do not have enough observations to perform control vari-
able adjustments and to estimate effects for separate project-by-project
analyses. Just as there are insufficient degrees of freedom to test the
covariance matrices at the project level for assumptions of the ANCOVA
model, there also are too few degrees of freedom to perform separate
ANCOVAS (or even ANOVAS) on a project-by-project basis. On the other
hand, combining projects within cohorts and grade streams into separate
analyses does develop sufficient observations or degrees of freedom for
hypothesis tests. Use of project descriptor variables as covariates for
the interproject variance component enables unbiased estimation of FT/NFT
effects, which, through use of planned comparisons, can be tested on a
project-by-project basis. In summary, if one is willing to assume that
the project descriptors appropriately index the interproject variance
component, then the larger (cohortL-level) analyses on a set of independent
projects should yield comparable results to those of separate (and un-
feasible) project-by-project analyses.
The consideration of repbated-measures analyses across the one and
two year outcomes of CohortI projects was based on concern for even
further reducion in error variance through use of correlated properties
in these data. Howe'er, we rejected this analysis method for the follow-
ing reasons:
The one year sample was only a subset of -like two year sample.
Different measures were obtained across the years.
Classroom compositions were noacomparable from' year to year.
As such, separate analyses were performed on the Cohort I one year
(Spring 1970) and two year (Spring 1971) data, as well as the Cohort II
one year (Spring 1971) data. Since data for separate grade streams (K and
EF) were analyzed separately, a tota of six separate data matrices were
analyzed.
Robustness and Power
Two factors of considerable concern in selecting our analysis method
were robustness and power. Robustness is the extent to which the results
A-16
of our hypothesis tests are affected by departures in our data from as-
sumptions in the statistical model employed. Power is the extent to which
our procedures lead to valid rejection of null hypotheses.
Robustness
The three basic assumptions' underlying the fixed effects model
one-way analysis of variance are:
Independence of within-cell error components
Normality of within-cell error components
Homogeneity, between cells, of within-cell error
variances.
For the analysis 8f covariance (the model used in the present
study), the above three assumptions hold plus a fourth:
Homogeneity, between cells, of within-cell dependent-
variable/covariable(s) regression.
Certainly, AssuMption 1 is critical for a valid analysis, and
the rationale (presented earlier) underlying the choice of the classroom
as the unit of statistical analysis is relevant here. Since the individ-
ual teacher is likely to be the most potent factor (aside from experimental
treatment variation) in studies of the present type, "-sa-,considerable lack
of independence could be expected by treating the pupil as the unit of
analysis. One could argue for aggregating to an even larger unit, e.g.,
the school or even the district. However, as has been noted earlier,
serious problems regarding degrees of freedom could be expected and it
is debatable whether the decrease in potential nonindependence would make
the effort worthwhile.
The effects Jf violations of Assumption 2 on Type I error rates
and power when the n's are equal or unequal are well known (see Glass etal., 1972). Assumptions 3 and 4 have been shown to be relatively unimpor-
tant at the practical level (i.e., they can be violated with little effect),
as long as 'the cell n's are equal; Otherwise, the combined effects of heter-
ogeneous n's and Q's are unpredictable and can be substantial. Again,
using the analyses of FT versus NFT based on orthogonal contrasts as an
example for the present'study, the n's were unequal.
A7-17
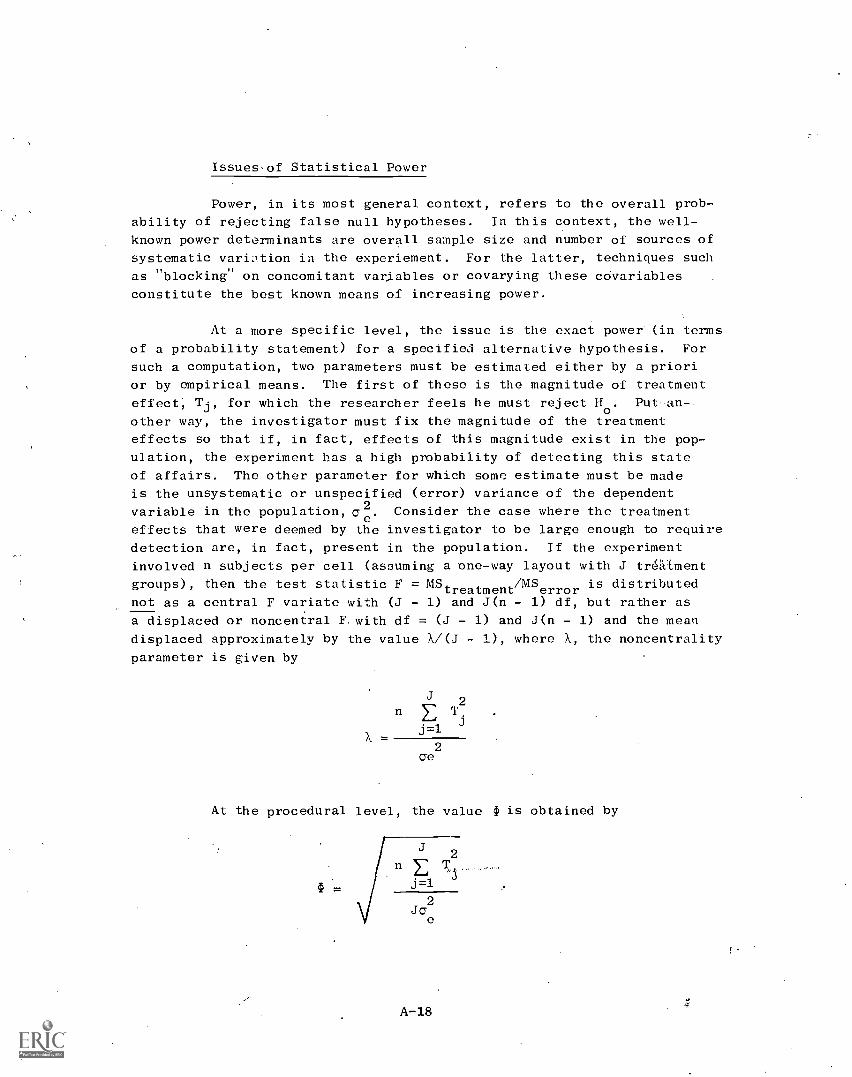
if
Issuesof Statistical Power
Power, in its most general context, refers to the overall prob-
ability of rejecting false null hypotheses. In this context, the well-
known power determinants are overall sample size and number of sources of
systematic variation in the experiement. For the latter, techniques such
as "blocking" on concomitant variables or covarying these covariables
constitute the best known means of increasing power.
At a more specific level, the issue is the exact power (in terms
of a probability statement) for a specified alternative hypothesis. For
such a computation, two parameters must be estimated either by a priori
or by empirical means. The first of these is the magnitude of treatment
effect; Ti, for which the researcher feels he must reject Ho. Put, an
other way, the investigator must fix the magnitude of the treatment
effects so that if, in fact, effects of this magnitude exist in the pop-
ulation, the experiment has a high probability of detecting this state
of affairs. The other parameter for which some estimate must be made
is the unsystematic or unspecified (error) variance of the dependent
variable in the population, a 2. Consider the case where the treatment
effects that were deemed by the investigator to be large enough to require
detection are, in fact, present in the population. If the experiment
involved n subjects per cell (assuming a one-way layout with J treatment
groups), then the test statistic F = MS treatment/MSerror is distributed
not as a central F variate with (J - 1) and J(n - 1) df, but rather as
a displaced or noncentral F. with df = - 1) and J(n - 1) and the mean
displaced approximately by the value X/(J - 1), where X, the noncentrality
parameter is given by
2n 2] T.
j=1 j
2ae
At the procedural level, the value I) is obtained by
2n Ti
j =1
2Jo
Although it is generally understood that increasing N, which is equal to
J
Enj=1
can be expected to increase the overall power of an experiment, this
fact is--loosely speaking--"truest" if J, the number of treatment groups,
remains constant. For example, if we had an experiment with two groups,
10 subjects per group, a2 = 100, and Tj = 4, b in the above formula,
would be 1.26. If a = .05, the power of this experiment would be approx-
imately 'AO. On the other hand, if we redistributed the 20 subjects into9
four groups, leaving T.'
a-e
and a the same, would be .89, and the power
would be about .25. To leave 10 subjects per cell and have four treat-
ment groups would require doubling the sample. size, and if we left the
values' e
T.J
a2 and a as before, we would have = 1.26 again, but this
time the power would approximately equal to .49.
The preceding example reinforces the idea that power is more
than simply a function of N. Needless to say, the investigator is wise
to divide his total N into as few groups as empirically and intuitively
possible.
In the Follow Through study, analyses were often performed on
large numbers of classrooms (the sampling unit) and large number of pro-
jects (an independent variable). Also, to some extent, the locus of
greatest interest involves the individual FT versus NFT comparisons within
projects. These comparisons are often based on means having a small number
of observations, despite the overall large N in some cases.
For this reason, we consider it important to assess power along
with some of the dependent variables. Two complicating factors arose in
this power analysis. First, a large number of FT versus NFT comparisons
were made on the same dependent variable, whereas what was really desired
was an overall assessment of power. Secondly, each comparison was based
on different cell n's and also different adjusted (by the covariables)
estimates of 6e. Thus, to be able to arrive at an overall--albeit notecompletely precise--estimate of the power of, for example, the planned
contrasts using the Cohort I-K sample and the achievement-dependent
variable, pooling of n's (see Cohen, 1969) and ae2 's and averaging were
employed. More specifically, if we have 2J cells of nj observations each
(J projects for both FT and NFT), and adjusted variance errors of com-2
parisons ad, we may define
A-19
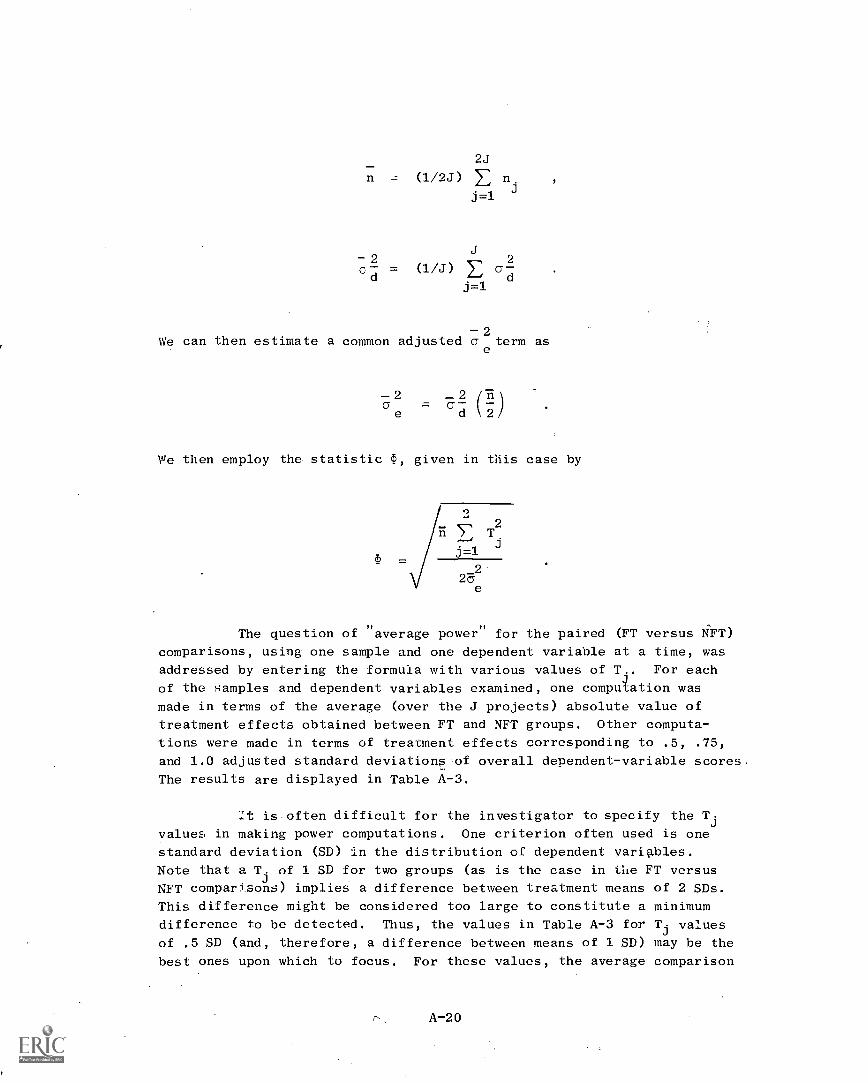
2J
= (1/2J) 1] n.j=1
J
0d
= (1/J) E cid
2
j=1
-2We can then estimate a common adjusted a term as
e
6ed \2/
We then employ the statistic given in this case by
7 T2
j=1
_220.
e
The question of "average power" for the paired (FT versus NFT)
comparisons, using one sample and one dependent variable at a time, was
addressed by entering the formula with various values of T.. For each
of the samples and dependent variables examined, one computation was
made in terms of the average (over the J projects) absolute value of
treatment effects obtained between FT and NFT groups. Other computa-
tions were made in terms of treatment effects corresponding to .5, .75,
and 1.0 adjusted standard deviations-of overall dependent-variable scores.
The results are displayed in Table A-3.
It is often difficult for the investigator to specify the Tj
valueE, in making power computations. One criterion often used is one
standard deviation (SD) in the distribution of dependent variables.
Note that al'. of 1 SD for two groups (as is the case in the FT versus
NFT comparisons) implies a difference between treatment means of 2 SDs.
This difference might be considered too large to constitute a minimum
difference to be detected. Thus, the values in Table A-3 for Tj values
of .5 SD (and, therefore, a difference between means of 1 SD) may be the
best ones upon which to focus. For these values, the average comparison
A-20
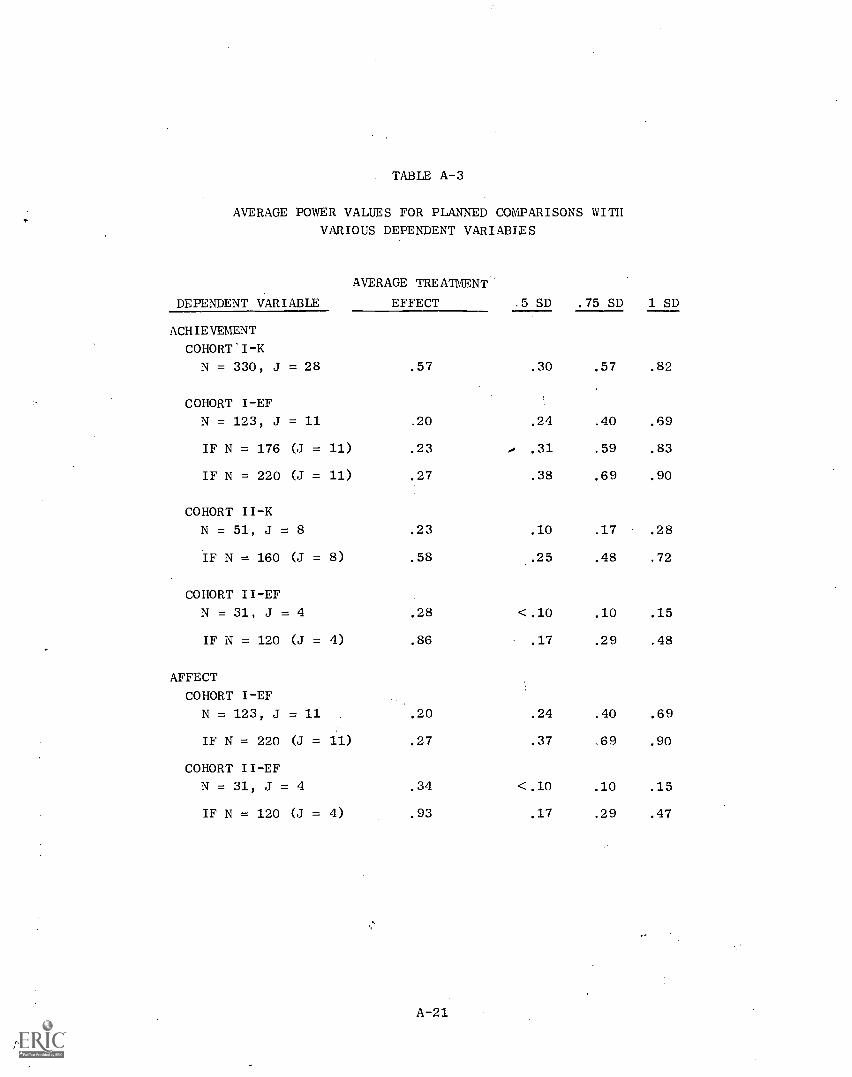
TABLE A-3
AVERAGE POWER VALUES FOR PLANNED COMPARISONS WITH
VARIOUS DEPENDENT VARIABLES
AVERAGE TREATMENT
DEPENDENT VARIABLE EFFECT .5 SD .75 SD 1 SD
ACHIEVEMENT
COHORT.I-K
N = 330, J = 28 .57 .30 .57 .82
COHORT I-EF
N = 123, J = 11 .20 .24 .40 .69
IF N = 176 (J = 11) .23 .31 .59 .83
IF N = 220 (J = 11) .27 .38 .69 .90
COHORT II-K
N = 51, J = 8 .23 .10 .17 .28
IF N = 160 (J = 8) .58 .25 .48 .72
COHORT II-EF
N = 31, J = 4 .28 <.10 .10 .15
IF N = 120 (J = 4) .86 .17 .29 .48
AFFECT
COHORT I-EF
N = 123, J = 11 .20 .24 .40 .69
IF N = 220 (J = 11) .27 .37 .69 .90
COHORT II-EF
N = 31, J = 4 .34 <.10 .10 .15
IF N = 120 (J = 4) .93 .17 .29 .47
between FT and NFT means appears to have somewhat lower power than would
be considered optimal on both the achievement and affective variables.
This fact is particularly true in the case of the Cohort II data--both
K and EF. One must remember that the power values are averages, however,
and that they are somewhat crude averages at that. The power for a
specific within-project comparison--between FT and NFT--on these dependent
variables may be greater than the tabled values, although some comparisons
will also have lower power.
In general, the effects of increasing overall sample size
while leaving the number of treatment groups unchanged resulted in power
increases that could perhaps be considered not worth the effort. For
example, almost doubling the Cohort I-EF sample to 22C classrooms wouldincrease the average probability of detecting a (real) difference be-
tween means of .5 SD from .24 to only .38.
To discover the effects of redistributing the sample classrooms
into a smaller number of treatment groups, the 330 Cohort I-K sample
classrooms were hypothetically spread over 56 projects by treatment (FT
versus NFT) cells. Had there been only 20 such cells (10 projects, as
opposed to 28) to which the 330 classrooms were assigned, the power for
detecting a .5-SD effect, on the average, would have increased from .30
to .67. For detecting a .75-SD effect, the power would have increased
from .57 to .95, and for 1.0 SD, from .82 to, for all intents and pur-
poses, 1.0.
Although only a small number of pupil-dependent variables were
employed in the assessment of power, the general findings can be expected
to be generalizable to the other variables analyzed. Table A-3 shows
that the power values for a given sample on the achievement-dependent
variable were almost identical to those on the affective-dependent var-
iable in the cases in which both were examined. This correspondence can
be expected to hold throughout the other analyses.
The implications of the preceding discussion are twofold. First,
the fact that more significant diffetences were not found in the FT versus
NFT comparisons must be tempered somewhat by the fact that real differences
of a magnitude most would consider worth reporting may have, in some cases,
gone undetected becaus^ of the relatively low power in many of the analyses.
Secondly, it would appear that a case could be made--at least from the
evaluation point of view--of implementing the "planned variation" concept
with fewer "variations" and a more substantial data base for each. This
latter notion would appear to be reasonably consonant with the view of
Follow Through as an experiment.
A-22
Interpretability
The third factor of concern in our selection of the analysis method
was the interpretability of results. In this context, our one-way anal-
ysis of covariance is considered appropriate for a number of reasons.
First, for each replication sample (CI-K, CI-EF, CII-K, CII-EF), the
method provides unbiased estimates of treatment effects for each
treatment/control combination entered. These effects can be directly
interpreted in terms of their absolute or relative magnit,Ides and fur-
ther evaluated against an error term yielding probability statements
concerning hypotheses tests.
Second, the method enables the development and testing of literally
any hypothesis of interest within each replication sample--at a known
confidence (alpha) level. Moreover, through use of Bonferroni or Fisher
techniques of constructing joint confidence intervals, post hoc hypoth-
eses (comparisons or groupings of interest-thAt may emerge after the
data are analyzed) can be tested.
Third, since each analysis produces unbiased estimates of program Of-,
fects, these effects can be compared across replication samples for the ap-
propriate subgroups. This provides a means for, say, examining first year
effects for a given sponsor on Cohort I versus Cohort II data and hence,
for evaluating improved implementation. Similarly, second year effects for
Cohort I can be contrasted with first year effects for either Cohort I or
Cohort II. Anti with a substantial amount of difficulty, hypothesis tests
can be constructed for these interanalysis comparisons,*
To clarify the analysis flexibility afforded by the one-way fixed
effects ANCOVA, consider the following example. Cohort I-K pupil data
consists of 330 classrooms distributed across 28 projects, for which
two-year effects are analyzable.t Since each project contains two treat-
ment groups--FT and NFT--there are a total of 56 cells in the one-way
design for this data set; and the overall or omnibus F test for treatment
effects is on 55 df. Since we are interested in estimating effects and
*Such tests would require appropriate combination of estimated effect
and error components from cthe separate analyses, and they would be
based on the assumption that these components are independent across
analyses.
For a project to be analyzable, classroom data must be available for
ai least two FT and two NFT classrooms.
A-23

testing hypotheses concerning FT outcomes, this omnibus test is not of
interest. Rather, through use of linear contrasts, 26 separate and
orthogonal (mutually exclusive) tests corresponding to FT versus NFT groups
within each project are of interest, and each of these tests is based on
a single degree of freedom. Other linear contrasts, also with each on
1 df, might be used to simultaneously contrast all projects within spon-
sors or groups of sponsors. Such contrasts would not, however, be orthog-
onal to the project-level contrasts. In short, through use of properly.
corlArr ucted contrasts each having the property Eci = 0, where each ci is
a coefticient (usually +1,0) by which level of treatment is multiplied,
all possible comparisons of interest can be generated and tested at known
(or estimated) confidence limits. Since treatment effects estimated by
this fixed effects model are assumed unbiased, they can presumably be
compared across analyses. This means that the estimated FT effect for a
Cohort I project can be directly compared to the estimated FT effect for
that (or any other) project in, say, Cohort II. And since these estimates
are based on independent samples, the test statistic for such a cross-
cohort comparison would be:
where
- a1 2
\/ (N1cx
1)SE2 + (N2 - 1)SE2
1 2
N + N - 21 2
a. =. project effects,
SE. =qstandard error of project effects,
and N = size of project sample.
This is the familiar t-test for independent samples.
We stated above that the one-way fixed effects ANCOVA enables testing
all such outcome comparisons of interest at known (or estimated) confidence
limits. In the actual analyses of these interim data, only tests on pro-
gram effects (FT versus NFT) at the project and sponsor level were performed,
and those were orthogonal within each analysis. (The next subsection dis-
cusses reasons for performing separate analyses on project- and sponsor-
level groupings.) Although strictly speaking, project and sponsor tests
are nonorthogonal to each other, they are performed on slightly different
A-24
data sets and thus are partially independent. This overlap in analysis
is of concern r,Iy to the extent thalt it affects the width of the confi-
dence interval that we construct to evaluate significance of results.
For example, if we assume that sponsor- and project-level analyses are
mutually exclusive, our confidence intervals for orthogonal tests within
these analyses will be a function of the alpha value selected for sig-
nificance testing. If we wish to take into account the nonindependence
of the two levels of analysis, this confidence interval will have to be
expanded in terms of a presumed joint probability distribution of the
form aT = 1 (1 - (On, where n is the number of sponsor and project tests
common to the same data subsets.
This issue can perhaps best be clarified by specific example. The
Cohort I-K two-year project analysis involves 28 projects (330 classrooms),
while the sponsor analysis involves 12 sponsors (356 classrooms). Hence,
there are an average of slightly more than two projects per sponsor.
Project-level tests are independent, and so are sponsor tests. But, on
the average, three tests per sponsor are performed: two at the project
level, and one at the sponsor level. To maintain a .95 confidence inter-
val for any test at either level, each individual test should be performed
at the (1 .983) or the .017 level.
On the other hand, we could argue that the project level is the
most appropriate and that, on the average, 1-1/2 tests are performed
for each project. This suggests that the appropriate confidence inter-
val for each individual test would be at the .965 (ci = .035) level.
Thus, it appears that the .95 confidence interval for individual tests-
both project and sponsor level--will be biased toward Type I errors, so
that depending upon how one wishes to interpret the situation, the true
alpha will be somewhere between .14 and .07. We believe that such bias
is acceptable and possibly desirable in terms of offsetting the Type II
bias because of lack of analysis power.
The actual confidence intervals for interpreting the significance
of each test are obtained by using the formula
95 Percent Confidence Interval =±1.96 X Standard Error of
Contrast.*
This corresponds to the general expression
x - SE(Z1/2u
) 5 p 5 + SE(Z1/2u
)
A -2 5
Separate confidence intervals are calculated for each comparison. These
confidence intervals are;then combined (added and subtracted) to the
corresponding estimated treatment effects. They provide a convenient
and direct method of evaluating the significance of individual results.
One method of reading the confidence intervals is: "We are .95 confident
that the true FT effect for (project or sponsor comparison) is at leastl
(lower interval estimate) and as much as (upper interval estimate)."
If the confidence interval crosses zero, we conclude nonsignificancef
Arguments for Parallel Analysis at Project and Sponsor Levels
of Treatment
We have indicated that separate ANCOVAS were performed on project-
and sponsor-level groupings of the data. The decision to conduct such
parallel analyses was based on several considerations, including number
of observations, assumptions regarding district-level variance, and
evaluation objectives. These considerations are discussed in the follow-
ing paragraphs.
With regard to number of, observations, one of the most serious
weaknesses of this interim evaluation is the lack of power in statis-
tical tests, primarily due to,limited Dbservations. ThiS problem is
aggravated when project-level groupings of the data reveal that often
only a single control classroom is available for given projects, thus
excluding these data from the project-level analyses. But if observa-
tions within cohorts are grouped at the sponsor level such that the
sponsor defines the treatment variable, then all available and valid
data can be included. To reduce the impact of the pooled within-sponsor
districf variance on estimation of treatment effects, appropriate
district-le7e1 covariables are obtained from the project descriptors
and incorporated in the ANCOVAS. With the exception of Cohort II-E data,
these sponsor-level analyses result in fewer treatment groups and more
observations, yielding notable increases in degrees of freedom for error
variance.
The effect of pooling district variance within a spoh,or is likely
to obscure, to some extent, estimates of variance due to treatment. We
considered statistically correcting the data, but solutions involving
least-square adjustments or corrections require that we model the assumed
district effects as constant within and across sponsors, which is prob-
ably false. This means that hypothesis tests regarding FT/NFT outcomes
for sponsor-level analyses will most likely be too conservative. On the
other hand, estimates of FT/NFT effects should not be biased by district
A-26

effect. And sponsor-level tests showing significance should be quite
generalizable, provided a reasonable number of projects comprise the
test.
Finally, one goal of the evaluation is to identify the programs
that produce measurable impacts on a natiorallevel. Sponsor analyses
include all currently available evidence of such impacts, whereas, as
noted above, project-level anllyses exclude many observations because
of variance estimation problems. Hence, the spor.sor analyses can, in a
sense, be considered more appropriate to the 'overall evaluation objec-
tives but less appropriate in terms of detection of significant interim
program effects.
Consideration of Alternative Methods of Analysis
In the course of developing our final method of analysis, we explored
several alternative methods, each designed to deal with a major Cifficulty
encountered in the interim data. One such alternative addressed the prob-
lem of FT/NFT comparability, another dealt With problems of degrees of
freedom (limited observations),-and a third set of alternatives were
considered for techniques of covariable adjustment and bias reduction.
Since a detailed presentation of our research into these alternatives
is beyond the scope of this report, we will present only a brief dis-
cussion of cach.
Problems in Control Group Matches
As previously indicated, preliminary inspection of the interim
dat(suggested moderate and occasionally severe noncempPrability of
tre bent and control pupils on many demographic and experiential vari-
able . As might be expected, this noncomparability was most severe att.,
the population extremes; i.e., the FT samples tended tc be more disadvan-
taged than the NFT samples. This problem became particularly acute when,
in a preliminary analysis, (SRI, 1972a) we restricted our observations
to just those FT and NFT pupils whose families met the 0E0 poverty guide-
lines (about :121 percent of the data). This restriction resulted in a
disproportionate representation of FT pupils in the samplefand o':casionally
nearly totally excluded the in-district controls. To develop sufficient
data for analysis, we reasoned that careful matching on concomitants of
district variance on a pupil-to-pupil basis should effectively account
for the district effects, thus enabling us to'pool control pupils across
districts and to implement a post hoc matched-pairs analysis for-i,FT
projects on a project -by- project basis. This matching involved arranging
A-27

all. "eligible" (i.e., meeting 0E0 poverty guidelines) NFT pupils within
each cohort one selected matching variables (preschool experience,
ethnicity, sex, parent education, and parent-child interaction score).
Then, for each "eligible" FT pupil within the project, a NFT "match" was
drawn with respect to these five matching variables. This matching was
constructed independently from project to project, with replacements
across but not within projects.
This procedure had the Advantages of increasing both the power
and precision of the analysis (as well as enabling an analysis in the first
plate) and of providing estimates of FT effects at the child level. The
disadvantages of this approach included the use of post hoc matches, the
nonindependence of units across projects, and the lack of attention to
classroom-level effects. Currently, we feel this method might be useful
for detection and analysis of subtle or complex interactions at the child
level (i.e., aptitude by treatment interactions) but that the approach is
inappropriate for assessment of overall program effect (i.e., it lacks
the necessary generalizability for evaluation of a national program).
On the other hand, if national or regional level effects can
be established, the next step might wer_ lor. that of analyzing for dif-
ferential effects on the individual level. The thrust of such an approach
would most likely involve the identification of patterns of results for
purposes of individual diagnoses and prescription This implies we could
preciely define antecedents, treatments, and consequents at the level of
the individual child, a capability that we are currently attempting tc
develop (but that is not present is these interim data).
For the overall problem of noncomparability of control and
treatment groups on the classroom-level bases (i.e., our curent aAalyses),
there does not appear to be a convenient solulion. )4lowever, the impact of
the problem is lessened by recalling that our model assumes classroom var-
iance dominates other nontreatment sources of variance within the district.
Since the NFT samples do control for district variance, and since reason-
able efforts are made to match FT/NFT classrooms, our analysis method
should appropriately and validly detect the treatment variance.
A-28
Limited Degrees of Freedom
Another diffictIlty encountered in the current analysis is the
limited observations when classroom-level units are used. The direct
implications of this problem have been discussed both in terms of assump-.
tions of the covariance model and of effects on the power of the analyses.
An alternative analysis procedure, which wascthought might produce some
savings in degrees of freedom lost to covariables, was explored. This
procedure is described as indirect standardization, and it is presented
in detail in a recent paper by David Wiley (in press). The followingexcerpt is particularly relevant:
In ind4ect standardization, instead of applying a set
of reference proportions to the subgroup means for each
group, we calculate the subgroup means for the whole
group an then use the subgroup proportions in each
comparison group to produce a predicted value for each
subgroup. These predicted values are a forecast of
the values which would result if there were no dif-
ferences between the comparison groups except those
generated by the unequal performance of the subgroups
and the unequal distribution of subgroups in the com-
parison groups. These values may be used to adjust the
original comparison group meang'by estimating the bias
due to the unequal distribution and eliminating it
(pages 9-10).
For data sets composed of relatively few observations, this
procedure appears to offer the advantage that a la-ge number of concom-
itants or covariables could be used, via conventional regres9icn tech-
niques, to produce a single composite--or indirectly standardized--con-
trol variable. This rAsultant control variable employs a single degree
of freedom in ANCOVA, whereas multiple covariates would correspondingly
use multiple degrees of freedom.
Several important analysis issues must be resolved before the
indirect standardization approach can be generally adopted, *First, the
approach subsumes all assumptions of conventional ANCOVA in addition to
those involved in the standardization procedure.. Second, the approach
is more likely to operate on bias than on error variance, This argues in
favor of th- procedure, since it is bias that is most evident\in our de-
scriptive analysis of within-project control groups. Third, it is not
intuitively clear that the same probability distribution (i,e,, the F
distribution) used for hypothesis tests for conventional ANCOVA would be
appropriate for indirect standardized ANCOVA tests,
.A-29
To evaluate empirically the relative consequences of proceeding
with conventional ANCOVA, as compared with indirectly standardi;ed ANCOVA,
we applied both procedures to a subset of data in this interim analysis.
The specific subset was the parent-lev-el outcome analyses, where it is
believed that the estimation problems were most variable from project to
project and where missing data problems were moderate. The results of these
two procedures are summarized in Tables A-4 to A-7. Using conventional
ANCOVA as the standard, the results of indirect standardized ANCOVA appear
to conform to the above prediction; namely, indirect standardization pro-
duces a substantial shift toward FT-favoring results (i.e., it produces
greater adjustment for NFT bias), whereas the conventional ANCOVA procedure
displays more results as significant. Hence, for these data, conventional
ANCOVA appears to optimize on error variance reduction, whereas indirect
standardized ANCOVA optimizes on bias reduction.*
Alternate Techniques for Covariable Adjustment
and Bias Reduttion
Two alternate techniques suggested for covariable adjustment
and bias reduction in the analysis of these interim data were:
Correction of covariable weights for unreliability(Porter, 1967).
Estimation of FT effects by deviation from sub-
group (project or district) means, as opposed togrand (cohort) means.
The basis for the first alternative is well described elseWhero (Porter,
1967, 1972; Glass et al., 1972) and is disc-ssed here only for purposesof completass. Specifically, under the assumption that many covariable
measures represent fallible data, an adjustment in the covariable re-
gression coefficient (i.e., the "beta weights") can be made to reflect
the expected value if measurement were error-free. This adjustment isessentially equal to the proportional difference of the reliability of
*Note that another important distinction is that, for these analyses,
ANCOVA is performed on unweighted means, whereas the indirect stan-
dardization procedure was based on pupil data that would have pro-
duced weighted-means predicted scores; hence, the selective sensitivity
to bias.
A-30
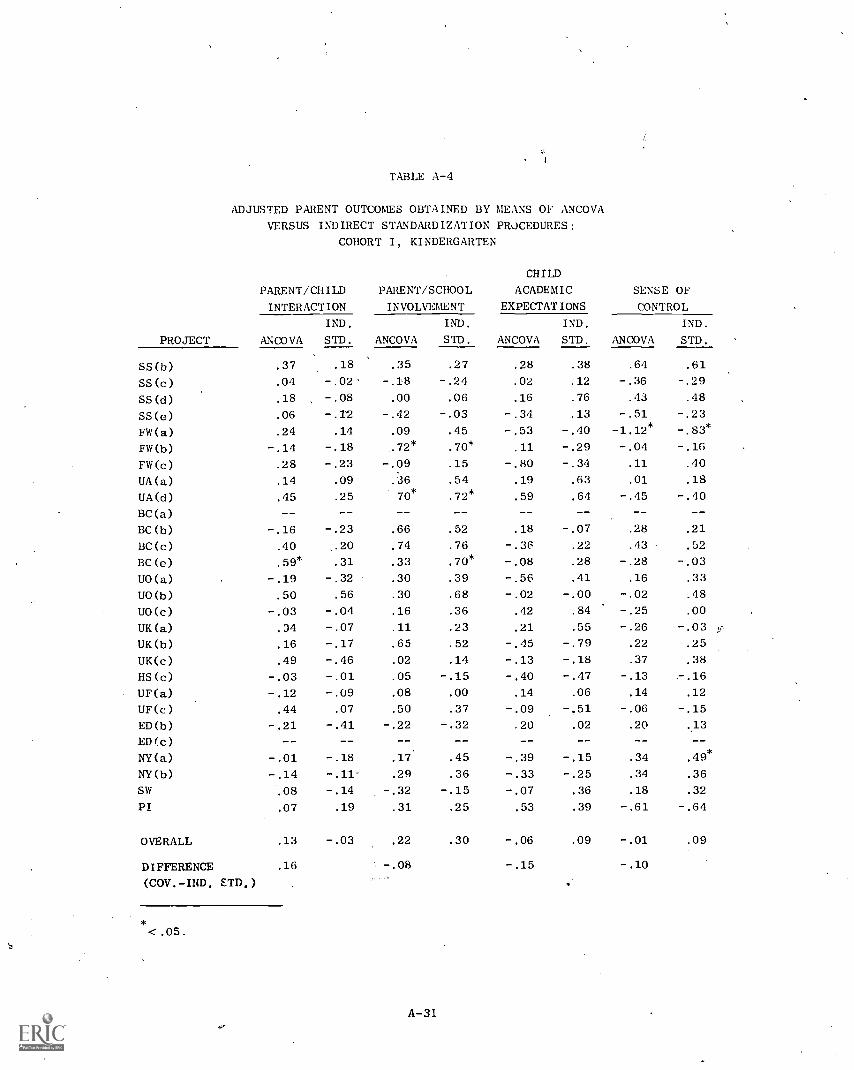
TABLE A-4
ADJUSTED PARENT OUTCOMES OBTAINED BY MEANS OF ANCOVA
VERSUS INDIRECT STANDARDIZATION PROCEDURES:
COHORT I, KINDERGARTEN
CHILD
PARENT/CHILD PARENT/SCHOOL ACADEMIC SENSE OF
INTERACTION INVOLVEMENT EXPECTATIONS CONTROL
PROJECT ANCOVA
IND.
STD. ANCOVA
IND.
STD. ANCOVA
IND.
STD. ANCOVA
IND.
STD.
SS(b) .37 .18 .35 .27 .28 .38 .64 .61
SS(c) .04 -.02 -.18 -.24 .02 .12 -.36 -.29
SS(d) .18 -.08 .00 .06 .16 .76 .43 .48
SS(e) .06 -.1'2 -.42 -.03 -.34 .13 -.51 -.23
FW(a) .24 .14 .09 .45 -.53 -.40 -1.12*
-.83*
FW(b) -.14 -.18 .72* .70* .11 -.29 -.04 -.16
FW(c) .28 -.23 -.09 .15 -.80 -.34 .11 .40
UA(a) .14 .09 .36 .54 .19 .63 .01 .18
UA(d) .45 .25 70* .72* .59 .64 -.45 -.40
BC(a) __ -- -- -- -- -- --
BC(b) -.16 -.23 .66 .52 .18 -.07 .28 .21
BC(c) .40 ,.20 .74 .76 -.36 .22 .43 .52
BC(e) .59* .31 .33 .70* -.08 .28 -.28 -.03
U0(a) -.19 -.32 .30 .39 -.56 .41 .16 .33
U0(b) .50 .56 .30 .68 -.02 -.00 -.02 .48
U0(c) -.03 -.04 .16 .36 .42 .84 -.25 .00
UK(a) .34 -.07 .11 .23 .21 .55 -.26 -.03
UK(b) .16 -.17 .65 .52 -.45 -.79 .22 .25
UK(c) .49 -.46 .02 .14 -.13 -.18 .37 .38
HS(c) -.03 -.01 .05 -.15 -.40 -.47 -.13 -.16
UF(a) -.12 -.09 .08 .00 .14 .06 .14 .12
UF(c) .44 .07 .50 .37 -.09 -.51 -.06 -.15
ED(b) -.21 -.41 -.22 -.32 .20 .02 .20 ,13
ED(c) -- -- -- -- -- --
NY(a) -.01 -.18 .17 .45 -.39 -.15 .34 .49*
NY(b) -.14 -.11. .29 .36 -.33 -.25 .34 .36
SW .08 -.14 -.32 -.15 -.07 .36 .18 .32
PI .07 .19 .31 .25 .53 .39 -.61 -.64
OVERALL .13 -.03 .22 .30 -.06 .09 -.01 .09
DIFFERENCE .16 -.08 -.15 -.10
(COV.-IND. ETD.)
<.05.
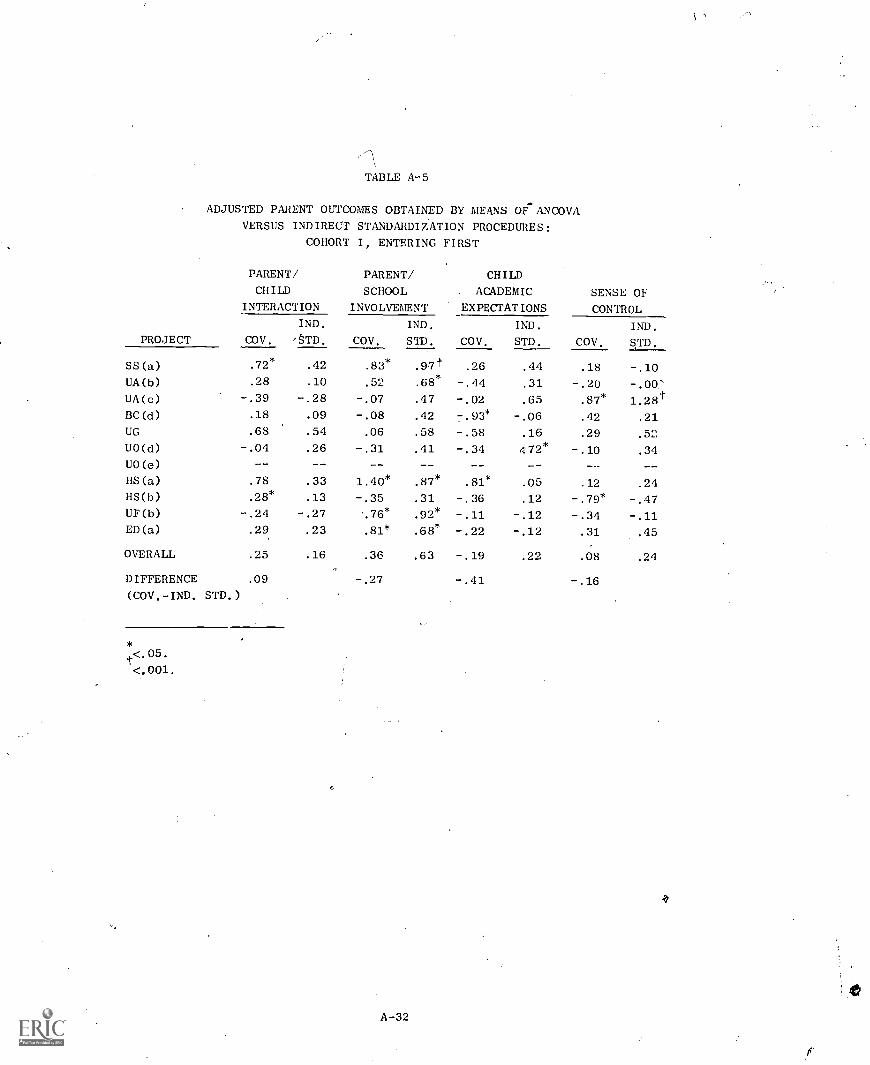
TABLE A-5
ADJUSTED PARENT OUTCOMES OBTAINED BY MEANS OFANCOVAVERSUS INDIRECT STANDARDIZATION PROCEDURES:
COHORT I, ENTERING FIRST
PARENT/
CHILD
INTERACTION
PARENT/
SCHOOL
INVOLVEMENT
CHILD
ACADEMIC
EXPECTATIONSSENSE OF
CONTROLIND. IND. IND. IND.
PROJECT COV. 'STD. COV. STD. COV. STD. COV. STD.
SS(a) .72* .42 .83* .9,7t .26 .44 .18 -.10UA(b) .28 .10 .52 .68
*-.44 .31 -.20 -.00"
UA(c) -.39 -.28 -.07 .47 -.02 .65 .87* 1.28tBC(d) .18 .09 -.08 .42 7.93* -.06 .42 .21
UG .68 .54 .06 .58 -.58 .16 .29 .52
U0(d) -.04 .26 -.31 .41 -.34 472* -.10 .34
U0(e) __ -- -- -- -- -- -- --
HS(a) .78 .33 1.40* .87* .81* .05 .12 .24
HS(b) .28* .13 -.35 .31 -.36 .12 -.79* -.47UF(b) -.24 -.27 76* .92* -.11 -.12 -.34 -.11ED(a) .29 .23 .81* .68
*-.22 -.12 .31 .45
OVERALL .25 .16 .36 .63 -.19 .22 .08 .24
DIFFERENCE .09 -.27 -.41 -.16(COV.-IND. STD,)
<.05.t<.001.
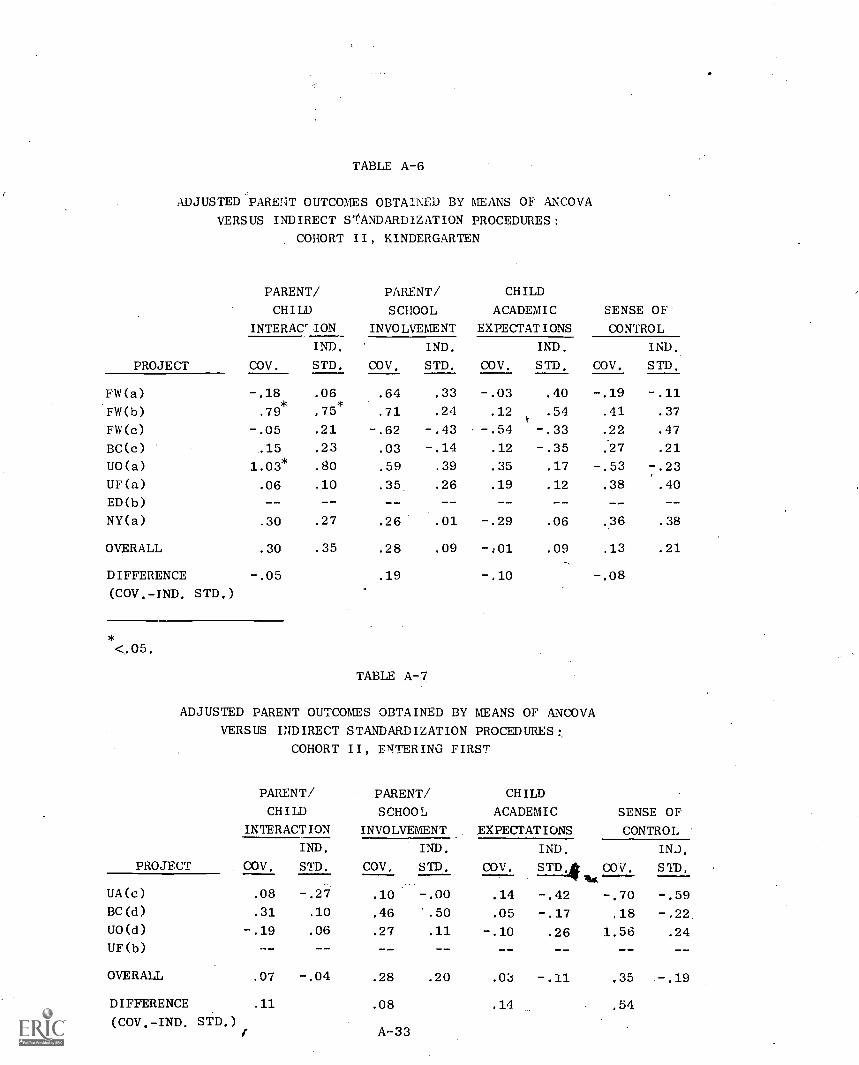
TABLE A-6
ADJUSTED PARENT OUTCOMES OBTAINED BY MEANS OF ANCOVA
VERSUS INDIRECT Sq'ANDARDIZATION PROCEDURES:
COHORT II, KINDERGARTEN
PARENT/ PARENT/ CHILD
CHILD SCHOOL ACADEMIC SENSE OF
INTERACTION INVOLVEMENT EXPECTATIONS CONTROL
PROJECT COV.
IND.
STD. COV.
IND.
STD. COV.
IND.
STD. COV.
IND.
STD.
FW(a) -.18 .06 .64 .33 -.03 .40 -.19 -.11
FW(b) .79*
, 75*
.71 .24 .12t
.54 .41 .37
FW(c) -.05 .21 -.62 -.43 -.54 -.33 .22 .47
BC(c) .15 ,23 .03 -.14 .12 -.35 .27 .21
U0(a) 1.03* .80 .59 .39 .35 .17 -.53 -.23
UF(a) .06 .10 .35 .26 .19 .12 .38 .40
ED(b) --
NY(a) .30 .27 .26 .01 -.29 .06 .36 .38
OVERALL .30 .35 .28 .09 -:01 .09 .13 .21
DIFFERENCE -.05 .19 -.10 -.08
(COV.-IND. STD.)
<.05.
TABLE A-7
ADJUSTED PARENT OUTCOMES OBTAINED BY MEANS OF ANCOVA
VERSUS INDIRECT STANDARDIZATION PROCEDURES:,
COHORT II, ENTERING FIRST
PROJECT
PARENT/
CHILD
INTERACTION
PARENT/
SCHOOL
INVOLVEMENT
CHILD
ACADEMIC
EXPECTATIONS
SENSE OF
CONTROL
00V.
IND.
STD. COV,
IND.
STD. 00V.
IND.
STD.* COV.
INJ,
STD,'. Its.
UA(c) .08 -.27 .10 -.00 .14 -.42 -.70 -.59BC(d) .31 .10 .46 .50 .05 -.17 ,18 -.22.
U0(d) -.19 .06, .27 .11 -.10 .26 1.56 .24
UF(b) .._.
OVERALL .07 -.04 .28 .20 .03 -.11 ,35 -.19
DIFFERENCE .11 .08 .14 .54
(COV.-IND. STD.)r A-33

the measure and a perfectly reliable measure (i.e., error-free). The
net Wect of the procedure is an increase in the slope of the betas-
i.e., greater covariable adjustment. However, since our data are aggre-
gated to classroom-level variables, reliability. estimates of all covari-
ables are such that this correction procedure would have virtually no
net effect, All covariables for pupil and parent analyses have estimated
reliabilities (where estimable) in excess of :95, and currently, the
reliability of teacher covariables is unestimable and thus must be assumed
to be error-free.
The second procedure, using disOict- or project-level subgroup
means to deviate cell means for covariable adjustments, does produce dif-
ferent absolute cell valuer compared with deviation of cell means from
grand means. However, our goal is to estimate and to interpret relative
FT/NFT differences, and these relative cell estimates are identical for
both procedures. Since computer methods exist for conventional (grand
mean) adjustments, we chose to follow this procedure.
The actual results of overall regression covariables on the
outcome variables are tabulated and summarized in Annex B. These tables
are prepared for the project-level analyses and present summary and re-
gression statistics for each major group of analyses.

Annex B
PSYCHOMETRIC AND REGRESSION DATA
,t
Annex B
PSYCHOMETRIC AND REGRESSION DATA
This annex consists of two parts. The first part presents the
results of reliability analyses of the pupil outcome measures. The second
part contains summary and regression statistics obtained from the sepa-
rate ANCOVAS performed on the project-level data.,
Part 1: Psychometric Data--Item Analyses and Reliability
Data for Pupil Outcome Measures
The item analyses and relevant statistical information on the 1971
pupil outcome measures were compiled separately for each cohort group
evaluated in this report. Both Follow Through and Non-Follow Through
scores were pooled in computing item and test statistics for outcome
variables for each cohort by grade streams.
Table B-1 summarizes the principal statistical results of the reli-
ability analyses. Included in the table are mean scores, standard de-
viations, coefficient alpha reliability estimates, standard errors of
measurement, indices of skew and kurtosis, and the number of cases. In
all, nearly 14,000 pupils contributed to these data: over 7,500 in Co-
hort I, Kindergarten (CI-K), 3,200 in Cohort I, Entering First (CI-E),
2,000 in Cohort II, Kindergarten (CII-K), and 1,000 in Cohort II, Enter-
ing First (CII-E). Measures included were the WRAT, achievement, and
disaggregated component variables. The affect measure was not includee
in this analysis.
Inspection of Table B-1 reveals that remarkably high reliability
estimates are obtained for these measures. In particular reliability
oT the achievement measure ranges from a low of .964 to a high of .986.
WRAT varies from .934 to .973. The quantitative, reading, and language
measures range from .762 to .982, with a median value of .92. The cog-
knitive processes measure, which was omitted from the CI-E battery, dis-
played the poorest measurement properties, with reliability varying from
.580 to .760.
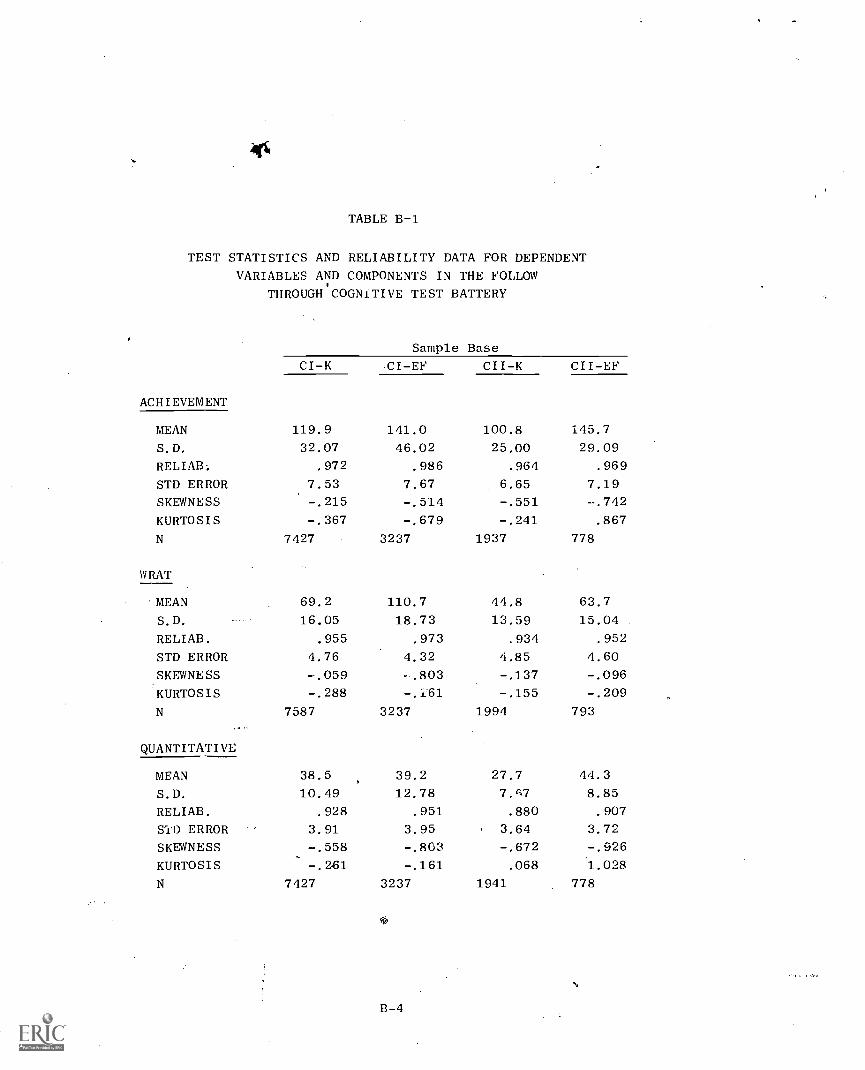
TABLE B-1
TEST STATISTICS AND RELIABILITY DATA FOR DEPENDENT
VARIABLES AND COMPONENTS IN THE FOLLOW
THROUGH COGNITIVE TEST BATTERY
ACHIEVEMENT
Sample Base
CI-K CI-EF CII-K CII-EF
MEAN 119.9 141.0 100.8 145.7
S.D. 32.07 46.02 25.00 29.09
RELIAB; .972 .986 .964 .969
STD ERROR 7.53 7.67 6.65 7.19
SKEWNESS -.215 -.514 -.551 - -.742
KURTOSIS -.367 -.679 -.241 .867
N 7427 3237 1937 778
WRAT
MEAN 69.2 110.7 44.8 63.7
S.D. 16.05 18.73 13.59 15.04
RELIAB. .955 .973 .934 .952
STD ERROR 4.76 4.32 4.85 4.60
SKEWNESS -.059 -.803 -.137 -.096
KURTOSIS -.288 --.161 -.155 -.209
N 7587 3237 1994 793
QUANTITATIVE
MEAN 38.5 39.2 27.7 44.3
S.D. 10.49 12.78 7,47 8.85
RELIAB. .928 .951 .880 .907
SID ERROR 3.91 3.95 , 3.64 3.72
SKEWNESS -.558 -.803 -.672 -.926
KURTOSIS -.261 -.161 .068 1.028
N 7427 3237 1941 778
pa
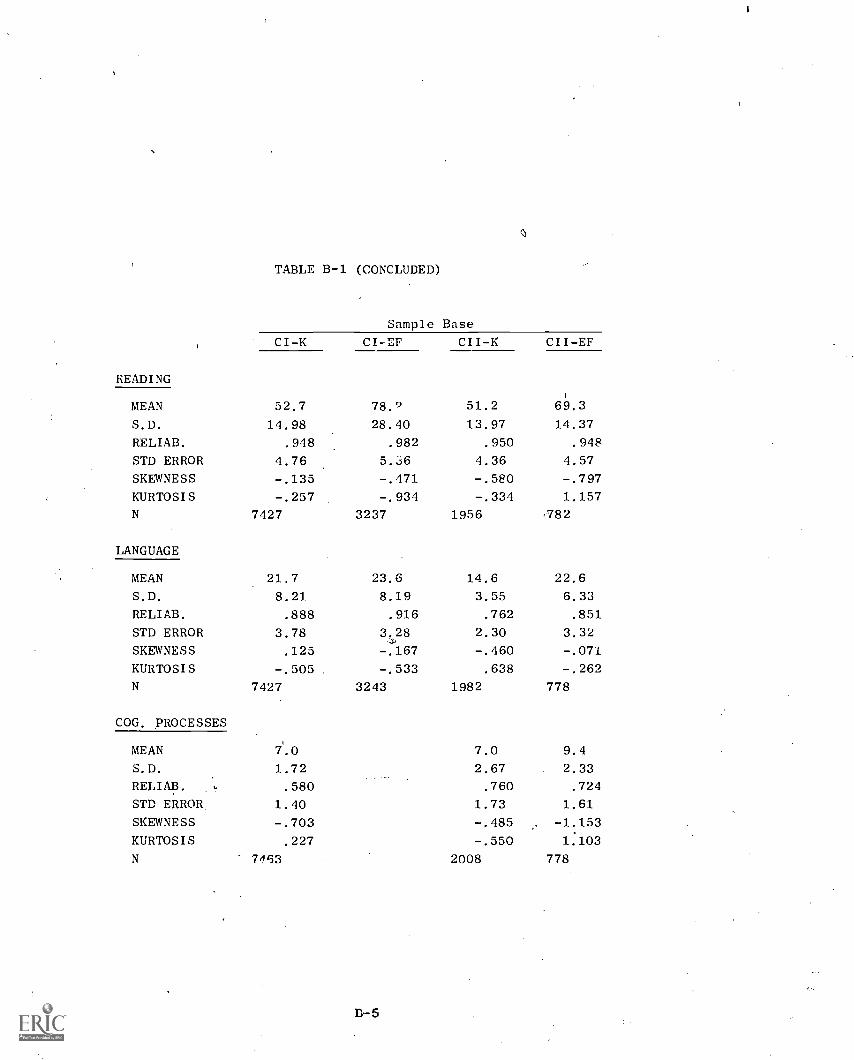
TABLE B-1 (CONCLUDED)
Sample Base
READING
CI-K CI-EF CII-K CII-EF
MEAN 52.7 78.9 51.2 69.3
S.D. 14.98 28.40 13.97 14.37
RELIAB. .948 .982 .950 .948
STD ERROR 4.76 5.36 4.36 4.57
SKEWNESS -.135 -.471 -.580 -.797
KURTOSIS -.257 -.934 -.334 1.157
N
LANGUAGE
7427
21.7
8.21.
.888
3.78
.125
-.505
7427
71.0
1.72
.580
1.40
-.703
.227
7453
3237
23.6
8.19
.916
3.28.._.4.
-.167
-.533
3243
1956
14.6
3.55
.762
2.30
-.460
.638
1982
7.0
2.67
.760
1.73
-.485
-.550
2008
,782
22.6
6.33
.851
3.32
-.071
-.262
778
9.4
2.33
.724
1.61
-1.153
1:103
778
MEAN
S.D.
RELIAB.
STD ERROR
SKEWNESS
KURTOSIS
N
COG. PROCESSES
MEAN
S.D.
RELIAB. w
STD ERROR
SKEWNESS
KURTOSIS
N
Table B-2 presents the detailed results of the item analysis for the
contents of the 1971 Follow Through Pupil Test Battery. These results
display the item difficulty (percent passed) and variance for the test
samples on each of the items contained in the battery. Items are arranged
in terms of the major achievement components (i.e., quantitative, reading,
language, and cognitive processes), and thus, this table serves to define
operationally the variables, as well as to display item statistics; also
included is the booklet source of the item. Since not all items were given
tc all pupils, the patter of administration is also noted in this table.
Of particular interest are the apparent scalogram properties in terms
of item difficulties as noted in this table. For example, increasing
difficulties can be noted to correspond to item sequences and to grade
levels (or cohorts) for the, arithmetic, reading, and spelling sections
of the WRAT. Mese item Properties correspond well to those described
by the authors (Jastak and Jastak, 1965) and indicate this test has desir-
able measurement properties. With few exceptions, other groups of items
produced very uniform high or low difficulty indices, suggesting the test
might profitably be shortened in these areas. The notable exceptions are
for the MAT and SAT items in language and reading. Also, the letter dis-
crimination items did not generally differentiate performance, which sug-
gests questionable utility.
In sum, the data presented in this table are considered particularly
useful for subsequent planning and test selection. Also, although the
overall reliability is suite high, there does not appear to be any strik-
ing evidence that this Ls because of items other than those in the WRAT.
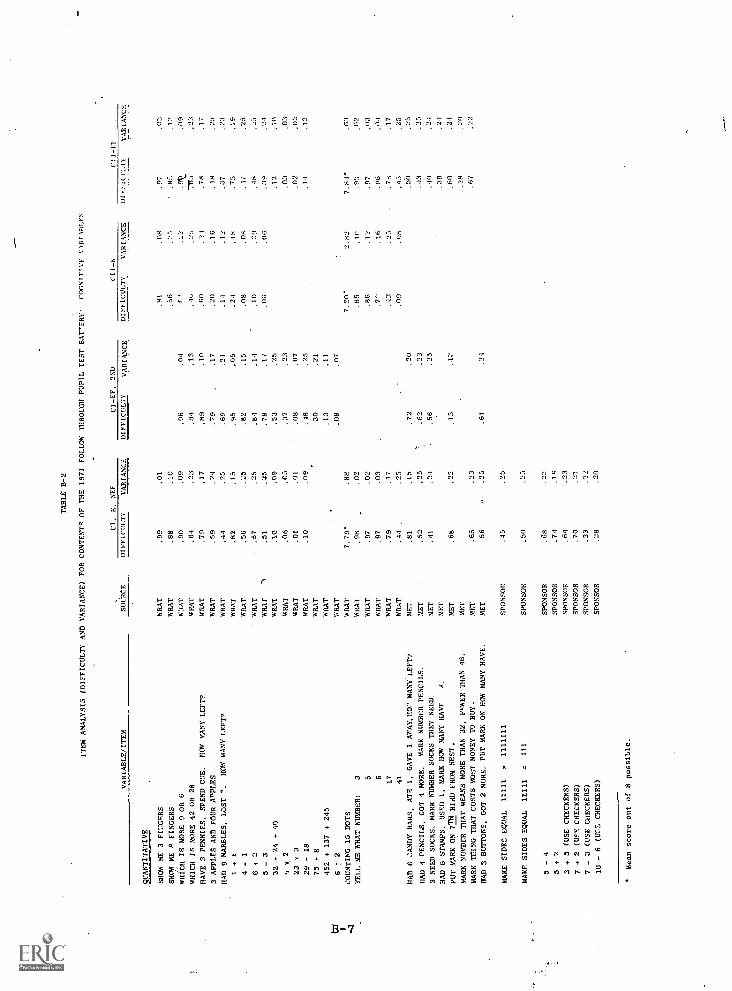
CC
aa
tr.
a0
:11
-4
E, 145
CC
N0I..
N
CC
C
6
C
C
M
CM.0,27X,
CI CI
CNr4 m ,S.1
`cr, g 4 :2CO
L.2,. 5;N
M K x CCS 122,S2,9,2
E- E- E- E- E- E- I- I-, E- E- E- E- E- E- Z Z Z. Zg gggggggg*ggggggggLiizr.,[7.;35Lt.", 2 2 RIgg,..gg.g.2 2 2 2
FE
47N..t
c-W,A
N>.
.. B
F -'4!,:i f 6b4 c '':i! 1i;
." 7 7 7+,..
. N ,
m
17; Ev-.'
+ 2
N 2
'.2
,"1 ...I. i ..1..)
4 CD
i,. !4!1- g . '5 :;qc-,;,s.gi::!g:''.
1'.. .0(01.15 R8'1'- .,.. - si .a: . . ci., . z . .:1
ti : z ' !7.1. N :-.
-s 2 °.:: 8 -"A'el.,.-g2,,i;.--1Rd CO
1 $ELi.wg5n0.1.STV.. M
`" z gzo4E-w.Qg = ,,, g in
72..1
4 u
- -7.4
:
-
,.1
M M
g gg
222Zca.c
te"L,,Veig636'."
VI
''' L" '`I ', 7. . 7, o++++11. . ... ,.. F4
B - 7
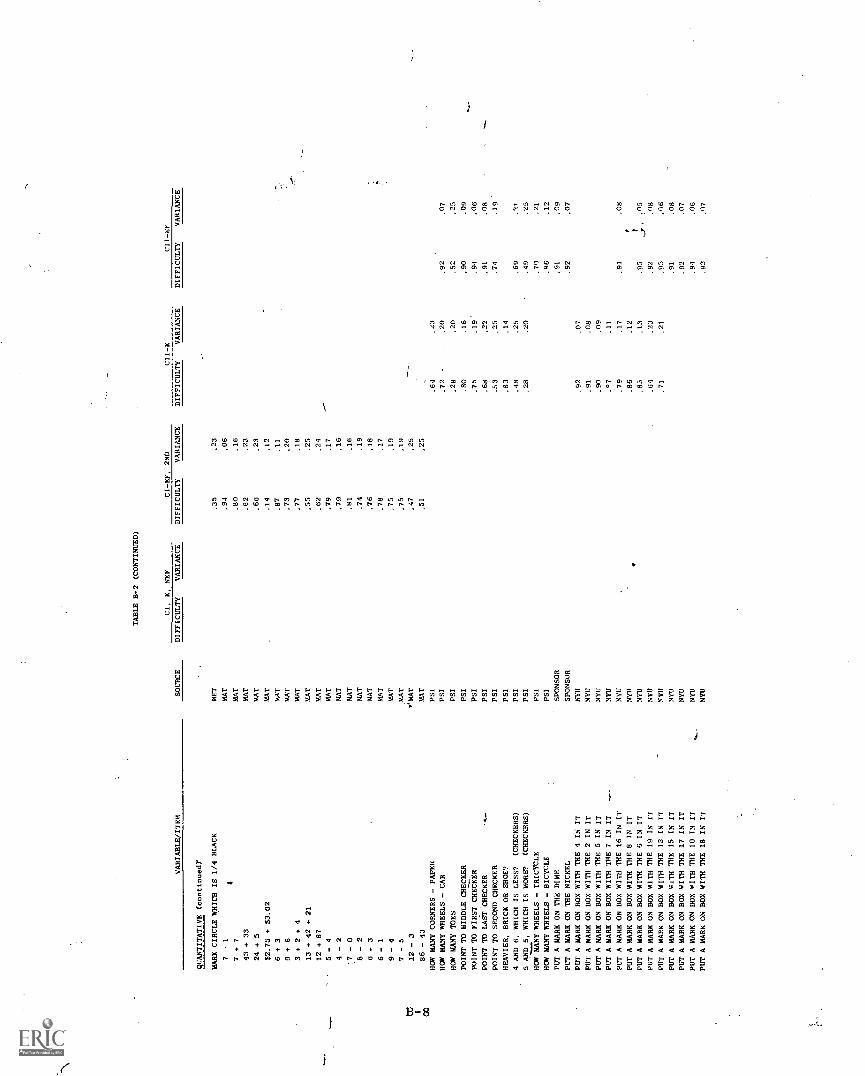
`f
U
O
8
CO
N
iei
E.
O
UW
N
MO O LOMNLn0N. N. N. N. ". N. N.
tO Cn N 0 c0 Ln n t.0 oD cn ..rfN 0 .NN ..N.NN.. ..... N N
CCN CO CO
. P. `4,
8`.
C CO5: cc' °". `":;".. .6"7.
Cn N0 0 0 CI N
N'61 `0"- r.
CO
COO
o
?1 5` 5 5 5 5 5 5 5 5 5 5 5 5 5 5 5 5 5 5. g 2. 2 2 2 2 2 2 2. 2. 2 akEEEEREE.H.REE.
E. E. E. F . F E.ZZZZZZ
E.., 2 cal u:, c, c., . ,... 0 oD. . . . . .
011 8 8 43Z W v N in n . ce EC, . . . . . .
.... v p N .1 13 13 NI
64c 9- 9- rrrrrrrrrrr/ -....,
En 14c4 . C) 4E.)
.....,E .0 , .. 'ZI [ ; 1) ) 3r.) 111 [ 3 Qg 1: 33 (i' f -4. CO n z w xxxxx';';;;5 I I CO 6 2 6 = En En
U0
N l'2 En CO 52°''''..)NN22222222228222 N Eis33,u2a,,,,,ctu.addzzzzzzzzzzzzzzz
En CO 41000000000000000t.. N CO ; gMgMMggclgreCIMgrCtl
69 a+ 8 g.i.,.:..n..3,'''''OP....g. 047,1;7". ,t2 rILON +TrN ONEn.Trin7 '7111FggF.,.s.ROgIggl2g121g
++ +T,,,,
M I, C. ';11 CI 49 ti: , 01 CO 2 .Ni ,/, Tr ,--Ntli 5$$I°X.,C.t.t.t.t .C.C6.t6666.t6
& g .'''''''''011.." E t . .. t ,., P kl. E.;'. P E,.. ,. :q. ,. ,. C.
B-8
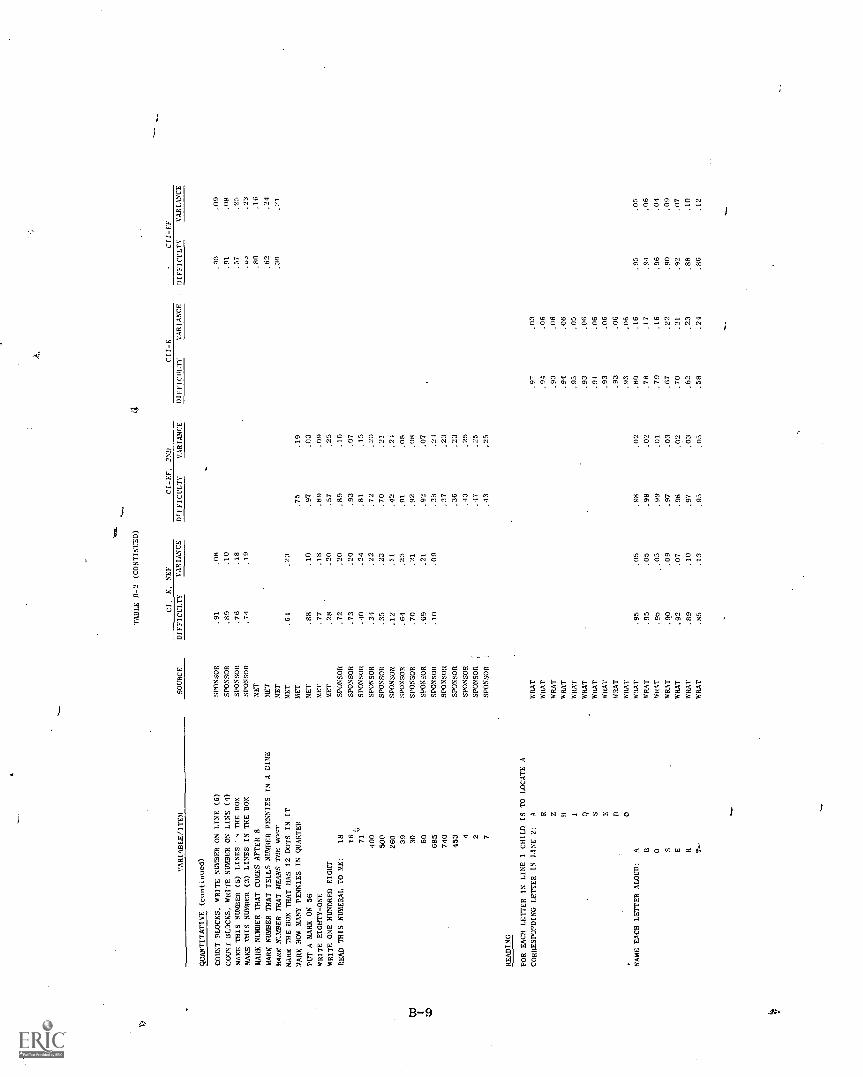
TABLE B-2 (CONTINUED)
CI, K. NEF
CI-EF, 2ND
CII-K
CII-EF
VARIABLE/ITEM
SOURCE
DIFFICULTY
VARIANCE
DIFFICULTY
VARIANCE
DIFFICULTY
VARIANCE
DIFFICULTY
VARIANCE
QUANTITATIVE (continued)
COUNT BLOCKS, WRITE NUMBER ON LINE (6)
SPONSOR
.91
.08
.90
.09
COUNT BLOCKS, WRITE NUMBER ON LINE (4)
SPONSOR
.89
.10
.91
.08
MAKE THIS NUMBER (5) LINES 'y THE BOX
SPONSOR
.76
.18
.57
.25
MAKE THIS NUMBER (3) LINES IN THE BOX
SPONSOR
.71
.19
.94
.23
MARK NUMBER THAT COMES AFTER 8
MET
.80
.16
MARK NUMBER THAT TELLS NUMBER PENNIES
IN A DIME
MET
.62
.24
MARK NUMBER THAT MEANS THE MOST
MET
.30
.21
MASK THE BOX THAT HAS 12 DOTS IN IT
MET
.61
.23
MARK HOW MANY PENNIES IN QUARTER
MET
.75
.19
PUT A MARK ON 56
MET
.88
.10
.97
.03
WRITE EIGHTY-ONE
MET
.77
.18
.89
.09
WRITE ONE HUNDRED EIGHT
MET
.28
.20
.57
.25
READ THIS NUMERAL TO ME:
18
SPONSOR
.72
.20
.89
.10
16 _
SPONSOR
.73
.20
.93
.07
71"
SPONSOR
.40
.24
.81
.15
400
SPONSOR
.34
.22
,72
.20
500
SPONSOR
.35
.23
.70
.21
260
SPONSOR
.12
.11
.42
.21
39
SPONSOR
.64
.23
.91
.08
tri
30
SPONSOR
.70
.21
.92
.08
60
SPONSOR
.69
.21
.92
.07
685
SPONSOR
.10
.09
.39
.24
740
SPONSOR
.37
,23
453
SPONSOR
.36
.23
4SPONSOR
.43
,25
2SPONSOR
.47
.25
7SPONSOR
.13
,25
READING
FOR EACH LETTER IN LINE 1
CHILD IS TO LOCATE A
CORRESPONDING LETTER IN LINE 2:
AWRAT
.97
.03
RWRAT
.94
.06
ZWRAT
.93
.06
HWRAT
.94
.06
IWHAT
.95
.05
QWHAT
.93
.06
5WRAT
.94
.06
EWHAT
.93
.06
BWRAT
.93
.06
0WRAT
.93
,06
NAME EACH LETTER ALOUD:
AWIAT
.95
.05
.98
.02
.80
.16
.95
.05
BWRAT
.95
.05
.98
.02
.78
.17
.94
.06
0WRAT
.95
.05
.99
.01
.79
.16
.96
.04
SWHAT
.90
.09
.97
.03
.67
.22
.90
.09
EWHAT
.92
.07
.98
.02
.70
.21
.92
.07
RWRAT
.89
.10
,97
,03
.62
.23
.88
.10
T-
WRAT
.85
.13
.95
.05
.58
.24
.86
.12

YA
M A
BL
E.,
I T
EA
TSO
UR
CE
TA
BL
E B
-2 (
CO
NT
INU
ED
)
CI,
K. S
EE
CI-
SF. 2
ND
CII
-KC
I I-
FFD
IFFI
CU
LT
YV
AR
IAN
CE
DIF
FIC
UL
TY
VA
RIA
NC
ED
IFFI
CU
LT
}'V
AR
IAN
CE
DI
Ft' I
CU
LT
YV
AR
IAN
CE
RE
AD
ING
(co
ntin
ued)
NA
ME
EA
CH
LE
TT
ER
AL
OU
D:
HW
HA
T,8
9.0
9.9
7.0
3.2
3.8
9.1
0P
W R
AT
.89
.09
.97
.02
.64
.23
.86
.12
IW
RIT
.58
.2.1
.77
.1.
.55
.25
.57
UW
HA
T.8
5.1
4.9
5.0
5.5
3.2
5.8
4.1
3Z
WR
AT
.81
.15
.91
.08
.25
.78
.17
QW
RIT
.84
.14
.93
.06
.24
.82
.15
DR
AW
EA
CH
MA
RK
IN
BO
X: =
WH
AT
.96
.04
.87
.11
.96
.0.1
WR
AT
.97
.03
.91
.09
.96
.04
/W
RA
T.9
3.0
7.7
2.2
0.9
0.0
9\
WH
AT
.93
.07
.71
.20
.89
.09
0W
HA
T.9
6.Q
4.8
8.1
1.9
5.0
5X
rW
RA
T.9
3,O
6.6
7.2
2.8
8.1
0_J
WR
AT
V -1_,
_
WH
AT
.82
,86
.12
.59
.53
.25
.76
,77
.18
.18
WH
AT
.77
.18
.61
.70
I -
WH
AT
.94
.06
.77
.17
.91
.08
AW
HA
T.8
4,1
3.5
0.2
2.7
8.1
7E
WR
AT
.84
.14
.59
.24
.78
,I7
AW
RA
Ttz
DW
RIT
.72
.82
.20
.15
....
.35 .7
.23
.25
.68
,78
.22
.17
1-"
UW
HA
T.8
0.1
6.1
6._
5.7
7.1
80
VW
RA
T.5
725
. 22
.17
.45
WR
AT
.72
.20
. :19
.67
.22
nW
HA
T.7
2.2
0.4
0.2
4.7
0.2
1SA
Y E
AC
H W
OR
D A
LO
UD
:C
AT
WR
AT
.84
.13
.96
.04
.43
.24
.79
.17
SEE
WR
AT
.69
.21
.93
.07
.13
.11
.75
....
.19
RE
Dw
HA
T.7
2.2
0.1
414
.11
.14
.12
.63
.23
TO
WR
AT
.76
.18
.95
.05
.17
.1.1
.80
.16
BIG
WR
IT.6
1.8
6.1
2.1
2.10
.61
WO
RK
WR
IT.4
5.2
5.7
8.1
7.0
5.0
5.52
. 25
BO
OK
WH
AT
.54
.25
..087
'-.1
2.0
9.0
8.5
7.2
5E
AT
WR
AT
.11
.25
.80
.16
.06
.06
.43
._5
WA
SW
RA
T.3
9.2
1.7
4.1
9.0
5.0
4.3
5.2
3H
IMW
HA
T.5
1.2
5.8
1.1
6.1
0.0
9.4
6.2
5H
OW
WR
AT
.34
.22
. 69
. 21
. 06
, 05
. 32
.22
TH
EN
WR
AT
.36
.23
.72
.20
.04
. (1.
1.:1
8O
PEN
WH
AT
.26
.19
.66
.22
.03
.03
.20
.16
LE
TT
ER
WR
AT
.25
.19
.67
.22
.03
.03
.26
.19
JAR
WR
AT
.78
.20
.62
.24
.20
..T6
DE
EP
WH
AT
.20
.16
.53
.25
.12
.11
EV
EN
WR
AT
.15
.15
.45
.25
.09
.08
SPE
LL
WH
AT
.18
.15
.51
.25
.05
.05
AW
AK
EW
HA
T.1
3.1
1.4
8.2
5.0
5.0
5B
LO
CK
W R
AT
.18
.15
.52
.25
.03
.03
SIZ
EW
HA
T.1
2.1
0.2
4.1
3.1
2W
EA
TH
ER
WR
AT
.12
.10
.41
.24
.07
.07
SHO
UL
DW
RA
T.0
8.0
8.4
0.2
4
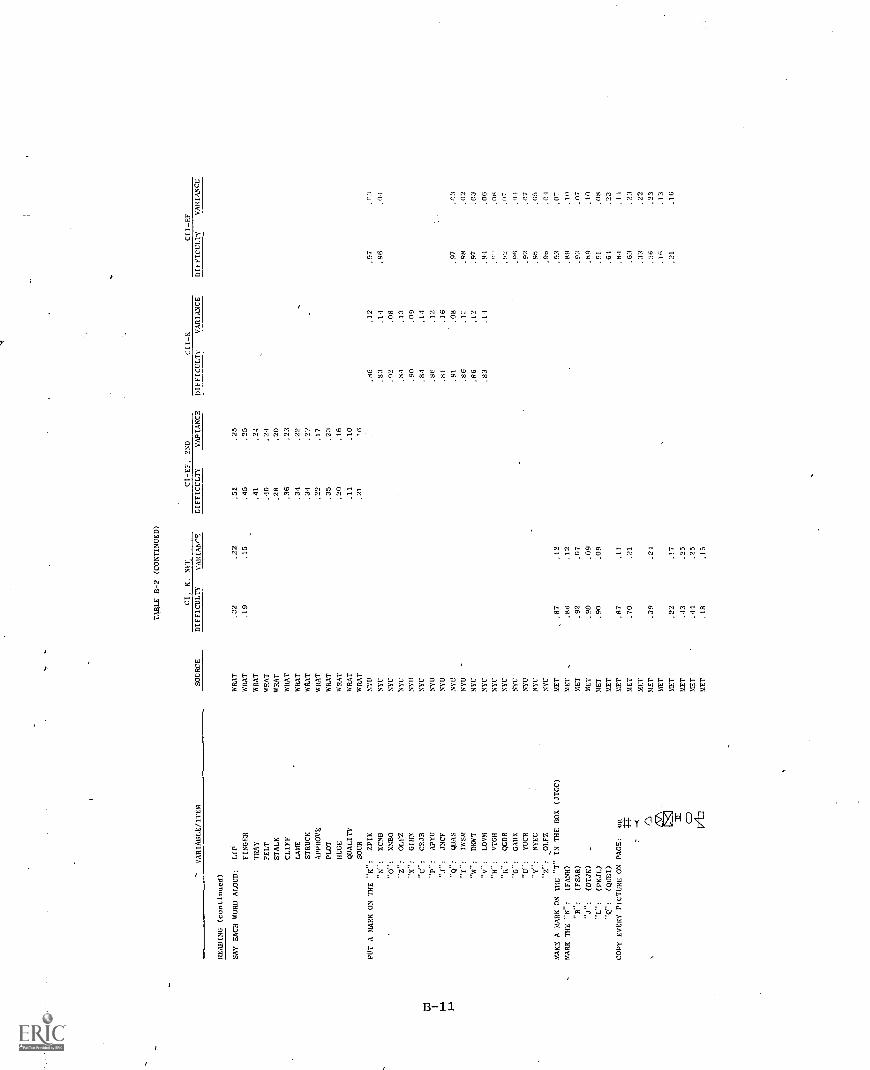
TABLE B-2 (CONTINUED)
CI, K, NEF
CI-EF, 2ND
CII-K
CII-EF
VARIABLE/ITEM
SOURCE
DIFFICULTY
VARIANCE
CIFFICULTY
VARIANCE
DIFFICULTY
VARIANCE
DIFFICULTY
VARIANCE
READING (continued)
SAY EACH WORD ALOUD:
LIP
WRAT
.32
.22
.51
.25
FINGER
WRAT
.19
.15
.45
.25
TRAY
WRAT
.41
.24
FELT
WRAT
.40
.24
STALK
WRAT
.28
.20
CLIFF
WRAT
.36
.23
LAME
WRAT
.34
STRUCK
WRAT
.34
.22
APPROVE
WRAT
.22
.17
PLOT
WRAT
.35
.23
HUGE
SEAT
.20
.16
QUALITY
WHAT
.11
.10
SOUR
WRAT
.21
'6
PUT A MARK ON THE "K":
ZPIK
NYU
.86
.12
.97
.mi
"N":
XCNB
NYU
.82
.14
.96
.01
"O":
XNBO
NYU
.92
.08
"Z":
OLFZ
NYU
.81
.13
"X":
GIHX
NYU
.90
.09
td
"C":
CRJB
"P":
NYU
.84
iAPYU
NYU
.86
.12
I"
"J":
JNCF
NYU
.81
.16
I"
"Q":
QBAS
NYU'
.91
.08
.97
.03
"/":
IWSM
NYU
.86
.1:2
.98
.02
"8":
DKWT
NYU
.86
.12
.97
.03
"V":
LOVM
NYU
.82
.11
.94
.06
"H":
VTGH
NYU
.00
"C":
.QGDR
NYU
,07'.
07
"G":
GAME
NYU
.96
.04
"U":
YUCR
NYU
.92
.07
"Y":
NYEC
NYU
.95
.05
"Z":
OLFZ
NYU
.98
.01
MAKE A MARK ON THE "T" IN THE BOX (JTGC)
MET
.87
.12
.92
.07
MARK THE "N":
(FANH)
MET
.86
.12
.89
.10
"R":
(FSAR)
MET
.92
.07
.92
.07
"J":
(DTJK)
MET
.90
.09
.89
.10
"L":
(PKJL)
MET
.90
.09
.91
.08
"Q",
(QUBI)
MET
.61
.23
COPY EVERY PICTURE ON PAGE:
eg
MET
.87
.11
.84
.13
MET
.70
.21
.63
.23
MET
.32
.22
/1
MET
.39
.21
.26
.23
LM -
MET
.16
.13
NET
.22
.17
-
.21
.16
3E
MET
.43
.25
CD
NET
.44
.25
OD
MET
.18
.15
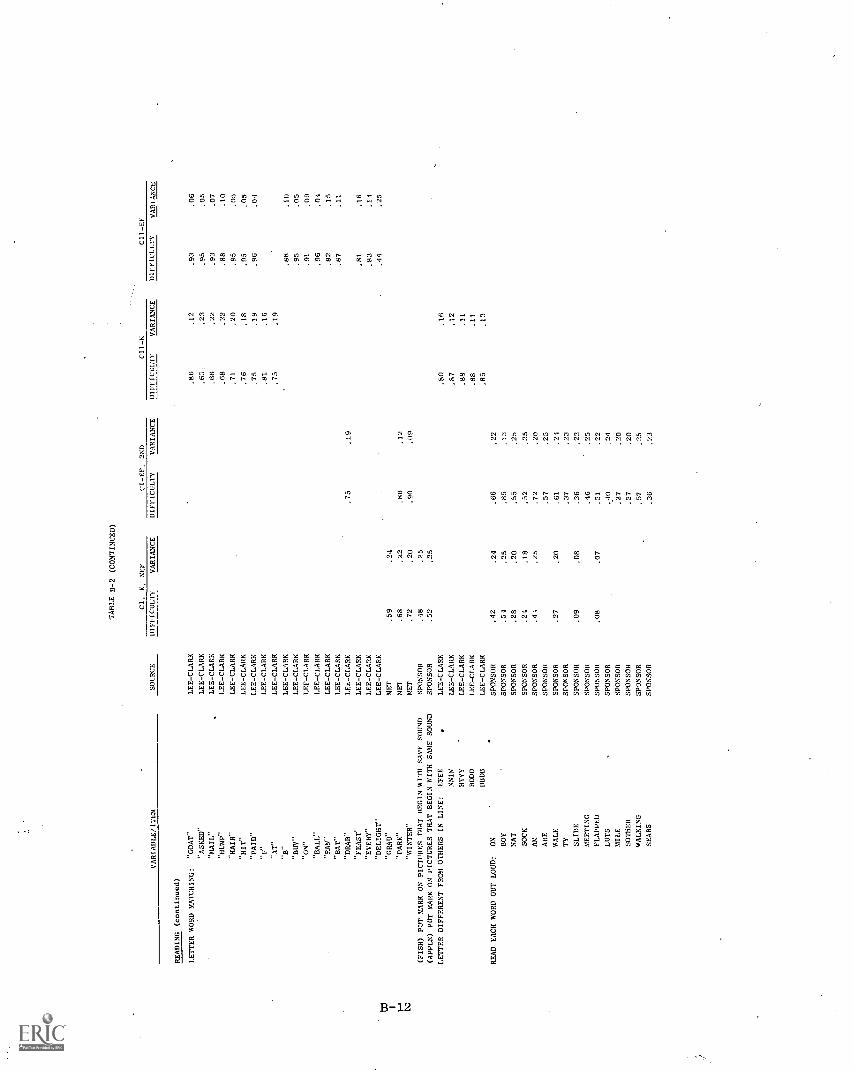
TABLE B-2 (CONTINUED)
CI, K. NEF
CI-EF, 2ND
C11 -K
CII-EF
VARIABLE/ITEM
SOURCE
DIFFICULTY
VARIANCE
DIFFICULTY
VARIANCE
DIFFICULTY
VARIANCE
DIFFICULTY
VARIANCE
.06
.05
.07
.10
.05
.05
.04
.10
READING (continued)
LEE-CLARK
LEE-CLARK
LEE-CLARK
LEE-CLARK
LEE-CLARK
LEE-CLARK
LEE-CLARK
LEE-CLARK
LEE-CLARK
LEE-CLARK
.86
.63,
.66
.68
.71
.76
.75
.81
.75
.12
.23
.22
.22
.20
.18
.19
.16
.19
.93
.95
.93
.88
.95
.95
.96
.88
LETTER WORD MATCHING:
"ASKED"
"MAIL"
"HUMP"
"HAIR"
"HIT"
"PAID"
"BUY"
LEE-CLARK
.95
.05
"ON"
LEE-CLARK
.91
.09
"BALL"
LEE-CLARK
.96
.01
"BAN"
LEE-CLARK
.82
.15
"BAT"
LEE-CLARK
.87
.11
LEE-CLARK
.75
,19
"FEAST"
LEE-CLARK
.81
.16
"EVERY"
LEE-CLARK
.83
.14
I
"DELIGHT"
LEE-CLARK
MET
MET
.59
.24
.44
.25
F'
"PARK"
MET
.68
.22
.86
.12
ta
"WINTER"
MET
.72
.20
.90
.09
(FISH) PUT MARK ON PICTURES THAT BEGIN WITH SANE SOUND
SPONSOR
.48
.25
(APPLE) PUT MARK ON PICTURES THAT BEGIN WITH SAME SOUND
SPONSOR
.52
,25
LETTER DIFFERENT FROM OTHERS IN LINE:
EFEE
.LEE-CLARK
.80
.16
NNIN
LEE-CLARK
,87
.12
HYYY
LEE-CLARK
.88
.11
BDDD
LEE-CLARK
.88
.11
BBDB
LEE-CLARK
.85
.13
READ EACH WORD OUT LOUD:
ON
SPONSOR
.42
.24
.66
,22
BOY
SPONSOR
.54
.25
.85
.13
NAT
SPONSOR
.28
.20
.55
.25
SOCK
SPONSOR
.24
.18
.52
.25
AM
SPONSOR
.44
.25
.72
.20
ARE
SPONSOR
.57
.25
WALK
SPONSOR
.27
.20
.61
TY
SPONSOR
.37
.23
SLIDE
SPONSOR
.09
.08
.36
.23
MEETING
SPONSOR
.46
.25
FLAPPED
SPONSOR
.08
.07
.31
.22
LUTS
SPONSOR
.40
.24
MILE
SPONSOR
.27
.20
SOTHER
SPONSOR
.27
.20
WALKING
SPONSOR
,57
.25
SEARS
SPONSOR
.36
.23
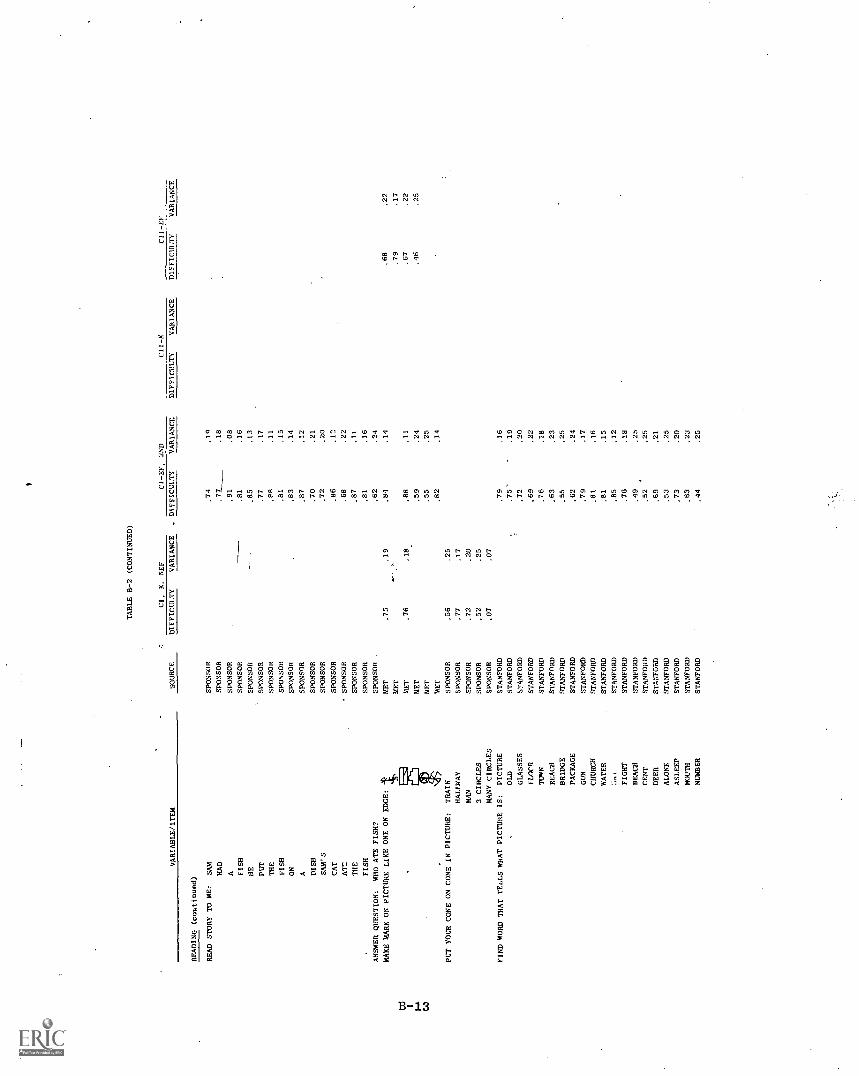
40
LI
Ca
......
'J'c'g2.1;',2%P.r. 2Tm
N N
°.
miN
01 N N CT) tO CI N N ul CO 0 N 01 CI (.7N N N m N CO 0 ,17 0=c:cwt.-vow
g r.CCI:Cggr.gg acc1885_,:cc46 02 9oo,o0@,o000q00002 v 2 ° ,t9.° 2 2 2 2 2 8 2 2 .
Rz RzIERz5 73 EV) tn V) 0 V2 Vl V2 1,7 VI LO W Q
El,,,, cut N
411MES4
ws% M0 -.7PS 5 E
i, ,.)z3.E:PA,..ictglEEi:1,-...mtp2,7,' ''c R z
Ei'',,i,t',iz i fg
1., o o,,, ,..,F.
,...-.4 8 E . ,
5.0.
n F.
0 E 5 u 3 E E ; F. 14 tal .:, :1. ia t"...` 0. P r4 8 a E. 6 a ,.-.: V)
,..,"''''
W .. 414
2 Z..z F.
lg. 2 E'''" rag.tr, 0aF.
at r" g 'gt.)
5O 1st g
II 51 g P,,.
U:
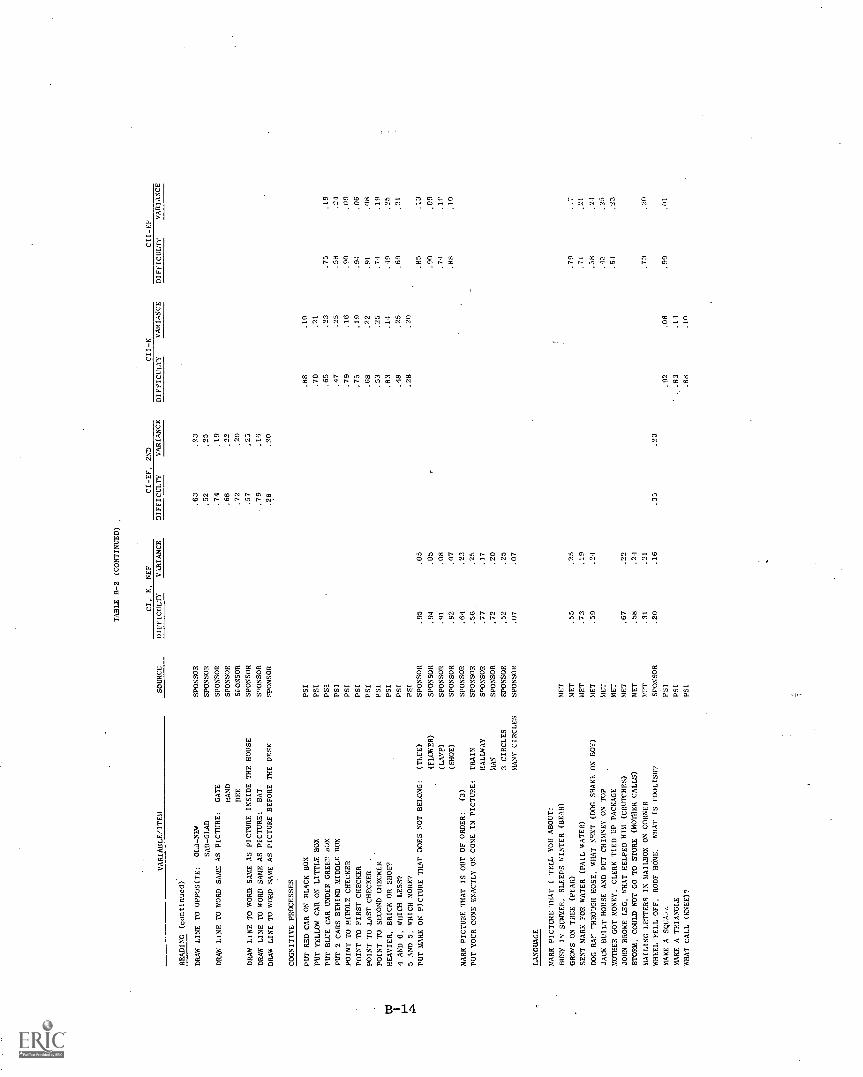
VARIABLE/ITEM
READING (continued)
DRAW LINE TO OPPOSITE:
OLD-NEW
SAD-GLAD
DRAW LINE TO WORD SAME AS PICTURE:
GATE
HAND
BEE
DRAW LINE TO WORD SAME AS PICTURE INSIDE THE HOUSE
DRAW LINE TO WORD SAME AS PICTURE:
BAT
DRAW LINE TO WORD SAME AS PICTURE BEFORE THE DESK
COGNITIVE PROCESSES
PUT RED CAR ON BLACK BOX
PUT YELLOW CAR ON LITTLE
PUT BLUE CAR UNDER GREEN
PUT 2 CARS BEHIND MIDDLE
POINT TO MIDDLE CHECKER
POINT TO FIRST CHECKER
POINT TO LAST CHECKER
POINT TO SECOND CHECKER
HEAVIER, BRICK OR SHOE?
4 AND 6, WHICH LESS?
5 AND 5, WHICH MORE?
PUT MARK ON PICTURE THAT
MARK PICTURE THAT IS OUT
PUT YOUR CONE EXACTLY ON
LANGUAGE
BOX
o0X
BOX
DOES NOT BELONG:
(THEE)
(FLOWER)
(LAMP)
(SHOE)
OF ORDER:
(3)
CONE IN PICTURE:
TRAIN
HALLWAY
MAN
3 CIRCLES
MANY CIRCLES
MARK PICTURE THAT I TELL YOU ABOUT:
BUSY IN SUMMER, SLEEPS WINTER (BEAR)
GROWS ON TREE (PEAR)
SENT MARK FOR WATER (PAIL WATER)
DOG RAr THROUGH HOSE, WHAT NEXT (DOG SHAKE ON BOY)
JACK BUILT HOUSE AND PUT CHIMNEY ON TOP
MOTHER GOT MONEY, CLERK TIED UP PACKAGE
JOHN BROKE LEG, WHAT HELPED HIM (CRUTCHES)
STORM, COULD NOT
GO
70
STO
RE
(MOTHER CALLS)
MAILING LETTERS IN MAILBOX ON CORNER
WHEEL FELL OFF, RODE HOME.
WHAT IS FOOLISH?
MAKE A SQUA:,
MAKE A TRIANGLE
WHAT CALL (KNEE)?
TABLE B-2 (CONTINUED)
CI, K, REF
CI-EF, 2ND
CII-K
SOURCE
DIFFICULTY
ViRIANCE
DIFFICULTY
VARIANCE
DCII-K
IFFICULTY
VARLtNCE
DIFFICULTY
SPONSOR
SPONSOR
SPONSOR
SPONSOR
SPONSOR
SPONSOR
S "ONSOR
SPONSOR
PSI
PSI
PSI
PSI
PSI
PSI
PSI
PSI
PSI
PSI
PSI
SPONSOR
SPONSOR
SPONSOR
SPONSOR
SPONSOR
SPONSOR
SPONSOR
SPONSOR
SPONSOR
SPONSOR
MET
MET
MET
MET
MET
MET
MET
MET
MFT
SPONSOR
PSI
PSI
PSI
.95
.94
.91
.92
.64
.56
.77
,72
,52
.07
.55
,73
.59
.67
.58
.31
.20
.05
.05
.08
.07
.23
.25
.17
.20
.25
.07
.25
.19
.22
.24
.21
.16
,63
.52
.74
.68
.72
.57
,79
,28
.35
.23
.25
.19
.22
.20
.23
.16
.20
,23
.88
.70
.65
.47
.79
.75
.68
.53
.83
.48
.28
.92
.83
.88
_10
.21
.23
.25
.16
.19
.22
.25
.14
,25
.20
.08
.11
.10
.75
.58
.90
.94
.91
.74
.49
.69
.85
.90
.74
.88
.79
.71
,58
_45
.64
. 73
.99
VARIANCE
.19
.24
.09
.06
.08
.19
.25
.21
.13
.09
if
.10
..7
.21
.24
.25
.25
.20
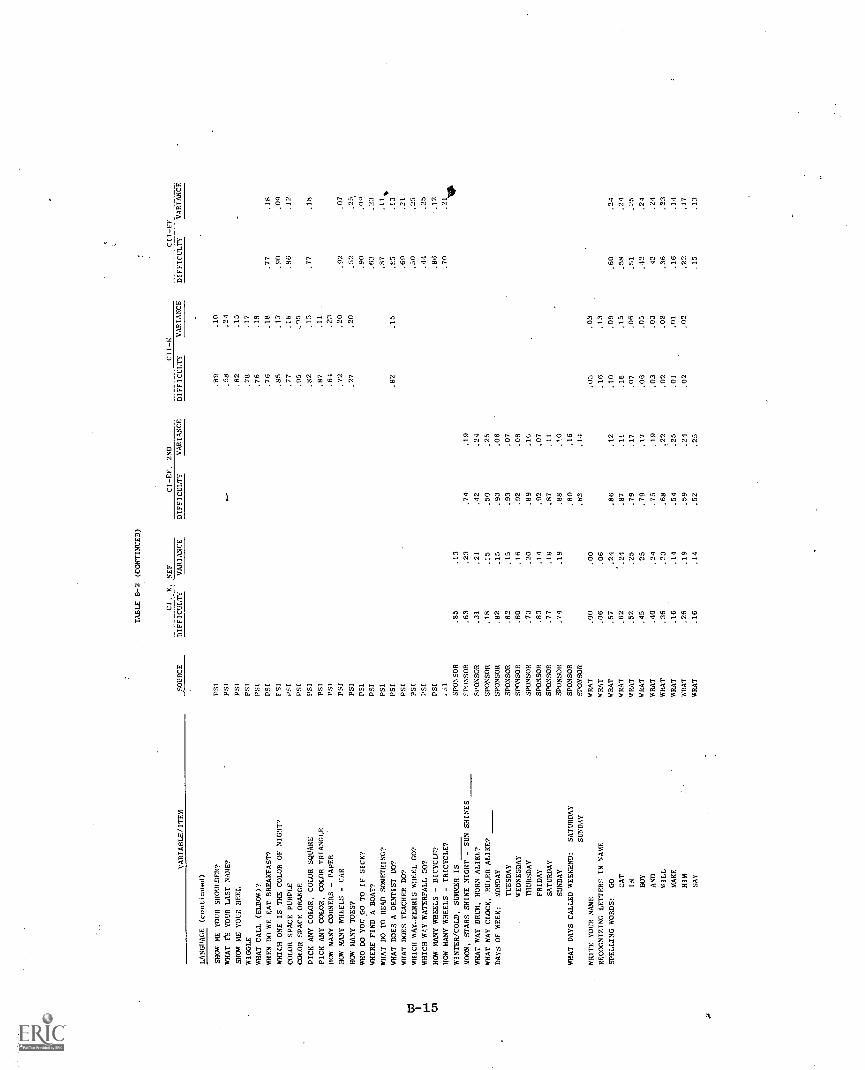
TABLE B-2 (CONTINUED)
CI, K, NEE
CI-EF, 2ND
CII-K
CII-EF
VARIABLE/ITEM
SOURCE
DIFFICULTY
VARIANCE
DIFFICULTY
VARIANCE
DIFFICULTY
VARIANCE
DIFFICULTY
VARIANCE
LANGUAGE (continued)
PSI
PSI
PSI
.89
.58
.82
.10
.24
.15
SHOW ME YOUR SHOULDER?
WHAT It YOUR LAST NAME?
SHOW ME YOUR HEEL
WIGGLE
PSI
.78
.17
WHAT CALL (ELBOW)?
PSI
.76
.18
WHEN DO WE EAT BREAKFAST?
PSI
.76
.18
.77
.18
WHICH ONE IS THE COLOR OF NIGIT,
PSI
.85
.13
.90
.09
COLOR SPACE PURPLE
PSI
.77
.18
.86
.12
COLOR SPACE ORANGE
PSI
.95
_95
PICK ANY COLOR, COLOR SQUARE
PSI
.82
.15
.77
.18
PICK ANY COLOR, COLOR TRIANGLE
PSI
.87
.11
HOW MANY CORNERS - PAPER
PSI
.64
.27
HOW MANY WHEELS - CAR
PSI
.72
.20
.92
.07
HOW MANY TOES?
PSI
.27
.20
.52
.25.
WHO DO YOU GO TO IF SICK?
PSI
.90
.09
WHERE FIND A BOAT?
PSI
.63
.23
WHAT DO TO READ SOMETHING?
PSI
.87
.11,,
WHAT DOES A DENTIST DO?
PSI
.82
.15
.K5
.13
WHAT DOES TEACHER DO?
PSI
.69
.21
ell
WHICH WAY-FERRIS WHEEL GO?
PSI
.50
.25
1WHICH WIN WATERFALL GO?
PSI
.44
.25
CD
HOW MANY WHEELS - BICYCLE?
PSI
.86
-.12
HOW MANY WHEELS - TRICYCLE?
,SI
.70
.21
WINTER/COLD, SUMMER IS
SPONSOR
.85
.13
Nill
MOON, STARS SHINE NIGHT - SUN SHINES
SPONSOR
.63
.23
.74
.19
WHAT WAY DRUM, HORN ALIKE?
SPONSOR
.31
.21
.42
.24
WHAT WAY CLOCK, RULER ALIKE?
SPONSOR
.18
.15
.50
.25
DAYS OF WEEK:
MONDAY
SPONSOR
.82
.15
.93
.06
TUESDAY
SPONSOR
.82
.15
.93
.07
WEDNESDAY
SPONSOR
.80
.16
.92
.08
THURSDAY
SPONSOR
.73
.20
.89
.16
FRIDAY
SPONSOR
.83
.14
.92
.07
SATURDAY
SPONSOR
.77
.18
.87
.11
SUNDAY
SPONSOR
.74
.19
.88
.10
WHAT DAYS CALLED WEEKEND:
SATURDAY
SPONSOR
.80
.16
SUNDAY
SPONSOR
.83
.14
WRITE YOUR NAME
WRAT
.00
.00
.03
.03
RECOGNIZING LETTERS IN NAME
WRAT
.06
.06
.16
.13
SPELLING WORDS:
GO
WRAT
.57
.24
.86
.12
.10
.09
.60
.24
CAT
WRAT
.62
.24
.87
.11
.18
.15
.58
.24
IN
WRAT
.52
.25
.79
.17
.07
.06
.51
.25
BOY
WRAT
.45
25
.79
.17
.06
.05
.42
.24
AND
WRAT
.40
.24
.75
.19
.03
.03
42
.24
WILL
WRAT
.36
.23
.68
.22
.02
.02
.36
.23
MAKE
WRAT
.16
.14
.54
.25
.01
.01
.16
.14
HIM
WRAT
.26
.19
.59
.24
.02
.02
.22
.17
SAY
WRAT
.16
.14
.52
.25
.15
.13
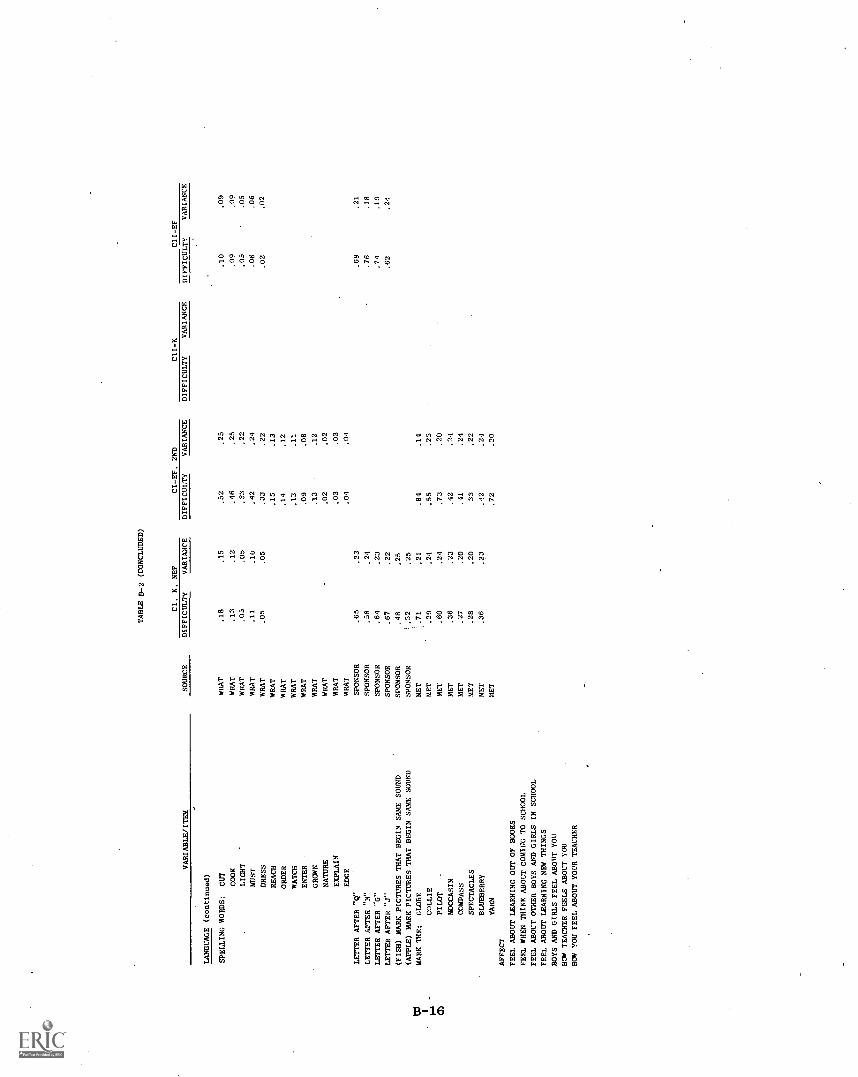
TABLE B-2 (CONCLUDED)
CII-K
CII-EF
CI, K, REF
CI-EF, 2ND
DIFFICULTY
VARIANCE
DIFFICULTY
VARIANCE
DIFFICULTY
VARIANCE
DIFFICULTY
VARIABLE/ITEM
SOURCE
VARIANCE
LANGUAGE (continued)
15
,52
.25
09
SPELLING WORDS:
CUT
WRAT
.18
..10
.09
COOK
WRAT
.13
.12
,46
.25
.09
LIGHT
WHAT
.05
.05
,33
.22
.05
.05
MUST
WRAT
.11
.10
.42
.24
.06
.06
DRESS
WRAT
.05
.05
.33
.22
.02
.02
.15
.13
REACH
WRAT
ORDER
WRAT
.14
.12
WATCH
WRAT
.13
.11
ENTER
-WRAT
,09
.08
,13
.12
GROWN
WRAT
NATURE
WHAT
.02
.02
EXPLAIN
WRAT
.03
.03
EDGE
WHAT
.04
.04
LETTER AFTER "Q"
SPONSOR
.65
.74
.19
.62
.24
.18
23
.69
.21
LETTER AFTER "N"
SPONSOR
.58
.24
.76
LETTER AFTER "G"
SPONSOR
.64
.23
LETTER AFTER "J"
SPONSOR
.67
.22
SPONSOR
.48
.25
(FISH) MARK PICTURES THAT BEGIN SAME SOUND
(APPLE) MARK PICTURES THAT BEGIN SAME SOUND
SPONSOR
.52
.25
10
MARK THE:
GLOBE
MET
;.71
.21
.84
.14
.
-COLLIE
MET
.39
.24
.55
.25
Cr)
PILOT
MET
.60
.24
.73
.20
MET
.36
.23
.24
MOCCASIN
.42
.24
COMPASS
MET
.27
.20
.41
SPECTACLES
MET
.28
.20
33
.22
BLUEBERRY
MET
.36
.23
.42
.24
.7
YARN
MET
220
AFFECT
FEEL ABOUT LEARNING OUT OF BOOKS
FEEL WHEN THINK ABOUT COMING TO SCHOOL
FEEL ABOUT OTHER BOYS AND GIRLS IN SCHOOL
FEEL ABOUT LEARNING NEW THINGS
BOYS AND GIRLS FEEL ABOUT YOU
HOW TEACHER FEELS ABOUT YOU
HOW YOU FEEL ABOUT YOUR TEACHER
Part 2: Summary Statistics and ANCOVA Regression Data
This part of Annex B presents summary tables of regression analyses
of outcome measures on control variables. Tables B-3 to B-18 are summar-
ized from each of the 12 independent ANCOVAS conducted on the project-
level data. The covariable regression data from each analysis (p'ipil,
parent, teacher for CI-K, CI-EF, CII-K, and CII-EF) are summarized in a
separate table (two tables are required to display pupil results--eight
variables).
The entries in a given table show the sample size (N), the errorH
degrees of freedom (residual df), descriptive statistics* (mean and stan-
dard deviation) for each covariable included in the analysis, and regres-
sion statistics (zero order correlation coefficient, or ro; raw regression
coefficient; standardized regression coefficient, or beta values, and the
standard errcrs of the raw regression coefficients) fOr each dependent
variable on the covariables. Finally, summary statistics showing the
mean and covariable of eadh dependent variable (both before and after
regression on covariables) and the variance explained by the covariables
(R2) are presented.
Inspection of these tables reveals the highly variable contribution
of covariance analysis to error reduction. In some instances, the high
variance reduction is due to problems of regression shrinkage (e.g.,
Cohort II-E) and should be disregarded. Overall, the covariance regres-
sions appear to have produced about a 50-percent reduction in error var-
iance on pupil measures. The regression effects tend to be somewhat less
pronounced but highly variable for parent and teacher analyses, which sug-
gests that better covariables could be selected for future analyses.
*The means and standard deviations of the baseline test measures are
presented in transformed scale. This scale has the parameters of mean =
zero, and standard deviation = reliability of measure.
B-17
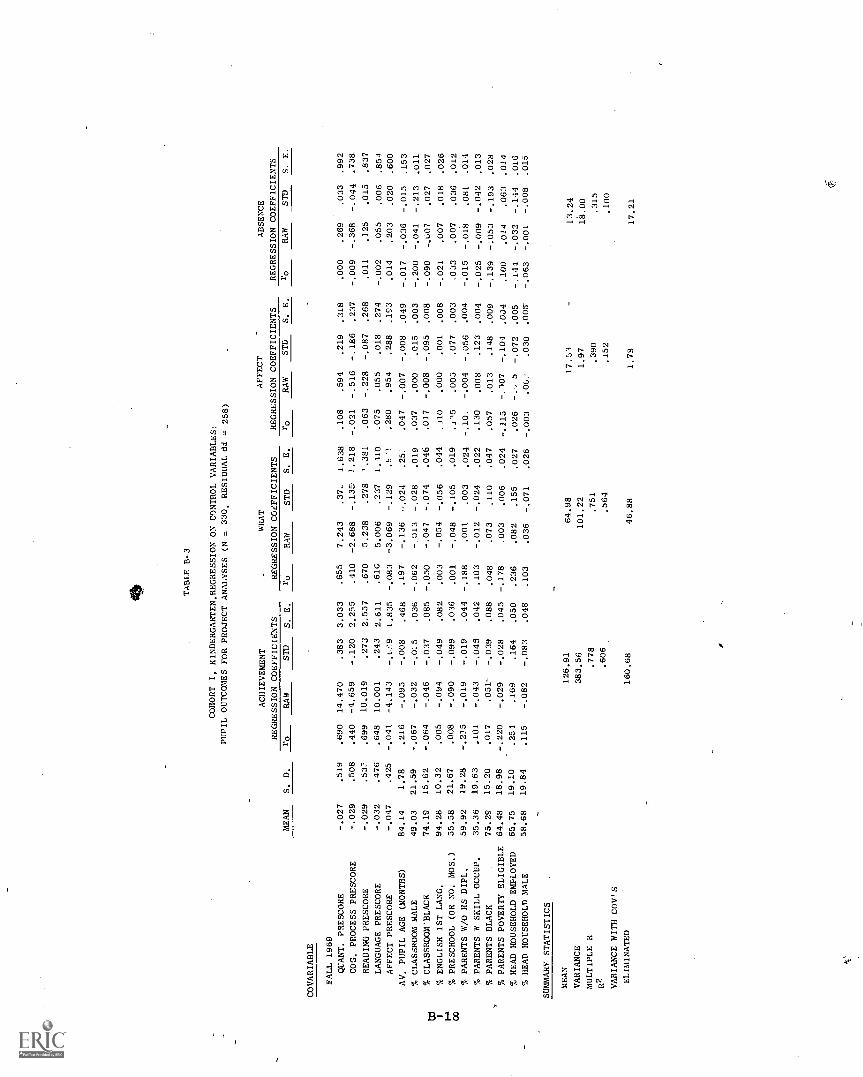
ito TABLE B-3
COHORT I, KINDERGARTEN,REGRESSION ON CONTROL VARIABLES:
PUPIL OUTCOMES FOR PROJECT ANALYSES (N = 330, RESIDUAL dl = 258)
CO VARIABLE
MEAN
S. D.
ACHIEVEMENT
REGRESSION COEFFICIENTS
WRAT
REGRESSION COEFFICIENTS
AFFECT
-
REGRESSION COEFFICIENTS
ABSENCE
REGRESSION COEFFICIENTS
ro
RAW
STD
S. E.
ro
RAW
STD
S. E.
ro
RAW
STD
S. E.
ro
RAW
STD
S. E.
FALL 1969
QUANT. PRESCORE
-.027
.519
.690
14.470
.383
3.033
.655
7.243
.37..
1.638
.108
.594
.219
.318
.000
.269
.033
.992
COG. PROCESS PRESCORE
-.029
.508
.440
-4.659
-.120
2.255
.410
-2.688
-.136
J.218
-.021
-.516
-.186
.237
-.009
-.368
-.044
.738
READING PRESCORE
-.029
.53:-
.699
10.019
.273
2.557
.670
5.238
.278
'.381
.063
-.228
-.087
.268
.011
.125
.015
.837
LANGUAGE PRESCORE
-.032
.476
.648
10.001
.243
2.611
.61G
5.006
.237
1.410
.075
.055
.018
.274
-.002
.055
.006
.854
AFFECT PRESCORE
-.047
.425
-.041
-4.143
-.cr9
1.835
-.083
-3.069
-.129
.!: 'I
.280
.954
.288
.193
.014
.203
.020
.600
AV. PUPIL AGE (MONTHS)
84.14
1.78
.216
-.095
-.008
.468
.197
-.136
-.024
.25.
.047
-.007
-.008
.049
-.017
-.036
-.015
.153
% CLASSROOM MALE
49.03
21.59
-.067
-.032
-.0:5
.036
-.062
-.013
-.028
.019
.037
.000
.015
.003
-.200
-.041
-.213
.011
t110
% CLASSROOM.BLACK
74.1S
15.62
-.064
-.046
-.037
.085
-.050
-.047
-.074
.046
.017
-.008
-.095
.008
-.090
-.u07
.027
.027
I% ENGLISH 1ST LANG.
94.28
10.32
.005
-.094
-.049
.082
.003
-.054
-.056
.044
.i10
.000
.001
.008
-.021
.007
.018
.026
F4
% PRESCHOOL (OR NO. MOS.)
55.58
21.67
.008
-.090
-.099
.036
.001
-.048
-.105
.019
.115
.005
.077
.003
.033
.007
.036
.012
00
% PARENTS W/O HS DIPL.
59.92
19.28
-.2)5
-.019
-.019
.044
-.188
.001
.003
.024
-.10.
-.004
-.056
.004
-.015
-.018
.081
.014
% PARENTS W SKILL OCCUP.
35.36
19.63
.101
-.043
-.043
.042
.103
-.012
-.024
.022
.130
.008
.123
.004
-.025
-.009
-.042
.013
% PARENTS BLACK
75.29
15.20
.017
.051-
-.039
.088
.048
.073
.110
.047
.057
.013
.148
.009
-.139
-.053
-.193
.028
% PARENTS POVERTY ELIGIBLE
64.48
18.98
-.220
-.029
-.028
.045
-.178
.003
.006
.024
-.115
-.107
-.104
.004
.100
.014
.063
.014
% HEAD HOUSEHOLD EMPLOYED
65.75
19.10
.251
.169
.164
.050
.236
.082
.155
.027
.026
-..'5
-.072
.005
-.144
-.032
-.144
.016
HEAD HOUSEHOLD MALE
58.68
19.84
.115
-.082
-.083
.048
.103
.036
-.071
.026
-.003
.0L.
.030
.005-
-.063
-.001
-.008
.015
SUMMARY STATISTICS
MEAN
126.91
64.98
17.51
13.24
VARIANCE
383.56
101.22
1.97
18.00
MULTIPLE R
.778
.751
.390
.315
R2
.606
.564
.152
.100
VARIANCE WITH COV'S
ELIMINATED
160.68
46.88
1.78
17.21

TABLE B-4
COHORT I, KINDERGARTEN, REGRESSION ON CONTROL VARIABLES:
DISAGGREGATED ACHIEVEMENT
PUPIL OUTCOMES FOR PROJECT ANALYSES (N = 330, RESIDUAL df = 258)
QUANT
COGNITIVE PROCESSES
READING
LANGUAGE
REGRESSION COEFFICIENTS
REGRESSION COEFFICIENTS
REGRESSION COEFFICIENTS
RECRESSION COEFFICIENTS
COVARIAbLE
mj.:AN
S.
D.
ro
RAW
STD
S. E.
ro
RAW
STD
S. E.
I-,
RAW
STD
S. E.
ro
RAW
STD
S. E.
FALL 1969
QUANT. PRESCORE
-.027
.519
.696
5.049
.428
.974
.455
.382
.224
.182
.633
5.753
.328
1.504
.637
3.255
.348
:835.
COG. PROCESS PRESCORE
-.029
.508
.455
-1.349
-.112
.724
.251
-.191
-.110
.135
.387
-2.52.9
-.141
1.119
.430
-.578
-.060
.621
READING PRESCORE
-.029
.535
.673
2.352
.206
.821
.488
.463
.280
.153
.668
5.299
.311
1.268
.630
1.884
.208
.704
LANGUAGE PRESCORE
-.032
.476
.649
3.379
.263
.838
.409
.187
.100
,.156
.606
4.477
.234
1.295
:588
1.979
.194
.719
AFFECT PRESCORE
-.047
.425
.009
-.506
-.035
.589
"-.027
-.146-
-.070
.110
-.078
-2.673
-.125
.910
-.021
-.748
-.066
.505
AV. PUPIL AGE (MONTHS)
84.14
1.78
.183
-.123
-.036
.150
i.174
.013
.02:,
.028
.199
-.130
-.025
.233
.240
.153
.056
.129
% CLASSROOM MALE
49.03
21.59
-.033
-.000
-.002
.012
.035
.002
.057
.002
-.059
-.012
-.029
.018
-.127
-.022
-.099
.010
% CLASSROOM BLACK
74.19
15.62
-.105
-.038
-.098
.027
-.044
.007
.124
.005
-.060
-.038
-.065
.042
-.012
.021
.066
.024
% ENGLISH 1ST LANG.
94.28
10.32
.010
-.017
-.028
.026
-.007
-.002
-.022
.005
-.023
-.071
-.080
.041
.051
-.005
-.011
.023
% PRESCHOOL (OR NO. MOS.)
55.58
21.67
.009
-.029
-.102
.012
.027
-.002
-.059
.002
.014
-.038
-.090
.018
-.009
-.022
-.097
.010
% PARENTS W/O HS DIPL.
59.92
19.28
-.215
-.010
-.%033
.014
-.185
-.003
-.076
.003
-.191
-.005
-.010
.002
-.203
-.001
-.003
.012
% PARENTS W SKILL OCCUP.
35.36
19.63
.103
-.012
-.039
.014
.075
-.002
-.046
.003
.072
-.029
-.061
.021
.137
.000
.002
.012
% PARENTS BLACK
75.29
15.20
-.012
.022
.054
.028
-.049
-.011
-.183
.005
.036
.056
.093
.044
.026
-.015
.047
.024
% PARENTS POVERTY ELIGIBLE
64.48
18.98
-.186
.005
.015
.015
-.167
-.002
-.036
.003
-.203
-.012
-.025
.023
-.250
-.022
-.087
.013
% HEAD HOUSEHOLD EMPLOYED
65.75
19.10
.235
.046
.143
.016
.187
.009
.186
.003
.250
.078
.164
.025
.233
.037
.146
.014
% HEAD HOUSEHOLD MALE
58.68
19.84
.110
-.020
-.065
.016
.029
-.008
-.169
.003
.117
-.033
-.072
.024
.102
-.023
-.094
.013
SUMMARY STATISTICS
MEAN
39.186
7.020
54.26
26.43
vARIANCE
37.486
.785
83.036
23.568
MULTIPLE R
.764
.556
743
.716
R2
.584
.309
.552
.513
VARIANCE WITH
COV'S
ELIMINATED
16.554
.576
39.520'
12.183
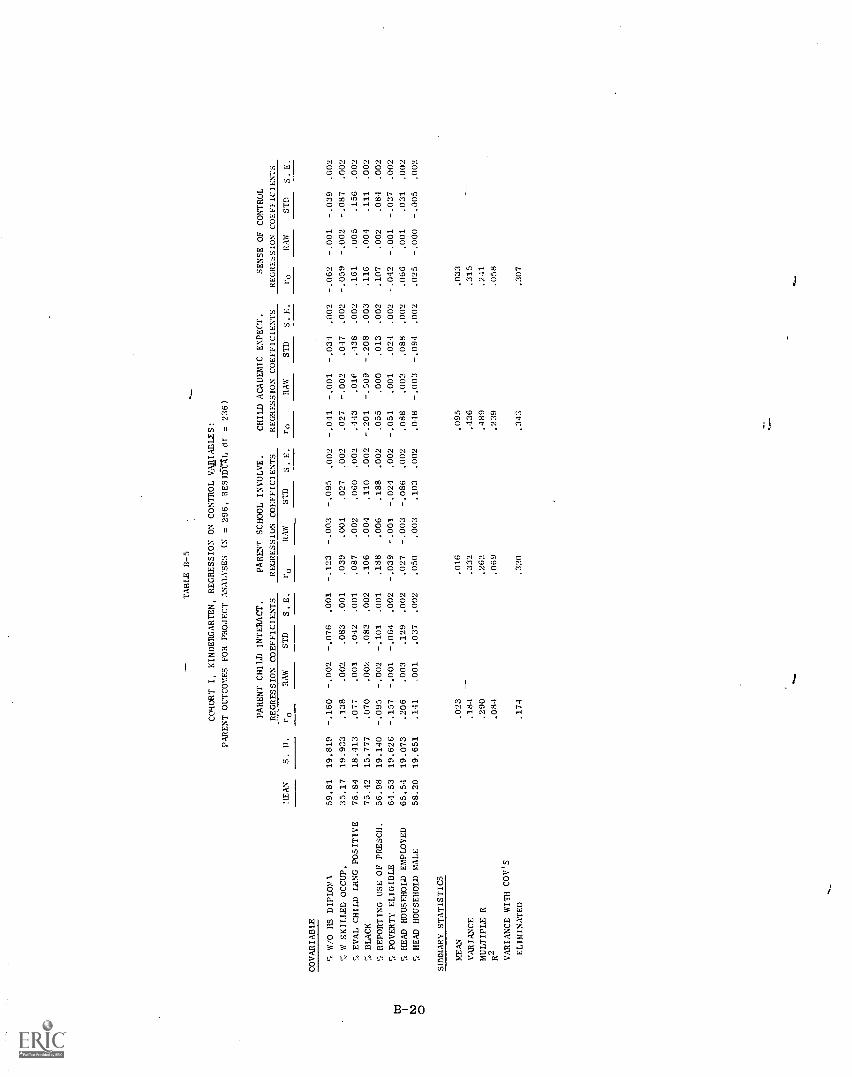
TABLE B-5
COHORT I, KINDERGARTEN, REGRESSION ON CONTROL VARIABLES:
PARENT OUTCOMES FOR PROJECT ANALYSES (N = 296, RESIDUAL df = 236)
PARENT CHILD INTERACT.
PARENT SCHOOL INVOLVE.
CHILD ACADEMIC EXPECT.
SENSE OF CONTROL
REGRESSION COEFFICIENTS
REGRESSION COEFFICIENTS
REGRESSION COEFFICIENTS
REGRESSION COEFFICIENTS
COVARIABLE
MEAN
S. D.
ro
RAW
STD
S.E.
r0
RAW
STD
S.E.
r0
RAW
STD
S.F.
r0
RAW
STD
S.E.
W/O HS DIPLOMA
59.81
19.819
-.160
-.002
-.076
.001
-.123
-.003
-.095
.002
-.041
-.001
-.034
.002
-.062
-.001
-.039
.G02
W SKILLED OCCUP.
35.17
19.933
.138
.002
.083
.001
.039
.001
.027
.002
.027
-.002
.047
.002
-.059
-.002
-.087
.002
EVAL CHILD IRNG POSITIVE
78.84
18.413
.077
.001
.042
.001
.087
.002
.060
.002
.43
.01E
.438
.002
.161
.005
.156
.002
7c BLACK
75.42
15.777
.070
.002
.083
.002
.106
.004
.110
.002
-.201
-.208
.003
.116
.004
.111
.002
'-,-, REPORTING USE OF PRESCH.
56.98
19.140
-.095
-.002
-.101
.001
.188
.006
.188
.002
.055
.000
.013
.002
.107
.002
.084
.002
POVERTY ELIGIBLE
64.53
19.626
-.157
-.001
-.064
.002
-.039
-.001
-.024
.002
-.051
-.001
.024
.002
-.042
-.001
-.037
.002
HEAD HOUSEHOLD EMPLOYED
65.54
19.073
.206
.003
.129
.002
.027
-.003
-.086
.002
.088
.003
.088
.002
.066
.001
.031
.002
HEAD HOUSEHOLD MALE
58.20
19.651
.141
.001
.037
.002
.050
.003
.103
.002
.048
-.003
-.094
.002
.025
-.000
-.305
.002
SUMMARY STATISTICS
MEAN
.023
.016
.095
.033
VARIANCE
.18 -1
.332
.436
.315
MULTIPLE R
.290
.262
.489
.241
R 2
.084
.069
.239
.058
VARIANCE WITH COV'S
ELIMINATED
.174
.320
.343
.307

TABLE B-6
COHORT I, KINDERGARTEN, REGRESSION ON CONTROL VARIABLES:
TEACHER OUTCOMES FOR PROJECT ANALYSES (N = 195, RESIDUAL df = 146)
PARENT EDUCATOR IMAGE
REGRESSION COEFFICIENTS
PROFESSIONAL
ACCEPTANCE OF FT
REGRESSION COEFFICIENTS
CO VARIABLE
MEAN
S. D.
ro
RAW
STD
S. E.
ro
RAW
STD.
S. E.
JOB SATISF. RATING
1,77
.376
.037
.028
.042
.055
.320
.314
.320
.076
tri
BOOK RESOURCE SCALE
3.38
.934
.032
-.000
-.002
.022
-.069
-.030
-.078
.030
i tv
RACE !BLACK/NONBLACK)
.600
.285
-.085
-.062
-.070
.070
-.180
-.208
-.161
.098
1i
'DENT. W. COMMUNITY_
.567
.543
-.106
-.024
-.052
.038
.119
.024
.035
.053
NO. HELPERS
1.29
.512
.260
.120
.243
.040
-.170
-.129
-.179
.056
ABLE TO CHOOSE ASSIGN.
1.61--
.918
-.051
-.028
-.103
.022
.030
.002
.006
.031
-TRNG & TEACHER EXPER.
5.08
1.18
.160
.032
.151
.017
-.019
.0001
.0004
.024
SUMMARY STATISTICS
MEAN
-389
1.59
VARIANCE
.064
.135
MULTIPLE R
.326
.415
R2
.106
.172
VARIANCE WITH COV/S
ELIMINATED
.060
.118

TABLF B-7
COHORT I, ENTERING FIRST, REGRESSION ON CONTROL VARIABLES:
PUPIL OUTCOMES FOR PROJECT ANALYSES (N = 133, RESIDUAL df = 50)
ACHIEVEMENT
WRAT
AFFECT
ABSENCE
REGRESSION COEFFICIENTS
REGRESSION COEFFICIENTS
REGRESSION COEFFICIENTS
REGRESSION COEFFICIENTS
CO VARIABLE
MEAN
S. D.
RAW
STD
S, E.
r0
RAW
STD
S.E.
aRAW
STD
S.E.
.r0
RAW
STD
S. E.
FALL 1969
QUANT. PRESCORE
.019
.525
.671
.473
.011
7.576
.553
-.633
-.042
3.259
.281
.752
.354
.491
-.260
-5.669
-.582
2.510
COG. PROCESS PRESCORE
-.069
.590
.573
5.633
.150
5.068
.468
1.269
.092
2.180
.310
.292
.154
.328
-.114
2.777
.320
1.679
READING PRESCORE
.120
.567
.720
18.340
.470
5.268
.622
6.256
.438
2.266
.026
-1.032
-.524
.341
-.094
3.377
.374
1.745
LANGUAGE PRESCORE
-.074
.560
.553
3.251
.082
5.436
.465
1.079
.074
2.338
.244
.944
.474
.352
-.155
-3.913
-.428
1.800
AFF:CT PRESCORE
-.039
.505
.440
3.627
.082
3.690
.366
.872
.054
1.587
-%086
-.645
-.292
.239
.058
2.124
.209
1.222
AV. PUPIL AGE (MONTHS)
98.34
2.39
.173
1.550
.167
.676
.156
.571
.168
.290
.046
.046
.100
.043
-.117
-.425
-.198
.e24
% CLASSROOM MALE
52.90
25.59
-.181
-.102
-.118
.065
-.186
-.046
-.148
.028
-.031
-.001
-.041
.004
.014
.010
.052
.021
% CLASSROOM BLACK
46.81
25.58
-.139
-.116
-.134
.132
-.099
-.034
-.110
.057
-.130
-.003
-.089
.008
.162
.075
.377
.044.
W% ENGLISH 1ST LANG.
86.98
16.76
.068
.089
.067
.147
.106
.053
.111
.063
-.190
-.022
-.342
.009
.138
.013
.043
.048
% PRESCHOOL (OR NO. MOS.)
61.19
25.43
-.063
.003
.004
.068
-.047
-.005
-.016
.029
.073
.006
.159
.004
-.098
-.015
-.078
.022
ND
ND
% PARENTS W/O HS DIPL.
65.34
13.96
-.228
.058
.037
.127
-.253
-.006
-.010
.054
-.154
-.010
-.130
.008
.038
-.022
-.061
.042
% PARENTS W SKILL OCCUP
35.30
14.26
.282
.082
.053
.127
.297
.051
.091
.055
.059
-.005
-.065
.008
-.020
.002
.007
.042
% PARENTS BLACK
47.95
19.96
-.209
.084
.075
.145
-.178
.023
.057
.062
.004
.007
.140
.009
.022
-.079
-.309
.048
% PARENTS POVERTY ELIGIBLE
58.17
14.28
-.294
-.190
-.123
.117
-.284
-.057
-.102
.050
-.097
-.006
-.084
.007
.094
.032
.092
.038
% HEAD HOUSEHOLD EMPLOYED
83.46
12.85
.133
-.000
-.000
.135
.136
-.001
-.002
.058
.047
.J01
.018
.008
.001
-.003
-.009
.044
% HEAD HOUSEHOLD MALE
81.97
9.89
.256
.191
.085
.182
.256
.079
.097
.078
.104
.006
.057
.011
-.045
-.001
-.003
.060
SUMMARY STATISTICS
MEAN
138.6
37.05
18.51
10.15
VARIANCE
488.1
65.33
1.24
26.16
MULTIPLE R
.796
.706
.634
.508
R2
.638
.499
.402
.258
VARIANCE WITH COV'S
ELIMINATED
210.2
38.90
.883
23.07
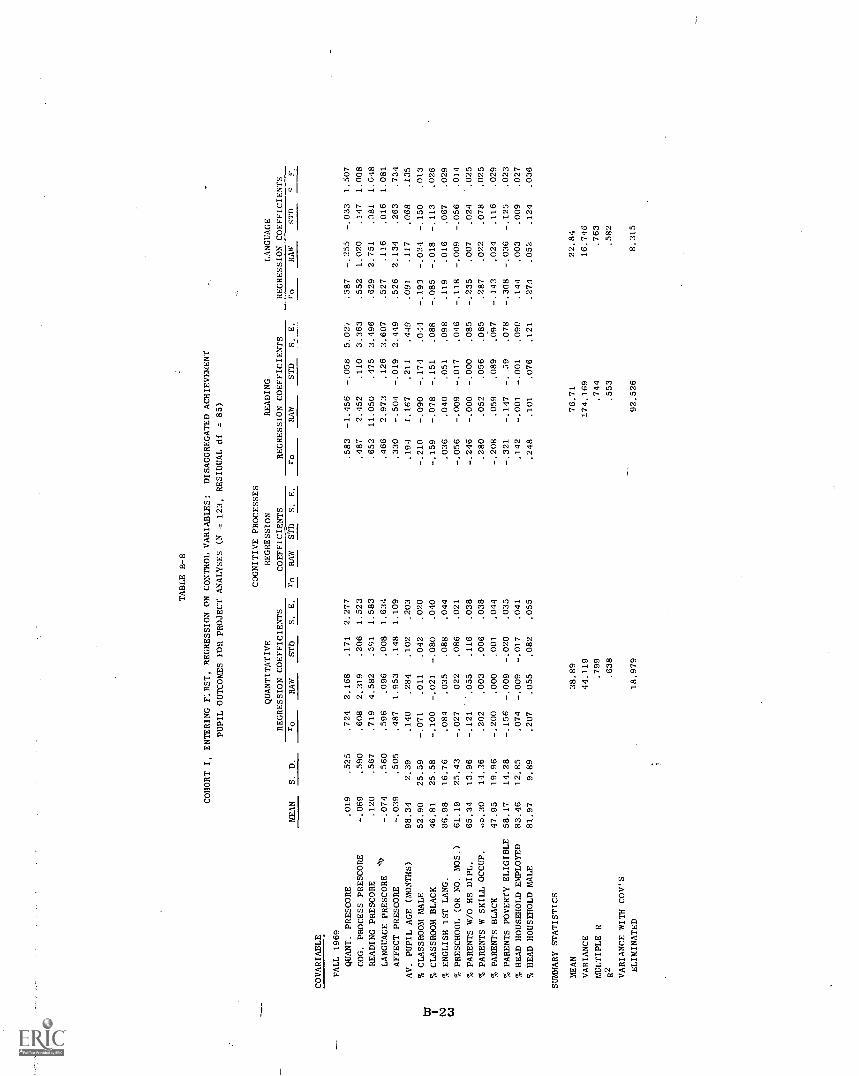
--
TABLE 8-8
COHORT I, ENTERING FIRST, REGRESSION ON CONTROL VARIABLES:
DISAGGREGATED ACHIEVEMENT
PUPIL OUTCOMES FOR PROJECT ANALYSES (N = 123, RESIDUAL df = 85)
COGNITIVE PROCESSES
QUANTITATIVE
REGRESSION
READING
LANGUAGE
REGRESSION COEFFICIENTS
COEFFICIENTS
REGRESSION COEFFICIENTS
REGRESSION COEFFICIENTS
MEAN
S.
D.
r0
RAW
STD
S.
E.
ro
RAW
STD
S.
E.
r0
RAW
STD
S.
E.
ro
RAW
.7-)
a.
?-s.
CO VARIABLE
FALL 1969
QUANT. PRESCORE
.019
.525
.724
2.168
.171
2.277
.583
-1.456
-.058
5.02',
.587
-.255
-.033
1.507
COG. PROCESS PRESCORE
-.069
.590
.608
2.319
.206
1.523
.487
2.452
.110
3.363
.552
1.020
.147
1.008
READING PRESCORE
.120
.567
.719
4.582
.:',,I.
1.583
.652
11.050
.475
3.496
.629
2.751
.381
1.048
LANGUAGE PRESCORE
,-.074
.560
.596
.096
.008
1.634
.466
2.973
.126
3.607
.527
.116
.016
1.081
AFFECT PRESCORE
-.039
.505
.487
1.953
.148
1.109
.330
-.504
-.019
2.449
.526
2.134
.263
.734
AV. PUPIL AGE (MONTHS)
98.34
2.39
.140
.284
.102
.203
.194
1.167
.211
.449
.091
.117
.068
.135
% CLASSROOM MALE
52.90
25.59
-.071
.011
.042
.020
-.210
-.090
-.174
.0-:4
-.193
-.024
-.150
.013
(11
I% CLASSROOM BLACK
46.81
25.58
-.100
-.021
-.080
.040
-.159
-.078
-.151
.088
-.085
-.018
-.113
.026
ND
% ENGLISH 1ST LANG.
86.98
16.76
.084
.035
.088
.044
.036
.040
.051
.098
.119
.016
.067
.029
0.1
% PRESCHOOL (OR NO. MOS.)
61.19
25.43
-.027
,022
.086
.021
-.056
-.009
-.017
.046
-.118
-.009
-.056
.014
% PARENTS W/O HS DIPL.
65.34
13.96
-.121
.055
.116
.038
-.246
-.000
-.000
.085
-.235
.007
.024
.025
% PARENTS W SKILL OCCUP.
.,D.30
14.26
.202
.003
.006
.038
.280
.052
.056
.085
.287
.022
.078
.025
% PARENTS BLACK
47.95
19.96
-.200
.000
.001
.044
-.208
.059
.089
.097
-.143
.024
.116
.029
% PARENTS POVERTY ELIGIBLE
58.17
14.28
-.156
-.009
-.020
.035
-.321
-.147
-. 59
.078
-.308
-.036
-.125
.023
% HEAD HOUSEHOLD EMPLOYED
83.46
12.85
.074
-.009
-.017
.041
.142
-.001
-.001
.090
.144
.003
.009
.027
% HEAD HOUSEHOLD MALE
81.97
9.89
.207
.055
.082
.055
.248
.101
.076
.121
.274
.052
.124
.036
SUMMARY STATISTICS
MEAN
38.89
76.71
22.84
VARIANCE
44.119
174.169
16.746
MULTIPLE R
.799
.744
.763
R2
.638
.553
.582
VARIANCE WITH COV'S
ELIMINATED
18.979
92.526
8.315

TABLE B-9
COHORT I, ENTERING FIRST, REGRESSION ON CONTROL VARIABLES:
PARENT OUTCOMES FOR PROJECT ANALYSES (N = 105, RESIDUAL df = 77)
COVARIABLE
MEAN
S. D.
PARENT CHILD INTERACT.
REGRESSION COEFFICIENTS
PARENT SCHOOL INVOLVE.
REGRESSION COEFFICIENTS
CHILD ACADEMIC EXPECT.
REGRESSION COEFFICIENTS
SENSE OF CONTROL
REGRESSION COEFFICIENTS
__
RAW
STD
S. E.
ro
RAW
STD
S. E.
ro
RAW
STD
S. E.
ro
RAW
STD
S. E.
% W/0 HS DIPLOMA
65.62
14.806
-.236
-.002
-.069
.004
-.334
-.011
-.336
.004
-.280
-.010
-.274
.004
-.099
-.000
-.014
.004
% W SKILLED OCCUP.
34.31
15.240
.194
.007
.235
.004
.179
.007
.197
.004
.178
.005
.141
.004
.242
.010
.358
.004
% EVAL CHILD LRNG POSITIVE
71.34
20.136
.040
.000
.008
.002
-.206
-.005
-.184
.003
.490
.013
.505
.003
.083
.001
.061
.002
% BLACK
48.01
21.055
.193
.006
.264
.003
.172
.004
.155
.003
-.011
-.001
-.030
.003
.042
.003
.149
.0)2
% REPORTING USE OF PRESCH.
60.11
17.428
-.048
-.002
-.064
.003
.191
.005
.172
.003
.046
.003
.095
.003
-.149
-.004
-.166
.003
% POVERTY ELIGIBLE
58.32
15.313
-.253
-.006
-.210
.004
.052
.005
.156
.004
.042
.005
.138
.004
.122
.007
.235
.003
% HEAD ROUSEHOLD EMPLOYED
82.50
13.961
.069
.002
.070
.004
-.227
-.009
-.239
.004
-.013
-.001
-.030
.004
-.079
-.004
-.123
.004
% HEAD HOUSEHOLD MALE
81.10.
10.694
-.030
-.008
-.177
.005
-.030
.002
.048
.006
-.134
-.013
-.271
.006
.066
.003
.078
.005
tO
r
NSUMMARY STATISTICS
A.
MEAN
.010
-.033
.050
.129
VARIANCE
.215
.264
.296
.203
MULTIPLE R
.424
_.554
R2
.180
.306
.397
.16-
VARIANCE WITH COV'S ELIMINATED
.195
.202
.197
.187
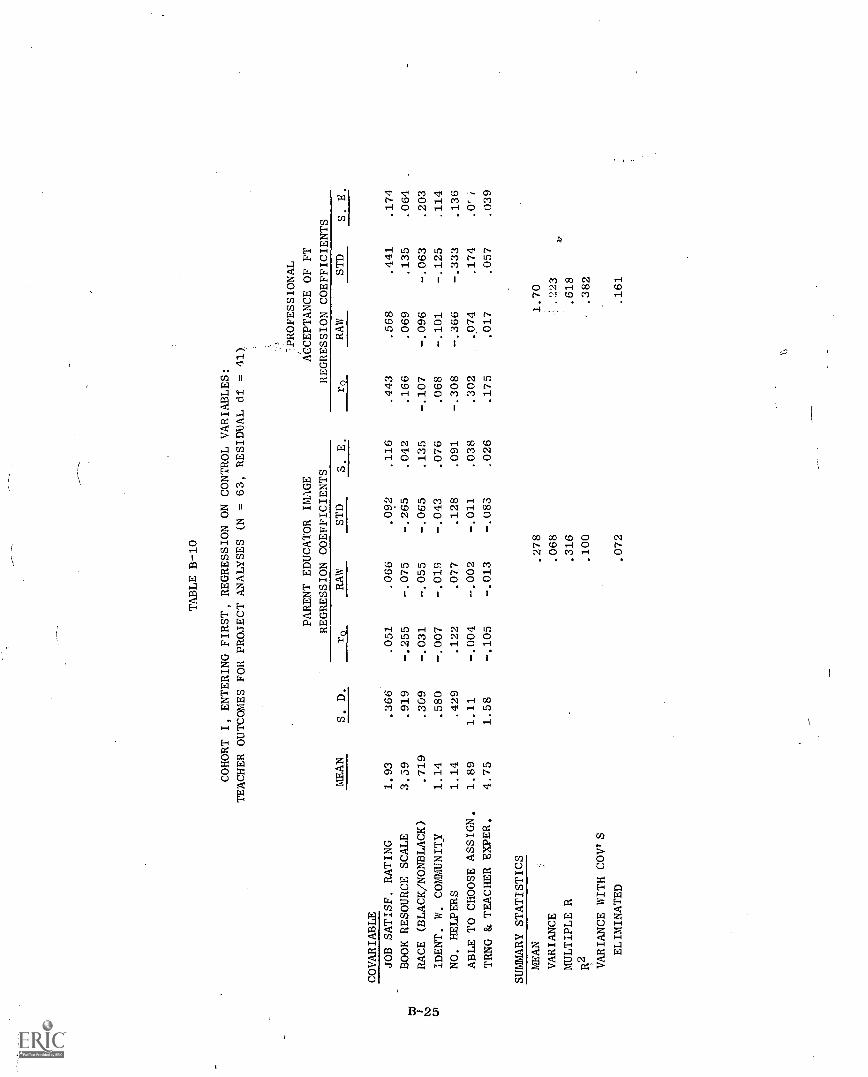
TABLE B-10
COHORT I, ENTERING FIRST, REGRESSION ON CONTROL VARIABLES:
TEACHER OUTCOMES FOR PROJECT ANALYSES (N = 63, RESIDUAL df = 41) -PROFESSIONAL
PARENT EDUCATOR IMAGE
ACCEPTANCE OF FT
COVARIABLE
MEAN
S. D.
REGRESSION COEFFICIENTS
REGRESSION COEFFICIENTS
ro
RAW
STD
S. E.
To
RAW
STD
S. E.
JOB SATISF. RATING
1.93
.366
.051
.066
.092
.116
.443
.568
.441
.174
BOOK RESOURCE SCALE
3.59
.919
-.255
-.075
-.265
.042
.166
.069
.135
.064
i NRACE (BLACK/NONBLACK)
.719
.309
-.031
-.055
-.065
.135
-.107
-.096
-.063
.203
m'DENT. W. COMMUNITY
1.14
.580
-.007
-.019
-.043
.076
.068
-.101
-.125
.114
NO. HELPERS
1.14
.429
.122
.077
.128
.091
-.308
-.366
-.333
.136
ABLE TO CHOOSE ASSIGN.
1.89
1.11
-.004
-.002
-.011
.038
.302
.074
.174
.0ri
TRNG & TEACHER EXPER.
4.75
1.58
-.105
-.013
-.083
A026
.175
.017
.057
.039
SUMMARY STATISTICS
MEAN
VARIANCE
MULTIPLE R
R2 VARIANCE WITH COVIS
ELIMINATED
.278
.068
.316
.100
.072
1.70
.223
.618
.382
.161
36.
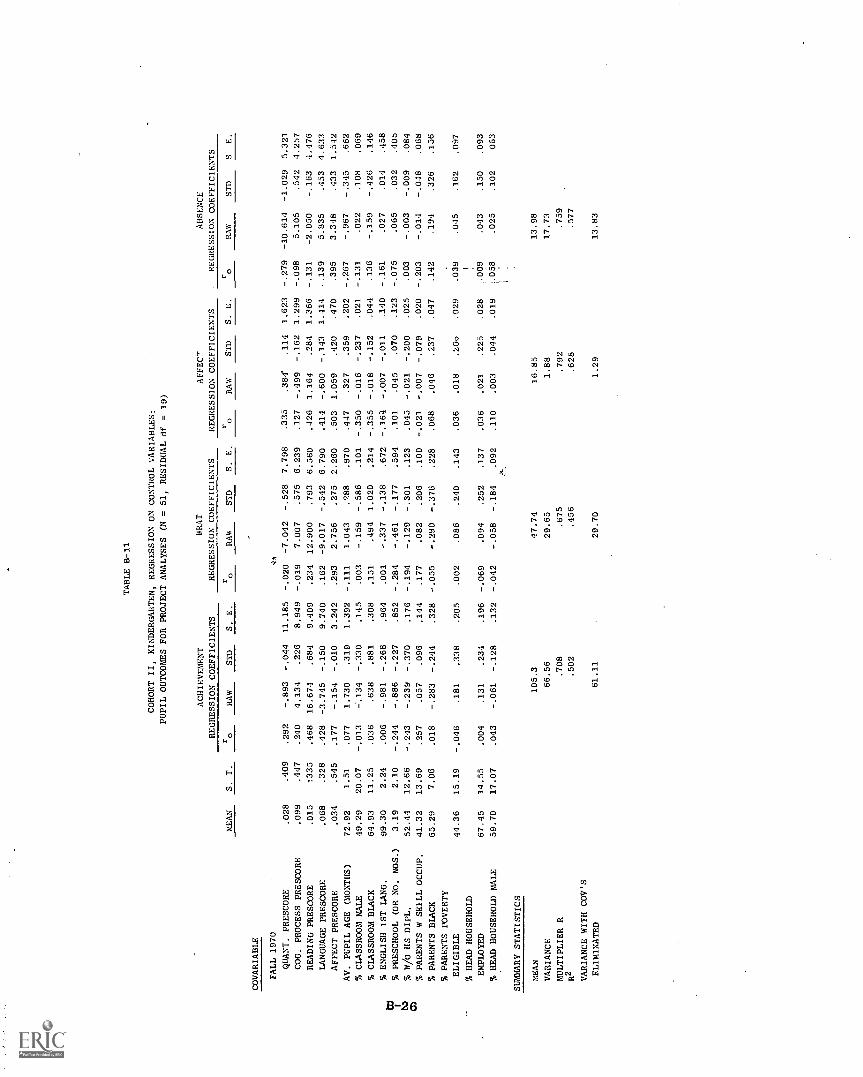
TABLE B-11
COHORT II, KINDERGARTEN, REGRESSION ON CONTROL VARIABLES:
PUPIL OUTCOMES FOR PROJECT ANALYSES (N = 51, RESIDUAL df = 19)
COVARIABLE
MEAN
S. T.
ACHIEVEMENT
REGRESSION COEFFICIENTS
WRAT
REGRESSION COEFFICIENTS
AFFECT
REGRESSION COEFFICIENTS
ABSENCE
REGRESSION COEFFICIENTS
ro
RAW
STD
S S. E.
ro
RAW
STD
S. E.
ro
RAW
STD
S. E.
ro
RAW
STD
SE.
41,
FALL 1970
QUANT. PRESCORE
.028
.409
.292
-.893
-.044
11.185
-.020
-7.042
-.528
7.798
.335
.384'
.114
1.623
-.279
-10.614
-1.029
5.321
COG. PROCESS PRESCORE
.099
.447
.240
4.134
.226
8.949
-.019
7.007
.575
6.239
.127
-.499
-.162
1.299
-.098
5.105
.542
4.257
READING PRESCORE
.015
:335
.468
16.674
.684
9.409
.234
12.900
.793
6.560
.426
1.164
.284
1.366
-.131
-2.050
-.163
1.476
LANGUAGE PRESCORE
.068
.328
.428
-3.745
-.150
9.740
.162
-9.017
-.542
6.790
.414
-.600
-.143
1.414
.139
5.835
.453
4.633
AFFECT PRESCORE
.034
.545
.177
-.154
-.010
3.242
.293
2.756
.275
2.260
.503
1.059
.420
.470
.395
3.348
.433
1.542
AV. PUPIL AGE (MONTHS)
72.92
1.51
.077
1.730
.319
1.392
-.111
1.043
.988
.970
.447
.327
.359
.202
-.267
-.967
-.345
.662
% CLASSROOM MALE
49.29
20.07
-.013
-.134
-.330
.145
.003
-.159
-.586
.101
-.350
-.016
-.237
.021
-.131
.022
.108
.069
% CLASSROOM BLACK
64.93
11.25
.036
.638
,881
.308
.151
.494
1.020
.214
-.355
-.018
-.152
.044
.136
-.159
-:,10 21
.146
% ENGLISH 1ST LANG.
99.30
2.24
.006
-.981
-.268
.964
.001
-.337
-.138
.672
-.164
-.007
-.011
.140
-.161
.458
IXI
% PRESCHOOL (OR NO. MOS.)
3.19
2.10
-.244
-.886
-.227
.852
-.284
-.461
-.177
.594
.101
.045
.070
.123
-.075
.065
.032
.405
BD
% W/0 HS DIPL.
52.44
12.66
-.243
-.239
-.370
.176
-.194
-.129
-.301
.123
.045
-.021
-.200
.025
.003
-.003
-.009
.084
4.0
% PARENTS W SKILL OCCUP.
41.32
13.69
.257
.057
.096
.144
.177
.082
.206
.100
-.021
-.007
-.079
.020
-.203
-.014
-.048
.068
% PARENTS BLACK
65.29
7.06
.018
-.283
-.244
.328
-.055
-.290
-.376
.228
.068
.046
.237
.047
.142
.194
.326
.156
% PARENTS POVERTY
ELIGIBLE
44.36
15.19
-.046
.181
.338
.205
.002
.086
.240
.143
.036
.018
.206
.029
.039
.045
.162
.097
% HEAD HOUSEHOLD
?
EMPLOYED
67.45
14.55
.004
.131
.234
.196
-.069
.094
.252
.137
.036
.021
.225
.028
.009
.043
.150
.093
%HEAD HOUSEHOLD MALE
59.70
17.07
.043
-.061
-.128
.132
-.042
-.058
-.184
.092
.110
.003
.044
.019
.058
i
.025
.102
063
:',--
1.
SUMMARY STATISTICS
MEAN
105.3
47.74
16,85
13.98
VARIANCE
66.56
29:1
1.88
17.73
MULTIPLIER R
.708
.792
.759
R2
.502
.456
.628
.577
VARIANCE WITH COV'S
ELIMINATED
61.11
29.70
1.29
13.83

TABLE B-12
COHORT II, KINDERGARTEN, REGRESSION ON CONTROL VARIABLES:
DISAGGREGATED ACHIEVEMENT
PUPIL OUTCOMES FOP. PROJECT ANALYSES (N = 51, RESIDUAL df = 19)
COVARIABLE
MEAN
S. D.
QUANTITATIVE
REGRESSION COEFFICIENTS
COGNITIVE PROCESSES
REGRESSION COEFFICIENTS
READING
REGRESSION COEFFICIENTS
LANGUAGE
REGRESSION COEFFICIENTS
ro
RAW
STD
S. E.
ro
RAW
STD
S. E.
ro
RAW
STD
S. E.
ro
RAW
STD
S. E.
FALL 1970
QUINT. PRESCORE
.028
.409
.393
.387
.066
3.252
.558
1.912
1.034
.711
.092
-3.765
-.295
7.251
.365
.455
.136
1.655
COG. PROCESS PRESCORE
.099
.447
.355
1.751
.325
2.602
.467
-1.002
-.593
.569
.033
3.873
.333
5.802
.392
-.370
-.121
1.321
L'ADING PRESCORE
.015
.335
.464
3.840
.534
2.735
.445
-.244
-.108
.598
.352
12.801
.823
6.100
.385
.353
.086
1.392
LANGUAGE PRESCORE
.068
.328
.302
-2.034
-.277
2.832
.436
.948
.411
.619
.300
-6.146
-.387
6.315
.614
2.986
.716
1.441
AFFECT PRESCORE
.034
.545
.138
.240
.054
.943
-.195
-.653
-.471
.206
.248
1.237
.129
2.102
.009
-.791
-.315
.480
AV. PUPIL AGE (MONTHS)
79.92
1.51
.037
.356
.223
.405
.380
.179
.356
.089
-.047
1.019
.295
.903
.362
.200
.221
.206
% CLASSROOM MALE
49.29
20.07
.184
-.006
-.052
.042
.080
.016
.428
.009
-.062
-.160
-.615
.094
-.217
.013
.121
.021
% CLASSROOM BLACK
64.93
11.25
.048
.109
.510
.090
-.093
.017
.249
.020
.119
.491
1.061
.200
-.252
.023
.186
.046
% ENGLISH 1ST LANG:
99.30
2.24
.104
-.211
-.196
.280
-.038
-.146
-.433
.061
-.032
-.397
-.170
.625
-.004
-.211
-.346
.143
% PRESCHOOL (OR NO. MOS.)
3.19
2.10
-.131
-.248
-.216
.248
.066
-.078
-.217
.054
-.272
-.423
-.170
.552
-.228
-.157
-.241
.126
% PARENTS W/O HS DIPL.
52.44
12.66
-.246
-.057
-.297
-.051
-.135
-.027
-.445
.011
-.226
-.136
-.330
.115
-.090
-.025
-.232
.026
% PARENTS W SKILL OCCUP.
41.32
13.69
.250
.032
.183
.042
.208
-.007
-.12/
.009
.217
.053
.140
.093
.172
-.012
-.125
.021
% PARENTS BLACK
65.29
7.06
.098
.013
.038
.095
.158
.014
.129
.021
-.009
-.275
-.373
.213
-.088
-.021
-.108
.049
% PARENTS POVERTY ELIGIBLE
44.36
15.19
.020
.032
.202
.060
-.022
.030
.608
.013
-.119
.086
.250
.133
.192
.043
.476
.030
% HEAD HOUSEHOLD EMPLOYED
67.45
14.55
-.108
.015
.091
.057
.061
.004
.074
.013
.073
.102
.286
.128
-.136
.011
.11.3
.029
% HEAD HOUSEHOLD MALE
57.70
17.07
-.174
-.046
-.324
.038
.195
.011
.247
.008
.135
.012
.041
.086
-.065
-.009
-.115
.020
SUMMARY STATISTICS
MEAN
28.10
7.934
51.32
17.95
VARIANCE
5.803
.570
27.129
1.869
9LTIPLE R
.719
.875
.697
.782
R.517
.765
.486
.612
VARIANCE WITH COV'S
ELIMINATED
5.164
.247
25.684
1.337
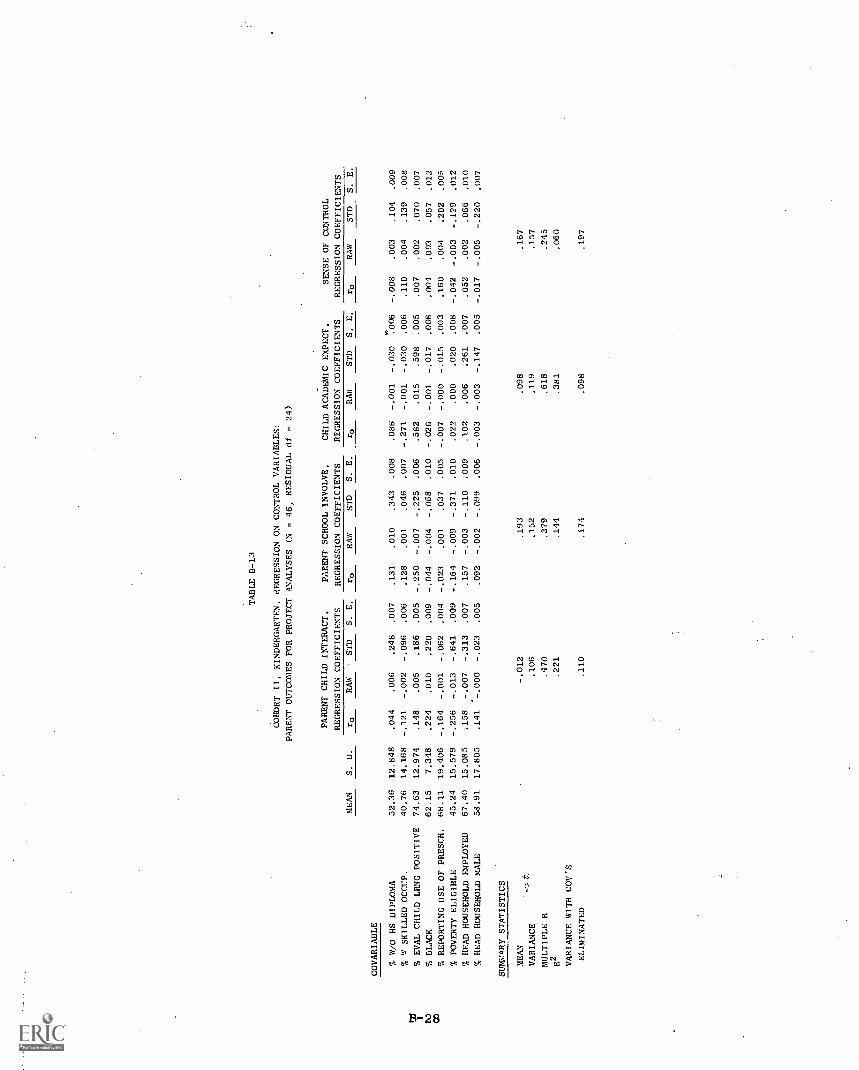
TABLE B-13
COHORT II, KINDERGARTEN, REGRESSION ON CONTROL VARIABLES:
PARENT OUTCOMES FOR PROJECT ANALYSES (N = 46, RESIDUAL df = 24)
PARENT CHILD INTERACT,
PARENT SCHOOL INVOLVE.
CHILD ACADEMIC EXPECT,
SENSE OF CONTROL
REGRESSION COEFFICIENTS
REGRESSION COEFFICIENTS
REGRESSION COEFFICIENTS
REGRESSION COEFFICIENTS
COVARIABLE
MEAN
S. D.
ro
.044
-.121
.148
RAW
STD
S. E.
r0
RAW
STD
S. E.
ro
RAW
STD
S. E.
ro
RAW
STD
S. E.
52.36
40.76
74.63
12.848
14.168
12.974
.006
.248
-.002
-.096
.005
.186
.007
.006
.005
.131
.128
-.250
.010
.001
-.007
.343
.046
-.225
.008
.007
.006
.086
-.271
.582
-.001
-.001
.015
-.030
-.030
.598
'!006
.006
.005
-.008
.110
.007
.003
.004
.002
.104
.139
.070
.009
.008
.007
% W/O HS DIPLOMA
% W SKILLED OCCUP.
% EVAL CHILD LRNG POSITIVE
IV
% BLACK
62.15
7.348
.224
.010
.220
.009
-.044
-.004
-.068
.010
-.026
-.001
-.017
.008
.004
.003
.057
.012
CO
% REPORTING USE OF PRESCH.
68.11
19.406
-.164
-.001
-.062
.004
-.023
.001
.037
.005
-.007
-.000
-.015
.003
.160
.004
.202
.005
% POVERTY ELIGIBLE
45.24
15.579
-.256
-.013
-.641
.009
-.164
-.009
-.371
.010
.022
.000
.020
.008
-.042
-.003
-.129
.012
% HEAD HOUSEHOLD EMPLOYED
67.40
15.085
.158
-.007
-.313
.007
.157
-.003
-.110
.009
.102
.006
.261
.007
.052
.002
.066
.010
% HEAD HOUSEHOLD MALE
58.91
17.805
.141
.-.000
-.023
.005
.092
-.002
-.099
.006
-.003
-.003
-.147
.005
-.017
-.005
-.220
.007
SUMFJARY STATISTICS
MEAN
-.012
.193
.098
.167
VARIANCE
.106
.152
.119
.157
MULTIPLE R
.470
.379
.618
.245
R 2
.221
.144
.381
.060
VARIANCE WITH COV'S
ELIMINATED
.110
.174
.098
.197

TABLE B-14
COHORT II, KINDERGARTEN, REGRESSION ON CONTROL VARIABLES:
TEACHER OUTCOMES FOR PROJECT ANALYSES (N = 19, RESIDUAL df = 4)
PARENT EDUCATOR IMAGE
PROFESSIONAL
ACCEPTANCE OF FT
COVARIABLE
MEAN
S. D.
REGRESSION COEFFICIENTS
REGRESSION COEFFICIENTS
ro
RAW
STD
S. E.
ro
RAW
STD
S. E.
JOB SATISF. RATING
1.88
.487
-.361
.051
.102
.161
.051
-.251
-.405
.513
BOOK RESOURCE SCALE
2.53
.937
-.151
-.046
-.177
.095
.000
-.066
-.208
.302
WI
RACE (BLACK/NONBLACK)
.895
.302
-.265
-.238
-.294
.181
-.500
-.674
-.674
.576
wIDENT. W. COMMUNITY
,737
.769
-.729
-.106
-.335
.125
.196
-.071
-.Ib2
.399
NO. HELPERS
1.32
.640
.583
.129
.339
.082
-.471
-.246
-.523
.261
ABLE TO CHOOSE ASSIGN.
1.79
1.07
-.729
-.121
-.537
.041
.280
.178
.636
.131
TRNG & TEACHER EXPER.
5.68
1.83
.430
.015
.116
.071
-.164
.013
.084
.228
SUMMARY STATISTICS
MEAN
.437
1.79
VARIANCE
.059
.091
MULTIPLE R
.976
.832
R2
.953
.692
VARI
E WITH COV'S
Al
ELIM
ATED
.008
.077

TABLE B-15
COHORT II, ENTERING FIRST, REGRESSION ON CONTROL VARIABLES:
PUPIL OUTCOMES FOR PROJECT ANALYSES (N = 31, RESIDUAL cif = 8)
ACHIEVEMENT
WRAT
AFFECT
ABSENCE
REGRESSION COEFFICIENTS
REGRESSION COEFFICIENTS
REGRESSION COEFFICIENTS
REGRESSION COEFFICIENTS
CO VARIABLE
MEAN
S. D
EcL__
RAW
STD
S. E.
r0
RAW
STD
S. E.
rte_
RAW
STD
S. E.
ro
RAW
STD
S. E,
FALL 1970
QUART. PRESCORE
-.077
.535
.742
-12.00
-.463
17.574
.730
-8.96
-.527
11.79
.697
-1.67
-.888
1.05
-.329
-.315
-.018
6.298
COG. PROCESS PRESCORE
-.070
.537
.801
17.72
.685
13.449
.782
9.78
.577
9.02
.795
2.63
1.40
.802
-.501
-6.797
-1.048
4.820
READING PRESCORE
-.119
.555
.644
13.19
.528
13:064
.655
13.69
.836
8.77
.691
.399
.220
.779
-.130
3.952
.630
1.682
LANGUAGE PRESCORE
-.051
.459
.712
6.47
.214
9.444
.678
.17
.009
6.34
.590
-.523
-.239
.564
-.429
-1.414
-.187
3.385
AFFECT PRESCORE
-.072
.377
.437
-4.76
-.130
11.506
.482
-6.09
-.253
7.72
.542
1.06
.399
.687
.022
1.452
.157
4.124
CO I
AV. PUPIL AGE (MONTHS)
86.46
2.83
-.038
.30
.062
1.073
-.013
.45
.139
.72
.179
.0G1
172
.064
-.010
.331
.269
.384
CO
% CLASSROOM MALE
51.57
15.75
.058
-.15
-.170
.157
.076
-.10
-.181
.11
.333
.016
.254
.009
-.105
-.039
-.176
.056
CD
% CLASSROOM BLACK
50.34
14.58
-.217
.40
.416
.378
-.187
.26
.411
.25
-.199
-.002
-.024
.023
.065
-.085
-.355
.136
% PRESCHOOL (OR NO: MOS.)
5.21
2.55
.097
.71
.131
1.024
.145
1.05
,294
.69
.088
-.021
-.053
.061
-.241
-.018
-.014
.367
% PARENTS W/O HS DIPL,
70.39
11.95
-.400
-.41
-,357
.329
-.453
-.37
-.490
.22
-.338
-.002
-.024
.020
.331
.026
.091
.1I8
% PARENTS W SKILL OCCUP.
32.61
15.29
.308
.18
.199
.201
.398
.21
.353
.13
.306
.017
.252
.012
.026
.097
.428
.072
% PARENTS BLACK
52.18
13.62
-.211
-.76
-.784
.404
-.208
-.55
-.823
.27
-.182
-.011
-.150
.024
.124
.110
.430
.145
% PARENTS POVERTY ELIGIBLE
50.10
18.01
-.197
.63
.825
.243
-.217
.44
.866
.1S
-.249
'.007
.121
.015
.098
.090
.461
.087
% HEAD HOUSEHOLD EMPLOYED
81.77
10.33
.376
.02
.014
.388
.343
.04
.044
.26
.446
-.016
-.167
.023
-,024
.137
.108
.139
% HEAD HOUSEHOLD MALE
73.17
11.55
.206
.69
.574
.270
.147
.41
.526
.18
.162
.037
.428
.016
.224
.104
.346
.097
SUMMARY STATISTICS
MEAN
VARIANCE
MULTIPLE R
R2
VARIANCE WITH COV'S
ELIMINATED
124.7
192.06
.936
.876
68.74
61.90
82.64
.912
.886
27.08
17.43
1.01
.957
.916
.244
13.98
12.12
.79
.576
8.83

TABLE B-16
COHORT II, ENTiRI G FIRST, REGRESSION ON CONTROL VARIABLES:
DISAGGREGATED ACHIEVEMENT
PUPIL OUTCOMES FOR PROJECT ANALYSES (N = 31, RESIDUAL df = 8)
,\
COVARIABLE
MEAN
S. D.
1
QUANTITATIVE
REGRESSION COEFFICIENTS
COGNITIVE PROCESSES
REGRESSION COEFFICIENTS
READING
REGRESSION COEFFICIENTS
LANGUAGE
REGRESSION COEFFICIENTS
r0
RAW
STD
S. E.
r0
RAW
STD
S. E.
ro
RAW
STD
S. E.
r0
RAW
STD
S.
E.
FALL 1970
QUA1T: PRESCORE
-,077
:535
.740
-4.934
-.533
7.487
.626
-.258
-.102
2.784
.714
-6.785
-.448
9.781
.756
-6.732
-1.100
3.866
COG. PROCESS PRESCORE
-.070
.537
.789
7.098
.770
5.730
.711
2.654
1.056
2.130
.770
7.967
.528
7.485
.859
7.575
1.141
2.959
READING PRESCORE
-.119
.555
.633
3.971
.446
5.566
.499
-1.840
-.757
2.069
.632
11.026
.756
7.271
.704
2.707
.422
2.874
LANGUAGE PRESCORE
-.051
.459
.709
2.150
.200
4.024
.640
1.612
.549
1.496
.678
2.712
.154
5.256
.729
2.322
.299
2.077
AFFECT PRESCORE
-.072
.377
.445
-1.209
-.092
4.902
.370
1.739
.486
1.823
.414
-5.275
-.246
6.404
.510
1.7XI
.183
2.531
AV. PUPIL AGE (MONTHS)
86.46
-2.83
-.049
.059
.034
.457
.008
.000
.000
.170
-.036
.246
.086
.597
.wn
.07S
.062
.2::6
% CLASSROOM MALE
51.57
15.75
.106
-.017
-.053
.067
.006
-.007
-.064
.025
.036
-.126
-.246
.087
.065
-.029
-.127
.035
% CLASSROOM BLACK
50.34
14.58
-.247
-.031
.092
.161
-.269
.033
.357
.060
-.176
.332
.598
.211
-.220
.078
.320
.083
% PRESCHOOL (OR NO. MOS.)
5.21
2.55
.098
.178
.092
.436
.124
-.103
-.194
.162
.086
.637
.200
.570
.064
.031
.022
.225
% PARENTS W/O HS DIPL.
70.39
11.95
-.425
-.151
-.364
.140
-.204
.039
.347
.052
-.391
-.303
.447
.183
-.402
-.037
-.123
.072
Ca 1
% PARENTS W SKILL °COIF.
32.61
15.29
.288
.054
.167
.086
.130
-.000
-.008
.032
.330
.127
.239
.112
.389
.061
.261
.044
Ca3
% PARENTS BLACK
52.18
13.62
-.205
-.158
-.434
.172
-.237
-.042
-.422
.064
-.196
-.562
-.945
.225
-.224
-.125
-.476
.089
% PARENTS POVERTY
ELIGIBLE
50.10
18.01
-.213
.194
.706
.104
-.115
.008
.100
.038
-.187
.434
.964
.135
-.226
.084
.427
.053
% HEAD HOUSEHOLD EMPLOYED81.77
10.33
.374
-.025
-.052
.165
.294
-.034
-.260
.062
.366
.078
.099
.216
.401
-.018
-.052
.085
% HEAD HOUSEHOLD MALE
73.17
11.55
.226
.238
.556
.115
.038
.028
.238
.043
.206
.424
.604
.150
.054
.105
.341
.059
SUMMARY STATISTICS
MEAN
44.88
9.424
70.42
21.56
VARIANCE
24.481
1.818
65.633
12.700
MULTIPLE R
.907
.819
.942
.953
R2
.823
.670
.887
.f.09
VARIANCE WITH CCV'S
ELIMINATED
12.477
1.725
21.293
3.326
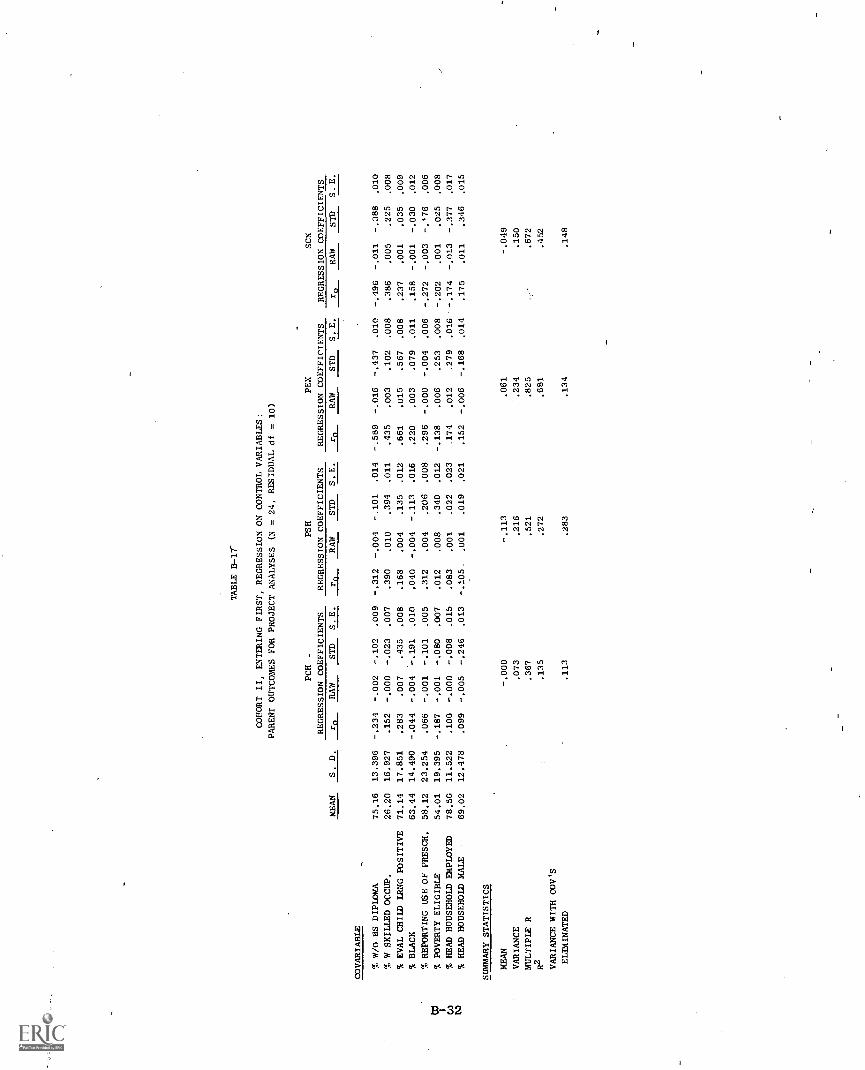
TABLE B-17-
COHORT II, ENTERING FIRST, REGRESSION ON CONTROL VARIABLES:
PARENT OUTCOMES FOR PROJECT ANALYSES (N = 24, RESIDUAL df = 10)
PCH -
PSH
PEX
SCN
REGRESSION COEFFICIENTS
REGRESSION COEFFICIENTS
REGRESSION COEFFICIENTS
REGRESSION COEFFICIENTS
COVARIABLE
MEAN
S. D.
re,
RAW
STD
S.E.
rRAW
STD
S.E.
re,
RAW
STD
S.E.
re,
RAW
STD
S.E.
% W/O HS DIPLOMA
75.16
13.396
-.234
-.002
-.102
.009
-.312
-.004
-.101
.014
-.589
-.016
-.437
.010
-.496
-.011
-.388
.010
% W SKILLED OCCUP.
26.20
16.927
.152
-.000
-.023
.007
.390
.010
.394
.011
.435
.003
.102
.008
.386
.005
.225
.008
% EVAL CHILD LRNG POSITIVE
71.14
17.851
.283
.007
.435
.008
.168
.004
.135
.012
.661
.015
.567
.008
.237
.001
.035
.009
% BLACK
63.44
14.490
-.044
-.004
-.191
.020
.040
-.004
-.113
.016
.220
.003
.079
.011
.158
-.001
-.030
.012
% REPORTING USE OF PRESCH.
58.12
23.254
.066
-.001
-.101
.005
.312
.004
.206
.008
.296
-.000
-.004
.006
-.272
-.003
-.'76
.006
10
% POVERTY ELIGIBLE
54.01
19.395
-.187
-.001
-.080
.007
.012
.008
.340
.012
-.138
.006
.253
.008
-.202
.001
.025
.008
COO
% HEAD HOUSEHOLD EMPLOYED
78.50
11.522
.100
-.000
-.008
.015
.083
.001
.022
.023
.174
.012
.279
.016
-.174
-.013
-.377
.017
IV
% HEAD HOUSEHOLD MALE
69.02
12.478
.099
-.005
-.246
.013
-.105_
.001
.019
.021
.152
-.006
-.168
.014
.175
.011
.346
.015
SUMMARY STATISTICS
MEAN
-.000
-.113
.061
-.049
VARIANCE
.073
.216
.234
.150
MULTIPLE R
.367
.521
.825
.672
R2
.135
.272
.681
.452
VARIANCE WITH COV'S
ELIMINATED
.113
.283
.134
.148

TABLE B-18
COHORT II, ENTERING FIRST, REGRESSION ON CONTROL VARIABLES:
TEACHER OUTCOMES FOR PROJECT ANALYSES (N = 27, RESIDUAL df = 12)
PARENT EDUCATOR IMAGE
PROFESSIONAL ACCEPTANCE OF FT
REGRESSION COEFFICIENTS
REGRESSION COEFFICIENTS
CO VARIABLE
MEAN
S. D.
ro
RAW
STD
S. E.
ro
RAW
STD
S. E.
JOB SATISF. RATING
1.85
.480
.299
.144
.206
.180
.231
.248
.322
.196-
IX/
IBOOK RESOURCE SCALE
3.52
.937
-.040
-.043
-.119
.096
.017
-.069
-.177
.104
wRACE (BLACK/NONBLACK)
.593
.296
-.372
-.556
-.490
.361
-.080
.064
.051
.392
IDENT. W. COMMUNITY
.963
.824
-.136
-.062
-.151
.119
.490
.270
.604
.129
NO. HELPERS
1.55
.670
.091
.003
.007
.126
.106
-.038
-.070
.13,
ABLE TO CHOOSE ASSIGN.
1.39
.920
-.382
-.051
-.140
.105
.194
.002
.006
.114
TRNG & TEACHER EXPER.
5.14
1.859
.146
.051
.282
.050
.119
.034
.173
.054
SUMMARY STATISTICS
MEAN
.36
1.74
VARIANCE
.113
.136
MULTIPLE R
.605
.616
R2
.365
.379
VARIANCE WITH COV'S
ELIMINATED
.113
.134
REFERENCES
Averch, H. A., et How effective is schooling. (Final Report to the
President's Commission on School Finances) Santa Monica, Ca.:
The Rand Corporaticn, 1971.
Baratz, S., & Baratz, J. Early childhood intervention: The social
science base of institutional racism. Harvard Educational Review,
1970, 40 (1), 29-50.
Bloom, B. Stability and change in human characteristics. New York:Wiley, 1964.
Bock, R. D., & Haggard, E. A. Chapter 3: The use of multivariate
analysis of variance in behavioral research. In D. K. Whitla
(Ed.), Handbook of Measurement and assessment in behavioral
sciences. Reading, Mass.: Addison-Wesley, 1968.
Campbell, D. T. Temporal changes in treatment-effect correlations:
A quasi-experimental midel for institutional records and longi-
tudinal studies. In G. V. Glass (Chm.), Proceedings of the 1970
Invitational Conference on Testing Problems. Princeton, N.J.:
Educational Testing Service, 1971.
Campbell, D. T., & Erlebacher, A. How regression artifacts in quasi-
experimental evaluations can mistakenly make compensatory educa-
tion look harmful. In J. Hellmuth (Ed.), Disadvantaged child.
Volume 3. Compensatory education: a national debate. New York:
Brunner/Mazel, 1970,
Campbell, D. T., & Stanley, J. C. Experimental and quasi-experimental
designs for research. Chicago: Rand McNally, 1963.
Cicerelli, V. G., et al., The impact of head start: An evaluation of
the effects of head start on children's cognitive and affective
development. (0E0 contract to Westinghouse Learning Corporation,
Ohio University) Springfield, Va.: Clearinghouse for Federal
Scientific and Technical Information, 1969.
Cohen, J. Statistical power analysis for the behavioral sciences,New York: Academic Press, 1969.
R-1
Coleman, J. s., et al. Equality of educational opportunity. Washington,
D.C.: U.S. Government Printing Office, 1966.
Committee for Economic Development. Innovation in education: New
directions for the american school. (A statement on national
policy by the Research and Policy Committee) New York: July 1968.
Egbert, R. Follow through, an informal historical review of the follow
through program ana evaluation. Washington, D.C.: U.S. Office
of Education, undated, ca. 1971.
Federal/state task force on education evaluation: An overview.
Washington, D.C.: U.S. Office of Education, February 1971.
Glass, G, V., Peckham, P. D., & Sanders, J. R. Consequences of failure
to meet assumptions underlying the fixed effects analyses of
variance and covariance. Review of educational research, Summer
1972, 42, 237-288.
Gray, S. W., & Klaus, R. A. Au experimental preschool program for cul-
turally deprived children. Child Development, 1965, 36 (4),
887-898.
Gurin, G., & Gurin, P. Expectancy theory in the study of poverty.
Journal of social issues, 1970, 26 (2), 83-1041
Harris, C. W. (Ed.), Problems in measuring change. Madison, Wis.:
University of Wisconsin Press, 1967.
Hawkridge, D. G., et al. A study of selected exemplary programs for
the education of disadvantaged children. Palo Alto, Ca.: American
Institutes for Research, 1968.
Hess, R. D., et al. Parent involvement in early education. In
E. Hi Grotberg (Ed.), Day care: resources for decisions.
Washington, D.C.: Office of Economic Opportunity, 1969.
Hodges, W., McCandless, B. R., & Spicker, H. The development and
evaluation of a diagnostically based curriculum for preschool
psycho-socially deprived children. (Final Report t4 U.S. Office
of Education, Grant No. OREG=32-24-0210-1011) Bloomington:
Indiana University, 1967.
Hsia, J. Integration in Evanston, 1967-71: a longitudinal evaluation.
(PR-71-9) Princeton, N.J.: Educational Testing Service, August 1971.
R -2
Hunt, J. M." Intelligence and experience. New York: Ronald Press, 1961.
Jastak, J. R., & Jastak, S. R. WRAT manual. Wilmington, Del.: Guidance
Associates, 1965.
Jencks, C., et al. Inequality, New York: Basic Books, 1972
Mosteller, F., & Moynihan, D. P. (Eds). On Equality of Educational
Opportunity. New York: Vintage Books, 1972.
Moynihan, D. P. Maximum feasible misunderstanding. New York: The
Free Press, 1969.
O'Connor, E F., Jr. Extending classical test theory to the measurement
of change. Review of Educational Research, 1972, 42 (1), 73-97.
Passow, A. H. Compensatory instructional intervention. In Review of
research in education, in press.
Porter, A. C. The effects oIf
using fallible variables in the analysis
'of covariance. Unpublished. Doctoral. dissertation, University of
Wisconsin, 1967.
Porter, A. C. Some design and analysis concerns for quasi-experiments
such as Follow Through. Paper presented at the meeting of the
American Psychological Association, Honolulu, August 1972.
President's Science Advisory Committee. Progress report of the panelof educational research and development. Washington, D.C.: Author,
1964.
Searle, S. R. Linear models. New York: Wiley, 1971.
Shaycoft, M. F., Shanner, W. M., Tallmadge, G. K., & Gamel, N. N.
Designing retrospective.studies of the effects of school desegre-
gation on academic achievement. Pale Alto, Ca.: AmericanInstitutes for Research, 1972.
Skeels, H. M. Adult status of children with contrasting early life
experiences: A follow-up study. Monographs of the Society for
Research in Child Development, 1966, 31 (3, Serial No. 105).
Stanford Research Institute. A preliminary guide to Follow ThroughA progress report on the national evaluation 1969-71. MenloPark, Ca.: Author, February 1972.
R-3
Stanford Research Institute. Evaluation of the national Follow Through
program, 1969-1971 (DRAFT). Appendix B. Classroom observations.
Appendix D. Project descriptors. Appendix E. Community studies.
Appendix F. Administrative history of Follow Through, 1968-1972.
Menlo Park, Ca.: Author, 1972b.
Stanford Research Institute. Results of Fall 1971 Follow Through supple=,
mental testing. Menlo Park, Ca.: Author, 1972c.
Stanford Research Institute. Results of the Winter 1971 pretest for the
Spring 1972 Follow Through noncognitive test battery. Menlo Park,
Ca.: Author, 1972d.
Stanford Research Institute. General instructions and manual ofprocedures for Follow ThrOugh testing. Menlo Park, Ca.:Author, Fall 1969.
Stanford Research Institute. Issues of non-cognitive measurement.
Menlo Park, Ca.: Author, December 1970.
Stanford Research Institute. Longitudinal evaluation of selected
features of the national Follow Through program (DRAFT). MenloPark, Ca. : Author, March 1971.
Timpane, P. M. Educational experimentation in national social policy.
Harvard educational review, 1970, 40 (4), 547566.
Tukey, J. W. Chapter 6, Appendix 2, and Appendix 4. In National
halothenes study: A study of the possible association between
halothene anaesthesia and post operative hepatic necrosis.
(National Institutes of Health) Washington, D.C.: U.S. Govern-ment Printing Office, 1969.
Wargo, M. et al. ESEA Title I: A reanalysis and synthesis of evaluationdata from FY 1965 through 1970. Palo Alto, Cal.: American Institutes
for Research, 1972.
Whitla, D. K. (Ed.) Handbook of measurement and assessment inbehavioral sciences. Reading, Mass.: Addison-Wesley, 1968.
Wiley, D. E. Approximation to ceteris paribus: Data adjustment ineducational research. In W. Edelstein and D. Hopf (Eds.),
Proceedings of the international research seminar on learning andthe educational processes. Stuttgart: Klett Verlag, in press.
R-4
Winer, b. J. Statistical principles in experimental design. New York:
Wiley, 1962.
Wolff, M., & Stein, A. Study I: Six months later. A comparison of
children who had head start, summer 1965, with their classmates
in kindergarten. In A case study of kindergartens in four public
elementary schools, New York City. Washington, D.C.: Office of
Economic Opportunity, 1966.
Zurcher, L. A., Jr. The poverty board: Some consequences of "maximum
feasible participation." Journal of social issues, 1970, 26 (3),
85-107.
R-5.
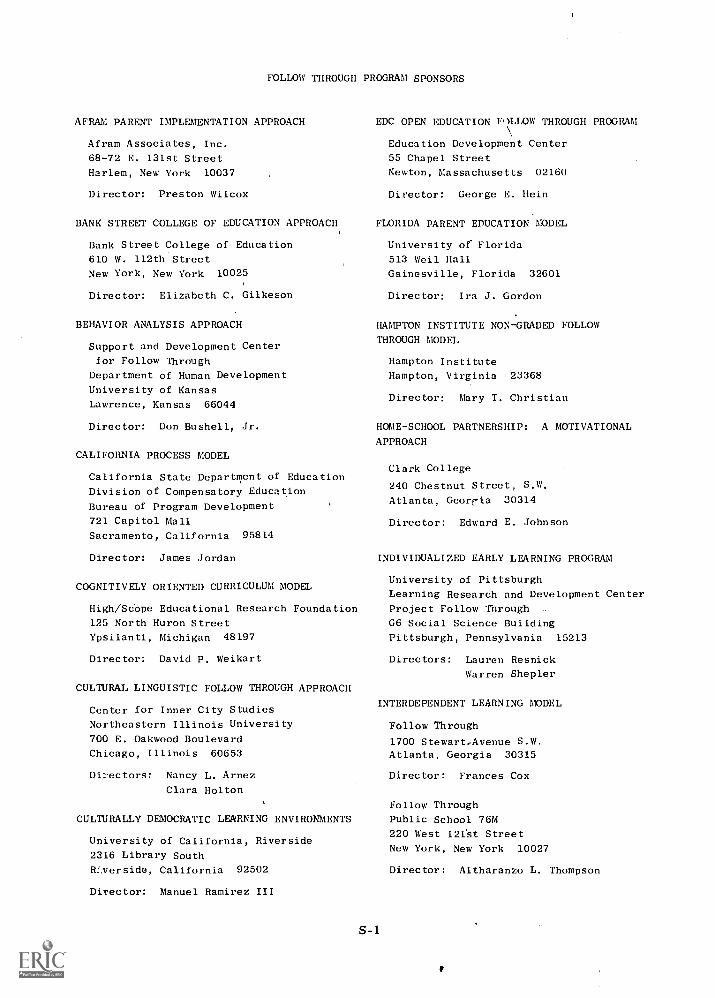
FOLLOW THROUGH PROGRAM SPONSORS
AFRAM PARENT IMPLEMENTATION APPROACH
Afram Associates, Inc.
68-72 E. 131st Street
Harlem, New York 10037
EDC OPEN EDUCATION FOLLOW THROUGH PROGRAM
Education Development Center
55 Chapel Street
Newton, Massachusetts 02160
Director: Preston Wilcox Director: George E. Hein
BANK STREET COLLEGE OF EDUCATION APPROACH FLORIDA PARENT EDUCATION MODEL
Bank Street College of Education
610 W. 112th Street
New York, New York 10025
University of Florida
513 Weil Hall
Gainesville, Florida 32601
Director: Elizabeth C. Gilkeson Director: Ira J. Gordon
BEHAVIOR ANALYSIS APPROACH HAMPTON INSTITUTE NON-GRADED FOLLOW
THROUGH MODELSupport and Development Center
for Follow Through
Department of Human Development
University of Kansas
Lawrence, Kansas 66044
Hampton Institute
Hampton, Virginia 23368
Director: Mary T. Christian
Director: Don Bushell, Jr. HOME-SCHOOL PARTNERSHIP: A MOTIVATIONAL
APPROACHCALIFORNIA PROCESS MODEL
California State Department of Education
Division of Compensatory Education
Bureau of Program Development
721 Capitol Mall
Sacramento, California 95814
Clark College
240 Chestnut Street, S.W.
Atlanta, Georf-ia 30314
Director: Edward E. Johnson
Director: James Jordan INDIVIDUALIZED EARLY LEARNING PROGRAM
COGNITIVELY ORIENTED CURRICULUM MODEL
High/Scope Educational Research Foundation
125 North Huron Street
Ypsilanti, Michigan 48197
University of Pittsburgh
Learning Research and Development Center
Project Follow Through .
G6 Social Science Building
Pittsburgh, Pennsylvania 15213
Director: David P. Weikart Directors: Lauren Resnick
Warren SheplerCULTURAL LINGUISTIC FOLLOW THROUGH APPROACH
Center for Inner City Studies
Northeastern Illinois University
700 E. Oakwood Boulevard
Chicago, Illinois 60653
INTERDEPENDENT LEARNING MODEL
Follow Through
1700 Stewart,Avenue S.W.Atlanta, Georgia 30315
Directors: Nancy L. Arnez Director: Frances Cox
Clara Holton
CULTURALLY DEMOCRATIC LEARNING ENVIRONMENTS
University of California, Riverside
2316 Library South
W.verside, California 92502
Director: Manuel Ramirez III
S-1
Follow Through
Public School 76M
220 West 121st Street
New York, New York 10027
Director: Altharanzo L. Thompson
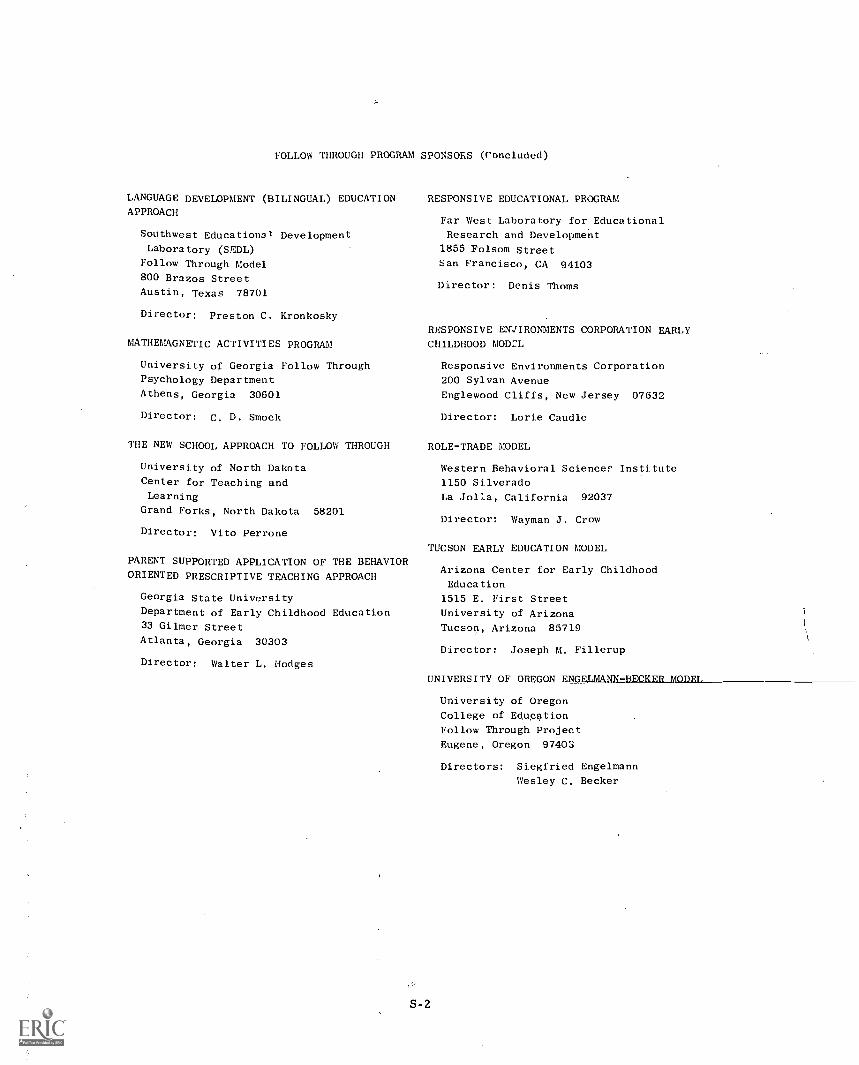
FOLLOW THROUGH PROGRAM SPONSORS (Concluded)
LANGUAGE DEVELOPMENT (BILINGUAL) EDUCATIONAPPROACH
Southwest Educational DevelopmentLaboratory (STDL)
Follow Through Model
800 Brazos Street
Austin, Texas 78701
Director: Preston C. Kronkosky
MATHEMAGNETIC ACTIVITIES PROGRAM
University of Georgia Follow ThroughPsychology Department
Athens, Georgia 30601
Director: C. D. Smock
THE NEW SCHOOL APPROACH TO FOLLOW THROUGH
University of North Dakota
Center for Teaching andLearning
Grand Forks, North Dakota 58201
Director: Vito Perrone
PARENT SUPPORTED APPLICATION OF THE BEHAVIOR
ORIENTED PRESCRIPTIVE TEACHING APPROACH
Georgia State University
Department of Early Childhood Education33 Gilmer Street
Atlanta, Georgia 30303
Director: Walter L. Hodges
RESPONSIVE EDUCATIONAL PROGRAM
Far West Laboratory for Educational
Research and Development1855 Folsom Street
San Francisco, CA 94103
Director: Denis Thorns
RESPONSIVE ENVIRONMENTS CORPORATION EARLY
CHILDHOOD MOD7I,
Responsive Environments Corporation
200 Sylvan Avenue
Englewood Cliffs, New Jersey 07632
Director: Lorie Caudle
ROLE-TRADE MODEL
Western Behavioral Sciences Institute
1150 Silverado
La Jolla, California 92037
Director: Wayman J. Crow
TUCSON EARLY EDUCATION MODEL
Arizona Center for Early Childhood
Education
1515 E. First Street
University of Arizona
Tucson, Arizona 85719
Director: Joseph M. Fillerup
UNIVERSITY OF OREGON ENGELIv
University of Oregon
College of Education
Follow Through Project
Eugene, Oregon 97403
' klik. t us 11
Directors: Siegfried Engelmann
Wesley C. Becker