Providing Consumers with Sale Information: Evidence from a ...
44
Providing Consumers with Sale Information: Evidence from a Field Experiment in Online Supermarket Shopping. Kr Eliaz y , Orli Oren-Kolbinger z and Sarit Weisburd x June 1, 2018 Abstract Does providing consumers with information about discounts help them re- alize more savings? We address this question using data from a eld experiment on a website for online grocery shopping. Our results illustrate the di¢ culty in using information provision to steer shoppers towards cheaper alternatives (of equal or higher quality than their substitutes). We nd that providing (treat- ment) shoppers with promotional information on sale categories increases the probability of purchasing within the category. This e/ect is driven by an increase in purchasing rates for both the reduced priced items and regularly priced substitutes. Our analysis focuses on understanding how item place- ment, promotional information, and the way promotional information is dis- played impact consumer choices in a multi-product environment where prices are changing. Keywords: Limited attention, Salience, Information processing, Supermarket shopping. Financial support from the The Pinhas Sapir Center for Development at Tel-Aviv University and the Michigan Institute for Teaching and Research in Economics is greatfully acknowledged. We are in debt to Benny Wang for his tremendous help with this project. y School of Economics, Tel-Aviv University, [email protected]. z School of Law, Villanova University, [email protected] x School of Economics, Tel-Aviv University, [email protected].
-
Upload
khangminh22 -
Category
Documents
-
view
2 -
download
0
Transcript of Providing Consumers with Sale Information: Evidence from a ...

Providing Consumers with Sale Information:Evidence from a Field Experimentin Online Supermarket Shopping.�
K�r Eliazy, Orli Oren-Kolbingerzand Sarit Weisburdx
June 1, 2018
Abstract
Does providing consumers with information about discounts help them re-alize more savings? We address this question using data from a �eld experimenton a website for online grocery shopping. Our results illustrate the di¢ culty inusing information provision to steer shoppers towards cheaper alternatives (ofequal or higher quality than their substitutes). We �nd that providing (treat-ment) shoppers with promotional information on sale categories increases theprobability of purchasing within the category. This e¤ect is driven by anincrease in purchasing rates for both the reduced priced items and regularlypriced substitutes. Our analysis focuses on understanding how item place-ment, promotional information, and the way promotional information is dis-played impact consumer choices in a multi-product environment where pricesare changing.Keywords: Limited attention, Salience, Information processing, Supermarketshopping.
�Financial support from the The Pinhas Sapir Center for Development at Tel-Aviv Universityand the Michigan Institute for Teaching and Research in Economics is greatfully acknowledged. Weare in debt to Benny Wang for his tremendous help with this project.
ySchool of Economics, Tel-Aviv University, k�[email protected] of Law, Villanova University, [email protected] of Economics, Tel-Aviv University, [email protected].

1 Introduction
A consumer in the modern market place is faced with an overwhelming amount
of information about a multitude of consumption alternatives. There is an ocean of
substitutes for almost every product type, each product type is o¤ered by a myriad of
suppliers, and there are many frequent promotions that cause prices across suppliers
to �uctuate almost continuously. Since consumers may have only a limited amount
of time to devote to price comparisons, they may end up missing bargains that can
help them save money. In light of this, are consumers more likely to buy discounted
items when provided with information about sales? Addressing this question can
improve our understanding of how promotional information a¤ects demand. The
answer is important for both policy makers interested in helping consumers realize
potential savings, and for retailers interested in using discounts to steer consumers
to particular items.
To tackle the above question, we analyze data from a �eld experiment conducted
on a website for online grocery shopping. The experiment consisted of o¤ering tem-
porary discounts on select items and providing information about these discounts to
a (randomly selected) subset of shoppers via weekly emails. The discounted items
were selected such that each had an obvious, more expensive substitute of equal or
lower perceived quality (e.g., organic fruits were priced lower than their conventional
counterparts). Our goal is to understand how information provision impacts the
likelihood of choosing the discounted item over its more expensive (and often lower
perceived quality) substitute, and how this likelihood is a¤ected by product display
(whether a discounted item appears next to its substitute), the amount of infor-
mation provided (e.g. listing categories of items with the largest discounts versus
adding more detailed information on the types of items on sale), and by shoppers�
"attentiveness" (as measured by a proxy we propose).
Our analysis provides a number of key observations. While some of these obser-
vations are intuitive, our study permits us to quantify their magnitudes and their
e¤ect on savings.
Searching for substitutes is costly, and the likelihood of realizing savings from
discounts decreases with search costs. The likelihood of buying a discounted item
(of weakly higher quality) versus its substitute increases by 31 percentage points
(s.e. 14) when the discounted item and its substitute appear adjacent on the screen
(the average pre-discount relative purchase rate is roughly 24 percent).1 The e¤ect
of the sale is much smaller and more noisily measured for items that are farther
apart from their substitutes (an increase of 7.5 percentage points s.e. 10). On
average, purchasing a discounted item versus its substitute resulted in savings of 88
cents relative to the non-discount price (which averaged $2.99). This means that
displaying substitutes next to each other (which then does not require shoppers to
search for the di¤erent substitutes of a particular product) can lead to a 24 percent
increase in the savings uptake, or 21 cents per item for the average shopper. It is
important to keep in mind that the average American supermarket carries close to
40,000 items, so that even if only one percent of these items is on sale, the placement
of these items could result in signi�cant changes to consumer surplus.2
Providing shoppers with information on sales does not necessarily lead to savings.
Notifying shoppers of food categories with discounts increases their probability of
making a purchase within these categories by roughly 200 percent relative to the
control group (an increase of 1.6 percentage points (s.e. 0.6) at an average purchase
rate of 0.8 percent (s.d. 9)).3 During each week of the experiment discounts were
o¤ered in roughly 13 food categories, such that shoppers could save a total of $11 if
they switched to each discounted item from its more expensive substitute in every
category. However, the bene�t of the sale only averaged $2, as 70 percent of the
increase in purchases made by treatment shoppers was due to an increase in the
purchase rate of the more expensive substitute item.
The framing of information impacts choices. The largest di¤erence between the
treatment and control groups is observed for items in the discounted food category
that was listed �rst in the treatment email. During most weeks the top listed cate-
gory consisted of items with the smallest discounts, and while control shoppers were
less likely to purchase discounted items in this category, treatment shoppers were
more likely to purchase. Thus, the di¤erence in purchasing rates between the treat-
ment and control group was 3 times larger in the �rst item category with treatment
1Whether a pair of substitutes are displayed next to each other is independent of their prices,or of the di¤erence between their prices. Buying a substitute item was on average 28 percent moreexpensive than the on-sale target item for non-neighboring items, and 25 percent more expensivethan the on-sale target item for neighboring items.
2The Food Marketing Institute, a trade group, reported that the average number of items carriedin a US supermarket in 2016 was 38,900.
3Speci�cally, treatment shoppers were told what are the four categories with the biggest sales,and what is the largest discount (in percentage terms) in each of these categories.

shoppers increasing their purchase rate of the discounted item by 1.8 percentage
points (s.e. 0.8) more than the control group.
The impact of information provision depends on the �attentiveness�of a shopper.
Each week all shoppers (both treatment and control) were noti�ed via email of a
weekly promotion o¤ering an immediate rebate (applied at check-out) that would be
awarded for buying at least one unit of an eligible item on the site.4 A shopper may
be described as being in an �attentive state� if he purchases the rebate-awarding
item whenever the rebate is higher than the item�s price (this was true in most
weeks, and in some weeks the di¤erence was at least $9). Treatment shoppers in
an attentive state are almost twice as likely to purchase the discounted item (an
increase of 10 percentage points (s.e. 3) ) relative to control shoppers who increase
their purchase rate by 5.2 percentage points (s.e. 4.8). Furthermore, treatment
shoppers in an attentive state did not increase their demand for the more expensive
substitute. In contrast, treatment shoppers in an inattentive state are 10 percentage
points (s.e. 5.9) more likely than control shoppers in an inattentive state to buy the
more expensive item.
The above observations suggest that search-costs or limited-attention introduce
frictions that may prevent shoppers from realizing savings opportunities even when
they are noti�ed of these opportunities. In particular, coarse information - specifying
only the product categories with the biggest sales - can also lead to higher purchases
of the items that are not on sale.
The remainder of the paper is organized as follows. Section 2 discusses related
literature. The design of the randomized control trials is explained in Section 3.
Summary statistics on the sample are provided in Section 4 and the results are
discussed in Section 5. Section 6 discusses the responses to a post-experiment survey
regarding consumer preferences. Section 7 concludes.
2 Related literature
Our paper is motivated by recent theoretical analysis of the e¤ect of salience on
consumer behavior. Most notably, Bordalo, Gennaioli and Shleifer (2016) propose a
model of how one product attribute may be more salient than another. In our data,
4To avoid situations where customers only bought a single item of the eligible good, the rebatewas also conditional on spending at least $20.

salience plays a role in terms of which discounts are more prominent (e.g., appear on
the same line on the computer screen).
A number of studies provide experimental evidence on how individuals manage
limited attention. Gabaix, Laibson, Moloche and Weinberg (2006) provide evidence
that laboratory behavior of subjects in experiments where instrumental information
was costly to acquire (either �nancially or because time was scarce) matches the
predictions of a boundedly rational model where individuals use only approximate
option-value calculations. Caplin and Dean (2013) use a laboratory design to test
a behavioral property of the rational inattention model. In contrast to our work,
these studies have been performed on students in laboratory settings. A recent
exception is Bartos, Bauer, Chytilová and Majt¼eka (2016), who provide evidence
from �eld experiments in rental housing and job applications showing that suppliers
in these markets do not acquire all the available information (they do not view the
resumes of all the applicants), but rather focus their attention only on a select group
of applicants, based on stereotypical attributes of that group (employers are more
likely to view resumes of majority candidates while landlords are more likely to view
resumes of minority candidates).
The prevalence of limited attention also suggests that �nudges�or reminders that
make some information salient may help individuals make better decisions. In our
study consumers in the treatment group were sent emails alerting them to the item
categories with the biggest sales. We �nd that this nudge increased the probability
of purchasing within a category but not necessarily the on-sale item.
There are only a few studies that present empirical evidence on the implications
of limited attention on consumer behavior. The main obstacle in providing such
evidence is the di¢ culty in obtaining data on the information that consumers paid
attention to. One line of inquiry investigated the impact of making associated fees
salient to consumers. Hossain and Morgan (2006) conduct a �eld experiment on
eBay and �nd that when two auctions o¤er the same e¤ective total price, more
bidders are attracted to the auction with a lower opening price and higher shipping
price. Chetty, Looney and Kroft (2009) provide evidence from a �eld experiment in a
grocery store showing that posting prices that include taxes reduces demand. Blake,
Moshary, Sweeney and Tadelis (2017) use data from a �eld experiment carried out
by an online retailer to show that up-front display of the total cost of each available
item, including all fees, (as opposed to displaying only the listed prices and adding
the fees at check out) a¤ects not only the likelihood of purchase but also the quality
of the items purchased.
A second strand of literature focused on the extent to which consumers search for
the best prices. De los Santos, Hortacsu, and Wildenbeest (2012) use a large data set
on web browsing and purchasing behavior to test whether consumers are searching in
accordance to various classical search models. Helmers, Krishnan and Patnam (2015)
use a unique data set from an online retailer to show that consumers are more likely
to buy products that receive a saliency shock when they are recommended by new
products.5 Clerides and Courty (2015) use scanner data from a supermarket chain
to show that during periods in which the price of a discounted pack of detergent
was lower than the corresponding price of a larger (�economy-size�) pack (of the
same product), consumers still bought the larger, and more expensive pack. This
�nding suggests that some consumers are either not comparing all prices, or are
not computing (or computing erroneously) the price per-unit when making their
purchasing decisions.
This study adds to the existing literature by examining how consumers�shopping
decisions are a¤ected by the relative prices of substitute goods and how di¤erent
levels of information provisions a¤ect these choices. Our experimental design sheds
new light on the di¢ culty consumers face in allocating their attention and in making
optimal choices even when the information is readily available on a single webpage.
Importantly, as supermarket shopping involves repeat purchases of goods over short
time periods, we are able to verify the robustness of our results when examining the
same individual making choices over the same products at varying prices.
3 Experimental design
The platform. We partnered with a website that o¤ers a purchase and next day
delivery service from a large U.S. supermarket in a University city. The website
includes roughly 3,000 items that are sold in the supermarket store. These items
are divided into several categories to help shoppers perform an intuitive search (e.g.
produce, dairy, etc.). Shoppers can also search the website for any item they would
like to purchase using a search command. Shoppers need to add the items that they
5The salience shock was created by a group of items that appeared below each product with thetitle "You May Also Like."

would like to purchase to their basket, and at checkout they pay for the products plus
a �at delivery fee of $2.99 for each order. During the period of the experiment there
was no option to re-order previous baskets or to add items from previous orders. In
addition, all prices were �xed and there were no promotional sales. Shoppers are
required to choose a delivery date and a two-hour delivery window. The cuto¤ time
for next day delivery is midnight every day. These shoppers are mainly students
(80 percent) with some professors (10 percent). Only 10 percent of shoppers are
una¢ liated with the University.6
The website was interested in encouraging its registered customers to increase
the frequency and volume of their purchases, and to learn how di¤erent promotional
tactics a¤ect shopping behavior. To achieve this goal, it planned to conduct a series
of randomized control trials, and agreed to allow us to in�uence the design of these
trials in a way that would also enable us to address our questions. Hence, the
experimental design was somewhat constrained by the objectives of the website.
Temporary discounts. The experiment was conducted over a period of 13 weeks
during which the website o¤ered temporary discounts so that the prices of some
select items �uctuated, dropping during the sale and rising when the sale expires.
Discounted items were marked on the website with two asterisks (**), and a footnote
at the bottom of the screen explained that the marked item was on sale and the
original higher price was speci�ed. This method of marking discounts was used
because of the following reasoning. First, we did not want discounts to be too salient
so there would be an advantage for receiving an email that provided information on
which items were discounted. Second, we wanted to allow any shopper who accessed
the website to �nd out about the temporary sale if he exerted some e¤ort in noticing
�ne details.7
The experiment focused on items in 28 categories that were popular with shoppers
in the pre-experiment period (see Table (1)).8 All of these categories include at
least 2 items that could be considered substitutes. Each month a di¤erent set of6This information was obtained from responses to an optional survey conducted at checkout
during the �rst month of the experiment period. Eighty percent of the shoppers who made apurchase during the experiment period responded to the survey.
7We operated under the constraint that all shoppers must face the same exact set of prices.8The 28 item categories are: bananas, kiwis, lemons, raspberries, apples, bulk apples, blueberries,
pineapples, avocados, broccoli, cucumbers, kale, onions, green onions, peppers, lettuces, limes,tomatoes, bread, organic bread, eggs, brown eggs, organic eggs, milk, bulk milk, organic milk,yogurt, and water.

categories were discounted so that a discount on an item was valid for one month.
The items whose prices were manipulated during the experiment were de�ned as
target items, and their alternatives were de�ned as substitute items. During the
period with the lowest relative discounts (in percentages) on target items, the highest
discount was 25%, while during the period with the highest relative discounts, the
maximal discount was 75%. See Tables (2-3) for a full list of the relevant target and
substitute items as well as the discounts given during the experiment period.
These discounted target items fell into four general categories: (i) organic and
conventional items, (ii) same items that are o¤ered in di¤erent sizes (e.g. jumbo
avocado and regular avocado) or bulk quantities (e.g. apples, that are o¤ered as
single units or 3lb bags, or milk that is o¤ered in 0.5gal and 1gal) (iii) brand names
vs. generic store brand (e.g. Aunt Millie�s breads vs. generic supermarket whole
wheat bread), and (iv) two competing brands of the same exact product (e.g., Dasani
vs. Ice Mountain mineral water in bottles of the same size).
There are two motivating factors behind the choice of target items. First, we tried
to select target items that had �almost perfect�substitutes and which had low levels
of brand loyalty. Recent evidence suggests that consumers display relatively low
brand loyalty to supermarket items as compared to clothing and appliances (Nielsen
(2013)), and their choice of food brands is most a¤ected by price considerations
(Byron (2008)). Within the food and beverage category, consumers tend to exhibit
more brand loyalty to breakfast cereals, carbonated drinks and snacks (Chidmi and
Lopez (2007), Nielsen (2013)). None of these were included as target items in the
experiment, hence, we assume that price sensitivity is stronger than brand loyalty in
deciding between a target item and its substitute.9
The second motivating factor is the public perception of organic items. Studies
have indicated that consumers generally express positive attitudes toward organic
foods, perceiving them as tastier and kinder to the environment (Roddy et al. (1996),
Magnusson et al. (2001), Perkovic and Orquin (2017)). While there may be disagree-
ment among researchers whether this perception is backed by scienti�c evidence (see
Baransky et al. (2014) for a meta-analysis that claims there are healthier aspects of
9In a post study questionnaire of the participants, 80% of 55 individuals who responded answeredthat they would switch brands for a discount of 20%. We found a similar response when surveyingan additional 378 US respondents in the same age and education categories. See Section 6 for moredetail.

organic food), what is important for the current study is the public perception.10
An important feature of the discounted items was the variation in their display:
Some close substitutes (where one was discounted and the other was not) appeared
next to each other on the screen, while others appeared in di¤erent rows and re-
quired scrolling down to notice both items. Whether a target item and its substitute
appeared on the same row was independent of their prices relative to other products.
We will use the variation in location as a proxy for the cost involved in comparing
the price of a target item with its substitutes.
Rebates. In weekly emails, shoppers were o¤ered an immediate rebate (applied
at the time of checkout) if they spent at least $20 and also bought at least one unit
of an item from a given group of eligible items (which changed every week). During
the �rst three weeks of the study, the rebate was equal to the �at delivery fee of
$2.99 (it was presented to shoppers as free delivery), and in the last three weeks it
was raised to $10.11 Between the fourth and the eleventh week the rebate was $2.99
for the control group and $10 for the treatment group (the di¤erence between these
two groups is explained below).
Table (4) lists the rebate item o¤er for each week as well as both the price of
the item and bene�t of purchase for individuals in both the treatment and control
groups. In almost all weeks the rebate o¤er was strictly higher than the price of a
single unit of an eligible item. This meant that a consumer who noticed this o¤er
could save a non-negligible amount of money by buying a single unit of an eligible
item even if he did not consume it after (as evident from Table (4) a single unit of
an eligible item was often a piece of fruit or vegetable so that it did not require extra
storage). As explained in the next section, we can use this fact as a proxy for how
much attention the shopper paid to the consumption problem.
Treatment and control. The 355 shoppers who had made purchases in the sec-
ond half of 2015 were randomly divided into two groups � 178 in treatment and
177 in control.12 The di¤erence between these groups was that treatment shoppers
10In our post study questionnaire, 91% of 55 responders said they would buy an organic item ifits price was weakly cheaper than a conventional version of the same item. This result also held inan additional survey follow up with 378 participants. See Section 6.11Starting o¤ with free delivery before moving to the high rebate was also meant to give some
credibility to this promotional o¤er.12While we have data on shoppers beginning in December 2014 (over a year before the experiment
was run) we only include shoppers who had made a purchase within the previous 6 months when

received additional information on discounted items in the weekly email. In order
to separately measure the e¤ect of the email contents from a general salience e¤ect
or compliance e¤ect, both groups were sent weekly promotional emails. However,
during the entire period of the study the email to the control group did not mention
any price discounts.
In contrast, the email to the treatment group displayed the following: four product
categories (e.g., milk, eggs, fruits, bread) that were on (temporary) sale that month,
the item with the biggest discount in each category (expressed in percentage points)
and a link to the relevant page of each category. The treatment group was also
informed that discounted items were marked by �**�.
During the second half of the study (from the sixth week on), shoppers in the
treatment group began to receive a more detailed weekly email. For these weeks
the email included a line alerting shoppers to the fact that many organic items were
now on sale and even cheaper than non-organic items. Additionally, those who had
purchased a substitute item in a category that is now on sale received a personalized
email alerting them to this fact (e.g. "Don�t forget to consider some alternatives to
your last purchase of eggs that we have on sale this month"). Figure (1) and (2)
depict examples of the email formats for both the treatment and control group.
4 The Data
This paper analyzes purchasing decisions made by 355 shoppers over the 13 weeks
of the experiment in 28 product categories (177 shoppers were assigned to control
and 178 to treatment).13 For each of these 355 shoppers, we track their decision
of whether or not to make a purchase in each category over the duration of the
experiment (129,220 observations). In total, 1,046 category purchases were made
over 338 shopping trips by 130 shoppers during the experiment period. 167 by 66
shoppers in the control group and 171 by 64 shoppers in the treatment group.
Table (5) provides summary statistics in the pre-experiment period (December
de�ning the original treatment and control groups. We expected these shoppers to be the mostlikely to make purchases during the period of the experiment.13The 28 item categories are: bananas, kiwis, lemons, raspberries, apples, bulk apples, blueberries,
pineapples, avocados, broccoli, cucumbers, kale, onions, green onions, peppers, lettuces, limes,tomatoes, bread, organic bread, eggs, brown eggs, organic eggs, milk, bulk milk, organic milk,yogurt, and water.
2014 - January 2016) for both the full sample and a subset of 305 shoppers who
had a history of purchasing in at least one of the 28 item categories (152 in control
and 153 in treatment). This subset is important as it turns out that past purchases
within the category are a very strong predictor of current purchases with di¤erential
e¤ects between those allocated to the control and treatment groups. Not surprisingly,
since individuals were randomly allocated to treatment and control, there are no
signi�cant di¤erences in shopping trends between the treatment and control groups.
Generally, shoppers had shopped on the site 5 times prior to the experiment with
trips averaging roughly $70. Importantly, when conditioning on shoppers who made
purchases of either the target or substitute items, the control and treatment groups
continue to look very similar. Generally, the substitute items were purchased much
more frequently than the target items.
Recall that when a shopper browses through items, some discounted target items
are displayed right next to their substitutes (or in the same row), while others may
require scrolling down. In light of this, we say that a target item and its substitute
are �neighbors�if they appear on the same line on the website. Figure (4) illustrates
this by displaying a screenshot from the website. The target item that is shown,
organic bananas, was on sale for $0.24 per unit (regular price $0.49), while the two
corresponding - and adjacent - substitutes are �banana ripe� and �banana mild
green�whose prices remained constant at $0.39 per unit. Six out of the twenty-eight
item categories are neighbors (avocados, bananas, kiwis, lemons, raspberries, and
water).14 These neighboring categories make up roughly a quarter of purchases of
target items and almost a third of substitute item purchases. If comparing prices
among neigboring items is simpler, we would expect shoppers to be more likely
(not) to purchase a discounted target item when its neighboring substitute is more
expensive (cheaper).
5 Findings
This section examines how all shoppers respond to exogenous price changes, and
then measures the impact of information on this response by di¤erentiating between
14The 22 non-neighboring item categories are: apples, bulk apples, blueberries, pineapples, broc-coli, cucumbers, kale, onions, green onions, peppers, lettuces, limes, tomatoes, bread, organic bread,eggs, brown eggs, organic eggs, milk, bulk milk, organic milk, yogurt. See a detailed explanation inTables (2) & (3).

shoppers in the treatment and control groups. Surprisingly, our results suggest that
the treatment group responds by purchasing more of the higher priced (weakly lower
quality) substitute items. In order to understand whether increased information is
the factor driving this outcome, we move on to examine the di¤erential responses of
the treatment and control groups across speci�c item categories and across di¤erent
types of shopping trips.
We �rst focus on categories that appeared at the top of the email sent to the
treatment group.15 If making information more accessible to the treatment group
is what drives the di¤erence in outcomes between treatment and control, we would
expect the di¤erence to be sharpest for the most salient categories. We next estimate
the extent to which providing additional detail in the treatment email regarding sales
on organic items with shopper speci�c suggestions impacted outcomes. If information
is the mechanism driving our results, we would expect a stronger di¤erences in on-
sale purchasing rates between the treatment and control group during weeks when
the treatment group received more detailed sale information. Finally, we focus on
purchases in the rebate item category. While only treatment shoppers were noti�ed
of sales, both treatment and control shoppers were encouraged to buy in the rebate
item category. This provides an opportunity to di¤erentiate between a salience shock
that shoppers in both the treatment and control group received and an information
shock that was received only by treatment shoppers.
Are shopping trips heterogeneously impacted by information? Throughout the
experiment, shoppers in both the treatment and control groups were given the op-
portunity to save a signi�cant amount of money on their shopping trip if they pur-
chased a rebate item. This provides an opportunity to di¤erentiate between shoppers
making purchases on the site in an attentive state (purchased the rebate item) and
inattentive state (missed out on savings from rebate item). We show that this classi-
�cation plays an important role in predicting the impact of information on shopping
decisions.
5.1 The E¤ect of a Sale on Purchasing Decisions
Figure (3) graphs the fraction of shoppers purchasing the target item versus the
substitute in the same category over time. This �gure focuses on the fraction of
15In the �rst 3 weeks of the experiment this line focused on the vegetables category, weeks 4 and5 focused on eggs, weeks 6-9 focused on yogurt, and weeks 10-13 focused on milk.

shoppers buying within a category (which includes target and substitute items) who
choose a target item and how this ratio changes during the sale period. Each item
category is mapped to 1 during the �rst two weeks of it going on sale, and 2 for the
last two weeks of it remaining on sale. The purchase rate at time 0 is the purchase
rate in the two weeks leading up to the sale, and the purchase rate in time 3 refers
to the purchase rate 2 weeks after the sale. Thus, prior to the sale, shoppers selected
the target item roughly 35 percent of the time. During the sale period this number
increases to roughly 50 percent of purchases and then returns to the prior purchase
level after the sale. While this di¤erence is large in size, the estimate is noisy.
Table (6) illustrates that the largest and most signi�cant e¤ect relates to the
choice between a substitute and target item that appear on the same line on the
webpage. Thus, while generally the probability of purchasing a target item instead
of a substitute item increases by 13 percentage points (s.e. 7.9) during the sale
period, for those items that appear on the same line as their substitute, the e¤ect is
a 30 percentage point increase (s.e. 14.2). This suggests that inattention may have
played a role, leading some shoppers to choose dominated items (lower perceived
quality and more expensive).
Table (7) further illustrates the change in purchasing trends created by the tar-
get item sale. This analysis di¤erentiates between 3 di¤erent outcomes for the full
sample of 355 shoppers over the 13 weeks of the experiment in each of the 28 product
categories. The �rst 3 columns of Table (7) examine the extent to which the sale
increased purchases within the item category. In other words, did the sale primarily
cause shoppers to shift their purchase from the substitute to target item, or alterna-
tively, draw shoppers to purchase in an additional category. The second 3 columns
under the title "Buy Target" examine the e¤ect on the on-sale target item. The last
3 columns of the table under the title "Buy Substitute" examine the e¤ect of the
target item sale on the substitute item. The analysis includes individuals in the sam-
ple who did not make a shopping trip during that week. For these shoppers: make
purchase, buy target, and buy substitute are equal to zero for all product categories
in that week.
All speci�cations in Table (7) include week, item and shopper �xed e¤ects. The
average purchase rate within item categories is 0.8 percent (s.d. 9) with a rate of
0.2 percent (s.d. 5) buying target and 0.5 percent (s.d. 7.4) buying the substitute.
We observe a general increase in purchasing rates within product categories during a

target item sale. This increase is driven by shoppers roughly tripling their purchase
rate of the target item during the sale period (increasing their probability of purchase
by 0.6 percentage points (s.e. 0.2)). Table (7) illustrates that the e¤ect of the sale
is concentrated among shoppers purchasing in a category where they have a history
of shopping previously. Despite these signi�cant responses to the sale, Figure (6)
still illustrates that while some shoppers (15 percent) move from purchasing the
substitute to the target item when it goes on sale, many (50 percent) pay the same
price or more to remain with the substitute item.
5.2 The Role of Promotional Materials
Why did a signi�cant proportion of shoppers choose apparently dominated alterna-
tives on their shopping trips (more expensive and of lower quality)? One plausible
explanation may be that shoppers were not fully attentive to all available discounts.16
If we focus on treatment shoppers who received additional information on the sale -
how much do they alter their shopping decisions relative to the control group?
Before discussing the results of this analysis it is important to clarify the random
assignment that occurred between the treatment and control groups. Shoppers in the
sample were randomly allocated to treatment (receiving a weekly promotional email
with sale information and a rebate item) and control (receiving a weekly promotional
email with a rebate item). Thus, examining shopping outcomes based on allocation
to treatment and control group provides "intention to treat" results. We therefore
focus primarily on these outcomes as opposed to limiting the sample to shoppers
who made purchases or read the promotional email which could introduce selection
concerns.17
Shoppers in the treatment group were much more a¤ected by sales than shoppers
in the control (see Table (8)). Speci�cally, in item categories where they had made
purchases in the past, they increased their purchase rate by 1.2 percentage points
(s.e. 0.4) at an average purchase rate of 0.8 percent in the sample. If anything,
shoppers with a history of purchases in the control group decrease their purchase
16An alternative hypothesis may be that many shoppers suspected that an item on sale was oflower quality (close to expiration date). However, in our post-study questionnaire only 3 out of 27respondents said they did not buy an item on sale because they thought it was of lower quality orclose to its expiration date.17While we attempted to collect information on email opens, there are concerns about the accu-
racy of this measure. We discuss this further in Subsection 5.4.

rate during this period by -0.4 percentage points (s.e. 0.4). Some of this e¤ect on
purchasing rates is a result of increased purchases of the target item (an increase of
0.8 percentage points (s.e. 0.3)) that is driven by item categories where the target
and substitute appear on the same line (an increase of 1.1 percentage points (s.e.
6)). This suggests that a consumer who considers a particular option is more likely
to notice �neighboring�options than options that require scrolling down.
The largest sale e¤ect measured in Table (8) relates to the purchase of substitute
items (see column (9)). Shoppers in the treatment group who have a history of pur-
chasing in a category are 1.5 (s.e. 0.5) percentage points more likely than shoppers
in the control group to purchase a substitute item during the period when the alter-
native target item was on sale. The measured di¤erence is three times smaller and
not statistically signi�cant for neigboring items.
Why would receiving information on category sales increase the probability of
purchasing a substitute item? One possible explanation is that the email to the
treatment group impacted two separate shopping decisions. The �rst is what item
categories to purchase, and the second, is whether to purchase the substitute or target
item. In other words, receiving an email that noti�es you that vegetables are on-sale
may increase the probability of purchasing vegetables on the site. This increase could
be driven by your interest in the sale and/or a salience reminder that you would like
to buy vegetables. This salience reminder is unique to the treatment group and could
lead to an increase in purchases of the substitute item. Purchasing the substitute
may be especially likely in categories where this item is visually separated from the
on-sale target item. Shoppers who have a history of buying in a given category are
more likely to be familiar with the substitute items, which were purchased 3-4 times
more frequently than the target items in the pre experiment period.
An alternative explanation to the di¤erential information explanation that we
just described is one of di¤erential incentives. Recall that the size of the rebate
ranged between $2.99 and $10 over the di¤erent weeks of the experiment. We control
for rebate size in all speci�cations, as there were weeks where the treatment group
received a $10 o¤er, while control shoppers received a $2.99 o¤er. In order to make
sure that our results are not driven by a selection issue where certain types respond
to a $2.99 versus $10 rebate o¤er we re-run our analysis from Table (8) including
only weeks when the treatment and control group received the same rebate o¤er.
Table (9) illustrates that the observed di¤erences in behavior between the treatment

and control groups cannot be explained by di¤erential incentives.
5.3 Does Content Matter?
If the saliency of item categories is driving the purchasing patterns observed in Table
(8), then we might expect this phenomenon to be strongest in item categories that
appeared �rst in the treatment email. It is speci�cally in these item categories
where the treatment group received the largest salience shock (assuming they are
impacted more by information they see �rst) and the control group did not receive
any information. We focus our comparison on non-neighboring item categories, as
there are weeks where their broader category (vegetables) was on sale and appeared
in the �rst line of the email but not all sub categories (e.g. tomatoes) were on sale.
This allows us to separately identify the e¤ect of appearing in the �rst sale category in
the treatment email from actually being on sale. We also only include the purchasing
decisions of shoppers in item categories where they have made a purchase in the pre-
experiment period. Table (8) illustrates that these are the decisions that are being
most impacted by the target sales.
Table (10) compares the purchasing decisions of the treatment and control groups
for general item categories versus �rst-item categories. Purchases of the target item
increased on average by 0.5 percentage points (s.e. 0.3) during the sale period for
shoppers in the control group in categories outside of the �rst item categories. This
increase was primarily driven by "switchers" as these shoppers decreased their pur-
chase rate of the substitute item by 0.7 percentage points (s.e. 0.4). While, the
treatment group similarly increased their purchase rate of the target items in these
categories by 0.6 percentage points (s.e. 0.3) they also increased their purchase rate of
the substitute items by 0.3 percentage points (s.e. 0.4). Thus, in these sale categories
that are less salient to the treatment group, we observe fewer people purchasing the
discounted item, but a similar number of substitute item purchases to that observed
among all categories in Table (8).
The e¤ect of the sale on target purchases of the control group was smaller for
the �rst-item categories (and was even below regular purchase rates). During most
weeks these �rst item categories were those with the smallest discounts which may
explain the lower interest in these items. However, the treatment group behaves
signi�cantly di¤erently in regard to these �rst item categories. They increase their

purchasing rate of the on-sale target items by an additional 1.8 percentage points
(s.e. 0.8) relative to the control group at an average purchase rate of 0.8 percent
(s.d. 9.1). The treatment group also increases their purchase rate of the substitute
items by 1.6 percentage points (s.e. 1.1) relative to the control group at an average
purchase rate of 2.1 percent (s.d. 14.5). Thus, the di¤erences between the treatment
and control group are largest for these more salient �rst item categories.
In Table (11) we consider the impact of more detailed emails on the treatment
group. During this period, the treatment email always included a line alerting shop-
pers to the fact that many organic items are on sale and in some cases even cheaper
than the non-organic alternative. Additionally, if the shopper in the treatment group
had purchased a substitute item in his/her previous trip, these personalized emails
included the line "you may want to consider some alternatives to your last purchase
in category � that are now on sale."
During the non-detail weeks, the signi�cant observed change in shopping behavior
is that shoppers in the treatment group increase their purchase rate of non-organic
items (substitutes) by 1.5 percentage points (s.e. 0.6) in categories that include an
on-sale organic item (target). This e¤ect is unique to non-neighboring categories,
as treatment shoppers if anything decrease their purchase rate of substitutes by 0.9
percentage points (s.e. 1.7) in neighboring categories. During this same period, the
control group increase their purchase of the substitute item by 0.2 percentage points
(s.e. 0.7). This e¤ect is much smaller in size and more noisily measured.
During the detail email weeks, shoppers in the treatment group increase their
purchase rate of on-sale organic target items by 0.9 percentage points (s.e. 0.5)
and are much less likely to purchase the substitute items in these categories than
they were during the non-detail weeks (a measured increase of 0.2 percentage points
(s.e. 0.5)). However, since we observe a similar increase of 0.7 percentage points
(s.e. 0.4) in purchase of the target item among control shoppers during these detail
weeks, we cannot attribute this e¤ect to an information e¤ect.18 Thus, the e¤ect of
more detailed information was primarily a reduction in purchasing "mistakes" of the
substitute item for treatment shoppers.
In order to further examine the source of the increased purchasing rate of substi-
tute items during a sale period, we di¤erentiate between the general e¤ect of a sale
18This di¤erence between detail and non detail weeks could be driven by di¤erences in the targetitems that were on sale or in the size of the discount that was o¤ered.

and the e¤ect of a sale in the rebate item category in Table (12). This comparison
is important because shoppers in both the treatment and control group received a
salience reminder to purchase in the rebate item category, whereas only the treat-
ment group received a summary of the other item categories where sales were taking
place. Table (12) illustrates that shoppers in the treatment group are much more
likely to purchase a target item in the rebate category than the control group when
the target and substitute items are "neighbors" (an increase of 2.8 percentage points
(s.e. 1.4) relative to an average purchase rate of 1.6 percent (s.d. 12.7). This e¤ect
does not appear for other items.
For categories outside of the rebate item, the treatment group increased their
purchase rate of substitute items relative to the control group during the target item
sale (an increase of 1 percentage point (s.e. 0.4)). Note, that while the increase
in treatment purchases of the target item was driven by neighboring categories, the
increase of substitute purchases is driven by non-neighboring categories. This e¤ect
remains in the rebate item categories, but is much more noisily measured (a 1.3
percentage point increase (s.e. 1).
Our results so far suggest that the way information was presented in the treatment
email impacted shopper choices. The di¤erence in purchase rates of the on-sale target
items between treatment shoppers and control shoppers was largest in categories that
appeared �rst in the email and in situations where both groups received a saliency
shock to the category (rebate item categories). However, the observed increase in
substitute item purchases for the control group is fairly similar across these di¤erent
salience categories. While we do observe a decrease in this "mistake" during detailed
email weeks, this detail did not signi�cantly increase the likelihood of treatment
shoppers purchasing the on-sale target item. In other words, it seems information
helped shoppers to avoid these "mistakes" by simply not purchasing in the category,
as opposed to purchasing the on-sale item. In the next subsection we explore whether
a proxy for "shopping inattention" can explain the observed increase in purchasing
rates of the substitute items among treatment shoppers during a target sale period.

5.4 Heterogenous E¤ects of Promotional Materials on Pur-
chasing Decisions
Is it possible that the information provided in the email was more helpful to some
consumers than others? If we could categorize shoppers in both the treatment and
control group as being in an attentive or inattentive state, would they be di¤erentially
e¤ected by the information provided in the email? During the experiment period, all
shoppers were awarded either free shipping (with a value of $2.99) or an immediate
rebate of $10 if they purchased the weekly rebate item and spent $20 or more. The
price of the rebate item, during most weeks, was lower than $2.99, and more than 95%
of purchases in this period were above $20. Hence, conditional on paying attention
to the promotional email, adding the rebate item to the basket (in most weeks) is
the rational response to these o¤ers (see Table(4)). However, if a shopper did not
pay close attention to the email, then he might miss or misunderstand the rebate
o¤er and not take advantage of it. 19 We can use this information to characterize the
state of a shopper as attentive if they purchased the rebate item during their trip
and inattentive otherwise.
Table (13) focuses on shopping trips conducted during weeks when the rebate
was higher than the price of the rebate item. The reason for this is that we are only
able to classify a shopper as attentive or inattentive if they made a purchase during
a week when adding the rebate item was the rational response to paying attention
to the email. This di¤ers from our previous analysis, where we included all shoppers
in all weeks of the experiment. It is important to clarify that shoppers in both the
treatment and control group were o¤ered the rebate on their shopping trip as long
as they purchased in the rebate item category (which included both a target and
substitute item). The average purchase rate of the target (substitute) items during
these conducted shopping trips is 10.1 percent (s.d. 30.1) (25 percent (s.d. 43.3)).
Shoppers in the control group in an attentive state (who purchased the rebate
item) increased their purchase rate of on-sale target items by 5.2 percentage points
19One may be concerned that some shoppers did not respond to the rebate o¤er because theysuspected a hidden "catch". However, in our post study questionnaire only two out of 44 responderssaid they did not take advantage of the rebate o¤er because they thought it was not a good deal.Roughly 39% of the responders stated that they did not have time to consider the rebate o¤er,while 50% said they did not need the eligible item. Note, however, that in many cases shopperscould save on average $6 by simply adding a single piece of a vegetable or fruit. See Section 6 forfurther discussion of this.

(s.e. 4.8). This e¤ect was much larger and more precisely measured for those in the
treatment group who increased their purchase rate of these items by 9.9 percentage
points (s.e. 2.9). For these treatment shoppers in an attentive state, the sale had
almost no e¤ect on the purchase rate of substitute items in the categories with on-
sale target items (a change of -0.4 percentage points s.e. (4.8)). However, shoppers
who fail to purchase the rebate item behave very di¤erently.
Shoppers in the control group in an inattentive state (who did not purchase the
rebate item) increased their purchase rate of on-sale target items by 1.5 percentage
points (s.e. 3.1). This e¤ect is larger but still very noisy for those in the treatment
group (5.7 percentage points (s.e. 4.3)). It is shoppers in the treatment group in
an inattentive state who show a large increase in the purchase of substitute items
relative to the control group during a target sale in that category. Speci�cally these
shoppers in the treatment group in an inattentive state are 10 percentage points
(s.e. 5.9) more likely to add a substitute item to their shopping cart than the control
group.
In our discussion so far, we have labeled these shoppers as being in an attentive
or inattentive state, but is it possible that they are compliers versus non-compliers?
Where compliers read their email and are aware of the target sale if they are in
the treatment group and non-compliers are not. In order to address this concern
we collected information on whether or not the weekly email was opened for all
individuals in the sample. Generally, the email was opened 38 percent of the time
for shoppers in both the treatment and control groups. While this can provide an
indicator of compliance it is not exact due to concerns regarding the accuracy of this
measure.20 Selection is an additional concern with using this compliance information.
Generally, we may be concerned that only more careful shoppers in the treatment
group will be compliers which would bias our results. In this way our experiment
is unique in that we are also able to focus on compliers in both the treatment and
control groups. When we constrain the sample in Table (13) to shoppers who opened
their weekly email, we are left with 752 observations on shoppers in an attentive
20There are a few issues that lower the accuracy of this measure. First, if emails are forwardedto a di¤erent account it will be marked in our data as unopened. Additionally, even if a treatmentshopper does not open emails every week, after the email was opened once this shopper will bebetter informed about sales than a control shopper (due to the added information on sales beingmarked with asteriks). There is also the opposite concern as some spam detectors will result inemails being marked as opened in our database regardless of consumer behavior. We are thereforecareful in applying this information to our analysis.

state and 503 by shoppers in an inattentive state. This increases the variance of our
estimates substantially as only 461 of the 672 item purchases analyzed in Table (13)
were conducted by shoppers who were tagged as opening their email.
Table (14) summarizes the results for shoppers in both the treatment and control
groups for weeks where we observed them opening their emails. Generally, shoppers
who opened their email were more likely to purchase the target item in both the
treatment and control groups (compared to estimates from Table (13)). This result
is not surprising as more careful shoppers may be more likely to read emails. Thus,
highlighting the importance of being able to identify these "complier" types in both
the treatment and control groups. It is important to clarify that the analysis in Tables
(13) and (14) only includes shoppers during weeks when they made a purchase on
the site. Therefore, this result cannot be explained by shoppers reading the email
because they plan to go shopping and subsequently being more likely to make a
purchase.
Excluding shoppers who did not open their email from the analysis in Table
(13) shrinks the reported di¤erence in purchase rates of the target item between
treatment and control shoppers in attentive and inattentive states. Shoppers in
the control group in an inattentive state, increased their purchase rate of the on-
sale target items by 5.3 percentage points (s.e. 5.9). This e¤ect is larger and more
precisely measured for those in the treatment group (9.7 percentage points (s.e. 5.3)).
Shoppers in the control group in an attentive state, increased their purchase of the
target item by 7.4 percentage points (s.e. 5.8). The e¤ect on the treatment group
shoppers is larger, an increase of 11.1 (s.e. 3.2) on their purchase rate of target items.
Table (14) shows similar estimated di¤erences in comparing the purchase rates of
substitute items between treatment and control shoppers in attentive and inattentive
states to those shown in Table (13). While these estimates are much more noisily
measured, they continue to suggest that treatment shoppers in an attentive state
behave di¤erently than they do in an inattentive state. Treatment shoppers in an
attentive state decrease their purchase rate of the substitute items relative to the
control group, the opposite seems to be occur in an inattentive state.
6 Discussion
Our interpretation of the data relies on the following key assumptions:

1. Shoppers are willing to purchase an item they do not need if this leads to
signi�cant savings.
2. Shoppers prefer organic items if they are not more expensive than their non-
organic counterparts.
3. Shoppers would switch brands if a competing brand is reduced to or below the
price of the regular brand they usually purchase.
In order to ensure the validity of these assumptions, we conducted two follow up
surveys. The �rst was sent only to the participants of our study and had a response
rate of only 24 percent (55 shoppers). 91 percent of the responders answered that
they would choose an organic item if it was weakly cheaper than it�s non-organic
alternative. 80 percent of the responders reported that they would switch brands for
a discount of 20 percent.
Because of the low response rate of our �rst follow up survey, we conducted an
additional survey using the Qualtrics platform on 378 US participants with ages
ranging between 18 and 30 and with at least some college education. 76 (84) percent
of participants answered that they would purchase a 50 cent item they did not need
in order to receive a $3 ($10) discount on their supermarket purchase. Their response
shrunk to 62 (83) percent when the question focused on a $2.50 item that they did
not need in order to receive a $3 ($10) discount. Over 70 percent of respondents
reported that they would choose organic if it was the same price as the non-organic
alternative for prices ranging between $1.00-$3.50. This percent climbs to close to 90
percent when organic is cheaper than the non-organic alternative. Lastly, 68 percent
of respondents replied that they would switch brands if the alternative brand was
discounted to the same price as the item they usually buy. This percent climbs to 80
percent when the discounted alternative becomes cheaper than the item they usually
buy.
These survey results provide some support to our underlying assumptions, and
hence, lend support to our interpretation of the data as re�ecting shopping behavior
under limited attention. The reason is that the behavior of our participants stand
in stark contrast to the vast majority of the survey responses.

7 Concluding remarks
Comparing prices across a large variety of products is a non-trivial task, especially
when prices are constantly changing. Much of the economic analysis is based on the
premise that individuals are attuned to all price �uctuations and perfectly process
signals about these price changes. In contrast, the results of our �eld experiment
show that individuals can miss opportunities to save and tend to focus on price
comparisons that are more salient. Moreover, a signi�cant proportion of individuals
forego opportunities to save that are brought to their attention. Indeed, a surprising
conclusion that arises from our �ndings is that it is not straightforward to draw
individuals� attention to price changes that can help them save, even when they
are provided with personalized messages. Our analysis suggests that advertising
sales can end up increasing purchase rates of all items in the category where a sale is
taking place. Speci�cally, information on within category sales can increase purchase
rates of both the on-sale item and other alternatives in that category. If indeed,
promotional materials increase "mistakes" among consumers, �rms could pro�t by
increasing prices of "substitutes" while advertising "target" discounts.
Our data hints at the existence of a typology of shopping trips where one type
is more focused on processing information on savings opportunities. Speci�cally,
shoppers in a "high ability/attention" state could bene�t while shoppers in a "low
ability/attention" state may not. Interestingly, Heiss et al. (2016) �nd a similar
result in a much more complex environment. Their study examines the mechanisms
driving inertia in consumer�s choice of health insurance plans over time. They also
�nd that while certain consumers pro�t when forced to pay attention to di¤erences
between plans, others are worse o¤. Our �nding, that this di¤erence exists even when
information is clearly summarized in a single email and risk aversion should play a
much smaller role, suggests a promising direction for future research. To improve
consumer welfare it is imperative to understand both the characteristics of both more
and less "attentive" states, as well as the strategies that can improve information
processing across all consumers.
References
[1] Baranski, Marcin et al.(2014): �Higher Antioxidant and Lower Cadmium Con-
centrations and Lower Incidence of Pesticide Residues in Organically Grown
Crops: A Systematic Literature Review and Meta-analyses.�British Journal of
Nutrition 112, 794�811.
[2] Bartos, Vojt¼ech, Michal Bauer, Julie Chytilová and Filip Majt¼eka (2016): �At-
tention Discrimination: Theory and Field Experiments with Monitoring Infor-
mation Acquisition,�American Economic Review 106(6), 1437-75.
[3] Blake, Tom, Sarah Moshary, Kane Sweeney and Steve Tadelis (2017): �Price
Salience and Product Choice,�Working Paper.
[4] Byron, Ellen (2008): �At the Supermarket Checkout, Frugality Trumps Brand
Loyalty,�Wall Street Journal, Nov. 6.
[5] Bordalo, Pedro, Nicola Gennaioli, and Andrei Shleifer (2016): �Competition for
Attention,�Review of Economic Studies 83(2), 481-513.
[6] Caplin, Andrew and Mark Dean (2013): �The Behavioral Implications of Ratio-
nal Inattention with Shannon Entropy,�Working Paper, New York University.
[7] Chidmi, Benaissa and Rigoberto A. Lopez (2007): �Brand-Supermarket Demand
for Breakfast Cereals and Retail Competition,�American Journal of Agricul-
tural Economics 89(2), 324-337.
[8] Chetty, Raj, Adam Looney and Kory Kroft (2009): �Salience and Taxation:
Theory and Evidence,�The American Economic Review 99(4), 1145-1177.
[9] Clerides, Sofronis. and Pascal Courty (2015): �Sales, Quantity Surcharge, and
Consumer Inattention.�Review of Economics and Statistics, forthcoming.
[10] Costa, Dora L. and Matthew E. Kahn (2013): �Energy Conservation �Nudges�
and Environmentalist Ideology: Evidence from a Randomized Residential Elec-
tricity Field Experiment,� Journal of European Economic Association 11(3),
680-702.
[11] De Clippel, Geo¤roy, K�r Eliaz and Kareen Rozen (2014): �Competing for
Consumer Inattention,�Journal of Political Economy 122(6), 1203-1234.

[12] De los Santos, Babur, Ali Hortaçsu and Matthijs R. Wildenbeest (2012). �Test-
ing Models of Consumer Search Using Data on Web Browsing and Purchasing
Behavior,�American Economic Review Vol. 102, Number 6, pp. 2955-2980.
[13] Gabaix, Xavier, David Laibson, Guillermo Moloche and Stephen Weinberg
(2006): �Costly Information Acquisition: Experimental Analysis of a Bound-
edly Rational Mode,�The American Economic Review 96(4), 1043-1068.
[14] Heiss, Florian, Daniel McFadden,Joachim Winter, Amelie Wuppermann, and
Bo Zhou (2016): "Inattention and Switching Costs as Sources of Intertia in
Medicare Part D," NBER Working Paper 22765.
[15] Helmers, Christian, Pramila Krishnan and Manasa Patnam (2015). �Attention
and Saliency on the Internet: Evidence from an Online Recommendation Sys-
tem,�CEPR Discussion Paper No. 10939.
[16] Hossain, Tanjim and John Morgan (2006): �... Plus Shipping and Handling:
Revenue (Non) Equivalence in Field Experiments on eBay,� B.E. Journal of
Economic Analysis and Policy: Advances in Economic Analysis and Policy 6(2),
1-27.
[17] Iyengar, Sheena (2010): The Art of Choosing. Twelve, Hachette Book Group.
[18] Karlan, Dean, Margaret McConnell, Sendhil Mullainathan and Jonathan Zin-
man (2016): �Getting to the Top of Mind: How Reminders Increase Saving,�
Management Science 62(12), 3393�3411.
[19] K½oszegi, Botond and Matthew Rabin (2006): "A Model of Reference-Dependent
Preferences," Quarterly Journal of Economics, 121, 1133-1165.
[20] Magnusson, Maria, Anne Arvola, Ulla-Kaisa Koivisto Hursti, Lars Åberg and
Per-Olow Sjödén (2001): �Attitudes towards organic foods among Swedish con-
sumers,�British Food Journal 103(3), 209-227.
[21] Manzini, Paola and Marco Mariotti (2014): �Stochastic Choice and Considera-
tion Sets,�Econometrica 82 (3): 1153-1176.
[22] Nielsen Global Report of Loyalty Sentiment (2013).

[23] Perkovic, Sonja and Jacob Lund Orquin (2017): �Implicit Statistical Learning
in Real World Environments Behind Ecologically Rational Decision Making,�
forthcoming in Psychological Science.
[24] Rayner, Keith (1998): �Eye Movements in Reading and Information Processing:
20 Years of Research,�Psychological Bulletin 124(3), 372-422.
[25] Roddy, Gerardine, Cathal A. Cowan and W George Hutchinson (1996): �Con-
sumer Attitudes and Behavior to Organic Foods in Ireland,�Journal of Inter-
national Consumer Marketing 9(2), 41-63.
[26] Sallee, James M. and Joel Slemrod (2012): �Car notches: Strategic automaker
responses to fuel economy policy,�Journal of Public Economics 96, 981-999.
[27] Sims, Christopher (2003): �Implications of Rational Inattention,� Journal of
Monetary Economics 50(3), 665�690.
[28] Sims, Christopher (2010): �Rational Inattention and Monetary Economics,�
Chapter 4 of Handbook of Monetary Economics, edited by Ben Friedman and
Michael Woodford for Elsevier, 155-181.

Table 1: Purchasing Frequency of Target and Substitute Items Prior to Experiment
Product Name Quantity Purchased
Bananas 357Bananas (Organic) 72Onions 191Onions (Organic) 42Kroger: Bread 139Aunt Millie's Bread 56Kroger: Eggs 12ct 134EggLands Best: Cage Free Large Brown Eggs 12ct 14Kroger: Grade A Large Brown Eggs 12ct 19Simple Truth: Natural Cage Free Large Brown Eggs 12ct 78Kroger: Milk (1gal) 114Kroger: Milk (0.5gal) 96Horizon: Organic Milk (0.5gal) 22Simple Truth Organic: Milk (0.5gal) 43Apple (Lg) 103Apple (Organic) 69Apple Bag 3 lb bag 65Bell Pepper 99Bell Pepper (Organic) 15Blueberries 94Blueberry (Organic) 11Avocado 76Jumbo Avocado 28Cucumber 75Cucumber (Organic) 15Ice Mountain: Water 24pk 74Kroger: Purified Drinking Water 24pk 11Dasani: Water 24pk 20Aquafina 24pk 11Chobani: Greek Yogurt 71Fage: Greek Yogurt 55Raspberries 62Raspberries (Organic) 10Roma Tomato 41Roma Tomato (Organic) 4Romaine Lettuce 33Romaine Lettuce (Organic) 3Broccoli, Kiwi, Lime, Kale, Pineapple, and Lemon were excluded from this table for lack ofspace.

Table 2: Target and Substitute Produce Items
Weeks Target Item Price SalePrice
Substitute Item Price
15 Organic Banana 0.49 0.39 Regular Banana 0.3915 Organic Blueberries 5.49 4.99 Regular Blueberries 4.9915 Organic Kiwi 0.99 0.79 Regular Kiwi 0.7915 Organic Apple (Fuji) 1.49 1.25 Regular Apple (Fuji) 1.2515 Organic Apple (Gala) 1.49 1.25 Regular Apple (Gala) 1.2515 Organic Apple (Granny Smith) 1.49 1.25 Regular Apple (Granny Smith) 1.2515 Organic Lime 1.29 0.89 Regular Lime 0.8915 Organic Broccoli 3.49 3.25 Regular Broccoli 3.2515 Organic Romaine Lettuce 3.29 2.59 Regular Romaine lettuce 2.5915 Organic Cucumber 1.89 0.99 Regular Cucumber 0.9915 Jumbo Ripe Avocado 2.25 1.49 Jumbo Unripe Avocado 2.2569 Organic Tomato 0.79 0.59 Regular Tomato 0.5969 Organic Red Bell Pepper 2.79 2.59 Regular Red Bell Pepper 2.5969 Organic Onion 2.59 1.99 Regular Sweet Onion 1.9969 Organic Kale 2.19 1.99 Regular Kale 1.9969 Organic Green Onion 0.99 0.95 Regular Green Onion 0.9569 Apples 3 lb bag (~4 ct.) 5.39 4.49 Regular Apple 1.2569 Organic Lemon 1.49 1.29 Regular Lemon 1.2969 Organic Pineapple 6.49 5.49 Regular Pineapple 5.491013 Organic Banana 0.49 0.24 Regular Banana 0.391013 Organic Blueberries 5.49 4.00 Regular Blueberries 4.991013 Organic Apple 1.49 1.00 Regular Apple 1.251013 Organic Apple (Fuji) 1.49 1.00 Regular Apple 1.251013 Organic Raspberries 5.49 3.89 Regular Raspberries 3.991013 Organic lemon 1.49 0.99 Regular Lemon 1.291013 Organic Broccoli 3.49 2.00 Regular Broccoli 3.251013 Organic Cucumber 1.89 0.75 Regular Cucumber 0.991013 Roma Tomato Organic 0.79 0.20 Regular Tomato 0.591013 Red Bell Pepper Organic 2.79 1.99 Regular Red Bell Pepper 2.591013 Sweet Onion Organic 2.59 1.00 Regular Sweet Onion 1.991013 Organic Green Onion 0.99 0.50 Regular Green Onion 0.95

Table 3: Target and Substitute Dairy, Egg, and Durable Items
Dairy
Weeks Target Item Price Sale Price Substitute Item Price15 Kroger: Milk (0.5gal) 2.99 1.75 Kroger: Milk (1gal) 3.9915 Horizon Organic: 0% fat
free Milk (0.5gal))5.45 4.49 Simple Truth Organic: Fat
Free Milk4.49
15 Fage: 0% and 2% fatYogurt (plain and cherry)
1.89 1.50 Chobani: Yogurt,Fage: Yogurt (Other)
1.89
69 Fage: 0% and 2% fatYogurt (plain and cherry)
1.89 1.50 Chobani: Yogurt,Fage: Yogurt (Other)
1.89
1013 Simple Truth Organic:Milk (0.5gal)
4.49 2.99 Horizon Organic: Milk 5.45
Eggs
Weeks Target Item Price Sale Price Substitute Item Price15 Kroger: Grade A large
Brown Eggs12ct3.69 2.89 Kroger Grade A Large
Eggs12ct2.99
15 EggLand's Best: CageFree Large Brown Eggs12ct
5.49 4.35 Simple Truth: NaturalCage Free Grain FedLarge Brown Eggs12ct
4.45
1013 Kroger: Grade A LargeBrown Eggs12ct
3.69 1.89 Kroger Grade A LargeEggs12ct
2.99
1013 Simple Truth: NaturalCage Free Grain FedLarge Brown Eggs12ct
4.45 2.50 Kroger Grade A LargeEggs12ct
2.99
Durables
Weeks Target Item Price Sale Price Substitute Item Price69 Kroger: Multigrain Bread 2.59 1.99 Kroger: 100% Whole
Wheat Bread2.59
69 Kroger: Wheat Bread 2.45 1.99 Kroger: Buttermilk Bread 2.1969 Dasani: Water 6.99 5.49 Ice mountain: Water
Aquafina: WaterKroger: WaterNiagara: Water
5.996.995.495.99
1213 Aunt Millie's Bread:100% Whole Wheat
3.65 2.19 Aunt Millies: 12 WholeGrain, Honey & CrunchOat, Honey Wheat, MultiGrainKroger 100% WholeWheat
3.65
2.59
1213 Aunt Millie's Bread:Butter Top White
3.65 2.19 Kroger: Buttermilk Bread,Wheat Bread
2.45
1213 Aunt Millie's Bread:Whole Grain White
3.65 2.19 Aunt Millies: ItalianKroger: White, Italian
3.652.19
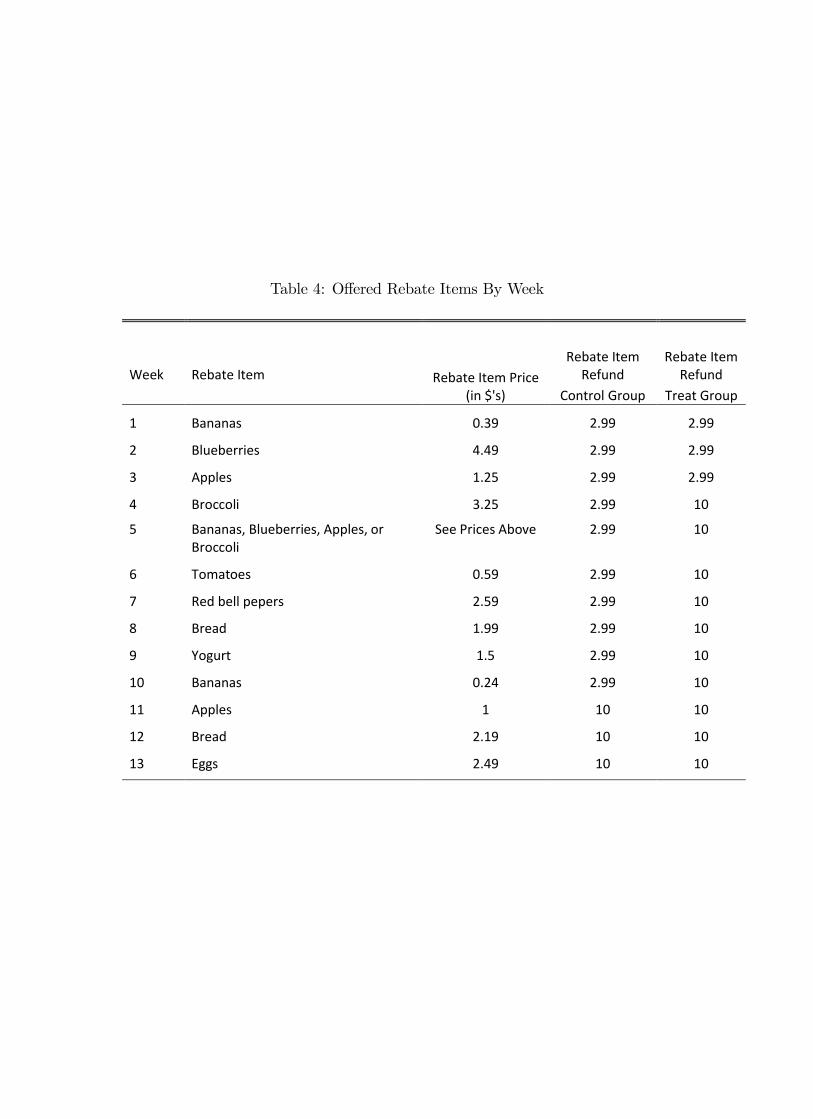
Table 4: O¤ered Rebate Items By Week
Week Rebate Item Rebate Item Price(in $'s)
Rebate ItemRefund
Rebate ItemRefund
Control Group Treat Group
1 Bananas 0.39 2.99 2.99
2 Blueberries 4.49 2.99 2.99
3 Apples 1.25 2.99 2.99
4 Broccoli 3.25 2.99 10
5 Bananas, Blueberries, Apples, orBroccoli
See Prices Above 2.99 10
6 Tomatoes 0.59 2.99 10
7 Red bell pepers 2.59 2.99 10
8 Bread 1.99 2.99 10
9 Yogurt 1.5 2.99 10
10 Bananas 0.24 2.99 10
11 Apples 1 10 10
12 Bread 2.19 10 10
13 Eggs 2.49 10 10

Table 5: Sample Characteristics in Pre Experiment Period
Controla Treata Diffb Controla Treata Diffb
Number of Shopping Trips 4.373 4.264 0.097 4.829 4.732 0.097(5.814) (5.678) (0.693) (6.122) (5.988) (0.693)
Number of Items Purchased 12.544 13.039 0.856 13.529 14.385 0.856(7.157) (8.553) (0.883) (7.017) (8.337) (0.883)
Number of Target Items Purchased: 2.198 2.758 0.65 2.559 3.209 0.65(28 Categories) (4.856) (6.372) (0.689) (5.153) (6.769) (0.689)
Neigboring Categories: 0.599 0.702 0.103 0.697 0.817 0.120 (6 Categories) (1.683) (2.397) (0.220) (1.798) (2.569) (0.254)
NonNeighboring Categories: 1.599 2.056 0.457 1.862 2.392 0.530 (22 Categories) (3.900) (4.989) (0.475) (4.151) (5.308) (0.546)
Number of Substitute Items Purchased: 8.565 8.360 0.205 9.974 9.725 0.248(28 Categories) (11.585) (12.901) (1.302) (11.929) (13.433) (1.455)
Neigboring Categories: 2.904 2.427 0.477 3.382 2.824 0.558 (6 Categories) (6.555) (5.125) (0.624) (6.961) (5.428) (0.714)
NonNeighboring Categories: 5.661 5.933 0.272 6.592 6.902 0.310 (22 Categories) (7.341) (8.624) (0.850) (7.525) (8.937) (0.946)
Number of Categories Purchased 4.260 4.500 0.240 4.961 5.235 0.275(3.587) (3.690) (0.386) (3.390) (3.462) (0.392)
Total $ Amount Spent on Purchase 66.186 65.198 0.988 70.957 70.166 0.791(38.556) (40.119) (4.177) (38.403) (39.833) (4.481)
Number of Shoppers 177 178 152 153aStandard deviations are presented in parenthesisbStandard errors are presented in parenthesis
Full Sample Target or Substitute History
Our analysis focuses on 28 item categories. Six of these items are charectorized as NeighborCategories item categories where the substitute and target items appear on the same line of thewebpage (avocados, bananas, kiwis, lemons, raspberries, and water). The remaining 22 nonneighboring categories are the following: apples, bulk apples, blueberries, pineapples, broccoli,cucumbers, kale, onions, green onions, peppers, lettuces, limes, tomatoes, bread, organic bread,eggs, brown eggs, organic eggs, milk, bulk milk, organic milk, yogurt.

Table 6: The Probability of Purchasing a Target (vs. Substitute) ItemAll Items Neighbors Non Neigbors
(1) (2) (3)
Pre Sale 0.033 0.003 0.042(Weeks 5 & 6) (0.048) (0.087) (0.064)
Pre Sale 0.045 0.071 0.068(Weeks 3 & 4) (0.048) (0.063) (0.065)
Sale Event 0.129 0.307** 0.075(Weeks 1 & 2) (0.079) (0.142) (0.100)
Sale Event 0.136 0.322** 0.091(Weeks 3 & 4) (0.115) (0.139) (0.139)
Post Sale 0.133 0.058 0.172(Weeks 1 & 2) (0.117) (0.150) (0.155)
Post Sale 0.008 0.234 0.015(Weeks 3 & 4) (0.145) (0.247) (0.136)
Item Fixed Effects Yes Yes YesShopper Fixed Effects Yes Yes Yes
Number of Items 914 266 648
Standard errors are presented in parenthesis and clustered at the shopper level.An observation is defined as a purchase of either a target or substitute item.Neighbors refers to item categories where the substitute and target items appear on thesame line of the website.The 2 weeks prior to the sales event are excluded from the analysis, so that these estimatesshow the change in the purchasing rate of the target item relative to these excluded weeks.*Significant at 10%; **significant at 5%; ***significant at 1%

Table7:Shopper�sResponsetoaSaleontheTargetItem
Targ
et S
ale
0.00
1**
0.00
3***
0.00
10.
001*
**0.
002*
**0.
001*
*0.
0000
30.
001
0.0
002
(0.0
004)
(0.0
01)
(0.0
005)
(0.0
005)
(0.0
01)
(0.0
003)
(0.0
003)
(0.0
01)
(0.0
004)
Targ
et S
ale
X Hi
stor
y0.
003
0.00
40.
002
0.00
5**
0.00
60.
004*
*0
.001
0.0
000
.001
(0.0
03)
(0.0
06)
(0.0
03)
(0.0
02)
(0.0
06)
(0.0
02)
(0.0
02)
(0.0
06)
(0.0
03)
Hist
ory
of P
urch
ase
0.02
8***
0.03
7***
0.02
4***
0.00
6***
0.00
7**
0.00
5***
0.02
2***
0.02
9***
0.01
8***
in C
ateg
ory
(0/1
)(0
.004
)(0
.006
)(0
.003
)(0
.001
)(0
.003
)(0
.001
)(0
.003
)(0
.006
)(0
.003
)
High
Reb
ate
Wee
k0.
005*
**0.
007*
*0.
004*
**0.
001
0.00
10.
001
0.00
4***
0.00
6***
0.00
3**
(0/1
)(0
.002
)(0
.003
)(0
.002
)(0
.001
)(0
.001
)(0
.001
)(0
.001
)(0
.002
)(0
.001
)
Item
Cat
egor
y FE
'sX
XX
XX
XX
XX
Shop
per &
Wee
k FE
'sX
XX
XX
XX
XX
N It
emsx
Wee
ks12
9,22
027
,690
101,
530
129,
220
27,6
9010
1,53
012
9,22
027
,690
101,
530
Mea
n of
Dep
ende
nt0.
008
0.01
30.
007
0.00
20.
004
0.00
20.
005
0.00
90.
005
Varia
ble:
[0.0
90]
[0.1
15]
[0.0
81]
[0.0
50]
[0.0
64]
[0.0
45]
[0.0
74]
[0.0
94]
[0.0
67]
Stan
dard
err
ors a
re p
rese
nted
in p
aren
thes
is a
nd cl
uste
red
at th
e sh
oppe
r lev
el. S
tand
ard
devi
atio
ns a
ppea
r in
brac
kets
.
Sam
e lin
e ca
teto
ries r
efer
to n
eigb
ors w
here
the
subs
titut
e an
d ta
rget
item
s app
ear o
n th
e sa
me
line
of th
e w
ebsi
te.
Hist
ory
of P
urch
ase
is e
qual
to 1
if th
e sh
oppe
r pur
chas
ed e
ither
a su
bstit
ute
or ta
rget
item
in th
is ca
tego
ry in
the
pre
expe
rimen
t per
iod.
A h
igh
reba
te w
eek
refe
rs to
wee
ks w
hen
the
reba
te w
as $
10 fo
r pur
chas
ing
the
reba
te it
em.
High
reba
te w
eek=
0 w
hen
the
reba
te w
as $
2.99
.*S
igni
fican
t at 1
0%;
**si
gnifi
cant
at 5
%;
***s
igni
fican
t at 1
%
An o
bser
vatio
n is
def
ined
by
a sh
oppe
r, w
eek,
and
item
cate
gory
.
Sam
eLi
neDi
ff Li
ne
Purc
hase
Item
in C
ateg
ory
Buy
Targ
etBu
y Su
bstit
ute
All
Sam
eLi
neDi
ff Li
neAl
lSa
me
Line
Diff
Line
All

Table8:DoTreatmentShoppersRespondDi¤erentlytoaSaleontheTargetItem?
Trea
t X T
arge
t Sal
e0
.001
0.0
002
0.0
010
.000
10
.000
20
.000
10
.001
0.0
001
0.0
01(0
.001
)(0
.002
)(0
.001
)(0
.001
)(0
.001
)(0
.001
)(0
.001
)(0
.002
)(0
.001
)
Trea
t X T
arge
t Sal
e X
Hist
0.01
7***
0.01
10.
018*
**0.
005
0.00
70.
004
0.01
2***
0.00
50.
015*
**(0
.006
)(0
.012
)(0
.006
)(0
.004
)(0
.011
)(0
.003
)(0
.005
)(0
.011
)(0
.005
)
Targ
et S
ale
(TS)
0.00
1**
0.00
3**
0.00
10.
001*
*0.
002*
*0.
001
0.00
030.
001
0.00
01(0
.001
)(0
.001
)(0
.001
)(0
.000
5)(0
.001
)(0
.000
4)(0
.000
4)(0
.001
)(0
.000
4)
Targ
et S
ale
X Hi
stor
y0
.006
0.0
010
.008
*0.
002
0.00
20.
002
0.0
07**
0.0
030
.009
**(0
.004
)(0
.008
)(0
.005
)(0
.003
)(0
.009
)(0
.002
)(0
.003
)(0
.009
)(0
.004
)
High
Reb
ate
Wee
k (0
/1)
0.00
5***
0.00
7**
0.00
5***
0.00
10.
001
0.00
10.
004*
**0.
006*
**0.
003*
**(0
.002
)(0
.003
)(0
.002
)(0
.001
)(0
.001
)(0
.001
)(0
.001
)(0
.002
)(0
.001
)
Cate
gory
, Sho
pper
& W
eek
FE's
XX
XX
XX
XX
X
N It
emsx
Wee
ks12
9,22
027
,690
101,
530
129,
220
27,6
9010
1,53
012
9,22
027
,690
101,
530
Mea
n of
Dep
ende
nt0.
008
0.01
30.
007
0.00
20.
004
0.00
20.
005
0.00
90.
005
Varia
ble:
[0.0
90]
[0.1
15]
[0.0
81]
[0.0
50]
[0.0
64]
[0.0
45]
[0.0
74]
[0.0
94]
[0.0
67]
Chan
ge in
Pur
chas
e Ra
te o
f Tre
atm
ent G
roup
Dur
ing
Sale
Per
iod
(With
His
tory
in C
ateg
ory)
:TS
+ H
isto
ry x
TS
+0.
012*
**0.
012
0.01
1***
0.00
8***
0.01
1*0.
007*
*0.
005
0.00
30.
005
Tre
at X
TS
+ Tr
eat X
TS
X H
(0.0
04)
(0.0
10)
(0.0
04)
(0.0
03)
(0.0
06)
(0.0
03)
(0.0
03)
(0.0
07)
(0.0
03)
Chan
ge in
Pur
chas
e Ra
te o
f Con
trol
Gro
up D
urin
g Sa
le P
erio
d (W
ith H
isto
ry in
Cat
egor
y):
TS +
His
otry
x T
S0
.004
0.00
10
.007
0.00
30.
004
0.00
30
.007
**0
.001
0.0
09**
(0.0
04)
(0.0
08)
(0.0
04)
(0.0
03)
(0.0
09)
(0.0
02)
(0.0
03)
(0.0
09)
(0.0
04)
*Sig
nific
ant a
t 10%
; **
sign
ifica
nt a
t 5%
; **
*sig
nific
ant a
t 1%
Stan
dard
err
ors a
re p
rese
nted
in p
aren
thes
is a
nd cl
uste
red
at th
e sh
oppe
r lev
el. S
tand
ard
devi
atio
ns a
re p
rese
nted
inbr
acke
ts. A
n ob
serv
atio
n is
def
ined
by
a sh
oppe
r, w
eek,
and
item
cate
gory
. Sam
e lin
e ca
teto
ries r
efer
to n
eigb
ors
whe
re th
e su
bstit
ute
and
targ
et it
ems a
ppea
r on
the
sam
e lin
e of
the
web
site
. His
tory
of P
urch
ase
is e
qual
to 1
if th
esh
oppe
r pur
chas
ed e
ither
a su
bstit
ute
or ta
rget
item
in th
is ca
tego
ry in
the
pre
exp
erim
ent p
erio
d. A
hig
h re
bate
wee
kre
fers
to w
eeks
whe
n th
e re
bate
was
$10
for p
urch
asin
g th
e re
bate
item
(oth
erw
ise
it w
as w
as se
t at $
2.99
). Ad
ditio
nal
cont
rols
incl
ude:
an
indi
cato
r var
iabl
e fo
r whe
ther
or n
ot th
e sh
oppe
r has
a h
isto
ry o
f pur
chas
e in
cate
gory
and
this
varia
ble
inte
ract
ed w
ith tr
eatm
ent.
Sam
eLi
neDi
ff Li
ne
Purc
hase
Item
in C
ateg
ory
Buy
Targ
etBu
y Su
bstit
ute
All
Sam
eLi
neDi
ff Li
neAl
lSa
me
Line
Diff
Line
All

Table9:DoTreatmentShoppersRespondDi¤erentlytoaSaleontheTargetItem
(IdenticalRebateWeeks)?
Trea
t X T
arge
t Sal
e0
.001
0.00
20
.002
0.0
001
0.00
10
.000
30
.001
0.00
040
.001
*(0
.001
)(0
.002
)(0
.001
)(0
.001
)(0
.002
)(0
.001
)(0
.001
)(0
.002
)(0
.001
)
Trea
t X T
arge
t Sal
e X
Hist
0.02
1**
0.01
70.
021*
*0.
007
0.01
30.
005
0.01
4**
0.00
60.
016*
*(0
.008
)(0
.016
)(0
.009
)(0
.005
)(0
.015
)(0
.005
)(0
.007
)(0
.018
)(0
.008
)
Targ
et S
ale
(TS)
0.00
10.
001
0.00
20.
0004
0.00
10.
0001
0.00
10
.000
30.
001*
(0.0
01)
(0.0
02)
(0.0
01)
(0.0
01)
(0.0
01)
(0.0
01)
(0.0
01)
(0.0
02)
(0.0
01)
Targ
et S
ale
X Hi
stor
y0
.010
0.0
120
.009
0.00
20.
001
0.00
30
.010
**0
.010
0.0
11*
(0.0
06)
(0.0
12)
(0.0
07)
(0.0
04)
(0.0
13)
(0.0
03)
(0.0
05)
(0.0
15)
(0.0
06)
High
Reb
ate
Wee
k (0
/1)
0.0
04*
0.0
08*
0.0
020
.001
0.0
000
.001
0.0
04**
0.0
09**
*0
.003
*(0
.002
)(0
.004
)(0
.002
)(0
.001
)(0
.002
)(0
.001
)(0
.002
)(0
.004
)(0
.001
)
N It
em C
ateg
orie
sxW
eeks
59,6
4012
,780
46,8
6059
,640
12,7
8046
,860
59,6
4012
,780
46,8
60
Mea
n of
Dep
ende
nt0.
008
0.01
30.
007
0.00
30.
005
0.00
20.
005
0.00
90.
004
Varia
ble:
[0.0
90]
[0.1
15]
[0.0
81]
[0.0
52]
[0.0
68]
[0.0
46]
[0.0
72]
[0.0
93]
[0.0
66]
Chan
ge in
Pur
chas
e Ra
te o
f Tre
atm
ent G
roup
Dur
ing
Sale
Per
iod
(With
His
tory
in C
ateg
ory)
:TS
+ H
isto
ry x
TS
+0.
011*
*0.
008
0.01
2**
0.00
9***
0.01
5*0.
008*
*0.
004
0.0
040.
005
Tre
at X
TS
+ Tr
eat X
TS
X H
(0.0
05)
(0.0
12)
(0.0
05)
(0.0
03)
(0.0
08)
(0.0
03)
(0.0
04)
(0.0
09)
(0.0
04)
Chan
ge in
Pur
chas
e Ra
te o
f Con
trol
Gro
up D
urin
g Sa
le P
erio
d (W
ith H
isto
ry in
Cat
egor
y):
TS +
His
otry
x T
S0
.008
0.0
110
.008
0.00
30.
001
0.00
30
.009
*0
.010
0.0
10(0
.006
)(0
.012
)(0
.007
)(0
.004
)(0
.013
)(0
.003
)(0
.005
)(0
.014
)(0
.006
)
*Sig
nific
ant a
t 10%
; **
sign
ifica
nt a
t 5%
; **
*sig
nific
ant a
t 1%
Stan
dard
err
ors a
re p
rese
nted
in p
aren
thes
is &
clus
tere
d at
the
shop
per l
evel
. Sta
ndar
d de
viat
ions
are
pre
sent
edin
bra
cket
s. A
n ob
serv
atio
n is
def
ined
by
a sh
oppe
r, w
eek,
and
item
cate
gory
. All
spec
ifica
tions
incl
ude
cate
gory
fixed
eff
ects
, sho
pper
fixe
d ef
fect
s, a
nd w
eek
fixed
eff
ects
. Onl
y w
eeks
whe
n th
e tr
eatm
ent a
nd co
ntro
l gro
upre
ceiv
ed th
e sa
me
reba
te o
ffer
are
incl
uded
in a
naly
sis.
Sam
e lin
e ca
teto
ries r
efer
to n
eigb
ors w
here
the
subs
titut
e an
d ta
rget
item
s app
ear o
n th
e sa
me
line
of th
e w
ebsi
te. H
isto
ry o
f Pur
chas
e is
equ
al to
1 if
the
shop
per p
urch
ased
eith
er a
subs
titut
e or
targ
et it
em in
this
cate
gory
in th
e p
ree
xper
imen
t per
iod.
A h
igh
reba
tew
eek
refe
rs to
wee
ks w
hen
the
reba
te w
as $
10 fo
r pur
chas
ing
the
reba
te it
em (o
ther
wis
e it
was
was
set a
t $2.
99).
Addi
tiona
l con
trol
s inc
lude
: an
indi
cato
r var
iabl
e fo
r whe
ther
or n
ot th
e sh
oppe
r has
a h
isto
ry o
f pur
chas
e in
Sam
eLi
neDi
ff Li
ne
Purc
hase
Item
in C
ateg
ory
Buy
Targ
etBu
y Su
bstit
ute
All
Sam
eLi
neDi
ff Li
neAl
lSa
me
Line
Diff
Line
All

Table 10: Is the Sale E¤ect Di¤erent for First Line Categories?
Treat X Target Sale (TS) 0.010 0.001 0.010*(0.006) (0.004) (0.006)
Treat X TS X FirstItem (FI) 0.026* 0.017** 0.006(0.015) (0.008) (0.013)
Target Sale (TS) 0.002 0.005* 0.007*(0.005) (0.003) (0.004)
FirstItem X (TS) 0.018 0.015** 0.000(0.013) (0.007) (0.010)
FirstItem Category 0.0004 0.003 0.004(0.009) (0.004) (0.007)
Treat X FirstItem (FI) 0.008 0.002 0.004(0.011) (0.004) (0.009)
Item Category Fixed Effects X X XShopper & Week Fixed Effects X X X
N ItemsxWeeks 15,093 15,093 15,093
Mean of Dependent 0.030 0.008 0.021Variable: [0.172] [0.091] [0.145]
Change in Purchase Rate of Treatment Group During Sale Period:TS+ Treat x TS 0.008** 0.006** 0.003
(0.004) (0.003) (0.004)
First Item: TS + Treat x TS + 0.016* 0.008 0.009 FI x TS + Treat x TS x FI (0.009) (0.007) (0.008)
Change in Purchase Rate of Control Group During Sale Period:First Item: TS + TS x FirstItem 0.020* 0.010* 0.007
(0.011) (0.005) (0.008)
*Significant at 10%; **significant at 5%; ***significant at 1%
Buy SubstituteMake Purchase Buy Target
Additional controls include: an indicator for a high rebate week (a rebate of $10 versus $2.99) as wellas a control for the number of times this shopper purchased in this category during the preexperiment period.
Standard errors are presented in parenthesis and clustered at the shopper level. Standarddeviations are presented in brackets. First Item refers to the item category that appeared first in theemail to the treatment group.An observation is defined by a shopper, week, and item category. For each shopper, we only includenonneighboring item categories where this shopper had a history of purchasing either the target orsubstitute item during the preexperiment period. We focus on nonneighboring item categories,as there are weeks where their broader category (vegetables) was on sale and appeared in the firstline of the email but not all sub categories (e.g. tomatoes) were on sale that week. This allows us toseparate out the effect of a firstitem category from an onsale firstitem category.

Table11:IstheSaleE¤ectDi¤erentwhentheTreatmentGroupReceivedMoreDetailedSaleInformation?
Trea
t X T
arge
t Sal
e (T
S)0.
020*
0.0
330.
039*
*0.
008
0.0
060.
007
0.01
30
.032
0.03
2***
(0.0
12)
(0.0
31)
(0.0
15)
(0.0
07)
(0.0
17)
(0.0
11)
(0.0
09)
(0.0
21)
(0.0
11)
Trea
t X T
S X
Deta
il0
.011
0.04
80
.032
*0
.006
0.00
90
.006
0.0
040.
046
0.0
25*
(0.0
14)
(0.0
35)
(0.0
19)
(0.0
10)
(0.0
16)
(0.0
13)
(0.0
12)
(0.0
30)
(0.0
15)
Targ
et S
ale
(TS)
0.00
050.
033
0.0
150
.001
0.01
30
.002
0.00
20.
023
0.0
12(0
.008
)(0
.021
)(0
.011
)(0
.005
)(0
.012
)(0
.007
)(0
.007
)(0
.016
)(0
.008
)
Deta
il X
Targ
et S
ale
(TS)
0.00
10
.034
0.01
60.
008
0.0
020.
008
0.0
090
.035
*0.
005
(0.0
11)
(0.0
22)
(0.0
16)
(0.0
07)
(0.0
13)
(0.0
09)
(0.0
10)
(0.0
19)
(0.0
12)
N It
emsx
Wee
ks14
,443
4,53
79,
906
14,4
434,
537
9,90
614
,443
4,53
79,
906
Mea
n of
Dep
ende
nt0.
036
0.05
00.
030
0.01
10.
016
0.00
90.
025
0.03
40.
021
Varia
ble:
[0.1
87]
[0.2
18]
[0.1
70]
[0.1
04]
[0.1
25]
[0.0
93]
[0.1
56]
[0.1
81]
[0.1
43]
Chan
ge in
Pur
chas
e Ra
te o
f Tre
atm
ent G
roup
Dur
ing
Sale
Per
iod:
TS+
Trea
t x T
S0.
020*
*0
.001
0.02
4*0.
007
0.00
80.
005
0.01
5**
0.0
090.
020*
*(0
.009
)(0
.02)
(0.0
13)
(0.0
06)
(0.0
13)
(0.0
11)
(0.0
06)
(0.0
17)
(0.0
08)
Deta
il: T
S+ T
reat
x T
S +
0.00
90.
013
0.00
70.
009*
0.01
50.
007
0.00
20.
002
0.00
1 D
etai
l x T
S +
Trea
t x T
S x
D(0
.008
)(0
.018
)(0
.008
)(0
.005
)(0
.012
)(0
.005
)(0
.005
)(0
.014
)(0
.005
)
Chan
ge in
Pur
chas
e Ra
te o
f Con
trol
Gro
up D
urin
g Sa
le P
erio
d:De
tail:
TS+
Deta
ilxTS
0.00
10
.001
0.00
10.
007*
0.01
10.
006
0.0
070
.012
0.0
07(0
.006
)(0
.012
)(0
.008
)(0
.004
)(0
.01)
(0.0
04)
(0.0
05)
(0.0
1)(0
.006
)
Stan
dard
err
ors a
re p
rese
nted
in p
aren
thes
is a
nd cl
uste
red
at th
e sh
oppe
r lev
el. A
n ob
serv
atio
n is
def
ined
by
a sh
oppe
r,w
eek,
and
item
cate
gory
. De
tail
refe
rs to
wee
ks w
here
the
trea
tmen
t em
ail s
peci
fical
ly m
entio
ned
that
som
e or
gani
cite
ms a
re o
n sa
le.
This
ana
lysi
s is r
un o
n a
subs
et o
f 20
out o
f 28
of th
e ite
m ca
tego
ries f
or w
hich
the
targ
et it
em is
orga
nic.
For
eac
h sh
oppe
r, w
e on
ly in
clud
e ite
m ca
tego
ries w
here
this
shop
per h
ad a
his
tory
of p
urch
asin
g ei
ther
the
targ
et o
r sub
stitu
te it
em d
urin
g th
e pr
eex
perim
ent p
erio
d. A
ll sp
ecifi
catio
ns in
clud
e sh
oppe
r, ite
m ca
tego
ry, a
nd w
eek
fixed
eff
ects
. Add
ition
al co
ntro
ls in
clud
e: a
n in
dica
tor v
aria
ble
for w
heth
er o
r not
this
was
a d
etai
led
emai
l wee
k, a
s wel
las
this
var
iabl
e in
tera
cted
with
trea
tmen
t, an
indi
cato
r for
a h
igh
reba
te w
eek
(a re
bate
of $
10 v
ersu
s $2.
99) a
s wel
l as a
cont
rol f
or th
e nu
mbe
r of t
imes
this
shop
per p
urch
ased
in th
is ca
tego
ry d
urin
g th
e pr
eex
perim
ent p
erio
d. *
Sign
ifica
nt a
t10
%;
**si
gnifi
cant
at 5
%;
***s
igni
fican
t at 1
%
Sam
eLi
neDi
ff Li
ne
Purc
hase
Item
in C
ateg
ory
Buy
Targ
etBu
y Su
bstit
ute
All
Sam
eLi
neDi
ff Li
neAl
lSa
me
Line
Diff
Line
All

Table12:IstheSaleE¤ectDi¤erentforRebateItem
Categories?
Trea
t X T
arge
t Sal
e (T
S)0.
014*
**0.
008
0.01
5***
0.00
40
.001
0.00
40.
010*
*0.
007
0.01
1**
(0.0
05)
(0.0
15)
(0.0
06)
(0.0
04)
(0.0
14)
(0.0
03)
(0.0
04)
(0.0
12)
(0.0
05)
Trea
t X T
S X
Reba
teIte
m0
.005
0.00
70
.008
0.00
10.
029*
0.0
110
.004
0.0
130.
002
(0.0
11)
(0.0
26)
(0.0
11)
(0.0
06)
(0.0
16)
(0.0
07)
(0.0
10)
(0.0
24)
(0.0
10)
Targ
et S
ale
(TS)
0.0
040
.001
0.0
050.
003
0.00
90.
002
0.0
07**
0.0
080
.007
**(0
.004
)(0
.010
)(0
.004
)(0
.003
)(0
.011
)(0
.002
)(0
.003
)(0
.011
)(0
.004
)
Reba
te It
em (R
I) X
(TS)
0.02
0***
0.01
30.
018*
*0.
005
0.0
120.
011*
0.01
3**
0.02
00.
006
(0.0
07)
(0.0
16)
(0.0
07)
(0.0
05)
(0.0
11)
(0.0
06)
(0.0
06)
(0.0
19)
(0.0
06)
N It
emsx
Wee
ks20
,215
5,12
215
,093
20,2
155,
122
15,0
9320
,215
5,12
215
,093
Mea
n of
Dep
ende
nt0.
037
0.05
50.
030
0.01
00.
016
0.00
80.
026
0.03
70.
021
Varia
ble:
[0.1
88]
[0.2
28]
[0.1
72]
[0.1
02]
[0.1
27]
[0.0
91]
[0.1
58]
[0.1
90]
[0.1
45]
Chan
ge in
Pur
chas
e Ra
te o
f Tre
atm
ent G
roup
Dur
ing
Sale
Per
iod:
TS+
Trea
t x T
S0.
010*
*0.
007
0.00
9***
0.00
7**
0.00
80.
006*
*0.
004
0.0
010.
004
(0.0
04)
(0.0
11)
(0.0
03)
(0.0
03)
(0.0
09)
(0.0
02)
(0.0
03)
(0.0
07)
(0.0
03)
Reba
te: T
S+ T
reat
x T
S +
0.02
5***
0.02
70.
019*
*0.
013*
*0.
024*
**0.
006
0.01
30.
006
0.01
2 R
I x T
S +
Trea
t x T
S X
RI(0
.009
)(0
.021
)(0
.009
)(0
.005
)(0
.012
)(0
.005
)(0
.008
)(0
.017
)(0
.008
)
Chan
ge in
Pur
chas
e Ra
te o
f Con
trol
Gro
up D
urin
g Sa
le P
erio
d:Re
bate
: TS+
Tre
at x
TS
+0.
016*
*0.
012
0.01
30.
008
0.0
040.
013*
0.00
70.
012
0.0
01 R
I x T
S +
Trea
t x T
S X
RI(0
.008
)(0
.018
)(0
.008
)(0
.006
)(0
.011
)(0
.006
)(0
.006
)(0
.020
)(0
.007
)St
anda
rd e
rror
s are
pre
sent
ed in
par
enth
esis
and
clus
tere
d at
the
shop
per l
evel
. Sta
ndar
d de
viat
ions
are
pre
sent
ed in
brac
kets
. An
obse
rvat
ion
is d
efin
ed b
y a
shop
per,
wee
k, a
nd it
em ca
tego
ry. F
or e
ach
shop
per,
we
only
incl
ude
item
cate
gorie
s whe
re th
is sh
oppe
r had
a h
isto
ry o
f pur
chas
ing
eith
er th
e ta
rget
or s
ubst
itute
item
dur
ing
the
pre
expe
rimen
tpe
riod.
All
spec
ifica
tions
incl
ude
shop
per,
item
cate
gory
, and
wee
k fix
ed e
ffec
ts. R
ebat
e Ite
m is
def
ined
as t
he it
emca
tego
ry th
at re
sulte
d in
a d
isco
unt (
reba
te) i
f pur
chas
ing
is e
ither
a ta
rget
or s
ubst
itute
item
with
in th
isca
tego
ry. A
dditi
onal
cont
rols
incl
ude:
an
indi
cato
r var
iabl
e fo
r a h
igh
reba
te w
eek
(a re
bate
of $
10 v
ersu
s $2.
99) a
s wel
las
a co
ntro
l for
the
num
ber o
f tim
es th
is sh
oppe
r pur
chas
ed in
this
cate
gory
dur
ing
the
pre
expe
rimen
t per
iod.
*Sig
nific
ant a
t 10%
; **
sign
ifica
nt a
t 5%
; **
*sig
nific
ant a
t 1%
Sam
eLi
neDi
ff Li
ne
Purc
hase
Item
in C
ateg
ory
Buy
Targ
etBu
y Su
bstit
ute
All
Sam
eLi
neDi
ff Li
neAl
lSa
me
Line
Diff
Line
All

Table 13: What "Types" of Shoppers React to Information?
Treat X Target Sale 0.037 0.046 0.042 0.029 0.009 0.100*(0.042) (0.056) (0.050) (0.044) (0.068) (0.059)
Target Sale (TS) 0.040 0.052 0.015 0.015 0.013 0.050(0.036) (0.048) (0.031) (0.037) (0.047) (0.044)
Prior Purchases 0.022*** 0.023*** 0.020*** 0.028*** 0.027*** 0.029***in Category (0.004) (0.005) (0.005) (0.006) (0.007) (0.008)
High Rebate Week 0.022 0.017 0.028 0.035 0.009 0.068(0/1) (0.033) (0.059) (0.033) (0.041) (0.055) (0.080)
Item Category FE's X X X X X XShopper & Week FE's X X X X X X
N ItemsxWeeks 1,891 963 928 1,891 963 928
Mean of Dependent 0.101 0.119 0.082 0.250 0.250 0.249Variable: [0.301] [0.324] [0.274] [0.433] [0.433] [0.433]
Change in Purchase Rate of Treatment Group During Sale Period:Target Sale + Treat x TS 0.077*** 0.099*** 0.057 0.014 0.004 0.050
(0.026) (0.029) (0.043) (0.024) (0.048) (0.041)Standard errors are presented in parenthesis and clustered at the shopper level.Standard deviations are presented in brackets.
*Significant at 10%; **significant at 5%; ***significant at 1%
A high rebate week refers to weeks when the rebate was $10 for purchasing the rebateitem. This indicator is equal to zero when the rebate amount was set at $2.99.
PurchaseRebate
MissRebate
Buy Target Buy Substitute
AllPurchaseRebate
MissRebate All
An observation is defined by a shopper, week, and item category. For each shopper,we only include item categories where this shopper had a history of purchasing eitherthe target or substitute item during the preexperiment period. We only includeweeks when the rebate item cost less than the rebate and the shopper made apurchase. During these weeks we are able to differentiate between "attentive" and"inattentive" shoppers. An "attentive" shopper is defined as one that purchased therebate item, an "inattentive" shopper is defined as someone who made a shoppingtrip but missed the rebate savings he would have received for making a purchase inthe rebate item category.

Table 14: What "Types" of Shoppers React to Information (conditioning on openingemail)?
Treat X Target Sale 0.026 0.038 0.044 0.018 0.031 0.081(0.058) (0.065) (0.075) (0.062) (0.077) (0.089)
Target Sale (TS) 0.072 0.074 0.053 0.017 0.014 0.023(0.052) (0.058) (0.059) (0.053) (0.049) (0.084)
Prior Purchases 0.019*** 0.020*** 0.017*** 0.030*** 0.026*** 0.035***in Category (0.004) (0.004) (0.005) (0.007) (0.006) (0.009)
High Rebate Week 0.050 0.016 0.020 0.011 0.028 0.053(0/1) (0.045) (0.053) (0.051) (0.062) (0.057) (0.091)
Item Category Fixed Effects X X X X X XShopper & Week FE's X X X X X X
N ItemsxWeeks 1,255 752 503 1,255 752 503
Mean of Dependent 0.107 0.121 0.085 0.257 0.243 0.276Variable: [0.309] [0.326] [0.280] [0.437] [0.429] [0.448]
Change in Purchase Rate of Treatment Group During Sale Period:Target Sale + Treat x TS 0.098*** 0.111*** 0.097* 0.001 0.017 0.058
(0.026) (0.032) (0.053) (0.033) (0.059) (0.044)Standard errors are presented in parenthesis and clustered at the shopper level.Standard deviations are presented in brackets.
*Significant at 10%; **significant at 5%; ***significant at 1%
A high rebate week refers to weeks when the rebate was $10 for purchasing the rebateitem. This indicator is equal to zero when the rebate amount was set at $2.99.
Buy Target Buy Substitue
AllPurchaseRebate
MissRebate All
PurchaseRebate
MissRebate
An observation is defined by a shopper, week, and item category. For each shopper, weonly include item categories where this shopper had a history of purchasing either thetarget or substitute item during the preexperiment period. We only include weekswhen the shopper opened his email, the rebate item cost less than the rebate, and theshopper made a purchase. During these weeks we are able to differentiate between"attentive" and "inattentive" shoppers. An "attentive" shopper is defined as one thatpurchased the rebate item after opening the email, an "inattentive" shopper is definedas someone who opened the promotional email and made a shopping trip but missedthe rebate savings he would have received for making a purchase in the rebate item

Figure 1: Examples of Email Format During Basic Weeks
Control (email title: Free Shipping on if you Buy a Banana!!!)
, your local grocery delivery service!Greetings from
Got a banana? Get a onetime refund on shipping for a purchase of over $20 if you buy one bananaor more!1(Click here)1 Offer valid on all bananas. Use this email address when placing your purchase and a refund of$2.99 will be applied within 24 hours of purchase. Valid until
Treatment (email title: Free Shipping on if you Buy a Banana!!!)
cal grocery delivery service!, your loGreetings from
Got a banana? Get a onetime refund on shipping for a purchase of over $20 if you buy one bananaor more!1 (Click here)
… and if that’s not enough, make sure you check our discounts for the month of February(discounted items are marked by **).
Our biggest discounts are in the following categories:
1. Vegetables –up to 45% off select items (Click here)
2. Milk –up to 40% off select items (Click here)
3. Fruits –up to 30% off select items (Click here)
4. Eggs –up to 20% off select items (Click here)1 Offer valid on all bananas. Use this email address when placing your purchase and a refund of$2.99 will be applied within 24 hours of purchase. Valid until

Figure 2: Examples of Email Format During Detailed Weeks
Control: (email title: Click for $10 off your purchase!!)
Greetings from , your local grocery delivery service!
Got apples? Get a $10 refund by simply purchasing at least one apple and inserting the couponcode dcash at checkout! 1 (Click here)
1 Offer valid on all apples. Use this email address and the dcash coupon code when placing your purchase and youwill receive a $10.00 onetime refund on your purchase of $20 or more. The refund will be applied within 24 hours.Valid until .
Treatment: (email title: Click for $10 off your purchase!!)
Greetings from , your local grocery delivery service!
We are devoted to helping our customers get the "best bang for the buck".
So don't miss out on our April discounts! Our April sale prices are so low that organic sale itemsare often even cheaper than the nonorganic alternative! (discounted items are marked by **)
Don't forget to consider some alternatives to your last purchase of eggs that we have on salethis month.
To use your $10 refund simply click on one of the links below to the site, purchase at least oneapple and insert the coupon code found below.
Our biggest discounts are on the following products:
1. Milk – up to 33% off select items (Click here)
2. Eggs – up to 49% off select items (Click here)
3. Fruit – up to 51% off select items (Click here).
4. Vegetables – up to 75% off select items (Click here)
Make sure to purchase one or more apples and enter couponcode dcash at checkout!1
1 Offer valid on all apples. Use this email address and the dcash coupon code when placing your purchase and youwill receive a $10.00 onetime refund on your purchase of $20 or more. The refund will be applied within 24 hours.Valid until .

Figure 3: The Fraction of Shoppers Purchasing a Target vs. Substitute Item
0.2
.4.6
.8Pr
obab
ility
of P
urch
asin
g Ta
rget
Rel
ativ
e to
Sub
stitu
te
3 2 1 0 1 2 3 4Weeks of Sale
The Effect of a Sale on Target Item Purchases

Figure 4: Example of Target versus Substitute Item During Sale Period