Development and validation of a flax (Linum usitatissimum L.) gene expression oligo microarray

1
Proteome profiling of flax (Linum usitatissimum) seed: Characterization of functional
metabolic pathways operating during seed development
Vitthal T. Barvkar, Varsha C. Pardeshi, Sandip M. Kale, Narendra Y. Kadoo, Ashok P. Giri,
Vidya S. Gupta*
Biochemical Sciences Division, CSIR-National Chemical Laboratory, Pune 411008, India.
*Corresponding author
Dr. Vidya Gupta,
Chief Scientist and Chair,
Biochemical Sciences Division,
CSIR-National Chemical Laboratory,
Pune 411008, India
E-mail address: [email protected]
Tel: +91-20-25902237
Fax: +91-20-25902648
Page 1 of 35
123456789101112131415161718192021222324252627282930313233343536373839404142434445464748495051525354555657585960

2
Abstract
Flax (Linum usitatissimum L.) seeds are an important source of food and feed due to the
presence of various health promoting compounds, making it a nutritionally and economically
important plant. An in-depth analysis of the proteome of developing flax seed is expected to
provide significant information with respect to the regulation and accumulation of such
storage compounds. Therefore, a proteomic analysis of seven seed developmental stages (4,
8, 12, 16, 22, 30 and 48 days after anthesis) in a flax variety, NL-97 was carried out using a
combination of 1D-SDS-PAGE and LC-MSE methods. A total 1716 proteins were identified
and their functional annotation revealed that a majority of them were involved in primary
metabolism, protein destination, storage and energy. Three carbon assimilatory pathways
appeared to operate in flax seeds. Reverse transcription quantitative PCR of selected 19 was
carried out to understand their role during seed development. Besides storage proteins,
methionine synthase, RuBisCO and S-adenosylmethionine synthetase, were highly expressed
transcripts, highlighting their importance in flax seed development. Further, the identified
proteins were mapped on to developmental seed specific EST libraries of flax to obtain
transcriptional evidence and 81% of them had detectable expression at mRNA level. This
study provides new insights into the complex seed developmental processes operating in flax.
Keywords
Flax seed development, carbon flux, MSE, digital expression analysis, α-linolenic acid,
secoisolariciresinol diglucoside
Page 2 of 35
123456789101112131415161718192021222324252627282930313233343536373839404142434445464748495051525354555657585960

3
Introduction
Flax (Linum usitatissimum L.) seeds have been used as human food and animal feed since
ancient times. It has also been cultivated for many industrial uses such as in the production of
linen, oil paints, stains and oleochemicals. The importance of flax seeds lies in their relatively
high contents of fat (30-40%), protein (20-30%), dietary fiber (20%) and ash (4%) 1. More
recently, interest has increased for incorporation of the flax seeds in a number of health food
products due to the presence of bioactive ingredients such as α-linolenic acid (ALA), lignans
like secoisolariciresinol diglucoside (SDG) and mucilage (fiber) for human health 2.
Moreover, the flax seed proteins contain desirable amino acids profile similar to that of
soybean, which is a well-regarded protein source 3. However, flax seeds also contain some
compounds that are considered undesirable or might have some anti-nutritional effects such
as cyanogenic glycosides, linatine, anti-pyridoxine factor, trypsin inhibitors, phytic acid,
allergens and goitrogens 4. Due to all these attributes, flax appears to be an important model
to understand seed development.
Biochemical and genetic studies of flax seeds have been carried out to identify,
characterize and understand accumulation of the fatty acids; mainly cyanogenic compounds 5,
6, ALA
7, lignan
8, 9 and seed storage proteins
10. Recently, extensive transcriptomic analyses
of developing seeds have been performed to describe biosynthetic pathways leading to the
accumulation of these storage compounds in flax seed 11, 12
. These studies catalogued
temporal and spatial changes in gene expression specific to metabolic pathways related to the
accumulation of oil, protein and carbohydrate (mucilage) reserves during seed development.
Despite this, little is known about the translational and post-translational regulation of
proteins during seed development. For example, although biosynthetic pathway of fatty acid
production in linseed is known, the biological mechanisms controlling linolenic acid level
remains unknown 13
. As flax seeds accumulate diverse seed storage compounds of nutritional
and economical importance, understanding the seed development process is vital.
Seed development is a highly complex process and many genes involved in various pathways
are under precise regulation for proper development. Therefore, it is necessary to apply
systematic and parallel approaches on a global scale to elucidate the relationships among
various metabolic networks operating during seed development. Recent advances in various
high-throughput technologies provide a unique opportunity to analyze biological systems on
a genome-wide scale. The relationship between protein and oil composition in seed was
revealed by the proteomics approach 14
. The proteomes of oilseeds, such as soybean 15, 16
,
Page 3 of 35
123456789101112131415161718192021222324252627282930313233343536373839404142434445464748495051525354555657585960

4
rapeseed 17
, Castor 18
and Arabidopsis 19
were investigated to gain insights in to the metabolic
pathways operating during the respective seed development. Hradilova et al 20
investigated
the effect of cadmium exposure on proteome changes of contrasting flax cultivars. Klubicova
et al. 21-23
developed a quantitative reference map of mature and developing flax seed proteins
harvested from the remediated Chernobyl area respectively. They identified a total of 102
proteins in developing flax seed and a large number of proteins could not be assigned any
known function. This could be due to the limited genomic resources for flax available at that
time. Recently, a revised version of the draft genome sequence of flax has been published 24
(http://www.linum.ca and http://www.phytozome.net/flax), which is expected to increase the
protein identification efficiency.
The goal of the present study was to develop a comprehensive proteomics based
dataset for flax to better understand its seed development. Among the various protein pre-
fractionation approaches reported, 1D-SDS-PAGE followed by LC-MSE approach was used
to analyze seven seed development stages. This identified a total of 1716 proteins, which
were classified into 15 functional groups. This information was used to understand the carbon
assimilatory, storage proteins and cyanogenic glycoside biosynthetic pathways in flax seed.
Further, the proteomics data were compared with the transcript data to understand the
regulation of the genes involved in particular pathways. For validation of proteomics result
reverse transcription quantitative PCR (RT-qPCR) of important 19 genes was performed and
it revealed that their expression patterns are consistent with the proteins identified at that
particular stages. By comparison of the results obtained in this study with those from other
model plants, the biological mechanisms involved in seed development that are either
common or unique to different plants can be identified.
Materials and methods
Plant material
The flax variety NL-97 was grown at College of Agriculture, Nagpur (2010-2011,
November-March). Flax flowers were tagged after opening (between 7.30 and 8.30 AM IST),
and developing bolls were collected at 4, 8, 12, 16, 22, 30 and 48 days after anthesis (DAA).
Developing seeds were harvested from bolls at 4 ºC to prevent dehydration and stored at -80
ºC until further use. To determine seed fresh weight and dry weight, three pools of 10
randomly selected seeds were weighed just after harvest and after drying at 50 ºC for 24 h in
hot air oven. The seed length, thickness and width were measured using a scale.
Page 4 of 35
123456789101112131415161718192021222324252627282930313233343536373839404142434445464748495051525354555657585960

5
Fatty acid analysis of developing seeds
Fatty acid methyl esters (FAMES) were extracted from seven seed developmental stages as
described by Rajwade et al. 25
with some modifications. 1 µL of chloroform reconstituted
extracts were injected in AutoSystem XL GC (Perkin Elmer, USA) with SP-2330 Supelco
capillary column, 30 m long and 0.32 mm diameter. Fatty acid (FA) peaks were identified by
comparing them with the standard FA profiles (Sigma–Aldrich, USA). The area under the
peak was expressed as percentage fatty acid content. FA profiling for each stage was repeated
three times. Mean of three replicates was averaged to get the percent FA content of each
developmental stage.
Protein extraction, 1D-SDS-PAGE and in-gel digestion
Total proteins from each seed developmental stage were extracted according to Wang et al.
26. Three independent protein extractions were performed with the tissue. Total protein
content was measured at each stage using a dye-binding protein assay 27
. Protein samples (80
µg each) were loaded on 12% SDS polyacrylamide constant separation gel with a 4%
stacking gel and electrophoresed at 20 °C using a vertical PROTEAN II xicell (BioRad,
USA) at constant current of 50 Amp/gel. The gels were visualized with coomassie brilliant
blue staining (CBB) and scanned at 300 dpi using high resolution image scanner (Biorad GS
800, USA). Each lane (representing a seed developmental stage) of the gel was sliced with a
scalpel into 13 pieces based on protein abundance as outlined in Figure 1. Each slice was
transferred into a 1.5mL tube and in-gel digestion using trypsin was performed as described
by Haynes et al. 28
with slight modifications. In brief, protein bands were excised from the
CBB-stained gels, washed twice with milli-Q water, destained with a 1:1 (v/v) solution of
50% acetonitrile and 50mM NH4HCO3 and then dehydrated in 100% acetonitrile (ACN) until
the gel pieces were shrunken. The dried gel pieces were reduced with 10mM dithiothreitol for
45 min at 56 °C and alkylated with 55mM iodoacetamide in dark at RT for 40 min. Gel
pieces were dehydrated and then digested with trypsin (Sigma, USA) at 37 °C overnight. The
resulting peptides were extracted using sonicator (Branson, USA) twice by adding 200µL of a
solution containing 0.1% formic acid and 5% acetonitrile for 15 min, respectively. The
peptides were dried in a SpeedVac (Labconco, USA) and then reconstituted in 10µL of 5%
aqueous ACN containing 0.1% formic acid for subsequent analysis.
Page 5 of 35
123456789101112131415161718192021222324252627282930313233343536373839404142434445464748495051525354555657585960

6
Liquid chromatography mass spectrometry analysis
All the samples were analyzed by LC-MSE
using a NanoAcquity ultra performance liquid
chromatography (UPLC) system (Waters, USA) coupled to a SYNAPT High Definition Mass
Spectrometer (Waters, USA). The nano-LC separation was performed using a bridged-ethyl
hybrid (BEH) C18 reversed phase column (1.7 µm particle size) with an internal diameter of
75 µm length of 150 mm (Waters, USA). The binary solvent system that was used, comprised
99.9% water and 0.1% formic acid (mobile phase A) and 99.9% acetonitrile and 0.1% formic
acid (mobile phase B). The samples were initially pre-concentrated and desalted online at a
flow rate of 5 µL/min using a Symmetry C18 trapping column (internal diameter 180 µm,
length 20 mm) (Waters, USA) with a 0.1% B mobile phase. Each sample (total digested
protein) was applied to the trapping column and flushed with 0.1% solvent B for 3 min at a
flow rate of 15µL/min. After each injection, peptides were eluted into the NanoLockSpray
ion source at a flow rate of 300 nL/min using a gradient of 2-40% B over 50 min. The
lockmass calibrant peptide standard, 600fmol/µL Glu-fibrinopeptide B (Sigma-Aldrich,
USA), was infused into the NanoLockSpray ion source at a flow rate of 300nL/min and was
sampled during the acquisition at 30s intervals. The mass spectrometer was operated in V-
mode at a resolution of at least 9000 full width at half height (fwhh). For LC-MSE, full scan
(m/z 50-2000) data were collected using the “expression” mode of acquisition, which
acquires alternating 1s scans of normal and elevated collision energy. Data were collected at
a constant collision energy setting of low (4V) and high (ramp from 20 to 40 V) energy mode
MSE scans.
Data processing and database searching
The continuum LC-MSE data were processed and searched using ProteinLynx Global Server
2.4 (PLGS; Waters, USA) software. Protein identifications were obtained by searching the
47,912 predicted gene models from flax whole genome sequence (November, 2011;
http://www.linum.ca). LC-MSE data were searched with a fixed carbamidomethyl
modification for cysteine residues, along with a variable modification for oxidation of
methionine, N-terminal acetylation, deamidation of asparagine and glutamine and
phosphorylation of serine, threonine and tyrosine. The ion accounting search algorithm
within PLGS was developed specifically for searching data-independent MSE data sets, and a
detailed description of the algorithm was reported by Li et al. 29
The ion accounting search
parameters were; precursor and product ion tolerance: automatic setting, minimum number of
product ion matches per peptide: 3, minimum number of product ion matches per protein: 7,
Page 6 of 35
123456789101112131415161718192021222324252627282930313233343536373839404142434445464748495051525354555657585960

7
minimum number of peptide matches per protein: 2, and missed tryptic cleavage sites: 2. The
false positive rate was 4%. Search results of the proteins and the individual MS/MS spectra
with confidence level at or above >95% were accepted.
Functional classification
Gene Ontology (GO) annotation was performed with Blast2GO 30
based on sequence
similarity. For annotation, the default configuration settings were used and the proteins were
searched against the NCBI-nr protein database (December, 2011). Plant related GO terms
were then retrieved using the GO slim viewer from the AgBase web server
(http://www.agbase.msstate.edu). Proteins with unknown function or without specific
homology or similarity descriptions were BlastP searched against the NCBI-nr database to
confirm their function. Sub-cellular localizations of proteins were predicted using WoLF
PSORT web server 31
(http://www.wolfpsort.org/). The information about subcellular
localization was incorporated into protein description. The identified proteins were also
classified into 15 functional classes according to Hajduch et al. 17
Digital expression analysis
Developing flax seed specific ESTs were downloaded from NCBI
(http://www.ncbi.nlm.nih.gov/nucest/?term=linum%20usitatissimum) [eight libraries;
Globular embryo (GE), heart shaped embryo (HE), torpedo embryo (TE), cotyledon embryo
(CE), mature embryo (ME), globular stage seed coat (GC) and torpedo stage seed coat (TC)
and pooled endosperm (EN), total 2,20,724 EST sequences; Jan, 2012)]. Makeblastdb
(ftp://ftp.ncbi.nlm.nih.gov/blast/) was used to create developing flax seed EST database on an
in-house server. Viroblast (v. 2.2+) 32
was configured to use the stand-alone suite of Blast
programs (v. 2.2.24+). The identified proteins were TBlastN searched against the EST
database with an E-value threshold of ≤e-10
and ≥95% sequence identity criteria to map the
ESTs onto gene models to obtain transcriptional evidence for individual proteins.
Reverse transcription quantitative real time PCR
RNA was extracted from seven seed developmental stages using SpectrumTM
Plant Total
RNA Kit (Sigma-Aldrich, USA). DNaseI treated total RNA was reverse transcribed using
oligo(dT) primer and MultiScribeTM
reverse transcriptase (Applied Biosystems, USA). Gene
specific primers for 19 genes were designed using Primer 3 (listed in Table S1). PCR
conditions were optimized for annealing temperature and primer concentration. Real-time
PCR was carried out in 7900HT Fast real-time PCR system (Applied Biosystems, USA)
Page 7 of 35
123456789101112131415161718192021222324252627282930313233343536373839404142434445464748495051525354555657585960

8
using FastStart universal SYBR green master mix (Roche USA). Real time PCR
amplification reactions were performed as described by Barvkar et al. 33
. For each of the
three biological replicates, two independent technical replications were performed and
averaged for further calculations. PCR conditions were optimized such that PCR efficiencies
of housekeeping gene and gene of interest will be closer to two. PCR efficiencies were
calculated using LinRegPCR 34
. Relative transcript abundance calculations were performed
using comparative CT (∆CT) method as described by Schmittgen and Livak 35
.
Results and Discussion
The present study of flax seed proteome describes a detailed analysis of proteins identified in
developing flax seeds and characterizes the metabolic pathways operating during seed
development. The major economic value of flax lies in its contents of oil and secondary
metabolites and a thorough knowledge of the regulation of their accumulation during seed
development could be exploited for different applications.
Biochemical characterization of developing flax seed
The biochemical characterization of developing flax seed was performed to define the various
seed developmental events. Whole flax seeds were analyzed at 4, 8, 12, 16, 22, 30 and 48
days after anthesis (DAA). This time interval covered the major seed developmental events
such as embryogenesis, seed filling and maturation 36
. Seed size and color changed during the
course of seed development (Figure 1A). The fresh seed weight increased till 22 DAA and
declined later, indicating that the seeds entered the pre-desiccation phase; whereas, dry seed
weight started increasing after 12 DAA (Figure 1B) and continued to increase till maturity.
This observation was also supported by shrinkage of seeds at the maturation phase indicated
by the decrease in size (Figure 1C). We observed that during embryogenesis (from 4 to 16
DAA), water content of the seed remained high (~90%); whereas, the protein content
increased during seed filling, which coincided with increased fresh as well as dry weight of
the seed revealing high metabolic activity in flax seeds during the 4 to 16 DAA (Figure 1D).
At the early developmental stages (4-8 DAA), palmitic acid (PA; C16:0), linoleic acid
(LA; C18:2), and ALA (C18:3) were the most abundant FAs. The PA content was high
(30.74%) at 4 DAF stage further gradually decreased throughout seed development till
maturity. The proportion of stearic acid (SA; C18:0) remained nearly constant. The oleic acid
(OA; C18:1) content showed steady increase from 4 (6.19%) to 12 DAF (28%) and further
maintained similar levels. The accumulation pattern of LA and ALA showed a correlation
between product and precursor ratio. LA content was high (34.28%) at the 4 DAA stage
Page 8 of 35
123456789101112131415161718192021222324252627282930313233343536373839404142434445464748495051525354555657585960

9
which gradually declined from 12 to 48 DAA. The ALA content was low at the 4 DAA
(22.66 %) and from 12 DAA onwards showed a steady increase till maturity. At maturity the
total ALA accumulation was 46% where as LA content was 11.84% of the total fatty acids
quantified (Figure 1E). Thus, biochemical analysis of flax seed indicates that the period from
4-16 DAA constitutes the embryogenesis phase while period from 17-30DAA and 31
onwards represents seed filling and maturation phases respectively.
1D-SDS-PAGE and LC-MSE efficiently cover the flax seed proteome
The developing seed proteome is a complex mixture and seed storage proteins constitute
~23% of total flax seed protein 10
. However, this high abundance of storage proteins masks
the identification of low abundant proteins and requires efficient pre-fractionation. To reduce
and fractionate the protein complexity, we used 1D-SDS PAGE and the fractionated proteins
were identified using the LC-MSE
(Figure 1F-G). Total of 1716 non-redundant proteins were
identified (for summary of identified proteins see Table S2). We found that 1D-SDS-PAGE
gave good coverage of the flax proteome. Earlier studies also reported 1D-SDS-PAGE as the
most effective method for maximum proteome coverage and to fractionate complex protein
mixtures 37
. Previously, such a combination of 1D-SDS-PAGE protein separation and LC-
MS/MS analysis was employed to analyze the roles of chloroplast proteases (ClpPR) in
plastid biogenesis and homeostasis 38
, to understand the kiwi fruit ripening 39
and in shotgun
proteomic analysis of Arabidopsis leaves 40
.
GO annotation, functional categorization and family relationship
To understand the biological functions of the expressed proteins, Gene Ontology (GO)
annotation was performed. The identified 1716 proteins were analyzed using BlastP against
the NCBI-nr plant database, which yielded 14,801 GO annotations. The Venn diagram
(Figure S1) shows the distribution of GO annotation in the three categories.
According to GO annotation, the cellular component assignments were mostly to the
cellular components (15%), cell, intracellular and cytoplasm (13% each), plastid (10%),
membrane (8%) and cytosol (6%) (Figure 2A). As per the biological processes of the flax
seed proteome, 18% proteins with metabolic processes, 17% with cellular processes, 15%
with biological processes and 6% with biosynthetic processes were observed in the flax
proteome (Figure 2B). Furthermore, the highly enriched molecular functions of the flax seeds
were revealed as proteins with catalytic activity (25%) followed by binding proteins (18%)
and hydrolase activity (13%), respectively (Figure 2C).
Page 9 of 35
123456789101112131415161718192021222324252627282930313233343536373839404142434445464748495051525354555657585960

10
Most of the identified proteins (19%) were involved in primary metabolism, followed
by protein destination and storage (14%) and energy (10%). Similar observation was reported
in other oilseeds such as rapeseed 17
, soybean 16
and castor 18
. More than half of the flax
proteins showed high similarity to castor bean proteins, supporting the taxonomic grouping of
flax and castor bean within the order Malpighiales. The flax transcriptomic data also showed
similar results 12
. Such information will be helpful for molecular taxonomy of this order as
the taxonomic relationship of families within this order is still poorly resolved.
Diversity of seed storage proteins in flax
A majority of the flax seed proteins are storage proteins and constitute ~23% of the whole
flax seed 10
. Usually, seeds of many plant species accumulate two of the three (2S, 7S and
11S) types of storage proteins. Previous studies reported that flax seed contains an unusual
diversity of storage proteins in the form of cupin, conlinin and cruciferin 12
. In the present
study, we identified 2S albumin (conlinin) and 11S globulin (legumin, glutenin type A,
cupin) proteins, confirming previous reports. In addition, we also detected 7S globulin
(48kDa glycoprotein precursor) protein. This heterogeneity was consistent with the fact that
seed reserve proteins are encoded by multi-gene families 41
. Expression of legumin B protein
was much more abundant compared to other seed storage proteins analyzed (Figure 3A-D).
These storage proteins accumulated in a specific temporal order with 7S and 11S (except
cupin) accumulating during the maturation phase, while 2S is identified throughout the seed
development. Transcripts encoding the abundant storage proteins were expressed in similar
developmental stages, 12
suggesting that the temporal accumulation of storage proteins is
transcriptionally controlled.
Flax seed maturation marker proteins
Several proteins known to play important roles in seed maturation were also identified.
Gutierrez et al. 36
reported the expression of cysteine protease gene, which marks the embryo
growth phase, at 10 days after flowering (DAF) in the Barbara ecotype of flax. Whereas, in
NL-97, it was identified at 8 DAA indicating that the embryo was still in growth phase. The
LEA proteins were identified during the desiccation phase of seed maturation 42
. In NL-97,
the LEA protein was identified at 30-48 DAA, and also supported by the RT-qPCR
expression indicating that this period represents the late maturation phase of flax seed (Figure
3E). Moreover, at 30 DAA, there was a sharp decrease in seed fresh weight indicating that
the seed entered the desiccation phase or maturation phase at this time point.
Page 10 of 35
123456789101112131415161718192021222324252627282930313233343536373839404142434445464748495051525354555657585960

11
In general, storage proteins are expressed abundantly during the cell expansion phase,
after the embryo has been completely differentiated. Gutierrez et al. 36
reported that flax seed
filling phase lasts from 20-30 DAF; however, in NL-97, the 16 DAA stage indicated the start
of seed storage phase and a majority of the flax storage proteins were identified at this stage.
Therefore, 16 to 30 DAA might represent the seed filling stage in NL-97. The transition
between the embryogenesis and seed filling phases probably occurred at around 16 DAA,
which marked a key change in several aspects of seed development; most importantly, the
beginning of storage product accumulation.
Carbon entry and assimilation by glycolytic pathway
It has been suggested that carbon assimilation during seed development begins with the
transport of photosynthetically assimilated carbon in the form of sucrose into seed and
cleavage of sucrose plays a key role in inducing the seed maturation process. Sucrose
synthase (SuSy) is the key enzyme implicated in the first step of sucrose metabolism. Four
isoforms of SuSy identified mainly during embryogenesis and seed filling stages, suggesting
the presence of two types of SuSy and active sugar metabolism during these stages. We
analyzed the expression of one of the isoform; g4346 using RT-qPCR and transcript
abundance was higher during embrogenesis with peak at 12DAA (Figure 3F). The hexose
phosphates generated via the action of SuSy are metabolized through glycolysis or the
oxidative pentose phosphate pathway (OPPP). Proteomic, biochemical and transcriptional
studies suggest that glycolytic enzymes play a critical role in carbon metabolism during seed
development 43-45
. In our study of flax seed development, both cytosolic and plastidial
isoforms of all the glycolytic enzymes were identified suggesting both were important for
flax during seed development (Figure 4). The presence of such complete glycolytic pathway
has been reported in rapeseed embryos, cauliflower buds, castor seed endosperm and non-
photosynthetic plastids from pea 46-49
.
For almost all the enzymes, we could detect both cytosolic and plastidial isoforms, except for
the cytosolic phosphoglucomutase (PGM) and plastidial iPGAM isoforms. A possible
explanation for this could be the lower expression of these proteins during seed development.
Likewise, the plastidial iPGAM could not be detected even in rapeseed 17
. A notable feature
of our study was the detection of only plastidial isoforms of the PGM expressed especially
during the embyrogenesis stages (Figure 3G). The plastidial PGM is reported to play an
essential role in starch synthesis 50
as well as degradation of assimilatory starch 51
. The starch
Page 11 of 35
123456789101112131415161718192021222324252627282930313233343536373839404142434445464748495051525354555657585960

12
accumulated in young embryos of oilseeds provides carbon resources for lipid biosynthesis
and thus, the plastidic PGM is a crucial factor affecting seed oil content 52
. The studies in
plants lacking the plastidial PGM indicate that it has a significant impact on the deposition of
other storage products in seed 53
. Therefore, in flax, plastidial PGM might have a crucial role
to play in oil accumulation. In rapeseed, the seed specific expression of cytosolic
glyceraldehyde 3-phosphate dehydrogenase (GAPDH) increased glyceraldehyde 3-phosphate
levels by three to fourfold in developing seeds, resulting in 40% increase in the oil content 54
.
Therefore we studied expression pattern of GAPDH. RT-qPCR of GAPDH revealed that it is
expressed throughout seed development indicating GAPDH in flax might play a key role in
seed development (Figure 3H).
Varied carbon flux pathways are functional during flax seed development
Oil synthesis studies in plant seeds propose two major routes of carbon flow for de novo fatty
acid synthesis 55
. In the first route, cytosolic glycolysis takes place till phosphoenolpyruvate
(PEP) synthesis followed by its transport into plastid and conversion into acetyl-CoA, which
is further used for FA synthesis. The functional existence of this route of carbon flux is
supported by transcriptomics, stable isotopic labeling and proteomic analyses of developing
seed from Arabidopsis and rapeseed 17, 56, 57
although a plastid pyruvate translocator is yet to
be identified. In the present study, six of the seven isoforms of enolase identified were
cytosolic in origin, indicating that PEP was transported across plastid as a carbon source for
fatty acid production. Therefore, this route of carbon flux seems to be operating in flax seeds.
In the second route of carbon flow, phosphoenolpyruvate carboxylase (PEPC) converts
cytosolic PEP to oxaloacetic acid, followed by its malate dehydrogenase (MDH) mediated
conversion to malate. The malate is imported in plastids and plastidial NADP malic enzyme
decarboxylates it to pyruvate. Further, the pyruvate is converted to acetyl-CoA (by plastidial
pyruvate dehydrogenase) for de novo fatty acid synthesis. Biochemical studies of developing
seed and isolated leucoplasts from castor bean 57
support this second route of carbon flux. In
the present study, MDH and plastidial NADP malic enzyme decarboxylates were identified.
The MDH was expressed throughout the seed developmental stages suggesting that this route
might also be functional in flax seeds (Figure 3I). Collectively, these data indicate that both
the routes of carbon flow might be functional in flax seeds. Further studies of these pathway
enzymes might help in understanding the major routes of carbon flow for de novo fatty acid
synthesis in flax seeds.
Page 12 of 35
123456789101112131415161718192021222324252627282930313233343536373839404142434445464748495051525354555657585960

13
A third pathway of carbon assimilation is via Ribulose-1,5-bisphosphate carboxylase
oxygenase (RuBisCO) bypass to fulfill the high demand of carbon for fatty acid synthesis 58
.
In green photoheterotrophic plastids of rapeseed embryos, RuBisCO is able to fix CO2 apart
from the Calvin cycle. The identification of plastidial enolase and RuBisCO bypass enzymes
(RuBisCO and phosphoribulo kinase) suggested that the 3-phosphoglycerate produced during
the plastidial glycolysis needs to be converted to PEP using cytosolic enzymes and then
transported back into plastids for fatty acid synthesis. The RuBisCO was expressed during
embryogenesis stage and was one of the highly expressed enzymes amoung the selected 19
genes used for RT-qPCR analysis, indicating that this route is functional during early seed
developmental stages (Figure 3J).
Lipid accumulation is associated with oleosin and lipoxygenase expression
Oil storage proteins such as oleosins (9 isoforms) and lipoxygenase (6 isoforms) were
identified during seed maturation phase. Oleosins are structural proteins found in vascular
plant oil bodies and help to stabilize oil bodies in seeds and account for about 2-8% of the
total seed proteins 59
. Nine isoforms of oleosin were detected during seed filling and mature
stages. Expression pattern of Oleosin isoform g44859 matched the pattern of flax fatty acid
desaturases 60
that are involved in the formation of the omega-3 fatty acids, indicating their
role in the accumulation of oil (Figure 3K).
Lipoxygenases (LOX) are widely distributed in plants and animals and are critically
important for plant growth and development 61
. They are also involved in mobilizing storage
lipids during germination 62
. Flax seed proteome as well as transcript analysis of isoform
g14677 showed LOX proteins detected mainly during the maturation stage and therefore,
most probably served as nutrient reservoir (Figure 3L). High expression of LOX was also
observed in developing seeds of Medicago 63
and soybean, 16
thereby strengthening their role
in oil accumulation in seeds.
High activity of β-oxidation and glyoxylate pathway might accumulate alpha-linolenic
acid in flax seed
Fatty acids are widely found as major carbon and chemical energy reserves in seeds. Acetyl-
CoA carboxylase (ACC), which catalyzes the conversion of acetyl-CoA into malonyl-CoA, is
the key enzyme in FA biosynthesis. This plastid complex comprises four subunits, the biotin
carboxylase, biotin carboxyl carrier protein and carboxyltransferase subunits (α and β). We
identified all the enzyme subunits (except the β subunit of the carboxyltranferase, which was
Page 13 of 35
123456789101112131415161718192021222324252627282930313233343536373839404142434445464748495051525354555657585960

14
not detected). Flax seed is enriched in ALA (18:3n-3) and fatty acid desaturases (SAD, FAD2
and FAD3) play important roles in synthesis of this fatty acid. The SAD (two isoforms),
FAD2 and FAD3A proteins were detected at 22 DAA. Banik et al. 60
detected peak in
transcript activity of these enzymes during the similar seed developmental stages. These
studies indicate that the expression of these proteins is transcriptionally controlled and these
stages are important for ALA accumulation in flax seed.
Interestingly, we also identified enzymes involved in β-oxidation of the fatty acids
during the embryogenesis and seed filling stages. β-oxidation occurs widely in plant tissues
and also during seed development, implying a more general role during germination and
seedling establishment than in lipid degradation 64
. As a matter of fact, the 3-ketoacyl-CoA
thiolase-2 (kat2) mutation in Arabidopsis resulted in loss of activity and decrease in lipids up
to 30% in the seeds revealing the importance of β-oxidation during seed development 65
.
Such loss of lipids in embryos is also evident in other oilseed species such as castor bean, 66
cotton, 67
Arabidopsis 68
and rapeseed 69
. Hence, degradation of stored oil is likely to be a
normal maturation process in flax seed development. Moreover, key enzymes involved in
glyoxylate pathway, isocitrate lyase (ICL) and malate synthase (MS) were also identified at
later stage of seed filling and maturation also supported by their transcript expression pattern
(Figure 2M-N). Studies conducted in developing rapeseed proposed that enhanced activity of
enzymes involved in β-oxidation and glyoxylate pathway leads to accumulation of specific
fatty acids 69
. This could be the possible reason for high accumulation of ALA in flax and the
present study supports this observation.
Simultaneous biosynthesis and degradation of cyanogenic glycosides occurs in
developing flax seed
Cyanogenic glycosides (CGs) are the biggest and extensively studied class of plant secondary
metabolites found in more than 2,650 plant species and play important roles in primary
metabolism especially in plant insect interactions 70, 71
. After intake by humans, cyanogenic
glycosides are degraded in intestines by the intestinal microorganisms’ β-glycosidase
enzymes, which produce thiocyanates; causing iodine-deficiency disorders such as goiter and
cretinism 72
. Flax seed contains a considerable amount of CGs such as linamarin, linustatin,
lotaustralin and neolinustatin, 6 which limits the use of flax seed meal as food. Therefore, it is
essential to understand the accumulation pattern of such toxic CGs during flax seed
development. CGs biosynthetic pathway can be unanimously divided in three steps, wherein
Page 14 of 35
123456789101112131415161718192021222324252627282930313233343536373839404142434445464748495051525354555657585960

15
the first two steps are catalyzed by the enzymes of cytochrome-P450 family that produce
cyanohydrins, which are glycosylated by UDP-glucosyltransferase.
In the present study, three isoforms of cytochrome-P450 or valine N-monooxygenase
(g28397, g29398 and g29400) were detected during embryogenesis, which were homologues
to CYP79D1 and CYP71E1, respectively. The CYP79D1 catalyzes the first two committed
steps in the biosynthesis of linamarin in cassava, 73
whereas the CYP71E7 exhibits broader
substrate specificity and catalyzes the conversion of Z-p-hydroxyphenyl acetaldoxime into
cyanohydrin, p-hydroxy-mandelonitrile 74
. Niedzwiedz-Siegien 6 and Frehner et al.
5 reported
that monoglucosides (linamarin and lotaustralin) and diglucosides (linustatin and
neolinustatin) appeared in developing flax embryos soon after anthesis; however, mature
seeds accumulated only diglucosides. In the present study, the enzymes responsible for the
monoglucosides synthesis were identified during embryogenesis. Expression of valine N-
monooxygenase at 4DAA confirms the earlier reports (Figure 3O).
CGs undergo catabolic processes eventually leading to hydrogen cyanide and the enzymes, β-
glucosidases (linamarase) and R-hydroxynitrile lyases are involved in this degradation. Both
these enzymes were detected at the late seed filling and maturation stages. The expression
pattern of β-glucosidases showed similar pattern and confirms the proteomic findings (Figure
3P). Another catabolic enzyme, β-cyanoalanine synthase was also detected and expressed
during the embryogenesis and seed filling stages of flax seed (Figure 3Q).
Flax seed development demands enhanced methionine metabolism
Methionine (Met) is one of the important amino acids and a fundamental metabolite
synthesized by plants. The proteomic analyses of Arabidopsis seed germination and priming,
75 developing Medicago and Chinese fir seeds
44, 63, 76 suggested that Met metabolism has an
important role in seed development and germination. In plants, Met can be synthesized
through two pathways, de novo and S-methylmethionine (SMM) cycle. In the present study,
two important enzymes involved in the de novo biosynthetic pathway of Met, cystathionine γ-
synthase and methionine synthase were detected. The expression pattern of methionine
synthase was consistent with the high demand for protein synthesis during embryogenesis
(Figure 3R). Similarly, the enzyme involved in the Met recycling pathway, AdoMet:Met S-
methyltransferase, 77
was also detected. Additionally, two more enzymes, AdoMet synthetase
and S-Adenosyl-L-homocysteine (AdoHcy) hydrolase, which constitute the SMM cycle and
consume about half of the AdoMet produced 78
were also identified. These enzymes help in
the short term control of AdoMet level, which is the regulator of methionine biosynthesis.
Page 15 of 35
123456789101112131415161718192021222324252627282930313233343536373839404142434445464748495051525354555657585960

16
Among them, the AdoMet synthetase is a key enzyme in plant metabolism catalyzing
the biosynthesis of AdoMet, which is one of the key regulators of seed metabolism and has
an important influence on cell growth and development. It is the primary methyl-group donor
for methylation of varied compounds and involved in biosynthesis of ethylene, biotin and
polyamine 79
. In the present study as well as in Medicago, a conspicuous decrease in the level
of AdoMet synthetase was observed during seed development, indicating a switch from a
period of highly active metabolism to a quiescence period (Figure 3S). On the contrary,
during germination in Arabidopsis, AdoMet synthetase accumulated in the transition from a
quiescent to a highly active state 75
.
AdoHcy hydrolase catalyzes the production of AdoHcy, which is a potent competitive
inhibitor of methyltransferases crucial for cell growth and development 80
and is an important
intermediate in maintaining proper AdoMet levels. AdoHcy hydrolase was active during flax
seed development, supporting the hypothesis that methionine recycling via the
AdoMet/AdoHcy and the SMM cycle is limiting in mature seeds and is unable to maintain
appropriate methionine pool for germination and seedling establishment, as also observed in
Medicago 81
.
Besides the enzymes involved in the Met biosynthesis and SMM cycle, other enzymes
involved in Met metabolism were also detected. Two isoforms of cysteine synthase,
catalyzing the production of cysteine, which serves as the sulphur donor for Met from O-
acetyl-serine and hydrogen sulphide, were detected. ACC oxidase, an enzyme involved in the
synthesis of the plant ripening hormone, ethylene was also identified. During embryo
development in rapeseed, this enzyme controls cotyledon expansion 82
. Based on the above
results, we propose a functional model of methionine metabolism (Figure 5), which suggests
that the metabolism of Met is critical for storage protein synthesis in flax.
Transcriptional evidences correlate with proteome profiling
To obtain preliminary transcriptional evidence, the frequency of the ESTs mapping per
protein was determined using the publicly available flax EST datasets from the developing
seeds. A total of 1397 proteins (81%) had corresponding transcripts expressed in above-
mentioned libraries. This approach confirms gene expression at transcript level and would be
helpful for candidate gene isolation and characterization (Figure S2 and Table S3). However,
when the whole EST database of flax was used for the analysis, all the proteins had
transcriptional evidence (data not shown).
Page 16 of 35
123456789101112131415161718192021222324252627282930313233343536373839404142434445464748495051525354555657585960

17
Conclusions
This study provides a global proteomics perspective of the complex metabolic processes
occurring during flax seed development. The combined use of 1D-SDS-PAGE and LC-MSE
technique for profiling the complex seed proteome was found to be very effective. Several
proteins involved or associated with synthesis of the health promoting compounds were
identified. Their temporal expression pattern revealed development stages important for their
accumulation. We demonstrate the presence of three major carbon assimilatory routes for de
novo fatty acid synthesis in flax. In addition, the study also revealed unusual diversity of flax
seed storage proteins. As reported in other oilseeds, methionine metabolism was enhanced
during the transition from embryogenesis to seed filling, indicating a switch from active
growth phase to quiescence phase. Moreover, about 81% of the identified proteins had
transcriptional evidence in the form of ESTs from developing seeds of flax. This confirms
gene expression at transcript level and would be helpful for candidate gene isolation and
characterization. More in-depth studies of the identified proteins will be useful for better
understanding of the complexities of flax seed development.
Supporting Information
This material is available free of charge via the Internet at http://pubs.acs.org.
Figure S1. Venn diagram: Venn diagram of flax seed proteins annotated by one, a
combination of two and all three GO vocabularies. (CC: cellular component, BP: biological
process, MF: molecular function)
Figure S2. Digital expression analysis of identified proteins using seed specific EST
libraries: Identified 1716 proteins were TBlastN queried against developmental seed specific
EST database and EST clone frequencies were represented as heat map. The left and upper
side of the heat map shows hierarchical clustering based on Pearson correlation matrix.
Abbreviations used for libraries Globular (GE), heart shaped (HE), torpedo (TE), cotyledon
(CE), mature (ME) embryo and globular (GC) and torpedo (TC) stage seed coat and pooled
endosperm (EN).
Table S1. Sequences of primers used for reverse transcription quantitative PCR.
Table S2. Summary of identified proteins
Identified proteins were listed along with relative amount of protein in each of biological
replicate. Functional classification, PLGS score and mass spectrometric data were also
represented. Sub-cellular localization of proteins was predicted by WoLF PSORT web server
Page 17 of 35
123456789101112131415161718192021222324252627282930313233343536373839404142434445464748495051525354555657585960

18
and values indicate scores. Protein homologue was identified by using BlastP suite from
NCBI.
Table S3. Digital expression analysis of identified proteins using seed specific EST
libraries
A. Details of TBlastN parameters and NCBI accession numbers of mapped ESTs
B. Frequency of EST clones mapped onto the proteins
Acknowledgments
This project was supported by the Department of Biotechnology, Government of India at the
National Chemical Laboratory, Pune, India (Project Code: GAP278426). VTB, and SMK
acknowledge the Council of Scientific and Industrial Research (CSIR), India for research
fellowships. VCP acknowledge the Department of Biotechnology, Government of India for
research fellowships (Bio-CARe scheme). We thank Dr. P.B. Ghorpade College of
Agriculture, Nagpur for providing field facilities for growing and collection of seed
developmental tissue.
Competing interests
The authors declare that they have no competing interests.
Page 18 of 35
123456789101112131415161718192021222324252627282930313233343536373839404142434445464748495051525354555657585960

19
References
1.Daun, J. K.; Barthet, V. J.; Chornick, T. L.; Duguid, S., Flaxseed in Human Nutrition. In
Structure, composition and variety development of flaxseed, 2 ed.; Thompson, L.; Cunnane,
S., Eds. AOCS Press: Champaign, IL, 2003; pp 1-40.
2.Hall, C.; Tulbek, M. C.; Xu, T. Y., Flaxseed. In Advances in Food and Nutrition Research,
Academic Press: 2006; Vol. 51, pp 1-97.
3.Oomah, B. D., Flaxseed as a functional food source. Journal of the Science of Food and
Agriculture 2001, 81, (9), 889-894.
4.Cunnane, S. C.; Thompson, L. U., Flaxseed in human nutrition. AOCS Press Champaign, IL,
USA, 1995.
5.Frehner, M.; Scalet, M.; Conn, E. E., Pattern of the cyanide-potential in developing fruits -
Implications for plants accumulating cyanogenic monoglucosides (Phaseolus lunatus) or
cyanogenic diglucosides in their seeds (Linum usitatissimum, Prunus amygdalus). Plant
Physiology 1990, 94, (1), 28-34.
6.Niedzwiedz-Siegien, I., Cyanogenic glucosides in Linum usitatissimum. Phytochemistry 1998,
49, (1), 59-63.
7.Daun, J. K.; DeClercq, D. R. In Sixty years of Canadian flaxseed quality surveys at the Grain
Research Laboratory, Proceeding of the Flax Institute of the United States, Fargo, ND US.,
1994; Fargo, ND US., 1994; pp 192-200.
8.Ford, J. D.; Huang, K. S.; Wang, H. B.; Davin, L. B.; Lewis, N. G., Biosynthetic pathway to
the cancer chemopreventive secoisolariciresinol diglucoside-hydroxymethyl glutaryl ester-
linked lignan oligomers in flax (Linum usitatissimum) seed. Journal of Natural Products
2001, 64, (11), 1388-1397.
9.Eliasson, C.; Kamal-Eldin, A.; Andersson, R.; Aman, P., High-performance liquid
chromatographic analysis of secoisolariciresinol diglucoside and hydroxycinnamic acid
glucosides in flaxseed by alkaline extraction. Journal of Chromatography A 2003, 1012, (2),
151-159.
10.DeClercq, D. R.; Daun, J. K., Quality of Western Canadian Flaxseed. Canadian Grain
Commission. In http://www.grainscanada.gc.ca/flax-lin/harvest-recolte/2011/hqf11-qrl11-
eng.htm, 2002.
Page 19 of 35
123456789101112131415161718192021222324252627282930313233343536373839404142434445464748495051525354555657585960

20
11.Fenart, S.; Ndong, Y. P. A.; Duarte, J.; Riviere, N.; Wilmer, J.; van Wuytswinkel, O.; Lucau,
A.; Cariou, E.; Neutelings, G.; Gutierrez, L.; Chabbert, B.; Guillot, X.; Tavernier, R.;
Hawkins, S.; Thomasset, B., Development and validation of a flax (Linum usitatissimum L.)
gene expression oligo microarray. BMC Genomics 2010, 11, 592.
12.Venglat, P.; Xiang, D.; Qiu, S.; Stone, S. L.; Tibiche, C.; Cram, D.; Alting-Mees, M.; Nowak,
J.; Cloutier, S.; Deyholos, M.; Bekkaoui, F.; Sharpe, A.; Wang, E.; Rowland, G.; Selvaraj, G.;
Datla, R., Gene expression analysis of flax seed development. BMC Plant Biology 2011, 11,
74.
13.Rao, S.; Abdel-Reheem, M.; Bhella, R.; McCracken, C.; Hildebrand, D., Characteristics of
high alpha-linolenic acid accumulation in seed oils. Lipids 2008, 43, (8), 749-755.
14.Chen, M. J.; Mooney, B. P.; Hajduch, M.; Joshi, T.; Zhou, M. Y.; Xu, D.; Thelen, J. J.,
System analysis of an Arabidopsis mutant altered in de novo fatty acid synthesis reveals
diverse changes in seed composition and metabolism. Plant Physiology 2009, 150, (1), 27-41.
15.Hajduch, M.; Ganapathy, A.; Stein, J. W.; Thelen, J. J., A systematic proteomic study of seed
filling in soybean. Establishment of high-resolution two-dimensional reference maps,
expression profiles, and an interactive proteome database. Plant Physiology 2005, 137, (4),
1397-1419.
16.Agrawal, G. K.; Hajduch, M.; Graham, K.; Thelen, J. J., In-depth investigation of the soybean
seed-filling proteome and comparison with a parallel study of rapeseed. Plant Physiology
2008, 148, (1), 504-518.
17.Hajduch, M.; Casteel, J. E.; Hurrelmeyer, K. E.; Song, Z.; Agrawal, G. K.; Thelen, J. J.,
Proteomic analysis of seed filling in Brassica napus. Developmental characterization of
metabolic isozymes using high-resolution two-dimensional gel electrophoresis. Plant
Physiology 2006, 141, (3), 1159-1159.
18.Houston, N. L.; Hajduch, M.; Thelen, J. J., Quantitative proteomics of seed filling in castor:
comparison with soybean and rapeseed reveals differences between photosynthetic and
nonphotosynthetic seed metabolism. Plant Physiology 2009, 151, (2), 857-868.
19.Hajduch, M.; Hearne, L. B.; Miernyk, J. A.; Casteel, J. E.; Joshi, T.; Agrawal, G. K.; Song,
Z.; Zhou, M. Y.; Xu, D.; Thelen, J. J., Systems analysis of seed filling in arabidopsis: Using
general linear modeling to assess concordance of transcript and protein expression. Plant
Physiology 2010, 152, (4), 2078-2087.
Page 20 of 35
123456789101112131415161718192021222324252627282930313233343536373839404142434445464748495051525354555657585960

21
20.Hradilova, J.; Rehulka, P.; Rehulkova, H.; Vrbova, M.; Griga, M.; Brzobohaty, B.,
Comparative analysis of proteomic changes in contrasting flax cultivars upon cadmium
exposure. Electrophoresis 2010, 31, (2), 421-431.
21.Klubicova, K.; Bercak, M.; Danchenko, M.; Skultety, L.; Rashydov, N. M.; Berezhna, V. V.;
Miernyk, J. A.; Hajduch, M., Agricultural recovery of a formerly radioactive area: I.
Establishment of high-resolution quantitative protein map of mature flax seeds harvested from
the remediated Chernobyl area. Phytochemistry 2011a, 72, (10), 1308-1315.
22.Klubicova, K.; Danchenko, M.; Skultety, L.; Miernyk, J. A.; Rashydov, N. M.; Berezhna, V.
V.; Pret'Ova, A.; Hajduch, M., Proteomics analysis of Flax grown in chernobyl area suggests
limited effect of contaminated environment on seed proteome. Environmental Science &
Technology 2010, 44, (18), 6940-6946.
23.Klubicova, K.; Danchenko, M.; Skultety, L.; Berezhna, V. V.; Hricova, A.; Rashydav, N. M.;
Hajduch, M., Agricultural recovery of a formerly radioactive area: II. Systematic proteomic
characterization of flax seed development in the remediated Chernobyl area. Journal of
Proteomics 2011b, 74, (8), 1378-1384.
24.Wang, Z.; Hobson, N.; Galindo, L.; Zhu, S.; Shi, D.; McDill, J.; Yang, L.; Hawkins, S.;
Neutelings, G.; Datla, R.; Lambert, G.; Galbraith, D. W.; Grassa, C. J.; Geraldes, A.; Cronk,
Q. C.; Cullis, C.; Dash, P. K.; Kumar, P. A.; Cloutier, S.; Sharpe, A.; Wong, G. K.; Wang, J.;
Deyholos, M. K., The genome of flax (Linum usitatissimum) assembled de novo from short
shotgun sequence reads. Plant J 2012, DOI: 10.1111/j.1365-313X.2012.05093.x, In press.
25.Rajwade, A. V.; Arora, R. S.; Kadoo, N. Y.; Harsulkar, A. M.; Ghorpade, P. B.; Gupta, V. S.,
Relatedness of Indian flax genotypes (Linum usitatissimum L.): An inter-simple sequence
repeat (ISSR) primer assay. Molecular Biotechnology 2010, 45, (2), 161-170.
26.Wang, W.; Vignani, R.; Scali, M.; Cresti, M., A universal and rapid protocol for protein
extraction from recalcitrant plant tissues for proteomic analysis. Electrophoresis 2006, 27,
(13), 2782-2786.
27.Bradford, M. M., Rapid and sensitive method for quantitation of microgram quantities of
protein utilizing principle of protein-dye binding. Analytical Biochemistry 1976, 72, (1-2),
248-254.
Page 21 of 35
123456789101112131415161718192021222324252627282930313233343536373839404142434445464748495051525354555657585960
22
28.Haynes, P. A.; Fripp, N.; Aebersold, R., Identification of gel-separated proteins by liquid
chromatography electrospray tandem mass spectrometry: Comparison of methods and their
limitations. Electrophoresis 1998, 19, (6), 939-945.
29.Li, G. Z.; Vissers, J. P. C.; Silva, J. C.; Golick, D.; Gorenstein, M. V.; Geromanos, S. J.,
Database searching and accounting of multiplexed precursor and product ion spectra from the
data independent analysis of simple and complex peptide mixtures. Proteomics 2009, 9, (6),
1696-1719.
30.Conesa, A.; Gotz, S.; Garcia-Gomez, J. M.; Terol, J.; Talon, M.; Robles, M., Blast2GO: a
universal tool for annotation, visualization and analysis in functional genomics research.
Bioinformatics 2005, 21, (18), 3674-3676.
31.Horton, P.; Park, K. J.; Obayashi, T.; Fujita, N.; Harada, H.; Adams-Collier, C. J.; Nakai, K.,
WoLF PSORT: protein localization predictor. Nucleic Acids Research 2007, 35, W585-
W587.
32.Deng, W.; Nickle, D. C.; Learn, G. H.; Maust, B.; Mullins, J. I., ViroBLAST: a stand-alone
BLAST web server for flexible queries of multiple databases and user's datasets.
Bioinformatics 2007, 23, (17), 2334-2336.
33.Barvkar, V. T.; Pardeshi, V. C.; Kale, S. M.; Kadoo, N. Y.; Gupta, V. S., Phylogenomic
analysis of UDP glycosyltransferase 1 multigene family in Linum usitatissimum identified
genes with varied expression patterns. BMC Genomics 2012, 13, (1), 175.
34.Ramakers, C.; Ruijter, J. M.; Deprez, R. H. L.; Moorman, A. F. M., Assumption-free analysis
of quantitative real-time polymerase chain reaction (PCR) data. Neuroscience Letters 2003,
339, (1), 62-66.
35.Schmittgen, T. D.; Livak, K. J., Analyzing real-time PCR data by the comparative Ct method.
Nature Protocols 2008, 3, (6), 1101-1108.
36.Gutierrez, L.; Conejero, G.; Castelain, M.; Guenin, S.; Verdeil, J. L.; Thomasset, B.; Van
Wuytswinkel, O., Identification of new gene expression regulators specifically expressed
during plant seed maturation. Journal of Experimental Botany 2006, 57, (9), 1919-1932.
37.Fang, Y.; Robinson, D. P.; Foster, L. J., Quantitative analysis of proteome coverage and
recovery rates for upstream fractionation methods in proteomics. Journal of Proteome
Research 2010, 9, (4), 1902-1912.
Page 22 of 35
123456789101112131415161718192021222324252627282930313233343536373839404142434445464748495051525354555657585960

23
38.Zybailov, B.; Friso, G.; Kim, J.; Rudella, A.; Rodriguez, V. R.; Asakura, Y.; Sun, Q.; van
Wijk, K. J., Large scale comparative proteomics of a chloroplast Clp protease mutant reveals
folding stress, altered protein homeostasis, and feedback regulation of metabolism. Molecular
& Cellular Proteomics 2009, 8, (8), 1789-1810.
39.Minas, I. S.; Tanou, G.; Belghazi, M.; Job, D.; Manganaris, G. A.; Molassiotis, A.;
Vasilakakis, M., Physiological and proteomic approaches to address the active role of ozone
in kiwifruit post-harvest ripening. Journal of Experimental Botany 2012, PMID 22268155.
40.Lee, J.; Garrett, W. M.; Cooper, B., Shotgun proteomic analysis of Arabidopsis thaliana
leaves. Journal of Separation Science 2007, 30, (14), 2225-2230.
41.Shewry, P. R.; Napier, J. A.; Tatham, A. S., Seed storage proteins: structures and
biosynthesis. Plant Cell 1995, 7, (7), 945-956.
42.Wise, M. J.; Tunnacliffe, A., POPP the question: what do LEA proteins do? Trends in Plant
Science 2004, 9, (1), 13-17.
43.Dennis, D. T.; Miernyk, J. A., Compartmentation of non-photosynthetic carbohydrate
metabolism. Annual Review of Plant Physiology and Plant Molecular Biology 1982, 33, 27-
50.
44.Gallardo, K.; Firnhaber, C.; Zuber, H.; Hericher, D.; Belghazi, M.; Henry, C.; Kuster, H.;
Thompson, R., A combined proteome and transcriptome analysis of developing Medicago
truncatula seeds. Molecular & Cellular Proteomics 2007, 6, (12), 2165-2179.
45.Hajduch, M.; Matusova, R.; Houston, N. L.; Thelen, J. J., Comparative proteomics of seed
maturation in oilseeds reveals differences in intermediary metabolism. Proteomics 2011, 11,
(9), 1619-1629.
46.Simcox, P. D.; Reid, E. E.; Canvin, D. T.; Dennis, D. T., Enzymes of the glycolytic and
pentose phosphate pathways in proplastids from the developing endosperm of Ricinus
communis L. Plant Physiology 1977, 59, (6), 1128-32.
47.Journet, E. P.; Douce, R., Enzymic capacities of purified cauliflower bud plastids for lipid
synthesis and carbohydrate metabolism. Plant Physiology 1985, 79, (2), 458-467.
48.Denyer, K.; Smith, A. M., The capacity of plastids from developing Pea cotyledons to
synthesize acetyl CoA. Planta 1988, 173, (2), 172-182.
Page 23 of 35
123456789101112131415161718192021222324252627282930313233343536373839404142434445464748495051525354555657585960

24
49.Eastmond, P. J.; Rawsthorne, S., Coordinate changes in carbon partitioning and plastidial
metabolism during the development of oilseed rape embryo. Plant Physiology 2000, 122, (3),
767-774.
50.Dietz, K. J. In Control function of hexosemonophosphate isomerase and phosphoglucomutase
in starch synthesis in leaves, Proceedings of the 7th International Congress on Photosynthesis,
The Hague, The Netherlands, 1987; Biggins, J., Ed. Martinus Nijhoff Dr. W. Junk
Publications: The Hague, The Netherlands, 1987; pp 329–332.
51.Hattenbach, A.; Heineke, D., On the role of chloroplastic phosphoglucomutase in the
regulation of starch turn over. Planta 1999, 207, 527–532.
52.Periappuram, C.; Steinhauer, L.; Barton, D. L.; Taylor, D. C.; Chatson, B.; Zou, J., The
plastidic phosphoglucomutase from Arabidopsis. A reversible enzyme reaction with an
important role in metabolic control. Plant Physiology 2000, 122, (4), 1193-1200.
53.Casey, R.; Domoney, C.; Forster, C.; Hedley, C.; Hitchin, E.; Wang, T., The effect of
modifying carbohydrate metabolism on seed protein gene expression in peas. Journal of Plant
Physiology 1998, 152, (6), 636-640.
54.Vigeolas, H.; Waldeck, P.; Zank, T.; Geigenberger, P., Increasing seed oil content in oil-seed
rape (Brassica napus L.) by over-expression of a yeast glycerol-3-phosphate dehydrogenase
under the control of a seed-specific promoter. Plant Biotechnology Journal 2007, 5, (3), 431-
441.
55.Schwender, J.; Ohlrogge, J.; Shachar-Hill, Y., Understanding flux in plant metabolic
networks. Current Opinion in Plant Biology 2004, 7, (3), 309-317.
56.Ruuska, S. A.; Girke, T.; Benning, C.; Ohlrogge, J. B., Contrapuntal networks of gene
expression during Arabidopsis seed filling. Plant Cell 2002, 14, (6), 1191-1206.
57.Plaxton, W. C.; Podesta, F. E., The functional organization and control of plant respiration.
Critical Reviews in Plant Sciences 2006, 25, (2), 159-198.
58.Schwender, J.; Shachar-Hill, Y.; Ohlrogge, J. B., Mitochondrial metabolism in developing
embryos of Brassica napus. Journal of Biological Chemistry 2006, 281, (45), 34040-34047.
59.Huang, A. H. C., Oil bodies and oleosins in seeds. Annual Review of Plant Physiology and
Plant Molecular Biology 1992, 43, 177-200.
60.Banik, M.; Duguid, S.; Cloutier, S., Transcript profiling and gene characterization of three
fatty acid desaturase genes in high, moderate, and low linolenic acid genotypes of flax (Linum
Page 24 of 35
123456789101112131415161718192021222324252627282930313233343536373839404142434445464748495051525354555657585960

25
usitatissimum L.) and their role in linolenic acid accumulation. Genome 2011, 54, (6), 471-
483.
61.Porta, H.; Rocha-Sosa, M., Plant lipoxygenases. Physiological and molecular features. Plant
Physiology 2002, 130, (1), 15-21.
62.Feussner, I.; Kuhn, H.; Wasternack, C., Lipoxygenase-dependent degradation of storage
lipids. Trends in Plant Science 2001, 6, (6), 268-273.
63.Gallardo, K.; Le Signor, C.; Vandekerckhove, J.; Thompson, R. D.; Burstin, J., Proteomics of
Medicago truncatula seed development establishes the time frame of diverse metabolic
processes related to reserve accumulation. Plant Physiology 2003, 133, (2), 664-682.
64.Moire, L.; Rezzonico, E.; Goepfert, S.; Poirier, Y., Impact of unusual fatty acid synthesis on
futile cycling through beta-oxidation and on gene expression in transgenic plants. Plant
Physiology 2004, 134, (1), 432-442.
65.Germain, V.; Rylott, E. L.; Larson, T. R.; Sherson, S. M.; Bechtold, N.; Carde, J. P.; Bryce, J.
H.; Graham, I. A.; Smith, S. M., Requirement for 3-ketoacyl-CoA thiolase-2 in peroxisome
development, fatty acid beta-oxidation and breakdown of triacylglycerol in lipid bodies of
Arabidopsis seedlings. Plant Journal 2001, 28, (1), 1-12.
66.Hutton, D.; Stumpf, P. K., Fat metabolism in higher plants XXXVII. Characterization of the
beta -oxidation systems from maturing and germinating castor bean seeds. Plant physiology
1969, 44, 508–16.
67.Miernyk, J. A.; Trelease, R. N., Control of enzyme-activities in cotton cotyledons during
maturation and germination: IV. Beta-oxidation. Plant Physiology 1981, 67, (2), 341-346.
68.Baud, S.; Boutin, J. P.; Miquel, M.; Lepiniec, L.; Rochat, C., An integrated overview of seed
development in Arabidopsis thaliana ecotype WS. Plant Physiology and Biochemistry 2002,
40, (2), 151-160.
69.Chia, T. Y. P.; Pike, M. J.; Rawsthorne, S., Storage oil breakdown during embryo
development of Brassica napus (L.). Journal of Experimental Botany 2005, 56, (415), 1285-
1296.
70.Zagrobelny, M.; Bak, S.; Rasmussen, A. V.; Jorgensen, B.; Naumann, C. M.; Moller, B. L.,
Cyanogenic glucosides and plant-insect interactions. Phytochemistry 2004, 65, (3), 293-306.
Page 25 of 35
123456789101112131415161718192021222324252627282930313233343536373839404142434445464748495051525354555657585960

26
71.Ganjewala, D.; Kumar, S.; Devi, S. A.; Ambika, K., Advances in cyanogenic glycosides
biosynthesis and analyses in plants: A review. Acta Biologica Szegediensis 2010, 54, (1), 1-
14.
72.Delange, F.; Ekpechi, L. O.; Rosling, H., Cassava cyanogenesis and iodine defciency
disorders. Acta Horticulturae 1994, 375, 289-293.
73.Andersen, M. D.; Busk, P. K.; Svendsen, I.; Moller, B. L., Cytochromes P-450 from cassava
(Manihot esculenta Crantz) catalyzing the first steps in the biosynthesis of the cyanogenic
glucosides linamarin and lotaustralin - Cloning, functional expression in Pichia pastoris, and
substrate specificity of the isolated recombinant enzymes. Journal of Biological Chemistry
2000, 275, (3), 1966-1975.
74.Bak, S.; Kahn, R. A.; Nielsen, H. L.; Moller, B. L.; Halkier, B. A., Cloning of three A-type
cytochromes p450, CYP71E1, CYP98, and CYP99 from Sorghum bicolor (L.) Moench by a
PCR approach and identification by expression in Escherichia coli of CYP71E1 as a
multifunctional cytochrome p450 in the biosynthesis of the cyanogenic glucoside dhurrin.
Plant Molecular Biology 1998, 36, (3), 393-405.
75.Gallardo, K.; Job, C.; Groot, S. P. C.; Puype, M.; Demol, H.; Vandekerckhove, J.; Job, D.,
Proteomic analysis of Arabidopsis seed germination and priming. Plant Physiology 2001,
126, (2), 835-848.
76.Shi, J. S.; Zhen, Y.; Zheng, R. H., Proteome profiling of early seed development in
Cunninghamia lanceolata (Lamb.) Hook. Journal of Experimental Botany 2010, 61, (9),
2367-2381.
77.Hanson, A. D.; Roje, S., One-carbon metabolism in higher plants. Annual Review of Plant
Physiology and Plant Molecular Biology 2001, 52, 119-137.
78.Ranocha, P.; McNeil, S. D.; Ziemak, M. J.; Li, C. J.; Tarczynski, M. C.; Hanson, A. D., The
S-methylmethionine cycle in angiosperms: ubiquity, antiquity and activity. Plant Journal
2001, 25, (5), 575-584.
79.Ravanel, S.; Gakiere, B.; Job, D.; Douce, R., The specific features of methionine biosynthesis
and metabolism in plants. Proceedings of the National Academy of Sciences of the United
States of America 1998, 95, (13), 7805-7812.
Page 26 of 35
123456789101112131415161718192021222324252627282930313233343536373839404142434445464748495051525354555657585960

27
80.Turner, M. A.; Yang, X. D.; Yin, D.; Kuczera, K.; Borchardt, R. T.; Howell, P. L., Structure
and function of S-adenosylhomocysteine hydrolase. Cell Biochemistry and Biophysics 2000,
33, (2), 101-125.
81.Gallardo, K.; Job, C.; Groot, S. P. C.; Puype, M.; Demol, H.; Vandekerckhove, J.; Job, D.,
Importance of methionine biosynthesis for Arabidopsis seed germination and seedling growth.
Physiologia Plantarum 2002, 116, (2), 238-247.
82.Hays, D. B.; Reid, D. M.; Yeung, E. C.; Pharis, R. P., Role of ethylene in cotyledon
development of microspore-derived embryos of Brassica napus. Journal of Experimental
Botany 2000, 51, (352), 1851-1859.
Page 27 of 35
123456789101112131415161718192021222324252627282930313233343536373839404142434445464748495051525354555657585960

28
Figure legends
Figure 1. Biochemical characterization and schematic representation of experimental
design for proteome analysis of developing flax seeds: A) The image of flax seed
developmental stages (7 stages, 4, 8, 12, 16, 22, 30 and 48 DAA) subjected to proteome analysis.
B) Seed fresh and dry mass during the experimental period expressed as mass per seed. Values
are the average of 10 determinations; SE is denoted as error bars. C) Individual seed size
characteristics, including length (x), thickness (y), and width (z), were determined using scale.
Each value is an average of 10 seeds; SE is denoted by error bars. D) Total protein content per
seed during the seven seed developmental stages. Values are the average of 3 replicates; SE is
denoted as error bars. E) Percent fatty acid content per seed analyzed during the seven seed
developmental stages. Accumulation of five main fatty acids, namely palmitic (PA, C16:0),
stearic (SA, C18:0), oleic (OA, C18:1), linoleic (LA, C18:2), and linolenic (ALA, C18:3) acids
is illustrated. Values are the average of 3 biological replicates; SE is shown as error bars F) Gel
image of 1D-SDS-PAGE (12%), gel slicing (13 pieces), in-gel trypsin digestion followed by
nano LC-ESI -MSE G) The LC-MS/MS spectra were searched against the predicted flax gene
models database (http://www.linum.ca) using ProteinLynx Global Server 2.4 (PLGS) with
criteria as described in Materials and Methods. The identified non-redundant proteins were
BlastP searched against the NCBI-nr database along with Blast2Go software to assign the
functional role to the identified proteins. The identified proteins were TBlastN searched against
the seed specific EST libraries (see Material and Methods) to study the digital expression
analysis.
Figure 2. GO analysis of proteins identified in developing flax seeds: A total of 1716 unique
proteins were analyzed with the Blast2GO program. The GO categories: A) 25 cellular
components (CC) B) 43 biological processes (BP) and C) 24 molecular functions (MF) are
shown as pie charts.
Figure 3: RT-qPCR expression profile of 20 candidate genes
Seven seed developmental stages (4, 8, 12, 16, 22, 30, 48 DAA) were used in the study. These
graphs show the relative transcript abundance of each gene in comparison with the reference
gene, Linum usitatissimum ETIF5A (GR508912). Expression values are reported as the average
of three biological and two technical replicates. Values correspond to the mean and standard
error of biological triplicates.
Page 28 of 35
123456789101112131415161718192021222324252627282930313233343536373839404142434445464748495051525354555657585960

29
Figure 4. Schematic view of carbohydrate metabolism during flax seed development:
Values in the parentheses represent the number of isoforms identified for that protein. C and P
denote the cytosolic and plastidial locations of enzymes. Abbreviations for metabolites: UDP-G:
uridine diphosphoglucose; G-1-P: Glucose 1 phosphate; G-6-P: Glucose 6 phosphate; F-6-P:
Fructose 6 phosphate; F-1,6bP: Fructose 1,6-bisphosphate; GAP: glyceraldehydes 3-Phosphate;
DHAP: dihydroxyacetone phosphate; 1,3-bis PGA: 1,3-bisphosphoglyceric acid; 3-PGA: 3-
phosphoglyceric acid; 2-PGA: 2-phosphoglyceric acid; PEP, phosphoenolpyruvate. The enzymes
are: 1. Sucrose synthase, 2. UDP-Glucose Pyrophosphorylase, 3. Phosphoglucomutase, 4.
Glucose-6-phosphate isomerase, 5. Fructokinase, 6. Phosphofructose kinase, 7. Fructose-
bisphosphate aldolase, 8.Triose-phosphate isomerase, 9. Glyceraldehyde 3-phosphate
dehydrogenase, 10. Phosphoglycerate kinase, 11. 2,3-bisphosphoglycerate independent PGAM,
12. Enolase, 13. Pyruvate kinase, 14. Phosphoribulokinase, 15. Ribulose-1, 5-bisphosphate
carboxylase oxygenase (RuBisCO), 16. Pyruvate dehydrogenase, 17. PEP Carboxylase, 18.
Malate dehydrogenase, and 19. NADP- Dependant malic enzyme.
Figure 5. Schematic view of methionine metabolic pathway during flax seed development:
Values in the parentheses represent the number of isoforms identified for that protein. Enzymes
shown in grey color were not identified in the present study. Abbreviations for enzymes and
metabolites: MMT: methionine S-methyltransferase; HMT: SMM: homocysteine S-
methyltransferase; AMP: Adenosine monophosphate.
Page 29 of 35
123456789101112131415161718192021222324252627282930313233343536373839404142434445464748495051525354555657585960

Figure 1. Biochemical characterization and schematic representation of experimental design for proteome analysis of developing flax seeds: A) The image of flax seed developmental stages (7 stages, 4, 8, 12, 16, 22, 30 and 48 DAA) subjected to proteome analysis. B) Seed fresh and dry mass during the experimental
period expressed as mass per seed. Values are the average of 10 determinations; SE is denoted as error bars. C) Individual seed size characteristics, including length (x), thickness (y), and width (z), were
determined using scale. Each value is an average of 10 seeds; SE is denoted by error bars. D) Total protein content per seed during the seven seed developmental stages. Values are the average of 3 replicates; SE is denoted as error bars. E) Percent fatty acid content per seed analyzed during the seven seed developmental stages. Accumulation of five main fatty acids, namely palmitic (PA, C16:0), stearic (SA, C18:0), oleic (OA, C18:1), linoleic (LA, C18:2), and linolenic (ALA, C18:3) acids is illustrated. Values are the average of 3
biological replicates; SE is shown as error bars F) Gel image of 1D-SDS-PAGE (12%), gel slicing (13 pieces), in-gel trypsin digestion followed by nano LC-ESI -MSE G) The LC-MS/MS spectra were searched against the predicted flax gene models database (http://www.linum.ca) using ProteinLynx Global Server 2.4 (PLGS)
Page 30 of 35
123456789101112131415161718192021222324252627282930313233343536373839404142434445464748495051525354555657585960

with criteria as described in Materials and Methods. The identified non-redundant proteins were BlastP searched against the NCBI-nr database along with Blast2Go software to assign the functional role to the
identified proteins. The identified proteins were TBlastN searched against the seed specific EST libraries (see Material and Methods) to study the digital expression analysis.
186x232mm (300 x 300 DPI)
Page 31 of 35
123456789101112131415161718192021222324252627282930313233343536373839404142434445464748495051525354555657585960

Figure 2. GO analysis of proteins identified in developing flax seeds: A total of 1716 unique proteins were analyzed with the Blast2GO program. The GO categories: A) 25 cellular components (CC) B) 43 biological
processes (BP) and C) 24 molecular functions (MF) are shown as pie charts. 88x98mm (300 x 300 DPI)
Page 32 of 35
123456789101112131415161718192021222324252627282930313233343536373839404142434445464748495051525354555657585960
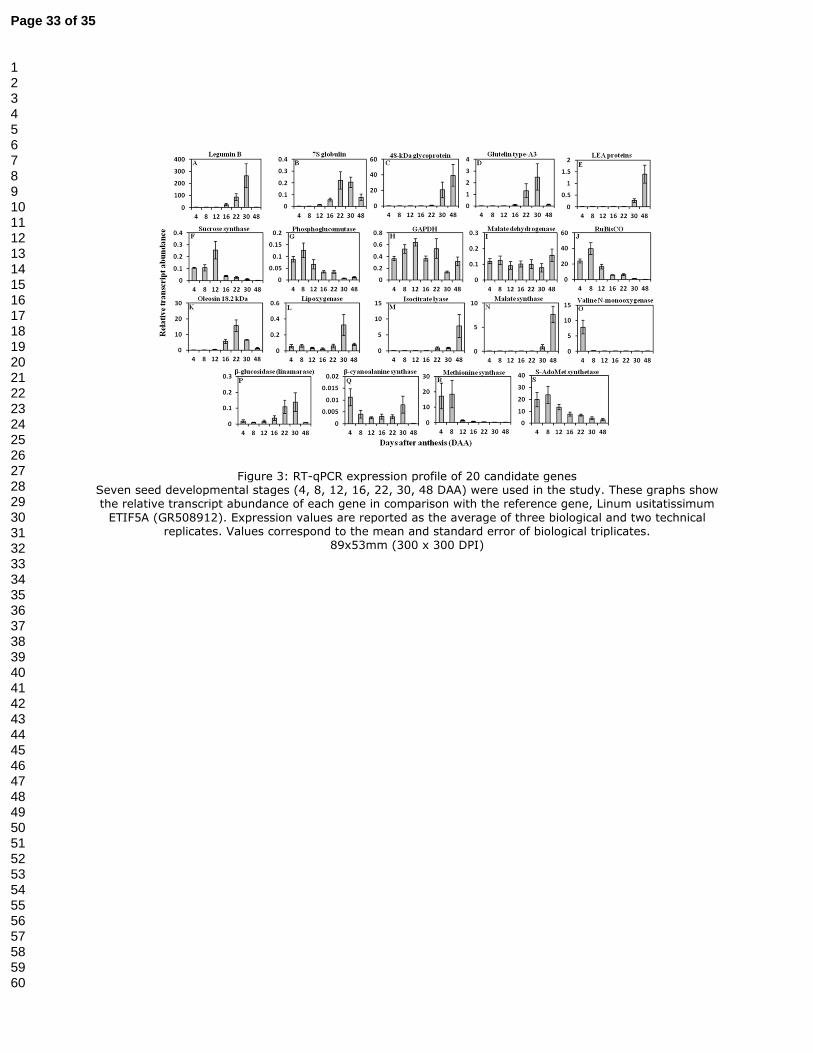
Figure 3: RT-qPCR expression profile of 20 candidate genes Seven seed developmental stages (4, 8, 12, 16, 22, 30, 48 DAA) were used in the study. These graphs show the relative transcript abundance of each gene in comparison with the reference gene, Linum usitatissimum
ETIF5A (GR508912). Expression values are reported as the average of three biological and two technical replicates. Values correspond to the mean and standard error of biological triplicates.
89x53mm (300 x 300 DPI)
Page 33 of 35
123456789101112131415161718192021222324252627282930313233343536373839404142434445464748495051525354555657585960

Figure 4. Schematic view of carbohydrate metabolism during flax seed development: Values in the parentheses represent the number of isoforms identified for that protein. C and P denote the cytosolic and plastidial locations of enzymes. Abbreviations for metabolites: UDP-G: uridine diphosphoglucose; G-1-P:
Glucose 1 phosphate; G-6-P: Glucose 6 phosphate; F-6-P: Fructose 6 phosphate; F-1,6bP: Fructose 1,6-bisphosphate; GAP: glyceraldehydes 3-Phosphate; DHAP: dihydroxyacetone phosphate; 1,3-bis PGA: 1,3-
bisphosphoglyceric acid; 3-PGA: 3- phosphoglyceric acid; 2-PGA: 2-phosphoglyceric acid; PEP, phosphoenolpyruvate. The enzymes are: 1. Sucrose synthase, 2. UDP-Glucose Pyrophosphorylase, 3.
Phosphoglucomutase, 4. Glucose-6-phosphate isomerase, 5. Fructokinase, 6. Phosphofructose kinase, 7. Fructose-bisphosphate aldolase, 8.Triose-phosphate isomerase, 9. Glyceraldehyde 3-phosphate
dehydrogenase, 10. Phosphoglycerate kinase, 11. 2,3-bisphosphoglycerate independent PGAM, 12. Enolase, 13. Pyruvate kinase, 14. Phosphoribulokinase, 15. Ribulose-1, 5-bisphosphate carboxylase oxygenase
(RuBisCO), 16. Pyruvate dehydrogenase, 17. PEP Carboxylase, 18. Malate dehydrogenase, and 19. NADP- Dependant malic enzyme. 74x82mm (300 x 300 DPI)
Page 34 of 35
123456789101112131415161718192021222324252627282930313233343536373839404142434445464748495051525354555657585960

Figure 5. Schematic view of methionine metabolic pathway during flax seed development: Values in the parentheses represent the number of isoforms identified for that protein. Enzymes shown in grey color were
not identified in the present study. Abbreviations for enzymes and metabolites: MMT: methionine S-
methyltransferase; HMT: SMM: homocysteine S-methyltransferase; AMP: Adenosine monophosphate. 73x77mm (300 x 300 DPI)
Page 35 of 35
123456789101112131415161718192021222324252627282930313233343536373839404142434445464748495051525354555657585960

Graphical Abstract
49x62mm (300 x 300 DPI)
Page 36 of 35
123456789101112131415161718192021222324252627282930313233343536373839404142434445464748495051525354555657585960
Copyright © 2022 FDOKUMEN