Prosocial development from childhood to adolescence: a multi‐informant perspective with Canadian...
10
Prosocial development from childhood to adolescence: a multi-informant perspective with Canadian and Italian longitudinal studies Ame ´ lie Nantel-Vivier, 1 Katja Kokko, 2 Gian Vittorio Caprara, 3 Concetta Pastorelli, 3 Maria Grazia Gerbino, 3 Marinella Paciello, 3 Sylvana Co ˆte ´, 4 Robert O. Pihl, 1 Frank Vitaro, 4 and Richard E. Tremblay 4 1 McGill University, Canada; 2 University of Jyva ¨skyla ¨, Finland; 3 La Sapienza University, Italy; 4 University of Montreal, Canada Objectives: To longitudinally describe prosocial behaviour development from childhood to adoles- cence, using multiple informants within Canadian and Italian samples. Method: Participants in Study 1 were 1037 boys from low socioeconomic status (SES) areas in Montreal, Canada, for whom yearly teacher and mother reports were obtained between the ages of 10 and 15. Participants in Study 2 were 472 children (209 girls) from Genzano, Italy, for whom yearly self and teacher reports were obtained between the ages of 10 and 14. Developmental trajectories were estimated from ratings by each infor- mant to identify subgroups of children following distinct courses of prosocial development. Results: In Study 1, three trajectory groups (low/declining 53%, high/declining 16%, high/steep declining 31%) were identified from teacher ratings, while five trajectories (low/stable 7%, low/declining 19%, mod- erate/stable 41%, high/declining 24%, high/stable 9%) were identified from mother ratings. Small but significant associations were observed between mother and teacher ratings. In Study 2, three trajectory groups (low/stable 9%, moderate/stable 50%, high/stable 42%) were identified from self-ratings, while four trajectory groups (low/stable 8%, moderate/declining 48%, high/declining 37%, increasing 7%) were identified from teacher ratings. Small but significant associations were observed between self- and teacher ratings. Conclusions: The present studies investigated levels of prosocial behaviours from childhood to adolescence, using a multi-informant, cross-cultural perspective. All but one of the developmental trajectories identified were characterised by stable or declining levels of prosocial behaviours. Further research longitudinally investigating prosociality across developmental periods is needed to clarify prosocial behaviour development over time. Keywords: Prosocial behaviours, longi- tudinal analysis. Abbreviations: SES: socioeconomic status; SBQ: Social Behaviour Questionnaire; BIC: Bayesian Information Criterion. A common statement within developmental psy- chology is that prosocial behaviours, including helping, sharing, comforting, and cooperating, increase in frequency as children grow older. Soci- alisation processes, together with maturation within different developmental spheres, such as the affec- tive (e.g., empathy) and socio-cognitive domains (e.g., moral reasoning), are believed to underlie this trend (Eisenberg, Fabes, & Spinrad, 2006). However, the investigation of age-related changes in prosocial behaviours has not been a simple endeavour, with prominent reviews concluding that the developmen- tal course of prosocial behaviours is complex (see Bar-Tal, 1982; Eisenberg, 2003; Eisenberg & Fabes, 1998; Radke-Yarrow, Zahn-Waxler, & Chapman, 1983; Zahn-Waxler & Smith, 1992). Providing a quantitative summary of available empirical evidence, Eisenberg and Fabes (1998) performed a meta-analysis of 179 studies. A signifi- cant positive relationship emerged between fre- quencies of prosocial behaviours and age (mean weighted effect size (d) = .26). The magnitude of the relationship, however, varied as a function of meth- odological factors (e.g., focus age groups, infor- mants). As well, only 13% of individual effect sizes presented (11/87) were above .5, a value generally thought to reflect a medium effect size (Cohen, 1992). Therefore, the meta-analysis by Eisenberg and Fabes (1998) highlighted the complexity of pro- social development, emphasising the importance of further qualifying the statement that prosocial behaviours increase in frequency throughout devel- opment. Caplan (1993) and Hay (1994) suggested that early childhood prosocial impulses become increasingly differentiated and individualised over time. From this perspective, maturation and socialisation do not only promote children’s prosociality, but rather help them regulate their prosocial inclinations. With age, children acquire display rules that help them bal- ance prosocial acts with self-interest, and exhibit prosocial actions that are gradually more relation- ship specific (Caplan, 1993). The interaction of facilitative (e.g., empathy) and inhibitory (e.g., self- interest) forces predicts that a general increase in prosocial behaviour frequency is unlikely. Conflict of interest statement: No conflicts declared. Journal of Child Psychology and Psychiatry 50:5 (2009), pp 590–598 doi:10.1111/j.1469-7610.2008.02039.x Ó 2009 The Authors Journal compilation Ó 2009 Association for Child and Adolescent Mental Health. Published by Blackwell Publishing, 9600 Garsington Road, Oxford OX4 2DQ, UK and 350 Main Street, Malden, MA 02148, USA
-
Upload
uninettuno -
Category
Documents
-
view
2 -
download
0
Transcript of Prosocial development from childhood to adolescence: a multi‐informant perspective with Canadian...
Prosocial development from childhood toadolescence: a multi-informant perspective
with Canadian and Italian longitudinal studies
Amelie Nantel-Vivier,1 Katja Kokko,2 Gian Vittorio Caprara,3
Concetta Pastorelli,3 Maria Grazia Gerbino,3 Marinella Paciello,3 Sylvana Cote,4
Robert O. Pihl,1 Frank Vitaro,4 and Richard E. Tremblay4
1McGill University, Canada; 2University of Jyvaskyla, Finland; 3La Sapienza University, Italy;4University of Montreal, Canada
Objectives: To longitudinally describe prosocial behaviour development from childhood to adoles-cence, using multiple informants within Canadian and Italian samples. Method: Participants in Study1 were 1037 boys from low socioeconomic status (SES) areas in Montreal, Canada, for whom yearlyteacher and mother reports were obtained between the ages of 10 and 15. Participants in Study 2 were472 children (209 girls) from Genzano, Italy, for whom yearly self and teacher reports were obtainedbetween the ages of 10 and 14. Developmental trajectories were estimated from ratings by each infor-mant to identify subgroups of children following distinct courses of prosocial development. Results: InStudy 1, three trajectory groups (low/declining 53%, high/declining 16%, high/steep declining 31%)were identified from teacher ratings, while five trajectories (low/stable 7%, low/declining 19%, mod-erate/stable 41%, high/declining 24%, high/stable 9%) were identified from mother ratings. Small butsignificant associations were observed between mother and teacher ratings. In Study 2, three trajectorygroups (low/stable 9%, moderate/stable 50%, high/stable 42%) were identified from self-ratings, whilefour trajectory groups (low/stable 8%, moderate/declining 48%, high/declining 37%, increasing 7%)were identified from teacher ratings. Small but significant associations were observed between self- andteacher ratings. Conclusions: The present studies investigated levels of prosocial behaviours fromchildhood to adolescence, using a multi-informant, cross-cultural perspective. All but one of thedevelopmental trajectories identified were characterised by stable or declining levels of prosocialbehaviours. Further research longitudinally investigating prosociality across developmental periods isneeded to clarify prosocial behaviour development over time. Keywords: Prosocial behaviours, longi-tudinal analysis. Abbreviations: SES: socioeconomic status; SBQ: Social Behaviour Questionnaire;BIC: Bayesian Information Criterion.
A common statement within developmental psy-chology is that prosocial behaviours, includinghelping, sharing, comforting, and cooperating,increase in frequency as children grow older. Soci-alisation processes, together with maturation withindifferent developmental spheres, such as the affec-tive (e.g., empathy) and socio-cognitive domains(e.g., moral reasoning), are believed to underlie thistrend (Eisenberg, Fabes, & Spinrad, 2006). However,the investigation of age-related changes in prosocialbehaviours has not been a simple endeavour, withprominent reviews concluding that the developmen-tal course of prosocial behaviours is complex (seeBar-Tal, 1982; Eisenberg, 2003; Eisenberg & Fabes,1998; Radke-Yarrow, Zahn-Waxler, & Chapman,1983; Zahn-Waxler & Smith, 1992).
Providing a quantitative summary of availableempirical evidence, Eisenberg and Fabes (1998)performed a meta-analysis of 179 studies. A signifi-cant positive relationship emerged between fre-quencies of prosocial behaviours and age (meanweighted effect size (d) = .26). The magnitude of the
relationship, however, varied as a function of meth-odological factors (e.g., focus age groups, infor-mants). As well, only 13% of individual effect sizespresented (11/87) were above .5, a value generallythought to reflect a medium effect size (Cohen,1992). Therefore, the meta-analysis by Eisenbergand Fabes (1998) highlighted the complexity of pro-social development, emphasising the importance offurther qualifying the statement that prosocialbehaviours increase in frequency throughout devel-opment.
Caplan (1993) and Hay (1994) suggested that earlychildhood prosocial impulses become increasinglydifferentiated and individualised over time. Fromthis perspective, maturation and socialisation do notonly promote children’s prosociality, but rather helpthem regulate their prosocial inclinations. With age,children acquire display rules that help them bal-ance prosocial acts with self-interest, and exhibitprosocial actions that are gradually more relation-ship specific (Caplan, 1993). The interaction offacilitative (e.g., empathy) and inhibitory (e.g., self-interest) forces predicts that a general increasein prosocial behaviour frequency is unlikely.
Conflict of interest statement: No conflicts declared.
Journal of Child Psychology and Psychiatry 50:5 (2009), pp 590–598 doi:10.1111/j.1469-7610.2008.02039.x
� 2009 The AuthorsJournal compilation � 2009 Association for Child and Adolescent Mental Health.Published by Blackwell Publishing, 9600 Garsington Road, Oxford OX4 2DQ, UK and 350 Main Street, Malden, MA 02148, USA
Importantly, the interplay of inhibitory and facilita-tive factors is hypothesised to be subject to individ-ual differences, with different children displayingdifferent developmental trajectories (Caplan, 1993).Research on age-related changes in the frequency ofprosocial behaviours should thus consider hetero-geneity in developmental patterns.
Prosociality has at times been described as adouble-edged sword, promoting healthy develop-ment when appropriately regulated, but creatingdifficulties if too low (e.g., antisocial behaviours) ortoo high (e.g., depression) (Hay, 1994). Cote,Tremblay, Nagin, Zoccolillo, and Vitaro (2002b)found that girls following an atypically low leveltrajectory of prosocial behaviours during the ele-mentary school years were at high risk for conductdisorder in adolescence (16 years). This was nottrue, however, for boys. In addition, young girlswith highest prosociality levels may be at anincreased risk for internalising forms of psychopa-thology (Gjerde & Block, 1991). Optimal develop-ment may therefore require flexible, regulatedprosociality.
Few long-term longitudinal studies have focusedon the course of prosocial development. An exceptionis work by Eisenberg and colleagues, prospectivelyfollowing individuals from the preschool years toearly adulthood (Eisenberg et al., 2002; Eisenberg,Miller, Shell, McNalley, & Shea, 1991; Eisenberget al, 1987). This research programme provided evi-dence for rank-order stability of individual differ-ences in prosocial responding, with childhoodprosociality indexes significantly correlating withadulthood indexes (Eisenberg et al., 2002). Analysesfocusing on the transition from adolescence to earlyadulthood (Eisenberg, Cumberland, Guthrie, Mur-phy, & Shepard, 2005) found an increase in socio-cognitive aspects of prosocial responding (e.g.,perspective taking, prosocial moral reasoning), withno parallel increase in helping behaviours. Cote,Tremblay, Nagin, Zoccolillo, and Vitaro (2002a)investigated prosocial development from ages sixthrough 12. The behaviours of 1865 children wererated yearly by teachers from kindergarten to gradesix. Using a group-based trajectory method (Nagin,2005), three subgroups, respectively characterisedby 1) high, 2) moderate, and 3) low frequencies ofprosocial behaviours, were identified, for both boysand girls. Frequencies were relatively stable for eachsubgroup, with no evidence of an increase in thefrequency of prosocial behaviours over time. Simi-larly, Carlo, Crockett, Randall, and Roesch (2007)recently found evidence for a decline in levels ofprosocial behaviours from the beginning to the endof high school, with a slight increase noted in Grade12. This pattern was most notable for boys (Carloet al., 2007). Overall, the above findings are consis-tent with the proposal that greater competencewithin the sociocognitive and affective spheres maynot translate into greater behavioural performance.
Eisenberg andFabes (1998) noted that the choice ofinformant influenced the magnitude of the relation-ship between prosocial behaviour frequencies andage, rendering multiple informants important wheninvestigatingprosocial development. The literature oninterinformant agreement has described agreementbetween parents, teachers, and children concerningchildren’s behaviours as low to moderate (Gagnon,Vitaro, & Tremblay, 1992; Offord et al., 1996; Sines,1988; Touliatos & Lindholm, 1981; Verhulst &Akkerhuis, 1989), with mean correlations rangingfrom .22 to .27 (Achenbach, McConaughy, & Howell,1987). Studies that have explored interinformantagreement on children’s prosocial behaviourshave reported correlations ranging from .01 to .34(Pulkkinen, Kaprio, & Rose, 1999; Sines, 1988; Vit-aro, Gagnon, & Tremblay, 1991).
The present two studies aimed to longitudinallymap the frequency of prosocial behaviours duringthe transition from childhood to adolescence,focusing on reports from multiple informants. Usingthe same person-oriented approach that was used byCote et al. (2002a), developmental trajectories weremodelled to identify subgroups of children exhibitingdistinct patterns of prosocial development. Childrenin the first study were boys from low SES back-grounds in Montreal, Canada, followed from ages 10to 15. Children in the second study were boys andgirls from a representative sample of children inGenzano, Italy, followed from ages 10 to 14. Separatetrajectories were modelled from ratings by eachinformant. Mothers, teachers, and children wereselected as informants as they are the main infor-mants used in both research and clinical work onchildren’s adjustment (e.g., CBCL; Achenbach,1994). It was believed that using reports fromdifferent informants and sampling behaviours ofchildren from different cultural and socioeconomicbackgrounds would offer a portrait of the variabilityin prosocial development.
Study 1
Methodology
Participants, measurement and procedures. Onethousand and thirty-seven boys were recruited in1984 by asking kindergarten teachers working in thelowest socioeconomic areas of Montreal, Canada, torate the behaviours of all their male students. Onlyboys of biological parents born in Canada and whosemother tongue was French were included inthe study. Informed consent was obtained for allparticipants (see Tremblay, Vitaro, Nagin, Pagani,& Seguin, 2003 and Kokko, Tremblay, Lacourse,Nagin, & Vitaro, 2006 for further sample descrip-tion). Teachers and mothers provided yearly ratingsusing the Social Behaviour Questionnaire (SBQ;Tremblay et al., 1991) when the boys were betweenthe ages of 10 and 15. Teachers and mothers rated
Prosocial development from childhood to adolescence 591
� 2009 The AuthorsJournal compilation � 2009 Association for Child and Adolescent Mental Health.

the extent to which each statement described a givenchild (from 0 = never applies, to 2 = frequentlyapplies). Prosocial behaviours items were: 1) showssympathy; 2) praises others; 3) helps sick child; 4)helps hurt child; 5) helps child with a difficult task;6) helps clean up mess; 7) invites bystanders to joinin a game; 8) stops quarrels; 9) helps pick up objects;and 10) comforts upset child. Cronbach alphasranged from .82 to .85 for mother ratings and .87 to.91 for teacher ratings.
Data analysis. Prosocial behaviour trajectorieswere modelled using yearly scores obtained fromteachers and mothers. Trajectories were derivedfrom a general nonlinear Mixture of Curves (MOC)procedure in R programming (Boulerice, 2001). Themethod summarises population heterogeneity indevelopmental patterns using polynomial functions,each constituting a developmental trajectory group(Nagin & Tremblay, 2005). As a first step, modelswith different numbers of trajectory groups weremodelled and tested to find the model with the opti-mal number of trajectory groups. The BayesianInformation Criterion (BIC; Schwarz, 1978) is usedto determine the optimal number of groups. Trajec-tory groups may differ in both their level and shape(i.e., linear, quadratic, cubic) over time.
Each trajectory group summarises the behavioursof subgroups of children that exhibit similar patternsover time. As summaries, trajectory groups do notconstitute literal descriptions of the behaviours ofindividual participants. Group membership is notabsolute, and members of a trajectory group exhibitfluctuations around the group average trend.Uncertainty in group assignment is illustratedthrough one of the main outputs of the model, theposterior probabilities of group membership,consisting in the probability for each individual tobelong to each trajectory estimated from the sample.The maximum probability rule is used to assignindividuals to the trajectory to which they have thehighest probability of belonging (see Nagin, 2005 fora complete discussion of developmental trajectoryanalyses).
Associations between mother and teacher ratingswere assessed using different indicators. Meandifferences in prosocial behaviours ratings werecalculated, as were correlations between yearlyreports. Longitudinal associations were investigatedusing continuous and categorical outputs of thetrajectory models. Specifically, for each participant,the probability of belonging to each trajectory fromone informant (i.e., posterior probability of belongingto Mother Group 1, 2, 3, etc) was multiplied by theprobability of belonging to each trajectory fromthe other informant (i.e., posterior probability ofbelonging to Teacher Group 1, 2, 3, etc). The multi-plied probabilities for each participant were thensummed within each combination (i.e., M1T1, M1T2,M1T3, M2T1, M2T2, etc.). Chi-square analyses were
performed to investigate whether the distributionrevealed significant associations (greater thanexpected N within a cell). Chi-square analyses wererepeated using trajectory membership assignmentby maximum probability rule, a categorical variable,to assess associations between category member-ship. Because trajectory groups are not determined apriori but are rather estimated from the data, modelsbased on different informants are likely to generatedifferent numbers and patterns of trajectory groups.Therefore, although originating from the samequestionnaire items, trajectory models based ondifferent informants may not map on directly to eachother. This may restrict the strength of the associa-tions observed.
Results
Prosocial development over time. Trajectory groupassignment by maximum probability rule yieldedmean assignment probabilities ranging from .69 to.87, indicating satisfactory model fit (Nagin, 1999,2005).
Figure 1 presents estimated models based onyearly prosocial behaviour ratings from each infor-mant. Three trajectories emerged from teacher rat-ings (Figure 1.A.): 1) 53% of boys initially exhibitedrelatively low levels of prosocial behaviours, whichsubsequently declined (low/declining group); 2)31% of boys exhibited relatively high levels at age10, followed by a notably steep decline (high/steepdeclining group); 3) 16% of boys exhibited initiallevels identical to boys in group 2, with subsequentslower rates of decline over time (high/declininggroup). Five trajectories were modelled from moth-ers’ ratings (Figure 1.B.): 1) 7% of boys exhibitedlow and stable levels of prosocial behaviours (low/stable group); 2) 19% of boys initially exhibited lowlevels which subsequently declined (low/declininggroup); 3) 41% of boys demonstrated stable andmoderate levels (moderate/stable group); 4) 24% ofboys exhibited initially high levels which thereafterdeclined (high/declining group); 5) 9% of boysexhibited high, stable levels (high/stable group).Therefore, the five trajectories identified based onmother ratings and the three trajectories identifiedfrom teacher ratings were all characterised by sta-ble or declining levels of prosocial behaviours overtime.
Associations between mother and teacher rat-ings. As described in Figure 1, information pro-vided by mothers and teachers differed in terms ofthe underlying subgroups that could be identified.Table 1 presents yearly mean scores, standarddeviations, and correlations. Averaging across thesix assessments, the mean rating given by teacherswas 1.47, while the mean rating given by motherswas 2.01 (t = )24.180, p = .000). Significant corre-lations between the yearly sum scores for mother
592 Amelie Nantel-Vivier et al.
� 2009 The AuthorsJournal compilation � 2009 Association for Child and Adolescent Mental Health.

and teacher reports were of small magnitude, rang-ing from .08 to .15.
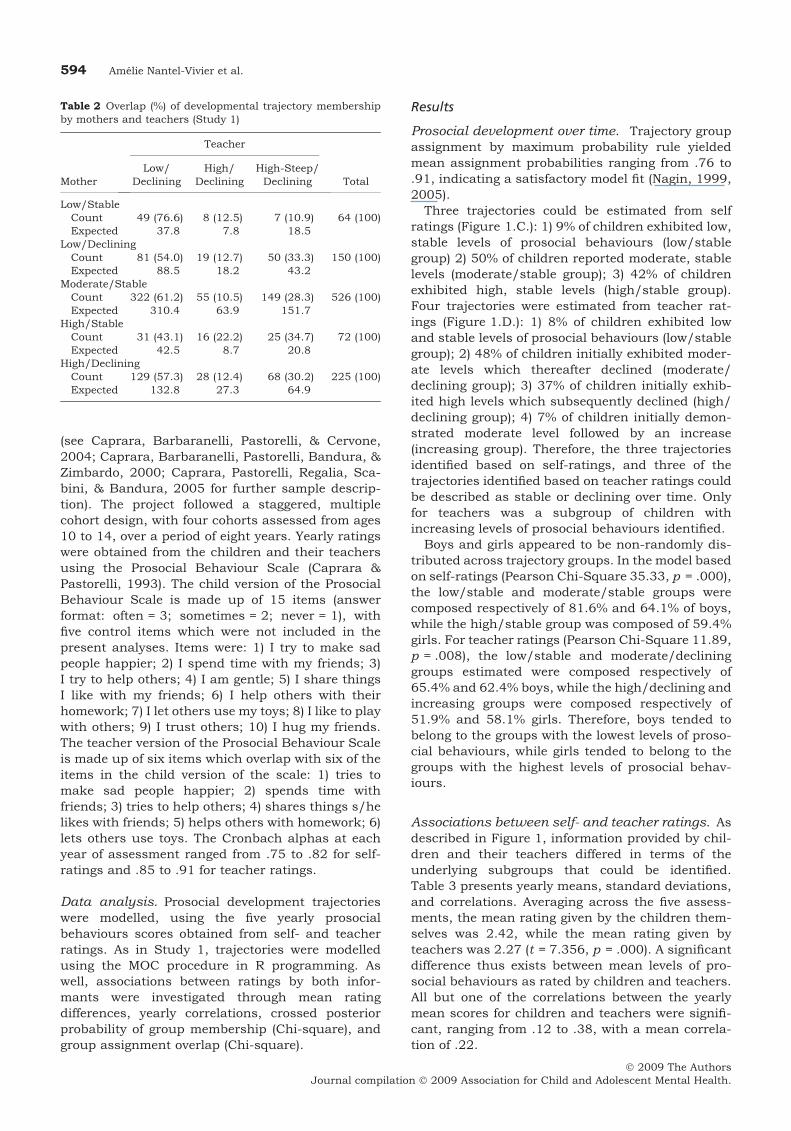
Analyses of the associations between trajectorymodels from mother and teacher ratingsyielded positive, significant results, both for crossedposterior probabilities of group membership (Chi-Square: 699.83, p = .000) and trajectory groupassignment by maximum probability rule(Chi-Square: 24.16, p = .002). Continuous andcategorical indicators of group membership there-fore pointed to significant associations betweenmother and teacher ratings. Table 2 presents theoverlap in trajectory group assignment between thetwo trajectory models computed. Observed patternsof assignment suggest that boys assigned to low-level groups based on maternal ratings tended toalso be assigned to low-level groups based on tea-
cher ratings, with 76.6% of boys assigned to thelow/stable mother group being assigned to the low/declining teacher group.
Study 2
Methodology
Participants, measurement and procedures. Par-ticipants were 472 children (209 females) from alongitudinal research programme focused on socialadjustment in childhood and adolescence. All weredrawn from schools in Genzano, located near Rome,Italy. The participants varied with regards to theirsocioeconomic background and the Genzano com-munity represents a microcosm of the larger society.Informed consent was obtained for all participants
Table 1 Yearly means (SD) and correlations of mother and teacher ratings (Study 1)
Mother
Teacher
101.70 (.49)
111.64 (.47)
121.56 (.42)
131.39 (.41)
141.27 (.34)
151.20 (.30)
102.08 (.40)
.15** .11** .06 .02 .10* .04
112.13 (.38)
.08* .09* .10* ).03 .008 .03
122.10 (.37)
.03 .10** .07 .05 .06 .04
132.02 (.38)
.13** .14** .14** .03 .09 .05
141.95 (.39)
.10* .07 .07 .06 .13** .12**
151.88 (.40)
.09* .04 .04 ).01 .06 .08
**significant at p < .01.*significant at p < .05.
(A)
Study 1 - Teachers
Study 2 - Teachers
Study 1 - Mothers
1 1.2 1.4 1.6 1.8
2.2 2
2.4 2.6 2.8
3
15 14 13 12 11 10 Age
Pro
soci
al B
ehav
iour
sP
roso
cial
Beh
avio
urs
Pro
soci
al B
ehav
iour
sP
roso
cial
Beh
avio
urs
53% 31% 16%
(C)Study 2 - Children
11.21.41.61.8
22.22.42.62.8
3
14 13 12 11 10 Age
42%
50%
9%
(B)
1 1.2 1.4 1.6 1.8
2.2 2
2.4 2.6 2.8
3
15 14 13 12 11 10 Age
7% 19%
41% 24%
9%
(D)
1.2 1
1.4 1.6 1.8
2 2.2 2.4 2.6 2.8
3
14 13 12 11 10 Age
7%
37%
48%
8%
Figure 1 Trajectories by informants for studies 1 and 2
Prosocial development from childhood to adolescence 593
� 2009 The AuthorsJournal compilation � 2009 Association for Child and Adolescent Mental Health.
(see Caprara, Barbaranelli, Pastorelli, & Cervone,2004; Caprara, Barbaranelli, Pastorelli, Bandura, &Zimbardo, 2000; Caprara, Pastorelli, Regalia, Sca-bini, & Bandura, 2005 for further sample descrip-tion). The project followed a staggered, multiplecohort design, with four cohorts assessed from ages10 to 14, over a period of eight years. Yearly ratingswere obtained from the children and their teachersusing the Prosocial Behaviour Scale (Caprara &Pastorelli, 1993). The child version of the ProsocialBehaviour Scale is made up of 15 items (answerformat: often = 3; sometimes = 2; never = 1), withfive control items which were not included in thepresent analyses. Items were: 1) I try to make sadpeople happier; 2) I spend time with my friends; 3)I try to help others; 4) I am gentle; 5) I share thingsI like with my friends; 6) I help others with theirhomework; 7) I let others use my toys; 8) I like to playwith others; 9) I trust others; 10) I hug my friends.The teacher version of the Prosocial Behaviour Scaleis made up of six items which overlap with six of theitems in the child version of the scale: 1) tries tomake sad people happier; 2) spends time withfriends; 3) tries to help others; 4) shares things s/helikes with friends; 5) helps others with homework; 6)lets others use toys. The Cronbach alphas at eachyear of assessment ranged from .75 to .82 for self-ratings and .85 to .91 for teacher ratings.
Data analysis. Prosocial development trajectorieswere modelled, using the five yearly prosocialbehaviours scores obtained from self- and teacherratings. As in Study 1, trajectories were modelledusing the MOC procedure in R programming. Aswell, associations between ratings by both infor-mants were investigated through mean ratingdifferences, yearly correlations, crossed posteriorprobability of group membership (Chi-square), andgroup assignment overlap (Chi-square).
Results
Prosocial development over time. Trajectory groupassignment by maximum probability rule yieldedmean assignment probabilities ranging from .76 to.91, indicating a satisfactory model fit (Nagin, 1999,2005).
Three trajectories could be estimated from selfratings (Figure 1.C.): 1) 9% of children exhibited low,stable levels of prosocial behaviours (low/stablegroup) 2) 50% of children reported moderate, stablelevels (moderate/stable group); 3) 42% of childrenexhibited high, stable levels (high/stable group).Four trajectories were estimated from teacher rat-ings (Figure 1.D.): 1) 8% of children exhibited lowand stable levels of prosocial behaviours (low/stablegroup); 2) 48% of children initially exhibited moder-ate levels which thereafter declined (moderate/declining group); 3) 37% of children initially exhib-ited high levels which subsequently declined (high/declining group); 4) 7% of children initially demon-strated moderate level followed by an increase(increasing group). Therefore, the three trajectoriesidentified based on self-ratings, and three of thetrajectories identified based on teacher ratings couldbe described as stable or declining over time. Onlyfor teachers was a subgroup of children withincreasing levels of prosocial behaviours identified.
Boys and girls appeared to be non-randomly dis-tributed across trajectory groups. In the model basedon self-ratings (Pearson Chi-Square 35.33, p = .000),the low/stable and moderate/stable groups werecomposed respectively of 81.6% and 64.1% of boys,while the high/stable group was composed of 59.4%girls. For teacher ratings (Pearson Chi-Square 11.89,p = .008), the low/stable and moderate/declininggroups estimated were composed respectively of65.4% and 62.4% boys, while the high/declining andincreasing groups were composed respectively of51.9% and 58.1% girls. Therefore, boys tended tobelong to the groups with the lowest levels of proso-cial behaviours, while girls tended to belong to thegroups with the highest levels of prosocial behav-iours.
Associations between self- and teacher ratings. Asdescribed in Figure 1, information provided by chil-dren and their teachers differed in terms of theunderlying subgroups that could be identified.Table 3 presents yearly means, standard deviations,and correlations. Averaging across the five assess-ments, the mean rating given by the children them-selves was 2.42, while the mean rating given byteachers was 2.27 (t = 7.356, p = .000). A significantdifference thus exists between mean levels of pro-social behaviours as rated by children and teachers.All but one of the correlations between the yearlymean scores for children and teachers were signifi-cant, ranging from .12 to .38, with a mean correla-tion of .22.
Table 2 Overlap (%) of developmental trajectory membershipby mothers and teachers (Study 1)
Mother
Teacher
TotalLow/
DecliningHigh/
DecliningHigh-Steep/Declining
Low/StableCount 49 (76.6) 8 (12.5) 7 (10.9) 64 (100)Expected 37.8 7.8 18.5
Low/DecliningCount 81 (54.0) 19 (12.7) 50 (33.3) 150 (100)Expected 88.5 18.2 43.2
Moderate/StableCount 322 (61.2) 55 (10.5) 149 (28.3) 526 (100)Expected 310.4 63.9 151.7
High/StableCount 31 (43.1) 16 (22.2) 25 (34.7) 72 (100)Expected 42.5 8.7 20.8
High/DecliningCount 129 (57.3) 28 (12.4) 68 (30.2) 225 (100)Expected 132.8 27.3 64.9
594 Amelie Nantel-Vivier et al.
� 2009 The AuthorsJournal compilation � 2009 Association for Child and Adolescent Mental Health.

Analyses of the association between trajectorymodels from self- and teacher ratings yielded posi-tive, significant results, both for crossed posteriorprobabilities of group membership (Chi-Square:499.27, p = .000) and trajectory group assignmentby maximum probability rule (Chi-Square: 41.72,p = .000). Continuous and categorical indicators ofgroup membership therefore pointed to significantassociations between mother and teacher ratings.Table 4 presents the overlap in category membershipfor the two trajectory models computed. Close to70% of children assigned to the low/stable trajectorygroup based on self-ratings were assigned to themoderate/declining group based on teacher ratings.Slightly more than half of the children assigned tothe moderate/stable group based on self-ratingswere assigned to the moderate/declining groupbased on teacher ratings. Similarly, close to half ofthe children assigned to the high/stable group basedon self-ratings were assigned to the high/declininggroup based on teacher ratings.
Discussion
The present studies longitudinally investigated pro-social behaviours during the transition from child-hood to adolescence, focusing on multiple
informants. Results indicated that 1) the majority oftrajectory groups were characterised by stable ordeclining prosocial behaviour levels over time, 2)associations between ratings by different informantscould be characterised as low to moderate.
Findings from the present analyses do not supportthe frequently proposed increase in prosocialbehaviour frequencies with age. Only for teacherreports in Study 2 was a trajectory characterised byincreasing levels of prosocial behaviours observed.This trajectory, however, represented only 7% ofchildren in the sample. All other trajectories, whilediffering in their relative levels, were characterisedby stable or declining frequencies. The majority ofchildren could therefore be described as exhibitingstable or declining levels of prosocial behaviours overtime.
Findings from the present studies may be viewedas consistent with work by Hay (1994) and Caplan(1993). Past research has shown that maturationalchanges in the cognitive and affective spheres, aswell as certain socialisation practices, may promoteprosocial responding (see Eisenberg, Fabes, &Spinrad, 2006 for a review). However, facilitativeforces may not be associated with a general increasein the frequency of prosocial behaviours, as childrensimultaneously learn to focus their prosocial
Table 3 Yearly means (SD) and correlations of self and teacher ratings (Study 2)
Self
Teacher
102.44 (.49)
112.36 (.45)
122.19 (.49)
132.28 (.51)
142.19 (.48)
102.40 (.36)
.27** .30** .13* .21** .17**
112.44 (.35)
.31** .38** .20** .16** .22**
122.43 (.36)
.23** .35** .20** .16** .15**
132.42 (.36)
.26** .27** .10 .18** .16**
142.40 (.37)
.19** .28** .12* .12** .18**
**significant at p < .01.*significant at p < .05.
Table 4 Overlap (%) of developmental trajectory membership by self and teachers (Study 2)
Self
Teacher
TotalLow/Stable Moderate/Declining High/Declining Increasing
Low/StableCount 4 (10.5) 26 (68.4) 7 (18.4) 1 (2.6) 38 (100)Expected 2.1 18.8 14.6 2.5
Moderate/StableCount 19 (8) 134 (56.5) 72 (30.4) 12 (5.1) 237 (100)Expected 13.1 117 90.9 15.6
High/StableCount 3 (1.5) 74 (37.6) 102 (51.8) 18 (9.1) 197 (100)Expected 10.9 97.7 75.5 12.9
Prosocial development from childhood to adolescence 595
� 2009 The AuthorsJournal compilation � 2009 Association for Child and Adolescent Mental Health.

responding and empathic abilities in more selective,differentiated ways with age. Findings of highermaternal prosociality ratings in Study 1 are consis-tent with the notion that children may exhibit moreprosocial behaviours towards their affiliative groups(e.g., family, friends) as they age. Greater differenti-ation and individuality in prosocial behaviour pat-terns may render prosocial behaviours more privateover time, emphasising the importance of self-reports and observations of prosocial behaviourstowards different targets.
Children in the present two studies were pur-posely drawn from very different sociocultural envi-ronments in order to investigate variability withinthe complex process that is prosocial development.Children in Study 1 were boys from the lowestsocioeconomic areas of a large city, Montreal, Can-ada. Children in Study 2 were boys and girls growingup in Genzano, Italy, a town located near Rome.Lower levels and steeper declines of prosocialbehaviours were obtained from teacher ratingswithin the Montreal sample (Study 1). As our focuswas on the transition from childhood to adolescence,children in both studies experienced a change inschool environment during the longitudinal investi-gations. Children in Canada start middle school (orgrade 7) at age 12, while children in Italy transitionfrom elementary school to middle school (Scuolemedie inferiori) at age 11. While the relationshipbetween SES and levels of prosocial behavioursremains equivocal (Eisenberg & Fabes, 1998), it ispossible that transition to a low SES middle schoolcontext may have contributed to lower levels andgreater declines of prosocial behaviours in the eyesof teachers for the Montreal boys. As well, it is pos-sible that the smaller community context of theGenzano sample may have been associated withstronger reputations for children and consequentlygreater stability in teacher-reported prosocial levels.Furthermore, different measures were used for thetwo studies, perhaps contributing to observeddifferences in patterns for the two samples. However,it is important to note that teachers in Italy diddescribe a group with clearly non-stable prosocialbehaviour levels (Increasers, 7%), suggesting somesensitivity on their part to changing levels of proso-cial behaviours with age. Also important to note isthe fact that in spite of varying sociocultural con-texts, informants, and measures, nowhere wereincreasing levels of prosocial behaviours considerednormative.
The low to moderate associations found betweeninformants in the two present studies were consis-tent with past research on interinformant agreement(Achenbach et al., 1987). Children may exhibit dif-ferent patterns of prosocial behaviours at home andat school, and the differential patterns found inStudy 1 between mother and teacher reports mayreflect the context specificity of prosocial behav-iours. It is also possible that teachers and parents
perceive children’s prosocial behaviours differently.Teachers, generally able to compare a child to alarge number of children, may have a better sense ofnormative development, while parents may hold amore individualised and specific view of a particularchild’s behavioural development. Somewhat stron-ger associations were found between children andteacher reports in Study 2, which may be due toratings of behaviours sampled from the same con-text (i.e., school). No correlation, however, wasabove .40. Different perspectives from differentinformants may yield very different depictions ofchildren’s behaviours, emphasising the importanceof considering numerous sources of informationwhen investigating behavioural development. Aswell, consistent with past literature (Eisenberget al., 2006), higher levels of prosocial behaviourstended to be observed in girls in Study 2. Expec-tancies regarding boys and girls’ social behaviours,and the impact of such expectancies on observedfrequency patterns of prosocial behaviours, shouldbe considered.
In sum, the present two studies strongly suggestthat the frequency of prosocial behaviours does notincrease between the ages of 10 and 15 for themajority of children. The present studies were thefirst, to the best of our knowledge, to longitudinallymap individual differences in the frequency ofprosocial behaviours during the transition fromchildhood to adolescence, using information frommultiple informants. One trajectory, including 7% ofchildren in Study 2, was characterised by increas-ing levels of prosociality over time, while all othertrajectories presented stable or declining levels.Factors predisposing children to follow particulartrajectories, as well as the predictive power ofmembership to a particular trajectory group forlater psychosocial adjustment, should be furtherinvestigated.
Acknowledgements
This research has been supported by a graduatescholarship to Amelie Nantel-Vivier by the FondQuebecois de Rercherche Societe et Culture, grantsfrom the Ministero dell’Istruzione dell’Universita edella Ricerca (MIUR-COFIN 1998-00/2000-02) andfrom the University of Rome (Ateneo 2000, 2001,2002) to Gian Vittorio Caprara, and researchgrants from the Academy of Finland (Nos. 54489and 55289) to Katja Kokko. Grants from the Fondspour la Formation de Chercheurs et l’Aide a laRecherche (FCAR-Centre), the Conseil Quebecoisde la Recherche Sociale (CQRS), the Fonds de laRecherche en Sante du Quebec (FRSQ), the SocialSciences and Humanities Research Council ofCanada (SSHRC), the Molson Foundation and theCanadian Institute of Advanced Research alsosupported the present research. We thank Alain
596 Amelie Nantel-Vivier et al.
� 2009 The AuthorsJournal compilation � 2009 Association for Child and Adolescent Mental Health.
Girard, Abdeljelil Farhat, and Danielle Forest forhelp with statistical analyses, Helene Beauchesnefor coordinating the data collection, Muriel Rorivefor coordinating the data management, and LyseDesmarais-Gervais for general coordination of theresearch activities.
Correspondence to
Amelie Nantel-Vivier, Department of Psychology,McGill University, 1205 Dr. Penfield Avenue, Mon-treal, Quebec, H3A 1B1, Canada; Tel.: 398-6119;Fax: 398-4896; Email: [email protected]
Key points
• Past research has provided mixed empirical evidence on the relationship between age and the frequency ofprosocial behaviours.
• The present studies investigated levels of prosocial behaviours from childhood to adolescence, using amulti-informant, cross-cultural perspective. Developmental trajectories were modelled in order to identifysubgroups of children exhibiting distinct longitudinal patterns of prosocial behaviour frequencies.
• Results indicated that the majority of children followed developmental trajectories characterised by stableor declining levels of prosocial behaviours over time.
• Factors predisposing children to follow particular trajectories, as well as the predictive power of mem-bership to a particular trajectory group for later psychosocial adjustment, warrant further investigations.
References
Achenbach, T.M. (1994). Child Behavior Checklist andrelated instruments. In M.E. Maruish (ed.), The useof psychological testing for treatment planning andoutcome assessment (pp. 517–549). Hillsdale, NJ:Lawrence Erlbaum Associates.
Achenbach, T.M., McConaughy, S.H., & Howell, C.T.(1987). Child/adolescent behavioural and emotionalproblems: Implications of cross-informant correla-tions for situational specificity. Psychological Bulletin,101, 213–232.
Bar-Tal, D. (1982). Sequential development of helpingbehaviour: A cognitive-learning approach. Develop-mental Review, 2, 101–124.
Boulerice, B. (2001). General nonlinear mixtures ofcurves (MOC). Statistical software program. http://lib.stat.cmu.edu/R/CRAN/.
Caplan, M. (1993). Inhibitory influences in develop-ment: The case of prosocial behavior. In D.F. Hay, &A. Angold (Eds.), Precursors and causes in develop-ment psychopathology (pp. 169–198). New York:Wiley.
Caprara, G.V., Barbaranelli, C., Pastorelli, C., Bandura,A., & Zimbardo, P.G. (2000). Prosocial foundations ofchildren’s academic achievement. Psychological Sci-ence, 11, 302–306.
Caprara, G.V., Barbaranelli, C., Pastorelli, C., & Cerv-one, D. (2004). The contribution of self-efficacy beliefsto psychosocial outcomes in adolescence: Predictingbeyond global dispositional tendencies. Personalityand Individual Differences, 37, 751–763.
Caprara, G.V., & Pastorelli, C. (1993). Early emotionalinstability, prosocial behaviour, and aggression:Some methodological aspects. European Journal ofPersonality, 7, 19–36.
Caprara, G.V, Pastorelli, C., Regalia, C., Scabini, E., &Bandura, A. (2005). Impact of adolescents’ filial self-efficacy on quality of family functioning and satisfac-tion. Journal of Research on Adolescence, 15, 71–97.
Carlo, G., Crockett, L.J., Randall, B.A., & Roesch, S.C.(2007). A latent growth curve analysis of prosocial
behavior among rural adolescents. Journal ofResearch on Adolescence, 17, 301–324.
Cohen, J. (1992). A power primer. Psychological Bulle-tin, 112, 155–159.
Cote, S., Tremblay, R.E., Nagin, D., Zoccolillo, M., &Vitaro, F. (2002a). The development of impulsivity,fearfulness, and helpfulness during childhood: Pat-terns of consistency and change in the trajectories ofboys and girls. Journal of Child Psychology andPsychiatry, 43, 609–618.
Cote, S., Tremblay, R.E., Nagin, D.S., Zoccolillo, M., &Vitaro, F. (2002b). Childhood behavioral profilesand adolescent conduct disorder: Risk trajectoriesfor boys and girls. Journal of the American Academyof Child and Adolescent Psychiatry, 41, 1086–1094.
Eisenberg, N. (2003). Prosocial behaviour, empathy,and sympathy. In M.H. Bornstein, L. Davidson,C.L.M. Keyes, & K.A. Moore (Eds.), Well-being:Positive development across the life course (pp. 253–265). Mahwah, NJ: Lawrence Erlbaum Associates.
Eisenberg, N., Cumberland, A., Guthrie, I.K., Murphy,B.C., & Shepard, S.A. (2005). Age changes in proso-cial responding and moral reasoning in adolescenceand early adulthood. Journal of Research on Adoles-cence, 15, 235–260.
Eisenberg, N., & Fabes, R.A. (1998). Prosocial develop-ment. In W. Damon (Series Ed.) & N. Eisenberg (Vol.Ed.), Handbook of child psychology: Vol.3. Socialemotional and personality development (5th edn, pp.779–862). New York: Wiley.
Eisenberg, N., Fabes, R.A., & Spinard, T.L. (2006).Prosocial development. In W. Damon (Series Ed.),R.M. Lerner (Series Ed.), & N. Eisenberg (Vol. Ed.),Handbook of child psychology: Vol. 3. Social, emo-tional, and personality development (6th edn, pp.646–718). New York: Wiley.
Eisenberg, N., Guthrie, I.K., Cumberland, A., Murphy,B.C., Shepard, S.A., Zhou, Q., & Carlo, G. (2002).Prosocial development in early adulthood: A longitu-dinal study. Journal of Personality and Social Psy-chology, 82, 993–1006.
Prosocial development from childhood to adolescence 597
� 2009 The AuthorsJournal compilation � 2009 Association for Child and Adolescent Mental Health.
Eisenberg, N., Miller, P.A., Shell, R., McNalley, S., &Shea, C. (1991). Prosocial development in adoles-cence: A longitudinal study. Developmental Psychol-ogy, 27, 849–857.
Eisenberg, N., Shell, R., Pasternack, J., Lennon, R.,Beller, R., & Mathy, R.M. (1987). Prosocial develop-ment in middle childhood: A longitudinal study.Developmental Psychology, 23, 712–718.
Gagnon, C., Vitaro, F., & Tremblay, R.E. (1992). Parent–teacher agreement on kindergarteners’ behaviorproblems: A research note. Journal of Child Psychol-ogy and Psychiatry, 33, 1255–1261.
Gjerde, P.F., & Block, J. (1991). Preadolescent ante-cedents of depressive symptomatology at age 18: aprospective study. Journal of Youth and Adolescence,20, 217–232.
Hay, D.F. (1994). Prosocial development. Journal ofChild Psychology and Psychiatry, 35, 29–71.
Kokko, K., Tremblay, R.E., Lacourse, E., Nagin, D.S., &Vitaro, F. (2006). Trajectories of prosocial behaviorand physical aggression in middle childhood: Links toadolescent school dropout and physical violence.Journal of Research on Adolescence, 16, 403–428.
Nagin, D. (1999). Analyzing developmental trajectories:A semiparametric, group-based approach. Psycholog-ical Methods, 4, 139–157.
Nagin, D.S. (2005). Group based modeling of develop-ment. Cambridge, MA: Harvard University Press.
Nagin, D.S., & Tremblay, R.E. (2005). Developmentaltrajectory groups: Fact or a useful statistical fiction?Criminology, 43, 873–904.
Offord, D.R., Boyle, M.H., Racine, Y., Szatmari, P.,Fleming, J.E., Sanford, M., & Lipman, E.L.(1996). Integrating assessment data from multiple -informants. Journal of the American Academy of Childand Adolescent Psychiatry, 35, 1078–1085.
Pulkkinen, L., Kaprio, J., & Rose, R. (1999). Peers,teachers, and parents as assessors of the behaviouraland emotional problems of twins and their adjust-ment: The Multidimensional Peer Nomination Inven-tory. Twin Research, 2, 274–285.
Radke-Yarrow, M., Zahn-Waxler, C., & Chapman, M.(1983). Children’s prosocial dispositions and behav-
iour. In P.H. Mussen, & E.M. Hetherington (Eds.),Handbook of child psychology: Socialization personal-ity, and social development (vol. 4, pp. 469–545). NewYork: Wiley.
Schwarz, G. (1978). Estimating the dimension of amodel. Annals of Statistics, 6, 461–464.
Sines, J.O. (1988). Teacher’s norms and teacher–parentagreement on the Missouri Children’s BehaviorChecklist. Journal of School Psychology, 26, 413–416.
Touliatos, J., & Lindholm, B.W. (1981). Congruence ofparents’ and teachers’ ratings of children’s behaviorproblems. Journal of Abnormal Child Psychology, 9,347–354.
Tremblay, R.E., Loeber, R., Gagnon, C., Charlebois, P.,Larivee, S., & LeBlanc, M. (1991). Disruptive boyswith stable and unstable high fighting behaviorpatterns during junior elementary school. Journal ofAbnormal Child Psychology, 19, 285–300.
Tremblay, R.E., Vitaro, F., Nagin, D.S., Pagani, L., &Seguin, J.R. (2003). The Montreal longitudinal andexperimental study: Rediscovering the power ofdescriptions. In T.P. Thornberry, & M.D. Krohn(Eds.), Taking stock of delinquency: An overview offindings from contemporary longitudinal studies (pp.205–254). New York: Kluwer Academic/Plenum.
Verhulst, F.C., & Akkerhuis, G.W. (1989). Agreementbetween parents’ and teachers’ ratings of behavioral/emotional problems of children aged 4–12. Journal ofChild Psychology and Psychiatry, 30, 123–136.
Vitaro, F., Gagnon, C., & Tremblay, R.E. (1991).Teachers’ and mothers’ assessment of children’sbehaviors from kindergarten to grade two: Stabilityand change within and across informants. Journal ofPsychopathology and Behavioural Assessment, 13,325–343.
Zahn-Waxler, C., & Smith, K.D. (1992). The develop-ment of prosocial behavior. In V.B. Van Hasselt, &M.H. Hersen (Eds.), Handbook of social development:A lifespan perspective (pp. 229–256). New York:Plenum Press.
Manuscript accepted 15 September 2008
598 Amelie Nantel-Vivier et al.
� 2009 The AuthorsJournal compilation � 2009 Association for Child and Adolescent Mental Health.