PROPERTY-LIABILITY INSURER FINANCIAL STRENGTH RATINGS: DIFFERENCES ACROSS RATING AGENCIES
22
621 ©The Journal of Risk and Insurance, 1999, Vol. 66, No. 4, 621-642 PROPERTY-LIABILITY INSURER FINANCIAL STRENGTH RATINGS: DIFFERENCES ACROSS RATING AGENCIES Steven W. Pottier David W. Sommer ABSTRACT Regulators, investors, consumers, and insurance brokers use insurer finan- cial strength ratings to evaluate the insolvency risk of insurers. This article investigates the factors influencing the decision to obtain a rating or mul- tiple ratings, the determinants of ratings for the three major insurer rating agencies, and reasons for differences in ratings across agencies. This study indicates that insurers obtain ratings to reduce ex ante uncertainty about insolvency risk. It also provides evidence that specific rating determinants and their weights differ across agencies. Evidence of sample selection bias is found only in relation to Best’s ratings. INTRODUCTION Insurer financial strength ratings provide a rating agency’s opinion of the insurer’s overall financial strength and ability to meet its policyholder obligations. 1 As such, ratings are meant to be summary measures of insolvency risk. In this article, we ex- amine the property-liability insurer financial strength ratings of the three major in- surer rating agencies, A.M. Best, Moody’s Investors Service and Standard and Poor’s (S&P). Our purpose is to address three fundamental questions regarding insurer rat- ings. First, what are the factors that influence whether or not an insurer chooses to obtain a rating or to obtain multiple ratings? Second, what are the determinants of insurer ratings from the three major rating agencies? Finally, what factors help ex- plain differences in ratings for the same insurers across agencies? In addressing these questions, we control for the potentially important issue of sample selection bias, which can result from estimating empirical models using only data on rated insurers when there are systematic reasons why some insurers have chosen to be rated and others have chosen not to be rated. Steven W. Pottier and David W. Sommer are Assistant Professors of Risk Management and Insurance at the Terry College of Business, University of Georgia. The authors gratefully acknowledge the helpful comments of the Editors and two anonymous referees. 1 The rating process involves both quantitative and qualitative evaluations of an insurer’s financial condition and performance. For a thorough discussion of the methods and procedures of the rating agencies, see Klein (1992).
-
Upload
independent -
Category
Documents
-
view
8 -
download
0
Transcript of PROPERTY-LIABILITY INSURER FINANCIAL STRENGTH RATINGS: DIFFERENCES ACROSS RATING AGENCIES
621
©The Journal of Risk and Insurance, 1999, Vol. 66, No. 4, 621-642
PROPERTY-LIABILITY INSURER FINANCIAL STRENGTHRATINGS: DIFFERENCES ACROSS RATING AGENCIES
Steven W. PottierDavid W. Sommer
ABSTRACT
Regulators, investors, consumers, and insurance brokers use insurer finan-cial strength ratings to evaluate the insolvency risk of insurers. This articleinvestigates the factors influencing the decision to obtain a rating or mul-tiple ratings, the determinants of ratings for the three major insurer ratingagencies, and reasons for differences in ratings across agencies. This studyindicates that insurers obtain ratings to reduce ex ante uncertainty aboutinsolvency risk. It also provides evidence that specific rating determinantsand their weights differ across agencies. Evidence of sample selection biasis found only in relation to Best’s ratings.
INTRODUCTION
Insurer financial strength ratings provide a rating agency’s opinion of the insurer’soverall financial strength and ability to meet its policyholder obligations.1 As such,ratings are meant to be summary measures of insolvency risk. In this article, we ex-amine the property-liability insurer financial strength ratings of the three major in-surer rating agencies, A.M. Best, Moody’s Investors Service and Standard and Poor’s(S&P). Our purpose is to address three fundamental questions regarding insurer rat-ings. First, what are the factors that influence whether or not an insurer chooses toobtain a rating or to obtain multiple ratings? Second, what are the determinants ofinsurer ratings from the three major rating agencies? Finally, what factors help ex-plain differences in ratings for the same insurers across agencies? In addressing thesequestions, we control for the potentially important issue of sample selection bias,which can result from estimating empirical models using only data on rated insurerswhen there are systematic reasons why some insurers have chosen to be rated andothers have chosen not to be rated.
Steven W. Pottier and David W. Sommer are Assistant Professors of Risk Management andInsurance at the Terry College of Business, University of Georgia. The authors gratefullyacknowledge the helpful comments of the Editors and two anonymous referees.
1 The rating process involves both quantitative and qualitative evaluations of an insurer’sfinancial condition and performance. For a thorough discussion of the methods andprocedures of the rating agencies, see Klein (1992).
622 THE JOURNAL OF RISK AND INSURANCE
This research is motivated by a number of factors. First and foremost is the criticalimportance of insurer ratings. As discussed more fully below, insurer financial strengthratings are heavily relied upon by insurance agents, brokers, and consumers, areused by insurers in their advertising, provide a tool for regulators to assess insurerrisk, and are often used in academic research as measures of insolvency risk. Interestin ratings has been particularly strong since the rate of property-liability insurer in-solvencies began to increase rapidly in the late 1980s. Given their great importance, itis valuable to examine these ratings.
The first step in understanding ratings is analyzing the determinants of ratings. Rat-ing determinants models help establish the relative importance given to various fac-tors in the rating process. This can help insurer management predict what their rat-ing might be before deciding to apply for it, as well as assess the impact of proposedactions on their existing rating. For example, it is known that ratings influence in-surer investment policies (Jones, 1994).
It is also very important to understand why insurers choose to obtain or not obtain arating from a particular agency or agencies. Unlike bond ratings, insurer financialstrength ratings are not required by regulation. They are voluntary, and while thevast majority of insurers choose to obtain a rating from A.M. Best, only a fraction optto apply for a second or third rating from Moody’s and/or S&P. It is particularlyinteresting to explore the motivations of insurers in obtaining these additional rat-ings, especially given the fact that the ratings given by Moody’s and S&P tend to belower on average than the ratings given by Best.
Finally, it is very important to understand the differences in ratings across ratingagencies, as many insurers receive ratings from two or three rating organizationsthat do not agree. As stated earlier, insurer ratings are used for a variety of importantpurposes. For example, some corporate purchasers of insurance set minimum ratingcriteria for potential insurers. In order to establish these criteria in a logical manner,users need to know whether or not a rating of, say, “adequate” by one agency isequivalent to a rating of “adequate” by another. It is also worthwhile to know whetherdifferences in ratings across agencies appear to be random or can be systematicallyexplained. Related to this, another important question is whether differences in aver-age ratings are truly driven by differing rating models, or are simply the result ofselection bias.
RELEVANT LITERATURE
The determinants of debt ratings have been examined in many studies (see Kaplanand Urwitz, 1979; Ederington, 1985). Ederington and Yawitz (1987) provide an excel-lent survey of earlier work. The explanatory variables used include measures of prof-itability, capitalization, interest coverage, liquidity, debt subordination status, andindustry indicators. Ederington (1986) focuses on bonds with split ratings; i.e., bondsthat receive different ratings from different rating agencies. In examining bond rat-ings from Moody’s and Standard and Poor’s, Ederington (1986) does not find anyevidence that split ratings result from differences in rating standards (i.e., differentcutoff points) or weights attached to rating determinants. He concludes that splitratings represent random differences of opinion. Moon and Stotsky (1993) examinemunicipal bond ratings and find that split ratings reflect differences in the weights

PROPERTY-LIABILITY INSURER FINANCIAL STRENGTH RATINGS: DIFFERENCES ACROSS RATING AGENCIES 623
attached to rating determinants and differences in cutoff points. They also find lim-ited evidence of sample selection bias. Cantor and Packer (1997) examine corporatedebt ratings and test whether observed rating differences reflect different ratingmodels or simply result from sample selection bias. Since virtually all publicly-tradedcorporate debt is rated by both Moody’s and Standard and Poor’s, they considerwhat types of firms are likely to seek a third rating. They find limited evidence ofsample selection bias. Their results suggest that observed differences in average rat-ings reflect differences in rating models.
The academic literature on the determinants of insurer financial strength ratings isvery limited. Pottier (1997) examines the determinants of Best’s life insurer ratingsand finds casual evidence suggestive of selection bias, but does not perform anyformal tests for it or control for it econometrically. In addition, insurer ratings havebeen widely used as measures of insolvency risk and financial quality (Adiel, 1996;Anthony and Petroni, 1997; Cummins and Danzon, 1997; Pottier, 1998). These stud-ies have only used Best’s ratings.
The current article is most similar to Cantor and Packer (1997). Aside from the factthat they analyze only rating differences and not rating determinants, the key differ-ences between their study and this one lie in the nature of the ratings being studied.Cantor and Packer analyze ratings that assess the default probability of particularbond issues, whereas we analyze ratings that assess the claims-paying ability of en-tire entities. By nature, their ratings are on publicly-traded securities and are de-signed for use primarily by investors, whereas the ratings analyzed here are on in-surers of all sizes and ownership structures and are designed for use primarily byinsurance consumers rather than investors. As such, the motivations for obtainingratings may be expected to differ between the two types of ratings. In addition, Can-tor and Packer (1997) compare bond ratings from agencies that specialize in bondratings. The agencies we compare include one (A.M. Best) which focuses exclusivelyon insurer financial strength ratings and two (Moody’s and S&P) that focus prima-rily on bond ratings and only recently entered the field of insurer financial strengthratings.
This article makes significant contributions to the insurance literature. As stated above,while insurer financial strength ratings have long been recognized as important andused in academic research, very little attention has been paid to the determinants ofratings. No study of insurer ratings has examined the decision to obtain a rating ormultiple ratings, or analyzed the potential impact of sample selection bias. In addi-tion, this is the first study to investigate differences in insurer ratings across ratingagencies.
THE ROLE OF INSURER RATINGS
Insurance company ratings provided by private rating agencies are vitally importantto investors, regulators, consumers, insurers, and insurance agents/brokers. Insur-ers use ratings in their advertising to assure buyers of the firm’s strength. Insurancebuyers use them in choosing their insurance companies and/or deciding how muchthey are willing to pay for insurance from particular firms. Brokers and agents oftenwill not recommend coverage with unrated insurers or insurers with ratings belowsome threshold of financial strength (Moody’s, 1998), and many corporate insurance

624 THE JOURNAL OF RISK AND INSURANCE
buyers require that all their insurers be highly rated. Strong financial ratings giveinsurers better access to capital markets. Insurer ratings also have a direct impact onthe cost of capital, since the primary source of debt capital to insurers is policy liabili-ties, and lower rated firms will likely have to sell their policies at lower prices com-pared to higher rated firms (Doherty and Tinic, 1981; Berger, Cummins, and Tennyson,1992). Ratings also provide a valuable tool for regulators in assessing the financialstrength of insurers (Schwartz, 1994). As noted earlier, academic studies often useratings as summary measures of solvency risk.
It should be noted that despite similarities, insurer ratings are quite different fromcorporate bond ratings.2 First, as noted earlier, financial strength ratings are entirelyoptional in that there are no regulatory requirements to obtain a rating and agencieswill not issue a full rating unless requested to do so by the insurer.3 In addition, abond rating applies to a particular debt issue, whereas an insurer rating applies tothe entity itself and assesses the overall claims-paying ability of the insurer, sincepolicyholder obligations must be met before payments are made to any other credi-tors or shareholders. Insurer ratings are particularly complex in that, unlike bondissues, which have fixed payments that are to be made at fixed times, claims pay-ments involve financial obligations that are uncertain in both timing and amount.
The purposes of insurer ratings are also very different. Corporate bond ratings areused almost exclusively by investors and regulators, while the primary users of in-surer financial strength ratings are insurance consumers and the agents/brokers whomarket insurance to consumers.4 This point is illustrated by the fact that the majorityof insurers rated by A.M. Best are either mutuals or privately-held stock firms. Addi-tionally, the fact that many insurers with rated debt still choose to obtain one or moreinsurer financial strength ratings, and that these ratings often differ from their debtratings, again illustrates the fact that bond ratings and insurer financial strength rat-ings do not serve the same purpose or measure precisely the same risk.
One interesting practical distinction between bond ratings and insurer ratings is thatthe bond rating agencies that rate a smaller proportion of bonds tend to issue higher
2 For a description of the relationship between bond ratings and insurer financial strengthratings from the perspective of the rating agencies, see Buckley (1997) and Moody’s (1998).
3 As noted in footnote 6, S&P does issue a type of purely quantitative rating even on insurersthat do not apply for a rating.
4 Despite the existence of state guaranty funds, consumers have reason to care about thefinancial strength of their insurer. Insurance guaranty fund coverage is incomplete, andwide variations in coverage exist from state to state. Some lines of insurance are not coveredat all and all states limit the maximum recovery per policy (typically $300,000). Also, 22states employ net worth criteria to determine an insured’s eligibility for their guarantyfunds which particularly limits coverage for many commercial policyholders. State insuranceguaranty funds use a post-insolvency assessment mechanism, except for New York’sguaranty fund (see Standard and Poor’s, 1996). Sommer (1996) found that because of theincompleteness of these funds, riskier insurers receive a lower market price for the insurancethey sell than safer insurers. Cummins and Danzon (1997) also find that price is positivelyrelated to financial quality. However, the existence of guaranty funds potentially limits theimpact of ratings on firm value, to the extent that it shields some policyholders from thefull impact of insolvencies.
PROPERTY-LIABILITY INSURER FINANCIAL STRENGTH RATINGS: DIFFERENCES ACROSS RATING AGENCIES 625
ratings than the agencies that rate almost all bonds (Cantor and Packer, 1997), whereasthe agencies (Moody’s, S&P) that rate a smaller proportion of insurers tend to issuelower ratings than the agency (A.M. Best) that rates most insurers. Another distinc-tion is that there appears to be a greater divergence of opinion among rating agenciesregarding insurer financial strength ratings than bond ratings.5
Almost 90 percent of eligible property-liability insurers in 1995 applied for a ratingfrom A.M. Best, while only about 18 percent applied for a rating from S&P and only10 percent applied for a rating from Moody’s.6 Given the overwhelming proportionof insurers that receive Best’s ratings, it appears that insurers consider obtaining atleast one rating essential. There are some potential explanations for why A.M. Bestappears to be the agency of choice for most insurers for a first rating rather than S&Por Moody’s. The most important factor is probably the historic relationship betweenBest and the insurance industry. A.M. Best focuses exclusively on the insurance in-dustry, and has been in the insurer rating business for over 90 years. Moody’s andS&P, on the other hand, while long established in the bond rating business, just en-tered the insurer financial strength rating field in the 1980s.7 In addition, while allthe agencies use a sliding cost scale, the minimum charge to obtain a Best rating isonly $1,000, whereas the minimum cost of a Moody’s or S&P rating is around $15,000.8
HYPOTHESES
Our empirical work consists of two sets of models, one for rating determinants andone for differences in ratings across agencies. Each model consists of two stages andcontrols for potential sample selection bias. For the rating determinants models, thefirst stage is a probit regression modeling the decision to obtain a rating, while thesecond stage is an ordered probit regression modeling the determinants of the rat-ing. For the rating differences models, the first stage is a probit regression modelingthe decision to obtain a particular pair of ratings, while the second stage is an or-dered probit regression modeling the difference between those ratings.9
5 For example, in the study by Ederington (1986), only 13 percent of the corporate bondsrated by Moody’s and S&P received different ratings. In our sample, 56 percent of the insurersrated by these same two agencies received different financial strength ratings.
6 Standard and Poor’s issues two types of ratings, “interactive” and “quantitative” ratings.Only interactive ratings are considered in this study since these ratings must be applied forby the insurer and involve the full rating process. Quantitative ratings are assigned at thediscretion of S&P and involve only publicly available, quantitative information. Since firmswith quantitative ratings have not chosen to receive a rating, they are categorized here asnot rated. Other agencies also issue insurer ratings. Weiss ratings, like S&P quantitativeratings, are not applied for and are based solely on publicly available data. Duff & Phelpsrates 97 of the firms in our sample. However, 94 of the ratings are in the range of AA to A-,leaving very little dispersion for statistical analysis.
7 Unlike Moody’s and Standard and Poor’s, A.M. Best does not rate insurer debt.8 Since the rating process typically entails meetings with insurance company management
and responding to information requests from rating analysts, the cost of obtaining a ratingis potentially much higher than the rating agency’s fee.
9 The details of the sample selection methodology employed will be discussed later.

626 THE JOURNAL OF RISK AND INSURANCE
The Decision To Be RatedFor each of the models, the same set of variables is used in the first stage probitregression. These variables are hypothesized to influence the decision by the firm toobtain a rating or multiple ratings. According to the theory of financial intermedia-tion, the principal role of credit rating agencies is the reduction of ex ante uncertaintyor informational asymmetry about a firm’s economic value and probability of finan-cial distress (Ramakrishnan and Thakor, 1984; Millon and Thakor, 1985). Thus, themore likely investors, consumers, and regulators are to have different opinions aboutthe true insolvency risk of an insurer, the greater the demand for and value of afinancial strength rating. In addition to uncertainty about an insurer’s default risk,other factors are also expected to affect the decision to seek a rating, as describedbelow.
Numerous variables are included in the model to proxy for the level of uncertaintyabout the firm’s risk. Cantor and Packer (1997) argue that relatively high levels ofprofitability and leverage may be associated with greater uncertainty and thus a higherprobability of obtaining an optional rating.10 Therefore, our model includes a lever-age measure and a profitability measure. A measure of premium growth is also in-cluded. While strong premium growth may be very positive for the financial healthof the firm, growth by property-liability insurers is sometimes due to lower under-writing standards or underpricing (Harrington and Danzon, 1994). Because the ef-fect of growth on firm value is ambiguous, relatively high rates of growth might beassociated with greater uncertainty. Higher levels of investment in common stocksand in bonds of below investment grade quality (junk bonds) would also be associ-ated with greater uncertainty, while higher levels of investment in cash would beassociated with lower uncertainty because stocks and junk bonds are riskier and moredifficult to value than cash. Selling more lines of insurance and selling insurance inmore states would also increase uncertainty.11 Therefore, line of business and geo-graphic diversification measures are included.
The impact of the extent of reinsurance use on uncertainty is ambiguous. On the onehand, reinsurance involves the transfer of risk away from the primary insurer to thereinsurer. Berger, Cummins, and Tennyson (1992) suggest that reinsurance is a sourceof capital and a risk-diversification device. Thus, reinsurance usage may be expectedto reduce uncertainty. On the other hand, reinsurance only accomplishes its purposeto the extent that reinsurers fulfill their obligations. Therefore, the risk of a heavilyreinsured company largely depends on the risk of its reinsurers. This complicates theassessment of the primary insurer’s true risk level. Rating agencies explicitly statethat they consider the financial strength of a company’s reinsurers in assigning arating (Best, 1996; S&P, 1996; Moody’s, 1998). The expertise of insurer rating agenciesin assessing the quality and appropriateness of reinsurance should increase the valueof obtaining a rating for heavily reinsured firms. Thus, higher levels of reinsurancemight increase the probability of obtaining a rating or multiple ratings.
10 Cantor and Packer (1997) consider bond ratings from Moody’s and S&P to be mandatorybecause these agencies rate virtually all publicly-traded debt, while they consider ratingsfrom Duff & Phelps and Fitch to be optional.
11 In the terminology of Mayers and Smith (1981), writing insurance in more lines and acrossmore states involves greater managerial discretion, and hence, greater uncertainty.
PROPERTY-LIABILITY INSURER FINANCIAL STRENGTH RATINGS: DIFFERENCES ACROSS RATING AGENCIES 627
Another variable included in the first stage regression is the percent of premiumswritten in so-called “long-tail” lines of business.12 Long-tail lines of insurance arethose lines of business in which there is often a long period of time between theinsured event and the final claim payment by the insurer. A variable measuring theextent of business in long-tail lines is included for two reasons. First, as with thevariables discussed above, long-tail lines are associated with greater levels of uncer-tainty (Sommer, 1996; Fung et al., 1998). Second, buyers of long-tail lines of insuranceare likely to be even more concerned about the financial health of their insurer thanbuyers of short-tail lines, since the value of the insurance purchased is dependent onthe insurer being solvent until all claims associated with the policy are settled. Boththe uncertainty hypothesis and the demand of long-tail insurance buyers would leadto a predicted positive association between long-tail business and the probability ofobtaining a rating or multiple ratings.
The percent of business in personal lines is also included in the first stage.13 While allinsurance consumers have reason to be concerned about the financial strength oftheir insurers, the structure of the guaranty fund system gives commercial insurancebuyers even greater reason to be concerned than personal insurance buyers. Com-mercial insurance buyers are much less protected by guaranty funds than personalinsurance buyers. Also, as a consequence of due diligence requirements, many cor-porate insurance buyers will not purchase insurance from unrated insurers. It wouldtherefore be expected that commercial buyers would demand ratings to an evengreater extent than personal buyers. Thus, we expect a negative association betweenthe percent of business in personal lines and the probability of obtaining a rating ormultiple ratings.
Whether or not an insurer is publicly traded is also hypothesized to be an importantdeterminant in the decision to obtain a rating. Compared to a mutual insurer or aclosely-held stock insurer, a publicly-traded stock insurer has an additional groupinterested in its financial strength, namely, outside investors. As stated earlier, rat-ings can improve an insurer’s access to capital markets and reduce its cost of obtain-ing capital. Any security issued by an insurance company is subordinate to the obli-gations to policyholders, so a claim-paying ability rating provides valuable informa-tion to potential investors. Just as an investor in the subordinate debt of a corpora-tion might want to know the rating of the senior debt of that corporation, investors inthe securities of an insurer might want to know the claim-paying ability rating of theinsurer. Moreover, Thompson and Vaz (1990) find that investors value the certifica-tion function of rating agencies and that bond issuers are generally better off if theyobtain more than one bond rating.14 In addition, since publicly-traded companiesare more likely to issue rated debt, the marginal cost of obtaining a claims-payingability rating is probably reduced after having already obtained ratings on their debt
12 Long-tail lines are defined as in Sommer (1996) to include auto liability, other liability,farmowners/homeowners/commercial multiple peril, medical malpractice, workerscompensation, ocean marine, aircraft, and boiler and machinery. Examples of short-taillines are fire, automobile physical damage, and earthquake.
13 Personal lines are defined to include private passenger auto liability, auto physical damage,and homeowners.
14 Specifically, they find that bond yields tend to be lower for issuers that obtain multipleratings compared to issuers that obtain only one rating.
628 THE JOURNAL OF RISK AND INSURANCE
from the same agencies. For the above reasons, we hypothesize that being publiclytraded is associated with a higher probability of obtaining multiple ratings.
In their equation for the decision to obtain an optional rating, Cantor and Packer(1997) include the natural logarithm of long-term debt outstanding as a measure ofthe potential benefit of an additional rating. This variable is used because the majorbenefit of obtaining an additional rating is a lower cost of debt, which should accruein direct proportion to the amount of debt issued. Since in our context ratings are forclaim-paying ability on policies written rather than for long-term debt, we includethe natural logarithm of direct premiums written in our model following the samerationale. We expect that the more premiums written, the greater the likelihood ofobtaining a rating.
Rating DeterminantsThe second stage of the rating determinants models contains numerous variablesintended to measure various aspects of the risk of the insurer. The variables includedrepresent factors that previous theory has indicated are important in determininginsurer insolvency risk. These include variables reflecting capitalization (Kahane etal., 1986; MacMinn and Witt, 1987; Cummins, 1988; Doherty, 1989), asset and liabilityrisk (Kahane et al., 1986; MacMinn and Witt, 1987; Cummins, 1988), liquidity (Kahaneet al., 1986), size (Cummins et al., 1995; Cummins and Sommer, 1996), growth(Harrington and Danzon, 1994), diversification (Sommer, 1996), reinsurance usage(Borch, 1974; Berger et al., 1992), and profitability (Kahane et al., 1986; MacMinn andWitt, 1987).15 Many of the variables are similar to measures used in articles studyingthe determinants of bond ratings, while others are explicitly stated as determinantsof insurer ratings by the rating agencies themselves. Specifically, the variables in-clude measures of liquidity (CASH), investment risk (JUNK, STOCKS), use of rein-surance (REINSURANCE), size (LN(ASSET)), leverage (CAPASSET), growth(CHGNPW), profitability (ROA), percentage of business in long-tail lines(LONGTAIL), geographic diversification (STATES), and line-of-business diversifica-tion (LOBHERF). Each of these variables is defined in the note to Table 4.
Determinants of Rating Differences Across AgenciesEderington (1986) has proposed three explanations for differences in ratings acrossagencies. The first is that agencies agree on the default risk of the firm but applydifferent cutoff points for their ratings; the second is that agencies include differentfactors in their rating models or apply different weights to these factors; and thethird is that differences merely reflect random variations in judgment. The first twoof these reasons both imply that differences in ratings across agencies might be ex-plained by the same variables that are rating determinants for the agencies.16 There-fore, the second stage of the rating differences models contains the same variablesthat are included in the second stage of the determinants models.
15 For a collection of articles dealing with financial models of insurer solvency, see Cumminsand Derrig, 1989.
16 The third reason implies that there is no difference in average ratings and that no variableswould successfully explain any differences, since subjective differences in judgment wouldshow up in the error term of any model of rating differences.
PROPERTY-LIABILITY INSURER FINANCIAL STRENGTH RATINGS: DIFFERENCES ACROSS RATING AGENCIES 629
DATA AND SAMPLE
Our sample consists of 1678 individual property-liability insurers.17 The primary datasources for ratings were Best’s Key Rating Guide, Property-Casualty (PC) Edition;Moody’s PC Insurance Financial Strength Rating List, and S&P’s Insurer Solvency Re-view, PC Edition. The ratings were effective as of July, 1996, and are based on thefinancial statement year ending December 31, 1995.18 Data for financial ratios andother firm-specific variables are from the National Association of Insurance Com-missioners (NAIC) annual statement database. Publicly-traded insurers are identi-fied using the Compact Disclosure database, which provides information on subsid-iaries of publicly-traded insurers and insurance holding companies. In order to beincluded in our sample, an insurer must have financial data available on the NAICdatabase necessary to calculate the various explanatory variables. As shown in Table 1,1,510, 296, and 170 property-liability insurers are included in the sample of insurersrated by Best, S&P and Moody’s, respectively.19
The dependent variables in our rating determinants models are based on the actualrating categories assigned by Best, Moody’s, and S&P to property-liability insurers.Rating categories are combined as shown in Table 1 to conform with the correspon-dence of the verbal descriptions provided by the three rating agencies (also see Garber,1994).20 The four-level rating categories are denoted BCAT4, MCAT4, and SPCAT4.Each rating category is assigned an ordered numerical value as shown in Table 1,where a higher value indicates a higher rating. Table 2 presents summary statisticson selected firm-specific variables. Insurers rated by Moody’s or S&P are larger andlicensed in more states than insurers rated by Best. While over 70 percent of insurersrated by Moody’s and S&P are publicly traded, only 32 percent of insurers rated byBest are publicly traded.
17 Data on individual insurers are used. As pointed out by an anonymous referee, Best oftenassigns group ratings. This may result in correlation in the disturbances across groupmembers. As a robustness check, we ran our Best’s rating determinants model using onlyinsurers that received a stand-alone (not group) rating and our results were qualitativelysimilar. Thus, using individual insurer data does not appear to be a problem.
18 Annual financial statement data is filed with the National Association of InsuranceCommissioners in March each year, and ratings based on the annual data are releasedbetween April and June.
19 Of the 1,510 insurers rated by Best, 94 received Financial Performance Ratings (FPRs).Although the rating process for letter ratings and FPRs is the same, FPRs are assigned tofirms that are either too small or too young to qualify for a letter rating. In this study, FPRsare grouped with the letter ratings according to the correspondence given in Best (1996). Ifthese FPR firms are categorized as “not rated” the results for the Best’s rating model arequalitatively unchanged. Results for the difference models are totally unaffected, since noneof the FPR firms are rated by Moody’s or S&P.
20 Our results do not appear sensitive to any particular categorization of the ratings. Asrobustness tests, we tried running the determinants models using a number of differentcategorizations, including simply ranking the thirteen rating categories of each agency withno grouping. In each case, the results were qualitatively unchanged. In addition, we testeddifferences in coefficients across agencies (similar to Table 6) using nine categories for eachagency, with consolidation only for the lowest category. Again, results were qualitativelyunchanged compared to using four categories. We focus on the four-category specificationbecause of the close correspondence between the verbal interpretations of the ratings forBest and the other two agencies that exists at this level of aggregation (see Table 1).

630T
HE JO
URN
AL O
F RISK A
ND IN
SURA
NC
E
TABLE 1Insurer Financial Strength Rating Symbols and Rating Distributionsa
Best S&P Moody’s
Interpretationb BCAT Number BCAT4 SPCAT Number SPCAT4 MCAT Number MCAT4
Superior/Superior/Exceptional A++ 105 4 AAA 54 4 Aaa 14 4A+ 219 4
Excellent/Excellent/Excellent A 392 3 AA+ 32 3 Aa1 20 3A– 372 3 AA 37 3 Aa2 22 3
AA– 39 3 Aa3 11 3Very good/Good/Good B++ 115 2 A+ 54 2 A1 40 2
B+ 146 2 A 38 2 A2 22 2A– 24 2 A3 11 2
Adequate/Adequate/Adequate B 62 1 BBB+ 4 1 Baa1 14 1B– 53 1 BBB 14 1 Baa2 5 1
BBB– 0 1 Baa3 10 1Uncertain claims-paying abilityc C++ 10 1 BB+ 0 1 Ba1 1 1
C+ 19 1 BB 0 1 Ba2 0 1C 9 1 BB– 0 1 Ba3 0 1C– 5 1D 3 1
Totals 1,510 296 170
a BCAT, SPCAT, and MCAT are the actual rating levels for Best, S&P, and Moody’s, respectively. BCAT4, SPCAT4, and MCAT4 representrating categories after ratings have been consolidated to four levels. As can be seen, the four levels have corresponding verbal interpretationsacross rating agencies.
b These are the descriptions used by the three major rating agencies (Best/S&P/Moody’s).c The descriptions used by the rating agencies are more difficult to compare below the “adequate” level. All insurers rated by more than
one of the rating agencies had Best’s ratings of very good (B++, B+) or higher, except for one company rated by both Best and Moody’s.Consequently, grouping all ratings below adequate into one category only affects the rating difference for one firm.

PROPERTY-LIABILITY INSURER FINANCIAL STRENGTH RATINGS: DIFFERENCES ACROSS RATING AGENCIES 631
TABLE 2Selected Summary Statistics
Total Sample Best S&P Moody’s
Number of firms 1,678 1,510 296 170
Means:
Assets (000s) $409,255 $450,237 $1,601,283 $2,354,251
Net premiums written (NPW) (000s) $135,531 $149,068 $502,898 $751,383
Personal lines NPW/Total NPW 37.5% 38.4% 30.1% 33.3%
Long-tail NPW/Total NPW 65.6% 67.0% 73.1% 76.1%
Number of states licensed 16.3 17.6 33.0 39.8
Publicly-traded 29.7% 32.4% 72.0% 75.3%
Spearman rank correlations of rating categories based on assigned (original) ratingcategories and combined rating categories were calculated. The correlation betweenMoody’s and S&P ratings based on the original rating categories and the four-levelrating categorization is .92, while the correlation between Best and Moody’s is .62;between Best and S&P it is .67. These correlations suggest that we would find moredifferences of opinion regarding insurer risk between Best and the other two agen-cies than between Moody’s and S&P. Correlations, however, only measure the rela-tive level of agreement between rating agencies and might not capture differences inaverage ratings.
The dependent variables in our rating differences models represent the rating differ-ences reduced to three levels.21 Rating differences are calculated by assigning orderednumerical values to ratings, where a higher number indicates a higher rating. In thecase of differences between Best and the other two agencies, the rating difference isdefined as BCAT4-SPCAT4 for S&P compared to Best, and BCAT4-MCAT4 forMoody’s compared to Best. The sample of companies rated by both Best and S&Pincludes 295 firms, and the sample rated by both Best and Moody’s consists of 169firms. The three levels represent same, higher by one level, and higher by two levels,because hardly any insurers rated by both Best and one of the other two agenciesreceive a lower rating from Best (see Table 3).22 Best’s and Moody’s assigned ratings(based on four-level categorization) differ for almost 82 percent of insurers, whileBest’s and S&P’s assigned ratings differ for over 64 percent of insurers. The sampleof insurers rated by both Moody’s and S&P includes 140 companies. In the case ofMoody’s compared to S&P, the rating difference is defined as SPCAT-MCAT,23 andall differences are combined into three categories representing lower, same, or higherrating. It should be noted that we were able to exploit a finer partitioning of therating scale in calculating the rating difference between Moody’s and S&P because ofthe closer correspondence in the rating categories of these two agencies. Also, if rat-
21 This approach is similar to Cantor and Packer (1997) in the case of their trinomial orderedprobit model of rating differences.
22 As shown in Table 3, Best rated only 5 insurers lower than S&P and 2 lower than Moody’s.These firms were included in the “same” category.
23 SPCAT and MCAT were assigned numerical values ranging from 1 for BB+ and Ba1 to 11 forAAA and Aaa.

632 THE JOURNAL OF RISK AND INSURANCE
ing differences between Moody’s and S&P were calculated based on the four-levelrating categorization used in the rating determinants model (i.e., SPCAT4-MCAT4),then almost 83 percent of the 140 insurers rated by these two agencies would be inthe same rating category. The finer partitioning results in only 44 percent (62 out of140) of the insurers rated by Moody’s and S&P in the same rating category. As Table3 shows, because so few rating differences are more than one category higher orlower, classification of differences into three categories results in minimal grouping,while reducing the sample sparsity in some cells. The summary statistics presentedin Table 3 show that on average Best’s ratings are higher than both S&P and Moody’s,and S&P ratings are higher than Moody’s. As a univariate test of rating differences,we compared the distribution of ratings across the four categories (three pairwisecomparisons using BCAT4, SPCAT4, and MCAT4) and find that each of the actualrating distributions is significantly different from the others at the .01 level of signifi-cance based on the chi-squared test statistics.
It is interesting that Best’s ratings tend to be higher than Moody’s and S&P ratings. InTABLE 3Rating Differencesa
Best vs. S&P Best vs. Moody’s S&P vs. Moody’s
Higher by four 0 0 8Higher by three 0 0 4Higher by two 26 43 2Higher by one 164 95 39
Same 100 29 62
Lower by one 5 1 24Lower by two 0 1 0Lower by three 0 0 1
Total 295 169 140a The rating differences between S&P and Moody’s are based on the original rating categories,
similar to Cantor and Packer (1997). The four-level categorization is used to calculatedifferences between Best and the other two rating agencies (see footnote 20 for the rationalefor using the four-level categorization for rating differences models involving Best).
the area of bond ratings, Cantor and Packer (1997) consider Moody’s and S&P to be“mandatory” rating agencies, and others to be “optional” agencies. For insurer fi-nancial strength ratings, Best would most properly be called the “mandatory” agency,while Moody’s and S&P are “optional.” However, whereas Cantor and Packer foundthat for bond ratings the optional agencies tended to issue higher ratings than themandatory agencies, just the opposite appears true for insurer ratings.24 Here, theoptional agencies tend to issue lower ratings than the mandatory agency. Thus, manyfirms are volunteering to obtain optional ratings that are in many cases lower than
24 Cantor and Packer (1997) do not include any analysis of differences between Moody’s andS&P ratings. Ederington (1986) finds no significant differences in the determinants ofMoody’s and S&P corporate bond ratings. It is interesting that while the corporate bondrating models of Moody’s and S&P may not differ, their insurer rating models do, as will beseen later.
PROPERTY-LIABILITY INSURER FINANCIAL STRENGTH RATINGS: DIFFERENCES ACROSS RATING AGENCIES 633
their Best’s rating. Clearly, there must be potential benefits to obtaining additionalratings even if the additional ratings may be lower than the firm’s first rating.
METHODOLOGY
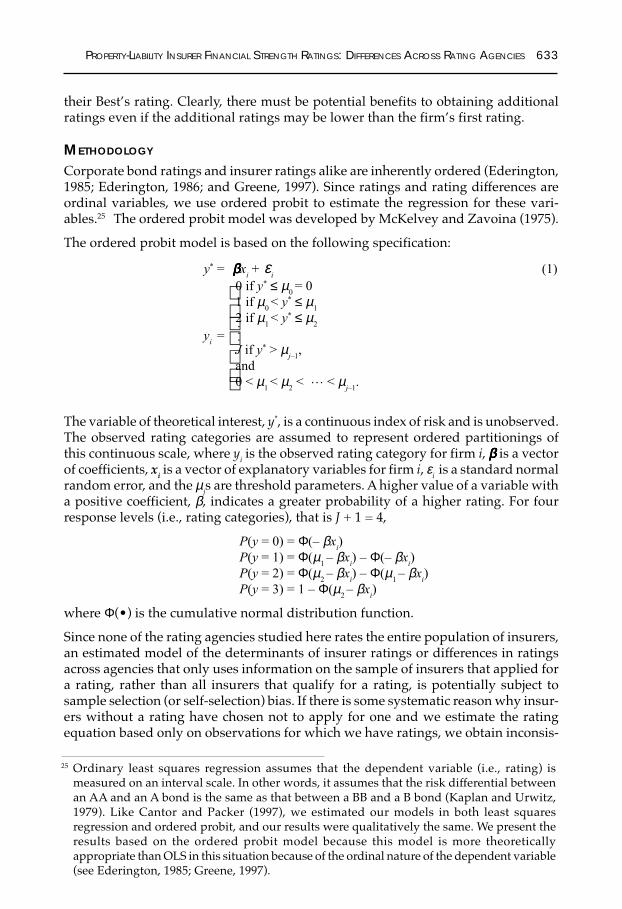
Corporate bond ratings and insurer ratings alike are inherently ordered (Ederington,1985; Ederington, 1986; and Greene, 1997). Since ratings and rating differences areordinal variables, we use ordered probit to estimate the regression for these vari-ables.25 The ordered probit model was developed by McKelvey and Zavoina (1975).
The ordered probit model is based on the following specification:
y* = βββββxi + ε
i (1)
0 if y* ≤ µ0 = 0
1 if µ0 < y* ≤ µ
1
2 if µ1 < y* ≤ µ
2
J if y* > µj–1
,and0 < µ
1 < µ
2 < … < µ
j–1.
The variable of theoretical interest, y*, is a continuous index of risk and is unobserved.The observed rating categories are assumed to represent ordered partitionings ofthis continuous scale, where yi is the observed rating category for firm i, βββββ is a vectorof coefficients, xi is a vector of explanatory variables for firm i, εi is a standard normalrandom error, and the µjs are threshold parameters. A higher value of a variable witha positive coefficient, β, indicates a greater probability of a higher rating. For fourresponse levels (i.e., rating categories), that is J + 1 = 4,
P(y = 0) = Φ(– βxi)
P(y = 1) = Φ(µ1 – βx
i) – Φ(– βx
i)
P(y = 2) = Φ(µ2 – βx
i) – Φ(µ
1 – βx
i)
P(y = 3) = 1 – Φ(µ2 – βx
i)
where Φ(•) is the cumulative normal distribution function.
Since none of the rating agencies studied here rates the entire population of insurers,an estimated model of the determinants of insurer ratings or differences in ratingsacross agencies that only uses information on the sample of insurers that applied fora rating, rather than all insurers that qualify for a rating, is potentially subject tosample selection (or self-selection) bias. If there is some systematic reason why insur-ers without a rating have chosen not to apply for one and we estimate the ratingequation based only on observations for which we have ratings, we obtain inconsis-
25 Ordinary least squares regression assumes that the dependent variable (i.e., rating) ismeasured on an interval scale. In other words, it assumes that the risk differential betweenan AA and an A bond is the same as that between a BB and a B bond (Kaplan and Urwitz,1979). Like Cantor and Packer (1997), we estimated our models in both least squaresregression and ordered probit, and our results were qualitatively the same. We present theresults based on the ordered probit model because this model is more theoreticallyappropriate than OLS in this situation because of the ordinal nature of the dependent variable(see Ederington, 1985; Greene, 1997).
. . .
yi =
634 THE JOURNAL OF RISK AND INSURANCE
tent estimates of the parameters and the expected error term conditional on the firmobtaining a rating is not equal to zero (Heckman, 1979; Cantor and Packer, 1997; andGreene, 1997). For this reason, we run all our models using techniques that controlfor sample selection bias.
In the standard sample selection model, a continuous random variable is subject tosample selection (Heckman, 1979). The standard sample selection model has beenextended to ordinal random variables (Dubin and Rivers, 1990; and Greene, 1998). Inthe ordered probit model with selection, in addition to obtaining estimates of param-eter coefficients, the correlation between the error terms from the decision to obtain arating equation and the rating determination equation (denoted ρ) is obtained. A testfor the selectivity bias is ρ=0 (Dubin and Rivers, 1990).
The ordered probit model with sample selection is:
d* = α zi+ ui, (2)di = 1 if d* > 0 and 0 otherwise,yi satisfies the ordered probit specification of equation (1),[yi, xi] is observed if and only if di = 1.
The variable d* is a continuous unobserved variable measuring the propensity toobtain a rating, while di is a binary variable indicating whether a firm has a rating ornot. The coefficient vector is ααααα. The vector of explanatory variables is zi. The randomerrors, εi and ui, follow a bivariate standard normal distribution with correlation, ρ. Ahigher value for an explanatory variable with a positive coefficient, ααααα, indicates ahigher probability of obtaining a rating or multiple ratings.
EMPIRICAL RESULTS
The Decision To Be RatedThe empirical results for the decision to be rated appear in the upper panels of Tables4 and 5.26 The coefficient on the inverse measure of leverage (capital to assets), isnegative and significant in three of the six first stage regressions, but significantlypositive in the Best equation. The three significantly negative results are consistentwith the Cantor and Packer (1997) hypothesis that higher leverage is associated withgreater uncertainty, which in turn is associated with a greater value of ratings. Alsoconsistent with the uncertainty hypothesis is the positive and significant sign of thecoefficient on the profitability variable in the Best regression.27
The results on the growth variable are surprising. If a high growth rate is associatedwith greater uncertainty, we would expect a positive association between growthand the probability of being rated. In fact, in five of six regressions, the coefficient onthe growth variable is negative and significant at better than the .10 level.
As with some of the leverage and profitability results, the results for several other
26 Collinearity diagnostics were performed for all models and multicollinearity does not appearto be a problem. The highest correlation coefficient is .57 (between LN(ASSET) and STATES),and the highest variance inflation factor is 2.93 (for LN(ASSET)).
27 Our mixed results on these variables are not surprising. Cantor and Packer’s (1997) resultsfor both leverage and profitability do not support the uncertainty hypothesis.

PROPERTY-LIABILITY INSURER FINANCIAL STRENGTH RATINGS: DIFFERENCES ACROSS RATING AGENCIES 635
TABLE 4Rating Determinants Models
Decision To Be Rated
Best S&P Moody’sVariablea coefficient p-value coefficient p-value coefficient p-value
CAPASSET 0.6829 0.0409 –0.3414 0.3058 –2.8952 0.0000ROA 2.9429 0.0000 1.1966 0.2395 –0.9119 0.6245CHGNPW –0.5108 0.0001 –0.2448 0.0915 –0.5820 0.0218STATES 0.0149 0.0006 0.0166 0.0000 0.0219 0.0000LOBHERF –1.4373 0.0000 –0.9125 0.0000 –1.7836 0.0006JUNK –1.2973 0.6859 –1.2892 0.7123 3.9777 0.3107STOCKS –0.6317 0.1197 0.4233 0.1972 –0.2067 0.7082CASH –1.4724 0.0000 –5.1466 0.0000 –27.3857 0.0002REINSURANCE –0.0498 0.8164 0.5157 0.0091 0.8873 0.0054LONGTAIL 0.1799 0.2600 0.6159 0.0022 0.9941 0.0125PERSONAL –0.0313 0.8401 –0.3970 0.0135 0.2130 0.4345TRADED 0.5405 0.0010 1.0255 0.0000 1.0248 0.0000LN(DPW) 0.1591 0.0000 0.0393 0.1688 0.1151 0.0114
Rating Determinants
Best rating S&P rating Moody’s ratingcoefficient p-value coefficient p-value coefficient p-value
CAPASSET 2.6242 0.0000 1.3921 0.0284 –0.1676 0.9090ROA 2.8748 0.0000 4.7529 0.0036 4.1311 0.2102CHGNPW 0.2832 0.0011 0.5817 0.0036 0.2316 0.4475STATES 0.0007 0.7063 0.0019 0.6705 –0.0032 0.6998LOBHERF –0.6490 0.0000 –0.2570 0.5213 –0.9190 0.4030JUNK –4.7768 0.0486 –15.2217 0.0032 –21.3680 0.0024STOCKS –1.0103 0.0000 –0.0371 0.9428 0.4401 0.6360CASH –1.6629 0.0000 –4.1962 0.3266 –8.3181 0.5168REINSURANCE 0.4932 0.0000 –0.1000 0.7167 0.6727 0.2608LONGTAIL –0.0644 0.5718 –0.7657 0.0339 –1.0263 0.2227LN(ASSET) 0.4023 0.0000 0.1086 0.0849 0.2632 0.0127Rho(ε,u) –0.5158 0.0009 –0.0248 0.9181 0.1289 0.7389
a CAPASSET is statutory capital divided by total assets; ROA is net income divided by totalassets; CHGNPW is the percentage change in net premiums written (NPW) between 1994and 1995; STATES is the number of states licensed; LOBHERF is the line-of-businessHerfindahl index using NPW; JUNK is investments in speculative grade bonds divided byinvested assets; STOCKS is common stock investments divided by invested assets; CASHis cash and short-term investments divided by invested assets; REINSURANCE isreinsurance ceded divided by the sum of direct premiums written (DPW) and reinsuranceassumed; LONGTAIL is NPW in long-tail lines of insurance divided by total NPW;PERSONAL is NPW in personal lines divided by total NPW; TRADED equals one if publiclytraded, zero otherwise; LN(DPW) is the natural logarithm of DPW; LN(ASSET) is the naturallogarithm of total assets. Constants and threshold parameters are suppressed to conservespace.
636 THE JOURNAL OF RISK AND INSURANCE
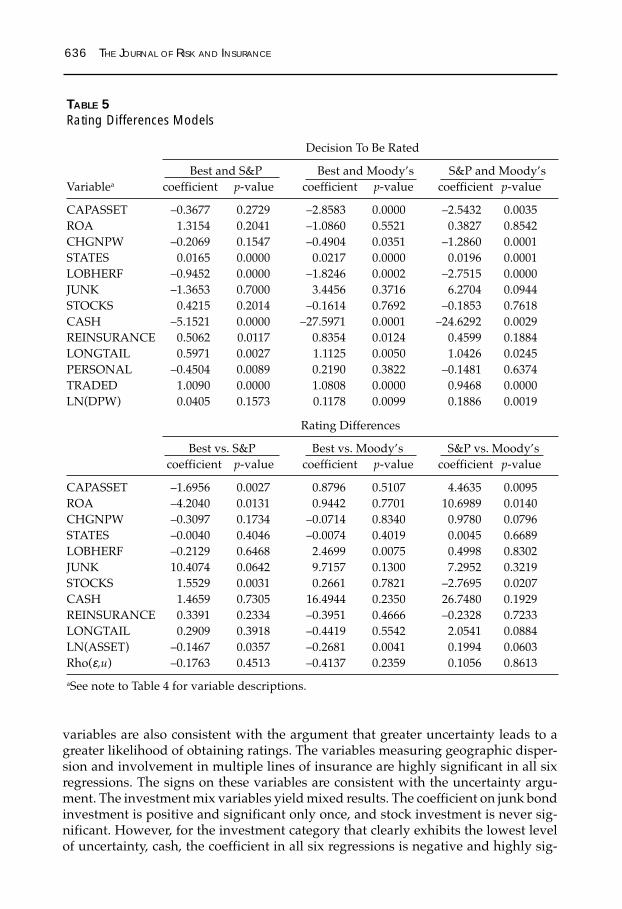
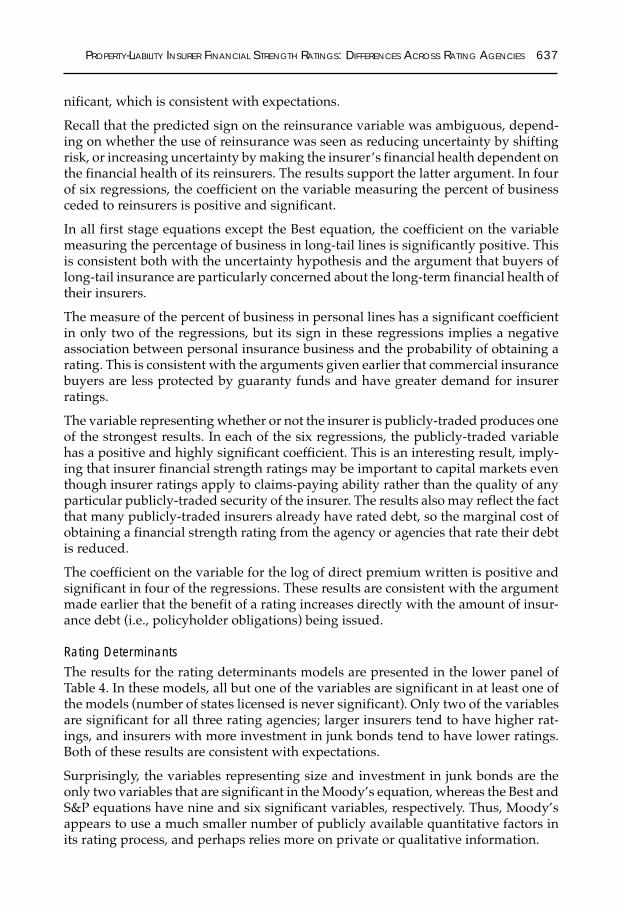
TABLE 5Rating Differences Models
Decision To Be Rated
Best and S&P Best and Moody’s S&P and Moody’sVariablea coefficient p-value coefficient p-value coefficient p-value
CAPASSET –0.3677 0.2729 –2.8583 0.0000 –2.5432 0.0035ROA 1.3154 0.2041 –1.0860 0.5521 0.3827 0.8542CHGNPW –0.2069 0.1547 –0.4904 0.0351 –1.2860 0.0001STATES 0.0165 0.0000 0.0217 0.0000 0.0196 0.0001LOBHERF –0.9452 0.0000 –1.8246 0.0002 –2.7515 0.0000JUNK –1.3653 0.7000 3.4456 0.3716 6.2704 0.0944STOCKS 0.4215 0.2014 –0.1614 0.7692 –0.1853 0.7618CASH –5.1521 0.0000 –27.5971 0.0001 –24.6292 0.0029REINSURANCE 0.5062 0.0117 0.8354 0.0124 0.4599 0.1884LONGTAIL 0.5971 0.0027 1.1125 0.0050 1.0426 0.0245PERSONAL –0.4504 0.0089 0.2190 0.3822 –0.1481 0.6374TRADED 1.0090 0.0000 1.0808 0.0000 0.9468 0.0000LN(DPW) 0.0405 0.1573 0.1178 0.0099 0.1886 0.0019
Rating Differences
Best vs. S&P Best vs. Moody’s S&P vs. Moody’scoefficient p-value coefficient p-value coefficient p-value
CAPASSET –1.6956 0.0027 0.8796 0.5107 4.4635 0.0095ROA –4.2040 0.0131 0.9442 0.7701 10.6989 0.0140CHGNPW –0.3097 0.1734 –0.0714 0.8340 0.9780 0.0796STATES –0.0040 0.4046 –0.0074 0.4019 0.0045 0.6689LOBHERF –0.2129 0.6468 2.4699 0.0075 0.4998 0.8302JUNK 10.4074 0.0642 9.7157 0.1300 7.2952 0.3219STOCKS 1.5529 0.0031 0.2661 0.7821 –2.7695 0.0207CASH 1.4659 0.7305 16.4944 0.2350 26.7480 0.1929REINSURANCE 0.3391 0.2334 –0.3951 0.4666 –0.2328 0.7233LONGTAIL 0.2909 0.3918 –0.4419 0.5542 2.0541 0.0884LN(ASSET) –0.1467 0.0357 –0.2681 0.0041 0.1994 0.0603Rho(ε,u) –0.1763 0.4513 –0.4137 0.2359 0.1056 0.8613
aSee note to Table 4 for variable descriptions.
variables are also consistent with the argument that greater uncertainty leads to agreater likelihood of obtaining ratings. The variables measuring geographic disper-sion and involvement in multiple lines of insurance are highly significant in all sixregressions. The signs on these variables are consistent with the uncertainty argu-ment. The investment mix variables yield mixed results. The coefficient on junk bondinvestment is positive and significant only once, and stock investment is never sig-nificant. However, for the investment category that clearly exhibits the lowest levelof uncertainty, cash, the coefficient in all six regressions is negative and highly sig-
PROPERTY-LIABILITY INSURER FINANCIAL STRENGTH RATINGS: DIFFERENCES ACROSS RATING AGENCIES 637
nificant, which is consistent with expectations.
Recall that the predicted sign on the reinsurance variable was ambiguous, depend-ing on whether the use of reinsurance was seen as reducing uncertainty by shiftingrisk, or increasing uncertainty by making the insurer’s financial health dependent onthe financial health of its reinsurers. The results support the latter argument. In fourof six regressions, the coefficient on the variable measuring the percent of businessceded to reinsurers is positive and significant.
In all first stage equations except the Best equation, the coefficient on the variablemeasuring the percentage of business in long-tail lines is significantly positive. Thisis consistent both with the uncertainty hypothesis and the argument that buyers oflong-tail insurance are particularly concerned about the long-term financial health oftheir insurers.
The measure of the percent of business in personal lines has a significant coefficientin only two of the regressions, but its sign in these regressions implies a negativeassociation between personal insurance business and the probability of obtaining arating. This is consistent with the arguments given earlier that commercial insurancebuyers are less protected by guaranty funds and have greater demand for insurerratings.
The variable representing whether or not the insurer is publicly-traded produces oneof the strongest results. In each of the six regressions, the publicly-traded variablehas a positive and highly significant coefficient. This is an interesting result, imply-ing that insurer financial strength ratings may be important to capital markets eventhough insurer ratings apply to claims-paying ability rather than the quality of anyparticular publicly-traded security of the insurer. The results also may reflect the factthat many publicly-traded insurers already have rated debt, so the marginal cost ofobtaining a financial strength rating from the agency or agencies that rate their debtis reduced.
The coefficient on the variable for the log of direct premium written is positive andsignificant in four of the regressions. These results are consistent with the argumentmade earlier that the benefit of a rating increases directly with the amount of insur-ance debt (i.e., policyholder obligations) being issued.
Rating DeterminantsThe results for the rating determinants models are presented in the lower panel ofTable 4. In these models, all but one of the variables are significant in at least one ofthe models (number of states licensed is never significant). Only two of the variablesare significant for all three rating agencies; larger insurers tend to have higher rat-ings, and insurers with more investment in junk bonds tend to have lower ratings.Both of these results are consistent with expectations.
Surprisingly, the variables representing size and investment in junk bonds are theonly two variables that are significant in the Moody’s equation, whereas the Best andS&P equations have nine and six significant variables, respectively. Thus, Moody’sappears to use a much smaller number of publicly available quantitative factors inits rating process, and perhaps relies more on private or qualitative information.

638 THE JOURNAL OF RISK AND INSURANCE
Consistent with the bond rating literature, the coefficient on profitability is positiveand significant in the Best and S&P models. Additionally, the coefficient on capitali-zation (inverse leverage) is positive and significant in these two models. Growth inpremiums written is also associated with higher ratings for Best and S&P.
The coefficient on the variable measuring the percent of business in long-tail lines,which are generally considered more risky than short-tailed lines, is negative andsignificant only in the S&P equation. Of the remaining variables, cash holdings, stockinvestments, reinsurance usage, and line of business diversification are significant inthe Best equation only.
Comparison of Rating ModelsLooking at the results for the rating determinants models, it appears that the threemodels differ, in that each has a different set of statistically significant variables.However, this casual observation is not enough to determine whether the models arestatistically different. Thus, we perform formal statistical tests for differences amongthe models. The results reported here are for the comparison between S&P andMoody’s.28 Following Ederington (1986), we estimated the two models jointly, whilefirst restricting the µs (i.e., cutoff points) to be equal across the models but allowingthe βs to vary. The results are shown in Table 6. The log likelihood for this joint modelis then compared with the sum of the log likelihoods from the two models estimatedseparately. This difference then provides a chi-squared statistic to test for equality ofthe µs in the two models. With the resulting chi-squared statistic of 3.1 and threedegrees of freedom, we are unable to reject the null hypothesis of equality of the µseven at the .10 level of significance. Thus, the cutoff points for S&P and Moody’s donot appear to differ.
With µs constrained to be equal, the final column of Table 6 also provides chi-squaredtests for differences in βs across the models. The βs differ between models at the .10level of significance for only one variable. However, another log likelihood test wasperformed to test the null hypothesis that all of the βs were equal across the twomodels. This null hypothesis was rejected at the .01 level (chi-square = 24.8, 11 de-grees of freedom), so we cannot conclude that the models for S&P and Moody’s arethe same.
Determinants of Rating DifferencesThe final set of results to be discussed is for the rating differences models. Theseresults are shown in the lower panel of Table 5. For Best versus S&P, five variables(common stock investments, junk bond investments, size, capitalization, and profit-ability) are significant. Only two variables are significant in the model for Best ver-
28 Since no evidence of selection bias was found for the S&P or Moody’s models (p-values forρ are .92 and .74, respectively; see discussion below), we do not incorporate sample selectionmethods into this analysis. Similar tests were performed comparing Best to S&P andMoody’s. These tests decisively rejected the null hypotheses of equal µs and βs. This is notsurprising, given the relatively low correlation reported earlier between Best ratings andthe others (.62 and .67), compared to the correlation between S&P versus Moody’s (.92).

PROPERTY-LIABILITY INSURER FINANCIAL STRENGTH RATINGS: DIFFERENCES ACROSS RATING AGENCIES 639
sus Moody’s (size and line-of-business diversification). Finally, the S&P versusMoody’s model has six significant variables (common stock investments, size, capi-talization, growth in premiums, profitability, and long-tail lines percentage).
Our results are consistent with the hypothesis that rating agencies differ systemati-cally in the relative importance given to the different factors they consider. The num-ber of significant coefficients in the rating differences models is actually rather sur-prising. While the bond rating literature has found numerous variables important indetermining ratings, there has been little success in explaining rating differences.Cantor and Packer (1997) use measures of leverage, coverage, profitability, and size(along with industry dummies) in their models for explaining bond rating differ-ences. In their four models, comparing Moody’s and S&P to DCR and Fitch, size andprofitability were each significant in only one model, while the other financial vari-ables were never significant.
Sample SelectionOne interesting aspect of our results is the relative lack of evidence of sample selec-tion bias. In the rating determinants models, only the Best rating model yields a valueof ρ that is significantly different from zero. None of the rating differences modelsshow evidence of selection bias. Thus, the differences in ratings across agencies donot seem to be driven by self-selection issues.
TABLE 6Rating Determinants Model With Different Coefficients and Equal Division Points
p-value for nullS&P’s Moody’s hypothesis of
Variable coefficient coefficient coefficient equality
CAPASSET 1.5175 –0.3717 0.0681
ROA 4.7214 3.6263 0.7209CHGNPW 0.5712 0.2762 0.3852STATES 0.0013 –0.0034 0.4794LOBHERF –0.2567 –0.9671 0.3349JUNK –15.3630 –21.9693 0.3509STOCKS –0.1455 0.9268 0.2271CASH –4.1953 –5.9479 0.8811REINSURANCE –0.0531 0.4177 0.2949LONGTAIL –0.7113 –1.4468 0.3339LN(ASSET) 0.1413 0.1817 0.2846
Division pointsa
Mu(1) 1.5014
Mu(2) 2.7452
Constant –1.1236aThe constant and threshold parameters were constrained to be equal for S&P and Moody’s.
640 THE JOURNAL OF RISK AND INSURANCE
CONCLUSION
This is the first study to extensively analyze insurer financial strength ratings. It ex-amines the decision to be rated, the determinants of ratings, and the determinants ofrating differences across agencies, while controlling for sample selection bias. Al-though corporate bond ratings have been studied extensively, the ratings analyzedhere are quite distinct. Bond ratings are related to specific issues of publicly-tradeddebt. Insurer ratings, by contrast, relate to the overall financial strength of the insurerand are issued for mutual firms and privately-held stock firms in addition to pub-licly-traded stock companies.
The results demonstrate that each of the rating agencies examined uses a distinctrating model, with its own important factors and its own weights on those factors.This helps explain the large proportion of rating differences found among insurersrated by more than one agency. Particularly interesting are the differences foundbetween Moody’s and Standard and Poor’s, given that Ederington (1986) did notfind any differences in rating determinants for these two agencies in examining cor-porate bond ratings. An important implication of our results is that regulators, in-vestors, consumers, and other interested parties should not assume equivalence ofrating scales across rating agencies. Another point shown clearly is that insurer fi-nancial strength rating differences do not appear to be driven by sample selectionbias, with only the Best rating determinants model providing any evidence of sampleselection bias.
A number of interesting results are also found regarding the decision to obtain arating. First, unlike Cantor and Packer (1997), we find support for the hypothesisthat insurers seek ratings in order to resolve ex ante uncertainty about their level ofinsolvency risk. In addition, we find some evidence that insurers that write morebusiness in lines with less guaranty fund protection are more likely to obtain ratings.Also, more heavily reinsured firms are found to be more likely to obtain ratings,consistent with the hypothesis that reinsurance adds another layer of complexity toevaluation of an insurer’s risk. Publicly-traded firms are also found to be more likelyto obtain ratings, even though insurer ratings do not relate to any specific publicly-traded security.
Our results suggest that more research dealing with the issue of insurer ratings wouldbe valuable. For example, while this study shows that rating agencies appear to usedifferent insurer rating models, future work could consider whether the ratings ofany one of the agencies are consistently better at reflecting the true insolvency risk ofthe insurers it rates.
REFERENCES
Adiel, R., 1996, Reinsurance and the Management of Regulatory Ratios and Taxes inthe Property-Casualty Insurance Industry, Journal of Accounting and Economics,22: 207-240.
A.M. Best, 1996, Best’s Key Rating Guide, Property-Casualty Edition (Oldwick, NJ: A.M.Best Co., Inc.).
Anthony, J. H., and K. R. Petroni, 1997, Accounting Estimation Disclosures and FirmValuation in the Property-Casualty Insurance Industry, Journal of Accounting,Auditing and Finance, 12: 257-281.

PROPERTY-LIABILITY INSURER FINANCIAL STRENGTH RATINGS: DIFFERENCES ACROSS RATING AGENCIES 641
Beattie, V., and S. Searle, 1992, Bond Ratings and Inter-Rater Agreement, Journal ofInternational Securities Markets, summer: 167-172.
Berger, L. A., J. D. Cummins, and S. Tennyson, 1992, Reinsurance and the LiabilityInsurance Crisis, Journal of Risk and Uncertainty, 5: 253-272.
Borch, K., 1974, Capital Markets and the Supervision of Insurance Companies, Jour-nal of Risk and Insurance, 41: 397-405.
Buckley, K. M., 1997, The Relationship Between Insurance Company Debt and Claims Pay-ing Ability Ratings (Chicago, IL: Duff and Phelps Credit Rating Company).
Cantor, R., and F. Packer, 1997, Differences of Opinion and Selection Bias in the CreditRating Industry, Journal of Banking and Finance, 21: 1395-1417.
Cantor, R., and F. Packer, 1995, The Credit Rating Industry, Journal of Fixed Income, 5:10-34.
Cummins, J. D., and P. M. Danzon, 1997, Price, Financial Quality, and Capital Flowsin Insurance Markets, Journal of Financial Intermediation, 6: 3-38.
Cummins, J. D., and R. A. Derrig, 1989, Financial Models of Insurance Solvency (Norwell,MA: Kluwer Academic Publishers).
Cummins, J. D., and D. W. Sommer, 1996, Capital and Risk in Property-Liability In-surance Markets, Journal of Banking and Finance, 20: 1069-1092.
Doherty, N., 1989, On the Capital Structure of Insurance Firms, in: J. D. Cumminsand R. A. Derrig, eds., Financial Models of Insurer Solvency (Norwell, MA: KluwerAcademic Publishers).
Doherty, N., and S. Tinic, 1981, Reinsurance Under Conditions of Capital MarketEquilibrium: A Note, Journal of Finance, 36: 949-953.
Dubin, J. A., and D. Rivers, 1990, Selection Bias in Linear Regression, Logit and ProbitModels, in: J. Fox and J. S. Long, eds., Modern Methods of Data Analysis (NewburyPark, CA: Sage Publications).
Ederington, L. H., 1985, Classification Models and Bond Ratings, Financial Review, 20:237-262.
Ederington, L. H., 1986, Why Split Ratings Occur, Financial Management, 15: 37-47.Ederington, L. H., and J. Yawitz, 1987, The Bond Rating Process, in: E. Altman, ed.,
Handbook of Financial Markets and Institutions, 6th ed. (New York: John Wiley andSons).
Fung, H. G., G. C. Lai, G. A. Patterson, and R. C. Witt, 1998, Underwriting Cycles inProperty and Liability Insurance: An Empirical Analysis of Industry and By-LineData, Journal of Risk and Insurance, 65: 539-561.
Garber, H. D., 1994, Financial Statements and Ratings, in: E. E. Graves, ed., McGill’sLife Insurance (Bryn Mawr, PA: American College).
Greene, W. H., 1998, LIMDEP Version 7.0 User’s Manual Revised Edition (Plainview,NY: Econometric Software, Inc).
Greene, W. H., 1997, Econometric Analysis, 3rd ed. (Englewood Cliffs, NJ: Prentice-Hall).
Harrington, S. E., and P. M. Danzon, 1994, Price Cutting in Liability Insurance Mar-kets, Journal of Business, 67: 511-538.

642 THE JOURNAL OF RISK AND INSURANCE
Heckman, J., 1979, Sample Selection Bias as a Specification Error, Econometrica, 47:153-161.
Jones, D. C., 1994, Rating Agencies Sway Insurer Investment Moves, National Under-writer, Life, Health, and Financial Services, 98 (19 December): 35.
Kahane, Y., C. S. Tapiero, and L. Jacques, 1986, Concepts and Trends in the Study ofInsurer’s Solvency, in: J. D. Cummins and R. A. Derrig, eds., Financial Models ofInsurer Solvency (Norwell, MA.: Kluwer Academic Publishers).
Kaplan, R. S., and G. Urwitz, 1979, Statistical Models of Bond Ratings: A Method-ological Inquiry, Journal of Business, 52: 231-261.
Klein, R. W., 1992, Insurance Company Rating Agencies: A Description of Their Methodsand Procedures (Kansas City, MO: National Association of Insurance Commission-ers).
MacMinn, R. D., and R. C. Witt, 1987, A Financial Theory of the Insurance Firm Un-der Uncertainty and Regulatory Constraints, Geneva Papers on Risk and Insurance,12: 3-20.
Mayers, D., and C. W. Smith, Jr., 1981, Contractual Provisions, Organizational Struc-ture, and Conflict Control in Insurance Markets, Journal of Business, 54: 407-434.
McKelvey, R. D., and W. Zavoina, 1975, A Statistical Model for the Analysis of Ordi-nal Level Dependent Variables, Journal of Mathematical Sociology, 4: 103-120.
Millon, M. M., and A. V. Thakor, 1985, Moral Hazard and Information Sharing: AModel of Financial Information Gathering Agencies, Journal of Finance, 40: 1403-1422.
Moody’s, 1998, Property and Casualty Insurance and Reinsurance (New York: Moody’sInvestors Service).
Moon, C. G., and J. G. Stotsky, 1993, Testing the Differences Between the Determi-nants of Moody’s and Standard & Poor’s Ratings, Journal of Applied Econometrics,8: 51-69.
Munch, P., and D. E. Smallwood, 1982, Theory of Solvency Regulation in the Prop-erty and Casualty Insurance Industry, in: Gary Fromm, ed., Studies in Public Regu-lation (Cambridge, MA: MIT Press).
Pottier, S. W., 1998, Life Insurer Financial Distress, Best’s Ratings and Financial Ra-tios, Journal of Risk and Insurance, 65: 275-288.
Pottier, S. W., 1997, Life Insurer Risk Characteristics and the Rating Process, Journal ofInsurance Issues, 20: 111-130.
Schwartz, R., 1994, Good, Better, Best, ReActions, 14: 34-35.Ramakrishnan, R. T., and A. V. Thakor, 1984, Information Reliability and a Theory of
Financial Intermediation, Review of Economic Studies, 51: 415-432.Sommer, D. W., 1996, The Impact of Firm Risk on Property-Liability Insurance Prices,
Journal of Risk and Insurance, 63: 501-514.Standard and Poor’s, 1996, Insurer Solvency Review, Property-Casualty Edition (New
York: Standard and Poor’s).Thompson, G. R., and P. Vaz, 1990, Dual Bond Ratings: A Test of the Certification
Function of Rating Agencies, Financial Review, 25: 457-471.