Propenomy of Malaysian Property Outlook 2015, the where - what and when for a 5 years property...
81
Propenomy Outlook 2015 Greater KL & Klang Valley: What, Where and When Current and Future Corridors of Property Growth “Connecting the …… dots between economy, demographic trends and current-new property hotspots” REI Group of Companies - Presentation by Dr. Daniele Gambero
-
Upload
independent -
Category
Documents
-
view
1 -
download
0
Transcript of Propenomy of Malaysian Property Outlook 2015, the where - what and when for a 5 years property...
Propenomy Outlook 2015Greater KL & Klang Valley: What, Where and
WhenCurrent and Future Corridors of Property
Growth
“Connecting the …… dots between economy, demographic trends and current-new property hotspots”
REI Group of Companies - Presentation by Dr. Daniele Gambero

DISCLAIMER AND COPYWRITETo the best of our knowledge, all information included here falls under the fair use or public domain guidelines of copyright laws. We strive for accuracy but cannot be held responsible for any errors in information featured in the slides or incorrect attributions. REI Group of Companies uses reasonable efforts to include accurate and up to date information however REI Group of Companies makes no warranties or representations as to its accuracy. REI Group of Companies assumes no liability or responsibility for any errors or omissions in the content. The quotes, articles, news and views are not necessarily representative of the views of REI Group of Companies and its directors and Management.
This Presentation has been shared for personal use and knowledge ONLY. Any inappropriate use will be prosecuted according to the law and any total or partial use of this presentation for public viewing or publishing must be pre-authorized in writing by REI Group of Companies.
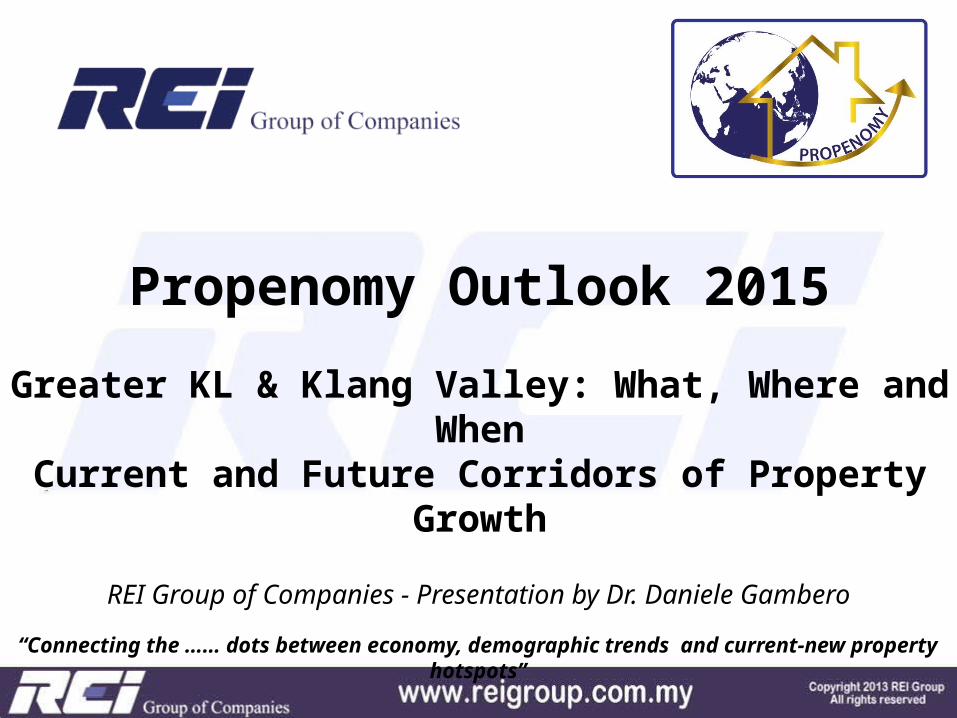
CONSULTANCY
- Strategic Marketing Consultancies: design, concept, pricing, branding
- Property Market Surveys: defining the best product for each specific area
- Property Market Reporting: give developers an independent platform to take strategic decision on future development
- Property Market Analysis: research and definition of new development products based on existing market situation
- Branding: adding value by endorsement of project, branding of new development areas, defining and creating catalyzer for future development
- Creative: converting ideas in fact and having fun
…………What we do


Organizations that have invited Dr. Daniele Gambero as speaker to their events are:Rehda KL, Rehda JB, Rehda Malacca and Rehda PenangSheda KuchingAsian Strategic Leadership Institute (ASLI)FIABCI Malaysian ChapteriProperty, PropertyGuru Malaysia and Singapore and EG ExposMalaysian Property IncorporatedUniversity Malaya KLWealth Mastery Academy, Comfori and Starfish
Special Property Market Outlook presentation to the Bod of: Encorp BhdHatten GroupUEM Sunrise


Regular columnist for several newspapers and specialized magazine such as:
The StarMalaysian ReserveMalay MailThe SunPropertyTimesReal Estate MalaysiaProperty HunterProperty InsightProperty King
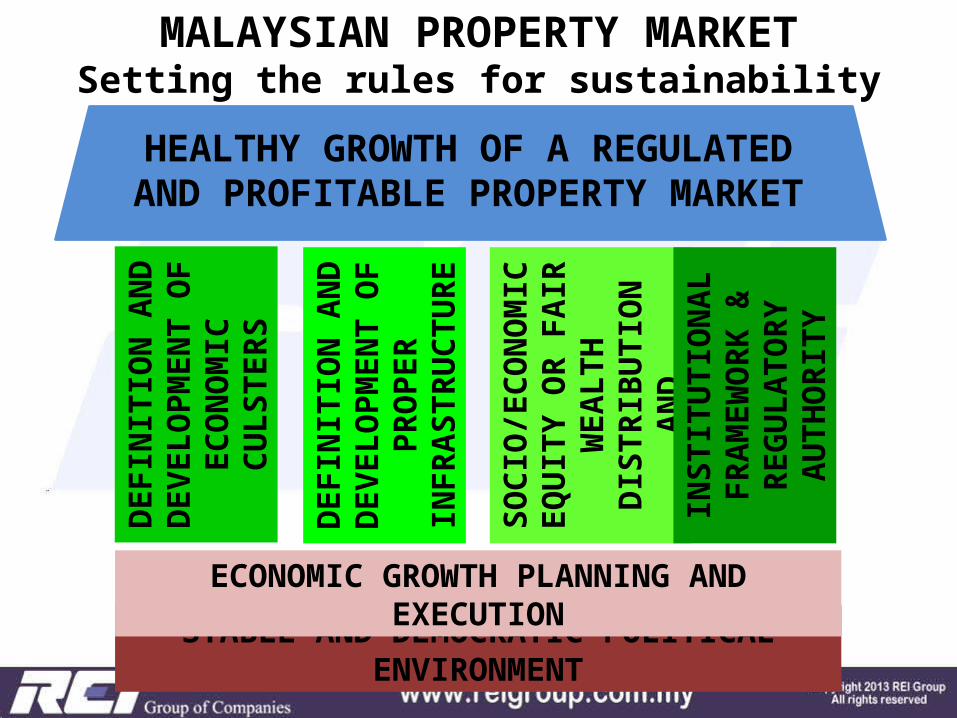
MALAYSIAN PROPERTY MARKETSetting the rules for sustainability
STABLE AND DEMOCRATIC POLITICAL ENVIRONMENT
ECONOMIC GROWTH PLANNING AND EXECUTION
DEFINITION AND
DEVELOPMENT OF
ECONOMIC
CULSTERS
DEFINITION AND
DEVELOPMENT OF
PROPER
INFRASTRUCTURE
SOCIO/ECONOMIC
EQUITY OR FAIR
WEALTH
DISTRIBUTION
AND
INSTITUTIONAL
FRAMEWORK &
REGULATORY
AUTHORITY
HEALTHY GROWTH OF A REGULATED AND PROFITABLE PROPERTY MARKET
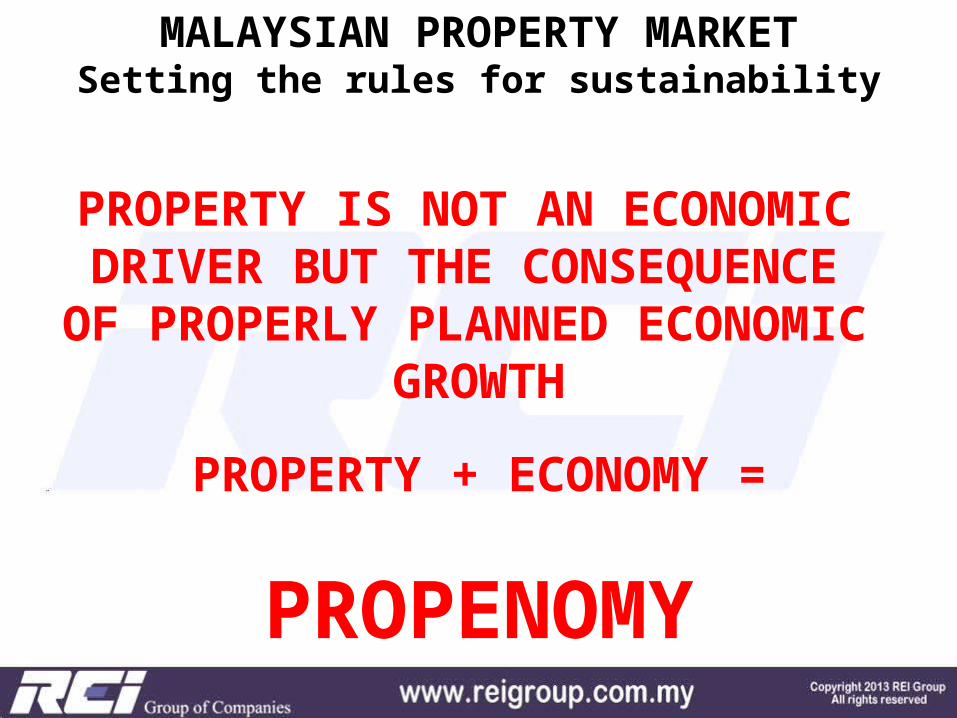
MALAYSIAN PROPERTY MARKETSetting the rules for sustainability
PROPERTY IS NOT AN ECONOMIC DRIVER BUT THE CONSEQUENCE
OF PROPERLY PLANNED ECONOMIC GROWTH
PROPERTY + ECONOMY =
PROPENOMY
MALAYSIAN PROPERTY MARKETSetting the rules for sustainability

MALAYSIAN PROPERTY MARKET
Malaysian Economic Performance and
The Future of the Property Market
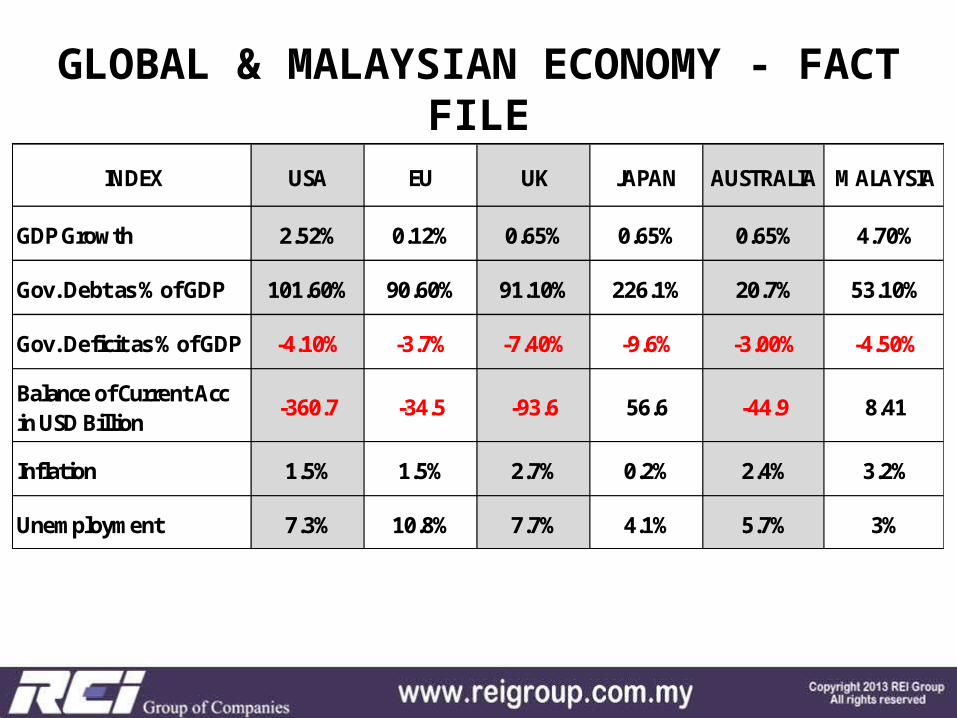
GLOBAL & MALAYSIAN ECONOMY - FACT FILE
INDEX USA EU UK JAPAN AUSTRALIA M ALAYSIA
GDP Growth 2.52% 0.12% 0.65% 0.65% 0.65% 4.70%
Gov. Debt as % of GDP 101.60% 90.60% 91.10% 226.1% 20.7% 53.10%
Gov. Deficit as % of GDP -4.10% -3.7% -7.40% -9.6% -3.00% -4.50%
Balance of Current Acc in USD Billion -360.7 -34.5 -93.6 56.6 -44.9 8.41
Inflation 1.5% 1.5% 2.7% 0.2% 2.4% 3.2%
Unem ploym ent 7.3% 10.8% 7.7% 4.1% 5.7% 3%
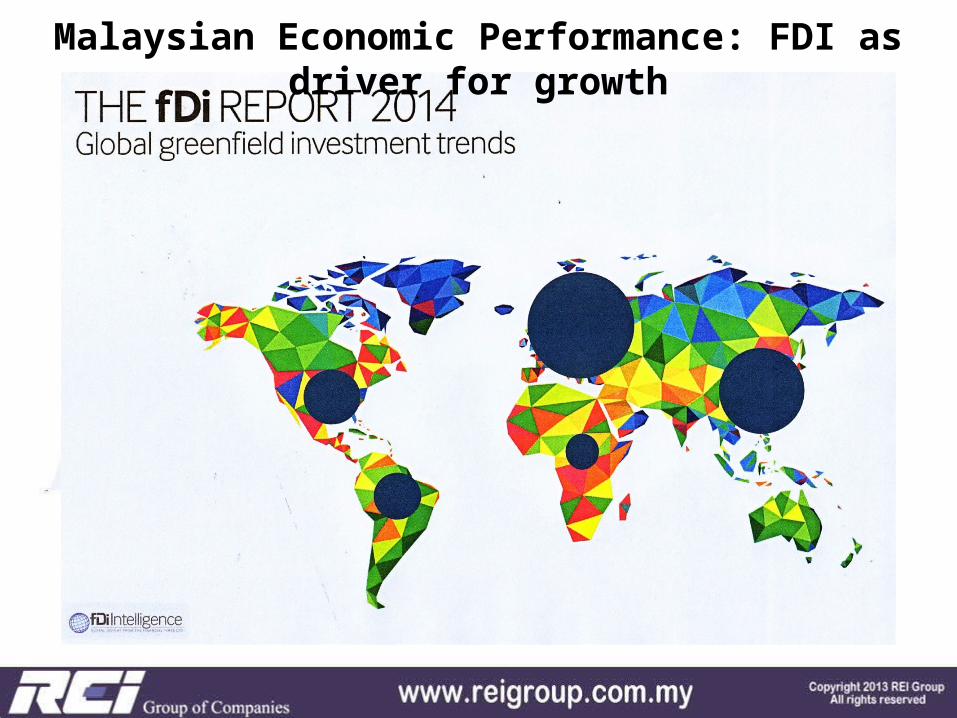
Malaysian Economic Performance: FDI as driver for growth
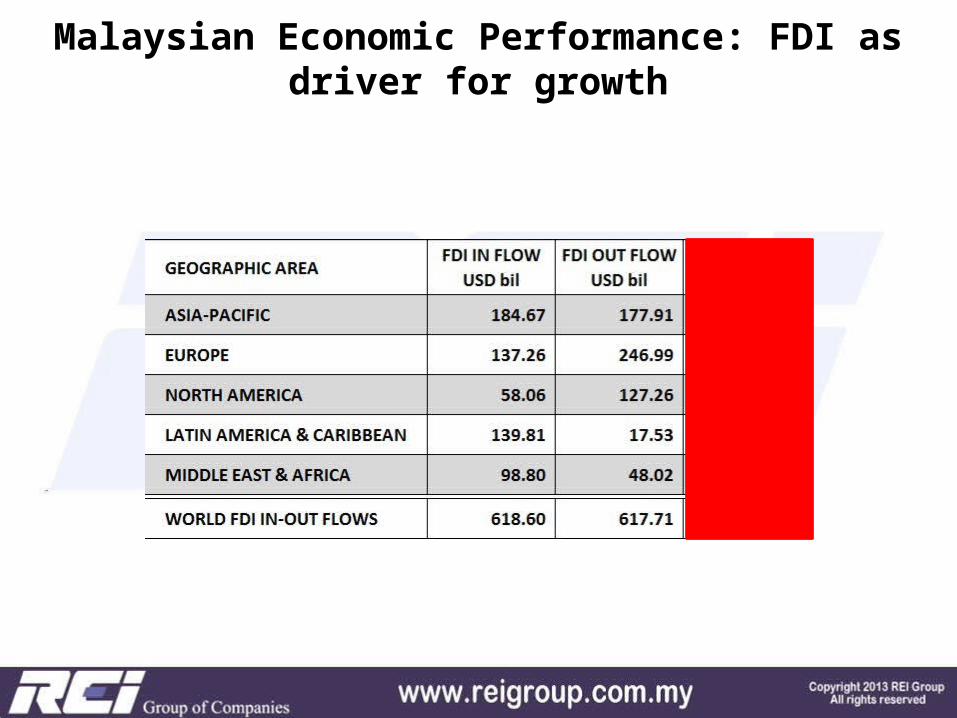
Malaysian Economic Performance: FDI as driver for growth
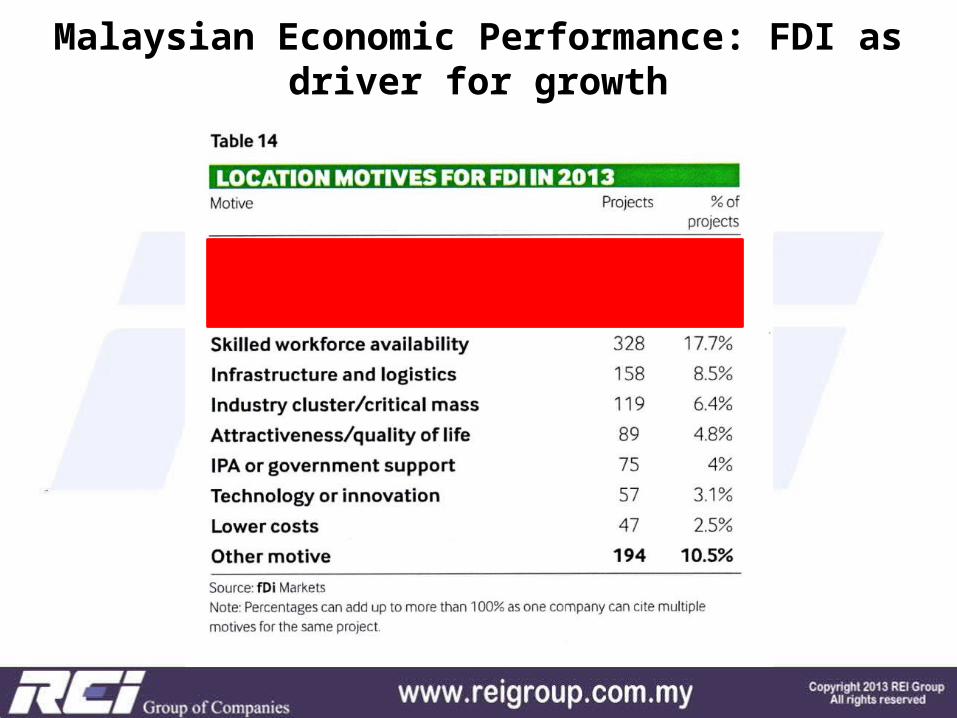
Malaysian Economic Performance: FDI as driver for growth
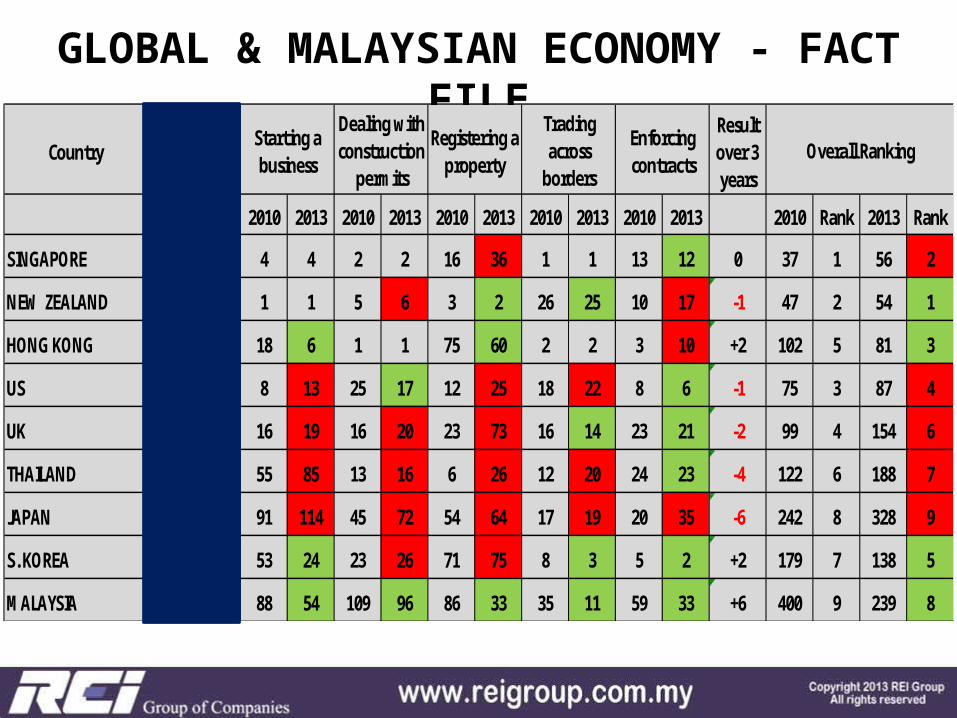
GLOBAL & MALAYSIAN ECONOMY - FACT FILE
CountryResult over 3 years
2010 2013 2010 2013 2010 2013 2010 2013 2010 2013 2010 2013 2010 Rank 2013 RankSINGAPORE 1 1 4 4 2 2 16 36 1 1 13 12 0 37 1 56 2
NEW ZEALAND 2 3 1 1 5 6 3 2 26 25 10 17 -1 47 2 54 1
HONG KONG 3 2 18 6 1 1 75 60 2 2 3 10 +2 102 5 81 3
US 4 4 8 13 25 17 12 25 18 22 8 6 -1 75 3 87 4
UK 5 7 16 19 16 20 23 73 16 14 23 21 -2 99 4 154 6
THAILAND 12 18 55 85 13 16 6 26 12 20 24 23 -4 122 6 188 7
JAPAN 15 24 91 114 45 72 54 64 17 19 20 35 -6 242 8 328 9
S. KOREA 19 8 53 24 23 26 71 75 8 3 5 2 +2 179 7 138 5
M ALAYSIA 23 12 88 54 109 96 86 33 35 11 59 33 +6 400 9 239 8
Overall RankingEase of doing business
Starting a business
Dealing with construction perm its
Registering a property
Trading across borders
Enforcing contracts
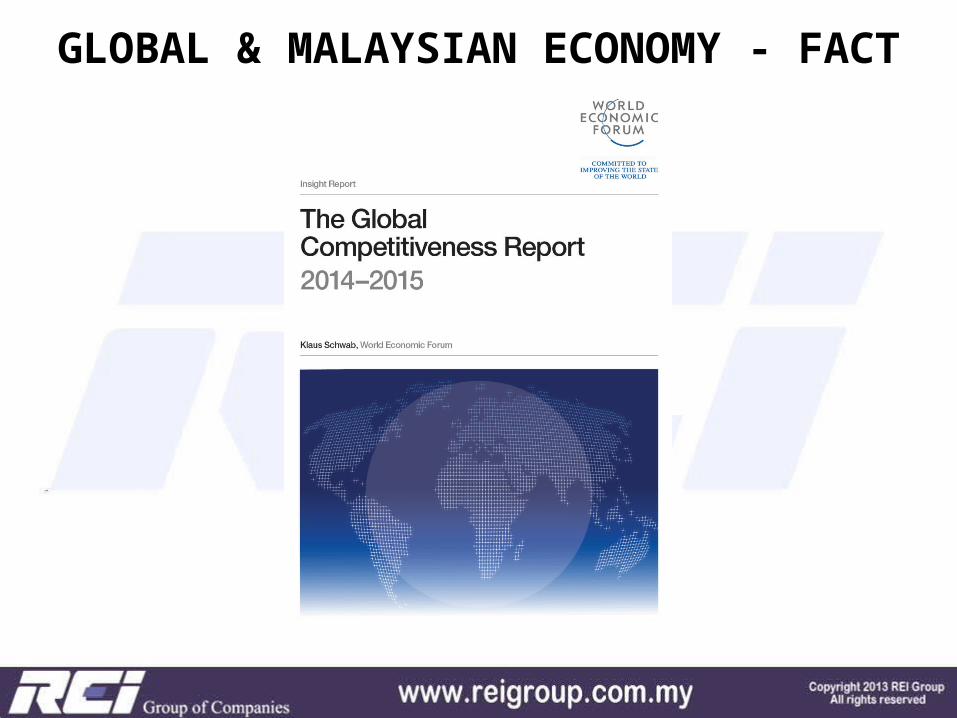
GLOBAL & MALAYSIAN ECONOMY - FACT FILE
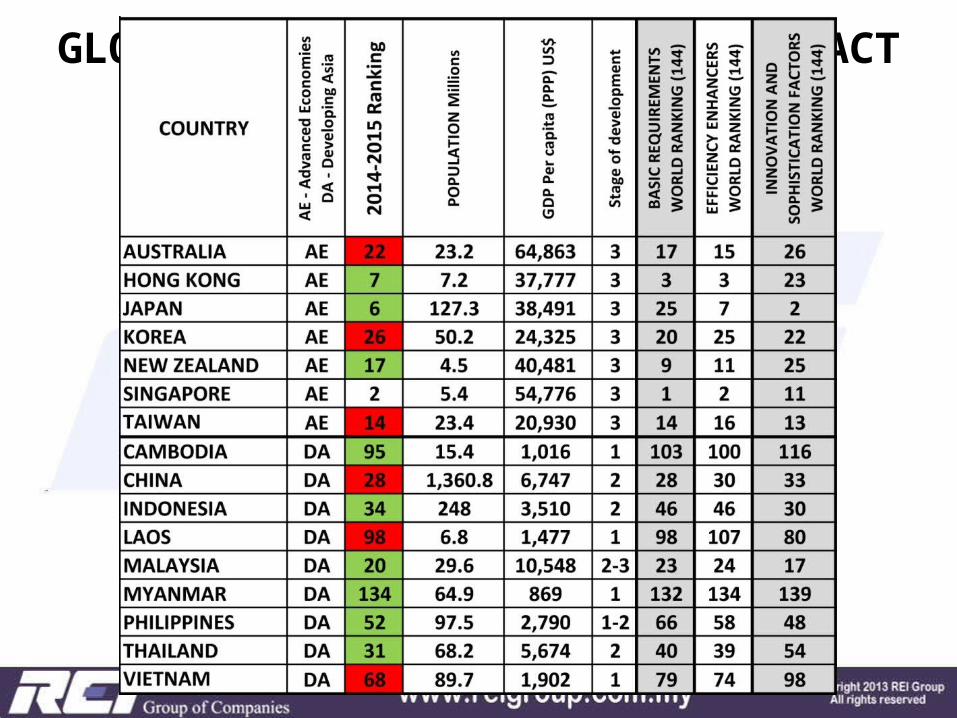
GLOBAL & MALAYSIAN ECONOMY - FACT FILE
GLOBAL & MALAYSIAN ECONOMY - FACT FILE
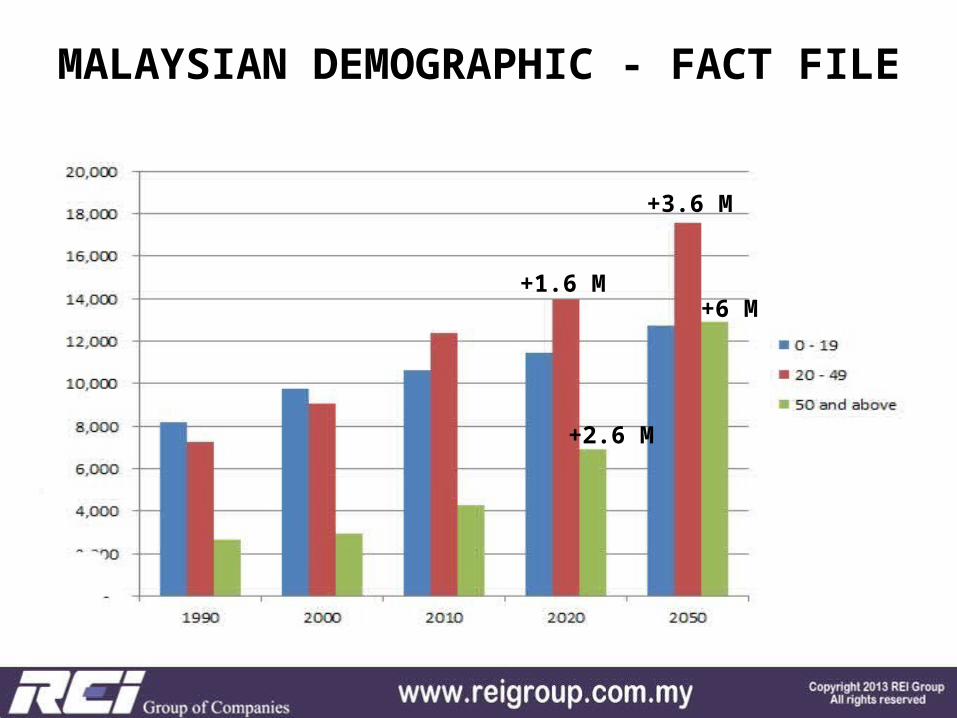
MALAYSIAN DEMOGRAPHIC - FACT FILE
+1.6 M
+3.6 M
+2.6 M
+6 M

MALAYSIAN DEMOGRAPHIC - FACT FILE
+1.6 M
+3.6 M
+2.6 M
+6 M
35-3930-3425-2920-2415-19
('000) ('000)
10-145-90-4
05001,500 0 500 1,000 1,5001,000
AGEING M ALAYSIA BASED ON 2012 ESTIM ATE DATA
M ale Fem ale
GEN Z
GEN Y
GEN X
BABY BO
OMER
Age Group75+70-7465-6960-6455-5950-5445-4940-44
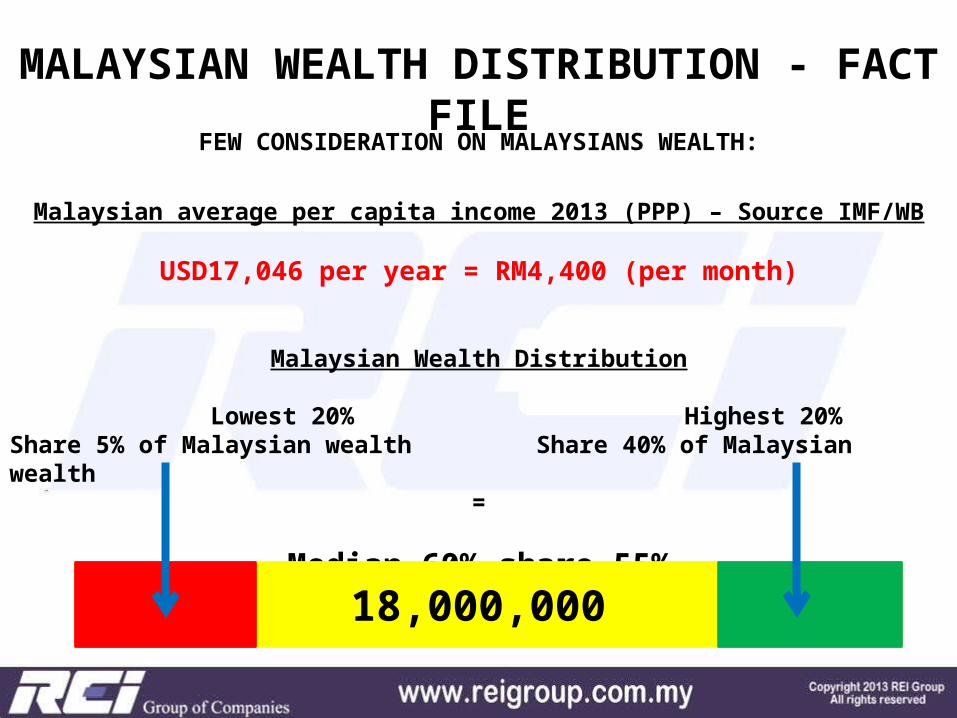
FEW CONSIDERATION ON MALAYSIANS WEALTH:
Malaysian average per capita income 2013 (PPP) – Source IMF/WB
USD17,046 per year = RM4,400 (per month)
Malaysian Wealth Distribution
Lowest 20% Highest 20% Share 5% of Malaysian wealth Share 40% of Malaysian wealth
=
Median 60% share 55%
MALAYSIAN WEALTH DISTRIBUTION - FACT FILE
18,000,000
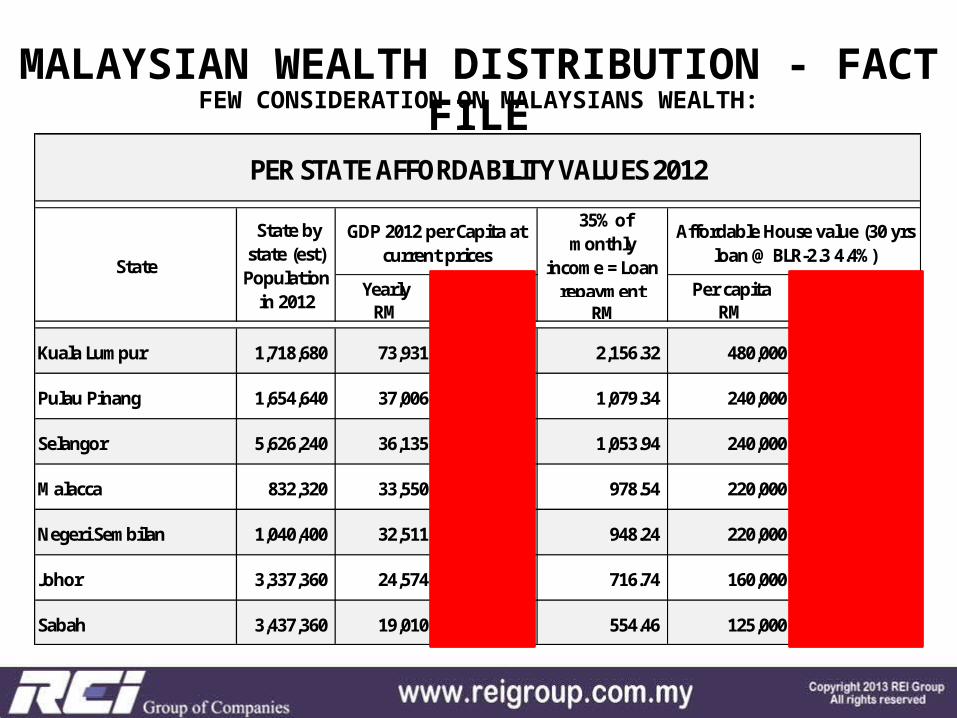
FEW CONSIDERATION ON MALAYSIANS WEALTH:MALAYSIAN WEALTH DISTRIBUTION - FACT
FILE
Yearly M onthly Per capita Per householdRM RM RM RM RM
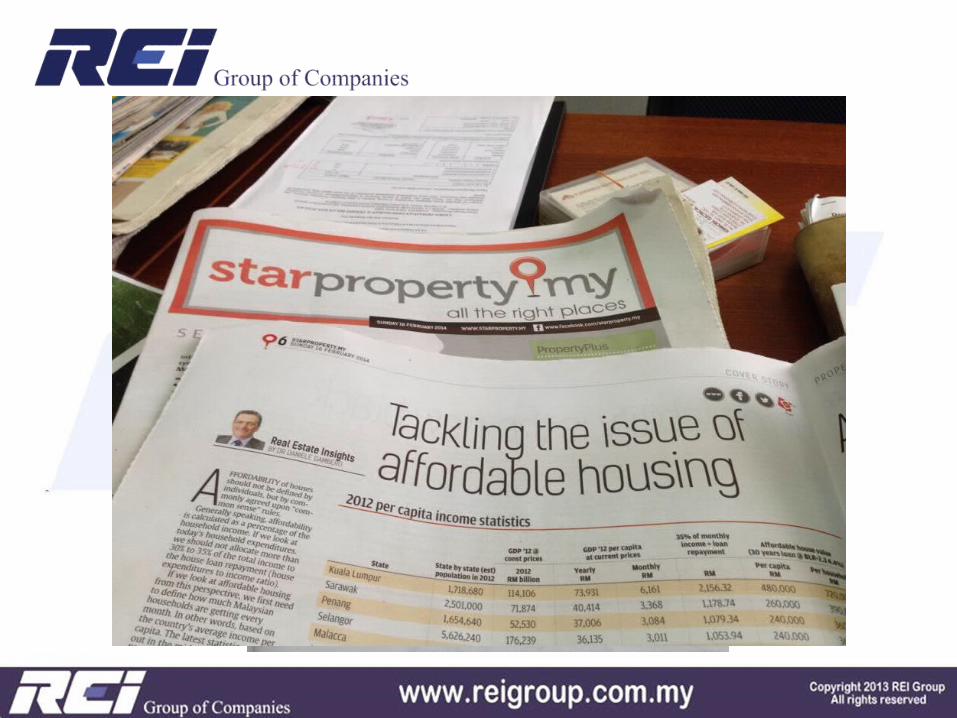
Kuala Lum pur 1,718,680 73,931 6,161 2,156.32 480,000 720,000
Pulau Pinang 1,654,640 37,006 3,084 1,079.34 240,000 360,000
Selangor 5,626,240 36,135 3,011 1,053.94 240,000 360,000
M alacca 832,320 33,550 2,796 978.54 220,000 330,000
Negeri Sem bilan 1,040,400 32,511 2,709 948.24 220,000 330,000
Johor 3,337,360 24,574 2,048 716.74 160,000 240,000
Sabah 3,437,360 19,010 1,584 554.46 125,000 187,500
PER STATE AFFORDABILITY VALUES 2012
State State by state (est) Population in 2012
GDP 2012 per Capita at current prices
35% of m onthly
incom e = Loan repaym ent
Affordable House value (30 yrs loan @ BLR-2.3 4.4%)
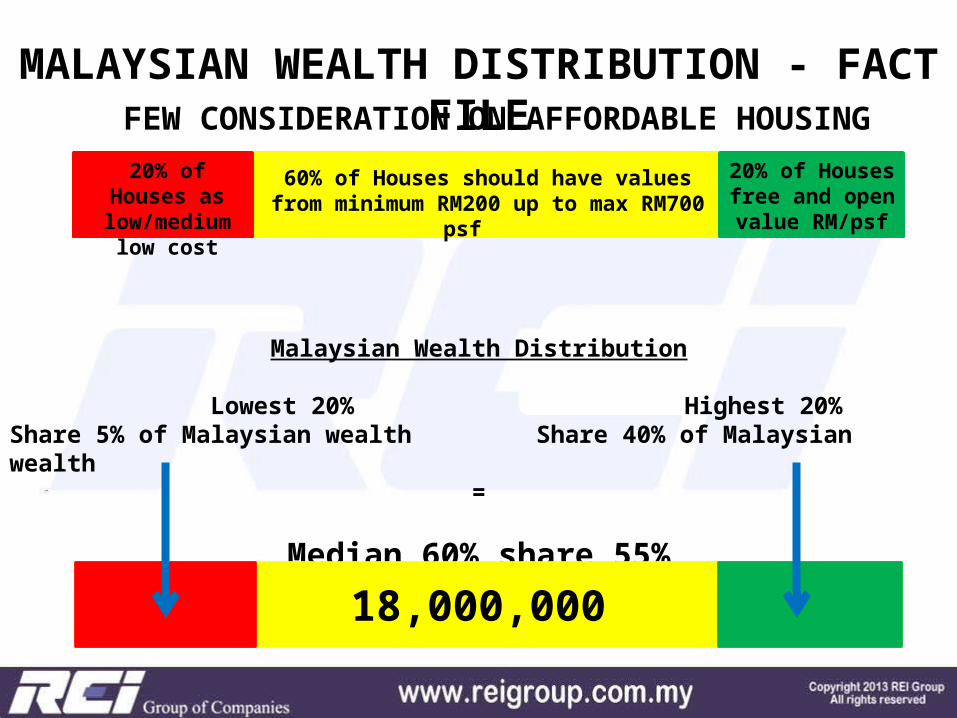
20% of Houses as low/medium low cost
Malaysian Wealth Distribution
Lowest 20% Highest 20% Share 5% of Malaysian wealth Share 40% of Malaysian wealth
=
Median 60% share 55%
MALAYSIAN WEALTH DISTRIBUTION - FACT FILE
18,000,000
20% of Houses free and open value RM/psf
60% of Houses should have values from minimum RM200 up to max RM700
psf
FEW CONSIDERATION ON AFFORDABLE HOUSING
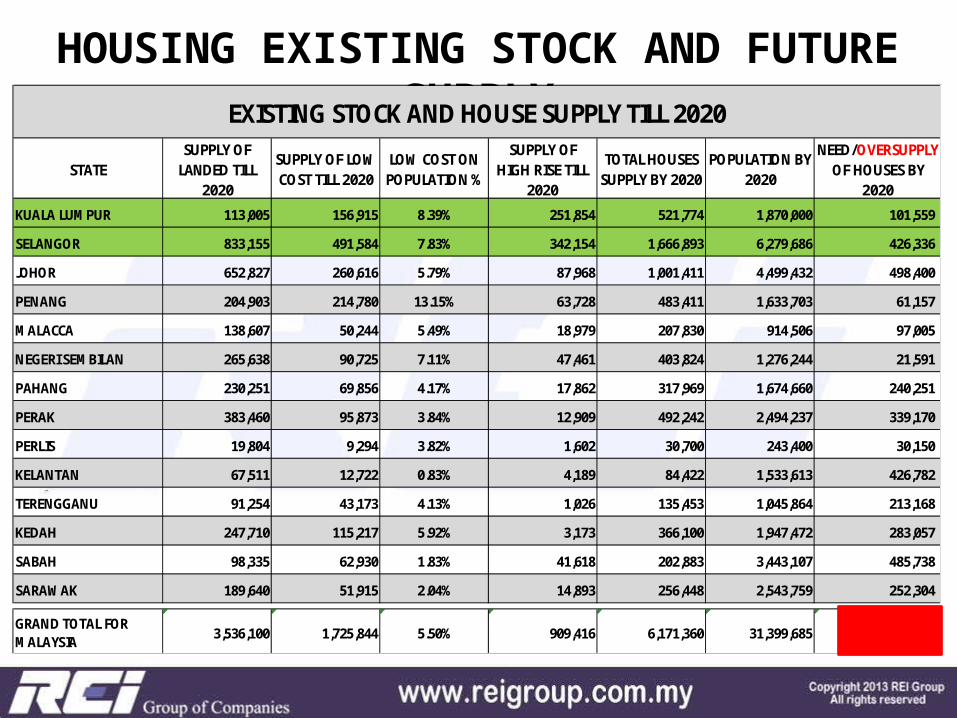
HOUSING EXISTING STOCK AND FUTURE SUPPLY
STATESUPPLY OF LANDED TILL
2020
SUPPLY OF LOW COST TILL 2020
LOW COST ON POPULATION %
SUPPLY OF HIGH RISE TILL
2020
TOTAL HOUSES SUPPLY BY 2020
POPULATION BY 2020
NEED/OVERSUPPLY OF HOUSES BY
2020KUALA LUM PUR 113,005 156,915 8.39% 251,854 521,774 1,870,000 101,559
SELANGOR 833,155 491,584 7.83% 342,154 1,666,893 6,279,686 426,336
JOHOR 652,827 260,616 5.79% 87,968 1,001,411 4,499,432 498,400
PENANG 204,903 214,780 13.15% 63,728 483,411 1,633,703 61,157
M ALACCA 138,607 50,244 5.49% 18,979 207,830 914,506 97,005
NEGERI SEM BILAN 265,638 90,725 7.11% 47,461 403,824 1,276,244 21,591
PAHANG 230,251 69,856 4.17% 17,862 317,969 1,674,660 240,251
PERAK 383,460 95,873 3.84% 12,909 492,242 2,494,237 339,170
PERLIS 19,804 9,294 3.82% 1,602 30,700 243,400 30,150
KELANTAN 67,511 12,722 0.83% 4,189 84,422 1,533,613 426,782
TERENGGANU 91,254 43,173 4.13% 1,026 135,453 1,045,864 213,168
KEDAH 247,710 115,217 5.92% 3,173 366,100 1,947,472 283,057
SABAH 98,335 62,930 1.83% 41,618 202,883 3,443,107 485,738
SARAW AK 189,640 51,915 2.04% 14,893 256,448 2,543,759 252,304
GRAND TOTAL FOR M ALAYSIA 3,536,100 1,725,844 5.50% 909,416 6,171,360 31,399,685 3,476,669
EXISTING STOCK AND HOUSE SUPPLY TILL 2020
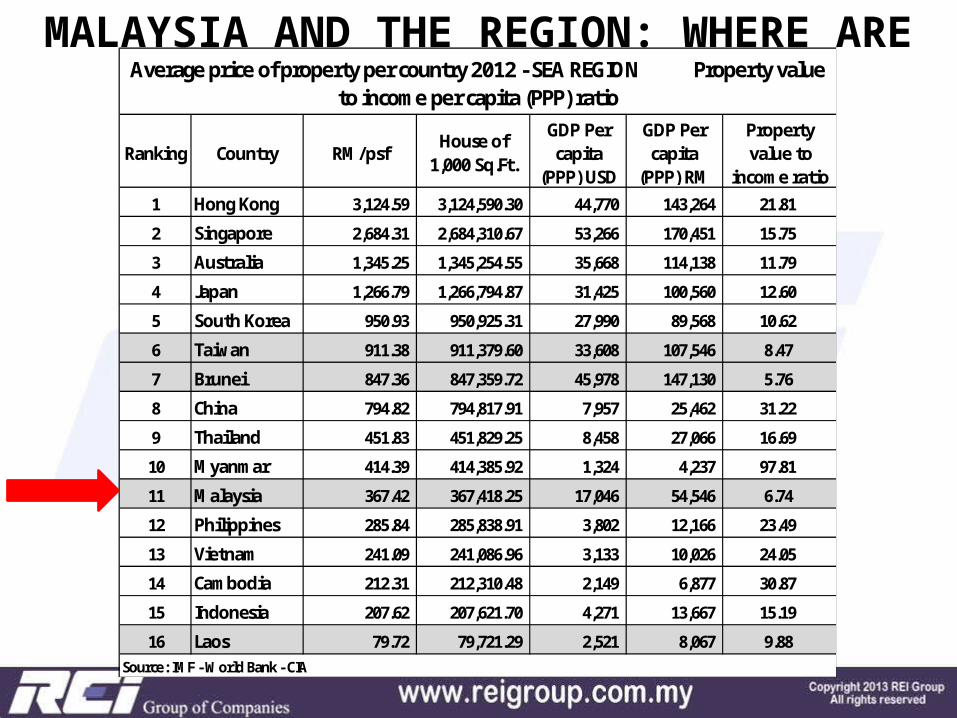
MALAYSIA AND THE REGION: WHERE ARE WE?
Ranking Country RM /psf House of 1,000 Sq.Ft.
GDP Per capita
(PPP) USD
GDP Per capita
(PPP) RM
Property value to
incom e ratio1 Hong Kong 3,124.59 3,124,590.30 44,770 143,264 21.812 Singapore 2,684.31 2,684,310.67 53,266 170,451 15.753 Australia 1,345.25 1,345,254.55 35,668 114,138 11.794 Japan 1,266.79 1,266,794.87 31,425 100,560 12.605 South Korea 950.93 950,925.31 27,990 89,568 10.626 Taiwan 911.38 911,379.60 33,608 107,546 8.477 Brunei 847.36 847,359.72 45,978 147,130 5.768 China 794.82 794,817.91 7,957 25,462 31.229 Thailand 451.83 451,829.25 8,458 27,066 16.6910 M yanm ar 414.39 414,385.92 1,324 4,237 97.8111 M alaysia 367.42 367,418.25 17,046 54,546 6.7412 Philippines 285.84 285,838.91 3,802 12,166 23.4913 Vietnam 241.09 241,086.96 3,133 10,026 24.0514 Cam bodia 212.31 212,310.48 2,149 6,877 30.8715 Indonesia 207.62 207,621.70 4,271 13,667 15.1916 Laos 79.72 79,721.29 2,521 8,067 9.88
Source: IM F - W orld Bank - CIA
Average price of property per country 2012 - SEA REGION Property value to income per capita (PPP) ratio
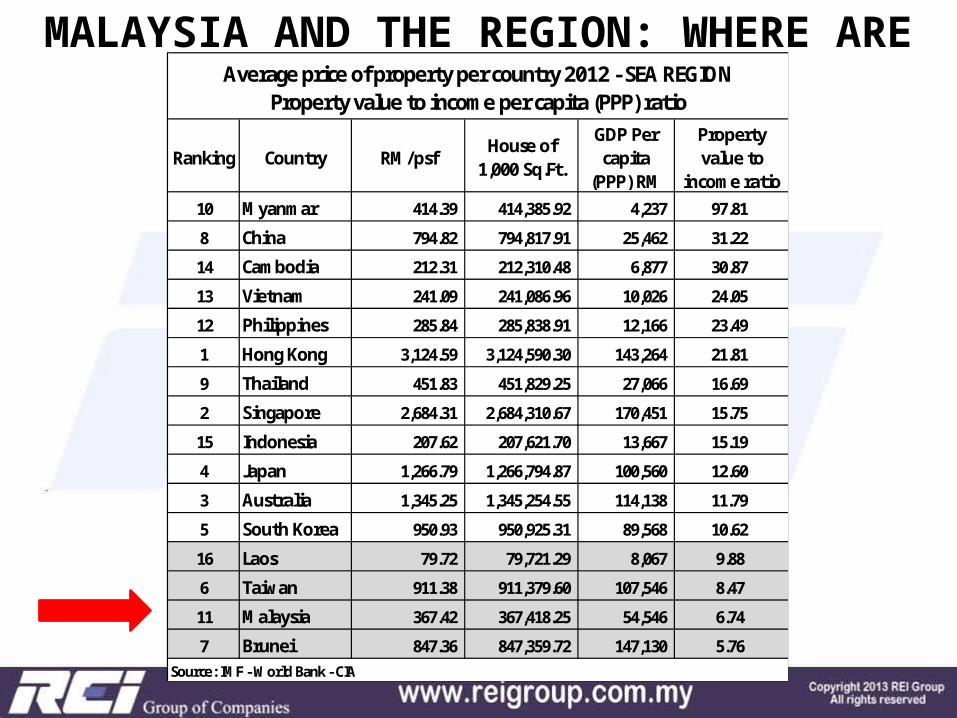
MALAYSIA AND THE REGION: WHERE ARE WE?
Ranking Country RM /psf House of 1,000 Sq.Ft.
GDP Per capita
(PPP) RM
Property value to
incom e ratio10 M yanm ar 414.39 414,385.92 4,237 97.818 China 794.82 794,817.91 25,462 31.2214 Cam bodia 212.31 212,310.48 6,877 30.8713 Vietnam 241.09 241,086.96 10,026 24.0512 Philippines 285.84 285,838.91 12,166 23.491 Hong Kong 3,124.59 3,124,590.30 143,264 21.819 Thailand 451.83 451,829.25 27,066 16.692 Singapore 2,684.31 2,684,310.67 170,451 15.7515 Indonesia 207.62 207,621.70 13,667 15.194 Japan 1,266.79 1,266,794.87 100,560 12.603 Australia 1,345.25 1,345,254.55 114,138 11.795 South Korea 950.93 950,925.31 89,568 10.6216 Laos 79.72 79,721.29 8,067 9.886 Taiwan 911.38 911,379.60 107,546 8.4711 M alaysia 367.42 367,418.25 54,546 6.747 Brunei 847.36 847,359.72 147,130 5.76
Average price of property per country 2012 - SEA REGION Property value to incom e per capita (PPP) ratio
Source: IM F - W orld Bank - CIA
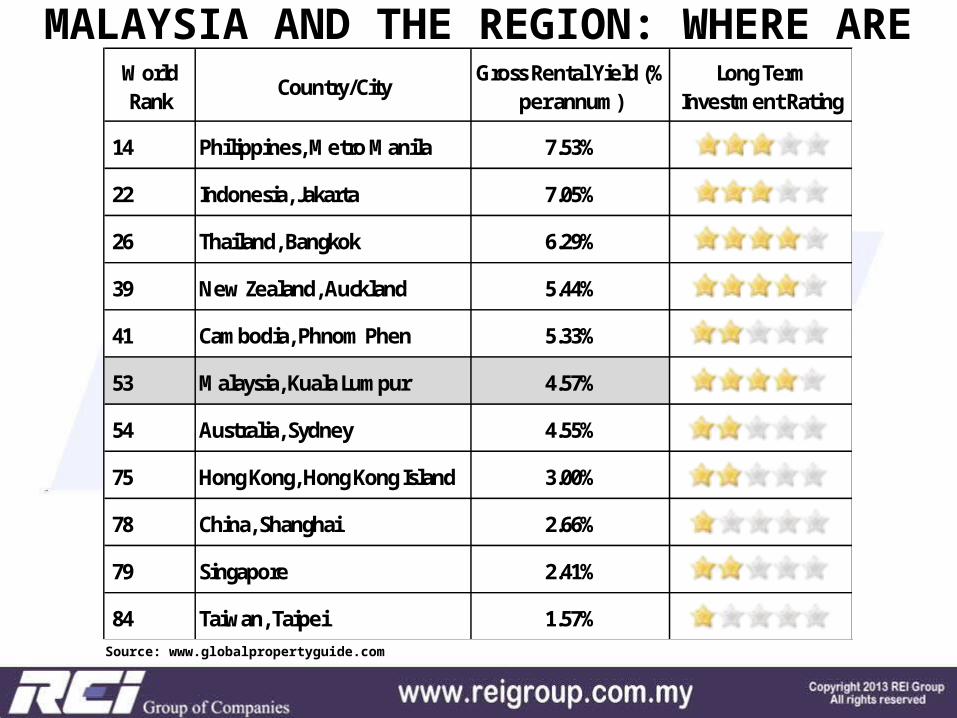
MALAYSIA AND THE REGION: WHERE ARE WE?
14 Philippines, M etro M anila 7.53%
22 Indonesia, Jakarta 7.05%
26 Thailand, Bangkok 6.29%
39 New Zealand, Auckland 5.44%
41 Cam bodia, Phnom Phen 5.33%
53 M alaysia, Kuala Lum pur 4.57%
54 Australia, Sydney 4.55%
75 Hong Kong, Hong Kong Island 3.00%
78 China, Shanghai 2.66%
79 Singapore 2.41%
84 Taiwan, Taipei 1.57%
W orld Rank Country/City Long Term
Investm ent RatingGross Rental Yield (%
per annum )
Source: www.globalpropertyguide.com
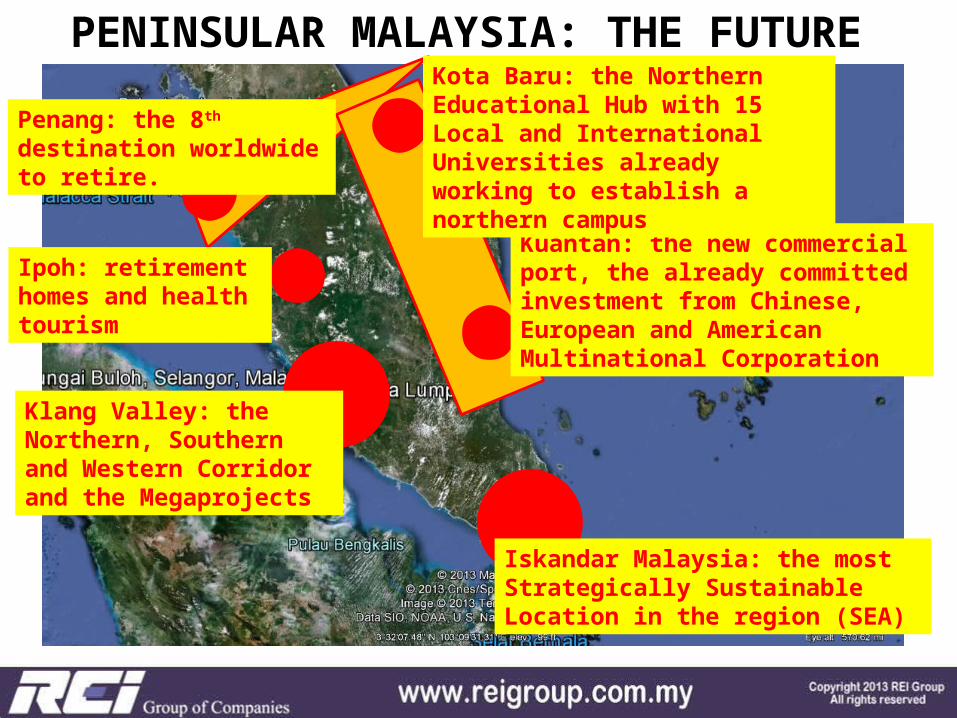
PENINSULAR MALAYSIA: THE FUTURE
Kuantan: the new commercial port, the already committed investment from Chinese, European and American Multinational Corporation
Kota Baru: the Northern Educational Hub with 15 Local and International Universities already working to establish a northern campus
Penang: the 8th destination worldwide to retire.
Ipoh: retirement homes and health tourism
Klang Valley: the Northern, Southern and Western Corridor and the Megaprojects
Iskandar Malaysia: the most Strategically Sustainable Location in the region (SEA)
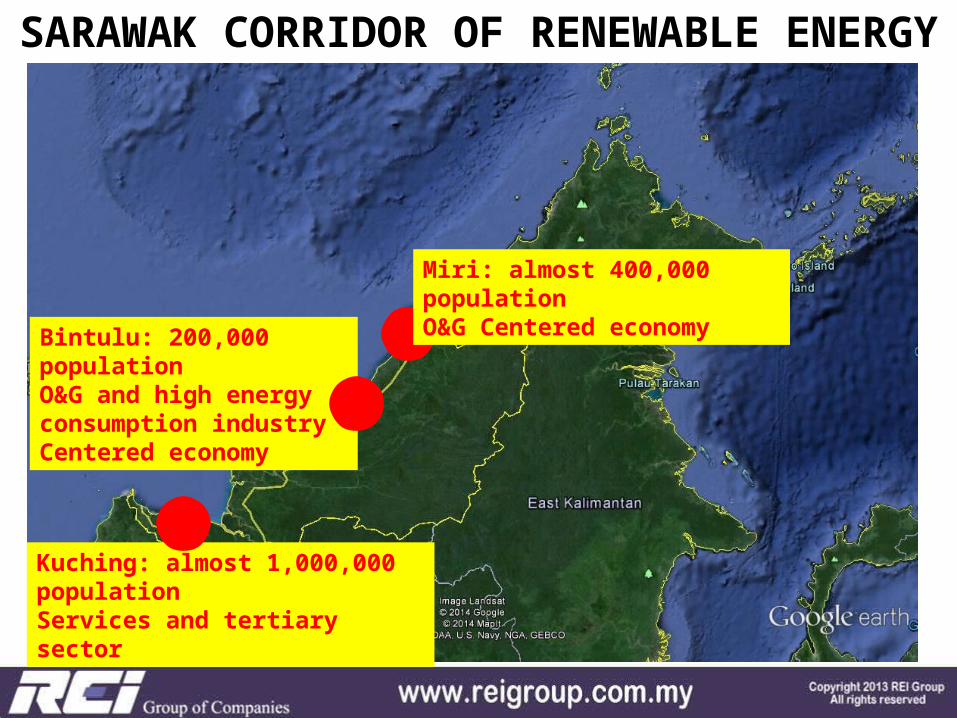
SARAWAK CORRIDOR OF RENEWABLE ENERGY
Miri: almost 400,000 populationO&G Centered economy
Kuching: almost 1,000,000 populationServices and tertiary sector
Bintulu: 200,000 populationO&G and high energy consumption industry Centered economy
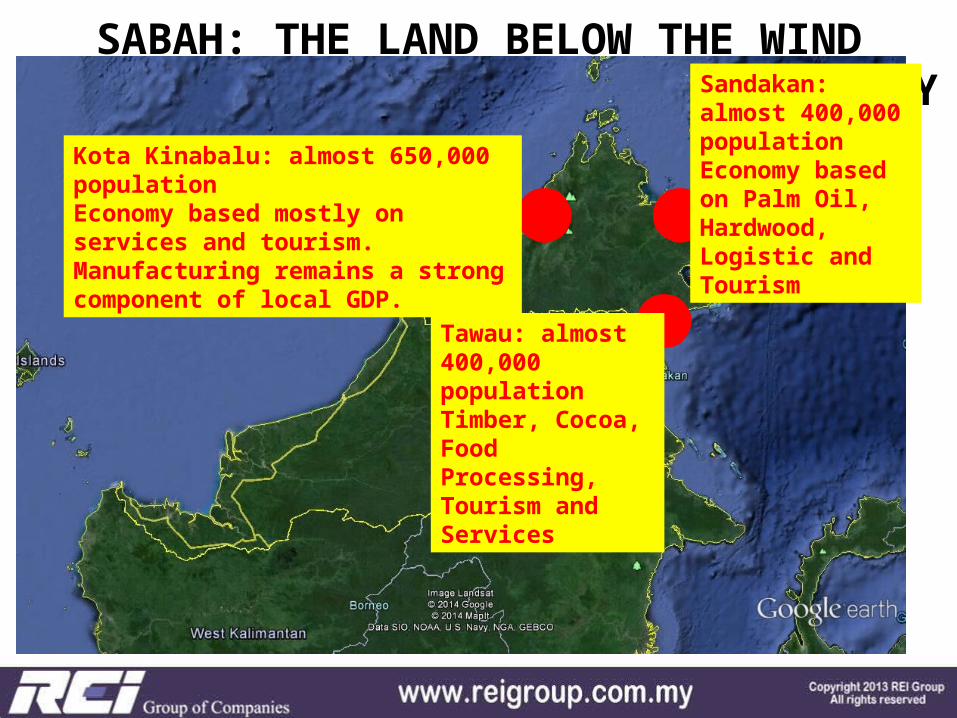
SABAH: THE LAND BELOW THE WINDSABAH PROPERTY MARKET SUSTAINABILITY
Kota Kinabalu: almost 650,000 populationEconomy based mostly on services and tourism. Manufacturing remains a strong component of local GDP.
Tawau: almost 400,000 populationTimber, Cocoa, Food Processing, Tourism and Services
Sandakan: almost 400,000 population Economy based on Palm Oil, Hardwood, Logistic and Tourism
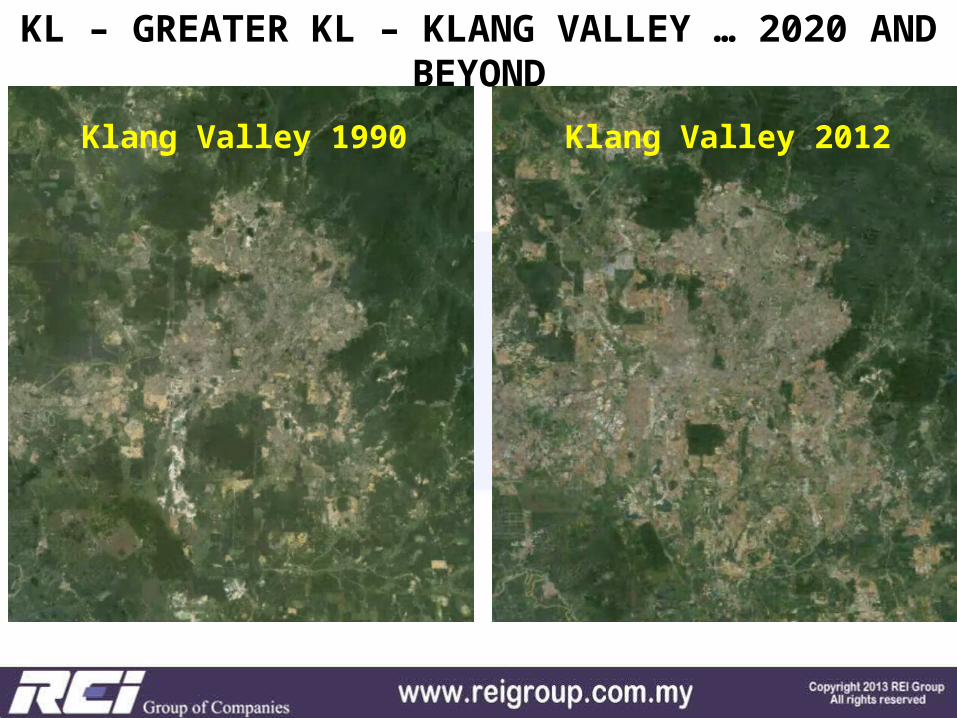
KL – GREATER KL – KLANG VALLEY … 2020 AND BEYOND
Klang Valley 1990 Klang Valley 2012
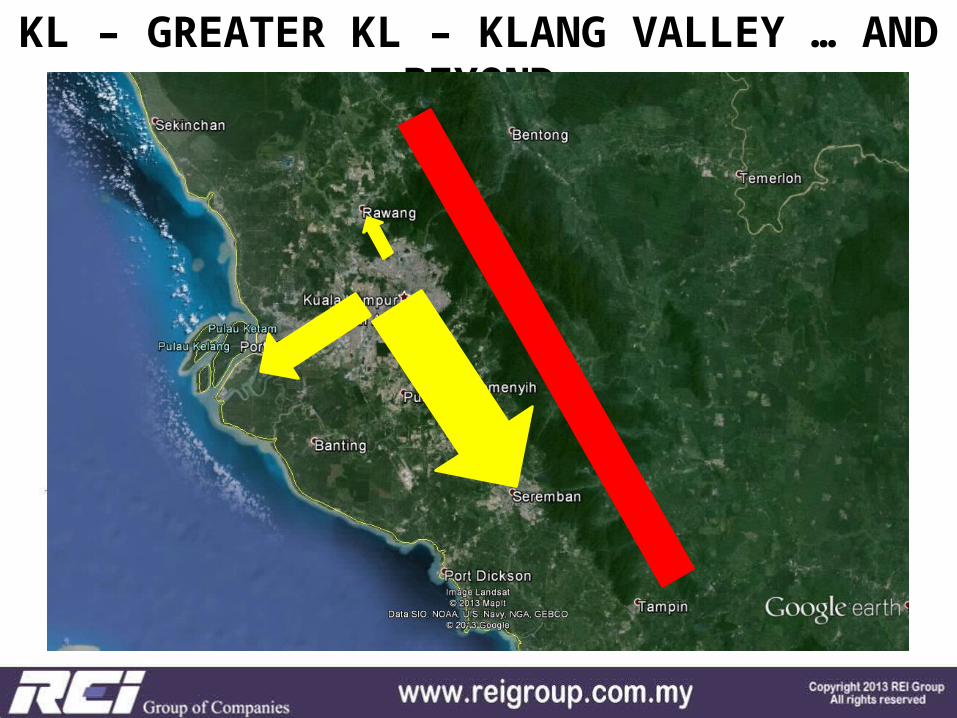
KL – GREATER KL – KLANG VALLEY … AND BEYOND
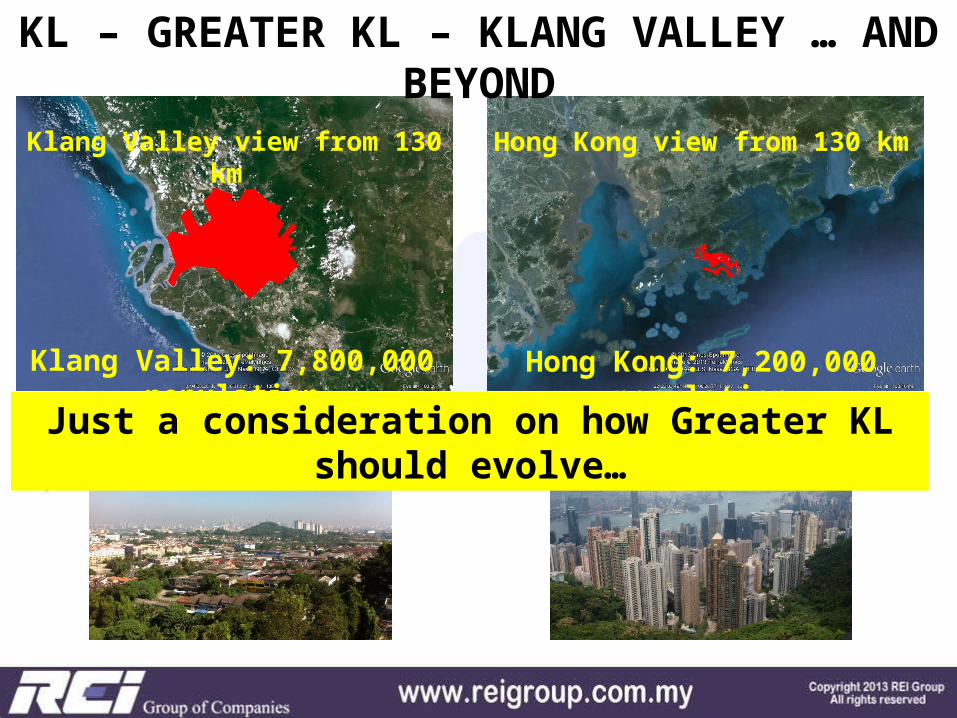
Klang Valley: 7,800,000 population
Hong Kong: 7,200,000 populationJust a consideration on how Greater KL
should evolve…
Klang Valley view from 130 km
Hong Kong view from 130 km
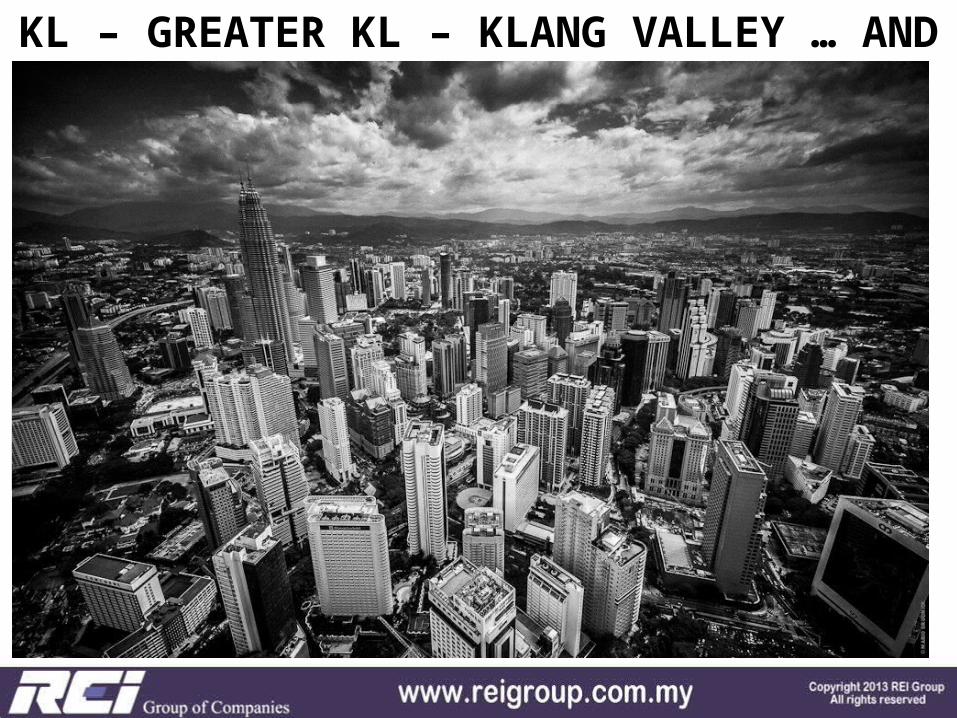
KL – GREATER KL – KLANG VALLEY … AND BEYOND
Klang Valley: 7,800,000 population
Hong Kong: 7,200,000 populationJust a consideration on how Greater KL
should evolve…
Klang Valley view from 130 km
Hong Kong view from 130 km
KL – GREATER KL – KLANG VALLEY … AND BEYOND
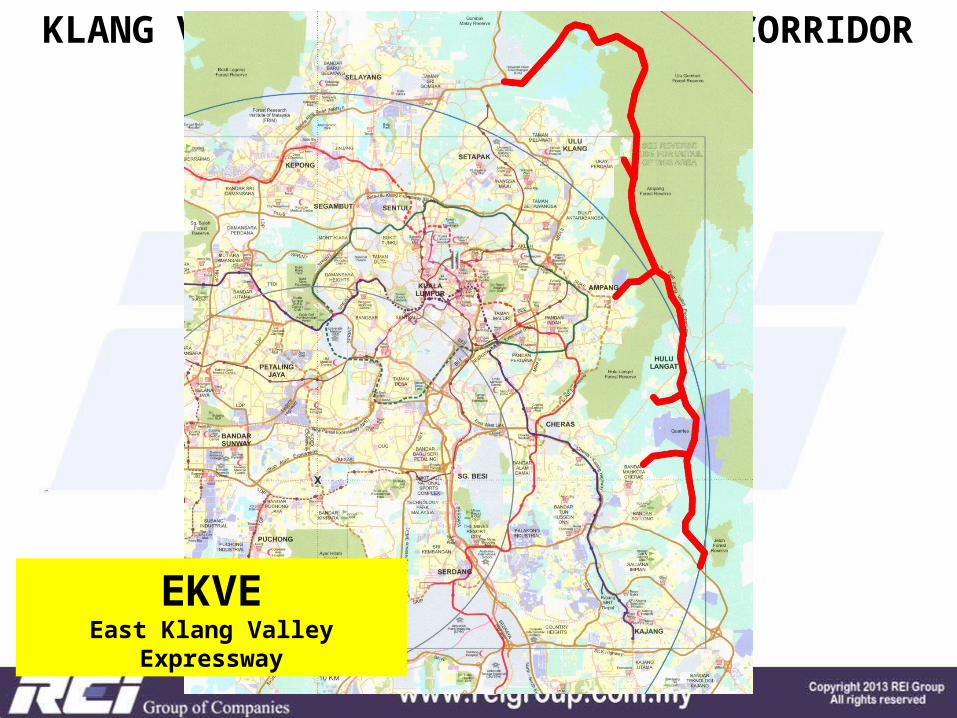
KLANG VALLEY AND THE SOUTHERN CORRIDOR
EKVEEast Klang Valley
Expressway

KLANG VALLEY AND THE SOUTHERN CORRIDOR
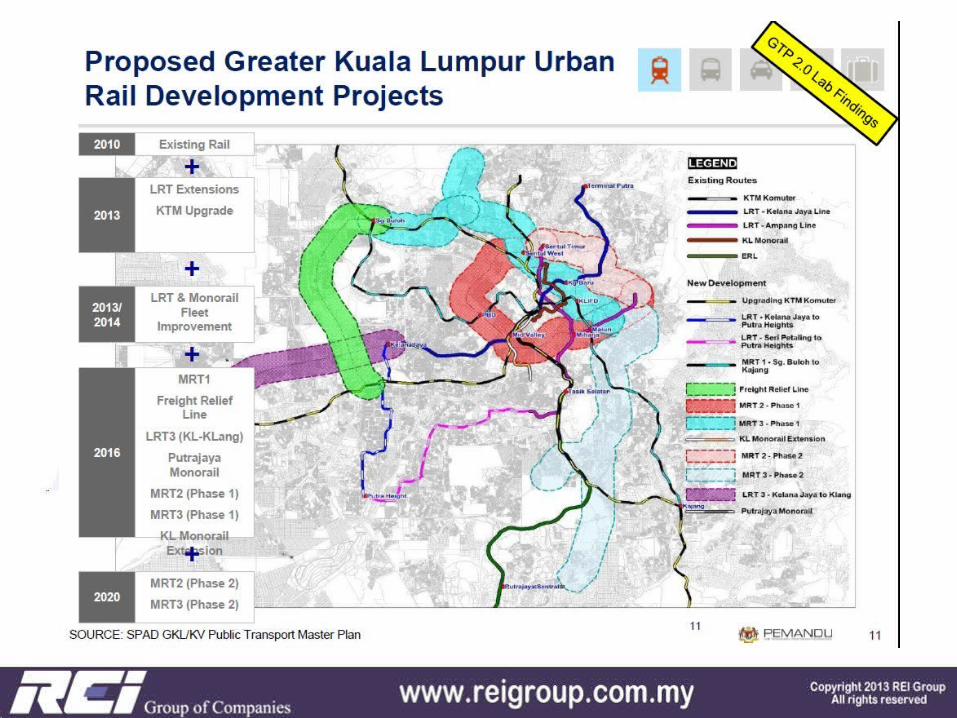
MRT Line 2 – Phase 1
Sungai Buloh - Serdang

KLANG VALLEY AND THE SOUTHERN CORRIDOR
MRT Line 2 – Phase 2
Extention Serdang - Putrajaya

DASH HIGHWAYDamansara – Shah Alam
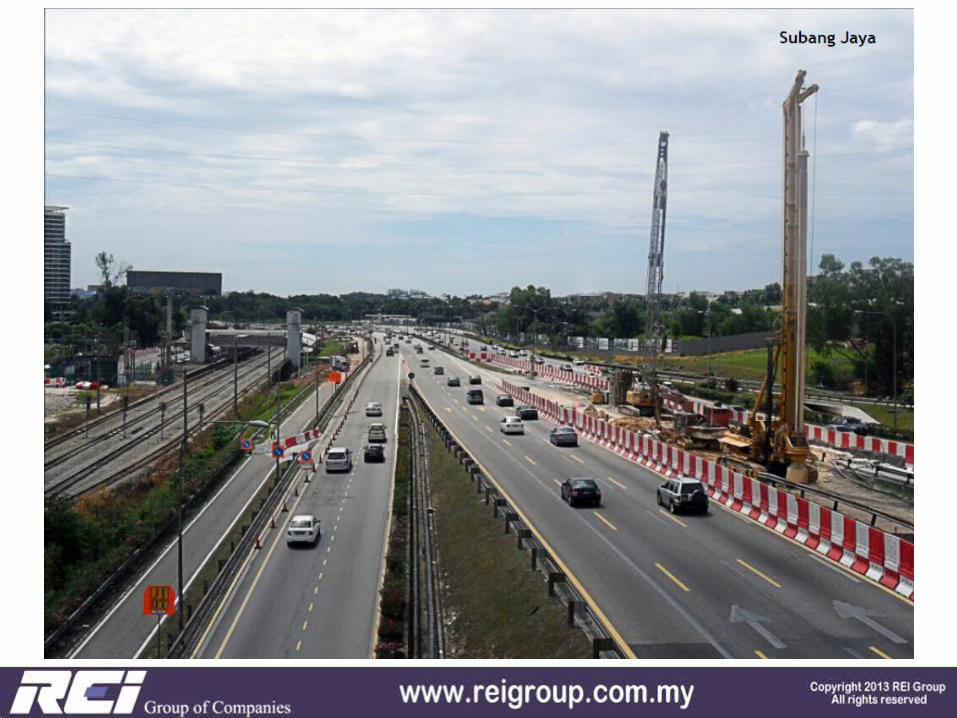
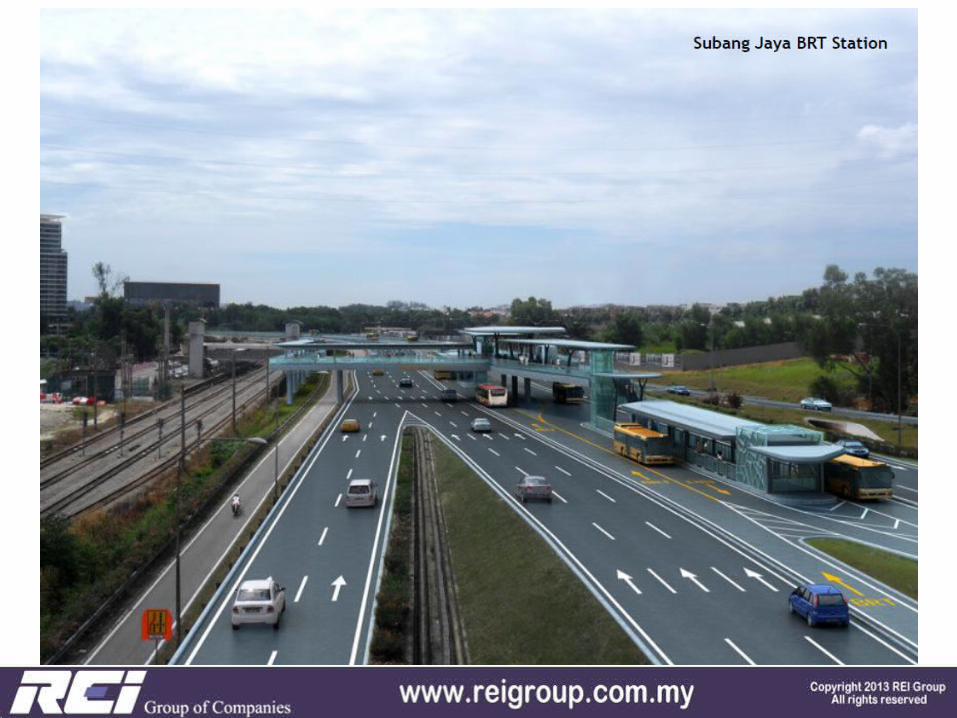
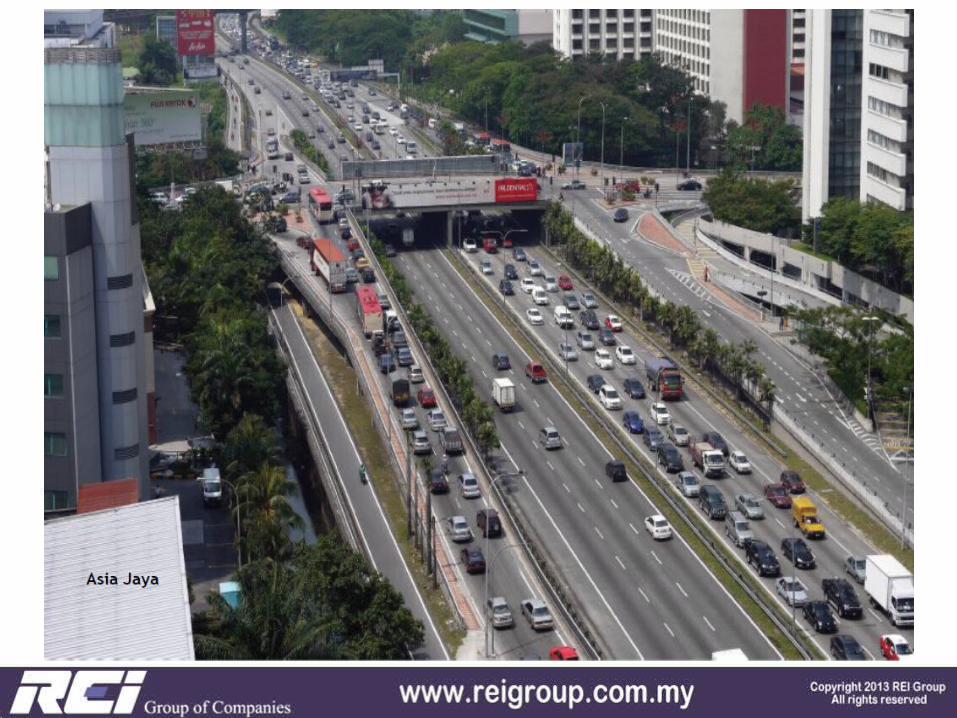
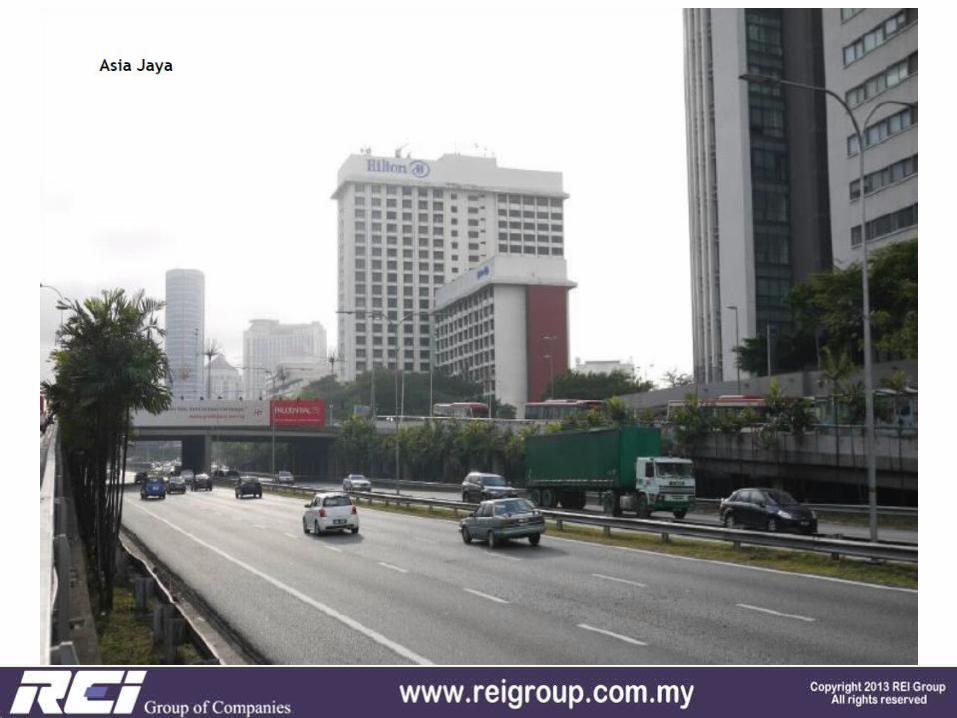
KLANG VALLEY AND THE WEST CORRIDOR
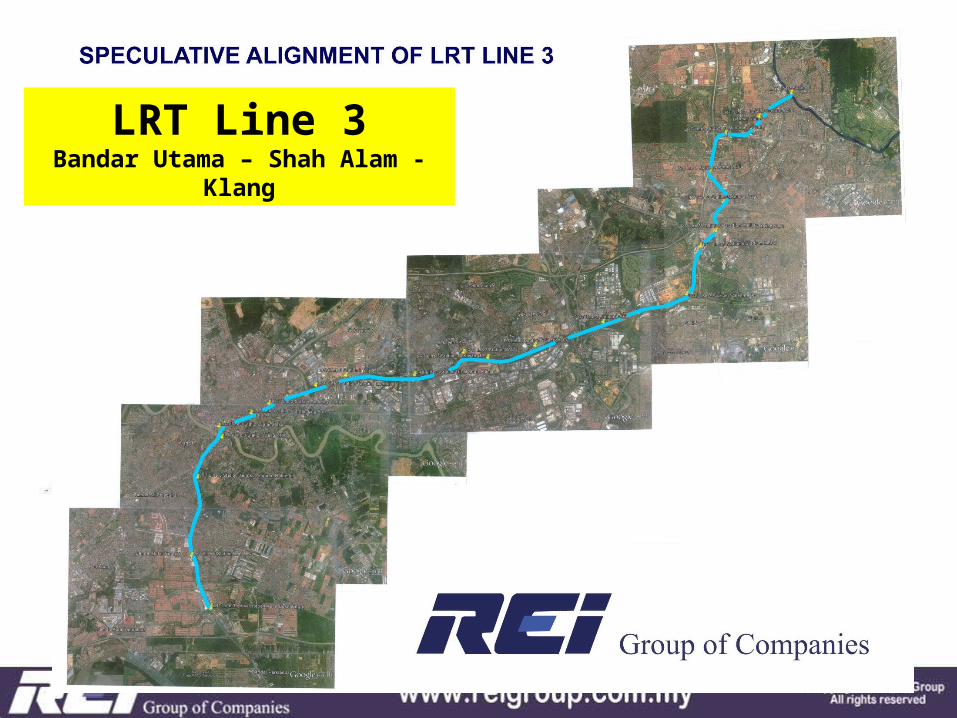
LRT Line 3Bandar Utama – Shah Alam -
Klang
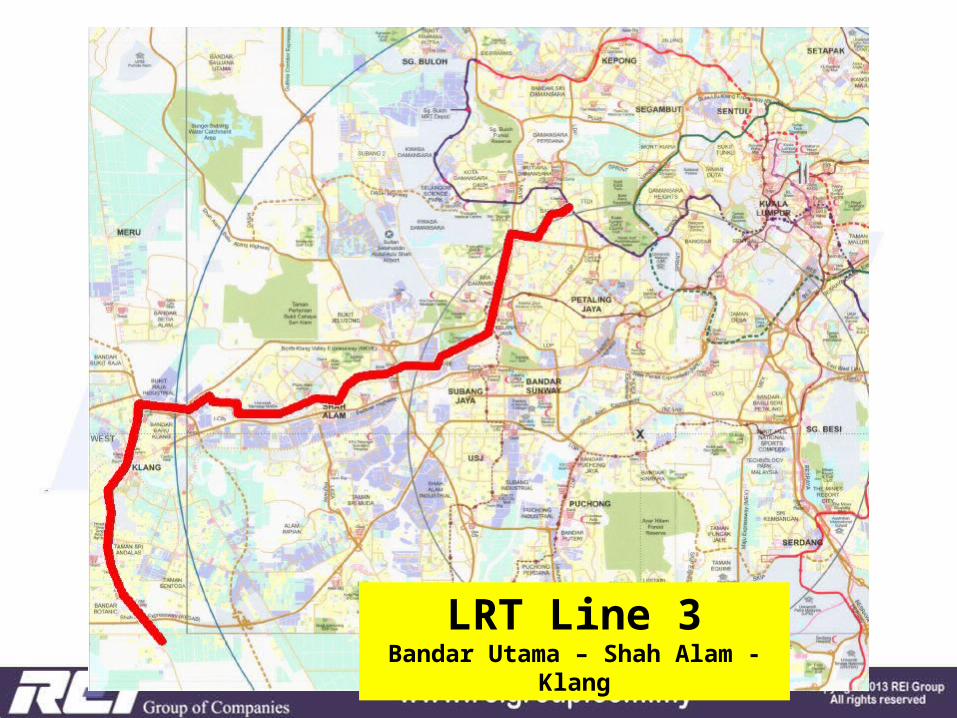
LRT Line 3Bandar Utama – Shah Alam -
Klang
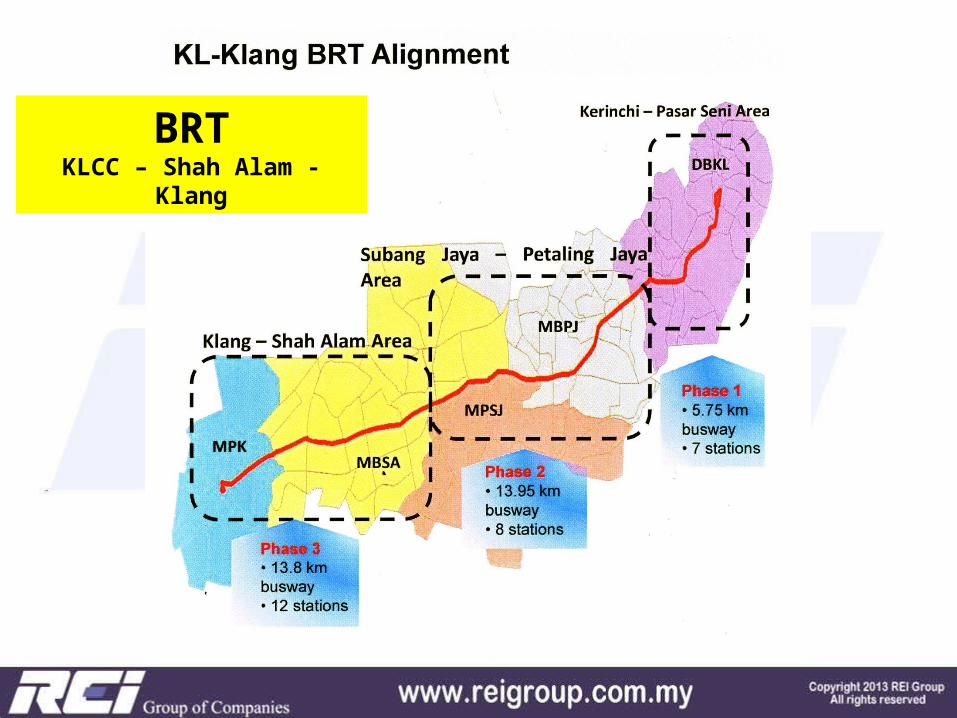
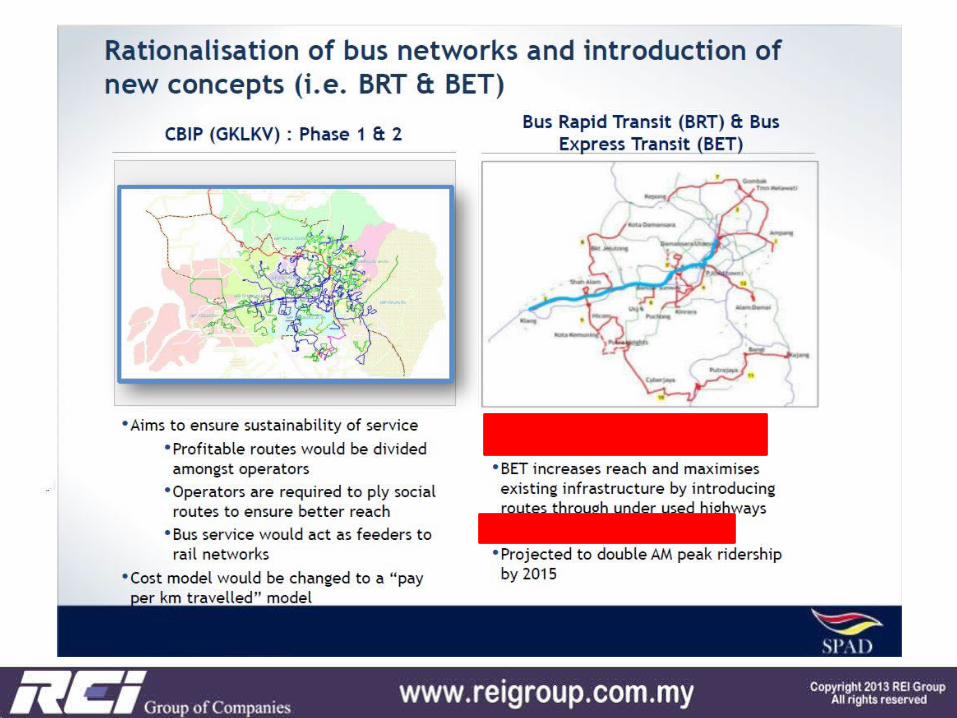
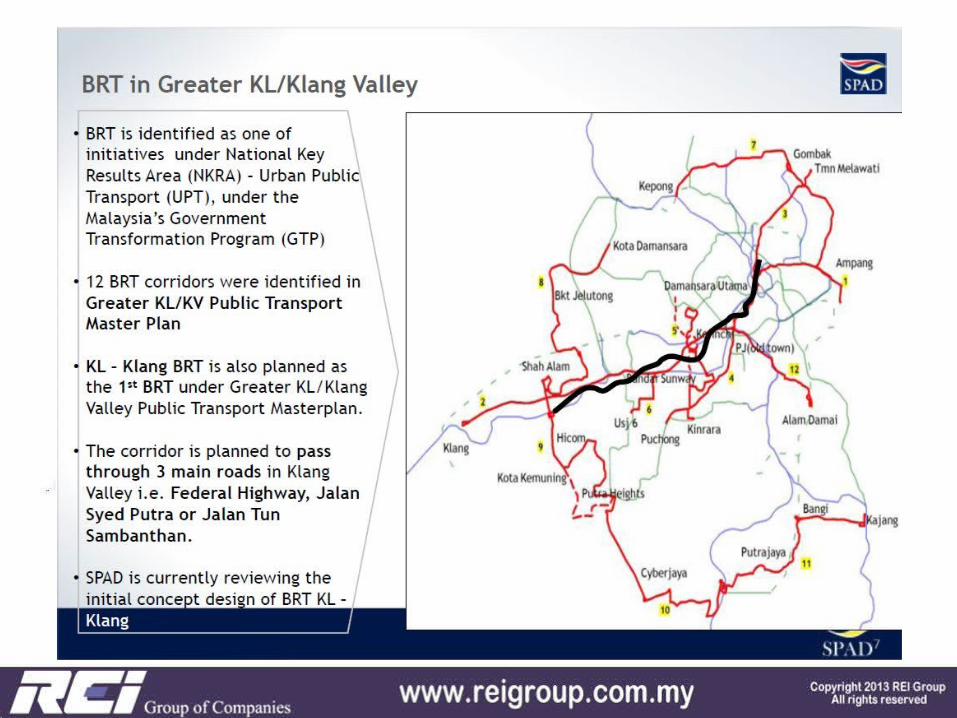
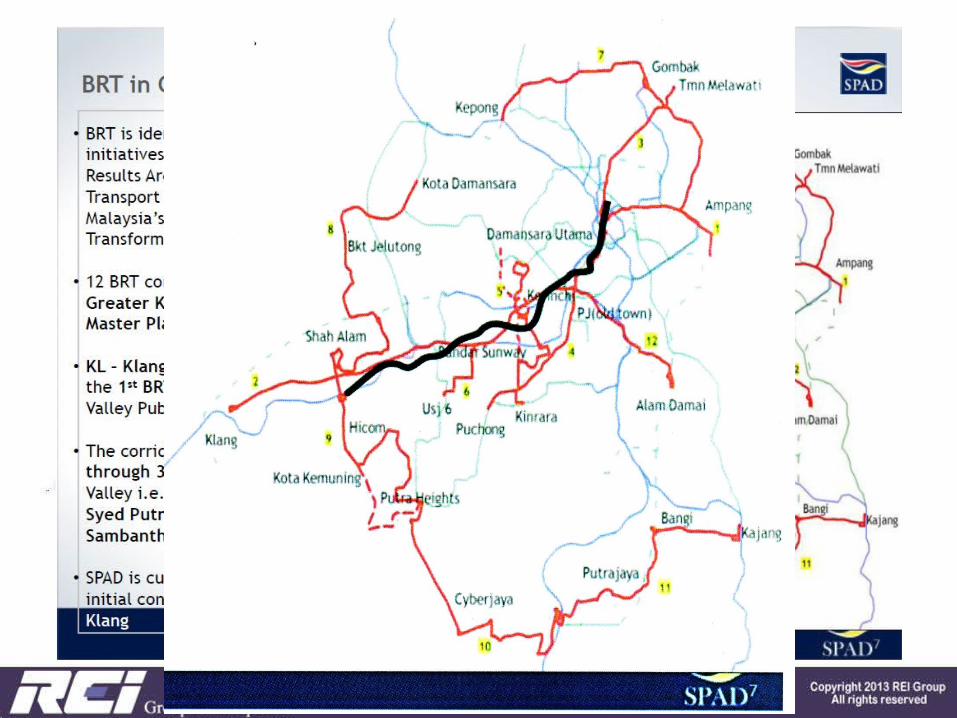
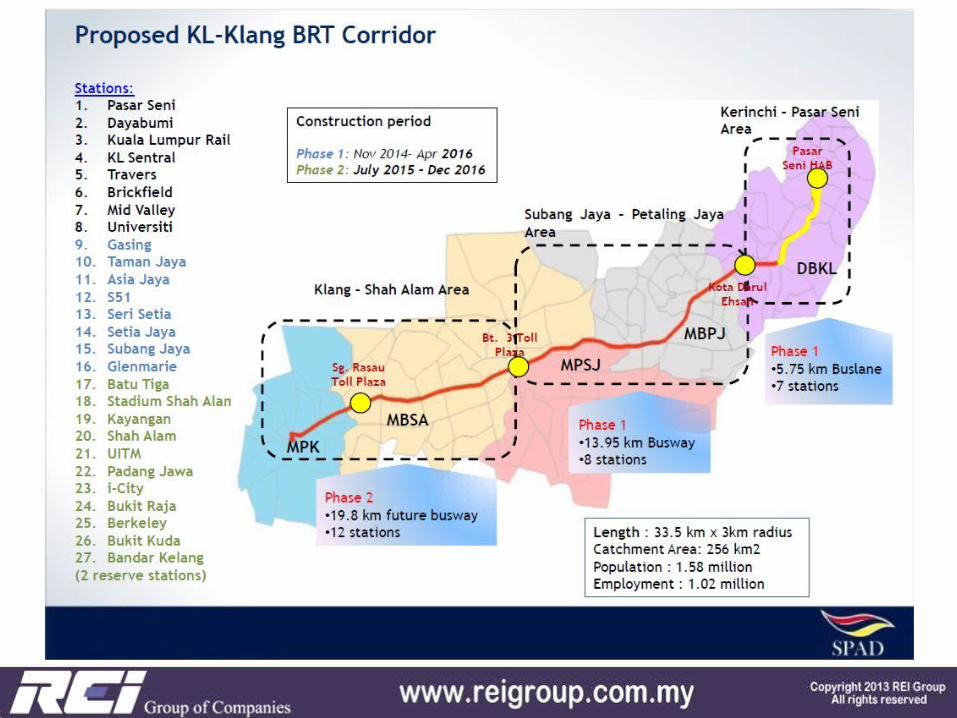
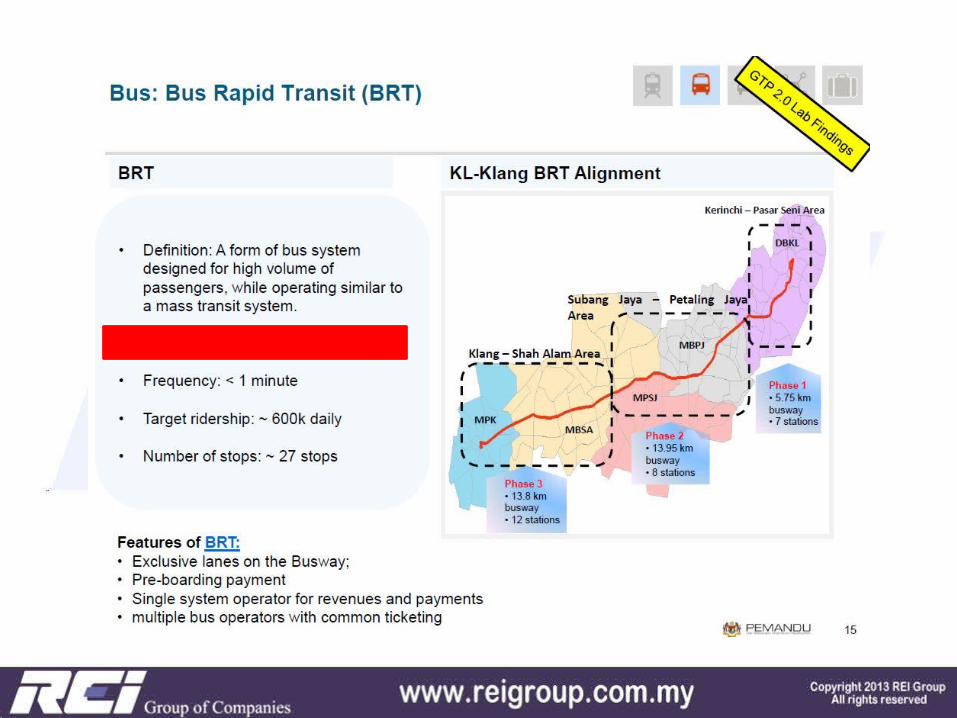
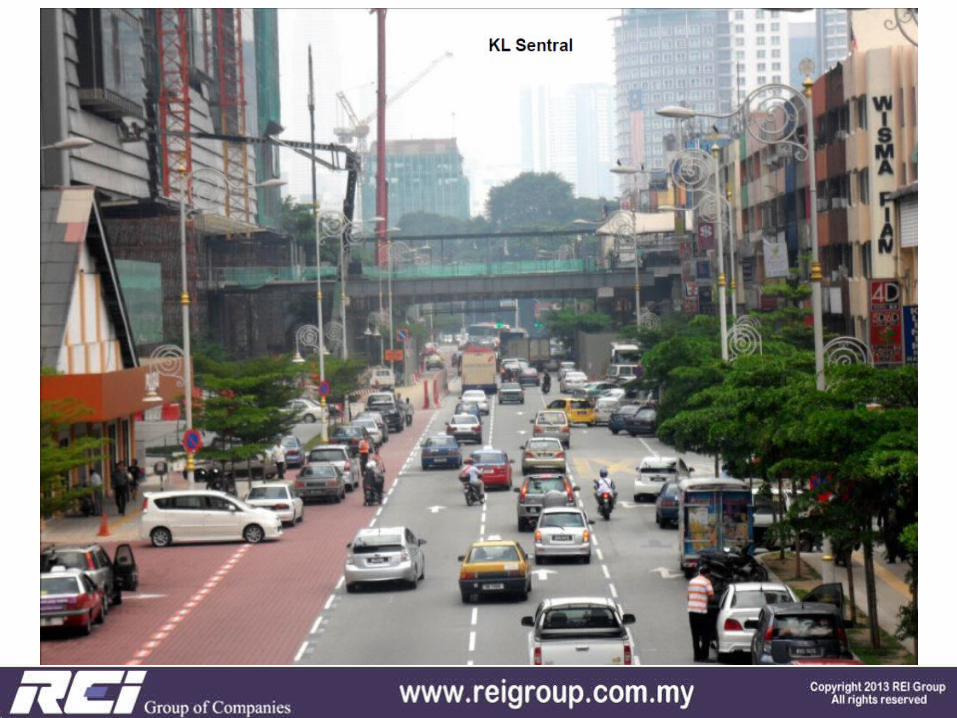
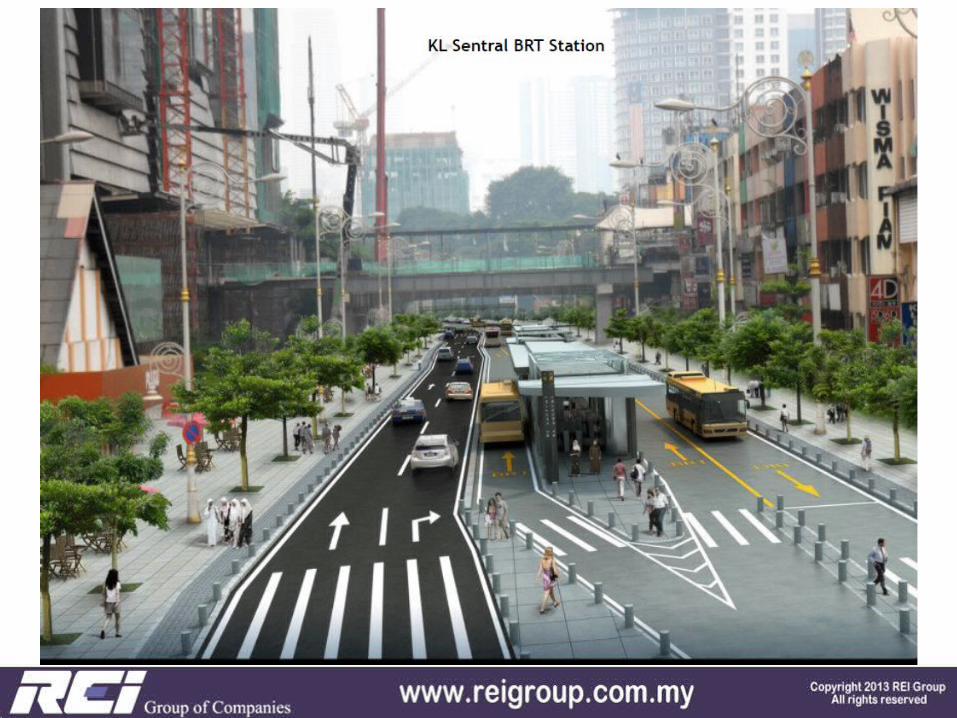
BRTKLCC – Shah Alam -
Klang


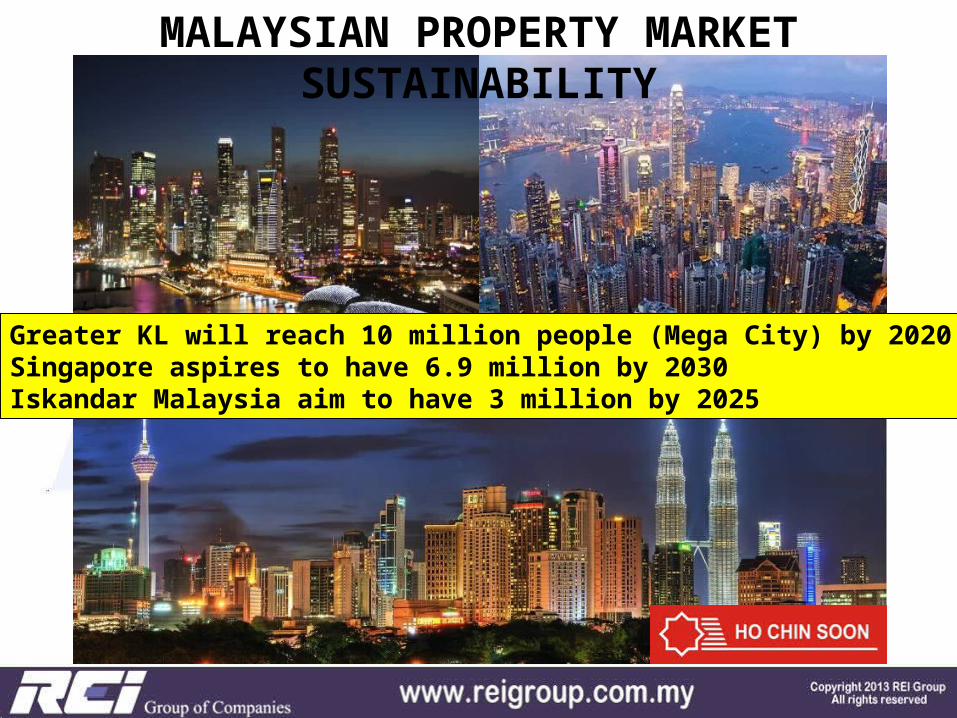
Greater KL will reach 10 million people (Mega City) by 2020Singapore aspires to have 6.9 million by 2030Iskandar Malaysia aim to have 3 million by 2025
MALAYSIAN PROPERTY MARKET SUSTAINABILITY
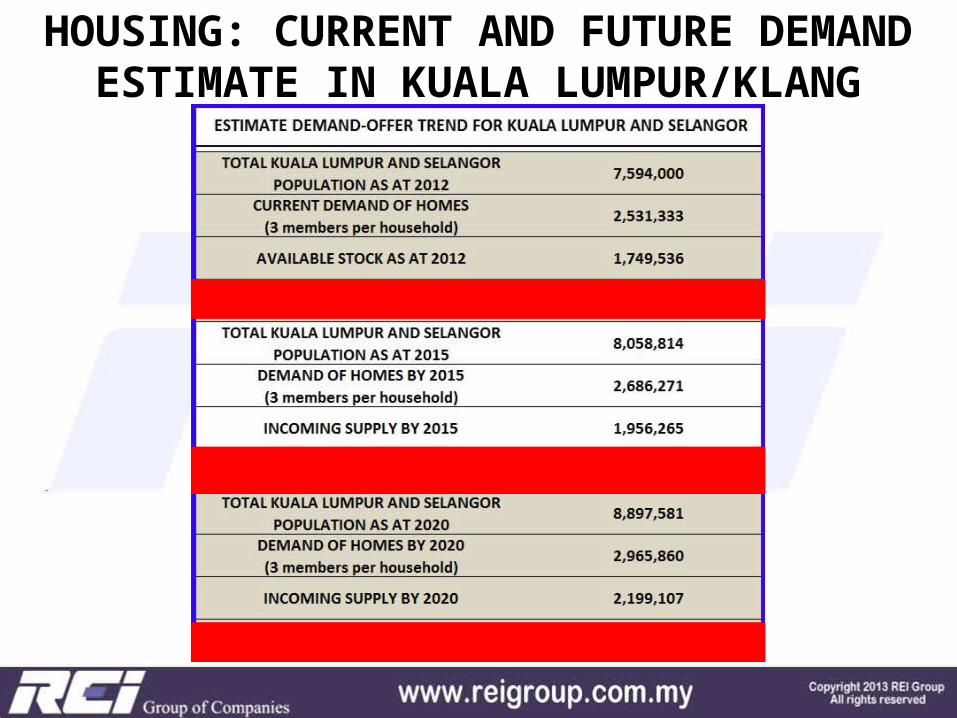
HOUSING: CURRENT AND FUTURE DEMAND ESTIMATE IN KUALA LUMPUR/KLANG
VALLEY

FUTURE THREATS
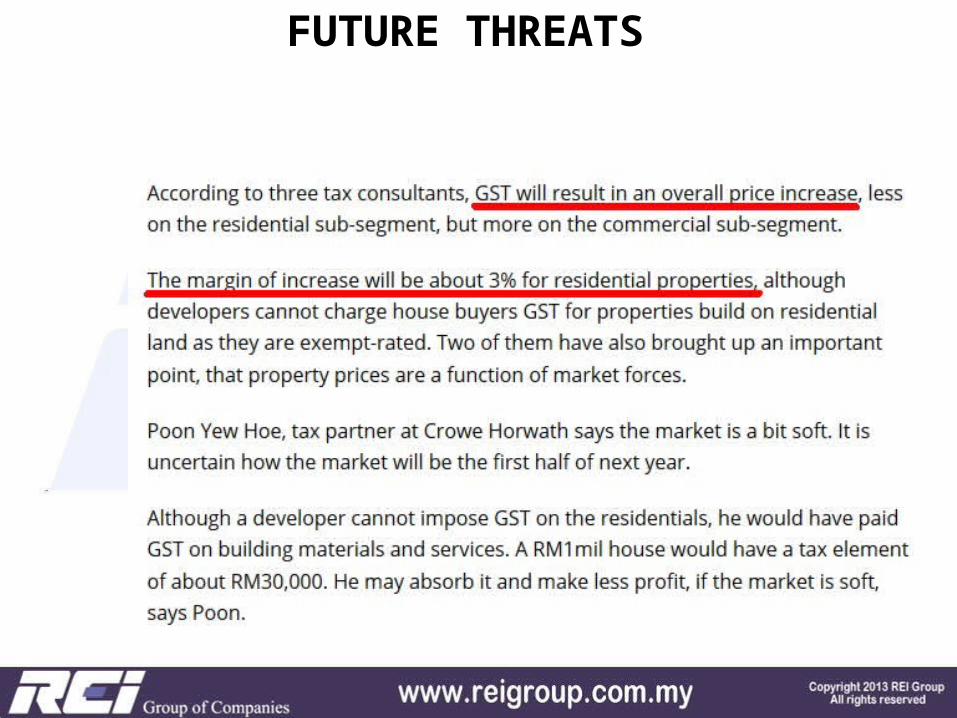
FUTURE THREATS

FUTURE THREATS
FUTURE THREATS
FUTURE THREATS
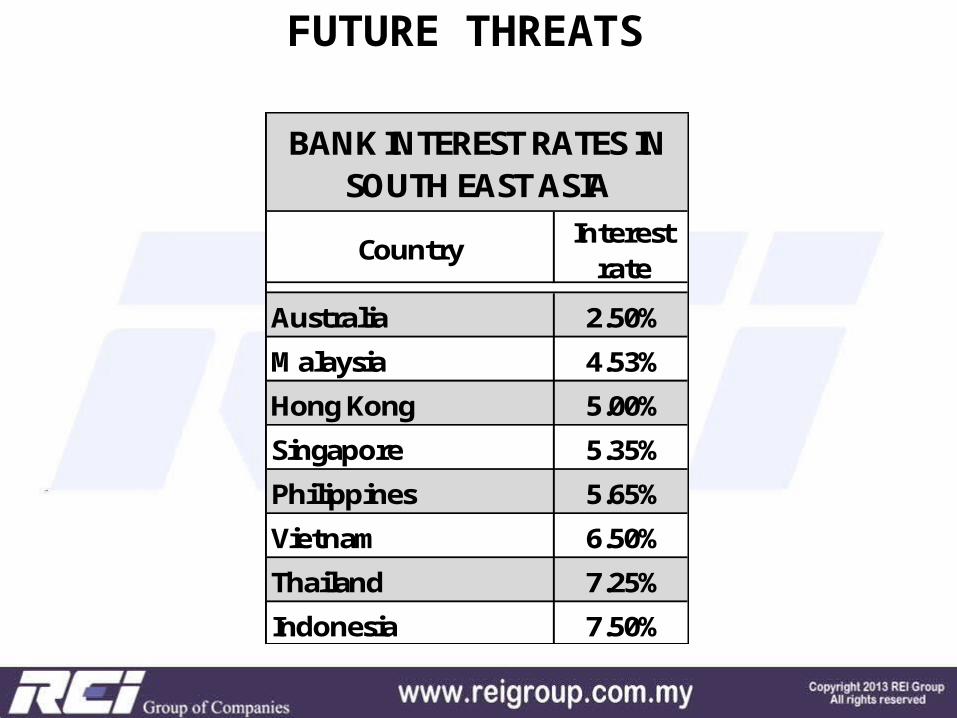
Country Interest rate
Australia 2.50%M alaysia 4.53%Hong Kong 5.00%Singapore 5.35%Philippines 5.65%Vietnam 6.50%Thailand 7.25%Indonesia 7.50%
BANK INTEREST RATES IN SOUTH EAST ASIA
FUTURE THREATS

MALAYSIAN REAL ESTATE: HOWLearn how to be a wise smart
investor

MALAYSIAN REAL ESTATE: HOWLearn how to be a wise smart
investor
X

How to contact me:Through Facebook:
Type my name: Daniele GamberoThis is my timeline:
How to contact me:You can also log into our REI Group Web site at:www.reigroup.com.myAnd check out the resources
available in the menu
Thank you
FacebookDaniele Gambero