Project Status Report Template - Mountain-Pacific Quality Health
51
Health Information Technology Electronic Clinical Quality Improvement (eCQI) Toolkit Version 6: February 2021 Table of Contents Introduction .................................................................................................................................. 2 How to Use this eCQI Toolkit ..................................................................................................... 4 eCQI High-Level Generic Project Plan ....................................................................................... 5 eCQI Generic Detailed Plan......................................................................................................... 5 PDSA Quality Improvement Cycle Diagram ............................................................................ 10 Conclusion ................................................................................................................................. 11 Appendix A: Outcome and Process Measures ........................................................................... 12 Appendix B: SMART Goals ...................................................................................................... 13 Appendix C: Project Scope and Change Backlog – Template .................................................. 15 Appendix C: Project Scope and Change Backlog – Completed Example ................................. 16 Appendix D: PDSA Worksheet – Template .............................................................................. 18 Appendix D: PDSA Worksheet – Completed Example ............................................................ 19 Appendix E: eCQI EHR Functionality ...................................................................................... 21 Appendix F: eCQI Brainstorm Worksheet Template ................................................................ 26 Appendix G: PDSA Cycle ......................................................................................................... 29 Appendix H: Use of Data ........................................................................................................... 32 Appendix I: Basic QI Data Collection Tools ............................................................................. 36 Appendix J: Organization eCQI Assessment Survey Sample ................................................... 41 Appendix K: Certified EHR & EHR Adoption ......................................................................... 44 Appendix L: eCQI Project Management Checklist ................................................................... 46 Appendix M: Workflow/Process Mapping Info and Template ................................................. 47 Appendix N: References, Resources and Acronyms ................................................................. 50
-
Upload
khangminh22 -
Category
Documents
-
view
0 -
download
0
Transcript of Project Status Report Template - Mountain-Pacific Quality Health

Health Information Technology
Electronic Clinical Quality Improvement (eCQI) Toolkit
Version 6: February 2021
Table of Contents
Introduction .................................................................................................................................. 2
How to Use this eCQI Toolkit ..................................................................................................... 4
eCQI High-Level Generic Project Plan ....................................................................................... 5
eCQI Generic Detailed Plan ......................................................................................................... 5
PDSA Quality Improvement Cycle Diagram ............................................................................ 10
Conclusion ................................................................................................................................. 11
Appendix A: Outcome and Process Measures ........................................................................... 12
Appendix B: SMART Goals ...................................................................................................... 13
Appendix C: Project Scope and Change Backlog – Template .................................................. 15
Appendix C: Project Scope and Change Backlog – Completed Example ................................. 16
Appendix D: PDSA Worksheet – Template .............................................................................. 18
Appendix D: PDSA Worksheet – Completed Example ............................................................ 19
Appendix E: eCQI EHR Functionality ...................................................................................... 21
Appendix F: eCQI Brainstorm Worksheet Template ................................................................ 26
Appendix G: PDSA Cycle ......................................................................................................... 29
Appendix H: Use of Data ........................................................................................................... 32
Appendix I: Basic QI Data Collection Tools ............................................................................. 36
Appendix J: Organization eCQI Assessment Survey Sample ................................................... 41
Appendix K: Certified EHR & EHR Adoption ......................................................................... 44
Appendix L: eCQI Project Management Checklist ................................................................... 46
Appendix M: Workflow/Process Mapping Info and Template ................................................. 47
Appendix N: References, Resources and Acronyms ................................................................. 50

2 | P a g e
Introduction
Quality improvement (QI) consists of systematic and continuous actions that lead to measurable
improvement in health care services and the health status of targeted patient groups (this
definition supplied by Health Resources and Services Administration [HRSA]).
Electronic clinical quality improvement (eCQI) is the use of health information technology (HIT),
the functionality and data in your electronic health record (EHR) and the clinical best practices
to support, leverage and advance your QI initiatives.
This eCQI toolkit was created as a practical guide to assist organizations with leveraging HIT
and the plan-do-study-act (PDSA) process improvement methodology to support and advance
health QI initiatives. This toolkit is:
• Designed to provide eCQI tools and resources that may be used by organizations to
help manage their eCQI priorities in an organized, efficient and repeatable manner
• Developed for use by inpatient and outpatient organizations who are currently utilizing
certified EHR software to manage their patient encounters (See Appendix K of this
toolkit for more information on certified EHRs.)
• Meant to help identify, align and manage quality initiatives for both internal and external
QI goals
• Focused on use of standardized clinical quality measures (CQMs) and tracking and
monitoring this data in their EHRs when possible
• Encourages physical, electronic and data workflow review as part of each eCQI project
to insure consistent, reliable and quality data and improvement
Development of this document was completed by Mountain-Pacific Quality Health and funded
by the Montana Department of Public Health and Human Services (DPHHS).
eCQI Methodology Overview Using HIT does not automatically translate to improved outcomes. Using HIT for quality
improvement requires purposeful and thoughtful planning, effort and allocation of resources.
This toolkit combines aspects of the Institute for Healthcare Improvement (IHI) Model for
Improvement, which includes the PDSA quality improvement cycle methodology and the
agile/scrum delivery cycle (created for the IT industry). The goal of this combined approach is to
help produce valuable, quality results in a quick and streamlined manner.
Quality Improvement Model
This toolkit will use aspects of the agile/scrum delivery cycle, which focuses on achieving value-
added changes quickly and efficiently, one change (or one group of changes) at a time. These
systematic improvement cycles are called “sprints.” The goal of each sprint is to provide value-
added results for an organization approximately every two to six weeks. Sprints also enable an
organization to balance improvement initiatives with current workloads. Each sprint should focus
on one change (or logical group of changes) and may include one PDSA iterative cycle (multiple
times through the cycle).

3 | P a g e
The PDSA quality improvement methodology is an iterative, four-stage, problem-solving model
used for improving a process. PDSA is a simple but powerful tool for accelerating change. (See
Appendix G of this toolkit for more information about PDSA.) To ensure stabilization of the
implemented changes and to spread improvements or best practices once they are defined and
proven, we recommend adding phases to stabilize and spread changes at the end of the final
PDSA cycle, once goals are met.
The foundation of the PDSA methodology is the recognition that quality improvement is an
ongoing cycle, with strong emphasis on the use of data for decision-making and to verify
performance. (See Appendix H for more information on the effective use of data and Appendix I
for a review of seven basic data collection tools.) This methodology will also incorporate the use
of SMART (specific, measurable, attainable, relevant, time-based) goal setting as the foundation
for planning and evaluating QI project success. (See Appendix B for more information on
SMART goals.)
Project Management
This toolkit is based on a “lightweight” project management approach, incorporating aspects of
the agile/scrum delivery cycle for QI initiatives, which focuses on a minimum of structure and
documentation and any value-added requirements necessary to ensure success. It includes a
process for helping monitor and control responsibilities, activities, changes and data for a QI
project.
Tools are included in the appendices to assist with project management and implementation of
QI initiatives.
Electronic Clinical Quality Measures
As noted by the Centers for Medicare & Medicaid Services (CMS) in their online eCQI Resource
Center, clinical quality measures (CQMs) allow for performance tracking as improvements are
made, and progress toward national shared goals of better care, smarter spending and healthier
people to be quantified.
Electronic clinical quality measures (eCQMs) are used to quantify and track health care quality
performance in a standard way. eCQMs are derived from information stored in and shared by
HIT systems, such as EHRs and patient registries. They convert information about care
processes or outcomes into a rate or percentage that allows providers, facilities and patients to
measure and evaluate aspects of care, including
• clinical management,
• intervention effectiveness,
• patient safety,
• efficient use of health care resources,
• care coordination,
• patient and family engagement,
• population and public health.
eCQM reporting, including population health indicators, is required for several federal incentive
programs.
Measuring quality provides tangible feedback to clinicians and other health care team members
on their improvement efforts. Quality measures also drive provider and facility reimbursement

4 | P a g e
now that federal and private insurers are shifting to value-based payment programs.
Measurement is thus a key engine for optimizing healthcare. Learn more at
https://ecqi.healthit.gov/.
Since the ability for EHRs to report standard CQMs is part of the process for EHR vendors to
obtain CMS/Office of National Coordinator for Health Information Technology (ONC) certification
for their products, and since the reports should be available in all certified EHRs, this eCQI
toolkit and process encourage the use of standardized CQMs whenever possible and
appropriate for outcome and process evaluation metrics for eCQI projects.
How to Use this eCQI Toolkit
Based on the scale of the electronic clinical quality improvement (eCQI) project, the desired
changes, the availability of resources or the quality improvement (QI) culture of the organization,
eCQI support needs may be unique for each organization or project.
This toolkit and its resources provide a step-by-step walk-through of the entire process, or
individual components can be used. We have included a high-level project plan for those
already comfortable with the process, and a more detailed plan for others.
The templates and information in the appendices are to provide basic tools and additional
information on some of the concepts discussed in this process. Organizations are welcome to
use the information and tools as they are or as templates or starting points that can be
customized to best benefit the organization or project. Here are some key elements to keep in
mind for a successful eCQI project:
• Make sure teams are represented with the needed subject matter experts. eCQI involves
the whole organization, not just IT, quality, etc.
• Create QI initiatives that make sense and/or align with other business or QI priorities.
• Use SMART goals (specific, measurable, attainable, relevant, time-based).
• Standardize your data goals (outcome measures); Use nationally recognized (e.g., CMS,
National Quality Forum [NQF], Uniform Data System [UDS], Inpatient Quality Reporting
[IQR], Merit-based Incentive Payment System [MIPS]) goals when possible.
• Identify data goals that are easily measured and consistently obtained, with data
available from the organization’s electronic health record (EHR) or other system. Do not
make the data tracking/reporting a difficult or manual task.
• Establishing baseline data and identifying the correct electronic/data entry workflow of
the chosen measure should be the project’s first step.
• Use and incorporate EHR functionality to support eCQI efforts.
• Identify and use existing clinical or workflow best practices when possible. Solutions may
have already been identified for the issue to be improved or changed.
• Use one plan-do-study-act (PDSA) process (may have many iterative cycles) for each
process measure/change (or logical group of changes).
• Use data for decision-making and to validate change.

5 | P a g e
• Provide necessary communication and training to staff on the eCQI process and
changes being implemented.
• Fully test theories before full implementation.
• Once changes are in place, continue to monitor these changes to ensure performance
continues as expected.
eCQI High-Level Generic Project Plan
1. Identify project scope (outcome measure - top level item to change).
2. Choose a project team.
3. Create change backlog (a list of possible changes/process measures that will help
improve the outcome measure).
4. Prioritize change backlog based on “value” of each change.
5. Create sprint backlog (identify item[s] to be included in first “sprint” or plan-do-study-act
[PDSA] cycle).
6. Plan “sprint”/PDSA cycle.
7. Complete PDSA cycle.
8. Perform a sprint review.
9. Review, update and reprioritize change backlog.
10. Begin new sprint.
See Appendix L for an eCQI Project Management Checklist.
eCQI Process Cycle Diagram
eCQI Generic Detailed Plan
The following eCQI project plan focuses on using HIT functionality and data, along with clinical
best practices to advance quality improvement projects. Sprints or PDSA cycles will be used for

6 | P a g e
each planned change. Following is a detailed generic project plan that can be used for most
eCQI projects, focusing on the use of HIT to advance QI goals. (See appendix L for an eCQI
Project Management Checklist.)
Step 1: Identify project scope.
1. Choose project goal.
a. Answer this question: “What are we trying to accomplish?” Below are some
possible ways to identify possible goals.
i. Identify quality reporting requirements evaluated and used for payment
reform/reimbursement or ranking, e.g., Accountable Care Organization
(ACO), CMS Quality Payment Program (QPP) Advanced Payment
Models (APMs) and MIPS, Patient Centered Medical Home (PCMH),
HRSA UDS reporting, Government Performance and Results Act
(GPRA), IQR
ii. Internal quality improvement goals already established or mandated
iii. Quality improvement requirements from funding opportunities/grants
iv. Data analysis determinations (biggest quality issue, quality issue with the
highest cost, issue affecting the most patients, etc.)
v. Use data obtained by completing Organization eCQI Assessment Survey
(Appendix J)
b. When applicable, the project goal should be an outcome measure. (See
Appendix A for more information on outcome and process measures.)
c. Use SMART criteria. (See appendix B for more information on choosing SMART
goals.)
d. Use standardized or nationally recognized measures when possible (e.g., CMS,
NQF, IQR, MIPS UDS, GPRA, measures) easily and consistently obtained from
the organization’s EHR. (Do not make the data tracking/reporting a difficult task.
Save resources for the change process.)
e. Align the QI project with other quality reporting requirements and programs (e.g.,
Meaningful Use, PCMH, MIPS, IQR, Comprehensive Primary Care Plus [CPC+],
UDS).
2. Identify the evaluation measure(s) that will be used to monitor performance to the project
goal. Establish and document the baseline data (starting point) for the evaluation
measure.
3. Identify boundaries for project (guidelines). Boundaries include what should be included
in the project and what should not be included, what is the expected timeframe, budget
and use of resources.

7 | P a g e
4. Document the project scope. (See appendix C for sample eCQI Project Scope and
Change Backlog Template and a completed example.)
Step 2: Choose a project team.
Assemble a team that has knowledge of the problem or opportunity for improvement. Including
the right people on a process improvement team is critical to a successful improvement effort.
Step 3: Create change backlog.
1. Answer this question: “What changes can we make that will result in an improvement to
the project goal selected?”
2. Choose the evaluation measures. If the evaluation measure(s) for the project needs data
validation, or if there are questions on the correct workflow or data entry for the
measure, or if staff needs training on the correct workflow/data entry for the evaluation
measure, this should be the first item included on the Change Backlog and should be
prioritized as the first sprint or PDSA/cycle.
3. Brainstorm ideas for possible changes that will ultimately improve the project
goal/outcome measure. (See Appendix F for an eCQI worksheet to help identify possible
changes). Other items to review for possible ideas for improvement:
a. Identify possible physical or electronic workflows that need to be reviewed for
possible improvement or streamlining. (See Appendix M to learn more about the
process of workflow mapping.)
b. Identify possible EHR functionality changes. (See Appendix E to learn more
about EHR functionality that can impact QI.)
i. Review staff use and workflows (based on clinical best practices for QI
topic)
1. Computer provider order entry (CPOE)
2. Care coordination and transition of care
ii. Determine available options, decide on applicability (based on clinical
best practices for QI topic)
1. Clinical decision support (CDS)
2. Patient portal/eSecure messaging
3. Patient education materials
4. Care Coordination
5. Interfaces
6. Etc.

8 | P a g e
iii. Determine how to optimize point of care documentation to ensure
accurate and streamlined data entry (based on clinical best practices for
QI topic)
c. Ideas for change may come from the insights of those who work in the system,
from previous PDSA cycles, from change concepts or other creative thinking
techniques or by borrowing from the experience of others who have successfully
improved.
d. Document the list of possible changes/improvements. Changes could include
process or workflow changes, EHR changes, education/outreach to patients,
data entry changes, etc. (See Appendix C for sample eCQI Project Scope and
Change Backlog Template and a completed example.)
Step 4: Prioritize the change backlog based on “value” of each change.
1. Prioritize or order the list of possible changes. Determine the order based on
organization priorities. Priorities can be based on cost, resources, timeframes, most
return on investment (ROI), alignment with other quality initiatives, etc.
2. Document the list of changes. (See Appendix C for a sample eCQI Project Scope and
Change Backlog Template and completed example.)
Step 5: Create sprint backlog. (Identify item[s] to be included in first “sprint” or PDSA
cycle.)
Based on the priority identified on the change backlog, choose one change (or one group of
changes) for the first sprint/PDSA. (Each sprint should be able to be completed in approximately
2 to 6 weeks.)
Step 6: Plan “sprint”/PDSA cycle.
1. Plan.
a. Based on the chosen change for this sprint, answer this question: “How will we
know a change is an improvement?”
b. Choose evaluation measures for this change. Choose SMART evaluation
measures, with standardized data easily obtained from EHR or other system. Do
not make the data tracking/reporting a difficult task. Save resources for the
change process. (See Appendix B for more information on SMART goals.)
c. Establish and document baseline data points for the evaluation measure(s).
i. Create standard/customized reports and verify accuracy.
ii. Create documentation (chart, graph, etc.) for baseline data and for
tracking.
d. If the evaluation measure(s) for this change needs data validation, or if there are
questions on the correct workflow or data entry for the measure, or if staff needs

9 | P a g e
training on the correct workflow/data entry for the evaluation measure, this
should be the first task of the PDSA cycle.
e. Create PDSA worksheet. (See Appendix D for a sample PDSA Worksheet
Template and completed example.) Use one PDSA worksheet for each proposed
change.
Step 7: Complete PDSA Cycle
1. Do.
a. Communicate plans to all staff/stakeholders involved in change.
b. Implement changes as identified on PDSA worksheet.
c. Provide training for staff on changes.
i. EHR functionality
ii. New workflows
iii. Clinical best practices
iv. Reports and use of data
v. Other
2. Study.
a. Monitor progress/collect data. (See Appendix I for info on standard data
collection methodologies and tools.)
b. Analyze data. (See Appendix H for more information on data validation and use.)
c. Identify areas of needed improvement.
3. Act.
a. If goal(s) identified in “plan” step are met, continue with the stabilize/improve
steps.
b. If goal(s) are not met, create new PDSA cycle using data analysis and revise as
necessary until goal(s) identified in “plan” step are met. (Go to Step 8.)
4. Stabilize/spread.
a. Stabilize new processes. Verify changes have been implemented, staff are
performing new tasks and train or coach staff as needed.
b. Create ongoing data collection, tracking and reporting to ensure changes
continue to meet original goals.
c. Identify areas to improve the newly established standard process.

10 | P a g e
d. Propose new QI project based on new possible improvements.
Step 8: Perform a sprint review.
1. Identify best practices from sprint.
2. Identify lessons learned to be applied to next or future sprints.
3. Identify recommended updates to change backlog (add, remove or change items).
Step 9: Review, update and reprioritize change backlog and prepare for new sprint.
Step 10: Begin next sprint/PDSA cycle.
1. Choose next change from list (to support overall project goal/outcome measure).
2. Continue cycle again starting with Step 5: Create sprint backlog.
3. Keep creating new sprints/PDSA cycles for this QI project until the high-level
goal/outcome measure is met, the project scope is revised or the project is canceled.
Remember to celebrate improvement success and document lessons learned for use in future
eCQI projects.
PDSA Quality Improvement Cycle Diagram

11 | P a g e
Conclusion
This toolkit is meant to provide some structure and information to help support eCQI initiatives.
The appendices that follow provide additional detailed information and tools that might assist in
improving processes and outcomes.
For any technical assistance or with comments or questions about this toolkit, please contact
Mountain-Pacific Quality Health or Montana Department of Public Health and Human Services.
Contact Information:
Mountain-Pacific Quality Health
Patty Kosednar, PMP, CPEHR, CPHIMS
eCQI Consultant
[email protected] | (406) 461-4410

12 | P a g e
Appendix A: Outcome and Process Measures
Outcome measures: The high-level outcome targets chosen to improve. Outcome measures
should represent a true effect or outcome. An improvement in an outcome measure should
represent unquestionable improvement and value for an organization and its patients.
• Improvement to outcome measures may take longer to see, and it may take change to
many process measures to see improvement.
• When choosing outcome measures, try to choose a standardized, nationality recognized
data point that is easily and readily obtainable. Do not choose measures that take a lot
of resources to obtain and track or that cannot be validated for accuracy.
• For eCQI projects, it may be useful to consider outcome measures associated with
reimbursement programs such as value-based payment initiatives (MIPS), Meaningful
Use, Patient Centered Medical Home (PCMH) or other quality reporting programs to
capitalize on improvement efforts.
Process measures: These measures are the specific steps in a process that lead, either
positively or negatively, to a particular outcome measure.
• It may take improvement on more than one process measure to affect an outcome
measure.
• Improvement in process measures should happen more quickly than outcome measures
and should show value to the organization/patients in a shorter timeframe.
• Choose process measures that have reliable evaluation measures to confirm
performance.
• It may be useful to identify process measure/changes applicable to an outcome measure
by completing the brainstorming form in Appendix F and available with more detail on
the Health IT.gov website: https://www.healthit.gov/providers-professionals/planning-
and-implementing-improved-care-processes and on measuring care processes:
https://www.healthit.gov/providers-professionals/measuring-care-processes-and-
outcomes.
o Direct link to the inpatient form:
https://www.healthit.gov/sites/default/files/cds/eCQI-Worksheet-Inpatient-
Essential-05-15.pdf.
o Direct link to the outpatient form:
https://www.healthit.gov/sites/default/files/cds/eCQI-Worksheet-Ambulatory-
Enhanced-05-15.pdf

13 | P a g e
Appendix B: SMART Goals
The benefits of using SMART criteria when determining goals is that being SMART means
goals are not vague, progress is easy to monitor, it is easy to identify missed targets, and they
help create action plans. Below describes each SMART criterion.
Specific
This criterion stresses the need for a specific goal rather than a more general one. This means
the goal is clear and unambiguous, easy to determine if goal is met or not met.
A specific goal usually answers the five “W” questions:
• What: What do I want to accomplish?
• Why: Specific reasons, purpose or benefits of accomplishing the goal
• Who: Who is involved?
• Where: Identify a location.
• Which: Identify requirements and constraints.
Measurable
This criterion stresses the need for concrete criteria for measuring progress toward the
attainment of the goal. If a goal is not measurable, the project team members will not know
whether they are making progress toward a successful completion.
• A measurable goal will usually answer questions such as:
• How much?
• How many?
• How will I know when it is accomplished?
• Indicators should be quantifiable
Attainable (or achievable, agreed upon, action-oriented)
This criterion stresses the importance of realistic and attainable goals. While an attainable goal
may stretch a team to achieve it, the goal should not be extreme.
An achievable goal will usually answer a “how” question:
• How can the goal be accomplished?
• How realistic is the goal based on other constraints?

14 | P a g e
Relevant (or realistic, results-oriented)
This criterion stresses the importance of choosing goals that matter. Relevant goals (when met)
drive the team, department and organization forward. A goal that supports or is in alignment
with other goals would be considered a relevant goal.
A relevant goal can answer yes to these questions:
• Does this seem worthwhile?
• Is this the right time?
• Does this match our other efforts/needs?
• Are you the right person?
• Is it applicable in the current socio-economic environment?
Time-based (or time-bound)
This criterion stresses the importance of setting goals within a timeframe, giving them a target
date. A commitment to a deadline helps a team focus efforts on completion of the goal on or
before the due date.
A time-based goal will usually answer the questions:
• When?
• What can I do six months from now?
• What can I do six weeks from now?
• What can I do today?

15 | P a g e
Appendix C: Project Scope and Change Backlog – Template
eCQI PROJECT SCOPE/CHANGE BACKLOG Template Location Name:
Project Aim: (What are we trying to accomplish?)
Goal: (Make sure goal is SMART.)
Project Constraints: (What are the boundaries for this project?)
Budget: Schedule: Quality: Other: (Policies, regulations, management decisions)
Evaluation Measure: (Use standardized data, easily obtainable if possible. Examples include CMS, NQF, MIPS, IQR and/or UDS measures.)
Measure Description Data Source
Target Performance
Current Performance/Date
Final Performance Date
Project Team:
Name Title/Department Role Responsibilities
Possible Changes - Backlog
Possible Change (Process measures)
Priority Ranking (Low, medium, high)
Estimated Sprint Assignment
Notes

16 | P a g e
Appendix C: Project Scope and Change Backlog – Completed Example
eCQI PROJECT SCOPE/CHANGE BACKLOG Location: Northwest Pediatric Clinic
Project Aim: Achieve and maintain control for asthma patients
Goal: Improve the % of active patients with asthma diagnosis with an ACT score >/= 20 by 20% by Dec 31, 2017
Project Constraints: (What are the boundaries for this project?)
Budget: Schedule: Quality Reporting for this measure is due by Feb 28, 2018 Quality: Focus on Northwest Clinic location only Other: (Policies, regulations, senior management requirements)
Evaluation Measure (Use standardized data, easily obtainable if possible. Examples include MIPS, NQF, CMS, IQR and/or UDS measures.)
Measure Description Data Source
Target Performance
Current Performance
Current Performance Date
Custom (NIH Asthma guidelines)
% of active patients with any asthma diagnosis with ACT score greater than or equal to 20
EHR/EPIC Asthma flow sheet
67% 47% 3/1/17
Project Team
Name Title/Department Role Responsibilities
Jane Doe Clinic Administrator
Project Leader Work with EHR Vendor for data reports. Assist with communication to staff
John Doe PCMH Coordinator Clinical Leader EHR expertise, workflow and process development, training and communication
Mary Smith Quality Coordinator
Project Manager Provide eCQI resources and templates, provide project management structure and reporting
Possible Changes - Backlog
Possible Change (Process measures)
Priority Ranking (Low, medium, high)
Estimated Sprint Assignment
Notes
Improve workflow for documenting ACT score and other assessment info in EPIC
High In process

17 | P a g e
Possible Change (Process measures)
Priority Ranking (Low, medium, high)
Estimated Sprint Assignment
Notes
Improve follow up appts for active asthma patients with prescription for daily inhaled steroid medication
High 3 FU appts every 6 months – check into EHR functionality for patient reminders and best practice alerts
Improve follow up appts for active asthma patients with ACT score less than 20
FU appts every 2-6 weeks until ACT score is over 19
Improve % of active asthma patients who have a care plan established and documented in EHR
Improve % of active patients diagnosed with persistent asthma who are on appropriate medication
High 2 CMS 126 Percentage of patients 5-64 years of age who were identified as having persistent asthma and were appropriately ordered medication during the measurement period

18 | P a g e
Appendix D: PDSA Worksheet – Template
Current Date: Location Name: Sprint Start Date: Sprint/PDSA Cycle #
Outcome Measure: (Project Goal – from Project Scope/Change Backlog Template) Sprint/PDSA Cycle Aim: (Make a SMART goal)
Evaluation Measure(s) for this Aim: (Use standardized data, easily obtainable if possible)
Measure Description Data Source Target Performance
Current Performance/ Date
Final Performance/ Date
Sprint/PDSA Cycle Team
Name Title/Department Role Responsibilities
Current Status:
Plan
List the tasks needed to set up test of change Person Responsible
Due Date Notes
Task 1:
Task 2:
Task 3:
Task 4:
Task 5:
Task 6:
Task 7: (add more rows if needed)
Do Describe the results, successes and barriers of the PDSA activities. Study Describe the measured results and how they compare to the predictions. Act Identify the next PDSA cycle needed based on what was learned or plans to
sustain changes or improvements.

19 | P a g e
Appendix D: PDSA Worksheet – Completed Example
Current Date: Location Name: Sprint Start Date: Sprint/PDSA Cycle #
3/15/2021 Northwest Clinic 3/1/2021 2
Outcome Measure: Achieve and maintain asthma control; Improve the % of active patients with asthma diagnosis with an ACT score >/= 20 by 10% by Dec 31, 2021. Sprint/PDSA Cycle Aim: Improve performance by 20% for percentage of patients 5-64 years of age who were identified as having persistent asthma and were appropriately ordered medication during the measurement period (CMS 126) by June 1, 2021
Evaluation Measure(s) for this Aim: (Use standardized data, easily obtainable if possible)
Measure Description Data Source Target Performance
Current Performance/ Date
Final Performance/ Date
CMS 126 Denominator: Patients 5-64 years of age with persistent asthma and a visit during the measurement period Numerator: Patients who were ordered at least one prescription for a preferred therapy during the measurement period
EHR CQM report
60% 40% 3/5/2021
Sprint/PDSA Cycle Team
Name Title/Department Role Responsibilities
Jane Doe Clinic Administrator
Project Leader Work with EHR vendor for data reports. Assist with communication to staff
John Doe PCMH Coordinator Clinical Leader EHR expertise, workflow and process development, training and communication
Mary Smith Clinical Staff Medical Assistant Provide clinical best practices and guidelines for asthma, help train staff and develop workflows
Current Status:
Team established baseline data for evaluation measure on 3/5 and confirmed correct workflow in EHR for CQM 126. Team is in process of training staff on correct electronic workflow. Jane working with EHR vendor to identify process for using EHR functionality for clinical reminder/ alert to support measure. Mary is working on creating workflow to include chart prep procedure.

20 | P a g e
Plan
List the tasks needed to set up test of change Person Responsible
Due Date Notes
Task 1: Establish baseline measure criteria for cycle/sprint (see above)
Jane Complete
Task 2: Confirm correct electronic data entry workflow to populate CMS 126
Jane Complete
Task 3: Work with EHR vendor to identify any clinical decision support (CDS) rules or alerts that can be set up to support measure and include in new workflow
Jane 3/15
Task 4: Create workflow for chart prep to include asthma patient encounters
Mary 3/15
Task 5: Train staff on new workflows: electronic data entry, chart prep and using reminders/alerts
Mary 3/20
Task 6: Create and perform audit to confirm adherence to new workflow adjust workflows/ training as needed
Jane 3/27
Task 7: Run updated evaluation measure report for current performance information
Jane 3/30 Run each week to confirm improvement/ process
Task 8: Make changes in workflow or training as needed based on updated data
Mary 4/15
Task 9: Continue cycle until performance target is achieved
Team 5/30
Task 10: Create plan to sustain or continue to improve measure
Team 6/5
Task 11: Perform sprint/cycle review meeting and discuss this sprint, update change backlog and identify next sprint
Team 6/5
Do Describe the results, successes and barriers of the PDSA activities. Study Describe the measured results and how they compare to the predictions. Act Identify the next PDSA cycle needed based on what was learned or plans to
sustain changes or improvements.

21 | P a g e
Appendix E: eCQI EHR Functionality
1. Computerized Provider Order Entry (CPOE) The basic functionality and purpose of CPOE is to encourage the direct entry of orders into
the EHR by providers, or someone licensed that is close to the provider, who understands the
purpose of the order and can determine whether it is clinically relevant and safe for the patient.
This is a standard component to certified electronic health record technology (CEHRT).
However, the workflow differs greatly between software systems.
It is important to understand system securities should be in effect with CPOE allowing or not
allowing certain “job roles” to enter, edit or view provider orders. This is typically determined by
the facility, not just the software company, when a system is initially implemented.
What does using CPOE mean to quality improvement efforts?
There are a multitude of data points that can be retrieved from CPOE to effect care
improvement. Examples of data collected through order entry models are antibiotic usage,
narcotic prescription monitoring and lab and diagnostic test usage. Using CPOE also provides
the organization the opportunity to implement clinical decision support rules or guidelines at the
point of care, which will be discussed later.
2. Patient Portals
The basic functionality and purpose of the patient portal is to provide patients and
beneficiaries electronic access to some health information and ultimately promote active
engagement of a patient in their care.
In 2014, all CEHRT had to be upgraded to a version that had some form of patient portal to
meet Meaningful Use. Again, while the requirement is standard, the workflow and approach to
implementation differs by software and facility. The requirement is that a patient must have the
ability to “view, download and transmit” their electronic health information. Functionality that is
available with most portals is to:
• Allow the patient to view/edit demographic and insurance information
• View lab test results
• View imaging reports
• Review clinical visit summary
• Review medication list
• Review/edit allergy list
• Request an appointment
• Request a refill
• Pay a bill
• Send a secure email to a provider/nurse
While most portals have the above functions available, it is ultimately decided by the
organization/provider what functions are “active” or “turned on” for the patient to be able to use.
For example, clinic A may choose not to show any lab test results, where clinic B may choose to
show all lab test results after they are reviewed by a provider.
Use the patient portal to
ngage patients in monitoring blood or blood sugar as well as to direct them to credible patient education resources.
e

22 | P a g e
In addition, portals are sometimes a standalone or third-party application and may be a different
vendor than the primary EHR. This will be an important consideration when we discuss what
data is available from a patient portal.
What does having a patient portal mean for quality improvement efforts?
A patient portal can provide direct, “outside-the-office” access to patients. Use it for patient
education. Most patients are searching the Internet regarding their medical condition, so why
not have patients search using a patient portal or a provider-supplied credible source? Engaging
patients in reporting their own measurements for blood pressure or blood glucose online could
be an effective way to collect data as well as improve patient care with real-time monitoring.
3. Health Information Exchange Overview
The basic concept of health information exchange (HIE)
is to allow health care professionals and patients to
appropriately access and securely share vital medical
information electronically. HIE is sometimes used as a
noun or a verb. With Meaningful Use, there were HIEs created to act as central repositories for
patient information, while at the same time a facility/provider can exchange health information
with another individual facility/provider (Office of National Coordinator, 2014).
Participating in and using the functionality of HIE can be a key factor in successful transitions of
care between providers and facilities as well as communicate information to data registries.
The process to successful information exchange at the facility/provider level (also known as
directed exchange) is:
1. Outline how you see the process working.
2. Start small. Test with one other provider/organization willing to help.
3. Pilot the process with involvement from those who will be doing it on a day-to-day basis.
4. Take the time to review the process.
5. Try again.
6. When successful, move on to performing the task more frequently, i.e., all transfers to
“x” facility/provider will have a clinical summary sent electronically.
7. Review the process as a continuous improvement indicator, monitoring successful and
failed exchanges until the process is hardwired.
What does using health information exchange mean for quality improvement?
HIE is all about improving communication between providers and/or facilities. This is potentially
one of the areas where patients stand to gain through the continuity of care delivery. Moving
through the steps noted above to improve the ability to communicate with one another can only
be a benefit to the patient.
Health information exchange = Continuity of care for patients

23 | P a g e
4. Clinical Decision Support (CDS): More than just alerts!
“CDS is an interactive part of an application that assists clinicians with decision-making tasks—it
is a hallmark of any clinical information system. Its primary objectives are to prevent errors of
commission (the wrong thing was done) and of omission (something was not done that should
have been), through alerts and templates with required data entry elements; and improve quality
of care, through reminders and other forms of guidance.” (Stratis Health, 2009)
To improve targeted health care decisions/outcomes with well developed and deployed CDS
interventions, the interventions must provide
• the right information,
• to the right people,
• in the right intervention formats,
• through the right channels,
• at the right points in workflow.
CDS functionality differs by software in the level of sophistication that is available.
The different levels of sophistication are:
• Data Display: Data review tools such as flow sheets, patient data reports and graphic
displays, search tools
• Workflow Assistance: Task lists, patient status lists, integrated clinical and financial
tools and instant messaging/internal communication tools
• Data Entry: Templates to guide documentation and structured data collection
• Decision Making: Access to resources on a topic from within the EHR, rule-based
alerts, clinical guidelines or pathways, patient/family preferences and diagnostic decision
support
CDS rules can be active, require user action, or passive, and do not require user action.
Using CDS to target conditions and standardize treatments
Most CEHRT software will have a “starter set” of clinical decision support rules to coincide with
the clinical quality measures (CQMs) in addition to being able to set up some individual facility
specific rules.
The following considerations need to be given to evaluate the usefulness of a CDS function
when setting up CDS to improve quality of care delivery and patient safety:
• Specificity
– Relevance to the patient
– Accurate information
– Consistent with standard of care
– Promote action or alternative actions
• Sensitivity and workflow
– Directed to the right person/role based user
Think beyond pop-ups when
using CDS!

24 | P a g e
– Directed to the right situation
• Safe/efficient handling
– Overrides should not be easy or frequent in use
– Reasons for noncompliance should be requested
– Consider screen design, size
– Minimize scrolling, keystrokes, typing, clicks, steps and screen changes
Taking the time to map the process associated with the quality improvement goal and identify
exactly where in the workflow data exists to support the quality improvement goal is a
worthwhile exercise. Then establish CDS interventions at those points to support data collection
and achieve goals.
Some specific examples of CDS functionality being used to support specific conditions:
• Tdap reminder/screening tool
• Coumadin regimen documentation templates
• Links to clinical guidelines/pathways within the EHR
• Chlamydia screening tools
• Tobacco cessation counseling triggers and templates
• Weight counseling for elevated body mass index (BMI)
• Documented use of aspirin or anti-thrombolytic in emergency department patients
• Standing orders for admission of a pneumonia patient
• Chronic disease self-management education materials and documentation templates
What does using CDS mean for quality improvement?
A key part of implementing CDS and using it effectively for quality improvement is responsibility
for the ongoing management of the functionality. It is highly recommended that management of
CDS rules and activities is done in alignment with quality reporting and data collection and not a
silo function of any one department or individual. It may even be suggested the task of
managing CDS is done by an existing quality improvement committee. This may also mean that
information technology (IT) staff will need to be part of the committee to effectively monitor and
implement what is needed.
The responsibilities associated with managing the CDS functionality for effective quality
improvement collection and reporting are:
• Evaluation of current CDS rules (see Appendix A). A review or compilation of what
rules/templates/guidelines currently in use at the practice/in our workflow? Do you have
rules set up that do not apply?
• Review and approval process for adding or dropping rules with a formal change
management request and IT involvement
• Communicate the change in the CDS
• Follow up on changes made with reviewing alert usage/overrides, monitoring for
template usage, chart reviews
• Ensure resources used in CDS are kept up-to-date. Not all systems are connected to a

25 | P a g e
service that updates reference materials. This would also include review and upkeep of
internal or customized documents.
5. Patient Level Alerts
The basic functionality and purpose of the patient level alert is to provide an option other
than, or in conjunction with CDS alerts, to target a specific patient. Unlike CDS alerts, which
have a “global” affect, different alerts can be set for the same condition, for different patients,
based on individual needs, timeframes or provider preference. (Not all EHRs may have this
functionality.) Also, unlike CDS, these alerts do not “automatically fire” based on criteria and
existing data in the HER. Instead, they are manually created individually and customized for
each patient.
What does using patient level alerts mean for quality improvement?
Use patient level alerts to act as a note, alert or reminder to providers and staff on specific
needs of an individual patient or to address a specific aspect of care for a specific patient. For
example, set up a patient level alert for a prehypertensive patient to provide reminders or notes
on care specific to that patient’s condition and based on information from the previous
encounter.

26 | P a g e
Appendix F: eCQI Brainstorm Worksheet Template
HIT-enabled Quality Improvement [eCQI] Worksheet (Ambulatory, Essential Version)
This tool can help users document and analyze current approaches to specific quality
improvement targets and plan enhancements.
Instructions for using this worksheet:
Step 1: Document the improvement target and current performance.
Step 2: Think about pertinent information flows and workflows driving performance.
Step 3: After discussion with pertinent stakeholders, document current state information flows
and workflows for the target. Brainstorm potential enhancements to the current state with the QI
team and document these in the pertinent boxes beneath the current state.
Step 4: Review all entries and summarize them in the overview table.
Step 5: Use this completed worksheet with the quality improvement (QI) team to help prioritize
and implement high-yield enhancements to current workflows and information flows; consider
beginning with those that will yield the greatest benefits with the least effort and resources (see
ONC eCQI Process Improvement page for further details).
Worksheet Provided By:
Jerome A. Osheroff, MD, TMIT Consulting, LLC
This tool has been refined based on experience using the eCQI worksheets in quality
improvement (QI) projects. It builds on QI tools sponsored by the Office of the National
Coordinator for Health IT (ONC). Those ONC tools were based on work of the CDS/PI
Collaborative (supported by the California Healthcare Foundation), which builds, in turn, on the
HIMSS CDS Guidebook Series. The information in this document is not intended to serve as
legal advice nor should it substitute for legal counsel. Users are encouraged to seek additional
detailed technical guidance to supplement the information contained within.
Version 2.0; May 22, 2015
More information on this worksheet and completed sample worksheets for both ambulatory and
inpatient QI initiatives can be found at https://www.healthit.gov/providers-
professionals/planning-and-implementing-improved-care-processes.

27 | P a g e
Ambulatory QI Worksheet (Simplified Version)
Target
Current Performance on Target
Not Visit Related
Before Patient
Comes to Office
Daily Care Team
Huddle
Check-in/ Waiting/ Rooming
Provider Encounter
Encounter Closing
After Patient Leaves Office
Outside Encounters (Population
Management)
Current Information Flow
Planned Enhancements
Section 1: Activities that occur with specific patients (Note: population management activities, e.g., Registry use, belong in Section 2)
A. These activities occur when the patient is not in the office (see C. below for activities “After Patient Leaves Office”).
Not Visit-Related
Description: Not related to a patient’s visit to the office/clinic or just before or after that visit
Current Information Flow
•
Planned Enhancements
•
Before Patient Comes to Office
Description: After a patient has an office visit scheduled but before they arrive for that appointment
Current Information Flow
•
Planned Enhancements
•

28 | P a g e
B. These activities occur when the patient is in the office.
Daily Care Team Huddle
Description: Provider team preparations for all patient visits scheduled for the day
Current Information Flow
•
Planned Enhancements
•
Check-in/ Waiting Room
Description: After patient checks in, before encounter with clinical team
Current Information Flow
•
Planned Enhancements
•
Provider Encounter
Description: Main encounter with provider
Current Information Flow
•
Planned Enhancements
•
Encounter Closing
Description: After main provider encounter, but before patient leaves the office
Current Information Flow
•
Planned Enhancements
•
C. These activities occur after the patient leaves the office.
After Patient Leaves Office
Description: After main provider encounter, but before patient leaves the office
Current Information Flow
•
Planned Enhancements
•
Outside Encounters
Description: Activities focused on the entire patient portal
Current Information Flow
•
Planned Enhancements
•

29 | P a g e
Appendix G: PDSA Cycle
The PDSA cycle is a systematic series of steps for gaining valuable learning and knowledge for
the continual improvement of a product or process. Also known as the Deming Wheel, or
Deming Cycle, the concept and application was first introduced to Dr. Deming by his mentor,
Walter Shewhart of the famous Bell Laboratories in New York.
The cycle begins with the plan step. This involves identifying a
goal or purpose, formulating a theory, defining success metrics
and putting a plan into action.
These activities are followed by the do step, in which the
components of the plan are implemented, such as making a
product.
Next comes the study step, where outcomes are monitored to
test the validity of the plan for signs of progress and success, or
problems and areas for improvement.
The act step closes the cycle, integrating the learning generated by the entire process, which
can be used to adjust the goal, change methods or even reformulate a theory altogether. These
four steps are repeated over and over as part of a never-ending cycle of continual improvement.
Reference: The Deming Institute: https://www.deming.org/theman/theories/pdsacycle
The Institute for Healthcare Improvement (IHI) Model for Improvement
The IHI Model for Improvement is a simple strategy that many organizations currently use to
accelerate their improvement strategies. A clinical quality improvement (CQI) initiative based on
the IHI Model for Improvement focuses on setting aims and teambuilding to achieve change. It
promotes improvement by seeking answers to three questions:
• What are we trying to accomplish?
• How will we know that a change is an improvement?
• What changes can we make that will result in improvement?
Principles
To answer these questions, a CQI initiative uses a plan-do-study-act (PDSA) cycle to test a
proposed change or CQI initiative in the actual work setting so changes are rapidly deployed
and disseminated. The cycle involves the following seven steps:
1. Form the team. Including the appropriate people on a process improvement team is
critical to a successful effort. The practice (or provider) must determine the team’s size
and members. Practice staff persons are the experts at what works well in the practice
and what needs to be improved. Include them in identifying and planning the
implementation of any eCQI initiative.

30 | P a g e
2. Set aims. This step answers the question: What are we trying to accomplish? Aims
should be specific, have a defined time period and be measurable. Aims should also
include a definition of who will be affected: patient population, staff members, etc. For
practice transformation, the aims should ideally be consistent with achieving one or more
of the triple aims previously discussed.
3. Establish measures. This step answers the question: How will we know that a change
is an improvement? Outcome measures should be identified to evaluate if aims are met.
Practices should select measures using data they are able to collect.
4. Select changes. This step answers the question: What changes can we make that will
result in improvement? The team should consider ideas from multiple sources and select
changes that make sense.
5. Test changes. First, the changes must be planned and downstream impacts analyzed
to assess whether they had the desired outcome or output. Once the changes are
implemented, the results should be observed so that lessons learned, and best practices
can be used to drive future changes.
6. Implement changes. After testing a change on a small scale, learning from each tes,
and refining the change through several PDSA cycles, the team may implement the
change on a broader scale, for example, for a pilot population or on an entire unit.
7. Spread changes. After successful implementation of a change(s) for a pilot population
or an entire unit, the team can disseminate the changes to other parts of the
organization.
Reference:
http://www.ihi.org/resources/Pages/HowtoImprove/ScienceofImprovementHowtoImprove.aspx
Identifying and Selecting Changes
While all changes do not lead to improvement, all improvement requires change. The ability to
develop, test and implement changes is essential for any individual, group or organization that
wants to continuously improve. There are many kinds of changes that will lead to improvement,
but these specific changes are developed from a limited number of change concepts.
A change concept is a general notion or approach to change that has been found to be useful in
developing specific ideas for changes that lead to improvement.
Creatively combining these change concepts with knowledge about specific subjects can help
generate ideas for tests of change.
After generating ideas, run PDSA cycles to test a change or group of changes on a small scale
to see if they result in improvement. If they do, expand the tests and gradually incorporate larger
and larger samples until you are confident that the changes should be adopted more widely.
• Eliminate waste – Look for ways of eliminating any activity or resource in the
organization that does not add value to an external customer.
• Improve workflow – Improving the flow of work in processes is an important way to

31 | P a g e
improve the quality of the goods and services produced by those processes.
• Optimize inventory – Inventory of all types is a possible source of waste in
organizations. Understanding where inventory is stored in a system is the first step in
finding opportunities for improvement.
• Change the work environment – Changing the work environment itself can be a high-
leverage opportunity for making all other process changes more effective.
• Producer/customer interface – To benefit from improvements in quality of products
and services, the customer must recognize and appreciate the improvements.
• Manage time – An organization can gain a competitive advantage by reducing the time
to develop new products, waiting times for services, lead times for orders and deliveries
and cycle times for all functions in the organization.
• Focus on variation – Reducing variation improves the predictability of outcomes and
helps reduce the frequency of poor results.
• Error proofing – Organizations can reduce errors by redesigning the system to make it
less likely for people in the system to make errors. One way to error proof a system is to
make the information necessary to perform a task available in the external world, and
not just in one’s memory, by writing it down or by actually making it inherent in the
product or process.
Reference: Institute for Healthcare Improvement:
http://www.reachoutandread.org/FileRepository/QI_ImprovementMethods_0311_FINAL_POST.

32 | P a g e
Appendix H: Use of Data
Overview: Have the Right Data and Use the Data Well For all electronic clinical quality improvement (eCQI) projects, a practice must use quality data.
Therefore, every effort should be made to ensure data are timely, accurate and measure what
they are intended to measure.
• Consider the source of the data for each metric needed to assess performance.
The electronic health record (EHR) cannot collect every kind of data needed for clinical
quality improvement (CQI). Some data may have to be collected by someone watching
and tracking activities in real time or through surveys of staff and patients.
• Ensure the EHR collects the data needed to support eCQI efforts as structured
data in the EHR. Data stored in free text fields or document images will not automate
data collection. Ideally, it is best to know this before an EHR is purchased or upgraded.
• Establish targets and benchmarks. The results of an eCQI analysis are meaningless if
no data exist for comparison. Many clinical measures have national and regional
benchmarks (e.g., Healthcare Effectiveness Data and Information Set [HEDIS] for
process of care measures). The best benchmark, however, is generated within the
practice through the collection of baseline data which the practice uses to set a
reasonable target for improvement over a specified period. Improvement is tracked by
periodic comparison of pre- and post-data.
• Establish a broad set of measures—structure, process and outcomes. Although
quality (outcome) measurement is a prime concern, on its own, it tells nothing about why
outcomes occur. Collecting structure and process measures will help uncover and
address the underlying causes of poor performance.
• Aggregate data to assess the practice population. One of the most efficient ways to
carry out eCQI initiatives focused on quality of care is to aggregate the data for patients
with similar conditions into a registry. These patients often experience similar issues with
treatments, medication adherence and coordination with specialists, so it makes sense
to view them as a distinct population that a practice monitors and tracks over time. In
addition, a disease registry allows the practice to identify patients who are outliers and
may need even more attention and follow-up.
• Conduct periodic data quality audits. Most measures are captured as simple statistics
(e.g., counts, percent, mean and mode) to ensure the EHR is producing accurate and
complete denominator and numerator data.
Reference:
http://www.healthit.gov/sites/default/files/continuousqualityimprovementprimer_feb2014.pdf
Specific steps you can take to understand, use and validate your data:
1. First, understand your reporting capability.
The following factors can affect what level of reporting functionality you have at your facility:

33 | P a g e
• Reporting functionality differs between software companies.
• Even with the same software, functionality may vary between facilities based on what
was purchased by the facility.
• Functionality at the facility level can vary between individuals based on permissions and
security access levels. You may need to obtain permission from your system
administrator for the access to run or create reports.
Standard or Canned Reports
Most facilities will have purchased a basic level of reporting
that allows for the creation of required reports such as
Meaningful Use, Clinical Quality Measures and Physician
Quality Reporting. These may be referred to by your
software as “canned” or “standard” report options.
There may also be canned reports available to other departments, such as pharmacy or
accounting, and executive level staff that may be surprisingly useful in QI projects. It would be a
useful exercise to query other departments or get a list from the software company of the types
of canned reports available. For example, the pharmacy may have access to a drug use
evaluation report that could be used for monitoring an antibiotic stewardship program.
Standard reports used by a software company may be from third party software (e.g., Iatric
Systems with Meditech) that may need to be accessed. It is important to learn which reports are
standard.
Customized or Ad Hoc Reports
Some organizations can generate customized reports internally, while others cannot. If
customized reports cannot be generated internally, they may need to be requested from the
software company. However, only make this request if the first step above does not yield the
needed reports, as there is often an associated cost with generating customized reports.
If customized reports can be generated internally, learn the following from the software
company about the reports:
• What kind of operators or “query strings” are available (commands like AND, OR,
EQUALS, LESS THAN, MORE THAN, etc.)?
• What fields are identified as “available” or “not available” from which to pull data, and
where is this information found (e.g., software manual)?
• From what databases can reports be run? As noted in section one, if databases are
separate for clinical and practice management information, separate reports may need
to be run to gather all the necessary information.
• Can data be pulled from customized documentation templates?
• How can data be pulled and exported into another program (e.g., Microsoft Excel) for
Data validation is a key step to
ensuring data credibility.

34 | P a g e
effective analysis and use? For example, pulling data into an Adobe Acrobat (PDF) file
does not allow for manipulation of the information.
However, we know that reporting alone does not equal improvement….
2. Second, collect and use EHR data.
Once an organization understands what reports are available, the next step is using the
available data to make real improvements.
After defining a metric and identifying a data element on a report, validate the data being pulled
into the report. This process involves working backward from the report all the way to the data
field from which the data is pulled to validate the accuracy of the information. It is much like
the process of a root cause analysis. Follow the data back to its “root” and then discover why it
may not be entered or pulled to the report correctly.
Validating Data
The following are key factors promoted by the Healthcare Information and Management
Systems Society (HIMSS) to ensure the useful and accurate collection of data from an EHR
(Ellen Harper DNP, 2015):

35 | P a g e
• Promote/use standardized terminologies, e.g., American Nurses Association (ANA)
terminology, Systematized Nomenclature of Medicine Clinical Terms (SNOMED CT) and
Logical Observation Identifiers Names and Codes (LOINC). Most of these terminologies
are in place for CEHRT, as they are part of the certification process for Meaningful Use.
• Use research-based, nationally recognized assessment scales or tools, because they
are evidence-based, can be more cost effective than designing unique tools and allow
for quality improvement purposes as an opportunity for care delivery comparison with
potential national benchmarking capability.
• Consistently use discrete data, which equates to little to no free text in important fields.
Free text entry has its purpose, but not in fields from where organizations are trying to
collect accurate, useful data. Entries of “within normal limits” also do not provide useful
data.
Streamlining clinicians’ workflow, as opposed to making them chart one more thing, is a
significant contributor to user success. The following strategies can be used to optimize
documenting with an EHR:
• Directly observing how staff uses the EHR
• Evaluating for a need for additional training on EHR software or computer skills, taking
advantage of user “favorites” for ease of use, sensitivity of clinical decision support
(CDS), etc.
• Mapping process and workflows, including EHR processes and workflows, with frontline
staff to identify where they are performing workarounds, avoiding alerts, running into
issues
• Evaluating the effect of the physical environment – Is the layout and placement of
computers/laptops/tablets conducive to productivity and accurate charting? Do clinicians
have to walk a long distance from the patient’s room to chart? Are there enough
devices? How many staff can be logged into a patient’s chart at the same time?
• Evaluating what information is being collected and how often it is duplicated by another
role or the same user – This should be done on an ongoing basis before any “new”
item/assessment tool, etc., is added to the EHR. Be sure the information is not already
captured elsewhere.
• Determining alternative sources for data entry, e.g., previous admission information,
demographics, office visit information, emergency department visit information, etc. –
There is the potential for the patient/family to enter some information into the record on a
device at the bedside or in the waiting room.
• Supplying value for and feedback on the data being collected to the clinicians –
Involvement in choosing QI metrics and information flowing back to the clinicians provide
value for time spent on data entry.
36 | P a g e
Appendix I: Basic QI Data Collection Tools
Introduction
Most organizations use quality tools for various purposes to improve, control and assure quality.
Although several quality tools are available for certain domains, fields and practices, some of
the quality tools can be used across industries. The quality tools included in this guide are
intended to be generic for use in any setting for various disease conditions, workflow
improvement or any other outcome.
There are primarily seven, basic quality tools. When used appropriately, these tools can provide
objective insight to problems in the organization and assist with developing solutions. Typically,
brief training, mostly self-training, is sufficient for someone to start using the tools.
We will briefly review each of the seven tools.
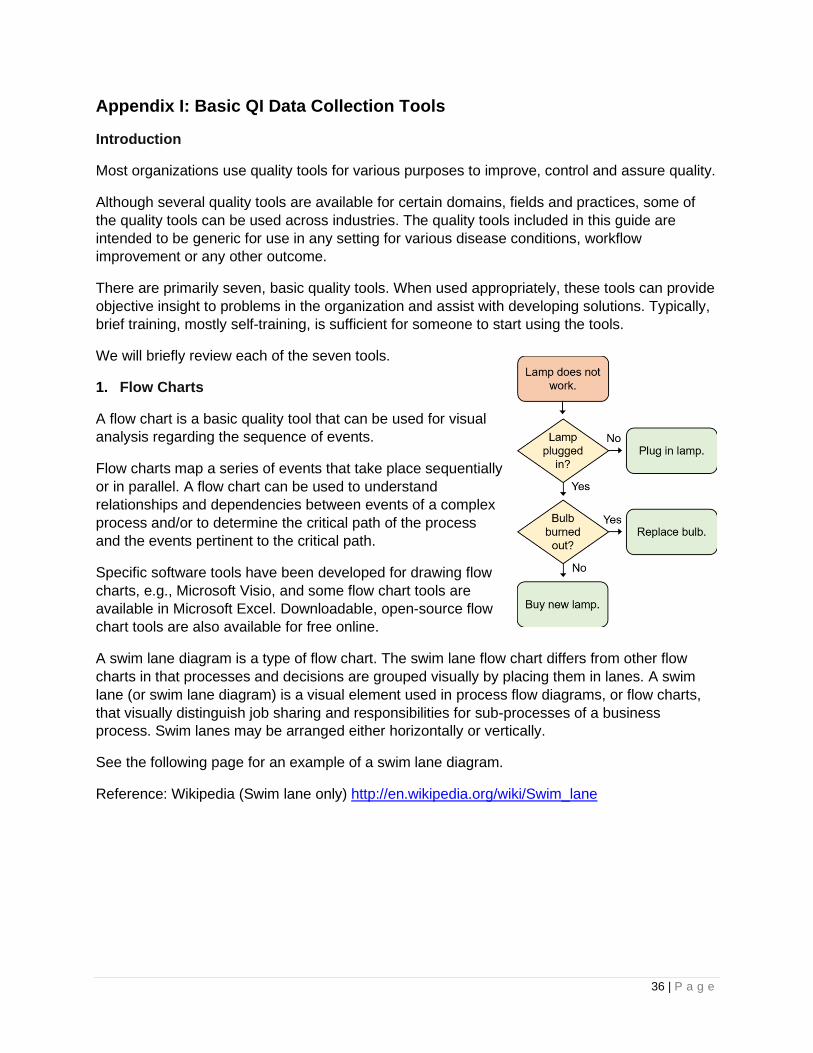
1. Flow Charts
A flow chart is a basic quality tool that can be used for visual
analysis regarding the sequence of events.
Flow charts map a series of events that take place sequentially
or in parallel. A flow chart can be used to understand
relationships and dependencies between events of a complex
process and/or to determine the critical path of the process
and the events pertinent to the critical path.
Specific software tools have been developed for drawing flow
charts, e.g., Microsoft Visio, and some flow chart tools are
available in Microsoft Excel. Downloadable, open-source flow
chart tools are also available for free online.
A swim lane diagram is a type of flow chart. The swim lane flow chart differs from other flow
charts in that processes and decisions are grouped visually by placing them in lanes. A swim
lane (or swim lane diagram) is a visual element used in process flow diagrams, or flow charts,
that visually distinguish job sharing and responsibilities for sub-processes of a business
process. Swim lanes may be arranged either horizontally or vertically.
See the following page for an example of a swim lane diagram.
Reference: Wikipedia (Swim lane only) http://en.wikipedia.org/wiki/Swim_lane

37 | P a g e
2. Histogram
A histogram is used for illustrating the frequency and extent in the context of two variables. The
histogram is a chart with columns that represent distribution by mean. If the histogram is normal,
the graph takes the shape of a bell curve. If it is not normal, it may take different shapes based
on the condition of the distribution. A histogram should always be two variables measured
against each other.
Consider the following example. This histogram shows morning attendance of a class. The X-
axis is the number of students, and the Y-axis is the time of day.
3. Cause-and-Effect Diagram
Organizations face problems every day, and it is important to understand the causes of these

38 | P a g e
problems to solve them effectively. Cause-and-effect diagrams, or Ishikawa diagrams, are used
for understanding organizational or business problem causes. Developing a cause-and-effect
diagram should be a teamwork exercise and consists of the following steps:
1. A brainstorming session is required to come up with the components of the cause-and-
effect diagram.
2. All the main components of a problem area are listed, as are possible causes from each
area.
3. Then, the most likely causes of the problems are identified for further analysis.
Here is an example of a completed cause and effect diagram:
4. Check Sheet
A check sheet can be introduced as the most basic tool for quality. A check sheet is basically
used for gathering and organizing data and for standardizing processes.
When a check sheet is done with the help of software packages such as Microsoft Excel,
organizations can derive further analysis graphs and automate through available macros.
Therefore, it is a good idea to use a software check sheet for information gathering and
organizing needs.
Organizations can always use a paper-based check sheet when the information gathered is only
used for backup or storing purposes other than further processing.
5. Scatter Diagram
When it comes to the values of two variables, scatter diagrams are the best presentation.
Scatter diagrams depict the relationship between two variables and illustrate the results on a

39 | P a g e
Cartesian plane. Then, further analysis, e.g., trend analysis, can be performed on the values. In
these diagrams, one variable denotes one axis, and another variable denotes the other axis.
6. Control Charts
A control chart is the best tool for
monitoring the performance of a
process. These types of charts can
be used for monitoring any processes
related to function of the organization.
These charts identify the following
conditions related to the monitored
process:
• Stability of the process
• Predictability of the process
• Identification of common cause of variation
• Special conditions where the monitoring party needs to react
7. Pareto Charts
Pareto charts are used for identifying a set of priorities. Organizations can chart any number of
issues/variables related to a specific concern to record the number of occurrences.
This tool assists in determining the parameters that have the highest impact on the specific
concern to prioritize issues and work more focused and effectively on controlling the process.
An example of a pareto chart is on the following page.

40 | P a g e
Conclusion
These seven basic quality tools can assist with addressing different concerns. Widespread and
standardized use of such tools in improvement activities could enhance the efficiency of quality
improvement projects and the organization as a whole.
Reference: http://www.tutorialspoint.com/management_concepts/basic_quality_tools.htm (all
except swim lane diagram)

41 | P a g e
Appendix J: Organization eCQI Assessment Survey Sample
Date completed:
Organization Name:
Organization City: Organization State:
Organization Type (Clinic/RHC/FQHC/Hospital/PPS/CAH):
System Assessment Facility
Response
EHR Vendor
EHR System and Version
Is this system/version CHPL Certified to 2014 or later standards?
Is this system hosted or off site? If so, by whom?
Finance system and version (if different from EHR)
Report writing system and version (if different from EHR)
Do you have onsite EHR technical support? If not, who provides this for you?
Who currently has access to running standard reports (Meaningful Use, MIPS, IQR, etc.)?
Who currently has access to creating and running custom reporting?
Is your organization comfortable and experienced creating customized reports?
Additional information/notes/questions
EHR Use Assessment Facility
Response
Number of locations included in EHR database
Patient population using EHR (all, main clinic only partial population, ER only, inpatient only)
What clinical decision support (CDS) rules are currently in place?
Can you create new or customize existing CDS rules?
Is patient portal functionality activated?
Are patients actively using patient portal?
What information is currently available to patients via the portal?
Do you use patient level alerts?
Can you create new or customize existing patient alerts?
Are reports available that monitor the use/override of CDS alerts?

42 | P a g e
EHR Use Assessment Facility
Response
Are reports available that identify all CDS rules currently active?
Are reports available that identify all patient level alerts currently active?
Do you submit information to any chronic condition registry? If so, which one?
Do you submit immunization or lab information to the state registry?
Do you electronically submit transition of care documents to other facilities?
Do you have a meaningful use dashboard?
Do you have a chronic care management dashboard?
Additional information/notes/questions
Quality Reporting Assessment Facility
Response
Did you attest Meaningful Use (MU) last year? If so, what stage?
Are you currently or did you ever report to the EHR Incentive program (MU)?
Who is currently monitoring your MU performance and in charge of success?
Did you report Physician Quality Reporting System (PQRS) last year?
If so, what method (claims, registry, EHR GPRO Web Interface)?
Will you be reporting Merit-based Incentive Payment System (MIPS) this year?
If so, what method (claims, registry, EHR GPRO Web Interface)?
Who is currently monitoring your MIPS performance and in charge of success?
What efforts have you taken to validate the quality performance data?
Please identify any other external initiatives you are participating in (UDS, PCMH, APM, IQR,
DPHHS, QIO, etc.). What measures are you tracking for these initiatives?
Who is currently monitoring performance and in charge of success?
Please identify any internal QI indicators currently monitored and to whom they are reported.
Who is currently monitoring performance and in charge of success?
What efforts have you taken to validate this quality performance data?
How many clinical quality measures (CQMs) are you tracking and reporting on in your EHR?
Can you run quality reports (CQM) on demand?
Can you customize your quality (CQM) reports (fields, date ranges, payer, diagnosis, etc.)?
What other quality reporting options (other than CQMs) or functionality is available in your
EHR (dashboards, IQR/PCMH or other quality program tracking)?
Are you confident in the quality of data in your CQM or other reports?

43 | P a g e
Quality Reporting Assessment Facility
Response
Are you confident the correct workflows are being used to populate the EHR with data
needed to populate the quality reports?
Does your EHR vendor provide documented workflows to support the CQM reports?
Are you able to export your CQM reports in QRDS type 1 or 3 format?
Additional information/notes/questions
Quality Improvement (QI) Culture Assessment Facility
Response
Do you have a QI committee?
Do you have a QI team?
Do you have a clear process for the flow of data and reporting through your facility to outside
entities?
Do staff/providers receive feedback reports regarding QI initiatives/reporting?
Is QI performance tracked/graphed regularly and reported to staff or displayed?
Additional information/notes/questions
Technical Assistance (TA) Assessment Facility
Response
What type of TA would you like?
Additional information/notes/questions

44 | P a g e
Appendix K: Certified EHR & EHR Adoption
Definition of a Certified EHR
What does it mean to have a certified electronic
health record (EHR)?
The Office of the National Coordinator (ONC) has
established standards and certification criteria by which vendors (software companies are
referred to as vendors) can become accredited to indicate their software has met the functional
requirements necessary to assist a facility or provider in meeting Meaningful Use. To attest to
Meaningful Use, providers/organizations must have implemented certified electronic health
record technology (CEHRT) and used this technology to meet the Meaningful Use criteria.
What does it NOT mean to have a certified EHR?
Certification does not mean standardization. Certification simply indicates that software has met
the basic necessary criteria for achieving Meaningful Use. The outcome is that software
systems differ greatly in their workflow. This has resulted in some confusion and frustration
among providers and organizations.
There are some consistent components to an EHR.
EHRs are consistently composed of “like” basic parts:
1. The Practice Management System (PMS) is often a separate database from the EHR,
but typically includes the following parts:
• Scheduling and billing module
• Registration/check in
• Demographics
• Claims
• Business report generation
2. The Electronic Health Record (EHR) is the
clinical documentation and results system that
generally includes:
• Health information and data
• Clinical decision support (CDS)
• Computer Provider Order Entry (CPOE) – procedures, tests, med, imaging, etc.
• Medication management (drug formulary, allergy, reconciliation)
• eRX – electronic prescribing (usually a third-party application, integrated with
EHR, e.g., Surescripts)
• Population Health Management – data collection and transmission tools/interface
Achieving Widespread Use/Adoption of the EHR
There is no “magic bullet” to successfully achieve widespread use, and achieving widespread
use is far different from being successful at widespread user satisfaction. What does exist now
that did not exist 10 years ago is mainstream use that provides us experience to do a better job
Certification does not mean
standardization of EHR software!
The components of an EHR may be built from different
databases, which could impact how QI data is collected.

45 | P a g e
at adopting EHRs. Briefly, the factors consistent with the most successful organizations
(success meaning, widespread use with general user acceptance):
• Active leadership involvement at all levels, to include the board, executive, management
and supervisors
• Active provider and frontline staff input in the selection process
• Use of decision-making tools (to provide documentation)
• Narrowing the field early to vendors that make sense for the organization (Do not spend
time on a vendor that is unaffordable in the end.)
• Due diligence in understanding the contract and maintenance agreements
• Ongoing communication and discussion after implementation!
• Dedication to continuing to make improvements for increased user satisfaction and
adoption
What does achieving widespread use mean for quality improvement?
The basic foundations for quality improvement can be addressed if providers and staff are using
the same tool for data collection, i.e., the EHR. It can allow for more well defined processes to
reduce variation, monitor a process and to collect the data from charting without creating
another data collection tool. (Stratis Health, 2009)

46 | P a g e
Appendix L: eCQI Project Management Checklist
Top Level Tasks Sub Tasks Date Complete
Comments
Identify Project Scope
Identify outcome measure(s)
Establish baseline data/ confirm EHR workflow to support outcome measure
Document project scope
Select Project Team
Document roles and responsibilities on project scope
Create Change Log
Brainstorm list of possible changes
Review possible EHR functionality and clinical workflow changes
Prioritize change backlog
Document change backlog on project scope document
Create Sprint Backlog
Identify changed to be included in sprint
Create plan-do-study-act (PDSA) document
Perform PDSA Cycle
Document PDSA findings (update PDSA document)
Perform Sprint Review
Review and update change backlog
Continue Sprint/PDSA Cycle (as needed)
Project goals are met
Stabilize/Spread
Identify ongoing tracking of improvement
Create implementation plan
Close Project Document lessons learned and best practices to be used on future eCQI projects

47 | P a g e
Appendix M: Workflow/Process Mapping Info and Template
When to use workflow mapping for an existing process:
• Process is wasteful
• Root cause analysis/known to be problem/error prone area
• Bad data – garbage in garbage out is in full force
• New device/product/supply is being added to a current process
• Significant EHR documentation change
• Patient/staff dissatisfied with current process
• Examples:
– Patient scheduling takes too long
– Increase in Med errors with bedside bar code scanning
– Validate/review data entry and collection for clinical quality measures
(CQMs)
When to use workflow mapping for a new process:
• Significant change in flow of care delivery
• Significant change in documentation of care delivery
• Addition of or change in a device or product
• New regulatory requirements
• Examples:
– Moving into a new unit or building – process of the move in addition to utilization
of new space
– Adding bedside bar code scanning
– Additional documentation required for new sepsis protocol
Who to involve in a workflow mapping exercise:
• Frontline staff is a MUST! If frontline staff cannot get to a meeting, simply shadow them
and document their steps. If evaluating an EHR workflow, do screenshots at each step.
An entire process can be put together after a file of screenshots have been assembled.
• Managers and supervisors should provide policies, protocols, guidelines or training
materials that display how the process is supposed to look.
Layers of workflow to be evaluated:
• Physical
– Includes environmental layout of patient room, equipment, devices, supplies, etc.
• Electronic
– How is the work documented? What screens and fields are used?
• Data
– Where does the information documented go?
– Why does it go there (triggers or reports)?
– How does it get there (interfaces, uploads, etc.)?

48 | P a g e
Steps to workflow mapping:
1. Map the “as is” process.
2. Analyze the “as is” process.
3. Create the “to be” process.
a. Identify points of change and what the change will look like.
4. Map the part of the process that is:
a. Measurable
b. Most directly affects the overall outcome
Workflow Scope Template
1. Process to be analyzed:
Basic overview/title
2. Why is this process chosen to analyze?
What brought up the desire to map the
process?
3. Improvement SMART goal/target:
(Specific, measurable, action-oriented,
realistic, time-based)
4. Scope of workflow to be analyzed:
(Clearly define start and end point.)
5. EHR/documentation system, module
and/or applications involved:
6. Items/equipment/devices involved in
process:
7. Physical locations involved in process:
8. Staff/people involved in process:
9. How will the process be mapped (swim
lane, basic workflow, etc.) and using what
method (discussion or observation)?
10. Who will own the map once complete?
11. Planned start date/target end date:
(of mapping exercise)

49 | P a g e
Materials Checklist:
□ Flipchart
□ Marker board
□ Erasable markers
□ Smart board
□ Sticky notes
□ Electronic documentation tool – Microsoft Visio, Microsoft Excel, Gliffy.com
□ Map of workflow project area, blueprints or a simple sketch, several copies or blown up on
projector screen, Smart board or marker board
□ EHR access to systems, screens, fields used during workflow
□ Printer
□ New product, device, equipment or supply item (if applicable)

50 | P a g e
Appendix N: References, Resources and Acronyms
References and Resources:
• Ellen Harper DNP, R.-B. M.-B. (2015, February 23). Guiding Principles for Big Data in
Nursing.
• Office of National Coordinator. (n.d.). Policy-Researchers. Retrieved from healthit.gov:
http://www.healthit.gov/policy-researchers-implementers/about-onc-hit-certification-
program
• Stratis Health. (n.d.). Quality Improvement. Retrieved March 12, 2015, from
stratishealth.org: http://www.stratishealth.org/expertise/quality/QIBasics.html
• Stratis Health. (2009, April 27). Quality Improvment Basics: From QA to QI.
• Office of National Coordinator Healthit.gov; eCQI: What it is, and it can help you
• Office of National Coordinator, National Learning Consortium (2013, April 30)
healthit.gov; Continuous Quality Improvement Strategies to Optimize your Practice
• Institute for Healthcare Improvement: www.ihi.org. How to improve:
http://www.ihi.org/resources/Pages/HowtoImprove/default.aspx
• Health IT.gov eCQI resources: https://www.healthit.gov/providers-
professionals/planning- and-implementing-improved-care-processes ,
https://ecqi.healthit.gov/, https://www.healthit.gov/providers-professionals/measuring-
care-processes-and-outcomes,
• Institute for Healthcare Improvement: Quality Improvement Basics:
http://www.ihi.org/resources/pages/howtoimprove/scienceofimprovementhowtoimprove.a
spx
• Agile/Scrum Methodology: https://www.cprime.com/resources/what-is-agile-what-is-
scrum/
Acronyms:
• ANA – American Nurses Association
• APM – Advanced Alternative Payment Models
• CDS – Clinical Decision Support
• CMS – Centers for Medicare & Medicaid Services
• CPOE – Computer Provider Order Entry
• CQM – Clinical Quality Measures
• eCQI – Health IT Enabled (or electronic) Clinical Quality Improvement
• eCQM – electronically reporting Clinical Quality Measures
• EHR – Electronic Health Record
• EMR – Electronic Medical Record
• eAccess – Electronic access to health records – Patient Portal

51 | P a g e
• EH – Eligible Hospital
• EP – Eligible Provider
• eRX – Electronic prescribing
• HIE – Health Information Exchange
• HIT – Health Information Technology
• LOINC – Logical Observation Identifiers Names & Codes
• MU – Meaningful Use
• MACRA – Medicare Access and CHIP Reauthorization Act
• MIPS – Merit-based Incentive Payment System
• NQF – National Quality Forum
• ONC –The Office of the National Coordinator for Health Information Technology
• PCMH – Patient Centered Medical Home
• PDSA – Plan Do Study Act
• PM – Project Management
• PMS – Practice Management System
• PQRS – Physician Quality Reporting System
• QI – Quality Improvement
• SNOMED CT - Systematized Nomenclature of Medicine -- Clinical Terms
• SRA – Security Risk Assessment
• VDT – View, Download and Transfer