PROFILING OF SMES AND VCISIS IN VALUE CHAINS OF STAPLE FOOD SUB-SECTORS IN TANZANIA AND UGANDA CASE...
37
PROFILING OF SMES AND VCISIS IN VALUE CHAINS OF STAPLE FOOD SUB-SECTORS IN TANZANIA AND UGANDA CASE STUDIES OF SMES ACTIVITIES ON VALUE CHAIN OF MAIZE, RICE SWEET POTATOES AND DAIRY SPREAD ACROSS PRODUCTION, PROCESSING AND TRADING NODES By Gabriel Landa P.O.Box 11313 Dar es Salaam, Tanzania Mob: +255719123216 Email: [email protected] or [email protected] SEPTEMBER 2013
-
Upload
independent -
Category
Documents
-
view
1 -
download
0
Transcript of PROFILING OF SMES AND VCISIS IN VALUE CHAINS OF STAPLE FOOD SUB-SECTORS IN TANZANIA AND UGANDA CASE...
PROFILING OF SMES AND VCISIS IN VALUE CHAINS OF STAPLE FOOD SUB-SECTORS IN TANZANIA AND UGANDA
CASE STUDIES OF SMES ACTIVITIES ON VALUE CHAIN OF MAIZE, RICE SWEET POTATOES AND DAIRY SPREAD
ACROSS PRODUCTION, PROCESSING AND TRADING NODES
By
Gabriel Landa P.O.Box 11313 Dar es Salaam, Tanzania Mob: +255719123216 Email: [email protected] or [email protected]
SEPTEMBER 2013
i
TABLE OF CONTENTS
1 Introduction ........................................................................................................................... 1 1.1 Background to Staple Food in Tanzania ................................................................... 1 1.2 Constraints to the development of Staple food Production in Tanzania .................... 1
1.2.1 Scale of cultivation ................................................................................................. 1 1.2.2 Low productivity ..................................................................................................... 2 1.2.3 Poor coordination and limited capacity .................................................................. 2 1.2.4 Underdeveloped supporting facilities ..................................................................... 2
1.3 Value Chain Analysis ................................................................................................ 2 1.4 Objective of the Analysis ........................................................................................... 3 1.5 Methodology .............................................................................................................. 3 1.6 Limitations ................................................................................................................. 3
2 Analysis of Sweet Potato Value Chain ................................................................................. 5 2.1 Production and Consumption Patterns ...................................................................... 5 2.2 Constraints in Sweet Potato Development ................................................................ 5 2.3 Sweet Potato Value Chain Analysis .......................................................................... 6 2.4 Key Players (SMEs) in the Value Chain .................................................................... 7
2.4.1 Producers/processors ............................................................................................ 7 2.4.2 Small Traders ........................................................................................................ 7 2.4.3 Rural hawkers ........................................................................................................ 7 2.4.4 Processors ............................................................................................................. 7 2.4.5 Retailers ................................................................................................................. 8 2.4.6 End users ............................................................................................................... 8 2.4.7 Input suppliers ....................................................................................................... 8
2.5 Cases in Sweet Potato Value Chain ......................................................................... 8 2.5.1 Introduction ............................................................................................................ 8 2.5.2 Description of the current business ....................................................................... 8 2.5.3 Business environment ........................................................................................... 9 2.5.4 Structure of the SME ............................................................................................. 9 2.5.5 Capital Investments ............................................................................................... 9 2.5.6 Technology type and utilization ............................................................................. 9 2.5.7 Relationship with other actors/ Networking ............................................................ 9 2.5.8 Critical success / failure / graduation/ factors ........................................................ 9 2.5.9 Conclusions ......................................................................................................... 10
3 Analysis of Rice Value Chain ............................................................................................. 11 3.1 Introduction .............................................................................................................. 11 3.2 Opportunities in the Rice Value Chain .................................................................... 12 3.3 Constraints in Rice Value Chain .............................................................................. 13 3.4 Production and Consumption .................................................................................. 14 3.5 Seeds ...................................................................................................................... 14 3.6 Farming Practices ................................................................................................... 15 3.7 Storage .................................................................................................................... 15 3.8 Milling ...................................................................................................................... 15 3.9 Rice Value Chain ..................................................................................................... 15 3.10 Cases in Rice Value Chain ...................................................................................... 16
3.10.1 Introduction .......................................................................................................... 16 3.10.2 Description of the current business ..................................................................... 16
4 Analysis of Maize Value Chain ........................................................................................... 19 4.1 Introduction .............................................................................................................. 19
ii
4.2 Production and Consumption .................................................................................. 20 4.3 Exports and Imports ................................................................................................ 20
4.3.1 Maize Value Chain Mapping ................................................................................ 20 4.4 Maize Value Chain Mapping ................................................................................... 22 4.5 Challenges in the Maize Sector ............................................................................... 22 4.6 Cases in Maize Value Chain ................................................................................... 23
4.6.1 Introduction to Grain Processing Ltd ................................................................... 23 4.6.2 Description of the current business ..................................................................... 23 4.6.3 Business environment ......................................................................................... 23 4.6.4 Structure of the SME ........................................................................................... 24 4.6.5 Capital Investments ............................................................................................. 24 4.6.6 Technology deployment. ...................................................................................... 24 4.6.7 Relationship with other actors/ Networking .......................................................... 24 4.6.8 Critical success / failure / graduation/ factors ...................................................... 24 4.6.9 Conclusions ......................................................................................................... 25
5 Analysis of Dairy Value Chain ............................................................................................ 26 5.1 Background Information .......................................................................................... 26 5.2 Dairy Market Structure ............................................................................................ 26
5.2.1 Product Range in the Market ............................................................................... 26 5.2.2 Household Market Segment ................................................................................ 26
5.3 Milk Processing Opportunities ................................................................................. 27 5.4 Potential market share ............................................................................................ 28 5.5 Product markets ...................................................................................................... 29 5.6 Cases in Milk Value Chain ...................................................................................... 30
5.6.1 Introduction to Morogoro Milk Processing Ltd ..................................................... 30 5.6.2 Description of the current business ..................................................................... 31 5.6.3 Integration and Diversification ............................................................................. 31 5.6.4 Business environment ......................................................................................... 31 5.6.5 Capital Investments ............................................................................................. 31 5.6.6 Technology type and utilization. .......................................................................... 32 5.6.7 Relationship with other actors/ Networking .......................................................... 32 5.6.8 Critical success / failure / graduation/ factors ...................................................... 32 5.6.9 Conclusions ......................................................................................................... 32
6 Reviewed Documents and Materials .................................................................................. 33
iii
ABBREVIATIONS
AIDS : Acquired Immune Deficiency Syndrome AKF : The Aga Khan Foundation AKIRIGO : Association of Kilombero High Quality Rice Growers Company ASDP : Agriculture Sector Development Programme BRELA : Business Registration and Licensing Authority COSTECH : Commission for Science and Technology DALDO : District Agriculture and Livestock Development Officer EAC : East African Community FAO : Food and Agriculture Organisation FMG : Farmer Marketing Groups GDP : Gross Domestic Product GHP : Group Health Plan GMP : Good Manufacturing Practices GS1 : Global Standard One HIV : Human immunodeficiency virus JICA : Japan International Cooperation Agency KPL : Kilombero Plantation Limited LGA : Local Government Authority MAFS : Ministry of Agriculture and Food Security MVIWATA : Muungano wa Vikundi vya Wakulima Tanzania NAFCO : National Agricultural and Food Corporation NFRA : and National Food Reserve Agency NGO : Non Governmental Organisation OFSP : Orange Fleshed Sweet Potatoes Products RUDI : Rural Development Initiative SACCO : Savings and Credits Cooperative Organisation SAGCOT : Southern Agricultural Growth Corridor of Tanzania SGR : Strategic Grain Reserve SHC : Southern Highland Company SME : Small and Medium Enterprise SPCSV : Sweet Potato Chlorotic Stunt Virus SPVD : Sweet Potato Virus Disease SUGECO : Sokoine University Graduate Entrepreneurs Cooperative TAMPA : Tanzania Milk Processors’ Association TAP : Tanzania Agricultural Partnership TBS : Tanzania Bureau of Standards TFDA : Tanzania Foods and Drugs Authority UDEC : University of Dar es Salaam Entrepreneurship Center URT : United Republic of Tanzania USA : United State of America USAID : US Agency for International Development USD : United States Dollar WFP : World Food Programme WRS : Warehouse Receipt System

1
1 INTRODUCTION 1.1 Background to Staple Food in Tanzania
The Tanzanian population is estimated at 44 million (Tanzania census of 2012) with an annual growth rate of 2.8%. The population density is therefore estimated at 44.3 persons per square kilometer. The urban population is estimated to be 26% while the rural population is 74%. The rate of urbanization is estimated at 4.7% per annum. However, this estimated rate might be lower than the real situation as the observed current trend for rural-urban migration is very high especially for young people who migrate in towns to seek jobs. Agriculture is the major economic activity in Tanzania and is regarded as the backbone of the economy. The sector is dominated by small-scale subsistence farmers whose farming activities are mostly rain fed and with very few irrigation farming activities. Technically the sector has had limited backward and forward linkages to other sectors of the economy such as industries, manufacturing, water, transport, energy, land, environment, natural resources. It contributes to around 24% of the country’s GDP and 26% of the total annual export earnings. The sector also is important to the government’s efforts to reduce widespread poverty partly because over 70% of the population depends on the agricultural sector for jobs, food and income. The other key sectors of the economy include mining, tourism, trade, transport and communication, finance, and construction (URT, 2011a). Agriculture is seen as the foundation of the Tanzania economy; underpinning employment, food production and export (MAFS 2007). The agricultural sector accounts for about 45% of GDP, and actively employs over 70% of the population (USAID 2009). The agriculture sector is dominated by food crop production with livestock equaling only about 3% of the sector (MAFS 2007). Food crop production is limited mainly to small-scale subsistence farming. Throughout Tanzania there are estimated to be between 4 and 5 million small-scale and over 1,000 large-scale private sector agricultural operations. Of the small-scale farms 70% are less than 2 hectares (ha) each, with 64% producing crops alone, 35% producing both crops and livestock, and only 1% farming livestock only. With regards to the large-scale operations, 58% specialize in crops, 22% are mixed farms and 20% produce livestock only (USAID 2009). Maize and Cassava are the most important staple foods in Tanzania. Per capita consumption of cassava is twice that of maize, 157 kg per capita and 73 kg per capita, respectively. Tanzania is more dependent on maize than its neighbours Uganda and Ethiopia but less so than Malawi and Zambia. It is important to also note the role of rice, wheat, and sorghum.
1.2 Constraints to the development of Staple food Production in Tanzania
The development of staple food production in Tanzania is constrained by a number of issues including the scale of cultivation, low productivity, poor coordination (limited capacity), and underdeveloped support services. These constraints are as highlighted hereunder.
1.2.1 Scale of cultivation
Tanzania has a land area of 94.5 million ha out of which 44 million hactors are classified as suitable for agriculture. Part of the land indicated to be arable may be only marginally suitable for agricultural production. This is for a range of reasons, including soil leaching, drought proneness, and tsetse infestation. According to recent studies, only 23% of the arable land is under cultivation (Ngirwa et al. 2006). The main constraints to the development of this land are the development of physical infrastructure and the eradication of tsetse, but if progress could
2
be made a largely untapped resource could be taken advantage of.
1.2.2 Low productivity
The central challenge to increasing the productivity of the agriculture sector, and thus reducing rural poverty, is the effective utilisation of the land available. The salient constraint is the restrictive technologies available and consequently the low levels of labour productivity. Although the labour force is growing, concerns including rural-urban migration, non-farm employment opportunities, and health concerns such as the HIV/AIDS and Malaria all stand to lessen the agricultural labour force and hence agricultural output. Not only is the volume of the workforce significant but also the quality of labourer available. Declining literacy rates may impact on the potential to transform the agricultural sector using improved technologies and methodologies.
1.2.3 Poor coordination and limited capacity
The agricultural sector involves many actors within the public sector who are currently poorly coordinated in terms of policy formulation, programme planning and implementation. Public institutions also lack the capacity; staff, funding, and facilities, to provide the necessary services to a high standard. The private sector is still relatively undeveloped and commercial farming suffers due to poor quality marketing systems, a lack of private investment, and poor incentives. Many of those currently involved in agribusiness lack the entrepreneurial skills, information and capital to expand their productivity and thus profits.
1.2.4 Underdeveloped supporting facilities
Weak agro-industries and poor connections within marketing, processing and production affect the performance of the agriculture sector. The predominately low quality rural infrastructure creates high transport costs both the distribution of inputs and the delivery of produce. This consequently leads to lower farm gate prices for the producer. Incomplete liberalization and continued poor regulation of food markets critically constrains agricultural development and damages the profit margins of the sector. Private sector productive capacity is adversely affected by the lack of support services for agribusiness development as previously mentioned, and by non-conducive legal, trade and tax regimes and underdeveloped or lack of financial services in agriculture (Ngirwa et al. 2006).
1.3 Value Chain Analysis
Value chain analysis is a powerful tool for managers to identify the key activities within the firm, which form the value chain for that organization, and have the potential of a sustainable competitive advantage for a company. Therein, competitive advantage of an organization lies in its ability to perform crucial activities along the value chain better than its competitors. The value chain framework of Porter (1990) is “an interdependent system or network of activities, connected by linkages”. When the system is managed carefully, the linkages can be a vital source of competitive advantage (Pathania, 2001). The value chain analysis essentially entails the linkage of two areas. Firstly, the value chain links the value of the organizations’ activities with its main functional parts. Then the assessment of the contribution of each part in the overall added value of the business is made (Lynch, 2003).
3
1.4 Objective of the Analysis
The objective of this assignment was to review relevant secondary data and/or grey literature on SMEs in the four (4) focus value chains of Dairy, Maize, Rice and Sweet Potatoes in Tanzania and write 4 case studies spread across production, processing and trading nodes of small and medium enterprises of these value chains on:
i Small and medium enterprises that have succeeded and the underlying reasons
ii Small and medium enterprises that have failed (including those that are struggling) and the underlying reasons; and
iii Large enterprises that have grown/ graduated from being small or medium scale – to articulate the drivers and pathway of the growth
1.5 Methodology
Data to accomplish this assignment were secondary data obtained from existing literature sources or data collected by other people for some other purposes. These were collected from a number of publications, documents, journals and books on Value Chain Analysis of staple foods in African Countries. Other data were collected from the Tanzania National Bureau of Statistics and from relevant website sources. However, preliminary primary data were collected from the sampled SMEs through interviews (face to face as well as telephone interviews) in order to obtain insight of the data required. SMEs were selected in Coastal region, Morogoro and Shinyanga. However most of the SMEs preferred to remain anonymous in the sense that they did not want their names to be displayed in this report. The data and figures presented in the case studies are the real data regarding their businesses.
1.6 Limitations
The major limitation when writing this report was the scope of information made available in recent VC studies in Tanzania. There are insignificant documentation on information available in value chain studies which have dealt with specific SMEs not only on the staple foods but for most of the value chain crops as a whole. However there are few scoping studies, which have been undertaken on the various interventions especially on the Value Chain Institutions and Support Institutions. In order to explore further on SMEs in the value chain, it requires substantial field visits, alongside interviews with small and large traders and processors and government officials. Analysis of this study depended on “biased “ primary information from selected SMEs who showed willingness to provide information. Because of time constraint, the analysis is therefore not very exhaustive as it depended on the selected primary data and available secondary data available at the ministries, academic institutions, research institutions and some very few independent researchers and consultants. Therefore in order to explore the SMEs in the value chains, a thorough study is a requisite. The second limitation encountered during this study was the reliability of the secondary data used to prepare this study. The quality of the data available has not been verified with data sources stating that some data as unofficial, semi-official, or estimated. It would be ideal to have a data set containing confirmed and trusted data so that accurate and robust analysis can be completed.

4
The last limitation for this study was the issue of the status of the agriculture sector whereby most of the SMEs are informally operated. There are very few enterprises operating formally but most of the players in the entire value chain are not formal. However, there are also very few larger enterprises formally operating and which have a very key role in developing other nodes in the value chain. This is a policy issue that needs to be tackled to facilitate the development of a robust agriculture sector.
5
2 ANALYSIS OF SWEET POTATO VALUE CHAIN
Sweet potatoes are said to be a native to Central America and are one of the oldest vegetables known to man. They have been consumed since prehistoric times as evidenced by sweet potato relics dating back 10,000 years that have been discovered in Peruvian caves (WHFoods, 2012).
2.1 Production and Consumption Patterns
Sweet potato is a food and nutrition security crop, grown in almost all agro-ecological zones of Tanzania. It is grown by smallholders, especially youth and women, and occupies approximately 14% of total arable land of the farms surveyed (Kapinga et al., 1995). Sweet potato production is mainly for home consumption. The preparation for consumption in most families in Tanzania involves boiling, roasting and deep-frying of the roots and the leaves are eaten as a green vegetable with ugali, rice or other food items. The vegetables are sometimes dried and packed for consumption during the dry season. In most parts of Tanzania sweet potato has gained importance due to its adaptability to marginal conditions such as drought, wet conditions, low soil fertility, and is ranked high as food security crop when local staple crops like maize and rice are scarce or fail. The problems of cassava mosaic, brown streak, banana bacterial wilt, sigatoka, nematodes and weevils on staple crops aggravate food security, and thus increase the importance of sweet potato in the country.
2.2 Constraints in Sweet Potato Development
Sweet potato productivity in Tanzania is very low compared to international standards despite its potential. Low yields are due to the fact that farmers use local landraces that are low yielding and susceptible to disease and insect pests. Unavailability of high quality planting material of improved varieties, especially during critical periods of planting sweet potato has contributed to these problems (Kapinga et al., 1995 and Mukasa et al., 2003). Sweet potato virus disease (SPVD) is another problem, which is arguably the most devastating disease affecting sweet potato production in Tanzania. The disease can yield losses of up to 50% of the total production. Sweet potato weevils (Cylas spp and Blocyrus spp.) are the most important insect pests of sweet potato, affect the crop by tunnelling in the root flesh rendering the roots inedible (Kapinga et al., 1995).
According to Ndunguru et al. (2009) sweet potato production is constrained by “the lack of clean planting materials, lack of high-yielding cultivars, low soil fertility, lack of resistant cultivars and weevils”. However, although plants may recover from some combination of these factors Ndunguru et al. (2009) found that co-infection of sweet potato feathery mottle virus (SPFMV) and sweet potato chlorotic stunt virus (SPCSV), were the most detrimental to yields.
Drought and low soil fertility in many parts of the country affect crop productivity. Genetic erosion accelerated by the climate change has been another major problem in the country limiting the genetic diversity for sweet potato improvement.
According to a McKnight Foundation report (2005), the major limiting factor for increased sweet potato production is the shortage of clean planting materials of superior varieties. Carey et al. (1998) reported that throughout the Sub-Saharan region production of the sweet potato crop is mainly based on the large numbers of landraces where farmers have to source planting
6
material from neighbouring farms. This is supported by anecdotal evidence in Tanzania where most sweet potato farmers interviewed reported receiving vines through other farmers.
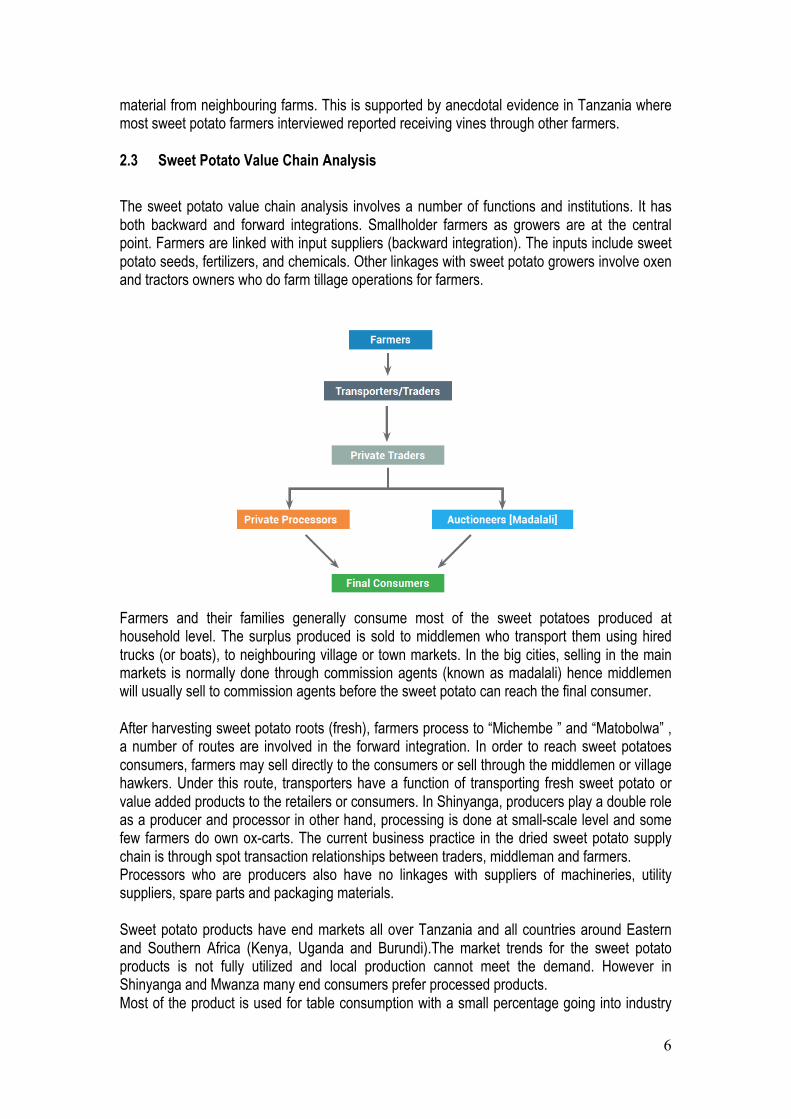
2.3 Sweet Potato Value Chain Analysis
The sweet potato value chain analysis involves a number of functions and institutions. It has both backward and forward integrations. Smallholder farmers as growers are at the central point. Farmers are linked with input suppliers (backward integration). The inputs include sweet potato seeds, fertilizers, and chemicals. Other linkages with sweet potato growers involve oxen and tractors owners who do farm tillage operations for farmers.
Farmers and their families generally consume most of the sweet potatoes produced at household level. The surplus produced is sold to middlemen who transport them using hired trucks (or boats), to neighbouring village or town markets. In the big cities, selling in the main markets is normally done through commission agents (known as madalali) hence middlemen will usually sell to commission agents before the sweet potato can reach the final consumer.
After harvesting sweet potato roots (fresh), farmers process to “Michembe ” and “Matobolwa” , a number of routes are involved in the forward integration. In order to reach sweet potatoes consumers, farmers may sell directly to the consumers or sell through the middlemen or village hawkers. Under this route, transporters have a function of transporting fresh sweet potato or value added products to the retailers or consumers. In Shinyanga, producers play a double role as a producer and processor in other hand, processing is done at small-scale level and some few farmers do own ox-carts. The current business practice in the dried sweet potato supply chain is through spot transaction relationships between traders, middleman and farmers. Processors who are producers also have no linkages with suppliers of machineries, utility suppliers, spare parts and packaging materials. Sweet potato products have end markets all over Tanzania and all countries around Eastern and Southern Africa (Kenya, Uganda and Burundi).The market trends for the sweet potato products is not fully utilized and local production cannot meet the demand. However in Shinyanga and Mwanza many end consumers prefer processed products. Most of the product is used for table consumption with a small percentage going into industry
7
uses and animal feed (FAO, 2010). Furthermore United State of America (USA) is the leading sweet potato earners with total value of more than 37 million US $ followed by France and Israel (FAO,2010). Surprisingly Tanzania earns about one million US $ from sales of sweet potatoes.
2.4 Key Players (SMEs) in the Value Chain
Key players of sweet potato (sweet potato-sector in particular) in Tanzania comprise a number of participants (actors) as described in the manner below.
2.4.1 Producers/processors
Usually producers of sweet potato sell part of their processed sweet potato to traders or fellow farmers with food shortages within the villages or nearby villages. The amount sold varies by the size of sweet potato fields, amount harvested and food requirement of household (quantities of cereals). They sell processed sweet potato in auction each Sunday during season and off-season the year depending on the household’s cash needs. They sell individually in various forms including fresh sweet potato (unpeeled roots) for consumption, dried sweet potato per tin or sack (“Michembe” and “Matobolwa”) and processed into floor. Producers who are processors also sell processed products (“Michembe” and “Matobolwa”) at household home or at the village-open markets (auction) every Sunday to end users consumers. Usually producers have access to marketing information on prices by direct visit to auction or hearing from their fellow friends. Bargain is mostly on an individual basis. They do not make any pre-arrangement with vendors or traders in selling their sweet potatoes. Also, very interesting story, Producers play a dual role as a processors also; you can’t separate characteristics and functions of the two actors.
2.4.2 Small Traders
Practically no small traders involving in this business. The reason could be due to limited information on production and marketing of sweet potato.
2.4.3 Rural hawkers
Sweet potato vendors are few in numbers and not widely available in the region but they are not organized in business arena. Rural vendors/hawkers buy dried sweet potato or fresh direct from farmers. They are inadequate by capital and know where to sell. Their major transport means is bicycle and or by hiring handcart or pushcart/ox-carts
2.4.4 Processors
They are also sweet potatoes growers per-se mainly engaged in processing of fresh sweet potato to “Michembe and Matobolwa”. At present they have very limited technologies on processing of sweet potato as their raw materials in producing products. The work is done manually at small scale level no idea to scale up the technology. They are not aware of the benefits of the sweet potato products
8
2.4.5 Retailers
These are both urban and rural retailers involved in selling fresh and /or dried Sweet potato. Their selling points are at town markets, at village centres and along roadsides. They buy from farmers or big traders in Kahama or Bukombe Districts. They manage only small quantities such as 300kg (3bags) to 10 000 kg (10bags) of fresh sweet potato per trip for up to 7 days of selling. In additional they process the product at the market place to avoid decaying of the produce due to shorter shelf life. Retailers can buy Sweet potato from farmers
2.4.6 End users
Consumers from local and regional markets for the case michembe and matobolwa and byproducts as livestock feed.
2.4.7 Input suppliers
Input suppliers are not vertically integrated with producers, framers normally search seeds for planting from their fellow farmers not from recognized source/agent. There is farm gate levy which producers pay fees before transporting the products to the buyers. However, suppliers of machine, spare parts and packaging materials do not interact with producers/processors at all and R&D is not vested to this crop unlike other roots crops. Research and Development is important factor that the Tanzania needs to invest for the development of new technology. Commission for Science and Technology (COSTECH) should be capacitate to undertake this role.
2.5 Cases in Sweet Potato Value Chain
2.5.1 Introduction
Shinyanga Potato Company Ltd deals with Orange Fleshed Sweet Potatoes Products (OFSP). The firm is a small sized Company which is a Tanzanian profit making business arm of a member based Association with common interests in nutrition, home economics and food technologies. The Association realized the business opportunity for Orange Fleshed Sweet Potato products. The Association members had facilitated product development to targeted communities for income generating purposes for a number of years. Since 2006, the Association had promoted OFSP through production cultivars, cottage processing, marketing and consumption by women, children and people living with HIV and AIDS (PLWHIV/AIDS). The business opportunity was eminent and in 2011 they registered Shinyanga Potato Company Ltd for the purpose of going into business by producing OFSP products in order to compete with items of the like in the market.
2.5.2 Description of the current business
Scale of operation The volume handed yearly is about 180 tones of OFSP products. Estimated revenue Annual turnover is about TZS150, 000,000 as of 2012. Integration and Diversification
9
Shinyanga Potato Company Ltd is horizontally integrated with it supply chain that uses Farmer Marking Groups (FMG) who produce and sale the sweet potatoes in several districts in the Lake zone region where Grain Processing Ltd operates. Its parent Organization, the Association has supply chain outreach programs as part of its community work thereby rendering the much needed integration.
2.5.3 Business environment
Competition Shinyanga Potato Company Ltd produces unique products other producers of the OFSP products are research institutes and Sokoine University of Agriculture under SUGECO incubator program. However, cottage producers who graduate at SUGECO and research institutes are yet to perfect the techniques and equipment installation. Shinyanga Potato Company Ltd produces OFSP flour and OFSP buns, doughnuts, biscuits, crisps.
2.5.4 Structure of the SME
Legal status Shinyanga Potato Company Ltd is a private liability company whose shareholders are limited to 50 only by law. It is a small enterprise is registered under Tanzanian company law Number of employees, skills set – Shinyanga Potato Company Ltd employs 6 staff most of whom are semi-skilled. The Owners are graduates and diploma holders in Agriculture, Home Economics, Food Technology and processing.
2.5.5 Capital Investments
The Company had deployed own equity and donor funded matching grants. Initially, the equipment and processing premises were not GHP and GMP compliant. With support from donor funds appropriate stainless steel equipment was procured and installed. Products were further developed and diversified. Cash at hand would need Shinyanga Potato Company Ltd owners consent.
2.5.6 Technology type and utilization
Appropriate technology from Intermech, which is national fabricating Shinyanga Potato Company Ltd based in Morogoro. Most production operations are manual operated.
2.5.7 Relationship with other actors/ Networking
Shinyanga Potato Company Ltd has supply chain relation with many FMGs in the Lake Zone of Tanzania and under its parent Association in which its shareholders are members.
2.5.8 Critical success / failure / graduation/ factors
From Shinyanga Potato Company Ltd point of view, the key issues hindering company’s ability to expand its size and market share as of 2012 were:
10
• Needs for new manpower to lead the business. • Seasonality of market demand and agricultural production • Excessive wastage due to low shelf life of the product • Ineffective production planning process • Operational management difficulties • Low customer base • Unsustainable cash flow • Overdependence on donor funding for production capacity building • Lack of long term strategic vision
Other limiting factors to success as of 2012 were:
• For compliance purposes, a proper industrial production site should be secured and a specifically designed production premises should be built. The current production premises within a domestic residential unit is neither suitable nor compliant with GHP and GMP
• Despite the sufficient area within the residential unit, the current production shed needs to be built.
• Non-compliance with GHPs and GMPs may result in Shinyanga Potato Company Ltd being denied TBS/TFDA licenses if and when the current production premises are inspected
• Equipment yet to be procured includes as of 2012: a) Double chamber electric deep fat fryer with accurate temperature control (and
timer); b) Digital weighing scale(s) with capacity to measure from 0.001 kg (1.0 g) to 5.0 kg; c) Kitchen equipment for handling flour and for rolling, cutting and shaping biscuit
dough, and d) Multi-tray oven with hot-air circulation fan.
2.5.9 Conclusions
Shinyanga Potato Company Ltd has the potential to grow. Owners could unleash this potential by management upgrading their business knowledge and skills, tackle the issues highlighted as factors leading to limited success.
11
3 ANALYSIS OF RICE VALUE CHAIN 3.1 Introduction
Rice is the second most important crop in Tanzania after maize and mostly used as a cash crop. Tanzanian rice productivity is lower than most neighbouring countries and one of the lowest in the world. Tanzania hardly meets its own rice demand and therefore imports large quantities, mostly from South-East Asia. However Tanzania is the second largest rice producer in Eastern Africa. Tanzania’s total rice production is 899,000 Mt, from which a small part is exported to neighbouring countries.
Around 90% of the rice production is by (subsistence) smallholders and production concentrates in Mbeya, Morogoro, Arusha, Iringa and Dar es Salaam Regions. The rice subsector is highly fragmented with millers and brokers playing a central role in the trading process. The supply channels are generally long and the produce changes many hands before reaching the final consumer. A few more structured supply chains are emerging and there is increasing interest from large (foreign) investors.
Critical weaknesses of the subsector are, among others, limited production and distribution of improved seeds (inputs), low quality (i.e. due to mixing of varieties), inefficient chains, insufficient input suppliers and extension workers, inadequate storage capacity, high post-harvest losses due to poor post-harvest handling and uses of inefficient milling machines. Production and productivity is low (average of 2- 4 Mt/ha), farmer organisations are weak and transport costs are significantly high. Moreover there is a general lack of transparency, enforcement of regulations, traceability and a conductive business environment.
There are numerous project interventions by NGOs and the government but these have not yet managed to sustainably improve the situation by developing effective and efficient supply chains in order to take full advantage of growing market opportunities.
Based on these subsector findings, three supply chains are found on the growing market segments identified for further development. These are coupled with it a number of business models including WRS, out-grower/contract farming, tenant lease model, stockists led credit/SACCO and crop insurance that have been crafted for value chain upgrading strategies. Whilst the primary target of supply/value chain improvements will target local market self sufficiency (medium/high income and institutional), there are deliberate efforts to craft efficient supply chains that will take up a substantial export market in the region taking into account the comparative advantage that Tanzania has.
The first selected chain is the ‘integrated channel aiming at local medium-high urban consumers’. In this chain the Mtenda Company is the clear chain leader, as it has set-up outgrowers’ schemes with over 10,000 farmers. Mtenda has a strong partnership with Wela miller, owns two retail outlets and has a strong network of wholesalers in Dar es Salaam. This chain is proposed to increase its focus on the local upmarket by, among other things, expanding its distribution system, to double its outgrowers (farmers), expanding its storage capacity and a feasibility study on the attractiveness of an own rice mill and transport facilities. In the medium-long term the chain is recommended to target the regional export market, however, an extensive feasibility and market study ought to guide this expansion. To successfully penetrate the regional market it was recommended to work with distributers in the respective country. Branding will play, both in the local as in the regional export market, a key
12
marketing strategy in the development of this value chain. Analysis indicated that transport and storage are the main costs drivers and thus setting up strong modalities around them are key for the chain’s competitiveness. Specific identified support organisation (TAP, TPSF, MIKO, NMB, DALDO etc.), are proposed to play specific supportive tasks to catalyze the chain.
Six producer groups (associations) and the marketing organisation - Association of Kilombero High Quality Rice Growers Company (AKIRIGO), both in Kilombero District (Ifakara), are the main actors in the second chain. In the short term 3,000 producers will be active in the chain and that number is expected to double in three to five years. In Kenya there is a large deficit of quality rice and this chain is in the right position to benefit from this opportunity. However, the chain will continue to supply the local market. The main cost drivers (transport and storage), play an even more crucial role than in the other chain. Therefore, transport modelling in particular will be essential to compete with local Kenyan and foreign competitors. To become more competitive, support institutions with TAP and RUDI in a crucial coordinating role should play an important task of strengthening and supporting the expansion of the chain, especially on production and marketing. Currently, AKIRIGO sells its produce in an ad-hoc manner to different buyers and no long-term relations are in place. The value chain development recommendation is geared at changing this and setting up long-term relationships with dedicated buyers in Kenya. Moreover introducing and/or strengthening business models like the ‘renewed’ WRS and especially the TPAWU model (providing inputs and crop insurance on credit to producers) will further strengthen the trust.
The final chain is the ‘large scale led channel selling to institutional clients’. The chain actors namely Southern Highland Company (SHC) in Mbarali District (Mbeya Region), Export Trading with headquarters in Dar es Salaam and Kilombero Plantation Limited (KPL) in Kilombero District (Morogoro Region) are the three prominent potential chain leaders, with potential of selling to institutional clients (army barracks, schools, hospitals, mining companies etc.); however none of them is targeting such clients. This is mainly because the tendering process is rather bureaucratic and has recently been decentralised. The large scale farmers have two crucial benefits to successfully penetrate this segment, namely the ability to consistently supply larger volumes. Secondly the payment terms can be complex and payments irregular and/or lengthy, therefore larger suppliers are more likely to have substantial working capital to absorb payment problems (delays). The large scale producers are recommended to work extensively with SHF in a so-called tenant’s model. It is envisioned that SHF work on the land owned and managed (maintained for a fee) by the large scale holder and are for a large part supplying the institutional clients. Support organisations like TAP, LGA-DALDO, FAO and TPSF were further proposed, among other things, to set-up producer group (WRS/AMCOS), trials with different seeds, harmonizing harvest and post-harvest methods, stimulating stronger chain linkages and developing an efficient transport modality.
Although the analysed chains are located in specific districts, the chains and their respective approaches (business models) are replicable in other areas. TAP is envisioned to play a vital role in the coordination and catalyzing of the proposed chains but also lead, together with other identified support organisations on some specific interventions.
3.2 Opportunities in the Rice Value Chain
There is a big potential for growth of rice sector due to a number of issues. The existence of improved seed varieties with higher productivity, tolerance to diseases and water efficiency
13
poses an opportunity. Existence of private seed companies who are ready to invest in multiplication and distribution of improved rice seeds.
Rice is among the crop that is given priority in the national agenda for agriculture including the Agriculture Sector Development Programme (ASDP I and ASDP II), KILIMO KWANZA, and SAGCOT. In the country there are three rice research and breeding centers in Morogoro and one rice training center in Kilimanjaro. International research on rice is much advanced.
There is a high market value of rice with ever increasing price with large unsatisfied domestic market demand. The urban market is always faced by seasonal rice shortages leading to price hikes every year. The urban population (Dar) has 4.3% growth rate per annum offering more market for rice.
Other opportunities include the following;
• Unused processing capacities of integrated and small milling plants with ability to mill more rice at the high quality and grade according to the needs of the market.
• Political will of the Government to enhance production and productivity of rice as seen through Government effort on establishing a National Rice Development Strategy.
• Suitable policy environment such as exemption of taxes on agricultural inputs e.g. machinery, fertilizers, and subsidy on agricultural inputs such as fertilizers, improved seeds and pesticides.
• Farmer’s willingness to form or join small farmers’ groups at village levels with some connected to a network of farmer groups (MVIWATA) at regional levels.
• Existence of some large irrigation schemes both traditional and modern where growth potentials are high with farmers more organized and receptive to agriculture market development programs.
• Willingness of development partners to support and the sector development. (JICA, AKF, Oxfam, USAID, FAO).
• World Bank’s support into making Tanzania centre for Rice excellence.
3.3 Constraints in Rice Value Chain
At a glance, the rice sub sector seems to be functioning well, but with a deeper assessment and analysis the sub sector is faced with a number of both structural and operational constraints hindering realization of its outspoken potentials in productivity and quality. These include among other things, the following constraints;
• Lack of availability and limited knowledge on improved seeds with higher productivity. Not much effort has been made to disseminate improved seed varieties to the farmers even though a lot of improved seed varieties exist.
• Farmers lack knowledge and skills on better agronomic practice and post harvest management. They are adopting new better practices very slowly.
• Where irrigation schemes exist the water management is mostly poor. • Lack of direct business relationship between farmers and the processors/millers who
are key actors in rice marketing. Marketing is still very much linked to traditional relationships with local agents and brokers.
• Most of the farmers are dealing individually with the existing problem; there are only few farmers’ organizations in the sector and mostly limited to small production groups

14
of 20-40 members at the village level. Further up there is a no collective representation of rice producers both at regional and national levels.
• Farmers do not have access to financial services due to distance to banks, lack of appropriate financial products for farmers and missing microfinance institutions near to the farmers.
• Limited reliable commercial storage facilities especially close to farmers’ production areas. All the warehouses used are owned by millers and are located in town/urban centers. Farmers only have their traditional storage facilities with limited capacities and cleanliness.
• Lack of relevant market information (price, quality, market areas of high demand, transport costs)
3.4 Production and Consumption
Rice, like maize, is a foundational component of Tanzania‘s broader agriculture sector. Total annual rice production has increased from 192,000 MT in 1994 to about 900,000 MT in 2007. Estimates of the number of farmers growing rice vary from 642,000 to 966,000. The total cropped area is about 900,000 ha (USAID 2009). Rice is grown in almost all regions of the country and is mainly grown by small-scale farmers. Small traditional farmers typically cultivate 1 to 5 acres using traditional methods, small irrigation farmers grow about 2 to 2.5ha in an irrigation scheme often initiated and controlled by the government; larger irrigation farmers grow more than 5ha in an irrigation scheme, outsource ploughing, and hire most of their labour. Large-scale commercial rice production is limited to few private firms who bought farms when large-scale irrigated National Agricultural and Food Corporation (NAFCO) schemes were privatized. There are three large-scale rice irrigation schemes for rice in Mbarali District, namely, Madibira 3,000 ha, Kapunga 3,000 ha and Mbarali 3,200 ha, and a few others at Kilombero and Mtibwa. There are small irrigation schemes distributed throughout North-East Tanzania. Elsewhere rice is rain fed, or lowland rain fed. See Figure 9 for more details. Tanzania exports Rice regionally to both Kenya and Uganda. The rate of export to Kenya seems to have decreased from 2004 to present day, export to Uganda is intermittent but when exported it seems to be to a fairly high level. The rate of export tends to be greatest when the Rice is available in the second half of the year.
3.5 Seeds
Tanzanian farmers have historically used local varieties of rice that are descendants of the seeds imported by Arab traders before 1960. These varieties (supa) are well adapted to the climate and the tastes of Tanzanians, but they have low-yields (about 2.5 – 3 tons per hectare). Higher yielding varieties, such as “subarimati” from India, are less popular in local markets and command significantly lower prices. Despite the higher yield, the financial return on non-traditional varieties is often lower. Tanzania has invested in rice research to develop new varieties of rice that both appeal to local tastes and have the virtue of higher yields. Breeders at Katrin, the Tanzanian rice research institute in Morogoro Region, have developed three new varieties. TXD 85 and 88, and TXD 306 . These are high yielding varieties (6.5- 7.5 tons/ha at the research institute; actual farm yields are lower) but are of relatively low quality. Research and breeding is on going. Saro V, a new varietal, is being pushed heavily. It has
15
strong and appealing aroma and flavour but it has not been grow for enough seasons and in enough types of growing conditions for its ultimate success and impact to be determined.
3.6 Farming Practices
In rice planting, for instance, planting seedlings in a row would have a meaningful impact on yield. The principal issue around improving farming practices is the underfunded Tanzanian agricultural extension service.
3.7 Storage
Storage capacity on own farms is not well designed for long-term storage; poor conditions cause significant post-harvest losses and erratic and inconsistent drying makes further processing and sorting difficult. Rice and pulses are largely, though not totally, immune to losses.
3.8 Milling
For rice, the quality of the milling in Tanzania is very poor. Consequently, farmers incur a greater loss of the valuable rice grain than necessary. The causes are poor quality milling equipment and poorly trained millers. A related issue is that mixed varieties of rice are presented for milling together. This leads to broken grains driving down the sale price of the rice significantly and increasing the amount of grain taken off of “softer” paddy before the “harder” paddy is finished. Broken rice and the presence of impurities and discolored rice also reduce the quality and sale price of rice substantially. Colour sorting machines (e.g., Sortex Colour) are extremely expensive but sorting manually is extremely tedious and labour intensive. The best option is not to mix product to begin with.
3.9 Rice Value Chain
Rice Sector Map
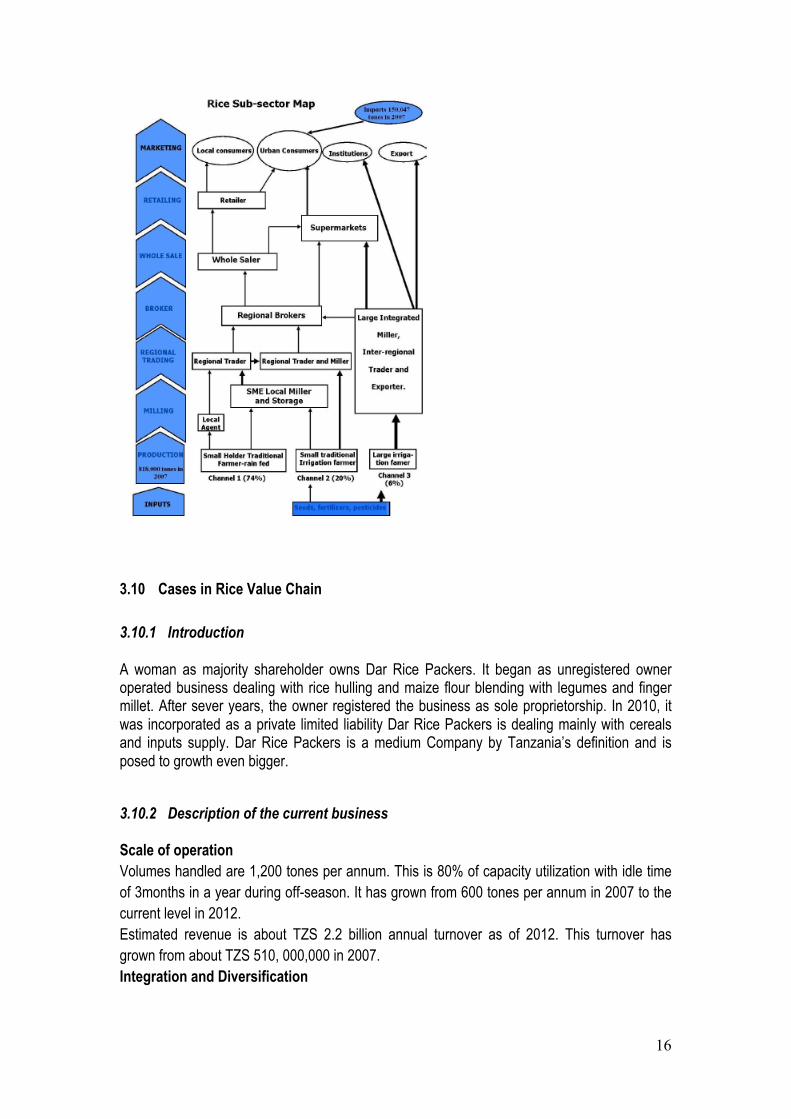
16
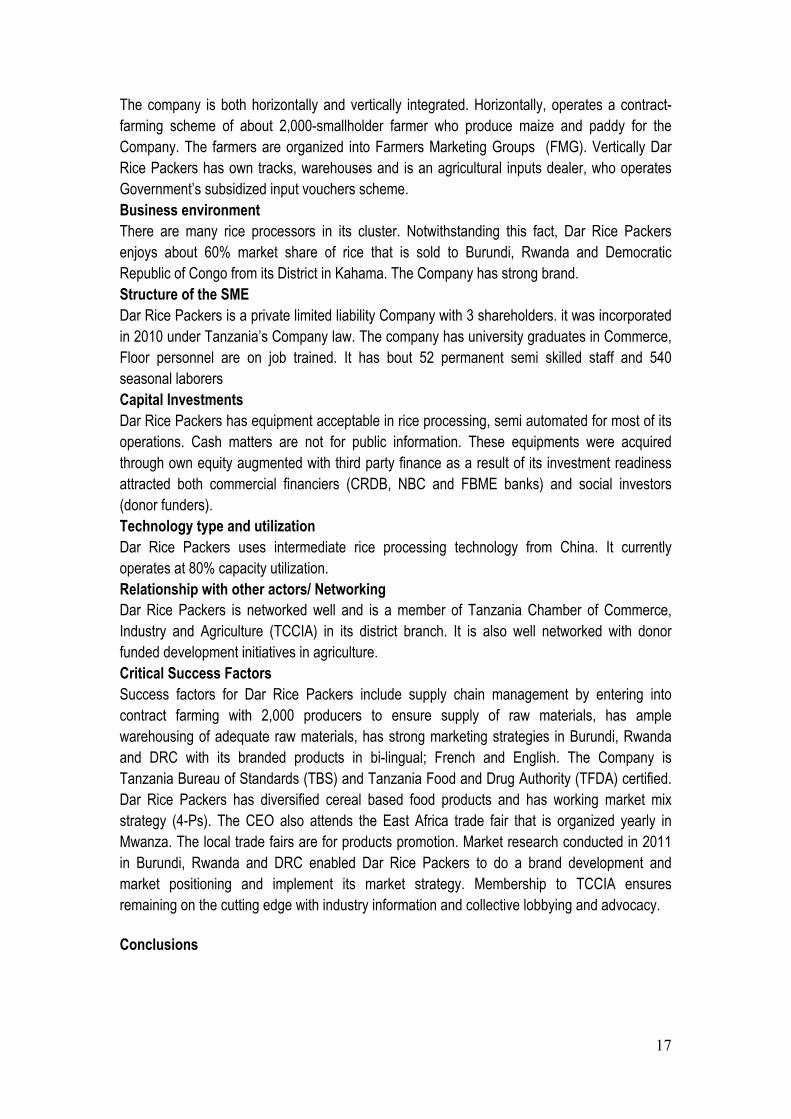
3.10 Cases in Rice Value Chain
3.10.1 Introduction
A woman as majority shareholder owns Dar Rice Packers. It began as unregistered owner operated business dealing with rice hulling and maize flour blending with legumes and finger millet. After sever years, the owner registered the business as sole proprietorship. In 2010, it was incorporated as a private limited liability Dar Rice Packers is dealing mainly with cereals and inputs supply. Dar Rice Packers is a medium Company by Tanzania’s definition and is posed to growth even bigger.
3.10.2 Description of the current business
Scale of operation Volumes handled are 1,200 tones per annum. This is 80% of capacity utilization with idle time of 3months in a year during off-season. It has grown from 600 tones per annum in 2007 to the current level in 2012. Estimated revenue is about TZS 2.2 billion annual turnover as of 2012. This turnover has grown from about TZS 510, 000,000 in 2007. Integration and Diversification
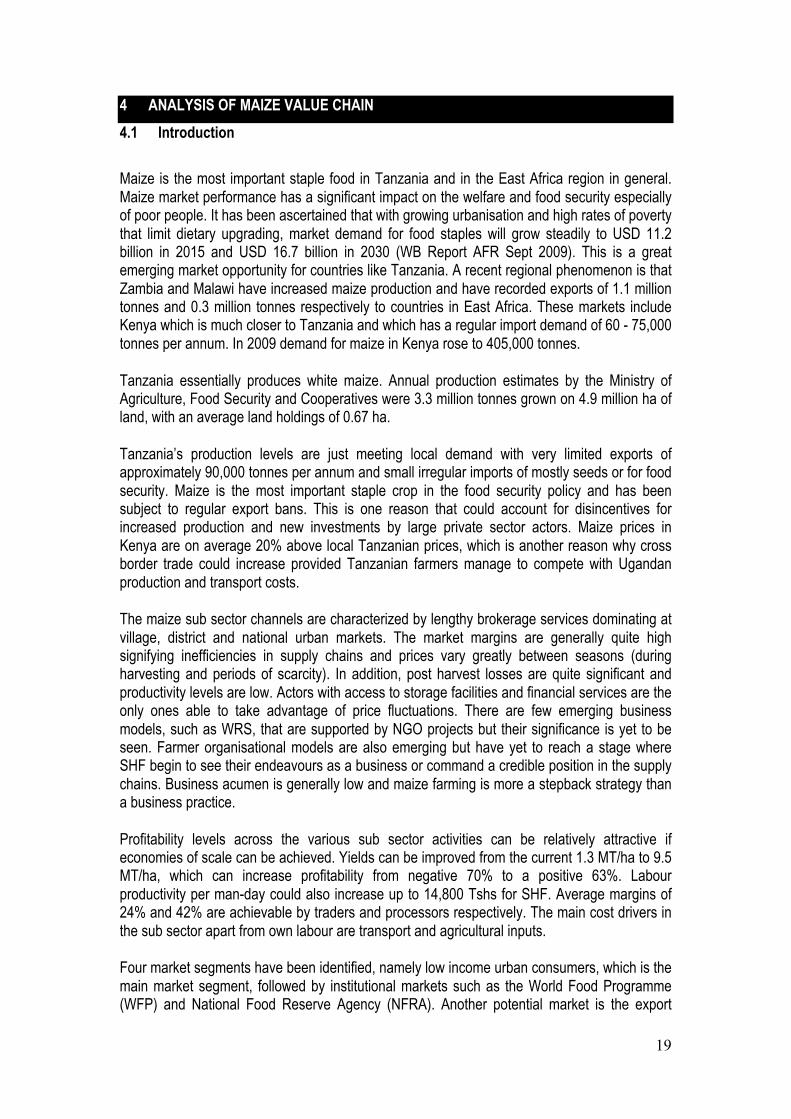
17
The company is both horizontally and vertically integrated. Horizontally, operates a contract-farming scheme of about 2,000-smallholder farmer who produce maize and paddy for the Company. The farmers are organized into Farmers Marketing Groups (FMG). Vertically Dar Rice Packers has own tracks, warehouses and is an agricultural inputs dealer, who operates Government’s subsidized input vouchers scheme. Business environment There are many rice processors in its cluster. Notwithstanding this fact, Dar Rice Packers enjoys about 60% market share of rice that is sold to Burundi, Rwanda and Democratic Republic of Congo from its District in Kahama. The Company has strong brand. Structure of the SME Dar Rice Packers is a private limited liability Company with 3 shareholders. it was incorporated in 2010 under Tanzania’s Company law. The company has university graduates in Commerce, Floor personnel are on job trained. It has bout 52 permanent semi skilled staff and 540 seasonal laborers Capital Investments Dar Rice Packers has equipment acceptable in rice processing, semi automated for most of its operations. Cash matters are not for public information. These equipments were acquired through own equity augmented with third party finance as a result of its investment readiness attracted both commercial financiers (CRDB, NBC and FBME banks) and social investors (donor funders). Technology type and utilization Dar Rice Packers uses intermediate rice processing technology from China. It currently operates at 80% capacity utilization. Relationship with other actors/ Networking Dar Rice Packers is networked well and is a member of Tanzania Chamber of Commerce, Industry and Agriculture (TCCIA) in its district branch. It is also well networked with donor funded development initiatives in agriculture. Critical Success Factors Success factors for Dar Rice Packers include supply chain management by entering into contract farming with 2,000 producers to ensure supply of raw materials, has ample warehousing of adequate raw materials, has strong marketing strategies in Burundi, Rwanda and DRC with its branded products in bi-lingual; French and English. The Company is Tanzania Bureau of Standards (TBS) and Tanzania Food and Drug Authority (TFDA) certified. Dar Rice Packers has diversified cereal based food products and has working market mix strategy (4-Ps). The CEO also attends the East Africa trade fair that is organized yearly in Mwanza. The local trade fairs are for products promotion. Market research conducted in 2011 in Burundi, Rwanda and DRC enabled Dar Rice Packers to do a brand development and market positioning and implement its market strategy. Membership to TCCIA ensures remaining on the cutting edge with industry information and collective lobbying and advocacy.
Conclusions

18
Dar Rice Packers has grown from unregistered to an incorporated medium enterprise as per Tanzania’s definition mainly because of commitment of owners to upgrade and modernize business management and operations.
The photographs on branded logo, packaging material and plant equipments are available. These would be shared once company owners provide consent to it.
19
4 ANALYSIS OF MAIZE VALUE CHAIN 4.1 Introduction
Maize is the most important staple food in Tanzania and in the East Africa region in general. Maize market performance has a significant impact on the welfare and food security especially of poor people. It has been ascertained that with growing urbanisation and high rates of poverty that limit dietary upgrading, market demand for food staples will grow steadily to USD 11.2 billion in 2015 and USD 16.7 billion in 2030 (WB Report AFR Sept 2009). This is a great emerging market opportunity for countries like Tanzania. A recent regional phenomenon is that Zambia and Malawi have increased maize production and have recorded exports of 1.1 million tonnes and 0.3 million tonnes respectively to countries in East Africa. These markets include Kenya which is much closer to Tanzania and which has a regular import demand of 60 - 75,000 tonnes per annum. In 2009 demand for maize in Kenya rose to 405,000 tonnes.
Tanzania essentially produces white maize. Annual production estimates by the Ministry of Agriculture, Food Security and Cooperatives were 3.3 million tonnes grown on 4.9 million ha of land, with an average land holdings of 0.67 ha.
Tanzania’s production levels are just meeting local demand with very limited exports of approximately 90,000 tonnes per annum and small irregular imports of mostly seeds or for food security. Maize is the most important staple crop in the food security policy and has been subject to regular export bans. This is one reason that could account for disincentives for increased production and new investments by large private sector actors. Maize prices in Kenya are on average 20% above local Tanzanian prices, which is another reason why cross border trade could increase provided Tanzanian farmers manage to compete with Ugandan production and transport costs.
The maize sub sector channels are characterized by lengthy brokerage services dominating at village, district and national urban markets. The market margins are generally quite high signifying inefficiencies in supply chains and prices vary greatly between seasons (during harvesting and periods of scarcity). In addition, post harvest losses are quite significant and productivity levels are low. Actors with access to storage facilities and financial services are the only ones able to take advantage of price fluctuations. There are few emerging business models, such as WRS, that are supported by NGO projects but their significance is yet to be seen. Farmer organisational models are also emerging but have yet to reach a stage where SHF begin to see their endeavours as a business or command a credible position in the supply chains. Business acumen is generally low and maize farming is more a stepback strategy than a business practice.
Profitability levels across the various sub sector activities can be relatively attractive if economies of scale can be achieved. Yields can be improved from the current 1.3 MT/ha to 9.5 MT/ha, which can increase profitability from negative 70% to a positive 63%. Labour productivity per man-day could also increase up to 14,800 Tshs for SHF. Average margins of 24% and 42% are achievable by traders and processors respectively. The main cost drivers in the sub sector apart from own labour are transport and agricultural inputs.
Four market segments have been identified, namely low income urban consumers, which is the main market segment, followed by institutional markets such as the World Food Programme (WFP) and National Food Reserve Agency (NFRA). Another potential market is the export
20
market to the East African Community (EAC) and to a lesser extent the urban medium/high-income consumers who traditionally would not forgo this staple food. There is a huge potential to create linkages with the animal feed industry if respective value development is promoted.
Supply chain improvement strategies and business models to foster linkages with the above market led chains have been suggested.
4.2 Production and Consumption
The USAID Tanzania Value Chain Synthesis and Analysis Report of 2009 states that, maize is considered the most important food crop in Tanzania. It is grown on 45% of the total arable land. About 50% of rural incomes come from maize. Though only an estimate, in 2008 marketed maize averaged about US$100 per household producing maize. Official estimates suggest that in 2003 some 4 million households were growing maize on an area of about 3.7 million ha. Maize cultivation is dominated by smallholders. On average smallholder farms are less than 1.2 ha in size and are rain-fed. Although maize is produced by farmers all over the country, over half the national production comes from only a few regions; namely Iringa, Mbeya, Ruvuma and Rukwa. Arusha is also an important production region as it is located in the bimodal area and thus able to provide maize stock at the onset and during the main production period.
4.3 Exports and Imports
Maize is both consumed on farms by growers and sold into chains where it ends up consumed domestically. Maize is also exported but it should be noted that in some season there are ban on exporting Maize. Ground maize is used to prepare the staple edible food called Ugali. Tables 5 and 6 show the monthly exports and imports, respectively, between Tanzania and Kenya over the past six years. Exports on the whole are variable and are clearly in line with the crop size and maize demand per year. The periods during which export bans were implemented are clearly visible. The importation of Maize is clearly less than the exportation. It can be concluded that during poor productive season, when export bans were implemented, the need for maize was high to ensure food security and thus Maize was imported; for example the 2005/06 season.
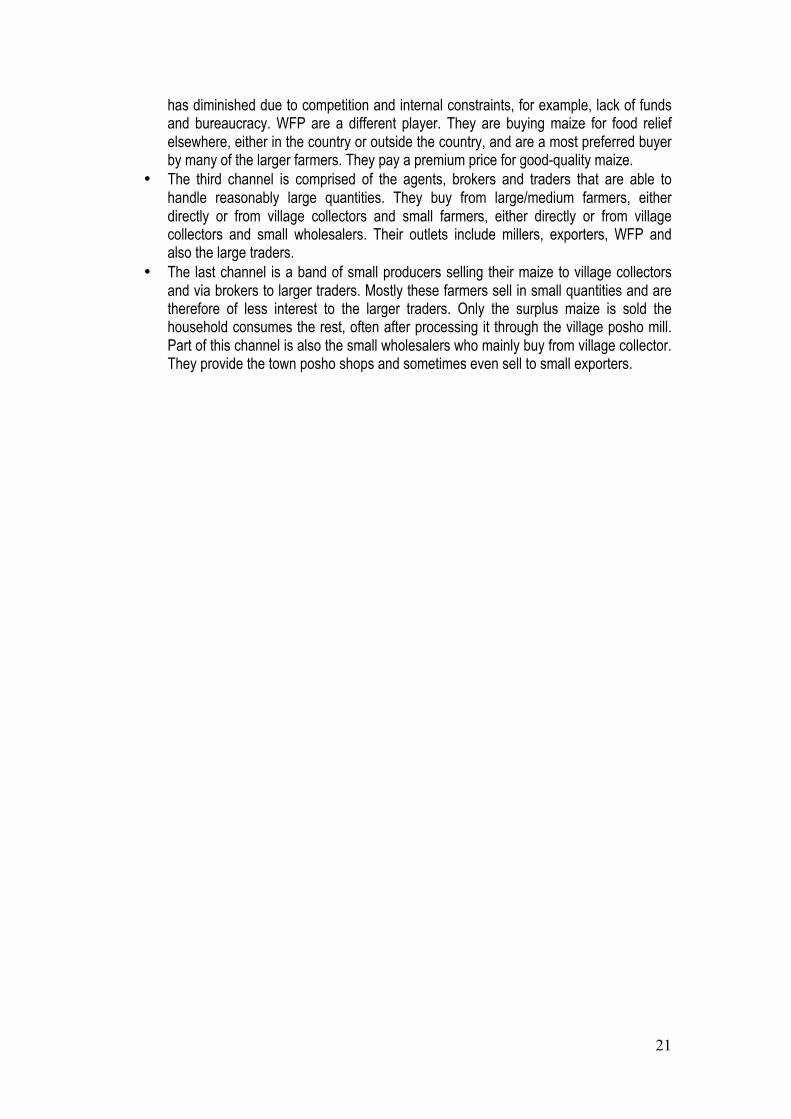
4.3.1 Maize Value Chain Mapping
The maize marketing value chain in Tanzania is comprised of four main channels. • The first channel entails the large traders/processors such as Mohamed Enterprise
and Export Trading Co. They mostly buy directly form the large producers and integrate a number of the value chain functions (in other words, they are partially vertically integrated). These big companies not only trade in maize but also process and export maize. They operate both in the Southern and Northern areas of Tanzania and, due to their volume of trade, are price setters. They have a number of buying posts in the town areas which are managed by their own staff but they also buy through networks of agents. Moreover, they own big go-downs that enable them to buy large quantities when the price is low and store the same until the price improves.
• The second channel is the Strategic Grain Reserve (SGR) and the World Food Programme (WFP) disaster fund. Prior to liberalisation, SGR was one of the key players in the Northern and Southern regions of Tanzania. After liberalisation its role
21
has diminished due to competition and internal constraints, for example, lack of funds and bureaucracy. WFP are a different player. They are buying maize for food relief elsewhere, either in the country or outside the country, and are a most preferred buyer by many of the larger farmers. They pay a premium price for good-quality maize.
• The third channel is comprised of the agents, brokers and traders that are able to handle reasonably large quantities. They buy from large/medium farmers, either directly or from village collectors and small farmers, either directly or from village collectors and small wholesalers. Their outlets include millers, exporters, WFP and also the large traders.
• The last channel is a band of small producers selling their maize to village collectors and via brokers to larger traders. Mostly these farmers sell in small quantities and are therefore of less interest to the larger traders. Only the surplus maize is sold the household consumes the rest, often after processing it through the village posho mill. Part of this channel is also the small wholesalers who mainly buy from village collector. They provide the town posho shops and sometimes even sell to small exporters.
22
4.4 Maize Value Chain Mapping
4.5 Challenges in the Maize Sector
Factors stemming from both the private sector and the public sector plague the maize sector. A brief list of significant issues affecting the sector is:

23
• High cost of fertilizers and improved seed (DAP has increased five times in the 15 months prior to August 2008; urea has more than doubled in the nine months prior to August 2008);
• Low production of local seed varieties in the country; • Insufficient, understaffed government extension program; • Inadequate transportation network for distributing food throughout the country; • Difficulty to access credit; and • Low market prices/lack of alternative markets for maize.
4.6 Cases in Maize Value Chain
4.6.1 Introduction to Grain Processing Ltd
Grain Processing Ltd is a medium sized limited liability company registered in Tanzania under Companies Ordinance cap 212 in 2006. Grain Processing Ltd upgraded its legal status from partnership registered for the first time with BRELA as a business name in 2001. It also changed it business direction from primarily selling office and school stationeries, computers and computer accessories and provision of Internet and general secretarial services to food processing in 2006, whereby it refocused its business strategy by introducing a completely new business line of processing and packaging dry cereals. It is Tanzania Foods and Drugs Agency-TFDA certified with certificate number 1031 of 2008. Its range of food products Sun Dried Raw Cashew Nuts (Unsalted), Roasted Cashew Nuts (Salted), Roasted Peanuts (Peeled and Unsalted), Roasted Peanuts (Unpeeled and Unsalted), Soya Powder for making delicious and healthy drinks, Finger Millet Flour for making delicious porridge, Lishe Soya Mix for making vegetarian hamburgers, cassava and maize flour. Grain Processing Ltd main market outlets include supermarkets, tourist hotels and Ships for cashew nuts products, and both domestic and foreign markets in Kenya, Democratic Republic of Congo and Uganda for other dried food products and cereal products.
4.6.2 Description of the current business
The company’s production of processed cereals stands at 15 tons per week translating into 780 tones per annum and 0.5 tons per week for dry products (snacks) equivalent to 26 tones per annum. Its estimated annual revenue is approximately TZS1.5 billion Integration and Diversification Grain Processing Ltd is integrated both vertically and horizontally. It is a member of stakeholders under C:AVA and other initiatives in the cereals development initiatives in the country notably those being promoted by AGRA and UN Delivering as one. Grain Processing Ltd has contractual suppliers of raw materials and uses Enterprise Resource Planning with its upper end market customers like Shoprite retailer chain. Grain Processing Ltd owns own engraver and packing material printing machine. It has a diversified food products within cereal and dry foods (snacks)
4.6.3 Business environment
Grain Processing Ltd has many competitors in the cereals products notably Power Foods, Kalmon, Nyeri Farm. Notwithstanding the competition, the Grain Processing Ltd commands sizable shelf space in many super markets in Dar Es Salaam including Shoprite and Uchumi.
24
4.6.4 Structure of the SME
Grain Processing Ltd is registered as a private limited liability Company by the Business Registration and Licensing Authority (BRELA), whose subscribes should not be more than 50 by law. The company has ten (10) full time employees with business management and accounting credentials. Some a semi skilled machine operators and artwork and engraver experts.
4.6.5 Capital Investments
The company has imported machinery mostly from China and Turkey. It has also locally fabricated machinery from Intermech of Morogoro. The sources of funding are from Equity finance, commercial finance and donor funding in the form of matching grants.
4.6.6 Technology deployment.
The company has an intermediate technology with above 75% capacity utilization.
4.6.7 Relationship with other actors/ Networking
Grain Processing Ltd is well networked and is a member of national and regional initiatives including Feed the Future, DFID, UN Delivery as One, C:AVA and Melinda & Bill Gate initiatives.
4.6.8 Critical success / failure / graduation/ factors
• Grain Processing Ltd management is young and dynamic, has perquisite business knowledge and skills, upgrades its knowledge through in service training like in Denmark, attends international and local trade fairs for exposure.
• Grain Processing Ltd is networked with many donor supported initiatives in the food industry in Tanzania and in the East Africa region thereby gain knowledge, synergy and leveraging its internal resources.
• Grain Processing Ltd owns own engraver and packing material printing machine, which ensures timely delivery of orders and producing printing materials just in time not tying up working capital in packaging materials for fear of delayed delivery if printing were to be done outside.
• Grain Processing Ltd has food standards and safety compliance. It also meets other trade standards like GS1 barcode, which is necessary to supply into Supermarkets retail outlets.

25
4.6.9 Conclusions
Grain Processing Ltd is posed for more growth if it keep ups to its upgrading and innovating strategies, which it does every after some years by diversifying its products mix and market mix (4 Ps).
26
5 ANALYSIS OF DAIRY VALUE CHAIN 5.1 Background Information
Tanzania has a big potential to develop its dairy industry, in 2008 it was estimated to have 18.8 million heads of cattle, the third in Africa after Ethiopia and Sudan. However the performance of the sector has been dismal in absolute context, the output of milk per cow is such low that in 2008 Tanzania produced 1,664 million litres of milk. A study in 2009 that covered Dodoma, Manyara, Morogoro, Shinyanga, Singida and Tabora indicated that output per traditional cattle is as low as 0.5 litres per lactating day/cow. It is estimated that the dairy sector accounts for 30% of livestock GDP valued at USD 262 million equivalent to Tshs 300 billion. Tanzania has an annual installed milk processing capacity of 353,100 litres per day; in 2009 the milk processed was 88,440 lpd or 32.28 million litres per annum. Thus the installed capacity can absorb 7.75% of domestically produced milk. In 2008 dairy plants operated at about 25% of their capacity, this is 1.94% of the total milk produced in Tanzania. The current situation contrasts sharply with the situation in the 1980s and early 1990s when processing plants were able to process and dispose about 400,000 litres per day.
5.2 Dairy Market Structure
5.2.1 Product Range in the Market
In the market there are a variety of products comprising of domestic and international brands, Tanzania processors however produce fewer products. About 54% of the capacity of processors is used to produce cultured milk; UHT takes 23% followed by yoghurt at 12% and cheese at 11%. Other products produced locally include ghee and cream. Imports of dairy products in liquid milk equivalent between 2004 and 2009 have averaged at 25.925 million litres per annum, growing 9.41% p.a. In 2009 dairy products under milk and cream, concentrated or sweetened account for 68% of the volume of imports, non-concentrated or sweetened milk and cream made 16% and cheese and curd at 6%. Butter and other fats and oils accounted for 5%, buttermilk, curdled milk and cream, yoghurt, etc. were at 3%. Whey and other natural milk constituents made 2%. Major sources of imported dairy products are Kenya, South Africa and United Arab Emirates.
5.2.2 Household Market Segment
Consumption of packed milk is very low even in urban areas, the 2007 HBS estimates that only 0.078% of the households consume processed milk, Dar es Salaam Urban has the highest rate at 1.148% followed by Mara Urban by 0.78%. The low uptake of packed milk could be attributed to relative higher prices, negative consumer perception that processed milk has most of its nutrients taken out, limited distribution capacity of processors and most importantly readily availability of raw milk. Among the surveyed towns, kiosks/small shops are the most important point of sale for processed milk in Arusha and Dar es Salaam, in Dodoma it is the gulio while in Mwanza it they prefer large shops. Dar es Salaam dairy product market is estimated to be worth Tshs 2.68 billion per month or Tshs 32.12 billion per annum. The total demand of milk in Tanzania then could be around Tshs 96.36 billion or USD 74 million. Imports that occupy 48% at present market for processed dairy products do therefore represent about 11% of the potential market. The current domestic production has a base value of USD 27.41 million leaving a gap of more than USD 40 million. It should be remembered however that milk is sensitive to price. If we look at price trend for
27
processed milk in Tanzania in dollar terms, a litre of processed milk has increased 2.7 times suppressing consumption. Competition among domestic producers in the dairy industry is not very strong, the most serious competition is from hawkers and imports to some extent. Competition with imports is growing in UHT and some cold range products in Arusha. Hawkers (of raw milk) however have a number of advantages over processors including price, efficiency and costeffectiveness. Major competing countries are Kenya, South African and United Arab Emirates. Weaknesses in enforcing common EAC external tariffs have seen imports compete with domestic products pricewise.
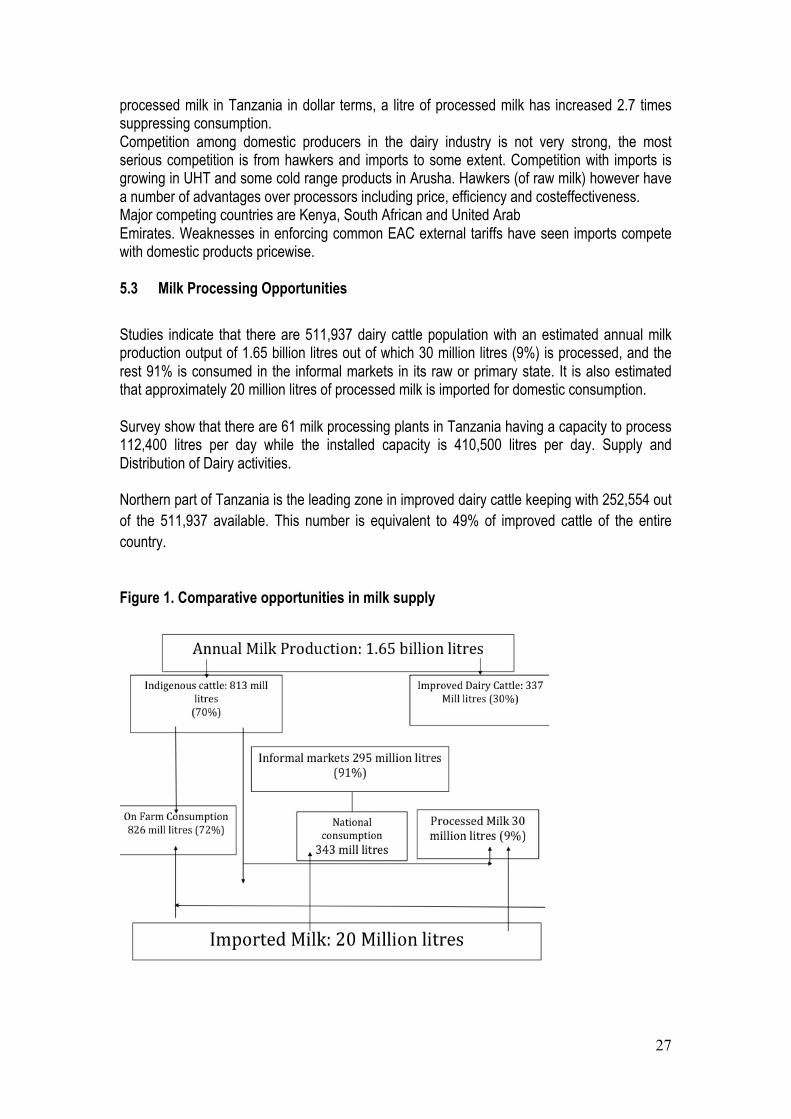
5.3 Milk Processing Opportunities
Studies indicate that there are 511,937 dairy cattle population with an estimated annual milk production output of 1.65 billion litres out of which 30 million litres (9%) is processed, and the rest 91% is consumed in the informal markets in its raw or primary state. It is also estimated that approximately 20 million litres of processed milk is imported for domestic consumption.
Survey show that there are 61 milk processing plants in Tanzania having a capacity to process 112,400 litres per day while the installed capacity is 410,500 litres per day. Supply and Distribution of Dairy activities.
Northern part of Tanzania is the leading zone in improved dairy cattle keeping with 252,554 out of the 511,937 available. This number is equivalent to 49% of improved cattle of the entire country.
Figure 1. Comparative opportunities in milk supply
28
5.4 Potential market share
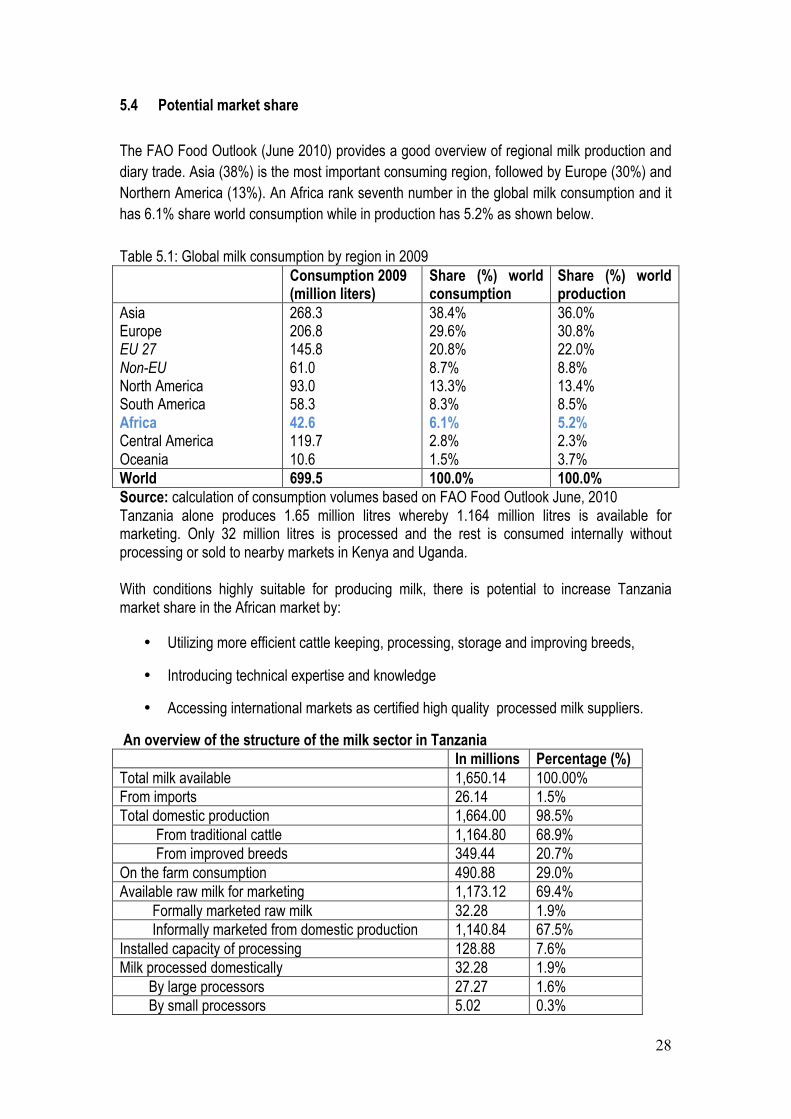
The FAO Food Outlook (June 2010) provides a good overview of regional milk production and diary trade. Asia (38%) is the most important consuming region, followed by Europe (30%) and Northern America (13%). An Africa rank seventh number in the global milk consumption and it has 6.1% share world consumption while in production has 5.2% as shown below. Table 5.1: Global milk consumption by region in 2009 Consumption 2009
(million liters) Share (%) world consumption
Share (%) world production
Asia Europe EU 27 Non-EU North America South America Africa Central America Oceania
268.3 206.8 145.8 61.0 93.0 58.3 42.6 119.7 10.6
38.4% 29.6% 20.8% 8.7% 13.3% 8.3% 6.1% 2.8% 1.5%
36.0% 30.8% 22.0% 8.8% 13.4% 8.5% 5.2% 2.3% 3.7%
World 699.5 100.0% 100.0% Source: calculation of consumption volumes based on FAO Food Outlook June, 2010 Tanzania alone produces 1.65 million litres whereby 1.164 million litres is available for marketing. Only 32 million litres is processed and the rest is consumed internally without processing or sold to nearby markets in Kenya and Uganda.
With conditions highly suitable for producing milk, there is potential to increase Tanzania market share in the African market by:
• Utilizing more efficient cattle keeping, processing, storage and improving breeds,
• Introducing technical expertise and knowledge
• Accessing international markets as certified high quality processed milk suppliers.
An overview of the structure of the milk sector in Tanzania In millions Percentage (%) Total milk available 1,650.14 100.00% From imports 26.14 1.5% Total domestic production 1,664.00 98.5% From traditional cattle 1,164.80 68.9% From improved breeds 349.44 20.7% On the farm consumption 490.88 29.0% Available raw milk for marketing 1,173.12 69.4% Formally marketed raw milk 32.28 1.9% Informally marketed from domestic production 1,140.84 67.5% Installed capacity of processing 128.88 7.6% Milk processed domestically 32.28 1.9% By large processors 27.27 1.6% By small processors 5.02 0.3%
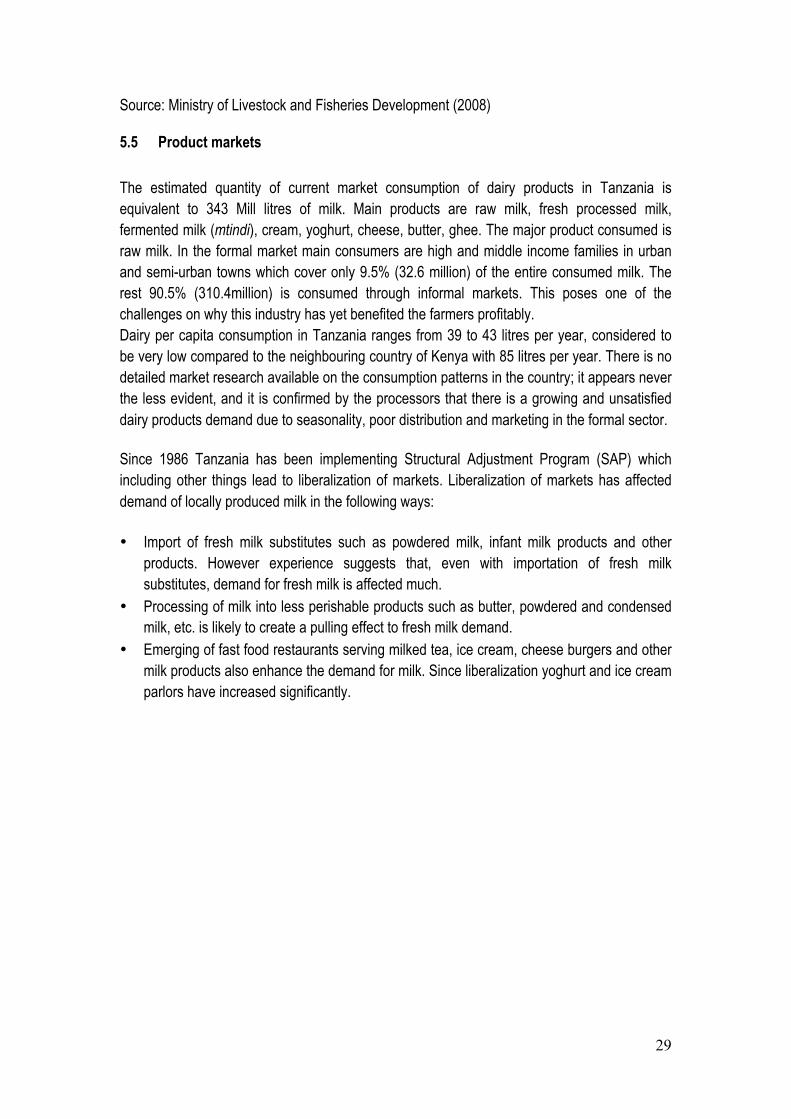
29
Source: Ministry of Livestock and Fisheries Development (2008)
5.5 Product markets
The estimated quantity of current market consumption of dairy products in Tanzania is equivalent to 343 Mill litres of milk. Main products are raw milk, fresh processed milk, fermented milk (mtindi), cream, yoghurt, cheese, butter, ghee. The major product consumed is raw milk. In the formal market main consumers are high and middle income families in urban and semi-urban towns which cover only 9.5% (32.6 million) of the entire consumed milk. The rest 90.5% (310.4million) is consumed through informal markets. This poses one of the challenges on why this industry has yet benefited the farmers profitably. Dairy per capita consumption in Tanzania ranges from 39 to 43 litres per year, considered to be very low compared to the neighbouring country of Kenya with 85 litres per year. There is no detailed market research available on the consumption patterns in the country; it appears never the less evident, and it is confirmed by the processors that there is a growing and unsatisfied dairy products demand due to seasonality, poor distribution and marketing in the formal sector.
Since 1986 Tanzania has been implementing Structural Adjustment Program (SAP) which including other things lead to liberalization of markets. Liberalization of markets has affected demand of locally produced milk in the following ways:
• Import of fresh milk substitutes such as powdered milk, infant milk products and other products. However experience suggests that, even with importation of fresh milk substitutes, demand for fresh milk is affected much.
• Processing of milk into less perishable products such as butter, powdered and condensed milk, etc. is likely to create a pulling effect to fresh milk demand.
• Emerging of fast food restaurants serving milked tea, ice cream, cheese burgers and other milk products also enhance the demand for milk. Since liberalization yoghurt and ice cream parlors have increased significantly.
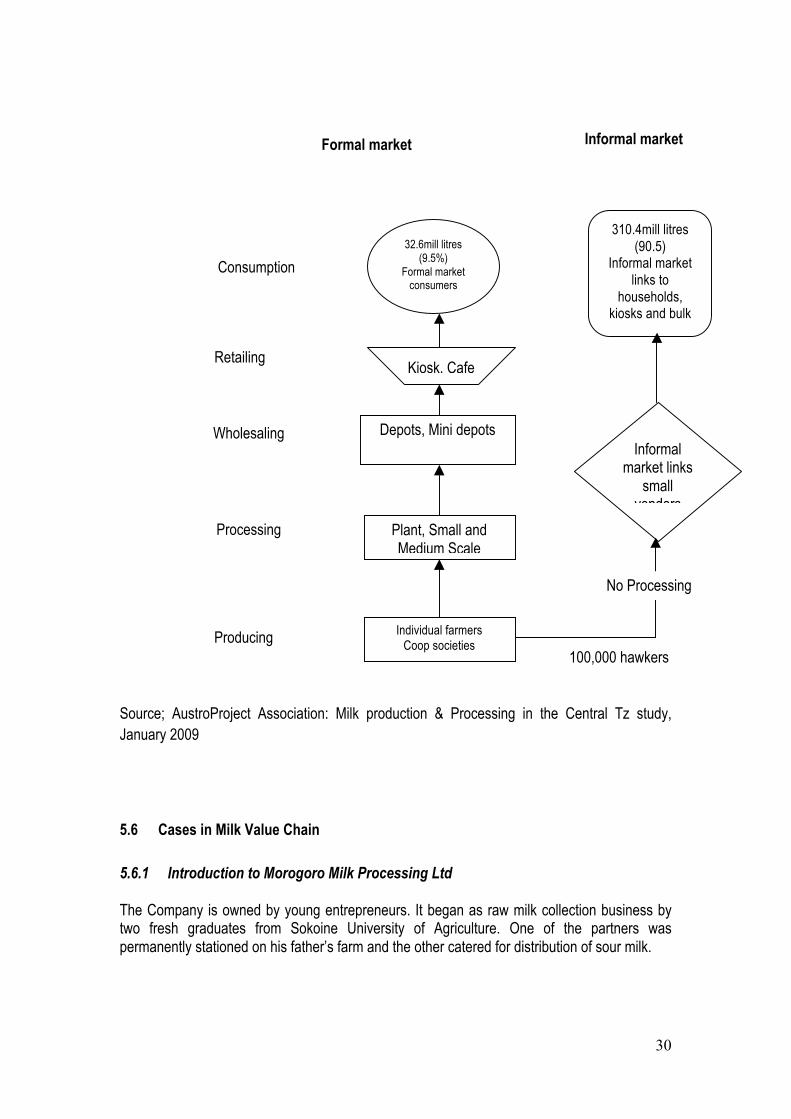
30
Source; AustroProject Association: Milk production & Processing in the Central Tz study, January 2009
5.6 Cases in Milk Value Chain
5.6.1 Introduction to Morogoro Milk Processing Ltd
The Company is owned by young entrepreneurs. It began as raw milk collection business by two fresh graduates from Sokoine University of Agriculture. One of the partners was permanently stationed on his father’s farm and the other catered for distribution of sour milk.
32.6mill litres (9.5%)
Formal market consumers
Kiosk, Cafe
Depots, Mini depots
Plant, Small and Medium Scale
Individual farmers Coop societies
310.4mill litres (90.5)
Informal market links to
households, kiosks and bulk
consumers
Informal market links
small vendors
Producing
Wholesaling
Consumption
Processing
Retailing
No Processing
100,000 hawkers
Formal market Informal market
31
The company transformed itself in 2003 into a registered partnership and later in 2006 into a private limited liability Company. This legal transformation had took about 6 years since commencement of business operations.
5.6.2 Description of the current business
Scale of operation Volumes handled is 3,000 litre per day of single 8hrs shift. This is 75% of capacity utilization. It has grown from 500 litres per day of single 8hrs shift in 2007 to the current level in 2012. The current standing annual estimated revenue is about TZS 450,000,000 as of 2012. This turnover has grown from about TZS 85,000,000 in 2007.
5.6.3 Integration and Diversification
The company is both horizontally and vertically integrated. Horizontally, it is a member of Tanzania Milk Processors’ Association (TAMPA) and Kikundi cha Wazalishaji Maziwa Ngerengere (KIWAMANGE), which is a milk producers group in its main source catchment area. KIWAMANGE with 110 members were trained and taken to Tanga Fresh study tour to learn on milk handling and hygiene. Vertically the firm has own raw milk collection center in its prime source of milk supplied by mostly Maasai women. It works with Maasai producers mostly women. The firm expanded the capacity of its raw milk collection center from 1,000 litres per batch in 2007 to 3,000 litres in 2010. It owns distribution-chilled vans for milk distribution to buyers in Morogoro, Dodoma and Dar Es Salaam.
5.6.4 Business environment
The company enjoys about 60% market share of liquid milk products in products in Morogoro and Dodoma regions with its home delivery marketing. The main products are fresh milk and cultured milk. The Company produces ghee as well. Competitors in its main market segment are Tanga Fresh and Asas Dairies. Legal status. It was incorporated in 2012 under Tanzania’s Company law. The firm is a private limited liability Company with 4 shareholders. The firm has university graduates in Bsc. Agriculure General, Diploma in Dairy Husbandry and Financial Management and Accounting. Floor personnel are on job trained. It has about 22 permanent staff.
5.6.5 Capital Investments
The firm has stainless still equipment acceptable in dairy processing, semi automated for most of its operations. In 2011 it upgraded it processing plant from a capacity of 2500 litres per day to 4000 litres per day of 8 hrs shifts. Cash matters are not for public information. The firm had own equity augmented with third party finance as a result of its investment readiness to attract both commercial financiers (banks) and social investors (donor funders). The company had won a number of national and international business plan competitions, matching grants and soft loans from donor programs and Trusts.
32
5.6.6 Technology type and utilization.
The firm uses modern dairy processing technology with stainless steel equipment. It currently operates at 75% capacity utilization.
5.6.7 Relationship with other actors/ Networking
The firm is networked well and is a member of TAMPA. It has created good relationship with Cattle farmer groups and cooperatives. The firm supports these farmer groups and cooperatives with cold chain facilities including milk-cooling centers. The firm has good relationship with donors and various development partners including Tanzania Private Sector Foundation, SME Competitiveness Facility, University of Dar es Salaam Entrepreneurship center (UDEC) and SIDO.
5.6.8 Critical success / failure / graduation/ factors
Success factors include supply chain management by training raw milk suppliers on milk handling and hygiene thereby reducing milk rejections from 1,500litres per day to negligible amounts. Improvement of business management skills including upgrading its record keeping by comprising, using Tally accounting software enabling monitoring of business financial information, CEO attending a number of knowledge and skills upgrading trainings on financial management, business planning and management, the CEO also attends both local and international trade fairs. The International trade fairs are for learning and technology identification and search among others. The local trade fairs are for products promotion. Market research to enable the firm to do a brand development and market positioning and implement its market strategy. The engagement with milk producers and owning collection centers ensure supply of adequate raw material. Membership to the industry association ensures remaining on the cutting edge with industry information and collective lobbying and advocacy.
5.6.9 Conclusions
The firm has grown from micro to medium enterprise as per Tanzania’s definition mainly because of commitment of owners to upgrade and modernize business management and operations.
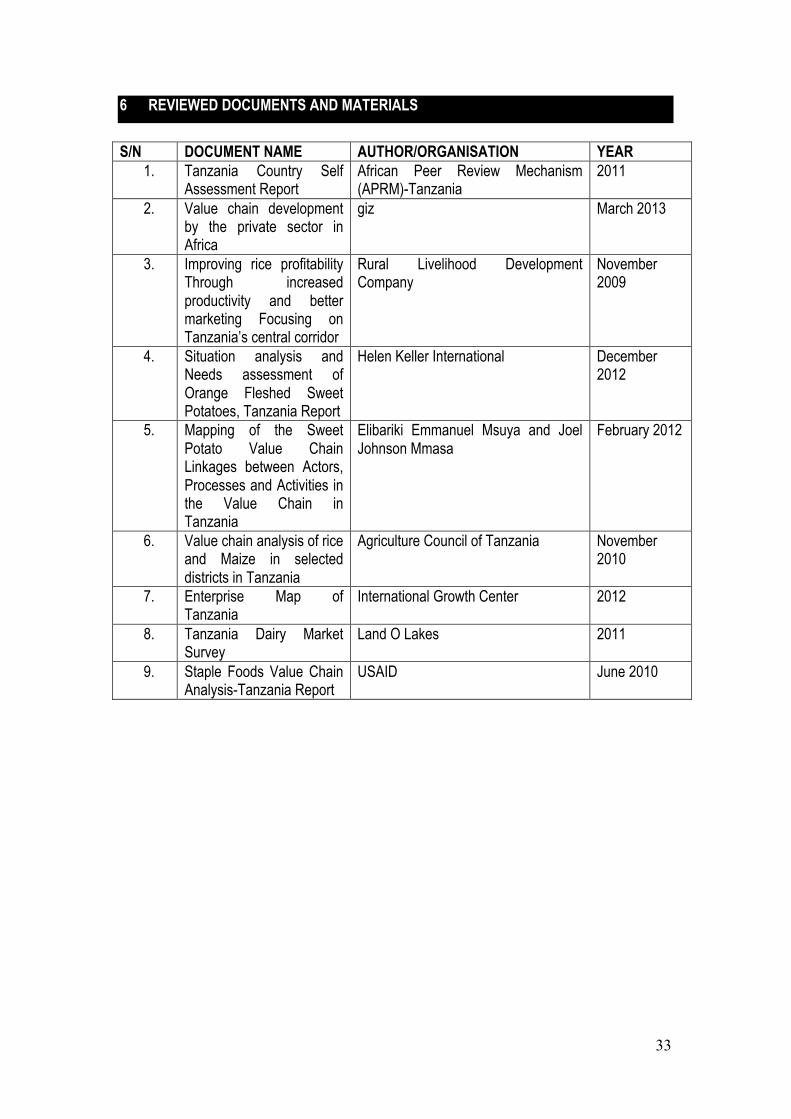
33
6 REVIEWED DOCUMENTS AND MATERIALS
S/N DOCUMENT NAME AUTHOR/ORGANISATION YEAR 1. Tanzania Country Self
Assessment Report African Peer Review Mechanism (APRM)-Tanzania
2011
2. Value chain development by the private sector in Africa
giz March 2013
3. Improving rice profitability Through increased productivity and better marketing Focusing on Tanzania’s central corridor
Rural Livelihood Development Company
November 2009
4. Situation analysis and Needs assessment of Orange Fleshed Sweet Potatoes, Tanzania Report
Helen Keller International December 2012
5. Mapping of the Sweet Potato Value Chain Linkages between Actors, Processes and Activities in the Value Chain in Tanzania
Elibariki Emmanuel Msuya and Joel Johnson Mmasa
February 2012
6. Value chain analysis of rice and Maize in selected districts in Tanzania
Agriculture Council of Tanzania November 2010
7. Enterprise Map of Tanzania
International Growth Center 2012
8. Tanzania Dairy Market Survey
Land O Lakes 2011
9. Staple Foods Value Chain Analysis-Tanzania Report
USAID June 2010


![El comercio de noticias [The Staple of News]](https://static.fdokumen.com/doc/165x107/63133367c32ab5e46f0c4fd0/el-comercio-de-noticias-the-staple-of-news.jpg)