Analysis of PAHs in Edible Oils by Online Enrichment, Matrix ...

Energy Conversion and Management 80 (2014) 202–228
Contents lists available at ScienceDirect
Energy Conversion and Management
journal homepage: www.elsevier .com/locate /enconman
Review
Production and comparison of fuel properties, engine performance,and emission characteristics of biodiesel from various non-ediblevegetable oils: A review
http://dx.doi.org/10.1016/j.enconman.2014.01.0370196-8904/� 2014 Elsevier Ltd. All rights reserved.
⇑ Corresponding author. Tel.: +60 1 02577943; fax: +60 3 79675317.E-mail address: [email protected] (A.M. Ashraful).
A.M. Ashraful ⇑, H.H. Masjuki, M.A. Kalam, I.M. Rizwanul Fattah, S. Imtenan, S.A. Shahir, H.M. MobarakCentre for Energy Sciences, Department of Mechanical Engineering, Faculty of Engineering, University of Malaya, 50603 Kuala Lumpur, Malaysia
a r t i c l e i n f o
Article history:Received 28 October 2013Accepted 21 January 2014Available online 13 February 2014
Keywords:BiodieselNon-edible oilsFuel propertiesPerformanceEmissionRenewable energy
a b s t r a c t
Energy demand is increasing dramatically because of the fast industrial development, rising population,expanding urbanization, and economic growth in the world. To fulfill this energy demand, a large amountof fuel is widely used from different fossil resources. Burning of fossil fuels has caused serious detrimentalenvironmental consequences. The application of biodiesel has shown a positive impact in resolving theseissues. Edible vegetable oils are one of the potential feedstocks for biodiesel production. However, as theuse of edible oils will jeopardize food supplies and biodiversity, non-edible vegetable oils, also known assecond-generation feedstocks, are considered potential substitutes of edible food crops for biodiesel pro-duction. This paper introduces some species of non-edible vegetables whose oils are potential sources ofbiodiesel. These species are Pongamia pinnata (karanja), Calophyllum inophyllum (Polanga), Maduca indica(mahua), Hevea brasiliensis (rubber seed), Cotton seed, Simmondsia chinesnsis (Jojoba), Nicotianna tabacum(tobacco), Azadirachta indica (Neem), Linum usitatissimum (Linseed) and Jatropha curcas (Jatropha). Vari-ous aspects of non-edible feedstocks, such as biology, distribution, and chemistry, the biodiesel’s physi-cochemical properties, and its effect on engine performance and emission, are reviewed based onpublished articles. From the review, fuel properties are found to considerably vary depending on feed-stocks. Analysis of the performance results revealed that most of the biodiesel generally give higher brakethermal efficiency and lower brake-specific fuel consumption. Emission results showed that in mostcases, NOx emission is increased, and HC, CO, and PM emissions are decreases. It was reported that a die-sel engine could be successfully run and could give excellent performance and the study revealed themost effective regulated emissions on the application of karanja, mahua, rubber seed, and tobacco biodie-sel and their blends as fuel in a CI engine.
� 2014 Elsevier Ltd. All rights reserved.
Contents
1. Introduction . . . . . . . . . . . . . . . . . . . . . . . . . . . . . . . . . . . . . . . . . . . . . . . . . . . . . . . . . . . . . . . . . . . . . . . . . . . . . . . . . . . . . . . . . . . . . . . . . . . . . . . . . 203
1.1. Current energy scenario . . . . . . . . . . . . . . . . . . . . . . . . . . . . . . . . . . . . . . . . . . . . . . . . . . . . . . . . . . . . . . . . . . . . . . . . . . . . . . . . . . . . . . . . . . 2032. Resources of non-edible vegetable oils . . . . . . . . . . . . . . . . . . . . . . . . . . . . . . . . . . . . . . . . . . . . . . . . . . . . . . . . . . . . . . . . . . . . . . . . . . . . . . . . . . . . 205
2.1. Biology, distribution, and chemistry of the selected non-edible sources. . . . . . . . . . . . . . . . . . . . . . . . . . . . . . . . . . . . . . . . . . . . . . . . . . . . 2052.1.1. Karanja . . . . . . . . . . . . . . . . . . . . . . . . . . . . . . . . . . . . . . . . . . . . . . . . . . . . . . . . . . . . . . . . . . . . . . . . . . . . . . . . . . . . . . . . . . . . . . . . 2052.1.2. Polanga . . . . . . . . . . . . . . . . . . . . . . . . . . . . . . . . . . . . . . . . . . . . . . . . . . . . . . . . . . . . . . . . . . . . . . . . . . . . . . . . . . . . . . . . . . . . . . . . 2052.1.3. Mahua . . . . . . . . . . . . . . . . . . . . . . . . . . . . . . . . . . . . . . . . . . . . . . . . . . . . . . . . . . . . . . . . . . . . . . . . . . . . . . . . . . . . . . . . . . . . . . . . . 2052.1.4. Rubber seed oil . . . . . . . . . . . . . . . . . . . . . . . . . . . . . . . . . . . . . . . . . . . . . . . . . . . . . . . . . . . . . . . . . . . . . . . . . . . . . . . . . . . . . . . . . . 2052.1.5. Cotton seed oil . . . . . . . . . . . . . . . . . . . . . . . . . . . . . . . . . . . . . . . . . . . . . . . . . . . . . . . . . . . . . . . . . . . . . . . . . . . . . . . . . . . . . . . . . . 2052.1.6. Jojoba oil . . . . . . . . . . . . . . . . . . . . . . . . . . . . . . . . . . . . . . . . . . . . . . . . . . . . . . . . . . . . . . . . . . . . . . . . . . . . . . . . . . . . . . . . . . . . . . . 2062.1.7. Tobacco oil . . . . . . . . . . . . . . . . . . . . . . . . . . . . . . . . . . . . . . . . . . . . . . . . . . . . . . . . . . . . . . . . . . . . . . . . . . . . . . . . . . . . . . . . . . . . . 2062.1.8. Neem . . . . . . . . . . . . . . . . . . . . . . . . . . . . . . . . . . . . . . . . . . . . . . . . . . . . . . . . . . . . . . . . . . . . . . . . . . . . . . . . . . . . . . . . . . . . . . . . . . 206

A.M. Ashraful et al. / Energy Conversion and Management 80 (2014) 202–228 203
2.1.9. Linseed . . . . . . . . . . . . . . . . . . . . . . . . . . . . . . . . . . . . . . . . . . . . . . . . . . . . . . . . . . . . . . . . . . . . . . . . . . . . . . . . . . . . . . . . . . . . . . . . 2062.1.10. Jatropha. . . . . . . . . . . . . . . . . . . . . . . . . . . . . . . . . . . . . . . . . . . . . . . . . . . . . . . . . . . . . . . . . . . . . . . . . . . . . . . . . . . . . . . . . . . . . . . 207
3. Fuel properties of various non-edible biodiesels . . . . . . . . . . . . . . . . . . . . . . . . . . . . . . . . . . . . . . . . . . . . . . . . . . . . . . . . . . . . . . . . . . . . . . . . . . . . 207
3.1. Density . . . . . . . . . . . . . . . . . . . . . . . . . . . . . . . . . . . . . . . . . . . . . . . . . . . . . . . . . . . . . . . . . . . . . . . . . . . . . . . . . . . . . . . . . . . . . . . . . . . . . . . . 2073.2. Kinematic viscosity . . . . . . . . . . . . . . . . . . . . . . . . . . . . . . . . . . . . . . . . . . . . . . . . . . . . . . . . . . . . . . . . . . . . . . . . . . . . . . . . . . . . . . . . . . . . . . 2073.3. Flash point . . . . . . . . . . . . . . . . . . . . . . . . . . . . . . . . . . . . . . . . . . . . . . . . . . . . . . . . . . . . . . . . . . . . . . . . . . . . . . . . . . . . . . . . . . . . . . . . . . . . . 2073.4. Cloud point and pour point . . . . . . . . . . . . . . . . . . . . . . . . . . . . . . . . . . . . . . . . . . . . . . . . . . . . . . . . . . . . . . . . . . . . . . . . . . . . . . . . . . . . . . . 2073.5. Cetane number (CN) . . . . . . . . . . . . . . . . . . . . . . . . . . . . . . . . . . . . . . . . . . . . . . . . . . . . . . . . . . . . . . . . . . . . . . . . . . . . . . . . . . . . . . . . . . . . . 2073.6. Calorific value . . . . . . . . . . . . . . . . . . . . . . . . . . . . . . . . . . . . . . . . . . . . . . . . . . . . . . . . . . . . . . . . . . . . . . . . . . . . . . . . . . . . . . . . . . . . . . . . . . 2084. Fatty acid composition of various non-edible oils . . . . . . . . . . . . . . . . . . . . . . . . . . . . . . . . . . . . . . . . . . . . . . . . . . . . . . . . . . . . . . . . . . . . . . . . . . . 2085. Engine performance of a diesel engine using non-edible vegetable biodiesel . . . . . . . . . . . . . . . . . . . . . . . . . . . . . . . . . . . . . . . . . . . . . . . . . . . . . 208
5.1. Karanja biodiesel . . . . . . . . . . . . . . . . . . . . . . . . . . . . . . . . . . . . . . . . . . . . . . . . . . . . . . . . . . . . . . . . . . . . . . . . . . . . . . . . . . . . . . . . . . . . . . . . 2085.2. Polanga biodiesel. . . . . . . . . . . . . . . . . . . . . . . . . . . . . . . . . . . . . . . . . . . . . . . . . . . . . . . . . . . . . . . . . . . . . . . . . . . . . . . . . . . . . . . . . . . . . . . . 2105.3. Mahua biodiesel . . . . . . . . . . . . . . . . . . . . . . . . . . . . . . . . . . . . . . . . . . . . . . . . . . . . . . . . . . . . . . . . . . . . . . . . . . . . . . . . . . . . . . . . . . . . . . . . 2105.4. Rubber seed biodiesel . . . . . . . . . . . . . . . . . . . . . . . . . . . . . . . . . . . . . . . . . . . . . . . . . . . . . . . . . . . . . . . . . . . . . . . . . . . . . . . . . . . . . . . . . . . . 2105.5. Cotton seed biodiesel . . . . . . . . . . . . . . . . . . . . . . . . . . . . . . . . . . . . . . . . . . . . . . . . . . . . . . . . . . . . . . . . . . . . . . . . . . . . . . . . . . . . . . . . . . . . 2135.6. Jojoba oil biodiesel . . . . . . . . . . . . . . . . . . . . . . . . . . . . . . . . . . . . . . . . . . . . . . . . . . . . . . . . . . . . . . . . . . . . . . . . . . . . . . . . . . . . . . . . . . . . . . 2135.7. Tobacco oil biodiesel . . . . . . . . . . . . . . . . . . . . . . . . . . . . . . . . . . . . . . . . . . . . . . . . . . . . . . . . . . . . . . . . . . . . . . . . . . . . . . . . . . . . . . . . . . . . . 2135.8. Neem biodiesel . . . . . . . . . . . . . . . . . . . . . . . . . . . . . . . . . . . . . . . . . . . . . . . . . . . . . . . . . . . . . . . . . . . . . . . . . . . . . . . . . . . . . . . . . . . . . . . . . 2145.9. Linseed oil biodiesel . . . . . . . . . . . . . . . . . . . . . . . . . . . . . . . . . . . . . . . . . . . . . . . . . . . . . . . . . . . . . . . . . . . . . . . . . . . . . . . . . . . . . . . . . . . . . 2145.10. Jatropha biodiesel . . . . . . . . . . . . . . . . . . . . . . . . . . . . . . . . . . . . . . . . . . . . . . . . . . . . . . . . . . . . . . . . . . . . . . . . . . . . . . . . . . . . . . . . . . . . . . 214
6. Engine emission performance when non-edible vegetable biodiesel is used in a diesel engine. . . . . . . . . . . . . . . . . . . . . . . . . . . . . . . . . . . . . . . 216
6.1. Karanja biodiesel . . . . . . . . . . . . . . . . . . . . . . . . . . . . . . . . . . . . . . . . . . . . . . . . . . . . . . . . . . . . . . . . . . . . . . . . . . . . . . . . . . . . . . . . . . . . . . . . 2166.2. Polanga biodiesel. . . . . . . . . . . . . . . . . . . . . . . . . . . . . . . . . . . . . . . . . . . . . . . . . . . . . . . . . . . . . . . . . . . . . . . . . . . . . . . . . . . . . . . . . . . . . . . . 2166.3. Mohua biodiesel . . . . . . . . . . . . . . . . . . . . . . . . . . . . . . . . . . . . . . . . . . . . . . . . . . . . . . . . . . . . . . . . . . . . . . . . . . . . . . . . . . . . . . . . . . . . . . . . 2166.4. Rubber seed oil biodiesel . . . . . . . . . . . . . . . . . . . . . . . . . . . . . . . . . . . . . . . . . . . . . . . . . . . . . . . . . . . . . . . . . . . . . . . . . . . . . . . . . . . . . . . . . 2186.5. Cotton seed biodiesel . . . . . . . . . . . . . . . . . . . . . . . . . . . . . . . . . . . . . . . . . . . . . . . . . . . . . . . . . . . . . . . . . . . . . . . . . . . . . . . . . . . . . . . . . . . . 2186.6. Jojoba oil biodiesel . . . . . . . . . . . . . . . . . . . . . . . . . . . . . . . . . . . . . . . . . . . . . . . . . . . . . . . . . . . . . . . . . . . . . . . . . . . . . . . . . . . . . . . . . . . . . . 2206.7. Tobacco oil biodiesel . . . . . . . . . . . . . . . . . . . . . . . . . . . . . . . . . . . . . . . . . . . . . . . . . . . . . . . . . . . . . . . . . . . . . . . . . . . . . . . . . . . . . . . . . . . . . 2206.8. Neem biodiesel . . . . . . . . . . . . . . . . . . . . . . . . . . . . . . . . . . . . . . . . . . . . . . . . . . . . . . . . . . . . . . . . . . . . . . . . . . . . . . . . . . . . . . . . . . . . . . . . . 2206.9. Linseed oil biodiesel . . . . . . . . . . . . . . . . . . . . . . . . . . . . . . . . . . . . . . . . . . . . . . . . . . . . . . . . . . . . . . . . . . . . . . . . . . . . . . . . . . . . . . . . . . . . . 2256.10. Jatropha biodiesel . . . . . . . . . . . . . . . . . . . . . . . . . . . . . . . . . . . . . . . . . . . . . . . . . . . . . . . . . . . . . . . . . . . . . . . . . . . . . . . . . . . . . . . . . . . . . . 2257. Recommendations . . . . . . . . . . . . . . . . . . . . . . . . . . . . . . . . . . . . . . . . . . . . . . . . . . . . . . . . . . . . . . . . . . . . . . . . . . . . . . . . . . . . . . . . . . . . . . . . . . . . 2258. Conclusion and summary of results . . . . . . . . . . . . . . . . . . . . . . . . . . . . . . . . . . . . . . . . . . . . . . . . . . . . . . . . . . . . . . . . . . . . . . . . . . . . . . . . . . . . . . 225
Acknowledgments . . . . . . . . . . . . . . . . . . . . . . . . . . . . . . . . . . . . . . . . . . . . . . . . . . . . . . . . . . . . . . . . . . . . . . . . . . . . . . . . . . . . . . . . . . . . . . . . . . . . 226Reference . . . . . . . . . . . . . . . . . . . . . . . . . . . . . . . . . . . . . . . . . . . . . . . . . . . . . . . . . . . . . . . . . . . . . . . . . . . . . . . . . . . . . . . . . . . . . . . . . . . . . . . . . . . 226
Table 1World primary energy consumption and percentage of share [1].
Source 1980 2012
Mtoe Share (%) Mtoe Share (%)
Petroleum 2979.8 44.9 4130.5 33.7Coal 1807.9 27.3 3730.1 30.5Natural gas 1296.8 19.6 2987.1 24.4Nuclear 161 2.4 560.4 4.6Hydropower 384.3 5.8 831.1 6.8Total 6629.8 100 12239.2 100
1. Introduction
Since the industrial revolution, different forms of energy havebecome essential for human beings to maintain a standard of livingand to conserve economic growth. In the past few decades, fossilfuels, mainly petroleum-based liquid fuels, natural gas and coal,have played an important role in fulfilling this energy demand.However, because of their non-renewable nature, these fossil fuelsare projected to be exhausted in the near future. This situation hasworsened with the rapid increase in energy demand with signifi-cant worldwide population growth. Therefore, the demand forclean, reliable, and yet economically feasible renewable energysources has led researchers to search for new sources. In this con-text, biodiesel derived from vegetable oil has drawn attention as apotential alternative for diesel fuel for diesel engines.
1.1. Current energy scenario
Gobal energy demand is increasing dramatically because of ris-ing population. In 1980, fuel consumption was 6630 million tons ofoil equivalents (Mtoe). It almost doubled in 2012 at 12,239 Mtoe,as shown in Table 1 [1]. According to the International EnergyAgency estimation, global energy demand is expected to increaseby 53% by 2030. Currently, a major part of energy demand(88.6%) is fulfilled by fossil fuels, in which crude oil accounts for33.7%, coal for 30.5%, and natural gas for 24.4% [2]. Conversely, nu-clear energy and hydroelectric energy contribute only small pro-portions at 4.6% and 6.8%, respectively. Over the past 25 years,total energy supply has increased steadily. However, with the cur-
rent consumption rates, the reserves of crude oil and natural gaswill diminish after approximately 41.8 and 60.3 years, respectively.The total primary fuel consumption was estimated to reachapproximately 12,239 Mtoe in 2012; the estimate is 70% higherthan that in 1987, as shown in Fig. 1 [1]. Globally, we consumethe equivalent of more than 11 billion tons of oil in fossil fuel everyyear. Crude oil reserves are vanishing at a rate of 4 billion tons ayear. If this rate continues, oil deposits will be exhausted by2052 [3]. However, if increased gas production can fills up the en-ergy gap left by oil, then those reserves will give an additionalbackup of eight years until 2060. The world has enough coal re-serve to a last century, but production is necessary to fill the gapcaused by depleting oil and gas reserves. Coal deposits will giveus enough energy to last as long as 2088. Moreover, the rate of en-ergy consumption in the world is not steady, as it increases dra-matically with the increase in global population and living
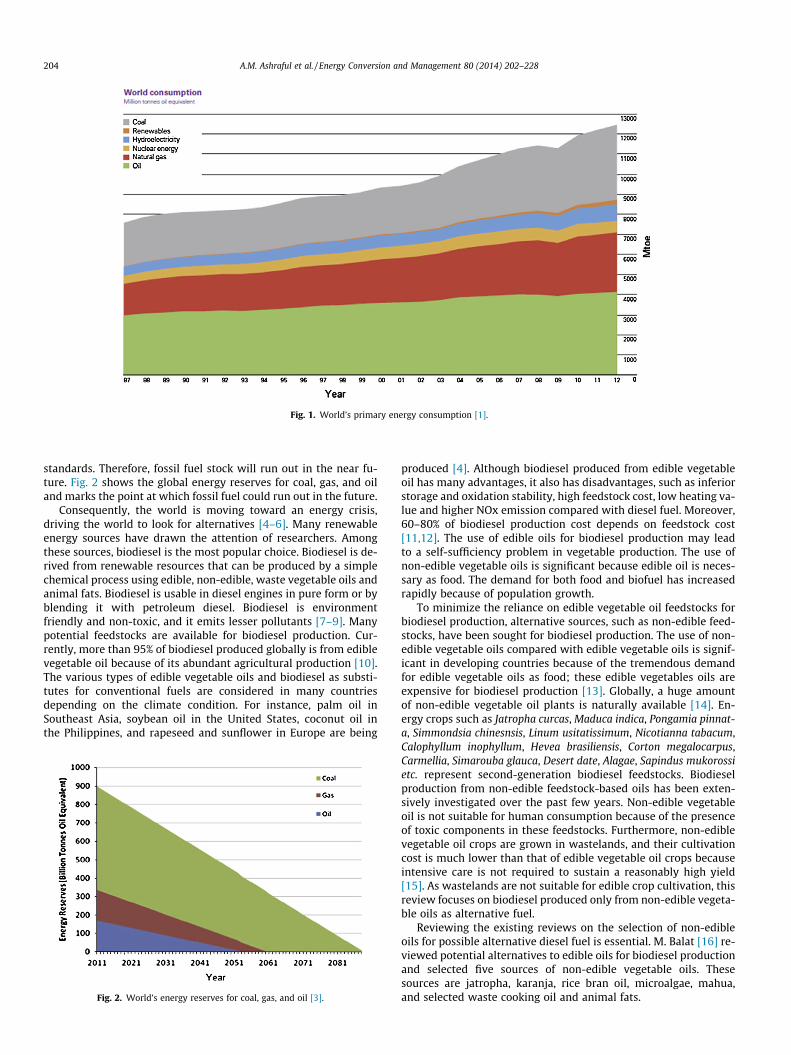
Fig. 1. World’s primary energy consumption [1].
204 A.M. Ashraful et al. / Energy Conversion and Management 80 (2014) 202–228
standards. Therefore, fossil fuel stock will run out in the near fu-ture. Fig. 2 shows the global energy reserves for coal, gas, and oiland marks the point at which fossil fuel could run out in the future.
Consequently, the world is moving toward an energy crisis,driving the world to look for alternatives [4–6]. Many renewableenergy sources have drawn the attention of researchers. Amongthese sources, biodiesel is the most popular choice. Biodiesel is de-rived from renewable resources that can be produced by a simplechemical process using edible, non-edible, waste vegetable oils andanimal fats. Biodiesel is usable in diesel engines in pure form or byblending it with petroleum diesel. Biodiesel is environmentfriendly and non-toxic, and it emits lesser pollutants [7–9]. Manypotential feedstocks are available for biodiesel production. Cur-rently, more than 95% of biodiesel produced globally is from ediblevegetable oil because of its abundant agricultural production [10].The various types of edible vegetable oils and biodiesel as substi-tutes for conventional fuels are considered in many countriesdepending on the climate condition. For instance, palm oil inSoutheast Asia, soybean oil in the United States, coconut oil inthe Philippines, and rapeseed and sunflower in Europe are being
Fig. 2. World’s energy reserves for coal, gas, and oil [3].
produced [4]. Although biodiesel produced from edible vegetableoil has many advantages, it also has disadvantages, such as inferiorstorage and oxidation stability, high feedstock cost, low heating va-lue and higher NOx emission compared with diesel fuel. Moreover,60–80% of biodiesel production cost depends on feedstock cost[11,12]. The use of edible oils for biodiesel production may leadto a self-sufficiency problem in vegetable production. The use ofnon-edible vegetable oils is significant because edible oil is neces-sary as food. The demand for both food and biofuel has increasedrapidly because of population growth.
To minimize the reliance on edible vegetable oil feedstocks forbiodiesel production, alternative sources, such as non-edible feed-stocks, have been sought for biodiesel production. The use of non-edible vegetable oils compared with edible vegetable oils is signif-icant in developing countries because of the tremendous demandfor edible vegetable oils as food; these edible vegetables oils areexpensive for biodiesel production [13]. Globally, a huge amountof non-edible vegetable oil plants is naturally available [14]. En-ergy crops such as Jatropha curcas, Maduca indica, Pongamia pinnat-a, Simmondsia chinesnsis, Linum usitatissimum, Nicotianna tabacum,Calophyllum inophyllum, Hevea brasiliensis, Corton megalocarpus,Carmellia, Simarouba glauca, Desert date, Alagae, Sapindus mukorossietc. represent second-generation biodiesel feedstocks. Biodieselproduction from non-edible feedstock-based oils has been exten-sively investigated over the past few years. Non-edible vegetableoil is not suitable for human consumption because of the presenceof toxic components in these feedstocks. Furthermore, non-ediblevegetable oil crops are grown in wastelands, and their cultivationcost is much lower than that of edible vegetable oil crops becauseintensive care is not required to sustain a reasonably high yield[15]. As wastelands are not suitable for edible crop cultivation, thisreview focuses on biodiesel produced only from non-edible vegeta-ble oils as alternative fuel.
Reviewing the existing reviews on the selection of non-edibleoils for possible alternative diesel fuel is essential. M. Balat [16] re-viewed potential alternatives to edible oils for biodiesel productionand selected five sources of non-edible vegetable oils. Thesesources are jatropha, karanja, rice bran oil, microalgae, mahua,and selected waste cooking oil and animal fats.

A.M. Ashraful et al. / Energy Conversion and Management 80 (2014) 202–228 205
In a review of oil production, vegetable oils, and their methylester characterization as alternatives to diesel fuel [7], four non-edible vegetable oils, namely, jatropha, karanja, polanga, and rub-ber seed oils, were suggested as sources for biodiesel production.
Silitonga et al. [17] recently reviewed the general properties ofbiodiesel blend from edible and inedible feedstocks, such as palmoil, Alurietas mollucana, Jatropha curcas, Sterculiafoetida, Calophylluinophyllum, Ceiba pentandra, Cerbere manghas, Pangium edule andHevea brasilinensis, as potential alternatives to diesel fuel. They rec-ommended that these fuel meet the biodiesel standards of USASTM D 6751 and European EN 14214. Moreover, they found thatjatropha and karanja vegetable oils are suitable for used in cold cli-mate conditions compared with other vegetable oils.
In a critical review of biodiesels, Balat et al. [18] found thatmore than 350 oilseed crops have been indentified. They arguedthat edible oils such as rapeseed, soybean, sunflower, peanut, andsafflower are potential alternative sources of diesel fuel for dieselengines. They also recommended other non-edible vegetable oilssuch as jatropha, tobacco, karanja, rice bran, rubber seed, and ma-hua. However, only jatropha, karanja, and mahua oils were brieflyexplained in this review on the progress in biodiesel processing.
A recent review discussed the sources of non-edible vegetableoils, as well as their production and characterization, as sustainablepetroleum diesel fuel [19] and the performance of non-edible oilsas sources of fuel. Moreover, 15 oilseed crops were recommendedas sources of biodiesel in India.
Non-edible vegetable oils have high potential for biodiesel pro-duction. Olivera et al. [15] identified nine vegetable oils and exam-ined their fuel properties and biodiesel production methods. Theyfound that biodiesel production using jatropha, karanja, mahua,and castor oil is commonly used in biodiesel synthesis.
Based on the review works considered in this study, severaltrees that are naturally available can be exploited for the produc-tion of sustainable fuel for petrodiesel engine. The raw materialsof the biofuel being exploited commercially and scientifically byseveral researchers are the non-edible oils derived from jatropha,mahua, karanja, rubber seed, linseed, neem, tobacco seed, polanga,cotton seed, castor, jojoba, moringa, poon, desert date, crambe,mango and so forth [6,8,9,20]. The selection of non-edible oils aspossible fuel for use in a diesel engine is based on the literature.Some of the non-edible vegetable oils that are promising substi-tutes for petroleum diesel and the acceptable non-edible biodieselfeedstocks for biodiesel production include karanja, polanga, ma-hua, rubber seed, cotton seed, Simmondsia chinensis (jojoba), tobac-co, neem, linseed, Jatropha carcus, and so on [20–25]. The objectiveof this paper is to present the various sources of non-edible oilsthat can replace edible oils and fossil fuels for biodiesel productionas well as their fuel properties. This study also compares theirphysicochemical properties, engine performance, and emissioncharacteristics in a diesel engine through a review and discussion.
2. Resources of non-edible vegetable oils
Non-edible oils have several advantages over edible oils. Non-edible oils possess toxic components that make them unsuitable[26]. The use of non-edible oils for biodiesel production solvesthe food-versus-fuel concern and other issues [27]. Moreover,unproductive lands, degraded forests, cultivators’ fallow lands, irri-gation canals, and boundaries of roads and fields can be used forthe plantation of non-edible oil crops. Biodiesel development fromnon-edible oil can become a major poverty alleviation program forthe rural poor apart from providing energy security for the masses.This development can upgrade the rural non-farm sector and helpin the sustainable biodiesel production. Many researchers haverecommended non-edible oils to be a sustainable alternative to
edible oils for biodiesel production [6,28–31]. Researchers haveidentified several non-edible crops that can be used for biodieselproduction [28,32]. Fig. 3 shows the various non-edible vegetableoil feedstocks for biodiesel.
2.1. Biology, distribution, and chemistry of the selected non-ediblesources
2.1.1. KaranjaKaranja is a medium-sized green tree from the legumnosae fam-
ily. It grows approximately 15–25 m in height. Flowering startsthree to four years after plantation, and it matures four to sevenyears after. Recently, karanja has been recognized as an invaluablesource of oil. A single tree is said to yield 9–90 kg of seeds. Severalresearchers have discovered the large variability of oil content inkaranja seed oil. The seed contains approximately 25–40 wt.% oil[16,36–38]. Karanja mainly grows in Southeast Asia and has beensuccessfully introduced in humid tropical regions of the worldand part of China, the United States, and Australia [39,40]. Karanjaoil mainly contains oleic acid (44.5–71.3%), followed by linoleic(10.8–18.3%) and stearic acids (2.4–8.9%) [41–43].
2.1.2. PolangaPolanga is a large- or medium-sized green tree that grows in
deep soil or on exposed sea sand. It belongs to the Clusiaceae fam-ily. The rainfall requirement of polanga seed plantation is 750 mm/year to 5000 mm/year. The tree has multiple origins, such asSoutheast Asia, India, East Africa, and Australia [36,39,44,24,45].Its growth rate is 1 m in height, and it yields approximately 100fruits/kg to 200 fruits/kg. Oil yield per unit area is approximately2000 kg/ha (cite). The seed has a high oil content of 65–75 wt.%.The oil is thick and nutty smelling [5,44,24,45,46], and it containsmainly unsaturated fatty acids, that is, approximately 34.09–37.57% oleic acid and 26.33–38.26% linoleic acid. Saturated acids,such as stearic (12.95–19.96%) and palmitic (12.01–14.6%) acids,can also be found in this oil [47,48].
2.1.3. MahuaMahua is a large-sized evergreen or semi-evergreen tree from
the Sapotaceae family. Mahua is a forest-based tree largely pro-duced in India [4,16,49,50]. It is cultivated in warm and humid re-gions for its oleaginous seeds (producing 20–200 kg of seedsannually per tree, depending on maturity), flowers, and wood. Ma-hua oil fat (solid at ambient temperature) has been used in skincare and in manufacturing soap or detergents. The mahua treestarts producing seeds 10 years after plantation and continues todo so up to 60 years. Tree growth is approximately 20 m in height,and its seed has an oil content of 35–50 wt.% [16,24,50,51]. Mahuaoil contains approximately 41–51% oleic acid. Other fatty acids arealso present in the oil, such as stearic (20.0–25.1%), palmitic (16.0–28.2%), and linoleic acids (8.9–18.3%) [52–54].
2.1.4. Rubber seed oilRubber seed oil comes from the Euphorbiaceae family. This tree
originates from Brazil. It is a forest-based tree largely produced inMalaysia, India, Thailand, and Indonesia. In the wild, plant heightcan reach up to 34 m [55]. The tree requires heavy rainfall andnon-frost climate condition. Rubber seed contains 50–60 wt.% oil,and its kernel contains 40–50 wt.% of brown oil [4,39,24,56]. Rub-ber seed oil is high in unsaturated constituents, such as 39.6–40.5%linoleic acid, 17–24.6% oleic acid, and 16.3–26% linolenic acid[55,57].
2.1.5. Cotton seed oilCotton seed oil is extracted from the seeds of the cotton plant of
various species, mainly Gossypium hirsutum and Gossypium herba-

pongamia pinnata (karanja) calophyllum inophyllum (polanga) madhuca indica (mahua)
hevea brasiliensis (rubberseed) cotton seed simmondsia chinensis (jojoba)
nicotiana tabacum (tobacco) azadirachata indica (neem) Linseed
Jatropha
Fig. 3. Various non-edible vegetable oil feedstocks for biodiesel [24,33–35].
206 A.M. Ashraful et al. / Energy Conversion and Management 80 (2014) 202–228
ceum, which are grown for cotton fiber. Cotton plant grows mainlyin China, the United States, and Europe. Crude cotton seed oil con-tains several types of non-glyceride materials, such as gossypol,phospholipids, sterols, resins, carbohydrates, and related pigments.Cotton seed oil has a density that ranges from 0.917 g/cm3 to0.933 g/cm3. The seed contains 17–25 wt.% oil. The fatty acid com-position of cotton seed oil is mainly linoleic (55.2–55.5%), palmitic(11.67–20.1%), and oleic acids (19.2–23.26%) [58–60].
2.1.6. Jojoba oilJojoba is native to the Mojave and Sonoran deserts of California,
Arizona, and Mexico. The jojoba tree is from the Simmondsiaceaefamily. Jojoba has been grown commercially for its oil, a liquidwax ester, extracted from the seed. The plant has been used tocombat and prevent desertification in some parts of India. The jo-joba tree grows to a height of 1–2 m, and it has a broad and densecrown. The leaves are oval in shape, approximately 2–4 cm longand 1.5–3 cm broad; they are thick, waxy glaucous grayish green[61,62]. The seed contains approximately 40–50 wt.% oil [63] witha fatty acid composition of 43.5–66% oleic acid and 25.2–34.4% lin-oleic acid [24,63,64].
2.1.7. Tobacco oilTobacco belongs to the Solanaceae family, and it is cultivated in
several countries worldwide, such as Turkey, Macedonia, NorthAmerica, South America, India and Russia [37,65,66]. The tree iscommonly grown for leaf collection. The physical and chemicalproperties of tobacco oil are comparable with those of other vege-table oils, and tobacco is considered a new potential feedstock for
biodiesel production [66–68]. The seed contains approximately35–49 wt.% oil with fatty acid composition of 69.49–75.58% of lin-oleic acid [67,69].
2.1.8. NeemNeem is a medium-sized evergreen tree from the Meliaceae
family. The tree grows 12–18 m in height. The neem tree can growin all kinds of soil, including saline, clay, dry, shallow, alkaline, andstony soils, and even in highly calcareous soil. Neem grows in sev-eral Asian countries, such as Sri Lanka, Pakistan, India, Bangladesh,Japan, Malaysia, Indonesia, and Burma, and in the tropical regionsof Australia. Normally, neem thrives in areas with sub-arid to sub-humid conditions and with an annual rainfall of 400–1200 mm. Itreaches a maximum productivity of 15 years after plantation, witha life span of approximately 150–200 years. Neem seed contains20–30 wt.% oil, and its kernels contain 40–50% brown oil[24,36,39,70]. Neem oil has high-unsaturated constituents, suchas linoleic acid (6–16%) and oleic (25–54%) acid, and saturated oillike stearic acid (9–24%) [71,72].
2.1.9. LinseedLinseed is an herbaceous annual-type plant that grows in coun-
tries such as India, Canada, Argentina, and some parts of Europe.Linseed contains 35–45 wt.% oil and is high in unsaturated constit-uents, such as linoleic (13.29–14.93%), oleic (20.17–24.05%), andlinolenic acids (46.10–51.12%). Other fatty acids found in linseedoil include saturated species such as stearic (5.47–5.63%) and pal-mitic (5.85–6.21%) acids [73,74].

A.M. Ashraful et al. / Energy Conversion and Management 80 (2014) 202–228 207
2.1.10. JatrophaJatropha is a small tree from the Euphorbiaceae family, and it
grows 5–7 m in height [23,28,30,75–77]. Jatropha thrives inarid, semi-arid, and tropical areas with an annual rainfall of1000–1500 mm. The jatropha plant is native to the United States,Brazil, Bolivia, Argentina, Mexico, Africa, Paraguay, and India[23,28,36,24,78]. The jatropha seed contains 20–60 wt.% oil.Jatropha produces seeds after 12 months of plantation, reachesmaximum productivity by 5 years, and can live for 30 years to50 years [29]. Jatropha oil contains mainly unsaturated constitu-ents, such as linoleic (31.4–43.2%) and oleic acids (34.3–44.7%),and some unsaturated species, such as stearic (7.1–7.4%) andpalmitic acids (13.6–15.1%) [79,80].
3. Fuel properties of various non-edible biodiesels
Density, viscosity, flash point, cetane number, cloud and pourpoint, and calorific value, among others are the most importantfuel properties considered in the application of non-edible biodie-sels in diesel engines. Many researchers have reported that fuelproperties of non-edible biodiesels vary depending on their fattyacid and chemical composition [51,69,81–83]. Therefore, beforeusing non-edible-based biodiesels in diesel engines, measuringthe fuel properties of selected biodiesels is necessary. The fuelproperties of biodiesels are specified by different standardizationorganizations; the ASTM D6751 and EN14214 are the most popularstandards for biodiesel. Fuel properties of various non-edible bio-diesels are shown in Table 2. The following section discusses thefuel properties of the reviewed biodiesels.
3.1. Density
The molecular weight of biodiesel is one of the factors that con-tribute in the increase in biodiesel density [84]. Biodiesel density ismeasured using the ASTM standard D1298 and EN ISO 3675 testmethod. According to these standards, density should be tested at15 �C [85]. Table 2 shows that biodiesel density is usually higherthan that of ordinary diesel fuel. Neem biodiesel has the highestdensity ranging from 912 kg/m3 to 965 kg/m3 [86,87], and jojobabiodiesel has the lowest density ranging from 863 kg/m3 to866 kg/m3 [88,89]. Diesel has a density range of 816–840 kg/m3
[90].
3.2. Kinematic viscosity
Viscosity is the most important property of fuel that must beconsidered to maintain engine performance that is close to dieseloperation. High viscosity causes poor flow of fuel in the enginecombustion chamber during intake stroke and takes a long timeto mix with air. Therefore, it results in delayed combustion. Viscosity
Table 2Fuel properties of various non-edible biodiesel.
Vegetable oil Density at40 �C (kg/m3)
Viscosity at40 �C (mm2/s)
Flashpoint (�C)
Karanja (Pongamia pinnata L.) 876–890 4.37–9.60 163–187Polanga (Calophyllum inophyllum) 888.6–910 4–5.34 151–170Mohua (Madhuca indica) 904–916 3.98–5.8 127–129Rubber Seed oil (Hevea brasiliensis) 860–881 5.81–5.96 130–140Cotton seed 874–911 4–4.9 210–243Jojoba oil (Simmondsia chinensis) 863–866 19.2–25.4 61–75Tobacco oil (Nicotiana tabacum) 860–888.5 3.5–4.23 152–165.4Neem (Azadirachta) 912–965 20.5–48.5 34Linseed oil (Linum usitatissimum) 865–950 16.2–36.6 108Jatropha (Jatropha curcas L.) 864–880 3.7–5.8 163–238Diesel 816–840 2.5–5.7 50–98
of fuel has been proved to decrease with the increase in tempera-ture. Kinematic viscosity is determined using the ASTM D445 andEN ISO 3104 test methods [91]. Table 2 shows that some non-edi-ble biodiesels, such as jojoba, neem, and linseed, have high viscos-ity that ranges from 19.2 mm2/s to 25.4 mm2/s, 20.5 mm2/s to48.5 mm2/s, and 16.2 mm2/s to 36.6 mm2/s, respectively, whichare higher than that of diesel fuel [86–89,92]. However, the viscos-ity of jatropha, tobacco, and mohua biodiesels ranges from3.7 mm2/s to 5.8 mm2/s, 3.5 mm2/s to 4.23 mm2/s, and 3.98 mm2/s to 5.8 mm2/s, respectively, which are close to that of diesel at2.5–5.7 mm2/s [66,68,93–96]. Therefore, these biodiesels can givebetter atomization and provide improved combustion than others.
3.3. Flash point
Flash point is the most important property that must be consid-ered in assessing the overall flammability hazard of a material. Atthis temperature, vapor stops burning if the source of ignition is re-moved. Each biodiesel has its own flash point. Many factors affectthe change in biodiesel flash point, with residual alcohol contentbeing one of them [97]. Moreover, flash point is influenced bythe chemical compositions of the biodiesel, including the numberof double bonds, number of carbon atoms, and so on. [98]. The flashpoint of biodiesel is measured using the ASTM D93 and EN ISO3697 test methods [85]. Table 2 shows that biodiesel has a higherflash point than diesel fuel. The ASTM D6751 standard recom-mends a minimum flash point of 130 �C for biodiesel, as clearlyillustrated in Table 2. With the exception of neem, linseed, and jo-joba, all biodiesels meet the ASTM specification.
3.4. Cloud point and pour point
Biodiesel has higher cloud and pour points than conventionaldiesel fuel [99,100]. Cloud and pour points are measured usingthe ASTM D2500 and D97 test methods, respectively. Table 2 illus-trates that linseed and cotton seed biodiesels have the lowest cloudpoint of 1.7 �C, whereas jojoba oil has the highest cloud point rangeof 6–16 �C. On the contrary, cotton seed and linseed biodiesel havethe lowest pour point range of �10 �C to �15 �C and �4 �C to�18 �C, respectively, whereas mohua has the highest pour pointrange of 1–6 �C.
3.5. Cetane number (CN)
CN is the most important property of fuel that directly affects itscombustion quality. Ignition quality of fuel in a power diesel en-gine is measured by CN. Higher CN implies shorter ignition delay.The CN of pure diesel fuel is lower than that of biodiesel [39,101].The CN of biodiesel is higher because of its longer fatty acid carbonchains and the presence of saturation in molecules. CN is based on
Cloudpoint (�C)
Pourpoint (�C)
Cetanenumber
Calorific value(MJ/kg)
Refs.
13–15 �3 to 5.1 52–58 36–38 [38,39,47,108,109]13.2–14 4.3 57.3 39.25–41.3 [39,48,110]3–5 1–6 51–52 39.4–39.91 [39,95,107,96,111]4–5 �8 37–49 36.5–41.07 [55,105,112,113]1.7 �10 to �15 41.2–59.5 39.5–40.1 [83,114,115]6–16 �6 to 6 63.5 42.76–47.38 [61,64,70,88,89]– �12 49–51.6 38.43–39.81 [65,67,68]– – 51 33.7–39.5 [72,83,86,87]1.7 �4 to �18 28–35 37.7–39.8 [73,83,92]– 5 46–55 38.5–42 [94,116]�10 to �5 �20 to 5 45–55 42–45.9 [6,90,117]

Tabl
e3
Typi
cal
fatt
yac
idco
mpo
siti
onof
vari
ous
non-
edib
leve
geta
ble
oils
(wt.%
)[1
8,36
,38,
41,4
2,55
,61,
64,7
1,87
,89,
52,1
23–1
32].
Fatt
yac
id(x
x:y)
Ch
emic
alfo
rmu
lae
Syst
emic
nam
eK
aran
jaPo
lan
gaM
ohu
aR
ubb
erse
edoi
lC
otto
nse
edJo
joba
oil
Toba
cco
oil
Nee
mLi
nse
edoi
lJa
trop
ha
Myr
isti
cac
id(C
14:0
)C 1
4H
28O
2Te
trad
ecan
oic
acid
–0.
09–
2.2
0.7
–0.
09–0
.17
0.2–
0.26
0.04
51.
4Pa
lmit
icac
id(C
16:0
)C 1
6H
32O
2H
exad
ecan
oic
acid
3.7–
7.9
12.0
1–14
.616
–28.
28.
7–10
.611
.67–
20.1
3–16
8.46
–10.
9616
–33
5.85
–6.2
113
.6–1
5.1
Palm
itol
eic
acid
(C16
:1)
C 16H
30O
29-
Hex
adec
anoi
cac
id–
2.5
––
––
0.2
0.24
0.3
–St
eari
cac
id(C
18:0
)C 1
8H
36O
2O
ctad
ecen
oic
acid
2.4–
8.9
12.9
5–19
.96
20.0
–25.
18.
0–12
2.6–
3.15
0.5–
6.5
2.64
–3.3
49–
245.
47–5
.63
7.1–
7.4
Ole
icac
id(C
18:1
)C 1
8H
34O
29-
Oct
adec
enoi
cac
id44
.5–7
1.3
34.0
9–37
.57
41.0
–51.
017
–24.
619
.2–2
3.26
43.5
–66
11.2
4–14
.54
25–5
420
.17–
24.0
534
.3–4
4.7
Lin
olei
cac
id(C
18:2
)C 1
8H
32O
29,
12-O
ctad
ecen
oic
acid
10.8
–18.
326
.33–
38.2
68.
9–18
.339
.6–4
0.5
55.2
–55.
525
.2–3
4.4
69.4
9–75
.58
6–16
13.2
9–14
.93
31.4
–43.
2a
-Lin
olen
icac
id(C
18:3
)C 1
8H
32O
26,
9,12
-Oct
adec
enoi
cac
id–
0.27
–0.3
14.7
416
.3–2
60.
6–6.
310
0.69
–4.2
00.
5646
.10–
51.1
2–
Ara
chid
icac
id(C
20:0
)C 2
0H
40O
2Ei
cosa
noi
cac
id2.
2–4.
10.
940.
0–3.
3–
–_
0.25
1.04
0.2
0.2–
0.3
Beh
enic
acid
(C22
:0)
C 22H
44O
2D
ocos
anoi
cac
id4.
2–5.
3–
––
––
0.12
0.3
0.3
–O
ilco
nte
nt
(wt%
)25
–40
65–7
535
–50
50–6
017
–25
40–5
035
–49
20–3
035
–45
20–6
0
208 A.M. Ashraful et al. / Energy Conversion and Management 80 (2014) 202–228
two compounds, namely, hexadecane and heptamethyl nonane.The CN of biodiesel is measured by the ASTM D613 and EN ISO5165 test methods [85]. Table 2 shows that most biodiesel fuelshave higher CN than diesel fuel (45–55), except for rubber seedand linseed biodiesels, which have low CN that is equal to 37–49and 28–35, respectively [55]. Jatropha, mohua, neem, and tobaccohave CN close to that of diesel fuel. Jojoba, karanja, and polangausually have higher CN than other biodiesels; thus, they are moresuperior.
3.6. Calorific value
Calorific value is the measure of heat energy content of a fuel.Higher calorific value of fuel is desired because it releases higherheat and consequently improves engine performance during com-bustion [102–104]. Biofuel usually has lower calorific value thandiesel fuel because of its higher oxygen content [105–107]. Table 2shows that the calorific values of jojoba and jatropha are 42.76–47.38 MJ/kg and 38.5–42 MJ/kg [93,94], respectively, which areclose to that of diesel at 42–45.9 MJ/kg. Jojoba biodiesel has thehighest calorific value of 47.38 MJ/kg among all reviewed biodiesels;this value is also much higher than that of diesel fuel. Therefore, jo-joba gives better engine performance than other biodiesel fuels.
4. Fatty acid composition of various non-edible oils
Fatty acid composition, such as the type and percentage, deter-mines the fuel properties of biodiesel. It depends on the fatty acidcomposition of the parent oil. Non-edible-based biodiesel mainlycontains C16 and C18 acids. However, some feedstocks have a sig-nificant amount of fatty acids other than C16 and C18 acids [118].Palmitic acid (C16:0), stearic acid (C18:0), oleic acid (C18:1), lino-leic acid (C18:2), and linolenic acid (C18:3) are the common fattyacids in vegetable oils [119]. The quality of biodiesel and its fuelproperties highly depend on the presence of fatty acid compositionin the fuel blend. The presence of monounsaturated fatty acid in abiodiesel blend at low temperature may improve ignition quality,fuel flow properties, and fuel stability [39]. Several researchershave found that biodiesel oxidation stability and fuel flow proper-ties increase with the presence of capric acid [120,121]. However,Sahoo et al. [122] reported that fuel CN, cloud point, and stabilityincrease with the presence of saturated fatty acid alkyl ester in fuelblend. Biodiesel viscosity and freezing point increase with the in-crease in carbon chain length and decrease with the increase indouble bond chain. Table 3 shows the average fatty acid composi-tion of the reviewed non-edible vegetable oils [121].
5. Engine performance of a diesel engine using non-ediblevegetable biodiesel
Availability and economic aspects are first considered whenselecting biodiesel. The characteristics of engine performance arethen considered, indicating the applicability of the biodiesel in en-gines. Brake power, brake torque, brake thermal efficiency (BTE),and brake specific fuel consumption (BSFC) are the performanceindicators. Factors such as air–fuel mixture, fuel injection pressure,fuel spray pattern, and fuel properties affect performance. Theseparameters are tested against engine load or engine speed in theliterature review [42,43,47]. Engine performance characteristicsof the reviewed biodiesel are discussed below.
5.1. Karanja biodiesel
Karanja gives higher BTE at higher load condition and higherBSFC with the increase in blend ratio [42,95,133]. However, the

Table 4Engine performance results using karanja (Pongamia pinnata L.) biodiesel compared with diesel fuel at different test condition.
Engine type Test condition Result Refs.
Power/torque BTE BSFC
3-Cylinder, AVL make CIengine, D: 3.44 l, CR: 18.1,WC, RS: 2200 rpm, P:44.1 kw
Full/part throttle at different speeds(1200 rpm, 1800 rpm and 2200 rpm)and different blends (20%, 50% and100%)
Slightly reduction in the range of 0.44–1.93% and 1.2–2.55% using 20% and 40%biodiesel blend at higher speed engineoperation
– Increases with increase of blend ratio anddecreases with increase engine speeds. For partthrottle experiment BSFC decrease with use higherbiodiesel blend
[47]
2-Cylinder, 4S, petter KirloskarCI engine, RP: 10HP, RS:1500 rpm, DI, WC, CR:16.5:1,RP: 7.5 kw
Constant speed (1500 rpm) anddifferent blends (5%, 10%, 20% and 30%)
– Reduce 5.72% as compared with dieselfuel
Slightly Higher (Min 0.313 kg/kw h) as comparedto diesel fuel
[41]
1-Cylinder,AV-1, 4S, CS, WC, DI,CI engine, RP: 3.67 kw, D:552.92 cm3, CR:17.5
Different blends (10%, 20%, 50%, 75%)and constant speed (1500 rpm) anddifferent load condition
– Improve (0–25%) compared withdiesel fuel and use without preheatingbiodiesel blends
Improve use preheated lower biodiesel blend up to50%
[42]
1- cylinder, 4S, RP: 5.9 kw, CR:17.5, CI engine
Constant speed (1500 rpm), 20% blendand different load condition
At similar performance compared withdiesel fuel
BTE is higher in all loads condition Decreases with the increases engine load [133]
1- Cylinder, 4S, DI, RP: 6 kw,WC, CI engine
Different blends (5%, 10%, 15% and 20%)and different load (0%, 20%, 40%, 60%,80% and 100%), constant speed(1500 rpm)
– Slightly Improve at lower loads andreduce at higher loads condition ascompared to neat petroleum baseddiesel fuel
Slightly increases as all blends compared with neatpetro-diesel
[43]
1- Cylinder, 4S, WC, DI, RP:7.5 kw, CR: 16:1, CI engine
Different loads (10%, 25%, 50%, 75%, 85%and 100%), different blends (20%, 40%,60%, 80%) and constant speed 3000 rpm
Engine power increases on average 6% upto biodiesel blend used 40% and increaseswith decreases blend ratio
Increase with increases engine load 0.8–7.4% lower at 20% and 40% blend, and higherwith higher percentage of blend ratio
[109]
1- Cylinder, 4S, RP: 3.75 kw, D:553 cm3, CR: 16.5, DI, WC, CIengine
Different loads (33.3%, 66.6% and 100%),different blends (20%, 40%, 60% and80%) and constant speed 1500 rpm
– Slightly decrease with uses higherpercentage of biodiesel bland ratio
Increase with up to 40% bland ratio used in dieselengine
[135]
1- Cylinder, 4S, WC, DI, D:553 cm3, RP: 4.476 kw, CR:16.5:1, CI engine
Different blends (10%, 25%, 50% and100%) and constant speed (1200 rpm)
– Almost unchanged compared withdiesel fuel
– [136]
4-Cylinder, DI, D: 3298 cm3,CR: 17.5:1, RP: 70 kw, WC,CI engine
Constant speed, different loads andblend (B100, B90M10)
– Increase 4.2% at high load condition – [137]
1- Cylinder, DI, WC, 4S, CR:17.5:1, RP: 3.5, CI engine
Constant speed (1500 rpm) anddifferent load condition
– Increase significantly at higher loadcondition
Decrease 12% at higher load condition comparedwith other biodiesel blend, but increase 14.7%compared with diesel fuel
[134]
Engine codes: S = stock; DI = direct injection; AC = air cooled; WC = water cooled; IC = intercooled; TC = turbocharger; CI = compression ignition; CR = compression ratio; RP: rated power; D: displacement; RS: rated speed; EGR:exhaust gas recirculation.Performance analysis codes: BTE: Brake thermal efficiency; BSFC: Brake specific fuel consumption; BSEC: Brake specific energy consumption.Emission analysis codes: CO: Carbon monoxide; HC: Hydrocarbon; NOx: Nitrogen oxide; BSU: Bosch smoke unit.
A.M
.Ashraful
etal./Energy
Conversionand
Managem
ent80
(2014)202–
228209

Tabl
e5
Dif
fere
ntex
peri
men
tal
engi
nepe
rfor
man
cere
sult
sus
ing
pola
nga
(Cal
ophy
llum
inop
hyllu
m)
biod
iese
lco
mpa
red
wit
hdi
esel
fuel
.
Engi
ne
Test
con
diti
onR
esu
ltR
efs.
Pow
er/t
orqu
eB
TEB
SFC
3C
ylin
der,
AV
Lm
ake
CI
engi
ne,
D:
3.44
l,C
R:
18.1
,WC
,RS:
2200
rpm
,P:
44.1
kw
Full
/par
tth
rott
leat
diff
eren
tsp
eeds
(120
0rp
m,1
400
rpm
and
2200
rpm
)an
ddi
ffer
ent
blen
ds(2
0%,5
0%an
d10
0%)
Slig
ht
redu
ctio
nin
pow
er1.
93%
usi
ng
20%
biod
iese
lbl
end
but
impr
ove
0.19
–0.8
8%u
sin
g50
%bi
odie
sel
blen
dco
mpa
red
wit
hdi
esel
fuel
duri
ng
the
enti
rera
nge
ofen
gin
eop
erat
ion
–In
crea
ses
wit
hin
crea
seof
blen
dra
tio
and
decr
ease
sw
ith
incr
ease
engi
ne
spee
ds.F
orpa
rtth
rott
lete
stB
SFC
decr
ease
wit
hm
ore
than
20%
,bl
end
[47]
1-C
ylin
der,
4S,
WC
,DI
Dif
fere
nt
load
s(0
%,2
0%,4
0%,6
0%,8
0%an
d10
0%)
and
diff
eren
tbl
ends
(20%
,40
%,6
0%,8
0%an
d10
0%)
Slig
htl
yin
crea
seco
mpa
red
wit
hdi
esel
fuel
0.1%
Incr
ease
wit
hin
crea
seof
blen
dra
tio
Red
uce
wit
hu
sin
gh
igh
erbi
odie
selb
len
dra
tio
and
engi
ne
spee
ds[4
4]
1-C
ylin
der,
4S,W
C,D
I,C
Ien
gin
eD
iffe
ren
tbl
ends
(B10
,B20
,B30
and
B40
)an
dco
nst
ant
spee
d(1
500
rpm
)–
Incr
ease
wit
had
diti
onad
diti
ves
inth
ebi
odie
sel
fuel
blen
d
Dec
reas
esw
ith
adde
dad
diti
ves
inth
efu
elbl
end
[48]
210 A.M. Ashraful et al. / Energy Conversion and Management 80 (2014) 202–228
opposite trend was observed by some researchers [47,109]. Sri-vastava et al. [41] experimented different karanja biodiesel blendsusing a two-cylinder CI engine. They concluded that pure biodieselgives lower BTE than diesel fuel, but biodiesel blend gives higherBTE than pure biodiesel. Jindal et al. [134] found that karanjabiodiesel blend gives better BTE and BSFC than other biodiesels.Table 4 shows different experimental results of engine performanceusing karanja biodiesel. The following conclusions were drawnbased on the result analysis:
� Engine power increases by about 6% with the presence of higherbiodiesel percentage in fuel blend.� Higher engine speed and lower biodiesel concentration give
higher engine power.� BTE increases with higher engine load and decreases when a
lower percentage of biodiesel is used in the fuel blend.� BSFC decreases about 0.8% with used lower biodiesel blend ratio
and higher engine speed.� BSFC decreases significantly when pre-heated biodiesel fuel
blends are used.
5.2. Polanga biodiesel
Polanga biodiesel usually gives high power output, high BTE,and low BSFC when used in a diesel engine [44]. However, someresearchers obtained the opposite trend [47]. Table 5 presentsthe engine performance parameters using polanga biodiesel in adiesel engine. The following conclusions can be made by analyzingthe results:
� Engine power is slightly reduced when a lower biodiesel fuelblend is used but increases when a medium percentage of bio-diesel fuel blend is used.� BTE increases with the use of higher biodiesel blend and added
additives in the fuel.� Lower BSFC is observed when the biodiesel blend has added
additives and when the engine is operated at high speed.
5.3. Mahua biodiesel
Mahua biodiesel gives poor results in terms of engine perfor-mance. Most researchers found that it has high BSFC and lowBTE [96,107,111,138]. However, some test conditions gave higherthermal efficiency [53,54,139]. Different experimental resultsusing mahua biodiesel in different test conditions are shown in Ta-ble 6. The following conclusions can be made by analyzing the dif-ferent experimental observations:
� A 20% biodiesel blend gives about 1–32.5% higher BTE at higherengine load condition than any other blend.� BTE is reduced with the presence of a higher percentage of bio-
diesel in the fuel blend.� BSFC increases by 4.1% with the increased proportion of biodie-
sel in the fuel blend.
5.4. Rubber seed biodiesel
Most experiments show that BSFC is higher when rubber seedbiodiesel is used in a diesel engine. However, higher BTE and brakepower were observed with increased percentage of biodiesel infuel blend and with engine load [106,141]. Table 7 shows the en-gine performance when rubber seed biodiesel is used in differenttest conditions. BTE increases at about 1.14–1.33% in a full loadcondition. The following conclusions can be made from the analy-sis of the different experimental results:

Table 6Different experimental engine performance results using mahua (Madhuca indica) biodiesel compared with diesel fuel.
Engine type Test condition Result Refs.
Power/torque
BTE BSFC
1-Cylinder, 4S, WC, CR: 18:1, P:9 kw, CI engine
Different blends (B20, B40, B60 and B80), different loads (25%,50%, 75% and 100%) and constant speed (1500 rpm)
– Increase 1% with using 20% biodiesel blend andDecrease 10.1% with used 100% biodiesel
Increased min 4.1% with the increasedproportion of biodiesel in the blends
[96]
1-Cylinder, 4S, WC, CI engine, RP:4 kw
Different blends (10, 20 and 30%), different loads and constantspeed (1500 rpm)
– Increased 0–30% with increased of biodieselpercentage in the fuel blend
– [53]
6- Cylinder, 4S, AC, D: 5.9 L, CR:17.6:1, HP: 158, CI engine
Different loads, different blends (B20, B40, B60) and constantspeed (1500 rpm)
_ Increased 32.5% using 20% biodiesel blendcompared with diesel fuel
Increase with increase in the proportion ofbiodiesel in the fuel blends and engine loads
[111]
1-Cylinder, 4S, WC, DI, CR: 16.5:1,RP: 3.7 kw, D: 553 cm3
Constant speed (1500 rpm) – 13% Lower than that of diesel fuel 20% Higher than the ordinary diesel fuel [107]
1-Cylinder, 4S, WC, DI, CR: 16.5:1,RP: 3.7 kw, D: 553 cm3
Constant speed (1500 rpm) – Gradually increase 26.42%-28.307% for both esterused compared to diesel fuel
Increase about 6% and 14% compared with dieselfuel
[54]
1-Cylinder, 4S, WC, DI, CR: 16.5:1,RP: 3.7 kw, D: 553 cm3
Constant speed (1500 rpm) – 1.95% higher than that of diesel fuel Higher compared to diesel fuel [140]
1- Cylinder, 4S, WC, DI, HP: 7, Blend (B20), constant speed (1500 rpm), and steady statecondition
– 20% biodiesel blend gave higher efficiency thandiesel fuel at higher load condition
– [139]
3-Cylinder, 4S, AC, DI, D:2826 cm3, CR: 17:1
Different loads, different blends (B10, B20, B40, B60, B80) andconstant speed (1500 rpm)
– Decrease with increase of blend ratio. Maximumefficiency obtained at use B20 bland
Increase with increase biodiesel blend ratiocompare with diesel
[138]
Table 7Different experimental engine performance results using rubber seed oil (Hevea brasiliensis) biodiesel compared with diesel fuel.
Engine type Test condition Result Refs.
Power/torque BTE BSFC
1-Cylinder, 4S, DI, RP: 5.5 kw, WC,CI engine, RS: 1500 rpm
Different loads, different blends (B20, B40, B60, B80 and B100)and constant speed (1500 rpm)
Increase with increaseof biodiesel blend ratio
Increase with the increase of biodiesel blendratio compared to diesel fuel
Higher compare with dieselfuel
[141]
1-Cylinder, 4S, DI, RP: 5.5 kw, WC,CI engine, RS: 1500 rpm
Different loads, different blends (B10, B20, B50, B75 and B100)and constant speed (1500 rpm)
Increased with theincreased in engineload
3% Increase using 20% biodiesel blend withincrease in engine loads
Increased 12% using 100%biodiesel compared with dieselfuel
[106]
1-Cylinder, 4S, DI, RP: 4.4 kw, CR:17.5:1, D: 661.5 cm3, RS:1500 rpm
Constant speed (1500 rpm) and different load (25%, 50% 75%,100%), Duel fueling with hydrogen induction (25%, 50% and 75%)
– Increase about 1.33% and 1.14% at full loadcondition with hydrogen induction using RSOME
– [113]
1-Cylinder, DI, 4S, RP: 5.5 kw, CIengine, WC, RS: 1500 rpm
Constant speed (1500 rpm)and different load condition – Reduce for incomplete combustion comparedwith diesel fuel
Higher than that of diesel fuelfor duel fuel operation
[142]
1-cylinder, AC, CR: 17.5:1, 4S, DI, CIengine, RP: 4.4 kw, RS:1500 rpm
Using net RSO and Various diethyl ether with RSO (50 g/h,100 g/h, 150 g/h, 200 g/h and 250 g/h) and full load condition
– 3.4% Lower than that of diesel fuel using net RSO.But improved at using RSO with DEE injection
– [143]
1-Cylinder, WC, 4S, DI, RS:1500 rpm, RP: 5.5 kw, CR:16.5:1
Different loads and constant speed 1500 rpm Less than that of dieselfuel
4.95% Lower than that of diesel fuel at full loadcondition
34.8% Higher than that ofdiesel fuel at 70% loadcondition
[144]
A.M
.Ashraful
etal./Energy
Conversionand
Managem
ent80
(2014)202–
228211

Table 8Different experimental engine performance results using cotton seed biodiesel compared with diesel fuel.
Engine type Test condition Result Refs.
Power/torque BTE BSFC
1-Cylinder, WC, 4S, DI, CR: 19.8:1,RS: 4500 rpm
Constant speed 2000 rpm, Different blends (10% and20%) medium and high load condition
Same compared with dieselfuel all load condition
Same compared with diesel fuel allload condition
Higher than that of diesel fuel at medium andhigher load condition
[114]
6-Cylinder, 4S, WC, DI, D: 5958 ,CR: 18:1, RP: 177 kw, RS:2600 rpm
Different speeds (1200 and 1500 rpm), differentloads (20%, 40%, 60% and full load)
_ Similar compared with neat diesel fuel Little higher than that of diesel fuel with thehigher percentage of biodiesel in the blend
[147]
1-Clynder, 4S, DI, WC, CR: 17:1,D: 770 cm3, RP: 8 HP, RS:2000 rpm
Full load and different speeds (900–1800 rpm) Reduced about 3%compared with diesel fuel
– SFC of methyl ester has lower compared with rawoil fuel, Higher fuel consumption due to lowerenergy contain
[115]
1-Cylinder, 4S, AC, DI, D: 406 cm3,RP: 10 HP, RS: 3600 rpm, CR:18:1
Different speeds (1250–2500 rpm) and differentblends (B5, B20, B50, B75 and B100)
Increase at higher enginespeed but less then dieselfuel
– Lower at full load operation and 2000 rpm speedfor using 5% and 20% biodiesel blend
[145]
1-Cylinder, 4S, DI, WC, NA, D:553 cc, CR: 16.5:1, RP:4.476 kw, RS: 1800 rpm
Constant speed 850 rpm and different blends (B10,B20, B30)
– Increase with the increased in enginetorque, but decreased due to themaximum torque
Decrease with increase in engine torque [59]
6-Cylinder, 4S, DI, WC, TC, D:5958 cc, CR: 18:1, RP: 177 kw,RS: 2600 rpm
Different blends (B10, B20), different speeds(1200 rpm and 1500 rpm) and different loadcondition (20%, 40% and 60%)
– Same compared with diesel fuel at allload condition
Littlie higher than that of neat diesel fuel [148]
1-Cylinder, 4S, DI, CR: 18:1, NA,RS: 3600 rpm,
Different speeds and preheated blend (30�, 60�, 90�,120 �C)
Decrease compared withdiesel fuel at all operatingtemperature
Increase 6.34% at high operatingtemperature
– [149]
1-Cylinder, DI, 4S, AC, CR: 18:1, D:395 cc, RS: 3600 rpm, RP:6.25 kw
Full load and different speeds (2800–1300 rpm) 3–9% Lowers than that ofdiesel fuel
– 8–10% Higher than that of diesel fuel [150]
4-Cylinder, 4S, DI, NA, WC, CR:16.8:1, RP: 51 kw, RS:2400 rpm,
Full load and different speeds (1200–2400 rpm) Increase with the increasedof engine speed
Improved slightly both NA and TCoperation compared with diesel fuel
Slightly higher both NA and TC operationcompared with diesel fuel
[146]
1-Cylinder, 4S, AC, DI, CR: 18:1,RP: 6.25 kw, RS: 3600 rpm,
Full load and different speeds (1700, 2000, 2300,2600 and 3000 rpm)
2.2–2.3% Increased at fullload operating condition
Increased 6% at B20 and 3.5% at B40biodiesel
Increased compared with diesel fuel [151]
1-Cylinder, 4S, AC, DI, CR: 18:1,RP: 6.25, RS: 3600 rpm
Full load, varied injection pressure and constantspeed
3–6% Decreased than dieselfuel at all injection pressure
_ 3–7% Increased compared with diesel fuel [60]
212A
.M.A
shrafulet
al./EnergyConversion
andM
anagement
80(2014)
202–228

Tabl
e9
Engi
nepe
rfor
man
cere
sult
sus
ing
jojo
baoi
lba
sed
biod
iese
lat
diff
eren
tte
stco
ndit
ion.
Engi
ne
type
Test
con
diti
onR
esu
ltR
efs.
Pow
er/t
orqu
eB
TEB
SFC
1-C
ylin
der,
4S,A
C,D
I,C
R:
17:1
,RP:
5.77
5kw
,RS:
1500
rpm
Var
iou
slo
ads
(no
load
,1/3
,2/3
and
full
load
),di
ffer
ent
blen
ds(B
20,B
40,B
60)
and
diff
eren
tsp
eeds
Slig
htl
yde
crea
sed
wit
hin
crea
sed
ofbi
odie
sel
perc
enta
gein
fuel
blen
d–
Slig
htl
yin
crea
sed
wit
hin
crea
sed
ofbi
odie
sel
perc
enta
gein
fuel
blen
d[6
1]
2-C
ylin
der,
4S,W
C,D
I,D
:22
66cc
,C
R:
16.4
:1,R
S:15
00rp
m,R
P:26
HP
Dif
fere
nt
spee
ds(1
000–
1900
rpm
)an
dfu
lllo
adSl
igh
tly
hig
her
than
that
ofdi
esel
fuel
wit
hth
ein
crea
seof
engi
ne
spee
d
Slig
htl
yh
igh
erco
mpa
red
wit
hdi
esel
fuel
wit
hth
ein
crea
seof
engi
ne
spee
d8.
2%an
d9.
8%lo
wer
aten
gin
esp
eed
1200
and
1600
rpm
com
pare
dw
ith
dies
elfu
el[1
52]
1-C
ylin
der,
4S,A
C,D
I,N
A,C
R:
17:1
,R
P:5.
775
kw,R
S:15
00rp
mD
iffe
ren
tsp
eeds
and
inje
ctio
nti
min
gof
24C
AD
BTD
CIn
crea
sed
5%w
ith
EGR
oper
atio
nD
ecre
ased
6%an
d13
%w
ith
EGR
and
wit
hou
tEG
Rop
erat
ion
Dec
reas
ed8%
wit
hEG
Ran
d14
%in
crea
sed
wit
hou
tEG
Rop
erat
ion
[64]
A.M. Ashraful et al. / Energy Conversion and Management 80 (2014) 202–228 213
� Engine power increases with the increased percentages of bio-diesel in the fuel blend and higher engine speed condition.� A 20% biodiesel blend ratio and higher engine speed give higher
BTE.� Diethyl ether (DEE) injection with rubber seed oil-based biodie-
sel blend shows high peak pressure and gives high BTE.� BSFC increases with increased engine load and higher biodiesel
percentages in the fuel blend.
5.5. Cotton seed biodiesel
Cotton seed biodiesel gives poor engine performance resultscompared with other biodiesel fuels. BSFC is high in most test con-ditions, along with lower brake power and BTE [115,145], but itgives high thermal efficiency in some specific conditions [59,146].Table 8 presents the engine performance results using cotton seedbiodiesel in different test conditions. The following conclusionscan be made by analyzing the different experimental results:
� Engine power increases by about 2.2–2.3% in a full load operat-ing condition.� Engine power decreases with the use of preheated biodiesel
blend and higher injection pressure.� BTE improves in both naturally aspirated and turbo-charged
operations, the increment of which is about 6.34% with fuelsat elevated temperature.� BTE increases by about 6% with low biodiesel present in the
blend and with high engine torque condition.� BSFC increases by about 3.7% with increased engine load and
high percentage of biodiesel present in the fuel blend.� BSFC decreases with the lower percentage of biodiesel present
in the fuel blend.
5.6. Jojoba oil biodiesel
Jojoba oil-based biodiesel can be considered a good alternativefuel because of its give higher brake power using in diesel engine.Moreover, its thermal efficiency and BSFC decrease at differentspeeds and in a full load condition [64,152]. However, it gives high-er BSFC in some specific conditions [61]. Different engine perfor-mance results using jojoba oil-based biodiesel in a diesel engineare shown in Table 9. The following conclusions can be made fromthe analysis of the different experimental results:
� Engine power increases by 5% using jojoba oil methyl ester withEGR operation.� Engine power slightly decreases when the fuel blend used has a
high percentage of biodiesel in the fuel blend.� BTE slightly increases in a full load condition and with high
engine speed but decreases by 6% with EGR operation.� BSFC decreases about 8% when jojoba oil methyl ester is used in
EGR operation and with high engine speed.
5.7. Tobacco oil biodiesel
Tobacco oil biodiesel has shown excellent results in terms of en-gine performance, with high brake power and BTE, and low BSFC[66,68,153]. However, it gives high BSFC in some specific condi-tions [154,155]. Different engine performance results using tobac-co oil-based biodiesel in a diesel engine are shown in Table 10. Thefollowing outcomes can be concluded by analyzing the results:
� Engine power increases by about 3.13% with high engine loadand low biodiesel percentage in the fuel blend.� At high engine speed and low biodiesel percentage, BTE
increases by 2.02%.

Tabl
e10
Engi
nepe
rfor
man
cere
sult
sus
ing
toba
cco
oil
base
dbi
odie
sel
atdi
ffer
ent
test
cond
itio
n.
Engi
ne
type
Test
con
diti
onR
esu
ltR
efs.
Pow
er/t
orqu
eB
TEB
SFC
4-C
ylin
der,
4S,T
C,W
C,R
P:55
kw,
RS:
2200
rpm
Dif
fere
nt
load
s(5
0%,7
5%an
d10
0%),
diff
eren
tbl
ends
(B10
,B17
.5an
dB
25)
and
spee
d(1
500–
3000
rpm
)
Incr
ease
dw
ith
the
incr
ease
dof
engi
ne
spee
dan
dh
igh
erlo
adco
ndi
tion
0.27
2–0.
292%
Incr
ease
dw
ith
incr
ease
dof
engi
ne
spee
dan
dh
igh
erlo
adco
ndi
tion
Incr
ease
dw
ith
the
incr
ease
dof
engi
ne
spee
d[6
6]
4-C
ylin
der,
4S,T
C,W
C,ID
I,C
R:
21.5
:1,D
:1.
753,
RP:
55kw
,RS:
2200
rpm
Dif
fere
nt
load
s(5
0%,7
5%an
d10
0%),
diff
eren
tbl
ends
(B10
,B17
.5an
dB
25)
3.13
%H
igh
erth
anth
atof
dies
elfu
elat
hig
her
load
and
low
erbl
end
rati
ou
sed
indi
esel
engi
ne
2.02
%H
igh
erco
mpa
red
dies
elfu
elw
ith
low
erbi
odie
sel
perc
enta
gein
the
fuel
Slig
htl
yin
crea
sed
wit
hlo
wlo
adco
ndi
tion
[68]
1-C
ylin
der,
4S,N
A,R
S:15
00rp
m,
RP:
5H
PC
onst
ant
spee
d15
00rp
m,d
iffe
ren
tlo
ads
and
diff
eren
tbl
ends
(B2
and
B5)
–1.
69%
Incr
ease
dth
anth
atof
dies
elfu
elat
hig
her
load
con
diti
on9.
8%Lo
wer
that
ofdi
esel
fuel
low
biod
iese
lpe
rcen
tage
inth
ebl
end
[154
]
1-C
ylin
der,
4S,N
A,D
I,R
P:14
.7:1
,R
S:25
00rp
mFu
lllo
adan
ddi
ffer
ent
spee
ds(1
200,
1400
,160
0,18
00,2
000,
2200
and
2400
rpm
)In
crea
sed
wit
hth
ein
crea
sed
ofen
gin
esp
eed
and
full
load
con
diti
on–
Incr
ease
dsl
igh
tly
com
pare
dw
ith
dies
elfu
elat
low
eren
gin
esp
eed
[153
]
1-C
ylin
der,
4S,D
I,W
C,R
P:5.
2kw
,C
R:
17.5
:1D
iffe
ren
tin
ject
ion
pres
sure
s(2
05,2
20,2
40an
d26
0ba
r)–
Low
erco
mpa
red
wit
hdi
esel
fuel
atlo
wer
inje
ctio
npr
essu
reD
ecre
ased
wit
hin
crea
sed
ofbr
eak
pow
eran
dlo
wer
inje
ctio
npr
essu
re
[155
]
214 A.M. Ashraful et al. / Energy Conversion and Management 80 (2014) 202–228
� High engine load condition, high injection pressure, and biodie-sel percentage affect the BTE of an engine.� BSFC slightly decreases because of high brake power and low
injection pressure.� Engine load and speed also affect specific fuel consumption.
5.8. Neem biodiesel
Neem biodiesel generally gives slightly lower BTE and higherBSFC [86,156–158] but gives higher BTE than diesel fuel insome conditions [87,159,160]. Different experimental engineperformance results are shown in Table 11. Its low calorific valuecauses neem biodiesel to give low BTE with high fuel consumptionin most cases. The following deductions can be made based onTable 11:
� BTE significantly increases with increased biodiesel percentagein the fuel blend and engine load.� In a part load condition, the BTE of an increases about 63.11%
compared with that of diesel fuel. However, it decreases in a fullload condition.� BSFC decreases by about 8.25% at constant speed in a part
load condition but significantly increases in a full loadcondition.
5.9. Linseed oil biodiesel
The use of linseed oil biodiesel in diesel engine gives excellentresults, such as high BTE, high power output, and low BSFC. Someexperimental results also show its high BSFC and low BTE[73,92,164]. Table 12 shows the engine performance results usinglinseed oil-based biodiesel in a diesel engine in different condi-tions. The following conclusions can be made from the analysisof the different experimental findings:
� Engine power increases with the presence of high engine loadand high percentage of biodiesel in the fuel blend.� BTE increases because of improved atomization and better mix-
ing process at a high injection pressure.� BTE increases by about 10–12% with increased biodiesel con-
centration in the fuel blend and high engine load condition.� BSFC decreases by about 4–6% with high engine load and high
biodiesel percentage in the fuel blend. It significantly increaseswith at a high injection pressure in the engine.
5.10. Jatropha biodiesel
Jatropha biodiesel gives high thermal efficiency with highfuel consumption [116,166–168]. Its blends give better brakepower than diesel fuel in some cases [47]. It also exhibitslow BTE in some conditions [116,169]. Engine performanceresults in different test conditions are shown in Table 13. Thefollowing deductions can be made by analyzing the results inTable 13:
� A 20% biodiesel blend gives better engine power, which is about0.09–2.64% higher, than diesel fuel.� Engine power decreases with increased biodiesel percentage in
the fuel blend.� BTE slightly improves (percentage) in medium engine speed
and improves by 0.1–6.7% in high engine speed. However, itdecreases when a high biodiesel percentage is present in thefuel blend.� BSFC increases by 6.8% with increased engine speed and high
biodiesel percentage in the fuel blend.

Table 11Engine performance results using neem biodiesel at different test condition.
Engine type Test condition Result Refs.
Power/torque
BTE BSFC
1-Cylinder, 4S, DI, WC, RP: 5.2 kw, CR:17.5:1, RS: 1500 rpm
Constant speed 1500 rpm, duel fueling – 5% lower than that of diesel fuel – [161]
1-Cylinder, 4S, DI, NA, WC, RP: 9.8 kw,CR: 20:1, RS: 2000 rpm
Different blends (B5, B10 and B15), differentspeed (600–1200 rpm) and different BMEP
– Increased with increased of fuel supply up to 1000 rpmand decreased when engine speed above 1000 rpm
– [162]
1-Cylinder, 4S, DI, D: 425 cc, CR: 15.5:1,RP: 7.5HP, RS: 1500 rpm
Different loads (4, 8, 12, 16 and 20 kg) andconstant speed 1500 rpm
– Increased with the increased of engine load Decreased with the increased of engine load [87]
1-Cylinder, 4S, DI, WC, RS: 1500 rpm, RP:3.7 kw, CR: 16.5:1
Constant speed and different loads (1000–4000Watt) condition
– Slightly lower at higher loads compared with diesel fuel Slightly higher at low load condition comparedwith diesel fuel
[156]
1-Cylinder, 4S, WC, DI, CR: 17.5:1, D:661 cc, RP: 5.2 kw, RS: 1500 rpm
Different BMEP (100, 200, 300, 400, 500, 600 and650) and constant speed 1500 rpm
_ 63.11% higher than that of diesel fuel at part loadcondition and 11.2% lower at full load condition
8.25% Lower at part load and 27.25% higher atfull load condition than that of diesel fuel
[163]
1-Cylinder, 4S, DI, NA, WC, RP: 5HP, RS:1500 rpm, CR: 16.5:1
Constant speed and different BP (0–5 kw) – Lower than that of diesel fuel at all loads condition – [157]
1-Cylinder, AC, DI, CR: 17.5:1, RP: 4.4 kw,RS: 1500 rpm
Different blends (B10, B20, B30, B40 and B50),constant speed and different break power
– Decreased with the increased of biodiesel percentage inthe blend
Slightly higher for B20 and all biodiesel nearlyclosed to diesel fuel
[158]
1-Cylinder, DI, WC, RP: 5.2 kw, RS:1500 rpm
Different blends (B20, B40, B60, B80 and B100),Different BMEP and constant speed 1500 rpm
– Increased 7.01% at full load condition and lower biodieselpercentage in the fuel blend
27.75% Higher at full load condition and higherbiodiesel percentage in the blend
[159]
1-Cylinder, 4S, NA, DI, CR: 16.5:1, RP:3.5 kw, RS: 1500 rpm
Different blends (B5, B10, B15, B20), differentloads and constant speed 1500 rpm
– Increased with the increased of percentage of biodiesel inthe fuel blend at all load condition
– [160]
1-Cylinder, 4S, DI, WC, RP: 8 HP, CR:16.5:1, RS: 1800 rpm
Different loads, constant speed 1800 rpm anddifferent blends (B10, B20)
– Decreased with higher biodiesel in the blends comparedwith diesel fuel
Increased 23.38% and 12.12% of B10 and B20compared with diesel fuel
[86]
Table 12Engine performance results using linseed oil biodiesel at different test condition.
Engine type Test condition Result Refs.
Power/torque BTE BSFC
1-Cylinder, WC, 4S, DI, D:662 cc, RP: 4 kw, RS:1500 rpm
Different blends (B10, B20, B30 and B50, v/v), constant speed 1500 rpm and differentloads
– Increases with the increase of engine loads and concentration ofbiodiesel in the fuel blend
Lower by used blend B50compared with others blends
[164]
1-Cylinder, 4S, AC, DI, RP:4.4 kw, CR: 17.5:1, RS:1500 rpm
Different loads, constant speed 1500 rpmand different injection pressure (200, 220and 240 bar)
– Increases at full load condition are closer to diesel fuel because ofimproved atomization and better mixing process at higherinjection pressures
Higher than that of diesel fuelat all load and higher injectionpressure
[92]
1-Cylinder, 4S, AC, DI, RP:4.4 kw, D: 661 cc, CR:17.5:1, RS: 1500 rpm
Different loads and constant speed1500 rpm
– Lower compare with others biodiesel blend at full load condition Similar compare with othersbiodiesel blend
[73]
1-Cylinder, WC, 4S, Di, RP:3.5 kw, CR: 17.5:1, RS:1500 rpm
Different blends (B5, B10, B15 and B20),constant speed 1500 rpm and differentloads
Decreases with increasingbiodiesel concentration in thefuel blend
Increases 10–12% with the increase of engine power andincreasing concentration of biodiesel in the fuel blend
Decreased 4–6% with theincrease biodiesel percentage infuel blend
[165]
A.M
.Ashraful
etal./Energy
Conversionand
Managem
ent80
(2014)202–
228215

Tabl
e13
Engi
nepe
rfor
man
cere
sult
sus
ing
jatr
opha
biod
iese
lat
diff
eren
tte
stco
ndit
ion.
Engi
ne
type
Test
con
diti
onR
esu
ltR
efs.
Pow
er/t
orqu
eB
TEB
SFC
1-C
ylin
der,
4S,D
I,W
C,D
:10
07cc
,CR
:18
.5:1
,RS:
2400
rpm
Dif
fere
nt
blen
ds(B
10,B
20,B
50an
dB
100)
and
diff
eren
tsp
eeds
(100
0–24
00rp
m)
Dec
reas
edw
ith
incr
ease
dof
perc
enta
geof
biod
iese
lin
the
fuel
Low
erco
mpa
red
wit
hdi
esel
fuel
Hig
her
than
that
ofdi
esel
fuel
[79]
3-C
ylin
der,
4S,D
I,W
C,D
:34
40cc
,CR
:18
:1,R
S:22
00rp
m
Dif
fere
nt
spee
ds(1
200,
1800
and
2200
rpm
)an
ddi
ffer
ent
blen
ds(B
20,B
50an
dB
100)
Incr
ease
d0.
09–2
.64%
use
d20
%bi
odie
sel
blen
dw
ith
enti
rera
nge
ofen
gin
eop
erat
ion
_In
crea
sew
ith
incr
ease
dof
perc
enta
geof
biod
iese
lin
the
fuel
blen
d,bu
tde
crea
sed
wit
hh
igh
eren
gin
esp
eed
[47]
1-C
ylin
der,
4S,D
I,C
R:
16.5
:1,
RP:
5HP,
RS:
1500
rpm
Dif
fere
nt
blen
ds(B
20,B
40,B
50,B
60,B
80an
dB
100)
and
diff
eren
tlo
ads
(25%
,50%
75%
and
100%
)
–H
igh
erth
anth
atof
dies
elfu
elab
out
(20–
80%
)bl
ends
Low
erco
mpa
red
wit
hdi
esel
fuel
wh
enB
20u
sed,
for
oth
erbl
ends
alm
ost
sam
eas
dies
el[1
70]
4-C
ylin
der,
4S,D
I,TC
,D:
1609
cc,R
P:84
.5kw
,CR
:18
.5:1
,RS:
3800
rpm
Dif
fere
nt
spee
dsan
dfu
lllo
adco
ndi
tion
Dec
reas
edco
mpa
red
wit
hdi
esel
fuel
Alm
ost
sam
eco
mpa
red
wit
hdi
esel
fuel
Hig
her
than
that
ofdi
esel
fuel
[80]
1-C
ylin
der,
4S,D
I,W
C,R
P:8
HP,
RS:
1500
rpm
Dif
fere
nt
blen
ds(B
25,B
50,B
75an
dB
100)
and
cons
tan
tsp
eed
–7%
Dec
reas
edco
mpa
red
wit
hdi
esel
fuel
for
B10
0In
crea
sed
wit
hth
ein
crea
sed
ofpe
rcen
tage
ofbi
odie
sel
inth
efu
el[1
69]
1-C
ylin
der,
4S,W
C,D
I,D
:81
5cc
,RP:
8.82
kw,C
R:1
7:1,
RS:
2000
rpm
Dif
fere
nt
spee
ds(1
500
and
2000
rpm
)an
ddi
ffer
ent
load
–0.
2–3.
5%an
d0.
1–6.
7%in
crea
sed
for
1500
rpm
and
2000
rpm
Ave
rage
9.3%
and
6.8%
incr
ease
dfo
r15
00rp
man
d20
00rp
m[1
66]
1-C
ylin
der,
4S,D
I,A
C,C
R:
18:1
,D
:39
5cc
,RP:
5.59
kw,R
S:36
00rp
m
Dif
fere
nt
spee
ds(1
800,
2500
and
3200
rpm
)–
Low
erco
mpa
red
wit
hdi
esel
fuel
Hig
her
than
that
ofdi
esel
fuel
[94]
1-C
ylin
der,
4S,D
I,A
C,D
:94
7.8
cc,C
R:
17.5
:1,R
P:7.
4kw
,RS:
1500
rpm
Dif
fere
nt
blen
ds(B
5,B
10,B
20,B
30an
dB
100)
and
diff
eren
tlo
ads
(20%
,40%
,60%
,80
%an
d10
0%)
–D
ecre
ased
wit
hth
ein
crea
sed
ofpe
rcen
tage
ofbi
odie
sel
inth
efu
elco
mpa
red
wit
hdi
esel
Hig
her
than
that
ofdi
esel
fuel
and
incr
ease
dw
ith
the
incr
ease
dof
blen
dra
tio
[171
]
216 A.M. Ashraful et al. / Energy Conversion and Management 80 (2014) 202–228
6. Engine emission performance when non-edible vegetablebiodiesel is used in a diesel engine
Biodiesel is an oxygenated fuel. Therefore, it produces a com-plete combustion, provides excellent emission properties, and cre-ates less negative environmental effects [82,172]. Differentexperimental investigations on engine emission characteristicsusing the reviewed non-edible oil biodiesels are presented.
6.1. Karanja biodiesel
Engine operating condition and biodiesel percentage in theblend significantly affect engine emission characteristics. Althoughsome experimental results show high CO and NOx emissions, oth-ers present low CO, HC, and smoke emission [41,42,47]. Table 14shows the engine emission results using karanja biodiesel in differ-ent test conditions. The following conclusions can be made by ana-lyzing the different experimental results:
� CO emission decreases by approximately 4–46.5% in a high loadcondition but increases with the presence of a high percentageof biodiesel in the fuel blend.� HC emission decreases with a low percentage of biodiesel pres-
ent in the fuel blend and in a high load condition.� PM decreases with increased biodiesel content in the fuel blend.� NOx emission increases by 4.15–14.18% with increased biodie-
sel percentage in the fuel blend. However, it decreases by 4–39%with the presence of low biodiesel percentage in the fuel blend.� Smoke level is reduced (20–43%) with a high engine load and
high biodiesel concentration in the fuel blend.
6.2. Polanga biodiesel
Only a few researchers conducted experiments using polangabiodiesel in a diesel engine. These researchers found that it giveslow-criteria engine emission. Table 15 presents the engine emis-sion results using polanga biodiesel in different operating condi-tions. Clearly, biodiesel blends greatly affect emission. Thefollowing deductions can be made based on the analysis of the dif-ferent experimental results:
� Higher biodiesel blend ratio gives higher CO emission.� HC emission significantly decreases with the presence of high
biodiesel percentage in the fuel blend.� Polanga biodiesel produces a low reduction of PM at about
9.88–42.06% with increased biodiesel percentage in the fuelblend.� NOx emission increases when a fuel blend is used with high bio-
diesel percentage. However, it decreases by 4% in a high loadcondition.� Smoke level decreases at a maximum of 35% at high biodiesel
blend and high engine speed condition.
6.3. Mohua biodiesel
Experimental results on engine operation using mohua oil-based biodiesel show that it gives low CO, HC, NOx, and smokeemission [54,95,107,139,140] but produces high NOx emission insome cases [53,96,111]. An emission characteristic of the differentexperimental results using Mohua biodiesel and its blends isshown in Table 16. The following conclusions are attained by ana-lyzing the different experimental results:
� CO emission decreases by 0.02–0.16% with the increase in bio-diesel concentration in the fuel blend.

Table 14Engine emission results using karanja biodiesel at different condition.
Engine Test condition Emission Refs.
CO HC PM Nox Smoke
3 Cylinder, AVL make CIengine, D: 3.44 l, CR: 18.1,WC, RS: 2200 rpm, P:44.1 kw
Full throttle at different speeds(1200 rpm, 1400 rpm and 2200 rpm)and different blends (20%, 50% and100%)
Improvement 2.93–5.87% less thanthat of diesel fuel using 20% 50% and100% biodiesel blend entire range ofengine operation
Reduce range of 4.30–20.64% with increase ofbland ratio
Reduce range of16.43–45.48%with increase ofbland ratio
Slightly increase withrange of 4.15–14.18%with increase of blendratio
Reduction with increaseof blend ratio
[47]
2-Cylinder, 4S, petterKirloskar CI engine, RP:10HP, RS: 1500 rpm, DI,WC, CR: 16.5:1, RP: 7.5 kw
Constant speed (1500 rpm) anddifferent blends (5%, 10%, 20% and30%)
Slightly Increase about 0.03% atincreases of blend ratio
Exhibited 11.76%higher HC emissionwith the increasedbiodiesel percentage
– Increase 12%compared with dieselfuel
– [41]
1-Cylinder, 4S, CS, WC, DI, CIengine, RP: 3.67 kw, D:552.92 cm3, CR: 17.5
Different blends (10%, 20%, 50%, 75%)and constant speed (1500 rpm)
Increase min 10 g/kw h use withoutpreheating blend
Lower as use of lowerblends compared thandiesel
– – Smoke density almostsame compared withdiesel fuel
[42]
1-Cylinder, 4S, RP: 5.9 kw, CR:17.5, CI engine
Constant speed (1500 rpm), 20%blend and different load condition
Reduce with use of net biodiesel andblend
Reduce with use of netbiodiesel and blend
– Increases 10–25%compared withconventional diesel
Reduce with use of netbiodiesel and blend
[133]
1-Cylinder, 4S, DI, RP: 6 kw,WC, CI engine
Different blends (5%, 10%, 15% and20%) and different load (0%, 20%,40%, 60%, 80% and 100%)
Approximately 4% decreases withhigher load condition
Lower at 10% blend and70% load
– At 20% blend and 80%load give 4% lowerNox compared todiesel
Smoke was significantlyreduce for all blends
[43]
1-Cylinder, 4S, WC, DI, RP:7.5 kw, CR: 16:1, CI engine
Different loads (10%, 25%, 50%, 75%,85% and 100%), different blends(20%, 40%, 60%, 80%) and constantspeed 3000 rpm
Reduce 60% at low load condition _ –– Average 26%reduction ascompared to diesel
Smoke density min 20%decrease and maximum80% decrease with highengine load
[109]
1-Cylinder, 4S, RP: 3.75 kw,D: 553 cm3, CR: 16.5 DI,WC, CI engine
Different loads (33.3%, 66.6% and100%), different blends (20%, 40%,60% and 80%) and constant speed1500 rpm
Slightly higher than baseline diesel Reduce 2.85%-12.8% for20% and 40% biodieselblends used in dieselengine
– Decrease 28%-39%with 20% and 40%biodiesel blends used
– [135]
1-Cylinder, 4S, WC, DI, D:553 cm3, RP: 4.476 kw, CR:16.5:1, CI engine
Different blends (10%, 25%, 50% and100%) and constant speed(1200 rpm)
Reduce 50% compared with diesel – – Increases 15% Noxemission
B100 reduce smokeopacity by 43%
[136]
4-Cylinder, DI, D: 3298 cm3,CR: 17.5:1, RP: 70 kw, WC,CI engine
Constant speed, different loads andblend (B100, B90M10)
Decrease significantly at higher loadcondition, maximum 46.5% decrease atfull load condition
Slightly higher at lowload condition
– – Lower at high load (80%)condition
[137]
1-Cylinder, DI, WC, 4S, CR:17.5:1, RP: 3.5, CI engine
Constant Speed (1500 rpm) anddifferent load condition
Lower 23% compared with diesel fuelemission
Reduce 50% comparedwith diesel fuel
– 48% reduction in NOxcompared with dieselfuel
Lower (20%) as comparedwith diesel fuel
[134]
A.M
.Ashraful
etal./Energy
Conversionand
Managem
ent80
(2014)202–
228217

Tabl
e15
Engi
neem
issi
onre
sult
sus
ing
pola
nga
biod
iese
lat
diff
eren
tco
ndit
ion.
Engi
ne
Test
con
diti
onEm
issi
onR
efs.
CO
HC
PMN
oxSm
oke
3C
ylin
der,
AV
Lm
ake
CI
engi
ne,
D:
3.44
l,C
R:
18.1
,WC
,RS:
2200
rpm
,P:
44.1
kw
Full
thro
ttle
atdi
ffer
ent
spee
ds(1
200
rpm
,14
00rp
man
d22
00rp
m)
and
diff
eren
tbl
ends
(20%
,50%
and
100%
)
Slig
htl
yim
prov
emen
t12
.96%
wit
hh
ighe
rbi
odie
sel
blen
dra
tio
Red
uce
6.75
%w
ith
use
ofh
igh
erbl
and
rati
o
Red
uce
9.88
–42.
06%
wit
hin
crea
seof
blan
dra
tio
Incr
ease
14.8
7–22
.5%
wit
hin
crea
seof
blen
dra
tio
Red
uct
ion
wit
hin
crea
seof
blen
dra
tio
and
engi
ne
spee
ds
[47]
1-C
ylin
der,
4S,
WC
,DI
Dif
fere
nt
load
s(0
%,2
0%,4
0%,6
0%,8
0%an
d10
0%)
and
diff
eren
tbl
ends
(20%
,40%
,60%
,80%
and
100%
)
––
–4%
Red
uce
for
B10
0bi
odie
sel
use
dat
full
load
35%
redu
cew
ith
B60
biod
iese
lu
sed
asco
mpa
red
todi
esel
[44]
1-C
ylin
der,
4S,W
C,D
I,C
Ien
gin
eD
iffe
ren
tbl
ends
(B10
,B20
,B30
and
B40
),C
onst
ant
spee
d(1
500
rpm
)an
dad
ded
addi
tive
s–
––
Mar
gin
ally
incr
ease
–[4
8]
218 A.M. Ashraful et al. / Energy Conversion and Management 80 (2014) 202–228
� HC emission dramatically decreases by 35-60% with theincrease in biodiesel percentage in the fuel blend and in highengine load condition.� NOx emission increases (6–16%) with increased engine load and
high biodiesel percentage in the blend. However, it decreases(9–27%) when mohua ethyl ester is used.� Smoke level decreases (5–46%) in a full load condition and with
high biodiesel percentage present in the fuel blend.
6.4. Rubber seed oil biodiesel
Rubber seed biodiesel produces lower emission than diesel fuel[106,113,141]. However, it produces high emissions in some spe-cific conditions [142]. The emission characteristics of rubber seedbiodiesel are presented in Table 17. The following deductions canbe made by analyzing the findings of the different experiments:
� CO emission decreases by about 0.13–1.13% with a low biodie-sel concentration in the blend and a high load condition.� With the DEE additive, high load, and low biodiesel percentage
concentration, CO and HC emission is considerably decreased.� NOx emission increases by about 13% with a high biodiesel per-
centage in the blend and a high load condition.� Smoke opacity decreases by 37.09% with a low load condition
and high biodiesel concentration present in the fuel blend.� The volatility and oxygen enrichment provided by DEE are ben-
eficial in improving fuel evaporation and smoke reduction.� The presence of oxygen and the better mixing of DEE with air
lead to an improved combustion rate.
6.5. Cotton seed biodiesel
Some studies examined the use of cotton seed-based biodieselin a diesel engine, and the emission results showed low emissionsof CO, HC, NOx, and smoke opacity [145,146,173]. However, someconditions also showed high emissions [145,148]. Table 18 pre-sents the different experimental results of emission characteristicsusing cotton seed biodiesel and its blends. The table also showsthat the maximum reduction of cotton seed biodiesel of CO, HC,and smoke emission is 45%, 67%, and 14%, respectively, with NOxdecreasing by 25% in some conditions compared with diesel fuel.The following conclusions can be made from the analysis of the dif-ferent experimental results:
� CO and NOx emissions decrease with the increase in fuel injec-tion pressure.� CO and HC emissions drastically decrease with high BMEP and
turbo charging operation.� CO emission decreases by about 4–45.66% depending on differ-
ent conditions.� HC emission increases with increased percentage of biodiesel
present in the fuel blend.� PM emission decreases (24–69%) because of high BMEP.� Higher NOx emission is emitted (6–39.5%) because of low
engine load condition. However, low emission is produced witha high concentration of biodiesel present in the fuel blend.� NOx emission decreases by about 10–25% in a full load
condition.� NOx emission increases with increased BMEP in the combustion
chamber.� Low smoke emission is produced because of the low percentage
of biodiesel present in the fuel blend. However, it increases in ahigh load condition.

Table 16Engine emission results using mohua (Madhuca indica) biodiesel at different condition.
Engine type Test condition Emission Refs.
CO HC PM Nox Smoke
1-Cylinder, 4S, WC, CR: 18:1, P: 9 kw,CI engine
Different blends (B20, B40, B60 andB80), different loads (25%, 50%, 75%and 100%) and constant speed(1500 rpm)
Reduce 0.02–0.2% comparison ofdiesel fuel with the increase ofbiodiesel concentration in theblends
– – Increased 6% comparedwith diesel fuel
Reduce 5–46% with increase ofpercentage of biodiesel in theblends
[96]
1-Cylinder, 4S, WC, CI engine, RP:4 kw
Different blends (10%, 20% and 30%),different loads and constant speed(1500 rpm)
– – – Higher at lower loadcompared to diesel fuel
– [53]
6-Cylinder, 4S, AC, D: 5.9 L, CR:17.6:1, HP: 158, CI engine
Different loads, different blends (B20,B40, B60) and constant speed(1500 rpm)
Reduce 0.02–0.16% with theincrease of biodiesel blendscompared with diesel fuel
Reduce with increaseof blend ratiocompared with dieselfuel
– Increased 11.6% withincrease proportion ofbiodiesel in the blends
– [111]
1-Cylinder, 4S, WC, DI, CR: 16.5:1, RP:3.7 kw, D: 553 cm3
Constant speed (1500 rpm) Reduce 30% compared with dieselfuel
Reduce 35% comparedwith diesel
– Reduced 11% comparedwith diesel
– [107]
1-Cylinder, 4S, WC, DI, CR: 16.5:1, RP:3.7 kw, D: 553 cm3
Constant speed (1500 rpm) and usedMME and MEE
Reduce 67%-79% for both esterused compared with diesel fuel
49%-60% lessercompared to dieselfuel.
– Reduced 9% for methylester and 27% for Ethylester compared todiesel.
– [54]
1-Cylinder, 4S, WC, DI, CR: 16.5:1, RP:3.7 kw, D: 553 cm3
Constant speed (1500 rpm) 0.34% lower compared with diesel Lower than that ofdiesel
– Lower compared todiesel fuel
_ [140]
1- Cylinder, 4S, WC, DI, HP: 7, Blend (B20), constant speed(1500 rpm), and steady state condition
–– – – – Higher compared with diesel fuel [139]
1-Cylinder, 4S, AC, DI, CR: 17.5:1, RP:4.4 kw
Constant speed (1500 rpm) anddifferent loads (0%, 25%, 50%, 75% and100%)
At full load condition COreduction, about 26% comparedwith diesel fuel
Reduce graduallywith increase of loadcompared with dieselfuel
– 4% Lower than dieselfuel
At part load 30% reduction and fullload condition there about 15%reduction compared with dieselfuel
[95]
3-Cylinder, 4S, AC, DI, D: 2826 cm3,CR: 17:1
Different loads, different blends (B10,B20, B40, B60, B80) and constant speed(1500 rpm)
Lower compared to diesel fuel Lower than that ofdiesel fuel
– 16% Increase withincrease ofconcentration ofbiodiesel in diesel fuel
– [138]
A.M
.Ashraful
etal./Energy
Conversionand
Managem
ent80
(2014)202–
228219

Tabl
e17
Engi
neem
issi
onre
sult
sus
ing
rubb
erse
edoi
lbi
odie
sel
atdi
ffer
ent
cond
itio
n.
Engi
ne
type
Test
con
diti
onEm
issi
onR
efs.
CO
HC
Nox
Smok
e
1-C
ylin
der,
4S,D
I,R
P:5.
5kw
,WC
,CI
engi
ne
Dif
fere
nt
load
s,di
ffer
ent
blen
ds(B
20,
B40
,B60
,B80
and
B10
0)an
dco
nst
ant
spee
d(1
500
rpm
)
0.13
–1.1
3%Lo
wer
com
pare
dto
dies
elfu
el–
–In
crea
sew
ith
incr
ease
ofen
gin
elo
ad[1
41]
1-C
ylin
der,
4S,D
I,R
P:5.
5kw
,WC
,CI
engi
ne
Dif
fere
nt
load
s,di
ffer
ent
blen
ds(B
10,
B20
,B50
,B75
and
B10
0)an
dco
nst
ant
spee
d(1
500
rpm
)
Dec
reas
ew
ith
incr
easi
ng
perc
enta
geof
biod
iese
lin
the
fuel
and
low
load
con
diti
on
–In
crea
sew
ith
the
incr
easi
ng
biod
iese
lbl
ends
20%
Bio
dies
elbl
end
gave
low
erab
out
17%
smok
eop
acit
yco
mpa
red
wit
hdi
esel
fuel
[106
]
1-C
ylin
der,
4S,D
I,R
P:4.
4kw
,CR
:17
.5:1
,D:
661.
5cm
3
Con
stan
tsp
eed
(150
0rp
m)
and
diff
eren
tlo
ad(2
5%,5
0%75
%,1
00%
)R
edu
ced
atal
llo
adco
ndi
tion
wit
hth
ein
duct
ion
ofh
ydro
gen
for
all
inje
cted
fuel
Red
uce
dw
ith
the
indu
ctio
nof
hyd
roge
nfo
ral
lin
ject
edfu
el
Incr
ease
1.01
%w
ith
hyd
roge
nen
ergy
shea
rR
edu
ced
smok
ele
vel
37.0
9%at
full
load
con
diti
on[1
13]
1-C
ylin
der,
DI,
4S,R
P:5.
5kw
,CI
engi
ne,
WC
Con
stan
tsp
eed
(150
0rp
m)a
nd
diff
eren
tlo
adco
ndi
tion
Hig
her
than
that
ofdi
esel
inal
lop
erat
ion
con
diti
on–
–H
igh
erth
anth
atof
dies
elw
ith
hig
hlo
adco
ndi
tion
[142
]
1-cy
lin
der,
AC
,CR
:17
.5:1
,4S
,DI,
CI
engi
ne,
RP:
4.4
kw,R
S:15
00rp
m
Var
iou
sdi
eth
ylet
her
(DEE
)(50
g/h
,10
0g/
h,1
50g/
h,2
00g/
han
d25
0g/
h)
and
full
load
con
diti
on
Dec
reas
e26
%w
ith
usi
ng
inje
ctio
nof
DEE
com
pare
dw
ith
RSO
Dec
reas
ew
ith
usi
ng
DEE
oper
atio
nco
mpa
red
wit
hdi
esel
fuel
13%
Hig
her
usi
ng
DEE
inbi
odie
sel
com
pare
dw
ith
dies
elfu
elLa
rge
redu
ctio
nin
smok
eop
acit
yab
out
34.4
%u
sin
gD
EE[1
43]
1-C
ylin
der,
WC
,4S,
DI,
RS:
1500
rpm
,RP:
5.5
kw,
CR
:16
.5:1
Dif
fere
nt
load
san
dco
nst
ant
spee
d15
00rp
m0.
037%
low
erth
anco
mpa
red
wit
hdi
esel
fuel
Low
erco
mpa
red
wit
hdi
esel
fuel
Hig
her
com
pare
dw
ith
dies
elfu
elbu
tlo
wer
6.02
–20.
1%co
mpa
reto
oth
erbi
odie
sel
atal
llo
adco
ndi
tion
–[1
44]
220 A.M. Ashraful et al. / Energy Conversion and Management 80 (2014) 202–228
6.6. Jojoba oil biodiesel
Studies have been conducted on the use of jojoba biodiesel in adiesel engine, and jojoba biodiesel has been found to give higheremission than diesel fuel [61,64,152]. Table 19 shows the differentexperimental results of the emission characteristics of jojoba bio-diesel. Jojoba biodiesel produces high CO, HC, and NOx emissionsin most cases but produces low CO emission in some specific con-ditions. The following conclusions can be deduced from the analy-sis of the different experimental results:
� CO emission increases (12–14%) with the increase in biodieselpercentage in the fuel blend and with EGR operation. However,it decreases in a high engine speed condition.� CO emission decreases dramatically because of high engine
speed.� HC emission decreases significantly in a low engine speed con-
dition and increases with EGR operation.� NOx emission (14–16%) increases with increased engine speed
but decreases by about 11–13% when jojoba methyl ester isused without EGR operation.
6.7. Tobacco oil biodiesel
Tobacco biodiesel in diesel engine produces better emissionperformance compared with diesel fuel in most studies. Table 20shows that blends of tobacco biodiesel reduce CO and increaseHC and NOx emissions. However, HC and NOx emissionssignificantly decrease in some special conditions. The followingdeductions can be made from the analysis of the differentexperimental results:
� With the increase in engine load and biodiesel content in thefuel blend, CO and HC emissions decrease. However, increasewith high injection pressure.� With a full load and in a high injection pressure condition, NOx
increases by about 5–6% but significantly decreases with lowcontent of biodiesel in the fuel blend.� Smoke emission slightly decreases with a full load and in high
engine speed condition.
6.8. Neem biodiesel
Many researchers have used Neem biodiesel in a diesel engineand have found low emission characteristics [156,158–160,162].Some specific condition show high emissions of CO, HC, NOx, andsmoke opacity [157,161]. Table 21 shows the different experimen-tal engine emission results using neem biodiesel in a diesel enginein different conditions. The following conclusions can be madefrom the analysis of the different experimental results:
� CO decreases with increased percentage of ethanol content inthe fuel blend. However, with higher BMEP and engine load,CO emission increases by about 20–40%.� Engine operation with dual mode condition produces high CO
emission.� HC emission increases by 24–54% with the increase in engine
load and decreases by 2.59–5.26% in full load and half loadconditions.� HC emission is higher with the addition of ethanol in fuel blends
in all operating load conditions.� NOx emission decreases by 3.2–6.06% in half load and full load
conditions.� NOx emission decreases by 37% when pure oil is used and by
19% when methyl ester is used in a full load condition.

Table 18Engine emission results using cotton seed biodiesel at different condition.
Engine type Test condition Emission Refs.
CO HC PM NOx Smoke
1-Cylinder, WC, 4S, DI, CR:19.8:1, RS: 4500 rpm
Constant speed (2000 rpm), differentblends (10% and 20%), medium and highload condition
Increase compared withneat diesel fuel atmedium and high loads
Slightly increase withusing 10% biodiesel in thefuel blend
– Lower as compare withneat diesel fuel in bothmedium and high loads
Increase compare with neatdiesel fuel at medium andhigh loads
[114]
6-Cylinder, 4S, WC, DI, D:5958 cm3, CR: 18:1, RP:177 kw, RS: 2600 rpm,
Different speeds (1200 and 1500 rpm),different loads (20%, 40%, 60% and full load)
Reduced with increasingbiodiesel percentage inthe blend
Slightly increase withincrease of biodieselpercentage in the fuelblend
– Slightly increases withhigher percentage ofbiodiesel in the fuel blend
– [147]
1-Clynder, 4S, DI, WC, CR:17:1, D: 770 cm3, RP: 8HP, RS: 2000 rpm
Full load and different speeds (900–1800 rpm)
Increase compared withdiesel fuel
– – – Higher than that of dieselfuel but lower compare withother biodiesel blends
[115]
1-Cylinder, 4S, AC, DI, D:406 cm3, RP: 10 HP, RS:3600 rpm, CR: 18:1
Different speeds (1250–2500 rpm) anddifferent blends (B5, B20, B50, B75 andB100)
Decrease with increase ofbiodiesel percentage inthe fuel blend
– – Decrease at high enginespeed condition
Increase with increase ofblend ratio
[145]
1-Cylinder, 4S, DI, WC, NA,D: 553 cc, CR: 16.5:1, RP:4.476 kw, RS: 1800 rpm
Different speeds and different blends (B10,B20, B30)
Lower than that of dieselfuel
– Reduced 24%compare with neatdiesel fuel
10% increases withincrease engine torque
Reduced 14% at used 10%biodiesel blend
[59]
6-Cylinder, 4S, DI, TC, D:5.9, CR: 17.5:1, RP:136 kw, RS: 2500 rpm
Constant speed 1500 rpm, different BMEPand different methyl ester used
Average 4–16% reducedat high BMEP
Average 45–67% reducedcompare with diesel fuel
Reduced 53–69%on averagecompare withdiesel fuel
Increases 10–23% athigher BMEP
– [174]
6-Cylinder, 4S, DI, WC, TC,D: 5958 cc, CR: 18:1, RP:177 kw, RS: 2600 rpm
Different blends (B10, B20), differentspeeds (1200 rpm and 1500 rpm) anddifferent load condition (20%, 40% and 60%)
Slightly increase withhigher percentage ofbiodiesel in the fuelblend
Increase slightly withincrease biodieselpercentage in the fuelblend
– Slightly increase withhigher percentage ofbiodiesel in the blend
Reduced with the increaseof percentage of oil in thefuel blend
[148]
1-Cylinder, 4S, DI, CR: 18:1,RS: 3600 rpm, NA,
Different speeds and preheated blend at(30�, 60�, 90�, 120 �C)
Decreases 14.40%-45.66%compare with diesel fuel
– – Increase approximately11.21%-39.1% as comparewith diesel fuel
– [149]
1-Cylinder, DI, 4S, AC, CR:18:1, D: 395 cc, RS:3600 rpm, RP: 6.25 kw
Full load and different speeds (2800–1300 rpm)
Decrease about 35%compare with diesel fuel
– – 10–22% decreasecompare with diesel fuel
– [150]
4-Cylinder, 4S, DI, NA, WC,CR: 16.8:1, RP: 51 kw,RS: 2400 rpm,
Full load and different speeds (1200–2400 rpm)
Decrease 5% comparewith diesel fuel
– – Increase 6% compare withdiesel fuel
– [146]
1-Cylinder, 4S, AC, DI, CR:18:1, RP: 6.25 kw, RS:3600 rpm,
Full load and different speeds (1700, 2000,2300, 2600 and 3000 rpm)
17–21% decrease for bothengine test
– – 6.5–7.4% increase forengine test
Lower emission comparedwith diesel fuel
[151]
1-Cylinder, 4S, AC, DI, CR:18:1, RP: 6.25, RS:3600 rpm
Full load, varied injection pressure andconstant speed
Reduction about 30%compare with diesel fuel
– – Reduction 25% comparewith diesel fuel
– [60]
A.M
.Ashraful
etal./Energy
Conversionand
Managem
ent80
(2014)202–
228221

Table 19Engine emission results using jojoba biodiesel at different condition.
Engine type Test condition Emission Refs.
CO HC Nox Smoke
1-Cylinder, 4S, AC, DI, CR:17:1, RP: 5.775 kw, RS:1500 rpm
Various loads (no load, 1/3, 2/3 and fullload), different blends (B20, B40, B60)and different speeds
Increase with the increaseof biodiesel percentage inthe fuel blend
– Increase with the increase of engine speeds – [61]
2-Cylinder, 4S, WC, DI, D:2266 cc, CR: 16.4:1, RS:1500 rpm, RP: 26HP
Different speeds (1000–1900 rpm) andfull load
Decrease with increase ofengine speed compare withdiesel fuel
Higher at low speed condition and EGRoperation but at higher engine speed givelower emission than diesel fuel
Increase about 16% and 14% at engine speed1200 rpm and 1600 rpm but 33% reduction inNOx with EGR operation
– [152]
1-Cylinder, 4S, AC, DI, NA,CR: 17:1, RP: 5.775 kw,RS: 1500 rpm
Different speeds and injection timing of24 CAD BTDC
Increase 12% and 14% withEGR and without EGR
– Decrease about 11% and 13% with EGR andwithout EGR operation
– [64]
Table 20Engine emission results using tobacco oil biodiesel at different condition.
Engine type Test condition Emission Refs.
CO HC Nox Smoke
4-Cylinder, 4S, TC, WC, RP: 112 kw,RS: 9000 rpm
Different loads (50%, 75% and 100%), differentblends (B10, B17.5 and B25) and speed (1500–3000 rpm)
Reduced 100–1600 ppmat medium loadcondition
– Slightly increase at full load – [66]
4-Cylinder, 4S, TC, WC, IDI, CR:21.5:1, D: 1.753, RP: 55 kw, RS:2200 rpm
Different loads (50%, 75% and 100%), differentblends (B10, B17.5 and B25)
Decrease at full loadcondition
– 5% Increase at full loadcondition
– [68]
1-Cylinder, 4S, NA, RS: 1500 rpm,RP: 5 HP
Constant speed 1500 rpm, different loads anddifferent blends (B2 and B5)
Decrease with theincrease of biodieselpercentage
Increase with the increase ofbiodiesel percentage in the fuelblend
Decrease with increase ofbiodiesel percentage in the fuelblend
– [154]
1-Cylinder, 4S, NA, DI, RP: 14.7:1,RS: 2500 rpm
Full load and different speeds (1200, 1400, 1600,1800, 2000, 2200 and 2400 rpm)
Decrease with increaseof engine speed
Decrease with increase of enginespeed
6% Increase compared withdiesel fuel
Reduced slightly athigher engine speedcondition
[153]
1-Cylinder, 4S, DI, WC, RP: 5.2 kw,CR: 17.5:1
Different injection pressures (205, 220, 240 and260 bar)
Slightly highercompared with dieselfuel
Higher than that of diesel fuel Increase with increase ofengine load
– [155]
222A
.M.A
shrafulet
al./EnergyConversion
andM
anagement
80(2014)
202–228

Table 21Engine emission results using neem biodiesel at different condition.
Engine type Test condition Emission Refs.
CO HC PM Nox Smoke
1-Cylinder, 4S, DI, WC, RP:5.2 kw, CR: 17.5:1, RS:1500 rpm
Constant speed 1500 rpm, duelfueling
Increase at dual mode operation Increase with the increaseof engine load
– – Lower as compare with diesel fuel [161]
1-Cylinder, 4S, DI, NA, WC,RP: 9.8 kw, CR: 20:1, RS:2000 rpm
Different blends (B5, B10 and B15),different speed (600–1200 rpm) anddifferent BMEP
Reduced compare with dieselfuel
– – Increase compare with dieselfuel
Reduced compare with diesel fuel [162]
1-Cylinder, 4S, DI, WC, RS:1500 rpm, RP: 3.7 kw,CR: 16.5:1
Constant speed and different loads(1000–4000 watt) condition
Lower compared with diesel fuel Slightly reduced comparewith diesel fuel
– Lower than that of diesel fuel Slightly reduced all load condition [156]
1-Cylinder, 4S, WC, DI, CR:17.5:1, D: 661 cc, RP:5.2 kw, RS: 1500 rpm
Different BMEP (100, 200,300,400,500,600 and 650) andconstant speed 1500 rpm
Increase at increase of BMEP Reduced 5.26% at part loadand 2.59% at full loadcondition
– Decrease about 3.22% at partload and 6.06% at full loadcondition
– [163]
1-Cylinder, 4S, DI, NA, WC,RP: 5HP, RS: 1500 rpm,CR: 16.5:1,
Constant speed and different BP (0–5 kw)
Increase 40% for pure oil and 20%for methyl ester at full load
Increase 54% and 24% forpure oil and methyl ester atfull load condition
– 37% reduction for pure oil and19% reduction for methyl esterat full load condition
Higher than that of diesel fuel [157]
1-Cylinder, AC, DI, CR:17.5:1, RP: 4.4 kw, RS:1500 rpm
Different blends (B10, B20, B30, B40and B50), constant speed anddeferent break power
Lower at all load compared withdiesel fuel
Lower compared with dieselfuel
– Increases with the increase ofengine load
Increase with the increase ofpercentage of biodiesel in the fuelblend and increase engine load
[158]
1-Cylinder, DI, WC, RP:5.2 kw, RS: 1500 rpm
Different blends (B20, B40, B60, B80and B100), Different BMEP andconstant speed 1500 rpm
– Reduced 2.59% at full load – Reduced 6.06% at full load 18.39% reduction at full loadcondition
[159]
1-Cylinder, 4S, NA, DI, CR:16.5:1, RP: 3.5 kw, RS:1500 rpm
Different blends (B5, B10, B15, B20),different loads and constant speed1500 rpm
Lower with the higherpercentage of ethanol in the fuelblend at high loads condition
Higher with the addition ofethanol in the blends at allloads
– Increase slightly at full loadscondition
Decrease at higher engine load withthe addition of ethanol in the fuelblends
[160]
Table 22Engine emission results using linseed biodiesel at different condition.
Engine type Test condition Emission Refs.
CO HC NOx Smoke
1-Cylinder, 4S, AC, DI, RP:4.4 kw, CR: 17.5:1, RS:1500 rpm
Different loads, constant speed 1500 rpmand different injection pressure (200,220and 240 bar)
Lower than that of diesel fuel at all theinjection pressure
HC emission decreases with theincrease of fuel injection pressure
Increase by the increase inengine loads but near thediesel fuel
Lower emissioncompare with dieselfuel
[92]
1-Cylinder, 4S, AC, DI, RP:4.4 kw, D: 661 cc, CR:17.5:1, RS: 1500 rpm
Different loads and constant speed1500 rpm
Higher compare with others biodiesel athigh load condition
Increase with the increase of engineloads
Higher than that of othersbiodiesel
Higher emissioncompare withothers biodiesel
[73]
1-Cylinder, WC, 4S, Di, RP:3.5 kw, CR: 17.5:1, RS:1500 rpm
Different blends (B5, B10, B15 and B20),constant speed 1500 rpm and differentloads
Decrease with the increase of load andincrease of biodiesel concentration inthe fuel blend
Increase with the increase of biodieselconcentration in the fuel blend andengine loads
Slightly increase comparewith the diesel fuel
– [165]
A.M
.Ashraful
etal./Energy
Conversionand
Managem
ent80
(2014)202–
228223

Table 23Engine emission results using jatropha biodiesel at different condition.
Engine type Test condition Emission Refs.
CO HC Nox Smoke
1-Cylinder, 4S, DI, WC, D:1007 cc, CR: 18.5:1, RS:2400 rpm
Different blends (B10, B20, B50 andB100) and different speeds (1000–2400 rpm)
6.51–12.32% Reduced with theincrease of blend ratio
14.91–27.53% Decreases withthe increase of biodieselpercentage in the fuel blend
3.29–10.75% Increases compared withdiesel fuel
Reduced compared withdiesel fuel at higherpercentage of biodiesel blend
[79]
3-Cylinder, 4S, DI, WC, D:3440 cc, CR: 18:1, RS:2200 rpm
Different speeds (1200,1800 and2200 rpm) and different blends (B20,B50 and B100)
Reduced 5.57–35.21% with theincrease of percentage ofbiodiesel in the fuel blend
Reduce about 18.19–32.28% with lower percentage ofbiodiesel blend used
Increased 20.54% with 20% biodieselblend used and 15.65% increased withused 50% biodiesel
Reduced with the increase ofbiodiesel percentage in thefuel blend
[47]
1-Cylinder, 4S, DI, CR:16.5:1, RP: 5HP, RS:1500 rpm
Different blends (B20, B40, B50, B60,B80 and B100) and different loads(25%, 50% 75% and 100%)
Lower compare with diesel fuel Lower than that of diesel fuel Lower compared with diesel fuel – [170]
4-Cylinder, 4S, DI, TC, D:1609 cc, RP: 84.5 kw, CR:18.5:1, RS: 3800 rpm
Different speeds and full loadcondition
10–40% Reduced compare withdiesel fuel
Lower than that of diesel fuel atfull load condition
5–10% Reduction with full loadcondition
Reduce compared with dieselfuel
[80]
1-Cylinder, 4S, DI, WC, RP: 8HP, RS: 1500 rpm
Different blends (B25, B50, B75 andB100) and constant speed
Higher than that of diesel fuel athigh load
Decreases with the increase ofbiodiesel percentage in fuelblend
Increases with the increase of biodieselpercentage in fuel blend and higherthan that of diesel fuel
Lower than that of diesel fuel [169]
1-Cylinder, 4S, WC, DI, D:815 cc, RP: 8.82 kw, CR:17:1, RS: 2000 rpm
Different speeds (1500 and 2000 rpm)and different load
Lower compare with diesel fuelat pick load condition
Decreases with the increase ofengine speed
Lower with the increase of enginespeed
– [166]
1-Cylinder, 4S, DI, AC, CR:18:1, D: 395 cc, RP:5.59 kw, RS: 3600 rpm
Different speeds (1800, 2500 and3200 rpm)
Lower than that of diesel fuel Lower than that of diesel fuel Higher than that of diesel fuel Lower compared with dieselfuel
[94]
1-Cylinder, 4S, DI, AC, D:947.8 cc, CR: 17.5:1, RP:7.4 kw, RS: 1500 rpm
Different blends (B5, B10, B20, B30and B100) and different loads (20%,40%, 60%, 80% and 100%)
Decreases with the increasepercentage of biodiesel in thefuel blend
Decreases with the increase ofbiodiesel blend ratio
Higher than that of diesel fuel Decreases with the increaseof biodiesel concentration inthe fuel blend
[171]
224A
.M.A
shrafulet
al./EnergyConversion
andM
anagement
80(2014)
202–228

A.M. Ashraful et al. / Energy Conversion and Management 80 (2014) 202–228 225
� Smoke opacity decreases by 18.39% with the addition of ethanolin fuel blends and high load condition. However, it increasessignificantly when a high percentage of biodiesel is present inthe blend.
6.9. Linseed oil biodiesel
The emission behavior of linseed oil-based biodiesel used in adiesel engine depends on the engine’s operating condition. Emis-sion results using linseed based biodiesel in a diesel engine showlow emissions of CO, HC, NOx, and smoke [73,92]. However, it pro-duces a high emission in some specific cases. Table 22 shows theemission characteristics affected by different blend ratios. The fol-lowing deductions can be made from the analysis of the differentexperimental results:
� CO decreases when a high content of biodiesel is present in fuelblends and in a high engine load condition.� Linseed biodiesel produces higher HC emission when higher
biodiesel content is present in the fuel blends and in a higherload condition.� HC emission dramatically decreases with the increase in fuel
injection pressure.� NOx emission generally increases when used high biodiesel
percentage in the fuel blned.� Smoke level decreases but NOx emission increases with
increased fuel injection pressure.
6.10. Jatropha biodiesel
Low emissions of CO, HC, NOx, and smoke opacity were ob-served when jatropha biodiesel was used [47,94,166,169]. How-ever, engine emission decreases significantly in some specificconditions [47,94,169]. Table 23 shows the different experimentalengine emission results. Specifically, emissions of CO, HC, andsmoke opacity decrease, with NOx emission decreasing in mostcases. As jatropha biodiesel lowers the heating value, NOx emissionsignificantly decreases. The following deductions can be madefrom the analysis of the different experimental results:
� CO and HC emissions increase because of high engine load withEGR operation and gradually decrease because of a high per-centage of biodiesel concentration present in fuel blends.� CO emission decreases by 5.57–35.21% and HC emission
decreases by 14.91–32.28% because of high biodiesel contentin fuel blends.� NOx emission decreases with EGR operation but increases with
increased engine load and biodiesel content in fuel blends.� NOx emission increases by 3.29–10.75% in some specific condi-
tions. However, it reduces in a full load condition.� Smoke opacity increases in a high engine load condition but
decreases with the increase in biodiesel concentration in fuelblends.
7. Recommendations
Driven by energy security and other environmental concerns,research on biodiesel is rapidly growing around the globe. Appar-ently, the demand for biodiesel will significantly increase in the fu-ture. Although edible oils are available as feedstock sources forbiodiesel production, they may not be sustainable sources. There-fore, reliable, economical, and sustainable feedstocks for biodieselproduction must be sought. As mentioned in previous sections,there are many potential non-edible sources of oil that can com-pete with edible oils, considering that most non-edible oil-growingplants can be cultivated in non-arable lands. Therefore, wasteland
can be used for oil–crop cultivation for biodiesel production tominimize the use of limited arable lands for growing edible oilcrops for biodiesel production. When all these factors are consid-ered, non-edible oils may definitely overrun edible oils as biodieselfeedstocks. However, feedstocks for biodiesel should have a diver-sified oil source depending on geographical location. The use ofedible oils as fuels instead of food will certainly affect the priceof the former. Considering all factors, non-edible vegetable feed-stocks have more advantages than edible vegetable feedstocks.Fertile agricultural land should be maintained for planting edibleoil crops, while wastelands should be maintained for cultivatingnon-edible vegetable crops that have simple ecological require-ments. Developed countries should maximize the utilization oflimited land areas. Variegated resources for biofuel feedstocks willensure that the quality of obtained biodiesel is suitable for thatparticular region. Therefore, non-edible vegetable oil feedstockscan ensure sustainable alternative fuel in the future.
8. Conclusion and summary of results
Biodiesel has attracted much research because of its economicand environmental benefits as well as its renewable origin. Biodie-sel produced from non-edible oil resources can defy the use of edi-ble oil for biodiesel production. Therefore, its demand is growingsteadily, and researchers are looking for possible newer sourcesof non-edible oil. This review concludes that non-edible oil is apromising source that can sustain biodiesel growth.
Fuel properties vary depending on feedstock and the biodieselconversion process. Most reviewed biodiesel fuels have excellentkinematic viscosity, except jojoba, neem, and linseed biodiesel.However, the viscosity ranges of jatropha, tobacco, and mohua bio-diesels are close to that of diesel fuel. Rubber seed, jojoba, tobacco,and jatropha biodiesels are better than others in terms of density.Except for jojoba, neem, and linseed oil biodiesels, other biodieselsmeet the specified flash point limit. Karanja, polanga, cotton seed,jojoba, and jatropha oil biodiesels are excellent in terms of CN. Jo-joba and jatropha biodiesel have better calorific value than otherbiodiesels.
Palmitic acid, stearic acid, oleic acid, linoleic acid, and linolenicacid are the common fatty acids in vegetable oils. Biodiesel qualityand fuel properties are highly dependent on the presence of fattyacid composition in the fuel blend. Several researchers found thatthe presence of monounsaturated fatty acid in biodiesel blend atlow temperature could improve ignition quality, fuel flow proper-ties, and fuel stability. Moreover, biodiesel CN, cloud point, and sta-bility increase with the presence of saturated fatty acid alkyl esterin the fuel blend.
Several studies were carried out to determine power output,BSFC, and BTE of an engine operating with non-edible oil-basedbiodiesel. In most cases, cotton seed and jatropha biodiesels gavehigher BSFC but had better thermal efficiency than other biodie-sels. Their brake power and torque were closer to those of dieselfuel because of their calorific value. Karanja, rubber seed, jojoba,and tobacco biodiesels had higher BTE and power and lower BSFCthan other biodiesels. Moreover, the low percentage of biodieselblends (<20%) caused high brake power and reduced fuel consump-tion because of complete combustion. Therefore, biodiesels withhigh calorific value and low viscosity are more suitable for theimprovement of engine performance.
Biodiesel is an oxygenated fuel that leads to complete combus-tion. Based on several experimental results, the use of karanja, mo-hua, rubber seed, and tobacco biodiesel in CI engine can reduce CO,HC, and smoke emission with an increase in NOx emission. The lowHC emission in most cases is usually caused by advanced injectiontiming and proper combustion in the combustion chamber. More-

226 A.M. Ashraful et al. / Energy Conversion and Management 80 (2014) 202–228
over, higher oxygen contains and higher CN, which is favored tolower emission. However, some authors found a significant reduc-tion of NOx emission. Based on the review of the emission charac-teristics, cotton seed, rubber seed, and karanja biodiesels areconcluded to give better emission characteristics than other bio-diesels. Therefore, non-edible vegetable oil resources have goodpotential to replace edible oil-based biodiesels in the near future.
Acknowledgments
The authors would like to appreciate University of Malayafor financial support through High Impact Research grant titled:‘‘Development of Alternative and Renewable Energy Carrier (DAREC)’’having Grant Number UM.C/HIR/MOHE/ENG/60
Reference
[1] British Petroleum. BP statistical review of world energy. <http://www.bp.com/statistical review of world energy> (2013).
[2] International Energy Agency (IEA). <http://www.iea.org> (2013).[3] CIA World Factbook. <https://www.cia.gov/library/publications/the-world-
factbook/geos/af.html> (2013).[4] Demirbas A. Progress and recent trends in biodiesel fuels. Energy Convers
Manage 2009;50:14–34.[5] No S. Inedible vegetable oils and their derivatives for alternative diesel fuels
in CI engines: a review. Renew Sustain Energy Rev 2011;15:131–49.[6] Silitonga A, Masjuki H, Mahlia T, Ong HC, Chong W. Experimental study on
performance and exhaust emissions of a diesel engine fuelled with Ceibapentandra biodiesel blends. Energy Convers Manage 2013;76:828–36.
[7] Agarwal AK, Rajamanoharan K. Biofuels (alcohols and biodiesel) applicationsas fuels for internal combustion engines. Prog Energy Combust Sci2007;33:233–71.
[8] Ahmad AL, Yasin NHM, Derek CJC, Lim JK. Microalgae as a sustainable energysource for biodiesel production: a review. Renew Sustain Energy Rev2011;15:584–93.
[9] Lapuerta M, Armas O, Rodríguez FJ. Effect of biodiesel fuels on diesel engineemissions. Prog Energy Combust Sci 2008;34:198–223.
[10] Abbaszaadeh A, Ghobadian B, Omidkhah MR, Najafi G. Current biodieselproduction technologies: a comparative review. Energy Convers Manage2012;63:138–48.
[11] Gui MM, Lee KT, Bhatia S. Feasibility of edible oil vs. non-edible oil vs. wasteedible oil as biodiesel feedstock. Energy 2008;33:1646–53.
[12] Leung DYC, Wu X, Leung MKH. A review on biodiesel production usingcatalyzed transesterification. Appl Energy 2010;87:1083–95.
[13] Pramanik K. Properties and use of jatropha curcas oil and diesel fuel blends incompression ignition engine. Renew Energy 2003;28:239–48.
[14] Demirbas A. Potential resources of non-edible oils for biodiesel. Energy Sour,Part B 2009;4:310–4.
[15] Bankovic-Ilic IB, Stamenkovic OS, Veljkovic VB. Biodiesel production fromnon-edible plant oils. Renew Sustain Energy Rev 2012;16:3621–47.
[16] Balat M, Balat H. Progress in biodiesel processing. Appl Energy2010;87:1815–35.
[17] Silitonga A, Masjuki H, Mahlia T, Ong H, Chong W, Boosroh M. Overviewproperties of biodiesel diesel blends from edible and non-edible feedstock.Renew Sustain Energy Rev 2013;22:346–60.
[18] Balat M, Balat H. A critical review of bio-diesel as a vehicular fuel. EnergyConvers Manage 2008;49:2727–41.
[19] Borugadda VB, Goud VV. Biodiesel production from renewable feedstocks:status and opportunities. Renew Sustain Energy Rev 2012;16:4763–84.
[20] Moser BR. Biodiesel production, properties, and feedstocks. Biofuels.Springer; 2011. pp. 285–347.
[21] Hebbal OD, Reddy KV, Rajagopal K. Performance characteristics of a dieselengine with deccan hemp oil. Fuel 2006;85:2187–94.
[22] Sahoo PK, Das LM, Babu MKG, Naik SN. Biodiesel development from high acidvalue polanga seed oil and performance evaluation in a CI engine. Fuel2007;86:448–54.
[23] Kibazohi O, Sangwan RS. Vegetable oil production potential from Jatrophacurcas, Croton megalocarpus, Aleurites moluccana, Moringa oleifera and Pachiraglabra: assessment of renewable energy resources for bio-energy productionin Africa. Biomass Bioenergy 2011;35:1352–6.
[24] Kumar A, Sharma S. Potential non-edible oil resources as biodiesel feedstock:an Indian perspective. Renew Sustain Energy Rev 2011;15:1791–800.
[25] Sekhar MC, Mamilla VR, Mallikarjun M, Reddy KVK. Production of biodieselfrom neem oil. Int J Eng Study 2009;1:295–302.
[26] Ahmad A, Yasin N, Derek C, Lim J. Microalgae as a sustainable energy sourcefor biodiesel production: a review. Renew Sustain Energy Rev2011;15:584–93.
[27] Gui MM, Lee K, Bhatia S. Feasibility of edible oil vs. non-edible oil vs. wasteedible oil as biodiesel feedstock. Energy 2008;33:1646–53.
[28] Syers JK, Wood D, Thongbai P. The proceedings of the international technicalworkshop on the feasibility of non-edible oil seed crops for biofuelproduction. Mae Fah Luang University, Chiang Rai, Thailand; 2007.
[29] Ong H, Silitonga A, Masjuki H, Mahlia T, Chong W, Boosroh M. Production andcomparative fuel properties of biodiesel from non-edible oils: Jatropha curcas,Sterculia foetida and Ceiba pentandra. Energy Convers Manage2013;73:245–55.
[30] Mustafa B. Potential alternatives to edible oils for biodiesel production – areview of current work. Energy Convers Manage 2011;52:1479–92.
[31] Vedharaj S, Vallinayagam R, Yang W, Chou S, Chua K, Lee P. Experimentalinvestigation of kapok Ceiba pentandra oil biodiesel as an alternate fuel fordiesel engine. Energy Convers Manage 2013;75:773–9.
[32] Razon LF. Review alternative crops for biodiesel feedstock; 2009.[33] Chhetri AB, Tango MS, Budge SM, Watts KC, Islam MR. Non-edible plant oils
as new sources for biodiesel production. Int J Mol Sci 2008;9:169–80.[34] Uriarte FAJ. Biofuels from plant oils; 2010 [cited 24 January 2010]. <http://
www.aseanfoundation.org/documents/books/biofuel.pdf> (2010).[35] Atabani AE, Silitonga AS, Ong HC, Mahlia TMI, Masjuki HH, Anjum Badruddina
Irfan, et al. Non-edible vegetable oils: a critical evaluation of oil extraction,fatty acid compositions, biodiesel production, characteristics, engineperformance and emissions production. Renew Sustain Energy Rev2013;18:211–45.
[36] Mohibbe Azam M, Waris A, Nahar NM. Prospects and potential of fatty acidmethyl esters of some non-traditional seed oils for use as biodiesel in India.Biomass Bioenergy 2005;29:293–302.
[37] Bryan RM. Biodiesel production, properties and feedstocks. Vitro Cell DevBiol—Plant 2009;45:229–66.
[38] Karmee SK, Chadha A. Preparation of biodiesel from crude oil of Pongamiapinnata. Bioresour Technol 2005;96:1425–9.
[39] Pinzi S, Garcia IL, Gimenez FJL, Castro MDL, Dorado G, Dorado MP. The idealvegetable oil-based biodiesel composition: a review of social. Econ TechImplic Energy Fuels 2009;23:2325–41.
[40] Scott PT, Pregelj L, Chen N, Hadler JS, Djordjevic MA, Gresshoff PM. Pongamiapinnata: an untapped resource for the biofuels industry of the future.Bioenergy Res 2008;1:2–11.
[41] Srivastava PK, Verma M. Methyl ester of karanja oil as an alternativerenewable source energy. Fuel 2008;87:1673–7.
[42] Agarwal KRAK. Experimental investigations of performance and emissions ofKaranja oil and its blends in a single cylinder agricultural diesel engine. ApplEnergy 2009;86:106–12.
[43] Bajpai S, Sahoo PK, Das LM. Feasibility of blending karanja vegetable oil inpetro-diesel and utilization in a direct injection diesel engine. Fuel2009;88:705–11.
[44] Sahoo P, Das L, Babu M, Naik S. Biodiesel development from high acid valuepolanga seed oil and performance evaluation in a CI engine. Fuel2007;86:448–54.
[45] Venkanna B, Venkataramana Reddy C. Biodiesel production and optimizationfrom Calophyllum inophyllum linn oil (honne oil) A three stage method.Bioresour Technol 2009;100:5122–5.
[46] Hathurusingha S, Ashwath N, Subedi P. Variation in oil content and fatty acidprofile of Calophyllum inophyllum L. with fruit maturity and its implicationson resultant biodiesel quality. Ind Crops Prod 2011;33:629–32.
[47] Sahoo P, Das L, Babu M, Arora P, Singh V, Kumar N, et al. Comparativeevaluation of performance and emission characteristics of jatropha, karanjaand polanga based biodiesel as fuel in a tractor engine. Fuel2009;88:1698–707.
[48] Hegde AK, Rao KS. Performance and emission study of 4S CI engine usingcalophyllum inophyllum biodiesel with additives. Int J Theor Appl Res MechEng (IJTARME) 2012;1:2319–3182.
[49] Ghadge SV, Raheman H. Biodiesel production from mahua (Madhuca indica)oil having high free fatty acids. Biomass Bioenergy 2005;28:601–5.
[50] Jena PC, Raheman H, Prasanna Kumar G, Machavaram R. Biodiesel productionfrom mixture of mahua and simarouba oils with high free fatty acids. BiomassBioenergy 2010;34:1108–16.
[51] Balat M. Potential alternatives to edible oils for biodiesel production – areview of current work. Energy Convers Manage 2011;52:1479–92.
[52] Singh SP, Singh D. Biodiesel production through the use of different sourcesand characterization of oils and their esters as the substitute of diesel: areview. Renew Sustain Energy Rev 2010;14:200–16.
[53] Agarwal D, Kumar L, Agarwal AK. Performance evaluation of a vegetable oilfuelled compression ignition engine. Renew Energy 2008;33:1147–56.
[54] Puhan S, Nagarajan G, Vedaraman N, Ramabramhmam B. Mahua oil (Madhucaindica oil) derivatives as a renewable fuel for diesel engine systems in India: aperformance and emissions comparative study. Int J Green Energy2007;4:89–104.
[55] Ahmad J, Yusup S, Bokhari A, Kamil RNM. Study of fuel properties of rubberseed oil based biodiesel. Energy Convers Manage 2014;78:266–75.
[56] Gill P, Soni SK, Kundu K, Srivastava S. Effect of blends of rubber seed oil onengine performance and emissions; 2011.
[57] Gimbun J, Ali S, Kanwal CCSC, Shah LA, Ghazali NHM, Cheng CK, et al.Biodiesel production from rubber seed oil using activated cement clinker ascatalyst. Proc Eng 2013;53:13–9.
[58] Fontaras G, Tzamkiozis T, Hatziemmanouil E, Samaras Z. Experimental studyon the potential application of cottonseed oil–diesel blends as fuels forautomotive diesel engines. Process Saf Environ Protect 2007;85:396–403.

A.M. Ashraful et al. / Energy Conversion and Management 80 (2014) 202–228 227
[59] Nabi MN, Rahman MM, Akhter MS. Biodiesel from cotton seed oil and itseffect on engine performance and exhaust emissions. Appl Therm Eng2009;29:2265–70.
[60] Ilkilic C, Yücesu H. The use of cottonseed oil methyl ester on a diesel engine.Energy Sour, Part A 2008;30:742–53.
[61] Huzayyin A, Bawady A, Rady M, Dawood A. Experimental evaluation of dieselengine performance and emission using blends of jojoba oil and diesel fuel.Energy Convers Manage 2004;45:2093–112.
[62] Selim MYE, Radwan MS, Elfeky SMS. Combustion of jojoba methyl ester in anindirect injection diesel engine. Renew Energy 2003;28:1401–20.
[63] Al-Widyan MI, Al-Muhtaseb MtA. Experimental investigation of jojoba as arenewable energy source. Energy Convers Manage 2010;51:1702–7.
[64] Shehata M, Razek S. Experimental investigation of diesel engine performanceand emission characteristics using jojoba/diesel blend and sunflower oil. Fuel2011;90:886–97.
[65] Veljkovic V, Lakicevic S, Stamenkovic O, Todorovic Z, Lazic M. Biodieselproduction from tobacco (Nicotiana tabacum L.) seed oil with a high contentof free fatty acids. Fuel 2006;85:2671–5.
[66] Usta N. An experimental study on performance and exhaust emissions of adiesel engine fuelled with tobacco seed oil methyl ester. Energy ConversManage 2005;46:2373–86.
[67] Usta N, Aydogan B, Çon A, Uguzdogan E, Özkal S. Properties and qualityverification of biodiesel produced from tobacco seed oil. Energy ConversManage 2011;52:2031–9.
[68] Usta N. Use of tobacco seed oil methyl ester in a turbocharged indirectinjection diesel engine. Biomass Bioenergy 2005;28:77–86.
[69] Giannelos P, Zannikos F, Stournas S, Lois E, Anastopoulos G. Tobacco seed oilas an alternative diesel fuel: physical and chemical properties. Ind Crops Prod2002;16:1–9.
[70] Sanford SD, White JM, Shah PS, Wee C, Valverde MA, Meier GR. Feedstock andbiodiesel characteristics report. Renew Energy Group 2009;416.
[71] Anyanwu C, Mbajiorgu C, Ibeto C, Ejikeme P. Effect of reaction temperatureand time on neem methyl ester yield in a batch reactor. Energy ConversManage 2013;74:81–7.
[72] Ali MH, Mashud M, Rubel MR, Ahmad RH. Biodiesel from neem oil as analternative fuel for diesel engine. Proc Eng 2013;56:625–30.
[73] Puhan S, Saravanan N, Nagarajan G, Vedaraman N. Effect of biodieselunsaturated fatty acid on combustion characteristics of a DI compressionignition engine. Biomass Bioenergy 2010;34:1079–88.
[74] Dixit S, Rehman A. Linseed oil as a potential resource for bio-diesel: a review.Renew Sustain Energy Rev 2012;16:4415–21.
[75] Openshaw K. A review of Jatropha curcas: an oil plant of unfulfilled promise.Biomass Bioenergy 2000;19:1–15.
[76] Misra RD, Murthy MS. Performance, emission and combustion evaluation ofsoapnut oil-diesel blends in a compression ignition engine. Fuel2011;90:2514–8.
[77] Silitonga AS, Atabani AE, Mahlia TMI, Masjuki HH, Anjum Badruddin Irfan,Mekhilef S. A review on prospect of Jatropha curcas for biodiesel in Indonesia.Renew Sustain Energy Rev 2011;15:3733–56.
[78] Achten WMJ, Verchot L, Franken YJ, Mathijs E, Singh VP, Aerts R, et al.Jatropha bio-diesel production and use. Biomass Bioenergy 2008;32:1063–84.
[79] Reksowardojo I, Lubis I, Manggala W, Brodjonegoro T, Soerawidjaja T,Arismunandar W. Performance and exhaust gas emissions of usingbiodiesel fuel from physic nut (Jatropha curcas L.) oil on a direct injectiondiesel engine (DI). Training 2013;2007:11–9.
[80] Manickam M, Kadambamattam M, Abraham M. Combustion characteristicsand optimization of neat biodiesel on high speed common rail diesel enginepowered SUV. SAE Technical paper 2009-01-2786, 2009.
[81] Rashid U, Anwar F, Moser BR, Knothe G. Moringa oleifera oil: a possiblesource of biodiesel. Bioresour Technol 2008;99:8175–9.
[82] Rizwanul Fattah IM, Masjuki H, Liaquat A, Ramli R, Kalam M, Riazuddin V.Impact of various biodiesel fuels obtained from edible and non-edible oils onengine exhaust gas and noise emissions. Renew Sustain Energy Rev2013;18:552–67.
[83] No SY. Inedible vegetable oils and their derivatives for alternative dieselfuels in CI engines: a review. Renew Sustain Energy Rev 2011;15:131–49.
[84] Alptekin E, Canakci M. Determination of the density and the viscosities ofbiodiesel–diesel fuel blends. Renew Energy 2008;33:2623–30.
[85] Masjuki HH. Biofuel engine: a new challange. Kuala Lumpur: International &Corporate relation office, University of Malaya; 2010. p. 1–56.
[86] Prasad L, Agrawal A. Experimental investigation of performance of dieselengine working on diesel and neem oil blends. Carbon 2012;86:78.92.
[87] Anbumani K, Singh AP. Performance of mustard and neem oil blends withdiesel fuel in CI engine. Carbon 2006;86:78–92.
[88] Panwar NL, Shrirame HS, Rathore NS, Jindal S, Kurchania AK. Performanceevaluation of a diesel engine fueled with methyl ester of castor seed oil. ApplTherm Eng 2010;30:245–9.
[89] Ghadge SV, Raheman H. Process optimization for biodiesel production frommahua (Madhuca indica) oil using response surface methodology. BioresourTechnol 2006;97:379–84.
[90] Palash S, Masjuki H, Kalam M, Masum B, Sanjid A, Abedin M. State of the art ofNOx mitigation technologies and their effect on the performance andemission characteristics of biodiesel-fueled Compression Ignition engines.Energy Convers Manage 2013;76:400–20.
[91] Shahabuddin M, Kalam M, Masjuki H, Bhuiya M, Mofijur M. An experimentalinvestigation into biodiesel stability by means of oxidation and propertydetermination. Energy 2012;44:616–22.
[92] Puhan S, Jegan R, Balasubbramanian K, Nagarajan G. Effect of injectionpressure on performance, emission and combustion characteristics of highlinolenic linseed oil methyl ester in a DI diesel engine. Renew Energy2009;34:1227–33.
[93] Chauhan BS, Kumar N, Du Jun Y, Lee KB. Performance and emission study ofpreheated Jatropha oil on medium capacity diesel engine. Energy2010;35:2484–92.
[94] Ganapathy T, Gakkhar RP, Murugesan K. Influence of injection timing onperformance, combustion and emission characteristics of Jatropha biodieselengine. Appl Energy 2011;88:4376–86.
[95] Saravanan N, Nagarajan G, Puhan S. Experimental investigation on a DI dieselengine fuelled with Madhuca indica ester and diesel blend. Biomass Bioenergy2010;34:838–43.
[96] Raheman H, Ghadge SV. Performance of compression ignition engine withmahua (Madhuca indica) biodiesel. Fuel 2007;86:2568–73.
[97] Boog JHF, Silveira ELC, De Caland LB, Tubino M. Determining the residualalcohol in biodiesel through its flash point. Fuel 2011;90:905–7.
[98] Carareto NDD, Kimura CYCS, Oliveira EC, Costa MC, Meirelles AJA. Flash pointsof mixtures containing ethyl esters or ethylic biodiesel and ethanol. Fuel2012;96:319–26.
[99] Fernando S, Karra P, Hernandez R, Jha SK. Effect of incompletely convertedsoybean oil on biodiesel quality. Energy 2007;32:844–51.
[100] Sanford S, White J, Shah P, Wee C, Valverde M, Meier G. Feedstock andbiodiesel characteristics report. <http://www.regfuel.com/pdfs/FeedstockandBiodieselCharacteristicsReport.pdf> (2011).
[101] Krishna BM, Mallikarjuna JM. Properties and performance of cotton seed oil–diesel blends as a fuel for compression ignition engines. J Renew SustainEnergy 2009;1:1–10.
[102] Botanic Garden of Indian Republic (BGIR). Data base of oil yielding plants.<http://www.mnre.gov.in/list/oil-plants.pdfS> (2004).
[103] Yusuf SKKNNAN, Yaakub Z. Overview on the current trends in biodieselproduction. Energy Convers Manage 2010;52:2741–51.
[104] Nwafor O. The effect of elevated fuel inlet temperature on performance ofdiesel engine running on neat vegetable oil at constant speed conditions.Renew Energy 2003;28:171–81.
[105] Ramadhas AS, Jayaraj S, Muraleedharan C. Biodiesel production from highFFA rubber seed oil. Fuel 2005;84:335–40.
[106] Ramadhas CMuraleedharan, Jayaraj S. Performance and emission evaluationof a diesel engine fueled with methyl esters of rubber seed oil. Renew Energy2005;30:1789–800.
[107] Puhan S, Vedaraman N, Ram BV, Sankarnarayanan G, Jeychandran K. Mahuaoil (Madhuca indica seed oil) methyl ester as biodiesel-preparation andemission characteristics. Biomass Bioenergy 2005;28:87–93.
[108] Sureshkumar K, Velraj R, Ganesan R. Performance and exhaust emissioncharacteristics of a CI engine fueled with Pongamia pinnata methyl ester(PPME) and its blends with diesel. Renew Energy 2008;33:2294–302.
[109] Raheman H, Phadatare A. Diesel engine emissions and performance fromblends of karanja methyl ester and diesel. Biomass Bioenergy 2004;27:393–7.
[110] Department of Forestry of The Republic of Indonesia. The Forestry Researchand Development Agency (Badan Penelitandan Pengembangan Kehutanan)(Nyamplung Calophyllum inophyllum. Lapotential source of biofuel).Department of Forestry Bogor; 2008.
[111] Godiganur S, Suryanarayana Murthy CH, Reddy RP. 6BTA 5.9 G2-1 Cumminsengine performance and emission tests using methyl ester mahua (Madhucaindica) oil/diesel blends. Renew Energy 2009;34:2172–7.
[112] Ikwuagwu O, Ononogbu I, Njoku O. Production of biodiesel using rubber[Hevea brasiliensis (Kunth. Muell.)] seed oil. Ind Crops Prod 2000;12:57–62.
[113] Edwin Geo V, Nagarajan G, Nagalingam B. Studies on dual fuel operation ofrubber seed oil and its bio-diesel with hydrogen as the inducted fuel. Int JHydrogen Energy 2008;33:6357–67.
[114] Rakopoulos C, Antonopoulos K, Rakopoulos D, Hountalas D, Giakoumis E.Comparative performance and emissions study of a direct injection dieselengine using blends of diesel fuel with vegetable oils or bio-diesels of variousorigins. Energy Convers Manage 2006;47:3272–87.
[115] Altin R, Cetinkaya S, Yücesu H. The potential of using vegetable oil fuels asfuel for diesel engines. Energy Convers Manage 2001;42:529–38.
[116] Chauhan BS, Kumar N, Jun YD, Lee KB. Performance and emission study ofpreheated Jatropha oil on medium capacity diesel engine. Energy2010;35:2484–92.
[117] Palash S, Kalam M, Masjuki H, Arbab M, Masum B, Sanjid A. Impacts of NOxreducing antioxidant additive on performance and emissions of a multi-cylinder diesel engine fueled with Jatropha biodiesel blends. Energy ConversManage 2014;77:577–85.
[118] Knothe G. Biodiesel and renewable diesel. Inform Champaign 2008;19:149.[119] Mohammad Fauzi AH, Saidina Amin NA. Optimization of oleic acid
esterification catalyzed by ionic liquid for green biodiesel synthesis. EnergyConvers Manage 2013;76:818–27.
[120] Alptekin E, Canakci M. Characterization of the key fuel properties of methylester–diesel fuel blends. Fuel 2009;88:75–80.
[121] Canakci M, Sanli H. Biodiesel production from various feedstocks and theireffects on the fuel properties. J Ind Microbiol Biotechnol 2008;35:431–41.
[122] Sahoo P, Das L. Process optimization for biodiesel production from Jatropha,Karanja and Polanga oils. Fuel 2009;88:1588–94.

228 A.M. Ashraful et al. / Energy Conversion and Management 80 (2014) 202–228
[123] Moser B. Biodiesel production, properties, and feedstocks. Vitro Cell DevBiol—Plant 2009;45:229–66.
[124] Sharma YC, Singh B, Upadhyay SN. Advancements in development andcharacterization of biodiesel: a review. Fuel 2008;87:2355–73.
[125] Subramanian K, Singal S, Saxena M, Singhal S. Utilization of liquid biofuels inautomotive diesel engines: an Indian perspective. Biomass Bioenergy2005;29:65–72.
[126] Banapurmath NR, Tewari PG, Hosmath RS. Performance and emissioncharacteristics of a DI compression ignition engine operated on Honge,Jatropha and sesame oil methyl esters. Renew Energy 2008;33:1982–8.
[127] Mahanta P, Mishra SC, Kushwah YS. An experimental study of Pongamiapinnata L, oil as a diesel substitute. Proc Inst Mech Engrs, Part A: J PowerEnergy 2006;220:803–8.
[128] Acikgoz C, Kockar O. Flash pyrolysis of linseed (Linum usitatissimum L.) forproduction of liquid fuels. J Anal Appl Pyrol 2007;78:406–12.
[129] Lapuerta M, Armas O, Ballesteros R, Fernández J. Diesel emissions frombiofuels derived from Spanish potential vegetable oils. Fuel 2005;84:773–80.
[130] Okieimen F, Bakare O, Okieimen C. Studies on the epoxidation of rubber seedoil. Ind Crops Prod 2002;15:139–44.
[131] Kasote DM, Badhe YS, Hegde MV. Effect of mechanical press oil extractionprocessing on quality of linseed oil. Ind Crops Prod 2013;42:10–3.
[132] Sajjad H, Masjuki H, Varman M, Kalam M, Arbab M, Imtenan S, et al. Enginecombustion, performance and emission characteristics of gas to liquid (GTL)fuels and its blends with diesel and bio-diesel. Renew Sustain Energy Rev2014;30:961–86.
[133] Baiju B, Naik MK, Das LMA. Comparative evaluation of compression ignitionengine characteristics using methyl and ethyl esters of Karanja oil. RenewEnergy 2009;34:1616–21.
[134] Jindal S, Nandwana BP, Rathore NS. Comparative evaluation of combustion,performance, and emissions of jatropha methyl ester and karanj methyl esterin a direct injection diesel engine. Energy Fuels 2010;24:1565–72.
[135] Nagarhalli M, Nandedkar V, Mohite K. Emission and performancecharacteristics of karanja biodiesel and its blends in a CI engine and it’seconomics. ARPN J Eng Appl Sci 2010;5:52–6.
[136] Nabi MN, Hoque SMN, Akhter MS. Karanja (Pongamia Pinnata) biodieselproduction in Bangladesh, characterization of karanja biodiesel and its effecton diesel emissions. Fuel Process Technol 2009;90:1080–6.
[137] Anand K, Sharma R, Mehta PS. Experimental investigations on combustion,performance and emissions characteristics of neat karanji biodiesel and itsmethanol blend in a diesel engine. Biomass Bioenergy 2011;35:533–41.
[138] Godiganur S, Murthy CS, Reddy RP. Performance and emission characteristicsof a Kirloskar HA394 diesel engine operated on Mahua oil methyl ester.Thammasat Int J Sci Technol 2010;15.
[139] Kapilan N, Reddy R. Evaluation of methyl esters of mahua oil (Madhucaindica) as diesel fuel. J Am Oil Chem Soc 2008;85:185–8.
[140] Puhan S, Vedaraman N, Rambrahamam B, Nagarajan G. Mahua (Madhucaindica) seed oil: a source of renewable energy in India. J Sci Ind Res2005;64:890.
[141] Ramadhas A, Jayaraj S, Muraleedharan C. Characterization and effect of usingrubber seed oil as fuel in the compression ignition engines. Renew Energy2005;30:795–803.
[142] Ramadhas A, Jayaraj S, Muraleedharan C. Dual fuel mode operation in dieselengines using renewable fuels: rubber seed oil and coir-pith producer gas.Renew Energy 2008;33:2077–83.
[143] Geo VE, Nagarajan G, Nagalingam B. Studies on improving the performance ofrubber seed oil fuel for diesel engine with DEE port injection. Fuel2010;89:3559–67.
[144] Satyanarayana M, Muraleedharan C. Investigations on performance andemission characteristics of vegetable oil biodiesels as fuels in a singlecylinder direct injection diesel engine. Energy Sour, Part A: Recov, UtilizEnviron Eff 2011;34:177–86.
[145] Aydin H, Bayindir H. Performance and emission analysis of cottonseed oilmethyl ester in a diesel engine. Renew Energy 2010;35:588–92.
[146] Karabektas M. The effects of turbocharger on the performance and exhaustemissions of a diesel engine fuelled with biodiesel. Renew Energy2009;34:989–93.
[147] Rakopoulos C, Rakopoulos D, Hountalas D, Giakoumis E, Andritsakis E.Performance and emissions of bus engine using blends of diesel fuel with bio-diesel of sunflower or cottonseed oils derived from Greek feedstock. Fuel2008;87:147–57.
[148] Rakopoulos D, Rakopoulos C, Giakoumis E, Dimaratos A, Founti M.Comparative environmental behavior of bus engine operating on blends ofdiesel fuel with four straight vegetable oils of Greek origin: sunflower,cottonseed, corn and olive. Fuel 2011;90:3439–46.
[149] Karabektas M, Ergen G, Hosoz M. The effects of preheated cottonseed oilmethyl ester on the performance and exhaust emissions of a diesel engine.Appl Therm Eng 2008;28:2136–43.
[150] Yücesu HS, _Ilkiliç C. Effect of cotton seed oil methyl ester on the performanceand exhaust emission of a diesel engine. Energy Sour, Part A 2006;28:389–98.
[151] Hazar H. Cotton methyl ester usage in a diesel engine equipped withinsulated combustion chamber. Appl Energy 2010;87:134–40.
[152] Saleh H. Effect of exhaust gas recirculation on diesel engine nitrogen oxidereduction operating with jojoba methyl ester. Renew Energy2009;34:2178–86.
[153] Parlak A, Ayhan V, Cesur _I, Kökkülünk G. Investigation of the effects of steaminjection on performance and emissions of a diesel engine fuelled withtobacco seed oil methyl ester. Fuel Process Technol 2013;116:101–9.
[154] Murthy YS. Performance of tobacco oil-based bio-diesel fuel in a singlecylinder direct injection engine. Int J Phys Sci 2010;5:2066–74.
[155] Rao DA, Govindarajulu K, Mohan C. Experimental investigations on a fourstroke compression ignition engine using neat tobacco seed oil as analternate fuel. Global J Res Eng 2013;13.
[156] Sharma D, Soni S, Mathur J. Emission reduction in a direct injection dieselengine fueled by neem–diesel blend. Energy Sour, Part A 2009;31:500–8.
[157] Sivalakshmi S, Balusamy T. Experimental investigation on a diesel enginefuelled with neem oil and its methyl ester. Therm Sci 2011;15:1193–204.
[158] Elango T, Senthilkumar T. Effect of methyl esters of neem and diesel oilblends on the combustion and emission characteristics of a CI engine. ARPN JEng Appl Sci 2010;5:80–5.
[159] Ragit S, Mohapatra S, Kundu K. Comparative study of engine performance andexhaust emission characteristics of a single cylinder 4-stroke CI engineoperated on the esters of hemp oil and neem oil. Ind J Eng Mater Sci2011;18:204–10.
[160] Sivalakshmi S, Balusamy T. Influence of ethanol addition on a diesel enginefuelled with neem oil methyl ester. Int J Green Energy 2012;9:218–28.
[161] Banapurmath N, Tewari P, Yaliwal V, Kambalimath S, Basavarajappa Y.Combustion characteristics of a 4-stroke CI engine operated on Honge oil,Neem and Rice Bran oils when directly injected and dual fuelled withproducer gas induction. Renew Energy 2009;34:1877–84.
[162] Nabi MN, Akhter MS, Zaglul Shahadat MM. Improvement of engine emissionswith conventional diesel fuel and diesel–biodiesel blends. Bioresour Technol2006;97:372–8.
[163] Ragit S, Mohapatra S, Kundu K. Performance and emission evaluation of adiesel engine fueled with methyl ester of neem oil and filtered neem oil. J SciInd Res 2010;69:62–6.
[164] Agarwal DK, Agarwal L, Kumar A. Performance evaluation of a vegetable oilfuelled compression ignition engine. Renew Energy 2008;33:1147–56.
[165] Jindal S, Salvi B. Sustainability aspects and optimization of linseed biodieselblends for compression ignition engine. J Renew Sustain Energy2012;4:043111.
[166] Huang J, Wang Y, Qin J-B, Roskilly AP. Comparative study of performance andemissions of a diesel engine using Chinese pistache and jatropha biodiesel.Fuel Process Technol 2010;91:1761–7.
[167] Agarwal D, Agarwal AK. Performance and emissions characteristics ofJatropha oil (preheated and blends) in a direct injection compressionignition engine. Appl Therm Eng 2007;27:2314–23.
[168] Kannan D, Pachamuthu S, Nurun Nabi M, Hustad JE, Løvås T. Theoretical andexperimental investigation of diesel engine performance, combustion andemissions analysis fuelled with the blends of ethanol, diesel and jatrophamethyl ester. Energy Convers Manage 2012;53:322–31.
[169] Sundaresan M, Chandrasekaran S, Porai PT, combustion Analysis of.performance and emissions characteristics of blends of methyl esters ofjatropha oil (MEJ) in DI diesel engine. SAE Technical paper 2007-32-0066,2007.
[170] Choudhury S, Bose P. Jatropha derived biodiesel—its suitability as CI enginefuel. SAE Int 2008;28:0040.
[171] Chauhan BS, Kumar N, Cho HM. A study on the performance and emission of adiesel engine fueled with Jatropha biodiesel oil and its blends. Energy2012;37:616–22.
[172] Al-Dawody MF, Bhatti S. Optimization strategies to reduce the biodiesel NOxeffect in diesel engine with experimental verification. Energy ConversManage 2013;68:96–104.
[173] Rakopoulos D. Heat release analysis of combustion in heavy-dutyturbocharged diesel engine operating on blends of diesel fuel withcottonseed or sunflower oils and their bio-diesel. Fuel 2012;96:524–34.
[174] Wu F, Wang J, Chen W, Shuai S. A study on emission performance of a dieselengine fueled with five typical methyl ester biodiesels. Atmos Environ2009;43:1481–5.
Copyright © 2022 FDOKUMEN