Probation and Parole 1990 - Bureau of Justice Statistics
12
U.S. Department of Justice Office of Justice Programs Bureau of Justice Statistics Probation and Parole 1990 By Louis Jankowski BJS Statistician During 1990 the number of adults on pro- bation or on parole Increased to record high levels. State and Federal agencies reported that 2,670,234 adult offenders were on probation and 531,407 were on parole - an estimated 1.7% of all adults In the United States. The number of men on probation or parole was about 3% of all adult males. -The estimated total of adults In the Nation under some form of correctional super- vision, including those in local jails or State and Federal prisons, reached a new high of over 4.3 million - an increase of about 7% since 1989 and 44% since 1985 (figure 1). An estimated 1 out of every 43 adults in the United States were under some form of correctional supervision on a given day In 1990. One in every 24 men and 1 in every 162 women were being supervised. Probation The probation population in 1990 showed a 5.9% gain over the previous year's count (table 1). The number of adults on proba- tion in the States increased at a rate of 6.1 %, while the number under Federal supervision decreased by 1.5 percentage points. The increase in the probation population occurred in every region, with the West reporting the highest gain (9.5%) and the Northeast the lowest (3.7%). Five States reported increases of over 16% In their probation populations: Delaware (26.0%). Rhode Island (25.6%). Oregon (18.0%). Montana (17.1%), and Correctional populations In the United States, 1985-90 Probation Jail Prison Parole Figura 1 Total Number of adult offenders 4 million :3 2 o November 1991 For more than a decade, this reporting series has documented the large popula- tion of offenders who serve all or part of their sentences under supervision in the community. In 1990, among the estimat- ed 4.3 million adults being Incarcerated or supervised by correctional agencies, three-quarters were living in the community. The agencies that supervise persons on probation or parole undertake challenging work. The probation and parole officers must impress on a grow- ing number of offenders that society requires lawful conduct and that their behavior will be monitored. Adult probationers are often serving their first criminal sentences, while parolees are re-entering the community from prison. For both groups the community supelvision represents a period of testing. The report also notes that about 72,000 offenders on probation or parole were under intensive supervision. This intermediate punishment enables the courts to require that certain offenders be supervised more closely and regularly. BJS depends on the cooperation of State, local, and Federal officials to report on the vital work of community correctional agencies. I trust that readers will find the results of this collab- orative effort valuable, and I hope that we and the agencies can continue to work together in providing the Nation with the iatest and best information on its criminal justice system. Steven D. Dillingham, Ph.D. Director
-
Upload
khangminh22 -
Category
Documents
-
view
4 -
download
0
Transcript of Probation and Parole 1990 - Bureau of Justice Statistics

U.S. Department of Justice Office of Justice Programs Bureau of Justice Statistics
Probation and Parole 1990 By Louis Jankowski
BJS Statistician
During 1990 the number of adults on probation or on parole Increased to record high levels. State and Federal agencies reported that 2,670,234 adult offenders were on probation and 531,407 were on parole - an estimated 1.7% of all adults In the United States. The number of men on probation or parole was about 3% of all adult males.
-The estimated total of adults In the Nation under some form of correctional supervision, including those in local jails or State and Federal prisons, reached a new high of over 4.3 million - an increase of about 7% since 1989 and 44% since 1985 (figure 1). An estimated 1 out of every 43 adults in the United States were under some form of
correctional supervision on a given day In 1990. One in every 24 men and 1 in every 162 women were being supervised.
Probation
The probation population in 1990 showed a 5.9% gain over the previous year's count (table 1). The number of adults on probation in the States increased at a rate of 6.1 %, while the number under Federal supervision decreased by 1.5 percentage points. The increase in the probation population occurred in every region, with the West reporting the highest gain (9.5%) and the Northeast the lowest (3.7%).
Five States reported increases of over 16% In their probation populations: Delaware (26.0%). Rhode Island (25.6%). Oregon (18.0%). Montana (17.1%), and
Correctional populations In the United States, 1985-90
Probation Jail Prison Parole
Figura 1
Total
Number of adult offenders
4 million
:3
2
o
November 1991
For more than a decade, this reporting series has documented the large population of offenders who serve all or part of their sentences under supervision in the community. In 1990, among the estimated 4.3 million adults being Incarcerated or supervised by correctional agencies, three-quarters were living in the community.
The agencies that supervise persons on probation or parole undertake challenging work. The probation and parole officers must impress on a growing number of offenders that society requires lawful conduct and that their behavior will be monitored.
Adult probationers are often serving their first criminal sentences, while parolees are re-entering the community from prison. For both groups the community supelvision represents a period of testing. The report also notes that about 72,000 offenders on probation or parole were under intensive supervision. This intermediate punishment enables the courts to require that certain offenders be supervised more closely and regularly.
BJS depends on the cooperation of State, local, and Federal officials to report on the vital work of community correctional agencies. I trust that readers will find the results of this collaborative effort valuable, and I hope that we and the agencies can continue to work together in providing the Nation with the iatest and best information on its criminal justice system.
Steven D. Dillingham, Ph.D. Director

Table 1. Adults on probation, 1990
Percent Number on change In probation on
Probation Probation probation 12131/90 par Region and population, 1990 population, population 100,000 adult Jurisdiction 1/1/90 Entries Exits 12131/90 during 1990 residents
U.S. total 2,521,525 1,637,557 1,489,448 2,670,234 5.9% 1,443
Federal 59,106 .. Jl,388 21,272 58,222 -1.5% 31 State 2,462,419 1,617,169 1,468,176 2,612,012 6.1 1,411
Northeast 449,418 219,442 202,854 466,006 3.7% 1,198
Connecticut 42,842 28,738 24,940 46,640 8.9 1,838 Maine 6,851 4,698 4,000 7,549 10.2 821 Massachusetts 88,529 44,486 60,556 72,459 -18.2 1,554 New Hampshire 2,991 1,775 1,620 3,146 5.2 379 New Jersey 64,398 33,540 25,597 72,341 12.3 1,220 New York 136,686 47,656 39,076 145,256 6.3 1,058 Pennsylvania 88,491 46,111 38,275 97,327 8.8 1,071 Rhode Island 12,231 9,294 6,159 15,366 25.6 1,975 Vermont 5,399 3,144 2,631 5,912 9.5 1,408
Midwest 538,394 392,972 364,127 567,839 5.5% 1,289
illinois 93,944 58,870 57,115 95,699 1.9 1,128 Ind!ana 61,177 65,388 58,482 68,683 12.3 1,680 Iowa 13,722 346 173 13,895 1.3 675 Kansas 21,675 12,683 12,175 22,183 2.3 1,222 Michigan 122,459 100,151 89,171 133,439 9.0 1,952 Minnesota 58,648 31,394 30,719 59,323 1.2 1,849 Missouri 44,158 25,000 26,836 42,322 -4.2 1,113 N(lbraska 12,627 17,767 15,740 14,654 16.1 1,275 North Dakota 1,644 523 436 1,731 5.3 374 Ohio 78,299 59,049 53,968 83,380 6.5 1,036 South Dakota 2,757 3,995 3,592 3,160 14.6 635 Wisconsin 27,284 17,8(16 15,720 29,370 7.6 815
South 984,909 595,398 638,295 1,042,012 5.8% 1,643
Alabama 25,519 14,251 12,084 27,Fl86 8.5 928 Arkansas 15,552 3,531 3,100 15,983 Z.8 924 Delaware 9,701 6,393 3,871 12,223 26.0 2,430 DlstrictofColumbla 10,132 8,070 8,460 9,742 -3.8 1,988 Florida 192,731 266,244 248,194 210,781 9.4 2,093 Georgia 125,147 76,042 66,349 134,840 7.7 2,838 Kentucky 8,062 3,030 3,610 7,482 -7.2 274 Louisiana 32,295 13,310 15,414 30,191 -6.5 1,009 Maryland 84,456 44,435 45,993 82,898 -1.8 2,291 Mississippi 7,333 3,138 2,250 8,221 12.1 450 North Carolina 72,325 41,981 36,477 77,829 7.6 1,550 Oklahoma 24,240 12,565 12,394 24,411 .7 1,057 South Carolina 31,623 14,405 13,741 32,287 2.1 1,258 Tennessee 30,906 21,925 20,112 32,719 5.9 894 Texas 291,156 151,767 134,566 308,357 5.9 2,538 Virginia 19,085 11,951 9,733 21,303 11.6 455 West Virginia 4,646 2,360 1,947 5,059 8.9 375
West 489,698 309,357 262,900 536,155 9.5% 1,385
Alaska 3,335 1,993 1,729 3,599 7.9 952 Arizona 27,340 11,978 8,921 30,397 11.2 1,133 California 284,437 173,883 152,620 305,700 7.5 1.389 Colorado 28,037 22,310 19,236 31,111 11.0 1,279 HawaII 10,960 6,442 5,735 11,667 6.5 1,409 Idaho 4,025 2,024 1,672 4,377 8.7 627 Montana 3,459 1,873 1,280 4,052 17.1 702 Nevada 7,065 3,518 2,883 7,700 9.0 851 New Mexico 5,660 9,650 9,016 6,294 11.2 589 Oregon 31,878 15,742 9,989 37,631 18.0 1.777 Utah 5,524 3,596 3,290 5,830 5.5 532 Washington 74,918 54,791 44,892 84,817 13.2 2,353 Wyoming 3,060 1,557 1,637 2,980 -2.6 937
Note: Seven States estimated numbers In one or more categories. See the detailed probation notes for further Information.
2
Nebraska (H3.1 %). Six States and the District of Columbia showed decreases ranging from -1.8% In Maryland to -18.2% • In Massachusetts.
As a ratio per 100,000 adult residents, the probation population in the South was the highest -1,643 offenders per 100,000 adult residents, This ratio surpassed that for tne Northeast by 445, the Midwest by 345, and the West by 258,
The State of Georgia had the highest individual rate of persons on probation -2,838 per 100,000 adult residents. Texas, Delaware, Washington, Maryland, and Florida also had more than 2,000 persons on probation for every 100,000 adult residents. At the end of 1990, 6 States reported over 100,000 persons on probation: New York, Michigan, Florida, Georgia, Texas, and California, Texas reported the largest number of persons on probation, over 308,000. Federal probationers (58,222) accounted for 2.2% of the national caseload.
During 1990 there were over 1.6 million admissions to probation supervision. Of the reporting jurisdictions, Florida reported the largest number of entries with more • than 266,000. Entries to Federal probation (20,388) were 1.2% of the Nation's admissions.
•

~-
Tabla 2. Adults on parola, 1990
Percent Number - change on parole on
Parole Parole Irlparo\e 12131/90 per Region and population, 1990 population, popUlation 100,000 adult Jurlsdlct Ion 1/1/90 Entries Exits 12131/90 during 1990 residents
U.S. total 456,803 358,820 284,216 531,407 16.3% 287
Federal 21,422 9,790 9,519 21,693 1.3% 12 State 435,381 349,030 274,697 509,714 17.1% 275
Northeast 111),749 71,214 53,017 128,946 16.4% 332
Connecticut 322 49 80 291 -9.6 11 Massachusetts 4,688 5,774 5,742 4,720 ,7 101 New Hampshire 477 408 363 522 9.4 63 New Jersey 20,062 13,019 9,783 23,298 16.1 393 New York 36,885 23,273 17,321 42,837 16.1 312 Pennsylvania 47.702 28,225 19,270 56,657 18.8 623 Rhode Island 393 276 348 321 -18,3 41 Vermont 220 190 110 300 36.4 71
Midwest 55,773 50,053 40,133 65,693 17,8% 149
illinois 14,550 16,349 13,228 17,671 21.5 208 Indiana 3,456 2,965 2,643 3,778 9,3 92 Iowa 1,900 1,572 1,361 2,111 11.1 103 Kansas 5,089 3,107 2,445 5,751 13.0 317 Michigan 9,890 8,994 6,983 11,901 20.3 174 Minnesota 1,699 2,249 2,075 1,873 10.2 58 Missouri 7,545 4,746 3,095 9,196 21.9 242 Nebraska 490 840 698 632 29.0 55 North Dakota 138 136 158 116 -15.9 25 Ohio 6,464 5,788 4,307 7,945 22.9 99 South Dakota 510 571 461 620 21.S 124 Wisconsin 4,042 2,736 2,679 4,099 1.4 114
South 183,715 117,556 85,498 215,773 17.4% 340
Alabama 5,724 2,225 1,979 5,970 4.3 200 Arkansas 3,657 2,402 ~,088 3,971 8.6 230 Delaware 1,013 676 406 1,283 26.7 255 DlstrlctofColumbla 4,915 3,268 2,837 5,346 8.8 1,091 Florida 2,318 645 899 2,064 -11.0 20 Georgia 17,437 16,611 11,402 22,646 29.9 477 Kentucky 3,133 2,210 2,160 3,183 1.6 117 Louisiana 9,177 6,220 6,520 8,877 -3.3 297 Maryland 9,862 7,715 6,385 11,192 13.5 3u9 Mississippi 3.349 1,657 1,528 3,478 3.9 190 North Carolina 7,559 9,148 6,824 9,883 30.7 197 Oklahoma 1,993 1,990 747 3,236 62.4 140 South Carolina 3,386 1,129 972 3,543 4.6 138 Tennessee 10,511 5,914 5,098 11.327 7.8 309 Texas 91.294 46,476 28,044 109.726 20.2 903 Virginia 7,444 8,790 7,186 9,048 21.5 193 WestVirginla 943 480 423 1,000 6.0 74
West 85,144 110,207 96,049 99,302 16.6% 256
Alaska 533 542 507 568 6.6 150 Arizona 2,048 4,087 3,424 2,711 32.4 101 California 57,515 91,379 81,332 67,562 17.5 307 Colorado 1,974 2,149 1,727 2,396 21.4 98 HawaII 1,287 527 389 1,425 10.7 172 Idaho 238 275 270 243 2.1 35 Montana 752 406 347 811 7.8 141 Nevada: 2,417 1,620 1,187 2,850 17.9 315 New Mexico 1,151 1,277 1,204 1,224 6.3 115 Oregon 5,794 5,805 3,576 8,023 38.5 379 Utah 1,277 1,244 960 1,561 22.2 143 Washington 9,832 741 958 9,615 -2.2 267 Wyoming 326 155 168 313 -4.0 98
Nolll: Five States estimated numbers In one or more categories. Maine eliminated parole in 1976. See the detailed parole notes for further Information •
• 3
Parole
The parole population grew 16.3% during 1990 (table 2). Five States reported Increases above 30% of their 1989 parole populations: Oklahoma (62.4%), Oregon (38.5%), Vermont (36.4%). Arizona (32.4%), and North Carolina (30.7%), Among regions of the country, the parole population In the Midwest showed the largest percentage Increase over the year, gaining 17.8%. The Northeast had the slowest growing parole population, with an increase of 16.4"/0.
Seven States In 1990 reported a declining parole population. The average decrease for these States was 9%. Rhode Island, North Dakota, and Florida each reduced Its parole population more than 10% during 1990.
The Midwest, tha region with the largest Increase in the number of persons on parole, had the lowest ratio of parolees to residents: 149 per 100,000 adults. The South had the highest ratio of parolees to residents at 340 per 100,000. Among Individual JUrisdictions, the District of Columbia had the highest ratio, 1,091 per 100,000. Texas reported the second highest ratio, 903 per 100,OCO adults.
At the end of 1990 Texas maintained the largest parole population of any reporting Jurisdiction, over 109,000 adults. The Federal parole population (21,693) accounted for 4.1 % of all parolees in the United States.
California's total of 91.379 admIssions to parole supervision during the year was the largest of any State. Federal parole entrias (1.790) were 2.7% of admissions nationwide.

... Intensive supervision and electronic
Table 3. Adults on probation or parole under IntensIve supervision monitoring or electronIc munltorlng. 1990
Probation and parole agencies often have Estimated number -,-seVera! iavels of supervision, according to Probation Parole
the offenders' sentence and criminal ReporUng Intensive Electronic Intensive Electronic
history. The highest level of supervision, Jurisdiction supervision monitoring supervision monitoring
usually refefrEld to as Intensive supervision, U.S. total 55.722 7.868 16.787 1.385
varies from Jurisdiction to jurisdiction but Federal 0 85 I most often Includes frequent contact State 55.722 7.783 16.787 1.385
between officers and offenders. Some Alabama 705 91 5 144
Jurisdictions also use electronic monitoring, Alaska 0 0 15 such as devIces attached to the telephone Arizona 2.232 127 116
system, to ensure that the probationer or Arkansas 0 0 66 California I I 7.207 40
parolee Is observing the condItion of home Colorado 1,015 248 45 confinement or curfew. Connectlcut 160 6 10 2
Delaware 951 93 100 10 District of Columbia 100 0 198
Jurisdictions reported over 55,000 proba-tioners under Intensive supervIsIon - about Florida 11.215 1.312
Georgia 2.820 0 422 2% of all adults on probation (table 3). At Hawaii 22 6 70 11 yearend 1990, nearly 7,000 probationers Idaho 141 0 J I
were under electronic monitoring - about illinois 660 I 49 41 Indiana 111 983
13% of all those under intensive super~ Iowa I I 269 60 vision. Nearly 17,000 parolees were under Kentucky 506 0 883
Intensive supervision during 1990. Of those Louisiana 50 6 I
under Intensive supervisIon, over 1,300 Maine 95 10
were under electronic monitoring. Maryland 151 0 541 Massachusetts 0 0 34 Michigan 1.128 1.801
Adults under correctional supervision Mississippi 244 0 112 Missouri 460 96 38 Montana 35 19 8
Of the more than 4.3 million adults under Nebraska 45 45 37 1 the care or custody of a correctional agency Nevada 718 25 912 8
on a given day In 1990, approximately 3 of New Hampshire 25 10 41 1 4 offenders were living in the community: NewJersey 572 263 373 49
New Mexico 270 135 54 27
Supervised in the community 73.6% New York 3,400 I 16 North Carolina 1.452 704 437 124
Probation 61.4 Ohio 2.341 358
Parole 12.2 Oregon 1.033 380 65 Pennsylvania 10.400 200 1.397 223 Rhode Island 0 0 23
Incarcerated 26.4% Jail 9.3 South Carolina 1.824 0 426
South Dakota 50 0 64 Prison 17.1 Tennessee 735 280
Texas 7.124 463 2.110 30e
Total under correctional Utah 140 0 199 3': Vermont 230 0 34
supervision 100.0% Virginia 327 0 426 6 Washington 1.996 50 Wisconsin 222 55 222 55 Wyoming 17 17 1 1
Note: Counts of persons under intensive supervision reported by some States Include persons under electronic monitoring. Some jurisdictions were unable to provide separate counts of parole and probation populations under Intensive supervision. The following States reportEJd either not having persons under Intensive supervision and electronic monitoring or not knowin9 their number: Kansas. Minnesota. North Dekota, and Oklahoma • • • • No program. I Jurisdiction did not know.
• 4

• The probation and parole populations Increased 41.2% from 1985 to 1989
etable4}.
Type of release from prison
More than 85% of those released from prison receive supervision in the community. Prisoners enter parole supervision either by a discretIonary parole board decision or by fulfilling the conditions
mlnatlon of eligibility. Usually prisoners must serve some portion of their sentence before becoming eligible for parole.
In other Jurisdictions, primarily those with determinate sentencing statutes, Inmates are conditionally released from prison when they have served their original sentence minus time for good behavior or program participation; this type of release is referred to as supervised mandatory release. In both discretionary parole release and supervised mandatory release, conditions of the release are supervised by a parole officer. and rule violations or new crimes may result In a return to prison for the balance of the unexpired santence.
By contrast, unconditional prison releases are those prison releases in which the offender'S obligation to serve a sentence has been fully satisfied. Expiration of term, for example, refers to a release from prison after full service of a sentence or after reductions for earned credits. No further conditional supervision in the community Is required.
for a mandatory release.
In most Jurisdictions tha parole board has discretionary authority to release prisoners to conditional supervision In the community based on statutory or administrative deter-
The percent of supervised mandatory releases from prison Increased fivefold over the past 12 years, from about 6% of all releases In 19n to nearly 30% In 1990 (table 5 and figure 2). The number of prisoners released by a parole board decision declined from almost 72% of all
Table 4. Correctional populations: Percent of adult population under sanction and percent change, 1985-90
Total estimated correctional !:!o!:!u!ation Probation Jail' Prison Parole
Percent Percent Percent Percent Percent of adult of adult of adult of adult of adult
Year Number population Number population Number popUlation Number population Number population
1985 3.011.000 1.7% 1,968,712 1.12% 254,986 .15% 487,593 .28% 300,203 .17% 1986 3,240,000 1.8 2,114,621 1.19 272,736 .15 526,436 .30 325,638 .18 1987 3,460,000 1.9 2,247,158 1.25 294,092 .16 562,814 .31 355,505 .20 1988 3,713,000 2.0 2,356,483 1.30 341,893 .19 606,810 .33 407,977 .22 1989 4,055,000 2.2 2,521,525 1.37 393,303 .21 683,382 .37 456,803 .25 1990 4,350,000 2.4 2,670,234 1.44 403,019 .22 745,157 .40 531,407 .29
Percent change, 1985-90 44% 35.6% 36.6% 52.8% 77.0%
Note: The following are estimates of the U.S. resident population age 18 or older on July 1: 1985-175,727,000; 1986-177,807,000; 1987-179,856,000; 1988-181,963,000; and 1989-184,157,000. The 1990 Decennial Census counted 185,105,000 on April 1, 1990. Population counts for probation, parole, and prison custody ara for December 31, and jail counts are for June 30 In 1985-89 and June 29, 1990. Every year some States update their report; this table uses the corrected counts. Because some persons may have multiple statuses, the sum of the number of persons on probation, on parole, In Jail, and In prison will provide an overestimate of the total correctional population. (See Technical note on page 7 for further discussion.) 'Estimates of jail populations include convicted and unconvicted adult Inmates.
Table 5. State prison releases, by method, 19n-90
Percentof!:!rison releases Conditional releases Supervised Unconditional releases
Total releases Dlscretion- mandatory Expiration Commu-Year from prison All ary parole release Probation Other' ofsentence tation Other
1977 115,213 100% 71.9% 5.9% 3.6% 1.0% 16.1% 1.1% .4% 1978 119,796 100 70.4 5.8 3.3 2.3 17.0 .7 .5 1979 128,954 100 60.2 16.9 3.3 2.4 16.3 .4 .6 1980 136,968 100 57.4 19.5 3.6 3.2 14.9 .5 .8 1981 142,489 100 54.6 21.4 3.7 3.1 13.9 2.4 '1.0 1982 157,144 100 51.9 24.4 4.8 3.6 14.4 .3 .6
1983 191,237 100% 48.1% 26.9% 5.2% 2.5% 16.1% .5% .6% 1984 191,499 100 46.0 28.7 4.9 2.7 16.3 .5 .9 1985 203,895 100 43.2 30.8 4.5 3.0 16.9 .4 1.2 1986 230,672 100 43.2 31.1 4.5 4.6 14.8 .3 1.4 1987 270,506 100 40.6 31.2 4.4 5.7 16.2 1.0 .9 1988 301,378 100 40.3 30.6 4.1 6.0 16.8 1.0 1.2
1989 364,434 100% 39.1% 30.5% 4.4% 8.9% 16.0% .2% .9% 1990 394,682 100% 40.5 29.6 5.3 10.6 13.1 .1 .9
Note: The data are from the National Prisoner Statistics reporting program. The total releases fmm State prison are those for which the method of release was reported. Deaths, unspecified releases, transfers, and escapes were not Included. Altogether, 419,783 persons were released or removed from State prisons In 1990. 'Other conditional releases Include prisoners discharged under special procedures that Included early release because of crowding, supervised work furloughs, relea5eto home detention, release to community residence, release to special programs with required supervision, supervised reprieves, and emergency releases. Approximately 93% of the 41,837 ·other conditional releases· in 1990 occurred in 5 States: Arizona, Connecticut, Florida, Georgia, and Oregon.
5
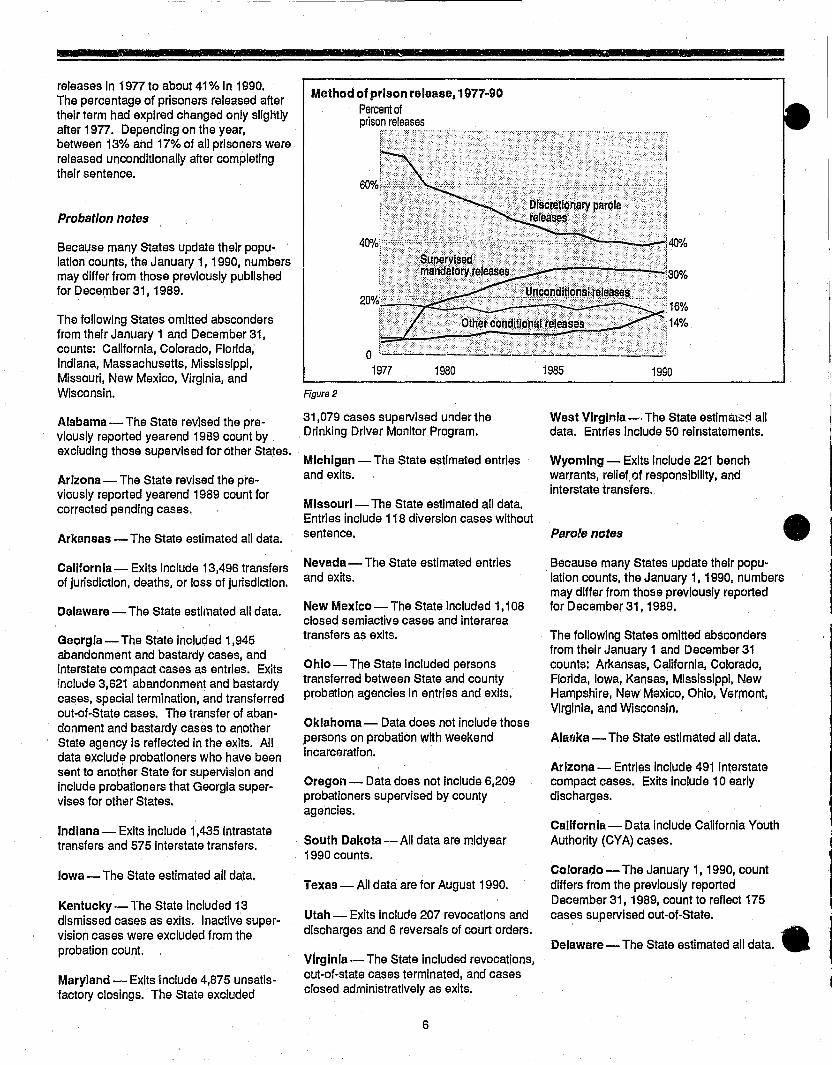
releases In 19n to about 41 % In 1990. The percentage of prisoners released after theIr term had expired changed only slightly after 19n. Depending on the year, between 13% and 17% of all prisoners were released unconditionally after completing their sentence.
Probation notes
Because many States update their population counts, the January 1, 1990, numbers may differ from those prevIously published for December 31, 1989.
The following States omitted absconders from their January 1 and December 31, counts: California, Colorado, Florida, Indiana, Massachusetts, Mississippi, Missouri, New Mexico, Virginia, and Wisconsin.
Alabama - The State revised the previously reported yearend 1989 count by excluding those supervised for other States.
Arizona - The State revised the previously reported yearend 1989 count for corrected pending cases.
Arkansas - The State estimated all data.
California - Exits Include 13,496 transfers of Jurisdiction, deaths, or loss of Jurisdiction.
Delaware - The State estimated all data.
Georgia - The State Included 1,945 abandonment and bastardy cases, and interstate compact cases as entries. Exits Include 3,621 abandonment and bastardy cases, special termination, and transferred out-of-State cases. The transfer of abandonment and bastardy cases to another State agency is reflected In the exits. All data exclude probationers who have been sent to another State for supervision and Include probationers that Georgia supervises for other States.
Indiana - Exits Include 1,435 Intrastate transfers and 575 interstate transfers.
Iowa - The State estimated all data.
Kentucky- The State Included 13 dismissed cases as exits. Inactive supervision cases were excluded from the probation count.
Maryland - Exits Include 4,875 unsatisfactory closings. The State excluded
-Method of prison release, 1977-90
Percent of prison releases
.: .. ,".",." .. , ........ ,' .. ' ..... , ..
1980
Figura 2
31,079 cases supervised under the Drinking Driver MonItor Program.
Michigan - The State estimated entries and exits.
Mlssourl- The State estimated all data. Entries include 118 diversion cases without sentence.
Nevada - The State estimated entries and exits.
New Mexico - The State Included 1,108 closed semlactive cases and interarea transfers as exits.
Ohio - The State Included parsons transferred between State and county probation agencies In entries and exits.
Oklahoma- Data does not Include those persons on probation with weekend incarceration.
Oregon - Data does not Include 6,209 probationers supervised by county agencies.
South Dakota - All data are midyear 1990 counts.
Texas - All data are for August 1990.
Utah - Exits include 207 revocations and discharges and 6 reversals of court orders.
Virginia - The State included revocations, out-of-state cases terminated, and cases closed administratively as exits.
6
1985 1990
West Virginia -. The State estlmal~!i all data. Entries Include 50 reinstatements.
Wyoming - Exits Include 221 bench warrants, relief of responsibility, and Interstate transfers.
Parole notes •
Because many States update their popu-lation counts, the January 1, 1990, numbers may differ from those previously reported for December 31,1989.
The following States omitted absconders from their January 1 and December 31 counts: Arkansas, California, Colorado, Florida, Iowa, Kansas, Mississippi, New Hampshire, New Mexico, Ohio, Vsrmont, Virginia, and Wisconsin.
Ala!Jka - The State estimated all data.
Arizona - Entries Include 491 Interstate compact cases. Exits Include 10 early discharges.
Callfornia- Data include California Youth Authority (CYA) cases.
Colorado - The January 1, 1990, count differs from the previously reported December 31, 1989, count to reflect 175 cases supe.rvlsed out-of-State.
Delaware - The State estimated all data. •
Florida - The State supervised only persons sentenced to a year or more.
• Hawall- Exits Include 69 parolees whose maximum sentence had expired.
Illinois - Only persons sentenced to a year or more are supervised. Entries include 533 out-of-State parolees and 2,Oou Interstate compact and apprehension cases. The number under supervlsloli by Illinois authorities on December 31,1990, was 14,973; the remainder were under supervision by other authorities.
Iowa - The State \)nly supervises persons sentenced to a year or more.
Kansas - The January 1 population differs from the previously reported 1989 yearend count to Include 296 parolees with an active warrant but with a known location. Exits exclude an unknown number of persons returned to prison or Jail, parole revocation pending; returned to prison or Jail, new charges pending; or transferred to another parole Jurisdiction. Exits Include 275 absconded, 290 expiration of sentence, 62 pre-revocation confinements, and 229 Kansas offenders supervised out-of-State.
• The State monitors absconders (563) apart from the regular parole caseload.
Kentucky - The State included 489 transfers from out-of-State districts as entries.
Maine - The State abolished parole In 1976. Thirty pre-1976 parolees remain under supervision, and 25 in prison will become eligible for parole.
Massachusetts - The State estimated entries and exits.
MInnesota - Entries Inciude 402 parolees on work release.
Mlsslsslppl- Entries Include Intrastate transfers and 2 work release cases.
Missourl- The State estimated all data. Data exclude 283 parolees from local Jails.
New Hampshire - The State supervised only persons sentenced to a year or more. Entries Include 92 administrative parolees.
• New Jersey - Exits Include 151 persons recalled by court and discharged by Parole Authority Decree.
• New Mexico - The State estimated entries • absconders on agency case loads In one and exits. Jurisdiction may actually be Incarcerated In
another Jurisdiction; Ohio - Entries Include 139 parolees supervised out-of-State. Exits Include 31 inactlve cases and 67 interstate compact cases.
Prmnsylvanla - Entries Include 21,271 parolees released by county courts. The State supervised 610 parolees from local Jails.
Rhode Island - Absconders are removed from parole only If a revocation warrant has been Issued.
South Carolina - Exits Include 12 pardoned parolees. The State excluded youthful offenders from its counts.
Tennessee - The January 1, 1990, count differs from the previously reported December 31, 1989, count because 189 parolees with an alias were doublecounted. Exits Include 436 Inactive parolees whose supervision was terminated.
Texas - Data are for the year ending August 1990. Entries Include approximately 12,000 parole releases direct from county Jail.
Virginia - Entries Include 367 transfers from other States. Exits Include 379 terminated out-of-State cases.
West Virginia - Entries Include 95 Interstate compact cases.
WisconsIn - Data do not include parolees superJlsed out-of-State. Exits Include 15 administrative closings.
Wyoming - Exits include 29 administrative clOSings and pardons.
Technical note
To estimate the total correctional populations In table 4, the four correctional populations are assumed to contain individuals wIth only one status at a time. This assumption Is not valid. Multiple correctional statuses may occur because-
• probation and parole agencies are not always notified of new arrests, jail entries, or prison admissions;
'7
• Individuals may be admitted to Jail or prison before the completion of formal revocation hearings by a probation or parole agency.
By adding the number of persons on probation, on parole, In Jail, and In prison, some persons will be counted more than once; consequently, the sum will be an overestimate of the total number of persons under correctional supervision at anyone time. The magnitude of the over-estimation Is not known; however, data collected In previous BJS surveys of prison and Jail Inmates Indicate that the number of Inmates doublecounted may be smail relative to the total population under correctional supervision.
Results from the 1969 Survey of Inmates in Local Jails Indicated that 28% of the Jail Inmates were on probation and 10% were on parole at the time of their admission to Jail. Results from the 1986 Survey of Inmates of State Correctional Facilities also Indicated that 21 % of the State prisoners were on probation and 23% were on parole at the time of their admission to prison.
If the survey results are applled to the total Jail and prison populatlC\ns In 1990, and If all of these inmates are assumed to have been doublecounted, then the total number of doublecounted inmates would be 452,000, or about 10.4% of the estimated correctional population In table 3. This Is an extreme assumption.
Somewhat lower estlmat-as are generated If It Is assumed that the survey figures should be applied only to those Jail Inmates who are unconvlcted and to prisoners who are technical violators of parole or probation supervision. Under this assumption, the doubJecount would be an estimated 122,000 Inmates, or 2.8% of the total correctional population.
Doublecounting may also Include an unknown, but relatively small, number of persons on both probation and parole.

Louis Jankowski wrote this Bulletin, It was edited by Thomas Hester and produced by Marilyn Marbrook, Betty Sherman, Jayne Pugh, and Yvonne Boston. Lisa McNelis, Theresa Reitz, Betty Ford, Diana Cull, and others of the Bureau of the Census managed and carried out the collection and processing of the data.
November 1991, NCJ-133285
The Assistant Attorney Generalis responsible for matters of administration and management with respect to the OJP agencies: Bureau of Justice Assistance, Bureau of Justice Statistics, National Institute of Justice, Office of Juvenile Justice and Delinquency Prevention, and the Office for Victims of Crime. The Assistant Attorney General further establishes poilcles and priorities consistent with the statutory purposes of the OJP agencies and the priorities of the Department of Justice.
•
•
• 8

4 • ,
• BJS sets census of probation and parole agencies for early 1992
For the first time in 15 years, a national census will collect information about probation and parole agencies. Early in 1992 every probation and parole agency in the Nation will be able to participate in a census. It is the second such national census; the first was completed in 1976.
The census, sponsored by the Bureau of Justice Statistics (BJS) and conducted by the U.S. Bureau of the Census, will-
• enable a national description of probation and parole agencies, going beyond head-counts to
• include programs, staff, budgets, and policies
• serve as a means of comparison that can be used by every agency administrator
• provide more precise measures of the size and nature of the supervised population and the progress made since the last complete national census conducted in 1976.
BJS designed the questionnaire with the advice of numerous probation and parole administrators. The American Probation and Parole Association, the American Correctional Association, and National Institute of Corrections have all noted the need for a complete enumeration of agencies that supervise offenders in the community.
The 1976 census revealed that 3,868 State and local probation and parole agencies supervised nearly 1.1 million adults and 400,000 juveniles. The agencies employed 55,807 persons, including
• more than 33,000 who directly counseled and supervised offenders. During the year ending In September 1976 the agencies had completed almost a million presentence investigations.
Since 1976 BJS estimates that the number of offenders supervised in the community has tripled. Today more than 3 million offenders are under conditional release and supervision - about 3 times th9 combined number in jails and prisons.
The National Census of Probation and Parole Agencies will give an up-to-date and comprehensive description of how agencies fulfill these two cruoiai functions.
BJS plans a number of Bulletins and Special Reports that will present analyses of the data reported. Copies of the dataset, when complete, will be available for public use 'from the National Archive of Criminal Justice Data at the University of Michigan. When all agencies participate in the development of these data, all agencies will also be able to benefit directly from the information.
For more information, please call any of the following BJS Corrections Unit statisticians: Robyn Cohen (202) 616·3278 Allen Beck (202) 616-3277 Larry Greenfeld (202) 616-3281.
Steven D. Dillingham, Ph.D. Director Bureau of Justice Statistics
. \ No'w a~ailable on, rnicroflch,e' '.' ",.' \' . ,"','. ~ . ,.... ,.'. , ." - . . . ,
For librarians and researchers, 20 years of criminal justice statistics in complete, convenient form - free bibliographies have subject-title index and abstract for each title
Publications of the Bureau of Justice Statistics: 1985-89 (240 reports) 1971-84 (284 reports) Reports on crime, victims, offenders, and criminal justice system operations from major data series:
II National Crime Survey II Computer crime II Law enforcement management II Prisons, jails, capital punishment II Recidivism, parole, probation
II Criminal justice information policy II Federal justice statistics II Justice expenditure and employment II Bulletins and Special Reports II Courts
II Drugs and crime II Privacy and security
Order form
o Yesl Send me Publications of/he Bureau of Justice Statistics, 1985·89 microfiche library with free Topical Bibliography for $190 ($200 Canada and $235 other foreign countries):
$_--o Yesl Send me Publications of the Bureau of Justice Statistics, 1971·84 microfiche library with free Topical Bibliography for $203 U.S. and Canada ($248.25 other foreign countries):
$--:--::-o Send me only the topical bibliography(ies) for Publications of the Bureau of Justice Statistics for $17.50 each ($18.50 Canada, $22,50 other foreign countries): 01985-89 $ __ _ o 1971-84 $ __ _
Return with payment to: Justice StEitistics Clearinghouse/NCJRS, Dept. F-AKD, Box 6000, Rockville, MD 20850
III Sourcebook of Criminal Justice Statistics II Report to the Nation on Crime and Justice
For more information, call the Justice Statistics Clearinghouse
at 800-732-3277
Name ______ . ______________ ___
Title ____________________ _
Agency ____________________ .
Address _____________________ _
Telephone .!.-( __ ..!..-______________ _
o My check for $ _____ is enclosed.
o Charge my Visa Mastercard
Card no. ________________ _
EXp. date ________________ _ Signature _________________ _
o Charge my NCJRS Deposit Account no. __________ _
o Government Purchase Order no. (add $2 processing fee) ______ _ Total of order: $ ____ _
•
•
•
Bureau of Justice Statistics
•ports vised December 1991)
Call \oll·free 800·732·3277 (local 301' 251·5500) to order BJS reports, to be added to Oile of the BJS mailing lists, or to speak to a reference specialist In statistics at the Justice Stallstics Clearinghouse, National Criminal Justice Reference Service, Box 6000, Rockville, MD 20850. BJS maintains the following mailing lists: • Law enforcement reports (new) • Drugs and crime data (new) • Justice spending & employment • Whlte·collar crime • National Crime Survey (annual) • Corrections (annual) • Courts (annual) .. Privacy and security of criminal
history information and Information policy
• Federal statistics (annual) • BJS bulletins and special reports
(approKimately twice a month) • Sourcebook of Criminal Justice
Statistics (annual) Single copies of reports are free; use NCJ number to order. Postage and handling are charged for bulk orders of single reports. For single copies of multiple titles, up to 10 titles are free; 11·40 titles $10; more than 40, $20; libraries cali for special rates.
Public·use tapes of BJ" data sets and other criminal Justice data are available from the National Archive of Criminal Justice Data (formerly
•
AIN), P.O. Box 1248, Ann Arbor, MI 106 (toll·free 1-800·999·0960).
National Crime Victimization Survey The Nation's two crime measures: Uniform
Crime Reports and the National Crime Survey, NCJ·12270S, 4190
Criminal victimization in the U.S.: 1973·66 trends, NCJ·129392, 7191 1969 (final). NCJ·129391, 6191 1968 (final), NCJ·122024, 10190
BJS special reports Handgun crime victims, NCJ·123559, 7190 Black victims, NCJ·122562, 4/90 Hispanic victims, NCJ·120507, 1190 The redesigned National Crime Survey:
Selocted new data, NCJ·114746, 1189 Motor vehicle theft, NCJ·l09978, 31B8 Elderly victims, NCJ·l07676, 11187 Violent crime trends, NCJ·l07217, 11187 Robbery victims, NCJ·l04638, 4187 Violent crime by strangers and non·
strangers, NCJ·l03702, 1187 Preventing domestic violence against
women, NCJ·l02037, 8186 Crime prevenhon measures, NCJ·l00438,
3186 The use of weapons In committing crimes,
NCJ·99643. 1186 Reporting crimes to the police, NCJ·99432,
12185 The economic cost of crime to victims,
NCJ·93450, 4184
BJS bulletins Criminal victimization 1990, NCJ·130234,
10191 Crime and the Nallon's households, 1990,
NCJ·130302,8/91 The crime of rape, NCJ·96777, 3185 Household burglary, NCJ·96021, 1185 Measuring crime, NCJ·75710, 2181
Jl.s technical reports
ew directions for the NCS, NCJ·115571. 3/89
Series crimes: Report of a field test, NCJ·l04615, 4187
School crime, NCJ·131645, 9191 Teenage victims, NCJ·128129, 5/91 Female victims of vlolenl crime,
NCJ·126826, 1/91
Redesign of the Nallonal Crime Survey. NCJ·111457.3189
The seasonality of crime vlcllmlzallon, NCJ·ll1033, 6188
Crime and older Americans Information package. NCJ·l04569, S1B7, $10
Victimization and fear of crime: World perspectives, NCJ·93872, 1185, $9,15
The National Crime Survey: Working papers, Current and historical pc~spactives, vol. I,
NCJ·75374, 8/82 Methodology studies, vol. II,
NCJ·90307, 12184
Corrections BJS bulletins and special reports
Capital punishment 1990, NCJ·131648, 9191 Prisoners In 1990, NL.J·129198, 5/91 Women In prison, NCJ·127991, 4191 Violent State prison Inmates and their
victims, NCJ·124133, 7/90 Prison rule viola lars, NCJ·120344, 12/89 Recidivism 01 prisoners released in 1983,
NCJ·116261,4189 Drug use and crime: State prison Inmate
survey, 1986, NCJ·111940, 7188 Time selved In prison and on parole, 1984,
NCJ·l08544, 12187 Profile of State prison Inmates, 1986,
NCJ·l09926, 1188 Imprisonment In four countries,
NCJ·l03967,2187 Population denslly In State prisons,
NCJ·l03204, 12186 State and Federal prisoners, 1925·85,
NCJ·l02494, 11186 Prison admissions and releases, 1983,
NCJ·l00582, 3186 The prevalence of Imprisonment,
NCJ·93657, 7185
Prisoners at midyear 1991 (press release), NCJ·133281, 10/91
Correctional populations In the United States: 1989, NCJ·130445, 1019t 1988, NCJ·124280, 3191
Race of prisoners admitted to State and Federallnslilutlons, 1926-86, NCJ·125618, 6191
National correcllons reporting program, 1985, NCJ·123522, 12/90
Historical slatlsllcs on prisoners In Slate and Federal Institutions, yearend 1925·86, NCJ·l11098,6188
1984 census 01 State ac."jlt correctional facllilles, NCJ·l05585, 7187
Census 01 jails and survey of lallinmates BJS bulletins and spec/al reports
Drugs and jail inmates, NCJ·130836, 8191 Jail Inmates, 1990, NCJ·129756, 6191 Profile of jail Inmates, 1989, NCJ·129097,
4191 Jat! Inmates, 1989, NCJ·123264, 6/90 Population density In local Jails, 1988,
NCJ·122299,3190 Census of local jails, 1988 (BJS bulletin),
NCJ·121101,2190 Jail inmates, 1987, NCJ·114319, 12188 Drunk driving, NCJ·l09945, 2188 Jallinmales, 1986, NCJ·l07123, 10187
Census of local jails 198B: Summary and methodology, vol. I,
NCJ·127992, 3191 Data for Individual jails In the Northeast,
Midwest, South, West, vols. II·V, NCJ·130759·130762, 9191
Census of local jails, 1983: Data for Individual jails, Northeast, rilidwest, South,
West, vols. J.lV, NCJ·112796·9, 11/88 Selected findings, methodology, summary
tables, vol. V, NCJ·112796, 11/88
Parole and probation BJS bulletins
Probation and parole: 1990, NCJ·125833, 11191 1989, NCJ·125833, 11/90 1988, NCJ·119970, 11189
BJS special reports Recidivism of young parolees, NCJ·l04916,
5187
Children in custody Census of public and private juvenile
detention, correL~ional, and shelter facUities, 1975·85, NCJ·114065, 6189
Survey of youth In /;ustody, 1987 (special reporl). I~CJ·113365, 91S8
Law enforcement management BJS bulletins and special reports
State and local police departments, 1990, NCJ·133284, 12191
Sheriffs' departments, 1990, NCJ·133283, 12191
Profile of state and local law enforcemenl agencies, 1987, NCJ·113949, 3189
Expenditure and employment BJS bulletins
Justice expenditure and employment: 1988, NCJ·124132, 7190
Antl·drug abuse formula grants: Justice .varlable pass·through data, 1988 (BJS lechnlcal report), NCJ·120070, 3190
Justice expenditure and employment: 1988 (full report), NCJ·125619, 8/91 1985 (full report), NCJ·l06356, 8/89 Extracts, 1984, 1985, 1986, NCJ·124139, S/91
Courts BJS buJle/lns
Pretrial release of felony defendants, 19B8, NCJ·127202, 2191
Felony sentences In State courts, 1968, NCJ·126923, 12190
Criminal defense for the poor, 1986, NCJ·112919,9188
State lelony courts and felony laws, NCJ·l06273,8/87
The growth of appeals: 1973·83 trends, NCJ·96381,21S5
Case filings In State courts 1983, NCJ·95111.10IS4
BJS special reports Felony case precessing In Slate courts,
1986, NCJ·121753, 2190 Felony case·processlng time, NCJ·l01985,
8/B6 Felony sentencing In 18 local jurisdictions,
NCJ·97681,6185
Felons sentenced to probation In State courts, 19&6, NCJ·124944, 11190
Felony defendants In large urban counties, 1985, NCJ·122385, 4190
Profile of felons convicted In State courts, 1986, NC,j·120021, 1/90
Sentencing outcomes In 28 felony courts, NCJ·l05743,8/87
The prosecution of felony arrests: 19B7, NCJ·124140, 9/90
Felony laws 01 the 50 States and tM District 01 Cotumbla, 1986, NCJ·l05066, 21&,. $14.60
State court model statistical dictionary: Supplement, NCJ·98326, 9185 1st edition, NCJ·62320, 9180
Privacy and security Compendium of State privacy and security
leglsla1/on: 1989 ovelvlew, NCJ·121157, 5190 1981 overview, NCJ·l11097, 9188 1989 full report (,I, 500 pages,
microfiche $2, hard copy $145), NCJ·121158, 9/90
Criminal justice Information policy: Forensic DNA analysis: Issues, NCJ·128567,
6191 Statutes requiring use of criminal history
record Informallon, NCJ·129896, 6191 Survey of criminal hlstoty Information
systems, NCJ·125620, 3/91 Original records of entry, NCJ·125626.
12190 BJS/SEI\RCH conference proceedings:
Criminal justice In the 1990's: The future 01 Informal/on management, NCJ·121697,5190
Juvenile and adult records: One system, one record?, NCJ·114947, 1/90
Open vs. conflde.,tlal records, NCJ·113560, li88
Strategies lor improving data quaUty, NCJ·115339, 5/89
Public access to criminal history record information, NCJ·111458, 11/88
Juvenile records and recordkeeping systems, NCJ·112815, 11188
Automated fingerprint Identification systems: Technology and policy Issues, NCJ·l04342, 4187
Criminal justice "hot" files, NCJ·l01850, 12186
Drugs & crime data Catalog of selected Federal publications
on II/egal drug and alcohOl abu~e, NCJ·132582, 10191
Drugs and crime facts, 1990, NCJ·128662, 8191 State drug resources: A national directory,
NCJ·122582, 5190 Federal drug data for national policy,
NCJ·122715,4190 Drugs and crime facts, 1989, NCJ·121022,
1190
Computer crime B,IS specIal reports
Electronic fund transfer: fraud, NCJ·96666, 3185 and crime, NCJ·92650, 2184
Electronic fund Iransfer systems fraud, NCJ·l00461.4186
Expert witness manual, NCJ·77927, 91S1. $11.50
Federal justice statistics Compendium of Federal justice statistics:
1988, NCJ·130474, 12191 1986, NCJ·125617, 1191 1985, NCJ·123560, 8/90
Federal criminal case processing, 1980·89, with preliminary data for 1990, NCJ·130526, 10191
The Federal civil justice system (BJS bulletin), NCJ·104769, 8/87
Federal offenses and offenders BJS special reports
Immigration offenses, NCJ·124546, 8190 Federal criminal cases, 1980·87,
NCJ·118311,7/89 Drug law vlolalors, lS8()·86, NCJ·111163,
6188 Pretrial release and detention: The Ball
Reform Act of 1984, NCJ.l09929, 2/88 Whlte·collar crime, NCJ·l06876, 9187
General BJS bulletins and special reports
BJS lelephone contacts, '91, NCJ·130133, 7191
Tracking offenders, 1988, NCJ·129861, 6191 Tracking offenders, lY87, NCJ·125315, 10190 Criminal cases In five States, 1983·86,
NCJ·118798,9189 International crime rates, NCJ·l10776, 5188
BJS national update: Jan. '92, NCJ·133097, 12/91 Oct. '91, NCJ·13177S, 10191 July '91, NCJ·129863, 7191
Sourcebook of criminal justice stat/sllcs, 1990, NCJ·130580, 9/91
BJS program ap!lllcation klt, lis cal 1991, NCJ·128413, 3/91
Violent crimo in the United Stales, NCJ·127855,3/91
Attorney General's program for Improving the Nation's criminal history records and Identifying felons who attempt to purchase firearms, NCJ·128131, 3/91
BJS data report, 1989, NCJ·121514, 1191 Publications of BJS, 1985·89:
Microfiche library, PR030014, 5190, $190 BibliographY, TB0030013, 5190, $17.50
Publications of BJS, 1971·84: Microfiche library, PR030012, 10186, $203 Bibliography, TB030012, 10186, $17.50
1990 directory of automated criminal just/ce Information systems, Vol. 1, Corrections, $10.60; 2, Courts, $11.50; 3, Law enforcement, free; 4, Probation and parole, $11,50; 5, Prosecution, $11,50; NCJ·12226-30, 5190
BJS annual report, fiscal 1988, NCJ·115749. 4189
Report to the Nation on crime and justice: Second edition, NCJ·l05506, 6188 Technical appendix, NCJ·112011, 8188
Criminal justice microcomputer guide and software catalog, NCJ·112178, 8188
National survey of crime severity, NCJ·96017, 10185
See order form on last page

an
Please put me on the mailing list for
O Law enforcement reports-national data on State and local police and sheriffs' departments, operations, equipment, personnel, salaries, spending, policies, programs
n Federal statistics-data describing Federal case processing, from investigation through prosecution, adjudication, and corrections
[J Drugs and crime-sentencing and time served by drug offenders, drug use at time of crime by jail inmates and State prisoners, and other quality data on drugs, crime, and law enforcement .
o Justice expenditure & employmentannual spending and staffing by Federal, State, and local aovernments and by function (polica, courts, corrections, etc.)
To be add~d to any BJS mailing list, please copy or cut out this page, fill in, fold, stamp, and mail to the Justice Statistics Clearinghouse/NCJ RS.
You will receive an annual renewal card. If you do not return it, we must drop you from the mailing list.
o Privacy and security of criminal history data and iniormation policynew legislation; maintaining and releasing intelligence and investigative records; data quality issues
o BJS bulletins and special reportstimely reports of the most current justice data in all BJS data series
o Prosecution and adjudication in State courts-case processing from prosecution through court disposition, State felony laws, felony sentencing, public defenders, pretrial release
o Corrections reports-results of sample surveys and censuses of jails, prisons, parole, probation, and other corrections data
Name:
Title:
,
o National Crime Victimization Survey-the only ongoing national • survey of crime victimization
o Sourcebook of Criminal Justice . Statistics (annual)-broad-based data from 150 + sources with addresses; 400 + tables, figures, index, annotated bibliography
o BJS National Update-a quarterly summary of new BJS data, programs, and information services and products
o Send me a signup form for NIJ Catalog, free 6 times a year, which abstracts private and government criminal justice publications
Organization: _________________ _
Street or box: _________________ _
City, State, Zip: Daytime phone number:
Criminal lustice interest:
Put your organization and title here if you
• To order copies of recent BJS reports, check here 0 and circle items you want to receive on other side used home address above: -------------------of this sheet.
U.S. Deplutment of Justice Office of Justice Programs
Bureau of Justice Statistics
Washington, D.C. 20531
Bulletin
Official Business
Penalty for Private Use $300 BULK RATE POSTAGE & FEES PAID
DOJ/BJS Permit No. G-91