The Sociology of the Gulf Rentier Systems: Societies of Intermediaries
Upload
independentCategory
view
3download
0
AGRICULTURAL ECONOMICS
ELSEVIER Agricultural Economics 12 (1995) 79-90
Price expectations of sheep and goats by producers and intermediaries in Quetta market, Pakistan
Abelardo Rodriguez a,*, Imran Ali b, Muhammad Afzal b, Nisar A. Shah b,
Usman Mustafa b
a International Center for Agricultural Research in the Dry Areas, P. 0. Box 5466, Aleppo, Syria b Arid Zone Research Institute, Pakistan Agricultural Research Council, P.O. Box 63, Quetta, Pakistan
Accepted 7 June 1994
Abstract
Analysis of producers' and intermediaries' livestock price expectations was used to describe the market in Quetta, the largest livestock market in the highlands of Balochistan Province, Pakistan, and to identify factors that determine price expectations of small ruminants. A total of 4800 expected prices for sheep and goats were collected from producers and market intermediaries at monthly intervals between January 1991 and December 1992. In addition to the expected price of the animal, liveweight, species, sex, breed, body condition (fatness), calendar day and month were recorded, and whether data were collected on a meat or meatless day. Monthly rainfall data were also collected. Models of goat and sheep price expectations were built to compare the similarity of the behaviour of producers and intermediaries.
Results indicated that producers and intermediaries expected high prices from November to January and during religious holidays. They expected premiums and discounts related to animals' attributes. Liveweight and seasonality had the strongest effect on prices. Rainfall in the current and previous month was positively related to seller's expected prices suggesting that livestock are retained to take advantage of favourable grazing conditions. The models of price expectations showed that producers adjusted expected goat prices (P ~ 0.10) for seasonality, liveweight, body condition, age, sex and breed, while they adjusted sheep prices for seasonality and liveweight only. High pay-offs could be expected if extension efforts focused on factors that determine sheep meat quality; however, the retail ceiling price of meat and the lack of grading are a disincentive to work in this direction.
Seasonality of supply and demand is important in determining prices and this study provides baseline information for market scheduling; however, scheduling of sales of transhumant pastoralists may be difficult to achieve. Further investigation is justified to understand the gap in marketing knowledge between producers who sell in the villages and those who sell in Quetta.
Livestock production and marketing constraints have been identified as the major factors that limit animal offtake in the highlands of Balochistan Province, Pakistan (Nagy et al., 1991).
• Corresponding author.
Elsevier Science B.V. SSDI 0169-5150(94)00020-3
Research and extension services, when available, have focused on the biological aspects of production such as de-worming, vaccination, supplemental feeding and breeding. However, other aspects that affect animal offtake such as the grazing rights of pastoral and agro-pastoral production systems, the existence of a ceiling price on re-

80 A. Rodrfguez et al. /Agricultural Economics 12 (1995) 79-90
tailed meat which favours urban consumers at the expense of producers, the lack of livestock and meat grading, and the lack of pricing information have been grossly neglected (Rodriguez, 1992).
In developing economies, price information is mostly restricted to personal interactions between market agents. Livestock price expectations by these agents are used to begin a bargaining process whereby the knowledge or perceptions of the supply and demand situation, and the inherent attributes of the animals on sale determine a final price. Analysis of these expectations can be useful to understand the complexities of the price discovery mechanism between market agents and to identify factors that hinder market efficiency. Development of the livestock subsector in highland Balochistan will be difficult as long as the signals sent by the market to improve offtake and quality are non-existent or are not perceived by the producers (Mahmood and Rodriguez, 1993).
This study was conducted to evaluate the factors that determine the price expectations for small ruminants of producers and intermediaries (butchers, wholesalers and commission agents) in the Quetta livestock market. The underlying hypothesis was that the pricing mechanisms, or the breakdown of price expectations, of different market agents may provide valuable information to agricultural policy makers, extensionists, producers and intermediaries. The specific objectives were: (a) to quantify price expectations of producers and intermediaries on the basis of body condition, sex, breed, age, liveweight, meat and meatless days (during meatless days it is illegal to slaughter livestock or to sell red meat in butchers' shops or in restaurants), seasonality and forage availability; (b) to develop price expectation models for sheep and goats; (c) to test the homogeneity of the models with respect to market agents; and (d) to evaluate the potential impact of extension services to improve producers' awareness of market opportunities.
1. Livestock production and marketing
Balochistan is the largest, driest and least-developed province of Pakistan; it is located in the
west of the country, sharing borders with Iran to the west and Mghanistan to the north. Crop and forage production are limited by low annual rainfall which averages from 50 to 150 mm in the lowland areas below 1000 m in the south, and from 175 to 350 mm in the highland areas above 1000 m in the north (Kidd et al., 1988). Most of the economic value of agriculture is contributed by fruit and vegetables produced under irrigation.
The province has 11.3 million sheep and 7.4 million goats, 0.8 million cattle and 0.24 million camels (GOP, 1989). It is estimated that the livestock sub-sector contributes 25% to the Gross Agricultural Product (FAO, 1983; GOB, 1989). Two-thirds of the small ruminant population is concentrated in the highlands. Small ruminant production systems are largely transhumant (60%) and nomadic (25%). Even though the number of small ruminants in the provincial highlands represents 19% of the national flock, the estimated annual offtake represents less than 7% of the total mutton production in the country (Rodriguez et al., 1993). The estimated annual revenue from meat in the highlands is Rs 1800 million (US$ 82 million, using US$ 1.00 = Rs 21.8, July 1990) and other products such as skin, bones, blood, and internal organs add a further Rs 315 million (US$ 14 million).
Marketing of livestock and meat involves many agents and it is difficult to be precise about their number or their role in the marketing process which can often be multiple (Mahmood and Rodriguez, 1993). Livestock producers are widely dispersed and the majority dispose of their sheep and goats at the village level because they have no transport to take them to larger markets located 20-150 km away. They also sell when they migrate in search for grazing resources or temporary employment. "Informal interviews with producers revealed that because they sell small numbers to meet urgent cash demands, the producers are not in a position to bargain very effectively. In a few cases producers attempt to time animal sales to take advantage of seasonal fluctuations in demand. But, in general, the expected price was not the major determinant of the decision to sell" (Mahmood and Rodriguez, 1993).
Village dealers purchase animals from sur-

A. Rodrfguez eta!./ Agricultural Economics 12 (1995) 79-90 81
rounding areas and sell them to wholesalers in village markets. Wholesalers transport the livestock to Quetta, the major consumption centre in the province, as well as to other consumption centres in other provinces such as Karachi and Lahore, or to other countries such as Iran and Afghanistan whose borders are relatively close to Quetta. Wholesalers sell to commission agents in the larger markets. In Quetta, wholesalers stated that commission agents were an essential link with the buyers (butchers) because of their role in bargaining and arranging livestock sales (Mahmood and Rodriguez, 1993). No records of transactions are kept by officials of the Livestock Department or the municipal slaughterhouses which are adjacent to the livestock markets. Grading of livestock and carcasses is not practised.
Sheep and goat meat is sold fresh in butcher shops where there is an official ceiling price; however, this price is not easily enforced. Even· though price regulation aims to protect urban consumers, the quality of meat is variable. Consumers do not have ways to convey their degree of dissatisfaction to producers through the marketing chain (Mahmood and Rodriguez, 1993). Red meat in Pakistan is sold from Thursday to Monday. Tuesday and Wednesday are 'meatless' days; meatless days were introduced in Pakistan in the late 1950s to offset red meat shortages. Specialized merchants process and distribute skins and internal organs (Mahmood and Rodriguez, 1993).
2. Price monitoring and procedures
Each month, from January 1991 to December 1992, the expected prices (price that sellers expect to receive) of 100 sheep and 100 goats were recorded in the Quetta livestock market from two types of market agents: producers and intermediaries. For each animal species, 50 expected prices were collected from producers and 50 from intermediaries between 10:30 a.m. and 12:00 noon. Producers and intermediaries knew that researchers were not buying animals and therefore only granted their time towards the end of the
marketing day. Three to five days were necessary to collect the desired information each month. The sampling period was never extended beyond eight days in any one month.
In the absence of any records of livestock transactions in the market, producers and intermediaries were asked the prices they expected to receive for their animals. Producers and intermediaries quoted prices for different animals; thus, these quotations can be considered as the price expectations at the beginning of the bargaining process for the average type of animals on offer. After the expected price for each animal was quoted, the following information was recorded: liveweight measured with an electronic portable platform balance, species, sex, breed, body condition (fatness), calendar day and month, and whether the data were collected on a meat or meatless day. Monthly rainfall data from five stations in highland Balochistan (Arid Zone Research Institute in Quetta, Agricultural Research Institute in Sariab, Tomagh, Kolpur and Mastung) were used as an indicator of forage availability under the assumption that rangelands are the main source of livestock feed.
A modification of the model used by Andargachew and Brokken (1993) was used to assess price expectations of sheep and goats:
WPRICE = {3 1 + {3 2 JUL + {33 LWT + {34 LWT 2
+ {35 RAIN1 + {36 RAIN2 + "l1{31MTH 1
+ "l 1{3 1MD 1 + "l 1{3 1BR 1 + "l 1{3 1s1
+ "l 1{3 1BC 1 + "l 1{3 1A 1 + l 1{31LWTMTH 1
+ l 1{31LWTBR 1 + l 1{31LWTS1 + l 1{31LWTBC 1
+ l,{3,LWTAi + l,{3,LWTMAi + l,{3,MAi
+ "l1{31A 1JUL + l 1{31MA 1MTH 1
+ l 1{31MA 1MD1 + l 1{31MA 1BR 1
+ "l 1{3 1MA 1S 1 + "l 1{3 1MA 1 BC 1
+ "l1{31MA 1A1 + e1
where WPRICE is the price expectation per kg liveweight (Rs) obtained by dividing the price per head, quoted by producers or intermediaries, by the animal liveweight; JUL is the accumulated calendar day of two consecutive years; and LWT is the liveweight of the animals in kg. The accumulated rainfall of the month when the observation
82 A. Rodriguez et al. I Agricultural Economics 12 (1995) 79-90
was made and the previous month is represented by RAINl. Similarly, RAIN2 is the accumulated rainfall of the second and third month previous to the month when the observation was made. Sets of dummy variables are used for month (MTH), meat days (MD), breed (sR), sex (s), body condition (sc), age (A) and market agent (MA).
The twelve months of the year were used in MTH,
meatless and meat days were used in MD, five breeds were used for BR in goats and six for BR in sheep. Females and males were used in S; good, average and bad body condition were used in sc,
ages of less than a year, 1-2 years, 2-3 years and older than 3 years were used in A When an observation pertains to a variable in a dummy set, its value is 1; otherwise it is 0. For example, if the observation is from producers, the variable MA1
in the set MA has a value of 1, alternatively, MA 2
is 0. {3s and f3;s are structural parameters in the equation. Interactions of liveweight with month, breed, sex, body condition, age and market agent are included. To account for producers' expectations the variable MA 1 interacts with other discrete variables.
The model was fitted for both sheep and goats using the general linear model procedure in (SAS, 1988, pp. 549-640). Covariance analysis was used to test homogeneity (Johnston, 1972) of price expectations between producers and intermediaries. The model above, that is unrestricted model U, was reduced into more restrictive models: (a) restricted model R2, by elimination of MA and MA 1 interacting with other variables in the U model, and (b) restricted model R1, with further
Table 1
elimination of the intercept MA in the R2 model. The homogeneity of expectations of intermediaries and producers, regardless of specific management variables, was tested comparing the R1 and R2 models, and the homogeneity of specific producers' management variables was tested comparing the U and R2 models. Overall homogeneity, combining the expectations of the market agents plus specific producers' management variables was tested comparing the R1 and U models. Similar procedures were used by Francis (1990) to compare different sheep markets in south-west Nigeria.
3. Liveweights and prices of goats and sheep
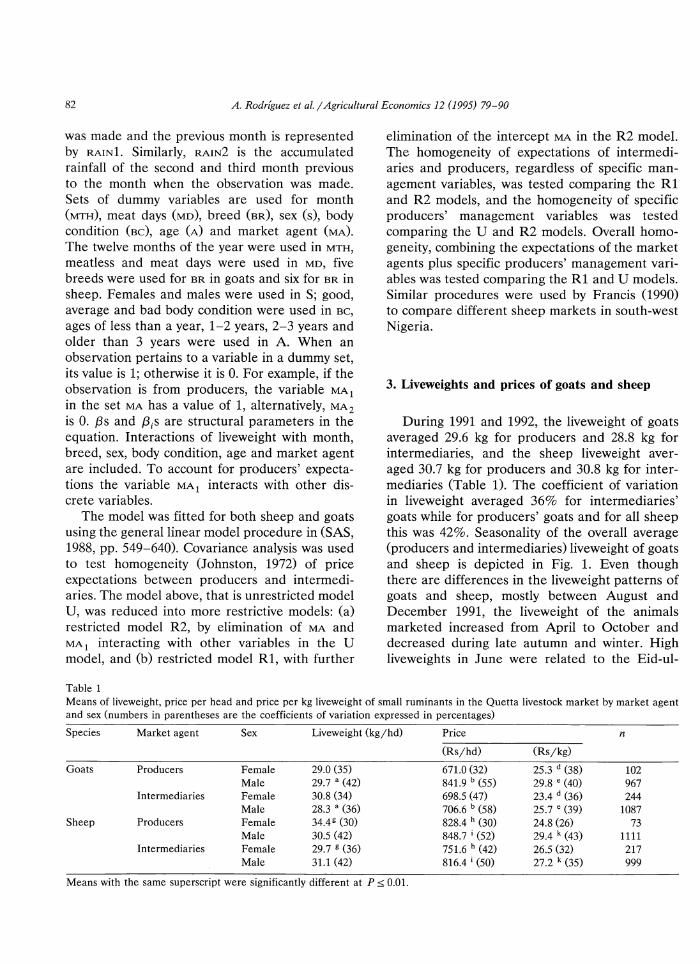
During 1991 and 1992, the liveweight of goats averaged 29.6 kg for producers and 28.8 kg for intermediaries, and the sheep liveweight averaged 30.7 kg for producers and 30.8 kg for intermediaries (Table 1). The coefficient of variation in liveweight averaged 36% for intermediaries' goats while for producers' goats and for all sheep this was 42%. Seasonality of the overall average (producers and intermediaries) liveweight of goats and sheep is depicted in Fig. 1. Even though there are differences in the liveweight patterns of goats and sheep, mostly between August and December 1991, the liveweight of the animals marketed increased from April to October and decreased during late autumn and winter. High liveweights in June were related to the Eid-ul-
Means of liveweight, price per head and price per kg liveweight of small ruminants in the Quetta livestock market by market agent and sex (numbers in parentheses are the coefficients of variation expressed in percentages)
Species Market agent Sex Liveweight (kgjhd) Price n
(Rs/hd) (Rsjkg)
Goats Producers Female 29.0 (35) 671.0 (32) 25.3 d (38) 102 Male 29.7 a (42) 841.9 b (55) 29.8 e (40) 967
Intermediaries Female 30.8 (34) 698.5 (47) 23.4 d (36) 244 Male 28.3 a (36) 706.6 b (58) 25.7 e (39) 1087
Sheep Producers Female 34.4g (30) 828.4 h (30) 24.8 (26) 73 Male 30.5 (42) 848.7 i (52) 29.4 k (43) 1111
Intermediaries Female 29.7 g (36) 751.6 h (42) 26.5 (32) 217 Male 31.1 (42) 816.4 i (50) 27.2 k (35) 999
Means with the same superscript were significantly different at P:::; 0.01.

A. Rodriguez eta!./ Agricultural Economics 12 (1995) 79-90 83
40•.-------------------------~--------.
38
36
OJ 34 c. .E 32 OJ ·a;
~ -~ -'
26
24
22.l-,....,...~--r-,.......,-_;;:~~~~r-r-.,.--,~r-r-J Jan Jul Jan Jul 91 Apr Oct 92 Apr Oct
j ....,..._ Goats --El- Sheep
Fig. 1. Goat and sheep liveweights in the Quetta livestock market.
Azha 1 when small ruminants are slaughtered by most families. Seasonal variations in liveweight were also related to migratory movements from the highlands to the lowlands from September to November, and from the lowlands to the highlands from March to April. Unregulated imports and exports to Iran and Afghanistan throughout the year compounded the variation of average liveweight in the Quetta market. The pattern and amount of rainfall in 1991 (321 mm) and 1992 (328 mm) were very similar and well above the long-term average of 235 mm (AZRijiCARDA, 1992, AZRIJICARDA, 1993).
Price expectations for goats were Rs 837 and Rs 707 for producers and intermediaries, respectively. Those for sheep were Rs 847 and Rs 805 (Table 1): Dynamics of producers' and intermediaries' price expectations per kg liveweight for goats and sheep are depicted in Fig. 2. During 1991 and 1992, there was a trend to increased prices: prices were highest from November to January and during the Eid-ul-Azha which occurred in June in both years. Furthermore, in March, when Eid-Iftr 2 occurred, the prices in-
1 Moslem holiday to celebrate the return of pilgrims from Mecca in the Islamic month of Haj{
2 Moslem celebration at the end of Ramadan.
45-r---------~====~---------------, [ Eid-ui-Azha [···· ..•
- 40 <J)
fE.
t 35
! 1; 30 OJ -"'
~ 25 ., " ~
20
/ ··.
15Lr~~-r~~-r~~-r~~-r~~-r,-~ Jan Jul Jan Jul 91 Apr Oct 92 Apr Oct
j--- Goats --El- Sheep
Fig. 2. Goat and sheep prices per kg liveweight in the Quetta livestock market.
creased, reversing the trend from January to May. The high prices during November to January coincided with the lowest number of animals on offer at the Quetta market, although only qualitative observations of animal numbers were available.
The timing of sales, and possible productionscheduling, deserves more attention as it can override the benefits of improved husbandry practices. Results published by Nagy et al. (1989) were re-analysed to evaluate the impact of selling sheep 10% below the average price (poor timing) in above-average and below-average rainfall years. It was found that the economic returns of improved animal husbandry practices were offset by poor timing. Lamb fattening schemes have been introduced to agro-pastoralists, under self-help organizations, where scheduling is emphasized to take advantage of price seasonality and feed procurement (Rodriguez and Mayer, 1995).
The price differentials 3 between producers' and intermediaries' price expectations represent the bargaining space between these agents in the marketing chain. On average, the actual price received by the producers is somewhere between
3 We do not refer to them as price margins since they are not actual prices.
84 A. Rodriguez et al. /Agricultural Economics 12 (1995) 79-90
their price expectations and those of the intermediaries. Monthly price differentials per kg liveweight for goats and sheep and averaged for
Table 2
the two years are depicted in Fig. 3. The lowest price differentials for goats occurred in spring and were high during summer, part of autumn
Price perception models for sheep and goats (unrestricted model U) in the Quetta livestock market
Parameter and Goats interaction (X) Estimate
INTERCEPT 30.103 ' * *
Julian day 0.012 * * *
Liveweight -1.178 * * * (Liveweight) 2 0.014 * * *
Month January 18.783 * * *
February -4.860 *
March -0.222 April -2.013 May -2.544 June 2.691 July -2.482 August 9.252 * * *
September 3.852 October 8.154 * *. *
November 15.373 * * *
December 0.000
Meat day Meatless day 0.849 Meat day 0.000
Breed Lehri 4.535 * * *
Barbari -1.458 Other a 0.688 Sind Desi 4.091 * *
Afghani 0.000
Sex Female -1.580 Male 0.000
Body condition Poor 7.978 Average 0.000 Good -1.856
Age < 1 yr -6.862 1-2 yr -5.794 2-3 yr -5.777 > 3 yr 0.000
Market agent Producer 27.028 * * *
Intermediary 0.000
SE
8.831
0.001 0.260 0.001
2.740 2.818 3.460 3.981 3.566 3.500 3.277 2.936 2.859 2.720 2.733 0.000
0.620
1.600 1.871 1.438 1.723
1.795
1.942
0.049
8.444 8.423 8.475
6.382
Breed Harnai Other b
Afghani Sherwani Bagnari Mangli
Sheep
Estimate SE
40.515 * * * 5.352
0.012 * * * 0.002 -1.010 * * * 0.158
0.014 * * * 0.001
15.420 * * * 2.972 -10.090 * * * 3.509 -6.246 4.014 -9.614 ** 4.823
4.924 3.785 10.335 * * * 3.478 0.770 3.583
-4.019 * 2.934 -5.043 * 2.756 -6.427 * 2.984 -7.947 * 2.666
-0.003 1.280 0.000
-1.885 1.835 -2.703 1.874 -5.165 *** 1.790
1.141 2.444 -1.063 2.597
0.000
2.178 2.012 0.000
2.353 1.908 0.000
-3.592 * 1.955
4.962 4.525 7.367 4.534 4.089 4.585 0.000
12.722 * * * 3.516 0.000

A. Rodriguez eta/./ Agricultural Economics 12 (1995) 79-90 85
Table 2 (continued)
Parameter and Goats Sheep interaction (X) Estimate SE Estimate SE
Liveweight X
Month January -0.258 * * * 0.088 -0.346 * * * 0.078 February 0.065 0.082 0.246 * * * 0.072 March -0.077 0.086 0.172 * 0.078 April -0.130 0.093 0.193 ' 0.078 May 0.043 0.085 -0.066 0.075 June 0.037 0.087 -0.038 0.070 July -0.013 0.092 0.024 0.078 August -0.160 0.092 0.074 0.072 September -0.086 0.090 0.076 0.064 October -0.133 * 0.082 0.102 0.072 November -0.324 * * * 0.088 0.195 * * * 0.065 December 0.000 0.000
Liveweight X
Breed Breed Lehri -0.112 * 0.050 Harnai 0.077 0.049 Barbari 0.113 * * 0.053 Other b 0.089 * 0.050 Other a 0.068 0.046 Afghani 0.156 0.046 Sind Desi -O.D75 0.051 SheJWani -0.033 0.069 Afghani 0.000 Bagnari 0.008 0.066
Mangli 0.000
Liveweight X
Sex Female -0.034 0.057 -0.102 ' 0.060 Male 0.000 0.000
Liveweight X
Body condition Poor -0.272 0.078 -0.183 • * 0.076 Average 0.000 0.000 Good 0.049 0.542 0.051 0.051
Liveweight X
Age < 1 yr 0.095 0.239 -0.301 * 0.136 1-2 yr 0.056 0.238 -0.347 * 0.136 2-3 yr 0.089 0.239 -0.234 • 0.137 > 3 yr 0.000 0.000
Liveweight X
Market agent Producer -0.249 • * • 0.043 -0.163 ''* 0.040 Intermediary 0.000 0.000
RAIN1 0.042 •• 0.016 0.041 •• 0.017 RAIN2 0.041 • * 0.016 -0.019 0.016
Julian day X
Market agent Producer -0.004 * 0.002 -0.002 0.002 Intermediary 0.000 0.000

86 A. Rodriguez et al. I Agricultural Economics 12 (1995) 79-90
Table 2 (continued)
Parameter and Goats Sheep interaction (X) Estimate SE Estimate SE
Producer X
Month January 5.900 * * * 2.130 -6.894 * •• 2.160 February 0.679 1.821 -6.590 ••• 2.543 March -6.608 ••• 2.198 -2.273 2.237 April -3.612 •• 1.748 -5.568 * * 2.452 May -3.506 • 1.833 -5.642 ••• 1.915 June 5.076 •• * 1.791 7.076 ••• 1.950 July -1.819 1.781 -8.497 * *. 2.376 August -6.734 ••• 2.086 -4.293 • * 2.043 September 1.072 1.723 -3.032 2.047 October 0.912 1.891 -3.793 • 1.970 November -1.190 1.800 -3.427 • 1.917 December 0.000 0.000
Producer X
Meat day Meatless day 0.891 1.171 -1.189 1.437 Meat day 0.000 0.000
Producer X
Breed Breed Lehri -2.281 • 1.102 Harnai -1.062 1.312 Barbari -3.110 • 1.342 Other b -0.841 1.459 Other a -3.090 ••• 1.060 Afghani -1.306 1.318 Sind Desi 1.404 1.179 Sherwani 0.771 1.628 Afghani 0.000 Bagnari -0.233 1.817
Mangli 0.000
Producer X
Sex Female 2.638 • 1.241 2.397 1.506 Male 0.000 0.000
Producer X
Body condition Poor -7.755 ••• 1.709 -0.992 1.667 Average 0.000 0.000 Good 0.655 1.031 0.282 1.067
Producer X
Age < 1 yr -14.858 •• 6.118 0.405 2.491 1-2yr -13.192 • * 6.099 -0.396 2.440 2-3yr -16.538 ••• 6.098 -1.644 2.558 > 3 yr 0.000 0.000
Mean 27.316 28.093 Adj. R 2 0.466 0.391 N 2399 2389
a Other goat breeds were Kharasani, Khagani and Teddy. b Other sheep breeds were Balochi and Turkey. * P ~ 0.10. * • P ~ 0.05 . • • * p ~ 0.01.

A. Rodriguez et al. /Agricultural Economics 12 (1995) 79-90 87
12~----------------------------------,
10 [Eid-ui-Azha f··--............ .._
-2+-----.-----,---,---.--.---.---,-.-----.-:-~--r:-:--r------1 Jan Mar May Jul Sep Nov
Feb Apr Jun Aug Oct Dec
I ~ Goats - Sheep I Fig. 3. Price differentials between producers and intermediaries in the Quetta livestock market averaged for 1991 and 1992.
and during winter. Producers expected lower sheep prices than intermediaries in January, February and July but expected higher prices in March and June when Eid-Iftr and Eid-ul-Azha took place. Producers' expectations during the Gulf crisis in early 1991 were 25% below intermediaries' price expectations and in February 1992 they were 10% below the price expectations of intermediaries. The average price differential for goats represented 14% of the average price per kg liveweight expected by producers with a coefficient of variation of 55%. In contrast, the price differentials for sheep represented only 8% of the price per kg liveweight expected by producers, with a coefficient of variation of 145%. The goat market has more room for bargaining and is less volatile than the sheep market.
4. Goats and sheep models of price expectations
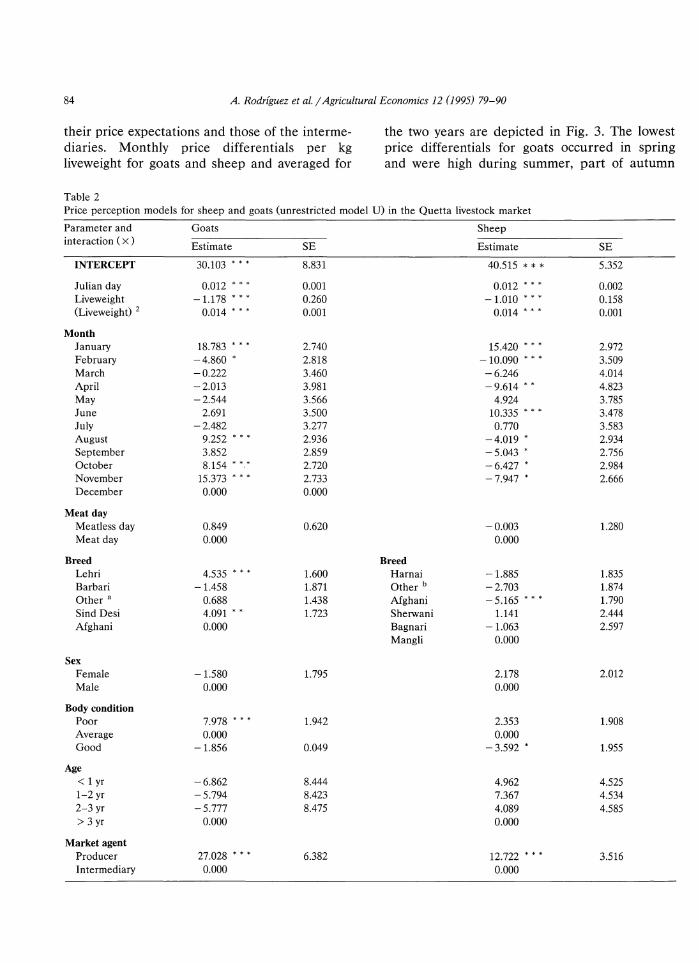
The parameters estimated for both goats and sheep for the unrestricted model (U) are shown in Table 2. The adjusted R 2 of the goat model was about 47% while for sheep it was about 39%. Analogous models for price per head had adjusted R 2 of 67% and 66% for goats and sheep, respectively. Because of seasonal fluctuations in liveweight it was decided to present the results in
prices per head adjusted to liveweight. Henceforth, price will refer to price per kg liveweight.
The coefficients for Julian day indicated that price expectations increased slightly above 1% per month. These trends were related to the average change in the official retail prices, from Rs 50/kg in January 1991 toRs 60/kg in December 1992. For both goats and sheep, liveweight was negatively and liveweight-squared positively related to price, indicating how price decreased, but at a decreasing rate, as the animals got heavier. Comparable results were obtained by Andargachew and Brokken (1993) for sheep in the Ethiopian highlands.
Price seasonality for both producers and intermediaries was captured by monthly coefficients, and by the interaction of month with liveweight. The model was further adjusted for seasonality using coefficients of the interaction between producers and month to represent producers' expectations.
The coefficients for meat and meatless days, and their interaction with producers showed that producers expected higher prices for goats on meatless days compared to intermediaries, but expected lower prices for sheep.
Lehri and Sind Desi breeds of goats had higher prices than Afghani goats, and Afghani sheep fetched Rs 5 /kg less than the Mangli sheep. Breeds interacting with liveweight also had a significant effect on price. Price of female goats was about Rs 1.6 /kg below the price of male goats and, when liveweight interacted with sex, the price of female goats dropped Rs 0.3 per 10 kg. In contrast, female sheep were priced Rs 2.1/kg higher than male sheep based only on sex, but when liveweight interacted with sex the price of female sheep dropped about Rs 1 per 10 kg liveweight. With the information available, it is not possible to explain the nature of the effect of the interaction between sex and liveweight with expected prices. Consumers' preferences need to be assessed to explain price expectations.
4 The goats and sheep from Afghanistan seen in the Quetta market are a mixture of breeds but are recognized by the producers and intermediaries.

88 A. Rodriguez et al. I Agricultural Economics 12 (1995) 79-90
Price of goats and sheep declined with improvement of body condition but when body condition interacted with liveweight, higher prices were obtained for goats and sheep in good condition. Originally, there were four categories of body condition: poor, average, good and very good. The last two were not significantly different in liveweight or price, so they were collapsed into the good body condition category.
The coefficients for market agents in the unrestricted model U showed that producers expected higher prices for both goats (Rs 27 jkg) and sheep (Rs 13 /kg) compared to intermediaries. These coefficients, relatively large compared to the average price of livestock, were decreased by negative coefficients of the interactions liveweight with producer, producer by age and producer by month. The corresponding coefficients for producers in the R2 models, not shown in the table, were Rs 3.9 jkg for goats and Rs 2.3 jkg for sheep. Prices were further adjusted for producers with a negative coefficient for liveweight: - 0.25 and -0.16 Rsjkg for goats and sheep, respectively.
Rainfall in the month of observation and the previous month had a positive effect on prices of both goats and sheep. Rainfall in the second and third months prior to the month of observation was positively related with goat prices but negatively related to sheep prices. This suggests that more abundant forage within a season increased price expectations in the short term: 100 mm in a two-month period, which is possible during November to April, can increase price by Rs 4.1jkg. Livestock must be held longer to take
Table 3
advantage of favourable grazing conditions, decreasing the number of animals on offer.
Nagy et al. (1989) observed that more livestock were sold in highland Balochistan in above-average rainfall years and less in below-average rainfall years. Our monthly visual observations of the animal numbers in the market did not allow the determination of intra-seasonal livestock supply responses which were strongly affected by religious festivals. A distinction between our results and the observations of Nagy et al. is that our model reflects intra-seasonal response to rainfall during two seasons with above-average rainfall ( > 320 mm), while Nagy et al. refer to inter-seasonal responses to rainfall. Long-term pricemonitoring is required to verify the relationship between rainfall, feed availability and livestock prices.
5. Producers view
To examine how producers view price seasonality and animal characteristics, MA 1 was incorporated into the model interacting with month, liveweight, age, body condition and sex.
A large proportion of the monthly coefficients in Table 2 were significant, suggesting that, using December as the base value, producers make further adjustments for seasonality. Producers also perceived prices of animals differently depending upon the breed. Sind Desi goats and Sherwani sheep had the highest prices. Goats and sheep in poor condition had the lowest price.
Tests of homogeneity of price expectations of producers and intermediaries in the goat and sheep models for the Quetta market
Comparing Goats Sheep
F Adj. R 2 F Adj. R 2
Homogeneous intercept MA (R1 a vs. R2 b) 111.9 '* 0.401a 34.3 •• 0.348 a
Homogeneity of MA and MA 1 interacting with other variables (R2 b VS. U <) 6.9 •• 0.428 b 5.1 •• 0.357 b
Overall homogeneity (U c vs. R1 a) 11.4 * * 0.467 c 6.3 * * 0.391 c
a Restricted model R1 where no intercept MAin the R2 model. b Unrestricted model R2 where MA 1 not interacting with other variables in the U model. c Unrestricted model U described in the procedures section. * ' Significant at P 5: 0.01.

A. Rodriguez et al. /Agricultural Economics 12 (1995) 79-90 89
These coefficients need to be added to those found for goats and sheep without discriminating between producers and intermediaries. For example, adding Rs 7.981kg (goats in poor body condition for both market agents) and Rs -7.751kg (goats in poor body condition for producers) yields Rs 0.23 I kg premium for goats in poor condition. Body condition was scored by the enumerators and not by the market agents and enumerators' perceptions may have been biased.
Producers assigned a premium for female goats and sheep but this needs to be complemented with the interaction between liveweight and sex which gives a discount for each kg of female liveweight. Producers perceived that younger goats had lower prices than older goats. On the other hand, younger sheep had higher prices than older sheep.
The F and R 2-values of the homogeneity tests are shown in Table 3. In all cases the differences between the models were significant. The highest F-values were found for the test of the intercept MA and lowest values were for the test of MA and MA 1 interacting with other variables. These results suggest that indeed producers and intermediaries have different price expectations (U versus Rl models). The difference was related to their position in the marketing chain (Rl versus R2 models), or the average difference in expectations between producers and intermediaries, but it was also related to producers' perception of price seasonality and appreciation of animal attributes such as liveweight, age, breed, sex and body condition (R2 versus U models).
Based on the number of significant coefficients interacting with MA 1 (Table 2) and the F-values for the comparison of models R2 and Rl in Table 3, producers pay more attention to management of goats compared to sheep. Because there are more sheep than goats in highland Balochistan, the impact of improved extension services for sheep could be larger than extension efforts for goats. However, the bargaining space for the sheep market is more restricted and more variable than that of the goat market. In any case, improved extension services could prepare sheep producers to cope with tougher bargaining conditions.
6. Conclusions
Liveweight and seasonality had the strongest effect on producers' and intermediaries' expected prices. Rainfall in the current and previous month was positively related to seller's expected prices suggesting that livestock are retained to take advantage of favourable grazing conditions. Models of price expectations showed that producers adjusted expected goat prices (P ~ 0.10) for seasonality, liveweight, body condition, age, sex and breed, while they adjusted sheep prices for seasonality and liveweight only. High pay-offs could be expected if extension efforts focused on factors that determine sheep meat quality; however, the retail ceiling price of meat and the lack of grading are a disincentive to work in this direction. Monitoring of prices and the number of animals could be useful to estimate producers' response to intra-seasonal prices. Assessment of consumers' preferences for meat can complement the understanding of marketing practices.
This study did not seek to demonstrate benefits of alternative livestock policies to improve market efficiency, it only analysed components of livestock price expectations of producers and intermediaries and has provided a baseline for market scheduling. However, scheduling of sales by transhumant pastoralists may be difficult to achieve because sales are made to raise cash rather than to maximize sales revenues. The livestock policy environment in Balochistan and in the rest of Pakistan needs to be evaluated in accordance with provincial and national development goals.
Acknowledgements
This research was supported by the USAID Mission to Pakistan through the Management and Agricultural Research Technology 1 Arid Zone Component (MART 1 AZR) project. We are grateful to producers, butchers, wholesalers and commission agents with whom we spent hours in Quetta market and who allowed us to weigh their livestock. We thank Luis Mater6n who made SAS computing an enjoyable task. Luis, Kamil Shideed,

90 A. Rodriguez eta/./ Agricultural Economics 12 (1995) 79-90
Tom Nordblom, Liz Bailey, Euan Thomson, Guy Manners and two anonymous reviewers made valuable comments to earlier versions of this paper.
References
Andargachew, K. and Brokken, R., 1993. Intra-annual sheep price patterns and factors underlying price variations in the central highlands of Ethiopia. Agric. Econ., 8: 125-138.
AZRijiCARDA (Arid Zone Research Institute/International Center for Agricultural Research in the Dry Areas), 1992. High elevation research in Pakistan, the MART 1 AZR project annual report 1991. I CARDA, Quetta, Pakistan, 69 pp.
AZRI/ICARDA (Arid Zone Research Institute/International Center for Agricultural Research in the Dry Areas), 1993. High elevation research in Pakistan, the MART/AZR project annual report 1992. ICARDA, Quetta, Pakistan, 43 pp.
FAO, 1983. Report of the assistance to rangeland and livestock development survey in Baluchistan. FAO Technical Cooperation Program TCP /PAK/0107, Food and Agricultural Organization, Islamabad, Pakistan, 18 pp.
Francis, P., 1990. Small-ruminant marketing in southwest Nigeria. Agric. Econ., 4: 193-208.
GOB, 1989. Agricultural Statistics Balochistan. Statistics Wing, Directorate General of Agriculture Department, Government of Balochistan, Quetta, Pakistan, 136 pp.
GOP, 1989. Pakistan Census of Livestock 1986. Agricultural Census Organization, Statistics Division, Government of Pakistan, Lahore, 53 pp.
Johnston, J., 1972. Econometric Methods. McGraw-Hill, New York, 568 pp.
Kidd, C.H.R., Rees, D.J., Keatinge, J.D.H., Rehman, F., Samiullah, A. and Raza, S.H., 1988. Meteorological data analysis of Balochistan. MART/AZR Res. Rep. 19. ICARDA, Quetta, Pakistan, 33 pp.
Mahmood, K. and Rodriguez, A., 1993. Marketing and processing of small ruminants in highland Balochistan, Pakistan. Small Rumin. Res., 10: 93-102.
Nagy, J.G., Stubbs, J.M. and Mallorie, E.R., 1989. Ex-ante economic technology evaluation for research and extension program design: sheep production improvement in Balochistan, Pakistan. Pak. J. Agric. Soc. Sci., 3/4: 1-18.
Nagy, J.G., Sabir, G.F. and Stubbs, J.M., 1991. Sheep and goat production in upland Balochistan. Small Rumin. Res., 4: 219-233.
Rodriguez, A., 1992. Social and economic considerations of sheep and goat production and marketing in Balochistan, Pakistan. MART/AZR Project Res. Rep. 74, ICARDA, Quetta, Pakistan, 12 pp.
Rodriguez, A., Ali, I., Afzal, M. and Shah, N.A., 1993. The marketing of goat and sheep skins in highland Balochistan, Pakistan. Small Rumin. Res., 12: 259-270.
Rodriguez, A. and Mayer, L., 1995. Development of sheep fattening schemes in Highland Balochistan. Small Rumin. Res. (in press).
SAS, 1988. SAS/STAT User's guide, release 6.03 edition. SAS Institute Inc., Cary, NC.
Copyright © 2022 FDOKUMEN