PREPARED FOR THE CHALLENGES AHEAD - Shui On Land
260
Annual Report 2018 Shui On Land Limited PREPARED FOR THE CHALLENGES AHEAD STOCK CODE 272
-
Upload
khangminh22 -
Category
Documents
-
view
1 -
download
0
Transcript of PREPARED FOR THE CHALLENGES AHEAD - Shui On Land

Shui O
n Land Limited
Annual R
eport 2018
Annual Report 2018Shui On Land Limited
PREPARED FOR THE CHALLENGES AHEAD
STOCK CODE 272
SOLM067_AR18_Cover AW.indd 1 9/4/2019 11:17

DES
IGN
CO
NC
EPT:
YEL
LOW
CRE
ATI
VE
( HK
) LIM
ITED
w
ww
.yel
low
crea
tive.
com
A LEADING COMMERCIAL FOCUSED PROPERTY DEVELOPER, OWNER AND ASSET MANAGER IN CHINAEstablished in 2004 and listed on The Stock Exchange of Hong Kong (Stock Code: 272) in October 2006, Shui On Land Limited is the Shui On Group’s flagship property development company in the Chinese Mainland. Headquartered in Shanghai, Shui On Land has established a solid foundation in the Chinese Mainland and has a proven track record in developing mixed-use, sustainable communities.
Shui On Land develops, owns and manages high-quality residential, office, retail, entertainment and cultural properties in the Chinese Mainland. Shui On Land applies its hallmark approach of master-planning to all projects to ensure that developments are fully consistent with government objectives in economic development and urban planning while simultaneously incorporating local historical and cultural characteristics into our designs and planning. Manifesting the “Total Community” concept, our projects provide a unique environment enabling life enrichment of “Live-Work-Play”.
Shui On Land’s landbank stood at 8.5 million sq.m. (6.8 million sq.m. of leasable and saleable GFA, and 1.7 million sq.m. of clubhouses, car parking spaces and other facilities). Its nine projects, in various stages of development, are all situated in prime locations within the key cities of Shanghai, Wuhan, Chongqing and Foshan.
SOLM067_AR18_Cover AW.indd 2 4/4/2019 11:50

Prepared for the Challenges AheadOur prudent approach over the past three years has placed us in an excellent situation, buttressed by a strong financial position which should enable us to weather heightened global market volatility and China’s slowing economy. Underpinned by a portfolio of high-quality commercial properties in Shanghai and other major cities in China, its well-established brand and management expertise, the Group will transform itself into a leading commercial focused property developer, owner and asset manager. We will remain constantly alert to both challenges and opportunities for expansion that arise.
Asset LightStrategy
Asset Management & Development Initiatives
Strategic Partnerships
Investment Platform

OUR COMMITMENT TOINVESTORSWe are committed to providing attractive and sustainable returns for our investors based on a well-planned, long-term growth trajectory and strategic direction.
CUSTOMERSThe expectations of our customers are always at the forefront of our thinking and planning, enabling us to provide high quality and add value to all our projects.
COMMUNITYWe continually look for innovative ways to build and contribute to the community.
We sustain our vision by integrating quality into all of
our operations and aspiring to world-class standards
of excel lence in management, planning, execution
and corporate governance.
VISIONTo be a leading commercial focused
property developer, owner and asset manager in China
Innovation • Quality • Excellence
BRAND PROMISE
SHUI ON SPIRITIntegrity • Dedication • Innovation • Excellence
ENVIRONMENTAs an experienced and socially responsible property developer, Shui On Land considers respect for the environment to be a key ingredient for the long-term development of the communities in which we are involved.
EMPLOYEESShui On Land believes that care for our employees and for the development of their talents is crucial to the long-term success of the Group.

CONTENTS4 Financial Highlights
6 Achievement Highlights
8 Chairman’s Statement
13 Market Updates and Project Profiles
32 Business Review
42 Landbank
44 Financial Review
50 Market Outlook
52 Corporate Governance Report
66 Risk Management Report
68 Corporate Social Responsibilities
105 Biographies of Directors and Senior Management
111 Directors’ Report
125 Independent Auditor’s Report
132 Consolidated Statement of Profit or Loss
133 Consolidated Statement of Profit or Loss and Other Comprehensive Income
134 Consolidated Statement of Financial Position
136 Consolidated Statement of Changes in Equity
138 Consolidated Statement of Cash Flows
140 Notes to the Consolidated Financial Statements
255 Financial Summary
256 Corporate Information

LANDBANK as of 31 December 2018
million sq.m.
Residential 2.1
Office 2.5
Retail 2.0
Hotel/Serviced Apartments 0.2
Total leasable and saleable GFA 6.8
Attributable GFA 4.3
3%
31%
36%
30%
GFABY USAGE
million sq.m.
Shanghai 2.2
Wuhan 2.2
Chongqing 1.4
Foshan 1.0
Total leasable and saleable GFA 6.8
Attributable GFA 4.332%
15%
21%
32%
GFABY CITY
OPERATING RESULTS for the year ended 31 December
2018HKD’million
2017HKD’million
2018RMB’million
2017RMB’million
Revenue 29,362 21,329 24,841 18,451
Represented by:
Property development 26,272 18,691 22,227 16,169
Property investment 2,496 2,267 2,112 1,961
Construction 350 224 296 194
Others 244 147 206 127
Gross profit 8,445 9,084 7,145 7,858
Increase in fair value of the remaining investment properties 1,147 599 970 518
Profit attributable to shareholders 2,253 1,929 1,906 1,669
Core earnings of the Group 3,617 3,638 3,060 3,147
Basic earnings per share HKD28.0 cents HKD24.1 cents RMB23.7 cents RMB20.8 cents
Dividend per share
Interim paid HKD0.036 HKD0.03 HKD0.036 HKD0.03
Proposed final HKD0.084 HKD0.07 HKD0.084 HKD0.07
Full year HKD0.12 HKD0.10 HKD0.12 HKD0.10
Note:
Except for dividend per share that is originally denominated in HK dollar, all of the HK dollar figures presented above are shown for reference only and have been arrived at based on the exchange rate of RMB1.000 to HKD1.182 for 2018 and RMB1.000 to HKD1.156 for 2017 being the average exchange rates that prevailed during the respective years.
FINANCIAL POSITION as of 31 December
2018RMB’million
2017RMB’million
Total cash and bank deposits 15,392 16,760
Total assets 110,250 114,292
Total equity 47,219 49,175
Total debt 34,269 41,699
Bank borrowings 26,321 30,993
Senior notes 7,424 10,706
Receipts under securitisation arrangements 524 –
Net gearing ratio* 40% 51%
* Calculated on the basis of the excess of the sum of bank borrowings, senior notes and receipts under securitisation arragements net of the sum of total cash and bank deposits over the total equity.
FINANCIAL HIGHLIGHTS
Shui On Land Limited4

20.8
1,86
9
2017 2018
2,20
0*
18,4
51
2017 2018
24,8
41
CONTRACTED PROPERTY SALES & OTHER ASSET DISPOSAL(RMB’million)
(%)
(HKD/share)
(RMB’million)
(RMB’million)
(RMB’million)
(RMB’million)
(RMB’cent/share)
(%)
(RMB’million)
(RMB/share)
(RMB’million)
21,3
66
2017 2018
22,2
79
REVENUE RENTAL AND RELATED INCOME
GROSS PROFIT
GROSS PROFIT MARGIN
1,90
6
1,66
9
2017 2018
4.75
2017 2018
4.84
PROFIT ATTRIBUTABLE TO SHAREHOLDERS
BASIC EARNINGS PER SHARE
SHAREHOLDERS’ EQUITY PER SHARE
DIVIDEND PER SHARE
0.07
0
2017Final
2018Final
0.08
4
114,
292
2017 2018
110,
250
51
2017 2018
40 16,7
60
2017 2018
TOTAL ASSETS
NET GEARING RATIO
TOTAL CASH AND BANK DEPOSITS
43
2017 2018
29
2017 2018
23.7
7,85
8
2017 2018
7,14
515
,392
* Including Rental Income from Rui Hong Xin Cheng Commercial Partnership Portfolio, in which, the Group has 49.5% effective interest, if exclude and deconsolidate in 2018, rental and related income for the Group was RMB2,016 million.
Annual Report 2018 5
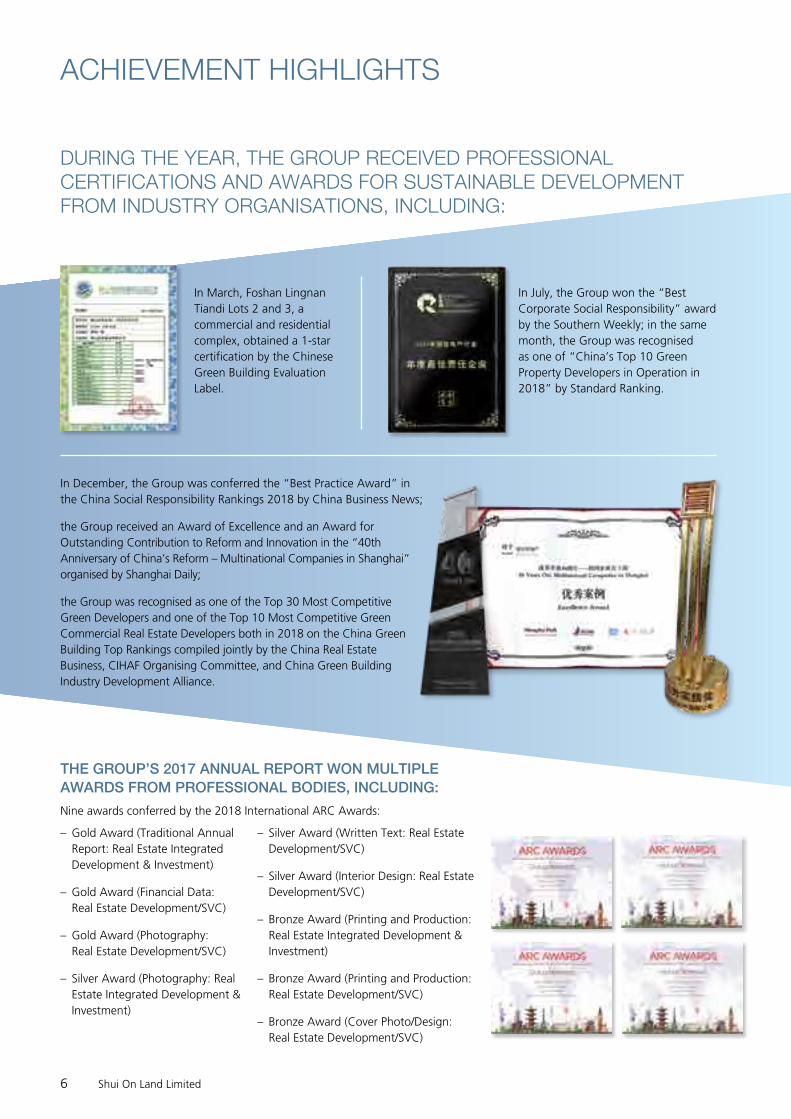
THE GROUP’S 2017 ANNUAL REPORT WON MULTIPLE AWARDS FROM PROFESSIONAL BODIES, INCLUDING:
In March, Foshan Lingnan Tiandi Lots 2 and 3, a commercial and residential complex, obtained a 1-star certification by the Chinese Green Building Evaluation Label.
In July, the Group won the “Best Corporate Social Responsibility” award by the Southern Weekly; in the same month, the Group was recognised as one of “China’s Top 10 Green Property Developers in Operation in 2018” by Standard Ranking.
In December, the Group was conferred the “Best Practice Award” in the China Social Responsibility Rankings 2018 by China Business News;
the Group received an Award of Excellence and an Award for Outstanding Contribution to Reform and Innovation in the “40th Anniversary of China’s Reform – Multinational Companies in Shanghai” organised by Shanghai Daily;
the Group was recognised as one of the Top 30 Most Competitive Green Developers and one of the Top 10 Most Competitive Green Commercial Real Estate Developers both in 2018 on the China Green Building Top Rankings compiled jointly by the China Real Estate Business, CIHAF Organising Committee, and China Green Building Industry Development Alliance.
ACHIEVEMENT HIGHLIGHTS
DURING THE YEAR, THE GROUP RECEIVED PROFESSIONAL CERTIFICATIONS AND AWARDS FOR SUSTAINABLE DEVELOPMENT FROM INDUSTRY ORGANISATIONS, INCLUDING:
Nine awards conferred by the 2018 International ARC Awards:
– Gold Award (Traditional Annual Report: Real Estate Integrated Development & Investment)
– Gold Award (Financial Data: Real Estate Development/SVC)
– Gold Award (Photography: Real Estate Development/SVC)
– Silver Award (Photography: Real Estate Integrated Development & Investment)
– Silver Award (Written Text: Real Estate Development/SVC)
– Silver Award (Interior Design: Real Estate Development/SVC)
– Bronze Award (Printing and Production: Real Estate Integrated Development & Investment)
– Bronze Award (Printing and Production: Real Estate Development/SVC)
– Bronze Award (Cover Photo/Design: Real Estate Development/SVC)
Shui On Land Limited6

GROUP
SUBSIDIARIES AND PROJECTS
March
Optics Valley Innovation Tiandi jointly developed by the Group and CITIC Limited was launched.
July
The Group succeeded in bidding jointly with China Pacific Life Insurance Co., Ltd. and Shanghai Yongye Enterprise (Group) Co., Ltd. for the development rights of three land lots (Lots 123, 124, 132) in Huangpu District in Shanghai to develop a world-class commercial and office complex, as part of a project integrating commercial, office and residential developments with the Group’s existing properties in the Taipingqiao Project.
1. China Xintiandi received one silver award for innovative retailing concepts and 4 silver awards for marketing as the biggest winner of marketing accolades at the award ceremony organised by ICSC China Shopping Centres & Retailers.
2. Feng Cheng Property Management received multiple honours in the year, including being named as a Shanghai Property Management Integrity Commitment Class-AA Enterprise.
3. The Taipingqiao project has received a variety of awards. The Lakeville Luxe received Residential High-rise Architecture China Award in the 2017-2018 Asia Pacific Property Awards, and was named “the Residential High-rise Architecture China” by the RICS Awards 2018 Winner.
4. The Gallery of Rui Hong Xin Cheng was conferred Asia Property Awards – Best CONDO Development (China)and Asia Property Awards (China) – BEST CONDO Development at the Asia Property Awards.
5. THE HUB was recognised as one of “Shanghai’s Art and Business Cooperative Commercial Enterprises” in 2018 by the Shanghai Municipal Commission of Commerce.
6. The Knowledge and Innovation Community (KIC) won various awards in the year, including being named as an “Innovation and Development Model Zone in Shanghai’s Service Industry” by the Shanghai Municipal Development & Reform Commission for supporting the functional development of the KIC project.
7. InnoSpace, an innovative startup platform under the Group, received various honours in the year. It was awarded the “2017-2018 Best Investment Award” by Crowd Innovation Space Association Yangpu District.
8. Wuhan Tiandi was recognised as an Excellent Enterprise for Social Responsibility and for Innovative Development in 2016-2017 by the Wuhan Association of Foreign-invested Enterprises.
9. Chongqing Tiandi received an award as one of “Top 10 Most Beautiful Commercial Streets in Chongqing” conferred by the Chongqing Broadcasting Group.
10. Foshan Lingnan Tiandi received various awards including the “Outstanding Contribution and Caring Award – Foshan Real Estate Industry” conferred by the Foshan Real Estate Association.
August
Group Chairman Mr. Vincent Lo was awarded the “Lifetime Achievement Award for Hong Kong People in Shanghai during 40 Years of Reform and Opening Up” by the Shanghai Hong Kong Association.
November
Group Chairman Mr. Vincent Lo received the “Outstanding Contribution Award for Foreign-invested Companies in Shanghai during 40 Years of Reform and Opening Up” by the Shanghai Association of Foreign Investment.
Annual Report 2018 7

Our success in growing rental income depends on our strong
portfolio of investment properties capable of generating
rising, recurrent income, our continual investment in our
brand and our relentless attempt to innovate. The portfolio is
the cornerstone of the Group’s future development.
CHAIRMAN’S STATEMENT
“
“
Shui On Land Limited8

Against a backdrop of heightened political and economic uncertainties, and despite trade tensions with the U.S. slowing China’s GDP growth to 6.6%, the Group delivered commendable results in 2018. We, achieved higher profits, together with new partners, won the bid for an important new commercial development at Taipingqiao (“TPQ”) in Shanghai. The formation of Core-Plus Office Investment Platform with partners ended the year on a high note.
These achievements are the result of the sustained execution of our forward-thinking Asset Light Strategy, which was initiated three years ago in response to expected changes in the business environment. The strategy is beginning to pay off and the resultant strong financial position of the Group makes us well placed to take advantage of the opportunities expected to arise during the unfortunate but inevitable coming downturn.
FINANCIAL HIGHLIGHTS2018 revenue increased by 35% to RMB24,841 million. General property sales accounted for RMB7,093 million, while other asset disposals accounted for RMB15,038 million. Rental and related income contributed RMB2,016 million during the year, as well as RMB694 million arising from hotel, construction, asset management fee income and other activities.
Backed by the higher revenue, profit for the year grew to RMB2,686 million in 2018, compared to RMB2,324 million in 2017. Accordingly, profit attributable to shareholders rose 14% to RMB1,906 million in 2018, from RMB1,669 million a year ago.
The Group’s net gearing ratio was 40% as at 31 December 2018, representing a decrease of 11 percentage points from 51% as at 31 December 2017. Cash and bank deposits remained healthy at RMB15,392 million. The Group’s solid balance sheet should enable it to weather any market volatility that may arise.
ROBUST RESIDENTIAL AND INVESTMENT PROPERTY BUSINESSESThe range of restrictions on China’s residential property market remained throughout 2018. Notwithstanding these headwinds, the Group’s residential sales went well, with the full-year contracted residential property sales reaching RMB14.12 billion, an increase of 63%. Total contracted sales including general property sales, other assets disposal and commercial property sales for the year amounted to RMB22.279 billion. At Lakeville Luxe in Shanghai, all 118 units sold out in one day. Similarly, at La Riva II in Wuhan and Rui Hong Xin Cheng·The Gallery in Shanghai, all units launched were subscribed in a single day. This testifies to the strong brand reputation we enjoy and our ability to create the kind of high-quality developments sought after by China’s rising middle and upper class.
Our investment properties achieved an 8% increase in rental and related income to RMB2,016 million for the year. Including the income generated from the Rui Hong Xin Cheng (“RHXC”) commercial partnership portfolio which is now accounted as joint venture income, total rental and related income increased by 18% to RMB2,200 million. Our success in growing rental income depends on our strong portfolio of investment properties capable of generating rising, recurrent income, our continual investment in our brand and our relentless attempt to innovate. The portfolio is the cornerstone of the Group’s future development.
To keep enhancing the value of these assets, we are creating new products to cater to the market’s needs and strengthen our competitiveness. Over the years, the original Xintiandi brand has managed to stay at the heart of Shanghai’s retail and leisure experience by always leading and responding to the latest trends and changes. Xintiandi has gone from strength to strength with its new proposition of “Social Renaissance”, creating social destinations where people “meet, grow and engage”.
Annual Report 2018 9
CHAIRMAN’S STATEMENT
By the close of the year, we
made a significant move
to optimise our ability to
grasp market opportunities
through the formation of
Core-Plus Office Investment
Platform with partners.
“
“In December, at the new Xintiandi Plaza in TPQ, we soft-launched our latest asset enhancement initiative which created a shopping and social destination specifically for women – a powerful force in retail. We are in the process of shaping the Xintiandi Community around the idea of “Social” attributes – Foodie Social, Design Social and Social House. Foodie Social aims to give rise to a special niche for the community, celebrating chefs and the art of cooking. Design Social will offer a collection of contemporary design brands, including original Chinese boutiques, and will act as a communication platform for fashion communities. Social House is a diversified business eco-system integrating retail, leisure, restaurants and social space themed around “Refresh Mind, Recharge Energy, Renew Look”.
During the year we also launched our off ice brand INNO, which creates office space with social attributes, constructing a unique eco-system for growing innovation and entrepreneurship. The first INNO project, INNO Zhujiang Lu in Nanjing, has started business, and we are expanding the concept to Shanghai at INNO KIC in Yangpu.
THE HUB, China’s first commercial complex directly connected to the Hongqiao Transportation Hub that we created in 2015, has become a business, leisure and entertainment hub for the 75 million people living and working in the Hongqiao area and Yangtze River Delta, as well as those living within an hour’s reach via high speed rail. The China International Import Expo is giving added vigor to Hongqiao and hosting this annual mega event also endorses the potential of the district.
In line with our strategic transformation to be a leading commercial focused property developer, owner and asset manager in China, in December, we announced the proposed acquisition of the remaining 21.894% interest in China Xintiandi Holding Company Limited (“CXTD Holding”). The acquisition will make CXTD Holding our wholly-owned subsidiary and will provide us with greater flexibility in the strategic direction and day-to-day management of the portfolio, noticeably in consolidating the Group’s control of the asset portfolio held by CXTD Holding. We will also continue to innovate to make sure our existing and new assets become key destinations, with a particular emphasis on Shanghai, where we see tremendous potential.
FORWARD-THINKING ASSET LIGHT STRATEGY AND STRONG PARTNERSHIPSDuring 2018, we continued to pursue the Asset Light Strategy, unlocking value in our existing assets and striking new partnerships, leveraging our brand advantage and asset management expertise. By realising the value of these assets ahead of the expected market downturn, we have built up a war chest which will come in handy when investment opportunities arise.
The Group further deleveraged, with net gearing down from 87% in 2015 to 40% as at 31 December 2018. We also have a healthy cash balance of RMB15,392 million.
A major transaction was completed in Shanghai during the year. The Group disposed of its 49.5% effective interests in the Shanghai RHXC Residential Portfolio Lots 1 & 7. This allowed the Group to enhance shareholder return through unlocking the value in these assets at a substantial profit.
We made another major step forward in Shanghai in July when we entered into a new partnership to acquire Lots 123, 124 and 132 in TPQ Project. The site will be developed into world-class commercial and office spaces, completing an integrated hub of office, commercial and residential properties developed by Shui On Land in the TPQ area. With the Group taking a minority stake but providing development and management expertise in the project, the acquisition is a good example of our Asset Light Strategy allowing us to engage in exciting opportunities at lower risk.
Shui On Land Limited10

Our partnerships with major Chinese enterprises including Pacific Life, China Life and CITIC demonstrate that we are a valuable proposition to both the private sector and government organisations engaged in the planning of new communities, as they seek to acquire advanced international expertise. The current global situation prompts many cities to revitalise and reposition themselves to enhance competitiveness and our expertise is helpful to them. Our track record shows that we do not just construct buildings, but we actually work with the government on what a city needs, then master-plan the project to cater to those needs with the ultimate aim of creating value for the community. We are being approached by more and more municipal governments, who want to work with us to energise and revitalise their cities.
We also continued to leverage our commercial asset management expertise to enhance third-party assets. The two commercial projects in Nanjing, INNO Zhujiang Lu and Nanjing Bai Zi Ting, are successful test cases of pure asset light operating projects.
By the close of the year, we made a significant move to optimise our ability to grasp market opportunities through the formation of Core-Plus Office Investment Platform with Manulife Investors and China Life Trustees Limited. In line with other Asset Light Strategy initiatives, we are taking a stake in the platform along with other partners and will assume the manager role. The platform will seek investments in primarily office properties in Shanghai and other tier one cities in China, such as Beijing, Shenzhen and Guangzhou, with a targeted total capital commitment of USD1 billion. With the significant capital raised from global financial investors, this platform will create value and expand our commercial property portfolio together with long-term partners. This will further enhance our position as a market leader in Shanghai commercial property portfolio, provide us with stable, recurrent management income from diverse revenue sources, while opening a new avenue in the investment arena.
Annual Report 2018 11

CHAIRMAN’S STATEMENT
OUTLOOKWe remain very cautious as regards the immediate future and the medium-term outlook in view of the worsening geopolitical and economic situation around the world. The trade “war” between the U.S. and China is unlikely to be settled soon and it will have a major impact on the Chinese economy, as well as globally. We have seen most institutions lowering their economic growth forecasts, and, without a doubt, many problems may emerge going forward. The coming downturn may be even more severe than that of 2008 due to a higher level of debt among corporates around the world, plus the fact that the low interest rate environment in the past decade has inflated global asset prices to their peak.
In fact, the real estate market in China has been in a downturn since late last year. Prices and sales volumes started to drop considerably in the second and third tier cities, although the top tier cities such as Shanghai, underpinned by high demands, have proven resilient.
This being the case, we are going to maintain the same prudent approach we have pursued in business over the past three years. I believe our stakeholders are beginning to appreciate this approach and how it has put us in an excellent shape to face the likely downturn. Over the past 20 years we have invested in a large number of high-quality commercial properties in Shanghai and other major cities in China, which form the basis of the Group’s further development. The development of such commercial assets requires significant low-cost long-term capital, and our Asset Light Strategy has significantly reduced financing costs through realising some of our assets’ value, while deepening our cooperation with various sources of capital in recent years.
We are now fully prepared to make purchases when the right opportunities arise. In identifying investment opportunities, we will use the principle of “urban screening”, selecting the most dynamic core cities in China that are suitable for multi-project development and premium commercial asset investment.
In this, we will be helped by the strong brand reputation we have nurtured over the years. The “Xintiandi” brand has given Shui On Land a first-mover advantage in the transformation of old cities and in urban renewal capabilities. We will continue to invest in our brand, and bring further innovation to the market, which will earn us access to the huge urban renewal opportunity in China’s core cities in the years ahead.
To make sure we are well-placed to seize the opportunities as they emerge, we are also strengthening our human resources, so that we have the right talents to handle projects creatively and efficiently. We intend to do a lot more with the Shui On Academy set up to help train and develop our “people capital”.
THANK YOUMy heartfelt thanks go to my fellow Board members, our management and employees, as well as business partners, for their support throughout the year.
Now, more than ever before in recent years, we see many challenges ahead. Given the deteriorating global business environment, we need to maintain the Group’s prudent approach, strengthen our balance sheet further and deepen our relationship with partners. The bottom line is that we have a good strategy in place that is starting to pay off, and we are poised to capture asset acquisition opportunities at attractive prices when they arise.
VINCENT H. S. LOChairman
Hong Kong, 20 March 2019
Shui On Land Limited12

MARKET UPDATES AND
PROJECTPROFILES
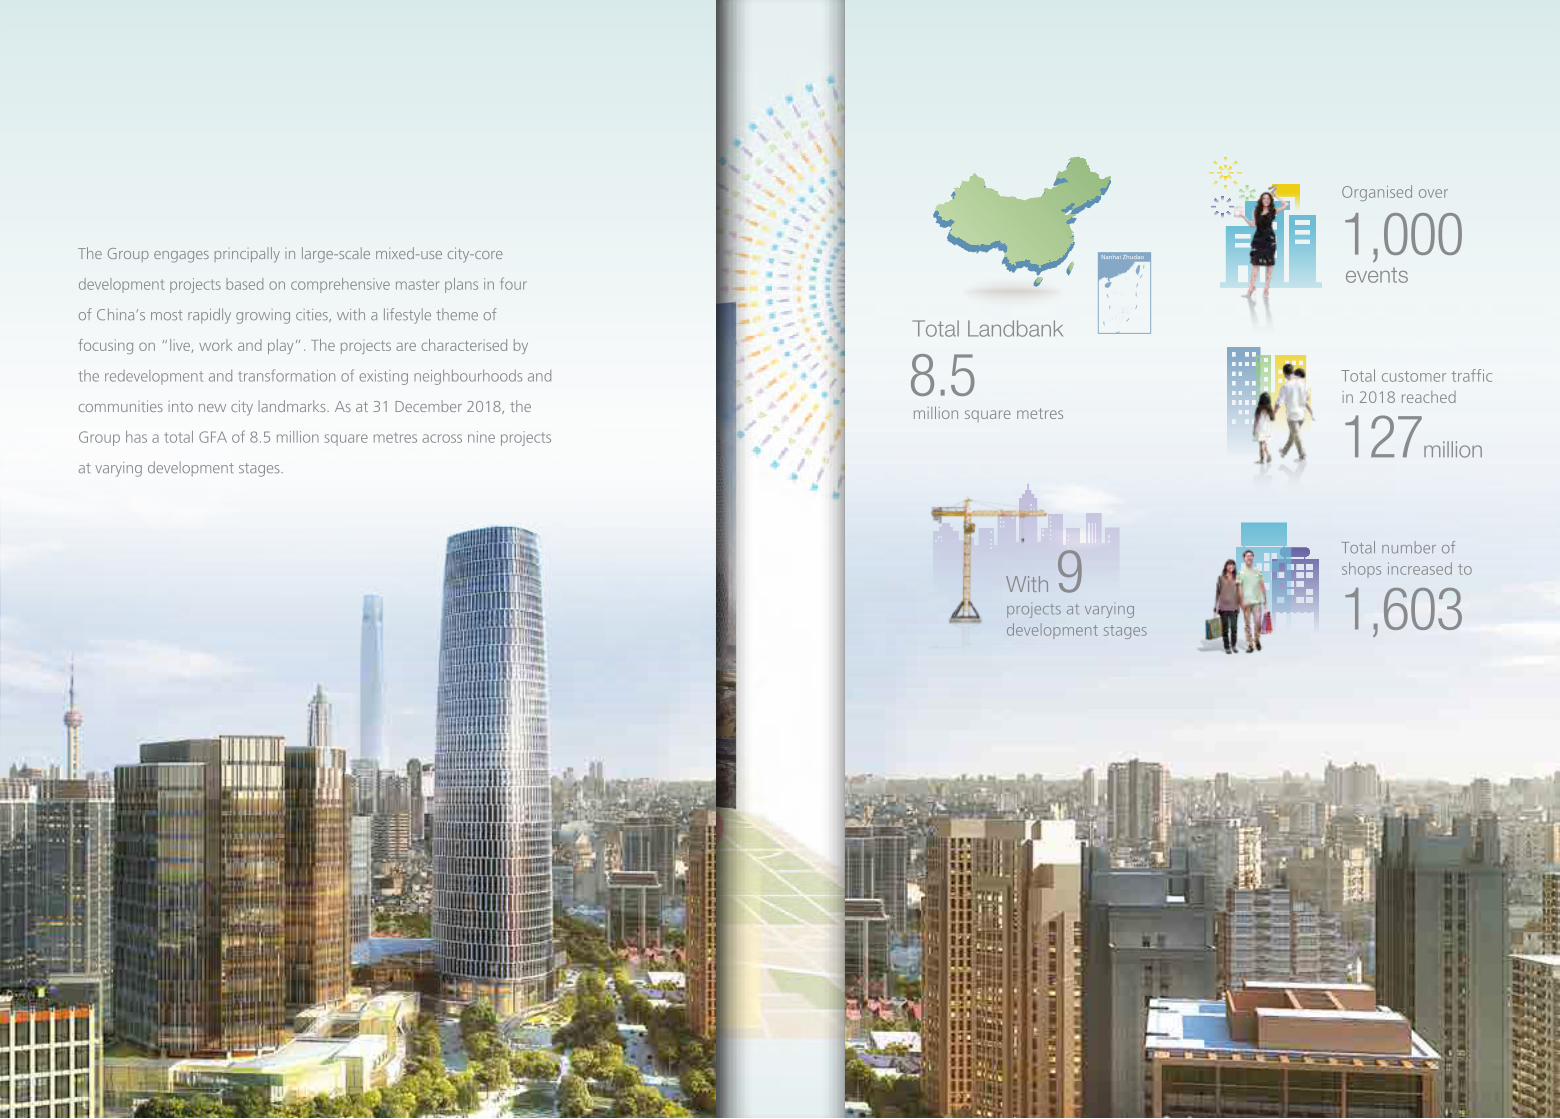
The Group engages principally in large-scale mixed-use city-core
development projects based on comprehensive master plans in four
of China’s most rapidly growing cities, with a lifestyle theme of
focusing on “live, work and play”. The projects are characterised by
the redevelopment and transformation of existing neighbourhoods and
communities into new city landmarks. As at 31 December 2018, the
Group has a total GFA of 8.5 million square metres across nine projects
at varying development stages.
events1,000Organised over
1,603Total number of shops increased to
Total Landbank
8.5million square metres
127million
Total customer traffic in 2018 reached
Nanhai Zhudao
Withprojects at varying development stages
9
WORKOur unique “INNO” line office products offer a business-social platform that integrates work, entrepreneurship, learning, and leisure, meeting the needs of businesses with diverse office and lease requirements
PLAYA focal point where people can enjoy dynamic dining and retail opportunities, as well as experiencing exciting events. Our new Social Renaissance concept provides a destination where people can meet, grow and engage

LIVE
SHUI ON LAND IS ABOUT...
High-end residences that cater to today’s diverse lifestyles, set in green parks offering access to nature, alongside club houses and entertainment facilities in which to relax and recharge
WORKOur unique “INNO” line office products offer a business-social platform that integrates work, entrepreneurship, learning, and leisure, meeting the needs of businesses with diverse office and lease requirements
PLAYA focal point where people can enjoy dynamic dining and retail opportunities, as well as experiencing exciting events. Our new Social Renaissance concept provides a destination where people can meet, grow and engage
LEARNAn unparalleled eco-system with co-working spaces and incubators, Shui On Land has created an environ-ment in which innovation and entrepreneurship can thrive through collaboration and the exchange of ideas

SHANGHAI

SITE LOCATION: The Taipingqiao project with a total GFA of 1.3 million sq.m. is in Huangpu District, within the inner ring of Shanghai. The project is in the proximity of The Bund – a renowned idyllic waterfront landmark – and close by the site of Shanghai’s municipal government headquarters. Huangpu District is the main commercial centre of Puxi (along the west side of the Huangpu River) and is home to flagship stores of major retail luxury brands.
The Taipingqiao project, which began development in 1996, comprises retail, office, residential and cultural properties.
Shanghai Xintiandi, a historic restoration zone that has been successfully rejuvenated and reshaped into a lifestyle community, offers a wide section of terrace restaurants and retail options, which is today a must-go destination of Shanghai. As Shanghai’s premier lifestyle destination,
TAIPINGQIAO PROJECT
Shanghai Xintiandi continues to attract new tenants from across the world. Shanghai Xintiandi has also enjoyed steady rental growth since its opening in 2001. Xintiandi Style, located south of Shanghai Xintiandi, is a fashion themed shopping mall. Shui On Plaza is an office tower with a retail portion located in the north of Shanghai Xintiandi. A 28,000 sq.m. asset enhancement initiative (“AEI”) was commenced in the first half of 2017 for the retail portion. The AEI was completed in late 2018 with the soft opening held in December 2018 and re-branded as Xintiandi Plaza.
Lakeville, a premium residential project first launched in 2002, has sold and delivered to buyers Phases 1 to 4 with a total GFA of approximately 322,000 sq.m. as at 31 December 2018. The average selling price (“ASP”) for high-rises apartments at this project has increased from approximately RMB20,000 per
An economic metropolis and one of the four municipalities of China, Shanghai is the country’s leading commercial, financial, shipping and trading centre. For 2018, Shanghai has achieved a 6.6% year-on-year growth in GDP to RMB3,268.0 billion, translating into a GDP per capita of RMB135,000.
Lakeville creates a good living environment for the owners and has become a noble residential brand recognised by the market
Annual Report 2018 17

SHANGHAI –
TAIPINGQIAO PROJECT
GFA BY USAGE
sq.m.
Residential 190,000
Office 233,000
Retail 243,000
Hotel/Serviced Apartments 38,000
Total Leasable and Saleable GFA 704,000
27%
5%
33%
35%
sq.m. to RMB143,600 per sq.m.. It is next to Xintiandi and a man-made lake. Lakeville Phase 5 (Lot 118) with a total GFA of 79,000 sq.m., started development in 2018 and is planned for pre-sales starting from the first half of 2020.
On 5 July 2018, the Group together with China Pacific Life Insurance Company Limited and Shanghai Yongye Enterprise (Group) Company Limited acquired the land use rights of Lots 123, 124 & 132 with a total leasable GFA of 302,689 sq.m. The Group holds an effective interest of 25% in Lots 123, 124 and 132. The remaining Lots 119, 120 and 122 are yet to commence relocation.
Further, on 29 December 2018, the Group entered into an agreement with Manulife Investors and China Life Trustees Limited to establish a Core-Plus Office Investment Platform to pursue office investments in the Shanghai and other first tier cities in the PRC, with a targeted total capital commitment of USD1.0 billion. The platform’s inaugural investment is
5 Corporate Avenue, a Grade-A office building with a total GFA of 52,000 sq.m. for office use and 27,000 sq.m. for retail use. 5 Corporate Avenue was developed and completed by the Group in 2013. Upon completion of the transaction, the Group will hold 20% effective interest in the property.
TAIPINGQIAO PROJECT

SITE LOCATION: THE HUB with a total GFA of 308,000 sq.m. is ideally located at the heart of the Shanghai Hongqiao Central Business District (Hongqiao CBD) and is the only site that is directly connected to the Hongqiao Transportation Hub, thus facilitating convenient accesses to major transportation nodes such as the High-Speed Railway Station, Hongqiao International Airport Terminal 2, as well as three operating Metro lines. As described in the Shanghai’s 13th Five Year Plan (2016-2020), Hongqiao CBD is poised to become a world-class business centre providing services for business, exhibition & conventions, and transportation for the Yangtze River Delta and beyond.
Construction of THE HUB commenced in 2011 and was completed in the second half of 2015. It is today a new business, cultural and lifestyle landmark, comprising a large retail component, offices and a performance and exhibition centre. THE HUB enjoys irreplaceable market positioning, via a unique and seamless blend of shopping, entertainment and F&B with the performing arts, as well as kids & family friendly experiences.
Occupancy rate for four office towers with a total leasable GFA of 93,000 sq.m. was 96% as at 31 December 2018. Regional headquarters and branch offices of leading companies in various industries have been moving in since late 2014, including Fortune 500 companies such as Roche Diagnostics (Greater China Headquarters) and Shell (Downstream Business Headquarters).
The combined retail portfolio has a total GFA of 151,000 sq.m. including THE HUB shopping mall, Xintiandi sunken plaza, and the office retail space. The tenants started operation in the second half of 2015. The shopping mall with a total GFA of 125,000 sq.m, accommodates over 200 shops and offers a strong tenant mix with many brands making their first appearance in China and/or Shanghai. THE HUB recorded a 25% of rental and related income growth in 2018 compared to 2017. The strong performance was due to stronger shoppers’ traffic and retail sales in 2018.
THE HUB
GFA BY USAGE
sq.m.
Office 93,000
Retail 170,000
Total Leasable and Saleable GFA 263,000
35%65%
THE HUB
THE HUB – a new landmark for work, leisure and entertainment in western Shanghai
Annual Report 2018 19

SHANGHAI –
SITE LOCATION: The Rui Hong Xin Cheng project (“RHXC”), is located within the inner ring of Shanghai in Hongkou District (the “District”). The District, which has a long history and is currently undergoing urban renewal, enjoys excellent connectivity to the Lujiazui CBD and Pudong commercial district via four metro lines: Shanghai Metro Lines 4, 8, 10 and 12, as well as two tunnels: Xinjian Road Tunnel and Dalian Road Tunnel. RHXC is being revitalised to become a fashionable urban living destination. RHXC is an integrated community comprising office buildings, shopping centres, hotels, culture & entertainment space and residential properties with a total GFA of 1.75 million sq.m..
For the residential segment, the Group has developed, sold and delivered a total GFA of approximately 749,700 sq.m., which were completed in seven phases since 1998.
RUI HONG XIN CHENG
Lot 1 with a total GFA of 116,000 sq.m., has completed relocation activities in 2017 and will be developed into high-end residential apartments. Construction work started in 2018 and is planned for pre-sales from late 2019. Lot 7, which has a total GFA of 159,000 sq.m., is under relocation with 99.75% of relocation agreements signed as at 31 December 2018 and was completed in February 2019. On 26 June 2018, the Group entered into the agreement to the disposal of 49.5% effective interest in certain portfolio of properties in relation to Lots 1 and 7 of RHXC project for a total contracted amount of RMB4,589 million. The transaction was completed and the Group has a 49.5% effective interest in Lots 1 & 7.
For the completed commercial properties, Hall of the Moon (Ruihong Tiandi Lot 3), with a total leasable GFA of 64,000
Rendering of Rui Hong Xin Cheng·The Gallery
Shui On Land Limited20
RUI HONG XIN CHENG
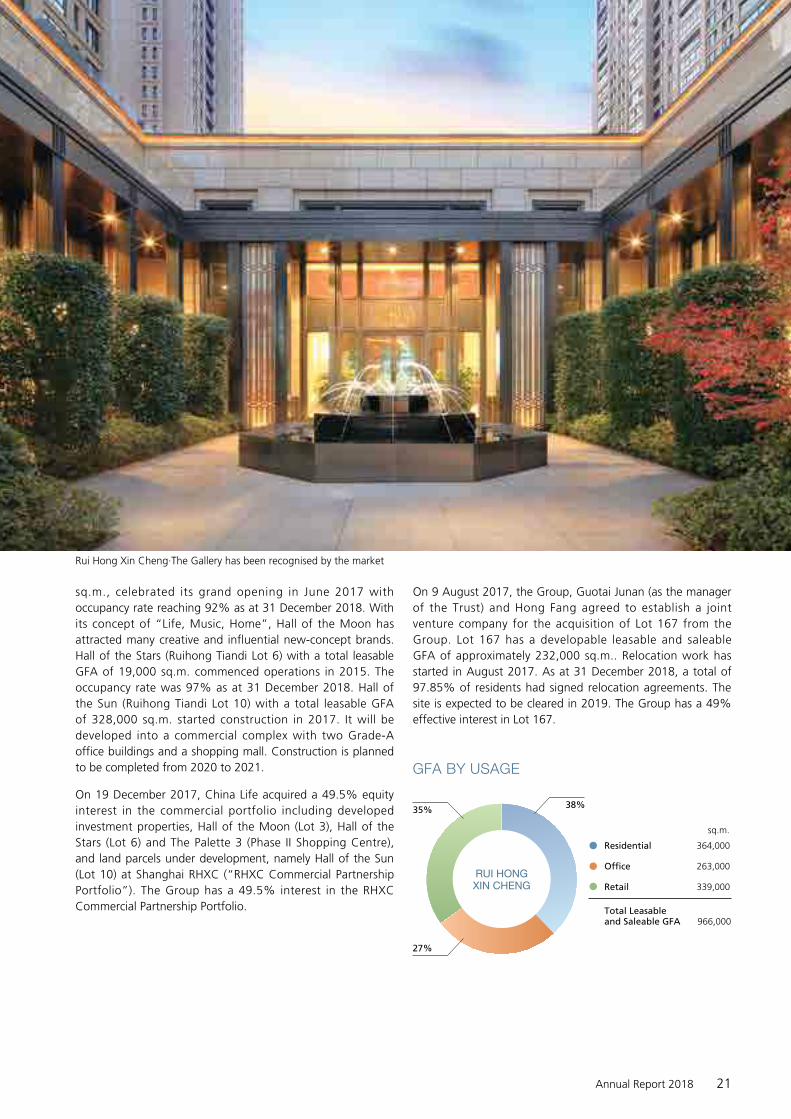
sq.m., celebrated its grand opening in June 2017 with occupancy rate reaching 92% as at 31 December 2018. With its concept of “Life, Music, Home”, Hall of the Moon has attracted many creative and influential new-concept brands. Hall of the Stars (Ruihong Tiandi Lot 6) with a total leasable GFA of 19,000 sq.m. commenced operations in 2015. The occupancy rate was 97% as at 31 December 2018. Hall of the Sun (Ruihong Tiandi Lot 10) with a total leasable GFA of 328,000 sq.m. started construction in 2017. It will be developed into a commercial complex with two Grade-A office buildings and a shopping mall. Construction is planned to be completed from 2020 to 2021.
On 19 December 2017, China Life acquired a 49.5% equity interest in the commercial portfolio including developed investment properties, Hall of the Moon (Lot 3), Hall of the Stars (Lot 6) and The Palette 3 (Phase II Shopping Centre), and land parcels under development, namely Hall of the Sun (Lot 10) at Shanghai RHXC (“RHXC Commercial Partnership Portfolio”). The Group has a 49.5% interest in the RHXC Commercial Partnership Portfolio.
On 9 August 2017, the Group, Guotai Junan (as the manager of the Trust) and Hong Fang agreed to establish a joint venture company for the acquisition of Lot 167 from the Group. Lot 167 has a developable leasable and saleable GFA of approximately 232,000 sq.m.. Relocation work has started in August 2017. As at 31 December 2018, a total of 97.85% of residents had signed relocation agreements. The site is expected to be cleared in 2019. The Group has a 49% effective interest in Lot 167.
GFA BY USAGE
sq.m.
Residential 364,000
Office 263,000
Retail 339,000
Total Leasable and Saleable GFA 966,000
RUI HONG XIN CHENG
38%
27%
35%
Rui Hong Xin Cheng·The Gallery has been recognised by the market
Annual Report 2018 21

SITE LOCATION: The Knowledge and Innovation Community (“KIC”) project is strategically located in the immediate vicinity of major universities and colleges in Wujiaochang, within the heart of Yangpu District – a key knowledge industry and support services hub of Shanghai – which sits northeast of downtown Shanghai. The public transportation network provides commuters with multiple connections between the project and the city centre, including the Middle-Ring Highway, over 30 public transportation routes and Shanghai Metro Line 10.
KIC with a total GFA of 498,000 sq.m. is an international knowledge community that aims to integrate work, live, learning and play. KIC has been regarded as a landmark of innovation and entrepreneurship in Shanghai. After 15 years of development, KIC has emerged as a cradle for entrepreneurs, and a mature knowledge community which combines the spirit of entrepreneurship and vibrant cultural communications. Over 500 start-ups incubators are in KIC, playing pioneering roles in multiple industries including
KNOWLEDGE AND INNOVATION COMMUNITY
Technology, Media, Telecom (“TMT”), design, education, and services etc. Nearby universities, industry giants (MNC tenants), and growing start-ups have come together to form a mutually beneficial eco-system.
A total GFA of 132,000 sq.m. in residential developments has been sold and delivered for this project. ASP has increased from RMB18,700 per sq.m. in 2007 to RMB38,600 per sq.m. for the last batch in 2013.
A total leasable GFA of 249,000 sq.m. has been progressively completed for office and retail use in the last 15 years. The occupancy rate at KIC remains high, with established technology, service and design companies, including EMC2, Oracle, EBAO, VMware, Splunk, Deloitte and AECOM as tenants. University Avenue is a vibrant part of KIC. The road mainly offers a wide selection of gourmet cuisines, coffee shops, book stores, galleries and creative retail stores. University Avenue • Next Stop, an underground commercial zone connecting University Avenue and the KIC Plaza area,
InnoSpace is an entrepreneurial community focusing on investment incubation of early projects and industrial innovation of large enterprises
Shui On Land Limited22
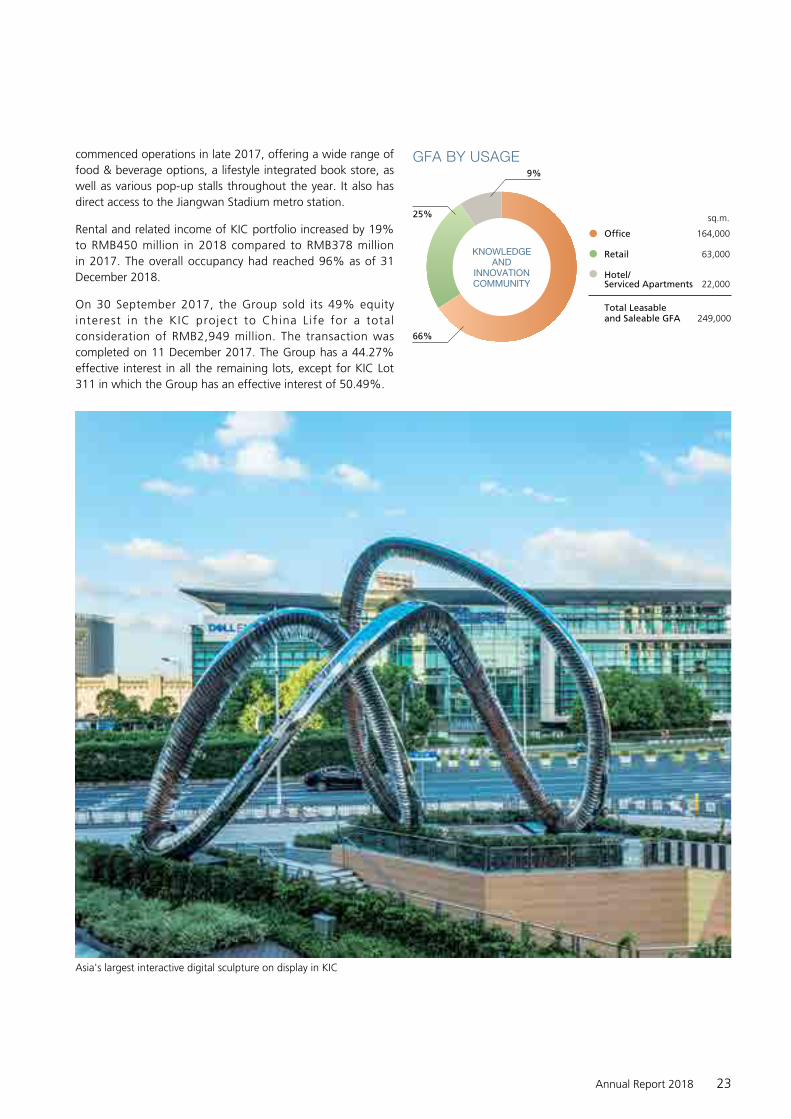
commenced operations in late 2017, offering a wide range of food & beverage options, a lifestyle integrated book store, as well as various pop-up stalls throughout the year. It also has direct access to the Jiangwan Stadium metro station.
Rental and related income of KIC portfolio increased by 19% to RMB450 million in 2018 compared to RMB378 million in 2017. The overall occupancy had reached 96% as of 31 December 2018.
On 30 September 2017, the Group sold its 49% equity interest in the KIC project to China Life for a total consideration of RMB2,949 million. The transaction was completed on 11 December 2017. The Group has a 44.27% effective interest in all the remaining lots, except for KIC Lot 311 in which the Group has an effective interest of 50.49%.
GFA BY USAGE
sq.m.
Office 164,000
Retail 63,000
Hotel/Serviced Apartments 22,000
Total Leasable and Saleable GFA 249,000
KNOWLEDGE AND
INNOVATION COMMUNITY
9%
66%
25%
Asia's largest interactive digital sculpture on display in KIC
Annual Report 2018 23

SHANGHAI –
INNO KIC is one of multiple projects created by INNO Office, our new multiform office brand in China Xintiandi. INNO KIC aims to provide a complete life-cycle workspace solution for start-ups as well as small-to-medium and large enterprises. INNO KIC is located in the Xinjiangwan central business district of Yangpu District, Shanghai, with an above ground construction area of 45,700 square meters. The project introduces a new business social platform that integrates work, entrepreneurship, learning, and leisure, covering the four major product modules of INNO SOCIAL, INNO OFFICE, INNO WORK, and INNO STUDIO, as well as the two service systems of INNO SERVICE and INNO +. The ultimate objective of this project is to create a diversified working ecosystem that promotes the growth and development of enterprises. The Group has a 100% interest of this project.
NANJING INNO ZHUJIANG LU & BAI ZI TING The Group also seizes opportunities to manage third party assets, in particular to leverage on, and to introduce new asset management services to properties in prime locations that have preservation elements. These asset management initiatives include Nanjing INNO Zhujiang Lu, which is the first asset light project of the Group applying the INNO office concept. Nanjing INNO Zhujiang Lu has a total GFA of 16,000
INNO KIC
sq.m., under a long-term lease contract with a third party landlord. The property has been under pre-leasing since late 2018. Nanjing Bai Zi Ting, the Group’s second asset light project in Nanjing, has a total GFA of 45,000 sq.m of retail, culture and leisure space. We are planning to launch the project for pre-leasing in 2019.
The indoor view of INNO KIC
The indoor view of INNO KIC
Shui On Land Limited24
INNO KIC

WUHAN

WUHAN –
SITE LOCATION: The Wuhan Tiandi project with a total GFA of 1.58 million sq.m. is situated in the city centre of Hankou District, occupying a prime location on the Yangtze River waterfront, promising unparalleled views of the Yangtze River and scenic Jiangtan Park. In December 2008, the municipal government formally approved plans for a “Riverside Business Zone”which includes the Wuhan Tiandi project. The Riverside Business Zone is designed to be a premium destination for the city’s financial and business needs, as well as a hub for innovation and culture.
Wuhan T iand i p ro jec t i s a l a rge-sca le , mixed-use redevelopment comprising two major sites. Site A includes office towers, retail, food and beverage, and entertainment facilities, together with some residential blocks. Site B comprises mainly residential and office buildings, supported by an ancillary retail centre.
Wuhan Xintiandi at Lots A4-1/2/3 started operation in 2007 and has since become a well-recognised landmark of Wuhan, benefiting from a careful balance of preserving local historical architecture while injecting new commercial value.
HORIZON - South Shopping Mall (Lots A1/A2/A3) with a total GFA of 120,000 sq.m. commenced operation in September 2016 with an occupancy rate of 89% as at 31 December 2018. A total GFA of 72,000 sq.m. for commercial usage at HORIZON – North Shopping Mall (Lot B4 Retail) is undergoing internal fitting out and pre-leasing, with soft opening planned in April 2019.
Office towers at Lots A2/A3/A5, have been sold to buyers from 2011 for a total GFA of 156,000 sq.m. Construction work of office building at Lot A1 was temporary suspended in April 2018 due to the changes of certain local planning requirements. The construction work resumed in late 2018.
Residential developments in Wuhan Tiandi have been well received by the market. Site A residential units with a total GFA of 204,000 sq.m. were sold and delivered from 2007 to 2011. In Site B, Wuhan Tiandi Lots B5, B9, B11, B13 & B14, comprising a total GFA of 305,000 sq.m., were sold and delivered to buyers following its completion from 2012 to 2017. Lot B10 with a total GFA of 115,000 sq.m. for
WUHAN TIANDI
Situated at the junction of the Yangtze and Han rivers, Wuhan is the capital city of Hubei Province. It is central China’s largest city and a nucleus of manufacturing, commerce, and transportation. Rail travel time between Wuhan and major provincial capitals in central China takes only two hours, while mega cities such as Beijing, Shanghai, Guangzhou, Chongqing and Chengdu are a mere five hours away. In 2018, its total GDP stood at RMB1,484.7 billion with a year-on-year growth rate of 8.0%, and GDP per capita at RMB135,136.
residential use is under construction. It had its first batch pre-sales for a total GFA of 27,500 sq.m. launched in late 2018 with almost all launched units sold/subscribed on the day of launched for a total amount of RMB903 million. The remaining portion is planned for pre-sales in batches in 2019.
WUHAN TIANDI
GFA BY USAGE
sq.m.
Residential 250,000
Office 326,000
Retail 332,000
Total Leasable and Saleable GFA 908,000
27%
36%
37%
Wuhan Tiandi has become the leading high-end urban complex in
Wuhan
Shui On Land Limited26
WUHAN TIANDI

WUHAN OPTICS VALLEY
INNOVATION TIANDI
GFA BY USAGE
sq.m.
Residential 443,000
Office 637,000
Retail 197,000
Total Leasable and Saleable GFA 1,277,000
35%
50%
15%
In January 2017, the Group together with CITIC Limited (“CITIC”) made a successful bid for a land in East Lake High-tech Development Zone, Wuhan. Total land cost was RMB2,298 million for GFA of 1,279,000 sq.m. The Group has 50% effective interest in the project.
The aforesaid land plot is in the central area of Optics Valley Central City which is the administrative services centre and business centre of Optics Valley. Optics Valley is located in Wuhan East Lake High-tech Development Zone and is ranked the third among the 114 high-tech zones in China in 2016, and is one of the National Innovation Demonstration and Free Trade Zones in China. Optics Valley Central City serves as the engine of the national innovation city and is positioned to be a world-class innovation centre.
Construction work of the first phase residential with a total GFA of 122,000 sq.m. started in 2018 and the first batch of pre-sales with a total GFA of 37,400 sq.m. was launched in late 2018, for a total contracted sales amount of RMB359 million in 2018.
WUHAN OPTICS VALLEY INNOVATION TIANDI
Rendering of Optics Valley Innovation Tiandi
Annual Report 2018 27

CHONGQING

GFA BY USAGE
sq.m.
Residential 687,000
Office 259,000
Retail 421,000
Hotel/Serviced Apartments 25,000
Total Leasable and Saleable GFA 1,392,000
CHONGQING TIANDI
49%
2%
19%
30%
SITE LOCATION: The Chongqing Tiandi, with a total plan GFA of 2.8 million sq.m, is an urban renewal project located in Yuzhong District, the International Business District of Chongqing. The landmark retail zone in Chongqing Tiandi, Lot B3/01, with a total GFA of 49,000 sq.m. started operation in the year 2010. In addition, a total GFA of 79,000 sq.m. of ancillary retail spaces for Corporate Avenue 2,6,7 and 8 is also held by the Group for providing retail, food and beverage, and entertainment facilities to the tenants and residents in the neighborhood. The Group has 99% effective interest of the properties.
The residential phases “Riviera I to VII & Lake Ville Phase 1 to 2” have been completed and progressively delivered to customers since 2008, comprising a total GFA of 998,000 sq.m..
Chongqing Corporate Avenue 2,3,4,5,6,7 and 8 with a total GFA of 351,000 sq.m. for office use have been sold to buyers from 2011 to 2013.
CHONGQING TIANDI
On 26 May 2017, the Group sold a 79.2% interest in the portfolio of 11 parcels at the Chongqing Tiandi (“Chongqing Partnership Portfolio”) for a total consideration of RMB4,133 million. The transaction was completed on 29 June 2017. The Group has 19.8% of effective interest of the partnership portfolio.
Chongqing is strategically located at the headwaters of the Yangtze River. It is the only municipality in western China and is emerging as the regional economic hub of western China. Given its inland location and relatively low urbanization rate, Chongqing is advantageously positioned to benefit from the Chinese leadership’s focus on re-balancing and urbanization strategies. In 2018, Chongqing’s total GDP was RMB2,036.3 billion with a year-on-year growth rate of 6.0%, and GDP per capita at RMB65,933.
The show flat of residential property in Chongqing Tiandi
Annual Report 2018 29
FOSHAN

SITE LOCATION: The Foshan Lingnan Tiandi project with a total GFA of 1.5 million sq.m. is strategically located in the old town centre of central Chancheng District, Foshan’s traditional downtown area and public transportation hub. Two subway stations of the Guangzhou-Foshan metro line are connected to the project site. The Guangfo Metro Line 1 is connected to Haizhu District, allowing for convenient access to downtown Guangzhou. The extended line from Xilang Station to Yangang Station, which passes through the Zhujiang River, commenced operations in 2015. The project is a large-scale urban redevelopment comprising office, retail, hotel and cultural facilities and residential complexes in an integrated community. The centre piece of Foshan’s cultural heritage is Zumiao, an immaculately preserved ancient Taoist temple. This, together with another well-known historic area, the Donghuali, are national grade heritage sites and are both located within the project.
Since 2011, the Group has developed and delivered to buyers the residential units with a total GFA of approximately 504,000 sq.m. as at 31 December 2018. The Royal (Lots 2 and 3) with a total GFA of 65,000 sq.m. for residential use was launched for pre-sales in 2018 and is planned for delivery to buyers in 2019.
FOSHAN LINGNAN TIANDI
Situated at the Greater Bay Area and only 28 km to the southwest of the Guangzhou city centre, Foshan is one of the most vigorous cities of Southern China, supported by its economic dynamism along with a rich historical and cultural heritage. In 2018, Foshan’s GDP growth reached 6.3% with a total GDP of RMB993.6 billion.
The rental income of Lingnan Tiandi has seen stable increase over the year. NOVA (Lot E Retail) with a GFA of 73,000 sq.m. for retail use, is a shopping mall positioned as “Young and Trendy”. Occupancy level further increased to 99% as at 31 December 2018 since its grand opening in December 2016. Rental and related income in Foshan in 2018 reached RMB217 million, an increase of 37% compared to 2017.
GFA BY USAGE
sq.m.
Residential 143,000
Office 466,000
Retail 274,000
Hotel/Serviced Apartments 123,000
Total Leasable and Saleable GFA 1,006,000
FOSHAN LINGNAN
TIANDI
14%
12%
47%
27%
NOVA at Foshan Lingnan Tiandi creates a new consuming experience
Annual Report 2018 31

BUSINESS REVIEW
• Strategic transformation underway: 2018 marked an important chapter for the Group. Our Asset Light Strategy has greatly enhanced the Group’s financial strength. In addition, we have embarked on a strategic transformation for Shui On Land to become a leading commercial-focused property developer, owner and asset manager in China. During the year, the Group acquired a prime office and retail mixed-use site via a land auction with China Pacific Life Insurance Company Limited and Shanghai Yongye Enterprise (Group) Company Limited, formed an office investment platform with Manulife Investors and China Life Trustees Limited to purchase 5 Corporate Avenue in Shanghai, and acquired 21.894% interest in CXTD Holding from BSREP CXTD Holdings L.P. (“Brookfield”). The above transactions will further enhance the Group’s position as one of the largest commercial owners and asset managers in Shanghai.
• Strong revenue growth of 35%: 2018 revenue increased by 35% to RMB24,841 million. General property sales accounted for RMB7,093 million, while other asset disposals accounted for RMB15,038 million. Rental and related income contributed RMB2,016 million during the year, as well as RMB694 million arising from hotel, construction, asset management fee income and other activities.
• Profit attributable to shareholders up 14%: Backed by the higher revenue, profit for the year grew to RMB2,686 million in 2018, compared to RMB2,324 million in 2017. Accordingly, profit attributable to shareholders rose 14% to RMB1,906 million in 2018, from RMB1,669 million a year ago.
• Solid balance sheet to weather market volatilities: Net gearing ratio was 40% as at 31 December 2018, representing a decrease of 11 percentage points from 51% as at 31 December 2017; cash and bank deposits remained healthy at RMB15,392 million. The Group’s solid balance sheet should enable it to weather any normal market volatility that may arise.
• Rental income underpinned by active asset management and proactive leasing: The Group completed over 1,100 leasing deals of which over 300 leases were new tenants during the year. This includes several notable international and local brands which are entering China and the region for the first time. The completion of asset enhancements at Xintiandi Plaza during the year also contributed to the strong leasing activities. Rental and related income increased by 8% to RMB2,016 million in 2018 compared to 2017. Including the RMB184 million rental and related income generated from the RHXC commercial partnership portfolio which is now accounted as joint venture income, total rental and related income increase was 18% year-on-year. The shoppers’ traffic and retail sales of the portfolio increased by 15% and 20%, respectively.
Shui On Land Limited32

STRATEGIC TRANSFORMATION INTO A LEADING COMMERCIAL FOCUSED PROPERTY DEVELOPER, OWNER AND ASSET MANAGERIn recent years, the Group has adjusted its business model to adopt an “Asset Light Strategy” which enables us to greatly enhance our financial strength, diversify our capital base and invest in new opportunities. The goal of our Asset Light Strategy is to transform Shui On Land into a leading commercial focused property developer, owner and asset manager in China.
KEY ACHIEVEMENTS IN 2018
The Group achieved several major milestones in 2018. We divested its 49.5% effective interest in the Shanghai RHXC Residential Portfolio Lots 1 & 7 to Joy City Property Limited in 2018, and the two partners will jointly develop the project. In July 2018, together with China Pacific Life Insurance Company Limited and Shanghai Yongye Enterprise (Group) Company Limited, the Group successfully bid for a major office and retail mix-used site in the Taipingqiao area. On 28 December 2018, the Group acquired all the remaining interest held by Brookfield in CXTD Holding, comprising approximately 21.894% of all the issued shares in the capital of CXTD Holding (the “Sale Shares”) and the outstanding convertible perpetual securities in the principal amount of USD100,000 (the “Sale CPS”) (the “Brookfield Transaction”). This transaction consolidates the Group’s control of the asset portfolio held by CXTD Holding and provides greater flexibility in the strategic direction and day-to-day management of the portfolio.
Further, on 29 December 2018, the Group entered into an agreement with Manulife Investors and China Life Trustees Limited to establish a Core-Plus Office Investment Platform to pursue office investments in Shanghai and other first tier cities
in the PRC, with a targeted total capital commitment of USD1.0 billion. The platform’s inaugural investment is 5 Corporate Avenue, a Grade-A office building with a total GFA of 52,000 sq.m. for office use and 27,000 sq.m. for retail use, which sits near the Group’s flagship Shanghai Xintiandi. 5 Corporate Avenue was developed and completed by the Group in 2013.
A MARKET LEADER IN SHANGHAI COMMERCIAL PROPERTY PORTFOLIO
The Group currently holds and manages a total of 1.67 million sq.m. of leasable and saleable GFA in Shanghai. This comprises (i) 763,000 sq.m. of completed GFA held for long-term investment, (ii) 45,000 sq.m. of GFA under renovation, (iii) 787,000 sq.m. of GFA under development or held for future development, and (iv) 79,000 sq.m. under management. Our existing office/commercial portfolio is amongst one of the largest in Shanghai. As of 31 December 2018, the total asset value of the Group’s investment properties (including properties under development) owned or under management amounted to RMB72.2 billion, while the Group’s overall effective interest in this portfolio is approximately 47%.
FUTURE GROWTH DRIVERS IN THE GROUPAs the Group expands its investment management scope and capabilities, we envisage that going forward fee income contributions will gradually increase and along with rental income and development and trading profit, should provide the Group a more balanced sources of income.
INVESTMENT MANAGEMENT The implementation of the “asset light strategy” continues to show good progress and is allowing us to recycle capital faster and capture growth opportunities. Currently, we are the investment manager, project manager and/or asset manager of 6 projects with partners/co-investors under different status of development. The following table shows the details.
Annual Report 2018 33

BUSINESS REVIEW
The table below provides an analysis of the rental and related income from investment properties for 2018 and 2017 and occupancy rate of the properties:
Project ProductLeasable
GFARental & related income
RMB’million Occupancy rate
sq.m. 2018 2017 Change
31December
2018
31December
2017Change
ppt
Shanghai TaipingqiaoShanghai Xintiandi Office/Retail 54,000 417 410 2% 100% 100% –Xintiandi Style Retail 26,000 100 88 14% 100% 94% 6Shui On Plaza3 Office 24,000 91 88 3% 91% 97% (6)Xintiandi Plaza1 Retail 28,000 24 11 118% 82% N/A N/A
THE HUB Office/Retail 263,000 407 326 25% 91% 95% (4)Shanghai KIC3 Office/Retail/Hotel 243,000 450 378 19% 96% 96% –Wuhan Tiandi Retail 166,000 265 220 20% 87% 88% (1)Foshan Lingnan Tiandi3 Office/Retail 151,000 217 158 37% 86% 81% 5Chongqing Tiandi Retail 134,000 45 46 (2%) 59% 62% (3)
SUBTOTAL 1,089,000 2,016 1,725 17%
Shanghai RHXC2
(classified as joint venture income in 2018) Retail 111,000 184 144 28% 94% 93% 1
GRAND TOTAL 1,200,000 2,200 1,869 18%
1 Xintiandi Plaza was under AEI in 2017 and was re-opened in December 2018.
2 The Group divested 49.5% effective interest in the RHXC Commercial Partnership Portfolio in late 2017. The rental and related income of the completed properties of RHXC Commercial Partnership Portfolio was deconsolidated by the Group; if such was included for like-for-like comparison, the total rental and related income of the portfolio increased by 18% compared to 2017.
3 A total GFA of 16,000 sq.m. located at Shanghai Shui On Plaza, Shanghai KIC and Foshan Lingnan Tiandi were occupied by the Group and were excluded from the above table.
Project Partners Nature Year
Office & retail GFA
sq.m.
Residential GFA
sq.m.
Total GFA
sq.m.
Asset value as of 31
December 2018RMB’bn
Group’s Interest
Attributable value
RMB’bn
Shanghai KIC China LifeCompleted Office and Retail Properties
2017 249,000 – 249,000 8.3 44.27%1 3.83
Shanghai RHXC Commercial Portfolio
China LifeCompleted retail, under-development office & retail site
2017 448,000 – 448,000 10.7 49.50% 5.29
Wuhan Optics Valley Innovation Tiandi
Citic
Land acquisitionResidential, Office & Retail mix-used sites
2017 834,000 443,000 1,277,000 2.3 50.00% 1.15
Shanghai RHXC Lots 167A&B
GTJA
RelocationResidential, Office & Retail mix-used sites
2017 149,000 83,000 232,000 10.7 49.00% 5.24
Shanghai TPQ Lots 123,124,132
China Pacific Life Insurance /Yongye
Land acquisition, Office & retail Mix-used sites
2018 303,000 – 303,000 17.3 25.00% 4.33
Shui On Core- Plus Office Investment Platform
Manulife /China Life
Acquisition of 5 Corporate Avenue, Completed IP
2018 79,000 – 79,000 6.4 20.00%2 1.28
TOTAL 2,062,000 526,000 2,588,000 55.7 21.12
1 The Group has a 44.27% interest in all the remaining lots, except for KIC Lot 311 in which the Group has an effective interest of 50.49%.
2 5 Corporate Avenue targets to having the closing in Q2 2019.
ASSET MANAGEMENT The Brookfield Transaction was completed on 15 March 2019, and CXTD Holding became a wholly-owned subsidiary of the Company. It is positioned to be our asset management platform and will continue to focus on enhancing the value of our investment properties through active asset management and development of new products and services.
INVESTMENT PROPERTIES PERFORMANCES
Rental and related income increased by 8% to RMB2,016 million in 2018 compared to 2017. Including the RMB184 million rental and related income generated from the RHXC commercial partnership portfolio which is now accounted as joint venture income, total rental and related income increase was 18% year-on-year.
Shui On Land Limited34

Shanghai Xintiandi’s rental and related income remained stable in 2018. After a series of tenant upgrades taken place since 2017, new tenants such as Tom Ford Cosmetic, Glaciel and LeTAO from Tokyo, have launched their first China stores in Shanghai Xintiandi in the second half 2018. Subsequent to the year end, New York burger chain Shake Shack opened the doors to its first China outlet at Xintiandi in January 2019.
Xintiandi Plaza’s AEI was completed and held its soft opening in December 2018 attracting a myriad of new tenants, including many whom are making their first appearance in China and/or Shanghai. PS Café from Singapore, FOMO Pancake from Japan, L’Eclair de Genie from France are among the brands that have launched their first stores in China. Pink of HEYTEA, select boutique brand ICON, and lifestyle brand nisiss free, all of which have launched their maiden Shanghai-based stores for the first time. In addition, Social House on 4 & 5/F as a new concept integrating books, travel, wellness, design, cooking, etc has been bringing in new social elements and experience to the customers. The Grand Opening of Xintiandi Plaza is expected to be held in mid 2019.
RHXC’s rental and related income was RMB184 million for 2018, an increase of 28% compared to RMB144 million in 2017. THE HUB recorded a 25% of rental and related income growth in 2018 compared to 2017. The strong performance was due to stronger shoppers’ traffic and retail sales in 2018. KIC recorded 19% of rental growth in 2018. “University Avenue·Next Stop” connecting metro station Jiangwan Stadium of Line 10 to University Avenue had its opening in second half of 2017 contributing rental income for the full year of 2018.
Wuhan Xintiandi and HORIZON – South Shopping Mall achieved robust performance with rental and related income growing by 20% to RMB265 million in 2018 compared to 2017. Occupancy levels of the NOVA shopping mall at Foshan Lingnan Tiandi reached 99% since its grand opening in December 2016. Lingnan Tiandi Phase 2 upgrade was completed in 2018. In 2018, a total GFA of 48,463 sq.m. was leased to 27 new tenants for the new opening and 121 existing tenants’ renewal. The rental and related income generated from these two properties reached RMB217 million in 2018, an increase of 37% compared to 2017 mainly from increased occupancy rate and other income of the NOVA shopping mall.
Among the retail portfolio managed by China Xintiandi Asset Management team, the Group completed over 1,100 leasing deals of which over 300 leases were new tenants. This includes several notable international and local brands which are entering China and the region for the first time. In 2018, the team organised over a thousand events for the portfolio which includes Shanghai Fashion Week, Xintiandi Design Week, Tiandi Restaurants Week, Tiandi World Music Festival, Xintiandi Festival by partnership with Edinburgh Fringe Showcase, LUMIÈRES SHANGHAI by partnership with Fête des Lumières Lyon and the new year Count-down Party, etc., and have been rolling out some of these events to our other projects. In addition, with the faster growing members at iTiandi loyalty program, more than 200 members-only events were organized in 2018. These events have increased footfall and raised retail sales. The shoppers’ traffic and retail sales of the portfolio increased by 15% and 20%, respectively, compared to 2017.
NEW OFFICE PRODUCTS & SERVICES
INNO KIC is one of multiple projects created by INNO Office, our new multiform office brand in China Xintiandi. INNO KIC aims to provide a complete life-cycle workspace solution for start-ups as well as small-to-medium and large enterprises. INNO KIC is located in the Xinjiangwan central business district of Yangpu District, Shanghai, with an above GFA of 45,700 sq.m.. The project introduces a new business social platform that integrates work, entrepreneurship, learning, and leisure, covering the four major product modules of INNO SOCIAL, INNO OFFICE, INNO WORK, and INNO STUDIO, as well as the two service systems of INNO SERVICE and INNO +. The ultimate objective of this project is to create a diversified working ecosystem that promotes the growth and development of enterprises.
The Group also seizes opportunities to manage third party assets, in particular to leverage on, and to introduce new asset management services to properties in prime locations that have preservation elements. These asset management initiatives include Nanjing INNO Zhujiang Lu, which is the first asset light project of the Group applying the INNO office concept. Nanjing INNO Zhujiang Lu has a total GFA of 16,000 sq.m., under a long-term lease contract with a third party landlord. The property has been under pre-leasing since late 2018. Nanjing Bai Zi Ting, the Group’s second asset light project in Nanjing, has a total GFA of 45,000 sq.m. of retail, culture and leisure spaces. We are planning to launch the project for pre-leasing in 2019.
Annual Report 2018 35

BUSINESS REVIEW
The table below summarises the carrying value of the investment properties at valuation as at 31 December 2018 together with the change in fair value for 2018:
Project Leasable GFA
Increase/(decrease)
in fair value for 2018
Carrying value as at
31 December 2018
Valuation gain
/(loss) to carrying
value
sq.m. RMB’million RMB’million
COMPLETED INVESTMENT PROPERTIES AT VALUATION
Shanghai Taipingqiao
Shanghai Xintiandi and Xintiandi Style 80,000 56 7,533 0.8%
Shui On Plaza (retail podium is renamed as Xintiandi Plaza after the AEI) 52,000 400 4,239 9.4%
THE HUB 263,000 13 8,944 0.1%
Shanghai KIC 243,000 522 8,066 6.5%
Wuhan Tiandi 238,000 9 7,157 0.1%
Foshan Lingnan Tiandi 151,000 – 4,325 –
Chongqing Tiandi 134,000 (32) 1,696 (1.9%)
SUBTOTAL 1,161,000 968 41,960 2.3%
INVESTMENT PROPERTIES UNDER DEVELOPMENT AT VALUATION
INNO KIC 45,000 2 1,391 0.1%
SUBTOTAL 45,000 2 1,391 0.1%
GRAND TOTAL OF INVESTMENT PROPERTIES AT VALUATION 1,206,000 970 43,351 2.2%
PROPERTY DEVELOPMENTRECOGNISED PROPERTY SALES
For 2018, the Group’s total recognised property sales including general property sales, other asset disposals and disposal of investment properties was RMB22,150 million (after deduction of applicable taxes). Of the total recognised property sales, general property sales accounted for 32%, other asset disposal and disposal of investment properties accounted for 68%.
General property sales (after deduction of applicable taxes) recognised as revenue was RMB7,093 million, on a total GFA sold of 70,290 sq.m.. Average selling price (“ASP”) (excluding other asset disposal) increased by 164% to RMB106,400 per sq.m. compared to 2017. The significant increase was mainly due to a higher proportion of property sales was from Shanghai Taipingqiao and Rui Hong Xin Cheng (“RHXC”)
projects, which accounted for 96% of total general property sales. The ASP for Lakeville Luxe in Shanghai Taipingqiao and RHXC increased by 7% and 13%, respectively, in 2018 compared to 2017.
RMB14,981 million of revenue recognised was contributed by the disposal of 49.5% effective interest of residential inventory in certain portfolio of properties in relation to Shanghai RHXC Lots 1 and 7. The disposal was accounted for the sales of property inventories in the ordinary course of the Group’s property business. Revenue from the sales of properties under development for sale amounted to RMB14,981 million, representing a 99% interest held by the Group. The transaction was completed in 2018. The Group has a 49.5% effective interest in the portfolio.
RMB19 million was recognised as disposal of investment properties.
INVESTMENT PROPERTY VALUATION
The carrying value of the completed investment properties of the Group (excluding hotels for operation and self-use properties) with a total GFA of 1,161,000 sq.m. was RMB41,960 million as of 31 December 2018. Of this sum, RMB968 million (representing 2.3% of the carrying value) arose from increased fair value during 2018. The properties located in Shanghai, Wuhan, Foshan and Chongqing, respectively contributed 69%, 17%, 10% and 4% of the carrying value. The increase was mainly contributed by Shanghai KIC with strong rental reversion achieved in 2018
and the completion of AEI of Shui On Plaza retail podium, which was repositioned as “Xintiandi Plaza” and held the soft opening in December 2018.
The carrying value of the investment properties under development at valuation for a total GFA of 45,000 sq.m. was RMB1,391 million as at 31 December 2018.
Except for the above-mentioned investment properties at valuation, the carrying value of the investment properties under development and for future development at cost was RMB5,749 million.
Shui On Land Limited36

The table below summarises by project the recognised property sales (stated after the deduction of applicable taxes) for 2018 and 2017:
Project
2018 2017
Sales revenue
GFA sold ASP1
Sales revenue
GFA sold ASP1
RMB’million sq.m.
RMB per sq.m.
RMB’million sq.m.
RMBper sq.m.
Shanghai Taipingqiao 2,617 18,200 151,500 1,963 14,700 141,500
Shanghai RHXC
Residential 3,721 39,000 101,000 7,609 90,000 89,400
Retail 19 450 44,400 671 16,400 43,200
Lot 3 Hotel – – – 473 15,500 32,300
Wuhan Tiandi – – – 1,154 40,600 30,100
Chongqing Tiandi
Residential2 6 570 12,800 1,041 113,800 9,700
Retail 155 7,900 20,800 373 24,200 16,400
Foshan Lingnan Tiandi
Residential 58 3,400 17,900 102 5,200 20,800
Retail 64 1,220 56,600 156 3,900 42,300
SUBTOTAL 6,640 70,740 99,200 13,542 324,300 44,200
Carparks and others 472 – – 563 – –
Dalian Tiandi3 – – – 520 61,300 9,000
SUBTOTAL 7,112 70,740 106,400 14,625 385,600 40,300
Other asset disposal:
Shanghai RHXC4 14,981 9,915
Chongqing Tiandi5
Residential inventories 57 3,229
Commercial – 2,527
GRAND TOTAL 22,150 30,296
Recognised as:
– property sales in revenue of the Group6 22,131 16,169
– disposal of investment properties7 19 1,144
– disposal of property, plant and equipment – 21
– disposal of equity in subsidiaries holding commercial properties – 12,442
– revenue of associates – 520
GRAND TOTAL 22,150 30,296
1 The calculation of ASP per sq.m. is based on gross sales revenue before the deduction of value-added tax and other surcharges/taxes.
2 ASP of Chongqing residential sales is based on net floor area, a common market practice in the region.
3 On 14 November 2017, the Group entered into the agreement in relation to the disposal of its all interest in Dalian Tiandi. The transaction was completed on 14 May 2018 and the Group no longer holds any interest in Dalian Tiandi.
4 On 26 June 2018, the Group entered into the agreement to dispose of 49.5% of the interests in certain portfolio of properties in relation to Shanghai RHXC project Lots 1 and 7 residential inventories. The disposal was accounted for the sales of property inventories in the ordinary course of the Group’s property business. Revenue from the sales of properties under development for sale amounted to RMB14,981 million, representing a 99% interest held by the Group. On 19 December 2017, the Group entered into an agreement to dispose of 49.5% interest in the Shanghai RHXC commercial partnership portfolio. The disposal was accounted for as disposal of equity in subsidiaries holding commercial properties. Sales revenue from the disposal accounted to RMB9,915 million, representing a 99% interest held by the Group.
5 For Chongqing Tiandi, the disposal was partially accounted for the sales of property inventories in the ordinary course of the Group’s property business. In 2017, revenue from the sales of properties under development for sale amounted to RMB3,229 million, representing a 99% interest held by the Group. The remaining sales of RMB2,527 million represents “Disposal of equity in subsidiaries holding commercial properties”. In 2018, revenue from the sales of properties under development accounting to RMB57 million was recognised due to the consideration adjustment.
6 Sales of commercial properties are recognised as “revenue” if the properties concerned are designated for sale prior to the commencement of development.
7 Sales of commercial properties previously designated as held for capital appreciation or rental income are recognised as “disposal of investment properties”.
Annual Report 2018 37

CONTRACTED PROPERTY SALES AND OTHER ASSET DISPOSAL AND SUBSCRIBED SALES
For 2018, the Group’s total contracted sales including general property sales, other assets disposal and commercial property sales was RMB22,279 million, an increase of 4% compared to 2017. Of the total contracted sales, residential property sales accounted for 63%, other asset disposal accounted for 35%, with the remaining 2% contributed by disposal of investment properties. The ASP of residential property sales decreased by 11% to RMB40,300 per sq.m. in 2018, compared to RMB45,300 per sq.m. in 2017.
Contracted property sales from residential properties and carparks was RMB14,120 million, an increase of 63% over RMB8,676 million in 2017.
Under the tightened pre-sale permit policy environment, Shanghai Taipingqiao Lakeville Luxe (Lot 116) obtained the pre-sales permit in April 2018 for four high-rise residential towers with a total of 118 apartments. All of the apartments were launched for pre-sales in April 2018 for a total GFA of 42,300 sq.m.. With the prime location, right positioning of the product, high quality of delivery standard and the prestige sales and marketing program, all of the units were subscribed by customers on the day of the launch for a total sale amounted to RMB6.1 billion. The apartment selling prices ranged from approximately RMB37 million to RMB139 million.
Shanghai RHXC – The Gallery (Lot 2) obtained pre-sale permit in September 2018. One tower of residential apartments was launched for pre-sales for a total of RMB1.5 billion contracted.
In Wuhan Tiandi, the first batch of La Riva II (Lot B10) with a total of 27,500 sq.m. was launched for pre-sales in late 2018 with almost all of the apartments sold/subscribed on the day
of launch. The total contracted sales of RMB903 million in 2018. Wuhan Optics Valley Innovation Tiandi has launched the first phase (Lot R1) with a total GFA of 37,400 sq.m. for pre-sales in late 2018. A total sales amount of RMB359 million was contracted.
Chongqing Tiandi also achieved strong pre-sales throughout the year for a total amount of RMB3,321 million contracted in 2018. Foshan Lingnan Tiandi launched for sales in early 2018 for a total contracted amount of RMB1,191 million.
Contracted commercial property sales for 2018 was RMB410 million for a total GFA of 10,500 sq.m.. The major contributions were from disposals of street front shops in Foshan.
The disposal of Dalian Tiandi project for a total contracted amount of RMB3,160 million was completed in May 2018. The disposal was recorded as contracted sales in other asset disposal in 2018.
On 26 June 2018, the Group entered into the agreement to the disposal of 49.5% effective interests in certain portfolio of properties in relation to Shanghai RHXC project Lots 1 & 7 for a total contracted amount of RMB4,589 million. The transaction allowed the Group to unlock value in these assets at a substantial profit and is aligned with the Group’s Asset Light Strategy to enhance shareholders’ return by cooperating with strategic partners to create synergies.
In addition to the contracted property sales and other asset disposal outlined above, as of 31 December 2018, a total GFA of 17,300 sq.m., producing a total value of RMB358 million, was subscribed subject to formal sales and purchase agreements.
Wuhan Tiandi has become the local leading high-end urban complex
Shui On Land Limited38

The table below provides an analysis by project of contracted sales (stated before the deduction of applicable taxes) for 2018 and 2017:
2018 2017
ProjectContracted
amountGFA sold ASP
Contracted amount
GFA sold ASP
RMB’million sq.m.
RMB per sq.m.
RMB’million sq.m.
RMB per sq.m.
RESIDENTIAL PROPERTY SALES:
Shanghai Taipingqiao 6,102 42,500 143,600 1,389 9,500 146,200
Shanghai RHXC 1,733 17,000 101,900 4,529 44,700 101,300
Wuhan Tiandi 903 23,500 38,400 – – –
Chongqing Tiandi1 3,321 179,000 22,600 764 41,800 22,300
Foshan Lingnan Tiandi 1,191 63,100 18,900 99 4,600 21,500
Wuhan Optics Valley Innovation Tiandi 359 25,400 14,100 – – –
Dalian Tiandi2 – – – 1,184 91,100 13,000
Carparks and others 511 – – 711 – –
SUBTOTAL FOR RESIDENTIAL PROPERTY SALES 14,120 350,500 40,300 8,676 191,700 45,300
COMMERCIAL PROPERTY SALES:
Shanghai RHXC
Retail 31 600 51,700 111 2,100 52,900
Lot 3 Hotal – – – 500 15,500 32,300
The Palette 2 – – – 579 11,700 49,500
Chongqing Tiandi
Office 2 100 20,000 59 4,700 12,600
Retail 73 4,300 17,000 337 16,700 20,200
Foshan Lingnan Tiandi 304 5,500 55,300 132 3,000 44,000
Carparks and others – – – 21 – –
SUBTOTAL FOR COMMERCIAL PROPERTY SALES 410 10,500 39,000 1,739 53,700 32,400
OTHER ASSET DISPOSAL:
Shanghai RHXC3 4,589 3,869
Shanghai KIC – 2,949
Chongqing Tiand – 4,133
Dalian Tiandi2 3,160 –
SUBTOTAL FOR OTHER ASSET DISPOSAL 7,749 10,951
GRAND TOTAL 22,279 21,366
1 ASP of Chongqing residential sales is based on net floor area, a common market practice in the region. Chongqing Tiandi partnership portfolio is a project developed by associates of the Group. The Group held 19.8% of the partnership portfolio.
2 On 14 November 2017, the Group entered into the agreement in relation to the disposal of its all interest in Dalian Tiandi. The transaction was completed on 14 May 2018 and the Group no longer holds any interest in Dalian Tiandi.
3 On 26 June 2018, the Group entered into the agreement to dispose of 49.5% of the interests in certain portfolio of properties in relation to Shanghai RHXC project Lots 1 and 7 residential inventories for a total contracted amount of RMB4,589 million.
Annual Report 2018 39

BUSINESS REVIEW
RESIDENTIAL GFA AVAILABLE FOR SALE AND PRE-SALE IN 2019
The Group has approximately 406,800 sq.m. of residential GFA spanning five projects which, subject to obtaining pre-sale permits and other relevant government approvals, is available for sale and pre-sale during 2019, as summarised below:
ProjectAvailable for sale
and pre-sale in 2019
GFA in sq.m.Group’s
interest %AttributableGFA in sq.m.
Shanghai RHXC High-rises 117,200 49.5%1 60,100
Wuhan Tiandi High-rises 91,400 100% 91,400
Foshan Lingnan Tiandi Townhouses, Low-rises and High-rises 13,300 100% 13,300
Wuhan Optics Valley
Innovation Tiandi High-rises 119,100 50% 59,600
Chongqing Tiandi High-rises 65,800 19.8% 13,000
TOTAL 406,800 237,400
1 GFA of 4,200 sq.m.in Shanghai RHXC – The Gallery (Lot 2) in which the Group has a 99% effective interest.
RESIDENTIAL PROPERTIES UNDER DEVELOPMENT
Shanghai Taipingqiao
Lakeville Luxe (Lot 116) has a total residential apartment with saleable GFA of 94,000 sq.m. was completed as of 31 December 2017. A total GFA of 45,000 sq.m. (including underground GFA of 1,400 sq.m.) was delivered to the buyers
By way of a cautionary note, the actual market launch dates depend on and will be affected by factors such as construction progress, changes in market environments, and changes in government regulations.
The following section provides further details of the development progress and completion of each of the projects located in Shanghai, Wuhan, Chongqing and Foshan.
The commercial part of INNO Zhujiang Lu has been open for trial operation
Shui On Land Limited40

in 2016 and 2017. The remaining portion was launched for pre-sales in April 2018 with all apartments sold on the date of launch for a total amount of RMB6,102 million. A total GFA of approximately 23,500 sq.m. (including underground GFA of 5,300 sq.m.) was delivered to the buyers in 2018 while the remaining portion planned for delivery in 2019. The Group has a 98% effective interest. Lot 118 with a total saleable GFA of 79,000 sq.m. for residential use is under development. Pre-sales is planned to start from the first half of 2020. The Group has a 99% effective interest.
Shanghai RHXC
Construction works of The Gallery (Lot 2), with a total GFA of 104,000 sq.m. of residential and 1,000 sq.m. of ancillary retail space, was completed in 2017. A total GFA of 38,200 sq.m. was delivered to the buyers in 2018 for a total revenue of RMB3,682 million recorded. The third batch with a total GFA of 15,000 sq.m. was launched for pre-sale in September 2018. All apartments launched were sold on the day of launch with a total of RMB1.5 billion in contracted sales recorded in 2018. The Group has 99% effective interest.
Lot 1 with a total GFA of 113,000 sq.m. for residential use with the remaining GFA of 3,000 sq.m. for retail use started construction in 2018. Pre-sales of the residential segment is planned for late 2019. The relocation of Lot 7 with a total GFA of 159,000 sq.m. was completed in February 2019. The Group has a 49.5% effective interest in both sites.
Wuhan Tiandi
Lot B10 is under development with a total GFA of 115,000 sq.m.. A total of 27,500 sq.m. was launched for pre-sales in late 2018 with almost all of the apartments sold/subscribed on the day of launch for a total contracted sales of RMB903 million in 2018. The remaining portion is planned for pre-sales launch in 2019. Lot B10 is planned for completion and delivery in 2020. The Group has a 100% effective interest.
Wuhan Optics Valley Innovation Tiandi
The site was acquired in 2017. The first phase (Lot R1) with a total GFA of 122,000 sq.m. is under construction. A total of 37,400 sq.m. was launched for pre-sales in late 2018, for a total contracted sales amount of RMB359 million in 2018. The remaining portion of the first phase is planned to be launched for pre-sales in 2019. The Group has a 50% effective interest.
Chongqing Tiandi
The Group sold 79.2% effective interest in the Chongqing Partnership Portfolio in June 2017. Lot B15 with a total saleable GFA of 209,000 sq.m. is under construction. Lot B14 with a total saleable GFA of 88,000 sq.m. is under development. Pre-sales was launched in late 2018. The construction work will be completed in 2020. Total contracted sales of Lots B15 and B14 were RMB3,321 million in 2018. The Partnership Portfolio is an associate of the Group. The Group has 19.8% of the Partnership Portfolio.
Foshan Lingnan Tiandi
The Royal (Lots 2 and 3) with a total GFA of 72,000 sq.m. was completed and various pre-sales launched in 2018. The Group has a 100% effective interest.
COMMERCIAL PROPERTIES UNDER DEVELOPMENT
Shanghai Taipingqiao
The Asset Enhancement Initiatives of retail space with a total GFA of 28,000 sq.m. at Shui On Plaza was completed and held its soft opening in December 2018 and renamed as “Xintiandi Plaza”. Construction of Lots 123,124 and 132 is planned for commencement in 2019. The site is planned to be developed into three office buildings and a shopping mall. The Group has a 25% effective interest.
Shanghai RHXC
Hall of the Sun (Ruihong Tiandi Lot 10) with a total leasable GFA of 328,000 sq.m. started construction in 2017. It will be developed into a commercial complex with two Grade-A office buildings and a shopping mall. Construction is planned to be completed from 2020 to 2021. The Group has a 49.5% effective interest.
INNO KIC
Two office buildings with a total GFA of 45,000 sq.m. were acquired on a bare shell basis in late 2017. Internal fitting out work was commenced in early 2018 and is planned for completion and opening in 2019. The Group has a 100% effective interest.
Wuhan Tiandi
Construction work of Lot A1 office building with a total GFA of 160,000 sq.m. resumed in late 2018. HORIZON – North Shopping Mall (Lot B4 Retail) is undergoing internal fitting out and pre-leasing, with soft opening planned in April 2019. The Group has a 100% effective interest in both properties.
By way of a cautionary note, the actual completion date and launch date depend on and will be affected by construction progress, changes in market environments, changes in government regulations and other factors. The Group plans its project construction in advance while adapting to government policy changes, as well as implemented operational tactics to enhance turnover and increase development efficiency. The Group will, nevertheless, adjust the progress of construction, delivery plan and launch schedules, in accordance with the sales conditions of each project, and with respect to the rapid changing market conditions.
Annual Report 2018 41

LANDBANKLANDBANK
As at 31 December 2018, the Group’s landbank, including contributions from the joint ventures, partnership portfolios and associates, stood at a total GFA of 8.5 million sq.m. (comprising 6.8 million sq.m. of leasable and saleable area, and 1.7 million sq.m. for clubhouses, car parking spaces and other facilities) spread across nine development projects located in the prime areas of four major PRC cities, namely: Shanghai, Wuhan, Chongqing and Foshan. The leasable and saleable GFA attributable to the Group was 4.3 million sq.m..
Of the total leasable and saleable GFA of 6.8 million sq.m., approximately 1.5 million sq.m. was completed, and held for sale and/or investment. Approximately 2.0 million sq.m. is under development, with the remaining 3.3 million sq.m. held for future development.
RELOCATION PROJECT
As of 31 December 2018, the relocation of Lots 7 and 167 A and B in Shanghai RHXC is in progress. 99.75% and 97.85% of residents of Lot 7 and Lots 167 A and B sites have signed relocation agreements, respectively. Lot 167 A will be developed into high-end residential apartments and Lot 167 B will be developed into a commercial complex with office buildings and retail podium. The relocation of Lot 7 was completed in February 2019 and Lot 167 is expected to be completed in 2019.
By way of a cautionary note, the actual completion date of the above-mentioned sites depends on and will be affected by changes in government regulations, negotiations with relevant parties and other factors. The above represents the best estimates as of the reporting period.
Shui On Land Limited42
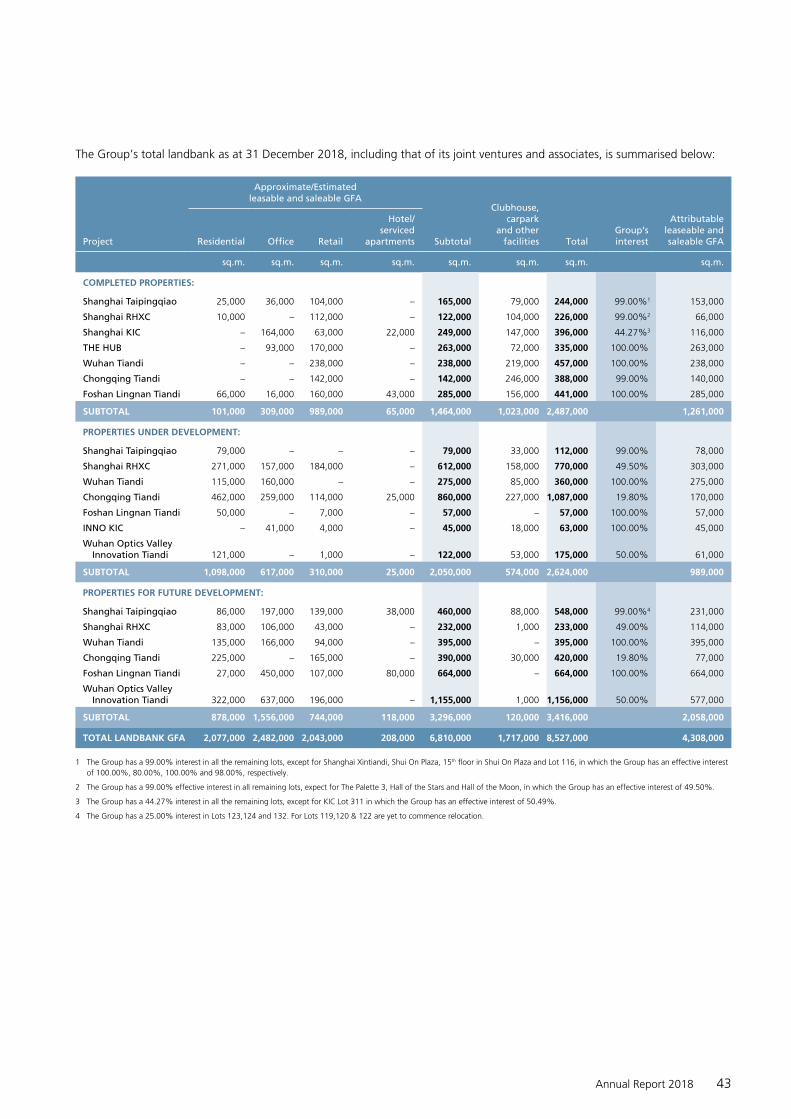
The Group’s total landbank as at 31 December 2018, including that of its joint ventures and associates, is summarised below:
Approximate/Estimatedleasable and saleable GFA
Clubhouse,carpark
and other facilitiesProject Residential Office Retail
Hotel/ serviced
apartments Subtotal TotalGroup’s interest
Attributable leaseable and saleable GFA
sq.m. sq.m. sq.m. sq.m. sq.m. sq.m. sq.m. sq.m.
COMPLETED PROPERTIES:
Shanghai Taipingqiao 25,000 36,000 104,000 – 165,000 79,000 244,000 99.00%1 153,000
Shanghai RHXC 10,000 – 112,000 – 122,000 104,000 226,000 99.00%2 66,000
Shanghai KIC – 164,000 63,000 22,000 249,000 147,000 396,000 44.27%3 116,000
THE HUB – 93,000 170,000 – 263,000 72,000 335,000 100.00% 263,000
Wuhan Tiandi – – 238,000 – 238,000 219,000 457,000 100.00% 238,000
Chongqing Tiandi – – 142,000 – 142,000 246,000 388,000 99.00% 140,000
Foshan Lingnan Tiandi 66,000 16,000 160,000 43,000 285,000 156,000 441,000 100.00% 285,000
SUBTOTAL 101,000 309,000 989,000 65,000 1,464,000 1,023,000 2,487,000 1,261,000
PROPERTIES UNDER DEVELOPMENT:
Shanghai Taipingqiao 79,000 – – – 79,000 33,000 112,000 99.00% 78,000
Shanghai RHXC 271,000 157,000 184,000 – 612,000 158,000 770,000 49.50% 303,000
Wuhan Tiandi 115,000 160,000 – – 275,000 85,000 360,000 100.00% 275,000
Chongqing Tiandi 462,000 259,000 114,000 25,000 860,000 227,000 1,087,000 19.80% 170,000
Foshan Lingnan Tiandi 50,000 – 7,000 – 57,000 – 57,000 100.00% 57,000
INNO KIC – 41,000 4,000 – 45,000 18,000 63,000 100.00% 45,000
Wuhan Optics Valley Innovation Tiandi 121,000 – 1,000 – 122,000 53,000 175,000 50.00% 61,000
SUBTOTAL 1,098,000 617,000 310,000 25,000 2,050,000 574,000 2,624,000 989,000
PROPERTIES FOR FUTURE DEVELOPMENT:
Shanghai Taipingqiao 86,000 197,000 139,000 38,000 460,000 88,000 548,000 99.00%4 231,000
Shanghai RHXC 83,000 106,000 43,000 – 232,000 1,000 233,000 49.00% 114,000
Wuhan Tiandi 135,000 166,000 94,000 – 395,000 – 395,000 100.00% 395,000
Chongqing Tiandi 225,000 – 165,000 – 390,000 30,000 420,000 19.80% 77,000
Foshan Lingnan Tiandi 27,000 450,000 107,000 80,000 664,000 – 664,000 100.00% 664,000
Wuhan Optics Valley Innovation Tiandi 322,000 637,000 196,000 – 1,155,000 1,000 1,156,000 50.00% 577,000
SUBTOTAL 878,000 1,556,000 744,000 118,000 3,296,000 120,000 3,416,000 2,058,000
TOTAL LANDBANK GFA 2,077,000 2,482,000 2,043,000 208,000 6,810,000 1,717,000 8,527,000 4,308,000
1 The Group has a 99.00% interest in all the remaining lots, except for Shanghai Xintiandi, Shui On Plaza, 15th floor in Shui On Plaza and Lot 116, in which the Group has an effective interest of 100.00%, 80.00%, 100.00% and 98.00%, respectively.
2 The Group has a 99.00% effective interest in all remaining lots, expect for The Palette 3, Hall of the Stars and Hall of the Moon, in which the Group has an effective interest of 49.50%.
3 The Group has a 44.27% interest in all the remaining lots, except for KIC Lot 311 in which the Group has an effective interest of 50.49%.
4 The Group has a 25.00% interest in Lots 123,124 and 132. For Lots 119,120 & 122 are yet to commence relocation.
Annual Report 2018 43

FINANCIAL REVIEW
The Group’s revenue for 2018 increased by 35% to RMB24,841 million (2017: RMB18,451 million), mainly due to a significant increase in recognised property sales for the year.
Property sales for 2018 increased by 37% to RMB22,131 million (2017: RMB16,169 million) as a result of increased property deliveries, especially for the Shanghai Rui Hong Xin Cheng (“RHXC”) project. Property sales of RHXC increased by 141% to RMB18,932 million for 2018 (2017: RMB7,852 million), accounting for 86% of the year’s total property sales. RHXC property sales include general property sales of The Gallery (Lot 2) and a 49.5% interest disposal of the residential developments at RHXC Lots 1 and 7. Property sales in 2017 comprised mainly of the RHXC and Chongqing projects, which accounted for RMB7,852 million and RMB4,716 million respectively. Details of 2018 property sales are in the paragraph titled “Property Development” in the Business Review Section.
Income from property investment increased to RMB2,112 million (2017: RMB1,961 million), while rental and related income from investment properties increased to RMB2,016 million (2017: RMB1,869 million). Rental and related income from the Group’s Shanghai properties increased to RMB1,489 million (2017: RMB1,445 million), accounting for 74% of total rental and related income. The Group saw a 3% increase in rental and related income generated from Shanghai, mainly due to substained rental growth from its existing completed
properties, which off-set a decrease in rental income from the RHXC commercial properties. The Group had sold 49.5% interest in the RHXC Commercial Partnership Portfolio (Lots 3, 6, 10 and Phase II retail) at the end of 2017 and the related rental income from RHXC Commercial Partnership Portfolio has accordingly been classified as interests in joint venture since January 2018. Income from hotel operations, comprising contributions from the Marco Polo Hotel in Foshan, increased to RMB96 million for 2018 (2017: RMB92 million). Details of the business performance of investment properties are in the paragraph titled “Asset Management” in the Business Review Section.
Construction income generated by the construction business increased to RMB296 million for 2018 (2017: RMB194 million).
Gross profit for 2018 decreased by 9% to RMB7,145 million (2017: RMB7,858 million), while gross profit margin decreased to 29% (2017: 43%). The lower gross profit margin was mainly due to lower margins arising from the 49.5% interest disposal of the residential developments at RHXC Lots 1 and 7, which accounted for 68% of the Group’s property sales for the year 2018. If excluding the 49.5% interest disposal of the residential developments at Lots 1 and 7, both gross profit margin of general property sales and property investment for the year 2018 would have remained in line with 2017.
Shui On Land Limited44

Other income decreased by 9% to RMB417 million (2017: RMB456 million), which comprised bank interest income and interest income from joint ventures and associates.
Selling and marketing expenses decreased by 15% to RMB254 million (2017: RMB298 million) notwithstanding a 29% increase in contracted property sales (excluding sales by joint ventures or associates and other asset disposal) to RMB 10,850 million (2017: RMB8,440 million. This was mainly due to decreased selling and promotional activities as the Group’s residential products have already been well accepted by the market.
General and administrative expenses, which comprises staff costs, depreciation charges and advisory costs incurred, decreased by 4% to RMB790 million (2017: RMB826 million).
As a result of the above, operating profit decreased by 9% to RMB6,518 million for 2018 (2017: RMB7,190 million).
Gain on disposal of investment properties through disposal of subsidiaries amounted to RMB194 million for the year 2018, representing the consideration adjustments for the disposal of 49.5% interests in the RHXC Commercial Partnership Portfolio in 2017. The corresponding gain in 2017 was mainly in relation to the disposal of 49.5% interests in the RHXC Commercial Partnership Portfolio and the disposal of 79.2% of the Group’s interests in the Partnership Portfolio in Chongqing’s commercial portion in 2017 which amounted to a gain of RMB1,870 million and a loss of RMB78 million respectively.
Increase in fair value of the remaining investment properties increased 87% to report a gain of RMB970 million (2017: RMB518 million), of which RMB642 million (2017: RMB412 million) was contributed by completed investment properties and RMB328 million (2017: RMB106 million) from investment properties under construction or development. The increase in fair value of the remaining investment properties for the year 2018 represented a 2.2% gain compared with the value of investment properties as of 31 December 2018. The paragraph titled “Asset Management” in the Business Review Section provides detailed descriptions of these properties.
Other gains and losses amounted to a loss of RMB990 million (2017: a loss of RMB595 million), of which RMB376 million (2017: Nil) was in relation to an impairment loss of investment in a joint venture and RMB380 million (2017: Nil) was in relation to a provision of commercial lands costs in Foshan Lingnan Tiandi. The Group reviewed the remaining commercial lands development of Foshan Lingnan Tiandi and determined a provision amounting to RMB380 million for the undeveloped lands of Foshan Lot A/B/C due to Foshan’s sluggish office market.
Share of gains (losses) of associates and joint ventures was a gain of RMB61 million for the year 2018 (2017: a loss of RMB927 million). The turnaround was mainly due to the
absence of a loss recorded in 2017 in relation to the Group’s disposal of its entire interest in the Dalian Tiandi project. The disposal of the Dalian Tiandi project was completed in May 2018.
Finance costs, inclusive of exchange differences, amounted to RMB1,716 million (2017: RMB1,691 million). Total interest costs decreased by 27% to RMB2,329 million (2017: RMB3,179 million), due mainly to the repayment of bank borrowings and senior notes since 2H 2017. However, of these interest costs, 41% (2017: 42%) or RMB945 million (2017: RMB1,344 million) was capitalised as cost of property development, with the remaining 59% (2017: 58%) of interest costs relating to mortgage loans on completed properties and borrowings for general working capital purposes accounted for as expenses. Exchange loss of RMB273 million (2017: gain of RMB195 million) was recorded as a result of the depreciation of the RMB against the HKD and the USD for the year 2018.
Impairment losses, net of reversal, amounted to RMB122 million (2017: Nil), of which RMB180 million was a provision for a receivable relating to the companies disposed to a purchaser in 2016, and RMB64 million was a reversion for impairment allowance based on the provision matrix. The Group is still working with the purchaser and the Government to sort out the some land issues under the companies the Group had disposed to the purchaser in 2016. According to the agreement, the purchaser will provide payment to the Group once the land issues have been resolved. As the completion timing in relation to the aforesaid is not certain, a provision amounting to RMB180 million for this receivable has been made for 2018.
Profit before taxation decreased by 21% to RMB4,915 million (2017: RMB6,250 million). The decrease in profit before taxation is primarily due to the absence of a one-off gain arising from the disposal of investment properties in the RHXC Commercial Partnership Portfolio, the one-off impairment loss of investment in a joint venture and commercial lots provision for Foshan Lingnan Tiandi incurred in 2018 as well as the other factors mentioned above.
Taxation decreased 43% to RMB2,229 million (2017: RMB3,926 mil l ion). The tax rate including PRC land appreciation tax for the year 2018 was 45.35% (2017: 62.82%). PRC Enterprise Income Tax has been provided for at the applicable income tax rate of 25% on the assessable profits during the year. Land appreciation tax was levied at progressing rates ranging from 30 percent to 60 percent on the appreciation value, being the proceeds of properties sales less deductible expenditure including costs of land, development and construction. The lower tax rate was mainly resulted from PRC land appreciation tax decreasing 70% to RMB589 million (2017: RMB1,959 million).
Annual Report 2018 45

FINANCIAL REVIEW
Profit for the year 2018 was RMB2,686 million (2017: RMB2,324 million).
Profit attributable to shareholders of the Company for the year 2018 was RMB1,906 million, an increase of 14% compared to the corresponding period (2017: RMB1,669 million).
Core earnings of the Group are as follows:
2018RMB’million
2017RMB’million Change
Profit attributable to shareholders of the Company 1,906 1,669 14%
Net increase in fair value of the remaining investment properties, net of tax (736) (389)
Realised fair value gains from investment properties disposed of 6 851
Realised bargain purchase gain from acquisition of subsidiaries 115 256
Impairment loss on investment properties under development at cost 380 –
Impairment loss on investment in a joint venture 376 –
Share of results of associates – realised fair value gains from investment properties disposed of /fair value losses of investment properties, net of tax 374 183
Share of results of joint ventures – fair value gains of investment properties, net of tax (61) –
454 901 (50%)
Non-controlling interests 329 4
Net effect of changes in the valuation 783 905 (13%)
Profit attributable to shareholders of the Company before revaluation 2,689 2,574 4%
Add:
Profit attributable to owners of convertible perpetual capital securities 112 114 (2%)
Profit attributable to owners of perpetual capital securities 259 459 (44%)
Core earnings of the Group 3,060 3,147 (3%)
Earnings per share (basic) was RMB23.7 cents, which was calculated based on a weighted average of approximately 8,043 million shares in issue for the year 2018 (2017: RMB20.8 cents, which was calculated based on a weighted average of approximately 8,018 million shares in issue).
Dividends payable to shareholders of the Company have to comply with certain covenants under the senior notes and perpetual capital securities as follows:
• Dividends payable to the shareholders of the Company (together with any redemption, repurchase or acquisition of the Company’s shares) should not exceed 60% of the Company’s consolidated profit for the two most recent semi-annual periods prior to payment of the dividend, unless certain conditions pursuant to the terms of the senior notes have been met.
• In the case where the Company opts to defer the payment of coupons to the owners of perpetual capital securities, no dividend payments should be made to the shareholders of the Company unless all coupons deferred have been paid in full.
Having taken into consideration that the Group’s financial position and improved cashflow, the Board has resolved to recommend the payment of a 2018 final dividend of HKD0.084 per share (2017: HKD0.07 per share).
MAJOR ACQUISITION AND DISPOSAL The Group has pursued an asset light strategy to dispose its assets to increase asset revenue over the past few years. In 2018, the Group also forged partnerships with strategic partners to develop both residential and commercial properties. These transactions will help accelerate the Company’s strategic transition to a leading commercial focused property developer, owner and asset manager in China.
Shui On Land Limited46

The details are as follows:
1. In June 2018, the Group entered into an agreement with Joy City Property Limited, a listed company in Hong Kong, to sell 49.5% interest in the Shanghai RHXC Residential Partnership Portfolio (i.e. Lots 1 and 7) for a consideration of around RMB4,623 million. The Group and Joy City Property Limited will cooperate to develop this residential partnership portfolio. For details pertaining to the disposal of the Shanghai RHXC Residential Partnership Portfolio, please refer to the Company’s circular dated 18 July 2018.
2. In July 2018, the Group entered into an agreement with two parties (i.e. China Pacific Life Insurance Company Limited and Shanghai Yongye Enterprise (Group) Company Limited) which resulted in the Group owning a 25% interest in Shanghai Taipingqiao Lots 123,124 and 132. The investment is approximately RMB19.5 billion of which include land costs amounted to RMB13.61 billion. For details, please refer to the circular issued by the Company dated 26 July 2018.
3. In December 2018, the Group entered into an agreement with Brookfield, an affiliate of Brookfield Asset Management Inc., to acquire 21.894% interest held by Brookfield in CXTD Holding for a consideration of around RMB3,406 million. On 15 March 2019, the transaction was completed. For details, please refer to the circular issued by the Company dated 20 February 2019.
4. In December 2018, the Group has established Shui On Core-Plus Office Investment Platform with Manulife Investors and China Life Trustees Limited. The targeted total capital commitment of the office investment platform is USD1.0 billion. The office investment platform’s first investment is the prime Grade A office building with an ancillary retail podium and carparks in Taipingqiao, Shanghai, known as 5 Corporate Avenue. For details, please refer to the Company’s announcement dated 31 December 2018.
LIQUIDITY, CAPITAL STRUCTURE AND GEARING RATIOUp to the date of this report, the Group has arranged two repayments/redemptions of senior notes, two new issuances of senior notes and one new issuance of receipts under securitisation arrangements. The purpose of refinancing and redemption is to take advantage of the lower finance costs and to extend the maturity of senior notes. The details are as follows:
1. In December 2017 and January 2018, the Group has fully redeemed senior notes with principal amount of USD550 million due 2019 at a yield of 9.625% per annum with a redemption price equal to 104.813% of the total amount plus the accrued and unpaid interest. The total amount for such redemption is equivalent to RMB3,810 million.
2. In March and April 2018, the Group issued an aggregate principal amount of RMB2,200 million senior notes due 2021 at a yield of 6.875% per annum.
3. In May 2018, the Group has fully repaid an aggregate principal amount of USD637 million senior notes at a yield of 8.7% per annum.
4. In November 2018, Foshan An Ying Property Development Co., Ltd, a wholly-owned subsidiary of the Company, issued receipts under securitisation arrangements with the final maturity date in 2036 with a net proceeds of RMB524 million.
5. In February 2019, the Group issued an aggregate principal amount of USD500 million senior notes due 2021 at a yield of 6.25% per annum.
Show flat of La Riva II at Wuhan Tiandi
Annual Report 2018 47

FINANCIAL REVIEW
The structure of the Group’s borrowings as of 31 December 2018 is summarised below:
Total(in RMB
equivalent)Due within
one year
Due in morethan one
year but notexceedingtwo years
Due in more than two
years but notexceedingfive years
Due in morethan
five years
RMB’million RMB’million RMB’million RMB’million RMB’million
Bank borrowings – RMB 13,644 5,577 2,761 1,684 3,622
Bank borrowings – HKD 3,726 3,376 87 263 –
Bank borrowings – USD 8,951 3,829 3,256 1,866 –
Senior notes – USD 5,193 1,722 – 3,471 –
Senior notes – RMB 2,231 – – 2,231 –
Receipts under securitisation arrangements – RMB 524 5 7 40 472
TOTAL 34,269 14,509 6,111 9,555 4,094
Total cash and bank deposits amounted to RMB15,392 million as of 31 December 2018 (31 December 2017: RMB16,760 million), which included RMB2,288 million (31 December 2017: RMB2,153 million) of deposits pledged to banks and RMB3,348 million (31 December 2017: RMB1,013 million) of restricted bank deposits which can only be applied to designated property development projects of the Group.
As of 31 December 2018, the Group’s net debt was RMB18,877 million (31 December 2017: RMB24,939 million) and its total equity was RMB47,219 million (31 December 2017: RMB49,175 million). The Group’s net gearing ratio was 40% as of 31 December 2018 (31 December 2017: 51%), calculated based on the excess of the sum of senior notes,
receipts under securitisation arrangements, bank borrowings net of bank balances and cash (including pledged bank deposits and restricted bank deposits) over the total equity. The Group’s solid balance sheet should enable it to weather any normal market volatility that may arise.
As of 31 December 2018, HKD/USD borrowings including senior notes (unhedged) amounted to approximately RMB8,607 million in equivalent, which is around 25% of the total borrowings (31 December 2017: 21%).
Total undrawn banking facilities available to the Group amounted to approximately RMB2,539 million as of 31 December 2018 (31 December 2017: RMB2,380 million).
XINTIANDI PLAZA – creates a complex social space of new retail
Shui On Land Limited48

PLEDGED ASSETSAs of 31 December 2018, the Group had pledged investment properties, property, plant and equipment, prepaid lease payments, properties under development for sale, properties held for sale, accounts receivable and bank deposits totalling RMB37,036 million (31 December 2017: RMB44,741 million) to secure the Group’s borrowings of RMB11,280 million (31 December 2017: RMB18,304 million).
CAPITAL AND OTHER DEVELOPMENT RELATED COMMITMENTSAs of 31 December 2018, the Group had contracted commitments for development costs, capital expenditure and other investments in the amount of RMB3,501 million (31 December 2017: RMB2,750 million).
CASH FLOW MANAGEMENT AND LIQUIDITY RISKManagement of cash flow is the responsibility of the Group’s treasury function at the corporate level.
The Group’s commitment is to maintain a balance between continuity of funding and flexibility through a combination of internal resources, bank borrowings and debt financing, as appropriate. The present financial and liquidity position enables the Group to maintain a reasonable liquidity buffer so that sufficient funds are available to meet liquidity requirements at all times.
EXCHANGE RATE AND INTEREST RATE RISKSThe Group’s revenue is denominated in RMB. The RMB senior notes issued in 2018 are also denominated in RMB. Thus, the coupon payments and repayment of the principal amounts of the senior notes issued in 2018 does not expose the Group to any exchange rate risk.
However, a portion of the revenue is converted into other currencies to meet our foreign-currency-denominated debt obligations, such as bank borrowings denominated in HKD and USD, and senior notes and CPCS denominated in USD issued from 2015 to 2017. Thus, to the extent that the Group has a net currency exposure, there is exposure to fluctuations in foreign exchange rates. As of 31 December 2018, the Group has entered approximately USD954 million forward to hedge the USD currency risk against RMB and HKD1,050 million forward to hedge the HKD currency risk against RMB. In addition, from 1 January 2019 till today, the Group has further entered USD580 million and HKD300 million forward to hedge the USD and HKD currency risk against RMB.
The Group’s exposure to interest rate risk results from fluctuations in interest rates. Most of the Group’s bank borrowings consist of variable rate debt obligations with original maturities ranging from two to five years for project construction loans, and two to fifteen years for mortgage loans. Increases in interest rates would raise interest expenses relating to the outstanding variable rate borrowings and cost of new debt. Fluctuations in interest rates may also lead to significant fluctuations in the fair value of the debt obligations.
Save for disclosed above, as of 31 December 2018, the Group does not hold any other derivative financial instruments that are linked to exchange rates or interest rates. The Group continues to closely monitor its exposure to exchange rate and interest rate risks, and may employ derivative financial instruments to hedge against risk if necessary.
CONTINGENT LIABILITIESTemporary guarantees are provided to banks with respect to mortgage loans procured by some purchasers of the Group’s properties. Such guarantees will be released by banks upon the issuance of the real estate ownership certificate to the purchasers or the repayment of mortgage loan by the purchasers, whichever is earlier. In the opinion of the Board, the fair value of these financial guarantee contracts is insignificant.
Annual Report 2018 49

Global economic expansion is losing momentum following the emergence of cycle de-synchronization in 2018. There has been a notable uptick of populism and social unrest in South America, the Middle East and throughout Europe, reflecting fragility of the current economic recovery. While last year the world was estimated to achieve a robust 3.7% growth, there were rising signs of policy inaction and political gridlock, which has led the IMF to downgrade the economic prospects of several key Eurozone economies including Germany, France, and Italy. In addition, a possible “no-deal” Brexit, worsening US-China relations, and tightening financial conditions will erode business confidence, and the ensuing rise in risk sentiment could have adverse implications on this year’s economic performance.
Against this backdrop, China’s GDP growth softened to 6.6% in 2018 as the government pushed through a deleveraging campaign. Fixed asset investment slowed from 7.2% in 2017 to 5.9% in 2018, while retail sales dropped from 10.2% to 9.0%. In the first ten months of 2018, China exports and imports soared as traders rushed to fulfil orders to avoid steeper tariff, but trade volume fell in December due to cooling demand. This is likely to get worse if a deal to resolve
the trade dispute between the US and China is not reached very soon. The RMB depreciated 4.79% against US dollar amid persistent trade tension in 2018, but with the US Fed policy turning dovish, the exchange rate has stabilized at around 6.75 – 6.80 in January despite mounting uncertainties.
China residential sales area and revenue reached a record high of 1.48 billion square meters and RMB12.64 trillion in 2018, representing respective annual increases of 2.2% and 14.7%. The government will continue to establish a long term housing system that ensures supply through multiple sources, provides housing support through multiple channels, and encourages rental market to be developed along with home ownership. There are growing signs that housing demand is weakening towards 2018 year end and several cities have started to loosen some of the property control measures. With housing policy turning supportive and mortgage rate falling, tier one and strong tier two cities should continue to maintain stable transaction level this year. However, several provinces and municipalities including Beijing, Fujian, Anhui, Sichuan, Henan and Shanxi have announced plans to scale back their shantytown redevelopment programs, and this could lead to reduced demand as the housing market reached a turning point in 2019.
Shui On Land Limited50
MARKET OUTLOOK

In 2018, China’s office leasing momentum moderated in line with a slower pace of economic growth. Despite government’s efforts to further open the financial sector to foreign investment, the clamp down on domestic P2P lending activities has reduced leasing demand from the small and medium finance companies. While Grade A office leasing demand in tier one cities in China is expected to remain stable in longer-term, excess supply across many tier two cities means that rising vacancy will continue to suppress office rental growth this year for projects in non-core areas. For retail commercial markets, there is rising competition from numerous new shopping mall supply together with online and omni-channel competitors. Many retail operators have moved to create new consumer experiences through adopting new business model and experimenting with new technology, introducing new brands and adjusting tenant mixes to keep up with fast changing consumer lifestyle and tastes. According to CBRE, despite the large volume of new supply, overall shopping centre vacancy in China declined from 9.5% in 2013 to 6.5% in 2018. The recent cuts in import tariffs and personal income tax are expected to provide a boost to China’s domestic consumption for 2019.
After achieving a healthy pace of 6.6% economic growth in 2018, Shanghai government has announced a 6.0%-6.5% growth target for 2019. Recent steps to encourage foreign investment in finance, healthcare and education are set to stimulate services sector growth this year. Investment in infrastructure and industrial upgrading will increase with the Yangtze River Delta (YRD) integration initiatives elevated to become a national development strategic priority. This should bring more regional traffic and trade flows through the Hongqiao CBD. The proposed establishment of a new technology board in Shanghai should bode well for domestic technology enterprises, especially those located in the Yangtze Delta.
Wuhan attracted fixed assets investment of RMB870.6 billion in 2018, which helped to propel the city’s economic growth to 8.0%. The city aims to transform itself into a major regional hub city, assuming multiple roles as national science and technology innovation centre, modern services centre, advanced manufacturing centre, comprehensive transportation centre, and international waterfront cultural city. In 2019, Wuhan will continue its university graduates and talent retention program to enhance city competitiveness. Major investment will be undertaken to further revamp the Yangtze River Axis and to develop the Yangtze River New Town in Hankou.
Chongqing, an economic powerhouse in southwestern China that has led regional growth in recent years, is facing transition challenges as the municipality shift towards a high-quality growth model. In 2018, Chongqing’s GDP growth slowed to 6.0% due to slackening automobile sales,
which resulted in its secondary industry growth dropping to 3.0%. The tertiary industry maintained robust growth of 9.1% and accounted for 52.3% of the municipality’s GDP, a notable improvement from the 49.0% share achieved in the previous year. Benefiting from its regional hub position, Chongqing’s finance and tourism sectors have continued to show promising growth. In order to pursue an innovation-driven growth model, the government has released new plans to speed up development of new energy, artificial intelligence and autonomous vehicles, and successfully hosted a national 2018 Smart China Expo event.
Foshan’s economic growth decelerated to 6.3% in 2018. The city is transitioning towards an innovation-driven development model; and aims to develop Sanlong Bay near Guangzhou South Railway Station into a high-end innovation cluster. Apart from the Tanzhou International Exhibition Centre, Sanlong Bay also provides headquarter functions for Country Garden, the Midea Group, and Guangzhou advanced manufacturing science and technology laboratory. Foshan is seen to benefit from the recent opening of the Guangzhou-Shenzhen-Hong Kong high-speed railway in September 2018, making it conveniently accessible from Hong Kong via Guangzhou South Railway Station or Foshan West Railway Station.
The economy of Nanjing expanded at 8.0% in 2018, and has set a 7.5%-8.0% growth target for 2019. The city’s development is seen to benefit from the national ‘Belt and Road’, ‘Yangtze River Economic Belt’ and ‘Regional Integration of Yangtze River Delta’ strategies. In line with the city’s ambition to become an innovative city having global influence, the government has set its R&D expenditure to GDP ratio at 3.1% for 2019. Future development opportunities will arise from the Jiangbei New Area, which is earmarked to become a modern, international and innovation-oriented demonstration zone. According to the development blueprint, Jaingbei’s core area will feature a central business district, a healthcare district and an industrial research and development park.
Sino-US trade tension, export under pressure, and a housing market operating at the peak all time high are the key challenges affecting China’s economic outlook for 2019. In order to maintain stable growth, the government has announced a comprehensive economic work plan and is expected to implement proactive fiscal policy and prudent monetary policy this year to stimulate domestic demand. In view of a slowdown in economic growth, the local government will be given more leeway to loosen housing control restrictions based on local circumstances, with a stated goal of stabilization of land and home prices, but will continue to maintain a firm grip to prevent speculation in the housing market. 2019 is shaping up to be an uncertain and challenging year, and we will closely monitor changes in the global and domestic markets, and will make adaptation as necessary to the evolving market environment.
Annual Report 2018 51

CORPORATE GOVERNANCE REPORT
The Board of Directors of the Company (the “Board”) is pleased to present the Corporate Governance Report for the year ended 31 December 2018.
CORPORATE GOVERNANCE PRACTICES OF THE COMPANYThe Company is committed to enhancing its corporate governance practices and to pursuing the right balance between conformance and performance in its corporate governance. The Board believes that good corporate governance is essential to the success of the Company, the enhancement of shareholder value, and stakeholders’ confidence in the Company. Good corporate governance practices have enabled the Company to leverage its competitive advantages from many perspectives. The trust and support of the Company’s stakeholders drive its continuing success and growth. The Company has experienced these benefits during its on-shore and off-shore fund raisings, as well as when entering into long-term strategic partnerships with renowned companies. From an ethical perspective, we believe integrity has won the trust of the PRC Government, which has in consequence granted the Company more new opportunities involving large scale metropolitan development projects.
The Company reviews its corporate governance practices from time to time to ensure it complies with all the applicable code provisions (the “CG Code”) set out in Appendix 14 of the Rules Governing the Listing of Securities (the “Listing Rules”) on The Stock Exchange of Hong Kong Limited (the “Stock Exchange”) and aligns with its latest developments. The Board has reviewed the corporate governance practices of the Company along with the adoption and improvement of various procedures and documentation, which are detailed in this report. During the year ended 31 December 2018, the Company has applied the principles of and complied with all the applicable code provisions of the CG Code.
BOARD OF DIRECTORSThe Board is responsible for the leadership and control of the Company and oversees the Company’s businesses, strategic decisions and performance. The Board has reserved for its decision or consideration matters concerning principally the Company’s overall strategy, annual operating budget, annual and interim results, recommendations on Directors’ appointments or re-appointments, material contracts and transactions as well as other significant policies and financial matters.
Shui On Land Limited52

An indoor view of INNO Zhujiang Lu
The Board has delegated the dai ly operat ions and administration of the Company to the management. The respective functions of the Board and the management of the Company are published on the Company’s website and are reviewed from time to time as appropriate. The Board had the full support of the senior management of the Company in discharging its responsibilities during the year ended 31 December 2018.
In addition, to assist in fulfilling its duties, the Board has established four Board committees, namely the Audit and Risk Committee, the Remuneration Committee, the Nomination Committee and the Finance Committee, and has delegated to these Board committees various responsibilities as set out in their respective terms of reference.
All Directors have full and timely access to all relevant information as well as the advice and services of the Company Secretary, with a view to ensuring that the Board procedures and all applicable rules and regulations are followed. In addition, a written procedure has been established to enable the Directors, in the discharge of their duties, to seek independent professional advice in appropriate circumstances at a reasonable cost to be borne by the Company.
BOARD COMPOSITIONDuring the year ended 31 December 2018 and at the date of this report, the Board comprises ten members in total, with three Executive Directors, one Non-executive Director and six Independent Non-executive Directors (“INEDs”):
Executive Directors
Mr. Vincent H. S. LO(Chairman of the Board, member of the Remuneration Committee, Chairman of the Nomination Committee and Chairman of the Finance Committee)
Mr. Douglas H. H. SUNG(Managing Director, Chief Financial Officer and member of the Finance Committee)
Ms. Stephanie B. Y. LO*
Non-executive Director
Mr. Frankie Y. L. WONG(Vice Chairman of the Finance Committee)
INEDs
Sir John R. H. BOND(Member of each of the Nomination Committee and the Finance Committee)
Dr. William K. L. FUNG(Chairman of the Remuneration Committee and member of the Finance Committee)
Professor Gary C. BIDDLE(Chairman of the Audit and Risk Committee and member of each of the Remuneration Committee, the Nomination Committee and the Finance Committee)
Dr. Roger L. McCARTHY(Member of the Audit and Risk Committee)
Mr. David J. SHAW(Member of the Audit and Risk Committee)
Mr. Anthony J. L. NIGHTINGALE(Member of the Finance Committee)
* Ms. Stephanie B. Y. LO was appointed as an Executive Director with effect from 27 August 2018.
THE COMPANY PURSUES A RIGHT BALANCE BETWEEN CONFORMANCE AND PERFORMANCE IN ITS CORPORATE GOVERNANCE.
PERFORMANCECONFORMANCE
EFFECTIVE GOVERNANCE
BOARD
EXTERNAL AUDIT
INTERNAL AUDIT
MANAGEMENT
Annual Report 2018 53

CORPORATE GOVERNANCE REPORT
The list of current Directors and a description of their roles and functions were published on the websites of the Company and the Stock Exchange.
Brief biographical details of the Directors are set out in the “Biographies of Directors and Senior Management” section on pages 105 to 110.
Except that Ms. Stephanie B. Y. LO is the daughter of Mr. Vincent H. S. LO, none of the Directors has any relationship (including financial, business, family or other material/relevant relationship(s)) with any other Directors.
As a commitment to good corporate governance, the Company’s Articles of Association stipulate that, subject to the provisions contained therein, the Board shall include a majority of INEDs. Currently, the Company has six INEDs representing more than half of the Board members. The number of INEDs who have appropriate professional qualifications or accounting or related financial management expertise exceeds the requirement as stipulated under Rule 3.10 of the Listing Rules. The Board has received from each INED an annual confirmation of his independence and considers that all the INEDs are independent under the guidelines set out in Rule 3.13 of the Listing Rules.
The existing Directors, including the INEDs, bring a wide spectrum of valuable business experience, knowledge and professionalism to the Board to ensure its efficient and effective functioning. INEDs are invited to serve on the Board committees of the Company. Their active participation in the Board and the Board committee meetings brings independent judgment on issues relating to the Company’s strategies, performance and management processes, considering the interests of shareholders of the Company. Site visits to the Company’s projects are arranged from time to time to allow members of the Board to keep abreast of project developments.
The Board reviews its own structure, size and composition regularly to ensure that it has a balance of expertise, skills and experience appropriate for the requirements of the business of the Company. The Board believes that the current composition of the Board reflects the necessary balance of skills and experience desirable for effective leadership of the Company and independence in decision-making.
BOARD DIVERSITYWith a view to enhancing the Board’s effectiveness and corporate governance, the Company understands that increasing diversity at the Board level is essential to maintaining a competitive edge in the evolving market environment.
The Board Diversity Policy, which sets out the Company’s approach to achieve diversity in the boardroom, was adopted in March 2013. Under the policy, in designing the composition of the Board and during selection of candidates, the Nomination Committee considers a number of diversity indicators, including but not limited to gender, age, cultural and educational background, professional and industry experience, skills, knowledge, ethnicity and other qualities essential to the Company’s business. The final decision is made based on merit and the contribution that the selected candidates will bring to the Board, having due regard to the benefits of diversity on the Board and also the needs of the Board, and without focusing on a single diversity aspects.
APPOINTMENT, RE-ELECTION AND REMOVAL OF DIRECTORSThe procedures and process of the appointment, re-election and removal of Directors are governed by the Company’s Articles of Association, a copy of which has been published on the Company’s website for public inspection. The Board, with the recommendation of the Nomination Committee, is responsible for reviewing the Board composition, developing and formulating the relevant procedures for the nomination and appointment of Directors, monitoring the appointment of Directors and assessing the independence of INEDs.
Non-executive Directors of the Company, including INEDs, are subject to retirement by rotation at least once every three years and the re-election of Directors is pursuant to the Company’s Articles of Association, the Listing Rules and any other applicable laws.
All Directors appointed to fill a casual vacancy should be subject to election by shareholders at the first general meeting after their appointment; and every Director, including those appointed for a specific term, is subject to retirement by rotation at least once every three years. As such, no Director has a term of appointment longer than three years.
The Company’s Articles of Association also allow a qualified shareholder to propose a person, other than a retiring Director of the Company or a person recommended by the Directors, for election as a Director of the Company. The detailed requirements and procedure for such action have been published on the Company’s website.
Shui On Land Limited54

TRAINING, INDUCTION AND CONTINUING DEVELOPMENT FOR DIRECTORSEach newly appointed Director will receive a comprehensive, formal and tailored induction on the first occasion of his/her appointment to ensure that he/she has an appropriate understanding of the business and operations of the Company and that he/she is fully aware of his/her responsibilities and obligations under the Listing Rules and relevant regulatory requirements.
The Directors are continually updated on legal and regulatory developments, as well as business and market changes, in order to facilitate the discharge of their responsibilities. During the year ended 31 December 2018, the Directors attended five training sessions organised by the Company.
In addition, individual Directors participated in forums and workshops organised by external professional consultants for continuous professional development. All Directors have provided the Company with their training records for the year ended 31 December 2018.
BOARD AND BOARD COMMITTEES MEETINGS AND SHAREHOLDERS’ MEETINGSNUMBER OF MEETINGS AND DIRECTORS’ ATTENDANCE
The Company held an annual general meeting on 16 May 2018 (“2018 AGM”) and five regular Board meetings during the year. Directors’ attendance records at Board and Board Committee meetings and 2018 AGM are set out below:
Meetings attended/held during tenure
Name of Directors Board meetings 2018 AGMAudit and Risk
Committee Remuneration
CommitteeNomination Committee
Finance Committee
EXECUTIVE DIRECTORS
Mr. Vincent H. S. LO 5/5 N/A 1/1 1/1 2/2
Mr. Douglas H. H. SUNG 5/5 N/A N/A N/A 2/2
Ms. Stephanie B. Y. LO* 1/1 N/A N/A N/A N/A N/A
NON-EXECUTIVE DIRECTOR
Mr. Frankie Y. L. WONG 5/5 N/A N/A N/A 2/2
INDEPENDENT NON-EXECUTIVE DIRECTORS
Sir John R. H. BOND 3/5 N/A N/A 1/1 2/2
Dr. William K. L. FUNG 5/5 N/A 1/1 N/A 2/2
Professor Gary C. BIDDLE 5/5 5/5 1/1 1/1 2/2
Dr. Roger L. McCARTHY 5/5 5/5 N/A N/A N/A
Mr. David J. SHAW 5/5 5/5 N/A N/A N/A
Mr. Anthony J. L. NIGHTINGALE 4/5 – N/A N/A N/A 1/2
* Appointed as an Executive Director with effect from 27 August 2018.
Annual Report 2018 55

Night view of THE HUB
PRACTICE AND CONDUCT OF MEETINGS
In observance of the CG Code and to facilitate the maximum attendance of Directors, regular Board and Board committee meetings are scheduled at least one year in advance. Draft agendas of each meeting are made available to Directors in advance to ensure that all Directors are given an opportunity to include matters in the agendas for regular Board and Board committee meetings.
Notices of regular Board and Board committee meetings are served to all Directors at least 14 days before the meetings. Board papers together with appropriate, complete and reliable information are sent to all Directors at least three days before each Board and Board committee meeting, or such other period as specified in the terms of reference of the relevant Board committees, to keep the Directors abreast of the latest developments and financial position of the Company and to enable them to make informed decisions. The Board and each Director also have separate and independent access to the senior management whenever necessary.
The senior management attends all regular Board meetings and, when necessary, other Board and Board committee meetings to advise on business developments, financial and accounting matters, statutory compliance, corporate governance and other major aspects of the Company.
The Company Secretary is responsible for taking and keeping minutes of all Board and Board committee meetings. Draft minutes are normally circulated to Directors for comment within a reasonable time after each meeting and the final version is open for Directors’ inspection.
According to current Board practice, any material transaction that involves a conflict of interest for a substantial shareholder or a Director will be considered and dealt with by the Board at a duly convened Board meeting. The interested Directors shall abstain from voting and shall not be counted in the quorum at meetings for approving transactions in which such Directors or any of their associates have a material interest.
Shui On Land Limited56

SHUI ON LAND CORPORATE GOVERNANCE ORGANISATION FOR THE YEAR ENDED 31 DECEMBER 2018
COMPANY SECRETARY
EXECUTIVE COMMITTEE
MANAGEMENT ETHICS COMMITTEE
CORPORATE GOVERNANCE &
COMPLIANCEINTERNAL
AUDIT
FINANCE COMMITTEE
NOMINATION COMMITTEE
REMUNERATION COMMITTEE
AUDIT AND RISK COMMITTEE THE BOARD
CHAIRMAN
BOARD COMMITTEES The Board has established four Board committees, namely, the Audit and Risk Committee, the Remuneration Committee, the Nomination Committee and the Finance Committee, for overseeing particular aspects of the Company’s affairs. The majority of the members of each Board committee are INEDs.
The terms of reference of the Board committees, which set out the Board committees’ respective duties, are in line with the CG Code and are approved by the Board. The terms of reference of the Board committees are reviewed from time to time to cope with the latest amendments of the Listing Rules and needs of the Company.
The Board committees are provided with sufficient resources to discharge their duties and, upon reasonable request, are able to seek independent professional advice in appropriate circumstances at the Company’s expense.
AUDIT AND RISK COMMITTEEThe Audit and Risk Committee currently comprises entirely INEDs, namely Professor Gary C. BIDDLE (Chairman of the Audit and Risk Committee), Dr. Roger L. McCARTHY and Mr. David J. SHAW. None of the members of the Audit and Risk Committee have any relationship with the Company’s existing external auditor.
Main duties of the Audit and Risk Committee include:
• To review the Company’s financial statements and reports and consider any significant or unusual items raised by the qualified accountant, compliance officer, internal auditor or external auditor before submission to the Board.
• To review and monitor the relationship with the external auditor by reference to the work performed by the auditor, their fees and terms of engagement, and make recommendations to the Board on the appointment, re-appointment and removal of the external auditor.
• To review the adequacy and effectiveness of the Company’s financial controls, risk management and internal control systems and associated procedures.
• To deve lop and rev iew the Company’s po l i c ies and practices on corporate governance and make recommendations to the Board.
The terms of reference of the Audit and Risk Committee are available on the websites of the Company and the Stock Exchange.
Annual Report 2018 57

CORPORATE GOVERNANCE REPORT
REMUNERATION COMMITTEE The Remuneration Committee currently consists of three members, namely Dr. William K. L. FUNG (Chairman of the Remuneration Committee), Mr. Vincent H. S. LO (“Mr. LO”) and Professor Gary C. BIDDLE. The majority of the members of the Remuneration Committee are INEDs.
Primary functions of the Remuneration Committee are:
• To review and make recommendations to the Board on the remuneration policy and structure of the Company.
• To determine annual remuneration packages of the Executive Directors and the senior management and to make recommendations to the Board of the remuneration of non-executive Directors.
• To evaluate and make recommendations on employee benefit arrangements.
• To operate and administer the Company’s share option schemes, share award schemes and other incentive schemes and make recommendation to the Board and shareholders of the Company on proposed grants of share options or share awards.
The terms of reference of the Remuneration Committee are published and available on the websites of the Company and the Stock Exchange.
The Human Resources Department is responsible for collecting and administering human resources data and making recommendations to the Remuneration Committee for its consideration. The Remuneration Committee shall report to the Board about these recommendations on remuneration policy, structure and packages.
The Remuneration Committee held one meeting during the year ended 31 December 2018 (with an attendance rate of 100%). During the year under review, the Remuneration Committee had reviewed the remuneration policy and structure of the Company; the current remuneration package of Executive Directors and senior management in consideration of their duties, responsibilities and market conditions; as well as the incentive plans for the employees of the Group.
The Audit and Risk Committee held five meetings during the year ended 31 December 2018 (with an attendance rate of 100%). The Audit and Risk Committee also held separate meetings with the external auditor and the internal auditor during the year to discuss pertinent issues of the Company without the presence of Executive Directors.
During the year ended 31 December 2018 and up to the date of this report, the Audit and Risk Committee had reviewed the Group’s interim results for the six months ended 30 June 2018 and annual results for the years ended 31 December 2017 and 2018, including the accounting principles and practices adopted by the Company, in conjunction with the Company’s external auditor. No material uncertainties relating to events or conditions that may cast significant doubt upon the Company’s ability to continue as a going concern had been found. Periodically, members of the Audit and Risk Committee visited the Company’s projects to keep abreast of their development.
The Audit and Risk Committee had also reviewed the auditor’s remuneration and made recommendation to the Board on the re-appointment of the auditor. The Audit and Risk Committee has the same view as the Board regarding the selection, appointment, resignation or dismissal of external auditors.
In addition, the Audit and Risk Committee had reviewed the risk assessment conducted by the internal auditor in the Audit and Risk Committee meetings and made summary reports to the Board. It also uses a self-assessment checklist to review and enhance its performance.
The Audit and Risk Committee also reviewed the Company’s policies and practices on corporate governance; the training and continuous professional development of Directors and senior management; the Company’s policies and practices on compliance with legal and regulatory requirements; and the Company’s compliance with the CG Code and disclosure in the Corporate Governance Report as stipulated under code provision D.3.1 of the CG Code.
Shui On Land Limited58

NOMINATION COMMITTEEThe Nomination Committee currently consists of three members, namely Mr. LO (Chairman of the Nomination Committee), Sir John R. H. BOND and Professor Gary C. BIDDLE. The majority of members of the Nomination Committee are INEDs.
The primary functions of the Nomination Committee are:
• To review and make recommendations to the Board on the structure, size and composition of the Board.
• To identify and recommend to the Board individuals suitably qualified to become members of the Board.
• To assess the independence of INEDs and make recommendations to the Board on the appointment, re-appointment of Directors and succession planning for Directors.
• To formulate and review the Board Diversity Policy.
The terms of reference of the Nomination Committee are published and available on the websites of the Company and the Stock Exchange.
The Nomination Committee held one meeting during the year ended 31 December 2018 (with an attendance rate of 100%). During the year under review and up to the date of this report, the Nomination Committee had (i) assessed the independence of INEDs and made recommendation to the Board on re-appointment of Directors; (ii) reviewed the structure, size and composition of the Board with reference to the Board Diversity Policy to complement the Company’s corporate strategy; (iii) updated the Board Diversity Policy to ensure that it aligns with the Listing Rules and the CG Code. A summary of the Board Diversity Policy is set out in the “Board Diversity” section on page 54.
The Nomination Committee has a policy for nomination of directors. Appointment and re-appointment of Directors are made in accordance with the Company’s Articles of Association, the Listing Rules and other applicable rules and regulations. In assessing the suitability of individuals nominated for directorship, the Nomination Committee considers, among other criteria, factors including reputation for integrity, accomplishment, experience and reputation in the real estate industry, time commitment and attention to the businesses of the Company and its subsidiaries, as well as diversity of perspectives, including the measurable objectives stated in the Board Diversity Policy.
FINANCE COMMITTEEThe Finance Committee currently consists of seven members, namely, Mr. LO (Chairman of the Finance Committee), Mr. Frankie Y. L. WONG (Vice Chairman of Finance Committee), Sir John R. H. BOND, Dr. William K. L. FUNG, Professor Gary C. BIDDLE, Mr. Anthony J. L. NIGHTINGALE and Mr. Douglas H. H. SUNG. The majority of the members of the Finance Committee are INEDs.
The primary functions of the Finance Committee are to stipulate and monitor the financial strategies, policies and guidelines of the Company, review and monitor the Company’s financial performance and performance of the Chief Financial Officer. In June 2015, the Board expanded the terms of reference of the Finance Committee to include the functions and duties of an investment committee.
The Finance Committee held two meetings during the year ended 31 December 2018. All members of the Finance Committee attended the two meetings, except for Anthony J. L. NIGHTINGALE who attended one of the meetings.
During the year ended 31 December 2018, the Finance Committee had reviewed the financial policies and guidelines of the Company; considered and approved the financial strategies and objectives recommended by the Chief Financial Officer; and submitted to the Board a summary of the investment/disposal analysis and recommended to the Board in respect of the related property projects.
CHAIRMAN AND CHIEF EXECUTIVE OFFICERThe roles of Chairman and Chief Executive of the Company are separated and currently performed by Mr. LO and the Executive Committee of the Company (the “EXCOM”) respectively. Mr. LO, who is the Chairman of the Company and one of the members of the EXCOM, takes an active role in steering the business and leverages his experience to guide the EXCOM at a strategic level and promote the Company’s sustainable growth. The reformed EXCOM, following the Group’s reorganisation of management, collectively takes the key management role of the Company on executive decisions and takes up the functional duties of Chief Executive Officer. The division of responsibilities between the Chairman and the Chief Executive Officer is clearly established and set out in writing.
Annual Report 2018 59

CORPORATE GOVERNANCE REPORT
MODEL CODE FOR SECURITIES TRANSACTIONSThe Company has adopted the Model Code for Securities Transactions by Directors of Listed Issuers (the “Model Code”) as set out in Appendix 10 of the Listing Rules as the code of conduct regarding securities transactions by the Directors.
Specific enquiry has been made of all the Directors, and the Directors have confirmed that they have complied with the required standard set out in the Model Code throughout the year ended 31 December 2018.
To comply with code provision A.6.4 of the CG Code, the Company has established and adopted a Code for Securities Transactions by Relevant Employees (as defined by the Listing Rules), on terms no less exacting than the Model Code, to regulate dealings in the securities of the Company by certain employees of the Company or any of its subsidiaries who are considered to be likely in possession of unpublished inside information in relation to the Company or its securities because of their offices or employment.
No incident of non-compliance with the Model Code by the Directors and the Code for Securities Transactions by Relevant Employees was noted by the Company during the year ended 31 December 2018.
RESPONSIBILITIES IN RESPECT OF THE FINANCIAL STATEMENTSThe Directors acknowledge their responsibility for preparing the financial statements of the Company for the year ended 31 December 2018.
The Board is responsible for overseeing the preparation of the financial statements of the Company and reviewing the same to ensure that such financial statements give a true and fair view of the state of affairs of the Company and relevant statutory requirements and applicable accounting standards are complied with.
The management provides such explanation and information to the Board to enable the Board to make an informed assessment of the financial information and position of the Company that is put to the Board for approval.
The statement of the external auditor of the Company about its reporting responsibilities in regard to the financial statements is set out in the “Independent Auditor’s Report” on pages 125 to 131.
RISK ASSESSMENT/MANAGEMENTSTRATEGIC PLANNING
In 2018, the Company made a decisive strategic move to increase asset turnover and to continue the implementation of its asset-light business model. This fine-tuning of business strategy has allowed the Company to accelerate capital recycling, capture new business opportunities and create more value for shareholders.
The Company continued to develop its competit ive advantages in innovation and to strive for excellence. Strategic action plans were developed, implemented and monitored by relevant executives and management to improve services and enhance the customer experience so as to achieve an operational model that is market-driven and customer-focused. The Company also developed balanced scorecards to measure individual performance in relation to these corporate objectives.
RESOURCES PLANNING AND COST CONTROLS
During the year ended 31 December 2018, the Company’s main focus as regards resources planning remained fund raising through various means to expedite the completion of maturing projects, as well as to strengthen its ability to manage its retail resources to meet future challenges. This was carried out successfully, enabling the Company to increase its focus on delivering on the targets in its business plan.
Management continues to focus on controlling costs over the short and long term, enhancing the Company’s cost conscious culture and behaviour, as well as reviewing and monitoring the Company’s expenditures.
ENTERPRISE RISK MANAGEMENT
The Company has had a formal risk identification and management process in place from virtually its initial public listing. With the amendments to Appendix 14 “Corporate Governance Code and Corporate Governance Report” of the Listing Rules, the Company has elected to formalise its existing risk management system via a Risk Management Policy, to reference explicitly its conformance to the guidance set forth in Appendix 14 of the Listing Rules.
Shui On Land Limited60

A “Top-Down” approach is adopted in the Company’s risk management framework as this most accurately reflects the Company’s risk profile. The Company recognises that the overwhelming majority of its corporate risk stems from uncontrollable events in its business and operating environments, which can only be addressed by Board level policy. Thus, the most effective enterprise risk management is facilitated by strong oversight exercised by the Board of Directors, the Audit and Risk Committee and the EXCOM in the establishment and maintenance of the risk management policy, framework and programme. These oversight components provide leadership and guidance that the business needs in order to focus, balance risk and reward, and steer the Company in the planned direction. This approach ensures clarity about the most extreme/high risks involved in shaping the Company’s objectives and performance, supports risk related decisions at the Board/EXCOM and ensures effective communication amongst the management and operations teams with a view to identifying and reporting new risks of potentially strategic importance to senior management.
The project directors and functional department heads of the Company are responsible for operational risk assessment. The operational risk assessment comprises risk identification, risk assessment and prioritisation, risk response, risk monitoring and risk reporting. The Audit and Risk Committee requires management to present a risk assessment/management report at the Audit and Risk Committee meeting. The Chief Internal Auditor has facilitated this by interviewing relevant management semi-annually to help document major risks faced by the Company and the key management actions taken to manage them. Details about the Group’s risk management framework and risk assessment are set out in the Risk Management Report.
INTERNAL CONTROLSDuring the year ended 31 December 2018, management and the Internal Audit and Risk Department conducted reviews of the effectiveness of the Company’s system of internal controls, including those of its subsidiaries and major associates. The Audit and Risk Committee reviewed the summary report prepared by the internal auditors on the effectiveness of the Company’s system of internal controls and reported its summary results to the Board covering all material controls, including financial, operational and compliance controls and risk management functions. The Board also considered the adequacy of resources, staff qualifications and experience, training programmes and budget of the Company’s accounting and financial reporting functions.
The Company is in the process of updating its policies and procedures to reflect ongoing organisational changes.
INTERNAL AUDIT AND RISK During the year ended 31 December 2018, the Chief Internal Auditor of the Internal Audit and Risk Department functionally reported to the Chairman and had full and free access to the Audit and Risk Committee. The internal audit charter allows the internal auditors to have unrestricted access to all functions, records, property and personnel, while maintaining appropriate confidentiality in performing their work.
The Internal Audit and Risk Department helps the Company accomplish its objectives by bringing a systematic, disciplined approach to evaluating and improving the effectiveness of the risk management, control and governance processes. Risk assessments are conducted semi-annually by the Internal Audit and Risk Department to formulate a risk-based internal audit plan based on interviews and discussion with management and staff for the Audit and Risk Committee’s approval.
During the year ended 31 December 2018, the Internal Audit and Risk Department issued reports to the Chairman and relevant management personal covering various operational and financial processes and projects of the Company. It provides summary reports to the Audit and Risk Committee together with the status of the implementation of their recommendations in each Audit and Risk Committee meeting.
ETHICAL CORPORATE CULTURE The Company has established various policies, including its Code of Conduct and Business Ethics, to govern business ethics and best practices. The Company emphasises integrity as an important foundation of its corporate culture and a strategic choice, and leverages it as one of its competitive advantages. New staff will undergo an introduction to ethics in their orientation and are requested to complete a declaration of their commitment to abide by the Company’s Code of Conduct and Business Ethics. In addition, they are required to join an online ethics training session upon completion of their probationary period. Selected staff members are designated as ethics experts, whose mission is to enhance the ethical awareness and standards of the Company by providing coaching and training to other staff. Ethics training is developed by the Human Resources Department and various training sessions were delivered to staff during 2018.
Before the end of each year, all staff of manager grade and above, together with other selected staff, must complete an on-line declaration of their commitment to abide by the Company’s Code of Conduct and Business Ethics in all their business dealings.
Annual Report 2018 61

CORPORATE GOVERNANCE REPORT
ANTI-FRAUD MEASURESAn Irregularities Reporting System (or whistle-blowing system) was introduced for reporting violations of the Company’s Code of Conduct and Business Ethics as well as for making complaints about integrity-related matters from staff, vendors, customers and/or business partners. Telephone hotlines and special e-mail addresses and mailboxes were set up to enable any such complaints to reach the Chairman of the Audit and Risk Committee or the secretary of the Ethics Committee. At each Audit and Risk Committee meeting, a summary report of the complaints received and their follow-up results are tabled for review.
The Ethics Committee also issued an Irregularity Report Policy. This policy clarifies the Company’s treatment and procedures for handling potential violations that have been reported, but at the same time tries to discourage abuse by disgruntled employees or ex-employees.
An incident reporting procedure was formulated to enable the systematic, timely and uniform reporting of incidents such as potential fraud to the Chief Financial Officer by personnel involved in internal control activities related to financial and/or automated information systems.
EXTERNAL AUDITOR AND AUDITOR’S REMUNERATION The remuneration paid/payable to the external auditor of the Company in respect of audit services and non-audit services for the year ended 31 December 2018 is set out as follows:
Services rendered for the CompanyFee paid/ payable
(HK$ ’M)
AUDIT SERVICES:
Annual audit of the financial statements of the Company and its subsidiaries 6.4
NON-AUDIT SERVICES:
Review of interim report for the six months ended 30 June 2018 1.5
Issue of comfort letters in respect of perpetual capital securities or senior notes of the Company 1.3
Issue of letters of indebtedness statement and working capital statement in respect of the major disposal transactions 1.1
Tax compliance review and advisory services 2.8
Others 0.9
TOTAL: 14.0
ANNUAL REMUNERATION OF DIRECTORS AND SENIOR MANAGEMENTThe remuneration of the Directors and senior management of the Company is determined in accordance with the Company’s remuneration policy and structure.
Pursuant to code provision B.1.5 of the CG Code, the remuneration of the members of the senior management by band for the year ended 31 December 2018 is set out below:
Annual remuneration by band Number of individuals
RMB2,000,001 – RMB4,000,000 5
RMB4,000,001 – RMB6,000,000 7
RMB6,000,001 – RMB8,000,000 2
RMB8,000,001 and above 1
Details of the remuneration of the Directors for the year ended 31 December 2018 are set out in note 10 to the consolidated financial statements.
Shui On Land Limited62

Show flat of Lakeville Luxe
COMMUNICATIONS WITH SHAREHOLDERS AND INVESTORS/INVESTOR RELATIONSThe Company believes that effective communication with shareholders is essential for enhancing investor relations and investors’ understanding of the Company’s business performance and strategies. The Company also recognises the importance of transparency and timely disclosure of corporate information, which enables shareholders and investors to make the most informed investment decisions. The goal of our communication activities is to provide a true and fair view of the Company. A Shareholders’ Communication Policy has been published and is available on the Company’s website.
To enhance the transparency of corporate information and comply with the relevant regulatory regime, the Company has been disseminating inside information regarding the monthly sales information in the form of announcements through the electronic publication system of the Stock Exchange as well as the website of the Company since January 2013 for equal, timely and effective access by the public. Announcements regarding the monthly sales updates are prepared on the basis of internal management records.
In addition, the connected and major transactions are reviewed and assessed by the Board or an independent Board committee as required for such purposes before submission at shareholders’ meetings for approval and/or public disclosure (if necessary).
The Company uses various channels and platforms, including its annual and interim results announcements, press conferences and analyst briefings, as well as various industry conferences, to ensure the timely release of important messages.
Annual Report 2018 63

CORPORATE GOVERNANCE REPORT
Information released by the Company to the Stock Exchange is also published on the Company’s website, which is regularly updated with corporate developments. Key events regarding financial results, business developments and operations are also announced on a timely basis to investors through the corporate website. With a free subscription, registered shareholders and investors can receive automatic email alerts and press releases on the Company’s public announcements. Request forms for site visits and management meetings, as well as contact details of persons on the investor relations team can also be found on the Company’s website.
To maintain and improve the visibility of the Company in the financial community, the Company held numerous road shows and participated in investor conferences during the year ended 31 December 2018. The management and the investor relations team met hundreds of investors personally to discuss the Company as well as its development and strategies in conference calls and video meetings.
The general meetings of the Company provide the best opportunity for the exchange of views between the Board and the shareholders. The Chairman of the Board as well as the Chairmen of the Audit and Risk Committee, the Remuneration Committee, the Nomination Committee and the Finance Committee or, in their absence, other members of the respective Board committees and, where applicable, the independent Board committee, are available to answer questions at the shareholders’ meetings. The Chairman of the independent Board committee (if any) is also available to answer questions at any general meeting for approval of a connected transaction or any other transaction that is subject to independent shareholders’ approval.
To enhance communication with shareholders at the Company’s annual general meeting and extraordinary general meetings, the conducting language has been changed to Cantonese with simultaneous interpretation in English. Most of the Directors were present at the 2018 AGM. The general meetings provided shareholders with a useful forum to exchange views with the Board.
To provide more direct communications with the Company’s shareholders, a Networking with Shareholders session was conducted immediately after the 2018 AGM. During the session, shareholders had the chance to discuss matters directly with the senior management of the Company, have their questions answered and learn about the latest business initiatives and long-term development strategies of the Company. Networking opportunities held by the Company were well attended by the Company’s shareholders.
The Company continues to enhance communications and relationships with its investors. Designated members of the senior management of the Company maintain regular dialogue with institutional investors and analysts to keep them abreast of the Company’s development. Enquiries from investors are dealt with in an informative and timely manner.
MAJOR INVESTOR RELATIONS EVENTS IN 2018/20192018 Event City
January BNP Paribas APAC Financials Property Conference Hong Kong
January UBS Greater China Conference Shanghai
March 2017 Results Roadshow Hong Kong, Singapore, Shanghai
April UBS Hong Kong/China Property Conference Hong Kong
May HSBC China Conference Shenzhen
June J.P. Morgan Global China Summit Beijing
June Citi Hong Kong/China Property Conference Hong Kong
August/September 1H2018 Results Roadshow Hong Kong, Singapore, Shanghai, Europe
November Citi Greater China Conference Macau
2019 Event City
January UBS Greater China Conference Shanghai
Shui On Land Limited64

SHAREHOLDERS’ RIGHTSTo safeguard shareholders’ interests and rights, separate resolutions are proposed at shareholders’ meetings on each substantial issue, including the election of individual Directors.
The rights of shareholders and the procedures for demanding a poll on resolutions at shareholders’ meetings are contained in the Company’s Articles of Association.
Poll results are made available by way of an announcement, which is published in accordance with the Listing Rules.
Pursuant to Article No. 66 of the Company’s Articles of Association, shareholders holding at the date of deposit of the requisition not less than one-tenth of the paid up capital of the Company carrying the right of voting at general meetings of the Company shall at all times have the right to require an Extraordinary General Meeting of the Company (“EGM”) to be called by the Board by written requisition to the Board or the Company Secretary of the Company. Shareholders should specify the business they wish to discuss at the EGM in the written requisition. Shareholders may put forward proposals at general meetings of the Company in the same manner as set out above.
The Board shall arrange to hold the EGM within two months after deposit of such requisition. If within 21 days of deposit of the written requisition the Board fails to proceed to convene the EGM, the shareholders themselves may do so in the same manner, and all reasonable expenses incurred by the shareholders shall be reimbursed to the shareholders by the Company.
Shareholders may at any time direct their enquiries about the Company to the Board by writing to the Company’s place of business in Hong Kong at 34/F, Shui On Centre, 6-8 Harbour Road, Wan Chai, Hong Kong, or by email to [email protected].
Shareholders may also put forward their enquiries to the Board at the general meetings of the Company.
COMPANY SECRETARYMr. UY Kim Lun, our Company Secretary, is an employee of the Company and is appointed by the Board. The Company Secretary is responsible for facilitating the Board’s processes and communications among Board members, with the shareholders and with the management. During the year ended 31 December 2018, Mr. UY had undertaken not less than 15 hours of relevant professional training to update his skills and knowledge.
CONSTITUTIONAL DOCUMENTSThere was no change in the constitutional documents of the Company during the year ended 31 December 2018.
CORPORATE GOVERNANCE ENHANCEMENTEnhancing corporate governance is not simply a matter of applying and complying with the CG Code but involves promoting and developing an ethical and healthy corporate culture. The Company is committed to maintaining a high standard of corporate governance within a sensible framework, with an emphasis on the principles of transparency, integrity, accountability, sustainable development and independence. We will continue to review and, where appropriate, improve our current practices on the basis of our experience, regulatory changes and developments. We have also experienced the trust of our shareholders, especially our minority shareholders, noting that they and the investment analyst community have lent the Company their full support based on their recognition of our efforts to enhance corporate governance. All views and suggestions from our shareholders to promote transparency are welcome.
Annual Report 2018 65

Internal Audit and Risk Department
Board of Directors
Executive Committee
Business/Corporate Functions
Audit and Risk Committee
Line of Strategic Defence
Line of Management Defence
Line of Operational Defence
RISK MANAGEMENT REPORT
The Company is committed to continual improvement of its risk management and internal control system to ensure the long-term sustainability of its business.
The Company established before its IPO and has since continually operated a risk identification and management system under the responsibility of the Audit and Risk Committee of the Company. Our approach and methodology in establishing the risk audit mechanism is tailored to the Company’s complex business, operating as it does in numerous locations throughout the PRC. The Company’s internal risk management system exceeds the regulatory requirements and was instituted to enhance the risk management of the Group. With the amendments to Appendix 14 “Corporate Governance Code and Corporate Governance Report” of the Listing Rules on the Stock Exchange, the Company has elected to formalise its existing risk management system by a Risk Management Policy to explicitly reference its conformance to the guidance set forth in Appendix 14.
RISK MANAGEMENT FRAMEWORKThe Group’s risk management framework comprises the risk governance structure and the risk management methodology and programme.
(I) RISK GOVERNANCE STRUCTURE
The Board is ultimately responsible for overseeing the Group’s risk management and internal control systems and ensures review of their effectiveness at least annually.
The Audit and Risk Committee has been delegated the responsibil ity by the Board to oversee the corporate governance roles in the Group’s financial, operational, compliance, risk management and internal controls, and the resourcing of the finance and internal audit functions.
Shui On Land Limited66

The Executive Committee of the Company assists the Board and the Audit and Risk Committee in overseeing the risk management system on an ongoing basis, ensuring that the risk management culture is fostered and the system is implemented effectively in daily operations and to arbitrate risk management policies that involve conflicts between functional divisions.
The Internal Audit and Risk Department carries out the role of an independent assessor. It performs analysis and independent appraisals to assess the adequacy and effectiveness of the Company’s risk management framework and programme. The Internal Audit and Risk Department reports to the Executive Committee and the Audit and Risk Committee on the results of the independent risk and control assessment, of which the scope, frequency and timing are subject to the discretion of the Executive Committee and the Audit and Risk Committee.
The Business/Corporate Functions of the Group assist the Executive Committee in the development and approval of policies to limit the risks consistent with the Company’s business model, participate in the implementation and monitoring of the risk management programme, identify the risks associated with business activities within the Group’s own Business/Corporate Functions, together with their impact and vulnerability, manage and conduct risk and control self-assessment to evaluate the effectiveness of controls that are in place to mitigate the risks.
(II) RISK MANAGEMENT METHODOLOGY AND PROGRAMME
The Company has developed a risk management framework and programme customised to its business model to manage the business and operational risks of the Company. The key processes used to identify, evaluate and manage the Group’s significant risks are as follows:
a. Risk Identification
Business/Corporate Functions, which directly oversee their respective processes, are responsible for identifying the potential risks of their processes that arise in their daily operations. Risks identified during the risk identification process should be reflected in the risk inventory collated by the risk coordinator and subsequently tested for control effectiveness by the Internal Audit and Risk Department, which summarises the risks that the Company is facing.
b. Risk Assessment and Prioritisation
Risks are continually evaluated and the top risks of the Company are prioritised for the development of risk effect management plans.
c. Risk Response
The Executive Committee shall review the risks identified and will be responsible for formulating risk mitigation plans for the significant risks identified relating to their processes.
There are two types of risk responses in general:
Acceptance: Risks being considered as immaterial and the acceptance is based on the risk appetite of the Company and therefore no action is considered necessary.
Reduction: Risks that cannot be considered immaterial, actions such as greater management controls, automation in monitoring, alarms, etc., should be considered to reduce the impact and vulnerability to a practicable level.
The risk mitigation measures for risks that are potentially material should be assessed by the Internal Audit and Risk Department and be reviewed and approved by the Executive Committee before implementation.
d. Risk Monitoring
Monitoring is a key component of the risk management system and ensures that r isks are identif ied and communicated in a timely manner to those responsible for taking corrective action and to the Board as appropriate.
e. Risk Reporting
Annual risk assessment is conducted to manage effectively the Company risk profile. The Audit and Risk Committee provides continuous updates to the Board at the regularly scheduled meetings throughout the year based on the risk inventory collated by the risk coordinator and the respective key control effectiveness testing results reported by the Internal Audit and Risk Department.
Relevant policies and controls have also been long established to ensure that assets are safeguarded against improper use or disposal, relevant regulations are complied with, the financial and accounting records are prepared and maintained per relevant accounting standards and regulatory reporting requirements, and major risks that may impact on the Group’s performance are identified and managed appropriately. It should be acknowledged that the risk management framework can only provide reasonable, but not absolute, assurance against material misstatement or loss, as it is designed to manage rather than eliminate the risk of failure in achieving the business goals of the Company.
Annual Report 2018 67

CORPORATE SOCIAL RESPONSIBILITIES
CSR PHILOSOPHY AND STRATEGIESWith the change of global economic landscape and adjustment of China’s macroeconomic policies, China’s real estate industry has also stepped into a new stage of development. Economic fluctuation and changes in demand have brought both risks and new development opportunities to the Group. Adhering to the spirit of “Integrity • Dedication • Innovation • Excellence” and the principle of “cooperating with governments to promote prosperity and growing with the community” since its inception, the Group has made unremitting contribution to the process of urban modernisation and internationalisation in China and promoted building of sustainable communities and
cities while changing the pattern that “a thousand cities all share the same appearance” and preserving historical culture and urban characteristics. During the process, the Group has gradually developed three major components of its CSR DNA, namely: “Sustainable Development”, “Community Prosperity” and “Talent Development”. With the advancement of Asset Light Strategy, the Group becomes more focused on the importance of environment and human and begins to think about the relationship of buildings with environment, human, community and city, in a hope to create future-oriented new urban world and ideal new life by fully integrating the three major components of its CSR DNA during development and operation.
CSR MANAGEMENT
Shui On Land Limited68

Respect nature, Build green communities
Pursue a harmonious unity of the real estate industry with the environment and culture, build sustainable communities, consistently adhere to green planning, green design, green construction and green operation, and continuously promote urban sustainable development
Put people first, Share growth
Gather together diversified talents, build platforms for talents cultivation and innovation, support development of entrepreneurial talents in society, and jointly promote career development and social progress
Strive for perfection, Lead the future
Create quality living spaces and pleasant and interconnected communities, maintain visionary and innovative thinking, enhance integrated value at the regional level, and spearhead the joint efforts of the Company and the community to create prosperity SUSTAINABLE
DEVELOPMENT
COMMUNITY PROSPERITY
TALENT DEVELOPMENT
CSR IMPLEMENTATION AND ADVANCEMENT To better propel the synergetic development of its CSR DNA (i.e. “Sustainable Development”, “Community Prosperity” and “Talent Development”) in its operation, in 2006, the Group set up the Sustainable Development Committee directly led by the senior management with cross-deparments and projects. The Sustainable Development Committee regularly analyses, promotes and tracks the sustainability performance of the Group. From 2012 onwards, the Group issues the sustainable development guidelines every five years to guide the Company’s sustainable development practices. In 2018, the Sustainable Development Committee provided trainings on sustainable development to employees of related departments and key projects, which helped employees learn better about the contents of sustainable development and its relationship with daily operations and further enhanced employees’ awareness and capability in respect of sustainable development practices.
• Consist of the Company’s executive directors, managing director and persons in charge of the functional departments and various project companies of the headquarters
• Hold a meeting every quarter to discuss and formulate the susta inable deve lopment strategies
• Hold a meeting every month to coordinate and promote the implementation of the susta inable deve lopment strategies
• Participate in the preparation of the sustainable development reports
• Consist of relevant members of various project companies
• Provide mater ia ls for the contents of the sustainable development report to be prepared
Sustainable Development Committee
Sustainable Development Working Team
Sustainable Development Coordinator
Synergetic promotion mechanism for sustainable development
The Group’s CSR DNA
Annual Report 2018 69

While following the state laws and regulations and relevant policies, the Group has formulated corresponding environment, social and governance management systems considering the nature of the industry and the Group, and ensured effective implementation of such systems by setting relevant targets and indexes.
Strictly following the Company Law, Corporate Governance Code and other laws, regulations and normative guidance, the Group establishes a complete corporate governance framework and process mechanism and specifies the systems for risk assessment management and internal control. Meanwhile, the Group formulates the Code of Conduct & Business Ethics and relevant reporting, approval and whistle blowing mechanism, includes relevant code requirements in the employee handbook and supplier contracts and requests employees to sign the Letter of Guarantee on the Compliance With the Code of Conduct & Business Ethics to ensure that all employees and suppliers shall comply with the code of ethics. The Ethics Committee reviews, updates and audits the Code of Conduct & Business Ethics every year and the Internal Audit and Risk Department conducts relevant investigations to prevent corruption and bribery.
Strictly following the Law on Environmental Protection, Law on Environmental Impact Assessment, Water Pollution Prevention and Control Law, Energy Conservation Law and other laws and regulations relating to ecological environment alprotection, the Group always adheres to green healthy planning, green healthy design, green healthy construction and green healthy operation, and analyses, evaluates and traces the effects of green strategies through “green inventories”. Meanwhile, the Group has formulated and released the Six Major Guidelines of Sustainable Development at an interval of 5 years since 2012, which promoted the continuous improvement of sustainable development.
Strictly following the Urban Real Estate Administration Law, Construction Law, Contract Law, Labor Contract Law, Law on Prevention and Control of Occupational Diseases, Charity Law and other laws and regulations relating to business operation, employees’ interests and community development, the Group actively promotes the healthy development of the industry and integrates relevant responsibility norms into workbooks and management and operation indicator systems of various departments to meet the needs of various stakeholders while leading future trends.
GOVERNANCE
ENVIRONMENTALSOCIAL
Overview of the Group’s environmental, social and governance management policies and measures
Shui On Land Limited70
CORPORATE SOCIAL RESPONSIBILITIES

COMMUNICATION WITH AND RESPONSE TO KEY STAKEHOLDERS The Group’s development depends heavily on the support from and cooperation with stakeholders. Therefore, the Group makes proactive efforts to understand and respond to its stakeholders’ appeals and expectations through various means and channels, in an effort to create more comprehensive value to all parties.
Stakeholders Concerns Participation or communication approaches
Governmental and regulatory authorities
Integrity compliance and risk management
Carry out compliance and risk management, clearly prohibit bribery and corruption and regularly update the Code of Conduct & Business Ethics
Proactively pay taxes and implement national policies
Regional economic development Provide suggestions for relevant departments in line with the urban development plan
Cultural inheritance and integration Sustainable communities which respect history and pass down relevant culture
Shareholders Financial performance Regularly disclose information on operations
Strategic transformation Convene general meetings regularly, issue annual reports and specify the direction and plan for strategic transformation
Integrity compliance and risk management
Carry out compliance and risk management to ensure the effective management and control of financial and non-financial risks
Customers Quality of projects and buildings Enhance the management over the whole lifecycle of products and the intellectualization of engineering projects
Tenant/customer service Regularly carry out customer satisfaction surveys and strengthen one-stop service through application of the automatic service management platform
Cooperation partners
Supplier/contractor management Regularly carry out supplier review and assessment, improve supplier management system and scope and promote responsible procurement
Industrial development Organize or participate in industrial development forums and industrial activities
Staff Employees’ interests and welfare Protect the employees’ fundamental interests according to laws and regulations and provide competitive remuneration package
Employee training and development Establish complete career development path and provide diversified employee trainings and supports
Occupational health and safety Establish the occupational health and safety management system
Environment Energy efficiency Promote the implementation of the Six Major Guidelines of Sustainable Development, insist on entire process management of four majoreco-friendly aspects, improve the energy monitoring platform and advocate green office
Green building and healthy building Insist on LEED and China Green Building Label certification and promote healthy building certification
Wastes and emission management Minimize and reasonably and effectively recycle wastes and emissions and continuously reduce greenhouse gas emissions through green operation
Water resources management Use water resources reasonably to reduce water consumption
Society and the public
Innovation and entrepreneurship Build an innovation and entrepreneurial ecosystem to promote the growth of innovation and entrepreneurial talents
Community integration Improve communities’ integrated value
Philanthropy Carry out volunteer services and community activities to promote the cultivation of talents in charity
Cultural inheritance and development
Integrate historical and cultural elements into the process of project development and planning to pass down and expand theconnotations of traditional culture
Regional economic development Promote regional business prosperity and economic structure optimization in line with the urban development plan
Importance to the Group High Higher
Higher
Imp
ort
ance
to
sta
keh
old
ers
Strategic transformation
Corporate governance
Green building and healthy building
Sustainable developmentIntegrity compliance and risk management
Quality of projects and buildings
Energy efficiency
Wastes and emissions management
Water resources management
Occupational health and safety
Employees’ interests and welfare Employee training
and development
Supplier/contractor management
Cultural inheritance and integration
Community integration
Financial performance
Community prosperityInnovation and entrepreneurship
Talent development
Economic development
Tenant/customer service
Regional economic development
Philanthropy
The Group has created a materiality matrix by analyzing the issues important to itself and stakeholders considering sustainable development trend, state policy, industry characteristics, its development strategy and stakeholders’ expectations.
Annual Report 2018 71

A dynamic community must be in harmony with nature and contribute to inheritance and renewal of history and culture. With a globalised vision, the Group has integrated the sustainable development philosophy of green and health into various stages of strategic planning, product development and daily operation and management, and formed a closed-loop management system featuring internal-external linkage by setting relevant targets, improving relevant mechanism and process and advocating corresponding lifestyle.
The Group has always insisted on building sustainable communities. In 2017, the Group issued the “Six Major Guidelines of Sustainable Development” guiding the development for the coming five years for the second time, which specifies the implementation method and development direction of the green and healthy philosophy.
SUSTAINABLE DEVELOPMENT
Shui On Land Limited72
CORPORATE SOCIAL RESPONSIBILITIES

The Group has added the element of “health” to its sustainable development guidelines for the new five years from 2017 to 2021 and is committed to building “green and healthy sustainable communities”. The Group has set up the “green inventories” management mechanism to cover the entire process management of green and healthy projects, continued to improve digitalised and dynamic energy consumption management platform and adhered to high-standard green and healthy building certification to effectively implement the sustainable development guidelines.
The Group is committed to building high-quality, green and healthy sustainable communities
All large-scale master-planning projects majority owned and managed by Shui On Land to receive LEED-ND certification
Actively strive for the healthy building certifications
All new commercial projects and furnished residential projects majority owned and managed by Shui On Land to receive China Green Building Label or LEED
1 2 3By 2021, the carbon emission per unit area of all real estates owned and operated by Shui On Land to be reduced by 1/3 compared with that of 2011
All new commercial projects owned and operated by Shui On Land to be equipped with systems to monitor energy and water consumption
All new office-building projects owned and operated by Shui On Land to display environmental health indexes to their residence4 5 6
Green and Healthy Sustainable
Communities
Service
Exercise
Air Water
CultureComfort
The Group’s sustainable development guidelines for 2017-2021
Gre
en H
ealth
y Opera
tion Green Healthy Planning
Green H
ealthy Procurement
and Construction Green H
ea
lthy
Desig
n
Green Inventories
Green Healthy Certification
Annual Report 2018 73

CREATE GREEN ENVIRONMENT WITH THE CITY In adherence to the operation philosophy of “cooperating with governments to promote prosperity and growing with the community” and in light of regional cultural and geographical environment, the Group has been exploring ways to build mixed-use and human-oriented integrated development communities and tap local undiscovered value and potentials.
Build sustainable communities The Group believes each piece of land is a unique precious resource, which has vitality and value and is closely linked to its environment. A sustainable community should be an integrated mixed-use community that focuses on human comfort, has pleasant green public areas and walkability-oriented streets, and coexists harmoniously with the ecological environment toward prosperity. Therefore, in making plan and design, the Group respects and works to look for the roots of land and establishes interactive link between human and environment to help revive the land.
Shanghai Taipingqiao
New space “where the past and tomorrow meet the present”In adherence to the development idea of “repairing the old as the old”, the Group has formed a new mode which protects historical buildings by a way of exploitation. With a repair area of 21,000m2, historical information conveyed and contents of life carried by buildings formed a striking contrast between the new and the old, thus creating a scene where the past and tomorrow meet the present.
Foshan Lingnan Tiandi Continuation and rebirth of history memoryDuring development, the Group has retained and repaired cultural sites under state protection, namely “Zumiao Ancestral Temple” and “Donghuali Old Town” and 20 provincial and municipal cultural relic conservation units, which preserved the history of Lingnan culture and the characteristics of traditional neighbour hoodblocks.
History inheritance
Shui On Land Limited74
CORPORATE SOCIAL RESPONSIBILITIES

Chongqing TiandiLiveable residence embraced by mountains and lakesBy restriction of development boundary and compact development, the Group has ensured sufficient green and public spaces integrated with natural environment of valleys between different lots, which has preserved natural characteristics to the greatest extent and ensured the quality of environment and urban characteristics of the whole area, thus forming a community featuring a happy blend of rivers & mountains and urban blocks.
KIC
“3-zone interaction” creating a LOHAS space for innovation and entrepreneurial talentsCreating an environment and atmosphere for “3-zone interaction” (interaction between campuses, science parks and public communities) based on the idea of developing small lots with multifunction, the Group has built vibrant streets with community-concentrated open spaces, which have become a LOHAS space for innovation and entrepreneurial talents, to meet young makers’ needs for social intercourse. Particularly, the University Road has been rated as one of the “12 most beautiful roads in Shanghai”.
Rui Hong Xin ChengGarden-like ecological landscape creating a relaxing and comfortable environmentAdopting the greening design with higher ecological effects, the Group has realised the water-saving and environmentally friendly green life through establishment and application of cycling treatment of reclaimed water, micro-irrigation system and other sustainable technologies. In addition, the artistic garden which gathers rare trees all over the world presents all seasonal colours, creating a comfortable and relaxing environment.
Human orientation
Natural integration
Wuhan Tiandi
Small block planning providing a safe and comfortable environment for walkingThe Group has created a unique and interesting environment for walking through diversified streets created by its unique small block planning. With vehicle speed slowdown from the consideration over details such as winding streets and reduced turn radius, the environment in communities has become safer and
morecomfortable.
Annual Report 2018 75

Nanhai Zhudao
Among the master-planned community building projects as urban center in Shanghai, Wuhan, Foshan and Chongqing, six projects of the Group were awarded LEED-ND Gold level certification.
Up to now, Shui On has ranked first among developers in mainland China in terms of total building area
awarded LEED-ND Stage 2 Gold level Certification.
Shanghai Rui Hong Xin Cheng• A w a r d e d L E E D - N D ( N e i g h b o u r h o o d
Development) 2009 stage 2 Gold level, it has become the first project winning this stage of certification in East China
• Its overall designed energy consumption is 12% lower than ASHRAE Standards in the US
Shanghai Taipingqiao• A w a r d e d L E E D - N D ( N e i g h b o u r h o o d
Development) 2009 stage 2 Gold level
• Complete the repair and reconstruction of 21,000m2 of old buildings and 41,600m2 of artificial lakes and greenlands
Shanghai KIC• A w a r d e d L E E D - N D ( N e i g h b o u r h o o d
Development) 2009 stage 2 Gold level
• Protect 18,700m2 of historical buildings in Jiangwan Stadium
CHONGQING
SHANGHAI
WUHAN
Chongqing Tiandi• A w a r d e d L E E D - N D ( N e i g h b o u r h o o d
Development) 2009 stage 2 Gold level
• Actually complete about 100,000m2 of green roofs and about 400,000m2 of artif icial wetlands, with the water-source heat pump (WSHP) awarded the Demonstration Projects for Renewable Energy Construction Application of Chongqing City
FOSHAN
Wuhan Tiandi• With its master planning awarded LEED-ND
(Neighbourhood Development) stage 2 Gold level (pre-certified), it has become the first commercial development project winning this accolade in China
• Preserve 8 historical buildings, 60 ancient trees and 139,320m2 of green roofs, with a designed water-saving rate of 30%
Foshan Lingnan Tiandi• A w a r d e d L E E D - N D ( N e i g h b o u r h o o d
Development) 2009 stage 2 Gold level
• Repair and renovate 17.92 hectares of historical blocks, including 2 state-level and 1 province-level cultural relics, actually complete about 139,024m2 of green roofs and treat 236,411 tonnes of reclaimed water per year, with a designed water-saving rate of 50%
Shui On Land Limited76
CORPORATE SOCIAL RESPONSIBILITIES

Build green and healthy buildings Advocating harmonious coexistence between buildings and nature, the Group has fully considered the sustainable development principle in designing each building. To further promote the development of green buildings, the Group adopts Building Information Modeling (BIM) for detailed project design. Through BIM, the Group can prepare detailed construction drawings, which improves communication efficiency, reduces material waste and minimizes the environmental pollution in all aspects including energy saving, water saving, and material saving, etc., providing people with healthy, safe, comfortable and efficient space.
Carbon emission reduction
Quality indoor air
Renewable energy Water saving
• Build green roofs
• Use energy-saving air-driven dehumidification heat pumps
• Use magnetic compressor-based refrigerating units
• Release indoor air quality and other environmental data in real time through multimedia installations inelevators
• Monitor energy consumption data through energy consumption management platforms and continuously optimise energy saving retrofit to reduce energyconsumption
• Regularly invite third parties to conduct carbon emission certification every year
• Collect and use rain water
• Fully use reclaimed water
• Use water saving devices
• Manage rain water run off
• Use wind-driven generator
• Use PV streetlights
• Use solar hot water
• Use environment-friendly refrigerants
Application technologies and measures of green and healthy buildings
Annual Report 2018 77

Innovate landscape ecology to reshape the ideal nature
Lead innovative life through international community planning
Wuhan Optics Valley Innovation Tiandi: An innovative international community that creates new inhabitation experience Based on the global advanced inhabitation building concept, Wuhan Optics Valley Innovation Tiandi is committed to creating a future-oriented innovative life center through international community planning and innovative product design. The planning and design philosophy is mainly reflected as follows:
• It innovatively introduces the philosophy of “suturing the city” to skilfully connect commerce with residential buildings and improve vitality of the area;
• It forms a cluster of courtyard buildings under the enclosed cluster layout and environment-based building design;
• Through open streets, it organically integrates urban public resources and functional space to create a relaxing and enjoyable communication atmosphere in the community.
• It creates recreational space for residents at various ages under the sustainable ecological design featuring strolling under camphor trees and multi-level combination of four major themed gardens;
• A multiple seepage ground system for the rain garden was designed, building a complete ecological management.
• It creates a three-dimensional and spacious look for the buildings through the vertical partitioning and the balance between block and plane in architectural design;
• By horizontal partitioning and meticulous depiction, it added variety to buildings that also form a harmonious and united whole.
• Through the high-low scattered landscape design and extra-wide floor space, it creates a safe and comfortable living environment while meeting daylighting requirements of each building and ensure flowing space, fresh air, comfortable temperature, quiet environment and adequate sunshine residents.
Create extraordinary spaces with remarkable architectural design
Innovate inhabitation experience basedon the people-oriented concept
Shui On Land Limited78
CORPORATE SOCIAL RESPONSIBILITIES

6 12
31 2
4
2
11
1
1
17
7
LEED for Neighbourhood Development LEED-ND 9,050,000m2
Gold
271,813m2
Three-star
LEED for Core and Shell LEED-CS 138,919.35m2
Silver
524,796m2
One-star
LEED for Core and Shell LEED-CS 883,409.90m2
Gold
LEED for Core and Shell LEED-CS 1,328,453.24m2
Gold (pre-certified)
LEED for Commercial Interiors LEED-CI 1,940m2
Gold
1,736,794m2
Two-star
LEED for Core and Shell LEED-CS 53,764m2
Platinum
LEED for Commercial Interiors LEED-CI 3,069m2
Silver
LEED for Core and Shell LEED-CS 23,301m2
Silver (pre-certified)
“Very Good”
GreenBuilding Evaluation System
BREEAM
At present, many projects and buildings of the Group have been awarded LEED certification, China Green Building Label certification and Green Building Evaluation system(BREEAM) certification. In addition, the Group is also active in promoting the construction of healthy communities and buildings, in a hope to interpret the 10 core concepts, i.e. air, water, nutrition, light, health, temperature, sound, materials, spirit and community by utilizing natural, human and technological resources in an efficient, fair and reliable manner and promote healthy life and public welfare. In 2018, the Group renovated outdoor drinking fountains, baby care rooms and outdoor smoking spaces and other facilities of some projects and made positive efforts to pursue WELL healthy building and community certification.
Various green certifications awarded to the Group as of December 2018
Annual Report 2018 79

Investigation and evaluation
Factories
Evaluation
HSE Regulations
Site visit
Random checks on plant
Daily evaluation
Welfare of workers
Construction safety
Construction site environmental protection
Temporary facilities
ACCELERATING GREEN MANAGEMENT WITH PARTNERS The Group proactively joins hands with its partners to implement the people-oriented and green concept and promote responsibility management throughout the value chain. From supplier and contractor selection management and omnidirectional tracking and control of the construction process to project delivery and later-period operation, the Group keeps improving the management system and encourages and propels its partners to integrate the environmental protection and quality concept into practice.
Supplier and contractor selection management method and major focus
To improve the sustainability of suppliers and contractors, the Group has established a complete system of inspection and evaluation, takes HSE Management Policy, Shui On’s Standard Material and Workmanship Requirements and Requirements for Building Materials of Green Environmental Protection Projects as an evaluation standard for selecting suppliers and contractors, and puts forward requirements in such aspects as construction safety management, construction site environmental protection, temporary facilities and welfare of workers. Meanwhile, the Group communicates with its suppliers on a regular basis to learn about their problems and feedback and discusses solutions with them, so as to achieve common progress.
In 2008, the Group worked out the Requirements for Site Safety, Environmental Protection and Workers’ Health (HSE) and increased the relevant requirements for protecting and improving the life of workers based on the environmental protection, safe construction and occupational health involved in the traditional HSE. The Group evaluates the contractors every month and conducts verification in internal audit via relevant functional departments, to ensure actual implementation of the measures.
HSE Management System
• Establish a complete management framework
• Formulate a security and environment management system and a job accountability system
Management regulations and measures for green construction
Environmental Protection
• Prevent and control pollutions in respect of atmosphere, water, noise and light
• Promote unified management of material stacking and waste management
• Reduce the impact on the environment and transportation of surrounding communities
Employee Care
• Provide employees with standard-compliant living, healthcare and recreational facilities
• Provide employees with vocational training
Safety and Health
• Specify the construction safety facilities and operation procedure
• Enhance the employees’ safety awareness
Shui On Land Limited80
CORPORATE SOCIAL RESPONSIBILITIES

Satisfacto
ry
Unsatisfactory
Environmental protection
Safety protection
Employees’ living assurance
Monthly evaluation
Pay the HSE special fund
Temporarily retain the HSE special fund
HSE regulations
ConstructionBefore
DeliveryAfter
Delivery
• Contractors and construction units are required to work in accordance with the basic requirements of the Company’s engineering measures
• Communicate regularly with the contractor on how to improve project quality
• An indoor air test is conducted for each housing unit to ensure compliance with the relevant air quality standards, so as to safeguard the health of relevant customers
• Provide a warranty period of three years
• Work with property managers to record all defects found within the warranty period
• Conduct a delivery-related survey six months after delivery and prepare a survey report. Conduct a statistical analysis of existing defects and come up with a systematic solution
Internal audit and examination mechanism for contractors
The Group incorporates customer needs into the whole lifecycle of each project, with a view to providing customers with reliable and high-quality buildings. All the projects of the Group are designed, built and decorated with quality materials in accordance with international standards. Based on the ISO9001 quality management system, the Group has developed a comprehensive construction quality management system, supported by a series of rules and regulations, including Shui On’s Standard Material and Workmanship Requirements, Shui On’s Atlas of Standard Nodes and Quality Control and the Product Defect Improvement Manual.
Housing quality management process and approaches
Annual Report 2018 81

Test results
Explore to improve the indoor air quality of fine-decorated buildings for delivery To ensure the product quality and protect the customers’ health as well as avoid indoor air pollution of fine-decorated buildings for delivery, the Sustainable Development Committee set up an indoor air quality research team in 2018 and did many tests to explore methods for effectively mitigating indoor air pollution such as formaldehyde pollution so as to provide customers with higher-quality services.
To meet the customers’ expectations for green and healthy life, the Group keeps designing and adjusting relevant technical solutions and management plans to improve the product quality and service level.
Untreated
Simultaneously measure the air quality of two houses facing the same direction on the same floor at high temperature
Treated1. Compare with the data
measured in spring
2. Compare with international standards
1. No obvious changes in the amount of volatilized formaldehyde
2. Up to the standard
1. Dramatic increase in the amount of volatilized formaldehyde
2. Not up to standard
Treated
Untreated
The Group evaluates the delivery and quality maintenance from multiple dimensions and invites third-party organisations to regularly audit the project quality, so as to ensure the delivery quality and make improvement constantly.
Score for quality assessment by third parties during the delivery stage
Timely handling rate after a request for project repairs
89
99%
94%
100%
Zero defect ratio for project quality after delivery (residential projects)
One-time repair completion rate after a request for project repairs
Shui On Land Limited82
CORPORATE SOCIAL RESPONSIBILITIES

SHARING GREEN ENVIRONMENT WITH COMMUNITIES For the Group, the green health concept is not just reflected in project planning, design and delivery, but it is more crucial to implement green health and sustainable development in project operation. The Group practices green operation management through various policies, green office, service integration and concept advocation to actually promote implementation of sustainable development in operation.
The Group promotes green concept from multiple dimensions
Policy formulation
The Group promotes its sustainable development from top to bottom through such policies as Environmental and Occupational Health and Safety Objectives, Indicators and Management Plans and 2018 Evaluation Report on the Compliance of Feng Cheng Property Management.
Green office
The Group advocates green office and encourages the employees to move towards paperless office, save water, electricity and paper and commute by taking public transportation. Meanwhile, the Group improves the employees’ involvement and enthusiasm through holding “Potting Action” and other activities.
Service integration
The Group provides its customers with all-round one-stop green, healthy and comfortable service to meet customers’ needs for tailor-made comfortable service while improving energy and resource use efficiency and reducing carbon emission.
Concept advocation
The Group advocates a green and healthy life and carries out activities relating to sustainable development for employees, consumers and the masses.
The Group calls on its employees to practice green office via such measures as control of air conditioner temperature on a seasonal basis and paperless office, in a bid to reduce energy consumption and waste production. Feng Cheng Property Management under the Group leverages the energy consumption management platform to conduct meticulous management on energy conservation, examines and updates its equipment and keeps conducting energy conservation technology reform, so as to reduce energy consumption. Since 2010, the Group has engaged a third-party certification body to quantify the greenhouse gas emissions generated by the Group’s own properties under normal operation and track the progress of achieving sustainable development goals.
Annual Report 2018 83

140
120
100
80
60
40
20
0
Overall energy consumption of the Group 2017 2018
Gasoline (ton) 91,639.02 101,555.98
Diesel (ton) 13,204.14 12,304.56
Sulphide emissions from gasoline (ton) 1.35 1.64
Sulphide emissions from diesel (ton) 0.21 0.18
Energy consumption density (MWh/m2) 73.60 72.71
Water consumption density (ton/m2) 664.00 868.25
Sewage discharge (ton) 997,715.47 1,303,165.00
Groups’ total amount
Shanghai Taipingqiao
Rui Hong Xin Cheng
KIC THE HUB Chongqing Tiandi
Wuhan Tiandi
Foshan Lingnan Tiandi
Notes:
1. Foshan Lingnan Tiandi had no property under normal operation in 2011;
2. THE HUB had no property under normal operation before 2015;
3. Corporate Avenue of Shanghai Taipingqiao Project was sold and hence not included in the statistics of and after 2015.
Trend on change in carbon emissions per sq m of the Group’s properties during 2011-2018
To constantly improve the service quality and discover and respond to customer needs in time, the Group has set up a high-standard service platform and enhances its property management staff’s service standards and overall quality from theory and practice through meticulous management. Meanwhile, by adhering to the “Know You Better Than Yourself” service philosophy, Feng Cheng Property Management under the Group launched “Bauhinia Premier Service” to provide owners with all-dimensional and integrated premium services based on the core values of “prestige, care and peace of mind” from such aspects as landscaping, security, maintenance, public activities and caring initiatives and strictly protect the owners’ privacy.
tCO2/km2
Despite constantly increasing businesses, the Group witnessed a decrease of 1.2%
in the total energy consumption/energy consumption density.
In 2018, the Group recorded a total carbon emission of 107,166 t CO2 equivalent
from various projects and a carbon emission of 64.23 kg CO2 equivalent/m2 per unit
area, representing a decrease of 29.5% as compared with 2011.
2011 2012 2013 2014 2015 2016 2017 2018
Shui On Land Limited84
CORPORATE SOCIAL RESPONSIBILITIES

91.7 95.7
91.190.8
Introduction of design at the early stage of a project
Inspection during property construction
Acceptance of inspection
Maintenance Center
Check quality problems in the entire process of project
design, construction and delivery to relieve workloads for subsequent delivery inspections and reduce worries for owners
Central maintenance teams and panel of experts
Bauhinia Cloud Platform
Coordination of construction disputes
Standardisation of project management modes
Before project delivery After project delivery
Bauhinia Premier Service
Eagle Eye Plan
Key job positions are monitored and key job-holders are examined for effective implementation of the Bauhinia Customer Service Standards
Bauhinia Cloud Platform
All residential projects are equipped with the Bauhinia Cloud Platform to receive calls from customers seeking rectification and repair work for 24 hours through an advanced e-service system and 400 customer service centers
Internal Audit
Refine the Bauhinia classification to clearly provide the customer service standards and optimise management process and effects
Mystery Visitor
Basic conditions, including vehicular/pedestrian access/exits and property service centers and parking lots in buildings of public areas, are assessed f rom the per spec t i ve o f owners ’ experience
Functions of security, customer service and maintenance teams are assessed from the functional perspective of staff
Bauhinia Service Skills Contests
Bauhinia Service Skills Contests are organised according to the Bauhinia service standards to improve employees’ professional service ability
Feng Cheng Property Management ensures the quality of premium services via various management methods
Score for overall customer satisfaction of the properties in 2018
To ensure the customer service quality, the Group obtains customers’ opinions, suggestions, complaints and feedbacks via a various of online and offline channels, conducts customer satisfaction investigation every year and analyses customers’ opinions and feedbacks to constantly improve its service standards.
Score for residential customer satisfaction in 2018
Score for office building customer satisfaction in 2018
Score for shopping mall customer satisfaction in 2018
Annual Report 2018 85

The Group believes that community prosperity represents beyond only a quality and diversified life. It represents also the endless endogenous power and creativity, as well as the discovering of connection and interaction among each individual, social group, and organisation in which new value is created.
To better promote the development of community prosperity, the Group returns to the understanding of “people”, reconsiders how community ecology and living space should serve “people” in the future, and proposes the “new socialising, new office and Xintiandi” concept. Based on this concept, the Group consolidates advantageous resources and creates new social space, new social scenarios and new ways to socialise that both caters to the habits of the new generations and propels communication as well as understanding between different generations. In the meantime, the Group integrates different elements such as humanities & arts, philanthropy, environmental protection and innovation & entrepreneurship into daily life to promote co-existence and shared prosperity between enterprise, community and city.
COMMUNITY PROSPERITY
Shui On Land Limited86
CORPORATE SOCIAL RESPONSIBILITIES

Creating special experience through new lifestyle and
social spaces
Fashion market
Top brands
Fashionable items
Cultural and art
activities
i Tiandi member activities
Immersive social
scenarios
Creating new social destinations with
extraordinary vitalityUsing the open pedestrian streets and one-stop shopping
centre as the carrier
Rooted in Tiandi series projects managed and operated by Shui On
Shanghai Xintiandi
Wuhan TiandiTHE
HUB
Foshan Lingnan Tiandi
Ruihong Tiandi
Chongqing Tiandi
SOCIAL RENAISSANCE Having the values of socialising in mind, the Group launched the “Social Renaissance” brand strategy in 2018 and created the new commercial retail brand “XINTIANDI” and new office brand “INNO” with the view to rediscover fundamental value of socialising that is gradually disappearing within tides of advancing technologies, then ultimately to redefine the intrinsic value of socialising : building a genuine connection sourcing from people to people, community, and city via socialising in order to promote cooperation and spark creativity.
The Group integrates its Tiandi series projects and builds the new commercial retail brand “XINTIANDI” to inject new energy into urban socialising
The Group creates office-based socialising space with commercial vitality based on the core ecological idea of “new socialising, new office and Xintiandi”
Traditional commercial and office spaces with a single function can only meet the basic needs for physical space
Deconstruct, integrate and expand traditional commercial and office spaces, reallocate spatial resources and redefine relevant functional attributes
Create the new type of office “INNO”
Way of living as an individual is simple, free and dedicated
Numerous possibilities arise from cooperation, communication and sharing of an individual with another individual
When different groups meet, people’s social attributes are magnified to create vibrant and more inclusive social spaces
Covering three social states, i.e. “I”, “NN” and “O” simultaneously, INNO brings them together easily
ONE
ONE to ONE
GROUP to GROUP
Annual Report 2018 87

Social Matters – Focus on platforms producing original social group-related contents to accelerate the connection between people in the Internet era
OFFLINE
ONLINE
Chairs set everywhere make it possible to work and exchange with others in any place
Conference rooms with different themes satisfy different meeting requirements
Leisure facilities for afternoon tea break the boundary between work and leisure
Trapezoidal conference rooms can offer open spaces for free communication
As the first integration of the brand INNO with Tiandi series projects, the Group grasps the core connotation of innovative working needs – socialising between individuals, and successfully implants the new INNO office product module INNO Social in KIC by sustaining the concept of “community”, organically combining commerce, retail, dining and other functions with a series of co-existing office modules and social ideas.
People’s gathering does not necessarily form valuable social interactions; the creation of social space requires a complete design of social scenarios. Through the combination of different forms and scenarios including offline and online, reality and virtual, purposiveness and randomness, the Group innovatively builds a social ecological chain and explores the “new social business model” derived from various social groups to provide online and offline consumers with more unique and quality experience so as to promote the deep communication in terms of cognition, emotion and value.
China Xintiandi under the Group accelerates the connection of online and offline platforms by the Internet social group to promote deeper communication between people, people and commerce, and people and society, and provides new ideas for the commercial real estate industry to embrace socialnomics by empowering commercial real estate with social groups.
Social House – Redefine socialising forms methods through a diversified business ecosystem that integrates retail, leisure, restaurants and social spaces
Social Paper – The first issue of a magazine gathering various stories of social groups and dialogues of characters, which offers a new way for the communication between social groups
Social Friday – Inspire new understandings and thoughts about social intercourse through field visit and study activities with diversified themes
INNO Social@KIC – INNO office product module is successfully implanted in Shanghai KIC project
Shui On Land Limited88
CORPORATE SOCIAL RESPONSIBILITIES

L6
L5
L4
L3
B1
B2
L6
L3
B1
B2
L5
L4
Social House by XINTIANDI: Offline compound new retail social space Open in December 2018, Xintiandi Plaza, targeting at “new female trend socialising” and reinforcing the idea of building social groups, becomes another venue for people to meet, grow and interact.
As the first attempt to connect offline social groups driven by the backdrop of new retail, Social House adheres to the social attitude of “Refresh Mind, Recharge Energy, Renew Look” to create a diversified business eco-system, which integrates retail, leisure, restaurants and social spaces.
Heaven of global delicacy
By building a cross-industry mix through breaking boundary, Social House enables urban women to contact the most cutting-edge culture, art, design, food and technology, share their quality time with like-minded partners and get new urban social experiences in real conversation. Thus, it has become the third “breathing” space (in addition to work and home) for women to relax and find themselves.
L3 Rest area of urban inspiration
Named after “attitude towards life”, highlights the spiritual pursuit of urban women and mainly accommodates merchants engaged in music and tourism
Themed on “aesthetics of life”, focuses on external aesthetic and internal cultivation of urban women and mainly accommodates merchants engaged in fashion brands, cooking workshops, boutique bookstores and gymnasia
B2 Harbour of soul for urban white-collar workers
Social House
B1 Cluster of fashion trends
Annual Report 2018 89

LOVE BOOM! Lingnan Tiandi x BRITTO Pop Art Carnival brings about collision between Chinese and Western cultures, and traditional and modern arts. During the BRITTO Pop Art Carnival, a large number of BRITTO classic styling artworks were on show in Lingnan Tiandi and NOVA, coming into close contact with tourists.
The 2018 “Croisements Festival” national series activities were held in Chongqing Tiandi, where Cheptel Aleïkoum acrobatics and music performance team (Circa Tsuica) composed of seven French artists was introduced in Chongqing for the first time to present classic French culture and create a landmark event of Chongqing.
The 2018 World Music Asia brought 51 wonderful music feasts by building an international culture platform for cooperation and communication between Chinese and foreign musicians, combining 7 projects in Shanghai, Wuhan, Chongqing and Foshan and gathering 23 top bands.
Focusing on “People Connection”, the world-class Light Art Festival 2018 “Lumieres Shanghai”, through four landmarks in Shanghai, presented 23 lumia artworks from 8 countries and regions around the world, including 10 specially-commissioned artworks of this festival, and multiple lumia artworks that were first exhibited and showed in China.
BUILDING COLOURFUL AND WARM COMMUNITIES Creating rich experiences by diverse-arts Cultural art is the carrier to express emotion, pass down culture and promote innovation. The Group is committed to integrating cultural art into community life so as to give play to the social and fusion roles of intangible art in tangible communities. The Group keeps bringing unique and frontier international cultural and artistic experiences to the public, creates rich and diverse public spaces, always adheres to the philosophy of “Created in China” and actively promotes and supports the new force of Chinese creative culture.
Shui On Land Limited90
CORPORATE SOCIAL RESPONSIBILITIES

The 4th “Run for Love”: Run for love
The Seagull Club has organized the employees to participate in the Run for Love for three consecutive years. As the sponsor of the event, the Group will use all the funds raised to support the education of students in poverty-stricken areas through the Soong Ching Ling Foundation.
Education supporting activities at primary schools in Luoding mountainous area, Foshan
Volunteers from Foshan Branch of the Seagull Club conducted education supporting activities at primary schools in Luoding mountainous area, where they donated computers, books and sports goods, rebuilt libraries and added additional canopies to create a better study environment.
“E.G.G.Walkathon” charity hiking event: Two teams completed the 50KM walkathon challenge, achieving fundraising goals
The Group organised an employee volunteer team for the first time to participate in the charity hiking event, and raised funds by such a creative method to support the healthy growth and equal development of children aged 0-18, and inspire the public spirit and social responsibility of the surrounding people.
Lakeville “Love Meets Love 2018”: Pay it forward on Christmas Eve
On the eve of Christmas, the project Lakeville and property owners involved as volunteers sent warmth to children of Luwan Special School affiliated to East China Normal University by giving them well-prepared Christmas gifts in the cold winter.
Expanding the impact of charity with the power of love The Group, constantly paying attention to the development and social integration of disadvantaged groups, cooperates with professional charities and encourages its employees to participate in charity activities on their own initiatives to contribute to the development of philanthropy.
Annual Report 2018 91

`The Group not only organises employee volunteers to take an active part in charity activities, but also strives to build a sustainable charity ecological chain and cultivates talents in charity to promote the sound development of the charity sector.
Training programme for capacity building: cultivating high-calibre professionals specialising in charity Mr Vincent H.S.Lo, Shui On Group Chairman and a director of the China Foundation for Disabled Persons has a long-standing interest in and concern for the well-being of people with disabilities. Given that China’s philanthropy is still in its infancy and in view of insufficient talents, low degree of professionalism and lack of management experience and international vision at present, the Group has worked with China Foundation for Disabled Persons since 2013 to conduct this programme, with an aim to cultivate all-around talents in charity suitable for the new context and promote the professional development of philanthropy.
• The Group provided financial aid for the training program to improve the leadership and execution skills of charitable institutions launched by the China Foundation for Disabled Persons (“CFDP”)
• During the 5 years, the Group successively organised leaders and key staff of 35 federations and foundations for disabled persons at provincial, district and municipal levels to learn about local social security and welfare systems, means of social service and other innovative ideas in advanced countries and areas
• The Group donated RMB1.2 million to the CFDP to initiate for the three-year training program for capacity building
• Based on the first five-year cooperation, the Group invited the China Global Philanthropy Institute to join the program as a partner to customise brand-new training courses for leaders and key staff of foundations for disabled persons in China
2018-2020
2013-2017
A total of 115 volunteers participating in volunteer service activities in 2018
A total of 460 hours of volunteer services on a cumulative basis in 2018
A total of RMB147,667 donated by the Seagull Club in 2018
A total of RMB94,071 donated by the employees of Seagull Club in 2018
RMB3,090,000 donated by the Group in 2018
• Against the backdrop of the implementation of Charity Law and relevant supporting policies, the Group paid attention to building credibility for foundations for disabled persons in China throughout the entire process of charity program management; and through sharing of poverty alleviation cases and visiting to non-profit organisations, it helps trainees improve new ideas for developing public welfare undertakings, master the keys to project management and drive the progress in practices of charity programs
Shui On Land Limited92
CORPORATE SOCIAL RESPONSIBILITIES
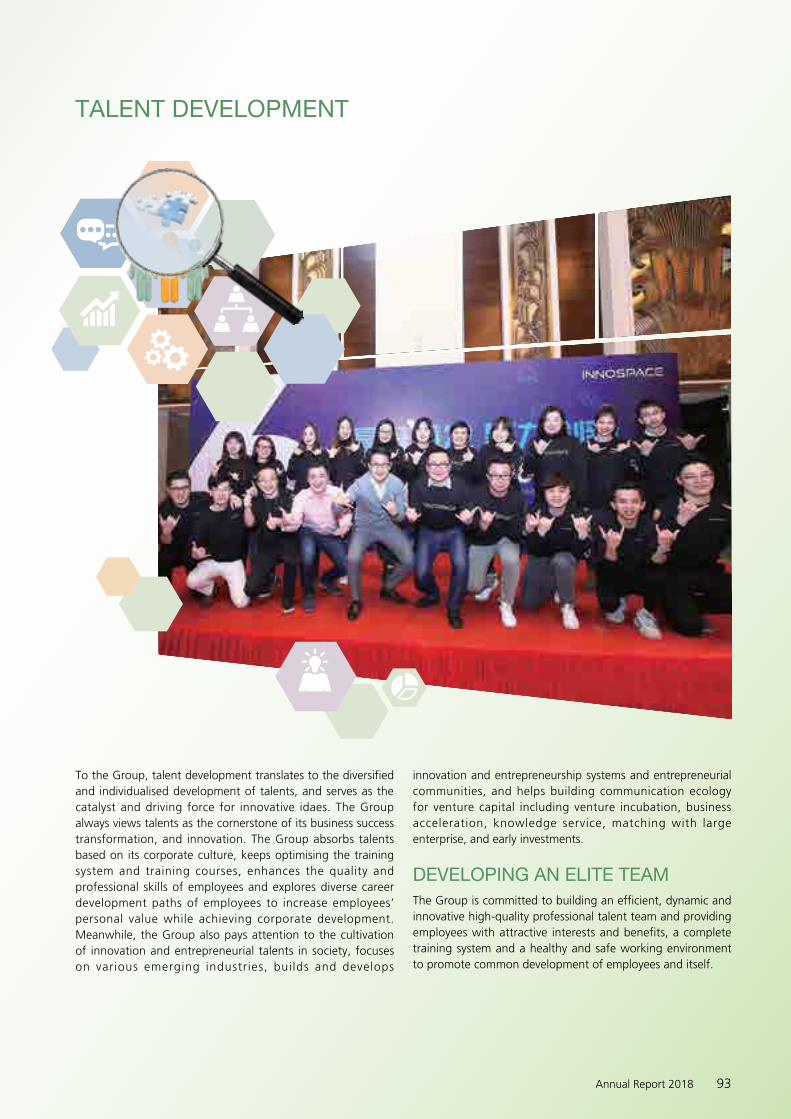
To the Group, talent development translates to the diversified and individualised development of talents, and serves as the catalyst and driving force for innovative idaes. The Group always views talents as the cornerstone of its business success transformation, and innovation. The Group absorbs talents based on its corporate culture, keeps optimising the training system and training courses, enhances the quality and professional skills of employees and explores diverse career development paths of employees to increase employees’ personal value while achieving corporate development. Meanwhile, the Group also pays attention to the cultivation of innovation and entrepreneurial talents in society, focuses on various emerging industries, builds and develops
innovation and entrepreneurship systems and entrepreneurial communities, and helps building communication ecology for venture capital including venture incubation, business acceleration, knowledge service, matching with large enterprise, and early investments.
DEVELOPING AN ELITE TEAM The Group is committed to building an efficient, dynamic and innovative high-quality professional talent team and providing employees with attractive interests and benefits, a complete training system and a healthy and safe working environment to promote common development of employees and itself.
TALENT DEVELOPMENT
Annual Report 2018 93

Employees’ interests and benefits The Group, according to the Labour Law of the People’s Republic of China, prepares and publishes human resource management-related systems, provides fair development opportunities, respects cultural diversity and equality and strictly prohibits child labour or forced labour to effectively protect various interests of its employees.
Measures taken by the Group in protection of employees’ interests
Equal employment
Forbid all forms of discrimination in the workplace Ensure equal pay for equal work, across genders Prohibit employment of child labour and forced labour
Smooth communications
Group-wide communications: dialogue with chairman, mentoring, experiential weeks for management to experience life at the grass-roots level of society
Ongoing communications: WeChat enterprise account “Shui On +”, employee activities, internal publication Shui On Spirit, coffee corner for employee communications
A l l - r o u n d c o m m u n i c a t i o n s : p r o j e c t communication meetings, newsletters project
Comprehensive benefits
Rate of signing labor contract with regular employee: 100%
Pay social insurance contributions for full-time employees The salary growth of employees is in line with the Company’s development
Fair promotion
Opportunities for promotion based on the attitude, capability and performance of individuals
PROTECTION OF EMPLOYEES’
INTERESTS
The Group’s Strategy Courses
Focus on the core business of the year to support the
Group’s strategic development from top to bottom
Nation-wide Training Programs
Promote the core efficiency of the organisation with vertical and horizontal
learning programs
O2O Learning Program
Study effectively anytime and anywhere with
seamlessly connected online and offline courses
Employee training and development The Group established Shui On Academy in 2008 to keep improving its training product system, train employees’ skills and develop their capabilities so as to promote common development of employees and the Group. In 2018, the Group improved and expanded its training product system considering its business highlights:
Training Product System of Shui On Academy
Shui On Land Limited94
CORPORATE SOCIAL RESPONSIBILITIES

Training mode of the New Manager Camp
New Manager Camp As a premier learning programme offered by Shui On Academy for many years, New Manager Camp, through iterative optimisation in 2018, placed its emphasis on the “Personal Management Challenge” (PMC) of each new manager, allowing learners to put in practice their own management tasks and expand their capacity.
Individual
Seagull School Book reading
Team
Group communication
Collectivity
Case study PMC Workshop
Asset Management Camp
Build AMC into a featured product of Shui On Academy’s nationwide training programs through further linking course contents with relevant business layout and set up AMC Advance Session to support the development of businesses in the field of commercial properties under the Group’s asset light transformation strategies
Set up the first Asset Management Camp (AMC)
Cover three core modules, i.e. major asset management system, financial analysis and operating decision from the perspective of asset management and overall operation management
O2O Learning Program
Aiming at creating a “I own my learning” learning culture, O2O Learning Program
provides a variety of learning channels and choices for employees. In the meantime,
the curriculum is optimised every year based on market trends and industry
characteristics. Due to its diversity in topic and form, in 2018 the learners covered
by O2O Learning Program increased by 75% as compared with 2017.
2018
2017
Annual Report 2018 95

Employee health and safetyThe Group has taken various measures to ensure the safety and physical and mental health of employees, so as to boost their sense of belonging and working efficiency. In addition to the Company’s employees, the Group also paid attention to occupational health and safety in the construction process of the project by formulating relevant safety systems to ensure the facilities were operated safely, relevant procedures were followed and relevant workers were security-conscious.
In addition, the Group is committed to balancing the work and life of employees and maintaining good employee relations by organising a variety of group activities to keep a pleasant atmosphere within the Group.
Employee health and safety management measures
• With the establishment of an integrated management system of quality, environment and occupational health and safety, Feng Cheng Property Management obtained OHSAS 18001 certification
• Organise health examination and improve items under health examination packages for employees in 2018 by increasing more comprehensive examination indicators
• Provide employees with diversified optional commercial insurance plans
• Carry out health knowledge-related training and organise healthy sport activities
• PM2.5 index in offices is announced on a daily basis
• Filters are installed on outlets of air conditioners
• Additional air purifiers are installed for crowded places
• Distribute various green plants in offices to purify the air
• Provide in-house gyms and facilities
Shui On Land and China Xintiandi’s trip to the town of bamboo – Anji in 2018 enhanced employee friendship and increased employees’ sense of belonging and identity to the Group.
Improving occupational health security system
Creating a safe and comfortable work environment
Shui On Land Limited96
CORPORATE SOCIAL RESPONSIBILITIES

ENERGISE INNOVATIVE TALENT
As innovation and entrepreneurship become increasingly important for industry upgrading and value discovery, more and more entrepreneurs are hunger for a platform that can integrate resources and provide mutual support. Through its reflection on space and function, the Group linked upstream and downstream participants in the venture capital industry to create a complete innovation and entrepreneurial ecological chain that enables a polymerisation effect.
2018 marks the 6th anniversary of InnoSpace. For InnoSpace, the six years is a process from quantitative changes to qualitative changes in respect of both rapid layout of businesses and full expansion of innovative projects. The upgraded InnoSpace is no longer a pure startup incubator but a venture capital eco-system integrating investment, incubation, industry-university-research linkage, enterprise innovation and other services, building a more solid bridge for more dreamers of innovation and entrepreneurship.
InnoSpace provides full services to support innovation and entrepreneurial talent
• Assist and support start-ups in the whole lifecycle by providing venture incubation, business acceleration, knowledge service, matching with large enterprises, early investments and active communication ecology for venture capital
• Link cooperation resources of large enterprises
• Launch training camps for key projects to accelerate talent cultivation and drive the projects to enter into the market rapidly
• Develop a community platform for knowledge sharing and cultivation of innovative talents based on the openness and expansibility of communities
• Gather entrepreneurs, investors and other entities of venture capital ecosystem to share venture capital experience and industrial knowledge, promote the continuous optimisation of venture capital circle and establish a comprehensive entrepreneurial knowledge system for entrepreneurs
• Gather emerging industries represented by Internet, mobile Internet, smart hardware, new retail and supply chain
• Establish cooperation relation with large enterprises and investment institutions to provide makers with longer and better investment and financing service
• Expand innovation projects in China to leverage the driving force and spillover effect of such projects
• The Angel Fund – Yinuo Venture Capital (Phase I) have invested 46 outstanding entrepreneurial projects which have an estimated value of more than RMB1.8 billion in total and mainly focus on new consumption, smart manufacturing, TMT and other fields
• The Angel Fund – Yinuo Venture Capital (Phase II) under establishment will raise the upper limit of investment and cover multiple rounds of investment from Angel
Incubation acceleration
Knowledge system construction
Industrial layout
Venture capital
InnoSpace Create value
for innovative talents
Up to now,
InnoSpace has supported more than 400 entrepreneurial programs in
total Helped create more than 6,000 jobs
Accumulatively incubated 11 star projects and unicorn enterprises worth over RMB100 million, becoming the birthplace of Wuta Camera, XPOWER, Huizuche.com and NEO intelligent economic blockchain project
Annual Report 2018 97

Education
Creation and smart manufacturing
Technology and art
In addition to its services to support innovation and entrepreneurship, the Group actively built a platform for future talent to present themselves and connect with the market, so as to help them better integrate creativity and business.
• Hold the Maker Carnival Shanghai for 7th consecutive years
• Organise 5 highlight activities in 2018, i.e. robot game, drone racing contest, maker show, maker forum and overseas zone
• Attract tens of thousands of makers, technical artists and maker educators
• Jointly discuss the possibility of integrating the 3 core plates (“education”, “creation and smart manufacturing” and “technology and art”) with artificial intelligence
Working with international partners to help “new designers” glow
Under the backdrop of globalisation, China Xintiandi under the Group has spared no effort to help “Created in China” earn a place in the global design arena. In addition to supporting Chinese originality designers as it has always done, the Group also paid attention to energising new designers. In 2015, working with Central Saint Martins College of Art & Design of University of the Arts London (“UAL”), China Xintiandi established “XINTIANDI Scholarship” to honor and subsidise those Chinese students with outstanding performance in fashion design and originality. In 2018, China Xintiandi again signed a three-year cooperation agreement on “XINTIANDI Scholarship” with Central Saint Martins College of Art & Design of UAL. Subsidised students and new designers can not only showcase their works on Shanghai Fashion Week, but also get a chance to interact with buyers, the media and other professionals to timely obtain market feedbacks.
Shui On Land Limited98
CORPORATE SOCIAL RESPONSIBILITIES

2018 KEY PERFORMANCE TABLEENVIRONMENTAL PERFORMANCE
Indicator Unit
Group’s Total
Amount
Group’s Total
Amount Shanghai
TaipingqiaoRui Hong
Xin Cheng KIC The HubChongqing
TiandiWuhan Tiandi
Foshan Lingnan
Tiandi2018 2017 2018 2018 2018 2018 2018 2018 2018
Emissions
Diesel consumption litre 12,034.56 13,204.14 1.550.10 0 5,478 2,364 2,912.46 0 0Gasoline consumption litre 101,555.99 91,639.02 48,130.73 9,808.78 0 0 7,790.48 13.267.20 22,558.80Sulphide emissions from diesel
kg 0.17 0.21 0.02 0 0.08 0.03 0.04 0 0
Sulphide emissions from gasoline
kg 1.63 1.35 0.77 0.16 0 0 0.13 0.36 0.21
Total sulphide emissions kg 1.81 1.56 0.80 0.16 0.08 0.03 0.17 0.36 0.21Greenhouse gas emissions
Scope 1: Direct emissions of greenhouse gas
kgCO2 equivalent
9,243,145 8,066,064 704,227 2,498,555 2,245,514 6,298 584,767 2,111,517 1,092,267
Scope 2: Indirect emissions of greenhouse gas
kgCO2 equivalent
97,923,674 100,776,421 12,030,209 9,536,935 18,017,902 18,487,296 5,206,150 13,478,141 21,167,041
Total greenhouse gas emissions (Scope 1 and 2)
kgCO2 equivalent
107,166,819 108,842,485 12,734,436 12,035,490 20,263,416 18,493,594 5,790,917 15,589,658 22,259,308
Floor area m2 1,668,572 1,669,531.85 140,152 176,226 335,644 326,188 120,018 308,023 262,321Greenhouse gas emissions per square metres of floor area (Scope 1 and 2)
kgCO2 equivalent/m2
64.23 65.19 90.86 68.30 60.37 56.70 48.25 50.61 84.86
Non-hazardous wasteTotal volume of construction waste
Ton 37,776.15 50,877.23 4,396.75 8,074 2,340 5,528.40 7,485 9,726 226
Total discharge of household garbage
Ton 68,853.22 52,050.85 5,768.1 12,150.80 1,681.5 10,505.70 11,973 15,206.12 11,568
Total discharge of non-hazardous waste
Ton 106,629.37 102,928.08 10,164.85 20,224.80 4,021.50 16,034.10 19,458 24,932.12 11,794
Property management area
m2 6,593,458.13 6,580,288.13 556,836.39 1,037,301.12 639,725,21 324,312.29 1,975,356.80 1,314,784.87 745,141.45
Discharge density of non-hazardous waste
Ton/1,000m2 16.17 15.64 18.25 19.49 6.29 49.44 9.85 18.96 15.83
Energy consumption
Direct energy consumption
Diesel MWh 122.47 131.42 15.43 0 54.52 23.53 28.99 0 0
Gasoline MWh 887.02 800.41 420.39 85.67 0 0 68.04 115.88 197.04Total direct energy consumption
MWh 1,009.49 931.83 435.82 85.67 54.52 23.53 97.03 115.88 197.04
Indirect energy consumption
Natural gas MWh 26,576.09 22,549.08 1,994.39 5,482.76 10,550.12 0 259.27 8,289.55 0
Power purchase
MWh 93,814.24 99,392.54 14,731.79 11,756.61 14,507.43 15,637.87 5,471.52 14,165.15 17,543.87
Total indirect energy consumption
MWh 121,399.80 121,941.63 16,726.17 17,239.37 25,057.55 15,637.87 5,730.79 2,245.70 17,543.87
Total energy consumption MWh 121,399.80 122,873.45 17,161.99 17,325.04 25,112.08 15,661.39 5,827.82 22,570.58 17,740.90Energy consumption density
MWh/ 1,000m2
72.71 73.60 122.45 98.31 74.81 48.01 48.53 73.27 67.38
Water consumption
Total water consumption m3 1,449,626 1,108,572.75 157,389 186,621 604,158 87,691 64,633 107,714 241,420Water consumption density
m3 1,000m2
868.25 664.00 1,122.99 1,058.99 1,800.00 268.84 538.21 349.69 916.97
Sewage discharge m3 1,303,165 997,715.47 140,152 167,958 543,742 78,922 58,170 96,943 217,278
Remarks:
1. There were no confirmed violations or complaints related to environmental protection which may have a significant impact on the Group in 2018.
2. The data on greenhouse gas emissions are listed as carbon dioxide equivalents and have been verified by the German TUV Rheinland.
3. Direct energy consumption refers to consumption by the sites owned or controlled by the Group, including gasoline and diesel consumption; indirect energy consumption refers to consumption of energy purchased or acquired by the Group, including natural gas and power consumption.
4. The energy consumption is calculated based on the consumption of electricity and fuel as well as the relevant coefficients provided in the General Principles for Calculation of Comprehensive Energy Consumption (GB/T2589-2008).
5. The consumption of diesel and gasoline includes the consumption of fuels for keeping vehicles and other mechanical equipment in operation.
6. The statistical data on construction waste include but are not limited to the total discharge of concrete, construction scrap metal, cables, plastics, and demolition waste; the statistical data on household garbage include but are not limited to the total volume of waste paper, waste edible oil, household garbage and kitchen waste generated.
7. In 2018 the Group did not have any problems in sourcing water that is fit for purpose, all of which was from municipal water.
8. In Annual Report 2017, the unit of diesel/ gasoline oil consumption should be “litre”, the unit of sulphide emissions from diesel/ gasoline and total sulphide emissions should be “kg”, the unit of greenhouse gas emission density should be “kg/ CO2 equivalent per square meters”, the unit of discharge density of non-hazardous waste should be “ton/1,000 m2”, the unit of energy consumption density should be “MWh/1,000m2”, the unit of water consumption density should be “m3/1,000m2”.
9. The area used to calculate the density of greenhouse gas emission, energy consumption and water consumption is in accordance with the floor area of carbon verification project, which excludes residence area and a few hotels and performance center. The area used to calculate the discharge density of non-hazardous waste is the management area of Feng Cheng Property Management.
Annual Report 2018 99

SOCIAL PERFORMANCE
Measure Unit The Group’s Performance
in 2018
The Group’s Performance
in 2017
Employment
Total number of employees Person(s) 3,114 3,199
By gender:
Total number of male employees Person(s) 1,647 1,746
Total number of female employees Person(s) 1,467 1,453
By age:
Total number of employees aged > 50 Person(s) 372 389
Total number of employees aged 30 to 50 Person(s) 2,069 2,160
Total number of employees aged < 30 Person(s) 673 650
Employee turnover rate % 28% 30.34%
By gender:
Turnover rate of male employees % 30.8% 34.71%
Turnover rate of female employees % 24.89% 27.43%
By age:
Turnover rate of employees aged > 50 % 25.42% 23.16%
Turnover rate of employees aged 30 to 50 % 26.43% 26.79%
Turnover rate of employees aged < 30 % 35.23% 44.24%
Health and safety
Number of work-related fatalities Person(s) 1 0
Lost days due to work injuries Day(s) 305 883
Coverage rate of medical examination of employees % 100% 90%
Development and training
Percentage of male employees trained % 87.91% 87%
Percentage of female employees trained % 75.9% 73%
Percentage of general employees trained % 84.43% 84%
Percentage of middle management trained % 82.27% 72%
Percentage of senior management trained % 74.26% 81%
Hours of training per each employee every year Hour 15.83 15.51
Hours of training per each male employee every year Hour 17.99 17.14
Hours of training per each female employee every year Hour 13.41 13.27
Average hours of training per each general employee Hour 15.27 15.19
Average hours of training per each middle manager Hour 14.37 16.23
Average hours of training per each senior manager Hour 12.04 16.38
Shui On Land Limited100
CORPORATE SOCIAL RESPONSIBILITIES

Measure Unit The Group’s Performance
in 2018
The Group’s Performance
in 2017
Products and services
Overall customer satisfaction of the properties Score 91.7 93.38
Residential customer satisfaction Score 90.8 93.35
Office building customer satisfaction Score 95.7 94.9
Shopping mall customer satisfaction Score 91.1 91.9
Number of complaints Number 317 -
Complaint handling rate % 89.6% -
Supply chain management
Number of increased Chinese Mainland suppliers Number 55 74
Number of increased Chinese Mainland contractors Number 36 54
Anti-corruption and fair operation
Total hours of anti-corruption related training Hour 75.5 2
Total hours of training on increasing employees’ awareness of competition legislation and fair competition
Hour 2 2
Number of concluded legal cases concerning corruption charges brought against the issuer or its employees
Number 0 0
Community investment
Number of employees participating in voluntary activities
Person(s) 115 285
Total time spent in voluntary activities Hour 460 552
Total charitable donations by employees RMB 94,071 90,514
Total donations by the Company RMB’0,000 309 174
Remarks:
1. An employee was attacked by acute myocardial infarction during work and later died despite emergency rescue efforts. The Company actively handled the funeral affairs and assisted in filing social insurance and commercial insurance claims for the employee.
2. The Group was not aware of any confirmed violations or complaints concerning human rights or labour practices which may have a significant impact on the Group in 2018.
3. The Group was not aware of any non-conformances concerning health, advertising, labelling and privacy matters which may have a significant impact on the Group in 2018.
4. In 2018, there were new suppliers and contractors only in the Chinese Mainland, rather than in Hong Kong and elsewhere.
5. The Group was not aware of any significant negative impact, real or potential, caused by its major suppliers on business ethics, environmental protection, human rights and labour practices or any non-conformance on human rights issues in 2018.
6. There were no significant risks associated with bribery and corruption in 2018.
Annual Report 2018 101

CONTENT INDEX OF THE ENVIRONMENTAL, SOCIAL AND GOVERNANCE REPORTING GUIDE
Environmental, Social and Governance Aspects, General Disclosures and Key Performance Indicators (“KPI”) Reference
A. Environment
Aspect A1: Emission General disclosure Information on:
(a) the policies; and
(b) compliance with relevant laws and regulations that have a significant impact on the issuer
relating to air and greenhouse gas emissions, discharges into water and land, and generation of hazardous and non-hazardous waste.
Sustainable development
A1.1 The types of emissions and respective emission data. 2018 Key performance table
A1.2 Greenhouse gas emissions in total (in tonnes) and, where appropriate, intensity (e.g. per unit of production volume, per facility).
2018 Key performance table
A1.3 Total hazardous waste produced (in tonnes) and, where appropriate, intensity (e.g. per unit of production volume, per facility).
Not applicable. The Group does not produce large amounts of hazardous waste during construction and operation. Small amounts of hazardous waste (e.g. toner cartridge) is disposed of by a qualified institution.
A1.4 Total non-hazardous waste produced (in tonnes) and, where appropriate, intensity (e.g. per unit of production volume, per facility).
2018 Key performance table
A1.5 Description of measures to mitigate emissions and results achieved.
Sustainable development
A1.6 Description of how hazardous and non-hazardous wastes are handled, reduction initiatives and results achieved.
Sustainable development and 2018 key performance table
Aspect A2: Use of resources General disclosure Policies on the efficient use of resources, including energy, water and other raw materials.
Sustainable development
A2.1 Direct and/or indirect energy consumption by type (e.g. electricity, gas or oil) in total (kWh in ‘000s) and intensity (e.g. per unit of production volume, per facility).
2018 Key performance table
A2.2 Water consumption in total and intensity (e.g. per unit of production volume, per facility).
2018 Key performance table
A2.3 Description of energy use efficiency initiatives and results achieved.
Sustainable development
A2.4 Description of whether there is any issue in sourcing water that is fit for purpose, water efficiency initiatives and results achieved.
Sustainable development and 2018 key performance table
A2.5 Total packaging material used for finished products (in tonnes) and, if applicable, with reference to per unit produced.
Not applicable. The Group mainly provides real estate development and operation services, not involving packaging materials used for manufactured goods.
Aspect A3: The environment and natural resources
General disclosure Policies on minimising the issuer’s significant impact on the environment and natural resources.
Sustainable development
A3.1 Description of the significant impacts of activities on the environment and natural resources and the actions taken to manage them.
Sustainable development
B. Social
Aspect B1: Employment General disclosure Information on:
(a) the policies; and
(b) compliance with relevant laws and regulations that have a significant impact on the issuer
relating to compensation and dismissal, recruitment and promotion, working hours, rest periods, equal opportunity, diversity, anti-discrimination, and other benefits and welfare.
Talent development
B1.1 Total workforce by gender, employment type, age group and geographical region.
2018 Key performance table
B1.2 Employee turnover rate by gender, age group and geographical region.
2018 Key performance table
Shui On Land Limited102
CORPORATE SOCIAL RESPONSIBILITIES

Environmental, Social and Governance Aspects, General Disclosures and Key Performance Indicators (“KPI”) Reference
Aspect B2: Health and safety General disclosure Information on:
(a) the policies; and
(b) compliance with relevant laws and regulations that have a significant impact on the issuer
relating to providing a safe working environment and protecting employees from occupational hazards.
Talent development
B2.1 Number and rate of work-related fatalities. 2018 Key performance table
B2.2 Lost days due to work injury. 2018 Key performance table
B2.3 Description of occupational health and safety measures adopted, how they are implemented and monitored.
Talent development
Aspect B3: Development and training
General disclosure Policies on improving employees’ knowledge and skills for discharging duties at work. Description of training activities.
Talent development
B3.1 The percentage of employees trained by gender and employee category.
2018 Key performance table
B3.2 The average training hours completed per employee by gender and employee category.
2018 Key performance table
Aspect B4: Labour standards General disclosure Information on:
(a) the policies; and
(b) compliance with relevant laws and regulations that have a significant impact on the issuer
relating to preventing child and forced labour.
Talent development
B4.1 Description of measures to review employment practices to avoid child and forced labour.
Talent development
B4.2 Description of steps taken to eliminate such practices when discovered.
Talent development
Aspect B5: Supply chain management
General disclosure Policies on managing environmental and social risks of the supply chain.
Sustainable development
B5.1 Number of suppliers by geographical region. 2018 Key performance table
B5.2 Description of practices relating to engaging suppliers, number of suppliers against whom the practices are being implemented, how they are implemented and monitored.
Sustainable development
Aspect B6: Product responsibility
General disclosure Information on:
(a) the policies; and
(b) compliance with relevant laws and regulations that have a significant impact on the issuer
relating to health and safety, advertising, labeling and privacy matters relating to products and services provided and methods of redress.
Sustainable development
B6.1 Percentage of total products sold or shipped subject to recalls for safety and health reasons.
Not applicable. The Group mainly provides real estate development and operation services, not involving product recall.
B6.2 Number of products and service related complaints received and how they are dealt with.
2018 Key performance table
B6.3 Description of practices relating to observing and protecting intellectual property rights.
Not applicable. Although the Group is not a technology-oriented company, it still strictly protects its intellectual property rights, e.g. trademark rights, and respects the intellectual property rights of other operators and partners in the industry.
B6.4 Description of quality assurance process and recall procedures. Sustainable development
B6.5 Description of consumer data protection and privacy policies, how they are implemented and monitored.
Sustainable development
Annual Report 2018 103

Environmental, Social and Governance Aspects, General Disclosures and Key Performance Indicators (“KPI”) Reference
Aspect B7: Anti-corruption General disclosure Information on:
(a) the policies; and
(b) compliance with relevant laws and regulations that have a significant impact on the issuer
relating to bribery, extortion, fraud and money laundering.
CSR management
B7.1 Number of concluded legal cases regarding corrupt practices brought against the issuer or its employees during the reporting period and the outcomes of the cases.
2018 Key performance table
B7.2 Description of preventive measures and whistle-blowing procedures, how they are implemented and monitored.
CSR management
Aspect B8: Community investment
General disclosure Policies on community engagement to understand the needs of the communities where the issuer operates and to ensure its activities take into consideration the communities’ interests.
Community prosperity
B8.1 Focus areas of contribution (e.g. education, environmental concerns, labour needs, health, culture, sport).
Community prosperity
B8.2 Resources contributed (e.g. money or time) to the focus area. Community prosperity and 2018 key performance table
ABOUT THIS REPORT This is the 2018 Environmental, Social and Governance Report published by Shui On Land Limited for disclosure of the Company’s management policies, processes, practices and performance in respect of the environment, society and governance to stakeholders, aiming to help stakeholders further understand the risks, opportunities and management level of Shui On Land Limited in the operation process, and make appropriate decisions. This Report is released concurrently with the annual report of the Company for a third time.
BASIS OF PREPARATION This Report was prepared in accordance with the Environmental, Social and Governance Reporting Guide (2015) published by The Stock Exchange of Hong Kong Ltd.
SCOPE OF THE REPORTOrganisational Scope: Shui On Land Limited is the subject of this chapter, which includes two subsidiaries, namely China Xintiandi Co. Ltd. and Shanghai Feng Cheng Property Management Co., Ltd., while some chapters involve Shui On Construction Co., Ltd. For the convenience of expression and reading, in this chapter, Shui On Land Limited is also referred to as “Shui On Land, “the Group”, “the Company” or “we”; China Xintiandi Co. Ltd. as “CXTD”; Shanghai Feng Cheng Property Management Co., Ltd. as “Feng Cheng Property Management”; Shui On Construction Co., Ltd. as “Shui On Construction”. As the Group has completed the sale of Dalian Tiandi in 2018, the disclosure of environmental and social performance in this Report does not cover this project.
Reporting Period: 1 January 2018 to 31 December 2018.
Report cycle: This is an annual report.
NOTES ON THE DATAThe sources of information, data and cases in the Report include original records, financial reports, public information and interviews with key departments in actual operation of Shui On Land.
Unless otherwise specified, all currency involved in the Report are denominated in CNY.
Shui On Land Limited104
CORPORATE SOCIAL RESPONSIBILITIES
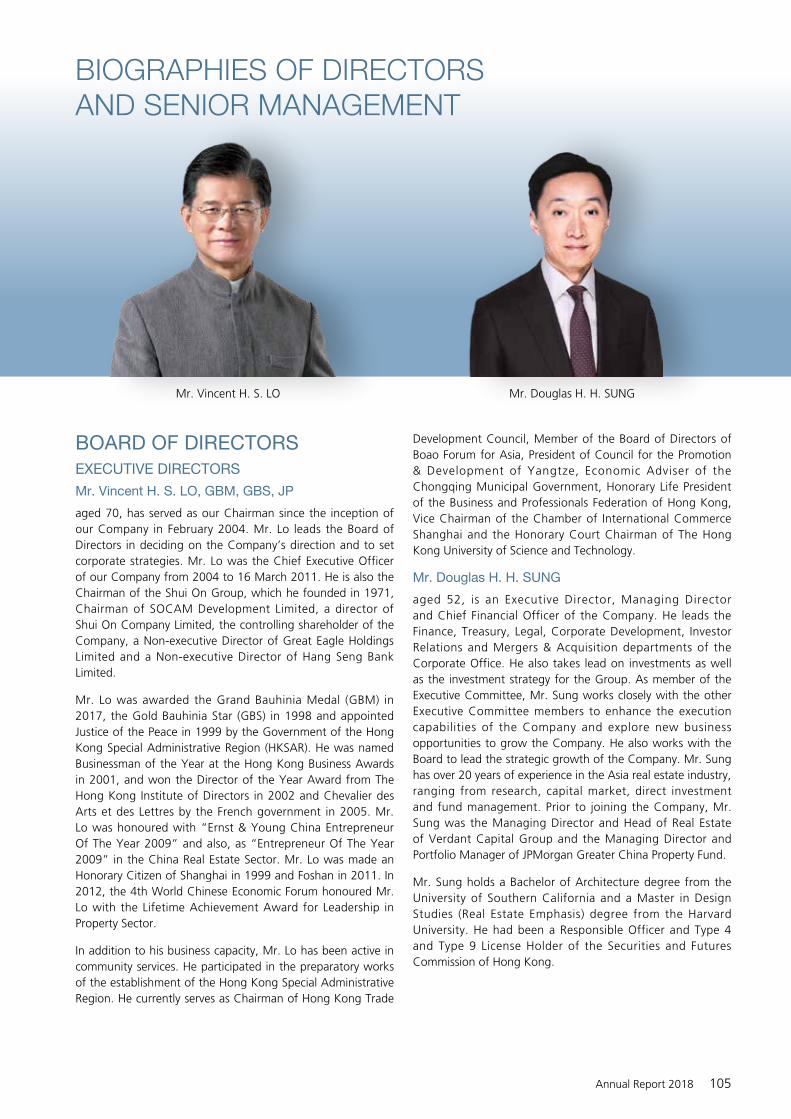
BIOGRAPHIES OF DIRECTORS AND SENIOR MANAGEMENT
Mr. Vincent H. S. LO Mr. Douglas H. H. SUNG
BOARD OF DIRECTORSEXECUTIVE DIRECTORS
Mr. Vincent H. S. LO, GBM, GBS, JP
aged 70, has served as our Chairman since the inception of our Company in February 2004. Mr. Lo leads the Board of Directors in deciding on the Company’s direction and to set corporate strategies. Mr. Lo was the Chief Executive Officer of our Company from 2004 to 16 March 2011. He is also the Chairman of the Shui On Group, which he founded in 1971, Chairman of SOCAM Development Limited, a director of Shui On Company Limited, the controlling shareholder of the Company, a Non-executive Director of Great Eagle Holdings Limited and a Non-executive Director of Hang Seng Bank Limited.
Mr. Lo was awarded the Grand Bauhinia Medal (GBM) in 2017, the Gold Bauhinia Star (GBS) in 1998 and appointed Justice of the Peace in 1999 by the Government of the Hong Kong Special Administrative Region (HKSAR). He was named Businessman of the Year at the Hong Kong Business Awards in 2001, and won the Director of the Year Award from The Hong Kong Institute of Directors in 2002 and Chevalier des Arts et des Lettres by the French government in 2005. Mr. Lo was honoured with “Ernst & Young China Entrepreneur Of The Year 2009” and also, as “Entrepreneur Of The Year 2009” in the China Real Estate Sector. Mr. Lo was made an Honorary Citizen of Shanghai in 1999 and Foshan in 2011. In 2012, the 4th World Chinese Economic Forum honoured Mr. Lo with the Lifetime Achievement Award for Leadership in Property Sector.
In addition to his business capacity, Mr. Lo has been active in community services. He participated in the preparatory works of the establishment of the Hong Kong Special Administrative Region. He currently serves as Chairman of Hong Kong Trade
Development Council, Member of the Board of Directors of Boao Forum for Asia, President of Council for the Promotion & Development of Yangtze, Economic Adviser of the Chongqing Municipal Government, Honorary Life President of the Business and Professionals Federation of Hong Kong, Vice Chairman of the Chamber of International Commerce Shanghai and the Honorary Court Chairman of The Hong Kong University of Science and Technology.
Mr. Douglas H. H. SUNG
aged 52, is an Executive Director, Managing Director and Chief Financial Officer of the Company. He leads the Finance, Treasury, Legal, Corporate Development, Investor Relations and Mergers & Acquisition departments of the Corporate Office. He also takes lead on investments as well as the investment strategy for the Group. As member of the Executive Committee, Mr. Sung works closely with the other Executive Committee members to enhance the execution capabilities of the Company and explore new business opportunities to grow the Company. He also works with the Board to lead the strategic growth of the Company. Mr. Sung has over 20 years of experience in the Asia real estate industry, ranging from research, capital market, direct investment and fund management. Prior to joining the Company, Mr. Sung was the Managing Director and Head of Real Estate of Verdant Capital Group and the Managing Director and Portfolio Manager of JPMorgan Greater China Property Fund.
Mr. Sung holds a Bachelor of Architecture degree from the University of Southern California and a Master in Design Studies (Real Estate Emphasis) degree from the Harvard University. He had been a Responsible Officer and Type 4 and Type 9 License Holder of the Securities and Futures Commission of Hong Kong.
Annual Report 2018 105

BIOGRAPHIES OF DIRECTORS AND SENIOR MANAGEMENT
Ms. Stephanie B. Y. LO
aged 36, is an Executive Director of the Company, an Executive Director of Shui On Management Limited (“SOM”) and the Vice Chairman of China Xintiandi Holding Company Limited, both being subsidiaries of the Company. She is responsible for the development of China Xintiandi (“CXTD”)’s commercial strategy and project positioning. Ms. Lo oversees market positioning and strategy for the Group’s projects and leads the Human Resources department, the Corporate Administration Services department and the Process & Information Management department of the Company. She also assists the Chairman of the Company in leading the overall development of the Company. Ms. Lo joined the Group in August 2012 and has over 15 years of working experience in property development industry in the PRC, architecture and interior design as well as other art enterprises. Prior to joining the Group, Ms. Lo worked for various architecture and design firms in New York City, amongst which was Studio Sofield, a firm well-known for its capability in retail design. She holds a Bachelor of Arts degree in architecture from Wellesley College in Massachusetts. She currently serves as a Member of The Thirteenth Shanghai Committee of Chinese People's Political Consultative Conference and The Seventh Council Member of Shanghai Chinese Overseas Friendship Association. Ms. Lo is the daughter of Mr. Vincent H. S. LO, the Chairman of the Company, a Director of Shui On Company Limited, the controlling shareholder of the Company and was appointed as a Non-executive Director of SOCAM Development Limited with effect from 1 January 2019.
NON-EXECUTIVE DIRECTOR
Mr. Frankie Y. L. WONG
aged 70, was re-designated as a Non-executive Director of the Company on 1 January 2017. He was an Executive Director of the Company from June 2015 to December 2016 and a Non-executive Director of the Company from August 2011 to June 2015. He was a Director of the Company from May 2004 to May 2006 prior to the listing of the Company on The Stock Exchange of Hong Kong Limited (the “Stock Exchange”) in October 2006. Mr. Wong is currently an Executive Director, the Chief Executive Officer and the Chief Financial Officer of SOCAM Development Limited (“SOCAM”) which is listed on the Stock Exchange. He was a Non-executive Director of SOCAM from September 2011 to August 2014, Vice Chairman of SOCAM from 1997 to 2004 and from April 2010 to August 2011 and the Chief Executive Officer of SOCAM from July 2004 to March 2010. Mr. Frankie Wong joined the Shui On Group in 1981. He is currently an Executive Director of Shui On Holdings Limited and a Director of Shui On Company Limited, the controlling shareholder of the Company. He is also one of the Trustees of the Shui On Provident and Retirement Scheme. Prior to joining the Shui On Group, Mr. Wong had many years of banking experience with several major international banks in Hong Kong. He graduated with a Bachelor of Science degree in Economics and a Master of Arts degree from the London School of Economics and Political Science and The University of Lancaster in the United Kingdom respectively. Mr. Wong is currently a Non-executive Chairman of Walcom Group Limited, a company listed on the Alternative Investment Market of the London Stock Exchange plc. He was a Non-executive Director of Solomon Systech (International) Limited, which is listed on the Stock Exchange, from February 2004 to December 2006, an Independent Non-executive Director of this Company from January 2007 to May 2014 and a director of Sichuan Shuangma Cement Co., Ltd. (四川雙馬水泥股份有限公司), a company listed on the Shenzhen Stock Exchange, from 18 July 2012 to 11 August 2015.
Mr. Frankie Y. L. WONGMs. Stephanie B. Y. LO
Shui On Land Limited106

INDEPENDENT NON-EXECUTIVE DIRECTORS
Sir John R. H. BOND
aged 77, has served as an Independent Non-executive Director of our Company since September 2006. He was previously the Group Chairman of HSBC Holdings plc and was with HSBC from 1961 until May 2006. He was the Chairman of Vodafone Group Plc until 26 July 2011, the Chairman of Xstrata plc until May 2013, an Advisory Director of Northern Trust Corporation until 21 April 2015 and a Non-executive Director of A. P. Moller Maersk until April 2016. Sir John Bond is currently a member of the Mayor of Shanghai's International Business Leaders' Advisory Council and a participant in the China Development Forum.
Dr. William K. L. FUNG, SBS, JP
aged 70, has served as an Independent Non-executive Director of our Company since May 2006. Dr. Fung is the Group Chairman of Li & Fung Limited. He has held key positions in major trade associations. He is past Chairman of the Hong Kong General Chamber of Commerce (1994-1996), Hong Kong Exporters' Association (1989-1991) and the Hong Kong Committee for Pacific Economic Cooperation (1993-2002). He was a Hong Kong Special Administrative Region delegate to the Chinese People’s Political Consultative Conference (1998-2003). He has been awarded the Silver Bauhinia Star by the Hong Kong Special Administrative Region Government in 2008. Dr. Fung graduated from Princeton University with a Bachelor of Science degree in Engineering and also holds an MBA degree from the Harvard Graduate School of Business. He was conferred Honorary Doctorate degrees of Business Administration by The Hong Kong University of Science and Technology, by The Hong Kong Polytechnic University and by Hong Kong Baptist University. Dr. Fung is an Independent Non-executive Director of VTech Holdings Limited, Sun Hung Kai Properties Limited and The Hongkong and Shanghai Hotels, Limited. He is also a Non-executive Director of other listed Fung Group companies including Convenience Retail
Asia Limited and Chairman and Non-executive director of Global Brands Group Holding Limited. He resigned as a Non-executive director of Trinity Limited on 18 April 2018.
Professor Gary C. BIDDLE
aged 67, has served as an Independent Non-executive Director of our Company since May 2006. Professor Biddle is Professor of Accounting at University of Melbourne and Visiting Professor at Columbia Business School, University of Hong Kong (HKU), and London Business School. Professor Biddle earned his MBA and PhD degrees at University of Chicago. He previously served as professor at University of Chicago, University of Washington, Hong Kong University of Science and Technology (HKUST), and as visiting professor at China Europe International Business School (China), Fudan University (China), University of Glasgow (UK), IMD (Switzerland), and Skolkovo Business School (Russia). In academic leadership, Professor Biddle served as Dean and Chair Professor at HKU, and as Academic Dean, Department Head, Council member, Court member, Senate member, and Chair Professor at HKUST. He co-created the EMBA-Global Asia EMBA program and taught the first class and decade of the Kellogg-HKUST EMBA program, both recently ranked #1 in the world (Financial Times and QS). Professionally, he is a member of the Financial Reporting Review Panel of the Financial Reporting Council of Hong Kong, AICPA, CPA Australia, and HKICPA. He also is Accounting Area Editor for Journal of International Business Studies, Book Editor for The Accounting Review, and an editorial board member of the other premier academic journals. Professor Biddle has served as a member of the American Accounting Association Executive Board and as Vice-President and President-Elect Candidate, Accounting Hall of Fame Selection Committee, HKICPA Council, Accreditation and Financial Reporting Standards Committees of HKICPA, Hong Kong Institute of Directors Training Committee, and as President and co-founding Council Member of the Hong Kong Academic Accounting Association. Professor Biddle conducts research on financial and management accounting (teaching
Sir John R. H. BOND Dr. William K. L. FUNG Professor Gary C. BIDDLE
Annual Report 2018 107

BIOGRAPHIES OF DIRECTORS AND SENIOR MANAGEMENT
Dr. Roger L. McCARTHY Mr. David J. SHAW Mr. Anthony J. L. NIGHTINGALE
both), value creation, economic forecasting, corporate governance and performance metrics, including EVA®. His research appears in leading academic journals and in the financial press including CNN, The Economist, and The Wall Street Journal. He has over 6,500 Google Scholar citations and ranks among the top 0.32% in career research citations and downloads among all social scientists (SSRN). Professor Biddle has won 30 teaching honours, including three “Professor of Year” awards from the world’s top-ranked EMBA programs. He also proudly serves as Independent Non-Executive Director and Audit Committee Chair of Kingdee International Software Group Limited and served as remuneration committee chair of Chinachem Group.
Dr. Roger L. McCARTHY
aged 70, has served as an Independent Non-executive Director of our Company since May 2006. Dr. McCarthy is currently the principal of McCarthy Engineering. He was formerly Chairman Emeritus of Exponent, Inc. (NASDAQ symbol “EXPO”). He was also Chairman of Exponent Science and Technology Consulting Co., Ltd. (Hangzhou) ( 毅博科技諮詢(杭州)有限 公 司), a wholly owned subsidiary of Exponent, Inc., which he founded in 2005 to expand Exponent Inc.'s services to the PRC. Dr. McCarthy holds five academic degrees: an Arts Bachelor (A.B.) in Philosophy and a Bachelor of Science in Mechanical Engineering (B.S.E.M.E.) from the University of Michigan; and an S.M. degree in Mechanical Engineering, the professional degree of Mechanical Engineer (Mech.E.), and a Ph.D. in Mechanical Engineering all from the Massachusetts Institute of Technology (“MIT”). He graduated from the University of Michigan Phi Beta Kappa, summa cum laude, the Outstanding Undergraduate in Mechanical Engineering in 1972. He was a National Science Foundation fellow. In 1992, Dr. McCarthy was appointed by the first President Bush to the President’s Commission on the National Medal of Science. Dr. McCarthy is one of approximately 165 US Mechanical
Engineers elected to the National Academy of Engineering. He currently serves on MIT’s Material Science and Engineering Visiting Committee, External Advisory Board of the Mechanical Engineering Department at the University of Michigan, and the Stanford Materials Science & Engineering Advisory Board. Dr. McCarthy delivered the 2008 commencement address for the University of Michigan's College of Engineering. He is currently a member of the US National Academy of Engineering’s Finance and Budget Committee.
Mr. David J. SHAW
aged 72, has served as an Independent Non-executive Director of our Company since May 2006. Mr. Shaw acted as the Group Adviser to the Board of HSBC Holdings plc from June 1998 until 30 September 2013 and retired from the HSBC Group in 2015. Mr. Shaw is a solicitor, admitted in England and Wales and in Hong Kong. He was a partner of Norton Rose from 1973 until 1998 and during that period spent approximately 20 years working in Hong Kong. Mr. Shaw obtained a law degree from Cambridge University. He is also an Independent Non-executive Director of Kowloon Development Company Limited.
Mr. Anthony J. L. NIGHTINGALE, CMG, SBS, JP
aged 71, has been appointed as an Independent Non-executive Director of our Company since 1 January 2016. He was the Managing Director of Jardine Matheson Holdings Limited. He is currently a non-executive director of Jardine Matheson Holdings Limited and of other Jardine Group companies, including Jardine Strategic Holdings Limited, Jardine Cycle & Carriage Limited, Dairy Farm International Holdings Limited, Hongkong Land Holdings Limited and Mandarin Oriental International Limited. He is also a non-executive Director of Schindler Holding Limited, Prudential plc and Vitasoy International Holdings Limited.
Shui On Land Limited108

Mr. Nightingale is a commissioner of PT Astra International Tbk., a member of The HKSAR Chief Executive’s Council of Advisers on Innovation and Strategic Development, a Hong Kong representative to the APEC Vision Group, a council member of the Employers’ Federation of Hong Kong and chairperson of The Sailors Home and Missions to Seafarers and chairman of The Friends of Uppingham School Limited in Hong Kong. He is the former chairman of the Hong Kong General Chamber of Commerce and was appointed as an ABAC Representative of Hong Kong, China from 2005 to 2017.
Mr. Nightingale was an independent non-executive director of China Xintiandi Holding Company Limited, a wholly-owned subsidiary of the Company.
SENIOR MANAGEMENT
Ms. Jessica Y. WANG
aged 44, is the Managing Director of SOM and CXTD. Ms. Wang takes lead on land acquisition and property development business of the Group and the property project development business of the Group in Shanghai, Wuhan, Foshan and Chongqing. She also leads and co-ordinates the business operation and development of CXTD. She joined the Group in August 1997 and has over 24 years of working experience in the property development industry in PRC. Prior to joining the Group, Ms. Wang was engaged in sales & marketing in one of the well-known real estate company. Ms. Wang holds a Bachelor of Engineering degree in Shanghai University of Technology and the Executive Master of Business Administration (EMBA) from Shanghai Fudan University. Ms. Wang is a member of the Standing Committee of People’s Congress of Hong Kou District, Shanghai, Chairman of Hong Kou District Association of Enterprises with Foreign Investment, Director and the Director of Commerce Cscg of Shanghai Federation of Industry & Commerce Real Estate Chamber of Commerce and Vice Chairman of Hong Kou District non-Party Intellectuals Association.
Mr. Allan B. ZHANG
aged 41, is an Executive Director of SOM. Mr. Zhang takes lead on product development and project development design, cost and construction management functions, as well as the construction business of the Group. He also takes lead of the office building business of CXTD in PRC, the project development business of Taipingqiao projects, the Knowledge and Innovation Community (“KIC’) project and the Company’s mixed-use development business in Nanjing. Mr. Zhang joined the Group in 2004 and has over 15 years of working experience in the property development industry in PRC. Prior to his present position, Mr. Zhang was the Chief Operating Officer of CXTD. He was involved in various mixed-
use city center communities such as Rui Hong Xin Cheng project, Wuhan project, KIC project and Taipingqiao mixed-use development projects. Mr. Zhang has rich experience in property development and commercial asset management in multiple cities in mainland China, of which Wuhan Tiandi is now the landmark in Wuhan after ten years’ development, and KIC has been the City-Industry integration and vibrant industrial ecosystem community in Shanghai. Mr. Zhang holds a Bachelor degree and a Master degree in Engineering from Tongji University. He is also the certified member of Royal Institution of Chartered Surveyors (RICS).
Ms. Rachel Y. Q. LEI
aged 39, is the Director of Corporate Development Department and Asset Management Department. She is responsible for corporate strategy development, business planning and commercial asset management functions. She joined the Group in 2001 and has over 17 years of working experience in the real estate industry in the PRC. Ms. Lei holds a Bachelor’s degree in Journalism and a Bachelor’s degree in Finance from Shanghai Jiao Tong University.
Mr. UY Kim Lun
aged 55, is Director of Legal Affairs and Company Secretary of our Company. He joined our Company in 2005 and is responsible for the legal, company secretarial, compliance, risk management and business ethics issues of our Company. Mr. Uy holds a Bachelor’s degree, with honours, in Laws and a Postgraduate Certificate in Laws from The University of Hong Kong. He was admitted as a solicitor in Hong Kong in 1991 and in England and Wales in 1994. He has over 27 years of post-qualification experience and has worked in the legal departments of several blue-chip companies in Hong Kong before joining our Company.
Mr. Timmy T. M. LEUNG
aged 60, is the Director of Treasury of SOM. He is responsible for the treasury function of the Group. He joined SOM in 2009 and has over 34 years of working experience in financial institutions. Prior to joining SOM, Mr. Leung was the Chief Marketing Officer of Temasek’s wholly owned subsidiary, Fullerton Investment Guarantee Company. Mr. Leung completed his Business studies in East China University of Science and Technology in Shanghai. He is the Vice President of Shanghai Huangpu District Federation of Returned Overseas Chinese. Mr. Leung was also a Committee member for Hangzhou Committee of The Chinese People’s Political Consultative Conference and Vice President and Head of Finance Group of Hong Kong Chamber of Commerce in China, Shanghai and a Committee member for Shanghai Huangpu District Committee of The Chinese People’s Political Consultative Conference.
Annual Report 2018 109

BIOGRAPHIES OF DIRECTORS AND SENIOR MANAGEMENT
Mr. Alfred S. S. LAI
aged 58, is Director of Finance of SOM. He joined the Group in 2015 and is currently responsible for the overall finance and taxation functions of SOM. He has over 35 years of working experience in financial management. Before joining the Group, Mr. Lai had worked in SOCAM for years. During that period, he was seconded to Lafarge Shui On Co. Ltd. as Chief Financial Officer. He holds a Bachelor of Science Degree in Economics and MBA Degree from the London School of Economics and Political Science and Heriot-Watt University in the United Kingdom respectively. He is the associate member of The Hong Kong Institute of Certified Public Accountants and the fellow member of The Association of Chartered Certified Accountants, United Kingdom.
Mr. Albert K. B. CHAN
aged 59, is the Director of Development Planning and Design. Mr. Chan joined Shui On in 1997, and has over 30 years of experience in planning, design and real estate development. Mr. Chan manages the conceptualization, site feasibility studies, masterplanning and design of developments for the Company. From 1997 to 2001, he led the planning and design effort for the Shanghai Xintiandi development. He also focuses on mixed-use development, planning and design research and development, and chairs the Sustainable Development Committee of the Company.
Prior to joining Shui On, Mr. Chan worked at the New York City Department of Design and Construction and at Cooper, Robertson + Partners. Mr. Chan holds a Bachelor of Architecture degree from the University of Minnesota, a Master of Architecture degree from the University of California, Berkeley, and a Master of Science degree in Architecture and Urban Design from Columbia University. He also holds an MBA from New York University. He is a Global Trustee of the Urban Land Institute and Chairs the ULI Mainland China Council, and a member of the Board of Directors of American Institute of Architects Shanghai Chapter.
Mr. David P. K. WONG
aged 63, is Chief Economist and Director of Development Research. He is responsible for macroeconomic analysis, city screening, property policy research, and leads a team to undertake project feasibility analysis and market trends research. He joined the Group in 1996 and has over 28 years of working experience in the Chinese property markets. Before joining the Group, he was Assistant Chief Economist of Hong Kong Trade Development Council. Mr. Wong holds a Bachelor of Science degree from the University of Minnesota and a Master degree in Economics from the University of California, Berkeley. He is a member of Urban Land Institute and China Strategic Thinkers.
Mr. Alex L. H. WANG
aged 39, is Project Director of Wuhan Project and is responsible for the total development, construction, and operations. Mr. Wang joined the Group in 2003 and has over 16 years of experience in the China real estate industry. Mr. Wang holds a Bachelor of Architecture Degree from Chongqing University. He is currently the Member of Wuhan Municipal Committee of CPPCC. He serves as the Vice President of Wuhan Real Estate Development Industry Association, the Vice President of Wuhan Association of Enterprises with Foreign Investment and the Vice President of Hong Kong Chamber of Commerce in China-Wuhan among his other positions.
Mr. Dave Q. S. CHEN
aged 41, is an Executive Director of CXTD and is responsible for the overall operation and management of CXTD. He takes lead of Shanghai, Wuhan, Foshan and Chongqing projects of CXTD. Mr. Chen also leads the planning and development of the commercial sites in the Qingpu project and is responsible for the property management business of the Group. Mr. Chen holds a Bachelor degree of Economics from Wuhan University and has been working in the commercial property industry in Mainland China for many years. Mr. Chen joined the Group in October 2017. Prior to joining CXTD of Shui On Group, he was Deputy General Manager of Commercial Property Business and General Manager of E-commerce at China Resources Land. He is in particular experienced in commercial complex development and management as well as development of e-commerce platforms.
Ms. Carol C. CHEN
aged 40, is the Commercial Director of CXTD. She is responsible for the management and development of the commercial business at the Rui Hong Xin Cheng project, and also leads the HUB project, CXTD’s Central Retail Leasing team and business innovation of CXTD. Ms. Chen joined the Group in 2001 and has over 15 years of working experience in real estate industry. She obtained a Bachelor degree in Management from Sun Yat-sen University in 2001, and she is now an EMBA candidate of China Europe International Business School. Ms. Chen is a member of International Council of Shopping Centers and ULI retail committee. She has been honored with 2012 China Outstanding Fashion Personages awards from the China Fashion Forum in 2012.
Shui On Land Limited110

DIRECTORS’ REPORT
PRINCIPAL ACTIVITIESThe Company acts as an investment holding company. The activities of its major subsidiaries, associates and joint ventures are set out in Notes 51, 16 and 17 respectively to the consolidated financial statements.
BUSINESS REVIEW A fair review of the business of the Group during the year and the discussions on the Group’s future business development are provided in the Chairman’s Statement, the Market Updates and Project Profiles, the Business Review, the Landbank and the Financial Review respectively from pages 8 to 12, pages 13 to 31, pages 32 to 41, pages 42 to 43 and pages 44 to 49 of this Annual Report. Description of possible risks and uncertainties that the Group may be facing can be found in the Financial Review on pages 44 to 49. Also, the financial risk management objectives and policies of the Group can be found in Notes 47 and 48 to the consolidated financial statements. Particulars of important event affecting the Group that has occurred since the end of the financial year ended 31 December 2018 are provided in Note 46 to the consolidated financial statements. Indications of likely future development in the business of the Company can be found in the Business Review and the Financial Review on pages 32 to 41 and pages 44 to 49. An analysis of the Group’s performance during the year using financial key performance indicators is provided in the Financial Review on pages 44 to 49. The discussions on the Group’s environmental policies, relationships with its key stakeholders and compliance with relevant laws and regulations which have a significant impact on the Group are contained in the Chairman’s Statement, the Corporate Governance Report, the Corporate Social Responsibility and this Directors’ Report on pages 8 to 12, pages 52 to 65, pages 68 to 104 and pages 111 to 124 of this Annual Report and in the Corporate Social Responsibility Report available on the Group’s corporate website.
RESULTS AND APPROPRIATIONS The results of the Group for the year ended 31 December 2018 are set out in the consolidated statement of profit or loss on page 132.
An interim dividend of HK$0.036 per share was paid to the shareholders on 27 September 2018.
The Board has resolved to recommend the payment of a final dividend of HK$0.084 per share for the year ended 31 December 2018 (2017: HK$0.07), amounting to approximately RMB593 million (2017: RMB461 million) in aggregate. Subject to shareholders’ approval of the final dividend at the forthcoming annual general meeting (“AGM”) to be held on 31 May 2019, the final dividend is expected to be paid on or about 21 June 2019 to shareholders whose names appear on the register of members of the Company on 6 June 2019.
In order to qualify for the proposed final dividend, all transfer documents accompanied by the relevant share certificates must be lodged with the Company’s branch share registrar in Hong Kong, Computershare Hong Kong Investor Services Limited, at Shops 1712-1716, 17th Floor, Hopewell Centre, 183 Queen’s Road East, Wan Chai, Hong Kong for registration not later than 4:30 p.m. on 6 June 2019.
Annual Report 2018 111

INVESTMENT PROPERTIESDetails of the movements in the investment properties of the Group during the year are set out in Note 13 to the consolidated financial statements.
PROPERTY, PLANT AND EQUIPMENTDetails of the movements in the property, plant and equipment of the Group during the year are set out in Note 14 to the consolidated financial statements.
SHARE CAPITALDetails of share capital of the Company during the year ended 31 December 2018 are set out in Note 28 to the consolidated financial statements.
DISTRIBUTABLE RESERVES OF THE COMPANYThe Company’s reserves available for distribution to shareholders as of 31 December 2018 were RMB16,903 million (2017: RMB17,146 million).
DIRECTORSThe Directors of the Company during the year ended 31 December 2018 and up to the date of this report were:
Executive Directors:
Mr. Vincent H. S. LO
Mr. Douglas H. H. SUNG
Ms. Stephanie B. Y. LO (appointed on 27 August 2018)
Non-executive Director:
Mr. Frankie Y. L. WONG
Independent Non-executive Directors:
Sir John R. H. BOND
Dr. William K. L. FUNG
Professor Gary C. BIDDLE
Dr. Roger L. McCARTHY
Mr. David J. SHAW
Mr. Anthony J. L. NIGHTINGALE
In accordance with Article 97(3) of the Articles of Association of the Company (the “Articles of Association”), Ms. Stephanie B. Y. LO shall hold office until the AGM and, being eligible, will offer herself for re-election at the AGM.
In accordance with Article 102 of the Articles of Association, Sir John R. H. BOND, Dr. William K. L. FUNG, Professor Gary C. BIDDLE and Dr. Roger L. McCARTHY will retire from office by rotation at the AGM. Except for Dr. William K. L. FUNG who will not stand for re-election, the other Directors, being eligible, will offer themselves for re-election at the AGM.
DIRECTORS’ REPORT
Shui On Land Limited112

PERMITTED INDEMNITYThe Articles of Association provides that, every Director (including any alternate Director appointed pursuant to the relevant articles) shall be indemnified and secured harmless out of the assets and funds of the Company against all actions, proceedings, costs, charges, expenses, losses, damages or liabilities incurred or sustained by him in or about the conduct of the Company’s business or affairs or in the execution or discharge of his duties, powers, authorities or discretions, including without prejudice to the generality of the foregoing, any costs, expenses, losses or liabilities incurred by him in defending (whether successfully or otherwise) any civil proceedings concerning the Company or its affairs in any court whether in the Cayman Islands or elsewhere. The Company has arranged appropriate directors’ and officers’ liability insurance coverage for the Directors and officers of the Group.
DIRECTORS’ INTERESTS IN SECURITIESAt 31 December 2018, the interests and short positions of the Directors and the chief executive of the Company in the shares, underlying shares and debentures of the Company or any of its associated corporations (within the meaning of Part XV of the Securities and Futures Ordinance (the “SFO”)) which (i) were required to be notified to the Company and The Stock Exchange of Hong Kong Limited (the “Stock Exchange”) pursuant to Divisions 7 and 8 of Part XV of the SFO (including interests and short positions which were taken or deemed to have been taken under such provisions of the SFO); or (ii) were recorded in the register required to be kept under section 352 of the SFO; or (iii) were required to be notified to the Company and the Stock Exchange pursuant to the Model Code for Securities Transactions by Directors of Listed Issuers (the “Model Code”) of the Rules Governing the Listing of Securities on the Stock Exchange (the “Listing Rules”) were as follows:
(A) LONG POSITION IN THE SHARES AND THE UNDERLYING SHARES OF THE COMPANY
Number of ordinary shares
Interests in the
underlying shares
Total
Approximate percentage of
interests to the issued share capital of the
Company(Note 4)Name of Directors
Personal interests
Family interests
Other interests
Share options(Note 3)
Mr. Vincent H. S. LO (“Mr. Lo”) – 1,849,521(Note 1)
4,611,835,751(Note 2)
– 4,613,685,272 57.23%
Mr. Douglas H. H. SUNG – – – 437,000 437,000 0.0054%
Ms. Stephanie B. Y. LO (“Ms. Lo”) – – 4,611,835,751 (Note 2)
437,000 4,612,272,751 57.21%
Sir John R. H. BOND 250,000 – – – 250,000 0.003%
Dr. William K. L. FUNG 5,511,456 – – – 5,511,456 0.06%
Professor Gary C. BIDDLE 305,381 – – – 305,381 0.0038%
Dr. Roger L. McCARTHY 200,000 – – – 200,000 0.002%
Notes:
(1) These shares were beneficially owned by Ms. Loletta CHU (“Mrs. Lo”), the spouse of Mr. Lo. Mr. Lo was deemed to be interested in 1,849,521 shares under Part XV of the SFO.
(2) These shares were held by Shui On Company Limited (“SOCL”) through its controlled corporations, comprising 675,493,996 shares, 1,477,888,889 shares, 183,503,493 shares, 29,847,937 shares, 633,333,333 shares, 908,448,322 shares, 150,000,000 shares, 323,319,781 shares and 230,000,000 shares held by Shui On Properties Limited (“SOP”), Shui On Investment Company Limited (“SOI”), Chester International Cayman Limited (“Chester International”), New Rainbow Investments Limited (“NRI”), Lanvic Limited (“Lanvic”), Boswell Limited (“Boswell”), Merchant Treasure Limited (“Merchant Treasure”), Doreturn Limited (“Doreturn”) and Smart Will Investments Limited (“Smart Will”) respectively whereas SOP, Chester International, Lanvic, Boswell, Merchant Treasure, Doreturn and Smart Will were all wholly-owned subsidiaries of SOI. NRI was a wholly-owned subsidiary of SOCAM Development Limited (“SOCAM”) which in turn was held by SOCL as to 60.97% as of 31 December 2018. SOCL was held under the Bosrich Unit Trust, the trustee of which was Bosrich Holdings (PTC) Inc. (“Bosrich”). The units of the Bosrich Unit Trust were the property of a discretionary trust, of which Mr. Lo was the founder and a discretionary beneficiary, Ms. Lo was a discretionary beneficiary and HSBC International Trustee Limited (“HSBC Trustee”) was the trustee. Accordingly, Mr. Lo, Mrs. Lo, Ms. Lo, Bosrich and HSBC Trustee were deemed to be interested in such shares under Part XV of the SFO.
(3) These represent the interests of share options granted to the Directors and/or their respective associate(s) for subscription of shares of the Company under the share option scheme adopted by the Company on 8 June 2007.
(4) These percentages were compiled based on the total number of issued shares (i.e. 8,062,216,324 shares) of the Company at 31 December 2018.
Annual Report 2018 113

(B) LONG POSITION IN THE SHARES OF THE ASSOCIATED CORPORATION – SOCAM
Number of ordinary shares
Name of Directors Personal interests Family interests Other interests Total
Approximate percentage of interests to the issued
share capital(Note 3)
Mr. Lo – 312,000(Note 1)
234,381,000 (Note 2)
234,693,000 61.05%
Ms. Lo – – 234,381,000 (Note 2)
234,381,000 60.97%
Mr. Frankie Y. L. WONG 3,928,000 – – 3,928,000 1.02%
Notes:
(1) These shares were beneficially owned by Mrs. Lo, the spouse of Mr. Lo. Mr. Lo was deemed to be interested in 312,000 shares under Part XV of the SFO.
(2) These shares comprised 232,148,000 shares beneficially owned by SOCL and 2,233,000 shares held by Shui On Finance Company Limited, an indirect wholly-owned subsidiary of SOCL. SOCL was owned by the Bosrich Unit Trust, the trustee of which was Bosrich. The units of the Bosrich Unit Trust were the property of a discretionary trust, of which Mr. Lo was the founder and one of the discretionary beneficiaries, Ms. Lo was a discretionary beneficiary and HSBC Trustee was the trustee. Accordingly, Mr. Lo, Mrs. Lo, Ms. Lo, HSBC Trustee and Bosrich were deemed to be interested in such shares under the SFO.
(3) These percentages have been compiled based on the total number of issued shares (i.e. 384,410,164 shares) at 31 December 2018.
(C) INTERESTS IN THE DEBENTURES OF THE ASSOCIATED CORPORATION OF THE COMPANY
Name of Directors Name of Associated Corporation Nature of Interests Amount of Debentures
Mr. Lo Shui On Development(Holding) Limited
Founder and discretionarybeneficiary of a trust
Family interestsFamily interests
RMB50,000,000
RMB35,500,000USD2,000,000
Mr. Douglas H. H. SUNG SOCAM Personal USD200,000
Ms. Lo Shui On Development(Holding) Limited
discretionary beneficiary of a trust RMB50,000,000
Save as disclosed above, at 31 December 2018, none of the Directors or the chief executive of the Company had an interest or short position in any shares, underlying shares or debentures of the Company or any of its associated corporations (within the meaning of Part XV of the SFO) as recorded in the register of interests required to be kept by the Company pursuant to Section 352 of the SFO, or as otherwise notified to the Company and the Stock Exchange pursuant to the Model Code.
DIRECTORS’ REPORT
Shui On Land Limited114

SUBSTANTIAL SHAREHOLDERS’ INTERESTS IN SECURITIESAt 31 December 2018, the persons or corporations (other than a Director or chief executive of the Company) who had interests or short positions in the shares or underlying shares of the Company as recorded in the register required to be kept by the Company pursuant to section 336 of the SFO were as follows:
Name of shareholders Capacity / Nature of interests
Total number of ordinary shares and underlying shares
Approximatepercentage of interests
in the Company(Note 4)
Mrs. Lo Family and Personal 4,613,685,272 (Notes 1 & 3)
57.23%
HSBC Trustee Trustee 4,611,835,751(Notes 2 & 3)
57.21%
Bosrich Trustee 4,611,835,751(Notes 2 & 3)
57.21%
SOCL Interests of Controlled Corporation 4,611,835,751(Notes 2 & 3)
57.21%
Notes:
(1) These shares comprised 1,849,521 shares beneficially owned by Mrs. Lo and 4,611,835,751 shares in which Mr. Lo, the spouse of Mrs. Lo, had a deemed interest under Part XV of the SFO as mentioned in Note (2) below. Accordingly, Mrs. Lo was also deemed to be interested in 4,611,835,751 shares under Part XV of the SFO.
(2) These shares were held by SOCL through its controlled corporations, comprising 675,493,996 shares, 1,477,888,889 shares, 183,503,493 shares, 29,847,937 shares, 633,333,333 shares, 908,448,322 shares, 150,000,000 shares, 323,319,781 shares and 230,000,000 shares held by SOP, SOI, Chester International, NRI, Lanvic, Boswell, Merchant Treasure, Doreturn and Smart Will respectively whereas SOP, Chester International, Lanvic, Boswell, Merchant Treasure, Doreturn and Smart Will were all wholly-owned subsidiaries of SOI. NRI was a wholly-owned subsidiary of SOCAM which in turn was held by SOCL as to 60.97% as of 31 December 2018. SOCL was held under the Bosrich Unit Trust, the trustee of which was Bosrich. The units of the Bosrich Unit Trust were the property of a discretionary trust, of which Mr. Lo was the founder and a discretionary beneficiary, Ms. Lo was a discretionary beneficiary and HSBC Trustee was the trustee. Accordingly, Mr. Lo, Mrs. Lo, Ms. Lo, Bosrich and HSBC Trustee were deemed to be interested in such shares under Part XV of the SFO.
(3) All the interests stated above represent long positions.
(4) These percentages were compiled based on the total number of issued shares (i.e. 8,062,216,324 shares) of the Company at 31 December 2018.
Save as disclosed above, at 31 December 2018, the Directors are not aware of any other person or corporation (other than a Director or chief executive of the Company), having an interest or short position in the shares or underlying shares of the Company as recorded in the register of interests required to be kept by the Company under Section 336 of the SFO.
Annual Report 2018 115

SHARE OPTIONS The share option scheme of the Company adopted on 8 June 2007 (the “Old Scheme”) expired on 7 June 2017 and no further share options can be granted thereunder. However, the rules of the Old Scheme remain in full force and effect to the extent necessary to give effect to the exercise of options granted prior to its expiration or otherwise as may be required in accordance with the rules of the Old Scheme. All outstanding share options granted prior to the expiration of the Old Scheme shall continue to be valid and exercisable in accordance with the rules of the Old Scheme.
A new share option scheme (the “Share Option Scheme”) was adopted by the Company on 24 May 2017 and no share option has been granted under the Share Option Scheme since its adoption.
Particulars of the Old Scheme are set out in note 41 to the consolidated financial statements.
The following table sets out the movement of the Company’s share options during the year under review:
Name or category of eligible Participants
Date of grant
Exerciseprice
per shareHKD
At 1 January
2018Reclassi-fication
Grantedduring
the period
Exercisedduring
the period
Lapsedduring
the period
At 31 December
2018
Period duringwhich the share
options areexercisable
Directors
Mr. Douglas H. H. SUNG
4 July 2016 1.98 437,000 – – – – 437,000 1 June 2017 – 3 July 2022
Ms. Lo 4 July 2016 1.98 – 437,000 – – – 437,000 1 June 2017 – 3 July 2022
SUB-TOTAL 437,000 437,000 – – – 874,000
Employees (in aggregate)
18 January2012
2.41 7,271,261 – – (1,567,255) 5,704,006 28 June 2013 – 17 January 2020
3 September2012
4.93 1,594,927 – – (1,594,927) – 3 October 2012 – 28 October 2018
3 September2012
4.93 6,117,249 – – (1,763,623) 4,353,626 5 November 2012 – 4 November 2019
7 July 2015 2.092 5,675,200 – – (570,000) (842,400) 4,262,800 1 June 2016 – 6 July 2021
4 July 2016 1.98 7,950,400 (437,000) – (341,800) (1,459,400) 5,712,200 1 June 2017 – 3 July 2022
SUB–TOTAL 28,609,037 – – (911,800) (7,227,605) 20,032,632
TOTAL 29,046,037 – (911,800) (7,227,605) 20,906,632
Note:
Ms. Lo was appointed as an Executive Director of the Company on 27 August 2018 and her share options were reclassified under the category of “Directors” effective from 27 August 2018.
DIRECTORS’ REPORT
Shui On Land Limited116
SUMMARY OF THE SHARE OPTION SCHEME ARE AS FOLLOWS:
(I) PURPOSE
The purpose of the Share Option Scheme is to provide a strategic driver to enhance shareholder value of the Company through achieving excellent business results and rapid growth; and to build a high performing organization with loyal staff and other key contributors who are committed to achieving the vision and goals of the Company.
(II) QUALIFYING PARTICIPANTS
The Board may offer to grant an option to any employees as the Remuneration Committee may recommend and the Board may approve; and any non-executive director, consultant, advisor of the Company or its subsidiaries, or service providers and business partners who have or may contribute to the Group as the Chairman may recommend and the Board may approve.
(III) MAXIMUM NUMBER OF SHARES
The total number of shares which may be issued upon exercise of all options to be granted under the Share Option Scheme must not in aggregate exceed 10% of the issued share capital of the Company at the adoption date or 30% of the issued share capital of the Company from time to time. No options may be granted under the Share Option Scheme if this will result in such limit exceeded. At 31 December 2018, the number of shares available for issue in respect thereof is 802,663,018 shares.
(IV) LIMIT FOR EACH PARTICIPANT
The total number of shares of the Company issued and to be issued upon exercise of options (whether exercised or outstanding) granted in any 12-month period to each participant must not exceed 1% of the shares of the Company in issue.
(V) OPTION PERIOD
In respect of any particular option, such time period as the Remuneration Committee may in its absolute discretion determine and specify in relation to any particular grantee in his option agreement during which the option may be exercised (subject to such restriction on exercisability specified therein) but which shall not, in any circumstances, exceed the period prescribed by the Listing Rules from time to time (which is, at the date of adoption of the Share Option Scheme, a period of ten (10) years from the commencement date of the relevant option).
(VI) ACCEPTANCE AND PAYMENT ON ACCEPTANCE
An offer shall remain open for acceptance by the qualifying participant concerned for a period of 30 days from the date of the offer (or such longer period as the Board may specify in writing). HK$1.00 is payable by the grantee to the Company on acceptance of the offer of the option. If such remittance is not made upon acceptance, acceptance of an offer shall create a promise by the relevant grantee to pay to the Company HK$1.00 on demand.
(VII) SUBSCRIPTION PRICE
The subscription price in respect of any particular option shall be at least the higher of ((i) the closing price of the shares as stated in the Stock Exchange’s daily quotations sheet on the subscription price reference date; (ii) the average closing price of the shares as stated in the Stock Exchange’s daily quotations sheets for the five business days immediately preceding the subscription price reference date; and (iii) the nominal value of a share.
(VIII) REMAINING LIFE OF THE SHARE OPTION SCHEME
The Board shall be entitled at any time within 10 years commencing on 24 May 2017 to make an offer for the grant of an option to any qualifying participants.
Annual Report 2018 117

ARRANGEMENT TO PURCHASE SHARES OR DEBENTURES Other than the share option holdings disclosed above, at no time during the year was the Company or any of its subsidiaries a party to any arrangements to enable the Directors of the Company to acquire benefits by means of the acquisition of shares in or debentures of the Company or any other body corporate.
EQUITY-LINKED AGREEMENT During the year, the Company has not entered into any equity-linked agreement.
PURCHASE, SALE OR REDEMPTION/CANCELLATION OF LISTED SECURITIES On 10 June 2014, Shui On Development (Holding) Limited (“SODH”) issued USD550 million in 9.625% senior notes due 2019 (the “2019 SODH Notes”). On 28 December 2017, SODH partially redeemed USD300 million of the outstanding 2019 SODH Notes with the aggregate principal amount of USD550 million on a pro rata basis and paid the redemption price plus the accrued and unpaid interest. Upon such redemption, the outstanding principal amount of 2019 SODH Notes was USD250 million. On 22 January 2018, SODH further redeemed the outstanding 2019 SODH Notes with the aggregate principal amount of USD250 million and paid the redemption price plus the accrued and unpaid interest. Upon completion of the redemption, the 2019 SODH Notes were cancelled.
On 19 May 2014, SODH issued USD637,027,000 in 8.700% senior notes due 2018 (the “2018 SODH Notes”). SODH had fully repaid the principal amount of the outstanding 2018 SODH Notes together with the accrued and unpaid interest upon its maturity on 19 May 2018.
Save as disclosed above, neither the Company nor any of its subsidiaries has purchased, sold or redeemed any of the Company’s listed securities during the year ended 31 December 2018.
CORPORATE GOVERNANCEThe Company is committed to maintaining a high standard of corporate governance practices. Information on the corporate governance practices adopted by the Company is set out in the “Corporate Governance Report” on pages 52 to 65.
CONNECTED TRANSACTIONSCertain related party transactions as disclosed in note 45 to the consolidated financial statements also constituted non-exempt connected transactions of the Company and are required to be disclosed in accordance with Chapter 14A of the Listing Rules. The following transactions are the connected transactions of the Company and its subsidiaries during the year under review, certain of which are ongoing.
(1) CONTINUING CONNECTED TRANSACTIONS IN RESPECT OF THE USE OF AIRCRAFT OWNED BY A SUBSIDIARY OF SOCL
On 4 September 2009, the Company entered into an agreement with Top Dynasty Investment Limited (“Top Dynasty”) pursuant to which the Group may use an aircraft owned by Top Dynasty for the purpose of transporting passengers for business of the Group. As Top Dynasty is a subsidiary of SOCL, the transactions contemplated under the agreement constitute continuing connected transactions of the Company under the Listing Rules.
The term of the agreement was extended to 31 December 2013 by a supplemental agreement dated 2 November 2010, further extended to 31 December 2016 by a second supplemental agreement dated 18 September 2013 and further extended to 31 December 2019 by a third supplemental agreement dated 23 November 2016. The fees payable under the agreement are calculated based on the actual travelling schedules of the passengers.
DIRECTORS’ REPORT
Shui On Land Limited118

Maximum annual fees payable by the Group to Top Dynasty and its affiliates under the agreement for each of the three financial years ending on 31 December 2019 should not exceed RMB18 million.
An amount of RMB9.0 million was paid and/or is payable by the Group to Top Dynasty and its affiliates for the use of aircraft during the year under review.
(2) CONTINUING CONNECTED TRANSACTIONS IN RESPECT OF THE PROVISION OF CONSTRUCTION SERVICES BY DALIAN YIDA DEVELOPMENT COMPANY LIMITED (“DALIAN YIDA”) (PREVIOUSLY BY YIDA GROUP CO., LTD. (“YIDA PRC”) AND ITS SUBSIDIARIES (“YIDA PRC GROUP”)) FOR DALIAN TIANDI
On 7 August 2008, Richcoast Group Limited (“Richcoast”) and Yida PRC entered into a framework construction agreement, pursuant to which Yida PRC Group may enter into contracts with Richcoast and its subsidiaries (“Richcoast Group”) to perform site formation and construction works, which include excavation and/or back filling, clearance of the construction site, removal of the construction garbage, setting up a drainage system and construction of the main structures on the land area constituting Dalian Tiandi, for a term expiring no later than 31 December 2010. The term of the agreement was subsequently extended to 31 December 2011 by a supplemental agreement dated 17 July 2009 and further extended to 31 December 2012 by a second supplemental agreement dated 26 August 2010.
On 23 November 2012, Richcoast and Yida PRC entered into the third supplemental agreement to the framework construction agreement to provide guidelines and basis of annual caps for the provision of construction services by Yida PRC Group to Richcoast Group for a further term of three financial years ended on 31 December 2015.
On 4 December 2015, Richcoast, Yida PRC and Dalian Yida entered into the fourth supplemental agreement to the framework construction agreement, whereby the parties agreed (i) the transfer of all the rights and obligations of Yida PRC under the framework construction agreement from Yida PRC to Dalian Yida with effect from 1 January 2016; and (ii) the further extension of the term of the framework construction agreement for three financial years ended on 31 December 2018. The maximum annual fees for the construction services provided by Dalian Yida and its subsidiaries (“Dalian Yida Group”) to Richcoast Group for each of the three financial years ended on 31 December 2018 should not exceed RMB600 million.
Prior to completion of the disposal of the Group’s interests in Richcoast (details were set out in the announcement of the Company dated 14 May 2018) (the “Disposal”), Dalian Yida, through its wholly-owned subsidiary, was a substantial shareholder of certain non-wholly owned subsidiaries of the Company for the purpose of the Listing Rules and therefore a connected person of the Company. Transactions contemplated under the framework construction agreement constituted continuing connected transactions of the Company under the Listing Rules.
Subsequent to completion of the Disposal on 14 May 2018, Dalian Yida ceased to be a connected person of the Company and transactions contemplated under the framework construction agreement thereafter ceased to be continuing connected transactions of the Company under the Listing Rules.
An amount of RMB64.9 million was paid and/or is payable by Richcoast Group to Dalian Yida Group for the construction services fees during the period from 1 January 2018 to 14 May 2018.
(3) CONTINUING CONNECTED TRANSACTIONS IN RESPECT OF THE PROVISION OF PROPERTY MANAGEMENT SERVICES BY FENG CHENG PROPERTY MANAGEMENT SERVICES LIMITED (“FENG CHENG”) AND ITS SUBSIDIARIES (“FENG CHENG GROUP”) TO RICHCOAST GROUP
On 7 December 2016, Richcoast entered into a framework services agreement with Feng Cheng pursuant to which Richcoast Group may enter into contracts with Feng Cheng Group for the provision of property management services by Feng Cheng Group to Richcoast Group during the period of three years from 1 January 2016 to 31 December 2018. Details of the transactions were set out in the announcement of the Company dated 7 December 2016.
Feng Cheng will discuss and negotiate the relevant service prices with the relevant parties and ensure that the final service prices will be within the then market rates. The information related to the market rates are obtained through online searches and from the relevant information provided by the related property companies.
Annual Report 2018 119

Maximum cap for the service fees payable by Richcoast Group to Feng Cheng Group under the framework services agreement for the financial year ended on 31 December 2018 should not exceed RMB49.8 million.
Prior to completion of the Disposal, Richcoast was a connected subsidiary of the Company for the purposes of the Listing Rules. Transactions contemplated under the framework services agreement therefore constituted continuing connected transactions of the Company under the Listing Rules.
Subsequent to completion of the Disposal on 14 May 2018, Richcoast ceased to be a connected subsidiary of the Company and transactions contemplated under the framework services agreement thereafter ceased to be continuing connected transactions of the Company under the Listing Rules.
An amount of RMB5.4 million was paid and/or is payable by Richcoast Group to Feng Cheng Group for the property management services fees during the period from 1 January 2018 to 14 May 2018.
(4) FURTHER SUPPLEMENTAL AGREEMENT IN RELATION TO THE DISPOSAL AND CONNECTED FINANCIAL ASSISTANCE
On 29 March 2018, Innovate Zone Group Limited (“Innovate Zone”) and SODH entered into a further supplemental agreement to the Disposal with Many Gain International Limited (“Many Gain”) and Yida China Holdings Limited (“Yida China”), pursuant to which the parties agreed to, among other things, (i) extend the long stop date from 31 March 2018 to 15 May 2018; and (ii) provision of financial assistance in an amount of RMB440 million from Innovate Zone or a designated member of the Group to Richcoast Group to facilitate certain debt restructuring exercise to be carried out by Richcoast Group before completion of the Disposal (“Completion”). Details of the transaction were set out in the announcement of the Company dated 29 March 2018.
Before Completion, Richcoast was an indirect non-wholly owned subsidiary of the Company for the purposes of the Listing Rules, and Many Gain, being a substantial shareholder of Richcoast, was therefore a connected person of the Company at the subsidiary level under the Listing Rules. Accordingly, provision of financial assistance to Richcoast Group constituted a connected transaction with a connected person at the subsidiary level for the Company.
(5) WAIVER OF NON-PAYMENT FEE OWED BY MAIN ZONE GROUP LIMITED (“MAIN ZONE”)
On 14 May 2018, Innovate Zone, Main Zone, Many Gain, Richcoast and other parties entered into a termination deed pursuant to which Innovate Zone agreed to waive certain fee due by Main Zone, a direct wholly-owned subsidiary of SOCAM, in an amount of RMB27,535,310 (the “SOCAM Non-payment Fee”). Details of the transaction were set out in the announcement of the Company dated 14 May 2018.
Mr. Lo, the Chairman of the Company and an executive Director, and his associates are together entitled to control the exercise of more than 30% of the voting power at general meetings of the Company and a connected person of the Company. Mr. Lo is also the chairman and an executive director of SOCAM, and he together with his associates are in control of more than 30% of the voting power at general meetings of SOCAM. As such, Main Zone, being a subsidiary of SOCAM, is an associate of Mr. Lo and a connected person of the Company. Waiver of the SOCAM Non-payment Fee constituted a connected transaction of the Company.
(6) ACQUISITION OF ALL THE REMAINING INTEREST HELD BY BSREP CXTD HOLDINGS L.P. (“BSREP CXTD”) IN CHINA XINTIANDI HOLDING COMPANY LIMITED (“CXTD HOLDING”)
On 28 December 2018, China Xintiandi Limited (a wholly-owned subsidiary of the Company) as purchaser, BSREP CXTD as seller and other parties entered into a sale and purchase agreement, pursuant to which BSREP CXTD agreed to sell, and China Xintiandi Limited conditionally agreed to acquire all the interest held by BSREP CXTD in CXTD Holding at a consideration of approximately RMB3,405,611,700. Details of the transaction were set out in the announcement of the Company dated 31 December 2018.
DIRECTORS’ REPORT
Shui On Land Limited120

Prior to completion of the acquisition, CXTD Holding was a non-wholly owned subsidiary of the Company of which BSREP CXTD held a minority interest. Therefore BSREP CXTD was a substantial shareholder of CXTD Holding and a connected person of the Company at the subsidiary level. Accordingly, the acquisition constituted a connected transaction of the Company.
Subsequent to completion of the acquisition on 15 March 2019, CXTD Holding became a wholly-owned subsidiary of the Company.
(7) FORMATION OF JOINT VENTURE
On 29 December 2018, Ally Victory Limited (“Shui On Investor”) and Oasis Power Management Limited (both being indirect wholly-owned subsidiaries of the Company), certain wholly-owned subsidiaries of Manulife Financial Corporation (“Manulife Investors”) and China Life Trustees Limited (“China Life Trustees”), entered into a framework agreement, pursuant to which the parties agreed to establish a joint venture to engage in investment in properties in the PRC and the management and administration of such properties (the “Joint Venture”). The targeted total capital commitment of the Joint Venture is US$1 billion and the currently agreed capital commitment of US$750 million which were made by Shui On Investor, Manulife Investors and China Life Trustees in proportion to their respective interest in the Joint Venture, being US$200 million, US$450 million and US$100 million.
On the same date, the Joint Venture established a joint venture company (the “JV Company”) to invest in an office building in Huangpu District, Shanghai, the PRC known as 5 Corporate Avenue. Pursuant to a shareholders’ deed of the JV Company entered into between Shui On Investor, Manulife Investors, China Life Trustees, SODH and the JV Company, SODH committed to invest in the JV Company in the amount of US$140,500,000.
Details of the transactions were set out in the announcement of the Company dated 31 December 2018.
As China Life Trustees is an associate of substantial shareholder of certain subsidiaries of the Company, it is a connected person at the subsidiary level of the Company under the Listing Rules. Therefore, the transactions contemplated under the framework agreement and the shareholders’ deed constituted connected transactions of the Company.
Pursuant to Rule 14A.55 of the Listing Rules, the Independent Non-executive Directors of the Company have reviewed the above continuing connected transactions referred to in items (1) to (3) and are of the opinion that the continuing connected transactions as stated in items (1) to (3) above have been entered into:
(i) in the ordinary and usual course of business of the Group;
(ii) on normal commercial terms; and
(iii) in accordance with the terms of the respective agreements which are fair and reasonable and in the interests of the Company’s shareholders as a whole.
The Company’s auditor was engaged to report on the Group’s continuing connected transactions in accordance with Hong Kong Standard on Assurance Engagements 3000 “Assurance Engagements Other Than Audits or Reviews of Historical Financial Information” and with reference to Practice Note 740 “Auditor’s Letter on Continuing Connected Transactions under the Hong Kong Listing Rules” issued by the Hong Kong Institute of Certified Public Accountants. The auditor has issued his unqualified letter containing his findings and conclusions in respect of the continuing connected transactions referred to in items (1) to (3) disclosed by the Group in the Annual Report in accordance with Rule 14A.56 of the Listing Rule. A copy of the auditor’s letter has been provided by the Company to the Stock Exchange.
Annual Report 2018 121

DIRECTORS’ SERVICE CONTRACTSNo Director proposed for re-election at the AGM has a service contract which is not determinable by the Group within one year without payment of compensation (other than statutory compensation).
DIRECTORS’ INTERESTS IN CONTRACTS OF SIGNIFICANCESave for the related party transactions disclosed in Note 45 to the consolidated financial statements, no contract to which the Company, or any of the subsidiaries of the Company was a party, and in which a Director of the Company had, at any time during the year, whether directly or indirectly, an interest, (being, in either case, in the opinion of the Directors, a contract of significance in relation to the Company’s business and in which the Director’s interest is or was material), subsisted at the end of the year or at any time during the year.
DIRECTORS’ INTERESTS IN COMPETING BUSINESSThe following Directors or their associates are considered to have interests in the businesses which compete or are likely to compete, either directly or indirectly, with the businesses of the Group pursuant to the Listing Rules as set out below:
Name of Director
Name of businesses which entity are considered to compete or likely to compete with the businesses of the Group
Description of the businesses of the entity which are considered to compete with the businesses of the Group
Nature of interest of the Director in the entity
Mr. Lo SOCL Property investment in the PRC Director and controlling shareholder
Mr. Lo SOCAM Property investment in the PRC Director and controlling shareholder
Mr. Lo Great Eagle Holdings Limited Property investment in the PRC Director
Ms. Lo SOCL Property investment in the PRC Director
Ms. Lo SOCAM Property investment in the PRC Director
Mr. Frankie Y. L. Wong SOCL Property investment in the PRC Director
Mr. Frankie Y. L. Wong SOCAM Property investment in the PRC Director
There is a deed of non-competition dated 30 May 2006 (the “Deed”) and entered into between Mr. Lo, SOCL and the Company pursuant to which Mr. Lo and SOCL have given certain undertakings to the Company, among others, that the Company is to be the flagship company of the Shui On Group (that is, SOCL and its subsidiaries and for the purpose of this section “Directors’ Interests in Competing Business”, excluding SOCAM and its subsidiaries) for the Shui On Group’s property development and investment business in the PRC and concerning the Shui On Group’s investment in future property development projects in the PRC. Such information has been disclosed in the Company’s prospectus dated 20 September 2006. In respect of the year ended 31 December 2018, the Company has received from each of Mr. Lo and SOCL a confirmation on compliance with the non-competition undertakings as contemplated under the Deed.
Save as aforesaid, as of the date of this report, none of the Directors of the Company has an interest in any business which competes or is likely to compete, either directly or indirectly, with the businesses of the Group.
DISCLOSURE UNDER RULE 13.21 OF THE LISTING RULES On 19 May 2014, a written agreement (the “2018 SODH Indenture”) was entered into between the Company as guarantor, SODH as issuer and DB Trustee (Hong Kong) Limited (“DB”) as trustee of the 2018 SODH Notes, pursuant to which the 2018 SODH Notes was issued. The 2018 SODH Indenture provides that upon the occurrence of a change of control (as defined in the 2018 SODH Indenture), the Company or SODH will make an offer to repurchase all outstanding 2018 SODH Notes, at a purchase price equal to 101% of the principal amount thereof plus accrued and unpaid interest, if any, at the date of repurchase. Details of the transaction were set out in the announcement of the Company dated 20 May 2014. SODH had fully repaid the principal amount of the outstanding 2018 SODH Notes together with the accrued and unpaid interest upon its maturity on 19 May 2018.
DIRECTORS’ REPORT
Shui On Land Limited122

On 10 June 2014, a written agreement (the “2019 SODH Indenture”) was entered into between the Company as guarantor, SODH as issuer and DB as trustee of the 2019 SODH Notes issued by SODH, pursuant to which the 2019 SODH Notes were issued. The 2019 SODH Indenture provides that upon the occurrence of a change of control (as defined in the 2019 SODH Indenture), the Company or SODH will make an offer to repurchase all outstanding 2019 SODH Notes, at a purchase price equal to 101% of the principal amount thereof plus accrued and unpaid interest, if any, at the date of repurchase. Details of the transaction were set out in the announcement of the Company dated 11 June 2014. On 28 December 2017, SODH partially redeemed USD300 million of the outstanding 2019 SODH Notes with the aggregate principal amount of USD550 million on a pro rata basis and paid the redemption price plus the accrued and unpaid interest. Upon such redemption, the outstanding principal amount of 2019 SODH Notes was USD250 million. On 22 January 2018, SODH further redeemed the outstanding 2019 SODH Notes with the aggregate principal amount of USD250 million and paid the redemption price plus the accrued and unpaid interest. Upon completion of the redemption, the 2019 SODH Notes were cancelled.
On 5 October 2016, a written agreement (the “2019 Indenture”) was entered into between the Company as guarantor, SODH as issuer and DB as trustee of the USD250 million in 4.375% senior notes due 2019 issued by SODH (the “2019 Notes”), pursuant to which the 2019 Notes were issued. The 2019 Indenture provides that upon the occurrence of a change of control (as defined in the 2019 Indenture), the Company or SODH will make an offer to repurchase all outstanding 2019 Notes, at a purchase price equal to 101% of the principal amount thereof plus accrued and unpaid interest, if any, at the date of repurchase. Details of the transaction were set out in the announcement of the Company dated 6 October 2016.
On 6 February 2017, a written agreement (the “2021 Indenture”) was entered into between the Company as guarantor, SODH as issuer and DB as trustee of the USD500 million in 5.70% senior notes due 2021 issued by SODH (the “2021 Notes”), pursuant to which the 2021 Notes were issued. The 2021 Indenture provides that upon the occurrence of a change of control (as defined in the 2021 Indenture), the Company or SODH will make an offer to repurchase all outstanding 2021 Notes, at a purchase price equal to 101% of the principal amount thereof plus accrued and unpaid interest, if any, at the date of repurchase. Details of the transaction were set out in the announcement of the Company dated 7 February 2017.
On 24 April 2017, SODH entered into a facility agreement with China CITIC Bank International Limited (the “Facility Agreement”) whereby SODH was granted a two-year term loan facility of HKD400 million (the “Facility”) for refinancing of the existing facility. Pursuant to the Facility Agreement, there is a requirement that Mr. Lo (i) beneficially owns at least 35% of the issued share capital of the Company and be the single largest shareholder of the Company; (ii) be the Chairman of the Company and (iii) maintains management control of the Company. Details of the transaction were set out in the announcement of the Company dated 5 May 2017.
On 20 June 2017, a written agreement (the “2022 Trust Deed”) was entered into between the Company as guarantor, SODH as issuer and DB as trustee of the USD600 million in 6.40% senior perpetual capital securities callable 2022 issued by SODH (the “Senior Perpetual Securities”), pursuant to which the Senior Perpetual Securities were issued. The 2022 Trust Deed provides that upon the occurrence of a change of control (as defined in the 2022 Trust Deed), SODH may at its option, redeem in whole but not in part the Senior Perpetual Securities at (i) their applicable early redemption amount (as defined in the 2022 Trust Deed) if such redemption occurs prior to 20 June 2022; or (ii) their principal amount, together with any distribution accrued to the date fixed for redemption (including any arrears of distribution and any additional distribution amount), if such a redemption occurs on or after 20 June 2022. Details of the transaction were set out in the announcement of the Company dated 20 June 2017.
On 2 March 2018, a written agreement (the “2021 CNH Indenture”) was entered into between the Company as guarantor, SODH as issuer and DB as trustee of the RMB1,600 million in 6.875% senior notes due 2021 issued by SODH (the “2021 CNH Notes”), pursuant to which the 2021 CNH Notes were issued. The 2021 CNH Indenture provides that upon the occurrence of a change of control (as defined in the 2021 CNH Indenture), the Company or SODH will make an offer to repurchase all outstanding 2021 CNH Notes, at a purchase price equal to 101% of the principal amount thereof plus accrued and unpaid interest, if any, at the date of repurchase. Details of the transaction were set out in the announcement of the Company dated 2 March 2018. On 19 April 2018, the Company and SODH entered into a purchase agreement with Standard Chartered Bank in connection with the further issue of RMB600 million in 6.875% senior notes due 2021 (the “Additional Notes”), consolidated and formed a single series with the 2021 CNH Notes. The Additional Notes were issued pursuant to the 2021 CNH Indenture. Details of the transaction are set out in the announcement of the Company dated 26 April 2018.
Any breach of the above obligations will cause a default in respect of the 2019 Notes, 2021 Notes, the Facility, the Senior Perpetual Securities and the 2021 CNH Notes may trigger cross defaults in other outstanding debts of the Group, in the aggregate amount of approximately RMB12,633 million at 31 December 2018.
Annual Report 2018 123

On 28 February 2019, a written agreement (the “2021 SODH Indenture”) was entered into between the Company as guarantor, SODH as issuer and DB as trustee of the USD500 million in 6.25% senior notes due 2021 issued by SODH (the “2021 SODH Notes”), pursuant to which the 2021 SODH Notes were issued. The 2021 SODH Indenture provides that upon the occurrence of a change of control (as defined in the 2021 SODH Indenture), the Company or SODH will make an offer to repurchase all outstanding 2021 SODH Notes, at a purchase price equal to 101% of the principal amount thereof plus accrued and unpaid interest, if any, at the date of repurchase. Details of the transaction were set out in the announcement of the Company dated 28 February 2019.
REMUNERATION POLICYThe remuneration policy of the Group to reward its employees is based on individual performance, qualifications and competence displayed.
The emoluments of the Directors of the Company are decided by the Remuneration Committee, having regard to the Company’s operating results, individual performance and comparable market statistics.
PROVIDENT AND RETIREMENT FUND SCHEMESDetails of the Group’s provident and retirement fund schemes are shown in Note 38 to the consolidated financial statements.
PRE-EMPTIVE RIGHTSThere are no provisions for pre-emptive rights under the Articles of Association, or the laws of Cayman Islands, which would oblige the Company to offer new shares on a pro rata basis to existing shareholders.
SUFFICIENCY OF PUBLIC FLOATThe Company has maintained a sufficient public float during the year ended 31 December 2018, as required under the Listing Rules.
CHARITABLE DONATIONSDuring the year, the Group made charitable donations amounting to RMB3.1 million (2017: RMB1.7 million).
MAJOR CUSTOMERS AND SUPPLIERS For the year ended 31 December 2018, approximately 62% of the Group sales were attributable to the five largest customers combined and the largest customer contributed approximately 60% of the Group sales. None of the Directors, their close associates or any shareholders of the Company holding more than 5% of the issued shares of the Company holds any interests in the five largest customers of the Group.
For the year ended 31 December 2018, the five largest construction contractors accounted for less than 30% of our total payments for construction services.
AUDITORA resolution will be submitted to the AGM to re-appoint Messrs. Deloitte Touche Tohmatsu as auditor of the Company.
On behalf of the Board
Vincent H. S. LOChairman
20 March 2019
DIRECTORS’ REPORT
Shui On Land Limited124

TO THE SHAREHOLDERS OF SHUI ON LAND LIMITED(incorporated in the Cayman Islands with limited liability)
OPINIONWe have audited the consolidated financial statements of Shui On Land Limited (the “Company”) and its subsidiaries (collectively referred to as the “Group”) set out on pages 132 to 254, which comprise the consolidated statement of financial position as at 31 December 2018, and the consolidated statement of profit or loss, consolidated statement of profit or loss and other comprehensive income, consolidated statement of changes in equity and consolidated statement of cash flows for the year then ended, and notes to the consolidated financial statements, including a summary of significant accounting policies.
In our opinion, the consolidated financial statements give a true and fair view of the consolidated financial position of the Group as at 31 December 2018, and of its consolidated financial performance and its consolidated cash flows for the year then ended in accordance with International Financial Reporting Standards (“IFRSs”) issued by the International Accounting Standard Board (the “IASB”) and have been properly prepared in compliance with the disclosure requirements of the Hong Kong Companies Ordinance.
BASIS FOR OPINIONWe conducted our audit in accordance with Hong Kong Standards on Auditing (“HKSAs”) issued by the Hong Kong Institute of Certified Public Accountants (the “HKICPA”). Our responsibilities under those standards are further described in the Auditor’s Responsibilities for the Audit of the Consolidated Financial Statements section of our report. We are independent of the Group in accordance with the HKICPA’s Code of Ethics for Professional Accountants (the “Code”), and we have fulfilled our other ethical responsibilities in accordance with the Code. We believe that the audit evidence we have obtained is sufficient and appropriate to provide a basis for our opinion.
KEY AUDIT MATTERSKey audit matters are those matters that, in our professional judgement, were of most significance in our audit of the consolidated financial statements of the current period. These matters were addressed in the context of our audit of the consolidated financial statements as a whole, and in forming our opinion thereon, and we do not provide a separate opinion on these matters.
Annual Report 2018 125
INDEPENDENT AUDITOR’S REPORT

TO THE SHAREHOLDERS OF SHUI ON LAND LIMITED – CONTINUED(incorporated in the Cayman Islands with limited liability)
KEY AUDIT MATTERS – CONTINUEDKey audit matter How our audit addressed the key audit matter
Valuation of investment properties stated at fair value
We identified the valuation of investment properties stated at fair value as a key audit matter due to the significance of the balance to the consolidated financial statements as a whole and the involvement of management’s judgement in determining the fair value.
As disclosed in note 13 to the consolidated financial statements, the investment properties are located in the People’s Republic of China (the “PRC”). The fair value of completed investment properties and investment properties under construction or development at fair value, amounted to RMB41,960 million and RMB1,391million, respectively as at 31 December 2018, which in aggregate represents 39% of the Group’s total assets. An increase in fair value of RMB970 million was recognised in the consolidated statement of profit or loss for the year then ended. In estimating the fair value of these investment properties stated at fair value, the Group engaged an independent qualified professional valuer to perform the valuation. As disclosed in note 4 to the consolidated financial statements, the management of the Group worked with the valuer to establish and determine the appropriate valuation technique and inputs for fair value measurements.
As disclosed in note 13 to the consolidated financial statements, for those completed investment properties, the key inputs in the income capitalisation approach are capitalisation rate and daily market rent while for those investment properties under construction or development that are measured at fair value, the key inputs in the market-based approach are gross development value, level adjustment and developer’s profit. Changes in these key inputs would result in changes in fair value.
Our procedures in relation to the valuation of investment properties stated at fair value included:
• Evaluating the competence, capabilities and objectivity of the independent qualified professional valuer;
• Obtaining an understanding of the valuation processes and significant assumptions from the management of the Group and the valuer to assess if the income capitalisation approach or the market-based approach adopted are appropriate or not;
• Evaluating the appropriateness of the estimations used by the management of the Group and the valuer, in particular, the valuation model and the capitalisation rate used by the management of the Group and the valuer; and
• Assessing the reasonableness of other key inputs used in the valuation model by comparing daily market rent, gross development value, level adjustment, developer’s profit and forecast construction costs to be incurred, on a sample basis, against current market data and entity-specific information.
INDEPENDENT AUDITOR’S REPORT
Shui On Land Limited126

TO THE SHAREHOLDERS OF SHUI ON LAND LIMITED – CONTINUED(incorporated in the Cayman Islands with limited liability)
KEY AUDIT MATTERS – CONTINUEDKey audit matter How our audit addressed the key audit matter
Valuation of liability arising from a rental guarantee arrangement
We identified the valuation of liability arising from a rental guarantee arrangement as a key audit matter as a significant judgement is required in determining the fair value.
As disclosed in notes 4 and 35 to the consolidated financial statements, the Group has liability arising from a rental guarantee arrangement in relation to the disposal of certain properties in prior years. As part of these disposals, the Group agreed to provide the purchasers of these properties with rental guarantees, which are based on the excess of a fixed rate of the consideration received by the Group over the net operating income to be generated by the properties. As at 31 December 2018, the Group has recognised liability arising from a rental guarantee arrangement amounting to RMB549 million, while no loss was recognised in the consolidated statement of profit or loss for the year ended arising from a rental guarantee arrangement.
In estimating the fair value of the liability arising from the rental guarantee arrangement, the Group engaged an independent qualified professional valuer to perform the valuation. As disclosed in note 4 to the consolidated financial statements, the management of the Group worked with the valuer to establish and determine the appropriate valuation technique and inputs for fair value measurements.
The determination of the fair value of such liability involves significant judgements and estimates. The key assumptions used in the valuation include the estimated office unit rental, the occupancy rate, risk-free rate, discount rate and expected expiry date.
Our procedures in relation to the valuation of liability arising from a rental guarantee arrangement included:
• Evaluating the competence, capabilities and objectivity of the valuer;
• Obtaining an understanding of the valuation processes and significant assumptions from the management of the Group and the valuer to assess if the approach adopted on valuing the liability arising from a rental guarantee arrangement is appropriate or not;
• Assessing the reasonableness of the key inputs used in the valuation model, including but not limited to comparing the forecast occupancy rate and estimated rental income per square meter of the properties against current market data and entity-specific historical information; and
• Performing an assessment of the accuracy of historical forecasts made by the management of the Group by comparing the actual and forecasted performance in the prior years and understanding any significant differences.
Annual Report 2018 127

TO THE SHAREHOLDERS OF SHUI ON LAND LIMITED – CONTINUED(incorporated in the Cayman Islands with limited liability)
KEY AUDIT MATTERS – CONTINUEDKey audit matter How our audit addressed the key audit matter
Valuation of a call option to buy back an investment property disposed of in previous years
We identified the valuation of a call option to buy back an investment property disposed of in previous years as a key audit matter due to the involvement of management's judgement in determining the fair value.
As disclosed in notes 4 and 34 to the consolidated financial statements, in previous years, the Group disposed of its entire equity interest in a subsidiary, and the related intercompany loans, that indirectly, owned 99% interest in an investment property located in Shanghai, the PRC, to an independent third party. In accordance with the relevant sale and purchase agreement, the Group was granted a call option to repurchase all the equity interest of the disposed subsidiary and the related shareholder's loans within two months before the fifth anniversary or the seventh anniversary of the completion of the disposal at a cash consideration that represented the original consideration plus a premium per annum.
As at 31 December 2018, the fair value of the call option to buy back an investment property amounted to RMB243 million, with the decrease in fair value of RMB99 million recognised in the financial line item of "other gains and losses" in the consolidated statement of profit or loss for the year then ended. In estimating the fair value of the call option, the Group engaged independent qualified professional valuers to perform the valuation on the underlying investment property and the call option. As disclosed in note 4 to the consolidated financial statements, the management of the Group worked with the valuers to establish and determine the appropriate valuation technique and inputs for fair value measurements.
Our procedures in relation to the valuation of a call option to buy back an investment property disposed of in previous years included:
• Evaluating the competence, capabilities and objectivity of the valuers;
• Obtaining an understanding of the valuation processes and significant assumptions from the management of the Group and the valuers to assess if the approaches adopted in valuing the call option are appropriate or not;
• Evaluating the appropriateness of the estimations used by the management of the Group and the valuers, in particular, the underlying assumptions and methodologies used by the management of the Group and the valuers; and
• Assessing the reasonableness of the key inputs used in the valuation model, including but not limited to comparing against the fair value of similar properties within the same locality and comparing the risk free rate used against current market data and entity-specific historical information.
INDEPENDENT AUDITOR’S REPORT
Shui On Land Limited128

TO THE SHAREHOLDERS OF SHUI ON LAND LIMITED – CONTINUED(incorporated in the Cayman Islands with limited liability)
OTHER INFORMATIONThe Directors of the Company are responsible for the other information. The other information comprises the information included in the annual report, but does not include the consolidated financial statements and our auditor's report thereon.
Our opinion on the consolidated financial statements does not cover the other information and we do not and will not express any form of assurance conclusion thereon.
In connection with our audit of the consolidated financial statements, our responsibility is to read the other information and, in doing so, consider whether the other information is materially inconsistent with the consolidated financial statements or our knowledge obtained in the audit or otherwise appears to be materially misstated. If, based on the work we have performed, we conclude that there is a material misstatement of this other information, we are required to report that fact. We have nothing to report in this regard.
RESPONSIBILITIES OF DIRECTORS AND THOSE CHARGED WITH GOVERNANCE FOR THE CONSOLIDATED FINANCIAL STATEMENTSThe Directors of the Company are responsible for the preparation of the consolidated financial statements that give a true and fair view in accordance with IFRSs issued by the IASB and the disclosure requirements of the Hong Kong Companies Ordinance, and for such internal control as the directors determine is necessary to enable the preparation of consolidated financial statements that are free from material misstatement, whether due to fraud or error.
In preparing the consolidated financial statements, the directors are responsible for assessing the Group's ability to continue as a going concern, disclosing, as applicable, matters related to going concern and using the going concern basis of accounting unless the directors either intend to liquidate the Group or to cease operations, or have no realistic alternative but to do so.
Those charged with governance are responsible for overseeing the Group's financial reporting process.
Annual Report 2018 129

TO THE SHAREHOLDERS OF SHUI ON LAND LIMITED – CONTINUED(incorporated in the Cayman Islands with limited liability)
AUDITOR'S RESPONSIBILITIES FOR THE AUDIT OF THE CONSOLIDATED FINANCIAL STATEMENTSOur objectives are to obtain reasonable assurance about whether the consolidated financial statements as a whole are free from material misstatement, whether due to fraud or error, and to issue an auditor's report that includes our opinion solely to you, as a body, in accordance with our agreed terms of engagement, and for no other purpose. We do not assume responsibility towards or accept liability to any other person for the contents of this report. Reasonable assurance is a high level of assurance, but is not a guarantee that an audit conducted in accordance with HKSAs will always detect a material misstatement when it exists. Misstatements can arise from fraud or error and are considered material if, individually or in the aggregate, they could reasonably be expected to influence the economic decisions of users taken on the basis of these consolidated financial statements.
As part of an audit in accordance with HKSAs, we exercise professional judgement and maintain professional skepticism throughout the audit. We also:
• Identify and assess the risks of material misstatement of the consolidated financial statements, whether due to fraud or error, design and perform audit procedures responsive to those risks, and obtain audit evidence that is sufficient and appropriate to provide a basis for our opinion. The risk of not detecting a material misstatement resulting from fraud is higher than for one resulting from error, as fraud may involve collusion, forgery, intentional omissions, misrepresentations, or the override of internal control.
• Obtain an understanding of internal control relevant to the audit in order to design audit procedures that are appropriate in the circumstances, but not for the purpose of expressing an opinion on the effectiveness of the Group's internal control.
• Evaluate the appropriateness of accounting policies used and the reasonableness of accounting estimates and related disclosures made by the directors.
• Conclude on the appropriateness of the directors' use of the going concern basis of accounting and, based on the audit evidence obtained, whether a material uncertainty exists related to events or conditions that may cast significant doubt on the Group's ability to continue as a going concern. If we conclude that a material uncertainty exists, we are required to draw attention in our auditor's report to the related disclosures in the consolidated financial statements or, if such disclosures are inadequate, to modify our opinion. Our conclusions are based on the audit evidence obtained up to the date of our auditor's report. However, future events or conditions may cause the Group to cease to continue as a going concern.
• Evaluate the overall presentation, structure and content of the consolidated financial statements, including the disclosures, and whether the consolidated financial statements represent the underlying transactions and events in a manner that achieves fair presentation.
INDEPENDENT AUDITOR’S REPORT
Shui On Land Limited130

TO THE SHAREHOLDERS OF SHUI ON LAND LIMITED – CONTINUED(incorporated in the Cayman Islands with limited liability)
AUDITOR’S RESPONSIBILITIES FOR THE AUDIT OF THE CONSOLIDATED FINANCIAL STATEMENTS – CONTINUED• Obtain sufficient appropriate audit evidence regarding the financial information of the entities or business activities within
the Group to express an opinion on the consolidated financial statements. We are responsible for the direction, supervision and performance of the group audit. We remain solely responsible for our audit opinion.
We communicate with those charged with governance regarding, among other matters, the planned scope and timing of the audit and significant audit findings, including any significant deficiencies in internal control that we identify during our audit.
We also provide those charged with governance with a statement that we have complied with relevant ethical requirements regarding independence, and to communicate with them all relationships and other matters that may reasonably be thought to bear on our independence, and where applicable, related safeguards.
From the matters communicated with those charged with governance, we determine those matters that were of most significance in the audit of the consolidated financial statements of the current period and are therefore the key audit matters. We describe these matters in our auditor's report unless law or regulation precludes public disclosure about the matter or when, in extremely rare circumstances, we determine that a matter should not be communicated in our report because the adverse consequences of doing so would reasonably be expected to outweigh the public interest benefits of such communication.
The engagement partner on the audit resulting in the independent auditor's report is Joseph Wing Ming Chan.
Deloitte Touche Tohmatsu Certified Public Accountants
Hong Kong 20 March 2019
Annual Report 2018 131

NOTES2018
RMB’million2017
RMB’million
Revenue
– The Company and its subsidiaries (the “Group”) 24,841 18,451
– Share of joint ventures 91 –
24,932 18,451
Revenue of the Group 5 24,841 18,451
Cost of sales (17,696) (10,593)
Gross profit 7,145 7,858
Other income 6 417 456
Selling and marketing expenses (254) (298)
General and administrative expenses (790) (826)
Operating profit 6,518 7,190
Gain on disposal of investment properties through disposal of subsidiaries 39 194 1,755
Increase in fair value of the remaining investment properties 13 970 518
Other gains and losses 6 (990) (595)
Share of gains (losses) of associates and joint ventures 61 (927)
Finance costs, inclusive of exchange differences 7 (1,716) (1,691)
Impairment losses, net of reversal 8 (122) –
Profit before taxation 8 4,915 6,250
Taxation 9 (2,229) (3,926)
Profit for the year 2,686 2,324
Attributable to:
Shareholders of the Company 1,906 1,669
Owners of perpetual capital securities 259 459
Owners of convertible perpetual capital securities 112 114
Non-controlling shareholders of subsidiaries 409 82
780 655
2,686 2,324
Earnings per share 12
– Basic RMB23.7 cents RMB20.8 cents
– Diluted RMB23.3 cents RMB20.7 cents
Shui On Land Limited132
CONSOLIDATED STATEMENT OF PROFIT OR LOSSFOR THE YEAR ENDED 31 DECEMBER 2018

NOTES2018
RMB’million2017
RMB’million
Profit for the year 2,686 2,324
Other comprehensive income (expense)
Items that may be subsequently reclassified to profit or loss:
Exchange difference arising on translation of foreign operations 1 6
Fair value adjustments on currency forward contracts designated as cash flow hedges 34 435 (532)
Reclassification from hedge reserve to profit or loss arising from currency forward contracts (504) 372
Share of other comprehensive income of a joint venture 22 –
Items that will not be reclassified to profit or loss:
Remeasurement of defined benefit obligations 38 (3) 10
Gain on revaluation of properties transferred from property, plant and equipment to investment properties, net of tax 4 6
Other comprehensive expense for the year (45) (138)
Total comprehensive income for the year 2,641 2,186
Total comprehensive income attributable to:
Shareholders of the Company 1,861 1,531
Owners of perpetual capital securities 259 459
Owners of convertible perpetual capital securities 112 114
Non-controlling shareholders of subsidiaries 409 82
780 655
2,641 2,186
Annual Report 2018 133
CONSOLIDATED STATEMENT OF PROFIT OR LOSS AND OTHER COMPREHENSIVE INCOMEFOR THE YEAR ENDED 31 DECEMBER 2018

NOTES2018
RMB’million2017
RMB’million
Non-current assets
Investment properties 13 49,100 47,989
Interests in associates 16 4,998 1,030
Interests in joint ventures 17 10,682 6,584
Property, plant and equipment 14 1,080 1,187
Accounts receivable, deposits and prepayments 18 1,349 1,088
Pledged bank deposits 21 1,796 2,134
Derivative financial instruments 34 243 342
Deferred tax assets 36 1,043 992
Other non-current assets 51 42
70,342 61,388
Current assets
Properties under development for sale 15 11,927 18,112
Properties held for sale 22 5,315 8,058
Accounts receivable, deposits and prepayments 18 3,115 7,520
Loans to/amounts due from associates 16 3,434 –
Loans to/amounts due from joint ventures 17 1,853 660
Amounts due from related companies 23 159 642
Contract assets 19 59 –
Amounts due from customers for contract work 20 – 126
Pledged bank deposits 21 492 19
Bank balances and cash 21 13,104 14,607
Derivative financial instruments 34 221 –
Prepaid taxes 229 –
39,908 49,744
Assets classified as held for sale 40 – 3,160
39,908 52,904
Current liabilities
Accounts payable, deposits received and accrued charges 25 10,002 10,369
Contract liabilities 26 6,017 –
Bank borrowings – due within one year 27 12,782 9,596
Senior notes 30 1,722 5,781
Receipts under securitisation arrangements 37 5 –
Tax liabilities 3,196 3,443
Loans from/amounts due to non-controlling shareholders of subsidiaries 24 1,718 1,659
Amount due to an associate 383 –
Amount due to a joint venture 384 –
Amounts due to related companies 23 15 347
Derivative financial instruments 34 – 214
Liability arising from a rental guarantee arrangement 35 169 177
36,393 31,586
Liabilities associated with assets classified as held for sale 40 – 8
36,393 31,594
Shui On Land Limited134
CONSOLIDATED STATEMENT OF FINANCIAL POSITIONAS OF 31 DECEMBER 2018

NOTES2018
RMB’million2017
RMB’million
Net current assets 3,515 21,310
Total assets less current liabilities 73,857 82,698
Non-current liabilities
Bank borrowings – due after one year 27 13,539 21,397
Senior notes 30 5,702 4,925
Receipts under securitisation arrangements 37 519 –
Liability arising from a rental guarantee arrangement 35 380 551
Deferred tax liabilities 36 6,490 6,645
Defined benefit liabilities 38 8 5
26,638 33,523
Capital and reserves
Share capital 28 146 146
Reserves 29 38,901 38,136
Equity attributable to shareholders of the Company 39,047 38,282
Convertible perpetual securities 31 – 1
Convertible perpetual capital securities 32 1,345 1,345
Perpetual capital securities 33 4,055 4,052
Non-controlling shareholders of subsidiaries 2,772 5,495
8,172 10,893
Total equity 47,219 49,175
Total equity and non-current liabilities 73,857 82,698
The consolidated financial statements on pages 132 to 254 were approved and authorised for issue by the Board of Directors on 20 March 2019 and are signed on its behalf by:
VINCENT H. S. LO DOUGLAS H. H. SUNGDIRECTOR DIRECTOR
Annual Report 2018 135
CONSOLIDATED STATEMENT OF FINANCIAL POSITIONAS OF 31 DECEMBER 2018
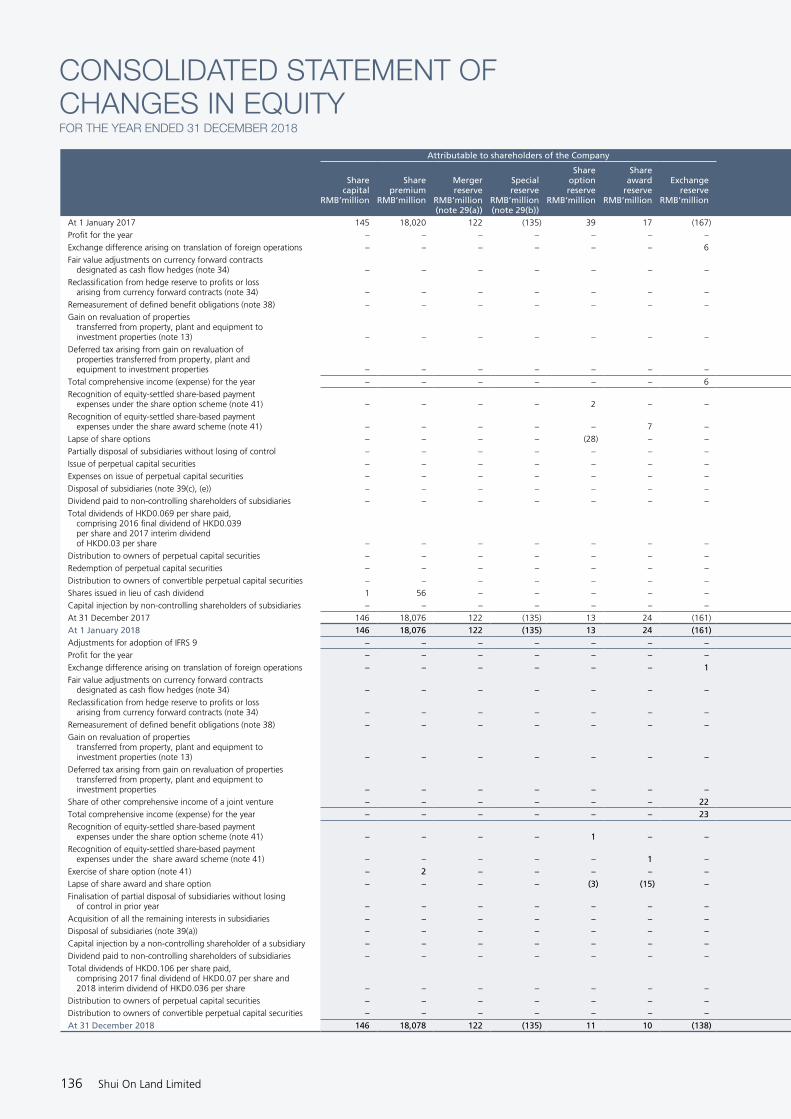
Attributable to shareholders of the Company Attributable to shareholders of the Company
Convertibleperpetualsecurities
RMB’million(note 31)
Convertibleperpetual
capitalsecurities
RMB’million(note 32)
Perpetualcapital
securitiesRMB’million
(note 33)
Non-controlling
shareholders of subsidiaries
RMB’millionSub-total
RMB’million Total
Sharecapital
RMB’million
Sharepremium
RMB’million
Mergerreserve
RMB’million(note 29(a))
Specialreserve
RMB’million(note 29(b))
Share optionreserve
RMB’million
Shareaward
reserveRMB’million
Hedgereserve
RMB’million
Otherreserves
RMB’million(note 29(c))
Propertyrevaluation
reserveRMB’million
Retainedearnings
RMB’millionSub-total
RMB’million
Exchangereserve
RMB’million
At 1 January 2017 145 18,020 122 (135) 39 17 (167) 122 654 78 18,555 37,450 1 1,345 3,046 4,414 8,806 46,256Profit for the year – – – – – – – – – – 1,669 1,669 – 114 459 82 655 2,324Exchange difference arising on translation of foreign operations – – – – – – 6 – – – – 6 – – – – – 6Fair value adjustments on currency forward contracts
designated as cash flow hedges (note 34) – – – – – – – (532) – – – (532) – – – – – (532)Reclassification from hedge reserve to profits or loss arising from currency forward contracts (note 34) – – – – – – – 372 – – – 372 – – – – – 372Remeasurement of defined benefit obligations (note 38) – – – – – – – – – – 10 10 – – – – – 10Gain on revaluation of properties
transferred from property, plant and equipment to investment properties (note 13) – – – – – – – – – 8 – 8 – – – – – 8
Deferred tax arising from gain on revaluation of properties transferred from property, plant and equipment to investment properties – – – – – – – – – (2) – (2) – – – – – (2)
Total comprehensive income (expense) for the year – – – – – – 6 (160) – 6 1,679 1,531 – 114 459 82 655 2,186Recognition of equity-settled share-based payment
expenses under the share option scheme (note 41) – – – – 2 – – – – – – 2 – – – – – 2Recognition of equity-settled share-based payment
expenses under the share award scheme (note 41) – – – – – 7 – – – – – 7 – – – – – 7Lapse of share options – – – – (28) – – – – – 28 – – – – – – – Partially disposal of subsidiaries without losing of control – – – – – – – – (14) – – (14) – – – 1,117 1,117 1,103Issue of perpetual capital securities – – – – – – – – – – – – – – 4,085 – 4,085 4,085Expenses on issue of perpetual capital securities – – – – – – – – – – – – – – (43) – (43) (43)Disposal of subsidiaries (note 39(c), (e)) – – – – – – – – – – – – – – – (78) (78) (78)Dividend paid to non-controlling shareholders of subsidiaries – – – – – – – – – – – – – – – (41) (41) (41)Total dividends of HKD0.069 per share paid,
comprising 2016 final dividend of HKD0.039 per share and 2017 interim dividend of HKD0.03 per share – – – – – – – – – – (475) (475) – – – – – (475)
Distribution to owners of perpetual capital securities – – – – – – – – – – – – – – (467) – (467) (467)Redemption of perpetual capital securities – – – – – – – – (276) – – (276) – – (3,028) – (3,028) (3,304)Distribution to owners of convertible perpetual capital securities – – – – – – – – – – – – – (114) – – (114) (114)Shares issued in lieu of cash dividend 1 56 – – – – – – – – – 57 – – – – – 57Capital injection by non-controlling shareholders of subsidiaries – – – – – – – – – – – – – – – 1 1 1At 31 December 2017 146 18,076 122 (135) 13 24 (161) (38) 364 84 19,787 38,282 1 1,345 4,052 5,495 10,893 49,175At 1 January 2018 146 18,076 122 (135) 13 24 (161) (38) 364 84 19,787 38,282 1 1,345 4,052 5,495 10,893 49,175Adjustments for adoption of IFRS 9 – – – – – – – – – – (91) (91) – – – – – (91)Profit for the year – – – – – – – – – – 1,906 1,906 – 112 259 409 780 2,686Exchange difference arising on translation of foreign operations – – – – – – 1 – – – – 1 – – – – – 1Fair value adjustments on currency forward contracts
designated as cash flow hedges (note 34) – – – – – – – 435 – – – 435 – – – – – 435Reclassification from hedge reserve to profits or loss arising from currency forward contracts (note 34) – – – – – – – (504) – – – (504) – – – – – (504)Remeasurement of defined benefit obligations (note 38) – – – – – – – – – – (3) (3) – – – – – (3)Gain on revaluation of properties
transferred from property, plant and equipment to investment properties (note 13) – – – – – – – – – 5 – 5 – – – – – 5
Deferred tax arising from gain on revaluation of properties transferred from property, plant and equipment to investment properties – – – – – – – – – (1) – (1) – – – – – (1)
Share of other comprehensive income of a joint venture – – – – – – 22 – – – – 22 – – – – – 22Total comprehensive income (expense) for the year – – – – – – 23 (69) – 4 1,903 1,861 – 112 259 409 780 2,641Recognition of equity-settled share-based payment
expenses under the share option scheme (note 41) – – – – 1 – – – – – – 1 – – – – – 1Recognition of equity-settled share-based payment
expenses under the share award scheme (note 41) – – – – – 1 – – – – – 1 – – – – – 1Exercise of share option (note 41) – 2 – – – – – – – – – 2 – – – – – 2Lapse of share award and share option – – – – (3) (15) – – – – 18 – – – – – – –Finalisation of partial disposal of subsidiaries without losing
of control in prior year – – – – – – – – 86 – – 86 – – – – – 86Acquisition of all the remaining interests in subsidiaries – – – – – – – – (381) – – (381) (1) – – (3,024) (3,025) (3,406)Disposal of subsidiaries (note 39(a)) – – – – – – – – – – – – – – – (14) (14) (14)Capital injection by a non-controlling shareholder of a subsidiary – – – – – – – – – – – – – – – 1 1 1Dividend paid to non-controlling shareholders of subsidiaries – – – – – – – – – – – – – – – (95) (95) (95)Total dividends of HKD0.106 per share paid,
comprising 2017 final dividend of HKD0.07 per share and 2018 interim dividend of HKD0.036 per share – – – – – – – – – – (714) (714) – – – – – (714)
Distribution to owners of perpetual capital securities – – – – – – – – – – – – – – (256) – (256) (256)Distribution to owners of convertible perpetual capital securities – – – – – – – – – – – – – (112) – – (112) (112)At 31 December 2018 146 18,078 122 (135) 11 10 (138) (107) 69 88 20,903 39,047 – 1,345 4,055 2,772 8,172 47,219
Shui On Land Limited136
CONSOLIDATED STATEMENT OF CHANGES IN EQUITYFOR THE YEAR ENDED 31 DECEMBER 2018

Attributable to shareholders of the Company Attributable to shareholders of the Company
Convertibleperpetualsecurities
RMB’million(note 31)
Convertibleperpetual
capitalsecurities
RMB’million(note 32)
Perpetualcapital
securitiesRMB’million
(note 33)
Non-controlling
shareholders of subsidiaries
RMB’millionSub-total
RMB’million Total
Sharecapital
RMB’million
Sharepremium
RMB’million
Mergerreserve
RMB’million(note 29(a))
Specialreserve
RMB’million(note 29(b))
Share optionreserve
RMB’million
Shareaward
reserveRMB’million
Hedgereserve
RMB’million
Otherreserves
RMB’million(note 29(c))
Propertyrevaluation
reserveRMB’million
Retainedearnings
RMB’millionSub-total
RMB’million
Exchangereserve
RMB’million
At 1 January 2017 145 18,020 122 (135) 39 17 (167) 122 654 78 18,555 37,450 1 1,345 3,046 4,414 8,806 46,256Profit for the year – – – – – – – – – – 1,669 1,669 – 114 459 82 655 2,324Exchange difference arising on translation of foreign operations – – – – – – 6 – – – – 6 – – – – – 6Fair value adjustments on currency forward contracts designated as cash flow hedges (note 34) – – – – – – – (532) – – – (532) – – – – – (532)Reclassification from hedge reserve to profits or loss arising from currency forward contracts (note 34) – – – – – – – 372 – – – 372 – – – – – 372Remeasurement of defined benefit obligations (note 38) – – – – – – – – – – 10 10 – – – – – 10Gain on revaluation of properties transferred from property, plant and equipment to investment properties (note 13) – – – – – – – – – 8 – 8 – – – – – 8Deferred tax arising from gain on revaluation of properties transferred from property, plant and equipment to investment properties – – – – – – – – – (2) – (2) – – – – – (2)Total comprehensive income (expense) for the year – – – – – – 6 (160) – 6 1,679 1,531 – 114 459 82 655 2,186Recognition of equity-settled share-based payment expenses under the share option scheme (note 41) – – – – 2 – – – – – – 2 – – – – – 2Recognition of equity-settled share-based payment expenses under the share award scheme (note 41) – – – – – 7 – – – – – 7 – – – – – 7Lapse of share options – – – – (28) – – – – – 28 – – – – – – – Partially disposal of subsidiaries without losing of control – – – – – – – – (14) – – (14) – – – 1,117 1,117 1,103Issue of perpetual capital securities – – – – – – – – – – – – – – 4,085 – 4,085 4,085Expenses on issue of perpetual capital securities – – – – – – – – – – – – – – (43) – (43) (43)Disposal of subsidiaries (note 39(c), (e)) – – – – – – – – – – – – – – – (78) (78) (78)Dividend paid to non-controlling shareholders of subsidiaries – – – – – – – – – – – – – – – (41) (41) (41)Total dividends of HKD0.069 per share paid, comprising 2016 final dividend of HKD0.039 per share and 2017 interim dividend of HKD0.03 per share – – – – – – – – – – (475) (475) – – – – – (475)Distribution to owners of perpetual capital securities – – – – – – – – – – – – – – (467) – (467) (467)Redemption of perpetual capital securities – – – – – – – – (276) – – (276) – – (3,028) – (3,028) (3,304)Distribution to owners of convertible perpetual capital securities – – – – – – – – – – – – – (114) – – (114) (114)Shares issued in lieu of cash dividend 1 56 – – – – – – – – – 57 – – – – – 57Capital injection by non-controlling shareholders of subsidiaries – – – – – – – – – – – – – – – 1 1 1At 31 December 2017 146 18,076 122 (135) 13 24 (161) (38) 364 84 19,787 38,282 1 1,345 4,052 5,495 10,893 49,175At 1 January 2018 146 18,076 122 (135) 13 24 (161) (38) 364 84 19,787 38,282 1 1,345 4,052 5,495 10,893 49,175Adjustments for adoption of IFRS 9 – – – – – – – – – – (91) (91) – – – – – (91)Profit for the year – – – – – – – – – – 1,906 1,906 – 112 259 409 780 2,686Exchange difference arising on translation of foreign operations – – – – – – 1 – – – – 1 – – – – – 1Fair value adjustments on currency forward contracts designated as cash flow hedges (note 34) – – – – – – – 435 – – – 435 – – – – – 435Reclassification from hedge reserve to profits or loss arising from currency forward contracts (note 34) – – – – – – – (504) – – – (504) – – – – – (504)Remeasurement of defined benefit obligations (note 38) – – – – – – – – – – (3) (3) – – – – – (3)Gain on revaluation of properties transferred from property, plant and equipment to investment properties (note 13) – – – – – – – – – 5 – 5 – – – – – 5Deferred tax arising from gain on revaluation of properties transferred from property, plant and equipment to investment properties – – – – – – – – – (1) – (1) – – – – – (1)Share of other comprehensive income of a joint venture – – – – – – 22 – – – – 22 – – – – – 22Total comprehensive income (expense) for the year – – – – – – 23 (69) – 4 1,903 1,861 – 112 259 409 780 2,641Recognition of equity-settled share-based payment expenses under the share option scheme (note 41) – – – – 1 – – – – – – 1 – – – – – 1Recognition of equity-settled share-based payment expenses under the share award scheme (note 41) – – – – – 1 – – – – – 1 – – – – – 1Exercise of share option (note 41) – 2 – – – – – – – – – 2 – – – – – 2Lapse of share award and share option – – – – (3) (15) – – – – 18 – – – – – – –Finalisation of partial disposal of subsidiaries without losing of control in prior year – – – – – – – – 86 – – 86 – – – – – 86Acquisition of all the remaining interests in subsidiaries – – – – – – – – (381) – – (381) (1) – – (3,024) (3,025) (3,406)Disposal of subsidiaries (note 39(a)) – – – – – – – – – – – – – – – (14) (14) (14)Capital injection by a non-controlling shareholder of a subsidiary – – – – – – – – – – – – – – – 1 1 1Dividend paid to non-controlling shareholders of subsidiaries – – – – – – – – – – – – – – – (95) (95) (95)Total dividends of HKD0.106 per share paid, comprising 2017 final dividend of HKD0.07 per share and 2018 interim dividend of HKD0.036 per share – – – – – – – – – – (714) (714) – – – – – (714) Distribution to owners of perpetual capital securities – – – – – – – – – – – – – – (256) – (256) (256)Distribution to owners of convertible perpetual capital securities – – – – – – – – – – – – – (112) – – (112) (112)At 31 December 2018 146 18,078 122 (135) 11 10 (138) (107) 69 88 20,903 39,047 – 1,345 4,055 2,772 8,172 47,219
Annual Report 2018 137

2018RMB’million
2017RMB’million
Operating activitiesProfit before taxation 4,915 6,250Adjustments for:
Depreciation of property, plant and equipment 98 108Net foreign exchange difference 127 (42)Share of (gains) losses of associates and joint ventures (61) 927Gain on disposal of property, plant and equipment – (5)Finance costs, inclusive of exchange differences 1,716 1,691Interest income (385) (405)Gain on disposal of investment properties
through disposal of subsidiaries (194) (1,755)Gain on disposal of investment properties (11) (156)Increase in fair value of the remaining investment properties (970) (518)Decrease in fair value of call option 99 118Fair value gain on other derivative financial instruments – (64)Impairment loss on property, plant and equipment – 61Impairment loss on properties held for sale 54 29Impairment loss on investment property under
development at cost 380 –Impairment loss of investment in a joint venture 376 – Impairment losses, net of reversal 122 – Loss on early redemption of senior notes 78 235Fair value loss on remeasurement of liability under
a rental guarantee arrangement – 458Share option expenses 1 2Share award expenses 1 7Release of prepaid lease payments 1 1Remeasurement of defined benefit liabilities 3 (10)
Operating cash flows before movements in working capital 6,350 6,932Decrease in accounts receivable, deposits and prepayments 5,286 5,483Decrease in contract assets 67 – Increase in inventories of properties (784) (25)Decrease in amounts due from related companies 101 –Decrease in amounts due to related companies – (129)Increase in amounts due from joint ventures (31) – Increase in amount due to a joint venture 384 – (Increase) decrease in amounts due from associates (194) 20Increase in amount due to an associate 383 – Increase in amounts due from customers for contract work – (29)Decrease in value-added tax payable (315) (215)Increase in contract liabilities 3,128 –Decrease in accounts payable, deposits received and accrued charges (738) (5,766)Cash generated from operations 13,637 6,271Tax paid (2,277) (2,490)Net cash from operating activities 11,360 3,781
Investing activitiesInterest received 382 220Purchase of property, plant and equipment (36) (112)Additions to investment properties (377) (543)
Shui On Land Limited138
CONSOLIDATED STATEMENT OF CASH FLOWSFOR THE YEAR ENDED 31 DECEMBER 2018

NOTES2018
RMB’million2017
RMB’millionProceeds from disposal of investment properties, net of transaction costs 44 668Proceeds from disposal of assets classified as held for sale 1,135 811Advances to associates (1,974) (329)Repayments from associates – 612Repayments from joint ventures 670 100Advances to related companies (48) (72)Repayments from related companies 430 218Net cash inflow on disposals of investment properties through disposal of subsidiaries 39(c),(d),(e),(f) 97 5,167Withdrawal of pledged bank deposits 1,330 2,469Placement of pledged bank deposits (1,465) (143)Acquisition of a subsidiary and shareholders’ loans 39(b) (542) (2,743)Deposits for acquisition of a subsidiary 18 – (630)Deposits for investment in an associate 18 (1,041) – Capital injection on formation of a joint venture (3,513) – Loans to joint ventures (1,352) (2,660)Payments made under a rental guarantee arrangement (179) (329)Others (7) 20Net cash (used in) from investing activities (6,446) 2,724
Financing activitiesCapital injected by a non-controlling shareholder of a subsidiary 1 1Exercise of share option 2 – Receipts under securitisation arrangements 525 – Expenditure incurred on receipts under securitisation arrangements (1) – Drawdown of bank borrowings 14,680 13,494Repayment of bank borrowings (14,326) (9,196)Settlement for derivative financial instruments designated as cash flow hedge (324) (767)Issue of senior notes 30 2,183 3,379Repayment of senior notes 30 (5,761) (9,484)Expenditure incurred on issue of senior notes 30 (4) (10)Issue of perpetual capital securities 33 – 4,085Expenditure incurred on issue of perpetual capital securities 33 – (43)Interest paid (2,030) (3,052)Advances from related companies – 85Repayments to related companies (307) – Payment of dividends (714) (418)Distribution to owners of convertible perpetual capital securities (112) (114)Distribution to owners of perpetual capital securities (256) (467)Redemption of perpetual capital securities – (3,304)Dividend payment to non-controlling shareholders of subsidiaries (95) (41)Proceeds from disposals of partial equity interest of subsidiaries 30 1,300Loans from a non-controlling shareholder of subsidiaries – 1,647Net cash used in financing activities (6,509) (2,905)Net (decrease) increase in cash and cash equivalents (1,595) 3,600Cash and cash equivalents at the beginning of the year 14,607 11,088Effect of foreign exchange rate changes 92 (81)Cash and cash equivalents at the end of the year 13,104 14,607Analysis of the balances of cash and cash equivalentsBank balances and cash 13,104 14,607
Annual Report 2018 139
CONSOLIDATED STATEMENT OF CASH FLOWSFOR THE YEAR ENDED 31 DECEMBER 2018

1. GENERAL Shui On Land Limited (the “Company”) was incorporated on 12 February 2004 as an exempted company with limitedliability in the Cayman Islands under the Companies Law, Chapter 22 (Law 3 of 1961, as consolidated and revised) of theCayman Islands. The shares of the Company have been listed on The Stock Exchange of Hong Kong Limited (the “StockExchange”) with effect from 4 October 2006. The Directors of the Company consider that its parent and ultimate holdingcompany is Shui On Company Limited (“SOCL”), a private limited liability company incorporated in the British VirginIslands (“BVI”) and its ultimate controlling party is Mr. Vincent H.S. Lo, who is also the Chairman and Executive Director ofthe Company.
The addresses of the registered office and principal place of business of the Company are disclosed in the CorporateInformation section of the annual report.
The Company acts as an investment holding company. The principal activities of the Company’s major subsidiaries are setout in note 51. The Company and its subsidiaries are hereinafter collectively referred to as the Group.
The consolidated financial statements are presented in Renminbi (“RMB”), which is also the functional currency of theCompany.
2. APPLICATION OF NEW AND AMENDMENTS TO INTERNATIONALFINANCIAL REPORTING STANDARDS ("IFRSs")NEW AND AMENDMENTS TO IFRSs THAT ARE MANDATORILY EFFECTIVE FOR THECURRENT YEAR
The Group has applied the following new and amendments to IFRSs and interpretation for the first time in the currentyear:
IFRS 9 Financial Instruments
IFRS 15 Revenue from Contracts with Customers and the related Amendments
IFRIC 22 Foreign Currency Transactions and Advance Consideration
Amendments to IFRS 2 Classification and Measurement of Share-based Payment Transactions
Amendments to IFRS 4 Applying IFRS 9 Financial Instruments with IFRS 4 Insurance Contracts
Amendments to IAS 28 As part of the Annual Improvements to IFRSs 2014 – 2016 Cycle
Amendments to IAS 40 Transfers of Investment Property
The new and amendments to IFRSs and interpretation have been applied in accordance with the relevant transition provisions in the respective standards and amendments which results in changes in accounting policies, amounts reported and/or disclosures as described below.
Shui On Land Limited140
NOTES TO THE CONSOLIDATED FINANCIAL STATEMENTSFOR THE YEAR ENDED 31 DECEMBER 2018
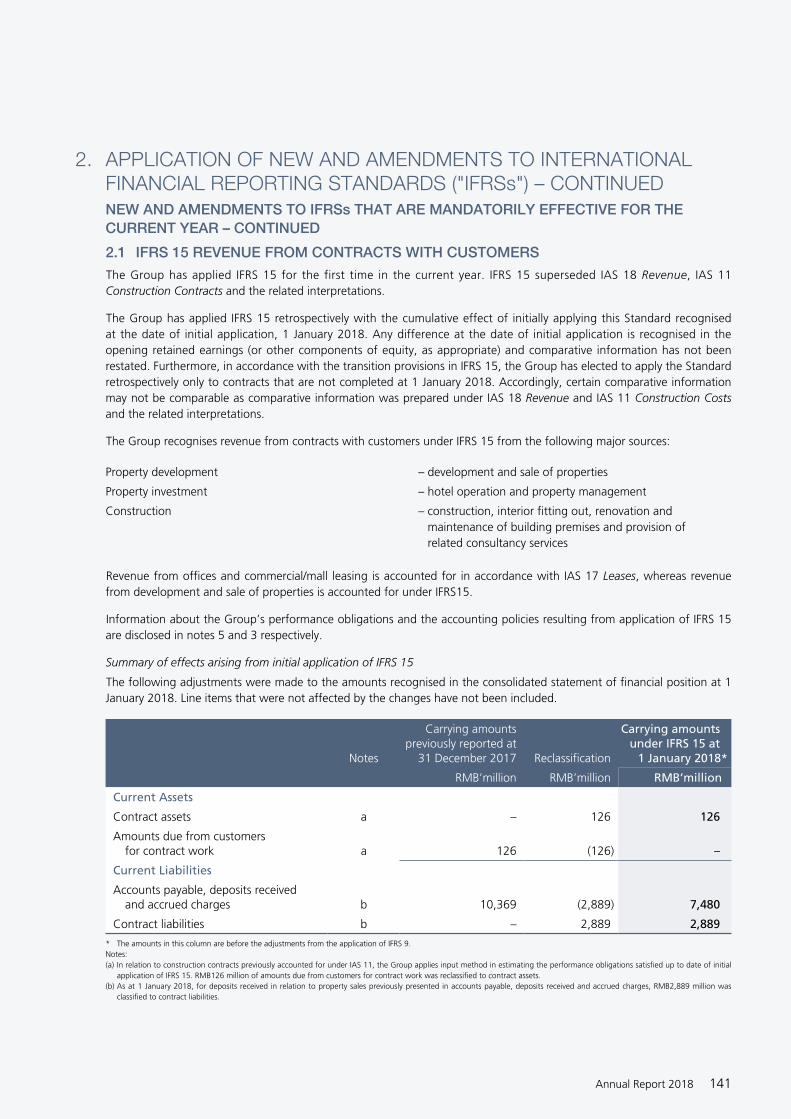
2. APPLICATION OF NEW AND AMENDMENTS TO INTERNATIONAL FINANCIAL REPORTING STANDARDS ("IFRSs") – CONTINUEDNEW AND AMENDMENTS TO IFRSs THAT ARE MANDATORILY EFFECTIVE FOR THE CURRENT YEAR – CONTINUED
2.1 IFRS 15 REVENUE FROM CONTRACTS WITH CUSTOMERS
The Group has applied IFRS 15 for the first time in the current year. IFRS 15 superseded IAS 18 Revenue, IAS 11 Construction Contracts and the related interpretations.
The Group has applied IFRS 15 retrospectively with the cumulative effect of initially applying this Standard recognised at the date of initial application, 1 January 2018. Any difference at the date of initial application is recognised in the opening retained earnings (or other components of equity, as appropriate) and comparative information has not been restated. Furthermore, in accordance with the transition provisions in IFRS 15, the Group has elected to apply the Standard retrospectively only to contracts that are not completed at 1 January 2018. Accordingly, certain comparative information may not be comparable as comparative information was prepared under IAS 18 Revenue and IAS 11 Construction Costs and the related interpretations.
The Group recognises revenue from contracts with customers under IFRS 15 from the following major sources:
Property development – development and sale of properties
Property investment – hotel operation and property management
Construction – construction, interior fitting out, renovation and maintenance of building premises and provision of related consultancy services
Revenue from offices and commercial/mall leasing is accounted for in accordance with IAS 17 Leases, whereas revenue from development and sale of properties is accounted for under IFRS15.
Information about the Group’s performance obligations and the accounting policies resulting from application of IFRS 15 are disclosed in notes 5 and 3 respectively.
Summary of effects arising from initial application of IFRS 15
The following adjustments were made to the amounts recognised in the consolidated statement of financial position at 1 January 2018. Line items that were not affected by the changes have not been included.
Notes
Carrying amounts previously reported at
31 December 2017 Reclassification
Carrying amounts under IFRS 15 at
1 January 2018*
RMB’million RMB’million RMB’million
Current Assets
Contract assets a – 126 126
Amounts due from customers for contract work a 126 (126) –
Current Liabilities
Accounts payable, deposits received and accrued charges b 10,369 (2,889) 7,480
Contract liabilities b – 2,889 2,889
* The amounts in this column are before the adjustments from the application of IFRS 9.Notes:(a) In relation to construction contracts previously accounted for under IAS 11, the Group applies input method in estimating the performance obligations satisfied up to date of initial
application of IFRS 15. RMB126 million of amounts due from customers for contract work was reclassified to contract assets.(b) As at 1 January 2018, for deposits received in relation to property sales previously presented in accounts payable, deposits received and accrued charges, RMB2,889 million was
classified to contract liabilities.
Annual Report 2018 141

2. APPLICATION OF NEW AND AMENDMENTS TO INTERNATIONAL FINANCIAL REPORTING STANDARDS ("IFRSs") – CONTINUEDNEW AND AMENDMENTS TO IFRSs THAT ARE MANDATORILY EFFECTIVE FOR THE CURRENT YEAR – CONTINUED
2.1 IFRS 15 REVENUE FROM CONTRACTS WITH CUSTOMERS – CONTINUED
The following tables summarise the impacts of applying IFRS 15 on the Group’s consolidated statement of financial position as at 31 December 2018 and its consolidated statement of cash flows for the current year for each of the line items affected. Line items that were not affected by the changes have not been included.
Impact on the consolidated statement of financial position
As reportedRMB’million
AdjustmentsRMB’million
Amounts without application of
IFRS 15RMB’million
Current Assets
Contract assets 59 (59) –
Amounts due from customers for contract work – 59 59
Current Liabilities
Accounts payable, deposits received and accrued charges 10,002 6,017 16,019
Contract liabilities 6,017 (6,017) –
Impact on the consolidated statement of cash flows
As reportedRMB’million
AdjustmentsRMB’million
Amounts without application of
IFRS 15RMB’million
Operating Activities
Decrease in amounts due from customers for contract work – 67 67
Decrease/(increase) in contract assets 67 (67) –
(Decrease)/increase in accounts payable, deposits received and accrued charges (738) 3,128 2,390
Increase/(decrease) in contract liabilities 3,128 (3,128) –
NOTES TO THE CONSOLIDATED FINANCIAL STATEMENTS
FOR THE YEAR ENDED 31 DECEMBER 2018
Shui On Land Limited142

2. APPLICATION OF NEW AND AMENDMENTS TO INTERNATIONAL FINANCIAL REPORTING STANDARDS ("IFRSs") – CONTINUEDNEW AND AMENDMENTS TO IFRSs THAT ARE MANDATORILY EFFECTIVE FOR THE CURRENT YEAR – CONTINUED
2.2 IFRS 9 FINANCIAL INSTRUMENTS
In the current year, the Group has applied IFRS 9 Financial Instruments and the related consequential amendments to other IFRSs. IFRS 9 introduces new requirements for 1) the classification and measurement of financial assets and financial liabilities, 2) expected credit losses (“ECL”) for financial assets and other items (for example, contract assets and accounts receivable) and 3) general hedge accounting.
The Group has applied IFRS 9 in accordance with the transition provisions set out in IFRS 9. i.e. applied the classification and measurement requirements (including impairment under ECL model) retrospectively to instruments that have not been derecognised as at 1 January 2018 (date of initial application) and has not applied the requirements to instruments that have already been derecognised as at 1 January 2018. The difference between carrying amounts as at 31 December 2017 and the carrying amounts as at 1 January 2018 are recognised in the opening retained earnings and other components of equity, without restating comparative information.
Accordingly, certain comparative information may not be comparable as comparative information was prepared under IAS 39 Financial Instruments: Recognition and Measurement.
In addition, the Group applied the hedge accounting prospectively.
Accounting policies resulting from application of IFRS 9 are disclosed in note 3.
Summary of effects arising from initial application of IFRS 9
The table below illustrates the classification and measurement of financial assets and financial liabilities and other items subject to ECL under IFRS 9 and IAS 39 at the date of initial application, 1 January 2018.
Financialassets at fair value through
profit or loss (“FVTPL”)*
RMB’million
Financial assets
at amortisedcost
(previouslyclassified as
loans and receivables)RMB’million
Contractassets
RMB’million
Financialliabilities
atamortised
costRMB’million
Financialliabilities at
FVTPL**
RMB’million
Retainedearnings
RMB’million
Closing balance at 31 December 2017
– IAS 39 342 21,497 – 50,408 942 19,787
Effect arising from initial application of IFRS 15 – – 126 – – –
Remeasurement
Impairment under ECL model (a) – (91) – – – (91)
Opening balance at 1 January 2018 342 21,406 126 50,408 942 19,696
* Balances represent derivative financial instruments** Balances represent derivative financial instruments and liability arising from a rental guarantee arrangement
Annual Report 2018 143

2. APPLICATION OF NEW AND AMENDMENTS TO INTERNATIONAL FINANCIAL REPORTING STANDARDS ("IFRSs") – CONTINUEDNEW AND AMENDMENTS TO IFRSs THAT ARE MANDATORILY EFFECTIVE FOR THE CURRENT YEAR – CONTINUED
2.2 IFRS 9 FINANCIAL INSTRUMENTS – CONTINUED
(a) Impairment under ECL model
The Group applies the IFRS 9 simplified approach to measure ECL which uses a lifetime ECL for all contract assets and accounts receivable. To measure the ECL, contract assets and accounts receivable have been assessed individually for debtors with significant balances or grouped based on shared credit risk characteristics. The contract assets relate to unbilled work in progress and have substantially the same risk characteristics as the accounts receivable for the same types of contracts. The Group has therefore concluded that the expected loss rates for the accounts receivable are a reasonable approximation of the loss rates for the contract assets.
ECL for other financial assets at amortised cost mainly comprise of bank balances and cash, pledged bank deposits, other receivables, amounts due from related companies, loans to/amounts due from joint ventures and loans to/amounts due from associates are measured on 12-month ECL (“12m ECL”) basis and there had been no significant increase in credit risk since initial recognition.
As at 1 January 2018, the additional credit loss allowance of RMB91 million has been recognised against retained earnings. The additional loss allowance is charged against the respective assets.
All loss allowances for financial assets and contract assets as at 31 December 2017 reconcile to the opening loss allowance as at 1 January 2018 is as follows:
Other financial assets at
amortised costRMB’million
Contract assets RMB’million
Accounts receivable
RMB’million
At 31 December 2017
– IAS 39 – N/A –
Amounts remeasured through opening retained earnings – – 91
At 1 January 2018 – – 91
(b) Hedge accounting
The Group applies the hedge accounting requirements of IFRS 9 prospectively. At the date of the initial application, hedging relationships that qualified for hedge accounting in accordance with IAS 39 are regarded as continuing hedging relationship if all qualifying criteria under IFRS 9 are met, after considering any rebalancing of the hedging relationship on transition.
NOTES TO THE CONSOLIDATED FINANCIAL STATEMENTS
FOR THE YEAR ENDED 31 DECEMBER 2018
Shui On Land Limited144

2. APPLICATION OF NEW AND AMENDMENTS TO INTERNATIONAL FINANCIAL REPORTING STANDARDS ("IFRSs") – CONTINUEDNEW AND AMENDMENTS TO IFRSs THAT ARE MANDATORILY EFFECTIVE FOR THE CURRENT YEAR – CONTINUED
2.3 AMENDMENTS TO IAS 40 TRANSFERS OF INVESTMENT PROPERTY
The amendments clarify that a transfer to, or from, investment property necessitates an assessment of whether a property meets, or has ceased to meet, the definition of investment property, supported by evidence that a change in use has occurred. The amendments further clarify that situations other than the ones listed in IAS 40 may evidence a change in use, and that a change in use is possible for properties under construction (i.e. a change in use is not limited to completed properties). At the date of initial application, the Group assessed the classification of certain properties based on conditions existing at that date. There is no impact to the classification at 1 January 2018.
2.4 IMPACTS ON OPENING CONSOLIDATED STATEMENT OF FINANCIAL POSITION ARISING FROM THE APPLICATION OF ALL NEW STANDARDS
As a result of the changes in the Group’s accounting policies above, the opening consolidated statement of financial position had to be restated. The following table shows the adjustments recognised for each of the lines affected. Line items that were not affected by the changes have not been included.
31 December 2017 (Audited)
RMB’millionIFRS 15
RMB’millionIFRS 9
RMB’million
1 January 2018 (Restated)
RMB’million
Current Assets
Contract assets – 126 – 126
Amounts due from customers for contract work 126 (126) – –
Accounts receivable, deposits and prepayments 7,520 – (91) 7,429
Current Liabilities
Accounts payable, deposits received and accrued charges 10,369 (2,889) – 7,480
Contract liabilities – 2,889 – 2,889
Capital and Reserves
Reserves 38,136 – (91) 38,045
Note:For the purpose of reporting cash flows from operating activities under indirect method for the year ended 31 December 2018, movements in working capital have been computed based on opening statement of financial position as at 1 January 2018 as disclosed above.
Annual Report 2018 145

2. APPLICATION OF NEW AND AMENDMENTS TO INTERNATIONAL FINANCIAL REPORTING STANDARDS ("IFRSs") – CONTINUEDNEW AND AMENDMENTS TO IFRSs IN ISSUE BUT NOT YET EFFECTIVE
The Group has not early applied the following new and amendments to IFRSs that have been issued but are not yet effective:
IFRS 16 Leases1
IFRS 17 Insurance Contracts3
IFRIC 23 Uncertainty over Income Tax Treatments1
Amendments to IFRS 3 Definition of a Business4
Amendments to IFRS 9 Prepayment Features with Negative Compensation1
Amendments to IFRS 10 and IAS 28 Sale or Contribution of Assets between an Investor and its Associate or Joint Venture2
Amendments to IAS 1 and IAS 8 Definition of Material5
Amendments to IAS 19 Plan Amendment, Curtailment or Settlement1
Amendments to IAS 28 Long-term Interests in Associates and Joint Ventures1
Amendments to IFRSs Annual Improvements to IFRS Standards 2015 – 2017 Cycle1
1 Effective for annual periods beginning on or after 1 January 20192 Effective for annual periods beginning on or after a date to be determined3 Effective for annual periods beginning on or after 1 January 20214 Effective for business combinations and asset acquisitions for which the acquisition date is on or after the beginning of the first annual period beginning on or after 1 January 20205 Effective for annual periods beginning on or after 1 January 2020
Except for the new and amendments to IFRSs mentioned below, the Directors of the Company anticipate that the application of all other new and amendments to IFRSs will have no material impact on the consolidated financial statements in the foreseeable future.
IFRS 16 LEASES
IFRS 16 introduces a comprehensive model for the identification of lease arrangements and accounting treatments for both lessors and lessees. IFRS 16 will supersede IAS 17 Leases and the related interpretations when it becomes effective.
IFRS 16 distinguishes lease and service contracts based on whether an identified asset is controlled by a customer. Distinctions of operating leases and finance leases are removed for lessee accounting; and is replaced by a model where a right-of-use asset and a corresponding liability must be recognised for all leases by lessees, except for short-term leases and leases of low value assets.
The right-of-use asset is initially measured at cost and subsequently measured at cost (subject to certain exceptions) less accumulated depreciation and impairment losses, adjusted for any remeasurement of the lease liability. The lease liability is initially measured at the present value of the lease payments that are not paid at that date. Subsequently, the lease liability is adjusted for interest and lease payments, as well as the impact of lease modifications, amongst others. For the classification of cash flows, the Group currently presents upfront prepaid lease payments as investment cash flows in relation to leasehold lands for owned use and those classified as investment properties while other operating lease payments are presented as operating cash flows. Upon application of IFRS 16, lease payments in relation to lease liability will be allocated into principal and an interest portion which will be presented as financing cash flows.
NOTES TO THE CONSOLIDATED FINANCIAL STATEMENTS
FOR THE YEAR ENDED 31 DECEMBER 2018
Shui On Land Limited146

2. APPLICATION OF NEW AND AMENDMENTS TO INTERNATIONAL FINANCIAL REPORTING STANDARDS ("IFRSs") – CONTINUEDNEW AND AMENDMENTS TO IFRSs IN ISSUE BUT NOT YET EFFECTIVE – CONTINUED
IFRS 16 LEASES – CONTINUED
Under IAS 17, the Group has already recognised prepaid lease payments for leasehold lands where the Group is a lessee. The application of IFRS 16 may result in potential changes in classification of these assets depending on whether the Group presents right-of-use assets separately or within the same line item at which the corresponding underlying assets would be presented if they were owned.
Other than certain requirements which are also applicable to lessor, IFRS 16 substantially carries forward the lessor accounting requirements in IAS 17, and continues to require a lessor to classify a lease either as an operating lease or a finance lease.
Furthermore, extensive disclosures are required by IFRS 16.
As at 31 December 2018, the Group has non-cancellable operating lease commitments of RMB620 million as disclosed in note 43. A preliminary assessment indicates that these arrangements will meet the definition of a lease. Upon application of IFRS 16, the Group will recognise a right-of-use asset and a corresponding liability in respect of all these leases unless they qualify for low value or short-term leases.
In addition, the Group currently considers refundable rental deposits paid of RMB3 million and refundable rental deposit received of RMB640 million as rights and obligations under leases to which IAS 17 applies. Based on the definition of lease payment under IFRS 16, such deposits are not payments relating to the right to use the underlying assets, accordingly, the carrying amounts of such deposits may be adjusted to the amortised cost and such adjustments are considered as advance lease payments. Adjustments to refundable rental deposits paid would be included in the carrying amount of right-of-use assets. Adjustments to refundable rental deposits received would be considered as advance lease payment.
The application of new requirements may result in changes in measurement, presentation and disclosure as indicated above.
3. SIGNIFICANT ACCOUNTING POLICIES The consolidated financial statements have been prepared in accordance with IFRSs issued by the International Accounting Standards Board. In addition, the consolidated financial statements include applicable disclosures required by the Rules Governing the Listing of Securities on the Stock Exchange (the “Listing Rules”) and by the Hong Kong Companies Ordinance.
The consolidated financial statements have been prepared on the historical cost basis except for certain investment properties and derivative financial instruments which are measured at fair values at the end of each reporting period, as explained in the accounting policies set out below.
Historical cost is generally based on the fair value of the consideration given in exchange for goods and services.
Fair value is the price that would be received to sell an asset or paid to transfer a liability in an orderly transaction between market participants at the measurement date, regardless of whether that price is directly observable or estimated using another valuation technique. In estimating the fair value of an asset or a liability, the Group takes into account the characteristics of the asset or liability if market participants would take those characteristics into account when pricing the asset or liability at the measurement date. Fair value for measurement and/or disclosure purposes in these consolidated financial statements is determined on such a basis, except for share-based payment transactions that are within the scope of IFRS 2 Share-based Payment, leasing transactions that are within the scope of IAS 17 Leases, and measurements that have some similarities to fair value but are not fair value, such as net realisable value in IAS 2 Inventories or value in use in IAS 36 Impairment of Assets.
Annual Report 2018 147

3. SIGNIFICANT ACCOUNTING POLICIES – CONTINUEDA fair value measurement of a non-financial asset takes into account a market participant’s ability to generate economic benefits by using the asset in its highest and best use or by selling it to another market participant that would use the asset in its highest and best use.
In addition, for financial reporting purposes, fair value measurements are categorised into Level 1, 2 or 3 based on the degree to which the inputs to the fair value measurements are observable and the significance of the inputs to the fair value measurement in its entirety, which are described as follows:
• Level 1 inputs are quoted prices (unadjusted) in active markets for identical assets or liabilities that the entity can access at the measurement date;
• Level 2 inputs are inputs, other than quoted prices included within Level 1, that are observable for the asset or liability, either directly or indirectly; and
• Level 3 inputs are unobservable inputs for the asset or liability.
The significant accounting policies adopted are set out below.
BASIS OF CONSOLIDATION
The consolidated financial statements incorporate the financial statements of the Company and entities controlled by the Company and its subsidiaries. Control is achieved when the Company:
• has power over the investee;
• is exposed, or has rights, to variable returns from its involvement with the investee; and
• has the ability to use its power to affect its returns.
The Group reassesses whether or not it controls an investee if facts and circumstances indicate that there are changes to one or more of the three elements of control listed above.
Consolidation of a subsidiary begins when the Group obtains control over the subsidiary and ceases when the Group loses control of the subsidiary. Specifically, income and expenses of a subsidiary acquired or disposed of during the year are included in the consolidated statement of profit or loss from the date the Group gains control until the date when the Group ceases to control the subsidiary.
Profit or loss and each item of other comprehensive income are attributed to the owners of the Company and to the non-controlling interests. Total comprehensive income of subsidiaries is attributed to the owners of the Company and to the non-controlling interests even if this results in the non-controlling interests having a deficit balance.
When necessary, adjustments are made to the financial statements of subsidiaries to bring their accounting policies in line with the Group’s accounting policies.
All intragroup assets and liabilities, equity, income, expenses and cash flows relating to transactions between members of the Group are eliminated in full on consolidation.
NOTES TO THE CONSOLIDATED FINANCIAL STATEMENTS
FOR THE YEAR ENDED 31 DECEMBER 2018
Shui On Land Limited148

3. SIGNIFICANT ACCOUNTING POLICIES – CONTINUED CHANGES IN THE GROUP’S OWNERSHIP INTERESTS IN EXISTING SUBSIDIARIES
Changes in the Group’s ownership interests in existing subsidiaries that do not result in the Group losing control over the subsidiaries are accounted for as equity transactions. The carrying amounts of the Group’s relevant components of equity including reserves and the non-controlling interests are adjusted to reflect the changes in their relative interests in the subsidiaries. Any difference between the amount by which the non-controlling interests are adjusted after reattribution of the relevant equity component, and the fair value of the consideration paid or received is recognised directly in equity and attributed to shareholders of the Company.
When the Group loses control of a subsidiary, a gain or loss is recognised in profit or loss and is calculated as the difference between (i) the aggregate of the fair value of the consideration received and the fair value of any retained interest and (ii) the carrying amount of the assets (including goodwill), and liabilities of the subsidiary attributable to the shareholders of the Company. All amounts previously recognised in other comprehensive income in relation to that subsidiary are accounted for as if the Group had directly disposed of the related assets or liabilities of the subsidiary (i.e. reclassified to profit or loss or transferred to another category of equity as specified/permitted by applicable IFRSs). The fair value of any investment retained in the former subsidiary at the date when control is lost is regarded as the fair value on initial recognition for subsequent accounting under IAS 39 or, when applicable, the cost on initial recognition of an investment in an associate or a joint venture.
BUSINESS COMBINATIONS
Acquisitions of businesses, other than business combination under common control, are accounted for using the acquisition method. The consideration transferred in a business combination is measured at fair value, which is calculated as the sum of the acquisition-date fair values of the assets transferred by the Group, liabilities incurred by the Group to the former owners of the acquiree and the equity interests issued by the Group in exchange for control of the acquiree. Acquisition-related costs are generally recognised in profit or loss as incurred.
At the acquisition date, the identifiable assets acquired and the liabilities assumed are recognised at their fair value, except that:
• deferred tax assets or liabilities, and assets or liabilities related to employee benefit arrangements are recognised and measured in accordance with IAS 12 Income Taxes and IAS 19 Employee Benefits respectively;
• liabilities or equity instruments related to share-based payment arrangements of the acquiree or share-based payment arrangements of the Group entered into to replace share-based payment arrangements of the acquiree are measured in accordance with IFRS 2 Share-based Payment at the acquisition date (see the accounting policy below); and
• assets (or disposal groups) that are classified as held for sale in accordance with IFRS 5 Non-current Assets Held for Sale and Discontinued Operations are measured in accordance with that standard.
Goodwill is measured as the excess of the sum of the consideration transferred, the amount of any non-controlling interests in the acquiree, and the fair value of the acquirer’s previously held equity interest in the acquiree (if any) over the net amount of the identifiable assets acquired and the liabilities assumed as at acquisition date. If, after re-assessment, the net of the acquisition-date amounts of the identifiable assets acquired and liabilities assumed exceeds the sum of the consideration transferred, the amount of any non-controlling interests in the acquiree and the fair value of the acquirer’s previously held interest in the acquiree (if any), the excess is recognised immediately in profit or loss as a bargain purchase gain.
Non-controlling interests that are present ownership interests and entitle their holders to a proportionate share of the relevant subsidiary’s net assets in the event of liquidation may be initially measured either at fair value or at the non-controlling interests’ proportionate share of the recognised amounts of the acquiree’s identifiable net assets. The choice of measurement basis is made on a transaction-by-transaction basis. Other types of non-controlling interests are measured at their fair value.
Annual Report 2018 149

3. SIGNIFICANT ACCOUNTING POLICIES – CONTINUED INVESTMENT PROPERTIES
Investment properties are properties held to earn rentals and/or for capital appreciation. Investment properties include land held for undetermined future use, which is regarded as held for capital appreciation purpose.
Investment properties are initially measured at cost, including any directly attributable expenditure. Cost incurred for investment properties under construction or development comprises development expenditure including professional charges directly attributable to the development and borrowing costs, and these costs are capitalised as part of the carrying amount of the investment properties under construction or development during the development period.
Subsequent to initial recognition, investment properties, including completed investment properties and certain investment properties under construction or development, are measured at their fair values. Gains or losses arising from changes in the fair value of investment properties are included in profit or loss for the period in which they arise.
In circumstances where the fair values of investment properties under construction or development are not reliably determinable, such investment properties under construction or development are measured at cost less impairment, if any, until when their fair values become reliably determinable, which occur upon finalisation of the development plan, at which point in time the land and relocation costs and construction costs attributable to the investment property portion is reliably determinable.
An investment property is derecognised upon disposal or when the investment property is permanently withdrawn from use and no future economic benefits are expected from its disposals. Any gain or loss arising on derecognition of the property (calculated as the difference between the net disposal proceeds and the carrying amount of the property) is included in the profit or loss in the period in which the property is derecognised.
Properties under construction or development are transferred from inventories to investment properties when and only when there is evidence that substantiates the change in use. Properties held for sale are transferred to investment properties at the inception of operating lease. At the date of transfer, any difference between the fair value of the properties and their carrying amount is recognised in profit or loss.
Owner-occupied properties are transferred to investment properties when and only when there is a change in use evidenced by end of owner occupation. At the date of transfer, the properties are measured at their fair value, with any gain being recognised in other comprehensive income and accumulated in “property revaluation reserve”, which will not be reclassified to profit or loss at the time of disposal (it will instead be transferred to retained earnings at the time of disposal), while with any loss being recognised in profit or loss.
Transfer from investment properties to property, plant and equipment will be made when there is a change in use evidenced by commencement of owner occupation. The fair value at the date of transfer becomes the deemed cost for subsequent accounting as property, plant and equipment.
Transfer from investment properties under development to properties under development for sale will be made when there is a change in use evidenced by the commencement of development with a view to sale for a transfer from investment properties to properties under development for sale.
NOTES TO THE CONSOLIDATED FINANCIAL STATEMENTS
FOR THE YEAR ENDED 31 DECEMBER 2018
Shui On Land Limited150

3. SIGNIFICANT ACCOUNTING POLICIES – CONTINUED CURRENT ASSETS CLASSIFIED AS HELD FOR SALE
Current assets and disposal groups are classified as held for sale if their carrying amount will be recovered principally through a sale transaction rather than through continuing use. This condition is regarded as met only when the asset (or disposal group) is available for immediate sale in its present condition subject only to terms that are usual and customary for sales of such asset (or disposal group) and its sale is highly probable. Management must be committed to the sale, which should be expected to qualify for recognition as a completed sale within one year from the date of classification.
When the Group is committed to a sale plan involving loss of control of a subsidiary, all of the assets and liabilities of that subsidiary are classified as held for sale when the criteria described above are met, regardless of whether the Group will retain a non-controlling interest in its former subsidiary after the sale.
Assets (and disposal groups) classified as held for sale are measured at the lower of their previous carrying amount and fair value less costs to sell.
Investment properties classified as held for sale are measured using the fair value model in accordance with IAS 40 Investment Property.
PROPERTY, PLANT AND EQUIPMENT
Property, plant and equipment, other than hotels under development, are stated in the consolidated statement of financial position at cost less subsequent accumulated depreciation and accumulated impairment losses, if any.
Hotels under development held for owner’s operation are stated at cost less subsequent accumulated impairment losses, if any. Cost comprises development expenditure including professional charges directly attributable to the development and borrowing cost capitalised during the development period. Depreciation is recognised when hotels are available for intended use and continues until they are derecognised.
Depreciation is recognised so as to write off the cost of items of property, plant and equipment, other than hotels under development, over their estimated useful lives and after taking into account their estimated residual value, using the straight-line method. The estimated useful lives, residual values and depreciation method are reviewed at the end of each reporting period, with the effect of any changes in estimate accounted for on a prospective basis.
An item of property, plant and equipment is derecognised upon disposal or when no future economic benefits are expected to arise from the continued use of the asset. Any gain or loss arising on the disposal or retirement of an item of property, plant and equipment is determined as the difference between the sales proceeds and the carrying amount of the asset and is recognised in profit or loss.
PROPERTIES UNDER DEVELOPMENT FOR SALE
Properties under development which are intended to be held for sale are carried at lower of cost and net realisable value and are shown as current assets. Cost includes the costs of land (including relocation costs), development expenditure incurred and, where appropriate, borrowing costs capitalised during construction period. Net realisable value is determined based on prevailing market conditions.
Properties under development for sales are transferred to properties held for sale upon completion of development activities, which is when the relevant completion certificates are issued by the respective government authorities.
PROPERTIES HELD FOR SALE
Properties held for sale are stated at the lower of cost and net realisable value. Cost is determined by apportionment of the total land and development costs attributable to the properties held for sale. Net realisable value is determined based on prevailing market conditions.
Annual Report 2018 151

3. SIGNIFICANT ACCOUNTING POLICIES – CONTINUED INVESTMENTS IN ASSOCIATES AND JOINT VENTURES
An associate is an entity over which the Group has significant influence. Significant influence is the power to participate in the financial and operating policy decisions of the investee but is not control or joint control over those policies.
A joint venture is a joint arrangement whereby the parties that have joint control of the arrangement have rights to the net assets of the joint arrangement. Joint control is the contractually agreed sharing of control of an arrangement, which exists only when decisions about the relevant activities require unanimous consent of the parties sharing control.
The results and assets and liabilities of associates and joint ventures are incorporated in these consolidated financial statements using the equity method of accounting. The financial statements of associates and joint ventures used for equity accounting purposes are prepared using uniform accounting policies as those of the Group for like transactions and events in similar circumstances. Under the equity method, an investment in an associate or a joint venture is initially recognised in the consolidated statement of financial position at cost and adjusted thereafter to recognise the Group’s share of the profit or loss and other comprehensive income of the associate or joint venture. When the Group’s share of losses of an associate or a joint venture exceeds the Group’s interest in that associate or joint venture (which includes any long-term interests that, in substance, form part of the Group’s net investment in the associate or joint venture), the Group discontinues recognising its share of further losses. Additional losses are recognised only to the extent that the Group has incurred legal or constructive obligations or made payments on behalf of the associate or joint venture.
An investment in an associate or a joint venture is accounted for using the equity method from the date on which the investee becomes an associate or a joint venture.
The Group assesses whether there is an objective evidence that the interest in an associate or a joint venture may be impaired. When any objective evidence exists, the entire carrying amount of the investment (including goodwill) is tested for impairment in accordance with IAS 36 Impairment of Assets as a single asset by comparing its recoverable amount (higher of value in use and fair value less costs of disposal) with its carrying amount. Any impairment loss recognised forms part of the carrying amount of the investment. Any reversal of that impairment loss is recognised in accordance with IAS 36 to the extent that the recoverable amount of the investment subsequently increases.
When a group entity transacts with an associate or a joint venture of the Group, profits and losses resulting from the transactions with the associate or joint venture are recognised in the Group’s consolidated financial statements only to the extent of interests in the associate or joint venture that are not related to the Group.
IMPAIRMENT ON TANGIBLE ASSETS
At the end of the reporting period, the Group reviews the carrying amounts of its tangible assets to determine whether there is any indication that those assets have suffered an impairment loss. If any such indication exists, the recoverable amount of the asset is estimated in order to determine the extent of the impairment loss, if any. When it is not possible to estimate the recoverable amount of an individual asset, the Group estimates the recoverable amount of the cash-generating unit to which the asset belongs. When a reasonable and consistent basis of allocation can be identified, corporate assets are also allocated to individual cash-generating units, or otherwise they are allocated to the smallest group of cash-generating units for which a reasonable and consistent allocation basis can be identified.
Recoverable amount is the higher of fair value less costs of disposal and value in use. In assessing value in use, the estimated future cash flows are discounted to their present value using a pre-tax discount rate that reflects current market assessments of the time value of money and the risks specific to the asset for which the estimates of future cash flows have not been adjusted.
If the recoverable amount of an asset (or a cash-generating unit) is estimated to be less than its carrying amount, the carrying amount of the asset (or a cash-generating unit) is reduced to its recoverable amount. An impairment loss is recognised immediately in profit or loss.
Where an impairment loss subsequently reverses, the carrying amount of the asset (or cash-generating unit) is increased to the revised estimate of its recoverable amount, but so that the increased carrying amount does not exceed the carrying amount that would have been determined had no impairment loss been recognised for the asset (or a cash-generating unit) in prior years. A reversal of an impairment loss is recognised immediately in profit or loss.
NOTES TO THE CONSOLIDATED FINANCIAL STATEMENTS
FOR THE YEAR ENDED 31 DECEMBER 2018
Shui On Land Limited152

3. SIGNIFICANT ACCOUNTING POLICIES – CONTINUED FINANCIAL INSTRUMENTS
Financial assets and financial liabilities are recognised when a group entity becomes a party to the contractual provisions of the instrument.
Financial assets and financial liabilities are initially measured at fair value. Transaction costs that are directly attributable to the acquisition or issue of financial assets and financial liabilities (other than financial assets or financial liabilities at FVTPL) are added to or deducted from the fair value of the financial assets or financial liabilities, as appropriate, on initial recognition. Transaction costs directly attributable to the acquisition of financial assets or financial liabilities at fair value through profit or loss are recognised immediately in profit or loss.
The effective interest method is a method of calculating the amortised cost of a financial asset or financial liability and of allocating interest income and interest expense over the relevant period. The effective interest rate is the rate that exactly discounts estimated future cash receipts and payments (including all fees and points paid or received that form an integral part of the effective interest rate, transaction costs and other premiums or discounts) through the expected life of the financial asset or financial liability, or, where appropriate, a shorter period, to the net carrying amount on initial recognition.
Financial assets
Classification and subsequent measurement of financial assets (upon application of IFRS 9 in accordance with transitions in note 2)
Financial assets that meet the following conditions are subsequently measured at amortised cost:
• the financial asset is held within a business model whose objective is to collect contractual cash flows; and
• the contractual terms give rise on specified dates to cash flows that are solely payments of principal and interest on the principal amount outstanding.
Financial assets that meet the following conditions are subsequently measured at fair value through other comprehensive income (“FVTOCI”):
• the financial assets is held within a business model whose objective is achieved by both collecting contractual cash flows and selling; and
• the contractual terms give rise on specified dates to cash flows that are solely payments of principal and interest on the principal amount outstanding.
All other financial assets are subsequently measured at FVTPL.
In addition, the Group may irrevocably designate a financial asset that is required to be measured at the amortised cost or FVTOCI as measured at FVTPL if doing so eliminates or significantly reduces an accounting mismatch.
Annual Report 2018 153

3. SIGNIFICANT ACCOUNTING POLICIES – CONTINUED FINANCIAL INSTRUMENTS – CONTINUED
Financial assets – continued
Impairment of financial assets (upon application of IFRS 9 with transitions in accordance with note 2)
(i) Amortised cost and interest income
Interest income is recognised using the effective interest method for financial assets measured subsequently at amortised. Interest income is calculated by applying the effective interest rate to the gross carrying amount of a financial asset, except for financial assets that have subsequently become credit-impaired. For financial assets that have subsequently become credit-impaired, interest income is recognised by applying the effective interest rate to the amortised cost of the financial asset from the next reporting period. If the credit risk on the credit-impaired financial instrument improves so that the financial asset is no longer credit-impaired, interest income is recognised by applying the effective interest rate to the gross carrying amount of the financial asset from the beginning of the reporting period following the determination that the asset is no longer credit impaired.
The Group recognises a loss allowance for ECL on financial assets and other items which are subject to impairment under IFRS 9. The amount of ECL is updated at each reporting date to reflect changes in credit risk since initial recognition.
Lifetime ECL represents the ECL that will result from all possible default events over the expected life of the relevant instrument. In contrast, 12m ECL represents the portion of lifetime ECL that is expected to result from default events that are possible within 12 months after the reporting date. Assessment are done based on the Group’s historical credit loss experience, adjusted for factors that are specific to the debtors, general economic conditions and an assessment of both the current conditions at the reporting date as well as the forecast of future conditions.
The Group always recognises lifetime ECL for accounts receivable and contract assets. The ECL on these assets are assessed individually for debtors with significant balances. The remaining balances are assessed collectively using a provision matrix with appropriate groupings.
For all other instruments, the Group measures the loss allowance equal to 12m ECL, unless when there has been a significant increase in credit risk since initial recognition, the Group recognises lifetime ECL. The assessment of whether lifetime ECL should be recognised is based on significant increases in the likelihood or risk of a default occurring since initial recognition.
NOTES TO THE CONSOLIDATED FINANCIAL STATEMENTS
FOR THE YEAR ENDED 31 DECEMBER 2018
Shui On Land Limited154

3. SIGNIFICANT ACCOUNTING POLICIES – CONTINUED FINANCIAL INSTRUMENTS – CONTINUED
Financial assets – continued
Impairment of financial assets (upon application of IFRS 9 with transitions in accordance with note 2) – continued
(ii) Significant increase in credit risk
In assessing whether the credit risk has increased significantly since initial recognition, the Group compares the risk of a default occurring on the financial instrument as at the reporting date with the risk of a default occurring on the financial instrument as at the date of initial recognition. In making this assessment, the Group considers both quantitative and qualitative information that is reasonable and supportable, including historical experience and forward-looking information that is available without undue cost or effort.
In particular, the following information is taken into account when assessing whether credit risk has increased significantly:
• an actual or expected significant deterioration in the financial instrument’s external (if available) or internal credit rating;
• significant deterioration in external market indicators of credit risk, e.g. a significant increase in the credit spread, the credit default swap prices for the debtor;
• existing or forecast adverse changes in business, financial or economic conditions that are expected to cause a significant decrease in the debtor’s ability to meet its debt obligations;
• an actual or expected significant deterioration in the operating results of the debtor;
• an actual or expected significant adverse change in the regulatory, economic, or technological environment of the debtor that results in a significant decrease in the debtor’s ability to meet its debt obligations.
Irrespective of the outcome of the above assessment, the Group presumes that the credit risk has increased significantly since initial recognition when contractual payments are more than 30 days past due, unless the Group has reasonable and supportable information that demonstrates otherwise.
Despite the aforegoing, the Group assumes that the credit risk on a financial instrument has not increased significantly since initial recognition if the financial instrument is determined to have low credit risk at the reporting date. A financial instrument is determined to have low credit risk if i) the financial instrument has a low risk of default, ii) the borrower has a strong capacity to meet its contractual cash flow obligations in the near term and iii) adverse changes in economic and business conditions in the longer term may, but will not necessarily, reduce the ability of the borrower to fulfill its contractual cash flow obligations. The Group considers a financial asset to have low credit risk when it has an internal or external credit rating of ‘investment grade’ as per globally understood definition.
The Group regularly monitors the effectiveness of the criteria used to identify whether there has been a significant increase in credit risk and revises them as appropriate to ensure that the criteria are capable of identifying significant increase in credit risk before the amount becomes past due.
Annual Report 2018 155

3. SIGNIFICANT ACCOUNTING POLICIES – CONTINUED FINANCIAL INSTRUMENTS – CONTINUED
Financial assets – continued
Impairment of financial assets (upon application of IFRS 9 with transitions in accordance with note 2) – continued
(iii) Definition of default
The Group considers the following as constituting an event of default for internal credit risk management purposes as historical experience indicates that receivables that meet either of the following criteria are generally not recoverable.
• when there is a breach of financial covenants by the counterparty; or
• information developed internally or obtained from external sources indicates that the debtor is unlikely to pay its creditors, including the Group, in full (without taking into account any collaterals held by the Group).
Irrespective of the above analysis, the Group considers that default has occurred when a financial asset is more than 90 days past due unless the Group has reasonable and supportable information to demonstrate that a more lagging default criterion is more appropriate.
(iv) Credit-impaired financial assets
A financial asset is credit-impaired when one or more events of default that have a detrimental impact on the estimated future cash flows of that financial asset have occurred. Evidence that a financial asset is credit-impaired includes observable data about the following events:
a) significant financial difficulty of the issuer or the borrower;
b) a breach of contract, such as a default or past due event;
c) the lender(s) of the borrower, for economic or contractual reasons relating to the borrower’s financial difficulty, having granted to the borrower a concession(s) that the lender(s) would not otherwise consider;
d) it is becoming probable that the borrower will enter bankruptcy or other financial reorganisation.
(v) Write-off policy
The Group writes off a financial asset when there is information indicating that the counterparty is in severe financial difficulty and there is no realistic prospect of recovery, e.g. when the counterparty has been placed under liquidation or has entered into bankruptcy proceedings, or in the case of trade receivables, when the amounts are over five years past due, whichever occurs sooner. Financial assets written off may still be subject to enforcement activities under the Group’s recovery procedures, taking into account legal advice where appropriate. Any recoveries made are recognised in profit or loss.
(vi) Measurement and recognition of ECL
The measurement of ECL is a function of the probability of default, loss given default (i.e. the magnitude of the loss if there is a default) and the exposure at default. The assessment of the probability of default and loss given default is based on historical data adjusted by forward-looking information. Estimation of ECL reflects an unbiased and probability-weighted amount that is determined with the respective risks of default occurring as the weights.
Generally, the ECL is the difference between all contractual cash flows that are due to the Group in accordance with the contract and the cash flows that the Group expects to receive, discounted at the effective interest rate determined at initial recognition. For a lease receivable, the cash flows used for determining the ECL is consistent with the cash flows used in measuring the lease receivable in accordance with IAS 17 Leases. For a financial guarantee contract, the Group is required to make payments only in the event of a default by the debtor in accordance with the terms of the instrument that is guaranteed. Accordingly, the expected losses is the present value of the expected payments to reimburse the holder for a credit loss that it incurs less any amounts that the Group expects to receive from the holder, the debtor or any other party.
NOTES TO THE CONSOLIDATED FINANCIAL STATEMENTS
FOR THE YEAR ENDED 31 DECEMBER 2018
Shui On Land Limited156
3. SIGNIFICANT ACCOUNTING POLICIES – CONTINUED FINANCIAL INSTRUMENTS – CONTINUED
Financial assets – continued
Impairment of financial assets (upon application of IFRS 9 with transitions in accordance with note 2) – continued
(vi) Measurement and recognition of ECL – continued
For financial guarantee contracts, the loss allowances are recognised at the higher of the amount of the loss allowance determined in accordance with IFRS 9; and the amount initially recognised less, where appropriate, cumulative amount of income recognised over the guarantee period.
The Group recognises an impairment gain or loss in profit or loss for financial instruments with a corresponding adjustment to their carrying amount through a loss allowance account, with the exception for financial guarantee contracts, where the Group recognises an impairment gain or loss in profit or loss by adjusting their carrying amount.
Classification and subsequent measurement of financial assets (before application of IFRS 9 on January 1, 2018)
The Group’s financial assets that include loans to associates, loans to joint ventures, accounts receivable, amounts due from associates, amounts due from related companies, amounts due from joint ventures, pledged bank deposits and bank balances and cash are categorised as loans and receivables.
Loans and receivables are non-derivative financial assets with fixed or determinable payments that are not quoted in an active market. Subsequent to initial recognition, loans and receivables are measured at amortised cost using the effective interest method, less any impairment.
Interest income is recognised by applying the effective interest rate, except for short-term receivables where the recognition of interest would be immaterial.
Impairment of loans and receivables (before application of IFRS 9 on January 1, 2018)
Loans and receivables are assessed for indicators of impairment at the end of each reporting period. Loans and receivables are considered to be impaired where there is objective evidence that, as a result of one or more events that occurred after the initial recognition of the loans and receivables, the estimated future cash flows of loans and receivables have been affected.
The objective evidence of impairment could include:
• significant financial difficulty of the issuer or counterparty; or
• breach of contract, such as default or delinquency in interest and principal payments; or
• it becoming probable that the borrower will enter bankruptcy or financial re-organisation.
For certain categories of loans and receivables, such as trade receivables, assets that are assessed not to be impaired individually are, in addition, assessed for impairment on a collective basis. Objective evidence of impairment for receivables could include the Group’s past experience of collecting payments, an increase in the number of delayed payments in the portfolio past the credit period, as well as observable changes in national or local economic conditions that correlate with default on receivables.
The amount of the impairment loss recognised is the difference between the asset’s carrying amount and the present value of the estimated future cash flows discounted at the financial asset’s original effective interest rate.
The carrying amount of loans and receivables is reduced by the impairment loss directly for all financial assets with the exception of trade receivables, where the carrying amount is reduced through the use of an allowance account. Changes in the carrying amount of the allowance account are recognised in profit or loss. When the trade receivables are considered uncollectible, it is written off against the allowance account. Subsequent recoveries of amounts previously written off are credited to profit or loss.
If, in a subsequent period, the amount of impairment loss of loans and receivables decreases and the decrease can be related objectively to an event occurring after the impairment was recognised, the previously recognised impairment loss is reversed through profit or loss to the extent that the carrying amount of the asset at the date the impairment is reversed does not exceed what the amortised cost would have been had the impairment not been recognised.
Annual Report 2018 157
3. SIGNIFICANT ACCOUNTING POLICIES – CONTINUED FINANCIAL INSTRUMENTS – CONTINUED
Financial assets – continued
Derecognition of financial assets
The Group derecognises a financial asset only when the contractual rights to the cash flows from the asset expire, or when it transfers the financial asset and substantially all the risks and rewards of ownership of the asset to another entity.
On derecognition of a financial asset measured at amortised cost, the difference between the asset’s carrying amount and the sum of the consideration received and receivable is recognised in profit or loss.
Financial liabilities and equity
Classification as debt or equity
Debt and equity instruments issued by a group entity are classified as either financial liabilities or equity in accordance with the substance of the contractual arrangements and the definitions of a financial liability and an equity instrument.
Equity instruments
An equity instrument is any contract that evidences a residual interest in the assets of an entity after deducting all of its liabilities. Equity instruments issued by the Group are recognised at the proceeds received, net of direct issue costs.
A financial instrument issued by a group entity, which includes no contractual obligation for the Group to deliver cash or other financial assets to the holders or to exchange financial assets or financial liabilities with the holders under conditions that are potentially unfavourable to the Group, is classified as an equity instrument and is initially recorded at the proceeds received.
A non-derivative contract that will or may oblige the Group to deliver a fixed number of a group entity’s own ordinary shares (subject to anti-dilutive adjustments) is classified as an equity instrument of the group entity. A derivative contract that will or may be settled by the exchange of a fixed amount of cash or another financial asset for a fixed number of a group entity’s own equity instruments (subject to anti-dilutive adjustments) is classified as an equity instrument of the group entity.
Perpetual capital securities, convertible perpetual securities and convertible perpetual capital securities issued by the Group that have the above characteristics are classified as equity instruments.
Financial liabilities at amortised cost
The Group’s financial liabilities (including accounts payable, loans from a non-controlling shareholder of subsidiaries, receipts under securitisation arrangements, amount due to a joint venture, amount due to an associate, amounts due to related companies, amounts due to non-controlling shareholders of subsidiaries, senior notes, and bank borrowings) are subsequently measured at amortised cost, using the effective interest method.
Financial guarantee contracts
A financial guarantee contract is a contract that requires the issuer to make specified payments to reimburse the holder for a loss it incurs because a specified debtor fails to make payment when due in accordance with terms of a debt instrument.
Financial guarantee contracts issued by the Group are initially measured at their fair values and, if not designated as at fair value through profit or loss, are subsequently measured at the higher of:
(i) the amount of the loss allowance determined in accordance with IFRS 9 (since 1 January 2018)/IAS 37 Provisions, Contingent Liabilities and Contingent Assets before application of IFRS 9 on 1 January 2018) ; and
(ii) the amount initially recognised less, when appropriate, cumulative amortisation recognised over the guarantee period.
NOTES TO THE CONSOLIDATED FINANCIAL STATEMENTS
FOR THE YEAR ENDED 31 DECEMBER 2018
Shui On Land Limited158
3. SIGNIFICANT ACCOUNTING POLICIES – CONTINUED FINANCIAL INSTRUMENTS – CONTINUED
Derivative financial instruments
Derivatives are initially recognised at fair value at the date when derivative contracts are entered into and are subsequently remeasured to their fair value at the end of the reporting period. The resulting gain or loss is recognised in profit or loss unless the derivative is designated and effective as a hedging instrument, in which event the timing of the recognition in profit or loss depends on the nature of the hedge relationship.
Hedge accounting
The Group designates certain derivatives as hedging instruments for cash flow hedges.
At the inception of the hedging relationship the Group documents the relationship between the hedging instrument and the hedged item, along with its risk management objectives and its strategy for undertaking various hedge transactions. Furthermore, at the inception of the hedge and on an ongoing basis, the Group documents whether the hedging instrument is highly effective in offsetting changes in cash flows of the hedged item attributable to the hedged risk.
Assessment of hedging relationship and effectiveness (under IFRS 9 since January 1, 2018)
For hedge effectiveness assessment, the Group considers whether the hedging instrument is effective in offsetting changes in cash flows of the hedged item attributable to the hedged risk, which is when the hedging relationships meet all of the following hedge effectiveness requirements:
• there is an economic relationship between the hedged item and the hedging instrument;
• the effect of credit risk does not dominate the value changes that result from that economic relationship; and
• the hedge ratio of the hedging relationship is the same as that resulting from the quantity of the hedged item that the Group actually hedges and the quantity of the hedging instrument that the entity actually uses to hedge that quantity of hedged item.
If a hedging relationship ceases to meet the hedge effectiveness requirement relating to the hedge ratio but the risk management objective for that designated hedging relationship remains the same, the Group adjusts the hedge ratio of the hedging relationship (i.e. rebalances the hedge) so that it meets the qualifying criteria again.
Assessment of hedging relationship and effectiveness (before application of IFRS 9 on 1 January 2018)
A hedge is regarded as highly effective only if both of the following conditions are met:
• at the inception and in subsequent periods, the hedge is expected to be highly effective; and
• the actual results of the hedge are within a range of 80 to 125 per cent.
Cash flow hedges
The effective portion of changes in the fair value of derivatives and other qualifying hedging instruments that are designated and qualify as cash flow hedges is recognised in other comprehensive income and accumulated under the heading of hedge reserve, limited to the cumulative change in fair value of the hedged item from inception of the hedge. The gain or loss relating to the ineffective portion is recognised immediately in profit or loss, and is include in the “other gains and losses” line item.
Amounts previously recognised in other comprehensive income and accumulated in equity are reclassified to profit or loss in the periods when the hedged item affects profit or loss, in the same line as the recognised hedger item.
Annual Report 2018 159

3. SIGNIFICANT ACCOUNTING POLICIES – CONTINUED FINANCIAL INSTRUMENTS – CONTINUED
Hedge accounting – continued
Discontinuation of hedge accounting (under IFRS9 since 1 January 2018)
The Group discontinues hedge accounting prospectively only when the hedging relationship (or a part thereof) ceases to meet the qualifying criteria (after rebalancing, if applicable). This includes instances when the hedging instrument expires or is sold, terminated or exercised. Discontinuing hedge accounting can either affect a hedging relationship in its entirety or only a part of it (in which case hedge accounting continues for the remainder of the hedging relationship).
For cash flow hedge, any gain or loss recognised in other comprehensive income and accumulated in equity at that time remains in equity and is recognised when the forecast transactions is ultimately recognised in profit or loss. When a forecast transaction is no longer expected to occur, the gain or loss accumulated in equity is recognised immediately in profit or loss.
Discontinuation of hedge accounting (before application of IFRS 9 on 1 January 2018)
Hedge accounting is discontinued when the Group revokes the hedging relationship, when the hedging instrument expires or is sold, terminated or exercised, or when it no longer qualifies for hedge accounting.
For cash flow hedge, any gain or loss recognised in other comprehensive income and accumulated in equity at that time remains in equity and is recognised when the forecast transactions is ultimately recognised in profit or loss. When a forecast transaction is no longer expected to occur, the gain or loss accumulated in equity is recognised immediately in profit or loss.
Derecognition of financial liabilities
The Group derecognises financial liabilities when, and only when, the Group’s obligations are discharged, cancelled or have expired. The difference between the carrying amount of the financial liabilty derecognised and the consideration paid and payable is recognised in profit or loss.
LEASING
Leases are classified as finance leases whenever the terms of the lease transfer substantially all the risks and rewards of ownership to the lessee. All other leases are classified as operating leases.
The Group as lessor
Rental income from operating leases is recognised in profit or loss on a straight-line basis over the term of the relevant lease. Contingent rents are recorded as income in the periods in which they are earned.
The Group as lessee
Operating lease payments are recognised as an expense on a straight-line basis over the lease term. Contingent rentals arising under operating leases are recognised as an expense in the period in which they are incurred.
BORROWING COSTS
Borrowing costs directly attributable to the acquisition, construction or production of qualifying assets, which are assets that necessarily take a substantial period of time to get ready for their intended use or sale, are added to the cost of those assets until such time as the assets are substantially ready for their intended use or sale.
Investment income earned on the temporary investment of specific borrowings pending their expenditure on qualifying assets is deducted from the borrowing costs eligible for capitalisation.
All other borrowing costs are recognised in profit or loss in the period in which they are incurred.
NOTES TO THE CONSOLIDATED FINANCIAL STATEMENTS
FOR THE YEAR ENDED 31 DECEMBER 2018
Shui On Land Limited160

3. SIGNIFICANT ACCOUNTING POLICIES – CONTINUED TAXATION
Taxation represents the sum of the tax currently payable and deferred tax.
The tax currently payable is based on taxable profit for the year. Taxable profit differs from ‘profit before taxation’ as reported in the consolidated statement of profit or loss because of income or expense that are taxable or deductible in other years and items that are never taxable or deductible. The Group’s liability for current tax is calculated using tax rates that have been enacted or substantively enacted by the end of the reporting period.
Deferred tax is recognised on temporary differences between the carrying amounts of assets and liabilities in the consolidated financial statements and the corresponding tax base used in the computation of taxable profit. Deferred tax liabilities are generally recognised for all taxable temporary differences. Deferred tax assets are generally recognised for all deductible temporary differences to the extent that it is probable that taxable profits will be available against which those deductible temporary differences can be utilised. Such assets and liabilities are not recognised if the temporary difference arises from goodwill or from the initial recognition (other than in a business combination) of other assets and liabilities in a transaction that affects neither the taxable profit nor the accounting profit.
Deferred tax liabilities are recognised for taxable temporary differences associated with investments in subsidiaries and associates, and interests in joint ventures, except where the Group is able to control the reversal of the temporary difference and it is probable that the temporary difference will not reverse in the foreseeable future. Deferred tax assets arising from deductible temporary differences associated with such investments and interests are only recognised to the extent that it is probable that there will be sufficient taxable profits against which to utilise the benefits of the temporary differences and they are expected to reverse in the foreseeable future.
The carrying amount of deferred tax assets is reviewed at the end of each reporting period and reduced to the extent that it is no longer probable that sufficient taxable profits will be available to allow all or part of the asset to be recovered.
Deferred tax assets and liabilities are measured at the tax rates that are expected to apply in the period in which the liability is settled or the asset is realised, based on tax rate (and tax laws) that have been enacted or substantively enacted by the end of the reporting period.
The measurement of deferred tax liabilities and assets reflects the tax consequences that would follow from the manner in which the Group expects, at the end of the reporting period, to recover or settle the carrying amount of its assets and liabilities.
For the purposes of measuring deferred tax liabilities or deferred tax assets for investment properties that are measured using the fair value model, the carrying amounts of such properties are presumed to be recovered entirely through sale, unless the presumption is rebutted. The presumption is rebutted when the investment property is depreciable and is held within a business model whose objective is to consume substantially all of the economic benefits embodied in the investment property over time, rather than through sale.
Current and deferred tax are recognised in profit or loss, except when they relate to items that are recognised in other comprehensive income or directly in equity, in which case, the current and deferred tax are also recognised in other comprehensive income or directly in equity respectively. Where current tax or deferred tax arises from the initial accounting for a business combination, the tax effect is included in the accounting for the business combination.
Annual Report 2018 161
3. SIGNIFICANT ACCOUNTING POLICIES – CONTINUED FOREIGN CURRENCIES
In preparing the financial statements of each individual group entity, transactions in currencies other than the functional currency of that entity (foreign currencies) are recognised at the rates of exchanges prevailing on the dates of the transactions. At the end of the reporting period, monetary items denominated in foreign currencies are retranslated at the rates prevailing at that date. Non-monetary items carried at fair value that are denominated in foreign currencies are retranslated at the rates prevailing on the date when the fair value was determined. Non-monetary items that are measured in terms of historical cost in a foreign currency are not retranslated.
Exchange differences arising on the settlement of monetary items and on the retranslation of monetary items are recognised in profit or loss in the period in which they arise except for:
• exchange differences on foreign currency borrowings relating to assets under construction for future productive use, which are included in the cost of those assets when they are regarded as an adjustment to interest costs on those foreign currency borrowings; and
• exchange differences on transactions entered into in order to hedge certain foreign currency risks (see the accounting policies under “Hedge accounting” above).
For the purposes of presenting the consolidated financial statements, the assets and liabilities of the Group’s foreign operations are translated into the presentation currency of the Group (i.e. RMB) using exchange rates prevailing at the end of each reporting period. Income and expenses are translated at the average exchange rates for the period, unless exchange rates fluctuate significantly during the period, in which case, the exchange rates prevailing at the dates of transactions are used. Exchange differences arising, if any, are recognised in other comprehensive income and accumulated in equity under the heading of “exchange reserve” (attributed to non-controlling interests as appropriate).
On the disposal of a foreign operation (that is, a disposal of the Group’s entire interest in a foreign operation, or a disposal involving loss of control over a subsidiary that includes a foreign operation, or a partial disposal of an interest in a joint arrangement or an associate that includes a foreign operation of which the retained interest becomes a financial asset), all of the exchange differences accumulated in equity in respect of that operation attributable to the owners of the Company are reclassified to profit or loss.
In addition, in relation to a partial disposal of a subsidiary that does not result in the Group losing control over the subsidiary, the proportionate share of accumulated exchange differences are re-attributed to non-controlling interests and are not recognised in profit or loss. For all other partial disposals (i.e. partial disposals of associates or joint arrangements that do not result in the Group losing significant influence or joint control), the proportionate share of the accumulated exchange differences is reclassified to profit or loss.
EQUITY-SETTLED SHARE-BASED PAYMENT TRANSACTIONS
Share options granted to employees (including Directors of the Company)
For grants of share options that are conditional upon satisfying specified vesting conditions, the fair value of services received is determined by reference to the fair value of share options granted at the date of grant and is expensed on a straight-line basis over the vesting period, with a corresponding increase in equity (share option reserve).
At the end of each reporting period, the Group revises its estimates of the number of options that are expected to ultimately vest. The impact of the revision of the original estimates, if any, is recognised in profit or loss, such that the cumulative expenses reflects the revised estimates, with a corresponding adjustment to share option reserve.
For share options that vest immediately at the date of grant, the fair value of the share options granted is expensed immediately to profit or loss.
When share options are exercised, the amount previously recognised in share option reserve will be transferred to share premium. When the share options are forfeited after the vesting date or are still not exercised at the expiry date, the amount previously recognised in share option reserve will be transferred to retained earnings.
NOTES TO THE CONSOLIDATED FINANCIAL STATEMENTS
FOR THE YEAR ENDED 31 DECEMBER 2018
Shui On Land Limited162

3. SIGNIFICANT ACCOUNTING POLICIES – CONTINUED EQUITY-SETTLED SHARE-BASED PAYMENT TRANSACTIONS – CONTINUED
Share awards granted to employees (including Directors of the Company)
For share award schemes, the fair value of services received, determined by reference to the fair value of awarded shares granted at the grant date, is expensed on a straight-line basis over the vesting period, with a corresponding increase in share award reserve. The cost of acquisition of the Company’s shares held for the share award scheme, if any, is recorded as treasury shares (shares held for share award scheme). At the time when the awarded shares are vested, the amount previously recognised in share award reserve and the amount of the relevant treasury shares will be transferred to retained earnings.
At the end of each reporting period, the Group revises its estimates of the number of awarded shares that are expected to ultimately vest based on the best available estimate of the management. The impact of the revision of the estimates during the vesting period, if any, is recognised in profit or loss, with a corresponding adjustment to the share award reserve.
RETIREMENT BENEFIT COSTS
Payments to state-managed retirement benefit schemes and the Mandatory Provident Fund Scheme are charged as an expense when employees have rendered service entitling them to the contributions.
For defined benefit retirement benefit plans, the cost of providing benefits is determined using the projected unit credit method, with actuarial valuations being carried out at the end of each annual reporting period. Remeasurement, comprising actuarial gains and losses and the return on plan assets (excluding interest), is reflected immediately in the consolidated statement of financial position with a charge or credit recognised in other comprehensive income in the period in which they occur. Remeasurement recognised in other comprehensive income is reflected immediately in retained earnings and will not be reclassified to profit or loss. Net interest is calculated by applying the discount rate at the beginning of the period to the net defined benefit liability or asset. Defined benefit costs are categorised as follows:
• service cost (including current service cost);
• net interest expense or income; and
• remeasurement.
The Group presents the first two components of defined benefit costs in profit or loss in the line item “retirement benefits costs”.
The retirement benefit obligation recognised in the consolidated statement of financial position includes the actual deficit or surplus in the Group’s defined benefit plans.
GOVERNMENT GRANTS
Government grants are not recognised until there is reasonable assurance that the Group will comply with the conditions attaching to them and that the grants will be received.
Government grants are recognised in profit or loss on a systematic basis over the periods in which the Group recognises as expenses the related costs for which the grants are intended to compensate.
Government grants that are receivable as compensation for expenses or losses already incurred or for the purpose of giving immediate financial support to the Group with no future related costs are recognised in profit or loss in the period in which they become receivable.
Annual Report 2018 163

3. SIGNIFICANT ACCOUNTING POLICIES – CONTINUEDREVENUE FROM CONTRACTS WITH CUSTOMERS (UPON APPLICATION OF IFRS 15 IN ACCORDANCE WITH TRANSITIONS IN NOTE 2)
Under IFRS 15, the Group recognises revenue when (or as) a performance obligation is satisfied, i.e. when “control” of the goods or services underlying the particular performance obligation is transferred to customers.
A performance obligation represents a good and service (or a bundle of goods and services) that is distinct or a series of distinct goods or service that are substantially the same.
Control is transferred over time and revenue is recognised over time by reference to the progress towards complete satisfaction of the relevant performance obligation if one of the following criteria is met:
• the customer simultaneously receives and consumes the benefits provided by the Group’s performance as the Group performs;
• the Group’s performance creates and enhances an asset that the customer controls as the Group performs; or
• the Group’s performance does not create an asset with an alternative use to the Group and the Group has an enforceable right to payment for performance completed to date.
Otherwise, revenue is recognised at a point in time when the customer obtains control of the distinct good or service.
A contract asset represents the Group’s right to consideration in exchange for goods or services that the Group has transferred to a customer that is not yet unconditional. It is assessed for impairment in accordance with IFRS 9. In contrast, a receivable represents the Group’s unconditional right to consideration, i.e. only the passage of time is required before payment of that consideration is due.
A contract liability represents the Group’s obligation to transfer goods or services to a customer for which the Group has received consideration (or an amount of consideration is due) from the customer.
A contract asset and a contract liability relating to the same contract are accounted for and presented on a net basis.
Over time revenue recognition: measurement of progress towards complete satisfaction of a performance obligation
Output method
The progress towards complete satisfaction of a performance obligation is measured based on output method, which is to recognise revenue on the basis of direct measurements of the value of the goods or services transferred to the customer to date relative to the remaining goods or services promised under the contract, that best depict the Group’s performance in transferring control of goods or services.
Input method
The progress towards complete satisfaction of a performance obligation is measured based on input method, which is to recognise revenue on the basis of the Group’s efforts or inputs to the satisfaction of a performance obligation relative to the total expected inputs to the satisfaction of that performance obligation, that best depict the Group’s performance in transferring control of goods or services.
NOTES TO THE CONSOLIDATED FINANCIAL STATEMENTS
FOR THE YEAR ENDED 31 DECEMBER 2018
Shui On Land Limited164

3. SIGNIFICANT ACCOUNTING POLICIES – CONTINUEDREVENUE FROM CONTRACTS WITH CUSTOMERS (UPON APPLICATION OF IFRS 15 IN ACCORDANCE WITH TRANSITIONS IN NOTE 2) – CONTINUED
Variable consideration
For contracts that contain variable consideration, the Group estimates the amount of consideration to which it will be entitled using either (a) the expected value method or (b) the most likely amount, depending on which method better predicts the amount of consideration to which the Group will be entitled.
The estimated amount of variable consideration is included in the transaction price only to the extent that it is highly probable that such an inclusion will not result in a significant revenue reversal in the future when the uncertainty associated with the variable consideration is subsequently resolved.
At the end of each reporting period, the Group updates the estimated transaction price (including updating its assessment of whether an estimate of variable consideration is constrained) to represent faithfully the circumstances present at the end of the reporting period and the changes in circumstances during the reporting period.
Existence of significant financing component
In determining the transaction price, the Group adjusts the promised amount of consideration for the effects of the time value of money if the timing of payments agreed (either explicitly or implicitly) provides the customer or the Group with a significant benefit of financing the transfer of goods or services to the customer. In those circumstances, the contract contains a significant financing component. A significant financing component may exist regardless of whether the promise of financing is explicitly stated in the contract or implied by the payment terms agreed to by the parties to the contract.
For contracts where the period between payment and transfer of the associated goods or services is less than one year, the Group applies the practical expedient of not adjusting the transaction price for any significant financing component. For contracts where the period between the payment by the customer and the transfer of the promised good or service exceeds one year, the transaction price is adjusted for the effects of a financing component, if significant.
Incremental costs of obtaining a contract
Incremental costs of obtaining a contract are those costs that the Group incurs to obtain a contract with a customer that it would not have incurred if the contract had not been obtained.
The Group applies the practical expedient of expensing all incremental costs to obtain a contract if these costs would otherwise have been fully amortised to profit or loss within one year.
Annual Report 2018 165

3. SIGNIFICANT ACCOUNTING POLICIES – CONTINUEDREVENUE RECOGNITION (PRIOR TO 1 JANUARY 2018)
Revenue is measured at the fair value of the consideration received or receivable and represents amounts receivable for goods sold and services provided in the course of ordinary activities of the Group, net of discounts and sales related taxes.
Revenue from sale of properties in the course of ordinary activities of the Group is recognised when the properties are delivered and the significant risks and rewards of ownership have been transferred to the buyer, provided that at that stage it is probable that the economic benefits will flow to the Group and the revenue can be measured reliably and provided that the Group maintains neither managerial involvement to the degree usually associated with ownership nor effective control over the land and other properties sold.
Deposits and instalments received from purchasers prior to meeting the above criteria for revenue recognition are included in the consolidated statement of financial position under current liabilities.
Revenue from hotel operations is recognised when the relevant services are provided.
Property management fee income and rental related income are recognised in profit or loss when the services are rendered.
Interest income from a financial asset is recognised when it is probable that the economic benefits will flow to the Group and the amount of income can be measured reliably. Interest income is accrued on a time basis, by reference to the principal outstanding and at the effective interest rate applicable, which is the rate that exactly discounts the estimated future cash receipts through the expected life of the financial asset to that asset’s net carrying amount on initial recognition.
The Group’s accounting policy for recognition of revenue from operating leases is described in the accounting policy for leasing above.
CONSTRUCTION CONTRACTS (PRIOR TO 1 JANUARY 2018)
Where the outcome of a construction and building maintenance contract can be estimated reliably, revenue and costs are recognised by reference to the stage of completion of the contract activity at the end of the reporting period, measured by reference to the value of work carried out during the period. Variations in contract work, claims and incentive payments are included to the extent that the amount can be measured reliably and its receipt is considered probable.
Where the outcome of a construction and building maintenance contract cannot be estimated reliably, contract revenue is recognised to the extent of contract costs incurred that probably will be recoverable. Contract costs are recognised as expenses in the period in which they are incurred.
When it is probable that total contract costs will exceed total contract revenue, the expected loss is recognised as an expense immediately.
Where contract costs incurred to date plus recognised profits less recognised losses exceed progress billings, the surplus is shown as an amount due from customers for contract work. For contracts where progress billings exceed contract costs incurred to date plus recognised profits less recognised losses, the surplus is shown as an amount due to customers for contract work. Amounts received before the related work is performed are included in the consolidated statement of financial position, as a liability, as advances received. Amounts billed for work performed but not yet paid by the customer are included in the consolidated statement of financial position under accounts receivable, deposits and prepayments.
NOTES TO THE CONSOLIDATED FINANCIAL STATEMENTS
FOR THE YEAR ENDED 31 DECEMBER 2018
Shui On Land Limited166

4. CRITICAL ACCOUNTING JUDGEMENTS AND KEY SOURCES OF ESTIMATION UNCERTAINTY In the application of the Group’s accounting policies, which are described in note 3, the Directors of the Company are required to make judgements, estimates and assumptions about the carrying amounts of assets and liabilities that are not readily apparent from other sources. The estimates and associated assumptions are based on historical experience and other factors that are considered to be relevant. Actual results may differ from these estimates.
The estimates and underlying assumptions are reviewed on an on-going basis. Revisions to accounting estimates are recognised in the period in which the estimate is revised if the revision affects only that period, or in the period of the revision and future periods if the revision affects both current and future periods.
CRITICAL JUDGEMENTS IN APPLYING ACCOUNTING POLICIES
The following are the critical judgements, apart from those involving estimations (see below), that the Directors of the Company have made in the process of applying the Group’s accounting policies and that have the most significant effect on the amounts recognised in the consolidated financial statements.
Revenue recognition from sales of properties at a point in time
Under IFRS 15, control of the asset is transferred over time when the Group’s performance does not create an asset with an alternative use to the Group and the Group has an enforceable right to payment for performance completed to date. Significant judgment is required in determining whether the terms of the Group’s contracts with customers in relation to properties create an enforceable right to payment for the Group. The Group has considered the relevant local laws that apply to those relevant contracts and opinion from external legal counsel. Based on the assessment of the Group’s management, the terms of the relevant sales contracts do not create an enforceable right to payment for the Group. Accordingly, the sales of properties is considered to be performance obligation satisfied at a point in time.
Perpetual capital securities and convertible perpetual capital securities
Pursuant to the terms of the Perpetual Capital Securities (as defined in note 33) and Convertible Perpetual Capital Securities (as defined in note 32), a subsidiary of the Company, as an issuer of the Perpetual Capital Securities and Convertible Perpetual Capital Securities, can at its option to redeem the Perpetual Capital Securities and Convertible Perpetual Capital Securities and at its discretion to defer distributions on the Perpetual Capital Securities and Convertible Perpetual Capital Securities. However, in those cases, the Company and the issuer will not be able to declare or pay any dividends to their ordinary shareholders if any distributions on the Perpetual Capital Securities and Convertible Perpetual Capital Securities are unpaid or deferred. In the opinion of the Directors of the Company, this restriction does not result in the Group having the obligation to redeem the Perpetual Capital Securities and Convertible Perpetual Capital Securities or to pay distributions on the Perpetual Capital Securities and Convertible Perpetual Capital Securities. Accordingly, the Perpetual Capital Securities and Convertible Perpetual Capital Securities are classified as equity instruments. As at 31 December 2018, the carrying amounts of the Perpetual Capital Securities and Convertible Perpetual Capital Securities are RMB4,055 million (2017: RMB4,052 million) and RMB1,345 million (2017: 1,345 million), respectively.
Deferred taxation on investment properties
In measuring the Group’s deferred taxation on certain investment properties measured at fair value, the Directors of the Company have determined that the presumption that the carrying amounts of these investment properties measured using the fair value model were recovered entirely through sales was not rebutted. The Directors of the Company have considered whether additional land appreciation tax (“Land Appreciation Tax”) is required regarding potential asset transfer. After assessment, the Directors of the Company have concluded that the deferred tax liabilities recognised are adequate.
KEY SOURCES OF ESTIMATION UNCERTAINTY
The followings are the key assumptions concerning the future, and other key sources of estimation uncertainty at the end of the reporting period, that have a significant risk of causing a material adjustment to the carrying amounts of assets and liabilities within the next financial year.
Annual Report 2018 167

4. CRITICAL ACCOUNTING JUDGEMENTS AND KEY SOURCES OF ESTIMATION UNCERTAINTY – CONTINUED
KEY SOURCES OF ESTIMATION UNCERTAINTY – CONTINUED
Fair value measurements and valuation processes
The Group’s certain assets and liabilities are measured at fair value for financial reporting purposes. In estimating the fair value of an asset or a liability, the management of the Group uses market-observable data to the extent it is available. Where Level 1 inputs are not available, the Group engages third party qualified valuers to perform the valuation. At the end of the reporting period, the management of the Group works closely with the qualified external valuers to establish and determine the appropriate valuation techniques and inputs for Level 2 and Level 3 fair value measurements. The management of the Group will first consider and adopt Level 2 inputs where inputs can be derived from observable quoted prices in the active market. When Level 2 inputs are not available, the management of the Group will adopt valuation techniques that include Level 3 inputs. Where there is a material change in the fair value of an asset or a liability, the causes of the fluctuations will be reported to the Directors of the Company for appropriate actions to be taken.
Information about the valuation techniques, inputs and key assumptions used in the determination of the fair value of various assets and liabilities are disclosed in notes 13, 34, 35 and 48(c).
Liability arising from a rental guarantee arrangement
As disclosed in note 35, the Group disposed of certain properties in prior years. As part of these disposals, the Group agreed to provide the purchasers of these properties with rental guarantees, which are based on the excess of a fixed rate of the consideration received by the Group over the net operating income to be generated by the properties. In measuring the fair value of the liability arising from the rental guarantee arrangement, the Group has prepared budgets regarding how much rental income can be generated from these properties. As of 31 December 2018, the Group has recognised liability arising from a rental guarantee arrangement amounting to RMB549 million (2017: RMB728 million), which, in the opinion of Directors of the Company, is the best estimate of the outstanding amount taking into account the forecasted unit rental and occupancy rate. Where there are significant changes to the estimates, the Group’s liabilities would increase or decrease with the corresponding adjustment being made to the profit or loss.
Fair value of a call option to buy back an investment property disposed of in previous years
In previous years, the Group disposed of an investment property through disposal of the equity interest in a subsidiary. Based on the relevant sale and purchase agreement entered into in previous years, the Group was granted a call option which enables the Group to buy back the equity interest in that subsidiary within two months before the fifth anniversary or the seventh anniversary of the completion of the disposal (i.e. 18 December 2013), at a price equals to the original consideration plus a premium per annum. As at 31 December 2018, the fair value of the call option was estimated to be approximately RMB243 million (2017: RMB342 million) with reference to the fair value of similar properties within the same locality as at that date. The Group has engaged an independent qualified professional valuer to estimate the fair value of the option as at 31 December 2018. Details of the methodology and assumptions are disclosed in note 34. The fair value of the option was included in the “derivative financial instruments” line item of the Group’s consolidated statement of financial position as at 31 December 2018. In the opinion of the Directors of the Company, the methodology and assumptions used in estimating the fair value of the option as at 31 December 2018 were appropriate and reasonable. If the call option is not exercised in subsequent years or when the fair value of underlying property decreases, the Group will recognise a loss in the profit or loss in subsequent years.
Land Appreciation Tax
The Group is subject to Land Appreciation Tax in the People’s Republic of China (the “PRC”). However, the implementation and settlement of the tax varies amongst different tax jurisdictions in various cities of the PRC and the Group has not finalised its Land Appreciation Tax calculation and payments with local tax authorities for all land lots in the PRC. Accordingly, significant judgement is required in determining the amount of the Land Appreciation Tax and its related income tax provisions. The Group recognised the Land Appreciation Tax based on management’s best estimates. The final tax outcome could be different from the amounts that were initially recorded, and these differences will impact the income tax provisions in the periods in which such tax is finalised with local tax authorities.
NOTES TO THE CONSOLIDATED FINANCIAL STATEMENTS
FOR THE YEAR ENDED 31 DECEMBER 2018
Shui On Land Limited168

4. CRITICAL ACCOUNTING JUDGEMENTS AND KEY SOURCES OF ESTIMATION UNCERTAINTY – CONTINUED
KEY SOURCES OF ESTIMATION UNCERTAINTY – CONTINUED
Estimated impairment of properties under development for sale and properties held for sale
Properties under development for sale and properties held for sale are stated at lower of the cost and net realisable value. The net realisable value is the estimated selling price of the completed units (based on the current prevailing market conditions) less estimated selling expenses and estimated cost of completion (if any), which are determined based on best available information and valuation performed by independent professional valuers. The Group has recognised an impairment loss amounting to RMB54 million during the year ended 31 December 2018 (2017: RMB29 million). Where there is any decrease in the estimated selling price arising from any changes to the property market conditions in the PRC, a further loss will be recognised on the properties under development for sale and properties held for sale in the consolidated statement of profit or loss.
5. REVENUE AND SEGMENTAL INFORMATIONA. For the year ended 31 December 2018
Disaggregation of revenue from contracts with customers under IFRS 15
Year ended 31 December 2018
Total RevenueRMB’million
Property development:
Property sales 22,131
Property management fee income and other income 96
22,227
Property investment:
Income from hotel operations 96
Property management fee income 153
249
Construction 296
Others 206
Total 22,978
Geographical markets
Shanghai 22,350
Wuhan 29
Chongqing 311
Foshan 288
Total 22,978
Timing of revenue recognition
A point in time 22,131
Over time 847
Total 22,978
Annual Report 2018 169

5. REVENUE AND SEGMENTAL INFORMATION – CONTINUEDA. For the year ended 31 December 2018 – continued
Set out below is the reconciliation of the revenue from contracts with customers with the amounts disclosed in the segment information.
The GroupRMB’million
Share of joint ventures
RMB’millionTotal
RMB’million
Property development:
Property sales 22,131 – 22,131
Property management fee income and other income 96 – 96
22,227 – 22,227
Property investment:
Income from hotel operations 96 – 96
Property management fee income 153 – 153
249 – 249
Construction 296 – 296
Others 206 – 206
Revenue from contracts with customers 22,978 – 22,978
Rental income received from investment properties (property investment segment) 1,674 91 1,765
Rental related income (property investment segment) 189 – 189
Total 24,841 91 24,932
Property sales
Revenue from sales of residential properties is recognised at a point in time when the completed property is transferred to customers, being at the point that the customer obtains the control of the completed property and the Group has present right to payment and collection of the consideration is probable.
The Group receives 20%-100% of the contract value as deposits from customers or receipts in advance from customers upon signing the sale and purchase agreement for sales of properties. Such advance payment schemes result in contract liabilities being recognised throughout the property construction period.
Construction services
The Group provides building construction services to customers. Such services are recognised as a performance obligation satisfied over time as the Group creates or enhances an asset that the customer controls as the asset is created or enhanced. Revenue is recognised for these construction services based on the stage of completion of the contract using input method.
The Group’s construction contracts include payment schedules which require stage payments over the construction period once certain specified milestones are reached.
A contract asset, net of contract liability related to the same contract, is recognised over the period in which the construction services are performed representing the Group’s right to consideration for the services performed because the rights are conditioned on the Group’s future performance in achieving specified milestones. The contract assets are transferred to trade receivables when the rights become unconditional. The Group typically achieves specified milestones and thus have the right to bill the customers when the progress certificate, settlement letter or payment notice is obtained.
NOTES TO THE CONSOLIDATED FINANCIAL STATEMENTS
FOR THE YEAR ENDED 31 DECEMBER 2018
Shui On Land Limited170

5. REVENUE AND SEGMENTAL INFORMATION – CONTINUEDA. For the year ended 31 December 2018 – continued
Property management services
Revenue from property management services is recognised over time, and the progress measured using the output method. The property management service fees are billed to the clients periodically (either monthly or quarterly billing period).
Hotel operations
The Group’s performance obligation from hotel operations is to provide accommodation and other goods and services to guests. Revenue includes rooms revenue and food and beverage sales, which is recognised when the rooms are occupied and food and beverages are sold.
Rental and rental related income
The Group’s accounting policy for recognition of revenue from operating leases is described in the accounting policy for leasing.
B. Transaction price allocated to the remaining performance obligation for contracts with customers
The transaction price allocated to the remaining performance obligations (unsatisfied or partially unsatisfied) as at 31 December 2018 and the expected timing of recognising revenue are as follows:
Sales of properties
RMB’million
Construction contracts
RMB’million
Within one year – 519
More than one year but not more than two years 903 215
More than two years – 59
903 793
The amount disclosed above do not include transaction price allocated to performance obligation which are part of contracts that have original expected duration of one year or less.
Annual Report 2018 171

5. REVENUE AND SEGMENTAL INFORMATION – CONTINUEDC. For the year ended 31 December 2017
An analysis of the Group’s revenue for the year is as follows:
Total RevenueRMB’million
Property development:
Property sales 16,169
Property investment:
Rental income received from investment properties 1,675
Income from hotel operations 92
Property management fee income 31
Rental related income 163
1,961
Construction 194
Others 127
Total 18,451
D. Operating segments
Operating segments are identified from the financial information provided regularly to the Group’s chief operating decision maker (“CODM”) (i.e. the executive director and the chairman of the Group) for the purposes of allocating resources to, and assessing the performance of the Group’s various lines of business.
The Group is organised based on its business activities and has the following three major reportable segments:
Property development – development and sale of properties
Property investment – offices and commercial/mall leasing, property management and hotel operations
Construction – construction, interior fitting-out, renovation and maintenance of building premises and provision of related consultancy services
The property development and property investment projects of the Group are in Shanghai, Chongqing, Wuhan and Foshan, the PRC, and their revenues are primarily derived from property sales and leasing respectively. The Directors of the Company consider the various operating segments under property development and property investment segments are aggregated for financial reporting purposes because those segments have similar characteristics in terms of production process, class of customers and distribution method and are under similar economic conditions and subject to similar regulatory policies.
NOTES TO THE CONSOLIDATED FINANCIAL STATEMENTS
FOR THE YEAR ENDED 31 DECEMBER 2018
Shui On Land Limited172
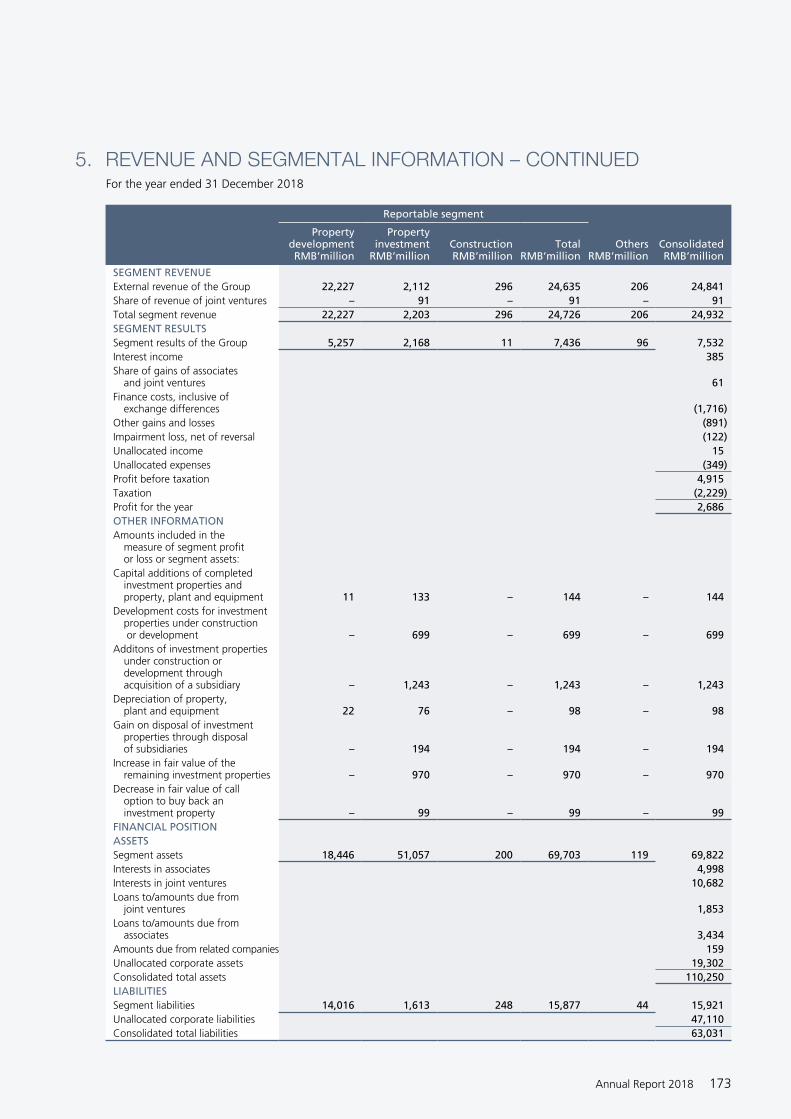
5. REVENUE AND SEGMENTAL INFORMATION – CONTINUED For the year ended 31 December 2018
Reportable segment
OthersRMB’million
ConsolidatedRMB’million
PropertydevelopmentRMB’million
Propertyinvestment
RMB’millionConstructionRMB’million
TotalRMB’million
SEGMENT REVENUEExternal revenue of the Group 22,227 2,112 296 24,635 206 24,841Share of revenue of joint ventures – 91 – 91 – 91Total segment revenue 22,227 2,203 296 24,726 206 24,932SEGMENT RESULTSSegment results of the Group 5,257 2,168 11 7,436 96 7,532Interest income 385Share of gains of associates and joint ventures 61Finance costs, inclusive of exchange differences (1,716)Other gains and losses (891)Impairment loss, net of reversal (122)Unallocated income 15Unallocated expenses (349)Profit before taxation 4,915Taxation (2,229)Profit for the year 2,686OTHER INFORMATIONAmounts included in the measure of segment profit or loss or segment assets:Capital additions of completed investment properties and property, plant and equipment 11 133 – 144 – 144Development costs for investment properties under construction or development – 699 – 699 – 699Additons of investment properties under construction or development through acquisition of a subsidiary – 1,243 – 1,243 – 1,243Depreciation of property, plant and equipment 22 76 – 98 – 98Gain on disposal of investment properties through disposal of subsidiaries – 194 – 194 – 194Increase in fair value of the remaining investment properties – 970 – 970 – 970Decrease in fair value of call option to buy back an investment property – 99 – 99 – 99FINANCIAL POSITION ASSETSSegment assets 18,446 51,057 200 69,703 119 69,822Interests in associates 4,998Interests in joint ventures 10,682Loans to/amounts due from joint ventures 1,853Loans to/amounts due from associates 3,434Amounts due from related companies 159Unallocated corporate assets 19,302Consolidated total assets 110,250LIABILITIESSegment liabilities 14,016 1,613 248 15,877 44 15,921Unallocated corporate liabilities 47,110Consolidated total liabilities 63,031
Annual Report 2018 173

5. REVENUE AND SEGMENTAL INFORMATION – CONTINUED For the year ended 31 December 2017
Reportable segment
OthersRMB’million
ConsolidatedRMB’million
PropertydevelopmentRMB’million
Propertyinvestment
RMB’millionConstructionRMB’million
TotalRMB’million
SEGMENT REVENUE
External revenue of the Group 16,169 1,961 194 18,324 127 18,451
Total segment revenue 16,169 1,961 194 18,324 127 18,451
SEGMENT RESULTS
Segment results of the Group 5,968 3,063 (14) 9,017 120 9,137
Interest income 405
Share of losses of associates and joint ventures (927)
Finance costs, inclusive of exchange differences (1,691)
Other gains and losses (416)
Unallocated income 72
Unallocated expenses (330)
Profit before taxation 6,250
Taxation (3,926)
Profit for the year 2,324
OTHER INFORMATION
Amounts included in the measure of segment profit or loss or segment assets:
Capital additions of completed investment properties and property, plant and equipment – 128 – 128 – 128
Development costs for investment properties under construction or development – 873 – 873 – 873
Depreciation of property, plant and equipment 52 56 – 108 – 108
Gain on disposal of investment properties through disposal of subsidiaries – 1,755 – 1,755 – 1,755
Increase in fair value of the remaining investment properties – 518 – 518 – 518
Decrease in fair value of call option to buy back an investment property – 118 – 118 – 118
FINANCIAL POSITION
ASSETS
Segment assets 33,351 50,530 343 84,224 (19) 84,205
Interests in associates 1,030
Interests in joint ventures 6,584
Loans to/amounts due from joint ventures 660
Amounts due from related companies 642
Unallocated corporate assets 21,171
Consolidated total assets 114,292
LIABILITIES
Segment liabilities 9,374 2,253 280 11,907 1 11,908
Unallocated corporate liabilities 53,209
Consolidated total liabilities 65,117
NOTES TO THE CONSOLIDATED FINANCIAL STATEMENTS
FOR THE YEAR ENDED 31 DECEMBER 2018
Shui On Land Limited174

5. REVENUE AND SEGMENTAL INFORMATION – CONTINUED Segment revenue represents the revenue of the Group and the share of revenue of joint ventures.
Segment results represent the profit earned or loss incurred by each segment without allocation of central administration costs, Directors’ salaries, interest income, share of gains (losses) of associates and joint ventures, impairment loss, net of reversal, unallocated income, other gains and losses except for the change in fair value of call option to buy back an investment property, and finance costs inclusive of exchange differences. This is the measure reported to the chief operating decision makers who are the Executive Directors of the Company for resource allocation and performance assessment.
For the purposes of monitoring segment performance and allocating resources between segments:
• all assets are allocated to reportable segments other than interests in associates, interests in joint ventures, loans to associates, loans to joint ventures, amounts due from associates, amounts due from joint ventures, amounts due from related companies, deferred tax assets, derivative financial instruments, pledged bank deposits, restricted bank deposits, bank balances and cash and other unallocated corporate assets; and
• all liabilities are allocated to reportable segments other than amounts due to related companies, amounts due to non-controlling shareholders of subsidiaries, loans from a non-controlling shareholder of subsidiaries, tax liabilities, deferred tax liabilities, derivative financial instruments, defined benefit liabilities, bank borrowings, senior notes and other unallocated corporate liabilities.
The Group’s revenue and contribution to operating profit are mainly attributable to the market in the PRC for both years. Accordingly, no analysis of geographical segment is presented.
No geographical segment information of the Group’s non-current assets is shown as the assets are substantially located in the PRC.
During the year ended 31 December 2018, a customer contributed RMB14,981 million to the revenue of the Group in respect of the property development segment. During the year ended 31 December 2017, a customer contributed RMB3,229 million to the revenue of the Group in respect of the property development segment.
Annual Report 2018 175

6. OTHER INCOME, OTHER GAINS AND LOSSES2018
RMB’million2017
RMB’million
Other income
Interest income from banks 297 220
Interest income from associates (note 45) 25 94
Interest income from loans to joint ventures (note 45) 63 58
Imputed interest income on consideration receivable from disposal of a subsidiary – 33
Grants received from local government 17 18
Others 15 33
417 456
Other gains and losses
Impairment loss on investment properties under development at cost (note(i)) (380) –
Impairment loss of investment in a joint venture (note 17) (376) –
Loss arising from a rental guarantee arrangement (note 35) – (458)
Loss on early redemption of senior notes (78) (235)
Gain on disposal of investment properties (note (ii)) 11 156
Decrease in fair value of call option (note 34) (99) (118)
Fair value gain on other derivative financial instruments (note 34) – 64
Impairment loss on property, plant and equipment (note 14) – (61)
Loss on termination of sales of beneficial interest in certain properties (48) –
Others (20) 57
(990) (595)
Notes:(i) The amount represents the difference between the net realisable value of certain investment properties under development at cost in Foshan and the carrying amount of the
properties recognised in profit or loss for the year ended 31 December 2018.(ii) During the year ended 31 December 2017, the amount mainly included a disposal gain arising from the disposal of certain retail units located in Shanghai, which were classified as
completed investment properties, for a cash consideration after the deduction of value-added tax and transaction cost of RMB656 million, and recognised a gain of RMB144 million on disposal of investment properties for the year ended 31 December 2017.
7. FINANCE COSTS, INCLUSIVE OF EXCHANGE DIFFERENCES2018
RMB’million2017
RMB’million
Interest on bank borrowings 1,658 1,718
Imputed interest of deferred consideration in relation to acquisition of a subsidiary – 82
Interest on senior notes (note 30) 612 1,372
Interest on loans from a non-controlling shareholder of subsidiaries 59 7
Total interest costs 2,329 3,179
Less: Amount capitalised to investment properties under construction or development and properties under development for sale (945) (1,344)
Interest expense charged to profit or loss 1,384 1,835
Net exchange loss (gain) on bank borrowings and other financing activities 273 (195)
Others 59 51
1,716 1,691
Borrowing costs capitalised during the year were calculated by applying a capitalisation rate of approximately 5.2% (2017: 5.1%) per annum to expenditure on the qualifying assets.
NOTES TO THE CONSOLIDATED FINANCIAL STATEMENTS
FOR THE YEAR ENDED 31 DECEMBER 2018
Shui On Land Limited176

8. PROFIT BEFORE TAXATION2018
RMB’million2017
RMB’million
Profit before taxation has been arrived at after charging:
Auditor’s remuneration
– audit services 6 5
Depreciation of property, plant and equipment 98 108
Release of prepaid lease payments 1 1
Gain on disposal of property, plant and equipment – (5)
Employee benefits expenses
Directors’ emoluments
Fees 2 3
Salaries, bonuses and other benefits 18 12
20 15
Other staff costs
Salaries, bonuses and other benefits 580 590
Retirement benefits costs 38 39
Share option expenses 1 2
Share award expenses 1 7
620 638
Total employee benefits expenses 640 653
Less: Amount capitalised to investment properties under construction or development and properties under development for sale (66) (120)
574 533
Impairment loss, net of reversal
Accounts receivable (58) –
Receivables from disposal of a subsidiary 180 –
122 –
Cost of properties sold recognised as an expense 16,621 11,430
Minimum lease payments under operating leases 34 15
impairment loss on properties held for sale (included in "cost of sales") 54 29
Annual Report 2018 177

9. TAXATION2018
RMB’million2017
RMB’million
PRC Enterprise Income Tax
– Current provision 1,131 1,535
PRC Withholding Tax
– Current provision 310 7
PRC Land Appreciation Tax
– Provision for the year 589 1,959
Deferred taxation (note 36)
– Provision for the year 199 425
2,229 3,926
No provision for Hong Kong Profits Tax has been made as the income of the Group neither arises in, nor is derived from, Hong Kong.
PRC Enterprise Income Tax (“EIT”) has been provided for at the applicable income tax rate of 25% on the assessable profits of the companies in the Group during both years.
The PRC EIT Law requires withholding tax to be levied on distribution of profits earned by PRC entities for profits generated after 1 January 2008 at rate of 5% for Hong Kong resident companies, and at rate of 10% (5% if obtained the Hong Kong residents) for companies incorporated in BVI and Republic of Mauritius (“Mauritius”), which are the beneficial owners of the dividend received. As at 31 December 2018 and 31 December 2017, deferred tax was provided for in respect of the temporary differences attributable to such profits, except to the extent that the Group is able to control the timing of the reversal of such temporary differences and it is probable that such temporary differences would not be reversed in the foreseeable future.
The provision of PRC Land Appreciation Tax is estimated per the requirements set forth in the relevant PRC tax laws and regulations. PRC Land Appreciation Tax has been provided at ranges of progressive rates of the appreciation value, with certain allowable deductions including land costs, borrowing costs and the relevant property development expenditures.
The current income tax provided for the current year also included applicable income taxes on transfers of equity interest in subsidiaries of the Group.
The tax charge for the year can be reconciled to the profit before taxation per the consolidated statement of profit or loss as follows:
2018RMB’million
2017RMB’million
Profit before taxation 4,915 6,250
PRC Enterprise Income Tax at 25% 1,229 1,563
PRC Land Appreciation Tax 589 1,959
Tax effect of PRC Land Appreciation Tax (147) (490)
Deferred tax (reversed) provided for withholding tax on income derived in the PRC (78) 98
Tax effect of share of (gains) losses of associates and joint ventures (15) 232
Tax effect of expenses not deductible for tax purposes 832 626
Tax effect of income not taxable for tax purposes (17) (40)
Tax effect of tax losses not recognised 32 31
Tax effect of utilisation of tax losses previously not recognised (16) (14)
Tax effect on disposals of subsidiaries (note) (180) (39)
Tax charge for the year 2,229 3,926
Note:EIT on disposals of subsidiaries is calculated at 10% of the difference between consideration and the registered capital of the relevant subsidiary incorporated in the PRC.
NOTES TO THE CONSOLIDATED FINANCIAL STATEMENTS
FOR THE YEAR ENDED 31 DECEMBER 2018
Shui On Land Limited178
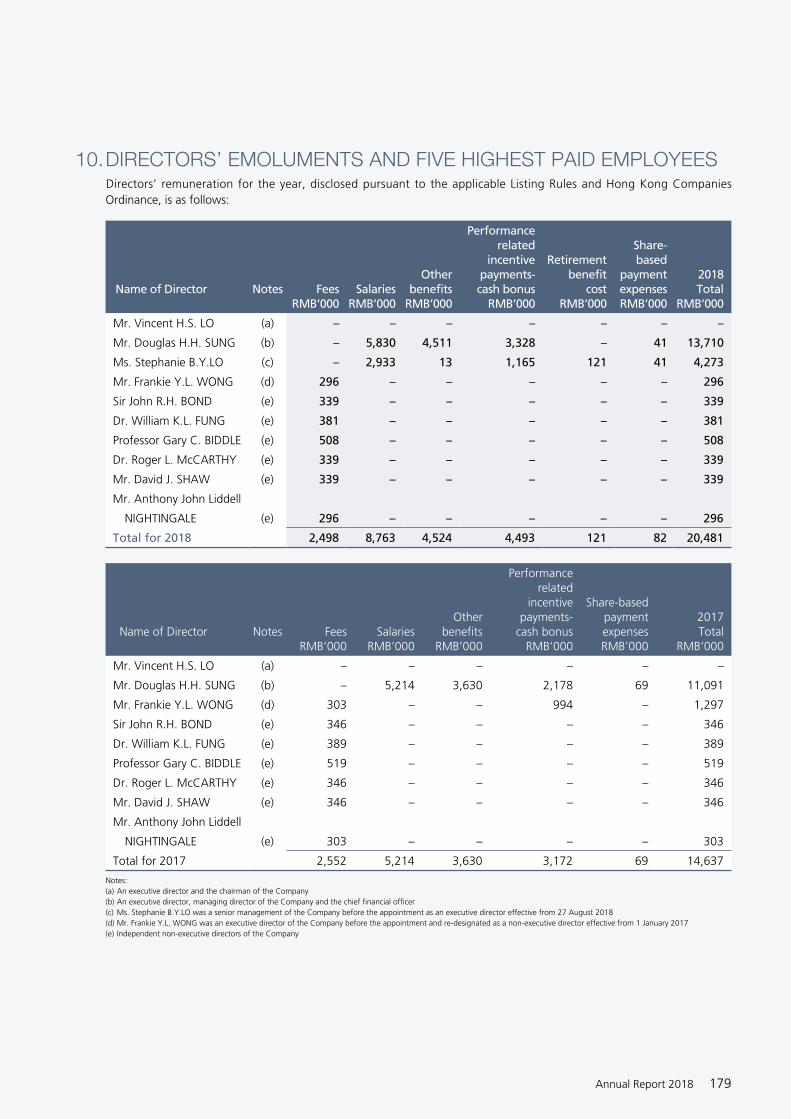
10. DIRECTORS’ EMOLUMENTS AND FIVE HIGHEST PAID EMPLOYEES Directors’ remuneration for the year, disclosed pursuant to the applicable Listing Rules and Hong Kong Companies Ordinance, is as follows:
Name of Director Notes FeesRMB’000
SalariesRMB’000
Otherbenefits
RMB’000
Performance related
incentive payments- cash bonus
RMB’000
Retirementbenefit
costRMB’000
Share-based
paymentexpensesRMB’000
2018Total
RMB’000
Mr. Vincent H.S. LO (a) – – – – – – –
Mr. Douglas H.H. SUNG (b) – 5,830 4,511 3,328 – 41 13,710
Ms. Stephanie B.Y.LO (c) – 2,933 13 1,165 121 41 4,273
Mr. Frankie Y.L. WONG (d) 296 – – – – – 296
Sir John R.H. BOND (e) 339 – – – – – 339
Dr. William K.L. FUNG (e) 381 – – – – – 381
Professor Gary C. BIDDLE (e) 508 – – – – – 508
Dr. Roger L. McCARTHY (e) 339 – – – – – 339
Mr. David J. SHAW (e) 339 – – – – – 339
Mr. Anthony John Liddell
NIGHTINGALE (e) 296 – – – – – 296
Total for 2018 2,498 8,763 4,524 4,493 121 82 20,481
Name of Director Notes FeesRMB’000
SalariesRMB’000
Otherbenefits
RMB’000
Performance related
incentive payments-
cash bonus RMB’000
Share-based payment expenses RMB’000
2017 Total
RMB’000
Mr. Vincent H.S. LO (a) – – – – – –
Mr. Douglas H.H. SUNG (b) – 5,214 3,630 2,178 69 11,091
Mr. Frankie Y.L. WONG (d) 303 – – 994 – 1,297
Sir John R.H. BOND (e) 346 – – – – 346
Dr. William K.L. FUNG (e) 389 – – – – 389
Professor Gary C. BIDDLE (e) 519 – – – – 519
Dr. Roger L. McCARTHY (e) 346 – – – – 346
Mr. David J. SHAW (e) 346 – – – – 346
Mr. Anthony John Liddell
NIGHTINGALE (e) 303 – – – – 303
Total for 2017 2,552 5,214 3,630 3,172 69 14,637
Notes:(a) An executive director and the chairman of the Company(b) An executive director, managing director of the Company and the chief financial officer(c) Ms. Stephanie B.Y.LO was a senior management of the Company before the appointment as an executive director effective from 27 August 2018(d) Mr. Frankie Y.L. WONG was an executive director of the Company before the appointment and re-designated as a non-executive director effective from 1 January 2017(e) Independent non-executive directors of the Company
Annual Report 2018 179

10. DIRECTORS’ EMOLUMENTS AND FIVE HIGHEST PAID EMPLOYEES – CONTINUEDThe executive directors’ emoluments shown above were for their services in connection with the management of the affairs of the Company and the Group.
The independent non-executive directors’ emoluments shown above were for their services as Directors of the Company.
The five highest paid employees of the Group during the year included one director (2017: one director), details of whose remuneration are set out above. Details of the remuneration for the year of the remaining four (2017: four) highest paid employees who are not a director of the Company are as follows:
2018RMB’million
2017RMB’million
Salaries 16 15
Other benefits 5 6
Performance related incentive payments 6 6
Retirement benefit costs 1 2
Share award expenses – 2
28 31
The emoluments of the remaining highest paid employees were within the following bands:
2018Number ofemployees
2017Number ofemployees
Emolument bands
HKD6,500,001 – HKD7,000,000 1 –
HKD7,000,001 – HKD7,500,000 1 –
HKD7,500,001 – HKD8,000,000 – 1
HKD8,000,001 – HKD8,500,000 – 2
HKD8,500,001 – HKD9,000,000 1 –
HKD9,500,001 – HKD10,000,000 – 1
HKD10,500,001 – HKD11,000,000 1 –
4 4
There was no arrangement under which a director waived or agreed to waive any remuneration during the year.
Certain executive directors of the Company are entitled to cash bonus payments which are determined based on the Group’s and directors’ personal performance.
NOTES TO THE CONSOLIDATED FINANCIAL STATEMENTS
FOR THE YEAR ENDED 31 DECEMBER 2018
Shui On Land Limited180

11. DIVIDENDS2018
RMB’million2017
RMB’million
Dividends recognised as distribution during the year:
Interim dividend paid in respect of 2018 of HKD0.036 per share (2017: Interim dividend paid in respect of 2017 of HKD0.03 per share) 253 205
Final dividend paid in respect of 2017 of HKD0.07 per share (2017: Final dividend paid in respect of 2016 of HKD0.039 per share) 461 270
714 475
A final dividend for the year ended 31 December 2018 of HKD0.084 (equivalent to RMB0.074 translated using the exchange rate of 0.87620 as at 31 December 2018) per share, amounting to HKD677 million (equivalent to RMB593 million translated using the exchange rate of 0.87620 as at 31 December 2018) in aggregate, was proposed by the Directors of the Company on 20 March 2019 and is subject to the approval of the shareholders at the forthcoming annual general meeting.
12. EARNINGS PER SHARE The calculation of the basic and diluted earnings per share attributable to shareholders of the Company is based on the following data:
EARNINGS
2018RMB’million
2017RMB’million
Earnings for the purpose of basic earnings per share, being profit for the year attributable to shareholders of the Company 1,906 1,669
Effect of dilutive potential ordinary shares:
Adjustment for convertible perpetual capital securities 112 114
Earnings for the purpose of diluted earnings per share 2,018 1,783
NUMBER OF SHARES
2018’million
2017’million
Weighted average number of ordinary shares for the purpose of basic earnings per share (note (a)) 8,043 8,018
Effect of dilutive potential ordinary shares:
Convertible perpetual capital securities 632 597
Outstanding share awards 1 17
Weighted average number of ordinary shares for the purpose of diluted earnings per share 8,676 8,632
Basic earnings per share (note (b)) RMB23.7 cents RMB20.8 cents
HKD28.0 cents HKD24.1 cents
Diluted earnings per share (note (b)) RMB23.3 cents RMB20.7 cents
HKD27.5 cents HKD23.9 cents
Notes:(a) The weighted average number of ordinary shares shown above have been arrived at after deducting the weighted average effect on 19,076,778 (2017: 24,854,000) shares held by
a share award scheme trust as set out in note 41.(b) The Hong Kong dollar figures presented above are shown for reference only and have been arrived at based on the exchange rate of RMB1.000 to HKD1.182 for 2018 and
RMB1.000 to HKD1.156 for 2017, being the average exchange rates that prevailed during the respective years.(c) There were no dilution effects from outstanding share options as the exercise prices of each of these share options were higher than the average market price of the Company’s
shares per share for the years ended 31 December 2018 and 2017, as appropriate.
Annual Report 2018 181

13. INVESTMENT PROPERTIES
Completed investment properties
RMB’million
Investment properties
under construction
or development
at fair valueRMB’million
Investment properties
under construction
or development
at costRMB’million
TotalRMB’million
At 1 January 2017 42,065 2,999 11,556 56,620
Additions 16 721 152 889
Cost adjustment (218) – – (218)
Disposal of subsidiaries (note 39(c), (d), (e)) (3,642) (2,102) (4,221) (9,965)
Disposals (512) – – (512)
Transfer due to refurbishment (1,633) 1,633 – –
Transfer upon completion 1,585 (1,585) – –
Transfer from property, plant and equipment (note 14, note (b)) 630 – – 630
Transfer to property, plant and equipment (note 14) (15) – – (15)
Transfer to properties under development for sale (note 15) – – (134) (134)
Transfer from properties held-for-sale 176 – – 176
Increase in fair value of the remaining properties recognised in profit or loss 412 106 – 518
At 31 December 2017 38,864 1,772 7,353 47,989
At 31 December 2017
– Stated at fair value 38,864 1,772 – 40,636
– Stated at cost – – 7,353 7,353
At 1 January 2018 38,864 1,772 7,353 47,989
Additions 108 314 385 807
Transfer upon formation of a joint venture (note (a)) – – (1,609) (1,609)
Disposals (16) – – (16)
Transfer upon completion 2,266 (2,266) – –
Transfer from property, plant and equipment (note 14, note (b)) 54 – – 54
Transfer to property, plant and equipment (note 14) (8) – – (8)
Transfer from properties held-for-sale 50 – – 50
Increase in fair value of the remaining properties recognised in profit or loss 642 328 – 970
Acquisition of a subsidiary (note 39(b)) – 1,243 – 1,243
Impairment loss on investment properties under development at cost (note 6) – – (380) (380)
At 31 December 2018 41,960 1,391 5,749 49,100
At 31 December 2018
– Stated at fair value 41,960 1,391 – 43,351
– Stated at cost – – 5,749 5,749
Notes:(a) In July 2018, a wholly-owned subsidiary of the Company with strategic partners established a joint venture for carrying out property development project at a land in Shanghai.
Upon the establishment, the historical costs invested by the Group into the land, net of taxes, was accounted as original investment and accordingly transferred to investment in a joint venture.
(b) During the year ended 31 December 2018, certain self-use properties with carrying amount of RMB49 million (2017: RMB622 million) was transferred to completed investment properties upon the change in use of the properties evidenced by the end of owner-occupation. At the date of transfer, the gain on revaluation of properties transferred from property, plant and equipment to investment properties amounting to RMB5 million (2017: RMB8 million) was recognised in other comprehensive income.
NOTES TO THE CONSOLIDATED FINANCIAL STATEMENTS
FOR THE YEAR ENDED 31 DECEMBER 2018
Shui On Land Limited182

13. INVESTMENT PROPERTIES – CONTINUEDThe Group is in the process of obtaining land use rights certificates in respect of investment properties under construction or development with the aggregate carrying amount of RMB1,736 million (2017: RMB3,418 million). The Directors of the Company believe that the relevant land use rights certificates will be granted in due course and the absence of land use rights certificates does not impair the value of the relevant properties.
The fair values of the Group’s investment properties as at 31 December 2018 and 31 December 2017, and the fair values of properties at the dates of transfer to/from investment properties have been arrived at on the basis of valuations carried out on those dates by Knight Frank Petty Limited, independent qualified professional valuers not connected to the Group.
For completed investment properties, the valuations have been arrived at using income capitalisation approach. In the valuation using income capitalisation of net income method, the market rentals of all lettable units of the properties are assessed by reference to the rentals achieved in the lettable units as well as other lettings of similar properties in the neighbourhood. The capitalisation rate adopted is made by reference to the yield rates observed by the valuers for similar properties in the locality and adjusted based on the valuers’ knowledge of the factors specific to the respective properties.
For investment properties under construction or development that are measured at fair value, the valuations have been arrived at assuming that the investment properties will be completed in accordance with the development proposals and the relevant approvals for the proposals have been obtained. The key inputs in the valuations include the market value of the completed investment properties, which are estimated with reference to sales evidence of similar properties in the nearest locality, with adjustments made to account for differences in locations and other factors specific to the respective properties based on the valuers’ judgement. Costs of development are also taken into account including construction costs, finance costs and professional fees, as well as developer’s profit margin which reflects the remaining risks associated with the development of the properties at the valuation date and the return that the developer would require for bringing them to completion status, which is determined by the valuers based on its analyses of recent land transactions and market value of similar completed properties in the respective locations.
In estimating the fair value of the properties, the management of the Group has taken into consideration the highest and best use of the properties.
Annual Report 2018 183

13. INVESTMENT PROPERTIES – CONTINUED The major inputs used in the fair value measurement of the Group’s major investment properties as at 31 December 2018 and 31 December 2017 are set out below:
Investment propertiesheld by the Group in theconsolidated statementof financial position
Fair valuehierarchy
Valuation techniqueand key inputs
Significantunobservable input(s)
Relationship ofunobservableinputs to fair value Sensitivity
Completed investment properties
Completed investmentproperties located inShanghai with an aggregate carrying amount of RMB28,782 million (2017: RMB25,728 million)
Level 3 Income Capitalisation Approach
The key inputs are:(1) Capitalisation rate; and(2) Daily market rent.
Capitalisation rate, taking into account the capitalisation of rental income potential, nature of the property, and prevailing market condition, of a range from 3.5% to 7.5% (2017: from 3.5% to 7.5%).
The higher the capitalisation rate, the lower the fair value.
A slight increase in the capitalisation rate used would result in a significant decrease in fair value, and vice versa.
Daily market rent, taking into account the time, location, and individual factors, such as frontage and size, between the comparables and the property, at an average of a range from RMB2.9 to RMB18.5 (2017: from RMB2.9 to RMB18.1) per square metre ("sqm") per day on gross floor area basis.
The higher the daily market rent, the higher the fair value.
A significant increase in the daily market rent used would result in a significant increase in fair value, and vice versa.
Completed investment properties located in Wuhan with an aggregate carrying amount of RMB7,157million (2017: RMB7,086 million)
Level 3 Income Capitalisation Approach
The key inputs are: (1) Capitalisation rate; and(2) Daily market rent.
Capitalisation rate, taking into account the capitalisation of rental income potential, nature of the property, and prevailing market condition, of a range from 4.5% to 6.25% (2017: from 4.5% to 6.25%).
The higher the capitalisation rate, the lower the fair value.
A slight increase in the capitalisation rate used would result in a significant decrease in fair value, and vice versa.
Daily market rent, taking into account the time, location, and individual factors, such as frontage and size, between the comparables and the property, at an average of a range from RMB6.3 to RMB6.7 (2017: from RMB6.3 to RMB6.6) per sqm per day on gross floor area basis.
The higher the dailymarket rent, the higher the fair value.
A significant increase in the daily market rent used would result in a significant increase in fair value, and vice versa.
Completed investment properties located in Foshan with an aggregate carrying amount of RMB4,325million (2017: RMB4,324 million)
Level 3 Income Capitalisation Approach
The key inputs are: (1) Capitalisation rate; and(2) Daily market rent.
Capitalisation rate, taking into account the capitalisation of rental income potential, nature of the property, and prevailing market condition, of a range from 4.0% to 5.5% (2017: from 4.0% to 5.5%).
The higher the capitalisation rate, the lower the fair value.
A slight increase in the capitalisation rate used would result in a significant decrease in fair value, and vice versa.
Daily market rent, taking into account the time, location, and individual factors, such as frontage and size, between the comparables and the property, at an average ranging from RMB1.9 to RMB5.2 (2017: from RMB1.8 to RMB4.6) per sqm per day on gross floor area basis.
The higher the dailymarket rent, the higher the fair value.
A significant increase in the daily market rent used would result in a significant increase in fair value, and vice versa.
NOTES TO THE CONSOLIDATED FINANCIAL STATEMENTS
FOR THE YEAR ENDED 31 DECEMBER 2018
Shui On Land Limited184

13. INVESTMENT PROPERTIES – CONTINUEDInvestment propertiesheld by the Group in theconsolidated statementof financial position
Fair valuehierarchy
Valuation techniqueand key inputs
Significantunobservable input(s)
Relationship ofunobservableinputs to fair value Sensitivity
Completed investment properties – continued
Completed investment properties located in Chongqing with an aggregate carrying amount of RMB1,696 million (2017: RMB1,726 million)
Level 3 Income Capitalisation Approach
The key inputs are: (1) Capitalisation rate; and(2) Daily market rent.
Capitalisation rate, taking into account the capitalisation of rental income potential, nature of the property, and prevailing market condition, of a range from 4.25% to 5.0% (2017: 4.25% to 5.0%).
The higher the capitalisation rate, the lower the fair value.
A slight increase in the capitalisation rate used would result in a significant decrease in fair value, and vice versa.
Daily market rent, taking into account the time, location, and individual factors, such as frontage and size, between the comparables and the property, at an average of a range from RMB0.4 to RMB2.3 (2017: from RMB0.4 to RMB2.3) per sqm per day on gross floor area basis.
The higher the dailymarket rent, the higher the fair value.
A significant increase in the daily market rent used would result in a significant increase in fair value, and vice versa.
Investment properties under construction or development are measured at fair value
Investment properties under construction or development located in Shanghai with an aggregate carrying amount of RMB1,391million (2017: RMB1,772 million )
Level 3 Market-based Approach
The key inputs are:(1) Gross development value; and(2) Level adjustment
Gross development value on completion basis, taking into account the time, location, and individual factors, such as frontage and size, between the comparables and the property, of RMB1,420 million (2017: RMB2,028 million).
The higher the gross development value, the higher the fair value.
A significant increase in gross development value used would result in a significant increase in fair value, and vice versa.
Level adjustment on individual floor of retail portion of the property of 60% (2017: 60% to 95%) on specific levels.
The higher the level adjustment, the lower the fair value.
A significant increase in level adjustment used would result in a significant decrease in fair value, and vice versa.
There were no transfers in or out of Level 3 during both years.
Annual Report 2018 185
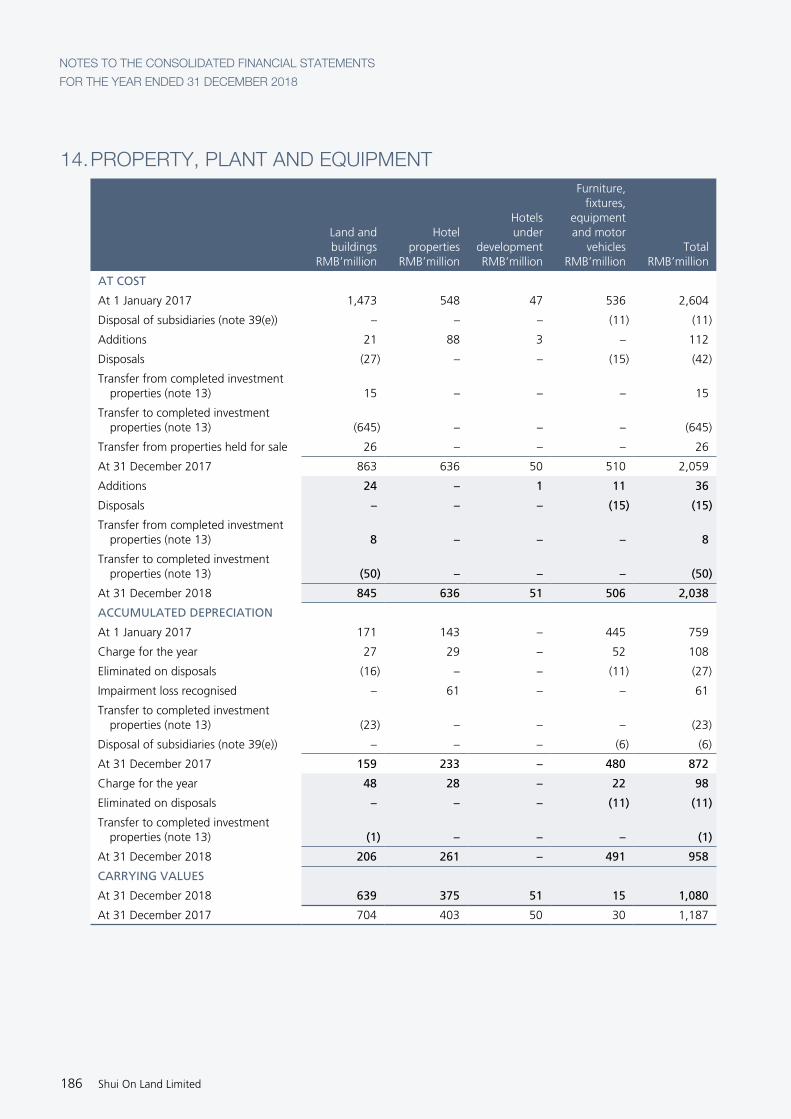
14. PROPERTY, PLANT AND EQUIPMENT
Land andbuildings
RMB’million
Hotelproperties
RMB’million
Hotelsunder
developmentRMB’million
Furniture,fixtures,
equipmentand motor
vehiclesRMB’million
TotalRMB’million
AT COST
At 1 January 2017 1,473 548 47 536 2,604
Disposal of subsidiaries (note 39(e)) – – – (11) (11)
Additions 21 88 3 – 112
Disposals (27) – – (15) (42)
Transfer from completed investment properties (note 13) 15 – – – 15
Transfer to completed investment properties (note 13) (645) – – – (645)
Transfer from properties held for sale 26 – – – 26
At 31 December 2017 863 636 50 510 2,059
Additions 24 – 1 11 36
Disposals – – – (15) (15)
Transfer from completed investment properties (note 13) 8 – – – 8
Transfer to completed investment properties (note 13) (50) – – – (50)
At 31 December 2018 845 636 51 506 2,038
ACCUMULATED DEPRECIATION
At 1 January 2017 171 143 – 445 759
Charge for the year 27 29 – 52 108
Eliminated on disposals (16) – – (11) (27)
Impairment loss recognised – 61 – – 61
Transfer to completed investment properties (note 13) (23) – – – (23)
Disposal of subsidiaries (note 39(e)) – – – (6) (6)
At 31 December 2017 159 233 – 480 872
Charge for the year 48 28 – 22 98
Eliminated on disposals – – – (11) (11)
Transfer to completed investment properties (note 13) (1) – – – (1)
At 31 December 2018 206 261 – 491 958
CARRYING VALUES
At 31 December 2018 639 375 51 15 1,080
At 31 December 2017 704 403 50 30 1,187
NOTES TO THE CONSOLIDATED FINANCIAL STATEMENTS
FOR THE YEAR ENDED 31 DECEMBER 2018
Shui On Land Limited186

14. PROPERTY, PLANT AND EQUIPMENT – CONTINUED The carrying amounts of owner-occupied leasehold land and buildings of RMB543 million (2017: RMB566 million) and hotel properties of RMB375 million (2017: RMB403 million) at the end of the reporting period included both the leasehold land and building elements in property, plant and equipment, as in the opinion of the Directors of the Company, allocations of the carrying amounts between the leasehold land and buildings elements cannot be made reliably. The land portions of the remaining owner-occupied properties were included in prepaid lease payments.
During the year ended 31 December 2018, the Directors of the Company conducted an impairment review on the property, plant and equipment and an impairment loss of nil (2017: RMB61 million) was recognised with reference its estimated recoverable amount.
The above items of property, plant and equipment, except for hotels under development, are depreciated on a straight-line basis at the following rates per annum:
Land and buildings Over the shorter of the term of the lease, or 50 years
Hotel properties Over the shorter of the term of the lease, or 50 years
Furniture, fixtures, equipment and motor vehicles 20% to 331/3%
15. PROPERTIES UNDER DEVELOPMENT FOR SALE2018
RMB’million2017
RMB’million
At beginning of the year 18,112 21,838
Additions 7,914 9,336
Disposal of subsidiaries (note 39(a),(c),(d)) (12,320) (1,642)
Transfer to properties held for sale (1,779) (11,554)
Transfer from investment properties under construction or development at cost (note 13) – 134
At end of the year 11,927 18,112
Included in the properties under development for sale as at 31 December 2018 is carrying value of RMB11,916 million (2017: RMB18,112 million) which represents the carrying value of the properties expected to be realised after twelve months from the end of the reporting period.
The Group is in the process of obtaining land use rights certificates in respect of properties under development for sale with the aggregate carrying amount of RMB8,639million (2017: RMB8,639 million). The Directors of the Company believe that the relevant land use rights certificates will be granted in due course and the absence of land use rights certificates does not impair the value of the relevant properties.
Annual Report 2018 187

16. INTERESTS IN ASSOCIATES/LOANS TO/AMOUNTS DUE FROM ASSOCIATES
Notes2018
RMB’million2017
RMB’million
Interests in associates
– Cost of investments, unlisted (a) 5,033 1,033
– Share of post-acquisition results, net of effect on elimination of unrealised interest income (35) (3)
4,998 1,030
Loans to an associate – current
– Unsecured, interest bearing and repayable in 2019 (b) 3,240 –
Amounts due from associates – current
– Interest free (c) 194 –
3,434 –
Notes:(a) As disclosed in note 39(a), on 26 June 2018, the Group disposed of 49.5% effective rights and interests pertaining to the portfolio of certain properties of Shanghai Rui Hong Xin
Cheng Co., Ltd. (“Shanghai RHXC”) for residential development and has accounted for the remaining 49.5% interests as interests in associate at its fair value at the date when control was lost.
As disclosed in note 39(c), in May 2017, the Group disposed of a 79.2% equity interests in Chongqing Shui On Tiandi Real Estate Development Company Limited (“Chongqing Shui On Tiandi”) and has accounted for the remaining 19.8% interests as interests in associate at its fair value at the date when control was lost.
(b) The loans to an associate, representing the loans to 49.5% effective rights and interests pertaining to a portfolio of certain properties of Shanghai RHXC, are unsecured, carrying interest at rates from 4.785% to 5.39% per annum and repayable within twelve months from the end of the reporting period.
(c) The amounts due from associates are unsecured, interest free and repayable on demand.
Particulars of the Group’s associates as at 31 December 2018 and 31 December 2017 are as follows:
Name of associate
Proportion ofvoting rights
held by the Group
Proportion ofnominal value ofissued ordinaryshare capital/
registered capitalheld by the Group
Place ofincorporation/
registrationand operations Principal activities2018 2017 2018 2017
Interests pertaining to a net portfolio of certain residential properties in Shanghai RHXC
49.5% 99% 49.5% 99% PRC Property development and
other activities
Chongqing Shui On Tiandi 19.8% 19.8% 19.8% 19.8% PRC Property development and
other activities
Interests pertaining to a net portfolio of certain residential properties in Shanghai RHXC:
2018RMB’million
Current assets 15,525
Non-current assets –
Current liabilities 7,536
Non-current liabilities –
Net assets 7,989
Revenue –
Loss and total comprehensive expenses for the year 3
NOTES TO THE CONSOLIDATED FINANCIAL STATEMENTS
FOR THE YEAR ENDED 31 DECEMBER 2018
Shui On Land Limited188

16. INTERESTS IN ASSOCIATES/LOANS TO/AMOUNTS DUE FROM ASSOCIATES – CONTINUED Reconciliation of the above summarised consolidated financial information to the carrying amount of the interest in associates recognised in the consolidated financial statements:
2018RMB’million
Net assets of interests pertaining to a net portfolio of certain residential properties in Shanghai RHXC 7,989
Less: Non-controlling interests pertaining to a net portfolio of certain residential properties in Shanghai RHXC (14)
Equity attributable to shareholders of Colour Bridge Holdings Limited (“Colour Bridge”) 7,975
Proportion of the Group’s ownership interests in Colour Bridge 50%
3,987
Add:
Elimination of unrealised interest expense capitalised as part of the cost of properties under development (25)
Carrying amount of the Group’s interests pertaining to a net portfolio of certain residential properties in Shanghai RHXC 3,962
The summarised consolidated financial information of Chongqing Shui On Tiandi for the years ended 31 December 2018 and 31 December 2017 is set out below:
2018RMB’million
2017RMB’million
Current assets 9,851 6,864
Non-current assets 35 5
Current liabilities 4,656 1,325
Non-current liabilities – 340
Net assets 5,230 5,204
Revenue – –
Loss and total comprehensive expenses for the year 31 13
Annual Report 2018 189

16. INTERESTS IN ASSOCIATES/LOANS TO/AMOUNTS DUE FROM ASSOCIATES – CONTINUEDReconciliation of the above summarised financial information to the carrying amount of the interests in Chongqing Shui On Tiandi recognised in the consolidated financial statements:
2018RMB’million
2017RMB’million
Net assets of Chongqing Shui On Tiandi (note) 5,230 5,204
Proportion of the Group’s ownership interest in Chongqing Shui On Tiandi 19.8% 19.8%
Carrying amount of the Group’s interest in Chongqing Shui On Tiandi 1,036 1,030
Note:The net asset value at the date of disposal was finalised during the year ended 31 December 2018 and the net asset value was adjusted upward by RMB57 million.
17. INTERESTS IN JOINT VENTURES/LOANS TO/AMOUNTS DUE FROM JOINT VENTURES
2018RMB’million
2017RMB’million
Investment in joint ventures
– Cost of investment, unlisted 8,858 4,040
– Impairment provision (376) –
– Share of post-acquisition results, net of effect on elimination of unrealised interest income (23) (35)
– Share of other comprehensive income of a joint venture 22 –
8,481 4,005
Loans to joint ventures – non-current
– Unsecured, interest bearing at 110% of People’s Bank of China ("PBOC") Prescribed Interest Rate 1,488 1,899
Amounts due from joint ventures – non-current
– Unsecured, interest free 713 680
10,682 6,584
Loans to joint ventures – current
– Unsecured, interest bearing at 100% of PBOC Prescribed Interest Rate and repayable in 2018 – 654
– Unsecured, interest bearing at 110% of PBOC Prescribed Interest Rate and repayable in 2019 1,822 –
Amounts due from joint ventures – current
– Unsecured, interest-free and repayable on demand 31 6
1,853 660
NOTES TO THE CONSOLIDATED FINANCIAL STATEMENTS
FOR THE YEAR ENDED 31 DECEMBER 2018
Shui On Land Limited190

17. INTERESTS IN JOINT VENTURES/LOANS TO/AMOUNTS DUE FROM JOINT VENTURES – CONTINUED Particulars of the Group’s joint ventures as at 31 December 2018 and 31 December 2017 are as follows:
Name of joint venture
Proportion ofvoting rights
held by the Group
Proportion ofnominal value ofissued ordinaryshare capital/
registered capitalheld by the Group
Place ofincorporation/
registrationand
operations Principal activities2018 2017 2018 2017
Interests pertaining to a net portfolio of certain commercial properties in Shanghai RHXC# (Note (a))
50% 50% 49.5% 49.5% PRC Property development and other activities
上海瑞永景房地產開發有限公司 (“Shanghai Rui Yong Jing”)# (Note (b))
29% – 25% – PRC Property development and other activities
Hua Xia Rising (Hong Kong) Limited 50% 50% 50% 50% Hong Kong Investment holding
上海磐興管理咨詢有限公司 (Shanghai Panxing Tiandi Co., Ltd) (“Shanghai Panxing”)# (Note (c))
50% 50% 49% 49% PRC Property management and other activities
上海景綽企業發展有限公司 (“Shanghai Jingchuo”)# (Note (d))
40% 40% 49% 49% PRC Property management and other activities
大連億達德基裝飾工程有限公司 50% 50% 50% 50% PRC Provision of decoration services
上海永麟投資管理有限公司 Shanghai Yong Lin Investment Management Limited (“Shanghai Yong Lin”)# (Note (e))
50% 50% 19.8% 19.8% PRC Property management and other activities
(a) On 19 December 2017, the Group entered into an agreement with an independent third party pursuant to which the Group would effectively dispose its 49.5% interests pertaining to a net portfolio of certain commercial properties via disposal of 21.4% equity interests in Shanghai RHXC, a subsidiary in which the Group originally owned 99% equity interest. The transaction was completed on 27 December 2017, and the Group accounted for this as a joint venture upon completion. According to the joint venture agreement, the Group and the other equity owner (the “JV Partner 1”, an independent third party which own 49.5% equity interests pertaining to a net portfolio of certain properties) are considered to have joint control over the net portfolio of certain commercial properties as major decisions that relate to the relevant activities of the net portfolio of certain commercial properties require unanimous consent from the Group and the JV Partner 1.
(b) On 5 July 2018, the Group through a wholly owned subsidiary, entered into an agreement with strategic partners to establish Shanghai Rui Yong Jing for carrying out property development project in Shanghai.
Persuant to joint venture agreement, the Group and the other equity owners ( the “JV Partners 2”, two independent third parties which own 70%, 5% equity interest in Shanghai Rui Yong Jing respectively ) are considered to have joint control over Shanghai Rui Yong Jing as all major decisions require unanimous approval of all directors of Shanghai Rui Yong Jing.
(c) Pursuant to the joint venture agreement and articles of association of Shanghai Panxing, the Group, through a wholly owned subsidiary, and the other equity owner (the “JV Partner 3”, an independent third party which own 51% equity interest in Shanghai Panxing) are considered to have joint control over Shanghai Panxing as major decisions that relate to the relevant activities of Shanghai Panxing require unanimous consent from the Group and the JV Partner 3.
(d) Pursuant to the joint venture agreement and articles of association of Shanghai Jingchuo, the Group, through a wholly owned subsidiary, and the other equity owners (the “JV Partners 4”, two independent third parties which own 20%, 31% equity interest in Shanghai Jingchuo respectively) are considered to have joint control over Shanghai Jingchuo as major decisions that relate to the relevant activities of Shanghai Jingchuo require unanimous consent from the Group and the JV Partners 4.
(e) Pursuant to the memorandum and articles of association of Shanghai Yong Lin, the Group, through a subsidiary which the Company owns 99% equity interest, and the other equity owner (the “JV Partner 5”, an independent third party which owns 80.2% equity interest in Shanghai Yong Lin) are considered to have joint control over Shanghai Yong Lin as major decisions that relate to the relevant activities of Shanghai Yong Lin require unanimous consent from the Group and the JV Partner 5.
Shanghai Yong Lin is principally engaged in the property management and other activities in respect of relocation activities in Shanghai. Its principal activities are considered as strategic to the Group’s activities as the relocation activities are carried out in the vicinity of one of the Group’s property projects.
# English name is for identification only
Annual Report 2018 191

17. INTERESTS IN JOINT VENTURES/LOANS TO/AMOUNTS DUE FROM JOINT VENTURES – CONTINUED Summarised financial information of material joint ventures:
Summarised financial information in respect of the Group’s material joint ventures, the interests pertaining to a net portfolio of certain commercial properties in Shanghai RHXC and Shanghai Rui Yong Jing is set out below. The summarised financial information below represents amounts shown in the joint venture’s financial statements prepared in accordance with IFRSs.
The joint ventures are accounted for using the equity method in these consolidated financial statements.
Interests pertaining to a net portfolio of certain commercial properties in Shanghai RHXC:
2018RMB’million
2017RMB’million
Current assets 101 86
Non-current assets 10,739 10,036
Current liabilities 1,342 542
Non-current liabilities 1,322 1,740
The above amounts of assets and liabilities include the following:
Cash and cash equivalents 70 78
Current financial liabilities
(excluding trade and other payables and provisions) 1,242 414
Non-current financial liabilities
(excluding trade and other payables and provisions) 1,246 1,740
Revenue 183 3
Profit and total comprehensive income for the year 139 24
The above profit for the year includes the following:
2018RMB’million
2017RMB’million
Depreciation and amortisation 2 –
Interest income 1 –
Interest expense 70 1
Income tax expense – 1
NOTES TO THE CONSOLIDATED FINANCIAL STATEMENTS
FOR THE YEAR ENDED 31 DECEMBER 2018
Shui On Land Limited192
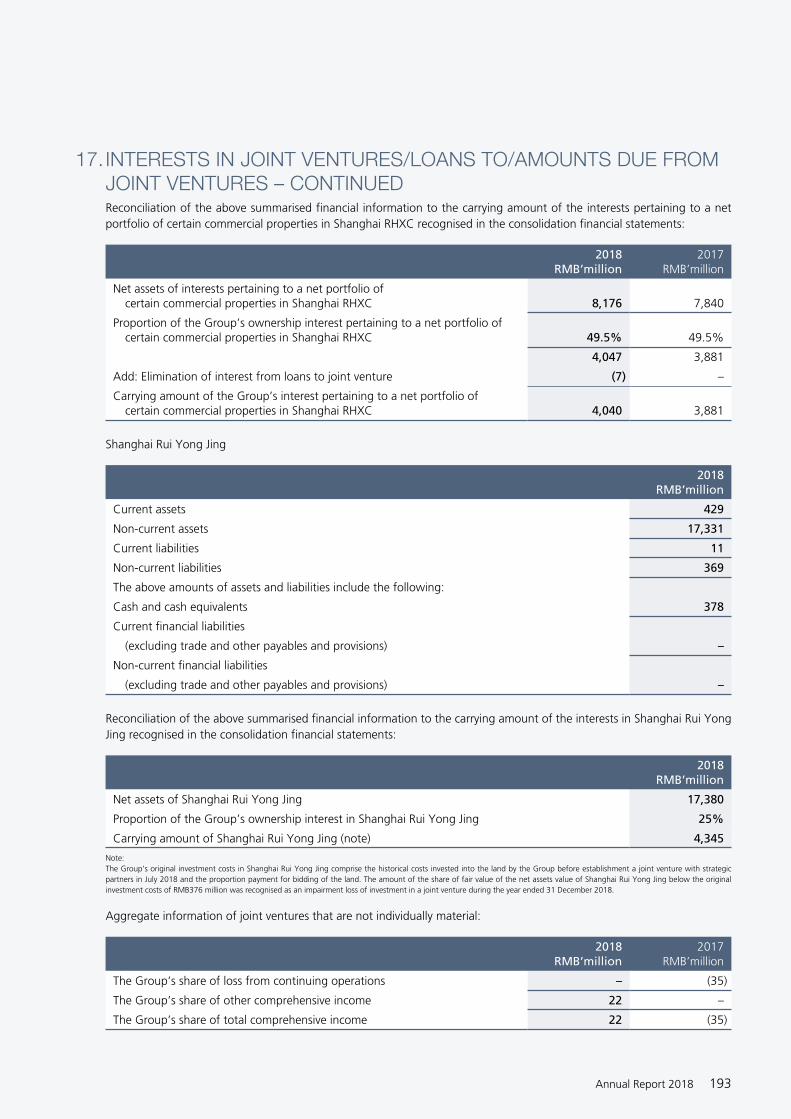
17. INTERESTS IN JOINT VENTURES/LOANS TO/AMOUNTS DUE FROM JOINT VENTURES – CONTINUEDReconciliation of the above summarised financial information to the carrying amount of the interests pertaining to a net portfolio of certain commercial properties in Shanghai RHXC recognised in the consolidation financial statements:
2018RMB’million
2017RMB’million
Net assets of interests pertaining to a net portfolio of certain commercial properties in Shanghai RHXC 8,176 7,840
Proportion of the Group’s ownership interest pertaining to a net portfolio of certain commercial properties in Shanghai RHXC 49.5% 49.5%
4,047 3,881
Add: Elimination of interest from loans to joint venture (7) –
Carrying amount of the Group’s interest pertaining to a net portfolio of certain commercial properties in Shanghai RHXC 4,040 3,881
Shanghai Rui Yong Jing
2018RMB’million
Current assets 429
Non-current assets 17,331
Current liabilities 11
Non-current liabilities 369
The above amounts of assets and liabilities include the following:
Cash and cash equivalents 378
Current financial liabilities
(excluding trade and other payables and provisions) –
Non-current financial liabilities
(excluding trade and other payables and provisions) –
Reconciliation of the above summarised financial information to the carrying amount of the interests in Shanghai Rui Yong Jing recognised in the consolidation financial statements:
2018RMB’million
Net assets of Shanghai Rui Yong Jing 17,380
Proportion of the Group’s ownership interest in Shanghai Rui Yong Jing 25%
Carrying amount of Shanghai Rui Yong Jing (note) 4,345
Note:The Group’s original investment costs in Shanghai Rui Yong Jing comprise the historical costs invested into the land by the Group before establishment a joint venture with strategic partners in July 2018 and the proportion payment for bidding of the land. The amount of the share of fair value of the net assets value of Shanghai Rui Yong Jing below the original investment costs of RMB376 million was recognised as an impairment loss of investment in a joint venture during the year ended 31 December 2018.
Aggregate information of joint ventures that are not individually material:
2018RMB’million
2017RMB’million
The Group’s share of loss from continuing operations – (35)
The Group’s share of other comprehensive income 22 –
The Group’s share of total comprehensive income 22 (35)
Annual Report 2018 193

17. INTERESTS IN JOINT VENTURES/LOANS TO/AMOUNTS DUE FROM JOINT VENTURES – CONTINUED Aggregate carrying amount of the Group’s interests in these individually not material joint ventures
2018RMB’million
2017RMB’million
Investment in joint ventures 96 124
18. ACCOUNTS RECEIVABLE, DEPOSITS AND PREPAYMENTS2018
RMB’million2017
RMB’million
Non-current assets comprise:
Rental receivables in respect of rent-free periods 250 277
Trade receivables
– goods and services 57 139
– operating lease receivables – 5
Deposits for acquisition of a subsidiary – 630
Deposit paid on investment in an associate 1,041 –
Other receivables 1 37
1,349 1,088
Current assets comprise:
Trade receivables
– goods and services 68 145
– operating lease receivables 29 13
Prepayments of relocation costs (note) 347 6,004
Other deposits, prepayments and receivables 383 903
Receivables from disposal of subsidiaries 447 380
Rental receivables in respect of rent-free periods 106 75
Receivables from disposal of associates 1,735 –
3,115 7,520
Note: The balances represent the amounts that will be capitalised to properties under development for sale as soon as the relocation is completed. Such relocation process in respect of the land portion which will be developed for sale is in accordance with the Group’s normal operating cycle and accordingly the related relocation costs are classified as current assets.
Trade receivables comprise:
(i) receivables arising from sales of properties which are due for settlement in accordance with the terms of the relevant sale and purchase agreements;
(ii) rental receivables which are due for settlement upon issuance of monthly debit notes to the tenants; and
(iii) receivables arising from construction revenue of which a credit term of 40 days are granted to the customers.
As at 31 December 2018 and 1 January 2018, trade receivables form contracts with customers amounted to RMB125 million and RMB284 million respectively.
Included in the Group’s accounts receivable, deposits and prepayments are trade receivable balances of RMB154 million (2017: RMB302 million), of which 52% (2017: 46%) are aged less than 90 days, and 48% (2017: 54%) are aged over 90 days, as compared to when revenue was recognised.
Included in the Group’s trade receivable balances as at 31 December 2017 are debtors with aggregate carrying amount of RMB258 million which are past due at the end of the reporting period for which the Group has not provided for impairment loss, of which 31% are past due within 90 days, and 69% are past due over 90 days, based on the repayment terms set out in the sale and purchase agreements.
NOTES TO THE CONSOLIDATED FINANCIAL STATEMENTS
FOR THE YEAR ENDED 31 DECEMBER 2018
Shui On Land Limited194

19. CONTRACT ASSETS 31/12/2018
RMB’million1/1/2018*
RMB’million
Construction 59 126
The contract assets primarily relate to the Group’s right to consideration for work completed and not billed because the rights are conditional on the Group’s future performance in achieving specified milestones at the reporting date on construction. The contract assets are transferred to trade receivables when the rights become unconditional.
The Group’s construction contracts include payment schedules which require stage payments over the construction period once certain specified milestones are reached. The Group typically achieves specified milestones and thus have the right to bill the customers when the progress certificate, settlement letter or payment notice is obtained.
* The amounts in this column are after the adjustments from the application of IFRS 9 and 15.
20. AMOUNTS DUE FROM CUSTOMERS FOR CONTRACT WORK2017
RMB’million
Contracts in progress at the end of the reporting period
Contract costs incurred plus recognised profits less recognised losses 7,808
Less: progress billings (7,682)
Analysed for reporting purposes as amounts due from contract customers 126
As at 31 December 2017, retentions held by customers for contract works amounted to RMB15 million.
21. BANK BALANCES AND CASH /PLEDGED BANK DEPOSITS 2018
RMB’million2017
RMB’million
Bank and cash – unrestricted 9,756 13,594
Bank balances – restricted 3,348 1,013
13,104 14,607
Rrestricted bank balances as at 31 December 2018 and 2017 include:
• monies placed by the Group with banks amounting to RMB3,142 million (2017: RMB768 million) which can only be applied to designated property development projects of the Group.
• monies placed in designated bank accounts for the guarantee of due performance in relation to the acquisition of all the remaining interest of a subsidiary amounting to RMB206 million (2017:nil).
• as at 31 December 2017, RMB245 million was placed in designated bank accounts for the settlement of tax in relation to the disposal of a subsidiary (note 39(e)).
Bank balances and restricted bank balances carry interest at market rates which range from 0.00% to 1.495% (2017: 0.30% to 1.89%) per annum. Pledged bank deposits carry interest at fixed rates which range from 0.30% to 1.61% (2017: 0.30% to 2.35%) per annum.
Pledged bank deposits represent deposits pledged to banks to secure the banking facilities granted to the Group. The pledged bank deposits will be released upon the settlement of relevant bank borrowings. Deposits amounting to RMB1,796 million (2017: RMB2,134 million) have been pledged to secure long-term bank loans and are therefore classified as non-current assets. The remaining deposits have been pledged to secure short-term bank loans and are classified as current assets.
Annual Report 2018 195

22. PROPERTIES HELD FOR SALE The Group’s properties held for sale are situated in the PRC. All the properties held for sale are stated at the lower of cost or net realisable value.
23. AMOUNTS DUE FROM/TO RELATED COMPANIES2018
RMB’million2017
RMB’million
Amounts due from related companies comprise:
Fellow subsidiaries 159 101
Investees of SOCAM Development Limited (“SOCAM”) – 541
159 642
Amounts due to related companies comprise:
Fellow subsidiaries 15 6
Subsidiaries of SOCAM – 341
15 347
An aggregate amount of RMB23 million as at 31 December 2018 (2017: RMB110 million) included in amounts due from related companies are trade nature and with the credit period of 40 days granted by the Group, of which 50% (2017: nil) are aged less than 90 days, and 50% (2017: 100%) are aged over 90 days, as compared to when revenue was recognised.
An aggregate amount of RMB136 million as at 31 December 2018 (2017: RMB532 million) included in amounts due from related companies are non-trade nature, unsecured, interest free and repayable on demand.
In the opinion of the Directors of the Company, the amounts due from related companies amounting to RMB159 million (2017: RMB642 million) are expected to be repaid within twelve months after the end of the reporting period and accordingly the amounts are classified as current assets.
Amounts due to related companies are non-trade nature, unsecured, interest free and repayable on demand.
24. LOANS FROM/AMOUNTS DUE TO NON-CONTROLLING SHAREHOLDERS OF SUBSIDIARIES
2018RMB’million
2017RMB’million
Loans from a non-controlling shareholder of subsidiaries 1,710 1,651
Amounts due to non-controlling shareholders of subsidiaries 8 8
1,718 1,659
As at 31 December 2018, the loans from a non-controlling shareholder of subsidiaries are unsecured, repayable on demand and carry interest at 110% of PBOC Prescribed Interest Rate.
The amounts due to non-controlling shareholders of subsidiaries are unsecured, interest free and repayable on demand.
NOTES TO THE CONSOLIDATED FINANCIAL STATEMENTS
FOR THE YEAR ENDED 31 DECEMBER 2018
Shui On Land Limited196

25. ACCOUNTS PAYABLE, DEPOSITS RECEIVED AND ACCRUED CHARGES
2018RMB’million
2017RMB’million
Trade payables 1,980 3,505
Relocation cost payables 2,681 1,552
Retention payables (note (a)) 281 381
Deed tax, business tax and other tax payables 185 353
Deposits received and receipt in advance from property sales – 2,889
Deposits received and receipt in advance in respect of rental of investment properties 765 603
Deposits received from disposal of associates (note 40) – 343
Value-added tax payable 7 90
Other payables and accrued charges 697 653
Payables for acquisition of the remaining interest in subsidiaries (note (b)) 3,406 –
10,002 10,369
Notes:(a) Retention payables are expected to be paid upon the expiry of the retention periods according to the respective contracts.(b) On 28 December 2018, China Xintiandi Limited (a wholly-owned subsidiary of the Company) entered into an agreement with BSREP CXTD Holdings L.P. (“BSREP CXTD”) to acquire
all the interest held by BSREP CXTD in China Xintiandi Holding Company Limited (“China Xintiandi”), comprising approximately 21.894% of all the issued shares in the capital of China Xintiandi and the outstanding convertible perpetual securities in the principal amount of USD100,000 (the “Sale CPS”) (the “Brookfield Transaction”) at a consideration of RMB3,405 million and USD100,000 (equivalent to RMB1 million) respectively . As the Company has obtained the necessary written approval from its shareholders on 28 December 2018, the acquisition became unconditional. Accordingly, the carrying value of respective non-controlling interest of China Xintiandi and the Sale CPS were derecognised and reclassified to payables, respectively.
Included in the Group’s accounts payable, deposits received and accrued charges are trade payable balances of RMB1,980 million (2017: RMB3,505 million), of which 88% (2017: 89%) are aged less than 30 days, 1% (2017: 1% ) are aged between 31 to 60 days, and 11% (2017: 10%) are aged more than 90 days, based on invoice date.
26. CONTRACT LIABILITIES31/12/2018
RMB’million1/1/2018*
RMB’million
Sales of properties 6,017 2,889
* The amounts in this column are after the adjustments from the application of IFRS 15.
Revenue of RMB2,889 million was recognised during the year ended 31 December 2018 that was included in the contract liabilities at the beginning of the year of 2018.
The Group receives 20%-100% of the contract value as deposits from customers or receipts in advance form customers upon signing the sale and purchase agreement for sales of properties. Such advance payment schemes result in contract liabilities being recognised throughout the property construction period. Included in the contract liabilities as at 31 December 2018 are balances of RMB828 million (2017: nil) which are expected to be realised after twelve months from the end of the reporting period.
Annual Report 2018 197
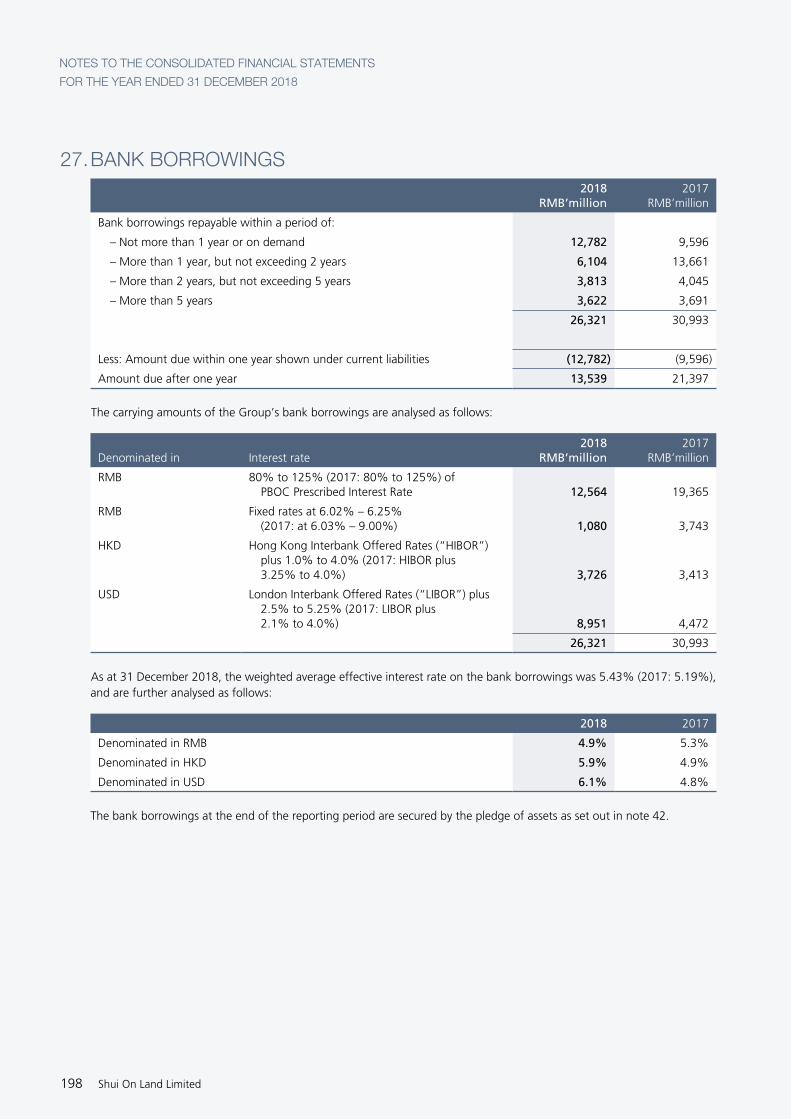
27. BANK BORROWINGS2018
RMB’million2017
RMB’million
Bank borrowings repayable within a period of:
– Not more than 1 year or on demand 12,782 9,596
– More than 1 year, but not exceeding 2 years 6,104 13,661
– More than 2 years, but not exceeding 5 years 3,813 4,045
– More than 5 years 3,622 3,691
26,321 30,993
Less: Amount due within one year shown under current liabilities (12,782) (9,596)
Amount due after one year 13,539 21,397
The carrying amounts of the Group’s bank borrowings are analysed as follows:
Denominated in Interest rate2018
RMB’million2017
RMB’million
RMB 80% to 125% (2017: 80% to 125%) of PBOC Prescribed Interest Rate 12,564 19,365
RMB Fixed rates at 6.02% – 6.25% (2017: at 6.03% – 9.00%) 1,080 3,743
HKD Hong Kong Interbank Offered Rates (“HIBOR”) plus 1.0% to 4.0% (2017: HIBOR plus 3.25% to 4.0%) 3,726 3,413
USD London Interbank Offered Rates (“LIBOR”) plus 2.5% to 5.25% (2017: LIBOR plus 2.1% to 4.0%) 8,951 4,472
26,321 30,993
As at 31 December 2018, the weighted average effective interest rate on the bank borrowings was 5.43% (2017: 5.19%), and are further analysed as follows:
2018 2017
Denominated in RMB 4.9% 5.3%
Denominated in HKD 5.9% 4.9%
Denominated in USD 6.1% 4.8%
The bank borrowings at the end of the reporting period are secured by the pledge of assets as set out in note 42.
NOTES TO THE CONSOLIDATED FINANCIAL STATEMENTS
FOR THE YEAR ENDED 31 DECEMBER 2018
Shui On Land Limited198

28. SHARE CAPITALAuthorised Issued and fully paid
Numberof shares USD’000
Numberof shares USD’000
Ordinary shares of USD0.0025 each
At 1 January 2017 12,000,000,000 30,000 8,026,630,189 20,066
Exercise of share options (note 41) – – 293,400 1
Issue of shares in lieu of cash dividends – – 34,380,935 86
At 31 December 2017 12,000,000,000 30,000 8,061,304,524 20,153
Exercise of share options (note 41) – – 911,800 2
At 31 December 2018 12,000,000,000 30,000 8,062,216,324 20,155
2018RMB’million
2017RMB’million
Shown in the consolidated statement of financial position as 146 146
The new shares rank pari passu with the existing shares in all respects.
29. RESERVES(a) Merger reserve represents the aggregate of:
(i) the difference between the nominal value of the share capital and share premium on the shares issued by the Company and the aggregate of the share capital and share premium of the holding companies of the subsidiaries acquired;
(ii) the share of profit attributable to the deemed non-controlling shareholders exchanged upon the group reorganisation in 2004; and
(iii) the difference between the fair value and the carrying amount of the net assets attributable to the additional interest in the subsidiaries being acquired from a non-controlling shareholder upon the group reorganisation in 2004.
(b) Special reserve comprise:
The difference between the fair value and the carrying amount of the net assets attributable to the additional interest in the subsidiaries being acquired from non-controlling shareholders, which will be recognised in equity upon the earlier of the disposal of the assets, disposal of the subsidiary of the assets which the assets relate, or when the related assets affect profit or loss.
(c) Other reserves mainly comprise:
(i) An amount of RMB483 million, which represents payable waived in 2004 by Shui On Investment Company Limited (“SOI”, a shareholder of the Company, which is wholly owned by SOCL), in respect of development costs of the same amount originally paid by Shanghai Shui On Property Development Management Co., Ltd., a fellow subsidiary of SOI, and recharged to certain subsidiaries of the Company.
(ii) A debit amount of RMB21 million represents capital contribution arising on the fair value adjustments at the initial recognition of an interest free loan advanced by a non-controlling shareholder of a subsidiary in 2005.
(iii) A debit amount of RMB99 million represents non-distributable reserve arising from the capitalisation of retained earnings as registered capital of a subsidiary in the PRC in 2006.
Annual Report 2018 199

29. RESERVES – CONTINUED(c) Other reserves mainly comprise: – continued
(iv) A credit amount of RMB34 million recognised in the year ended 31 December 2010, which represents the difference between the fair value of the consideration paid and the carrying amount of the net assets attributable to the additional interest of 16.8% in Yang Pu Centre Development Co., Ltd. being acquired from the non-controlling interests in 2010.
(v) A credit amount of RMB188 million recognised against the other reserve in the year ended 31 December 2012, which arose from the Group’s acquisition of additional interest of 4.81% in Foresight Profits Limited (“Foresight”) through capital injection in Foresight. Following the acquisition of the entire non-controlling interest in Foresight during the prior year, all balances of non-controlling interest related to Foresight are derecognised and hence the corresponding adjustment of RMB188 million is made to other reserve.
(vi) A credit amount of RMB138 million recognised in the year ended 31 December 2012, which represents the difference between the fair value of the consideration received and the carrying amount of the net assets attributable to the partial disposal of equity interests of 49% in Glory Land Investments Limited (“Glory Land”, an indirect wholly-owned subsidiary of the Company which is engaged in property development in Foshan, the PRC). The 49% equity interests in Glory Land was acquired during the year ended 31 December 2015 and a debit balance of RMB80 million, representing the difference between the fair value of the consideration paid and the carrying amount of the net assets attributable to such acquisition, was recognised in “other reserves”. The net difference of RMB58 million previously recognised in other reserve was transferred to retained earnings.
(vii) A debit amount of RMB43 million recognised in the year ended 31 December 2013, which represents the difference between the fair value of the consideration paid and the carrying amount of the net assets attributable to the additional interest in Shanghai Bai-Xing Properties Co., Ltd. (“Bai-Xing”), Shanghai Ji-Xing Properties Co., Ltd. (“Ji-Xing”), Shanghai Tai Ping Qiao Properties Management Co., Ltd. (“TPQM”), Shanghai Xin-tian-di Plaza Co., Ltd. (“XTD Plaza”), Shanghai Xing Bang Properties Co., Ltd. (“Xing Bang”) and Shanghai Xing-Qi Properties Co., Ltd. (“Xing-Qi”). RMB9 million in relation to Xing-Bang was derecognised following the disposal of Brixworth International Limited during the year ended 31 December 2015.
(viii) A credit amount of RMB120 million recognised in the year ended 31 December 2014, which represents the difference between the fair value of consideration paid and the decrease in the non-controlling shareholders of subsidiaries.
(ix) A debit amount of RMB57 million recognised in the year ended 31 December 2015, which represents the difference between the fair value of the consideration paid and the carrying amount of the net liabilities attributable to the additional interest in Beaming Leader Limited.
(x) A debit amount of RMB14 million recognised in the year ended 31 December 2017, which represents the difference between the fair value of the consideration received and the increase in the non-controlling interests of subsidiaries of RMB1,117 million which arose from the Group’s partial disposal of equity interests of 49% in Bright Power Enterprises Limited (“Bright Power”) and Merry Wave Limited (“Merry Wave”) (indirectly wholly-owned subsidiaries of the Company which are engaged in property development in Shanghai, the PRC).
The consideration was finalised and a credit amount of RMB86 million was recognised during the year ended 31 December 2018.
(xi) A debit amount of RMB276 million recognised in the year ended 31 December 2017, which represents the exchange loss on redemption of perpetual capital securities.
(xii) A debit amount of RMB381 million recognised in the year ended 31 December 2018, which represents the difference between the consideration and the decrease in the non-controlling shareholders of subsidiaries which arose form the Brookfield Transaction.
NOTES TO THE CONSOLIDATED FINANCIAL STATEMENTS
FOR THE YEAR ENDED 31 DECEMBER 2018
Shui On Land Limited200

30. SENIOR NOTES2018
RMB’million2017
RMB’million
At 1 January 10,706 17,312
Issue of new senior notes 2,183 3,379
Less: Transaction costs directly attributable to issue of senior notes (4) (10)
Interest charged during the year 612 1,372
Loss on early redemption of senior notes 78 235
Less: Interest paid (524) (1,270)
Less: Repayment of senior notes (5,761) (9,484)
Exchange translation 134 (828)
At 31 December 7,424 10,706
Less: Amount due within one year shown under current liabilities (1,722) (5,781)
Amount due after one year 5,702 4,925
As at 31 December 2018, the effective interest rates on the senior notes ranged from 4.7% to 7.24% (2017: 4.7% to 9.8%) per annum.
ISSUANCE OF SENIOR NOTES DURING THE CURRENT PERIOD
On 2 March 2018, Shui On Development (Holding) Limited (“SODH”) issued RMB1,600 million senior notes (“Original Notes”) to independent third parties with a maturity of three years due on 2 March 2021.
On 26 April 2018, SODH further issued RMB600 million senior notes (“Additional Notes”) to independent third parties due on 2 March 2021. In all respects except for the issue date and issue price, the Additional Notes were consolidated and formed a single series with the Original Notes issued on 2 March 2021 and were voted together as one series on all matters with respect to the abovementioned senior notes (the “2021 RMB2,200 million Notes”). The 2021 RMB2,200 million Notes bear coupon at 6.875% per annum payable semi-annually in arrears.
PRINCIPAL TERMS OF 2021 RMB2,200 MILLION NOTES
The 2021 RMB2,200 million Notes are:
(a) senior in right of payment to any existing and future obligations of SODH expressly subordinated in right of payment to the 2021 RMB2,200 million Notes;
(b) ranked at least pari passu in right of payment with all other unsecured, unsubordinated indebtedness of SODH (subject to any priority rights of such unsubordinated indebtedness pursuant to applicable law);
(c) guaranteed by the Company on a senior basis, subject to certain limitations;
(d) effectively subordinated to the secured obligations (if any) of the Company and SODH, to the extent of the value of the assets serving as security therefor; and
(e) effectively subordinated to all existing and future obligations of the subsidiaries of SODH.
Annual Report 2018 201

30. SENIOR NOTES – CONTINUED PRINCIPAL TERMS OF 2021 RMB2,200 MILLION NOTES – CONTINUED
At any time and from time to time on or after 2 March 2020, SODH may at its option to redeem the 2021 RMB2,200 million Notes, in whole or in part, at a redemption price equal to 103.438% of the principal amount plus accrued and unpaid interest, if any, to (but not including) the redemption date if redeemed during the twelve month period beginning on 2 March 2020.
At any time prior to 2 March 2020, the 2021 RMB2,200 million Notes may be redeemed at the option of SODH, in whole or in part, at a redemption price equal to the sum of 100% of the principal amount of the 2021 RMB2,200 million Notes plus accrued and unpaid interest (if any) and an Applicable Premium (see the definition below). In the opinion of the Directors of the Company, the fair value of the option to early redeem the 2021 RMB2,200 million Notes is insignificant at initial recognition and at the end of the reporting period.
“Applicable Premium” means with respect to the 2021 RMB2,200 million Notes at any redemption date, the greater of (1) 1.00% of the principal amount of the 2021 RMB2,200 million Notes and (2) the excess of (A) the present value at such redemption date of (i) the redemption amount of the senior notes redeemed, plus (ii) all required remaining scheduled interest payments due on the 2021 RMB2,200 million Notes through 2 March 2020 (but excluding accrued and unpaid interest to the redemption date), computed using a discount rate of 2.5% per annum, over (B) the principal amount of the senior notes redeemed on such redemption date.
At any time and from time to time prior to 2 March 2020, SODH may redeem up to 35% of the aggregate principal amount of the 2021 RMB2,200 million Notes at a redemption price of 106.875% of the principal amount of the 2021 RMB2,200 million Notes, plus accrued and unpaid interest, if any, to (but not including) the redemption date. In the opinion of the Directors of the Company, the fair value of the option to early redeem the 2021 RMB2,200 million Notes is insignificant at initial recognition and at the end of the reporting period.
31. CONVERTIBLE PERPETUAL SECURITIES AND WARRANTS In October 2013, the Company and China Xintiandi, the then wholly-owned subsidiary of the Company, entered into a set of agreements with an independent third party (the “Investor”), pursuant to which the Investor conditionally agreed to subscribe for the following for USD495 million (net of closing fee to the Investor of USD5 million):
• convertible perpetual securities issued by China Xintiandi with the aggregate principal amount of USD500 million; and
• 415 million warrants issued by the Company.
The transaction was completed on 17 February 2014 (“closing date”). The principal terms of the convertible perpetual securities and warrants were disclosed in a circular issued by the Company dated 30 November 2013.
The convertible perpetual securities were recognised as equity instruments of a subsidiary in the Group’s consolidated financial statements as the Group did not have a contractual obligation to deliver cash or other financial assets arising from the issue of the convertible perpetual securities.
The warrants are classified as derivative liabilities and measured at fair value at initial recognition and at subsequent reporting dates.
On the initial recognition of the convertible perpetual securities and warrants, the aggregate consideration of USD495 million (equivalent to RMB3,025 million translated using the spot rate as at 17 February 2014) were allocated to the convertible perpetual securities and warrants taking into account the fair value of warrants of USD21 million (equivalent to RMB129 million translated using the spot rate as at 17 February 2014) at initial recognition with the residual of USD474 million (equivalent to RMB2,896 million translated using the spot rate as at 17 February 2014) being allocated to the convertible perpetual securities. Transaction costs of RMB94 million and RMB4 million, respectively, have been allocated to convertible perpetual securities and warrants. Transaction costs allocated to the convertible perpetual securities are recognised in equity whereas transaction costs allocated to the warrants are recognised as expenses when they are incurred.
NOTES TO THE CONSOLIDATED FINANCIAL STATEMENTS
FOR THE YEAR ENDED 31 DECEMBER 2018
Shui On Land Limited202

31. CONVERTIBLE PERPETUAL SECURITIES AND WARRANTS – CONTINUED
KEY TERMS OF THE CONVERTIBLE PERPETUAL SECURITIES
The convertible perpetual securities were issued in registered form in denominations of principal amount of USD100,000 each and integral multiples thereof.
The convertible perpetual securities do not have any maturity.
China Xintiandi has the option to pay distributions from and including the issue date (i.e. 17 February 2014), semi-annually in arrears on each distribution payment date in cash at the following distribution rate:
• in respect of the period from, and including the issue date to, but excluding 17 February 2019, 8.3 per cent per annum;
• in respect of the period from, and including 17 February 2019, 20 per cent per annum.
If China Xintiandi elects not to pay a distribution or does not pay a distribution on two separate distribution payment dates, China Xintiandi shall not, for as long as any convertible perpetual securities are outstanding, declare or pay in cash or in kind any dividend distribution or make any other payment on, and shall procure that, no dividend, distribution or other payment is made on, any of its junior securities or parity obligations, or redeem, reduce, cancel or buy-back or acquire for any consideration any of its junior securities, or parity obligations, unless and until it is permitted to do so by written consent of the holders of the majority of the convertible perpetual securities then outstanding.
The convertible perpetual securities may be converted into ordinary shares of China Xintiandi at any time at the option of the holders which, if converted in full, will represent 21.90 per cent of the share capital of China Xintiandi. The convertible perpetual securities will convert automatically into ordinary shares of China Xintiandi upon a qualified IPO or a listing approved by the holders (“China Xintiandi Listing”) at the same pre-determined conversion price. If China Xintiandi completes a listing of China Xintiandi that is not a China Xintiandi Listing, the convertible perpetual securities will remain outstanding after such listing of China Xintiandi.
The convertible perpetual securities may be redeemed at China Xintiandi’s option beginning on the fifth anniversary of the closing date by (i) paying to the holders the applicable redemption price of such outstanding convertible perpetual securities to be redeemed; or (ii) if no China Xintiandi Listing has occurred by the time of such redemption, procuring the issue by the Company a certain number of ordinary shares of the Company which has a value equal to the applicable redemption price for the convertible perpetual securities to be redeemed.
China Xintiandi has the right to redeem the convertible perpetual securities at their applicable redemption price if it becomes liable to pay additional tax amounts in respect of such convertible perpetual securities, subject to certain circumstances.
For so long as a holder holds convertible perpetual securities representing 10% of the ordinary shares of China Xintiandi on a fully diluted basis, upon the occurrence of a Change of Control Event (which happens when either: (i) Mr. Vincent Lo, his family and his and their affiliated trusts and companies (the Permitted Party) cease to control, either directly or indirectly through one or more subsidiaries, more than 30 per cent of the total voting power of the Company; (ii) any person or persons other than the Permitted Party acquires more voting rights of the issued share capital of the Company than the Permitted Party; or (iii) any person or persons other than the Permitted Party acquires more voting rights of the issued share capital of China Xintiandi than the Permitted Party), the Investor may request the Company to redeem all the convertible perpetual Securities it holds. Upon such redemption request, China Xintiandi may elect to either: (i) redeem the convertible perpetual securities at the applicable redemption price (see the definition above); or (ii) leave the convertible perpetual securities outstanding, in which case the applicable distribution rate (please see above) will increase by 4%.
Annual Report 2018 203

31. CONVERTIBLE PERPETUAL SECURITIES AND WARRANTS – CONTINUED
KEY TERMS OF THE CONVERTIBLE PERPETUAL SECURITIES – CONTINUED
In addition, as part of the agreements, the Investor has been given a right to exchange the convertible perpetual securities for a certain number of ordinary shares of the Company at any time during a certain period of time starting from and including the third anniversary of the issue date, or when there is a Change of Control Event at an initial exchange price of HKD3.25 subject to certain anti-dilutive adjustments. The Company then has a right to exchange the convertible perpetual securities by:
• paying to the Investor a cash redemption premium of an amount (in US dollars) equal to 0.7% per annum on the aggregate principal amount of the convertible perpetual securities being exchanged; and
• at the Company’s election, either (i) paying to the Investor the applicable redemption amount of such convertible perpetual securities (in US dollars) in cash; or (ii) exchanging the convertible perpetual securities at the above-mentioned predetermined exchange price.
During the year ended 31 December 2015, convertible perpetual securities with a principal amount of USD499,900,000 have been converted into newly issued ordinary shares of China Xintiandi, representing 21.89% of the enlarged share capital of China Xintiandi. An amount of RMB1,516 million, representing the difference between the carrying amount of the convertible perpetual securities derecognised amounting to RMB2,802 million and the net assets of China Xintiandi attributable to non-controlling interests after conversion of RMB4,318 million, were recognised directly in retained earnings.
Any distributions made by China Xintiandi to the Investor will be recognised in equity. The Group has made distribution payments amounting to RMB54,000 (2017: RMB58,000) during the year ended 31 December 2018.
As mentioned above in note 25, the outstanding balance of USD100,000 convertible perpetual securities was derecognised and classified to payables during the year ended 31 December 2018.
KEY TERMS OF THE WARRANTS
The 415 million warrants are exercisable for 415 million ordinary shares of the Company from the closing date until the third anniversary of the closing date at an exercise price of HKD2.85 per ordinary share subject to certain anti-dilutive adjustments. Upon exercise of the warrants, to the extent that the-then market value of each ordinary share of the Company exceeds the exercise price of the warrant by HKD3.62, the number of ordinary shares to be issued will be reduced such that the gain to be received by the holder of the warrant will be capped at HKD3.62 per warrant.
Upon exercise of any warrant by a warrantholder, the Company, as the issuer, may, at its sole discretion, settle its obligations with respect of the warrants in one of the following manners:
• deliver a certain number of ordinary shares of the Company to the warrantholders based on the above-mentioned exercise price with the HKD3.62 cap mechanism;
• deliver a certain number of ordinary shares of the Company to the warrantholders with an aggregate value (calculated based on the market price of ordinary shares of the Company at the time of exercise) equal to the difference between (i) the aggregate value (calculated based on the market price of the ordinary shares of the Company at the time of exercise) of the ordinary shares underlying the warrants being exercised (taking into account the above-mentioned HKD3.62 cap mechanism) and (ii) the aggregate amount of the exercise price to be paid for the warrants being exercised; or
• deliver cash to the warrantholders equal to the difference between (i) the aggregate value (calculated based on the market price of the ordinary shares of the Company at the time of exercise) of the ordinary shares underlying the warrants being exercised (taking into account the above-mentioned HKD3.62 cap mechanism) and (ii) the aggregate amount of the exercise price to be paid for the warrants being exercised.
All warrants had been expired on 16 February 2017.
NOTES TO THE CONSOLIDATED FINANCIAL STATEMENTS
FOR THE YEAR ENDED 31 DECEMBER 2018
Shui On Land Limited204

32. CONVERTIBLE PERPETUAL CAPITAL SECURITIES On 4 June 2015, SODH issued convertible perpetual capital securities (“CPCS”) with an aggregate principal amount of USD225 million (equivalent to approximately RMB1,376 million translated using the spot rate as at 4 June 2015). The CPCS are guaranteed by the Company on a senior basis for the due payment of all sums which may be payable by SODH. Transaction costs relating to the issue of CPCS amounted to approximately RMB37 million.
KEY TERMS OF THE CPCS
Subject to the below, distributions shall be paid the semi-annually in arrears on each distribution payment date in cash at the following distribution rates:
• in respect of the period from, and including the issue date to, but excluding 4 June 2020, 7.5 per cent per annum;
• in respect of the periods (i) from, and including 4 June 2020 to, but excluding, the immediately following Reset Date (i.e. 4 June 2020 and each day falling every five calendar years after 4 June 2020) and (ii) from, and including each Reset Date falling thereafter to, but excluding, the immediately following Reset Date, the Relevant Reset Distribution Rate (i.e. the rate for U.S. Dollars Swaps with a maturity of 5 years from the relevant reset rate plus the 5.809% Initial Spread plus the 3.00% Step-Up Margin per annum).
SODH has, at its sole discretion, a right to elect to defer a distribution, unless a compulsory distribution payment event has occurred. If on any distribution payment date SODH elects not to pay a distribution, SODH and the Company, shall not, and the Company shall procure that no dividend, distribution or other payment is made on, any of its junior securities or parity obligations, or to redeem, reduce, cancel or buy-back or acquire for any consideration any of its junior securities, or parity obligations, unless and until SODH and the Company satisfies in full all arrears of distribution and the interest thereof or it is permitted to do so by an extraordinary resolution of the holders of the CPCS.
A compulsory distribution payment event happens when (i) a discretionary dividend, distribution or other payment has been paid or declared by the Company or (ii) the Company or SODH has at its discretion repurchased, redeemed or otherwise acquired any of its junior securities, preference shares or parity securities.
The CPCS can be converted into ordinary shares of the Company at any time on or after 15 July 2015 at the option of the holders at a fixed conversion price of HKD3.2280 (at a fixed exchange rate of HKD7.7528 to USD1) per share of the Company, subject to certain anti-dilutive adjustments. Adjustments have been made to the conversion price from HKD2.92 to HKD2.76 as a result of the dividends paid by the Company to its ordinary shareholders in June 2018 and September 2018.
The CPCS have no fixed redemption date. SODH may at its option redeem all, but not some only, of the CPCS on 4 June 2020 or on any of 4 June or 4 December after 4 June 2020, and in certain specified circumstances specified in the agreements.
In case of occurrence of any delisting or suspension of the trading of the Company’s shares for more than 30 consecutive days that were initiated or made by the Company, the holder of CPCS will have the right to require the Company to procure the redemption of the CPCSs.
The CPCS are included in equity in the Group’s consolidated financial statements as the Group does not have a contractual obligation to deliver cash or other financial assets arising from the issue of the CPCS.
Up to the date of the authorisation of the Group’s consolidated financial statements for the year ended 31 December 2018, no CPCS have been converted into ordinary shares of the Company.
Any distributions made by SODH to the holders will be recognised in equity in the consolidated financial statements of the Group. The distribution amounting to RMB112 million (2017: RMB114 million) was paid during the current year.
Annual Report 2018 205

33. PERPETUAL CAPITAL SECURITIES PERPETUAL CAPITAL SECURITIES ISSUED IN 2012
On 10 December 2012, SODH issued USD500 million (equivalent to approximately RMB3,137 million) 10.125% guaranteed perpetual capital securities (“2012 Perpetual Capital Securities”) at an issue price of 100% of the principal amount. The 2012 Perpetual Capital Securities were guaranteed by the Company on a senior basis for the due payment of all sums which may be payable by SODH under the 2012 Perpetual Capital Securities. Distributions on the 2012 Perpetual Capital Securities are paid semi-annually in arrears from 10 June 2013 and can be deferred at the discretion of SODH. The 2012 Perpetual Capital Securities have no fixed maturity and are redeemable at SODH’s option on or after 10 December 2017 at their principal amounts together with any accrued, unpaid or deferred distributions. While any distributions are unpaid or deferred, the Company and SODH cannot declare or, pay dividends or make distributions or similar periodic payments in respect of, or repurchase, redeem or otherwise acquire any securities of lower or equal rank, which includes the ordinary shares of the Company and SODH. The 2012 Perpetual Capital Securities has been redeemed during the year ended 31 December 2017. An amount of RMB276 million, representing the difference between the settlement paid and the carrying amount derecognised was included in other reserves.
PERPETUAL CAPITAL SECURITIES ISSUED IN 2017
On 20 June 2017, SODH issued USD600 million (equivalent to approximately RMB4,085 million) 6.40% guaranteed perpetual capital securities (“2017 Perpetual Capital Securities”) at an issue price of 100% of the principal amount. The 2017 Perpetual Capital Securities were guaranteed by the Company on a senior basis for the due payment of all sums which may be payable by SODH under the 2017 Perpetual Capital Securities. Distributions on the 2017 Perpetual Capital Securities are paid semi-annually in arrears in U.S. dollars on 20 June and 20 December in each year, commencing on 20 December 2017 and can be deferred at the discretion of SODH. The 2017 Perpetual Capital Securities have no fixed maturity and are redeemable at SODH’s option on or after 20 June 2022 at their principal amounts together with any accrued, unpaid or deferred distributions. While any distributions are unpaid or deferred, the Company and SODH cannot declare or, pay dividends or make distributions or similar periodic payments in respect of, or repurchase, redeem or otherwise acquire any securities of lower or equal rank, which includes the ordinary shares of the Company and SODH.
34. DERIVATIVE FINANCIAL INSTRUMENTS2018
RMB’million2017
RMB’million
Call option to buy back an investment property 243 342
Currency forward contracts designated as hedging instruments 221 (214)
For the purpose of financial statement presentation:
Non-current assets 243 342
Current assets 221 –
464 342
Current liabilities – 214
NOTES TO THE CONSOLIDATED FINANCIAL STATEMENTS
FOR THE YEAR ENDED 31 DECEMBER 2018
Shui On Land Limited206

34. DERIVATIVE FINANCIAL INSTRUMENTS – CONTINUED CALL OPTION TO BUY BACK AN INVESTMENT PROPERTY
In previous years, the Group disposed of its entire equity interest in a subsidiary (the “Disposed Subsidiary”), and the related intercompany loans, that indirectly, owned 99% interest in an investment property located in Shanghai, the PRC, to an independent third party for a cash consideration of RMB3,364 million.
In accordance with the relevant sale and purchase agreement entered into in previous years, the Group was granted a call option to repurchase all the equity interest of the Disposed Subsidiary and the related shareholder’s loans within two months before the fifth anniversary or the seventh anniversary of the completion of the disposal (i.e. 18 December 2013), at a cash consideration that represented the original consideration plus a premium per annum.
The Group has engaged an independent qualified professional valuer to estimate the fair value of the option as at 31 December 2018 and 31 December 2017. As at 31 December 2018, the fair value of the call option was estimated to be RMB243 million (2017: RMB342 million). The fair value of the option as at 31 December 2018 and 31 December 2017 are determined using Monte-Carlo simulation with the following key assumptions:
2018 2017
99% interest of property valuation RMB6,331 million RMB5,891 million
Time to maturity 1.97 years 2.97 years
1.97-year risk-free rate (2017: 2.97 years ) 2.80% 3.79%
0-year forward 0-year risk-free rate (2017: 0.97-year forward 2-year) N/A 3.78%
Volatility 4.59% 5.34%
The property valuation as at 31 December 2018 and 31 December 2017 have been arrived at on the basis of valuation carried out by Knight Frank Petty Limited with reference to the fair value of similar properties within the same locality as at that date. The above risk free rates were determined with reference to yields of RMBChina government bond. The volatility was determined with reference to the average rent of Premium Grade A office in the same region as the location of the subject investment property.
The call option measured at fair value as at 31 December 2018 and 31 December 2017 is grouped under Level 3. Level 3 fair value measurements are those derived from inputs that are unobservable for the asset or liability.
An increase in the property valuation would result in an increase in the fair value of the call option, and vice versa. If the property valuation is 3% (2017: 3%) higher and lower while all other variables are held constant, the carrying amount of the call option would increase to approximately RMB382 million (2017: RMB498 million) and decrease to approximately RMB136 million (2017: RMB223 million), respectively.
Annual Report 2018 207

34. DERIVATIVE FINANCIAL INSTRUMENTS – CONTINUEDCURRENCY FORWARD CONTRACTS DESIGNATED AS HEDGING INSTRUMENTS
During the years ended 31 December 2017 and 2018, the Group entered into several currency forward contracts to reduce currency exchange fluctuation of the Group’s certain senior notes, accounts payable, bank borrowings and shareholder loan. They are qualified for hedge accounting as cash flow hedge. During the years ended 31 December 2017 and 2018, an amount of gain of RMB372 million, and loss of RMB504 million respectively has been released from hedge reserve to the profit or loss.
The effects of applying hedge accounting on the Group’s financial position and performance are as follows:
2018 2017
Outstanding currency forward contracts:
Carrying amount (RMB’million) 221 (214)
Notional amount (original foreign currency) (’million) USD954 USD797
HKD1,050 HKD423
Notional amount (RMB’million) 7,468 5,561
Maturity date From 1 February 2019 to 7 November 2019
From 18 May 2018 to 21 December 2018
Hedge ratio (Note) 1:1 1:1
Change in foreign exchange risk component of outstanding hedging instruments during the year (RMB’million) (221) 214
Change in value of hedged item used to determine hedge effectiveness during the year (RMB’million) 328 (171)
Strike rate USD:RMB6.4385-7.0745 USD:RMB6.7650-7.0860
HKD:RMB0.8285-0.8988 HKD:RMB0.8703
Note: The currency forward contracts are denominated in the same currency as the highly probable future debt payments, therefore the hedge ratio is 1:1.
NOTES TO THE CONSOLIDATED FINANCIAL STATEMENTS
FOR THE YEAR ENDED 31 DECEMBER 2018
Shui On Land Limited208

35. LIABILITY ARISING FROM A RENTAL GUARANTEE ARRANGEMENT2018
RMB’million2017
RMB’million
Rental guarantees, at fair values 549 728
For the purpose of financial statements presentation:
Non-current liabilities 380 551
Current liabilities 169 177
549 728
During the year ended 31 December 2014, the Group disposed of an investment property to an independent third party (“purchaser”) for a cash consideration of RMB2,412 million. As part of the disposal, the Group also agreed to provide the purchaser with a rental guarantee whereby the Group agreed to compensate the purchaser on a yearly basis, from the date when the first instalment was received till 31 January 2019 which could be further extended by the purchaser for three times, each for a one-year period when certain conditions are met, the shortfall between a fixed rate of the consideration received by the Group from the purchaser and the net operating income to be generated by the property. On the other hand, the Group shall be entitled to receive from the purchaser a fee amounting to 80% of the excess of net operating income above a fixed rate of the consideration received by the Group from the purchaser.
A similar arrangement was entered into during the year ended 31 December 2013 with another independent third party purchaser, which, in accordance with the related sales and purchase agreement, the rental guarantee arrangement was last till January 2017.
In the current year, the Group has reassessed and revised the related cash flow forecast take into account the latest market conditions.
As at 31 December 2018, the fair value of financial liability arising from the abovementioned rental guarantee arrangement, which is calculated by using Monte-Carlo simulation using the following assumptions:
2018 2017
Estimated office unit rental RMB81 to RMB84 per square meter
RMB79 to RMB86 per square meter
Occupancy rate 68% to 90% 62% to 90%
Risk-free rate 2.65% 3.82%
Discount rate 9.89% 9.38%
Expected expiry date (in accordance with conditional term as described above)
31 January 2022 31 January 2022
Risk-free rates represent the corresponding yield to maturity of respective China Sovereign Fixed Rate.
Nil (2017: a loss of RMB458 million) has been recognised in profit or loss in the current year to reflect changes in estimates (included in “other gains and losses” line item).
The Group’s liability arising from a rental guarantee arrangement that are measured at fair value at the end of the reporting period are grouped under Level 3. There were no transfers in or out of Level 3 during the year. Level 3 fair value measurements are those derived from inputs that are unobservable for the asset or liability. The higher the estimated office unit rental and occupancy rate, the lower the fair value of the liability arising from a rental guarantee arrangement. The higher the discount rate, the lower the fair value of the liability arising from a rental guarantee arrangement.
Annual Report 2018 209

36. DEFERRED TAX ASSETS/LIABILITIES The following are the major deferred tax liabilities (assets) recognised and movements thereon during the current and prior years:
Acceleratedtax
depreciationRMB’million
Revaluationof
investmentproperties
RMB’million
Taxlosses
RMB’million
Recognition of sales
and relatedcost of salesRMB’million
Withholding tax on
income derived
in the PRCRMB’million
OthersRMB’million
TotalRMB’million
At 1 January 2017 1,630 4,392 (355) (320) 353 (266) 5,434
Charge (credit) to profit or loss 151 82 21 305 91 (225) 425
Charge to other comprehensive income – – – – – 2 2
Disposal of equity interest in subsidiaries (Note 39(c) (e)) (84) (264) – 140 – – (208)
At 31 December 2017 1,697 4,210 (334) 125 444 (489) 5,653
Charge (credit) to profit or loss 134 241 (124) 153 (229) 24 199
Charge to other comprehensive income – 1 – – – – 1
Transfer upon formation of a joint venture (note 13(a)) (402) – – – – – (402)
Acquisition of subsidiaries – – (4) – – – (4)
At 31 December 2018 1,429 4,452 (462) 278 215 (465) 5,447
For the purposes of presentation of the consolidated statement of financial position, certain deferred tax (assets) liabilities have been offset. The following is the analysis of the deferred tax balances for financial reporting purposes:
2018RMB’million
2017RMB’million
Deferred tax assets (1,043) (992)
Deferred tax liabilities 6,490 6,645
5,447 5,653
At the end of the reporting period, the Group has unused tax losses of RMB2,708 million (2017: RMB2,012 million) available to offset against future profits. A deferred tax asset has been recognised in respect of such tax losses amounting to RMB1,848 million (2017: RMB1,336 million). No deferred tax asset has been recognised in respect of the remaining tax losses of RMB860 million (2017: RMB676 million) due to the unpredictability of future profit streams. The unrecognised tax losses will expire in the following years ending 31 December:
2018RMB’million
2017RMB’million
2018 – 66
2019 144 150
2020 154 150
2021 257 215
2022 179 95
2023 126 –
860 676
NOTES TO THE CONSOLIDATED FINANCIAL STATEMENTS
FOR THE YEAR ENDED 31 DECEMBER 2018
Shui On Land Limited210

37. RECEIPTS UNDER SECURITISATION ARRANGEMENTSOn 27 November 2018, Foshan An Ying Property Development Co., Ltd (the “Foshan An Ying”), a wholly-owned subsidiary of the Company, issued receipts under securitisation arrangements (the “Receipts Under Securitisation Arrangements”) with an aggregate principal amount of RMB770,000,000 at 100% of face value comprising (i) RMB525,000,000 with a term of fixed annual coupon rate of 6% and provide distribution semi-annually (the “Senior Tranche A Securities”), (ii) RMB240,000,000 with a term of fixed annual coupon rate of 6.5% and provide distribution semi-annually (the “Senior Tranche B&C Securities”), and (iii) RMB5,000,000 with a term of no annual coupon rate (the “Junior Tranche Securities”). The Receipts Under Securitisation Arrangements are listed on the Shanghai Stock Exchange. The net proceeds of the Receipts Under Securitisation Arrangements, after deduction of arrangement fee amounted to RMB524 million. The Senior Tranche A Securities, the Senior Tranche B&C Securities and the Junior Tranche Securities will be repaid by instalments till 23 January 2036. The Receipts Under Securitisation Arrangements are assets backed securitisation collateralised by the certain commercial assets held by Foshan An Ying and its certain future rental income.
38. PROVIDENT AND RETIREMENT FUND SCHEMES HONG KONG
The Group participates in both a defined benefit plan (the “Plan”) which is registered under the Occupational Retirement Schemes Ordinance and a Mandatory Provident Fund Scheme (the “MPF Scheme”) established under the Mandatory Provident Fund Schemes Ordinance in December 2000. The Plan was effective in 2004. The assets of the Plan are held separately from those of the Group and are invested in securities and funds under the control of trustees. Employees who were members of the Plan prior to the establishment of MPF Scheme were offered a choice of staying within the Plan or switching to the MPF Scheme, whereas all new employees joining the Group on or after 1 December 2000 are required to join the MPF Scheme.
The MPF Scheme
For members of the MPF Scheme, contributions are made by the employees at 5% of relevant income and by the Group at rates ranging from 5% to 10% of the employees’ salaries, depending on the employees’ length of services with the Group.
The Group’s contributions to the MPF Scheme charged to the consolidated statement of profit or loss as staff costs during the year ended 31 December 2018 is RMB2 million (2017: RMB7 million).
Annual Report 2018 211

38. PROVIDENT AND RETIREMENT FUND SCHEMES – CONTINUED HONG KONG – CONTINUED
The Plan
Contributions to the Plan are made by the members at 5% of their salaries and by the Group which are based on recommendations made by the actuary of the Plan. Under the Plan, a member is entitled to retirement benefits which comprise the sum of any benefits transferred from another scheme and the greater of the sum of employer’s basic contribution plus the member’s basic contribution accumulated with interest at a rate of no less than 6% per annum before 1 September 2003 and 1% per annum in respect of contributions made on or after 1 September 2003 or 1.8 times the final salary times the length of employment with the Group on the attainment of the retirement age of 60. For members who joined the Plan before 1997, the retirement age is 60 for male members and 55 for female members. No other post-retirement benefits are provided.
The actuarial valuations of the plan assets and the present value of the defined benefit obligation are carried out as at 31 December 2018 and 31 December 2017 by Ms. Elaine Hwang of Towers Watson Hong Kong Limited, who is a Fellow of the Society of Actuaries. The present value of the defined benefit obligations and the related current service cost are measured using the Projected Unit Credit Method.
The Plan exposes the Group to actuarial risks such as investment risk, interest risk and salary risk.
Investment risk The plan assets are invested in a diversified portfolio of equities, hedge funds, bonds and cash, covering major geographical locations around the world. The diversification of asset classes and geographical location helps to reduce the concentration of risk associated with the plan investments.
Interest risk The present value of the defined benefit plan liabilities is calculated using a discount rate determined by reference to market corporate bond yields. A decrease in the discount rate will increase the plan liabilities.
Salary risk The present value of the defined benefit plan liabilities is calculated by reference to the future salaries of members. An increase in the salaries of members will increase the plan liabilities.
The principal assumptions used for the purposes of the actuarial valuations were as follows:
Valuation at
2018 2017
Discount rate per annum 1.8% 1.6%
Expected rate of salary increase 3.5% 4.0%
The actuarial valuation showed that the market value of plan assets was RMB46 million (2017: RMB56 million) and that the actuarial value of these assets represented 85% (2017: 92%) of the benefits that had accrued to members.
NOTES TO THE CONSOLIDATED FINANCIAL STATEMENTS
FOR THE YEAR ENDED 31 DECEMBER 2018
Shui On Land Limited212

38. PROVIDENT AND RETIREMENT FUND SCHEMES – CONTINUED HONG KONG – CONTINUED
The Plan – CONTINUED
Amounts recognised in profit or loss and other comprehensive income in respect of these defined benefit plans are as follows:
2018RMB’million
2017RMB’million
Service cost and components of defined benefit costs recognised in profit or loss:
– Current service cost 2 2
2 2
Remeasurement of the net defined benefit liability and components of defined benefit costs recognised in other comprehensive income:
– Return on plan assets (excluding amounts included in net interest expense) 6 (10)
– Actuarial gains and losses arising from changes in financial assumptions (2) –
– Actuarial gains and losses arising from experience adjustments (1) –
3 (10)
Total 5 (8)
The expense for the year is included in the retirement benefits costs in profit or loss.
The remeasurement of the net defined benefit liability is included in other comprehensive income.
The amount included in the consolidated statement of financial position arising from the Group’s obligation in respect of its defined benefit plans is as follows:
2018RMB’million
2017RMB’million
Present value of funded defined benefit obligations 54 61
Fair value of plan assets (46) (56)
Net liabilities arising from defined benefit obligations 8 5
Movements in the present value of the defined benefit obligations in the current year were as follows:
2018RMB’million
2017RMB’million
At 1 January 61 67
Current service cost 2 2
Interest cost 1 1
Remeasurement gains:
– Actuarial gains and losses arising from changes in financial assumptions (2) –
– Actuarial gains and losses arising from experience adjustments (1) –
Contributions from plan participants 1 1
Benefits paid from scheme assets (11) (5)
Exchange realignment 3 (5)
At 31 December 54 61
Annual Report 2018 213

38. PROVIDENT AND RETIREMENT FUND SCHEMES – CONTINUED HONG KONG – CONTINUED
The Plan – CONTINUED
Movements in the present value of the plan assets in the current year were as follows:
2018RMB’million
2017RMB’million
At 1 January 56 45
Remeasurement (loss) gain:
– Interest income on scheme assets 1 1
– Return on plan assets (excluding amounts included in net interest expense) (6) 10
Contributions from the employer 2 7
Contributions from plan participants 1 1
Benefits paid from scheme assets (11) (5)
Exchange realignment 3 (3)
At 31 December 46 56
The major categories of plan assets at the end of the reporting period are as follows:
2018RMB’million
2017RMB’million
Equities 30 41
Hedge funds 6 5
Bonds and cash 10 10
46 56
The fair values of the above equity and debt instruments are determined based on quoted market prices in active markets.
The actual return on plan assets was loss of RMB5 million (2017: gain of RMB11 million).
Significant actuarial assumptions for the determination of the defined benefit obligations are discount rate and expected rate of salary increase. No sensitivity analysis is prepared as the financial impact arising from the changes in discount rate and expected rate of salary increase is insignificant.
The management has regularly monitored the investment strategies of the plan assets and there has been no change in the process used by the management to manage its risks from prior periods.
The average duration of the benefit obligation as at 31 December 2018 is 4.3 years (2017: 4.5 years).
The Group expects to make a contribution of RMB1 million (2017: RMB2 million) to the defined benefit plan during the next financial year.
PRC
According to the relevant laws and regulations in the PRC, certain subsidiaries established in the PRC are required to contribute a specific percentage of the payroll of their employees to retirement benefit schemes to fund the retirement benefits of their employees. The only obligation of the Group with respect to the retirement benefit schemes is to make the required contributions under the respective schemes.
The Group’s contributions to the state-managed retirement benefit schemes charged to the consolidated statement of profit or loss as staff costs during the year ended 31 December 2018 amounted to RMB38 million (2017: RMB38 million).
NOTES TO THE CONSOLIDATED FINANCIAL STATEMENTS
FOR THE YEAR ENDED 31 DECEMBER 2018
Shui On Land Limited214

39. ACQUISITIONS AND DISPOSALS(a) Disposal of 49.5% effective rights and interests pertaining to a portfolio of certain properties for residential
development of Shanghai Rui Hong Xin Cheng Co., Ltd. (“Shanghai RHXC”)
On 26 June 2018, the Group entered into an agreement with an independent third party pursuant to which the Group would effectively dispose of its 49.5% interests pertaining to the portfolio of certain properties for residential development via disposal of 50% equity interests in Colour Bridge, a subsidiary in which the Group originally owned 100% equity interest, at a consideration of approximately RMB4,623 million. As of 28 June 2018, the equity disposal was completed and the Group accounted for the remaining interest as interest in an associate upon the loss of the control.
The net assets of the portfolio of certain properties for residential development of Shanghai RHXC at the date of the disposal were as follows:
RMB’million
Net assets disposed of:
Properties under development for sale 12,320
Accounts receivable, deposits and prepayments 6
Accounts payable, accrued charges and deposits received (3)
Amount due to group companies (1,229)
Bank borrowings (5,818)
5,276
Gain on disposal of subsidiaries:
Cash consideration 4,623
Less: Transaction costs payable (30)
Less: Withholding tax (354)
Less: Net assets disposed of (5,276)
Add: Non-controlling interests 14
Add: Fair value of the remaining interest accounted for as interest in an associate 4,623
Net gain on disposal 3,600
The Group recognised net gain on disposal of RMB2,400 million for the year ended 31 December 2018. The disposal was accounted for as a sale of property inventories in the ordinary course of the Group’s property business, and the Group recognises revenue when “control” of the properties was transferred to the customer at a point in time. As the Group’s entitlement to certain consideration was contingent on the occurrence or non-occurrence of a future event thus the transaction price included a variable consideration. The Group would record such part of consideration only when it became probable that a significant reversal in the amount of cumulative revenue would not occur when uncertainty associated with variable consideration was subsequently resolved. Revenue from the sale of properties under development for sale amounting to RMB14,981 million and the cost of sales amounting to RMB12,197 million were recognised, representing 99% interest disposed by the Group. In addition, the transaction costs of RMB30 million and withholding tax of RMB354 million have been expensed in profit or loss for the year ended 31 December 2018.
(b) Acquisition of equity interest in Shanghai Xin Wan Jing Property Limited
On 20 December 2017, Shanghai Ze Chen Real Estate Co., Limited (an indirect wholly-owned subsidiary of the Company) (as the “Purchaser”), entered into a sale and purchase agreement with an independent third party seller, pursuant to which the seller has agreed to dispose of, and the purchaser has agreed to acquire 100% equity interest of Shanghai Xin Wan Jing Property Limited for a consideration of RMB1,172 million of which RMB542 million was paid in the current year and RMB630 million was paid in 2017. The acquisition was completed on 4 January 2018 and was accounted for as an asset acquisition. Certain assets and liabilities were acquired, of which investment properties amounting to RMB1,243 million were recognised (see note 13).
Annual Report 2018 215

39. ACQUISITIONS AND DISPOSALS – CONTINUED(c) Disposal of equity interest in Chongqing Shui On Tiandi
On 26 May 2017, the Group entered into an agreement with an independent third party pursuant to which the Group would effectively dispose its 79.2% interest in the portfolio of certain properties via disposal at relevant equity interests in Chongqing Shui On Tiandi, a subsidiary in which the Group owned 99% equity interest, at a consideration of approximately RMB4,133 million. The equity disposal was completed on 29 June 2017.
The net assets of the portfolio of certain properties at the date of the disposal were as follows:
RMB’million
Net assets disposed of:
Properties under development for sale 1,585
Investment properties under construction or development 2,488
Accounts receivable, deposits and prepayments 2
Deferred tax assets 169
Bank loans (515)
Accounts payable, deposits received and accrued charges (54)
3,675
Gain on disposal of subsidiaries:
Cash consideration received 4,133
Less: Transaction costs (14)
Less: Net assets disposed of (3,675)
Add: Non-controlling interests 29
Add: Fair value of the remaining interest in an associate 1,033
Gain on disposal (note (i)) 1,506
Net cash inflow arising on the disposal, net of transaction costs for the year ended 31 December 2017:
Cash consideration received from disposal of properties inventories 2,458
Cash consideration received from disposal of investment properties and related assets and liabilities 1,464
Note:(i) The disposal was partially accounted for as a sale of property inventories in the ordinary course of the Group’s property business. Revenue from the sale of properties under
development for sale amounting to RMB3,229 million and the cost of sales amounting to RMB1,645 million were recognised at the completion date, representing 99% interest disposed by the Group. The remaining loss of RMB78 million represents loss on disposal of investment properties under construction or development and other net assets included in “Gain on disposal of investment properties through disposal of subsidiaries” for the year ended 31 December 2018.
In addition, the net asset value at the date of disposal was finalised during the year ended 31 December 2018, the consideration was adjusted upward by RMB45 million, and revenue from the sale of properties under development for sale amounting to RMB57 million was recognised during the year ended 31 December 2018.
NOTES TO THE CONSOLIDATED FINANCIAL STATEMENTS
FOR THE YEAR ENDED 31 DECEMBER 2018
Shui On Land Limited216

39. ACQUISITIONS AND DISPOSALS – CONTINUED(d) Disposal of equity interests in Shanghai Baili Property Development Company Limited to a joint venture (“JV”) of the
Group
On 9 August 2017, the Group entered into an agreement with an independent third party pursuant to which the Group would dispose of its 100% equity interest in Shanghai Baili Property Development Company Limited (“Shanghai Baili”), a wholly own subsidiary of the Group to the JV. The equity disposal was completed on 15 August 2017.
The net assets of the portfolio of certain properties at the date of the disposal were as follows:
RMB’million
Net assets disposed of:
Investment properties 75
Properties under development for sale 57
Accounts receivable, deposits and prepayments 4
Amount due to group companies (8)
Net assets disposal of 128
Gain on disposal of subsidiaries:
Cash consideration received 110
Net loss on disposal (18)
Net cash inflow arising on the disposal:
Cash from disposal of investment properties and others 110
Annual Report 2018 217
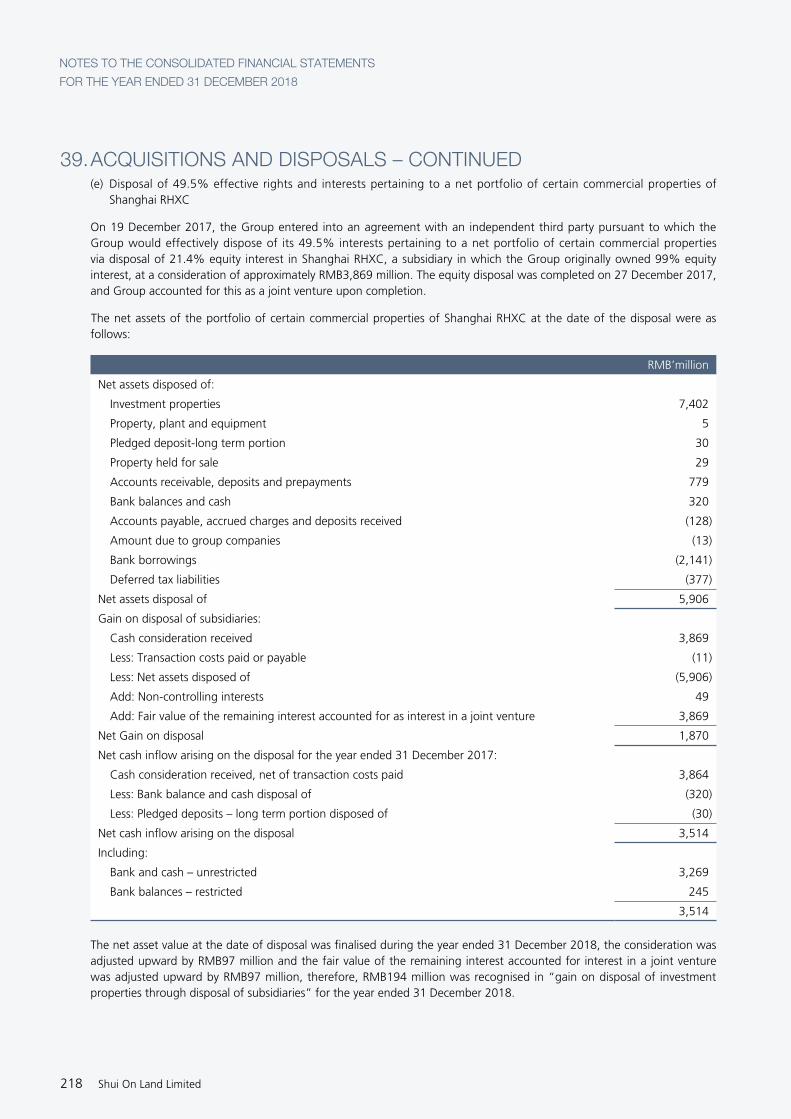
39. ACQUISITIONS AND DISPOSALS – CONTINUED(e) Disposal of 49.5% effective rights and interests pertaining to a net portfolio of certain commercial properties of
Shanghai RHXC
On 19 December 2017, the Group entered into an agreement with an independent third party pursuant to which the Group would effectively dispose of its 49.5% interests pertaining to a net portfolio of certain commercial properties via disposal of 21.4% equity interest in Shanghai RHXC, a subsidiary in which the Group originally owned 99% equity interest, at a consideration of approximately RMB3,869 million. The equity disposal was completed on 27 December 2017, and Group accounted for this as a joint venture upon completion.
The net assets of the portfolio of certain commercial properties of Shanghai RHXC at the date of the disposal were as follows:
RMB’million
Net assets disposed of:
Investment properties 7,402
Property, plant and equipment 5
Pledged deposit-long term portion 30
Property held for sale 29
Accounts receivable, deposits and prepayments 779
Bank balances and cash 320
Accounts payable, accrued charges and deposits received (128)
Amount due to group companies (13)
Bank borrowings (2,141)
Deferred tax liabilities (377)
Net assets disposal of 5,906
Gain on disposal of subsidiaries:
Cash consideration received 3,869
Less: Transaction costs paid or payable (11)
Less: Net assets disposed of (5,906)
Add: Non-controlling interests 49
Add: Fair value of the remaining interest accounted for as interest in a joint venture 3,869
Net Gain on disposal 1,870
Net cash inflow arising on the disposal for the year ended 31 December 2017:
Cash consideration received, net of transaction costs paid 3,864
Less: Bank balance and cash disposal of (320)
Less: Pledged deposits – long term portion disposed of (30)
Net cash inflow arising on the disposal 3,514
Including:
Bank and cash – unrestricted 3,269
Bank balances – restricted 245
3,514
The net asset value at the date of disposal was finalised during the year ended 31 December 2018, the consideration was adjusted upward by RMB97 million and the fair value of the remaining interest accounted for interest in a joint venture was adjusted upward by RMB97 million, therefore, RMB194 million was recognised in “gain on disposal of investment properties through disposal of subsidiaries” for the year ended 31 December 2018.
NOTES TO THE CONSOLIDATED FINANCIAL STATEMENTS
FOR THE YEAR ENDED 31 DECEMBER 2018
Shui On Land Limited218

39. ACQUISITIONS AND DISPOSALS – CONTINUED(f) Disposal of equity interest in Infoshore International Limited in the prior period
Pursuant to a sale and purchase agreement entered into with independent third parties on 10 December 2015, the Group, on 2 February 2016, completed a disposal of its entire equity interest in a subsidiary, namely Infoshore International Limited (“Infoshore”) and the related shareholders’ loans for an aggregate cash consideration of approximately RMB5,759 million. Infoshore indirectly held an investment property located in Shanghai, the PRC.
The total gain of RMB476 million was recognised for the year ended 31 December 2016. In addition, the net asset value of the disposal subsidiaries was finalised in the year ended 31 December 2017, the consideration was adjusted downward by RMB19 million and recognised as loss for 2017.
(g) Disposal of equity interest in Richcoast Group
On 14 November 2017, Innovate Zone Group Limited, an indirect subsidiary of the Company entered into a sale and purchase agreement with Many Gain and Yida, in relation to the sale of 61.54% of the issued share capital in and the related loans to Richcoast Group for the consideration of RMB3,160 million. The transaction was completed on 14 May 2018. An impairment loss on loans to associates and amounts due from associates amounting to RMB524 million was recognised in profit or loss during the year ended 31 December 2017.
40. ASSETS CLASSIFIED AS HELD FOR SALE On 14 November 2017, Innovate Zone entered into a sale and purchase agreement with Many Gain and Yida, in relation to the sale of 61.54% of the issued share capital in and the related loans to Richcoast Group for the consideration of RMB3,160 million.
The Directors of the Company believe that it is highly probable that the disposal will be completed within twelve months from the date when the assets are classified as held for sale, and therefore the related assets and liabilities have been classified as “assets classified as held for sale” as at 31 December 2017, in accordance with IFRS 5 Non-current Assets Held for Sale and Discontinue Operations.
Assets classified as held for sale and related liabilities are as follows:
RMB’million
Assets classified as held for sale
Interests in associates –
Loans to associates 1,805
Amounts due from associates 1,355
3,160
Liabilities classified as held for sale
Accounts payable, deposits received and accrued charges (8)
During the year ended 31 December 2017, deposits amounting to RMB343 million was received. The transaction was completed on 14 May 2018 and RMB1,135 million was received in 2018.
Annual Report 2018 219

41. SHARE-BASED PAYMENT TRANSACTIONS SHARE OPTION SCHEME
The Company’s share option scheme (the “Scheme”) was adopted pursuant to a resolution passed by the shareholders on 8 June 2007 for the primary purpose of providing incentives to Directors, eligible employees and consultants. Under the Scheme, the total number of shares in respect of which options may be granted is not permitted to exceed 10% of the shares of the Company in issue at any point in time, without prior approval from the Company’s shareholders.
As at 31 December 2018, 20,906,632 share options (2017: 29,046,037 share options) remains outstanding under the Scheme, representing 0.3% (2017: 0.4%) of the ordinary shares of the Company in issue at that date. The Scheme allows the Board of Directors of the Company, when offering the grant of any option, to impose any condition including any performance target which must be met before the option shall vest and become exercisable. The exercise price is determined by the Directors of the Company, and will not be less than the highest of (i) the closing price of the Company’s shares on the date of grant; (ii) the average closing price of the shares for the five business days immediately preceding the date of grant; and (iii) the nominal value of the Company’s share.
HKD1.00 is payable by each eligible participant to the Company on acceptance of an offer of options, to be paid within 1 month from the date of the offer.
The movement in the Company’s share options is set out below:
Date of grantExercise
price
Number of options
At1 January
2018
Grantedduring
the year
Exercisedduring
the year
Lapsedduring
the year
At31 December
2018
HKD
18 January 2012 2.41 7,271,261 – – (1,567,255) 5,704,006
3 September 2012 4.93 7,712,176 – – (3,358,550) 4,353,626
7 July 2015 2.092 5,675,200 – (570,000) (842,400) 4,262,800
4 July 2016 1.98 8,387,400 – (341,800) (1,459,400) 6,586,200
29,046,037 – (911,800) (7,227,605) 20,906,632
Categorised as:
Directors (note(a)) 874,000 – – – 874,000
Employees 28,172,037 – (911,800) (7,227,605) 20,032,632
29,046,037 – (911,800) (7,227,605) 20,906,632
Number of options exercisable 17,327,381 14,660,632
In respect of the share options exercised during the year ended 31 December 2018, the weighted average share price at the date of exercise is HKD2.29.
Note:(a) A senior management was appointed as an executive director on 27 August 2018.
NOTES TO THE CONSOLIDATED FINANCIAL STATEMENTS
FOR THE YEAR ENDED 31 DECEMBER 2018
Shui On Land Limited220

41. SHARE-BASED PAYMENT TRANSACTIONS – CONTINUED SHARE OPTION SCHEME – CONTINUED
Date of grantExercise
price
Number of options
At1 January
2017
Grantedduring
the year
Exercisedduring
the year
Lapsedduring
the year
At31 December
2017
HKD
2 January 2008 8.27 1,068,828 – – (1,068,828) –
1 February 2008 7.42 213,336 – – (213,336) –
3 March 2008 7.08 76,429 – – (76,429) –
2 May 2008 7.31 1,926,641 – – (1,926,641) –
2 June 2008 6.77 4,458,806 – – (4,458,806) –
2 July 2008 5.95 86,804 – – (86,804) –
4 September 2009 4.52 3,803,331 – – (3,803,331) –
18 January 2012 2.41 7,271,261 – – – 7,271,261
3 September 2012 4.93 10,941,127 – – (3,228,951) 7,712,176
7 July 2015 2.092 5,776,000 – (100,800) – 5,675,200
4 July 2016 1.98 8,580,000 – (192,600) – 8,387,400
44,202,563 – (293,400) (14,863,126) 29,046,037
Categorised as:
Directors 437,000 – – – 437,000
Employees 43,765,563 – (293,400) (14,863,126) 28,609,037
44,202,563 – (293,400) (14,863,126) 29,046,037
Number of options exercisable 27,645,755 17,327,381
The Scheme expired on 7 June 2017 and no further share options can be granted thereunder. However, the rules of the Scheme remain in full force and effect to the extent necessary to give effect to the exercise of options granted prior to its expiration or otherwise as may be required in accordance with the rules of the Scheme. All outstanding share options granted prior to the expiration of the Scheme shall continue to be valid and exercisable in accordance with the rules of the Scheme.
A new share option scheme was adopted by the Company on 24 May 2017.
Annual Report 2018 221

41. SHARE-BASED PAYMENT TRANSACTIONS – CONTINUED SHARE OPTION SCHEME – CONTINUED
The vesting period and the exercisable period of the share options granted to eligible employees on 4 July 2016 are as follows:
Vesting period Exercisable period
The first 1/5 of the grant: From date of grant to 29 June 2017 From 30 June 2017 to 3 July 2022
The second 1/5 of the grant: From date of grant to 29 June 2018 From 30 June 2018 to 3 July 2022
The third 1/5 of the grant: From date of grant to 29 June 2019 From 30 June 2019 to 3 July 2022
The fourth 1/5 of the grant: From date of grant to 29 June 2020 From 30 June 2020 to 3 July 2022
The fifth 1/5 of the grant: From date of grant to 29 June 2021 From 30 June 2021 to 3 July 2022
The vesting period and the exercisable period of the share options granted to eligible employees on 7 July 2015 are as follows:
Vesting period Exercisable period
The first 1/5 of the grant: From date of grant to 29 June 2016 From 30 June 2016 to 6 July 2021
The second 1/5 of the grant: From date of grant to 29 June 2017 From 30 June 2017 to 6 July 2021
The third 1/5 of the grant: From date of grant to 29 June 2018 From 30 June 2018 to 6 July 2021
The fourth 1/5 of the grant: From date of grant to 29 June 2019 From 30 June 2019 to 6 July 2021
The fifth 1/5 of the grant: From date of grant to 29 June 2020 From 30 June 2020 to 6 July 2021
The vesting period and the exercisable period of the share options granted to eligible employees and Directors on 3 September 2012 are as follows:
Vesting period Exercisable period
The first 1/7 of the grant: From date of grant to 4 November 2012 From 5 November 2012 to 4 November 2017
The second 1/7 of the grant: From date of grant to 4 November 2013 From 5 November 2013 to 4 November 2018
The third 1/7 of the grant: From date of grant to 4 November 2014 From 5 November 2014 to 4 November 2019
The fourth 1/7 of the grant: From date of grant to 4 November 2015 From 5 November 2015 to 4 November 2019
The fifth 1/7 of the grant: From date of grant to 4 November 2016 From 5 November 2016 to 4 November 2019
The sixth 1/7 of the grant: From date of grant to 4 November 2017 From 5 November 2017 to 4 November 2019
The last 1/7 of the grant: From date of grant to 4 November 2018 From 5 November 2018 to 4 November 2019
The vesting period and the exercisable period of the share options granted to eligible employees and Directors on 18 January 2012 are as follows:
Vesting period Exercisable period
The first 50% of the grant: From date of grant to 27 June 2013 From 28 June 2013 to 17 January 2020
The second 25% of the grant: From date of grant to 31 December 2013 From 1 January 2014 to 17 January 2020
The last 25% of the grant: From date of grant to 31 December 2014 From 1 January 2015 to 17 January 2020
The Group has recognised the total expense of RMB1 million (2017: RMB2 million) in the profit or loss in relation to share options granted by the Company.
During the year ended 31 December 2018, 911,800 (2017: 293,400) share options have been exercised.
NOTES TO THE CONSOLIDATED FINANCIAL STATEMENTS
FOR THE YEAR ENDED 31 DECEMBER 2018
Shui On Land Limited222

41. SHARE-BASED PAYMENT TRANSACTIONS – CONTINUED SHARE AWARD SCHEME
On 1 April 2015, (1) a connected employee share award scheme and (2) an employee share award scheme were adopted by the Company. The share award scheme is effective for a period of 16 years commencing from 1 April 2015. Pursuant to these two schemes, the Group has set up a trust for the purpose of administering the share award scheme and holding the awarded shares before they vest. The Company shall pay to the trustee monies and give directions or recommendation to the trustee to apply such monies and/or such other net amount of cash derived from shares held as part of the fund of the trusts to acquire shares from the market, and/or to allot and issue shares to the trustee, to satisfy any award made to selected participants. The remuneration committee of the Company shall select eligible persons and determine the number of shares to be awarded. Upon termination of the schemes, the trustee shall sell all unvested shares remaining in the trusts within a reasonable time period as agreed between the trustee and the Company, and remit all cash and net proceeds of such sale and such other funds remaining in the trust to the Company.
During the year ended 31 December 2015, a total of 17,149,000 award shares (which, depending on the performance of the Group, may be adjusted to a maximum of 42,872,500 award shares, i.e. 250% of the award shares granted during the year) and 7,705,000 award shares (which, depending on the performance of the Group, may be adjusted to a maximum of 19,262,500 award shares, i.e. 250% of the award shares granted during the year) of the Company have been awarded to certain connected employees (including Directors of the Company and of certain subsidiaries) and employees of the Group respectively at no consideration.
The awarded shares shall vest upon condition relating to the Group’s performance and the individual performance being met during the 3-year performance period. The key measures to the performance were taken with reference to the key performance indicators such as the Group’s financial performance and the strategic growth.
The movement in the Company’s award shares is set out below:
Vesting datesOutstanding at 1 January 2018
Movement during the year Outstanding at 31 December 2018Awarded Vested Lapsed
Connected Employee Share Award Scheme
On or before 30 June 2017 (after the publication of 2016 annual results by the Company) 6,119,500 – (2,346,688) (3,772,812) –
2 January 2018 3,059,750 – (1,173,347) (1,886,403) –
2 January 2019 3,059,750 – (47,187) (2,224,035) 788,528
12,239,000 – (3,567,222) (7,883,250) 788,528
Employee Share Award Scheme
On or before 30 June 2017 (after the publication of 2016 annual results by the Company) 2,448,000 – (1,428,000) (1,020,000) –
2 January 2018 1,224,000 – (714,000) (510,000) –
2 January 2019 1,224,000 – (68,000) (578,000) 578,000
4,896,000 – (2,210,000) (2,108,000) 578,000
17,135,000 – (5,777,222) (9,991,250) 1,366,528
Annual Report 2018 223

41. SHARE-BASED PAYMENT TRANSACTIONS – CONTINUED SHARE AWARD SCHEME – CONTINUED
Vesting datesOutstanding at 1 January 2017
Movement during the year Outstanding at 31 December 2017Awarded Vested Lapsed
Connected Employee Share Award Scheme
On or before 30 June 2017 (after the publication of 2016 annual results by the Company) 6,119,500 – – – 6,119,500
2 January 2018 3,059,750 – – – 3,059,750
2 January 2019 3,059,750 – – – 3,059,750
12,239,000 – – – 12,239,000
Employee Share Award Scheme
On or before 30 June 2017 (after the publication of 2016 annual results by the Company) 2,448,000 – – – 2,448,000
2 January 2018 1,224,000 – – – 1,224,000
2 January 2019 1,224,000 – – – 1,224,000
4,896,000 – – – 4,896,000
17,135,000 – – – 17,135,000
As at 31 December 2018, 19,076,778 (31 December 2017: 24,854,000) shares are allocated at par and held by the trust for the share award schemes.
The aggregate fair value of 24,854,000 award shares determined based on the share price of the Company at the date of grant amounted to approximately HKD45 million (approximately RMB39 million), of which RMB1 million (2017: RMB7 million) was recognised as an expense in profit or loss for the current year with the corresponding credit being recognised in equity under the heading of “share award reserve”.
42. PLEDGE OF ASSETS The following assets are pledged to banks as securities to obtain certain banking facilities at the end of the reporting period:
2018RMB’million
2017RMB’million
Investment properties 32,250 31,394
Property, plant and equipment 76 546
Prepaid lease payments 7 7
Properties under development for sale 1,833 8,278
Properties held for sale 543 2,321
Accounts receivable 39 42
Bank deposits 2,288 2,153
37,036 44,741
In addition, the equity interests in certain subsidiaries with carrying amount of net assets of RMB5,897 million (2017: RMB6,363 million) are also pledged to banks as securities to obtain banking facilities granted to the Group at the end of the reporting period.
NOTES TO THE CONSOLIDATED FINANCIAL STATEMENTS
FOR THE YEAR ENDED 31 DECEMBER 2018
Shui On Land Limited224
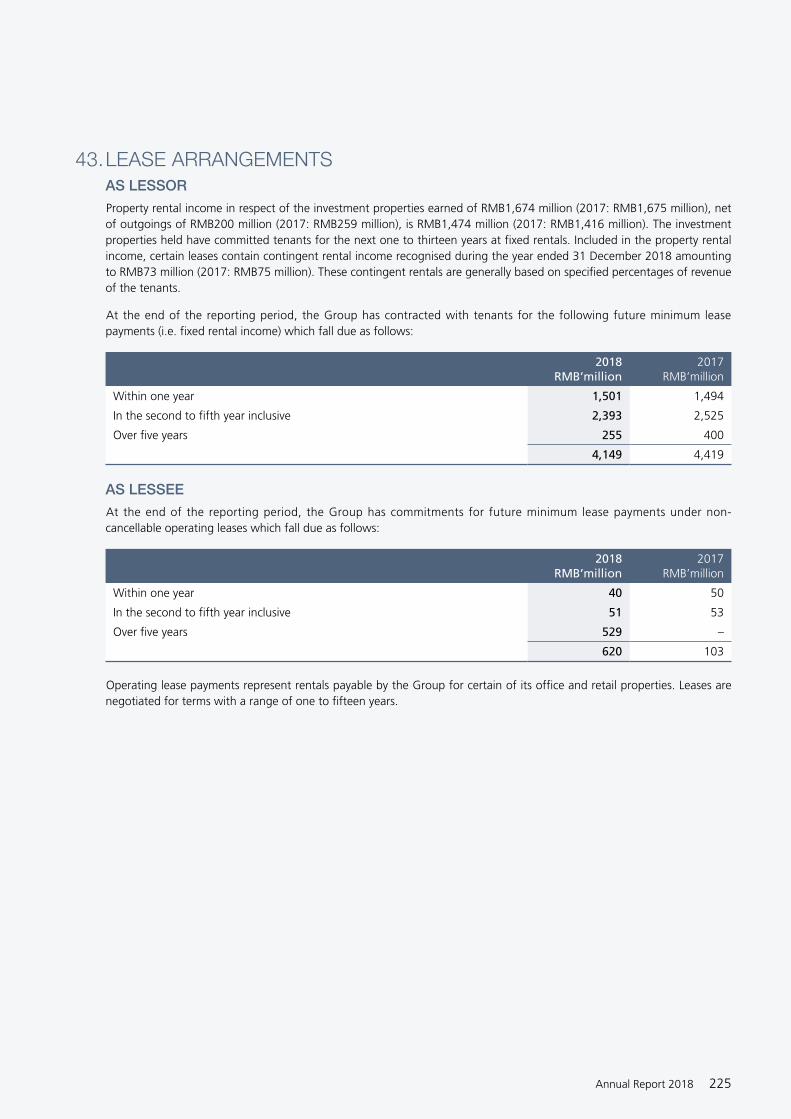
43. LEASE ARRANGEMENTS AS LESSOR
Property rental income in respect of the investment properties earned of RMB1,674 million (2017: RMB1,675 million), net of outgoings of RMB200 million (2017: RMB259 million), is RMB1,474 million (2017: RMB1,416 million). The investment properties held have committed tenants for the next one to thirteen years at fixed rentals. Included in the property rental income, certain leases contain contingent rental income recognised during the year ended 31 December 2018 amounting to RMB73 million (2017: RMB75 million). These contingent rentals are generally based on specified percentages of revenue of the tenants.
At the end of the reporting period, the Group has contracted with tenants for the following future minimum lease payments (i.e. fixed rental income) which fall due as follows:
2018RMB’million
2017RMB’million
Within one year 1,501 1,494
In the second to fifth year inclusive 2,393 2,525
Over five years 255 400
4,149 4,419
AS LESSEE
At the end of the reporting period, the Group has commitments for future minimum lease payments under non-cancellable operating leases which fall due as follows:
2018RMB’million
2017RMB’million
Within one year 40 50
In the second to fifth year inclusive 51 53
Over five years 529 –
620 103
Operating lease payments represent rentals payable by the Group for certain of its office and retail properties. Leases are negotiated for terms with a range of one to fifteen years.
Annual Report 2018 225

44. COMMITMENTS AND CONTINGENCIES(a) Capital and other commitments
At the end of the reporting period, the Group has the following commitments:
2018RMB’million
2017RMB’million
Contracted but not provided for:
Development costs for investment properties under construction or development 731 964
Development costs for properties under development held for sale 1,475 1,272
Acquisition of subsidiaries – 514
Investment in an associate (Note) 1,295 –
3,501 2,750
Note:On 29 December 2018, the Group entered into an agreement with two independent third parties to establish an associate company to engage in the investment in properies in the PRC and the management and administration of such properties.
(b) Contingent liabilities
(i) The Group arranged a standby letter of credit with a commercial bank and in the amount of USD30 million (approximately RMB206 million) in favour of BSREP CXTD to secure the due performance of China Xintiandi Limited under the Sale and Purchase Agreement. The said standby letter of credit will only become payable in case completion does not take place as a result of China Xintiandi Limited’s breach under the Sale and Purchase Agreement.
(ii) The Group provided guarantees of RMB1,398 million as at 31 December 2018 (31 December 2017: RMB1,929 million) to banks in favour of its customers in respect of the mortgage loans provided by the banks to those customers for the purchase of the Group’s developed properties. These guarantees provided by the Group to the banks will be released upon receiving the building ownership certificates of the respective properties by the bank from the customers as a pledge for security to the mortgage loans granted.
In determining whether financial liabilities should be recognised in respect of the Group’s financial guarantee contracts, the Directors of the Company exercise judgment in evaluation of the probability of resources outflow that will be required and the assessment of whether a reliable estimate can be made of the amount of the obligation.
In the opinion of the Directors of the Company, the fair values of the financial guarantee contracts of the Group are insignificant at initial recognition and the Directors consider that the possibility of the default of the parties involved is remote, accordingly, no value has been recognised in the consolidated statement of financial position as at 31 December 2018 and 31 December 2017. Should the actual outcome be different from expected, provision for losses will be recognised in the consolidated financial statements.
NOTES TO THE CONSOLIDATED FINANCIAL STATEMENTS
FOR THE YEAR ENDED 31 DECEMBER 2018
Shui On Land Limited226

45. RELATED PARTY TRANSACTIONSApart from the related party transactions and balances as stated in notes 16, 17, 23 and 24, the Group has the following transactions with related companies during the year:
2018RMB’million
2017RMB’million
SOCL and its subsidiaries other than those of the Group
Rental and building management fee expenses 4 4
Travelling expenses 9 9
SOCAM and its subsidiaries, being subsidiaries of SOCL
Revenue from construction services 67 56
Associates
Revenue from constructive service 121 6
Interest income 25 94
Labor fee income – 7
Joint ventures
Project management fee income 63 1
Interest income 63 58
Loss on disposal of investment properties through disposal of a subsidiary (note 39(d)) – (18)
Asset management fee income 11 -
Construction income 21 -
Non-controlling shareholder of subsidiaries
Interest expense 59 7
Key management personnel
Property sales – 2
Short-term benefits 72 70
Post-employment benefits 1 3
Share option expenses – 1
Share award expenses – 4
73 78
46. EVENTS AFTER THE REPRORTING PERIODThe Group has noted the following events after the reporting period:
(a) On 28 February 2019, SODH issued USD500 million senior notes to independent third parties with a maturity of two years and nine months due on 28 November 2021, bearing coupon at 6.25% per annum, payable semi-annually in arrears.
(b) On 15 March 2019, consideration of RMB3,406 million in relation to the Brookfield Transaction has been paid. Details were set out in note 25.
Annual Report 2018 227
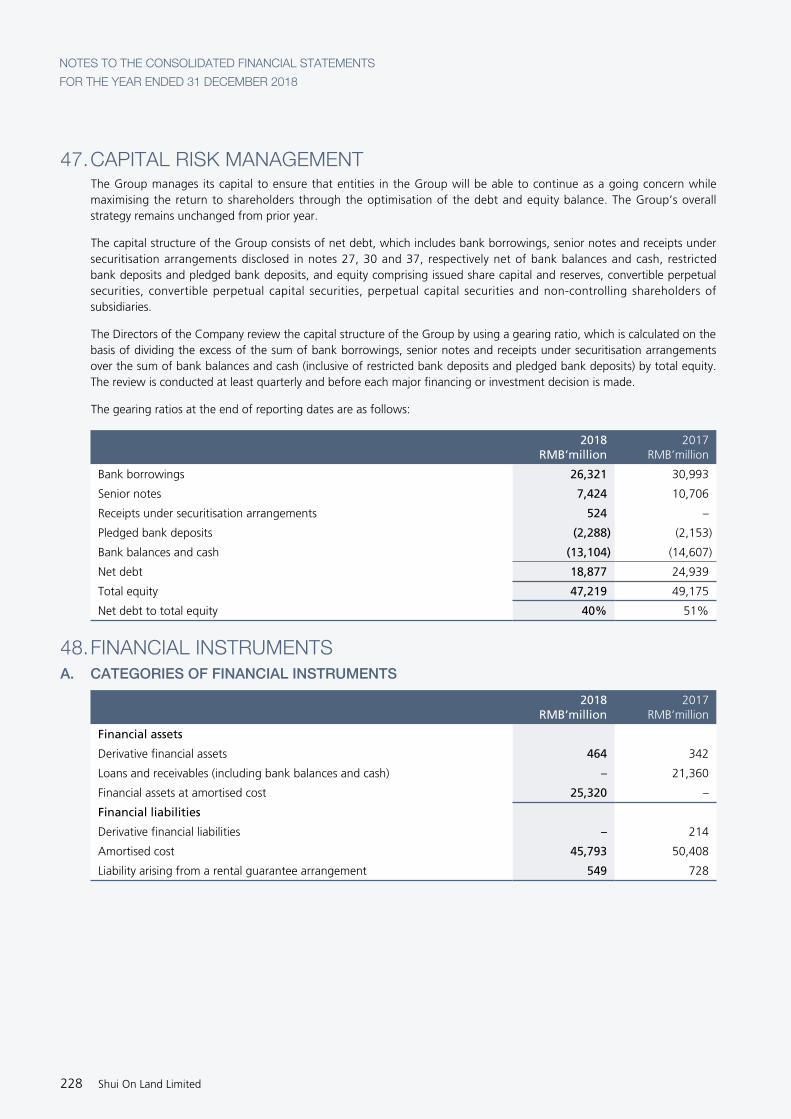
47. CAPITAL RISK MANAGEMENT The Group manages its capital to ensure that entities in the Group will be able to continue as a going concern while maximising the return to shareholders through the optimisation of the debt and equity balance. The Group’s overall strategy remains unchanged from prior year.
The capital structure of the Group consists of net debt, which includes bank borrowings, senior notes and receipts under securitisation arrangements disclosed in notes 27, 30 and 37, respectively net of bank balances and cash, restricted bank deposits and pledged bank deposits, and equity comprising issued share capital and reserves, convertible perpetual securities, convertible perpetual capital securities, perpetual capital securities and non-controlling shareholders of subsidiaries.
The Directors of the Company review the capital structure of the Group by using a gearing ratio, which is calculated on the basis of dividing the excess of the sum of bank borrowings, senior notes and receipts under securitisation arrangements over the sum of bank balances and cash (inclusive of restricted bank deposits and pledged bank deposits) by total equity. The review is conducted at least quarterly and before each major financing or investment decision is made.
The gearing ratios at the end of reporting dates are as follows:
2018RMB’million
2017RMB’million
Bank borrowings 26,321 30,993
Senior notes 7,424 10,706
Receipts under securitisation arrangements 524 –
Pledged bank deposits (2,288) (2,153)
Bank balances and cash (13,104) (14,607)
Net debt 18,877 24,939
Total equity 47,219 49,175
Net debt to total equity 40% 51%
48. FINANCIAL INSTRUMENTSA. CATEGORIES OF FINANCIAL INSTRUMENTS
2018RMB’million
2017RMB’million
Financial assets
Derivative financial assets 464 342
Loans and receivables (including bank balances and cash) – 21,360
Financial assets at amortised cost 25,320 –
Financial liabilities
Derivative financial liabilities – 214
Amortised cost 45,793 50,408
Liability arising from a rental guarantee arrangement 549 728
NOTES TO THE CONSOLIDATED FINANCIAL STATEMENTS
FOR THE YEAR ENDED 31 DECEMBER 2018
Shui On Land Limited228

48. FINANCIAL INSTRUMENTS – CONTINUEDB. FINANCIAL RISK MANAGEMENT OBJECTIVES AND POLICIES
The Group’s major financial instruments include derivative financial assets, loans to associates, loans to joint ventures, accounts receivable, amounts due from associates, amounts due from related companies, amounts due from joint ventures, pledged bank deposits, restricted bank deposits, bank balances and cash, accounts payable, amount due to a joint venture, amount due to an associate, amounts due to related companies, loans from a non-controlling shareholder of subsidiaries, amounts due to non-controlling shareholders of subsidiaries, bank borrowings, senior notes, receipts under securitisation arrangements, derivative financial liabilities and liability arising from a rental guarantee arrangement.
Details of these financial instruments are disclosed in the respective notes. The risks associated with these financial instruments and the policies on how to mitigate these risks are set out below. The management manages and monitors these exposures to ensure appropriate measures are implemented on a timely and effective manner.
The main risks arising from the Group’s financial instruments are currency risk, interest rate risk, credit risk and liquidity risk. The Directors review and agree policies for managing each of these risks and they are summarised below.
Currency risk
All of the Group’s revenue is denominated in RMB. However, the Group has certain bank balances and debt obligations that are denominated in foreign currency. As a result, the Group is exposed to fluctuations in foreign exchange rates. The foreign currency exposure are managed within approved policy parameters utilising currency forward contracts.
The Group applies hedge accounting to present its consolidated financial statements. The Group determines the economic relationship between the hedged items and the hedging instruments by reviewing their critical terms and performing a quantitative assessment as needed. As a result, the Group concludes that the risk being hedged for the hedged items and the risk inherent in the hedging instruments are sufficiently aligned. The main sources of hedge ineffectiveness are considered to be the effects of mismatch in timing. In most of the cases, the hedging instruments have a one-to-one hedge ratio with the hedged items. In view of the nature of the hedging activities, no significant ineffectiveness is expected at inception.
The carrying amounts of the Group’s foreign currency denominated monetary assets and liabilities at the end of the reporting period are as follows:
2018RMB’million
2017RMB’million
HKD
Assets 230 2,050
Liabilities 2,528 3,154
USD
Assets 1,651 3,888
Liabilities 56,274 10,765
The Group has entered into such forward contracts in relation to the foreign currency denominated monetary liabilities amounting to RMB7,468 million (equivalent to USD954 million and HKD1,050 million respectively) (31 December 2017: RMB5,561 million (equivalent to USD797 million and HKD423 million respectively)). It is the Group’s policy to negotiate the terms of the hedge derivatives, to the extent possible, to match or approximate the terms of the hedged item to maximise hedge effectiveness (see note 34 for details).
Sensitivity analysis
The Group is mainly exposed to the currency of HKD and USD.
The following table details the Group’s sensitivity to a 5% increase and decrease in RMB against the relevant foreign currency. 5% is the sensitivity rate used when reporting foreign currency risk internally to key management personnel and represents management’s assessment of the reasonably possible change in foreign exchange rates.
Annual Report 2018 229
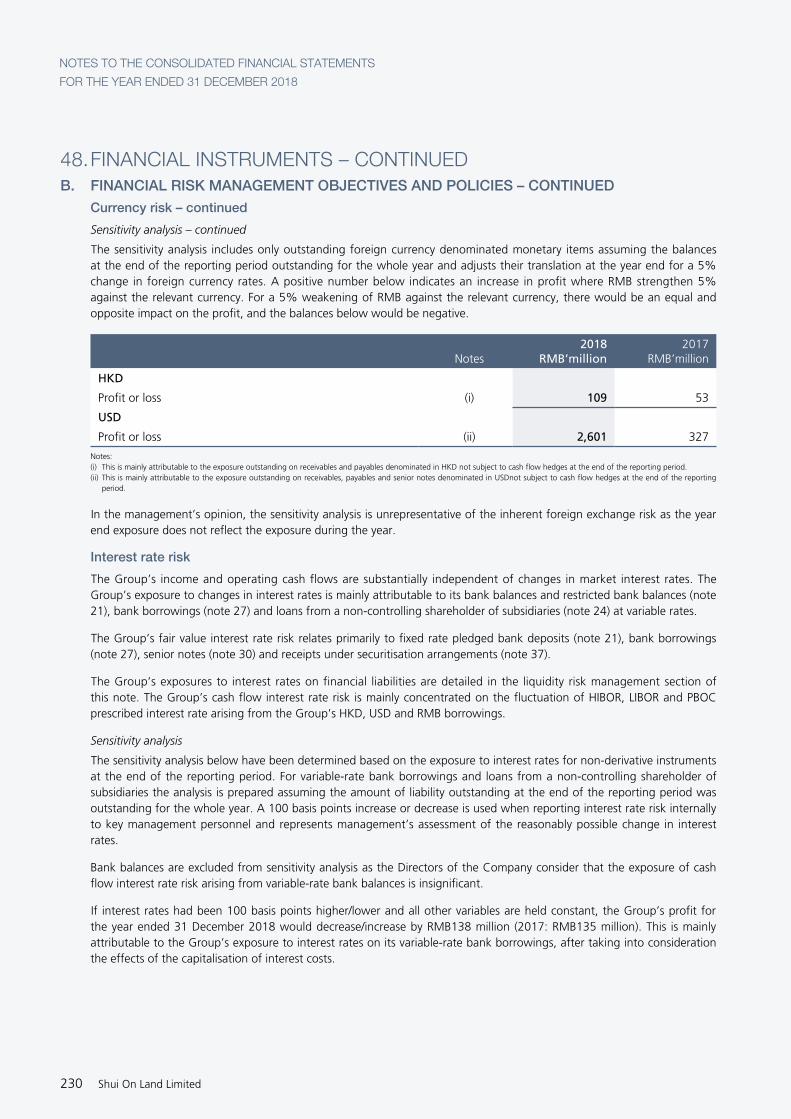
48. FINANCIAL INSTRUMENTS – CONTINUEDB. FINANCIAL RISK MANAGEMENT OBJECTIVES AND POLICIES – CONTINUED
Currency risk – continued
Sensitivity analysis – continued
The sensitivity analysis includes only outstanding foreign currency denominated monetary items assuming the balances at the end of the reporting period outstanding for the whole year and adjusts their translation at the year end for a 5% change in foreign currency rates. A positive number below indicates an increase in profit where RMB strengthen 5% against the relevant currency. For a 5% weakening of RMB against the relevant currency, there would be an equal and opposite impact on the profit, and the balances below would be negative.
Notes2018
RMB’million2017
RMB’million
HKD
Profit or loss (i) 109 53
USD
Profit or loss (ii) 2,601 327
Notes:(i) This is mainly attributable to the exposure outstanding on receivables and payables denominated in HKD not subject to cash flow hedges at the end of the reporting period.(ii) This is mainly attributable to the exposure outstanding on receivables, payables and senior notes denominated in USDnot subject to cash flow hedges at the end of the reporting
period.
In the management’s opinion, the sensitivity analysis is unrepresentative of the inherent foreign exchange risk as the year end exposure does not reflect the exposure during the year.
Interest rate risk
The Group’s income and operating cash flows are substantially independent of changes in market interest rates. The Group’s exposure to changes in interest rates is mainly attributable to its bank balances and restricted bank balances (note 21), bank borrowings (note 27) and loans from a non-controlling shareholder of subsidiaries (note 24) at variable rates.
The Group’s fair value interest rate risk relates primarily to fixed rate pledged bank deposits (note 21), bank borrowings (note 27), senior notes (note 30) and receipts under securitisation arrangements (note 37).
The Group’s exposures to interest rates on financial liabilities are detailed in the liquidity risk management section of this note. The Group’s cash flow interest rate risk is mainly concentrated on the fluctuation of HIBOR, LIBOR and PBOC prescribed interest rate arising from the Group’s HKD, USD and RMB borrowings.
Sensitivity analysis
The sensitivity analysis below have been determined based on the exposure to interest rates for non-derivative instruments at the end of the reporting period. For variable-rate bank borrowings and loans from a non-controlling shareholder of subsidiaries the analysis is prepared assuming the amount of liability outstanding at the end of the reporting period was outstanding for the whole year. A 100 basis points increase or decrease is used when reporting interest rate risk internally to key management personnel and represents management’s assessment of the reasonably possible change in interest rates.
Bank balances are excluded from sensitivity analysis as the Directors of the Company consider that the exposure of cash flow interest rate risk arising from variable-rate bank balances is insignificant.
If interest rates had been 100 basis points higher/lower and all other variables are held constant, the Group’s profit for the year ended 31 December 2018 would decrease/increase by RMB138 million (2017: RMB135 million). This is mainly attributable to the Group’s exposure to interest rates on its variable-rate bank borrowings, after taking into consideration the effects of the capitalisation of interest costs.
NOTES TO THE CONSOLIDATED FINANCIAL STATEMENTS
FOR THE YEAR ENDED 31 DECEMBER 2018
Shui On Land Limited230

48. FINANCIAL INSTRUMENTS – CONTINUEDB. FINANCIAL RISK MANAGEMENT OBJECTIVES AND POLICIES – CONTINUED
Credit risk and impairment assessment
As at 31 December 2018, the Group’s maximum exposure to credit risk which will cause a financial loss to the Group due to failure to discharge an obligation by the counterparties and financial guarantees provided by the Group is arising from the carrying amount of the respective recognised financial assets as stated in the consolidated statement of financial position and the amount in relation to financial guarantee issued by the Group as disclosed in note 44.
The Group’s credit risk is primarily attributable to its loans to related parties (including loans to associates, loans to joint ventures, amounts due from associates, amounts due from related companies and amounts due from joint ventures), accounts receivable, other receivables (including other receivables, receivables from disposal of subsidiaries and receivables from disposal of associates), contract assets, cash deposits with banks and amount in relation to the financial guarantees provided by the Group.
Accounts receivable and contract assets arising from contracts with customers
In order to minimise the credit risk, the Group has policies in place to ensure that sales are made to purchasers with an appropriate financial strength and appropriate percentage of down payments. It also has other monitoring procedures to ensure that follow-up action is taken to recover overdue debts. In addition, the Group performs impairment assessment under ECL model upon application of IFRS 9 (2017: incurred loss model) on trade balances arising from sales of properties and arising from construction revenue based on provision matrix. The credit risk of rental receivables are minimal as the Group has collected rental deposits from the tenants to secure any potential losses from uncollectible debts.
Other receivables
The credit risk of other receivables is managed through an internal process. The Group actively monitors the outstanding amounts owed by each debtor and uses past due information to assess whether credit risk has increased significantly since initial recognition.
Loans to related parties
The credit risk of loans to related parties is managed through an internal process. The credit quality of each counterparty is investigated before an advance is made. The Group also actively monitors the outstanding amounts owed by each debtor and uses past due information to assess whether credit risk has increased significantly since initial recognition. The Group has concentration of credit risk from loans to joint ventures of RMB3,310 million (2017: RMB2,553 million), amounts due from joint ventures of RMB744 million (2017: RMB686 million), amounts due from related companies of RMB103 million (2017: RMB642 million), loans to associates of RMB3,240 million (2017: nil) and amounts due from associates of RMB194 million (2017:nil).
Cash deposits with banks
Cash deposits are mainly placed with state-owned financial institutions and reputable banks which are all high-credit-quality financial institutions, therefore the Group’s credit risk on liquid funds is limited.
Annual Report 2018 231
48. FINANCIAL INSTRUMENTS – CONTINUEDB. FINANCIAL RISK MANAGEMENT OBJECTIVES AND POLICIES – CONTINUED
Credit risk and impairment assessment – CONTINUED
Contingent liabilities in relation to the financial guarantees
For properties that are still under construction, the Group typically provides guarantees to banks in connection with the customers’ borrowing of mortgage loans to finance their purchase of the properties. If a purchaser defaults on the payment of its mortgage during the term of the guarantee, the bank holding the mortgage may demand the Group to repay the outstanding amount under the loan and any accrued interest thereon. Under such circumstances, the Group is able to retain the customer’s deposits and sell the property to recover any amounts paid by the Group to the bank. Unless the selling price drop significantly, which the probability is considered remote, the Group would not be in a loss position in selling those properties out. In this regard, the Directors of the Company consider that the Group’s credit risk in relation to financial guarantees from mortgage loans is largely mitigated.
Other than concentration of credit risk on some of the loans to related parties as disclosed above, the Group does not have any other significant concentration of credit risk. Accounts receivable consist of a large number of customers and counterparties.
The Group’s internal credit risk grading assessment comprises the following categories:
Internal creditrating Description
Accounts receivable/contract assets
Other financial assets/other items
Low risk The counterparty has a low risk of default and does not have any past-due amounts
Lifetime ECL – not credit-impaired
12-month ECL
Watch list Debtor frequently repays after due dates but usually settle after due date
Lifetime ECL – not credit-impaired
12-month ECL
Doubtful There have been significant increases in credit risk since initial recognition through information developed internally or external resources
Lifetime ECL – not credit-impaired
Lifetime ECL – not credit-impaired
Loss There is evidence indicating the asset is credit-impaired
Lifetime ECL – credit-impaired
Lifetime ECL – credit-impaired
Write-off There is evidence indicating that the debtor is in severe financial difficulty and the Group has no realistic prospect of recovery
Amount is written-off Amount is written-off
NOTES TO THE CONSOLIDATED FINANCIAL STATEMENTS
FOR THE YEAR ENDED 31 DECEMBER 2018
Shui On Land Limited232

48. FINANCIAL INSTRUMENTS – CONTINUEDB. FINANCIAL RISK MANAGEMENT OBJECTIVES AND POLICIES – CONTINUED
Credit risk and impairment assessment – CONTINUED
The tables below detail the credit risk exposures of the Group’s financial assets, contract assets and financial guarantee contracts which are subject to ECL assessment:
2018 NotesExternal
credit ratingInternal
credit rating12-month or lifetime
ECL
Grosscarryingamount
(RMB’million)
Financial assets at amortised cost
Accounts receivable 18 N/A Note 3 Lifetime ECL (provision matrix)
188
Loans to/amounts due from associates
16 N/A Note 1 12-month ECL 3,434
Loans to/amounts due from joint ventures
17 N/A Note 1 12-month ECL 4,054
Amounts due from related companies
23 N/A Note 1 Lifetime ECL (not credit-impaired)
103
Other receivables (including receivables from disposal of subsidiaries and receivables from disposal of associates)
18 N/A Note 1 12-month ECL 2,182
Lifetime ECL (credit-impaired) 180
2,362
Pledged bank deposits 21 aaa to a- N/A 12-month ECL 2,288
Bank balances and cash 21 aaa to a- N/A 12-month ECL 13,104
Other items
Contract assets 19 N/A Note 3 Lifetime ECL (not credit-impaired)
59
Financial guarantee contracts (Note 2)
44 N/A Low risk 12-month ECL 1,398
Notes:1. For the purposes of internal credit risk management, the Group uses past due information to assess whether credit risk has increased significantly since initial recognition.
Past dueRMB’million
Not past due/No fixed repayment term
RMB’millionTotal
RMB’million
Loans to/amounts due from associates – 3,434 3,434
Loans to/amounts due from joint ventures – 4,054 4,054
Amounts due from related companies 100 3 103
Other receivables – 2,182 2,182
100 9,673 9,773
2. For financial guarantee contracts, the gross carrying amount represents the maximum amount the Group has guaranteed under the respective contracts. The maximum amount that the Group has guaranteed under the respective contracts was RMB1,398 million as at 31 December 2018. At the end of the reporting period, the Directors of the Company have performed impairment assessment, and concluded that there has been no significant increase in credit risk since initial recognition of the financial guarantee contracts. Accordingly, the loss allowance for financial guarantee contracts issued by the Group is measured at an amount equal to 12m ECL. The Directors of the Company considered that the 12m ECL allowance is insignificant at 1 January 2018 and 31 December 2018.
3. For accounts receivable and contract assets, the Group has applied the simplified approach in IFRS 9 to measure the loss allowance at lifetime ECL. Except for debtors with significant outstanding balances or credit-impaired, the Group determines the expected credit losses on these items by using a provision matrix.
As part of the Group’s credit risk management, the Group uses debtors’ aging to assess the impairment for its customers in relation to its property sales and construction operation because these customers consist of a large number of small customers with common risk characteristics that are representative of the customers’ abilities to pay all amounts due in accordance with the contractual terms. The following table provides information about the exposure to credit risk for accounts receivable and contract assets which are assessed based on provision matrix as at 31 December 2018 within lifetime ECL (not credit impaired). Debtors with significant outstanding balances with gross carrying amounts of RMB180 million as at 31 December 2018 were assessed individually.
Annual Report 2018 233

48. FINANCIAL INSTRUMENTS – CONTINUEDB. FINANCIAL RISK MANAGEMENT OBJECTIVES AND POLICIES – CONTINUED
Credit risk and impairment assessment – CONTINUED
Average Loss rate
Accountsreceivables and contract assets
RMB’million
Gross carrying amount
Current (not past due) 0.1% 121
1-30 days past due 1% 37
31-60 days past due 2% 34
61-90 days past due 4% 4
More than 90 days past due 63% 51
247
The estimated loss rates are estimated based on historical observed default rates over the expected life of the debtors and are adjusted for forward-looking information that is available without undue cost or effort.
During the year ended 31 December 2018, the Group reversed RMB64 million impairment allowance and provided RMB6 million impairment allowance for accounts receivable, based on the provision matrix. Impairment allowance of RMB180 million was made individually on debtors with significant balances.
The following table shows the movement in lifetime ECL that has been recognised for accounts receivable, contract assets and other receivables under the simplified approach.
Lifetime ECL (not credit-impaired)
RMB’million
Lifetime ECL (credit-impaired)
RMB’millionTotal
RMB’million
As at 31 December 2017 under IAS 39 – – –
Adjustment upon application of IFRS 9 91 – 91
As at 1 January 2018 – As restated 91 – 91
Changes due to financial instruments recognised as at 1 January:
– Impairment losses recognised 6 180 186
– Impairment losses reversed (64) – (64)
As at 31 December 2018 33 180 213
Changes in the loss allowance are mainly due to:
31/12/2018
Increase/(decrease) in lifetime ECL
Not credit-impaired
RMB’million
Credit-impaired
RMB’million
One debtor with a gross carrying amount of RMB180 million defaulted – 180
Settlement in full of trade debtors with a gross carrying amount of RMB64 million (58) –
NOTES TO THE CONSOLIDATED FINANCIAL STATEMENTS
FOR THE YEAR ENDED 31 DECEMBER 2018
Shui On Land Limited234

48. FINANCIAL INSTRUMENTS – CONTINUEDB. FINANCIAL RISK MANAGEMENT OBJECTIVES AND POLICIES – CONTINUED
Liquidity risk
The Group’s objective is to maintain a balance between continuity of funding and the flexibility through the use of bank borrowings. The Group also monitors the current and expected liquidity requirements and its compliance with lending covenants regularly to ensure it maintains sufficient working capital and adequate committed lines of funding to meet its liquidity requirement.
The following table details the maturities of the Group’s financial liabilities. The table has been drawn up based on the undiscounted cash flows of financial liabilities based on the earliest date on which the Group can be required to pay. The table includes both interest and principal cash flows.
For derivative instruments that are settled on a net basis, undiscounted net cash outflows are presented.
Liquidity and interest risk tables
Weighted average
effective interest rate
%
Within 1 year or on demand
RMB’million
More than 1 year but less than 2 years RMB’million
More than 2 years but less than 5 years RMB’million
More than 5 years
RMB’million
Total undiscounted
cash flows RMB’million
Carrying amount at 31.12.2018
RMB’million
2018
Non-derivative financial liabilities
Accounts payable, deposits received and accrued charges – 9,024 – – – 9,024 9,024
Bank borrowings at variable rates 5.4% 12,821 6,723 4,577 3,855 27,976 25,241
Bank borrowings at fixed rates 6.1% 1,108 – – – 1,108 1,080
Receipts under securitisation arrangements 6.0% 39 41 138 550 768 524
Senior notes 6.0% 2,138 347 5,805 – 8,290 7,424
Amounts due to related companies – 15 – – – 15 15
Amount due to a joint venture /an associate – 767 – – – 767 767
Amounts due to non-controlling shareholders of subsidiaries – 8 – – – 8 8
Financial guarantee contracts (note a) – 1,398 – – – 1,398 –
Loans from a non-controlling shareholder of subsidiaries 5.2% 1,710 – – – 1,710 1,710
Liability arising from a rental guarantee arrangement (note b) – 169 232 484 – 885 549
29,197 7,343 11,004 4,405 51,949 46,342
Annual Report 2018 235

48. FINANCIAL INSTRUMENTS – CONTINUEDB. FINANCIAL RISK MANAGEMENT OBJECTIVES AND POLICIES – CONTINUED
Liquidity risk – CONTINUED
Weighted average effective
interest rate %
Within 1 year or on demand
RMB’million
More than 1 year but less than 2 years RMB’million
More than 2 years but less than 5 years RMB’million
More than 5 years
RMB’million
Total undiscounted cash flows
RMB’million
Carrying amount at
31.12.2017 RMB’million
2017
Non-derivative financial liabilities
Accounts payable, deposits received and accrued charges – 6,703 – – – 6,703 6,703
Bank borrowings at variable rates 5.2% 7,062 14,512 4,812 4,057 30,443 27,250
Bank borrowings at fixed rates 7.8% 3,902 – – – 3,902 3,743
Senior notes 7.5% 6,246 1,891 3,546 – 11,683 10,706
Amounts due to related companies – 347 – – – 347 347
Amounts due to non-controlling shareholders of subsidiaries – 8 – – – 8 8
Financial guarantee contracts (note a) – 2,693 – – – 2,693 –
Loans from a non-controlling shareholder of subsidiaries 5.2% 1,651 – – – 1,651 1,651
Liability arising from a rental guarantee arrangement (note b) – 177 232 716 – 1,125 728
28,789 16,635 9,074 4,057 58,555 51,136
Derivatives – net settlement
Cash flow hedge instruments 214 – – – 214 214
Notes:a. The amounts included above for financial guarantee contracts are the maximum amounts the Group could be required to settle under the arrangement for the full guaranteed
amount if that amount is claimed by the counterparty to the guarantee. Based on the expectations at the end of the reporting period, the Group considers that it is more likely than not that no amount will be payable under the arrangement. However, this estimate is subject to change depending on the probability of the counterparty claiming under the guarantee which is a function of the likelihood that the financial receivables held by the counterparty which are guaranteed suffer credit losses.
b. The amounts included above relate to the rental guarantee arrangement entered into by the Group (see note 35). In respect of the compensation for the current year, the amounts above represent the actual amount. In respect of the remaining guarantee period for 2019 (2017: 2018) and beyond, the amounts represent the maximum amounts the Group could be required to settle as if there was no operating income to be generated by the disposed properties. Based on the expectations at the end of the reporting period, the Group considers that it is more likely that a much lower amount will be payable under the arrangement as some of the properties have been generating rental income. In addition, as mentioned in note 35, liability arising from a rental guarantee arrangement is measured at fair value at the end of the reporting period. However, this estimate is subject to change depending on the future rental income that will be generated from the properties.
The amounts included above for variable interest rate instruments for non-derivative financial liabilities are subject to change if changes in variable interest rates differ to those estimates of interest rates determined at the end of the reporting period.
NOTES TO THE CONSOLIDATED FINANCIAL STATEMENTS
FOR THE YEAR ENDED 31 DECEMBER 2018
Shui On Land Limited236

48. FINANCIAL INSTRUMENTS – CONTINUEDC. FAIR VALUE MEASUREMENT
The fair values of the Group’s financial assets and financial liabilities excluding derivative financial instruments are determined in accordance with generally accepted pricing models based on discounted cash flow analysis.
The Group’s derivative financial instruments are measured at fair value at the end of the reporting period and they are grouped under Level 2 financial instruments based on the degree to which the fair value is observable.
The Group’s currency forward contracts amounting to RMB221 million (2017: RMB214 million) are measured at the present value of future cash flows, estimated based on forward exchange rates (from observable forward exchange rates at the end of the reporting periods) and contracted forward rates, discounted at a rate that reflects the credit risk of various counterparties.
The Group’s call option to buy back an investment property and liability arising from a rental guarantee arrangement that are measured at fair value at the end of the reporting period are grouped under Level 3. The fair values of both instruments are estimated based on Monte-Carlo simulation using key inputs as disclosed in notes 34 and 35 respectively.
The following table presents the reconciliation of level 3 instruments for the years ended 31 December 2018 and 31 December 2017:
Liability arising from a rental
guarantee arrangement RMB’million
Note 35
Call option tobuy back aninvestment
propertyRMB’million
Note 34
At 1 January 2017 (599) 460
Payments 329 –
Fair value changes (note 6) (458) (118)
At 31 December 2017 (728) 342
Payments 179 –
Fair value changes (note 6) – (99)
At 31 December 2018 (549) 243
The fair values of other financial assets and financial liabilities are determined in accordance with generally accepted pricing models base on discounted cash flow analysis.
The Directors of the Company consider that the carrying amounts of financial assets and financial liabilities recognised at amortised cost in the consolidated financial statements approximate their fair values.
In estimating the fair value of an asset or a liability, the Group uses market-observable data to the extent it is available. Where Level 1 inputs are not available, the Group engages third party qualified valuers to perform the valuation. Where there is a material change in the fair value of an asset or a liability, the causes of the fluctuations will be reported to the Directors of the Company for appropriate actions to be taken.
Information about the valuation techniques, and inputs and key assumptions used in determining the fair value of various assets and liabilities are disclosed in notes 34 and 35.
Annual Report 2018 237

49. RECONCILIATION OF LIABILITIES ARISING FROM FINANCING ACTIVITIESThe table below details changes in the Group’s liabilities arising from financing activities, including both cash and non-cash changes. Liabilities arising from financing activities are those for which cash flows were, or future cash flows will be, classified in the Group’s consolidated statement of cash flows as cash flows from financing activities.
Amountsdue to
relatedcompanies
RMB’millionBorrowings
RMB’million
Senior notes
RMB’million
Receipes under securitisation arrangement RMB’million
Derivative financial
instrumentsRMB’million
Loans from/Amounts due tonon-controllingshareholders of
subsidiaries*RMB’million
Dividendsand
distributionsRMB’million
Total RMB’million
Note 23 Note 27 Note 30 Note 37 Note 34 Note 24Notes 11, 32
and 33
At 1 January 2018 347 30,993 10,706 – 214 1,651 – 43,911
Financing cash flows (307) (1,152) (4,106) 524 (324) – (1,177) (6,542)
Disposal of subsidiaries – (5,818) – – – – – (5,818)
Fair value adjustments – – – – (214) – – (214)
Distributions to owners of perpetual capital securities and CPCS – – – – – – 368 368
Foreign exchange translation (25) 697 134 – 324 – – 1,130
Interest expenses – 1,658 612 – – 59 – 2,329
Loss on early redemption of senior notes – – 78 – – – – 78
Final dividends for 2017 and interim dividend for 2018 – – – – – – 714 714
Dividends to non-controlling shareholders of subsidiaries – – – – – – 95 95
Interest payable – (57) – – – – – (57)
At 31 December 2018 15 26,321 7,424 524 – 1,710 – 35,994
NOTES TO THE CONSOLIDATED FINANCIAL STATEMENTS
FOR THE YEAR ENDED 31 DECEMBER 2018
Shui On Land Limited238

49. RECONCILIATION OF LIABILITIES ARISING FROM FINANCING ACTIVITIES – CONTINUED
Amountsdue to related
companiesRMB’million
BorrowingsRMB’million
Senior notesRMB’million
Derivative financial
instrumentsRMB’million
Loans from/Amounts due tonon-controllingshareholders of
subsidiaries*RMB’million
Dividendsand
distributionsRMB’million
TotalRMB’million
Note 23 Note 27 Note 30 Note 34 Note 24Notes 11, 32 and
33
At 1 January 2017 283 29,811 17,312 368 – – 47,774
Financing cash flows 85 2,519 (7,385) (767) 1,644 (1,040) (4,944)
Disposal of subsidiaries (21) (2,656) – – – – (2,677)
Fair value adjustments – – – 126 – – 126
Distributions to owners of perpetual capital securities and CPCS – – – – – 581 581
Foreign exchange translation – (460) (828) 487 – – (801)
Interest expenses – 1,718 1,372 – 7 – 3,097
Loss on early redemption of senior notes – – 235 – – – 235
Shares issued in lieu of cash dividend – – – – – (57) (57)
Final dividends for 2016 and interim dividend for 2017 – – – – – 475 475
Dividends to non-controlling shareholders of subsidiaries – – – – – 41 41
Interests payable – 61 – – – – 61
At 31 December 2017 347 30,993 10,706 214 1,651 – 43,911
* Out of the total loans from/amounts due to non-controlling shareholders of subsidiaries for RMB1,718 million (2017: RMB1,659 million) as of 31 December 2018, RMB1,710 million (2017: RMB1,651 million) are liabilities arising from financing activities.
Annual Report 2018 239

50. STATEMENT OF FINANCIAL POSITION OF THE COMPANY2018
RMB’million 2017
RMB’million
Non-current assets
Investments in subsidiaries 7,181 6,662
Loan to a subsidiary 10,203 10,943
17,384 17,605
Current assets
Other prepayment – 23
Bank balances 3 2
3 25
Total assets 17,387 17,630
Capital and reserves
Share capital 146 146
Reserves (note) 17,241 17,484
Total equity 17,387 17,630
Note:Details of the Company’s reserves are set out below:
Sharepremium
RMB’million
Shareaward
reserveRMB’million
Convertiblebond
equity reserveRMB’million
Otherreserve
RMB’million
Share optionreserve
RMB’million
Accumulatedlosses
RMB’millionTotal
RMB’million
At 1 January 2017 18,020 17 – 507 39 (1,488) 17,095
Profit and total comprehensive income for the year – – – – – 799 799
Recognition of equity-settled share-based payment expenses (note 41) – – – – 2 – 2
Lapsed of share options – – – – (28) 28 –
Recognition of equity-settled share based payment expenses under the share award scheme (note 41) – 7 – – – – 7
Total dividends of HKD0.069 per share paid, comprising 2016 final dividend of HKD0.039 per share and 2017 interim dividend of HKD0.03 per share – – – – – (475) (475)
Share issued in lieu of cash dividend 56 – – – – – 56
At 31 December 2017 18,076 24 – 507 13 (1,136) 17,484
Profit and total comprehensive income for the year – – – – – 467 467
Recognition of equity-settled share-based payment expenses (note 41) – – – – 1 – 1
Lapsed of share award and share options – (15) – – (3) 18 –
Recognition of equity-settled share based payment expenses under the share award scheme (note 41) – 1 – – – – 1
Total dividend of HKD0.106 per share paid, comprising 2017 final dividend of HKD0.07 per share and 2018 interim dividend of HKD0.036 per share – – – – – (714) (714)
Exercise of share option 2 – – – – – 2
At 31 December 2018 18,078 10 – 507 11 (1,365) 17,241
NOTES TO THE CONSOLIDATED FINANCIAL STATEMENTS
FOR THE YEAR ENDED 31 DECEMBER 2018
Shui On Land Limited240

51. PARTICULARS OF MAJOR SUBSIDIARIES Particulars of the Company’s subsidiaries at 31 December 2018 and 31 December 2017 are as follows:
Name of subsidiary
Place and dateof incorporation/establishment
Issued andfully paidshare capital/registered capital
Attributable equity interest
held
Place ofoperation Principal activities
2018 2017
(note a)
Ally Victory Limited BVI 18 April 2008 1 ordinary share of USD1
100% 100% Hong Kong Investment holding
Beaming Leader Limited BVI 5 October 2012 10,000 ordinary shares of USD1 each
100% 78.11% Hong Kong Investment holding
Best Scene Retail Asset Management (Hong Kong) Limited
Hong Kong 4 April 2011
HKD1 100% 78.11% Hong Kong Investment holding
Best View Development Limited
Hong Kong 5 March 2008
HKD1 100% 100% Hong Kong Investment holding
Big Glory (H.K.) Limited Hong Kong 24 February 2014
HKD1 100% 78.11% Hong Kong Investment holding
Billion China Investments Limited
BVI 18 October 2007 20 ordinary shares of USD1 each
100% 100% Hong Kong Investment holding
Billion World Limited Hong Kong 19 November 2003
HKD2 100% 100% Hong Kong Investment holding
Bondwise Profits Limited BVI 28 December 2000
1 ordinary share of USD1
100% 100% Hong Kong Investment holding
Bright Continental Limited Hong Kong 5 March 2003
HKD2 51% 51% Hong Kong Investment holding
Bright Power Enterprises Limited
BVI 1 July 2004 100 ordinary shares of USD1 each
51% 51% Hong Kong Investment holding
Central Fit Investments Limited
BVI 23 October 2007 10 ordinary shares of USD1 each
100% 100% Hong Kong Investment holding
Century Team Limited Hong Kong 16 January 1998
HKD2 100% 78.11% Hong Kong Investment holding
China Advance Limited Hong Kong 13 November 2006
HKD1 100% 100% Hong Kong Investment holding
China Wealth (H.K.) Limited Hong Kong 4 January 2006
HKD1 100% 100% Hong Kong Investment holding
China Xintiandi Company Limited
BVI 21 March 2011 1 ordinary share of USD1
100% 78.11% Hong Kong Investment holding
China Xintiandi Limited Cayman Islands 18 April 2011
1 ordinary share of USD0.01
100% 100% Hong Kong Investment holding
China Xintiandi Development Company Limited
Cayman Islands 3 November 2011
1 ordinary share of USD0.01
100% 78.11% Hong Kong Investment holding
China Xintiandi Holding Company Limited
Cayman Islands 27 October 2011
1,280,312 ordinary shares of USD0.001 each
100% 78.11% Hong Kong Investment holding
China Xintiandi Management (Hong Kong) Limited
Hong Kong 12 October 2012
HKD1 100% 78.11% Hong Kong Investment holding
Annual Report 2018 241

Name of subsidiary
Place and dateof incorporation/establishment
Issued andfully paidshare capital/registered capital
Attributable equity interest
held
Place ofoperation Principal activities
2018 2017
(note a)
China Xintiandi Property Company Limited
Cayman Islands 27 October 2011
1 ordinary share of USD0.01
100% 78.11% Hong Kong Investment holding
Citichamp Limited Hong Kong 19 July 2006
HKD1 100% 100% Hong Kong Investment holding
Cititop Pacific Limited Hong Kong 1 December 2000
HKD2 100% 100% Hong Kong Investment holding
Clear Max Enterprises Limited BVI 15 January 2008 1 ordinary share of USD1
100% 100% Hong Kong Investment holding
Costworth Investments Limited
BVI 12 January 2001 1 ordinary share of USD1
100% 78.11% Hong Kong Investment holding
Crown Fame Limited Hong Kong 18 October 2007
HKD1 100% 100% Hong Kong Investment holding
Cybricity Limited Hong Kong 28 April 2000
HKD2 51% 51% Hong Kong Investment holding
Dalian Yingjia Science and Technology Development Co., Ltd. (Note d)
PRC 3 December 2009
Registered and paid up capital USD23,000,000
100% 100% PRC Science and technology development
East Capital Development Limited
Hong Kong 18 April 2008
HKD1 100% 100% Hong Kong Investment holding
East Trend Limited Hong Kong 14 February 2001
HKD2 100% 78.11% Hong Kong Investment holding
Eastern View Limited Hong Kong 18 October 2007
HKD1 100% 100% Hong Kong Investment holding
Excel Efficient Limited BVI 19 August 2002 1 ordinary share of USD1
100% 100% Hong Kong Investment holding
Excellent Goal Limited Hong Kong 16 January 2014
HKD1 100% 100% Hong Kong Investment holding
Excellent Hope Limited Hong Kong 5 February 2014
HKD1 100% 100% Hong Kong Investment holding
Excellent Win Enterprises Limited
Hong Kong 5 February 2010
HKD1 100% 100% Hong Kong Investment holding
Famous Scene Holdings Limited
BVI 13 December 2007
1 ordinary share of USD1
100% 100% Hong Kong Investment holding
Fast China Limited BVI 23 April 2008 1 ordinary share of USD1
100% 100% Hong Kong Investment holding
Feng Cheng Property Management Services Limited
Hong Kong 14 November 2003
HKD100 100% 100% Hong Kong Investment holding
Fieldcity Investments Limited
BVI 30 March 2005 100 ordinary shares of USD1 each
100% 100% Hong Kong Investment holding
Firm Gain Investments Limited
BVI 26 July 2011 1 ordinary share of USD1
100% 78.11% Hong Kong Investment holding
Focus Top Limited Hong Kong 24 April 1998
HKD2 100% 78.11% Hong Kong Investment holding
51. PARTICULARS OF MAJOR SUBSIDIARIES – CONTINUED
NOTES TO THE CONSOLIDATED FINANCIAL STATEMENTS
FOR THE YEAR ENDED 31 DECEMBER 2018
Shui On Land Limited242
Name of subsidiary
Place and dateof incorporation/establishment
Issued andfully paidshare capital/registered capital
Attributable equity interest
held
Place ofoperation Principal activities
2018 2017
(note a)
Foresight Profits Limited (Note h)
BVI 8 February 2001 5,000 A shares and 5,000 B shares of USD1 each
A shares:100%
100% Hong Kong Investment holding
B shares: 100%
Fo Shan An Ying Property Development Co., Ltd. (Note d)
PRC 8 January 2008 Registered and paid up capital RMB830,000,000
100% 100% PRC Property development
Fo Shan Rui Dong Property Development Co., Ltd. (Note d)
PRC 25 April 2008 Registered capital RMB1,410,000,000 paid up capital RMB1,386,000,000
100% 100% PRC Property development
Fo Shan Rui Fang Property Development Co., Ltd. (Note d)
PRC 21 May 2008 Registered capital is RMB940,000,000 and paid up capital RMB795,410,398
100% 100% PRC Property development
Fo Shan Rui Kang Tian Di Property Development Co., Ltd. (Note d)
PRC 21 May 2008 Registered and paid up capital RMB690,000,000
100% 100% PRC Property development
Fo Shan Shui On Property Development Co., Ltd. (Note d)
PRC 8 January 2008 Registered and paid up capital RMB900,000,000
100% 100% PRC Property development
Fo Shan Yi Kang Property Development Co., Ltd. (Note d)
PRC 8 January 2008 Registered and paid up capital RMB1,130,000,000
100% 100% PRC Property development
Fo Shan Yi Kang Hotel Management Co., Ltd. (Note d)
PRC 8 August 2011 Registered and paid up capital RMB5,000,000
100% 100% PRC Hotel management
Fo Shan Yong Rui Tian Di Property Development Co., Ltd. (Note d)
PRC 21 March 2008 Registered capital RMB570,000,000 paid up capital RMB594,000,000
100% 100% PRC Property development
Fo Shan Shui On Tiandi Trading Co., Ltd. (Note d)
PRC 3 August 2010 Registered and paid up capital RMB1,000,000
100% 100% PRC Retail business
Fuhui Limited BVI 1 April 2010 1 ordinary share of USD1
100% 100% Hong Kong Investment holding
Gains Ally Limited BVI 3 May 2013 1 ordinary share of USD1
100% 100% Hong Kong Investment holding
Galore Profits Limited BVI 23 January 2001 1 ordinary share of USD1
100% 100% Hong Kong Investment holding
Global Ocean Investments Limited
BVI 1 November 2002
1 ordinary share of USD1
100% 100% Hong Kong Investment holding
Globaland Limited Hong Kong 30 October 2002
HKD2 100% 100% Hong Kong Investment holding
Globe State Properties Limited
BVI 12 October 2005
100 ordinary shares of USD1 each
100% 100% Hong Kong Investment holding
Glory Land Investment Limited
Cayman Islands 3 July 2012
100 ordinary shares of USD1 each
100% 100% Hong Kong Investment holding
51. PARTICULARS OF MAJOR SUBSIDIARIES – CONTINUED
Annual Report 2018 243

Name of subsidiary
Place and dateof incorporation/establishment
Issued andfully paidshare capital/registered capital
Attributable equity interest
held
Place ofoperation Principal activities
2018 2017
(note a)
Grand Hope Limited Hong Kong 14 March 2003
100 A ordinary shares of HKD1 each and
A shares: Hong Kong Investment holding
100% 100%
2 B ordinary shares of HKD1 each
B shares:
100% 100%
Greatwood Development Limited
Hong Kong 22 April 2013
HKD1 100% 100% Hong Kong Investment holding
Hing Tin Investments Limited BVI 23 October 2007 10 ordinary shares of USD1 each
100% 100% Hong Kong Investment holding
Hollyfield Holdings Limited Mauritius 19 April 2001
2 ordinary shares of USD1 each
100% 100% Hong Kong Investment holding
Info Union Limited Hong Kong 18 October 2007
HKD1 100% 100% Hong Kong Investment holding
Innovate Zone Group Limited BVI 3 January 2007 1 ordinary share of USD1
100% 100% Hong Kong Investment holding
Intellect Profit Investments Limited
BVI 10 August 2007 10 ordinary shares of USD1 each
100% 100% Hong Kong Investment holding
Interchina International Limited BVI 12 January 2001 100 ordinary shares of USD1 each
100% 78.11% Hong Kong Investment holding
Joyous Bond Limited BVI 18 April 2008 1 ordinary share of USD1
100% 100% Hong Kong Investment holding
Keen Allied Investments Limited
BVI 18 September 2002
1 ordinary share of USD1
100% 100% Hong Kong Investment holding
King Concord Limited Hong Kong 3 October 2006
HKD1 100% 78.11% Hong Kong Investment holding
Kinmax Limited Hong Kong 24 April 1998
HKD2 100% 78.11% Hong Kong Investment holding
Land Pacific Limited Hong Kong 2 November 2007
HKD1 100% 100% Hong Kong Investment holding
Legend City Limited Hong Kong 4 June 1997
HKD2 100% 100% Hong Kong Investment holding
Lucky Gain Limited Hong Kong 8 November 2002
HKD2 100% 100% Hong Kong Investment holding
Lucky Mate Development Limited
Hong Kong 15 October 2014
HKD1 100% 100% Hong Kong Investment holding
Magic Best Investments Limited
BVI 19 July 2007 10 ordinary shares of USD1 each
100% 100% Hong Kong Investment holding
Magic Bright Investments Limited
BVI 18 September 2007
20 ordinary shares of USD1 each
100% 100% Hong Kong Investment holding
Marble Way Limited BVI 28 August 1996 1 ordinary share of USD1
100% 78.11% Hong Kong Investment holding
Merry Wave Limited BVI 23 April 2008 100 ordinary shares of USD1 each
51% 51% Hong Kong Investment holding
Modern Prosper Investments Limited
BVI 1 November 2002
1 ordinary share of USD1
100% 100% Hong Kong Investment holding
51. PARTICULARS OF MAJOR SUBSIDIARIES – CONTINUED
NOTES TO THE CONSOLIDATED FINANCIAL STATEMENTS
FOR THE YEAR ENDED 31 DECEMBER 2018
Shui On Land Limited244

Name of subsidiary
Place and dateof incorporation/establishment
Issued andfully paidshare capital/registered capital
Attributable equity interest
held
Place ofoperation Principal activities
2018 2017
(note a)
Mount Eastern Limited BVI 18 April 2008 1 ordinary share of USD1
100% 100% Hong Kong Investment holding
New Power Profits Limited BVI 18 October 2005 1 ordinary share of USD1
100% 100% Hong Kong Investment holding
New Venture Enterprises Limited
Hong Kong 26 October 2010
HKD1 100% 100% Hong Kong Investment holding
Nice In Investments Limited BVI 18 October 2007 10 ordinary shares of USD1 each
100% 100% Hong Kong Investment holding
Oasis Power Management Limited
Cayman Islands 10 December 2018
1 ordinary share of USD1
100% – Hong Kong Asset Management
Onfair Limited Hong Kong 13 November 2002
HKD2 100% 100% Hong Kong Investment holding
Onwin Limited Hong Kong 13 November 2002
HKD2 100% 100% Hong Kong Investment holding
Oriental Gain Limited Hong Kong 2 February 2001
HKD2 100% 100% Hong Kong Investment holding
Oriental Host Limited Hong Kong 23 October 2007
HKD1 100% 100% Hong Kong Investment holding
Pacific Sunrise Holdings Limited BVI 16 January 2013 1 ordinary share of USD1
100% 78.11% Hong Kong Investment holding
Pat Daive (China) Limited Hong Kong 1 November 1994
HKD2 100% 100% Hong Kong Investment holding
Portspin Limited BVI 22 May 1997 123,980 ordinary shares of USD0.001 each
100% 100% Hong Kong Investment holding
Power Fast Holdings Limited Hong Kong 11 March 2008
HKD1 100% 100% Hong Kong Investment holding
Princemax Limited Hong Kong 15 April 1998
HKD2 100% 78.11% Hong Kong Investment holding
Profit Estate Limited BVI 30 October 2014 1 ordinary share of USD1
100% 100% Hong Kong Investment holding
Profitstock Holdings Limited BVI 2 June 2005 100 ordinary shares of USD1 each
100% 100% Hong Kong Investment holding
Rainbow Yield Investments Limited
BVI 4 July 2016 1 ordinary share of USD1
100% 100% Hong Kong Investment holding
Regal Victory Limited Hong Kong 18 October 2007
HKD1 100% 100% Hong Kong Investment holding
Renown Best Limited BVI 18 February 2014 1 ordinary share of USD1
100% 100% Hong Kong Investment holding
Rich Prime Limited Hong Kong 18 October 2007
HKD1 100% 100% Hong Kong Investment holding
Rightchina Limited BVI 2 July 2008 100 ordinary shares of USD1 each
100% 100% Hong Kong Investment holding
Rightidea Limited BVI 2 July 2008 100 ordinary shares of USD1 each
100% 100% Hong Kong Investment holding
51. PARTICULARS OF MAJOR SUBSIDIARIES – CONTINUED
Annual Report 2018 245

Name of subsidiary
Place and dateof incorporation/establishment
Issued andfully paidshare capital/registered capital
Attributable equity interest
held
Place ofoperation Principal activities
2018 2017
(note a)
Rimmer Investments Limited BVI 22 July 1994 1 ordinary share of USD1
100% 78.11% Hong Kong Investment holding
Rise Lake Investments Limited BVI 23 August 2007 10 ordinary shares of USD1 each
100% 100% Hong Kong Investment holding
Score High Limited BVI 12 February 2003 1,000 ordinary shares of USD1 each
100% 100% Hong Kong Investment holding
Selfers Limited BVI 29 November 1995
1 ordinary share of USD1
100% 100% Hong Kong Investment holding
Shanghai Bai-Xing Properties Co., Ltd. (Note d)
PRC 2 February 1999 Registered and paid up capital RMB146,761,000
100% 78.11% PRC Property development and property investment
Shanghai Fu Ji Properties Co., Ltd. (Note b)
PRC 18 January 2004 Registered and paid up capital USD35,773,000
99% 99% PRC Property development
Shanghai Fu-Xiang Properties Co., Ltd. (Note b)
PRC 19 December 2001
Registered and paid up capital RMB645,000,000
99% 77.33% PRC Property development and property investment
Shanghai Ji-Xing Properties Co., Ltd. (Note d)
PRC 2 February 1999 Registered and paid up capital RMB69,452,000
100% 78.11% PRC Property development and property investment
Shanghai Jing-Fu Properties Co., Ltd. (Note b)
PRC 26 December 2001
Registered and paid up capital RMB400,000,000
99% 99% PRC Property development
Shanghai Jiu Hai Rimmer Properties Co., Ltd. (Note b)
PRC 1 November 1994
Registered and paid up capital USD30,000,000
80% 62.49% PRC Property development and property investment
Shanghai Jun Xing Property Co., Ltd (Note b)
PRC 5 March 2009 Registered and paid up capital RMB4,661,300,000
98% 98% PRC Property development
Shanghai Knowledge and Innovation Community Development Co., Ltd (Note b)
PRC 9 June 2010 Registered and paid up capital HKD1,550,000,000
50.49% 50.49% PRC Property development
Shanghai IPO Food & Beverage Co., Ltd. (Note d)
PRC 6 September 2006
Registered and paid up capital USD1,890,000
100% 100% PRC Food and beverage services
Shanghai Rui Chen Property Co., Ltd. (Note d)
PRC 6 May 1996 Registered and paid up capital RMB189,000,000
100% 100% PRC Property development and property investment
Shanghai Rui Qiao Property Development Co., Ltd. (Note d)
PRC 28 December 2010
Registered and paid up capital RMB3,900,000,000
100% 78.11% PRC Property development
51. PARTICULARS OF MAJOR SUBSIDIARIES – CONTINUED
NOTES TO THE CONSOLIDATED FINANCIAL STATEMENTS
FOR THE YEAR ENDED 31 DECEMBER 2018
Shui On Land Limited246

Name of subsidiary
Place and dateof incorporation/establishment
Issued andfully paidshare capital/registered capital
Attributable equity interest
held
Place ofoperation Principal activities
2018 2017
(note a)
Shanghai Rui Hong Xin Cheng Co., Ltd. (Note c)
PRC 2 July 2001 Registered and paid up capital RMB6,700,000,000
77.6% 77.6% PRC Property development and property investment
Shanghai Shui On Club Business Management Co., Ltd. (Note d)
PRC 29 July 2010 Registered capital RMB1,000,000 and paid up capital RMB200,000
100% 100% PRC Provision of business management services
Shanghai Tai Ping Qiao Property Management Co., Ltd. (Note d)
PRC 31 August 2001 Registered and paid up capital USD198,000
100% 78.11% PRC Property management
Shanghai Xin-Tian-Di Plaza Co., Ltd. (Note d)
PRC 2 February 1999 Registered and paid up capital RMB98,261,000
100% 78.11% PRC Property development and property investment
Shanghai Xintiandi Live Culture & Event Co., Ltd. (Note d)
PRC 28 June 2014 Registered capital RMB2,800,000 paid up capital nil
100% 78.11% PRC Cultural diffusion and business information consulting
Shanghai Xing-Qi Properties Co., Ltd. (Note d)
PRC 2 February 1999 Registered and paid up capital RMB266,653,000
100% 78.11% PRC Property development and property investment
Shanghai Yang Pu Centre Development Co., Ltd. (Note b, g)
PRC 26 August 2003 Registered and paid up capital USD137,500,000
44.268% 44.268% PRC Property development and property investment
Shui On Development (Holding) Limited
Cayman Islands 27 July 2005
22 ordinary shares of USD0.01 each
100% 100% Hong Kong Investment holding and debt financing
Shui On Granpex Limited Hong Kong 13 January 1997
HKD2 100% 100% Hong Kong Investment holding
Shui On Knowledge and Innovation Partners
Cayman Islands 6 September 2016
1 ordinary share of USD1
100% 100% Hong Kong Acting as general partner
Shui On Land Management Limited
Hong Kong 12 May 2004
HKD1 100% 100% Hong Kong Provision of management services
Shine First Limited BVI 25 October 2006 1 ordinary share of USD1
100% 78.11% Hong Kong Investment holding
Shine Prime Investments Limited
BVI 2 November 2006
1 ordinary share of USD1
100% 100% Hong Kong Investment holding
Shui On Secretaries & Nominees Limited
Hong Kong 30 November 2016
HKD1 100% 100% Hong Kong Provision of secretarial services
Shui On Tian Di Business Management (Chongqing) Co., Ltd (Note d)
PRC 21 June 2017 Registered and paid up capital RMB5,000,000
100% 100% PRC Provision of management services
51. PARTICULARS OF MAJOR SUBSIDIARIES – CONTINUED
Annual Report 2018 247

Name of subsidiary
Place and dateof incorporation/establishment
Issued andfully paidshare capital/registered capital
Attributable equity interest
held
Place ofoperation Principal activities
2018 2017
(note a)
Silomax Limited BVI 25 March 1996 1 ordinary share of USD1
100% 100% Hong Kong Investment holding
Sino Atrium Global Limited BVI 3 June 2014 1 ordinary share of USD1
100% 100% Hong Kong Investment holding
Sinomount Holdings Limited BVI 18 October 2013 1 ordinary share of USD1
100% 78.11% Hong Kong Investment holding
Sino Ascend Holdings Limited BVI 9 February 2015 1 ordinary share of USD1
100% 78.11% Hong Kong Investment holding
Sino City (Hong Kong) Limited Hong Kong 9 January 2014
HKD1 100% 78.11% Hong Kong Investment holding
Sino Gate Developments Limited
BVI 3 June 2014 1 ordinary share of USD1
100% 100% Hong Kong Investment holding
Sino Heritage Holdings Limited BVI 28 October 2013 1 ordinary share of USD1
100% 78.11% Hong Kong Investment holding
Sino Luck International Limited BVI 3 June 2014 1 ordinary share of USD1
100% 100% Hong Kong Investment holding
Sino Tone Investments Limited BVI 26 July 2016 1 ordinary share of USD1
100% 100% Hong Kong Investment holding
Smart Century Limited Hong Kong 18 October 2007
HKD1 100% 100% Hong Kong Investment holding
Success Field Holdings Limited BVI 28 July 2016 1 ordinary share of USD1
100% 100% Hong Kong Investment holding
Strategic Glory Limited BVI 28 May 2014 1 ordinary share of USD1
100% 78.11% Hong Kong Investment holding
Success Champion Investments Limited
Hong Kong 26 March 2014
HKD1 100% 100% Hong Kong Investment holding
Success Sino Investment Limited
Hong Kong 6 November 2013
HKD1 100% 100% Hong Kong Investment holding
Super Field Limited Hong Kong 25 February 2005
HKD1 100% 100% Hong Kong Investment holding
Super Victory Global Limited BVI 30 May 2014 1 ordinary share of USD1
100% 78.11% Hong Kong Investment holding
Taipingqiao Holding Company Limited
BVI 25 October 2011 1 ordinary share of USD1
100% 78.11% Hong Kong Investment holding
Team Sky Enterprises Limited BVI 8 July 2016 1 ordinary share of USD1
100% 100% Hong Kong Investment holding
Timezone Management Limited
BVI 28 February 2001 1 ordinary share of USD1
100% 78.11% Hong Kong Investment holding
Tip Profit Limited BVI 18 July 2006 1 ordinary share of USD1
100% 100% Hong Kong Investment holding
Toprace Corporate Limited BVI 28 February 2014 1 ordinary share of USD1
100% 78.11% Hong Kong Investment holding
Top Glory (H.K.) Limited Hong Kong 7 February 2014
HKD1 100% 78.11% Hong Kong Investment holding
51. PARTICULARS OF MAJOR SUBSIDIARIES – CONTINUED
NOTES TO THE CONSOLIDATED FINANCIAL STATEMENTS
FOR THE YEAR ENDED 31 DECEMBER 2018
Shui On Land Limited248

Name of subsidiary
Place and dateof incorporation/establishment
Issued andfully paidshare capital/registered capital
Attributable equity interest
held
Place ofoperation Principal activities
2018 2017
(note a)
Top Faith Development Limited Hong Kong 18 April 2008
HKD1 100% 100% Hong Kong Investment holding
Top Victory Development Limited
Hong Kong 5 March 2008
HKD1 51% 51% Hong Kong Investment holding
Trendex Investment Limited Hong Kong 6 January 1997
HKD91,920,000 100% 78.11% PRC Property investment
Triumph Sky Group Limited BVI 23 October 2007 1 ordinary share of USD1
100% 100% Hong Kong Investment holding
True Perfect Investments Limited
BVI 3 July 2014 1 ordinary share of USD1
100% 100% Hong Kong Investment holding
Value Land Investment Limited Cayman Islands 2 September 2011
1,010,000 ordinary shares of USD0.01 each
100% 100% Hong Kong Investment holding
Victory Win Development Limited
Hong Kong 18 April 2008
HKD1 100% 100% Hong Kong Investment holding
Winsome Sino Limited BVI 11 October 2013 1 ordinary share of USD1
100% 100% Hong Kong Investment holding
Wise Keen International Limited
Hong Kong 24 April 2008
HKD1 100% 100% Hong Kong Investment holding
Wuhan Shuion Shangqi Company Limited (Note d)
PRC 24 July 2012 Registered and paid up capital USD14,400,000
100% 78.11% PRC Property investment
Wuhan Shui On Tiandi Property Development Co., Ltd. (Note d)
PRC 2 August 2005 Registered and paid up capital USD273,600,000
100%
100% PRC Property development and property investment
上海彩興房地產開發有限公司 (Shanghai Cai Xing Properties Development Co., Ltd.*) (Note b)
PRC 16 May 2014 Registered capital RMB3,600,000,000 paid up capital RMB2,150,000,000
99% 99% PRC Property development
上海豐誠物業管理有限公司 (Shanghai Feng Cheng Property Management Co., Ltd.*) (Note d)
PRC 18 January 2004 Registered and paid up capital RMB37,079,950
100% 100% PRC Property management
上海豐誠楊浦物業管理有限 公司 (Shanghai Feng Cheng Yang Pu Property Management Co., Ltd*) (Note e)
PRC 21 July 2010 Registered and paid up capital RMB950,000
100% 100% PRC Property management
上海豐誠虹口物業管理有限 公司 (Note e)
PRC 17 July 2015 Registered capital RMB500,000 paid up capital nil
100% 100% PRC Property management
上海瑞橋企業管理有限公司 (Shanghai Rui Qiao Enterprise Management Co., Ltd.*) (Note e, g)
PRC 23 April 2009 Registered and paid up capital RMB1,000,000
44.268% 44.268% PRC Property development
51. PARTICULARS OF MAJOR SUBSIDIARIES – CONTINUED
Annual Report 2018 249

Name of subsidiary
Place and dateof incorporation/establishment
Issued andfully paidshare capital/registered capital
Attributable equity interest
held
Place ofoperation Principal activities
2018 2017
(note a)
上海瑞展教育信息咨詢有限 公司 (Shanghai Rui Zhan Education Information Consultant Co., Ltd.*) (Note e)
PRC 20 April 2010 Registered capital RMB2,000,000 and paid up capital RMB100,000
100%
100% PRC Provision of education information and consultancy services
瑞安管理 (上海 )有限公司 (Shui On Management Limited*) (Note d)
PRC 14 June 2004 Registered and paid up capital USD58,000,000
100% 100% PRC Provision of management services
上海速和物業管理有限公司 (Note e)
PRC 25 November 2015
Registered capital RMB500,000 and paid up capital nil
100% 100% PRC Property management
上海家連商貿有限公司 (Note e)
PRC 25 November 2015
Registered capital RMB1,000,000 and paid up capital nil
100% 100% PRC Retail and trade business
武漢瑞安天地商貿有限公司 (Wuhan Shui On Tian Di Trading Co., Ltd.*) (Note d)
PRC 8 January 2007 Registered and paid up capital USD1,800,000
100% 100% PRC Retail business
上海夏欣商業管理有限公司 (Note d)
PRC 31 May 2012 Registered and paid up capital USD25,000,000
100%
78.11% PRC Provision of management services
上海新天地商業管理有限公司 (Shanghai Xintiandi Management Limited*) (Note d)
PRC 25 February 2013
Registered and paid up capital USD10,000,000
100% 78.11% PRC Provision of management services
上海新天地品牌管理有限公司 (Shanghai Xintiandi Branding Management Limited*) (Note d)
PRC 9 October 2014
Registered capital RMB500,000 paid up capital nil
100% 78.11% PRC Provision of management services
新天地商務管理 (上海 )有限 公司 (Xintiandi Commercial Management (Shanghai) Limited*) (Note d)
PRC 28 August 2014 Registered capital RMB500,000 paid up capital RMB50,200.40
100% 78.11% PRC Provision of management services
大連嘉銳科技發展有限公司 (Note d)
PRC 5 November 2009
Registered and paid up capital USD10,000,000
100% 100% PRC Science and technology development
重慶豐德豪門實業有限公司 (Note e)
PRC 26 April 2006 Registered and paid up capital RMB10,000,000
100% 100% PRC Property development
瑞安建築有限公司 (Note b) PRC 27 April 1985 Registered and paid up capital RMB100,000,000
100% 100% PRC Provision of construction services
上海德基諮詢有限公司 (Note d)
PRC 13 May 2003 Registered and paid up capital USD140,000
100% 100% PRC Provision of consultancy services
51. PARTICULARS OF MAJOR SUBSIDIARIES – CONTINUED
NOTES TO THE CONSOLIDATED FINANCIAL STATEMENTS
FOR THE YEAR ENDED 31 DECEMBER 2018
Shui On Land Limited250

Name of subsidiary
Place and dateof incorporation/establishment
Issued andfully paidshare capital/registered capital
Attributable equity interest
held
Place ofoperation Principal activities
2018 2017
(note a)
上海德建裝飾工程有限公司 (Note d)
PRC 5 August 2008 Registered and paid up capital USD800,000
100% 100% PRC Provision of decoration services
上海衡景貿易有限公司 (Note d)
PRC 1 August 2011 Registered and paid up capital RMB50,000,000
100% 100% PRC Retail business
上海創派投資諮詢有限公司 (Note d)
PRC 30 July 2015 Resigtered and paid up capital RMB43,500,000
100% 100% PRC Investment management
上海瑞安創智商業經營管理 有限公司 (Shanghai Rui An Chuang Zhi Business Management Co., Ltd.*) (Note e, g)
PRC 12 December 2013
Registered and paid up capital RMB500,000
44.268% 44.268% PRC Provision of management and consultancy services
上海瑞新房產經營有限公司 (Shanghai Rui Xin Property Management Co., Ltd*) (Note d)
PRC 12 January 2015 Registered and paid up capital RMB265,000,000
100% 100% PRC Property management
武漢企業天地環球智慧商業 管理有限公司 (Note e)
PRC 3 December 2015
Registered and paid up capital RMB100,000
100% 78.11% PRC Provision of management services
上海磐銳投資管理有限公司 (Note e)
PRC 28 March 2016 Registered capital RMB50,000,000 paid up capital nil
100% 100% PRC Investment management
上海雋復企業管理有限公司 (Note b)
PRC 20 June 2016 Registered and paid up capital RMB10,000,000
98% 98% PRC Provision of management services
上海興雋設計諮詢有限公司 (Note e)
PRC 8 July 2016 Registered and paid up capital RMB8,000,000
98% 98% PRC Provision of consultancy services
上海澤辰房地產經營 有限公司 (Note d)
PRC 1 December 2017
Registered capital RMB20,000,000 paid up capital RMB10,000,000
100% 100% PRC Property development
創派(深圳)科技孵化器 有限公司 (Note e)
PRC 22 September 2017
Registered and paid up capital RMB3,000,000
100% 100% PRC Investment management
上海瑞安知社商業管理 有限公司 (Note d)
PRC 14 September 2016
Registered and paid up capital RMB20,000,000
100% 100% PRC Provision of management services
上海庚立實業有限公司 (Note d)
PRC 10 November 2016
Registered capital RMB1,400,000,000 paid up capital nil
100% 100% PRC Property development
上海盛甫企業管理咨詢 有限公司 (Note e)
PRC 1 December 2016
Registered capital RMB1,390,000,000 paid up capital RMB1,099,200,000
100% 100% PRC Provision of management and consultancy services
51. PARTICULARS OF MAJOR SUBSIDIARIES – CONTINUED
Annual Report 2018 251

Name of subsidiary
Place and dateof incorporation/establishment
Issued andfully paidshare capital/registered capital
Attributable equity interest
held
Place ofoperation Principal activities
2018 2017
(note a)
廣州市瑞磐新安電子商務 有限公司 (Note d)
PRC 16 November 2016
Registered and paid up capital RMB50,000,000
100% 100% PRC Electronic commerce
南京瑞安知社商业管理 有限公司 (Note e)
PRC 1 December 2017
Registered and paid up capital RMB5,000,000
100% 100% PRC Provision of management services
南京賦瑞能科技企業 孵化器有限公司 (Note e)
PRC 18 April 2018 Registered and paid up capital RMB3,000,000
100% – PRC Investment management
上海家連薈食品有限公司 (Note e)
PRC 21 March 2018 Registered capital RMB1,000,000 paid up capital nil
100% – PRC Food and beverage services
上海新灣景置業有限公司 (Note e)
PRC 28 March 2018 Registered and paid up capital RMB10,000,000
100% – PRC Property development and property investment
上海新天地音諾企業管理 諮詢有限公司 (Note d)
PRC 26 October 2018
Registered capital RMB3,000,000 paid up capital nil
100% – PRC Provision of management and consultancy services
上海氦刻眾創空間管理 有限公司 (Note e)
PRC 7 August 2018 Registered and paid up capital RMB3,000,000
100% – PRC Provision of management services
Notes:a. The Company directly holds the equity interest in Shui On Development (Holding) Limited. All other equity interests shown above are indirectly held by the Company.b. This Company is a sino-foreign equity joint venture.c. This Company is a sino-foreign cooperative joint venture.d. This Company is a wholly-foreign owned enterprise.e. This Company is a wholly-domestic owned enterprise.f. Except for Shui On Development (Holding) Limited, none of the subsidiaries had any debt securities subsisting as at 31 December 2018 or at any time during the year.g. This company is a subsidiary of Bright Power Enterprises Limited, in which the Group holds 51% (2017: 51%) of equity interests in 2018.h. Shui On Land Limited through Rainbow Yida Investments Limited holds 50% in Colour Bridge which in turn holds 100% class A shares in Foresight Profits Limited. Class A shares
represent interest in the portfolio of certain properties for residential development of Shanghai Rui Hong Xin Cheng Co., Ltd.* For identification purposes
51. PARTICULARS OF MAJOR SUBSIDIARIES – CONTINUED
NOTES TO THE CONSOLIDATED FINANCIAL STATEMENTS
FOR THE YEAR ENDED 31 DECEMBER 2018
Shui On Land Limited252

51. PARTICULARS OF MAJOR SUBSIDIARIES – CONTINUEDThe table below shows details of non-wholly owned subsidiaries of the Company that have material non-controlling interests:
Proportion of equityinterest held bynon-controlling
shareholdersAt
31 December
Profitallocated to
non-controllingshareholdersYear ended
31 December
Accumulatednon-controlling
interestsAt
31 December
2018 2017 2018 2017 2018 2017
RMB’million RMB’million RMB’million RMB’million
Name of subsidiary
Bright Power 49% 49% 109 19 966 857
Merry Wave 49% 49% 104 10 392 288
China Xintiandi N/A 21.89% 52 27 – 3,034
Individually immaterial subsidiaries with non-controlling interests N/A N/A 144 26 1,414 1,316
409 82 2,772 5,495
Summarised financial information in respect of Bright Power is set out below. The summarised financial information below represents amounts before intragroup eliminations:
At 31 December
2018RMB’million
2017RMB’million
Current assets 173 138
Non-current assets 5,858 5,593
Current liabilities 1,993 1,935
Non-current liabilities 1,592 1,591
Equity attributable to shareholders of Bright Power 1,972 1,749
Year ended 31 December
2018RMB’million
2017RMB’million
Revenue 330 289
Profit and total comprehensive income for the year 255 193
Dividend paid to non-controlling shareholder of Bright Power – –
Net cash from operating activities 227 205
Net cash used in investing activities (85) (30)
Net cash used in financing activities (83) (239)
Net cash inflow (outflow) 59 (64)
Annual Report 2018 253

51. PARTICULARS OF MAJOR SUBSIDIARIES – CONTINUEDSummarised financial information in respect of Merry Wave is set out below. The summarised financial information below represents amounts before intragroup eliminations:
At 31 December
2018RMB’million
2017RMB’million
Current assets 969 806
Non-current assets 2,570 2,272
Current liabilities 2,466 2,265
Non-current liabilities 247 200
Equity attributable to shareholders of Merry Wave 801 588
Year ended 31 December
2018RMB’million
2017RMB’million
Revenue 128 115
Profit and total comprehensive income for the year 214 175
Dividend paid to non-controlling shareholder of Merry Wave – –
Net cash from operating activities 93 2
Net cash from investing activities 13 495
Net cash used in financing activities – (435)
Net cash inflow 106 62
NOTES TO THE CONSOLIDATED FINANCIAL STATEMENTS
FOR THE YEAR ENDED 31 DECEMBER 2018
Shui On Land Limited254

Annual Report 2018 255
FINANCIAL SUMMARY
SUMMARY OF CONSOLIDATED STATEMENT OF PROFIT OR LOSSfor the year ended 31 December
2014RMB’ million
2015RMB’ million
2016RMB’ million
2017RMB’ million
2018RMB’ million
Revenue 10,249 6,472 17,600 18,451 24,841Profit attributable to shareholders 1,778 788 1,088 1,669 1,906Owners of convertible perpetual securities 224 174 – – –Owners of perpetual capital securities 311 316 337 459 259Owners of convertible perpetual capital securities – 61 112 114 112Non-controlling shareholders of subsidiaries 172 428 239 82 409Profit for the year 2,485 1,767 1,776 2,324 2,686
SUMMARY OF CONSOLIDATED STATEMENT OF FINANCIAL POSITIONas of 31 December
2014RMB’ million
2015RMB’ million
2016RMB’ million
2017RMB’ million
2018RMB’ million
Investment properties 58,162 55,600 56,620 47,989 49,100Property, plant,and equiptment 1,418 2,268 1,845 1,187 1,080Properties under development for sale 14,684 20,102 21,838 18,112 11,927Properties held for sale 4,648 2,560 4,865 8,058 5,315Interests in associates 3,959 4,402 4,400 1,030 4,998Interests in joint ventures 1,805 2,939 783 6,584 10,682Account receivables, deposits,
and prepayments 9,222 10,951 13,326 8,734 4,523Other assets 1,995 7,734 2,969 5,838 7,233Pledged bank deposits,
bank balances and cash 12,430 10,614 15,567 16,760 15,392Total assets 108,323 117,170 122,213 114,292 110,250Current liabilities 20,387 29,910 34,700 31,594 36,393Non-current liabilities 43,014 41,142 41,257 33,523 26,638Total liabilities 63,401 71,052 75,957 65,117 63,031Net assets 44,922 46,118 46,256 49,175 47,219Equity attributable to:Shareholders of the Company 37,811 36,645 37,450 38,282 39,047Owners of convertible perpetual securities 2,898 16 1 1 –Owners of convertible perpetual capital securities – 1,346 1,345 1,345 1,345Owners of perpetual capital securities 3,051 3,050 3,046 4,052 4,055Non-controlling shareholders of subsidiaries 1,162 5,061 4,414 5,495 2,772Total equity 44,922 46,118 46,256 49,175 47,219
PER SHARE DATAfor the year ended 31 December
2014 2015 2016 2017 2018Basic earnings per share (RMB) 0.22 0.10 0.14 0.21 0.24Dividend per share – Interim paid (HKD) 0.022 0.022 0.011 0.03 0.036– Final proposed (HKD) 0.040 0.028 0.039 0.07 0.084– Full year (HKD) 0.062 0.050 0.050 0.10 0.120Bonus shares – – – – –
BOARD OF DIRECTORS
Executive Directors
Mr. Vincent H. S. LO (Chairman) Mr. Douglas H. H. SUNG (Managing Director and Chief Financial Officer)
Ms. Stephanie B. Y. LO
Non-executive Director
Mr. Frankie Y. L. WONG
Independent Non-executive Directors
Sir John R. H. BOND Dr. William K. L. FUNG Professor Gary C. BIDDLE Dr. Roger L. McCARTHY Mr. David J. SHAW Mr. Anthony J. L. NIGHTINGALE
AUDIT AND RISK COMMITTEE
Professor Gary C. BIDDLE (Chairman) Dr. Roger L. McCARTHY Mr. David J. SHAW
REMUNERATION COMMITTEE
Dr. William K. L. FUNG (Chairman) Mr. Vincent H. S. LO Professor Gary C. BIDDLE
NOMINATION COMMITTEE
Mr. Vincent H. S. LO (Chairman) Sir John R. H. BOND Professor Gary C. BIDDLE
FINANCE COMMITTEE
Mr. Vincent H. S. LO (Chairman) Mr. Frankie Y. L. WONG (Vice Chairman) Sir John R. H. BOND Dr. William K. L. FUNG Professor Gary C. BIDDLE Mr. Douglas H. H. SUNG Mr. Anthony J. L. NIGHTINGALE
COMPANY SECRETARY
Mr. UY Kim Lun
AUDITOR
Deloitte Touche Tohmatsu
LEGAL ADVISERS
Freshfields Bruckhaus Deringer Mayer Brown
REGISTERED OFFICE
190 Elgin Avenue George Town Grand Cayman KY1-9005 Cayman Islands
CORPORATE HEADQUARTERS
26/F, Shui On Plaza 333 Huai Hai Zhong Road Shanghai 200021 PRC
PLACE OF BUSINESS IN HONG KONG
34/F, Shui On Centre 6-8 Harbour RoadWan ChaiHong Kong
PRINCIPAL SHARE REGISTRAR AND TRANSFER OFFICE
SMP Partners (Cayman) Limited Royal Bank House – 3rd Floor 24 Shedden Road P.O. Box 1586 Grand Cayman, KY1-1110 Cayman Islands
BRANCH SHARE REGISTRAR AND TRANSFER OFFICE
Computershare Hong Kong Investor Services LimitedShops 1712-1716, 17/F, Hopewell Centre 183 Queen’s Road East Wan Chai Hong Kong
PRINCIPAL BANKERS
Agricultural Bank of China Limited Bank of China Limited China Merchants Bank Co., Limited Hang Seng Bank Limited Industrial and Commercial Bank of China Limited Standard Chartered Bank Limited United Overseas Bank Limited
STOCK CODE
272
WEBSITE
www.shuionland.com
INVESTOR RELATIONS
Ms. Michelle K. P. SZETelephone: (852) 2879 1859Email: [email protected]: 34/F, Shui On Centre
6-8 Harbour RoadWan ChaiHong Kong
Shui On Land Limited256
CORPORATE INFORMATION

DES
IGN
CO
NC
EPT:
YEL
LOW
CRE
ATI
VE
( HK
) LIM
ITED
w
ww
.yel
low
crea
tive.
com
A LEADING COMMERCIAL FOCUSED PROPERTY DEVELOPER, OWNER AND ASSET MANAGER IN CHINAEstablished in 2004 and listed on The Stock Exchange of Hong Kong (Stock Code: 272) in October 2006, Shui On Land Limited is the Shui On Group’s flagship property development company in the Chinese Mainland. Headquartered in Shanghai, Shui On Land has established a solid foundation in the Chinese Mainland and has a proven track record in developing mixed-use, sustainable communities.
Shui On Land develops, owns and manages high-quality residential, office, retail, entertainment and cultural properties in the Chinese Mainland. Shui On Land applies its hallmark approach of master-planning to all projects to ensure that developments are fully consistent with government objectives in economic development and urban planning while simultaneously incorporating local historical and cultural characteristics into our designs and planning. Manifesting the “Total Community” concept, our projects provide a unique environment enabling life enrichment of “Live-Work-Play”.
Shui On Land’s landbank stood at 8.5 million sq.m. (6.8 million sq.m. of leasable and saleable GFA, and 1.7 million sq.m. of clubhouses, car parking spaces and other facilities). Its nine projects, in various stages of development, are all situated in prime locations within the key cities of Shanghai, Wuhan, Chongqing and Foshan.
SOLM067_AR18_Cover AW.indd 2 4/4/2019 11:50

Shui O
n Land Limited
Annual R
eport 2018
Annual Report 2018Shui On Land Limited
PREPARED FOR THE CHALLENGES AHEAD
STOCK CODE 272
SOLM067_AR18_Cover AW.indd 1 4/4/2019 11:50