Prepared for : Southmont Borough Planning Commission - PA ...
318
Prepared for : Southmont Borough Planning Commission Prepared by : Cambrio County Planning Commission
-
Upload
khangminh22 -
Category
Documents
-
view
0 -
download
0
Transcript of Prepared for : Southmont Borough Planning Commission - PA ...

Prepared for : Southmont Borough Planning Commission Prepared by : Cambrio County Planning Commission

PREPARED FOR .
SOUTHMONT BOROUGH
CAMBRIA COUNTY, PENNSYLVANIA
EXISTING CONDITIONS REPORT Prepared By:,
Cambria County Planning Commission Court House Ebensburg , Pennsylvania
March, 1969
The preparation of this report and the maps contained herein was financed in part throughan urban planning grant from the Depart- ment of Housing and Urban Development, under the provisions of Section 701 of the Housing Act of 1954, a s amended, administered by the Bureau of Planning, Pennsylvania Department of Commun- ity Affairs.

C A M B R I A COUNTY PLANNING COMMISSION
cout lmuu C @ C l l @ @ m , MMnA 1@@81 CI(0I I : 4T8-T@@@
t. mce vouyo a c n s u t m OIIICI#
b
March 31, 1969
M r . Charles Bloom, Chairman southmont Borough Planning Commission Cambria County, Pennsylvania
Dear Mr . Bloom:
We are pleased to submit herewith the EXISTING CONDITIONS REPORT for Southmont Borough. It is the interit of the report to provide the background studies necessary for the preparation of the Long Range Development Plan. In addition, the report represents a compilation of information concerning the Borough which will be of assistance to elected officials, citizens and private enterprise.
This report is also published to encourage discussion by citizens' groups, civic and business organizations nc5 the general public. It is intended that they will present their comments to the Southmont Borough Planning Commi?si?_,. Whenever possible, the Planning Commission should meet with organizations to discuss their ideas of cominmity iv- provement. This report will be used as a guide in developing the Long Range Development Plan and will servt bs a program framework for capital improvements and the review of many private and public projects.
A report of this nature is necessarily the product of many persons and agencies in addition to ine stz~h of the Cambria Cbunty Planning Commission. Special acknowledgement is hereby given to those personsand the members ni the Southmont Planning Commission for their comments and contributions.
Respectfully submitted,
i l
Executive Directcr Lj

LIST O F OFFICIALS SOUTHMONT BOROUGH
COUNCILMEN :
T h o m a s L. C a r r o l l , Jr . W. L. C a r s t e n s e n Richard B. Edwards Harold Stahler Howard Volber s Stephen G. K r o u s e Paul L. Weir
PLANNING COMMISSION:
C h a r l e s A . Bloom John W. Owen M u r r a y J. Bowman Ivan M. M e i e r

TITLE PAGE LETTER OF TRANSMITTAL PARTICIPATING 0 F FIC MLS TABLEOFCONTENTS LIST OF MAPS, CHARTS, AND ILLUSTRATIONS LIST OF TABLES INTRODUCTION AND HISTORY REGIONAL MAP
Page
LAND USE AND SLOPE ANALYSIS
Introduction Physiography Slope Analysis Water sheds C onclu sion Land U s e Analysis Undersirable Patterns of Land U s e Ribbon Development Mixed Use Transition Areas Undesirable Lotting and Street Patterns Isolated Concentrations Land U s e Categories Developed Land U s e Undeveloped Land Use Conclusions
1 2 2 6 6 7 8 9 9
10 10 11 11 12 15 16

POPULATION ANALYSIS
Introduction Growth Patterns Population Characteristics Migration Population Density and Distribution Future Population Existing Residential Density Future Population Based on Altsrnative Densities
HOUSING CHARACTERISTICS
Introduction Existing Housing Character is tic s Housing Condition Age of Structures Housing Character istic s Housing Value Projection Conclusions
THOROUGHFARE ANALYSIS
Introduction Highway Classifications Existing Street and Highway System
18 19 21 25 27 28 32 33
36 37 37 39 40 41 42 43
47 48 50
COMMUNITY FACILITIES
Introduction Existing Schools Existing School Buildings Recreation Protection to Persons and Property Water and Sewer Facilities Sewage Facilities
FISCAL ANALYSIS
Introduction Assessed Valuation Receipts Debt Level Expenditures Miscellaneous Expenditures Capital Improvements Budget
57 58 58 59 63 63A 66
68 69 70 74 77 78 80

LIST OF TABLES
Number Title Page
I 11 111 IV V VI WI VIII Ix X XI XI1 XIII XIV xv XVI XVII XVIII XIX I XX XXI XXII XXIII XXIV XXV XXVI
Slope Analysis Percentage of Land Deve loped/Undeve 1 oped Land Use tabulation Population Change 1930-1960 Population Composition Age Group Comparison Comparative Median Age Comparative Population Per Household Comparative Population and Density Population Projection Based on 1930-1960 Trends Potential Land Aailable for Future Development Existing Pattern of Dwelling Unit and Residential Density Population Capacity and Future Den6X.y Total Housing Units Comparison of Housing Conditions Comparison Age of Structures Comparisons of Housing Characteristics Value of Owner Occupied Dwelling Units Length, Paving, and Volume of Existing Streets Enrollment 1963-1969 Assessed Valuation Receipts Outstanding Indebtedness Actual Expenditures Receipt Expenditure Cornparison
5 8
14 21 22 24 26 27 28 29 31 32 33 37 38 39 40 41 42 51 59 69 73 75 76 77

LEST O F MAPS
5 6 a 8 9
10
Regional Location Map Slope Map Water shed Map Existing Land Use Map Population Distribution Map Regional Thoroarghfxres Map Existing Major Thoroughfares Map Ex is t ing Street Surfae ing Existing Traffic Volumes Ex is t ing C ommunity Fac il it ie s Existing Water Lines Existing Sewer Lines
Intr oduc t ion 4 6A 13 34 4 7A 52 54 55 63B 65 6 6A
LIST OF CHARTS
P m b e r Title Page
Population 1928 - 1960 Age, Sex, Composition 1950 - 1960 Population, 1920 - 1960 Summary of Revenue arid Expendihres 1968 '- 67
20 23 30 Appendix
LEST OF ILLUSTRATIONS
I WT Title Page - ---
I L
banghome Avenue Playground Southmont School Playground
60 61

INTRODUCTION AND HISTORY
The following report contains an inventory of existing conditions within Southmont Borough. Conclusions to be developed from an analysis of this inventory will form the framework for the Long Range Development Plan to be presented later in the planning pro- gram.
Although this data has been prepared as a part of the formal planning program, it is by its very nature subject to continual change. Additional growth -and changing internal and external pressures, which may invalidate certain assumptions and projections, will create a constant need for review and, if necessary, revision. Therefore, when the formal planning program is completed, all inventory studies should be periodically updated. This procedure will provide current data from which to proceed with additional studies and r e - sult in a continuing program of community improvement.
History and Regional Setting:
Southmont Borough isa residential, dormitory suburb of the City of Johnstownlo- cated in the southern part of Cambria County, Pennsylvania. The Borough is located southwest of Johnstown and immediately adjacent to that city. It has an area of approxi- mately one (1) square mile and a 1960 population of 2,85 7. Southmont , like so many other suburbs of Johnstown, is located on the hillsides of the valley floor occupied by the City of Johnstown.
Southmont is a typical suburb of Johnstown in that it is dominantly a residential com- munity with rural origins which developed from a combination of local factors. The first settler in the Borough was Yost Hochstein, who returnedfrom the gold fields of California in the 1850's to settle in what is now Southmont. The arearemainedprimarily agricultural until the early 1900's when residential development began under the efforts of Franklin Otto. By the personal acquisition of several farms and through the facilities of the Cambria Land and Improvement Company, of which he was the president, Mr. Otto became the guid- ing force of the residential trend. This development in Southmont was part of a movement which eventually spread to the surrounding mountainous areas outside of Johnstown. This exodus from thevalleyfloor was the result of the famous JohnstownFloodof 1889, the nat- ural disaster which accounted for 2,200 deaths anddestruction of much of the valley floor

area. Fearinganother flood, the citizens of Johnstown moved to the surrounding hills to escape subsequent flood waters. Under Otto's direction, acreage was plotted, streets were laid out, and Southmont Boulevard was planned and graded. He tapped springs and piped water to all parts of the Borough with power froma windmill which stood near Mill- creek Road and Gardner Street. In addition, the firstbuildingrestrictions were set. An- other development took place in 1914, which spurred population growth in Southmont - street car service was extended to the Borough.
Southmont was incorporated on June 2, 191 9, one of the later dates of incorporation of the City's suburbs. Before its incorporation, the Southmont a rea was part of Upper Yoder Township. In 1921, the Borough's boundaries were extended with the acquisition of two other tracts from Upper Yoder , including the large Gradview Cemertery area.
Southmont has made rapid population gains since its inception, and should continue to expand its population in the future because of the continuing movement trend to the sub- urbs on both the local and national level. In 1919, the population stood at less than 300. In 1960, the population was 2,857, and the projection for 1990 is 4,500. Because of strict zoning and the small amount of land available for future development, Southmont will retain its present status as a residential suburb of Johnstown.
The future of the Borough thus hinges on the future of Johnstown, the parent com- munity. If the Johnstown area successfully copes with its economic problems in the fu- ture, Southmont will continue to thrive as a prosperous residential community of the Greater Johnstown Area.


LAND USE AND SLOPE ANALYSIS

INTRODUCTION
The Land U s e and Slope Analysis provides basic information necessary for Com- prehensive Planning. The Land U s e Study determines the amount of land that is used for various developed and undeveloped purposes and the arrangement or patterns of activities within the community. The arrangement of land use provides an insight to the quality of the environment by showing basic relationships among such activities as living, working, shopping and recreation.
The Slope Analysis evaluates the past and future effect of the natural physical fea- tures on existing patterns and intensity of development. The Slope Analysis is also instru- mental in determining the location and amount of land withinthe Township which is avail- able for future development.
The Land U s e and Slope Analysis is not, therefore, an end in itself; but, based on this information, judgements can be made as to how existing patterns can be adapted to future needs and how new patterns of development will blend harmoniously with the com- munity .

D D
LAND USE AND SLOPE ANALYSIS
To properly determine and project the long range potential of any a rea , it is necessary to fully expore and study all existing physical conditions directly affecting the community. One of the major studies involves an inven- tory of the types and locations of existing land uses. The resultant information is important in the identification of sound growth areas as well as problem areas such as incompatible land uses, which ultimately affect property value. Furthermore, the existing land use study indicates definite patterns of development which establish trends and thereby influence the future land use study, which is a part of the Long Range Development Plan.
PHYSIOGRAPHY
Southmont Borough is situated generally within a single valley, with an average elevation of 1,400 feet above sea level. The Borough has elevational extremes from 1,250toover 1 , 6 5 0 feet, many of which have slopes in ex- cess of 25 per cent grade # There is a limited amount of developable land within the Borough which will hinder fu- ture development The entire Borough drains into the Stonycreek River, and drainage also occurs northward through the metropolitan area into the Conemaugh River.
The climate of the Regional area is moderate, but over the centuries has influenced the existing physical characteristics. February is ordinari1.y the coldest month and July the warmest, with normal average minimum and maximum temperatures of 46 and 85 degrees Fahrenheit respectively. Extremes of both these averages are not uncommon with occasional winter readings of below 0 degrees and around 100 degrees Fahrenheit in the sum- mer. The average annual precipitation is approximately 36 inches and the regional area annually receives an av- erage of 33 inches of snow with larger accumulations in the higher elevations.
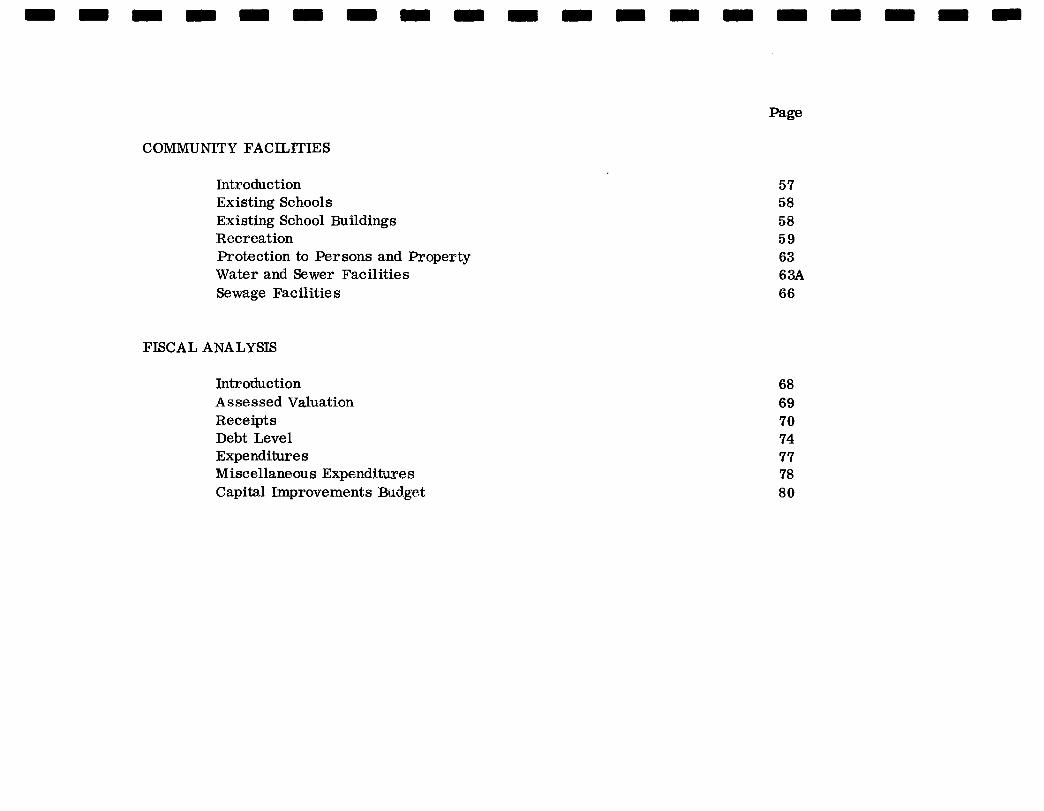
SLOPE ANALYSIS
The purpose of analyzing the slope characteristics is to determine how and why the natural features of the municipality have influenced development in the past, Through the study and analysis of these characteristics it is also possible to determine how they will affect future development within the Borough.

Southmont Borough, as with the Johnstown Region, is topographically typical of the Pennsylvania plateau region since much of the local land area is located on a rolling, connecting valley between the mountain plateau region and the valley floor areas. The valleys, as they exist today, have been created through centuries of ero- sion.
The character of the terrain in Southmont Borough is a dominate factor'which willalways dictate develop- ment patterns and land use within the municipality as well as the region. The following analysis delineates four slope categories. These categories are shown on the Slope Map which graphically portrays topographic condi- tions on a community-wide basis.
Percent of Slope
1. Zero to eight percent 0 to 8%
2. Eight to sixteen percent 8 to 16%
3. Sixteen to twenty-five percent 16 to 25%
4. Qver twenty-five percent 25% and Over
SLOPE CATEGORIES
SOUTHMONT BOROUGH
Character istics
Predominately level - preferred for development
Gently rolling - suitable for dev- elopment
HilIy - difficult for most devel- opment purposes
Steep - generally unsuitable for development
The first two categories, zero to eight and eight to sixteen percent slope ,,accommodate most types of dev- elopment provided utilities and accessibility a r e appropriate. Inmany instances the size of landarea and inacces- sibility may preclude moderately sloping land from future development.
1 “ W E PREPARATION OF THIS MAP WAS FINANCED IN PART THROUGH AN URBAN PLANNING GRANT FROM THE DEPARTMENT OF HOUSING AND URBAN DEVELOPMENT, UNDER lNE.PRO- VISIONS OF SECTION TU OF THE HOUSING ACT OF I%#, AS AMENDED, AND AS ADMIHISTERED BY THE BUREAU OF PLANNING, PENNSYLVANIA DEPARTMENT OF COMMUNITY AFFAIRS.”

Sixteen to twenty-five percent slope is developable, although the usable area per acre is significantly re- duced. Problems in development of this type of land are usually morecommon, andalarger land parcel is nec- essary to provide adequate building area.
Slope areas in excess of twenty-five percent are generally unsuitable for most types of building. Ordin- arily the development of residential or commerccal structures under such extreme slope conditions will cause numerous problems and expense to the municipality. Usually these slope areas are difficult to service with utilities and create complications in street construction, excessive excavation, and maintenance procedures. Experience in many communities where homes have been established on steep slopes indicates that the cost of local government is often in excess of revenue received through taxation. Therefore, excessive slope areas have practical value only when properly utilized. In Southmont Borough much of the rugged terrain provides natural scenic beauty and recreationalpotential which should be preserved as a natural asset to the community and re- gio& The value of existing development and more readily developable land may actually be enhanced by preserv- ing strategically located slope areas. Therefore, thoughtful consideration should be given to either development o r preservation of this type of slope area to optimize i ts use for the community.
TABLE1 .
SLOPE ANALYSIS
SOUTHMONT BOROUGH
PERCENT OF SLOPE@) ACRES PERCENT
0 to 8% 8 to 16% 16 to 25% 25% and Over
Total Acres
241.2 160.4 112.3 164.5 678.4
35.5 23.6 16.6 24.3 100.0
(a) Percent of slope refers to the vertical rise in 100 feet of horizontal distance. means a 5 foot rise in 100 feet of horizontal distance.
For example: a 5% slope *. -...
Source: Cambria County Planning Commission, 1967.

A t the present time , as shown on the Slope Analysis Table , only about 35 per cent of the development in Southmont Borough is on relatively level land. About 16% of the Borough's development is located on land having 16 per cent to 25 per cent slopes.
Two hundred forty-one acres in the 0 to 8 per cent slope categoryof a total 678 acres are located within the Borough. This land is made up of the valley floor and the plateau a reas , located in the Southmont School vicinity, along Menoher Boulevard near Westmont , and Grandview Cemetery.
One hundred sixty acres or approximately 23 percent of the total Borough area is moderately rolling land of 8 to 16 per cent slope. For the most part , this land has been developed for residential purposes.
The two exheme categories of slope within the Borough, 16 to 25 per cent and 25 per cent and over , ac- count for 276 acres or 40 per cent of the total land area. Most of thisextreme topographyis undeveloped at the present time and is located in two major areas, the area aroundthe Grandview Cemetery and the area separat- ing the Menoher Boulevard from Southmont Boulevard.
WATERSHEDS
There are three major watersheds within Southmont Borough. The major portion of the Borough is col- lected by Cheney Run which eventually drains into the Stonycreek River. The Southwest portion of Southmont Borough is drained by part of the Mill Creek Watershed. The third watershed is located in the eastern portion of the Gradview Cemetery and eventually drains into the StonycreekRiver . Seriousfloodinghas not been a prob- lem in the Borough, but occasional storm water flooding does occur inlimited areas . A s development continues in the upper plateau areas this intermittent problem might become more extensive and severe.
CONCLUSION
The natural characteristics of terrain are permanent features and a r e not subject to most of the changes which dominate man-made objects and situations. Although grading and erosion may alter the complexion of given parcels , the topography of a community remains basically static. All proposed development should be r e - viewed carefully by the Borough Planning commission since topographic conditions a r e so ex€reme in terms of their limitations and advantages.

- - WATERSHED BOUNDARY MAP NUMBER
2 "THE PREPARATION OF THIS MAP WAS FINAHCED IN PART THROUGH AN URBAN PLANNING GRANT FROM THE OEPARTMENT OF HOUSIHC AN0 URBAN DEVELOPMEIiT, UNDER THE PRO- VISIONS OF SECTION 101 OF THE HOUSlNG ACT OF 1958, AS AMENDED, AND AS AOHINISTERED BY .THE BUREAU OF PLANNING, PENNSYLVANIA DEPARTMENT OF COMMUNITY AFFAIRS."

The Slope and Watershed Analysis of the Borough clearly indicate the physical limitations of steep slope conditions as well as the development potential of level to moderate slopes, However, all steep slopes need not be considered as barr iers to future growth. Excessive slopes can often function as recreation and open space a reas , thus providing attractive links between the more actively developed districts. The need for this type of land reservation is becoming more acute throughout the nation as a resultofurban growthpatterns, and the Bor- ough is in anenviable position of havingundeveloped land which canbe designated for open space or recreation pur- poses.
Furthermore, it is imperative that the local officials acknowledge the importance of proper land devel- opment. The awareness and comprehension of the physical limitations anddevelopment potential of the commun- ity and its planning provides the first step toward realizing future development programs which will be a definite economic and attractive addition to the Borough.
LAND USE ANALYSIS
The Regional Comprehensive Planning Study of the JohnstownArea, published in March, 1964, provides a generalized analysis of existing land uses in Southmont Borough. The report characterizes the community as be- ing a self -contained valley development, dominated by steep wooded slopes and connecting the valley floor with the plateau region to the east. It was noted that a very limited amount of open land was available within the Borough and therefore s t resses the importance of proper development, The report predicted continuing residential infill- ing in &e middle income levels with pressures for supporting commercial uses. Additional recreation facilities would also be required to meet the increased population in the community.
The current Southmont Borough Planning Program, of whichthis study is a part , has gone beyond the r e - gional study by pursuing each planning element in considerably greater detail. The Land Use and Slope Analysis which utilized detailed data concerning the communities development permits a better under standing of specific problem areas , resulting in more explicit future land use and development proposals.
A basic tool necessary for the formation of a Long Range Development Plan is created through an under- standing and evaluation of existing land use patterns. Thesepatterns, asestablished over a period of time, indi- cate the results of a community'sphysical growth in terms of land developed for a specific use. Our purpose then

is to study the results of existing land use patterns and extract those desirable features which are economically sound, socially tolerant, and physically possible upon whichto built abetter Borough. This analysis will help to provide a basis for future development with reasonable objectives which may be achieved by the use of such de- velopment tools as the zoning ordinance, subdivision regulations, municipal codes, and fiscal planning.
TABLE II
PERCENTAGE OF LAND - DEVELOPED/UNDEVELOPED
SOUTHMONT BOROUGH
LAND USE CATEGORY ACRES
Developed 574.4
Undeveloped 104.0
Total Area 678.4
Source: Cambria County Planning Commission, 1967
PERCENT
84.67%
15.33%
100.00%
The table above vividly illustrates the significance to L e del-ieat,m between developed and undeveloped land use categories. With only 15.33 per cent of the entire Borough available for future development, a program to guide future growth in a desirable manner is eminent. The various components of the existing active land uses must be analyzed in terms of their relation to one another, and particularly, their relationship to the r e - maining undeveloped land. Trends and guidance for future development can thus be established.
UNDESIRABLE PATTERNS OF LAND USE
When a community grows without guidance, it -3 possible that undesira
(8)
le patterns of land use can develop.
The most common patterns of land use which have created undesirable situations within communities a re as follows:
RIBBON DEVELOPMENT
A major problem of communities which a r e trying to guide growth in order to secure the most efficient use of land, is the prevalence of "ribbon" development. This is the termused to describe the development of only that land abutting major roads, especially as they extend out from urban centers.
The disadvantages of ribbon development a re many. A t least a few should be mentioned here. First of all , a s the frontage is used, the number of access points hcreases , and with each one also comes the greater likelihood of accidents. In the case of commercial development, there is often little provision for off-street parking and num- erous interruptions to the smooth flow of traffic. Second, premature development of the frontage retards the proper growth of the interior. In some cases, any development of the interior land is judged to be so far in the future as to be of no concern to the present owner who either makes no provision for access to it, or perhaps retains only 15 or 20 feet easement for his own personal access. Others may leave a generous 60 foot right-of-way to the rear, but if the lots a r e 300 to 500 feet deep, development of the r ea r area will be discouragedbecause of the amount of road that must be built before the interior a rea can be subdivided and sold. Vacant frontage land is often necessary to make the whole development economically possible. Third, ribbon development often creates a demand for the uneco- nomical and inefficient extension of municipal services. Pressure and dependability are much better in water sys- tems which consist of many continuous loops and lines with reversible flow. Any service, whether it involves linear feet of pipe or the number of bus-stops, is more economical to provide when its customers are grouped.
MIXED USE
Mixed use of land constitutes one of the most obvious problems of our day. The tenement house in the "fac- tory district" and the term ffacross the tracks" have unfortunately become too well knownin our speech and writing. They convey the otherwise seldom spoken, but general agreement, that mixed land uses do not create healthful liv- ing conditions.
The most obvious combination of incompatible uses are a heavy industry and a single family home. Usually an industrial neighbor (without proper set-back or protective devides to screen smoke, noise, glare or odors) lowers the value of nearby residences to the level where there is no maintenance beyond that necessaryfor safety. Nearby

residences usually exert just as an adverse effect upon the factory. Adjacent dwellings limit the ability of the in- dustry to expand. Industry-sustaining trucks and children do.notusually produce a happy mixture. Complaints con- cerning real or imagined er rors on the part of the industry maybe filed. These and other obvious results of social interaction make the industry's position uncomfortable, its location less desirable, and oftennecessitates a move. Natural obsolescence is thus aggravated. When such an intermingling ofuses is to the detriment of the residences and industries alike, it should not be permitted in future development. Even those industries which seem relative- ly innocuous should still be allowed plenty of room for plant expansion and the enlargement of parking areas.
Industry has beenused just as an example of a use which does not mix well with residential use. Some types of industry do not mix well with each other. There are varying degrees of incompatibility between commercial, recreational, religious, residential, and other uses. The first infringement ona residential area is usually a small retail use. Without an appropriate set-back and by placing no special value on a side yard, such a use maybedet- rimental to properties as much as a block away. The area is not ideal for any one of the users , because of the presence of the others. No one can be certain for whom it will be best suited in the future. It may be tending to- ward one use or another, but it should have some guidance.
TRANSITION AREAS
A characteristic land use pattern found in most communities is the transition area. These are areas which are undergoing changes in character. One normally thinks of the type where a central business district is expand- ing intoareas formerly used for residentialpurposes. This is often referred to as the "zone of deterioration" be- cause the non-conforming uses are usually next in line for purchase, razing, and replacement with a commercial use; hence, maintenance is deferred as long as possible in the hope that the structure will somehow hold together, a s i s , until the sale takes place. Other transition areas are those which are changing from a rural to an urban character or large single family residences to apartments via conversions. We are particularly concerned with transition in the fringe and built up areas of the community. Growth and change must be accepted as inevitable, but if haphazard or misdirected growth and change is also accepted as inevitable, the loss to the municipality and even the entire region will be tremendous.
UNDESIRABLE LOTTING AND STREET PATTERNS
De9p lots can be as inefficient and costly to the community as can excessively narrow or small lots. Both have the common feature of not optimizing the use of the land and create an atmosphere for possible blighting con- ditions.
ISOLATED CONCENTRATIONS
Another type of undesirable land use pattern is the isolated concentration. This was a minor problem until the post-war trend to the mass-produced residential subdivision ofhundreds ofhomes When a shopping center or an industrial group locates outside a utility service area, it usually installs and/or pays for the extension, or the service is extended voluntarily by the utility because it is financially advantageous to do so. Residential develop- ments, on the other hand, require more services and pay less for them, therefore, there isagreater obligation to keep the extensions short. They are best located in areas already served by existing school, police, fire-fighting, sewer and water facilities This is especially true when the subdivisions consist of small lots.
LAND USE CATEGORIES
Two major components have been included in the discussion of present landuses: developed and undevelop- ed. The distinction between developed and undeveloped land is necessary to properly interpret present develop- ment patterns and comprehend future growth trends. The land use categories employed to define the developed portion of Southmont Borough are as follows:
1. Single Family Residential One -family detached dwelling units. Yard areas utilized for residential purposes are included in the tabulations.
2 e Multi-family Residential Any residential structure accommodating two o r more dwelling units, including converted single family structures, double houses and apartment structures.
3. Commercial Neighborhood, highway-oriented and other commercial activity, these uses include retail shop- ping facilities, banking, personal services and related uses.
4. Light Industrial Industrial, wholesale, warehousing and related activities.
5. Public Includes municipal buildings, fire stations, schools, parks and municipal facilities.
6 . Semi-Public Churches, civic and fraternal uses
7. Streets Dedicated rights-of-way. Includes
and related recreation use not classified as commercial.
state and local systems.
Land Use Categories pertaining to Undeveloped areas are:
1. Wooded Predominately wooded land not improved for any activity purpose.
2. Vacant Open land (non-wooded) and single lots void of structures, showing no evidence of agricultural o r other use. Reservoirs and cleared transmission lines rights-of-way are also included.
Table Ill depicts a detailed land use listing by percentage of total area and acres within Southmont Bor- ough. This table provides an insight into how the land within the Borough is presently used and its implications.
DEVELOPED LAND USE
Residential :
Although Southmont Borough is predominately a residential community, this type of landuse only accounts for approximately one third of the total land area encompassing 227.1 acres used for single family residential use. Another one per cent or approximately 8 acres of land is presently used for multi-family purposes and is dispersed throughout the Borough The structures, which a re discussed more intensively in the housing chapter ,. range in age from eighty years old to newly-constructed.
Commercial:
A very small segment of the community is devoted to commercial uses and accounts for two and one half acres of land. These commercial activities arelocated along the lower end of Southmont Boulevard; at the inter- section of State and Thoburn Streets and along Menoher Boulevard. Commercial uses for the most part a r e located in converted residential properties. In most cases, the commercial activities have not been detrimental to adjacent properties and primarily serve the neighborhoods rather than being regionally oriented.

MULTI- FAMILY
COMMERCIAL
PUBLIC
COMPREHENSIVE PLAN FOR SOUTHMONT BOROUGH, PENNSYLVANIA SEMI- PUBLIC
LIGHT INDUSTRIAL EXISTING LAND USE
0 VACANT mu*, m LII"IwBn"n,,llll, SCALE: 1''. 1-00D
Q SOUTHMONT BOROUGH PLANNING COMMISSION WOODED
C A r n l , m-1n nlllllll (CrnNIPI
MAP NUMBER 3
DATE: DEC. 1066
"THE PREPARATION OF T H U MAP WAS FINANCED IN PART THROUGH AN URBAN PLANMING GRANT FROM THE DEPARTYEIT OF HOUSING AHD URBAN DEVELOPMENT, UNOER TnE PRO- VlSlONS OF SECTION ID1 OF THE HDUSlHG ACT OF 1950, AS AMEIIDED, AND AS ADMINISTERED 81 THE EUREAU OF PLANNING, PENNSVLVANlA DEPARTYEIT OF COYYlUNlTl AFFAIRS."

TABLE I11
LAND USE TABULATION (Percentage & Acreage)
SOUTHMONT BOqOUGH
CATEGORY OF LAND USE ACRES PERCENT
Single Family 227.1 33.48 . Multi - Family 8.1 1.19
Commercial 2.5' ' .37 Y
Light Industrial .5 .07
2 -. Public 12.8 1.89
Sem i-Public 256.6 37.82
Streets 66.8 9.85
Total Developed 574.4 84.67
Wooded 60.0 8.84
Vacant 44.0 6.49
Total Undeveloped 104.0 15.33
Total Area 678.4 100.00
Source: Cambria County Planning Commission, 1967
i .
Light Industrial:
The only Light Industkial use is that of Korns Manufacturing, located on Southmont Boulevard which oc- cupies approximately a half acre of land. The facility provides a limited amount of off-street parking which is desirable. Although only a negligible amount of light industry is present, and only smaller tracts of land remain, it does not preclude the possibility of future land assemblage for expansion.
Public and Parks:
The land within the Borough devoted to public uses is a little over one percent accounting for 12.8 acres of land. These public uses encompass sFparate parcels of land being devoted to the Southmont School and playfields, the Borough hall, a small playground adjacent to Southmont Boulevard, and the undeveloped Southmont Park.
Semi-Public:
The largest consumer of land in Southmont Borough is devoted to the Semi-Public activities of the Grand- view Cemetery and the Bethlehem Management Club. These two activitiesaccount for 37 per cent of the land area or 256 acres.
Streets :
Almost ten per cent of the Borough or over 66 acres is devoted to streets and rights-of-way to provide ac- cess to the many properties within Southmont. Menoher Boulevard and Goucher Street are the only two thorough- fares which are maintained by the State $ while the remaining streets are Borough responsibility.
UNDEVELOPED LAND
Wooded:
Most of the undeveloped land within Southmont Borough is steep wooded slope area, which will be develop- ed properly only with extreme care and thoughtful design. Nearly nine per cent of the Borough is devoted to un- developed wooded areas accounting for 60 acres of land.
Vacant:
The vacant land remaining in the Borough, for the most part , consists of widely dispersed individual lots ~
Only six percent or 44 acres out of the total 678 acres within Southrnont falls within this category.

CONCLUSIONS
General: To implement planning decisions, land use controls are necessary. Planning decisions must be based upon a set of land use objectives. General objectives may be stated as follows:
1 . Provision of areas for different community activities that can meet the present and future character of the population, economic needs and opportunities, and particularly the goals and aspirations of the people of the community.
2. These areas must be related wherever possible to natural land characteristics.
3 . These areas must be related to each other, so as to achieve:
a. b . Accessibility. c.
Safety, health, convenience ; and ameriity..
Efficiency in development and in operation, to provide efficient publicfac- ilities and services, stable propertyvalues, anda sound tax base.
Specific: Southmont Borough is primarily a dormitory community with over 33 per cent of the developed land area devoted to single family use. The major use concentrations are in the western section of the Borough and contiguous with the City of Johnstown and Upper Yoder Township. In some instances the depth of development from street frontage has been limited due to topographic conditions. Topographic conditions have also influenced the development potential of undeveloped portions of the Borough which account for 104 acres and over 15 per cent of the total land area. The largest single consumer of land is the Grandview Cemeterywhich is located to the east of the Menoher Boulevard on a prominent ridge in the Johnstown Region.
I
Continued growth is anticipated as a result of the general expansion within the Johnstown Regional Area. Within Southmont Borough, however, this will tend to be an infilling of existing vacant lots and limited develop- ment on the steep undeveloped land that is remaining. Moderate to large lot area per structure, which will be dictatedby slope conditions throughout the Borough, should result in medium to high value real estate develop- ment.
.
A blight problem was revealed in the existing land use survey and is discussed inmore detail inthe H o u s e

..* ,
section. However, this deterioration which is quite scattered throughout most parts of the Borough will debrid= immediate attention for the protection of health, safety, and maintenance of property values. Blighted conditions a re dangerous since they a r e likely to spread rapidly in the older, established portion of the Borough. Not only do these conditions affect well-maintained existing properties, but in addition have a harmful effect on future de- velopment. This blight may also create an adverse impression of Southmont Borough when located at the ap- proaches to the community.
Commercial and light industrial uses total less than one per cent of the total land area within the Borough very little land is and account for three acres of land. Because of the nearly developed nature of Southmont ,
available for these types of activities. The continued residential activity may require some limited commercial\ expansion to meet local needs; however, major commercial expansion is not anticipated due to the nearness of 'j,
the central core area of the City and the Westwood shopping center serving the plateau area. Even though the present commercial and industrialbase is quite limited, and it would be desirable that these activities be encour- aged Lo supplement the local economy, CONSIDERABLECAUTION should%e exercised to preserve the residential character and natural values whichnow exist. This will require careful analysis of each proposed activity, the site, location, and hodthe type of use is contemplated.
'
- -
Considerable space within the Borough is devoted to public and semi-public facilities although consider - ation should be given to the development of these facilities for the residents and, a t the same time, conserving the natural beauty of the vicinity. Certain facilities, governed by the proper development controls, couldhelp to maintain and preserve thevalues of existing and future private development.
Detailed land use.recommendations which consider the foregoing data and conclusions will be developed as part of the long range program for Southmont's future.
. .
:.. . .

INTRODUCTION
The greatest resource of any community is its people. A Community's vitality is based on the productivity of the citizens who live or have lived in the area. Also, the condition or liveability of a community reflects the amount of energy and foresight that the citizenry have used in guiding their community.
Population analysis is a vital component of the local planning program, because a municipality's very existence is made possible and necessary by people. The compos- ition, distribution, and density of the population provides valuable insight to the existing character of the community as well as a basis for projecting future population and future facility needs. Planning proposals must deal with every facet of municipal needs in or - der to accurately determine existing and future needs.
Factors within and beyond the municipal limits must be evaluated as a basis for determining development potential and projecting future population. Data for the Johns- town Regional Area is available from the recently completed Regional Comprehensive Plan for the Johnstown Area , the Johnstown Area Transportation Study, and theU. S. Bur- eau of Census material which provide a framework for the development of the local plan for Southmont Borough. The population analysis is a detailed refinement of the Region- al Plan expanded to include additional detailed data for local planning purposes.

POPU 1 AT ION AN A LY SIS
POPULATION ANALYSIS
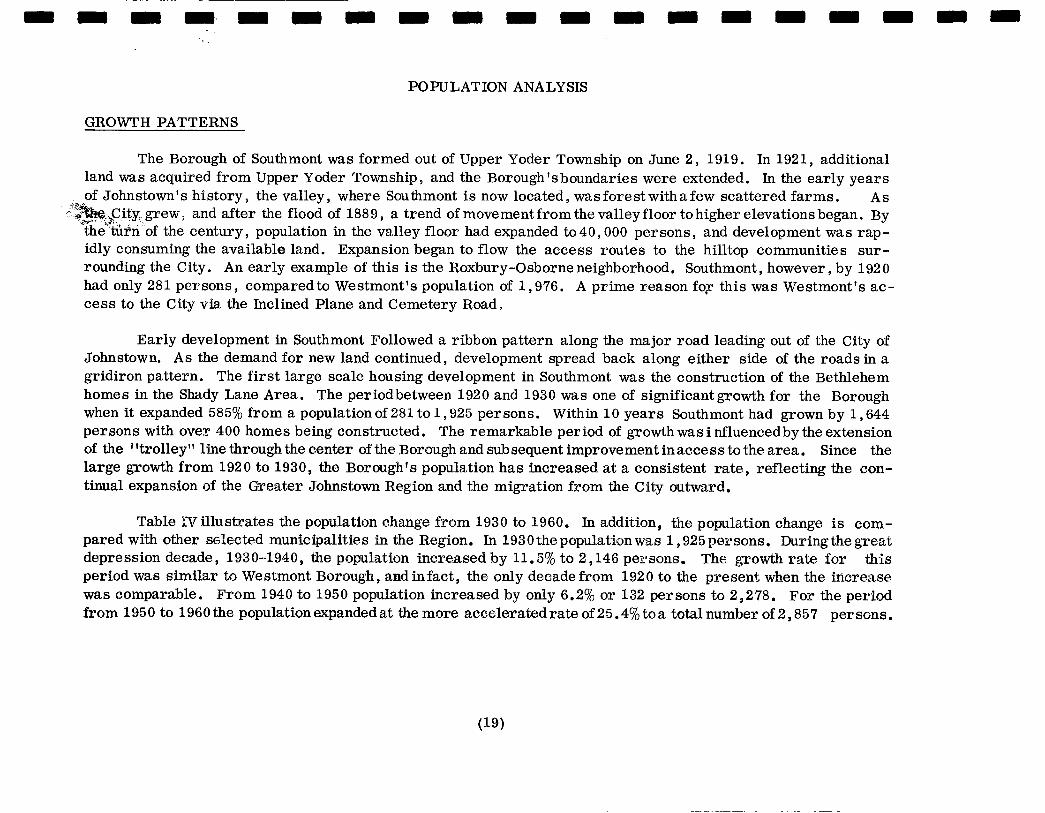
GROWTH PATTERNS
The Borough of Southmont was formed out of Upper Yoder Township on June 2 , 1919. In 1921, additional land was acquired from Upper Yoder Township, and the Borough'sboundaries were extended. In the early years of Johnstown's history the valley, where Southmont is now located , was forest with a few scattered farms. A s
- & i City, grew, and after the flood of 1889 a trend of movementfromthe valley floor to higher elevations began. By .i3-'- ,p ~ *
the turn of the century, population in the valley floor had expanded to 40 , 000 persons and development was rap- idly consuming the available land. Expansion began to flow the access routes to the hilltop communities sur- rounding the City. An early example of this is the Roxbury-Osborne neighborhood. Southmont , however, by 1920 had only 281 persons, comparedto Westmont's population of 1,976. A prime reason €07 this was Westmont's ac- cess to the City via the Inclined Plane and Cemetery Road.
.*.
Early development in Southmont Followed a ribbon pattern along the major road leading out of the City of Johnstown. A s the demand for new land continued, development spread back along either side of the roads in a gridiron pattern. The first €arge scale housing development in Southmont was the construction of the Bethlehem homes in the Shady Lane Area. The periodbetween 1920 and 1930 was one of significantgrowth for the Borough when it expanded 585% from a population of 281 to 1,925 persons. Within 10 years Southmont had grown by 1,644 persons with over 400 homes being constructed. The remarkable period of growth was i nfluencedby the extension of the ittrolley" line through the center of the Borough and subsequent improvement in access to the area. Since the large growth from 1920 to 1930, the Borough's population has increased at a consistent rate, reflecting the con- tinual expansion of the Greater Johnstown Region and the migration from the City outward.
Table IVillustrates the population change from 1930 to 1960. In addition, the population change is com- pared with other selected municipalities in the Region. In 1930the populationwas 1 925 persons. Duringthe great depression decade, 1930-1940, the population increased by 11.5% to 2,146 persons. The growth rate for this period was similar to Westmont Borough, and infact, the only decade from 1920 to the present when the increase was comparable. From 1940 to 1950 population increased by only 6.2% or 132 persons to 2,278. For the period from 195 0 to 1960 the population expanded at the more accelerated rate of 25.4% to a total number of 2,857 per sons.

= = m = = = = D
1920 NUMBER OF PEOPLE
6000
5000
4000
3000
2000
SOUTHMONT BOROUGH
19 30 1940 1950 1960
2857

TABLE IV
POPULATION CHANGE 1930 - 1960
COMPARISONS BY SELECTED AREAS
1930
We stmont Borough 3 , 388
Upper Yoder Township E, 821
Geistown Borough 8 71
City of Johnstown 66,993
Cambria County 203,146
SOUTHMONT BOROUGH 1 925
Source: U.S. Census of Population
% Change
+10.4%
+45 %
+19 %
- 0.5%
+ 5 %
+11.5%
1940
3,741
2 , 648
1 , 037
66,668
213,459
2,146
% Change
+17.9%
+46 %
+lo7 %
- 5 %
- 2 %
+ 6.2%
1950
4,410
3,872
2,148
63 , 232
209 , 541
2,278
% Change
+49 %
+41 %
+48 %
-14.6%
- 3 %
+25.4%
1960
6,373
5,474
3,186
53 , 949
203,283
2,857
A s indicated on the above table, the suburban communities were the major growth areas of the region. During this time the Westmont/Upper Yoder and Geistown/Richland Plateau a reas were increasing at a much faster rate than Southmont Borough. Population declines were being incurred in the City of Johnstown and the County as population migrated out from the center city a reas and in from the rural areas. This comparison indicates that a definite portion of the suburban increase can be attributed to migration rather than natural in- crease within each municipality.
POPULATION CHARACTERISTICS
The age-sex composition of the population a r e important to the planning process for two basic reasons.
(21 j
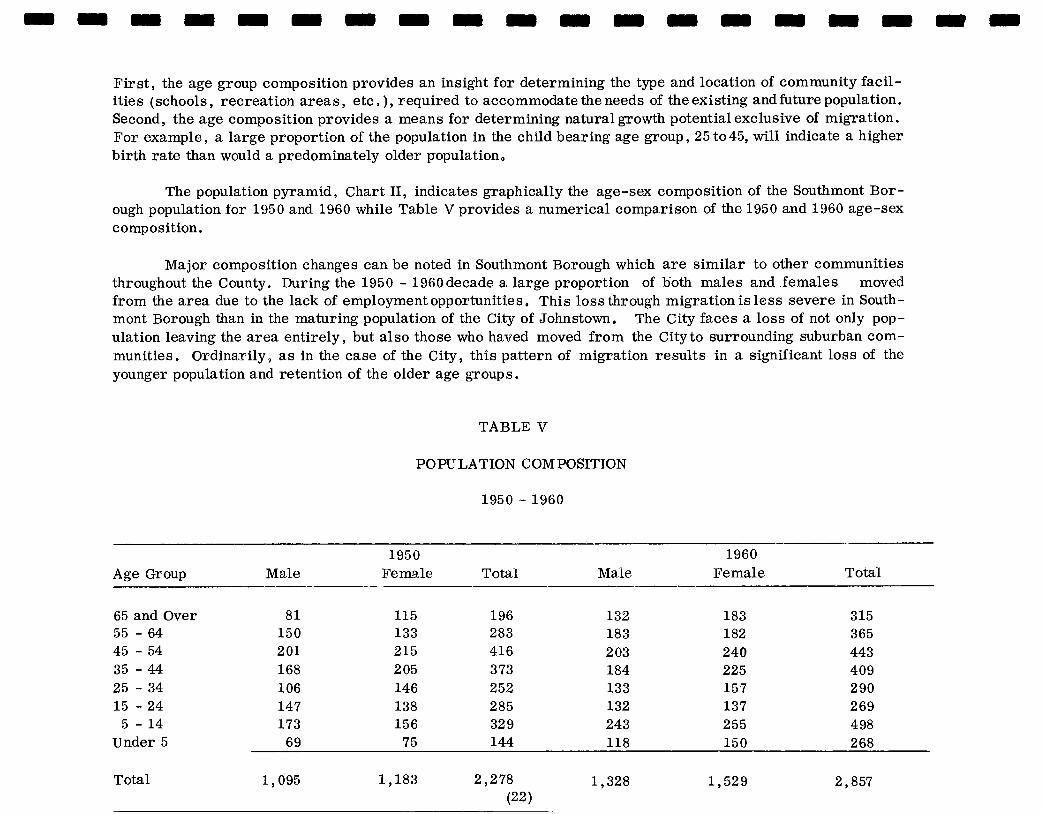
First , the age group composition provides an insight for determining the type and location of community facil- ities (schools recreation areas , etc ) , required to accommodate the needs of the existing and future population. Second, the age composition provides a means for determining natural growth potential exclusive of migration. For example, a large proportion of the population in the child bearing age group, 25 to45, will indicate a higher birth rate than would a predominately older population.
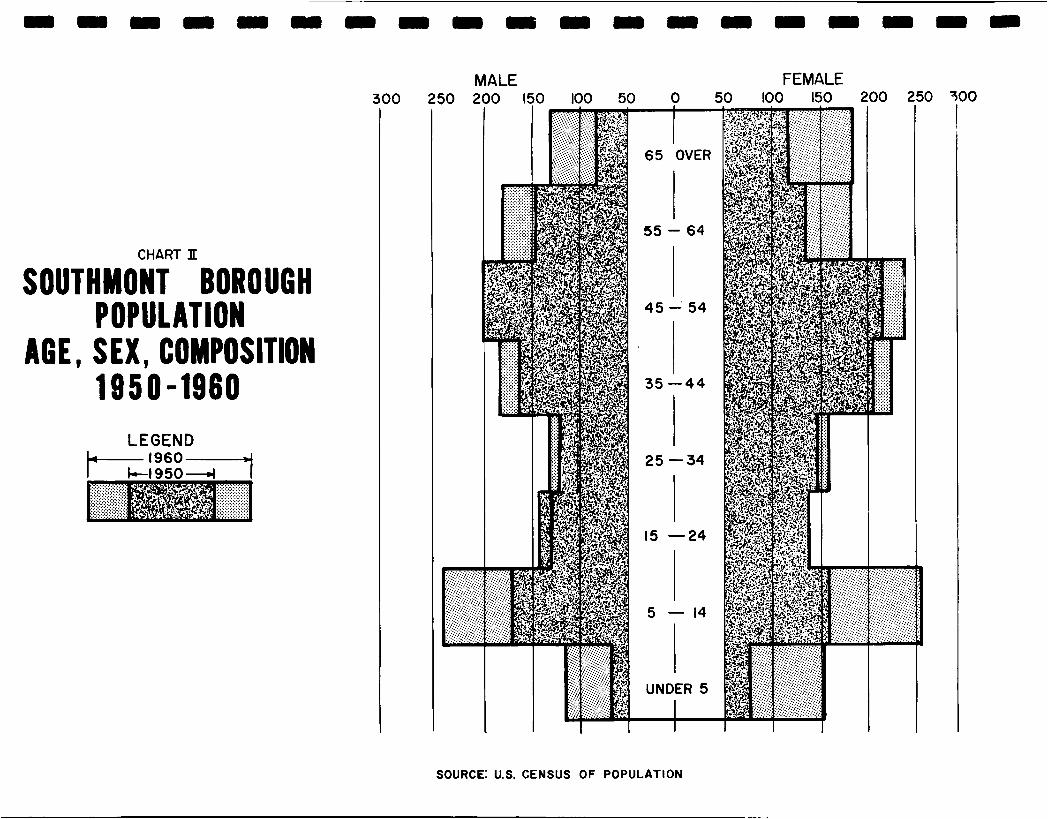
The population pyramid, Chart 11, indicates graphically the age-sex composition of the Southmont Bor- ough population for 1950 and 1960 while Table V provides a numerical comparison of the 1950 and 1960 age-sex composition.
Major composition changes can be noted in Southmont Borough which are similar to other communities throughout the County. During the 1950 - 1960decade a large proportion of both males and .females moved from the area due to the lack of employment opportunities e This loss through migration is less severe in South- mont Borough than in the maturing population of the City of Johnstown. The City faces a loss of not only pop- ulation leaving the area entirely, but also those who haved moved from the City to surrounding suburban com- munities. Ordinarily, as in the case of the City, this pattern of migration results in a significant loss of the younger population and retention of the older age groups.
TABLE V
POPULATION COMPOSITION
1950 - 1960
1950 1960 Age Group M a.1 e Female Total Male Female Total
65 and Over 55 - 64 45 - 54 35 - 44 25 - 34 15 - 24 5 - 14
Under 5
Total
81 115 196 132 183 315 150 133 283 183 182 365 2 01 215 416 2 03 240 443 168 2 05 3 73 184 225 409 106 146 252 133 157 290 147 138 285 132 137 269 173 156 32 9 243 255 4 98 69 75 144 118 150 2 68
1 , 095 1 , 183 2,278 1,328 1 , 529 2,857 (22 )
______~ ~~~~
MALE FEMALE 300 250 2
CHART II
SOUTHMONT BOROUGH POPULATION
AGE, SEX, COMPOSITION 18 5 0 4 9 6 0
LEGEND 6 1 9 6 0 4
0 150 100 50 0 50 100 150 200 r 6 5 OVER
55 - 64
45 - 54
35 - 4 4
25 -34
15 -24
5 - 14
UNDER 5 +- iOURCE: U.S. CENSUS OF POPULATION

Although Southmont Borough has recorded steady population growth for the last several decades, the growth has not been uniform amongthe various age groups. The largest expansion of population from 1950 to 1960 oc- curred in the 6 - 14 age group. The increase in this age group is due primarily to the in-migration of middle age home builders from 1950 to the present. The in-migration of these families resulted in a large increase in the 0-5 and 5-14 age groups. It should be noted that the 35-44 age group and particularly the 45-54 age group r e - present people who are established job holders and home owners. Therefore, the economic decline which has drastically reduced the 15-34 old persons by forcing them to leave the region to findemploymenthas not affected the older age groups. Also the obligations of home ownership and relative job stability make the older persons less mobile than the young.
TABLE VI
AGE GROUP COMPARISON 1960
Upper Southmont Westmont Y oder Geistown City of Cambria
Age Group Borough Borough Township Borough Johnstown County
65 and Over 55 -64 45 -54 35-44 25 -34 15 -24 5 -14
Under 5
11.0% 12.8% 15.5% 14.3% 10.2%
9.4% 17.4%
9.4%
10.8% 12.3% 14.9% 15.7%
9.8% 8.4%
19.4% 8.7%
7.5% 7.9%
12.8% 16.6% 12.7% 11.4% 20.0% 11.1%
6.9% 8.8%
12.3% 16.7% 13.2%
9.7% 21.5% 10.9%
11.7% 9.8%
12.9% 13.6% 11.3% 13.4% 17.6%
9.7%
9.8% 8.5%
12.0% 14.0% 11.4% 12.9% 20.6% 10.8%
100.0% 100.0% 100.0% 100.0% 100.0% 100.0% a
Source: U. S. Census of Population

Table VI reveals some interesting characteristics of Southmont in relation to other selected communities. These characteristics are especiallyevident when compared to the aforementioned age-sex composition chart.
In the young and middle age groups, Southmont's population composition is similar to suburban municipal- ities ~ Lh about 40% of t h e total population in age groups between 25 and 45 Children under 15 account fsr 26.8% of the totd popuhtfon which is comparable t o the City figure of 27.3% and somewhat lower than the suburban mun- icipalities which average over 32% of the& total population in the age groups under 15 years of age.
These comparisons of population composition reflect the relative mature of Southmont with respect to the City and region. Unlike many of the suburban municipalities where there has been an influx of very young families, Southmont has attracted proportionally more families with parents over 30 years of age, In addition, families with parents over 45 years of age have remained stable within the Boroughwhile the number of persons 55 to 64 and 65 and over have increased in number from 1950 to 1960. A s the populationcontinues to mature, the composition of Southmont's population will become similar to the City with increasing numbers and percent of total population in age groups 55 and older.
MIGRATION
Migration into Southmont Borough from older districts of the City of Johnstown can be expected to provide the basis for future growth. Urbanization of the remkining vacant areas i s a trend which will continue in the Bor- ough and is similar to the State and Regional patterns. Unless a considerably improved economy is developed in the Johnstown Region, a loss of population through out-migration of the young people will continue. This is a necessary fact of life if these age p o u p s cannotbe gainfully employed. Major industrial or commercial growth is not anticipated in the Borough, but the residential trends experienced in recent years are expected to continue. Present studies indicate the future predominance of single family dwellings particularly in the mixed price cate- gories. Due to the Borough's proximity to both the City of Johnstown and growth activities'in the Region, there will be a demand for townhouse and apartment uses which may become evident through new construction or con- version of larger homes.
Recent population estimates by the U. S. Census Bureau forecast increasing percentages of gain in the age groups from 0-24 years as a result of high birth rates following the Second World War. T$ese estimates also in- dicate smaller percentages of gain in the main working ages between 25-64aaaresult of the declines inthe national birth rate during the 1920's and 1930's. a lower average age for the working segment of the population.
Increases expected in the percentage of young adults will result in

A. It is evident that the growth in Southmont has’not followed expected patterns at the national level. The increase in the 35-44 age group indicates a probable migration from the more denselypopulationportions of the Johnstown area to the developing residential areas of the Borough. It is important to note that persons in some of the older pections of the Borough a re also moving further out into the suburban fringe areas. It is this age group, however which represents families ordinarily near the height of their earning capacities who construct most of the new homes .
The table of Comparative Median Age for 1960 again indicates that Southmont Borough has quite an old population, When compared to four other municipalities, the county, and state, none had an older population. Westmont Borough is the only municipality which is even similar in nature, both beingfour.years greater than the City of Johnstown.
TABLE VI1
COMPARATIVE MEDIAN AGE 1960
MALE FEMALE TOTAL
We stmont Borough 36.6
Upper Yoder Township 31.7
Geistown Borough
City of Johnstown
32.2
32.2
Cambr ia County 30.2
Pennsylvania
SOUTHMONT BOROUGH
31.2
37.0
38.1
31.6
31.4
34.4
30.9
32.7
38.1
37.4
31.6
31.8
33.3
30.6
32 .0
37.5
Source: U.S. Census of Population
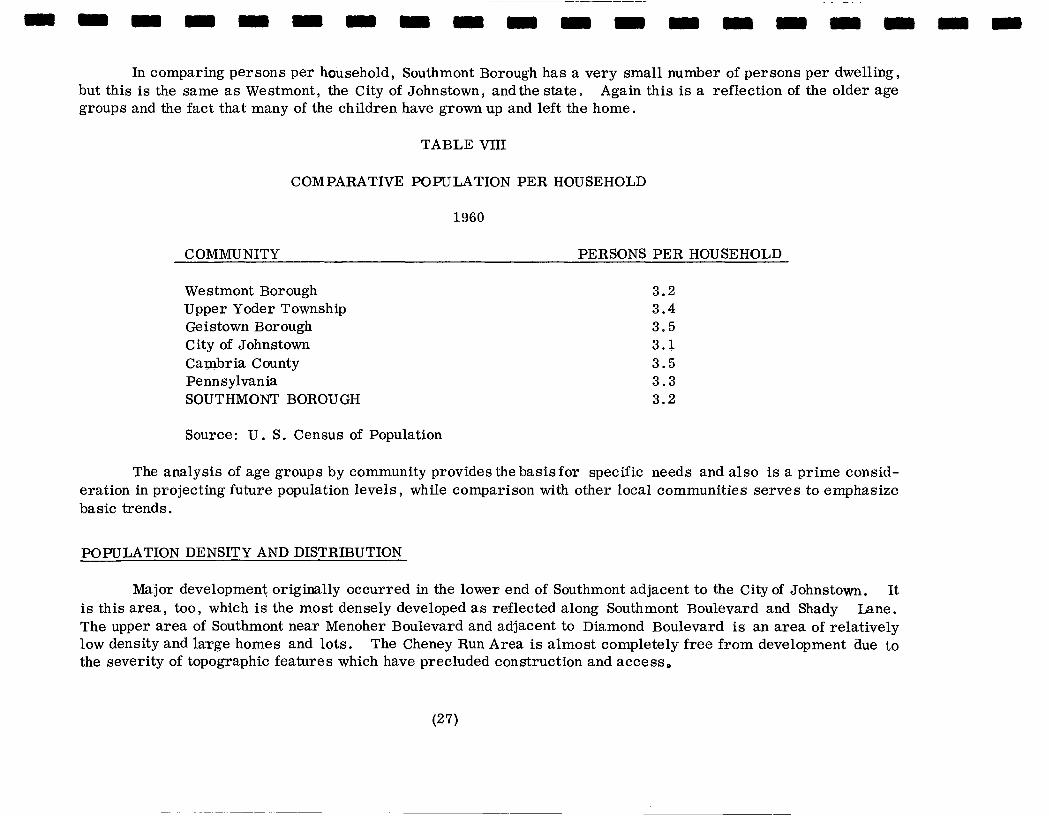
In comparing persons per household, Southmont Borough has a very small number of persons per dwelling, Again this is a reflection of the older age but this is the same as Westmont, the City of Johnstown, and the state
groups and the fact that many of the children have grown up and left the home
TABLE VI11
COMPARATIVE POPULATION PER HOUSEHOLD
1960
C OMNIU NITY PERSONS PER HOUSEHOLD
Westmont Borough Upper Yoder Township Geistown Borough City of Johnstown Cagnbria County Pennsylvania SOUTHMONT BOROUGH
3.2 3.4 3.5 3.1 3.5 3.3 3.2
Source: U . S. Census of Population
The analysis of age groups by community provides the basis for specific needs and also is a prime consid- eration in projecting future population levels, while comparison with other local communities serves to emphasize basic trends.
POPULATION DENSITY AND DISTRIBUTION
Major development originally occurred in the lower end of Southmont adjacent to the City of Johnstown. It is this area, too, which is the most densely developed as reflected along Southmont Boulevard and Shady Lane. The upper area of Southmont near Menoher Boulevard and adjacent to Diamond Boulevard is an area of relatively low density and large homes and lots. The Cheney Run Area is almost completely free from development due to the severity of topographic features which have precluded construction and access

TABLE IX
COMPARATIVE POPULATION AND DENSITY
COMMUNITY 1950/1960 POPULATION 1950/1060 DENSITY PER ACRE
We stmont Borough 4,410/ 6,573 2.87/ 4.27
Upper Yoder Township 3,872/ 5,474 0.52/ 0.73
Geistown Borough 2,148/ 3,186 0.31/ 0.47
City of Johnstown 63,232/53 949 15.81/13.49
SOUTHMONT BOROUGH 2,278/ 2,857 3.33/ 4.30
Source: U . S . Census of Population
In 1950, Southmont had an average of 3.33 persons per acre , but due to population increases it now has 4.3 persons per acre. In comparing Southmont to the selected municipalities it is similar to Westmont which has had in infilling of residential lots, but the density is much higher than the communities of Geistown and Up- per Yoder which average approxlmately 1/2 persons per acre. The City of Johnstown is more dense than any of the other communlties however, density reflects the decreasingpopulation, goingfrom 15 a 8 to 13.5 persons per acre from 1950 to 1960.
FUTURE POPULATION
Population projection is a process which defies percise accuracy due to a variety of mitigating circum- stances which are involved. A t the local level the problem is further complicatedby alack of detailed data and the susceptability of the projection to external factors e County state and national population studies are too generalized to be of specific use locally. The most accurate resultsare obtained from studies at the intermed- iate level which consider the common denominators of a given regional area.
The population projection for Southmont Borough has been prepared on the basis of information avail- able from the studies of the Regional Planning Commission of the Johnstown Area, Johnstown Area Transpor- tation Study, and Census Data. The projection is based on an analysis of trends from 1930 to 1960 translated
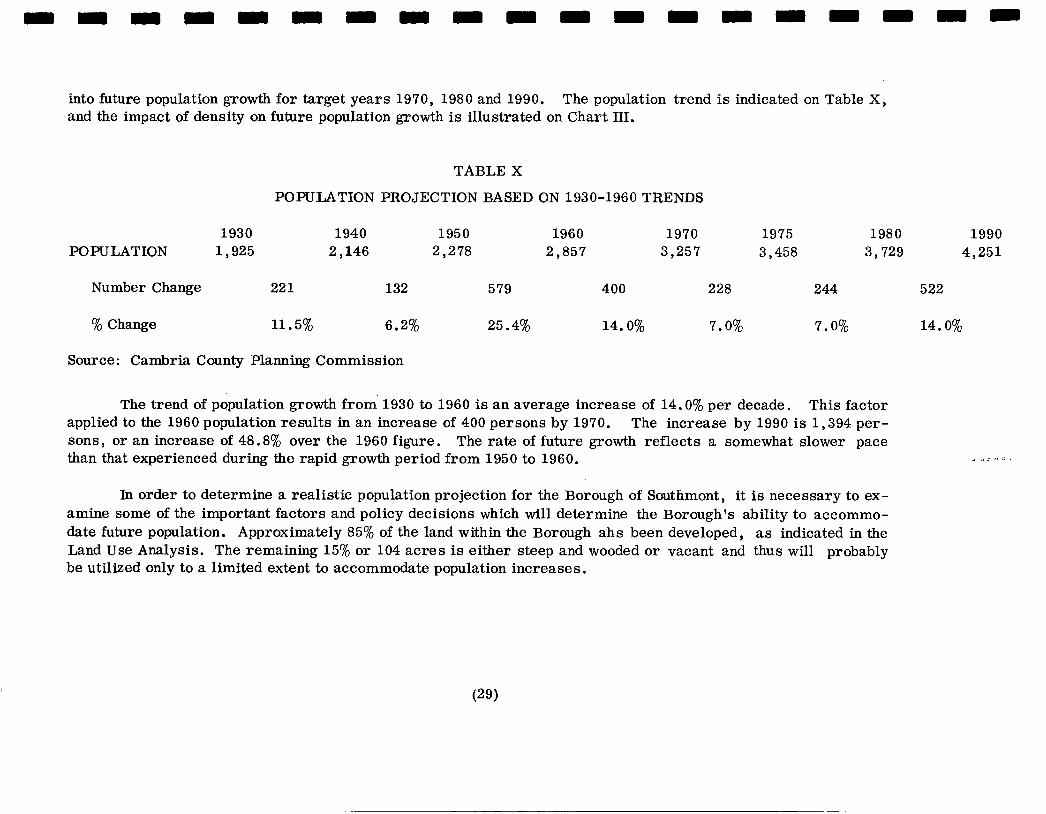
into future population growth for target years 1970, 1980 and 1990. and the impact of density on future population growth is illustrated on Chart 111.
The population trend is indicated on Table X,
TABLE X
POPULATION PROJECTION BASED ON 1930-1960 TRENDS
1930 1940 1950 1960 1970 1975 1980 1990 POPULATION 1,925 2 , 146 2,278 2,857 3,257 3,458 3,729 4,251
Number Change 22 1 132 5 79 400 228 244 522
% Change 11.5% 6.2% 25.4% 14.0% 7.0% 7.0% 14.0%
Source: Cambria County Planning Commission
The trend of population growth from. 1930 to 1960 is an average increase of 14.0% per decade. This factor The increase by 1990 is 1,394 per-
The rate of future growth reflects a somewhat slower pace applied to the 1960 population results in an increase of 400 persons by 1970. sons, or an increase of 48.8% over the 1960 figure. than that experienced during the rapid growth period from 1950 to 1960.
In order to determine a realistic population projection for the Borough of Southmont, it is necessary to ex- amine some of the important factors and policy decisions which will determine the Borough's ability to accommo- date future population. Approximately 85% of the land within the Borough ahs been developed, as indicated in the Land Use Analysis. The remaining 15% or 104 acres is either steep and wooded or vacant and thus will probably be utilized only to a limited extent to accommodate population increases.
.. Y i *I)
3000
4,000
3,000
POP U LATl ON 1820 -1090
High Densify Copacify 4,645 pbqole
Trend Projection 4,103 Peopk
Medium Densify Commty 3,903 People
Low Densify Copocify 3,318 P8oNe
1920 19% 1940 1950 1960 1970 1980 1990
Source: US Census of Population, Regional Planning Commission of the Johnstown Area, Cambria County Planning Commission

Topography is another factor which limits the amount of usable land available for extensive future develop- ment. Land in excess of 25% slope generally precludes extensive development because of difficulties imposed in providing access utilities streets and other site improvements. Approximately 60% of the undeveloped land in Southmont Borough is in excess of 25% slope. The wooded vacant land of less than 25% slope is 38.5 acres with ap- proximately 3 . 7 acres in parcels of less than 1/4 acre which will probably beused for single family detached units so the resulting land available for extensive future development is 34.7 acres. The following table indicates land available for future development
TABLE XI
POTENTIAL LAND AVAILABLE FOR FUTURE DEVELOPMENT
Total Wooded and Vacant: ACRES 104.0
In Excess of 25% Slope: 65.6
Land Available of Suitable Slope : 3 8 . 4
Lots and Parcels under 1/4 Acre 3 . 7
Area Suitable for Extensive Development: 37.7'
Source: Cambria County Planning Commission
Because of Southmont's mature nature and relatively scarce amount of land available for future development, population density is a critical factor in determining future population potential, The population projections for this report are based on alternative densities and their relation to accommodating future population.

EXISTING RESIDENTIAL DENSI-TY ..- v .
The following table indicates the existing net density of land used for residential purposes within the Bor- ough. Land devoted to single family residential use accommodates an average of 3.75 unitsper acre with a r e - sulting average lot size of approximately 11,600 square feet. The multi-family (two or more units to a struc- ture) has an average density of 9.27 dwelling units per acre. The net density of all land used for residential purposes is 3.95 units per acre.
In Southmont , the .population density closely parallels dwelling unit density, Land devoted to single family residential use has a population density of 12 persons per acre, while multi-family has a density of 31.2 per sons per acre. The gross population density (total population divided by total land area) is 4.3 persons per acre .
$.Q h\ TABLE XII
EXISTING PATTERN OF DWELLING UNIT AND RESIDENTIAL DENSITY
Dwelling Unit Density: Net Residential Density:
Single Family: Single Family:
853 Units = 3.75 Units 227.1 Acres Acre
3.75 Units x 3.2 Persons = 12.0 Persons/Acre Acre Unit
Average lot size = 11,616 Sq. Ft.
Multi-Family : Multi-Purpose :
75 Units = 9.27 Units 8.1 Acres Acre
Average lot size = 9,900 Sq. Ft.
Ne t Residential Dwelling Unit Density:
TOTAL UNITS = 3.95 Units TOT. RES. ACRES Acre
9.75 Units x 3.2 Persons = 31.2 Per sons/Acre Acre Unit
Gross Residential Density:
TOTAL POPULATION 2,857 = 4.3 Persons TOTAL LAND AREA 678.4 Total Acre
Source: Cambria County Planning Commission

FUTURE POPULATION BASED ON ALTERNATIVE DENSITIES
A s previously mentioned, Southmont Borough is of a mature nature, with small amounts of land avail- able for future development. A s a result , future density is an important determinant in projecting population potential and future population. The following table illustrates the relationship between future population ca- pacity and future densities.
Alternative I , Low Density, is based on a continuation of single familyresidential development onavail- able wooded or vacant land which is suitable for development.
Alternative 11, Medium Density, is based on a continuation of single family residential development on the remaining small scattered lots and medium density (9.75 units per acre) townhouse or apartmentunits on more extensive tracts.
Alternative III. High Densitv, i s based on the continuation of single familyconstruction on the scattered lots and the development of higher density (20 units per acre)apartments on the larger tracts suitable for such development.
TABLE XIII
POPULATION CAPACITY AND FUTURE DENSITY
Unit Total Persons Potential Population A lte r na t ive Acres Density Units Per Unit Incsease/Acre
I Low Density 38.4 3.75/Acre 144 3.2 461 Persons
II Medium Density Single Family 3.7 Multi-Family 34.7
Total Potential Units
3.75/Acre 14 338 9.75/Acre
352 -
3.2 1 , 126 Persons
111 High Density Single Family 3.7 3.75/Acre 14 3.2 45 Persons Multi-Tamily 34.7 20/Acre - 694 2.5 1 , 735 Per sons
Total Potential Units 7 08 1,788
Source: U .S. Census of Pop. , Regional Planning Comm. of the Johnstown Area, Cambria Co. Planning Commission (33) ~ ~~~

LEGEND COMPREHENSIVE PLAN FOR SOUTHMONT BOROUGH, PENNSYLVANIA P 0 P U LATl ON D IST R I B UT IO W
REPRESENTS 3.3 PERSONS
Q SOUTHMONT BOROUGH PLANNING COMMISSION
#;p;w-;&g~~,;~g;; S C A L E : I " = 1,000'
D A T E : D E C . IS68 MAP NUMBER
4 "THE PREPARATION O F THIS MAP WAS FINANCE0 I N PART THROUGH AN URBAN PLANNING
GRANT FROM THE DEPARTMENT OF HOUSING AN0 URBAN OEVELOPMENT, UNDER THE PRO- VISIONS OF SECTION 101 OF T H E HOUSING ACT OF 1154, AS AMENDED, AN0 AS AOUINISTEREO BY THE BUREAU OF PLANNING, PENHSYLVANIA OEPARTMENT OF COMMUNITY AFFAIRS."
Alternative I , Low Density development , is based on a continuation of the present single family residential development thraughout the remaining land within the Borough which is suitable for development and will result in a future expansion capacity of 144 units. Based on the 1960 population per household, these 144 additional units would accommodate approximately 460 persons. It is unlikely that the past low densitydevelopment will continue indefinitely in the Borough, particularly in view of the apartment building proposed along Menoher Boulevard and smaller multi-family units being constructed or converted in several locations.
Alternative 11, Medium Density, would consist of the development of single family units on scattered lots and the construction of moderate density (10 units per acre) townhouses and gardentype apartments on remaining suitable tracts. The capacity to accommodate new residents under this alternative wouldbe 35Onew dwellingunits or approximately 1 , 130 persons.
Alternative 111, High Density development, is based on the assumption that single family construction will continue on the remaining scattered lots and higher density (20 units per acre) apartments will be constructed on the remaining suitable areas. The resulting ability to accommodate future population would be 708 units , or ap - proximately 1 , 790 persons. It should be pointed out that under the higher density assumption, the average family size in the apartment units is expected to be somewhat lower than the single family units or townhouse develop- ments.
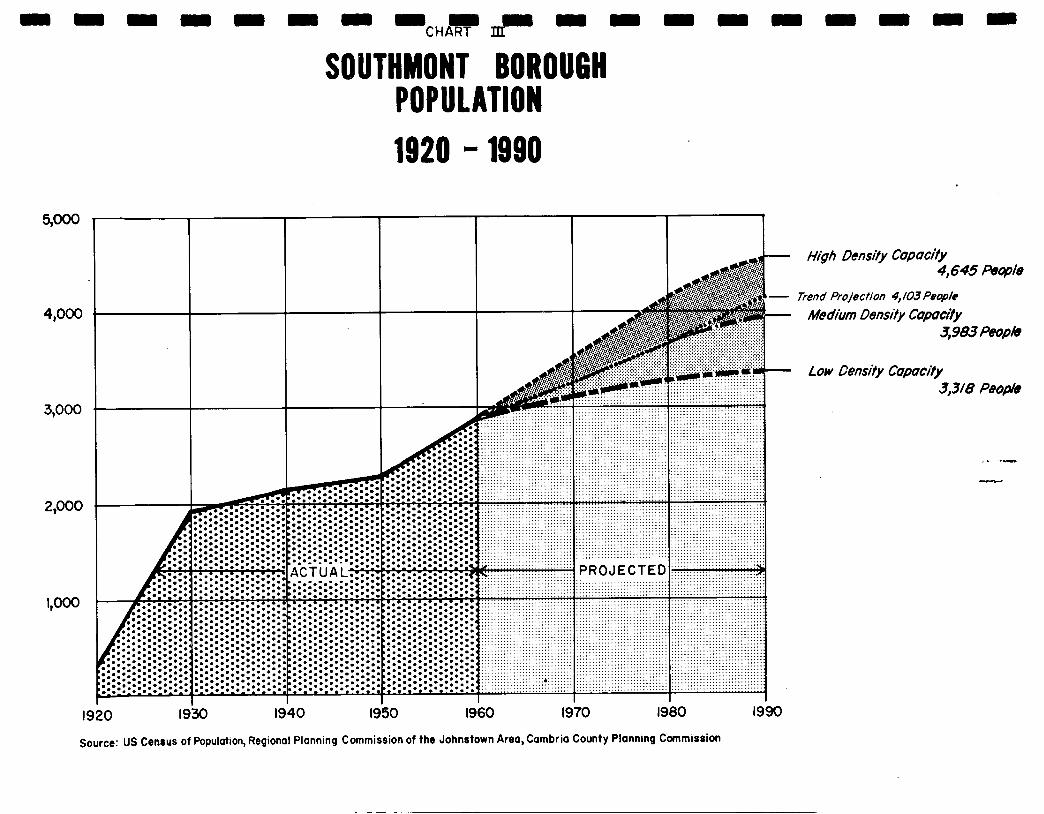
.Chart 111 depicts graphically the future populationof Southmont Borough. If extensive landarea were avail- able for development, past trends indicate that a population of 4,251 persons would be attainedby1990. This trendof population, will , of course , be tempered by the constant factor of land available within the Borough and the significant variable of density allowed. The graph depicts the modificationof the populationprojectionbasedona Low Densityof 3.75 dwelling units peracreasnowexists; Medium Density of 9.75 units per acre; and High Density of 20 units per acre as described in Table 13. Based on the policy decisions made by Southmont Borough, the future total population which could potentially be attained under the varying densities is 3,318; 3 , 983 ; or4,645personsby 1990. These policy decisions will also affect the service demand required of the community facilities within the Borough and a t the same time determine the potential revenue which the Borough can expect to receive.

HOUSING ANALYSIS

INTRODUCTION
Southmont Borough's rapid expansion in the past and the pressures for the conversion of existing homes into apartment buildings has createda number of problems that must be considered. It is easy to imagine how great the demand for dwelling space will continue to be as the City's pop- ulation migrates into the Borough, and how the increased demand will affect the value of housing units and housing density.
In Southmont, as in mostAmerican communities, the dominant land use is for residential purposes. Thus, as indicated earlier, the commun- ity's principal business i s , o r should 'be, to provide for residences and their related requirements; a knowledge of the number and quality of res- idences is, therefore, essential to community planning.

HOUSING ANALYSIS
EXISTING HOUSING CHARACTERISTICS
There has been a 58.6% increase in the number of housing units in Southmont Borough since 1950. In terms of percentage increase, this was considerably higher than that of many communities within the county.
TABLE XIV
SOUTHMONT BOROUGH AND OTHER PLACES
TOTAL HOUSING UNITS
1950-1960
PLACE 1950 1960 Increase % Change
We stmont Upper Yoder Geistown City of Johnstown Cambria County SOUTHMONT
1,349 2,121 996 1,582 545 937
16,860 17,869 51,842 60,772
585 92 8
7 72 57.2 58 6 58.8 3 92 71.9
1,009 6.0 8,930 17.2
343 58.6
Source: U . S. Census of Housing 1960
HOUSING CONDITION
An external analysis of existing building conditions was made to provide a reasonably accurate picture - of the structures in Southmont Borough. The following classification was applied:
1. Sound
Applies to new or recently rennovated structures as well as some aging but well maintained buildings.

2 Deteriorating
Applies to structures where the need for basic maintenance is noticeable. These structures are capable of rehabilitation and should be dealt with immediately so as to eliminate the possibility of blight,
3. Dilapidated
Structures which are in need of major repair , or wouldrequire reconstruction or demolit ion e
TABLE XV
SOUTHMONT BOROUGH AND OTHER PLACES
COMPARISON OF HOUSING CONDITIONS
AREA
Total Housing Sound Deteriorating Dilapidated
Units No. R No. No. O/n
We stmont 2,121 2,029 95.7% 83 3.9% 9 .4%
Upper Yoder 1,582 1,403 88.7% 132 8.3% 47 ’ 3.0%
Geistown 93 7 907 96.8% 24 2.6% 6 .6%
City of Johnstown 17,869 12,819 71.7% 3,410 19.1% 1,640 9.2%
Cambria County 60,772 44,707 73.6% 11,651 19.2% 4,414 7.2%
SOUTrnONT 92 8 919 99.0% . 7 .8% 2 .2%
Source: Cambria County Planning Commission 1968 . ., I
(38)

Ninety-nine per cent of all housing structures in Southmont Borough a re in sound condition. This is a very high, if not the highest, proportion per neighborhood of sound housing units in the Johnstown municipal area. The few and scattered dwellings classified as deteriorating or dilapidated pose no serious problem of blight but they should be alleviatedby the proper means as soon as possible, so as to curtail any future spread.
There a re two structures which warrant reconstraction or demolition. The remaining few a r e in need of minor repairs and could be the target of a neighborhood cleanup campaign or enforced zoning laws.
AGE O F STRUCTURES-
A relative high sixty-three percent of all st:ructures in Southmont were built prior to 1939. The next largest percentage occurs in homes built since 1950. The 87% of homes, aging or relatively new, represents a substantial amount of the entire number in the Borough. The already instilled pride and harmony of the Bor- ough is reflected in the conditions of the homes.
The most applicable step of a program of action would be the maintenance section for this particular borough. A s three-fourts of all the structures a re aged, it becomes the prime concern for the Borough ad- ministration and residents alike to continue to maintain their community as it presently appears.
TABLE XVI
SOUTHMONT BOROUGH AND OTHER PLACES
AREA
COMPARISON AGE OF STRUCTURES
Y E A R S T R U C T U R E B U I L T 1950 - 1960 1940 - 1949 Prior to 1939
No. Total Total Housing % Of %of % Of
Units No. Total No. Total ~ ~~ ~~ ~~
Westmont 2 , 121 772 36.4% 32 9 15.5% 1,020 48.1% Upper Y d e r 1,582 586 37.1% 342 21.6% 654 41.3% Geistown 93 7 3 92 41.8% 267 28.5% 278 29.7% City of Johnstown 17,869 1 , 039 5.8% 643 3.6% 16,187 90.6% Cambria County 60 , 772 9,290 15.3% 5,578 9.2% 45,904 75.5% SOUTHMONT 92 8 223 24.0% 12 1 13.0% 584 63.0%
Source: Cambria County Planning Commission, 1968

HOUSING CHARACTERISTICS
Ownership is a prime factor influencing building conditions. The dwelling which arb owner-occupied a r e those that generate the greatest degree of pride in the individual property and the community. This personal sense of responsibility somewhat relieves the need for municipal control to protect against blight. Of all the dwelling units in Southmont Borough, 81.3% are owner occupied. This figure may be compared to the City of Johnstown (41.5%) and Cambria County (62 1%). Comparable percentages of occupancyare found in urbanizing commurlities such as Geistown (82 9%) and Upper Yoder (81 3%). This dominance of owner-occupied dwellings should continue in Southmont, due to the fact that most expansion will take place inneighborhoods further fromthe City, with only a limited amount occuring in the Borough. The amount of blight in communities dominated by owner-occupied dwellings is significantly less than in a reas where rental units a r e more predominant.
The 152 rentalunits withinsouthmont Borough a re primarily single family houses with houses with apart- ments on the second floor. According to the 1960 Census, only 24 units were located in structures with 3 or more units per structure. Because of the low density and scattered nature of rental housing in Southmont, apartments and rental units are an inconspicuous par t of the total housing inventory.
TABLE XVII SOUTHMONT BOROUGH AND OTHER PLACES
COMPARISONS OF HOUSING CHARACTERISTICS Total Housing Owner Renter Median Rooms
AREA Units Occupied Occupied Vacant Per Unit We stmont 2,121 L 1 689 378 54 6.1
79.6% 17.8% 2.6%
Upper Yoder 1,582 1,286 81.3%
Geistown 937 777 82.9%
City of Johnstown 17,869 7 411 41.5%
Cambria County 60,772 37,745 62.1%
SOUTHMONT 928 775 81.3%
186 110 11.8%
132 14.1%
9,438 52.8%
19,519 32.1%
152 16.4%
6.9%
28 3.0% -
1,020 5.7%
3 508 5.8%
21 2.3%
5.5
5.4
5.0
5.4
5.9
Source: Cambria County Planning Commission

According to 1960 figures from the Bureau of the Census, the median number of rooms per occupied housing unit in Southmont is 5 e 9. This figure is relatively consistent with similar communities where upper moderate value dwelling units a r e the predominant residential use. Any future building will probably and should conform with this average number of rooms per unit figure.
HOUSING VALUE
Consistent with the high median room per unit figure is the average value of dwelling units in South- mont. The $15,800 average home value is the second highest of all neighborhoods in the Greater Johnstown area. A chart showing value of owner occupied dwellings in various communities reveals percentages in various categories of dwellings.
TABLE XVIII SOUTHMONT BOROUGH AND OTHER PLACES
VALUE OF OWNER OCCUPIED
$5,000 $10;,000 $15) 000 $20,000 $25,000 Total Less Than to t o to to or
Owner $5 ) 000 $9 9 000 $14,900 $19) 000 $24) 900 More AREA Occupied No. % No % No. % No. % No e % No. % MEDIAN
We stmont 1,614 20 1.2% 54 3.4%
Upper Yoder 1,206 60 4.9% 256 21.2%
Geistown 75 3 12 1.6% 114 15.1%
City of Johnstown 5 957 719 12.1% 2,893 48.6%
Cambria County 32,535 8,433 25.9% 11,322 34.8%
SOUTHMONT 73 9 4 .5% 103 13.9%
228 14.1% 428 26.5% 351 21.8% 533 33*0% $21,100
330 27.4% 319 26.5% 124 10.3% 117 g07% $14,400
370 49.1% 169 22.5% 45 6.0% 43 5.7% $13,000
1,783 29.9% 470 Tog% 61 1.0% 31 .5% $ 8,800
7,434 2208% 3,257 10.0% 1,089 3.4% 1,000 3.1% $ 8,200
227 30.8% 203 27*5% 96 13.0% 106 14.3% $15,800
Source: U . S . Census of Housing, 1960

Only 14% of all dwellings in the community are valued under $10,000. In contrast, a comparative figure for Johnstown is 60.7%. A community with an average dwelling unit value of $15,800 should not be plagued with any significant amount of blight , and every possible precaution should be taken to insure against-an increase in substandard conditions.
PROJECTION
By using the average number of persons per dwelling unit in proportion to the population projections, it is possible to determine the potential number of housing units for Southmont Borough. It should be noted, how- ever that these housing units could be single family , duplex , o r even multi-family structures , depending on the Borough's basic policy decisions regarding zoning and market demand. However , if only single family residences were to be constructed this would be adequate, since the Borough does not have enough vacant land to accom- modate the projected population.
Table XM shows the number of dwelling units in 1965 , 1975, and 1990 in Southmont and four other areas. Of the five areas compared, Southmont has the highest projected percentage increase,. 64.6%frOm 1965 to 1990. Geistown, a community similar to Southmont , shows a projected increase of 63.0% in dwelling units from 1995 to 1990. Also, Westmont Borough and Upper Yoder Township show a substantial increase in dwelling units, typ- ical of the suburban movement; the City of Johnstown, however, has a projected 21.8% decrease in dwellingunits in the 25 year period.
TABLE XM
AREA
SOUTHMONT BOROUGH AND OTHER PLACES
DWELLING UNITS
1965 to 1975 1975 to 1990 1965 1975 % Increase 1990 % Increase
We stmont 2,320 2 , 398 3.4% 3 , 169 36.6%
Upper Yoder 2,203 2,418 9.8% 3,428 55.6%
Geistown 971 1 , 110 14.3% 1 , 583 63.0%
City of Johnstown 15,807 13 , 778 -12. 8% 12 , 369 -21.8%
SOUTHMONT 857 1,000 16.7% 1,411 64.6%
c
Source: Cambria County Planning Commission 1968 (42)

There are factors which should be considered in determining the type of housing unit which will best accommodate the future population growth in Southmont. These factors are: (1) potential demand for new housing units inensueing years; (2) the Borough'sproximity tothe core city; and (3) the somewhat, Kmited amount of land available for future development. Consideration should be given to expanding the variety of housing within the borough to include the development of new, well-designed, multi-family units and apart- ments. The danger of multi-family housing being substandard is in the indiscriminate conversion of large, old, single-family buildings into so-called apartments. Quality, multi-family housing is growing in popular- ity and consideration should be given to include provisions for such a use in the future landuse plan and zoning ordinance.
C ONC LU SIONS
Based on specific procedures for achieving m n d l i o u s ~ g condiXiidns throughout Southmont, there shoirld Application of the action program to conditions exist a strong positive action program at the borough level,
noted in Southmont Borough should be enacted immediately.
A positive action lprogram should consist of phases for prevention, maintenance and improvement. The aims and means of achmplishing these phases will be individually discussed below.
Prevention :
Prevention is the elimination of practices which might eventually contribute to substandard conditions. The prevention element is aimed at new development in an effort to immediately alleviate any possibility of ad- verse conditions in the future. Social, cultural, and economic conditions shoutd dictate such a program so that the type of growth desired by the community may be achieved.
Prevention can be accomplished by:
A. Zoning Ordinance
B . Building Codes
C. Subdivision Regulations
--.

!
A . Zoning is necessary to protect the property owner and community from indiscriminate develop- ment practices. By controlling land use, the environmental conditions canthus be controlled and the causes of blighting conditions prevented.
B. The enforcement of building codes is an effective means of controlling building quality and insur- ing the community against blight resulting from substandard practices.
C. Subdivision control is the adequate setback, lot areas, street width, and construction standards and engineering considerations relative to grades drainage, and utilities required for proper control e
Since there is only a limited amount of land in Southmont which will lend itself to development, the applicability of the preventive phase is restricted. However, the future sites which a r e capable of, and most likely will be the site of, development should be accounted for by the above mentioned means of control.
Maintenance :
Maintenance is the protection sf existing housing. Protecting existing structures is a very important step in formulating a comprehensive appraach to huising problems. Protecting existing structures is an in- centive for property owe:cs tn maintain the caliber and value of their property. On the other hand, should adverse or non-compatible uses develop adjacent tn sound residential a reas , there may be a transfer in owner ship and general. downgrading and de terioriztion .,
Maintenance can be accomplished by:
A e Neighborhood Improvement
B. Zoning
A . Neighborhood Improvement includes those campaigns that generate semi-public participation in local neighborhood improvements. The paint-up clean-up programs generate pride and local harmony in an attempt to make the neighborhood a more attractive place to live.

many different types of people. Proper planning accompanied by dedicated administration of policies to maintain an attractive suburban atmosphere should be strivedfor inpreserving and providing for the fu- ture of housing in the community.

THOROUGHFARE
-.
A N ALY S I S

INTRODUCTION
The thoroughfare system which serves a community is of major importance to existing and potential community development. Without an adequate system land re- mains idle or development is severely limited.
The primary goal of the thoroughfare analysis is to identify the conditions and problems of the existing system in moving people and goods. Ideally, the transporta- tion system would work quickly and efficiently, with clarityand a sense of direction to points both within the community and the region.
A major portion of the Regional Plan for the Johnstown Area was devoted to a proposed highway program aimed at bringing new vitality to the Region. Every com- munity within the study area , however, must also make improvements to their local transportation system. This following analysis of existing conditions will provide the framework upon which to develop the future transportation plan for the community.
I
(47)

I LEGEND
3 ' - - REQIOIAL MIOMWAY
~slb-, DtblLSSWAY
-.-e- PROPOSED EXPRESSWAY
*rl COMPREHENSIVE PLAN FOR S O M V H Y O I T BOWOUGW, PENNSYLVWMIA

THOROUGHFARE ANALYSIS
The highway system which serves a community at the regional and local levels is of major importance to existing and potential community development. Prior to the advent of the automobile, major growth was limited to a reas with access to water or rail facilities. The historical development of Johnstown is an example of the initial importance of water (canal) transportation followed by the establishment of the railroads. Urbanization beyond the core of development was limited until the automobile expanded the horizon and converted rural areas to residential development. The ever-increasing number of vehicles has created new problems and magnified the importance of local and regional highway systems.
A major portion of the Johnstown Area Regional Plan was devoted to a proposed highway program aimed at bringing new vitality to the Region. Every community within the study area , including Southmont Borough, will benefit from the implimentation of these proposals which consist of a regional highway, and expressway, a sys- tem of beltways and subsidiary arterial and collector roads.
HIGHWAY CLASSIFICATIONS
The elements of the regional program a re defined and related to local application as follows:
Regional Highway:
A regional highway functions as a connection between the region and other regions of the state and nation. For example, U. S. Route 219 is currently being constructed to provide expressway access north to U.S. 22 and south to the Pennsylcariia Turnpike. The highway will eventually be extended through Pennsylvania intersecting such major routes a s the Keystone Shortway and U. S. 40. Benefits of modern expressway access to the Johns- town Region have obvious implications for the region as well a s for Southmont Borough.
Expressways :
This system will ca r ry major traffic flow around the developed portions of Johnstown to major traffic Beltway East will provide access to the east of Johnstown. Beltway West is of significance in the destinations.

local study since it will connect Southmont , Westmont and Upper Yoder areas with the rapidly growing areas to the south and east of Johnstown. Access will be provided between the eastandwest "hil1top"communities of the Johnstown Region without going through city congestion.
Beltway West will traverse the eastern portion of Upper Yoder Township ina north-south direction. This facility, which will run from Route 22 in the north to new U.S. 219 southof the city, will cross Route 271 in the general vicinity qf Millcreek and continue along the eastern edge of the watershed.
Regional Arterials:
A r t e r i a l s should carry minor through-traffic flows and connect major points within communities or be- tween communities. Route 271 (Menoher Boulevard) will serve the basic purpose from Johnstown to Ligonier.
Regional Collectors:
The function of collector roads is to connect the arterial system to communities or neighborhoods with- in communities. Goucher Street is designated in the regional concept as a collector beginning in Ferndale and terminating in the West End of Johnstown by the use of D Street. Franklin Street serves a dual role in the area highway system. A s a state traffic route, old U.S. 219, the street serves as a regional connecting Somerset and the area immediately south of the Johnstown Region with the Johnstown Central Business District. Franklin Street also serves a s a regional collector joining Southmont, Upper Yoder , Ferndale, Roxbury-Os- borne, and Kernville to the Central Business District.
arterial
Both the regional collectors and regional arterials should car ry substantial volumes of through traffic Ideally, these streets should which originate and terminate outside the area through which the street passes.
be free of local traffic conflict in order to provide uncongested rapid movement through an area.
Local Collectors:
Local collectors serve as a means of linking local traffic to the regional arterial and regional collector system. Traffic on the local collectors should either terminateor originate within the areabeing served by the street. Through traffic should be discouraged in order to facilitate turning movements of traffic intersecting from the local streets. *

Local collectors in Southmont Borough include: Southmont Boulevard , Olive Street, State Street and Harsberger Road. These streets link local traffic to Menoher Boulevard, Franklin Street and Goucher Sreet. .
Local Streets :
Local streets provide direct access to individual properties and points of a t e r e s t which abut thes t ree t A majority of the traffic onlocal streets should originate or terminate on somepoint along the street. Through traffic should be discouraged from cumulating along the local streets.
The Regional System , as outlined above , will provide a framework for relating development within Southmont Borough to the regional area. By reference to the regional network, arealist ic streetplan may be developed which will minimize the local through traffic conflict and provide better access of the Borough to the surrounding region.
EXISTING STREET AND HIGHWAY SYSTEM
State Routes:
The existing Traffic Volume Map provides a graphic indication of local highwayuse. Twenty-fbur-hour These counts represent average week-day 24
The existing volumes a r e also noted on the illustration at significant changes in the counts were made on major roads within Southmont Borough. hour, two way, travel. counts.
The most traveled thoroughfare is Menoher Boulevard/Route 271 which traverses the Borough from Westmont to the City of Johnstown. Volumes are fairly consistent along Menoher Boulevard, witha slight in- crease from Millcreek Road and Luzerne Street. The traffic from the Millcreek Road is undoubtedly through traffic with origin or destination in the City, whereas most of the traffic from the Luzerne Street area is traf- fic generated from residential activities in Westmont and Southmont Borough e
Menoher Boulevard functions primarily as a Regional Collector providing a linkbetween Upper Yoder , Westmont and Southmont areas to the Central Business District. This thoroughfare is maintained by the State as part of the Federal Aid Secondary Highway System. The basic construction is concrete with a small portion of bituminous. The paved width varies from 1 9 feet along Grandview Cemetery to over 36 feet along the Or- chard Street section.

TABLE XX
SOUTHMONT BOROUGH
*LENGTH AND PAVING OF EXISTING STREETS
Concrete % Brick % Macadam % Unpaved % Total % ---- 1.51 10.67 ---- ---- 2.78 19.65 State Maintained 1.27 8.98 ----
Borough 2.16 15.26 .94 6.64 6.34 44.81 1.39 9.82 10.83 75.53
---- ---- ----- .54 3.82 a 54 3.82
14.15 100.00
Alley & Not Ord. ---- ----- ----
Total Streets 3.43 24.24 .94 6.64 7.85 55.48 1.93 13,64
* Length inMiles
Source; Cambria County Planning Commission 1968
SOUTHMONT BOROUGH
VOLUME, PAVEMENT AND CONDITION OF SELECTED STREETS
24 Hour Two Eavement Length Pavement Major Street Way Volume Type Feet Width
Menoher Boulevard South mont Boulevard Goucher Street State Street Olive Street Orchard Street Milcreek Road Luzerne Street Harsberger Road
11,500/10,000 4,000/ 2,800 8 , 100 1,200 2,000 1,800
'2,800 2,200 1,600
Bituminous Bituminous Bibminous Bituminous Bituminous Bituminous Bituminous Bituminous Bituminous
10,900 3,400
900 4,000
900 3,000 2,750
550 2,500
20'/10' 1"/36 '5" 39'5" 25'9" 31 '5"/25'1" 31'7" 35' 19' 36' 27'
Source: Cambria County Planning Commission, 1968
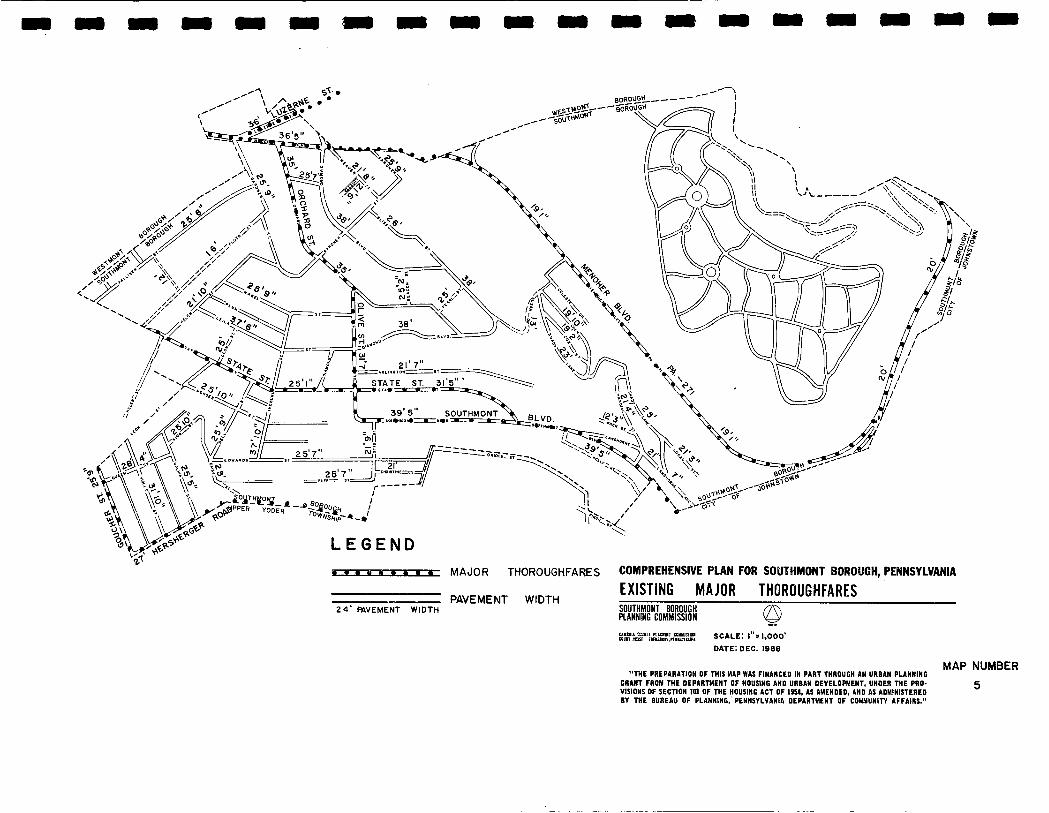
EXISTING MAJOR THOROUGHFARES
Q SOUTHMONT BOROUGH PLANNING COMMISSION
PAVEMENT WIDTH 2 4 ' PPVEMENT WIDTH
UMUU a l l n1Wi CTIIISIUI S C A L E : l " ~ 1,000' mum m IIIIsIL~.~uInw,
D A T E ; DEC. IS66
MAP NUMBER
5 "THE PREPARATION OF THIS MAP WAS FIHANCEO IN PART THROUGH AN URBAH PLANNING
GRANT FROM THE OEPARTMEHT OF HOUSING AND URBAN OEVELOPMEHT, UNDER THE PRO- VISIONS OF SEClIOH 101 OF THE HOUSIHG ACT OF 1954, AS AMENDED. AND AS ADMINISTERED BY THE BUREAU OF PLANHING,' PENNSYLVANIA OEPARTMEHT OF COMMUNITY AFFAIRS."
~ ~ ~~~ ~
= = = = = = m = = = = = = = = = = = =
The second most traveled thoroughfare is Goucher Street which traversesthe western edge of Southmont Borough. The regional collector provides a link with the City of Johnstown to the north via rrD" Street. The street also provides a link to Franklin Street , Westmont and Ferndale Boroughs. Volumesare fairly consistent along Goucher Street, with an increase noted in the vicinity of the golf course , commercial areas, and the Re- habilitation Center.
Goucher Street functions both as a regional collector and as a local collector street , serving the numer- ous local streets which join it , as well as tying together the previously mentioned major activity centers along the hilltop. This street is also maintained by the State as a part of .the FederalAidSecondary Highway System. The basic bituminous construction is in good condition, and the pavement is approximately 26 feet in width.
In addition to the above mentioned State Routes, there is one State Legislative Route in the Borough. Harshberger Road, which connects Goucher Street and the City of Johnstown, is narrow, steep and poorly sur- faced along portions of its route e Harshberger functions as a collector serving the Goucher Street area and the Berkley-Elim residential area where major population densities are found.
Borough Streets:
All streets which are not under the jurisdiction of Pennsylvania Department of Highways are built and maintained by Southmont Borough. Nearly all of the streets maintained by the Boroughaccommodate local traf- fic and function to provide access to activities within the Borough. Most of the traffic on these local streets or- iginates or terminates within the Borough Limits.
Local Collectors in the Borough include: Orchard Street, Oli.ve Street, State Street and Southmont Boule- vard. Pavements widths on the Local Collectors vary from 29 to 32 feet;pavement is of bituminous type and is generally in excellent condition. Volumes along the routes reflect the collectingfunctionandbuildas local streets flow onto the collectors filtering traffic from the Borough onto the regional collectors.
In general , the streets function well in the collector capacity; however, a number of poor safety features are evident along the routes The intersections of Orchard and Olive Street , and Olive and Southmont Boulevard are sharp difficult turns to negotiate safely. Poor sight distances on the turnsarealsoa safety problem. Curb parking along Southmont Boulevard constitutes a source of conflict between through and local traffic which will become more serious a problem as volumes on the street increase.
Y
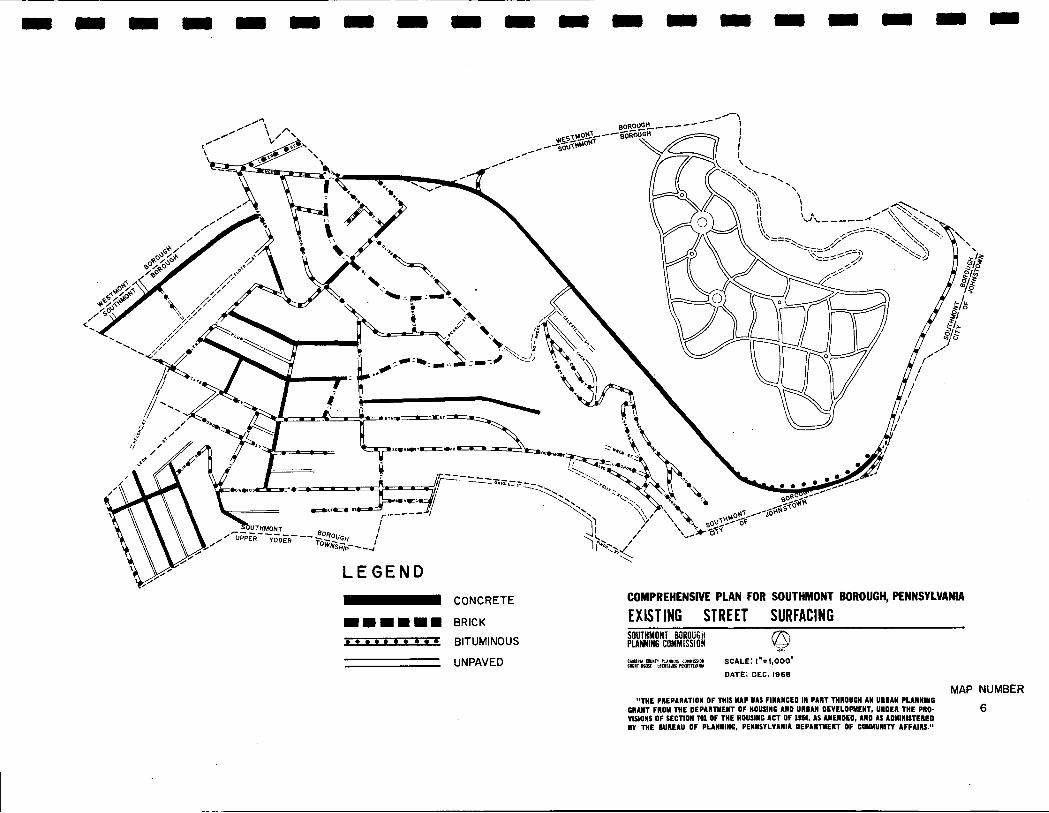
L E G E N D
mmmmmm BRICK EXISTING STREET SURFACING CONCRETE COMPREHENSIVE PLAN FOR SOUTHMONT BOROUGH, PENNSYLVANIA
Q SOUTHMONT BBiiOUGic . . * e * * . . . * BITUMINOUS PLANNING COMMISSION
UNPAVED CIMUU WOll WS4 ann I B t ~ l i . K l ~ ~ ~ 1 uw: w ~ m m SCALE: 1"s 1,000'
DATETE: DEC. IS68
MAP NUMBER
6 "THE PREPARATION OF THIS NAP WAS FINANCE0 IN PART THROUGH AN URBAN PLANNING
VISIONS OF SECTION 101 OF THE HOUSING ACT OF llM, AS WENDED, AN0 AS AOYtNlSTERED BY THE BUREAU OF PLANNING, PENNSYLVANIA OEPARTUENT OF CDWUNlTV AFFAIRS."
GRANT FROY THE DEPARTUENT OF HOUSING AN0 URBAN DEVELOPMENT, UNDER T H E PRO-

2 4 HOUK TWO-WAY COUNT
MAP NUMBER “THE PREPARATION OF THIS MAP WAS FINANCED IN PART THROUGH AN URBAN PLANNING
GRANT FROM THE DEPARTMENT OF HOUSING AND URBAN DEVELOPMENT, UNDER THE PRO- VISIONS OF SECTION 101 OF THE HOUSING ACT OF 1954, AS AMENDED, AN0 AS ADMINISTERED BY THE BUREAU OF PLANNING, PElhSVLVANlA DEPARTMENT OF COMMUNITY AFFAIRS.”
7

Southmont 'Boulevard is the most heavily traveled local collector with volumes ranging from 2,800 at the intersection of Otis Street to 4,000 at the eastern Borough limits. The 2 000vehicle volume on Olive Street and the 1,900 vehicles on State Street flow onto Southmont Boulevard. The building of volumes on Southmont Boule- vard reflects the traffic collected by State and Olive Streets a s well as "short cutff traffic passing through the Borough from the hilltop area to the valley floor.
The intersection of the local collectors and Regional collectors constitutes a problem in terms of safe efficient circulation. The intersection of Southmont Boulevard and Franklin Street is a particular problem. In addition to t raffk on Southmont Boulevard the intersection must accommodate turning movements of vehicles from Roxbury Avenue Harshberges Road and Barnett Street Operating problems in the area of the intersection usually result from the wide undefined turning move.ment conflicts a.nd proximity of intersecting streets There a r e two other intersections located- within 300 feet. of the intersection.
The remaining local streets :,iovrde access to the residential uses throughout the Borough. These streets a r e primarily bituminous and bi ick pa uement The capital improvement program in the later phases of the study will recommend a maintenance and improvement schedule for this local street system. It is important that the planning commission and council ctmshntly inspect and review all development proposals to guarantee that the new streets will be in accordance with sound design and planning principles. By constantly monitoring street conditions and new developments, a c8,pital improvement and maintenance program can be developedfor improv- ing Borough streets within the fiscal resources available

UTI LIT1 ES AND COMMUNITY FAG I I I TI E S
INTRODUCTION
The purpose of this section is to describe the services and facilities which a re provided by the Borough to its residents. The various commun- ity facilities and utilites located throughout Southmont Borough that provide the citizens with services will:be analyzed and discussed. Facilities such as schools, fire stations, recreation sites; municipal buildings, and other related institutions are those to be dealt with incontext of this section. To this list are added the various utility services, both public and private, that provide water, g a s , electkicity, sewage disposal, and refuse collection
*. zkbasic to the gen- era1 welfare and economic prosperity of=nd should therefore be continually improved and extended to maintain an optimum level of service and ‘bperation.
_ . .
throughout the Borough. All of thecam :. .\ -*

COMMUNITY FACILITIES
EXISTING SCHOOLS
Southmont Borougll, Westmont Borough, and Upper Yoder Townsllip are joint members of the Westmont Hilltop School District. Southmont's entry into the Westmont School District took place in 1950 under the com- bined efforts of the Westmont Borough, Upper Yoder Township, and Southmont Borough School Boards. In 1965, the entire school system was consolidated under one jurisdictional board known as the Westmont Hilltop School Board.
Under the existing system, the school board members are elected at large and are responsible for the formation of policy and operation of the schools throughout the system. In addition to the operation of schools, the school board serves jointly with the Township and Borough councils on the recreation commission to provide supervised recreation programs in the district.
EXISTING SCHOOL BUILDINGS
The Southmont Elementary School is situated on a 5.6 acre plotboundedby State, Thorburn, and Wonder Streets. Erected in 1924, the two-story brick structure contains 24 classrooms, a cafeteria, and a combination auditor ium-gymnas ium .
Play equipment is used by the students and also in the summerrecreationprogram. The capacity of the building is 700, and present enrollment figures reflect a good atmosphere inthat thereare now 629 students at- tending grades 1-6.
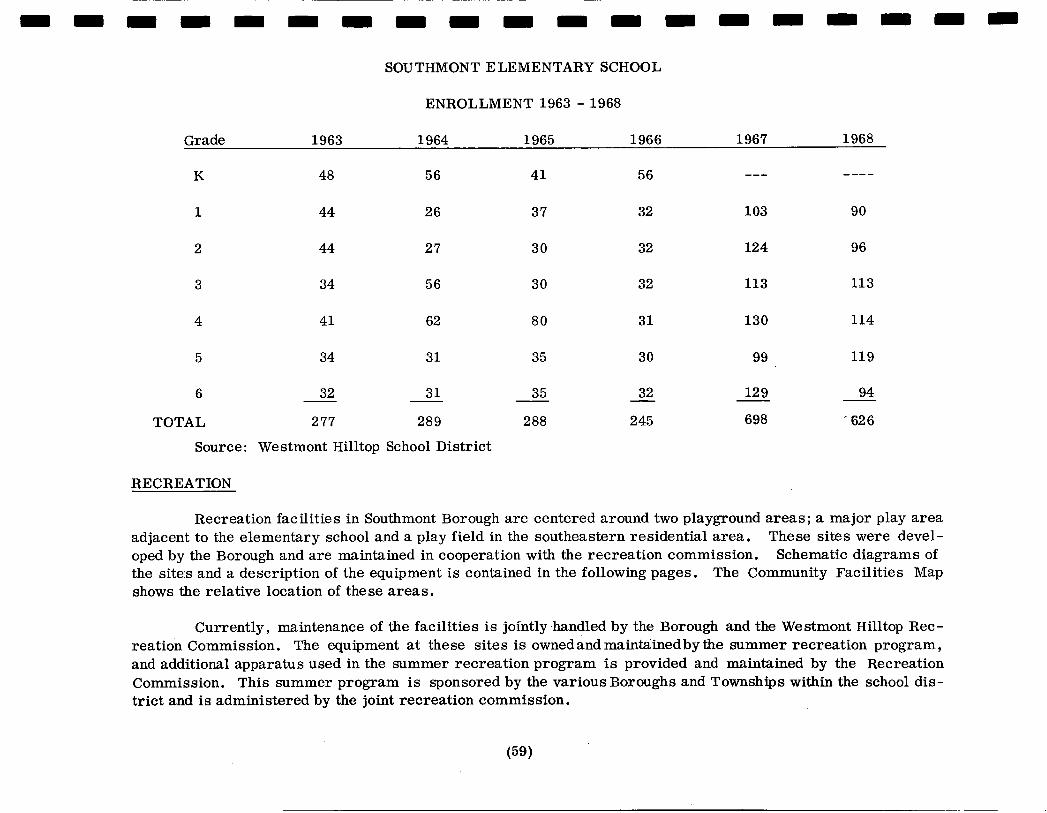
SOUTHMONT ELEMENTARY SCHOOL
ENROLLMENT 1963 - 1968
Grade 1963 1964 1965 1966 1967 1968
--- ---- K 48 56 41 56
1 44 26 37 32 103 90
2 44 27 30 32 124 96
3 34 56 30 32 113 113
4 41 62 80 31 130 114
5 34 31 35 30 99 119
6 32 31 35 32 12 9 94
TOTAL 2 77 289 288 2 45 698 ‘626
-
Source: Westmont Hilltop School District
RECREATION
Recreation facilities in Southmont Borough are centered around two playground areas; a major play area These sites were devel-
Schematic diagrams of The Community Facilities Map
adjacent to the elementary school and a play field in the southeastern residential area. oped by the Borough and are maintained in cooperation with the recreation commission. the site:s and a description of the equipment is contained in the following pages. shows the relative location of these areas.
Currently, maintenance of the facilities is jointly .handled by the Borough and the Westmont Hilltop Rec- reation Commission. The equipment at these sites is ownedand maintainedby the summer recreation program, and additional apparatus used in the summer recreation program is provided and maintained by the Recreation Commission. This summer program is sponsored by the various Boroughs and Townships within the school dis- trict and is administered by the joint recreation commission.

0 0 C 4 z 3 0 2 4
ILLUSTRATION I .
SOUTHMONT BOROUGH EXISTING RECREATION FACILITIES LANGHORNEAVENUE PLAYGROUND
Type of Park: Playground Active Recreation
Age Group: 5-15
Service Area: Overbrookarea of Southmont ,3-5 block radius
Size of Lot: Approximately 99' x 98' 9,134 Sq. Ft.
Owned By: Southmont Borough
Equipment and Facilities :
Shelter (12 x 12 I) Basketball Area (Half Court , paved) 3 swings 2 Chair Swings
Program and Supervision:
0
P 7
H A R D I N G S T. r source: Cambria County Planning Commission
During the mmmer months, a recreation program is conducted by the Westmont Hilltop Recreation Cornniissim under the sponsorship of Southmont Borough.
Operation and Maintenance :
Maintenance of the facilities is jointly handled by the Boraugh and the Recreation Commission. The equipment is owned and maintained by the Borough, while additional equipment is provided and maintained bv the Reereanen Commissicm for the summer program.

x
SOUTHMONT BOROUGH EXISTING RECREATION FACILITIES SOUTHMONT SCHOOL PLAYGROUND
WONDFR
. . ~.
r 1 Type of Park:
Service Area:
Playground Active Recreation
Entire Southmont Area except for northern extreme adjacent to Monoher Blvd. Play sites and southeast corner which is serviced by Langhorne Street play- ground. 1 - 12 block radius.
Size of Lot: 860' x 300' 255,650 sq. ft . Equipment & Facilities: 1 volleyball court; 1 basketball court (2
baskets); 12 swings; 6 teeter-totters; 1 merry- go-round; 1 jungle gym; 1 slide; 1 ball field (with backstop); 1 football field.
Age Group: 5 - 15
Source: Cambria County Planning Commission
Program Supervision: During the summer months a rezreat:cr program is conducted by the Westmont Hiirltc,~ Recreation Commission under the sponsorship of Southmont Borough.
Operation & Maintenance: Maintenance of the facilities is jointly handled by the Borough and the Keci-etlticn Commission. The equipment is ~wne i i and cih- tained by the Recreation Commission for the Sumrnar program.

The following standards a r e suggested and should be adopted in formulating future recreation pro- grams. These standards a re based upon recommendations of thehational Recreation'Association which Point out that various local factors will influence the scope of each program indiffereniareas and should therefore be adjusted accordingly.
Recreation Area Standards
~~~ ~
Facility Age Group Site Size Area Served Location Site Facilities
Play lot Up to 6 10,000 1 block or Limited Play apparatus or Tot years sq. f t . 1/8 mile Neighbor - suitable for Lot hood small children
Play- 5 -15 8-10 Residential N e a r Apparatus a reas , ground years acres neighborhood Center of open playfields,
(1/2 mile service c our t game s radius) area or
adjoining elementary school
Playfield
Parks
Young 15-25 People acres and adults
All age 20-50 groups acres
Approxi- mately 1 mile
Munici- pality
Court & field games , parking
N e a r Jr. or Sr . High School to and family serve 3-5 areas neighbor hoods
Easily Game areas , reached by pool, picnic, entire se r - trails vice area
Source: National Recreation Association

These standards will be adapted to meet local conditions prior to formulating specific proposals. Fi- nancial limitations and population density patterns may result in multi-purpose facilities, but the above stan- dards will serve as a guide for a comprehensive recreational planning approach to meet Borough needs.
In genera, the recreation sites in Southmont are distributedproportionally with the population. South- mont School playground serves the western portion, while the smaller Langhorne Street Playground accom- modates the southeast corner of the Borough. In addition, the extreme northern section of Southmont uses facilities in the Westmont area.
Both playgrounds conatin facilities which are primarily used by young people in the 5 to 15 yearage group. Approximately 17.4% of the total Borough population falls within this age category, and from the standpoint of population composition, the facilities accommodate the largest single age group. Location of the sites are quite favorable in that nearly all portions of the Borough are within walking distance of one of the playgrounds.
Perhaps a deficiency worthy of note is the apparent lack of tot-lot facilities with play apparatus designed primarily, to provide recreational opportunity for pre-school children. Similarly, recreation facilities for persons beyond teen-age years are not available within the Borough. But facilities within the Johnstwon area are accessible, such as the Municipal Golf Course and Roxbury Park, to name a few.
PROTECTION TO PERSONS AND PROPERTY
Police Protection:
The Southmont Borough Police Force is headquartered in the municipal building at 101 Thoburn Street. This force includes a full-time chief, one full-time officer, and a part'-time officer.
Equipment includes a 1968 Chevrolet police- d q equipped with first aid supplies police radio, and other operation equipment. Al l officers a re fully-equipped, and, inaddition, there a r e complete riot out- fits for six men.
Southmont Borough is a member of the Suburban Police Association andas such is tied into the cen- tral communication system. Under the agreement, all calls are received by the control dispatch and are relayed to the Southmont Borough officer on duty. The police car radio and the municipal building radio are the principal communication media. Working agreements 'have -been established with participating members to facilitate reciprocal authority. In addition to providing central communication and sponsoring educational programs, the association has enhanced cooperation between the police organizations in the Greater Johnstown Area a
Fire Protection:
Fire protection is provided by the Borough's volunteer fire company, In addition, this organization has cooperating agreements with fire companies in adjacent municipalities, which facilitate reciprocal pro- tection.
The fire company is located inthe Municipal Building at 101 Thoburn Street. The company is com- prised of about 30 active men; all those participating serve without pay and are trained in fire fighting, equipment operation, and first aid procedures.
There are three pieces of fire fighting equipment in the organization. They include a 1947La France 500 gallon pumper, a 1952 squad ca r , and a 1965 emergency squad truck
WATER AND SEWAGE FACILITIES
Southmont Borough's water and sewage facilities are maintained by the Greater Johnstown Water Authority and the Johnstown Municip.1 Authority, respectively, The quality of service of these a1ithorifii8s combined with the expected little or no development in Southmont Borough m k e s Southmont's water and sewage facilities more than adequate for the present and future years.

4. P L A Y F I E L D
5. PLAYGROUNr MUNICIPAL BUILDING
I. BOROUSH (MUNICIPAL OFFICE) A SEMI-PUBLIC
6. FIRST CNURCH O F CHRIST T H E SCIENTIST
7. OVERBRODK E.U.B. CHURCH
8. GRANOVIEW CEMETARY
FIRE STATION
2. SOUTHMONT STATION
SCHOOLS
3. S O U T H ~ D N T JUNIOR wen c? 9. SOUTHMONT VETERINARY HOSPITAL
COMPREHENSIVE PLAN FOR SOUTHMONT BOROUGH, PENNSYLVANIA
EXISTING COMMUNITY FACILITIES SOUTHMONT BOROUGH PLANNING COMMISSION
i i i i i t i N Y l T "Duy wri 1l l"fWE PLIIII~ ,tw,,mll* cnmmlor SCALE: 1". 1,000'
DATE: DEC. IS66
MAP NUMBER 8
"THE PREPARATION OF THIS MAP WAS FINANCED IN PART THROUGH AN URBAN PLANNING GRANT FROM THE DEPARTMENT OF HOUSING AN0 URBAN DEVELOPMENT, UNDER THE PRO- VISIONS OF SECTION 101 OF THE HOUSING ACT OF 1954, AS AMENOEO, AND AS ADMINISTERED BY THE BUREAU OF PLANNING, PENNSYLVANIA DEPARTMENT OF COMMUNITY AFFAIRS."

D m n
Southmont has expanded in population in the last thirty years. In fact, there was a 25.4% population increase from 1950 to 1960. But at present, 85% of all land in the Bmough is developed. Oftheremaining 15%, 9% is wooded and too steep for any residential, industrial, o r commercial development, and the remain- ing 6% is scattered vacant lots throughout the already developedparts of the Borough. Any substantial pop- ulation growth will thus be in the form of multi-family developments, notably apartments. In any event, no major water o r sewer facility construction will be necessary in Southmont. The projected population figures for Southmont are 3,149 residents in 1975 and 4,447 residents in 1990. Newbuildingswill be easily tiedinto the existing systems. It is difficult to speculate when this new constructionwill result, however, .as far as industrial developinent in the Borough is concerned, there will be none because of the limited land available.
Public water is supplied by t%e Greater Johnstown Water Authority. The location of existingwater lines and storage facilities is shown on the Existing Water Lines Map. The entire*systelfa of lines throughout the Borough is approximately 11 miles in length.
This authority serves an area of 110 square miles with a population of about 107,000 people, as of 1960. Southmont itself consists of about 1 square mile andapproximately 3,000 persons. The condition and extent of the present water distribution system is such that it will accommodate anticipated future develop- ment. A s mentioned previously, new lines will not have to be built because of the highrpercentage of land already developed.
Southmont's water distribution system is operated and maintainedby the Greater Johnstown Water Au- thority, and thus the participation of Southmont from a operational point of view.
Water rates are also established by the authority. There are two basic rate structures, the gravity system and the pumping system, although practically all the water in the BDrough is pumped. The schedule of rates on a quarterly basis i s as follows:
First 3,000 Gal. or less Next 3,000 Gal. Next 14,000 Gal. Next 80,000 Gal. Next 100,000 Gal. Next 100,000 Gal. Next 100,000 Gal. All Over 400,000 Gal.
Gravity $3.84
1 .11 per 1,000 gal. .90 per 1,000 gal. .62 per 1,000 gal. .38 per 1,000 gal. .28 per 1,000 gal. .22 per 1,000 gal. .187 per 1,000 gal.
Pumped $4.80 1.41 per 1,000 gal. 1.19 per 1,000 gal.
.86 per 1,000 gal.
.61 per 1,000 gal.
.47 per 1,000 gal.
.38 per 1,000 gal.
.31 per 1,000 gal.
Source: Greater Johnstown Water Authority

LEGEND -WATER LINES
0 FIRE HYDANT
0 WATER TANK
COMPREHENSIVE PLAN FOR SOUTHMONT BOROUGH, PENNSYLVANIA
EXISTING WATER LINES
Q SOUTHMONT BOROUGH PLANNING COMMISSION CMI111 ( P Y I T I PLLIlII6 CO11W411111 mun nm ~ I ~ N S I U ~ , ~ ~ S ~ ~ W ~ SCALE: I ‘I= 1 , 0 0 0 ‘
DATE: DEC. IS68
. MAP NUMBER “THE PREPARATION OF THIS MAP WAS FINANCED IN PART THROUGH AN URBAN PLANNING
VISIONS OF SECTION 1D1 OF THE HOUSING ACT OF 1150, AS AYIEHDED, AN0 AS AOMINISTEREO I IV THE BUREAU OF PLANNIHG, PEHNSVLVANIA DEPARTMENT OF COWUNIlY AFFAIRS.”
GRANT FROM THE DEPARTMENT OF HOUSING ANO URBAN DEVELOPMENT, UNDER THE Pno- 9

SEWAGE FACILITIES
Southmont sewage facilities a r e also adequate for future needs. The Borough is served by the Johns- town Municipal Authority, which began in 1961 with the completion of a treatment plant. The Municipal Author - ity serves a total population of 112,641 (1960census) in an area of 96.2 square miles; 19municipalities includ- ing Southmont are serviced by the authority. At present, there are over 12 miles of sewer lines in Southmont i
1 Borough. i
I The Sewage Treatment and Sludge Incinerator Plant of the Johnstown Municipal Authority has a rated
flow capacity of 12.0 M. G.D. (million gallons per day) to serve a 1980 estimated population of 120,000 per- sons.
i i
The plant provides primary treatment of sewage by prechlorination for odor-*control; screening and comminution of solids; pre-aeration for dissipation of volatile material, buildup of oxygen content and forma- tion of floc ; primary sedimentation for removal of settleable solids and floating matter; sewage flow measure- ment; and post-chlorination for sterilization of the treated sewage, which is discharged to the Conemaugh Riv- e r in liquid form.
l
The facilities were designed to remove practically all settleable solids in the sewage; to removeat least 35% of the organic pollution load, as measuredby thebiochemical oxygen demand test; to provide satis- factory disposal of sludge; and to produce afinal .treated effluent siiitable for dischapge into the Conemaugh Riv- er , under a construction and operation permit of the Sanitary Water Board of the Commonwealth.
The sewer system in Southmont isa separate system throughout the Borough. varies throughout the sewage system, but the main trunk lines are 60" in diameter.
The size of interceptors
There are no planned sewage facilities in the near future. Construction in July, 1969, eliminated the last public areas using on-lot systems, those on Palliser Street. At present , the only on-lot systems remain- ing in the Borough are on Peden Lane, which isprivate property. These septic tanks, however, have been examined by the Borough and present no health hazards.
The present sewer system was begun as early as 1919. Since that original date of construction, exist- ing lihes were added throughout the Borough as the need arose. Southmontfirst tapped into the Johnstown sew- age system in 1928. From that year until 1961, the JohnstownMunicipal Authority came into effect, Southmont tapped into the City system at a rate of $10 per tap. Now, however , the standard municipal authority ra tes are in effect.

EXISTING SEWER LINES - 12" LINE OR OVER
Q SOUTHMONT BOROUGH - UNDER t2" LINE PLAMING COMMISSION cwu mmwm rn~ fIUtDIT.rfUlnU1 n- mmsm SCALE: I"= 1,000'
DATE: DEC. lesa
"THE PREPARATION OF THIS '!AP WAS FINANCED IN PART THROUGH AN UREAN PLANNING GRANT FROM THE OEPARlUEI. OF HOUSING AN0 URBAN OEVELOPIIEWT. UNDER TH€ PRO-
BY THE EUREAU OF PLANNING, PENNSYLVANIA OEPARTMENT OF COWUNllY AFFAIRS."
MAP NUMBER IO VISIONS OF SECTION m OF THE HOUSING ACT OF M. AS UIENOEO, AND AS LOMINISTEREO
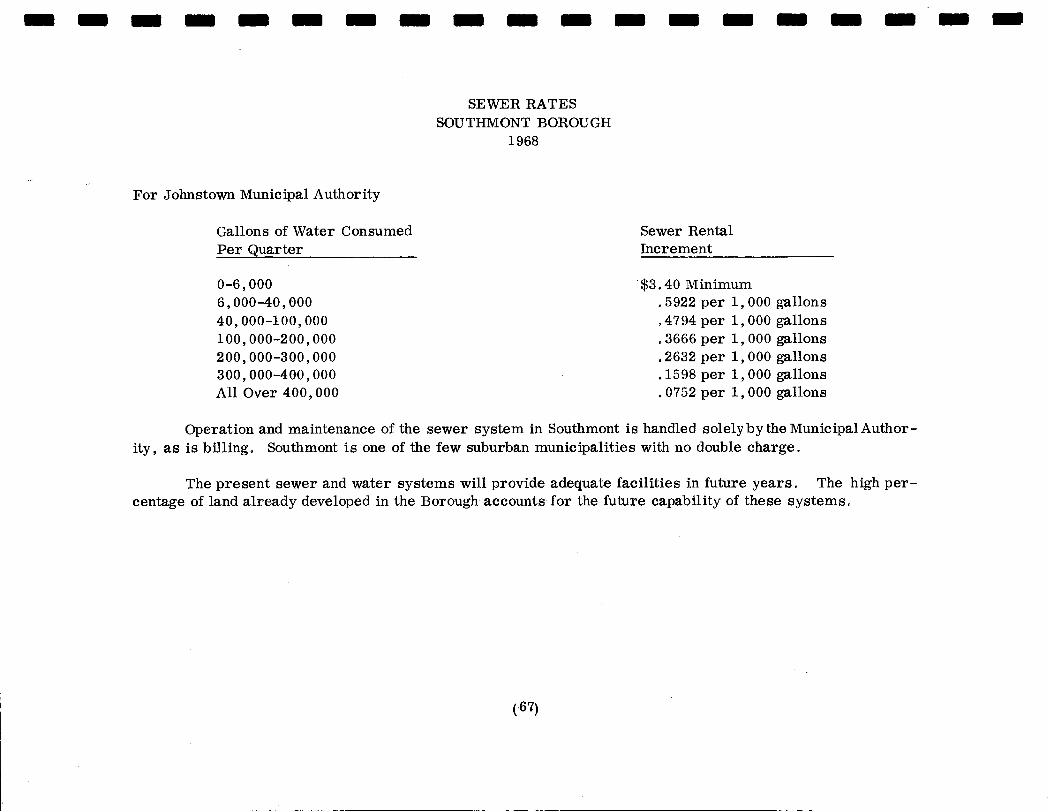
SEWER RATES SOUTHMONT BOROUGH
1968
For Johnstown Municipal Authority
Gallons of Water Consumed Per Quarter
0-6,000 6,000-40,000 40,000-100,000 100,000-200,000 200,000-300,000 300,000-400,000 Al l Over 400,000
Sewer Rental Increment
' $3.40 Minimum .5922 per 1,000 gallons .4794 per 1,000 gallons 3666 per 1 ,000 gallons
e 2632 per 1,000 gallons e 1598 per 1,000 gallons .0752 per 1,000 gallons
Operation and maintenance of the sewer system in Southmont is handled solely by the Municipal Author- ity, as is billing. Southmont is one of the few suburban municipalities with no double charge.
The present sewer and water systems will provide adequate facilities in future years. centage of land already developed in the Borough accounts for the future capability of these systems.
The high per-

FISCAL ANALYSIS

INTRODUCTION
The purpose of the Fiscal Analysis is to provide information to the Planning Commission members and Borough Commissioners onpast finanr cial operations of the Borough analyze current revenue and expenditures, determine applicable regulations of fiscal management within the context of the Borough Code;, to provide a basis for future fiscal policy and determine future capital improvement potential. The fiscal operation ofSouthmont Borough is governed by the provisions of the Borough Code under Article XIII "Taxation and Finance". Information contained in this report has been obtained from Purdons Pennsylvania Annotated, "Title 53 Municipal and Quasi-Municipal Corporations" a s supplemented by 1967 Cumulative Annual Pocket Part for use during 1968. Other data has been derived from County tax records and Southmont Borough Financial Reports.

ASSESSED VALUATION
One of the major local sources of revenue to Southmont Borough is its real estate tax which is levied on the basis of the assessed valuation of taxable property.
The assessed valuation is 35% of the market value of real estate as determinedby the County Assessment Office through an equalized assessment program.
Assessed valuation increases for Southmont Borough during the period 1962 to 1967 a re shown on Table XXII.
TABLE XXII
A SSE SSED VA LU AT ION
1962 - 1967
1962 1963 1964 1965 1966 1967 Assessed Valuation 5,055,390 5,064,140 5,080,420 5,084,420 5,103,770 5,137,670
Per Cent Increase 0.17% 0.32% 0.08% 0.38% 0.66%
Tax Rate (Mills) 10 1 0 1 0 10 12 12
Source : Southmont Borough Financial Statements

RECEIPTS
The Borough Council has the power, by ordinance, to levy anc collect annually, a tax, not exceed,,ig twenty- five mills for general Borough purposes and in addition thereto any of the following taxes:
To pay interest and sinking fund charges on the indebtedness of the Borough,
To provide for pensions, retirement or the purchase of annuity contracts for Borough employes, not exceeding one-half mill ,
To defray the cost and expenses of caring for shade trees as provided, and expense of publishing the notice not exceeding one-tenth mill,
For lighting and illuminating the streets, highways and other public with electric light, gas light or other tlluminant, not exceeding eight mills,
places
For gas, water and electric light , not exceeding eight mills, such additional millage is permitted only following a favorable referendum on the matter held in accordance with the act of April 16, 1875 (P.L. 55), as amended,
For the purchase of fire engines, fire apparatus and fire hose for the use of the Borough, or for assisting any fire company in the Borough in the purchase, renewal or repair of any of its fire engines, fire apparatus or fiYe hose, or for the purchase of land upon which to erect a fire house, or for the erection and maintenance of a fire house or fire houses, not exceeding three mills, such additional millage permitted only following a favorable referendum on the mat- ter held in accordance with the provisions of the Act of April 18,1923 (P. L. 70 ), as amended,
For building a fire house lockup and/or municipal building, not exceeding two mills, such additional millage permitted only following a favorablG Refer - endum on the matter held in accordance with the A c t of May 4, 1927 (P.L. 673),
To establish and/or maintaina local library or to maintain or aid in the mainten- ance of a local library established by deed, gift or testamentary provision, for the use of the residents of the borough, not exceeding three mills, such -addi- tional millage permitted only following a favorable referendum on the matter held in accordance with the A c t of June 14 1961 (P. L . 324).
The said taxes shall be levied on the dollar on the valuation assessed for County purposes, as now is o r may beprovided by law. Al l real property, offices, professions and persons, made taxable by the laws of this Commonwealth for County rates and levies may at the discretion o manner for such purposes.
In addition, the Borough Council may levy a special tax to create and maintain a fund for permanent street improvements. This tax is not to exceed five mills on thedollar in any one year. Whereprior col- lections are made, property owners may receive credit for taxes paid against their assessment for improve- ments made. Furthermore, the Borough Council must levy a special tax if there is insufficient funds to pay the debts incurred by the Borough.
Southmont's present tax rate on real estate property is 12 mills. The maximum tax rate, not includ- ing any of the previously listed taxes, is 25 mills. Therefore the Borough can increase the existing tax rate by 13 mills plus any of the forementioned taxes and special taxes.
Table XXIII, Receipts, 1962-1967, indicates that approximately one-thirdof the total receipts for each year were derived from real estate taxes. Approximately another third of the total receipts include non- revenue receipts, licenses, fine forfeits, gifts and grants, departmental earnings, payroll deductions, and sewer fund.
It is anticipated that the Earned Income Tax and Per Capita Tax will continue to increase in impor- tance as wages rise and employment opportunities expand in the Greater Johnstown area. The reliability and ease of collection makes the Earned Income Tax an attractive means of diversifying tax revenues to in- clude those residents of the Borough who earn wages. The tax also helps to diversify the taxbase by.in- cluding wage earners rather than total reliance on property ownerhsip as the basis for the local government revenues.
Grants and payments from other sources have been sporatic in terms of their contribution to the rev- enue receipts of Southmont Borough. The scale of the Borough'sfinancial operations does not lend itself to repeated grant application. Grants have been received for a specific purpose or project which was conceived and implimented in a given year. Long-range capital financing of major improvements would enhance the Township's ability to receive grants on a more systematic and regular basis. Again, the scale of the fin- ancial operations makes many grant programs impractical because of'the high cost of application preparation in relation to the amount of grant funds received.
Licenses, fines and interest have accounted for an extremely small portion of the Borough's revenues. Generally, these revenues cover costs for administering codes, ordinances and so forth, and as seen a re not true revenue producing items. A s the Borough adopts and administers additional local regulations the rev- enues derived from fees should provide sufficient funds to cover costs; however, it isnot anticipated that sub- stantial net revenues will be generated.
If additional revenues ever become necessary in the future, the tax ra te can be increased up to 25 mills and special purpose taxes can be assessed.

l.st Cash 1962
t Beginning 12 , 990
REVENUE RECEIPTS
TAXES
Current Prior Years
License s Fine Forfeits Interest and Rent Grants and Gifts* Departmental Earnings Motor License Fund** Public Utility Entp.*** Other Revenue Receipts
Earned Income Tax Per Capita
46,593 2 , 089
422 2 75 116
*7,458
**246 1 853
41 , 783 (33 143)
3,454
(8 Y 319)
Total Revenue Receipts 104,289
Non Revenue Recepts 44 , 751
TOTAL RECEIPTS 149 , 040
1963 5 , 010
47 , 637 2; 953
458 178 178
8 , 000 6 , 495 **245 1 , 989
49 , 401 (33 , 143)
(8 Y 321)
117,443
55 , 174
172 , 617
TABLE XXIII
RECEIPTS
1962 - 1967
* Motor Licenses Fund ** Payroll Deductions
*** Sewer Fund
Source: Southmont Borough Financial Statements
1964 16 , 622
47 , 701 1,818
'455 363 235
34 , 968 **251 1 , 970
50 , 669 (34,388)
(8 Y 160)
138,420
14 , 562
152 , 982
(73)
1965 11,425
47,162 1 , 994
25 7 851 288
78 7,779 **252 2 , 156
54,616 (35 , 767)'
(8 Y 007)
115,433
16,000
131 433
1966 18,305
57,402 2 , 587
422 604 3 74
16 , 466 2 , 615
79 , 039 (39,863)
(8 Y 256)
159,509
75 , 294
234,803
1967 11 , 703
57,699 2 , 622 1 023
463 12
22 , 357
58 , 969 (41,967)
(8,269)
143 , 145
47 , 555
190,000

DEBT LEVEL
All boroughs are restricted by the Pennsylvania Constitution to a maximum debt limit, o r amounty they may borrow. Prior to 1967, the Borough Council could borrow up to a maximum of 2% of the assessed valua- tion of borough property; and the borough debt could have increasedto a maximum of 7% if submitted to the vot- ers and a majority of the electors voting gave approval. A s of 1967 the councilmanic debt limit of 2% has been increased to 5% of the assessed valuation of borough property. Also the debit limit by action af tlie electors of 7% has been increased to 10%. This makes a total debit limit of 15%.
The outstanding indebtedness as of 1967 is shown on Table XXIV. This table includes a comparison of the debt limit to which the borough may borrow and its indebtedness for each year. Southmont's indebtedness is not beyond the possibility of potential increase if special programs so demand.
The period from 1962 to 1967 has been one of responsible financial operation for the Borough insofaras management of debt is concerned. The limited use of the Borough'sability to deficite finance is a reflection of a conservative FiscaI Policy during the period. A conservative debt policy is fine so long as the necessary equipment, facilities, services and uses for Borough residents can be provided without deficit financing. A conservative policy which prohibit the development and improvement of de sired and needed facilities is obviously an economic fallacy. Delaying the development of needed facilities until they can be cash financed f s a-desirable means; however, all too often the means do not result in the desiredobjectives and particularly if capital budget provisions are not utilized.
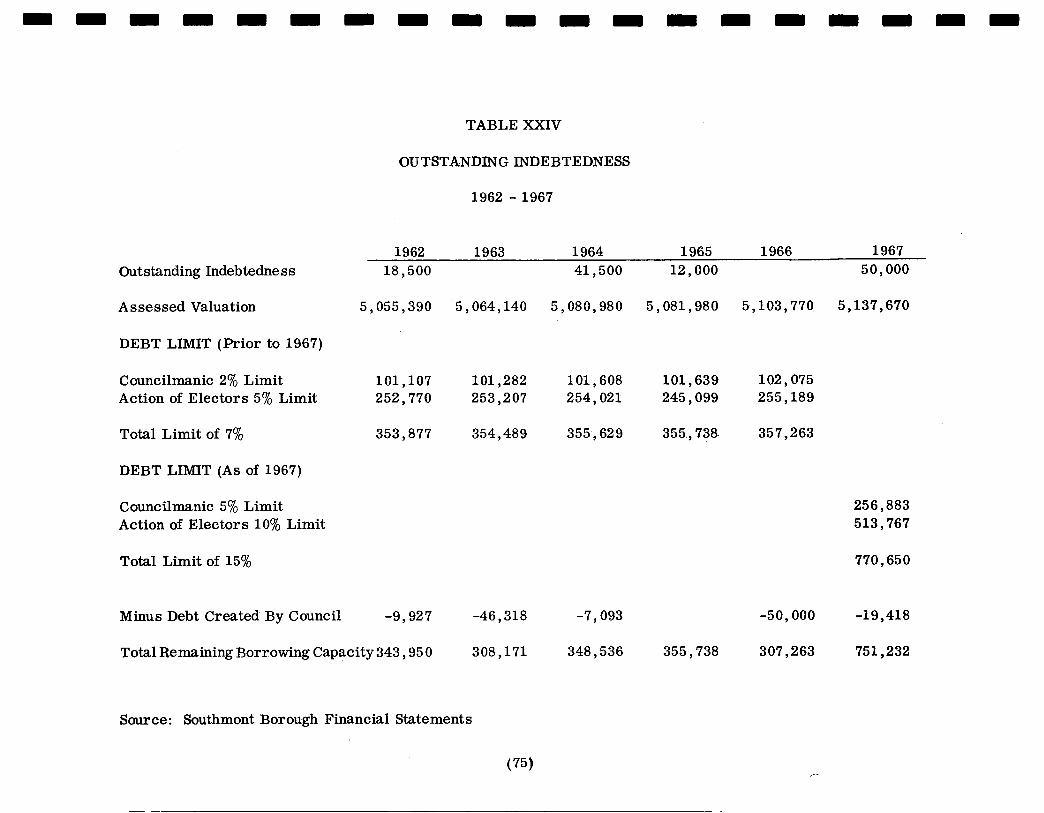
Outstanding Indebtedness
Assessed Valuation
DEBT LIMIT (Prior to 1967)
Councilmanic 2% Limit Action of Electors 5% Limit
Total Limit of 7%
DEBT LIMIT (As of 1967)
Councilmanic 5% Limit Action of Electors 10% Limit
Total Limit of 15%
TABLE XXIV
OUTSTANDING INDEBTEDNESS
1962 - 1967
1962 1963 1964 1965 1966 1967 18,500 41 , 500 12 ) 000 50,000
5,055,390 5,064,140 5,080,980 5,081,980 5,103,770 5,137,670
101,107 101,282 101, 608 101,639 102,075 252,770 253,207 254, 021 245, 099 255,189
353, 877 354,489 355,629 355, 738 357,263
256,883 513,767
770,650
Minus Debt Created By Council -9,927 -46,318 -7,093 -50,000 -19, 418
Total Remaining Borrowing Capacity 343 , 95 0 308,171 348, 536 355, 738 307,263 751,232
Source: Southmont Borough Financial Statements
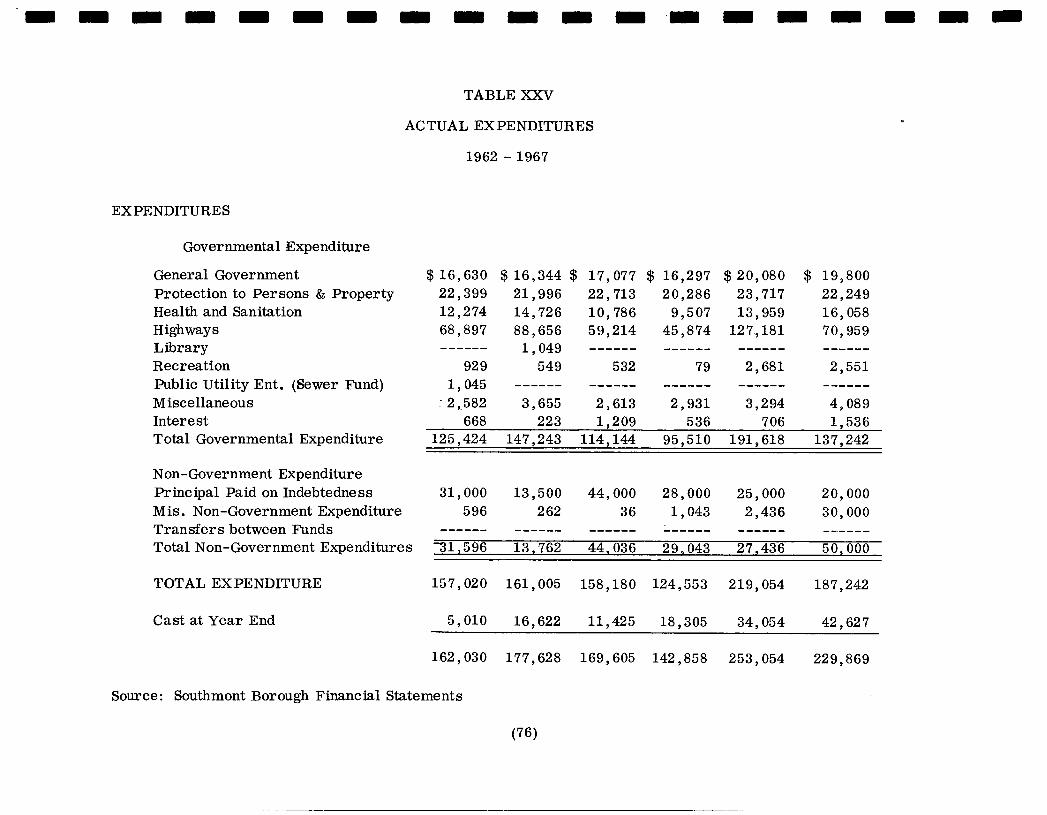
TABLE XXV
ACTUAL EXPENDITURES
1962 - 1967
EXPENDITURES
Governmental Expenditure
General Government Protection to Persons & Property Health and Sanitation Highways Library Recreation Public Utility Ent. (Sewer Fund) Miscellaneous Interest Total Governmental Expenditure
$16,630 22 , 399 12,274 68 , 897
92 9 1 , 045
- 2,582 668
------
$ 16,344 $ 17,077 $ 16,297 21,996 22,713 20,286 14,726 10,786 9,507 88,656 59,214 45,874
1,049 ------ ------ 549 532 79
3 , 655 2 , 613 2 , 931 223 1.209 536
------ ------ ------
$ 20,080 23 , 717 13 , 959
127,181
2 , 681
3,294 706
------
------
$ 19,800 22 , 249 16,058 70,959
2 , 551
4,089 1 - 536
------
------
125,424 147,243 114,144 95,510 191,618 137,242
Non-Government Expenditure
Mis. Non-Government Expenditure 596 2 62 36 1 , 043 2 , 436 30,000 Transfers between Funds ------ Total Non-Government Expenditures 31,596 13,762 44,036 29,043 27,436 50,000
Principal Paid on Indebtedness 31,000 13,500 44,000 28,000 25,000 20) 000
------ ------ ------ ------ ------
TOTAL EXPENDITURE 157,020 161,005 158,180 124,553 219,054 187,242
Cast at Year End 5,010 16,622 11,425 18,305 34,054 42 , 627
162,030 177,628 169,605 142,858 253,054 229,869
Source : Southmont Borough Financial Statements
EXPENDITURES
Expenditures, during the period from 1962-1967 varied from $157,020 in 1962 to $219,054 in 1966. The high expenditure in 1966 was due to a large capitol outlay for the reconstruction of Southmont Boulevard. And therefore does not reflect a normal expenditure year. For the period from 1962 - 1967 normal expenditures increased by approximately $30,000 this represents a 19% increase for the six year period or approximately 2*3% per year. The modest increase inexpenditure isprimarilydue to in- creased salaries and wages and increased cost of material and the Borough's participation in new endeavors and responsibilities.
General Governmentexpenditures increased slightlyduringthe periodfrom 16,630 in 1962 to 19,800 in 1967. The expend- iture includes the salaries and general administration cost for local government and in 1967 General Government accounted for about 10.6% of the total expenditure. Because of the limited number of full employees, it is anticipated that expenditures of the General Government category will remain stable in the forseeable future.
Protection to persons and property includes expenditures for Police Protection Fire Protection, and Code Enforcement. Because the Borough has a 'Volunteer Fire Company and does not administer a code enforcement program, expenditures in the
In 1967, the expenditure for Protection to Personsand Propertyamounted to$22,249 or 11.9% of the total expenditures. Increases in this expenditure can be anticipated in the future as the salaries and number of policemen increase in response to public de- mand for more and better police protection. In addition, the enforcement of protective codesand ordinance will be a necessity in the Toreseeable future.
category a re primarily devoted to Police Protection. Expendituresfor the category was virtually stable during the period.
Health and sanitation expenditures increasedby 30.8%from$12,274 in 1962 to $16,058 in 1968. It is anticipated that this expenditure will continue to increase as aresu l t of State Legislationand increased local demand for health and sanitation services. Joint municipal cooperation in areas such as solid waste management will help to provide an adequate level of service at a lower cost; however , the past levels of expenditure is not possible in the future because of changing requirements for health and sanita- tion services of local government.
Highway expenditures has been the largest single source of outlay for the Borough of Southmont. In terms of total expen- diture, highways have ranged from a high 58% in 1966 to a low of 36.8% in 1965. The expenditure of $127,181 in 1966 is a result of a major capitol outlay of approximately $60,000 for the reconstruction of Southmont Boulevard.
Library expenditures have been all but non existant in Southmont's fiinncial operation. During the period, the only library expenditure recorded was $1 049 in 1962. The proposed construction of a new regional library will result in a demand for addi- tional local support for the project. It is anticipated that the new regional facility will be equCtabIjr supportedby all municipalities in the Greater Johnstown Area. A half-mill tax would represent an annual contribution of $2 , 500 from Southmont Borough. It is anticipated that Southmont Borough will participate in the construction of a new regional library and contribute approximately $2,500 annually to the capitol cost of the proposed new facility.

Recreation expenditures have experienced wide fluctuations from a low of $79 in 1965 to a high of $2 , 681 in 1967 Prior to 1966, recreation expenditures constituted less than 1% of total expendihres and s h c e 1967 have accounted for about le2% of the boroughs total expenses, The expenditure of $2,551 in 1967 represents approximately one dollar per year per capita. The borough is able to achieve a good recreation program at the modest level of expenditures through participation in the Westmont' Hilltop Recreation Commission.
MISCELLANEOUS EXPENDITURES
Miscellaneous expenditures have increased by a.bout 1,500 from $2,568 in 1962 to $4,089 in 1967. In 1962, the expenditure accounted for about 2.2% of the total.
Non Government Expenditure , which includes Principal Paid on Indebtedness Transfer Between Funds and Mis- cellaneous Non Government Expenses has fluctuated substantially as the Borough utilized its borrowing capacity to fin- ance various capital expend-itures e
In general, the expenditures of the Borough of Southmont reflect the responsible conservative nature of the com- munity. Because of the limited scale of the Borough's operation and few number of municipal employees costs have not been severely increased in the past
A s the responsibilities of local government increase in response to public demand for local and regional services and facilities, the borough should consider joint participation with other municipalities as an alternative to initiating new responsibilities within the confines of the Borough.
The Borough enjoys ample solvency to finance capital improvements with a borrowing capacity of approximately $750,000 and an additional 13 mills of real estate tax available to accommodate increases in cost. It is not anticipated that increases in assessed valuation will keep pace with increases in cost and therefore e it is imperative that the Borough continue to diversify its local tax resource to avoid over dependence on Real Estate Property Tax.
A comparison of the annual change in expenditures and receipts is .indicated on Table XXVI as follows:
TABLE XXVI
RECEIPT - EXPENDITURE COMPARISON
1962 1963 1964 1965 1966 Receipts 149,040 +15.8% 172,617 -11-4% 152,982 -14.1% 131,433 +78.6% 234,803 - 8.
Expenditures 157,020 +2.5% 161,005 - 1.8% 158,180 -21.2% 124,533 +75.9% 219,054 -14.5%
1967 190,700
18 7,242
Source: Cambria County Planning Commission (78)

Added responsibilities on the local government are resulting in addit.iona1 expenditures which in most cases Therefore, in order to achieve afavorable a re beginning to meet, and eventually exceed, increases in revenue.
balance of revenue increases, the following factors e
Assessments
Jf property taxes are to continue to be the major source of Borough income it is advised that multi-family structures be encouraged in order to supplement assessments.
Sources of Assistance
Prior to initiation of projects to provide new and additional public facilities such as utility systems, public buildings, recreation land and programs beautification renewal, high- ways and other availability of State and Federal Grants shouldbe researched at the time it is brought under consideration to insure that all available assistance is obtained.
Local Improvements
If new subdivisions a re to be developed, the borough must consider the adequacy of both the proposed design and actual construction of all streets, utilities, and other improve- ments which the developer provides. Inadequate original development procedures can result in costly replacement or maintenance by the borough at a later date.
Capital Improvements
Capital Improvements should become avital part of every annual budget. Funds should be reserved each year for the development of capital improvements even if tax rates must be increased to provide the means.
Budget Adjustment
Current and future fiscal needs should be constantly re-evaluated. A surplus or defic- iency withinany particular category shouldbe adjusted accordingly in future budgets. A budget should not be developed solely on the basis of previous annual expenditures but should be oriented toward realistic appraisals of future fiscal requirements.

(6) Tax Structure
Constant review of tax structures is necessary to determine the need and feasibility for increases or decreases in local tax rates.
(7) Debt Structure
Municipal debt should be utilized with prudence ; however required improvements can often be un- dertaken with long-term financing. Two basic types bonding a.re ordinarily employed at the mun- icipal level General obligation bonds may be sold to finance permanent type improvements. Careful use of this type of financing permits immediate development of needed facilities e Costs can be spaced over a period of years and thus eliminate major tax increases ., Another type of financing is through the use of revenue bonds which return revenue through the use of the facility. Utility systems and parkingfacilities a re commonly financed with revenue bonds. The principal and interest charges a r e retired with the revenues derived from operation of the facility.
CAPITAL IMPROVEMENTS BUDGET
Before the initiation of any proposed capital improvements, xlong-range pmgramfor all capital improvements must be prepared. This involves:
(1) The preparation of a comprehensive listing of all recommended capital improvements.
(2)
(3)
(4)
An analysis of the scope and relative need of each improvement.
The assignment of costs and responsible agency for each improvement.
Establishing priority for each improvement.
Through this process the community is provided with a Capital Improvement Program which generally extends over a twenty year period. From this program, a Six Year Capital Improvement Budget is drawn which will guide the Borough and provide an orderly and systematic means of accomplishing each proposed improvement. Constant evalu- ation of the Capital Budget and the Total Capital Improvement Program is required in terms of current community needs and, of course available or anticipated municipal funds.
This evaluation must occur yearly Municipal officials should check those-improvements accomplished, delayed or revised during the previous year assess the boroughs resources for the coming year, andadd to the Capital Budget those projects necessary to future growth in the community. In this manner, a new budget is devised, extending over the next six-year period.

A P P E N D I X

SUMMARY OF REVENUES
Current Taxes Taxes Prior Years Licenses Fines and Forfeits Interest and Rent Payroll Deductions Department Earnings Sewer Fund Grants and Gifts Earned Income Other Revenue Receipts Non Revenue Receipts
SUMMARY OF EXPENDITURES
General Government Protection To Persons
And Property Health and Sanitation Highways Recreation Miscellaneous Interests
1962
31 3% 1.4%
0 3% 0 2% 0 1% .2%
2-3% 1.2% 5.0%
28 e 0% 30.0%
1006% 14.3%
708% 43 8%
.6% 1.6%
.4% Miscellaneous N.on Government .4% Principal Paid on Indebtedness 19.7% Library
SOUTHMONT BOROUGH
FISCA L ANALYSIS
1963
27.6% 1.7%
.3% 0 1% .I% 1%
3 . 8 % 1.1% 4.6%
28.6% 32 1%
10.2% 13 7%
9.1% 55.1%
.4% 2.3% .1% .2%
8.4% 0 5%
1964
31.2% 1.2%
.3%
.2% 0 2% .2%
22 8% 1.3%
33.1% 9$5%
10.8% 14.4%
6.8% 3T04%
.3%
.8%
29.5%
1965
35.9% 1.5%
e 2% 6%
0 2% .2%
5.9% 1.6%
1%
41.6% 12.2%
13.1% 16,3%
7'. 6% 36.8%
1% 2 *4%
- 4% .8%
22 5%
m =
1966
24.4% 1.1%
0 2% 3%
* 2% 1.1% 7.0%
33 a 7% 32.2%
9-2% 10.8%
6,4% 58,0%
1.2% 1.6%
0 3% 1.1%
11.4%
1967
30.3% 1.4%
0 5% - 2%
11 8%
30.9% 24.4%
10.6% 11.9%
8.6% 37.8%
104% 2.2%
0 8% 16.0% 10.7%
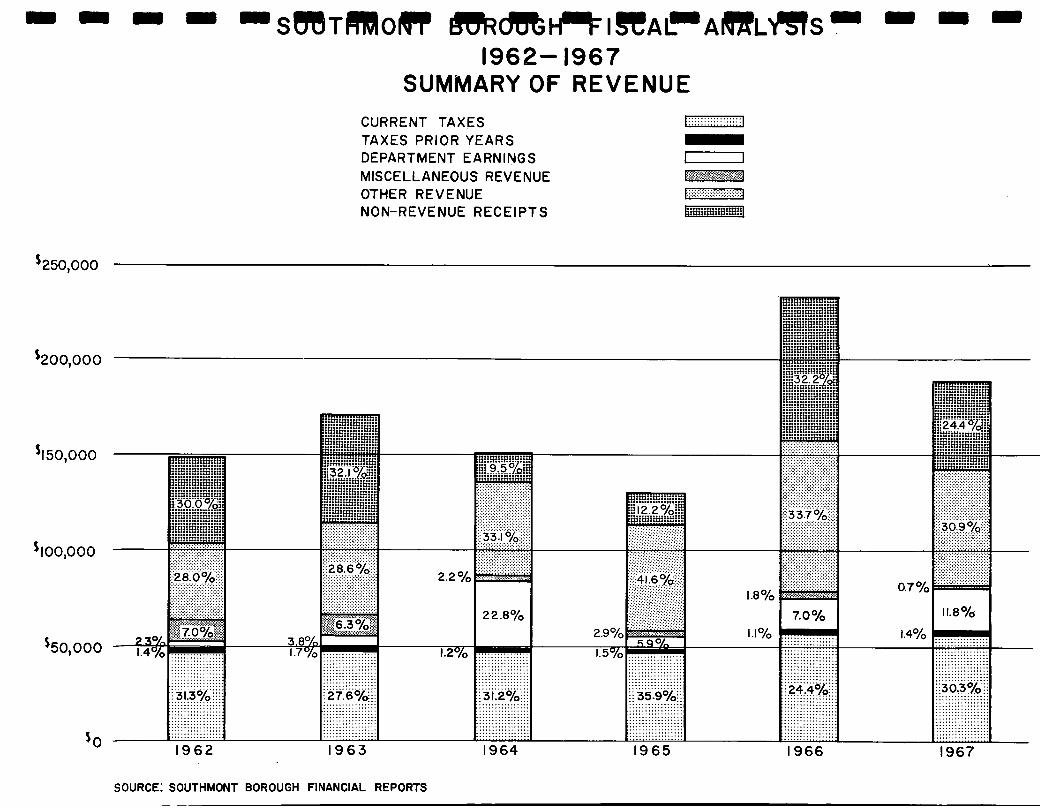
1962- 1967 SUMMARY OF REVENUE
CURRENT TAXES TAXES PRIOR YEARS DEPARTMENT EARNINGS MISCELLANEOUS REVENUE OTHER REVENUE N 0 N- R EVE NUE R EC E i P T 5
p $ j w
1-1 ,......,......... ................. ,................ ................. ,,...............
1250,000
$200,0 0 0
*150,000
$ 1 00,o 00
$50,000
SOURCE: SOUTHMONT BOROUGH FINANCIAL REPORTS

1962- 1967 SUMMARY OF EXPENDITURES
GENERAL GOVERNMENT PROTECTION TO PERSONS AND PROPERTY HEALTH AND SANITATION HIGH WAYS
R E C R E AT I 0 N OTHER MISCELLANEOUS DEBT SERVICE
0 -7 . . . . . . . . . . . . . . . .
SOURCE: SOUTHMONT BOROUGH FINANCIAL REPORTS
s250,000
~200,000
s150,000
~100,000
s50,000
1962 1963 1964 1965 1966 1967

PREPARED FOR STONYCREEK TOWNSHIP CAMBRIA COUNTY, PEJWSYLVANIA
LONG RANGE PLAN
PREPARED BY CAMBRIA COUhTY PLANNING CCMMISSION COURT HCUSE EBENSBURG, PENNSYLVANIA 15931
June, 1969
The preparation of t h i s report and the maps contained herein was financed in part through an Urban Planning Grant fran the Depart- ment of Housing and Urban Developnent, under the provisions of Section 701 of the Housing Act of 1954, as amended, administered by the Bureau of Planning, Pennsylvania Department of Camnunity Affairs.

I I I I I I I I I I I I I I
€F C A M B R I A COUNTY P L A N N I N G COMMISSION
T. FRED YOUNG EXECUTIVE DIRECTOR
June, 1969
COURT nousfi FIEMSBURO, P E Y Y A . i s v a i PHONE 4 7 2 - 7 0 1 8
M r . Edward Strayer, Chairman Stonycreek Township Planning C m i s s i o n Cambria County, Pennsylvania
Dear M r . Strayer:
We are pleased t o submit herewith the LONG RANGE D E V E 1 L ” T PLAN fo r Stonycreek Township. This report re f lec ts an analysis presented i n the Existing Conditions Report and contains recommendations f o r a Long Range Plan t o guide future development in the years ahead.
and organizations within the comunity . given t o those persons and the members of the Stonycreek Planning Commission for the i r contributions.
The preparation of t h i s report required the help of many people Special acknowledgement is hereby
This report emphasizes the need for continuing review of the recammendations contained herein and t o re f lec t changing needs and c o m n i t y at t i tudes i n the years ahead. the cit izens and the i r elected of f ic ia l s t o achieve an outstanding community.
We sincerely hope that th i s report w i l l help
Respectfully submitted,
T . Frederick Young Executive Director

TOWNSHIP COMMISSIONERS TOWNSHIP PLANNING COJMISSION
W i l l i a m M. Knipple, President Merrit N. Rininger, Vice President Warren D. Lehman Charles C . Cooper W i l l i a m C. Bowser Frank H. Ashbridge
Edward Strayer, Chairman E. Paul Brubaker, Secretary
Rdnald D. Hayes
CAMBRIA COUNTY PLANNING COMMISSION MEMBERS
James J. Long, Jr., Chairman Gilbert Salsgiver, Treasurer Thomas N. Crowley, Secretary Russell Thanas Fred J. McFadden, Jr. Elvin Overdorff, Jr. Leonard LaPorta John Kupchella Paul Melanson
W R I A COUNTY PLANNING CC%YIMISSION
T. Frederick Young, Executive Director John R. Swanson, Senior Planner Barry G. Polster, Junior Planner Thanas Elias, Junior Planner Bradford G . Beigay , Planning Technician David L. Belz , Draftsman Barbara Davis, Secretary Gail Novotny, Stenographer Gloria Kilraine, Stenographer Elaine Anderson, Stenographer
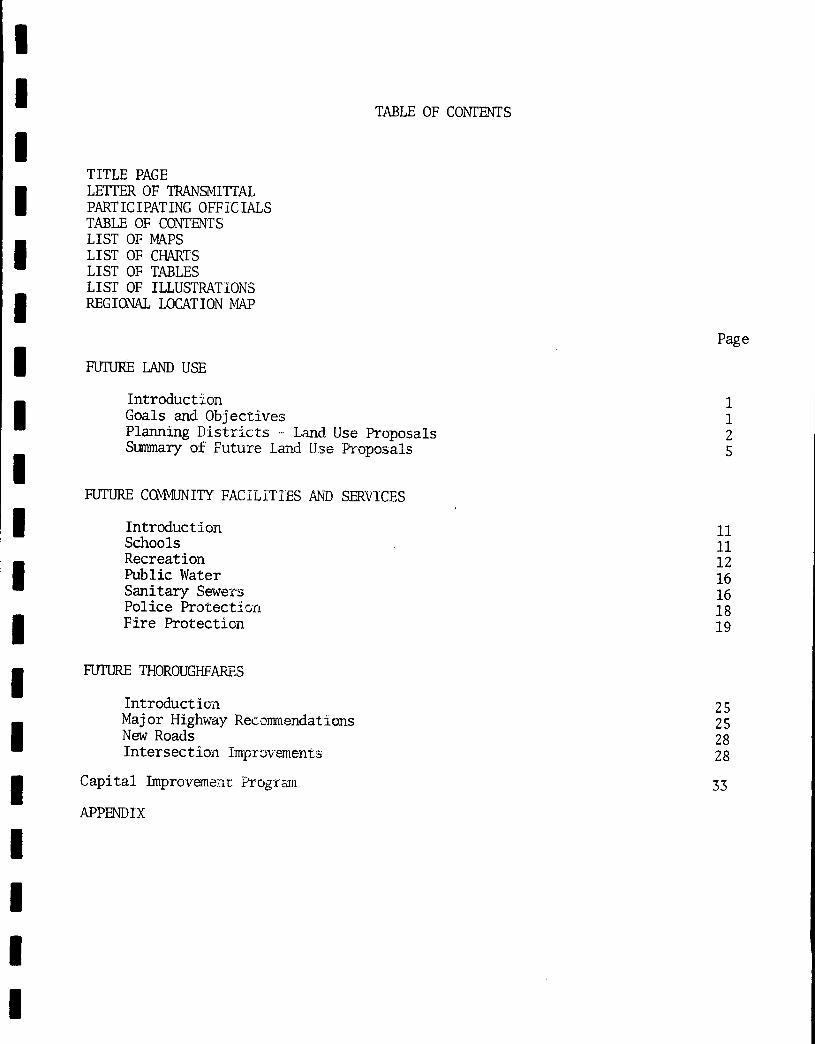
I I I I I I I I I I I I I I I I I I I
TABLE OF CONTENTS
TITLE PAGE LETTER OF TRANSMITTAL PART I C I PAT ING OFT IC wli.S TABLE OF CONTENTS LIST OF MAPS LIST OF CHARTS LIST OF TABLES LIST OF IUUSTRATHONS REGIONAL LOCATION MAP
Page
FUTUKk LAND USE
Introduction Goals and Objectives Planning Districts - Land Use Proposals Summary of Future Land Use Proposals
FUTURE COMMUNITY FACILITIES AND SERVICES
Introduction Schools Recreation Public Water Sanitary Sewers Police 'kotectim Fire Protection
FlTTuRE THOROUGHFARES
Int r oduct i un Maj o r Highway Recmnendatlsns N e w Roads Intersection Impr~vments
Capital Improvemenr: Program
APPENDIX
1 1 2 5 ~

LIST OF MAPS
I I I 1 I I 1 I
MAP NUMBER TITLE PAGE
Regional Location Map Future Land Use Future Cmuni ty Fac i l i t i es Future Water System Future Sewer System Regional Highway Network I; umre Thoroughfares
iii 7
22 23 24 31 32
LIST OF CHARTS
TITLE PAGE
Future Population - Future Dwelling Units Land Use By Planning District
LIST OF TABLES
8 1 0
Future Land Use Recreation Area Standards Length and Paving of Streets By Planning District Long Range Capital Improvement Br-ogram Six Year Capital Budget Pro j ected Municipal. Income
LIST OF ILLUSTRATIONS
9 1 4 30 34 42 43
TITLE PAGE
Proposed Oakland Playground Proposed Riverside Playground
ii
20 2 1
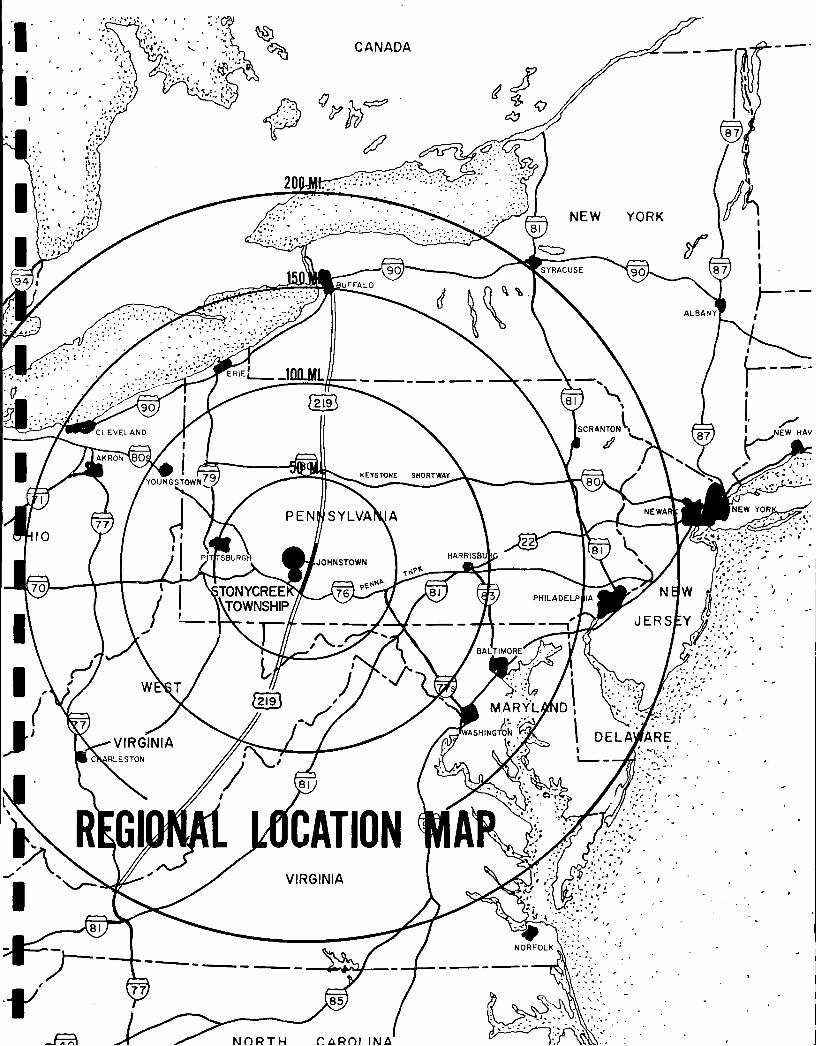
I I I I I I I I I ~I I I I I I I I
STONYCREEK TOWNSHIP
FUTURE LAND USE
The Land Use Plan is a guide for the future development in the Town- Such a plan proposes the location and types of land use ship of Stonycreek.
such as residential , c m e r c i a l , industrial, recreational, and public and semi-public.
Although the specific location of recommended uses cannot always be assigned t o individual parcels throughout the community, the Land Use Rec- ommendations do indicate types of land use and The approximate location where they should be situated. While such recommendations are general, they do in- clude a l l types of land use act ivi ty necessary t o a c m n i t y .
The Existing Conditions Report provided a specific analysis of land use in Stonycreek Township. the analysis 'of existing conditions which must be considered in the formulation of Future Land Use Recmendations for Stonycreek Township:
The following basic factors were revealed during
A. Large areas of the Township are undeveloped as evidenced by the fact that only 23% of the t o t a l land area is actively uti l ized.
B. Because of the excessive slope areas in Solomon Run, Belmont, and Riverside, development is primarily centered i n the Oakland Planning District,
The predominant use of land i n developed areas is for residential purposes.
"pockets" or "cluster" development.
C .
8 D. Physical features have effectively created the existing
Frm these basic factors a series of goals have been developed to be achieved through the implementation of a Cmprehensive Land Use Plan,
GOALS AND OBJECTIVES
1. The comrmrnity should develop primarily as a residential area.
Recent trends in population reveal a desire on the part of the residents in the older sections of the Johnstown vicinity, and new families who have cme into th i s area, t o s e t t l e i n outlying communities such as Stonycreek. forecasts for Stonycreek indicate in-migration by families in the middle age
Population
1
1 I I I I I I I I I I I I I I I I I I
groups who are a t or near maximum earning levels, ment w i l l create excellent residential neighborhods of middle t o high incane housing units. Since the majority of remaining developable land is ideal for such use, every means should be explored t o maintain an environment which w i l l nurture sound development of t h i s type.
The attraction of th i s ele-
2. Natural features must be adequately protected and preserved on a continuing basis.
Stonycreek Township is rich i n natural scenic beauty with many acres >
of unspoiled open space. These assets should be protected from the usual scars of civil ization as a means of preserving a natural asset of inf ini te value. Also, protection of open space w i l l provide an incentive for high caliber res i - dential development in areas which can be so ut i l ized without the sacrifice of natural beauty and resources.
3. Supplemental development must be provided in support of res i - dential land use.
The basic residential complex which has already developed i n Stonycreek Township, and the proposed extensions of th i s land use type, must be supported by related uses. Public f ac i l i t i e s , commercial outlets and sources of employ- ment should be provided whenever possible a t the local level. While it is true that most of these supporting elementsacan be found in adjacent communities, it must be realized that the factor of convenience is requisite t o the attraction of worthwhile residential development. Sound residential neighborhoods w i l l not materialize in the absence of the amenities necessary t o their function.
4. Local f i s ca l considerations must be related t o land use develoment.
The primary source of local municipal revenue is derived from property taxes which are based upon assessment levels. This revenue is v i t a l t o the c m u n i t y t o provide funds for s t ree t maintenance, c m u n i t y f a c i l i t i e s and other municipal services which are both necessary to, and expected by, the local residents. uses w i l l not ordinarily support local governmental revenue needs. planning is not aimed solely toward the attraction of profitable land uses, c m n i t i e s cannot ignore the relationship between revenues produced by various land use types and the municipal f a c i l i t i e s required t o sustain these act ivi t ies . For t h i s reason land areas which have a potential for development other than the residential purposes should be considered. A variety of land use types can, in many instances, be blended into the overall development concepts for the cm- munity, resulting in harmonious land use patterns and a beneficial tax balance.
A tax base geared predaninately t o single family residential Although
PLANNING DISTRICTS - LAND USE PROPOSALS
There are no universal standards for determining amounts of land needed in the future for each class of use or activity located within the planning area. Estimates can be made, however, of the future "space requirements'' f o r each class of use in a community, and these estimates can be employed in the prep-
2

I I I I I I I I I I I 1 I I I I I I I
aration of the land development plan. area i n the Township. frequently based on current space use and legal requirements in zoninp, subdivision, and housing codes. off-s t reet loading, and landscaping are added, plus a sizeable safety factor . Space standards are based on a unit of measurement, such as person, household, a worker, For this reason, population forecasts and economic trend projections are fundamental i n determining future space re- quirements.
units and when properly analyzed,indicates the future space requirements. I i l lus t ra tes the population and housing forecasts into meaningful space require- ments f o r Stonycreek Township.
The space requirements refers t o the land
Allowances for auxiliary space needs for off-s t reet parking,
The measures used t o estimate space requirements are
or a shopper, among others.
Chart I i l lus t ra tes the future growth potential of population and dwelling Table
Following is an analysis of proposed land uses presented on the basis of The suggested changes in land individual planning d i s t r i c t s as shown on Map #1.
use composition are cmpared graphically with existing uses on Chart 11, Land Use by Planning Distr ic t .
PLANNING QIsTRICT 1 - SOLOMON RUN
The Solomon Run Distr ic t is the most undeveloped portion of the c m u n i t y as a resul t of i ts location and topographic features. area is deterrant t o the construction of new homes and adds to the diff icul ty of providing an adequate sewerage collection and water system. However, if the sewer l ine i s extended adjacent t o the Old. Solomon Run Road, th i s area would be a potential residential. growth area.
The extreme slope in the
The Land Use Program recommends the retention of the basic residential functions, plus an increase t o 152.5 acres for residential use, avd additional public and semi-public uses. Most of the residential areas are single-family a t the present time and w i l l remain as such with the exception of a 1 2 . 1 acre s i t e for multi-family, low density, adjacent t o the Solanon Run Extension. growth in the d i s t r i c t w i l l involve the developnent of the area North of the Solomon Run Extension with access a t the Wydman Street Ramp.
but it is of v i t a l concern t o the Township that they do develop with proper guidance. graphic features and the pol i t ical boundary of Johnstown, it is an integral part of Stonycreek Township. area into a l i ab i l i t y while other portions of the cormunity expand.
The Land IJse Plan, Map #1 i l lus t ra tes the proDosals.
The remainder of residential
Development patterns. have not been established i n Planning District 1
While vir tual ly isolated from the balance of the cammunity by topo-
Haphazard growth must not be permitted t o turn this
PLANNING DISTRICT 2 - QAKLAND
Land Use in the Oakland Planning District is primarily limited t o residential and c m e r c i a l use and the s i t e of the Oakland Elementary School for
I the Johnstown Public School System. The Oakland Residential veloped in recent years atid is characterized by newer hmes.
3
area has been de- Additional bui Id ing

I I I I I I I I I 1 I I I
11 I I I I I
lo t s are s t i l l available i n th.is neigh-borhood which w i l l be limited t o residential growth and it is recommended tha t current development patterns continue.
A s previously discussed, there is a growinp emphasis on multi-family housing in suburban communities. in the Wertz H i l l Area and i n the northeastern section of the Oakland 4rea ad- jacent t o RichIan6 Par%. Chart 11, Land Use Comnosition specifies future multi- family use of 272.0 acres. Anarfments, town houses, or c o m n i t y unit develop- ments, which contain a variety of housing types under specific density controls, could blend into th i s vicinity without degrading the residential quality of ex- i s t ing units.
This type of land use sh'ould be established
The commercial area of Oakland is proposed to be located on a 40.0 acre s t r i p along Bedford Street. comercial development. of the easy access t o Bedford Street ,
This is a 30 .acre increase over tEe existing Growth trends should be limited t o th i s area because
Public and semi-publie land should be develoned around t b e existing ele- mentary school, the municipal building and the Richland Park. Continued cooper- ation between the Stonycreek Township Commissioners and the Hiphland Recreation Commission w i l l ensure th i s development for the ent i re community.
PLANNING DISIXICT 3 - BELIIONT
Development i n the Belmont Distr ic t is primarily limited t o single family residential . features and w i l l continue t o do so. Several t rac ts of land on the lower slopes of the mountain could be developed as ideal residential areas i f moper planning is undertaken to assure the best ut i l izat ion of sites involved. Fxcessive grades and irregular terrain make it imperative that detailed study be piven t o street grades, alignment and intersections, u t i l i t y service t o individual lo t s and pres- ervation of natural landscape features. A proposed expansion of 2 1 . 1 acres in the Highland neighborhood w i l l increase the multi-family, low density area to 26.1 acres. Hones is also proposed from the existinp 6 . 4 acres to 30.9 acres.
The pattern of develoment has followed the topographic
An expansion of multi-family use in the vicini ty of the Belmont
As indicated on the Future Land Use Map, a t o t a l of 57.6 acres is pro- An elementary school is proposed i n the posed for public and semi-public use.
Future Community Facilities Plan t o be located on a 25 acre s i t e i n the vicini ty of Sann Street. School Board in the preparation of the i r long-range development plan. public and semi-public use w i l l be centered around the Eighland Park Area.
The proposed s i t e is presently under consideration by the J o h n s t m The remaining
PLANNING DISTRICI' 4 - RIVERSIDE
A natural buffer zone of elevated open-space separates the primary in- dustr ia l area from the residential area. acres for future development; however, no major expansion growth. is anticipated due t o the fragmentary nature of the land available for future development.
North of the ridge lies 25.6 fragmented
4

I I I I I I I I I I I I I I I I I I I
South of the ridge 128.4 acres are proposed for industrial expansion. pansion of industry w i l l provide a local source of emDloyment and increased assessment levels t o bolster the local tax base. ab i l i ty t o Route 219, and. the improvement and extension of Eisenhower Boulevard through the area w i l l improve the accessability t o the regional highway network.
W Y OF FUTVRE LAND USE PROPOSALS
The ex-
This area has close access-
The planning proposals for future land use i n Stonycreek Townshin represents the continuation and expansion of basic land use types which have developed in previous years. in these proposals are i n the central portion of the c m n i t y , namely Oakland and Belmont. Proposals are based on a more logical and econamical use of land than has been achieved previously. uses in relation t o the functions or services intended, replace present piece meal growth and resul t in a more orderly approach to conununity development which w i l l benefit the land Owner and the community i n general.
The major areas of growth act ivi ty contemplated
Proposals suggest the re-grouninE of land This procedure would
The amounts of developable land and the local and regional highway relationships involved i n th i s vicini ty w i l l s e t the stage for future growth. Recmendations for future land use are in response to the housinp, and busi- ness requirements of a growing c m u n i t y and reflect the goals and ohjectives of the Future Land Use Plan.
The Solcnnon Run and Riverside Districts of Stonycreek Tomship can be expected t o develop along residential l ines i n modest proportions. the Riverside District is oriented more toward l igh t industrial than residen- t i a l development,
However,
The majority of c m e r c i a l development which has occurred within the Township has been of a regional nature and has been confined t o both sides of Bedford Street . Approximately 13% or 1 0 acres of the Oakland Planning Distr ic t is devoted t o th i s l ineal commercial development. for the largest proportion of land use €or ccmunercial pu-?poses, with ac t iv i t ies varying from general merchandizing t o the low volume, high value r e t a i l estab- lishments.
This planninp d i s t r i c t accounts
The Belmont, Riverside, and Solomon Run Planninp Districts are limited t o the neighborhood convenience shopping outlets, grocery stores, service stations, restaurant-tavern, and distribution type f a c i l i t i e s .
Stonycreek Township is primarily a dormitory community with over f i f t y per cent of the developed land used for residential Durposes. residential exnansion may require same limited commercial expansion t o meet local needs; however, any major commercial expansion is not anticipated clue t o the measures of the Central Core of the City and the principal shopping centers located i n the Geistown-Richland areas.
The continued
In the Future Land IJse Plan it i s recommended tha t approximately 46.0 acres of land be developed for commercial purposes would be adequ3te t o accm- modate convenient shopping needs of the projected population. No major c m e r -
5

II
cia1 f a c i l i t i e s are anticipated or recmended within the Township limits due t o the Township,'s proximity t o existing, regional commercial facil i t ies.
The present industr ia l base is limited i n size, and is l ikely t o remain so in the future.
. t he Riverside Planning District. s i te , and within easy access of major highways, railroad and u t i l i t i e s . and sewage is available fo r industrial use. occupies an area of 11.3 acres or 7 % of the t o t a l 161.3 acres of land tha t is available f o r l igh t industrial use.
The primary area of industrial development is located i n The industr ia l area occupies a 161.3 acre
Water Industrial development i n Riverside
Land set aside for industry, such as Riverside, is conveniently access- abi le t o workers employed i n the industries. The S i t e is located near in te r - connec:tinp t r a n s i t routes, highways, and other transportation fac i l i t ies such as railroads and truck routes. l i t y l ines , power, water, and waste disposal f a c i l i t i e s . The area is reason- ably level with a slope of not more than 5% and capable of being graded econm- ica l ly . residences, and t h e controls of manufacturing have placed the industrial area i n cmpa t ib i l i t y with other surrounding uses,
The s i t e is also served by large canacity u t i -
The direction of prevailing winds, open space between industry and
6

CHART I I I I ~I
1
POPULATION GROWTH I93 0-1990 POPULATION
DWELLING UNITS
3,000
SVOMVCREER VOWMSMUP HOUSING GROWTH
1930--1990 DWELLING UNITS BY DENSITY
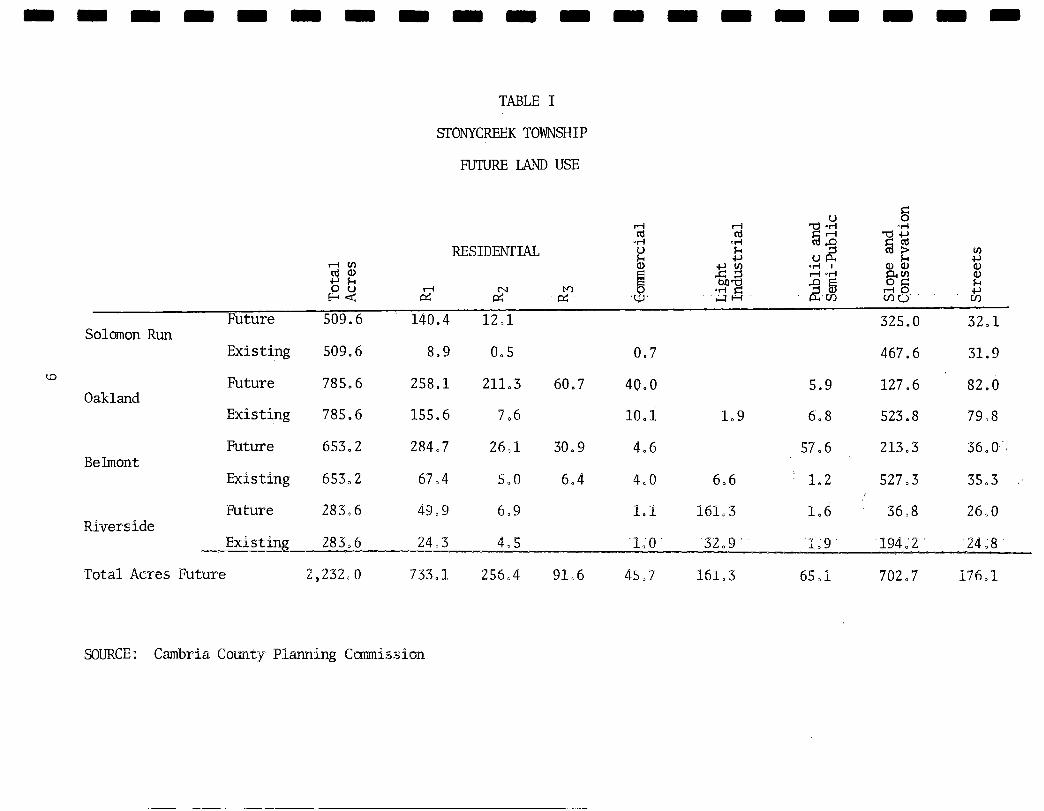
TABLE I
STONYCRFEK TOWNSHIP
FUTURE LAND USE
RESIDENTIAL tn w a, a, k c, cn
Future 509.6 140.4 1 2 , l 325.0 3 2 , l Solomon R u n
Exis t ing 509.6 8.9 0.5 0.7 467 6 31.9
Future 785.6 258.1 211,3 60.7 40.0 5.9 127 6 82.0
Ex i s t ing 785.6 155.6 7,6 10 .1 1 ,9 6 , 8 523 a 8 79,8
u3
Oakland
Future 653.2 284,3 26 ,P 30.9 4.6 57.6 213 e 3 56 ., O.., Belmont
EXiSth'lg 653 2 67,4 S,O 6.,4 4,O 6.6 - 1 . 2 527.3 35,3
Future 283,6 43,9 6 ,9 1.1 161,3 1 , 6 36,8 26,O Riuersi.de
Exfs t ing 2 8 3 , b 24:3 4,5 '118 . . '3209 ' '129 .P94d2 . 24 i 8
Tota l Acres Future 2 ,232 ,o 733,P 256,4 91,6 45,7 P6J, 3 65,P 702 0 7 176 ,P

CHART II LAND USE BY PLANNING DISTRICT
156 I \\ !56 -
211
I
ACRES
SINGLE FAMILY T
MEDIUM DENSITY
HIGH DENSITY
COhlMERClAL
LIGHT IND. i - 161
80 60 40 20 0 I I I
ACRES 0 $0 40 60 80 I I I
S 0 L 0 M 0 N
R U N
0 A K L A N D
I I SINGLE FAMILY
MEDIUM DENSITY
HIGH DENSITY
I COMMERCIAL p I LIGHT IND. 11
PUBLIC 1
527 CONSERVATIOrI
STREETS
466
I I
1 I
4 PUBLIC
524 I COI !SERVATION 1 - 1
STREETS
1
SOURCE: CAMBRIA COUNTY PLANNING COMMISSION
B E L M 0 N T
R I v E R S I D E

I I I I I I I I I I I II II
SI'ONYCREEK TOWNSPIP
C0M"ITY FACILITIES AND SERVICES
INTRODUCTION I
Cmuni ty Facilities and Services include a l l public and semi-public f a c i l i t i e s and services which when taken together provide for the safety, health education and general well-being of local residents. The avai labi l i ty and adequacy of these c m u n i t y f a c i l i t i e s i n turn reflect the general charac- t e r and desirabi l i ty of the Township as a place t o l ive ,
The essential community services such as protection, administration and education are provided t o the residents of the Township. However, a l l of these available community facil i t ies require expansion and. improvements t o adequately serve existinp and future needs.
SCHOOLS
Stonycreek Township is included as a part of the Johnstown School District: therefore, the Township's educational f a c i l i t i e s w i l l be i n accord- ance with the Long-range Development Plans made by the Johnstown School Board.
Currently there are elementary schools located i n the Oakland and River- side Planning Districts. Park Road, has been vacated for sane time and should be razed as it is a nuisance and a potential hazard to youngsters. the s i t e could be subdivided and sold as private residential lo t s or could be used as a playground and to t - lo t for childken of the neighborhood.
A third elementary school, located on t h e Highland
If the building were razed,
RECCNMENDED N E W ELINENTARY SCHOOL
In the Long-Range Development Plan being prepared by the Greater Johns- town School Board, the basic policy for elementary school. construction is t o consolidate existing obsolete elementary s c h o ~ l s with a new elementary unit of 1,000 students i n grades k through 6. la t ion i n Stonycreek Township and the Walnut Grove neighborhood is 875 students and with the projected population growth i n the Township the number of elemen- tary children w i l l exceed 1,000 by 1975.
The present elementary school popu-
Presently, elementary students from the Township attend the Riverside and Oakland Elementary Schools. 1910, houses children in grades k-4 with the f i f t h and s ixth graders from the attendance area beging transported t o the Roxbury or Maple Park Elementary Schools. grades k-6. Department of Public Instruction Standards and are located on s i t e s of an inadequate size.
The Oakland Elementary School, constructed i n
The Riverside Elementary, Constructed in 1922, houses children i n Both of the existing Schools would require rehabili tation to meet
(less than 2 acres)
In order t o provide an adequate elementary school t o house the existing and projected student population within the attendance area and. t o replace
11
I I 1 I I I I I I I I 1 I I I 1 I 1 I
1
I I I I I I I I I I I I I I I I I I I
several of the obsolete elementary schools currently serving the area, a new elementary school is proposed in the Sann Street area of the Township. s i t e is located near the geographic center of the Township and in an area where substantial future development w i l l occur because of the amount of available vacant land. s i t e is accessable t o the Moxham Neighborhood of the City of Johnstown and could accommodate an enrollment overlap from other portions of the school d i s t r i c t located nearby.
The
In addition t o serving the needs of the Township, the
The proposed elementary school should be of sufficient s ize t o accom- modate a projected enrollment of 1,000 t o 1,200 students, building should contain a minimum of forty classrooms as well as cafeteria, gymnasium and related f ac i l i t i e s . To comply with the necessary recreation and open-space standards, the s i t e should contain a minimum of 20 acres of usable land. Due t o the lack of available land within the school d i s t r i c t boundaries, it is recmended that the Sann Street s i t e be acquired in the near future and preserved for school purposes even though construction w i l l not be ini t ia ted unt i l 1975 according t o the School Boards pr ior i ty for ele- mentary school replacement.
improvements t o Highland Park Road and the proposed reconstruction of Krings Road w i l l make the Sann Street area increasingly attractive for new residential growth as well as an excellent s i t e for the proposed elementary school.
Obviously, the
The proposed extension of water and sewer service as well as proposed
RECREPT ION
Parks and recreation are fo r people. Therefore, they must be planned
They must be located t o take advantage of the natural and man-made
t o serve and sat isfy the unique and particular needs of each segment of the population. Also, the best park and recreation systems must be resource- oriented. resources of the area its h i l l s , valleys and its system of land use and t r a f f i c ways.
Fully a3 important as the amount of land is its proper distribution in relation t o needs and resources. It is cl&r that the park and recreation system of the future must be a balanced combination of recreation centers. The centers should grow out of natural features and the immediate and long-range needs of the people. area. that the whole Township becomes one inter-related system of parks with homes, insti tutions, and c m e r c i a l areas attractively distributed.
These green centers w i l l import a new structure t o the The effort must be t o so devise the park and recreation long-range plan
RECcMhENDATIONS
Recommendations for a Comprehensive Recreational Program t o serve the residents of Stonycreek Township are summarized below. f i e ld of recreation f a c i l i t i e s from those of a regional nature t o those which apply t o the individual neighborhood. A l l of these f a c i l i t i e s w i l l play an important part in the comprehensive approach t o a local recreation program. The responsibility of implementation and the means of financing th i s endeavor can be achieved through ut i l izat ion of Township Funds, grants from State and Federal Administered Recreation Programs - 500 Million Dollar Conservation and Recreation Program, Project 70 Funds, Federal Open-Space Act and Land and
This summary spans a
I I 1 i I 1~ I I 1 I I I I I I 1
1 2

I I I I I I I I I I 1 I I I I I I I I
Wat r Cons rvation Fund and through neirrhborhood ac ion committees. Th to t a l program is proposed on a long-range basis, but each element shal l be in tiated as soon as possible. These recreation f ac i l i t i e s are identified on Map No. 2 .
PROPOSED REGIONAL PARK
Richland Park - Highland Boosters
Located in the northeastern quadrant of the Oakland Planning Distr ic t , Richland Park is proposed as a regional park to serve Geistown Borough, Richland Township and Stonyereek Township. It is recmended that provisions be made fo r a f u l l range of ac t iv i t ies such as picnicking, hiking, playfields and winter sports ac t iv i t ies be developed within the area, area is approximately 60 acres.
The to t a l proposed developed
This regional park should include access and circulation roads, t r a i l s ,
Planning should be devel-oped as
picnic pavilions, play areas and scenic outlooks to emphasize the natural beauty of the area. This project w i l l preserve open-space in-a natural s t a t e and serve the recreation needs of a large regional area, soon as possible with construction phased over a period of years.
PROPOSED C@"ITY RECREATION FACILITIES
Lorain Park
Lorain Park cmprised of approximately 80 acres, is located in the central portion of Stonyereek Township. Currently, most of Lorain Park is un- developed because of the excessive degree of slope. and natural t r a i l s be located within thisdems6ly wooded park. I t is also rectnn- mended that Lorain Park should be a permanent conservation area because of the natural beauty of the wooded slopes and its location in the center of Stonycreek Township
I t is recmended that hiking
Highland Park
The 49 acre Highland Park, currently owned by the City of Johnstown, is located in the Belmont Planning Distr ic t adjacent t o the Public Housing Project. A t one time 5 acres of the park were developed as a picnic area. condition of the picnic pavilions, f i r e places an4 picnic.benches have deteriorated over the years t o the present unuseable condition. Stonycreek Township Officials and the Johnstown Housing Authority cooperate in a joint effor t t o either lease or purchase the park from the City of Johnstown. The park should be replaced and retained as a passive recreation area fo r the families of the Public Housing Units and Stonycreek Township. should be developed throughout the park.
However, the
I t is recommended that the
Hiking and nature t r a i l s
13
I I I I I I I I I I 1 I I I I I I 1 I
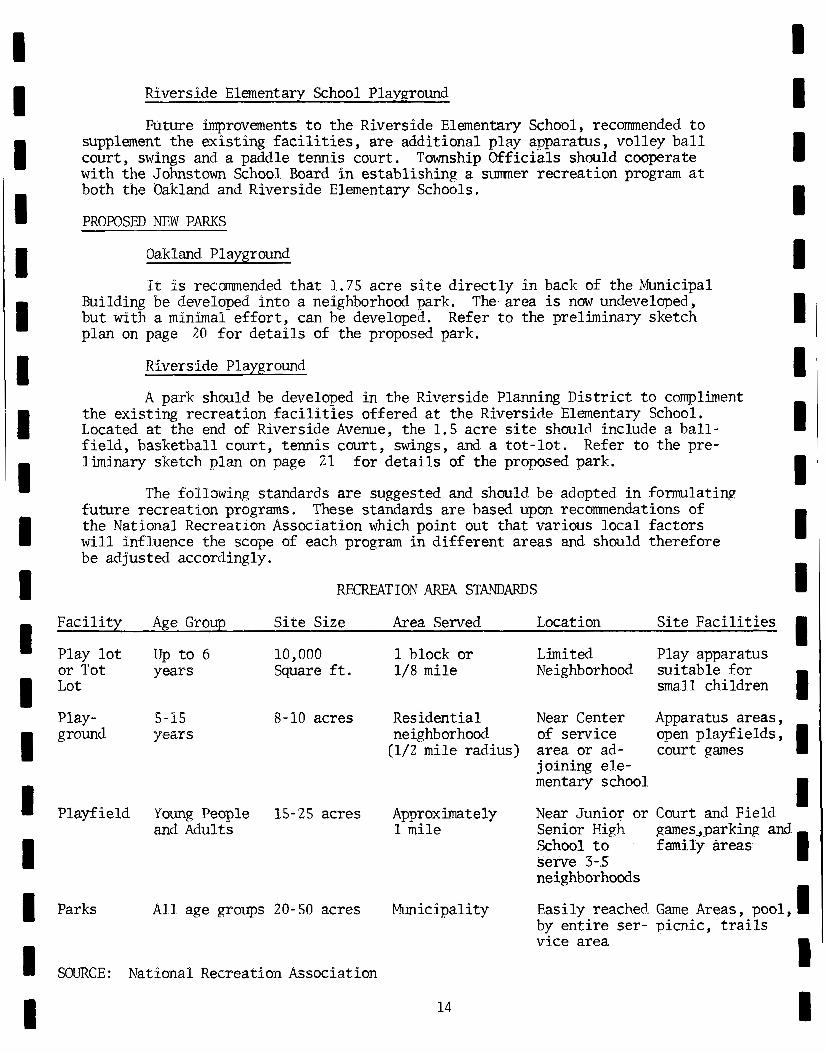
I I I I I I I I I I 1 I B I I I I I I
Riverside Elementaw School Plavuound
Future improvements t o the Riverside Elementary School, recmended t o supplement the existing f a c i l i t i e s , are additional play apparatus, volley b a l l court, swings and a paddle tennis court. with the Johnstown School Board i n establishing a summer recreation program a t both the Oakland and Riverside Elementary Schools,
Township Officials should cooperate
PROPOSED N E W PARKS
Oakland Playground
It is recmended that 1.75 acre s i te direct ly i n back of the Municipal Building be developed into a neighborhood park. but with a minimal e f for t , can be developed. plan on page 20 €or de ta i l s of the proposed park.
The area is now undeveloped, Refer t o the preliminary sketch
Riverside Playground
A park should be developed in th.e Riverside Planning District t o compliment the existing recreation f a c i l i t i e s offered a t the Riverside Elementary School. Located at the end of Riverside Avenue, the 1.5 acre s i te should- include a bal l - f i e ld , basketball court, tennis court, swings, and a to t - lo t . Refer t o the pre- liminary sketch plan on page 2 1 for de ta i l s of the proposed park.
The foll~~ing standards are suggested and should be adopted in f o m l a t i n p future recreation programs. These standards are based upon recommendations of the National Recreation Association which point out that various local factors w i l l influence the scope of each program in different areas and should therefore be adjusted accordingly.
RECREATION AREA STANDARDS
Fac i 1 i t y Age Group S i t e Size Area Served Locat ion S i te Fac i l i t i es
Play l o t or Tot Lot
Play- ground
Playfield
Parks
Up t o 6 years
'Young People and Adults
10,000 Square f t .
8-10 acres
15-25 acres
A 1 1 age groups 20-50 acres
SOURCE: National Recreation Association
1 block or Limited Play apparatus 1/8 mile Neighborhood suitable for
small children
Residential Near Center Apparatus areas, neighbor hood of service open playfields,
(1 /2 mile radius) area or ad- court games joining ele- mentary school
I I I I I I' I I I I I I I I I
Approximately Near Junior or Court and Field 1 mile Senior High games,parking and
School t o family areas serve 3-5 neighborhoods
by ent i re ser- picnic, t r a i l s
I Easily reached Game Areas, pool, I h n i c ipa l i t y
vice area
14

I I I I I I
I ,I
I I I I I I I I I I I
Dale Park
Part ia l ly located i n Stonycreek Township, Dale Park is under the jurisdiction of Dale Borough. 10 acres developed as playfields. Although the responsibility of expanding the parks f a c i l i t i e s belong t o the Dale Borough Council, it is recommended that the Stonycreek Officials cooperate i n any feasible effor t t o develop the park.
The park is approximately 20 acres i n s ize w i t h
PROPOSED NEIGHBOFWOOD PARK
Hoffman Park
Although small in number of usable acres, Hoffman Park can be used as a local sof tbal l f i e ld and a to t - lo t . I t is located on a h i l l s ide well away from Penrod Street and is a natural recreation area i n the Oaklancl Area. I t is recmended that a neighborhood clean-up campaign be in i t ia ted t o improve the playfield. Financial assistance from the Township plus local contributions from neighborhood families should be used as a means to equip th.e park with t o t l o t f a c i l i t i e s .
PROPOSED NEIGHBORHOOD PLAYGROUNDS
Belmont Home Plavnround
It is recommended that the existing playground be expanded and improved t o adequately service the Public Housing Project. area of 0.8 acre and should be expanded to a s ize of 8 t o 10 acres t o adequately serve the existing and future population. the Johnstown Housing Authority constantly informed of th i s need.
The playground occupies an
The Township Officials should keep
Coldren Street Playground
The Coldren Street Playground is approximately 0.8 of an acre i n s ize Because of the close and located i n a high density area next t o Lorain Park.
proximity t o Lorain Park, further expansion is not needed. should be provided for the pre-school children in the area.
Tot-lot f a c i l i t i e s
Frieda Street Playground
The Frieda Street Playground is one of the most a t t rac t ive play areas i n Stonycreek Township. is 1 . 2 acres i n size. t o t - l o t f a c i l i t i e s and the ba l l f ie ld should be reconstructed.
Located i n the Oakland Planning Dis t r ic t , th.e playground I t is recommended that improvements be made t o include
Oakland Elmentarv School Plavrrround
It is recomended that the Johnstown School Board improve the t o t - l o t f a c i l i t i e s and play area a t the Oakland Elementary School Playground. Stonycreek Township Officials and the Johnstown School Board should coordinate a s h e r playground program for the pre-school through grade 6 children i n the Oakland Area.
The
1 5
I I I I I, I I I I I I I I I I I I 1 I

I I I I
I , I I
I I I I I I u I I I I I 1
PUBLIC WATER
The existing public water systems in Stonycreek Township are operated by the Highland Sewer and Water Authority and the Greater Johnstown Water Authority. Public water in Stonycreek Township w i l l continue to be supplied by the High- land Sewer and Water Authority and the Greater Johnstown Water Authority. location of the existing future water lines and storage f a c i l i t i e s is indicated on Map 3, mended future water l ines f o r Stonycreek Township.
Presently they serve only the areas of concentrated developnent.
The
The following paragrphs list, by Planninp Distr ic ts , the recom-
Planning Distr ic t 1: Solmon Run
A s development occurs in the Solomon Run Planning Distr ic t the existing This proposed public water l ine along Old Solomon Run Road should be extended.
l ine w i l l be an extension of the Johnstown Water Authority System.
Plannine District 2 : Oakland
In the Oakland Planning Distr ic t , existing water l ines should'be extended t o the areas adjacent t o Richland Park and water lines should be laid in the Wertz Road area t o enhance developnent of the potential s i t e . the Oakland Planning District is , and w i l l continue t o be, supplied from the Johnstown Water Authority Storage Tanks near the end of Wertz Road,
The northern section of
Planning District 3: Belmont
Future water f a c i l i t i e s in the Belmont Planning District w i l l continue to be supplied by the Highland Sewer and Water Authority except f o r the Belmont Hmes Area, which w i l l continue t o be supplied FFi g Johnstown Water Authority Storage Tank located in the western portion of the Belmont Planning District.
Planning District 4: Riverside
In the Riverside Planning District exist-ing water lines should be ex- tended, and a new water l ine constructed from Niel Street into the l ight in- dustr ia l area as development warrants. The Riverside Planning District w i l l continue to be supplied by the Greater Johnstown Water Authority from a main l ine along Liberty Avenue.
i
I t . i s important that Stonycreek Township Officials monitor development in a l l four Planning Districts t o ensure orderly and. economic extension of public water line. and Water Authority should be advised of any development in these areas sa that their planning and programming of construction w i l l coincide with water demands i n these areas.
The Greater Johnstown Water Authority and the Highland Sewer
SANITARY SEWERS
A t present a l l of the developed areas in Stonycreek Township are served Construction of the system was begun in the summer of 1962
The present system consists of a 20 mile long network by sanitary sewers. and cmpleted i n 1963. of trunk lines and la terals . Authority Treatment Plant a t Dornick Point.
A l l sewage flows to the Johnstown Municipal
16
I I I I I I I I I I I I I I I I 1 I I

I I I I I I I I I I I I I I I I I I I
FUTURE SANITARY SEW€% REC-ATIONS
The size md location of existing and future l ines is indicated on Map 4, the extension of existing l ines and construction of new sewer l ines w i l l be necessary t o supply areas of future development.
The follawing paragraphs recommend , by Planning Districts, where
PPamim District 1: Solomon Run
A s development eears i n the Solomon Run Planninp District a sanitary sewer l ine can be extended from the existing Pine along Old Solomon Run Road. The existing Pine primarily serves as a collector for the northern Penrod Street section 05 the Oakland Planning District. The existing l ine and its future extension w i l l flow into the Johnstown Municipal Authority Collector i n the Walnut Grove section of Johstswn.
P l m i n ~ District 2: Oakland
Pumre s a n i t a y sewer construction i n the Oakland Planning Distr ic t should consist of the extension of existing l ines and the construction of a new lines i n both the northeastern and the Wertz Road portions of the Planning District. eastern side of Penrod Street above Florida Avenue.
Future extension of existing l ines w i l l occur predominantly on the
One of these l ines has already been proposed to run fran the existing sewer main located a t the intersection of the Falls Run and Walter Avenue i n Geistown Borough, dawn Devils Race Course t o the Solomon R u n Road, t b a point connecting with the Johstom~ Municipal Authority Sewer System. This proposed trunk Pine is t o be eonst-mcted i n 1972-1973 by the Highland Sewer and Water Authority. Park, a sewer l ine can be extended from the proposed "Falls Run" trunk l ine t o the develcpment s i te ,
A s sufficient development occurs i n the area adjacent t o Richland
A storm drainage problem exis ts in the Oakland Neighborhood on Ferg A stom sewer project should be implemented immediately t o channel Street.
the run-off amd t o insure against further water damage t o the property.
hood i s a potential s i te fo r multi-fmiP-y development. area fQr residential deve'iopment, proper sewer and water f a c i l i t i e s should be proposed, A sanitary sewer l ine e m be constructed i n th i s area by extending the Ruby Street sewer l ine t o the top of th.e Wertz H i l l .
A sanitary sewer l ine should be considered i n the Wertz Road neighbor- especially in Sight of' the f ac t that the area a t the top of Wertz Road
In order t o enhance th i s
Furure seww eonstriction i n the Behont Planning District w i l l be limited to the Sam Streer: area. A sewer l ine down Sann Street should receive immediate consideration because of the increasing residential development occurring i n th i s area. The Pine would flow into the Highland Park Road Sewer l ine which is a pan of the Johnstown Municipal Authority System.
17
I I I I 1 1 I I I I I i 1 I 1 I I 1 I

I I I I 1 I I I 1 I I I I I I 1 <I I I
Planning Distr ic t 4: Riverside
Future sewer construction in the Riverside Planning Distr ic t w i l l also be limited. Authority trunk l ine along the Stonycreek River t o Niel Street v ia the Stony- creek River Floodplain. This sewer l ine would serve the southwestern portion of the Riverside Planning District which is zoned fo r l ight industrial use. Adequate water and sewage f a c i l i t i e s w i l l serve t o a t t rac t potential l ight industrial firms t o t h i s area and to retain those which currently exist .
A sewer l ine should be constructed frm the JohnstownMunicipal
In addition t o the expansion of the sanitary sewer system throughout the Township immediate attention should be given t o the inf i l t ra t ion of storm water into these sanitary sewer lines. the Riverside Planning District where the trunk l ine runs along the Stonycreek River. In th i s area, the inf i l t ra t ion of storm water overloads the caDacity of l ines and, in sane cases, causes flooding as the overload is released into surface water courses. It is recmenc’ed that Stonycreek Township in cooper- ation with both the Johnstown Municipal Authority and the Highland Sewer and Water Authority establish pr ior i t ies and develop a schedule f o r the construc- t ion of storm sewers within the resources available. Both State and Federal assistance should be sought t o eliminate inadequacies of the system.
POLICE PROTECTION
This problem is especially acute i n
The Stonycreek Township Police Force is headquartered i n the Municipal Building on Bedford Street. time patrolman and four part time officers and one school patrolman. The officers provide 24 hour protection and are supplemented by the part-time men to provide a m a n on duty and on c a l l 7 days a week.
The force includes a f u l l time chief, one f u l l
In the future, police protection should be improved and the force ex- panded as population increases warrant.
By 1975 it is estimated that Stonycreek Township w i l l have approximately
Additional patrolmen, equipment and vehicles w i l l be necessary t o pro- 6,508 residents or an increase of 1,342 people from the 1965 population of 5,166. vide adequate protection.
In addition, inter-municipality police cooperation and protection should be attained. This would insure adequate police protection within the Township in the event that Stonycreek Township officers are not immediately available. The Township officers should also have access t o a modern crime lab where ad- vanced techniques in criminal apprehension could be applied t o d i f f icu l t cases.
18
I I I I I I I I I I 1 1 I I I i I 1 1

FIRE PROTECTION
Existing f i r e protection for Stonycreek Township is provided by the Oakland Volunteer Fire Company and th.e Riverside Volunteer Fire Company. In addition, both organizations have cooperating agreements with volunteer f i r e companies in adjacent municipalities.
Additional volunteer f i r e fighters and new equipment w i l l be needed t o maintain the excellent reputation of the volunteer companies in serving the Township as it develops. Cooperating agreements with the Johnstown Fire Department and volunteer f i r e companies in adjacent municipalities should be continued in order t o provide adequate future f i r e protection for Stonycreek Township residents.
Both f i r e cmpanies, in addition t o providing excellent f i r e pro- tection, also provide modern ambulance service,
19
I I I I I~ I I I 1 I I 1 1 I 1 I I I

J a
I-: u)
W a W LL
/
WINTER
APPROXIMATE SCALE I " = 80'
SOURCE: CAMBRIA COUNTY PLANNING COMMISSION
w = - - I = m
/
F BLDG.
/
PRICE ST
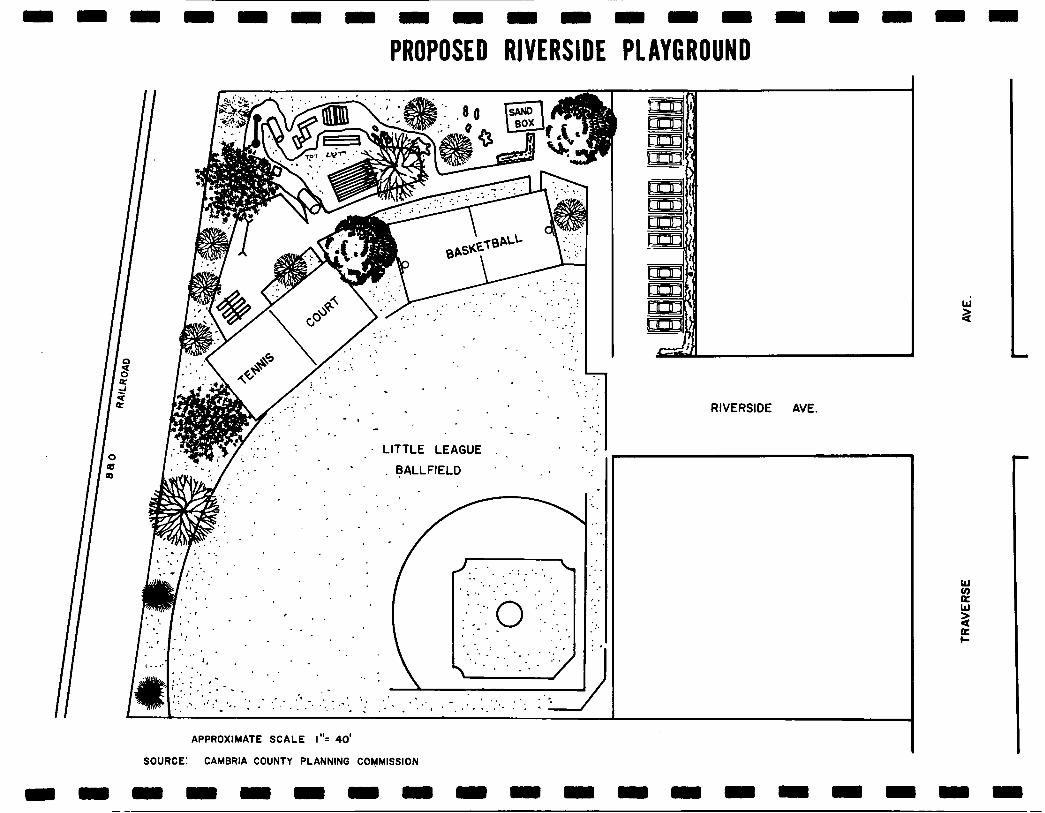
PROPOSED RIVERSIDE PLAYGROUND
:/. . . . . BALLFIELD '
. _ . . . .-. * . . . : . . . . , . .. . ' ( ' . '
APPROXIMATE SCALE I"= 40'
SOURCE: CAMBRIA COUNTY PLANNING COMMISSION
RIVERSIDE AVE.
W v)
W a
a z I-

I I
I
I I I I I I I I I I I I I I I I I
STONYCREEK TOWNSHIP
FUTURE THOROUGHFARES
INTRODUCTION
Local and regional highway systems play a c r i t i ca l Dart i n the projected growth or decline of a community. In fact , regional transportation f a c i l i t i e s and inter-community circulation systems have been daninant influences in past growth and w i l l exert an even greater influence on future developent. One of the prfmary bases for anticipated growth in Stonycreek Township is the gradual implementation of highway improvements which have been planned for the Greater Johnstown Regional Area. related t o highway considerations t o some degree.
Every major recommendation i n the Land TJse Plan is
The highway system i n Stonycreek Township w i l l eventually be cmprised of four general categories which include (1) regional, (2) a r t e r i a l , (3) collector, and (4) local t r a f f i c carriers. exert definite influences on the cmun i ty . Map No. 5, enti t led "Future Thoro- ughfares ," indicates the proposed system for Stonycreek Township.
Each of these serve as a specific function and
MAJOR HIGHWAY RECOIMENDATIONS
State Routes
State maintained routes are generally classified as a r te r ia l s wh.ich. take t r a f f i c through the Township i n addition t o providing access.to areas within Stonycreek Township.
Solamon Run ExPresswavs
The Solomon Run Expressway Legislative Route 11012, is a major express- way aonnection between the c i ty and Route 219, as well as the suburban East H i l l s commercial d i s t r i c t . t ion of a limited access highway w i l l begin in 1969 which will connect the Roose- ve l t Boulevard Expressway and the Solomon R u n Expressway. highway directly connects the c i ty and Route 219. the center of Johnstown, existing volumes of 3,800 vehicles per day, should in- crease and reduce the present through t r a f f i c volumes of 12,300 vehicles per day on Bedford Street.
To the west of the terminal point of t h i s highway, construc-
This new section of A s the route is extended into
Bedford Street
Bedford Street, FAP 222 , is the most heavily traveled s t ree t i n the
Variations i n the volumes along the route ref lect the
Township accomodating both through and local t ra f f ic . Volumes range f r m 12,300 a t the bottom of Oakland H i l l t o 11,500 vehicles west of the Penrod Street intersection. intensity of local t ra f f ic . the ci ty , 11,500 pass through Penrod Street intersection indicating that some 800 t r ips originate or are destined frm same area in the Oakland Planning District between the two points. Street ref lects t r a f f i c entering Bedford Street from Penrod Street. The further re- ductions of volumes between Wales and Walters Avenue is again a reflection of local t r a f f i c entering and leaving Bedford Street between the two points. A s
O f the 12,300 vehicles entering the Township from
The increase to 11,900 vehicles west of Penrod
25
I I I I I I I1 I I I I I I I I I I I I

I I I I I I I I I I I I I I I I I I I
previously indicated, the completion of the Solmon Run Expressway w i l l tend to reduce the flow of through t r a f f i c along t h i s route. Also, with the expressway completion, the function of Bedford Street w i l l change from a major a r t e r i a l t o a major collector. guard against hazardous conditions.
For th i s reason, continued maintenance is reconunended to
Ohio Street
Ohio Street, L.R. 756 carries approximately 7,300 vehicles per day through the Township and is a collector route between the G e i s t m area and the Moxham Area. The recent realignment and reconstruction of Ohio Street has greatly improved the s t ree t , however, some serious problems remain which should be considered for future improvement.
I t is recammended that sight distance and the turning movements be corrected a t the intersection of Brentwood and Ohio Streets, t o ensure safe access and egress a t this intersection.
Behont Avenue -.. Highland Park Road
Belmont Avenue, Legislative Route 11099 functions primarily as a local collector providing access t o the Belmont Planning Distr ic t . enters the Township from the Geistown Area the volume is 1,400 vehicles. mately 600 t r i p s terminate in the Belmont Area and an additional 600 t r i p s terminate a t the Behont Homes Project composed of t r a f f i c generated in the neighborhood i n addition to through t ra f f ic . Although Behont Avenue and Highland Park Road serve as the same collector s t ree t , the name changes in the separate areas it passes through. With the developnent of the residential area i n the Belmont Planning Distr ic t , Belmont Avenue w i l l become more important. I t is therefore reconunended that the serious alignment and grade problems be kproved if th i s s t ree t is t o efficiently service residents of the area in the future. i s the s i t e of the p-~oposed elementary school. This factor warrants the improve- ment of Highland Park Road near the C i t y boundary where most dangerous turning movements exist.
A s the s t ree t Approxi-
The 1,100 vehicle flow on Highland Park Road is
A large, vir tual ly undeveloped, plateau area on Sann Street
Boone Street
Boone Street , A5538, provides access to the Riverside Planning District as well as acecamnodating a substantial flow of through t r a f f i c from the Richland Hilltop t o the Westmont Hilltop. The local t r a f f i c is i l lustrated i n the River- side area by a reduction in volume from 2,700 t o 2,200 vehicles as the s t ree t crosses over "Hog Back" Ridge. Approximately 500 t r ips terminate or originate i n the developed portion of the neighborhood along the river. near the Krings Bridge is p r h a r i l y composed of through t r a f f i c , although some t r ips are generated by the l ight industrial ac t iv i t ies along the route. With the completion of Krirgs Road to Eisenhower Boulevard, access to the Richland area w i l l be greatly improved and the flow of through t r a f f i c in Riverside can be expected t o increase. Serious turning problems a t a number of places along Boone Street made th i s somewhat less than an efficient collector s t ree t . In- creasing volumes on Eisenhower Boulevard w i l l cause serious problems on Boone Street if the existing conditions are not improved.
The 1,700 volume
I t is also recommended that
26
1 I i 8 I I I~

I I I I I I I I I I I I I I I I I I I
Boone Street be reconstructed along the Stonycreek River, the hazardous curves eliminated and the sight distance a t the railroad crossing be improved.
Oakland Avenue
The "S" curve connecting Oakland Avenue and Penrod Street is very hazardous and should be given pr ior i ty consideration towards its realignment. This collector road presently accmodates about 5,500 vehicles daily. With the potential development of the Wertz Road Area, volumes w i l l become even greater. The realignment of t h i s road section is necessary t o eliminate an existing safety hazard and also to accomnodate increased use of this s t r ee t as a collector.
TOWNSHIP STREETS
The remaining s t ree ts within the Township function as local s t ree ts and provide direct access t o properties and ac t iv i t ies abutting them. out most of the Township, local s t ree ts are relatively free of excessive through t r a f f i c . Penrod Street accmodates the highest flow of local t r a f f i c with 1,700 vehicles per day near the intersection of Bedford Street. Because of the length and nature of Penrod Street it may be considered a local collector. Avenue and Neil Street i n the Riverside Planning Neighborhood accmodate limited volumes of through t r a f f i c generated by industrial ac t iv i t ies a t the ends of the s t ree t .,
Through-
Michigan
Local s t ree ts which provide access t o the residential properties i n each of the Planning District probably have volumes in the 100 t o 500 vehicle per day range depending on location and number of properties being served.
Penrod Street
Penrod Street is an important local s t ree t i n the Oakland Planning Distr ic t . A s development of the residential area north of Bedford Street continues, Penrod Street w i l l increase in importance as a local collector. I t is recmended- that Penrod Street be widened t o more easily and safely accmodate th i s anticipated increase in t r a f f i c volume.
Walter Avenue
Walter Avenue, jus t east of Stonycreek Township, serves as a collector fo r the Oaklmd and Belmont Planning Districts t o the Solmon Run Fxpressway and Route 219. a potential residential area in the northeast quadrant of Stonycreek Township, warrants improvements t o maximize its importance and efficiency. the entire length of the road plus realignment especially near the intersection a t Bedford Street are most urpent. An llS" curve, similar to the "S" curve connecting Oakland Avenue ana Penrod Street, presents the same type of hazardous situation. The condition a t th i s curve w i l l be a continuous hazard t o residen- t i a l development along and adjacent t o th i s s t ree t . curve should coincide with the recmended improvements to the entire length of Walter Avenue
This collector role, plus the fact that it provides access t o
Widening of
The realignment of th i s
27
I I I I 1 I I 1 I I 1 1 I I I I 1 1 1

I
Highland Park Road
more of The Highland Park Road i n the Townships Belmont neighborhood is becoming a Droblem as through t r a f f i c continues t o increase and develoDment i n the
adjacent &ea increases. more intensely developed as a residential area which in turn generates more vehicles using the road. severe intersection a t the City l ine, warrants the improvement of th i s road. These improvements w i l l f ac i l i t a t e easing t r a f f i c movements and provide better access t o the potential residential area in Belmont.
The area south of the Fighland Park Road is' becoming
The existing grades and sharp turns, along with the
Krings Road
The Krings Road in Belmont should be reconstructed and realigned so it may function as a collector street between Sann Street and the Belmont Homes, t o the new Eisenhower Boulevard. greatly intensified and accelerated with the construction of Krinp Road as an efficient t ra f f ic carr ier .
This area has started to develop and could be
NEW ROADS
I t is recwunended that the Township consider the construction of new roads into areas of potential development. Three areas in Stonycreek Township are vir tual ly undeveloped, but possess tremendous potential. In the northeast corner of the Township are about 150 acres of attractive land that is w e l l lo- cated to Bedford Street and the Solomon Run Expressway. of the existing, unpaved, Hollow Road w i l l provide an improved access road t o th i s area.
Widening and surfacing
A second new road needed is an extension of Ruby Street t o the top of Wertz H i l l . road off Bedford Street . A new road must be constructed t o ensure safe and effi- cient access.
The only accessway t o th i s area a t present is a very steep winding
The third new road recommended for Stonycreek Township is the extension This is a section of of the existing Boone Street located west of Neil Street .
the proposed Beltway Road System around the Deriphery o f Johnstown. would be a valuable asset i n the developnent of the l ight industrial area in the Riverside Planning District.
This road
INTERSECTION IMPROVEMENTS
An analysis of the future thoroughfare recommendations has led t o the recommended improvements of the following specific intersections t o coincide with the improved ar ter ia ls . ments because they present serious safety hazards i n their present condition.
The following intersections are cited in need of improve-
28
I I I 1 1 I I i 1 I I I I I I I I 1 I

I
Walters Avenue and Bedford Street Intersection
In the Oakland neighborhood a serious intersection hazard exists a t Walter Avenue and Bedford Street. v is ibi l i ty . I t is recommended that an effort be made to improve the visibi- l i t y f o r drivers turning onto Bedford Street, along with improvements t o the grade of Walter Avenue be implemented imediately t o lessen the danger a t this intersection.
The problem is a steep grade and limited
Highland Park Road and Belmont Avenue Intersection
In the Belmont Area there is a "Y" intersection a t Highland Park Road and Belmont Avenue which is serious because of poor markings and sharp turning movements and limited vis ibi l i ty . realigned t o provide the proper sight distance and alleviate the sharp turning movement
I t is recommended that the intersection be
Oakland Avenue and Ohio Street Intersection
Another intersection which is outside the Township, but on a road which services many Township residents, is the intersection of Oakland Avenue and Ohio Street i n Lorain Borough. tion and is cmpounded by very steep grades and poor v is ib i l i ty . along Ohio Street are very close t o the road which impairs vision and turning movement. Borough Officials in placing proper warning signs near and a t this intersection. Also, a t peak t r a f f i c hours a policeman should control a l l t r a f f i c to ensure the safety fo r a l l motorists.
Very serious turning movements exist from every direc- Structures
It is recomended that Township Officials cooperate with Lorain
I I I 1 I I
29
I I

I I I I I u ~I I I I I I I I I I I I I
STONYCREEK TOWNSHIP
LENGTH AND PAVING OF STREFTS BY PLANNING DISTRICTS
Existing Length i n Miles PLANNING DISTRICT Paved % Unpaved % Paved % 1Jnpaved %
Future Length i n Miles
Solomon Run
S t a t e Maintained Township Alleys tj Not Ordained
TcrrAL
Oakland
2 .12 96% 0.09 4% - - - - - - -
2 . 2 1
S t a t e Maintained Township Alleys G Not Ordained
TCrrAL
Belmont
S t a t e Maintained Township Alleys tj Not Ordained
TOTAL
Riverside
S t a t e Maintained Township Alleys 6 Not Ordained
TOTAL
TOWNSHIP TOTAL
S t a t e Maintained Township Alleys tj Not Ordained
TOTAL
.89 11.8% 6.68 88.0% 0.01 0.2%
7.58
1.10 26.4% 3.07 73.6% - - - - - - - - -
4.17
4.39
6.000 32.7% 12.300 67.2%
0.001 0.1%
18.301
SOURCE: Cambria County Planning Commission, 1969
30
2.76 100%
0.89 11.0% 44% 8.19 88.0% 56% 0.48 1.0%
- - - -
9.56 100%
5.36 100%
6.35 100%
- - - - 6.0 .26.9% 67% 16.66 67.25 33% 1.37 5.9%
24.03
I I I I I I I I I I I I I I I I I I I
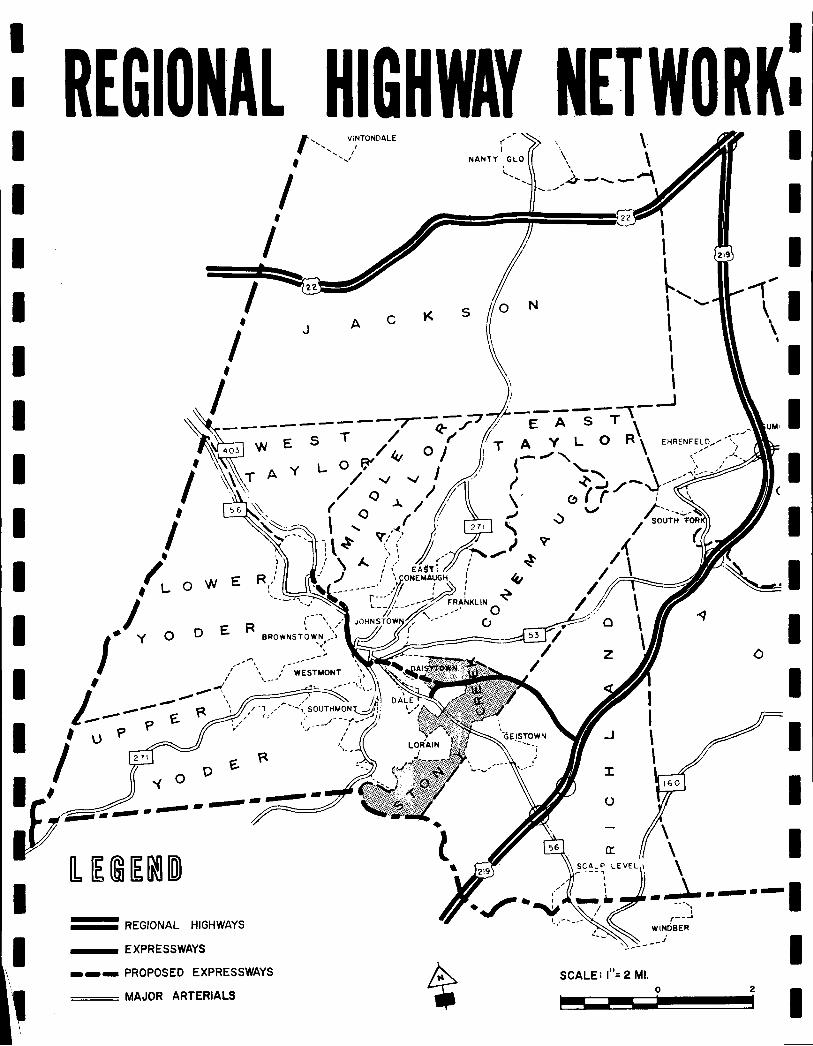
I I I I I I I I I I I
I I
REGIONAL HIGHWAY NET WORK: ~
STONYCREEK TOWNSHIP
CAPITAL IMPROVEMENT PROGRAM
The implementation of recommendations contained in the Long Range Plan can be accomplished through the preparation of a Capital Improvement Program and Budget. This involves:
9. The preparation of a comprehensive l i s t i np of a l l recommended capi ta l improvements.
2. An analysis of the scope and relat ive need of each improvement.
3. The assignment of costs and. responsible agency for each improvement.
4 .
Through this process, the community is provided a Capital Improve- ment Program which generally extends over a twenty year period. program, a s i x year Capital Improvement Budget is drawn which w i l l guide the Township and provide an orderly and systematic means of accomplishing each pro- posed improvement. Consistant evaluation of the Capital Budget, and the Total Capital Improvements Program, is required t o maintain a continuous program which re f lec ts current community needs and available or anticipated municipal funds.
check those improvements accomplished, delayed or revised during the previous year, assess the Township's resources f o r the coming year and add t o the Canital Budget those projects necessary for the future growth i n the community. In th i s manner, a new budget is devised, extending over the next six-year period.
Establishing pr ior i ty f o r each improvement.
From th is
This evaluation must occur yearly. Municipal o f f i c i a l s should
Table IV, Long Range Capital Improvement Program, outlines 20 pro-
Phase I1 and I11 are scheduled
posed capi ta l improvements which r e f l ec t proposals included i n the Lonp Range Plan. Phase I should be in- cluded in the i n i t i a l capi ta l budgeting period. throughout the planning period of twenty years.
These improvements are grouped in three phases.
33

1. Ferg Street Paves Curb Storm Sewer 1969 $25 000.00 Township Township Highway Fund FROM: 'Brier Street TO: Linwood Street
2 , Coldren Street Widen, Realign, Pave FROM: LaFree Avenue TO: Rustic Avenue
3 . Storm Sewer Project Penrod Street FROM: Florida Avenue TO: Bedford Street
4. Penrod Skeet Pave FROM: Florida Avenue TO: Ocala Avenue
1970
1970-71
1970-71
$27,000.00
$20,000,00
$25,000.00
Township
Township
Township
Township Highway Fund
Township Appropriation
Township Highway Fund
34 0
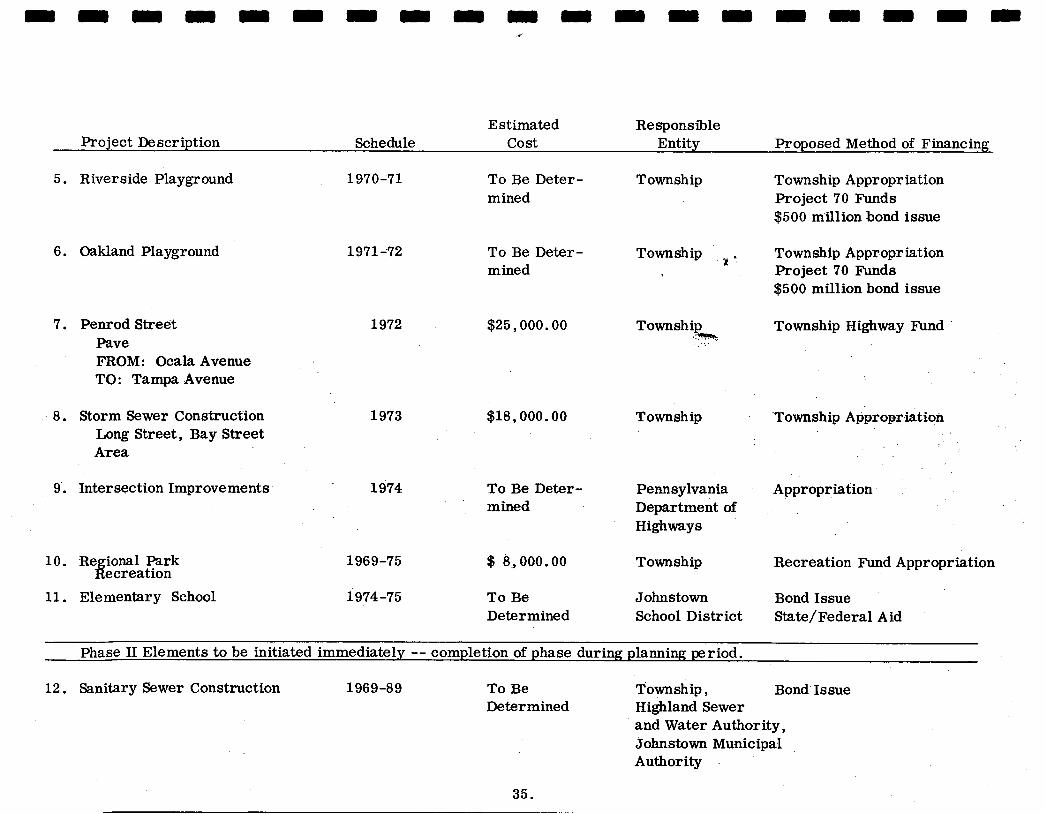
Estimated Responsible Project De scription Schedule cost Entity Proposed Method of Financing
5. Riverside Playground
6. Oakland Playground
7. Penrod Street Pave
1970-71 To Be Deter- Township Township Appropriation
$500 million bond issue mined Project 70 Funds
1971-72
1972
To Be Deter- Township r . Township Appropriation mined Projeet 70 Funds
$500 million bond issue
Township Township Highway Fund .‘W.
$25,000.00
FROM: Ocala Avenue TO: Tampa Avenue
8. Storm Sewer Construction 1973 $18,000.00 Township Township Appropriation Long Street, Bay Street Area
9. Intersection Improvements 1.974 To Be Deter- Pennsylvania Appropriation mined Department of
Highways
10. Re ional Park fiecreation
11. Elementary School
1969-75 $ 8,000.00 Township Recreation Fund Appropriation
1974-75 To Be Johnstown Bond Issue Determined School District State/Federal Aid
Phase I1 Elements to be initiated immediately -- completion of phase during planning pe riod,
12. Sanitary Sewer Construction 1969-89 To Be Township, Bond Issue Determined Highland Sewer
and Water Authority , Johnstown Municipal Authority
35.
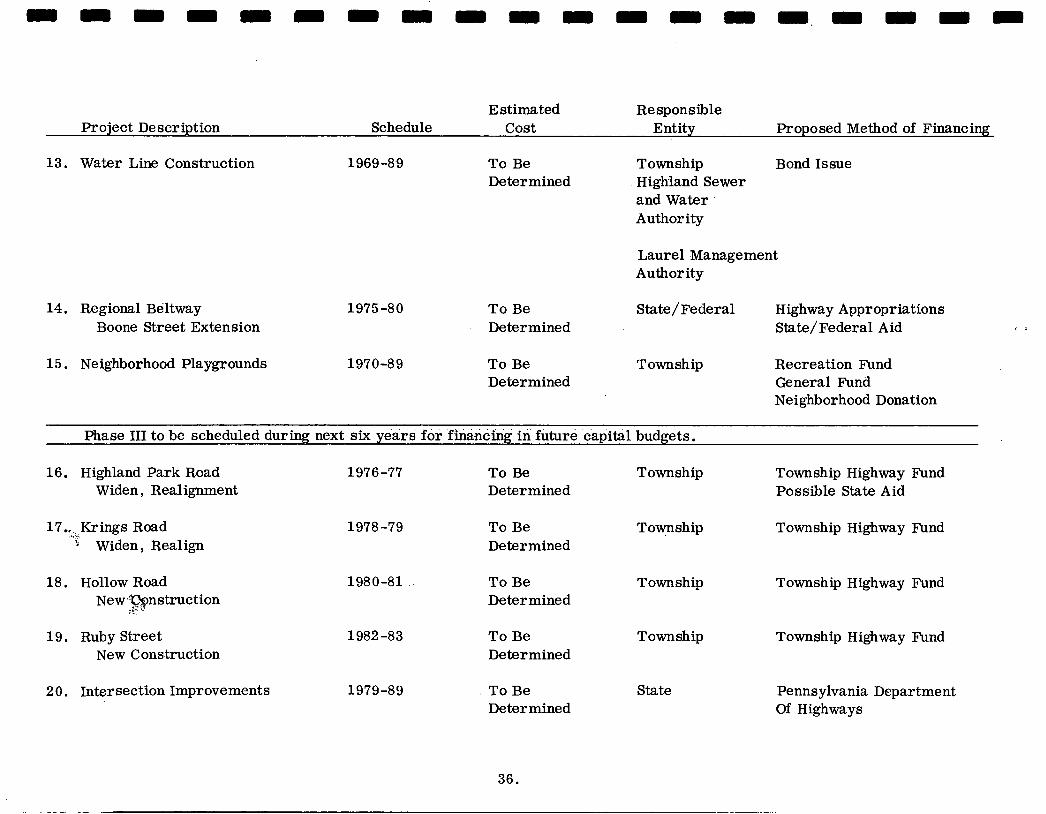
Estimated Responsible Project De script ion Schedule cost Entity Proposed Method of Financing
13. Water Line Construction 1969-89 To Be Township Bond Issue Determined Highland Sewer
and Water Authority
Laurel Management Authority
14. Regional Beltway 1975 -80 To Be State /Federal Highway Appropriations Boone Street Extension Determined State/Federal Aid
15. Neighborhood Playgrounds 1970-89 To Be Township Recreation Fund Determined General Fund
Neighborhood Donation
Phase 111 to be scheduled during next six years for financing in future capital budgets.
16. Highland Park Road Widen, Realignment
18 Hollow Road New 'Qpstruction
19. Ruby Street New Construction
1976-77 To Be Township Township Highway Fund Determined Possible State Aid
1978-79 To Be Township Township Highway Fund Determined
1980-81 To Be Township Township Highway Fund Deter mined
1982-83 To Be Township Township Highway Fund Determined
State Pennsylvania Department 20. Intersection Improvements 1979-89 To Be Deter mined Of Highways
36.
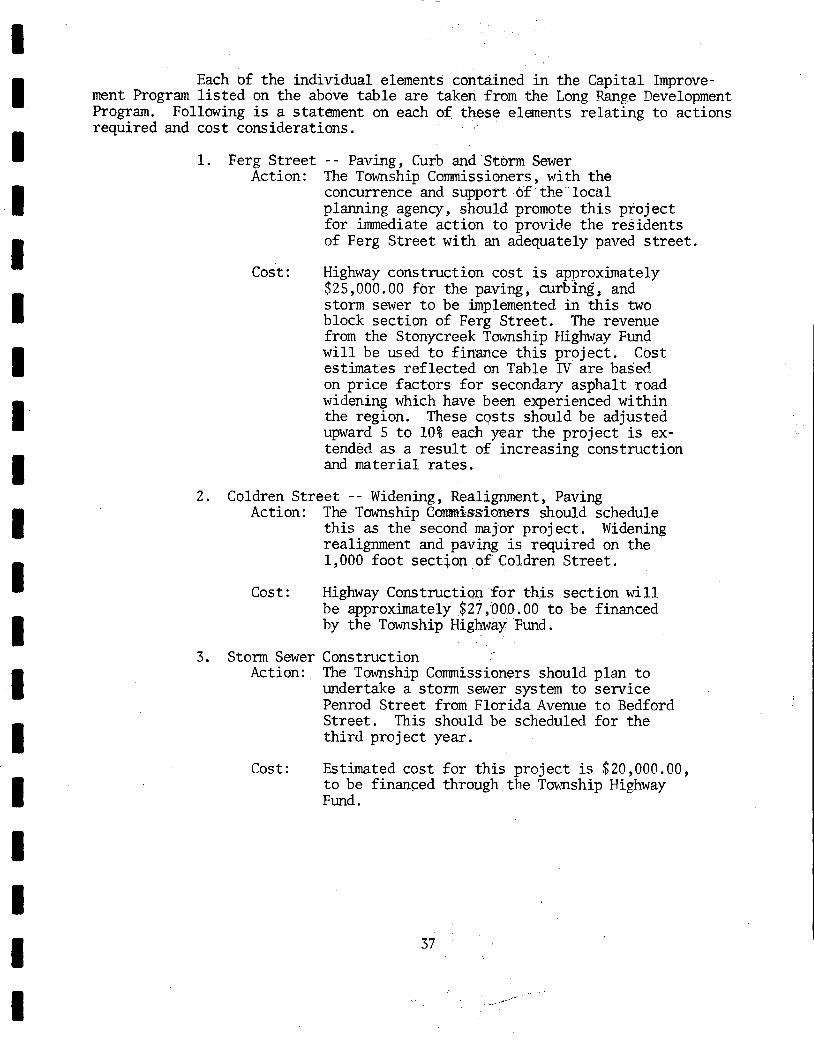
1 I I I I I I I I I I B I I I I I I I
Each bf the individual elements contained i n the Capital Improve- ment Program l i s t ed on the above table are taken from the Long Ranpe Development Program. Following is a statement on each of these elements re la t ing t o actions required and cost considerations.
1. Ferg Street - - Paving, Curb and Storm Sewer Action: The Township Commissioners, with the
concurrence and support bf the local planning agency, should promote t h i s project for immediate action t o provide the residents of Ferg Street with an adequately paved s t r ee t .
Cost: Highway construction cost is approximately $25,000.00 f b r the paving, curbing, and storm sewer t o be implemented in this two block section of Ferg Street . The revenue from the Stonycreek Township Highway Fund w i l l be used t o finance t h i s project. Cost estimates reflected on Table IV are based on pr ice factors for secondary asphalt road widening which have been experienced within the region. These costs should be adjusted upward 5 t o 10% each year the project is ex- tended as a result of increasing construction and material rates.
2. Coldren Street - - Widening, Realignment, Paving Action: The Township Commissioners should schedule
th i s as the second major project. realignment and paving is required on the 1,000 foot section of Coldren Street .
Widening
Cost: Highway Construction f o r t h i s section w i l l be approximately $27,000.00 t o be financed by the Township Highway Fund.
The Township Commissioners should plan t o undertake a storm sewer system to service Penrod Street from Florida Avenue t o Bedford Street . This should be scheduled for the th i rd project year.
3. Storm Sewer Construction Action:
Cost: Estimated cost for t h i s project is $20,000.00, t o be financed through the Township Highway Fund.
37
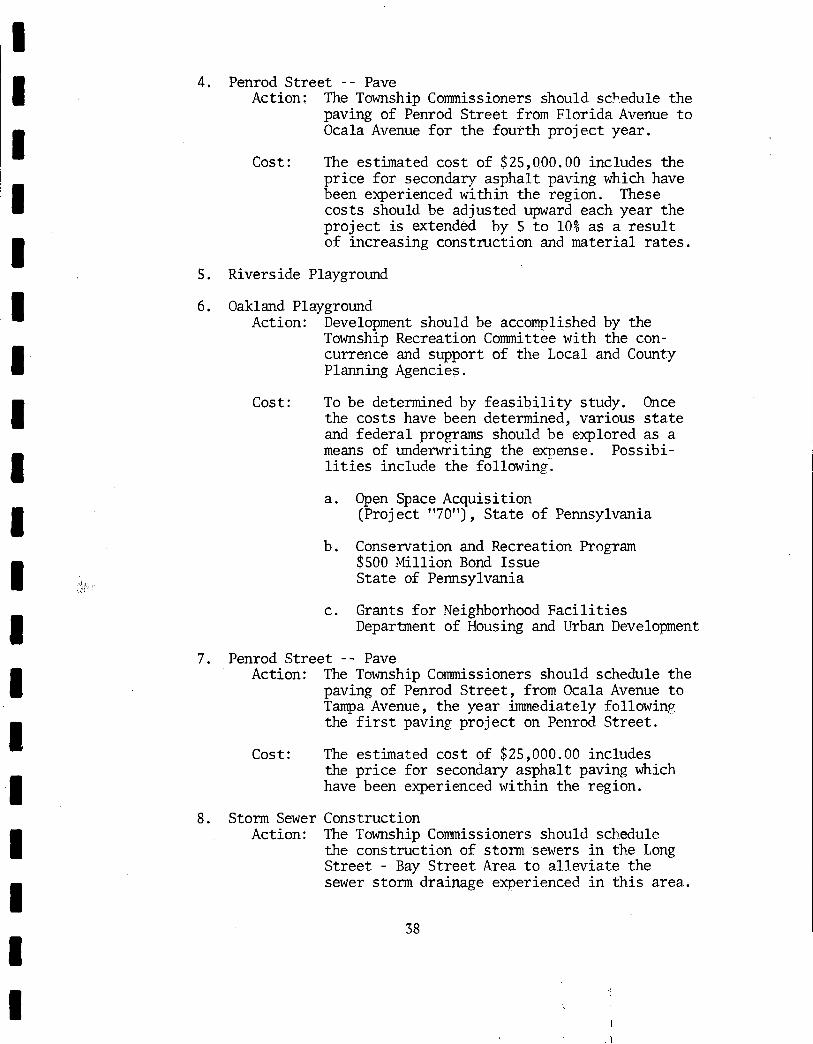
I I I
4. Penrod Street - - Pave Action: The Township Commissioners should schedule the
paving of Penrod Street from Florida Avenue t o Ocala Avenue fo r the fourth project year.
Cost: The estimated cost of $25,Q00.00 includes the pr ice for secondary asphalt paving which have been experienced within the region. costs should be adjusted upward each year the project is extended by 5 t o 10% as a result of increasing construction and material ra tes .
These
5. Riverside Playground
6. Oakland Playground Action: Development should be accomplished by the
Township Recreation Committee with the con- currence and support of the Local and County Planning Agencies.
Cost: To be determined by f eas ib i l i t y study. Once the costs have been determined, various s t a t e and federal programs should be explored as a means of underwriting the exgense. Possibi- l i t ies inc1ud.e the followini.
a . Open Space Acquisition (Project "70"), State of Pennsylvania
b. Conservation and Recreation Program $500 Million Bond Issue State of Pennsylvania
c. Grants fo r Neighborhood Fac i l i t i es Department of Housing and Urban Development
7 . Penrod Street - - Pave Action: The Township Commissioners should schedule the
paving of Penrod Street , from Ocala Avenue t o Tampa Avenue, the year immediately fol1owin;s the first paving project on Penrod Street .
Cost: The estimated cost of $25,000.00 includes the pr ice for secondary asphalt paving which have been experienced within the region.
8. Storm Sewer Construction Action: The Township Commissioners should schedule
the construction of storm sewers in the Long Street - Bay Street Area t o a l lev ia te the sewer storm drainage experienced i n th i s area.
38

r
B 1 I I 1 I I I I I I 1 I I I 1 I I 1
I
Cost: To be determined. To be Einanced through the Township highway Fund.
9. Intersection Improvement - Highland Park Road and Belmont Avenue Action: This project m u s t be effected by the State
Department of Highways. and Local Planning Commission should, with con- currence of t h e County Planning Commission, have t h i s project made par t of the State Highway De- partment Program.
The Township Commissioners
Cost: To be determined by State Feasibi l i ty and Engineering Study.
10. Regional Recreation - - Richland- Booster Park Action: A master plan should be developed immediately
which w i l l provide a schedule of improvements on a continuing basis according t o established phasing as programmed by the Inter-municipal Recreation Authority. (Richland, Geistown, Stonycreek) .
Cost: To be determined by f eas ib i l i t y study. Currently each municipality has agreed t o finance the program on a per capi ta r a t i o basis. is $8,000.00.
Stonycreek Township's share fo r 1969
11. Elementary School - - Sann Street
Action: The Planning Commissions from Stonycreek Township and the City of Johnstown should coordinate local growth data and report accordingly t o the J6hnstown School Board re la t ive t o the exact timing of t h i s f a c i l i t y .
Cost: To be determined by a Johnstown School Board Feasibi l i ty Study.
12 . . Sanitary Sewer Construction Action: The Township Commissioners should cooperate
with the Highland Sewer and Water Authority and the Johnstown Municipal Authority i n the development of a Sewer Feasibi l i ty Study. An engineering firm should be retained t o prepare a detailed study which w i l l provide data on cost ,service areas and timing of construction. This study should follow the basic u t i l i ty -Fogram which is outlined i n the Long Range Development Program.
To be determined by a f eas ib i l i t y study,. 1
Cost:
39

I
13. Water Line Construction Action: The Township Commissioners should cooperate with
the Highland Sewer and Water Authority and the Laurel Management Authority in the development of a Water Feasibility Study. An engineering firm should be retained to prepare a detailed. study which will provide data on cost, service areas and timing of construction. This study should follow the basic utility program which is outlined in the Long Range Development Pro- gram.
Cost: To be determined by a Feasibility Study.
Promotion of the beltway system has and will continue to be a prime mission of the Johnstown and Cambria County Planning Agencies. local planning commission should actively participate in the promotion and urge prompt design and construction of the Stonycreek portion of the Beltway System.
14, Boone Street - - Regional Beltway Action:
The
Cost: The estimated cost of $21,400,000.00 includes the entire regional beltway system. estimate is available for the portion of the beltway which traverses Stonycreek Township; however, the entire system is necessary to benefit growth in the Township and the surrounding area.
No
15. Neighborhood Playgrounds Action: Development of these facilities must be the
responsibility of the neighborhood residents and the developers of residential areas, at least during the initial six year capital budget period, due to the limitation on Township resources at this time, Sites specified in the Long Range Development Program should be developed through annual additions of improvements and equipment.
I
Cost: To be determined after an investigation by the Recreation Committee.
40

I 16. Highland Park Road - - Widen, Realignment Action: The Township Commissioners, with the concurrence
and support,of the County and Township Planning Commissions should promote t h i s project. heavy t r a f f i c volumes on t h i s road-warrants future action for improvements.
The
Cost: To be determined by a Feasibi l i ty Study. A l l possible State and Federal Aid Programs should be investigated.
17. Krings Road - - Widen, Realign Action: The Township Commissioners should schedule
Krings Road f o r improvement as development warrants.
Cost: To be determined.
18. Hollow Road - - New Street Action: A s development expands into the northeast
quadrant, the Township Commissioners should place Hollow Road on a future s i x year budget. If development is t o occur i n t h i s area, a new road is a m u s t f ac tor .
Cost: To be determined.
19. Ruby Street - - New Street Action: The Township Commissioners should schedule the
the extension of Ruby Street i n a future six year capi ta l budget. I t is visual ly evident tha t i f the Wertz H i l l Area is t o be developed, a new access road must be constructed t o ensure safe and ef f ic ien t access.
Cost: To be.determined.
20. Intersection Improvements Action: The Township Commissioners should cooperate
with the surrounding municipalities t o formulate an action policy to improve the following hazardous intersections.
a. b. c. Oakland Avenue and Ohio Street
Walters Avenue and Bedford Street Highland Park Road and Belmont Avenue
The Township, wip the concurrence and support of County and Local Planning Agencies, should promote th i s project through the Pennsylvania Department of Highways.
I I .
Cost: Engineering estimates by the State Department of Highways w i l l be required t o promote t h i s project.
41
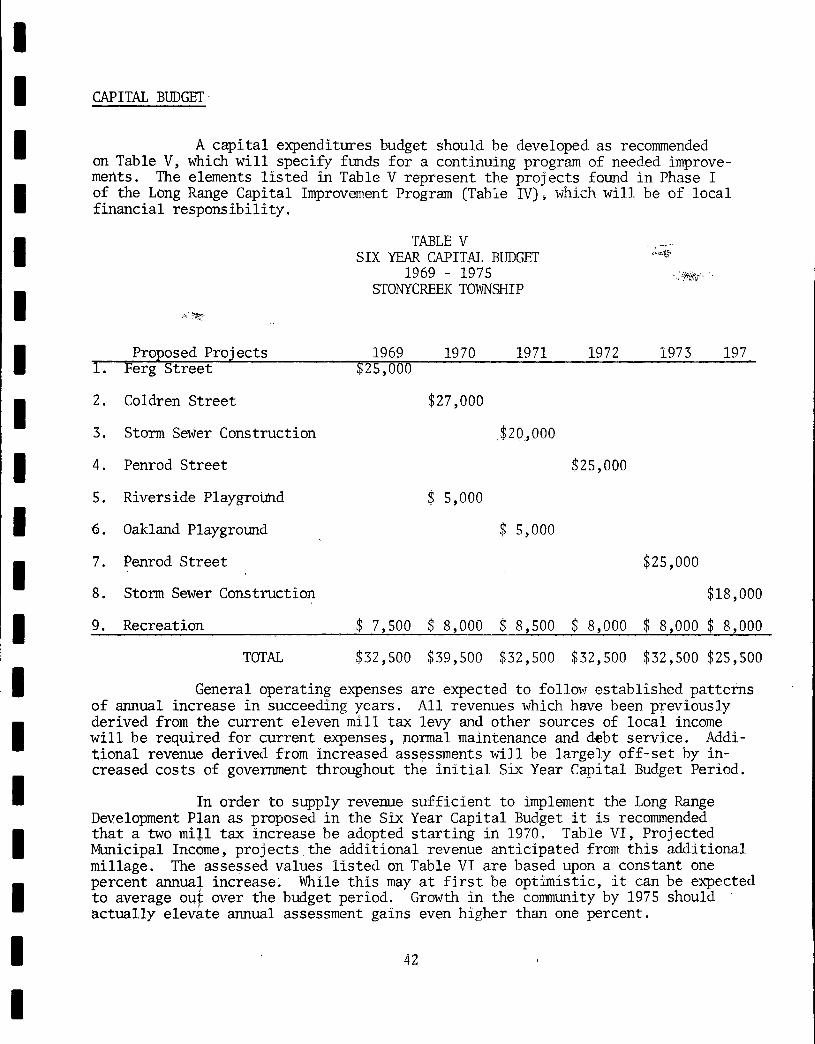
I I I I I
CAPITAL BUDGET
A capi ta l expenditures budget should be developed as recommended on Table V, which w i l l specify funds for a continuing program of needed improve- ments. of the Long Range Capital Improvement Program (Table IV], which wi.14. be of local f inancial responsibility.
The elements l i s t e d in Table V represent tb.e projects found i n Phase I
TABLE V SIX YEAR CAPITAL BUDGET
1969 - 1975 STONYCREEK TOWNSHIP
Proposed Projects 1969 1970 1971 I972 I973 197. f . Ferg Street $25,000
2. Coldren Street $27,000
3. Storm Sewer Construction $ 2 0,000
4. Penrod Street $25,000
5. Riverside Playgroimd !j 5,000
6. Oakland Playground $ 5,000
7 . Penrod Street $25,000
8. Storm Sewer Construction $18,000
9. Recreation $ 7,500 $ 8,000 $ 8,500 $ 8,000 $ 8,000 $ 8,000
TOTAL $32,500 $39,500 $32,500 $32,500 $32,500 $25,500
General operating expenses are expected t o follow established patterns of annual increase i n succeeding years. A l l revenues which have been previously derived from the current eleven m i l l tax levy and other sources of local income w i l l be required for current expenses, normal maintenance and debt service. Addi- t ional revenue derived from increased assessments w i l l be largely off-set by in- creased costs of government throughout the i n i t i a l S ix Year Capital Budget Period.
In order to supply revenue suff ic ient t o implement the Long Range
Table V I , Projected
The assessed values l i s t e d on Table V I a re based upon a constant one
Growth in the community by 1975 should
Development Plan as proposed i n the Six Year Capital Budget it is recommended tha t a two m i l l tax increase be adopted s ta r t ing i n 1970. Municipal Income, projects the additional revenue anticipated from th i s additional millage. percent annual increase. t o average ouf over the budget period. actually elevate annual assessment gains even higher than one percent.
While t h i s may a t first be optimistic, it can be expected
42

I I I I
%. I I I I 1 i 1 I I I 1 I I ,I I
FISCAL YEAR
TABLE V I PROJECTED MUNICIPAL I N C W
STONYCREEK TOWNSHIP 1969 - 1974
INCOME ADDITIONAL INCOME CURFENT 11 MILL LEVY TWO M I L L INCREASE
1968 4,816,010 52,976.11
1969 4,896,830 53,865.61
1970 4,945,798 54,403.78 9,891.60
1971 4,995,255 54,947.81 9,990.51
1972 5,045,207 55,497.28 10,090.41
1973 5,095,959 56,055.55 10,191.92
1974 5,146,918 56,616.10 10,293.83
I t w i l l be noted tha t the revenues anticipated from the additional
This w i l l provide f l ex ib i l i t y i n the event tha t actual revenues two m i l l s are i n excess of the Capital Improvements costs scheduled between 1969 and 1974. are less than the projections indicated.
I t must be noted that the indebtedness created in 1961 has been l iberated, therefore the two m i l l increase may not be necessary a t t h i s time. However, the Township Commissioners may create and maintain a separate reserve fund f o r any anticipated legal cap i ta l expenditures which sha l l be designated for it specif ic purpose or purposes a t the time of its creation, released by the l iberation of the indebtedness created i n 1961 can be diverted into a separate reserve fund fo r specif ic capi ta l expenditures.
t o borrow money and issue evidences of indebtedness to the extent, and i n the manner, i n which municipal d i s t r i c t s are now authorized t o incur or increase debts for the purpose of permanent improvalents but the t o t a l indebtedness so created sha l l not exceed tha t l imit setfor th by public law. borruwing capacity is i n excess of three hundred thousand dol lars .
t h i s program. which can channel the energies ahd resources of Stonycreek Township toward a new growth and opportunity.
and the Federal Government provide assistance t o cornunity develo&ent. subsidiary benefit , which would be of value t o the Township, is outlined, i n b r i e f , i n the appendix.
The monies
A second alternative is for the Township Commissioners, by ordinance,
Presently, the t o t a l
Undoubtedly adjustments w i l l be required during the development of However, the outline provided herewith offers goals t o be achieved
Through several Grants-In-Aid Programs, the State of Pennsylvania This
43

I I I I I I I I I I I I I I I
A P P E N D I X

FINANCIAL ASSISTANCE *
Through various grant-in-aid programs, the Commonwealth of Pennsylvania and the Federal Government provide financial assistance to local government. The following digest of assistance provides a general outline of some of the principal aids available to local government. These programs should be utilized by the community in carrying out the capital improvements program and other programs of community devel- opment.
PROGRAMS OF THE DEPARTMENT O F HOUSING AND URBAN DEVELOPMENT
Advances for Public Works Planning
Purpo se s : Interest-free advances to assist planning for local public works
Specific Uses: Examples: Water and sewer systems, school buildings,
All types of public works, except public housing.
recreation projects , public buildings, irrigation projects, health facilities bridges.
Terms: Advance repayhble to HUD promptly upon construction of the planned public work.
Grants for Advance Acquisition of Land
Purposes: To encourage communities to acquire, in a planned and orderly fashion, land for future construction of public works and facilities,
Terms : Grants may not exceed the interest charges on a loan incurred to finance the acquisition of land for a period of not more than 5 years .
Grants for Basic Sewer and Water FaciLities.
Purposes : To assist and encourage communities to construct adequate basic water and sewer facilities to promote their orderly and efficient growth and development.
Specific Grants to finance up.to 50% of the cost of improving or Uses: constructing basic water and sewer facilities. Where
there is no existing system, the project must be so designed that it can be linked with other independent sewer and water facilities in the future.
Terms : To be determined

I I I I I I I I I I I I I I I I I I I
Grants for Neighborhood Facilities
Purposes :
Specific Uses :
Terms:
Public Facility Loans
Purposes:
Specific Uses:
Terms:
Urban Renewal
Purposes:
Specific Uses:
To provide neighborhood faci lities needed for programs carrying out helath , recreation, social or similar necessary community services in the area.
Finances neighborhood or community centers, youth centers , health stations and other public buildings to provide health, recreat.iona1 or similar social services e
Up to two-thirds of project cost or 75% in redevelopment a reas designated under the Public Works and Economic Development Act of 1965 e
Long-term loans for construction of needed public facilities such as sewer or water facilities.
A variety of public works may be financed under this program. When aid is available from other Federal agencies, HUD assists only with those parts of the project not covered by other Federal programs.
Loan may be up to 40 years. It will be governed by applicant's ability to pay and by the estimated useful life of the proposed facility.
0
To assist cities undertaking local programs for the elimination and prevention of slums and blight, and the elimination of factors creating them. A long range effort to achieve better communities through planned redevelopment of deteriorated and deteriorating areas through partnership among local governments, private enterprise, citizens and the Federal Government e
Community-wi& renewal programs identifying needs and resources and establishing schedules and priorities for accomplishing the work; planning and carrying out urban renewal projects for rehabilitation and redevelop- ment of blighted areas; undertaking programs of con- centrated code enforcement and demolition of buildings that a r e substandard and constitute a hazard to public health and welfare

1 I I I
Terms: Federal advances and loans Federal grants, local contributions. Grants generally pay up to two-thirds of net project cost; but may be as high as three-fourths. Local contributions may include cash or non-cash grants- in-aid., Also avaikible a r e special rehabilitation loans and grants, and housing assistance programs for low income , elderly, and handicapped individuals and families residing in project areas
Urban Planning Assistance Program
Purposes:
Specific Uses:
Terms:
To foster good community, metropolitan a rea , regional and statewide planning.
Preparation of comprehensive development plans, including planning for the provision of public facilities, transportation, long-range fiscal plans and programming and scheduling of capital improvements.
Federal grants of two-thirds of the cost of the work; local contribution of one-third. In some cases Federal grants may amount to as much as three-fourths.
Open Space Land and Ur,an Beautification Grants
Purposes: To assist communities in acquiring and developing land for open space uses and in carrying out urban beauti- fication programs.
Specific Uses: scenic areas or preserve historic places. Urban
Provide parks and other recreation, conservation, and
beautification and improvement includes such activities as street landscaping, park improvements, t ree planting, and upgrading of malls and squares Relocation payments are provided for individuals families , and businesses displaced by land acquisition.
Terms: 50% to help public agencies acquire and preserve urban lands having value for park, recreation, scenic, or historic purposes. Where necessary to provide open- space in built-up urban areas , grants can cover up to 5 0% of the cost of acquiring and cP earing developed land. 50% is also available to assist in developing lands acquired under the open space land program, Grants up to 90% a r e authorized to car ry out projects of special value for demonstrating new and improved methods and materials for urban beautification.

I I I I I I a I I 1 1 I I I 1 I I I I
Solid Waste Disposal
Purposes:
Specific Uses:
Terms:
Law Enforcement Assistance
Purposes :
Specific Uses:
Terms:
Library Services and Construction
Purposes :
Specific Uses:
Financial Assistance for solid waste disposal projects.
Grants available for planning, constructing and operating disposal facilities and land acquisition.
To be determined.
Grants and technical assistance to develop the skills of the law officer.
Emphasis on improvement of techniques, and demonstratibn projects.
To be determined.
Grants to states to extend and improve library services . Financial assistance available to local public and non profit library agencies through the State Library for salaries, books, equipment, and construction.
Terms: To be determined.
Today, in most areas of municipal activity there are related State and Federal
* * *
programs which may be of local benefit. Also, new legislation is continually under con- sideration to broaden existing programs or initiate new ones. It will surely benefit the community to research these sources of assistance whenever local programs are con- templated.
The Housing Act of 1949, as amended, requires as a condition of certain financial assistance, the following:

I 1 1 1 I 1 1 1 8 1 1 I 1 I 1 1 1 I I
'' . . . a workable program for community improvement (which shall include an official plan of action, as it exists from time to time, for effectively.dea1- ing with the problem of urban slums and blight within the community and for the establishment and preservation of a well-planned community with well- organized environment fo:r adequate family life) for utilizing appropriate private and public resources to elimimte and prevent the development Or spread of slums znrl LrSa.n blight, to encourage needed urban rehabilitation, to provide for r..ed.reveiopment, of blighted, deteriorated, or slum a reas , or to undertake such of the aforesaid axtivities or other feasible community activities as may be e:ifk~bly employed to achieve the objectives of such a program. li
The specific requirrermnw of the workable program are based on the statutory objectives descr tDed sbo-fe 2nd z re designed to provide a flexible framework for organizing community efforts to dirnK&,=zte s9d prevent slums and blight. The work- able program calls for F C O ~ Y ~ ~ S S J Q zhe following four areas:
1. Code Adoption and Enforcement. The adoption of housing, building, and related codes, and development of an effective code enforcement pr0gra.m which is at least a2equate to deal with areas having high priority need f u ; ~ e-℞nent,, ixluding both blighted areas and basically PO'UXJ b y t deteriolating neighborhoods, and which is geared t0iiinl.d eventual community-wide compliance with such codes.
2 . Planning -- Programming and Budgeting. The establishment of a contiming public planning, programming and budgeting process which develops action progrzims within a comprehensive planning framework for olrercoming G:E major physical social, and economic problems related to the slum and blighted areas of the community, and for establishing 2nd p~ese rv ing a mtll-planned community with suitable living envi-r.unmer?+ for family life.
3 . Honsing m.d. Rc1oi~.Mon. The development of a centralized or _I_ _ I _ _ _ ~
coordirrdtsd p q m m f ~ r assisting in the relocation of all persons and jnsiness cop,cer~s displaced by public action in the community and the develcpmen~ cf B program to expand the supply of housing for low - and mdaxte-kmome families on the basis of equal opportxnity .
4. Citizen Inwlvemem. The establishment of programs designed to achieve meanizigful imolvement of citizens including poor and minority gy'cjlips, in planning and carrying out HUD-assisted programs related to the Wwkz,?;lle Ptogram.
A detailed expla.;natiofi of the policies and requirements for each of the above four areas is set forth in the HUD Handbook, Workable Program for Community Improve- ment, October 1968 *

I I
PROGRAMS O F THE COMMONWEALTH OF PENNSYLVANIA
The Commonwealth of Pennsylvania has many programs of technical and financial assistance available to local municipalities. The Department of Community Affairs is the principal agency administering the State aid programs. The major programs a r e as follows: Project 70
Purpose :
I Terms :
I
To acquire land for recreation, open-space preservation water -shed protection, historic preservation To enable local municipalities to acquire land for neighborhood, community and regional parks.
Financial assistance up to 50% for land acquisition is administered through the Department of Community Affa i r s
Title VI1 - The Open Space Land Program
Purpose : To supplement Project 70 Program in developing urban open space land.
Terms: Grants up to 50% administered through the State by the Federal Urban Renewal Administration.
500 Million Dollar Conservation and Recreation Program
Purpose : Grants a r e available for the development and acquisition of community and County park, recreation and open space lands and for the preparation of Community Recreation Studies, site plans and construction (architectural and engineering) plans and specifications.
Terms :
Solid Waste Management Act
Up to 80% aid from State-Federal sources a re available through the Department of Community Affairs .
Purpose: For counties municipalities , authorities or any combination thereof including municipalities with a population density of less than 300 persons per square mile to develop a Comprehensive Plan for the planning, recreation, collection, storage , transportation, processing and disposal of solid wastes.

Terms: Grants up to 50% administered through the Department of Health.
Act 537 Sewage Facilities Plan
Purpose : To prepare a sewage feasibility study of existing conditions in areas cited for violation of the Commonwealth Clean Stream Law and prepare sewerage recommendations. To prepare "Official sewer plans!'as required by the Act.
Terms: Up to 50% financing for feasibility study is available through the Commonwealth of Pennsylvania under the Pennsylvania Sewage Facilities Act (P. L. 1535).
In addition to the above mentioned programs, State aid is available for industrial site development, industrial financing, community facilities such as sewer and water, library, hospital and educational facilities. A directory of State aids is presently being printed by the Department of Community Affairs and should be available to the public in the near future.

SUMMERHILL BOROUGH
cambria county planning commission, court house annex, ebensburg, pa.

/.
S U M M E R H I L L B O R O U G H C O M P R E H E N S I V E P L A N
PREPARED 3 K
THE CAMBRIA COUNTY PrnWIKG C~~IISSION
COURT WUSE AIWEX, EBENSEURG, PEXXSYLVANIA 15931
1973
"The preparation of t h i s Report ms financed in part through a Comprehensive Planning Grant from the Depa-rtment of Housing and Urban Development, under the provisions of Seztion 701 of the Hoilsing Act of 1954, a s amended, and a s administered by the Surau of Planning, Pennsyl- va.tis Department of Community Affairs.''

0
I IBLIOGRAPHIC D A T A 2 rHEET
l l T L C P N D S U B T I T L E
0
3 RECIPIENT'S A C C E S S I O N NO
5 R E P O R T D I T €
0
P u r n O R I s ~
Staff P E R f O R Y l N t O R G P N I Z A T I O N NAY( A N D A O O R E S S
0
0 PLRFORYING ORGANIZATION R E P T
NO
10 P R O J L C l / T A S K / W O R K UNIT N O
2 S P O N S O R I N G O R G A N I Z A T I O N N A M E AND A D O R L S S
Summerhill Planning Committee Municipal Building Summerhill, Pennsylvania
? Smnerhill Borough Comprehensive Plan
13 I V P E O F R E P O R T 8 P f R l O O
C O V E R f O
F i n a l I 4
I
I A V A I L A B I L I T Y S f A l t MCNT 19 S E C U R I T Y C L I S S ( T H I S 21 NO OF P A G E S
100 Copies W?%dssif ied 160 2 0 ttcunirr C L A S S ( T H I S 22 . PRICE
$ 3.00 P € 1
Cambria County Planning Commission Courthouse Annex Ibensburg , Penns,ylvania 15931
Unclassified
P-1127
J
D A E S l R A C l ) 1 The purpose of t h i s study is to provide guidance for the future
development of Summerhill Borough. existing conditions, a Policy and Long Range Plan was developed. plan includes Future Land Use, Future Transportation and Future Community Facilities. A Capital Wldget and Improvement section is also included in order t o provide financial direction for the Borough in i ts endeavors t o further develop the community.
Through inventory and analysis of This
7 k L v W O R D S A N D D O C U M E N T A N A L Y S I S I ~ E o t s c R l P i o a s
7 3 ID€Nl IF I€ I )S /OPEN~-ENDED TERMS
I C C O S A l l F I L L D / G R O U P
e
~
I
1979
Mr. Lawrence Casey 535 Main Street P.O. Box 276 Summerhill, Pennsylvania 15958
D e a r Mr. Casey:
On behalf of the members and s taff of the Cambria County Planning Commission, I am pleased to transmit the attached copy of the Summerhill Borough Comprehensive Plan as a part of the continuing Comprehensive Phnning Program for Summerhill Bo rough.
The purpose of t h i s report is to provide guidance for the future development of S m e r h i l l Borough. of Summerhill Borough are inventoried and analyzed and future trends a re projected. These existing conditions and projected trends a re then analyzed in l i gh t of Community Goals developed by the S m e r h i l l Borough Planning Com- mission. The end result of t he data collection and analysis is a Policy and Long Range Plan for S m e r h i l l Borough. This plan includes Future Land Use, Future Transportation, and Future Community Faci l i t ies . A Capital Budget and Improvement section is also included in order to provide financial direction for the Borough in i ts endeavor t o further develop the Community.
We are confident that the information contained in t h i s study w i l l serve as a valuable basis for the formulation of ac t iv i t i e s and programs t o insure a viable future developnent of both the Borough of Summerhill and Cambria
Within t h i s report, existing conditions
county.
I wish to express my sincere gratitude for your continued interest and support of the ac t iv i t i e s of the Cambria County Planning Commission and t o the staff of the Commission for the i r effort in preparing t h i s report.
Respectfully s u h i t t e d ,
Chairman
cambria county planning commission /courthouse annex / ebensburg, pa. 15931 telephone (81 4) 472-5440
0
a
a
0
0
I
' 0
0
CAMBRIA COUNTY m1ss10NERs
T. T. Metzger, Jr,, President
W. Donald Templeton
CAMRRIA COUIWY PLANNING COiWISSION
John P. Kupchella, Chairman
Gilbert Salsgiver , Vice-chairman
Daniel Byrne, Secretary
Elvin Overdorff Treasurer
James J. Long, Jr.
SM"ILL BOROUGH PLANNING CCNMITTEE
Lawrence Casey, Chairman
James Gallardy
Jim Lesko
CAMRRIA CouwrY PLANNING CWISSION STAFF
Bradford G. Beigay, Executive Director
Thomas A. Maum, Principal Planner
David L. Belz , Principal Planner
Joseph P. Roberts
Fred McFadden
Thomas N. Crowley
Leonard LaPorta
Richard F. Truscello, Principal Planner
Shelly A. Kaltenbaugh, Planner
Norman Berzonsky, Planner
Jan A. Behe, Planning Technician
Colleen A. Schall, Administrative Assistant
Nanette G. Ludwig, Stenographer
Maryann KOza, Stenographer
Claudia M. McCloskey , Stenographer
T. Michael Crowley, Summer Intern
Mary Kay Waltimire, Summer Intern
Raymond Bodenschatz
Vince Kitchick
TABLE OF CONTENTS
0 H I STORY AND REG I O N SETTING
PHYSIOGRAPHIC STUDY
M I S T I N G LAM) USE S W D Y
ECONCMIC BASE STUDY
1
3
5 8 8 8 14 1 7
18
24 25 29 29 30
32 34 39
40 40 46 48
51 51 52
a

0
e
TABLE OF C0NI'E"S (CONTIMJED)
TRANSPORTATION STUDY
POLICY AND LONG RANGE PLAN
rn LAND USE
FUTURE C W I T Y FACILITIES
Swnmerhill Borough Community Facilities Goals -------------- Future Community Facilities Recommendations - - - - - - - - - - - - - - - - public Water and Sewer Service . . . . . . . . . . . . . . . . . . . . . . . . . . . . .
IMPLEMENTATION AND CONTROLL PLAN
Guiding Private Property Development . . . . . . . . . . . . . . . . . . . . . . . Guiding Private Property and Service Development - - - - - - - - - - - Capital Improvements Program Description ----------------I--
Wastewater Alternatives fo r shall Communities -------------- Sanitary Sewerage Disposal . . . . . . . . . . . . . . . . . . . . . . . . . . . . . . . . . Summary: LK-1 and Regional Options . . . . . . . . . . . . . . . . . . . . . . . Sewage Oxidation Ponds . . . . . . . . . . . . . . . . . . . . . . . . . . . . . . . . . . . . . Oxidation Ditch . . . . . . . . . . . . . . . . . . . . . . . . . . . . . . . . . . . . . . . . . . . .
54 54 55 55
58 60 62 63 75 76 77
79 81 81 90
92 92 94
98 98
103
105 108 109 111 11 5
11 7 119 120 120 1 2 2 123 124 125
0
le
TABLE OF CONTJ3RS (CONTIlk'UED)
1 2 5 1 2 6 1 2 7 1 2 8 1 2 8 130 130 130

I
I1
I11
Iv
V
V I
V I I
V I 1 1
M
X
X I
xr I X I 1 1
X I V
XV
XVI
X V I I
X V I I I
XIX
XX
XXI
Age - Sex Composition - Summerhill Borough, 1960-1970.----------- 27
29
30
31
Population and Density _-_____-_-_-__--________________________--
Migration Characteristics - Summerhill Borough, 1970-1976 - - - - - - -
Projected Population Levels - Summerhill Borough 1970-1985 - - - - - -
Detailed Occupational Tabulation of Summerhill Borough, 35
37
1970-1978 . . . . . . . . . . . . . . . . . . . . . . . . . . . . . . . . . . . . . . . . . . . . . . . . . . . . . . .
General Occupation Tabulation - Summerhill Borough, 1970-1978 - - -
Persons Per Household Unit - Summerhill Borough, 1970 - - - - - - - - - - - 42
43
44
Rooms Per Unit - Summerhill Borough, 1970 . . . . . . . . . . . . . . . . . . . . . . .
Age of Housing - Summerhill Borough, 1970 . . . . . . . . . . . . . . . . . . . . . . .
Value of Owner - Occupied Housing Units - Summerhill Borough, 1970 . . . . . . . . . . . . . . . . . . . . . . . . . . . . . . . . . . . . . . . . . . . . . . . . . . . . . . . . . . . . 45
1970 Housing Conditions - Summerhill Borough . . . . . . . . . . . . . . . . . . . . 46
49 Calculating Future Housing Needs - Summerhill Borough, 1985 - - - - -

LIST OF TABLES - CONTINUED - 0
XXII
XXII I
e XXIV
XXV
XXVI
e XXVI I
XXVIII
XX I X
i0
84 Summerhill Borough Receipts, 1974-1978 . . . . . . . . . . . . . . . . . . . . . . . . . .
86 Summerhill Borough Expenditures, 1974-1978 . . . . . . . . . . . . . . . . . . . . . .
133 Proposed Capital Budget - Phase I .L980-1984 . . . . . . . . . . . . . . . . . . . . .
Summerhill Borough - Future
Recommended Space Standards
Construction Costs for Unit
for Municipal Public Recreation - - - - - 101
128 Processes (0.1 MGD Treatment Plant) -
134 Proposed Capital Budget - Phase I1 1985-1989 . . . . . . . . . . . . . . . . . . . .

LIST OF MAPS
1.
2.
3.
4.
5 .
6.
7.
8.
9.
1.
2.
3.
4.
5.
7.
LIST OF FIGURES
Population pyramid 1960-.1976 --------------I------
Labor Force Trends 1970-1978 ------ - - - - - - - - - - ' - - - --
Occupational Trends 1970-1978 -------------:------- . .
Summary of Revenues . . . . . . . . . . . . . . . . . . . . . . . . . . . . . . Summary of Expenditures , . . . . . . . . . . . . . . . . . . . . . . . . .
4
9
16
23
53
56
57
67
97
7
22
26
28
33
38
88
89

e
e
INTI<ODUCTION

9
Comprehensive comunity planning is a systematic and continuing pro- cess to help solve current community problems and provide for future needs. Local govenunent officials frequently face issues on which decisions have to be made concerning the municipality and municipal services and facilities. All too often such decisions are based upon unreasoned opinion and pressures of the moment. result. These difficulties can be lessened and prevented through use of an or- ganized and thoughtful way to approach municipal decisions. a comprehensive plan is a very important asset to the existence and development of a successful comity.
The goal of this comprehensive plan is to develop a healthy, livable environment sustaining adequate housing, c o m i t y facilities, and transporta- tion facilities, thus enabling the residents to maintain both an individual and collective pride and identity with the comity. To attain this goal, objec- tives are aimed at establishing policies for preservation and creation of desir- able physical elements. Also, agencies actively involved in providing social services and economic stabilization must be established and retained in the comity. The purpose of this study is to develop a community plan that will lead to the attainment of these desired goals.
To effectively initiate and successfully develop a comprehensive com- munity plan, physical analysis of topography, climate, and land use factors must be evaluated together with studies of population and economic conditions, recre- ational and c o m i t y facilities, transportation systems, public utilities, and private concerns. light on why the c o m i t y has deteriorated, and therefore may hold the key as to what future proposals and development policies must be established to correct and prevent any future deficiencies.
Future proposals in comprehensive community planning concentrate on the physical elements and the socio-economic elements of the community, specif- ically housing, land use, and economic concerns. Physical elements generally include code enforcement, demolition and clearance, a community master plan for development, slope analysis, housing restoration, and private or public spon- sored rehabilitation campaigns. The socio-economic elements of the plan gener- ally include coordination of social services, the development of an effective citizens' association, home improvement and management services, a public rela- tions office, and programs oriented directly to economic stabilization.
junction with the comprehensive plan. tools necessary for a community to effectively accomplish the future proposals discussed in the plan.
Summerhill, utilizing all of the elements of a comprehensive plan. recommendations and proposals designed to eliminate many problems facing Summerhill are presently in the plan. also presented to meet the desires and needs of the community.
Frequently local officials find themselves in difficulty as a
For these reasons
Once examined thoroughly, the existing conditions may shed
Recommended zoning and subdivision regulations are prepared in con- These regulations are the implementation
This report contains an in-depth detailed study of the Borough of Specific
Functional implementation programs are
1

The following material contains an inventory of existing conditions within Summerhill Borough. Conclusions to be developed from an analysis of this inventory will form the framework for the Long Range Comprehensive Plan to be presented later in the planning program.
Although this data has been prepared as a part of the formal planning program, it is by its very nature subject to continual change. Additional growth and changing internal and external pressures, which may invalidate cer- tain assumptions and projections, will create a constant need for review, and if necessary, certain revision. Therefore, when a formal planning program has been completed, the Planning Commission should, as a matter of normal routine, periodically update all inventory studies. data from which to proceed additional studies, and result in a continuing pro- gram of cornunity inprovement .
This procedure will provide current *
. . .
2

e
HISrORY AND REGIONAL SEITINC

Smerhill Borough, one of the oldest communities in the area, is located in the south-central part of Cambria County. Township on the north, south and east, and by Ehrenfeld Borough on the west.
David Somers, was founded in 1810. ber 4, 1892, that Smerhill was incorporated.
the Borough's early days it was the scene of much industrial activity. in the community during the past were feed mills, saw mills, blacksmith shops, slaughter houses, hotels, a railroad company store, tannery, stone quarry, and others.
Nost of the area's economic vitality and growth during the years can be traced to the Allegheny-Portage Railroad which ran through the Borough. only did the presence of the Railroad stimulate the growth of the area, but it served as an invaluable link between east and west.
It is bordered by Croyle n
The Borough, originally named Somerhill after pioneers Joseph and It was not until 82 years later on Septem-
Although today there are no industries of any appreciable size, in 0 Included
Not
3

COUNTY COMPREHENSIVE PLAN
REGIONAL LOCATIO"- THE PUEPARATDN OF THIS YAP WAS FINAUCED IU PART TnUOUGn AN URBAN PLAUUIUG ORAUT CROY THE ' HOWIYQ ACT OC IBM. AS A Y Y M D , ADY(UETLRC0 BY THE BUREAU Of PLAUUIUC, ?LNYIVLYLNU OEMRTYLYT OF C O Y Y . . I V N U S
"
o c m a m m OF wousm AND URBAU DEVELOCYLUT, uwea THE ~ ~ O Y I S I O U S or ELCTIOU TOI OF T n i

e
PHYSIOGRAPHIC

c
To properly determine and project the long-range potential of any area, it is necessary to fu l ly explore and study a l l existing physical conditions. An investigation was made of five major physical characteristics of Summerhill Bor- ough in order t o determine the related effects of these characteristics upon the Borough's future developnent. These include: (1) Climatology; (2) Geology; (3) Soils; (4) Slope; and (5) Watersheds. Through the use of a Slope blap and Soils Flap, a graphic representation is provided to accompany the narrative on aspects of Summerhill Borough' s physiography.
CLIMATOLOGICAL DATA
In comprehensive planning, it is important to include an analysis of the area's climate. conseauently, human act ivi ty are a l l influenced by climate. Detailed data on temperature, ra infa l l , wind, and frost a re important in rural and urban planning. Wlilding and structural requirements, site selection, and project feas ib i l i ty are a l l influenced by climatic factors.
whole i s a h i d mesothermol @FA) characterized by four dis t inct seasons: summer; f a l l ; and winter. t h i s climate and occurs between early May and early October. The mountains are, in same instances, prominent enough to have a deflecting effect on storms, wind, and also in directing showers and thunderstorms up the valleys.
In Summerhill &rough, precipitation is usually adequate, dependable, and well distributed throughout the year. based on a nine-year period, is approximately 52.4 inches; however, short peri- odic dry spells are not mcomon during the hot summer months.
above 90' to below 0' F. average of monthly temperatures and precipitation in the Summerhill area.
ental a i r masses t o the north and the maritime continental tropical a i r masses to the south and southeast, are sources of periodic, highly changeable weather situatioris.
For planning purposes, the extremes of climatic conditions must be recognized and allowed for because these are the conditions which tend to be most uncomfortable or destructive. should be considered when building so that adequate cooling and heating sys- tems are provided. The typically large amounts of spring precipitation should be allowed for when building ditches, storm sewers, etc. cipitation is generally a t a minimum, care should be taken to provide adequate water supplies for the Borough. Because the temperatures fluctuate near 32' F during the winter months, allowance should be provided for the effects of continuous freezing and thawing.
Natural vegetation, formation of so i l s and land forms, and
The climate particular to Summerhill Borough and Cambria County a s a
A freeze-free period of 140-150 days i s average for spring;
The average annual precipitation,
Temperature extremes experienced throughout the year may range from Figure 1 is a graphic representation of a nine-year
Summerhill's location places it in a climate between the polar contin-
Contrasting a i r masses and severe frontal act ivi ty
Summerhill Borough' s temperature extremes
In February when pre-
Table I presents monthly average temperatures and to ta l precipita- t ion for the years- 1975 and to ta l precipitation
through 1977. Also, the yearly average temperatures by year is presented.
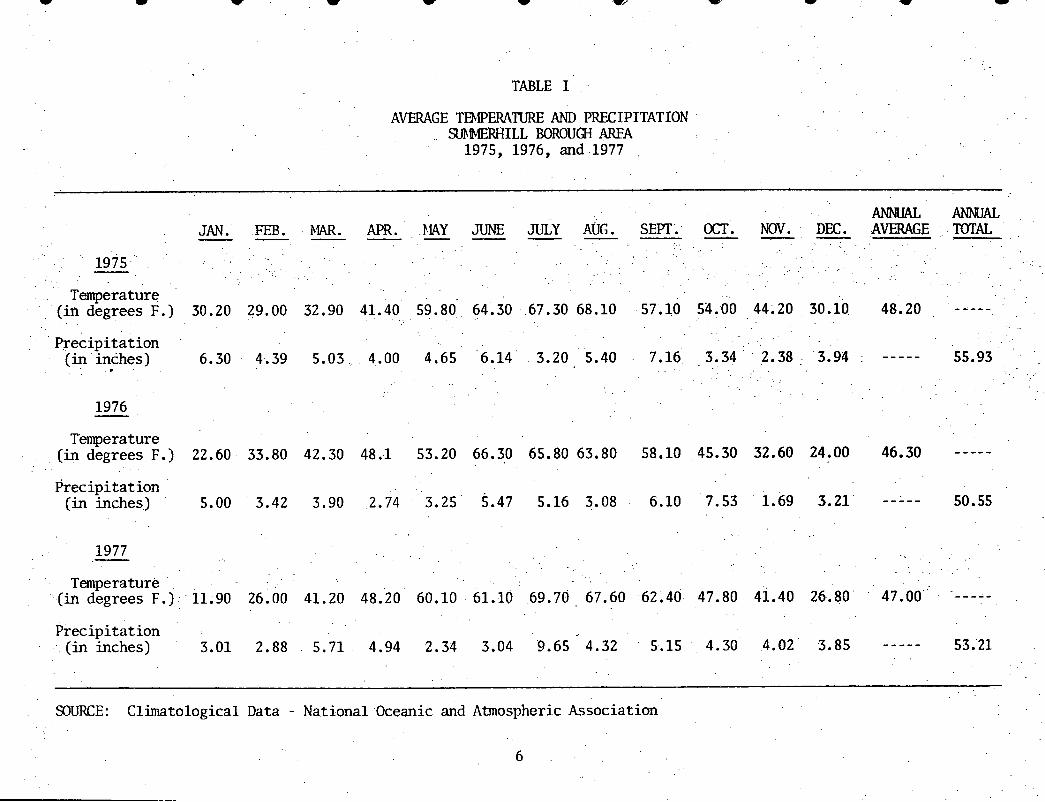
w 1
TABLE I
AVERAGE TEWERATURE AND PRECIPITATION SUMMERHILL BOROUGH E A
1975, 1976, and 1977
A M W A L A N N I J A L JAN. FEB. MR. APR. BiAY JUNE JULY AUG. SElT. OCT. NOV. DE. AVERAGE l"AL - - - - - - - - - - - -
1975
Temperature (in degrees F.)
Precipitation (in inches)
1976
Temperature (in degrees F . ) Prec i p i t a t ion
(in inches)
30.20 29.00 32.90 41.40 59.80 64.30 67.30 68.10 57.10 5'4.00 44.20 30.10 48.20 - - - - -
22.60 33.80 42.30 48.1 53.20 66.30 65.80 63.80 58.10 45.30 32.60 24.00 46.30 -----
5.00 3.42 3.90 2.74 3.25 5.47 5.16 3.08 6.10 7.53 1.69 3.21 - - - - - 50.55
1977
Temperature (in degrees F.) 11.90 26.00 41.20 48.20 60.10 61.10 69.70 67.60 62.40 47.80 41.40 26.80 47.00 ------ Precipitation
(in inches) 3.01 2.88 5.71 4.94 2.34 3.04 9.65 4.32 5.15 4.30 4.02 3.85 - - - - - 53.21
SOURCE: Climatological Data - National Oceanic and Atmospheric Association
6

'3
4
~ F E I E R H I L L BOROUGH
- 70' 6 in.-
TYPICAL TFMPIXA'rlJRliS AND PRECIPITATIONS
5 in
4 in,
3 i n .
2 i n .
1. i n .
\
J,w. Feb. Mar. Apr. Flay June July Aug. Sept. Oct. Nov. Dec.
Precipitation
- Temperature SOlJRCI',: Climatological Data, U.S. Department of Commerce
7 Figure 1
0 -60
0 -50
0 -40
0 -3 0
0 - 20
- loo

The geology data of an area is importcant because it i s an existing
Often minerals of eco- physical condition underlying the surface. or enhanced by qual i t ies of the subsiirface material. nomic importance a re contained within the imderlying material and these can have large effects on a community's development.
the Pennsylvanian geological period. subsurface of the Borough and consists of a variable seauence of sandstone, shale, clay, thin coals, and thin beds of limestone. maugh series varies from 300 t o 500 feet in t h i s section of the County.
COAL GEOLOGY
Surface ac t iv i t i e s can be limited
,
The subsurface rock structure f o m t i o n of Summerhill was formed in The Conemaugh series covers the en t i re
The thickness of the Cone-
Coal has his tor ical ly been of significant importance i n Summerhill Borough.
There a re primarily four coal beds of significance within the Borough. They a re the Upper Freeport, Lower Freeport, Upper Kittaning, and Lower Kittaning. A span of 200 feet separates the highest bed i n the Allegheny ser ies , the Upper Freeport bed, from the Lower Kittaning bed. Other beds of economic significance are the Lower Freeport and Upper Kittaning. Most of the coal tha t has had s ig- nificance in the Summerhill Borough area was extracted from the Lower Kittaning seam. The Lower Freeport seam has also played an important role i n the area, a s much of t h i s coal has also been extracted.
!filch of t h i s seam s t i l l exis ts within the Borough's botmdary today.
Soils consti tute a prime physical characterist ic and a future land use Soils which have excess slope, a seasonal high water table, and
On the other hand, so i l s with some of these qualities may be desired Although
determinate. large boulders o r hard bedrock conditions may present problems when building houses. for other land uses such as road construction, farming, parks, etc. so i l s have limiting factors for some land uses, i f need for development occurs, a l m s t any limitation can be overcome a t a cost.
There a re eleven basic types of so i l s i n Summerhill Borough. This section contains both a basic description of each so i l ser ies in the Borough and a list of mapping uni ts i n each series. init ions used in describing so i l s is also included on pages 10-11.
A l i s t containing terms and def-
Summerhill Borough so i l s have been classified and mapped by the United States Department of Agriculture Soil Conservation Service. The mapping units indicate the dominate kind of s o i l i n each area. clude small areas of different so i l s tha t were not practical t o map separately because of the scale used. of t h i s survey are adequate. so i l analysis should be made.
Each of these units may in-
For the purpose of general planning, the so i l units However, for actual construction, a more detailed
8

I I
j i I I ! !
[
i
I I
\
\

Definitions
a Slope -- The rise o r f a l l of the land, usually measured in feet per hundred o r percent.
Seasonal IJigh Water Table - - A zone o r saturation in the s o i l which is within eight t o 36 inches of the so i l surface during a t l eas t par t of the year. Seasonal water table is usually caused by a fluctuating water table generally not associated with the ground water table. I t is usually associated with somewhat poorly drained and moderately well- drained so i l s .
i
High Water Table - - ,2 zone of saturation in the so i l which is within eight inches of the surface in most seasons. water table of a perched water table. by mottling within eight inches of associated with poorly drained and very poorly drained so i l s .
I t may be caused by a normal ground High water table is indicated
I t is usually
9
the so i l surface.
Permeability -- The ra te a t which water wil l move through a saturated s o i l .
(a) (b) (c) Moderate -- 0.63 t o 2.0 inches per hour: (d) (e)
Slow -- less than 0.20 inches per hour; Yoderately Slow -- 0.20 t o 0.63 inches per hour:
Moderately Rapid - - 2.0 t o 6.3 inches per hour: o r Rapid -- m r e than 6.3 inches per hour.
Drainage Soil -- The following classes are used to express s o i l drainage:
within 36 inches of the surface. Well-drained - - excess water drains away rapidly and no mottling occurs 0
CP
Moderately well-drained - - water is removed from the so i l somewhat slowly, resulting in small but significant periods of wet- ness. Mottling occurs between 18 and 36 inches.
Somewhat poorly drained - - water is removed from the so i l slowly enough to keep it wet for significant periods but not a l l of the time. Yottling occurs between eight t o 18 inches.
Poorly drained - - water is removed so slowly that the s o i l i s wet for a large par t of the time. Mottling occurs between zero and eight inches.
Very poorly drained - - water is removed so slowly that the water table remains a t o r near the surface for the greater part of the time. There may also be periods of surface ponding. The so i l has a black to gray surface layer with mottles up to the surface.
10

Fragipan - - A dense, brittle, slowly or moderately slowly permeable subsurface layer which occurs 15 to 40 inches below the surface and may vary in thickness from a few inches to several feet.
Mottling Soil -- Contrasting gray, red, yellow, or brown color patches occurring in the soil profile, usually'resulting from varying degrees of wetness.
Loam - - A soil having a relatively even mixture of sand, silt, and clay. It has a somewhat gritty feel, yet fairly smooth and slightly plastic when. moist.
II
i
4 Silt -- Individual mineral particles of soil that range in diameter from 0.002
millimeters to 0.05 millimeters.
Clay -- Fine earth portion of the soil having a diameter of less than 0.002 millimeters.
Mapping Unit -- It is composed of a soil having defined properties. Also included are small areas of other soils that cannot be separated because of the limits imposed by the scale of mapping. A unit may have up to 15 per- cent inclusions of contrasting soils.
Soil Types in Smerhill Borough
The symbol and name of the mapping units in each series are listed at the end of each description. These mapping units correspond with Flap No. 2.
Borrow Pit :
Borrow pit designates areas where soil materials have been removed so extensively that no classifiable soil remains. leave bedrock exposed. tation.
These areas often These areas are variable for Fenera1 interpre-
On site investigation is needed.
Mapping Unit:
BP - Borrow Pit
Ernest .Soils:
Ernest soils have developed in silty materials which have washed or slid from the uplands. They are commonly found at the base of slopes and on concave landscape surfaces. well-drained, and have a fragipan and slowly permeable layer occuring at 18 to 36 inches. These soils are moderately permeable in the sur- face but slowly permeable in the fragipan. table and slow permeability are limiting factors.
These soils are deep, moderately
A seasonal high water
11

e
a
Soil Horizon Characteristics of a Typical Soil:
0-8 inches - Dark grayish brown silt loam, granular structure.
8-26 inches - Yellowish brown silty clay loam with mottles of light gray in the lower portion, subangular blocky structure.
26-42 inches - Dark grayish brown silt loam with mottles of light gray and strong brown. Very firm with platy structure.
Mapping Units :
96 Ernest silt loam, 8 to 15 percent slopes.
109Al3 Ernest very stony silt loam, 0 to 8 percent slopes. e Gilpin-Rape Soils:
e
0
This complex consists of Gilpin and Rayne soils. derived from alternate beds of shale and fine grained sandstone in the upland landscape. drained, and have moderate permeability. istics are found under the individual soils.
This complex is
The Gilpin s o i l s are moderately deep, well Soil horizon character-
Mapping IJnits:
12D - Gilpin-Rayne c h e r y silt loams, 15 to 25 percent slopes.
Gilpin Soils :
Gilpin soils are developed from shales, silt stones, and fine grained sandstones in the upland landscape. These soils are moderately deep, well-drained with moderate permeability. to bedrock.
They are limited by depth
Soil Horizon Characteristics of a Typical Soil:
0-10 inches - Very dark gray silt loam, granular structure.
10-25 inches - Yellowish brown silt loam, fine angular blocky structure.
28-33 inches - Light olive brown channery silt loam, fine platy struc- ture due t o shale fragments.
33-60 inches - Shale bedrock.
Napping Units :
15AR - Gilpin very stony silt loam, 0 to 8 percent slopes.
15CD - Gilpin very stony silt loam, 8 t o 25 percent slopes.
a 12

GilDin-Weikert Soils :
This complex consists of Gilpin and Weikert soils. This soil complex is developed from alternate beds of shales and fine grained sandstones in the upland landscape. The Gilpin soils are moderately deep, well- drained, and have moderate permeability. channery, well-drained, and have moderate rapid permeability. horizon characteristics are found under the individual soils.
The Weikert soils are shallow, Soil
Mapping Unit:
16EF - Gilpin-Weikert channery silt loam, 25 to 70 percent slopes.
Blairton Soils : 4
The Blairton soils are developed from interbedded shales, sandstones , and thin beds of clay shale. moderately deep and moderately well-drained. They have a moderately slow permeability in the sub-soil. depth to bedrock are limiting factors.
They have a silt loam, sub-soil, are
A seasonal high water table and
Soil Horizon Characteristics of a Tvnical Soi l :
0-9 inches - Very dark grayish brown silt loam, granular structure.
9-30 inches - Light gray channery silt loam with mottles of strong
30-38 inches - Light yellowish brown shaly silty clay loam, angular
brown and yellowish red, angular blocky structure.
structure due to shale fragments. inches.
Firm shale at 38
38-40 inches - Interbedded shale, siltstone and sandstone.
Napping Unit :
37C - Rlairton silt loam, 8 to 15 percent slopes.
Urban Land and Fill Land:
This land type consists of alluvial soil areas that have been filled with soil and non-soil material, increasing the elevation above the lower flood stages. It is completely urbanized. ing has so altered the mapping unit that individual soils cannot be identified.
Land fill and hous-
Napping Unit :
102AR - Urban Land and Fill Land, 0 to 8 percent slopes.
13
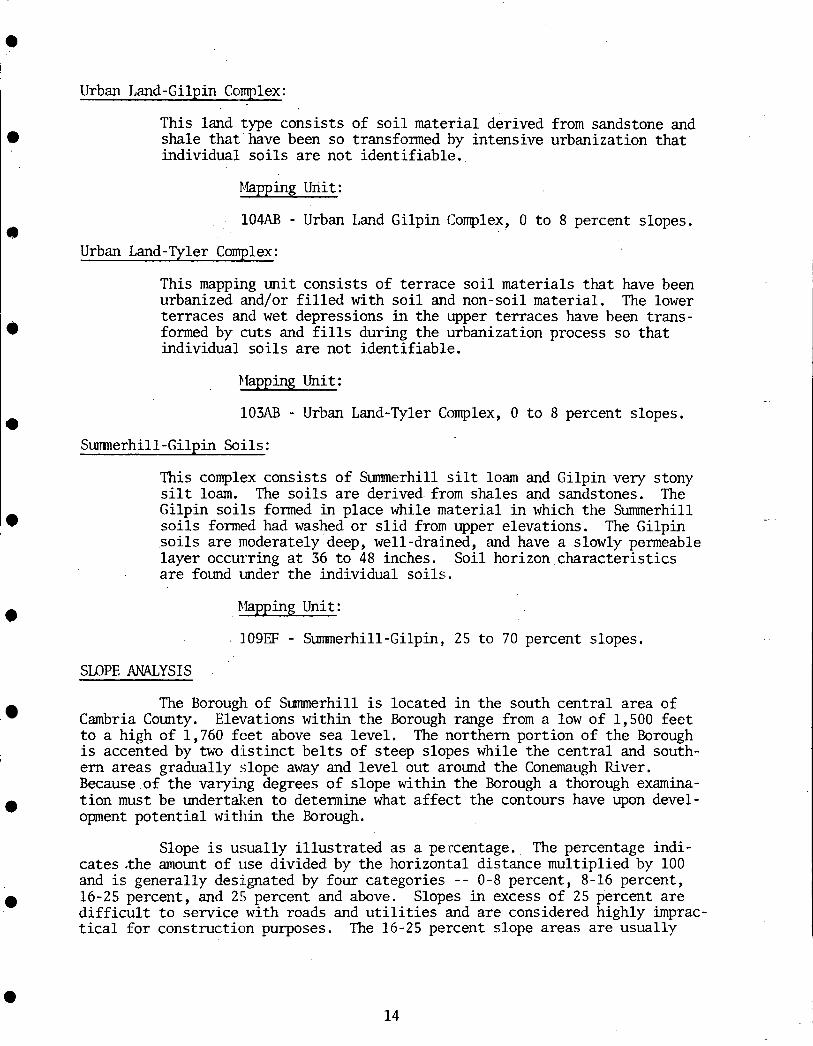
Urban Land-GilDin Comlex:
e
e
This land type consists of soil material derived from sandstone and shale that have been so transformed by intensive urbanization that individual soils are not identifiable.
Mapping Unit:
104AB - Urban Land Gilpin Complex, 0 to 8 percent slopes.
Urban Land-Tyler ComDlex:
This mapping unit consists of terrace soil materials that have been urbanized and/or filled with soil and non-soil material. The lower terraces and wet depressions in the upper terraces have been trans- formed by cuts and fills during the urbanization process so that individual soils are not identifiable.
Mapping Unit:
103AB - Urban Land-Tyler Complex, 0 to 8 percent slopes.
Sumnerhill-Gilpin Soils:
This complex consists of Summerhill silt loam and Gilpin very stony silt loam. Gilpin soils formed in place while material in which the Summerhill soils formed had washed or slid from upper elevations. soils are moderately deep, well-drained, and have a slowly permeable layer occurring at 36 to 48 inches. are found under the individual soils.
The soils are derived from shales and sandstones. The
The Gilpin _.
Soil horizon characteristics
Mapping Unit:
1 0 9 s - Summerhill-Gilpin, 25 to 70 percent slopes.
SLOPE ANALYSIS
The Borough of Summerhill is located in the south central area of Cambria County. to a high of 1,760 feet above sea level. is accented by two distinct belts of steep slopes while the central and south- ern areas gradually slope away and level out around the Conemaugh River. Because of the varying degrees of slope within the Borough a thorough examina- tion must be undertaken to determine what affect the contours have upon devel- opment potential within the Borough.
cates ,the amount of use divided by the horizontal distance multiplied by 100 and is generally designated by four categories - - 0-8 percent, 8-16 percent, 16-25 percent, and 25 percent and above. Slopes in excess of 25 percent are difficult to service with roads and utilities and are considered highly imprac- tical for construction purposes,
Elevations within the Borough range from a low of 1,500 feet The northern portion of the Borough
Slope is usually illustrated as a percentage. The percentage indi-
The 16-25 percent slope areas are usually
e 14
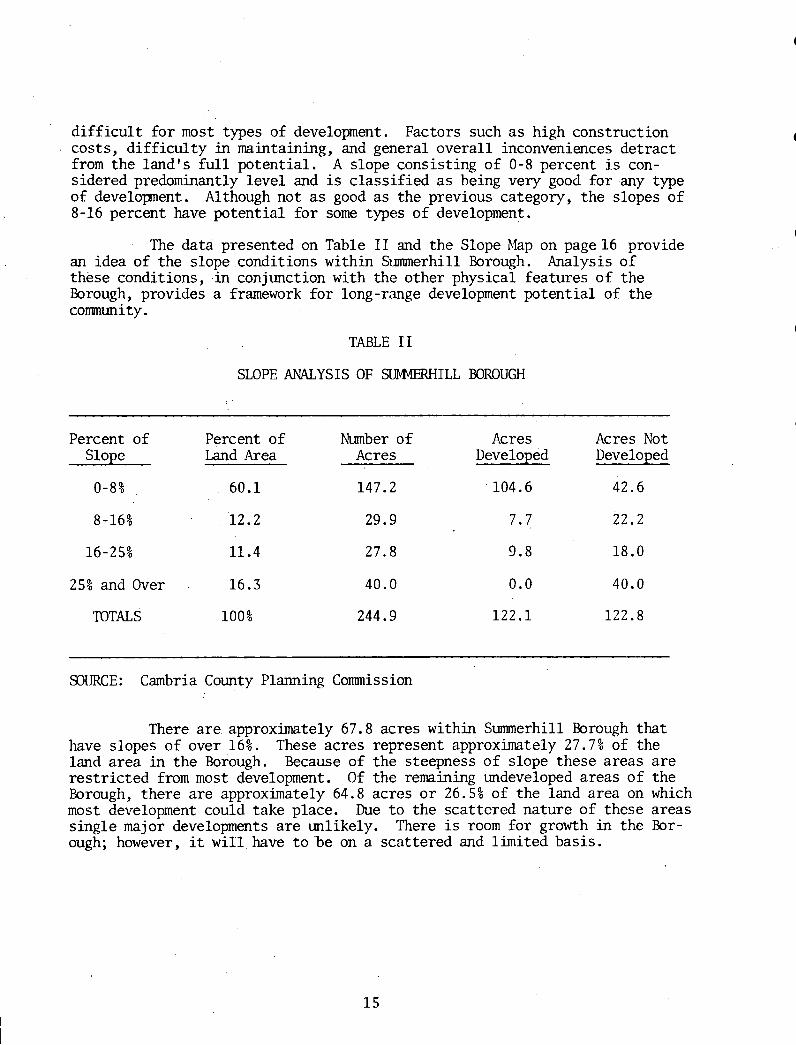
di f f icu l t for most types of development. costs, dif f icul ty in maintaining, and general overall inconveniences detract from the land's f u l l potential. sidered predominantly level and is classified as being very good for any type of development. Although not as good as the previous category, the slopes of 8-16 percent have potential for some types of development.
Factors such as high construction
A slope consisting of 0-8 percent is con-
The data presented on Table I1 and the Slope Map on page16 provide an idea of the slope conditions within Summerhill Borough. these conditions, i n conjunction with the other physical features of the Borough, provides a framework for long-range development potential of the conununi t y .
Analysis of
TABLE I1
SLOPE ANALYSIS OF SlJMERHILL BOROUGH
Percent of Percent of M b e r of k r e s Acres Not Slope Land Area Acres Developed Developed
0-8% 60.1 147.2 104.6 42.6
8-16% 1 2 . 2 29.9 7.7 2 2 . 2
16-25% 11.4 27.8 9.8 18.0
25% and Over 16.3 40.0 0.0 40.0
TOTALS 100% 244.9 1 2 2 . 1 122 .8
SIIIJRCE: Cambria County Planning Commission
There are approximately 67.8 acres within Summerhill Borough that have slopes of over 16%. land area in the Borough. res t r ic ted from most development. Borough, there are approximately 64.8 acres o r 26.5% of the land area on which most development could take place. Due t o the scattered nature of these areas single major developments are unlikely. ough; however, it w i l l have to 'be on a scattered and limited basis.
These acres represent approximately 27.7% of the Because of the steepness of slope these areas are
O f the remaining undeveloped areas of the
There is room for growth in the Bor-
15
*
e
0
e
a
WATERSHED/DRAINAGE BAS IN
The analysis of watershed and drainage basins is a significant supple- ment to slope analysis. The slope analysis determines the steepness of the land within the Borough, whereas the watershed/drainage basin analysis identifies the directional flow of water in relation to the local relief of the Borough.
Smerhill Rorough is part of the Little Conemaugh River watershed/ drainage basin. to the total Little Conemaugh watershed. icant in that its.drainage patterns help to form the headwaters of the Little Conemaugh River which ultimately flows into Johnstown.
The Borough contains 244.94 acres which is small in comparison However, Summerhill Borough is signif-
In July, 1977, much of the southern part of the Borough was either inundated or affected by flood waters, totaling damages in excess of $285,000, as estimated by the DSR (Disaster Survey Reports).
e 17

€XISTING LAND USE
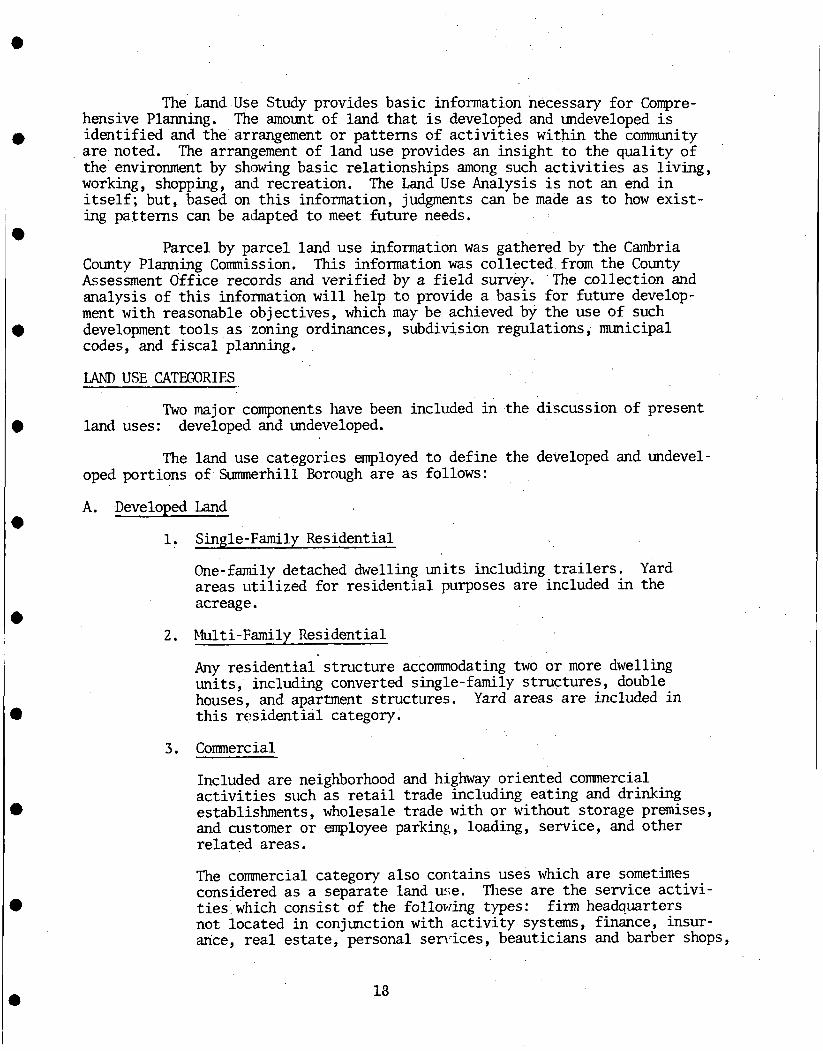
The Land Use Study provides basic information necessary for Compre- hensive Planning. identified and the arrangement or patterns of activities within the c o m i t y are noted. The arrangement of land use provides an insight to the quality of the environment by showing basic relationships among such activities as living, working, shopping, and recreation, itself; but, based on this information, judgments can be made as to how exist- ing patterns can be adapted to meet future needs.
The amount of land that is developed and undeveloped is
The Land Use Analysis is not an end in
Parcel by parcel land use information was gathered by the Cambria This information was collected from the County County Planning Commission.
Assessment Office records and verified by a field survey. The collection and analysis of this information will help to provide a basis for future develop- ment with reasonable objectives, which may be achieved by the use of such development tools as zoning ordinances, subdivision regulations, municipal codes, and fiscal planning.
LANn USE CATKDRIES
Two major components have been included in the discussion of present land uses: developed and undeveloped.
The land use categories employed to define the developed and undevel- oped portions of Summerhill Borough are as follows:
A. Developed Land
1. Single-Family Residential
One-family detached dwelling units including trailers. areas utilized for residential purposes are included in the acreage.
Yard
2 . Multi-Family Residential
Any residential' structure accmodating two or more dwelling units, including converted single-family structures, double houses, and apartment structures. this residential category.
Yard areas are included in
3. Commercial
Included are neighborhood and highway oriented commercial activities such as retail trade including eating and drinking establishments, wholesale trade with or without storage premises, and customer or employee parking, loading, service, and other related areas.
The commercial category also contains uses which are sometimes considered as a separate land we. Tliese are the service activi- ties which consist of the following types: not located in conjunction with activity systems, finance, insur- ance, real estate, personal senrices, beauticians and barber shops,
firm headauarters
18

I.
banking, large buildings acting as warehouses or storage areas, automotive repair and services that do not sell gasoline, miscel- laneous business and repair services, medical and health services except hospitals, sanatoria, convalescent and rest homes, funeral homes, offices and other professional services including profes- sional associations , labor unions , customer or employee parking , loading, service, and other related areas.
4. Public and Semi-Public 4 Education, libraries, museums, art galleries, historical sites, aboreta, botanical gardens, recreation not elsewhere classified including playgrounds, parks and related open space, golf courses, country clubs , riding academies , winter sports areas , auditoriums , stadiums, race tracks, fairgountls, outdoor water recreation, hunt- ing and fishing preserves, State Game Lands, summer camps, social halls, churches and other religious services, cemetaries, hospitals, sanatoria, convalescent and rest homes , protective services - - military and civilian - - including police, fire, correctional institutions, etc., service and welfare organizations and their headquarters, non-profit membership groups, and other institu- tional services not classified, parking , service, and other spaces incidental to these activities.
4
5. Transportation and Communication
Railroad transportation and related transfer, maintenance and station house facilities, local passenger systems and related maintenance including terminals for cross-country stage lines bus not including comter lines operated over railroad right- of-ways , motor freight transportation and related transfer and maintenance facilities, water transportation and related transfer, air transportation and related terminal transfer and maintenance facilities including landing areas and incidental space reserva- tion - - excluding the military - - pipeline transportation and related transfer, tank farm, and maintenance facilities, conununi- cations and related transfer and maintenance facilities including telephone, telegraph, radio, television, and post offices, pay parking areas, private garages owned and used by single-or double- residential housing, small private storage areas, and miscellaneous transportation and communication activities.
B. Undeveloped Land
1. Woodlands
Non-commercial forest land.
2 . Vacant Areas
Open land (non-wooded) and single lots void of structures, etc., showing no evidence of agriculture or other use,
3. Water Areas
Creeks, rivers, lakes, or reservoirs.
I
19

A distinction between developed and undeveloped land is necessary to properly interpret present development patterns and comprehend future growth trends.
Table I11 illustrates the acres of developed and undeveloped land in Smerhill Borough.
TABLE I11
DEVELOPED AND UNDEVELOPED LAND IN SUMMERHILL BOROUGH
Land Use Category Acres Percent
Developed 122.07 49.8%
Undeveloped 122.87 50.2%
mAL 244.94 100.0%
SOURCE: Cambria County Planning Commission
In order to summarize the existing land uses in Smerhill Borough, a land use tabulation.is provided on Table IV. graphically portray the percentages of existing land use for Summerhill Borough.
The Existing Land U s e Flap, page 23 , has been developed from informa- tion obtained through field surveys and the County Assessment Office records. By the use of color codes .for individual land use categories, this map graphi- cally indicates existing land use in Summerhill Borough.
Figure 2 is also provided to
There are sixty (60) acres in the residential land category of Smerhill Rorough. has limited potential for increase in the future.
This is the largest developed land use category and it
Transportation, the second largest developed land use category, includes approximately 47 acres.
Commercial lands are third ranked in size with 11.16 acres in Summerhill Borough. This acreage can be expected to increase slightly in the future.
Public and semi-public land constitutes 4.18 acres or 1.7% of the total land use of Summerhill Borough. (no longer an educational building), and the two churches constitute the signifi- cant portions of public and semi-public (and in the Borough it is expected that this acreage will remain relatively constant in the future).
half of the total land in the Borough. Most of this is vacant land. The wood- lands, for the most part, are those areas that are either too sleeply sloped or too close to stream or river channels to afford sound and stable development.
20
The Smerhill Fire Department, Summerhill school
The undeveloped land in Summerhill Borough constitutes approximately
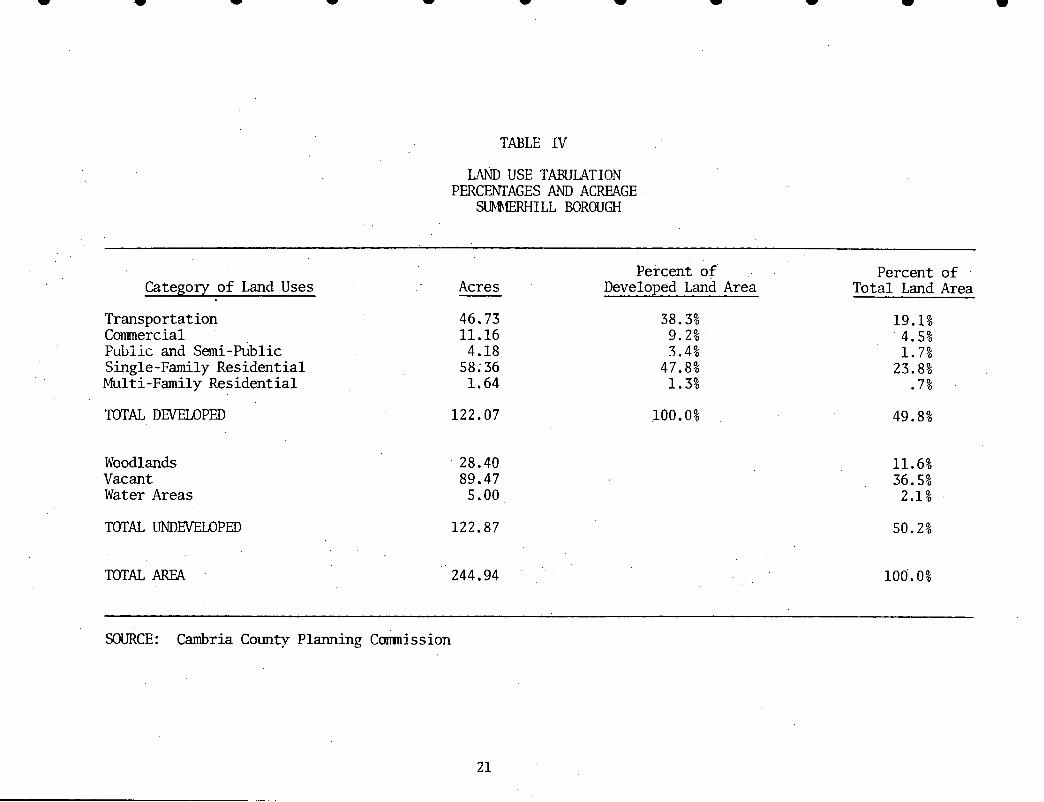
TABLE IV
LAND USE TABULATION PERCENTAGES AND ACREAGE
!3lIhbfERHILL BOROUGH
Percent of Percent of Category of Land Uses Acres Developed Land Area Total Land Area
Transport at ion Commercial Public and Semi-Public Single-Family Residential Multi-Family Residential
TOTAL DEVELOPED
Woodlands Vacant Water Areas
TOTAL UNnEVELOPED
TOTAL AREA
46.73 11.16 4.18 58 : 36 1.64
122.07
28.40 89.47 5.00
122.87
38.3% 9.2% 3.4% 47.8% 1.3%
100.0%
19.1% 4.5% 1.7% 23.8% .7%
49.8%
11.6% 36.5% 2.1%
50.2%
244.94 100.0%
SOURCE: Cambria County Planning Cmission
21

49 .l%
50.2
3 8 . 3 % 1 3 . 4 %
Total Develoned Land Area
4 . 5 %
1 . 7 %
5%
: Total Land Area
Residential
Commercial
1-1 Transportation
E d Undeveloped
22 Figure 2


POPULATION STUDY

Population analysis is a vital component in the local planning pro- gram. A comity's most important resource i s its people, and to fully under- stand its character one must first know the population, past and present. community and future development are a reflection of the productivity and fore- sight of its residents. Its composition, distribution, and density provide invaluable information about the present and help to project for the future needs of the community. The importance of this study cannot be minimized when planning for the future of the community.
the established boundaries of the Borough. Bureau, the Pennsylvania Department of Ilealth, and the Cambria County Planning Commission has been gathered to project a population analysis of Summerhill Borough. the amount and type of housing needs, park and recreational facilities, water, sewer and utility requirements, and locations of streets and highways to meet future population demands.
The
Future population of an area is basetl on factors within and beyond InCormation from the U.S. Census
This data is the groundwork for projecting future school enrollments,
POPULATION TRENDS
Table V and Figure 3 show the population trends for the years 1930-1970, with estimates for 1973 and 1976. and decline during the time period analyzed. increase in population for the Borough. ing decade of the sixties which continued into the early seventies. to a current 1J.S. Bureau of Census Estimate, the population has increased to 747 in 1976, and marks the beginning of a gradual upward trend in population for Sumnerhill Borough.
The Borough experienced alternating increase The fifties decade was one of
This trend was followed by the declin- According
'TABLE L'
F'OPULATION CHANGE 1930-1976 SUMERHILL BOROUGH
Year
1930 1940 1950 1960 ,
1970 1973 1976
Population
785 861 849 870 726 71 0 74 7
Change over Previous Decade Xbsolute Percent
+ 76 -12 +21
- 144 -16 +37
+9.68 -1.39 +2.47 -16.55 -2.20 +5.21
SOllRCF: U.S. Census Bureau
24

For planning puToses, the principal population characteristics of Smerhill Borough that are analyzed include age-sex composition, comparison of male and female population, household and average family size.
I Age-Sex Composition
The examination of the age-sex composition of the population is important for several reasons. into determining the type and location of community facilities (schools, recreation areas, libraries, etc.) required to accommodate the needs of the existing and future population. mining natural growth potential, exclusive of migration. For example, a large proportion of the population in the child-bearing age group, 25-45 will reflect a higher birth rate than would a predominately older population.
Sumnerhill Rorough, and Figure 4 graphically illustrates this data.
5 age group (-45.7%), 25-34 age group (-34%) and the 34-44 age group (-31.8%). Residents between the ages of 25-44 represent the largest proportion of the community's labor force. cant percentage of this labor force to seek employment outside the area.
been characteristic of the Borough alone. County was largely determined by the rich deposits of coal and iron ore. the turn of the century, over seven decades ago, Cambria County had a boom economy with rapid growth of steel and coal industries.
Technicological advances, shifting mcirkets in the coal and steel
The age group composition provides insight
The data also provides a means for deter-
I
Table VI illustrates numerically the age-sex composition for
The largest decreases between 1960-1970 were recorded in the under
Declining economic conditions can force a signifi-
These declining trends in Summerhill's socio-economic base have not The economic orientation of Cambria
At
industries, and changing transportation patterns are aiding to the decreasing employment opportunities within Cambria County. Due to the absence of indus- trial diversification and the lack of internal growth industries, the labor surplus from mine and steel industries could not be absorbed by the local economy. seeking better employment opportunities, and a subsequent population decline has occurred throughout the County.
This has resulted in large out-migration from the area by people
Persons ner I Iousehold
A person per household average figure is attained by dividing the total number of the population by the number of dweLling units.
Once this fi&.ure is reached, it is used in conjunction with the analysis of a community's family size, over-crowding characteristics, and approximate family distribution.
In Summerhill Rorough, the average number of persons per household in 1970 was 3.4 and 3.5 in 1977.
1
I
1
25

I , , i
i 0
i ! I 8
i 1 . ! i
! I I
e I
I
I
8 I
-0
I L
8 I
1
8 i ' 1
i I
I
i I
KIPI JLAT TON -
SJMl ilU I ILL J?OROUGH 1930-1976
SOURCE: U.S. Census Bureau
26 Figure 3

Under 5
5 - 14
15 - 24
25 - 34
35 - 44
4s - 54
55 - 64
65 and Over
1960
58
89
61
47
54
43
39
36
-
Male
1970
30
84
53
34
37
39
35
34
-
TABLE, V I
AGE - SEX COMFOS IT ION SUMlERHILL BOROUGH 1960-1970
% Change
-48.3%
-5.6%
-13.1%
-27.7%
-31.5%
-9.3%
-10.3%
-5.6%
1960
58
86
60
59
56
41
36
47
Female
1970
33
79
60
36
38
46
38
50
- % Change
-43.1%
-8.1%
-39.9%
-32.1%
+ 1 2 . 2 %
+5.6%
+6.4%
Total
1960 1970
116 63
175 163
121 113
106 70
110 75
84 85
75 73
83 84
- - % Change
-45.7%
-6.9%
-6.6%
-34.0%
-31.8%
+ 1 . 2 %
-2 .7%
+l. 2 %
SOURCE: U. S. Census of Population 1960 (1) -40B Census Tract 91SA - 1970 PHC(1)-97
27

r
0 a 0 m 0
POPULATION PYRANID
SUMMERHILL BOROUGH 1960-1970
1960
1 100 75 50 25 0 25 50 75 100
Male Female
r
1970
100 75 50 25 0 25 50 75 100 brdle Female
SNRCF: U.S. Census Bureau 28 Figure 4

e
a l
e
0
a
POPULATION DENSITY AND DISTRIBUTION
In 1960 Summerhill Borough had an average of 3.55 persons per acre. With the -16.55% decrease in population between 1960 and 1970, the persons per acre dropped to 2.96 people per acre. in 1973 caused the figure t o drop to 2.89 persons per acre. trend in population shows an increase t o 3.05 people per acre as seen on Table VII.
The additional decrease of population In 1976 the upward
TABLE V I 1
POPULATION AND DENSITY 1960, 1970, 1973, 1976
Y e a r
1960
Population
870
Density per Acre
3.55
1970 726 2.96
1973 710 2.89
1976 747 3.05
~- ~~
SOURCE: Cambria County Planning Commission
MIGRATION CHARACTERISTICS
Population change in any community is the r e su l t of a continuous pro- cess interrelat ing three basic factors: b i r ths , deaths and migration. The numerical difference between b i r ths and deaths in a community determines the natural increase o r decrease i n population over a specif ic time period.
Migration is defined as the movement of people from one community to another. Movement by people into the community i s defined a s in-migration, and out-migration is referred t o a s out-migration. Net migration i s therefore explained a s the numerical difference between in and out migration to t a l s . figures combined with natural changes (bir th and death) give a t rue picture of the direction a community is headed i n terms of t o t a l population growth or decline.
The
The net migration rate for Summerhill Borough was computed as follows:
Migration Rate
Let: Y = 1970 Population Z = 1976 Population B = 1970-1976 Births D = 1970-1976 1)eaths M = Migration Ibte (%)
e Then: (Z-Y) - - (B-D)
Y 29.

As shown i n Table V I 1 1 there were 26 b i r ths i n Summerhill Borough between 1970 and 1973. During the same time period there was a t o t a l of 37 deaths which caused the Borough to have ;L natural decrease of eleven people. Also, it was discovered that there was a decrease of migration by f ive people. Vital s t a t i s t i c s showed that fo r the years 1973 and 1976 there was a natural increase of 13 people and an in-migration rate of seven people.
because of the 1977 Flood that h i t Johnstown and many of the outlining areas , including S m e r h i l l Borough, devastating homes and businesses. t o consider in future in/out migration trends is the recent announcement of future employment levels by Bethlehem Steel Corporation.
The migration fo r Summerhill Borough i n the future cannot be determined
Another factor
a
4
TABLE V I 1 1
M IGRAT I ON CHARACTER I ST I C S SUMMERHILL BOROUGH 1970-1976
Population Natural Increase 1970-1976 Migration 1970-1976
Total Total Net Change Number Rate -- 1970 1976 1970-1976 Births Deaths Net Change -
726 74 7 + 2 1 23 1 6 +7 +14 +1.9
SOURCE: U.S. Bureau of Census Pennsylvania Department of Health
FU'TURE POPULATION LEVELS
Primarily, t h i s population projection, Table I X , is based on figures from the U.S. Census Department and the Pennsylvania Department of Health. mates were received fo r t o t a l population fo r Summerhill Borough for the year 1970, 1973, and 1976, plus the actual number of b i r th s and deaths fo r the Borough from 1970 to 1977. pal factors that were available t o us. population levels with accuracy is a d i f f i c u l t task. be made and future estimates a re then based on these assumptions.
1973, and 1976 was 726, 710, and 747, respectively. in population fo r those years of 2 1 people. Part of t h i s growth i n population during those six years can be traced to a net natural increase of seven people. The remainder must be a t t r ibu ted t o in-migration.
E s t i -
In/out migration statistics were projected from the princi- Keep i n mind that forecasting future
Certain assumptions must
I t was lmown that the population fo r Summerhill Borough €or 1970, This showed an increase
4
30

TABLE
PROJECTED FOPTJIATION LEVFLS 3 " I L L BOROUGH 1970-1985
c
0
e
e
0
e
a
0
Year
1970 1971 1972 1973 1974 1975 1976 1977 1978* 1979 1980 1981 1982 1983 1984 1985
- Population
726 721 716 710 722 7 34 74 7 7 54 759 762 767 772 779 784 789 794
In/Out Birth Rate Death Rate Migration
No. per 1,000
9 12 .4 6 8.3 5 7.0 6 8.5
1 4 19.4 13 17 .7 14 18.7 1 2 16.0 11 14.5 11 14.4 11 14.3 11 14.2 11 1 4 . 1 11 14.0 11 13.9 11 13.8
No. per 1,000
9 1 2 . 4 11 15.3 9 12.6 8 11.3
11 15.2 8 10.9 7 9.4 7 10.0 8 10.0 8 10.0 8 10 .0 8 10.0 8 10.0 8 10.0 8 10.0 8 10.0
No. per 1,000
' 0 0 -1 -1.4 - 2 -5.6 +9 +12.5 +7 +9.5 +6 +8.0 +2 +2.6 + 2 +2.6 +2 +2.6 +2 +2.6 +2 +2.6 +2 +2.6 + 2 +2.6 +2 +2.6 + 2 +2.6
SOURCE:
*Beginning in 1978, f igures are based on s t a t i s t i c a l trends from 1970-1977
U.S. Census Bureau, Pennsylvania Department of Health, Bureau of Health Data Systems, Cambria County Planning Commission
If you study closely the 1970 t o 1976 population f igures , you w i l l not ice that u n t i l 1974 deaths out-numbered b i r ths , and that there was some out-migration in the Borough. trend that began in the 1960's. Star t ing i n 1974 there is a complete reversal of the past population trends with increased bipth rates and some in-migration.
After 1977, ' the b i r t h and death rates for Summerhill Borough are not known. Consideration was given t o past trends, an average was taken fo r b i r t h and death rates, and an estimate was made fo r future population rates. I t is anticipated tha t the 1976 b i r t h rates of 18.7 persons per thousand population w i l l begin t o decrease, and approach County and State leve ls of 13 per thousand. An average death rate was established a t ten per thousand and i s lower than the County and State levels of eleven o r twelve per thousand.
for Summerhill Borough. moderate projection and is based on the assumption t h a t the posi t ive trend that s ta r ted in 1974 w i l l continue in the future.
b i l i t y of Summerhill Borough o f f i c i a l s . l i s h community goals t o meet future needs, and zoning regulations must be implemented.
This is a continimce of a downward population
For 1970 t o 1985 we are projecting a 9.3% increase i n the population This estimate of .OS% population growth per year is a '
Planning for t h i s growing population w i l l be an important responsi- To properly prepare, they must estab-
31

a
ECONOMIC BASE

e
a
When analyzing any c o m i t y in a comprehensive manner one factor that has direct correlation to the overall well being of the c o m i t y is that of an economic base study. The basic premise behind the use of economic base studies is to determine the most affective use of the factors of production, land, labor capital, and entrepreneurship. At the same time, economic base studies are used to fulfill economic goals and aspirations of the citizenry. If the study is in correlation with the planning process, industry and commercial establishments should realize greater profits which in turn should eventually illustrate notice- able improvements in the general welfare and economy of the Borough. A prosper- ing c o m i t y can attract many more industries and commercial establishments than one which is declining. mine past economic trends, to aid in analyzing present conditions, as well as to aid the present and future economic potential of Summerhill Borough.
Therefore, the purpose of this study is to deter-
FACTORS OF PRODUCTION
As previously mentioned, the extent of economic activity in any com- munity is dependent upon several factors of production, land, labor, capital, and entrepreneurship.
- - - Land may be defined in economic tern as any of the free gifts of nature which can be used in the productive process. Examples are farmable land, forests, mineral deposits, and water resources.
-- Labor consists of human activities that provide the goods or sew- ices in an economy in that the services are performed by workers for wages.
the risks of business or enterprise.
-.
- - Fatrepreneurship is the ability to manage, organize, and assume
- - Ca ita1 oods include all man made aids to production of a consum- *service. Ekamples of capital goods include tools, equipment, machinery, and transportation facilities..
As the four factors of production make up a comity's economic base, each small comity's economy both affects and is affected by the areawide economy. So, while this study is in specific reference to Summerhill Borough, much of the surrounding area is in a similar economic situation.
As previously mentioned, the extent of economic activity in any com- mity is dependent upon several factors of production. be considered most important to Summerhill Borough is that of the labor force. Without any large industries or commercial establishments, the labor force is predominantly reliant on outside employment. The largest employers of Borough citizens located outside of the Borough are the railroad (ConRail), coal mines (Bethlehem Mines), and steel mills (Bethlehem, U.S. Steel). To gain a clearer picture of the labor force in Summerhill Borough it is important to refer to the population pyramids that have been incorporated in the previous population study.
However, one which must
0 32

0 I
LABOR .FORCK T!??NnS
SIT F K!U TI LI, 1'x)ROIJC;I I 1970 - 1978
100 I I I I I 1 I
I I
1970 1971 1972 1973 1974 1
I 1
I 1
1 1
1975 1976 1977 1978
.SOIJRCE: Occupational Tabulations; Cambria County Assessment Office 1 1
33 Figure 5

As i l lus t ra ted in the population pyramids, Summerhill Borough has ex- perienced an increase only in the population range age 45 t o 54 from 1960 to 1970 (+1.2%). This decline in the older population is very small i n comparison t o the ages 0 t o 44 which show an average decline of -25.2%. older have established themselves in the Borough and are usually leas t l ike ly t o migrate out of the area: whereas the age group 25 t o 44 has the most potential for mobility when using employment and economic factors a s locational determinates.
The age group 45 and over has a t o t a l decline percentage of -1.5%.
Much of the population 45 and
Population in Summerhill Borough is stabil izing from a past trend of
However small, the commercial establishments Labor force is showing an upward trend f r o m 1970
slow decline. The recent s tabi l izat ion of the Borough's population should have minimal economic significance. w i l l show increased prof i t s . when 189 persons were employed, t o 1978 when 261 persons were employed (exclud- ing people on pension and housewives). With s tabi l izat ion of population, along with economic increases (labor force), the Borough appears to be destined for a sound economic future.
OCCUPATIONAL TABULATION OF SUMMERHILL BDROUGH
The following occupation tables and figures were developed t o describe the overall composition of the labor force in Summerhill Borough. table gives a complete breakdown by occupations for the years 1970 through 1978. This information was taken from the Occupational Records in the County Assessment Office. The 64 Labor Force categories were then grouped into four general cate- gories. This was done t o simplify the analysis of the level of s k i l l s possessed by workers residing in Summerhill Borough.
To more fu l ly explain the breakdown of the specific occupations into these general categories, it is important t o define w h a t each category consists of.
The f i r s t
Professional workers a re defined as those individuals who, through additional years of formal schooling, obtain academically-oriented s k i l l s . Occupations included in t h i s category a re doctors, dent is ts , nurses, ministers, morticians, teachers, e tc .
Craftsmen are described as industrial workers who possess specialized s k i l l s . t r ic ians , p ipef i t te rs , plumbers, technicians, welders, etc.
Included in this category a re carpenters, construction workers, elec-
The Laborer group is comprised of a l l workers who do not have special- ized s k i l l s o t n those obtained by on-the-job training. workers include miners, steelworkers, brakemen, railroad enginers, conductors, e tc .
The Service worker c lass i f icat ion is given t o those workers who pro- vide services m l i c o r private level. proprietors, policemen, waitresses, clerks, beauticians, etc.
Examples of
This category includes business
,
34
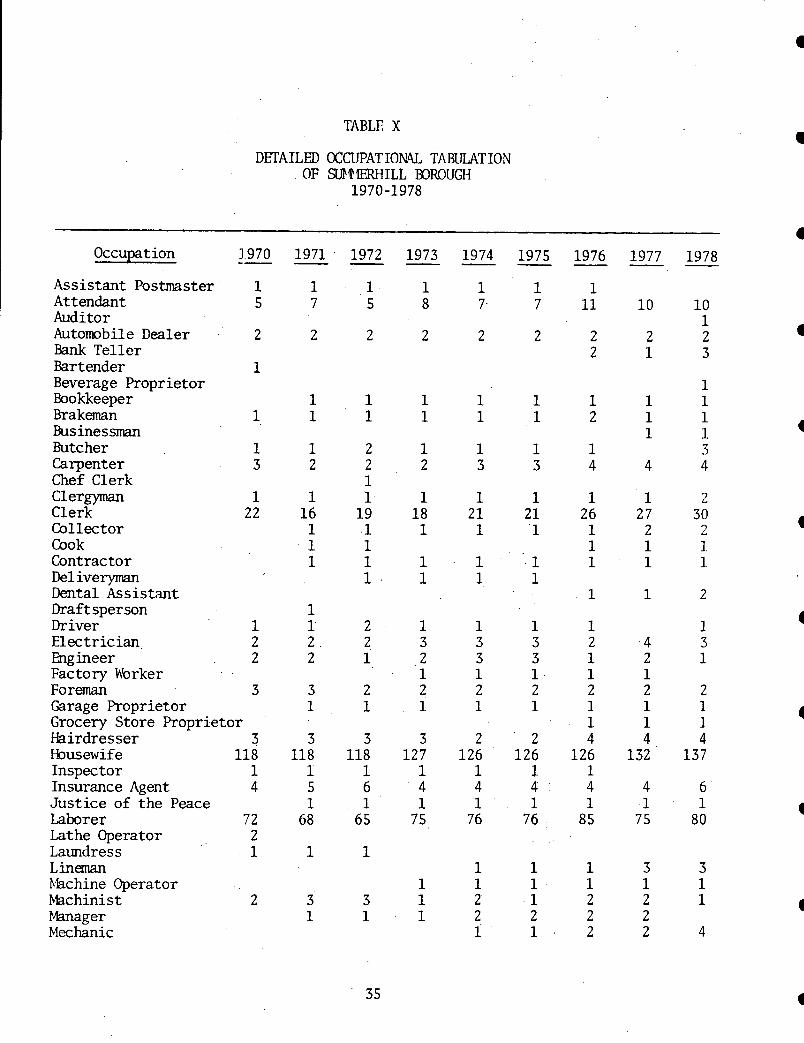
TABLE X
DETAILED OCCUPATIOML TABULATION OF WPIERHILL BOROUGH
1970-1978
Occupation
Assistant Postmaster Attendant Auditor Automobile Dealer Bank Teller Bartender Beverage Proprietor Bookkeeper Brakeman Businessman Butcher Carpenter Chef Clerk Clergyman Clerk Collector Cook Contractor Del iveryman Dental Assistant Draft sperson Driver Electrician Engineer Factory Worker Foreman Garage Proprietor
1.970
1 5
2
1
--
1
1 3
1 22
1 2 2
3
Grocery Store Proprietor Hairdresser 3 Housewife 118 Inspec t o r 1 Insurance Agent 4
Lathe Operator 2
Just ice of the Peace Laborer 72
Laundr es s 1 Lineman Machine Operator Machinist Manager Mechanic
2
1971
1 7
2
-
1 1
1 2
1 16 1 1 1
1 1 2 2
3 1
3 118
1 5 1
68
1
3 1
1972
1 5
2
-
1 1
2 2 1 1
19 1 1 1 1
2 2 1
2 1
3 118
1 6 1
65
1
3 1
35
1973
1 8
2
-
1 1
1 2
1 18 1
1 1
1 3
. 2 1 2 i 3
127 1 4 1
75
1 1 1
1974
1 7.
2
-
1 1
1 3
1 2 1 1
1 1
1 3 3 1 2 1
2 126
1 4 1
76
1 1 2 2 1
1975
1 7
2
-
1 1
1 3
1 2 1 1
1 1
1 3 3 1 2 1
2 126
1 4 1
76
1 1 1 2 1
1976
1 11
2 2
1 2
1 4
1 26 1 1 1
1
1 2 1 1 2 1 1 4
126 1 4 1
85
1 1 2 2 2
1 0
2 1
1 1 1
4
1 27
2 1 1
1
. 4 2 1 2 1 1 4
132
4 1
75
3 1 2 2 2
10 1 2 3
1 1 1 1 3 4
2 30
2 1. 1
2
1 3 1
2 1 1 4
137
6 1
80
3 1 1
4
4
1

0 \
TABLE X (Continued)
Occupation a Merchant Millwright Miner Nurse Painter Pension Plumber Pol iceman Postal Clerk Po stma s t er Railroad Engineer Repairman Restaurant Worker Retired Saleslady ,Salesman
Secretary Service Student Tavern Proprietor Technician
Tower Operator Unemployed Waitress Watchmaker Welder
Seamstress
Teacher
1970
2 3 6 5 1
16 1 2
-
1 5
11 1
1
1
1971 1972 1973 1974 1975 1976 1977 1978 - - - - - - - - 1 1 1 . 1 1 1 1 1 1 1 1 1 1 1 1 1 8 1 0 1 2 10 10 1 2 1 4 13 6 1
13 1 2
1 3
5 1
10
2
2. 4
8
5 5 1 1
15 25
1 3
1 1 4 3 1 7 2
5 7 5 8 1 1
23 23 27 27
3 2 1 1 1 1 1
1 1 1 3 3 3 3
2 5 2 ' 2 2 2
4 5 1 1 2 2 2 . 5 5 5 5 5 5 4 5 5 4 4 2 2 3 4 5 5 6 6 4 3 4
3 4 3 6 6 13 1 2 4 4 4 4 4 4 4 3
13 1 4 13 13 13 9 9 9 1 1 1 1 1 1 1 1
2 2 2 2 2 3 3 4
1
1 1
2 2 2 2 1 7 9 8
TOTAL LABDR FORCE 323 325 334 356 367 364 391 400 426 a
SOURCE: Occupational Records, County Assessment Office 0
a
0 36

Table XI indicates that the laborer group represented the largest per- centage of the work force in Summerhill Borough. In the time period shown (1970-1978), the numbers of employed laborers varied from a low of 91 to a high of 109. reason for such a large percentage is that the major employers in the area depend on this group of workers in production.
classification ran very close to the rofessional w o r m t i 1 1972 when the service group began to increase in *This n represents the most significant change in the Occupational Tabulation Table. service workers implies that there has also been some population development in the Borough. The craftsmen category fluctuated from a low of six in 1973 to a high of 14 in 1996 with an average of about 12.
Overall, the labor force increased considerably from 189 people in 1970, to 244 in 1978. occupational categories and good economic conditions.
In 1978 this group represented 46% of the working force. The
The second largest group of workers is the service category. This
A growth of 8%
The changes can be attributed to an increase in all the
TABLE XI
GENERAL OCCUPATION. TABULATION SUMMEWILL BOROUGH 1970-1978
1970 1971 1972 1973 1974 1975 1976 1977 1978 - - - - - - - - - Occupation
Laborer 100 91 94 106 104 104 112 104 109
Professional 35 41 41 40 42 42 39 38 44
Craftsmen 12 11 8 6 10 9 14 12 12
71 - 63 - 65 - 51 - 51 - 48 - 49 - 44 - 42 Seryice - TOTAL* 189 187 192 200 207 206 230 217 236
SOURCE:
*Totals do not agree with Table X because those individuals in the Housewife,
Occupational Records, County Assessment Office
Pension, Unemployed, Student and Retired categories are excluded.
I
4
37

120 -
110 -
100 -
90 -
80 -
70 -
60 - 50 -
40 -
30 -
Sl"ILL ROROUGH 1970-1978
11 2
104 104 104
49 48 51 51 . / *--d
-
38 40 < 39 41
35
1 0 ? 1 2 11 L-
/-'I0 9
1 2 1 2 ---- 1 4
6 I I I I I I 1 1 I I
1970 1971 1972 1973 1974 1975 1976 1977 1978
1 a borers
craftsmen
----- - - - professional
--- service
souR(=I~: Occupational Tax Records, Cambria County Assessment Office, 1970-1978
38 Figure 0

TABLE XI1
FMPLOYERS IN SUMIIERHILL ROROIJGH
Employer
Kirby s Store
Number of Persons Employed
1
1 Greater Beneficial Union
Costello Bros.
Costello Body and Manufacturing Company
E. L. Jones Dodge, Inc.
Summerhill Construction, tnc.
7
3
16
11
McCall ' s Garage 14
Scotty's Store 1
SOURCE: Cambria County Planning Commission Field Survey
MAJOR SlPLOYERS
Table XI1 indicates the eight employers in Summerhill Borough. They employ a total of 54 people, which is only 23% of the labor force. This is not unusual for municipalities in Cambria County, as most employ- ment opportunities are located in the more populated areas. Summerhill Borough can be considered mostly a residential area with businesses being comity-service oriented, with the exception of E. L. Jones Dodge, Inc.; Summerhill Construction, Inc.; Costello Bros.; and McCall's Garage which serve the c o m i t y and a regional area.
39

HOUSING STUDY

a
0
The overall character of a community is reflected by its housing. Attractive houses and a well maintained neighborhood a re one of the most important assets of the community. Good housing not only assures a sound tax base, but it also affects the quality of the l i f e of i t s residents. Health, a t t i tudes, and family characterist ics are closely associated with housing conditions.
existing housing characterist ics in Summerhill Borough. The data presented was extracted from housing reports prepared by the United States Department of Commerce, Bureau of Census.
The purpose of t h i s report is t o provide an up-to-date analysis of
HIUSING CHARACTERISTICS
Housing Units
The 1970 Census of Housing indicates that there a re approximately 207 housing units in the Borough of Summerhill. to dwelling uni t counts prepared by the Cambria County Planning Commission, there were 206 and 208 uni ts respectively.
In 1976 and 1977, according
Housing occupancy
One of the most important indicators of the current housing situa- t ion in an area is i ts occupancy and tenure characterist ics. i s t i c s can be defined by three classifications: owner occupied - the owner l ives in the house; renter occupied - a tenant l ives in a home owned by another individual; and vacant housing units - not being occupied by either of the above.
These character-
A s tabulated in the 1970 Census and interpreted in Table XIII, of the t o t a l 207 housing units within the Township, 152 uni ts or 73.5% were owner occupied; 45 uni ts o r 21.7% of a l l housing units were renter occupied; and 10 units or 4.8% were vacant.
This rather high incidence of home ownership is a positive factor in the future development of the Borough. I t i s evidenced that there i s a stable nature of employment in the area a s well as an individual desire of the people t o own and occupy their own property. the s t ab i l i t y of the housing inventory since home owners a re more l ike ly to remain permanent. in the maintenance of their property and making improvements.
Home ownership enhances
In addition, most homeowners tend to be more at tent ive
40

TABLE X I 1 1
HOUSING AND OCCUPANCY !3MME3HILL BOROUGH - 1970
occupancy
Owner Occupied
Renter Occupied
Available Vacant
For Sale ....... 2 For Rent ....... 2 Other Vacant ... 6
TOTAL
Number of Units
152
45
10
207
Percent
73.5
21.7
4.8
100.0
SOURCE: 1970 Census Tract PHC(1)-97
41
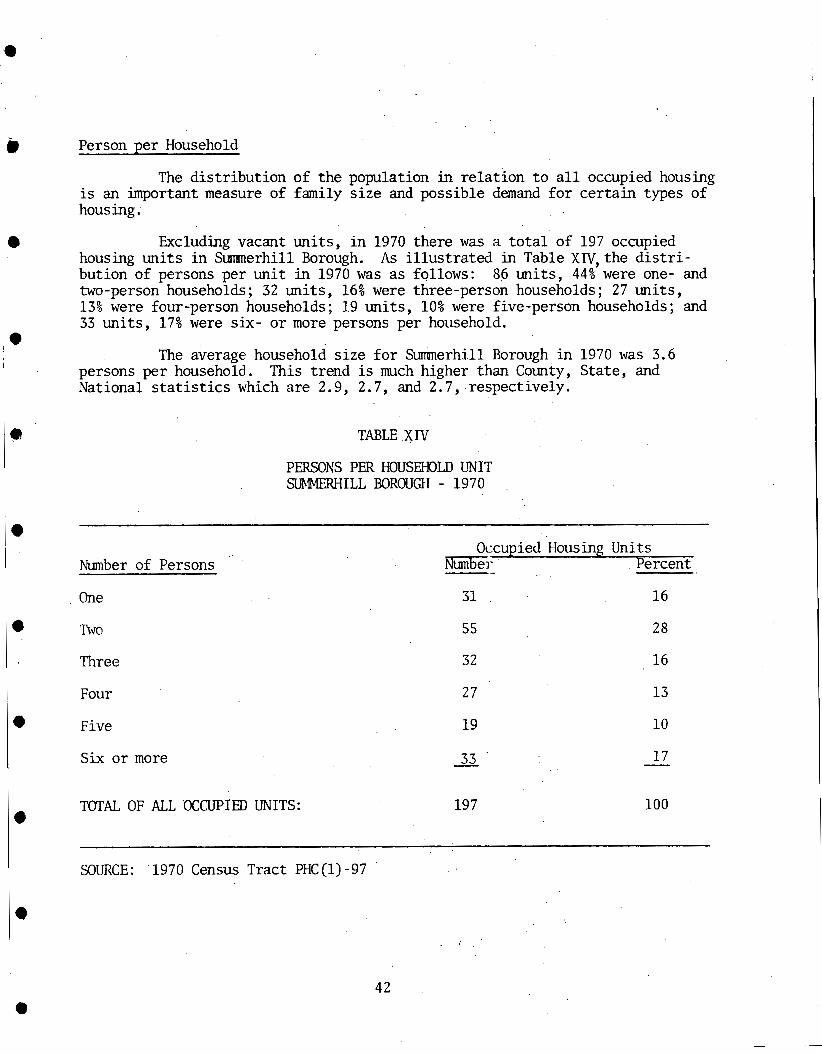
0
w
0
, *
Person per Household
The distribution of the population in relation to all occupied housing is an important measure of family size and possible demand for certain types of housing .
Excluding vacant units, in 1970 there was a total of 197 occupied housing units in Summerhill Borough. bution of persons per unit in 1970 was as follows: 86 units, 44% were one- and two-person households; 32 units, 16% were three-person households; 27 units, 13% were four-person households; 19 units, 10% were five-person households; and 33 units, 17% were six- or more persons per household.
persons per household. National statistics which are 2.9, 2.7, and 2.7, respectively.
As illustrated in Table XIV, the distri-
The average household size for Summerhill Borough in 1970 was 3.6 This trend is much higher than County, State, and
TABLE X I V
PERSONS PER HOUSEHOLD UNIT 5X"ILL BOROUGH - 1970
Number of Persons
One
TWO
Three
Four
Five
Six or more
Occupied Housing Units FXiiiiE. Percent
31 16
55 28
32
27
19
33 -
16
13
10
17 -
TOTAL OF ALL OCCUPIED UNITS: 197 100
~~
SOURCE: 1970 Census Tract PHC(1)-97

Rooms Per Unit
An analysis of the s ize of existing housing units leads t o further insight into the future housing needs of the connnunity. pared t o show the overall distribution of the number of rooms per unit . ing unit sizes i n S m e r h i l l Borough range from one (1) one-room dwelling t o eight (8) nine- or more room units. The most predominant categories was the four-, f ive- and six-room housing types compromised 147 units o r 71.1% of the housing inventory. room units numbered eight, or 3.9%; and seven- o r more room uni ts amounted t o 49, or 23.7%. The median size of a l l housing uni ts in 1970 was 5.6 rooms for Summerhi 11 Borough.
Table XV has been pre- Hous-
One- and two-room units numbered three, o r 1.3%; three-
The predominance of larger housing units with f ive o r more rooms is a positive factor i n Summerhill Borough's development. I t not only assures a range of housing that can re ta in larger families, but a l so implies a potential housing inventory t o accommodate childbearing and more productive age groups.
TABLE XV
ROOMS PER UNIT SUMMERHILL BOROUGH - 1970
Housing Units Number of Rooms h b e r Percent
One 1 .4
TWO 2 .9
Three 8 3.9
Four
Five
Six
Seven
Eight
Nine o r more
TOTAL YEAR ROUND DWELLING UNITS:
37
49
61
22
19
' 8 -
207
17.9
23.7
29.5
10.6
9.2
3.9
100.0
I
1
SOURCE: 1970 Census Tract PHC(1)-97
43

0
Age of Housing Units
Summerhill Borough is composed of a mixture of housing units with diverse ages. founding of the Borough in 1810. As shown in Table ~ 1 , the peak years in construction took place before 1939 with 170 structures being built, or 82.1% of the total housing units in the c o m i t y today. prosperity that was experienced in this area is a valid explanation of the predominance of residential construction that took place prior to 1940 in Summerhill Borough. With the building of the Portage Railroad, the Borough met with the largest increase of people and housing, and drew industry into the area.
These structures were built throughout the years since the
The economic
The rate of new housing being built decreased sharply after this This is evidenced in the fact that only 37 houses were constructed
Presently, this represents only 17.9% of the housing units in period. after 1940. the Borough.
Aging houses, such as those in Summerhill Borough, require periodic investment in upkeep and maintenance to prevent deterioration from occurring. Pride in their homes and substantial investment by residents of the Borough has prevented serious blight from developing. This characteristic is espe- cially important as a deteriorating or substandard residential neighborhoods will prevent potential homeowners from building in the area. provides a detailed tabulation of the number of homes constructed within specific time periods in the Borough. the ages of the housing structures in Summerhill Borough.
TableXVI
This allows for a better awareness of
AGE OF HOUSING SUMMERHILL BOROUGH - 1970
Year Built
1969 to March 1970
1965 to 1968
1960 to 1964
1950 to 1959
1940 to 1949
1939 or earlier
TOTAL
HousinP Units D
Number Percent
1 . 5
8 3.9
4 1.9
14 6.8
10 4.8
170 -
207
82.1
100.0
SOURCE: 1970 Census Tract PHC(1)-97
44

Housing Values
During the 1970 Census of Housing, a sampling was taken of the value of owner-occupied homes in Smerhi11 Borough. asked the cost of the home and a fair estimate of the current market price of the housing unit. The distribution of housing units in accordance with their reported value is shown in Table XVII.
Essentially, the respondent was
O f the 76% of owner-occupied homes tabulated, the largest proportion of housing units in the Borough, 50 units or 43%, were valued at $5,000 or less; 26 or 22.4% were valued at $5,000 to $7,499. 26.8%, were valued between $7,500 and $14,999.
An additional 31 housing units,
These rather low values can ?De expected when considering that the majority of homes were built before 1939, and the rural location of the community.
Those units valued over $15,000 accounted for only nine, or 7.8% of
The median value of owner-occupied housing units was estimated at
the sampled owner-occupied houses in Summerhill Borough.
$5,800 in 1970.
TABLE XVII
VALUE OF OWNER-OCCUPIED HOUSING UNITS SUMMERHILL BOROUGH - 1970
Value
Less than $5,000
$5,000 to $7,499
$7,500 to $9,999
$10,000 to $14,999
$15,000 to $19,999
$20,000 to $24,999
$25,000 to $34,999
$35,000 to $49,999
$50,000 or more
TOTAL Median Value : $5,800
Housing Units Number Percent
50
26
16
15
5
2
1
1
0 -
11 6
43.0
22.4
13.8
13.0
4.3
1.7
.9
.9
~~
100.0
SOURCE : 1970 Census Tract PHC (1) -97 45
1

HOUSING CONDITIONS
Util ization of the 1970 Census of Housing Data has provided a basic prof i le of the housing conditions in Summerhill Borough. tions were used t o distinguish the two general housing conditions:
The following defini-
Standard Houing Units - structures with complete plumbing f a c i l i t i e s
Substandard I-Iousing Units - structures lacking some or a l l plumbing f a c i l i t i e s
The above c r i t e r i a was proposed by the U.S. Census Bureau in 1972.
Summerhill Borough shares Census Tract 132 with Croyle Township, Ehrenfeld Borough and South Fork Borough. Summerhill represents approximately 13% of the housing or 207 units. 13% factor was then used t o extract Summerhill Borough housing information from Census Tract 132.
O f t h i s t r a c t , the Borough of The
Table XVIII shows the number and percent of standard and substandard housing units i n Summerhill Borough.
TABLE XVIII
1970 XIUSING CONDITIONS SUMMERHILL BOROUGH
~ ~~ _ _ ~~~
Total Total Occupied Standard Percent Substandard Percent Units Units Units of Total Units of Total
207 196 183 88.4% 24 11.6%
SY)URCE: U.S. Census Tracts PHC(1)-97
46
External Housing Conditions
In October of 1978, the Cambria County Planning Commission conducted The pur- a field survey of external housing conditions in Smerhill Borough.
pose was to identify the present external conditions of the Borough's housing units and to classify the structures as either externally sound or externally substandard.
A criteria was established to help in the classification of the housing units. good condition but still showed signs of minor improvements such as painting, shingle repair, window repair and other deterioration. units would encompass those structures with obvious signs of deterioration including a visible need for paint, shingles, sidings, window replacement, porch repair and foundation work.
Externally sound units would be those structures which were in
Fxternally substandard
Within the municipality, the Planning Commission found that less than 1% of the housing units were externally substandard. 99% of the housing units are externally sound. established within the Borough, and hopefully this high caliber of home mainten- ance will continue in the future.
Therefore, approximately An excellent standard has been
Appraisal of Interior and Exterior Conditions
The Cambria County Assessment Office conducts a housing unit inventory
The structure is then evaluated according to a grading scale based on the
program to appraise the quality of the housing structures. gathered by Assessment officials about the interior and exterior of the housing unit. worlananship and materials used in the unit.
Information is
The classes of quality are as follows:
Grade "A" = Excellent Quality
Grade "B'' = Good Quality
(I
4
d
4
Grade "C" = Average Quality
Grade ''D" = Cheap Quality
These four grades cover the entire range of dwelling construction from the cheapest (I to the finest quality.
When evaluating housing units, the Planning Commission utilized this appraisal system to categorize a structure as standard or substandard. only gave us an idea of the exterior conditions but also the interior quality.
less. A dwelling of this type would be characterized as being the cheapest qual- ity construction, inferior workmanship, and lacking sufficient normal facilities.
This not
For our purposes, we specified that substandard was anything rated as D-20 or a
According to data collected, there were only eleven units with this low
Moreover, rate in the Borough. to other areas, the amount of substandard housing. units is rather low. this low incidence of substandard housing is Sunurierhill Borough's greatest asset in attracting new people and insuring the quality of life within the community.
This accounts for 5 . 3 % of the total housing figure. Compared
47

I t is projected that Summerhill Borough's population w i l l be 794 by The housing needs of the future population w i l l be met through the use 1985.
of existing housing stock and the addition of new housing units.
In determining the amount of housing needed t o accommodate the 1985 population, the Cambria County Planning Commission has ut i l ized the Pennsylvania Housing Need and Allocation Model, 1973. projecting the future housing needs of Summerhill Borough. Although the ent i re model was not used, Parts I, 11, and 111 were ut i l ized t o determine the housing need for the Borough. t o t a l housing uni ts needed un t i l 1985, and the number of new uni ts which should be bu i l t t o f i l l those needs.
a This model was found appropriate for
Table x~ presents the procedure used t o estimate the 0
According t o the estimate, there would be a need for approximately 23 new uni ts fo r Summerhill Borough between 1970 and 1985, or 1 .5 housing uni ts per year. The Cambria County Planning Commission estimated that there was an increase of four uni ts from 1970 t o 1978. This annual r a t e of new housing is lower than expected, but not when considering that the Borough did not begin t o show any population growth u n t i l 1974. After 1980, the community should expect increased building ac t iv i ty within the Borough and prepare property for t h i s growth.
Data limitations prohibit the estimation of types of housing needed
0
* i n the Borough. should be located in the Land Use section of the Policy and Long Range Plan.
There are suggestions provided t o where the expected new units
a
e
48
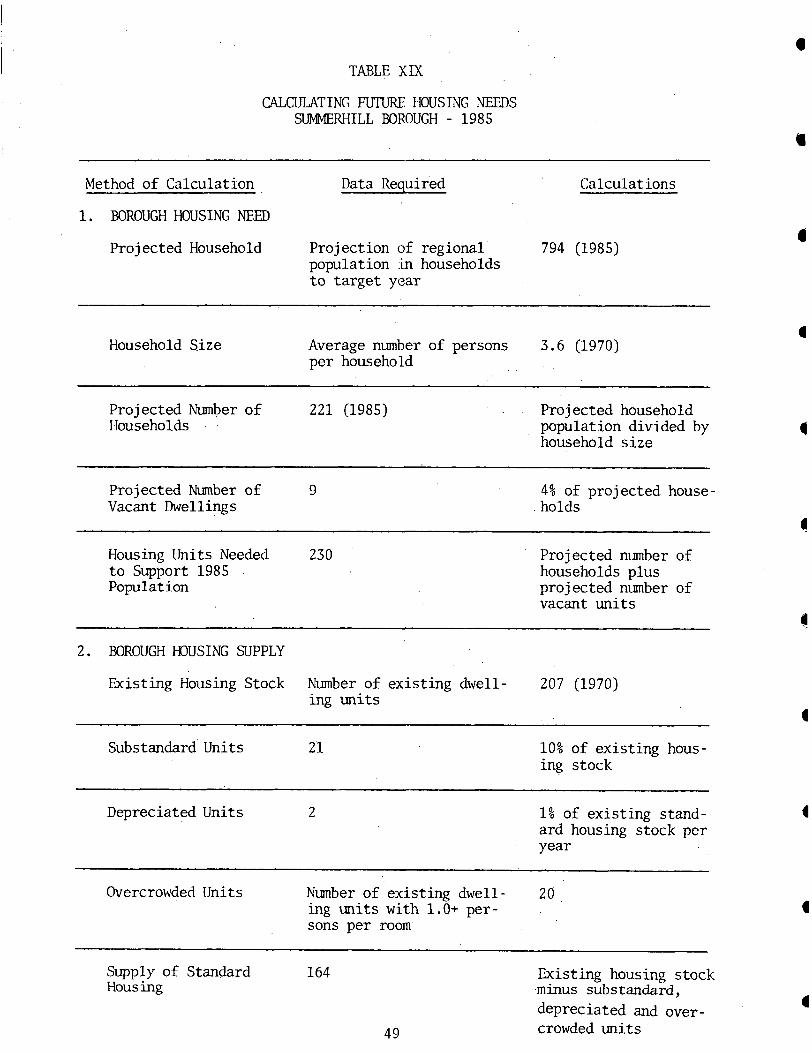
TABLE XIX
CALCULATING FUTURE HOUSING NEEDS SUMMERHILL BOROUGH - 1985
Method of Calculation Data Required Calculations
1. BOROUGH HOUSING NEED
Projected Household Pro j ect ion of regional 794 (1985) population in households to target year
Household Size Average number of persons 3.6 (1970) per househo Id
Projected Number of 221 (1985) . Projected household Households population divided by
household size
Projected Number of 9 Vacant Dwellings
4% of projected house- holds
Housing Units Needed 230 to Support 1985 P o p 1 at ion
Projected number of households plus projected number of vacant units
~~ ~ ~~
2. ROROUGH HOUSING SUPPLY
Existing Housing Stock Number of existing dwell- 207 (1970) ing units
Substandard Units 21 10% of existing hous- ing stock
Depreciated Units 2 1% of existing stand- ard housing stock per year
Overcrowded Units Number of existing dwell- 20 ing units with 1.0+ per- sons per room
1
Supply of Standard 164 Housing
49
Existing housing stock minus substandard, depreciated and over- crowded units
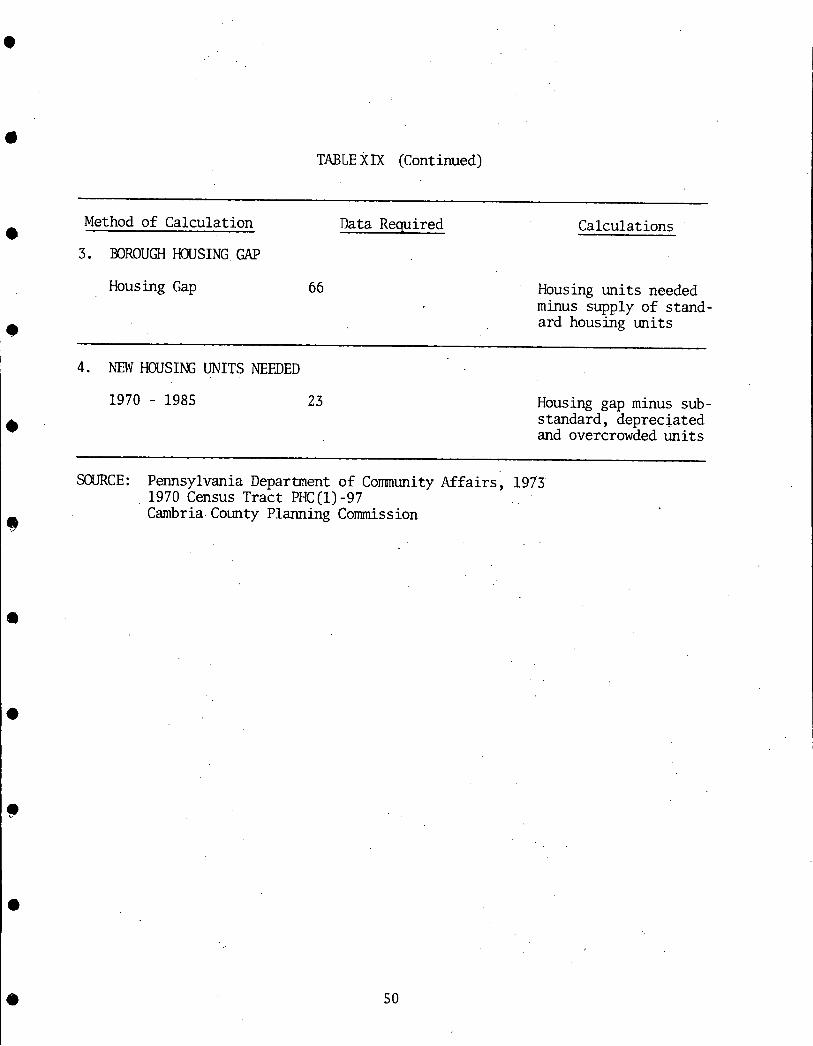
TABLE X IX (Continued)
Method of Calculation Data Required
3. BOROUGH HOUSING GAP
Housing Gap 66
~~
Calculations
Housing units needed minus supply of stand- ard housing units
~~
4. NEW HOUSING UNITS NEEDED
1970 - 1985 23 Housing gap minus sub- standard, depreciated and overcrowded units
SOURCE: Pennsylvania Department of Cornunity Affairs, 1973 1970 Census Tract PHC (1) -97 Cambria County Planning Commission
50

CCMWNITY FACIETTIES
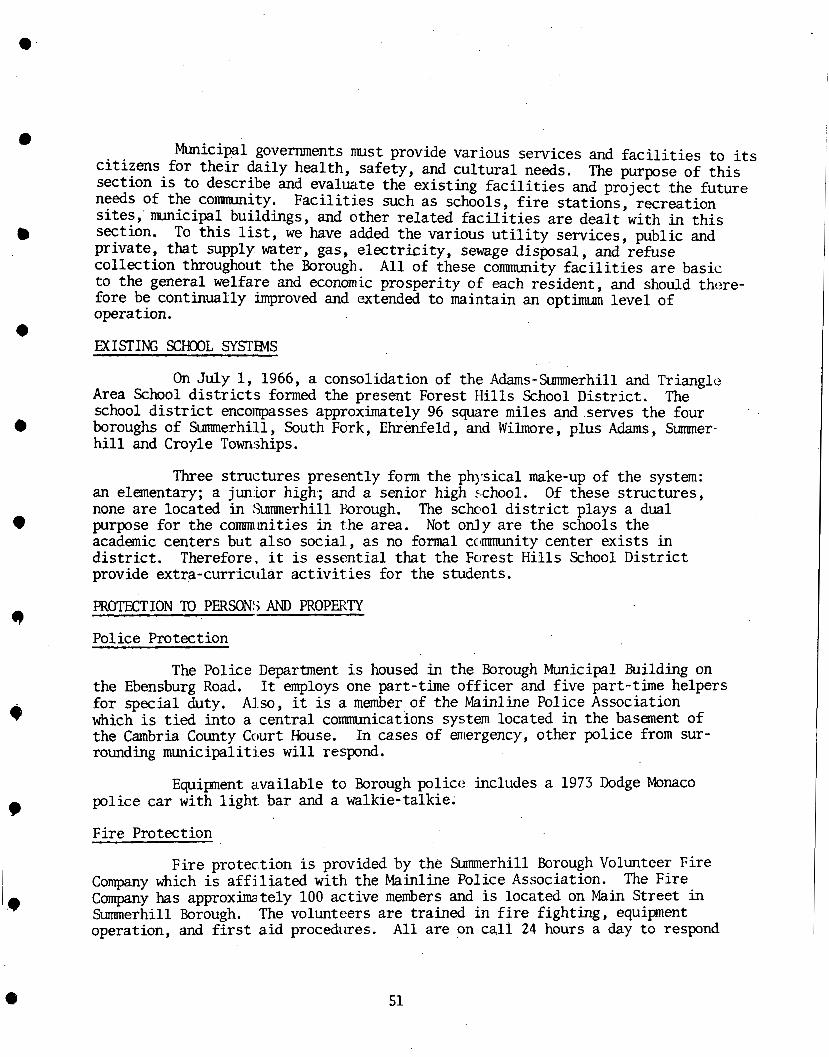
e
0
Municipal governments must provide various services and f ac i l i t i e s to i ts citizens for their daily health, safety, and cultural needs. section is to describe and evaluate the existing fac i l i t i es and project the future needs of the community. sites, municipal buildings, and other related fac i l i t i es are dealt with in this section. private, that supply water, gas, electricity, sewage disposal, and refuse collection throughout the Borough. A l l of these community f ac i l i t i e s are basic to the general welfare and economic prosperity of each resident, and should there- fore be continually improved and extended to maintain an optimum level of operation.
The purpose of th i s
Facil i t ies such as schools, f i r e stations, recreation
To this l ist , we have added the various u t i l i t y services, public and
e MISTING SCHOOL SYSTINS
On July 1, 1966, a consolidation of the Adams-Summerhill and Triangle Area School d i s t r ic t s formed the present Forest H i l l s School District. school d i s t r i c t encompasses approximately 96 square miles and.serves the four boroughs of Summerhill, South Fork, Ehrenfeld, and Wilmore, plus Adams, Summer- h i l l and Croyle Townships.
The
Three structures presently form the phlvsical make-up of the system: O f these structures, an elementary; a junior high; and a senior high xhool.
none are located in Summerhill Rorough. The schcol d i s t r ic t plays a dual purpose for the cornmities in the area. academic centers but also social, as no formal ccmmunity center exists in d is t r ic t . provide extra-curricular act ivi t ies for the students.
Not onJy are the schools the
Therefore, i t is essential that the Forest H i l l s School District
PROTECTION To PERSON!; AND PROPERTY
Police Protection 9
9
The Police Department is housed in the Borough Municipal Building on the Ebensburg Road. for special duty. which i s t ied into a central communications system located in the basement of the Cambria County Court House. rounding municipalities w i l l respond.
I t employs one part-time officer and five part-time helpers Also, it i s a member of the Mainline Police Association
In cases of emergency, other police from sur-
Equipment available t o Borough policc: includes a 1973 Dodge Monaco police car with light. bar and a walkie-talkie.
Fire Protection
Fire protection is provided by the Summerhill Borough Volunteer Fire Company which is aff j l ia ted with the Mainline Police Association. Company has approximately 100 active members and is located on Main Street in Summerhill Borough. operation, and f i r s t aid procedures.
The Fire
The volunteers are trained in f i r e fighting, equipment A l l are on ca l l 24 hours a day to respond
e 51

to any f i r e alarm or other casualties.
Equipment belonging to the organization includes one 750-gallon pumper, one 70-gallon pumper, one 435-gallon booster tank, and one 500- gallon booster tank. 2Y' hose, and 1050 feet of 1+" hose, a 24 foot wood ladder, and a 40 foot alumimum ladder a t their access. - necessary for adequate fire and rescue service including a squad car , portable pump, breathing apparatus, and resusitator.
They also have 100 feet of 4" hose, 950 feet of
The f i r e company also has other equipment
In addition t o water supplied by the pumpers, there are 6 hydrants located through out the Borough. There is also adequate amounts of surface water available.
Two more hydrants are planned for the future.
The Fire Company maintains i ts own station and purchase equipent through funds supplied by the Borough government and public donations. The building which is of a fire resistant material i s approximately twenty five years old.
Also, i n a close proximaty to offer f i r e coverage to the Borough in- cludes the Fire Companies of Ehrenfeld, Saint Michael, South Fork, Summerhill Township, and Wilmore.
Ambulance Service
Ambulance Service is provided for Summerhill Borough by the Forest H i l l Ambulance Association. Route 53 in the Borough. Service and employs one paid paramedic. drives and municipal funds.
There is an area headquarters located on old The service features a 24-hour Advanced Life Support
I t is funded through membership
EUILDINGS
Municipal Building
in the Borough of Summerhill on Ebensburg Road. With the completion of the new elementary school in Adams Township, the old structure was converted t o a communication center for Cambria County, and a meeting house for the Summerhill Borough Council. Borough from the Forest H i l l s School District. organizations in the community could u t i l i ze th i s space for meetings.
Electric Power Station
Until 1976, the elementary school building for the d i s t r i c t was located
The building and property is rresently being leased by the I t is conceivable that other
Summerhill Borough Electric Power Station is located on Main and Jack- son Streets. the Borough and nine homes outwide the Borough limits.
Power is purchased from Penelec t o serve a l l housing units within
I
4
52 a

COMPREHENSIVE PLAN FOR SUMMERHILL BOROUGH
MAP MI
5
i i

c
I *
8
a
a
RECRFAT ION
In the past twenty years, there has been an increasing awareness among persons of a l l ages towards more recreation fac i l i t i es , better physical fitness programs, beautification of the land, and improving the environmental quality of our surroundings. A s growth begins within the Borough, resources and undevelop- ed land w i l l diminish creating a demand f o r open space and more recreational faci l i t ies . In addition, greater mobility, higher incomes, and increased par- ticipation in recreation are factors that w i l l dictate a demand by the community's residents for a more satisfying, healthful, and stimulating living environment.
function physical
Recreation is a means of fulf i l l ing th i s demand. I t is an essential of modern government to provide these 1,ecreational fac i l i t i es for the , mental, emotional, moral health, and well being of the community's - -
residents.
Our main objective is t o present a complete inventory of recreational and open space available in Summerhill Borough.
Recreational Facil i t ies Available
1. Freedom Park (No Designation) Location : Site Acreage: 0.8 acre Owner ship : Facili t ies :
Ebensburg Road and Market Street
Borough of Summerhill 0.8 acres townscape, benches, drinking fountain and landscaping
2 . Summerhill Elementary School (2-playground)
Location : LR. 11025 (Ebensburg Road) Site Acreage: 5.2 acres Ownership :
Condition : Fair Facil i t ies :
Leased by the Forest H i l l s School District to the Borough of Summerhill
Occupied one-story brick structure, one l i t t l e league baseball f ield two multi-purpose courts; basketball, tennis volleyball, ice skating, miscellaneous play equipment
Also, the brough Co-ordinates various recreational programs incluc Little-League, T-League, and Cub Scouts.
KJBLIC WTER AND SEW11 SERVICE
Water Supply
Presently, 159 housing units, or 77 percent, are provided with water by Highland Sewer and Water Authority. Of the reamining units, 48 houses, or 23
54

percent, depend on an individual w e l l for their water supply. (See Map 7)
Sewer Facilities
Summerhill Borough is serviced by a combined sewage system. I t is designed to collect sanitary sewage from residential and commercial properties, plus storm water run-off. locations into the Li t t le Conemaugh River.
This sewage is then discharged from four different (See Map 6)
4
According to the 1970 U.S. Housing Census, 177 housing units, or 86 percent, used t h i s type of public sewage system; 24 housing units, or 1 2 percent, used septic tanks or cesspools; and 6 housing units, o r 2 per cent, used wild- cat collection systems or individual direct discharge. 4
A s the Borough grows, the need for a bet ter sewage disposal system w i l l The lack of proper disposal methods w i l l be one of become increasingly evident.
the most serious problems facing the community as the general health of the inhabitants is threatened and water is contaminated.
In 1969, a feas ib i l i ty study was completed on the sanitary sewage f a c i l i t i e s for Summerhill Borough. Borough could provide sewerage treatment servicc for the area and i ts financial feasibi l i ty . treatment plant located on the Litt le Coiiemaugh River.
This study dealt with methods by which the
The proposed f a c i l i t i e s included interceptor sewers and a sewage To date, no action has
been taken by Summerhill Borough of f ic ia l s t o i n s t a l l t h i s sewage system. 1
REFUSE COLLECTION AND DISPOSAL METHODS
Garbage Collection i n Summerhill B0roul.h is currently contracted to Mainline Sanitation. General Fund Account.
This private company is p:id monthly from the Borough's
PUBLIC UTILITIES AND SERVICES
Electric Power
Summerhill Borough has i ts own electric power plant which supplies e lec t r ic i ty t o the community. Pennsylvania Electric Company.
Telephone Service
residents of Summerhill Borough.
Power is purchased by the Borough government from Residents are then bi l led by the Borough.
This service is supplied by General Telephone of Pennsylvania t o the
55

COMPREHENSIVE PLAN FOR SUMMERHILL BOROUGH I-\. ; -.
I CAMBRIA COUNTY, PENNSYLVANIA EXISTING SMlEBLlNES
MAP NO. CWNTY RANNING COMMISSION COURTHOUSE ANNEX
2. 1 .- --. -.. .- .
I i SUMMERHILL BOROUGH
69 E.B_ENsB"Rt." --.- I DATE lp , s "nY-Y-.I.l_l--n."I. 6 _.._-. __.. i %-+ H - --n .-.--I "",I, I n -
\ PLANNING COMMITTEE /? 'I O&*~.r.fR
ine

a
COMPREHENSIVE PLAN FOR SUMMERHILL BOROUGH CAMBRIA COUNTY, PENNSYLVANIA
MAP NO. W COUNTY RANNlNG COMMISSION COURTHOUSE ANNEX (3 ~-B_E"s"uRE.d-..-." .dlUY - -?. 1-1 -I-"",-. Y m .-.Ml.n-"I.Y.--.l.mU OITE ,9,11 "~--.U-L.Y....,..I.(mll.
~-
i ___-__
-- --
\> Existing Water Line Sizes \. ', '.
Range From 2 " t o lo"
\ A ' 0
\i% ' 5 1% 2)

TRANSI'ORTATION STUDY

C PrinciDal Arterials
The rural primary a r te r ia l system consists of those highways which exhibit the following characteristics.
1. Serve substantial travel of a statewide or interstate system.
2 , Form an integrated network of highways without needing such intermediate roads as w i l l be subsequently described. This network w i l l connect virtually a l l urban areas of 50,000 o r more population.
The principal a r te r ia l system includes Interstate Highways and other principal ar ter ia ls . is Traffic Route 219. examined la te r in th is report.
Minor Arterial Roads
The only principal a r te r ia l traversing Summerhill Borough Specific characteristics of U.S. 219 w i l l be further
The rural minor a r te r ia l road system should, i n conjunction with major
1. L i n k t r a f f i c generators, such a s c i t i e s and larger towns, major resort areas and other attractions capable of attracting travel over long distances while providing interstate and intercounty service.
ar ter ia ls , provide a level of service consistent with the following characteristics.
2. Be spaced so tha t a l l developed areas are within reasonable dis- tance of an a r te r ia l highway.
3. Have designed characteristics which w i l l provide for relatively high overall travel speeds, within minimum interference t o through movement.
The only minor a r te r ia l road existing in Summerhill Borough is Traffic Route 53. Specific characteristics of T.R. 53, Locally known as Portage Street, w i l l be further described la te r in th i s report.
Collector Roads
The rural collector roads generally serve intracounty travel demands and are usually shorter i n length than ar ter ia l highways. function of these roads, their design w i l l generally require only moderate travel speed. c r i te r ia :
A s a result of the
Collector roads are subclassified according t o the following
Major Collectors
Major collectors should provide service t o larger towns not on the a r te r ia l system, to consolidated schools, shipping points, county parks, impor- tant mining and agricultural areas and similar t ra f f ic generators. collector routes w i l l also link the generators w i t h a r te r ia l routes so tha t
The major
c
r L
r
i
c
r L
c 59

0
e
0
0
0
0
0
0
e
access is available to interstate and intercounty travel three major collectors in Summerhill Borough: Ebensburg Route 11025), Main Street (Legislative Route 11025), and
corridors. There are Road (Legislative Jackson Street (Legis-
lative Route-11021). this report.
These highways w i l l be discussed in more detail l a te r in
Minor Collectors
Minor collectors should be spced such that a l l local roads are within a relatively short distance of a major collector. thereby be provided with relatively quick access t o larger c o m i t i e s via another collector and/or a r te r ia l highway. The minor collectors w i l l also l i nk locally important t ra f f ic generators with the more isolated regions of the rural area. According to the functional classification system, there are no roadways of the minor collector type existing in Summerhill Borough.
The entire population w i l l
Local Roads
The rural local road system w i l l constitute a l l roadway mileage not classified as an a r te r ia l or collector. provide access to the larid adjacent to them and w i l l provide service over a relatively short distance.
These roads w i l l serve primarily to
Included in th i s category are a l l the remaining streets and road- ways in S m e r h i l l Borough, which are maintained by the Borough.
DESIGN CHARACTERISTICS AND CRITERIA
The abi l i ty of a highway system t o adequately accommodate current and future t ra f f ic demands is dependent on design characteristics and t ra f f ic controls used for each roadway. Criteria such as right-of-way and pavement widths, grades, alignment, intersection features and t ra f f ic signalization, are a l l essential in the proper design of a highway. As part of the t ra f f ic survey for Summerhill Borough, a discussion of the 5asic design cr i ter ia used in the developnent and construction of a highway i s presentdd below and sum- marized, in part, in Table XX.
Right-of -Way-Widths
The right-of-way width of a street or highway consists of a l l land either occupied by the roadway or adjacent to the paved roadway and between the property lines of abutting properties. available for public use, including: planting s t r ips and u t i l i t i e s which may be either above or below ground. is a l l right-of-way occupied by the s t reet or other public faci l i t ies . width of the non-used right-of-way w i l l largely determine the potential of the street to carry additional t ra f f ic and/or support such additional public fac i l i - t i e s as mentioned above.
The entire right-of-way is generally s t reet widening, sidewalks, f i r e hydrants,
Rarely The
M i n i m u m right-of-way widths, as recommended by the Commonwealth of Pennsylvania, Department of Transportation (PennWT) for the various types of highways l is ted ear l ier , are shown in Table XXI.
e 60
Pavement Widths
Pavement width refers t o that portion of the roadway which i s suited to the flow of vehicular t raff ic . width regardless of whether the roadway includes parking or does not. parking is permitted, however, the effective ab i l i ty of the roadway t o support t ra f f ic may be decreased, For example, a thir ty foot wide paved roadway could support three ten foot t ra f f ic lanes if no parking is permitted, yet with park- ing, could probably only support two lanes.
This width would include the entire paved Where
Mininrm pavements widths for the various classes of highways reviewed earlier are presented in Table XX.
Street Intersection
Most highways intersect on relatively level land and a t right angles. Improperly designed intersections are frequently the s i t e s of t ra f f ic acci- dents. These accidents may of course have occurred as a result of drivers' carelessness, but they may be supporting causes such as the angle of the inter- section, the grades of the intersecting streets, sight distances and turning radii. The exact engineering prerequisites for a safe t ra f f ic intersection are beyond the scope of this report. design of the intersections, however, are that streets should intersect a t right angles and no more than two 5.treets should intersect a t one point.
Several general safety rules in the
Street Grades
The grade of a s t reet o r highway is nothing more than the slope or Grades affect the service provided by the roadway steepness of the roadway.
in three ways:
1. Required braking distance is less on upgrades and greater on downgrades than on level grades. Accordingly, more space i s required between vehjcles going down grades than on upgrades in order to maintain a safe braking distance.
2. The presence of a grade w i l l generally res t r ic t horizontal sight distance thereby limiting safe passing zones.
Some vehicles may not be capable of negotiating steep upgrades a t normal speed, and w i l l therefore slow the t ra f f ic flow of following vehicles.
The desirable maximum grades for the various classes of highways
3.
are indicated in the following Table XX.
(I
4
4
4
4
4
61 4

TABLE XX
0
0
*
0
e
0
RURAL DESIGN CRITERIA
Minimum Widths i n Feet Class of Highway Right-of -Way Pavement Maximum Grade**
Interstate and Other Four o r More Principal Arterials 236' - 336'* 12 ' Lanes (Divided) 3-4%
Minor Arterial Roads 90' - 100' 24' - 28' 4-6%
Collector Roads 70' 22 ' - 26' 5- 7%
Local Roads 60' 20' 9+%
*Right-of-way width includes a minimum 36' median.
**A range of one t o two percent may be just i f ied i n some cases, depending on geographic and traffic conditions.
W C E : PennDOT, Rural Design Criteria, 1973
REGIONAL HIGHWAY SYSTEM
Summerhill Borough is traversed by and connected t o a complex network of roadways including the U.S. 219 Expressway, several State legis la t ive routes and numerous Borough Streets. Traffic Route 219 extends i n a north-south direction fo r approximately .42 miles i n the northwest corner of the Borough. The principal arterial affords the Borough easy access t o a l l segments of Cambria County, connecting with U.S. 22 and U.S. 422 t o the north, and south t o the Pennsylvania Turnpike in Somerset County. highway calls for its eventual linkage with such major routes as Inters ta te 80 (Keystone Shortway) and U.S. 40 (National Pike) i n Maryland. Benefits of the modern expressway access t o a l l segments t o the County have obvious implications for both the region and Summerhill Borough.
Long range plans for the regional
Principal highway access t o many segments of the County is afforded by such State routes as T.R. 53 (L.R. 276), L.R. 11025 and L.R. 11021. Traffic Route 53, a minor arterial, traverses Summerhill Borough in an east-west direc- t ion, connecting the Borough with the Johnstown Urbanized Area to the south, and the smaller urban c o m i t i e s to the north. 11021, both major collectors according t o the Highway Functional Classifica- t ion, bisect the Borough in a north-south direction. origins outside Summerhill Borough and terminate within the Borough limits.
Legislative Routes 11025 and
Both highways have the i r
62

Legislative Route 11021 terminates a t i ts junction with L.R. 11025 and L.R. 11025 has its terminous with T.R. 53. These highways, as with U.S. 219 and T.R. 53, provide a direct l ink with the major residential , commercial and industrial c o m i t i e s of the region.
Connecting the more populated areas of the Borough with the regional a r te r ies is a complex network of Borough s t ree ts and some Township roads. Traffic on these local roads, for the most par t , originate or terminate within the Borough. and adjacent to Sumnerhill Borough.
They function primarily t o provide access t o ac t iv i t i e s within
EXISTING TIXIROUGHFARE CHARACTERISTICS
As mentioned in the previous section of t h i s report , Summerhill Borough i s served by a complex network of s t r ee t s and highways. these highways have statewide and regional significance a s is the case with U.S. 219 and State Route 53. Borough is contained in the numerous Borough s t r ee t s and roadways t h a t traverse the c o m i t y . address a l l of the Borough's local roads, and fo r t h i s reason, only those streets and highways which comprise the major s t r ee t system w i l l be discussed.
Several of
However, the majority of roadway mileage within the
I t would be impractical within the context of t h i s report to
Major Thoroughfare Classification
The purpose of t h i s section is to further describe and classify the roadway system in Summerhill Borough according t o the federal c lass i f icat ion of highways presented in the i n i t i a l sections of t h i s report, The functional use classi f icat ion includes a designation of those roads and highways within the major s t r ee t system that can be classed a s principal a r t e r i a l highways or expressways, minor a r t e r i a l roads, major and minor collector roads and local s t reets . and their characterist ics noted in the following Table XXI, and are i l lus t ra ted on the accompanying Map No. 8.
Those roads that f a l l within these classes of highways a re l i s t e d
4
4
63

e
TABLE )[SI EXISTING THOROLZX.WE CHARACTERISTICS
BOROUGH OF SWIERHILL, CX'LBRIA COUSTY, PEhTSPLVAKlA
Major Thoroughfare Length
P r i n c i p a l Arterial
U.S. 219 0.42 M i . (L .R. 1022)
l i n o r A r t e r i a l
P o r t a g e S t r e e t 0.74 M i . (T.R. 53, L.R. 276)
Major C o l l e c t o r
Ebensburg Road (L.R. 11025)
Main S t r e e t (L.R. 11025)
Jackson S t r e e t (L.R. 11021)
Loca l Roads
C r o y l e S t r e e t
D i b e r t S t r e e t
0 .23 M i .
0.49 M i .
0 .44 M i .
0.14 M i .
0.17 M i .
Righ t-of -Way Width
2LQ' - 280'
46'
30'
40'
30 '
28' - 30'
40 '
S u r f a c e Pavement C o n s t r u c t i o n
Width and C o n d i t i o n
Four 1 2 ' Lanes, C o n c r e t e , Div ided (48' ) Good
22' - 24'
14 ' - 26'
18'
18' - 26'
24'
20 '
Bituminous, Good
Bituminous, Good
Bituminous, Good
Bituminous Good
Bituminous , Good
Bituminous, Good
Grade
Moderate
Level t o S t e e p
S l i g h t t o Moderate
Level t o S t e e p
S l i g h t t o Moderate
S l i g h t t o Moderate
S l i g h t t o Moderate
H o r i z o n t a l Alignment
Curved
S l i g h t l y Curved
S t r a i g h t t o S l i g h t l y Curved
S t r a i g h t t o S h a r p l y Curved
S t r a i g h t t o S l i g h t l y Curved
S t r a i g h t
S t r a i g h t
1977* A.D.T. -
5,720
4,070- 4,950
1,210
2,310
1 ,430
----
----
T r a f f i c Flow
Twc !;a)., L imi ted Access
Two Lanes, ...., .,a). - ..
Two Lanes, Two Uay
Two Lanes,** Two Way
Two Lanes, Two Way
Two Lanes, Two Way
Two Lanes, Two Way
Roadside P a r k i n g Permi t ced
Emergency 0 r . l ~
Emergencv Onlv
Emergency Only
Part-One S i d e
Emergency Only
One S i d e
One S i d e
64

TABLE XXI -- Continued
Ma3 o r Thoroughfare
F i r s t Avenue
"K" S t r e e t
L a u r e l S t r e e t
Madison S t r e e t
Main S t r e e t
Manor Drive
Market S t r e e t
McArdles S t r e e t
M i l l S t r e e t
Orchard S t r e e t
P o r t a g e Lane
Length
0.12 Y i .
0.04 Y i .
0.06 Xi.
0.06 Y i .
0.14 Y i .
0.09 Y i .
0.06 >!i*
0.06 Y i .
0 . 2 4 X i .
0.06 X i .
0.13 X i .
Righ t-of-Way Width
40 '
17'
- 25'
25'
40 '
18'
40'
20'
30 '
25'
15'
Paveoen t i;idth
2 4 '
i3' - 14'
18'
15'
22' - 28'
1 2 ' - 14'
24
15' .
16'
19 '
13'
S u r f a c e C o n s t r u c t i o n
and Condi t ion
Bituminous, Good
Bituminous, Good
Bituminous, Good
Bituminous, Good
Bituminous, Good
Unpaved, F a i r
Bituminous, Good
Bituminous, Good
Bituminous, Good
Bituminous, Good
Bituminous, Good
Grade - Level t o Yodera te
Level
Level
S l i p h t to Moderate
S l i g h t t o Moderate
Moderate t o S t e e p
S l i g h t t o Yodera te
S l i g h t t o S t e e p
Level
Level
Level
Horizon t a l Alignment
S t r a i g h t
S t r a i g h t
S t r a i g h t t o . S l i g h t l y Curved
S t r a i g h t
S t r a i g h t
S t r a i g h t
S t r a i g h t
S t r a i g h t
S t r a i g h t
S t r a i g h t
S t r a i g h t t o S l i g h t l y Curved
Roadside
P e r m i t t e d T r a f f i c P a r k i n g
Flow -.
One S i d e Two Lanes, TGO Way
One Lane, Two Way
Two Lanes, Two Way
One Lane, Two Way
Two Lanes, Two Way
One Lane, Two Way
Two Lanes. Two Way
One Lane, Two Way
Two Lanes, Two Way
Two Lanes, Two Way
One Lane, Two Way
No R e s t r i c t i o n s
One S i d e
No P a r k i n g Any Time
Both S i d e s
No R e s t r i c t i o n s
One S i d e
No R e s t r i c t i o n s
One S i d e
One S i d e
N o P a r k i n g Any Time
65

e
TABLE XXI -- Continued
a e
Major Thoroughfare
P r i n g l e S t r e e t (T 398)
Second Avenue
Spr ing S t r e e t
Wendroth'Avenue
West Jackson S t . (T 395)
T 607
TOTAL ROAD MILEAGE
Right-of -Way Length Width
0. ii X i . 25 '
0 . i j Xi. 40'
0.06 Y i . 40 '
0 . l i ?ii. 25'
0.25 Yi. 40'
0.20 Mi. 38 '
4 . 5 7 Y i .
Pavement Width
. 20'
20'
20'
16 '
20 '
20'
S u r f a c e Cons t ruc t ion
and Condit ion
Bituminous, Good
Bituminous, cnod
Bituminous, Good
Bituminous, Good
Bituminous, Good
Rituminous, Good
Grade
Moderate t o S teep
Level t o Moderate
S l i g h t t o Moderate
L P W l
Level t o Mod e r a t e
S l i g h t t o Moderate
H o r i z o n t a l 1977* Alignment A.D.T .
S t r a i g h t ---_
S t r a i g h t ----
S t r a i g h t ----
S t r a i e h t t o ---- S l i g h t l y Curved
S t r a i g h t t o S l i g h t l y Curved
S t r a i g h t t o S l i g h t l y Curved
-__-
T r a f f i c Flow
Two Lanes, Two Way
Two Lanes, Two Way
Two Lanes, Two Way
One Lane, Two Way
Two Lanes, Two Way
Two Lanes, Two Way
L - r J s i d r
? i r ? i t t r d
-. :;:king
0:s EiJe
o=i : ;?e
So l e s c r i c t i o n s
One S i d e '
&.e S i d e
90 R s s f r i c t i o n s
*Average Da i ly T r a f f i c (X.D.T.) Volumes -- Avai l ab le on ly f o r s t a t e -ma in ta ined highways. **One lane t r a f f i c e x i s t s a c r o s s Main S t r e e t Bridge.
SOURCE: PennDOT (1978 Road Log), Cambria County Planning Commission
66


a
0
e
a
e
a
a
e
4
a
Major Thoroughfare Roadway Mileage
A s noted in Table XXI, Existing Thoroughfare Characteristics, there are
This includes .42 miles classed as Principal Arterials, .74 miles
As stated previously, there are no roadways of the
a to ta l of 4.57 miles of roadway on the major thoroughfare system in Summerhill Borough. classed as Minor Arterials, 1.16 miles classed as Major Collectors, and 2.25 miles in local streets. Minor Collector classification existing in the Borough.
as having 2.32 miles in State maintained roads a l l included i n the Principal and Minor Arterial and Major Collector highway categories. roadway mileage of 2.25 miles comprise the local s t ree t category which does not take into account the numerous alleys and unnamed roadways existing in the Borough. Map, are used primarily for access of the Summerhill Borough residents and business c o m i t y .
PennDOT's of f ic ia l road mileage inventory for 1977 records the Borough
The remaining
The local roads, as can be seen on the Major Thoroughfare Study
Right-of-way Widths
Right-of-way widths on the Borough's major thoroughfare system are generally either 30 or 40 fee t , except in rare cases where a local road, clas- s i f ied as a s t ree t , more closely resembles an al ley when considering width. Normal widths on the majority of a r t e r i a l and collector roads range from 30 feet to 46 feet and in most cases are below the recommended standard for their particular classification (refer to Table XX) . Only T.R. 219, with a right-of-way width of approximately 240 feet to 280 fee t , appears to meet the recommended standard for the Principal Arterial category.
The remaining majority of local s t reets provide a 25 to 40 foot right-of-way and carry a l i t t l e less t ra f f ic . The special cases mentioned with 20 feet or below right-of-way widths are McArdles Street, "IC' Street, Manor Drive, and Portage Lane. s t ree t , each has narrower right-of-way and carry much less t r a f f i c than the wider streets. major thoroughfare systems include parking and sidewalk f ac i l i t i e s .
Although a l l four are given the t i t l e of
Aside from pavement width, the right-of-way width in most
Pavement Widths
Pavement widths on the Borough s t reets and highways vary from as low as 1 2 feet along Manor Drive t o an ideal width of 48 fee t , with separate lanes, which exists on U.S. 219. Along with Route 219, the majority of the a r t e r i a l and collector roads meet the recommended standard widths for their basic functional use. are within the recmended pavement width of 20 fee t for local roads. A s with right-of -way widths, McArdles Street, "IC' Street, Manor Drive, and Portage Lane can support only one lane t r a f f i c a t best. Needed improvements along these roadways, such as a oneway s t reet system, w i l l be examined i n the plan section of th i s report.
The majority of the Borough Streets, with a few exceptions,
a 68

Surf ace Conditions
With the exception of U.S. 219, which uses reinforced concrete as i ts
The roadways that are rated as bitumin- base, a l l other highways and Borough s t reets consist of bituminous pavement with paving conditions generally good. ous-good appear in Table XXI, and were judged according t o the smoothness quality of the roadway, as a whole. of f a i r was Manor Drive which was noted as being unpaved.
The only roadway with a pavement condition rating
Horizontal Alignment and Grade
Coupled with s l ight ly inadequate surface conditions i s the unavoidable presence of unlevel and uneven s t reets with varying slopes or grades. h i l l Borough's s t ree t system was developed to serve the sloping land in the best way possible. community, north of the Consolidated Railroad Corporation (ConRail) freight tracks, is characterized by varying degrees of slope. those roadways such as F i r s t and Second Avenues, "IC' Street and Main Street (L.R. 11025) that extend in an east-west fashion across the slopes a re gener- a l l y more level,
Summer-
Generally speaking, the predominate northern sector of the
For the most par t ,
The others, such as Ebensburg Road and Main and Jackson Streets, run parallel up and-down the slopes aEd show a higher grade percentage (See Table XXI).
The southern most portion of the Borough is characterized with more
A s for horizontal alignments, the majority of the Borough streets gentle slopes, and the majority of the Borough s t ree ts here are of a level quality. are shorter in length =and are predominately straight. ship and legislative routes entering the Borough are longer in length and are characterized with straight t o curved alignments. Due to the h i l l y and some- times rugged terrain of the region it is doubtful, except in a few instances, that these situations can be effectively corrected.
Conversely, the town-
Average Daily Traffic
The average daily t r a f f i c (ADT) volume data shown in Table XXI and on the Major Thoroughfares Study Map are 1977 figures extracted from PennDOT's 1978 Pennsylvania Road Log. t r a f f i c data are compiled by PennDOT as input into the State Road Log. surveys are conducted along s ta te legislative routes only, and information is compiled on a County and PennDOT d i s t r i c t level. Inspection of recent t r a f f i c surveys for Cambria County has revealed minimal increases in t r a f f i c volumes along legislative routes entering Summerhill Borough. For example, t r a f f i c volumes along L.R. 11025 from its junction with T.R. 53 northwest across the Summerhill Borough Bridge to Jackson Street increiised from 2,180 vehicles a day in 1975 to 2,310 vehicles in 1977, a net increase of 130 vehicles over a 24-hour period. This increase in t r a f f i c along L.R. 11025 (Main Street) across the Summerhill Bridge may be attributed in part t o the recent closing in 1976 of the Fifficktown Bridge located in neighboring South Fork Borough. Although an increase of 130 vehicles a day over a two-year period does not appear to be excessive, it does, however, cause concern for the one-lane Summerhill Borough Bridge. Daily t r a f f i c of 2,310 vehicles over the one-lane span is close t o the estimated safe volumes of 2,500 vehicles per lane for a collector roadway. The Main Street bridge w i l l be discussed i n greater detai l in the following hazard- ous roadway section of th i s report.
Traditionally, t h i s and other kinds of pertinent Traffic
69
4
4

c
/.
Hazardous Intersections - Signalization
Hazardous intersections or roadway points are generally characterized by problems involving conflicting traffic-turning movements, heavy t r a f f i c vol- umes, poor sight distances, excessive grades and turning angles between roadways, railroad grade crossings and numerous other features. The survey of the Summer- h i l l Borough s t ree t system revealed m y roadways and street intersections with one o r a combination of the above-mentioned hazardous conditions. Most of these problems were created originally when the streets were first bu i l t , largely in conformity with the steep grades and numerous intersections that prevail i n the Borough. when passing through, o r avoid them altogether. As a resul t , f e w accidents may occur a t such points so tha t no real proof other than visual observation of the existing road construction characterist ics a t that point exis ts . An example of such an intersection o r roadway is along Main Street across the Summerhill Bor- ough Bridge which spans the four tracks of the ConRail System, formerly the Penn Central Railroad. Tlie Main Street structure connects the north and south sectors of the Borough with essential community services including f i re , police, garbage collection and school bus t r a f f i c . approaches t o the br dge creates an acute c-urve and must be negotiated with extreme caution.
Many of these problems a re well-horn and motorists use extreme caution
The steep grade and 90 degree angle of the
The Summerhill span was constructed as early as 1903 by the Penn Central Railroad which has maintained the structure fo r years. The approxi- mate 120-foot long bridge is characterized with a timber decking carrying an 18-foot wide roadway and six-foot wide sidewalks on each side of the roadway. The center span which crosses the railroad tracks is approximately 60 feet long and is supported with steel girders. The two end spans are approximately 30 feet long and the ent i re structure provides for a m i n i m u m overhead clearance of approximately 19 feet. The Main Street bridge was originally constructed t o support two lanes of two-way t r a f f i c with a nine ton weight l imit which is, in PennMT's opinion, inadequate for present day t r a f f i c patterns and types.
Constructed around the same time as the Summerhill bridge, was a
This f a c i l i t y was intended t o provide a safer option over the Due t o the deteriorated condition of
pedestrian underpass located approximately 150 yards east of t h e Main Street structure. adjacent bridge for pedestrian use. the underpass, coupled with the increased size and weight of railroad cars, t h i s f a c i l i t y was closed t o pedestrian trirffic i n early 1972.
In recent years, the condition and use of the Summerhill Borough bridge has been the subject of much concern by local residents. Several pub- l i c hearings between the Pennsylvania Public Ut i l i ty Commission (PUC), County and Borough of f ic ia l s , and representatives from PennDOT and ConRail were held during 1970, 1972, 1976 and 1978. As a result of these hearings, the follow- ing improvements have been completed at the bridge site.
70
-- In compliance with FUC order of September 19, 1972, PennDOT crews installed t r a f f i c l ights along bridge approaches a t a to ta l cost of $50,943.94.
-- A twelve ton weight limit and one-way t r a f f i c plan was imposed a t the bridge s i te .
-- During March, 1977 ConRail forces installed a new timber roadway deck a t a to ta l cost of $9,066.06.
During the recent FUC hearing held i n September, 1976, three alterna- t ives t o improve the Main Street structure were presented by PennDOT. The PennDOT schemes involve the construction of a new bridge a t i t s present loca- tion or a t a new s i t e approximately 500 feet west of the existing crossing. The developnent plans and associated costs for the Summerhill span w i l l be detailed in the plan section of t h i s report.
Up to th i s point the discussion of hazardous roadways has de l t with the Main Street bridge. Summerhill Borough Accident Statistics-Intersection and Mid-Blocks Combined, numerous t r a f f i c accidents have occurred throughout the Borough over a four- year period (1973-1976). dent reports prepared by PennDOT's Bureau of Accident Analysis. PennDOT compiles accident data statewide from accident reports received from involved motorists, State police and municipal police departments. information is available t o municipal governments that participate in the Bureau Accident Record System.
However, as revealed in the following Table XXII,
The accident table was compiled from municipal acci- Annually,
This
Inspection of PennDoT's accident reports for Cambria County over the four-year period (1973-1976) revealed many incidences of car accidents from Summerhill Borough. collisions, there are numerous cases of injured persons and often severe property damage. accident occurrence, are found on the following 'TableXXII . Not every inci- dent during the past four years is l i s ted on the Table since the c r i t e r i a for l i s t i n g them is only accidents within any particular intersection or roadway that was the scene of more than three accidents in the four-year period (January 1, 1973 - December 31, 1976).
major ar ter ies as Main and Portage Streets. terms of the number of injuries (twelve) and property damage ($6,500), involved a school bus a t the intersection of Portage and Main Streets. th i s accident was attributed to mechanical failure. because of factors such as driver error, slippery pavement, turning and pro- ceeding without clearance. accident data is useful i n identifying roadway areas where resurfacing with a grooved pavement is needed to a l leviate the deficiency. desired routes where t r a f f i c volumes are much greater, the problems are even more accentuated, and the Borough, in cooperation with the State, must take steps to alleviate some of the more severe intersection problems. This pro- cess w i l l involve such steps as additional stop sign regulations, automatic signalization and restricted turning movements. Perhaps enforcement of more no-parking zones should be considered t o contribute to better sight clearance and turning radius along some Borough streets.
Although there were no deaths as a result of two-car
This information, along with month, year and location of
The majority of t r a f f i c accidents reported have occurred along such The worst of these accidents, in
The cause of A l l others took place
With regards to slippery road conditions, the
Along the major
1
4
1
1
71

a 0
TABLE XXII
SUMMERHILL BOROUGH ACCIDENT STATISTICS - INTERSECTION AND MID-BLOCK COMl3INED 1973 - 1976
0
1 Locat ion
Main Street
South of Jackson Street South of Jackson Street Southwest of Jackson Street South of Jackson Street Intersection with Jackson Street
Intersection with Portage Street Intersection with Portage Street Intersection with Portage Street Intersection with Portage Street Intersection with Portage Street Northwest of Portage Street
Tbrthwest of Croyle Street Northwest of Croyle Street Intersection with Croyle Street
South of Ebensburg Road West of Ebensburg Road Intersection with Ebensburg Road
Month/Year
July, 1973 D e c . 1973 Octo 1975 June, 1976 Novo, 1974
July, 1974 Apr. 1975 Mar. 1976 Aug., 1976
Sept., 1976 Dec., 1975
Sept., 1974 Mar., 1976 Dec., 1973
Apr., 1975 Sept., 1975 Sept., 1975
Value of Number of Number of Property Injuries Deaths Danaage
Cause of Accident
Driving on wrong side of road Speeding Miscellaneous driver error h k e n Driver Turning without clearance
Speed iYlg Eoceeding without clearance Driving on wrong side of road lliscellaneous driver error Tire blowout Driving on wrong side of road
Careless Driving Driving on wrong side of road Slippery Pavement
Slippery Pavement Brake Failure H i t fixed object
72

TABLE XXII (Continued)
1 Locat ion
blain Street (Continued)
South of Main Street
Intersection with Wendroth Avenue South of Wendroth Avenue
Portage Street
Southwest of Main Street Southwest of k i n Street
West of M i l l Street West of M i l l Street Southwest of M i l l Street
Northwest of Croyle Street Northwest of Croyle Street Intersection with Croyle Street
Southwest of L.R. 1022 Southwest of L.R. 1022
Southwest of Portage Street
Month/Year
Apr., 1975
July, 1974 July, 1974
June, 1974 Nov., 1974
Jan., 1975 Feb., 1975 Aug., 1974
Jan., 1975 h g . , 1975 Oct . , 1976
Aug., 1974 Apr., 1975
Aug., 1976
Value of Manber of Property Deaths Damage
$ 700
400 700
1,400 500
2,000 500
1,900
1,200 600 400
1,500
1,000
500
Cause of Accident
S1 ippery pavement
Proceeding without caution Drunken driver
Speeding Careless Merge
Driver l o st control Driver l o s t control Slippery pavement
Driver l o s t control Following too closely Driver l o s t control
S1 ippery pavement Slippery pavement
Miscellaneous causation factor
Y i

0 0 0 0 0 a 0 0 a 0
TABLE XXII (Continued)
Location1
Jackson Street
South of Main Street Northwest of Main Street
South of F i r s t Avenue South of F i r s t Avenue Northwest of F i r s t Avenue Intersection with F i r s t Avenue
South of Dibert Street
South of L.R. 1022
South of Second Avenue
Ebensburg Road
Intersection with F i r s t Avenue
Intersection with Market Street
Month/Year
Feb. , 1973 Sept., 1975
D e c . , 1974 D e c . , 1975
Sept., 1976 Nov., 1974
Aug., 1974
Nov., 1975
Sept., 1975
Dec. , 1974
Jan., 1975
Value of Number of Number of Property Injuries Deaths Damage
200 - _ _ _ _ 1
Cause of Accident
Speeding/slippery pavement Driver Inattention
Slippery pavement Drunken driver Tire blowout Passing on r ight
Driver l o s t control
Driver l o s t control
Speeding
Driver- drowsy
Turning without clearance
b l y accident locations having three o r more accidents during 1973-76 have been recorded.
SOURCE: The above Table is a compilation of data from PennDI)T's Bureau of Accident Analysis - Municipal Intersection and Mid-Block Accident Location Reports for 1973 through 1976.
74
Traffic Flow and Parking
lane, two-directional highway, the balance of the Borough's major thoroughfare system consists of two-lane, two-directional roadways. A s indicated on Map 3, the one-lane segment of Main Street carries t r a f f i c across the Summerhill Borough bridge and provides a direct connection between the north and south portions of the Borough. The approaches to the Main Street structure a re controlled with automatic signalization devices. been erected on most local s t ree ts , in particular where a roadway with a lower classification intersects a highway of a higher classification.
s t reets in the Borough (See Table XXII) Along certain s t ree ts , e.g., Portage Lane and Madison Street, parking is prohibited because of narrow pavement conditions. Also, in certain sections of s t reets , parking is restr ic ted due t o emergency or loading zones, private driveways o r safe clearance on corners. In most cases these rest r ic ted zones are usually indicated by signs or by yellow paint on s t ree t curbing.
With the exception of Traffic-Iioute 219 (L.R. 1022) , which is a four-
Numerous stop signs have
Parking in general is permitted on either side of a majority of the
4
I
KJBL IC TRANSPORTAT ION
Public transportation in Summerhill Borough i s provided by various public and private transportation companies and social service agencies. Each has many pick-up points and destinations throughout Cambria County so that the varying travel needs of those residents with or without private automobiles can be met. Transportation services provided by these agencies include a i r travel, bus travel, taxi service and railroad f ac i l i t i e s .
A i r Transportation
A i r transportation service is provided a t two local a i r f ie lds located in Cambria County. County Airport located in Richland Township southwest of S m e r h i l l Borough via U.S. 219. The regional airport affords the residents and businesses of the Borough and County with excellent passenger and a i r freight services t o many destinations throughout the State and Nation. between Johnstown and Pittsburgh is provided on a regular scheduled basis a t the local airport.
The largest of these f a c i l i t i e s is the Johnstown-Cambria
Commuter a i r service
A small air s t r i p located along U.S. 22 west of Ebensburg Borough provides charter service t o the residents and businesses of Cambria County. The local a i r f i e ld is accessible t o Summerhill Borough via U.S. 219 north.
Bus Transportation
Public bus transportation service is provided throughout Cambria County by several private P.U.C. (Pennsylvania Public Ut i l i ty Commission) licensed carriers and numerous governmental and human service agencies. recently formed Cambria County Transit Authority i s licensed by the P.U.C. t o operate s t r i c t l y within the confines of the Johnstown Urbanized Area. private P.U.C. carriers, as w e l l as public service agencies, are res t r ic ted from operating within the Johnstown Area, but a re permitted to transport patrons from rural Cambria County into Johnstown. A t the present time, the privately owned Blue and White Bus Lines provides bus transportation service through Summerhill Borough via State Route 53 into Johnstown.
The
Other
I
75

Numerous governmental and human service agencies provide public bus or van transportation to social , medical, governmental and shopping facil i t ies primarily for the low income and elderly and handicapped segments of the rural population. Many of these agencies provide service to one o r mre of the above facil i t ies depending on the agency's primary function in servicing the commun- i ty , Notably, the Cambria County Community Action Council provides van service throughout rural Cambria County through the agency's Cambria Area Rural Transit (CART) Program. The CAR'T system operates on a regional basis outside Johnstown with destinations either t o Johnstown o r Altoona or within the rural dis- tricts, fees. Contractual services with other County agencies is provided, the largest of these agreements being with the County Transit Authority. Those municipali- t ies, including Summerhill Borough, served by CART are l i s t ed in the following schedule.
A l l rural residents of the County may r ide the CART vans a t established
THURSDAY
0 Effective Date January 15, 1979
FRIDAY
RURAL TRANSIT DESTINATIONS
Ba rnesboro Carroll town
s t i n ys Spaagier
Johns t own
Determine the township/boroqgh in which p u reside. Red across the
I I I 7 page*
I
I A 1 toon;i Johnstown
AREA( TOiAVSHIPS I BOROUGHS MONPAY TUESDA 1' WEDNESDA Y
i __-_I..-- I I I
Canbrio Jackson - -
1
0 I
e 11
IV B
Barr E l der h'. Carroll E . Ca.r ro l l
Chest White Reade C1 ear f l e l G
Dean
B1 ackl ick
Milaster Cresson Washingtcn Port age A 1 13ghen y G a l l i t z i n
Local John stown
As hvi 1 1 e Chest
S p r i n g s Patton
Altoona Johnstown A1 toona Local A1 toona
SOURCE: Cambria County Community Action Council, Iric.
Ebensburg Nanty G l o 'Jintondal e
Cassandra Cresson G a l 1 i t z i n L i l l y Loretto Portage Sankertown Tunnel H i 1 1
Ehren f el d South Fork Summerhi 11 W i l m r e
Johns t own Local Johastown
Johnstown A1 toona Johnstown I
Johnstown J o b s t o - 1 Johnstown
I
Local
Johnstown
i
Johnstown
Johnstown 9
I Johnstown Loca 1
Summerhill C r o y l e Adams
I-
0 76

Bus service t o a l l par ts of the United States is provided by Greyhound Bus Lines headquartered in Johnstown. Greyhound has only one regularly scheduled route that passes through Cambria County. Intra-County service is available between Cresson and Ebensburg Boroughs, north of Summerhill Ibrough, but the route primarily functions in the Greyhound system t o provide through service between Harrisburg and Pittsburgh.
With respect t o school bus transpartation, numerous bus companies pro- vide service t o the various school d i s t r i c t s operating in the County. Currently, Summerhill Borough, as part of the Forest Hills Area School District, is serviced by s i x separate contractors, transporting school aged children under contract with the School District.
1
T a x i Service
T a x i service in the Johnstown Urbanized Area is provided by Greater Johnstown Yellow Cab Corporation, a PUC licensed carr ier . Yellow Cab operates a c a l l and demand public tax i service within the limits of a six-mile radius of downtown Johnstown. However, taxi service for rural residents of the County is also provided, but because of the high fares and long waiting times, make fre- quent use of the service unfeasible a t the present time.
Railroad Facilities
Rail f re ight service in Cambria County is provided by f ive railroads, including the old Penn Central which is now part of the Consolidated Railroad Corporation (ConRail) System, the Johnstown and Stoneycreek, the Cambria and Indiana, the Baltimore and Ohio, and the Conemaugh and Rlacklick systems. ConRail maintains several freight tracks i n Summerhill Borough. service is not now provided nor is any anticipated within the future for the Borough. comuter service between Altoona and Johnstown from its terminal f ac i l i t y i n Johnstown, w i t h ultimate destinations being Washington, D.C. and New York City t o the east and St. Louis and Kansas City, bbsour i to the west.
SUMMARY OF FINDINGS
R a i l passenger
However, the National Railroad Passenger Corporation (Amtrak) provides
- As a resu l t of the transportation study for Summerhill Borough, cer-
ta in conditions and inadequacies in the major thoroughfare system can be noted as follows:
1. Traffic Route 219 a s a principal regional highway w i l l no doubt be used more extensively for through t r a f f i c , and w i l l play a key role in the continued development and growth of the County.
2. The transportation needs of the Borough are dictated by extensive use of the streets by residents for means of access t o and from the area. way mileage i s in local and collector streets.
This is supported by the fact that 74.6% of the road-
3. A majority of the Borough streets and highways were found t o be i n good surface condition and generally meet, a t a minimum, the current t r a f f i c demands placed upon them.
77

d
a
e
* l
e
4. The primary deficiency creating inadequacies in the Borough?s circulation system is the condition and current t r a f f i c demands placed on the Summerhill Borough bridge. be cognizant of the fact that the improvements completed on the bridge are temporary and that plans should be formulated for the eventual replacement of the structure. be in i t ia ted and completed on the South Fork - Fifficktown Bridge, it should ease, t o some extent, traffic demands placed on the Main Street bridge from adjacent cornmities .
Borough of f ic ia l s should
With improvements soon to
5 . Existing pavement widths along t i e majority of Borough streets are generally within the recomeided pavement widths for the i r roadway classifications. t o more adequate space for t r a f f i c flow, but would require the sacr i f ice of some resident parking.
A few of the Borough's more narrow streets can support one-lane traffic a t best. along these streets which would l i m i t or restrict on-street parking.
Sections of the Borough are characterized by steep grades which w i l l impose physical and financial constraints upon future highway development and maintenance as it now exists.
S t i l l , some widening would contribute
6. A one-way strect plan should be investigated
7 .
8. Several major intersections throughout the Borough might require stricter t r a f f i c regulators as indicated by the list of hazardous intersections. near corners of some blocks so as t o provide unimpaired sight clearance and a greater turning radius.
This may require imposition of no parking zones
With regard t o public transportation; air , rail and bus services, a re accessible t o Borough residents and the business community. development i n rural bus/van transportation was realized in 1978 when contractual arrangements between the County Transit Authority and Community Action, Inc. were completed, insuring the continued operation of the CART program in Cambria County. mode of travel throughout the County, the ensuing energy shortage and associated rising costs for fuel w i l l , i n a l l probability, create increased demands for mass transportation i n future years.
A significant
Although the private autombile is expected t o remain the dominant
e 78


a
0
a
0
e
a
e
e
One of the primary functions of any Borough Government is to provide services and fac i l i t i es to the people living within i t s jurisdiction. The Penn- sylvania General Assembly has enacted codes and laws that s ta te precisely w h a t a borough government may and must do. for providing these services and f ac i l i t i e s to borough residents, as well as certain expenditures and debt limitations, are regulated by Borough Codes and Laws as mandated by the Commonwealth of Pennsylvania.
mation on past f iscal operations and to inventory current revenues and expenditures. This w i l l aid in determining applicable regulations of f iscal management within the context of the &rough Code. policy and a foundation in determining future capitol improvement potential.
The sources and amounts of revenues obtainable
The purpose of a Fiscal Study for Summerhill Borough is to supply infor-
Also, it w i l l provide a basis for future fiscal
The f iscal operation of Summerhill Borough is Governed by the Local
The information for th i s study has been obtained from "The Borough's Tax Enabling A c t of 1965, A c t 511 and the Local Government Unit Debt Act of 1972, A c t 185. Codes and Related Laws," the Cambria County Assessment Office, and the Annual Audit and Financial Reports of Summerhill Borough 1974-78.
The format utilized in discussing Summerhill Borough's financial structure is based on annual Budgets as prepared by Summerhill Borough. it is based on the following: Expenditures.
Topically, Revenue Receipts, Non Revenue Receipts, and
RElrENUE RECEIPTS
In terms of receipts, th i s category encompasses the major and most dependable sources of revenues available to the Borough. categories w i l l be discussed individually: R e a l Estate or Property Tax, Occupation Tax, and a variety of taxes levied under the Local Tax Ebabling A c t of 1965, Act 511.
The following revenue
Real Estate Tax
The tax on real estate i s the most productive of a l l local taxes. In order for real estate to be taxed, an assessment by property must be set. setting of these assessments is a function of an elected County Board. This Board is responsible for property assessments, appeals, and reviews.
The
The County Assessment Office has a chief assessor. assessor t o place a value upon a l l property and occupations subject to local taxation. The law requires that this assessment be determined by the actual market value, but th i s is rarely the case. runs from as low as ten percent market value to a s high as more than a hundred percent. An average fo r the s ta te is around forty percent with higher rations found in the larger c i t ies . market value is thirty-five percent.
I t is the duty of the
Rations of assessment to market value
In Cambria County, the ration of assessment to
a 79

To further clarify the Real Estate taxing structure, the following simp1 i f ied formula is provided.
Example:
Market Value x Assessed Value x Millage (one-tenth of a cent)
12,000 35% = $4,200 County 20 = $84 Borough 8 = 34
School District 54 = 227 Total Real Estate Tax = $345
The above formula symbolizes the numerical flow of Real Estate Tax structure. The County Assessment Office follows a more involved process in obtaining the assessed valuation. work be done in order to get a constant update of property and value changes.
Records must be kept of each parcel and f ie ld
I t is significant t o point out that each property is taxed by governmental bodies: the local municipality, the county, and the school Table XXIII shows the revenues for Summerhill Borough received from Real Tax from 1974-78.
Occupation Tax
three d is t r ic t . Estate
Occupation may also be assessed by the County. The tax is charged t o any individual who works within the municipal limits, regardless of where he resides. Although th is tax is called a County Occupation Tax, the revenues are received by the local municipality. Borough.
Presently, there is no Occupational Tax in Summerhill
Act 511 Taxes
In 1947, the General Assembly passed A c t 481 which enabled a l l local units of government except counties to raise additional revenue from such taxes as those on earned income, mercantile transactions, real estate transfers, t ra i lers , amusement, mechanical devices, and persons. superseded by A c t 511. counties to levy taxes on certain subjects and under certain procedures and limitations. These include the following:
In 1965, th i s law was A c t 511, l ike A c t 481, allows a l l local units except
1. The e r ca i t a tax ra te is $10 maximum and may
school dis t r ic ts . be s k+ r e on a m t y - f i f t y percent basis with
2. The real estate transfer tax is one percent maximum of t f i o u n t o f e E t i o n . This tax must be shared if both the municipality and the school d i s t r i c t levy it.
4
80

0
0
0
3.
4.
5.
6.
7.
0
8.
The earned income and net profits tax is one percent maximum of t ~ u n ~ t F t ~ s a c t i o n . T i s tax must be shared i f both the municipality and the school d i s t r ic t levy it.
The mercantile - tax is from one t o one and a half m i l l s on sales.
On the r e t a i l -- sales tax of personal property, the rate is two percent, to be shared between the municipality and the school dis t r ic t .
A s to occ ation taxes, there is no l i m i t on the rate an +*-- no requirement for sharing.
The occ tional r i v i l e e tax rate remains a t $10 +-E-6-B maxmum an is su ject to sharing between the local units affected. The taxpayer must be gain- ful ly employed and may only be taxed once by th i s levy, even though he may work in more than one polit ical subdivision.
The amusement - tax on admissions t o places of amuse- ment i s ten percent of the cost of entry. Such a tax is prohibited on admissions to motion picture theatres except in Pittsburgh.
Note that the aggregate amount of a l l taxes imposed by any local unit may not exceed an imount equal to the product obtained by multiplying the la tes t total market valuation of real estate in the local unit by twelve m i l l s .
NON-RE\rENUE RECEIPTS
A non-revenue receipt is one which does not a l t e r the net value of municipal assets. Table XXIII provides a l i s t of non-revenue receipts sources as indicated in Summerhill Borough's Annual Audit and Financial Reports for the year 1974 to 1978. Sale of Property; Supplies, and Equipment; Miscellaneous, Non-Revenue Receipts, Borrowed Funds, and Transfers from other funds.
Included in this category is the following:
MPENDI?URES
In order to determine the efficiency of any budget, it is necessary to analyze the expenditures. penditures is needed t o insure the best use of Borough funds.
A clear howledge of the areas and amounts of ex-
81
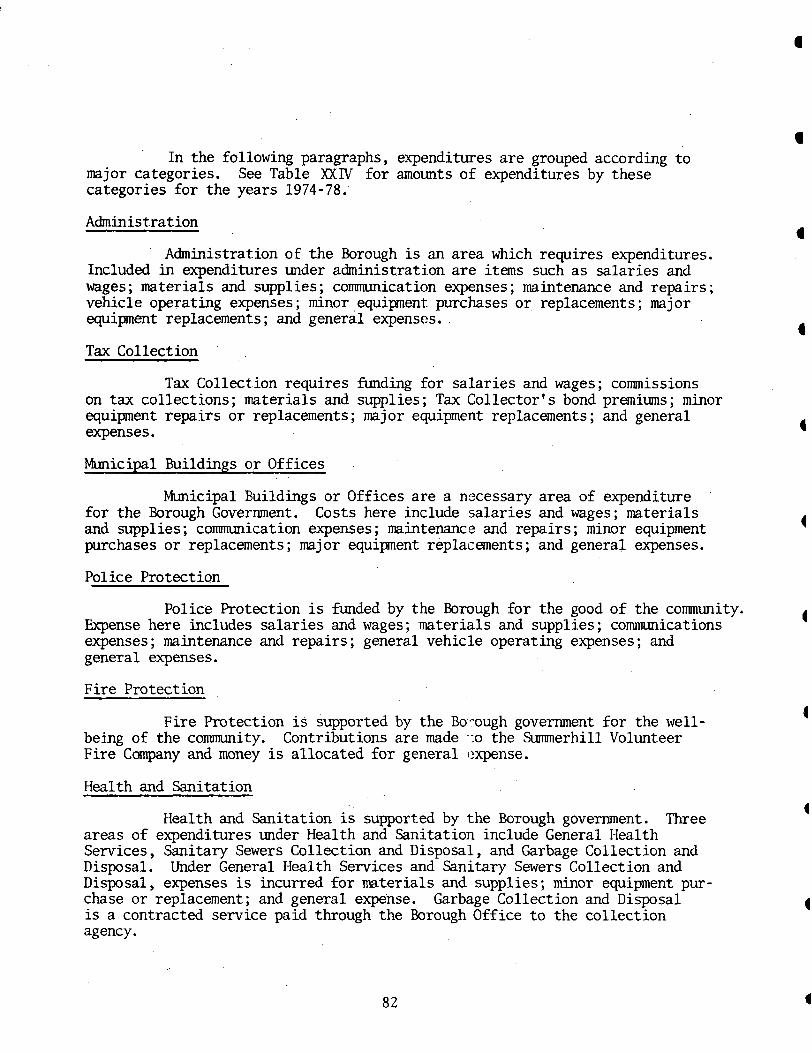
In the following paragraphs, expenditures are grouped according to major categories. categories for the years 1974-78.
See Table XXIV for amounts of expenditures by these
Administration
Administration of the Borough is an area which requires expenditures. Included in expenditures under administration are items such as salaries and wages; materials and supplies; communication expenses; maintenance and repairs; vehicle operating expenses; minor equipnent purchases or replacements; major equipment replacements; and general expenses.
Tax Collection
Tax Collection requires funding for salaries and wages; commissions on tax collections; materials and supplies; Tax Collector's bond premiums; minor equipment repairs or replacements; major equipment replacements; and general expenses.
MmiciDal Buildines o r Offices
Municipal Buildings or Offices are a necessary area of expenditure for the Borough Government. Costs here include salaries and wages; materials and supplies; communication expenses; maintenance and repairs; minor equipment purchases or replacements; major equipment replacements; and general expenses.
4
Police Protection
Q Police Protection is funded by the Borough for the good of the community. Expense here includes salaries and wages; materials and supplies; communications expenses; maintenance and repairs; general vehicle operating expenses; and general expenses.
Fire Protection
Fire Protection is supported by the Bo-ough government for the well- being of the community. Fire Company and money is allocated for general expense.
Contributions are made 10 the Summerhill Volunteer
Health and Sanitation
Health and Sanitation is supported by the Borough government. Three areas of expenditures under Health and Sanitation include General Health Services, Sanitary Sewers Collection and Disposal, and Garbage Collection and Disposal. Disposal, expenses is incurred for materials and supplies; minor equipment pur- chase or replacement; and general expense. is a contracted service paid through the Borough Office to the collection agency.
Under General Health Services and Sanitary Sewers Collection and
Garbage Collection and Disposal
Q
4
82

Disposal. Disposal, expenses is incurred for materials and supplies; minor equipment pur- chase or replacement; and general expense. is a contracted service paid through the Borough Office t o the collection agency.
Under General Health Services and Sanitary Sewers Collection and
Garbage Collection and Disposal a
Highways
under highways is incurred under the following c: tegories: materials and supplies; materials used for maintenance; engineering services; communications expense; vehicle operating expenses; maintenance cleaning of streets and gutters; snow and ice removal; road and street signs and markings; s t reet lighting; maintenance and repairs; and general expenses.
e flighways are a necessary expense of thc Borough government. Expense
salaries and wages;
0
Parks and Recreation
Parks and Recreation is supported by the Borough. clude contributions t o joint recreation programs and general expenses.
Expenditures in-
e Miscellaneous
Miscellaneous is a "catch-all" category which includes expenditures for items such as employee payroll taxes and benefits; social security taxes (paid by employer); health and accident insurance premiums; and other miscella- neous expenditures. a
e
a
e 83

s U h ” I L L BOROUGH RECEIKTS
1974- 1978 4
1978 - 1977 - 1976 - 1975 - 1974 - 4 REVENUE RECEIPTS
Cash Balance a t beginning o f year $15,575.02 $ 11,379.84 $ 14,071.01 $ 13,319.97 $ 15,692.57
ments Held a t Begin- ning 7,385.50 107,932.14 100,987,OO 107,819.41 103,625.76
Security and Invest- (
TAXES
Real Estate 5,946.44 7,916.44 8,611.25 9,226.85 9,396.19 Occupation
-
Local Tax Enabling A c t Tax (Act 511 of 1965)
Prior Years collected
12,912.58 14,276.57 13,174.75 14,335.09 14,140.38
Licenses and Permits 604.00 637.00 1,372.55 627.00 620.00 Fines , F o r f e i t s , and
Interests and Rents
costs 176.00 280.50 450.00 447.29 612.29 (
Grants and Gifts 10,541.56 8,696.23 3,000.00
73,316.96 75,482.39 84,642.14 87,184.89 Departmental Earnings 59,011.15
Special Liens and Assess-
Miscellaneous Revenue
74.24 ments 200.00 534.04
Receipts 1,003.87 2,313.65 - 1,836.43 8,401.73 56,727.57
Tota l Revenue Receipts $90,395.50 $107,437.35 $108,927.37 $118,214.14 $168,755.56
84

1 I i I I i & 1 ' I
i *
4 I i
I
i
I 1 + i I
I !
~
a
1
I I !
1
!
i
@ I I !
I ! I 0
1 ~
I I
I I l
e I
L j
, i I
i i
I I
TABLE XXIII
SMlERH1L.L BOROUGH RECEIPTS (Con't)
1974- 1978
1977 - 1976 - 1975 - 1974 - NON-REVENUE RECEIPTS
Sale of Property, Supplies
Miscellaneous Non-Revenue
and Equipment
Receipts 218.89 522.52 229.91 729.85
Transfers From Other Funds 4,000.00 1,740.52 7,000.00
Refunds from Prior Year's Expenditures 00.00 00.00 00.00 00.00
TOTAL NON-REVENUE RECEIPTS 4,218.89 552.52 1,970.43 7,729.85
1978 -
752.70
00.00
752.70
TOTAL REVENUE RECEIPTS 90,395.50 107,437.35 103,927.37 118,214.14 168,755.56
TOTAL RECEIPTS,
MENTS 117,574.91 227,271.85 220,963.81 247,083.37 228,763.59 CASH INVEST-
SOURCE: Cambria County Clerk of Courts Office
85

SUMMERHILL BOROUGH EXPENDITURES
1974-1978
1978 - 1977 - 1976 - 1975 - 1974 - GENERAL FUND EXPENDITURES
Administration
Tax Collection
$ 7,952.24 $ 5,460.15 $ 4,265.17 $ 8,389.07 $ 5,852.67
1,358.41 1,534.09 2,084.23 998.91 1,265.47
Municipal Building or Off ice 1,360.76 589.05 10,060.40
PROTECTION To PERSONS 6 PROPERTY
Police Protection 2,532.10 2,543.20 272.64 2,906.30
660.74 1,842.75 401.20 521.42 2,194.47 Fire Protection
Building Regulations, Planning and zoning
Civil Defense
HEALTH AND SANITATION
WATER, ELECTRIC, AND
HIGHWAYS
LIBRARY
5,708.19 6,047.60
39,210.39 59,261.75
13,617.93 13,637.22
16.58
6,716.38 7,095.00 7,384.92
75,283.56 86,426.89 90,259.12
10,491.41 12,425.30 4,169.85
3,570.34
86

TABLE XXIV --CONTINUED
~-
PARKS AND RECREATION
SPECIAL SERVICES
MISCELLANEOUS
TNTEREST
TOTAL CXliRRMEJKAL, EXPENDITURES
Refunds of Pr. or Year's Receipts
Transfers of Sinking Funds
Transfers t o Other Funds
TOTAL N O N - G O l E R " I A L , MPENDIWFES
Cash Balance a t End of Year
Securities 6 Investments Held a t End of Year
TOTAL EXPENDI?IIRES, CASH, AND I " T S
1974 - 3,072.76
300.00
6,439.70
1975 - 5,287.22
52.50
2,976.49
1976 - 46.35
4,703.86
1977 -
4,843.38
1978 - 1,829.41
5,965.81
80,492.96
99.36
12,679.85
4,000.00
16,779.21
11,379.84
8,922.90
117,574.91
98,374.35
88.84
10,000.00
10,088.84
16,486.77
102,321.89
227,271.85
104,916.32
2,000.00
2,000.00
11,328.98
100,987.00
219,232.30
121,824.20
5,000.00
5,000.00
12,439.76
107,819.41
247,083.37
136,277.52
18,270.68
134.215.39
288,763.59
SOURCE: Cambria County Clerk of Courts Office
87
Ir

a I I
I I
@
~
I
I
I
I
300
250
200
!3MlARY OF RWNJCS
SJM2ERHILL BOROUGH
150 . . . . . . . . . I
0
100
50
1974 1975
. . . . . ..... .....
..... ..... .....
..... ..... ..... .....
. . . . . ..... . . . . .
..... ..... . . . . . .....
..... . . . . .
. . . . . ..... ..... . . . . .
..... . . . . . . . . . . . . . . .
::::::I ......
t=l Non-Revenue Receipts
LSource: Cambria County Clerk of Courts
. . . . .... .... ....
.... .... ....
.... .... i i f f I .... ::::I .... : : : : I . . . . ::::I . . . . ::::I ....
1976 1977 1978
Tax Revenue Receipts r-j Other Revenue Receipts
88 Figure 7

300
250
200
150
100
50
0
SUh%LARY OF EXPENDITURES
1974 1975
[-I General Government
1976 1977 1978
Water, Electric, E Sewer = Protection to Persons 4 Prop. Highways
Health 4 Sanitation 11 Other
fnmml Non-Governmental . . . . . . . . Source: Cambria County Clerk of Courts
Figure 8

ANALYSIS OF RECEIPTS ANI MPEIDITURES
Summerhill Borough's to ta l receipts and expenditures have shown a steady increase from 1974-78. increase of over $100,000. and improved f ac i l i t i e s for the community plus increased costs due to the spiraling effect of inflation.
The sharpest rise in the budget occurred in 1975 with an This growth in the budget reflects better services,
The Annual Audit and Financial Reports for Summerhill Borough are standard reports which are f i led with the Cambria County Clerk of Courts Office, Ebensburg, and with the Department of Community Affairs, Harrisburg. are designed to condense and simplify a municipality's budget.
These forms
Table XZII and XXN include a condensed version of Summerhill Borough's General Fund Receipts and Expenditures for 1974 through 1978. condensed in order that a comparison and analysis of the f ive year period was practical.
These budgets are
The following is a general analysis of Summerhill Borough's budget.
Receipts
Under receipts, most categories increased steadily from 1974 to 1978. For instance, the Real Estate Tax increased from $5,946.44 in 1975, to $9,396.19 in 1978. With improvements to present housing structures and construction of new housing units, Summerhill Borough can expect an increase in revenues a s their tax base grows. Although the Borough w i l l be collecting additional revenues from an increasins tax base, mch of this growth w i l l be used to offset the demand for expanded municipal services.
Expenditures
Administrative and Tax Collection expenditures have experienced moderate increases since 1974. sharply with the acquisition of the Borough Flunicipal Building in 1976.
Police and Fi re Protection has required increased.funding in recent years as the population increases and services are improved to the community. Police Protection costs have increased moderately from $2,532.10 in 1974, t.o $2,906.30 in 1978.
The General Government category expenses did increase
In years 1976 and 1977, Police Protection was financed through a Federal Revenue Sharing Pro,, f l 8 K .
Expenses under the Highways category fluctuates on a yearly basis because they are determined by requirements of the highway system. improvements under Highways are capital improvements which do not require ad- ditional funding for several years.
providing electr ic service to Borough Residents. to increase as administrative and purchasifig costs grow.
Most of the
The Water, Electric, and Sewer category represents the expense of Expenditures can be expected
90.
The Receipts and Expenditures for Sunmerhill Borough w i l l increase i n future years. revenues w i l l be eminent. Borough w i l l be used to provide improved f ac i l i t i e s and services.
Because of inflationery trends, the need for zdditional However, the increased revenues realized by the
91


FUTURE LAND USE

The Puture Land Use Plan for Summerhill Borough i s designed t o serve as a guide for future land development. of land uses to promote the most efficient use of land, a more at t ract ive physical environment, and a stabil ization of property values in the area.
This plan w i l l recommend an organization
The development of the Future Land Use Plan was based on information and analyses that were presented in the Existing Conditions section of t h i s report. existing land use study, and the projections for future borough population levels, housing needs and economic growth.
Patricular attention was given to the physiography study, the
The three main topics to be discussed in th i s section include: Summary of Existing Conditions; Future Land Use Goals and Objectives; and the Future Land Use Recommendations.
SUEMARY OF MISTING CONOITIONS
d
I ? )
9
?
The Inventory and Analysis of Existing Conditions provided an overview of the predominant land use patterns in Summerhill Borough. the significance of land uses on the basis of individual areas, as well as the to ta l c o m i t y level, a workable program has been accomplished.
conditions. use recommendations. Those findings include:
By examining
The following factors were revealed during the analysis of existing Each must be considered during the formulation of future land
Residential - The largest land use is single and multi-family dwellings in Sunmerhill Borough. 24.5% of the to t a l acreage.
Transportation - The second largest land use in Summerhill Borough is transportation with approximately 46.73 acres or 19.1% of the to ta l land area.
Commercial - Only 11.16 acres, o r 4.5% of the to ta l land area in Summerhill Borough is ut i l ized for commercial purposes.
This accounts for 60 acres, o r
Public and Semi-Public - In Summerhill Borough, the public and semi-public lands represent the smallest land use with only 1.7% of the to ta l land area or 1.64 acres.
Vacant, Woodlands and Water Areas - respectively represent 36.5%, 11.6% and 2.1% of the to ta l land area. over 50% of the land in Summerhill Borough. woodland figures are particularly significant in the fact that they provide an area for future expansion.
These categories represent The vacant and
FUTURE LAND USE GOALS AND OBJECTIVES
When developing a future land use plan, it is essential t o develop a set of goals and objectives for guiding planning decisions. Borough Planning Commission functions a s the of f ic ia l c i t izen 's input agency for the Borough's Comprehensive Plan. of established residents from Summerhill Borough, has developed the following land use goals and objectives.
The Summerhill
This Planning Commission, composed
92
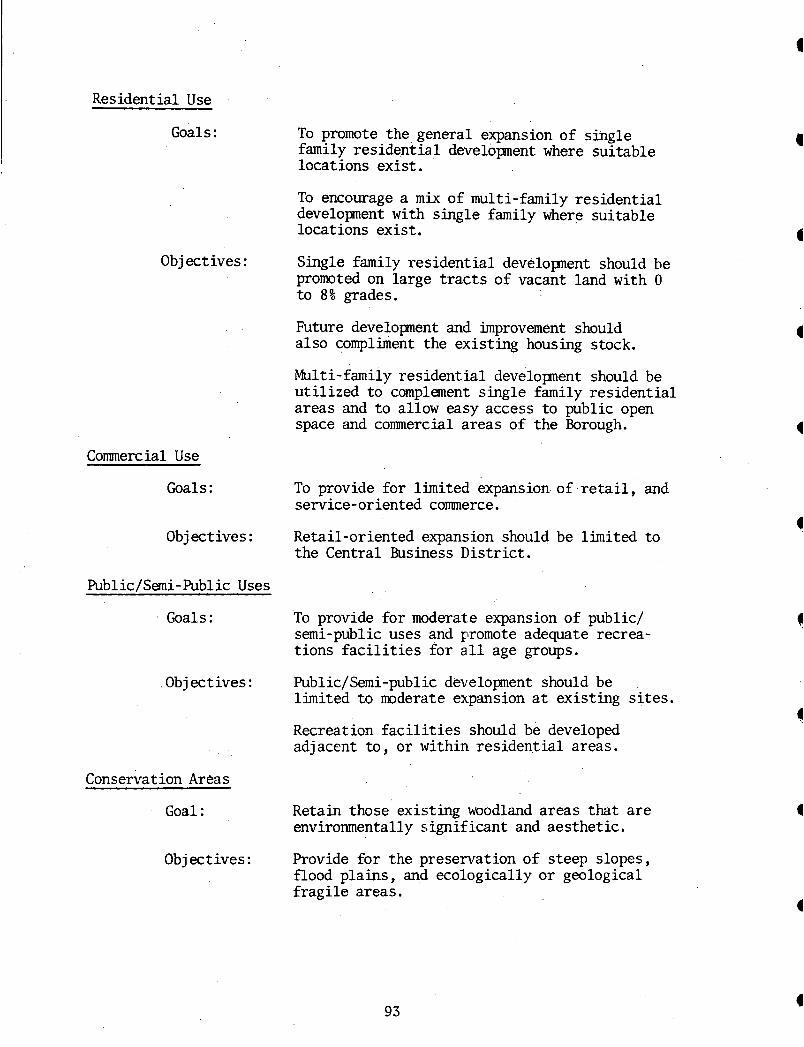
Residential Use
Goals:
Objectives:
Commercial Use
Goals:
Objectives :
Public/Smi-Public Uses
Goals:
Obj ect ives :
To promote the general expansion of single family residential development where suitable locations exist.
To encourage a m i x of multi-family residential development with single family where suitable locations exist.
Single family residential developnent should be promoted on large t rac ts of vacant land with 0 to 8% grades.
Future development and improvement should also complhent the existing housing stock.
Multi-family residential developnent should be uti l ized t o complement single family residential areas and to allow easy access to public open space and commercial areas of the Borough.
To provide for limited expansion of r e t a i l , and service-oriented commerce.
Retail-oriented expansion should be limited to the Central Business District.
To provide for moderate expansion of public/ semi-public uses and promote adequate recrea- tions f a c i l i t i e s fo r a l l age groups.
Pub1 ic/ Semi -pub1 ic development should be limited to moderate expansion a t existing s i tes .
Recreation f ac i l i t i e s should be developed adjacent to , o r within residential areas.
Conservation Areas
Goal :
Ob j ectives :
Retain those existing woodland areas that are environmentally significant and aesthetic.
Provide for the preservation of steep slopes, flood plains, and ecologically or geological f ragi le areas.
93

FUTURE LAND USE RECOMMENDATIONS
Residential
Summerhill Borough is a predominantly residential community. 50% of the developed land in the Borough is classif ied resident ia l , a s indicated in the "Existing Land Use" section.
Almost
Since 1974, the Borough has been experiencing moderate growth. This trend is expected t o continue in the future. According to Cambria County Planning Commission estimates, (See Table M, page 31) the population w i l l increase to 794 by 1985. that w i l l adequately accommodate t h i s population.
page 49) the number of additional homes needed by the year 1985 is 23. majority of these uni ts w i l l be single family dwellings with some demand for multi-family units i n the Borough.
A future residential land use plan must be designed
Utilizing the Pennsylvania Housing and Allocation Model, (Table X I X , The
Although most residential development w i l l be an expansion of exist- ing neighborhoods in the Borough, several factors were considered before projecting any future housing growth. They included: topography; s o i l limitations; stream locations; flooding conditions; and accessibil i ty. Future Land Use Map, page 97, i s provided to show the areas of the Borough which should be considered for residential land use expansion.
Sommerc i a l
The
The existing commercial areas in Summerhill Borough occupy 11.16 .acres of land. ,and along Route #53. the Borough.
tens i ty and timing of commercial development. given t o insure that the commercial areas accommodate the different types of buyers, but essentially they must relate in s ize t o the number and buying power of the inhabitants of Summerhill Borough. led growth are paid for by the taxpayers for many years i n terms of highway and t r a f f i c accidents, runoff problems and others.
Most of t h i s acreage is located in the center of the community Other smaller commercial areas a re scattered throughout
I t is important that community leaders begin to control the type, in- Special attention should be
The consequences of uncontrol-
A s i l lust rated in the Future Land Use Map, page 97, the plan recornends that a l l future commercial development in Summerhill Borough be concentrated along Route #53 with some expansion occuring on Croyle and Main Streets.
Public and Semi-Public
Public and Semi-Public land includes land which i s used for neighborhood and community services such a s municipal buildings, police and f i re stations, schools, parks, churches, parking l o t s , c iv ic and fraternal uses, and related recreational uses not c lass i f ied a s commercial. h i l l Borough, only 4.18 acres, o r 1 .7% of the to t a l land area, is c lassi f ied for public and semi-public uses.
In Summer-
94

The Future Land Use Plan suggests that t h i s amount of public and
An explanation of proposed public and semi-public land uses w i l l appear semi-public land be increased t o promote a sound and healthy living environ- ment. in the following section enti t led, 'Tuture Community Facilities."
Conservation Areas
Conservation Areas are defined a s land predominantly wooded in There a re 28.40 acres of
A s Summerhill Borough
nature and not suitable for development purposes. wooded land in Summerhill Borough. 89.47 acres of vacant land in Summerhill Borough. develops, some wooded and vacant land w i l l decrease a s other land uses expand. A s can be seen on Map No 4 , wooded and vacant areas exist primarily near the perimeter of the Borough. Areas which should remain wooded are areas whic:h have steep slopes, or have other physical problems which prohibit development. These areas can be seen on the Future Land Use Map, page 97.
In addition t o wooded land, there are
95
I
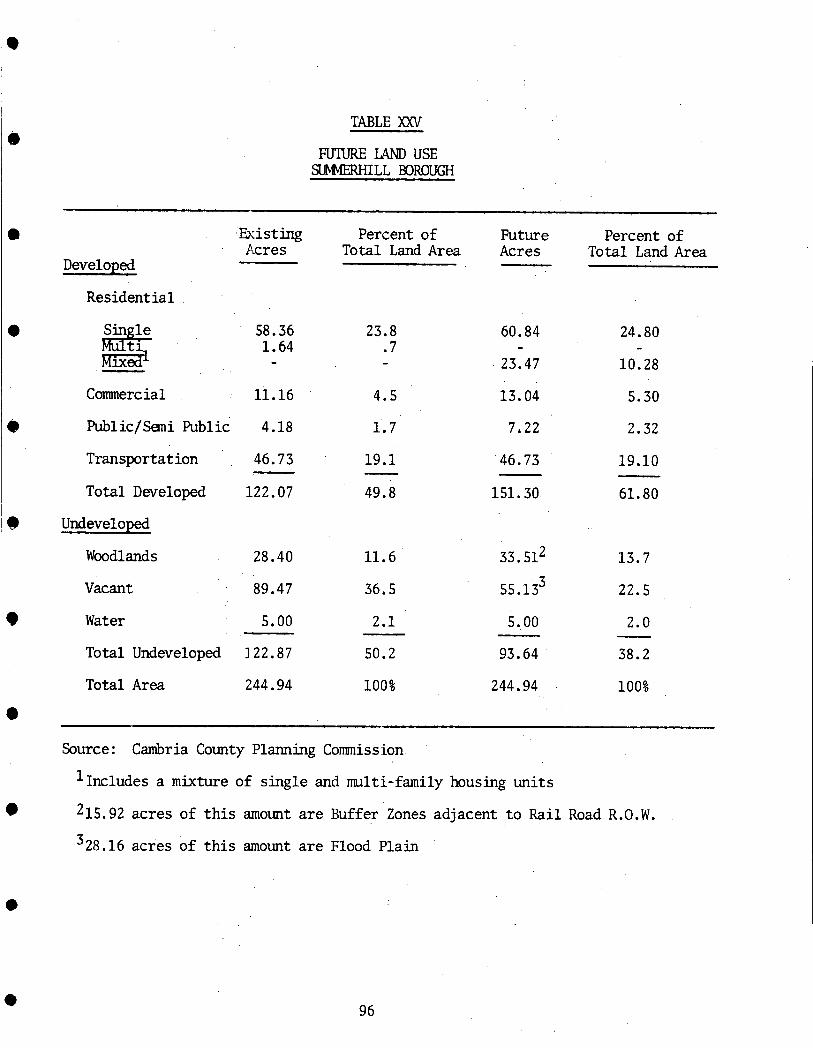
TABLE XXV
FUTURE LAND USE !3MMERHILL BOROUGH
Existing Acres
Developed
Residential
58.36 1.64 -
Commerc ial 11.16
PublicJSgni Public 4.18
Transportat ion 46.73
Total Developed 122.07
Undeveloped
Woodlands 28.40
Vacant 89.47
Water 5.00
Total Undeveloped 1 22.87
Total Area 244.94
Percent of Total Land Area
Future Acres
Percent of Total Land Area
23.8 .7 -
4.5
1 . 7
19.1
49.8 -
11.6
36.5
2 . 1
50.2
100%
-
60.84
23.47
13.04
7 .22
46.73
151.30
-
33.51'
55. 133
5.00
93.64
244.94
24.80
10.28
5.30
2.32
19.10
61.80
-
13.7
22.5
2.0
38.2
100%
-
Source: Cambria County Planning Commission
lIncludes a mixture of single and multi-family housing uni ts
215.92 acres of t h i s amount are Buffer Zones adjacent t o Rail Road R.O.W.
328.16 acres of t h i s amount are Flood Plain
96


a
8
8
s
a
FLKURE COWLJNIlY FACILITIES
S
e
a
8
0
The Future Community Facilities Study is a fundamental part of the Comprehensive Plan. proposed land use plan directly relate to the policies and recommendations for future c o m i t y f ac i l i t i e s and services.
represent an investment in the improvement of the quality of l i f e within Summerhill Borough.
Demographic, economic, and social changes, plus the
The recommended community fac i l i t i es and services that follow
SbMERHILL BOROUGH (33"ITY FACILITIES GOALS
The following are basic policy proposals developed by the Summerhill Borough Planning Commission. the future development of community faci l i t ies .
These proposals w i l l serve as guidelines for
1. To provide improved and extended municipal services such as f i r e and police protection, solid waste collection, water and sewer fac i l i t i es , and areas for proposed future developnent.
To provide adequate park and open space areas to satisfy the c o m i t y ' s active and passive recreational needs.
To promote the educational and social advancement needs of Summerhill Borough.
2.
3.
Fu?uRE C W I T Y FACILITIES RECCMMENDATIONS
Public School System
can be generally concluded that the residents of Summerhill Borough are provided good school service in terms of both operation and school plant fac i l i t i es , which according to enrollment projections, should serve the Forest H i l l s District for a period of the next eight years. deficiency of classroom space a t the senior high level, but only i f enrollments were to exceed current trends.
On the basis of a rather superficial school survey and study, it
The only apparent concern would be the
Protection to People and Property
Police Department
The Police Department in Summerhill Borough has been providing adequate service to area residents. Association has proven t o be beneficial because it provides service 24 hours a day t o receive any emergency calls. should continue. and updated when necessary.
Their relationship with Mainline Police
In the future, th i s relationship Also, equipment should be periodically checked, maintained,
Fire Department
company located on Main Street in Summerhill Borough. other f i r e departments in the surrounding area tha t are located within a safe travel distance, for a residential c o m i t y , of 1.5 to 2.0 miles.
The community is provided with f i r e protection by a volunteer f i r e There are three
This
98

standard was established by the American Insurance Agency t o provide sufficient f i r e coverage. include:
The f i r e departments within th i s two-mile radius Ehrenfeld; South Fork; and Wilmore.
The present f ire station is approximately 25 years old, and is in f a i r condition. In recent years, there has been some interest among Borough residents to construct a new f i r e station. suggested is the vacant l o t located on Main Street and the Ebensburg Road. This option and the rehabilitation of the present Fire Station are evaluated in the Capital Improvements Plan of th i s report.
One location that has been
A l l equipment is considered adequate a t th i s time; however, as Simmerhill Borough's population grows, it w i l l be necessary to continually re- evaluate and update the equipment.
Ambulance Service -
The Forest H i l l s Ambulance Service located on Route 53 provides Summerhill Borough residents with a 24-hour mobile emergency treatment faci l i ty . This v i ta l community service should be maintained and updated through periodic equipment improvements and in;tructional courses for paramedics.
w1 i ld ing s
Municipal Building
The Summerhill Borough Municipal Building was acquired from the Forest H i l l s School District in 1976. served a s the Elementary School for the District. Borough police, municipal offices, public meeting rooms, and the Cambria County Communication center.
Until th i s time, the building Presently, it houses the
4
4 This Building has the potential to become the heart of c o m i t y
Future uti l ization of th i s building could in- l i fe in Summerhill Borough. clude providing such community service:; as a library or a health c l inic; or such indoor recreation f ac i l i t i e s a s a day care center, senior citizen center, o r other activit ies. I t could also be a place where community organizations or social clubs hold regular meetings and special events. playground, t h i s building could provide year-round recreational opportunities for a l l ages.
With the adjoining
Recreation
It is the responsibility of the Summerhill Borough government to offer i ts residents an assortment of recreational fac i l i t i es . the National Recreation Association, there must be approximately 10 acres of park for every 1,000 persons in a community. creational acreage is low with only six acres for 759 people. a l land must increase t o comfortably accommodate the Borough's growing population.
According to
This recreation- Summerhill Borough's re-
A s shown on the Future Land Use Map, page 97, the l o t adjoining the Borough Municipal Wlilding on the Ebensburg Road (L.R. 11025)has been recommended for future recreational development and improvements. In addition to those existing f ac i l i t i e s , the Cambria County Planning Commission suggests that a fence be constructed along the Laurel RLur, improvements t o the l o t , leveling of
1
a
99

the baseball f ield, a guard r a i l along the Ebensburg Road, and landscaping. recommended jmprovanents w i l l be reviewed in more depth in the Capital Improve- ment Plan of th i s report.
In the 1977 Recreational Plan Update prepared by the Cambria County Planning Commission, space standards were established as a basis for comparison in measuring capacity, quantity, and quality of the recreational fac i l i t i es . These standards are not absolute requirements, but should serve as guidelines in future planning of recreational fac i l i t i es . factors to be considered in conjunction with these standards include: characteristics, climate, topography, and other local conditions.
These
a
Other population
Space standiirds are established to develop a unified and balanced recreation and open space system. The principal uses of standards are: (1) to develop a systemat ic approach TO land acquisition, preservation, and development; (2) to determine w h a t , how many, and where recreational fac i l i t i es are needed; (3) t o justify the acquisition and development of park, open space, and recreation lands, and fac i l i t i es ; and (4) to use as a measure of the effectiveness of the current park and recreation system.
by the Planning Commission as qualitative indices upon which municipal performance can be measured, judged, and analyzed.
0
Table XXVI is a l is t ing of the space standards and guidelines recommended 0
8
a
a
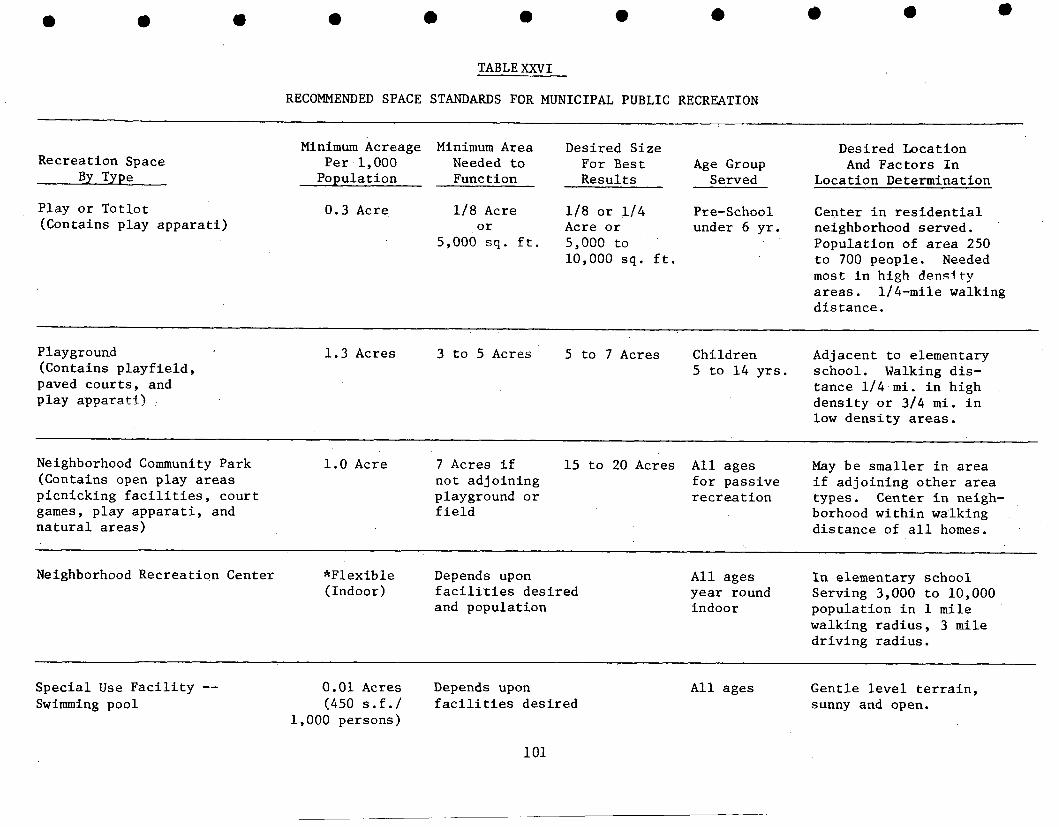
a e a 0 a 0 * TABLE XXVI
RECOMMENDED SPACE STANDARDS FOR MUNICIPAL PUBLIC RECREATION
Recrea t ion Space By Type
Play o r T o t l o t (Contains play a p p a r a t i )
Minimum Acreage Minimum Area Desired S i z e Desired Locat ion Per 1,000 Needed t o For B e s t Age Group And Fac to r s I n
Popula t ion Func t i on Resu l t s Served Locat ion Determinat ion
0.3 Acre 118 Acre 118 o r 1 / 4 Pre-School Center i n r e s i d e n t i a l o r Acre o r under 6 y r . neighborhood served .
5,000 sq. f t . 5,000 to Popula t ion of area 250 10,000 sq. f t . t o 700 people . Needed
most i n high d e n s i t y areas. 114-mile walking d i s t a n c e .
Playground (Contains p l a y f i e l d , paved cour t s , and p l ay appa ra t i )
1 . 3 Acres 3 t o 5 Acres 5 t o 7 Acres Chi ldren Adjacent t o elementary 5 t o 1 4 y r s . school . Walking d i s -
tance 114 m i . i n h igh d e n s i t y o r 3/4 m i . i n low d e n s i t y areas.
Neighborhood Community Park 1.0 Acre 7 Acres i f 15 t o 20 Acres A l l ages May b e smaller i n area (Contains open p lay areas n o t ad jo in ing f o r pas s ive i f ad jo in ing o t h e r area p icn ick ing f a c i l i t i e s , cou r t playground o r r e c r e a t i o n types . Center in neigh- games, p lay a p p a r a t i , and f i e l d borhood w i t h i n walking n a t u r a l a r eas ) d i s t a n c e of a l l homes.
Neighborhood Recrea t ion Center *F lex ib l e Depends upon (Indoor) f a c i l i t i e s des i r ed
and popula t ion
A l l ages I n elementary school y e a r round Serving 3,000 t o 10,000 indoor popula t ion i n 1 mile
walking r a d i u s , 3 mile d r i v i n g r ad ius .
Spec ia l Use F a c i l i t y -- 0.01 Acres Depends upon Swimming pool (450 s.f./ f a c i l i t i e s d e s i r e d
1,000 persons)
A l l ages Gent le l e v e l t e r r a i n , sunny and open.
101

TABLE X X V I , (Continued)
Recreation Space By Type
P1 ay f i e l d (Contains f i e l d and cour t games and parking)
Desired Locat ion
Locat ion Determination
Minimum Acreage Minimum Area Desired S i z e
Populat ion Funct ion Re su 1 t s Pe r 1,000 Needed t o For Best Age Group And F a c t o r s I n
Served
1 . 3 Acres 10 Acres 20 Acres A l l ages Centered i n 4 o r 5 neighborhoods. 1 / 2 t o 1 / 4 m i l e r a d i u s f o r walkers.
Community Recreat ion Center *F lex ib l e Depends upon (Indoor) f a c i l i t i e s d e s i r e d
and popu la t ion
A l l ages and I n Jr. o r S r . High i n t e L e s t s -- School. Within 1 / 2 t o indoor y e a r 1 m i l e of walkers o r 20 round t o 30 minutes f o r com-
muters.
Regional o r Dis t r ic t Park 3.0 Acres 20+ Acres i f 30 Acres i f A l l ages Close t o urban areas. (Contains v a r i e t y of a c t i v e C i t y -- 50 Ci ty -- 100 Vacant Land wi th n a t u r a l and pass ive r e c r e a t i o n Acres i f Acres i f s c e n i c f e a t u r e s . Users f a c i l i t i e s ) r e g i o n a l r e g i o n a l t ravel 1 / 2 t o 1-1/2 hours
and s t a y a l l day.
Spec.ial Use F a c i l i t y -- Golf .Course
3.0 Acres 75 Acres f o r 90 Acres f o r Depends on Gent le r o l l i n g t e r r a i n , 9-hole -- 9-hole -- f a c i l i t y and s c a t t e r e d woodland; 120 Acres 180 Acres l o c a l d e s i r e n a t u r a l f e a t u r e s f o r f o r 18-hole f o r 18-hole g o l f .
*Provides indoor a c t i v i t y (no t p a r t of 10 acres s t anda rd ) needed y e a r round by a l l a g e s and groups. It is d e s i r a b l e t o have outdoor areas such as t o t l o t s , playgrounds o r p l a y f i e l d s , and pa rks c l o s e by f o r f l e x i b i l i t y , management and economy.
NOTE: One acre -- approximately 40,000 s q u a r e f e e t o r area 200 f t . x 200 f t .
SOURCE: 1977 Rec rea t ion P lan - Cambria County Planning Commission
Ir
102
.L

a
e
0
a
e
e
a
a
PUBLIC W\TER AND SEWER SERVICE
Water Supply
Estimates indicate that 159 housing units, or 77 percent, are provided with water by Highland Sewer and Water Authority. water consumption rates per person was 45 gallons. Based on a 1978 pop- ulation estimate of 759 persons, the to ta l water requirements of 34,155 gallons is needed per day to service Summerhill Borough.
This consumption ra te w i l l increase a s new growth and develop- ment occurs. serve the 1985 population of 794 persons. over daily water consumption.
The daily
An additional 1575 gallons per day w i l l be needed t o adequately This represents a 4.6% increase
Based on a 1970 Comprehensive Water and Sewer Plan for Cambria County prepared by L. Robert Kimball Consulting Engineers, there w i l l be ample supply of potable water unti l 1990. and with the completion of the Beaverdale Reservoir there should be sufficient water supply for many years.
This area is verywell supplied
Sewage Facil i t ies
Presently, Summerhill Borough is serviced by a combined sewage I t was designed to col lect sanitary sewage from residential and system.
commercial properties, plus storm water run-off. charged from four different locations into the Li t t le Conemaugh River. Existing Sewer Lines Map, map no 6 , page 56).
This sewage is then dis- (See
This lack of proper sewage disposal methods is probably one of the most serious problems facing the community. essential in providing a healthy living environment and to encouraging future population growth. or extension of a sewage system is the most expensive.
A sanitary disposal system is
I t should-also be noted thit, of a l l u t i l i t i e s , the construction
A comprehensive water and sewer plan for Cambria County was prepared by L. Robert Kimball Consulting Engineers for the Cambria County Planning Commission in 1970. requirements through the year 1990. According to the base plan, a secondary treatment plant was t o be constructed a t the western end of South Fork Borough to t reat sewage for the additional boroughs of Ehrenfeld and Summerhill a s well as the Liberty Park-Ragers Corner section of Adams Township. Another secondary treatment plant would be constructed directly east of St . Michael to serve Creslo, Sidman, Allendale, Beaverdale, and Lloydell.
Subsequently, an economic feasibil i ty study was conducted for the Forest H i l l s Municipal Authority t o examine additional alternatives regarding sewage treatment fac i l i t i es . these service areas and provide central treatment a t a single fac i l i ty in South Fork. the Department of Environmental Resources (DER), together with an application for construction funding assistance. has assigned the project a comparatively low priority, a substantial delay will be experienced before s ta te assistance becomes available.
The study projected the County's municipal service
A final recommendation was made to consolidate
This plan was formally adopted and a detailed design submitted to
Because DER'S priority ranking system
103

I
Refuse Collection and Disposal
disposal system in relation to the regional situation. F i r s t , the Borough should be aware of the Pennsylvania Solid Waste Management A c t , A c t 241 of 1968 as amended, which stipulates that municipalities, with a population density of three-hundred o r more inhabitants per square mile, must s u h i t a solid waste plan to the Pennsylvania Department of Environmental Resources, @EX), o r be included in a plan covering the larger region. Borough has a population in excess of three hundred persons per square mile.
a Solid Waste Management Study (CCFC; March 1971) which serves as the regional solid waste plan tor the county. not off ic ia l ly adopted th i s plan by resolution. I t must be noted that only three other municipalities within the county which meet the density require- ments outlined above have not adopted the Cambria County Solid Waste Management Plan. plan, thirty-eight of which meet the density requirements.
S m e r h i l l Borough should review i ts solid waste collection and
Summerhill
Secondly, the Cambria County Planning Commission prepared and published
A s of the present time, the Borough has
A total of fifty-two Cambria County municipalities have adopted the
I t is recommended that the Borough review i ts solid waste situation While solid waste collection and disposal may not be an within th i s context.
immediate problem, the Borough may wish t o consider potential future refuse problems connected with the limited capacities of the three existing landfil ls in Cambria County and increasing transportation costs. request the Borough to prepare i ts own solid waste management plan since the Borough has failed to off ic ia l ly adopt the County Plan. Council, however; may s t i l l adopt the County Plan which recommends the establishment of a county-wide Solid Waste Disposal Authority to deal with a l l future solid waste disposal considerations.
In addition, DER may
Summerhill Borough
4
104
4
8
a
0
e
e
FUTURE TRANSFORTATION PLAN

e
a
0
e
0
0
e
~
0
Traffic problems in most communities, regardless of size, can be generally attributed to the fact that improvement of major thoroughfares has not kept pace with the increased number and use of automobiles. which a c o m i t y is urbanized, or i ts proximity to an urbanized area o r a major a r te r ia l , may also influence the amount of t r a f f i c that a community experiences. In addition, the major thoroughfares of many communities are required to pro- vide access for residents and on-street parking space which can contribute t o problems of delay and congestion of t r a f f i c flow. and economic growth may indicate specific needs for improvement of a community's highway system. Conversely, the condition and adequacy of the highway system miy influence the settlement trends of the community.
is the circulation network which provides for the orderly and safe movement of vehicles in and through the municipality. is one tha t provides for s w i f t , convenient, and safe movement of a l l types of vehicles in and through the community. components which affect t r a f f i c and t r a f f i c flow is essential t o planning and adjusting a highway system. of vehicles, the volume of t r a f f i c , inter-community and inter-regional through traffic, principal t r a f f i c generators, and on-street parking practices. Such existing conditions provide the basis for establishing policy goals and objectives for the major thoroughfare and circulation system of the community.
The degree t o
Finally, patterns of population
An obvious and c r i t i ca l element of a community's transportation system
An adequate and workable t r a f f i c system
A basic understanding of the more important
These components include the origin and destination
In the 'Major Thoroughfares Transportation Study" section of t h i s report, the major features of the transportation system of Summerhill Borough were described and analyzed. objectives a re outlined and detailed in th is section of the Borough Comprehensive Plan. major policy goals and objectives underlying the scope and purpose of the trans- portation plan be understood. This forms the basis for the Planning Commission's recommendations t o the Borough of f ic ia l s , and it is intended that these policies be uti l ized by a l l local agencies in presenting proposals to PennDOT and other implementing agencies.
Based on these existing conditions, policy goals and
Before specific recommendations are made, however, it is essential that the
SMMEFWILL BOROUGH TRANSPORTATION GOALS AND omxxIvEs A s a resul t of the Major Thoroughfares and Transportation Study and
the reviews of other ongoing highway and transportation planning for Cambria County, a number of the factors concerning t r a f f i c and circulation, highway con- dition, and other factors, such as land use and economic development which in- fluence transportation planning, are revealed which have a direct impact on Summer- h i l l Borough. These factors, and the objectives they dictate, can be summarized as follows:
Those features form the basis for general policy goals and objectives.
105

Traffic Route 219 is the only Major Arterial in Summerhill Borough, and w i l l no doubt be used m r e extensively fo r both through t r a f f i c and as an important link between Summerhill Borough and the r e s t of of Cambria County and the State. the continual development of the Borough and the County.
The major t r i p attractions in Cambria County are now and are l ikely to continue to be to the south-west of Summerhill Borough in the Johnstown Urbanized Area.
I t w i l l play a major role in
The private automobile w i l l continue to be the dominant mode of transportation in Summerhill Borough as well a s in the County. Increased cost and decreased availabil i ty of fuel ; however, w i l l make public transportation increasingly necessary, and Borough of f ic ia l s should consider a t i e - i n with the County Transit Authority system if and when it i s possible to do so.
Any road improvements planned for the Borough must be mainly associated with the existing conditions and transportation needs. Existing conditions dictate that while 50.2% of the land is undeveloped, most of t h i s land is unfit for profitable developnent due t o steep slopes and river banks. In that 38.3% of developed land is already given t o transportation and c o m i c a t i o n uses, and 49.1% is given to residential use, new road construction is not possible. The transportation needs of the Borough are indicated by the fact that 74.6% of a l l roadway mileage is in collector and local roads, and while Borough s t reets are generally in good condition, continual maintenance should be a high priority. constraints also dictate an emphasis on maintenance.
Fiscal
As was noted in the "Population Study" section of t h i s report, there is a projected growth of 9.3% in population from 1970 to 1985. This w i l l place increased demands on an already heavily used a r t e r i a l and collector system.
Traffic flow and circulation must be planned and executed so as to best meet the transportation needs and land-use patterns of the Borough. condition of the Summerhill Borough Bridge, and by the narrowness of certain streets. approaching s t reets w i l l be needed to correct the most c r i t i ca l problems. restrict ions imposed.
Presently, adequate flow i s badly hampered by the
Replacement of the bridge and widening of
Also, certain very narrow streets should have parking
1
(I
I
I
Recommended Policy Goals and Obiectives
The following discussion of specific transportation goals and policies fo r Summerhill Borough as proposed by the Cambria County Planning Commission ref lect generally accepted principles of transportation planning as well a s
106
I)
a
0
e
0
0
e
0
0
0
specific existing conditions in the Borough. decisions which should be adopted by the Borough Council for the future developent of the Borough's transportation system. f lects the Planning Commission's order of priority.
These goals reflect basic policy
The order in which they are l i s ted re-
A. Highways and streets in the Borough should be developed and improved so as t o provide adequate and efficient t ra f f ic flow throughout the community and access to surrounding commercial and employment centers. Traffic circulation is undoubtedly the most pressing problem in Summerhill Borough. The primary cause of traffic flow problems is the condition of the Summerhill Borough Bridge, and any effective solution to these problems w i l l depend on adequately correcting the existing bridge deficiencies. off ic ia ls should be aware that current repairs to the bridge are only temporary and that plans for the eventual replacement of the bridge must be formulated. Fork-Fifficktown Bridge w i l l reduce traffic volumes on the Sunnnerhill Borough Bridge somewhat, but the high ADT volumes, which the span must carry, w i l l necessitate the eventual replacement of the span with a two-lane bridge and the widening of Main Street to the recommended width for i t s classification.
Borough
Planned improvements on the South
O f secondary importance to the improvement of traffic circulation is the posting of 'Wo Parking" zones, and the improved signing of intersections in specific areas of the Borough. A l l of these recommendations w i l l be discussed in detai l in the "Future Thoroughfares and Highway Improvements" section of t h i s plan.
Borough off ic ia ls should encourage the continued maintenance of the thoroughfare system in order t o keep i ts present condition intact. The "Major Thoroughfares and Transportation Study" showed that almost every road in the Borough had surface conditions which could be characterized as good. roads, and a l l local roads with the exception of Manor Drive, which is unpaved. and efficient thoroughfare system, and every effort should be made to keep Borough roads in their present superior surface condition, particularly t o avoid costly resurfacing work in the future.
B.
This included a l l a r te r ia l and collector
Well maintained roadways are critical t o an adequate
C. Transit service to Borough residents should be provided a t the earliest possible opportunity. with mobility limitations, such a s the elderly and handicapped, should be provided with service.
In particular , Borough residents
The Cambria County Transit Authority has as a long-range goal the provision of t ransi t service throughout Cambria County. Summerhill Borough is not adjacent t o the current service area, and thus would not be one of the first communities served when the system expands, the support of Borough residents and off ic ia ls for the county wide transit system would be very useful i n making
Though
0 107
t rans i t service t o residents of the area a reali ty.
D. AccessibLlity of efficient bus, r a i l , and a i r transportation to adequateriy service the residents of the Borough should be maintained.
As maintained in the "Major Thoroughfares and Transportation Study", rail, a i r , and private bus l ine service is accessible to residents of Summerhill Borough, though these a l l l i e outside the Borough. While there are no plans to make these means of transportation more accessible to local residents, considerations should be made to keep them as available as possible and to be a l e r t t o opportunities f o r expanded service should they arise.
E. Borough of f ic ia l s should actively seek supplemental funding for the planned improvements t o the Borough roadway system, particularly for work on the Summerhill Borough bridge. can al leviate some of the burden on Borough taxpayers for such improvements .
Such supplemental funding
From time to time, special funding programs become available from State or Federal funding sources for improvement of local road- ways. Close communication with the Cambria County Planning Commission and PennDOT should serve t o keep the Borough abreast of these potential funding programs. must avail i t s e l f of a l l traditional funding sources, such as liquid fuel allocations, which are available.
In addition, the Borough
REGIONAL H I G M Y SYSTEM AND PLANS
Given the suspension of a l l planning, programming, and construction under the Statewide Twelve-Year Transportation Program in l a t e 1977, few changes in the regional highway system are forseen unt i l such time as the Twelve-Year Plan is reactivated. In that the suspension of the plan was a resul t of f i sca l constraints placed on PelmDOT, the elimination of these constraints, whether by legislative action or other means, w i l l be necessary t o revive the program.
Borough of f ic ia l s should be aware that when the Twelve-Year Program is reinstated, a program update w i l l be necessary. o f f ic ia l s should be in contact with the Cambria County Planning Commission and PennDOT to insure that the major highway needs of the c o m i t y a re included in the revised Twelve-Year Program. Of particular importance i s the reconstruc- t ion, o r relocation, of the S m e r h i l l Borough Bridge, with the accompanying widening of the approaches to the bridge. Some improvements to access roads leading into the Borough should also be proposed, specifically the resurfacing of T.R. 160 (L.R. 11025) from Ebensburg to Summerhill Borough and T.R. 53 from Portage to Summerhill Borough. While these segments of highway are not within Borough boundaries, they are crucial to the Borough for regional access, and thus should be considered as components of a revised Twelve-Year Program.
During th i s program update, Borough
It is also worthy of note that the Twelve-Year Program had a s a component
108
the reconstruction of U.S 2 2 , and that U.S. 219 is planned to eventually extend from Buffalo, N.Y. to southern West Virginia (though U.S. 219 was deleted from the suspended Twelve-Year Program). Officials of Summerhill Borough should take an active role in pressing for the inclusion of both projects on the new Twelve-Year Program since these improvements would enhance transportation and economic development potential for the entire County.
MISTING CONDITIONS INVENTDRY
Before specific future thoroughfare improvements are proposed, an inventory of existing conditions w i l l be presented. are f i r s t , to give a brief but complete summary of transportation conditions which influence the future plan, and second to identify those aspects of the existing conditions which relate t o Borough transportation goals and objectives, and for which specific recommendations w i l l be made in th i s report. aspects of the Borough's transportation and thoroughfare system which are determined to be adequate can be concisely stated, while those aspects which need detailed and specific recommendations can be discussed a t length.
The purposes of t h i s inventory
In so doing,
Highway Classification
A s with other aspects of the transportation plan for Summerhill Borough, future highway classification w i l l depend on w h a t option is chosen for the Summerhill Borough Bridge. in the "Future Thoroughfares and Highway Improvanents" section of t h i s plan). Two options ca l l for reconstructing the bridge in i ts present location. of these options is taken, Main Street w i l l remain a Major Collector s t ree t , and no changes w i l l occur in the functional highway classification for the Borough. bridge approximately 500 feet west of its present location. chosen, both Madison Street and M i l l Street would have t o be classified as Major Collectors rather than local roads, for they would be handling the high ADT volumes presently handled by Main Street. Main Street north of the ConRail tracks would most l ikely continue to function as a Major Collector, while that part of Main Street south of the ConRail tracks would be re-classified as a local road. Also, that part of Croyle Street south of M i l l Street would also be classed as a Major Collector.
Borough Bridge, no other changes are forseen in Summerhill Borough's functional highway classification.
(These options w i l l be considered in detai l
If either
A third option ca l l s for the relocation and reconstruction of the If t h i s option is
Under the plan, that part of
Aside from classification changes accompanying the third option for the
Right-of-way and Pavement Widths
Except for possible s t ree t expansions in conjunction with the work on the
Though no road other than U.S. 219 meets the recommended Summerhill Borough Bridge, no changes are planned in existing right-of-way or pavement widths. right-of-way width for i t s classification, acquisition of new right-of-way is precluded by considerations of high cost and the very low developnent potential of currently undeveloped land.
e Also, commercial and residential development
e 109

i n the Borough is such that homes and businesses often abut s t reets directly o r with very l i t t l e clear space. Such residential and commercial development also precludes any widening of pavements on s t reets where th i s would otherwise be advisable. For example, McArdles Street has only a 1 4 foot pavement and since it connects T.R. 53 with M i l l Street it would be desirable t o widen it. But since commercial structures abut the road directly, there is no possibil i ty of widening short of building and land acquisition, and site-clearances, the costs of which would be to ta l ly prohibitive.
Low right-of-way and pavement widths do affect t r a f f i c flow, and some solution must be found. and no MITOW s t ree ts widened, t r a f f i c flow must be improved by prohibiting any parking on narrow streets. made la te r in th i s plan.
Since no new right-of-way can be purchased,
Recommendations for specific s t reets w i l l be
Street Grades and Horizontal Alignment
serve the h i l l y terrain of the area, particularly in that section north of the ConRail tracks. are generally level, while those running up and down slopes have a steeper grade. variation in horizontal alignment. curving on Main Street, T.R. 53, and Jackson Street.
Since street grades and horizontal alignments must, for the most part, conform to local topography, the h i l l y terrain of Summerhill Borough precludes any changes in these features of the local transportation system. one exception would be a change in s t ree t grade on Croyle Street i f the second option for the Summerhill Bridge is taken since that option involves raising Croyle Street t o allow for a 22.5 feet vertical clearance for the bridge.
Street grades and horizontal alignments in the Borough were designed to
Those s t ree ts running parallel t o the railroad right-of-way
Most Borough roads extend for less than one-half mile and show l i t t l e Almost a l l are straight, with some s l ight
The
Average Daily Traffic
changes in such factors as population, employment, and regional transportation systems. increase which w i l l , in time, increase ADT volumes. Some employment increases are forseen, again raising the volume of t raff ic . On-going repairs t o the South Fork - Fifficktown Bridge should reduce t r a f f i c volumes over Main Street and the S m e r h i l l Bridge. t r a f f i c volumes experienced i n the Borough.
Any change in ADT volumes for Summerhill Borough w i l l depend upon
From 1970 to 1985, a population increase of 9.3% is projected, an
On the whole, however, no large changes a re expected in the
Hazardous Intersections - Signalization
Analysis of accident data compiled by PennDOT's Bureau of Accident Analysis and on-site inspections of roads and intersections in Summerhill Borough reveals several intersections which are hazardous and in need of
4
4
4
4
4
110
' e
e
a
improved signalization, and a hazardous t r a f f i c flow pattern around the Summerhill Borough Bridge .
A very hazardous intersection is that between Main Street and Portage Street (T.R. 53). accidents occurred, resulting in 1 6 injuries and $15,500 in property damage. A l l but one of these accidents were caused by driver error, prehaps contributed to by the high traffic volumes involved.
In the period covered by the PennDOT data, (See Table XXII), f ive
There a re other intersections i n the Borough which are in need of signalization for adequate safety. w i l l be made l a t e r in t h i s report.
have to do with the steep grades and 90 degree turns involved in crossing the bridge. While signalization is adequate to regulate the flow of t r a f f i c , provisions must be made for reducing the steep grades and sharp turns involved in negotiating the bridge. report.
Specific recommendations for intersections
The hazardous traffic flow problems a t the Summerhill Borough Bridge
Specific recommendations w i l l be made l a t e r in t h i s
Pub1 ic Transportat ion
In the near future, few changes are forseen in either the amount or avai labi l i ty of public transportation in Summerhill Borough. A i r , ra i l , and taxi service w i l l l ikely continue as i n the past. presently serves Summerhill Borough and is expected to do so in the future. CART is licensed by the KJC to carry patrons from rural Cambria County to the Johnstown Urbanized Area, any change i n service would have to be approved by the PUC. Mass Transit service through the Cambria County Transit Authority is presently limited to the Johnstown Urbanized Area but long-range plans call for service to the ent i re County. Thus, the future need of Summerhill Borough for mass t rans i t may be served by CCTA via a purchase of service agreement with the Borough, and Borough of f ic ia l s should be alert t o t h i s possibility.
FUlURE THOROUGHFARE AND H I G M Y IMPRWENENTS PLAN
Cambria Area Rural Transit (CART) In that
This section of the Future Transportation Plan w i l l de ta i l specific
These are recommended improvements t o problem areas which are of recommendations for certain thoroughfare improvements to be made in Summerhill Borough. critical importance t o the transportation system in the Borough, and should be considered as highest pr ior i ty items. the goals and objectives set for Summerhill Borough ear l ier in t h i s report, and take into account those existing conditions which were surveyed in the previous section.
These recommendations are consistent with
Future Traffic Circulation
Traffic circulation has been identified as the major deficiency in Summerhill Borough's transportation system. This deficiency has two aspects. The problems with the Sumnerhill Borough Bridge, and the numerous narrow s t ree ts in the Borough.
111

Summerhill Borough Bridge a The f i r s t pr ior i ty for transportation system improvement is to deal with
the situation a t the Summerhill Borough Bridge. A s was mentioned in the "Existing Conditions Inventory", solutions to inadequacies in the area such a s right-of-way and pvement widths, s t ree t grades, and horizontal alignments depend on w h a t action is taken in regard to the bridge. 4
Originally constructed to carry two lanes of two-way t r a f f i c with a 9-ton weight limit, the bridge now carries one lane of two-way t r a f f i c wi th a 12-ton weight limit. additional t r a f f i c generated by the closing of the South Fork - Fifficktown Bridge, the present bridge is wholly inadequate to serve the transportation needs of the Borough. serve to reduce t r a f f i c volume somewhat, but the Summerhill Bridge is inherently poor in design, and recent repairs t o i ts 'deck and the addition of electronic signalization must be regarded as temporary only, pending the construction of a new bridge. and the 90 degree turns required t o get on t o or off of the approaches.
With an ADT of 2,310 vehicles on Main Street , and with
Repairs to the South Fork Bridge which were recently @fay 1979) begun w i l l
Other design deficiencies are the steep approaches to the bridge,
Hearings have been held before the Pennsylvania Public Ut i l i ty Commission WC), PennDoT, Summerhill Borough, Cambria County, and the Penn Central Railroad to assess the condition of the bridge and plan for a future span. Hearings have been held in 1970, 1972, 1976, and 1978. A t the hearing held on September 16, 1976, PennDOT outlined three schemes for dealing with the bridge situation: 4
1.
2.
3.
A plan first developed in September of 1973 ca l l s for the construction of a new bridge a t the existing location. clearance of 19 .1 fee t over the ConRail tracks and would therefore require an 11 .2% grade on the southern approach and a 4.5% grade on the northern approach. This would require the reconstruction of 550 fee t of roadway including sections of Main Street and the bridge. Estimated cost of t h i s project in 1976 was $245,000.
I t would have a vertical
4
The second option ca l l s for a new bridge a t the same location, with a 22.5 foot clearance over the railroad right-of-way. require a southern approach grade of 1 2 % and a northern approach grade of 6%. Street and the bridge which the f i r s t option would require, t h i s option would also require the reconstruction of 200 fee t of Croyle Street.
This would
Along with the 550 feet of reconstruction on Main
Estimated cost of t h i s project in 1976 was $296,000.
The third option ca l l s for the construction of a new bridge a t a location approximately 500 feet west of the present location. This involves the relocation of part of L.R. 11025 beginning with the intersection of Main and Madison. Madison Street would be widened, and extended to the new bridge s i t e . turn to the south would take the road over the bridge and link the road eventually with M i l l Street. widening from th i s new intersection a s fa r a s Croyle Street.
A right-angle
M i l l Street would require
4
4
11 2
0
Traffic flow is then envisioned as moving down Croyle Street to T.R. 53. This project ca l l s for a 6.14% grade on the southern approach and a 1.5% grade on the northern approach. 1,700 feet of new construction are required, and the entire project had a 1976 estimated cost of $390,000.
I t should be noted that a l l these options w i l l c a l l for approaches and bridge roadway wider than presently exis t , a t least t o a width capable of safely carrying two lanes of two-way t ra f f ic . should carry a minimum of a 12-ton weight limit, a s th i s is required for school bus t raff ic .
I t i s also felt that any bridge
A t the December 20, 1978 hearing, those improvements to the existing bridge which had been completed (new deck, signalization, one-lane , two-way system and weight l imit) were detailed, and the above three options were dis- cussed. The first option received very l i t t l e support because it failed in any way to correct the design deficiencies in the present roadway system. favors the second option since it provides greater clearance for r a i l traffic. Despite the high costs ($390,000 estimated in 1976) and the large amount (1,700 feet) of new construction required, PennDOT favored the third option because it would greatly reduce the steep approaches to the bridge and re-route heavy traffic flow away from the most heavily populated residential and commercial areas in the center of the Borough.
Conrail
In making recommendations to Borough of f ic ia l s , the Planning Commission takes into account not only the principles of planning, but also existing conditions in the Borough and w h a t can be projected as future conditions. the land use pattern, both existing and future, and the terrain of the area, it does not seem possible t o eliminate the right angle turns onto the present bridge. Thus, adequate signalization and good sight distances must be provided to insure safety a t t h i s intersection. one-lane bridge can be eliminated by any of the three plans, particularly by the third option which involves the re-routing of L.R. 11025.
Given
The present "bottleneck" effect of the
However, the Cambria County Planning Commission, favors a fourth option,
(See Future Land Use
and that is to construct a new bridge approximately 200 feet east of the existing bridge. a more direct route through the Borough's business d is t r ic t . Map, page 97). engineering report evaluating a l l possible options should be conducted. and only then can a decision be made on the bridge location.
This new bridge would connect Croyle and Jackson Streets and provide
Then Once financial commitments a re made to th i s project, a detailed
As mentioned previously, the Summerhill Borough Bridge should be l i s ted as a very high pr ior i ty on the revised PennDOT 12-Year Program. contact should be maintained between the Borough, PennDOT, and the Planning Commission on a l l aspects of planning, funding, and execution of these programs.
Close
Narrow Streets - Restricted Parking
O f secondary importance to t r a f f i c flow problems in Summerhill Borough
113

are the narrow streets in certain areas of the Borough. are required to carry two-way t r a f f i c flow, they are typically only 1 4 feet wide, which is equal t o one wide lane. that they r e s t r i c t t r a f f i c flow and thus require special treatment. are:
Although these s t reets
Four Borough s t ree ts a re narrow enough These s t ree ts
"I(" Street, Manor Drive, McArdles Street, and Portage Lane.
"IC' Street, with 1 4 fee t of pavement and 1 7 feet of right-of-way. connects hbensburg Road (L.R. 11025) and Jackson Street. way street . on "IC' Street. no widening is possible.
I t is a one-lane, two- In order to f ac i l i t a t e t r a f f i c flow, a l l parking should be prohibited
Due t o limited right-of-way and existing land use characteristics,
Manor Drive is a 14' wide one lane, two-way road with no outlet which extends from Pringle Street t o a point approximately 225 fee t t o the west. With only 18 fee t of right-of-way and given the land use in the area, no widening is possible. a t a l l times.
To avoid congestion and enhance safety, parking should be prohibited
McArdles Street is a one-lane, two-way local street which connects M i l l Street t o T.R. 53 (Portage Street) , a minor a r t e r i a l highway. As was the case with "IC' Street and Manor Drive, existing conditions do not permit widening the s t ree t , and improved t r a f f i c flow and safety w i l l be realized by prohibiting parking a t a l l times. because of the t r a f f i c flow from T.R. 53 into the commercial and residential area around M i l l Street.
This is particularly important on McArdles Street
Porta e Lane a one lane two-way n a d , the 13 feet of pavement on Portage Lane is clearly * ultl equate for the t r a f f i c it must bear. A one-way s t ree t system cannot be effected here, and there is no possibil i ty of widening the s t reet . !'No Parking" restrictions a re already in effect and should be retained.
As was mentioned previously, a l l options for replacement of the Summer- h i l l Borough Bridge ca l l for the widening of approachies to the bridge, while specific plans c a l l for reconstructing certain s t reets . I t should be kept in mind that the t r a f f i c flow pattern in a community must be viewed as a integrated uni t and must, therefore, be evaluated as new projects a re introduced.
As mentioned in the "Existing Thoroughfares" section of t h i s report, a one-way s t ree t plan for Summerhill Borough was considered by the Planning Commission. Despite the fact that these above mentioned s t ree ts are narrow enough 3
warrant being made one-way, the existing land use and t r a f f i c flow characteristics in the Borough make any one-way s t ree t network impractical. Since making a s t ree t one-way requires altering the t r a f f i c flow of the entire community, the existing t r a f f i c network must be able t o be changed so as t o accommodate one o r several one-way s t reets . Given the heavy volumes of t r a f f i c on T.R. 53, L.R. 11025, and L.R. 11021, and how th i s t r a f f i c flows into the Borough over Main Street and the Summerhill Borough Bridge, these narrow s t ree ts , despite their low pavement widths, are adequate to serve their purpose of residential and
a
1 1 4

commercial access, provided parking restrictions are enforced. the bridge should also al leviate t r a f f i c f low problems which s p i l l over onto these narrow streets.
Improvements to
Hazardous Intersections and Proposed Signalization
Certain intersections i n the Borough have been identified as hazardous. Others have been identified as being in need of additional signalization. intersection of Main Street and T.R. 53 is clearly hazardous as shown by PennDOT accident data. Although stop signs are i n place on Main Street , additional signalization seems in order. Present t r a f f i c volumes on the two s t reets do not meet the minimum criterion se t by PennDOT for installation of electronic signals. the placement of an electronic signaling device.
The
Nevertheless, increased t r a f f i c volumes in the future may necessitate
Certain intersections are in need of stop signs for adequate safety and t r a f f i c flow. These intersections are Madison and Main, with a stop sign facing so as t o stop t r a f f i c moving from Madison t o Main; the intersection of McArdles and M i l l , with a stop sign facing to stop t r a f f i c moving from McArdles to M i l l ; and the intersection of Pringle Street and T.R. 53 (Portage Street) with a sign facing Pringle to stop t r a f f i c moving from Pringle to Portage Street.
Hazardous Pedestrian Walkway
150 yards east of the Summerhill Bridge, was closed in 1972 due to the deteriated condition of the underpass and the increased weight of railroad cars. An on- s i t e inspection in May 1979 revealed that the underpass remains in a deteriated condition, and while it is barricaded it is st i l l accessible to people. A s a safety precaution, it is recommended that the underpass be f i l l e d i n or blocked in such a way that access is impossible. of adequate pedestrian walkways on the new Summerhill Bridge.
A pedestrian walkway underneath the ConRail tracks, approximately
This would also point t o the necessity
FUBLIC TRANSPORTATION PLAN
Reference was made in the "Existing Conditions Inventory" to the status and possible future of public transportation in Summerhill Borough. In th i s section, each mode of public transportation w i l l be briefly reviewed to assess its potential for service to the needs of the Borough.
Public Mass Transportation
Public mass transportation is provided to residents of Summerhill Borough by several public and private carriers. Transit) system provides mass transportation services to the elderly, handicapped, and low-income residents of rural Cambria County including Summerhill Borough, with funding from a number of sources including A c t 1 0 contract funds with PennDOT and the Cambria County Transit Authority. The CCTA provides service in the Johns- town Metropolitan Area. and the Federal Department of Transportation' s Urban Mass Transit Administration
The CART (Cambria Area .Rural
Negotiations have been in progress between these two agencies
11 5

t o effect a County-wide mass should be a l e r t for opportun enter it when developed,
t rans i t system. Summerhill Borough off ic ia ls 4 ties to join i n the developnent of t h i s system and
Recent discussions with Federal DOT and PennDOT off ic ia l s have revealed that for the broadest possible transportation service to be afforded to a l l segments of the population, the private sector must become an integral part of the planning and providing of service. aware of t h i s development, and encourage private carr iers (such as Blue and White Lines) to become actively involved in mass t rans i t provision.
Borough of f ic ia l s should be 1
A i r Transportat ion
Access to a i r transportation is generally adequate for residents of the Borough. in a "Master Plan Report" prepared in 1973. improvements to airport runways and taxiways as well a s major expansion of its f ac i l i t i e s . development of the area, and provisions should be made for continued adequate highway access t o the airport is provided.
Development ac t iv i t ies a t the Cambria County Airport a re contained The multi-staged program includes
The airport is expected t o play a major role in the future
Rail Transportation
Although no major increases in r a i l service t o Summerhill Borough are forseen, steps should be taken to re ta in that service which is presently available. by r a i l , thus reducing heavy coal-truck t r a f f i c within the Borough as well as within the County.
Also, spurs should be developed so that more coal can be transported 4
116


IMPLEEYIENTATION
The Comprehensive Plan has value only to the extent it i s uti l ized t o bring about the de:;ired future c o m i t y which it portrays. a comprehensive plan is translated into actions and act ivi t ies , it is of l i t t l e value. positive local actions are carried out t o achieve the goals and recommendations contained in the plan.
In short, unless
Therefore, implementation should be viewed a s the process by which *
0
!. ' 0
0
*
a
The process used to achieve the objectives of th i s plan f a l l into
The principal mechanisms for guiding the use and developnent
two broad categories: property; and (2) those applied to the development and use of public property and senrices. of private property in harmony with the Comprehensive Plan are as follows.
GUIDING PRIVATE PROPERTY DEVELOFMENT
(1) those applied to the development and use of private
(1) Zoning Ordinance
(2) Subdivision Regulations
(3) Housing and Building Codes
Zoning
Zoning is the legal device that can enable Summerhill Borough to imple- ment its comprehensive plan. are the protection of the public health, safety, morals and general welfare of the Borough's residents. of structures permissible within the various zoning d is t r ic t s into which the Borough would be divided. to single family residential development with height regulations, minimum l o t size requirements and setback provisions appropriate for that kind of development. In other areas, commercial or industrial development would be permitted and regulations for these areas would reflect the level of control over th i s type of development desired by the Borough.
The basic issues addressed by.the zoning ordinance
This ordinance regulates the type, size, and location
Consequently, a certain d i s t r i c t would be restricted
Because zoning is prospective rather than retroactive, it cannot be relied upon to change existing conditions. zoning ordinance is accompanied by subdivision regulations and a housing and building codes which contain provisions for the correction of existing conditions. The zoning ordinance w i l l be of maximum use t o Summerhill Borough when it is enforced in conjunction with the subdivision regulations and housing and building codes for guiding the use and developnent of property. assure long-term plan implementation related to private development and uses, en- forcement measures would have to be established.
I t i s for th i s reason that a sound
Of course, to
Zoning enforcement is usually conducted through the establishment of a zoning officer and a zoning hearing board. for the l i t e r a l interpretation of the zoning ordinance and any variation from the written requirements must be judged by the zoning hearing board before any further action can be taken by a public or private developer.
The zoning officer is responsible
117
Subdivision Regulations
Subdivision regulations are defined as the locally adopted laws governing the process of converting raw land into two o r more l o t s for the purpose, whether immediate or future, of leasing, selling, or building developent. is accomplished through plot approval procedures, under which a developer is not permitted to make improvements or divide and se l l land until the local planning commission or governing body has approved a plan of the proposed subdivision. The approval or disapproval of the plan by the commission is based on compliance of the proposal with development standards set forth in the subdivision regulations. Failure of a developer to comply with the regulations may result in various c iv i l and criminal penalties.
This
In the end, three groups of people benefit from subdivision control: the developer; the buyer; and the general public.
The develo er benefits because he is given a definite set of minimum standards to meet. __f_ t gives the builder or developer the assurance that the lo t s meet a l l legal requirements, that the authorities w i l l not la te r demand a change of design or more improvements. When approved, the developer's l o t s should have a greater value and be easier to se l l because they have the government's approval.
rchaser benefits because he is buying a l o t which is both adequate in The size % an esign and legally recorded and la id out in accordance with planning practices.
The general public benefits in many ways. Population density is con- trolled, streets are properly la id out, and the land for schools, parks, and other public places is reserved o r dedicated. improve the s t reets , make arrangements for u t i l i t y connections, and make other improvements. due to building streets or providing other public improvements which were in- adequately provided a t the time of original development.
Developers are required t o
This protects the general community from unnecessary tax burdens
Any subdivision ordinance should include provisions for insuring that the layout of a subdivision shall conform to the comprehensive plan.
Housing and Building Codes
A housing code prescribes the minimum requirements for buildings used for human habitation. such dwelling f ac i l i t i e s as plumbing, heating and ventilation, sanitation and cleanliness in maintenance, and standards to prevent overcrowding by regulating space per occupant. extensions or other construction are t o be made in accordance with the applicable requirements of the zoning ordinance, subdivision regulations, and building codes.
outline the construction necessary t o insure the public against buildings which are structurally weak and potentially hazardous. minimum requirements for heating equipnent, water supplies and drainage systems. The necessity to adopt such a code is seen a s protection to the property buyer as w e l l as to the community, which would inevitably face financial loss a s well as a decline in civic reputation if its buildings were substandard.
I t sets min imum health and safety standards governing
The concept of t h i s code is that a l l repairs alterations,
A building code sets standards for the quality of materials and w i l l
This code may also specify
118

GUIDING PUBLIC PROPERTY MlD SERVICE DEVELQFMENT
The principal mechanism for guiding the developnent and use of public property in harmony with the Comprehensive Plan is the developnent and implementation of a Capital Improvements Program and Budget. Capital improve- ments may be defined as expenditures related t o the construction, reconstruction and the replacement of or improvements t o public f ac i l i t i e s such as municipal and community buildings, u t i l i t i e s , recreation areas, s t reets and highways and other publicly owned fac i l i t i es . significant policy choices for local government, not only due to the high costs frequently involved in improvements t o streets, u t i l i t y lines and other fac i l i t i es , but for other reasons as w e l l . only is a response to present or anticipated community needs, but may also cause change as well. For example, improved water and sewer l ines not only respond to existing service needs but may also enhance future development. capital improvements programming is one of the most important aspects of the planning process.
A capital improvements project is usually a self -contained proj ect which w i l l be constructed over a specific period of time a s a unit. Several individual projects w i l l be consecutive steps toward the final and complete im- plementation of th i s community improvement plan. only those items constructed or purchased which have a useful l i f e extending beyond a one-year period. pairs are not considered capital improvements.
Capital improvements decisions represent
A capital improvements program not
Therefore,
Capital improvements include
Recurring annual items and routine maintenance and re-
0
d
A capital improvements program should implement the recommendations contained in the Comprehensive Plan. related to the plan, but should complement one another. have l i t t l e probability of implementation, o r a project inventory of needed but unrelated act ivi t ies should be avoided. Linkages between the projects identified and the plan, and linkages among the individual projects require a budget manage- ment process which is capable of translating the identified act ivi t ies into workable projects. improvement recommended in the Comprehensive Plan, a long-range program encompas- sing a l l capital improvements scheduled for the Borough of Summerhill must be prepared. Basically th i s capital improvements schedule should include :
(1) The preparation of a comprehensive l is t ing of a l l re- commended capital improvements ;
(2) An analysis of the scope and relative need of each improvement ;
(3) An analysis of the relationships among the identified pro j ects ;
An analysis of the relationship of each project in terms of the Comprehensive Plan;
(5) A review of the short-term revenue feasibil i ty of potential budgets ;
The individual projects should not only be Grandiose schemes which
Prior to the init iation of any individually proposed capital
(4)
119
(6) An analysis of the potential municipal debt positions;
(7) A determination of costs for each project and potential federal and/or s ta te financial resources for each project;
(8) An assignment of relative priority to each of the projects; and
(9) The establishment of a schedule that includes phases of the capital improvements program, the time frame for each phase, and the time frame for the entire project.
Ideally, th i s process should program improvements over a ten (10) year period w i t h an allowance for annual updating. The annual review w i l l permit the pro- gramming of projects for an additional year and w i l l offer the Borough the opportunity to review and evaluate the accomplishments of the capital improve- ments program, make necessary revisions, re-evaluate community needs and assess the Borough's resources for the up-coming year. every year during the ten-year planning period, a new budget can easily be de- vised for the following ten-year period which has the support of the community, and conforms to the continuing planning process.
By making these evaluations
CAPITAL IMPROVJ3ENTS PROGRAM DESCRIPTION
This section summarizes proposed capital improvements which reflect the recommendations of the Comprehensive Plan. to depict a l l of the capital improvements required, it does depict a starting point for implementation, and future planning and programming. reviews suggested act ivi t ies related to sewerage, recreation, s t reets and highways and c o m i t y fac i l i t i es .
While th i s program is not meant
The description
SQNITARY SEWERAGE DISPOSQL
Sewerage disposal is one of the most serious problems facing Summerhill Borough, not only in terms of public health, but also in financial terms as well. In short, sewerage collection system improvements and sewerage treatment are very expansive capital outlays, especially for a small c o m i t y such as Summerhill Borough. Therefore, Borough off ic ia ls and citizens should review various options available to the c o m i t y to determine the most efficient and acceptable approach. struction of sewerage disposal fac i l i t i es , those being, (1) construction of a local system and treatment plant, (2) participation i n the Forest H i l l s Municipal Authority system, (3) participation in another sub-regional system, o r (4) con- struction of an alternate system. However, there are pragmatic problems associated with a l l options.
I t appears that the Borough has four (4) options regarding the con-
The recommendations outlined in the Comprehensive Water and Sewer Plan for Cambria County, Pennsylvania (CCPC; 1970), init iated a major trend in municipal sewerage planning which rejected expansion of the Johnstown sewerage service area, in favor of a system of local treatment f ac i l i t i e s for outlying communities in the L i t t l e Conemaugh sub-basin. This concept has been nearly ful ly implemented with the major exception of the area comprising the Forest H i l l s Municipal Authority (FI-MA), and Summerhill Borough. ceived a detailed analysis in the Comprehensive Water Quality Management Plan
This region re-
120.

e
(COW) Study Area 5 PER; 1978). have been incorporated into th i s narrative.
Elements of both of the previous studies
Local Option
Henry and Potter, Inc. to prepare a feasibil i ty report on sewerage fac i l i ty for the Borough. located on the Li t t le Conemaugh River in Ehrenfeld, along with necessary inter- ceptor sewers. would now cost nearly $900,000. funded total ly by local resources, and the availability of federal and/or state assistance for th i s project is also not likely.
the request of the Commonwealth in the la te 1960's. made available since regional sewerage fac i l i t i es became emphasized by the Common- wealth in the early 1970's. A s a reflection of th i s regional orientation, the Borough ws directed to j o i n the Forest H i l l s Municipal Authority (FI-MA) in 1972. 1969 feasibi l i ty report ordered by the Commonwealth, o r received credit for the above report in FI-MA planning costs.
The fac i l i t i e s proposed in the 1969 report would adequately address the sewerage needs of the Borough, and benefit the immediate environment. of equal importance is the expected regional results of sewage treatment, that being the upgrading of the entire South Fork basin, which cannot occur unless similar treatment f ac i l i t i e s are constructed upstream or downstream, o r i f the FHbfA plan is implemented. several regional considerations.
In 1969, the Summerhill Borough Council authorized the firm of Harris,
That report proposed a 0.10 MGD sewage treatment plant t o be
After allowing for increased costs due to inflation, th i s project I t is unlikely that th i s project could be
The feasibi l i ty report was authorized and paid for by the Borough a t However, funding was not
However, the Borough did not comply since it was not reimbursed for the
bwever,
Therefore, local off ic ia ls should be cognizant of
Regional Option
service area encompassing the Borough of South Fork, Ehrenfeld, Wilmore and portions of the Townships of Summerhill, Adams and Croyle. could also be served by th i s option. regional system with a central treatment fac i l i ty having a 1.31 MGD capacity, located near South Fork. wastewater t o the treatment faci l i ty . would be in the range of $600,000 t o 720,000, based on a per capita estimated share.
After the completion of the above local plan, FI-M was formed with a
Summerhill Borough This option would implement a ful ly
A rather extensive interceptor sewer system would convey The cost t o the Borough for th i s system
Local off ic ia ls should keep two factors in mind during the process of deciding upon a regional or local option. local option w i l l benefit only the immediate service area. w i l l only be realized when treatment fac i l i t i es downstream and upstream are oper- ational. federal assistance. Mwever, federal and s ta te financial assistance for the FIN4 project in the near future is unlikely due to the relatively low priority ranking as- signed t o it by the Pennsylvania Department of Environmental Resources (See Municipal Discharge Inventory Rank Order Listing for a l l municipalities; Pens lvania Bulletin, February 24, 1979), and local funding for the entire
The FI-MA project received only 57 priority points, while only those projects with a ranking of 70 or more are expected t o be
F i r s t of a l l , implementation of a Regional benefits
Secondly, the FHM4 plan has been already placed in an application for
seem feasible.
1 2 1

funded through 1982.
Sub-Regional Plan (I
The County Sewer Plan (1970) proposed five or six smaller plants to serve the region, located in Dunlo, Salix, Saint Michael, Wilmore and South Fork. The optional plan proposed a plant in the Beaverdale Area instead of the conveyance f ac i l i t i e s proposed i n the Base Plan. Plan wastewater from Summerhill Borough would be conveyed t o South Fork for treatment. m a t would be in the range of $675,000 to $750,000 a f te r allowing for inflation, based on a per capita estimated share. now are included in the FI-MA project, thus, the implementation of th i s option a t the present time would seem to be unlikely.
Under the County
4 The present estimated cost to the Borough fo r conveyance and t reat-
However most communities in th is option
W Y : LOCAL AND REGIONAL OPTIONS I
The local and regional options have inherent advantages and dis-
I t would not, however, advantages. F i r s t of a l l , a local treatment plant in the Borough would improve service and the environment in the immediate area. address the improvement of the water quality of the entire South Fork of the Litt le Conemaugh River, or the quality of the Conemaugh River below South Fork. On the other hand, a regional system would alleviate local and area-wide water quality problems. cooperation and coordination of seven municipal governments, while the local option wuld require action on the part of the Borough alone. regional options would require larger, more cost-effective, regional plants, but would also require additional expenses in extensive interceptor systems, while the local options require several smaller treatment plants and minimal interceptor systems. scattered growth adjacent t o the inteceptor systems, the local options would enhance the growth potential of existing settlements.
options, the C O W study, mentioned ear l ier , tentatively recommended the implementation of the F?MA plan, due to cos t effectiveness and water quality considerations. the County plans are compared, the regional plan could be implemented a t a regional savings of 20%.
Secondly, the regional options would require the
Thirdly, the
Finally, while the regional options would encourage
I t must also be noted that af ter an extensive review of a l l possible
In short, C O W estimates that when the regional plan and
a
I
1 2 2
WASI'EWTER ALTERNATIVES FOR SMALL CoIWUNITIES
If the c o m i t y decides to review the local sewerage problem, various alternatives should be reviewed. selected alternatives are l is ted below.
Since th i s would be part of plan implementation,
(1) Package Plants
a scaled-down conventional treatment plant. Package plants are available in many sizes, uti l izlng various treatment process(:s. Package plants are most efficient a t flow rates of under 20,000 gallons per day thus are well suited for residential areas, or portions of larger residential areas, with a population of under 200 people.
A package plant is a prefabricated standard unit which is basically
(a) Extended Aeration
This alternative is available as a package plant and sludge process and is generally suited to smal l , residential flows. sludge processes, which is the period of time required for bacteria to decompose organic wastes. sett l ing of heavier solids. sludge which must be periodically removed and disposed, and has a high power requirement, ment, a low in i t i a l capital cost and an average annual operating cost, when compared t o other systems. Other disadvantages include the inability to accept industrial waste and a potential odor nuisance.
I t requires a 24 hour aeration period, longest of a l l activate
Mixing is required to prevent premature This method produces a high amount of
Advantages include an average land require-
(b) Contact Stabilization
uses a process similar t o extended aeration, however, the basin volume is reduced due to a two-fold process using tanks. tank raw sewage mixes with recirculated sludge from the stabilization tank and is aerated for only 40 minutes. is discharged while the sludge is reused and/or removed and disposed. The major advantage of th i s system is the low land requirement, while the inability to accept industrial waste, the high in i t i a l capital costs, high annual operating costs and high sludge production costs are disadvantages. in the 1969 feasibi l i ty report.
This alternative is also available as a package plant and
In the contact
After sett l ing, the effluent
This process was recommended for the Borough
123
(c) Rotating Biological Disc (RBD)
The RBD process is also available a s a package plant. process includes rotating circular discs partially immersed in a trough of wastewater. material i n the wastewater. A i r is introduced in the rotations f i l ter ing the liquid through the growth. sludge production, average land requirement, low power requirement, no odor nuisance, ab i l i ty t o accept industrial waste, and average in i t i a l and operating costs. weather use and the need for a part-time operator.
The
Biological growth on the discs interact with organic
Advantages include average
Disadvantages include problems in cold
(d) Physical -Chemical
The physical-chemical process is also available as a package plant, and does not use the biological processes to remove organic material. Briefly, a chemical coagulant (i.e. iron s a l t , aluminum, lime, etc.) is added to wastewater a f te r it is subject to a series of screenings. to discharge. nuisance, cold weather use, and ab i l i ty t o accept industrial waste. Disadvantages include high sludge production, high power requirement, high capital and operating costs, and a need for an operator.
Effluent is then treated, usually with chlorine, prior Advantages include a low land requirement, no odor
I
Summary: Package Plants
The above review of package plants i s intended to ass i s t the Borough
Generally, package plants
in its review of the sewerage problem, by providing possible alternatives. However, the applicability of any of the above should be reviewed with a qualified technical consultant, such a s the Borough engineer. do have advantages over the more conventional custom designed plants for small c o m i t i e s . Package plants have a lower in i t i a l capital cost, require less land, can be installed quicker and produce less sludge than conventional plants. adapted t o meet local needs and characterisTic of the locality.
In a l l cases, package plants and process alternatives must -be
(2) SEWAGE OXIDATION PONDS
Sewage oxidation ponds have also been referred to a s "lagoons" or Some ponds rely on stabilization ponds, and can be found in various forms.
natural forces such a s aeration and require l i t t l e energy consumption, while other ponds u t i l i ze pumps and appurtenances, which t reat wastes by sedimentation,
124

*
digestion, photo-synthesis and seepage. vary, it is diff icul t to generalize. attention. months when biological activity increases, although a multicelled lagoon can at ta in constant secondary treatment, under certain conditions, i f it has a 6- month storage capacity. Secondly,.ponds may be most suitable for small rural towns not anticipating extensive industrial flows with suitable s o i l s , where land costs are relatively low. Thirdly, when only ponds with small capacities are possible, various alterations can be made, such as mechanical aeration, t o a t ta in secondary treatment standards. pnds in the 0.1-4.0 MGD range, t o t a l annual costs per person are lower than those for activated sludge process by one-third t o one-half.
Since the design and operation of ponds However, several factors require
F i r s t of a l l , secondary treatment may be attainable during the warmer
Finally, comparative information shows that for
The major advantages of ponds or lagoons are generally lower capital and operating costs, low sludge production, usually no need for an operator, low energy requirement and the ab i l i ty t o accept industrial waste. disadvantages of th i s process include a large land requirement, limited cold weather use, an odor nuisance and undesirability of residential development near the lagoon, However, proper planning can overcome some of the disadvantages. For example, a low pond level a t the beginning of the cold season can increase storage capacity and detention time during the winter months. Likewise, pond sit ing away from existing o r future sensitive land uses can reduce nuisance problems. one-third of the Country's secondary treatment processes, according to the Environmental Protection Agency (EPA) .
The major
A s a reflection of th i s , it should be noted that ponds comprise nearly
(3) OXIDATION DITCH
The oxidation ditch process has been used in Europe for many years, and has been recently used in colder areas of th i s country. of an oval ditch crossed by a partially immersed rotor which aerates wastewater along the oval track. Sludge is removed and disposed, o r reused in the ditch t o maintain the required biological balance. and noted a high degree of versat i l i ty and efficienty.
The major advantages of th i s system include secondary treatment capacity, average land area requirement, cold weather use, low in i t i a l capital cost and average operating costs. a part-time operator, high power requirement and the inability to accept industrial waste.
The process consists
The wastewater is retained in the ditch for 1 2 hours.
EPA analyzed an oxidation ditch in a small town in Minnesota
Disadvantages include high sludge production, need for
(4) LAM) APPLICATION TECHNIQUES
There has been growing interest in the area of applying wastewater t o agricultural lands for treatment purposes. overland flow, and infiltration-percolation. Municipal wastewater has been applied to land, usually a f te r same degree of pretreatment, using a l l three approaches. The following is a brief summary of the methods.
The major processes used are irrigation,
1 2 5
Irrigation
Irrigation methods have been the most widely used of the land treatment techniques, and involve the spray or surface application of wastewater to crop lands. but sands and clays are also acceptable. A s o i l depth of 5-6 feet is required, since treatment usually occures a f te r passage through the f i r s t 4 feet of so i l . Other s i t e selection factors are topography, climate and type of underground formations. method is the fer t i l izat ion of crops, while a major disadvantage is a large land requirement.
Well-drained, loamy soi ls are preferable,
A major benefit of th i s 4
(b) Overland Flow
This process requires land with a slope of 2-6 precent so that the wastewater flows over a grassy ground surface, and is less oriented 1 towards the fer t i l izat ion of crops. the sloping land and flows overland, percolates o r is evaporated. runoff usually occurs and may create problems if it does not meet treatment c r i te r ia , and i f suitable surface water is not nearly to receive the discharge.
are site selection, management practices and treatment of excess runoff. This process has been only recently used in th i s Country, although systems are being tested in Pennsylvania, Ohio and Maryland.
Wastewater i s usually sprayed on Excess
Slowly permeable soi ls such as clay loams and clay are most suitable for t h i s process. Other factors t o be considered 4
(c) Infiltration-Percolation
This process requires the surface injection of wastewater, and/or effluent from other treatment processes, into the soi l having a minimum depth of 15 Feet. Acceptable so i l types include rapidly permeable soi ls such as sands, loamy sands, and sandy loams, while course sand and gravel are less acceptable, since they allow fo r too rapid passage of the wastewater through the f i r s t f e w feet where biological and chemical action occur. Other factors requireing con- sideration include deep percolation rates, depth, ground water quality, topography and subsurface geology.
SUMMARY: LAND APPLICATION TECHNIQUES
4
4 A s was the case with the more conventional treatment processes, local
applicability of land, application techniques should be reviewed with the proper technical experts, such a s agricultural extension agents, university specialists, farmers and engineers. operating costs competitive with, o r lower than, the more conventional systems, but usually require a rather large land requirement. The application of pretreated wastewater, especially primary or secondary effluents, has been proven t o be an effective treatment process, with nearly a l l pollutants being removed. sludge produced by other treatment processes has been applied to agricultural land with some success. the use of so i l and natural biological processes as a f i l t e r and treatment system.
Generally land application methods require capital and 4
Likewise
Most land application techniques are based on the concept of 4
126
a
49
IO
'i
*
S M A R Y OF SEWERAGE OPTIONS
The above review of regional, local and alternatiave options is intended t o provide local citizens and off ic ia ls with information, so that a decision related. to the solution of the Borough's Sewerage problem may be reached and implemnted. none of the costs are programmed in the Capital Budget due to the fact that it is unlikely that any option would be total ly funded a t the loca l level. above detailed review of options is included here because sewerage is one of the most pressing needs of the Borough, and the Borough should continue to seek financial assistance, either with F M o r on i ts own, depending on the option being pursued. Budget as financial assistance becomes available, reflecting any required local shares.
The options have been noted in the Capital Budget, However , However, the
The project should be programmed in future revisions of the Capital
Potential funding sources for sewerage projects include:
(1) Farmer's Home Administration (U. S. Department .of A,piculture)
(2) Economic Developnent ,Idministration (U. S. Department of Commerce)
(3) Department of Housing and Urban Development (cannot fund treatment plants)
(4) Applachi& Regional Commission
(5) U. S. Environmental Progection Agency
(6) Pennsylvania Department of Finvironmental Resources PER)
I t should also be noted that the Planning and Training Services Section of DER is presently coordinating a pilot project which demonstrates and t e s t s various alternative collection and treatment systems in rural areas. Contact should be init iated by the Borough t o ascertain i f the Borough could t>articir>ate in th is momam. lJnti l assistance i s made available bv the federal and/& state goverkents, new residents may have to re ly upon on: l o t sewage disposal systems such a s septic tanks, aerobic tanks, seepage beds and/or elevated sand mounds. options, the Borough should be aware of the fact that the more natural the system used, the lower the capital and operating costs. techniques and/or stabilization ponds or lagoons can usually be constructed and maintained a t a fraction of the cost o f , for example, activated sludge processes.
Since costs are a mjo r determinent in treatment
In th i s regard, land applicatio.1
A s a reflection of th i s point the following table compares the construc-
I t should be noted that a l l costs are preliminary estimates t o be
tion costs for various processes for a hypothetical plant with a 0.1 MGD capacity, the size of the plant proposed for the Borough by the 1969 feasibi l i ty report. used for comparative purposes only, and do not account for such local variables such as land costs, etc. 1980 dollars. lated t o collection system improvements o r maintenance.
Costs have been adjusted for inflation and are in Costs are for plant construction only and do not include costs re-
127

TABLE XXVII
CONSTRUCTION COSTS FOR mIT PROCESSES (0.1 K D Treatment Plant)
Process Estimated Cost
Activated Sludge Sedimenta t ion/Chemical Addit ion Aerated Lagoon Spray Irrigation Extended Biological Oxidation
$292,305 $251,382 $175,383 $120,819 $103,281
Source: "Costs of Alternative Wastewater Treatment Systems ,11 in Wastewater Management in Rural Communities: A Socio-Economic Perspective, ed. by C. Mwm Young and Uonald J . Egg (University Park, Pa.: Pennsylvania State University, 1977), p.9.
Th e
MANHOLE CONSTRUCTION
The need for a t least six (6) manholes for the Borough's sewerage collection system has been demonstrated as a result of a regional T.V. Sewer Cleaning and Inspection program being administered by the Johnstown Redevelopment Authority, with coordination provided by the Redevelopment Authority of Cambria County. Only 1,000 lineal feet of sewer l ine were able to be inspected and cleaned under th i s program due t o the lack of manholes throughout the system. The Capital Budget includes estimated costs for the construction of six (6) manholes a t a per uni t cost of $1,500. following construction of new manholes is a maintenance i t e m and, therefore, is not included in the Capital Wldget.
A c t u a l inspection and cleaning of sewers
SI'REETS AND H I G M Y S
The Future Transportation Plan pointed out an obvious transportation need which w i l l have t o be addressed that being the Summerhill Borough Bridge. A s mentioned ear l ier , the signalization and other recent improvements are temporary in nature, and that plans for an eventual replacement of the structure should be formulated. option which would construct a new bridge approximately 200 feet east of the existing bridge, connecting Croyle and Jackson Streets. breakdown of the cost of th i s option i s not available a preliminary estimate would be in the range of $400,000.
The Cambria County Planning Commission favors an
While a technical
Due to the situation, a FUC order allocating costs among various parties would most l ikely result , therefore, a t the present time the financial responsibility of the Borough, if any, cannot presently be determined, however, the bridge has been included here and on the Capital Budget due t o i ts importance.
128

Two points require special attention related to any future bridge options. F i r s t of a l l the bridge presently carries a s ta te highway (L.R. 11025) over a railroad, and any realignment of the bridge should be preceeded by a relocation of a portion of L.R. 11025 to correspond with the new bridge. Secondly, local off ic ia ls , including Borough Council and the Planning Committee, should maintain contact with PennDOT and CCPC to assure that the bridge re- ceives a high priority on the revised PeIlnDOT highway construction program.
RECRFAT ION
Future recreational programs should focus on improvements to the existing Sumnerhill Borough Playground, rather than development of new active recreation sites. could support various outdoor recreational activit ies. A s i t e improvement program, sponsored by the Redevelopment Authority of Cambria County, is presently nearing completion. clearance, fencing, ballfield improvements, tennis court accessories, l ine painting and seeding. complement th i s program. ments t o be made over the next ten (10) years:
This site i s accessible to most sections of the Borough, and
Briefly, th i s project w i l l have provided site
The Capital Budget suggests the following improve- The Borough should consider additional act ivi t ies to
Placement of fencing on the eastern section of the playground, adjacent t o Laurel Run, as a safety feature. perimeter of the ballfield outfield, and a four- foot fence along the remaining stream border, is recommended;
A ten-foot fence along the
Additional improvements to the ballfield in- cluding re-grading of the field and infield improvements ;
Placement of approximately 300 l ineal feet of guardrail along the western boundary of the play- ground, adjacent to Ebensburg Road;
Provision of additional to t l o t f ac i l i t i e s in- cluding swings and spring animals; and
Landscaping around recreational f ac i l i t i e s by planting approximately fif teen (15) trees.
Implementation of the above act ivi t ies w i l l provide a wide range of recreational opportunities to Borough residents in a cost-effective manner. partial funding (50% of the costs) for outdoor recreation projects i s available through the Heritage Conservation and Recreation Service of the U.S. Depart- ment of Interior, with the Pennsylvania Department of Community Affairs.
Potential
The application process for these funds must be coordinated
* 129

CCMWNITY FACILITIES
The former schoolhouse which presently houses the Borough police, municipal offices, and a communication center has the potential of becoming a much needed c o m i t y center as well. of the structure for other uses is possible, and should be investigated by the Planning Committee. Special emphasis should be given t o the provision of c o m i t y services such as a library, senior citizens center, day care center and/or a community meeting room.
rehabilitation and renovations act ivi t ies w i l l be required. includes a preliminary cost for th i s activity. funding sources for th i s activity would depend on the services to be provided. For example, the Small Cities Community Development Block Grant program, administered by the Department of Housing and Urban Development (€UD), can aid in the development of a community center. be used for those portions of a center supporting governmental operations. addition, most HID programs are oriented towards benefitting low/moderate income persons. Thus, if HUD is to be approached for funding, costs related to the governmental portion of the project must be deleted, and services benefitting low/moderate services income persons must be emphasized. funding may be available for senior citizens centers, and are channeled through the Pennsylvania Department of the Aging. istration makes low interest loans available for various community f ac i l i t i e s a t a maximum term of 40 years. approximately 5% on the unpaid principal. cost of t h i s project based on the loan program, since grant funds are extremely scarce and competitive. would of course reduce the annual expenditure from the capital budget accordingly.
Future uti l ization of portions
If the building is t o be uti lzied as a community center, minor The Capital Budget
Potential federal and state
However, HLJD funds cannot In
Likewise, federal
Finally, the Farmer's Home Admin-
The current interest ra te on these loans is The Capital Wldget reviews the
Repayment for a term greater than ten (10) years
FIRE PROTECTION
Local residents have expressed their interest in the improvement of the structure housing the S m e r h i l l Borough Volunteer Fire Company, as noted in the Future Community Facil i t ies Section. The Borough has two options avail- able if it chooses to improve the faci l i ty . The options are the construction of a new faci l i ty , or the renovation of the existing faci l i ty . While no technical breakdown of costs are available, a rough estimate shows that the construction of a new fac i l i t y would be several times more expensive than the renovation of the existing structure. renovate the existing structure.
improvements, but generally the renovation option would cost a fraction of the costs of new construction. the scope of the renovation option, property prohibits any addition i n th i s direction. property would allow an addition in that direction without limiting on-site parking. not l i m i t internal renovations within the existing structure. Budget also summarizes the estimated costs for th i s option, based on a recent unfunded application submitted by the Borough to HUD, for consideration in the Small Cities Program.
Presently, the Fire Company is preparing to
The cost of th i s option would, of course, vary with the extent of
The s i t e of the existing structure would l i m i t Specifically, the narrow width of the existing
However, the depth of the
Obviously, the irregular size and proportion of the property would The Capital
I
130

c,
0
e
0
i3
0
e
0
The renovation option would modernize the present fac i l i ty without
Due to the fact that the federal and s ta te governments view
displacing residents and without taking additional property out of taxation but would be constrained by the existing property boundaries and require a modest capital outlay. f i r e protection as a local responsibility outside financial assistance for any such act ivi t ies is rather limited. Potential federal funding sources for th i s activity include the Small Cities Community Developent Block Grant Program and low interest community fac i l i ty loan program of the Farmers Home Administration. Pennsylvania Volunteer Loan Assistance Program, administered by the Pennsylvania Department of Community Affairs. volunteer f ire companies at a ra te of 2 % annually for a maximm term of 1 0 years. Loans for new construction or modernization of fac i l i t i es may not exceed $40,000 or 50% of the to ta l cost, whichever is less. financial option is included in the Capital Budget.
The major s ta te financial aid program for th i s activity is the
This program provides low interest loans to
This l a t t e r
Conclusion
The Comprehensive Plan, and the entire planning approach, must be viewed as a process, which simply stated i s an organized manner of thinking ahead about the future of a community. past of a community, an analysis of existing conditions and recommendations and projections related to future conditions. dynamic in nature, the preparation of a Comprehensive Plan should be viewed as a step in the planning process rather than the end of the process. the plan must be continually reviewed, re-evaluated and updated to reflect changing conditions within the Borough, and changing conditions affecting the Borough. consider as its future role, in addition t o future planning act ivi t ies , the ini t ia tor and coordinator of the implementation process. with Borough Council and other local governmental and civic agencies, can the Planning Committee accomplish th i s role.
which w i l l insure periodic updating. recording and mapping of a l l current and future building act ivi t ies , the periodic updating of published statistics which form the basis for current plans and the periodic re-evaluation of local development objectives. just as the Comprehensive Plan serves a s a guide for the future of the Borough it should also symbolize the init iation of planning a s a process within the Borough.
process, and is delineated on Table XXVIII and Table XXIX. and act ivi t ies within each category should be added during annual revisions. A l l costs represent i n i t i a l estimates in current dollars, thus, future budget revisions should allow for inflation. The major elements of the budget, specifically the sewerage and bridge projects, w i l l require federal and/or state assistance, therefore, the Borough off ic ia ls and agencies should begin to pursue these resources as a first step in the implementation process. to th i s fact , these projects have been noted t o designate the need, however, costs related to sewerage and bridge projects have not been programmed into an annual element of the Budget. the community building and the new or renovated f i r e company fac i l i ty is
This process requires a review of the
Since the planning process is
Therefore,
In th i s regard, the Summerhill Borough Planning Committee should
Only by working
[n order t o maintain th i s process, procedures have t o be developed These procedures should include the
Thus,
The Capital Improvement Budget and Program is a segment of th i s Additional categories
Due
In addition, due to the present grants situation,
131

programmed as a local project. available, the Capital Wldget should be revised accordingly t o reflect a lower overall local share.
Therefore, if and when grant funds become
132

c
TABLE XXVIII m m m CAP1-m m m
€WAS€ I 1980-1984
Project
SEWEBAGE TRE4- AND COLLETION h a 1 m t i o n Regionai Option Sub-regional option Alternate Option
MANHOLE CONSIWCIION
SIllEET AM) HIGHWYS
REfXATION . Fencmg
Bridge Canstrustion
Ballfield Grading Guardrail Tot Lot Improvanents Landscapping
UBMUh'I'I?' FACILITIES lmprovenents to
Building
FIRE PROTBcFIm Renovation of Fire
Station
Totals
Estimated Total Cost
[$800,000-900,000 J [ 600,000-720,0001
675,000-750,0001 [ 210,000-600,0001
$ 9,000
$ [400,0001
2,700 a 1.200 9,600 2,500 3,000
$ 51,000
$ 80,000
Estimated Local cos t
[$200,000- 300,OOC [ 150,000-180,OOC [ 168,750-187,50a [ 52,soo-i5o,ooa
$ 9.000
Undetermined
$ 1,350 600
4,800 1 , 2 X 1,500
$ 51,000~
$ 80,000
$ 159,000 $ 149,500
% Local c o s t 1980 1981 1982
25% 2 5% 25% 25%
100%
Undetermined
50% 50% 50%
100% $ 6,000
l O O % I --
94% $ 9,700 $ 15,400 $ 16,800 $ 15,900
1984
$ 12,200
DER, EPA, FmHA Local
Local
State , . ConRail Local
m, Local
F&4 (loan, or
Local, Private DCA (loan)).
Note: Cost figures for Sewerage and Bridge Construction are mt included in t o t a l s and have not been program& i n to annml expenditures, but have been shown to denonstrate t he need. As financial assistance becomes avai lable fo r these projects, the budget should be revised accordingly.
133.

TABLE XXM FROPOSED CAPITAL mEr PHASE I1 1985-1989
[$800,000-9M),0001 [$200,000-300,0001 [ 600,000- 720,0001 [ 150,000- 180,000) [ 675,000-750,0001 [ 168.750-187,5001 [ 210,000-600,0001 [ 52,500-150,0001
$ 9,000 $ 9,000
[$ 400,0001 Undetermined
h-oject
sEwERAGE?REAIMENTAND MlLLBcTIoN
h a 1 option Regional Option Sub-regional Option Alternate Option
25% 25% 25% 25%
100%
Undetermined
MA"lLE CONSIRUCIION (Con't.)
$ 51,000
SrREET AND HIGHWAYS Bridge Construction
RECRFATION ' F-mg
Bal l f ie ld G r a d i n g Guardl-ail
$ 51,000
Tot Lot Inqnuvenentr Landscapping
CUMJNITY FACILITIES Improvements to
Building (Con't.)
FIRE PRCllETION Renovation of Fire
Station (Con't.)
Totals
Estimated Total cost
Estimated Local cos t
% Local Cost
Project completed in k s e I
$ 80,000 1 $ 80,000
$ 159,000 $ 149,500
100%
100%
1985 1986. 1987 1988 1989
94% $.lS,OOO $ 17,800 f 17,600 $ 19,400 $ 19,200
F i n a K i n g
Local DJ3, EPA, FmU4,
Local
State , Local, ConRail
=,
FUIw (loan), o r
Private (1-1, Local, ,
I
Y
Note: Cost f igures fo r Sewerage and Bridge Construction a r e not included in t o t a l s and have mt been programed into annual expenditures, but have Shown t o dawns t r a t e the need. A s financial assis tance beurmes avai lable for these projects , the budget should be revised accordingly.
134.
Y A