Preparation Meeting Opportunity: How Do College Students Prepare for Public Speeches
16
Preparation Meeting Opportunity: How Do College Students Prepare for Public Speeches? Judy C. Pearson, Jeffrey T. Child, & David H. Kahl, Jr. Nearly half a million students prepare classroom speeches each year, but little is known about overall preparation time and the relative proportions of time used for each speech preparation activity. Further, we do not know the specific speech preparation activities that result in higher speech grades. Public speaking students completed journal entries over the course of a semester detailing their speech preparation process. Multiple regression revealed the relationship of time spent in five writing activities and overall speech grade averages. Overall preparation time correlated significantly with higher speech grades; in addition, students who spent more time in delivery and practice earned higher speech grades. Keywords: Public Speaking; Speech Grades; Speech Preparation Each year, approximately 450,000 college students enroll in public speaking courses in the United States. The public speaking course is the ‘‘bread and butter’’ of most communication departments (Morreale, Hanna, Berko, & Gibson, 1999). Because of the large number of these courses, a variety of pedagogical materials have been developed. Basic course directors guide the instruction by providing orientation, Judy C. Pearson (PhD, Indiana University, 1975) is a professor and associate dean in the College of Arts, Humanities, and Social Sciences at North Dakota State University, Fargo, ND 58105-5075, USA. Jeffrey T. Child (BS, Wayne State College, 2002) and David H. Kahl, Jr. (BA, Concordia College, 2002) are PhD students and teaching associates in the Department of Communication at North Dakota State University, Fargo, ND 58105- 5075, USA. The authors wish to thank Dr. Michelle Shumate and Dr. Paul E. Nelson for their advice and feedback on a previous version of this manuscript. Additionally, the authors would like to acknowledge Kristen A. Nanaziashvili and Min Liu (both from North Dakota State University) for assistance with data coding and feedback on a previous version of the manuscript. This paper was presented at the Eastern Communication Association Conference in 2005. Correspondence: Judy C. Pearson, North Dakota State University, College of Arts, Humanities, and Social Sciences, Dean’s Office, P.O. Box 5075, North Dakota State University, Fargo, ND 58105-5075. E-mail: [email protected] Communication Quarterly Vol. 54, No. 3, August 2006, pp. 351–366 ISSN 0146-3373 print/1746-4102 online # 2006 Eastern Communication Association DOI: 10.1080/01463370600878321
-
Upload
behrend-psu -
Category
Documents
-
view
2 -
download
0
Transcript of Preparation Meeting Opportunity: How Do College Students Prepare for Public Speeches
Preparation Meeting Opportunity:How Do College Students Preparefor Public Speeches?Judy C. Pearson, Jeffrey T. Child, & David H. Kahl, Jr.
Nearly half a million students prepare classroom speeches each year, but little is known
about overall preparation time and the relative proportions of time used for each speech
preparation activity. Further, we do not know the specific speech preparation activities
that result in higher speech grades. Public speaking students completed journal entries
over the course of a semester detailing their speech preparation process. Multiple
regression revealed the relationship of time spent in five writing activities and overall
speech grade averages. Overall preparation time correlated significantly with higher
speech grades; in addition, students who spent more time in delivery and practice earned
higher speech grades.
Keywords: Public Speaking; Speech Grades; Speech Preparation
Each year, approximately 450,000 college students enroll in public speaking courses
in the United States. The public speaking course is the ‘‘bread and butter’’ of most
communication departments (Morreale, Hanna, Berko, & Gibson, 1999). Because
of the large number of these courses, a variety of pedagogical materials have been
developed. Basic course directors guide the instruction by providing orientation,
Judy C. Pearson (PhD, Indiana University, 1975) is a professor and associate dean in the College of Arts,
Humanities, and Social Sciences at North Dakota State University, Fargo, ND 58105-5075, USA. Jeffrey T. Child
(BS, Wayne State College, 2002) and David H. Kahl, Jr. (BA, Concordia College, 2002) are PhD students and
teaching associates in the Department of Communication at North Dakota State University, Fargo, ND 58105-
5075, USA. The authors wish to thank Dr. Michelle Shumate and Dr. Paul E. Nelson for their advice and
feedback on a previous version of this manuscript. Additionally, the authors would like to acknowledge Kristen
A. Nanaziashvili and Min Liu (both from North Dakota State University) for assistance with data coding and
feedback on a previous version of the manuscript. This paper was presented at the Eastern Communication
Association Conference in 2005. Correspondence: Judy C. Pearson, North Dakota State University, College of
Arts, Humanities, and Social Sciences, Dean’s Office, P.O. Box 5075, North Dakota State University, Fargo,
ND 58105-5075. E-mail: [email protected]
Communication Quarterly
Vol. 54, No. 3, August 2006, pp. 351–366
ISSN 0146-3373 print/1746-4102 online # 2006 Eastern Communication Association
DOI: 10.1080/01463370600878321
workshops, and courses to instruct new teachers on how to teach public speaking.
Textbook authors assist the college speaker in becoming more proficient at public
communication. Virtually all of these voices suggest that students must spend time
in preparation to deliver high-quality speeches.
Nonetheless, little is known about how students prepare for classroom speeches.
Anecdotal bromides suggest that students prepare the evening before the assignment.
Students appear to have differential abilities in public speaking: Some students report
spending considerable time engaged in preparation without achieving high grades,
while others breeze through the public speaking course with apparent ease and high
grades.
Communication competence should increase after instruction and practice in
communication. One’s willingness to communicate, as well as one’s ability to
communicate, should be improved with instruction and practice (McCroskey, 2000;
Pearson & Daniels, 1988). A student’s prior experience with public speaking and for-
ensic activities, for example, probably portends higher grades in public speaking.
Students appear to become better communicators through instruction and prac-
tice. Rubin, Graham, and Mignerey (1990) conducted a longitudinal study of college
students over four years. In general, students became increasingly more communica-
tively competent with progression through college. An exception occurred in the
second year of college, when competence seemed to decrease: the authors named this
phenomenon the ‘‘sophomore slump,’’ which they suggest may occur as a result of
change and uncertainty experienced by many college students during their second year
of school. Students who were engaged in extracurricular communication experiences
were also more competent on a number of measures (Rubin et al., 1990). Because of
this evidence, we might posit that preparation leads to better grades. However, in
order to successfully prove this claim, related literature must first be examined.
Literature Review
Preparation Time
Communication teachers and coaches encourage students to prepare thoroughly and
practice speech presentations. Burkel-Rothfuss, Gray, and Yerby (1993) suggest that
practice must be accompanied by instruction. Consequently, they have their students
practice speeches with teaching assistant-led study groups.
A number of variables may influence the amount of practice a student needs. For
example, the student’s knowledge of the subject, the length of the speech, the stu-
dent’s previous experience with giving speeches, and the student’s communication
apprehension may all affect how much preparation time is desirable. Public speaking
textbooks encourage students that preparation is a means of gaining confidence in
public speaking (Lucas, 2004).
Public speaking preparation has been studied deductively and in quasi-experimental
settings (Daly, Vangelisti, & Weber, 1995; Menzel & Carrell, 1994). Menzel
and Carrell (1994) videotaped public speaking students giving a speech in an
352 J. C. Pearson et al.

experimental setting and asked them about their preparation time, past experience
with speaking, personal anxiety levels experienced with the speech, general anxiety
about communication, and grade point average. Grade point average, total prep-
aration time, number of rehearsals for an audience, and state anxiety predicted
the quality of a speech performance (Menzel & Carrell, 1994).
Daly et al. (1995) created an experimental situation in which students prepared a
speech while ‘‘talking aloud’’ about the process. Students were given 20 minutes to
prepare. The study divided the preparation activities into preparation and delivery.
While preparation and the quality of a speech performance are related, when speech
anxiety is statistically removed, the relationship between preparation and quality is
much smaller.
The Daly et al. (1995) study contributes to our knowledge about student speech
preparation, but the study is highly limited by the protocol. The artificial situation
in which people have only 20 minutes to prepare and must speak out loud about
what they are doing may not generalize to actual classroom students preparing
speeches over one to two weeks. In the artificial speaking situation, students could
not access reference materials, use audio-visual materials, practice their speech in
the classroom, spend time between actual work on the speech to think about the
topic, or talk with others about the speech.
While knowledge has been generated through artificial exploration, additional
methodology must be utilized. The only means to gain a precise understanding of
student preparation is through a naturalistic protocol in which students report their
behaviors near the time of completion. Only in such a setting are restrictions
removed and the actual student speech preparation process is more accurately
approached and understood.
Communication Apprehension
One of the principal means recommended for reducing anxiety in the past was speech
preparation (Robinson, 1956). Even today, textbook authors like Lucas (2004) and
Nelson and Pearson (2005) suggest that practice and preparation will lead to greater
confidence and less speech apprehension. McCroskey’s seminal work in this area
includes: measurements, causes, correlates, and methods of treatments (e.g., Daly &
McCroskey, 1975; McCroskey, 1970, 1976). In the last four decades, McCroskey
remains the leading scholar in this area of study and continues to add an in-depth
understanding of the communication apprehension construct (e.g., Beatty, McCroskey,
& Heisel, 1998; Burroughs, Marie, & McCroskey, 2003; Cole & McCroskey, 2003;
McCroskey, Richmond, & McCroskey, 2002; Neulip, Chadouir, & McCroskey, 2003).
Weissberg and Lamb (1977) tested three methods of reducing speech anxiety and found
that cognitive modification, or helping students rebuild negative thought processes
about public speaking, and speech preparation were most effective in reducing speech
anxiety.
Speech preparation time varies as a result of communication apprehension.
People high in communication apprehension spend more preparation time on
Communication Quarterly 353
non-communicative activities, while individuals low in communication apprehen-
sion spend more preparation time on communicative activities (Andersen, 1988;
Daly, Vangelisti, Neel, & Cavanaugh, 1989). For example, people with high com-
munication apprehension spend more time preparing speaking notes, but less time
on audience analysis and rehearsal. In addition, communication apprehension has
an impact on the speech preparation process as well as the process of delivery (Daly,
Vangelisti, & Weber, 1995). Although high apprehensives reported more overall
preparation time than low apprehensives, high apprehensives received lower grades
on their speeches (Ayres, 1996). This result may be explained by the meta-analytic
work of Bourhis and Allen (1992). Analysis of 23 studies involving communication
apprehension and cognitive performance found a negative correlation between the
two variables. In addition, it has been determined that students with high levels of
communication apprehension spend more time developing speeches but receive
lower grades than students who spend less time (Ayres, 1996). Ayres (1996) determ-
ined that students with high levels of communication apprehension spend more time
writing instead of spending time on other elements of the speech, such as practicing
delivery, in order to avoid communicating.
If speech preparation in laboratory situations leads to higher grades, then the same
phenomenon may be true in the classroom setting. Similarly, if practice and prep-
aration leads to lower levels of speech anxiety, students should similarly receive
higher classroom public speaking grades with more practice and preparation.
Purpose
How can researchers better understand how students prepare for public speeches?
One methodological approach is to seek information from the students after they
have given a speech. Several studies take this approach (for example, Ayres, 1996;
Menzel & Carrell, 1994). Another approach is to collect data by observing people
during speech preparation and to have them ‘‘talk out loud’’ about what they are
doing (Daly et al., 1995).
When students have been asked to describe their public speaking preparation, they
have generally recounted the process, long after the speech has occurred (Ayres, 1996;
Menzel & Carrell, 1994). Students estimate how much time they have spent in
preparation overall, in pre-rehearsal, and in oral and silent rehearsal. While this
methodology may serve as a building block, it may not give a completely accurate
picture of the students’ speech preparation process. For this reason, a naturalistic
study of the entire speech development process is necessary to discover more precise
information. No research to date has followed the naturalistic activities of students
enrolled in public speaking classes. Will a less intrusive and restrictive protocol dem-
onstrate that students’ preparation time is positively related to the grades earned on
speeches?
The purpose of this study is to determine the amount of time that college students
use to prepare their classroom speeches and to determine which activities of speech
preparation led to higher grades. No study has examined the self-reported behavior
354 J. C. Pearson et al.
of college students in public speaking courses over an entire semester, nor has pre-
vious research explored the relationships between preparation time (and individual
activities within preparation) and public speaking grades. Further scholarship may
have a direct impact on speech preparation instruction in basic courses. At this point,
instructors have general knowledge about beneficial behaviors but lack specific details
on the developmental process. Therefore, specific activities need to be discovered. To
achieve this purpose, three research questions are offered.
RQ1: How much time do college students use to prepare their classroom speeches?RQ2: What relative proportions of time do college students use to prepare the various
activities involved in public speaking?RQ3: What activities in the speech preparation process result in higher overall speech
grade averages?
Method
Participants
Participants for this study consisted of 95 undergraduate students enrolled in five sec-
tions of the fundamentals of public speaking course at a medium-sized Midwestern
university. Data collection among the participants occurred during the Spring 2004
semester. The sample included 48 male respondents (50.5%) and 47 female respon-
dents (49.5%). First-year students made up the largest portion of the sample at 69
students (72.6%). Nineteen sophomores (20%), three juniors (3.2%), and four seniors
(4.2%) made up the rest of the sample.
Students revealed their prior public speaking experience at the start of the funda-
mentals of public speaking course. The public speaking course is required of all stu-
dents as a general education course. From the sample, 15 students (15.8%) indicated
having no previous public speaking experience, 51 students (55.4%) indicated having
very little or one main prior public speaking experience, and 26 students (28.3%)
indicated having more than one or considerable public speaking experience.
Sample participants indicated having 31 different majors, spanning all areas of
study on the campus. The university had eight colleges with various majors. Phar-
macy students were the largest college sampled at 21 participants (22.1%). Seventeen
students (17.9%) came from Engineering and Architecture, 15 students (15.8%) were
from University Studies, 11 students (11.6%) identified Science and Mathematics as
their college, ten students (10.5%) were from Arts, Humanities, and Social Sciences,
ten students (10.5%) came from Human Development and Education, six students
(6.3%) were from Business Administration, and five students (5.3%) were in the
Agriculture College.
Procedure
Data collection and coding process
The primary researcher identified and solicited the two instructors participating in
the data collection before the start of the semester based on section and time
Communication Quarterly 355
convenience. The two instructors had students in five sections, which comprised the
final student sample. The instructors told the students that the completed journal
entries were part of a research study and that their responses would never be seen
by their own instructor. (The anonymity encouraged honesty among the students.)
Students completed journal entries at the beginning of each class session using
open-ended responses. Each student wrote her or his own unique numerical identi-
fier at the top of each journal entry instead of their name to ensure student privacy
and confidentiality. Students gained limited participation points for just completing
the journal entries as a part of the course requirements.
The instructors provided students the first few minutes of class to write down a
description of what they had done since the last class to prepare for the next speech
assignment. Instructors asked students to state the amount of time they spent to
complete each preparation activity. After completing each speech assignment,
journaling did not resume until the next speech assignment. Once students com-
pleted journal entries they placed their response in a large envelope. When all
students finished writing, the envelope of responses was sealed, dated, identified by
section, and taken to a central office for distribution to the researchers.
Each student in the two Tuesday and Thursday class sections completed a total of
22 journal entries, and each student in the three Monday, Wednesday, and Friday
class sections completed a total of 29 journal entries, both over fourteen weeks
(excluding spring break). Five independent coders coded approximately 2,471
open-ended responses.
Before conducting any analysis on the data, chi-square tests determined any sig-
nificant differences among sections by college, student classification, or sex. This
was done to address any differences among sections and instructors in the variable
measures. The tests allow for each individual public speaking student to be examined
as a unit of analysis. No significant differences occurred in student classifications by
section, v2(12, N ¼ 95) ¼ 12.80, p ¼ .384. College classification was not significantly
different by section, v2(28, N ¼ 95) ¼ 36.34, p ¼ .134. The sex of the student was
significantly different by section, v2(4, N ¼ 95) ¼ 9.67, p ¼ .046. However, the
difference was not significant when collapsed to the level of course instructor,
v2(1, N ¼ 95) ¼ 1.30, p ¼ .254.
The co-authors, including an established researcher in the communication field
and a small group of graduate students, jointly coded 40 journal entries to train
coders. First, the co-authors received an example of how to code the journal data
in the training session. To code a journal entry, coders examined responses, and each
sentence was the unit of measurement to extract the participant’s own descriptive
references for every preparation activity. The coders then wrote each descriptive ref-
erence at the bottom of the journal entry and noted the number of minutes spent
completing each specific activity. To employ a derived etic approach, the researchers
used no pre-determined categories. This approach revealed ‘‘what units make sense
within the world of the messages’’ instead of using prescribed categories that may
not encompass the range of actual student preparation experiences (Neuendorf,
2002, p. 72).
356 J. C. Pearson et al.
Next, each co-author coded sample journal entries individually and read her or his
coded journal entry aloud. All of the co-authors wrote down how they would have
coded the same journal entry, and the coding for that sample journal entry was then
revealed. Co-authors discussed differences and repeated the process until complete
agreement was reached. Finally, the co-authors coded using the derived etic approach
in order to determine the range of activities that emerged from the data.
The co-authors met again to reorganize the range of activities into mutually
exclusive categories for the final coding scheme. The entire list of activities the
research team identified was typed onto a sheet of paper and jointly examined by
the co-authors. Several ideas were discussed for potential categories for the responses.
The final five categories that the co-authors agreed upon coincided with the five rhe-
torical canons. The five coders independently coded an entire class session with the
final categories and corresponding time increments for determining intercoder
reliability before recoding all of the data.
Speech activity categories and reliability
The first category included generating ideas for speeches, researching speech topics,
and gathering or researching resources for presentational aids use. Students wrote
about this theme with comments such as
‘‘I spent about 15 minutes trying to come up with a topic during my lunch break at
work today. I’m having some difficulty coming up with something of personal
significance relating to a social issue’’ (523, 2-4-04) and
‘‘I spent 20 minutes researching social issues on the internet on the computer in my
dorm room’’ (114, 2-3-04).
(Note that each students was separated into sections and given an individual ref-
erence number within the section. The first number corresponds to the section and
unit number of the participant, and the second number refers to the date of the spe-
cific journal entry.) Commenting on the same theme, another individual indicated:
I spent about 20 minutes thinking about my speech. I was relaxing in my dormroom trying to think of a topic. I think I have my topic now but I don’t havemy thesis statement that I was supposed to have ready. (507, 2-4-04)
The second category included organizing the speech ideas or topics and completing
an informal outline for the speech. Reflecting on this theme, one student indicated:
I spent about 45 minutes writing my prep outline last evening—it still needs someembellishing. Some main points are a little thin yet. The intro and conclusion arebasically done though. (523, 2-6-04)
while another student said,
Since last class period I have worked on my prep outline. I have completed this taskbut still need more research. I have probably put about 1 hour of work into thisspeech. (508, 2-6-04)
The third category consisted of writing the formal speech outline. Students com-
menting on writing their formal outline said things like ‘‘On Sunday I worked until
Communication Quarterly 357
10:00 p.m. So, about 5 hours [was spent] on my formal outline’’ (520, 2-9-04) and ‘‘I
have now spent a significant amount of time preparing my formal outline. I probably
spent about 2–3 hours on it when I was preparing the outline. I was on my computer
in my room’’ (115, 2-5-04). Another student, while discussing formal outline writing,
said ‘‘I spent 30 minutes preparing my formal outline at the library. I think it was
adequate considering I had two tests last night and an English paper to write’’
(117, 2-5-04).
The fourth category included revising, editing, and fine-tuning the speech or for-
mal outline. Commenting on the revision process, students wrote:
‘‘Since the last class period I have spend 45 minutes rewriting my speech. I did this at
Babb’s Coffee House. It was fun. I recommend the while chocolate mocha.’’ (519,
2-11-04)
‘‘I spent about five minutes tweaking my speech in the library’s computer lab.’’ (510,
2-11-04)
‘‘I spent about a half an hour in my dorm room editing my formal outline.’’ (114,
2-10-04)
The fifth category included delivery, practice, creating presentational aids, and cre-
ating speaking outline notes for the speech. Comments about this theme included:
‘‘Today I spent about an hour finishing my notecards and practicing my speech. I
practiced it by myself in my dorm room. Made a couple of changes but I think
it sounds good.’’ (507, 2-11-04)
‘‘I didn’t spend any time on my speech last night, but the night before I spent an hour
practicing. I could’ve spent more time practicing but I had a test to study for.’’
(509, 2-11-04)
‘‘Since Tuesday I have spent a couple of hours in my dorm room and my friends’
room practicing with her and with my boyfriend.’’ (104, 2-12-04)
Krippendorff’s alpha reliability is a measure for calculating intercoder reliability
when multiple coders determine the themes (Neuendorf, 2002). The Krippendorff’s
reliability for the five themes was excellent (a ¼ .91). Once the researchers coded all
journal entries, they combined the time for each activity in weekly increments so that
they could examine a common unit of analysis or measure of time among the two
Tuesday=Thursday sections and the three Monday=Wednesday=Friday class sections.
The research group met as an entire group frequently during the data coding process
to address coding issues encountered by the five coders.
Measures
Dependent speech grade average measure
Over the fourteen weeks, students gave a total of four speeches. The researchers used
the grade given on each of the four speeches to compute a total speech grade average
for each participant. While students engaged in several preparatory outlines and
358 J. C. Pearson et al.
drafts of their speech with peers, outline grades are not reflected in the dependent
speech grade measure. Instructors provided the research group student speech grades
based on an assigned identification number to ensure student privacy and confiden-
tiality. Overall, participants of the study maintained a B speech grade average
(M ¼ 86.10, SD ¼ 4.44). The speech grade average variable was a normally distribu-
ted measure. The researchers used ANOVAs and t-tests to test the reliability of the
dependent speech grade measure by section and instructor. The overall speech grade
average of students was not significantly different by section (F[4, 90] ¼ 1.71,
p ¼ .154) nor instructor (t[93] ¼ .45, p ¼ .654).
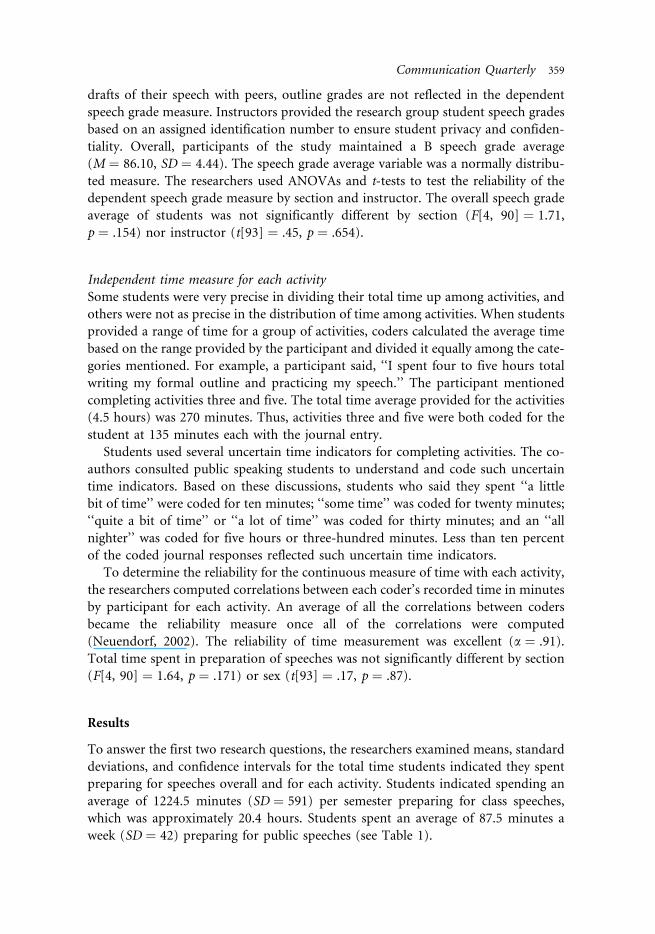
Independent time measure for each activity
Some students were very precise in dividing their total time up among activities, and
others were not as precise in the distribution of time among activities. When students
provided a range of time for a group of activities, coders calculated the average time
based on the range provided by the participant and divided it equally among the cate-
gories mentioned. For example, a participant said, ‘‘I spent four to five hours total
writing my formal outline and practicing my speech.’’ The participant mentioned
completing activities three and five. The total time average provided for the activities
(4.5 hours) was 270 minutes. Thus, activities three and five were both coded for the
student at 135 minutes each with the journal entry.
Students used several uncertain time indicators for completing activities. The co-
authors consulted public speaking students to understand and code such uncertain
time indicators. Based on these discussions, students who said they spent ‘‘a little
bit of time’’ were coded for ten minutes; ‘‘some time’’ was coded for twenty minutes;
‘‘quite a bit of time’’ or ‘‘a lot of time’’ was coded for thirty minutes; and an ‘‘all
nighter’’ was coded for five hours or three-hundred minutes. Less than ten percent
of the coded journal responses reflected such uncertain time indicators.
To determine the reliability for the continuous measure of time with each activity,
the researchers computed correlations between each coder’s recorded time in minutes
by participant for each activity. An average of all the correlations between coders
became the reliability measure once all of the correlations were computed
(Neuendorf, 2002). The reliability of time measurement was excellent (a ¼ .91).
Total time spent in preparation of speeches was not significantly different by section
(F[4, 90] ¼ 1.64, p ¼ .171) or sex (t[93] ¼ .17, p ¼ .87).
Results
To answer the first two research questions, the researchers examined means, standard
deviations, and confidence intervals for the total time students indicated they spent
preparing for speeches overall and for each activity. Students indicated spending an
average of 1224.5 minutes (SD ¼ 591) per semester preparing for class speeches,
which was approximately 20.4 hours. Students spent an average of 87.5 minutes a
week (SD ¼ 42) preparing for public speeches (see Table 1).
Communication Quarterly 359
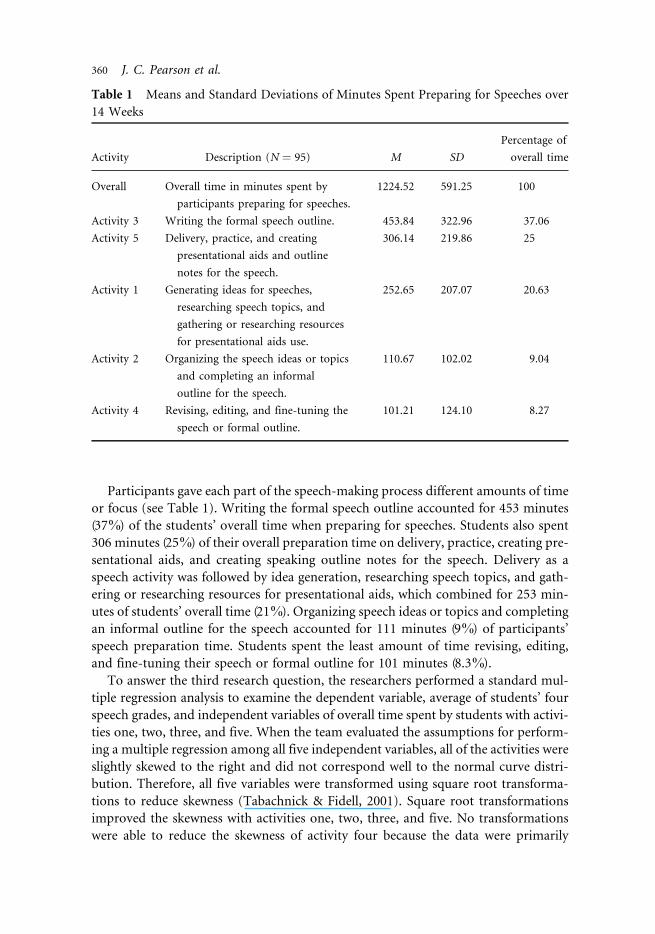
Participants gave each part of the speech-making process different amounts of time
or focus (see Table 1). Writing the formal speech outline accounted for 453 minutes
(37%) of the students’ overall time when preparing for speeches. Students also spent
306 minutes (25%) of their overall preparation time on delivery, practice, creating pre-
sentational aids, and creating speaking outline notes for the speech. Delivery as a
speech activity was followed by idea generation, researching speech topics, and gath-
ering or researching resources for presentational aids, which combined for 253 min-
utes of students’ overall time (21%). Organizing speech ideas or topics and completing
an informal outline for the speech accounted for 111 minutes (9%) of participants’
speech preparation time. Students spent the least amount of time revising, editing,
and fine-tuning their speech or formal outline for 101 minutes (8.3%).
To answer the third research question, the researchers performed a standard mul-
tiple regression analysis to examine the dependent variable, average of students’ four
speech grades, and independent variables of overall time spent by students with activi-
ties one, two, three, and five. When the team evaluated the assumptions for perform-
ing a multiple regression among all five independent variables, all of the activities were
slightly skewed to the right and did not correspond well to the normal curve distri-
bution. Therefore, all five variables were transformed using square root transforma-
tions to reduce skewness (Tabachnick & Fidell, 2001). Square root transformations
improved the skewness with activities one, two, three, and five. No transformations
were able to reduce the skewness of activity four because the data were primarily
Table 1 Means and Standard Deviations of Minutes Spent Preparing for Speeches over
14 Weeks
Activity Description (N ¼ 95) M SD
Percentage of
overall time
Overall Overall time in minutes spent by
participants preparing for speeches.
1224.52 591.25 100
Activity 3 Writing the formal speech outline. 453.84 322.96 37.06
Activity 5 Delivery, practice, and creating
presentational aids and outline
notes for the speech.
306.14 219.86 25
Activity 1 Generating ideas for speeches,
researching speech topics, and
gathering or researching resources
for presentational aids use.
252.65 207.07 20.63
Activity 2 Organizing the speech ideas or topics
and completing an informal
outline for the speech.
110.67 102.02 9.04
Activity 4 Revising, editing, and fine-tuning the
speech or formal outline.
101.21 124.10 8.27
360 J. C. Pearson et al.
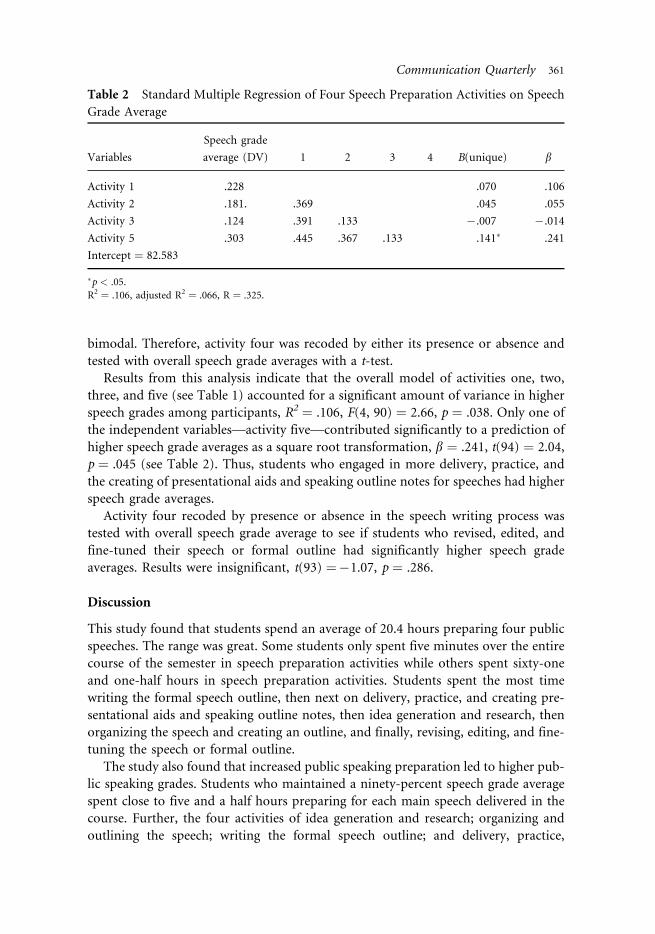
bimodal. Therefore, activity four was recoded by either its presence or absence and
tested with overall speech grade averages with a t-test.
Results from this analysis indicate that the overall model of activities one, two,
three, and five (see Table 1) accounted for a significant amount of variance in higher
speech grades among participants, R2 ¼ .106, F(4, 90) ¼ 2.66, p ¼ .038. Only one of
the independent variables—activity five—contributed significantly to a prediction of
higher speech grade averages as a square root transformation, b ¼ .241, t(94) ¼ 2.04,
p ¼ .045 (see Table 2). Thus, students who engaged in more delivery, practice, and
the creating of presentational aids and speaking outline notes for speeches had higher
speech grade averages.
Activity four recoded by presence or absence in the speech writing process was
tested with overall speech grade average to see if students who revised, edited, and
fine-tuned their speech or formal outline had significantly higher speech grade
averages. Results were insignificant, t(93) ¼�1.07, p ¼ .286.
Discussion
This study found that students spend an average of 20.4 hours preparing four public
speeches. The range was great. Some students only spent five minutes over the entire
course of the semester in speech preparation activities while others spent sixty-one
and one-half hours in speech preparation activities. Students spent the most time
writing the formal speech outline, then next on delivery, practice, and creating pre-
sentational aids and speaking outline notes, then idea generation and research, then
organizing the speech and creating an outline, and finally, revising, editing, and fine-
tuning the speech or formal outline.
The study also found that increased public speaking preparation led to higher pub-
lic speaking grades. Students who maintained a ninety-percent speech grade average
spent close to five and a half hours preparing for each main speech delivered in the
course. Further, the four activities of idea generation and research; organizing and
outlining the speech; writing the formal speech outline; and delivery, practice,
Table 2 Standard Multiple Regression of Four Speech Preparation Activities on Speech
Grade Average
Variables
Speech grade
average (DV) 1 2 3 4 B(unique) b
Activity 1 .228 .070 .106
Activity 2 .181. .369 .045 .055
Activity 3 .124 .391 .133 �.007 �.014
Activity 5 .303 .445 .367 .133 .141� .241
Intercept ¼ 82.583
�p < .05.
R2 ¼ .106, adjusted R2 ¼ .066, R ¼ .325.
Communication Quarterly 361
creating presentational aids and creating speaking outline notes all contribute to
higher grades. Taken alone, the category that included delivery, practice, creating
presentation aids, and creating speaking outlines notes was the only activity that pre-
dicts higher grades. The communicative-related tasks may be most important. This
finding is consistent with Ayres (1996), who found that high communication appre-
hensive students were more likely to engage in non-communicative activities and
receive lower speech grades.
A number of people have been critical of the basic public speaking course. The
principal criticism has been that little has changed over the years. Pearson and Nelson
(1990) were among the first to notice the phenomenon: ‘‘Little change has been
reported in the basic course even though dramatic changes have occurred in other
avenues of the field’’ (p. 4). Leff (1992) reflected on 20 years of connection with
the basic public speaking course: ‘‘During the past two decades the academic study
of rhetoric has passed through profound and revolutionary changes. . . Yet, they still
teach public speaking very much as I taught it’’ (p. 16). Frobish (2000) echoes the
lack of change through time in his analysis of The Art of Public Speaking, the most
widely used public speaking textbook. Using Jamieson’s theoretical model of
eloquence in an electronic age, Frobish determined that this influential text does
not successfully acknowledge contemporary communication situations. This work
indicates that the basic course in public speaking has not progressed as well as other
aspects of the communication discipline.
Its size alone renders the basic public speaking course an important site of
research. Although anecdotal evidence abounds, social scientific methods need to
be applied to the course to determine current practices and measure them against
current theories and research. Nearly half a million students pass through the public
speaking course each year. Being unclear about best practices or recommending out-
dated methods for giving speeches is poor pedagogy.
Understanding student preparation for the basic course in public speaking leads to
additional questions (Palmerton, 1992):
What is it that the students are preparing for?
What will students gain from their study and preparation?
Does the basic course teach skills, including performance skills, or does the course
teach students to be better critical thinkers?
These questions should guide the instruction of the basic course. Finding that the
only activity resulting in higher grades was delivery, practice, and rehearsal suggests
that more can be done to assess, encourage, teach, and reward deeper critical thinking
among students and instructors alike.
Powell (1992) argues that we must assess how successfully we teach critical think-
ing. Assessing the teaching of critical thinking is a multi-faceted task. The determi-
nation of effectiveness requires one to consider factors from both the student’s
and instructor’s points of view. Are students who are spending more time thinking
and conceptualizing their speech topic and outline actually engaging in deeper critical
362 J. C. Pearson et al.
thought, or are they just putting off deciding on a topic so they do not have to begin
the writing process?
Students from the current study prepared all four of their major public speaking
assignments around understanding relevant social issues and considering solutions to
unresolved problems individually in small groups—a problem-based learning
approach. Additionally, students were given feedback and points for the development
of preparatory drafts of their written speech work. Such an approach is especially
geared toward encouraging deeper critical thought among students. The results of
the study beg the question: does deeper critical thought happen more naturally at
higher course levels where students have more self-interest in the course content than
at introductory level courses?
Teaching deeper critical thinking skills can also be problematic for instructors. At
most major universities, graduate teaching assistants (GTAs) are responsible for
teaching the introductory public speaking course. While most communication
departments provide extensive training to new GTAs, value rests in considering
the feasibility of transmitting strategies and tactics for engaging students in the pro-
cess of deep critical thought to novice public speaking instructors—or, does the issue
of engaging students in deep critical thought cut deeper than simply developing such
strategies through more hands-on experience?
Dance (2002) laments the current state of affairs in the public speaking course.
He believes that the basic course should integrate dialectic and rhetoric, thought
and speech. For Dance, effective public speaking should be based on the quality
of the ideas of the speaker, a focus that promotes critical thinking. Such an
approach leads to considering how the simple virtue of assigning points implicitly
tells students how much to value the end-product in the public speaking preparation
process.
Allen, Berkowitz, Hunt, and Louden (1999) have the final word on the effect of
communication education (and forensics) on critical thinking. These authors con-
ducted a meta-analysis of all of the studies that have tried to determine the relation-
ship between either communication education or forensics and critical thinking and
demonstrated that both result in improvements in critical thinking. Consequently, it
can be asserted that the basic public speaking course, as it is, does serve to advance
the educational outcome of critical thinking. However, improving critical thought in
the one and only class that most undergraduate students will take as an introduction
to the communication discipline always warrants further discussion.
Gayle (2004) has offered specific strategies for teaching both critical thinking and
civil discourse. Encouraging students to take multiple perspectives on a single topic,
they began to understand different points of view. They were also able to engage in
‘‘civil, robust, and effective public discourse’’ (p. 174).
This study suggests that students understand the role of multiple speech activities.
Students reported spending time on the classic rhetorical canons of invention, dispo-
sition, style, delivery, and memory. At the same time, their emphasis on the com-
municative aspects of preparation, namely delivery and practice, was the only
activity that individually predicted public speaking grade. Basic courses may be
Communication Quarterly 363
teaching both thinking and speaking but privilege the performance aspects or the
development of skills.
Limitations
This study relies on self-report data. One limitation of self-report data is the possi-
bility of students over-reporting preparation time for each activity. Possibly students
over-reported consistently across all categories, given the lack of significant differ-
ences in total preparation time by section for all but one of the categories. The
researchers did not actually observe the students’ participation in the variety of prep-
aration activities referenced. The self-reports were also collected only twice or three
times a week rather than day by day or activity by activity.
Another method of collecting data would be to use a public speaking daily diary
where students would record an entry each time they spent time preparing for
speeches. This alternative method might capture the data more realistically, but stu-
dents might also forget to add entries to the diaries or journals. Ideally, researchers
would collect and analyze observational data.
Another limitation of this project was that the sample size is relatively small.
Nonetheless, the sample size was sufficient to reveal multiple relationships among
variables. In addition, the large numbers of comments (nearly 2,500) render larger
sample sizes difficult to manage.
Implications
This study suggests that classroom instructors can tell students that increased prep-
aration time will lead to higher grades on their classroom speeches. Preparation time
does matter. We also have a gauge as to how much time students do prepare for their
speeches. The most important preparation activity may be activities related to deliv-
ery, practice, creating presentational aids, and creating speaking outline notes. In
other words, the communicative-related tasks are most important.
Future Research
Studying actual classroom behavior is difficult. Following students throughout an
entire semester is time-consuming and can lead to large data sets. Nonetheless, we
need to continue to study the basic public speaking course. While laboratory studies
can be useful, studies of actual students and their behaviors is most important. As
Lucas (1999) observes, the basic public speaking course is the ‘‘bedrock of the under-
graduate curriculum’’ (p. 75). Future studies might test the ‘‘sophomore slump’’
phenomena discussed by Rubin, Graham, and Mignerey (1990) in regard to speech
preparation by classification with a larger sample.
Further, evaluative behavior needs to continue to be studied. Recently McGlone,
Kobrynowicz and Alexander (2005) tested the idea that people change their evalua-
tions when they verbalize them. They found a contamination effect as so-called
‘‘experts’’’ verbalized their reasons for liking or disliking an abstract piece of art.
364 J. C. Pearson et al.
Novice viewers changed their judgment about a second object even though the
experts did not identify their rationale.
How do classroom evaluations of speeches by instructors affect other students’
evaluations? Optimistically, the continued study and discussion of the introductory
public speaking course, which is required of all students at many colleges and univer-
sities, will similarly increase our ability as instructors to have an impact on students’
lives and assist them in obtaining sound educational outcomes.
References
Allen, M., Berkowitz, S., Hunt, S., & Louden, A. (1999). A meta-analysis of the impact of
forensics and communication education on critical thinking. Communication Education,
48, 18–30.
Andersen, S. M. (1988). The composing process and speech communication: An examination of the
strategies of six successful student speakers. Unpublished Ph.D. dissertation, University of
Central Florida, Orlando, Florida.
Ayres, J. (1996). Speech preparation processes and speech apprehension. Communication Education,
45, 228–235.
Beatty, M. J., McCroskey, J. C., & Heisel, A. D. (1998). Communication apprehension as tem-
peramental expression: A communibiological paradigm. Communication Monographs, 65,
197–219.
Bourhis, J., & Allen, M. (1992). Meta-analysis of the relationship between communication appre-
hension and cognitive performance. Communication Education, 41, 68–76.
Burkel-Rothfuss, N. L., Gray, P. L., & Yerby, J. (1993). The structured model of competency-based
instruction. Communication Education, 42, 22–36.
Burroughs, N. F., Marie, V., & McCroskey, J. C. (2003). Relationships of self-perceived communi-
cation competence and communication apprehension with willingness to communicate:
A comparison with first and second languages in Micronesia. Communication Research
Reports, 20, 230–239.
Cole, J. G., & McCroskey, J. C. (2003). The association of perceived communication apprehension,
shyness, and verbal aggression with perceptions of source credibility and affect in organiza-
tional and interpersonal contexts. Communication Quarterly, 51, 101–110.
Daly, J. A., & McCroskey, J. C. (1975). Occupational desirability and choice as a function of com-
munication apprehension. Journal of Counseling Psychology, 22, 309–313.
Daly, J. A., Vangelisti, A. L., Neel, H. L., & Cavanaugh, P. D. (1989). Pre-performance concerns
associated with public speaking anxiety. Communication Quarterly, 37, 39–53.
Daly, J. A., Vangelisti, A. L., & Weber, D. J. (1995). Speech anxiety affects how people prepare
speeches: A protocol analysis of the preparation processes of speakers. Communication
Monographs, 62, 383–397.
Dance, F. E. X. (2002). Speech and thought: A renewal. Communication Education, 51, 355–359.
Frobish, T. (2000). Jamieson meets Lucas: Eloquence and pedagogical model(s) in The Art of Public
Speaking. Communication Education, 49, 239–252.
Gayle, B. M. (2004). Transformations in a civil discourse public speaking class: Speakers’ and
listeners’ attitude change. Communication Education, 53, 174–184.
Leff, M. (1992, June). Teaching public speaking as composition. Basic Communication Course
Annual, 4, 116–122.
Lucas, S. E. (1999). Teaching public speaking. In A. Vangelisti, J. Daly, & G. Friedrich (Eds.),
Teaching communication: Theory, research and methods (2nd ed., pp. 75–84). Mahwah, NJ:
Lawrence Erlbaum Associates.
Lucas, S. E. (2004). The art of public speaking. (4th ed.). New York: McGraw-Hill.
Communication Quarterly 365
McCroskey, J. C. (1970). Measures of communication-bound anxiety. Speech Monographs, 37(4),
269–277.
McCroskey, J. C. (1976). The effects of communication apprehension on nonverbal behavior. Com-
munication Quarterly, 24, 39–44.
McCroskey, J. C. (2000). Introduction to rhetorical communication. (8th ed.). New York: Pearson
Allyn & Bacon.
McCroskey, L. L., Richmond, V. P., & McCroskey, J. C. (2002). The scholarship of teaching and
learning: Contributions from the discipline of communication. Communication Education,
51, 383–391.
McGlone, M. S., Kobrynowicz, D., & Alexander, R. B. (2005). A certain je ne sais quoi: Verbalization
bias in evaluation. Human Communication Research, 31, 241–267.
Menzel, K. E., & Carrell, L. J. (1994). The relationship between preparation and performance in
public speaking. Communication Education, 43, 17–26.
Morreale, S. P., Hanna, M. S., Berko, R. M., & Gibson, J. W. (1999). The basic communication
course at U.S. Colleges and Universities: VI. Basic Communication Course Annual, 11, 1–26.
Nelson, P. E., & Pearson, J. C. (2005). Confidence in public speaking (8th ed.). Los Angeles: Roxbury
Publishing Company.
Neuendorf, K. A. (2002). The content analysis guidebook. Thousand Oaks, Calif.: Sage Publications.
Neulip, J. W., Chadouir, M., & McCroskey, J. C. (2003). A cross-cultural test of the association
between temperament and communication apprehension. Communication Research Reports,
20, 320–330.
Palmerton, P. R. (1992). Teaching skills or teaching thinking? Journal of Applied Communication
Research, 20, 335–341.
Pearson, J. C., & Daniels, T. D. (1988). Oh what tangled webs we weave: Concerns about current
conceptions of communication competence. Communication Reports, 1, 95–100.
Pearson, J. C., & Nelson, P. (1990, November). The future of the basic course. Basic Course Annual,
2, 1–26.
Powell, R. G. (1992). Critical thinking and speech communication: Our teaching strategies are
warranted—Not! Journal of Applied Communication Research, 20, 342–347.
Robinson, E. R. (1956). An experimental investigation of certain commonly suggested teaching
methods for the development of confidence in beginning students of public speaking. Speech
Monographs, 23, 97–98.
Rubin, R. B., Graham, E. E., & Mignerey, J. T. (1990). A longitudinal study of college students’
communication competence. Communication Education, 39, 1–14.
Tabachnick, B. G., & Fidell, L. S. (2001). Using multivariate statistics. (4th ed.). Needham Heights,
Massachusetts: Allyn & Bacon.
Weissberg, M., & Lamb, D. (1977). Comparative effects of cognitive modification, systematic
desensitization, and speech preparation in the reduction of speech and general anxiety. Com-
munication Monographs, 44, 27–36.
366 J. C. Pearson et al.