PREDICTING THE VALUE OF STANDING TREES Through ...
10
-
Upload
khangminh22 -
Category
Documents
-
view
0 -
download
0
Transcript of PREDICTING THE VALUE OF STANDING TREES Through ...


1
Predicting the value of standing trees through quality inventory: a case study of Meranti trees (Shorea sp.) in Province of Jambi, Indonesia
Pendugaan Nilai Pohon Berdiri Melalui Inventarisasi Kualitas: Studi Kasus pada
Pohon Meranti (Shorea sp.) di Propinsi Jambi, Indonesia
Sitti Latifah
Jurusan Sosial Ekonomi, Fakultas Pertanian UNRAM
Abstract
The value of trees depends not only on dimension and price but also on its quality. Until now, the estimation of tree value is still done when the tree has already felled. This condition caused only certain quality of wood will be extracted. This study tried to correlate the dimension of standing tree, which is easy to measure, and its economic value. Quality inventory method was implemented on standing trees. The result shows that basically the value of standing tree can be estimated through its dimension which has already included the quality on it.
Key word: forest inventory, wood quality, quality inventory
Abstrak
Nilai ekonomis suatu pohon tidak hanya ditentukan oleh dimensi dan harganya tetapi sangat ditentukan pula oleh kualitasnya. Selama ini, penentuan nilai pohon hanya dilakukan ketika pohon telah rebah. Hal tersebut yang menyebabkan kayu dengan kualitas tertentu saja yang diekstrak ke luar hutan. Penelitian ini mencoba menghubungkan antara dimensi pohon berdiri yang mudah untuk diukur dengan nilai ekonomisnya. Metode invetarisasi kualitas pada pohon berdiri dicobakan pada penelitian ini. Hasil menunjukkan bahwa ternyata nilai satu pohon berdiri dapat diduga melalui dimensinya yang telah memasukkan unsur kualitas didalamnya. Kata kunci: invetarisasi hutan, kualitas kayu, inventarisasi kualitas
Introduction
One economic assumption in forest management in Indonesia has never been fully realized in that the trees in the forest have never been calculated as fixed assets. Thus, there is no risk or responsibility for the entrepreneur for the loss or the degradation of forests that had been managed (Kartodihardjo, 1999). This means that the standing trees have never been properly valued and tend to be arbitrarily used without consideration to the surrounding environment. The trend that only the best parts of the tree are utilized means that the other parts, which are still utilizable by industry to be left in the field as waste. Some studies showed that the utilized portion of the tree was only about 51.9% to 60.5%. This means that between 39.5% and 48.1% are discarded (Budiaman, 2002). Therefore, estimating the value of trees is absolutely necessary in the field.
The value of wood should be determined by volume estimation and grade quality in line with industrial purposes due to the fact that each tree or each part of the tree has different characteristics, such as taper and sound of defects which makes the wood more useful and valuable or less for a specific purpose. Therefore, the estimation of volume must be followed by grade quality in order to achieve evaluation precisely.
Davis and Jhonson (2001) remark, that for prospective buyers, a tree represents a storehouse of raw material which contains a tract of wood with a certain quantity of logs, plywood, pulpwood, fiberboard, wood working and other items that can be made into saleable product.
The buyers only see a tree with logs if good quality for their own purposes without considering the condition of industrial process in advance. Although in the field logs have been graded, the value of those logs has mostly decrease because they have been degraded of the grade quality and haven’t fitted the need of industrial purposes. Therefore, the value of the products presently derivable from the tree and balance this return against future growing stock value if the tree is left to grow so the lost value can be reduced.

2
Since the beginning of forest utilization in Indonesia in 1970s, the estimation of standing tree value has been based only on the volume estimation according to the price of each species group. This has never been changed. Quality estimation has never been included when valuing the standing trees. Thus, the estimate was sometimes much lower or higher than the real value, which is a disadvantage to all who are taking part in this activity. This can also have a large disadvantage for the remaining trees, and is grounds for the concern that tree quality will continue to decrease in the future. Most of them ignore the grade quality in the field due to the difficulty collecting the data. The sellers and buyers do not realize that if quality inventory of wood is implemented, the precise tree value in stumpage can be estimated in advance.
The objectives of this study are: (1) to estimate tree value using the quality inventory method, (2) to determinate the proper information about wood utilization for industrial purposes based on quality inventory, (3) to develop equations related to tree value and tree dimension and from this research, it is hoped that the value equation to predict tree value of meranti (Shorea sp.) can be formed.
Methodology
The study area was conduct in PT ASIALOG which according to the governmental administrative zone, belongs to subdistric Muara Bulian, regency of Batanghari and subdistrict Pauh, regency of Sarko, the province of Jambi. Geographically, this area situated between 103o15’-103o32’ West Longitude and 1o58’-2o20’ South latitude. The forest stand is dominated by Meranti (Shorea sp.), Medang (Litsea sp.) amd Kempas (Kompassia malaccensis mig). Undergrowth vegetation consists of rattan and shrubs.
This study used 3 harvesting compartments (1 km x 1 km/ 100 ha in size) and each compartment has different usable tree density, as follow:
Table 1. The density of usable trees
Compartment Density of usable trees (trees/100 ha)
Meranti group All kind of trees
Compartment 1 Compartment 2 Compartment 3
1.063 1.099 1.208
3.398 3.293 3.631
Source: Long-term planning PT ASIALOG
A total number or 68 plots were established. The number of meranti group which were measured and analyzed was 225 trees and 90 trees. The equipment used in this study was Spiegel Relascope Bitterlich (SRB), measurement tape, Haga hypsometer and STATISTICA software.
Quadratic sample plots having 40 m x 40 m in size were laid out on a grid through out the inventory area. The number of these plots relied accordingly on the density of usable trees. The distance between each plot was calculated using a distance formula for systematic sampling with a rectangular grid (Akca, 1997). All trees from meranti group on the sample were selected as sample trees. At least 30-40 usable trees in each investigated compartment were included. From 30-40 usable trees, at least 30 logs derived from those trees were selected as sample logs.
Dimension measured for each tree were diameter at breast height (dbh), butt diameter, diameter at the top height (dhtotal), diameter at commercial height (dhcomm), diameter at certain height (this study used 15 m, d15 mheight), total height (htotal) and commercial height (hcomm). Section wise measurements were also conducted on each tree to obtain the diameter at the large end (b) and small end (s) of each section. The length of each section was set to 2 m or less depending on the condition of trees. For logs, dimensions measured for each log were large-end diameter (b), small-end diameter (s) and length (L). The similar sectional measurements were also conducted. All measurements were taken on over-bark logs. The ‘true’ volume for total and commercial height was calculated by summing up the volume of each section of the tree related to certain height. The volume of each section is calculated by Smallian’s formula (Husch et al.,, 2003).
External defects dimensions recorded for each tree and log were the length and depth (deviation) of sweep and crook, the size, number and the distance of health and death knot, the number and condition of branch and the length of buttress. Internal defects measurements which usually occurred in logs and effect to quality grading were also recorded, there are hole and decay. The measurements were taken on each section which were set 2 m or less. The combination between two basic approaches for the assessment of external characteristics and defects on standing as well as felled trees was implemented in this study, namely: whole-tree method (tree concept) and log based method (section concept) (Davis et al., 2001;, Latifah, 2005; Schroeter, 2000; Schumann, 2001; Wiegard, 1998).
The quality of each section in each tree was determined on the Indonesian Grading Rules related to intern standard quality of the company and basic quality data from observation. The quality of each section for trees and logs are seen below:

3
Table 2. Section quality classes criteria for Meranti trees
Defect criteria
Section Quality Classes
Prime I II III Local I Local II R1 R2 Diameter (cm) Length (m) Sweep and Crook (cm) Health knot Death knot Branch Buttress
min. 60 min 2.50 ≤ 1/13 D Ø 2-4 * * *
min. 60 min 2.50 ≤ 1/10 D Ø 2-6 * * *
min. 50 min 2.50 ≤ 1/8 D Ø 2-8 * * *
min. 50 min 2.50 ≤ 1/5 D Ø 2-10 max 10cm * *
min. 50 min 2.50 ≤ 1/3 D maxØ15 max 3 max 2 *
30-59 - > 1/3D min Ø15 min 3 max 2
20-29 - - - - - > 1m
- 1.30 - - - - > 1m
Note: R=Reject; D=average diameter; *=not allowed; -=no restriction
Table 3. Section quality classes criteria for Meranti logs
Defect criteria
Section Quality Classes
Prime I II III Local I Local II R1 R2 Diameter (cm) Length (m) Sweep and Crook (cm) Health knot - Number - Size - Distance
between knot
Death knot - Number - Size Branch Cracks(max/L) Buttress,hole, Decay
min. 60 min 2.50 ≤ 1/13 D max1/2m Ø 2-4 min 2m * * * 10% *
min. 60 min 2.50 ≤ 1/10 D max1/2m Ø 2-6 min 1.5m * * * 20% *
min. 50 min 2.50 ≤ 1/8 D max1/1m Ø 2-8 min 1m * * * 30% *
min. 50 min 2.50 ≤ 1/5 D max1/1m Ø 2-10 - max 1/1m max 10cm * 40% *
min. 50 min 2.50 ≤ 1/3 D - ≤ 15 cm - - min 3 knot max 1 - -
30-59 - > 1/3D - > 15cm - - min 3knot max 2 - -
20-29 - - - - - - - - - > 1 m
- 1.30 - - - - - - - - > 1 m
Note: R=Reject; D=average diameter; L=average lenght *=not allowed; -=no restriction
Result
Volume equation
In this study, the establishment of the volume equation aims to find out the relationship between tree dimension measured in the field and ‘true’ volume, which is calculated by summing up the sectional volume of each tree. Using regression equation, twelve formulas of volume equation were fitted to the entire data without splitting, to ensure prediction accuracy of fitted equation. Each equation was applied for total and commercial volume based on its corresponding height.
The performance of tree volume equation model can be evaluated by one of the following criteria in order to select as the’best model’: (1) R2, (2) Adjusted R2, (3) MSE, (4) Mallow’s Cp, (5) Furnival index, (6) PRESS (Laar and Akca,1997; Philip, 1994). Based on the value of coefficient R2 and MSE four equation forms were selected, which are KRAMER and AKÇA (from “Leitfaden zur Waldmeβlehre”’ 1995), SCOOT and SPUUR (short cut and combined variable). For practical reasons, simplicity is also recommended for selecting the volume equation.
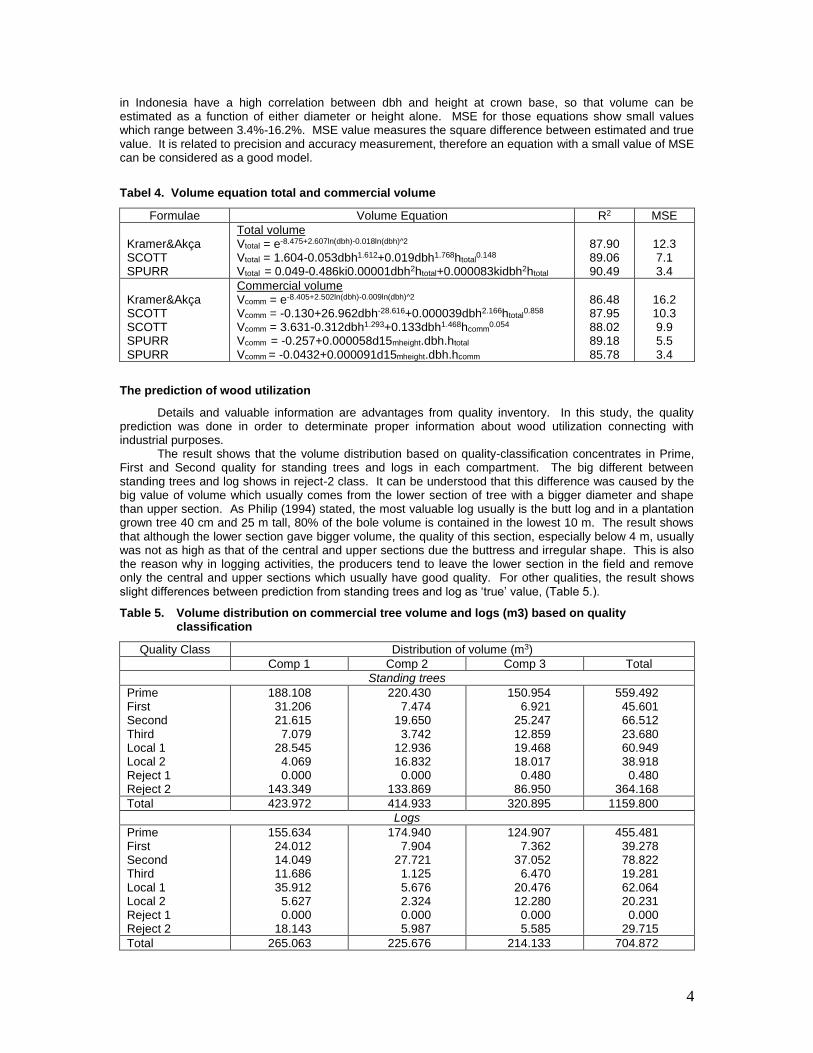
It can be seen from table 4, that those equations give high R2 with a range from 85.78%-90.49%. It means that more than 85% of the proportion of the variation of standing tree volume can be explained due to the variation of tree dimension from entire data collected in this study. The increasing of R2 is only less than 3% by additional tree dimension to the equation. For example, Scott’s formula which includes also height as predictor variable, the value of R2 only increases 1.16% from Kramer and Akça’s which only uses dbh as a predictor variable. The similar results are also shown for other formulas. Therefore, the equation with one predictor variable and gives high R2 is selected. Another advantage when the simply equation being selected is due to the easier measurement of the dbh in comparison to other tree dimensions such as height and diameter at certain height. In line with this, Suhendang (1993) stated that most commercial tree species
4
in Indonesia have a high correlation between dbh and height at crown base, so that volume can be estimated as a function of either diameter or height alone. MSE for those equations show small values which range between 3.4%-16.2%. MSE value measures the square difference between estimated and true value. It is related to precision and accuracy measurement, therefore an equation with a small value of MSE can be considered as a good model.
Tabel 4. Volume equation total and commercial volume
Formulae Volume Equation R2 MSE
Kramer&Akça SCOTT SPURR
Total volume Vtotal = e-8.475+2.607ln(dbh)-0.018ln(dbh)^2 Vtotal = 1.604-0.053dbh1.612+0.019dbh1.768htotal
0.148 Vtotal = 0.049-0.486ki0.00001dbh2htotal+0.000083kidbh2htotal
87.90 89.06 90.49
12.3 7.1 3.4
Kramer&Akça SCOTT SCOTT SPURR SPURR
Commercial volume Vcomm = e-8.405+2.502ln(dbh)-0.009ln(dbh)^2 Vcomm = -0.130+26.962dbh-28.616+0.000039dbh2.166htotal
0.858 Vcomm = 3.631-0.312dbh1.293+0.133dbh1.468hcomm
0.054 Vcomm = -0.257+0.000058d15mheight.dbh.htotal
Vcomm = -0.0432+0.000091d15mheight.dbh.hcomm
86.48 87.95 88.02 89.18 85.78
16.2 10.3 9.9 5.5 3.4
The prediction of wood utilization
Details and valuable information are advantages from quality inventory. In this study, the quality prediction was done in order to determinate proper information about wood utilization connecting with industrial purposes.
The result shows that the volume distribution based on quality-classification concentrates in Prime, First and Second quality for standing trees and logs in each compartment. The big different between standing trees and log shows in reject-2 class. It can be understood that this difference was caused by the big value of volume which usually comes from the lower section of tree with a bigger diameter and shape than upper section. As Philip (1994) stated, the most valuable log usually is the butt log and in a plantation grown tree 40 cm and 25 m tall, 80% of the bole volume is contained in the lowest 10 m. The result shows that although the lower section gave bigger volume, the quality of this section, especially below 4 m, usually was not as high as that of the central and upper sections due the buttress and irregular shape. This is also the reason why in logging activities, the producers tend to leave the lower section in the field and remove only the central and upper sections which usually have good quality. For other qualities, the result shows slight differences between prediction from standing trees and log as ‘true’ value, (Table 5.).
Table 5. Volume distribution on commercial tree volume and logs (m3) based on quality classification
Quality Class Distribution of volume (m3)
Comp 1 Comp 2 Comp 3 Total
Standing trees
Prime First Second Third Local 1 Local 2 Reject 1 Reject 2
188.108 31.206 21.615 7.079
28.545 4.069 0.000
143.349
220.430 7.474
19.650 3.742
12.936 16.832 0.000
133.869
150.954 6.921
25.247 12.859 19.468 18.017 0.480
86.950
559.492 45.601 66.512 23.680 60.949 38.918 0.480
364.168
Total 423.972 414.933 320.895 1159.800
Logs
Prime First Second Third Local 1 Local 2 Reject 1 Reject 2
155.634 24.012 14.049 11.686 35.912 5.627 0.000
18.143
174.940 7.904
27.721 1.125 5.676 2.324 0.000 5.987
124.907 7.362
37.052 6.470
20.476 12.280 0.000 5.585
455.481 39.278 78.822 19.281 62.064 20.231 0.000
29.715
Total 265.063 225.676 214.133 704.872

5
Tables 6 and 7 display the optimal utilization of wood based on volume distribution. The estimation
of volume from standing trees that can be used as material for industry is 1159 m3 whereas 704.872 m3 from logs. It means only 60.78% of wood is contained in standing tree removed as logs. There are also some differences in distribution to achieve optimal utilization of wood between estimation standing tree and log. In a standing tree, the utilization can be optimal if 58.5% is in compartment 1 distributed as plywood material whereas 60.56% goes for compartment 2 and 61.76% is in compartment 3. The distribution of wood working is 7.69% in compartment 1, 7.17% is in compartment 2 and 11.68% in compartment 3, whereas for fiberboard the distribution is 33.81%, 32.26% and 27.10%. The contrast result with log only showed in fiber board distribution. In log, the distribution for fiber board only ranges between 2.61%-6.84%.
Table 6. Composition of optimal utilization of each section for industrial purposes based on volume distribution
Industrial Purpose Volume distribution (m3) Total (m3)
Comp.1 Comp.2 Comp.3
Commercial height
Plywood Wood working Fiber board
248.008 32.614
143.349
251.296 29.768
133.869
195.981 37.485 86.950
695.285 100.347 364.168
Total 423.972 414.933 320.895 1159.800
Log
Plywood Wood working Fiber board
205.381 41.539 18.143
211.690 8.000 5.987
175.791 32.756 5.585
592.862 82.295 29.715
Total 263.063 225.676 214.133 704.872
Table 7. Percentage section class and optimal utilization for industrial purpose based on volume distribution
Comp Section Class (%) Industrial Purpose (%)
P F S T L1 L2 R1 R2 PW WW FB
Commercial Height
1 2 3
44.37 53.93 47.07
7.36 1.80 2.16
5.10 4.74 7.87
1.67 0.90 4.01
6.73 3.12 6.07
0.96 4.06 5.61
0.00 0.00 0.15
33.81 32.26 27.10
58.50 60.56 61.07
7.69 7.17
11.68
33.81 32.26 27.10
Logs
1 2 3
58.72 77.52 58.33
9.06 3.50 3.44
5.30 12.28 17.30
4.41 0.50 3.15
13.55 2.52 9.56
2.12 1.03 5.73
0.00 0.00 0.00
6.84 2.65 2.61
77.48 93.80 82.09
15.67 3.55
15.30
6.84 2.65 2.61
Key and Tim (2002) remark that the occurrence and percent volume of high value products was
strongly associated with increasing tree grade. This condition can be understood because the result of standing tree still includes lower section of the tree which have high volume but low quality which is usually being cut and left in logging activities.
The prediction of tree value
Based on standing and felled trees (logs) measurements the prediction of value based on quality-class was calculated. The result shows that the prime quality contributed the highest value due to a high value of volume and price. Reject-2 quality also contributes a high value of volume but only gave low value due to a low price. From this result, it can be understood that the value of the tree is not only affected by dbh but also due to some factors such as the length of usable section and quality-class which is determined by defects. The calculation of the relative value was also done in order to investigate how far the differences between ‘estimated’ over ‘true’ value.
The prediction value of standing trees base on the ratio between ‘estimated’ and ‘true’ value shows that the prediction of standing trees is 27.41% higher felled trees. The similar result shows for each compartment, that the predictions of standing trees are 24.83% (comp.1), (36.7%) and 20.25% (comp.3) higher than felled trees. On the other hand, it can be said that the value of felled trees only reaches 78.41% of the standing trees; (80.11% in comp.1, 73.15% in comp.2 and 83.16% in comp.3), (table 8).

6
Table 8. Commercial tree and log value prediction (Rp.)
Quality Class
Value prediction (xRp. 1.000.000) % value prediction
Comp. 1 Comp. 2 Comp. 3 Total Comp. 1 Comp. 2 Comp. 3 Total
Trees
Prime First Second Third Local 1 Local 2 Reject 1 Reject 2
82.77 13.73
7.78 2.55 9.56 1.10 0.00
11.47
96.99 3.29 7.07 1.35 4.33 4.54 0.00
10.71
66.42 3.05 9.09 4.63 6.52 4.86 0.07 6.96
246.18 20.06 23.94
8.52 20.42 10.51
0.07 29.13
64.18 10.65
6.03 1.98 7.42 0.85 0.00 8.89
75.60 2.56 5.51 1.05 3.38 3.54 0.00 8.35
65.47 3.00 0.96 4.56 6.43 4.65 0.07 6.86
68.63 5.59 6.68 2.38 5.69 2.89 0.02 8.12
Total 128.96 128.29 101.59 358.84 100.00 100.00 100.00 100.00
Logs
Prime First Second Third Local 1 Local 2 Reject 1 Reject 2
68.48 10.57
5.06 4.21
12.03 1.52 0.00 1.45
76.97 3.48 9.98 0.41 1.90 0.63 0.00 0.48
54.96 3.24
13.34 2.33 6.86 3.32 0.00 0.45
200.41 17.28 28.38
6.94 20.79
5.46 0.00 2.38
66.29 10.23
4.90 4.07
11.65 1.47 0.00 1.40
82.02 3.71
10.63 0.43 2.03 0.67 0.00 0.51
65.05 3.83
15.79 2.76 8.12 3.92 0.00 0.53
71.16 6.14
10.08 2.46 7.38 1.94 0.00 0.84
Total 103.31 93.84 84.49 281.64 100.00 100.00 100.00 100.00
Value equation for predicting the value of standing tree
In this study, tree value was calculated based on the optimal utilization of each section in each tree. Tree value is the result of correlation between price and quality in line with industry and volume which correlates with tree dimensions (diameter and height). As GOBAKKEN (2000) stated that the grade value of standing trees is the function of dbh, height and its price. Therefore, if s relationship can be developed from this information as a tree value equation, this equation will provide other information not giving by tree volume equation.
Table 9. Tree value equation
Tree Value Equation R2 (%)
TV = e-2.627+5.691 ln(dbh)-0.376 ln(dbh)^2
TV = -3447200 + 20216100 log(dbh) TV = 203.361 dbh2.230
TV = -644359 + 660 (dbh)2
TV = -1547800 + 20067 dbh + 553 dbh2
TV = 24.859 dbh2hcomm
TV = 176009 + 24.3 dbh2hcomm
84.86 64.71 84.67 84.71 84.58 87.63 87.54
Note: TV = Tree Value
Seven equations were fitted to the data using dbh and commercial height as predictor variables. The reason for using tree dimensions is because in determining the quality of each section, beside defects, diameter is a tree dimension which must be measured and considered. Four equations from five which are based on only dbh as predictor variable show a high R2 which ranging between 84.58-84.56)%, whereas one gives only 64.71%. The highest R2 is achieved by the equation with exponential form. This equation also applies to predict volume equation (KRAMER and AKÇA,1997) and also gives highest value of R2. Other two equations, includes commercial height as predictor variables. The results show that those equations give high R2 also which ranges between 87.54%-87.63%. This result shows that the tree value can be predicted by using the relationship between value and tree dimension. Beside statistical terms, simplicity is the important thing to be considered in applying equations in the field.
Conclusions
1. The estimation of standing trees value gives higher value than that of felled trees (logs) which is indicated by the relative value measurement. Compared to felled trees, in all sample trees, the estimation value of standing trees is 27.41% higher. In compartment 1, 2 and 3 the estimation value of

7
standing trees is 24.83%, 36.70% and 20.25%, respectively higher than felled trees (logs) as ‘true’ volume. This estimation also shows a positive bias measured through mean of error. The estimation also shows a positive bias measured through mean of error. The mean of error for all trees is 32.46%, whereas in compartment 1, 2 and 3 are 33.83%, 36.81% and 26.76%. This high positive bias is mainly caused by high value of volume from reject 2 class which mostly occurs in standing trees. In felled trees, this class does not contribute high value to the volume because it was already removed in logging activities due to low quality.
2. The optimal utilization of wood in order to reach maximum tree value will be attained if the allocation of wood purposes for each compartment is based on total length as well as volume distribution as follows: First, based on total length: compartment 1 (plywood 74.24%; wood working 14.39%; and fiber board 11.37%), compartment 2 (plywood 76.46%; wood working 14.82%; and fiber board 8.72%) and compartment 3 (plywood 73.13%; wood working 20.49%; and fiber board 6.38%). Second, based on total distribution: compartment 1 (plywood 58.50%; wood working 7.69%; and fiber board 33.81%), compartment 2 (plywood 60.56%; wood working 7.17%; and fiber board 32.26%) and compartment 3 (plywood 61.07%; wood working 11.68%; and fiber board 27.10%).
3. The tree value equations obtained from the relationship between tree value and tree dimension to predict tree value of meranti (Shorea sp.) are as follow: TV = e-2.627+5.691 ln(dbh)-0.376 ln(dbh)^2
TV = -3447200 + 20216100 log(dbh) TV = 203.361 dbh2.230
TV = -644359 + 660 (dbh)2
TV = -1547800 + 20067 dbh + 553 dbh2
TV = 24.859 dbh2hcomm
TV = 176009 + 24.3 dbh2hcomm Most of the equations have the value of R2 higher than 80%, while only one equation has R2 lower than 80% (64.71%). The equation with R2 lower than 80% is TV = -3447200 + 20216100 log(dbh).
Suggestions
1. Due to the subjectivity in determining quality of each section, grading rules of standing trees should be formed differently from felled trees. It is suggested that grading rules of standing trees are based upon external defects easy to recognize and measure in the field. Grading rules should be made also for each group of species because of the special characteristic of defects.
2. In this study, tree value was only until commercial height, while stems and branches higher than that calculated height. Therefore, it is suggested that when tree value is determined, this part should also calculated if possible. This part also has a value as a raw material. This is also part of the effort to achieve maximum tree value.
3. Predicting tree value can be applied in the field although it seems slightly complicated. But, it is suggested to apply this method in the timber plantation estate because usually consists of homogenous species which have similar characteristics of defects. It also useful to predict stand value in the future.
4. Due to the dynamic and temporal characteristic of tree value prediction, it is suggested to develop tree value equations in continual time. For further research, it is also suggested to develop software programs that can be used to predict tree value.
References
Anonymous, 1977. The Indonesian Scaling and Grading Rules for Hardwood Logs. Directorate of Bina Sarana Usaha Kehutanan, Jakarta, Indonesia.
Budiaman, A., 2002. Entwicklung und Bewertung von Holzerntekonzepten für Forstgenossenschaften in Indonesien-Ein Beispiel für ein Decision Support System. Dissertation. University of Göttingen.
Davis, L.S., 2001. Forest Management, 4th edition. MC Graw Hill. New York.
Gobakken, 2000. Model for Assessing Timber Grade Distribution and Economic Value of Standing Birch Trees. Scandinavian Journal Forest Resource 15, 570-578.
Kartodihardjo, H., 1999. Masalah Kebijakan Pengelolaan Hutan Alam Produksi. LATIN, Bogor, Indonesia.
Kramer, H and A. Akca, 1995. Leitfaden zur Waldmaßlehre. J.D. Sauerländer*s Verlag. Frankfurt am Main.
Nyland, R.D., 2002. Silviculture: Concepts and Applications, 2nd edition. Graw Hill. New York.w
Philip, M.S., 1994. Measuring Trees and Forests, 2nd Edition. CAB International. United Kingdom.

8
Schroeter, H., 2000. Konzetion einer Wertansprache für Eichenholz am Stehenden Stamm. Dissertation. University of Göttingen.
Schumann, K., 2001. Qualitätskontrolle in Buchenbeständen. Waldinventur, Waldwachstum und Forstplannung-Moderne Technologien, Methoden und Verfahrensweise (Festschrift zum 60. Geburstag von Prof. Dr. Dr. H. C. Klaus von Gadow. Zahab Verlag.
Suhendang, E. 1993. Estimating Standing Tree g Volume of Some Commercial Trees of The Tropical Rain Forest in Indonesia. IUFRO Proceeding of the Conference: Modern Methods of Estimating Tree and Log Volume. Morgantown, USA.
Van Laar, A and A. Akca, 1997: Forest Mensuration. Cuvillier-Verlag. Göttingen.
Wiegard, C., 1998. Untersuchungen zur Entwicklung flexibler Wetinventuren in Waldbeständen. Dissertation. University of Göttingen.