![arXiv:2109.02816v1 [gr-qc] 7 Sep 2021](https://static.fdokumen.com/doc/165x107/6313e95115106505030b21a2/arxiv210902816v1-gr-qc-7-sep-2021.jpg)
PR O VENTIA GR OUP O Y J
44
Financial statements 2018 PROVENTIA GROUP OYJ
-
Upload
khangminh22 -
Category
Documents
-
view
0 -
download
0
Transcript of PR O VENTIA GR OUP O Y J

Financialstatements2018P
RO
VE
NT
IA G
RO
UP
OY
J
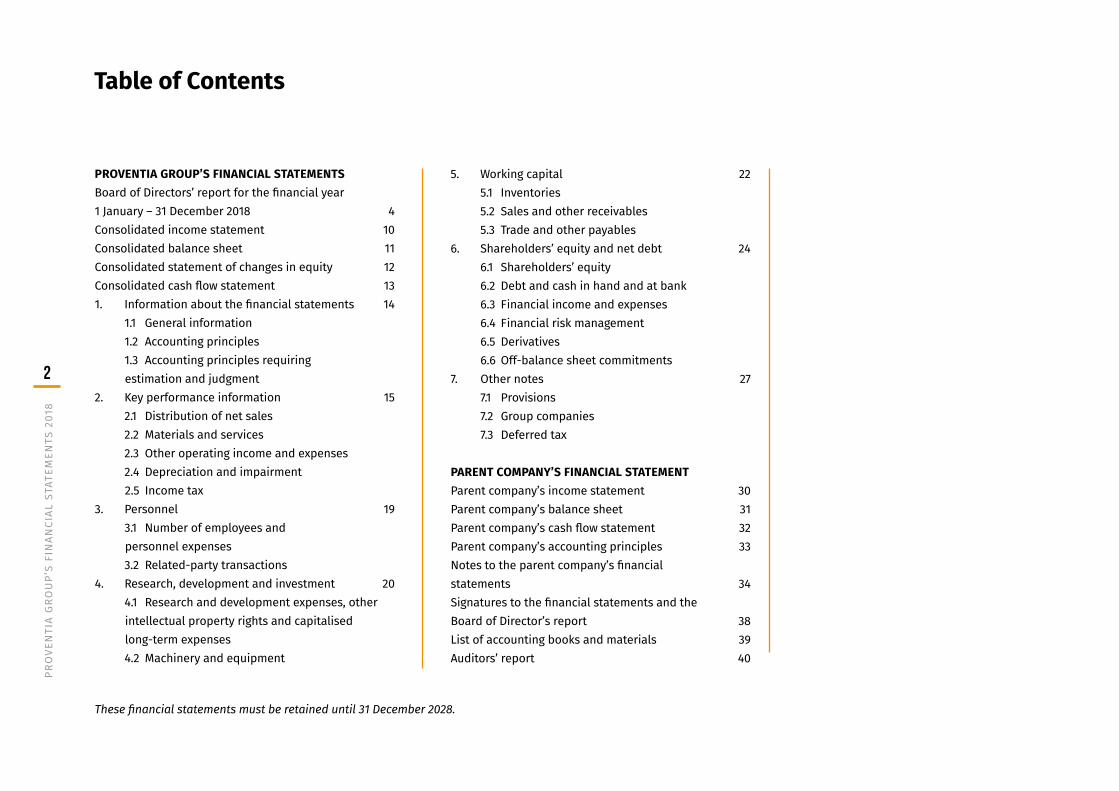
PROVENTIA GROUP’S FINANCIAL STATEMENTSBoard of Directors’ report for the financial year 1 January – 31 December 2018 4Consolidated income statement 10Consolidated balance sheet 11Consolidated statement of changes in equity 12Consolidated cash flow statement 131. Information about the financial statements 14 1.1 General information 1.2 Accounting principles 1.3 Accounting principles requiring
estimation and judgment 2. Key performance information 15 2.1 Distribution of net sales 2.2 Materials and services 2.3 Other operating income and expenses 2.4 Depreciation and impairment 2.5 Income tax 3. Personnel 19 3.1 Number of employees and
personnel expenses 3.2 Related-party transactions 4. Research, development and investment 20 4.1 Research and development expenses, other
intellectual property rights and capitalised long-term expenses
4.2 Machinery and equipment
5. Working capital 22 5.1 Inventories 5.2 Sales and other receivables 5.3 Trade and other payables 6. Shareholders’ equity and net debt 24 6.1 Shareholders’ equity 6.2 Debt and cash in hand and at bank 6.3 Financial income and expenses 6.4 Financial risk management 6.5 Derivatives 6.6 Off-balance sheet commitments 7. Other notes 27 7.1 Provisions 7.2 Group companies 7.3 Deferred tax
PARENT COMPANY’S FINANCIAL STATEMENTParent company’s income statement 30Parent company’s balance sheet 31Parent company’s cash flow statement 32Parent company’s accounting principles 33Notes to the parent company’s financial statements 34Signatures to the financial statements and the Board of Director’s report 38List of accounting books and materials 39Auditors’ report 40
Table of Contents
These financial statements must be retained until 31 December 2028.
2
PRO
VEN
TIA
GRO
UP’
S FI
NAN
CIAL
STA
TEM
ENTS
201
8

Financial statements
3
PRO
VEN
TIA
GRO
UP’
S FI
NAN
CIAL
STA
TEM
ENTS
201
8

Board of Directors’ report for the financial year 1 January – 31 December 2018
Operating environmentAccording to the World Health Organization (WHO), 90% of the global population are breathing polluted air. Air pol-lution is the most significant environment-induced health risk on a global scale. Some seven million people die pre-maturely due to illnesses caused by air pollution, every year. In Europe, the corresponding figure is 0.4 million.
Man-made air pollution comes, for example, from the consumption of fuels at power plants, in industries and in traffic. Traffic-induced air pollution is a more signifi-cant health risk than its relative proportion indicates, as emissions are generated at street level where people are exposed directly to exhaust emissions. Of diesel engine emissions, nitrogen oxides and particulates, in particular, are considered to be the most hazardous to health.
The scale of the global air quality challenge is massive, and the urgency of finding of solution has been widely recognised. The aim is to control the emission problem presented by vehicles and heavy-duty machinery, for example, by setting target values for air quality, issuing stricter emission regulations, shifting to cleaner engines and alternative fuels, seeking solutions from new power sources, such as electricity, and by supporting greener solutions and purchases.
Global air quality problems, stricter emission regula-tions and more intense focus placed on nitrogen oxide emissions have built a growing need for effective exhaust aftertreatment systems. Current exhaust aftertreatment
technologies help to significantly reduce hazardous emis-sions from diesel engines, making diesel still a competi-tive power source, particularly in applications demanding high engine performance. Diesel remains the most widely used power source in heavy-duty machinery, albeit being cleaner than before. The goal of the EU Stage V emission standard, which will enter into force in Europe in stages in 2019–2020, is to significantly reduce nitrogen oxide and particulate emissions from heavy-duty machinery. The Stage V emission standard requires a more effective reduction of nitrogen oxides, due to which systems are becoming more complex. In addition, the standard has been expanded to cover more engine sizes. This, in turn, broadens the scope of application of emission control systems.
Low air quality, combined with exceeded threshold values set for nitrogen oxides, has forced many countries and cities to make rapid decisions in order to improve the quality of air. Alternative solutions are being sought for traffic in city centres. However, the full-scale electri-fication of, for example, public transport is financially challenging in the short term. A large portion of city buses are still diesel-fuelled, and they are not even close to the end of their service life. Many countries and cities have decided to support the installation of effective exhaust aftertreatment system on existing vehicles by using pub-lic funds.
As awareness of the quality of air is increasing, the
automotive industry is trying to find alternatives for combustion engines. The popularity of electric cars has accelerated as a result of leaps in battery technologies, and different hybrids and fully electric vehicles have been launched in the markets. New alternative power sources have increased the need for vehicle R&D and testing. Electric vehicles and the use of battery technologies in new applications, in particular, set demands for more battery testing. Then again, battery testing demands new types of testing capabilities and systems.
Proventia’s business operationsProventia is an international technology company. It de-velops advanced technologies for emissions control and the electric vehicle industry to help to solve the global problem of air pollution. The company develops, designs and manufactures exhaust aftertreatment systems and components for diesel engines, work machines and heavy vehicles. The company also manufactures modular testing laboratories and centres for testing engines, powertrains, hybrid systems and batteries.
Proventia’s Emission Control business area has been divided into two customer segments: original equipment manufacturer (OEM) customers and retrofit custom-ers. Proventia’s OEM customers are manufacturers of diesel engines and work machines, for which Proventia develops, produces and delivers customised exhaust aftertreatment systems. The company focuses on special
4
PRO
VEN
TIA
GRO
UP’
S FI
NAN
CIAL
STA
TEM
ENTS
201
8

markets where customer applications require customised emission solutions. In addition to delivering full integrat-ed systems, Proventia provides its customers with R&D, simulation and validation services.
Proventia’s retrofit customers include public transport operators, for which the company provides exhaust af-tertreatment systems for installation on existing vehicles. Proventia’s retrofit systems have been designed to oper-ate in the challenging conditions of urban traffic. Technol-ogies developed for demanding OEM applications firmly support R&D and expertise related to retrofit systems.
For its Emission Control customers, Proventia also provides thermal insulation components for the thermal insulation of exhaust pipelines, aftertreatment systems and engine compartments. Efficient heat insulation is critical for modern exhaust aftertreatment systems to en-sure their optimal function and enable staying below the strict emission limits. In addition, the insulation of engine components reduces thermal radiation and enables the effective use of cramped engine compartments.
The Test Solutions business area responds to growing testing needs, resulting from stricter emission regu-lations, the development of alternative fuels and the increase in electric vehicles. Proventia provides modu-lar testing laboratories and centres for testing engines, powertrains, hybrid systems and batteries. Customers gain benefits from the company’s modular testing system through the rapid deployment, modifiability and flexibility
Sums in EUR 2018 2017 2016KEY FIGURES: PERFORMANCE AND FINANCIAL POSITIONProventia Group’s key figuresNet sales 38,298,943 19,635,779 12,110,730Operating profit 4,713,082 2,325,725 1,332,702Operating profit, % 12.3% 11.8% 11.0%Return on equity (ROE), % 41.8% 31.8% 22.9%Equity ratio, % 39.8% 52.9% 72.1%Return on capital employed (ROCE), % 41.6% 34.7% 28.4%Net debt 3,419,405 860,139 -372,677
Parent company’s key figuresNet sales 1,418,186 799,462 609,002Operating profit/loss -852,096 -53,271 -73,350Operating profit, % -60.1% -6.7% -12.0%Return on equity (ROE), % -13.0% -0.9% -3.1%Equity ratio, % 95.7% 96.8% 97.3%Return on capital employed (ROCE), % -13.2% -0.8% -1.1%Net debt -185,238 -6,676 56,928
The key figures have been calculated as follows:Return on equity (ROE), % = (Profit before appropriations and taxes - income taxes) ÷ Average
shareholders’ equity during the year × 100
Equity ratio, % = Shareholders’ equity ÷ (Balance sheet total – advances received) × 100
Return on capital employed (ROCE), % = (Profit before appropriations and taxes + financial expenses) ÷ (Average shareholders’
equity during the year + average interest-bearing liabilities during the year) × 100
Net debt = Interest-bearing liabilities – cash in hand and at bank
5
PRO
VEN
TIA
GRO
UP’
S FI
NAN
CIAL
STA
TEM
ENTS
201
8

of testing laboratories as testing needs change. According to its strategy, Proventia has made significant investments in battery testing systems and productised its battery testing solution to respond to growing market needs.
Performance and financial positionIn 2018, Proventia’s net sales grew by 95.0% year-on-year and were EUR 38.3 (19.6) million. Operating profit in 2018 increased by 102.7% to EUR 4.7 (2.3) million. The operating profit in 2018 was burdened by strategic advisory costs of cumulatively EUR 0.9 million. Operat-ing profit, excluding strategic advisory costs, stood at EUR 5.6 (2.3) million. Earnings were EUR 3.5 (1.8) million. Earnings per share, adjusted by the dilution effect, were EUR 0.23 (0.12).
At the end of December 2018, the consolidated balance sheet total stood at EUR 32.4 (14.9) million. The Group’s equity ratio was 39.8% (52.9%) at the end of 2018. The Group’s cash flow from operating activities was EUR 2.7 (0.6) million. Liquid assets amounted to EUR 1.1 (1.0) million at the end of 2018. The company has an EUR 3.0 million line of credit, of which EUR 2.4 (0,0) million was in use on the closing date. On 31 December 2018, the Group’s interest-bearing liabil-ities stood at EUR 4.5 (1.8) million. The increase in the balance sheet resulted from the significant increase in inventories, the application of POC to long-term proj-ects and investments made in fixed assets.
Research and developmentProventia made significant investments in R&D. R&D ex-penses totalled EUR 1.7 million (2017: EUR 0.7 million; 2016: EUR 0.8 million), comprising 4.5% of the Group’s net sales (2017: 3.3%; 2016: 6.4%). R&D expenses have been capital-ised on the balance sheet as development expenses in the amount of EUR 1.2 million (2017: EUR 0.4 million; 2016: EUR 0.4 million). R&D expenses recognised through profit or loss totalled EUR 0.6 million (2017: EUR 0.4 million; 2016: EUR 0.2 million).
Significant events during the financial yearDuring the financial year, Proventia established a subsidi-ary in the Czech Republic. Located in the Brno region, the new production facility is the company’s first production unit outside Finland.
Proventia’s extraordinary general meeting, held on 13 November 2018, decided to change the company form into a public limited company. At the same time, the name Proventia Group Ltd changed to Proventia Group Corporation on 14 November 2018 (registration date). These changes were made in order to prepare for strategic options.
Events after the financial yearNo significant changes have taken place in the company’s operations or financial position after the financial year.
Outlook The legislation for emission limits for work machines will gradually proceed by engine-size class from Stage IV to Stage V EU standard in 2019 and 2020. Because the regu-lations will come into force gradually, Proventia will con-tinue to deliver the current Stage IV systems to its OEM customers, but will launch production and delivery of Stage V systems in 2019. Retrofitting projects will proceed in accordance with country- and city-specific air quality regulations and schedules. New retrofitting projects are also starting outside Europe.
In test solutions markets, the need to test electric powertrains and components will also continue to grow. In particular, demand for battery testing systems is expected to increase substantially. Proventia will invest more in the development of test solutions for hybrid, electric and battery technologies in the near future.
In 2019, net sales and the operating profit are expected to increase from the 2018 levels. In 2018, net sales were EUR 38.3 million, and operating profit was EUR 4.7 million.
Key risks and uncertainties In 2018, no significant changes occurred in the risks and uncertainties related to Proventia’s business. The group’s most significant strategic risks are related to the demand for its products and the competitive situation in the mar-ket, as well as to its dependence on its major customers and main component suppliers. Uncertainty may also
6
PRO
VEN
TIA
GRO
UP’
S FI
NAN
CIAL
STA
TEM
ENTS
201
8

be caused by the development of local and interna-tional environmental or emission laws or delays in their implementation. The most significant operational risks are related to major fluctuations in demand as a result of the timing of customer and delivery projects, as well as to interruptions in the supply chain. The company’s Retrofit and Test Solutions business areas are largely based on projects, which exposes the company to risks related to the implementation of said projects. Project-specific risks are related to, for example, delivery schedules, product installation, product deployment, production capacity and the quality and technical functionality of end products.
Customer and delivery projects also involve liability risks, such as liability for compensation to customers or third parties as a result of delays, defective products, design or product rights. Strategic and operational risks are reduced by means of new customer procurement, product development operations, alternative suppliers, supplier audits and outsourced resources. Liability risks are sought to be reduced through IPR studies and invest-ments in the quality of design and products.
Financial risk management aims to support the achievement of the targets set and to protect the Group against major unfavourable changes in financial mar-kets, while helping to secure the Group’s performance, shareholders’ equity and liquidity. The Group’s financing activities and financial risk management have been cen-tralised in the parent company, with the aim of managing
risks effectively, achieving costs savings and optimising cash flows. The credit risk related to sales receivables is managed through effective debt collection and by only giving normal payment times to customers.
Liquidity risk means the continuous risk related to the availability of financing. The parent company is respon-sible for the Group’s liquidity and the sufficiency of financing for the Group. Sufficient liquidity is maintained through effective and proactive cash management.
The Group operates in international markets and can, therefore, be exposed to a currency risk arising from changes in exchange rates. Sales and purchases denomi-nated in foreign currencies (transaction risk) and balance sheet items (translation risk) constitute the currency risk. Currency risks are hedged against by means of forward contracts and currency options, if necessary. Derivatives are only used for hedging purposes. Currently, the most significant source of currency risks is the exchange rate between GBP and EUR. Financial risks are discussed in more detail in the notes to the financial statements (6.4 Financial risk management).
The Group is prepared for property, interruption, transport and liability risks, including product, opera-tional and management liabilities, by means of insurance policies covering the entire Group, as well as by means of supplementary local policies. It is possible, however, that the Group must compensate for damage not covered by insurance because of its scope or quality. Insurance
coverage is examined and maintained continuously.
Group structure A new subsidiary, Proventia Czech s.r.o., was established during the financial year. No other changes took place in the Group structure during the financial year.
Personnel During the financial year, the Group had an average of 92 employees (2017: 54 employees; 2016: 43 employees). At the end of the financial year, the Group had 118 employ-ees (2017: 65 employees; 2016: 43 employees).
Option schemes for key personnelThe company has two option schemes, both of which are divided into three series. Each option entitles its holder to subscribe for one new share. This deviation from the shareholders’ pre-emptive subscription rights is due to a weighty financial reason, as the option rights are intend-ed to be part of the company’s incentive system. Option rights involve conventional terms and conditions related to the validity of the employment relationship and lim-itations related to transferability. The subscription price must be paid in full in conjunction with the subscription, and it will be recognised in the invested unrestricted equity reserve.
7
PRO
VEN
TIA
GRO
UP’
S FI
NAN
CIAL
STA
TEM
ENTS
201
8
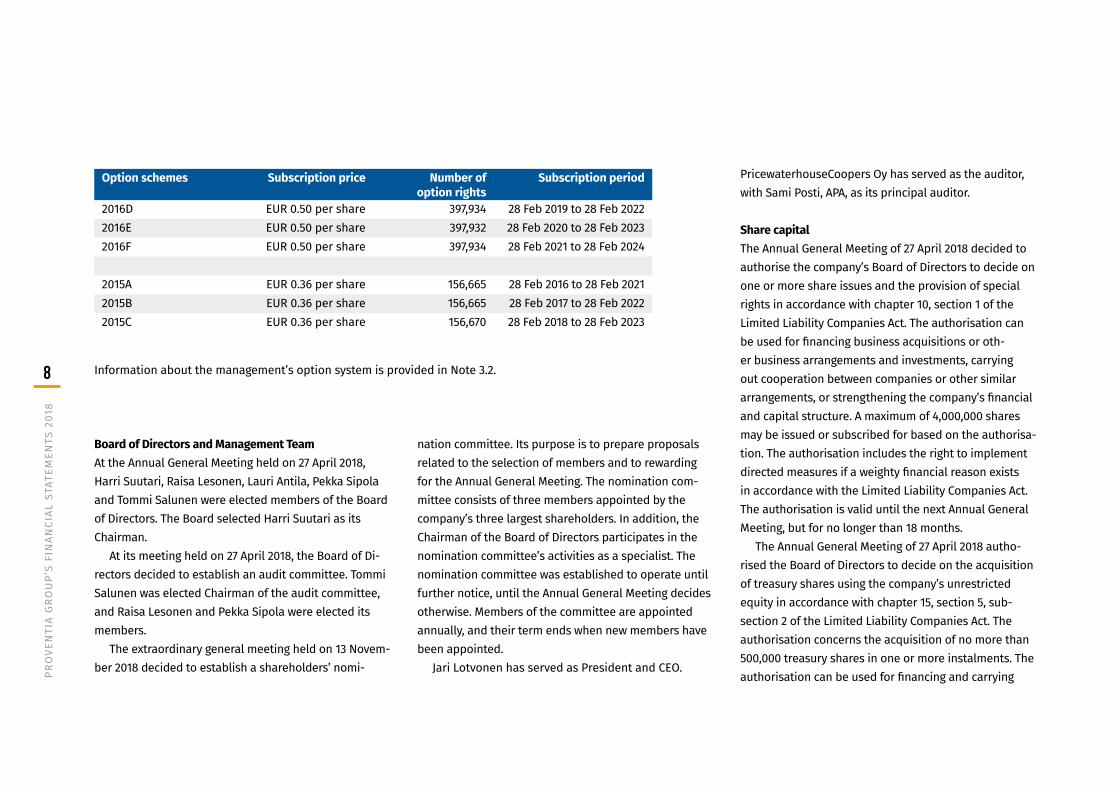
Option schemes Subscription price Number of option rights
Subscription period
2016D EUR 0.50 per share 397,934 28 Feb 2019 to 28 Feb 20222016E EUR 0.50 per share 397,932 28 Feb 2020 to 28 Feb 20232016F EUR 0.50 per share 397,934 28 Feb 2021 to 28 Feb 2024
2015A EUR 0.36 per share 156,665 28 Feb 2016 to 28 Feb 20212015B EUR 0.36 per share 156,665 28 Feb 2017 to 28 Feb 20222015C EUR 0.36 per share 156,670 28 Feb 2018 to 28 Feb 2023
Information about the management’s option system is provided in Note 3.2.
Board of Directors and Management TeamAt the Annual General Meeting held on 27 April 2018, Harri Suutari, Raisa Lesonen, Lauri Antila, Pekka Sipola and Tommi Salunen were elected members of the Board of Directors. The Board selected Harri Suutari as its Chairman.
At its meeting held on 27 April 2018, the Board of Di-rectors decided to establish an audit committee. Tommi Salunen was elected Chairman of the audit committee, and Raisa Lesonen and Pekka Sipola were elected its members.
The extraordinary general meeting held on 13 Novem-ber 2018 decided to establish a shareholders’ nomi-
nation committee. Its purpose is to prepare proposals related to the selection of members and to rewarding for the Annual General Meeting. The nomination com-mittee consists of three members appointed by the company’s three largest shareholders. In addition, the Chairman of the Board of Directors participates in the nomination committee’s activities as a specialist. The nomination committee was established to operate until further notice, until the Annual General Meeting decides otherwise. Members of the committee are appointed annually, and their term ends when new members have been appointed.
Jari Lotvonen has served as President and CEO.
PricewaterhouseCoopers Oy has served as the auditor, with Sami Posti, APA, as its principal auditor.
Share capitalThe Annual General Meeting of 27 April 2018 decided to authorise the company’s Board of Directors to decide on one or more share issues and the provision of special rights in accordance with chapter 10, section 1 of the Limited Liability Companies Act. The authorisation can be used for financing business acquisitions or oth-er business arrangements and investments, carrying out cooperation between companies or other similar arrangements, or strengthening the company’s financial and capital structure. A maximum of 4,000,000 shares may be issued or subscribed for based on the authorisa-tion. The authorisation includes the right to implement directed measures if a weighty financial reason exists in accordance with the Limited Liability Companies Act. The authorisation is valid until the next Annual General Meeting, but for no longer than 18 months.
The Annual General Meeting of 27 April 2018 autho-rised the Board of Directors to decide on the acquisition of treasury shares using the company’s unrestricted equity in accordance with chapter 15, section 5, sub-section 2 of the Limited Liability Companies Act. The authorisation concerns the acquisition of no more than 500,000 treasury shares in one or more instalments. The authorisation can be used for financing and carrying
8
PRO
VEN
TIA
GRO
UP’
S FI
NAN
CIAL
STA
TEM
ENTS
201
8

out business arrangements and investments, or for other purposes determined by the Board of Directors. The authorisation is valid until the next Annual General Meeting, but for no longer than 18 months.
The Annual General Meeting of 27 April 2018 autho-rised the Board of Directors to decide on the transfer of treasury shares in accordance with chapter 9, section 1, subsection 1 of the Limited Liability Companies Act. The authorisation concerns the transfer of no more than 500,000 treasury shares. The Board is authorised to decide to whom and in which order treasure shares are transferred, as well as determining the transfer price and other terms and conditions of the transfer. The authorisation is valid until the next Annual General Meeting, but for no longer than 18 months.
During the 2018 financial year, the Board did not exercise the authorisation issued by the Annual General Meeting on 27 April 2018 to issue shares or special rights or to transfer treasury shares. The share issue authorisation issued by the Annual General Meeting on 27 April 2018 was replaced by the share issue authorisa-tion issued by the extraordinary general meeting on 13 November 2018.
The Board of Directors has an authorisation issued by the extraordinary general meeting held on 13 November 2018 to decide on the issuance of new shares in one or more issues with or without a payment. On the basis of this authorisation, a maximum of 5,000,000 new shares
may be issued. According to the authorisation, the Board of Directors has the right to decide on the terms and conditions of the share issue, including criteria for defin-ing the subscription price of the shares issued and their final subscription price, as well as on the approval of subscriptions, the allocation of new shares issued and the final number of shares issued. The share issue may also deviate from the shareholders’ pre-emptive sub-scription right (directed issue), including the provision of shares for institutional and non-professional investors and Proventia’s personnel, i.e. members of the Board of Directors and Proventia’s employees in conjunction with the potential listing of the company. Shares can be offered to Proventia’s personnel potentially at a lower subscription price than to other investors as part of the company’s initial public offering. In addition, the au-thorisation includes the right to decide on whether the share subscription price be recognised, in full or in part, in unrestricted equity reserves or as an increase in the share capital. The authorisation remains in effect until the end of the next Annual General Meeting; however, no longer than until 30 June 2019.
During the 2018 financial year, the Board of Directors did not exercise the share issue authorisation issued by the extraordinary general meeting on 13 November 2018.
At its meeting held on 18 January 2018, Proventia Group Corporation’s Board of Directors decided to exercise its authorisations to acquire treasury shares
and to acquire 5,000 treasury shares at a total price of EUR 5,000. The acquired shares represented 0.04% of all shares in the company and their votes. The Board of Directors of Proventia Group Corporation decided, at its meeting on 21 September 2018, to cancel the 5,000 shares acquired on 18 January and held by the company. The cancellation of the treasury shares held by the com-pany was carried out in October. Therefore, the company or its subsidiaries do not hold or have not pledged any shares in the company or its parent company.
On 31 December 2018, Proventia Group Corporation’s registered share capital was EUR 1,090,281.04 and its total number of shares was 13,942,421. The company’s shares are registered in the book-entry system main-tained by Euroclear Finland Oy.
Other information The company has no capital loans, and it has not issued any loans to related parties. The company has no foreign affiliates, and it has not recognised any financial instru-ments at the fair value as defined in chapter 5, section 2 a, subsection 5 of the Accounting Act.
Board of Directors’ proposal for distribution of profit The Proventia Group Corporation’s distributable funds total EUR 5,444,603.82. The Board proposes that the profit for the period (EUR 158,882.84) be transferred to retained earnings and that no dividend be paid.
9
PRO
VEN
TIA
GRO
UP’
S FI
NAN
CIAL
STA
TEM
ENTS
201
8

Consolidated income statement
Sums in EUR Note 1 Jan 2018 –31 Dec 2018
1 Jan 2017 –31 Dec 2017
Net sales 2.1 38,298,942 19,635,779Change in inventories of finished goods and work in progress 2,058,106 723,176Other operating income 2.3 34,829 25,561Materials and services 2.2 -23,388,670 -10,584,287Personnel expenses 3.1 -5,515,573 -3,894,190Depreciation and impairment 2.4 -1,180,519 -1,060,567Other operating expenses 2.3 -5,594,033 -2,519,746Operating profit 4,713,082 2,325,725
Financial income and expenses 6.3 -213,683 -33,915Profit before taxes 4,499,399 2,291,810
Income tax 2.5 -954,104 -455,584Profit for the period 3,545,295 1,836,226
10
PRO
VEN
TIA
GRO
UP’
S FI
NAN
CIAL
STA
TEM
ENTS
201
8
Consolidated balance sheet
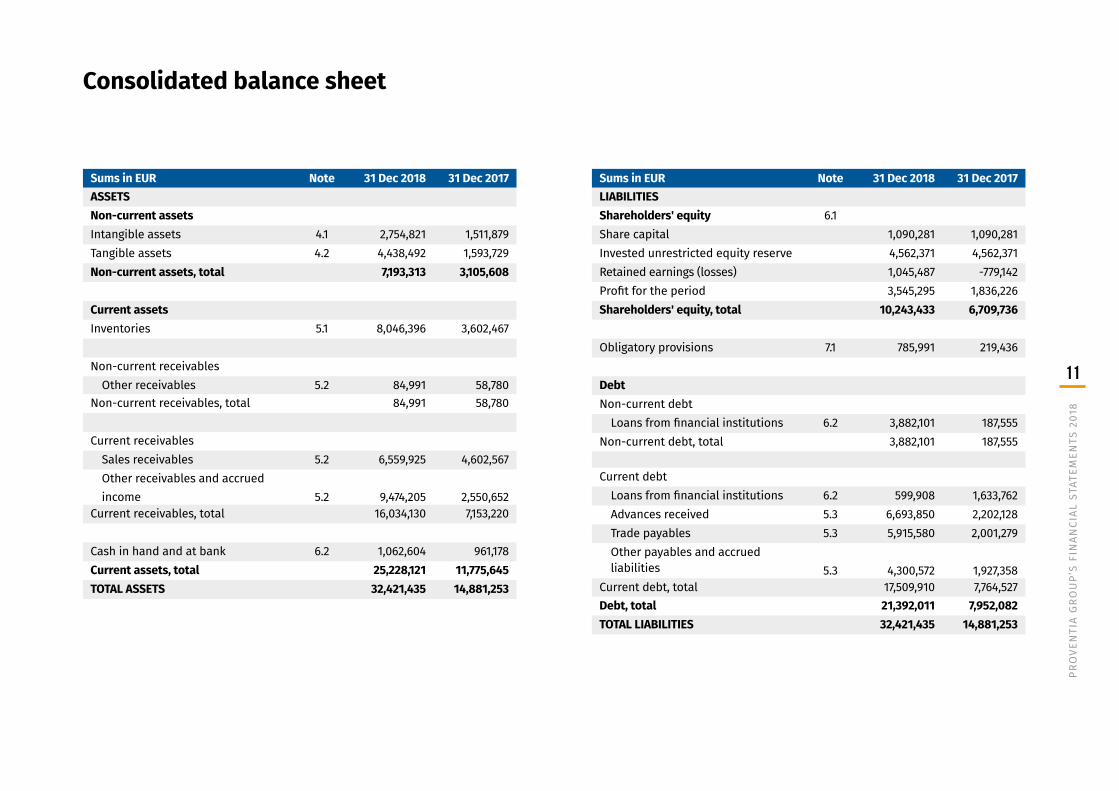
Sums in EUR Note 31 Dec 2018 31 Dec 2017ASSETSNon-current assetsIntangible assets 4.1 2,754,821 1,511,879Tangible assets 4.2 4,438,492 1,593,729Non-current assets, total 7,193,313 3,105,608
Current assetsInventories 5.1 8,046,396 3,602,467
Non-current receivablesOther receivables 5.2 84,991 58,780
Non-current receivables, total 84,991 58,780
Current receivablesSales receivables 5.2 6,559,925 4,602,567Other receivables and accrued income
5.2
9,474,205
2,550,652
Current receivables, total 16,034,130 7,153,220
Cash in hand and at bank 6.2 1,062,604 961,178Current assets, total 25,228,121 11,775,645TOTAL ASSETS 32,421,435 14,881,253
Sums in EUR Note 31 Dec 2018 31 Dec 2017LIABILITIESShareholders' equity 6.1Share capital 1,090,281 1,090,281Invested unrestricted equity reserve 4,562,371 4,562,371Retained earnings (losses) 1,045,487 -779,142Profit for the period 3,545,295 1,836,226Shareholders' equity, total 10,243,433 6,709,736
Obligatory provisions 7.1 785,991 219,436
DebtNon-current debt
Loans from financial institutions 6.2 3,882,101 187,555Non-current debt, total 3,882,101 187,555
Current debtLoans from financial institutions 6.2 599,908 1,633,762Advances received 5.3 6,693,850 2,202,128Trade payables 5.3 5,915,580 2,001,279Other payables and accrued liabilities
5.3
4,300,572
1,927,358
Current debt, total 17,509,910 7,764,527Debt, total 21,392,011 7,952,082TOTAL LIABILITIES 32,421,435 14,881,253
11
PRO
VEN
TIA
GRO
UP’
S FI
NAN
CIAL
STA
TEM
ENTS
201
8

Consolidated statement of changes in equity
Sums in EUR Note Share capital
Investedunrestricted
equity reserveRetained earnings Total
Shareholders' equity, 1 Jan 2018 1,090,281 4,562,371 1,057,084 6,709,736Redemption of treasury shares -5,080 -5,080Translation differences -6,517 -6,517Profit for the period 3,545,295 3,545,295Shareholders' equity, 31 Dec 2018 6.1 1,090,281 4,562,371 4,590,781 10,243,433 Shareholders' equity, 1 Jan 2017 1,090,281 4,562,371 -779,142 4,873,509Profit for the period 1,836,226 1,836,226Shareholders' equity, 31 Dec 2017 6.1 1,090,281 4,562,371 1,057,084 6,709,736
12
PRO
VEN
TIA
GRO
UP’
S FI
NAN
CIAL
STA
TEM
ENTS
201
8

Consolidated cash flow statement
Sums in EUR 2018 2017Cash flow from operating activities:Profit before taxes 4 499 399 2 291 810Adjustments: Planned depreciation 1 180 519 1 060 567 Financial income and expenses 213 683 33 915 Other adjustments 560 038 0 Cash flow before changes in working capital
6 453 639 3 386 292
Changes in working capital Changes in current non-interest-bearing trade receivables
-8 864 216 -4 933 467
Change in inventories -4 443 928 -1 659 715 Changes in current non-interest-bearing liabilities 10 704 140 4 139 128Interest paid and payments on other operating financial expenses
-215 269 -32 161
Direct taxes paid -920 328 -263 000Cash flow from operating activities (A) 2 714 038 637 077
Sums in EUR 2018 2017Cash flow from investing activities:Investments in tangible and intangible assets -5,268,224 -1,869,893Cash flow from investing activities (B) -5,268,224 -1,869,893
Cash flow from financing activities:Withdrawals of long-term and short-term loans
4,497,472 1,805,208
Repayments of long-term loans -1,836,779 -224,090Acquisition of treasury shares -5,080 0Cash flow from financing activities (C) 2,655,612 1,581,118
Changes in cash in hand and at bank (increase +, decrease -) (A+B+C)
101,427 348,303
Cash in hand and at bank at the beginning of the period 961,178 612,875Cash in hand and at bank at the end of the period
1,062,604 961,178
13
PRO
VEN
TIA
GRO
UP’
S FI
NAN
CIAL
STA
TEM
ENTS
201
8
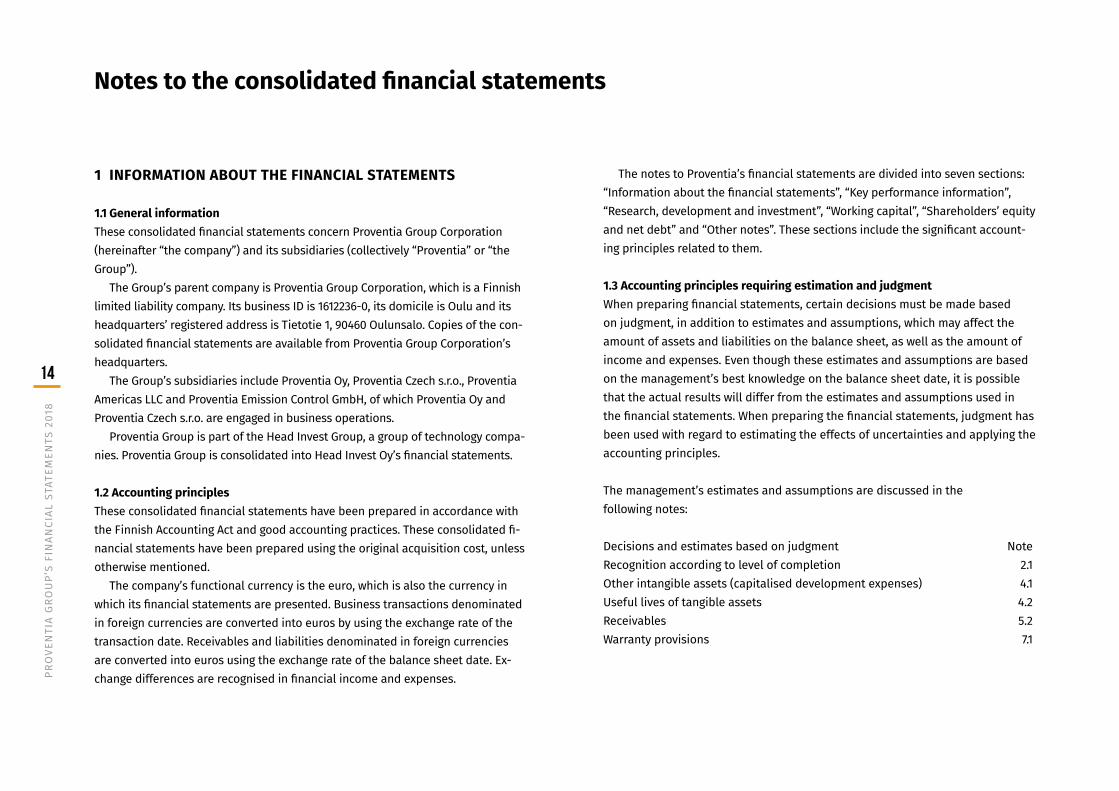
The notes to Proventia’s financial statements are divided into seven sections: “Information about the financial statements”, “Key performance information”, “Research, development and investment”, “Working capital”, “Shareholders’ equity and net debt” and “Other notes”. These sections include the significant account-ing principles related to them.
1.3 Accounting principles requiring estimation and judgmentWhen preparing financial statements, certain decisions must be made based on judgment, in addition to estimates and assumptions, which may affect the amount of assets and liabilities on the balance sheet, as well as the amount of income and expenses. Even though these estimates and assumptions are based on the management’s best knowledge on the balance sheet date, it is possible that the actual results will differ from the estimates and assumptions used in the financial statements. When preparing the financial statements, judgment has been used with regard to estimating the effects of uncertainties and applying the accounting principles.
The management’s estimates and assumptions are discussed in the following notes:
Decisions and estimates based on judgment NoteRecognition according to level of completion 2.1Other intangible assets (capitalised development expenses) 4.1Useful lives of tangible assets 4.2Receivables 5.2Warranty provisions 7.1
1 INFORMATION ABOUT THE FINANCIAL STATEMENTS
1.1 General informationThese consolidated financial statements concern Proventia Group Corporation (hereinafter “the company”) and its subsidiaries (collectively “Proventia” or “the Group”).
The Group’s parent company is Proventia Group Corporation, which is a Finnish limited liability company. Its business ID is 1612236-0, its domicile is Oulu and its headquarters’ registered address is Tietotie 1, 90460 Oulunsalo. Copies of the con-solidated financial statements are available from Proventia Group Corporation’s headquarters.
The Group’s subsidiaries include Proventia Oy, Proventia Czech s.r.o., Proventia Americas LLC and Proventia Emission Control GmbH, of which Proventia Oy and Proventia Czech s.r.o. are engaged in business operations.
Proventia Group is part of the Head Invest Group, a group of technology compa-nies. Proventia Group is consolidated into Head Invest Oy’s financial statements.
1.2 Accounting principlesThese consolidated financial statements have been prepared in accordance with the Finnish Accounting Act and good accounting practices. These consolidated fi-nancial statements have been prepared using the original acquisition cost, unless otherwise mentioned.
The company’s functional currency is the euro, which is also the currency in which its financial statements are presented. Business transactions denominated in foreign currencies are converted into euros by using the exchange rate of the transaction date. Receivables and liabilities denominated in foreign currencies are converted into euros using the exchange rate of the balance sheet date. Ex-change differences are recognised in financial income and expenses.
Notes to the consolidated financial statements
14
PRO
VEN
TIA
GRO
UP’
S FI
NAN
CIAL
STA
TEM
ENTS
201
8
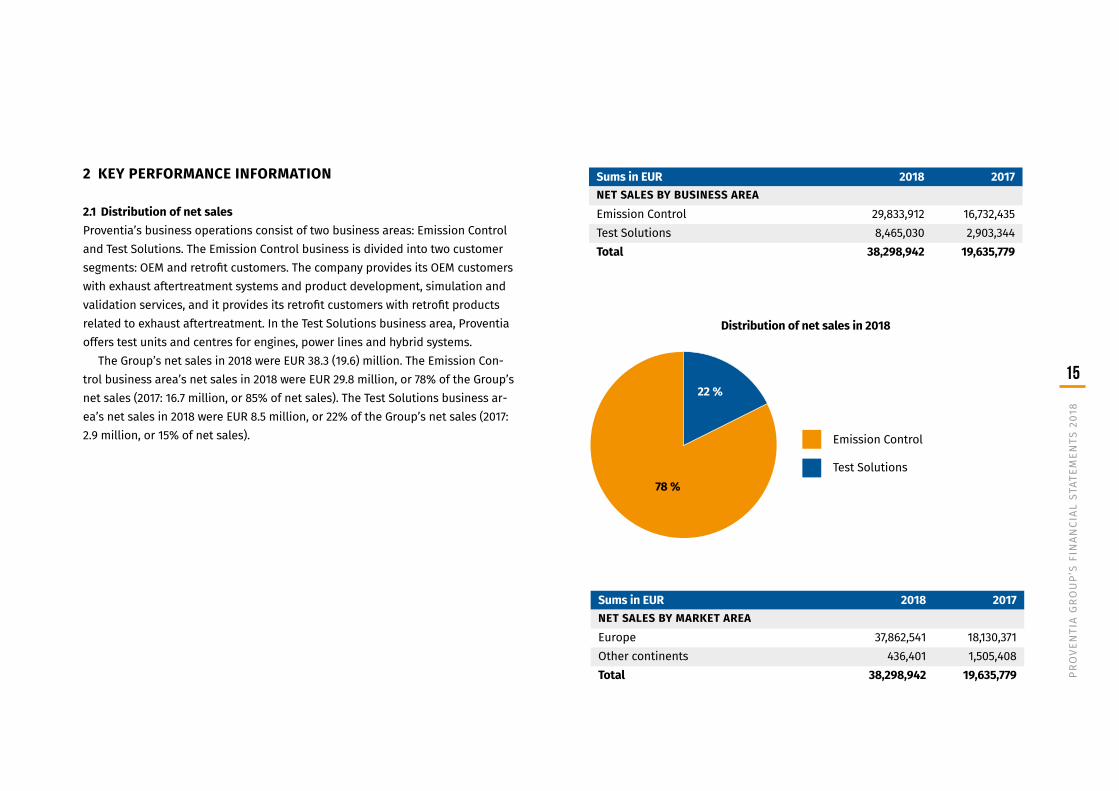
Sums in EUR 2018 2017NET SALES BY BUSINESS AREAEmission Control 29,833,912 16,732,435Test Solutions 8,465,030 2,903,344Total 38,298,942 19,635,779
Sums in EUR 2018 2017NET SALES BY MARKET AREAEurope 37,862,541 18,130,371Other continents 436,401 1,505,408Total 38,298,942 19,635,779
Distribution of net sales in 2018
Emission Control
Test Solutions
22 %
78 %
2 KEY PERFORMANCE INFORMATION
2.1 Distribution of net salesProventia’s business operations consist of two business areas: Emission Control and Test Solutions. The Emission Control business is divided into two customer segments: OEM and retrofit customers. The company provides its OEM customers with exhaust aftertreatment systems and product development, simulation and validation services, and it provides its retrofit customers with retrofit products related to exhaust aftertreatment. In the Test Solutions business area, Proventia offers test units and centres for engines, power lines and hybrid systems.
The Group’s net sales in 2018 were EUR 38.3 (19.6) million. The Emission Con-trol business area’s net sales in 2018 were EUR 29.8 million, or 78% of the Group’s net sales (2017: 16.7 million, or 85% of net sales). The Test Solutions business ar-ea’s net sales in 2018 were EUR 8.5 million, or 22% of the Group’s net sales (2017: 2.9 million, or 15% of net sales).
15
PRO
VEN
TIA
GRO
UP’
S FI
NAN
CIAL
STA
TEM
ENTS
201
8
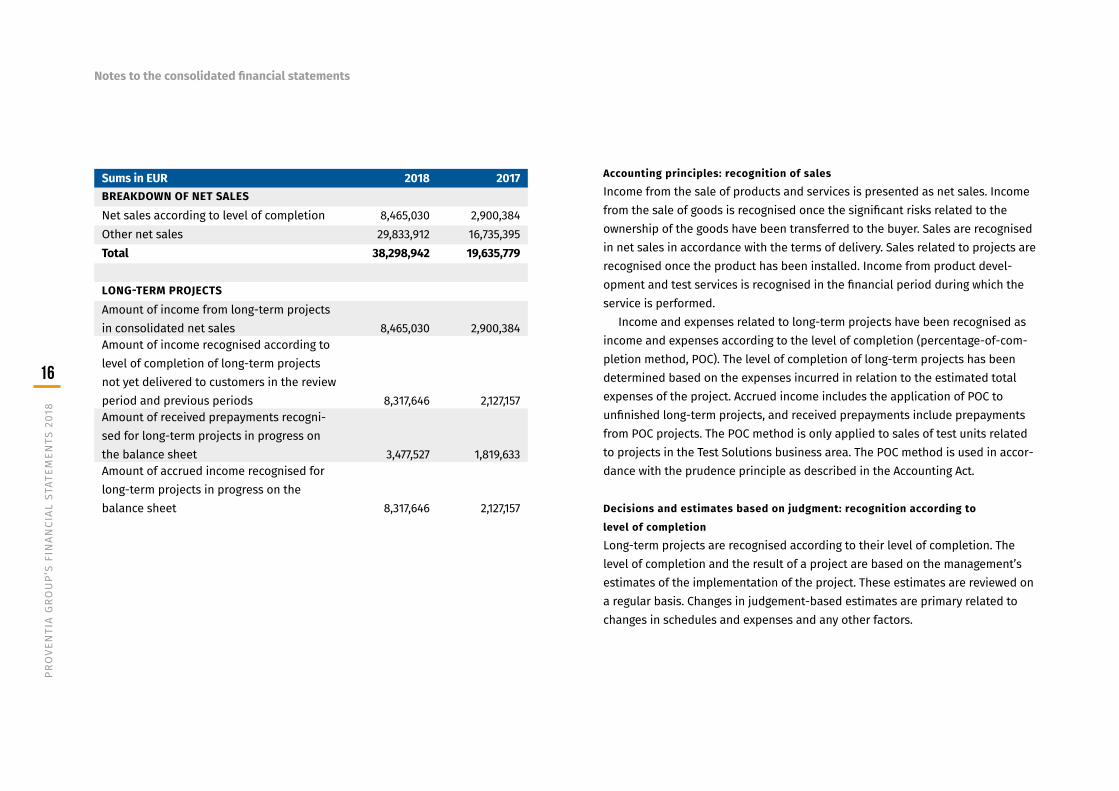
Sums in EUR 2018 2017BREAKDOWN OF NET SALESNet sales according to level of completion 8,465,030 2,900,384Other net sales 29,833,912 16,735,395Total 38,298,942 19,635,779
LONG-TERM PROJECTSAmount of income from long-term projects in consolidated net sales 8,465,030 2,900,384Amount of income recognised according to level of completion of long-term projects not yet delivered to customers in the review period and previous periods 8,317,646 2,127,157Amount of received prepayments recogni-sed for long-term projects in progress on the balance sheet 3,477,527 1,819,633Amount of accrued income recognised for long-term projects in progress on the balance sheet 8,317,646 2,127,157
Accounting principles: recognition of sales
Income from the sale of products and services is presented as net sales. Income from the sale of goods is recognised once the significant risks related to the ownership of the goods have been transferred to the buyer. Sales are recognised in net sales in accordance with the terms of delivery. Sales related to projects are recognised once the product has been installed. Income from product devel-opment and test services is recognised in the financial period during which the service is performed.
Income and expenses related to long-term projects have been recognised as income and expenses according to the level of completion (percentage-of-com-pletion method, POC). The level of completion of long-term projects has been determined based on the expenses incurred in relation to the estimated total expenses of the project. Accrued income includes the application of POC to unfinished long-term projects, and received prepayments include prepayments from POC projects. The POC method is only applied to sales of test units related to projects in the Test Solutions business area. The POC method is used in accor-dance with the prudence principle as described in the Accounting Act.
Decisions and estimates based on judgment: recognition according to
level of completion
Long-term projects are recognised according to their level of completion. The level of completion and the result of a project are based on the management’s estimates of the implementation of the project. These estimates are reviewed on a regular basis. Changes in judgement-based estimates are primary related to changes in schedules and expenses and any other factors.
Notes to the consolidated financial statements
16
PRO
VEN
TIA
GRO
UP’
S FI
NAN
CIAL
STA
TEM
ENTS
201
8

2.2 Materials and servicesMaterials and services consist of purchases of raw materials and services pur-chased from subcontractors.
2.3 Other operating income and expenses
Sums in EUR 2018 2017MATERIALS AND SERVICESSubstances, supplies and goods Purchases during the financial year 24,119,856 10,749,745 Increase in inventories -2,335,390 -993,932
External services 1,604,205 828,475Total 23,388,670 10,584,287
Sums in EUR 2018 2017OTHER OPERATING INCOMEOther operating income 34,829 25,561Total 34,829 25,561
OTHER OPERATING EXPENSESFacility expenses 869,817 585,646IT, device and equipment expenses 566,628 353,066Travel expenses 681,814 347,109Sales and marketing expenses 1,455,189 543,708Administrative services and other administrative expenses
1,629,943
372,163
Other expense items 390,641 318,055
Total 5,594,033 2,519,746
AUDITORS’ FEESAuditing 46,912 21,669Tax consultancy services 14,582 15,171Other services 14,452 9,389Total 75,946 46,228
17
PRO
VEN
TIA
GRO
UP’
S FI
NAN
CIAL
STA
TEM
ENTS
201
8

2.4 Depreciation and impairment 2.5. Income tax
Sums in EUR 2018 2017DEPRECIATION BY ASSET GROUPDevelopment expenses 381,592 296,700Intellectual property rights 91,970 55,240Other capitalised long-term expenses 189,871 69,617Machinery and equipment 517,085 502,270Depreciation, total 1,180,519 923,827Impairment of non-current assets 0 136,739Depreciation and impairment, total 1,180,519 1,060,567
Sums in EUR 2018 2017Income tax -997,010 -477,811Deferred tax 42,905 22,228Total -954,104 -455,584
Accounting principles: depreciation
Property, plant and equipment, as well as intangible assets, are recognised on the balance sheet at acquisition cost less depreciation according to plan and any impairment. Depreciation according to plan is calculated as straight-line depreci-ation based on useful lives. Small purchases are recognised as expenses for the financial year. The useful lives are presented in Notes 4.1 and 4.2.
Accounting principles: income tax
Income tax for the financial year consists of taxes based on taxable income and deferred tax. Taxes based on taxable income for the financial year are calculated in accordance with current tax regulations.
Deferred tax is recognised for temporary differences between taxable amounts and book values of assets and liabilities. Deferred tax assets are rec-ognised to the extent that it is probable that they can be used against taxable income. Deferred tax is discussed in more detail in Note 7.3.
Notes to the consolidated financial statements
18
PRO
VEN
TIA
GRO
UP’
S FI
NAN
CIAL
STA
TEM
ENTS
201
8

Euroa 2018 2017NUMBER OF EMPLOYEESAverage number for the period 92 54Number of employees at the end of the period
118 65
BREAKDOWN OF PERSONNEL EXPENSESSalaries and fees 4,511,462 3,186,217Pension expenses 847,519 606,648Other statutory indirect expenses 156,593 101,325Total 5,515,573 3,894,190
The employees are paid a monthly salary or are paid by the hour. The company used a bonus scheme in 2018. The company’s Board of Directors decides annually on the bonus scheme and its terms and conditions. Bonuses are paid based on the achieve-ment of the targets set for the financial year. Personnel expenses are recognised on an accrual basis. In 2018, personnel expenses included EUR 730,000 in expenses related to bonuses (EUR 756,000 in 2017).
Pension arrangements
Pension security for the company’s employees is arranged with an external pension insurance company in accordance with the Employees Pensions Act. Pension expens-es are recognised in the period during which they were incurred and are included in personnel expenses.
3 PERSONNEL
3.1 Number of employees and personnel expenses
3.2 Related-party transactionsThe Group’s related parties include its parent company and the subsidiaries men-tioned in Note 7.2, as well as the companies belonging to the Head Invest Group. In addition, related parties include members of the Board of Directors and the Man-agement Team, the CEO and the family members of these individuals, as well as any companies controlled by these.
During the 2018 financial year, the company’s related-party transactions totalled EUR 418,000 (407,000). The most significant related-party transactions were carried out with companies of the Head Invest Group and totalled EUR 403,000 (407,000). Of these, the most significant item consists of rents for facilities, totalling EUR 319,000 (321,000). Other related-party transactions comprise purchases of administration services and payroll services from the Head Invest Group. These related-party transactions were carried out on typical market terms. The Group does not have related-party loans.
The management’s salaries and fees
The Board of Directors decides on the remuneration of the CEO and the members of the Management Team, as well as the grounds for their remuneration. The CEO’s and the Management Team members’ salaries consist of a monthly salary and a bonus. The Board of Directors determines the terms and conditions of the bonus annually. Bonuses are paid to the CEO and the Management Team members based on the achievement of the targets set for the financial year. The CEO’s, Management Team members’ and Board members’ salaries and fees in 2018 and 2017 were as follows:
Sums in EUR 2018 2017CEO’s and Management Team members’ salaries and fees
970,132
1,042,316
Board members’ salaries and fees 117,000 58,500Total 1,087,132 1,100,816
19
PRO
VEN
TIA
GRO
UP’
S FI
NAN
CIAL
STA
TEM
ENTS
201
8

The management’s option system
Proventia currently has two option schemes for its key personnel. In addition to serving as incentives, the option schemes are intended to increase commitment. The option scheme implemented by the company’s Board of Directors in 2015 en-titles its key personnel to subscribe for a total of 470,000 shares at a price of EUR 0.36 per share in 2016–2023. The option scheme implemented in 2016 entitles the company’s key personnel to subscribe for a total of 1,193,800 shares at a price of EUR 0.50 per share in 2019–2024. Option rights involve conventional terms and conditions related to the validity of the employment relationship and limitations related to transferability.
Sums in EUR 2018 2017Research and development expenses, total 1,722,218 651,296Amount of product development costs capitalised as development expenses on the balance sheet: 1,154,435 368,889Impairment of research and development expenses 0 136,739Depreciation of research and development expenses 381,592 296,700Research and development expenses recognised through profit or loss 567,783 367,083Research and development expenses, % of net sales 4.50% 3.32%
4 RESEARCH, DEVELOPMENT AND INVESTMENT
4.1 Research and development expenses, other intellectual property rights and capitalised long-term expenses
The impairment of research and development expenses in the 2017 financial year was related to a product that did not meet the requirements for approval in its target markets. For this reason, it was recognised as a write-off.
Accounting principles: intangible assets
Intangible assets are recognised on the balance sheet at acquisition cost less depreciation according to plan and impairment. Depreciation according to plan is calculated as straight-line depreciation based on useful life of the asset.
Notes to the consolidated financial statements
20
PRO
VEN
TIA
GRO
UP’
S FI
NAN
CIAL
STA
TEM
ENTS
201
8

The following depreciation methods and periods are used when calculating depreciation according to plan:Development expenses Straight-line depreciation, 5 yearsIntellectual property rights Straight-line depreciation, 5 yearsCapitalised long-term expenses Straight-line depreciation, 3–10 years
The useful lives of assets are reviewed at the end of each financial year and are adjusted accordingly, if necessary. Development expenses
Expenses related to development operations carried out during the financial year have been capitalised on the balance sheet. Development expenses related to products intended for sale have been capitalised in accordance with the Ac-counting Act. The capitalised expenses consist of expenses related to materials and employees.
Decisions and estimates based on judgment: capitalised development expenses
The management has used its judgment and has made assumptions when estimating whether the expenses generated during the development phases of development projects meet the criteria for being capitalised as intangible assets. The management’s judgement has been applied to the determination of acqui-sition costs and useful lives. The management’s judgment has also been used when estimating the income to be expected from development projects. These estimates concern future net sales and the corresponding expenses. They involve uncertainties, and it is possible that the income to be expected from develop-ment projects changes if the conditions change. Any indications of impairment related to development projects are estimated by taking all relevant factors into account. If the expected income changes, the value of capitalised development projects may decrease.
Sums in EUR 2018 2017Development expenses Acquisition cost, 1 Jan 5,190,937 4,958,788Increase 1,154,435 368,889Decrease 0 -136,739Acquisition cost, 31 Dec 6,345,372 5,190,937Accumulated depreciation according to plan -4,352,074 -4,055,374Depreciation for the period -381,592 -296,700Book value, 31 Dec 1,611,705 838,863
Intellectual property rightsAcquisition cost, 1 Jan 1,475,855 1,352,603Increase 327,681 123,252Acquisition cost, 31 Dec 1,803,537 1,475,855Accumulated depreciation according to plan -1,260,644 -1,205,766Depreciation for the period -91,970 -54,878Book value, 31 Dec 450,923 215,211
Other capitalised long-term expensesAcquisition cost, 1 Jan 613,549 146,428Increase 426,534 467,121Decrease -2,275 0Acquisition cost, 31 Dec 1,037,808 613,549Accumulated depreciation according to plan -155,744 -85,764Depreciation for the period -189,871 -69,980Book value, 31 Dec 692,193 457,805Intangible assets, total 2,754,821 1,511,879
Changes in intangible assets are presented in the following table:
21
PRO
VEN
TIA
GRO
UP’
S FI
NAN
CIAL
STA
TEM
ENTS
201
8

4.2 Machinery and equipmentTangible assets consist of machinery, equipment and office furniture, which are depreciated by using the straight-line method over useful lives of 3–10 years.
Sums in EUR 2018 2017Machinery and equipmentAcquisition cost, 1 Jan 4,725,546 3,814,915Increase 3,361,848 911,112Decrease 0 -481Acquisition cost, 31 Dec 8,087,394 4,725,546Accumulated depreciation according to plan -3,131,817 -2,629,547Depreciation for the period -517,085 -502,270Book value, 31 Dec 4,438,492 1,593,729Tangible assets, total 4,438,492 1,593,729
Sums in EUR 2018 2017Substances and supplies 4,540,903 2,211,451Work in progress 720,102 248,043Finished products 2,685,472 1,078,049Prepayments on inventories 99,918 64,924Inventories, total 8,046,396 3,602,467
Accounting principles: tangible assets
Non-current assets are measured at direct acquisition cost. Small purchases, as well as commodities with useful lives shorter than three years, are recognised as expenses for the financial year. With regard to commodities recognised in non- current assets on the balance sheet, depreciation according to plan is recognised as of the month immediately following the acquisition month, or as of the month of implementation, depending on which comes later.
Decisions and estimates based on judgment: useful lives of tangible assets
Depreciation is based on the management’s estimates of the useful lives of tan-gible assets. The estimates may change due to technological development and other factors, which may cause changes to the estimated useful life and depreci-ation recognised in the income statement.
5 WORKING CAPITAL
5. 1 Inventories
Accounting principles: inventories
Inventories are measured at the lower of acquisition cost and selling price. The acquisition cost includes purchasing expenses, production expenses and other expenses arising from the achievement of the current condition of inventories. Purchasing expenses include the purchase price, transportation costs and other costs directly attributable to the acquisition of services. Production expenses include direct costs arising from materials and work performance.
5.2 Sales and other receivablesSales receivables consist of products sold or services delivered to the customer in the ordinary course of business. Credit losses on sales receivables are pre-sented in other operating expenses in the income statement.
Current receivables mainly include accrued income arising from the Group’s ordinary operations. On 31 December 2018, non-current receivables totalled EUR 85,000 (59,000) and consisted of rent deposits.
Notes to the consolidated financial statements
22
PRO
VEN
TIA
GRO
UP’
S FI
NAN
CIAL
STA
TEM
ENTS
201
8
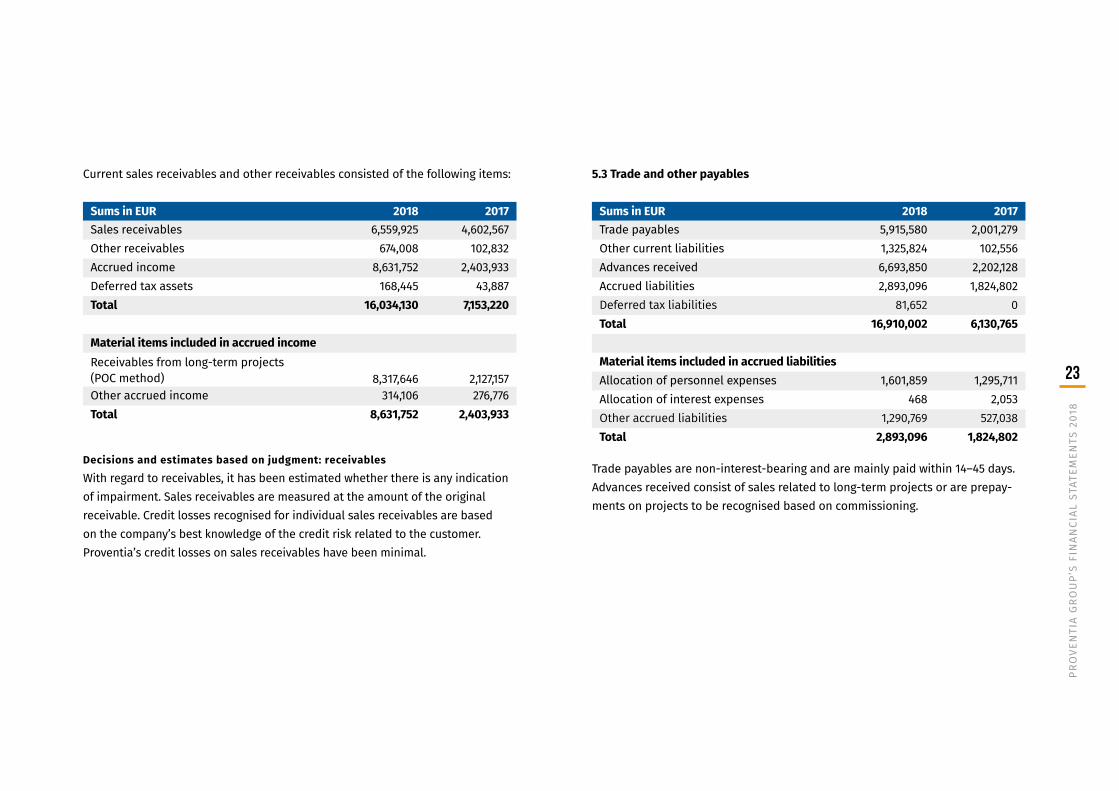
Sums in EUR 2018 2017Sales receivables 6,559,925 4,602,567Other receivables 674,008 102,832Accrued income 8,631,752 2,403,933Deferred tax assets 168,445 43,887Total 16,034,130 7,153,220
Material items included in accrued income Receivables from long-term projects (POC method) 8,317,646 2,127,157Other accrued income 314,106 276,776Total 8,631,752 2,403,933
Sums in EUR 2018 2017Trade payables 5,915,580 2,001,279Other current liabilities 1,325,824 102,556Advances received 6,693,850 2,202,128Accrued liabilities 2,893,096 1,824,802Deferred tax liabilities 81,652 0Total 16,910,002 6,130,765
Material items included in accrued liabilitiesAllocation of personnel expenses 1,601,859 1,295,711Allocation of interest expenses 468 2,053Other accrued liabilities 1,290,769 527,038Total 2,893,096 1,824,802
Current sales receivables and other receivables consisted of the following items:
Decisions and estimates based on judgment: receivables
With regard to receivables, it has been estimated whether there is any indication of impairment. Sales receivables are measured at the amount of the original receivable. Credit losses recognised for individual sales receivables are based on the company’s best knowledge of the credit risk related to the customer. Proventia’s credit losses on sales receivables have been minimal.
5.3 Trade and other payables
Trade payables are non-interest-bearing and are mainly paid within 14–45 days. Advances received consist of sales related to long-term projects or are prepay-ments on projects to be recognised based on commissioning.
23
PRO
VEN
TIA
GRO
UP’
S FI
NAN
CIAL
STA
TEM
ENTS
201
8
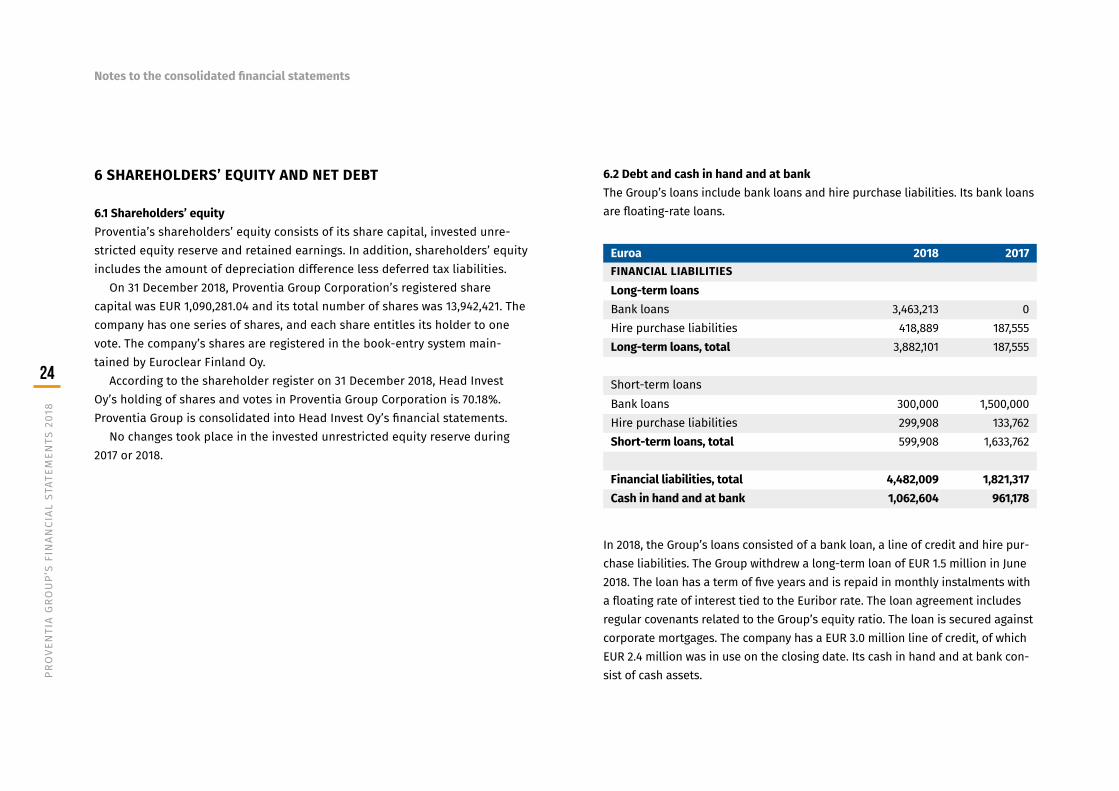
6 SHAREHOLDERS’ EQUITY AND NET DEBT
6.1 Shareholders’ equityProventia’s shareholders’ equity consists of its share capital, invested unre-stricted equity reserve and retained earnings. In addition, shareholders’ equity includes the amount of depreciation difference less deferred tax liabilities.
On 31 December 2018, Proventia Group Corporation’s registered share capital was EUR 1,090,281.04 and its total number of shares was 13,942,421. The company has one series of shares, and each share entitles its holder to one vote. The company’s shares are registered in the book-entry system main-tained by Euroclear Finland Oy.
According to the shareholder register on 31 December 2018, Head Invest Oy’s holding of shares and votes in Proventia Group Corporation is 70.18%. Proventia Group is consolidated into Head Invest Oy’s financial statements.
No changes took place in the invested unrestricted equity reserve during 2017 or 2018.
Euroa 2018 2017FINANCIAL LIABILITIESLong-term loansBank loans 3,463,213 0Hire purchase liabilities 418,889 187,555Long-term loans, total 3,882,101 187,555
Short-term loansBank loans 300,000 1,500,000Hire purchase liabilities 299,908 133,762Short-term loans, total 599,908 1,633,762 Financial liabilities, total 4,482,009 1,821,317Cash in hand and at bank 1,062,604 961,178
In 2018, the Group’s loans consisted of a bank loan, a line of credit and hire pur-chase liabilities. The Group withdrew a long-term loan of EUR 1.5 million in June 2018. The loan has a term of five years and is repaid in monthly instalments with a floating rate of interest tied to the Euribor rate. The loan agreement includes regular covenants related to the Group’s equity ratio. The loan is secured against corporate mortgages. The company has a EUR 3.0 million line of credit, of which EUR 2.4 million was in use on the closing date. Its cash in hand and at bank con-sist of cash assets.
6.2 Debt and cash in hand and at bankThe Group’s loans include bank loans and hire purchase liabilities. Its bank loans are floating-rate loans.
Notes to the consolidated financial statements
24
PRO
VEN
TIA
GRO
UP’
S FI
NAN
CIAL
STA
TEM
ENTS
201
8
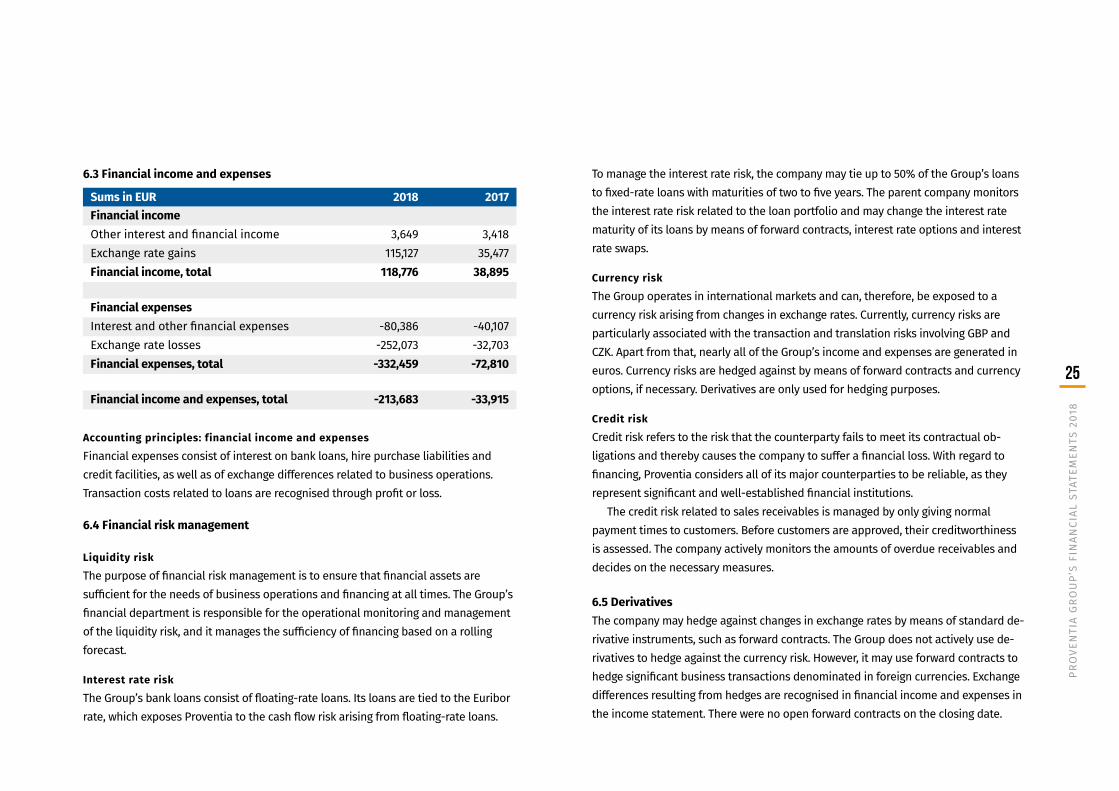
Sums in EUR 2018 2017Financial incomeOther interest and financial income 3,649 3,418Exchange rate gains 115,127 35,477Financial income, total 118,776 38,895
Financial expensesInterest and other financial expenses -80,386 -40,107Exchange rate losses -252,073 -32,703Financial expenses, total -332,459 -72,810 Financial income and expenses, total -213,683 -33,915
6.3 Financial income and expenses
Accounting principles: financial income and expenses
Financial expenses consist of interest on bank loans, hire purchase liabilities and credit facilities, as well as of exchange differences related to business operations. Transaction costs related to loans are recognised through profit or loss.
6.4 Financial risk management
Liquidity risk
The purpose of financial risk management is to ensure that financial assets are sufficient for the needs of business operations and financing at all times. The Group’s financial department is responsible for the operational monitoring and management of the liquidity risk, and it manages the sufficiency of financing based on a rolling forecast.
Interest rate risk
The Group’s bank loans consist of floating-rate loans. Its loans are tied to the Euribor rate, which exposes Proventia to the cash flow risk arising from floating-rate loans.
To manage the interest rate risk, the company may tie up to 50% of the Group’s loans to fixed-rate loans with maturities of two to five years. The parent company monitors the interest rate risk related to the loan portfolio and may change the interest rate maturity of its loans by means of forward contracts, interest rate options and interest rate swaps.
Currency risk
The Group operates in international markets and can, therefore, be exposed to a currency risk arising from changes in exchange rates. Currently, currency risks are particularly associated with the transaction and translation risks involving GBP and CZK. Apart from that, nearly all of the Group’s income and expenses are generated in euros. Currency risks are hedged against by means of forward contracts and currency options, if necessary. Derivatives are only used for hedging purposes.
Credit risk
Credit risk refers to the risk that the counterparty fails to meet its contractual ob-ligations and thereby causes the company to suffer a financial loss. With regard to financing, Proventia considers all of its major counterparties to be reliable, as they represent significant and well-established financial institutions.
The credit risk related to sales receivables is managed by only giving normal payment times to customers. Before customers are approved, their creditworthiness is assessed. The company actively monitors the amounts of overdue receivables and decides on the necessary measures.
6.5 DerivativesThe company may hedge against changes in exchange rates by means of standard de-rivative instruments, such as forward contracts. The Group does not actively use de-rivatives to hedge against the currency risk. However, it may use forward contracts to hedge significant business transactions denominated in foreign currencies. Exchange differences resulting from hedges are recognised in financial income and expenses in the income statement. There were no open forward contracts on the closing date.
25
PRO
VEN
TIA
GRO
UP’
S FI
NAN
CIAL
STA
TEM
ENTS
201
8

6.6 Off-balance sheet commitments
Sums in EUR 2018 2017PLEDGES AND CONTINGENT LIABILITIES
Securities and mortgages for own liabilities Business mortgages 8,300,839 8,300,839
Lines of credit Total credit amount 3,000,000 1,500,000 In use 2,413,213 0
Amounts paid from leasing agreements (VAT included) To be paid during the next financial year 245,971 112,767 To be paid later 282,151 131,060 Total 528,122 243,827
Other liabilities based on agreements (VAT included) To be paid during the next financial year 1,187,217 638,087 To be paid later 3,981,066 1,481,327 Total 5,168,283 2,119,414
Commercial bank guarantees 764,373 0
Liabilities for which mortgages or pledges have been given as securities Loans from financial institutions 3,763,213 1,500,000 Total 3,763,213 1,500,000
Other contractual liabilities consist of rental liabilities related to facilities. Rental obligations consist of future rents on Proventia’s facilities in Finland and the Czech Republic. Lease agreements are valid either until further notice or for a fixed period. They include the option to extend the agreement beyond its original end date. Bank guarantees consist of a delivery guarantee and prepayment guarantees.
During the 2018 financial year, the company applied to become retroactively liable to pay VAT in the UK. On the closing date, no decision on the retroactive registration date for the liability to pay VAT was received. The decision had no impact on profit or loss, as the company’s liability subject to VAT on the closing date will be invoiced from customers.
Notes to the consolidated financial statements
26
PRO
VEN
TIA
GRO
UP’
S FI
NAN
CIAL
STA
TEM
ENTS
201
8
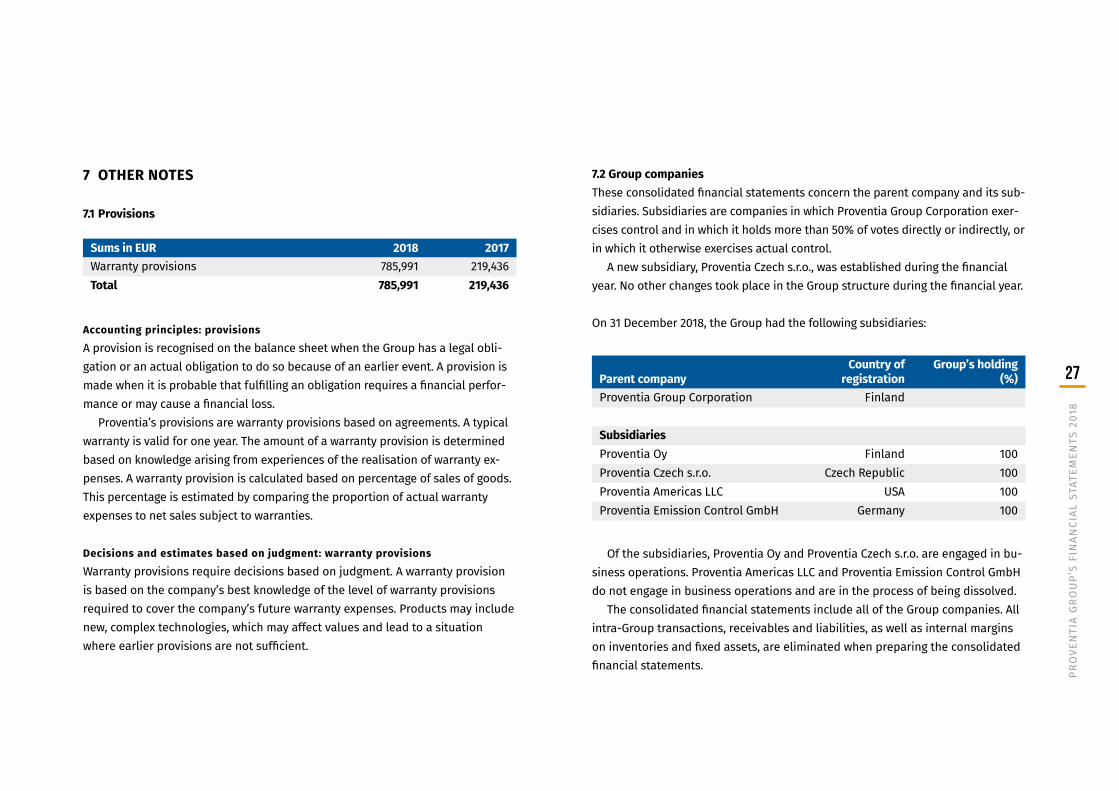
Sums in EUR 2018 2017Warranty provisions 785,991 219,436Total 785,991 219,436
Parent companyCountry of
registrationGroup’s holding
(%)Proventia Group Corporation Finland
Subsidiaries Proventia Oy Finland 100Proventia Czech s.r.o. Czech Republic 100Proventia Americas LLC USA 100Proventia Emission Control GmbH Germany 100
7 OTHER NOTES
7.1 Provisions
Accounting principles: provisions
A provision is recognised on the balance sheet when the Group has a legal obli-gation or an actual obligation to do so because of an earlier event. A provision is made when it is probable that fulfilling an obligation requires a financial perfor-mance or may cause a financial loss.
Proventia’s provisions are warranty provisions based on agreements. A typical warranty is valid for one year. The amount of a warranty provision is determined based on knowledge arising from experiences of the realisation of warranty ex-penses. A warranty provision is calculated based on percentage of sales of goods. This percentage is estimated by comparing the proportion of actual warranty expenses to net sales subject to warranties.
Decisions and estimates based on judgment: warranty provisions
Warranty provisions require decisions based on judgment. A warranty provision is based on the company’s best knowledge of the level of warranty provisions required to cover the company’s future warranty expenses. Products may include new, complex technologies, which may affect values and lead to a situation where earlier provisions are not sufficient.
7.2 Group companiesThese consolidated financial statements concern the parent company and its sub-sidiaries. Subsidiaries are companies in which Proventia Group Corporation exer-cises control and in which it holds more than 50% of votes directly or indirectly, or in which it otherwise exercises actual control.
A new subsidiary, Proventia Czech s.r.o., was established during the financial year. No other changes took place in the Group structure during the financial year.
On 31 December 2018, the Group had the following subsidiaries:
Of the subsidiaries, Proventia Oy and Proventia Czech s.r.o. are engaged in bu-siness operations. Proventia Americas LLC and Proventia Emission Control GmbH do not engage in business operations and are in the process of being dissolved.
The consolidated financial statements include all of the Group companies. All intra-Group transactions, receivables and liabilities, as well as internal margins on inventories and fixed assets, are eliminated when preparing the consolidated financial statements.
27
PRO
VEN
TIA
GRO
UP’
S FI
NAN
CIAL
STA
TEM
ENTS
201
8
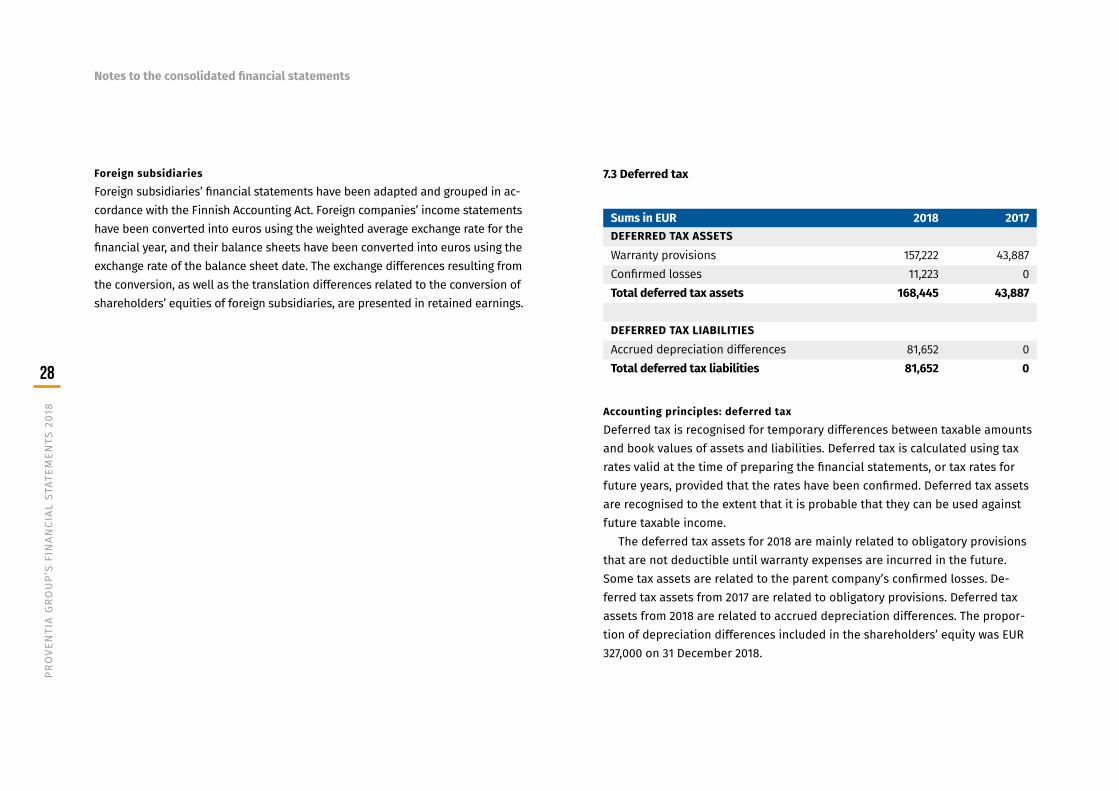
Foreign subsidiaries
Foreign subsidiaries’ financial statements have been adapted and grouped in ac-cordance with the Finnish Accounting Act. Foreign companies’ income statements have been converted into euros using the weighted average exchange rate for the financial year, and their balance sheets have been converted into euros using the exchange rate of the balance sheet date. The exchange differences resulting from the conversion, as well as the translation differences related to the conversion of shareholders’ equities of foreign subsidiaries, are presented in retained earnings.
Sums in EUR 2018 2017DEFERRED TAX ASSETSWarranty provisions 157,222 43,887Confirmed losses 11,223 0Total deferred tax assets 168,445 43,887
DEFERRED TAX LIABILITIESAccrued depreciation differences 81,652 0Total deferred tax liabilities 81,652 0
Accounting principles: deferred tax
Deferred tax is recognised for temporary differences between taxable amounts and book values of assets and liabilities. Deferred tax is calculated using tax rates valid at the time of preparing the financial statements, or tax rates for future years, provided that the rates have been confirmed. Deferred tax assets are recognised to the extent that it is probable that they can be used against future taxable income.
The deferred tax assets for 2018 are mainly related to obligatory provisions that are not deductible until warranty expenses are incurred in the future. Some tax assets are related to the parent company’s confirmed losses. De-ferred tax assets from 2017 are related to obligatory provisions. Deferred tax assets from 2018 are related to accrued depreciation differences. The propor-tion of depreciation differences included in the shareholders’ equity was EUR 327,000 on 31 December 2018.
7.3 Deferred tax
Notes to the consolidated financial statements
28
PRO
VEN
TIA
GRO
UP’
S FI
NAN
CIAL
STA
TEM
ENTS
201
8

Parent company’s financial statements
29
PRO
VEN
TIA
GRO
UP’
S FI
NAN
CIAL
STA
TEM
ENTS
201
8

Parent company’s income statement
Sums in EUR Note 1 Jan 2018 –31 Dec 2018
1 Jan 2017 –31 Dec 2017
Net sales 1 1,418,186 799,462Other operating income 2 2,598 8,964Materials and services 0 0Personnel expenses 3 -643,991 -480,426Depreciation and impairment 4 -34,609 -21,066Other operating expenses 5 -1,594,279 -360,205Operating loss -852,096 -53,271Financial income and expenses 6 -1,162 -1,198Loss before taxes -853,258 -54,469Appropriations 7 1,000,000 80,000Income tax 8 12,141 -4,260Profit for the period 158,883 21,271
30
PRO
VEN
TIA
GRO
UP’
S FI
NAN
CIAL
STA
TEM
ENTS
201
8

Sums in EUR Note 31 Dec 2018 31 Dec 2017ASSETSNon-current assetsIntangible assets 9 120,367 76,211Tangible assets 9 8,494 3,486Investment 10 5,421,157 5,421,157Non-current assets, total 5,550,018 5,500,854
Current assetsCurrent receivables 11
Sales receivables 202,421 275,263Other receivables and accrued income
888,517
812,379
Current receivables, total 1,090,937 1,087,642
Cash in hand and at bank 185,238 6,676Current assets, total 1,276,175 1,094,318TOTAL ASSETS 6,826,193 6,595,172
Sums in EUR Note 31 Dec 2018 31 Dec 2017LIABILITIESShareholders' equity 12Share capital 1,090,281 1,090,281Invested unrestricted equity reserve 4,562,371 4,562,371Retained earnings 723,350 707,159Profit for the period 158,883 21,271Shareholders' equity, total 6,534,885 6,381,082
DebtCurrent debt 13
Trade payables 108,586 28,533Other payables and accrued liabilities
182,723
185,556
Current debt, total 291,309 214,090Debt, total 291,309 214,090TOTAL LIABILITIES 6,826,193 6,595,172
Parent company’s balance sheet
31
PRO
VEN
TIA
GRO
UP’
S FI
NAN
CIAL
STA
TEM
ENTS
201
8

Parent company’s cash flow statement
Sums in EUR 2018 2017Cash flow from operating activities:Loss before taxes -853,258 -54,469Adjustments: Planned depreciation 34,609 21,066 Financial income and expenses 1,162 1,198 Cash flow before changes in working capital
-817,487
-32,205
Changes in working capital Changes in current non-interest-bearing trade receivables 996,705 7,712 Changes in current non-interest-bearing liabilities 78,137 121,117Interest paid and payments on other operating financial expenses -1,162 -1,323Cash flow from operating activities (A) 267,415 95,302
Sums in EUR 2018 2017Cash flow from investing activities:Investments in tangible and intangible assets -83,774 -31,698Cash flow from investing activities (B) -83,774 -31,698
Cash flow from financing activities:Repayments of long-term loans 0 -85,938Acquisition of treasury shares -5,080 0Cash flow from financing activities (C) -5,080 -85,938
Changes in cash in hand and at bank (increase +, decrease -) (A+B+C)
178,562
-22,333
Cash in hand and at bank at the beginning of the period
6,676
29,009
Cash in hand and at bank at the end of the period
185,238
6,676
32
PRO
VEN
TIA
GRO
UP’
S FI
NAN
CIAL
STA
TEM
ENTS
201
8

Parent company’s accounting principles
Proventia Group Corporation’s financial statements have been prepared in accor-dance with the Finnish Accounting Act.
Net salesThe parent company’s net sales consist of administrative service fees. Income from services is recognised in the financial period during which the service is performed.
Valuation of non-current assetsNon-current assets are recognised on the balance sheet at acquisition cost less depreciation according to plan. Depreciation according to plan is calculated as straight-line depreciation based on useful lives. Depreciation is recognised as of the month immediately following the acquisition month, or as of the month of implementation, depending on which comes later.
Depreciation periods:Intellectual property rights Straight-line depreciation, 5 yearsCapitalised long-term expenses Straight-line depreciation, 5–10 yearsMachinery and equipment Straight-line depreciation, 5–10 years
Items denominated in foreign currenciesBusiness transactions denominated in foreign currencies are converted into euros using the exchange rate of the transaction date. Receivables and liabilities denominated in foreign currencies are converted into euros using the exchange rate of the balance sheet date.
33
PRO
VEN
TIA
GRO
UP’
S FI
NAN
CIAL
STA
TEM
ENTS
201
8
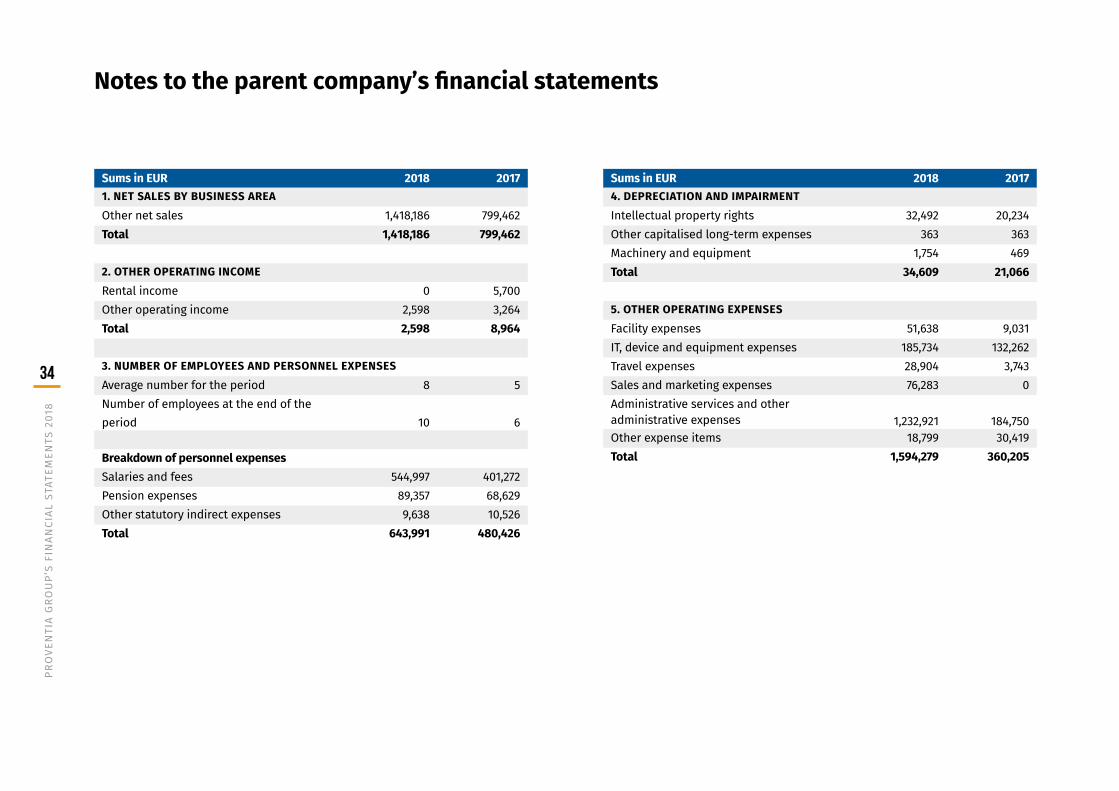
Notes to the parent company’s financial statements
Sums in EUR 2018 20171. NET SALES BY BUSINESS AREAOther net sales 1,418,186 799,462Total 1,418,186 799,462
2. OTHER OPERATING INCOMERental income 0 5,700Other operating income 2,598 3,264Total 2,598 8,964
3. NUMBER OF EMPLOYEES AND PERSONNEL EXPENSESAverage number for the period 8 5Number of employees at the end of the period
10
6
Breakdown of personnel expenses Salaries and fees 544,997 401,272Pension expenses 89,357 68,629Other statutory indirect expenses 9,638 10,526Total 643,991 480,426
Sums in EUR 2018 20174. DEPRECIATION AND IMPAIRMENTIntellectual property rights 32,492 20,234Other capitalised long-term expenses 363 363Machinery and equipment 1,754 469Total 34,609 21,066
5. OTHER OPERATING EXPENSESFacility expenses 51,638 9,031IT, device and equipment expenses 185,734 132,262Travel expenses 28,904 3,743Sales and marketing expenses 76,283 0Administrative services and other administrative expenses
1,232,921
184,750
Other expense items 18,799 30,419Total 1,594,279 360,205
34
PRO
VEN
TIA
GRO
UP’
S FI
NAN
CIAL
STA
TEM
ENTS
201
8

Sums in EUR 2018 20176. FINANCIAL INCOME AND EXPENSESInterest and other financial expenses
To Group companies -575 0To others -587 -1,198
Financial expenses, total -1,162 -1,198Financial income and expenses, total -1,162 -1,198
7. APPROPRIATIONSGroup contribution 1,000,000 80,000Total 1,000,000 80,000
8. INCOME TAXIncome tax 12,141 -4,260Total 12,141 -4,260
Sums in EUR 2018 20179. CHANGES IN NON-CURRENT ASSETSIntellectual property rightsAcquisition cost, 1 Jan 606,494 577,208Increase 77,011 29,286Acquisition cost, 31 Dec 683,505 606,494Accumulated depreciation according to plan -533,424 -513,190Depreciation for the period -32,492 -20,234Book value, 31 Dec 117,588 73,069
Other capitalised long-term expensesAcquisition cost, 1 Jan 3,625 3,625Increase 0 0Acquisition cost, 31 Dec 3,625 3,625Accumulated depreciation according to plan -483 -121Depreciation for the period -363 -363Book value, 31 Dec 2,779 3,142Intangible assets, total 120,367 76,211
Machinery and equipmentAcquisition cost, 1 Jan 180,580 178,168Increase 6,762 2,412Acquisition cost, 31 Dec 187,342 180,580Accumulated depreciation according to plan -177,094 -176,624Depreciation for the period -1,754 -469Book value, 31 Dec 8,494 3,486Tangible assets, total 8,494 3,486
35
PRO
VEN
TIA
GRO
UP’
S FI
NAN
CIAL
STA
TEM
ENTS
201
8

Sums in EUR 2018 201710. INVESTMENT
Shares and holdings in Group companiesAcquisition cost, 1 Jan 5,421,157 5,421,157Acquisition cost, 31 Dec 5,421,157 5,421,157Shares and holdings, total 5,421,157 5,421,157Investments, total 5,421,157 5,421,157
Holdings in other companies Group companies
Proventia Oy, Oulu, Finland 100% 100%Proventia Emission Control GmbH, Speyer, Germany
100% 100%
Proventia Czech s.r.o. / Brno, the Czech Republic (holdings through Proventia Oy) 100%Proventia Americas LLC / Minnesota, USA (holdings through Proventia Oy) 100% 100%
Other shares held by the parent companyOptatech Oy 15.26% 15.26%
Sums in EUR 2018 201711. CURRENT RECEIVABLESSales receivables
From Group companies 202,373 275,239From others 48 25Total 202,421 275,263
Other receivablesFrom others 65,319 0Total 65,319 0
Accrued incomeFrom Group companies 750,000 795,000From others 61,975 17,379Deferred tax assets 11,223 0Total 823,198 812,379
Current receivables, total 1,090,937 1,087,642
12. CHANGES IN SHAREHOLDERS’ EQUITYShare capital, 1 Jan 1,090,281 1,090,281Share capital, 31 Dec 1,090,281 1,090,281
Invested unrestricted equity reserve, 1 Jan 4,562,371 4,562,371Invested unrestricted equity reserve, share issue
0
0
Invested unrestricted equity reserve, 31 Dec 4,562,371 4,562,371
Retained earnings, 1 Jan 728,430 707,159Redemption of treasury shares -5,080 0Retained earnings, 31 Dec 723,350 707,159Profit for the period 158,883 21,271Earnings, 31 Dec 882,233 728,430
Notes to the parent company’s financial statements
36
PRO
VEN
TIA
GRO
UP’
S FI
NAN
CIAL
STA
TEM
ENTS
201
8

Sums in EUR 2018 2017Unrestricted equity, 31 Dec 5,444,604 5,290,801Shareholders' equity, total 6,534,885 6,381,082Distributable funds at the end of the period 5,444,604 5,290,801
13. CURRENT LIABILITIESTrade payables
To Group companies 42,292 0To others 66,294 28,533Total 108,586 28,533
Other current liabilitiesTo others 13,319 34,552Total 13,319 34,552
Accrued liabilitiesTo others 169,404 151,004Total 169,404 151,004
Current liabilities, total 291,309 214,090
Sums in EUR 2018 201714. PLEDGES AND CONTINGENT LIABILITIES
Securities and mortgages for liabilities of subsidiariesBusiness mortgages 1,000,000 1,000,000
Amounts paid from leasing agreements (VAT included)
To be paid during the next financial year 154,352 101,308To be paid later 194,034 118,897Total 348,385 220,205
Other liabilities based on agreements (VAT included)
To be paid during the next financial year 367,923 0To be paid later 3,249,985 0Total 3,617,908 0
37
PRO
VEN
TIA
GRO
UP’
S FI
NAN
CIAL
STA
TEM
ENTS
201
8

Signatures to the financial statements and the Board of Director’s report
Oulu, 15 March 2019
Harri Suutari Lauri Antila Raisa LesonenChairman of the Board Board member Board member
Tommi Salunen Pekka Sipola Jari Lotvonen Board member Board member CEO
Auditor’s confirmation
An auditor’s report has today been issued on the audit carried out.
Oulu, 19 March 2019
PricewaterhouseCoopers OyAuthorised Public Accountants
Sami PostiAPA
38
PRO
VEN
TIA
GRO
UP’
S FI
NAN
CIAL
STA
TEM
ENTS
201
8

List of accounting books and materials
Financial statements and account- specific reports
Storage method
Financial statements Bound paper versionBalance sheet specifications Electronic formatAccount-specific income statement Electronic formatAccount-specific balance sheet Electronic formatList of accounts Electronic format
Accounting booksGeneral journals and nominal ledgers Electronic formatAccounting of non-current assets Electronic formatPOC calculations Electronic formatProject accounting Electronic formatSales ledger Electronic formatPurchase ledger Electronic formatStock accounting Electronic formatPayroll accounting Paper format
ReceiptsBank receipts Electronic formatNominal ledger receipts Electronic formatSales invoices Electronic formatPurchase invoices Electronic formatTravel expense accounts Paper receiptsReceipts related to notes Electronic format
39
PRO
VEN
TIA
GRO
UP’
S FI
NAN
CIAL
STA
TEM
ENTS
201
8

Auditor’s Report
To the Annual General Meeting of Proventia Group Oyj
REPORT ON THE AUDIT OF THE FINANCIAL STATEMENTS
Opinion In our opinion, the financial statements give a true and fair view of the group’s and the company’s financial performance and financial position in accordance with the laws and regulations governing the preparation of financial statements in Finland and comply with statutory requirements.
What we have audited
We have audited the financial statements of Proventia Group Oyj (business iden-tity code 1612236-0) for the year ended 31 December 2018. The financial state-ments comprise the balance sheets, the income statements, cash flow state-ments and notes for the group as well as for the parent company.
Basis for Opinion We conducted our audit in accordance with good auditing practice in Finland. Our responsibilities under good auditing practice are further described in the Auditor’s Responsibilities for the Audit of Financial Statements section of our report.
We believe that the audit evidence we have obtained is sufficient and appro-priate to provide a basis for our opinion.
Independence
We are independent of the parent company and of the group companies in accordance with the ethical requirements that are applicable in Finland and are relevant to our audit, and we have fulfilled our other ethical responsibilities in accordance with these requirements.
Responsibilities of the Board of Directors and the Managing Director for the Financial StatementsThe Board of Directors and the Managing Director are responsible for the prepa-ration of financial statements that give a true and fair view in accordance with the laws and regulations governing the preparation of financial statements in Finland and comply with statutory requirements. The Board of Directors and the Managing Director are also responsible for such internal control as they deter-mine is necessary to enable the preparation of financial statements that are free from material misstatement, whether due to fraud or error.
In preparing the financial statements, the Board of Directors and the Manag-ing Director are responsible for assessing the parent company’s and the group’s ability to continue as a going concern, disclosing, as applicable, matters relating to going concern and using the going concern basis of accounting. The financial statements are prepared using the going concern basis of accounting unless there is an intention to liquidate the parent company or the group or to cease operations, or there is no realistic alternative but to do so.
40
PRO
VEN
TIA
GRO
UP’
S FI
NAN
CIAL
STA
TEM
ENTS
201
8
Auditor’s Responsibilities for the Audit of the Financial StatementsOur objectives are to obtain reasonable assurance about whether the financial statements as a whole are free from material misstatement, whether due to fraud or error, and to issue an auditor’s report that includes our opinion. Reason-able assurance is a high level of assurance, but is not a guarantee that an audit conducted in accordance with good auditing practice will always detect a materi-al misstatement when it exists. Misstatements can arise from fraud or error and are considered material if, individually or in the aggregate, they could reasonably be expected to influence the economic decisions of users taken on the basis of the financial statements.
As part of an audit in accordance with good auditing practice, we exercise pro-fessional judgment and maintain professional skepticism throughout the audit. We also:
• Identify and assess the risks of material misstatement of the financial state-ments, whether due to fraud or error, design and perform audit procedures responsive to those risks, and obtain audit evidence that is sufficient and appropriate to provide a basis for our opinion. The risk of not detecting a ma-terial misstatement resulting from fraud is higher than for one resulting from error, as fraud may involve collusion, forgery, intentional omissions, misrepre-sentations, or the override of internal control.
• Obtain an understanding of internal control relevant to the audit in order to design audit procedures that are appropriate in the circumstances, but not for the purpose of expressing an opinion on the effectiveness of the effectiveness of the parent company’s or the group’s internal control.
• Evaluate the appropriateness of accounting policies used and the reasonable-ness of accounting estimates and related disclosures made by management.
• Conclude on the appropriateness of the Board of Directors’ and the Managing Director’s use of the going concern basis of accounting and based on the audit evidence obtained, whether a material uncertainty exists related to events or conditions that may cast significant doubt on the parent company’s or the group’s ability to continue as a going concern. If we conclude that a material uncertainty exists, we are required to draw attention in our auditor’s report to the related disclosures in the financial statements or, if such disclosures are inadequate, to modify our opinion. Our conclusions are based on the audit ev-idence obtained up to the date of our auditor’s report. However, future events or conditions may cause the company to cease to continue as a going concern.
• Evaluate the overall presentation, structure and content of the financial state-ments, including the disclosures, and whether the financial statements repre-sent the underlying transactions and events so that the financial statements give a true and fair view.
• Obtain sufficient appropriate audit evidence regarding the financial infor-mation of the entities or business activities within the group to express an opinion on the consolidated financial statements. We are responsible for the direction, supervision and performance of the group audit. We remain solely responsible for our audit opinion.
We communicate with those charged with governance regarding, among other matters, the planned scope and timing of the audit and significant audit findings, including any significant deficiencies in internal control that we identify during our audit.
41
PRO
VEN
TIA
GRO
UP’
S FI
NAN
CIAL
STA
TEM
ENTS
201
8

OTHER REPORTING REQUIREMENTS
Other Information The Board of Directors and the Managing Director are responsible for the other information. The other information comprises the report of the Board of Direc-tors.
Our opinion on the financial statements does not cover the other information.In connection with our audit of the financial statements, our responsibility
is to read the other information and, in doing so, consider whether the other information is materially inconsistent with the financial statements or our knowl-edge obtained in the audit, or otherwise appears to be materially misstated. Our responsibility also includes considering whether the report of the Board of Direc-tors has been prepared in accordance with the applicable laws and regulations.
In our opinion, the information in the report of the Board of Directors is consistent with the information in the financial statements and the report of the Board of Directors has been prepared in accordance with the applicable laws and regulations.
If, based on the work we have performed, we conclude that there is a material misstatement of the report of the Board of Directors, we are required to report that fact. We have nothing to report in this regard.
Oulu 19 March 2019
PricewaterhouseCoopers OyAuthorised Public Accountants
Sami PostiAuthorised Public Accountant (KHT)
Tilintarkastuskertomus
42
PRO
VEN
TIA
GRO
UP’
S FI
NAN
CIAL
STA
TEM
ENTS
201
8

43
PRO
VEN
TIA
GRO
UP’
S FI
NAN
CIAL
STA
TEM
ENTS
201
8

Proventia Group OyjTietotie 1, 90460 Oulunsalo, Finland, Tel: +358 20 781 0200 [email protected], [email protected]


![arXiv:2102.06041v1 [gr-qc] 10 Feb 2021](https://static.fdokumen.com/doc/165x107/6329002409048e4b7c062cfe/arxiv210206041v1-gr-qc-10-feb-2021.jpg)


![TOURISM | Greece - Bulgaria: People & Statistics [GR]](https://static.fdokumen.com/doc/165x107/6321d64d61d7e169b00c591b/tourism-greece-bulgaria-people-statistics-gr.jpg)


![arXiv:0804.3742v1 [gr-qc] 23 Apr 2008](https://static.fdokumen.com/doc/165x107/6322df89117b4414ec0c14b7/arxiv08043742v1-gr-qc-23-apr-2008.jpg)