PPT JK Eco - UGC-Human Resource Development Centre ...
23
Jammu and Kashmir Economy Misplaced in Post-globalization era: Balance Sheet of Development • Basic macroeconomic framework-Keynesian version: Y= f ( L, K ) , post-energy evolution • Y = f ( L, K, E ), post 1990s, Y = f ( L,K,E, S) Social Capital, Trust, culture of trust. (1) FDIs USD 42 (b) SEZs, TN=90, UP=36,Telangana=73, (1) FDIs USD 42 (b) SEZs, TN=90, UP=36,Telangana=73, WG=19, etc • Primary sector • (a) Farm Sector (b) Farm allied sectors • Big Landed Estates Abolition Act- 1949-50 • 9000 Jagirs abolished, 4.5 lac acres of land given to landless.
-
Upload
khangminh22 -
Category
Documents
-
view
1 -
download
0
Transcript of PPT JK Eco - UGC-Human Resource Development Centre ...

Jammu and Kashmir Economy
Misplaced in Post-globalization era:
Balance Sheet of Development• Basic macroeconomic framework-Keynesian version:
Y= f ( L, K ) , post-energy evolution
• Y = f ( L, K, E ), post 1990s, Y = f ( L,K,E, S)
Social Capital, Trust, culture of trust.
(1) FDIs USD 42 (b) SEZs, TN=90, UP=36,Telangana=73, (1) FDIs USD 42 (b) SEZs, TN=90, UP=36,Telangana=73, WG=19, etc
• Primary sector
• (a) Farm Sector (b) Farm allied sectors
• Big Landed Estates Abolition Act- 1949-50
• 9000 Jagirs abolished, 4.5 lac acres of land given to landless.

Principal features of land
redistribution
• Land ceiling on the lower side
• Orchards exempted from ceiling laws
• No compensation to erstwhile landlords

Structural change over the period
• 1961 average size of holding 1.2 ha
• 1971 -do- 0.93 ha
• 1992 -do- 0.83 ha
• 2006 -do- o.65 ha• 2006 -do- o.65 ha
• Less than 0.5 ha holdings = 60 %
• Less than 0.5 ha area = 21 %
• Less than 1 ha holding =44.28 %
• Less than 1 ha area = 82.00 %

Sub-marginal holdings on rise
• Marginal holdings less than 1 ha 1971: 72.82%
Area operated: 32.12ha%
• 2006 holdings % 81.50
• Area operated % 25.7• Area operated % 25.7
• No. of holdings in 1971 9.79 lac
• No of holdings in 2006 13.78 lac
• Area operated 1971 9.16 lac ha
• Area operated 2006 9.23

Distress sale of land
• In valley alone 90 % holdings less than 0.15 ha
size. Distress sale of land-phenomenon
• Net area sown 614 thousand ha in 1955-56
• -do- 731 -do- 2010-11• -do- 731 -do- 2010-11
• Rate of growth p.a public investment in irrigation
800 %
• Rate of growth irrigation capacity building 1.33 %
• Inverse correlation
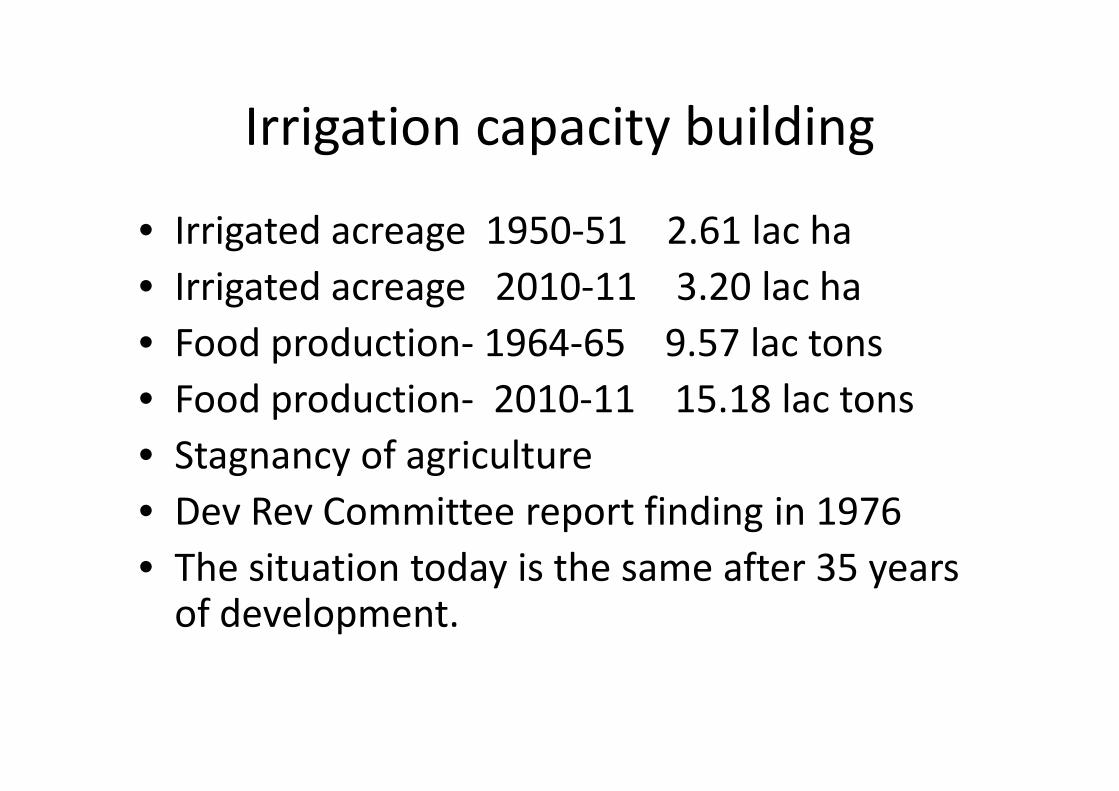
Irrigation capacity building
• Irrigated acreage 1950-51 2.61 lac ha
• Irrigated acreage 2010-11 3.20 lac ha
• Food production- 1964-65 9.57 lac tons
• Food production- 2010-11 15.18 lac tons• Food production- 2010-11 15.18 lac tons
• Stagnancy of agriculture
• Dev Rev Committee report finding in 1976
• The situation today is the same after 35 years of development.

Production and yields
• Production trends declining.
• 9.57 lac tones foodgrains production in 1965-65
• 13.18 lac tons in 2009-10
• Kashmir region 4.4 lac tons and Jammu region 10.7 lac tons10.7 lac tons
• Average yield of major foodgrains13.4 qts p/h 1964-65, rice 18.97, maize 15.11 and wheat 6.45
• Average yield of major foodgrains 14.9 qts p/h and in case of rice 19.28, wheat 10.03 and maize 15.66 qts p/h,
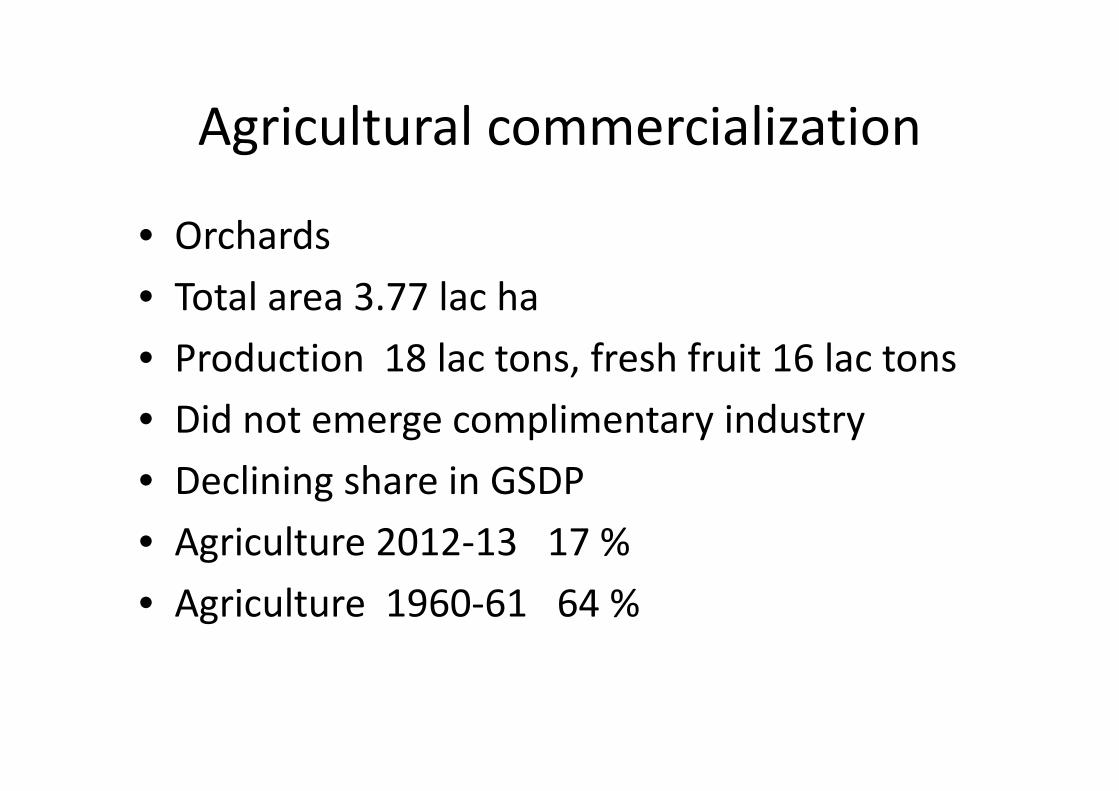
Agricultural commercialization
• Orchards
• Total area 3.77 lac ha
• Production 18 lac tons, fresh fruit 16 lac tons
• Did not emerge complimentary industry• Did not emerge complimentary industry
• Declining share in GSDP
• Agriculture 2012-13 17 %
• Agriculture 1960-61 64 %

Agricultural dependency
• Import of grains including pulses 1.88 lac tons
1973-74
• -do- 8.9 -do-
• Today including private trade more than 13 lac• Today including private trade more than 13 lac
tons.
• Agriculture investment multiplier effect in
importing regions.

Govt policy & programmes not visible
• Recent initiatives.
• Seed management-SSR
• Macro management of agriculture
Integrated cereal dev progm,wheat, pulses, Integrated cereal dev progm,wheat, pulses, promotion of agricultural mechanization, national watershed development project,soilconservation, flood prone river projects,stateland use board, technology mission, saffron and mushroom mission, oilseed, maize, RashtryaKrishi Vikas Yojana

Future
• DAIRY, POULTRY, SHEEP BREEDING, R&D IN
HORTICULTURE, PASTURE, FOOTHILL LANDS,
AEROMATIC CROPS AND HERBAL FARMING,
EG, NONI EXPERIMENTEG, NONI EXPERIMENT
• PUBLIC COMMITMENT
• GOVERNMENT EFFECTIVE ENFORCEMENT

Economics of industry
• Investment bottleneck
• Infrastructural bottleneck
• Geographical bottleneck-landlocked
• Politically-economy question• Politically-economy question
• Public perception- education, craft transfer from one generation to another
• Demonstration effect- changing sociology
• Creation of vacuum in labour market

Industrial policy
• Industrial policy-2004
• Incentive based- central incentive, state incentive
• Central package incentive-2002 till 2012• Central package incentive-2002 till 2012
• State on subsidy, promotion facilitation
• 100% subsidy DGS, project report,qualitytesting, 75% on R&D, 35 on working capital, 5% rebate on term loan of technocrats, land on lease, power incentives, tax exemption

Central incentives
• 15% subsidy on capital investment
• 3% on working capital
• 100 % insurance cover
• 90 % transport subsidy• 90 % transport subsidy
• Fiscal incentives-100 % excise refund, income
tax exemption

Industrial estates
• Directorate of industries
• J&K SIDCO
• J&K SICOP
• 50 estates, 34.75 thousand Kanals of land with • 50 estates, 34.75 thousand Kanals of land with
IE, 3338 units set up

Small scale sector
• SSI in 1980-81 8428 emp. 43000
• SSI in 2010-11 53544 emp.2.5 lac
• KVIs, decline of sriculture
• Craft production Rs 1650 crore, emp 3.5 lac• Craft production Rs 1650 crore, emp 3.5 lac
• Craft on decline, endangered species, extinguished species, training centres
• Huge market
• Social problem

PSUs
• Number 21, emp. 5515-1973-74. Prod. Rs3.8
cr
• Number 16 emp. 2519 2011-12 Prod. Rs 103
crcr
• Role of SFC
• Share of industry in GSDP 1980-81= 13%
• Share of industry in GSDP 2010-11 = 29.5%
• Share of construction 16.5%. Rgd mfg 2.8,

GSDP SHARE
• Construction is cause of concern
• On growth rates
• 2.55 % p.a2010-11
• Services• Services
• 9.0 % p.a
• GSDP 5.96
• Share of tertiary sector 55%, Agri 20.5 %, ind25 % (revised est 2012-13)
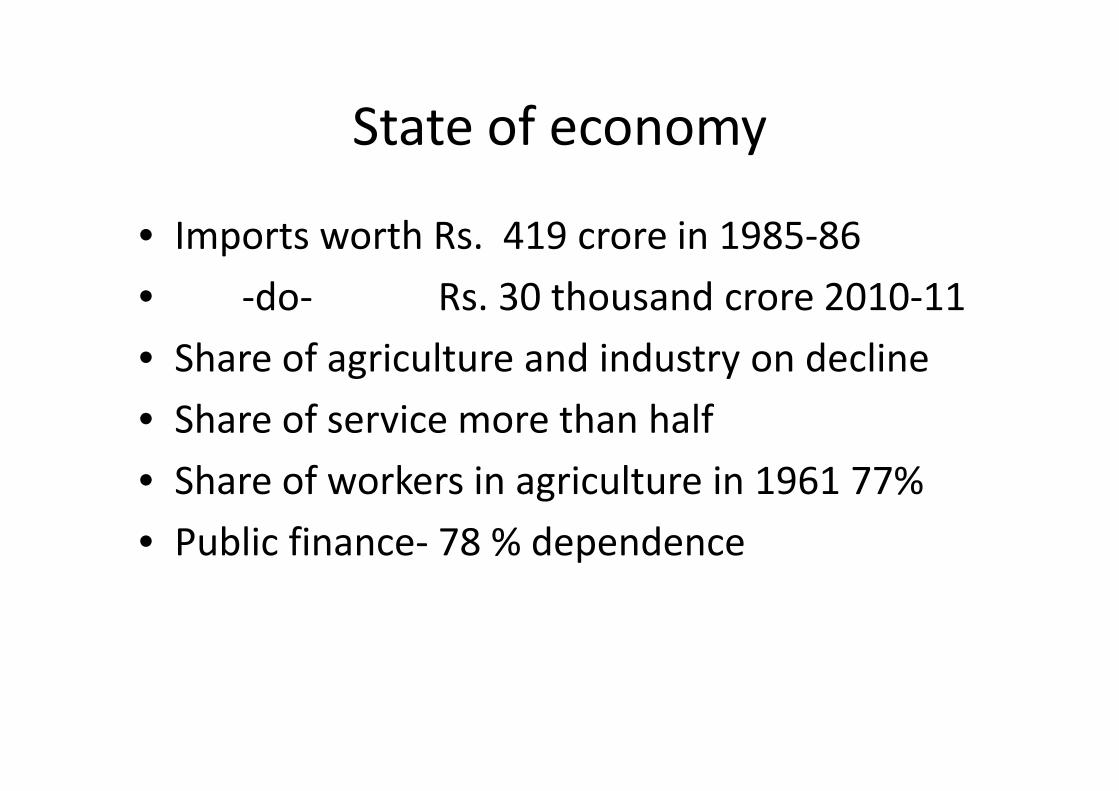
State of economy
• Imports worth Rs. 419 crore in 1985-86
• -do- Rs. 30 thousand crore 2010-11
• Share of agriculture and industry on decline
• Share of service more than half• Share of service more than half
• Share of workers in agriculture in 1961 77%
• Public finance- 78 % dependence

Crisis and explosive crisis
• In 1950s strategy of development
• Growth-oriented development strategy-NO
• Market-oriented development strategy-YES
• From 1960s, 1970s economic dependence• From 1960s, 1970s economic dependence
• Structurally dependence accelerate
• Financial/resource dependence-1973-74 IRM
49%, central devolution 51% and in 2009-19, IRM
20 % CDR 80% ,today IRM shows upward trend.

Economic opportunities
• Pursuant to MSG(market-orient strategy of
growth) eco opportunities bound to decline
• Crisis in primary sector and secondary sector
collide to generate explosive crisiscollide to generate explosive crisis
• System generates symptoms of syndrome
• Society gets in to syndrome

Dangerous fall-out characteristics
• Cumulative causation forces set in motion to
further contribute syndrome.
• Society develops corrupt methods and
practicespractices
• Lack of commitment and dedication to
development process itself
• Emergence of non-work culture
• Lose posterity

Resources
• Tourism industry
• Mineral resource
• Water resources
• Commercial farm-aromatic & herbal, • Commercial farm-aromatic & herbal,
floricalculture