
POSITIONED FOR SCALE AND GROWTH - Industrials REIT
203
Annual Report 2021 POSITIONED FOR SCALE AND GROWTH
-
Upload
khangminh22 -
Category
Documents
-
view
0 -
download
0
Transcript of POSITIONED FOR SCALE AND GROWTH - Industrials REIT

30051 17 June 2021 4:07 pm V3
Annual R
epo
rt 2021
Annual Report 2021
POSITIONED FOR SCALE AND GROWTH

30051 17 June 2021 4:07 pm V3
Welcome to Stenprop’s 2021 Annual Report
Who we areStenprop is a UK REIT listed on the Specialist Fund Segment of the London Stock Exchange (‘LSE’) and the Johannesburg Stock Exchange (‘JSE’). We specialise in the ownership and operation of UK multi-let industrial (MLI) property.
Our storyIn 2018, we set out to transform our portfolio from a passive diversified portfolio across multiple asset classes and geographies into a focused operational business specialising in owning and operating UK MLI assets. We have simultaneously reduced our leverage and exited a legacy fund management business. We anticipate being a 100% focused MLI business by 31 March 2022.

30051 17 June 2021 4:07 pm V3
HighlightsResilient financial performance through our transition
CONTENTSBUSINESS OVERVIEWOur Purpose and Culture 02Why Invest in Us 04At a Glance 06Transition into a 100% MLI Business is Almost Complete
08
STRATEGIC REPORTChief Executive’s Statement 12Our Business Model 16Our Strategy 18Key Performance Indicators 22A Year of Living With COVID-19 26Our Serviced Industrial Operating Platform
32
Our Market 34Our Portfolio 42Property Report and Investment Update 44Financial Review 54Risk Management 61Section 172 Statement and Stakeholder Engagement
69
Our Sustainable Business: ESG 72
GOVERNANCEChairman’s Statement 80
Our Board of Directors 82
Corporate Governance Overview 85Audit and Risk Committee Report 90Nomination Committee Report 93Remuneration Committee Report 96Social and Ethics Committee Report 109Directors’ Report 111
FINANCIAL STATEMENTSIndependent Auditor’s Report 114Consolidated Statement of Comprehensive Income
119
Consolidated Statement of Financial Position
120
Consolidated Statement of Changes in Equity
121
Consolidated Statement of Cash Flows 122Notes to the Consolidated Financial Statements
123
ADDITIONAL DISCLOSUREAlternative Performance Measures 172Task Force for Climate-related Financial Disclosures
175
Streamlined Energy and Carbon Reporting
178
EPRA Sustainability Best Practice Recommendations
180
Property Summary 184Property Analysis 185Consolidated Portfolio 186Assets Held for Sale 190Jointly Controlled Entities 190Tenant Analysis 192Analysis of Shareholders 193
OTHER INFORMATIONShareholder Diary 196Corporate Information 197Glossary 198Shareholder Notes 200
Total Accounting Return (TAR)
5.7%
5.4%
11.4%
2020
2019
2021
9.8%2018
Diluted IFRS earnings per share Adjusted earnings per share*
5.44p
8.35p
18.57p
2020
2019
2021
13.89p2018
6.88p
8.84p
6.78p
2020
2019
2021
9.09p2018
Diluted IFRS net asset value per share EPRA NTA per share^
£1.37
£1.36
£1.48
2020
2019
2021
£1.362018
£1.38
£1.37
£1.47
2020
2019
2021
£1.372018
Distribution per share Group loan-to-value
6.75p
6.75p
6.75p
2020
2019
2021
8.00p2018
26.2%
35.2%
28.1%
2020
2019
2021
46.2%2018
* Previously called diluted adjusted EPRA earnings per share^ EPRA NTA recalculated for earlier years
Readers should refer to Key Performance Indicators on page 22 for further detail. Terms are defined in the Glossary on page 198
01STENPROP ANNUAL REPORT 2021
BUSINESS OVERVIEW

30051 17 June 2021 4:07 pm V3
1 2 3
4 5
OUR VALUES OUR CULTURE
OUR PURPOSE OUR ASPIRATIONAL GOAL
02 STENPROP ANNUAL REPORT 2021
Our Purpose and Culture
To revolutionise the MLI sector in the UK for the benefit of our stakeholders
Read more about this in Our Strategy on pages 18 to 21 and Section 172 Statement and Stakeholder Engagement on pages 69 to 71
Continuous training and learning
Teamwork and collaboration
CUSTOMER FOCUSED
INNOVATIVE
RESULTS ORIENTED
DECISIVE
The leading MLI business
in the UK
WHY do we do this? WHAT do we want to be?
Decisive decision making
Results oriented approach
Awareness of wellbeing (of all stakeholders)
30051 17 June 2021 4:07 pm V3
1 2 3
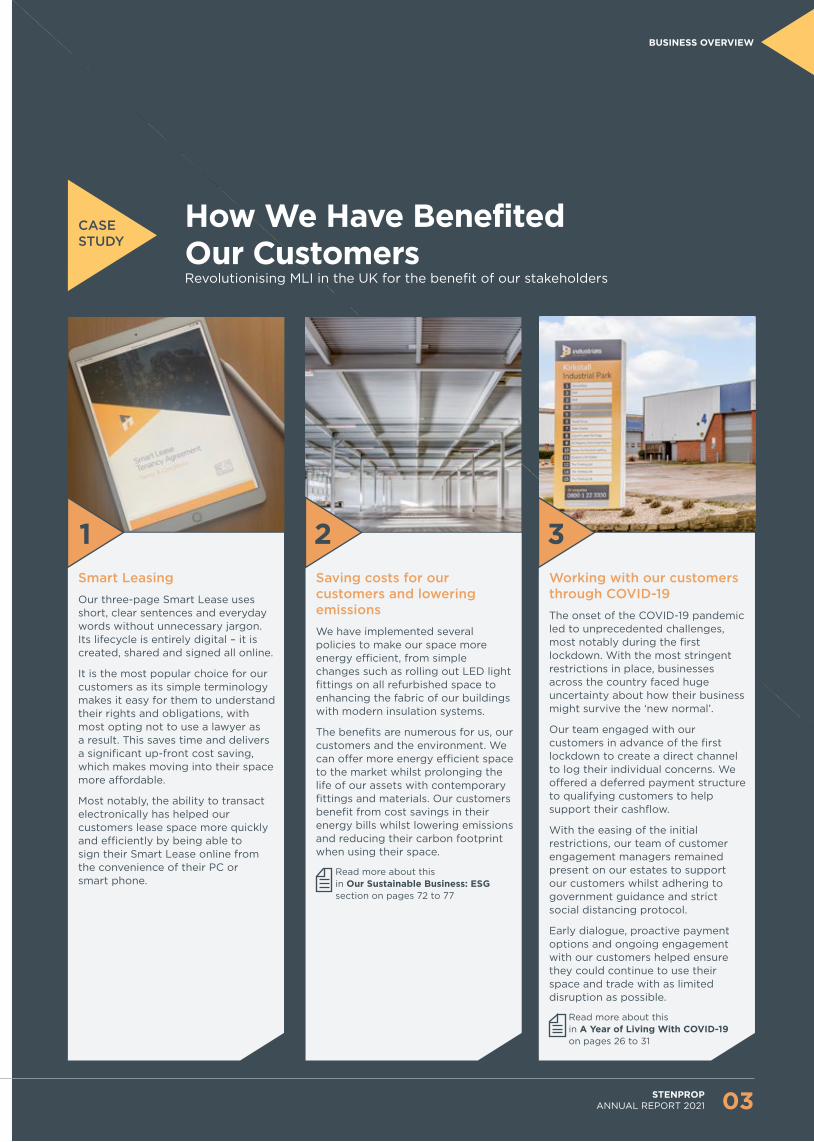
How We Have Benefited Our CustomersRevolutionising MLI in the UK for the benefit of our stakeholders
Smart LeasingOur three-page Smart Lease uses short, clear sentences and everyday words without unnecessary jargon. Its lifecycle is entirely digital – it is created, shared and signed all online.
It is the most popular choice for our customers as its simple terminology makes it easy for them to understand their rights and obligations, with most opting not to use a lawyer as a result. This saves time and delivers a significant up-front cost saving, which makes moving into their space more affordable.
Most notably, the ability to transact electronically has helped our customers lease space more quickly and efficiently by being able to sign their Smart Lease online from the convenience of their PC or smart phone.
Saving costs for our customers and lowering emissionsWe have implemented several policies to make our space more energy efficient, from simple changes such as rolling out LED light fittings on all refurbished space to enhancing the fabric of our buildings with modern insulation systems.
The benefits are numerous for us, our customers and the environment. We can offer more energy efficient space to the market whilst prolonging the life of our assets with contemporary fittings and materials. Our customers benefit from cost savings in their energy bills whilst lowering emissions and reducing their carbon footprint when using their space.
Read more about this in Our Sustainable Business: ESG section on pages 72 to 77
Working with our customers through COVID-19The onset of the COVID-19 pandemic led to unprecedented challenges, most notably during the first lockdown. With the most stringent restrictions in place, businesses across the country faced huge uncertainty about how their business might survive the ‘new normal’.
Our team engaged with our customers in advance of the first lockdown to create a direct channel to log their individual concerns. We offered a deferred payment structure to qualifying customers to help support their cashflow.
With the easing of the initial restrictions, our team of customer engagement managers remained present on our estates to support our customers whilst adhering to government guidance and strict social distancing protocol.
Early dialogue, proactive payment options and ongoing engagement with our customers helped ensure they could continue to use their space and trade with as limited disruption as possible.
Read more about this in A Year of Living With COVID-19 on pages 26 to 31
CASE STUDY
03
BUSINESS OVERVIEW
STENPROP ANNUAL REPORT 2021

30051 17 June 2021 4:07 pm V3
32 41
04 STENPROP ANNUAL REPORT 2021
Why Invest in Us
Favourable market dynamics (demand/supply fundamentals) ▶ COVID-19 has
accelerated existing trends that were already leading to growth in MLI demand, most notably due to e-commerce
▶ Supply is severely constrained due to a lack of available land and expensive build costs
▶ Existing fully let MLI properties can be acquired for less than replacement cost
▶ The imbalance between demand and supply is leading to 4-5% per annum MLI rental growth across the UK
56%growth in MLI enquiries in the quarter ended March 2021 vs the quarter ended December 2020
Read more about this in Key Performance Indicators on pages 22 to 24
Technology-driven MLI operating platform to deliver scale efficiencies ▶ Integrated operating
platform with a common data structure
▶ Cloud-based, mobile-friendly platform that puts data in the hands of customer-facing staff
▶ Evolved direct marketing platform that delivers enhanced customer experience, data and results
▶ Evergreen technology platform, which is constantly updated to deliver the latest innovations
▶ Highly scalable platform built on the Microsoft Dynamics platform
80%MLI lease renewal rate
Read more about this in Key Performance Indicators on pages 22 to 24
Well positioned for capital and earnings growth ▶ Almost 75% of
Stenprop’s portfolio is UK MLI property
▶ Target 100% MLI by March 2022
▶ Scalable management platform, which will deliver significant efficiency savings
▶ Strong pipeline of MLI opportunities
10%target Total Accounting Return
Read more about this in Key Performance Indicators on pages 22 to 24
Highly diversified and granular customer base and income ▶ Over 1,100 unique
customers
▶ Top 10 MLI customers account for less than 12.5% of the MLI rent roll
▶ 80% MLI customer retention rate
<12.5%of MLI rent roll accounted for from top 10 MLI customers
Read more about this in Key Performance Indicators on pages 22 to 24
30051 17 June 2021 4:07 pm V3
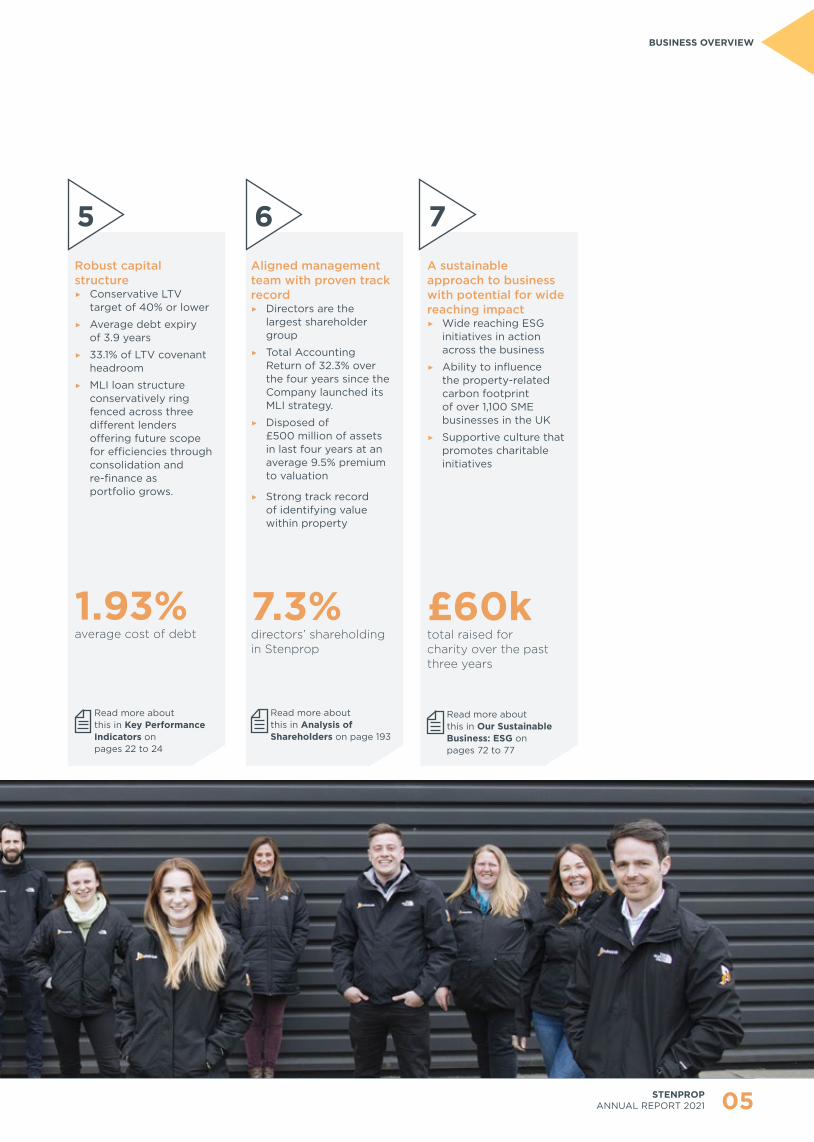
765Robust capital structure ▶ Conservative LTV
target of 40% or lower
▶ Average debt expiry of 3.9 years
▶ 33.1% of LTV covenant headroom
▶ MLI loan structure conservatively ring fenced across three different lenders offering future scope for efficiencies through consolidation and re-finance as portfolio grows.
1.93%average cost of debt
Read more about this in Key Performance Indicators on pages 22 to 24
Aligned management team with proven track record
▶ Directors are the largest shareholder group
▶ Total Accounting Return of 32.3% over the four years since the Company launched its MLI strategy.
▶ Disposed of £500 million of assets in last four years at an average 9.5% premium to valuation
▶ Strong track record of identifying value within property
7.3%directors’ shareholding in Stenprop
Read more about this in Analysis of Shareholders on page 193
A sustainable approach to business with potential for wide reaching impact
▶ Wide reaching ESG initiatives in action across the business
▶ Ability to influence the property-related carbon footprint of over 1,100 SME businesses in the UK
▶ Supportive culture that promotes charitable initiatives
£60ktotal raised for charity over the past three years
Read more about this in Our Sustainable Business: ESG on pages 72 to 77
05STENPROP ANNUAL REPORT 2021
BUSINESS OVERVIEW
30051 17 June 2021 4:07 pm V3
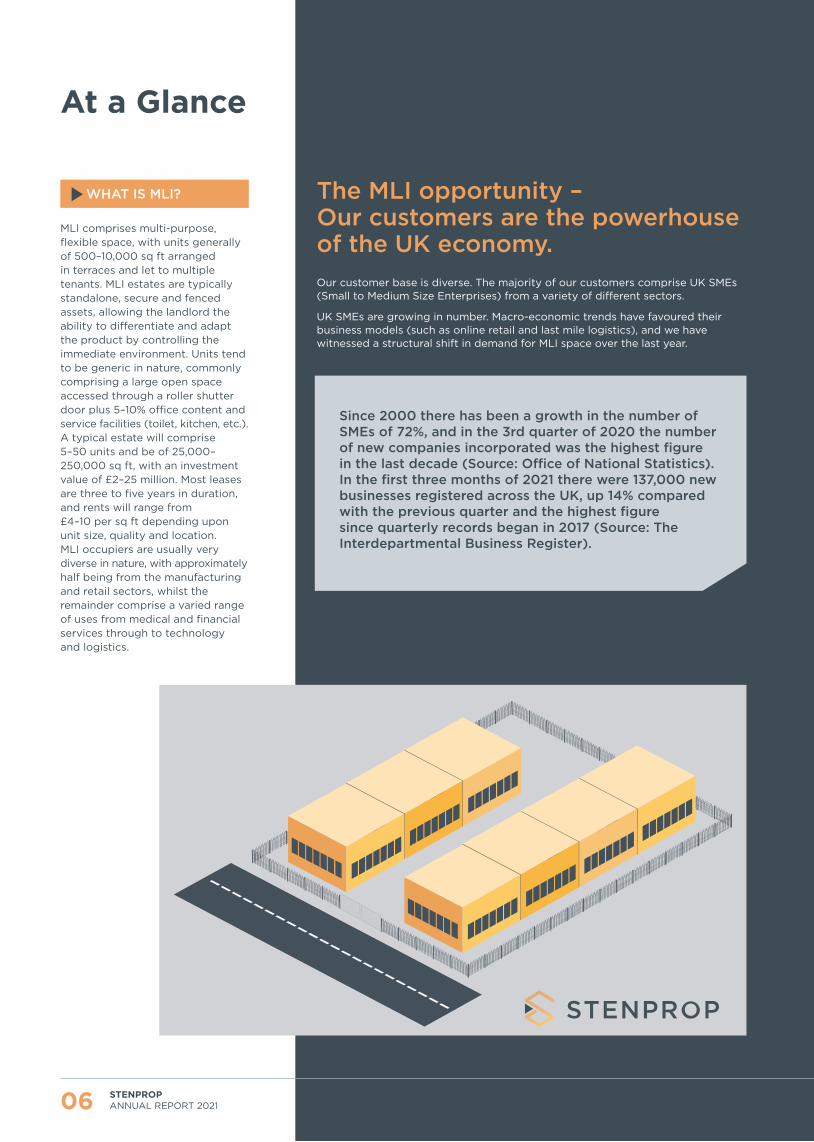
WHAT IS MLI?
06 STENPROP ANNUAL REPORT 2021
At a Glance
The MLI opportunity – Our customers are the powerhouse of the UK economy. Our customer base is diverse. The majority of our customers comprise UK SMEs (Small to Medium Size Enterprises) from a variety of different sectors.
UK SMEs are growing in number. Macro-economic trends have favoured their business models (such as online retail and last mile logistics), and we have witnessed a structural shift in demand for MLI space over the last year.
MLI comprises multi-purpose, flexible space, with units generally of 500–10,000 sq ft arranged in terraces and let to multiple tenants. MLI estates are typically standalone, secure and fenced assets, allowing the landlord the ability to differentiate and adapt the product by controlling the immediate environment. Units tend to be generic in nature, commonly comprising a large open space accessed through a roller shutter door plus 5–10% office content and service facilities (toilet, kitchen, etc.). A typical estate will comprise 5–50 units and be of 25,000–250,000 sq ft, with an investment value of £2–25 million. Most leases are three to five years in duration, and rents will range from £4–10 per sq ft depending upon unit size, quality and location. MLI occupiers are usually very diverse in nature, with approximately half being from the manufacturing and retail sectors, whilst the remainder comprise a varied range of uses from medical and financial services through to technology and logistics.
Since 2000 there has been a growth in the number of SMEs of 72%, and in the 3rd quarter of 2020 the number of new companies incorporated was the highest figure in the last decade (Source: Office of National Statistics). In the first three months of 2021 there were 137,000 new businesses registered across the UK, up 14% compared with the previous quarter and the highest figure since quarterly records began in 2017 (Source: The Interdepartmental Business Register).

30051 17 June 2021 4:07 pm V3
SPECIALIST OPERATING PLATFORM
We have built an operating platform that enables our business to operate more efficiently, and is flexible and dynamic in meeting our customers’ needs, whilst also enabling our business to scale at a reduced marginal cost.
Please see Our Serviced Industrial Operating Platform section on pages 32 to 33
07
BUSINESS OVERVIEW
STENPROP ANNUAL REPORT 2021

30051 17 June 2021 4:07 pm V3
2019 2020
08
Transition into a 100% MLI Business is Almost CompleteThroughout the year under review we continued our transition to become a 100% UK MLI business through a series of MLI acquisitions and non-MLI disposals.
Change in our portfolio based on property value
UK MLI acquisitions ▶ Total: £103.6 million
▶ Nine transactions
▶ 30 MLI estates
▶ 1,683,966 sq ft of MLI space
Non-MLI disposals ▶ Total: £249.3 million
▶ Argyll Street, London: £41.7 million (Sold: June 2018)
▶ Mixed portfolio, Switzerland: £80.8 million (Sold: July 2018)
▶ Aldi portfolio, Germany: £31.8 million (Sold: December 2018)
▶ Euston House, London: £95 million (Sold: March 2019)
UK MLI acquisitions ▶ Total: £38.8 million
▶ 11 transactions
▶ 10 MLI estates
▶ 504,137 sq ft of MLI space
Non-MLI disposals ▶ Total: £144.3 million
▶ The Marlowes, Hemel Hempstead: £1.9 million (Sold: June 2019)
▶ Park Street, Walsall: £1.7 million (Sold: August 2019)
▶ Victoria Street, Grimsby: £1.0 million (Sold: December 2019)
▶ Bleichenhof, Hamburg: £139.7 million (Sold: March 2020)
2019
LTV: 35.2% LTV: 26.2%
n 42.7% UK MLI
n 9.4% Guernsey
n 3.5% UK urban logistics
n 0.7% UK Other
n 41.0% Germany
n 2.6% Switzerland
n 58.0% MLI
n 10.8% Guernsey
n 4.0% UK urban logistics
n 24.5% Germany
n 2.7% Switzerland
2020
9% average uplift in sale price over book value at year end over the past three years
STENPROP ANNUAL REPORT 2021
30051 17 June 2021 4:07 pm V3
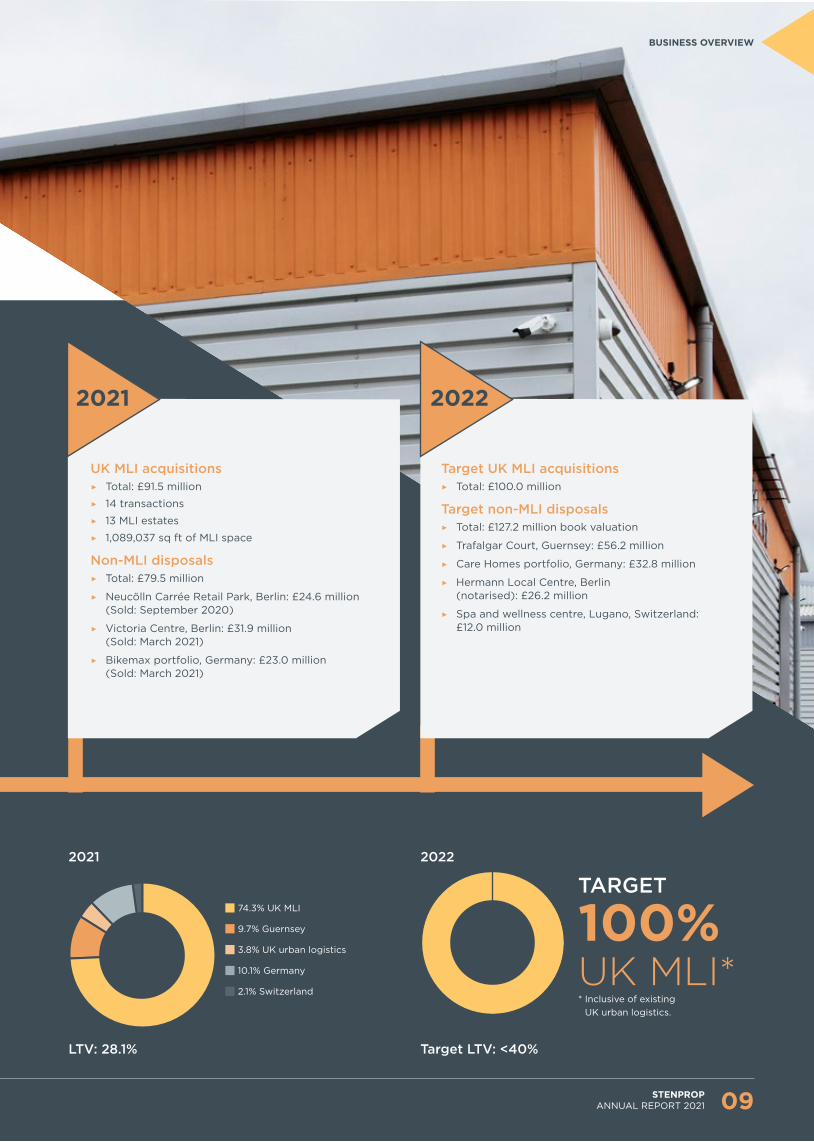
2021 2022
UK MLI acquisitions ▶ Total: £91.5 million
▶ 14 transactions
▶ 13 MLI estates
▶ 1,089,037 sq ft of MLI space
Non-MLI disposals ▶ Total: £79.5 million
▶ Neucölln Carrée Retail Park, Berlin: £24.6 million (Sold: September 2020)
▶ Victoria Centre, Berlin: £31.9 million (Sold: March 2021)
▶ Bikemax portfolio, Germany: £23.0 million (Sold: March 2021)
Target UK MLI acquisitions ▶ Total: £100.0 million
Target non-MLI disposals ▶ Total: £127.2 million book valuation
▶ Trafalgar Court, Guernsey: £56.2 million
▶ Care Homes portfolio, Germany: £32.8 million
▶ Hermann Local Centre, Berlin (notarised): £26.2 million
▶ Spa and wellness centre, Lugano, Switzerland: £12.0 million
LTV: 28.1% Target LTV: <40%
n 74.3% UK MLI
n 9.7% Guernsey
n 3.8% UK urban logistics
n 10.1% Germany
n 2.1% Switzerland
2021 2022
TARGET
100%UK MLI** Inclusive of existing
UK urban logistics.
09
BUSINESS OVERVIEW
STENPROP ANNUAL REPORT 2021

30051 17 June 2021 4:07 pm V3

30051 17 June 2021 4:07 pm V3
Strategic ReportChief Executive’s Statement 12
Our Business Model 16
Our Strategy 18
Key Performance Indicators 22
A Year of Living With COVID-19 26
Our Serviced Industrial Operating Platform 32
Our Market 34
Our Portfolio 42
Property Report and Investment Update 44
Financial Review 54
Risk Management 61
Section 172 Statement and Stakeholder Engagement
69
Our Sustainable Business: ESG 72

30051 17 June 2021 4:07 pm V3
Paul Arenson Chief Executive Officer
Chief Executive’s Statement
Our transition is mostly behind us and we have almost achieved our goal of becoming a fully focused MLI REIT.Strong asset class fundamentals I am pleased to be able to report that we have ended the financial year with our portfolio at over 74% UK multi-let industrial (‘MLI’). This is very satisfying, given that we began the year at 58% MLI and were intent on holding cash, which stood at approximately £70 million, as COVID-19 struck and the UK went into an unprecedented first lockdown. A year later, the UK was in its third lockdown, yet by this time, we had been investing in the acquisition of additional MLI since summer 2020, fully confident to push ahead with the completion of our transition into 100% MLI based on the data of accelerated enquiries for space we were receiving from our Industrials Hive operating platform. Our customers have proven to be very resilient and our collection rates are standing at over 90%, with MLI benefitting from an acceleration of e-commerce penetration in the UK which is driving greater demand for space from SME occupiers.
Our strategic decision taken in 2018 to become a focused UK MLI business has been the right one. The MLI asset class continues to enjoy strong demand, high levels of rent collection, significant rental growth and low levels of vacancy. This has enabled Stenprop to maintain its fully covered dividend of 6.75p for the financial year, notwithstanding the impact of both COVID-19 on collections and of holding large cash balances for the first few months of the pandemic.
Our transition to 100% MLI is almost completeWe view our transition to a 100% UK MLI business as largely complete. Our focus for the financial year to 31 March 2022 and beyond is now firmly on continuing to improve the performance of the Group’s MLI portfolio.
All that is left for us to do to complete the transition is to sell our remaining non-MLI assets (excluding our urban logistics assets) valued at £127.2 million.
12 STENPROP ANNUAL REPORT 2021

30051 17 June 2021 4:07 pm V3
In terms of growth and replacing the income that we will lose from these disposals, our intention is to acquire approximately £100 million of MLI property in the financial year to 31 March 2022, using previous and anticipated proceeds from the sale of non-MLI assets, together with approximately 40% leverage.
During the year, we acquired 14 individual MLI estates at an aggregate cost of £91.5 million before costs. We sold our Bike Max portfolio of retail warehouses and two of our three Berlin daily needs centres, and notarised on the sale of the third. We achieved an average of 15% uplift to the March 2020 valuations on these sales.
Prudent financial managementIn addition, we were able to take advantage of historically cheap debt markets to refinance a portfolio of properties with a £66.5 million loan, which we fixed for seven years, interest-only at an all-in rate of 1.66% per annum. We also extended an existing five-year tranche of debt by £23 million against recently acquired MLI assets at an all-in rate of 1.8% per annum, interest-only. We ended the financial year with an overall LTV of 28.1% when unrestricted cash is considered and having reduced the average cost of debt while increasing the average term.
A specialised MLI operating platformFurthermore, we made excellent progress in evolving our platform strategy, both on the ground and by embracing technology, to enhance efficiencies and enable us to manage significantly more scale with marginal incremental cost. Our decision to continue investing in our technology during COVID has proved to be the right one. Our customer relationship management (‘CRM’) system went live at the beginning of the 2021 financial year and has been a big success in assisting us managing our digital marketing and leasing process. A significant roll out of our unified finance and operations system is now well under way and anticipated to go live in the second quarter of the financial year to 31 March 2022. This will complete the first phase of our Industrials Hive platform development, allowing us to in-source several key processes and control the customer experience throughout its lifecycle. The Industrials Hive platform will provide Stenprop with the ability to
grow its business, expand its offering to customers and achieve future economies of scale through the use of technology and streamlined processes.
We believe our strategy to invest in and build a market-leading, technology-enabled MLI operating platform will be a part of fundamental changes to the way in which the UK MLI sector is likely to be managed in the future. In much the same way as platforms have transformed the risks, efficiencies, ratings, and valuations in other sectors like self-storage, student accommodation and hotels, we believe the MLI sector is ready for this. Our intention is to continue with the investment into our platform during this year to ensure that Stenprop is at the forefront of this process of change.
Performance of the UK MLI sectorNotwithstanding COVID-19 and the three UK lockdowns, the structural imbalance in supply and demand for UK MLI continued to deliver inflation-beating rental growth throughout the year. The fundamentals in the sector remained extremely positive and Stenprop experienced underlying like-for-like rental growth of 5-6% for the year.
We hold the view that this imbalance will continue for several years, as it is still not economically feasible to build MLI units in most locations at current rental levels and yields, and because in and around many conurbations, supply is also being taken out of the market in favour of other uses such as residential. Our MLI portfolio is valued at approximately £71.20 per sq ft on average.
Building a focused, scalable MLI operating business.” Paul Arenson Chief Executive Officer
13STENPROP ANNUAL REPORT 2021
STRATEGIC REPORT

30051 17 June 2021 4:07 pm V3
We estimate that replacement build costs are at least £125 per sq ft, which means rents must rise by a further 30-40% in most regions before development of new MLI units becomes widely viable, assuming suitable development land is available in and around densely populated towns and cities.
On the demand side, we are seeing increasing numbers of new types of businesses, enabled by the internet, needing MLI space. These are businesses who have not previously occupied MLI space and are now realising the value of affordable, flexible space close to towns and cities. Whilst COVID-19 has caused immense disruption to the economy, we can see that the response to it by business is paving the way for greater demand for MLI units. The internet sales and distribution channels for all businesses have taken another big step forward as the population was forced into isolation and had no choice but to embrace new technology, as well as supply and distribution channels. Home working and the explosion of communication technologies have fostered greater ability to work in a decentralised way, further fuelling demand for MLI space.
Companies have reassessed their globalised ‘just-in-time’ supply chains. It is becoming apparent to many businesses that it is not viable to rely solely on geographically distant supply chains from single undiversified sources. We sense an increasing desire from companies to have greater control over supplies and easier access, even if it means more cost. Similarly, retailers have expanded into online trading through websites, and many restaurants have opted for dark kitchens to facilitate the rapid increase in demand for delivered meals. There has also been a significant increase in demand from new businesses benefiting from COVID-19 seeking MLI space, such as those that are part of the PPE supply chain and those operating in entirely new industries like 3D printing. We believe that this type of strategic switching of business models will continue to drive the structural shift in demand for MLI units.
Rent collections have been robustWe have provided regular trading updates on our rent collection statistics and readers can find more about the financial impact of COVID-19 on the business on pages 26 to 31. The diversity and granularity of our customer base, both as to type of business and region,
has contributed to a high degree of resilience on the part of our portfolio during COVID-19. Fortunately, most have been able to continue working throughout as MLI units generally allow for socially distanced working, and most businesses in MLI have some form of e-commerce component, either being part of the distribution supply chain or as part of an online sales channel. Legislative restrictions remain in place which prevent landlords from enforcing against tenants who do not pay their rent. These restrictions are likely to be relaxed later in 2021, and we are optimistic that once this happens we will be able to recover additional historic rent arrears.
Total accounting return metric With the Company now firmly focused on MLI, we are introducing a new KPI metric of Total Accounting Return (‘TAR’) to benchmark and measure the future performance of this portfolio. TAR comprises the percentage EPRA NTA NAV per share increase in the financial year plus the distributions per share for the financial year, as a percentage of the opening EPRA NTA NAV per share at the beginning of the financial year.
Based on the past and current performance of our MLI portfolio and of the MLI asset class characteristics in general, we believe the MLI portfolio should deliver a TAR of at least 10% for the financial year to 31 March 2022 and for several years to come.
At least half of this (>5%) will come from valuation growth within the portfolio, as higher rents are translated into higher capital values. The balance (+/-5%) will come in the form of distributions.
Read more on total accounting return on page 21 and refer to Key performance indicators on page 23.
ESGWhile our primary purpose as a business is to revolutionise MLI in the UK for the benefit of all our stakeholders, we recognise the critical role that environmental, social and governance (‘ESG’) factors play in delivering operational and financial performance. In this respect we also understand that monitoring and disclosing the performance of our portfolio is fundamental to delivering value to our shareholders and meeting their expectations around ESG. As you will see later in this report, during 2020, we developed an ESG strategy and policy to
help further embed sustainability within our organisation whilst establishing our own internal ESG Steering Group to track our progress and identify new opportunities to drive further improvements. We look forward to updating shareholders as our strategy evolves.
Conclusion The fundamentals of the MLI asset class remain very positive in the medium to long term. We believe MLI continues to be well positioned to benefit from these fundamentals and to take a strong leap forward as the COVID-19 crisis passes. Our transition to a 100% UK MLI business is now largely complete, and we are delighted that over this four-year period we have delivered a Total Accounting Return of 32.3%. Looking forward, we return our focus to delivering sustainable and growing earnings and NAV, based upon MLI fundamentals which we believe will consistently deliver a 10% per annum total accounting return. We are also planning the transfer of our LSE listing from the Specialist Fund Segment to the Premium Segment of the Main Market, which we anticipate will take place before the end of the current financial year.
We are also increasingly focused on the operational aspects of managing this single-focused business and are confident that the work we have done and the investment we have made into our operating platform will soon start to show significant and long-lasting earnings enhancing benefits. It has been built to enable Stenprop to achieve the benefits of scaling the business with marginal increments in cost.
We take this opportunity to thank all of our stakeholders and our Board for their support. In particular, we wish to thank our staff who have adapted really well to working from home and to managing the relationships with our customers through these challenging times.
Paul Arenson Chief Executive Officer
10 June 2021
14 STENPROP ANNUAL REPORT 2021
Chief Executive’s Statement CONTINUED

30051 17 June 2021 4:07 pm V3
CASE STUDY
Fixed rate refinancingIn December 2020, we secured a new £66.5 million fixed rate senior debt facility with ReAssure, replacing an existing £61.5 million senior floating rate loan, which was due to expire in June 2022. The new loan was secured against 30 multi-let industrial assets located across the UK with a loan-to-value ratio of 38%.
The refinancing to a fixed rate facility was part of our existing business plan to diversify our borrowing base and extend our debt maturity profile. Until this point, our debt strategy had been focused on short-term flexible facilities to allow us to execute our non-MLI sales programme efficiently. The profile of a fixed rate loan matched our long-term investment approach, whilst also offering significant cost savings.
We ran a comprehensive process to identify the right lender both in terms of partner fit and pricing. We initially approached 10 active lenders in the debt market, using the current strong demand for industrial exposure to negotiate favourable terms and pricing.
The timing of the refinancing was critical. We originally planned to run the process at the start of 2020, but the onset of the pandemic and the uncertainty caused in the marketplace delayed this. Seeing the debt market bounce back strongly in favour of industrial property over the summer signalled an opportunity to take advantage of the appetite for low-leverage industrial lending. The market dynamics allowed us to create competitive tension in the process, leading to significantly reduced financing costs of around £930,000 per annum, as a result of the new loan being fixed at an annual rate of 1.66%, compared to 3.2% on the previous arrangement. We believe this all-in rate was lower than we could have achieved prior to the pandemic and reflects the substantial amount of capital looking to be deployed into the sector.
We were very pleased with the result and appreciative of our partners and advisers for their hard work in helping us deliver this solution. Across the whole MLI portfolio, the transaction reduced our average cost of debt from 3% to 2.2%, and substantially extended the weighted average maturity from 2.8 years to 5.6 years.
3.5%
3%
2.5%
2%
1.5%
1%
0.5%
0%
-0.5%
Refinance date
Mar
19
Ap
r 19
May
19
Jun
19
Ju
l 19
Aug
19
Sep
19
Oct
19
Nov
19
Dec
19
Jan
20
Feb
20
Mar
20
Ap
r 20
May
20
Jun
20
Jul 2
0
Aug
20
Sep
20
Oct
20
Nov
20
Dec
20
Jan
21
Feb
21
Mar
21
Ap
r 2
1
7 year Gilts All-in Rate
All-in Rate
All in rate comprises seven year GILTS yield at the time of fixing plus the weighted average spread of a basket of 14 UK real estate bonds as a proxy for senior debt pricing.
The timing of the refinancing allowed us to secure very competitively priced capital with a partner who demonstrated a strong understanding of our business model and provided us with the flexibility to deliver our ambitious business plan.”James Wakelin Head of Debt and Special Projects
Real estate senior debt pricing
15STENPROP ANNUAL REPORT 2021
STRATEGIC REPORT
30051 17 June 2021 4:07 pm V3
Our Business Model
OUR BUSINESS
1
4
2
5
3
6
OUR CORE PRINCIPLES
Focus and deep experience in MLI – doing things the ‘Industrials way’
High-quality, well-located properties that serve our customers’ needs in the long term
Disciplined financial management
A focus on customer service to deliver a simple, frictionless experience that surprises and delights
Deploy technological solutions, where appropriate, to maximise scalability and efficiency
Strong culture of acting responsibly and sustainably
16 STENPROP ANNUAL REPORT 2021
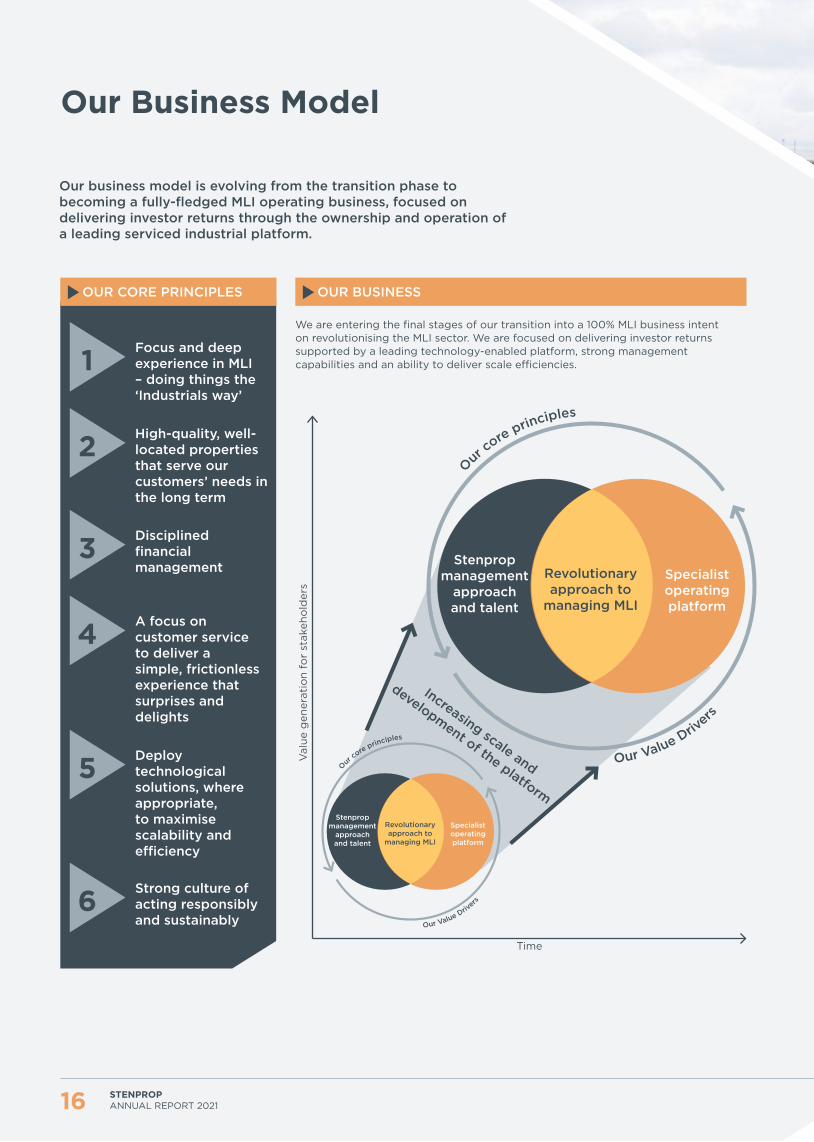
We are entering the final stages of our transition into a 100% MLI business intent on revolutionising the MLI sector. We are focused on delivering investor returns supported by a leading technology-enabled platform, strong management capabilities and an ability to deliver scale efficiencies.
Stenprop management
approach and talent
Specialist operating platform
Revolutionary approach to
managing MLI
Our core principles
Our Value Drivers
Stenprop management
approach and talent
Specialist operating platform
Revolutionary approach to
managing MLI
Our core principles
Our Value Drivers
Val
ue g
ener
atio
n fo
r st
akeh
old
ers
Time
Increasing scale and
development of the platform
Our business model is evolving from the transition phase to becoming a fully-fledged MLI operating business, focused on delivering investor returns through the ownership and operation of a leading serviced industrial platform.

30051 17 June 2021 4:07 pm V3
HOW WE CREATE VALUE
See pages 69 to 71 to read more about our section 172 statement and stakeholder engagement
See pages 22 to 24 to read more about Key Performance Indicators
Specialist operating platform Our scalable operating platform creates efficiencies through the use of technology, forward-thinking policies and physical infrastructure.
See pages 32 to 33 to read more about our serviced industrial operating platform
Stenprop management approach and talent Internalised management structure with highly skilled and multi-disciplinary team of 43 enables growth and the execution of our business strategy.
See pages 15, 44, and 52 to read more about Stenprop’s management approach and talent in the Fixed rate refinancing case study and Property Report and Investment Update
Increasing scale and development of the platform With 1,500 units and 1,100 customers, our portfolio is highly diversified and benefits from increasing economies of scale.
See pages 42 to 43 of our portfolio
TransactionsOur ability to source and acquire high-quality MLI assets facilitates growth and scaling, whilst also supporting the execution of our transition strategy.
See pages 52 to 53 to read more about our transactions overview
Revolutionary approach to managing MLIOur unique approach to managing MLI through initiatives such as our Smart Lease and fixed cost leasing, enables us to generate more value from our assets whilst better meeting the needs of our customers.
WHAT WE DELIVER
Our shareholders Once we complete our transition, we will target to deliver investors a minimum 10% total accounting return on an annual basis.
Our customersHigh-quality customer service is at the core of what we do. Our serviced industrial concept with frictionless leasing and flexible terms is designed to provide our customers with a best-in-class experience.
Business partners, lenders and suppliers We aim to be the partner of choice by nurturing long-term, consistent, transparent and mutually beneficial relationships with quality operators across our business.
Our people We deliver an innovative, engaging and caring work environment for our staff, with rewarding career opportunities from our offices in London and Stockport.
Local communities and the environment Through our expanding ESG policy and environmental initiatives, we aim to be both a good corporate citizen and a positive community influence across the 80+ locations where we operate.
17STENPROP ANNUAL REPORT 2021
STRATEGIC REPORTSTRATEGIC REPORT

30051 17 June 2021 4:07 pm V3
SPECIALIST OPERATING PLATFORM
DELIVER SUSTAINABLE AND GROWING INCOME AND NAV
QUALITY PROPERTIES
DELIVERING FOR ALL OUR STAKEHOLDERS
18 STENPROP ANNUAL REPORT 2021
We have built an operating platform that enables our business to operate more efficiently, and be flexible and dynamic in meeting our customers’ needs, whilst also enabling our business to scale at a reduced marginal cost. For more information on our Industrials Hive platform, please see our serviced industrial operating platform section on pages 32 to 33.
We only own and acquire buildings that work for our customers (urban locations, value for money, regular configuration, secure). Having the right assets enables us to maximise demand for our space and convert this into higher occupancy and rents. As we recycle our capital out of non-core assets, we are constantly seeking to grow our MLI portfolio, and in addition to our own contacts we maintain an extensive network of brokers around the UK to do this.
Delivering a minimum 10% total accounting return is a key aspect of Stenprop’s strategy. The fundamentals of UK MLI enable us to grow like-for-like rents, and hence also values, by 4–5% per annum, which, after modest leverage, will deliver our target return. The REIT structure and listings on the London and Johannesburg Stock Exchanges ensure enhanced efficiency, liquidity and access to a substantial marketplace of investors.
Making Stenprop a responsible, sustainable business that generates value and contributes to our shareholders; our customers; our people; our local communities and the environment, as well as business partners, lenders and suppliers requires the careful balancing of the needs of all of our stakeholders. Delivering upon our financial targets whilst also meeting our sustainability objectives is a critical business goal.
Our strategy is to own and operate a high-quality portfolio of UK urban multi-let industrial estates, operated in a way that supports the growth and prosperity of our stakeholders. We do this by focusing on the following key strategic goals:
Our Strategy

30051 17 June 2021 4:07 pm V3
Dividend
1
ObjectivesWe are in the final year of our four-year transition. We have met all our milestones over this period and have full confidence that we will complete the transition in the financial year to 31 March 2022. Whilst we intend to focus on completing the transition and the initial implementation of the platform this year, we are increasingly turning our attention to delivering on our longer-term growth potential.
Review of our objectives set for the financial year to 31 March 2021a. Managing our business through the COVID-19 crisis.
Through the year, we achieved our COVID-19 goals by maintaining a defensive balance sheet position, engaging actively with our customers, utilising our digital leasing platform to manage transactions and managing our workforce wellbeing through a challenging period. Going into the COVID-19 crisis, we benefited greatly from the historic investments we had made into cloud-based computing technology and our CRM system, meaning that little change was required to adapt to the new way of working. We have successfully collected 90% of rents due, whilst reducing vacancies and growing rents, and have grown our headcount from 28 to 43 over the period.
Read more about this in a year of living with COVID-19 on pages 26 to 31
b. Recycling of assets – selling and buying. During the course of the year, we continued to use the proceeds of sales to maintain leverage below 40% and acquire a further £91.5 million of new MLI assets. This is despite choosing to hold a significant cash balance for the first three months of the financial year when the COVID-19 pandemic hit the UK.
MLI%Group loan-to-value
(LTV)%Historic
target ActualHistoric
target Actual
2022 100% – 40% –2021 75% 74.3% 40% 28.1%2020 60% 58.0% 40% 26.2%2019 40% 42.7% 40% 35.2%
For the financial year to 31 March 2021, we achieved our transaction targets with over €122.3 million of non-MLI assets sold (target: €106.6 million) and £91.5 million MLI assets acquired (target: £90 million) to get to nearly 75% MLI.
c. Capital management – For the financial year, our goal was to proactively manage liquidity levels, debt and cashflows as we entered the COVID-19 pandemic, whilst maintaining an LTV ratio of below 40%. The Group entered the first COVID-19 UK lockdown with £71.1 million of available cash, which given the prevailing uncertainty was preserved until July 2020 when it was clear that MLI performance was picking up strongly, and hence it was appropriate to recommence our transition plans. However, at all times during the financial year
ended 31 March 2021, we maintained a strong balance sheet with a prudent minimum cash balance of £20 million in light of the risks posed by the pandemic and Brexit, whilst also raising capital through three successful refinancings.
See page 15 to read more in the Fixed rate refinancing case study
d. Multi-let industrial platform – our goal for the financial year to 31 March 2021 was to continue investing into our operating platform, enhance efficiencies, explore additional products and services to grow revenue, and scale the business at marginal additional cost. We started the financial year with the launch of an all-new CRM system, which has revolutionised how we track, manage, and execute upon our leasing leads and has materially grown our ability to lease directly to customers. We have also implemented many policy and process improvements that enhance how we work; rolled out the remainder of our on-site customer engagement management network and enjoyed record take-up of our Smart Lease. We have held back on additional products and services whilst we continued to invest in our integrated technology stack, with new ERP and CMS systems due to go live in 2021.
See pages 32 to 33 to read more on our serviced industrial operating platform
e. Dividend – Understanding the importance of distributions to our shareholders, our target was to maintain our full year dividend at 6.75p and to pay this, even if uncovered if this was a short-term position. However, the business performed well enough to allow us to maintain a covered 6.75p dividend for the financial year, despite a c.10% decline in rent collections over the period due to COVID-19.
Distribution per share (pence) 2022 guidance of 6.75p
6.75p
6.75p
6.75p
2020
2019
20
6.75p2022
21
Link to KPIs1
2
3
6
1
2
3
4
5
Link to risksA
B
C
D
E
F
G
H
I
J
We have maintained our dividend throughout our transition despite the impact of cash drag and transaction costs.”Julian Carey Managing Director
19STENPROP ANNUAL REPORT 2021
STRATEGIC REPORT

30051 17 June 2021 4:07 pm V3
2
20
Our Strategy CONTINUED
The financial year ending 31 March 2022 is the last of our transition into a 100% MLI business. As we close in on this important milestone, our focus is turning to maximising the potential of our MLI portfolio (see page 21: Post-transition Stenprop).
Our high level objectives for the financial year ending 31 March 2022 revolve around completing the transition to 100% MLI and further expanding the reach of our Industrials Hive Operating Platform. We also have significant corporate activity planned with a planned transfer to the Premium Segment of the Main Market of the LSE and rebrand of the Company.
31 March 2022 objectives – the final year of transition and the start of a new era for Stenprop
a. Complete transition to 100% MLI – complete the remainder of the transition to a portfolio of 100% MLI assets by disposing of the remaining £127.2 million of non-MLI assets in Germany, Switzerland and Guernsey, and reinvesting the proceeds as soon as practically possible into UK MLI property.
b. Maintain dividend – target at least 6.75p dividend for the year. Through the careful management of disposals, acquisitions, cash drag, and third-party finance, Stenprop has maintained the full year dividend at 6.75p through the three-year transition. Stenprop seeks to establish property-related earnings from the MLI portfolio, which will support sustainable growth in the dividend from the financial years commencing 1 April 2022 onwards.
c. Industrials Hive operating platform – complete the roll out of our new integrated ERP platform, content management platform, and data architecture. Evolve our sales and marketing process to extract greater value through the integration of our on-site customer engagement management and CRM system, whilst also in-sourcing all customer relationship management to deliver enhanced and consistent customer service through all phases of the lease lifecycle.
d. Liquidity and brand – Move from the Specialist Funds Segment to the Premium Segment of the Main Market of the LSE and, subject to shareholder approval, change the status of our JSE listing from Primary to Secondary to appeal to a wider range of investors. Rebrand the Company to complement the strategic direction of the business and enhance understanding of our value proposition.
e. Sustainability – enhance our ESG reporting by improving the measurement and reporting of key metrics. Encourage and embrace a culture of responsible and sustainable operations by making sustainability, and the needs of all our stakeholders, central to all decision making.
Link to KPIs1
2
3
1
3
4
5
Link to risksA
B
E
F
H
G
I
J
K
STENPROP ANNUAL REPORT 2021

30051 17 June 2021 4:07 pm V3
3Post-transition Stenprop Sustainable and growing earnings and NAVOnce we hold a portfolio wholly of MLI properties which is not impacted by the disruption, cash drag and costs associated with transition, we are confident Stenprop can generate a Total Accounting Return of at least 10% per annum for investors. This return will broadly be made up of the following components:
4-5% 5-6% 10%
Income return
+ =
Capital growth
Total accounting return
The 4-5% income return is represented by the dividend we are already paying on our portfolio, but in future will be derived solely from our MLI portfolio. This diversified income stream collected from over 1,000 different businesses forms the backbone of our Total Accounting Return.
The 5-6% capital return is delivered through the uplift in capital values of our MLI assets. This is predominantly realised through the revaluation of our assets each year and is reflected in the NAV of the Company. With the rental income and rental values growing at 4-5% per annum we expect property values to follow suit. The impact of leverage will add further to the NAV.
Combined, these two elements should deliver a Total Accounting Return of at least 10% per annum. We believe that MLI in the UK has the potential to continue growing in the medium to long term as favourable structural shifts take place to our economy and society, and as a result Stenprop will be able to deliver sustainable and growing earnings into the foreseeable future.
Link to KPIs1
2
3
4
6
1
3
4
5
Link to risksA
B
E
F
G
H
J
Further upside potential through the Industrials Hive PlatformThe Industrials Hive platform has been designed and built to allow Stenprop to grow the MLI portfolio at a progressively lower incremental cost, and hence benefit from economies of scale. These scale benefits are largely derived from a fixed central cost base which is increasingly diluted as the wider business grows. Our early stage modelling indicates that the central costs associated with managing an average MLI unit of c. 3,000 sq ft are currently £5,600 per annum, whilst each additional MLI unit that we add to the portfolio is likely to cost approximately only £1,500 per annum more. This represents a saving of 73% on the current cost per unit. With the assumption of a series of equity raises and deployment of capital into new MLI assets, the model shows that if Stenprop were to double the gross asset value of properties in its portfolio it should be able to cut the EPRA Cost Ratio by an absolute amount of approximately 6% as a result of this scale saving, producing in additional EPS of approximately 1p per share per annum.
Further upside can be achieved through the efficiencies and revenue opportunities presented by the Industrials Hive platform. Industrials Hive has been designed to cut out friction and reduce costs from the process of managing MLI property, whilst also supporting the generation of additional revenue streams through a sophisticated billing platform. Built on the Microsoft Dynamics platform, when fully operational, Industrials Hive will provide Stenprop with the latest technologies and tools to deliver a class leading customer experience, operating efficiencies and high-quality data and business intelligence tools. We believe that these benefits will materialise over the course of the next few years, and that the platform itself will become a valuable part of Stenprop’s business in years to come.
See pages 04 to 05 and 16 to 17 to read more in why invest in us and our business model
21STENPROP ANNUAL REPORT 2021
STRATEGIC REPORT
30051 17 June 2021 4:07 pm V3
22 STENPROP ANNUAL REPORT 2021
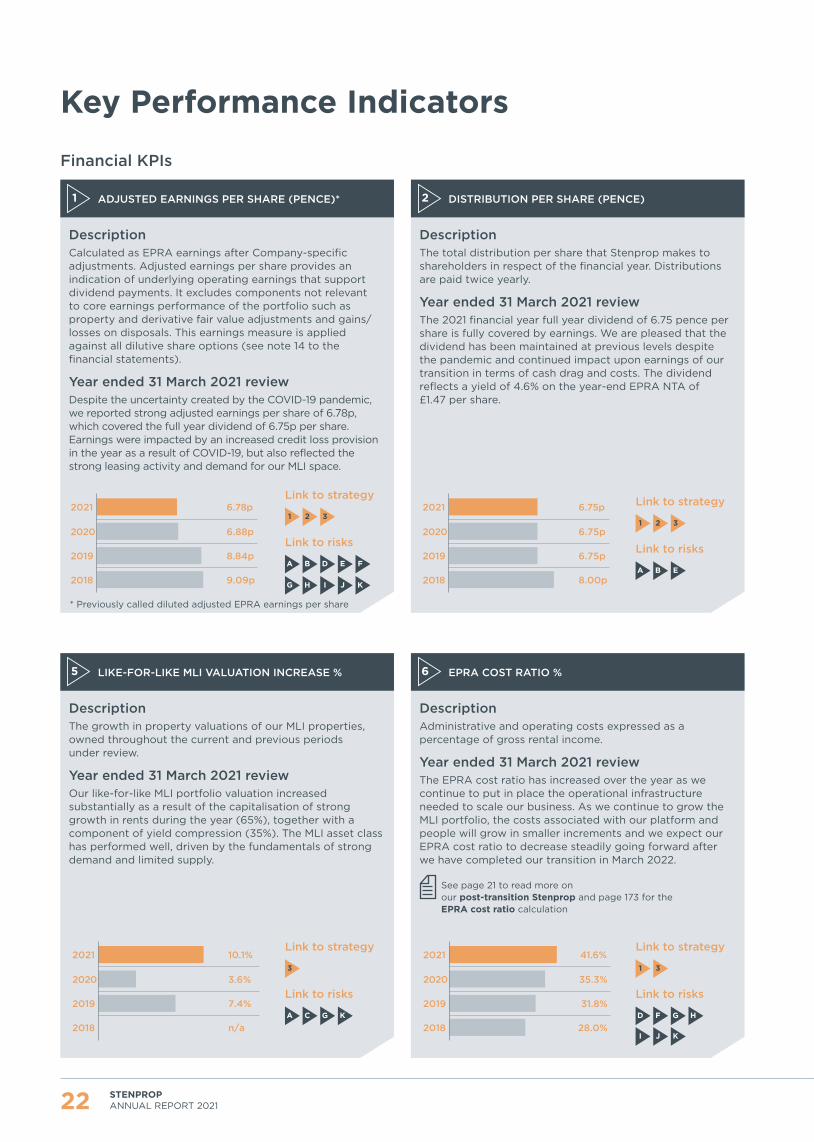
DescriptionThe growth in property valuations of our MLI properties, owned throughout the current and previous periods under review.
Year ended 31 March 2021 reviewOur like-for-like MLI portfolio valuation increased substantially as a result of the capitalisation of strong growth in rents during the year (65%), together with a component of yield compression (35%). The MLI asset class has performed well, driven by the fundamentals of strong demand and limited supply.
DescriptionAdministrative and operating costs expressed as a percentage of gross rental income.
Year ended 31 March 2021 reviewThe EPRA cost ratio has increased over the year as we continue to put in place the operational infrastructure needed to scale our business. As we continue to grow the MLI portfolio, the costs associated with our platform and people will grow in smaller increments and we expect our EPRA cost ratio to decrease steadily going forward after we have completed our transition in March 2022.
See page 21 to read more on our post-transition Stenprop and page 173 for the EPRA cost ratio calculation
Link to strategy
3
Link to risks
A C
G
K
Link to strategy
1
3
Link to risks
D
F G
H
I
J K
DescriptionCalculated as EPRA earnings after Company-specific adjustments. Adjusted earnings per share provides an indication of underlying operating earnings that support dividend payments. It excludes components not relevant to core earnings performance of the portfolio such as property and derivative fair value adjustments and gains/losses on disposals. This earnings measure is applied against all dilutive share options (see note 14 to the financial statements).
Year ended 31 March 2021 reviewDespite the uncertainty created by the COVID-19 pandemic, we reported strong adjusted earnings per share of 6.78p, which covered the full year dividend of 6.75p per share. Earnings were impacted by an increased credit loss provision in the year as a result of COVID-19, but also reflected the strong leasing activity and demand for our MLI space.
DescriptionThe total distribution per share that Stenprop makes to shareholders in respect of the financial year. Distributions are paid twice yearly.
Year ended 31 March 2021 reviewThe 2021 financial year full year dividend of 6.75 pence per share is fully covered by earnings. We are pleased that the dividend has been maintained at previous levels despite the pandemic and continued impact upon earnings of our transition in terms of cash drag and costs. The dividend reflects a yield of 4.6% on the year-end EPRA NTA of £1.47 per share.
Key Performance Indicators
Link to strategy
1
2
3
Link to risks
A
B D
E
F
G H
I
J
K
Link to strategy
1
2
3
Link to risks
A
B
E
6.88p
8.84p
6.78p
2020
2019
2021
9.09p2018
ADJUSTED EARNINGS PER SHARE (PENCE)*
LIKE-FOR-LIKE MLI VALUATION INCREASE %
DISTRIBUTION PER SHARE (PENCE)
EPRA COST RATIO %
1
5
2
6
6.75p
6.75p
6.75p
2020
2019
2021
8.00p2018
3.6%
7.4%
10.1%
2020
2019
2021
n/a2018
35.3%
31.8%
41.6%
2020
2019
2021
28.0%2018
Financial KPIs
* Previously called diluted adjusted EPRA earnings per share
30051 17 June 2021 4:07 pm V3
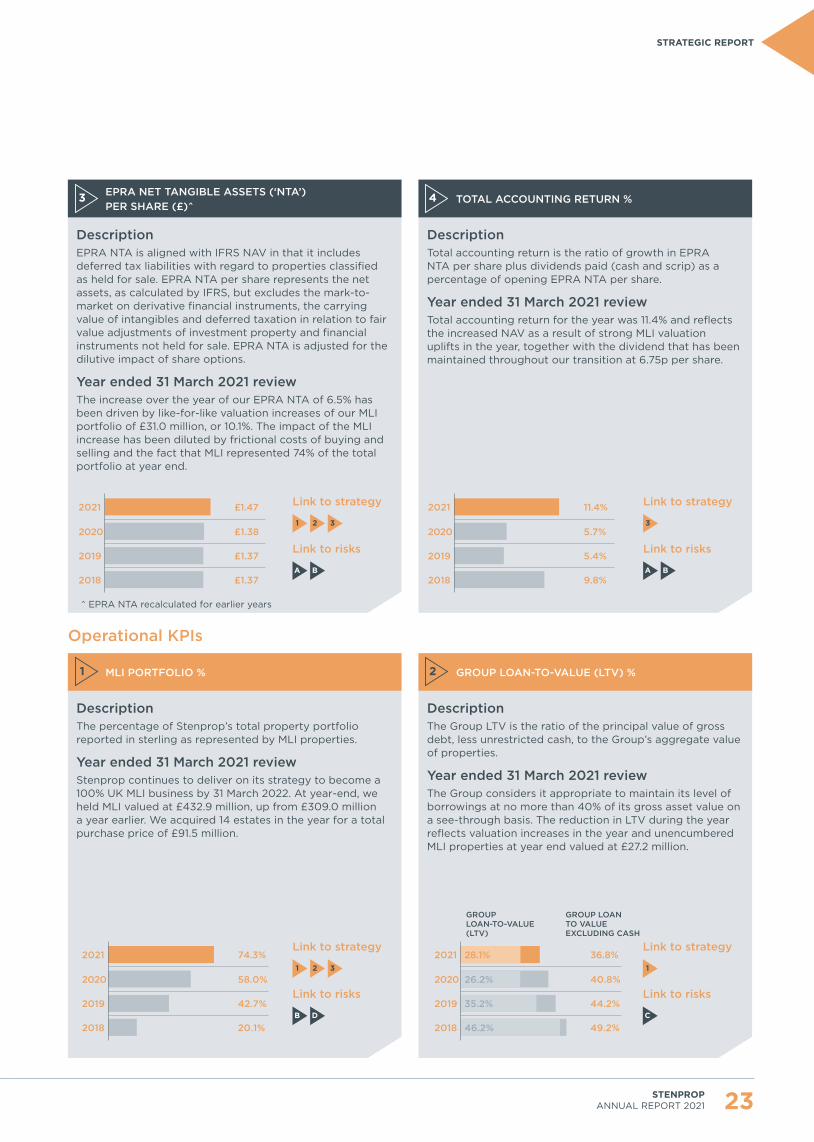
DescriptionThe percentage of Stenprop’s total property portfolio reported in sterling as represented by MLI properties.
Year ended 31 March 2021 reviewStenprop continues to deliver on its strategy to become a 100% UK MLI business by 31 March 2022. At year-end, we held MLI valued at £432.9 million, up from £309.0 million a year earlier. We acquired 14 estates in the year for a total purchase price of £91.5 million.
DescriptionThe Group LTV is the ratio of the principal value of gross debt, less unrestricted cash, to the Group’s aggregate value of properties.
Year ended 31 March 2021 reviewThe Group considers it appropriate to maintain its level of borrowings at no more than 40% of its gross asset value on a see-through basis. The reduction in LTV during the year reflects valuation increases in the year and unencumbered MLI properties at year end valued at £27.2 million.
Link to strategy
1
2
3
Link to risks
B D
Link to strategy
1
Link to risks
C
DescriptionEPRA NTA is aligned with IFRS NAV in that it includes deferred tax liabilities with regard to properties classified as held for sale. EPRA NTA per share represents the net assets, as calculated by IFRS, but excludes the mark-to-market on derivative financial instruments, the carrying value of intangibles and deferred taxation in relation to fair value adjustments of investment property and financial instruments not held for sale. EPRA NTA is adjusted for the dilutive impact of share options.
Year ended 31 March 2021 reviewThe increase over the year of our EPRA NTA of 6.5% has been driven by like-for-like valuation increases of our MLI portfolio of £31.0 million, or 10.1%. The impact of the MLI increase has been diluted by frictional costs of buying and selling and the fact that MLI represented 74% of the total portfolio at year end.
DescriptionTotal accounting return is the ratio of growth in EPRA NTA per share plus dividends paid (cash and scrip) as a percentage of opening EPRA NTA per share.
Year ended 31 March 2021 reviewTotal accounting return for the year was 11.4% and reflects the increased NAV as a result of strong MLI valuation uplifts in the year, together with the dividend that has been maintained throughout our transition at 6.75p per share.
Link to strategy
1
2
3
Link to risks
A
B
Link to strategy
3
Link to risks
A
B
EPRA NET TANGIBLE ASSETS (‘NTA’) PER SHARE (£)^
MLI PORTFOLIO %
TOTAL ACCOUNTING RETURN %
GROUP LOAN-TO-VALUE (LTV) %
3
1
4
2
£1.38
£1.37
£1.47
2020
2019
2021
£1.372018
5.7%
5.4%
11.4%
2020
2019
2021
9.8%2018
58.0%
42.7%
74.3%
2020
2019
2021
20.1%2018
40.8%
44.2%
36.8%
2020
2019
2021
49.2%
26.2%
35.2%
28.1%
46.2%2018
Operational KPIs
^ EPRA NTA recalculated for earlier years
GROUP LOAN-TO-VALUE (LTV)
GROUP LOAN TO VALUE EXCLUDING CASH
23STENPROP ANNUAL REPORT 2021
STRATEGIC REPORT

30051 17 June 2021 4:07 pm V3
24 STENPROP ANNUAL REPORT 2021
Key Performance Indicators CONTINUED
Operational KPIs
DescriptionOccupancy of the MLI portfolio as a percentage of total lettable area
Year ended 31 March 2021 reviewOccupancy has increased over the year as a result of the strong demand for MLI space. This is evidenced by increasing leasing enquiries over the year, culminating in Q4 2021 with enquiries 56% higher than the comparative period in Q4 2020. Structural voids are decreasing as we improve efficiency in the letting process through digital marketing, the Smart Lease and the ability to sign on-line.
DescriptionThe growth in the passing rent of the MLI portfolio owned at the start of the financial year.
Year ended 31 March 2021 reviewMLI like-for-like rental growth was 5.6% p.a. for the second consecutive year as we successfully secured strong rental uplifts upon rent review, the letting of vacant space and at lease renewal. The gap between ERV and passing rent remains substantial, delivering strong potential for further uplifts in future.
Link to strategy
1
2
3
Link to risks
F G
I
Link to strategy
1
2
3
Link to risks
F G
I
MLI OCCUPANCY % LIKE-FOR-LIKE MLI RENTAL GROWTH %3 4
DescriptionThe percentage of tenants who have chosen to remain in occupation post a contracted lease expiry or break option, during the current financial year.
Year ended 31 March 2021 reviewWe saw a healthy uplift in renewal rate during the financial year due to a combination of enhanced customer service from our Industrials platform and a lack of available supply in the market limiting alternative options for customers.
Link to strategy
1
2
3
Link to risks
F G
I
MLI LEASE RENEWAL RATE5
5.6%
4.8%
5.6%
2020
2019
2021
n/a2018
91.1%
89.8%
93.7%
2020
2019
2021
84.7%2018
76%
n/a
80%
2020
2019
2021
n/a2018

30051 17 June 2021 4:07 pm V3
25STENPROP ANNUAL REPORT 2021
STRATEGIC REPORT

30051 17 June 2021 4:07 pm V3
INTERNAL CUSTOMERS RENT COLLECTIONS TRANSACTIONS LEASING
April – June 2020
As a Company, we adapted to working from home quite seamlessly on the back of significant IT upgrades, which we had undertaken over the previous two years. All staff were given access to additional home working equipment, and on-site staff were provided with detailed guidance as to what was and was not possible in terms of viewings and meetings.
Upon lockdown being implemented, we proactively wrote to all customers to provide information and support around rent payment. We also hosted a page on industrials.co.uk with extensive information on government grants and other assistance available. We set up a case management programme to monitor requests and conversations around rent concessions and abatements and started offering rent deferral options to all customers.
30 day collections for these initial lockdown months were 60–66% on monthly rents, and 68% for the March quarterly rents. However, by the end of June, the monthly rents were up to around 80% collected, so signs were already emerging that long-term collection rates would be more positive than originally feared.
We started this period with £77.9 million of unrestricted cash. We chose to conserve this cash until the impact of the COVID-19 pandemic became clearer. The only MLI transaction we completed during this time was for £3.75 million, which we had under offer going into the pandemic, and which we completed towards the end of June when the situation appeared to be improving. However, we did proceed with the marketing of our German retail assets, as initial feedback on the ground was the German investment market remained largely unaffected by the pandemic.
During this time, many of our letting agents were put on furlough. As a result, we relied heavily on our on-the-ground customer engagement managers and digital Smart Leasing process to enable us to keep transacting. This enabled us to complete 42 leasing transactions during the quarter, some of which were to occupiers seeking to fill urgent space requirements in the early stages of the pandemic. Overall occupancy in the MLI portfolio grew from 91% to 92% as a result.
26 STENPROP ANNUAL REPORT 2021
A Year of Living With COVID-19
The last year has brought unprecedented challenges and opportunities for our Company. Whilst we have battled with challenging market conditions, we have emerged a stronger and more cohesive business, where a technology-enabled workforce has successfully delivered on behalf of all our stakeholders. The table below plots the impact of COVID-19 over the course of the year from the perspective of staff, customers and the wider market, and reviews some of our 2020 objectives around managing the risks and uncertainties brought about by COVID-19.
30051 17 June 2021 4:07 pm V3
INTERNAL CUSTOMERS RENT COLLECTIONS TRANSACTIONS LEASING
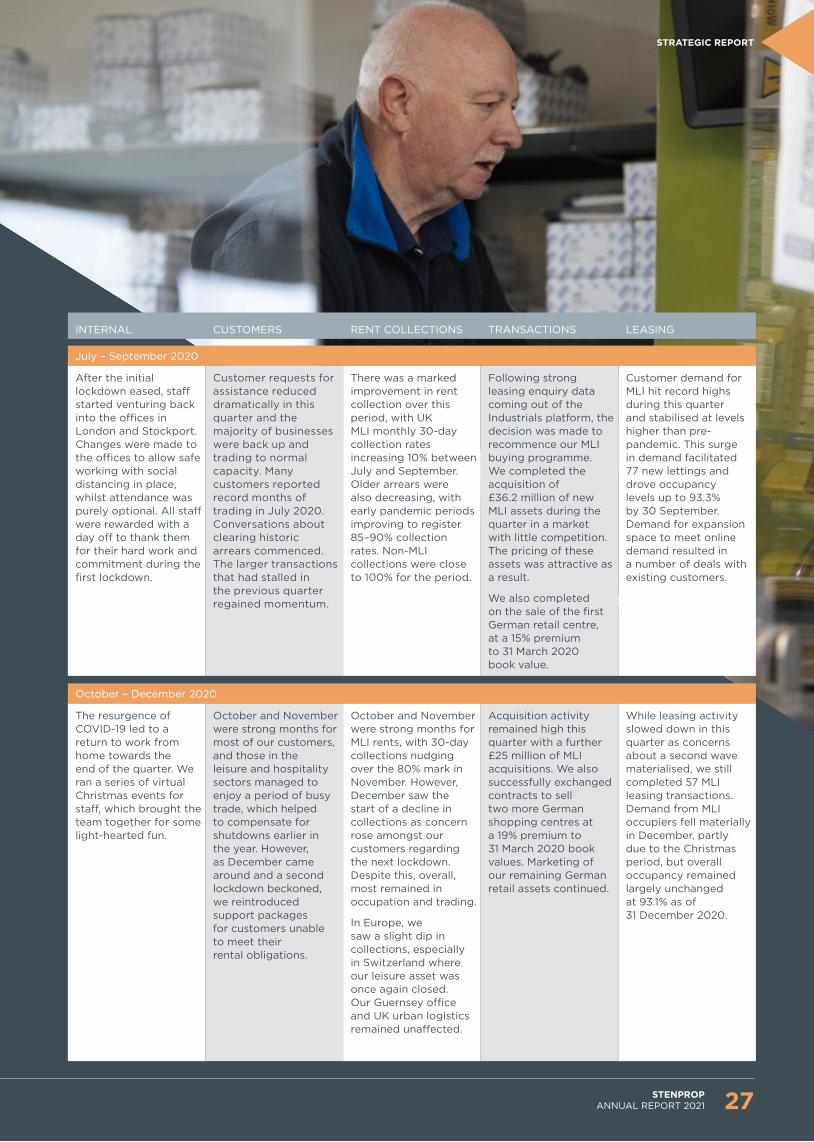
July – September 2020
After the initial lockdown eased, staff started venturing back into the offices in London and Stockport. Changes were made to the offices to allow safe working with social distancing in place, whilst attendance was purely optional. All staff were rewarded with a day off to thank them for their hard work and commitment during the first lockdown.
Customer requests for assistance reduced dramatically in this quarter and the majority of businesses were back up and trading to normal capacity. Many customers reported record months of trading in July 2020. Conversations about clearing historic arrears commenced. The larger transactions that had stalled in the previous quarter regained momentum.
There was a marked improvement in rent collection over this period, with UK MLI monthly 30-day collection rates increasing 10% between July and September. Older arrears were also decreasing, with early pandemic periods improving to register 85–90% collection rates. Non-MLI collections were close to 100% for the period.
Following strong leasing enquiry data coming out of the Industrials platform, the decision was made to recommence our MLI buying programme. We completed the acquisition of £36.2 million of new MLI assets during the quarter in a market with little competition. The pricing of these assets was attractive as a result.
We also completed on the sale of the first German retail centre, at a 15% premium to 31 March 2020 book value.
Customer demand for MLI hit record highs during this quarter and stabilised at levels higher than pre-pandemic. This surge in demand facilitated 77 new lettings and drove occupancy levels up to 93.3% by 30 September. Demand for expansion space to meet online demand resulted in a number of deals with existing customers.
October – December 2020
The resurgence of COVID-19 led to a return to work from home towards the end of the quarter. We ran a series of virtual Christmas events for staff, which brought the team together for some light-hearted fun.
October and November were strong months for most of our customers, and those in the leisure and hospitality sectors managed to enjoy a period of busy trade, which helped to compensate for shutdowns earlier in the year. However, as December came around and a second lockdown beckoned, we reintroduced support packages for customers unable to meet their rental obligations.
October and November were strong months for MLI rents, with 30-day collections nudging over the 80% mark in November. However, December saw the start of a decline in collections as concern rose amongst our customers regarding the next lockdown. Despite this, overall, most remained in occupation and trading.
In Europe, we saw a slight dip in collections, especially in Switzerland where our leisure asset was once again closed. Our Guernsey office and UK urban logistics remained unaffected.
Acquisition activity remained high this quarter with a further £25 million of MLI acquisitions. We also successfully exchanged contracts to sell two more German shopping centres at a 19% premium to 31 March 2020 book values. Marketing of our remaining German retail assets continued.
While leasing activity slowed down in this quarter as concerns about a second wave materialised, we still completed 57 MLI leasing transactions. Demand from MLI occupiers fell materially in December, partly due to the Christmas period, but overall occupancy remained largely unchanged at 93.1% as of 31 December 2020.
27
STRATEGIC REPORT
STENPROP ANNUAL REPORT 2021

30051 17 June 2021 4:07 pm V3
INTERNAL CUSTOMERS RENT COLLECTIONS TRANSACTIONS LEASING
January – March 2021
The year started with efforts to promote the benefits of exercise and wellbeing during the third lockdown with our 10,000 steps-a-day challenge on behalf of Brain Tumour Research.
See pages 71 and 75 to read more on our Charity of the year
It became clear early in 2021 that the restrictions were not going to impact our customers as much as they had before. Most remained open and trading, and it was just our leisure customers who remained shut and unable to trade for a prolonged period. As a result, requests for rent assistance were extremely limited.
In Europe, our customers were feeling the second lockdown more than the first and, as a result, rent concessions were agreed, which were not necessary in 2020.
January and February were poorer months for rent collections in the MLI portfolio, although not as bad as we had seen in the first lockdown. However, March showed significant signs of improvement, and we continued to have success in collecting older arrears from 2020, which took overall collection rates to over 90% for the financial year to 31 March 2021.
In Europe, we struggled more than usual. It was a subdued quarter with collections around 83%. Our Swiss leisure asset remained closed throughout.
The year started well with a further £25 million of MLI acquisitions in four transactions across the UK.
We successfully completed on two further German retail disposal transactions. The first was one of the shopping centres where contracts were exchanged at the end of 2020; the second was the Bikemax retail warehouse portfolio. The combined value of these transactions was €64.5 million. Despite the impact of the pandemic on rent collections in Germany, the investment market remained strong for the duration of the year, whilst the quality of the assets delivered good liquidity and higher pricing than pre-COVID-19.
We saw a sustained and material pick-up in enquiries in 2021, with levels rising 56% compared to the December 2020 quarter. This resulted in our busiest ever quarter of MLI leasing, with 83 transactions comprising over 212,000 sq ft of space. Rents continue to rise too, with 5.6% like-for-like rental growth over the year, and average lease incentives of under a month for a four-year lease.
At the end of the quarter, we had a further 234,000 sq ft of space under offer, which is encouraging as we head into the new financial year.
28 STENPROP ANNUAL REPORT 2021
A Year of Living With COVID-19 CONTINUED
30051 17 June 2021 4:07 pm V3
INTERNAL CUSTOMERS RENT COLLECTIONS TRANSACTIONS LEASING
April 2021 onwards
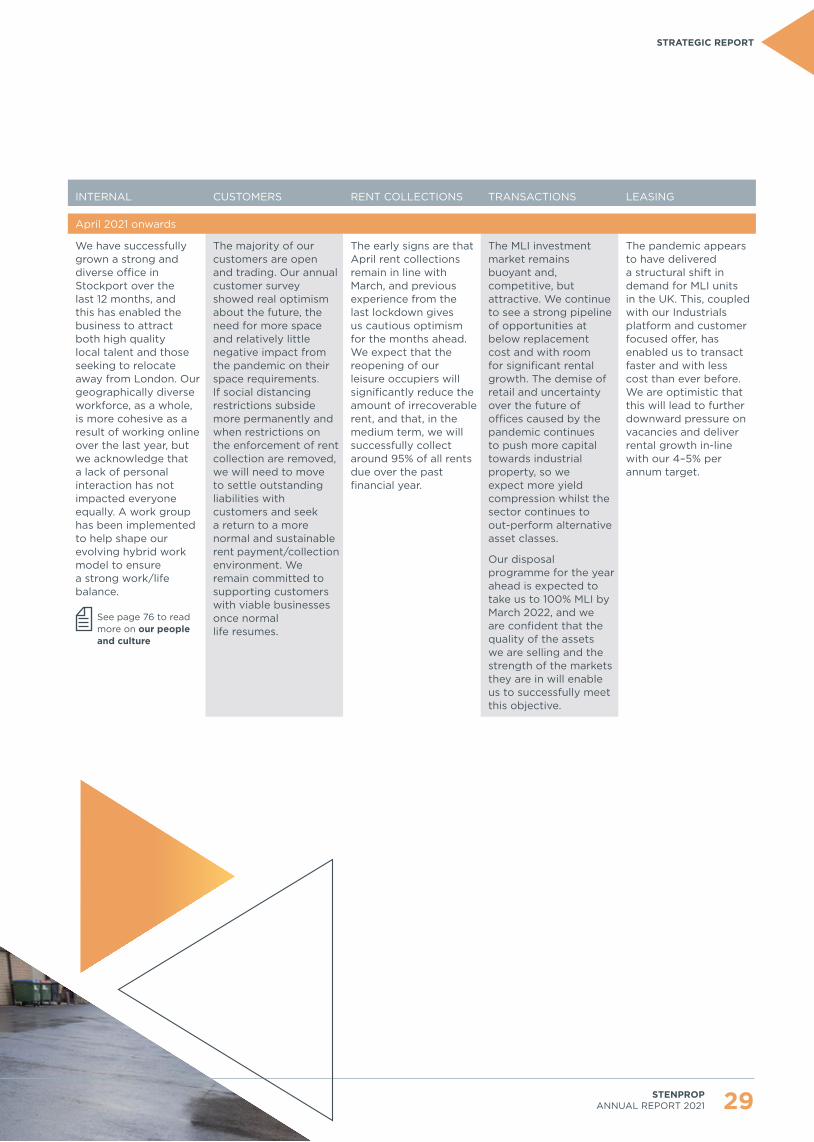
We have successfully grown a strong and diverse office in Stockport over the last 12 months, and this has enabled the business to attract both high quality local talent and those seeking to relocate away from London. Our geographically diverse workforce, as a whole, is more cohesive as a result of working online over the last year, but we acknowledge that a lack of personal interaction has not impacted everyone equally. A work group has been implemented to help shape our evolving hybrid work model to ensure a strong work/life balance.
See page 76 to read more on our people and culture
The majority of our customers are open and trading. Our annual customer survey showed real optimism about the future, the need for more space and relatively little negative impact from the pandemic on their space requirements. If social distancing restrictions subside more permanently and when restrictions on the enforcement of rent collection are removed, we will need to move to settle outstanding liabilities with customers and seek a return to a more normal and sustainable rent payment/collection environment. We remain committed to supporting customers with viable businesses once normal life resumes.
The early signs are that April rent collections remain in line with March, and previous experience from the last lockdown gives us cautious optimism for the months ahead. We expect that the reopening of our leisure occupiers will significantly reduce the amount of irrecoverable rent, and that, in the medium term, we will successfully collect around 95% of all rents due over the past financial year.
The MLI investment market remains buoyant and, competitive, but attractive. We continue to see a strong pipeline of opportunities at below replacement cost and with room for significant rental growth. The demise of retail and uncertainty over the future of offices caused by the pandemic continues to push more capital towards industrial property, so we expect more yield compression whilst the sector continues to out-perform alternative asset classes.
Our disposal programme for the year ahead is expected to take us to 100% MLI by March 2022, and we are confident that the quality of the assets we are selling and the strength of the markets they are in will enable us to successfully meet this objective.
The pandemic appears to have delivered a structural shift in demand for MLI units in the UK. This, coupled with our Industrials platform and customer focused offer, has enabled us to transact faster and with less cost than ever before. We are optimistic that this will lead to further downward pressure on vacancies and deliver rental growth in-line with our 4–5% per annum target.
29STENPROP ANNUAL REPORT 2021
STRATEGIC REPORT

30051 17 June 2021 4:07 pm V3
CASE STUDY
30 STENPROP ANNUAL REPORT 2021
The onset of the COVID-19 crisis affected all types of business in different ways. The immediate impact of the government announcements in March 2020 caused much uncertainty across the business community, where our customers questioned not only whether they could use their space but whether their business might survive.
The UK government’s first announcement issued on 16 March 2020 asked the general population to stop all non-essential contact and travel. With rumours of a national lockdown already circulating the prime minister ordered a national lockdown on 23 March, which came into effect on 26 March.
On 18 March 2020, we implemented a digital solution to capture all contact requests via an online form. The form was shared amongst the main roles that interface with our customers, including asset and property managers, customer engagement managers and our accounts team. It helped us gather key information to understand the impact and the steps our customers had taken to safeguard their business. This information helped us to make fast
decisions and implement the right policies to support them. We also posted advice on the industrials.co.uk website on loans, support and other measured put in place by the government to support SME businesses in the UK.
Over the course of the year, we logged 235 contact requests from customers. Most requests came in March and April 2020, when the first lockdown was at its height, before falling as lockdown measures eased and our customers returned to their space to continue to trade.
A Year of Living With COVID-19 CONTINUED
Engaging with customers during COVID-19
30051 17 June 2021 4:07 pm V3
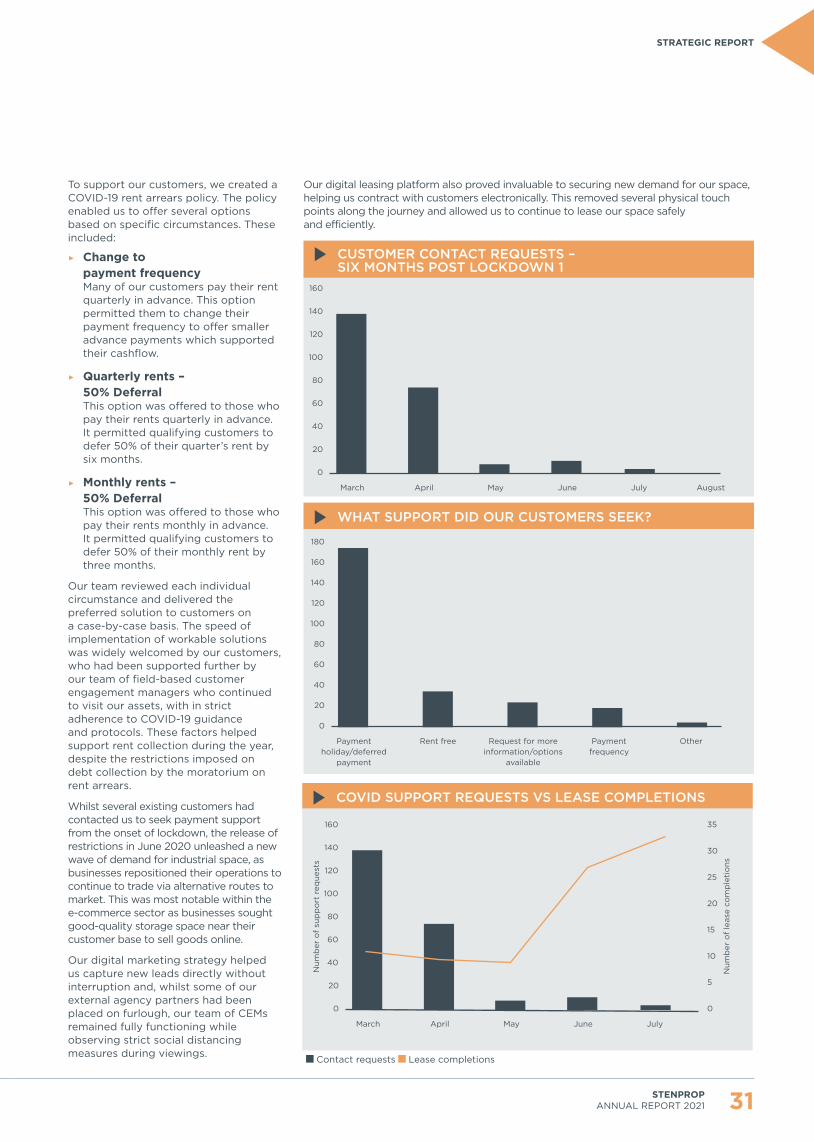
To support our customers, we created a COVID-19 rent arrears policy. The policy enabled us to offer several options based on specific circumstances. These included:
▶ Change to payment frequencyMany of our customers pay their rent quarterly in advance. This option permitted them to change their payment frequency to offer smaller advance payments which supported their cashflow.
▶ Quarterly rents – 50% DeferralThis option was offered to those who pay their rents quarterly in advance. It permitted qualifying customers to defer 50% of their quarter’s rent by six months.
▶ Monthly rents – 50% DeferralThis option was offered to those who pay their rents monthly in advance. It permitted qualifying customers to defer 50% of their monthly rent by three months.
Our team reviewed each individual circumstance and delivered the preferred solution to customers on a case-by-case basis. The speed of implementation of workable solutions was widely welcomed by our customers, who had been supported further by our team of field-based customer engagement managers who continued to visit our assets, with in strict adherence to COVID-19 guidance and protocols. These factors helped support rent collection during the year, despite the restrictions imposed on debt collection by the moratorium on rent arrears.
Whilst several existing customers had contacted us to seek payment support from the onset of lockdown, the release of restrictions in June 2020 unleashed a new wave of demand for industrial space, as businesses repositioned their operations to continue to trade via alternative routes to market. This was most notable within the e-commerce sector as businesses sought good-quality storage space near their customer base to sell goods online.
Our digital marketing strategy helped us capture new leads directly without interruption and, whilst some of our external agency partners had been placed on furlough, our team of CEMs remained fully functioning while observing strict social distancing measures during viewings.
CUSTOMER CONTACT REQUESTS – SIX MONTHS POST LOCKDOWN 1
0
20
March April May June July August
160
60
80
100
140
120
40
WHAT SUPPORT DID OUR CUSTOMERS SEEK?
0
20
Paymentholiday/deferred
payment
Rent free Request for moreinformation/options
available
Paymentfrequency
Other
180
160
60
80
100
140
120
40
COVID SUPPORT REQUESTS VS LEASE COMPLETIONS
0
20
160
60
80
100
140
120
40
0
5
35
15
20
25
30
10
March April May June July
Num
ber
of
sup
po
rt r
eque
sts
Num
ber
of
leas
e co
mp
leti
ons
Our digital leasing platform also proved invaluable to securing new demand for our space, helping us contract with customers electronically. This removed several physical touch points along the journey and allowed us to continue to lease our space safely and efficiently.
Contact requests Lease completions
31STENPROP ANNUAL REPORT 2021
STRATEGIC REPORT

30051 17 June 2021 4:07 pm V3
32 STENPROP ANNUAL REPORT 2021
Our Serviced Industrial Operating PlatformWhat do our customers expect?
Userfriendly
Quick
ServicedIndustrial
Flexible Responsive
CustomerfocusedLow risk
Over 50% of our customers have never signed an industrial lease before. As a result, many are unfamiliar with the traditional practices of commercial leasing and are wary of risks associated with leasing industrial premises. They are also increasingly looking to their landlord to provide space as a service (rather than just a simple box of space), complete with after-sales customer care and additional products and services (such as cleaning or utilities).
Readers can read more on how we incorporate the expectations of small business owners in how we work on page 39
To fulfil the requirements of our customers, Stenprop has developed the following additional products and services:
▶ Multi-channel communications
▶ Customer relationship/account management
▶ Online digital marketing
▶ Flexible terms
▶ Transparent and/or fixed price leasing
▶ Digital transaction management
▶ Direct to landlord leasing proposition
▶ Accurate billing and credit control
▶ Easy check in/check out processes
▶ Additional products and services (e.g. utilities, refuse, etc.)
The benefit to the landlord of providing a serviced industrial proposition is that customers are willing to pay a premium price for a service which reduces the risk, hassle, and burden of leasing commercial space. In addition, it offers the landlord:
1. Differentiation – in a marketplace with a relatively homogenous product, the customer experience and service offering is a key point of differentiation for prospective and existing customers.
2. Revenue – expanding the range of products and services offered to occupiers beyond the basic sq ft lease opens up opportunities for the serviced industrial landlord to grow revenue.
3. Stickiness – customers receiving good-quality customer service are less likely to leave, especially if other competing landlords are unable to replicate the service currently received.
Why do we need a platform?
83locations
250 lettings p.a.
1.100+customers
16,000+invoices p.a.
5,500+customer
enquiries p.a.
100,000+website visitors
p.a.
In order to deliver a consistent, high-quality service to our customers, it is necessary to implement and operate a comprehensive operating platform. The platform has three principal objectives:
1. Deliver a consistent, efficient and comprehensive service to potential and existing customers seeking MLI space.
2. Deliver a significant and long-lasting competitive advantage for Stenprop and allow us to capture additional revenue streams.
3. Enable Stenprop to manage significantly greater scale at a reducing marginal cost.
Readers can read more on our strategy to manage scale in Post-transition Stenprop on page 21
Julian Carey Managing Director

30051 17 June 2021 4:07 pm V3
Enhanced Value
Properties & Products
Pro
cess
& p
olic
yPhysical infrastructure
Systems &
Technology
Introducing Industrials Hive – our operating platform
There are three critical components to our operating platform.
The key elements to each are as follows:
1. Process and policy – this element governs how we operate our business, the rules we stick to and the policies we have in place as to how we respond to specific circumstances. For example, within this element of our platform we would include our marketing and sales strategy, building maintenance policy, lease pricing methodology, debt policy and customer lifecycle strategy. This is the ‘how to’ guide for managing MLI and dictates the experience that a customer will have when occupying industrials premises.
2. Systems and technology – this element covers all the software and hardware that are required to
operate our MLI business, including our finance and operating system, customer relationship management system, content management platform, websites, apps, third-party integrations, data model and business intelligence system. These critical pieces of software help govern and implement the processes and policies, whilst also capturing, cataloguing and surfacing business data for users.
3. Physical infrastructure – these are the tangible elements of the platform that are required to operate, such as our UK-wide network of customer engagement managers, the on-site branding or our maintenance regime. For our customers, these are the visible elements that differentiate an industrials estate from our competitors.
With the platform in place, we insert properties and products as the raw materials and generate enhanced value as the output. This value is generated in three principal ways:
1. Higher revenue – happy customers benefiting from excellent service are less price sensitive and generate higher margins. In the longer term, it is our ambition to sell them more products and services which is mutually beneficial as our customers have a better service while we are able to grow revenue and business profitability.
2. Lower costs – an efficient platform can reduce complexity and enable the business to run more efficiently, reducing gross-to-net leakage. It also enables the business to manage additional units at a significantly lower marginal cost, supporting growth across the wider enterprise and enhancing shareholder returns.
3. Data – a digital platform captures high-quality and comprehensive data on the operations of the business. This data gives real-time insight to users at the time of need enabling better decision making and speeding up business processes. It also delivers valuable insight into the performance of the wider business, enabling the executive management team to make key strategic decisions based upon accurate and timely information.
CASE STUDY
Our enquiries dataEnquiries is a good example of a data set that we did not have before we introduced this capability to our operational platform, having previously only used outsourced leasing providers. This data tells us the number of customer enquiries we receive daily, and can be stratified in many different ways (such as by type, source, location, form, etc.). We use this single data set to inform us of:
1. Enquiry volumes – how is the market performing this week vs. last week/month/year?
2. Enquiry volumes by type – where should I spend my marketing budget? How is customer behaviour changing?
3. Seasonal enquiry trends – when should I spend my marketing budget?
4. Impact of COVID-19 – when should I conserve or spend money? What is likely to happen next? What are the trends post-lockdown?
5. Structural change – when should I increase rents? Where should I increase rents?
6. A trend – how is the market evolving? What is the general direction of travel? Where is the greatest demand and for what profile of asset?
How do we use this data to create value?As customers adjusted to life after the first UK lockdown, we witnessed a very significant increase in customer enquiries over the months of June, July and August 2020. On the back of this surge in demand, in June 2020, we decided to change our strategy of conserving cash and recommence our industrial acquisition strategy. We did this approximately three months ahead of many of our competitors, securing several significant acquisitions from distressed vendors at pricing materially below the levels that would have been paid in the quarter to 31 March 2020. This is a good example of the benefit of live enquiry data, and how data from one sphere of our operating business, such as leasing, can be applied effectively to other areas of the business, such as investment.
See the MLI leasing enquiry analysis graph on page 45
33
STRATEGIC REPORT
STENPROP ANNUAL REPORT 2021

30051 17 June 2021 4:07 pm V3
34 STENPROP ANNUAL REPORT 2021
Our MarketUK Multi-let Industrial (‘MLI’)
Source: Gerald Eve/MSCI
MLI has outperformed retail and office in total returns since 1986. The chart above illustrates the average annual return for direct industrial multi-let properties versus a range of other financial assets over 1, 3, 5 and 10-year periods. Direct multi-let industrial property has comfortably outperformed all these sectors across all periods.
Source: Gerald Eve/MSCI
The graph above shows the elements that make up MLI Total Return. The strong and stable income return element makes this asset class ideally suited for a long-term permanent capital REIT investor like Stenprop.
ANNUALISED TOTAL RETURNS BY ASSET CLASS
INDEXED RETAIL AND INDUSTRIAL CAPITAL VALUES
Financial crisis Brexit referendum
Retail Industrial
Q1
200
5
Q4
20
05
Q3
200
6
Q2
200
7
Q1
200
8
Q14
20
08
Q3
200
9
Q2
2010
Q1
2011
Q4
20
11
Q3
2012
Q2
2013
Q1
2014
Q4
20
14
Q3
2015
Q2
2016
Q1
2017
Q4
20
17
Q3
2018
Q2
2019
Q1
2020
40
60
80
100
120
140
160
Capital value index, Q1 2005 = 100
REST OF UK MULTI-LET TOTAL RETURN AND COMPONENTS
Rental Value Growth
Income Return
Equivalent Yield Impact
Total Return
UK All Property total return
Q1
200
5Q
4 2
00
5Q
1 20
06
Q4
20
06
Q1
200
7Q
4 2
00
7Q
1 20
08
Q4
20
08
Q1
200
9Q
4 2
00
9Q
1 20
10Q
4 2
010
Q1
2011
Q4
20
11Q
1 20
12Q
4 2
012
Q1
2013
Q4
20
13Q
1 20
14Q
4 2
014
Q1
2015
Q4
20
15Q
1 20
16Q
4 2
016
Q1
2017
Q4
20
17Q
1 20
18Q
4 2
018
Q1
2019
Q4
20
19Q
1 20
20
% per year
30
20
10
0
-10
-20
-30
Source: Gerald Eve/MSCI
The graph above clearly illustrates that, whilst COVID-19 has recently accelerated trends away from retail and towards industrial/logistics, there has been a clear divergence in capital values since 2014.
Why MLI?
MU
LTI-
LET
All
pro
per
ty
RE
Fun
ds
List
ed R
E
Eq
uiti
es
Bo
nds
MU
LTI-
LET
All
pro
per
ty
RE
Fun
ds
List
ed R
E
Eq
uiti
es
Bo
nds
MU
LTI-
LET
All
pro
per
ty
RE
Fun
ds
List
ed R
E
Eq
uiti
es
Bo
nds
MU
LTI-
LET
All
pro
per
ty
RE
Fun
ds
List
ed R
E
Eq
uiti
es
Bo
nds
-20
-15
-10
-5
0
5
10
15
20
1 year 3 years 5 years 10 years
% per year
MLI
MLI
MLI
MLI
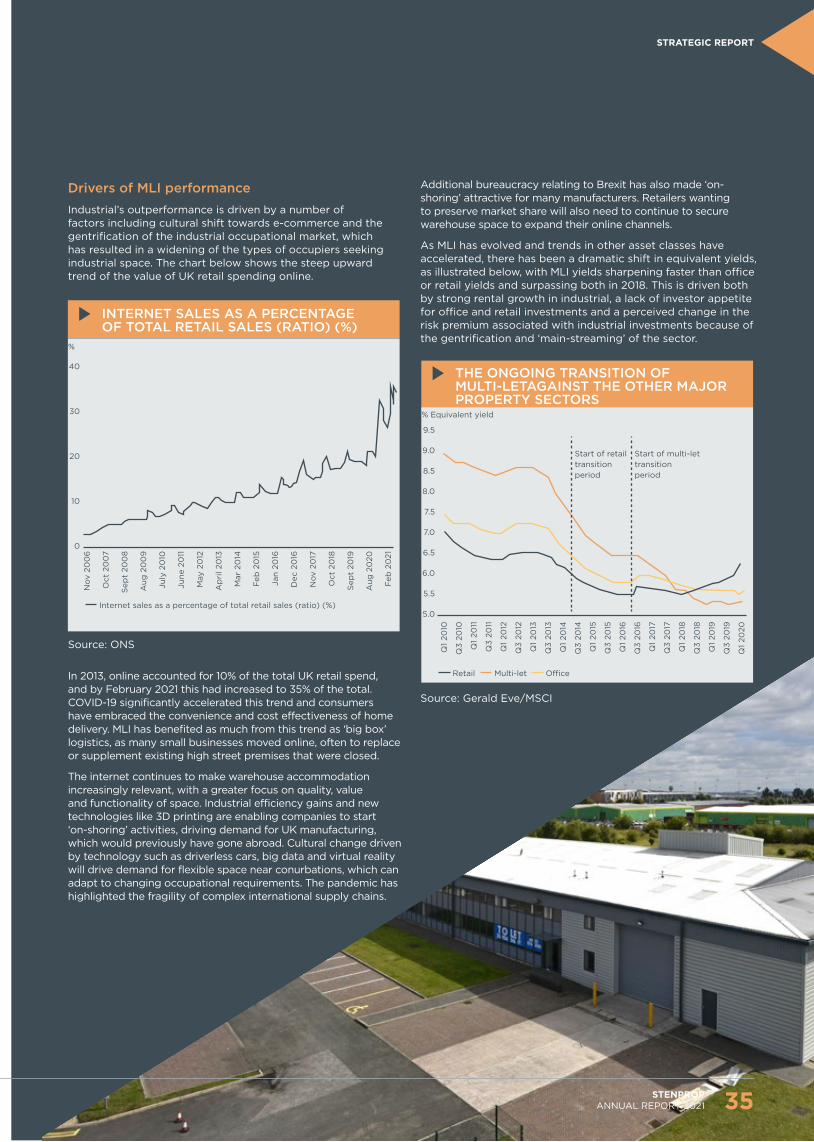
30051 17 June 2021 4:07 pm V3
Source: Gerald Eve/MSCI
INTERNET SALES AS A PERCENTAGE OF TOTAL RETAIL SALES (RATIO) (%)
Nov
20
06
Oct
20
07
Sep
t 20
08
Aug
20
09
July
20
10
June
20
11
May
20
12
Ap
ril 2
013
Mar
20
14
Feb
20
15
Jan
2016
Dec
20
16
Nov
20
17
Oct
20
18
Sep
t 20
19
Aug
20
20
Feb
20
21
0
Internet sales as a percentage of total retail sales (ratio) (%)
10
20
30
40
%
Drivers of MLI performanceIndustrial’s outperformance is driven by a number of factors including cultural shift towards e-commerce and the gentrification of the industrial occupational market, which has resulted in a widening of the types of occupiers seeking industrial space. The chart below shows the steep upward trend of the value of UK retail spending online.
THE ONGOING TRANSITION OF MULTI-LETAGAINST THE OTHER MAJOR PROPERTY SECTORS
Start of retailtransitionperiod
Start of multi-lettransitionperiod
Retail Multi-let O�ce
5.0
6.0
5.5
7.0
6.5
8.0
7.5
9.5
9.0
8.5
% Equivalent yield
Q1
2010
Q3
2010
Q1
2011
Q3
2011
Q1
2012
Q3
2012
Q1
2013
Q3
2013
Q1
2014
Q3
2014
Q1
2015
Q3
2015
Q1
2016
Q3
2016
Q1
2017
Q3
2017
Q1
2018
Q3
2018
Q1
2019
Q3
2019
Q1
2020
Additional bureaucracy relating to Brexit has also made ‘on-shoring’ attractive for many manufacturers. Retailers wanting to preserve market share will also need to continue to secure warehouse space to expand their online channels.
As MLI has evolved and trends in other asset classes have accelerated, there has been a dramatic shift in equivalent yields, as illustrated below, with MLI yields sharpening faster than office or retail yields and surpassing both in 2018. This is driven both by strong rental growth in industrial, a lack of investor appetite for office and retail investments and a perceived change in the risk premium associated with industrial investments because of the gentrification and ‘main-streaming’ of the sector.
In 2013, online accounted for 10% of the total UK retail spend, and by February 2021 this had increased to 35% of the total. COVID-19 significantly accelerated this trend and consumers have embraced the convenience and cost effectiveness of home delivery. MLI has benefited as much from this trend as ‘big box’ logistics, as many small businesses moved online, often to replace or supplement existing high street premises that were closed.
The internet continues to make warehouse accommodation increasingly relevant, with a greater focus on quality, value and functionality of space. Industrial efficiency gains and new technologies like 3D printing are enabling companies to start ‘on-shoring’ activities, driving demand for UK manufacturing, which would previously have gone abroad. Cultural change driven by technology such as driverless cars, big data and virtual reality will drive demand for flexible space near conurbations, which can adapt to changing occupational requirements. The pandemic has highlighted the fragility of complex international supply chains.
Source: ONS
35
STRATEGIC REPORT
STENPROP ANNUAL REPORT 2021

30051 17 June 2021 4:07 pm V3
Source: ONS
36 STENPROP ANNUAL REPORT 2021
Our Market CONTINUEDUK Multi-let Industrial (‘MLI’)
Demand and occupiersSmall businesses (1–49 employees) are of a size ideally suited to MLI units and account for 99.3% of all businesses in the UK as shown in the graph below. If this is expanded to include all SMEs (1–249 employees), the proportion rises to 99.9% of all businesses and 60.4% of all employment. Since 2000, the number of SME businesses in the UK private sector has increased by 69%. This growth has been driven by many factors, such as the advances in digital work technology, which has enabled small business owners to operate competitively and efficiently together and often alongside large organisations.
NUMBER OF PRIVATE SECTOR BUSINESSES IN THE UK, 2000 TO 2019
0.0
1.0
2000
3.5 3.5 3.6 3.73.9 3.9
4.14.3 4.3 4.4 4.5 4.6
4.8 4.95.2 5.4 5.5
5.7 5.75.9
2005 2010 2015 2019
2.0
3.0
4.0
5.0
6.0
Millions
UK BUSINESSES BY NUMBER, EMPLOYEES AND TURNOVER
Businesses Employment Turnover
99.3%
47.8% 47.8%
36.8%
0.6% 0.1%
12.6%
39.5%
15.4%
0
50
Small Medium Large
100
%
Source: ONS

30051 17 June 2021 4:07 pm V3
THE GENTRIFICATION OF MULTI-LET
30
40
35
50
45
60
55
70
65
%
Phase 2:rapid change
Phase 1:gradual gentrification
Phase 3: consolidation/nuanced change
200
8
200
9
2010
2011
2012
2013
2014
2015
2016
2017
2018
2019
London & the South East Rest of the UK
WIDE RANGE OF OCCUPIERS IN THE MLI MARKET
Trade counters/wholesalers
21.6%
In-houselogistics
6.9%
Logistics
8.1%
Foodmanufacturing
3.5%
Generalmanufacturing
23.5%
High techengineering
4.3%
O -siteservicing
10.8%
On-siteservices
4.5%
Leisure
2.7%
Quasio�ce/
archiving
9.2%
Leisure
4.9%
37% Retail & Logistics
Occupier type
Source: Gerald Eve Source: Gerald Eve
The graph below on the left, produced by Gerald Eve, shows the very wide range of occupiers in the MLI market as at the end of 2019. Retail and logistics is a significant proportion of user activity in the sector, although it is even greater inside London where it is 65% (vs. 37%). There has been a marked increase in the variety of occupiers in the MLI space as the sector has become more ‘gentrified’. These more specialist and higher value product users are attracted to MLI space by the low rents, easy access and parking, proximity to their customer base and increasing appeal as a customer-friendly environment. In the graph below on the right, occupiers such as high-tech engineering, off-site servicing, leisure, and archiving are examples of user types who historically would not have occupied this kind of space. The pace of the gentrification is illustrated below.
STRATEGIC REPORT
37STENPROP ANNUAL REPORT 2021
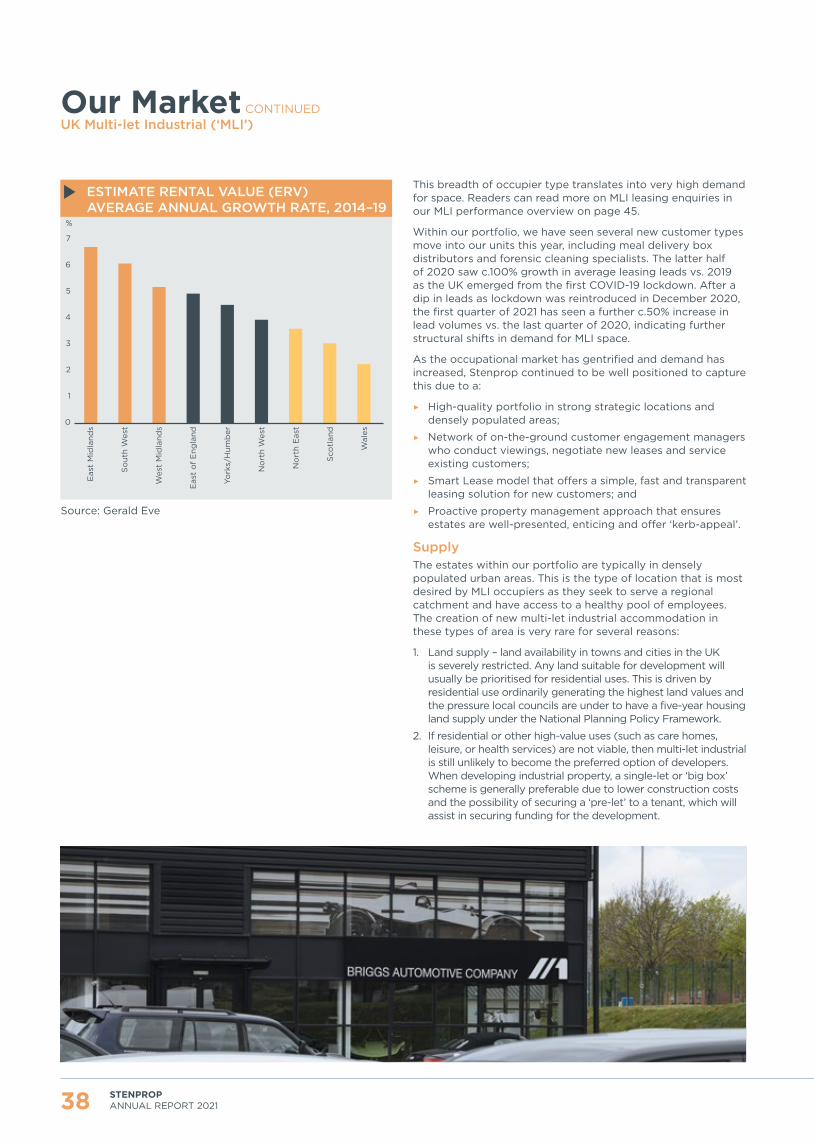
30051 17 June 2021 4:07 pm V3
38 STENPROP ANNUAL REPORT 2021
Our Market CONTINUEDUK Multi-let Industrial (‘MLI’)
ESTIMATE RENTAL VALUE (ERV) AVERAGE ANNUAL GROWTH RATE, 2014–19
0
3
2
1
Eas
t M
idla
nds
So
uth
Wes
t
Wes
t M
idla
nds
Eas
t o
f E
ngla
nd
York
s/H
umb
er
No
rth
Wes
t
No
rth
Eas
t
Sco
tlan
d
Wal
es
7
5
6
4
%
Source: Gerald Eve
This breadth of occupier type translates into very high demand for space. Readers can read more on MLI leasing enquiries in our MLI performance overview on page 45.
Within our portfolio, we have seen several new customer types move into our units this year, including meal delivery box distributors and forensic cleaning specialists. The latter half of 2020 saw c.100% growth in average leasing leads vs. 2019 as the UK emerged from the first COVID-19 lockdown. After a dip in leads as lockdown was reintroduced in December 2020, the first quarter of 2021 has seen a further c.50% increase in lead volumes vs. the last quarter of 2020, indicating further structural shifts in demand for MLI space.
As the occupational market has gentrified and demand has increased, Stenprop continued to be well positioned to capture this due to a:
▶ High-quality portfolio in strong strategic locations and densely populated areas;
▶ Network of on-the-ground customer engagement managers who conduct viewings, negotiate new leases and service existing customers;
▶ Smart Lease model that offers a simple, fast and transparent leasing solution for new customers; and
▶ Proactive property management approach that ensures estates are well-presented, enticing and offer ‘kerb-appeal’.
Supply The estates within our portfolio are typically in densely populated urban areas. This is the type of location that is most desired by MLI occupiers as they seek to serve a regional catchment and have access to a healthy pool of employees. The creation of new multi-let industrial accommodation in these types of area is very rare for several reasons:
1. Land supply – land availability in towns and cities in the UK is severely restricted. Any land suitable for development will usually be prioritised for residential uses. This is driven by residential use ordinarily generating the highest land values and the pressure local councils are under to have a five-year housing land supply under the National Planning Policy Framework.
2. If residential or other high-value uses (such as care homes, leisure, or health services) are not viable, then multi-let industrial is still unlikely to become the preferred option of developers. When developing industrial property, a single-let or ‘big box’ scheme is generally preferable due to lower construction costs and the possibility of securing a ‘pre-let’ to a tenant, which will assist in securing funding for the development.

30051 17 June 2021 4:07 pm V3
3. In most locations, multi-let industrial is not viable due to low rents and high build costs. We estimate the cost to develop a generic industrial estate, including acquiring the land, is £125 per sq ft and rents of at least £7.75 per sq ft would be required to make this viable. As MLI design has not evolved significantly for 40 years, occupiers will typically only pay a marginal premium to existing stock for new build accommodation. The average passing rent across our portfolio is £5.46 per sq ft and the average passing rent of acquisitions this financial year is £6.21 per sq ft, meaning that, in most locations, new MLI development is not feasible without external assistance by way of grants, etc. Given the quality of the locations where Stenprop owns MLI assets and the underlying land values, we are of the opinion that in the most attractive locations, rents of £9 per sq ft or more would be required in order to make development viable, should the land even be available.
It remains possible to acquire income producing estates at significantly less than development cost, meaning that most MLI investors are focused on investment rather than development. The average capital value of estates acquired in the financial year ended 31 March 2021 was £85 per sq ft, 32% less than the construction cost of those properties. With construction cost inflation running at levels similar to MLI rental growth, this gap seems unlikely to close in the near future and hence the supply of MLI space across the UK is likely to remain inelastic.
Rental growthDue to the increased demand and continued low levels of supply, there are strong rental growth trends in the UK MLI market across all regions.
This is borne out by the performance we have seen in the growth of contractual and passing rents on a like-for-like basis within our MLI portfolio:
Year 2020 2019 2018
Growth Rate 5.6% 5.6% 4.8%
Our operating model is designed to capture growth as soon as practicable and translate this through to improved earnings and valuations. Short leases allow growth to be captured on a more regular basis than longer terms. Most leases are drafted outside the Security of Tenure provisions of the Landlord and Tenant Act 1954 (‘Landlord and Tenant Act’), meaning that at lease renewal terms are negotiated on an open market basis, rather than governed by way of the strict procedure the Landlord and Tenant Act legislation requires. In addition to this, our Smart Lease typically includes annual fixed uplifts, which means that the passing rent tracks more closely with market movements, delivering incremental rent increases throughout the lease term and reducing the discrepancy between market value and passing rent at lease renewal. Indeed, 78% of new leases signed in the March 2021 quarter included this provision.
How we work
HOW WE WORK
User friendly
ServicedIndustrial
ResponsiveFlexible
CustomerfocusedLow risk
Quick
Our operating model is designed to deliver ‘Serviced Industrial’ accommodation to our customer, something that is typically difficult to offer on single-let assets leased on full repairing and insuring terms with no common services. We believe this benefits Stenprop by:
1. generating additional revenue streams and enhancing operating margin through the delivery of additional products, services and value to our customers;
2. providing our customers with a service that better meets their needs, helping to reduce vacancies and offering a key differentiator between Stenprop and our competitors; and
3. increasing the barriers to exit to existing customers by offering a service level that is difficult to replicate elsewhere. This enhances the lease renewal rate, driving down vacancy and the cost of new leasing.
The delivery of a Serviced Industrial product requires an operating platform that supports a range of products and services. Some elements of our serviced industrial offer are:
1. strong branding under our Industrials.co.uk name;
2. face-to-face customer service driven by our extensive network of on-the-ground customer engagement managers;
3. fixed price leasing to give clarity of total expenditure over the period of a customer’s lease;
4. reduced friction throughout the leasing process with our Smart Lease and clear customer journey mapping;
5. a proactive approach to ESG for the benefit of our customers and the wider community. This includes the use of hybrid cars and the installation of solar panels and LED lighting;
6. the use of paperless and digital transaction management to increase speed and efficiency; and
7. multi-channel communications including live chat, our 0800 call centre and web forms.
Further information on our serviced industrial operating platform can be found on pages 32 to 33
39STENPROP ANNUAL REPORT 2021
STRATEGIC REPORT
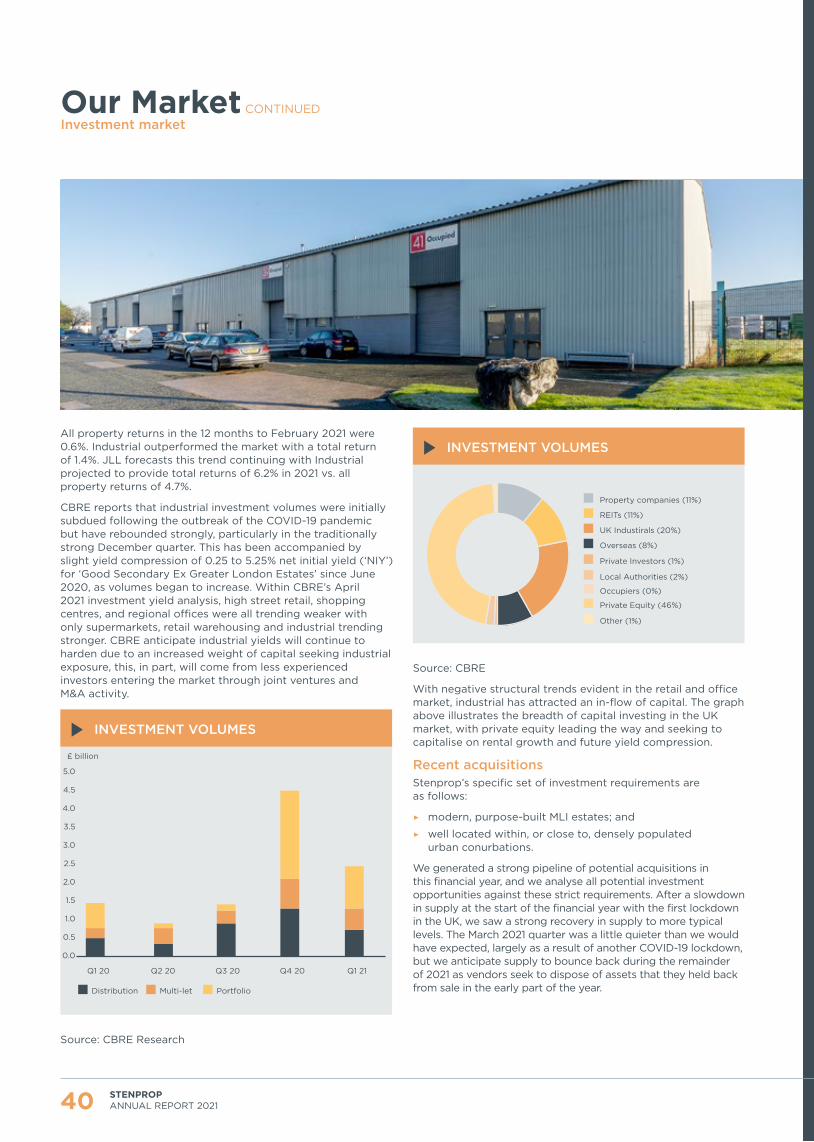
30051 17 June 2021 4:07 pm V3
40 STENPROP ANNUAL REPORT 2021
Our Market CONTINUEDInvestment market
All property returns in the 12 months to February 2021 were 0.6%. Industrial outperformed the market with a total return of 1.4%. JLL forecasts this trend continuing with Industrial projected to provide total returns of 6.2% in 2021 vs. all property returns of 4.7%.
CBRE reports that industrial investment volumes were initially subdued following the outbreak of the COVID-19 pandemic but have rebounded strongly, particularly in the traditionally strong December quarter. This has been accompanied by slight yield compression of 0.25 to 5.25% net initial yield (‘NIY’) for ‘Good Secondary Ex Greater London Estates’ since June 2020, as volumes began to increase. Within CBRE’s April 2021 investment yield analysis, high street retail, shopping centres, and regional offices were all trending weaker with only supermarkets, retail warehousing and industrial trending stronger. CBRE anticipate industrial yields will continue to harden due to an increased weight of capital seeking industrial exposure, this, in part, will come from less experienced investors entering the market through joint ventures and M&A activity.
INVESTMENT VOLUMES
0.0
1.5
1.0
0.5
Q1 20 Q2 20 Q3 20 Q4 20 Q1 21
5.0
2.5
3.0
3.5
4.5
4.0
2.0
£ billion
Distribution Multi-let Portfolio
Source: CBRE Research
INVESTMENT VOLUMES
Property companies (11%)
REITs (11%)
UK Industirals (20%)
Overseas (8%)
Private Investors (1%)
Local Authorities (2%)
Occupiers (0%)
Private Equity (46%)
Other (1%)
Source: CBRE
With negative structural trends evident in the retail and office market, industrial has attracted an in-flow of capital. The graph above illustrates the breadth of capital investing in the UK market, with private equity leading the way and seeking to capitalise on rental growth and future yield compression.
Recent acquisitionsStenprop’s specific set of investment requirements are as follows:
▶ modern, purpose-built MLI estates; and
▶ well located within, or close to, densely populated urban conurbations.
We generated a strong pipeline of potential acquisitions in this financial year, and we analyse all potential investment opportunities against these strict requirements. After a slowdown in supply at the start of the financial year with the first lockdown in the UK, we saw a strong recovery in supply to more typical levels. The March 2021 quarter was a little quieter than we would have expected, largely as a result of another COVID-19 lockdown, but we anticipate supply to bounce back during the remainder of 2021 as vendors seek to dispose of assets that they held back from sale in the early part of the year.
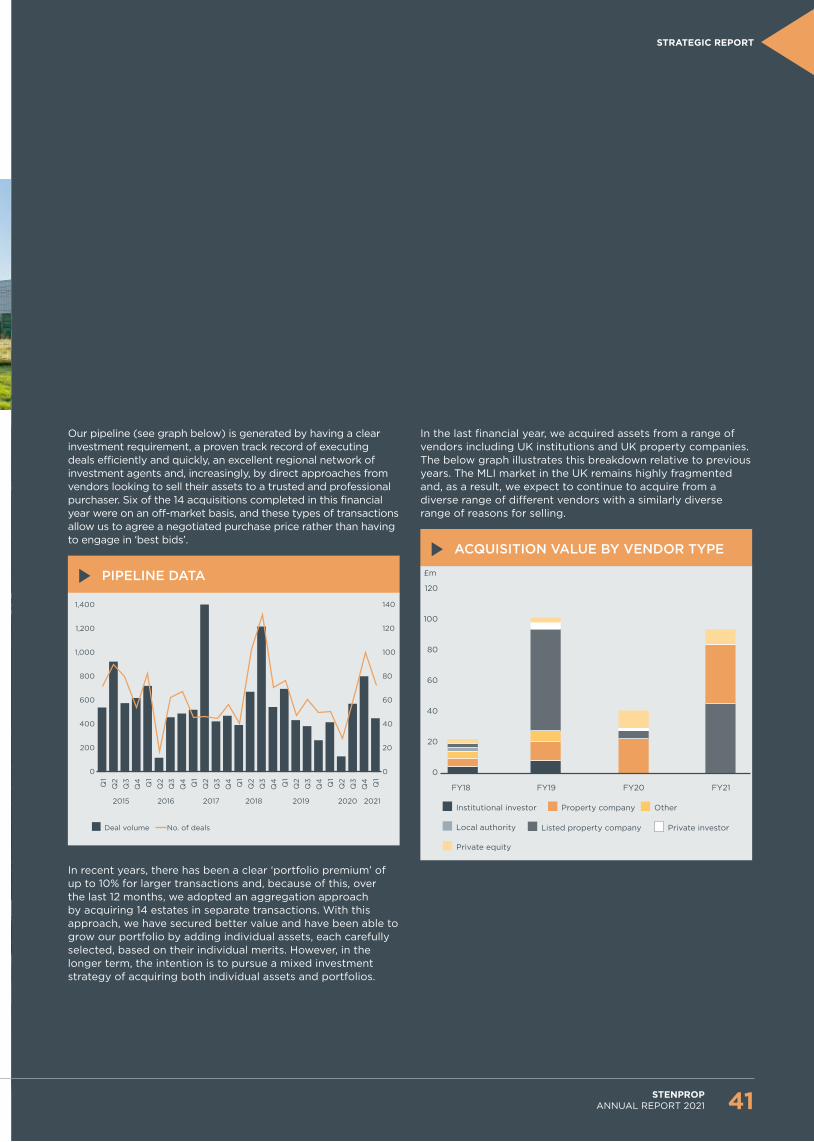
30051 17 June 2021 4:07 pm V3
Our pipeline (see graph below) is generated by having a clear investment requirement, a proven track record of executing deals efficiently and quickly, an excellent regional network of investment agents and, increasingly, by direct approaches from vendors looking to sell their assets to a trusted and professional purchaser. Six of the 14 acquisitions completed in this financial year were on an off-market basis, and these types of transactions allow us to agree a negotiated purchase price rather than having to engage in ‘best bids’.
PIPELINE DATA
0
800
600
400
200
2015 2016 2017 2018 2019 2020 2021
Q1
Q2
Q3
Q4 Q1
Q2
Q3
Q4 Q1
Q2
Q3
Q4 Q1
Q2
Q3
Q4 Q1
Q2
Q3
Q4 Q1
Q2
Q3
Q4 Q1
1,400
1,200
1,000
0
80
60
40
20
140
120
100
Deal volume No. of deals
In recent years, there has been a clear ‘portfolio premium’ of up to 10% for larger transactions and, because of this, over the last 12 months, we adopted an aggregation approach by acquiring 14 estates in separate transactions. With this approach, we have secured better value and have been able to grow our portfolio by adding individual assets, each carefully selected, based on their individual merits. However, in the longer term, the intention is to pursue a mixed investment strategy of acquiring both individual assets and portfolios.
In the last financial year, we acquired assets from a range of vendors including UK institutions and UK property companies. The below graph illustrates this breakdown relative to previous years. The MLI market in the UK remains highly fragmented and, as a result, we expect to continue to acquire from a diverse range of different vendors with a similarly diverse range of reasons for selling.
ACQUISITION VALUE BY VENDOR TYPE
0
FY18 FY19 FY20 FY21
120
20
40
60
100
80
£m
Institutional investor Property company Other
Listed property company Private investor
Private equity
Local authority
41STENPROP ANNUAL REPORT 2021
STRATEGIC REPORT

30051 17 June 2021 4:07 pm V3
n MLI 88.8%
n Nursing Homes 3.3%
n Office 1.8%
n Retail 2.4%
n Urban logistics 3.7%
n MLI 73.7%
n Nursing Homes 5.8%
n Office 10.8%
n Retail 5.5%
n Urban logistics 4.2%
UK PORTFOLIO
78.1%
GUERNSEY PORTFOLIO
9.7%Asset value: £56.2mGross lettable area: 10,564 sq mAnnual gross rental income: £4.4m
Our Portfolio
3.8%UK urban logistics Asset value: £22.2mGross lettable area: 21,861 sq mAnnual gross rental income: £1.7m
74.3%UK MLI Asset value: £432.9m
Gross lettable area: 521,288 sq mAnnual gross rental income: £30.2m
GERMAN PORTFOLIO
10.1%Asset value: £59.1mGross lettable area: 27,604 sq mAnnual gross rental income: £3.6m
SWISS PORTFOLIO
2.1% Asset value: £12.0mGross lettable area: 5,974 sq mAnnual gross rental income: £1.0m
Lettable area by market sector
Annual gross rental income by market sector
42 STENPROP ANNUAL REPORT 2021
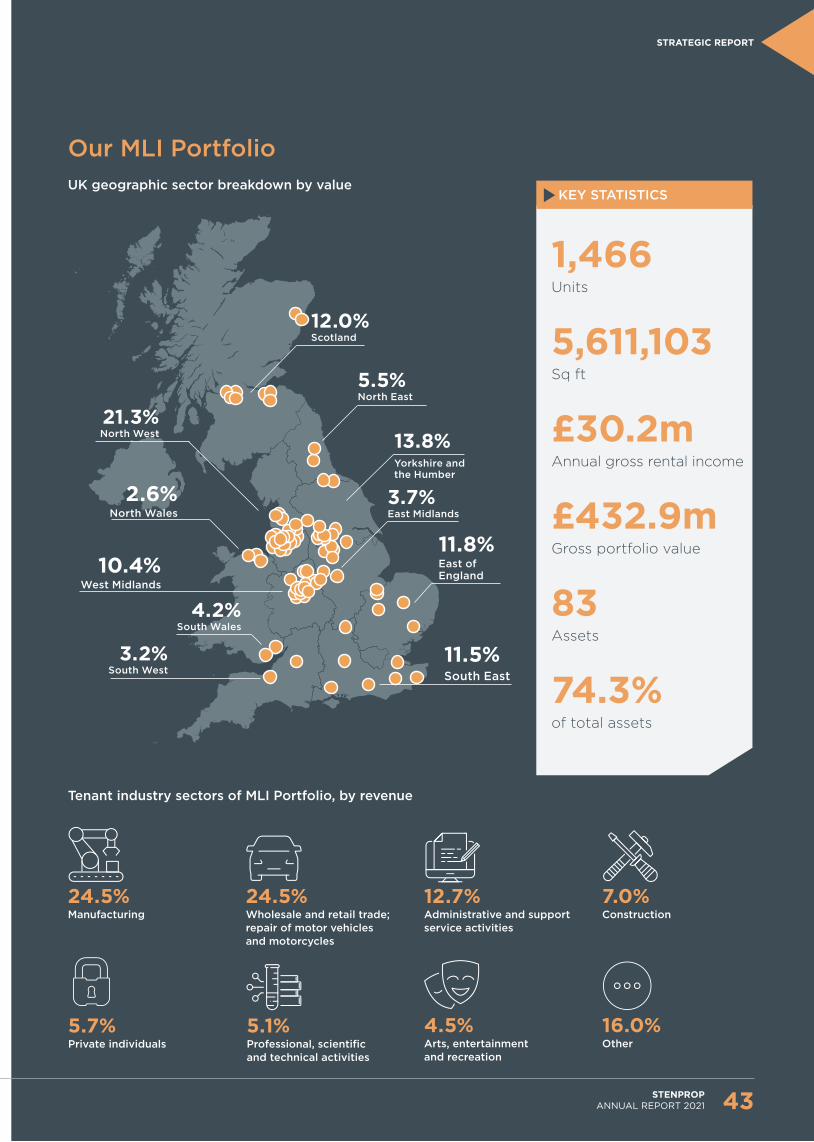
30051 17 June 2021 4:07 pm V3
STRATEGIC REPORT
Tenant industry sectors of MLI Portfolio, by revenue
KEY STATISTICS
24.5%Manufacturing
24.5%Wholesale and retail trade; repair of motor vehicles and motorcycles
12.7%Administrative and support service activities
7.0%Construction
4.5%Arts, entertainment and recreation
5.1%Professional, scientific and technical activities
5.7%Private individuals
16.0%Other
1,466Units
5,611,103Sq ft
£30.2mAnnual gross rental income
£432.9mGross portfolio value
83Assets
74.3%of total assets
Our MLI PortfolioUK geographic sector breakdown by value
21.3%North West
12.0%Scotland
5.5%North East
13.8%Yorkshire and the Humber
3.7%East Midlands
11.8%East of England
11.5%South East
3.2%South West
4.2%South Wales
10.4%West Midlands
2.6%North Wales
43STENPROP ANNUAL REPORT 2021

30051 17 June 2021 4:07 pm V3
44 STENPROP ANNUAL REPORT 2021
MLI performance overviewDespite the global pandemic, the MLI market and our portfolio performed well during the last year, allowing us to reduce our vacancy rate materially over the period. Demand has risen significantly because of the acceleration of consumer trends towards online retail, and the sector has proven resilient operationally through the lockdowns. Very limited supply of new MLI space entering the market and low levels of vacancy have continued to put rents under upward pressure, whilst lease incentives are down to almost insignificant levels. Despite the growth, witnessed rents remain very affordable especially for new entrants into the market who are migrating into MLI from more expensive sectors (such as retail and offices). Our efficient operating platform and Smart Lease offer has enabled us to capitalise on the opportunity and capture the demand generated through our Industrials brand, whilst we have also consistently generated significant uplifts at lease renewal from existing customers.
Portfolio ChangeVacancy has reduced from 9.0% to 6.3% during the year as demand has outstripped supply across the UK. Income has grown as we added over £90 million of new MLI estates to the portfolio and captured additional rent at renewal and upon new letting.
DIFFERENCE BETWEEN CONTRACTUAL RENT AND CURRENT PASSING RENT
Vacancy %
16
12
8
14
10
6
2
4
0
25
30
35
Income (£m pa)
20
15
10
5
0Q1
2019Q2
2019Q3
2019Q4
2019Q5
2020Q6
2020Q7
2020Q8
2020Q9
2021Q102021
Q112021
Q122021
Contractual Rent EoPVacancy %
Passing Rent EoP
Property Report and Investment Update
IncomeFor the second consecutive year, like-for-like rents grew 5.6% over the year as we captured significant rental uplifts upon new lettings and at lease renewal.
RENTAL UPLIFTS – CUMULATIVE RENTAL GROWTH (LIKE FOR LIKE)
5%
6%
Like
-fo
r=lik
e re
ntal
gro
wth
4%
3%
2%
1%
0%Q1
FY21
TARGET: 4-5%
Q2FY21
Q3FY21
Q4FY21
1.0%
3.5%
4.1%
5.6%
RentsERVs grew 6.2% during the course of the year, resulting in an increased gap between passing rent and ERV (12.5% vs 10.1% in the previous year), leading to increased potential for rental uplifts upon reletting or renewal. The increasing number of fixed rental uplifts in the leases is also generating 5.2% of guaranteed rental uplifts to come within the current lease terms vs 4.6% last year.
RENT BRIDGE AS AT MARCH 2021
£32m
£34m
£36m
£30m
£28m
£26m
£24m
Current Passing
Rent
Rent free periods & fixed uplifts
Contractual Rent
Portfolio Reversion
Occupied ERV
Vacant Space
ERV
£28.7m
£30.2m
+5.2%
+12.5%
+20.6%
£32.3m
£34.6m
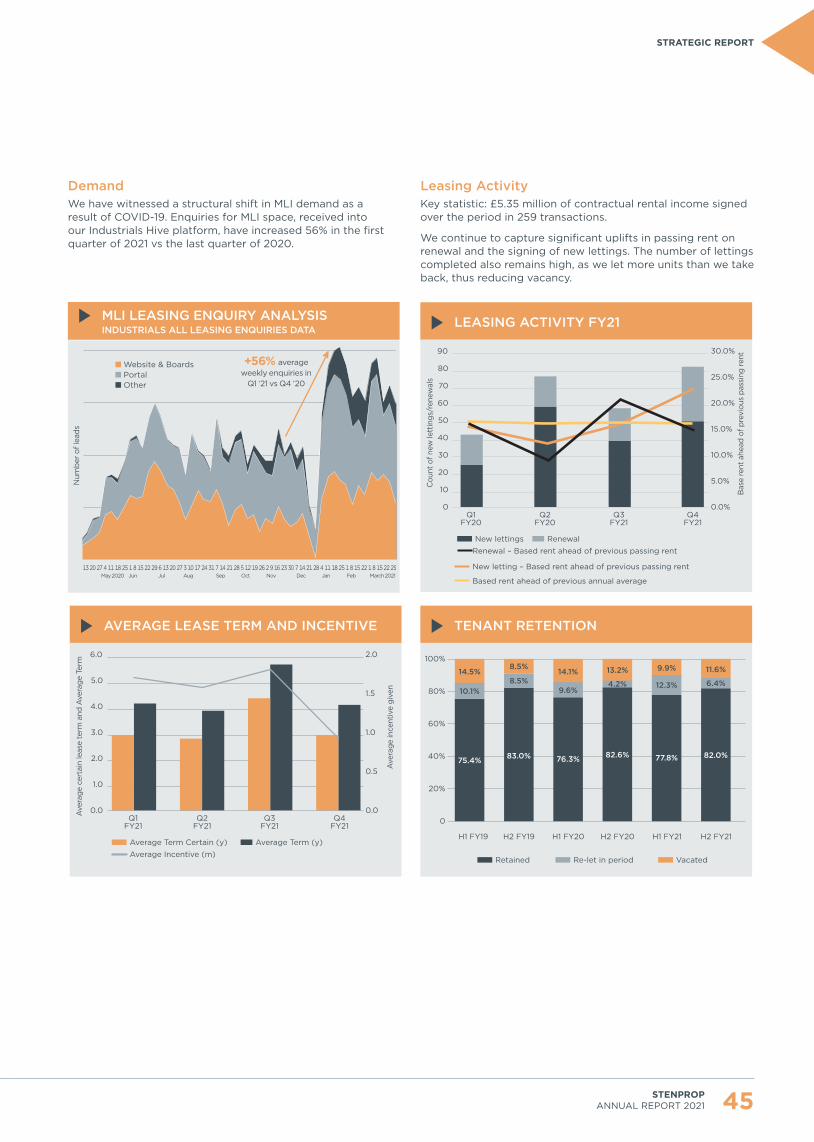
30051 17 June 2021 4:07 pm V3
DemandWe have witnessed a structural shift in MLI demand as a result of COVID-19. Enquiries for MLI space, received into our Industrials Hive platform, have increased 56% in the first quarter of 2021 vs the last quarter of 2020.
MLI LEASING ENQUIRY ANALYSIS INDUSTRIALS ALL LEASING ENQUIRIES DATA
13 20 27 4 11 18 25 1 8 15 22 29 6 13 20 27 3 10 17 24 31 7 14 21 28 5 12 19 26 2 9 16 23 30 7 14 21 28 4 11 18 25 1 8 15 22 1 8 15 22 29May 2020 Jun Jul Aug Sep Oct Nov Dec Jan Feb March 2021
+56% average weekly enquiries in
Q1 ‘21 vs Q4 ’20
Website & BoardsPortalOther
Num
ber
of le
ads
Leasing ActivityKey statistic: £5.35 million of contractual rental income signed over the period in 259 transactions.
We continue to capture significant uplifts in passing rent on renewal and the signing of new lettings. The number of lettings completed also remains high, as we let more units than we take back, thus reducing vacancy.
LEASING ACTIVITY FY21
0
90
80
70
60
50
40
30
20
10
0.0%
30.0%
25.0%
20.0%
15.0%
10.0%
5.0%Cou
nt o
f new
lett
ings
/ren
ewal
s
Bas
e re
nt a
head
of p
revi
ous
pass
ing
rent
Q1FY20
Q3FY21
Q4FY21
Q2FY20
New lettingsRenewal – Based rent ahead of previous passing rent
Renewal
New letting – Based rent ahead of previous passing rent
Based rent ahead of previous annual average
AVERAGE LEASE TERM AND INCENTIVE
0.0
6.0
5.0
4.0
3.0
2.0
1.0
0.0
2.0
1.5
1.0
0.5
Ave
rage
cer
tain
leas
e te
rm a
nd A
vera
ge T
erm
Ave
rage
ince
ntiv
e gi
ven
Q1FY21
Q3FY21
Q4FY21
Q2FY21
Average Term Certain (y)Average Incentive (m)
Average Term (y)
TENANT RETENTION
100%
80%
60%
40%
20%
0
H1 FY19 H2 FY19 H1 FY20 H2 FY20 H1 FY21 H2 FY21
10.1%
14.5%
83.0%
8.5%
8.5%
76.3%
9.6%
14.1%
82.6%
4.2%
13.2%
82.0%
6.4%
11.6%
77.8%
12.3%
9.9%
75.4%
Retained Re-let in period Vacated
45STENPROP ANNUAL REPORT 2021
STRATEGIC REPORT
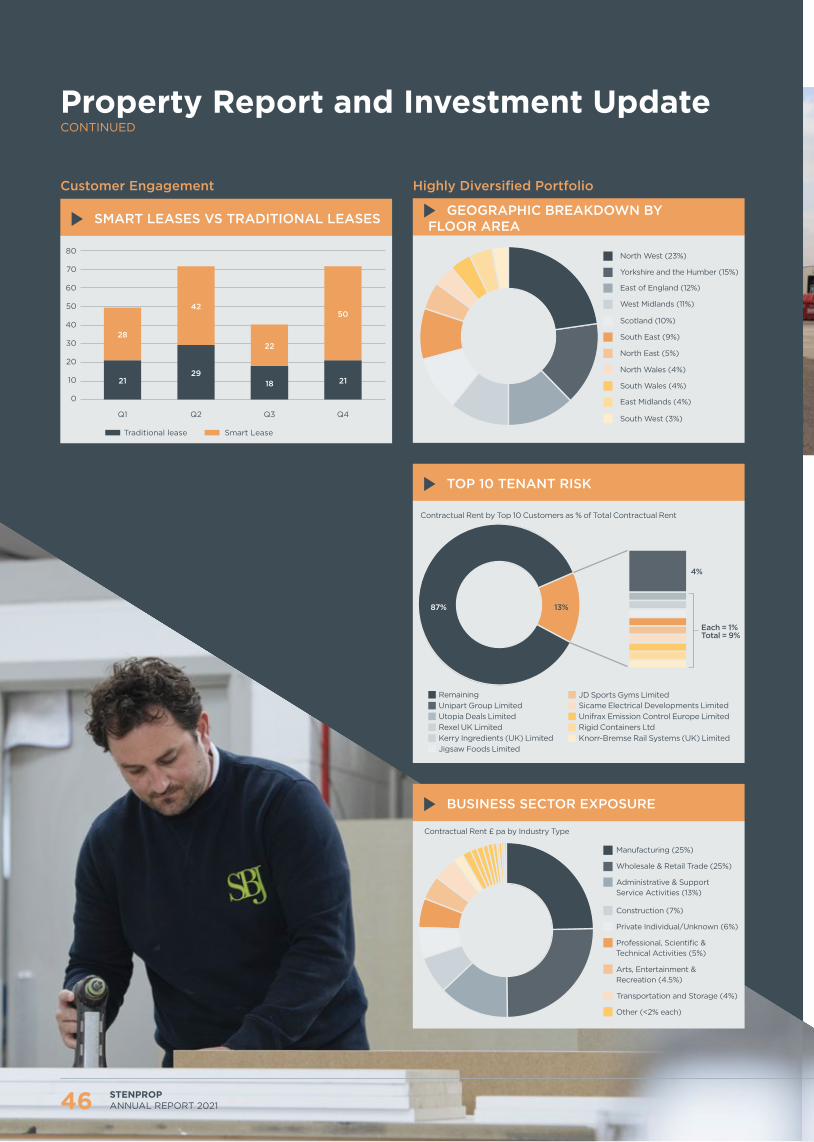
30051 17 June 2021 4:07 pm V3
46 STENPROP ANNUAL REPORT 2021
Property Report and Investment Update CONTINUED
Customer Engagement
SMART LEASES VS TRADITIONAL LEASES
50
60
70
80
40
30
20
10
0
Q1 Q2 Q3 Q4
2129
18 21
28
42
22
50
Smart LeaseTraditional lease
Highly Diversified Portfolio
GEOGRAPHIC BREAKDOWN BY FLOOR AREA
North West (23%)
Yorkshire and the Humber (15%)
East of England (12%)
West Midlands (11%)
Scotland (10%)
South East (9%)
North East (5%)
North Wales (4%)
South Wales (4%)
East Midlands (4%)
South West (3%)
TOP 10 TENANT RISK
87% 13%
4%
Unipart Group LimitedUtopia Deals LimitedRexel UK LimitedKerry Ingredients (UK) LimitedJigsaw Foods Limited
Remaining JD Sports Gyms LimitedSicame Electrical Developments LimitedUnifrax Emission Control Europe LimitedRigid Containers LtdKnorr-Bremse Rail Systems (UK) Limited
Each = 1%Total = 9%
Contractual Rent by Top 10 Customers as % of Total Contractual Rent
BUSINESS SECTOR EXPOSURE
Private Individual/Unknown (6%)
Manufacturing (25%)
Contractual Rent £ pa by Industry Type
Wholesale & Retail Trade (25%)
Administrative & Support Service Activities (13%)
Construction (7%)
Professional, Scientific & Technical Activities (5%)
Arts, Entertainment & Recreation (4.5%)
Transportation and Storage (4%)
Other (<2% each)

30051 17 June 2021 4:07 pm V3
CASE STUDY
Investing in our space to meet customer needsOld Mill Industrial Estate is located to the south east of Preston city centre. The estate comprises over 100,000 sq ft of multi-let industrial space arranged in a series of terraces. In October 2020, we identified an opportunity to enhance asset value by delivering a substantial capital works project to improve the building fabric, simplify leasing for existing customers and maximise income return.
The roofs on six terraces were failing as a result of a history of underinvestment and inadequate patch repair works by previous owners. Most of the leases held by customers were on Full Repairing and Insuring (‘FRI’) terms, meaning that they were liable for repairs. However, the occupiers generally lacked the knowledge or awareness of their responsibilities under their lease and were unable to undertake the works required.
Our strategy centred on overhauling the failing roof cladding whilst engaging with customers to restructure their leases in return for a longer lease commitment and higher rent. We forecasted a strong financial return by securing higher rental values and increasing demand for the space.
Our team of customer engagement managers liaised with each customer to understand their issues and their preferred outcome. It became clear that customers wanted simplicity and would be willing to contribute a higher rental offer if their ongoing repairing obligations were simplified so they could focus on running their business operations from fully functioning and hassle-free business space.
To meet customer requirements, new leases had been drafted on Internal Repairing and Insuring (‘IRI’) terms, meaning that our customers must only look after the inside of their space. Furthermore, the new leases had been secured using our digital leasing platform and Smart Lease terms and conditions, thus ensuring the cost of each new transaction remained low.
The newly agreed income profile for contracts secured is 30% above the previous passing rent and 18% above the March 2020 ERV.
With support from our customers, we instructed a comprehensive package of works that comprised of a full over cladding of each terrace, upgrading the existing rainwater goods to increase capacity, as well as replacing all existing rooflights with modern glass
reinforced plastic (‘GRP’) single skin translucent panels.
The delivered specification provides a watertight finish with a 15-year insurance backed guarantee and an expected life in excess of 25 years. The units benefit from increased levels of natural light, whilst the addition of an extra layer of insulation has improved thermal performance and energy efficiency of the space.
Such projects can be complex, complicated further with busy customers who need to have unrestricted access to their space. The project was delivered in line with budget and ahead of schedule. Most importantly, customer feedback has been emphatically positive, delivering peace of mind and a longer-term commitment to the estate.
This initiative was conceived and delivered by our team of experienced property professionals, to include both asset and customer engagement managers. By leveraging strong relationships held directly with our customers this project delivered a win-win outcome for all parties and ensured that Old Mill Industrial Estate continues to offer high-quality, sustainable multi-let industrial space long into the future.
47STENPROP ANNUAL REPORT 2021
STRATEGIC REPORT

30051 17 June 2021 4:07 pm V3
CASE STUDY
48 STENPROP ANNUAL REPORT 2021
Property Report and Investment Update
CONTINUED
Asset management starts on day oneAssessing where we can make improvements to add value is a key part of our due diligence ahead of making an investment and allows us to start active asset management immediately when we acquire new properties. Two new assets had been acquired in prominent and central locations in Glasgow, and the Industrials team’s early hard work and effort secured full occupation just months after acquisition.
St. Andrews Industrial Estate in Glasgow was acquired in July 2020. Upon acquisition, there were two unoccupied units, totalling 11,000 sq ft and representing a 15% void rate for the asset.
We embarked upon a scheme of capital works, which covered 49,000 sq ft of space and comprised an overclad of the roofs and a full external redecoration. This scheme enhanced the quality of the space whilst aligning the branding across the full terrace to deliver contemporary aesthetics.
We have subsequently let both vacant units in December 2020 and January 2021 at a 6.4% premium to the estimated rental value (‘ERV’) we had forecast upon acquisition.
Excelsior Industrial Estate in Glasgow was acquired in September 2020. One unit was vacant, spanning 4,300 sq ft, which represented a 7% void rate for the asset.
The unit was fully refurbished immediately once acquired to ensure that it was ready to let. Within a short space of time, our local customer engagement manager (‘CEM’) negotiated with an existing Industrials customer from another Industrials asset in north west Glasgow.
The customer was outgrowing its existing space and, with no alternative or available space at its existing estate, had been assessing options to relocate. Our CEM utilised the newly acquired stock and devised the solution to relocate and upsize them from one Industrials estate to another.
Intimate knowledge of our customers’ requirements has enabled us to stay alert to changing needs to explore options to retain businesses. With a growing portfolio, we can utilise our network of high-quality and well-located MLI stock to offer multiple unit solutions to our customers, meaning that our clients can adapt and expand without disruption.
St. Andrews Industrial Estate, Glasgow
Excelsior Industrial Estate, Glasgow
Simon Ross Head of Asset Management

30051 17 June 2021 4:07 pm V3
New breed of demandThe share of internet sales, as a percentage of total retail sales, has been increasing year-on-year since 2006. Consumers continue to look online when buying goods and services as the user experience continues to improve to offer more choice, price transparency and, most importantly, fast and efficient delivery.
Peak internet sales have routinely occurred each year in November in the run up to Christmas, with the share of online sales moving from 18.8% in November 2016 to 21.6% in November 2019.
COVID-19 forced the general population to stay at home, meaning they turned to the internet to buy anything and everything – from their weekly shop, new white goods, or materials to tend to home improvements.
November 2020 set a new record with the share of online sales reaching 36.2%. This has resulted in many small businesses needing to develop and launch an online arm to their business, typically choosing to do so from industrial business premises that offers the benefit of low costs, good labour supply, flexible space and easy access.
CASE STUDY
The Modern Milkman The Modern Milkman is a plastic-free grocery delivery service that makes it possible for its customers to order fresh milk and other groceries from the convenience of their smart phone for delivery to their door. This is a modern take on the traditional milk round, where the aim is to help customers reduce waste and reset the throwaway society.
This customer found our space on our industrials.co.uk website, and took its first unit from us in January 2021. The business has since expanded and now leases four units from us in Loughborough, Sheffield, Deeside and Wigan. Its expansion was facilitated by our network of customer engagement managers who were able to co-operate to offer a shortlist of suitable industrial units around the UK within their target locations.
Each new location met the customer’s needs, being near local households with an abundance of nearby transport links. The space it leases offers room to store stock within well-configured and open-plan space that can accommodate the distribution of goods to its customer base within tight timeframes.
The Modern Milkman’s expansion plans were made easier by its familiarity with the Smart Lease. The simple terms and the ability to receive, review and complete it all online meant that the business was able to act quickly and secure suitable opportunities when they arose.
Tom Shaw, Co-Founder and Operations Manager at Modern Milkman said: “The Smart lease is the best thing for us. With the speed at which we are growing, it is so important that we can move quickly. The Smart Lease has enabled us to do this despite working remotely.”
CUSTOMER SPOTLIGHT
This year we’ve seen new users entering the MLI market, such as last-mile grocery operators.”Simon Ross Head of Asset Management
49STENPROP ANNUAL REPORT 2021
STRATEGIC REPORT

30051 17 June 2021 4:07 pm V3
50 STENPROP ANNUAL REPORT 2021
Property Report and Investment Update
CONTINUED
UK urban logistics We have extended the leases of three single-let urban logistic assets over the course of this year. WAULT is now two years to break and 4.1 years to lease expiry.
The transactions included:
▶ A new 10-year lease to Menzies Distribution Limited at 1 Europa Drive in Sheffield. The lease included a tenant-only break option after three and five years, and an upward only rent review after the fifth year. The rent increased by 4% from the previous passing level.
▶ A new 10-year lease to Booker Limited at Unit 1, Knightsbridge Park in Worcester. The lease included a tenant-only break option and upward only rent review after the fifth year. The rent increased by 12% from the previous passing level.
▶ Whilst extending this lease, we took the opportunity to regear a separate lease at Unit 35 Merthyr Tydfil Industrial Park also let to Booker Limited. This lease expires in July 2021 and we have signed a reversionary lease that extends the term for a further 10 years with a tenant-only break option and upward only rent review after the fifth year.
We intend to retain our urban logistics assets as part of our wider MLI portfolio.”
Julian Carey Managing Director
Guernsey – Trafalgar CourtOver the last year, two small leases were renewed for a total annual rent of £33,000. We secured an uplift from the largest tenant at its July 2020 rent review of £22,000 and settled an RPI rent review on the lease to the second largest tenant, securing an uplift in rent of £71,000 pa.
The office investment market in the Channel Islands remains robust. There is strong demand, but transaction volumes have fallen due to a lack of supply. This was compounded in the first half of the financial year due to COVID-19, with total volumes of £185 million and £220 million in 2018 and 2019 respectively, falling to only £61 million in 2020. There was no material shift in yields over this period.
There has been some difficulty for investors from outside the islands gaining access in the last year due to travel restrictions and quarantine requirements. As these restrictions are lifted there is likely to be an increase in transaction volumes. Having said that, locally based high net-worth individuals and syndicates have been the most active buyers in the market in the last three years and can acquire assets of £50 million+ with no recourse to debt.
Despite the prevalence of local investors there has been an expanding pool of global investors attracted by long lease lengths, strong covenants, and a proven discount to mainland UK investment opportunities.
This asset is scheduled to be sold before March 2022, and brokers were appointed to start marketing the property in April 2021. We anticipate strong demand given the asset’s high quality, solid occupational market, and positive investor sentiment.

30051 17 June 2021 4:07 pm V3
GermanyCare Homes There have been no material asset management events in the previous financial year. Rent collection has been 100% and we intend to complete the sale of these assets by March 2022.
Hermann QuartierThe food anchored, covered shopping centre was marketed for sale at the beginning of 2020 through a formal process run by CBRE, and we successfully notarised a sale contract in December 2020. The sale will complete following the satisfaction of the last sale condition.
The centre performed well over the year despite some of the COVID-related government-imposed restrictions. Even when these restrictions were in place during March to June 2020 and January to March 2021, we maintained collection rates above 80%. We also completed the lease regear to our anchor tenant who represents 17% of the income from the centre. The new lease is for a 17-year term post the completion of tenant enhancement works.
SwitzerlandLugano The health club tenant has been closed for most of the year due to COVID-19 restrictions and remains closed as of April 2021. Rent payments have been intermittent with 37% of rent due, collected over the year. We are planning to sell the asset in this financial year and have active interest from potential investors.
51STENPROP ANNUAL REPORT 2021
STRATEGIC REPORT

30051 17 June 2021 4:07 pm V3
52 STENPROP ANNUAL REPORT 2021
Property Report and Investment Update
CONTINUED
Transactions overviewAcquisitionsIn this financial year we completed 14 separate acquisitions for a net value of £91.5 million in a range of large towns and cities across the UK. These acquisitions added good quality estates to our existing portfolio in markets with strong fundamentals and which met our strict investment requirements. In an investment market characterised by increased demand which is driving yield compression the average yield at acquisition compared favourably with those in previous years.
Of the 14 acquisitions, only two had formal closing dates, with pricing on the remainder being agreed on a negotiated basis either off-market or following a limited marketing campaign. The market remains fragmented and hence the type of vendors remains diverse, although during the financial year ended 31 March 2021, we executed on a greater proportion of distressed institutional sales than normal as a result of open-ended funds coming under redemption pressure. There are a range of sale motivations from vendors including moving to investments that require less management, reaching the end of their business plans, pressure to raise capital, and those reweighting their portfolio or changing their asset profiles (size, location, quality etc).
Summary of Stenprop’s three largest acquisitionsThe largest acquisition during the period was Bowthorpe Industrial Estate in Norwich, acquired from the Blackrock Industrial Trust. The purchase price was £19.6 million, representing a NIY of 6.4% and a capital value of £80 per sq ft. This asset was formally launched in March 2020, at a quoting price of £20.7 million and was subsequently withdrawn following the onset of the COVID-19 pandemic. As we gained comfort from the positive trends within our own portfolio relating to rent-collection, rental growth, and occupational demand we made an approach and negotiated the sale in July 2020. With an average unit size of c3,200 sq ft the estate is well suited for us to release maximum value through the use of our Smart Lease and serviced industrial model.
We completed the acquisition of Mandale Business Park, Durham in October 2020, for £11.2 million representing a NIY of 6.7% and a capital value of £82 per sq ft from a developer who had completed a back-to-frame refurbishment across all five terraces. This asset was originally marketed in June 2019 but failed to sell. We tracked the asset and made an approach and agreed a negotiated price. This estate provides highly specified multi-let industrial accommodation with an excellent letting history in a strong location just off the A1 in Durham.
Newburn Riverside Industrial Park, Newcastle was acquired in February 2021, for £10.9 million representing a NIY of 6.8% and a capital value of £93 per sq ft from Aegon’s (previously Kames) retail fund. It was marketed as part of a package with some adjacent office accommodation, and we made an approach on the industrial element only. This is a modern, well specified estate in a very strong strategic location adjacent to the A1 to the west of Newcastle City Centre. The Newcastle industrial market has been performing well over recent years, and we are pleased to increase our weighting to this market as a result of this acquisition.

30051 17 June 2021 4:07 pm V3
Summary of MLI acquisitions made over last 4 years
Purchase Price GIA Cap Val
NIY (inclusive of guarantees)
assuming 6.5% costs
Rent (inclusive of guarantees) at
acquisition £ per sq ft
FY17/18 £21,253,983 476,766 £44.58 6.72% £5.58FY18/19 £103,519,650 1,683,966 £61.11 6.90% £4.75FY19/20 £38,181,770 504,137 £75.74 6.85% £5.98FY20/21 £91,535,000 1,089,037 £84.05 6.64% £6.21Total/Average £254,490,403 3,753,906 £67.79 6.78% £5.43
Having disposed of the majority of our non-MLI UK assets, we began to focus on the disposal of our German portfolio to fund the transition to an MLI business. The completion of the sale of our largest asset in the portfolio, Bleichenhof took place in February 2020 ahead of the onset of the pandemic and at this time we were underway with the preparation for the sale of the three food anchored retail centres.
CASE STUDY – SUCCESSFUL TRANSACTING: SALE OF BERLIN SHOPPING CENTRES ABOVE NAV
COUNT OF PURCHASES MADE BY VENDOR MARKETING METHOD
Openly marketed - Formal closing date
O� market
0 1 2 3 4 5 6 7 8
Limited marketing - No formal closing date
ACQUISITIONS BY REGIONS FY2021
Yorkshire & Humber
West Midlands
South West
South Wales
Scotland
North West
North East
0 1 2 3
East of England
Number of Purchases per region
The profile of the assets, their strong locations and a well-run process allowed us to achieve successful sales above book values despite the considerable uncertainties brought about by the pandemic over the last 12 months.”
The three Berlin centres, Neucolln Carree, Victoria shopping centre, and Hermann Quartier, which had been acquired individually over the previous 15 years, were all anchored by prominent food retailers to include Kaufland, REWE and EDEKA. The three centres comprising a total of 35,000 sq meters are located in the popular, growing south west suburbs of Berlin and were 99% occupied at the point of marketing. CBRE was appointed sales advisor given their local retail expertise, combined with their international investor reach, to run a comprehensive marketing process to allow us to maximise value from the sale of these assets.
We commenced the sales process in early 2020 and initial interest in a portfolio acquisition was strong from both domestic and overseas buyers attracted by the locations, long term secure income and growth potential. As the impact of the pandemic became clear, most of the international purchasers fell away, but
we retained good interest from domestic buyers. As the buyers became more focused on the specific characteristics of the assets, it became clear that to maximise value from the sales we needed to focus on individual asset sales rather than a portfolio approach. We worked hard to position the assets in the most favourable light, extending leases where possible and used the competition generated from the sales process to achieve favourable results.
At the time of writing we have completed on the sale of Victoria and Neucolln, with Hermann notarised and awaiting completion. Following the completion of Hermann we will have achieved an aggregate sales value across the three centres of €95 million which represents a 15% uplift to our March 2020 valuations and most importantly the focus and cash to continue our transition towards a UK MLI business.
Image courtesy of CBRE
53STENPROP ANNUAL REPORT 2021
STRATEGIC REPORT
30051 17 June 2021 4:07 pm V3
54 STENPROP ANNUAL REPORT 2021
Financial Review
We are pleased to be reporting strong results in a year that saw much turbulence and uncertainty. Whilst we were not immune from the effects of the pandemic, we have been encouraged by the fact that the MLI asset class has been able to clearly demonstrate its resilience and versatility. Regional e-commerce sales and distribution channels are becoming ever more important, and MLI has shown its appeal to an increasingly diverse range of businesses, that have translated into increased tenant demand, growing rents and increased occupancy. Our ongoing transition to being 100% MLI was put on hold in the first quarter of the financial year as we focused on maintaining a healthy cash balance as the pandemic took hold. However, early signs of a strong recovery in MLI from our Industrials Hive platform meant we recommenced our acquisition programme in June and we concluded the year having acquired 14 MLI estates, in separate transactions, for a total purchase price of £91.5 million before costs which was in line with our target for the period. Our MLI portfolio now totals 5.6 million sq ft, and at the year-end made up 74.3% of our total investment property portfolio by market value. We also had a successful year in terms of our planned disposals with all our wholly owned German properties sold or notarised during the year, at an average premium of 15% to the March 2020 valuations.
The board of directors (the ‘Board’) have declared a dividend of 3.375 pence per share for the six months ended 31 March 2021, bringing the full year distribution to 6.75 pence per share (2020: 6.75 pence). The dividend is fully covered by adjusted earnings per share of 6.78 pence (2020: 6.88 pence) and, as in the past, can be taken as a cash payment or scrip share alternative.
Diluted IFRS earnings per share (‘EPS’) was 18.57 pence (2020: 5.44 pence), whilst the adjusted EPS amounted to 6.78 pence, compared with 6.88 pence in the prior year. The significant increase in IFRS profit was driven by a larger uplift in the fair value of investment properties when compared with the prior year. Earnings were impacted by
James Beaumont Chief Financial Officer
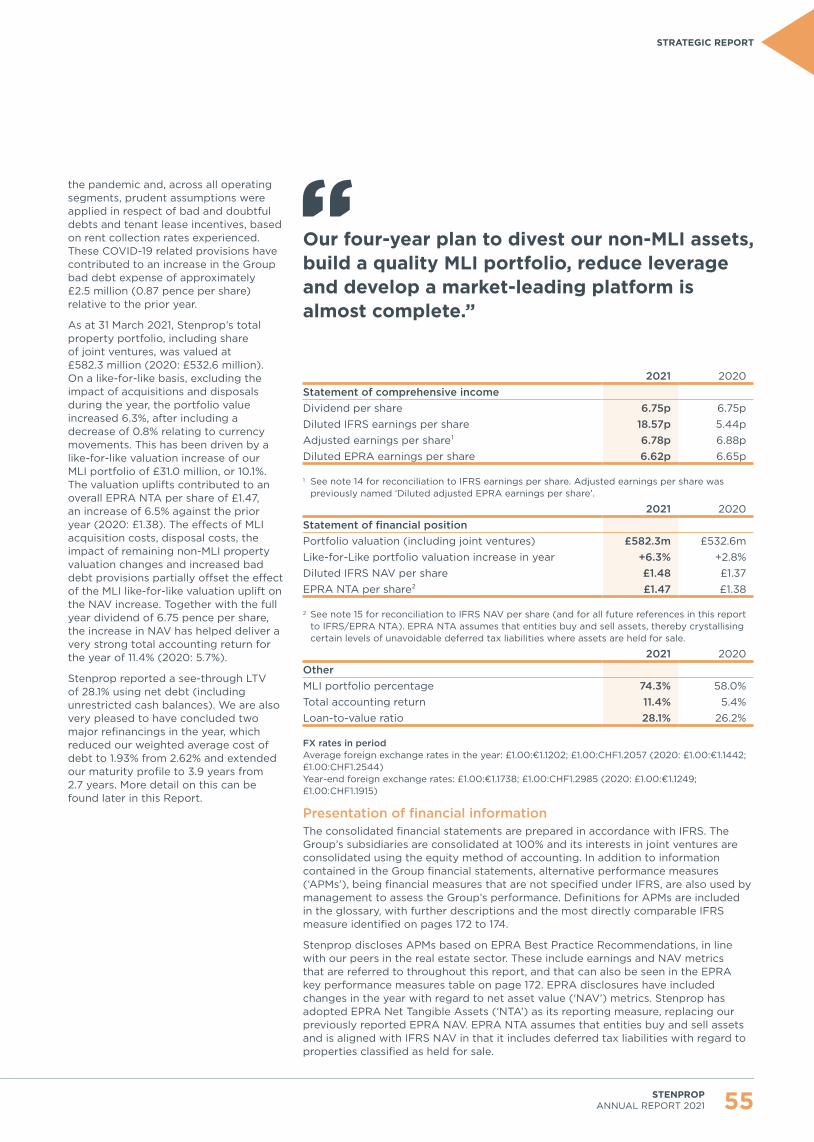
30051 17 June 2021 4:07 pm V3
the pandemic and, across all operating segments, prudent assumptions were applied in respect of bad and doubtful debts and tenant lease incentives, based on rent collection rates experienced. These COVID-19 related provisions have contributed to an increase in the Group bad debt expense of approximately £2.5 million (0.87 pence per share) relative to the prior year.
As at 31 March 2021, Stenprop’s total property portfolio, including share of joint ventures, was valued at £582.3 million (2020: £532.6 million). On a like-for-like basis, excluding the impact of acquisitions and disposals during the year, the portfolio value increased 6.3%, after including a decrease of 0.8% relating to currency movements. This has been driven by a like-for-like valuation increase of our MLI portfolio of £31.0 million, or 10.1%. The valuation uplifts contributed to an overall EPRA NTA per share of £1.47, an increase of 6.5% against the prior year (2020: £1.38). The effects of MLI acquisition costs, disposal costs, the impact of remaining non-MLI property valuation changes and increased bad debt provisions partially offset the effect of the MLI like-for-like valuation uplift on the NAV increase. Together with the full year dividend of 6.75 pence per share, the increase in NAV has helped deliver a very strong total accounting return for the year of 11.4% (2020: 5.7%).
Stenprop reported a see-through LTV of 28.1% using net debt (including unrestricted cash balances). We are also very pleased to have concluded two major refinancings in the year, which reduced our weighted average cost of debt to 1.93% from 2.62% and extended our maturity profile to 3.9 years from 2.7 years. More detail on this can be found later in this Report.
Our four-year plan to divest our non-MLI assets, build a quality MLI portfolio, reduce leverage and develop a market-leading platform is almost complete.”
2021 2020 Statement of comprehensive incomeDividend per share 6.75p 6.75pDiluted IFRS earnings per share 18.57p 5.44pAdjusted earnings per share¹ 6.78p 6.88pDiluted EPRA earnings per share 6.62p 6.65p
1 See note 14 for reconciliation to IFRS earnings per share. Adjusted earnings per share was previously named ‘Diluted adjusted EPRA earnings per share’.
2021 2020Statement of financial positionPortfolio valuation (including joint ventures) £582.3m £532.6mLike-for-Like portfolio valuation increase in year +6.3% +2.8%Diluted IFRS NAV per share £1.48 £1.37EPRA NTA per share² £1.47 £1.38
2 See note 15 for reconciliation to IFRS NAV per share (and for all future references in this report to IFRS/EPRA NTA). EPRA NTA assumes that entities buy and sell assets, thereby crystallising certain levels of unavoidable deferred tax liabilities where assets are held for sale.
2021 2020OtherMLI portfolio percentage 74.3% 58.0%Total accounting return 11.4% 5.4%Loan-to-value ratio 28.1% 26.2%
FX rates in periodAverage foreign exchange rates in the year: £1.00:€1.1202; £1.00:CHF1.2057 (2020: £1.00:€1.1442; £1.00:CHF1.2544) Year-end foreign exchange rates: £1.00:€1.1738; £1.00:CHF1.2985 (2020: £1.00:€1.1249; £1.00:CHF1.1915)
Presentation of financial informationThe consolidated financial statements are prepared in accordance with IFRS. The Group’s subsidiaries are consolidated at 100% and its interests in joint ventures are consolidated using the equity method of accounting. In addition to information contained in the Group financial statements, alternative performance measures (‘APMs’), being financial measures that are not specified under IFRS, are also used by management to assess the Group’s performance. Definitions for APMs are included in the glossary, with further descriptions and the most directly comparable IFRS measure identified on pages 172 to 174.
Stenprop discloses APMs based on EPRA Best Practice Recommendations, in line with our peers in the real estate sector. These include earnings and NAV metrics that are referred to throughout this report, and that can also be seen in the EPRA key performance measures table on page 172. EPRA disclosures have included changes in the year with regard to net asset value (‘NAV’) metrics. Stenprop has adopted EPRA Net Tangible Assets (‘NTA’) as its reporting measure, replacing our previously reported EPRA NAV. EPRA NTA assumes that entities buy and sell assets and is aligned with IFRS NAV in that it includes deferred tax liabilities with regard to properties classified as held for sale.
55STENPROP ANNUAL REPORT 2021
STRATEGIC REPORT

30051 17 June 2021 4:07 pm V3
56 STENPROP ANNUAL REPORT 2021
KEY STATISTICS
18.57pDiluted IFRS earnings per share
6.78pAdjusted earnings per share
6.75pFull year dividend per share
11.4%Total accounting return
Financial Review CONTINUED
EPRA earnings per share (pence) Year to 31 March 2021 (refer note 14)
Gro
ss r
enta
l re
venu
e
Pro
per
tyo
per
atin
gex
pen
ses
Man
agem
ent
fee
inco
me
Ad
min
and
oth
er o
per
atin
gco
sts
Inco
me
fro
m J
Vs
(inc
lud
ing
EP
RA
adju
stm
ents
)
Fin
ance
co
st
Oth
er
Dilu
ted
EP
RA
EP
S
13.37 2.03
2.05
3.72
0.52
2.07
6.78
0.160.29
0.26
6.62
Co
mp
any
- sp
ecifi
c ea
rnin
gs
adju
stm
ents
Ad
just
edE
PS
18.00
Pen
ce
16.00
14.00
12.00
10.00
8.00
6.00
4.00
2.00
FX rates in periodAverage foreign exchange rates in the year: £1.00:€1.1442; £1.00:CHF1.12544 (2019: £1.00:€1.1338; £1.00:CHF1.3002) Year-end foreign exchange rates: £1.00:€1.1249; £1.00:CHF1.1915 (2019: £1.00:€1.1617; £1.00:CHF1.2970)
EarningsFor the year ended 31 March 2021, basic IFRS earnings attributable to ordinary shareholders increased significantly to £53.0 million (2020: £15.6 million), equating to a diluted IFRS EPS of 18.57 pence (2020: 5.44 pence). The increase was driven by the fair value gain on investment properties in the year of £36.3 million versus the prior year (2020: £4.9 million) and was led by strong lettings and yield compression across our MLI portfolio. Valuations are discussed in more detail on page 58.
Net rental income from continuing operations was £32.0 million (2020: £33.0 million). The MLI portfolio contributed £21.4 million to the total at year-end; a 19.6% increase over the prior year contribution of £17.9 million and representing 67% (2020: 54%) of total net rental income.
Net rental income is presented after provision for expected credit losses. As a result of COVID-19, larger credit loss provisions were booked, resulting in a bad debt expense for the year, including discontinued operations, of £3.0 million (2020: £0.5 million). The total aggregate provision for expected credit losses stood at £3.6 million as at 31 March 2021 (31 March 2020: £1.3 million). On a portfolio level, the expense for expected credit losses reflected 7.4% of rents
invoiced compared with 1.2% in the prior year. Although not yet quantifiable in amount or timing, as the effects of the pandemic start to diminish, we anticipate that customers will be able to begin the process of settling their arrears. The payment of this rent will result in the unwind, over time, of a portion of the bad debt provision.
Operating expenses for the year were £10.5 million (2020: £10.1 million). There are several moving parts to this balance with the increase to prior year driven by staff remuneration costs, which includes the impact of a higher staff count of 43 at the year-end (2020: 28). The new hires include an expansion in our HR, sales and marketing capabilities as well as new team members to support our operational platform as we in-house property accounting and continue to grow our MLI portfolio. These important hires will allow Stenprop to own and manage the entire customer journey from initial enquiry through to leasing, move-in and ultimately move-out, helping to deliver our class leading customer service and value proposition.
In accordance with reporting standards widely adopted across the real estate industry in Europe, the directors feel it is appropriate and useful, in addition to providing the IFRS disclosed earnings, to also disclose EPRA earnings and adjusted earnings (in previous reports referred to as ‘diluted adjusted EPRA earnings’). As disclosed in note 14, this measure utilises EPRA’s Best Practices Recommendations, and applies further Company-specific adjustments to earnings to exclude items considered not to be in the ordinary course of business or other exceptional items, to provide additional information on the Group’s underlying operational performance. Adjusted earnings attributable to shareholders were £19.4 million (2020: £19.7 million), equating to an adjusted EPS of 6.78 pence (2020: 6.88 pence). A reconciliation of IFRS profit to EPRA earnings and adjusted earnings for the year is shown in note 14 to the financial statements.
In line with best practice, Stenprop also discloses EPRA cost ratios. The EPRA cost ratio (including direct vacancy costs) stood at 41.6% for the year ended 31 March 2021 (2020: 35.3%). The cost ratio includes the effects of a higher bad debt expense for the year of £3.0 million (2020: £0.5 million) as a result of COVID-19. The expense for expected credit losses accounted for 7.4% points of the EPRA cost ratio (2020: 1.2% points). We anticipate that,

30051 17 June 2021 4:07 pm V3
147138
EP
RA
NTA
31 M
arch
20
20
165
160
155
150
145
140
135
130
125
Pen
ce
Ad
just
ed
earn
ing
s
Po
rtfo
liore
valu
atio
n(i
ncl C
areh
om
es)
MLI
acq
uisi
tio
n co
sts
Cap
ital
E
xpen
dit
ure
Oth
er g
ains
and
Lo
sses
FX
Tra
nsla
tio
n o
n b
alan
ce s
heet
Div
iden
d
Oth
er
adju
stm
ents
EP
RA
NTA
31 M
arch
20
21
1.68
1.04
0.16
6.78
13.920.56
1.276.75
EPRA NTA per share (pence) movement since 31 March 2020
as we continue to grow the MLI portfolio with the benefit of our Industrials Hive operating platform, the marginal cost of each additional MLI property will be significantly lower than for the existing portfolio. Hence we expect our EPRA cost ratio to decrease steadily going forward.
See pages 18 to 21 to read more on our strategy
DividendsOn 9 June 2021, the Board declared a final dividend of 3.375 pence per share (2020: 3.375 pence), which, together with the interim dividend of 3.375 pence per share (2020: 3.375 pence per share) declared on 2 December 2020, results in a total dividend for the year ended 31 March 2021 of 6.75 pence per share (2020: 6.75 pence per share). The total dividend for the year is fully covered by earnings of 6.78 pence per share.
The dividend of 6.75 pence per share represents a dividend yield of 4.4% on the share price at 8 June 2021 of £1.55, and a yield of 4.6% on the diluted EPRA NTA per share at 31 March 2021 of £1.47.
Subject to the receipt of regulatory approvals, the directors intend to offer shareholders the option to receive all or part of their dividend entitlement by way of a scrip issue of new Stenprop ordinary shares, or in cash. A further announcement informing shareholders of the salient dates and tax treatment of the dividend will be released in due course.
Future distributionsStenprop’s business has proved resilient to the challenges caused by the pandemic and we are pleased to have been able to maintain a covered total dividend of 6.75p per share. In light of our strong operating performance and robust rent collection rates, it is the Board’s intention to maintain the dividend at 6.75p for the year ending 31 March 2022, our final transitional year. The key factors that are likely to determine whether this dividend is covered or not are the levels of the ongoing bad debt provision required because of COVID-19 and the levels of cash drag as a result of the sales of the last remaining non-MLI assets and the time taken to deploy the net proceeds into additional MLI assets. Once we complete the transition this coming year and COVID-19 is largely behind us, we anticipate growing earnings and dividends going forward as a 100% UK MLI business.
See pages 18 and 21 to read more on our strategy
Net asset valueThe IFRS basic and diluted net asset value per share at 31 March 2021 was £1.49 and £1.48 respectively (2020: basic £1.38; diluted £1.37) (see note 15). The increase over the year has been driven primarily by like-for-like valuation increases of our MLI portfolio of £31.0 million, or 10.1%. At year-end, the 83 MLI properties were valued at £432.9 million, representing 74.3% of our total portfolio.
As is the case regarding the disclosure of EPRA earnings, the directors feel that it is appropriate and useful, in addition to IFRS NAV, to disclose EPRA NTA. The EPRA NTA per share at 31 March 2021 was £1.47 (2020: £1.38). A reconciliation of this against IFRS NAV is shown in note 15 to the accounts. The EPRA NTA excludes £1.8 million of intangible assets related to the development of our MLI operating platform, called Industrials Hive. We anticipate further expenditure of approximately £1.5 million on Industrials Hive during the financial year ended 31 March 2022.
57STENPROP ANNUAL REPORT 2021
STRATEGIC REPORT
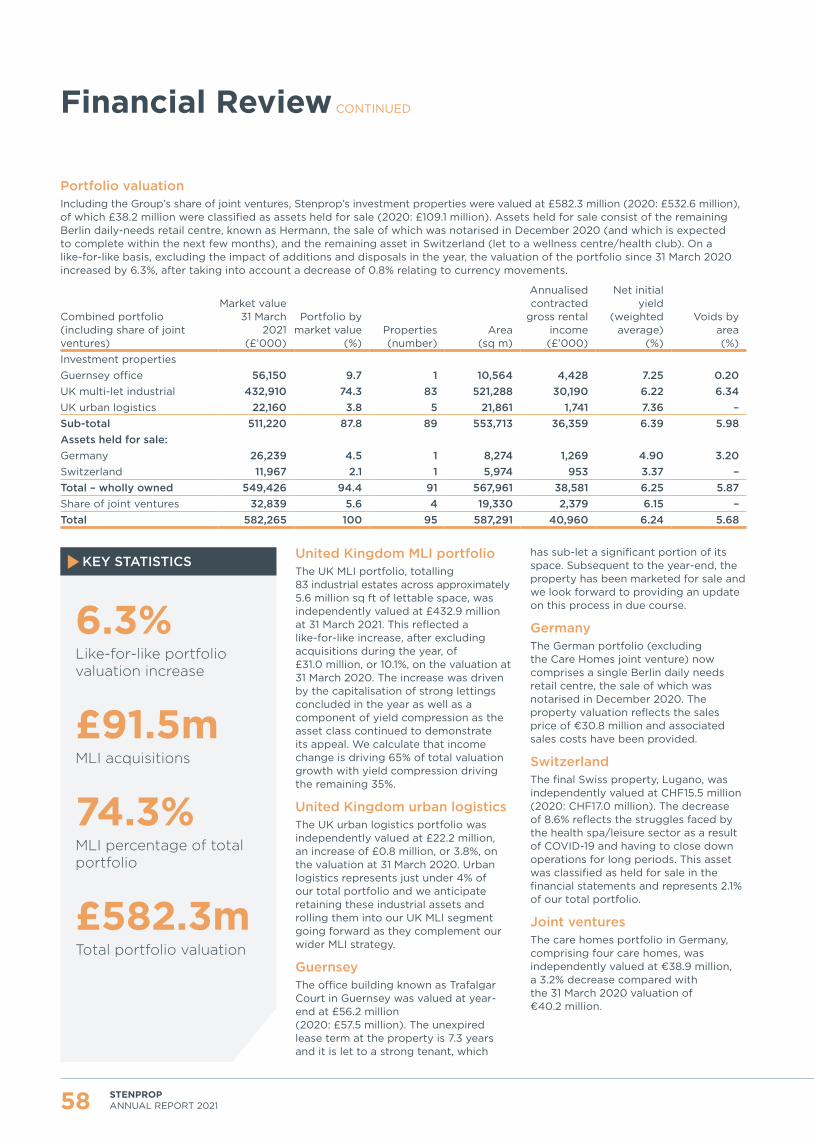
30051 17 June 2021 4:07 pm V3
KEY STATISTICS
58 STENPROP ANNUAL REPORT 2021
Financial Review CONTINUED
Portfolio valuationIncluding the Group’s share of joint ventures, Stenprop’s investment properties were valued at £582.3 million (2020: £532.6 million), of which £38.2 million were classified as assets held for sale (2020: £109.1 million). Assets held for sale consist of the remaining Berlin daily-needs retail centre, known as Hermann, the sale of which was notarised in December 2020 (and which is expected to complete within the next few months), and the remaining asset in Switzerland (let to a wellness centre/health club). On a like-for-like basis, excluding the impact of additions and disposals in the year, the valuation of the portfolio since 31 March 2020 increased by 6.3%, after taking into account a decrease of 0.8% relating to currency movements.
Combined portfolio (including share of joint ventures)
Market value 31 March
2021 (£’000)
Portfolio by market value
(%)Properties (number)
Area (sq m)
Annualised contracted
gross rental income (£’000)
Net initial yield
(weighted average)
(%)
Voids by area (%)
Investment propertiesGuernsey office 56,150 9.7 1 10,564 4,428 7.25 0.20UK multi-let industrial 432,910 74.3 83 521,288 30,190 6.22 6.34UK urban logistics 22,160 3.8 5 21,861 1,741 7.36 –Sub-total 511,220 87.8 89 553,713 36,359 6.39 5.98Assets held for sale:Germany 26,239 4.5 1 8,274 1,269 4.90 3.20Switzerland 11,967 2.1 1 5,974 953 3.37 –Total – wholly owned 549,426 94.4 91 567,961 38,581 6.25 5.87Share of joint ventures 32,839 5.6 4 19,330 2,379 6.15 –Total 582,265 100 95 587,291 40,960 6.24 5.68
6.3%Like-for-like portfolio valuation increase
£91.5mMLI acquisitions
74.3%MLI percentage of total portfolio
£582.3mTotal portfolio valuation
United Kingdom MLI portfolioThe UK MLI portfolio, totalling 83 industrial estates across approximately 5.6 million sq ft of lettable space, was independently valued at £432.9 million at 31 March 2021. This reflected a like-for-like increase, after excluding acquisitions during the year, of £31.0 million, or 10.1%, on the valuation at 31 March 2020. The increase was driven by the capitalisation of strong lettings concluded in the year as well as a component of yield compression as the asset class continued to demonstrate its appeal. We calculate that income change is driving 65% of total valuation growth with yield compression driving the remaining 35%.
United Kingdom urban logisticsThe UK urban logistics portfolio was independently valued at £22.2 million, an increase of £0.8 million, or 3.8%, on the valuation at 31 March 2020. Urban logistics represents just under 4% of our total portfolio and we anticipate retaining these industrial assets and rolling them into our UK MLI segment going forward as they complement our wider MLI strategy.
GuernseyThe office building known as Trafalgar Court in Guernsey was valued at year-end at £56.2 million (2020: £57.5 million). The unexpired lease term at the property is 7.3 years and it is let to a strong tenant, which
has sub-let a significant portion of its space. Subsequent to the year-end, the property has been marketed for sale and we look forward to providing an update on this process in due course.
GermanyThe German portfolio (excluding the Care Homes joint venture) now comprises a single Berlin daily needs retail centre, the sale of which was notarised in December 2020. The property valuation reflects the sales price of €30.8 million and associated sales costs have been provided.
SwitzerlandThe final Swiss property, Lugano, was independently valued at CHF15.5 million (2020: CHF17.0 million). The decrease of 8.6% reflects the struggles faced by the health spa/leisure sector as a result of COVID-19 and having to close down operations for long periods. This asset was classified as held for sale in the financial statements and represents 2.1% of our total portfolio.
Joint ventures The care homes portfolio in Germany, comprising four care homes, was independently valued at €38.9 million, a 3.2% decrease compared with the 31 March 2020 valuation of €40.2 million.
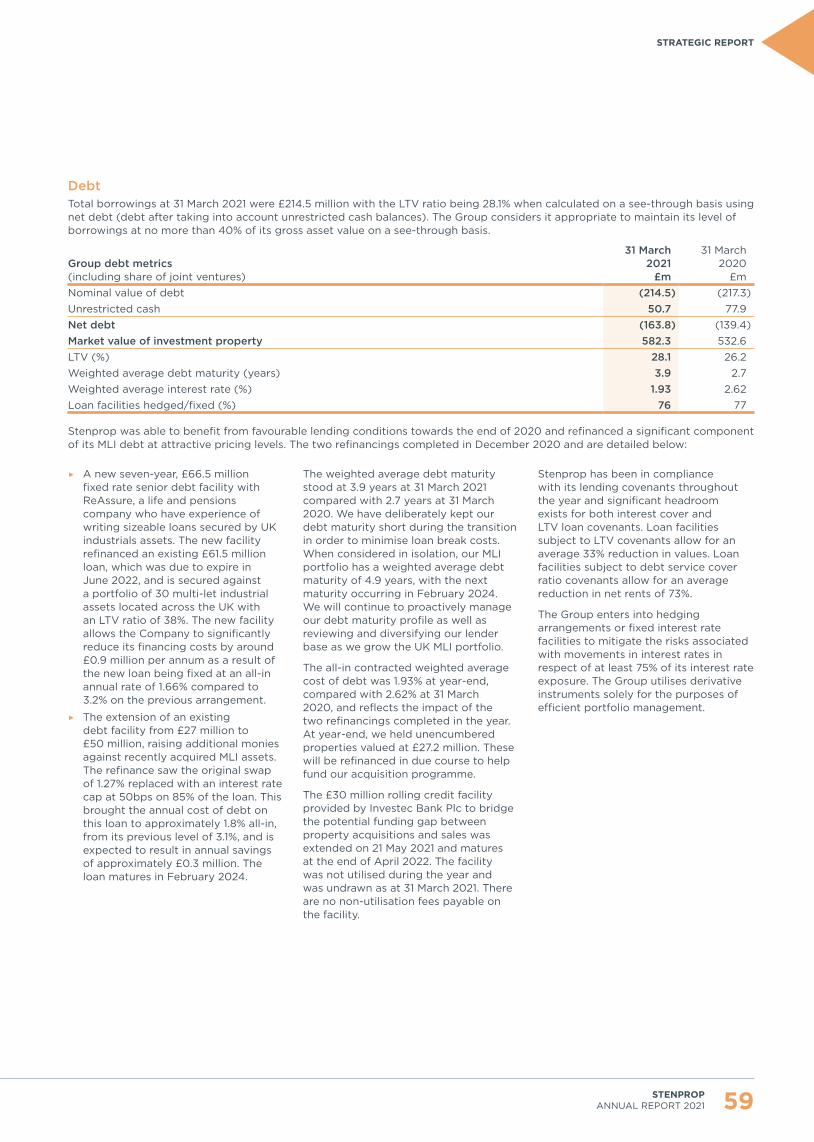
30051 17 June 2021 4:07 pm V3
Debt Total borrowings at 31 March 2021 were £214.5 million with the LTV ratio being 28.1% when calculated on a see-through basis using net debt (debt after taking into account unrestricted cash balances). The Group considers it appropriate to maintain its level of borrowings at no more than 40% of its gross asset value on a see-through basis.
Group debt metrics (including share of joint ventures)
31 March 2021
£m
31 March 2020
£m Nominal value of debt (214.5) (217.3)Unrestricted cash 50.7 77.9Net debt (163.8) (139.4)Market value of investment property 582.3 532.6LTV (%) 28.1 26.2Weighted average debt maturity (years) 3.9 2.7Weighted average interest rate (%) 1.93 2.62Loan facilities hedged/fixed (%) 76 77
Stenprop was able to benefit from favourable lending conditions towards the end of 2020 and refinanced a significant component of its MLI debt at attractive pricing levels. The two refinancings completed in December 2020 and are detailed below:
▶ A new seven-year, £66.5 million fixed rate senior debt facility with ReAssure, a life and pensions company who have experience of writing sizeable loans secured by UK industrials assets. The new facility refinanced an existing £61.5 million loan, which was due to expire in June 2022, and is secured against a portfolio of 30 multi-let industrial assets located across the UK with an LTV ratio of 38%. The new facility allows the Company to significantly reduce its financing costs by around £0.9 million per annum as a result of the new loan being fixed at an all-in annual rate of 1.66% compared to 3.2% on the previous arrangement.
▶ The extension of an existing debt facility from £27 million to £50 million, raising additional monies against recently acquired MLI assets. The refinance saw the original swap of 1.27% replaced with an interest rate cap at 50bps on 85% of the loan. This brought the annual cost of debt on this loan to approximately 1.8% all-in, from its previous level of 3.1%, and is expected to result in annual savings of approximately £0.3 million. The loan matures in February 2024.
The weighted average debt maturity stood at 3.9 years at 31 March 2021 compared with 2.7 years at 31 March 2020. We have deliberately kept our debt maturity short during the transition in order to minimise loan break costs. When considered in isolation, our MLI portfolio has a weighted average debt maturity of 4.9 years, with the next maturity occurring in February 2024. We will continue to proactively manage our debt maturity profile as well as reviewing and diversifying our lender base as we grow the UK MLI portfolio.
The all-in contracted weighted average cost of debt was 1.93% at year-end, compared with 2.62% at 31 March 2020, and reflects the impact of the two refinancings completed in the year. At year-end, we held unencumbered properties valued at £27.2 million. These will be refinanced in due course to help fund our acquisition programme.
The £30 million rolling credit facility provided by Investec Bank Plc to bridge the potential funding gap between property acquisitions and sales was extended on 21 May 2021 and matures at the end of April 2022. The facility was not utilised during the year and was undrawn as at 31 March 2021. There are no non-utilisation fees payable on the facility.
Stenprop has been in compliance with its lending covenants throughout the year and significant headroom exists for both interest cover and LTV loan covenants. Loan facilities subject to LTV covenants allow for an average 33% reduction in values. Loan facilities subject to debt service cover ratio covenants allow for an average reduction in net rents of 73%.
The Group enters into hedging arrangements or fixed interest rate facilities to mitigate the risks associated with movements in interest rates in respect of at least 75% of its interest rate exposure. The Group utilises derivative instruments solely for the purposes of efficient portfolio management.
59STENPROP ANNUAL REPORT 2021
STRATEGIC REPORT

30051 17 June 2021 4:07 pm V3
Financial Review CONTINUED
60 STENPROP ANNUAL REPORT 2021
Liquidity and COVID-19 We began the year focused on maintaining liquidity in a period of intense market uncertainty. With our regional network of customer engagement managers, we were able to proactively liaise with our customers to understand the immediate issues facing their businesses. Following disruption caused by the first lockdown, we were pleased to report robust rent collection levels at our Interim results of 90% across the portfolio, with MLI rent collection trending between 85–90%. The resilience of the MLI asset class was proven again in the second half of the year when we continued to experience strong demand for our units, growth in passing rents and ERVs, and reduced vacancy. Supply remains restricted, with acquisition cost still significantly below replacement cost and we believe that the effects of COVID-19 have accelerated the demand for the flexibility and affordability that MLI offers. At the end of the year, and despite the severity of the third lockdown, we are reporting rent collection across the Group of 92%, with MLI rent collections still trending at approximately 90%.
We maintained appropriate cash balances as the pandemic took hold but were able to deploy cash for acquisitions quickly as our platform gave us early insight into the increasing demand for MLI space. The first half of the year saw £40.0 million of acquisitions with a further £51.5 million completed by 31 March 2021.
Following the completion of the two German sales prior to the year-end, Stenprop held unrestricted cash balances of £51 million at 31 March 2021. Holding cash at these levels for prolonged periods has a detrimental impact on earnings in the form of cash drag and
growing earnings and NAV. We are confident that a stabilised MLI portfolio managed on our platform will deliver a total accounting return of at least 10% per annum, of which at least half will come from NAV increases as a result of capitalising predicted rental growth. The balance will come from earnings that are underpinned by the rental growth that we are currently experiencing. We are also excited about the opportunities that will be created by our technology enabled operating platform in improving our own efficiencies and returns and in opening up further market opportunities for Stenprop.
James BeaumontChief Financial Officer
10 June 2021
we continue to appraise appropriate acquisition opportunities that meet our disciplined investment criteria, and aim to deploy cash as quickly as we can. Combined with the continued, albeit reducing, impact of COVID-19, the timing of sales and acquisitions remains one of the biggest challenges of the coming year in terms of maximising earnings.
ConclusionOur four-year plan to divest our non-MLI assets, build a quality MLI portfolio, reduce leverage and develop a market-leading platform on which to deliver strong returns is almost complete. The most recent financial year has been challenging, but we end it having delivered a strong set of financial results, both in terms of robust earnings and a stronger balance sheet. Our MLI portfolio has proven itself to be resilient and we are gratified that we have performed well in a year that has created such instability across both the economy and our personal lives. Our staff and business have adapted brilliantly to remote working and we are capitalising on efficiencies learned over the last 12 months.
As we start the process of delivering our final transitional year, we look next to scaling our MLI business and leveraging off our Industrials Hive operating platform to deliver

30051 17 June 2021 4:07 pm V3
1
2
3
4
5
The Audit and Risk Committee is responsible for providing oversight and advice to the Board in relation to current and potential future risk exposures of the Group. It routinely considers risk at each quarterly meeting, reviews the risk profile of the Group and the significant risks identified alongside mitigating factors and action plans. The intention is not to eliminate risk entirely, but to manage our risk exposures across the business, whilst making the most of business opportunities that have the potential to create value.
In addition, the Board and the executive directors promote a risk awareness culture coupled with an open and accountable culture in which employees at all levels of the organisation are encouraged to participate in the risk identification process and to maintain an open dialogue with their colleagues and managers, as opposed to a blame culture. This ensures the early identification and management of risks.
More information regarding the work of the Board, the Audit and Risk Committee, and the executive and senior teams on risk management during the year ended 31 March 2021 can be found in the Audit and Risk Committee Report on pages 90 to 92 of this report.
At the Board meeting in June 2021, the Board completed its annual assessment of risks. This followed the Audit and Risk Committee’s formal assessment of risks and their review of the effectiveness of internal controls. Although it concluded that an effective system of risk management remained in place, it was agreed that a review of the risk management framework would be conducted during the financial year ending 31 March 2022 to identify areas of improvements in light of the growing workforce and the expected completion of the transition into a 100% MLI business by March 2022. The conclusion of this review will be set out in our 2022 Annual Report.
ReportSignificant risks, key controls, details of risk management decisions and all relevant management actions implemented as part of the risk assessment process are reported to the Audit and Risk Committee on a quarterly basis. Key risks which may have a material impact on the ability of the Company to achieve its strategic objectives are routinely reviewed and considered by the Board.
MonitorRisks and the effectiveness of the corresponding actions to manage these risks are monitored on an ongoing basis by management and reviewed on a quarterly basis by the Audit and Risk Committee.
ManageIdentified risks can be avoided, transferred, accepted or mitigated. The executive team will assess risks against potential benefits when considering how to manage risks. Decisions and actions are recorded and identified, weaknesses are highlighted and rectified with the aim of bringing the risk back within an acceptable limit.
AssessAll risks identified are assessed on a continuous basis. They are awarded an inherent risk rating which may lead to the implementation of controls/ actions to mitigate them. Risks are then assessed and awarded a residual risk rating after considering the adequacy and effectiveness of such controls, the financial and non-financial impact, as well as the probability of occurrence of a risk.
IdentityRisk identification is supervised by the executive directors and senior managers but involves every individual staff member in the Group.
OverviewStenprop’s board of directors (‘the Board’) has ultimate responsibility for maintaining sound risk management and internal controls systems. It also reviews and determines the Group’s risk appetite, bearing in mind the opportunities that often accompany risks and can drive performance. This is the foundation of the Stenprop five-step risk management plan.
Risk Management
61STENPROP ANNUAL REPORT 2021
STRATEGIC REPORT
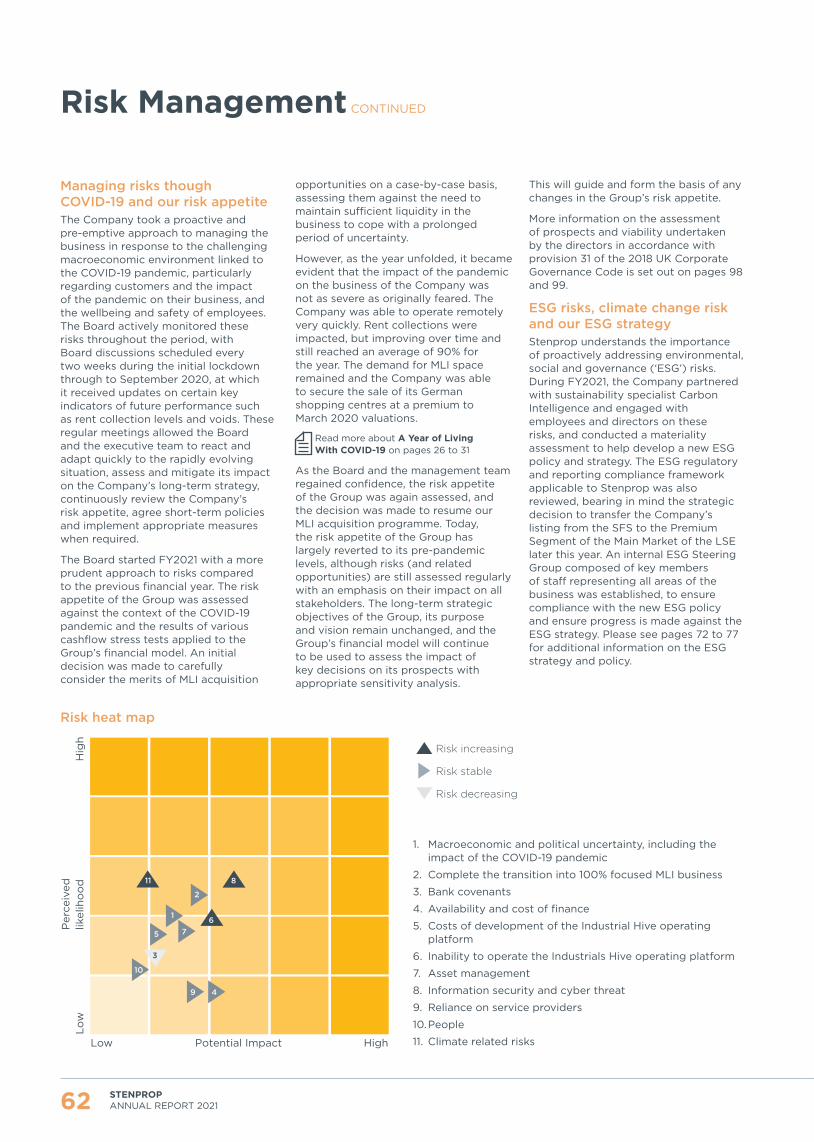
30051 17 June 2021 4:07 pm V3
Low
Per
ceiv
ed
likel
iho
od
Hig
h
Low Potential Impact High
811
7
10
9 4
3
2
6
5
1
Risk heat map
62 STENPROP ANNUAL REPORT 2021
Risk Management CONTINUED
Managing risks though COVID-19 and our risk appetiteThe Company took a proactive and pre-emptive approach to managing the business in response to the challenging macroeconomic environment linked to the COVID-19 pandemic, particularly regarding customers and the impact of the pandemic on their business, and the wellbeing and safety of employees. The Board actively monitored these risks throughout the period, with Board discussions scheduled every two weeks during the initial lockdown through to September 2020, at which it received updates on certain key indicators of future performance such as rent collection levels and voids. These regular meetings allowed the Board and the executive team to react and adapt quickly to the rapidly evolving situation, assess and mitigate its impact on the Company’s long-term strategy, continuously review the Company’s risk appetite, agree short-term policies and implement appropriate measures when required.
The Board started FY2021 with a more prudent approach to risks compared to the previous financial year. The risk appetite of the Group was assessed against the context of the COVID-19 pandemic and the results of various cashflow stress tests applied to the Group’s financial model. An initial decision was made to carefully consider the merits of MLI acquisition
1. Macroeconomic and political uncertainty, including the impact of the COVID-19 pandemic
2. Complete the transition into 100% focused MLI business
3. Bank covenants
4. Availability and cost of finance
5. Costs of development of the Industrial Hive operating platform
6. Inability to operate the Industrials Hive operating platform
7. Asset management
8. Information security and cyber threat
9. Reliance on service providers
10. People
11. Climate related risks
Risk increasing
Risk stable
Risk decreasing
opportunities on a case-by-case basis, assessing them against the need to maintain sufficient liquidity in the business to cope with a prolonged period of uncertainty.
However, as the year unfolded, it became evident that the impact of the pandemic on the business of the Company was not as severe as originally feared. The Company was able to operate remotely very quickly. Rent collections were impacted, but improving over time and still reached an average of 90% for the year. The demand for MLI space remained and the Company was able to secure the sale of its German shopping centres at a premium to March 2020 valuations.
Read more about A Year of Living With COVID-19 on pages 26 to 31
As the Board and the management team regained confidence, the risk appetite of the Group was again assessed, and the decision was made to resume our MLI acquisition programme. Today, the risk appetite of the Group has largely reverted to its pre-pandemic levels, although risks (and related opportunities) are still assessed regularly with an emphasis on their impact on all stakeholders. The long-term strategic objectives of the Group, its purpose and vision remain unchanged, and the Group’s financial model will continue to be used to assess the impact of key decisions on its prospects with appropriate sensitivity analysis.
This will guide and form the basis of any changes in the Group’s risk appetite.
More information on the assessment of prospects and viability undertaken by the directors in accordance with provision 31 of the 2018 UK Corporate Governance Code is set out on pages 98 and 99.
ESG risks, climate change risk and our ESG strategyStenprop understands the importance of proactively addressing environmental, social and governance (‘ESG’) risks. During FY2021, the Company partnered with sustainability specialist Carbon Intelligence and engaged with employees and directors on these risks, and conducted a materiality assessment to help develop a new ESG policy and strategy. The ESG regulatory and reporting compliance framework applicable to Stenprop was also reviewed, bearing in mind the strategic decision to transfer the Company’s listing from the SFS to the Premium Segment of the Main Market of the LSE later this year. An internal ESG Steering Group composed of key members of staff representing all areas of the business was established, to ensure compliance with the new ESG policy and ensure progress is made against the ESG strategy. Please see pages 72 to 77 for additional information on the ESG strategy and policy.

30051 17 June 2021 4:07 pm V3
For the first time this year, Stenprop provides its corporate disclosure against the recommendations and best practices of the Task Force on Climate-related Financial Disclosures (‘TCFD’). They cover the 11 recommended disclosures across the four core elements of governance, strategy, risk management, and metrics and targets. Please see pages 176 and 177 for an overview of the climate risks and opportunities identified.
BrexitThe Board considered the impact of Brexit on the Group, and again concluded that Brexit did not, in itself, constitute a significant risk to the business. As Stenprop completes its transition, the Group is relying on its UK MLI portfolio with no reliance on import and export. The Board considered certain areas that may impact business operations, such as property valuations and interest rates, as well as the impact on our MLI customers, but concluded that the impact from this specific risk factor was not material.
Robust assessment of principal risksThe Board has carried a robust assessment of the principal and emerging risks facing the Group. These are the risks that would threaten its business model, strategic objectives and future performance, solvency and liquidity. The process for how the Board reviews these risks is explained above and the key risks identified are presented on pages 64 to 68, including an assessment of their potential impact and controls and mitigating factors.
Statement of viabilityAssessment of prospectsIn accordance with provision 31 of the UK Corporate Governance Code and King IV, the directors have assessed the prospects of the Group for a period of five years to 31 March 2026. The Board considers this period to be appropriate as the Group’s financial review and business plan forecasts cover a five-year look forward period.
The Group’s five-year plan is supported by a detailed financial model, which considers the effects of the Group’s business model and strategy on earnings and dividends, taking appropriate account of the Group’s principal risks. See pages 16 to 21 of the Report for further details on the business model and strategy of the Group.
The forecast model is kept under regular review by management and the Board and is updated at least on a quarterly basis against actual performance.
Consideration of significant risks and uncertainties faced by the GroupThe principal risks and uncertainties faced by the Group are outlined on pages 64 to 68. The directors have carefully considered the significant risks and uncertainties within the context of the Group’s viability and prospects, with specific emphasis placed on the unprecedented challenges posed to the business and the Group’s occupiers as a result of the COVID-19 pandemic, and the potential microeconomic impact of Brexit.
The forecast model was subjected to appropriate scenarios to consider the impact of the significant risks and uncertainties facing the business, taking into account likely effectiveness of mitigating actions that the Group would have at its disposal. The significant risks and uncertainties identified as relevant to the forecast and its ability to continue to meet its obligations as they fall due, relate to the timing and quantum of acquisitions and disposals, financing of acquisitions, debt maturity and compliance, rental growth rates, void periods and REIT obligations.
AssumptionsThe Group has significant cash resources at the start of the look forward period, which is a key factor in assessing the viability of the Group.
Key assumptions underlying the base-case scenario of the model are as follows:
▶ It has been assumed that debt facilities can be refinanced as required in normal market lending conditions, consistent with the successful refinancings achieved during the period.
▶ Despite the disruption in the economy caused by COVID-19, The Board does not expect the risk of default to have increased and no breach cures have been assumed in the forecast model. This is considered appropriate in light of the strong relationships with facility providers, and, at the time of publishing this report, the significant headroom that exists for all interest cover ratios and, with the exception of Lugano discussed separately below, for loan to value (‘LTV’) ratio covenants.
▶ The assessment has not assumed any specific implications as a result of
Brexit, which the Board considers to have a low potential impact on the business.
▶ In respect of the current COVID-19 pandemic, Stenprop believes that the demand for MLI space will remain strong and that the majority of rents due will ultimately be collected as shown by rent collection rates and trends since the start of the pandemic. Readers are referred to a year of living with COVID-19 on pages 26 to 31. With the exception of Lugano, discussed separately below, the forecast model has assumed a collection rate of 90% for 18 months to September 2022, after which it is assumed that bad debts will fall back to pre-COVID levels (1.5%). The Board believes that the scenarios included in the base case model suitably address the low impact of COVID-19 on our business.
▶ Lugano: The Group owns a property known as Lugano in Switzerland with a rehabilitation medical facility and health club tenant. The property investment comprises 2% of the portfolio. No revenue has been assumed for this property until its targeted sale date. The property is subject to an LTV covenant only (no interest cover ratio covenant) of 50%. At year end, the LTV based on an external valuation was 48.9%. Notwithstanding this, the bank supports the ongoing sale process and the cash flow forecast illustrates that the Group would have sufficient cash resources available to cure a covenant breach if it crystallised and should the lender take a hard stance. It is further worth noting that the loan is not cross-collateralised and accordingly if the bank did act aggressively, the Group would continue to operate with the remaining portfolio of assets if any foreclosure event were to arise.
The model was subjected to sensitivity analysis to consider the impact of downside assumptions around these factors, specifically in regard to rental income given the uncertainty of the pandemic, taking into account the likely effectiveness of mitigating actions that the Group would have at its disposal.
Viability statementIn light of this review, the significant liquid assets at year end and the £27 million of unencumbered property at reporting date, the directors have a reasonable expectation that the Group will be able to continue in operation and meet its liabilities as they fall due over the five-year period of their assessment.
63STENPROP ANNUAL REPORT 2021
STRATEGIC REPORT

30051 17 June 2021 4:07 pm V3
64 STENPROP ANNUAL REPORT 2021
Risk Management CONTINUED
PRINCIPAL RISK
POTENTIAL IMPACT
HOW WE MONITOR AND MANAGE THE RISK
MOVEMENT IN THE PERIOD TREND
LINK TO KPIs
Strategic risks
A
Economic outlook and political risk, including the impact of the COVID-19 pandemic and Brexit Strategic risks
Macroeconomic conditions can impact both the delivery of our strategy and our financial performance. The economic disruption resulting from the COVID-19 pandemic has affected some of our tenants and impacted our rent collection levels, although not in a material manner. Significant political events, including decisions related to Brexit, could further impact the health of the UK economy.
The Board considers economic conditions and political uncertainty when setting strategy, as well as when overseeing the implement of the strategy and setting the Group’s risk appetite. The executive and senior teams are highly experienced and have a strong track record of understanding the property market. It ensures effective forecasting and scenario planning as well as the maintenance of appropriate liquidity levels.
See pages 26 to 31 of this Report for additional information on our approach to COVID-19.
Despite an initial decision at the beginning of the financial year to retain cash to ensure the Group would be able to sustain a prolonged period of uncertainty due to the pandemic, it became evident as the year unfolded that the impact of the pandemic on the business would not be as severe as originally feared.
The Company was able to operate remotely very quickly. Rent collections were impacted, but still reached an average of 90%. The demand for MLI space remained and we were able to secure the sale of our German shopping centres at a premium to March 2020 valuations.
1
2
3
4
5
B
Inability to increase the MLI component of our portfolio and complete the transition
The inability to identify and acquire suitable MLI properties (which deliver returns sufficient to meet the Group’s investment return criteria) will impact on the Group’s ability to become the leading UK MLI business and the ability to deliver sustainable dividends. A downturn in economic outlook may impact our ability to sell non-MLI assets at attractive prices.
The Company benefits from an experienced asset management team that continuously monitors and researches the multi-let industrial space to identify acquisitions opportunities. During FY2021, we exceeded our pre-pandemic acquisition MLI target of £90 million and successfully completed the sale of our German retail assets (other than the sale of Hermann Quarter, which exchanged in December 2020 and is expected to complete later in the year). As at 31 March 2021, MLI constitutes over 74% of Stenprop’s total portfolio and we remain confident in our ability to dispose of our remaining non-MLI assets by 31 March 2022. To mitigate any delays in our sale programme, we have also secured a credit facility for another year that could be used to finance MLI acquisitions and bridge the gap in our financing needs until completion of the sale of non-MLI assets.
We believe that this risk remained constant during the period despite the pandemic. See the Property Report and Investment Update on pages 44 to 53 of this Report for additional information on the UK MLI market.
1
2
3
4
1

30051 17 June 2021 4:07 pm V3
PRINCIPAL RISK
POTENTIAL IMPACT
HOW WE MONITOR AND MANAGE THE RISK
MOVEMENT IN THE PERIOD TREND
LINK TO KPIs
Financial risks
C
Bank covenants
This may result in the acceleration of the Group’s obligations to repay borrowings and the disposal of assets at discounted values
Loan facilities usually incorporate covenant headroom and cure provisions. Management closely monitors compliance with bank covenants and continuously assesses the likelihood of future breaches based on valuation and rental income.
Despite the disruptions in the economy caused by COVID-19, we believe that this risk has decreased. This is due to the strong relationships we maintain with our facility providers, the existing significant headroom for both interest cover and LTV loan covenants, and our Group LTV ratio being maintained at 40% or below. See page 59 of this Report for additional information on loan covenants.
5
2
D
Availability and cost of finance
The inability to raise adequate funding or refinance existing facilities would impact the ability of the Group to transition into a fully focused UK MLI business and would increase the costs of borrowing.
The Group maintains strong relationships with top-rated financial institutions through a solid track record at achieving strategy. It operates a conservative gearing policy with an LTV at 31 March 2021 of 28.1% as.
Although the costs of financing increased at the beginning of the period, they later reduced, and we were able to successfully refinance some of our existing facilities during the period at the same time significantly reducing our financing costs. See the Fixed rate refinancing case study on page 15.
1
6
1
Trend Key
Increase
Decrease
No change
KPI Key
1 Adjusted earnings per share (pence)
2 Distribution per share (pence)
3 EPRA net tangible assets (‘NTA’) per share (pence)
4 Total accounting return %
5 Like-for-like MLI valuation increase %
6 EPRA cost ratio %
1 MLI portfolio %
2 Group loan-to-value (LTV) %
3 HMLI occupancy %
4 Like-for-like MLI rental growth %
5 MLI lease renewal rate
65STENPROP ANNUAL REPORT 2021
STRATEGIC REPORT

30051 17 June 2021 4:07 pm V3
66 STENPROP ANNUAL REPORT 2021
Risk Management CONTINUED
PRINCIPAL RISK
POTENTIAL IMPACT
HOW WE MONITOR AND MANAGE THE RISK
MOVEMENT IN THE PERIOD TREND
LINK TO KPIs
Operational risks
E
Costs of development of the Industrial Hive operating platform
Inadequate planning, technical issues and inadequate budgeting would result in increased costs and delays and may impact rental growth and earnings.
Adequate planning and budgeting are key to managing this risk effectively. Our in-house tech platform manager leads the planning, development and implementation of all tech solutions under the active supervision of the Managing Director. The executive team keeps the implementation plans under constant review to identify early potential issues, suitable alternatives and solutions, and review its budget expectations to the extent required. The Board is regularly updated and monitors progress and budget.
This risk is not expected to increase now that the new system is in the advanced stages of implementation. See pages 32 and 33 for additional information.
1
6
F
Inability to operate the MLI platform
Failure to achieve its vision of becoming the leading UK MLI business leading to poorer than expected performance and earnings.
We have designed the platform in collaboration with industry and technology experts. We have also made the strategic decision to internalise the property accounting function and have hired a team of professionals to do that, who, together with our experienced and dedicated team of asset managers, bring deep expertise in managing MLI properties. They are supported internally by our in-house tech team and data analysts.
We have continued to make significant progress on developing our MLI operating platform during the year under review. We perceived this as an increased area of risks as we implement new systems and processes. However, we are confident that we have the appropriate controls in place to mitigate this risk and have recruited the right team of professionals. See pages 20 to 21 of this Report for additional information and our plans for the financial year ending 31 March 2022.
1
6
3
4
5
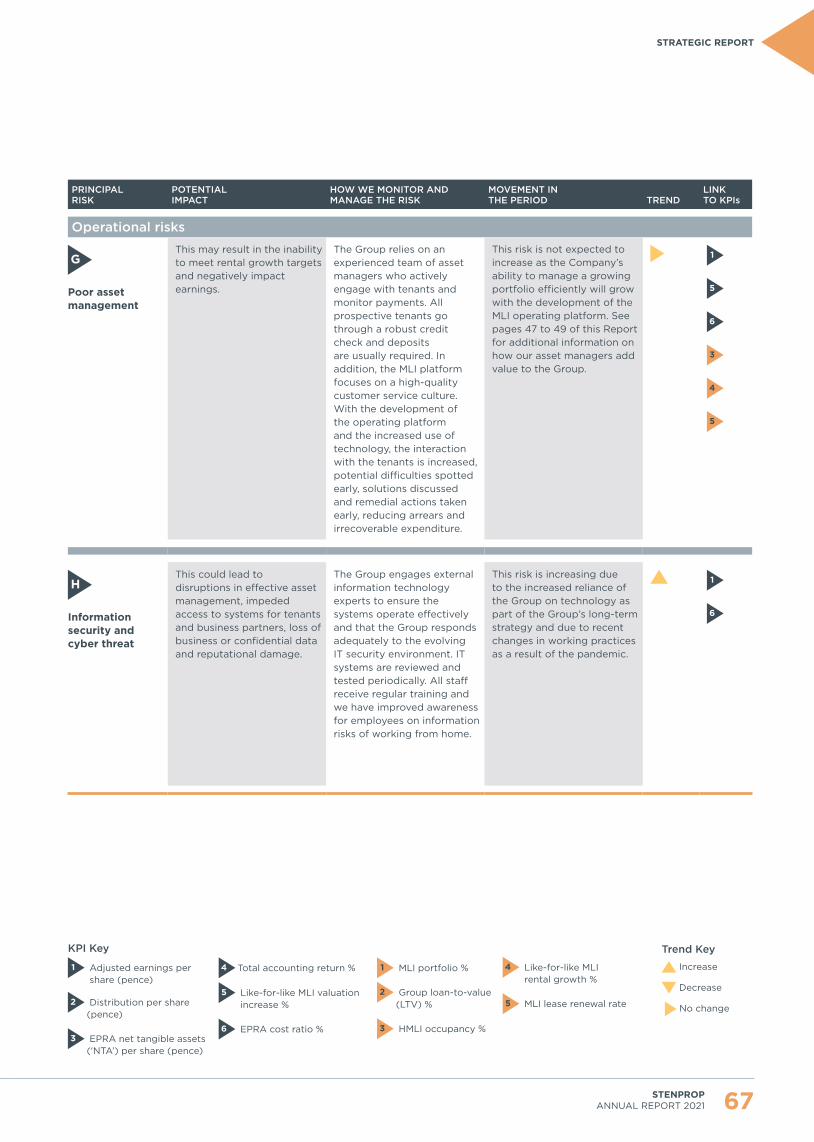
30051 17 June 2021 4:07 pm V3
PRINCIPAL RISK
POTENTIAL IMPACT
HOW WE MONITOR AND MANAGE THE RISK
MOVEMENT IN THE PERIOD TREND
LINK TO KPIs
Operational risks
G
Poor asset management
This may result in the inability to meet rental growth targets and negatively impact earnings.
The Group relies on an experienced team of asset managers who actively engage with tenants and monitor payments. All prospective tenants go through a robust credit check and deposits are usually required. In addition, the MLI platform focuses on a high-quality customer service culture. With the development of the operating platform and the increased use of technology, the interaction with the tenants is increased, potential difficulties spotted early, solutions discussed and remedial actions taken early, reducing arrears and irrecoverable expenditure.
This risk is not expected to increase as the Company’s ability to manage a growing portfolio efficiently will grow with the development of the MLI operating platform. See pages 47 to 49 of this Report for additional information on how our asset managers add value to the Group.
1
5
6
3
4
5
H
Information security and cyber threat
This could lead to disruptions in effective asset management, impeded access to systems for tenants and business partners, loss of business or confidential data and reputational damage.
The Group engages external information technology experts to ensure the systems operate effectively and that the Group responds adequately to the evolving IT security environment. IT systems are reviewed and tested periodically. All staff receive regular training and we have improved awareness for employees on information risks of working from home.
This risk is increasing due to the increased reliance of the Group on technology as part of the Group’s long-term strategy and due to recent changes in working practices as a result of the pandemic.
1
6
Trend Key
Increase
Decrease
No change
KPI Key
1 Adjusted earnings per share (pence)
2 Distribution per share (pence)
3 EPRA net tangible assets (‘NTA’) per share (pence)
4 Total accounting return %
5 Like-for-like MLI valuation increase %
6 EPRA cost ratio %
1 MLI portfolio %
2 Group loan-to-value (LTV) %
3 HMLI occupancy %
4 Like-for-like MLI rental growth %
5 MLI lease renewal rate
67STENPROP ANNUAL REPORT 2021
STRATEGIC REPORT

30051 17 June 2021 4:07 pm V3
68 STENPROP ANNUAL REPORT 2021
Risk Management CONTINUED
PRINCIPAL RISK
POTENTIAL IMPACT
HOW WE MONITOR AND MANAGE THE RISK
MOVEMENT IN THE PERIOD TREND
LINK TO KPIs
Operational risks
I
Reliance on key service providers
The Group relies on key service providers and is dependent on the performance of external property managers for successful and effective operations and financial reporting.
The Group has established and maintains a comprehensive system of procedures and controls. The Company’s asset managers, as well as a team of qualified in-house finance managers, work in close collaboration with property managers and accountants to ensure an appropriate level of oversight.
This risk remained constant during the reporting period.
1
6
3
4
5
J
Employment and retention of key personnel
The departure of key individuals and the inability to recruit suitable replacement could negatively impact the ability of the Group to source adequate UK MLI acquisition, development its MLI platform and realise its vision of becoming the leading UK MLI asset. It could impact performance and earnings.
The Company maintains policies and procedures to support and develop all employees. See pages 76 and 77 for additional information on our corporate culture, as well as the Remuneration Committee Report on pages 96 to 108 for additional information on the Company’s remuneration policy and incentive schemes.
This risk remained constant during the period. The Company is proud of its caring working culture, which focuses on the wellbeing of its employees as well as results. It continues to promote team working, trust and accountability, learning and innovation, and offers a supporting environment in which all employees are able to develop and make a meaningful contribution to the success of the Company.
1
6
ESG risks
K
Climate-related risks
The inability to efficiently assess, monitor and report on the impact of the Group’s activities on the environment with a view to limit that impact over time is expected to impact investors’ and other stakeholders’ confidence in the Company, and ultimately impact on its ability to deliver on its long-term strategic goals. Climate change risks also include regulatory risks (ongoing development of climate-related regulations), physical risks (the impact of extreme weather events) and transition risks (associated with the transition to a low-carbon economy).
We partnered with sustainability specialist Carbon Intelligence and developed a new ESG policy and strategy, which included a detailed assessment of all ESG risks, including climate-related risks, that may impact the Group. During the year ended March 2021, we continued investing in various initiatives as described in our sustainable business: ESG section on page 74.
As we complete our transition to a fully focused UK MLI business, the regulatory environment becomes more stringent, and we understand the increased expectation of all our stakeholders around reducing the impact of our activities on climate change. We believe that this risk is increasing and will continue to focus our efforts in this area.
1
5
6
Trend Key
Increase
Decrease
No change
KPI Key
1 Adjusted earnings per share (pence)
2 Distribution per share (pence)
3 EPRA net tangible assets (‘NTA’) per share (pence)
4 Total accounting return %
5 Like-for-like MLI valuation increase %
6 EPRA cost ratio %
1 MLI portfolio %
2 Group loan-to-value (LTV) %
3 HMLI occupancy %
4 Like-for-like MLI rental growth %
5 MLI lease renewal rate

30051 17 June 2021 4:07 pm V3
Section 172 Statement and Stakeholder EngagementThe Company seeks to comply with the 2018 UK Corporate Governance Code (the ‘Code’) wherever possible, which requires that a description be included in this report of how the interests of its key stakeholders and the matters set out in Section 172 of the UK Companies Act 2006 (‘Section 172’) (set out in the table below) have been considered in board discussions and decision-making. The Board welcomes this opportunity to provide further insights to all its stakeholders as to how it operates.
Section 172 imposes a statutory obligation on each director to act in the way that they consider, in good faith, would be most likely to promote the success of the Company for the benefit of its stakeholders as a whole having regard to certain factors. The Board understands and believes that the long-term success of the Company is intrinsically linked to the interests of its stakeholders. A summary of how we engage with our stakeholders is provided on pages 70 to 71 with examples and additional information disseminated throughout this report.
In the table below, we explain how the directors considered the matters set out in Section 172 when discharging their duties to the Company and its stakeholders by reference to some of the key activities and strategic decisions made during the year. Where relevant it includes explanations as to how the directors assessed and mitigated the impact of these decisions on stakeholders.
Additional information on the operation of the Board and its key activities during the year are also set out on pages 85 to 89.
SECTION 172 MATTERHOW THESE MATTERS WERE CONSIDERED IN DISCUSSIONS AND DECISION MAKING READ MORE
Likely consequences of any decisions in the long term
The long-term strategy of the Group remains to deliver sustainable and growing income to shareholders. Every strategic decision is made after considering how it may impact this long-term objective.
The Board continued its sales and purchase programme as well as its investment in technology. It was aware that some of the strategic decisions made may have the effect of dampening earnings in the short term, but were still necessary to ensure the long term success of the Company.
Our Business Model (pages 16 to 17)
Our Strategy (pages 18 to 21)
Risk Management (pages 61 to 68)
The interests of the Company’s employees
The Board is aware that the needs of its workforce may change as Stenprop transitions further into a 100% focused MLI business. It encourages feedback from employees and continues to review and assess its working practices accordingly.
Stakeholder Engagement (page 70)
Our Sustainable Business: ESG, and case studies from employees(pages 76 to 77)
Business relationships with suppliers, lenders and customers
The Board closely monitors the performance of key suppliers and promotes excellent customer service.
Our response to the challenges presented by the COVID-19 pandemic has been driven by the way it impacted our customers. We have actively engaged with our customers on an individual basis to assess the financial and operating impact of the current crisis on their business. The feedback and knowledge gained by the Group has driven the decisions of the Board on the Company’s COVID-19 rent arrears policy and offers of rent deferrals and changes to payment frequency.
The Board also monitors the lending market and benchmark debt pricing ensuring we achieve the most competitive terms when securing new facilities and refinancing transactions.
A Year of Living With COVID-19 (pages 26 to 31)
Investing in our space to meet customer needs(page 47)
Fixed rate refinancing(page 15)
The community and the environment
The Board recognises that the Group’s activities have an impact on the community and the environment. This year, the Board reviewed and approved Stenprop’s new ESG policy and strategy. For the first time the Company is also reporting in line with the Taskforce for Climate-related Financial Disclosure recommendations, EPRA Sustainability Best Practices Recommendations and the Government’s Streamlines Energy and Carbon Reporting.
Our Sustainable Business: ESG (page 74)
Risk Management (pages 61 to 68)
Maintaining high standards of business conduct
The Board continuously promotes the core values of the business – customer focus, results oriented, innovation and decisive – via the monitoring of the Group’s culture. It also seeks to maintain the highest standards of conduct and has made the decision to seek to comply with governance standards and reporting requirements even though these are not currently directly applicable to the Company such as compliance with the Code and TCFD disclosures.
Our values (page 02)
Corporate governance overview(pages 85 to 89)
Our shareholders The Board recognises the need to act fairly in the interest of all shareholders. This year we have regularly engaged with our shareholders and provided regular updates on our progress against targets and performance through the pandemic.
Our Shareholders(page 71)
69STENPROP ANNUAL REPORT 2021
STRATEGIC REPORT

30051 17 June 2021 4:07 pm V3
Stakeholder engagement
70 STENPROP ANNUAL REPORT 2021
Section 172 Statement and Stakeholder Engagement CONTINUED
STAKEHOLDER GROUP
WHY WE ENGAGED
HOW WE ENGAGED
WHAT WE DID FOLLOWING ENGAGEMENT
Our customers Understanding our customers is key to providing space which meets their needs, and improving customers’ experience, which ultimately leads Stenprop to being recognised as the MLI provider of choice. Engaging with our customers has been particularly important during the COVID-19 pandemic.
▶ We have grown our network of customer engagement managers and continued to interact and transact directly with our customers.
▶ We have maintained closed relationships with our customers throughout the pandemic
▶ Once again, we have conducted an annual customer survey to understand better our customers’ concerns and improve customer service.
▶ Additional investment in people and technology. Read more – pages 32 to 33.
▶ We have continued our Smart Lease roll out. Read more – page 03.
▶ We constantly and proactively adjust our sales and marketing strategy based upon feedback received from customers and the annual customer survey.
Our people Our people are at the heart of our business. We strive to promote a strong culture focusing on results, teamwork and innovation where our employees feel proud, passionate and motivated to be part of the journey.
▶ Weekly live updates from our CEO, Managing Director and CFO and encouraging direct feedback and ongoing dialogue.
▶ Live strategy presentations to all employees with an emphasis on short and long-term goals and setting expectations.
▶ All employees’ surveyed on work conditions during the pandemic and establishment of a working group with representatives of all departments and of all levels of the organisation to discuss future working practices.
▶ We engaged with all employees on ESG and conducted a detailed materiality assessment to understand what was important to them.
▶ We reviewed our annual leave policy to give employees more flexibility as to when to take leave. We also provided all employees with an additional bonus day leave in recognition of all their hard work and support during the pandemic.
▶ We reviewed and updated our annual performance review process to increase employee engagement and align performance with the Stenprop culture. Read more – page 77.
▶ We launched new initiatives to encourage diversity in the workforce. Read more – page 76.
▶ We developed and launched our new ESG policy and strategy. Read more – page 72.

30051 17 June 2021 4:07 pm V3
STAKEHOLDER GROUP
WHY WE ENGAGED
HOW WE ENGAGED
WHAT WE DID FOLLOWING ENGAGEMENT
Business partners, lenders and suppliers
We understand the importance of building trusted relationships with our business partners, lenders and suppliers to deliver on our strategy.
▶ We maintain close and constructive relationships with our business partners, lenders and suppliers. We provide clear and transparent reporting on key metrics and targets and demand the same in return.
▶ We monitor the lending market and continually benchmark debt pricing in the market.
▶ We refinanced one of our existing MLI facilities onto a longer term fixed rate facility on very competitive terms. Read more – fixed rate refinancing case study on page 15.
Our shareholders Our value proposition includes delivering consistent total returns to our investors, while meeting investors’ expectations around sustainability, social responsibility and governance.
▶ We have continued to issue quarterly trading updates, in addition to our half-year and annual results, and organised regular webinars with Q&A sessions to discuss our results.
▶ Investor meetings and presentations.
▶ We encourage feedback from our shareholders via our annual general meeting.
▶ We have taken the strategic decision to transfer our listing from the Specialist Fund Segment to the Premium Segment of the Main Market of the London Stock Exchange.
▶ We have appointed two new independent non-executive directors to the Board. Read more – page 84.
▶ We have reviewed our remuneration policy. Read more – page 100.
Local communities and the environment
We believe that supporting the local communities in which we operate is key to building the long-term sustainable success of the Company and we consider ESG factors in every decision we make.
▶ We maintained ongoing communication with our Charity of the Year, Brain Tumour Research, to find ways to support them during the pandemic.
▶ We promote a culture of awareness of ESG matters and seek to increase our engagement with local communities via our customer engagement managers and through our customers.
▶ We continued to support our Charity of the Year with various fundraising initiatives. Read more – pages 74 to 75.
▶ In April 2020, we provided rent free space to a charity that takes surplus produce and redistributes it to various organisations, supporting the community around Cardiff.
71STENPROP ANNUAL REPORT 2021
STRATEGIC REPORT

30051 17 June 2021 4:07 pm V3
w
A. Embed responsible business practices into day-to-day operations
B. Be an open and inclusive employer of choice
C. Listen to our stakeholders on their ESG aspirations
D. Have clear accountability and well-defined responsibility for developing opportunities and managing risk
E. Engage with our customers and local communities
F. Use insightful data to drive carbon efficiencies
OUR ESG PRINCIPLES
Low
Imp
ort
ance
to
sta
keho
lder
sH
igh
Low Importance to business High
12
58 9
11
6
7
10
13 12
14
15
4
3
Materiality matrix
Governance/economic considerations
Our Sustainable Business: ESGOur ESG aspiration is to be a leader in the promotion and delivery of responsible business activities.
OverviewStenprop remains on course to meet its target of being a 100% focused UK MLI business by March 2022. At 31 March 2021, MLI made up 74.3% of the portfolio (by value), comprising 83 estates spread across the UK. Our Purpose as a business is to revolutionise MLI in the UK for the benefit of our stakeholders. We recognise the critical role that environmental, social and governance (‘ESG’) considerations play in delivering operational and financial performance, and understand that monitoring and disclosing the performance of our portfolio is fundamental to delivering value to our shareholders and meeting their expectations around ESG. To this end, our focus over the last 12 months has been to develop an ESG strategy and policy with a principal focus on our long-term MLI business.
Read more about how we have supported Our Strategy on pages 18 to 21
Our ESG principles are central to what we do and drive how we create value to enable our stakeholders to achieve their own goals and objectives. This applies to investors looking for a sustainable return on their investment; customers who depend on our high-quality customer service, our funders and business partners who invest in a solid, dependable and mutually beneficial relationship. It applies to our employees who are cornerstone to the growth and success of the business and whom we want to feel proud, passionate and motivated, and it applies to the communities across the 80+ locations where we operate where we aim to make a difference and have a positive impact on the environment.
Read more about how we have supported Our People and Culture on pages 76 to 77
To ensure we achieve this sustainable approach to business and to have a wide-reaching impact, we have partnered with sustainability specialist Carbon Intelligence. Over the reporting period, we developed an ESG strategy and policy to help further embed sustainability within our organisation. We recognised that understanding the needs of our various stakeholders was integral to developing these business tools. We assessed our business operation against six key themes, covering direction, governance, data, engagement, performance, and reporting. This robust assessment ensures we are taking a holistic approach to sustainability. This financial year also saw the establishment of our own internal ESG Steering Group to track our progress and identify new opportunities to drive further improvements.
We have also undertaken a detailed materiality assessment, engaging our people, from customer engagement managers, to members of the finance team and the Board. The responses were analysed against the ‘importance to business’ indicators as determined by the Sustainability Accounting Standards Board. Our intention is to broaden this analysis to our wider stakeholder group in the future.
The materiality assessment highlighted that this group of stakeholders felt diversity and equal opportunity and socio-economic compliance were two of the most important ESG considerations. These observations were taken into account in the development of our ESG strategy and policy this year. We recognise that this is a fast evolving space and as peoples’ awareness increases so will their assessment of the importance of different considerations. We plan to perform this assessment on a regular basis to ensure we have a strong understanding all of our stakeholders’ needs and to enable us to deliver on our ambition to be a leader in the promotion and delivery of responsible business activities.
Top materiality considerations1. Diversity and equal
opportunities
2. Socio-economic compliance
3. Anti-bribery and corruption
4. Health & safety
5. Customer privacy
6. Reducing waste
7. Internal training
8. Climate change and target setting
9. Energy efficiency
10. Employee benefits
11. Segregation/independent from political activity
12. Renewable energy
13. Donations to charity
14. Positive impact on local communities
15. Biodiversity
Social considerations
Environmental considerations
72 STENPROP ANNUAL REPORT 2021
30051 17 June 2021 4:07 pm V3
w
ESG metricsAlthough we have always placed importance on, and been aware of, the wellbeing of our stakeholders, we have for the first time expanded our Annual Report to report on wider ESG metrics. There are a number of different organisations and structures against which these ESG metrics can be reported. We have undertaken a review of all mandatory and voluntary reporting requirements and frameworks and have updated our annual reporting disclosure in line with the Taskforce for Climate-related Financial Disclosures (‘TCFD‘) recommendations. Stenprop is a member of the European Public Real Estate Association (‘EPRA’) and this year, we have also expanded our reporting in line with their Sustainability Best Practices Recommendations (‘sBPR’) and reported in line with the government’s Streamlined Energy and Carbon Reporting (SECR). These frameworks aim to bring greater consistency and clarity to the disclosure of ESG impacts across real estate companies and create transparency for stakeholders, whilst supporting our goal of improving the integration of ESG into the management of our portfolio. For further detail, readers are referred as follows:
Task Force for Climate-related Financial Disclosures (‘TCFD’)
Additional disclosure Pages 175 to 177
European Public Real Estate Association Sustainability Best Practices Recommendations (‘EPRA sBPR’)
Additional disclosure Pages 180 to 183
Streamlined Energy and Carbon Reporting (‘SECR’)
Additional disclosure Pages 178 to 179
This is our first year of collecting data, and reporting against these metrics. The results will form the basis against which we will measure future performance. We will be looking to expand and improve the data set over the coming year, in addition to tracking our performance against various trends to ensure that we are promoting and delivering responsible business activities to all of our stakeholders.
For further information on sustainable initiatives and our engagement with communities, please see page 69. For information on wellbeing and opportunities for our employees, please see page 77. We continue to review our governance and management processes to ensure compliance with all relevant regulations and other requirements. For information on our governance framework and risk management process, please see our risk management report on pages 61 to 68 and our corporate governance overview report on pages 85 to 89.
73
STRATEGIC REPORT
STENPROP ANNUAL REPORT 2021

30051 17 June 2021 4:07 pm V3
Our Sustainable Business: ESG CONTINUED
Stenprop encourages its employees to make a positive contribution to society. Employees are offered the opportunity to take four half days per calendar year paid time off to volunteer for their chosen charitable initiative and every member of staff is entitled to claim a pound from the Company for every pound raised for registered charities of their choice, up to a maximum of £1,000 per year per employee.
In the previous financial year to 31 March 2020, we raised a fantastic £27,000 for our chosen Stenprop Charity of the Year, Demelza Hospice Care for Children. We are pleased to report that our fundraising efforts in the financial year ended 31 March 2021, were another great success with £21,000 contributed in total to Brain Tumour Research. For the next financial year, Stenprop employees have chosen Dementia UK as Stenprop’s Charity of the Year. We hope to be able to make a meaningful contribution to the charity and families living with the challenges of dementia.
74 STENPROP ANNUAL REPORT 2021
Our Environment and Communities
Our ESG strategy is aligned with our culture to ensure the wellbeing of all stakeholders. The Company places significant importance through our expanding ESG policy and environmental initiatives on being both a good corporate citizen and a positive community influence across the 80+ locations in which we operate.
SUSTAINABLE INITIATIVES
Alongside our quantitative reporting metrics and targets, we have a number of initiatives that have been undertaken or are in the process of being implemented, some examples of which are set out below:
▶ Only vehicles with hybrid electric engines were added to our fleet in the year under review, reducing our carbon emissions.
▶ Our capex programme to update our units includes improvements in energy efficiency and usability. Projects range from replacement of LED lighting through to complete upgrades of the units. Read more on how we benefited our stakeholders on page 03. We expect these works to result in improved EPC ratings, which in addition will ensure we comply with Minimum Energy Efficiency Standard (‘MEES’) Regulations going forward.
▶ We actively monitor and track health and safety risks across our portfolio. Monthly reporting identifies shortfalls which enables us the opportunity to remedy these. See page 181 to view our health and safety assessment data.
▶ We adopted DocuSign across the business. We seek to sign all documents electronically wherever possible saving paper, and printing, resources. Our Smart Leases advocate and promote this practice.
See page 46 to view the graph on Smart Lease vs traditional leases
▶ We actively seek to procure our utilities from green energy sources and over the course of the twelve months have placed all renewed contracts on renewably better energy contracts.
▶ We incorporated an ESG scoring matrix into our acquisition process to surface and identify considerations such as environmental considerations (e.g flood risks), EPC’s, customer profile etc., and ensure we include business plan measures to manage these going forward.

30051 17 June 2021 4:07 pm V3
£60,000Total raised for charity over the past three years
KEY STATISTICS
STENPROP ANNUAL REPORT 2021
Despite the pandemic having a huge impact on life as we know it, as a Company we got our thinking caps on to consider different ways we could fundraise for our 2021 Charity of the Year: Brain Tumour Research. When we bought our 75th industrial estate, we decided to create ‘Clocktober’, where, each employee was encouraged to cover 75 miles by either running, walking, or cycling for the month of October. Our Head of Asset Management, Simon Ross, kicked off the challenge by completing a marathon of 26.2 miles before work! As a company we covered 2,982.4 miles in total, hitting our minimum 2,400-mile target. In February, we joined Brain Tumour Research in their 10,000 Steps a Day challenge, encouraging our employees to head to their local parks to enjoy some fresh air, try and discover a new route every day or stay at home and complete the challenge around their home or garden.
We are delighted to say that the amount we have raised will sponsor the equivalent of seven days of vital research at one of the charity’s UK Centres of Excellence. Working at the cutting-edge of research, the researchers at Brain Tumour Research need a constant supply of specialist items to carry out their vital work and the money we have raised helps to supply the materials and consumables that are used on a daily basis, such as disposable micropipette tips, surgical gloves, microplates, bottles of tissue culture media, serum, assay kits, etc, as well as to pay the salaries of the scientists themselves. Although this year was tougher in terms of being able to get out there and take on bigger fundraising challenges, we are pleased we have still been able to contribute to Brain Tumour Research… socially distanced of course!
75
STRATEGIC REPORT

30051 17 June 2021 4:07 pm V3
76 STENPROP ANNUAL REPORT 2021
Our Sustainable Business: ESG CONTINUED
Our People and CultureEquality and DiversityStenprop continues to be committed to promoting equal opportunities in employment. We have already achieved balanced gender diversity statistics over our all-employees’ population, and to retain that balance and encourage further diversity across the business, we have implemented a blind hiring process.
We encourage our people to share their views and ideas as we recognise that everyone has specialist skills and different perspectives. We believe the ability to tap into this diverse pool of thinking is a great driver of innovation within the business and key to ensuring we can achieve our purpose of revolutionising the MLI space. To highlight this, we formed a working group drawn from the different departments across the business to look at how we could evolve our working practises following the first COVID-19 lock down. The views of this group are helping to shape our evolving hybrid
work model today, ensuring there is a strong work/life balance which we believe will enhance the productivity of the business.
We rolled out mandatory Equality and Diversity in the Workplace training to all Stenprop employees. The training focused on our commitment to equality and appreciating the value of diversity as well as recognising our responsibility to prevent discrimination and harassment. We launched a new Equal Opportunities Policy in June 2020.
n Male
n Female
53%
47%
Female/Male over all employees’ population:
1 2
3 4
5
OUR CULTURE
Teamwork and collaboration
Decisive decision making
Results oriented approach
Awareness of wellbeing (of all stakeholders)
Continuous training and learning

30051 17 June 2021 4:07 pm V3
CASE STUDY
Attracting talent and developing fulfilling, rewarding careersReading Stenprop’s mission on its website and from my initial conversation with the Head of Financial Operations, I knew Stenprop was where I wanted to be. I was instantly on board with the vision to revolutionise the MLI sector with not only a focused team but with a new operating platform, which will enable us to provide a great service.
From day one I instantly felt part of the team and my role as Property Accounts Manager in the Stockport office has given me the opportunity to scope and recruit a new property finance team as well as be heavily involved in the Industrial Hive project, both of which I have thoroughly enjoyed. I look forward to the system going live with the new team on board, which will provide great support to the business as it continues to grow.
Stenprop is a fantastic community with strong values and a great support system. Although the team has been working from home during the pandemic, training and development have continued, supported by family-friendly policies and a great communication network to promote wellbeing and a healthy work/life balance.
Stenprop is a fantastic community with strong values and a great support system.”Vicky Henstock: Property Accounts Manager
TrainingWe are actively progressing with other training initiatives at Stenprop focused on soft skills and technical skills. We are sponsoring several employees to study towards the Assessment of Professional Competence (‘APC’) to enable them to become qualified Chartered Surveyors (‘MRICS’). We are also in the process of reviewing our Learning and Development strategy and updating our training policy to encourage more training across each department. The aim is to enhance skills and improve performance, broaden career opportunities and increase job satisfaction, retain employees, and comply with regulatory requirements by ensuring employees are competent to perform in their roles.
Health and WellbeingWe maintain a caring environment, with the wellbeing of our employees being a key focus. As a result of the COVID-19 pandemic and the requirement for all employees to work from home since March 2020, we rolled out the following health & wellbeing training courses to all employees to ensure they were supported and able to work in a safe and comfortable environment: ▶ Mental Health Awareness ▶ Work-related Stress ▶ Working from Home ▶ Display Screen Equipment ▶ Stress, Anxiety and Depression at Work
▶ Managing Homeworkers
Stenprop also subscribes to an employee assistance programme so employees can seek free confidential advice at times when they may require additional support. We promote wellbeing through a number of additional benefits, including private medical insurance and travel insurance for all employees and a cycle to work scheme.
Employee EngagementWe implemented a new appraisal process for all Stenprop employees. The current process was updated to increase employee engagement and align performance with the Stenprop culture. Objectives are agreed for each department to support the group KPIs. We decided to add a competency framework to the new appraisal review process to reflect our values and culture (decisive, results, wellbeing, learning and innovation, and collaboration). The appraisal system now includes a competency framework around teamwork, innovation, communication, relationship building, planning, technical knowledge and ESG initiatives.
The new process has also been designed to encourage an open discussion between the employees and their managers by giving employees the opportunity to review and feedback against their own performance.
We are also taking into consideration the other factors that affect employee engagement, such as the recognition of employee contributions. We have recently asked all Stenprop employees to nominate their fellow colleagues for the following awards: innovator of the year, team player, ESG, above and beyond, customer service and problem solver. These awards are aligned to our culture and link into the competency framework which forms part of the new appraisal process.
CASE STUDY
The entire Company is aligned to delivering the vision to revolutionise MLI in the UK for the benefit of all stakeholders.”Mike Handley: Head of Financial Operations
Building an office in Stockport In September 2019, the regional office in Stockport, Cheshire was opened. Stenprop has a clear vision to revolutionise multi-let industrial in the UK for the benefit of all stakeholders and the entire company is aligned to delivering that vision.
Stockport was chosen as a regional location as it is conveniently located, with easy access to the M6 and M62 motorways and on the Manchester to London mainline. It brings us closer to our customers as it is within an hour’s drive of 30% of our estates and close to many of our third-party service providers. The area also has a highly skilled and diverse workforce, with 2,000,000 people of working age living within 30 minutes of the town centre.
Since the office opened, we have increased our staff numbers in that office from one to 20, covering roles at all levels of the business. Seven of these employees are employed in management roles.
COVID-19 has undoubtedly changed the way we work and are able to collaborate online and this has influenced our recruitment decisions. We have been able to recruit from a diverse area and we now have staff from across the North West region, including North Wales, Preston and Liverpool, within our team.
77STENPROP ANNUAL REPORT 2021
STRATEGIC REPORT

30051 Stenprop AR2021 Governance 17 June 2021 1:33 pm V2

30051 Stenprop AR2021 Governance 17 June 2021 1:33 pm V2
GovernanceChairman’s Statement 80Our Board of Directors 82Corporate Governance Overview 85Audit and Risk Committee Report 90Nomination Committee Report 93Remuneration Committee Report 96Social and Ethics Committee Report 109Directors’ Report 111
30051 Stenprop AR2021 Governance 17 June 2021 1:33 pm V2
Chairman’s Statement
I am writing this report after an unprecedented year, which, I am pleased to say, has ended with more positives for Stenprop than negatives. When I wrote my report this time last year, the full impact and challenges arising from COVID-19 were only just becoming apparent. A year on, it is becoming possible to get some perspective on the many and various changes brought to business and society as a result of the pandemic. On balance, I believe that Stenprop has managed the challenge of COVID-19 successfully and indeed has been able to benefit from many of the macro economic trends that have been caused by, or indeed accelerated by, the pandemic.
Financial Performance and Transition to 100% MLIIn such challenging times, next to ensuring the safety of our staff, our greatest achievement has been to achieve the major milestones for the transition of the business which we set for ourselves at the beginning of the year. We continued our programme of disposing of our legacy assets and in all cases achieved sales in excess of March 2020 book values. This helped us to achieve a total accounting return of 11.4% for the financial year ended 31 March 2021 and is a considerable achievement given the turmoil caused by the pandemic, which has impacted all property markets.
We have also continued our programme of adding to our portfolio of UK multi-let industrial assets, acquiring a total of 14 estates at a net cost of £91.5 million. Through these transactions we achieved our target of increasing the MLI proportion of our portfolio to 74%. We have also, as planned, maintained a balance sheet gearing of less than 40%, while simultaneously obtaining cheaper and more attractive debt facilities. We are confident that we will sell the remainder of our legacy assets before the end of this current financial year, and realise our strategic goal of becoming a 100% multi-let industrial (‘MLI’) business by 31 March 2022.
Dealing with COVID-19There is no doubt that many of the changes in the commercial activities of UK businesses resulting from the impact of COVID-19 have benefited our business. The most obvious of these
Richard Grant Independent Non-executive Chairman
80 STENPROP ANNUAL REPORT 2021

30051 Stenprop AR2021 Governance 17 June 2021 1:33 pm V2
are the dramatic acceleration in the move to online trading and retailing, and the desire for many businesses to shorten their supply chains. These trends have greatly assisted us in reducing our vacancy rate, whilst the surfeit of demand for MLI space has added to the upward pressure on rent levels that was already apparent pre-pandemic. As noted elsewhere in this report, our overall MLI vacancy levels have reduced from 9.0% at the beginning of the year to 6.3% at the end of the financial year, and we estimate that there has been an improvement of approximately 6.2% in average ERVs across our MLI portfolio over the same period.
Nearly all property companies have had to wrestle with the challenge of collecting rents from customers suffering to differing extents from the impact of COVID-19 on their businesses. For Stenprop, this has consumed much management time and has required varying degrees of flexibility, compassion and firmness. It is still too early to assess the eventual cost to the business from rents that we will ultimately be unable to collect due to COVID-19, but with 92% of rent already collected by 31 May 2021, for the year to 31 March 2021, we are already in a strong position, particularly when compared to the real estate sector as a whole. Furthermore, it is testament to the efforts we have made in collecting rents and to the overall financial management of the business that our cash position remains strong. Importantly this enabled us to maintain a covered dividend of 6.75p in line with both our forecasts and previous years.
The Industrials Hive Operating PlatformAnother area of the business that has received significant investment and management attention, in spite of the demands of managing the Company through COVID-19, has been the development and implementation of our Industrials Hive operating platform. The total cost of investment in our operating platform will be approximately £4.4 million, but we are confident that this not only provides a highly efficient base for our existing business, but will also enable us to expand our portfolio and range of activities substantially with minimal additional cost. Whilst we have a number of significant technology projects on Industrials Hive reaching their conclusion this year, we have already implemented a range of technology and process improvements
and have enjoyed significant benefits from improved connectivity, data and collaboration within the business, and from greater efficiencies in dealing with both existing and prospective customers and suppliers.
Board of DirectorsAs chairman of the Board, I have the responsibility for ensuring that the composition, operation and effectiveness of the Group Board works to provide the highest quality of leadership, direction and supervision for the overall benefit of the Company and for all its shareholders and other stakeholders. A sound and effective board requires the right blend of talent, energy and experience, while also being a forum for constructive discussion and diverse opinions.
A year ago, we recognised that we needed to improve the make-up of the Board by bringing in additional diverse and independent non-executive directors who could make significant contributions to the direction and operation of the business. We appointed external advisers to assist in our search and were delighted to find two highly respected and eminently suitable candidates to join the Board as additional independent non-executive directors.
Richard Smith and Louisa Bell joined the Board in November 2020. We were attracted to both because of their significant operational and commercial experience in modern digitally sophisticated businesses. Richard is CEO of Unite, the London Stock Exchange listed FTSE 250 business and the UK’s leading provider of purpose-built student accommodation. Louisa Bell is currently director of operations for P&O Ferries and has a background in the travel and leisure industries. I welcome both to the Board and am delighted by the level of involvement and guidance that they are already providing to the business.
Business ObjectivesLooking forward to the remainder of 2021 and into 2022, we have a clear focus on our priorities and key strategic aims. Firstly, we intend to complete the implementation of the first phase of our Industrials Hive operating platform before the end of this calendar year. We know this will provide us with many efficiencies and we anticipate that the benefits will have a long-term impact on the development of Stenprop. Secondly, we will complete the business transition which we embarked upon three years ago. We intend to dispose
of our remaining legacy assets, to continue to acquire additional multi-let industrial estates within the UK, and to further invest in those we already own. We anticipate that we will complete this process and become a 100% multi-let industrial REIT by 31 March 2022.
Thirdly, we are planning to move our London Stock Exchange listing from the Specialist Funds Segment to the Premium Segment of the Main Market before the end of the financial year. The London Stock Exchange will become our primary listing and, subject to shareholders’ approval, our listing on the Johannesburg Stock Exchange will become a secondary listing. This will reflect the reality that we will shortly be an entirely UK operating business, whilst providing additional liquidity and transparency for investors.
Strong fundamentalsUnderlying all these ambitions is our continued confidence in the UK multi-let industrial property business on which we will soon be totally focused. We believe that prospects for the multi-let industrial market remain strong with demand for new space continuing to exceed supply, leading to rising rents and values. The acceleration of favourable trends in business and society as a result of COVID-19, will continue to deliver growth for Stenprop’s business in the short and medium term.
It has been a turbulent and challenging year for obvious reasons. Making the right tactical decisions for the business in the face of the unprecedented COVID-19 pandemic has required cool heads and great clarity of vision in resetting priorities and managing resources. I am extremely grateful to Paul Arenson, Julian Carey and James Beaumont for the way in which they have risen to the management challenges of the last year, and I would like to thank them and all the Stenprop staff for their energy, enthusiasm and commitment throughout the year.
Richard GrantIndependent Non-executive Chairman
10 June 2021
81STENPROP ANNUAL REPORT 2021
GOVERNANCE

30051 Stenprop AR2021 Governance 17 June 2021 1:33 pm V2
Our Board of Directors
Paul has been Chief Executive Officer of Stenprop since October 2014.
Skills and expertisePaul founded Stenham Property Limited, a property fund management business for the Stenham Group, in 1995 and was its managing director from inception until October 2014. In October 2014, the Stenham Property business and a substantial part of the assets under management were transferred to a listed entity now known as Stenprop. Paul was appointed as its CEO. Stenprop was subsequently listed on the LSE in June 2018. Prior to joining the Stenham Group in 1995, Paul practiced as a UK corporate solicitor.
James was appointed Chief Financial Officer in June 2019.
Skills and expertiseJames was previously Stenprop Head of Finance from June 2015, with responsibility for all aspects of finance, financial control, tax, accounting and reporting for the Stenprop group and funds managed by Stenprop. He previously spent five years as finance director of alternative asset funds at Shore Capital Group Limited, where his focus was on German real estate and alternative investment funds. Prior to that, he had eight years of experience in European real estate and financial services through senior finance roles at Cambridge Place Investment Management and Genworth Plc, a Fortune 500 company. James qualified as a chartered accountant in 2002, after serving articles with UHY Hacker Young, a firm based in the City of London. He holds a BSc (Hons) degree from the University of Leeds.
Julian joined Stenprop in July 2017 and was appointed to the Board in May 2018.
Skills and expertiseJulian established C2 Capital Limited, a real estate fund management business, in 2009 in joint venture with the Ellis Campbell Group, a UK Family Office. He subsequently acquired the Ellis Campbell stake in the business in 2015 at the same time as C2 Capital launched Industrials.co.uk, a joint venture with Morgan Stanley Real Estate Investment focused on UK multi-let industrial. Between 2015 and 2017, the Industrials.co.uk portfolio grew to comprise 25 multi-let industrial estates and was sold to Stenprop in June 2017, along with C2 Capital. Julian previously worked in the leveraged opportunity funds team at LaSalle Investment Management from 2007–2009, prior to which he worked at Jones Lang LaSalle in the auction and private investment team. He has extensive experience in asset management, fund structuring, third-party finance, real estate technology and investment. Julian holds an MSc in real estate investment from Reading University, is chairman of the Investment Property Forum Tech Futures Group and is a qualified chartered surveyor.
Paul Arenson
Chief Executive Officer
James Beaumont
Chief Financial Officer
Julian Carey
Managing Director
82 STENPROP ANNUAL REPORT 2021

30051 Stenprop AR2021 Governance 17 June 2021 1:33 pm V2
Richard was appointed chairman of the board and chair of the Nomination Committee in May 2018.
Skills and expertiseRichard was the chief financial officer of Cadogan Group Limited from 1994 until his retirement in 2017. Cadogan is a property investment business operating in Chelsea and Knightsbridge in West London with a holding extending to 93 acres, built on the foundations of a traditional landed estate, which has been in the ownership of the Cadogan family since 1753.
Additional roles heldRichard is currently the non-executive chairman of Helical plc, a UK property investment and development company listed on the London Stock Exchange. He is also the chairman of Helical’s nominations committee. In addition, he is non-executive chairman of Wittington Investments Properties Limited, a private property investment business.
Paul was appointed to the Board in September 2016. He is the senior independent director and chairs the Remuneration Committee.
Skills and expertisePaul is a solicitor with over 25 years’ experience in cross border mergers and acquisitions, joint ventures, international offerings, listed and unlisted funds, and governance and securities laws issues, with a particularly focus on the real estate sector. Paul graduated from the University of Cape Town with Bachelor degrees in Commerce and Law. He built his career at Berwin Leighton Paisner LLP (now Bryan Cave Leighton Paisner LLP), where he was a senior partner and led the capital markets team for a number of years. He is now a director of Everglen Capital Partners LLP and remains a part-time consultant to Bryan Cave Leighton Paisner LLP.
Additional roles heldPaul is the CEO of Everglen Capital Partners LLP, a London-based operational management business servicing the interests of its founders.
Philip was appointed to the board in May 2018. He chairs the Audit and Risk Committee and the Social and Ethics Committee.
Skills and expertisePhilip is a chartered accountant with more than 22 years’ experience in board-level finance roles in the property sector. Between 2011 and 2017, Philip was finance director and deputy managing director of Primary Health Properties plc, a Real Estate Investment Trust listed on the Main Market of the LSE, and prior to that with Natixis Capital Partners Limited, Atlas Estates Limited, Teesland plc and Estates & General plc. Philip is currently the chief investment officer at Prime plc, the UK’s leading healthcare real estate company, having joined the group in April 2017.
Additional roles heldPhilip is also a non-executive director and chairman of the audit committee of TP Group plc, an AIM listed specialist services and advanced engineering company that operates in the defence, industrial and government sectors.
Executive Non-executive
Key Remuneration Committee
Audit and Risk Committee
Social and Ethics Committee
Nomination Committee
Chair of Committee
Richard Grant
Independent Non-executive Chairman
Paul Miller
Independent Non-executive Director
Philip Holland
Independent Non-executive Director
83STENPROP ANNUAL REPORT 2021
GOVERNANCE

30051 Stenprop AR2021 Governance 17 June 2021 1:33 pm V2
Our Board of Directors CONTINUED
Patsy became a non-executive director on 5 June 2019. Prior to that, she was Chief Financial Officer of Stenprop between October 2014 and June 2019, having joined Stenham Property Limited in May 2007 as finance director.
Skills and expertisePatsy holds Bachelor degrees in Commerce and Accountancy from the University of Witwatersrand in South Africa, where she also completed a two-year postgraduate course in taxation. She qualified as a chartered accountant in Johannesburg, after serving articles with PricewaterhouseCoopers. Patsy joined the project finance division of a South African merchant bank for three years, prior to becoming a founding partner in Neil Thomas & Associates, a boutique firm of corporate finance specialists in Johannesburg. There she had 13 years of experience in corporate finance and project structuring. Following a move to the UK, Patsy spent three years as finance director of a division of Regus before leaving to join Stenham Property Limited.
Louisa joined the board as a Non-executive Director in November 2020.
Skills and expertiseLouisa is a commercial and operational specialist with a career spanning 25 years primarily in the travel and transportation industry. Since January 2021, Louisa has been director of operations – Dover/Calais for P&O ferries with responsibility for the commercial and operational aspects of this nationally important tourist and freight route.
Successful in driving business transformation, she has held a number of senior roles for Avis Budget Group, Cigna Healthcare, Eurostar and British Airways. She has experience in transforming people-led, customer-focused businesses, significantly improving customer and employee satisfaction levels, as well as developing new customer markets.
Additional roles heldDirector of operations – Dover/Calais for P&O Ferries
Patsy Watson
Non-executive Director
Louisa Bell
Independent Non-executive Director
Executive Non-executive
Key Remuneration Committee
Audit and Risk Committee
Social and Ethics Committee
Nomination Committee
Chair of Committee
Richard joined the board in November 2020 as a Non-executive Director.
Skills and expertiseRichard is a qualified chartered institute of management accountant with over 25 years’ experience in finance, operations and business leadership. Richard is currently the chief executive of Unite Group Plc. Prior to Unite, Richard spent 18 years in the transport industry, working in the UK, Europe, Australia and North America. This included 13 years at National Express Group PLC where he held a range of senior finance, strategy and operations roles, including group development director and chief financial officer, North America.
Additional roles heldRichard is the CEO of Unite, a London stock exchange listed FTSE 250 business and the UK’s leading operator, manager and developer of purpose-built student accommodation.
Richard Smith
Independent Non-executive Director
84 STENPROP ANNUAL REPORT 2021

30051 Stenprop AR2021 Governance 17 June 2021 1:33 pm V2
Corporate Governance Overview
Stenprop is a UK REIT registered under the Companies (Guernsey) Law, 2008 (as amended) (‘Guernsey Law’). The Company’s shares are listed on the Specialist Fund Segment of the Main Market of the London Stock Exchange and have a premium listing on the Johannesburg Stock Exchange.The UK Corporate Governance Code 2018Whilst it is not required to do so, the board of directors (‘the Board’) decided once again that the Company would seek to comply with the 2018 UK Corporate Governance Code (the ‘Code’) wherever possible.
For the financial year ended 31 March 2021, the Board considers that the Company has complied with the provisions set out in the Code except in relation to provisions 38, 36 and 4 (see explanations on pages 98 to 99).
The table below sets out where disclosure against the principles of the Code can be found in this Corporate Governance Report.
Code section Pages
Board leadership and Company purpose 85 and 86Division of responsibilities 87Composition, succession and evaluation 87, 88 and 93 to 95Audit, risk and internal control 89 and 90 to 92Remuneration 96 to 108
The King IV Report on Corporate Governance for South Africa The Company also adheres to the governance outcomes contained in the King IV Report on Corporate Governance for South Africa (the ‘King IV Report’) of ethical culture, good performance, effective control and legitimacy in South Africa. The Board confirms that, at the date of this Report, the Company has applied the recommendations of King IV in all material respects. A Report setting out how King IV principles and recommended practices were applied during the year ended 31 March 2021 is available on the Company’s website.
Board leadership: the Company’s purpose, values and strategyThe Board is responsible for the Group’s purpose, values and strategy, promoting its culture and for the promotion of its long-term sustainable success for the benefit of all its stakeholders.
Stenprop’s purpose and aspirational goal are both clear: to revolutionise the way MLI is managed in the UK for the benefit of its stakeholders and to be the leading MLI business in the UK.
Stenprop’s purpose and aspirational goal help articulate its short and long-term strategy, business model and operating principles (read more on our business model and strategy on pages 16 to 21). They also drive how and why the Company engage with its stakeholders.
The five core components of the Company’s values and culture are designed to support and promote its purpose and aspirations:
▶ Decisiveness in its decision-making process;
▶ Results-orientated approach;
▶ Continuous training and learning;
▶ Teamwork and collaboration; and
▶ Awareness of wellbeing of all stakeholders.
Sarah BellilchiGroup General Counsel and Company Secretary
85STENPROP ANNUAL REPORT 2021
GOVERNANCE

30051 Stenprop AR2021 Governance 17 June 2021 1:33 pm V2
A competency framework was launched during the reporting period to promote these values and ensure that they are reflected in all that employees do and at all levels of the organisation. In addition to the core values described above, the competency framework also includes innovation and data as well as ESG initiatives.
Although the Board, as a whole, remains responsible for assessing and monitoring workplace culture, certain activities have been delegated to committees. For example, the Remuneration Committee plays a key role in implementing a results-orientated culture via the setting of corporate KPIs, whilst the Audit and Risk Committee monitors performance and financial results. The Social and Ethics Committee is responsible for the continuous review of employment
policies and practices with the wellbeing of employees in mind, as well as setting the Company’s ESG strategy. The Board receives regular updates from its committees and the management team on their discussions and activities. The Board itself works in an open and transparent manner with constructive discussions and challenges, and promotes an open and approachable culture throughout the business.
Our governance and leadership structure
Chairman: Richard Grant
Composition: Independent chairman, three executive directors, five non-executive directors (including four independent non-executive directors)
Responsible for the Group’s purpose, values and strategy, and the promotion of its long-term sustainable success. It
develops and reviews the Group’s strategy and ensures that adequate internal controls and risk management processes are in place. It is also responsible for ensuring effective communication with all stakeholders.
Certain matters are reserved for the Board’s approval, with other matters delegated to the committees of the Board or the executive directors as appropriate.
BOARD OF DIRECTORS
Responsibility for the day-to-day management of the business. The chief executive is responsible and accountable for the implementation of the approved strategy with specific areas of the business managed by the other executive directors.
CHIEF EXECUTIVE AND EXECUTIVE DIRECTORS
An executive committee comprising all executive directors and certain members of senior management. It focuses on the operational aspects of the effective management of the MLI portfolio of the Group, including financial reporting.
OPERATIONS COMMITTEE
Chair: Philip Holland
Oversees the external audit process, financial reporting, internal controls and risk management framework, and assesses the need for an internal audit function.
See the Audit and Risk Committee Report on pages 90 to 92
AUDIT AND RISK COMMITTEE
Chair: Richard Grant
Reviews the Board composition and recommends changes, reviews the independence of directors, responsible for succession planning and annual board evaluation.
See the Nomination Committee Report on pages 93 to 95
NOMINATION COMMITTEE
Chair: Paul Miller
Determines the remuneration policy, sets the executive directors and senior management remuneration, and approves annual and long-term performance objectives and awards.
See the Remuneration Committee Report on pages 96 to 108
REMUNERATION COMMITTEE
Chair: Philip Holland
Responsible for sustainable, social and economic development, responsible corporate citizenship and labour and employment relationships.
See the Social and Ethics Committee Report on pages 109 to 110
SOCIAL AND ETHICS COMMITTEE
Corporate Governance Overview CONTINUED
86 STENPROP ANNUAL REPORT 2021

30051 Stenprop AR2021 Governance 17 June 2021 1:33 pm V2
n Independent chairman
n Independent non-executive directors
n Non-executive directors
n Executive directors
Board structure
4
1
1
3
n Male
n Female
Board gender split
78%
22%
33%
12%
33%
22%
n Under 40
n 40 to 49
n 50 to 59
n 60 to 69
Board member age
n 5 to 7 years
n 3 to 5 years
n Less than 3 years
Tenure of non-executive directors
45%
22%33%
Composition of the Board and changes during the reporting periodAs announced, Warren Lawlor, who was not independent, resigned with effect from 16 September 2020. Following feedback from investors, the Board recruited not one but two new independent non-executive directors, who were both appointed on 4 November 2020: Louisa Bell and Richard Smith. Sam Allen Associates Ltd. was engaged as the external search consultancy for these two roles. The firm has no other connection with the Company or any of the individual directors. Louisa and Richard brought with them a range of complementary expertise and experience in operational management and business transformation.
The Board currently consists of the chairman, three executive directors and five non-executive directors. The Board continues to have a strong mix of experienced individuals with a diverse range of skills and a wealth of business experience in property, including the MLI sector, finance and governance. They provide strong and effective leadership.
More information on the composition of the Board can be found in the Nomination Committee Report on pages 93 to 95 of this Annual Report, and brief biographies of the directors and their skills and experience are set out on pages 82 to 84.
On the recommendation of the Nomination Committee, all the directors will offer themselves for re-election at the 2021 Annual general meeting.
IndependenceThe Board considers four of its five non-executive directors to be independent. Patsy Watson is not considered independent due to her previous role as chief financial officer of the Company. Accordingly, following the appointments of Louisa Bell and Richard Smith, and as at 31 March 2021, the Company fully complies with the requirement of the Code that at least half of the Board (excluding the chairman) is made up of independent non-executive directors. In addition, the chairman, Richard Grant, was considered independent on his appointment.
Role of the Board and division of responsibilitiesCertain key decisions and matters are reserved for the Board’s approval, including setting the Group’s strategy and overseeing its delivery, but also any changes to the Group’s capital or corporate structure, significant transactions, budgets and the regular review of the financial position of the Group. The Board is also responsible for ensuring that the Group’s culture is aligned to its purpose, values and strategy.
The directors believe that there is a clear balance of power and authority at Board level, such that no one individual or block of individuals can dominate the Board’s processes and decisions. The non-executive directors constructively challenge the executives and scrutinise the performance of management in meeting their agreed goals and objectives. This is key to the successful delivery of the Company’s purpose to become the leading MLI business in the UK. During Board meetings, a collaborative atmosphere allowing coherent discussions is maintained, with all directors given the opportunity to contribute to the debate.
There is a clear division of responsibilities between the chairman, responsible for the leadership and effectiveness of the Board, and the chief executive, responsible for the day-to day management of the business.
The Board has established four committees, the Audit and Risk Committee, the Nomination Committee, the Remuneration Committee, and the Social and Ethics Committee, to which certain powers have been delegated as detailed in the governance and leadership structure overview on the previous page. The reports of these four committees, their key areas of responsibilities and their activities in the year ended 31 March 2021 are set out on pages 90 to 110 of this Report.
The Operations Committee composed of all the executive directors and of certain members of senior management continued to oversee the MLI operations of the Group. Its key role and objectives are to improve efficiencies in the management of the MLI portfolio and financial reporting.
87STENPROP ANNUAL REPORT 2021
GOVERNANCE
30051 Stenprop AR2021 Governance 17 June 2021 1:33 pm V2
Corporate Governance Overview CONTINUED
88 STENPROP ANNUAL REPORT 2021
Board meetings and operationsQuarterly board meetings are scheduled during the financial year with additional meetings convened as necessary for exceptional business. This year, all meetings took place virtually due to the pandemic. During Q1 and Q2 FY2021, the Board also had regular video conference calls in addition to the scheduled board meetings mentioned in the table below. These allowed the Board to receive regular feedback from the executive team and manage the business through the pandemic, with a particular focus on financial performance and the safety of customers and employees.
The quarterly meetings follow a formal agenda, which includes a business review and updates on key operational matters, discussions on strategic matters, updates and reviews of the activities of the committees of the Board, any major transactions and legal and governance matters. A corporate board report with peer group comparisons, share price and volume analysis and share register analysis is also discussed at each quarterly meeting. Supporting documents and background information are circulated to all the directors in advance of the meetings to allow sufficient time for the directors to familiarise themselves with the business to be considered.
Directors
Meetings attended during
the relevant director’s tenure
Non-executivesRichard Grant (Chairman) 6/6Paul Miller 6/6Philip Holland 5/6Patsy Watson 6/6Warren Lawlor¹ 2/3Louisa Bell² 2/2Richard Smith² 2/2ExecutivesPaul Arenson 6/6James Beaumont 6/6Julian Carey 6/6
1 Resigned on 16 September 2020 2 Appointed on 4 November 2020
Key activities of the Board during the reporting periodTOPIC AREAS OF FOCUS FOR THE BOARD DURING THE YEAR
Strategy ▶ Review of Company purpose, aspirational goal and strategy following executives’ off-site strategy discussion
▶ Consideration of a transfer from the Specialist Fund Segment to the Premium Segment of the London Stock Exchange and decision to rebrand
▶ Review of MLI acquisition pipeline and progress against acquisition targets
▶ The sale of the German retail assets and consideration of the timing of the sale of remaining non-MLI assets
MLI operations
▶ Regular updates on rent collection statistics and business/financial performance throughout the pandemic, as well as wider consideration of the impact of the pandemic on the economy in general and the MLI sector in particular
▶ Short-term strategy to support customers through the pandemic
▶ Monitoring of the ERP project and budget
▶ Strategic decision to internalise the property accounting function
Financial ▶ Approval of half year and annual results
▶ Approval of a final dividend of 3.375p per share for the six months ended 31 March 2020, and of an interim dividend of 3.375p per share for the six months ended 30 September 2020
▶ Budget discussions
▶ Assessment of viability and going concern, including stress testing and sensitivity analysis
▶ Decision to recommend the appointment of BDO as auditor for Stenprop at the 2020 AGM
▶ Refinancings
Governance ▶ Appointments of Louisa Bell and Richard Smith to the Board and subsequent changes to the composition of the committees of the Board
▶ Approval of anti-slavery and human trafficking statement, equal opportunities policy and whistleblowing policy
▶ Review of terms of reference for the Board committees
▶ Consideration of results of 2020 AGM and shareholder engagement on the remuneration policy
▶ Approval of policy on diversity at board level
Risk management
▶ Monitoring of the Group’s performance
▶ Review of principal risks
Sustainability ▶ Consideration and approval of the Company’s ESG policy and ESG strategy
Our people and culture
▶ The safety and wellbeing of employees during the COVID-19 pandemic
▶ Grant of awards under the Stenprop STIP and Stenprop LTIP
Conflicts of interestAll the directors are required to avoid situations in which they may have potential conflicts of interest. Any potential, actual or perceived conflicts must be notified to the chairman and the company secretary, as well as all new outside interests that may affect them in their role as directors of the Company. Directors’ interests and conflicts are recorded and reviewed by the Board at each meeting.
Board evaluationThe evaluation of the Board and its committees for the reporting period was conducted internally via performance evaluation questionnaires and discussions led by Richard Grant, as chairman of the Board, and Paul Miller, as senior independent director. Information on the outcome of this process can be found in the Nomination Committee Report on page 94.

30051 Stenprop AR2021 Governance 17 June 2021 1:33 pm V2
Risk management and internal controlsThe Board determines the extent and nature of the risks it is prepared to take in order to achieve the Company’s strategic objectives. It carries out a robust assessment of the principal and any emerging risks facing the Group, including those that would threaten its business model, future performance, solvency or liquidity. For additional information regarding the five-step risk management process followed by the Company, the principal risks facing the Group and how they are being managed and mitigated, see the risk management section on page 61 of this Report.
The directors also acknowledge that they are responsible for establishing and maintaining the Group’s system of internal controls and reviewing its effectiveness. The directors promote a strong control environment.
The CFO and the head of financial operations assume overall responsibility for the accuracy of financial reporting. The Group employs a team of qualified finance managers who work in close collaboration with asset managers and property managers to ensure the appropriate level of oversight and analysis is provided to the financial reporting process.
The Operations Committee, composed of all the executive directors and certain members of senior management including the head of financial operations and the head of asset management, plays a key role in ensuring adequate and effective control procedures. The importance of accurate financial reporting is emphasised at all levels of the organisation and flows through to external property managers and other service providers who are monitored and reviewed with regard to the accuracy of their output on a monthly basis.
The key procedures established to provide internal control and support the directors’ review of the financial position and prospects of the Group are set out below.
▶ Monthly management accounts are prepared and presented to the Operations Committee for review and discussion.
▶ Quarterly management accounts including variances to prior periods, budget and adequate narrative are presented and explained in detail to the Board.
▶ Financial reporting standards are considered for all transactions and, where necessary, the Group’s auditors are consulted. Memos are produced for the benefit of the Audit and Risk Committee and the Board for material transactions and accounting policy decisions.
The Board has reviewed the need for an internal audit function and remains of the view that it is not suitable for the Group considering its size and structure. During the reporting period, the Board has engaged with BDO to perform some additional audit assurance work. Further information on the scope of the work undertaken can be found in the Audit and Risk Committee Report on page 90 of this Report. The Board will continue to review periodically whether an internal audit function is desirable.
It should be noted that internal controls over financial reporting are designed to provide reasonable assurance regarding the reliability of financial reporting. They can only provide reasonable but not absolute assurance against the risk of material misstatement or loss.
Company secretaryThe Board has direct access to the advice and services of the company secretary, Sarah Bellilchi, who is also general counsel to the group and a member of the senior management team. The company secretary provides guidance to the Board and individual directors on corporate governance matters. She is responsible for ensuring that the Board and committees’ procedures are followed and that the Company meets its statutory obligations.
The Board confirms that it has considered and satisfied itself on the competence, qualifications and experience of the company secretary.
Shareholder engagementStenprop issues quarterly trading updates in addition to its interim and annual results and the chief executive, managing director and chief financial officer have delivered live quarterly presentations with Q&A sessions with investors. They also regularly attend analyst meetings and are available to meet or talk to investors if requested. Individual meetings and conversations with shareholders also took place throughout the year. The feedback received and the outcome of these meetings and conversations were communicated to the Board.
All significant events and transactions, as well as the Group’s financial performance, are announced on a timely basis. Shareholders are encouraged to attend the Company’s Annual general meeting, which all the directors normally attend, and which provides an opportunity for shareholders to ask questions and discuss matters with the Board.
Employee engagementThe Board recognise the importance of engaging with all the employees of the Group, providing a clear explanation of the Company’s strategy and objectives as well as a channel for feedback and raising concerns.
This year, the Company held again strategic sessions with executive directors and all members of senior management with the goal of setting and clearly articulating the Group’s strategic objectives for the short and long term. The conclusions reached were then presented to all staff, encouraging questions and discussions to ensure buy-in from all employees to the Group’s vision and values.
Patsy Watson continued in her role as the designated non-executive director with responsibility for engagement with employees. She remained available throughout the year and ensures that all employees have a forum in which to air their views and that these views are fed back to the Board.
89STENPROP ANNUAL REPORT 2021
GOVERNANCE
30051 Stenprop AR2021 Governance 17 June 2021 1:33 pm V2
Audit and Risk Committee Report
Philip Holland Chair of the Audit and Risk Committee
Dear ShareholdersI am pleased to present the report of the Audit and Risk Committee for the year ended 31 March 2021.
Committee composition and governanceRichard Grant stepped down from his membership of the committee in December 2020 and Richard Smith and Louisa Bell were both appointed to the committee at the same time. The committee now comprises four members, all of whom are independent non-executive directors, in full compliance with the 2018 UK Corporate Governance Code. I meet the requirement of having appropriate recent and relevant financial experience. Paul Miller has been a valued member of the committee since September 2016 and we both welcome the commercial and operational expertise brought by Richard and Louisa to the committee.
Member biographies are set out on pages 82 to 84.
NUMBER OF MEETINGS
Number of Meetings
7Attendance
100%
Committee member
Meetings attendedduring the relevant
member’s tenure
Philip Holland 7/7Richard Grant 6/6Paul Miller 7/7Louisa Bell 1/1Richard Smith 1/1
AUDIT AND RISK COMMITTEE INFORMATION
Audit and Risk Committee Members
▶ Philip Holland Chair of the Audit and Risk Committee
▶ Richard Grant Chairman (resigned 2 December 2020)
▶ Paul Miller Independent Non-executive Director
▶ Louisa Bell Independent Non-executive Director (appointed 2 December 2020)
▶ Richard Smith Independent Non-executive Director (appointed 2 December 2020)
Role and responsibilitiesThe principal responsibilities of the committee are:
Oversight of external audit –
▶ Consider the appointment of the external auditor, making recommendations to the Board on their appointment or dismissal and approving their terms of engagement and remuneration;
▶ review the work of the external auditor;
▶ Monitor the external auditor’s independence and objectivity, review their performance and effectiveness and set the policy for non-audit services provided by the external auditor;
Integrity of reporting – review and challenge key judgements made by management, review and monitor the integrity of the full and half year financial statements, reports to shareholders and any other announcements regarding the Company’s results or other financial information to be made public, including statements on going concern and risk and controls; and advise the Board of its opinion whether, when read as a whole, such reports are fair, balanced and understandable and provide the information necessary for stakeholders to assess the Company’s position, performance, business model and strategy.
Internal controls and risks - review the risk management framework and ensure that risks are carefully identified and assessed, and that systems of risk management and internal control are in place.
Internal audit – consider annually whether there is a need for an internal audit function and make recommendations accordingly to the Board.
The committee’s terms of reference are set out on the Company’s website.
90 STENPROP ANNUAL REPORT 2021

30051 Stenprop AR2021 Governance 17 June 2021 1:33 pm V2
All meetings are attended by the CFO and the Company Secretary. In addition, representatives of the external auditors are invited to attend part of specific committee meetings. These attendees do not attend as members and as such have no voting rights.
As committee chairman, I also hold separate regular meetings with representatives of the external auditors and I meet privately with the Chief Financial Officer to obtain a good understanding of key issues affecting the Group.
Key areas of focus for the year under reviewThe committee usually meets the day before Board meetings, and I report to the Board as part of a separate agenda item on the activities of the committee and matters particularly important or relevant to the Board. This year, the committee had a total of seven meetings, and:
▶ Managed the tender process for the appointment of BDO as the new audit firm, oversaw the onboarding process and monitored their work throughout the financial year.
▶ Reviewed and recommended for approval the interim and annual financial statements and 2020 annual report. Considered the appropriateness of accounting treatment and areas of significant judgement.
▶ Assessed and monitored the appropriateness of the disclosures and accounting provisions made in respect of the impact of COVID-19.
▶ Assessed on an ongoing basis the risk matrix and its approach to considering the levels of risk tolerance, monitoring and mitigation.
▶ Monitored on an ongoing basis the Risk Management Plan and the communication of issues to the Board.
▶ Considered and confirmed that it was satisfied as to the expertise and experience of the Chief Financial Officer.
▶ Monitored the phased implementation of the new unified ERP system which will align finance, operations and customer relationship management systems of the Group, regularly reviewing progress against the timetable and budget.
▶ Mandated BDO technology risk assurance team to undertake advanced audit work on the ERP testing and go-live process controls as part of the annual audit procedures.
Financial reporting and significant areas of judgementThe Audit and Risk Committee continues to monitor the integrity of the Company’s results. It considers accounting policies and procedures adopted by the Group, reviews the content and messaging of the preliminary results, annual report and half year results, and the key judgements made by management in preparing the financial results.
The committee was satisfied that the processes and assumptions used by management in areas of judgement were reasonable and applied appropriately. The committee was further satisfied that areas of judgement had been reviewed and discussed with the external auditor who agreed with the accounting treatment adopted.
The committee has satisfied itself that the controls over the accuracy and consistency of the information presented in the annual report are robust. It is also satisfied that appropriate financial reporting procedures exit, are working effectively and include consideration of all Group’s entities. The committee therefore confirmed to the Board that it believes that the 2021 Annual Report was fair, balanced and understandable and that it provided the necessary information to stakeholders to assess the Group’s position, performance, business model and strategy.
SIGNIFICANT ISSUES DESCRIPTION
Going concern The appropriateness of adoption of the going concern basis of preparing the financial Statements
The committee has considered the financing requirements of the Group and the committed facilities available to it. It appraised management’s assessment of going concern, the assumptions made and the report of the external auditor in recommending that adoption of the going concern basis is valid. Further details can be found in note 2 of the financial statements and the viability statement on page 63.
Viability statement Review of the assessment of the Group’s long term viability and confirmation that the period of time used was appropriate
The committee reviewed and confirmed the appropriateness of the analysis prepared to support the Board’s longer-term viability statement (see page 63).
Investment property valuation The Group’s investment properties are stated at estimated fair value, determined by directors, based on an independent external appraisal
The committee reviewed the independent valuation of the Group’s investment properties, met with the external valuers and confirmed that judgements relating to assumptions and estimations underlying the valuations were appropriate. The committee reviewed and confirmed the classification of those assets identified as held for sale.
Assets held for sale In executing the transition to become a 100% UK MLI business, a number of assets have been identified as held for sale in accordance with the criteria defined in IFRS 5: Assets held for sale and discontinued operations (see note 4 of the financial statements). The committee reviewed and confirmed the classification of these assets as held for sale.
91STENPROP ANNUAL REPORT 2021
GOVERNANCE

30051 Stenprop AR2021 Governance 17 June 2021 1:33 pm V2
Audit and Risk Committee Report CONTINUED
Independent and external auditThe committee is responsible for monitoring the level of non-audit services provided by BDO. During the year, BDO provided non-audit services in its role as external auditor to the Group for the review of the half year report. The committee asked the auditors to confirm their continued independence and BDO has confirmed to the Board that it remains independent and has maintained the necessary internal safeguards to ensure the objectivity of the audit partner and staff. Disclosure of the non-audit fees incurred during the year ended 31 March 2021 can be found in note 7 of the financial statements. The committee was satisfied that both the non-audit work performed by BDO and the level of non-audit fees paid to it were appropriate and did not raise any concerns in terms of BDO’s independence as auditor to the Group.
The committee has reviewed the effectiveness of the auditor during the year. It considered the quality and scope of the audit plan and reporting and concluded that it was satisfied with the audit process and BDOs effectiveness and independence as an auditor. The committee had recommended to the Board that BDO be re-appointed as auditor for the financial year ending 31 March 2022.
Risk management and internal controlsThe risk management policy and process of the Group is detailed on pages 61 to 63 of this report. At every quarterly meeting, the committee reviews the Group’s principal risks, including any new, emerging or project-specific risks and the actions taken by management to manage and mitigate them. Their potential effect on the Group’s short and long-term results and goals are considered and discussed.
During the year under review, the committee monitored the risks associated with the implementation of the new ERP system and the decision to insource the property accounting function. It also carefully considered the effect and impact of the COVID-19 pandemic on the Group and its stakeholders, including its customers and employees, keeping the Group’s risk appetite under constant review and adapting to the changing circumstances. It received regular updates on rent collection levels and trends and supported the Board in its decision to continue with its MLI acquisition programme once it became clear that the pandemic would not have severe consequences on the cashflow position of the Group and that there was no need to retain cash for risk mitigation purposes. Today, the overall risk appetite of the Group has returned to its pre-pandemic levels, although the committee and the Board continue to closely monitor events that may impact the Group and its stakeholders.
The committee also considered ESG risks, including climate-related risks in light of the recommendations and best practices set by the Climate Standards Disclosure Board. ESG risks, and by extension climate risks, are considered principal risks. More information on these risks is provided on pages 62 and 68.
Extended assuranceThe Company does not have a formal internal audit function but does periodically make use of external service providers to perform extended assurance work. The need for the appointment of an internal auditor is reviewed by the committee and the Board at least once a year. The committee remains of the view that the appointment of an internal auditor is not justified considering the size of the Company.
During the financial year, BDO were engaged to undertake advanced audit work on the ERP testing and go-live process controls as part of the annual audit procedures. The objective of the review was to provide assurance over the quality control of testing , ensure the suitability of the tests and that all key scenarios had been covered. In advance of the go-live date, BDO continues to work closely with management and will share a report with the committee in due course.
Audit and Risk Committee evaluationThe committee’s effectiveness was reviewed and evaluated as part of the evaluation of the Board’s performance for the year under review. It was concluded that the committee continues to operate effectively.
Philip HollandChair of the Audit and Risk Committee
10 June 2021
92 STENPROP ANNUAL REPORT 2021

30051 Stenprop AR2021 Governance 17 June 2021 1:33 pm V2
Nomination Committee Report
Dear ShareholdersI am pleased to present the nomination committee report for the year ended 31 March 2021.
Committee composition The members of the committee are Philip Holland, Paul Miller, Patsy Watson and myself. The committee is composed of a majority of independent directors, as required by the 2018 UK Corporate Governance Code (the ‘Code’) and the King IV Report on Corporate Governance for South Africa (‘King IV’).
Appointment of Louisa Bell and Richard Smith to the BoardIn our 2020 Annual Report, we confirmed that we were aware of the need to improve the independent element in the composition of the Board. We reported that Warren Lawlor, who was not independent, intended to step down from the Board and that we would be seeking to recruit a new independent non-executive director. Warren Lawlor did not offer himself for re-election at our 2020 annual general meeting and effectively resigned from his position with effect from 16 September 2020.
Richard Grant Chair of the Nomination Committee
NOMINATION COMMITTEE INFORMATION
Nomination Committee Members
▶ Richard Grant Chairman of the Board and Chair of the Nomination Committee
▶ Philip Holland Independent Non-executive Director
▶ Paul Miller Independent Non-executive Director
▶ Patsy Watson Non-executive Director
Number of Meetings
4Attendance
100%
Committee member Meetings attended
Richard Grant (Chair) 4/4Philip Holland 4/4Paul Miller 4/4Patsy Watson 4/4
Role And Responsibilities
The principal responsibilities of the committee are:
▶ Board composition – keeping the structure, size and composition (including the skills, knowledge, experience and diversity) of the Board and its committees under review and recommending changes to the Board
▶ Succession planning – considering succession planning for the Board and the senior management team
▶ Independence and time commitment – reviewing the independence and time commitment requirements of the non-executive directors
▶ Board evaluation – lead the annual evaluation of the Board, its committee and individual directors and make recommendations to the Board accordingly
▶ The committee’s terms of reference are set out on the Company’s website.
I am pleased to note the continued emphasis on the promotion of equal opportunities in employment at Stenprop and the latest initiatives to encourage further diversity across the business.”
93STENPROP ANNUAL REPORT 2021
GOVERNANCE
30051 Stenprop AR2021 Governance 17 June 2021 1:33 pm V2
I am pleased to report that, after reviewing the skills and experience of the candidates for the position of non-executive director and listening to the feedback from our investors, we decided to appoint two new independent non-executive directors to the Board, Louisa Bell and Richard Smith. An external search consultant, Sam Allen Associates Ltd. (‘SA Associates’), led the search for both Louisa and Richard. SA Associates has no connection with the group or any individual directors.
Following Louisa and Richard’s appointment to the Board in November 2020, we also reviewed the composition of the various committees of the Board, with the intention to gradually involve Louisa and Richard in the work of the committees and allow the committees to benefit from their extensive operational and business experience. Louisa and Richard were subsequently appointed to the audit and risk committee and remuneration committee, with Louisa also accepting to join the social and ethics committee of the Board, and I stepped down from the audit and risk committee and the social and ethics committee. Further information on the changes to the committees’ composition is set out in the individual reports from the committees in this corporate governance section.
We have now achieved full compliance with both the Code and King IV in terms of the balance of independent and non-independent directors on the Board and in terms of the composition of the committees of the Board.
Succession and workforce planning Succession plans for directors and members of senior management have been reviewed by the committee, with an emphasis on training needs and development plans for each individual. Our policies on the promotion of diversity and equal opportunities (see below) are aligned with these succession plans.
In this transition period while the Company transforms into a fully focused operational UK MLI business, it is also key to assess future needs and identify any gaps in skills at board level as well as amongst the senior team against these future needs. With this in mind, the committee continues to review the non-executive directors’ contribution to the Board, and to monitor the skills, experience and performance of the executive directors and senior team.
The recruitment of Louisa Bell and Richard Smith during the period brings additional operational, business and marketing experience to the Board. The Company has also recruited a new Sales and Marketing Director who joins the senior management team. The committee believes that the Board as well as the senior management team has the correct balance of skills, experience and knowledge to ensure the future success of the group.
DiversityWe recognise the benefits of having a diverse board. During the reporting period, the Board adopted a policy on the promotion of diversity at board level, in line with the principles of the Code and the JSE Listings Requirements. The policy clearly states that the Company is committed to promoting broader diversity at board level, including diversity of gender, race, social and ethnic background, culture, age, field of knowledge, skills and experience. The committee has been mandated by the Board to implement and manage this policy and all board appointments as well as succession plans are based on merits with this policy and the promotion of diversity in mind. The committee and the Board also recognise that a diverse executive pipeline is important to increasing diversity levels among senior positions. I was pleased to note the continued emphasis on the promotion of equal opportunities in employment at Stenprop and the latest initiatives to encourage further diversity across the business.
Read more on Our People and Culture on page 76.
Since November 2020, there are two female directors on the Board, Patsy Watson and Louisa Bell, representing 22% of the total number of directors. We have therefore achieved our target initially set for March 2020 of having female directors constituting at least 20% of the total number of directors. At the end of the financial year, only one member of the senior management team was female (representing 16% of the senior management team), whilst 31% of all line managers and 67% of all other employees were females.
Board evaluationLast year, we appointed Board Alpha Limited, an advisory firm with no connection to Stenprop which specialises in external board evaluations, to undertake an independent and externally facilitated evaluation of the effectiveness of the Board and its committees. It concluded that the Board appeared to be strong and effective at guiding the Company. It also recognised that the Board had been instrumental in developing the strategic goal for Stenprop of becoming the leading multi-let industrial business in the UK.
Key recommendations included to review the composition of the Board to achieve independence in accordance with the Code; keeping gender diversity in mind; to ensure that shareholders continue to be kept informed of the progress of the transition and of any change in strategy; and that the Board reduces its involvement in matters that are more appropriately dealt with solely by the executive team. The majority of the recommendations have been implemented during the reporting period. As reported above and throughout this report, the Board is now fully compliant with the independence requirements of the Code, a new policy on the promotion of diversity at board level has been adopted, progress against transition targets have been released to shareholders throughout the year via our quarterly trading updates, annual and half-year results and reports on specific sales and acquisitions. The structure and agenda for board meetings have also been reviewed to ensure more effective discussions and debates on strategy and business matters.
This year, the evaluation was conducted internally. The feedback was that the Board and its committees continue to operate effectively. The most significant recommendation for improvement related to the need for more concise and better focused board papers. Although the Board and its committees have continued to meet as scheduled throughout the year, albeit almost entirely on a remote basis, the lack of meetings in person has undoubtedly had a detrimental impact on some aspects of the Board’s effectiveness and efficiency. Looking forward, the Board is planning for more frequent interaction between board members and with all employees and to visit more of the Company’s operating locations as soon as circumstances permit.
Nomination Committee Report CONTINUED
94 STENPROP ANNUAL REPORT 2021

30051 Stenprop AR2021 Governance 17 June 2021 1:33 pm V2
Independence and re-electionThe committee has assessed the time commitment required of all non-executive directors and whether their re-appointment would be in the best interests of the Company, taking into account their individual contributions to the Board and its committees, their qualification and experience. The committee is of the opinion that each non-executive director continues to demonstrate commitment to his or her role and discharges their duties effectively.
The committee has also assessed the continued independence of all non-executive directors. We re-assessed Paul Miller’s independence in light of his continued involvement with Bryan Cave Leighton Paisner LLP, corporate legal advisers to the Company. The committee and the Board remain of the opinion that Paul Miller’s independence is not impaired. The committee and the Board were able to reach that conclusion mainly based on the following factors:
▶ Paul Miller ceased to be an equity partner more than six years prior to his appointment to the Board and remains engaged with Bryan Cave Leighton Paisner LLP as a part time consultant with primary responsibility for matters relating to international business development, for which he receives a fixed fee;
▶ he is not involved in any work carried out by Bryan Cave Leighton Paisner LLP for the Company and his remuneration from them is not contingent on any such work; and
▶ the scope of day to day work carried out by Bryan Cave Leighton Paisner LLP for the Company remains relatively limited and the total fees paid to them by the Company in the reporting period are not deemed significant.
The committee and the Board also reviewed and confirmed my independence and the independence of Philip Holland, Louisa Bell and Richard Smith. Although Patsy Watson is not considered independent due to her previous role as Chief Financial Officer of the Company, she continues to make a valuable contribution to the leadership of the Company for the benefit of all stakeholders.
The committee recommends that resolutions to re-elect each of the non-executive directors be proposed at the 2021 Annual General Meeting alongside resolutions to re-elect the executive directors.
Accordingly, in accordance with the recommendations of the committee and in accordance with the Code, each of the directors in role at the date of this report will offer themselves for re-election at the 2021 Annual General Meeting.
Richard GrantChair of the Nomination Committee
10 June 2021
95STENPROP ANNUAL REPORT 2021
GOVERNANCE

30051 Stenprop AR2021 Governance 17 June 2021 1:33 pm V2
Remuneration Committee ReportLetter from the Chair
Paul Miller Chair of the Remuneration Committee
REMUNERATION COMMITTEE INFORMATION
Remuneration Committee Members
▶ Paul Miller Chair of the Remuneration Committee
▶ Richard Grant Independent Chairman
▶ Philip Holland Independent Non-executive Director
▶ Louisa Bell Independent Non-executive Director (appointed 2 December 2020)
▶ Richard Smith Independent Non-executive Director (appointed 2 December 2020)
▶ Warren Lawlor Non-executive Director (resigned on 16 September 2020)
Number of Meetings
3Attendance
Committee member
Meetings attended during the relevant
member’s tenurePaul Miller 3/3Philip Holland 2/3Richard Grant 3/3Warren Lawlor 2/2Louisa Bell 1/1Richard Smith 1/1
Role And Responsibilities
The principal responsibilities of the committee are to:
▶ Determine, agree with the Board, review and monitor the general policy for the remuneration of the Company’s chairperson, the executive directors and other senior executives.
▶ Oversee that the implementation and execution of the remuneration policy achieves the objectives of the policy.
▶ Determine targets for performance related pay schemes.
▶ Determine individual awards under share incentive plans to be made to executive directors and other senior executives.
▶ Approve the remuneration packages for the Company’s chairperson, the executive directors and other senior executives.
The committee’s terms of reference are set out on the Company’s website.
96 STENPROP ANNUAL REPORT 2021
Dear ShareholdersOn behalf of the Board, I am pleased to present our Remuneration Committee Report for the year ended 31 March 2021.
As in previous years, this report is divided into three main sections:
▶ this letter, setting out some background to our policies and the work of the Remuneration Committee during the reporting period;
▶ our remuneration policy; and
▶ the remuneration implementation report.
This year, we have also added a summary overview of Stenprop’s remuneration policy and implementation report for additional clarity. Please see page 100 of the report.
The remuneration policy and the remuneration implementation report (set out on pages 101 to 108) will again be subject to separate non-binding advisory votes at the 2021 annual general meeting, to allow shareholders to express their views on the remuneration structures adopted by the Company.
The year under reviewThe business has continued to make good strategic and operational progress over the year under review against an uncertain economic backdrop of the COVID-19 pandemic and Brexit.
Very significant progress with respect to the strategic milestones established a year ago (targeting to become 75% MLI through a specified sales and purchase programme, maintaining a maximum LTV of 40%, completing the move out of third-party fund management entirely and building a leading tech-enabled MLI management platform) has been made. This could not have happened without a strong culture of teamwork and the willingness of all staff to continue to embrace significant change.

30051 Stenprop AR2021 Governance 17 June 2021 1:33 pm V2
The Remuneration Committee was aware that some of these objectives would, if successfully achieved, have the effect of dampening earnings in the short term. An example of this was the strategy to accelerate the sales of non MLI property and accepting the cash drag consequences while funds were awaiting re-deployment into MLI. Another example was the strategic decision in the early stages of the pandemic to halt temporarily the MLI purchase programme and to hold cash as a risk mitigant until it became clear how the cashflow consequences of the pandemic would unfold and when it was prudent to continue with the purchase programme.
As such, the committee decided to set a range of KPIs, only one of which was directly earnings related, to ensure that management was focused on all strategic objectives as a composite whole. The Board, in coordination with the Remuneration Committee, also considered a series of Covid related cashflow stress tests in setting the objectives for the likely timing of the commencement of the purchase programme in the short term and consequent impact on the corporate objectives for the annual bonus scheme. No changes were made to the corporate objectives for the Stenprop long-term incentive plan (the ‘Stenprop LTIP’) which are set on a three-year rolling basis.
As the year unfolded, it became clear that the pandemic, whilst immediately impacting rent collections, did not impact negatively the demand for space from existing and new customers. Largely as a result of investments already made in the business, the Company was able to adapt and operate remotely very quickly. In particular, the Company was able to market its space digitally to customers and to contract quickly and efficiently online with prospective customers via its Smart Lease. The lease enquiry statistics were more robust than expected. The rent collections were also not as badly affected as was initially feared. The disposal programme in respect of our German assets also proceeded better than expected, especially as regards our three daily needs centres in Berlin. These early indicators gave management and the Board confidence to commence the MLI purchase programme earlier than was initially anticipated as it was recognised that there would not be
a need to hold as much cash for risk mitigation as was originally considered necessary. As a result, the Company was able to meet its corporate objectives in full. It also did not have any need to furlough staff, to avail itself of any government loans, or to cut its dividend.
In the period under review, all of the corporate objectives under the annual bonus scheme were met, in particular:
▶ EPRA EPS targets were fully achieved
▶ Aggregate MLI asset purchase targets were fully achieved
▶ Notarisation of all non MLI property sale targets was fully achieved
In light of the above, Paul Arenson and Julian Carey each received 100% of the maximum available award under the annual bonus scheme (2020: 47.57% each) and James Beaumont received 90% of the maximum available award under the annual bonus scheme. This took into account scores achieved in respect of personal objectives. The Remuneration Committee and the Board believe that this outcome demonstrates that the Company’s remuneration policy is working well, is aligned to the Company’s culture and is driving appropriate management performance.
Remuneration policy and implementation Stenprop’s remuneration policy as set out in the 2020 annual report was subject to a non-binding advisory vote at the 2020 annual general meeting and was approved by 70.73% of shareholders who voted. The 2020 remuneration implementation report was approved by 84.71% of shareholders who voted. Stenprop has engaged with a number of shareholders to understand the reasons behind their dissenting vote. The main objections raised related to the following:
▶ The market value options awarded to the Chief Financial Officer, James Beaumont, under the Stenprop LTIP considered to be not fully in line with UK best practice as a portion of the award vested in less than three years. In addition, the performance conditions attached to these market value options were considered to be inadequately disclosed; and
▶ The disparity between the Company’s pension contributions to Paul Arenson and Julian Carey compared to the rest of the workforce.
We welcome the feedback received and are committed to addressing the concerns raised. We reviewed the remuneration policy taking the above into account. Following this review, it was agreed with James Beaumont that he would no longer receive awards of market value options and would be eligible for the award of nil-cost options under the Stenprop LTIP with a value equal to 100% of his annual salary. These nil-cost options have the same characteristics as the nil-cost options awarded to each of Paul Arenson and Julian Carey under the Stenprop LTIP, with a three-year vesting period and vesting conditions determined by the committee and designed to promote the long-term success of the Company. See page 108 of this report for details of the vesting conditions attached to the awards of nil cost options made on 9 June 2021 in relation to the three-year performance period ending on 31 March 2024.
Contributions to the executive directors’ pension remain equal to 10% of base salary as opposed to the contributions made to the pension of the rest of the workforce which are up to 7% of base salary. We are aware that this disparity is not in compliance with the Code. The committee has mandated an independent consulting firm to review its remuneration policies and practices ahead of the planned move to the Premium Segment of the Main Market of the London Stock Exchange.
This review will include the disparity in pension contribution referred to above.
97STENPROP ANNUAL REPORT 2021
GOVERNANCE
30051 Stenprop AR2021 Governance 17 June 2021 1:33 pm V2
Remuneration Committee Report CONTINUED
Letter from the Chair
98 STENPROP ANNUAL REPORT 2021
Last year, the Remuneration Committee and the Board considered it appropriate to make some changes to the remuneration policy to take account of the uncertain business environment arising as a result of the COVID-19 pandemic. The main change was to apply equal weight to personal goals and corporate KPIs for the purpose of assessing awards under the annual bonus plan. The Committee now deems it appropriate to revert to its previous policy of applying a heavier weighting to corporate KPIs. For the year ending 31 March 2022, corporate KPIs will count for 70% of the maximum bonus available for executive directors whilst personal objectives will receive a weighting of 30%. For members of senior management, the weighting will be 60% for corporate KPIs and 40% for personal objectives. Further details are set out on page 108 of the remuneration policy section. The Remuneration Committee retains its overriding discretion to modify the amounts payable under the scheme to ensure that all awards are appropriate having regard to the overall financial performance of the Company. In addition, the Remuneration Committee will review each individual’s role, responsibility and performance and may alter the terms of their participation in the annual bonus scheme and/or long-term incentive scheme on an individual basis, in each case within the scope of the relevant scheme.
Apart from the above, the remuneration policy remains unchanged this year. It is included in full over pages 101 to 105.
The Remuneration Committee believes that its policy remains fair, appropriate and market-related, and that it complies with the five additional tests of simplicity, clarity, risk, predictability and proportionality introduced by the 2018 UK Corporate Governance Code.
When reviewing the remuneration policy, the Remuneration Committee also took into account the pay and benefits of all the employees of the Group, noting the general increase in salary proposed for all employees and levels of incentive payments and performance, before setting the remuneration of the executive directors and members of senior management. The committee is provided with data on the remuneration structure for all staff and uses this information to ensure consistency of approach throughout the Group. Although the remuneration packages of all staff were taken into account, the Remuneration Committee did not consult with the Company’s employees when drawing up the executive directors’ remuneration policy.
The 2018 UK Corporate Governance Code (the ‘Code’)In preparation for its move to the Premium Segment of the Main Market of the London Stock Exchange, Stenprop sought again to comply voluntarily with the provisions of the Code. We believe that the policy and its implementation are aligned with the Code in all material respect save in relation to Code Provisions 38 and 36, as further explained below. We also note that, following the votes against the remuneration policy received at the 2020 annual general meeting, the Company did not immediately explain what actions it intended to take to consult shareholders in order to understand the reasons behind the results, and it did not publish an update on the views of shareholders and actions taken within six months of the meeting, as required by Provision 4 of the Code. However, as explained above, Stenprop did engage with those dissenting shareholders and the objections raised by those shareholders have been or are being addressed.
The Code sets out principles against which the Committee should determine the remuneration policy for executive directors. The table below includes a summary of these principles, and how they are reflected in Stenprop’s remuneration policy.
Principles How it is being addressed by Stenprop
Clarity – remuneration arrangements should be transparent and promote effective engagement with shareholders and the workforce.
The remuneration policy is clearly set out in this report and the remuneration policy and the board determine clear metrics against which performance is measured which are communicated to all stakeholders and explained externally and internally. The policy is subject to a separate non-binding advisory vote at the AGM and shareholders are able to express their views on the remuneration structures adopted by the Company. Stenprop has engaged with dissenting shareholders and taken their concerns into consideration when reviewing the policy.
Simplicity – remuneration structures should avoid complexity and their rationale and operation should be easy to understand.
Stenprop operates a market standard remuneration policy with the remuneration package composed of a fixed pay element, an annual bonus and a long-term incentive plan.
Risk – remuneration arrangements should ensure reputational and other risks from excessive rewards, and behavioural risks that can arise from target-based incentive plans, are identified and mitigated.
The Remuneration Committee sets the corporate KPIs and personal goals of executive directors so as to be stretching but achievable. It retains its overriding discretion to modify the amounts payable under the schemes to ensure that all awards are appropriate having regard to the overall financial performance of the Company and/or to the budget. The Stenprop Deferred Share Bonus Plan and the Stenprop LTIP both incorporate malus and clawback provisions.

30051 Stenprop AR2021 Governance 17 June 2021 1:33 pm V2
Principles How it is being addressed by Stenprop
Predictability – the range of possible values of rewards to individual directors and any other limits or discretions should be identified and explained at the time of approving the policy.
The remuneration policy includes clear caps and the range of possible rewards to individual directors is illustrated on page 105 of this report. The Remuneration Committee’s overriding discretion to modify the amounts payable remains within the scope of the scheme.
Proportionality – the link between individual awards, the delivery of strategy and the long-term performance of the company should be clear. Outcomes should not reward poor performance.
The committee ensures performance metrics are aligned with Stenprop’s strategy each year. Performance targets are set to be stretching, but achievable. Details of the committee’s approach to target setting is set out on pages 103 to 104 of this report.
Alignment to culture – incentive schemes should drive behaviours consistent with company purpose, values and strategy
The policy is designed to promote the long-term success of the Company. Rewards are based on performance against corporate KPIs, which are aligned to Stenprop’s strategy, as well as performance against individual goals, which are assessed each year taking into account a competency framework which includes the behaviours that Stenprop wishes to promote consistent with its purpose, culture and strategy. This competency framework includes skills in relation to data and innovation, teamwork and leadership, communication and ESG.
As noted above, the committee is aware that the Company is not currently compliant with Code provision 38 according to which the pension contribution rates for executive directors, or payments in lieu, should be aligned with those available to the workforce, but is committed to addressing this disparity by the end of 2022.
The second issue of non-compliance, relating to Code Provision 36, is that we have not introduced a formal policy for shareholding requirements for executive directors post-employment. The remuneration policy as currently structured already provides for alignment between executive directors and investors. For example, the three-year vesting period and subsequent two-year post vesting holding period in relation to nil-cost options awarded under the Stenprop LTIP ensure that all the executive directors have a clear long-term interest in the performance of the business. The two-year post vesting holding period continues to apply following cessation of employment, meaning that a link to future performance remains beyond any termination of employment. However, the committee intends to introduce a formal policy regarding both in-employment and post-employment shareholding requirements for executive directors during the current financial year.
Board changesLouisa Bell and Richard Smith were appointed to the Board on 4 November 2020, ensuring full compliance with the independence requirements of the Code and adding significant operational and marketing experience to the Board.
Fees paid to Louisa and Richard are in line with the fees paid to the other non-executive directors, as disclosed on page 106.
The year aheadThe Remuneration Committee remains mindful of evolving best practice with respect to executive remuneration. It considers remuneration in the context of the overall strategy of the business in order to promote the Company’s strategic objectives, values and its long-term sustainable success.
As mentioned above, the committee has mandated an independent consulting firm to review its policies and practices ahead of the planned move to the Premium Segment of the Main Market of the London Stock Exchange. The committee will consider its recommendations and any changes to remuneration that may be advisable in light of the future growth of the business. It is also committed to enhancing disclosures on remuneration in future reports, including retrospective
disclosure of personal objectives of executive directors and performance against those objectives for the purpose of the annual bonus scheme.
ConclusionOn behalf of the Remuneration Committee and the Board, I thank you for your continued support. I trust you find this report helpful and informative. We are always looking to improve our policies and practices and would welcome any comments on the report, or any concerns about our remuneration policy or the way we have implemented it.
Paul MillerChair of the Remuneration Committee
10 June 2021
99STENPROP ANNUAL REPORT 2021
GOVERNANCE
30051 Stenprop AR2021 Governance 17 June 2021 1:33 pm V2
Overview of remuneration policy and implementationRemuneration in respect of the financial year to 31 March 2021
Policy summary Implementation for the financial year to 31 March 2022
Base salary
Salaries increased by 2.5% in line with inflation and the broader employee population effective 1 April 2020, as follows:
CEO, Paul Arenson: £281,500Managing Director, Julian Carey: £270,500CFO, James Beaumont: £179,400
Salaries are normally reviewed annually to ensure that they remain competitive and market related.
Salaries increased by 1.5%, as follows:
CEO, Paul Arenson: £285,800
Managing Director, Julian Carey: £274,600
CFO, James Beaumont: £182,100
Pension and benefits
Pension contributions (or equivalent cash allowance) of:
▶ CEO, Paul Arenson and Managing Director, Julian Carey: 10% of base salary.
▶ CFO, James Beaumont: 7% of base salary.
Benefits in line with policy.
For all new appointments, pension contributions will be at the level of the wider employee population.
Executive directors currently receive private medical insurance, life assurance and permanent health insurance. Other benefits such as car allowance may be provided where appropriate.
The intention is to review the disparity in pension contributions during the financial year to 31 March 2022.
No change to benefits are proposed for the financial year to 31 March 2022.
Annual bonus
CEO, Paul Arenson: 100% of the maximum available award
Managing Director, Julian Carey: 100% of the maximum available award
CFO, James Beaumont: 90% of the maximum available award
The maximum level of annual bonus which may be granted in respect of FY2021 is equivalent to 150% of basic salary for each of Paul Arenson and Julian Carey, and 75% of salary for James Beaumont.
An amount equal to 60% of salary for each of Paul Arenson and Julian Carey, and 30% of salary for James Beaumont will be paid in cash with the balance satisfied by the award of nil-cost options under the terms of the Stenprop STIP in respect of FY2021. For FY2022, the cash element for James Beaumont will increase to up to 45% of salary with the balance (if any) satisfied by awards of nil-cost options under the Stenprop STIP.
The performance targets set for the financial year to 31 March 2022 are:
▶ Growing adjusted earnings per share in a range around the budget plan forecast (21% weighting)
▶ Completing £90 million to £115 million of MLI acquisitions (21% weighting)
▶ 3.75% to 5% rental growth over the MLI portfolio (21% weighting)
▶ Contracts for the sale of all remaining non-MLI assets (7% weighting)
▶ Personal goals to each executive director (30% weighting)
LTIP awards
For each of Paul Arenson and Julian Carey, 2018 Stenprop LTIP (performance period: 1 April 2018 to 31 March 2021) vested at 55.5% based on:
▶ Growth in diluted EPRA EPS below threshold target
▶ Growth of the MLI portfolio below threshold target (actual: 74.3% as opposed to threshold, target of 75%)
▶ Group LTV of 28.1% against target range of 35% to 40%
▶ 30% increase on the financial year to 31 March 2021 targeted passing rent (UK MLI owned as at June 2018)
▶ TSR outperformance at 100% against stretched target of 85% percentile of the TSR European EPRA Index
Nil-cost options with a value equivalent to 200% of base salary for each of Paul Arenson and Julian Carey, and 100% of salary for James Beaumont (at the time of the grant).
Vesting at the end of a three-year period subject to vesting conditions linked to performance.
Additional two-year post vesting holding period.
Awards equivalent to 200% of base salary for each of Paul Arenson and Julian Carey and of 100% of salary for James Beaumont made in June 2021.
Performance to be measured over the three-year period ending 31 March 2024 against:
▶ Growth in adjusted EPS
▶ Rental growth on the MLI portfolio
▶ Reduction in EPRA Cost Ratio for the MLI portfolio
▶ TSR targets
Remuneration Committee Report CONTINUED
Policy
100 STENPROP ANNUAL REPORT 2021
30051 Stenprop AR2021 Governance 17 June 2021 1:33 pm V2
Stenprop’ Remuneration PolicyExecutive Directors’ remuneration policyThe remuneration policy ensures that a significant proportion of the remuneration of the executive and senior teams is linked to corporate and individual performance. The policy is designed to promote the long-term success of the Company, via a fixed element, made up of a market related salary with reasonable benefits, and a variable element, broken into short and long-term incentives, with KPIs and vesting conditions reflecting the Company’s strategic goals.
The table below sets out the elements of the executive directors’ remuneration and how they operate.
FIXED REMUNERATION
Purpose and operation Maximum opportunity Performance targets
Basic salaryTo attract, motivate and retain high calibre executives
Salaries are normally reviewed annually to ensure that they remain competitive and market related. The committee is required to obtain reliable, up-to-date information about remuneration in other comparable companies to confirm this is the case. There is no automatic entitlement to an increase each year.
Salary increases will typically be inflation or market-linked increases.
Above inflation or market increases will typically only be considered where the base salary is below market or where the scope, role and/or responsibility of the individual have increased in a way that justifies such an increase.
Individual performance is a factor when considering and reviewing salaries.
BenefitsTo provide market appropriate benefits as part of the total remuneration package
Executive directors currently receive private medical insurance, life assurance and permanent health insurance. Other benefits such as car allowance may be provided where appropriate.
Whilst there is no maximum level of benefits for executive directors, they are at the same level as the wider employee population.
N/A
Pension or pension allowanceTo provide appropriate retirement benefits (or cash allowance equivalent)
Pension benefits are provided via the Stenprop pension scheme, although employees including the executive directors, are entitled to receive a contribution towards their personal pension plan or a cash allowance instead of contributions to the Stenprop scheme.
Paul Arenson and Julian Carey: up to 10% of base salary.
James Beaumont: up to 7% of base salary.
For all new appointments, the maximum pension contribution will be at the level of the wider employee population. The intention is to review pension contributions during the financial year to 31 March 2022 to address the disparity in pension contributions between executive directors and the wider employee population by the end of FY2022.
N/A
101STENPROP ANNUAL REPORT 2021
GOVERNANCE

30051 Stenprop AR2021 Governance 17 June 2021 1:33 pm V2
Remuneration Committee Report CONTINUED
Policy
VARIABLE REMUNERATION
Purpose and operation Maximum opportunity Performance targets
Annual bonusTo encourage executive behaviour that improves Company performance, limits loss and promotes an ethical culture and responsible corporate citizenship.
Awards based on performance are granted following the financial year end when actual performance over that year is measured.
A portion of the annual bonus (equal to up to 60% of basic salary for Paul Arenson and Julian Carey, and up to 45% of basic salary for James Beaumont) is paid in cash with the balance (if any) satisfied by the award of nil-cost options under the terms of the Stenprop Deferred Share Bonus Plan (the short-term incentive plan or the ‘Stenprop STIP’).
The Stenprop STIP operates as follows: ▶ Vesting: 1/3 on the grant date, 1/3 on first
anniversary of year end; 1/3 on second anniversary of year end, subject to participant still being employed.
▶ Standard good leaver/bad leaver provisions: the Board has absolute discretion to determine that a participant is a good leaver (causing all unvested options to vest in full) except in case of gross misconduct.
▶ Reduction for malus provisions.
▶ Dividend equivalent payments in shares may be made.
The maximum level of annual bonus which may be granted is equivalent to 150% of basic salary for each of Paul Arenson and Julian Carey, and 100% of salary for James Beaumont.
Performance targets are determined each year by the Board following the committee’s recommendation normally at the beginning of the financial year. They typically consist of a mixture of corporate performance targets and individual performance, although the corporate performance targets usually have a higher weighting. Metrics and weightings may vary from year to year according to strategy and the market. See details on page 108 for the KPIs agreed by the Board for the financial year to 31 March 2022 and their weighting.
Long term incentive planTo align executive directors’ interests with the Company’s long term strategic goal and the interests of the shareholders.
Executive directors are eligible to receive annual awards of nil-cost options under the terms of Stenprop’s Long Term Incentive Plan (the ‘Stenprop LTIP’). Nil cost options will vest at the end of a three-year performance period subject to certain performance metrics being met at the end of the performance period.
▶ Vest on third anniversary of grant date or as otherwise decided by the committee and the Board (to allow sufficient time after the end of the performance period to determine whether the vesting conditions have been met). The number of nil-cost options vesting depends on the predetermined vesting conditions being met. All options not vesting on the vesting date automatically lapse. Vesting is subject to participant still being in employment or office but subject to Board discretion for good leavers.
▶ Two-year post vesting holding period following vesting.
▶ Clawback provisions before vesting and during the post vesting holding period.
▶ Dividend equivalent payments in shares may be made.
Nil-cost options with a value equivalent to 200% of base salary for each of Paul Arenson and Julian Carey, and 100% of salary for James Beaumont (at the time of the grant, i.e. taking into account any salary increase decided in June the same year) to be granted automatically (but vesting subject to vesting conditions (performance targets).
Vesting conditions for nil-cost options are typically determined by the Board following the committee’s recommendation in advance of awards being made. The committee and the Board retain full discretion to adjust or set different performance measures or targets where appropriate (e.g. to reflect a change in strategy or market conditions and/or to remain fair and consistent). See page 108 for the vesting conditions agreed by the Board for the period to 31 March 2024.
102 STENPROP ANNUAL REPORT 2021

30051 Stenprop AR2021 Governance 17 June 2021 1:33 pm V2
Non-executive directors’ remuneration policyThe remuneration policy for the Chairman and non-executive directors should attract and retain individuals with the appropriate level of expertise and experience, taking into account the time commitment and responsibilities of each role.
PURPOSE AND OPERATION MAXIMUM OPPORTUNITY PERFORMANCE TARGETS
Fees
The Chairman’s fee is set by the Remuneration Committee. Remuneration of the Non-executive Directors is a matter for the executive directors and the Chairman. Fees are reviewed annually. Fees are paid quarterly in cash. The Chairman and Non-executive Directors do not participate in any incentive, share schemes, benefits in kind or pension arrangements.
No maximum or minimum fee increase is operated although any increase will be guided by the average increase awarded to executive directors and other employees and/or general movements in the market.
N/A
Other arrangements
The Company may reimburse expenses reasonably incurred in fulfilment of the Company’s business. The Company also provides the Chairman and Non-executive Directors with Directors’ and Officers’ Liability Insurance.
The maximum reimbursement is expenses reasonably incurred.
N/A
Remuneration policy for other employeesSalary reviews across the Group are carried out on the same basis as salary reviews for executive directors. All employees are entitled to substantially the same benefits as executive directors and are currently entitled to a pension contribution of up to 7% of their basic salary.
The remuneration package of members of senior management also includes the same fixed and variable components as the executive directors. Senior management are eligible for an annual bonus with a proportion payable in cash and the balance in nil-cost options under the Stenprop STIP. The performance targets for the annual bonus are the same as those set for the executive directors, except that personal goals have historically had a heavier weighting when reviewing the performance of members of senior management as compared to executive directors.
Members of senior management also participate in the Stenprop LTIP but are not entitled to nil-cost options under the Stenprop LTIP. They typically receive
up to 100% of their salary in market value options, which vest in three equal tranches over a three-year period. The number of market value options an individual is entitled to receive is determined every year based on the same performance metrics used for rewards under the annual bonus scheme.
All other employees are also entitled to an annual cash bonus based on individual performance. We propose to further broaden equity ownership amongst staff by introducing an all-employee share incentive scheme in the second part of the financial year, for which shareholders’ approval will be sought at the 2021 AGM.
Principles followed by the committee when making recommendations for KPIs, vesting conditions and eligibility for each scheme for the year ending 31 March 2022.In setting vesting conditions and eligibility for awards of nil cost options under the Stenprop LTIP the committee applied the following principles:
The Remuneration Committee concluded that awards of nil cost options under the Stenprop LTIP should also be made to James Beaumont as well as to Paul Arenson and Julian Carey
in light of James’ seniority and in order to bring his remuneration package into compliance with the Code. Senior management should continue to be incentivised through awards of market related options under the Stenprop LTIP.
▶ In setting vesting conditions for nil cost options awarded under the Stenprop LTIP, achieving the top end of the performance range for any given condition should typically require outperformance against the Company’s budgets and business plan. Performance in line with budget and business plan should typically result in vesting of 50% of the award.
▶ Vesting conditions for nil-cost options under the Stenprop LTIP should comprise corporate goals only; and must be objective, so that they do not require subjective determination by the Remuneration Committee or the Board as to if, and the extent to which, any of the conditions have been met.
103STENPROP ANNUAL REPORT 2021
GOVERNANCE
30051 Stenprop AR2021 Governance 17 June 2021 1:33 pm V2
Remuneration Committee Report CONTINUED
Policy
In setting KPIs for the annual bonus element of the remuneration package of executive directors and members of senior management, the Remuneration Committee applies the following principles:
▶ all KPIs should be aligned with Stenprop’s objectives and strategies;
▶ in setting financial and/or total return goals or targets, preference should (other than in exceptional circumstances) be given to measuring financial performance and returns relative to an appropriate peer group;
▶ recognising the need to drive and reward individual performance, KPIs for the annual bonus element should comprise a combination of corporate and personal goals;
▶ the Remuneration Committee has determined to apply a weighting of 70% for corporate goals and 30% for personal goals for executive directors for the year ending 31 March 2022. The weighting applied when determining the annual bonus for members of senior management will be 60% towards corporate goals and 40% towards personal goals. The committee has also made all participants aware of the discretion it has retained to adjust awards to ensure they are appropriate in all the circumstances.
Illustration of application of the remuneration policy to executive directorsThe chart below provides an illustration of the potential future remuneration for the executive directors in respect of the financial year ending 31 March 2022, based on the current remuneration policy outlined above and base salary effective 1 April 2021, showing the potential split between the different element of the remuneration under four different performance scenarios:
▶ ‘Minimum’
▶ ‘On-target’
▶ ‘Maximum’
▶ ‘Maximum +50% share price increase for LTIP’
The ‘minimum’ scenario includes base salary, pension and benefits only (i.e. fixed remuneration) which are the elements of the executives’ remuneration packages not linked to performance.
The ‘on-target’ scenario includes fixed remuneration as for the ‘minimum’ scenario, plus a bonus payout equal to half of the maximum possible bonus for the period and Stenprop LTIP nil-cost options vesting at 50% of the maximum award for the performance period 1 April 2019 to 31 March 2022. Note that the Stenprop LTIP awards for the period will only vest at the end of the three-year performance period from the date of grant, and the projected value is based on value at the grant date (June 2019),
rather than vesting, i.e. excluding the impact of any share price movement over the three-year performance period. James Beaumont did not receive any Stenprop LTIP awards for that period.
The ‘maximum’ scenario includes fixed remuneration and full payout of all incentives (i.e. for each of Paul Arenson and Julian Carey: 150% of salary under the annual bonus scheme and 200% of salary under the Stenprop LTIP; and for James Beaumont: 100% of salary under the annual bonus scheme). It excludes the impact of any share price movement over the three-year performance period for awards made under the Stenprop LTIP.
The final ‘maximum +50% share price increase for LTIP includes fixed remuneration and full payout of all incentives. It also includes the impact of a 50% increase in share price on the value of the Stenprop LTIP, in effect valuing this element of the remuneration at 300% of salary for each of Paul Arenson and Julian Carey.
104 STENPROP ANNUAL REPORT 2021

30051 Stenprop AR2021 Governance 17 June 2021 1:33 pm V2
Salary, pension, benefits
Annual bonus
LTIP
PAUL ARENSON
£1,600,000
£1,400,000
£1,200,000
£1,000,000
£800,000
£600,000
£400,000
£200,000
£Minimum Maximum Maximum
+50% share price inc. for LTIP
On-target
100% 40% 25% 20%
34%
27%
42%
33%
52%
28%
JAMES BEAUMONT
Minimum MaximumOn-target
£400,000
£350,000
£300,000
£250,000
£200,000
£150,000
£100,000
£50,000
£Minimum MaximumOn-target
100% 69% 52%
31%
48%
JULIAN CAREY
Minimum Maximum Maximum +50% share
price inc. for LTIP
On-target
£1,600,000
£1,400,000
£1,200,000
£1,000,000
£800,000
£600,000
£400,000
£200,000
£Minimum Maximum Maximum
+50% share price inc. for LTIP
On-target
100% 40% 25% 20%
34%
27%
42%
33%
52%
28%
Approach to recruitment Stenprop’s approach to remuneration on recruitment follows the remuneration policy set out above. The salary of any newly appointed executive director should reflect the individual’s skills and experience. Benefits, pension, annual bonus and participation in the Stenprop LTIP would be on the basis set out in the remuneration policy table.
Executive directors’ service contracts The committee reviews the executive directors’ service contracts on an annual basis.
Executive directorNotice period
Date of first employment
Board appointment
Date of current contract
Paul Arenson Six months 2 October 2014 2 October 2014 1 June 2018Julian Carey Six months 30 June 2017 1 May 2018 22 May 2018James Beaumont Six months 1 June 2015 5 June 2019 10 June 2020
Policy on cessation of employmentOn termination of employment each executive director may be entitled to a payment in lieu of notice of basic salary and other contractual entitlements. If termination is by the Company (other than for fundamental breach by the executive concerned), the payment in lieu of notice may include payment in respect of any bonus that would otherwise have been payable during the notice period. If termination is by the executive director, the executive director will not normally be entitled to any bonus that might otherwise have been due during the notice period. The committee reserves the right to make additional payments where such payments are made in good faith by way of settlement or compromise of any claim arising in connection with the termination of an executive director’s office or employment. The committee also has discretion to determine whether an individual is a ‘good leaver’ under the Company’s incentive plans, resulting in part or all of unvested awards vesting in full as soon as practicable following termination of employment subject to such conditions as the Board may determine.
105STENPROP ANNUAL REPORT 2021
GOVERNANCE
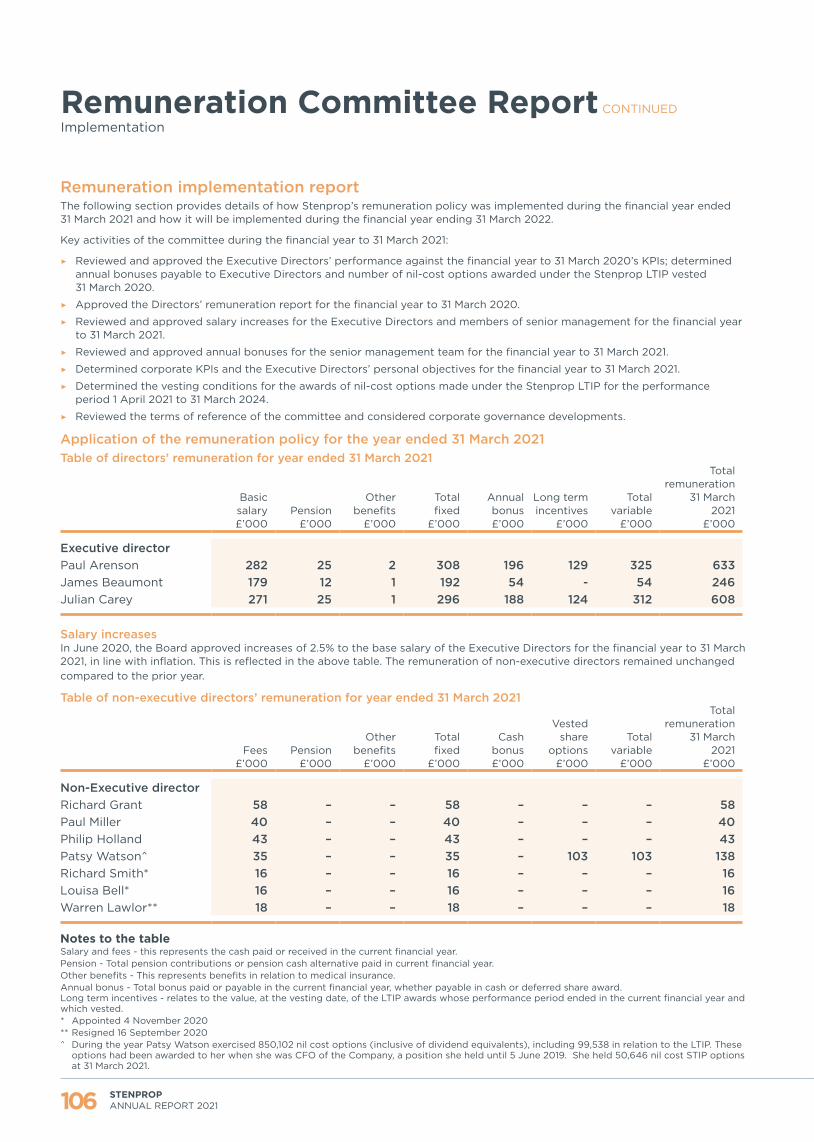
30051 Stenprop AR2021 Governance 17 June 2021 1:33 pm V2
Remuneration Committee Report CONTINUED
Implementation
Remuneration implementation reportThe following section provides details of how Stenprop’s remuneration policy was implemented during the financial year ended 31 March 2021 and how it will be implemented during the financial year ending 31 March 2022.
Key activities of the committee during the financial year to 31 March 2021:
▶ Reviewed and approved the Executive Directors’ performance against the financial year to 31 March 2020’s KPIs; determined annual bonuses payable to Executive Directors and number of nil-cost options awarded under the Stenprop LTIP vested 31 March 2020.
▶ Approved the Directors’ remuneration report for the financial year to 31 March 2020.
▶ Reviewed and approved salary increases for the Executive Directors and members of senior management for the financial year to 31 March 2021.
▶ Reviewed and approved annual bonuses for the senior management team for the financial year to 31 March 2021.
▶ Determined corporate KPIs and the Executive Directors’ personal objectives for the financial year to 31 March 2021.
▶ Determined the vesting conditions for the awards of nil-cost options made under the Stenprop LTIP for the performance period 1 April 2021 to 31 March 2024.
▶ Reviewed the terms of reference of the committee and considered corporate governance developments.
Application of the remuneration policy for the year ended 31 March 2021Table of directors’ remuneration for year ended 31 March 2021
Basic salary £’000
Pension £’000
Other benefits
£’000
Total fixed
£’000
Annual bonus £’000
Long term incentives
£’000
Total variable
£’000
Total remuneration
31 March 2021
£’000
Executive directorPaul Arenson 282 25 2 308 196 129 325 633James Beaumont 179 12 1 192 54 - 54 246Julian Carey 271 25 1 296 188 124 312 608
Salary increasesIn June 2020, the Board approved increases of 2.5% to the base salary of the Executive Directors for the financial year to 31 March 2021, in line with inflation. This is reflected in the above table. The remuneration of non-executive directors remained unchanged compared to the prior year.
Table of non-executive directors’ remuneration for year ended 31 March 2021
Fees £’000
Pension £’000
Other benefits
£’000
Total fixed
£’000
Cash bonus £’000
Vested share
options £’000
Total variable
£’000
Total remuneration
31 March 2021
£’000
Non-Executive directorRichard Grant 58 – – 58 – – – 58Paul Miller 40 – – 40 – – – 40Philip Holland 43 – – 43 – – – 43Patsy Watson^ 35 – – 35 – 103 103 138Richard Smith* 16 – – 16 – – – 16Louisa Bell* 16 – – 16 – – – 16Warren Lawlor** 18 – – 18 – – – 18
Notes to the table Salary and fees - this represents the cash paid or received in the current financial year. Pension - Total pension contributions or pension cash alternative paid in current financial year. Other benefits - This represents benefits in relation to medical insurance. Annual bonus - Total bonus paid or payable in the current financial year, whether payable in cash or deferred share award. Long term incentives - relates to the value, at the vesting date, of the LTIP awards whose performance period ended in the current financial year and which vested.* Appointed 4 November 2020 ** Resigned 16 September 2020^ During the year Patsy Watson exercised 850,102 nil cost options (inclusive of dividend equivalents), including 99,538 in relation to the LTIP. These
options had been awarded to her when she was CFO of the Company, a position she held until 5 June 2019. She held 50,646 nil cost STIP options at 31 March 2021.
106 STENPROP ANNUAL REPORT 2021

30051 Stenprop AR2021 Governance 17 June 2021 1:33 pm V2
Annual bonuses and awards under the Stenprop STIP made in respect of the financial year to 31 March 2021Paul Arenson and Julian Carey were each eligible to earn an annual bonus of up to 150% of their basic salary, determined by considering performance against the four KPIs set out in the table below. James Beaumont’s entitlement to an annual bonus was capped at up to 75% of his basic salary.
The corporate KPIs for the annual bonus scheme for the year ended March 2021 were set out at an early stage in the pandemic. As explained in the Letter from the chair (page 97), the committee and the Board, through the setting of the KPIs, sought to ensure that management remained focused on all long-term strategic objectives as a composite whole whilst managing risks linked to a prolonged period of uncertainty, including cashflow management.
KPI Weight Targeted KPIActual as at
31 March 2021% of bonus
element achieved
Adjusted earnings per share
20% Range between 4.00p and 5.00p
6.78p 100%
MLI acquisitions 20% Completing between £40 million to £60 million
of MLI acquisition
£91.5 million 100%
Notarising the sale of the German assets of the group1
10% No sliding scales – all sales to be notarised to achieve
100% of this element
Achieved 100%
Personal goals 50% Personal goals specific to each individual
Individual performance against personal goals
100% for each of Paul Arenson
and Julian Carey and
80% for James Beaumont
1 Comprising three shopping centres in Berlin and five retail warehouse units across central and southern Germany known as the Bikemax portfolio.
On 10 June 2021, the Board approved bonuses for the executive directors and members of senior management in line with the recommendations of the committee. Paul Arenson and Julian Carey each received a bonus equal to 150% of their basic salary, or 100% of the maximum annual bonus they could receive under the scheme, and James Beaumont received a bonus equal to 67.50% of his salary, or 90% of the maximum available.
The Stenprop LTIP – Conditional awards made for the performance period 1 April 2020 to 31 March 2023In June 2020, conditional awards of nil-cost options with a value equivalent to 200% of their basic salary were made to each of Paul Arenson and Julian Carey for the three-year period ending 31 March 2023. Vesting of these nil-cost options is subject to achievement of the following vesting conditions over the three-year period, each having a 1/3 weighting:
▶ Growing adjusted earnings per share in a range around the budget plan forecast;
▶ Growing the net operating income from the MLI business in a range around the budget plan forecast; and
▶ Achieving a total shareholder return that results in the total shareholder return of the Company being between the 48th and 75th percentile of the total shareholder return of the European EPRA index.
The Stenprop LTIP – Awards of market value optionsIn June 2020, James Beaumont received market value options under the Stenprop LTIP equivalent to 61.71% of his financial year to 31 March 2020 salary. 1/3 of these market value options vested on 31 March 2021, with 1/3 vesting on 31 March 2022 and 1/3 on 31 March 2023. Once vested, the options can be exercised upon payment of £1.0492 per share. From 1 April 2021, James Beaumont will no longer receive market value options, but will participate in the Stenprop LTIP on the same basis as Paul Arenson and Julian Carey except that he will receive nil-cost options equivalent in value to 100% of his base salary.
Vesting of nil-cost options under the Stenprop LTIP - Performance period 1 April 2018 to 31 March 2021On 9 June 2021, the Board, on the recommendation of the Remuneration Committee, determined that 55.5% of the awards of nil-cost options under the Stenprop LTIP in respect of the three-year period ended 31 March 2021 had vested.
The table below shows the number of nil-cost options that vested for each of Paul Arenson and Julian Carey as a result:
Original awards % vestedNo. of nil-cost
options fully vested
Paul Arenson 487,096 55.5 270,334Julian Carey 468,182 55.5 259,837
Nil-cost options which did not vest as per the above lapsed and will not be capable of exercise.
107STENPROP ANNUAL REPORT 2021
GOVERNANCE

30051 Stenprop AR2021 Governance 17 June 2021 1:33 pm V2
Remuneration Committee Report CONTINUED
Implementation
The table below shows how the Company performed over the three-year performance period against each of the five objectives initially set as vesting conditions (each with a weight of 20%):
Vesting condition TargetActual as at
31 March 2021
% of vesting condition achieved
Weighted average
Growth in adjusted EPSRange between 6.99p and 7.48p 6.78p – –
Growth of the MLI portfolio MLI assets to constitute between 75% and 85% of total portfolio 74.3% – –
Group loan to value ratio2 Range between 35% to 40% 28.1% 100% 20%The financial year to 31 March 2021 Actual Net Rent Receivable
Range from the targeted passing rent on the UK MLI assets owned as at June 2018
7.45% increase on targeted passing rent 77.5% 15.5%
Total shareholder returnRange between 50th and 85th percentile of the TSR European EPRA Index 100% 100% 20%
Total of vesting conditions achieved 55.5%
2 Net of Unrestricted cash
Application of the remuneration policy for the year to 31 March 2022We have set out below how the committee intends to implement the remuneration policy for the year ended 31 March 2022, including the KPIs which the committee intends to use to measure the performance of the executive directors and senior management team over the period, as well as the vesting conditions which have been set for options awarded under the long-term incentive plan in June 2021 for the period to 31 March 2024.
We note that the committee intends to apply discretion when determining the final outcomes under the annual bonus scheme and Stenprop LTIP awards.
Salary increasesThe Board approved increases of 1.5% to the base salary of the executive directors, in line with inflation.
KPIs for annual bonuses and awards under the Stenprop STIP for the year ending 31 March 2022The following KPIs have been set and will be used to measure the performance of the executive directors over the current financial year:
KPI Weighting
Growing adjusted earnings per share in a range around the budget plan forecast 21%Completing £90 million to £115 million of MLI acquisitions 21%Achieving between 3.75% and 5% rental growth over the MLI portfolio of the group as at 31 March 2021 21%Entering into legal contracts for the sale of all remaining non-MLI assets of the group 7%Personal goals specific to each individual 30%
The same KPIs will be used to measure the performance of members of senior management over the period, but with a heavier weighting of 40% attributed to individuals’ personal goals and the weighting of the first four corporate KPIs adjusted accordingly.
The above KPIs (with the weightings adjusted so that personal goals account for 40% of the total award) will also be used to determine any awards of market value options to members of senior management under the Stenprop LTIP for the period ending 31 March 2022.
Conditional awards under Stenprop LTIPOn 9 June 2021, the executive directors received conditional awards of nil-cost options for the three-year period ending 31 March 2024 equivalent to 200% of their basic salary for each of Paul Arenson and Julian Carey and 100% of basic salary for James Beaumont. Vesting will be subject to the conditions set out in the table below:
Vesting condition Weighting
Growing adjusted earnings per share in a range around the budget plan forecast 25%Achieving between 3.75% and 5% rental growth per annum over the performance period over the MLI portfolio of the group as at 31 March 2021 25%Reducing the EPRA cost ratio in relation to the MLI assets of the group at 31 March 2021 by 5 to 10 percentage points 25%Achieving a total shareholder return that results in the total shareholder return of the Company being between the 48th and the 75th percentile of the total shareholder return of the European EPRA index 25%
108 STENPROP ANNUAL REPORT 2021
30051 Stenprop AR2021 Governance 17 June 2021 1:33 pm V2
Social and Ethics Committee Report
Dear ShareholdersI am pleased to present the social and ethics committee report for the year ended 31 March 2021. This committee was established in accordance with the requirements of the King IV Report on Corporate Governance for South Africa (‘King IV’). Although it is not a requirement of the 2018 UK Corporate Governance Code (the ‘Code’) to have this committee, the Board empowered the committee to review and make recommendations to the Board on how the Company does business specifically having regard to ethical standards, environmental, social and governance matters, all important principles under the Code.
Committee compositionIn December 2020 the Chairman of the Company, Richard Grant, informed the Board of his decision to step down from the committee, whilst Louisa Bell and Patsy Watson, non-executive directors, were both appointed. Louisa brings significant operational expertise and experience in managing sustainability risks and opportunities, whilst Patsy Watson, who is also the designated non-executive director with responsibility for engagement with employees, has a keen interest in employees’ relationship.
We recognise the critical role of environmental, social and governance (‘ESG’) factors in achieving our aspirational goal of becoming the leading MLI business in the UK.”
Philip Holland Chair of the Social and Ethics Committee
SOCIAL AND ETHICS COMMITTEE INFORMATION
Social and Ethics Committee Members
▶ Philip Holland Chair of the Social and Ethics Committee
▶ Richard Grant Chairman (resigned 2 December 2020)
▶ Sarah Bellilchi General Counsel and Company Secretary (resigned 2 December 2020)
▶ Louisa Bell Independent Non-executive Director (appointed 2 December 2020)
▶ Patsy Watson Non-executive Director (appointed 2 December 2020)
▶ Julian Carey Managing Director (appointed 2 December 2020)
▶ James Wakelin Head of Debt and Special Projects (appointed 2 December 2020)
Number of Meetings
4Attendance
100%
Committee member
Meetings attendedduring the relevant
member’s tenure
Philip Holland 4/4Richard Grant 3/3Sarah Bellilchi 3/3Louisa Bell 1/1Patsy Watson 1/1Julian Carey 1/1James Wakelin 1/1
Role And Responsibilities
The principal responsibilities of the committee include monitoring the Group’s activity with regard to matters relating to:
▶ Social and economic development and good corporate citizenship – including the promotion of equality and the contribution to the development of local communities
▶ Sustainable development – the environment, health and public safety including the impact of the Group’s activities
▶ Employment relationships – including the Group’s contribution towards the development of its employees, working conditions, the safeguarding of human rights and the right to be free from slavery and servitude
The committee’s terms of reference are set out on the Company’s website.
109STENPROP ANNUAL REPORT 2021
GOVERNANCE
30051 Stenprop AR2021 Governance 17 June 2021 1:33 pm V2
Social and Ethics Committee Report CONTINUED
At the same time, Sarah Bellilchi, the Company Secretary and general counsel of the Group, also stood down from the committee to give way to Julian Carey, Managing Director, and James Wakelin, Head of Debts and Special Projects, who are both leading the Group and taking overall responsibility for all ESG matters. The committee is now composed of three non-executive directors, one executive director and one member of senior management. It has both executive and non-executive members with a majority of non-executive members, as required by King IV.
ESG strategy and reportingDuring the period under review, with the support of our sustainability partner, Carbon Intelligence, we developed an ESG strategy and policy with clearly defined ESG principles which have become an integral part of our core business principles.
We recognise the critical role of environmental, social and governance (‘ESG’) factors in achieving our aspirational goal of becoming the leading MLI business in the UK. For the first time, we are reporting in line with EPRA’s Sustainability Best Practices Recommendations (‘sBPR’) and with the Government’s Streamlined Energy and Carbon Reporting (SECR). We have also included disclosure in line with the Taskforce for Climate-related Financial Disclosures (‘TCFD‘) recommendations.
I invite all our stakeholders to read more on our ESG strategy and policy on pages 72 to 77 and to review the additional disclosures made on pages 175 to 183.
We have also established a new ESG Steering Group which includes representatives from all areas of the business and which is responsible for tracking progress against delivery of our strategy as well as identifying new ESG opportunities. The ESG Steering Group reports to the committee on a quarterly basis via its chair, James Wakelin, who is now also a member of the committee. On behalf of the committee, I then report to the Board on a quarterly basis on all new and significant developments.
The environmentAccess to data on our energy and carbon emissions, its collection and analysis is key to assessing and mitigating the impact of our business activities on the environment and climate. As part of our strategy, we will constantly be looking to expand and improve these data sets. For now, I am pleased to see the climate-related initiatives implemented by the asset management team and described on page 74.
People and communitiesThe year was challenging for all our stakeholders, including our employees. Significant efforts were made to support our growing team throughout the pandemic, facilitating working from home for all and looking after their wellbeing and mental health. We are proud to have not only avoided furloughing employees, but also recruited a significant number of new staff to support our transition into an operating business fully focused on UK MLI.
We continued to invest in training and development, and reviewed and updated Stenprop’s Equal Opportunities Policy, confirming our commitment to promoting equal opportunities in employment. All employees and any job applicants receive equal treatment regardless of age, disability, gender reassignment, marital or civil partner status, pregnancy or maternity, race, colour, nationality, ethnic or national origin, religion or belief, sex or sexual orientation. We believe that our dynamic and diverse team of individuals contribute to the success of the business. We have implemented a new blind recruitment process in line with our policy.
The committee is also proud of the support that all Stenprop’s employees have given to Brain Tumour Research. Despite the difficulties presented by the pandemic, they have raised over £20,000, taking into account our matched giving and company donation. It is a great testament to their dedication and commitment. We are excited to partner with Dementia UK for the year ending 31 March 2022 and look forward to another great year of fundraising activities.
Philip HollandChair of the Social and Ethics Committee
10 June 2021
110 STENPROP ANNUAL REPORT 2021

30051 Stenprop AR2021 Governance 17 June 2021 1:33 pm V2
Directors’ Report
The directors present their report and the audited consolidated financial statements for the year ended 31 March 2021.
Principal activitiesThe principal activity of the Group is that of a property investment company. The Company is a UK REIT and is incorporated in Guernsey. The address of the registered office is Kingsway House, Havilland Street, St Peter Port, Guernsey, GY1 2QE. The postal address of the Company is 180 Great Portland Street, London, W1W 5QZ.
Results and dividendsThe results of the Group for the year are set out in the consolidated statement of comprehensive income. A final dividend was declared on 9 June 2021 of 3.375 pence per share, which, together with the interim dividend declared on 2 December 2020 of 3.375 pence per share, results in a total dividend for the year ended 31 March 2021 of 6.75 pence per share (2020: 6.75 pence per share).
Given the nature of its business, Stenprop has adopted distribution per share as its key performance measure, as this is considered more relevant than earnings or headline earnings per share.
Capital structureDetails of the authorised and issued share capital are shown in Note 12 of the financial statements. The Company has one class of share; all shares rank equally and each share carries the right to one vote at general meetings of the Company.
Going concernThe financial statements of the Group have been prepared on a going concern basis. At the date of signing these accounts, the Group has positive operating cash flow forecasts and positive net assets. Management have reviewed the Group’s cash flow forecasts for the 18 months to 30 September 2022 and, considering this review and the current financial position, they are satisfied that the Company and the Group have access to adequate resources to meet their obligations and continue in operational existence for the foreseeable future, and specifically the 12 months subsequent to the signing of these financial statements. Further details are set out in note 2 to the financial statements.
DirectorsThe directors of the Company who served during the year and to the date of this report were as follows:
Executive Directors ▶ Paul Arenson
▶ Julian Carey
▶ James Beaumont
Non-executive Directors ▶ Richard Grant (Chairman)
▶ Paul Miller
▶ Warren Lawlor (resigned: 16 September 2020)
▶ Philip Holland
▶ Patsy Watson
▶ Louisa Bell (appointed: 4 November 2020)
▶ Richard Smith (appointed: 4 November 2020)
Independent auditorOn 16 September 2020, at the Company’s annual general meeting, a resolution to appoint BDO LLP as the independent auditor was approved. A resolution to reappoint BDO LLP as independent auditor will be provided at the next annual general meeting.
Statement as to disclosure of information to auditorsSo far as the directors are aware, there is no relevant audit information of which the Group’s auditors are unaware, and each director has taken all the steps that they ought to have taken as a director in order to make themselves aware of any relevant audit information and to establish that the Group’s auditors are aware of that information.
Statement of directors’ responsibilitiesThe directors are responsible for preparing the financial statements in accordance with applicable law and regulations. The Companies (Guernsey) Law, 2008 (as amended) requires the directors to prepare financial statements for each financial year. Under that law the directors are required to prepare the group financial statements in accordance with International Financial Reporting Standards (‘IFRS’). The financial statements are required to give a true and fair view of the state of affairs of the Group and of the profit or loss of the Group for that period. In preparing these financial statements, the directors are required to:
▶ properly select and apply accounting policies;
▶ present information, including accounting policies, in a manner that provides relevant, reliable, comparable and understandable information;
▶ provide additional disclosures when compliance with the specific requirements in IFRS is insufficient to enable users to understand the impact of particular transactions, other events and conditions on the entity’s financial position and financial performance; and
▶ make an assessment of the Company’s ability to continue as a going concern.
The directors are responsible for keeping proper accounting records which disclose with reasonable accuracy at any time the financial position of the Group and to enable them to ensure that the financial statements comply with the Companies (Guernsey) Law, 2008. They are also responsible for safeguarding the assets of the Group and hence for taking reasonable steps for the prevention and detection of fraud and other irregularities.
The directors are responsible for the maintenance and integrity of the corporate and financial information included on the Company’s website. Legislation in Guernsey governing the preparation and dissemination of financial statements may differ from legislation in other jurisdictions.
To the best of the directors’ knowledge, the financial statements, prepared in accordance with IFRS; give a true and fair view of the assets, liabilities, financial position and profit or loss of the Company and the undertakings included in the consolidation taken as a whole.
The directors consider that the annual report and accounts, taken as a whole, is fair, balanced and understandable, and provides the information necessary for shareholders to access the Company’s position, performance, business model, and strategy.
Statement of ComplianceThe Company is in compliance with the provisions of the Companies (Guernsey) Law, 2008 and operates in conformity with its Memorandum and Articles of Incorporation.
111STENPROP ANNUAL REPORT 2021
GOVERNANCE

30051 Stenprop AR2021 Governance 17 June 2021 1:33 pm V2
The CEO and CFO responsibility statementThe directors, whose names are stated below, hereby confirm that:
▶ the annual financial statements set out on pages 119 to 169, fairly present in all material respects the financial position, financial performance and cash flows of the issuer in terms of IFRS;
▶ no facts have been omitted or untrue statements made that would make the annual financial statements false or misleading;
▶ internal financial controls have been put in place to ensure that material information relating to the issuer and its consolidated subsidiaries have been provided to effectively prepare the financial statements of the issuer; and
▶ the internal financial controls are adequate and effective and can be relied upon in compiling the annual financial statements, having fulfilled our role and function within the combined assurance model pursuant to principle 15 of the King Code. Where we are not satisfied, we have disclosed to the audit committee and the auditors the deficiencies in design and operational effectiveness of the internal financial controls and any fraud that involves directors, and have taken the necessary remedial action.
Approval of annual financial statementsThe consolidated annual financial statements of Stenprop Limited were approved by the Board of Directors on 10 June 2021 and are signed on their behalf by:
Paul ArensonChief Executive Officer
James Beaumont Chief Financial Officer
Directors’ Report CONTINUED
112 STENPROP ANNUAL REPORT 2021

Job number 17 June 2021 2:57 pm V1
Financial StatementsIndependent Auditor’s Report 114
Consolidated Statement of Comprehensive Income
119
Consolidated Statement of Financial Position
120
Consolidated Statement of Changes in Equity
121
Consolidated Statement of Cash Flows 122
Notes to the Consolidated Financial Statements
123
W

Job number 17 June 2021 2:57 pm V1
Independent Auditor’s ReportTo the members of Stenprop Limited
114 STENPROP ANNUAL REPORT 2021
Opinion on the financial statementsIn our opinion the financial statements:
▶ give a true and fair view of the state of the Group’s affairs as at 31 March 2021 and of its profit for the year then ended;
▶ have been properly prepared in accordance with International Financial Reporting Standards (IFRSs) as issued by the International Accounting Standards Board (IASB);
▶ have been prepared in accordance with the requirements of the Companies (Guernsey) Law, 2008.
We have audited the financial statements of Stenprop Limited (the ‘Parent Company’) and its subsidiaries (the ‘Group’) for the year ended 31 March 2021 which comprise the Consolidated Statement of Comprehensive Income, the Consolidated Statement of Financial Position, the Consolidated Statement of Changes in Equity, the Consolidated Statement of Cash Flows and notes to the financial statements, including a summary of significant accounting policies. The financial reporting framework that has been applied in their preparation is applicable law and IFRSs as issued by the IASB.
Basis for opinionWe conducted our audit in accordance with International Standards on Auditing (UK) (ISAs (UK)) and applicable law. Our responsibilities under those standards are further described in the Auditor’s responsibilities for the audit of the financial statements section of our report. We believe that the audit evidence we have obtained is sufficient and appropriate to provide a basis for our opinion. Our audit opinion is consistent with the additional report to the audit committee.
IndependenceFollowing the recommendation of the audit committee, we were appointed by the Directors on 16 September 2020 to audit the financial statements for the year ending 31 March 2021 and subsequent financial periods. The period of total uninterrupted engagement including retenders and reappointments is one year, covering the year ending 31 March 2021. We remain independent of the Group and the Parent Company in accordance with the ethical requirements that are relevant to our audit of the financial statements in the UK, including the FRC’s Ethical Standard as applied to listed public interest entities, and we have fulfilled our other ethical responsibilities in accordance with these requirements. The non-audit services prohibited by that standard were not provided to the Group or the Parent Company.
Conclusions relating to going concernIn auditing the financial statements, we have concluded that the Directors’ use of the going concern basis of accounting in the preparation of the financial statements is appropriate. Our evaluation of the Directors’ assessment of the Group and the Parent Company’s ability to continue to adopt the going concern basis of accounting included:
We have reviewed and challenged management over the forecasts that support the Going Concern assessment. Our work included agreeing the Group’s available borrowing facilities and the related covenants to supporting financing documentation and calculations, assessing the forecasted cash flows with reference to budgeted and historic performance, agreeing the inputs to the forecasted cash flows to supporting documentation, challenging management’s assumptions and comparing them to historical and current performance, and considering the covenant compliance headroom for sensitivity to both future changes in property valuations and the Group’s future financial performance.
Based on the work we have performed, we have not identified any material uncertainties relating to events or conditions that, individually or collectively, may cast significant doubt on the Group and the Parent Company’s ability to continue as a going concern for a period of at least twelve months from when the financial statements are authorised for issue.
In relation to the Parent Company’s reporting on how it has applied the UK Corporate Governance Code, we have nothing material to add or draw attention to in relation to the Directors’ statement in the financial statements about whether the Directors considered it appropriate to adopt the going concern basis of accounting.
Our responsibilities and the responsibilities of the Directors with respect to going concern are described in the relevant sections of this report.
OverviewCoverage1 100% of Group profit before tax
100% of Group revenue
100% of Group total assetsKey audit matters 2021
KAM 1 Valuation of Investment Property
Materiality Group financial statements as a whole
£6,430,000 based on 1% of Group total assets
1. These are areas which have been subject to a full scope audit by the group engagement team

Job number 17 June 2021 2:57 pm V1
An overview of the scope of our auditOur Group audit was scoped by obtaining an understanding of the Group and its environment, including the Group’s system of internal control, and assessing the risks of material misstatement in the financial statements. We also addressed the risk of management override of internal controls, including assessing whether there was evidence of bias by the Directors that may have represented a risk of material misstatement.
The Group’s investment portfolio is geographically distributed across Germany, the United Kingdom and Switzerland. We scoped our audit in alignment with the operating segments as disclosed in Note 5, with all components being identified as significant with the exception of Switzerland. Each significant component was subject to a full scope audit utilising component materiality. Switzerland, as a non-significant component, was subject to a full scope audit utilising group materiality. Audit procedures for all components were performed by the Group audit team.
Key audit mattersKey audit matters are those matters that, in our professional judgement, were of most significance in our audit of the financial statements of the current period and include the most significant assessed risks of material misstatement (whether or not due to fraud) that we identified, including those which had the greatest effect on: the overall audit strategy, the allocation of resources in the audit, and directing the efforts of the engagement team. These matters were addressed in the context of our audit of the financial statements as a whole, and in forming our opinion thereon, and we do not provide a separate opinion on these matters.
Key audit matter How the scope of our audit addressed the key audit matter
Valuation of Investment PropertyRefer to Note 3 (Significant Accounting Policies), Note 4 (Key Sources of Estimation Uncertainty) and Note 16 (Investment Property)
The valuation of investment property requires significant judgement and estimates by the Directors, with the assistance of independent valuers (“the Valuers”), and is therefore considered a significant risk due to the subjective nature of certain assumptions inherent in each valuation.
The key inputs into the fair value model which are subject to significant management estimates include market rents, market yields, vacancy rates as well as discount and capitalisation rates used in the discounted cash flows. Unreasonable assumptions could give rise to a material misstatement.
There is also a risk that the Directors may influence the significant judgements and estimates in respect of property valuations in order to achieve property valuation and other performance targets to meet market expectations.
To respond to the key audit matter, we have performed the following audit procedures:
▶ We assessed the competency, independence and objectivity of the external valuer, which included making enquiries regarding interests and relationships that may have created a threat to the valuer’s objectivity;
▶ We used our knowledge and experience, alongside our valuation specialists, to evaluate and challenge the valuation assumptions, methodologies and inputs used. This included establishing our own range of expectations for the valuation of investment property based on externally available metrics and wider economic and commercial factors. This included the inputs for; market yields, discount rates and capitalisation rates. We assessed the valuation for each of the investment properties against our own expectation and challenged the external valuer in respect of those properties where the valuations fell outside of our range of expectation through discussion and inspection of corroborating information to determine the appropriate valuation;
▶ Assessed the accuracy of the tenancy schedules and reconciled the rental values used in the valuations to the tenancy schedules including tracing a sample back to underlying lease agreements, alongside verifying vacancy rates utilised in the valuation to the tenancy schedules;
▶ Assessed whether the disclosures in the financial statements are appropriate and in accordance with IFRS 13 Fair Value Measurement; and
▶ Assessed whether all property valuations have been correctly included in the financial statements.
Key Observations:Based on the procedures we performed, we consider the assumptions and methodologies used to value the Group’s investment portfolio to be appropriate.
115STENPROP ANNUAL REPORT 2021
FINANCIAL STATEMENTS
Job number 17 June 2021 2:57 pm V1
Independent Auditor’s Report CONTINUED
To the members of Stenprop Limited
116 STENPROP ANNUAL REPORT 2021
Our application of materialityWe apply the concept of materiality both in planning and performing our audit, and in evaluating the effect of misstatements. We consider materiality to be the magnitude by which misstatements, including omissions, could influence the economic decisions of reasonable users that are taken on the basis of the financial statements.
In order to reduce to an appropriately low level the probability that any misstatements exceed materiality, we use a lower materiality level, performance materiality, to determine the extent of testing needed. Importantly, misstatements below these levels will not necessarily be evaluated as immaterial as we also take account of the nature of identified misstatements, and the particular circumstances of their occurrence, when evaluating their effect on the financial statements as a whole.
Based on our professional judgement, we determined materiality for the financial statements as a whole and performance materiality as follows:
Group financial statements2021£
Materiality £6,430,000Basis for determining materiality Group financial statements as a whole - 1% of total assetsRationale for the benchmark applied We determined that total assets would be the most appropriate basis for determining
overall materiality as we consider this to be one of the principal considerations for users of the financial statements in assessing the financial performance of the Group.
Performance materiality £3,860,000Basis for determining performance materiality
60% of materiality – in determining performance materiality we have considered the follow factors;
▶ Our risk assessment, including our assessment of the Group’s overall control environment; and
▶ The impact of the year ending 31 March 2021 being the first year of our audit of the Group.
Specific materialityWe also determined that for other classes of transactions, balances or disclosures not related to investment properties, a misstatement of less than materiality for the financial statements as a whole, specific materiality, could influence the economic decisions of users. As a result, we determined materiality for these items should be £945,000. This was set at 5% of European Public Real Estate Association (“EPRA”) earnings. We further applied a performance materiality level of 60% of specific materiality to ensure that the risk of errors exceeding specific materiality was appropriately mitigated.
Component materialityWe set materiality for each component of the Group based on a percentage of Group materiality dependent on the size and our assessment of the risk of material misstatement of that component. Component materiality ranged from £1,163,000 to £5,790,000 and for amounts impacting EPRA earnings from £290,000 to £850,000. In the audit of each component, we further applied performance materiality levels of 60% of the component materiality to our testing to ensure that the risk of errors exceeding component materiality was appropriately mitigated.
Reporting threshold We agreed with the Audit Committee that we would report to them all individual audit differences in excess of £130,000 and for amounts impacting EPRA earnings in excess of £19,000. We also agreed to report differences below this threshold that, in our view, warranted reporting on qualitative grounds.
Other informationThe directors are responsible for the other information. The other information comprises the information included in the annual report other than the financial statements and our auditor’s report thereon. Our opinion on the financial statements does not cover the other information and, except to the extent otherwise explicitly stated in our report, we do not express any form of assurance conclusion thereon. Our responsibility is to read the other information and, in doing so, consider whether the other information is materially inconsistent with the financial statements or our knowledge obtained in the course of the audit, or otherwise appears to be materially misstated. If we identify such material inconsistencies or apparent material misstatements, we are required to determine whether this gives rise to a material misstatement in the financial statements themselves. If, based on the work we have performed, we conclude that there is a material misstatement of this other information, we are required to report that fact.
We have nothing to report in this regard.

Job number 17 June 2021 2:57 pm V1
Corporate governance statementISAs require us to review the Directors’ statement in relation to going concern, longer-term viability and that part of the Corporate Governance Statement relating to the parent company’s compliance with the provisions of the UK Corporate Governance Statement specified for our review.
Based on the work undertaken as part of our audit, we have concluded that each of the following elements of the Corporate Governance Statement is materially consistent with the financial statements or our knowledge obtained during the audit.
Going concern and longer-term viability
▶ The Directors’ statement with regards to the appropriateness of adopting the going concern basis of accounting and any material uncertainties identified set out on page 111; and
▶ The Directors’ explanation as to its assessment of the entity’s prospects, the period this assessment covers and why the period is appropriate set out on page 63.
Other Code provisions ▶ Directors’ statement on fair, balanced and understandable set out on page 111;
▶ Board’s confirmation that it has carried out a robust assessment of the emerging and principal risks set out on page 63;
▶ The section of the annual report that describes the review of effectiveness of risk management and internal control systems set out on pages 61 - 68; and
▶ The section describing the work of the audit committee set out on pages 90 - 92.
Other Companies (Guernsey) Law, 2008 reportingWe have nothing to report in respect of the following matters where the Companies (Guernsey) Law, 2008 requires us to report to you if, in our opinion:
▶ proper accounting records have not been kept by the Company; or
▶ the financial statements are not in agreement with the accounting records; or
▶ we have failed to obtain all the information and explanations which, to the best of our knowledge and belief, are necessary for the purposes of our audit.
Responsibilities of DirectorsAs explained more fully in the statement of directors’ responsibilities, the Directors are responsible for the preparation of the financial statements and for being satisfied that they give a true and fair view, and for such internal control as the Directors determine is necessary to enable the preparation of financial statements that are free from material misstatement, whether due to fraud or error.
In preparing the financial statements, the Directors are responsible for assessing the Group’s and the Parent Company’s ability to continue as a going concern, disclosing, as applicable, matters related to going concern and using the going concern basis of accounting unless the Directors either intend to liquidate the Group or the Parent Company or to cease operations, or have no realistic alternative but to do so.
Auditor’s responsibilities for the audit of the financial statementsOur objectives are to obtain reasonable assurance about whether the financial statements as a whole are free from material misstatement, whether due to fraud or error, and to issue an auditor’s report that includes our opinion. Reasonable assurance is a high level of assurance, but is not a guarantee that an audit conducted in accordance with ISAs (UK) will always detect a material misstatement when it exists. Misstatements can arise from fraud or error and are considered material if, individually or in the aggregate, they could reasonably be expected to influence the economic decisions of users taken on the basis of these financial statements.
Extent to which the audit was capable of detecting irregularities, including fraudIrregularities, including fraud, are instances of non-compliance with laws and regulations. We design procedures in line with our responsibilities, outlined above, to detect material misstatements in respect of irregularities, including fraud. The extent to which
117STENPROP ANNUAL REPORT 2021
FINANCIAL STATEMENTS

Job number 17 June 2021 2:57 pm V1
Independent Auditor’s Report CONTINUED
To the members of Stenprop Limited
118 STENPROP ANNUAL REPORT 2021
our procedures are capable of detecting irregularities, including fraud is detailed below:
▶ Obtaining an understanding of the control environment in monitoring compliance with laws and regulations and performing our own checks of compliance with relevant requirements including the Companies (Guernsey) Law 2008, the UK Listing Rules, JSE filing requirements and the REIT tax regime requirements;
▶ Agreement of the financial statement disclosures to underlying supporting documentation to assess compliance with those laws and regulations having an impact on the financial statements;
▶ Enquiries of management and the Audit Committee as to their identification of any non-compliance with laws or regulations, or any actual or potential claims;
▶ Review of minutes of Board meetings throughout the period;
▶ In relation to the risk of management override of internal controls, by undertaking procedures to review journal entries processed during and subsequent to the year end and evaluating whether there was a risk of material misstatement due to fraud;
▶ We assessed the susceptibility of the Group’s financial statements to material misstatement, including how fraud might occur by considering the key risks impacting the financial statements. We identified specific fraud risks with respect to the valuation of investment property, which has been included as a key audit matter and our audit response is set out in that section of our audit report; and
▶ We communicated relevant identified laws and regulations and potential fraud risks to all engagement team members and remained alert to any indications of fraud or non-compliance with laws and regulations throughout the audit.
Our audit procedures were designed to respond to risks of material misstatement in the financial statements, recognising that the risk of not detecting a material misstatement due to fraud is higher than the risk of not detecting one resulting from error, as fraud may involve deliberate concealment by, for example, forgery, misrepresentations or through collusion. There are inherent limitations in the audit procedures performed and the further removed non-compliance with laws and regulations is from the events and transactions reflected in the financial statements, the less likely we are to become aware of it.
A further description of our responsibilities is available on the Financial Reporting Council’s website at: www.frc.org.uk/auditorsresponsibilities. This description forms part of our auditor’s report.
Use of our reportThis report is made solely to the Parent Company’s members, as a body, in accordance with Section 262 of the Companies (Guernsey) Law, 2008. Our audit work has been undertaken so that we might state to the Parent Company’s members those matters we are required to state to them in an auditor’s report and for no other purpose. To the fullest extent permitted by law, we do not accept or assume responsibility to anyone other than the Parent Company and the Parent Company’s members as a body, for our audit work, for this report, or for the opinions we have formed.
Christopher Young For and on behalf of BDO LLP, Chartered AccountantsLondon, United Kingdom
10 June 2021
BDO LLP is a limited liability partnership registered in England and Wales (with registered number OC305127).

Job number 17 June 2021 2:57 pm V1
Consolidated Statement of Comprehensive Income For the year ended 31 March 2021
Note
31 March2021
£’000
31 March2020
£’000
Continued operationsRevenue 44,860 44,098Expected credit losses (2,345) (541)Property expenses (10,512) (10,508)Net rental income 6 32,003 33,049Management fee income 747 558Operating costs 7 (10,516) (10,053)Net operating income 22,234 23,554Fair value gain on investment properties 36,287 4,938Gain/(loss) on disposal of property 656 (2,779)Income from joint ventures 18 61 2,115Profit on disposal of subsidiaries 25 307 –Net foreign exchange (loss)/gain (44) 3Profit from operations 59,501 27,831Net gain/(loss) from fair value of derivative financial instruments 1,940 (2,410)Interest income 356 432Finance costs 9 (5,857) (9,719)Profit for the year before taxation 55,940 16,134Tax (expense)/credit 10 (2,034) 1,222Profit for the year from continuing operations 53,906 17,356
Discontinued operationsLoss for the year from discontinued operations 19 (891) (2,197)Profit for the year 53,015 15,159
Profit attributable to:Equity holders 53,045 15,565Non-controlling interest derived from continuing operations (30) (406)Other comprehensive incomeItems that may be reclassified subsequently to profit or loss:
Foreign currency translation reserve (3,663) 4,104Total comprehensive income for the year 49,352 19,263
Total comprehensive income attributable to:Equity holders 49,352 19,669Non-controlling interest (30) (406)
Earnings per share Pence Pence From continuing operations:
EPS 14 19.02 6.28Diluted EPS 14 18.88 6.20
From continuing and discontinued operations:EPS 14 18.71 5.50Diluted EPS 14 18.57 5.44
119STENPROP ANNUAL REPORT 2021
FINANCIAL STATEMENTS
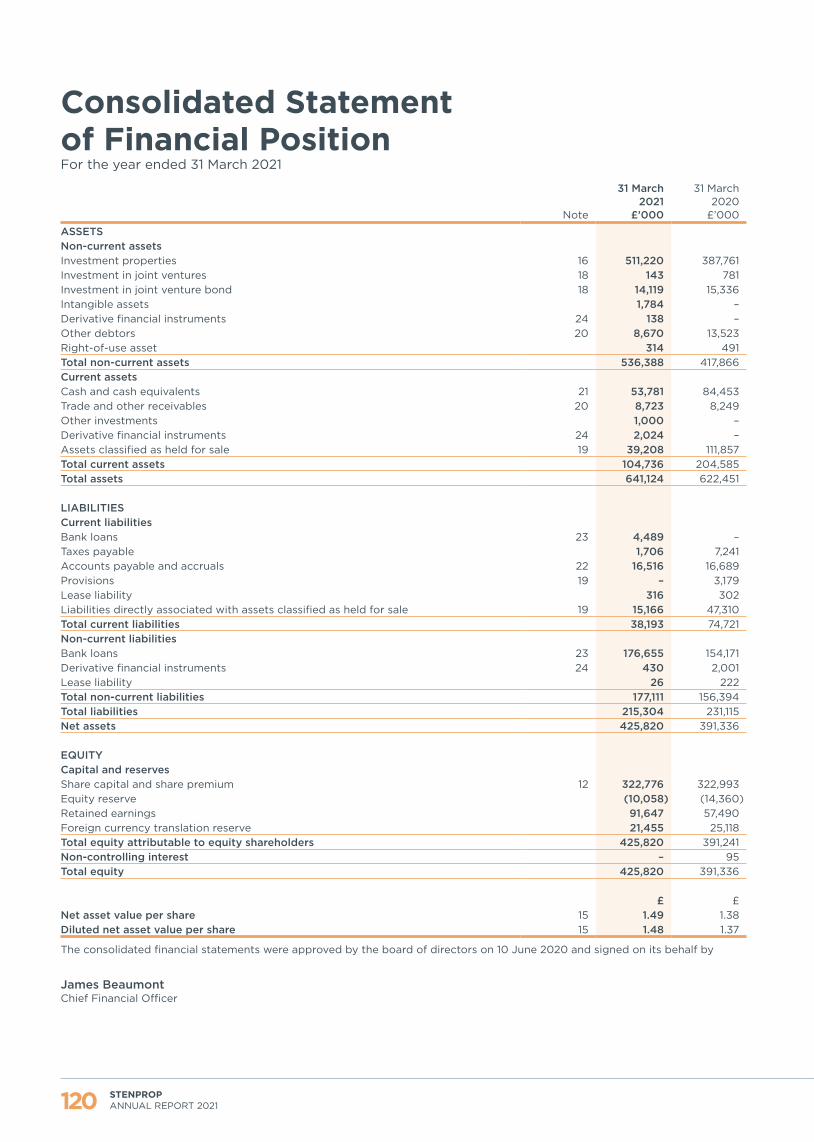
Job number 17 June 2021 2:57 pm V1
Consolidated Statement of Financial Position For the year ended 31 March 2021
120 STENPROP ANNUAL REPORT 2021
Note
31 March2021
£’000
31 March2020
£’000
ASSETSNon-current assetsInvestment properties 16 511,220 387,761Investment in joint ventures 18 143 781Investment in joint venture bond 18 14,119 15,336Intangible assets 1,784 –Derivative financial instruments 24 138 –Other debtors 20 8,670 13,523Right-of-use asset 314 491Total non-current assets 536,388 417,866Current assetsCash and cash equivalents 21 53,781 84,453Trade and other receivables 20 8,723 8,249Other investments 1,000 –Derivative financial instruments 24 2,024 –Assets classified as held for sale 19 39,208 111,857Total current assets 104,736 204,585Total assets 641,124 622,451
LIABILITIESCurrent liabilitiesBank loans 23 4,489 –Taxes payable 1,706 7,241Accounts payable and accruals 22 16,516 16,689Provisions 19 – 3,179Lease liability 316 302Liabilities directly associated with assets classified as held for sale 19 15,166 47,310Total current liabilities 38,193 74,721Non-current liabilitiesBank loans 23 176,655 154,171Derivative financial instruments 24 430 2,001Lease liability 26 222Total non-current liabilities 177,111 156,394Total liabilities 215,304 231,115Net assets 425,820 391,336
EQUITYCapital and reservesShare capital and share premium 12 322,776 322,993Equity reserve (10,058) (14,360)Retained earnings 91,647 57,490Foreign currency translation reserve 21,455 25,118Total equity attributable to equity shareholders 425,820 391,241Non-controlling interest – 95Total equity 425,820 391,336
£ £ Net asset value per share 15 1.49 1.38Diluted net asset value per share 15 1.48 1.37
The consolidated financial statements were approved by the board of directors on 10 June 2020 and signed on its behalf by
James Beaumont Chief Financial Officer

Job number 17 June 2021 2:57 pm V1
Consolidated Statement of Changes in Equity For the year ended 31 March 2021
Note
Share capital
and share premium
£’000
Equity reserve £’000
Retained earnings
£’000
Foreign currency
translation reserve £’000
Attributable to equity
shareholders £’000
Non-controlling
interest £’000
Total equity £’000
Balance at 1 April 2020 322,993 (14,360) 57,490 25,118 391,241 95 391,336Profit for the year – – 53,045 – 53,045 (95) 52,950Other comprehensive income for the year – – – (3,663) (3,663) – (3,663)Total comprehensive income for the year – – 53,045 (3,663) 49,382 (95) 49,287
Equity-settled share-based payments 13 (217) 1,219 213 – 1,215 – 1,215Repurchase of own shares – (4,110) – – (4,110) – (4,110)Ordinary dividends 11 – 7,193 (19,101) – (11,908) – (11,908)Total contributions and distribution recognised directly in equity (217) 4,302 (18,888) – (14,803) – (14,803)
Balance at 31 March 2021 322,776 (10,058) 91,647 21,455 425,820 – 425,820
Balance at 1 April 2019 322,993 (15,708) 60,952 21,014 389,251 2,969 392,220Profit for the year – – 15,565 – 15,565 (322) 15,243Other comprehensive income for the year – – – 4,104 4,104 – 4,104Total comprehensive income for the year – – 15,565 4,104 19,669 (322) 19,347
Equity-settled share-based payments 13 – 1,079 – – 1,079 – 1,079Repurchase of own shares – (4,828) – – (4,828) – (4,828)Other changes in non-controlling interest – – – – – (513) (513)Ordinary dividends 11 – 5,097 (19,027) – (13,930) (2,039) (15,969)Total contributions and distribution recognised directly in equity – 1,348 (19,027) – (17,679) (2,552) (20,231)
Balance at 31 March 2020 322,993 (14,360) 57,490 25,118 391,241 95 391,336
121STENPROP ANNUAL REPORT 2021
FINANCIAL STATEMENTS
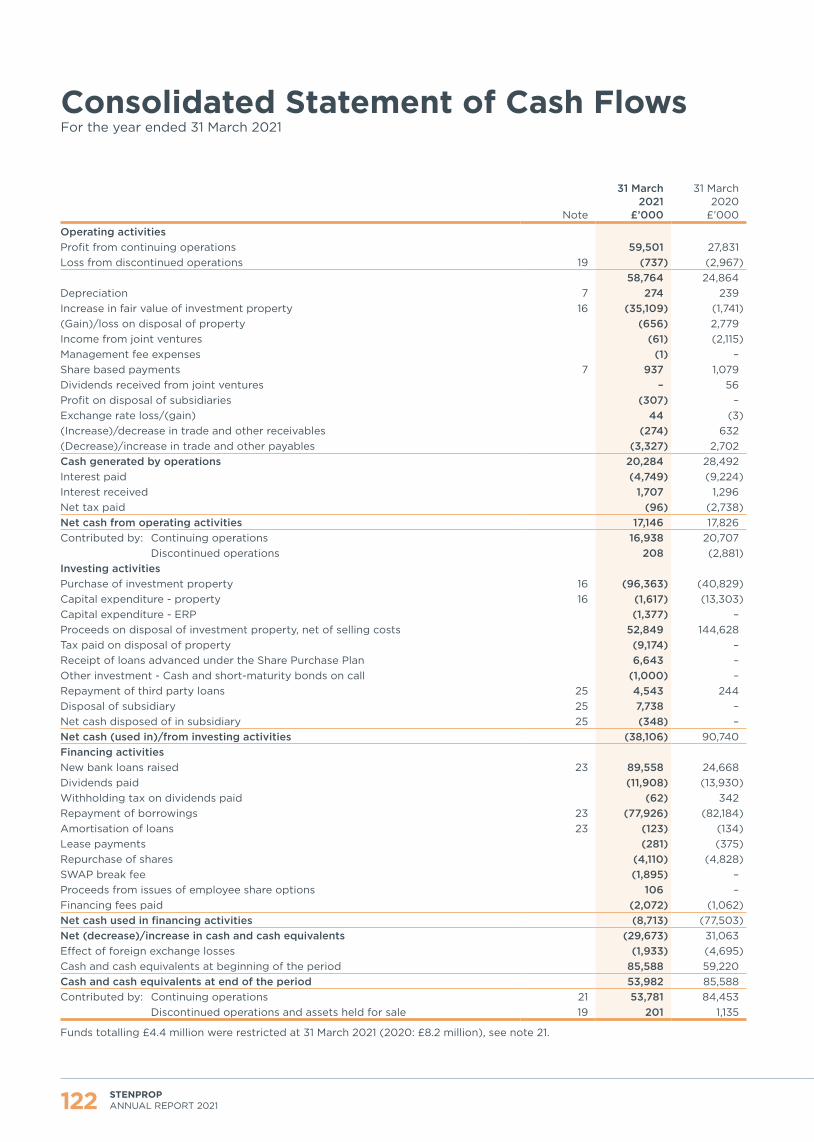
Job number 17 June 2021 2:57 pm V1
Consolidated Statement of Cash Flows For the year ended 31 March 2021
122 STENPROP ANNUAL REPORT 2021
Note
31 March2021
£’000
31 March2020
£’000
Operating activitiesProfit from continuing operations 59,501 27,831Loss from discontinued operations 19 (737) (2,967)
58,764 24,864Depreciation 7 274 239Increase in fair value of investment property 16 (35,109) (1,741)(Gain)/loss on disposal of property (656) 2,779Income from joint ventures (61) (2,115)Management fee expenses (1) –Share based payments 7 937 1,079Dividends received from joint ventures – 56Profit on disposal of subsidiaries (307) –Exchange rate loss/(gain) 44 (3)(Increase)/decrease in trade and other receivables (274) 632(Decrease)/increase in trade and other payables (3,327) 2,702Cash generated by operations 20,284 28,492Interest paid (4,749) (9,224)Interest received 1,707 1,296Net tax paid (96) (2,738)Net cash from operating activities 17,146 17,826Contributed by: Continuing operations 16,938 20,707 Discontinued operations 208 (2,881)Investing activitiesPurchase of investment property 16 (96,363) (40,829)Capital expenditure - property 16 (1,617) (13,303)Capital expenditure - ERP (1,377) –Proceeds on disposal of investment property, net of selling costs 52,849 144,628Tax paid on disposal of property (9,174) –Receipt of loans advanced under the Share Purchase Plan 6,643 –Other investment - Cash and short-maturity bonds on call (1,000) –Repayment of third party loans 25 4,543 244Disposal of subsidiary 25 7,738 –Net cash disposed of in subsidiary 25 (348) –Net cash (used in)/from investing activities (38,106) 90,740Financing activitiesNew bank loans raised 23 89,558 24,668Dividends paid (11,908) (13,930)Withholding tax on dividends paid (62) 342Repayment of borrowings 23 (77,926) (82,184)Amortisation of loans 23 (123) (134)Lease payments (281) (375)Repurchase of shares (4,110) (4,828)SWAP break fee (1,895) –Proceeds from issues of employee share options 106 –Financing fees paid (2,072) (1,062)Net cash used in financing activities (8,713) (77,503)Net (decrease)/increase in cash and cash equivalents (29,673) 31,063Effect of foreign exchange losses (1,933) (4,695)Cash and cash equivalents at beginning of the period 85,588 59,220Cash and cash equivalents at end of the period 53,982 85,588Contributed by: Continuing operations 21 53,781 84,453 Discontinued operations and assets held for sale 19 201 1,135
Funds totalling £4.4 million were restricted at 31 March 2021 (2020: £8.2 million), see note 21.

Job number 17 June 2021 2:57 pm V1
Notes to the Consolidated Financial Statements1 General InformationStenprop Limited (the ‘Company’ and together with its subsidiaries the ‘Group’) is registered in Guernsey (Registration number 64865). The registered address of the Company is Kingsway House, Havilland Street, St Peter Port, GY1 2QE, Guernsey. With effect from 1 May 2018, the Company converted to a UK real estate investment trust (‘REIT’).
2 Basis of preparationThe consolidated financial statements have been prepared in accordance with International Financial Reporting Standards (‘IFRS’s) as issued by the IASB, and the SAICA Financial Reporting Guides as issued by the Accounting Practices Committee and Financial Pronouncements as issued by Financial Reporting Standards Council and the Companies Act, 71 of 2008 (‘Companies Act’) applicable to companies reporting under IFRS and the JSE Listings Requirements, the Disclosure and Transparency Rules of the UK’s FCA and applicable Guernsey law. The consolidated financial statements have been prepared on the historical cost basis, except for the revaluation of investment properties and financial instruments that are measured at fair values at the end of each reporting period, as explained in the accounting policies below. Historical cost is generally based on the fair value of the consideration given in exchange for goods and services. The principal accounting policies, which are consistent with those applied in the previous annual financial statements, except for the adoption of new and revised standards (described below), are set out below. The consolidated financial statements are presented in GBP (Pounds Sterling).
Going concernAt the date of signing these consolidated financial statements, the Group has positive operating cash flows and positive net assets. Management have carefully considered the impact of the significant risks and uncertainties within the context of the Group’s viability and prospects, with specific emphasis placed on the unprecedented challenges posed to the business and the Group’s occupiers as a result of the COVID-19 pandemic, and the potential microeconomic impact of Brexit. Management subjected the Group’s cash flow forecast for the period to 30 September 2022 to appropriate scenarios, including a specific COVID-19 related income scenario in the base case, based on our rent collection experience over the period of the pandemic. This income scenario was further sensitised given the uncertainty of the pandemic. In addition, the impact of the significant risks and uncertainties facing the business, taking into account likely effectiveness of mitigating actions that the Group would have at its disposal. The significant risks and uncertainties identified as relevant to the forecast and its ability to continue to meet its obligations as they fall due, relate to the timing and quantum of acquisitions and disposals, financing of acquisitions, debt maturity and compliance, rental growth rates, void periods and REIT obligations.
The Group has significant cash resources at the start of the look forward period which is a key factor in assessing the validity of the going concern assumption for the Group.
Debt refinancing and sensitivities to loan covenants were assessed in detail, as well as the Group’s REIT obligations. It has been assumed that debt facilities can be refinanced as required in normal market lending conditions, consistent with what we are currently experiencing with our lenders. Despite the disruption in the economy caused by COVID-19, we do not expect the risk of default to have increased and no breach cures have been assumed in the forecast model. This is considered appropriate in light of the strong relationships we maintain with our facility providers, as evidenced by successful refinancings achieved during the period and, at the time of publishing this report, the significant headroom which exists for all interest cover ratios and, with the exception of Lugano discussed separately below, for Loan to Value ratio covenants.
Lugano: The Group owns a property known as Lugano in Switzerland with a rehabilitation medical facility and health club tenant. The property investment comprises 2% of the portfolio. The property is subject to an LTV covenant only (no interest cover ratio covenant) of 50%. At year end, the LTV based on an external valuation was 48.9%. Notwithstanding this, the bank supports the ongoing sale process and the cash flow forecast illustrates that the Group would have sufficient cash resources available to cure a covenant breach if it crystallised and should the lender take a hard stance. It is further worth noting that the loan is not cross-collateralised and accordingly if the bank did act aggressively, the Group would continue to operate with the remaining portfolio of assets if any foreclosure event were to arise.
In light of this review, the significant liquid assets at year end and the £27 million of unencumbered property at reporting date, management are satisfied that the Group has access to adequate resources to meet its obligations as they fall due and will continue in operational existence for a period of at least twelve months from the date of these financial statements. The directors believe that it is therefore appropriate to prepare the accounts on a going concern basis and no material uncertainty exists in reaching this conclusion.
Note 27 to the consolidated financial statements includes the Group’s objectives, policies, and procedures for managing its capital, market, credit, and liquidity risks.
Adoption of new and revised standardsIn the current period no new or revised Standards and Interpretations have been adopted. At the date of approval of these consolidated financial statements, the Group has not applied the following new standards that have been issued but are not yet effective:
▶ Amendments to IAS 1 Classification of liabilities as current or non-current
Impact assessment of adopting new accounting standardsThe directors have completed or are in the process of assessing these standards and do not expect that the adoption of the standards listed above will have a material impact on the financial statements of the Group in future periods.
123STENPROP ANNUAL REPORT 2021
FINANCIAL STATEMENTS

Job number 17 June 2021 2:57 pm V1
Notes to the Consolidated Financial Statements CONTINUED
124 STENPROP ANNUAL REPORT 2021
2 Basis of preparation CONTINUED
New standards in issue but not yet effectiveAmendments to IAS 1 Classification of liabilities as current or non-current. In January 2020, the IASB issued amendments to IAS 1, which are intended to clarify the requirements that an entity applies in determining whether a liability is classified as current or non-current. The amendments are intended to be narrow scope in nature and are meant to clarify the requirements in IAS 1 rather than modify the underlying principles. The amendments include clarifications relating to how events after the end of the reporting period affect liability classification, what the rights of an entity must be to classify a liability as non-current, how an entity assesses compliance with conditions of a liability (e.g., bank covenants), and how conversion features in liabilities affect their classification. The amendments are applied prospectively for annual reporting periods beginning on or after 1 January 2023, with early application permitted. However, they are yet to be endorsed for application in the United Kingdom.
3 Significant accounting policiesBasis of consolidationConsolidation of a subsidiary begins when the Group obtains control over the subsidiary and ceases when the Group loses control of the subsidiary. Specifically, the results of the subsidiaries acquired or disposed of during the period are included in the consolidated statement of comprehensive income from the date the Company gains control until the date when the Company ceases to control the subsidiary.
Profit or loss and each component of other comprehensive income are attributed to the owners of the Company and to the non-controlling interests. Total comprehensive income of the subsidiaries is attributed to the owners of the Company and to the non-controlling interests, even if this results in the non-controlling interests having a deficit balance.
Where necessary, adjustments are made to the financial statements of subsidiaries to bring the accounting policies used in line with the Group’s accounting policies.
All intragroup assets and liabilities, equity, income, expenses, and cash flows relating to transactions between the members of the Group are eliminated on consolidation.
When the Group loses control of a subsidiary, the gain or loss on disposal recognised in profit or loss is calculated as the difference between (i) the aggregate of the fair value of the consideration received and the fair value of any retained interest, and (ii) the previous carrying amount of the assets (including goodwill), less liabilities of the subsidiary and any non-controlling interests.
All amounts previously recognised in other comprehensive income in relation to that subsidiary are accounted for as if the Group had directly disposed of the related assets or liabilities of the subsidiary (i.e. reclassified to profit or loss or transferred to another category of equity as specified/permitted by applicable IFRS). The fair value of any investment retained in the former subsidiary at the date when control is lost is regarded as the fair value on initial recognition for subsequent accounting under IFRS 9 Financial Instruments or, when applicable, the costs on initial recognition of an investment in an associate or jointly controlled entity.
Joint venturesThe Group’s investment properties are typically held in property-specific separate legal entities, which may be legally structured as joint ventures. In assessing whether a particular legal entity is accounted for as a subsidiary or joint venture, the Group considers all of the contractual terms of the arrangement, including the extent to which the responsibilities and parameters of the venture are determined in advance of the joint venture agreement being agreed between the two parties. The Group will then consider whether it has the power to govern the financial and operating policies of the legal entity, to obtain benefits from its activities, and the existence of any legal disputes or challenges to this control in order to conclude on the classification of the legal entity as a joint venture or subsidiary undertaking. In applying this policy and as detailed in note 18, the Group’s investment in Elysion S.A. is classified as a joint venture because the share of beneficial ownership and management of the portfolio being conducted by the joint venture partner.
The consolidated financial statements account for interests in joint ventures using the equity method of accounting per IFRS 11 Joint Arrangements.
Loans to joint ventures are separately presented from equity interests in the Group’s consolidated statement of financial position. The Group eliminates upstream and downstream transactions with its joint ventures, including interest and any other costs, to the extent of the Group’s interest in the relevant joint venture. The classification and measurement of loans to joint ventures is determined in accordance with the Group’s accounting policies for financial assets.
Business combinations and asset acquisitionsBusiness combinations are accounted for using the acquisition method and any excess of the purchase consideration over the fair value of the net assets acquired is initially recognised as goodwill and subsequently reviewed for impairment. Any discount received and/or acquisition costs are recognised in the consolidated statement of comprehensive income.
The Group acquires subsidiaries that own real estate. At the time of acquisition, the Group considers whether the acquisition represents the acquisition of a business. The Group accounts for an acquisition as a business combination where an integrated set of activities is acquired in addition to the property. More specifically, the following criteria are considered:

Job number 17 June 2021 2:57 pm V1
3 Significant accounting policies CONTINUED
▶ The number of items of land and buildings owned by the subsidiary;
▶ The extent to which significant processes are acquired and in particular the extent of ancillary services provided by the subsidiary; and
▶ Whether the subsidiary has allocated its own staff to manage the property and/or to deploy any processes, including provision of all relevant administration and information to the entity’s owners.
When the acquisition of subsidiaries does not represent a business, it is accounted for as an acquisition of a group of assets and liabilities.
There were no business combinations acquired during the 12 months to 31 March 2021 (2020: nil).
Revenue recognitionThe Group earns returns from investments in direct property assets and management fees. Revenue is recognised when it is probable that the economic benefits associated with the transaction will flow to the Group and the amount of revenue can be measured reliably.
Rental income Rental income and lease incentives are recognised in accordance with IFRS 16 Leases. Rental income from investment property is recognised as revenue on a straight-line basis over the lease term. Lease incentives and costs associated with entering into tenant leases are amortised over the lease term, or if the probability that a break option will be exercised is considered high, over the period to the first break option. Rent reviews are recognised when such reviews have been agreed with tenants.
Rental income from operating leases is recognised on an accruals basis. A rent adjustment based on open market estimated rental value is recognised from the rent review date in relation to unsettled rent reviews. Where a significant rent-free period is included in a lease, the rental income forgone is allocated evenly over the period from the date of lease commencement to the expiry date of the lease.
Rental income from fixed and minimum guaranteed rent reviews is recognised on a straight-line basis over the entire lease term. Where such rental income is recognised ahead of the related cash flow, an adjustment is made to ensure the carrying value of the investment property, including the accrued rent, does not exceed the external valuation. Initial significant direct costs incurred in negotiating and arranging a new lease are amortised on a straight-line basis over the period from the date of lease commencement to the expiry date of the lease.
Where a lease incentive payment, or surrender premium is paid to enhance the value of a property, it is amortised on a straight-line basis over the period from the date of lease commencement to the expiry date of the lease. Upon receipt of a surrender premium for the early determination of a lease, the profit, net of dilapidations and non-recoverable outgoings relating to the lease concerned, is immediately reflected in income.
Lease modifications are a change in the scope of a lease, or the consideration for a lease, that was not part of the original terms and conditions of the lease (for example, adding or terminating the right to use one or more underlying assets, or extending or shortening the contractual lease term). Lease modifications are accounted for under IFRS 16 Leases. Modifications to a lease is recognised as a new lease from the effective date of the modification, considering any prepaid or accrued lease payments relating to the original lease as part of the lease payments for the new lease.
Deferred income relates to rental income that has been collected in advance of it being recognised as revenue.
Contingent rents, such as turnover rents, rent reviews and indexation, are recorded as income in the periods in which they are earned.
Tenant rechargesService charge income, property fee income and joint venture and associate management fees are recognised in accordance with IFRS 15 Revenue from contracts with customers, which prescribes the use of a five-step model for the recognition of revenue. These income streams are recognised as revenue in the period in which they are earned.
Service charge income is recognised in the accounting period in which the services are rendered, and the related property expenses are recognised in the period in which they are incurred.
Other incomeOther income mainly consists of maintenance contributions and dilapidations settlements from our customers. This revenue stream is accounted for under IFRS 15 Revenue from contracts with customers. These income streams are recognised as revenue in the period in which they are earned.
Management fee incomeManagement fees are recognised in the statement of comprehensive income over time as performance obligations are satisfied.
Foreign currenciesThe individual financial statements of each Group company are presented in the currency of the primary economic environment in which it operates (its functional currency). For the purpose of the consolidated financial statements, the results and financial position are expressed in GBP Sterling, which is the functional currency of the Company and the presentational currency for the Group.
125STENPROP ANNUAL REPORT 2021
FINANCIAL STATEMENTS

Job number 17 June 2021 2:57 pm V1
Notes to the Consolidated Financial Statements CONTINUED
126 STENPROP ANNUAL REPORT 2021
3 Significant accounting policies CONTINUED
In preparing the financial statements of the individual companies, transactions in currencies other than the entity’s functional currency (foreign currencies) are recognised at the rates of exchange prevailing on the dates of the transactions. At each statement of financial position date, monetary assets and liabilities that are denominated in foreign currencies are translated at the rates prevailing at that date. Non-monetary items carried at fair value that are denominated in foreign currencies are translated at the rates prevailing at the date when the fair value was determined. Non-monetary items that are measured in terms of historical cost in a foreign currency are not retranslated. Exchange differences are recognised in profit or loss for the period in which they arise.
For the purpose of presenting consolidated financial statements, the assets and liabilities of the Group’s foreign operations are translated at exchange rates prevailing on the reporting date. Income and expense items are translated at the average exchange rates for the period. Exchange differences arising are recognised in other comprehensive income and accumulated in equity (attributed to non-controlling interests as appropriate).
Borrowing costsInterest costs are recognised in the consolidated statement of comprehensive income using the effective interest rate method.
Borrowing costs directly attributable to arranging finance are amortised over the facility term in the consolidated statement of comprehensive income.
Current taxCurrent tax payable is based on taxable profit for the year. The Group’s liability for current tax is calculated using tax rates that have been enacted or substantively enacted by the balance sheet date.
Deferred taxDeferred tax is recognised on temporary differences between the carrying amounts of assets and liabilities in the financial statements and the corresponding tax bases used in the computation of taxable profit.
Deferred tax assets are generally recognised for all deductible temporary differences to the extent that it is probable that taxable profits will be available against which those deductible temporary differences can be utilised. Such deferred tax assets and liabilities are not recognised if the temporary difference arises from goodwill or from the initial recognition (other than in a business combination) of other assets and liabilities in a transaction that affects neither the taxable profit nor the accounting profit.
Deferred tax liabilities are recognised for taxable temporary differences associated with investments in subsidiaries and associates, and interests in joint ventures, except where the Group is able to control the reversal of the temporary difference and it is probable that the temporary difference will not reverse in the foreseeable future. Deferred tax assets arising from deductible temporary differences associated with such investments and interests are only recognised to the extent that it is probable that there will be sufficient taxable profits against which to utilise the benefits of the temporary differences and they are expected to reverse in the foreseeable future.
The carrying amount of deferred tax assets is reviewed at the end of each reporting period and reduced to the extent that it is no longer probable that sufficient taxable profits will be available to allow all or part of the asset to be recovered. Deferred tax assets and liabilities are measured at the tax rates that are expected to apply in the period in which the liability is settled or the asset realised, based on tax rates (and tax laws) that have been enacted or substantively enacted by the end of the reporting period. The measurement of deferred tax liabilities and assets reflects the tax consequences that would follow from the manner in which the Group expects, at the end of the reporting period, to recover or settle the carrying amount of its assets and liabilities.
Deferred tax assets and liabilities are offset when there is a legally enforceable right to set off current tax assets against current tax liabilities and when they relate to income taxes levied by the same taxation authority and the Group intends to settle its current tax assets and liabilities on a net basis.
Non-controlling interestsNon-controlling interests in the net assets (excluding goodwill) of consolidated subsidiaries are identified separately from the Group’s equity therein. Non-controlling interests consist of the amount of those interests at the date of the original business combination and the non-controlling interests’ share of the changes in equity since the date of the combination. Total comprehensive income is attributed to non-controlling interests even if this results in the non-controlling interests having a deficit balance.
Investment propertiesProperties held to earn rental income and/or capital appreciation are classified as investment properties. Investment properties comprise both freehold and long leasehold land and buildings.
Investment properties are recognised as assets when:
▶ it is probable that the future economic benefits that are associated with the investment property will flow to the Group;
▶ there are no material conditions precedent which could prevent completion; and
▶ the cost of the investment property can be measured reliably.

Job number 17 June 2021 2:57 pm V1
3 Significant accounting policies CONTINUED
Investment properties are measured initially at cost, including related transaction costs. After initial recognition, investment properties are carried at fair value, determined by the directors and/or based on independent external appraisals preformed by JLL, twice a year.
The Group uses the valuations prepared by its independent valuers as the fair value of its investment properties. These valuations are undertaken in accordance with the appropriate sections of the current Practice Statements contained in the Royal Institution of Chartered Surveyors Valuation – Professional Standards (‘Red Book’). This is an internationally accepted basis of valuation. The valuations are based upon assumptions including contractual and estimated rental values, future rental income, anticipated maintenance costs, future development costs and appropriate discount rates. The valuers also refer to market evidence of transaction prices for similar properties. The valuation techniques used are consistent with IFRS 13 Fair Value Measurement.
The difference between the fair value of a property at the reporting date and its carrying amount prior to remeasurement is included in the consolidated statement of comprehensive income as a valuation surplus or deficit in the fair value gain/(loss) on investment properties account.
Cash and cash equivalentsCash and cash equivalents in the balance sheet comprise cash at banks with an original maturity of three months or less. Cash balances are recorded net of tenant deposits. Restricted cash represents service charge monies held by managing agents as well as rent held in bank accounts which are secured by lenders, for the purposes of debt repayments.
ExpenditureExpenses are accounted for on an accrual basis. Property expenses include the costs of professional fees on lettings and other non-recoverable costs. Operating costs include all professional fees incurred in operating the business in the best interests of the shareholders.
Financial instrumentsA financial instrument is a contract that gives rise to a financial asset to one entity and a financial liability or equity instrument to another. The classification of financial assets and financial liabilities depends on the nature and purpose of the instrument and is determined at the time of initial recognition.
Financial assets and financial liabilities are initially measured at fair value. Transaction costs that are directly attributable to the acquisition or issue of financial assets and financial liabilities (other than financial assets at fair value through profit or loss (‘FVTPL’)) are added to or deducted from the fair value of the financial assets or financial liabilities, as appropriate, on initial recognition.
Transaction costs directly attributable to the acquisition of financial assets or financial liabilities at FVTPL are recognised immediately in the statement of comprehensive income.
In addition, for financial reporting purposes, fair value measurements are categorised into Level 1, 2 or 3 based on the degree to which the inputs to the fair value measurements are observable and the significance of the inputs to the fair value measurement in its entirety, which are described as follows:
Level 1 – Inputs are quoted prices (unadjusted) in active markets for identical assets or liabilities that the entity can access at the measurement date.
Level 2 – Inputs other than quoted prices included within Level 1, that are observable for the asset or liability, either directly or indirectly.
Level 3 – Inputs are unobservable inputs for the asset or liability.
Financial assetsThe Group classifies its financial assets as either at fair value through profit and loss or amortised cost. The Group classifies its financial assets based on both the Group’s business model for managing those financial assets and the contractual cash flow characteristics of the financial assets.
The Group’s financial assets classified at amortised cost are non-derivative financial assets with fixed or determinable payments that are not quoted in an active market. They include current assets with maturities or terms less than 12 months after the reporting date, as well as financial assets with maturities greater than 12 months after the reporting date, which are classified as non-current assets. These assets meet the condition of being held within a business model whose objective is to hold the financial assets in order to collect contractual cash flows and the terms of which give rise, on specified dates, to cash flows that are solely payments of principal and interest.
Financial assets, including those relating to the purchase of Stenprop shares (note 20), are measured at amortised cost using the effective interest method, less any loss allowance for expected credit losses (ECL) which are recognised in the statement of comprehensive income. The amount of expected credit loss is updated at each reporting date to reflect changes in credit risk since initial recognition of the respective financial instrument.
The effective interest rate is the rate that exactly discounts estimated future cash receipts excluding expected credit losses, through the expected life of the financial instrument, or, where appropriate, as shorter period, to the gross carrying amount of the financial instrument on initial recognition.
127STENPROP ANNUAL REPORT 2021
FINANCIAL STATEMENTS

Job number 17 June 2021 2:57 pm V1
Notes to the Consolidated Financial Statements CONTINUED
128 STENPROP ANNUAL REPORT 2021
3 Significant accounting policies CONTINUED
In the case of short-term trade receivables and other debtors the Group recognises lifetime ECL in accordance with the simplified approach under IFRS 9 Financial Instruments. The expected credit losses on these financial assets are estimated based on the Group’s historical credit loss experience, adjusted for factors that are specific to the debtors, general economic conditions, and an assessment of both the current and forecast direction of conditions at the reporting date.
The carrying amount of the financial asset is reduced by the ECL directly for all financial assets. When a trade receivable is considered uncollectable, it is written off against the ECL provision account. Changes in the ECL are recognised in the statement of comprehensive income in the period.
The Group classifies its financial assets at fair value through profit or loss where it has determined that the business model for managing the financial assets and the related contractual cash flow characteristics is not consistent with the policy for classification at amortised cost or fair value through other comprehensive income (OCI). The Group has determined the bond investment in the Elysion S.A. joint venture meets the criteria disclosed in note 4.
There are no financial assets measured at fair value through OCI, which would be classified as such where they are held within a business model whose objective is achieved by both collecting contractual cash flows and selling the financial assets; and cash flows relate solely to payments of principal and interest.
The Group derecognises a financial asset when the contractual rights to the cash flows from the asset have expired or have been transferred and the Group has transferred substantially all risk and rewards of ownership of the asset to another entity.
Financial liabilities and equityDebt and equity instruments are classified as either financial liabilities or as equity in accordance with the substance of the contractual agreement.
An equity instrument is any contract that evidences a residual interest in the assets of the Group after deducting all its liabilities. Ordinary shares are classed as equity. Equity instruments issued by the Group are recorded at the proceeds received, net of direct issue costs.
The Group’s financial liabilities comprise interest-bearing borrowings, loans and payables and trade payables. Financial liabilities
are recognised when the Group becomes party to the contractual provisions of the instrument. Financial liabilities are measured at amortised cost using the effective interest method. Trade and other payables are valued at their nominal value as the time value of money is immaterial for these current liabilities.
The Group derecognises financial liabilities when the Group’s obligations are discharged, cancelled or they expire.
Interest rate swaps have been initially recognised at fair value, and subsequently remeasured at fair value through profit and loss in accordance with IFRS 9, Financial Instruments. They have been entered into to hedge against the exposure to variable interest rate loans as described in note 27. They have been valued by an independent valuer in line with internationally accepted practice.
A derivative with a positive fair value is recognised as a financial asset whereas a derivative with a negative fair value is recognised as a financial liability. A derivative is presented as a non-current asset or non-current liability if the remaining maturity of the instrument is more than 12 months, and it is not expected to be realised or settled within 12 months. It is Group policy not to hedge account. Other derivatives are presented as current assets or current liabilities.
Intangible assetsIntangible assets comprise computer software developed for our ERP operating platform which will allow Stenprop to grow its MLI business. The expenditure capitalised includes the cost of platform development, contractor costs, and service providers. At 31 March 2021, the ERP operating platform is still in development and as such, amortisation will begin when the ERP platform is first available for use. Accordingly, no amortisation or impairment has been recognised in the reporting period ending 31 March 2021.
Non-current assets and disposal groups held for saleA non-current asset or a disposal group (comprising assets and liabilities) is classified as held for sale if their carrying amount is expected to be recovered or settled principally through sale rather than through continuing use. The asset or disposal group must be available for immediate sale, have the appropriate level of management commitment and the sale must be highly probable within one year of the reporting date. Investment properties included in the held for sale category continue to be measured in accordance with the accounting policy for investment properties.
Note, disclosures in these financial statements are recognised net of assets classified as held for sale and discontinued operations.
Segmental reportingAn operating segment is a component of the Group that engages in business activities from which it may earn revenues and in respect of which it may incur expenses. An operating segment’s operating results are reviewed regularly by the chief operating decision makers (the executive directors) to inform decisions about resources to be allocated to the segment and to assess its performance. Segmental financial information is available as disclosed in note 5.

Job number 17 June 2021 2:57 pm V1
3 Significant accounting policies CONTINUED
DividendsDividends to the Group’s ordinary shareholders are recognised when they are declared. This is when they are approved by the Board.
Stenprop offers shareholders the option to receive in respect of all or a part of their Stenprop shareholding either a scrip dividend by way of an issue of new Stenprop shares (of the same class as existing shares) credited as fully paid up (the ‘scrip dividend’), or a cash dividend (the ‘cash dividend’). The cash dividend will be paid to shareholders unless shareholders elect to receive the scrip dividend. Scrip dividends are paid out of Stenprop’s treasury share account.
Earnings per shareEarnings per share is calculated on the weighted average number of shares in issue in respect of the current period and is based on the profit attributable to the ordinary shareholders.
Net asset value per shareNet asset value per share is calculated on the number of shares in issue (excluding treasury shares) at the end of the current period and is based on the total equity attributable to equity shareholders.
Share-based paymentsDeferred Share Bonus Plan and Long-Term Incentive PlanShare options are granted to key management. The cost of equity-settled transactions is measured with reference to the fair value at the date at which they were granted. The Company accounts for the fair value of these options on a straight-line basis over the vesting period in the statement of comprehensive income, with a corresponding increase to the share-based payment reserve in equity. The cost to the Company is based on the Company’s best estimate of the number of equity instruments that will ultimately vest. Readers are referred to note 13: Share-based payments, where share-based payments are disclosed further.
Share Purchase PlanAs part of the Group’s previous remuneration policy, the Company awarded shares to qualifying participants, funded through the advance of loans to the participants. Loans advanced under the share purchase plan are interest-bearing at a rate equal to the average interest rate incurred by the Group from time to time. Interest is payable six monthly in arrears. Loans are repayable within 30 days of cessation of employment or loss of office (unless the participant ceases employment in circumstances beyond his or her control, in which case the loan is repayable within 12 months), and must in all circumstances be repaid in ten years. All dividends received by such employees (or his or her nominee), by virtue of their shareholding, must first be utilised to discharge any interest outstanding from the loan advanced on the Share Purchase Plan.
The loans have full recourse to the participants and as such fall outside of the scope of IFRS 2 and are accounted for as financial instruments under IFRS 9. The participants must charge their shares by way of security for the loan and are required to waive all rights to compensation for any loss in relation to the plan. No further awards will be made under the Share Purchase Plan.
Repurchase of share capital (own shares)Where share capital recognised as equity is repurchased, the amount of the consideration paid, including directly attributable costs, is recognised as a deduction from equity. Such shares may either be held as own shares (treasury shares) or cancelled. Where own shares are subsequently re-sold from treasury, the amount received is recognised as an increase in equity.
4 Critical accounting judgements and key sources of estimation uncertaintyThe preparation of the consolidated financial statements in accordance with IFRS requires the use of certain critical accounting estimates. It also requires management to exercise judgement in the process of applying the Group’s accounting policies. Although the estimates are based on management’s best knowledge of the amount, events or actions, actual results may ultimately differ from those estimates. The key assumptions concerning the future, and other key sources of estimation uncertainty at the end of the reporting year, that have a risk of causing a material adjustment to the carrying amounts of assets and liabilities within the next financial year, are discussed below.
Key sources of estimation uncertaintyValuation of the property portfolioThe Group’s investment properties are stated at estimated fair value, determined by directors, based on an independent external appraisal. The valuation of the Group’s property portfolio is inherently subjective due to several factors including the individual nature of each property, its location, expectation of future rentals and the discount yield applied to those cash flows. As a result, the valuations placed on the property portfolio are subject to a degree of uncertainty and are made based on assumptions that may not prove to be accurate, particularly in years of volatility or low transaction flow in the market. Due to the current economic uncertainty in the market due to COVID-19 the Switzerland valuers have issued their valuation report with a material valuation uncertainty clause. They have advised there is less certainty attached to their valuation in comparison to what would normally be the case, but that does not mean the valuations cannot be relied upon. For the avoidance of doubt, the UK and Guernsey valuations do not have a material valuation uncertainty clause attached the valuations and the German valuation is based on a signed contract of sale. The estimated market value may differ from the price at which the Group’s assets could be sold at a particular time, since actual selling prices are negotiated between willing buyers and sellers. As a result, if the assumptions prove to be different, actual results of operations and realisation of net assets could differ from the estimates set forth in these financial statements, and the difference could be significant. Further details as well as the key sensitivity variables, can be found in note 16.
129STENPROP ANNUAL REPORT 2021
FINANCIAL STATEMENTS

Job number 17 June 2021 2:57 pm V1
Notes to the Consolidated Financial Statements CONTINUED
130 STENPROP ANNUAL REPORT 2021
4 Critical accounting judgements and key sources of estimation uncertainty CONTINUED
The Group currently has two continental European investment properties classified as assets held for sale. Due to the same reasons mentioned above that the COVID-19 crisis has caused, the valuation of the Swiss asset held for sale is subject to a degree of valuation uncertainty and as such a key source of estimation uncertainty. Further information on assets held for sale can be found in note 19.
Critical judgementsAssets held for sale and discontinued operationsThe directors have disclosed two (2020: nine) properties which meet the criteria defined in IFRS 5: Non-current Assets Held for Sale and Discontinued Operations. Stenprop is committed to the disposal of these assets in line with its strategy to exit the Swiss market, dispose of its German assets and acquire multi-let industrial properties in the United Kingdom. The directors have classified the Swiss property as a discontinued operation as this is the only property that remains in the Swiss market. Stenprop is committed to exit the Swiss market and as such have classified the Swiss segment as a discontinued operation. The remaining property classified as held for sale is located in Germany, but it is not classified as a discontinued operation as Stenprop still has a material interest in the German market due to its holdings in the care homes joint venture, which is currently not held for sale. In respect of the Swiss property at Lugano, the directors consider the exceptions permitted by IFRS 5:9 to apply in respect to the one-year requirement within which a sale should complete. During the one-year period, circumstances arose that were previously considered unlikely. The circumstances were that the sole tenant of the property queried the validity of some of the conditions of the lease, particularly the requirement to pay the running costs of the building i.e. utilities. As a result, the property which was previously classified as held for sale was not sold; however:
i. during the initial one-year period, the Group responded to the change in circumstances by agreeing new lease terms with the tenant, remedying the deficiencies of the existing lease, with effect from 1 January 2020;
ii. the property was still being marketed at a price that was reasonable, given the change in circumstances;
iii. the Swiss government had prevented the tenant from trading during most of the year to 31 March 2021, due to COVID-19 restrictions;
iv. all other criteria in paragraphs 7 and 8 of IFRS 5 are met; and
v. the directors believe that the sale will now complete within one year.
If the judgement was that the Swiss property had not continued to be held for sale, this would have resulted in a restatement of the comparative period and presentation of the Swiss operating segment in continuing operations. This would not have had any impact on net assets or total comprehensive income as the fair value of the investment property has been determined by the directors, based on an independent external appraisal.
Classification of investment in joint venture bondClassification and measurement of financial assets under IFRS 9 are driven by the entity’s business model for managing financial assets and the contractual cash flow characteristics of those financial assets. The directors have determined that the contractual cash flow characteristics for bond investments into Elysion S.A. (‘JV’) (a joint venture) are not solely payments of principal and interest. The Group instead receives the return for each underlying loan net of additional fees and expenses in the JV and so it is not considered to be a basic lending arrangement under the standard. Further details on the structure are included in note 18. As such, these bond investments are required to be measured at fair value through profit or loss. In making this judgement, the directors have considered the power the Group has to influence the investment decisions of the JV housing the underlying loans, which are managed at the discretion of the JV partner and were the Group to hold the majority interest it has been determined that the contractual cash flow characteristics for a basic lending arrangement would have been met and therefore accounted for at amortised cost.

Job number 17 June 2021 2:57 pm V1
5 Operating segmentsThe Group is focused on real estate investment in well-developed, large economies with established real estate markets. The investment portfolio is geographically distributed across the United Kingdom, Germany, Guernsey and Switzerland, with a further sub-division within the UK between multi-let industrial and urban logistics. Each segment derives its revenue from the rental of investment properties in the respective geographical regions.
Relevant financial information is set out below:i) Information about reportable segments
For the year ended 31 March 2021
Continuing operationsDiscontinued
operationsUK multi-let
industrial£’000
UK urban logistics
£’000Guernsey
£’000Germany
£’000Group£’000
Switzerland£’000
Total£’000
Net rental income 21,356 1,628 4,478 4,466 75 – 32,003Net management fee income – – – – 747 – 747Fair value movement on investment properties 26,082 810 (1,310) 10,705 – – 36,287Net (loss)/gain from fair value of financial liabilities (209) – – 125 2,024 – 1,940(Loss)/gain on disposal of property – (9) – 665 – – 656Gain on disposal of subsidiary – – – 307 – – 307Income/(expense) from joint ventures – – – 62 (1) – 61Net finance (costs)/income (4,317) (181) (685) (354) 36 – (5,501)Tax, legal and professional fees (366) (38) (12) (494) (831) – (1,741)Audit fees – – – (13) (265) – (278)Administration fees (21) (5) (6) (34) (251) – (317)Investment advisory fees – – – (123) – – (123)Non-executive directors’ costs – – – – (416) – (416)Staff remuneration costs – – – – (4,100) – (4,100)Operating costs – (2) (10) (94) (3,435) – (3,541)Net foreign exchange gain/(loss) – – – 20 (64) – (44)Loss from discontinued operations (note 19) – – – – – (891) (891)Tax credit/(expense) – 81 – (2,164) 49 – (2,034)Total profit/(loss) per reportable segment 42,525 2,284 2,455 13,074 (6,432) (891) 53,015
As at 31 March 2021Investment properties 432,910 22,160 56,150 – – – 511,220Investment in joint ventures – – – 14,261 1 – 14,262Cash and cash equivalents 12,050 447 1,174 20,235 19,875 – 53,781Other 13,495 234 772 2,332 5,820 – 22,653Assets classified as held for sale – – – 26,592 – 12,616 39,208Total assets 458,455 22,841 58,096 63,420 25,696 12,616 641,124
Borrowings – bank loans 148,719 4,496 27,929 – – – 181,144Other 11,404 536 2,062 1,330 3,662 – 18,994Liabilities directly associated with assets classified as held for sale – – – 9,766 – 5,400 15,166Total liabilities 160,123 5,032 29,991 11,096 3,662 5,400 215,304
131STENPROP ANNUAL REPORT 2021
FINANCIAL STATEMENTS

Job number 17 June 2021 2:57 pm V1
Notes to the Consolidated Financial Statements CONTINUED
132 STENPROP ANNUAL REPORT 2021
5 Operating segments CONTINUED
Continuing operationsDiscontinued
operations
For the year ended 31 March 2020
UK multi-let industrial
£’000
UK urban logistics
£’000Guernsey
£’000Germany
£’000Group£’000
Switzerland£’000
Total£’000
Net rental income 17,932 2,032 4,311 8,708 66 – 33,049Net management fee income – – – – 558 – 558Fair value movement on investment properties 3,828 (55) (340) 1,505 – – 4,938Net (loss)/gain from fair value of financial liabilities (1,573) – 152 34 (1,023) – (2,410)Loss on disposal of property – (114) – (2,665) – – (2,779)Income from joint ventures – – – 2,114 1 – 2,115Net finance costs (3,759) (268) (1,196) (4,103) 39 – (9,287)Tax, legal and professional fees (204) 76 (10) (422) (952) – (1,512)Audit fees – – – (2) (266) – (268)Administration fees (166) (25) (6) (35) (200) – (432)Investment advisory fees – – – (253) – – (253)Non-executive directors’ costs – – – – (233) – (233)Staff remuneration costs – – – – (4,576) – (4,576)Operating costs (10) (22) (1) (78) (2,668) – (2,779)Net foreign exchange (loss)/gain – – – (60) 63 – 3Loss from discontinued operations (note 19) – – – – – (2,197) (2,197)Tax (expense)/credit (16) (11) (187) 1,327 109 – 1,222Total profit/(loss) per reportable segment 16,032 1,613 2,723 6,070 (9,082) (2,197) 15,159
As at 31 March 2020Investment properties 308,951 21,350 57,460 – – – 387,761Investment in joint ventures – – – 16,116 1 – 16,117Cash and cash equivalents 13,585 2,556 522 11,815 55,975 – 84,453Other 5,855 19 773 14,305 1,311 – 22,263Assets classified as held for sale – – – 96,605 – 15,252 111,857Total assets 328,391 23,925 58,755 138,841 57,287 15,252 622,451
Borrowings – bank loans 121,841 4,473 27,857 – – – 154,171Other 12,946 581 2,220 9,600 4,287 – 29,634Liabilities directly associated with assets classified as held for sale – – – 41,039 – 6,271 47,310Total liabilities 134,787 5,054 30,077 50,639 4,287 6,271 231,115
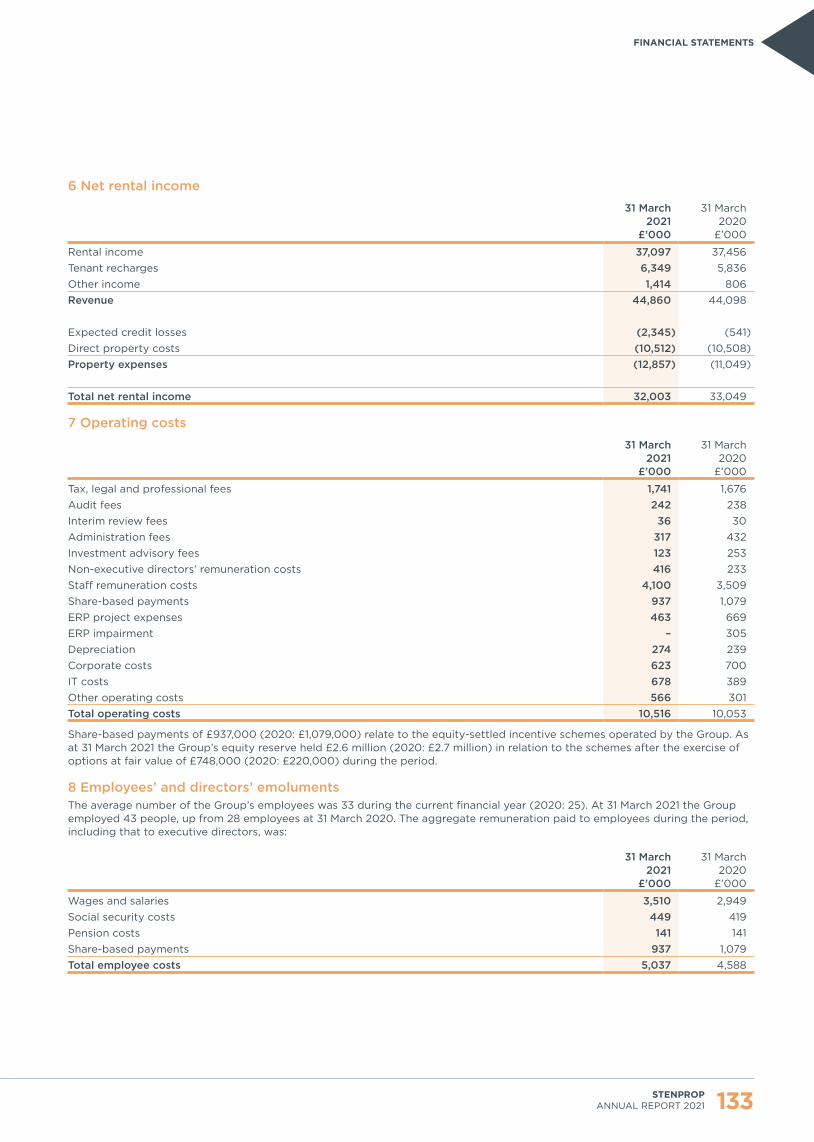
Job number 17 June 2021 2:57 pm V1
6 Net rental income
31 March2021
£’000
31 March2020
£’000
Rental income 37,097 37,456Tenant recharges 6,349 5,836Other income 1,414 806Revenue 44,860 44,098
Expected credit losses (2,345) (541)Direct property costs (10,512) (10,508)Property expenses (12,857) (11,049)
Total net rental income 32,003 33,049
7 Operating costs
31 March2021
£’000
31 March2020
£’000
Tax, legal and professional fees 1,741 1,676Audit fees 242 238Interim review fees 36 30Administration fees 317 432Investment advisory fees 123 253Non-executive directors’ remuneration costs 416 233Staff remuneration costs 4,100 3,509Share-based payments 937 1,079ERP project expenses 463 669ERP impairment – 305Depreciation 274 239Corporate costs 623 700IT costs 678 389Other operating costs 566 301Total operating costs 10,516 10,053
Share-based payments of £937,000 (2020: £1,079,000) relate to the equity-settled incentive schemes operated by the Group. As at 31 March 2021 the Group’s equity reserve held £2.6 million (2020: £2.7 million) in relation to the schemes after the exercise of options at fair value of £748,000 (2020: £220,000) during the period.
8 Employees’ and directors’ emolumentsThe average number of the Group’s employees was 33 during the current financial year (2020: 25). At 31 March 2021 the Group employed 43 people, up from 28 employees at 31 March 2020. The aggregate remuneration paid to employees during the period, including that to executive directors, was:
31 March2021
£’000
31 March2020
£’000
Wages and salaries 3,510 2,949Social security costs 449 419Pension costs 141 141Share-based payments 937 1,079Total employee costs 5,037 4,588
133STENPROP ANNUAL REPORT 2021
FINANCIAL STATEMENTS

Job number 17 June 2021 2:57 pm V1
Notes to the Consolidated Financial Statements CONTINUED
134 STENPROP ANNUAL REPORT 2021
8 Employees’ and directors’ emoluments CONTINUED
As at 31 March 2021, the Group had nine directors (2020: eight). The directors of the Group during the financial year and at the date of this report were as follows:
Non-executive directors AppointedChange in
appointmentPaul Miller 14 Sep 2016Warren Lawlor 5 Apr 2017 16 Sep 2020Richard Grant (chairman) 1 May 2018Philip Holland 1 May 2018Patsy Watson 5 Jun 2019Louisa Bell 4 Nov 2020Richard Smith 4 Nov 2020
Executive directors AppointedChange in
appointmentPaul Arenson (CEO) 2 Oct 2014Julian Carey 1 May 2018James Beaumont (CFO) 5 Jun 2019
Emoluments paid to executive directors are disclosed in the remuneration report on page 106. Emoluments paid to non-executive directors are summarised below:
Non-executive directors
31 March2021
£’000
31 March2020
£’000
Richard Grant 58 58Philip Holland 43 43Patsy Watson 35 29Paul Miller 40 40Louisa Bell* 16 –Richard Smith* 16 –Warren Lawlor – paid to Ferryman Capital Partners (Pty) Limited* 18 40Total 226 210
* Remuneration covers the period of directorship.
The above non-executive fees include all management, consulting, technical or other fees paid for such services rendered, including payments to management companies.
The Group’s share-based payments comprise the Deferred Share Bonus Plan (‘STIP’) and the Long-Term Incentive Plan (‘LTIP’) for executive directors and senior management respectively, and various share option schemes.
The Company measures the fair value of the equity-based share options at grant date and accounts for the cost over the vesting period in the statement of comprehensive income, with a corresponding increase to the share-based payment reserve. The cost is based on the quantity of shares that are likely to vest, taking into account expected performance against the relevant performance targets where applicable, and service periods. Share-based awards and the respective vesting dates are further detailed in note 13.
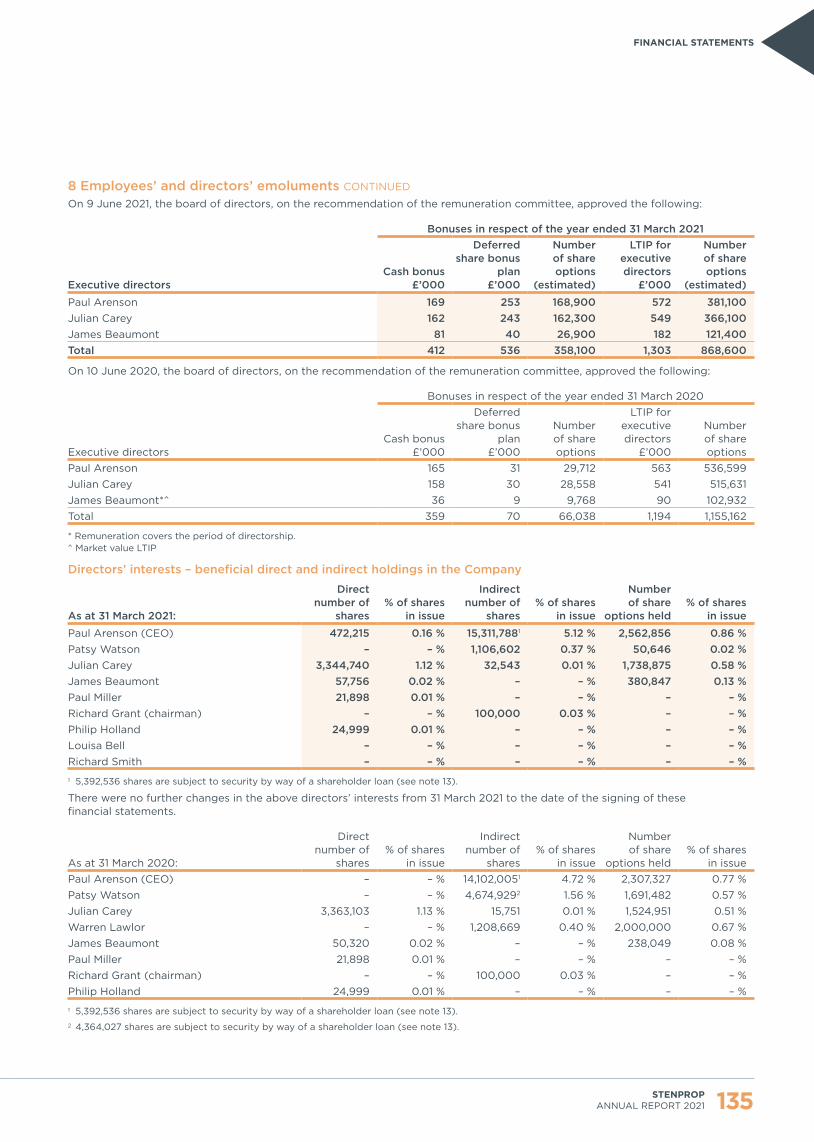
Job number 17 June 2021 2:57 pm V1
8 Employees’ and directors’ emoluments CONTINUED
On 9 June 2021, the board of directors, on the recommendation of the remuneration committee, approved the following:
Bonuses in respect of the year ended 31 March 2021
Executive directors Cash bonus
£’000
Deferred share bonus
plan£’000
Number of share options
(estimated)
LTIP for executive directors
£’000
Number of share options
(estimated)
Paul Arenson 169 253 168,900 572 381,100Julian Carey 162 243 162,300 549 366,100James Beaumont 81 40 26,900 182 121,400Total 412 536 358,100 1,303 868,600
On 10 June 2020, the board of directors, on the recommendation of the remuneration committee, approved the following:
Bonuses in respect of the year ended 31 March 2020
Executive directors Cash bonus
£’000
Deferred share bonus
plan£’000
Number of share options
LTIP for executive directors
£’000
Number of share options
Paul Arenson 165 31 29,712 563 536,599Julian Carey 158 30 28,558 541 515,631James Beaumont*^ 36 9 9,768 90 102,932Total 359 70 66,038 1,194 1,155,162
* Remuneration covers the period of directorship.^ Market value LTIP
Directors’ interests – beneficial direct and indirect holdings in the Company
As at 31 March 2021:
Direct number of
shares% of shares
in issue
Indirect number of
shares% of shares
in issue
Number of share
options held% of shares
in issue
Paul Arenson (CEO) 472,215 0.16 % 15,311,7881 5.12 % 2,562,856 0.86 %Patsy Watson – – % 1,106,602 0.37 % 50,646 0.02 %Julian Carey 3,344,740 1.12 % 32,543 0.01 % 1,738,875 0.58 %James Beaumont 57,756 0.02 % – – % 380,847 0.13 %Paul Miller 21,898 0.01 % – – % – – %Richard Grant (chairman) – – % 100,000 0.03 % – – %Philip Holland 24,999 0.01 % – – % – – %Louisa Bell – – % – – % – – %Richard Smith – – % – – % – – %1 5,392,536 shares are subject to security by way of a shareholder loan (see note 13).
There were no further changes in the above directors’ interests from 31 March 2021 to the date of the signing of these financial statements.
As at 31 March 2020:
Direct number of
shares% of shares
in issue
Indirect number of
shares% of shares
in issue
Number of share
options held% of shares
in issue Paul Arenson (CEO) – – % 14,102,0051 4.72 % 2,307,327 0.77 %Patsy Watson – – % 4,674,9292 1.56 % 1,691,482 0.57 %Julian Carey 3,363,103 1.13 % 15,751 0.01 % 1,524,951 0.51 %Warren Lawlor – – % 1,208,669 0.40 % 2,000,000 0.67 %James Beaumont 50,320 0.02 % – – % 238,049 0.08 %Paul Miller 21,898 0.01 % – – % – – %Richard Grant (chairman) – – % 100,000 0.03 % – – %Philip Holland 24,999 0.01 % – – % – – %
1 5,392,536 shares are subject to security by way of a shareholder loan (see note 13).2 4,364,027 shares are subject to security by way of a shareholder loan (see note 13).
135STENPROP ANNUAL REPORT 2021
FINANCIAL STATEMENTS

Job number 17 June 2021 2:57 pm V1
Notes to the Consolidated Financial Statements CONTINUED
136 STENPROP ANNUAL REPORT 2021
9 Finance costs
31 March2021
£’000
31 March2020
£’000
Interest on loans and borrowings 4,860 8,930Amortisation of facility costs 997 789Net finance costs 5,857 9,719
Included in the 31 March 2020 interest on loans and borrowings amount of £8.9 million is £2.6 million of borrowing costs in relation to the early repayment of the Bleichenhof bank loan upon sale of the property.
10 TaxationReal Estate Investment Trust regime (REIT regime)The Company converted to UK REIT status on 1 May 2018. As a member of the REIT regime, profits from its UK property rental business are tax exempt. The REIT regime only applies to certain property-related profits and has several criteria which have to be met. The main criteria are:
▶ the assets of the property rental business must be at least 75% of the Group’s assets;
▶ the profit from the tax-exempt property rental business must exceed 75% of the Group’s total profit; and
▶ at least 90% of the Group’s profit from the UK property rental business must be paid as dividends.
The Company continues to meet these conditions and management intends that Stenprop should continue as a REIT for the foreseeable future.
(i) Tax recognised in statement of comprehensive income
31 March2021
£’000
31 March2020
£’000
Current tax – UKOn net income for the year – (93)Current tax – ForeignOn net income for the year 3,532 5,967Total current tax 3,532 5,874
Deferred tax (1,498) (7,096)Total tax expense/(credit) 2,034 (1,222)
No tax was recognised on other comprehensive income during the period (2020: nil). Tax rates applicable in the jurisdictions which the Company operates in are:
▶ Germany: 15.825%
▶ United Kingdom: 19%
▶ Switzerland: 20%.

Job number 17 June 2021 2:57 pm V1
(ii) Reconciliation of tax charge for the year
31 March2021
£’000
31 March2020
£’000
Profit before taxation on continuing operations 55,940 16,134Expected tax charge on ordinary activities at the standard rate of taxation of 19% (2020: 19%) 10,629 3,065Property revaluation gains not taxable (5,200) (938)Fair value of derivative financial instrument (gains)/losses not taxable (369) 458Gains on disposal of subsidiary not taxable (58) –Income not taxable – (58)Property rental business profits exempt from tax in the REIT Group (3,429) (1,977)Expenditure not allowed for income tax purposes – 217Effect of tax losses 822 –Income from joint ventures – 402Effect of tax rates in other jurisdictions (471) (611)Foreign withholding tax provision charge/(release) 300 (1,880)Tax provision release (190) –Other – 30Total income tax expense/(credit) 2,034 (1,222)
11 Dividends
For the year ended 31 March 2021
Pence per share £’000
Amounts recognised as distributions to equity holders in the period:Final dividend for the year ended 31 March 2020 paid on 14 August 2020 3.375 9,550Interim dividend for the year ended 31 March 2021 paid on 12 February 2021 3.375 9,551Total dividends distributed 6.750 19,101
Scrip dividends issued during the period:Final scrip dividend for the year ended 31 March 2020 issued on 14 August 2020 3.375 4,074Interim scrip dividend for the year ended 31 March 2021 issued on 12 February 2021 3.375 3,119Total scrip dividends issued 6.750 7,193Dividends paid as reported in the consolidated statement of cash flows 11,908
For the year ended 31 March 2020
Pence per share £’000
Amounts recognised as distributions to equity holders in the period:Final dividend for the year ended 31 March 2019 paid on 16 August 2019 3.375 9,478Interim dividend for the year ended 31 March 2020 paid on 14 February 2020 3.375 9,549Total dividends distributed 6.750 19,027
Scrip dividends issued during the period:Final scrip dividend for the year ended 31 March 2019 issued on 16 August 2019 3.375 2,819Interim scrip dividend for the year ended 31 March 2020 issued on 14 February 2020 3.375 2,278Total scrip dividends issued 6.750 5,097Dividends paid as reported in the consolidated statement of cash flows 13,930
The directors declared a final dividend on 9 June 2021, for the year ended 31 March 2021, of 3.375 pence per share, which is detailed in note 30.
137STENPROP ANNUAL REPORT 2021
FINANCIAL STATEMENTS

Job number 17 June 2021 2:57 pm V1
Notes to the Consolidated Financial Statements CONTINUED
138 STENPROP ANNUAL REPORT 2021
12 Share capitalAuthorised1,000,000,000 ordinary shares with a par value of €0.000001258 each:
Issued share capital
31 March2021
(no. shares)
31 March2020
(no. shares)Opening balance 298,775,175 298,775,175Closing number of shares in issue 298,775,175 298,775,175
Authorised share capital £’000 £’000Share capital 1 1Share premium 322,775 322,992Total share capital and share premium 322,776 322,993
There were no changes made to the number of authorised shares of the Company during the period under review. Stenprop Limited has one class of share. All shares rank equally and are fully paid.
The Company has 298,775,175 (2020: 298,775,175) ordinary shares in issue at the reporting date, including treasury shares.
On 12 June 2020, the Company announced a final dividend of 3.375 pence per share in respect of the six months to 31 March 2020. On 13 August 2020, the Company announced a take-up of the scrip dividend representing 1.10% of the issued share capital and 3,301,265 shares were subsequently issued from treasury shares on 14 August 2020.
On 4 December 2020, the Company announced an interim dividend of 3.375 pence per share in respect of the six months to 30 September 2020. On 11 February 2021, the Company announced a take up of the scrip dividend representing 0.71% of the issued share capital and 2,135,516 shares were subsequently issued from treasury shares on 12 February 2021.
As at 31 March 2021, the Company held 12,866,950 treasury shares (2020: 15,830,040). During the period, the shareholders were offered the option to receive either a scrip dividend by way of an issue of Stenprop treasury shares, or a cash dividend. The Company’s share price was trading at a discount relative to NAV, up until mid-February 2021. Before mid-February, the directors bought back 3,476,265 of the issued 5,436,781 scrip alternative through share purchases to mitigate the dilutive effect that would otherwise have occurred through the issuance of new ordinary shares.
The equity reserve account within equity combines the activities of the Company’s treasury shares, including the issue of scrip dividend shares (detailed in the below table) as well as the equity-settled share-based payments that are credited to equity (see note 13). At 31 March 2021, the carrying value of the Company’s treasury shares was £12,694,000 (2020: £17,017,000) and the equity-settled share-based payments reserve reduced this account by £2,636,000 (2020: £2,657,000)
Retained earnings is the cumulative net profit of the Group. Retained earnings can either be paid out to shareholders as a dividend or be reinvested in the Group as working capital.
Treasury shares
31 March2021
(no. shares)
31 March2020
(no. shares)
Opening balance 15,830,040 16,028,050Issue of scrip dividend shares (5,436,781) (4,153,945)Market buy-back of shares at an average price of £1.18 per share (31 March 2020: £1.15) 3,476,265 4,153,945Exercised shares from the Deferred Share Bonus Plan (797,797) (198,010)Exercised shares from the Long Term Incentive Plan (204,777) –Closing number of treasury shares 12,866,950 15,830,040

Job number 17 June 2021 2:57 pm V1
13 Share-based paymentsThe Group operates share incentive plans which are used to attract and retain high-calibre employees to help grow the business. All awards are considered by the remuneration committee and are subject to board approval.
The Group recognised a total share-based expense of £937,000 in the year (2020: £1,079,000) in relation to the share option schemes. As at 31 March 2021, the equity reserve held £2,636,000 in relation to share-based payment transactions (2020: £2,657,000).
The incentive plans are discussed in more detail below.
Deferred Share Bonus PlanThe board may grant an award to an eligible employee following a recommendation from the remuneration committee over such number of shares that have an aggregate value equal to the deferred bonus. Such share options vest in three equal tranches; the first tranche vests on the date of grant with subsequent tranches vesting at the first and second anniversaries of the relevant year end. Share options may be exercised until the tenth anniversary of the grant date, after which time they will lapse.
The fair value of this nil-cost option is determined using the Black–Scholes model. The key inputs used in determining the award granted on 12 June 2020 are shown below:
Share price at date of grant 116.50pExpected option life in years 2Value per option 116.50p
Movement in options granted in terms of this plan are detailed below:
Date of grant
At1 April 2020 Granted
Dividend equivalents
Exercised/ Other
Outstanding at 31 March
2021
Exercisable at 31 March
2021
Fair value at grant date in
GBP
Exercise dates
From To
10 June 2015 427,820 – 16,947 (197,674) 247,093 247,093 £1.08 10 June 2015 10 June 20258 June 2016 273,649 – 11,315 (121,954) 163,010 163,010 £1.05 8 June 2016 8 June 20267 June 2017 13,720 – 602 – 14,322 14,322 £1.08 7 June 2017 7 June 20277 June 2018 311,836 – 14,381 (137,657) 188,560 188,560 £1.13 7 June 2018 7 June 20286 June 2019 500,843 – 30,685 (113,796) 417,732 417,732 £1.12 6 June 2019 6 June 202912 June 2020 – 93,229 34,214 (2,487) 124,956 62,803 £1.17 12 June 2020 12 June 2030
Weighted average exercise price of deferred share bonus plan share options
At31 March
2021
At31 March
2020
Exercisable £1.10 £1.10Non-exercisable £1.17 £1.12
Weighted average remaining contracted life of deferred share bonus plan share options
At31 March
2021
At31 March
2020
Exercisable 6.7 Years 7.1 YearsNon-exercisable 9.2 Years 9.1 Years
LTIP for senior managementSuch share options vest in three equal tranches; the first tranche vests on the first anniversary of year end, with subsequent tranches vesting at the second and third anniversaries of the relevant year ends. Share options may be exercised until the tenth anniversary of the grant date, after which time they will lapse. The fair value of this award is determined using the Black–Scholes model. The key inputs used in determining the award granted on 12 June 2020 are shown below:
Share price at date of grant 116.50pExercise price at grant date 104.92pExpected option life in years 10Risk-free rate (0.03%)Expected volatility 33.00%Value per option 37.00p
The volatility assumption is based on a statistical analysis of daily share prices of comparator companies over the three years prior to the 12 June 2020 grant date.
139STENPROP ANNUAL REPORT 2021
FINANCIAL STATEMENTS

Job number 17 June 2021 2:57 pm V1
Notes to the Consolidated Financial Statements CONTINUED
140 STENPROP ANNUAL REPORT 2021
13 Share-based payments CONTINUED
Date of grant
At1 April 2020 Granted
Dividend equivalents
Exercised/ Other
Outstanding at 31 March
2021
Exercisable at 31 March
2021
Fair value at grant date in
GBP
Exercise dates
From To
24 January 2018 94,528 – 4,416 – 98,944 98,944 £0.47 31 March 2018
24 January 2028
7 June 2018 462,324 – 21,601 – 483,925 483,925 £0.27 31 March 2019
7 June 2028
6 June 2019 515,778 – 25,566 (105,239) 436,105 290,737 £0.26 31 March 2020
6 June 2029
12 June 2020 – 411,248 21,600 – 432,848 144,283 £0.37 31 March 2021
12 June 2030
Weighted average exercise price of LTIP for senior management share options
At31 March
2021
At31 March
2020
Exercisable £1.12 £1.13Non-exercisable £1.12 £1.12
Weighted average remaining contracted life of LTIP for senior management share options
At31 March
2021
At31 March
2020
Exercisable 7.7 Years 8.4 YearsNon-exercisable 8.9 Years 8.9 Years
LTIP for executive directorsSuch share options vest on the third anniversary of grant date subject to pre-determined vesting conditions being met. All options not vesting on the vesting date will automatically lapse. All vested options and shares received upon the exercise of vested options are subject to a further two-year lock-in period during which they cannot be sold. The fair value of these nil-cost options is determined by external valuers using the Black-Scholes model and the Monte Carlo model. The key inputs used in determining the award granted on 12 June 2020 are shown below:
Share price 116.50pExercise price at grant date £0.00Expected option life in years 3+2Risk-free rate (0.03%)Expected volatility 33.00%Value per option - non-market awards 116.50pValue per option - market awards 75.00p
The volatility assumption is based on a statistical analysis of daily share prices of comparator companies over the three years prior to the 12 June 2020 grant date.
Date of grant
At1 April 2020 Granted
Dividend equivalents
Exercised/ Other
Outstanding at 31 March
2021
Exercisable at 31 March
2021
Fair value at grant date in
GBP
Exercise dates
From To
24 January 2018 467,720 – 14,436 (238,343) 243,813 – £0.68 8 June 2020*
8 June 2027
7 June 2018 1,073,863 – 50,175 – 1,124,038 – £0.52 7 June 2021*
7 June 2028
6 June 2019 1,021,654 – 50,643 – 1,072,297 – £0.52 6 June 2022*
6 June 2029
12 June 2020 – 1,052,230 55,267 – 1,107,497 – £0.75 12 June 2023*
12 June 2030
* Lock-in period of two years applies after vesting.

Job number 17 June 2021 2:57 pm V1
13 Share-based payments CONTINUED
Weighted average exercise price of LTIP for executive directors share options
At31 March
2021
At31 March
2020
Exercisable – –Non-exercisable – –
Weighted average remaining contracted life of LTIP for executive directors share options
At31 March
2021
At31 March
2020
Exercisable – –Non-exercisable 8.1 Years 8.4 Years
Other share optionsOn 30 March 2017, the Company agreed to grant to Ferryman Capital Partners Limited, a company in which Warren Lawlor, a former non-executive director, has a one-third beneficial interest, an option to subscribe for 2,000,000 Stenprop shares. The exercise price was £1.32. The full cost of this option was recognised in the year ended 31 March 2018. The option lapses on 31 March 2022. The option only has a dilutive effect when the average market price of ordinary shares exceeds the exercise price of the options.
The fair value of this award was determined using the Black–Scholes model. The key inputs used in determining the award granted on 30 March 2017 are shown below:
Share price £1.08Exercise price at grant date £1.31Expected option life in years 5Risk-free rate 1.50%Expected volatility 31.31%Expected dividend yield 5.00%Value per option £0.13
The volatility assumption is based on a statistical analysis of daily share prices of Stenprop over the two years prior to the 30 March 2017 grant date.
Date of grant
At1 April 2020 Granted Exercised
Outstandingat 31 March
2021
Fair valueat grantdate in
GBP
Exercisable at 31 March
2021
Exercise dates
From To
30 March 2017 2,000,000 – – 2,000,000 2,000,000 £0.13 30 March 2022
7 June 2029
Share Purchase PlanLoans advanced under the share purchase plan are interest-bearing at a rate equal to the average interest rate incurred by the Group from time to time. Interest is payable six-monthly in arrears. Loans are repayable within 30 days of cessation of employment or loss of office (unless the participant ceases employment in circumstances beyond his or her control, in which case the loan is repayable within 12 months), and must in all circumstances be repaid in 10 years. All dividends received by such employees (or his or her nominee) by virtue of their shareholding must first be utilised to discharge any interest outstanding in terms of the loan advanced in terms of the Share Purchase Plan. The loans have full recourse to the participants who must charge their shares by way of security for the loans.
141STENPROP ANNUAL REPORT 2021
FINANCIAL STATEMENTS

Job number 17 June 2021 2:57 pm V1
Notes to the Consolidated Financial Statements CONTINUED
142 STENPROP ANNUAL REPORT 2021
13 Share-based payments CONTINUED
The table below summarises the position at year end in terms of loans advanced and the number of shares to which they relate. No further awards will be made under the Share Purchase Plan.
31 March2021
31 March2020
Brought forward at start of year (number of shares) 10,037,162 10,211,145Share Purchase Plan shares issued in year (number of shares) – –Share Purchase Plan shares redeemed (number of shares) (4,644,626) (173,983)Carried forward at end of year (number of shares) 5,392,536 10,037,162
Stock price at advancement (€) N/A N/AShare Purchase Plan loans advanced (including accrued interest) (£’000) 6,540 12,265
Other share purchase loanOn 30 March 2017, a €1.22 million loan was advanced from Stenprop (Germany) Limited to Ferryman Capital Partners Limited, a company in which Warren Lawlor, a former non-executive director, has a one-third beneficial interest, to purchase 1,000,000 Stenprop shares in the market. The loan advanced is interest-bearing at a rate equal to the average interest rate incurred by the Group from time to time. Interest is payable six-monthly in arrears. The loan has full recourse to the borrower and the shares are charged as security for the loans. The loan, including accrued interest, was repaid in full in February 2021.
31 March2021
31 March2020
Brought forward at start of year (number of shares) 1,000,000 1,000,000Shares issued in year (number of shares) – –Shares redeemed (number of shares) (723,672) –Carried forward at end of year (number of shares) 276,328 1,000,000
Loan advanced (including accrued interest) (£’000) – 1,056

Job number 17 June 2021 2:57 pm V1
14 Earnings per ordinary share
31 March2021
£’000
31 March2020
£’000
Reconciliation of profit for the period to adjusted EPRA1 earningsEarnings per IFRS statement of comprehensive income attributable to shareholders 53,045 15,565Adjustment to exclude loss from discontinued operations 891 2,197Earnings per IFRS statement of comprehensive income from continuing operations attributable to shareholders 53,936 17,762
Earnings per IFRS statement of comprehensive income attributable to shareholders 53,045 15,565Adjustments to calculate EPRA earnings, exclude:
Gain on fair value of investment properties (35,109) (1,741)(Gain)/loss on fair value of financial instruments, debt and associated close out costs (1,784) 2,410Deferred tax in respect of EPRA adjustments (1,618) (6,843)Impairment of intangibles – 305(Gain)/loss on disposal of properties (639) 4,630Tax expense on disposal of properties 3,470 5,187Loss on disposal of subsidiaries 172 –
Adjustments above in respect of joint ventures:Loss/(gain) on fair value of investment properties 1,466 (674)Gain on fair value of financial instruments (41) –Deferred tax in respect of EPRA adjustments (51) 194
EPRA earnings attributable to shareholders 18,911 19,033Further adjustments to arrive at adjusted earnings:
Costs associated with ERP implementation 463 669Adjusted earnings attributable to shareholders2 19,374 19,702Weighted average number of shares in issue (excluding treasury shares) 283,549,160 282,777,020Share-based payment award 2,167,213 3,522,208Diluted weighted average number of shares in issue 285,716,373 286,299,228
Earnings per share from continuing operations Pence Pence
IFRS EPS 19.02 6.28Diluted IFRS EPS 18.88 6.20
Earnings per share from continuing and discontinued operations Pence PenceIFRS EPS 18.71 5.50Diluted IFRS EPS 18.57 5.44EPRA EPS 6.67 6.73Diluted EPRA EPS 6.62 6.65Adjusted EPS 6.78 6.88
1 The European Public Real Estate Association (EPRA) issued the Best Practices Recommendations policy in October 2019, which provides guidelines for performance measures relevant to real estate companies. Their recommended reporting standards are widely applied across this market, aiming to bring consistency and transparency to the sector. The EPRA earnings measure is intended to show the level of recurring earnings from core operational activities with the purpose of highlighting the Group’s underlying operating results from its property rental business and an indication of the extent to which current dividend payments are supported by earnings. The measure excludes unrealised changes in the value of investment properties, gains or losses on the disposal of properties and other items to provide additional information on the Group’s underlying operational performance. The measure is considered to accurately capture the long-term strategy of the Group, and is an indication of the sustainability of dividend payments.
2 As described in the EPRA Best Practice Recommendations policy issued in October 2019, should companies wish to make other adjustments to arrive at an underlying performance measure, they should do that below ‘EPRA earnings’ and use a different name for that measure. ‘Adjusted EPS’ is a measure that excludes items considered not to be in the ordinary course of business or other exceptional items that do not necessarily provide an accurate picture of the Group’s underlying operational performance.
As at 31 March 2021, the Company held 12,866,950 treasury shares (2020: 15,830,040).
143STENPROP ANNUAL REPORT 2021
FINANCIAL STATEMENTS

Job number 17 June 2021 2:57 pm V1
Notes to the Consolidated Financial Statements CONTINUED
144 STENPROP ANNUAL REPORT 2021
14 Earnings per ordinary share CONTINUED
Costs associated with ERP implementationStenprop is implementing a new enterprise resource planning (ERP) and customer engagement (CE) platform to help streamline and grow the business. Significant non-recurring costs will be incurred during the implementation phase before the systems go live.
The ERP implementation expense is related to a one-off project and is anticipated to complete shortly. It has been adjusted for as a ‘company-specific adjustment’.
Headline earnings per shareThe JSE listings conditions require the calculation of headline earnings and disclosure of a detailed reconciliation of headline earnings to the earnings numbers used in the calculation of basic earnings per share in accordance with the requirements of IAS 33 – Earnings per Share. Disclosure of headline earnings is not a requirement of IFRS.
Reconciliation of profit for the period to headline earnings
31 March2021
£’000
31 March2020
£’000
Earnings per statement of comprehensive income attributable to shareholders 53,045 15,565Adjustments to calculate headline earnings, exclude:
Gain on fair value of investment properties (35,109) (1,741)Deferred tax in respect of headline earnings adjustments (1,640) (6,848)Impairment of intangibles – 305(Gain)/loss on disposal of properties (639) 4,630Tax expense on disposal of properties 3,470 5,187Loss on disposal of subsidiaries 172 –
Adjustments above in respect of joint ventures:Loss/ (gain) on fair value of investment properties 1,466 (729)Deferred tax (57) 199
Headline earnings attributable to shareholders 20,708 16,568
Earnings per share pence penceHeadline EPS 7.30 5.86Diluted headline EPS 7.25 5.79

Job number 17 June 2021 2:57 pm V1
15 Net asset value metrics per share - reconciliations and bridgeIn October 2019, EPRA published new best practice recommendations for financial disclosures by public real estate companies. Three new measures of net asset value were introduced namely: EPRA net tangible assets (NTA), EPRA net reinvestment value (NRV) and EPRA net disposal value (NDV). These recommendations are effective for accounting periods starting on 1 January 2020 and have been adopted by the Group.
Stenprop considers EPRA NTA to be the most relevant measure of the three EPRA NAVs to report on and will act as the key net asset value measure going forward. The EPRA NTA metric is aligned with IFRS NAV in that it includes deferred tax liabilities with regard to properties classified as held for sale. A reconciliation of the three new EPRA NAV metrics from IFRS NAV is shown in the table below. The previously reported EPRA NAV has also been included for comparative purposes.
NAVNew
EPRA NAV measures
Previously reported
measures
As at 31 March 2021IFRS
£’000EPRA NRV
£’000EPRA NTA
£’000EPRA NDV
£’000EPRA NAV
£’000
Net assets attributable to equity shareholders 425,820 425,820 425,820 425,820 425,820Adjustments:
Derivative financial instruments – (1,732) (1,732) – (1,732)Deferred tax in relation to fair value of investment property and financial instruments1 – 1,712 – – 1,712Adjustments above in respect of joint ventures – 714 714 – 714Intangible assets – – (1,784) – –Purchaser's costs2 – 37,798 – – –
Net assets used in per share calculation 425,820 464,312 423,018 425,820 426,514
Number of shares in issue (excluding treasury shares)3 285,908,225 285,908,225 285,908,225 285,908,225 285,908,225Share-based payment award 2,167,213 2,167,213 2,167,213 2,167,213 2,167,213Diluted number of shares in issue 288,075,438 288,075,438 288,075,438 288,075,438 288,075,438
Net asset value per share IFRS
£EPRA NRV
£EPRA NTA
£EPRA NDV
£EPRA NAV
£
Net asset value per share 1.49 – – – –Diluted net asset value per share 1.48 1.61 1.47 1.48 1.48
NAVNew
EPRA NAV measures
Previously reported
measures
As at 31 March 2020IFRS
£’000EPRA NRV
£’000EPRA NTA
£’000EPRA NDV
£’000EPRA NAV
£’000
Net assets attributable to equity shareholders 391,241 391,241 391,241 391,241 391,241Adjustments:
Derivative financial instruments – 2,001 2,001 – 2,001Deferred tax in relation to fair value of investment property and financial instruments1 – 3,782 – – 3,782Adjustments above in respect of joint ventures – 1,921 1,921 – 1,921Purchasers' costs2 – 34,961 – – –
Net assets used in per share calculation 391,241 433,906 395,163 391,241 398,945
Number of shares in issue (excluding treasury shares)3 282,945,135 282,945,135 282,945,135 282,945,135 282,945,135Share-based payment award 3,522,208 3,522,208 3,522,208 3,522,208 3,522,208Diluted number of shares in issue 286,467,343 286,467,343 286,467,343 286,467,343 286,467,343
145STENPROP ANNUAL REPORT 2021
FINANCIAL STATEMENTS

Job number 17 June 2021 2:57 pm V1
Notes to the Consolidated Financial Statements CONTINUED
146 STENPROP ANNUAL REPORT 2021
15 Net asset value metrics per share - reconciliations and bridge CONTINUED
NAV New measures
Previously reported
measures
Net assets per shareIFRS
£EPRA NRV
£EPRA NTA
£EPRA NDV
£EPRA NAV
£
Net asset value per share 1.38 – – – –Diluted net asset value per share 1.37 1.51 1.38 1.37 1.39
1 The Group’s deferred tax in relation to the fair value of investment properties and financial instruments relates solely to those properties in the German portfolio included in assets held for sale which comprise 4.5% of the portfolio with a fair value of £26.2 million (2020: £94.8 million (17.8%)). No deferred tax was excluded from EPRA NTA as the deferred tax will be crystallised on sale of these properties in the short term.
2 EPRA NTA and EPRA NDV reflect IFRS values which are net of purchaser’s costs. Any purchaser’s costs deducted from the market value, are added back when calculating EPRA NRV.
3 As at 31 March 2021, the Company held 12,866,950 treasury shares (2020: 15,830,040).
16 Investment propertyThe fair value of the consolidated investment properties at 31 March 2021 was £511.2 million (2020: £387.8 million). This excludes an amount of £12.0 million (2020: £14.3 million) for the last remaining Swiss property (2020: one Swiss property) and £26.2 million (2020: £94.8 million) for the last remaining German property (2020: eight) which has been classified as held for sale. Apart from the one remaining German property, the carrying amount of the investment properties are stated at estimated fair value, determined by directors, based on an independent external appraisal. The sole remaining German property is based on a signed contract for the disposal of the property. The registered independent appraisers have an appropriate recognised professional qualification and recent experience in the location and category of the property being valued (‘valuers’).
The fair value of each of the properties for the period ended 31 March 2021, was assessed by the valuers in accordance with the Royal Institution of Chartered Surveyors (‘RICS’) standards and IFRS 13. Valuers are qualified for purposes of providing valuations in accordance with the ‘Appraisal and Valuation Manual’ published by RICS.
The valuation of the Group’s property portfolio is inherently subjective due to several factors including the individual nature of each property, its location, expectation of future rentals and the discount yield applied to those cash flows. As a result, the valuations placed on the property portfolio are subject to a degree of uncertainty and are made based on assumptions that may not prove to be accurate, particularly in years of volatility or low transaction flow in the market. Due to the current economic uncertainty in the market due to COVID-19 the Switzerland valuers have issued their valuation report with a material valuation uncertainty clause. They have advised there is less certainty attached to their valuation in comparison to what would normally be the case, but that does not mean the valuations cannot be relied upon. For the avoidance of doubt, the UK and Guernsey valuations do not have a material valuation uncertainty clause attached the valuations and the German valuation is based on a signed contract of sale. The estimated market value may differ from the price at which the Group’s assets could be sold at a particular time, since actual selling prices are negotiated between willing buyers and sellers. As a result, if the assumptions prove to be different, actual results of operations and realisation of net assets could differ from the estimates set forth in these financial statements, and the difference could be significant.
The valuations performed by the independent valuers are reviewed internally by senior management. This includes discussions of the assumptions used by the external valuers, as well as a review of the resulting valuations.
Discussions of the valuations process and results are held between the senior management and the external valuers on a biannual basis. The audit and risk committee reviews the valuation results and, provided the committee is satisfied with the results, recommends them to the board for approval.
The valuation techniques used are consistent with IFRS 13 and use significant ‘unobservable’ inputs. Investment properties are all at level 3 in the fair value hierarchy and valuations represent the highest and best use of the properties. There have been no changes in valuation techniques since the prior year and no transfers between the fair value hierarchy levels in the current or prior year.
There are interrelationships between all these unobservable inputs as they are determined by market conditions. An increase in more than one unobservable input would magnify the impact on the valuation. The impact on the valuation would be mitigated by the interrelationship of two unobservable inputs moving in opposite directions e.g. an increase in rent may be offset by an increase in yield, resulting in no net impact on the valuation. Expected vacancy rates may impact the yield with higher vacancy rates resulting in higher yield. All revenue is derived from the underlying tenancies given on the investment properties.
With the exception of five (2020: two) recently acquired MLI properties, all investment properties are mortgaged, details of which can be seen in note 23. As at the date of signing this report, there are no restrictions on the realisability of any of the underlying investment properties, nor on the remittance of income and disposal proceeds.

Job number 17 June 2021 2:57 pm V1
16 Investment property CONTINUED
The key unobservable inputs used in the valuation of the Group’s investment properties at 31 March 2021 are detailed in the table below:
Combined portfolio (including share of jointlycontrolled entities)
Marketvalue
31 March2021
(£’000)
Portfolioby market
value(%)
Properties(number)
Area(sq m)
Annualisedcontracted
gross rentalincome*(£’000)
Net initialyield
(Weightedaverage)
(%)
Voids by
area(%)
Marketrent rangeper month
(£/sq m)Investment propertiesGuernsey 56,150 9.7% 1 10,564 4,428 7.25% 0.20% 34.9UK multi-let industrial 432,910 74.3% 83^ 521,288 30,190 6.22% 6.34% 3.0–9.7UK urban logistics 22,160 3.8% 5 21,861 1,741 7.36% –% 3.0–21.4Subtotal 511,220 87.8% 89 553,713 36,359 6.39% 5.98% –
Assets held for saleGermany 26,239 4.5% 1 8,274 1,269 4.90% 3.20% 13.0Switzerland 11,967 2.1% 1 5,974 953 3.37% –% 13.3Total – wholly owned 549,426 94.4% 91 567,961 38,581 6.25% 5.87% –
Share of joint ventures 32,839 5.6% 4 19,330 2,379 6.15% –% 7.3–13.2Total 582,265 100.0% 95 587,291 40,960 6.24% 5.68% –
* Annualised contracted gross rental income excludes rent free periods and fixed uplifts. At 31 March 2021, annualised current passing rent for the Group totalled £39,520,000.
^ The Group completed 14 individual estate acquisitions in the financial year ended 31 March 2021. One of the estates, known as ‘The Levels’ was an acquisition of a long lease hold interest in an estate in which the Group was already the freeholder. For internal management purposes this estate has been absorbed into the existing freehold estate reducing the number of newly acquired estates internally to 13.
Subsequent to 31 March 2021, the Guernsey property met the conditions for it to be classified as an asset held for sale. Further information regarding this sale can be found in note 19.
Combined portfolio (including share of jointlycontrolled entities)
Marketvalue
31 March2020
(£’000)
Portfolioby market
value(%)
Properties(number)
Area(sq m)
Annualisedcontracted
gross rentalincome*(£’000)
Net initialyield
(Weightedaverage)
(%)
Voids by
area(%)
Marketrent rangeper month
(£/sq m)
Investment propertiesGuernsey 57,460 10.8% 1 10,564 4,335 7.05% 0.05% 34.2UK multi-let industrial 308,951 58.0% 70 420,483 22,701 6.47% 8.90% 2.6–8.6UK urban logistics 21,350 4.0% 5 21,835 1,709 7.56% –% 3.0–21.4Subtotal 387,761 72.8% 76 452,882 28,745 6.62% 8.27% –
Assets held for saleGermany 94,799 17.8% 8 52,122 5,736 5.10% 0.82% 4.9–12.7Switzerland 14,277 2.7% 1 5,974 1,038 5.81% –% 14.5Total – wholly owned 496,837 93.3% 85 510,978 35,519 5.19% 7.41% –
Share of joint ventures 35,737 6.7% 4 19,330 2,429 5.94% –% 7.6–13.5Total 532,574 100.0% 89 530,308 37,948 6.28% 7.14% –
* Annualised contracted gross rental income excludes rent free periods and fixed uplifts. At 31 March 2020, annualised current passing rent for the Group totalled £36,029,000.
147STENPROP ANNUAL REPORT 2021
FINANCIAL STATEMENTS
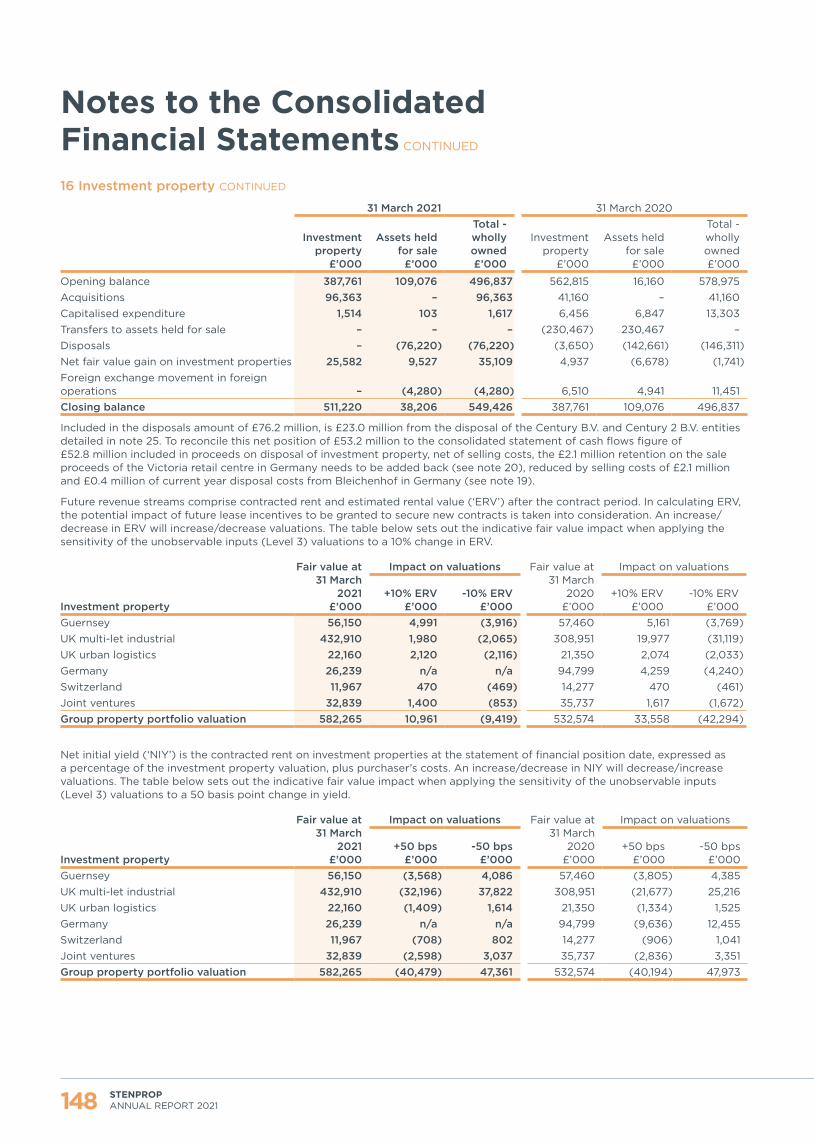
Job number 17 June 2021 2:57 pm V1
Notes to the Consolidated Financial Statements CONTINUED
148 STENPROP ANNUAL REPORT 2021
16 Investment property CONTINUED
31 March 2021 31 March 2020
Investment property
£’000
Assets held for sale
£’000
Total - wholly owned £’000
Investment property
£’000
Assets held for sale
£’000
Total - wholly owned £’000
Opening balance 387,761 109,076 496,837 562,815 16,160 578,975Acquisitions 96,363 – 96,363 41,160 – 41,160Capitalised expenditure 1,514 103 1,617 6,456 6,847 13,303Transfers to assets held for sale – – – (230,467) 230,467 –Disposals – (76,220) (76,220) (3,650) (142,661) (146,311)Net fair value gain on investment properties 25,582 9,527 35,109 4,937 (6,678) (1,741)Foreign exchange movement in foreign operations – (4,280) (4,280) 6,510 4,941 11,451Closing balance 511,220 38,206 549,426 387,761 109,076 496,837
Included in the disposals amount of £76.2 million, is £23.0 million from the disposal of the Century B.V. and Century 2 B.V. entities detailed in note 25. To reconcile this net position of £53.2 million to the consolidated statement of cash flows figure of £52.8 million included in proceeds on disposal of investment property, net of selling costs, the £2.1 million retention on the sale proceeds of the Victoria retail centre in Germany needs to be added back (see note 20), reduced by selling costs of £2.1 million and £0.4 million of current year disposal costs from Bleichenhof in Germany (see note 19).
Future revenue streams comprise contracted rent and estimated rental value (‘ERV’) after the contract period. In calculating ERV, the potential impact of future lease incentives to be granted to secure new contracts is taken into consideration. An increase/decrease in ERV will increase/decrease valuations. The table below sets out the indicative fair value impact when applying the sensitivity of the unobservable inputs (Level 3) valuations to a 10% change in ERV.
Investment property
Fair value at31 March
2021£’000
Impact on valuations Fair value at31 March
2020£’000
Impact on valuations
+10% ERV£’000
-10% ERV£’000
+10% ERV£’000
-10% ERV£’000
Guernsey 56,150 4,991 (3,916) 57,460 5,161 (3,769)UK multi-let industrial 432,910 1,980 (2,065) 308,951 19,977 (31,119)UK urban logistics 22,160 2,120 (2,116) 21,350 2,074 (2,033)Germany 26,239 n/a n/a 94,799 4,259 (4,240)Switzerland 11,967 470 (469) 14,277 470 (461)Joint ventures 32,839 1,400 (853) 35,737 1,617 (1,672)Group property portfolio valuation 582,265 10,961 (9,419) 532,574 33,558 (42,294)
Net initial yield (‘NIY’) is the contracted rent on investment properties at the statement of financial position date, expressed as a percentage of the investment property valuation, plus purchaser’s costs. An increase/decrease in NIY will decrease/increase valuations. The table below sets out the indicative fair value impact when applying the sensitivity of the unobservable inputs (Level 3) valuations to a 50 basis point change in yield.
Investment property
Fair value at31 March
2021£’000
Impact on valuations Fair value at31 March
2020£’000
Impact on valuations
+50 bps£’000
-50 bps£’000
+50 bps£’000
-50 bps£’000
Guernsey 56,150 (3,568) 4,086 57,460 (3,805) 4,385UK multi-let industrial 432,910 (32,196) 37,822 308,951 (21,677) 25,216UK urban logistics 22,160 (1,409) 1,614 21,350 (1,334) 1,525Germany 26,239 n/a n/a 94,799 (9,636) 12,455Switzerland 11,967 (708) 802 14,277 (906) 1,041Joint ventures 32,839 (2,598) 3,037 35,737 (2,836) 3,351Group property portfolio valuation 582,265 (40,479) 47,361 532,574 (40,194) 47,973
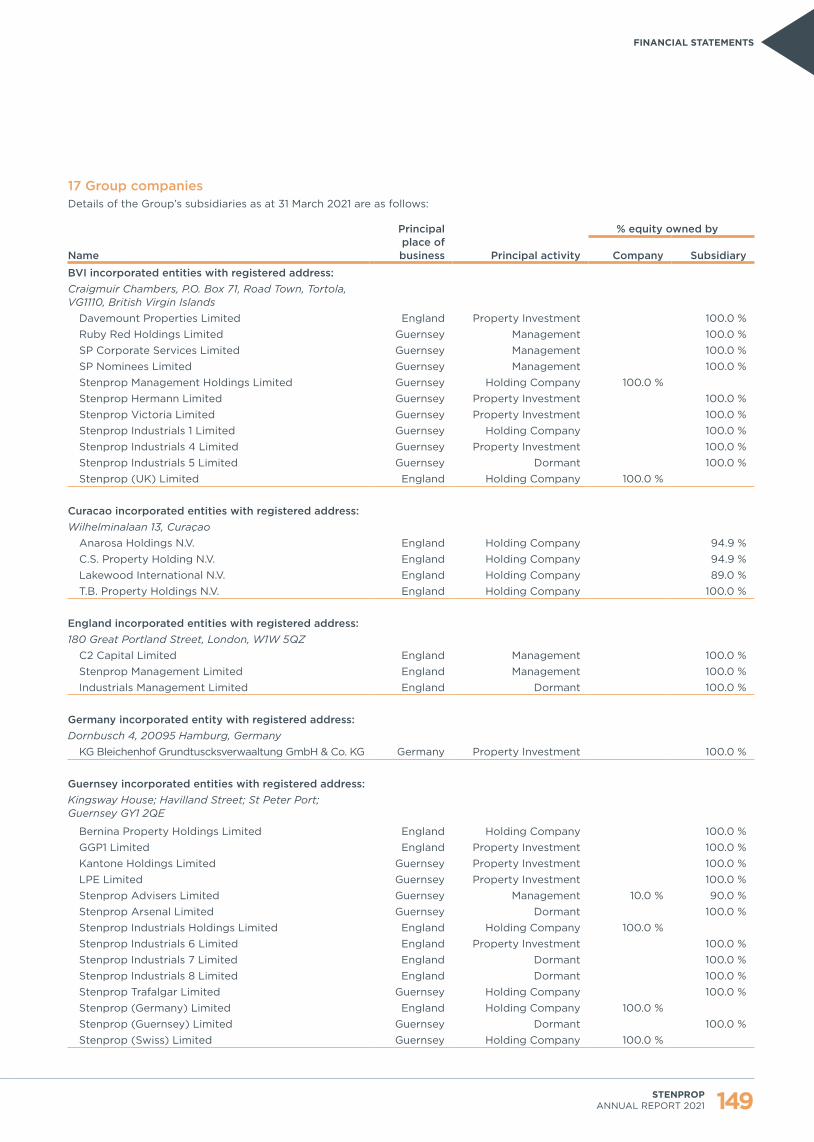
Job number 17 June 2021 2:57 pm V1
17 Group companiesDetails of the Group’s subsidiaries as at 31 March 2021 are as follows:
Name
Principal place of business Principal activity
% equity owned by
Company Subsidiary
BVI incorporated entities with registered address:Craigmuir Chambers, P.O. Box 71, Road Town, Tortola, VG1110, British Virgin Islands
Davemount Properties Limited England Property Investment 100.0 %Ruby Red Holdings Limited Guernsey Management 100.0 %SP Corporate Services Limited Guernsey Management 100.0 %SP Nominees Limited Guernsey Management 100.0 %Stenprop Management Holdings Limited Guernsey Holding Company 100.0 %Stenprop Hermann Limited Guernsey Property Investment 100.0 %Stenprop Victoria Limited Guernsey Property Investment 100.0 %Stenprop Industrials 1 Limited Guernsey Holding Company 100.0 %Stenprop Industrials 4 Limited Guernsey Property Investment 100.0 %Stenprop Industrials 5 Limited Guernsey Dormant 100.0 %Stenprop (UK) Limited England Holding Company 100.0 %
Curacao incorporated entities with registered address:Wilhelminalaan 13, Curaçao
Anarosa Holdings N.V. England Holding Company 94.9 %C.S. Property Holding N.V. England Holding Company 94.9 %Lakewood International N.V. England Holding Company 89.0 %T.B. Property Holdings N.V. England Holding Company 100.0 %
England incorporated entities with registered address:180 Great Portland Street, London, W1W 5QZ
C2 Capital Limited England Management 100.0 %Stenprop Management Limited England Management 100.0 %Industrials Management Limited England Dormant 100.0 %
Germany incorporated entity with registered address:Dornbusch 4, 20095 Hamburg, Germany
KG Bleichenhof Grundtuscksverwaaltung GmbH & Co. KG Germany Property Investment 100.0 %
Guernsey incorporated entities with registered address:Kingsway House; Havilland Street; St Peter Port; Guernsey GY1 2QE
Bernina Property Holdings Limited England Holding Company 100.0 %GGP1 Limited England Property Investment 100.0 %Kantone Holdings Limited Guernsey Property Investment 100.0 %LPE Limited Guernsey Property Investment 100.0 %Stenprop Advisers Limited Guernsey Management 10.0 % 90.0 %Stenprop Arsenal Limited Guernsey Dormant 100.0 %Stenprop Industrials Holdings Limited England Holding Company 100.0 %Stenprop Industrials 6 Limited England Property Investment 100.0 %Stenprop Industrials 7 Limited England Dormant 100.0 %Stenprop Industrials 8 Limited England Dormant 100.0 %Stenprop Trafalgar Limited Guernsey Holding Company 100.0 %Stenprop (Germany) Limited England Holding Company 100.0 %Stenprop (Guernsey) Limited Guernsey Dormant 100.0 %Stenprop (Swiss) Limited Guernsey Holding Company 100.0 %
149STENPROP ANNUAL REPORT 2021
FINANCIAL STATEMENTS

Job number 17 June 2021 2:57 pm V1
Notes to the Consolidated Financial Statements CONTINUED
150 STENPROP ANNUAL REPORT 2021
Name
Principal place of business Principal activity
% equity owned by
Company Subsidiary
Isle of Man incorporated entities with registered address:First Names House, Victoria Road, Douglas, Isle of Man IM2 4DF
Gemstone Properties Limited Guernsey Holding Company 100.0 %Stenham Beryl Limited Guernsey Property Investment 100.0 %Stenham Crystal Limited Guernsey Property Investment 100.0 %Stenham Jasper Limited Guernsey Property Investment 100.0 %
Netherlands incorporated entities with registered address:Fascinatio Boulevard 764, 2909 VA Capelle aan den IJssel, Netherlands
Isabel Properties BV Netherlands Property Investment 94.9 %Mindel Properties BV Netherlands Holding Company 94.5 %
United States incorporated entities with registered address:1209 Orange Street, Wilmington, Delaware 19801, USA
Industrials UK GP LLC England Holding Company 100.0 %Industrials UK LP England Property Investment 100.0 %
Details of the Group’s investments in joint ventures are disclosed in note 18.
18 Investment in joint venturesDetails of the Group’s joint ventures at the end of the reporting period are as follows:
NamePlace of
incorporation Principal activity
% equity owned by subsidiary
Luxembourg incorporated entities with registered address: 231, Val des Bons Malades, L-2121 Luxembourg
Elysion S.A. Luxembourg Holding company 50.0 %Elysion Braunschweig S.a.r.l Luxembourg Property company 50.0 %Elysion Dessau S.a.r.l Luxembourg Property company 50.0 %Elysion Kappeln S.a.r.l Luxembourg Property company 50.0 %Elysion Winzlar S.a.r.l Luxembourg Property company 50.0 %
Republic of Ireland incorporated entity with registered address: 18f Main Street, Dundrum, Dublin 14Ardale Industrials Limited Republic of Ireland Management company 50.0 %

Job number 17 June 2021 2:57 pm V1
18 Investment in joint ventures CONTINUED
Summarised consolidated financial information in respect of the Group’s joint ventures is set out below. Where applicable, these represent the consolidated results of the respective holding companies.
ElysionS.A.
£’000Other£’000
Total31 March
2021£’000
AssetsInvestment property 33,164 – 33,164Fixed assets 31 – 31Cash and cash equivalents 82 1 83Current assets 9 – 9Total assets 33,286 1 33,287
LiabilitiesBank loans (16,947) – (16,947)Bond (14,119) – (14,119)Deferred tax (1,326) – (1,326)Financial liability (488) – (488)Current liabilities (122) – (122)Total liabilities (33,002) – (33,002)
Net assets of joint ventures 284 1 285Group’s investment in joint venture bond 14,119 – 14,119Group’s share of joint ventures’ net assets 142 1 143
Loss and total comprehensive income from continuing operationsRevenue 2,518 – 2,518Finance costs (1,821) – (1,821)Net fair value loss (1,821) – (1,821)Tax expense (159) – (159)Loss and total comprehensive income (1,283) – (1,283)
Group income from joint ventures represented by:Share of joint venture loss (642) – (642)Interest income on joint venture bond 1,481 – 1,481Net loss on joint venture bond (778) – (778)Income from joint ventures 61 – 61
151STENPROP ANNUAL REPORT 2021
FINANCIAL STATEMENTS

Job number 17 June 2021 2:57 pm V1
Notes to the Consolidated Financial Statements CONTINUED
152 STENPROP ANNUAL REPORT 2021
18 Investment in joint ventures CONTINUED
ElysionS.A.
£’000Other£’000
Total31 March
2020£’000
AssetsInvestment property 35,737 – 35,737Fixed assets 227 – 227Cash and cash equivalents 543 10 553Current assets 42 2 44Total assets 36,549 12 36,561
LiabilitiesBank loans (18,364) – (18,364)Bond (14,557) – (14,557)Deferred tax (1,330) – (1,330)Financial liability (591) – (591)Current liabilities (148) (9) (157)Total liabilities (34,990) (9) (34,999)
Net assets of joint ventures 1,559 3 1,562Group’s investment in joint venture bond 15,336 – 15,336Group’s share of joint ventures’ net assets 780 1 781
Revenue 2,472 15 2,487Finance costs (2,193) (12) (2,205)Net fair value gains 674 – 674Tax expense (231) (2) (233)Profit and total comprehensive income from continuing operations 722 1 723
Group income from joint ventures represented by:Share of joint venture profits 361 1 362Interest income on joint venture bond 1,393 – 1,393Net gain on joint venture bond 360 – 360Income from joint ventures 2,114 1 2,115
Elysion S.A.Stenprop owns 100% of the shares and shareholder loans in Bernina Property Holdings Limited (‘Bernina’), the results and financial position of which is included within these consolidated financial statements. Bernina in turn owns 50% of the issued share capital and 100% of the bonds of Elysion S.A., a company incorporated in Luxembourg which is the beneficial owner of the Care Home portfolio. The remaining 50% of Elysion S.A. is owned by a joint venture partner who manages the portfolio.
The acquired bonds have attracted, and continue to attract, a 10% compounded interest rate since inception in 2007 and have limited recourse to compartment assets within Elysion S.A., with the proceeds made available to subsidiaries in the joint venture for real estate investment in Care Homes. All costs and expenses incurred by the Elysion S.A. compartment are deducted or withheld from any payment of principal or interest. The fair value has been determined based on the net assets of the compartment which would be available to settle the outstanding bond and which is intrinsically linked to the fair value of the investment property. Further details on the estimates and assumptions used in determining the fair value of investment property can be found in note 16.

Job number 17 June 2021 2:57 pm V1
18 Investment in joint ventures CONTINUED
Reconciliation of the above summarised financial information to the carrying amount of the interest recognised in the consolidated financial statements:
31 March 2021
BondElysion
S.A.£’000
Investment in joint venturesElysion
S.A.£’000
Other£’000
Total£’000
Opening balance 15,336 780 1 781Income/(loss) from joint ventures 1,481 (642) – (642)Loss on fair value movement (780) – – –Investment receipts (1,290) – – –Foreign exchange movement in foreign operations (628) 4 – 4Closing balance 14,119 142 1 143
31 March 2020
BondElysion
S.A.£’000
Investment in joint venturesElysion
S.A.£’000
Other£’000
Total£’000
Opening balance 14,077 409 56 465Income from joint ventures 1,765 349 1 350Investment receipts (975) – (56) (56)Foreign exchange movement in foreign operations 469 22 – 22Closing balance 15,336 780 1 781
19 Assets held for sale and discontinued operationsManagement considers the remaining Swiss property (2020: one) and the remaining German property (2020: eight) meet the conditions relating to assets held for sale, as per IFRS 5: Non-current Assets Held for Sale and Discontinued Operations. The properties are expected to be disposed of during the next 12 months. The fair value of Swiss property has been determined by a third-party valuer, JLL.
The remaining German property classified as held for sale was notarised for sale in December 2020 and is expected to complete shortly and the fair value has accordingly been determined by the directors based on the sale price. Associated selling costs have been provided.
All non-current assets, and the Swiss disposal group, classified as held for sale are disclosed at their fair value.
Subsequent to 31 March 2021, the Guernsey office building, known as Trafalgar Court, met the conditions for it to be classified as an asset held for sale, as per IFRS 5: Non-current Assets Held for Sale and Discontinued Operations. As there is only one property currently held in the Guernsey segment, this will result in the Guernsey segment being recognised in future financial statements as a discontinued operation.
The fair value of these properties, and their comparative values are disclosed in the table below along with associated assets and liabilities:
31 March2021
£’000
31 March2020
£’000
Investment properties (note 16) 38,206 109,076Cash and cash equivalents 201 1,135Trade and other receivables 801 1,646Assets classified as held for sale 39,208 111,857
Bank loans (note 23) 13,883 43,177Derivative financial instruments – 134Deferred tax (note 26) 1,190 3,782Tax credit (603) (611)Accounts payable and accruals 696 828Liabilities directly associated with assets classified as held for sale 15,166 47,310
153STENPROP ANNUAL REPORT 2021
FINANCIAL STATEMENTS

Job number 17 June 2021 2:57 pm V1
Notes to the Consolidated Financial Statements CONTINUED
154 STENPROP ANNUAL REPORT 2021
19 Assets held for sale and discontinued operations CONTINUED
The Swiss property is the only asset recognised as a discontinued operation as the Swiss segment is a disposal group. In the prior year, the entire Swiss segment (one property) was recognised as a discontinued operation in accordance with IFRS 5.32. The results of the discontinued operation were as follows:
31 March2021
£’000
31 March2020
£’000
Rental income 1,098 764Property expenses (703) (329)Net rental income 395 435
Operating costs (114) (214)Net operating income 281 221
Fair value loss on investment properties (1,178) (3,188)Profit on disposal of subsidiaries 160 –Loss from operations (737) (2,967)
Profit on disposal of property – 648Interest receivable – –Finance costs (71) (70)Net foreign exchange loss (1) (6)Loss for the year before taxation (809) (2,395)
Current tax (82) 198Deferred tax – –Loss for the year from discontinued operations (891) (2,197)
DisposalsOn 30 September 2020, the Group disposed of its property, Neucölln Carrée retail park, in Berlin, Germany, held in Isabel Properties B.V. for €27.0 million.
On 31 March 2021, the Group disposed of its property, Victoria-Center retail park, in Berlin, Germany, held in Stenprop Victoria Limited for €37.45 million.
On 31 March 2021, the Group disposed of five properties located in Frankfurt, Kassel, Ludwigsburg, Marburg and Sindelfingen, Germany, held in Century B.V. and Century 2 B.V. at a valuation of €27.0 million. The properties were disposed of as subsidiaries and are further discussed in note 25.
Prior year disposalsOn 21 June 2019, the Group disposed of its Hemel Hempstead property in Davemount Properties Limited for £1.9 million.
On 19 August 2019, the Group disposed of its Walsall property in Davemount Properties Limited for £1.7 million.
On 13 December 2019, the Group disposed of its Grimsby property in Davemount Properties Limited for £1.0 million.
On 28 February 2020, the group disposed of its largest single asset, known as Bleichenhof, in Hamburg. The property was sold for €160.15 million. One of the conditions attached to the disposal was completing the redevelopment works that were ongoing at the time of the sale. In the prior year statement of financial position, a provision for £3.2 million was included for these redevelopment costs.
On 19 July 2018, the Group disposed of seven properties in Switzerland. As part of the agreements entered into for the sale of these Swiss properties, all of which were sold to the same buyer, Stenprop provided a guarantee for obligations and liabilities of each of the selling entities. The maximum amount of the guarantee is CHF6.0 million, which lasts until all obligations under the sale agreements have been fulfilled, with a backstop date of 31 July 2028. As at the date of signing these accounts, there had not been any claim under the guarantee.

Job number 17 June 2021 2:57 pm V1
20 Trade and other receivables
Non-current receivables
31 March2021
£’000
31 March2020
£’000
Other debtors 8,670 13,523Total non-current receivables 8,670 13,523
Non-current other debtors includes £6.51 million (2020: £12.27 million) of loans advanced under the Share Purchase Plan (see note 13: Share-based payments). During the current financial year, a £1.0 million loan (2020: £1.0 million) used to purchase 1,000,000 Stenprop shares in the market by Ferryman Capital Partners Limited, a company in which Warren Lawlor, previously a non-executive director, has a one-third beneficial interest, was repaid in full. Two of the three remaining loans advanced under the Share Purchase Plan were also repaid in full before the reporting date. Only one loan advanced under the Share Purchase Plan remains outstanding at 31 March 2021.
The remaining loan has been assessed for an expected credit loss under IFRS 9. The analysis shows that due to the full recourse nature of the loan, secured against the shares issued and underlying assets of the borrower, loss given default is currently estimated at nil. There has been no perceived significant increase in credit risk and we have not recognised an 12 month expected credit loss on this loan. Refer to note 28 (i) to understand how the Group manages credit risk.
Non-current other debtors also includes £2.13 million (2020: nil) from part of the proceeds from the sale of the Victoria retail centre in Germany. A retention of €2.5 million from the purchase price is held in an escrow account in respect of claims against, and for certain liabilities of the seller under the disposal agreement for a period of up to 13 months from the completion date of 31 March 2021.
Current receivables
31 March2021
£’000
31 March2020
£’000
Accounts receivable 6,009 3,793Loss allowance on accounts receivables (2,311) (541)Net receivables 3,698 3,252
Lease incentives 1,769 2,183Loss allowance on lease incentives (261) –Net lease incentives 1,508 2,183
Other receivables 2,406 1,415Prepayments 1,111 1,399Total current receivables 8,723 8,249
Other receivables includes VAT receivable.
31 March 2021 31 March 2020Accounts
Receivables£’000
LossAllowance
£’000
NetReceivables
£’000
AccountsReceivables
£’000
LossAllowance
£’000
NetReceivables
£’000
Not yet due – – – 572 – 5721-30 days overdue 1,361 (37) 1,324 1,999 – 1,99931-60 days overdue 1,784 (109) 1,675 296 – 29661-90 days overdue 247 (99) 148 109 (60) 4991-120 days overdue 340 (323) 17 227 (147) 79More than 120 days overdue 2,277 (1,743) 534 590 (333) 257Closing balance 6,009 (2,311) 3,698 3,793 (541) 3,252
The Group applies the IFRS 9 simplified approach to measuring expected credit losses using a lifetime expected credit loss provision for trade receivables. To measure expected credit losses on a collective basis, trade receivables are grouped based on shared credit risk characteristics and the days overdue.
The expected loss rates on accounts receivables and lease incentives are based on the Group’s historical credit losses experienced over the current period. The historical loss rates are then adjusted for current and forward-looking information on macroeconomic factors affecting the Group’s customers.
Book value approximates fair value.
155STENPROP ANNUAL REPORT 2021
FINANCIAL STATEMENTS
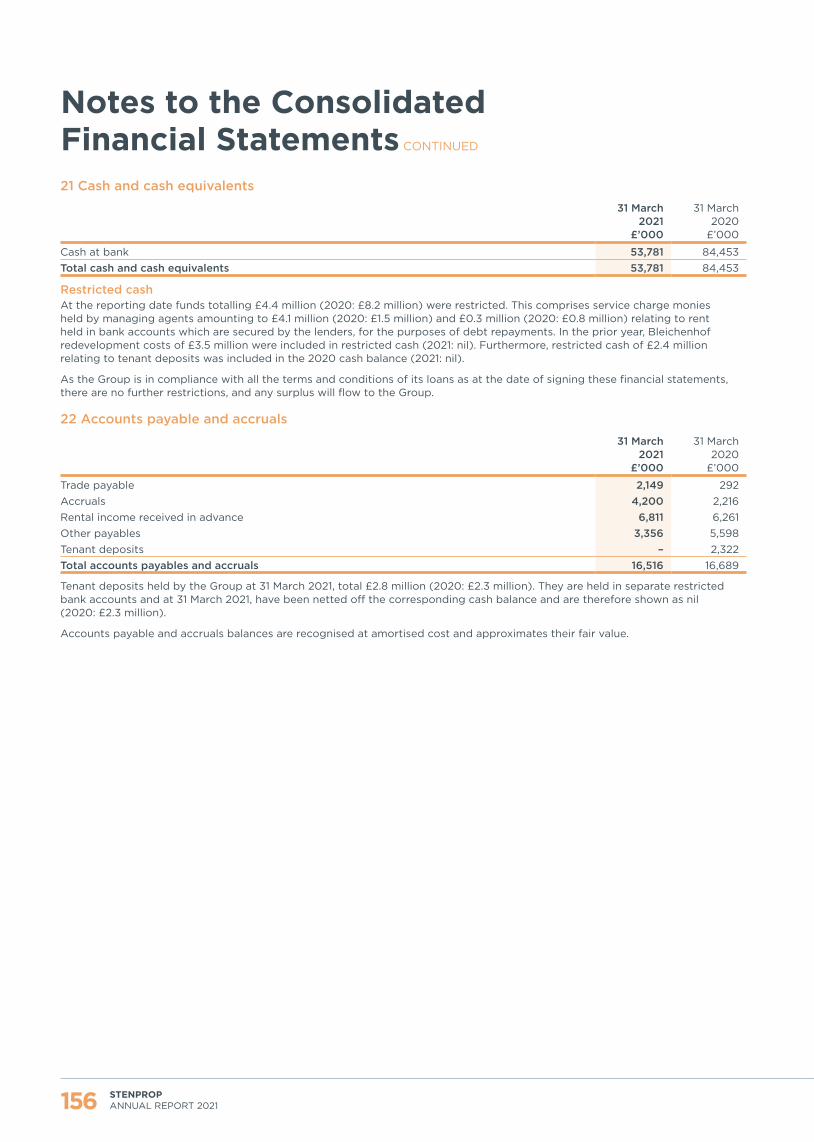
Job number 17 June 2021 2:57 pm V1
Notes to the Consolidated Financial Statements CONTINUED
156 STENPROP ANNUAL REPORT 2021
21 Cash and cash equivalents
31 March2021
£’000
31 March2020
£’000
Cash at bank 53,781 84,453Total cash and cash equivalents 53,781 84,453
Restricted cashAt the reporting date funds totalling £4.4 million (2020: £8.2 million) were restricted. This comprises service charge monies held by managing agents amounting to £4.1 million (2020: £1.5 million) and £0.3 million (2020: £0.8 million) relating to rent held in bank accounts which are secured by the lenders, for the purposes of debt repayments. In the prior year, Bleichenhof redevelopment costs of £3.5 million were included in restricted cash (2021: nil). Furthermore, restricted cash of £2.4 million relating to tenant deposits was included in the 2020 cash balance (2021: nil).
As the Group is in compliance with all the terms and conditions of its loans as at the date of signing these financial statements, there are no further restrictions, and any surplus will flow to the Group.
22 Accounts payable and accruals
31 March2021
£’000
31 March2020
£’000
Trade payable 2,149 292Accruals 4,200 2,216Rental income received in advance 6,811 6,261Other payables 3,356 5,598Tenant deposits – 2,322Total accounts payables and accruals 16,516 16,689
Tenant deposits held by the Group at 31 March 2021, total £2.8 million (2020: £2.3 million). They are held in separate restricted bank accounts and at 31 March 2021, have been netted off the corresponding cash balance and are therefore shown as nil (2020: £2.3 million).
Accounts payable and accruals balances are recognised at amortised cost and approximates their fair value.
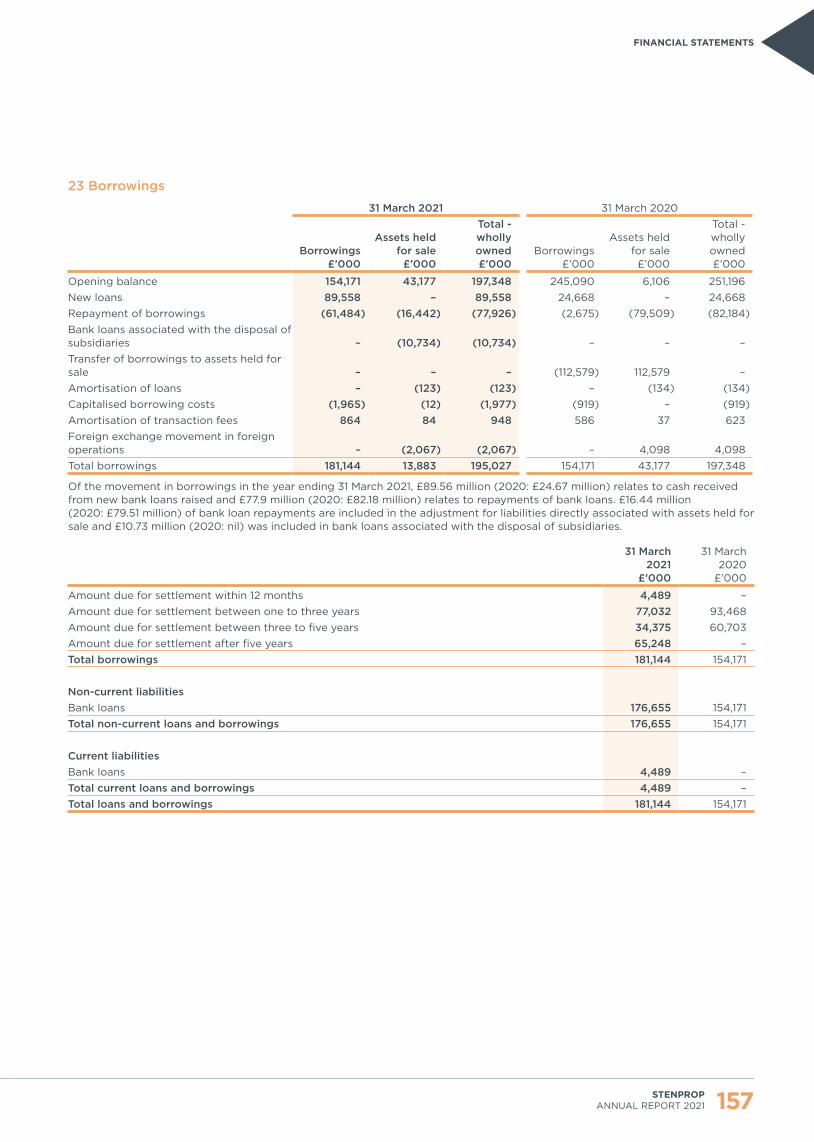
Job number 17 June 2021 2:57 pm V1
23 Borrowings
31 March 2021 31 March 2020
Borrowings£’000
Assets held for sale
£’000
Total - wholly owned£’000
Borrowings£’000
Assets held for sale
£’000
Total - wholly owned£’000
Opening balance 154,171 43,177 197,348 245,090 6,106 251,196New loans 89,558 – 89,558 24,668 – 24,668Repayment of borrowings (61,484) (16,442) (77,926) (2,675) (79,509) (82,184)Bank loans associated with the disposal of subsidiaries – (10,734) (10,734) – – –Transfer of borrowings to assets held for sale – – – (112,579) 112,579 –Amortisation of loans – (123) (123) – (134) (134)Capitalised borrowing costs (1,965) (12) (1,977) (919) – (919)Amortisation of transaction fees 864 84 948 586 37 623Foreign exchange movement in foreign operations – (2,067) (2,067) – 4,098 4,098Total borrowings 181,144 13,883 195,027 154,171 43,177 197,348
Of the movement in borrowings in the year ending 31 March 2021, £89.56 million (2020: £24.67 million) relates to cash received from new bank loans raised and £77.9 million (2020: £82.18 million) relates to repayments of bank loans. £16.44 million (2020: £79.51 million) of bank loan repayments are included in the adjustment for liabilities directly associated with assets held for sale and £10.73 million (2020: nil) was included in bank loans associated with the disposal of subsidiaries.
31 March2021
£’000
31 March2020
£’000
Amount due for settlement within 12 months 4,489 –Amount due for settlement between one to three years 77,032 93,468Amount due for settlement between three to five years 34,375 60,703Amount due for settlement after five years 65,248 –Total borrowings 181,144 154,171
Non-current liabilitiesBank loans 176,655 154,171Total non-current loans and borrowings 176,655 154,171
Current liabilitiesBank loans 4,489 –Total current loans and borrowings 4,489 –Total loans and borrowings 181,144 154,171
157STENPROP ANNUAL REPORT 2021
FINANCIAL STATEMENTS

Job number 17 June 2021 2:57 pm V1
Notes to the Consolidated Financial Statements CONTINUED
158 STENPROP ANNUAL REPORT 2021
23 BorrowingsThe facilities amounting to £197.7 million are secured by legal charges over the properties to which they correspond with a market value of £522.2 million. There is no cross-collateralisation of the facilities. The terms and conditions of outstanding loans are as follows:
Entity Note Amortising
Loan interest
rate CurrencyMaturity
date
Nominal value Carrying value*31 March
2021£’000
31 March2020
£’000
31 March2021
£’000
31 March2020
£’000Continuing operationsGuernsey
LPE Limited NoLIBOR +
2.00 % GBP 30/09/2022 28,000 28,000 27,929 27,857
United Kingdom - MLI
Industrials UK LP No1.66 %
fixed GBP 3/12/2027 66,500 – 65,248 –
Industrials UK LP NoLIBOR +
2.25 % GBP 2/06/2022 – 61,484 – 61,259Stenprop Industrials 4 Limited No
LIBOR + 2.00 % GBP 14/11/2025 34,879 34,879 34,375 34,255
Stenprop Industrials 6 Limited No
LIBOR + 1.75 % GBP 1/02/2024 49,898 – 49,104 –
Stenprop Industrials 6 Limited No
LIBOR +2.00 % GBP 1/02/2024 – 26,840 – 26,448
Stenprop Industrials Holdings Limited 1 Yes N/A GBP – – (8) (120)United Kingdom - Urban logistics
GGP1 Limited NoLIBOR +
2.25 % GBP 26/05/2021 4,500 4,500 4,496 4,472Total borrowings attributable to continuing operations 183,777 155,703 181,144 154,171
Switzerland - Discontinued operationKantone Holdings Limited Yes
LIBOR +1.15 % CHF
3–monthrolling facility 5,853 6,513 5,853 6,513
Germany - Assets held for sale
Century BV NoEuribor +
1.55 % EUR 31/12/2022 – 7,369 – 7,319
Century 2 BV NoEuribor +
1.55 % EUR 31/12/2022 – 3,832 – 3,804
Isabel Properties BV NoEuribor +
2.32 % EUR 30/12/2021 – 8,001 – 8,001
Stenprop Hermann Ltd NoEuribor +
1.13 % EUR 30/06/2021 8,033 8,383 8,030 8,383
Stenprop Victoria Ltd NoEuribor +
1.28 % EUR 31/08/2020 – 9,157 – 9,157Total borrowings attributable to discontinued operations and assets classified as held for sale (note 19) 13,886 43,255 13,883 43,177
Total borrowings 197,663 198,958 195,027 197,348
* The difference between the nominal and the carrying value represents unamortised facility costs.1 Net carrying value of the amortised facility costs on the Investec Bank Plc revolving credit facility.

Job number 17 June 2021 2:57 pm V1
23 Borrowings CONTINUED
Loans are subject to loan-to-value ratios (note 27) and interest coverage ratios. All loans are assessed quarterly for their covenant compliance and forecast headroom. No loan was in breach of its borrowing covenants during the period or period end.
31 March 2021 31 March 2020
Continuing operationsWeighted covenant
Weighted actual
Weighted covenant
Weighted actual
Loan to value 57.5 % 38.8 % 62.2 % 41.8 %Interest cover 2.3 9.5 1.9 5.5
31 March 2021 31 March 2020
Discontinued operationsWeighted covenant
Weighted actual
Weighted covenant
Weighted actual
Loan to value 50.0 % 48.9 % 50.0 % 45.6 %Interest cover n/a n/a n/a n/a
159STENPROP ANNUAL REPORT 2021
FINANCIAL STATEMENTS

Job number 17 June 2021 2:57 pm V1
Notes to the Consolidated Financial Statements CONTINUED
160 STENPROP ANNUAL REPORT 2021
24 Derivative financial instrumentsIn accordance with the terms of the borrowing arrangements and Group policy, the Group has entered into interest rate swap agreements which are entered into by the borrowing entities to convert the borrowings from floating to fixed interest rates and are used to manage the interest rate profile of financial liabilities and eliminate future exposure to interest rate fluctuations. It is the Group’s policy that no economic trading in derivatives is undertaken by the Group. The Group uses forward foreign exchange contracts to mitigate exchange rate exposure arising from forecast sales in euros (EUR). The Group’s policy is to hedge 100% of net foreign exchange exposure when a disposal contract has been signed. In the current year, the Group recognised a total net gain in fair value of financial instruments from continuing and discontinuing operations of £1,940,000 (2020: loss £2,410,000) and nil (2020: nil) respectively.
On 31 March 2021, the entities Century BV and Century 2 BV were disposed of by way of a share sale and the loan in Isabel Properties BV was repaid on the sale of the property in this entity. Therefore, the maturity dates and swap rate percentages are no longer applicable.
The following table sets out the interest rate swap agreements at 31 March 2021 and 31 March 2020.
Entity Effective
date Maturity
date Swaprate %
Notional value
31 March2021
£’000
Fair Value31 March
2021£’000
Notional value
31 March2020
£’000
Fair value31 March
2020£’000
Continuing operationsUK - MLIIndustrials UK LP n/a n/a n/a – – 60,375 (768)Stenprop Industrials 4 Limited 07/02/2020 14/11/2024 0.8856 % 24,000 (430) 24,000 (492)Stenprop Industrials 6 Limited 22/12/2020 01/02/2024 0.5000 % 42,413 138 22,814 (741)Liabilities directly associated with assets classified as held for saleGermanyCentury BV n/a n/a n/a – – 7,234 –Century 2 BV n/a n/a n/a – – 3,967 –Isabel Properties BV n/a n/a n/a – – 8,001 –Total swaps 66,413 (292) 126,391 (2,001)Stenprop LtdEUR forward contracts – 2,024 – –Total forwards 2,024Assets maturing within 12 months – 2,024 – –Liabilities maturing within 12 months – – – –Assets maturing after 12 months – 138 – –Liabilities maturing after 12 months – (430) – (2,001)Derivative financial instruments – on the Statement of Financial Position – 1,732 – (2,001)Swaps included in investment in joint venturesElysion Braunschweig S.à r.l. 29/03/2018 29/12/2023 0.5200 % 4,984 (122) 4,883 (150)Elysion Dessau S.à r.l. 29/03/2018 29/12/2023 0.5200 % 4,932 (121) 4,831 (143)Elysion Kappeln S.à r.l. 31/12/2018 29/12/2023 0.6325 % 5,341 (150) 5,379 (181)Elysion Winzlar S.à r.l. 31/12/2018 29/12/2023 0.6325 % 3,418 (96) 3,442 (116)Derivative financial instruments – joint ventures 18,675 (489) 18,535 (590)
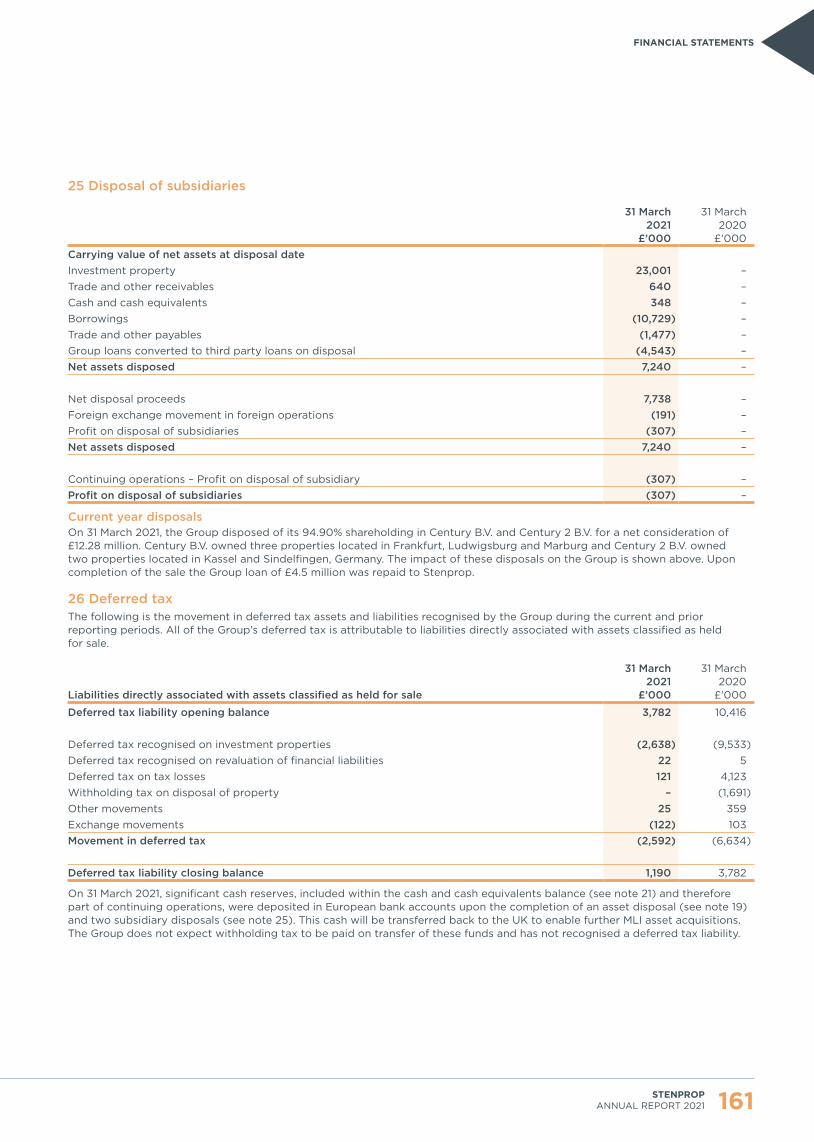
Job number 17 June 2021 2:57 pm V1
25 Disposal of subsidiaries
31 March2021
£’000
31 March2020
£’000Carrying value of net assets at disposal dateInvestment property 23,001 –Trade and other receivables 640 –Cash and cash equivalents 348 –Borrowings (10,729) –Trade and other payables (1,477) –Group loans converted to third party loans on disposal (4,543) –Net assets disposed 7,240 –
Net disposal proceeds 7,738 –Foreign exchange movement in foreign operations (191) –Profit on disposal of subsidiaries (307) –Net assets disposed 7,240 –
Continuing operations – Profit on disposal of subsidiary (307) –Profit on disposal of subsidiaries (307) –
Current year disposalsOn 31 March 2021, the Group disposed of its 94.90% shareholding in Century B.V. and Century 2 B.V. for a net consideration of £12.28 million. Century B.V. owned three properties located in Frankfurt, Ludwigsburg and Marburg and Century 2 B.V. owned two properties located in Kassel and Sindelfingen, Germany. The impact of these disposals on the Group is shown above. Upon completion of the sale the Group loan of £4.5 million was repaid to Stenprop.
26 Deferred taxThe following is the movement in deferred tax assets and liabilities recognised by the Group during the current and prior reporting periods. All of the Group’s deferred tax is attributable to liabilities directly associated with assets classified as held for sale.
Liabilities directly associated with assets classified as held for sale
31 March2021
£’000
31 March2020
£’000
Deferred tax liability opening balance 3,782 10,416
Deferred tax recognised on investment properties (2,638) (9,533)Deferred tax recognised on revaluation of financial liabilities 22 5Deferred tax on tax losses 121 4,123Withholding tax on disposal of property – (1,691)Other movements 25 359Exchange movements (122) 103Movement in deferred tax (2,592) (6,634)
Deferred tax liability closing balance 1,190 3,782
On 31 March 2021, significant cash reserves, included within the cash and cash equivalents balance (see note 21) and therefore part of continuing operations, were deposited in European bank accounts upon the completion of an asset disposal (see note 19) and two subsidiary disposals (see note 25). This cash will be transferred back to the UK to enable further MLI asset acquisitions. The Group does not expect withholding tax to be paid on transfer of these funds and has not recognised a deferred tax liability.
161STENPROP ANNUAL REPORT 2021
FINANCIAL STATEMENTS

Job number 17 June 2021 2:57 pm V1
Notes to the Consolidated Financial Statements CONTINUED
162 STENPROP ANNUAL REPORT 2021
27 Financial risk managementThe Group is exposed to a variety of financial risks including capital risk management, credit risk, liquidity risk and market risk. The overall risk management strategy seeks to minimise the potential adverse effects on the Group’s financial performance. Certain risk exposures are hedged via the use of financial derivatives.
This note presents information about the Group’s exposure to each of the above risks, the Group’s objectives, policies and processes for measuring and managing these risks, and the Group’s management of capital. Further quantitative disclosures are included throughout these audited financial statements where relevant. The Group’s board has overall responsibility for the establishment and oversight of the Group’s risk management framework.
The audit and risk committee participates in management’s process of formulating and implementing the risk management plan and it reports on the plan adopted by management to the board.
The objective of risk management is to identify, assess, manage and monitor the risks to which the business is exposed, including, but not limited to, information technology risk. The board is responsible for ensuring the adoption of appropriate risk management policies by management. The Group’s risk management policies are established to identify and analyse the risks faced by the Group, to set appropriate risk limits and controls and to monitor risks and adherence to limits. Risk management policies are reviewed regularly to reflect changes in market conditions and the Group’s activities. The board will also ensure that there are processes in place between itself and management enabling complete, timely, relevant, accurate and accessible risk disclosure to shareholders.
To enable the audit and risk committee to meet its responsibilities, terms of reference were adopted by the board. These include appropriate standards, the implementation of systems of internal control and an effective risk-based internal audit which comprises policies, procedures, systems and information to assist in:
▶ safeguarding assets and reducing the risk of loss, error, fraud and other irregularities;
▶ ensuring the accuracy and completeness of accounting records and reporting;
▶ preparing timely, reliable financial statements and information in compliance with relevant legislation and generally accepted accounting policies and practices; and
▶ increasing the probability of anticipating unpredictable risk.
The committee oversees how management monitors compliance with the Group’s risk management policies and procedures and reviews the adequacy of the risk management framework in relation to risks faced by the Group.
Capital risk managementThe capital structure of the Group consists of debt, which includes the borrowings disclosed in note 23, cash and cash equivalents and equity attributable to ordinary shareholders of the Company, comprising issued capital, reserves and retained earnings as disclosed in the statement of changes in equity. Stenprop’s weighted average loan-to-value (‘LTV’) ratio at 31 March 2021 was 28.1% (2020: 26.2%), including joint ventures and the Group is not subject to any external capital requirements. The Group strategy is to maintain a debt-to-equity ratio and LTV ratio to ensure that property performance is translated into an enhanced return for shareholders while at the same time ensuring that it will be able to continue as a going concern through changing market conditions. The directors are of the opinion that an LTV of no more than 40% in respect of secured external borrowings is an appropriate target for the Group, given the current market conditions. Debt covenants are disclosed further in note 23.
The financial statements of the Group have been prepared on a going concern basis. At the date of signing these accounts, the Group has positive operating cash flow forecasts and positive net assets. Management have reviewed the Group’s cash flow forecasts for the 18 months to 30 September 2022 and, considering this review and the current financial position, they are satisfied that the Company and the Group have access to adequate resources to meet their obligations and continue in operational existence for the foreseeable future, and specifically the 12 months subsequent to the signing of these financial statements. Further details are set out in note 2 to the financial statements.

Job number 17 June 2021 2:57 pm V1
27 Financial risk management CONTINUED
Credit riskThe Group’s principal financial assets are cash and cash equivalents as well as trade and other receivables. The credit risk arising from deposits with banks is managed through a policy of utilising only independently rated banks with acceptable credit ratings.
The credit quality of cash and cash equivalents can be assessed by reference to external credit ratings of the counterparty where the account or deposit is placed. The credit rating summary below represents the five European financial institutions that hold more than £1 million (or GBP equivalent) of the Group’s cash at 31 March 2021. Together these banks hold 99% (2020: 96%) of the Group’s total cash at bank.
31 March2021
S&P Global Ratings
31 March2021Fitch
Ratings
31 March2020
S&P Global Ratings
31 March2020Fitch
Ratings
Barclays Bank UK Plc BBB A– BBB A–Black Rock AA– N/A N/A N/AThe Bank of N. T. Butterfield & Son Limited A– Withdrawn BBB+ WithdrawnDeutsche Bank AG BBB+ N/A N/A N/AHamburg Commercial Bank AG BBB N/A BBB N/ALloyds Bank plc BBB+ A+ BBB+ A+Royal Bank of Scotland Group plc (NatWest Group) BBB A BBB ARoyal Bank of Scotland International Limited1 BBB A N/A N/ASantander UK plc A N/A N/A N/A
1 The financial institution is a private company. The credit rating of its parent company has been disclosed.
The directors are satisfied as to the creditworthiness of the banks where the remaining cash is held.
The majority of tenant leases are long-term contracts with rents payable quarterly in advance. Rent deposits and personal or corporate guarantees are held in respect of some leases. Taking these factors into account, the risk to the Group of individual tenant default and the credit risk of trade receivables are considered low. The concentration of credit risk is limited due to the large and diverse occupier base. Accordingly, the directors believe that there is no further expected credit loss required in excess of that provided. Trade receivables are presented after deducting a loss allowance provision, as set out in note 20.
At the time of acquisition of a property, and from time to time thereafter, the Group reviews the quality of the contracted tenants to ensure that the tenants meet acceptable covenants. Trade receivables are presented in the statement of financial position net of allowances for doubtful receivables. An allowance for impairment is made where there is an indefinable loss event, which based on previous experience, may give risk to a non-recovery of a receivable.
Non-current other debtors are long term loans secured against shares issued by the Group to the related parties referenced in note 20. In order to manage credit risk, the contractual terms include full recourse to assets of the borrower which are monitored alongside the aggregate value of the shares. Furthermore, in respect of the Share Purchase Plan, the terms allow recovery of amounts due through a deduction from salary or other amounts paid to the beneficiary.
The carrying amount of financial assets represents the maximum credit exposure at the reporting date.
At 31 March 2021, trade and other receivables and cash and cash equivalents amounts to £66.9 million (2020: £92.3 million) as shown in the statement of financial position. Further details on what makes up this balance can be found in note 20.
163STENPROP ANNUAL REPORT 2021
FINANCIAL STATEMENTS

Job number 17 June 2021 2:57 pm V1
Notes to the Consolidated Financial Statements CONTINUED
164 STENPROP ANNUAL REPORT 2021
27 Financial risk management CONTINUED
Liquidity riskPrudent liquidity risk management requires maintaining sufficient cash resources, appropriate and adequate funding, via lines of credit, as well as managing the ability of tenants to settle their lease obligations. Through the forecasting and budgeting of cash requirements, the Group ensures that adequate committed resources are available.
By its nature, the market for investment property is not immediately liquid. Therefore, the Group’s ability to vary its portfolio in a timely fashion and to receive a fair price in response to changes in economic and other conditions may be limited. Furthermore, where the Group acquires investment properties for which there is not a readily available market, the Group’s ability to deal in any such investment or obtain reliable information about the value of such investment or risks to which such property investment is exposed may be limited. The Group’s short-term liquidity risk is secured by the existence of cash balances, through the fact that rental income exceeds the Group’s cost structures and through ensuring that facilities are managed within debt covenants.
The following table details the contractual maturity date of the Group’s financial liabilities. The table has been compiled based on the undiscounted contractual maturities of the financial liabilities, including interest that will accrue to those liabilities, except where the Group is entitled and intends to repay the liability before its maturity. The discount column represents the possible future cash flows included in the maturity analysis, such as future interest or potential payments that have not been included in the carrying amount of the financial liability. The table also includes a reconciliation to the carrying value in the statement of financial position.
Group operations
Less than one
month £’000
One tothree
months £’000
Three to twelve
months £’000
One tofive
years £’000
Over fiveyears
£’000 Discount
£’000 Total
£’000
Interest-bearing loans – 4,489 – 111,407 65,248 – 181,144Loan interest 109 1,680 2,625 11,501 2,781 (17,808) 888Financial liabilities – – – 430 – – 430Other payables – 1,226 3,391 – – – 4,617Accruals – – 4,200 – – – 4,200Lease obligations 2 74 242 24 – – 342As at 31 March 2021 111 7,469 10,458 123,362 68,029 (17,808) 191,621
Group operations
Less than one
month £’000
One tothree
months £’000
Three to twelve
months £’000
One tofive
years £’000
Over fiveyears
£’000 Discount
£’000 Total
£’000
Interest-bearing loans – – (120) 93,588 60,703 – 154,171Loan interest 373 1,427 3,484 7,176 – (11,821) 639Financial liabilities – – – 2,001 – – 2,001Other payables – 824 4,906 2,116 – – 7,846Accruals – – 1,869 – – – 1,869Provisions – – 3,179 – – – 3,179Lease obligations 1 49 252 222 – – 524As at 31 March 2020 374 2,300 13,570 105,103 60,703 (11,821) 170,229
Market riskMarket risk is the risk that the fair value or future cash flows of a financial instrument will fluctuate because of changes in market prices. Market risk comprises three types of risk: foreign currency risk, interest rate risk and price risk (see fair value hierarchy section). The objective of market risk management is to manage and control market risk exposures within acceptable parameters, while optimising returns to shareholders.
Investment in property is subject to varying degrees of risk. The main factors which affect the value of the investment in property include:
▶ changes in the general economic climate;
▶ local conditions in respective markets, such as oversupply, or a reduction in demand, for commercial space in a specific area;
▶ competition from other available properties; and
▶ government regulations, including planning, environmental and tax laws.
While a large number of these factors are outside the control of the management, market and property-specific factors relevant to maintain a sustainable income stream within the Group’s yield parameters are considered as part of the initial due diligence. Properties and tenant leases are actively managed.
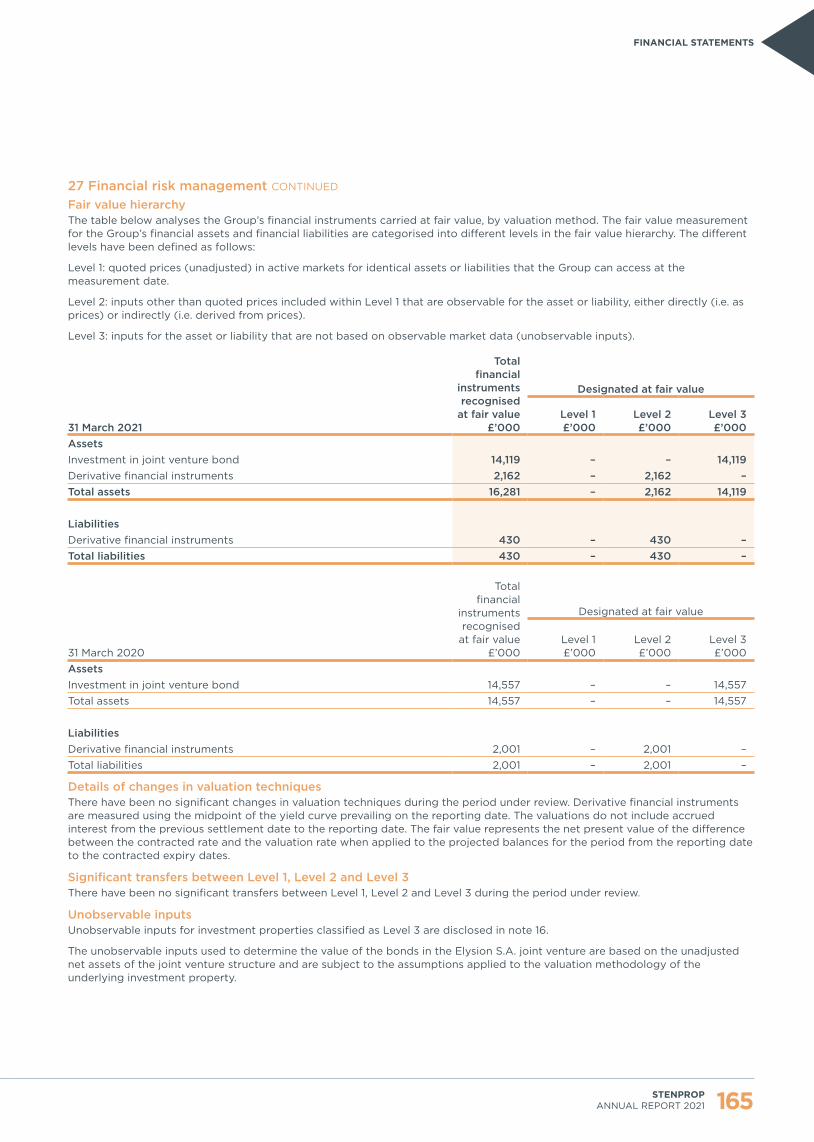
Job number 17 June 2021 2:57 pm V1
27 Financial risk management CONTINUED
Fair value hierarchyThe table below analyses the Group’s financial instruments carried at fair value, by valuation method. The fair value measurement for the Group’s financial assets and financial liabilities are categorised into different levels in the fair value hierarchy. The different levels have been defined as follows:
Level 1: quoted prices (unadjusted) in active markets for identical assets or liabilities that the Group can access at the measurement date.
Level 2: inputs other than quoted prices included within Level 1 that are observable for the asset or liability, either directly (i.e. as prices) or indirectly (i.e. derived from prices).
Level 3: inputs for the asset or liability that are not based on observable market data (unobservable inputs).
31 March 2021
Total financial
instruments recognised at fair value
£’000
Designated at fair value
Level 1 £’000
Level 2 £’000
Level 3 £’000
AssetsInvestment in joint venture bond 14,119 – – 14,119Derivative financial instruments 2,162 – 2,162 –Total assets 16,281 – 2,162 14,119
LiabilitiesDerivative financial instruments 430 – 430 –Total liabilities 430 – 430 –
31 March 2020
Total financial
instruments recognised at fair value
£’000
Designated at fair value
Level 1 £’000
Level 2 £’000
Level 3 £’000
AssetsInvestment in joint venture bond 14,557 – – 14,557Total assets 14,557 – – 14,557
LiabilitiesDerivative financial instruments 2,001 – 2,001 –Total liabilities 2,001 – 2,001 –
Details of changes in valuation techniquesThere have been no significant changes in valuation techniques during the period under review. Derivative financial instruments are measured using the midpoint of the yield curve prevailing on the reporting date. The valuations do not include accrued interest from the previous settlement date to the reporting date. The fair value represents the net present value of the difference between the contracted rate and the valuation rate when applied to the projected balances for the period from the reporting date to the contracted expiry dates.
Significant transfers between Level 1, Level 2 and Level 3There have been no significant transfers between Level 1, Level 2 and Level 3 during the period under review.
Unobservable inputsUnobservable inputs for investment properties classified as Level 3 are disclosed in note 16.
The unobservable inputs used to determine the value of the bonds in the Elysion S.A. joint venture are based on the unadjusted net assets of the joint venture structure and are subject to the assumptions applied to the valuation methodology of the underlying investment property.
165STENPROP ANNUAL REPORT 2021
FINANCIAL STATEMENTS
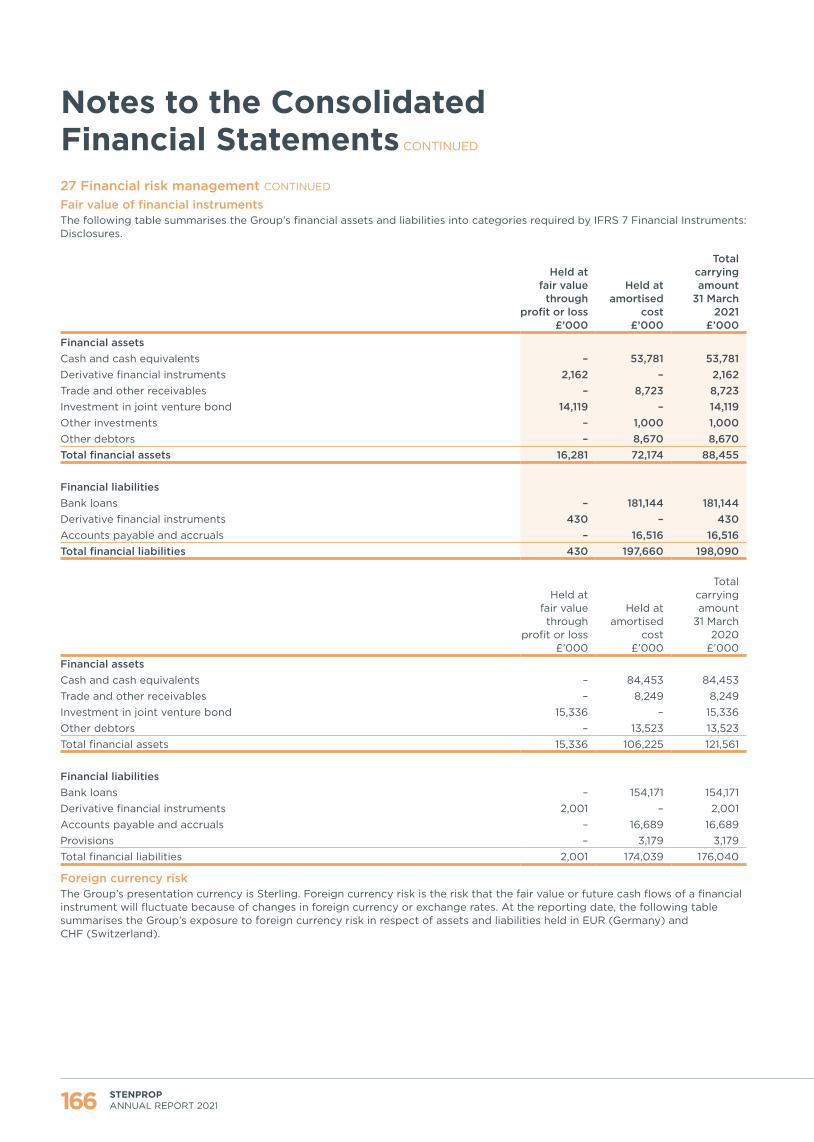
Job number 17 June 2021 2:57 pm V1
Notes to the Consolidated Financial Statements CONTINUED
166 STENPROP ANNUAL REPORT 2021
27 Financial risk management CONTINUED
Fair value of financial instrumentsThe following table summarises the Group’s financial assets and liabilities into categories required by IFRS 7 Financial Instruments: Disclosures.
Held at fair value
through profit or loss
£’000
Held at amortised
cost£’000
Total carrying amount
31 March2021
£’000
Financial assetsCash and cash equivalents – 53,781 53,781Derivative financial instruments 2,162 – 2,162Trade and other receivables – 8,723 8,723Investment in joint venture bond 14,119 – 14,119Other investments – 1,000 1,000Other debtors – 8,670 8,670Total financial assets 16,281 72,174 88,455
Financial liabilitiesBank loans – 181,144 181,144Derivative financial instruments 430 – 430Accounts payable and accruals – 16,516 16,516Total financial liabilities 430 197,660 198,090
Held at fair value through
profit or loss£’000
Held at amortised
cost£’000
Total carrying amount
31 March2020
£’000Financial assetsCash and cash equivalents – 84,453 84,453Trade and other receivables – 8,249 8,249Investment in joint venture bond 15,336 – 15,336Other debtors – 13,523 13,523Total financial assets 15,336 106,225 121,561
Financial liabilitiesBank loans – 154,171 154,171Derivative financial instruments 2,001 – 2,001Accounts payable and accruals – 16,689 16,689Provisions – 3,179 3,179Total financial liabilities 2,001 174,039 176,040
Foreign currency riskThe Group’s presentation currency is Sterling. Foreign currency risk is the risk that the fair value or future cash flows of a financial instrument will fluctuate because of changes in foreign currency or exchange rates. At the reporting date, the following table summarises the Group’s exposure to foreign currency risk in respect of assets and liabilities held in EUR (Germany) and CHF (Switzerland).
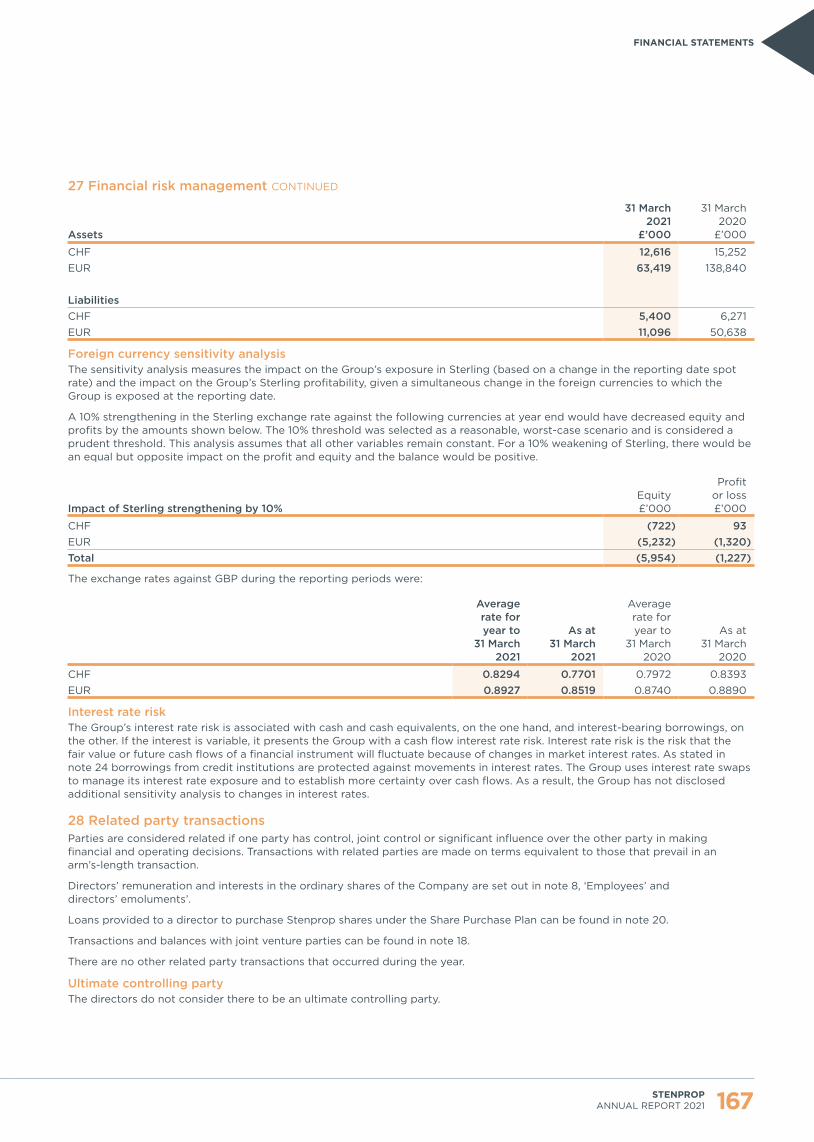
Job number 17 June 2021 2:57 pm V1
27 Financial risk management CONTINUED
Assets
31 March2021
£’000
31 March2020
£’000
CHF 12,616 15,252EUR 63,419 138,840
LiabilitiesCHF 5,400 6,271EUR 11,096 50,638
Foreign currency sensitivity analysis The sensitivity analysis measures the impact on the Group’s exposure in Sterling (based on a change in the reporting date spot rate) and the impact on the Group’s Sterling profitability, given a simultaneous change in the foreign currencies to which the Group is exposed at the reporting date.
A 10% strengthening in the Sterling exchange rate against the following currencies at year end would have decreased equity and profits by the amounts shown below. The 10% threshold was selected as a reasonable, worst-case scenario and is considered a prudent threshold. This analysis assumes that all other variables remain constant. For a 10% weakening of Sterling, there would be an equal but opposite impact on the profit and equity and the balance would be positive.
Impact of Sterling strengthening by 10%Equity£’000
Profit or loss£’000
CHF (722) 93EUR (5,232) (1,320)Total (5,954) (1,227)
The exchange rates against GBP during the reporting periods were:
Average rate foryear to
31 March2021
As at31 March
2021
Average rate foryear to
31 March2020
As at31 March
2020
CHF 0.8294 0.7701 0.7972 0.8393EUR 0.8927 0.8519 0.8740 0.8890
Interest rate riskThe Group’s interest rate risk is associated with cash and cash equivalents, on the one hand, and interest-bearing borrowings, on the other. If the interest is variable, it presents the Group with a cash flow interest rate risk. Interest rate risk is the risk that the fair value or future cash flows of a financial instrument will fluctuate because of changes in market interest rates. As stated in note 24 borrowings from credit institutions are protected against movements in interest rates. The Group uses interest rate swaps to manage its interest rate exposure and to establish more certainty over cash flows. As a result, the Group has not disclosed additional sensitivity analysis to changes in interest rates.
28 Related party transactionsParties are considered related if one party has control, joint control or significant influence over the other party in making financial and operating decisions. Transactions with related parties are made on terms equivalent to those that prevail in an arm’s-length transaction.
Directors’ remuneration and interests in the ordinary shares of the Company are set out in note 8, ‘Employees’ and directors’ emoluments’.
Loans provided to a director to purchase Stenprop shares under the Share Purchase Plan can be found in note 20.
Transactions and balances with joint venture parties can be found in note 18.
There are no other related party transactions that occurred during the year.
Ultimate controlling partyThe directors do not consider there to be an ultimate controlling party.
167STENPROP ANNUAL REPORT 2021
FINANCIAL STATEMENTS

Job number 17 June 2021 2:57 pm V1
Notes to the Consolidated Financial Statements CONTINUED
168 STENPROP ANNUAL REPORT 2021
29 Minimum lease paymentsThe Group earns rental income by leasing its investment properties to tenants under non-cancellable operating leases.
At the reporting date the Group had contracted with tenants the following future minimum lease payments on its investment properties:
31 March2021
£’000
31 March2020
£’000Continuing operationsWithin one year 31,534 30,607Between one and two years 21,653 25,095Between two and five years 32,717 40,944After five years 16,414 39,119Total 102,318 135,765
Discontinuing operationsWithin one year 953 1,038Between one and two years 953 1,038Between two and five years 2,858 3,115After five years 10,964 12,986Total 15,728 18,177
At the reporting date the Group had the following future minimum lease payments as a lessee:
31 March2021
£’000
31 March2020
£’000
Continuing operationsWithin one year 324 326Between one and two years 20 232Between two and five years 6 14After five years – –Total 350 572
At 31 March 2021, Stenprop had no (2020: nil) lessee leases in its discontinued operations.

Job number 17 June 2021 2:57 pm V1
30 Events after the reporting period(i) Declaration of dividendOn 9 June 2021, the Board declared a final dividend of 3.375 pence per share. The final dividend will be payable in cash or as a scrip dividend. An announcement containing details of the dividend, the timetable and the scrip dividend terms is anticipated to be made on 2 July 2021. It is expected that shares will commence trading ex-dividend on 21 July 2021 on the JSE and on 22 July 2021 on the LSE. The record date for the dividend is expected to be 23 July 2021, the last day for shareholders to submit an election to receive the scrip dividend is expected to be 30 July 2021, and the dividend payment date is expected to be 13 August 2021.
(ii) Share incentive awardsOn 9 June 2021, the board, on the recommendation of the remuneration committee, approved share-based awards in relation to the Long Term Incentive Plan and the Deferred Share Bonus Plan. Details of awards made to executive directors can be seen in note 8.
(iii) COVID-19 developmentsThe UK, German and Swiss governments have all recently announced measures to ease COVID-19 restrictions. Each country is at a different stage of economic recovery and as such the Group continues to monitor government policy changes on a daily basis. Our asset managers engage directly with our customers to understand the cash flow implications on their business and ability for them to pay their rent.
(IV) Adjusting eventsStenprop has identified no adjusting events at the date of signing these consolidated financial statements.
169STENPROP ANNUAL REPORT 2021
FINANCIAL STATEMENTS

Job number 17 June 2021 2:57 pm V1
We will be looking to expand the ESG data set over the coming year, in addition to tracking our performance against various trends to ensure that we are promoting and delivering responsible business activities to all of our stakeholders.”James Wakelin Head of Debt and Special Projects

Job number 17 June 2021 2:57 pm V1
Alternative Performance Measures 172
Task Force on Climate-related Financial Disclosures
175
Streamlined Energy and Carbon Reporting 178
EPRA Sustainability Best Practice Recommendations
180
Property Summary 184
Property Analysis 185
Consolidated Portfolio 186
Assets Held for Sale 190
Jointly Controlled Entities 190
Tenant Analysis 192
Analysis of Shareholders 193
Additional Disclosure

Job number 17 June 2021 2:57 pm V1
Alternative Performance MeasuresUnaudited
STENPROP ANNUAL REPORT 2021172
Stenprop’s financial statements are prepared under IFRS. Management considers several alternative performance measures (‘APMs’) important to improve the transparency and relevance of our published results, as well as the comparability of our results with other listed European real estate companies. Alternative performance measures do not have a standardised meaning under IFRS and therefore may not be comparable to similar measures presented by other companies. Alternative Performance Measures used by Stenprop include those defined by The European Public Real Estate Association (‘EPRA’) as part of their mission to establish consistency of calculation across the European listed real estate sector.
EPRA performance measuresEPRA’s recommended reporting standards are widely applied across this market, aiming to bring consistency and transparency to the sector. In October 2019, EPRA issued updated best practice guidelines which are effective for accounting periods starting on or before 1 January 2020, introducing three new net asset value metrics: EPRA net reinstatement value, EPRA net tangible assets and EPRA net disposal value.
The EPRA earnings measure is intended to show the level of recurring earnings from core operational activities with the purpose of highlighting the Group’s underlying operating results from its property rental business and provide an indication of the extent to which current dividend payments are supported by earnings. The measure excludes unrealised changes in the value of investment properties, gains, or losses on the disposal of properties and other items to provide additional information on the Group’s underlying operational performance. The measure is considered to accurately capture the long-term strategy of the Group and is an indication of the sustainability of dividend payments. The table below summarises the Group’s EPRA performance indicators, as well as the nearest IFRS measure where applicable, and a reference to where in these results further explanation and/or reconciliation can be found.
EPRA performance measures
Nearest IFRS
measureReference in
document31 March
202131 March
2020
EPRA cost ratio (excluding direct vacancy costs) N/A Page 173 37.4% 32.6%EPRA cost ratio (including direct vacancy costs) Key measure to enable meaningful measurement of the changes in a company’s operating costs.
N/A Operating and financial
review andPage 173
41.6% 35.3%
EPRA earnings A key measure of a company’s underlying operating results and an indication of the extent to which current dividend payments are supported by earnings.
Earnings Note 14 £18.91 million
£19.03 million
EPRA earnings per share IFRS EPS Note 14 6.78p 6.88pEPRA earnings per share (diluted) Diluted
IFRS EPSNote 14 6.62p 6.65p
EPRA net disposal value per share NAV measure that assumes assets are sold and/or liabilities are not held until maturity. Deferred tax, financial instruments and certain other adjustments are calculated as to the full extent of their liability, including tax exposure not reflected In the statement of financial position.
Diluted net assets per
share
Note 15 £1.48 £1.37
EPRA net reinstatement value per share NAV measure to highlight the value of net assets on a long-term basis. Fair value movements on financial derivatives and deferred taxes are excluded.
Diluted net assets per
share
Note 15 £1.61 £1.51
EPRA net tangible assets per share NAV measure that assumes entities buy and sell assets, thereby crystallising certain levels of deferred tax liability, which is included.
Diluted net assets per
share
Note 15 £1.47 £1.38
EPRA NIY Annualised rental income based on the cash rents passing at the reporting date, less non-recoverable property operating expenses, expressed as a percentage of the market value of property.
N/A Page 174 5.8% 6.0%
EPRA ‘topped up’ NIY N/A Page 174 6.0% 6.3%EPRA like-for-like rental income growth This measure illustrates the change in comparable income values
N/A Page 173 5.3% 2.2%
EPRA vacancy rate A ‘pure’ (%) measure of investment property space that is vacant, based on estimated market rental value (ERV).
N/A Page 173 5.1% 5.6%
Like-for-like valuation growth This measure illustrates the change in comparable property market values.
N/A Operating and financial
review
6.3% 2.8%

Job number 17 June 2021 2:57 pm V1
Supplementary calculations not included elsewhere in the audited financial statements
EPRA cost ratio
31 March2021
£’000
31 March2020
£’000
Operating costs per IFRS statement of comprehensive income (Including discontinued operations) 10,630 10,267Property expenses net of tenant recharges 7,211 5,133Other income (1,414) (806)Share of Joint Ventures expenses 520 313Costs (including direct vacancy costs) (A) 16,947 14,366Direct vacancy costs (1,721) (1,102)Costs (excluding direct vacancy costs) (B) 15,226 13,264
Gross Rental Income - per IFRS (Including discontinued operations) 38,195 38,220Add: Share of Joint Ventures (Gross Rental Income) 2,518 2,472Gross Rental Income (C) 40,713 40,692
EPRA Cost Ratio (including direct vacancy costs) (A/C) 41.6% 35.3%EPRA Cost Ratio (excluding direct vacancy costs) (B/C) 37.4% 32.6%
Capital expenditure
The Group does not typically have significant assets under development, and does not have a policy of capitalising any overhead and operating expenses. No costs directly attributable to overhead and operations, that would normally be classified as overhead or administrative costs were capitalised by the Group during the year (March 2020: nil).
Property related capital expenditure for the year ended 31 March 2021UK MLI£’000
Germany£’000
Total£’000
Acquisitions 412 – 412 Like-for-like portfolio 1,102 103 1,205 Total (see note 16 to the financial statements) 1,514 103 1,617
EPRA like-for-like rental income growth (%) Annualised gross rental income1
31 March 2021
£m
31 March 20202
£m Change
£mChange
%
UK multi-let Industrial3 24.4 22.7 1.7 7.3%UK urban logistics 1.7 1.7 – –Guernsey 4.4 4.3 0.1 2.1%Germany 1.3 1.3 – –Switzerland 1.0 1.0 – –Subtotal 32.8 31.0 1.8 5.7%Share of joint venture 2.4 2.4 – –Total like-for-like 35.2 33.4 1.8 5.3%Acquisitions 5.8Total 41.0
1. Gross contractual rental income at reporting date, generated by properties that were held by the Group for the year, excluding properties undergoing significant development. This measure illustrates the change in comparable income values.
2. A standardised rate has been used to translate the portfolio and remove any foreign exchange impact, for purposes of this like-for-like analysis.3. Like-for-like rental growth based on current passing rent for the UK multi-let industrial portfolio is 5.6% for the period (total portfolio: 4.1%), with
the difference being due to rent free periods and fixed uplifts.
EPRA vacancy rate
31 March2021(£m)
31 March2020(£m)
Estimated rental value of vacant space (A) 2.3 2.3Estimated rental value of the whole portfolio (B) 44.8 40.7EPRA Vacancy Rate (A/B) 5.1% 5.6%
STENPROP ANNUAL REPORT 2021 173
ADDITIONAL DISCLOSURE

Job number 17 June 2021 2:57 pm V1
Alternative Performance Measures CONTINUED
Unaudited
STENPROP ANNUAL REPORT 2021174
EPRA NIY and ‘topped-up’ NIY disclosure
Market value(£m)
Estimated purchaser's
costs(£m)
Gross up completed
property portfolio valuation
(B)(£m)
Annualised current passing
rental income
(£m)
Non-recoverable
property operating expenses
(£m)
Annualised net rents
(A)(£m)
EPRA NIY
Add: rent free periods
and fixed uplifts
(£m)
Topped-up net
annualised rent (C )
EPRA 'topped-
up' NIY
Continuing operations
Guernsey 56.2 4.1 60.3 4.4 – 4.4 7.3% – 4.4 7.3%UK MLI 432.9 29.4 462.3 28.7 (3.1) 25.6 5.5% 1.5 27.1 5.9%UK urban logistics 22.2 1.5 23.7 1.7 – 1.7 7.3% – 1.7 7.3%
Subtotal 511.3 35.0 546.3 34.8 (3.1) 31.7 5.8% 1.5 33.2 6.1%Assets held for sale
Germany 26.2 2.1 28.3 1.3 (0.3) 1.0 3.5% – 1.0 3.5%Switzerland 12.0 0.7 12.7 1.0 – 1.0 8.2% – 1.0 8.2%
Subtotal 38.2 2.8 41.0 2.3 (0.3) 2.0 5.0% – 2.0 4.9%Joint venturesShare of joint ventures 32.8 2.6 35.5 2.4 (0.2) 2.2 6.3% – 2.2 6.3%Total 582.3 40.4 622.8 39.5 (3.6) 35.9 5.8% 1.5 37.4 6.0%
Other alternative performance measuresManagement use certain financial performance measures to assess the financial and operational performance of the Group. These alternative performance measures are not defined or specified under IFRS or EPRA. However, management believe they provide useful information to readers. These non-IFRS measures may not be comparable to similar measures presented by other companies. The table below summarises the additional alternative performance measures included in these results.
Other alternative performance measure Nearest IFRS measureReference in
document31 March
202131 March
2020Adjusted earnings (previously diluted adjusted EPRA earnings)
Earnings Note 14 and operating and
financial review
£19.4 million £19.7 million
Adjusted earnings per share (previously diluted adjusted EPRA earnings per share)
Earnings per share Note 14 and operating and
financial review
6.78p 6.88p
Cost of debt N/A Operating and financial review
1.93% 2.62%
Debt maturity N/A Operating and financial review
3.9 years 2.7 years
Distribution per share N/A Operating and financial review
3.375p (9 June
2021)
3.375p (11 June
2020)Headline earnings per share Earnings per share Note 14 7.30p 5.86pHeadline earnings per share - diluted Diluted earnings per share Note 14 7.25p 5.79pLoan-to-value ratio (LTV) N/A Operating and
financial review28.1% 26.2%
Total accounting return N/A Operating and financial review
11.4% 5.7%
FX rates in period Average foreign exchange rates in the period: £1.00:€1.1202; £1.00:CHF1.2057 (2020: £1.00:€1.1442; £1.00:CHF1.2544)
Period end foreign exchange rates: £1.00:€1.1738; £1.00:CHF1.2985 (2020: £1.00:€1.1249; £1.00:CHF1.1914)

Job number 17 June 2021 2:57 pm V1
Task Force on Climate-related Financial Disclosures Unaudited
Task Force on Climate-related Financial Disclosures (‘TCFD)We are committed to implementing the recommendations and best practices of the TCFD, as set by the Climate Standards Disclosure Board (‘CDSB’). This is in order to provide all stakeholders, including investors, with useful information on the climate-related risks and opportunities that impact our business. We are proud to be amongst the 1,500+ organisations that support this initiative. This forms part of our wider approach to environmental, social and governance (‘ESG’) considerations.
In this section of the Annual Report, we provide our corporate TCFD disclosure that covers the 11 recommended disclosures across the four core elements of Governance, Strategy, Risk Management, and Metrics and Targets below (source: TCFD, Final Report: Recommendations of the Task Force on Climate-related Financial Disclosures, 2017). We will continue to use TCFD to strengthen our response to climate change.
1. Governancea) Board’s oversight
At Board level, our Chief Executive has overall responsibility for climate-related risks and opportunities, and for our response to climate change.
The Board, via the Audit and Risk Committee, has overall responsibility for monitoring climate change risks alongside all other risks that our business faces: safeguarding assets; operation of adequate and effective systems, internal and financial control processes; preparation of materially accurate financial reporting information and statements in compliance with all applicable legal and regulatory requirements and accounting standards; and the oversight of the external audit appointments and internal audit function. ESG, and, by extension, climate, are considered a principal risk. Information on the Audit and Risk Committee is included on page 90.
With increasing calls for directors of companies to have credible climate plans, the Board’s oversight for climate responsibility at Stenprop is also covered by the Social and Ethics Committee. The overall objective of this committee is to promote socially responsible and ethical behaviour across the organisation together with the development of sustainable practices and fostering of stakeholder relationships, all of which encompasses climate-related issues.
b) Management’s role
Ongoing oversight by management of sustainability risks, including climate-related issues, is performed by the ESG Steering Group (‘Steering Group’), with the Operations Committee (see page 186 for information on our governance structure) responsible for the implementation of identified operational projects.
Following the creation of an ESG strategy and ESG policy in 2020, the Steering Group now has oversight for the implementation of both. This includes accountabilities of each department in the Company for the implementation of specific measures and reporting on targets. The Steering Group, which is chaired by James Wakelin, Head of Debt and Special Projects, meets four times a year. Members currently comprise Julian Carey, Managing Director; Sarah Bellilchi, General Counsel and Company Secretary; Will Lutton, Head of Investment; Catherine Goldsworthy, Senior Finance Manager; and Will Outram, Asset Manager, representing all sections of the Stenprop business and including Board representation.
At the investment level, the CEO and Managing Director are presented with ESG risks and opportunities alongside other factors in the underwriting of potential acquisitions.
STENPROP ANNUAL REPORT 2021 175
ADDITIONAL DISCLOSURE

Job number 17 June 2021 2:57 pm V1
Task Force on Climate-related Financial Disclosures Unaudited CONTINUED
STENPROP ANNUAL REPORT 2021176
2. StrategyClimate-related risks and opportunities cover all aspects of our business, from debt origination and investment through to asset management of multi-let industrials.
a) Climate risks and opportunities identified over the short, medium, and long term
When reviewing climate risks and opportunities, we define time horizons as short (current financial year), medium (1-5 years) and long (risks over the asset lifetime of 30+ years at the point of investment) term. Assessments to determine risks and opportunities cover current regulation, emerging regulation, technology, legal, market, reputational, products and services, acute physical and chronic physical.
Through discussions with the ESG Steering Group potential risks are likely to include:
TYPE TIME IMPACT
1. Market
Short term
Operational and financial impacts from new environmental laws and regulations.
2. Acute physical
Medium term
Damage to buildings from extreme weather events. This can lead to loss of income from void units, write-downs to asset book values and increases in insurance premiums if the probability of these events increases.
3. Reputation
Medium term
Increased stakeholder concern or negative stakeholder feedback for failing to comply with ESG requirements.
4. Chronic physical
Long term
Reduced asset performance due to changing long-term weather patterns. Higher temperatures may influence the functioning of equipment and lead to an increase of fuel consumption or lower performance levels.
Readers are referred to our risk report on pages 61 to 68 where further information can be found on our risk management process, and the climate-related risks considered. Further work will be undertaken to determine more detailed risks as part of our TCDF workstream in the financial year ended 2022.
Specific opportunities identified by the ESG Steering Group include:
TYPE TIME IMPACT
1. Market
Short term
Growth in demand for energy efficient buildings or ‘green units’ driven by the global energy transition.
2. Products and services
Short term
Investment in renewable energy assets, on-site procurement of sustainable products and services e.g. bins, utilities etc., driven by the Paris Agreement (2015) and signatories’ own Nationally Determined Contributions to reduce emissions.
3. Reputation
Short term
Benefits as a responsible investor, by evidencing the positive ESG impacts delivered through our real estate investments.
b) Impacts of climate risks and opportunities on businesses, strategy, and financial planning
Based on materiality work undertaken, our ESG strategy aims to influence our business in the following ways:
▶ Products and services: Engaging with tenants to provide more sustainable solutions, which could include: regearing existing leases to enable us to overclad roofs, procuring a central estate bin service, providing more insulated space, reducing energy consumption and increasing building lifespans.
▶ Operations: Responding to increasing compliance burden and reputational risks as ESG requirements and stakeholder expectations continue to grow in the short to medium term for REITs. Embedding ESG principles within our day-to-day business activities; for example, enhanced recycling, low paper usage (Smart Lease via DocuSign) and promotion of learning and diversity within the workplace.
▶ Supply chain: Risks and opportunities within our investment value chain in relation to climate change will be a focus in future years.
Our financial planning and expenditure have been influenced in the following way:
▶ Capital budgeting: Climate-related risks and opportunities are considered through the investment approval processes. Capex: Climate-related initiatives and policies implemented to reduce consumption and emissions have been carried out during the year, such as internal refurbishment works, including the upgrade of lighting to LEDs, improving unit EPCs and allow savings to be generated from lower monthly energy bills. Refer to the case study on how we benefited our customers on page 03.

Job number 17 June 2021 2:57 pm V1
c) Resilience of strategy, taking into consideration different climate-related scenariosOur portfolio has been undergoing a transition to become 100% UK multi-let industrial. To date, climate-related scenarios have not been explicitly modelled to inform our business strategy; however, we will keep this under review and consideration going forward to ensure we can continue to deliver our financial targets whilst also meeting our sustainability objectives.
Read more about our sustainability objectives in Our Strategy on page 20
3. Risk ManagementAs an operator of real estate assets, our business is exposed to both risk and opportunity from climate change. Our risk framework enables us to identify, understand and manage all risks, including climate-related issues.
Stenprop maintains registers and frameworks to manage risk. Regular assessments identify, evaluate and assign a rating (low, medium, high) to risks. These consider likelihood of occurrence and materiality of impact. Climate-related risks are incorporated. Risk registers are reviewed regularly to ensure that all relevant risks have been captured, and to capture any changes to a risk. Decisions are then made to mitigate, transfer, accept or control climate-related risks.
At an asset level, risks are reviewed by asset managers. Any risk resulting in a potentially material impact triggers a detailed review.
To determine how our assets may be impacted by the physical risks and their exposure, modelling of acute (event-driven) and chronic (longer-term) changes in weather patterns will be considered in the future based on materiality assessments.
4. Metrics and TargetsFrom this year, we have commenced reporting our Scope 1 and 2 greenhouse gas (‘GHG’) emissions in accordance with the Greenhouse Gas Protocol, as published by the World Resources Institute. We have also begun reporting on Scope 3 emissions. Page 179 of the SECR statement outlines what is covered within these three scopes.
We have agreed to undertake a Scope 3 gap analysis in 2021 to understand applicable emissions categories and their future reporting requirements.
Wider developments in climate metrics are monitored for relevance and impact. This includes development of prices on carbon emissions, net zero carbon commitments amongst real estate investors and regulatory requirements (such as the EU’s Sustainable Finance Disclosure Regulation and Taxonomy).
STENPROP ANNUAL REPORT 2021 177
ADDITIONAL DISCLOSURE
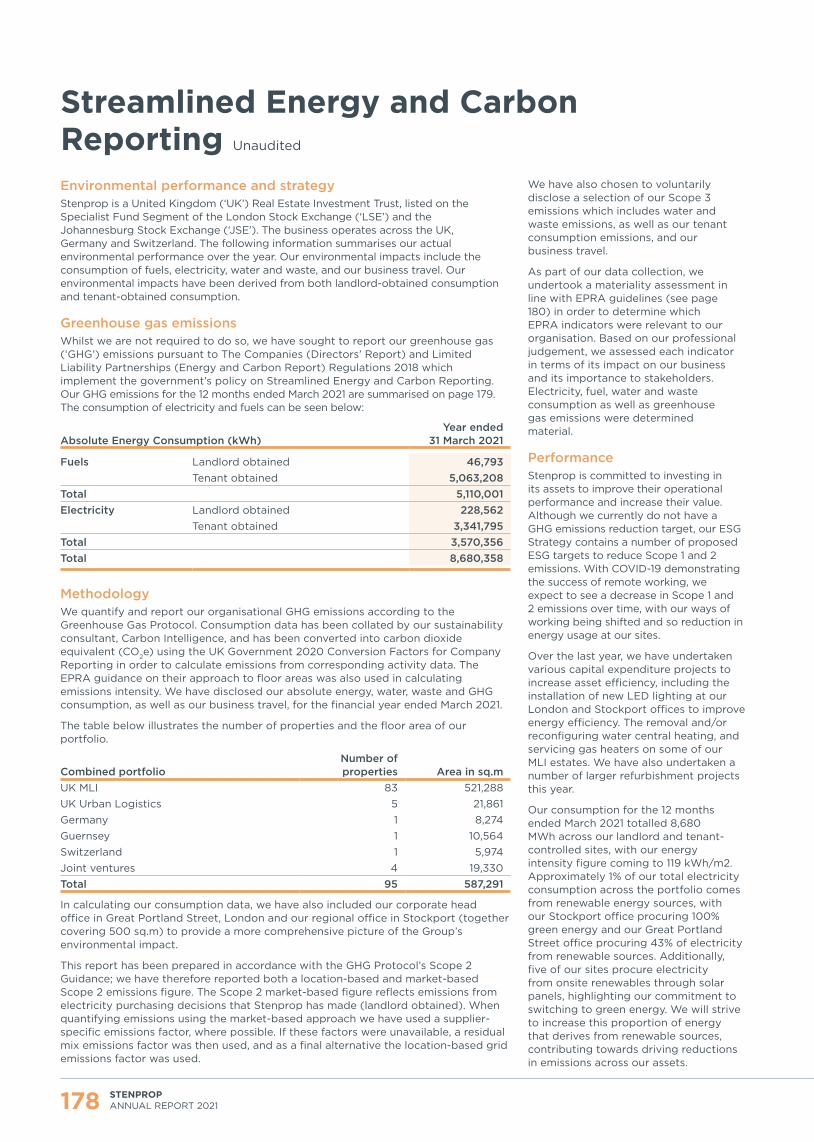
Job number 17 June 2021 2:57 pm V1
Streamlined Energy and Carbon Reporting Unaudited
STENPROP ANNUAL REPORT 2021178
Environmental performance and strategyStenprop is a United Kingdom (‘UK’) Real Estate Investment Trust, listed on the Specialist Fund Segment of the London Stock Exchange (‘LSE’) and the Johannesburg Stock Exchange (‘JSE’). The business operates across the UK, Germany and Switzerland. The following information summarises our actual environmental performance over the year. Our environmental impacts include the consumption of fuels, electricity, water and waste, and our business travel. Our environmental impacts have been derived from both landlord-obtained consumption and tenant-obtained consumption.
Greenhouse gas emissionsWhilst we are not required to do so, we have sought to report our greenhouse gas (‘GHG’) emissions pursuant to The Companies (Directors’ Report) and Limited Liability Partnerships (Energy and Carbon Report) Regulations 2018 which implement the government’s policy on Streamlined Energy and Carbon Reporting.Our GHG emissions for the 12 months ended March 2021 are summarised on page 179. The consumption of electricity and fuels can be seen below:
Absolute Energy Consumption (kWh)Year ended
31 March 2021
Fuels Landlord obtained 46,793Tenant obtained 5,063,208
Total 5,110,001Electricity Landlord obtained 228,562
Tenant obtained 3,341,795Total 3,570,356Total 8,680,358
MethodologyWe quantify and report our organisational GHG emissions according to the Greenhouse Gas Protocol. Consumption data has been collated by our sustainability consultant, Carbon Intelligence, and has been converted into carbon dioxide equivalent (CO2e) using the UK Government 2020 Conversion Factors for Company Reporting in order to calculate emissions from corresponding activity data. The EPRA guidance on their approach to floor areas was also used in calculating emissions intensity. We have disclosed our absolute energy, water, waste and GHG consumption, as well as our business travel, for the financial year ended March 2021.
The table below illustrates the number of properties and the floor area of our portfolio.
Combined portfolioNumber of properties Area in sq.m
UK MLI 83 521,288UK Urban Logistics 5 21,861Germany 1 8,274Guernsey 1 10,564Switzerland 1 5,974Joint ventures 4 19,330Total 95 587,291
In calculating our consumption data, we have also included our corporate head office in Great Portland Street, London and our regional office in Stockport (together covering 500 sq.m) to provide a more comprehensive picture of the Group’s environmental impact.
This report has been prepared in accordance with the GHG Protocol’s Scope 2 Guidance; we have therefore reported both a location-based and market-based Scope 2 emissions figure. The Scope 2 market-based figure reflects emissions from electricity purchasing decisions that Stenprop has made (landlord obtained). When quantifying emissions using the market-based approach we have used a supplier-specific emissions factor, where possible. If these factors were unavailable, a residual mix emissions factor was then used, and as a final alternative the location-based grid emissions factor was used.
We have also chosen to voluntarily disclose a selection of our Scope 3 emissions which includes water and waste emissions, as well as our tenant consumption emissions, and our business travel.
As part of our data collection, we undertook a materiality assessment in line with EPRA guidelines (see page 180) in order to determine which EPRA indicators were relevant to our organisation. Based on our professional judgement, we assessed each indicator in terms of its impact on our business and its importance to stakeholders. Electricity, fuel, water and waste consumption as well as greenhouse gas emissions were determined material.
PerformanceStenprop is committed to investing in its assets to improve their operational performance and increase their value. Although we currently do not have a GHG emissions reduction target, our ESG Strategy contains a number of proposed ESG targets to reduce Scope 1 and 2 emissions. With COVID-19 demonstrating the success of remote working, we expect to see a decrease in Scope 1 and 2 emissions over time, with our ways of working being shifted and so reduction in energy usage at our sites.
Over the last year, we have undertaken various capital expenditure projects to increase asset efficiency, including the installation of new LED lighting at our London and Stockport offices to improve energy efficiency. The removal and/or reconfiguring water central heating, and servicing gas heaters on some of our MLI estates. We have also undertaken a number of larger refurbishment projects this year.
Our consumption for the 12 months ended March 2021 totalled 8,680 MWh across our landlord and tenant-controlled sites, with our energy intensity figure coming to 119 kWh/m2. Approximately 1% of our total electricity consumption across the portfolio comes from renewable energy sources, with our Stockport office procuring 100% green energy and our Great Portland Street office procuring 43% of electricity from renewable sources. Additionally, five of our sites procure electricity from onsite renewables through solar panels, highlighting our commitment to switching to green energy. We will strive to increase this proportion of energy that derives from renewable sources, contributing towards driving reductions in emissions across our assets.
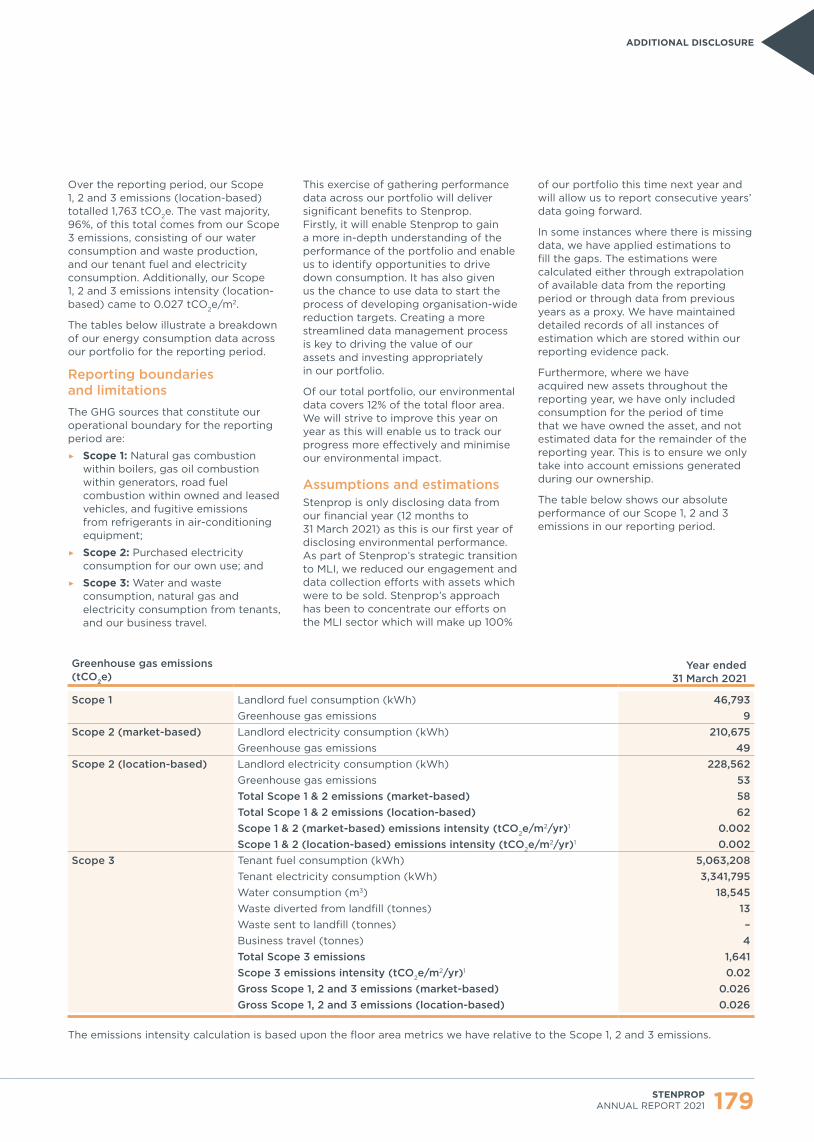
Job number 17 June 2021 2:57 pm V1
Over the reporting period, our Scope 1, 2 and 3 emissions (location-based) totalled 1,763 tCO2e. The vast majority, 96%, of this total comes from our Scope 3 emissions, consisting of our water consumption and waste production, and our tenant fuel and electricity consumption. Additionally, our Scope 1, 2 and 3 emissions intensity (location-based) came to 0.027 tCO2e/m2.
The tables below illustrate a breakdown of our energy consumption data across our portfolio for the reporting period.
Reporting boundaries and limitationsThe GHG sources that constitute our operational boundary for the reporting period are:
▶ Scope 1: Natural gas combustion within boilers, gas oil combustion within generators, road fuel combustion within owned and leased vehicles, and fugitive emissions from refrigerants in air-conditioning equipment;
▶ Scope 2: Purchased electricity consumption for our own use; and
▶ Scope 3: Water and waste consumption, natural gas and electricity consumption from tenants, and our business travel.
This exercise of gathering performance data across our portfolio will deliver significant benefits to Stenprop. Firstly, it will enable Stenprop to gain a more in-depth understanding of the performance of the portfolio and enable us to identify opportunities to drive down consumption. It has also given us the chance to use data to start the process of developing organisation-wide reduction targets. Creating a more streamlined data management process is key to driving the value of our assets and investing appropriately in our portfolio.
Of our total portfolio, our environmental data covers 12% of the total floor area. We will strive to improve this year on year as this will enable us to track our progress more effectively and minimise our environmental impact.
Assumptions and estimationsStenprop is only disclosing data from our financial year (12 months to 31 March 2021) as this is our first year of disclosing environmental performance. As part of Stenprop’s strategic transition to MLI, we reduced our engagement and data collection efforts with assets which were to be sold. Stenprop’s approach has been to concentrate our efforts on the MLI sector which will make up 100%
of our portfolio this time next year and will allow us to report consecutive years’ data going forward.
In some instances where there is missing data, we have applied estimations to fill the gaps. The estimations were calculated either through extrapolation of available data from the reporting period or through data from previous years as a proxy. We have maintained detailed records of all instances of estimation which are stored within our reporting evidence pack.
Furthermore, where we have acquired new assets throughout the reporting year, we have only included consumption for the period of time that we have owned the asset, and not estimated data for the remainder of the reporting year. This is to ensure we only take into account emissions generated during our ownership.
The table below shows our absolute performance of our Scope 1, 2 and 3 emissions in our reporting period.
Greenhouse gas emissions (tCO2e)
Year ended 31 March 2021
Scope 1 Landlord fuel consumption (kWh) 46,793Greenhouse gas emissions 9
Scope 2 (market-based) Landlord electricity consumption (kWh) 210,675Greenhouse gas emissions 49
Scope 2 (location-based) Landlord electricity consumption (kWh) 228,562Greenhouse gas emissions 53Total Scope 1 & 2 emissions (market-based) 58Total Scope 1 & 2 emissions (location-based) 62Scope 1 & 2 (market-based) emissions intensity (tCO2e/m2/yr)1 0.002Scope 1 & 2 (location-based) emissions intensity (tCO2e/m2/yr)1 0.002
Scope 3 Tenant fuel consumption (kWh) 5,063,208Tenant electricity consumption (kWh) 3,341,795Water consumption (m3) 18,545Waste diverted from landfill (tonnes) 13Waste sent to landfill (tonnes) – Business travel (tonnes) 4Total Scope 3 emissions 1,641Scope 3 emissions intensity (tCO2e/m2/yr)1 0.02Gross Scope 1, 2 and 3 emissions (market-based) 0.026Gross Scope 1, 2 and 3 emissions (location-based) 0.026
The emissions intensity calculation is based upon the floor area metrics we have relative to the Scope 1, 2 and 3 emissions.
STENPROP ANNUAL REPORT 2021 179
ADDITIONAL DISCLOSURE

Job number 17 June 2021 2:57 pm V1
EPRA Sustainability Best Practices Recommendations Unaudited
STENPROP ANNUAL REPORT 2021180
As a member of the European Public Real Estate Association (‘EPRA’), we want to contribute to greater transparency in reporting and have chosen to make annual publications based on the EPRA sBPR guidelines which aim to raise the standards and consistency of sustainability reporting for listed real estate companies across Europe. Furthermore, EPRA sBPR ratings are considered best practice and are utilised across the industry. Our
alignment will therefore enable us to compare our ESG performance against our peers and set clear benchmarks.
Our approach to our organisational boundaries, data coverage and estimations can be found on page 179 (in the SECR statement).
MaterialityThe scope of our EPRA sBPR data disclosure was influenced and validated
by our material topics. Stenprop undertook a materiality assessment to review the applicability of the full set of EPRA indicators. Based on our professional judgement, we assessed each indicator in terms of its impact on the business and its importance to stakeholders. This calculation resulted in an overall score which subsequently determined if an issue was material.
The table below sets out our material topics.
Environmental Sustainability Performance MeasuresRelevance assessment
Annual Report reference
Elec-Abs Total electricity consumption Material Page 182
Elec-LfL Like-for-like total electricity consumption Immaterial –
DH&C-Abs Total district heating and cooling consumption Material Page 182
DH&C-LfL Like-for-like total district heating and cooling consumption Immaterial –
Fuels-Abs Total fuel consumption Material Page 182
Fuels-LfL Like-for-like total fuel consumption Immaterial –
Energy-Int Building energy intensity Material Page 182
GHG-Dir-Abs Total direct greenhouse gas (GHG) emissions Material Page 183
GHG-Indir-Abs Total indirect greenhouse gas (GHG) emissions Material Page 183
GHG-IntGreenhouse gas (GHG) emissions intensity from building energy consumption Material Page 183
Water-Abs Total water consumption Material Page 183
Water-LfL Like-for-like total water consumption Immaterial –
Water-Int Building water intensity Material Page 183
Waste-Abs Total weight of waste by disposal route Material Page 183
Waste-LfL Like-for-like total weight of waste by disposal route Immaterial –
Cert-Tot Type and number of sustainably certified assets Material Page 183
Social Performance MeasuresDiversity-Emp Employee gender diversity Material Page 181
Diversity-Pay Gender pay ratio Immaterial –
Emp-Training Employee training and development Immaterial –
Emp-Dev Employee performance appraisals Material Page 181
Emp-Turnover New hires and turnover Material Page 181
H&S-Emp Employee health and safety Material Page 181
H&S-Asset Asset health and safety assessments Material Page 181
H&S-Comp Asset health and safety compliance Material Page 181
Comty-EngCommunity engagement, impact assessments and development programs Immaterial –
Governance Performance MeasuresGov-Board Composition of the highest governance body Material Page 86 and 87
Gov-Selec Process for nominating and selecting the highest governance body Material Page 93
Gov-CoI Process for managing conflicts of interest Material Page 88
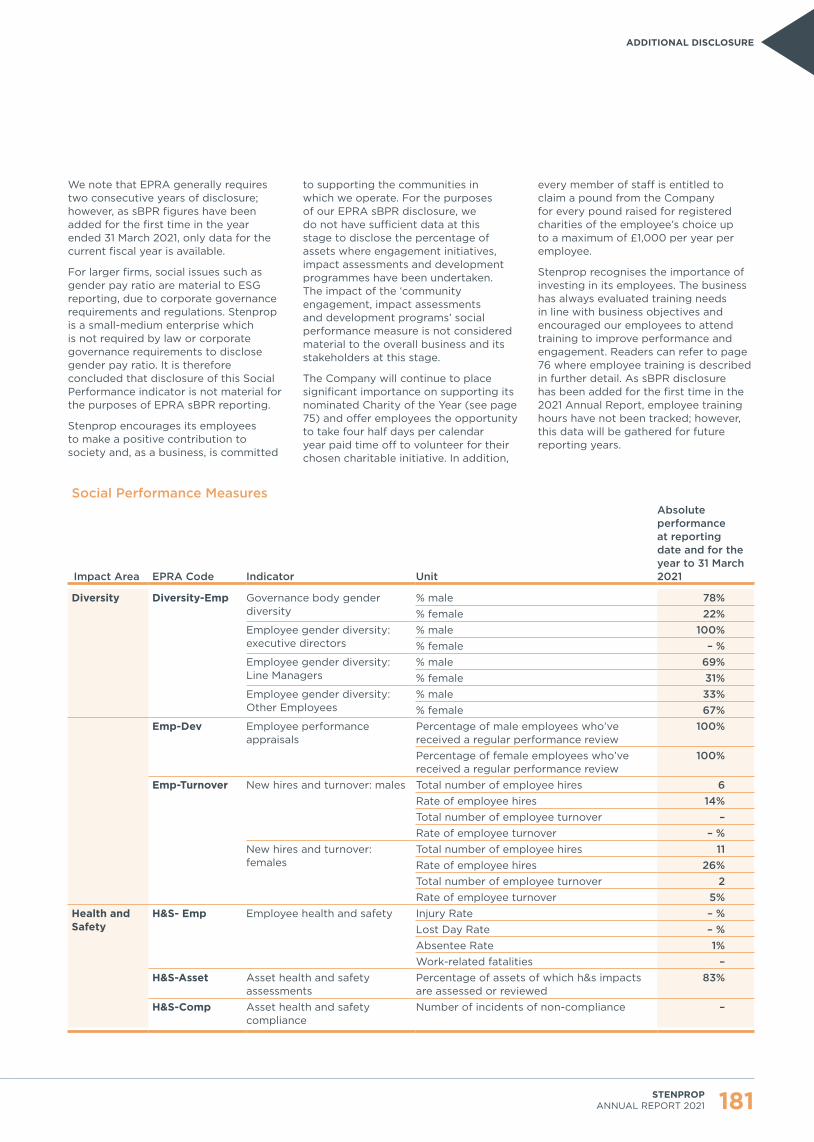
Job number 17 June 2021 2:57 pm V1
Social Performance Measures
Impact Area EPRA Code Indicator Unit
Absolute performanceat reporting date and for the year to 31 March 2021
Diversity Diversity-Emp Governance body gender diversity
% male 78%% female 22%
Employee gender diversity: executive directors
% male 100%% female – %
Employee gender diversity: Line Managers
% male 69%% female 31%
Employee gender diversity: Other Employees
% male 33%% female 67%
Emp-Dev Employee performance appraisals
Percentage of male employees who’ve received a regular performance review
100%
Percentage of female employees who’ve received a regular performance review
100%
Emp-Turnover New hires and turnover: males Total number of employee hires 6Rate of employee hires 14%Total number of employee turnover – Rate of employee turnover – %
New hires and turnover: females
Total number of employee hires 11Rate of employee hires 26%Total number of employee turnover 2Rate of employee turnover 5%
Health and Safety
H&S- Emp Employee health and safety Injury Rate – %Lost Day Rate – %Absentee Rate 1%Work-related fatalities –
H&S-Asset Asset health and safety assessments
Percentage of assets of which h&s impacts are assessed or reviewed
83%
H&S-Comp Asset health and safety compliance
Number of incidents of non-compliance –
We note that EPRA generally requires two consecutive years of disclosure; however, as sBPR figures have been added for the first time in the year ended 31 March 2021, only data for the current fiscal year is available.
For larger firms, social issues such as gender pay ratio are material to ESG reporting, due to corporate governance requirements and regulations. Stenprop is a small-medium enterprise which is not required by law or corporate governance requirements to disclose gender pay ratio. It is therefore concluded that disclosure of this Social Performance indicator is not material for the purposes of EPRA sBPR reporting.
Stenprop encourages its employees to make a positive contribution to society and, as a business, is committed
to supporting the communities in which we operate. For the purposes of our EPRA sBPR disclosure, we do not have sufficient data at this stage to disclose the percentage of assets where engagement initiatives, impact assessments and development programmes have been undertaken. The impact of the ‘community engagement, impact assessments and development programs’ social performance measure is not considered material to the overall business and its stakeholders at this stage.
The Company will continue to place significant importance on supporting its nominated Charity of the Year (see page 75) and offer employees the opportunity to take four half days per calendar year paid time off to volunteer for their chosen charitable initiative. In addition,
every member of staff is entitled to claim a pound from the Company for every pound raised for registered charities of the employee’s choice up to a maximum of £1,000 per year per employee.
Stenprop recognises the importance of investing in its employees. The business has always evaluated training needs in line with business objectives and encouraged our employees to attend training to improve performance and engagement. Readers can refer to page 76 where employee training is described in further detail. As sBPR disclosure has been added for the first time in the 2021 Annual Report, employee training hours have not been tracked; however, this data will be gathered for future reporting years.
STENPROP ANNUAL REPORT 2021 181
ADDITIONAL DISCLOSURE
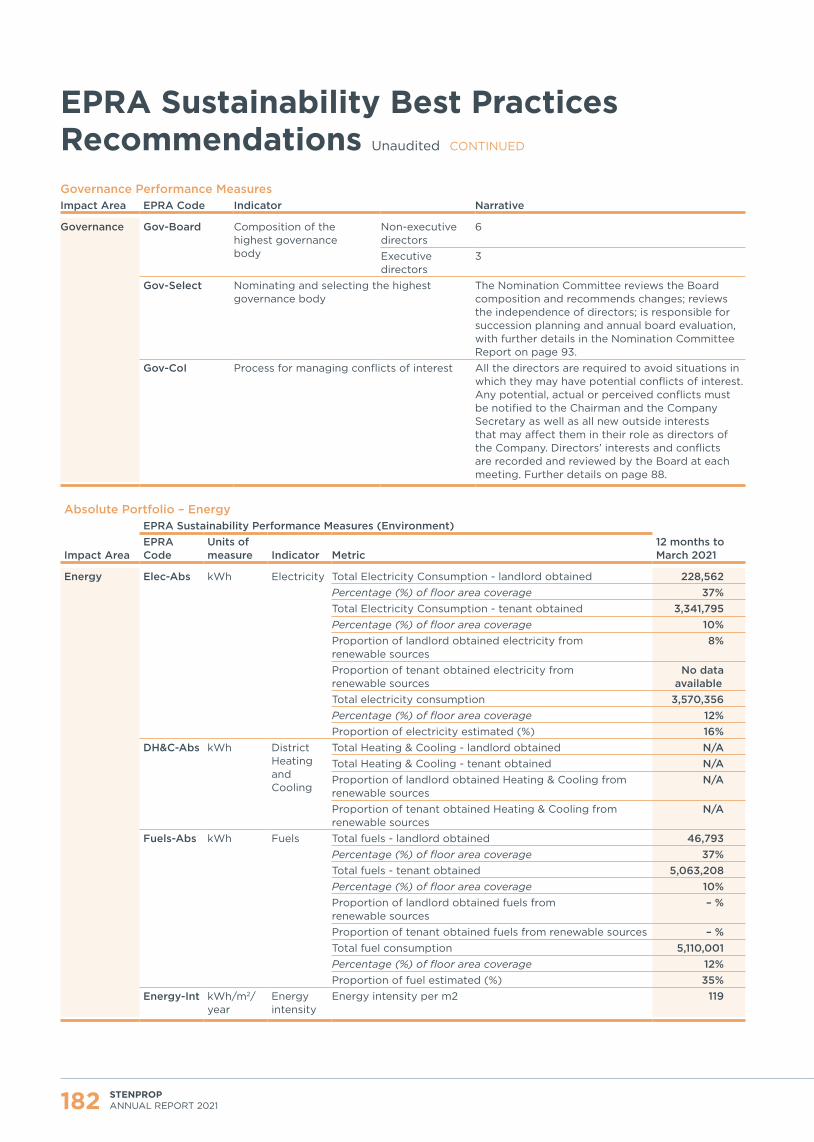
Job number 17 June 2021 2:57 pm V1
EPRA Sustainability Best Practices Recommendations Unaudited CONTINUED
STENPROP ANNUAL REPORT 2021182
Governance Performance MeasuresImpact Area EPRA Code Indicator Narrative
Governance Gov-Board Composition of the highest governance body
Non-executive directors
6
Executive directors
3
Gov-Select Nominating and selecting the highest governance body
The Nomination Committee reviews the Board composition and recommends changes; reviews the independence of directors; is responsible for succession planning and annual board evaluation, with further details in the Nomination Committee Report on page 93.
Gov-CoI Process for managing conflicts of interest All the directors are required to avoid situations in which they may have potential conflicts of interest. Any potential, actual or perceived conflicts must be notified to the Chairman and the Company Secretary as well as all new outside interests that may affect them in their role as directors of the Company. Directors’ interests and conflicts are recorded and reviewed by the Board at each meeting. Further details on page 88.
Absolute Portfolio – EnergyEPRA Sustainability Performance Measures (Environment)
12 months to March 2021Impact Area
EPRA Code
Units of measure Indicator Metric
Energy Elec-Abs kWh Electricity Total Electricity Consumption - landlord obtained 228,562 Percentage (%) of floor area coverage 37%Total Electricity Consumption - tenant obtained 3,341,795 Percentage (%) of floor area coverage 10%Proportion of landlord obtained electricity from renewable sources
8%
Proportion of tenant obtained electricity from renewable sources
No data available
Total electricity consumption 3,570,356 Percentage (%) of floor area coverage 12%Proportion of electricity estimated (%) 16%
DH&C-Abs kWh District Heating and Cooling
Total Heating & Cooling - landlord obtained N/ATotal Heating & Cooling - tenant obtained N/AProportion of landlord obtained Heating & Cooling from renewable sources
N/A
Proportion of tenant obtained Heating & Cooling from renewable sources
N/A
Fuels-Abs kWh Fuels Total fuels - landlord obtained 46,793 Percentage (%) of floor area coverage 37%Total fuels - tenant obtained 5,063,208 Percentage (%) of floor area coverage 10%Proportion of landlord obtained fuels from renewable sources
– %
Proportion of tenant obtained fuels from renewable sources – %Total fuel consumption 5,110,001 Percentage (%) of floor area coverage 12%Proportion of fuel estimated (%) 35%
Energy-Int kWh/m2/year
Energy intensity
Energy intensity per m2 119

Job number 17 June 2021 2:57 pm V1
Absolute Portfolio – Greenhouse Gas Emissions
12 months to March 2021Impact Area
EPRA Sustainability Performance Measures (Environment)
EPRA Code Units of measure Indicator Metric
Greenhouse Gas Emissions
GHG-Dir-Abs tonnes CO2e Direct Scope 1 9 Percentage (%) of floor area coverage 37%
GHG-Indir-Abs tonnes CO2e Indirect Scope 2 53 Percentage (%) of floor area coverage 37%
Indirect Scope 3 1,641 Percentage (%) of floor area coverage 13%
GHG-Int tCO2e/ m2/ yr GHG emissions intensity
Scope 1 and 2 0.002 Scope 3 0.024
Absolute Portfolio – Water and Waste
12 months to March 2021Impact Area
EPRA Sustainability Performance Measures (Environment)
EPRA Code Units of measure Indicator Metric
Water Water-Abs L Water Total water consumption 18,544,868 Percentage (%) of floor area coverage 0.1%Proportion of water estimated (%) – %
Water-Int L/ m2 / yr Water intensity Building water intensity 129 Waste Waste-Abs tonnes Waste Total waste sent to landfill –
Total waste diverted from landfill 13Percentage (%) of floor area coverage 0.1%
% Waste Proportion of waste sent to landfill estimated (%)
– %
Proportion waste diverted from landfill estimated (%)
9%
Absolute Portfolio – Certifications
12 months to March 2021Impact Area
EPRA Sustainability Performance Measures
EPRA Code Units of measure Indicator Metric
Certifications Cert-Tot EPC % of portfolio certified by floor area
Number of buildings with an EPC Rating:A 3%B 4%C 36%D 31%E 15%F 2%G 2%
STENPROP ANNUAL REPORT 2021 183
ADDITIONAL DISCLOSURE
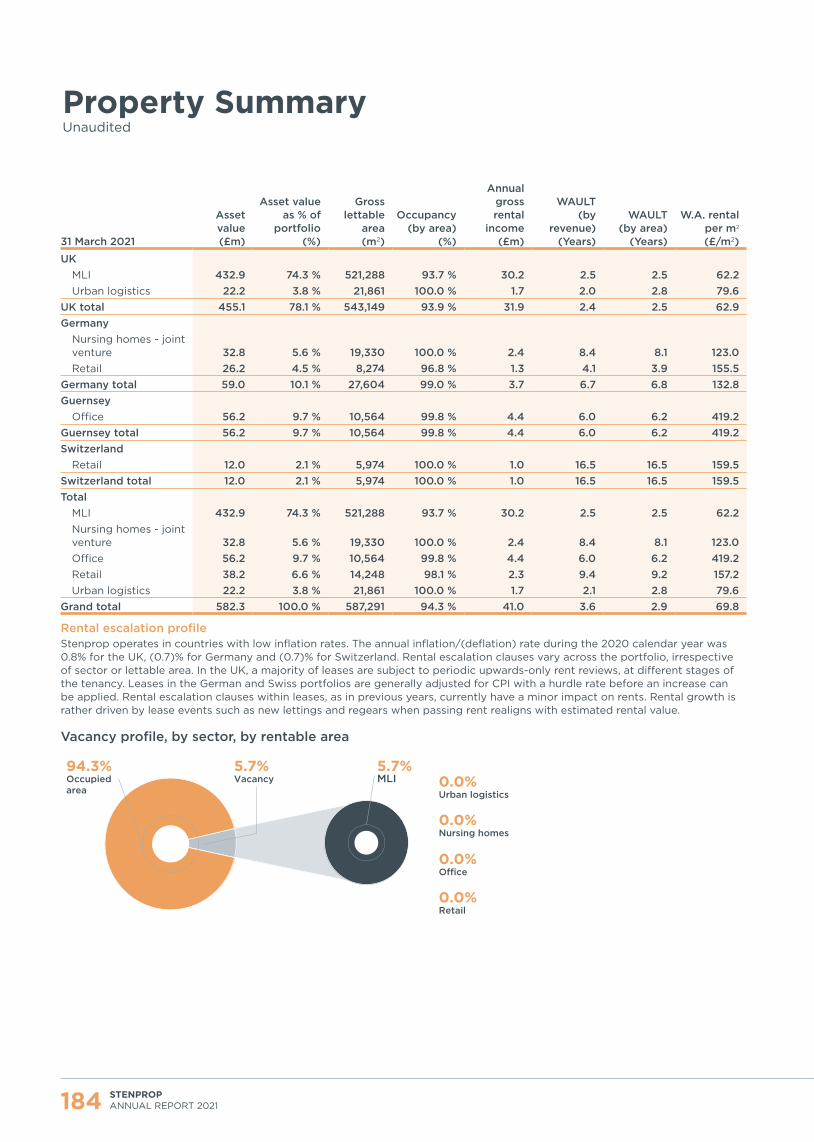
Job number 17 June 2021 2:57 pm V1
Property SummaryUnaudited
STENPROP ANNUAL REPORT 2021184
31 March 2021
Asset value(£m)
Asset value as % of
portfolio(%)
Gross lettable
area(m2)
Occupancy (by area)
(%)
Annual gross rental
income(£m)
WAULT (by
revenue)(Years)
WAULT (by area)
(Years)
W.A. rental per m2
(£/m2)
UKMLI 432.9 74.3 % 521,288 93.7 % 30.2 2.5 2.5 62.2Urban logistics 22.2 3.8 % 21,861 100.0 % 1.7 2.0 2.8 79.6
UK total 455.1 78.1 % 543,149 93.9 % 31.9 2.4 2.5 62.9Germany
Nursing homes - joint venture 32.8 5.6 % 19,330 100.0 % 2.4 8.4 8.1 123.0Retail 26.2 4.5 % 8,274 96.8 % 1.3 4.1 3.9 155.5
Germany total 59.0 10.1 % 27,604 99.0 % 3.7 6.7 6.8 132.8Guernsey
Office 56.2 9.7 % 10,564 99.8 % 4.4 6.0 6.2 419.2Guernsey total 56.2 9.7 % 10,564 99.8 % 4.4 6.0 6.2 419.2Switzerland
Retail 12.0 2.1 % 5,974 100.0 % 1.0 16.5 16.5 159.5Switzerland total 12.0 2.1 % 5,974 100.0 % 1.0 16.5 16.5 159.5Total
MLI 432.9 74.3 % 521,288 93.7 % 30.2 2.5 2.5 62.2Nursing homes - joint venture 32.8 5.6 % 19,330 100.0 % 2.4 8.4 8.1 123.0Office 56.2 9.7 % 10,564 99.8 % 4.4 6.0 6.2 419.2Retail 38.2 6.6 % 14,248 98.1 % 2.3 9.4 9.2 157.2Urban logistics 22.2 3.8 % 21,861 100.0 % 1.7 2.1 2.8 79.6
Grand total 582.3 100.0 % 587,291 94.3 % 41.0 3.6 2.9 69.8
Rental escalation profile Stenprop operates in countries with low inflation rates. The annual inflation/(deflation) rate during the 2020 calendar year was 0.8% for the UK, (0.7)% for Germany and (0.7)% for Switzerland. Rental escalation clauses vary across the portfolio, irrespective of sector or lettable area. In the UK, a majority of leases are subject to periodic upwards-only rent reviews, at different stages of the tenancy. Leases in the German and Swiss portfolios are generally adjusted for CPI with a hurdle rate before an increase can be applied. Rental escalation clauses within leases, as in previous years, currently have a minor impact on rents. Rental growth is rather driven by lease events such as new lettings and regears when passing rent realigns with estimated rental value.
Vacancy profile, by sector, by rentable area
Occupied area
Vacancy5.7%94.3%
Urban logistics0.0%
Nursing homes0.0%
MLI5.7%
O�ce0.0%
Retail0.0%
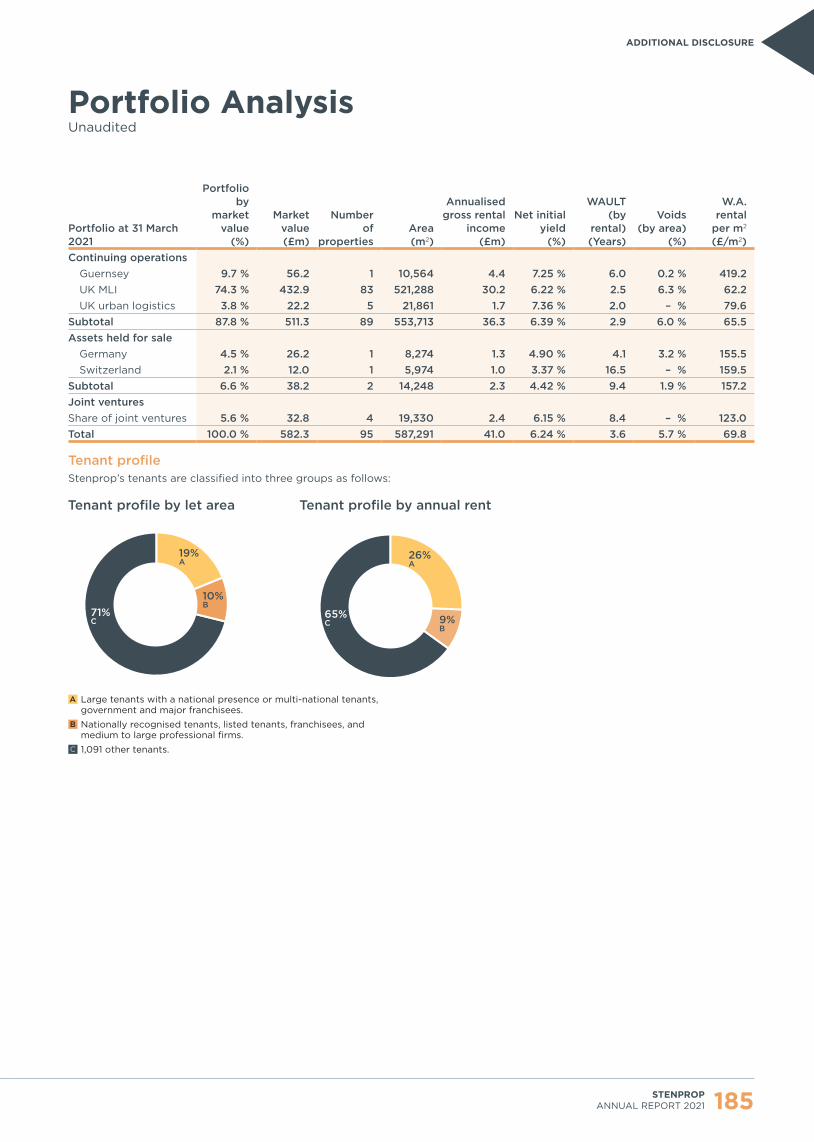
Job number 17 June 2021 2:57 pm V1
Portfolio AnalysisUnaudited
Portfolio at 31 March 2021
Portfolio by
market value
(%)
Market value(£m)
Number of
propertiesArea(m2)
Annualised gross rental
income(£m)
Net initial yield
(%)
WAULT (by
rental)(Years)
Voids (by area)
(%)
W.A. rental
per m2
(£/m2)Continuing operations
Guernsey 9.7 % 56.2 1 10,564 4.4 7.25 % 6.0 0.2 % 419.2UK MLI 74.3 % 432.9 83 521,288 30.2 6.22 % 2.5 6.3 % 62.2UK urban logistics 3.8 % 22.2 5 21,861 1.7 7.36 % 2.0 – % 79.6
Subtotal 87.8 % 511.3 89 553,713 36.3 6.39 % 2.9 6.0 % 65.5Assets held for sale
Germany 4.5 % 26.2 1 8,274 1.3 4.90 % 4.1 3.2 % 155.5Switzerland 2.1 % 12.0 1 5,974 1.0 3.37 % 16.5 – % 159.5
Subtotal 6.6 % 38.2 2 14,248 2.3 4.42 % 9.4 1.9 % 157.2Joint venturesShare of joint ventures 5.6 % 32.8 4 19,330 2.4 6.15 % 8.4 – % 123.0Total 100.0 % 582.3 95 587,291 41.0 6.24 % 3.6 5.7 % 69.8
Tenant profile Stenprop’s tenants are classified into three groups as follows:
71%C
19%A
10%B
26%A
9%B
65%C
n Large tenants with a national presence or multi-national tenants, government and major franchisees.
n Nationally recognised tenants, listed tenants, franchisees, and medium to large professional firms.
n 1,091 other tenants.
Tenant profile by annual rentTenant profile by let area
A
B
C
STENPROP ANNUAL REPORT 2021 185
ADDITIONAL DISCLOSURE

Job number 17 June 2021 2:57 pm V1
Consolidated PortfolioUnaudited
STENPROP ANNUAL REPORT 2021186
Sector Entity Property/Portfolio
Ownership interest
%
Market value at 31 March 2021
(£m) Number of Properties
Number ofUnits
Area (m2)
Annualised gross rental
income (£m)
Net initial yield 31 March
2021 (%)
WAULT (by rental)
(years)
Voids (by area)
(%)
Rental per m2 (£/m2)
GuernseyOffice LPE Ltd Trafalgar 100% 56.2 1 7 10,564 4.4 7.25 % 6.0 0.2 % 419.2
Total Guernsey 56.2 1 7 10,564 4.4 7.25 % 6.0 0.2 % 419.2
UKMLI Industrials UK LP Anniesland Business Park 100% 13.6 1 74 16,913 1.1 6.93% 3.0 4.7 % 70.3MLI Industrials UK LP Argyle Business Centre 100% 1.1 1 7 746 0.1 6.70% 2.4 – % 110.0MLI Industrials UK LP Boaler Street Industrial Estate 100% 3.5 1 14 4,480 0.3 7.14% 2.9 – % 60.4MLI Industrials UK LP Caldene Business Centre 100% 5.0 1 27 7,524 0.4 6.19% 1.5 20.3 % 65.9MLI Industrials UK LP Capital Business Park * 100% 14.7 1 41 17,111 1.0 6.02% 1.5 13.3 % 64.3MLI Industrials UK LP Compass Industrial Park 100% 20.4 1 79 22,601 1.5 6.38% 2.0 5.0 % 65.3MLI Industrials UK LP Coningsby Business Park 100% 18.0 1 23 23,428 1.3 6.18% 3.6 3.7 % 54.3MLI Industrials UK LP Croft Business Park 100% 3.4 1 32 3,083 0.2 6.47% 1.2 6.2% 86.1MLI Industrials UK LP Cuckoo Trade Park 100% 0.9 1 6 565 0.1 6.25% 2.4 – % 101.9MLI Industrials UK LP Dana Trading Estate 100% 18.8 1 1 20,966 1.2 6.21% 0.9 – % 59.4MLI Industrials UK LP Davey Close Trade Park 100% 5.9 1 27 5,028 0.4 5.74% 1.7 – % 80.6MLI Industrials UK LP Eurolink 31 100% 4.3 1 4 4,573 0.3 6.00% 3.3 – % 60.8MLI Industrials UK LP Globe Park 100% 2.8 1 12 3,528 0.2 6.74% 2.1 – % 63.8MLI Industrials UK LP Greenway Business Park 100% 4.5 1 22 4,762 0.3 5.12% 1.5 2.5 % 58.8MLI Industrials UK LP Imex Business Centre 100% 6.3 1 39 4,345 0.4 5.65% 1.6 6.0 % 96.7MLI Industrials UK LP Lake Enterprise Park 100% 4.1 1 28 3,465 0.3 6.33% 1.6 5.6 % 90.4MLI Industrials UK LP Lea Green Business Park 100% 11.2 1 23 14,181 0.8 6.39% 4.7 – % 55.4MLI Industrials UK LP Lion Business Park 100% 7.0 1 19 4,984 0.4 5.49% 4.0 – % 83.4MLI Industrials UK LP Nottingham Wholesale and Trade Park 100% 3.2 1 27 3,326 0.2 6.20% 1.9 14.3 % 75.2MLI Industrials UK LP Poulton Close Business Centre 100% 4.4 1 20 4,389 0.3 5.88% 2.1 – % 64.5MLI Industrials UK LP Rawdon Network Centre 100% 2.8 1 13 3,008 0.2 6.24% 2.5 – % 65.2MLI Industrials UK LP Redbrook Business Park 100% 7.4 1 46 14,923 0.6 6.46% 2.8 13.5 % 45.9MLI Industrials UK LP Rivermead Business Park 100% 3.7 1 12 2,527 0.2 5.04% 1.9 10.7 % 98.1MLI Industrials UK LP Sherwood Network Centre 100% 3.7 1 27 4,960 0.3 7.28% 1.7 3.7 % 60.7MLI Industrials UK LP Shire Court 100% 3.9 1 7 5,844 0.3 7.00% 3.7 – % 50.1MLI Industrials UK LP Souterhead Industrial Estate 100% 4.4 1 24 3,736 0.3 5.94% 2.2 19.6 % 115.9MLI Industrials UK LP Sovereign Business Park 100% 3.1 1 15 4,528 0.2 6.64% 1.4 10.3 % 56.1MLI Industrials UK LP Venture Park 100% 4.5 1 4 6,530 0.3 5.70% 2.7 – % 41.9MLI Industrials UK LP Wainwright Street Industrial Estate 100% 1.5 1 4 1,746 0.1 6.54% 1.8 – % 60.2MLI Industrials UK LP Wharton Street Industrial Estate 100% 1.8 1 5 2,104 0.1 6.74% 2.0 – % 59.5MLI Stenprop Industrials 4 Ltd Armthorpe Business Centre 100% 1.6 1 13 1,250 0.1 5.53% 1.4 13.3 % 90.1MLI Stenprop Industrials 4 Ltd Brookfoot Business Park 100% 6.5 1 13 9,765 0.5 7.57% 3.0 7.8 % 60.4MLI Stenprop Industrials 4 Ltd Carnfield Place 100% 4.2 1 7 5,528 0.3 6.39% 0.9 – % 57.4MLI Stenprop Industrials 4 Ltd Dunball Industrial Estate 100% 6.5 1 7 6,958 0.2 1.63% 2.0 48.5 % 67.7MLI Stenprop Industrials 4 Ltd Ellis Hill Industrial Park 100% 5.8 1 4 7,072 0.5 7.41% 1.9 – % 64.9MLI Stenprop Industrials 4 Ltd Enterprise 5 Industrial Estate 100% 3.4 1 16 2,954 0.2 5.92% 1.2 – % 79.2MLI Stenprop Industrials 4 Ltd Estuary Court 100% 3.5 1 17 3,421 0.2 4.85% 1.8 37.8 % 98.0MLI Stenprop Industrials 4 Ltd Forth Industrial Estate 100% 4.7 1 8 3,709 0.3 5.93% 2.9 – % 86.2MLI Stenprop Industrials 4 Ltd Gainsborough Trading Estate 100% 7.4 1 48 15,051 0.6 7.55% 2.1 1.1 % 38.2MLI Stenprop Industrials 4 Ltd Greenwood Court Industrial Estate 100% 3.4 1 24 4,144 0.2 5.71% 2.1 10.1 % 59.4MLI Stenprop Industrials 4 Ltd Headlands Trading Estate 100% 7.4 1 18 9,810 0.6 7.01% 2.0 – % 59.0MLI Stenprop Industrials 4 Ltd Hillfoot Industrial Estate 100% 5.9 1 45 6,034 0.4 5.87% 1.5 10.0 % 73.3MLI Stenprop Industrials 4 Ltd Kirkstall Industrial Park 100% 9.5 1 13 10,301 0.7 6.50% 5.7 – % 63.8MLI Stenprop Industrials 4 Ltd Lombard Centre 100% 2.9 1 9 3,031 0.1 1.54% 0.8 60.8 % 103.8MLI Stenprop Industrials 4 Ltd Merryhills Enterprise Park 100% 2.7 1 18 3,495 0.2 6.73% 2.6 19.4 % 61.9MLI Stenprop Industrials 4 Ltd Newburn Riverside Industrial Park 100% 10.9 1 17 11,054 0.7 6.13% 3.2 13.1 % 70.3

Job number 17 June 2021 2:57 pm V1
Sector Entity Property/Portfolio
Ownership interest
%
Market value at 31 March 2021
(£m) Number of Properties
Number ofUnits
Area (m2)
Annualised gross rental
income (£m)
Net initial yield 31 March
2021 (%)
WAULT (by rental)
(years)
Voids (by area)
(%)
Rental per m2 (£/m2)
GuernseyOffice LPE Ltd Trafalgar 100% 56.2 1 7 10,564 4.4 7.25 % 6.0 0.2 % 419.2
Total Guernsey 56.2 1 7 10,564 4.4 7.25 % 6.0 0.2 % 419.2
UKMLI Industrials UK LP Anniesland Business Park 100% 13.6 1 74 16,913 1.1 6.93% 3.0 4.7 % 70.3MLI Industrials UK LP Argyle Business Centre 100% 1.1 1 7 746 0.1 6.70% 2.4 – % 110.0MLI Industrials UK LP Boaler Street Industrial Estate 100% 3.5 1 14 4,480 0.3 7.14% 2.9 – % 60.4MLI Industrials UK LP Caldene Business Centre 100% 5.0 1 27 7,524 0.4 6.19% 1.5 20.3 % 65.9MLI Industrials UK LP Capital Business Park * 100% 14.7 1 41 17,111 1.0 6.02% 1.5 13.3 % 64.3MLI Industrials UK LP Compass Industrial Park 100% 20.4 1 79 22,601 1.5 6.38% 2.0 5.0 % 65.3MLI Industrials UK LP Coningsby Business Park 100% 18.0 1 23 23,428 1.3 6.18% 3.6 3.7 % 54.3MLI Industrials UK LP Croft Business Park 100% 3.4 1 32 3,083 0.2 6.47% 1.2 6.2% 86.1MLI Industrials UK LP Cuckoo Trade Park 100% 0.9 1 6 565 0.1 6.25% 2.4 – % 101.9MLI Industrials UK LP Dana Trading Estate 100% 18.8 1 1 20,966 1.2 6.21% 0.9 – % 59.4MLI Industrials UK LP Davey Close Trade Park 100% 5.9 1 27 5,028 0.4 5.74% 1.7 – % 80.6MLI Industrials UK LP Eurolink 31 100% 4.3 1 4 4,573 0.3 6.00% 3.3 – % 60.8MLI Industrials UK LP Globe Park 100% 2.8 1 12 3,528 0.2 6.74% 2.1 – % 63.8MLI Industrials UK LP Greenway Business Park 100% 4.5 1 22 4,762 0.3 5.12% 1.5 2.5 % 58.8MLI Industrials UK LP Imex Business Centre 100% 6.3 1 39 4,345 0.4 5.65% 1.6 6.0 % 96.7MLI Industrials UK LP Lake Enterprise Park 100% 4.1 1 28 3,465 0.3 6.33% 1.6 5.6 % 90.4MLI Industrials UK LP Lea Green Business Park 100% 11.2 1 23 14,181 0.8 6.39% 4.7 – % 55.4MLI Industrials UK LP Lion Business Park 100% 7.0 1 19 4,984 0.4 5.49% 4.0 – % 83.4MLI Industrials UK LP Nottingham Wholesale and Trade Park 100% 3.2 1 27 3,326 0.2 6.20% 1.9 14.3 % 75.2MLI Industrials UK LP Poulton Close Business Centre 100% 4.4 1 20 4,389 0.3 5.88% 2.1 – % 64.5MLI Industrials UK LP Rawdon Network Centre 100% 2.8 1 13 3,008 0.2 6.24% 2.5 – % 65.2MLI Industrials UK LP Redbrook Business Park 100% 7.4 1 46 14,923 0.6 6.46% 2.8 13.5 % 45.9MLI Industrials UK LP Rivermead Business Park 100% 3.7 1 12 2,527 0.2 5.04% 1.9 10.7 % 98.1MLI Industrials UK LP Sherwood Network Centre 100% 3.7 1 27 4,960 0.3 7.28% 1.7 3.7 % 60.7MLI Industrials UK LP Shire Court 100% 3.9 1 7 5,844 0.3 7.00% 3.7 – % 50.1MLI Industrials UK LP Souterhead Industrial Estate 100% 4.4 1 24 3,736 0.3 5.94% 2.2 19.6 % 115.9MLI Industrials UK LP Sovereign Business Park 100% 3.1 1 15 4,528 0.2 6.64% 1.4 10.3 % 56.1MLI Industrials UK LP Venture Park 100% 4.5 1 4 6,530 0.3 5.70% 2.7 – % 41.9MLI Industrials UK LP Wainwright Street Industrial Estate 100% 1.5 1 4 1,746 0.1 6.54% 1.8 – % 60.2MLI Industrials UK LP Wharton Street Industrial Estate 100% 1.8 1 5 2,104 0.1 6.74% 2.0 – % 59.5MLI Stenprop Industrials 4 Ltd Armthorpe Business Centre 100% 1.6 1 13 1,250 0.1 5.53% 1.4 13.3 % 90.1MLI Stenprop Industrials 4 Ltd Brookfoot Business Park 100% 6.5 1 13 9,765 0.5 7.57% 3.0 7.8 % 60.4MLI Stenprop Industrials 4 Ltd Carnfield Place 100% 4.2 1 7 5,528 0.3 6.39% 0.9 – % 57.4MLI Stenprop Industrials 4 Ltd Dunball Industrial Estate 100% 6.5 1 7 6,958 0.2 1.63% 2.0 48.5 % 67.7MLI Stenprop Industrials 4 Ltd Ellis Hill Industrial Park 100% 5.8 1 4 7,072 0.5 7.41% 1.9 – % 64.9MLI Stenprop Industrials 4 Ltd Enterprise 5 Industrial Estate 100% 3.4 1 16 2,954 0.2 5.92% 1.2 – % 79.2MLI Stenprop Industrials 4 Ltd Estuary Court 100% 3.5 1 17 3,421 0.2 4.85% 1.8 37.8 % 98.0MLI Stenprop Industrials 4 Ltd Forth Industrial Estate 100% 4.7 1 8 3,709 0.3 5.93% 2.9 – % 86.2MLI Stenprop Industrials 4 Ltd Gainsborough Trading Estate 100% 7.4 1 48 15,051 0.6 7.55% 2.1 1.1 % 38.2MLI Stenprop Industrials 4 Ltd Greenwood Court Industrial Estate 100% 3.4 1 24 4,144 0.2 5.71% 2.1 10.1 % 59.4MLI Stenprop Industrials 4 Ltd Headlands Trading Estate 100% 7.4 1 18 9,810 0.6 7.01% 2.0 – % 59.0MLI Stenprop Industrials 4 Ltd Hillfoot Industrial Estate 100% 5.9 1 45 6,034 0.4 5.87% 1.5 10.0 % 73.3MLI Stenprop Industrials 4 Ltd Kirkstall Industrial Park 100% 9.5 1 13 10,301 0.7 6.50% 5.7 – % 63.8MLI Stenprop Industrials 4 Ltd Lombard Centre 100% 2.9 1 9 3,031 0.1 1.54% 0.8 60.8 % 103.8MLI Stenprop Industrials 4 Ltd Merryhills Enterprise Park 100% 2.7 1 18 3,495 0.2 6.73% 2.6 19.4 % 61.9MLI Stenprop Industrials 4 Ltd Newburn Riverside Industrial Park 100% 10.9 1 17 11,054 0.7 6.13% 3.2 13.1 % 70.3
STENPROP ANNUAL REPORT 2021 187
ADDITIONAL DISCLOSURE
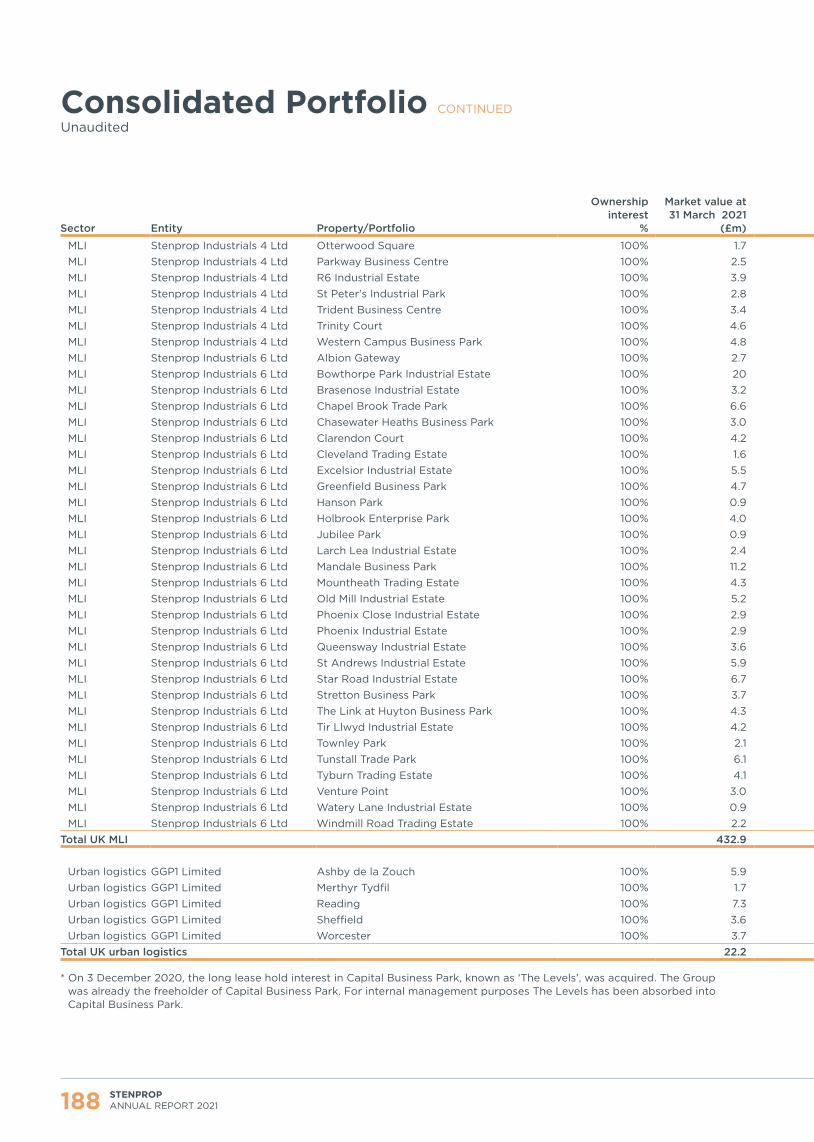
Job number 17 June 2021 2:57 pm V1
Consolidated Portfolio CONTINUED
Unaudited
STENPROP ANNUAL REPORT 2021188
Sector Entity Property/Portfolio
Ownership interest
%
Market value at 31 March 2021
(£m) Number of Properties
Number ofUnits
Area (m2)
Annualised gross rental
income (£m)
Net initial yield 31 March
2021 (%)
WAULT (by rental)
(years)
Voids (by area)
(%)
Rental per m2 (£/m2)
MLI Stenprop Industrials 4 Ltd Otterwood Square 100% 1.7 1 11 1,753 0.1 6.43% 0.9 – % 68.2MLI Stenprop Industrials 4 Ltd Parkway Business Centre 100% 2.5 1 9 2,933 0.2 6.98% 2.1 – % 65.3MLI Stenprop Industrials 4 Ltd R6 Industrial Estate 100% 3.9 1 6 2,960 0.2 6.42% 4.4 20.5 % 88.5MLI Stenprop Industrials 4 Ltd St Peter's Industrial Park 100% 2.8 1 4 4,148 0.2 4.80% 1.4 29.4 % 59.0MLI Stenprop Industrials 4 Ltd Trident Business Centre 100% 3.4 1 14 5,508 0.2 6.40% 1.1 4.4 % 45.7MLI Stenprop Industrials 4 Ltd Trinity Court 100% 4.6 1 12 3,455 0.3 5.98% 1.4 – % 91.3MLI Stenprop Industrials 4 Ltd Western Campus Business Park 100% 4.8 1 15 4,140 0.3 4.84% 3.2 9.0 % 92.3MLI Stenprop Industrials 6 Ltd Albion Gateway 100% 2.7 1 6 2,598 0.2 6.14% 6.1 – % 66.7MLI Stenprop Industrials 6 Ltd Bowthorpe Park Industrial Estate 100% 20 1 44 22,829 1.2 5.59% 3.2 6.7 % 57.8MLI Stenprop Industrials 6 Ltd Brasenose Industrial Estate 100% 3.2 1 25 7,909 0.3 8.04% 2.7 2.6 % 37.8MLI Stenprop Industrials 6 Ltd Chapel Brook Trade Park 100% 6.6 1 16 7,875 0.4 6.28% 2.5 – % 53.6MLI Stenprop Industrials 6 Ltd Chasewater Heaths Business Park 100% 3.0 1 11 3,739 0.2 7.33% 1.7 – % 64.4MLI Stenprop Industrials 6 Ltd Clarendon Court 100% 4.2 1 45 3,395 0.3 6.59% 0.8 7.0 % 95.5MLI Stenprop Industrials 6 Ltd Cleveland Trading Estate 100% 1.6 1 10 2,765 0.1 7.80% 1.5 – % 49.3MLI Stenprop Industrials 6 Ltd Excelsior Industrial Estate 100% 5.5 1 8 5,672 0.4 6.22% 2.6 – % 66.8MLI Stenprop Industrials 6 Ltd Greenfield Business Park 100% 4.7 1 12 11,929 0.4 6.64% 3.0 12.9 % 35.8MLI Stenprop Industrials 6 Ltd Hanson Park 100% 0.9 1 5 938 0.1 7.04% 1.1 – % 73.8MLI Stenprop Industrials 6 Ltd Holbrook Enterprise Park 100% 4.0 1 11 5,208 0.3 7.55% 1.9 – % 62.0MLI Stenprop Industrials 6 Ltd Jubilee Park 100% 0.9 1 3 1,421 0.1 7.56% 1.2 – % 53.4MLI Stenprop Industrials 6 Ltd Larch Lea Industrial Estate 100% 2.4 1 13 4,309 0.2 6.85% 1.9 – % 44.4MLI Stenprop Industrials 6 Ltd Mandale Business Park 100% 11.2 1 32 12,665 0.8 5.94% 3.3 – % 63.6MLI Stenprop Industrials 6 Ltd Mountheath Trading Estate 100% 4.3 1 28 3,431 0.3 6.35% 1.5 4.1 % 93.6MLI Stenprop Industrials 6 Ltd Old Mill Industrial Estate 100% 5.2 1 33 9,444 0.4 5.77% 1.2 28.9 % 58.3MLI Stenprop Industrials 6 Ltd Phoenix Close Industrial Estate 100% 2.9 1 13 3,909 0.2 6.60% 0.9 23.4 % 70.0MLI Stenprop Industrials 6 Ltd Phoenix Industrial Estate 100% 2.9 1 19 4,340 0.2 6.87% 0.9 – % 48.8MLI Stenprop Industrials 6 Ltd Queensway Industrial Estate 100% 3.6 1 10 5,999 0.3 6.99% 1.3 – % 45.5MLI Stenprop Industrials 6 Ltd St Andrews Industrial Estate 100% 5.9 1 9 6,805 0.4 5.90% 4.5 – % 61.9MLI Stenprop Industrials 6 Ltd Star Road Industrial Estate 100% 6.7 1 5 6,146 0.4 5.98% 4.1 – % 69.5MLI Stenprop Industrials 6 Ltd Stretton Business Park 100% 3.7 1 2 4,014 0.3 7.05% 1.0 – % 69.2MLI Stenprop Industrials 6 Ltd The Link at Huyton Business Park 100% 4.3 1 5 8,080 0.3 7.37% 1.9 – % 41.3MLI Stenprop Industrials 6 Ltd Tir Llwyd Industrial Estate 100% 4.2 1 20 6,321 0.3 6.55% 1.7 9.9 % 55.3MLI Stenprop Industrials 6 Ltd Townley Park 100% 2.1 1 7 3,029 0.1 6.52% 1.8 12.4 % 55.8MLI Stenprop Industrials 6 Ltd Tunstall Trade Park 100% 6.1 1 6 5,249 0.4 6.04% 5.3 – % 74.9MLI Stenprop Industrials 6 Ltd Tyburn Trading Estate 100% 4.1 1 7 4,764 0.3 6.47% 1.6 – % 60.2MLI Stenprop Industrials 6 Ltd Venture Point 100% 3.0 1 16 4,195 0.3 8.28% 0.7 2.7 % 65.4MLI Stenprop Industrials 6 Ltd Watery Lane Industrial Estate 100% 0.9 1 5 1,208 0.1 7.95% 1.8 – % 59.6MLI Stenprop Industrials 6 Ltd Windmill Road Trading Estate 100% 2.2 1 10 2,724 0.2 6.94% 1.5 – % 62.1
Total UK MLI 432.9 83 1,466 521,288 30.2 6.22 % 2.5 6.3 % 62.2
Urban logistics GGP1 Limited Ashby de la Zouch 100% 5.9 1 1 4,669 0.4 6.57 % 1.2 – % 88.6Urban logistics GGP1 Limited Merthyr Tydfil 100% 1.7 1 1 3,739 0.1 7.41 % 5.3 – % 36.1Urban logistics GGP1 Limited Reading 100% 7.3 1 1 2,820 0.7 9.22 % 1.0 – % 254.8Urban logistics GGP1 Limited Sheffield 100% 3.6 1 1 6,919 0.3 6.78 % 2.4 – % 37.6Urban logistics GGP1 Limited Worcester 100% 3.7 1 1 3,714 0.2 5.51 % 4.7 – % 57.7
Total UK urban logistics 22.2 5 5 21,861 1.7 7.36 % 2.0 – % 79.6
* On 3 December 2020, the long lease hold interest in Capital Business Park, known as ‘The Levels’, was acquired. The Group was already the freeholder of Capital Business Park. For internal management purposes The Levels has been absorbed into Capital Business Park.

Job number 17 June 2021 2:57 pm V1
Sector Entity Property/Portfolio
Ownership interest
%
Market value at 31 March 2021
(£m) Number of Properties
Number ofUnits
Area (m2)
Annualised gross rental
income (£m)
Net initial yield 31 March
2021 (%)
WAULT (by rental)
(years)
Voids (by area)
(%)
Rental per m2 (£/m2)
MLI Stenprop Industrials 4 Ltd Otterwood Square 100% 1.7 1 11 1,753 0.1 6.43% 0.9 – % 68.2MLI Stenprop Industrials 4 Ltd Parkway Business Centre 100% 2.5 1 9 2,933 0.2 6.98% 2.1 – % 65.3MLI Stenprop Industrials 4 Ltd R6 Industrial Estate 100% 3.9 1 6 2,960 0.2 6.42% 4.4 20.5 % 88.5MLI Stenprop Industrials 4 Ltd St Peter's Industrial Park 100% 2.8 1 4 4,148 0.2 4.80% 1.4 29.4 % 59.0MLI Stenprop Industrials 4 Ltd Trident Business Centre 100% 3.4 1 14 5,508 0.2 6.40% 1.1 4.4 % 45.7MLI Stenprop Industrials 4 Ltd Trinity Court 100% 4.6 1 12 3,455 0.3 5.98% 1.4 – % 91.3MLI Stenprop Industrials 4 Ltd Western Campus Business Park 100% 4.8 1 15 4,140 0.3 4.84% 3.2 9.0 % 92.3MLI Stenprop Industrials 6 Ltd Albion Gateway 100% 2.7 1 6 2,598 0.2 6.14% 6.1 – % 66.7MLI Stenprop Industrials 6 Ltd Bowthorpe Park Industrial Estate 100% 20 1 44 22,829 1.2 5.59% 3.2 6.7 % 57.8MLI Stenprop Industrials 6 Ltd Brasenose Industrial Estate 100% 3.2 1 25 7,909 0.3 8.04% 2.7 2.6 % 37.8MLI Stenprop Industrials 6 Ltd Chapel Brook Trade Park 100% 6.6 1 16 7,875 0.4 6.28% 2.5 – % 53.6MLI Stenprop Industrials 6 Ltd Chasewater Heaths Business Park 100% 3.0 1 11 3,739 0.2 7.33% 1.7 – % 64.4MLI Stenprop Industrials 6 Ltd Clarendon Court 100% 4.2 1 45 3,395 0.3 6.59% 0.8 7.0 % 95.5MLI Stenprop Industrials 6 Ltd Cleveland Trading Estate 100% 1.6 1 10 2,765 0.1 7.80% 1.5 – % 49.3MLI Stenprop Industrials 6 Ltd Excelsior Industrial Estate 100% 5.5 1 8 5,672 0.4 6.22% 2.6 – % 66.8MLI Stenprop Industrials 6 Ltd Greenfield Business Park 100% 4.7 1 12 11,929 0.4 6.64% 3.0 12.9 % 35.8MLI Stenprop Industrials 6 Ltd Hanson Park 100% 0.9 1 5 938 0.1 7.04% 1.1 – % 73.8MLI Stenprop Industrials 6 Ltd Holbrook Enterprise Park 100% 4.0 1 11 5,208 0.3 7.55% 1.9 – % 62.0MLI Stenprop Industrials 6 Ltd Jubilee Park 100% 0.9 1 3 1,421 0.1 7.56% 1.2 – % 53.4MLI Stenprop Industrials 6 Ltd Larch Lea Industrial Estate 100% 2.4 1 13 4,309 0.2 6.85% 1.9 – % 44.4MLI Stenprop Industrials 6 Ltd Mandale Business Park 100% 11.2 1 32 12,665 0.8 5.94% 3.3 – % 63.6MLI Stenprop Industrials 6 Ltd Mountheath Trading Estate 100% 4.3 1 28 3,431 0.3 6.35% 1.5 4.1 % 93.6MLI Stenprop Industrials 6 Ltd Old Mill Industrial Estate 100% 5.2 1 33 9,444 0.4 5.77% 1.2 28.9 % 58.3MLI Stenprop Industrials 6 Ltd Phoenix Close Industrial Estate 100% 2.9 1 13 3,909 0.2 6.60% 0.9 23.4 % 70.0MLI Stenprop Industrials 6 Ltd Phoenix Industrial Estate 100% 2.9 1 19 4,340 0.2 6.87% 0.9 – % 48.8MLI Stenprop Industrials 6 Ltd Queensway Industrial Estate 100% 3.6 1 10 5,999 0.3 6.99% 1.3 – % 45.5MLI Stenprop Industrials 6 Ltd St Andrews Industrial Estate 100% 5.9 1 9 6,805 0.4 5.90% 4.5 – % 61.9MLI Stenprop Industrials 6 Ltd Star Road Industrial Estate 100% 6.7 1 5 6,146 0.4 5.98% 4.1 – % 69.5MLI Stenprop Industrials 6 Ltd Stretton Business Park 100% 3.7 1 2 4,014 0.3 7.05% 1.0 – % 69.2MLI Stenprop Industrials 6 Ltd The Link at Huyton Business Park 100% 4.3 1 5 8,080 0.3 7.37% 1.9 – % 41.3MLI Stenprop Industrials 6 Ltd Tir Llwyd Industrial Estate 100% 4.2 1 20 6,321 0.3 6.55% 1.7 9.9 % 55.3MLI Stenprop Industrials 6 Ltd Townley Park 100% 2.1 1 7 3,029 0.1 6.52% 1.8 12.4 % 55.8MLI Stenprop Industrials 6 Ltd Tunstall Trade Park 100% 6.1 1 6 5,249 0.4 6.04% 5.3 – % 74.9MLI Stenprop Industrials 6 Ltd Tyburn Trading Estate 100% 4.1 1 7 4,764 0.3 6.47% 1.6 – % 60.2MLI Stenprop Industrials 6 Ltd Venture Point 100% 3.0 1 16 4,195 0.3 8.28% 0.7 2.7 % 65.4MLI Stenprop Industrials 6 Ltd Watery Lane Industrial Estate 100% 0.9 1 5 1,208 0.1 7.95% 1.8 – % 59.6MLI Stenprop Industrials 6 Ltd Windmill Road Trading Estate 100% 2.2 1 10 2,724 0.2 6.94% 1.5 – % 62.1
Total UK MLI 432.9 83 1,466 521,288 30.2 6.22 % 2.5 6.3 % 62.2
Urban logistics GGP1 Limited Ashby de la Zouch 100% 5.9 1 1 4,669 0.4 6.57 % 1.2 – % 88.6Urban logistics GGP1 Limited Merthyr Tydfil 100% 1.7 1 1 3,739 0.1 7.41 % 5.3 – % 36.1Urban logistics GGP1 Limited Reading 100% 7.3 1 1 2,820 0.7 9.22 % 1.0 – % 254.8Urban logistics GGP1 Limited Sheffield 100% 3.6 1 1 6,919 0.3 6.78 % 2.4 – % 37.6Urban logistics GGP1 Limited Worcester 100% 3.7 1 1 3,714 0.2 5.51 % 4.7 – % 57.7
Total UK urban logistics 22.2 5 5 21,861 1.7 7.36 % 2.0 – % 79.6
* On 3 December 2020, the long lease hold interest in Capital Business Park, known as ‘The Levels’, was acquired. The Group was already the freeholder of Capital Business Park. For internal management purposes The Levels has been absorbed into Capital Business Park.
STENPROP ANNUAL REPORT 2021 189
ADDITIONAL DISCLOSURE

Job number 17 June 2021 2:57 pm V1
Jointly Controlled Entities Unaudited
Assets Held for SaleUnaudited
STENPROP ANNUAL REPORT 2021190
Sector Entity Property
Ownership interest
%
Market value at 31 March 2021
(£m) Number ofProperties
Number ofUnits
Area(m2)
Annualised gross rental income
(£m)
Net initial yield 31 March 2021
(%)
WAULT (by rental)
(years)
Voids (by area)
(%)Rental per m2
(£/m2)
Germany
Retail Stenprop Hermann Ltd Hermann Quartier 100% 26.2 1 31 8,274 1.3 4.90 % 4.1 3.2 % 155.5Total Germany 26.2 1 31 8,274 1.3 4.90 % 4.1 3.2 % 155.5
SwitzerlandRetail Kantone Holdings Ltd Lugano 100% 12.0 1 1 5,974 1.0 3.37 % 16.5 – % 159.5
Total Switzerland 12.0 1 1 5,974 1.0 3.37 % 16.5 – % 159.5
Total assets held for sale 38.2 2 32 14,248 2.2 4.42 % 9.4 1.86 % 157.2
Property Entity Property
Ownership interest
%
Market value at 31 March 2021
(£m) Number ofProperties
Number ofUnits
Area(m2)
Annualised gross rental income
(£m)
Net initial yield 31 March 2021
(%)
WAULT (by rental)
(years)
Voids (by area)
(%)Rental per m2
(£/m2)
Joint venturesGermany
Nursing Homes Elysion Braunschweig S.à r.l. Braunschweig 99% 9.4 1 91 4,131 0.7 6.03% 7.0 – % 158.6Nursing Homes Elysion Dessau S.à r.l. Dessau 99% 6.9 1 76 6,195 0.5 6.33% 5.3 – % 87.1Nursing Homes Elysion Kappeln S.à r.l. Kappeln 99% 12.0 1 114 5,225 0.7 5.16% 12.8 – % 137.8Nursing Homes Elysion Winzlar S.à r.l. Winzlar 99% 4.5 1 68 3,779 0.5 8.73% 7.3 – % 122.8
Total Germany 32.8 4 349 19,330 2.4 6.15% 8.4 – % 123.0

Job number 17 June 2021 2:57 pm V1
Sector Entity Property
Ownership interest
%
Market value at 31 March 2021
(£m) Number ofProperties
Number ofUnits
Area(m2)
Annualised gross rental income
(£m)
Net initial yield 31 March 2021
(%)
WAULT (by rental)
(years)
Voids (by area)
(%)Rental per m2
(£/m2)
Germany
Retail Stenprop Hermann Ltd Hermann Quartier 100% 26.2 1 31 8,274 1.3 4.90 % 4.1 3.2 % 155.5Total Germany 26.2 1 31 8,274 1.3 4.90 % 4.1 3.2 % 155.5
SwitzerlandRetail Kantone Holdings Ltd Lugano 100% 12.0 1 1 5,974 1.0 3.37 % 16.5 – % 159.5
Total Switzerland 12.0 1 1 5,974 1.0 3.37 % 16.5 – % 159.5
Total assets held for sale 38.2 2 32 14,248 2.2 4.42 % 9.4 1.86 % 157.2
Property Entity Property
Ownership interest
%
Market value at 31 March 2021
(£m) Number ofProperties
Number ofUnits
Area(m2)
Annualised gross rental income
(£m)
Net initial yield 31 March 2021
(%)
WAULT (by rental)
(years)
Voids (by area)
(%)Rental per m2
(£/m2)
Joint venturesGermany
Nursing Homes Elysion Braunschweig S.à r.l. Braunschweig 99% 9.4 1 91 4,131 0.7 6.03% 7.0 – % 158.6Nursing Homes Elysion Dessau S.à r.l. Dessau 99% 6.9 1 76 6,195 0.5 6.33% 5.3 – % 87.1Nursing Homes Elysion Kappeln S.à r.l. Kappeln 99% 12.0 1 114 5,225 0.7 5.16% 12.8 – % 137.8Nursing Homes Elysion Winzlar S.à r.l. Winzlar 99% 4.5 1 68 3,779 0.5 8.73% 7.3 – % 122.8
Total Germany 32.8 4 349 19,330 2.4 6.15% 8.4 – % 123.0
STENPROP ANNUAL REPORT 2021 191
ADDITIONAL DISCLOSURE

Job number 17 June 2021 2:57 pm V1
Tenant AnalysisUnaudited
STENPROP ANNUAL REPORT 2021192
Number of tenants
CountryNumber of
tenants
Annual rental
income (%)UK 1134 88.4%Germany 27 9.2%Switzerland 1 2.4%Total 1162 100%
Top 15 tenants
Tenant
Sum of annualised rent 31 March 2020
(£)
Percentage of total rent
(%)WAULT(years)
1 Northern Trust (Guernsey) Limited 3,207,018 7.90% 7.5 2 Unipart Group Limited 1,246,374 3.07% 0.9 3 Aztec Financial Services (Guernsey) Ltd 1,188,330 2.93% 2.2 4 Planet Wellness 952,638 2.35% 16.5 5 Kappeln 727,903 1.79% 12.8 6 Thames Water Utilities Ltd 718,458 1.77% 1.0 7 Braunschweig 661,524 1.63% 7.0 8 Dessau 544,897 1.34% 5.3 9 Winzlar 468,703 1.15% 7.3 10 Siemens PLC 413,550 1.02% 1.2 11 Utopia Deals Limited 352,966 0.87% 1.4 12 Booker Ltd 349,186 0.86% 4.9 13 Rexel UK Limited 316,500 0.78% 4.2 14 Kerry Ingredients (UK) Limited 297,000 0.73% 3.0 15 Jigsaw Foods Limited 292,526 0.72% 3.7
Total 11,737,573 28.91% 6.0
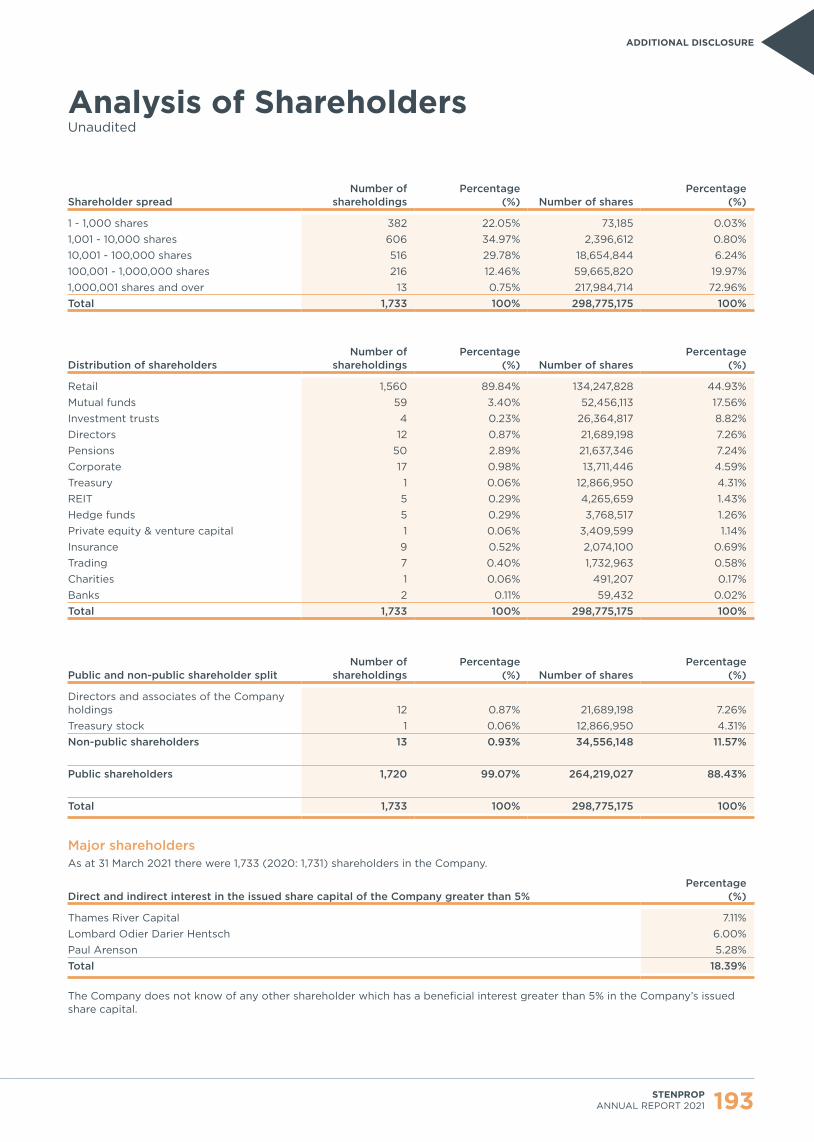
Job number 17 June 2021 2:57 pm V1
Analysis of ShareholdersUnaudited
Shareholder spreadNumber of
shareholdingsPercentage
(%) Number of sharesPercentage
(%)
1 - 1,000 shares 382 22.05% 73,185 0.03%1,001 - 10,000 shares 606 34.97% 2,396,612 0.80%10,001 - 100,000 shares 516 29.78% 18,654,844 6.24%100,001 - 1,000,000 shares 216 12.46% 59,665,820 19.97%1,000,001 shares and over 13 0.75% 217,984,714 72.96%Total 1,733 100% 298,775,175 100%
Distribution of shareholdersNumber of
shareholdingsPercentage
(%) Number of sharesPercentage
(%)
Retail 1,560 89.84% 134,247,828 44.93%Mutual funds 59 3.40% 52,456,113 17.56%Investment trusts 4 0.23% 26,364,817 8.82%Directors 12 0.87% 21,689,198 7.26%Pensions 50 2.89% 21,637,346 7.24%Corporate 17 0.98% 13,711,446 4.59%Treasury 1 0.06% 12,866,950 4.31%REIT 5 0.29% 4,265,659 1.43%Hedge funds 5 0.29% 3,768,517 1.26%Private equity & venture capital 1 0.06% 3,409,599 1.14%Insurance 9 0.52% 2,074,100 0.69%Trading 7 0.40% 1,732,963 0.58%Charities 1 0.06% 491,207 0.17%Banks 2 0.11% 59,432 0.02%Total 1,733 100% 298,775,175 100%
Public and non-public shareholder splitNumber of
shareholdingsPercentage
(%) Number of sharesPercentage
(%)
Directors and associates of the Company holdings 12 0.87% 21,689,198 7.26%Treasury stock 1 0.06% 12,866,950 4.31%Non-public shareholders 13 0.93% 34,556,148 11.57%
Public shareholders 1,720 99.07% 264,219,027 88.43%
Total 1,733 100% 298,775,175 100%
Major shareholdersAs at 31 March 2021 there were 1,733 (2020: 1,731) shareholders in the Company.
Direct and indirect interest in the issued share capital of the Company greater than 5%Percentage
(%)
Thames River Capital 7.11%Lombard Odier Darier Hentsch 6.00%Paul Arenson 5.28%Total 18.39%
The Company does not know of any other shareholder which has a beneficial interest greater than 5% in the Company’s issued share capital.
STENPROP ANNUAL REPORT 2021 193
ADDITIONAL DISCLOSURE

Job number 17 June 2021 2:57 pm V1

Job number 17 June 2021 2:57 pm V1
Shareholder Diary 196
Corporate Information 197
Glossary 198
Shareholder Notes 200
Other Information

Job number 17 June 2021 2:57 pm V1
STENPROP ANNUAL REPORT 2021196
Shareholder Diary
Financial year end 31 March 2021Annual report posted June 2021Annual general meeting September 2021
Announcement of results30 September 2021 Interim results December 202131 March 2022 Annual results June 2022
Dividends Declared Paid2021 Interim December 2021 February 20222022 Annual June 2022 August 2022

Job number 17 June 2021 2:57 pm V1
Corporate Information
Stenprop Limited Registered in GuernseyRegistration number: 64865LSE share code: STPJSE share code: STPISIN: GG00BFWMR296
Company secretary Sarah Bellilchi
United Kingdom
Postal address of the Company180 Great Portland StreetLondonW1W 5QZUnited Kingdom
Guernsey
Registered office of the CompanyStenprop LimitedKingsway HouseHavilland StreetSt Peter PortGY1 2QEGuernsey
South Africa
JSE sponsorJava Capital Trustees and Sponsors Proprietary Limited(Registration number 2006/005780/07)6th Floor, 1 Park LaneWeirda ValleySandton, 2196JohannesburgSouth Africa(PO Box 522606, Saxonwold, 2132)
Broker and financial adviser Numis Securities LimitedThe London Stock Exchange Building10 Paternoster SquareLondonEC4M 7LTUnited Kingdom
Guernsey registrarsComputershare Investor Services (Guernsey) Limited1st FloorTudor HouseLe BordageSt Peter PortGY1 1DBGuernsey
Corporate adviserJava Capital Proprietary Limited(Registration number 2012/089864/07)6th Floor, 1 Park LaneWeirda ValleySandton, 2196JohannesburgSouth Africa(PO Box 522606, Saxonwold, 2132)
Independent auditor BDO LLP55 Baker StreetLondonW1U 7EUUnited Kingdom
Correspondence address:2nd FloorQueensway HouseHilgrove StreetSt. HelierJE1 1ESJerseyChannel Islands
Transfer secretariesComputershare Investor Services Proprietary Limited(Registration number 2004/003647/07)Rosebank Towers15 Biermann AvenueRosebank, 2196JohannesburgSouth Africa(PO Box 61051, Marshalltown, 2107)
STENPROP ANNUAL REPORT 2021 197
OTHER INFORMATION
Job number 17 June 2021 2:57 pm V1
Glossary
STENPROP ANNUAL REPORT 2021198
Adjusted earnings Utilises EPRA earnings and applies further company-specific adjustments to earnings to exclude items considered not to be in the ordinary course of business or other exceptional items that do not necessarily provide an accurate picture of the Group’s underlying operational performance. (Previously referred to as Diluted adjusted EPRA Earnings).
Adjusted earnings per shareAdjusted earnings per share after considering dilutive share options. (Previously referred to as diluted adjusted EPRA Earnings per share).
Cost of debt This represents the all-in interest rate after including the reference rate, the margin and interest rate derivative, if applicable. The Group weighted average cost of debt is the all-in interest rate of the Group weighted by loan size.
Debt maturity Measured in years, the debt maturity is calculated by comparing the reference date (e.g. period-end) to the maturity date of the debt referred to.
Distribution per shareTotal distribution per share that Stenprop makes to shareholders in respect of the financial year. Distributions are paid twice yearly.
EPRAThe European Public Real Estate Association.
EPRA ‘topped up’ NIY EPRA NIY adjusted for the expiration of rent-free periods (or other unexpired lease incentives such as discounted rent periods and stepped rents).
EPRA cost ratio (excluding direct vacancy costs)Administrative and operating costs (adjusted to exclude vacancy costs) expressed as a percentage of gross rental income.
EPRA cost ratio (including direct vacancy costs)Administrative and operating costs expressed as a percentage of gross rental income.
EPRA earningsEarnings from operational activities. A key measure of the Group’s underlying operating results and an indication of the extent to which current dividend payments are supported by earnings.
EPRA earnings per shareEarnings from operational activities per share after considering dilutive share options.
EPRA NDV per shareEPRA net disposal value per share after considering dilutive share options.
EPRA net disposal value (NDV) An EPRA NAV measure that represents the shareholders’ value under a disposal scenario, where deferred tax, financial instruments and certain other adjustments are calculated to the full extent of their liability, net of any resulting tax.
EPRA net initial yield (NIY)Annualised rental income based on the cash rents passing at the statement of financial position date, less non-recoverable property operating expenses, expressed as a percentage of the market value of property.
EPRA net reinstatement value (NRV) An EPRA NAV measure that aims to represent the value required to rebuild the entity. The NAV per the IFRS financial statements is adjusted to assume that the entity never sells assets.
EPRA net tangible assets (NTA)The NAV per the IFRS financial statements is adjusted to assume that the entity buys and sells assets, thereby crystallising certain levels of unavoidable deferred tax.
EPRA NRV per shareEPRA net reinstatement value per share after considering dilutive share options.
EPRA NTA per shareEPRA net tangible assets per share after considering dilutive share options.
EPRA vacancy rate Estimated market rental value (ERV) of vacant space divided by ERV of the portfolio as a whole.
EPSEarnings per share based on the weighted average number of shares in issue
Estimated rental value (ERV) The external valuers’ opinion of the open market rent which, on the date of valuation, could reasonably be expected to be obtained on a new letting or rent review of a property.
GroupStenprop, its subsidiaries and its share of joint ventures.
Headline earnings A method of reporting corporate earnings, as required by the JSE listings requirements. The measure is based entirely on operational, trading, and capital investment activities achieved during the period. Excluded from the headline earnings figure are profits or losses associated with the sale or termination of discontinued operations, fixed assets or related businesses, or from any permanent devaluation or write-off of their values.
IFRSInternational Financial Reporting Standards issued by the International Accounting Standards Board.

Job number 17 June 2021 2:57 pm V1
Interest coverRepresents the number of times net interest payable is covered by underlying rental income (or net rental income, as appropriate).
LIBORLondon Interbank Offered Rate, the interest rate charged by one bank to another for lending money.
Like-for-like basisThis represents the change in a measure (such as passing rent or property valuation) for reference data that applies throughout the current and previous periods under review.
EPRA like-for-like rental income growthThe change in gross contractual rental income at reporting date, generated by properties that were held by the Group for the year, excluding properties undergoing significant development. This measure illustrates the change in comparable income values.
NAVNet asset value.
Net assets per shareNAV divided by the number of shares in issue at the period (less treasury shares).
Loan-to-value (LTV)Loan to value (LTV) is the ratio of principal value of gross debt, less unrestricted cash, to the Group’s aggregate value of properties.
Occupancy rate Estimated market rental value (ERV) of occupied space divided by ERV of the portfolio as a whole (the inverse of EPRA vacancy rate).
Property income distribution (PID)As a REIT, the Group is obliged to distribute 90% of its UK property tax-exempt profits. PIDs are profits distributed to shareholders, which are subject to tax in the hands of the shareholders as property income. PIDs are normally paid net of withholding tax currently at 20%, which the REIT pays to the tax authorities on behalf of the shareholder. Certain types of shareholder (e.g. pension funds) are tax exempt and receive PIDs without deduction of withholding tax. REITs also pay out normal dividends, which are taxed in the same way as dividends received from non-REIT companies and are not subject to withholding tax.
Real estate investment trust (REIT)REITs are property companies that allow people and organisations to invest in commercial property and receive benefits as if they directly owned the properties themselves. The effect is that taxation is moved from the corporate level to the investor level as investors are liable for tax as if they owned the property directly. Stenprop became a UK REIT in May 2018.
Restricted cashRepresents restricted cash balances, including service charge monies held by managing agents and monies held in bank accounts secured by lenders, for the purposes of debt repayments.
Total accounting returnGrowth in EPRA NTA per share plus dividends paid, expressed as a percentage of EPRA NTA per share at the beginning of the period.
Total shareholder returnThe growth in value of a shareholding over a specified period, assuming dividends are reinvested to purchase additional units of stock.
Treasury sharesShares repurchased by the Company, reducing the amount of outstanding stock on the open market.
Unrestricted cashCash, cash equivalents and liquid investments after deducting restricted cash.
VoidsUnlet space as a percentage of area, including voids where refurbishment work is being carried out unless specifically mentioned.
WAULT Weighted average unexpired lease term, indicating the average remaining life of the leases within our portfolio.
STENPROP ANNUAL REPORT 2021 199
OTHER INFORMATION

Job number 17 June 2021 2:57 pm V1
Shareholder Notes
STENPROP ANNUAL REPORT 2021200
30051 17 June 2021 4:07 pm V3
STENPROP.COMStenprop Limited3rd floor180 Great Portland StLondonW1W 5QZ
Annual R
epo
rt 2021