portfolio action comments as of 4/27/2018 - Raymond James
13
Page 1
-
Upload
khangminh22 -
Category
Documents
-
view
5 -
download
0
Transcript of portfolio action comments as of 4/27/2018 - Raymond James

Page 1
Page 2
PORTFOLIO ACTION COMMENTS AS OF 4/27/2018
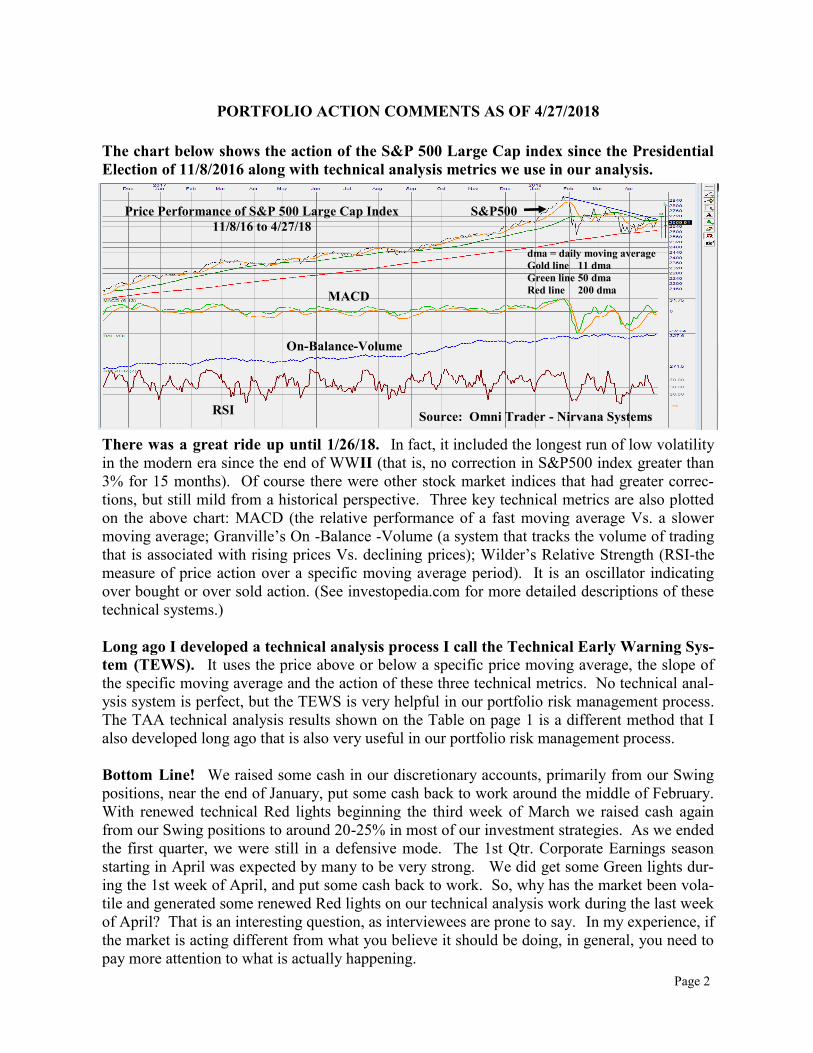
The chart below shows the action of the S&P 500 Large Cap index since the Presidential
Election of 11/8/2016 along with technical analysis metrics we use in our analysis.
There was a great ride up until 1/26/18. In fact, it included the longest run of low volatility
in the modern era since the end of WWII (that is, no correction in S&P500 index greater than
3% for 15 months). Of course there were other stock market indices that had greater correc-
tions, but still mild from a historical perspective. Three key technical metrics are also plotted
on the above chart: MACD (the relative performance of a fast moving average Vs. a slower
moving average; Granville’s On -Balance -Volume (a system that tracks the volume of trading
that is associated with rising prices Vs. declining prices); Wilder’s Relative Strength (RSI-the
measure of price action over a specific moving average period). It is an oscillator indicating
over bought or over sold action. (See investopedia.com for more detailed descriptions of these
technical systems.)
Long ago I developed a technical analysis process I call the Technical Early Warning Sys-
tem (TEWS). It uses the price above or below a specific price moving average, the slope of
the specific moving average and the action of these three technical metrics. No technical anal-
ysis system is perfect, but the TEWS is very helpful in our portfolio risk management process.
The TAA technical analysis results shown on the Table on page 1 is a different method that I
also developed long ago that is also very useful in our portfolio risk management process.
Bottom Line! We raised some cash in our discretionary accounts, primarily from our Swing
positions, near the end of January, put some cash back to work around the middle of February.
With renewed technical Red lights beginning the third week of March we raised cash again
from our Swing positions to around 20-25% in most of our investment strategies. As we ended
the first quarter, we were still in a defensive mode. The 1st Qtr. Corporate Earnings season
starting in April was expected by many to be very strong. We did get some Green lights dur-
ing the 1st week of April, and put some cash back to work. So, why has the market been vola-
tile and generated some renewed Red lights on our technical analysis work during the last week
of April? That is an interesting question, as interviewees are prone to say. In my experience, if
the market is acting different from what you believe it should be doing, in general, you need to
pay more attention to what is actually happening.
Source: Omni Trader - Nirvana Systems
Price Performance of S&P 500 Large Cap Index
11/8/16 to 4/27/18
S&P500
dma = daily moving average
Gold line 11 dma
Green line 50 dma
Red line 200 dma MACD
On-Balance-Volume
RSI
Page 3
You can consider several possibilities. The market doesn’t know what is going on and is out
of touch. Historically, that was a rare circumstance. Normally, when the market was acting
different from expectations, up or down, it was responding to information not generally known,
but was about to become known. However, with computer driven algorithms trading the mar-
ket without human input, having an out of control technical system problem is a greater random
type of possibility today, in my opinion. More likely, the current negative action since the end
of January is responding to the fear that the Trump Agenda for economic growth may be in un-
expected trouble. That could result from a misstep in terms of our trade policy with China not
working out as planned, or the Federal Reserve raising interest rates faster than anticipated.
I don’t think either of these fears will prove to be an on-going problem. The Chinese have
thousands of years of history. Probably all of their leaders have read Confucius’ writings and
Sun Tzu’s “The Art Of War” along with Trump’s “The Art of the Deal”. They have been rela-
tively moderate in their response to the Trump Tariff initiated because they know that they
have been taking advantage of America’s economic/trade policies for Decades. They now have
developed a domestic economy that needs global trade as much as the US. They could see that
America, with a strong leader, may have the upper hand in a global trade war and that it is time
to curtail their trade excesses somewhat. I think Sun Tzu would applaud their decision as a
strategic move. ‘Never go to battle if your odds of winning are unfavorable’, or something like
that. China will take strong face saving actions, but I doubt a global Trade War is likely.
Regarding the Federal Reserve action on the Fed Funds rate increases, I doubt that the
new Chairman, Jay Powell, will make the mistake of aggressively raising rates up 2% or more
(currently 1.75 to 3.75) in a short period of time, scaring the financial markets. Although inde-
pendent, he still is a Trump appointee and a former Wall Street executive with several invest-
ment banking firms and a respected Fed Governor for a number of years (check out his Wikipe-
dia bio for more details). To his advantage, he is not a professional economist that is expected
to adhere to classical economic principles. The global environment with roughly equal distri-
butions of talent, capital and knowledge may require more out-of-the-box thinking.
I am in the economic camp that believes changes to previous international trade policies
and historical low interest rate policies were very over due. American leadership has tried
at times over the last several decades to overcome the unequal global trade policies that have
ended up in the negotiated trade treaties. Previous administrations have always lost their nerve
and caved in to political pressure to not rock the global economic boat. Unfortunately, it was
at the expense of a lot of American manufacturing jobs and America’s middle class family cul-
ture over the last 40 years or so. I think the current administration has a good chance to stay
the course. Neither China nor the U.S. wants a global trade war. I believe that a FAIR and
Free trade policy has to be implemented for America to have a stable and prosperous future.
Yes, David Ricardo’s 1817 book (“On the Principles of Political Economy and Taxation” -
published in 1817 ) presented the economic theory of “Comparative Advantage.” This the-
ory for global economic activity served advanced nations well for nearly 2 centuries. However,
I believe the global internet system has created the ability of many nations to have capital, tech-
nology, and talent to also become high-end producers. This caused some of America’s manu-
facturing and technology jobs and capital to go elsewhere. The new Federal Corp Tax cut law
is helping bring these companies back home. That is a big long term positive, in my judgment.

Page 4
American Luddites, are those workers that are harmed and oppose automation and man-
ufacturing that goes overseas and takes their jobs. It is derived from English textile workers
in the early 1800s that were loosing their jobs and were fighting industrialization. American
workers that loose their jobs to foreign competitive workers have had trouble moving up the
food-chain to higher level jobs that the Ricardo economic theory predicts should occur. Of
course, technology advancements are decreasing all levels of human required input in produc-
tion. That has always been the case, but maybe not at the faster pace of this new internet world.
However, the H-1b visa policy of bringing in foreign technical talent to America, often replac-
ing domestic talent at lesser cost, is also an issue. The potential of increase robotic technology
input is also projected to reduce many human jobs in the future. Availability of good paying
jobs for Americans in the post WWII era, for a couple of generations, was not a problem like it
is today, at least in my observations.
The driving force often sited for these changes is that the American consumer benefits in
the end. That is often true, but I believe there needs to be a balance in terms of the culture out-
come, not just the pocket book $ outcome of these economic realities. If I seem to be old fash-
ion in my thinking, at times, so be it. Our political leaders have let globalization agendas dis-
tort our national needs and culture for too long, in my judgment. Hopefully, the political pen-
dulum is swinging back into a better balance for America’s economic and cultural domestic
interest relative to global interest.
The recovery of market volatility this year is also a function of the size of the stock mar-
ket. The U.S. stock market is about 26 $Trillion +/- a couple $Trillion on any given day. Tril-
lions of dollars want to move around daily and quickly which causes up or down pressures for
big price changes. The High Frequency trading of algorithms which are thought to be about
70% to 90% of all daily trading are designed to respond to financial market actions in ways of-
ten different from human propensities to respond to normal greed or fear psychological pres-
sures. With over 50 years of stock market participation, I firmly believe that the last fifteen or
so years is not the same financial market environment that I experienced earlier in my career.
In November 1989, while at Shearson Lehman Hutton, Inc., I presented a paper at the
New Orleans Hard Money Conference entitled “ Understanding and Dealing With Vola-
tility In Financial Markets”. Topics discussed included: The Information Explosion; The In-
stitutionalization of the Market Place; The Performance Syndrome; and, The Pro-active Federal
Reserve Bank. All of these topics have been a big part of what the market place has become,
even much greater and influential than I imagined 29 years ago. Note, there was no internet or
social media back then. News took much longer to get distributed and was much less political.
I believe these topics are still appropriate discussions for today’s financial markets. The
market value numbers are just a lot bigger. In November 1989, the Dow Jones 30 Industrial
average was trading around 2650, about 1/10 of todays value. In the year 2047 (29 years into
the future), will the DOW be trading around 265,000 with a similar gain as happened from
1989 to today? Maybe! That would be an 8.3% compounded rate of return (ten times) with
dividends reinvested. A 7.3% Rate of return provides only 7.7 times, and 6.3% rate of return
only provides 5.9 times. According to Investopedia, the S&P 500 average annual return since
1928 has been around 10%. (~ 16 times) with dividends contributing 40% of the total return.

Page 5
CAPITICALIZATION STYLES Our TAA table on page 1 captures the Short Term action of the market pretty well. We don’t attempt to
trade every wiggle in the financial markets, but it is worthwhile to have a feel for what the markets are
doing. The Swing holdings in our strategies are often impacted by the Red and Green lights on this ta-
ble. A time sequence of the capitalization styles Red/Green lights for Large Cap, Mid Cap, and Small
Cap is shown in the tables below:
As of 4/27/18
Note that the Weekly data (L-T) has remained mostly Red since the middle of February with some ex-
ceptions. Our Growth strategies still have 82% to 92 % market Exposure, but we are very close to in-
creasing our defenses on further weakness. A table of each managed investment strategies’ approximate
market exposure is included in the Summary section later in this report. Newer accounts that are not yet
fully invested will have more current cash. The chart below shows the price performance YTD for the
SPX500 (SPX - 0.88%), Mid Cap 400 (MID - 1.42%), and Russell 2000 Small Cap (RUT+ 0.56%).
S&P500 (Black), S&P400 Mid-Cap (Gold), Russell 2000 Small Cap (Blue)
Year-To-Date at 4/27/2018
Jan Feb Mar Apr

Page 6
INDUSTRIAL SECTORS
The table above shows the Industrial Sectors we follow with our Tactical Asset Allocation technical
analysis approach as of Friday’s close, April 27. It is a mixed bag of colors. The Double Green leaning
cells include Energy Services, Real Estate, Telecom, Transportation and Utilities. They are likely re-
sponding to a search for less volatility. The possibility of a Trade war would hurt the economic outlook,
so the Transportation index which is often a leading indicator of economic activity bears watching close-
ly. The Double Red leaning cells include the Internet and Retailing. Some of the internet related large
technology and social media companies have been in the news with negative commentary in recent
weeks. The Technology sector has a Short Term Red light, but the L-T cell has been Green since July
10, 2007. Technology related sectors, in general, have been the leading sectors for the bullish action of
2017 and early 2018. Since late January they have been treading water with a downward bias.
The chart below shows the daily performance since the beginning of the year for the DJ Technology Ti-
tan 30 Index - Black line, DJ Utility Index - Blue line, and the DJ Transportation Index - Gold line. The
Pink Zero% change line shows that Technology and Transportation are down 1% to 3% on the year with
Utilities slightly positive. Keep in mind that the S-T daily data changes direction frequently while the
L-T weekly data generally has fewer changes. Some other Technology sub-Sectors may be up YTD.
DJ Technology Titan 30 Index
Philadelphia Gold & Silver Index
Year-to-Date Action for Technology, Transportation and Utilities Indices
As of 4/27/2018
Technology
Utility
Transportation

Page 7
INTERNATIONAL MARKETS
There are 13 Red leaning lights and only 5 Green leaning lights. Consequently, International Market are
obviously under pressure. China, Europe and Southeast Asia x Japan are on double Red lights. There
are no Double Green lights. By ‘leaning’ I mean a solid color and a lighter color with a Neutral rating.
At the beginning of 2018 we noted that there was a lot of market commentary that International
markets were undervalued relative to the US Equity markets after the big advance in 2017. We
are now 4 months into the year so lets see what has happened. The chart below shows the Year-
To-Date Performance as of 4/27/18 for Europe, Asia, and Latin America compared to the U.S.
Dow Jones 30 index. Shown are the Dow Jones Asia 30 Index - ADOW (Black), Dow Jones
Europe 30 Index - EDOW (Blue ), S&P Latin America Index - SPLAC (Red), and the U.S.
Dow Jones Industrial Index (Gold) for comparison. The ADOW and the EDOW are composed
of 30 Blue Chips in their respective regions with the same procedure as the Dow Jones Industri-
al index is constructed for the U.S.
January 2018 started off positive for the global markets shown on the chart. However, they all
also suffered a sharp down turn from the peak in late January to the second week of February.
A modest bounce to late February and then a downward sloped trading range to the end of
April. The Latin America index has maintained the best performance with still a 4% gain at the
end of April. On the other hand, Europe, Asia and the U.S. tightly matched each others action
and ended April around minus 2%. With the exception of Latin America, the International mar-
kets in general have not done better as thought possible beginning the year. Of course, there are
always exceptions to any general statement. Individual countries may differ from these regional
results.
Emerging Mkts.
US DJIA
Year-To-Date Performance for Asia, Europe, Latin America & U.S. Dow Jones
As of 4/27/2018
Latin America - Red
Europe - Blue
U.S. Dow - Gold
Page 8
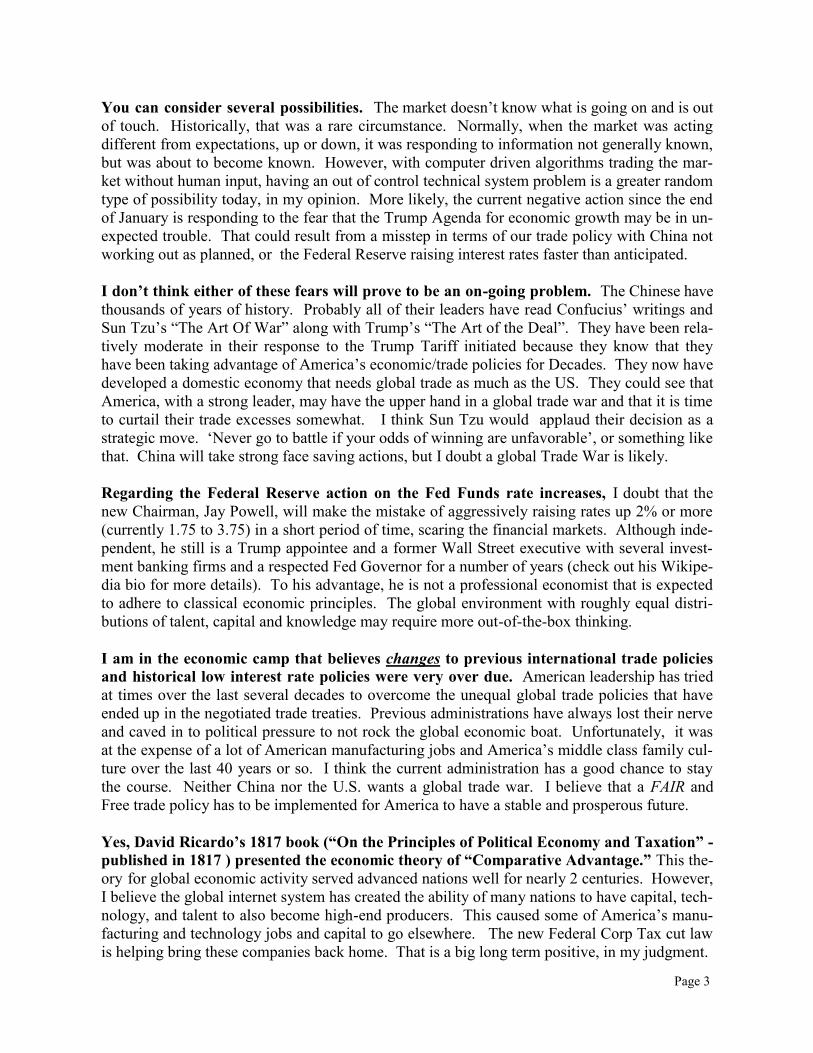
BOND MARKETS
For the Fixed Income sectors we monitor, we track the price trends of bond securities. There-
fore, Red lights mean bond prices are declining and consequently interest rates are rising for
that sector for the time period of interest. Currently Daily data shows Red leaning lights for all
the bond sectors we follow. There are Double Red leaning lights showing for Emerging Mar-
kets. I normally put more emphasis on weekly trends (L - T) where there are two Red leaning
and five Green leaning. Nevertheless with Red (S - T) lights, it is an indication that the long
expected trend towards the normalization of Treasury rates to higher levels has begun.
The big question that the financial markets are trying to answer is how fast will rates rise. A
slow rise will be handled pretty well. A fast rise will not be positive for the stock market. The
jury is still out on this issue. After peeking above the 3% level, the 10 year Treasury retreated
back below 3%, but not by much. This is the level reached at the end of 2013 and provides
some technical resistance. I expect that a higher level will be reached during 2018 with 3.3%
providing the next technical resistance level, in my opinion.
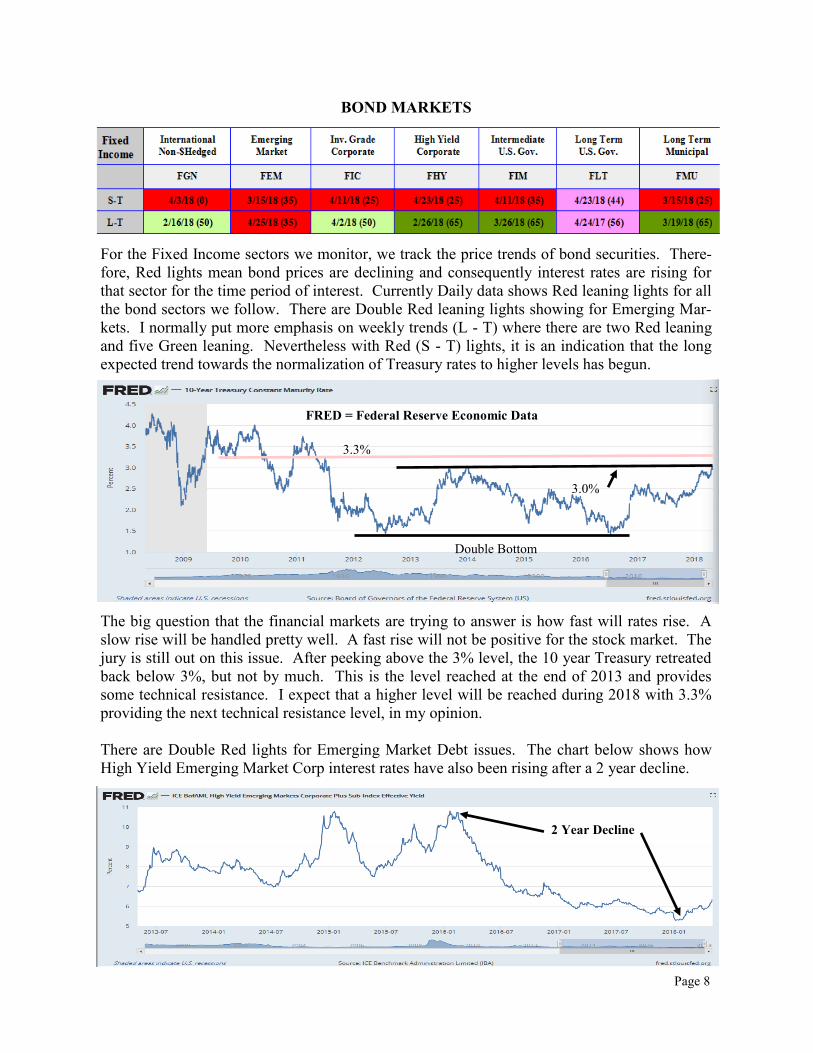
There are Double Red lights for Emerging Market Debt issues. The chart below shows how
High Yield Emerging Market Corp interest rates have also been rising after a 2 year decline.
3.3%
3.0%
Double Bottom
2 Year Decline
FRED = Federal Reserve Economic Data

SUMMARY AS OF 4/27/18 The decline that began on 1/26/18 ended on 2/8/18 with a drop of approximate 10% for the S&P500.
Since then, a Wedge type trading pattern has evolved. The wedge is formed by the down sloping blue
line through the trading highs and the double bottom flat blue line. Typically this type of pattern is
thought of as a correction that will eventually be a continuation of the trend prior to the correction. Un-
fortunately, trading patters don’t work 100% of the time. Note, that the amplitude of the wedge trading
is narrowing. Often, the break above or below the two blue lines occurs as they approach the point of
the wedge. However, todays’ financial markets are highly influenced by geopolitical events that can eas-
ily counter technical trading patterns. So, we won’t bet the farm on it occurring as anticipated. Some-
times, well advertised potential events begin in the anticipated direction and then quickly reverses direc-
tion generating either a bull or bear trap. A bull trap if initially starting up and then falling below the
wedge.
The current approximate net market exposure for our investment strategies, at progressive dates, are
shown in the table below (12/31/17 to 4/27/18). In general , the market had strong positive move up
until late January, 2018. That has been followed by a volatile consolidation period. Consequently, the
variations in net market exposure have been primarily a result of changes in our Swing positions that are
guided by our technical analysis of the market action and our Flexible Portfolio Method of portfolio
management.
12/31 1/31 2/28 3/31 4/27
% % % % %
Growth Portfolio Plus (GPP) 97 82 94 75 82
Focus List Plus (FLP) 89 86 91 80 88
Asset Allocation Portfolio Plus (AAPP) 91 86 87 85 92
Global Opportunity Plus (GOP) 93 84 88 80 92
Equity Income Portfolio Plus (EIPP) 88 90 91 80 88
Portfolio Income Plus (PIP) 90 79 93 79 86
MLP Energy Infrastructure Plus (MLPP) 74 92 92 79 94
Energy/Defense/Resources (EDRP) 97 95 95 88 92
Precious Metals Plus (PMP) 80 84 73 63 89
Global InDe-flation Plus (GIP) 92 85 92 84 92
Diversified Income Taxable Plus (DITP) 91 61 59 88 81
Note: The net market exposure values indicated are approximate since individual account exposure can
very somewhat from these values. Also, accounts opened during the calendar year may differ since we nor-
mally phase in exposure. These reported allocations are a snapshot at the dates indicated and do not neces-
sarily represent the average allocation during the reporting period. This net exposure is computed by sub-
tracting the total Bear Hedges (if any) from the long positions held in the strategy. Keep in mind that any
Bear hedges can be in styles and sectors that may not exactly match the long positions held in the strategy.
Consequently, the hedging process is not a perfect defense, but can be an effective risk management tool.
Past performance is not a guarantee of future results.
NOT FDIC INSURED ~ NOT BANK GUARANTEED ~ MAY LOSE VALUE
Page 8
S&P 500 Large Cap Index
12/31/16 to 4/27/18
Source: Omni Trader - Nirvana Systems
200 DMA Red
50 DMA Green
11 DMA Orange
S&P500

DISCLOSURES
There is no assurance that these movements or trends will be profitable or imply a successful invest-
ment strategy. The information has been prepared without regard to any particular investor’s invest-
ment objectives or financial situation. Investors should not act on the information in this report with-
out obtaining specific advice from their financial advisors.
Short Term (S-T) signals are based on daily price data and may be different and change more fre-
quently than the intermediate Term (I-T) signals that are based on price action for a trailing 5 day
period. These ratings are subject to change at any time and their accuracy is not guaranteed. Indi-
vidual securities may perform differently from these signals.
These directional signals are a useful tool in the portfolio management process but are not the sole
determinate of actual portfolio style or sector weightings. Market data used in this analysis is be-
lieved to be from reliable sources but it is not guaranteed. No investment strategy can guarantee suc-
cess.
Asset allocation does not guarantee a profit nor protect against loss. Investing involves risk including
the possible loss of capital . The performance noted does not include fees and charges which would
reduce an investor's returns.
The indexes mentioned are unmanaged and cannot be invested in directly. Mid-cap and small cap
securities generally involve greater risks. International investing involves additional risks such as
currency fluctuations, differing financial accounting standards, and possible political and economic
instability. These risk are greater in emerging markets. The companies engaged in any specific sec-
tor are subject to fierce competition and their products and services may be subject to rapid obsoles-
cence.
High-yield bonds are not suitable for all investors. Dollar cost averaging does not assure a profit and
does not protect against loss. It involves continuous investment regardless of fluctuating price levels
of such securities. Investors should consider their financial ability to continue purchases through
periods of low price levels. U.S. Treasury securities are guaranteed by the U.S. government and, if
held to maturity, offer a fixed rate of return and guaranteed principal value.
Page 9

Page
Technical Analysis Process Explanation
Ron’s Technical Analysis process utilizes the OMNI Trader software program developed by Nirvana
Systems in Austin, Texas. This program is essentially a tool box that contains many technical sys-
tems, such as moving averages, trend lines, overbought/oversold oscillators, classical price patterns,
etc. to determine the strength and direction of the current price direction of the security under review
based on an analysis of historical price data.
This process analyzes the price action of approximately 500 conventual and exchange traded mutual
funds daily. The mutual funds are organized into specific styles and sectors typically with 10 funds
representing each style and sector. For Example, there are 10 Biotech funds, 10 Banking funds, 10
Energy funds, and so on. Altogether, 45 styles and sectors are analyzed and shown on the webs site
table.
If the technical analysis indicates that a fund is in an up trending mode, it is given a green arrow
pointing up and if the analysis indicates a down trending mode, it is given a Red arrow pointing
down. If the analysis is indeterminate, that is noted as a Neutral rating split between a Green and
Red arrow. If 60% or more of the arrows are green for a style or sector, then the Table cell shows a
Green light. If 40% or less of the arrows are Green, then the Table shows a Red light.
The date on which the signal direction changed is noted in each cell of the Table along with it current
Rating number (i.e., the % of Green arrows). This majority rule of the style or sector fund arrows is
an essential part of determining the cell color. Please note that these signals do not represent actual
trading.
Web Site Commentary
My Portfolio Action Update commentary is a periodic update of my technical analysis view-point of
the financial market environment and the current portfolio management posture for our key portfolio
strategies. In general, my portfolio management approach is to determine current market conditions
through technical analysis and to position the various portfolio strategies to participate in the current
environment.
My belief is that the market price is the final arbiter of all available information as digested by all
market participants regarding security values. Therefore, carefully analyzing price action over time is
the key element in our portfolio management process. However, neither opinions, technical analysis
or fundamental security analysis produce perfect results. There is always a degree of risk present.
A few days may transpire from when these comments are written and when they are posted on the web
site. Obviously, the technical analysis data and portfolio positions could have changed in that
timeframe. Therefore, these comments should be read in the context of what we have been doing, not
necessarily what we may be doing when you actually read them. This information is not intended to
be a solicitation of a buy or sell of any financial security.
The opinions expressed herein are my own and do not reflect the positions of RAYMOND JAMES.
10

Page
Index Definitions
U.S. Market Index Information:
The Dow Jones Industrial Average (DJIA) is an unmanaged index of 30 widely held securities.
The Dow Jones Transportation Average is the most widely recognized gauge of the American transportation
sector.
The Dow Jones Utility Average keeps track of the performance of 15 prominent utility companies.
The S&P500 is an unmanaged index of 500 widely held stocks.
The S&P Mid Cap 400 index is a capitalization-weighted index that measures the performance of the mid-range
sector of the U.S stock market.
The S&P Small Cap 600 Index is an unmanaged index of 600 small-cap stocks.
The NASDAQ Composite Index is an unmanaged index of all stocks traded on the NASDAQ over-the-counter
market.
The Russell 2000 index is an unmanaged index of small cap securities which generally involve greater risk.
The BW Bank Sector (BKX) is a capitalization weighted index composed of 24 geographically diverse stocks
representing national money center banks and leading regional institutions.
The NYSE Arca Biotechnology index (BTK) is an equal dollar weighted index designed to measure the perfor-
mance of a cross section of companies in the biotechnology industry that are primarily involved in the use of
biological processes to develop products or provide services.
The NYSE Arca Oil index (XOP) is a price-weighted index of the leading companies involved in the explora-
tion, production, and development of petroleum.
The PHLX Semiconductor Sector Index (SOXX) measures the performance of U.S. traded securities
of companies engaged in the semiconductor business, which includes companies engaged in the de-
sign, distribution, manufacture, and sales of semiconductors.
The Philadelphia Gold and Silver index (XAU) is an index of 16 precious metal mining companies that are
traded on the Philadelphia stock Exchange.
The Value Line Geometric index is a broad based index of equally weighted approximately 1675 stocks selected
by the Value Line company from the NYSE, American Stock Exchange and the NASDAQ Over-the-counter
stock market.
Dow Jones Technology Titans 30 Index - Represents leading companies in the global Technology sector. The
index includes 30 stocks selected based on rankings by float-adjusted market capitalization , revenue and net
profit.
AMZ - Alerian MLP Index - is an index that is a composite of 50 energy infrastructure MLP constituents that
represent approximately 75% of total market capitalization.
11

Page
Foreign Markets Index Information:
The MSCI EAFE Index is recognized as the pre-eminent benchmark in the United States to measure interna-
tional equity performance. It comprises the MSCI country indexes that represent developed markets outside of
North America: Europe, Australasia and the Far East.
The MSCI Emerging Market Index is a free float-adjusted market capitalization index that is designed to meas-
ure equity market performance of over 800 securities in 23 markets representing approximately 13% of world
market cap; Brazil, Russia, India, China, Colombia, Mexico, Peru, Czech Republic, Greece, Egypt, Hungary,
Poland, Qatar, South Africa, Turkey, United Arab Emirates, Indonesia, Korea, Malaysia, Philippines, Taiwan,
and Thailand.
The Hang Seng is a free-float capitalization-weighted index of a selection of companies from the Stock Ex-
change of Hong Kong. The components of the index are divided into four sub indices: Commerce and Industry,
Finance, Utilities, and Properties. The index was developed with a base level of 100 as July 31, 1964.
The Shanghai Stock Exchange 180 A-Share Index is a free float-weighted index. The index tracks the daily
price performance of the 180 most representative A-Share stocks listed on the Shanghai Stock Exchange.
The Dow Asia index (ADOW) and the Dow Europe index (EDOW) are 30 Blue Chip companies in these re-
spected regions that is developed by the same organization and process as the Dow Jones Industrial Average is
composed.
The STOXX Europe 600 Index is derived from the STOXX Europe Total Market Index and is a subset of the
STOXX Global 1800 Index. The Global 1800 Index provides a broad yet liquid representation of the world’s
most developed markets with a fixed number of 1800 components.
Dow Jones Asian Titans Index is a market capitalization-weighted index of Asia-Pacific stocks designed to cap-
ture the blue-chip leaders of the region. The stock universe is the Dow Jones Asia-Pacific Index, from which the
50 largest Japan-based and 50 largest non-Japan based stocks are selected. The two lists of 50 stocks are given
final rankings based 60% on market cap, 20% on current revenues and 20% on current net income levels. The
top 25 members are then chosen from each list for the Asian Titans Index, half of which will be made up of Ja-
pan-based companies.
12