
Ancient Faiths embodied in Ancient Names (vol. 1) - Amazon S3
Population and History in the Ancient Titicaca Basin
by
Matthew Sebastian Bandy
B.A. (Stanford University) 1992M.A. (University of California at Berkeley) 1997
A dissertation submitted in partial satisfaction of the
requirements for the degree of
Doctor of Philosophy
in
Anthropology
in the
GRADUATE DIVISION
of the
UNIVERSITY of CALIFORNIA at BERKELEY
Committee in charge:
Professor Christine A. Hastorf, ChairProfessor Rosemary A. JoyceProfessor Jean-Pierre ProtzenProfessor M. Steven Shackley
Fall 2001
The dissertation of Matthew Sebastian Bandy is approved:
Chair Date
Date
Date
Date
University of California at Berkeley
Fall 2001
Population and History in the Ancient Titicaca Basin
Copyright 2001
by
Matthew Sebastian Bandy
1
Abstract
Population and History in the Ancient Titicaca Basin
by
Matthew Sebastian Bandy
Doctor of Philosophy in Anthropology
University of California at Berkeley
Professor Christine A. Hastorf, Chair
Our understanding of the processes leading to the emergence of the Tiwanaku state
around 500 A.D. has been severely hampered by a lack of information on the long For-
mative Period (1500 B.C. - 500 A.D.) which preceded it. This thesis develops an agent-
centered approach to studying prehistoric settlement system formation and transformation.
It is argued that any adequate understanding of settlement dynamics must consider varying
settlement growth rates as resulting from the concrete and historically contingent residen-
tial decisions of a regional population. Thus, regional settlement dynamics can be read in
such a way as to reveal broad, aggregate patterns of prehistoric decision-making. Agency
may be studied in the absence of a well-defined agent.
This approach is then applied to the problem of the southern Titicaca Basin Formative
Period. The evolution of the regional settlement system is traced from the establishment of
sedentary agricultural villages (1500 B.C.) through the early Colonial Period (1600 A.D.).
Significant milestones include: 1) the evolution of a system of permanent autonomous
villages (beginning 800 B.C.), 2) the development of a multi-community polity, which I
term the Taraco Peninsula Polity (250 B.C.), 3) Tiwanaku regional dominance and eventual
state formation (beginning perhaps around 400 A.D.), 4) Tiwanaku collapse (1100 A.D.),
and 5) conquest by foreign powers (ca. 1450 A.D.). These developments are interpreted in
light of the decision-making patterns revealed by settlement dynamics, as well as significant
2
changes in regional exchange systems, political relations, subsistence regimes, and the level
of Lake Titicaca. A new account of Tiwanaku state formation is finally presented, one
which stresses cross-cultural processes as they were played out against the field of Titicaca
Basin environmental, economic, and demographic history.
Professor Christine A. HastorfDissertation Committee Chair
i
Contents
List of Figures v
List of Tables vii
1 Introduction: states, chiefdoms, and social evolution 11.1 White’s ‘neo-Lamarckism’ . . . . . . . . . . . . . . . . . . . . . . . . . .21.2 Evolution as such . . . . . . . . . . . . . . . . . . . . . . . . . . . . . . .51.3 Society: primitive and civil, chiefdom and state . . . . . . . . . . . . . . .71.4 Steward’s ‘phenomena of limited occurrence’ . . . . . . . . . . . . . . . .121.5 Longitudinal studies . . . . . . . . . . . . . . . . . . . . . . . . . . . . . .141.6 The Tiwanaku state . . . . . . . . . . . . . . . . . . . . . . . . . . . . . .161.7 This volume . . . . . . . . . . . . . . . . . . . . . . . . . . . . . . . . . .18
2 The Taraco Peninsula 202.1 Geology . . . . . . . . . . . . . . . . . . . . . . . . . . . . . . . . . . . .202.2 Climate . . . . . . . . . . . . . . . . . . . . . . . . . . . . . . . . . . . .252.3 Micro-environmental zones . . . . . . . . . . . . . . . . . . . . . . . . . .27
2.3.1 Upper Colluvial Zone (UCZ) . . . . . . . . . . . . . . . . . . . . .272.3.2 Lower Colluvial Zone (LCZ) . . . . . . . . . . . . . . . . . . . . .282.3.3 Springs and Grass Zone (SGZ) . . . . . . . . . . . . . . . . . . . .29
2.4 Previous archaeological research . . . . . . . . . . . . . . . . . . . . . . .30
3 Field methodology and ceramic phase identification 383.1 Survey and site definition . . . . . . . . . . . . . . . . . . . . . . . . . . .40
3.1.1 Ceramic scatters . . . . . . . . . . . . . . . . . . . . . . . . . . .403.1.2 Agricultural features . . . . . . . . . . . . . . . . . . . . . . . . .42
3.2 Systematic surface collection . . . . . . . . . . . . . . . . . . . . . . . . .423.3 Ceramic phase identification . . . . . . . . . . . . . . . . . . . . . . . . .44
3.3.1 Identifying Early and Middle Formative period ceramics . . . . . .463.3.2 Identifying ceramics of the remaining periods . . . . . . . . . . . .56
ii
3.4 The dataset . . . . . . . . . . . . . . . . . . . . . . . . . . . . . . . . . .57
4 Interpreting settlement data 584.1 Correcting site sizes . . . . . . . . . . . . . . . . . . . . . . . . . . . . . .59
4.1.1 Assume that ancient household units are roughly comparable tomodern ones . . . . . . . . . . . . . . . . . . . . . . . . . . . . .60
4.1.2 Correct sector size for artifact “splash zone” . . . . . . . . . . . . .644.1.3 Assume “point contemporaneity” of occupation . . . . . . . . . . .684.1.4 Calculate total number of households for the sector . . . . . . . . .714.1.5 Calculate a “sector population index” for the sector . . . . . . . . .714.1.6 Calculate a “phase population index” for the region . . . . . . . . .73
4.2 Interpreting (corrected) sector sizes . . . . . . . . . . . . . . . . . . . . . .744.2.1 Population through time . . . . . . . . . . . . . . . . . . . . . . .744.2.2 Site size hierarchy . . . . . . . . . . . . . . . . . . . . . . . . . .814.2.3 Population density . . . . . . . . . . . . . . . . . . . . . . . . . .824.2.4 The site founding index . . . . . . . . . . . . . . . . . . . . . . .834.2.5 The occupation continuity index . . . . . . . . . . . . . . . . . . .834.2.6 Population density change . . . . . . . . . . . . . . . . . . . . . .85
4.3 Caveat . . . . . . . . . . . . . . . . . . . . . . . . . . . . . . . . . . . . .86
5 The Early Formative: initial settlement and population growth 875.1 Phase definition . . . . . . . . . . . . . . . . . . . . . . . . . . . . . . . .89
5.1.1 Early Chiripa . . . . . . . . . . . . . . . . . . . . . . . . . . . . .905.1.2 Middle Chiripa . . . . . . . . . . . . . . . . . . . . . . . . . . . .91
5.2 Principal sites . . . . . . . . . . . . . . . . . . . . . . . . . . . . . . . . .925.2.1 Early Formative 1 . . . . . . . . . . . . . . . . . . . . . . . . . . .925.2.2 Early Formative 2 . . . . . . . . . . . . . . . . . . . . . . . . . . .97
5.3 Settlement and population . . . . . . . . . . . . . . . . . . . . . . . . . .103
6 The Middle Formative: emerging complexity 1126.1 Phase definition . . . . . . . . . . . . . . . . . . . . . . . . . . . . . . . .1146.2 Principal sites . . . . . . . . . . . . . . . . . . . . . . . . . . . . . . . . .1186.3 Architectural evolution . . . . . . . . . . . . . . . . . . . . . . . . . . . .124
6.3.1 The Llusco Structure . . . . . . . . . . . . . . . . . . . . . . . . .1266.3.2 The Lower House Level . . . . . . . . . . . . . . . . . . . . . . .1266.3.3 The Upper House Level . . . . . . . . . . . . . . . . . . . . . . .1286.3.4 Other sites . . . . . . . . . . . . . . . . . . . . . . . . . . . . . .133
6.4 Lake level change . . . . . . . . . . . . . . . . . . . . . . . . . . . . . . .1366.5 Exchange . . . . . . . . . . . . . . . . . . . . . . . . . . . . . . . . . . .140
6.5.1 Olivine Basalt . . . . . . . . . . . . . . . . . . . . . . . . . . . . .141
iii
6.5.2 Estimating total olivine basalt imports . . . . . . . . . . . . . . . .1456.5.3 Source of exotic olivine basalt . . . . . . . . . . . . . . . . . . . .1476.5.4 Discussion . . . . . . . . . . . . . . . . . . . . . . . . . . . . . .148
6.6 Settlement and population . . . . . . . . . . . . . . . . . . . . . . . . . .1496.6.1 Decreasing population growth rate . . . . . . . . . . . . . . . . . .1496.6.2 Increasing settlement system stability . . . . . . . . . . . . . . . .1506.6.3 Two-tiered site size hierarchy . . . . . . . . . . . . . . . . . . . .151
6.7 Discussion . . . . . . . . . . . . . . . . . . . . . . . . . . . . . . . . . . .156
7 The Late Formative: multi-community polities and state formation 1627.1 Phase definition . . . . . . . . . . . . . . . . . . . . . . . . . . . . . . . .163
7.1.1 Late Formative 1 . . . . . . . . . . . . . . . . . . . . . . . . . . .1657.1.2 Late Formative 2 . . . . . . . . . . . . . . . . . . . . . . . . . . .171
7.2 Principal sites . . . . . . . . . . . . . . . . . . . . . . . . . . . . . . . . .1747.2.1 Late Formative 1 . . . . . . . . . . . . . . . . . . . . . . . . . . .1747.2.2 Late Formative 2 . . . . . . . . . . . . . . . . . . . . . . . . . . .180
7.3 Lake level change . . . . . . . . . . . . . . . . . . . . . . . . . . . . . . .1837.4 Exchange . . . . . . . . . . . . . . . . . . . . . . . . . . . . . . . . . . .1867.5 Settlement and population . . . . . . . . . . . . . . . . . . . . . . . . . .187
7.5.1 Late Formative 1 . . . . . . . . . . . . . . . . . . . . . . . . . . .1887.5.2 Late Formative 2 . . . . . . . . . . . . . . . . . . . . . . . . . . .196
7.6 Discussion . . . . . . . . . . . . . . . . . . . . . . . . . . . . . . . . . . .198
8 The Middle Horizon: the mature Tiwanaku state 2058.1 Phase definition . . . . . . . . . . . . . . . . . . . . . . . . . . . . . . . .2078.2 Principal sites . . . . . . . . . . . . . . . . . . . . . . . . . . . . . . . . .2108.3 Settlement and population . . . . . . . . . . . . . . . . . . . . . . . . . .2208.4 Discussion . . . . . . . . . . . . . . . . . . . . . . . . . . . . . . . . . . .226
9 The Late Intermediate Period: collapse and demographic decline 2289.1 Phase definition . . . . . . . . . . . . . . . . . . . . . . . . . . . . . . . .2299.2 Principal sites . . . . . . . . . . . . . . . . . . . . . . . . . . . . . . . . .2339.3 Settlement and population . . . . . . . . . . . . . . . . . . . . . . . . . .2359.4 Discussion . . . . . . . . . . . . . . . . . . . . . . . . . . . . . . . . . . .239
10 The Late Horizon and Early Colonial Period: conquest and colonial adminis-tration 24810.1 Phase definition . . . . . . . . . . . . . . . . . . . . . . . . . . . . . . . .249
10.1.1 Late Horizon . . . . . . . . . . . . . . . . . . . . . . . . . . . . .25010.1.2 Early Colonial Period . . . . . . . . . . . . . . . . . . . . . . . . .25410.1.3 Are the Pacajes phases temporally discrete? . . . . . . . . . . . . .257
iv
10.2 Principal sites . . . . . . . . . . . . . . . . . . . . . . . . . . . . . . . . .25910.2.1 Late Horizon . . . . . . . . . . . . . . . . . . . . . . . . . . . . .25910.2.2 Early Colonial Period . . . . . . . . . . . . . . . . . . . . . . . . .263
10.3 Settlement and population . . . . . . . . . . . . . . . . . . . . . . . . . .26610.3.1 Late Horizon . . . . . . . . . . . . . . . . . . . . . . . . . . . . .26610.3.2 Early Colonial Period . . . . . . . . . . . . . . . . . . . . . . . . .269
10.4 Discussion . . . . . . . . . . . . . . . . . . . . . . . . . . . . . . . . . . .272
11 The southern Titicaca Basin in the long term 27911.1 Initial settlement, population growth . . . . . . . . . . . . . . . . . . . . .28011.2 Autonomous villages, competitive ceremonialism . . . . . . . . . . . . . .28411.3 Multi-community polities, tributary relations . . . . . . . . . . . . . . . . .29011.4 Tiwanaku dominance, state formation . . . . . . . . . . . . . . . . . . . .29311.5 Collapse, demographic decline, conquest . . . . . . . . . . . . . . . . . . .300
Bibliography 303
A Site and sector registry 331
B Surface collection ceramic counts 352
C Ceramic analysis program code 364
D Occupation density program code 367
E Occupation continuity program code 370
F Settlement database schema 373
v
List of Figures
2.1 The Southern Lake Titicaca Basin . . . . . . . . . . . . . . . . . . . . . .212.2 Map of the Taraco Peninsula . . . . . . . . . . . . . . . . . . . . . . . . .232.3 Precipitation, temperature, and agricultural labor by month . . . . . . . . .262.4 Tiwanaku Core Region chronology . . . . . . . . . . . . . . . . . . . . . .32
3.1 Project Area: All Registered Sites . . . . . . . . . . . . . . . . . . . . . .393.2 Chiripa ceramic analysis process flow chart . . . . . . . . . . . . . . . . .51
4.1 Schematic representation of a contemporary Aymara residential compound.624.2 Habitation area and “splash zone” . . . . . . . . . . . . . . . . . . . . . .654.3 Scenarios for the formation of an archaeological sector . . . . . . . . . . .70
5.1 Early Formative Ceramics . . . . . . . . . . . . . . . . . . . . . . . . . .915.2 Early Formative 1 (Early Chiripa) Settlement Pattern . . . . . . . . . . . .935.3 Early Formative 2 (Middle Chiripa) Settlement Pattern . . . . . . . . . . .985.4 Early Formative site size distributions . . . . . . . . . . . . . . . . . . . .1065.5 EF: Sum of phase population index per 0.25 km2 . . . . . . . . . . . . . .1075.6 EF: Change in phase population index per 0.25 km2 . . . . . . . . . . . . .109
6.1 Middle Formative ceramics . . . . . . . . . . . . . . . . . . . . . . . . . .1166.2 Qaluyu-related Middle Formative ceramics from the Taraco Peninsula . . .1176.3 Middle Formative (Late Chiripa) Settlement Pattern . . . . . . . . . . . . .1206.4 Plan of Chiripa (T-1) . . . . . . . . . . . . . . . . . . . . . . . . . . . . .1216.5 Plan of Alto Pukara (T-430) . . . . . . . . . . . . . . . . . . . . . . . . . .1256.6 Upper House Level with excavations (T-1, Chiripa) . . . . . . . . . . . . .1306.7 Reconstructed shoreline of Lago Wiñaymarka, 1000 B.C.- 450 B.C. . . . .1386.8 Reconstructed shoreline of Lago Wiñaymarka, 450 B.C.- 250 B.C. . . . . .1396.9 Middle Formative site size distribution . . . . . . . . . . . . . . . . . . . .1526.10 Middle Formative: Sum of phase population index per 0.25 km2 . . . . . . 1536.11 Middle Formative: Change in phase population index per 0.25 km2 . . . . . 154
vi
7.1 Late Formative ceramics . . . . . . . . . . . . . . . . . . . . . . . . . . .1677.2 Late Formative ceramics . . . . . . . . . . . . . . . . . . . . . . . . . . .1697.3 Late Formative 1 (Tiwanaku I/Kalasasaya) Settlement Pattern . . . . . . . .1757.4 Late Formative 2 (Tiwanaku III/Qeya) Settlement Pattern . . . . . . . . . .1817.5 Reconstructed shoreline of Lago Wiñaymarka, 250 B.C.- 150 A.D. . . . . .1847.6 Late Formative site size distribution . . . . . . . . . . . . . . . . . . . . .1917.7 Late Formative: Sum of phase population index per 0.25 km2 . . . . . . . . 1937.8 Late Formative: Change in phase population index per 0.25 km2 . . . . . . 194
8.1 Tiwanaku ceramics . . . . . . . . . . . . . . . . . . . . . . . . . . . . . .2088.2 Tiwanaku (Tiwanaku IV/V) Settlement Pattern . . . . . . . . . . . . . . .2118.3 Middle Horizon site size distribution . . . . . . . . . . . . . . . . . . . . .2218.4 Tiwanaku: Sum of phase population index per 0.25 km2 . . . . . . . . . . .2238.5 Tiwanaku: Change in phase population index per 0.25 km2 . . . . . . . . . 224
9.1 Late Intermediate Period ceramics . . . . . . . . . . . . . . . . . . . . . .2319.2 Late Intermediate Period (Early Pacajes) Settlement Pattern . . . . . . . . .2349.3 Late Intermediate Period site size distribution . . . . . . . . . . . . . . . .2379.4 Early Pacajes: Sum of phase population index per 0.25 km2 . . . . . . . . . 2389.5 Early Pacajes: Change in phase population index per 0.25 km2 . . . . . . . 238
10.1 Late Horizon ceramics . . . . . . . . . . . . . . . . . . . . . . . . . . . .25210.2 Early Colonial Period ceramics . . . . . . . . . . . . . . . . . . . . . . . .25510.3 Late Horizon (Pacajes-Inka) Settlement Pattern . . . . . . . . . . . . . . .26010.4 Early Colonial Period (Late Pacajes) Settlement Pattern . . . . . . . . . . .26410.5 Late Horizon and Early Colonial site size distribution . . . . . . . . . . . .26810.6 PI-LP: Sum of phase population index per 0.25 km2 . . . . . . . . . . . . .27010.7 PI-LP: Change in phase population index per 0.25 km2 . . . . . . . . . . .271
vii
List of Tables
1.1 Two kinds of social evolutionary theory . . . . . . . . . . . . . . . . . . .13
2.1 Sector count by micro-environmental zone and elevation . . . . . . . . . .282.2 Tiwanaku Core Region chronology . . . . . . . . . . . . . . . . . . . . . .33
3.1 Correlation of CAT Paste Groups and Steadman’s Pastes. . . . . . . . . . .523.2 Index Profiles for the Chiripa phases . . . . . . . . . . . . . . . . . . . . .53
5.1 Early Formative: Metrics . . . . . . . . . . . . . . . . . . . . . . . . . . .104
6.1 Occurrence of exotic olivine basalt in the Chiripa phases . . . . . . . . . .1436.2 Surface densities of exotic olivine basalt at selected Taraco Peninsula sites .1436.3 Middle Formative: Metrics . . . . . . . . . . . . . . . . . . . . . . . . . .1506.4 Rates of annual population growth in the Middle Formative . . . . . . . . .155
7.1 Raw material frequency of lithic agricultural implements on the Pampa Koani1877.2 Late Formative: Metrics . . . . . . . . . . . . . . . . . . . . . . . . . . .1887.3 Hamlets as percentage of total phase population index, all periods . . . . .189
8.1 Middle Horizon: Metrics . . . . . . . . . . . . . . . . . . . . . . . . . . .2208.2 Population growth rate by settlement hierarchy tier . . . . . . . . . . . . .2228.3 Population growth rate by UTM easting . . . . . . . . . . . . . . . . . . .2258.4 Total raised field area (ha) by UTM easting . . . . . . . . . . . . . . . . .226
9.1 Late Intermediate Period: Metrics . . . . . . . . . . . . . . . . . . . . . .2369.2 Corrected and uncorrected aggregate population measures by region: Mid-
dle Horizon and Late Intermediate Period . . . . . . . . . . . . . . . . . .244
10.1 Percent of Pacajes-Inka sites also having other Pacajes occupations . . . . .25810.2 Late Horizon and Early Colonial: Metrics . . . . . . . . . . . . . . . . . .26710.3 Post-Tiwanaku annual population growth rates: Taraco Peninsula . . . . . .27410.4 Post-Tiwanaku annual population growth rates: Lower Tiwanaku Valley . .276
viii
Acknowledgements
The tally of people who have contributed to this research is for all practical purposes
endless, and a complete list would comprise a roster of the Andean archaeological research
community. I will single out first of all Amanda Cohen, my wife and colleague, Christine
Hastorf, my academic advisor and friend, and the various members of the Taraco Archae-
ological Project: Lee Steadman, William Whitehead, Emily Dean, David Kojan, Claudia
Rivera, Sonia Alconini, Katherine Moore, José Luis Paz, Deborah Blom, Miriam Doutri-
aux, Don Johnson, Melissa Goodman, Maria Bruno, and Andy Roddick.
I was assisted in the field at different times by Robin Beck, Erika Simborth, Michael
Wilkes, Augusto Cardona, and Kirk Frye. Felipe Choque and Facundo Llusco participated
in the entire project. It could not have been completed without their assistance. Leonardo
Laura of Tiwanaku drew almost all of the ceramics. Javier Escalante, Eduardo Pareja,
and Cesar Calisaya of DINAAR continually involved themselves in the research and made
things move forward when they seemed hopelessly mired. I was also assisted by represen-
tatives of each community, too numerous to name here. I would particularly like to thank
Pacifico Choquetarqui, then-alcalde of Taraco, together with Victor Acarapi, a more recent
mayor, for their help, for their friendship, and, in the case of Victor, for reminding me how
logarithms work. My many friends in Chiripa and in other Taraco Peninsula communities
made my stay there a pleasant experience that I would like to repeat: Silverio Choque-
huanca, Juan de la Cruz Marka, Luciano Acarapi, Valentín Choquetarqui, Pedro and Pablo
Marka, and many others. My friends and colleagues in La Paz displayed endless patience
with my one-track mind, and provided valuable feedback, commentary and discussion: Pi-
lar Lima, Dante Angelo, Denis Rodas, and Pablo Rendón. Ron Davis and Diane Bellomy
are good friends and helped me a great deal. John Janusek, Kirk Frye, Lee Steadman, and
Carlos Lémuz provided me with access to unpublished materials, and were extremely gen-
erous in sharing their knowledge of Titicaca Basin prehistory. In this connection, I would
also like to note the collegiality and assistance of David Browman, Charles Stanish, Clark
Erikson, William Isbell, and Juan Albarracín-Jordan. Jeffrey Parsons visited the field site
while research was in progress and was kind enough to offer some comments.
ix
The South-Central Andean archaeological community is a large and close-knit one.
I would like to specifically thank Paul Goldstein, Mark Aldenderfer, Karen Aldenderfer,
Bruce Owen, Karen Wise, Sergio Chávez, Karen Mohr-Chávez, Antonio Oquiche, Monika
Barrionuevo, Ryan Williams, Donna Nash, Rolando Paredes, Edmundo de la Vega, Ce-
cilia Chávez, JoEllen Burkholder, Lisa Cipolla, Matthew Seddon, Aimee Plourde, Cynthia
Klink, Elizabeth Arkush, Elizabeth Klarich, Cynthia Herhahn, Karen Anderson, Amy Rod-
man, Martín Giesso, Tim McAndrews, and Alexei Vranich. The patience of my professors
at U.C. Berkeley has been monumental: thanks to Steven Shackley, Jean-Pierre Protzen,
Rosemary Joyce, and Margaret Conkey. John Rick and Rosa Mendoza de Rick are re-
sponsible for my having chosen a career in archaeology in the first place, and have been
constantly supportive since my undergraduate days. John Rowe and Patricia Lyon have
also been extremely supportive over the years.
I would also like to acknowledge the support of my family: Paul, Amanda, Robin, Mary
Beth, and Lysa Bandy, Thomas Jeffrey Rae, Catherine Curry, and David and Sherry Cohen.
This dissertation was written almost entirely using free software. I would like to
thank all of the people who have contributed to the following projects: Linux, Gnome,
LYX, LATEX, Pybliographer, Sketch, GIMP, Perl, MySQL, Abiword, Gnumeric, Dia, Qcad,
GRASS, ghostscript, and gnuplot. You have made the world a better place.
The research was carried out with financial assistance from the Wenner-Gren Foun-
dation, the National Science Foundation, and a United States Department of Education
Fulbright-Hays fellowship.
The survey covered the following communities, in whole or in part: Huacullani, Sikuya,
Queruni, Kala Kala, Pequery, Chiripa, Chiaramaya, Zapana, Nachoca, Ñacoca, Santa Rosa,
San José, Coa Khollu, and Iwawe Grande.
The research reported here took place within the territories of these communities and
with the full consent of each. The process of negotiating access to community lands, though
often arduous, also proved very rewarding, and gave rise to considerable collaboration
with interested residents of the area. I would like to thank all of the inhabitants of these
communities for their assistance, support, interest, and hospitality.
x
This volume is dedicated most especially to two senior colleagues who passed away
during its completion: Karen Mohr-Chávez and Max Portugal Ortíz. Both of these scholars
made important contributions to the study of the Titicaca Basin Formative generally, and
the Chiripa Culture specifically. Both left us at a young age. They will be missed.
Last of all, I would like to thank Amanda Cohen. Again. For everything.
1
Chapter 1
Introduction: states, chiefdoms, and
social evolution
The state is surely one of the great ciphers of intellectual history. Speculation as to
its origins, function and legitimacy has most likely taken place in every place and ev-
ery age in which human beings found themselves ‘caged’ (Mann 1986) within these pe-
culiar and bewildering social formations. Within the conventional genealogy of Western
intellectualism, abstract thinking about the state dates at least as far back as Aristotle
(Weissleder 1978) and can be traced through both the Christian and Islamic worlds to the
present day (Service 1975Chapter 1,Service 1978). Anthropological theories of the state
and its origins, however, may be traced to the writings of “a group of speculative lawyers”
(Kuper 1988: 8) in the second half of the nineteenth century. First among these, chrono-
logically, was Henry Maine whoseAncient Societywas published in 1861.1 This book was
soon joined by the works of Bachofen, McLennan, Tylor, Morgan, Lubbock and others. As
a body, these works directly inspired the discipline of anthropology, primarily through the
methodology of kinship analysis, and contributed significantly - through the later writings
of Durkheim - to sociology as well. On a crude level, the theories of all these authors had
in common:1This discussion is in large part based on Kuper’s excellent treatment of nineteenth-century evolutionism
(Kuper 1988).

Chapter 1 2
1. a distinction between ‘primitive’ (Morgan’s ‘societas’) and ‘civil’ (Morgan’s ‘civi-
tas’) societies, the former based on kinship (blood), the latter on contract (soil),
2. the notion that ‘civil’ society had in some manner developed from ‘primitive’ society,
and
3. the conviction that contemporary ‘primitive’ societies represented various stages in
this evolutionary chain.
Primitive society thus became the privileged object of anthropological inquiry.
If this specific formulation of primitive society was to have a long and checkered his-
tory, the prospects for evolutionism itself seemed much less certain. By the turn of the cen-
tury, the Boasian critique had essentially rendered evolutionism a dead issue in America.
It lingered several decades longer in Britain, finally to be put to the sword by Malinowski.
Social evolutionism would have remained a curiosity of anthropological history, then, had
it not been for a revivalist movement in the United States in the 1940s and 50s led by Leslie
White and Julian Steward. Social evolution in archaeology is generally considered to have
stemmed from the work of these two authors, and from that of Elman Service, a student
both of White and of Steward. This being the case, I consider it worth exploring in some
detail the roots of their thought and the meaning they attributed to the term ‘evolution.’
1.1 White’s ‘neo-Lamarckism’
Many archaeologists seem to be laboring under the significant misapprehension that
the evolution of Steward, White, and Service derived from Darwinism. Thus, Price, for
example, writes:
What may generally be called adaptive models have had considerable impactthroughout American anthropology, at least since the work of White and Stew-ard. Such models are derived ultimately from the paradigm of Darwinian evo-lution; they are based upon the observed occurrence of random variation, thedifferential survival of which is non-random, governed by the principles ofadaptation and selection (Price 1978: 162).
Chapter 1 3
Leaving aside the fact that no ‘principle of adaptation,’ of equal standing with that of natural
selection, may be located in the writings of Darwin, it must be objected that this description
of social evolutionism has little to do with what White actually wrote. In fact, White has
little to do with Darwin at all. His theory rather represents a curiouspasticheincorporating
elements of Morgan (and the nineteenth century evolutionists in general), Marx and Herbert
Spencer.
As a rough approximation of the influence of various writers on White, we may take
the number of pages in hisThe Evolution of Culture(White 1959) on which each author’s
name is mentioned. We see, then, that Darwin’s name is mentioned on seven pages of
the 370-page book (and these references have primarily to do with his views on ‘primitive
promiscuity’), while Morgan and Tylor merit fifteen pages apiece. Moreover, the term
“natural selection” receives not a single mention in the entire volume.2
That White in no way conceived of his thought as related to Darwinism is also ap-
parent in the fact that he accepts ‘neo-platonism’ and ‘neo-Lamarckism’ as “valid terms”
(White 1959: ix) for his Science of Culture. No, his conception of evolution as “a tempo-
ral sequence of forms” (White 1959: 30) is clearly based on his reading of the nineteenth
century social evolutionists. Indeed, “the theory of evolution set forth in [his] work does
not differ one whit from that expressed in Tylor’s Anthropology in 1881” (White 1959: ix).
The evolutionary sequence he developed is formally quite similar to that set forth by Mor-
gan inAncient Society, comprising a series of stages distinguished by the acquisition of one
or more technological and/or ‘integrative’ traits, to use the term preferred by Service.
White’s debt to Marx is less explicit but no less significant. Writing as he was in the
United States in the 1950’s, he was understandably reticent in drawing attention to this
fact.3 Service however, writing in a relatively less oppressive climate, relates that White
taught Marx in his classes in the thirties at the University of Michigan (Service 1975: xvi).
The debt is obvious in White’s “theory of technological determinism” (White 1959: 24).
2Belaboring the point, we might add that Darwin appears in neither the index nor the bibliography ofSteward’sTheory of Culture Change(Steward 1955). Neither does he appear in Service’sPrimitive SocialOrganization(Service 1962), and he is mentioned only once inOrigins of the State and Civilizationto quotea short passage on social equality "retarding" civilization (Service 1975: 50).
3Marx appears on fewer pages even than Darwin: exactly one.
Chapter 1 4
The form of Marxism which he adopts is, however, a nondialectical, substantivist one, bor-
rowing Marx’s model of society but putting aside his theory of history. This is, as Price
notes, a “classical heresy”, and one which she herself adopts (Price 1978: 163). White even
betrays himself in certain turns of phrase. For example, he writes: “The families were in
association with one another like marbles in a sack; they were not knit together by specific
and particular ties between their respective constituent members” (White 1959: 81). This
immediately calls to mind, of course, Marx’s famous passage fromThe Eighteenth Bru-
maire of Luis Bonapartein which he likened the French peasantry to “potatoes in a sack”
(Marx 1963: 124).
White’s peculiar ideas about thermodynamics he borrows from Herbert Spencer, appar-
ently by way of Schrödinger (Carneiro 1973). He asserts that life in general, and human
social life in particular, is a form of reverse entropy, a mechanism for capturing and contain-
ing energy, temporarily and locally reversing the inexorable progress of the Second Law of
Thermodynamics (White 1959: 34-36). Thus his evolutionary stages are defined according
to levels of energy capture, each being defined by a broad category of technology; the first
by human labor power, the second by the addition of domesticated animals and plants and
the third by the use of fossil fuels.4 Each stage is associated with a particular form of social
organization; the first withsocietas, the second withcivitas (archaic states and empires)
and the third with that curious variant of civitas known as industrial society. Social change
thus took two forms:
1. technological revolutions, in Childe’s sense of the term, each followed by
2. a gradual expansion to the energetic limits of the new social form, a process concep-
tualized in terms of gradually increasing efficiency.
The relation is made clear by the following passage from Herbert Spencer:
The formula finally stands thus: Evolution is an integration of matter and con-comitant dissipation of motion; during which the matter passes from an indefi-nite, incoherent homogeneity to a definite, coherent heterogeneity; and during
4It was while explaining this scheme that Sahlins and Service coined the sublimely absurd phrase “ther-modynamic accomplishment” (Sahlins and Service 1960: 33).
Chapter 1 5
which the retained motion undergoes a parallel transformation. (Spencer 1862,part ii. chap. xvii. p. 396)
Civilization as a kind of potential energy. Thus, while White no doubt profited from the
Modern Synthesis by association, his theory, as Dunnell has done more than anyone to point
out, bears no relation whatsoever to evolutionism in the contemporary biological sciences
(e.g.Dunnell 1996). That we ever imagined such a theory, which moreover “average[s] all
environments together to form a constant factor which may be excluded from our formu-
lation of cultural development” (White 1959: 39), to be in any way Darwinian can only be
attributed to a profound uncertainty as to the meaning of the term ‘evolution.’
1.2 Evolution as such
The Oxford English Dictionary lists no fewer than twelve separate definitions for the
word ‘evolution’ in an entry which runs to 2500 words. We can recognize many of these
various senses of the term in almost any discussion of social evolution; often, it seems, in
defiance of the expressed intention of the authors. The word is a willful one, and resists
disciplined use. Some scholars (e.g.Shennan 1993) argue that the term itself is so freighted
with innuendo, so unruly and polysemous, that we should abandon the use of it altogether.
Giddens’s discussion is in some ways typical. After reviewing a selection of definitions
of social evolution, “culled more or less at random” (Giddens 1984: 230), he proceeds to
explore the possible meanings of a social theory that could be called ‘evolutionary.’ His first
contention, which leads to and justifies the remainder of his argument, is that ’evolutionary
theory’ in the social sciences, in order to have a “distinctive meaning” (Giddens 1984: 231)
- that is, to be distinguished from the study of social change in general - must have “at least
some conceptual continuity with biological evolution.” Otherwise the use of the term would
be “gratuitous.” It will be informative, then, to consider the meaning accorded the term in
historical biology.
Ernst Mayr contends that “Darwinism” has a much more restricted meaning for the
modern biologist than for the world at large (Mayr 1985). ’Darwinism,’ for the specialist, is
Chapter 1 6
apparently “the theory that attributes evolutionary change to selection forces” (Mayr 1985:
755). Evolutionism itself has a much broader meaning. Mayr distinguishes five compo-
nents to Darwin’s theory of evolution. These are:
1. ‘evolution as such,’
2. common descent,
3. gradualism,
4. the multiplication of species, and
5. natural selection.
Darwinism, then, is a composite theory. The theory of evolution is only one component
of Darwinism, and is thus not restricted to Darwinism. Indeed, Mayr defines evolution
simply as: “the theory that the world is neither constant nor perpetually cycling but rather
is steadily and perhaps directionally changing, and that organisms are being transformed
in time” (Mayr 1985: 757). This view, he contends, was fairly widely accepted among
continental intellectuals before the publication ofThe Origin of Species. Darwin’s genius
lay in elaborating the mechanisms of this process of “transformation in time” in order to
provide a coherent theory of biological evolution. Are we to cease calling Lamarck an
evolutionist because he did not credit natural selection? Mayr concludes:
Evolution is not a theory for the modern author. It is as much a fact as thatthe earth revolves around the sun rather than the reverse. The changes docu-mented by the fossil record in precisely dated geological strata are a fact thatwe designate as [biological] evolution. (Mayr 1985: 758)
Given this definition, evolution must be entirely unobjectionable to the social scientist. The
changes documented by the archaeological record in precisely dated strata are a fact that
we designate as social evolution. Social evolution and biological evolution are simply two
instances of a more general notion, that of ’evolution as such.’ This can be clearly seen
if we consider the range of theories to which we apply the label ‘evolutionary.’ They are,
minimally:
Chapter 1 7
1. the nineteenth-century evolutionists (Morgan, Tylor, Maine, etc.),
2. Darwinism, and
3. non-Darwinian biologies (Lamarck, Agassiz, etc.).
The only theoretical postulate that could possibly be shared by these three bodies of thought
is precisely ‘evolution as such.’ Any more specific use of the term would preclude its
application to one or more of the three. If the term ’evolution’ is to have any meaning in
scholarship, then it must be this.
1.3 Society: primitive and civil, chiefdom and state
It will be objected at this point that I have simply shifted the meaning of the term
‘evolution’ and have thereby, through sleight of hand, avoided the real issues involved in
the debates surrounding social evolutionism. Not so. I have simply argued that we should
not allow the pervasive and mistaken conflation of the word ’evolution’ with Darwinism
(cf. Dunnell 1996) to prejudice us against the use of the term. This is not to say that earlier
theories of social evolution have been unproblematic. Quite the contrary, in fact.
As Kuper has eloquently chronicled, and as was touched upon earlier, the origins of
social evolutionism coincided with the invention of a particular way of classifying human
social systems (Kuper 1988).5 Thus, all peoples of the world, and of the distant past, were
arrayed on either side of a great divide, the great watershed of world history. Primitive
Society was constituted as the antithesis of Civil Society, and the two forms were opposed
to one another point for point. In the process, notions of both ‘the primitive’ and ‘the
civilized’ were transformed, and each came to be constituted as an object of scholarly
inquiry. Thus sociology and economics, prominently, devoted themselves to the study of
Civil Society, while anthropology took Primitive Society as its special domain.
5I will not be concerned here with the various distinctions that have been made between cultural evolution,social evolution and political evolution. For the purposes of this essay they are taken to be synonymous.
Chapter 1 8
This primal dichotomy has subsequently undergone a complicated series of transforma-
tions, reformulations and ramifications, generating endless specialized vocabularies. The
ease with which these subsequent terms may be related in a logical diagram is a testament
to their common origin. Thus:
Primitive : Civil :: blood : soil ::kin society : class society ::egalitarian society : stratified society :: Friedsocietas : civitas :: MorganGemeinschaft : Gesselschaft :: Tönniesmechanical solidarity : organic solidarity :: Durkheimfolk : urban :: Redfieldsacred : secular :: Beckeraffectual : contractual Weber
While each of these oppositions is in some sense unique, since each has a somewhat differ-
ent emphasis (seeLoomis 1957for a discussion of some of these schemes in sociology; see
alsoNetting 1990: 22), all refer ultimately to the primary distinction of Primitive : Civil.
This is the founding myth of the social sciences.
An excursion into the checkered history of the chiefdom concept illustrates the way
in which this primary dichotomy has structured and in significant ways guided the subse-
quent course of social thought.6 The term chiefdom, in its modern sense, was introduced
by Oberg (Oberg 1955). Initially the term was invented for taxonomic purposes and em-
ployed to describe the distinctive sociopolitical organization of some protohistoric circum-
Caribbean groups. It was used in this way also by Steward in a survey of South American
ethnology (Steward and Faron 1959). Neither Oberg nor Steward used the term to denote
an intermediate stage in the band-state continuum, employing for this purpose the word
‘Formative.’ In fact, Steward and Faron explicitly state that “...the chiefdoms do not repre-
sent a developmental stage in any large scheme of South American culture history. They
do not necessarily exemplify an early phase of cultural development in the Central Andes
or a potential development of the tropical forest farmers or the food hunters and gatherers"
6Carneiro provides an illuminating discussion of the history of the chiefdom concept in anthropology(Carneiro 1981).
Chapter 1 9
(Steward and Faron 1959: 178). ‘Chiefdom’ in this formulation was a strictly taxonomic
term, with no evolutionary significance.
The ease and rapidity with which ‘the chiefdom’ was assimilated as a stage in universal
evolution is symptomatic of the tendency, in social evolutionary thought, for taxonomy to
be transformed into phylogeny, for time and space to be conflated. This critical though en-
tirely predictable step was taken by Service (Service 1962). The need for an intermediate
stage between Primitive and Civil society resulted from a characteristic notion of gradual-
ism on the part of Service. In this he followed most of the nineteenth-century evolutionists
and, of course, more directly, White and Childe. But the problem of origins derived, at
its root, from the fact that Primitive and Civil society are each the logical antitheses of the
other. The fundamental contradiction in imagining an ‘evolution’ from Primitive to Civil
Society is that Primitive and Civil are essences; they are (cosmo)logically discontinuous
categories, and, as Mayr has noted, “an essence cannot evolve” (Mayr 1985: 758).7
The postulation of intermediate stages, such as the chiefdom, “rank society”
(Fried 1967), what have you, might seem at first blush to provide a way out of this dif-
ficulty.
Many important theories and debates connected with the origin of the repres-sive state have been handicapped because it is so difficult to account convinc-ingly for its appearance out of the matrix of egalitarian society. But modernethnohistorical records argue powerfully for the presence around the world ofvaryingly developed chiefdoms, intermediate forms that seem clearly to havegradually grown out of egalitarian societies and to have preceded the foundingof all of the best-known primitive states. (Service 1975: 15-16)
In fact, however, the postulation of intermediate forms simply provokes a recursive iteration
of the original opposition. This situation can be represented as follows:
Primitive : Civil ::band/tribe : chiefdom ::chiefdom : state
7White said that Morgan’s primitive and civil societies are logically distinct categories, "... just as reptileand mammal are" (White 1959: 302). Lowie called this “palpable nonsense.”
Bourdieu: “Nothing is more misleading than the illusion created by hindsight in which all the traces of alife ... appear as the realization of an essence that seems to pre-exist them” (Bourdieu 1990: 55).
Chapter 1 10
The chiefdom thus occupies a logically ambiguous status in general evolution. It is at once
Primitive and Civil, and at the same time is neither. This logical ambiguity, inherent in
the idea of an intermediate stage in general evolution, clearly accounts for the extensive
controversies surrounding the chiefdom in the archaeological literature. The concept, by
its very nature, is endlessly malleable and endlessly problematic.
In fact, some subsequent attempts to clarify the idea of the chiefdom have pursued
precisely the strategy of Service and have proposed various stages within the transitional
stage itself! Steponaitis and Milisauskas for example, suggest a distinction between simple
and complex chiefdoms (Milisauskas 1978, Steponaitas 1978, Steponaitas 1991). This is
obviously a futile exercise, as it simply represents a further structural iteration:
Primitive : Civil ::band/tribe : simple chiefdom ::simple chiefdom : complex chiefdom ::complex chiefdom : state
The same can be said of Carneiro’s minimal, typical and maximal chiefdoms
(Carneiro 1981: 47), though the resulting diagram would be somewhat longer. In fact,
a general evolutionary continuum, as is evoked by White, Service and many subsequent
authors, is nothing more than the infinite recursion of the original structure. Civil and
Primitive Society.
In a very real sense, then, the idea of the chiefdom as a general evolutionary stage is
inherently paradoxical, and the extensive controversy revolving about the concept clearly
derives much of its vigor from this fact. The history of the chiefdom, from the 1960’s to
the present day, may from this perspective be seen simply asbricolage, an exploration of
the semantic space defined by the Primitive-Civil dichotomy.
Any evolutionary scheme which incorporates the Primitive-Civil dichotomy will pro-
duce a ‘world growth story.’ Shennan, recognizing this, concludes that “social evolutionary
approaches are inherently ideological” (Shennan 1993: 53). However to say that social evo-
lution is ideological is to say very little indeed. As Kuper has shown, one of the strengths
of the idea of Primitive Society is that it “yielded an endless succession of transformations
Chapter 1 11
which could accommodate any special interest” (Kuper 1988: 239). For Henry Maine,
Primitive Society was a means to refute Utilitarian claims of the corruption of the English
state. For Morgan, it served to demonstrate the moral order of history, the unfolding of the
‘Supreme Intelligence.’ And, of course, for Marx and Engels Primitive Society, in the guise
of primitive communism,8 stood as the first term in their dialectic of history, promising the
future advent of socialism and an end to class domination.
It must be noted, also, that recent attempts to correct the excesses and distortions of so-
cial evolutionary theory have often failed to escape entirely from the limits imposed by the
Primitive-Civil dichotomy. Michael Mann, for example, has provided many useful sugges-
tions as to how we might conceptualize power and social change. However, his generaliza-
tions, as he presents them, are restricted to societies on the late side of the Primitive-Civil
divide. Thus, “[n]one of the ... evolutionary theories bridges the gap...[b]etween rank and
stratified societies... All the theories are wrong because they presuppose a general social
evolution that had, in fact, stopped. Local history now took over” (Mann 1986: 62). Primi-
tive Society, then, precedes history itself. The phrase ’people without history’ takes on new
and sinister dimensions in this light.9
Giddens’s brief history of the world claims that prior to the genesis of the ‘class-divided
civilizations’ “there is little discernible progression with respect of either social or tech-
nological change: a ‘stable state’ would be a more accurate description” (Giddens 1984:
238-9). For Giddens, history begins with the state, as for Mann. Many students of forager
societies would no doubt take issue with these interpretations, and Mann and Giddens no
doubt speak from a position of relative ignorance in this regard. But what is important
for us to note is that these critics of ‘social evolutionism’ reproduce the Primitive-Civil
dichotomy even as they attempt to dismantle its theoretical superstructure.
Any ‘world-growth story,’ at least as produced by the social sciences to date, is in-
evitably ethnocentric, as the ’West’ invariably is placed at the summit of the ‘evolution-
8Interestingly, the phrase ‘primitive communism’ can be traced to Morgan, who called it “communism inliving” (seeLee 1990: 232).
9It is sometimes startling how effortlessly such phrases as ‘primitive religion,’ ‘primitive economies’ andso on seem to flow from Mann’s pen.
Chapter 1 12
ary stepladder’ (Yoffee 1993).10 This alone is reason enough to abandon Primitive Soci-
ety. It is important also to realize, however, that Primitive Society has no empirical exis-
tence. Recent scholarship pertaining to so-called ’egalitarian societies’ (this term also is a
legacy of the Primitive-Civil dichotomy) has begun the task of dismantling the notion (cf.
Flanagan 1989, Spielman 1986), but much work remains to be done. For, as Kuper puts it,
“The theory of primitive society is about something that does not and never has existed...
[it] is our phlogiston, our aether ...” (Kuper 1988: 8). He concludes: “Anthropologists de-
veloped the theory of primitive society, but we may make amends if we render it obsolete
at last, in all its protean forms” (Kuper 1988: 243).
I am no devotee of penitential scholarship. Nevertheless, Kuper’s point is taken. The
Primitive-Civil dichotomy is one of the deep structures of social scientific thought, and one
of its principal points of articulation with the public and with other scientific discourses.
If we wish to approach more nearly a scientific account of human history and culture, we
must attempt to do away with this most fundamental of mythologizing oppositions.
1.4 Steward’s ‘phenomena of limited occurrence’
Sahlins and Service, in order to effect a rapprochement between the theoretical works of
White and Steward, introduced a distinction between two kinds of evolutionary theory. The
first of these they called ‘general evolution.’ This is the perspective, championed by White,
that “general progress ... occurs in culture, and it can be absolutely, objectively, and non-
moralistically ascertained” (Sahlins and Service 1960: 27). It is precisely the perspective
that produces the ‘world growth stories’ we have just been discussing. It is transhistorical,
referring to a broad, total movement in Human Culture from its very beginnings and far into
the future, and making no reference to actual people or to actual societies except insofar as
they serve to exemplify the Progress of Culture.
Steward’s approach was very different. Sahlins and Service dubbed it ‘spe-
cific evolution,’ and characterized it as “a connected, historic sequence of forms”
10White provides perhaps the most succinct example of such a ‘world growth story’: “The crest of thewave of cultural development has been moving westward ever since the Pyramid Age" (White 1959: 369).

Chapter 1 13
Steward unilinear evolution multilinear evolutionWhite evolution historyKroeber - historyMurdock - evolutionSahlins and Service general evolution specific evolutionYoffee neoevolutionism new social evolutionary theory
Table 1.1: Two kinds of social evolutionary theory
(Sahlins and Service 1960: 33). Their conception was that general evolution understands
societies in terms of their ontogeny, while specific evolution does so in terms of their phy-
logeny. Steward himself termed this approach ‘multilinear evolution’ (Table1.1). This he
distinguished from -and proclaimed superior to - the ’unilineal evolution’ of White. The
focus of multilinear evolution is “the search for laws which formulate the interrelationships
of particular phenomena which may recur cross-culturally but are not necessarily univer-
sal” (Steward 1955: 29). Steward explicitly eschewed the grand pretensions of general
evolution, asserting that his “delimitation of problem and method precludes all efforts to
achieve universal explanations or formulations of human behavior” (Steward 1955: 7).11
He chose instead to study particular developmental sequences in particular geographical lo-
cations. These varied sequences are then compared to one another in order to divine certain
processual regularities that might be used to understand yet other similar cases, the ob-
jective being “to formulate the conditions determining phenomena of limited occurrence”
(Steward 1955: 8).
It is clear that Steward’s formulation of ‘multilinear evolution’ evades the many pitfalls
of general evolution. At the same time it avoids the twin traps of particularism and his-
toricism. It understands particular societies to be the product of particular, unique histor-
ical trajectories, while simultaneously recognizing that similarly-organized social groups
in similar physical environments will often undergo similar evolutionary processes. Thus
parallelism and the study of parallelisms are the analytical core of multilinear evolution.
11“A formula that explains the behavior of all mankind cannot explain culture" (Steward 1955: 8).
Chapter 1 14
1.5 Longitudinal studies
Typology is the method of general evolution. For Sahlins and Service, the “taxonomic
innovation that is required for the study of general evolution” is to “... arbitrarily rip cul-
tures out of the context of time and history and place them, just as arbitrarily, in categories
of lower and higher development” (Sahlins and Service 1960: 32). Steward also used so-
cial typology, but of a different order. The social type, for Steward, does not necessarily
represent or capture the essence of a society or culture. Rather, social types may be defined
according to analytical convenience; they are not considered to be natural categories. This
is very different from White’s position that one social type was as different from another
“as reptile and mammal are” (White 1959: 302). Steward himself defined two kinds of
social types (Steward 1955: 88): area types, defined on the basis of uniformities and pre-
sumably resulting from direct inheritance or diffusion, and cross-cultural types, defined on
the basis of “regularities” - or “causally interrelated phenomena."
Steward’s case studies typically involved relatively short time spans, on the order of a
century or less, and employed historic and ethnographic data. However, there are many
evolutionary processes which occurred in the past which may not be studied using Stew-
ard’s methods. It may be the case, in fact, that there exist many societies in the archae-
ological record for which there are no true analogues in the ethnographic record. This is
so on the one hand because all modern groups - and probably all ethnographic groups, as
well - are integrated to a greater or lesser extent into the modern world system and have
been transformed in significant ways as a result (Wolf 1982). Thus, they cannot be eas-
ily employed as analogues for prehistoric societies. On the other hand, the smaller-scale
societies we know ethnographically - such as those which have been used to define the
‘chiefdom’ social type - may in fact be very different from many prehistoric groups. The
modern groups are ethnographic ‘chiefdoms’ precisely because they were not transformed
into larger-scale social formations, and because they did not disintegrate into simpler, more
egalitarian communities. This alone is some indication that they differ in some significant
way - particularly in terms of stability - from the Formative period societies which were the
precursors of the great prehistoric states in the Americas and elsewhere (Yoffee 1993).
Chapter 1 15
Finally, as Feinman and Neitzel put it, social typology and studies of ethnographic and
historical cases “can only demonstrate correlations and cannot reveal historical or causal
processes responsible for societal variation” (Feinman and Neitzel 1984: 78). In order to
understand how social evolution actually took place - and is still taking place - over long
time periods it is necessary to study long sequences of social change (cf.Drennan 1987,
Drennan 1991). In the case of primary state formation, of course, these data may only be
obtained archaeologically.
Settlement archaeologists working in the mode of general evolution developed their
own set of correspondences to social typology. The analytical mode of much of settle-
ment archaeology has been, ironically, predominantly synchronic. By this I mean to say
that settlement analysis has often been undertaken in such a way as to constitute a re-
gional sequence as a succession of synchronic forms, correlated with particular social
types. Thus, a three-tiered site size hierarchy is taken to indicate a complex chiefdom
(Anderson 1994, Wright and Johnson 1975; also seePeebles and Kus 1977), as opposed to
the two-tiered hierarchy of simple chiefdoms. In this mode, the salient property of a re-
gional sequence is the temporal sequence of forms which it reveals. The longitudinal study,
by contrast, must consider much more carefully the manner in which the settlement system
changes from one phase to the next. For this reason, much of the effort in my own analysis
will be devoted to examining such measures as population growth, abandonment and site
foundation rates, and the relative growth rates of specific sites within the region. These are
inherently diachronic measures.
If social typology is the method of general evolution, then the longitudinal study is the
method of multilinear evolution. A number of studies of such long regional archaeological
sequences have been developed and presented for various parts of the world. It is my
intention here to present one for the southern Lake Titicaca Basin, the heartland of the
prehispanic Tiwanaku state.
Chapter 1 16
1.6 The Tiwanaku state
The Titicaca Basin, situated on the boundary between the modern states of Peru
and Bolivia, represents one of the relatively rare instances in world prehistory of the
pristine (Fried 1967) development or evolution of the state. This state, which we know as
Tiwanaku, has been the subject of a considerable amount of research over the past fifteen
years. Various projects have elucidated the nature of Tiwanaku urbanism and the settlement
hierarchy of its core area (Albarracín-Jordan and Mathews 1990, Albarracín-Jordan 1992,
Albarracín-Jordan et al. 1993, Albarracín-Jordan 1996b, Albarracín-Jordan 1996a,
McAndrews et al. 1997, Bermann 1990, Bermann 1994, Janusek 1994, Kolata 1982,
Kolata 1993, Stanish 1989), the operation of its agricultural surplus economy
(Kolata 1986, Kolata 1991, Kolata et al. 1996), the functioning and spatial organization
of its ceremony and ritual (Alconini Mujica 1995, Manzanilla 1992, Vranich 1999),
and the relations between Tiwanaku and its various peripheries, colonial and
otherwise (Bandy et al. 1996, Bermann and Castillo 1993, Cohen et al. 1995,
Bermann et al. 1989, Goldstein 1989b, Goldstein 1993b, Goldstein 1993a, Higueras 1995,
Oakland Rodman 1992).
What we still know very little about, however, is the process by which it came to be.
We know that the site of Tiwanaku rather abruptly became an urban center sometime in
the Tiwanaku III phase. We know that some of its monumental architecture - the semi-
subterranean temple - probably predates this urbanism, as does some of the stone sculpture.
We know something about the ceramic sequence, as well, though how much is actively de-
bated. But we know very little about the varied political formations which populated the
1800 years of settled agricultural village life before Tiwanaku’s rise to regional preemi-
nence. When did Tiwanaku begin to be regionally dominant? What were its relations with
neighboring polities? When indeed did multi-community polities begin to emerge in what
later became the core area of Tiwanaku? How should we characterize the social matrix
from which Tiwanaku developed? To these and to many other important questions we have
only vague and unsatisfactory responses.
It is an exciting time to be working on the Titicaca Basin Formative. The last decade
Chapter 1 17
has seen the completion of a number of significant projects, and the inauguration of many
more. Of great significance have been the regional settlement surveys completed in re-
cent years. Among these we may count those of Albarracín-Jordan and Matthews in the
Tiwanaku Valley (Albarracín-Jordan 1992, Mathews 1992), of Charles Stanish in the Juli-
Pomata area (Stanish 1994, Stanish et al. 1997, Stanish and Steadman 1994), of Alden-
derfer and Klink in the Ilave drainage, of Kirk Frye near Chucuito, of Janusek in the
Pampa Koani (Janusek and Kolata 2001), and of Carlos Lémuz in the Huatta area of Bo-
livia (Lémuz Aguirre 2001). Several other surveys have begun in the last few years or are
slated to begin soon (cf.Cohen 2001, Plourde and Stanish 2001). We will soon have a
very substantial settlement dataset from the Titicaca Basin, totaling well over 1000 km2 of
complete pedestrian coverage, which should permit comparisons of regional developmen-
tal trajectories and help to answer many of the questions about the rise of the Titicaca Basin
complex societies.
Many of these projects have taken the Formative as their focus and have been under-
taken in areas of special interest to the “formatólogo”. As a result, we find ourselves in the
somewhat unexpected position of knowing less about the Formative in the nuclear area of
Tiwanaku than in other areas, such as Juli-Pomata. This is partly so because the one pub-
lished survey of a portion of the Tiwanaku heartland - Albarracín-Jordan and Matthews’s
milestone publication of 1990 (Albarracín-Jordan and Mathews 1990)- treated the Forma-
tive as a single long, undivided phase, giving very little indication of historical development
internal to the period; and as it turns out, it is partly because the Tiwanaku Valley, including
Tiwanaku itself, was a rather peripheral area in the Early and Middle Formative periods;
sites there were few and small.
Since the work of Albarracín-Jordan and Matthews, however, Lee Steadman has
produced a quite usable ceramic chronology for the Early and Middle Formative peri-
ods in the Southern Basin (Steadman 1999). Janusek and Lémuz have independently
produced the beginnings of a usable chronology for the Late Formative (Janusek 2001,
Lémuz Aguirre 2001). This work has made possible detailed and relatively - relatively -
fine-grained settlement analysis of Formative period communities in the Tiwanaku heart-
Chapter 1 18
land. It was to undertake such an analysis that I began - in August of 1998 - an archaeolog-
ical survey of the Taraco Peninsula. This volume reports the results of my research.
1.7 This volume
Chapter2presents an introduction to the physical landscape of the Taraco Peninsula and
to the history of archaeological research in the immediate vicinity. The following chapter,
Chapter3, concerns the methodology employed in the collection of the settlement dataset.
It includes a discussion of what I consider to be a significant methodological innovation in
dealing with mixed surface collection assemblages. The method, termed frequency profile
analysis, is a technique which allows for estimation of the relative proportions of various
temporal components in a temporally mixed assemblage. It is used in this study in order to
identify the sizes of various occupations of a given site, and thereby to permit calculations
of rates of population growth or decline through time on both the site and regional scales.
The topic of Chapter4 is the manner in which settlement data will be used in my anal-
ysis of Taraco Peninsula social evolution. The first half of the chapter consists of the devel-
opment of a method of deriving a population index from the Taraco Peninsula settlement
data. It should be emphasized that I make no attempt to estimate actual population values
for settlements. Rather, I outline a method that produces population index values approx-
imately proportional to population values. This means that my population index values
may be used for internal comparisons, and perhaps for comparison between the Taraco
Peninsula data and other Titicaca Basin datasets produced and normalized using the same
techniques, but not for comparison with datasets from other parts of the world. However,
rates of change within the Taraco Peninsula settlement system, especially rates of popula-
tion growth, should be directly comparable cross-culturally. Also significant here is that my
method has the property of reducing the disproportionate significance accorded to smaller
and more ephemeral components of a settlement system by most population measures.
The most important part of Chapter4 is my discussion of the meaning of intraregional
variation in population growth rates. This discussion stems from the observation that at cer-
Chapter 1 19
tain time periods certain sites or groups of sites seem to have grown at radically different
rates, differences which cannot be attributed to differential fertility or mortality. The only
possible explanation for these differences is therefore movement of population between
sites and communities. This being the case, it becomes clear that the evidence of popu-
lation growth rate differentials in effect provides a record of aggregate human decisions
regarding the location of their residence. The disproportionate growth of one site, say, is
evidence of a systematic bias in residential decisions on the part of the prehistoric inhab-
itants of the region. It therefore becomes possible to adopt an agent-centered approach to
the interpretation of settlement data. The interpretive approach developed underpins the
entirety of my subsequent historical reconstruction. The discussion begins on page74.
This section must be read in order to appreciate the arguments as a whole. I suggest that it
be read before proceeding to the particulars of the archaeological sequence.
Following are Chapters5 through10, which present the Taraco Peninsula archaeolog-
ical sequence itself. Chapters5 and6 discuss the Early and Middle Formative periods,
when the settlement system was characterized by small, autonomous villages. Chapter7
covers the Late Formative, and charts the local development of a multi-community polity
and the early indications of Tiwanaku regional dominance. Chapter8 describes the Ti-
wanaku period itself, when the Taraco Peninsula was reorganized as a heartland province
of the Tiwanaku state, and Chapter9 the period following its collapse. Finally, in Chapter
10, the conquest of the Titicaca Basin, first by the Inka empire and later by the Spanish, is
discussed. Chapter11presents concluding remarks and observations.
20
Chapter 2
The Taraco Peninsula
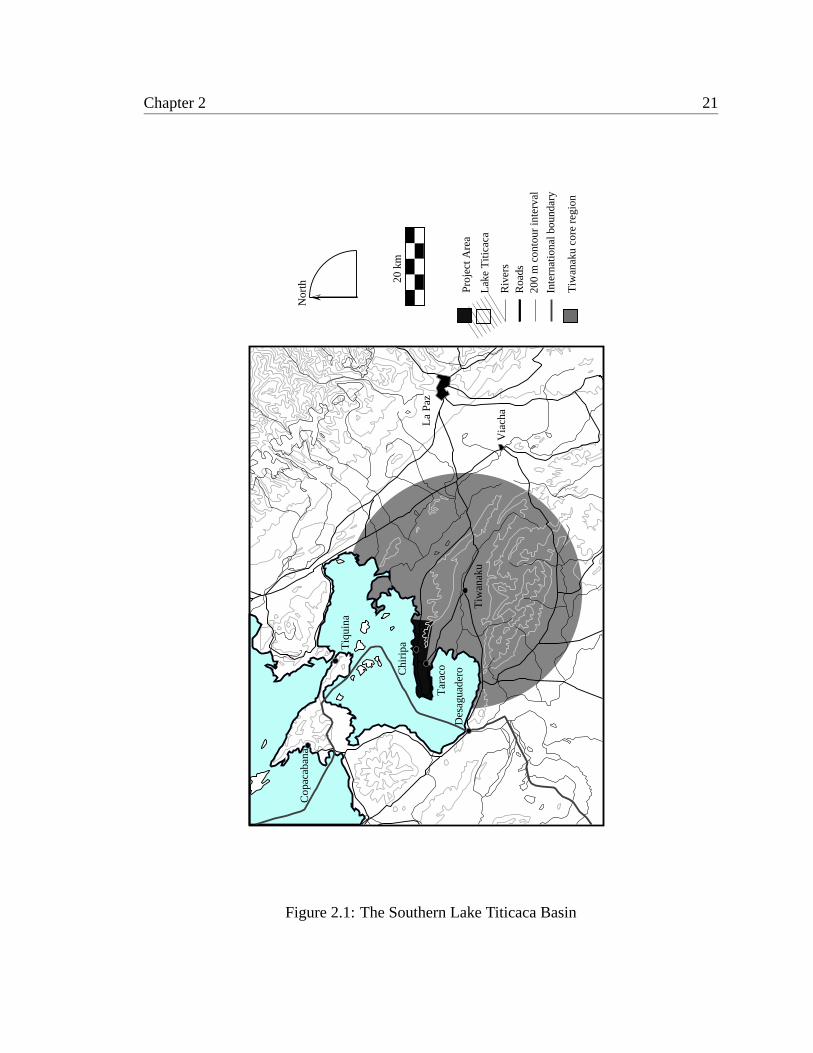
The Taraco Peninsula is an East-West trending spit of land projecting into Lake Wiñay-
marka, the southern arm of Late Titicaca (Figure2.1). It is located within the modern state
of Bolivia, though its western tip is less than 4 km from the Peruvian border. Administra-
tively, it pertains to Canton Taraco, Provincia Ingavi, and the Department of La Paz. The
principal town is Taraco, though a smaller town, Santa Rosa, is located on the tip of the
peninsula.
2.1 Geology
The spine of the peninsula is formed by theLomas de Taraco- the Taraco hills. These
are low, rolling hills whose peaks rarely exceed 4000 m.a.s.l.1 Geologically, the Taraco
Hills are formed by the Taraco Formation.
The Taraco Formation ... consists of conglomerates approximately 200 metersthick lying in discordance over the Middle Miocene Kollu Kollu Formation.Gravels predominate in clasts with diameters up to 20 centimeters embeddedin a sandy-clayish matrix ... The clasts are formed of Devonian mudstones,quartzites, vein quartz, Permian calcareous rocks, and ganodiorites. ... [I]thas been assumed that these deposits belong to the Pliocene, dated in otherlocations to 5.4 million years. (Argollo et al. 1996: 69)
1The modern lake level average is approximately 3810 m.a.s.l. Thus, the peaks of the Taraco Hills arerarely more than 200 meters above modern lake level.
Chapter 2 21
Tiw
anak
u co
re r
egio
n
Via
cha
La
Paz
Tar
aco
Tiw
anak
u
Chi
ripa
Des
agua
dero
Cop
acab
ana
Tiq
uina
20 k
m
Riv
ers
Lak
e T
itica
ca
200
m c
onto
ur in
terv
al
Inte
rnat
iona
l bou
ndar
y
Roa
ds
Nor
th
Proj
ect A
rea
Figure 2.1: The Southern Lake Titicaca Basin
Chapter 2 22
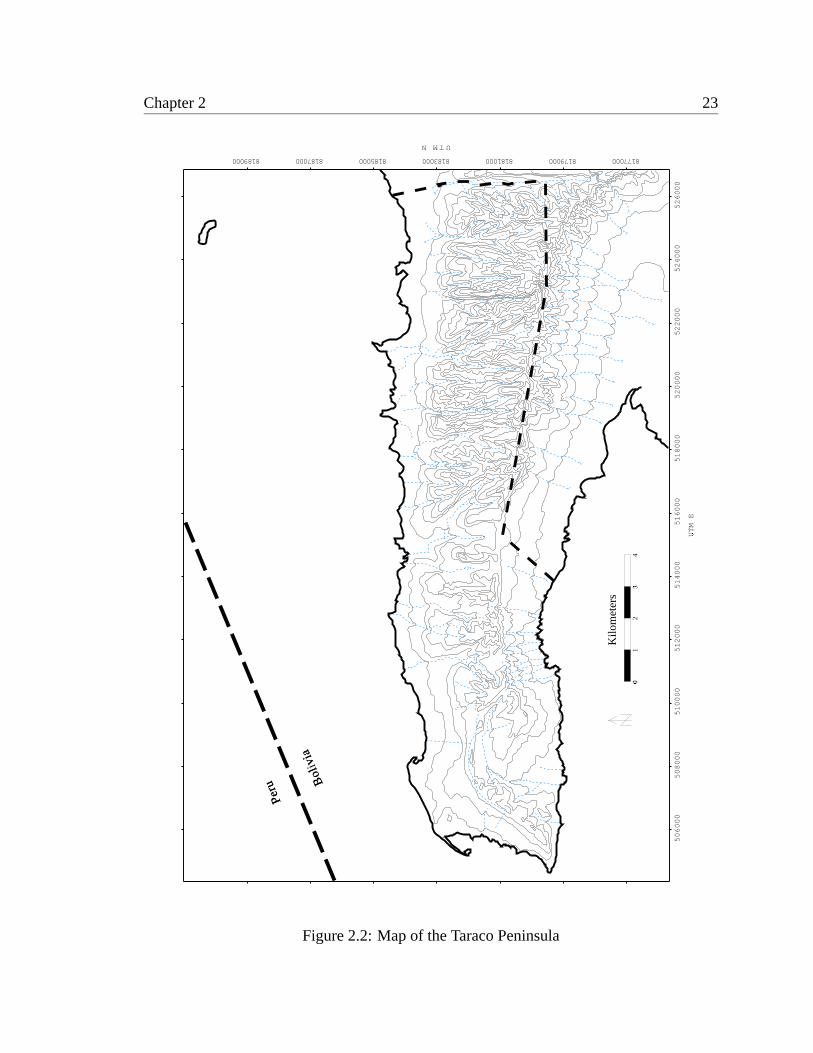
The elevation of the Taraco Hills tends to decrease from south to north, and for this reason
most watercourses run in this direction. The interior of the peninsula is therefore dissected
by deep gullies orquebradasrunning from south to north, interspersed with high ridges
(see contour map in Figure2.2).
The conglomerates of the Taraco Formation, at least where they are exposed on the
surface, are composed predominantly of quartzite cobbles. The ground surface over most
of the peninsula is littered with quartzite cobbles of all sizes. However, the formation also
contains large quantities of chert pebbles and cobbles. These are smaller than the quartzite
cobbles, rarely exceeding 8 cm or so. These chert nodules were frequently worked using
a hammer and anvil bipolar technique to extract short small flakes. I have also collected
samples of chalcedony from the hills near Chiripa. All of these materials were used in an
expedient manner by the prehistoric inhabitants for the production of stone tools, predom-
inantly informal flake tools. This kind of extensive quarrying activity has been practiced
since the first human occupation of the region. As a result the entire surface of the penin-
sula is a low-density lithic scatter. Within this scatter it is very difficult to discern any
true concentrations, and this long-term quarrying has no doubt obscured some more con-
centrated activity. This is possibly one of the reasons why no preceramic sites have been
reported from the peninsula, despite finds of Archaic Period projectile points in the Chiripa
excavations and in other regional surveys (Albarracín-Jordan and Mathews 1990: 51).
Finally, the quartzites of the Taraco Formation not uncommonly contain fossils, fre-
quently trilobites. There can be no doubt that the prehistoric inhabitants of the peninsula
remarked the existence of these fossils and accorded them some importance. Fossils are
found with some frequency on the surface and in the deposits of sites, indicating that they
were collected in prehistory. The significance which the inhabitants of the peninsula at-
tributed to these objects cannot be known with certainty.
The Kollu Kollu Formation is located below the Taraco Formation.
It is composed of conglomerates, red sandstones, clayish mudflows, and allu-vial clays intercalated with acid tuffs. Swanson et. al. ... assigned [middleMiocene] radiometric dates of 18.3 to 16.6 million years to this formation.(Argollo et al. 1996: 69)
Chapter 2 23
0�
12
3�
4
Kilo
met
ers
Peru B
oliv
ia
506000
508000
510000
512000
514000
516000
518000
520000
522000
524000
526000
UTM E
�
UTMN
8770008179008110000818500818700819000 108818300008
Figure 2.2: Map of the Taraco Peninsula
Chapter 2 24
This formation was used in several ways by the prehistoric inhabitants of the Taraco Penin-
sula. Most importantly, it was the source of all the clays which they used to manufacture
their ceramics. The red, yellow, and white pigments used on ceramics of the Chiripa cul-
ture were slip paints, and so were extracted from the Kollu Kollu Formation, which contains
clays of all these colors. These clays were also used to produce colored plaster used to dec-
orate buildings and to lay prepared clay floors. In short, the presence of red, yellow, and
white clays in the Kollu Kollu Formation determined the color palette of Chiripa Culture
architectural and ceramic decorative art. Less importantly, the tuffs encountered in the
Kollu Kollu Formation were used locally in the Late Formative and Tiwanaku periods for
the manufacture of an enigmatic class of stone tools known to archaeologists astrompos
(seeBermann 1994: 61 for illustrations).2 The function of these small, conical artifacts
remains uncertain, though it is debated wherever Titicaca Basin archaeologists gather.
The interface between the Taraco and Kollu Kollu Formations is generally located
slightly above the modern lake level. I have not made a formal survey, but the Kollu Kollu
deposits frequently appear in the bottom of quebradas near the base of the hills on the north-
ern side of the peninsula. It is also exposed on the surface over portions of the western half
of the peninsula, particularly in the modern communities of Nachoca, Ñacoca, and Santa
Rosa. My informal observations indicate that the elevation of this geological boundary is
typically between 3820 and 3840 m.a.s.l. A published geological section from somewhere
in the western Taraco Peninsula - probably close to the 508200 E meridian - shows that the
boundary in fact slopes down from south to north,3 with the Taraco/Kollu Kollu interface
at approximately 3850 m.a.s.l. on the southern side of the hills, and approximately 3820
m.a.s.l. on the northern side (Argollo et al. 1996: 75).
This geological boundary has one important implication for human occupation of
the Taraco Peninsula. The underlying Kollu Kollu Formation, being compact and com-
posed primarily of fine sediments and of clays in particular, is much less porous than are
2Tromposare also produced from quartzites, andesite, and a wide variety of other materials. However, inthe Taraco Peninsula sites tuff is the most common material. This may be a clue to their function, since thesetuffs are extremely low density, and the resulting artifacts very lightweight.
3As does the upper surface of the Taraco Formation. See my description of the Taraco Formation above.
Chapter 2 25
the Taraco Formation conglomerates. This creates a situation in which the groundwater
trapped in the natural aquifer of the Taraco Formation is forced to the surface where the
Taraco/Kollu Kollu Formation interface intersects the modern ground surface. This effect
creates a zone of springs and water sources in the lower slopes of the Taraco Hills and in
quebradas. On the northern side of the peninsula, this zone is located at approximately
3820-3830 m.a.s.l., and is somewhat higher on the southern side. Surface water on the
Taraco Peninsula is for this reason very abundant. At no point within this elevation range
is one more than a kilometer from a spring anywhere on the peninsula. It should come
as no surprise that this distribution of surface water is a significant determining factor in
Taraco Peninsula settlement systems. The majority of the population lives in the 3810-3850
m.a.s.l. elevation range today, and has for the peninsula’s entire history.
A final note on springs: since the volume of the Taraco Formation deposits on the
peninsula is actually relatively small as aquifers go, it can discharge its water content fairly
rapidly. I have observed spring flow over an annual cycle, and it is clear that discharge
rates begin to drop dramatically toward the end of the dry season, and some springs even
dry up. Typically, the aquifer is recharged by the annual rainy season. However, given
prolonged drought conditions it is possible that the aquifer could be depleted altogether
and most of the springs could be dry for most of the year. This would present difficulties
as far as continued occupation of the Taraco Peninsula is concerned.
2.2 Climate
The climate of the Titicaca Basin is dominated by typical tropical wet-dry seasons. The
majority of the precipitation is derived from warm air masses arriving from Amazonia, to
the east. Located as it is between two major weather systems, the Atlantic-Amazonian and
the Pacific, climate in the Titicaca Basin is highly variable, and “[i]nterpretation of long-
term climate averages must be tempered with the understanding that interannual variability
is expressed by standard deviations ranging from 20 to 70 percent of the average means”
(Binford and Kolata 1996: 30).
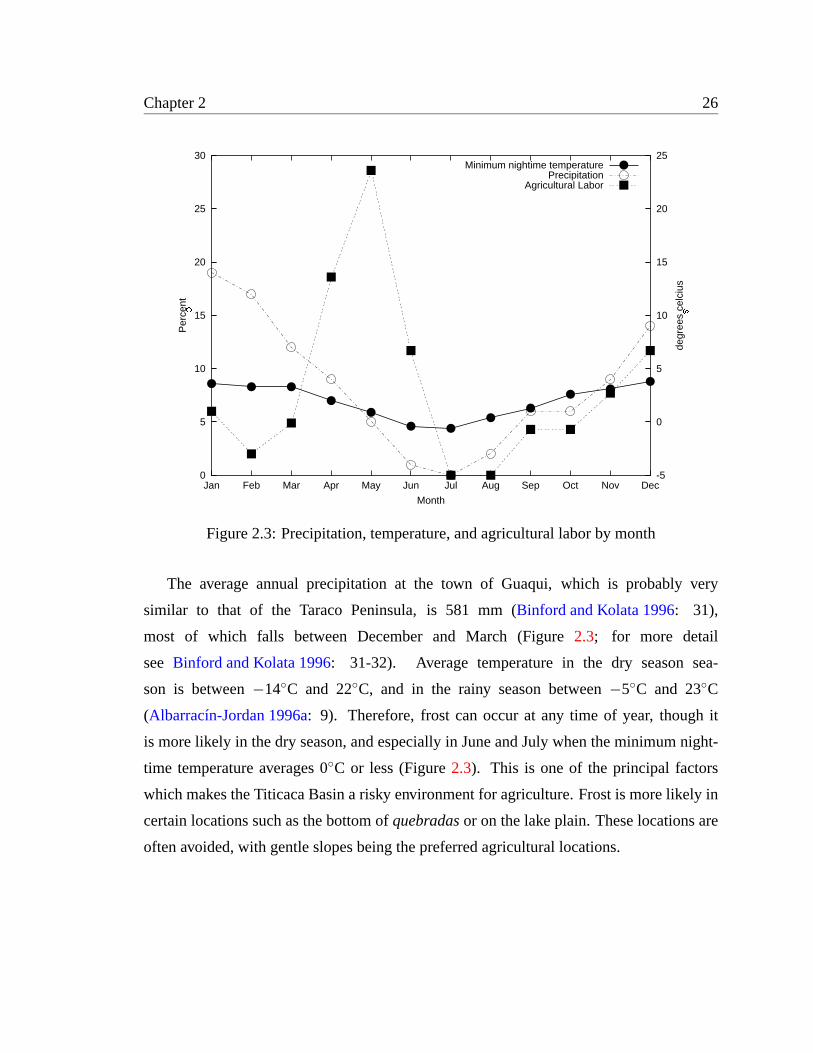
Chapter 2 26
0
5
10
15
20
25
30
Jan Feb Mar Apr May Jun Jul Aug Sep Oct Nov Dec-5
0
5
10
15
20
25
Per
cent
�
degr
ees
celc
ius
�
Month
Minimum nightime temperaturePrecipitation
Agricultural Labor
Figure 2.3: Precipitation, temperature, and agricultural labor by month
The average annual precipitation at the town of Guaqui, which is probably very
similar to that of the Taraco Peninsula, is 581 mm (Binford and Kolata 1996: 31),
most of which falls between December and March (Figure2.3; for more detail
see Binford and Kolata 1996: 31-32). Average temperature in the dry season sea-
son is between−14◦C and 22◦C, and in the rainy season between−5◦C and 23◦C
(Albarracín-Jordan 1996a: 9). Therefore, frost can occur at any time of year, though it
is more likely in the dry season, and especially in June and July when the minimum night-
time temperature averages 0◦C or less (Figure2.3). This is one of the principal factors
which makes the Titicaca Basin a risky environment for agriculture. Frost is more likely in
certain locations such as the bottom ofquebradasor on the lake plain. These locations are
often avoided, with gentle slopes being the preferred agricultural locations.
Chapter 2 27
2.3 Micro-environmental zones
Albarracín-Jordan and Mathews, as a part of their respective studies of Ti-
wanaku Valley settlement systems, formulated a typology of micro-environmental zones
(Albarracín-Jordan and Mathews 1990, Chapter 1). Although the Taraco Peninsula is
somewhat different from the Tiwanaku Valley in these respects, it is similar enough for me
to use some of their zones, and I have done so for the sake of comparability. Albarracín-
Jordan and Mathews defined seven micro-environmental zones:
1. Upper Colluvial Zone (UCZ),
2. Lower Colluvial Zone (LCZ),
3. Springs and Grass Zone (SGZ),
4. Alluvial Plain (AP),
5. Lacustrine Zone (LZ),
6. Terrace Zone (TZ), and
7. Intermontane Zone (IZ).
The Taraco Peninsula is a considerably less varied area than is the Tiwanaku Valley, and
only three of these zones are present. They are described below.
2.3.1 Upper Colluvial Zone (UCZ)
This zone is located in the higher elevations, on exposed erosional surfaces of the
Taraco Formation. Though it was originally said to exist from 3975-4100 m.a.s.l., my
own elevation distribution places it as low as 3860 m.a..s.l. (Table2.1). The zone is dis-
sected by deep, steep-sidedquebradas, normally running from south to north, as discussed
above. The ground in these areas is extremely rocky, and the soils are thin. Neverthe-
less, they are used for agriculture, though less so than lower and less rocky areas (contra
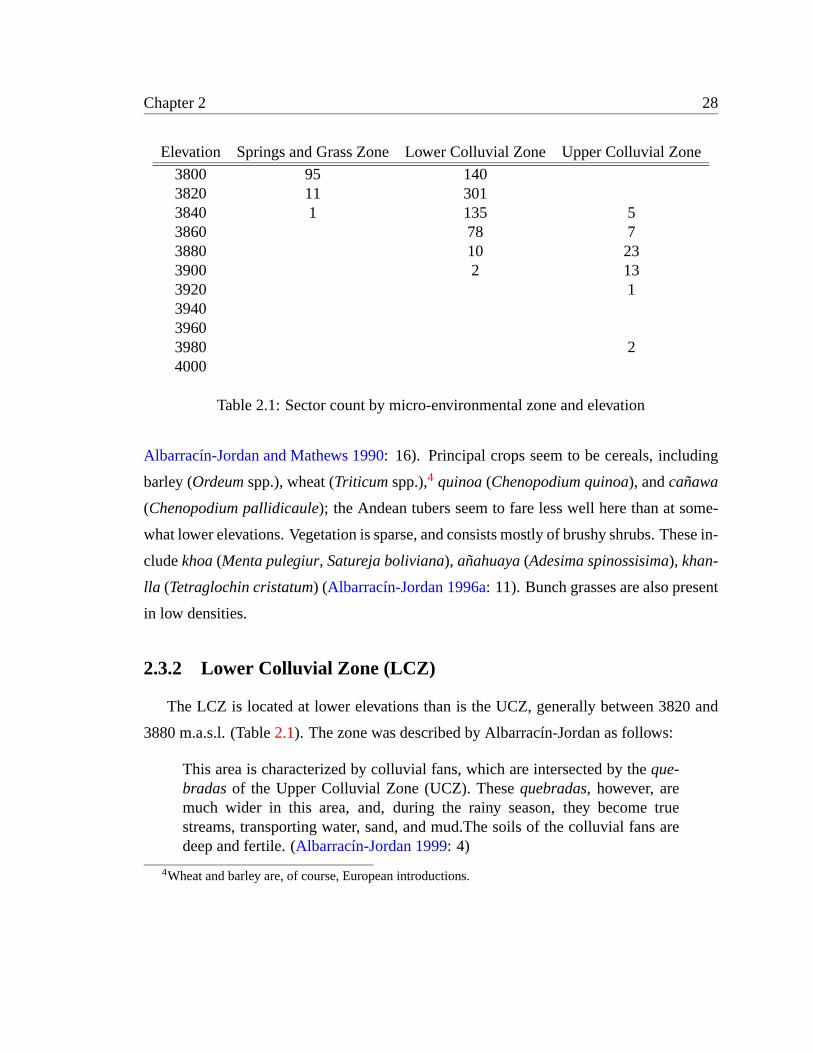
Chapter 2 28
Elevation Springs and Grass Zone Lower Colluvial Zone Upper Colluvial Zone
3800 95 1403820 11 3013840 1 135 53860 78 73880 10 233900 2 133920 1394039603980 24000
Table 2.1: Sector count by micro-environmental zone and elevation
Albarracín-Jordan and Mathews 1990: 16). Principal crops seem to be cereals, including
barley (Ordeumspp.), wheat (Triticumspp.),4 quinoa(Chenopodium quinoa), andcañawa
(Chenopodium pallidicaule); the Andean tubers seem to fare less well here than at some-
what lower elevations. Vegetation is sparse, and consists mostly of brushy shrubs. These in-
cludekhoa(Menta pulegiur, Satureja boliviana), añahuaya(Adesima spinossisima), khan-
lla (Tetraglochin cristatum) (Albarracín-Jordan 1996a: 11). Bunch grasses are also present
in low densities.
2.3.2 Lower Colluvial Zone (LCZ)
The LCZ is located at lower elevations than is the UCZ, generally between 3820 and
3880 m.a.s.l. (Table2.1). The zone was described by Albarracín-Jordan as follows:
This area is characterized by colluvial fans, which are intersected by theque-bradasof the Upper Colluvial Zone (UCZ). Thesequebradas, however, aremuch wider in this area, and, during the rainy season, they become truestreams, transporting water, sand, and mud.The soils of the colluvial fans aredeep and fertile. (Albarracín-Jordan 1999: 4)
4Wheat and barley are, of course, European introductions.
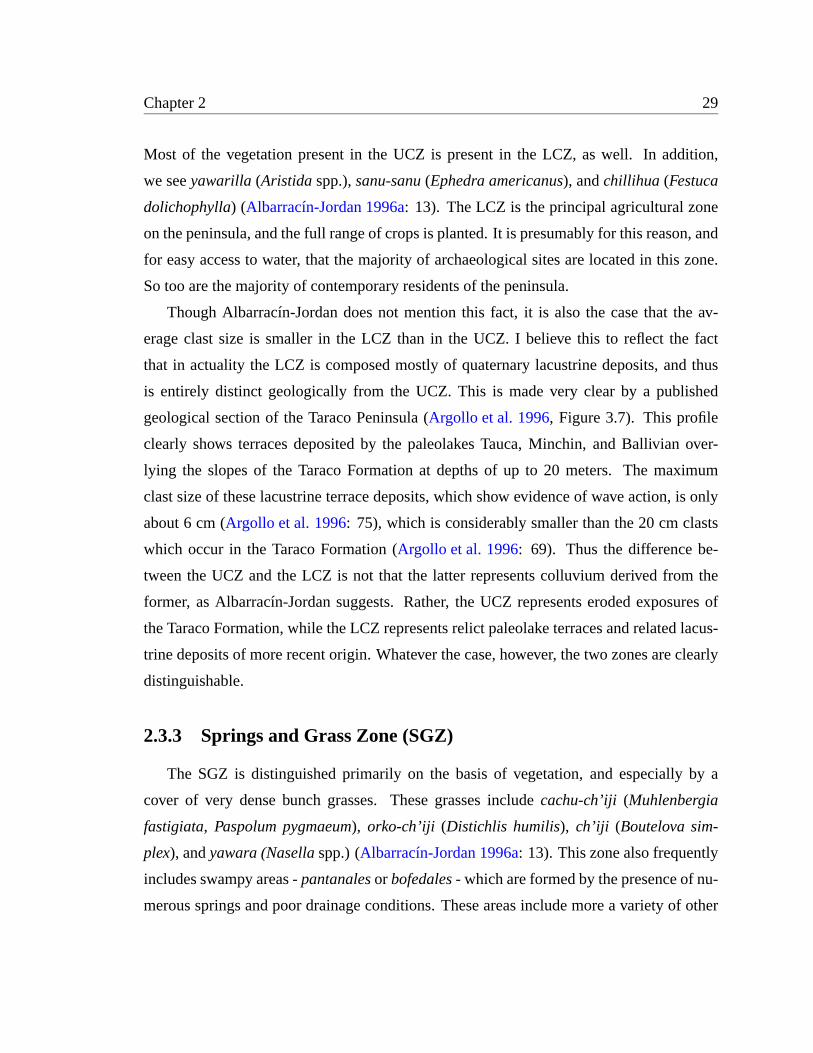
Chapter 2 29
Most of the vegetation present in the UCZ is present in the LCZ, as well. In addition,
we seeyawarilla (Aristida spp.),sanu-sanu(Ephedra americanus), andchillihua (Festuca
dolichophylla) (Albarracín-Jordan 1996a: 13). The LCZ is the principal agricultural zone
on the peninsula, and the full range of crops is planted. It is presumably for this reason, and
for easy access to water, that the majority of archaeological sites are located in this zone.
So too are the majority of contemporary residents of the peninsula.
Though Albarracín-Jordan does not mention this fact, it is also the case that the av-
erage clast size is smaller in the LCZ than in the UCZ. I believe this to reflect the fact
that in actuality the LCZ is composed mostly of quaternary lacustrine deposits, and thus
is entirely distinct geologically from the UCZ. This is made very clear by a published
geological section of the Taraco Peninsula (Argollo et al. 1996, Figure 3.7). This profile
clearly shows terraces deposited by the paleolakes Tauca, Minchin, and Ballivian over-
lying the slopes of the Taraco Formation at depths of up to 20 meters. The maximum
clast size of these lacustrine terrace deposits, which show evidence of wave action, is only
about 6 cm (Argollo et al. 1996: 75), which is considerably smaller than the 20 cm clasts
which occur in the Taraco Formation (Argollo et al. 1996: 69). Thus the difference be-
tween the UCZ and the LCZ is not that the latter represents colluvium derived from the
former, as Albarracín-Jordan suggests. Rather, the UCZ represents eroded exposures of
the Taraco Formation, while the LCZ represents relict paleolake terraces and related lacus-
trine deposits of more recent origin. Whatever the case, however, the two zones are clearly
distinguishable.
2.3.3 Springs and Grass Zone (SGZ)
The SGZ is distinguished primarily on the basis of vegetation, and especially by a
cover of very dense bunch grasses. These grasses includecachu-ch’iji (Muhlenbergia
fastigiata, Paspolum pygmaeum), orko-ch’iji (Distichlis humilis), ch’iji (Boutelova sim-
plex), andyawara (Nasellaspp.) (Albarracín-Jordan 1996a: 13). This zone also frequently
includes swampy areas -pantanalesor bofedales- which are formed by the presence of nu-
merous springs and poor drainage conditions. These areas include more a variety of other
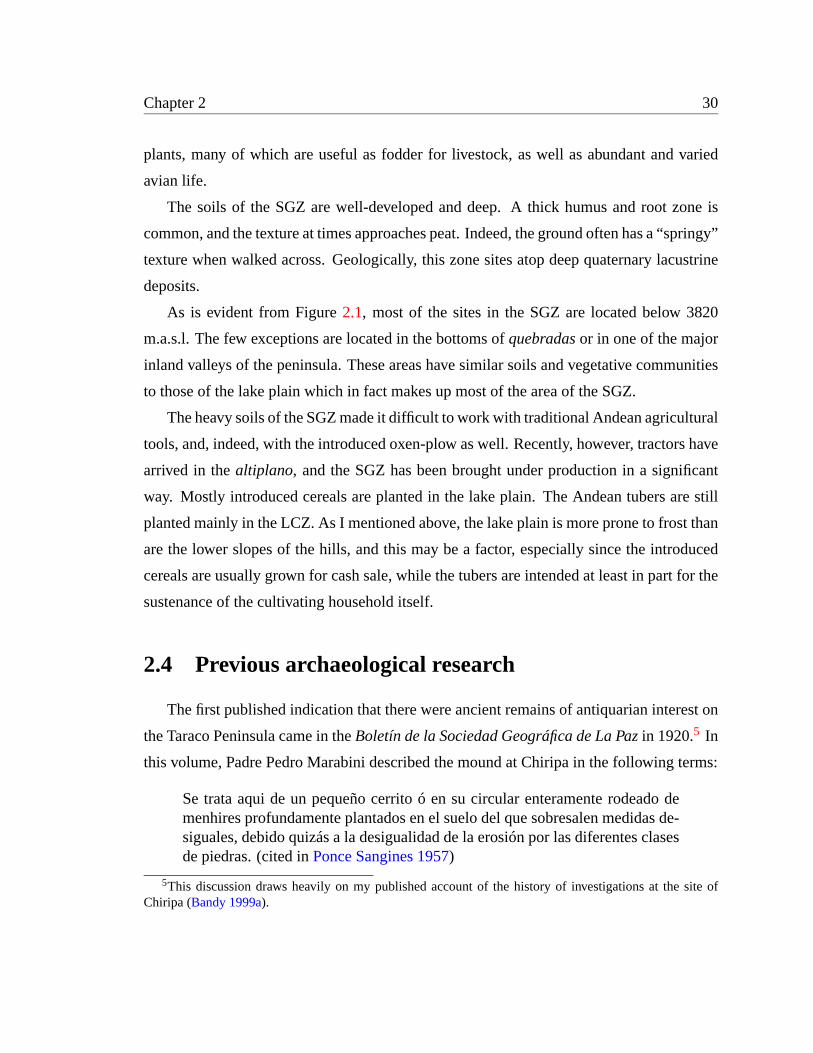
Chapter 2 30
plants, many of which are useful as fodder for livestock, as well as abundant and varied
avian life.
The soils of the SGZ are well-developed and deep. A thick humus and root zone is
common, and the texture at times approaches peat. Indeed, the ground often has a “springy”
texture when walked across. Geologically, this zone sites atop deep quaternary lacustrine
deposits.
As is evident from Figure2.1, most of the sites in the SGZ are located below 3820
m.a.s.l. The few exceptions are located in the bottoms ofquebradasor in one of the major
inland valleys of the peninsula. These areas have similar soils and vegetative communities
to those of the lake plain which in fact makes up most of the area of the SGZ.
The heavy soils of the SGZ made it difficult to work with traditional Andean agricultural
tools, and, indeed, with the introduced oxen-plow as well. Recently, however, tractors have
arrived in thealtiplano, and the SGZ has been brought under production in a significant
way. Mostly introduced cereals are planted in the lake plain. The Andean tubers are still
planted mainly in the LCZ. As I mentioned above, the lake plain is more prone to frost than
are the lower slopes of the hills, and this may be a factor, especially since the introduced
cereals are usually grown for cash sale, while the tubers are intended at least in part for the
sustenance of the cultivating household itself.
2.4 Previous archaeological research
The first published indication that there were ancient remains of antiquarian interest on
the Taraco Peninsula came in theBoletín de la Sociedad Geográfica de La Pazin 1920.5 In
this volume, Padre Pedro Marabini described the mound at Chiripa in the following terms:
Se trata aqui de un pequeño cerrito ó en su circular enteramente rodeado demenhires profundamente plantados en el suelo del que sobresalen medidas de-siguales, debido quizás a la desigualidad de la erosión por las diferentes clasesde piedras. (cited inPonce Sangines 1957)
5This discussion draws heavily on my published account of the history of investigations at the site ofChiripa (Bandy 1999a).
Chapter 2 31
We are speaking of a small mound entirely encircled by columns deeply set inthe earth; these project to different heights, owing perhaps to unequal erosionof the different stone types.
He also described another “cerrito” about 2 kilometers away, in the direction of the lake.
Given that the mound is currently less than 1 kilometer from the lake, it is not clear to what
he was referring. Elderly residents of the area have informed me that the lake level was very
low in the 1920s. Perhaps, then, this reference is to the site of Chiaramaya, approximately
2 km to the east, on which is located a substantial prehistoric mound construction. He
concludes with a suggestion that scientific work be conducted on the mound:
... no dudamos de que también aquí como en Huacullani una excavaciónmetódica pudiera ser de muy buenos resultados para la ciencia arqueológica.(cited inPonce Sangines 1957)
... we do not doubt that both here [Chiripa] and in Huacullani a methodicalexcavation could produce very good results for the science of archaeology.
It would be 14 years before Marabini’s suggestion was taken - though probably unknow-
ingly - by Wendell Bennett. Bennett was at the time employed by the American Museum
of Natural History in New York. His Bolivian expeditions of 1932 and 1933-34 included
excavations in numerous regions (Bennett 1933, Bennett 1934, Bennett 1936). In thealti-
plano, he excavated at Tiwanaku, Pajchiri, and Lukurmata, and on several islands in Lago
Wiñaymarka. He stayed in Chiripa - on the Taraco Peninsula - for five weeks, living in
the now-ruined hacienda house. Using the materials from his Tiwanaku excavations, Ben-
nett elaborated a three-phase ceramic chronology: Early Tiwanaku, Classic Tiwanaku, and
Decadent Tiwanaku (Bennett 1934). These phases correspond roughly to what I call the
Late Formative, and to the earlier and later parts of the Tiwanaku period (see Figure2.4).
Bennett recognized that the ceramics of the Chiripa culture were different from those he
had excavated at Tiwanaku. At first he though they should be placed between Classic and
Decadent Tiwanaku. This was based on a stratigraphic column he excavated on the island
of Pariti in which “the Chiripa level [was] ... above a Classic Tiahuanaco grave and below
a Decadent Tiahuanaco level, thus establishing its chronological position” (Bennett 1936:
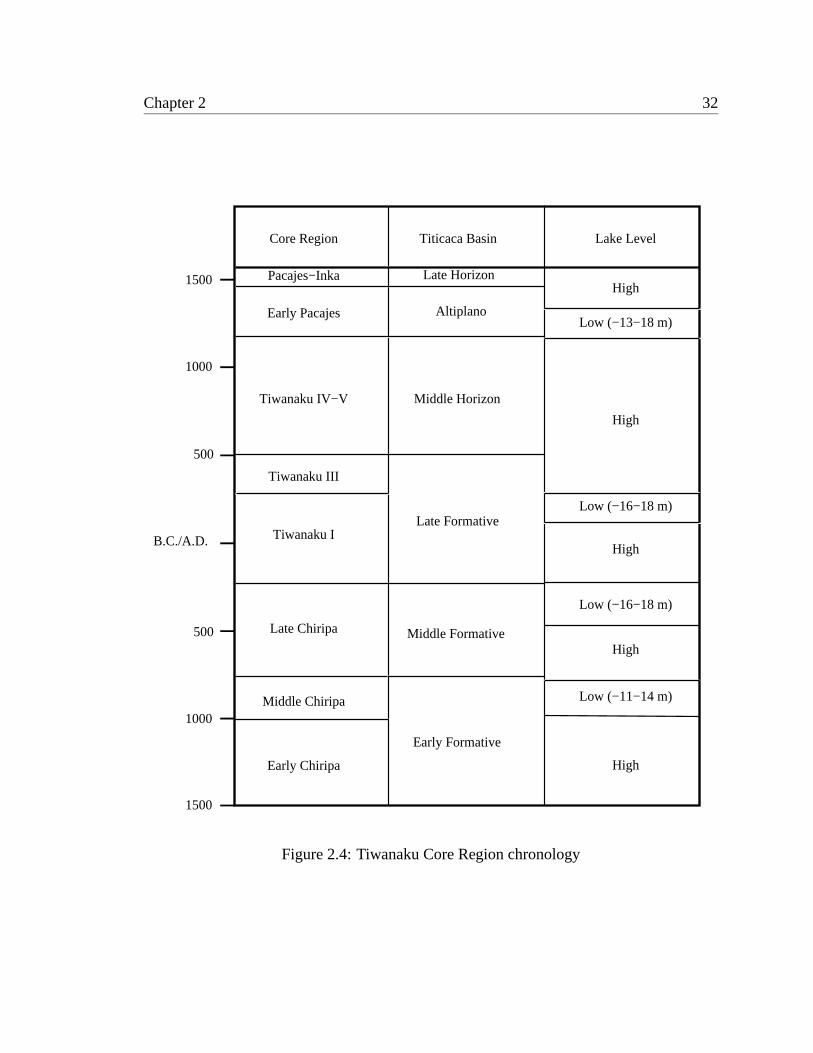
Chapter 2 32
Pacajes−Inka
1500
1000
1000
1500
500
500
B.C./A.D.
Core Region Titicaca Basin
Early Chiripa
Middle Chiripa
Tiwanaku I
Tiwanaku IV−V
Early Pacajes Altiplano
Middle Horizon
Late Formative
Middle Formative
Early Formative
Late Horizon
Tiwanaku III
Late Chiripa
Lake Level
High
Low (−13−18 m)
High
High
High
High
Low (−16−18 m)
Low (−16−18 m)
Low (−11−14 m)
Figure 2.4: Tiwanaku Core Region chronology

Chapter 2 33
Phase Date Span (years)
Late Pacajes 1540-1600 A.D. 60Pacajes-Inka 1450-1540 A.D. 90Early Pacajes 1100-1450 A.D. 350Tiwankau (Tiwanaku IV-V) 500-1100 A.D. 600Late Formative 2 (Tiwanaku III) 300-500 A.D. 200Late Formative 1 (Tiwanaku I) 250 B.C. - 300 A.D. 550Middle Formative (Late Chiripa) 800-250 B.C. 550Early Formative 2 (Middle Chiripa) 1000-800 B.C. 200Early Formative 1 (Early Chiripa) 1500-1000 B.C. 500
Table 2.2: Tiwanaku Core Region chronology
451). However, the work of Kidder in the northern Titicaca Basin caused Bennett to revise
his sequence, placing the Chiripa culture before Early Tiahuanaco. With the publication of
this revised sequence, the chronology of the southern Titicaca Basin assumed roughly its
contemporary form (compareBennett 1948, Table 3 to my Figure2.4). The excavations of
Bennett, and his meticulous and timely publications provide the baseline for our knowledge
of the Chiripa culture.
The next persons to carry out archaeological work on the Taraco Peninsula were Maks
Portugal Zamora and María Luisa Sánchez Bustamente de Urioste. There is some con-
fusion as to the exact date when these two carried out excavations at Chiripa. This
is compounded by the almost anecdotal evidence that their project did, in fact, take
place. This work is known, to my knowledge, only through a four-page 1940 report
to the Bolivian Minister of Education entitledLos Hallazgos de la Hacienda Chiripa
(Portugal Zamora 1940). This report was used by Portugal Ortíz (Portugal Ortíz 1992) in
an article published in the Universidad Mayor de San Andres’s journal,Textos Antropológi-
cos. In addition, Javier Escalante has published a plan derived from these excavations
(Escalante Moscoso 1994, Figure 56). The work is also referenced in an unpublished re-
port by Gregorio Cordero Miranda.
According to the Portugal Zamora report, he and Sra. Bustamente were sent on a recon-
naissance expedition to the Taraco Peninsula by the Bolivian Ministry of Education. They
Chapter 2 34
were charged specifically with investigation of Chiripa and of Huacullani, and of prospect-
ing for additional sites in the area. Indeed, Portugal Zamora is the first to clearly mention
the site of Chiaramaya, near Chiripa, which is only mentioned again in an unpublished
report from the 1970’s (Erickson 1975). They also apparently discovered the stone stela -
the famousídolo de Cala Cala- at the site of Waka Kala in the modern community of Cala
Cala (Portugal Ortíz 1998: 102). Portugal Ortíz, who obviously was in possession of the
Portugal Zamora report and quoted from it at length and verbatim (Portugal Ortíz 1992),
states that the work took place in 1940. Cordero Miranda, on the other hand, states that
Portugal Zamora and Bustamente were present in Chiripa in 1937. Given that Cordero’s
report was probably written in 1955 or 1956, I am inclined to credit his date and to assume
that Portugal Ortíz simply took the date of Portugal Zamora’s report to be the year of the
excavations. In terms of the work itself, Portugal Zamora and Bustamente cleaned some
of Bennett’s trenches, and excavated another structure on the Chiripa mound. Beneath
the floor of this structure they apparently uncovered a series of interments, some of which
have been described in print (Portugal Ortíz 1992). Their results have never been properly
published, however.
There followed a 15-year hiatus in which, to my knowledge, no archaeologist worked
on the Taraco Peninsula. The next project was that of Alfred Kidder II in 1955. Kidder was
employed at the time by the University of Pennsylvania, and had just completed a series of
excavations at Tiwanaku. He was accompanied by his wife, Mary, and various students and
colleagues, one of whom was Bolivian archaeological pioneer Gregorio Cordero Miranda.
Very little information on this project has been published. The only sources of which
I am aware are a short piece by Kidder in theUniversity Museum Bulletin(Kidder 1956)
and the very important article by Karen Mohr Chávez (Chávez 1988) based on the access
of that author to Kidder’s unpublished material. In addition, Cordero Miranda prepared
a nine-page typewritten report on his part in the excavations, which remains in typescript
form, and Chávez’s (then Karen Mohr) M.A. thesis (Mohr 1966) contains some additional
information.
Chapter 2 35
Kidder’s project excavated portions of at least three of the Chiripa culture structures first
discovered by Bennett. and cleaned the previously-excavated remains of others. Through
careful observation of profiles and earlier excavations, Kidder et. al. were able to re-
construct with remarkable precision the form of the entire complex, still buried beneath
a meter of later fill. Their excavations beneath structure floors also revealed a large
mortuary assemblage, including some examples with relatively elaborate treatment. Fi-
nally, excavating below the upper structures, they encountered an earlier layer of struc-
tures, entombed by the remains of the later ones discovered by Bennett. Using this three-
stage stratigraphic sequence (Upper House, Lower House, and Pre-Mound Levels), Karen
Chávez elaborated a three-phase ceramic sequence, comprising Early, Middle and Late
Chiripa (Mohr 1966, Chávez 1988). Though limited by very small sample sizes for the
earlier phases, this was an important advance in our understanding of the Formative Period
chronology of the southern Titicaca Basin.
It was another twenty years before another archaeologist was to excavate on the Taraco
Peninsula. David Browman of Washington University carried out two seasons of ex-
cavations, in 1974 and 1975. He was accompanied by Gregorio Cordero Miranda, the
same Cordero who had participated in Kidder’s excavations. Also present were a trio of
Browman’s students from Washington University, Clark Erickson, Charles Miksecek and
Jonathan Kent, who went on to advanced studies in Andean prehistory.
According to Browman, the work consisted of "two seasons of clearing at the temple
of Chiripa, including three stratified cuts testing earlier deposits" (Browman 1978a: 807).
Interestingly, this was the first project at the site which did not excavate any of the “Upper
House Level” structures originally discovered by Bennett. Instead, Browman devoted his
efforts to the clearing of the sunken court located in the center of the mound - from which
some 1450 cubic meters of fill was eventually removed (Browman 1978a: 811) - as well as
to the excavation of a several deeper test pits. Despite heavy disturbance related to recent
stone robbing, Browman was able to associate the upper sunken court with a Late Forma-
tive occupation. He also discovered another sunken court below the visible on, which he
assigned a Middle Formative date. He argued that this earlier structure was contemporary
Chapter 2 36
with the occupation of the Upper House Level. Like earlier investigators, Browman con-
tinued to think of the Chiripa mound as a small villages of 14-16 houses. However, he did
interpret at least the later sunken court as a special purpose structure - a “temple” - and
identified an associated Late Formative 2 (Tiwanaku III) habitation area in an off-mound
area.
Although Karen Chávez never actually conducted research in the area - she worked
instead with Kidder’s collections - no account of Taraco Peninsula research would be
complete without mentioning her very important 1988 article (Chávez 1988). This ar-
ticle singlehandedly and completely changed archaeologists’ conceptions of Chiripa.
Where other scholars had interpreted the mound with its enclosure of structures as a
small village, Chávez interpreted the mound, enclosure, and sunken court together as
a “temple-storage complex” (Chávez 1988: 17). In an exhaustive analysis, she ar-
gued that these structures were not in fact used for habitation. Rather, their architec-
tural properties, together with their associated sculptural, ceramic, and botanical assem-
blages all indicated use for storage and ritual. Further, a careful consideration of stylis-
tic relationships indicated that the Chiripa complex was antecedent to the temple struc-
tures of the later Pukara culture. She also associated Chiripa ceramics, architecture
and sculpture with the early Yaya-Mama stone sculptural style (Chávez and Chávez 1970,
Chávez and Mohr Chávez 1975). Together, all of these features comprised the “Yaya-
Mama Religious Tradition” (Chávez 1988: 17). At a stroke, the “houses” of Bennett,
Kidder, and Browman became special use structures, employed for the storage of ritual
goods, foodstuffs, or even ancestral mummies, and central to the ceremonies and rites
which unified ancient Titicaca Basin populations. The Upper House enclosure was no
longer a village, but rather a public ceremonial complex located at the center of a village,
the remains of which were scattered in the surrounding agricultural fields.
Following the established frequency of one archaeological project every 15-20 years,
the Taraco Archaeological Project (TAP) began work on the peninsula in 1992. This
project, directed by Christine Hastorf of the University of California, Berkeley, exca-

Chapter 2 37
vated in 1992, 1996, 1998, and 1999 at Chiripa.6 TAP began excavations, as noted,
only four years after the publication of Chávez’s article, and the excavation strategy was
guided by her conclusions. Excavations were designed to recover the remains of do-
mestic houses and middens (Hastorf 1990b), and for this reason were all initially lo-
cated off-mound. While ample evidence of domestic occupation was encountered - in
the form of refuse deposits and middens - poor preservational conditions made it im-
possible to excavate domestic architecture. What was preserved, however, was a series
of public architectural constructions which predates the Upper House Level enclosure
(Bandy 1999b, Bandy et al. 1998, Dean and Kojan 1999, Paz Soría 1999). Over four sea-
sons of excavation, TAP has managed to define a sequence of 5 separate public architec-
tural complexes beginning as early as 1000 B.C. This sequence is described in some detail
in section6.3.
Almost seventy years of sporadic archaeological research has therefore demonstrated
that the Taraco Peninsula was an early locus of settled village life. The region also saw
very early development of public architecture and ritual paraphernalia. Many of the fea-
tures proved to be very long-lived, far outlasting the culture that invented them. Echoes
of Chiripa Culture art and architectural practices can be discerned in the later Pukara,
Tiwanaku, and even perhaps Inka corporate styles. However, all research had been con-
ducted at the site of Chiripa itself. Many questions remained regarding the regional context
of these developments. A longitudinal study of settlement and demography on the Taraco
Peninsula promised to be relevant to questions of the development of social complexity and
social evolution generally. I resolved to undertake such a project; this document reports its
results.
6I participated in all of these seasons; and as co-director since 1998.
38
Chapter 3
Field methodology and ceramic phase
identification
Between July of 1998 and July of 1999 the Catastro Arqueológico Taraco (CAT), under
my direction, undertook a full coverage archaeological survey of the Taraco Peninsula.
The survey area covers approximately 85.22 km2. It may be found on Hoja 5844 IV of the
Carta Nacional of the Instituto Geográfico Militar de Bolivia. The project area is located
mainly in Canton Taraco, Provincia Ingavi in the Department of La Paz, though a small
portion of Canton Huacullani, Provincia Los Andes was also surveyed. In the course of the
work the project registered 476 prehistoric sites dating to all periods of the region’s human
occupation (Figure3.1and AppendixA).
The CAT survey of the Taraco Peninsula extends what is becoming a very important set-
tlement dataset in the southern Lake Titicaca Basin. This includes surveys of the Tiwanaku
Valley by Juan Alabarracín-Jordan and James Matthews, and of the Pampa Koani by John
Janusek. Together with the Taraco Peninsula, these surveys have covered about 600 con-
tiguous square kilometers and have registered nearly 2000 archaeological sites. This makes
the southern Titicaca Basin one of the best-studied areas in South America.
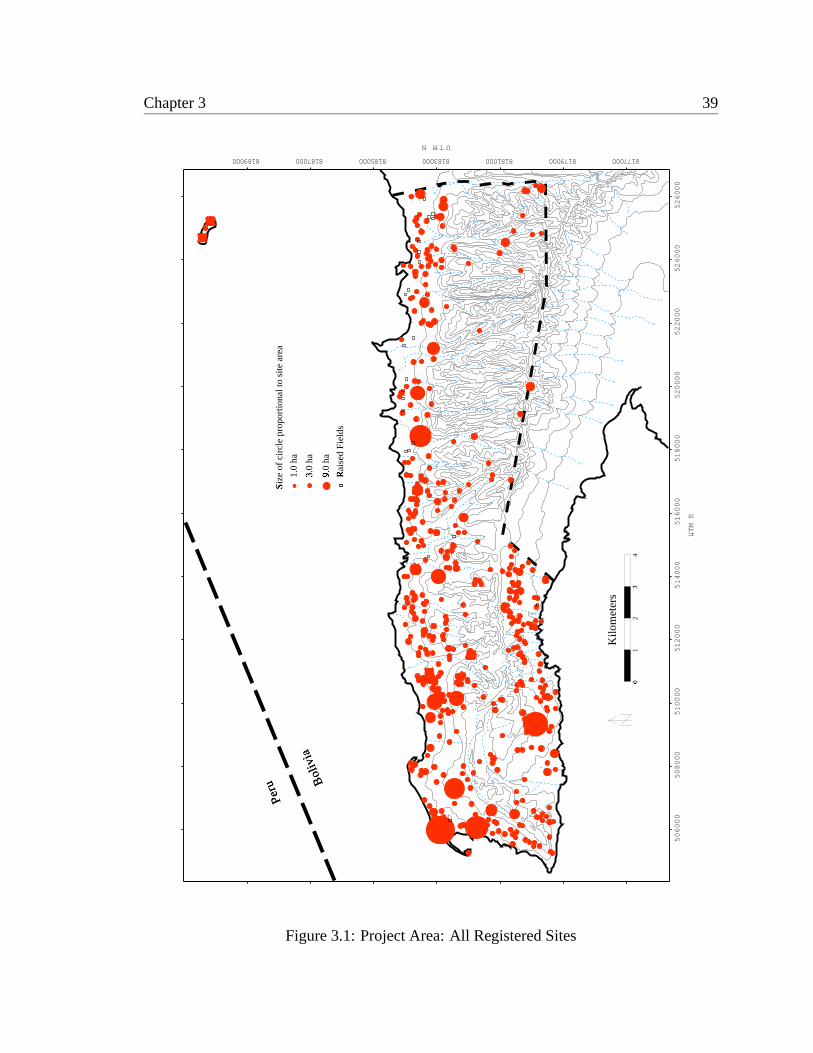
Chapter 3 39
0�
12
3�
4
Kilo
met
ers
1.0
ha
Rai
sed
Fiel
ds
�3.0
ha
�
Peru B
oliv
ia
Size
of
circ
le p
ropo
rtio
nal t
o si
te a
rea
�
9.0
ha
�
506000
508000
510000
512000
514000
516000
518000
520000
522000
524000
526000
UTM E
�
UTMN
8770008179008110000818500818700819000 108818300008
Figure 3.1: Project Area: All Registered Sites
Chapter 3 40
3.1 Survey and site definition
The methodology employed in site location and initial recording was the orthodox
methodology developed for total coverage pedestrian archaeological survey in arid and
semi-arid areas, and is therefore broadly comparable to that of prior settlement research car-
ried out in the Titicaca Basin (SeeAlbarracín-Jordan and Mathews 1990, Mathews 1992,
Albarracín-Jordan 1996a, Stanish et al. 1997, Stanish 1994) and in much of the Americas
(cf. Fish and Kowalewski 1990, Parsons 1976). Coverage was achieved by walking paral-
lel North-South transects with a crew of between five and seven persons. Crew members
were spaced at 30 meter intervals. When prehistoric cultural materials were encountered I
personally inspected the potential site.
Most sites consisted of ceramic scatters. Some agricultural features were observed and
were assigned site numbers. These were unusual, however.
3.1.1 Ceramic scatters
As no aceramic habitation sites were encountered, the sole criterion used to define
non-agricultural sites was the density of the prehistoric sherd scatter. I am aware of the
artificiality of the site concept, and of attempts that have been made to remedy it. However,
as the research progressed several things became clear which compelled me to adopt a
site-based approach to settlement research. First, all previous surveys in the region had
adopted such an approach, and I wanted to ensure compatibility with existing data sets.
Second, it rapidly became apparent that the quantity of prehistoric material in the research
area was quite extensive (almost 500 sites were eventually identified) and that without the
shorthand recording method of “the site” it would be quite impossible to document this
material with the limited resources at my disposal. Third and finally, it was clear that
certain clusters of ceramics in the study area were much more dense than others. While
the entire Taraco Peninsula is one large, low-density ceramic scatter, certain areas within
it do stand out as being more dense than others. This observation was made some years
earlier in my surface collection of the site of Chiripa (Bandy 1999d). I finally decided to
Chapter 3 41
use a density of 0.1 sherds per square meter over an area of at least 100 square meters as
the minimum site definition, the same site definition criterion I had earlier decided upon
for Chiripa. While this figure is indisputably arbitrary, it does nevertheless seem to have
some real significance, as the empirical evidence from the systematic surface collections
will show. The smallest possible site using this definition would be 10 sherds in a 10x10m
area. In actual fact, almost no sites approached the minimum, the vast majority covering at
least 1000 square meters with 100 or more sherds.
When a site was encountered - that is, a concentration of ceramic fragments in which
those pertaining to a single time period attained a density of at least 0.1 sherds per meter
squared over an area of at least 100 m2 - then the point of greatest density was located.
This was used as the site center, and was located in space using a Magellan GPS receiver
(set to the South American provisional datum of 1956). The dimensions of the scatter were
then determined by pacing North-South and East-West from this center. The area of the
site is calculated as the product of the length of these two axes. If ceramics from multiple
prehistoric time periods were present, then multiple sectors were defined.
“Sector” is best understood as a “site within a site,” and is conceptually similar to the
common usage of “component” or “occupation.” Indeed, I will use all of these terms inter-
changeably. A sector is an area containing a continuous distribution (at least 0.1 sherds per
m2) of ceramics from a single prehistoric time period. Sometimes multiple sectors overlap,
and together form a site. A site, then, could also be defined as one or more overlapping
sectors. As will become apparent later on, the sector represents the truly fundamental unit
of my analysis, the site being simply a convenient recording mechanism. It is important
to note at this juncture that agricultural features can be sectors, as well. Thus a scatter of
Early Pacajes sherds adjacent to a small raised field group would constitute a single site but
two sectors. These two sectors would have distinct sizes and phase attributions, and would
therefore be entirely separate analytically.
Site recording involved location, measurements and sector definition, as described
above. Additional information recorded on the site form included community, property
owner, time period, a basic site typology (useful for distinguishing habitation sites from
Chapter 3 42
agricultural features, primarily), microenvironmental zone (as defined in the Chapter2), lo-
cal resources (springs, viewshed properties, access limitations, etc.), modern disturbance,
agricultural history, ground cover and so on. A small sample of representative diagnos-
tic sherds was also recovered, along with any exotic lithic materials or prehistoric metal
objects (extremely rare) encountered. In general I tried to collect a minimum of 30-40
phase-diagnostic sherds from a given site, though this often proved to be impossible on the
smaller sites.
3.1.2 Agricultural features
Agricultural sites were almost exclusively remnant raised fields, though one small set
of probable prehistoric agricultural terraces was recorded. Raised fields are a common
sight in the Titicaca Basin, distinguishable as low, fairly subtle swales and dips in marshy
flat areas (Erickson 1994, Lennon 1982, Lennon 1983, Smith et al. 1968). These features
were typically photographed and were measured by pacing. They were given site numbers
continuous with those of the ceramic scatters. It is worthwhile to note that raised field
groups on the Peninsula were relatively uncommon and relatively small (< 1 ha) compared
to those in the adjacent Pampa Koani, where raised field groups are numerous and very
large (cf.Kolata 1986, Kolata 1991, Seddon 1994a). This is an immediate and compelling
fact and is very informative when considered in light of other differences between these
two areas. This will be discussed at considerable length in later chapters.
3.2 Systematic surface collection
The method outlined above for determining the dimensions and centers of the various
sectors that make up a site worked well on small sites and on sites with relatively short-
term occupations. In the case of larger sites, however - in the 5 to 15 ha range - with
very long-term occupations this method proved to be untenable. In order to collect detailed
occupation information over the entire occupation span of these larger sites, comparable to
that easily obtained for smaller sites, a program of intensive systematic surface collection
Chapter 3 43
was carried out. The methodology employed was the same as that I had used earlier at the
site of Chiripa (Bandy 1999d) and, with Paul Goldstein, at the site of Chen Chen (M-1) in
the Moquegua Valley of Peru (Bandy et al. 1996).
The surface collection was begun typically at the point of greatest ceramic density
within the site, as determined in the initial recording of the site, as described above. Around
this point, a circle with a radius of 3.99 meters (that is a 50 m2 circle) was scratched into the
surface, and all ceramics in this area were collected and assigned an arbitrary and sequen-
tial number which I refer to as a locus number. Locus numbers allocated for the surface
collection program were between 4000 and 4999, assigned arbitrarily, and were therefore
continuous with the locus numbers used in the various excavation seasons of the Taraco
Archaeological Project at Chiripa (0-3999). Each surface collection locus, therefore, refers
to a 50 m2 circular area within a site with a center defined in terms of a master site grid.
This grid was laid out on every site in which we undertook systematic surface collection.
It was oriented to the cardinal directions (though note that in the 1998-1999 surface collec-
tion program this grid was laid out using a magnetic compass and without correction for
declination; North in this case is magnetic North). The central point of the site, as defined
above, was typically assigned the coordinates 1000N/1000E. Additional surface collection
loci were collected at 50 meter intervals until the whole area of the site had been sampled
(that is, until the surface density of prehistoric ceramics had dropped below 0.1 sherds per
m2, equivalent to 5 sherds in the 50m2 circle). Each locus, or collection unit, sampled an
area of 50x50m or 0.25 ha. Thus, a 5 ha site, when surface collected, would comprise 20
collection loci. The ceramic data resulting from these surface collections are summarized
in AppendixB.
All ceramics within each locus were collected, washed, sorted and analyzed; almost
100,000 sherds altogether. Though I would like to have collected all lithics from each lo-
cus as well, this proved to be impossible. The density of debitage in most sites, particularly
Formative period ones, was such that systematic debitage collection would quickly have
exhausted my resources for both analysis and curation. This being the case, I decided that
only formal tools and debitage of non-local origin were to be collected; flakes and shatter
Chapter 3 44
of quartzite and local cherts were noted in a general way on the locus form but were not
recovered. Faunal material was not collected due to the fact the rapid deterioration of bone
when exposed to sunlight and to the elements and to the continued deposition of modern
faunal remains on site surfaces. Metal objects of clear prehistoric origin were collected,
though these were quite rare. Human skeletal material, encountered occasionally in dis-
turbed contexts, was not collected out of respect for local sensibilities and appreciation of
the evident curation difficulties. I wished to avoid associations with huaqueros or looters
and therefore avoided human remains as much as possible.
All told, 420 loci were collected in the course of the work (in addition to the 154 loci
of the 1996 Chiripa surface collection programme which were reanalyzed for the present
study), comprising over 1 km2 of systematically collected total site area. Even so, there
were some sites - T368 and T319 spring immediately to mind - that really should have
been systematically collected but were not due to lack of time and money. With these
few exceptions, though, every multicomponent site in the survey area larger than 5 ha was
systematically surface collected. In addition, many smaller Formative period sites were
collected. This is so because it proved to be impossible to distinguish Early and Middle
Formative occupations without systematically collected assemblages. Therefore all sites
with Early and Middle Formative occupations were collected - again with a few exceptions.
It is worth noting that the systematic surface collection program and analysis of the
resulting materials accounted for well over 2/3 of my total time in the field. Though this
method produces excellent fine-grained settlement data it must be acknowledged that it
requires a quite substantial investment of time and resources.
3.3 Ceramic phase identification
Analysis of the ceramics produced by both general and systematic surface collection
of sites was oriented almost completely toward chronological questions. The goal of the
fieldwork as a whole was to produce as temporally and spatially fine-grained a settlement
dataset as possible, and the goal of the ceramic analysis was the same.
Chapter 3 45
Fortunately, quite a lot of work has been done on the ceramics of the region obviat-
ing the need to produce an entirely new chronology. In particular, the Early and Middle
Formative period chronology of Steadman (Steadman 1999) proved to be quite workable
(though with some modifications as outlined below), as did the Pacajes chronology (Late
Intermediate Period/Late Horizon/Early Colonial Period) of Albarracín-Jordan and Math-
ews (Albarracín-Jordan 1992, Mathews 1992, Albarracín-Jordan and Mathews 1990). My
Early and Middle Formative and Pacajes chronologies as presented here are basically sim-
ple adaptations of these previous works.
Other time periods proved to be less tractable. I found that, like other settlement
archaeologists working in the Titicaca Basin, I was unable to distinguish between Ti-
wanaku periods IV and V (seePonce Sangines 1981) on the basis of surface materials.
It is becoming increasingly clear that neither the Wila Jawira chronology adapted by Ko-
lata and associates from Ponce’s work (Ponce Sangines 1981) nor the modified Bennett
(Bennett 1934, Bennett 1936, Bennett 1948) sequence of Albarracín-Jordan and Mathews
(Albarracín-Jordan 1992, Albarracín-Jordan 1996a) is a tenable chronology for settlement
survey. Goldstein’s chronology (Goldstein 1985, Goldstein 1989a) from the Moquegua
Valley, Peru is likewise unusable in the altiplano, though it does appear to be useful for Mo-
quegua. Burkholder’s recent work (Burkholder 1997) has promise, but seems - like other
chronologies - to rely on relatively intact decorated specimens, always a rarity in surface
assemblages. A new highland Tiwanaku chronology designed with mixed and fragmentary
surface materials in mind would be most welcome and would be a positive boon to research
in the South-Central Andes. Lacking this, however, I was forced to combine all Tiwanaku
IV-V materials into a single Tiwanaku phase, as unsatisfactory as this may be.
Also problematic were the Late Formative phases. Ponce originally defined the Ti-
wanaku I-III phases based on his excavations at Tiwanaku and on the prior definition by
Bennett of an ‘Early Tiwanaku’ phase. They have bedeviled archaeologists since. The
principal difficulty, as others have pointed out (c.f.Janusek 2001, Mathews 1992), is that
Ponce’s phases were defined in terms of decorated wares: zoned-incised in the case of Ti-
wanaku I, polychrome painted in the case of Tiwanaku III. This is even more problematic
Chapter 3 46
in the case of the Late Formative than in that of Tiwanaku IV-V, as the relative abundance
of decorated wares in the later Tiwanaku periods contrasts with their extreme scarcity in
the Late Formative. To resolve this difficulty John Janusek and Carlos Lémuz have both
produced Late Formative plainware ceramic chronologies for the southern Titicaca Basin
based on excavated materials (Janusek 2001, Lémuz Aguirre 2001). These chronologies
are at present in a tentative state. The rudimentary plainware chronology employed here,
and described in the Late Formative chapter (Chapter7), is my own invention, though
produced in close consultation with both Janusek and Lémuz who very generously shared
their insights and unpublished data with me. It is consistent with both of their chronologies,
though more limited in scope and focused on a restricted range of common paste types.
In short, then, my ceramic analysis was oriented to the identification of assemblages
from the various time periods. These assemblages differ radically. Perhaps even more
significant, the existing chronologies for the various phases diverge considerably in em-
phasis and focus. Thus the Early and Middle Formative chronology is focused largely on
plainware pastes, while the later period chronologies (Tiwanaku and Pacajes) center on
decorated wares. The Late Formative chronology is minimally developed. This situation
made it necessary to adopt different strategies for the identification of assemblages of the
various phases. Though this matter will be discussed in later chapters as well, here I pro-
vide a brief summary of the methods and techniques I developed to distinguish occupations
of various phases in mixed surface collection assemblages.
3.3.1 Identifying Early and Middle Formative period ceramics
The Early and Middle Formative periods, as I define them here, correspond to the Early,
Middle and Late Chiripa phases as defined by Steadman (1999). The many attributes em-
ployed by Steadman include paste, firing, slip, finish, rim form and diameter, and decora-
tion, among others. Each phase is identified by a particular combination of attribute ranges.
The key point here is that there are very few attributes that are unique to any given phase.
A particular paste, for example, will be most common (say 40%) in one phase, but will
also occur in lower frequencies (say 5-10%) in other phases as well. Of the few attributes
Chapter 3 47
that are truly diagnostic or phase-specific (such the neckless olla form for the Early Chiripa
phase [Steadman 1999: 62-63 and Figure 22]), all are quite rare, so that they may be ob-
served on only a small percentage of an assemblage. This means that while Steadman’s
chronology is quite directly and easily applicable to unmixed assemblages (assemblages
representing a single phase), it is more difficult to apply to mixed assemblages. Since the
vast majority of the Early and Middle Formative Period sites encountered in the survey
were multi-component, I was forced to devise a method for distinguishing relative per-
centages of phase-specific attribute frequency profiles in mixed assemblages. I term this
methodfrequency profile analysis.
Frequency profile analysis
Frequency profile analysis consists in comparing a series of attribute frequency profiles.
These profiles are of two types:index profilesandassemblage profiles. An index profile
is an ‘ideal’ profile which analytically identifies a phase.1 Let us say that our ceramic
analysis involves a single attribute with three possible states. A phase index profile consists
of the percentages of each of those attribute states in a given phase. So the index profile
of Phase 1 would be in the form A-B-C, where A is the percentage of attribute state A, B
the percentage of attribute state B, and C the percentage of attribute state C in an unmixed
Phase 1 assemblage. Thus a possible Phase 1 index profile would be 30-60-10, meaning
that in Phase 1 assemblages 30% of sherds have attribute state A, 60% have attribute state
B, and only 10% have attribute state C.
An assemblage profile consists of the relative frequencies of possible attribute states
within a given empirical assemblage, such as the ceramics from a surface collection or
excavation locus. The assemblage profile therefore represents an empirical frequency dis-
1What Kohler and Blinman call a “calibration data set” (Kohler and Blinman 1987: 2). I amaware of two previous attempts to mathematically separate mixed archaeological assemblages. One(Kohler and Blinman 1987) employed multiple linear regression to separate mixtures of six phases each de-fined in terms of relative frequencies of 18 ceramic types. Their case is considerably more complex than myown. The other attempt (Stahle and Dunn 1982) used regression to estimate the contribution of various stagesof biface manufacture to a mixed debitage assemblage.
My own solution to the mixture problem relies on the computational brute force made available by recentpersonal computers, rather than on the more elegant statistical analyses of earlier researchers.
Chapter 3 48
tribution, as opposed to the ideal frequency distribution of the index profile.
The method of frequency profile analysis is to generate a series of hypothetical assem-
blage profiles - one for every possible combination of the predefined index profiles. In the
case of my surface collection ceramic analysis, the index profiles represented the various
ceramic phases defined for the region, and the hypothetical assemblage profiles were every
possible mixture of these phases, ceramically defined. The empirical assemblage profile
is then compared to the full range of hypothetical assemblage profiles. The closest match
is found and this is taken to indicate the specific mixture of ceramic phases represented
in a particular empirical assemblage.2 Matching between the hypothetical and empirical
assemblage profiles is accomplished automatically by computer using a simple recursive
algorithm. The algorithm attempts to minimize the quantityd:
d = abs(H1−E1)+abs(H2−E2)+...+abs(Hn−En)n
where E = empirical assemblage profileH = hypothetical assemblage profile
Thus, the best match is the hypothetical assemblage profile with the lowest average depar-
ture from the frequencies recorded for the empirical assemblage profile. The short program
I have written for the analysis of the surface collection materials - which performs this
operation - is included as AppendixC.
Paste classification
Clearly frequency profile analysis may be applied to very complicated index schemes
involving multiple attributes and attribute states. For the analysis of the Taraco Peninsula
surface data, however, I designed a very simple index scheme, which is outlined below.
Given that I had a limited amount of time to complete the analysis of a substantial ceramic
dataset (approx. 94,000 sherds) I decided to use only a single attribute in defining the
2Frequency profile analysis is superficially related to standard seriation practice (Marquardt 1978), butonly superficially. Kohler and Blinman: “Unlike seriation, which would normally force a mixed collectioninto a single position on a linear continuum usually interpreted as time, this approach identifies mixing, ifpresent, and apportions the collection into one or more temporal components” (Kohler and Blinman 1987:2-3).
Chapter 3 49
phase index profiles. The attribute I chose was paste, for two principal reasons; first, Lee
Steadman had already demonstrated that there were quite significant shifts in the relative
frequencies of pastes between the phases of her Chiripa sequence; second, simple paste
classification is a very rapid process and enabled me to complete the analysis within the
available time.
My paste classification, designed as it is simply to distinguish the three phases of the
Chiripa sequence, is considerably less elaborate than that of Steadman (see Table3.1for the
relationship between my paste groups and Steadman’s pastes). As Cowgill has observed
with reference to seriation, “often one can throw away much of one’s information and still
obtain a good chronological ordering” (Cowgill 1972). Thanks to Steadman’s work, I was
able to avoid collecting much ceramic information at all, and focus instead on only a few
factors known to have chronological significance. Thus the attribute “paste” has in the
present analysis only four states: paste groups 1, 2, 3 and other. It should be emphasized
that all of these paste groups are subsets of Chiripa ceramics; thus, all are fiber-tempered.3
1. Paste Group 1: Any sherd containing one or more large, opaque, angular quartz
fragments. This group is similar to Steadman’s Paste 21, which as she says accounts
for 48% of the Late Chiripa assemblage (Steadman 1999: 66). This paste group is
easily identified without magnification. Composed principally of Steadman’s Pastes
19 and 21. Identified without magnification.
2. Paste Group 2: Any sherd not fitting the description of paste group 1 which has
translucent, rounded quartz inclusions. These inclusions are the predominant temper-
ing agent. This paste group is most common in the Middle Chiripa phase. Composed
principally of Steadman’s Pastes 19 and 26. Identified under 10X magnification.
3. Paste Group 3: Any sherd not fitting the description of groups 1 or 2 which has a large
amount of mica visible in the matrix and on the surface. This paste group is most
common in the Early Chiripa phase. Composed principally of Steadman’s Pastes 17,
18 and 19. Identified without magnification.
3SeeSteadman 1999for a much more detailed account of Chiripa ceramic chronology.
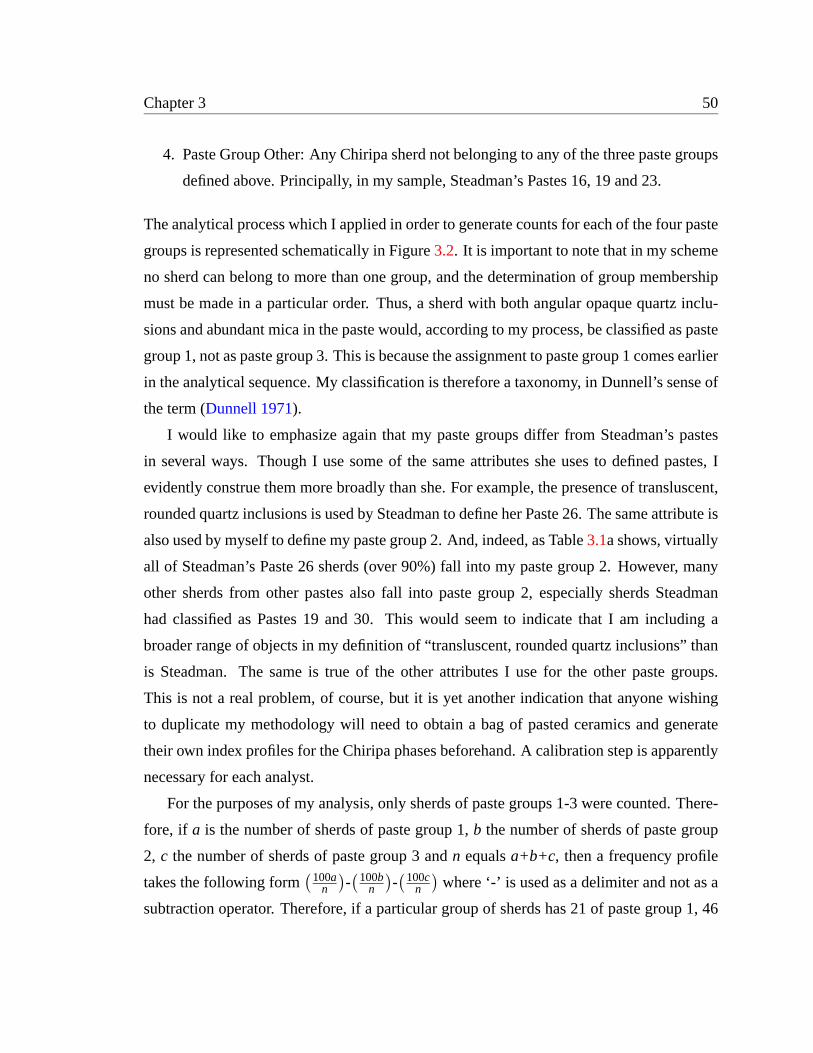
Chapter 3 50
4. Paste Group Other: Any Chiripa sherd not belonging to any of the three paste groups
defined above. Principally, in my sample, Steadman’s Pastes 16, 19 and 23.
The analytical process which I applied in order to generate counts for each of the four paste
groups is represented schematically in Figure3.2. It is important to note that in my scheme
no sherd can belong to more than one group, and the determination of group membership
must be made in a particular order. Thus, a sherd with both angular opaque quartz inclu-
sions and abundant mica in the paste would, according to my process, be classified as paste
group 1, not as paste group 3. This is because the assignment to paste group 1 comes earlier
in the analytical sequence. My classification is therefore a taxonomy, in Dunnell’s sense of
the term (Dunnell 1971).
I would like to emphasize again that my paste groups differ from Steadman’s pastes
in several ways. Though I use some of the same attributes she uses to defined pastes, I
evidently construe them more broadly than she. For example, the presence of transluscent,
rounded quartz inclusions is used by Steadman to define her Paste 26. The same attribute is
also used by myself to define my paste group 2. And, indeed, as Table3.1a shows, virtually
all of Steadman’s Paste 26 sherds (over 90%) fall into my paste group 2. However, many
other sherds from other pastes also fall into paste group 2, especially sherds Steadman
had classified as Pastes 19 and 30. This would seem to indicate that I am including a
broader range of objects in my definition of “transluscent, rounded quartz inclusions” than
is Steadman. The same is true of the other attributes I use for the other paste groups.
This is not a real problem, of course, but it is yet another indication that anyone wishing
to duplicate my methodology will need to obtain a bag of pasted ceramics and generate
their own index profiles for the Chiripa phases beforehand. A calibration step is apparently
necessary for each analyst.
For the purposes of my analysis, only sherds of paste groups 1-3 were counted. There-
fore, if a is the number of sherds of paste group 1,b the number of sherds of paste group
2, c the number of sherds of paste group 3 andn equalsa+b+c, then a frequency profile
takes the following form(100a
n
)-(100b
n
)-(100c
n
)where ‘-’ is used as a delimiter and not as a
subtraction operator. Therefore, if a particular group of sherds has 21 of paste group 1, 46
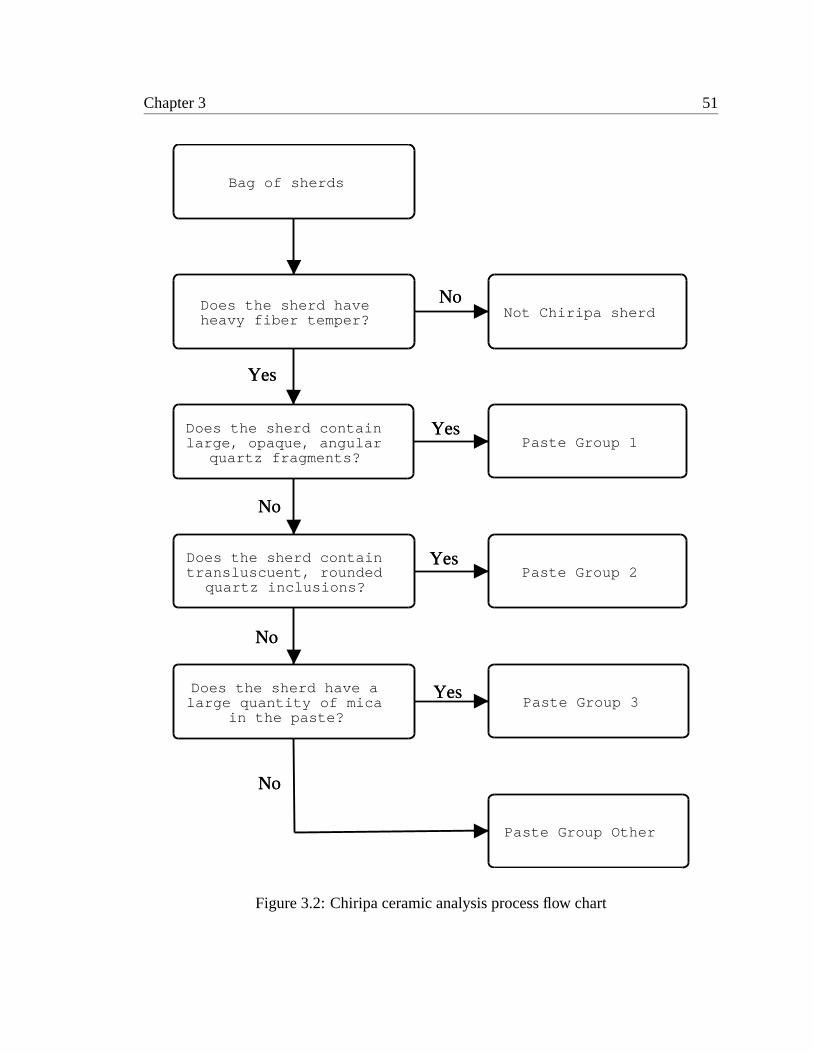
Chapter 3 51
Does the sherd haveheavy fiber temper?
Does the sherd containlarge, opaque, angular
quartz fragments?
Does the sherd containtransluscuent, rounded
quartz inclusions?
Does the sherd have alarge quantity of mica
in the paste?
Bag of sherds
Yes
Yes
Yes
Yes
Not Chiripa sherd
Paste Group 1
Paste Group 2
Paste Group 3
Paste Group Other
No
No
No
No
Figure 3.2: Chiripa ceramic analysis process flow chart
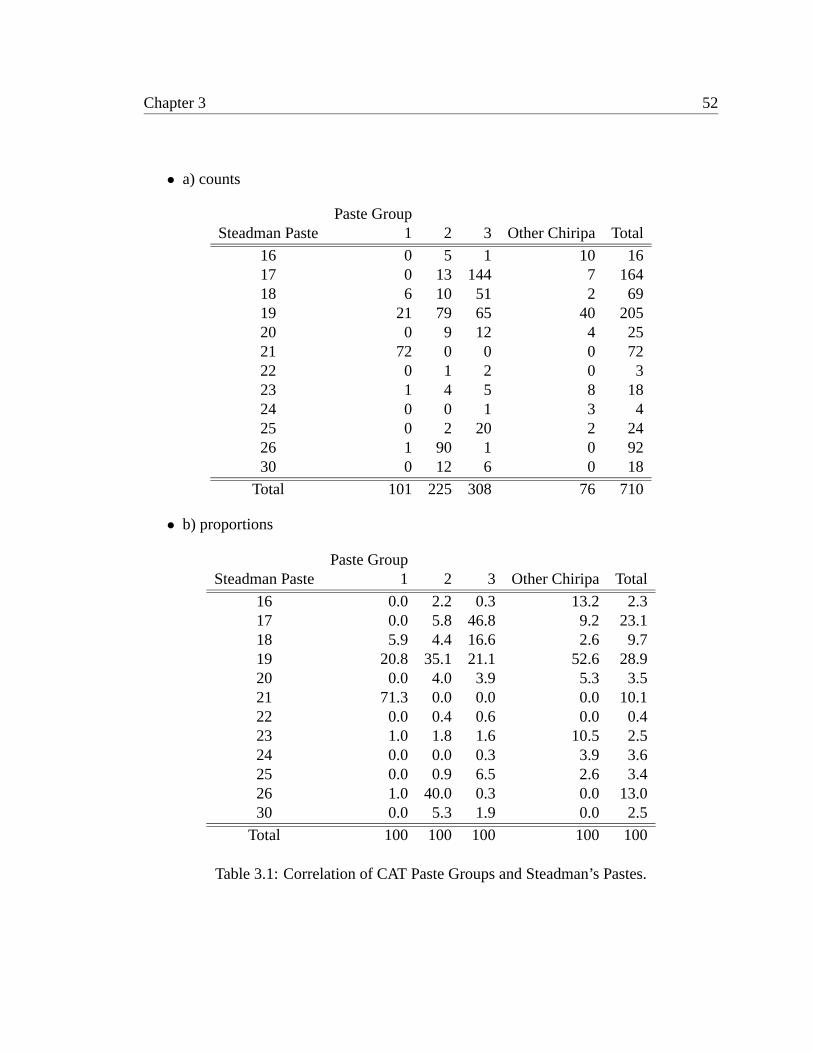
Chapter 3 52
• a) counts
Paste GroupSteadman Paste 1 2 3 Other Chiripa Total
16 0 5 1 10 1617 0 13 144 7 16418 6 10 51 2 6919 21 79 65 40 20520 0 9 12 4 2521 72 0 0 0 7222 0 1 2 0 323 1 4 5 8 1824 0 0 1 3 425 0 2 20 2 2426 1 90 1 0 9230 0 12 6 0 18
Total 101 225 308 76 710
• b) proportions
Paste GroupSteadman Paste 1 2 3 Other Chiripa Total
16 0.0 2.2 0.3 13.2 2.317 0.0 5.8 46.8 9.2 23.118 5.9 4.4 16.6 2.6 9.719 20.8 35.1 21.1 52.6 28.920 0.0 4.0 3.9 5.3 3.521 71.3 0.0 0.0 0.0 10.122 0.0 0.4 0.6 0.0 0.423 1.0 1.8 1.6 10.5 2.524 0.0 0.0 0.3 3.9 3.625 0.0 0.9 6.5 2.6 3.426 1.0 40.0 0.3 0.0 13.030 0.0 5.3 1.9 0.0 2.5
Total 100 100 100 100 100
Table 3.1: Correlation of CAT Paste Groups and Steadman’s Pastes.
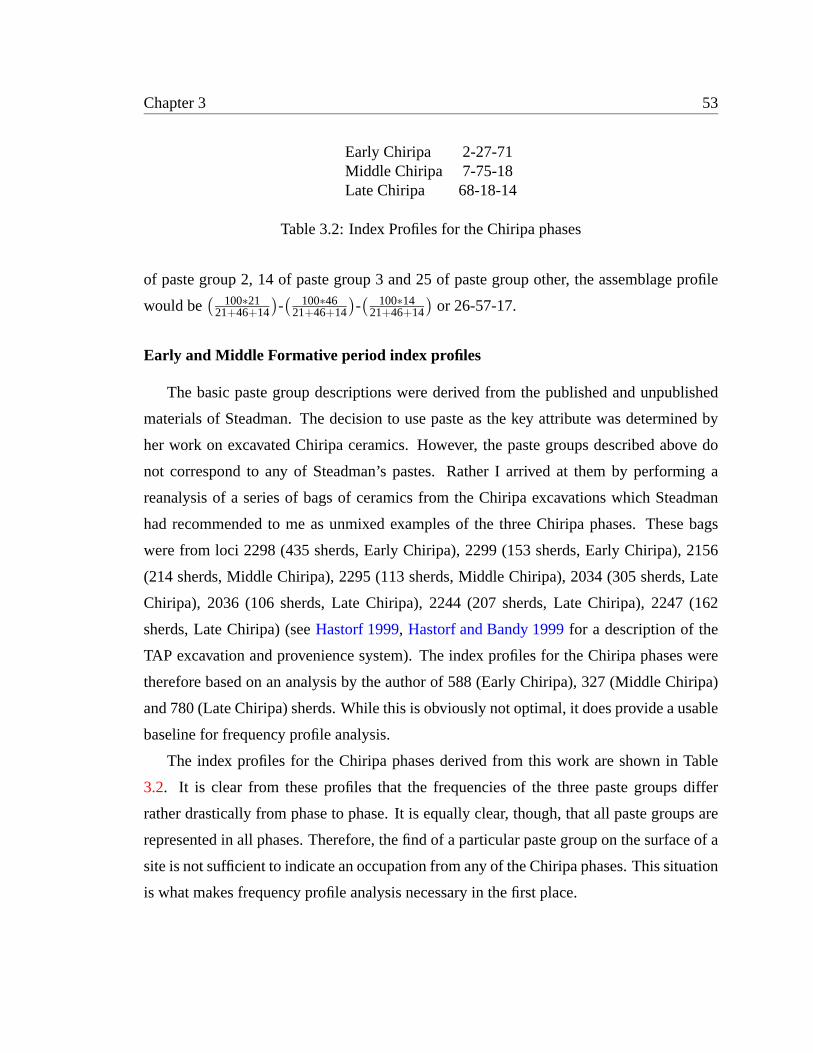
Chapter 3 53
Early Chiripa 2-27-71Middle Chiripa 7-75-18Late Chiripa 68-18-14
Table 3.2: Index Profiles for the Chiripa phases
of paste group 2, 14 of paste group 3 and 25 of paste group other, the assemblage profile
would be( 100∗21
21+46+14
)-( 100∗46
21+46+14
)-( 100∗14
21+46+14
)or 26-57-17.
Early and Middle Formative period index profiles
The basic paste group descriptions were derived from the published and unpublished
materials of Steadman. The decision to use paste as the key attribute was determined by
her work on excavated Chiripa ceramics. However, the paste groups described above do
not correspond to any of Steadman’s pastes. Rather I arrived at them by performing a
reanalysis of a series of bags of ceramics from the Chiripa excavations which Steadman
had recommended to me as unmixed examples of the three Chiripa phases. These bags
were from loci 2298 (435 sherds, Early Chiripa), 2299 (153 sherds, Early Chiripa), 2156
(214 sherds, Middle Chiripa), 2295 (113 sherds, Middle Chiripa), 2034 (305 sherds, Late
Chiripa), 2036 (106 sherds, Late Chiripa), 2244 (207 sherds, Late Chiripa), 2247 (162
sherds, Late Chiripa) (seeHastorf 1999, Hastorf and Bandy 1999for a description of the
TAP excavation and provenience system). The index profiles for the Chiripa phases were
therefore based on an analysis by the author of 588 (Early Chiripa), 327 (Middle Chiripa)
and 780 (Late Chiripa) sherds. While this is obviously not optimal, it does provide a usable
baseline for frequency profile analysis.
The index profiles for the Chiripa phases derived from this work are shown in Table
3.2. It is clear from these profiles that the frequencies of the three paste groups differ
rather drastically from phase to phase. It is equally clear, though, that all paste groups are
represented in all phases. Therefore, the find of a particular paste group on the surface of a
site is not sufficient to indicate an occupation from any of the Chiripa phases. This situation
is what makes frequency profile analysis necessary in the first place.
Chapter 3 54
Again I must stress that my paste groups are not the same as Steadman’s pastes. How-
ever, three of the bags which I analyzed (loci 2247, 2295, 2298) had previously been sorted
for paste by Steadman. It is therefore possible to correlate my paste groups with her pastes.
This is summarized in Table3.1. It is clear, then, that my paste group 1 is strongly corre-
lated with Steadman’s Paste 21. My paste group 2 is composed primarily of Steadman’s
Pastes 19 and 26 (26 is characteristic of the Middle Chiripa phase), and paste group 3 is
related to Paste 17, most common in the Early Chiripa phase. My paste groups therefore
capture the crudest chronological implications of Steadman’s paste chronology, while not
pretending to the precision of her classification.
Assemblage profile matching
Having defined the index profiles for the Chiripa phases, it remained only to produce
an algorithm to find the closest match to specific assemblage profiles from among the 5151
possible combinations of the three index profiles. To this end I wrote a simple program
in Perl, reproduced as AppendixC. This program presents a simple interface in which
the user enters the details of an assemblage composition. The program then constructs
an appropriate assemblage profile and compares this to the 5151 possible combinations
of the three index profiles. It reports all matches deviating from the assemblage profile
by less than 3 percentage points. Finally, it reports the closest possible combination, as
a percentage of the three Chiripa phases and the number of sherds from the assemblage
which would pertain to each phase. The output from a sample run of the program is given
below. The example given is from surface collection locus 4339, a 50 m2 collection unit at
the site of T-394 (Janko Kala) in the community of Zapana.
[/home/inti]> perl frequency_profile.plEnter Paste Group counts in the assemblage to be
analyzed:Paste Group 1: 61Paste Group 2: 37Paste Group 3: 21All others: 31
Summary of data:
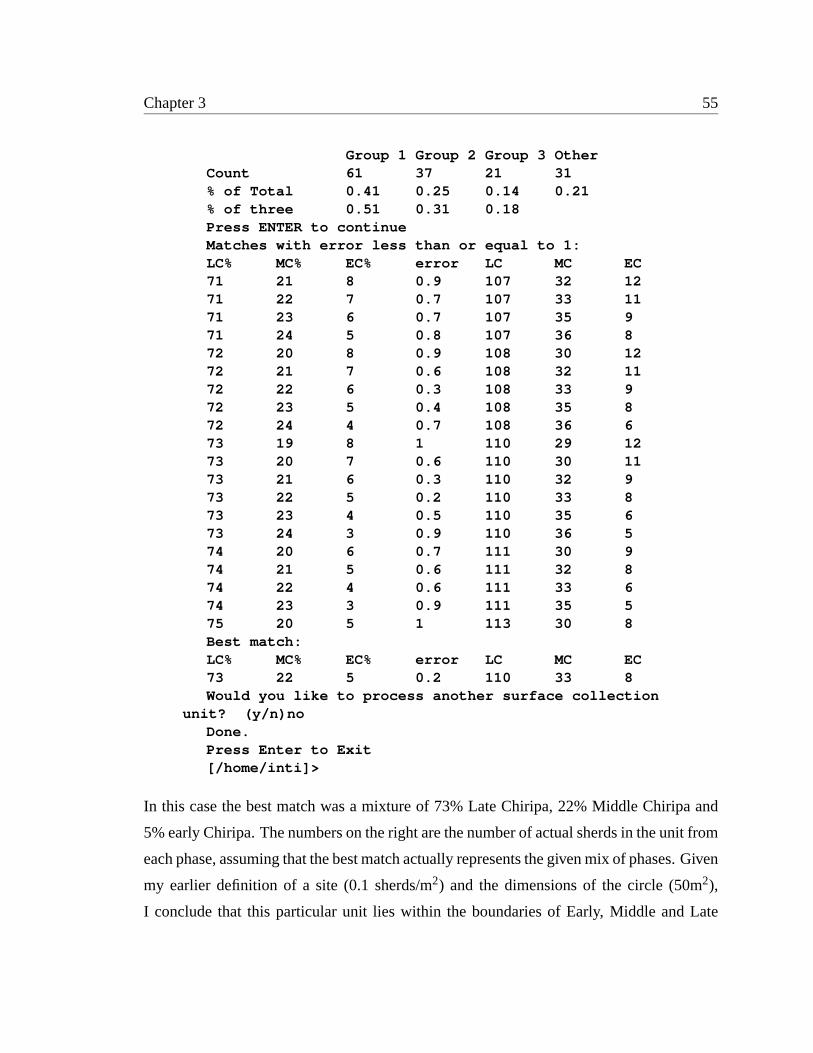
Chapter 3 55
Group 1 Group 2 Group 3 OtherCount 61 37 21 31% of Total 0.41 0.25 0.14 0.21% of three 0.51 0.31 0.18Press ENTER to continueMatches with error less than or equal to 1:LC% MC% EC% error LC MC EC71 21 8 0.9 107 32 1271 22 7 0.7 107 33 1171 23 6 0.7 107 35 971 24 5 0.8 107 36 872 20 8 0.9 108 30 1272 21 7 0.6 108 32 1172 22 6 0.3 108 33 972 23 5 0.4 108 35 872 24 4 0.7 108 36 673 19 8 1 110 29 1273 20 7 0.6 110 30 1173 21 6 0.3 110 32 973 22 5 0.2 110 33 873 23 4 0.5 110 35 673 24 3 0.9 110 36 574 20 6 0.7 111 30 974 21 5 0.6 111 32 874 22 4 0.6 111 33 674 23 3 0.9 111 35 575 20 5 1 113 30 8Best match:LC% MC% EC% error LC MC EC73 22 5 0.2 110 33 8Would you like to process another surface collection
unit? (y/n)noDone.Press Enter to Exit[/home/inti]>
In this case the best match was a mixture of 73% Late Chiripa, 22% Middle Chiripa and
5% early Chiripa. The numbers on the right are the number of actual sherds in the unit from
each phase, assuming that the best match actually represents the given mix of phases. Given
my earlier definition of a site (0.1 sherds/m2) and the dimensions of the circle (50m2),
I conclude that this particular unit lies within the boundaries of Early, Middle and Late

Chapter 3 56
Chiripa occupations (sectors) of the site - though the Early Chiripa occupation in this unit
is tenuous. In fact, this unit is from near the edge of the Early Chiripa sector. This is
the method by which I defined occupations and sectors of the Early and Middle Formative
Periods - the Early, Middle and Late Chiripa phases.
The method outlined in the foregoing is rather labor-intensive and not as precise as I
would like. However, at present it is the only method ever proposed for distinguishing oc-
cupations of the various Chiripa phases using mixed surface assemblages. I have described
it in such detail in the hopes that others may build on this work and hopefully supersede it.
As a final note, I should add that it is very difficult to learn to distinguish the various
paste groups as I have described them here. They really cannot be conveyed satisfactorily
in writing. I strongly urge anyone planning to employ this method to obtain a reference
collection of unmixed Chiripa phase assemblages and to develop their own index profiles
for the phases, as I did. The index profiles I have presented above will not be precisely
valid for anyone but myself.
3.3.2 Identifying ceramics of the remaining periods
The Late Formative, Middle Horizon, Late Intermediate, Late Horizon, and Early Colo-
nial Periods presented fewer difficulties in terms of ceramic identification. In none of these
cases was frequency profile analysis employed. This was so for two reasons. First, no
sufficiently detailed frequency seriation exists for these periods to allow such an analysis
to be undertaken. The work of Steadman is unique in the region. And, second, it was pos-
sible to identify ‘markers’ or ‘diagnostics’ for each of these phases which were sufficiently
common to permit the identification of sectors within multicomponent sites using surface
collected material. In the case of the two Late Formative phases, these are plainware diag-
nostics. In the case of the later periods, painted sherds and distinctive rim forms were more
useful, though in each a restricted range of plainware pastes could be used, as well. The
details of the ceramics for each of these later periods will be presented in the corresponding
chapters of this document. With the exception of the Late Formative period, they presented
no real difficulties.
Chapter 3 57
3.4 The dataset
The end product of the survey, the program of systematic surface collection and the
ceramic analysis is a fine-grained settlement dataset, spanning the period from the first in-
tensive human occupation of the region (around 1500 B.C.) through the first century of
Spanish colonial rule (ca. 1600 A.D.). The minimal unit of this particular dataset is the
sector, a spatially discrete cluster of archaeological materials pertaining to a single historic
or prehistoric phase. For each sector we have recorded its location, size, dimensions, and
any information that may be evident on the surface, such as the presence or absence of
mound architecture or visible (disturbed) tombs. Sectors of various phases which overlap
one another spatially are grouped together into units called ‘sites,’ which are numbered
sequentially from T-1 to T-476. A site, as the term is used here, is nothing more than
a collection of spatially contiguous sectors. For each site we have recorded information
pertaining to its locality, such as the proximity of water sources and arable land and topo-
graphical defensibility.
This dataset - a list of sectors and their various properties - is the basis of the analysis
that follows. The later chapters of this document discuss what this dataset reveals about
the demographic, economic and political dynamics of Taraco Peninsula prehistory. First,
though, it will be necessary to discuss in some detail the theoretical and methodological
concerns relating to the use of this dataset. Most important will be the question of how the
sector database may be used to measure prehistoric population. This is the theme of the
next chapter.
58
Chapter 4
Interpreting settlement data
The methodology described in the preceding chapter is an excellent procedure for pre-
cisely defining the distribution in space of a determinate set of ceramic attributes. Concen-
trations of sherds with these attributes which satisfy an explicitly-stated test (in this case,
the 0.1 sherds/m2 rule) are recorded with respect to their location and a range of ancillary
variables (topography, architecture, etc.). The register of these concentrations, or ‘sites,’
together with a much smaller list of other culturally significant spatial loci (agricultural
features, rock art, the like) constitutes a settlement dataset, of which Appendix A is an
example.
The dataset at this point has a strictly descriptive function. As yet it has acquired no
interpretive significance. Between settlement data and settlement analysis yawns the chasm
of “middle-range theory” or “bridging arguments.” For the purposes of settlement analysis,
crossing this chasm requires that the objective ceramic attribute distributions recorded in
the dataset be correlated with relevant analytical categories. Standard practices exist for
bridging the gap in settlement analysis, and these have become sufficiently transparent
to archaeological practitioners that they are frequently allowed to remain implicit. The
bridging arguments I intend to use here, however, differ somewhat from received theoretical
practice. For this reason, I wish to describe them as explicitly as possible.
As I emphasized in the introductory chapter, I am interested primarily in the an-
alytical categories of time and of population. Connecting ceramic attributes with the
Chapter 4 59
dimension of time is a relatively straightforward business, well-studied in archaeol-
ogy (for a review seeMarquardt 1978; for recent south-central Andean examples see
Alconini Mujica 1995, Goldstein 1985, Steadman 1995), and my chronology will be a ba-
sically conventional one. Ceramic chronology will be discussed in the various chapters to
follow. Connecting ceramic attribute distributions to measures of human population, how-
ever, and derived measures of demographic process, is a more difficult and disputatious
matter. It is to this question that the present chapter is devoted.
4.1 Correcting site sizes
The process of relating the size of a sector (as defined in Chapter3) to the size of the
resident human population may be conceptualized algorithmically; that is as a series of
operations performed upon an initial state or value (in this case, the sector size in hectares)
which produce a desired final state or value (the number of human residents in a location
at a given time). I refer to this process as “site size correction.” Each step in the correc-
tion process involves the postulation of a series of assumptions and relationships, which I
will attempt to spell out in what follows. It is worth emphasizing that site size correction
procedures will vary drastically with settlement system type and with local circumstances
and cultural peculiarities. The method I use in this study is limited in a double sense. First,
it is particular to the Titicaca Basin. Second, it is based on very incomplete information.
I expect this procedure to be considerably revised as reliable information on prehistoric
household and village configurations comes to light.
That said, I here present a schematic formulation of the procedure - a simple enumer-
ation of the steps involved in traversing the void between raw data and analytically useful
information - which I subsequently explain in more detail.
Summary formulation
1. Assume that ancient household units are roughly comparable to modern ones.
Chapter 4 60
2. Correct sector size for artifact “splash zone” in order to eliminate the influence of
post-depositional processes on the extent of the sherd scatter.
3. Assume “point contemporaneity” of occupation within the sector.
4. Calculate total number of households for the sector.
5. Calculate a “sector population index” for the sector.
6. Calculate a “phase population index” of the region.
Each of these point will be addressed in turn in the sections that follow.
4.1.1 Assume that ancient household units are roughly comparable to
modern ones
This is far from a safe assumption. First of all, as the archaeological literature on house-
holds clearly demonstrates, household configurations can change drastically over time (cf.
Ashmore and Wilk 1988, Netting 1989, Wilk and Netting 1984). Secondly, there is con-
crete evidence of a significant shift in residential patterns at the end of the Tiwanaku pe-
riod (ca. 1100 A.D.). Before this time, at least in the southern Titicaca Basin, people
lived almost exclusively in sedentary villages. I have referred to this pattern as “nucleated
habitation” (Bandy 1999d:24). After the collapse of Tiwanaku, however, people began to
live in small isolated farmsteads. That is, people inhabited small clusters of one or a few
households, separated from other such clusters by substantial tracts of uninhabited land, a
pattern I have called “dispersed habitation” (Bandy 1999d:24).1 This is how the majority of
the regional population still lives today. Apparently, therefore, residential patterns changed
significantly over time.
However, there is some evidence that while residential patterns shifted from nucleated
to dispersed, the configuration of the actual household remained consistent. At present,
1This “nucleated” vs. “dispersed” distinction is of course not a new one. Drennan, for example, capturesthe same dimension of variability in his “compact” vs. “ dispersed” settlement patterns (Drennan 1986).
Chapter 4 61
local residents live as do most Aymara communities in the Bolivian highlands. A single
family group - a married couple together with unmarried children and frequently with el-
derly relatives - will inhabit a small compound of structures (perhaps 3-5 rooms altogether),
often enclosed by an adobe wall, and separated from other such compounds by cultivated
fields (cf. Arnold 1988, Chapter 9).2 Figure4.1 is a schematic representation of a typi-
cal residential compound. Each of these compounds is adjacent to outdoor activity areas -
much of the daily work of the household takes place out of doors - where activities such
as threshing, chuño processing, weaving and so on take place. There are no well-defined
middens, and this entire inhabited area contains a sufficient density of cultural material to
qualify as a “site” according to my working definition.
To date, very few post-Tiwanaku, prehispanic household units have been excavated in
the southern Titicaca Basin. Those that have been excavated seem to indicate a residential
pattern broadly similar to that of the present day. The Late Intermediate Period structures
excavated at North Point in Lukurmata are tentatively interpreted by the excavator as form-
ing a “compound containing a number of houses and enclosed by a large wall” (Wise 1993:
111). A Late Horizon residential compound was excavated at the same site, comprising at
least two fieldstone structures and a fieldstone corral, all enclosed by a compound wall
(Wise 1993:109).3 The limited information at our disposal therefore seems to indicate that
the post-Tiwanaku household form has remained relatively stable, and has been broadly
similar to that observed among the modern inhabitants of the area.
Somewhat more archaeological evidence exists for the Tiwanaku period although the
excavated sample is still very small.4 Marc Bermann (Bermann 1990, Bermann 1993,
2“The Aymara household, although variable, typically consists of a nuclear or extended family livingtogether in an architecturally defined compound, or at least near one another in a nucleated compound cluster.Household members ... ideally share a common patio and other outdoor spaces ...” (Janusek 1994: 35).
3The record from the Juli-Pomata area for this time period is somewhat better understood(Stanish et al. 1993, Stanish et al. 1997). However, the sites from the western basin may not be directlycompared to the southern case. This is because the basic organizational unit of LIP domestic groups in thewestern basin is the domestic terrace, and terracing is conspicuously absent in the South.
4The specific conditions of the southern Titicaca Basin - relatively high rainfall, soil erosion, intensiveagriculture, high population density and the use of adobe for domestic architecture - conspire to make theidentification and excavation of prehistoric residential structures an extremely difficult undertaking.
Ironically, the best-documented Tiwanaku architecture is not from thealtiplanoat all, but from the coastal
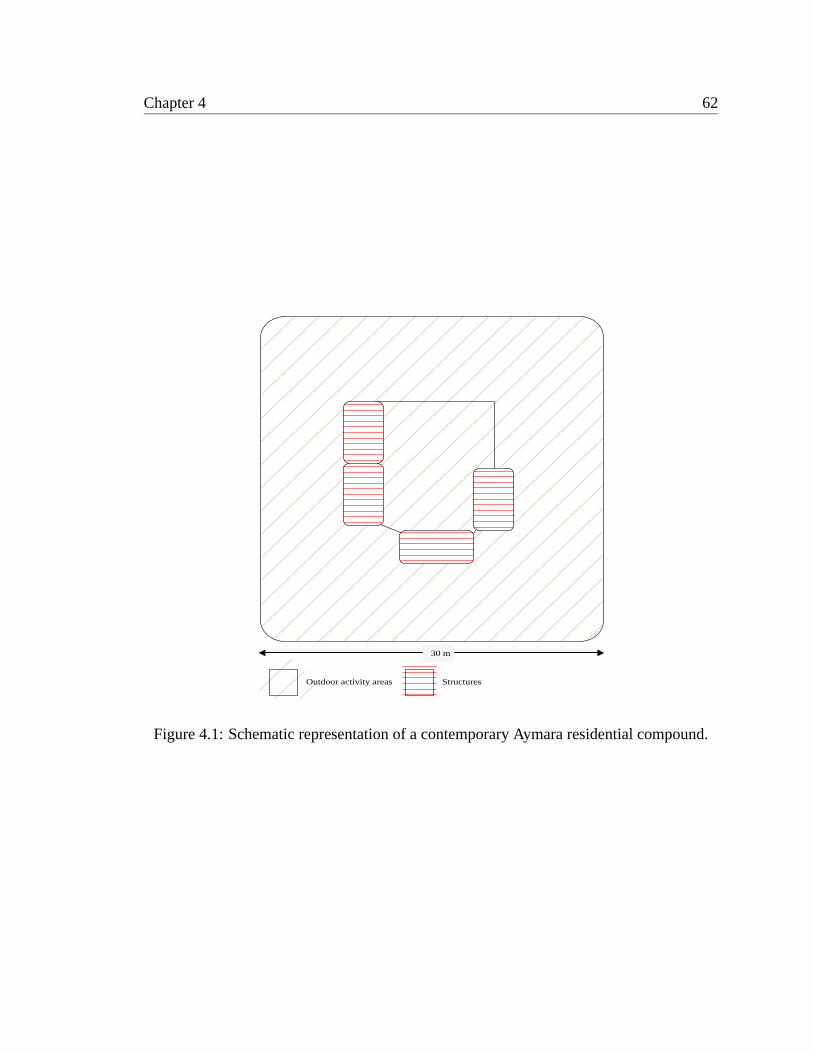
Chapter 4 62
Outdoor activity areas Structures
30 m
Figure 4.1: Schematic representation of a contemporary Aymara residential compound.
Chapter 4 63
Bermann 1994, Bermann and Graffam 1989) excavated a long sequence of domestic archi-
tecture from the site of Lukurmata. Though his sequence begins in the early Late Formative
and continues through to the LIP, the bulk of his data pertains to the Tiwanaku III-V pe-
riods (LF2 and Tiwanaku periods, in my chronology). He excavated several examples of
what he considers to be household compounds dating to these period. He describes the
typical Tiwanaku household unit at the site as “a house compound with three structures,
two primarily used for a wide range of domestic tasks or as a dwelling, and one for specific
and different purposes [storage, sleeping, etc] ... The household unit also included a small
enclosed patio used for most activities” (Bermann 1993: 128). Janusek has excavated sim-
ilar compounds at Tiwanaku and the Misitón area of Lukurmata, these with clear enclosing
walls (Janusek 1994). The excavations of the Proyecto Wila Jawira in the La Kkaraña area
of Tiwanaku have suggested household compounds in the early Late Formative, as well
(seeEscalante Moscoso 1994). The domestic residential compounds built and inhabited by
the modern Aymara can be traced with some certainty at least to the Late Formative period.
Sufficient evidence therefore exists for me to propose that the observable shift in resi-
dential patterns at the time of the Tiwanaku collapse reflects a change in the external rather
than the internal configuration of household compounds. That is to say that the Tiwanaku
and Formative Period villages were composed of agglomerations of many household resi-
dential compounds, and that the dispersal of population during the Early Pacajes period is
best understood as a dispersal of household compounds. In the Tiwanaku period and earlier
the compounds were grouped into large clusters which we refer to as “villages,” while more
recently they have been scattered individually among agricultural fields.
I will proceed, therefore, on the assumption that during all periods of the area’s prehis-
tory people lived in household compounds as described above, and that towns and villages
essentially comprised dense concentrations of such units.5
Moquegua Valley. Here the Tiwanaku state established a series of colonial enclaves, and the architecture atthese sites is relatively well-preserved (cf.Goldstein 1989a, Goldstein 1993a). However, I believe that thesecolonies were populated by a rotating labor force, and not by long-term inhabitants (seeBandy et al. 1996).Therefore, these households are not in any way comparable toaltiplano ones, and cannot be used for mypurposes here.
5Bermann (Bermann 1993: 125) contends that the household compound came into being in the LateFormative, and that in earlier phases people lived in single-structure domestic units. The data for this are
Chapter 4 64
4.1.2 Correct sector size for artifact “splash zone”
Remember that we are considering a household compound to be composed of a small
number of adobe structures together with associated unenclosed activity areas. In the
present, these activity areas include places for storing agricultural by-products and fire-
wood, as well as for tethering animals, threshing and winnowing cereals and for other
domestic tasks. The human activities in these structures and activity areas generate debris,
some of it durable, like ceramics. This debris is the source of the artifact scatters by which
we identify archaeological sites.
However, the correlation between the extent of the artifact scatter and the extent of the
habitation area (structures and unenclosed activity areas) is not direct. This is so for two
reasons. First, deposition of refuse is not restricted to habitation areas, though it is certainly
concentrated in habitation zones. Second, debris is subject to post-depositional processes
which tend to disperse what may initially have been a relatively discrete concentration.
These processes include trampling and kicking by livestock and humans (cf.Nielsen 1991)
and, perhaps most important on the Taraco Peninsula, displacement due to the plowing of
agricultural fields (cf.Roper 1976). The result is that an artifact scatter (archaeological
sector) will include both a habitation area and its associated “splash zone,” a corona of
displaced and peripheral artifacts deriving from that habitation area. This is illustrated in
Figure4.2. The first area directly represents human occupation; the second does not. To
arrive at a population estimate we must therefore subtract the splash zone from the total
area of the sherd scatter in order to derive the habitation area.
The simplest case is that illustrated in Figure4.2a. This is the isolated household com-
pound, surrounded by cultivated fields. I personally observed a number of such cases in
the field, and I took informal measurements on the habitation area and the area of the sherd
scatter. I refer to the house compounds of the present-day Aymara inhabitants of the region,
discussed in preceding paragraphs. My observations indicated that the average habitation
area was no less than 30x30 meters (0.09 ha) in area. This seems to be broadly consis-
tent with what we know of prehispanic household compounds as well. For example, the
extremely tentative, however, and I consider the question open.
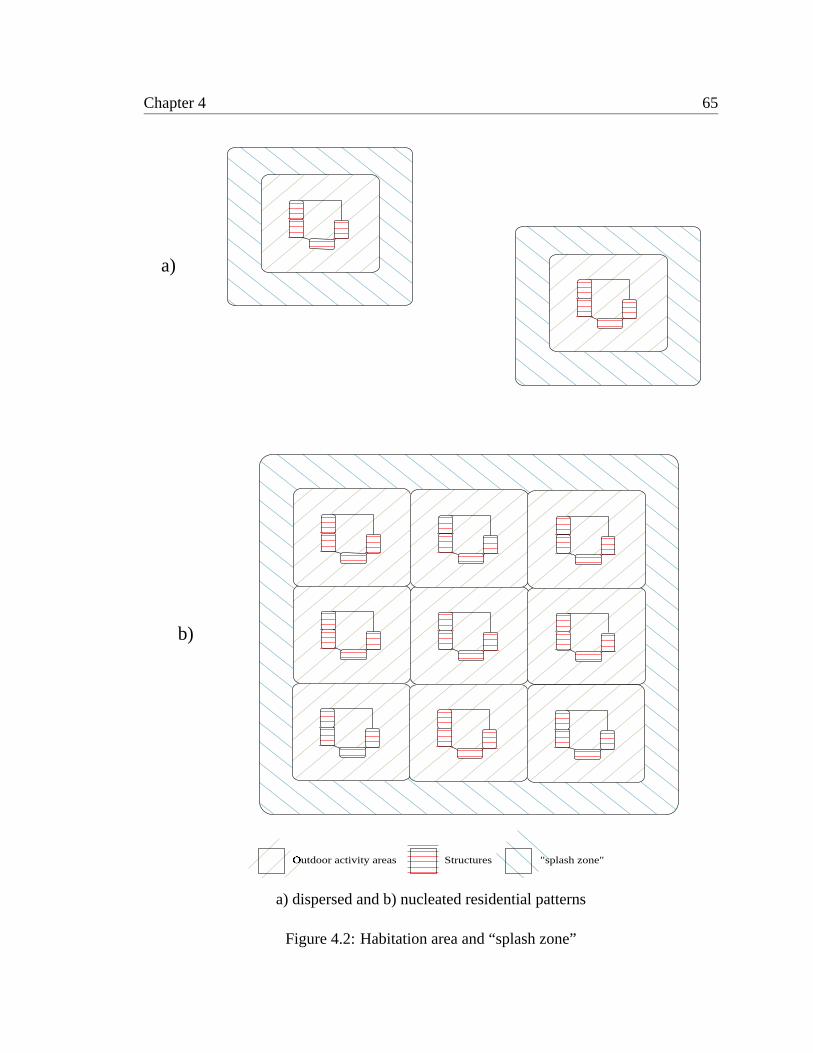
Chapter 4 65
a)
Outdoor activity areas�
Structures "splash zone"
b)
a) dispersed and b) nucleated residential patterns
Figure 4.2: Habitation area and “splash zone”
Chapter 4 66
Pacajes-Inka compound partially excavated by Wise at Lukurmata consisted of at least three
rooms and seems to have been enclosed by a stone wall (Wise 1993). It is therefore very
similar to modern compounds. The compound measures 16 m on one side, though the other
dimension could not be determines. Assuming it was square, the architectural compound
alone covered 0.03 ha.6 Since this was an isolated household (“dispersed habitation”) man
of the activity areas would have been located outside of the architectural compound itself,
as is the case with modern houses.
At least some Tiwanaku urban household compounds - those excavated by Janusek at
Tiwanaku - were considerably larger than this, suggesting that household activities were
more contained within the architectural limits of the compound wall. Excavations in the
AKE1-M and AKE-2 areas revealed very large residential compounds. These pertained
to the Tiwanaku IV phase. They were delimited by large encircling compound walls, and
contained a variety of domestic structures and outside activity areas. These are examples of
household compounds in a nucleated habitation context. The dimensions of the compounds
themselves are somewhat difficult to determine, since Janusek excavated only portions of
them. However, the eastern wall of the AKE1-M compound seems to be at least 25 m in
length, and the width of the compound could be no less than 8 m (Janusek 1994, Figure
7.1). The absolute minimum size for the compound, then, would be 0.02 ha. However, its
known dimensions are consistent with an area of 0.06 ha - 25 m square - or even more;
roughly the same size in terms of total habitation area as the modern and late prehispanic
household compounds discussed above.
A habitation area of 30x30 m is, in my small sample of modern household compounds,
associated with an artifact scatter of approximately 50x50 m (0.25 ha). That is to say that
6There are some indications that in certain times and places in prehistory the amount of habitation areaper compound was greatly compressed. Bermann, for example, excavated two patio groups at Lukurmatawhich averaged only 0.02 ha (160 m2) of total occupation area each (Bermann 1994: 178, 194). However,he takes no account of public space, walkways or roads in these figures. The fact remains, though, that usinga constant figure for habitation area per household for all periods in prehistory may well have the effect ofdecreasing population estimates of urban or nucleated habitation contexts as opposed to rural or dispersedones. Though the problem is at present without a solution, this fact should not be forgotten in the analysisto follow. Bermann’s estimate of 376 persons in a 0.60 ha area (Bermann 1994: 178), however, is almostcertainly greatly exaggerated.
Chapter 4 67
the splash zone extended for approximately 10 meters on any side of the habitation zone. I
consistently found this figure to be a good descriptor of the splash zones in modern houses,
so I will use it here.
If we measure area in hectares and model the plan of the artifact scatter as a square,
then:
H =(√
A∗10000−20)2
10000
where A = scatter areaH = habitation area
Figure4.2b shows the more complicated case of nucleated habitation in towns and villages.
In this case we have densely-packed habitation areas (residential compounds) with overlap-
ping splash zones. Almost all of the interior of the settlement is habitation area, with a rim
of uninhabited splash zone around the edge.7 If we view a village in this way, then we can
apply exactly the same correction equation to it that we applied to the isolated household
compound. Therefore, there is no need to distinguish between different residential patterns
in order to correct for the splash zone.
The actual correction method I used in my settlement database therefore consisted of
three steps:
1. Derive the habitation area from the scatter area using the equation given above.8
2. Make sure the corrected size of a sector is no less than the area of a single habitation
unit (0.09 ha, as above).9
3. Do not apply the correction to sites that are not artifact scatters (in this case, raised
fields or terrace groups).10
7Excepting non-habitation space occupied, for example, by public architecture, plaza space, and so on.For present purposes this complication will be ignored, though I acknowledge the difficulty of identifyinghabitation vs. non-habitation space in sites without preserved surface architecture.
8The actual SQL command used in constructing the database (see schema in AppendixF) is given below.All table and column names are references to the database schema documented in AppendixF.
UPDATE site SET area_corrected=((sqrt(area*10000)-20)*(sqrt(area*10000)-20))/10000 WHERE area>= 0.25;
9UPDATE site SET area_corrected=0.09 WHERE area > 0 AND area < 0.25;10UPDATE site SET area_corrected=area WHERE type IN (’Raised Fields’,’Terraces’);
Chapter 4 68
The correction method described here has the salutary effect of reducing the relative im-
portance of small sites at a regional scale. When applied to a regional settlement dataset,
the cumulative habitation area (“corrected area”) of small sites is reduced relative to that
of larger sites. This corrects an error which has been common in Titicaca Basin settlement
archaeology, and reverses some prior conclusions regarding the demographic effects of the
Tiwanaku collapse. This particular case will be discussed at more length in Chapter9.
Of course, matters are never this simple. Habitation density (persons per hectare) may
vary in contexts of nucleated or dispersed habitation, so that the relation between popu-
lation and habitation area is not direct. Other factors can affect the relation, as well. For
example, habitation density will typically be higher in walled settlements than in unwalled
ones (Wenke 1975), as people exchange living space for a reduction in collective labor
investment. However, to derive a useful relation empirically would require very exten-
sive horizontal excavations (or excellent surface visibility and architectural preservation;
seeMontmollin 1987for a Mesoamerican example). This has been accomplished in some
contexts (seeMilner and Oliver 1999: 90-93 for an example from Cahokia) with excellent
results, but we are very far from this point in Titicaca Basin archaeology. Mississippian or
Mesoamerican data clearly cannot be used directly. Such measures are specific to particular
historical contexts. The method I use here for calculating habitation area is dramatically
simplified, but is consistent with what little we know of contemporary and prehistoric habi-
tation in the region and therefore serves as a useful starting point. I fully expect it to be
replaced by a more reliable correction method when the necessary data become available.
4.1.3 Assume “point contemporaneity” of occupation
Large scale artifact scatters can often be thought of as palimpsests. That is, they may
actually be composed of a series of smaller overlapping artifact scatters formed at different
points in time. A good example of this is the so-called ‘standard model’ of Amazonian
settlement (perMeggers 1991, seeDeBoer et al. 1996, Heckenberger et al. 1996for refu-
tations). This model holds that the inhabitants of Amazonian villages practice swidden
agriculture and are therefore obliged to relocate their villages periodically. Over time,
Chapter 4 69
localities preferred for settlement may accumulate a substantial cultural overburden and
comprise artifact scatters of considerable extent, even though they in fact represent nothing
more than a superposition of many small settlements occupied at different points in time.11
Among truly sedentary societies, such as the Titicaca Basin lacustrine civilizations,
large artifact scatters often do in fact reflect large villages, towns or cities. They are not
palimpsests in the same sense as the Amazonian sites as understood by Meggers. However,
it is undoubtedly the case that the size of these settlements fluctuated over time as the social
units that inhabited them grew, fissioned, migrated or were decimated by disease, famine
or warfare. Therefore, the corrected size of a sector represents not the occupied area of
the settlement for the entire phase in question, but rather its occupied area at the moment
of its maximal extent. Thus, “point contemporaneity.” Under this assumption sectors are
not palimpsests, and the occupied area of the sector directly reflects the number of resident
households at the time of the “local maximum” (see Figure4.3 for an illustration of the
difference).
Assuming point contemporaneity does seem to be reasonable at least for the phases
(pre-Pacajes) characterized by nucleated habitation. In these periods, the villages and
towns undoubtedly grew and contracted; however there is no indication that they moved
from place to place and back again. In the Pacajes phases, the matter is less certain, since
dispersed residences were probably occupied for shorter periods of time and were consid-
erably more mobile. The small size - equivalent to only one or a few households - and
low density of most Pacajes sites would seem to indicate very limited within-phase sector
abandonment and resettlement, especially since the adobe structures endure no more than a
few years if uncared for (seeBermann 1994for a discussion of the decay process of adobe
residential structures). The point contemporaneity assumption is therefore preferable to the
palimpsest assumption for all phases of the region’s settlement history.
11Sites which have accumulated over very long time periods are also palimpsests (Foley 1981).
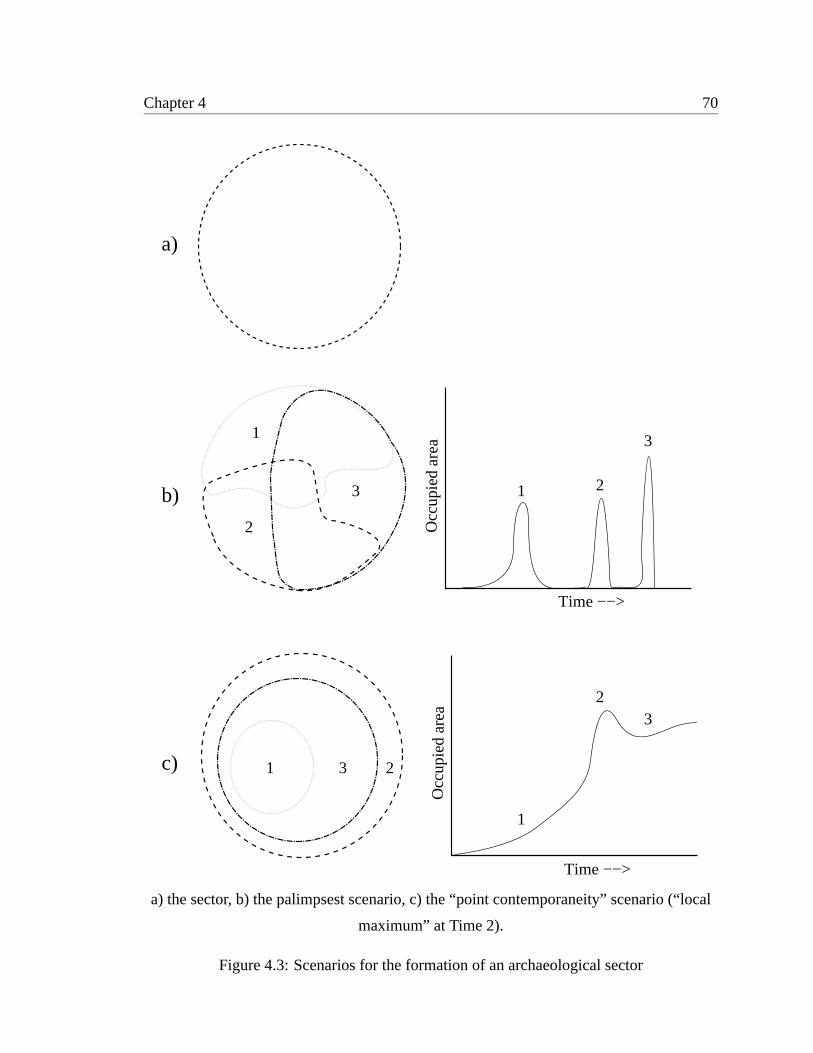
Chapter 4 70
1
23
Time −−>
Occ
upie
d ar
ea
231
1
2
3 1 2
3
Time −−>
Occ
upie
d ar
ea
a)
b)
c)
a) the sector, b) the palimpsest scenario, c) the “point contemporaneity” scenario (“local
maximum” at Time 2).
Figure 4.3: Scenarios for the formation of an archaeological sector
Chapter 4 71
4.1.4 Calculate total number of households for the sector
This step is straightforward. The corrected area of the sector (derived in section4.1.2,
above) is divided by the average area of the household compound (the basic residential
unit, described in section4.1.1). Under the point contemporaneity assumption (section
4.1.3) this yields the number of households occupying the site during a phase-specific local
maximum (the time of a site’s maximum occupied extent within a given chronological
phase). As I mentioned in the discussion of section4.1.2, above, observation and cursory
measurement of about a dozen modern Aymara residential compounds yielded an average
occupied area of 0.09 hectares per compound. This seems to be consistent with the small
set of prehispanic household data which is available in the published literature. I emphasize
again that this figure excludes the splash zone as described in section4.1.2.
The number of households in the sector is calculated using a simple equation:
H = AsAh
where H = number of householdsAs = corrected area of sectorAh = average household compound area
4.1.5 Calculate a “sector population index” for the sector
A population index for the sector is obtained by multiplying the number of households
for the sector’s local maximum (obtained in section4.1.4) by an average number of persons
per household. The same set of informal observations used to establish an average residen-
tial compound area also yielded an average of 6 persons per compound. This concurs ap-
proximately with ethnohistoric information. For example, at the time of Viceroy Toledo’s
visit to Tiwanaku in 1574, a total population of 4329 was recorded for therepartimiento
(Choque Canqui 1993: 81). Among these were 868tributarios (heads of household). This
yields an approximate ratio of 4.99 persons/household.
Therefore:12
12The SQL statement used combines the steps from sections4.1.4and4.1.5for habitation sites only:
Chapter 4 72
Ps = H ∗Ph
wherePs = sector population indexH = number of households in sectorPh = persons per household
This sequence of steps eventually returns a sector population index of 42.67 for a one
hectare sherd scatter, and of 66.67 for a hectare of occupied area. These numbers are
definitely on the low end of the range of numbers typically used to derive population es-
timates from site area. Adams, for example, used a figure of 200 persons/ha in his study
of Mesopotamian settlement (Adams 1965), This was based on modern population den-
sities from the old quarters of Baghdad and from other local examples. Kramer’s eth-
noarchaeological study of modern settlements in Southwest Asia yielded an average of
120 persons/ha (cited inHassan 1981: 66-67). Similarly, the classical city of Melos
has been estimated to have contained between 130 and 200 persons/ha within its walls
(Whitelaw and Davis 1991: 280). While my numbers therefore seem low compared to
figures employed in the analysis of Mediterranean and Near Eastern urban settlements,
they fall within the 25-50 persons/ha range of Basin of Mexico “High Density Compact
Villages” (Parsons 1976: 72). My numbers are also considerably lower than the 100 per-
sons/ha used by Parsons to estimate the population of Tiwanaku (Parsons 1968). Finally,
42-66 persona/ha falls into the middle of the range of Drennan’s “compact settlement”
category of Mesoamerican archaeological sites (Drennan 1986: Table 13.1).13
The sector population index, while not a direct measure of population, can be used as a
proxy measure. This is so because the index should vary directly with actual population. In
the remainder of this analysis I will use this index in place of actual population figures. At
no point should it be forgotten, however, that the measure I am using here is a provisional
one, and that it could stand a great deal of improvement. Finding better and more phase-
specific values for all of the variables employed is the only way in which this index will
UPDATE site SET pop_index = (area_corrected / 0.09) * 6 WHERE type NOT IN (’RaisedFields’,’Terraces’);
13Incidentally, 50 persons/ha seems to be a comfortable settlement density worldwide (seeFletcher 1995:75, 107).
Chapter 4 73
ever come to be trusted as a direct population estimate.
4.1.6 Calculate a “phase population index” for the region
While the sector population index is useful for intra-regional analysis - comparing sec-
tors within the region - an aggregate measure is needed for comparisons between regions.
This is the “phase population index”, and it consists simply of the sum of the sector popu-
lation index values for all of the sectors within a region pertaining to a particular chrono-
logical phase. As a measure derived from the sector population index, the phase population
index inherits all of the problems and ambiguities of its parent. In addition, it suffers from
the problem of sector contemporaneity. Sanders puts it thus:
A major methodological problem is chronology. Most researchers deal inblocks of time involving hundreds of years. Conceivably in the history of anarea, there could have been a period in which settlements were less sedentaryand village sites were frequently shifted, followed by a period in which peoplelived in more stable communities. In this case a simple calculation of the totalamount of habitation area[as I use here]or number of ruined houses of thevarious sites from each period would not give an accurate picture even of therelative population size of the two periods. (Sanders 1972: 102)
The percentage of sectors within a single given phase which are occupied simultaneously
at any point will vary from phase to phase, and also between different types of sites within
a single phase. In the present case it seems likely that a large percentage of the sectors
were occupied simultaneously and continuously throughout the Formative and Tiwanaku
periods on the Taraco Peninsula, since most of these sites were large villages, and they are
few in number. In the Pacajes phases, however, most sites represent individual household
compounds, probably occupied for no more than a generation or two, notwithstanding a
small number of Pacajes villages, which were probably continuously occupied.
The phase population index as defined here - as a simple sum of sector population
index values per phase - will therefore tend to exaggerate the contribution of small and
ephemerally-occupied components of a total settlement system relative to sedentary and
continuously-occupied components. In other words, farmsteads will count for relatively
Chapter 4 74
more than will villages, towns and cities. It will also tend to exaggerate the population
estimates for phases characterized by predominantly transitory settlementvis a vismore
settled or urban phases. In the present case, this means that the phase population index
values of the post-Tiwanaku phases will be inflated relative to those of the Formative and
Tiwanaku phases. These are caveats which must be remembered when using the phase
population index for analytical purposes. These distortions may of course be corrected
given accurate information on average occupation spans of different types of sites for a
given phase. At the moment, however, we lack the fine-grained excavation data necessary
for such calibration, and I will be forced to do without.
4.2 Interpreting (corrected) sector sizes
I have by now managed - with some contortions - to arrive at indices of population
for individual archaeological sectors and for regional settlement systems. The real goal,
however, is to analyze patterns of change in population though time and across space. In
order to do this, a series of additional metrics and analytical techniques are necessary.
These fall into three main categories: measures and techniques which analyse changes in
population through time, ones that measure changes in population over space, and ones that
combine changes through time and over space. These are described and discussed in this
section.
4.2.1 Population through time
Population, be it of a sector, a square kilometer, an entire region, or even only of a single
structure or room, is a quantity. Analyzing population change through time is therefore
simply a matter of tracking the increases and decreases of this quantity as it pertains to a
particular unit of analysis. The most convenient way to do this - since the time periods
used in this study are of unequal length - is by calculating for each phase an annual rate of
population growth relative to the previous phase. This is done using the following equation
Chapter 4 75
(Hassan 1981: 139):14
r = 1T ln
PfPi
wherer = annual rate of population changeT = number of yearsPi = initial population index valuePf = final population index value
Multiplying the derived value ofr by 100 yields an annual percentage rate of popula-
tion growth. This is the figure which I will use in this study to measure rates of popu-
lation growth or decline, since growth rates seem often to be reported in terms of annual
percentage rates (e.g.Hassan 1981: 140). Cross-cultural comparisons and archaeologi-
cal studies have shown that an annual growth rate of approximately 0.1% characterizes
non-industrial agricultural village populations worldwide (Hassan 1981: 220, 234; also
Carneiro and Hilse 1966, Cowgill 1975).15 This accords almost perfectly with the popula-
tion growth rates calculated for the various Taraco Peninsula phases.
Intraregional population growth differentials
It has been generally recognized at least since the ’70s that different villages within the
same region can have very different patterns of growth over time (cf.Winter 1976). This is
certainly the case on the Taraco Peninsula. We will see many examples in which different
villages and site clusters and even regions grow at drastically different rates during the
same phase. How are we to interpret these differences?
14My own calculations were originally carried out in the field using an equation I derived without benefitof reference material. Though unwieldy, it is equivalent to Hassan’s.
r =(
PfPi
) 1T −1
15This iscontraSchlanger, who estimates that the intrinsic growth rate of Colorado Plateau Anasazi pop-ulations was on the order of 2.4% annually (Schlanger 1985, Schlanger 1988: 786). Her estimate, equivalentto a doubling time of less than 30 years, is almost certainly much too high. It is roughly the same as themodern world population growth rate.
Chapter 4 76
A particularly striking - though by no means unique - example is the LF1 period de-
scribed in Chapter7. At this time, one site in particular grew very rapidly, at a rate of
0.17% annually. This is more than twice the growth rate of the population of the Taraco
Peninsula as a whole (0.08%, Table7.2). There are three factors that can affect population
growth rates:
1. a change in fertility rates,
2. a change in mortality rates, or
3. population movement (immigration/outmigration).
It is extremely difficult to imagine that in the LF1 one village on the Taraco Peninsula expe-
rienced greatly increased fertility or reduced mortality while at the same time the remainder
of the villages, roughly equivalent in the previous phase, experienced the opposite. This
is, after all, a small area with a uniform climate and relatively uniform distribution of re-
sources. The average distance between the villages in question is on the order of only 4 km.
Though appeal can always be made to acts of god, it is hard to think of any phenomenon
which could plausibly create such an effect. More parsimonious, then, is to postulate that
all of the villages on the peninsula experienced roughly similar rates of fertility and mor-
tality, and that the observable difference in population growth rates can be attributed to
movement of persons from the shrinking villages to the growing one.
We are now presented with the difficulty of explaining what form this population move-
ment took, and what were the specific motivations of the persons who chose to change their
residence. There are many possible explanations, of course. On the one hand, it is easy
to imagine a situation in which people are forced to move from one place to another. This
almost certainly accounts for some of the dramatic population movement which occurred
when the Inka Empire conquered the Titicaca Basin (this is discussed in Chapter10). The
Inka empire was certainly acquainted with the practice of forced relocation of populations.
However, it is difficult to imagine forced relocation of population in the absence of a state
structure, as was the case in the Formative Period Titicaca Basin. The observed population
Chapter 4 77
growth differentials can therefore only be interpreted as the result of human individuals
or small groups deciding to leave one settlement or community and take up residence in
another.
Given the long time periods involved, such population growth differentials would not
even necessarily imply the relocation of established households from one community to
another. For example, if we imagine that post-marital residence rules were at least some-
what flexible, and that village exogamy was a common practice, we could postulate a slight
preference on the part of newlyweds to establish a new household in the village of one of
the partners rather than in that of the other. Over centuries, this could certainly produce the
observed effect, but as a result only of a systematic bias in decision frequencies within a
particular social frame. I believe this type of process was probably more common than was
mass relocation, particularly earlier in the Formative Period, before large political forma-
tions had come into being (see especially Chapters6 and7).
The point of the preceding paragraphs is this: the unequal growth rates which can be
documented in various phases in the Taraco Peninsula archaeological sequence are evi-
dence of systematic biases in human decision-making. We are observing the results of
peoplemakingdecisionswithin a determinate economic, social, and culturalcontext. We
have therefore, somewhat inadvertently, entered into a discussion of the role ofagency
in human history and in social evolution (cf.Dobres and Robb 2000), and have stumbled
upon a truth: settlement systems have no autonomy; they are created, in their every detail,
by the informed, motivated and historically situated action of human beings. Surprisingly,
then, we may use settlement data to address questions of human agency and choice. The
dynamics of the settlement system, particularly relative rates of population growth of the
various sites, informs us of broad patterns of bias in decisions regarding residential loca-
tion.
Of course, this is a very restricted domain of agency, and would seem to be atypical
in some regards. We are discussing a single kind of decision: residential choice. While
many kinds of activity seem to be routinized and are undertaken with little or no discursive
awareness (cf.Dietler and Herbich 1998), residential choice is a kind of decision which
Chapter 4 78
only occurs rarely, in many cases only once or twice in a lifetime. In addition, residential
choice has significant ramifications for the future possibilities of a household or individual.
The decision affects future social and alliance relations, as well as ease of access to a
wide array of spatially concentrated or restricted resources, social, cultural and economic
in nature. This being the case, it is likely that residential choices are virtually always made
only subsequent to a conscious evaluation of the various alternatives and their implications.
Thus, residential choice may respond to short-term conditions and political realities in a
way that many kinds of human behavior do not.
Why might inhabitants of the Taraco Peninsula have systematically chosen to locate
their households in one particular village more often than they chose to live in others?
What are the factors which might have entered into their decision-making process? There
are many possible answers to this question, of course, but I would like to discuss one
in particular, since I will make use of it later on to interpret actual patterns of unequal
population growth: redistribution.
Redistribution
What Carneiro calls “the shibboleth of chiefly redistribution” (Carneiro 1988: 500)
was an important component of some early formulations of the chiefdom concept. Sahlins
and Service, particularly, in influential statements, characterized chiefship as a functional
institution which served to redistribute goods and to pool subsistence risk across a hetero-
geneous territory (Service 1962, Sahlins 1958, Sahlins 1963, Fried 1967).16 Redistribution
was such a central concept for Service that he defined chiefdoms as “redistributional soci-
eties with a permanent central agency of coordination” (Service 1962: 144).
The concept of chiefly redistribution suffered the reverses of functionalism generally in
the ’70s and ’80s. Various researchers pointed out that in fact many of the goods collected
by chiefs from their subject population were never redistributed at all, or were distributed
only to a restricted circle of other elites in a politically opportune manner (summarized in
Earle 1987a). That is, that chiefly redistribution was not in fact functional but rather was
16This was a development of Polanyi’s concept of redistribution (Polanyi 1944).
Chapter 4 79
oriented to the aggrandizement of the chiefly personage him- or herself.
Whether chiefly redistribution was, in fact, an adaptive mechanism or simply tribute, the
fact remains that chiefs - or more generically, leaders - in small scale societies world-wide
collected and the redistributed (“dissipated”, as Spencer would have it [Spencer 1998]) a
portion of the agricultural and other products of the populace at large. It is important to
remember, however, that the surplus agricultural product collected by leaders was eventu-
ally eaten. It was not, as a matter of course, destroyed. What this means is that the chief or
leader supports other people, to a greater or lesser extent. The distribution of this surplus
could take many forms. The chief could take many wives and support a large household, as
was commonly the case. Or the chief could support retainers or artisans, and participate in
a system of wealth finance (Earle 1997). Alternatively, the chief or leader could distribute
at least a portion of the surplus in massive acts of generosity (Hayden 1996a, Dietler 1996).
Most empirical cases will involve many different strategies employed in varying combina-
tions. In all of these cases, however, the chief or leader acquires dependents.
Conceptualized in this way, a chief or leader is a point resource on the landscape. S/he
is a location from which goods emanate, and proximity to this location could prove advan-
tageous to other persons. It is in this way that the location of certain chiefs or leaders can
become a settlement determinant. And it is in this way that the differential success of lead-
ers can lead to the kind of unequal population growth rates that we observe in Taraco Penin-
sula prehistory. To return to the example, if the leaders of one village are more successful
than are those of surrounding villages, then access to these leaders will be an inducement
for some people to establish their residence in the first village. I emphasize that this effect
does not have to be a strong one, nor does the difference in chiefly success between villages
have to be pronounced. The slightest difference might be enough to produce a systematic
bias in residential decisions which over the course of centuries could produce the observed
population growth differences between villages.
Chapter 4 80
Ritual and esoteric services
There are of course other possible factors which enter into residential decisions than
considerations proximity to a prominent and generous personage. Among these are access
to certain ritual of religious services considered essential to health and prosperity. Atkinson
provides a protracted discussion of shamanism and leadership among the Wana of inland
Sulawesi (Atkinson 1989). In her account, popular or renowned shamans constitute settle-
ment determinants in their own right.
The immediate neighbors of a prominent shaman stand to benefit most fromhis skills. Their advantage is not only logistic but also political. Establishedshamans use their reputations to attract people to their settlement, for onlythose who live nearby have primary claim on a shaman’s services. ... [A]powerful shaman can serve as an enticement and a justification for residencechoice... [Atkinson 1989: 271]
It should be noted here that Wana shamans perform no redistributive function whatsoever.
The various services provided by Wana ritual specialists, all of which are apparently sig-
nificant consideration in residential choice, include farming magic, legal knowledge and
counsel, and shamanic prowess, concerned primarily with health and healing. Successful
shamans, says Atkinson, “can combat the centrifugal tendencies of Wana communities by
encouraging the dependence of others on their skills” (Atkinson 1989: 269).
Thus, if the ritual efficacy of a particular community were to be considered superior to
that of its neighbors, this efficacy could itself have the sort of effect of residential choice
that we are discussing. That is it could, over a long time span, produce unequal rates of
population growth in different settlements due to systematic bias in residential decisions.
Individual shamans, of course, are unlikely to have such an effect over a long period of time,
since their career is limited by their lifespan. However, special efficacy could also come to
be attached to totemic figures, idols, monoliths, or ancestral mummies, all of which would
be included in the Andean concept ofhuaca. The efficacy of these entities is of course not
limited by the human lifespan.
There are many other possible explanations for differing rates of population growth, of
course. However, the ones I have outlined above, and especially the concept of redistri-
Chapter 4 81
bution, are of particular interest. I will use them on several occasions in the course of my
analysis. That is why I have discussed them at such length here.
4.2.2 Site size hierarchy
The kinds of population growth differentials that I have just discussed are of course
distributed across space. Sustained for centuries they can produce settlement systems with
various tiers of site sizes. Typically, following the assumptions of central place theory
(cf. Haggett 1965, Johnson 1972, Johnson 1977, McAndrews et al. 1997), these site size
hierarchies are taken to indicate various types of political organization (Anderson 1994).
Thus, a two-tier hierarchy indicates a simple chiefdom, a three-tier hierarchy a complex
chiefdom, and a four-tier hierarchy a state.
This kind of mechanical correspondence between settlement configuration and polit-
ical organization cannot of course be assumed. However, the fact remains that site size
hierarchies are often produced by the kinds of population growth differentials that I dis-
cussed above. And if large settlements are those which house the most successful leaders,
as I proposed above, then a hierarchy of leaders could in fact correspond to a hierarchy of
population growth rates and therefore to a hierarchy of site sizes. This scenario is overly
precise, but something similar seems to have taken place on the Taraco Basin in the Late
Formative period. At any rate, I have included site size hierarchies among the measures
I use to monitor settlement dynamics over time, mainly because it has become standard
practice to do so.
I have made one small modification to the presentation of site size hierarchies, however.
The traditional way to represent these hierarchies is with a histogram, the x axis of which
represents site size intervals, and the y axis of which represents a count of sites in each
category. Instead, I have used the x axis to represent intervals of the population index, and
the y axis to represent a sum of the population index value for all the sites in each size class
(see Figures5.4, 6.9, and7.6 for examples). This has the salutary effect of correcting the
common problem of being unable to discern the upper tiers of the site size hierarchy due
to their low count, despite the fact that they often represent the majority of the regional
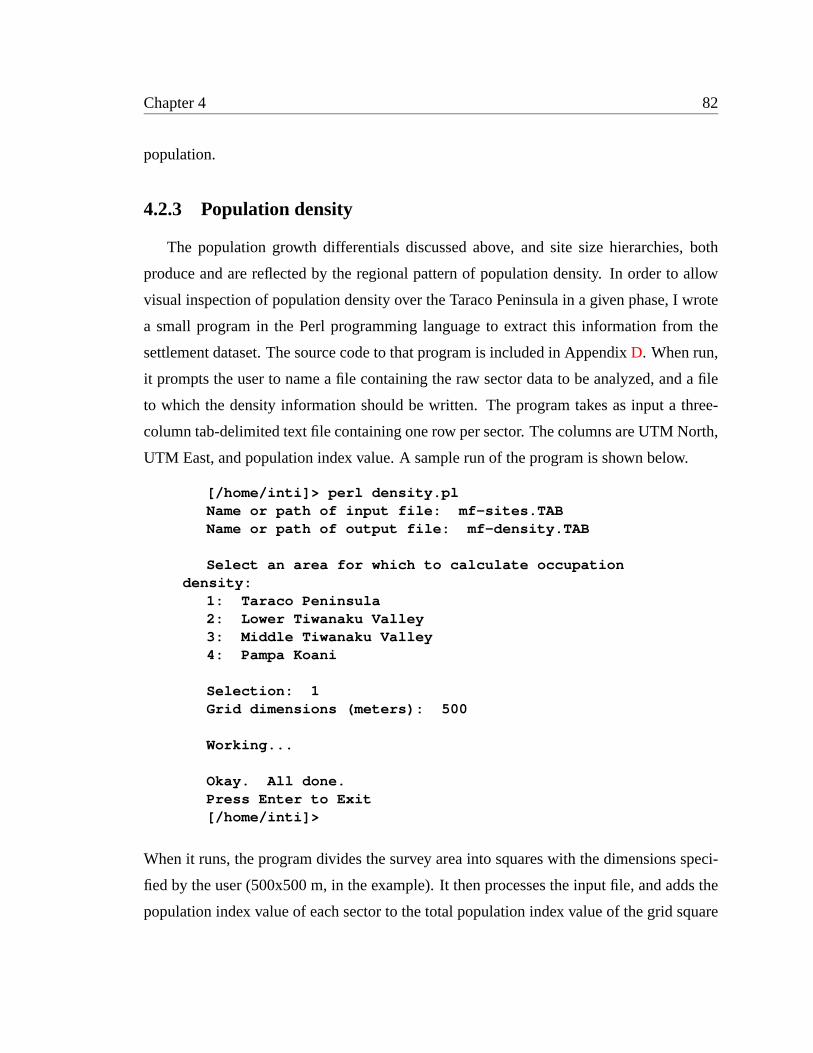
Chapter 4 82
population.
4.2.3 Population density
The population growth differentials discussed above, and site size hierarchies, both
produce and are reflected by the regional pattern of population density. In order to allow
visual inspection of population density over the Taraco Peninsula in a given phase, I wrote
a small program in the Perl programming language to extract this information from the
settlement dataset. The source code to that program is included in AppendixD. When run,
it prompts the user to name a file containing the raw sector data to be analyzed, and a file
to which the density information should be written. The program takes as input a three-
column tab-delimited text file containing one row per sector. The columns are UTM North,
UTM East, and population index value. A sample run of the program is shown below.
[/home/inti]> perl density.plName or path of input file: mf-sites.TABName or path of output file: mf-density.TAB
Select an area for which to calculate occupationdensity:
1: Taraco Peninsula2: Lower Tiwanaku Valley3: Middle Tiwanaku Valley4: Pampa Koani
Selection: 1Grid dimensions (meters): 500
Working...
Okay. All done.Press Enter to Exit[/home/inti]>
When it runs, the program divides the survey area into squares with the dimensions speci-
fied by the user (500x500 m, in the example). It then processes the input file, and adds the
population index value of each sector to the total population index value of the grid square
Chapter 4 83
in which it is located. When it finished, it outputs a three-column tab-delimited file contain-
ing one row for each grid square. The columns are UTM North, UTM East, and population
index value. The UTM values in the output file are those of the center of the grid square.
The data in the output file can then easily imported into any mapping program capable of
representing surfaces.17 Using this process, I generated population index surface maps for
each phase in the Taraco Peninsula sequence (see Figures5.5, 6.10, and7.7for examples).
All of my maps use a 500x500m grid, so each grid square represents 25 ha, or 0.25 km2
4.2.4 The site founding index
Three of the measures I use to monitor settlement dynamics have both a spatial and a
temporal component. They are described individually below. The first two have no direct
relationship to patterns of population growth or decline, being strictly derived from site
occupation and abandonment data. The third, however, is a way to monitor changes in
population density across the survey area.
The site founding index measures the percentage of sites in a given phase which were
not occupied in the preceding phase. Thus:
Is f = 100 SnSn+Sp
whereIs f = site founding indexSn = number of sites occupied in phase not occupied in the previous phaseSp = number of sites occupied in phase also occupied in the previous phase
Obviously, a high value means that many news sites were founded in a phase, and a low
value means few new sites were founded.
4.2.5 The occupation continuity index
The occupation continuity index measures the percentage of sites occupied during the
preceding phase which continued to be occupied during the phase in question. Its comple-
17I used Surfer and Scigraphica. Many GIS and mapping programs can do this, however.
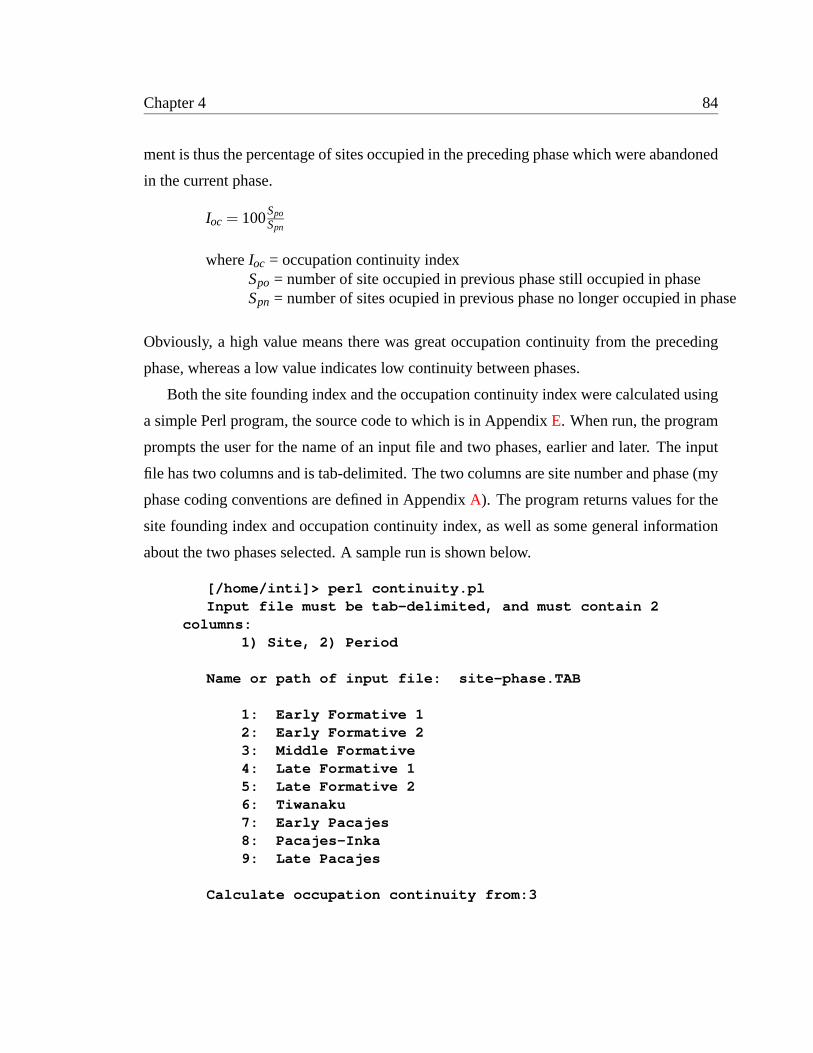
Chapter 4 84
ment is thus the percentage of sites occupied in the preceding phase which were abandoned
in the current phase.
Ioc = 100SpoSpn
whereIoc = occupation continuity indexSpo = number of site occupied in previous phase still occupied in phaseSpn = number of sites ocupied in previous phase no longer occupied in phase
Obviously, a high value means there was great occupation continuity from the preceding
phase, whereas a low value indicates low continuity between phases.
Both the site founding index and the occupation continuity index were calculated using
a simple Perl program, the source code to which is in AppendixE. When run, the program
prompts the user for the name of an input file and two phases, earlier and later. The input
file has two columns and is tab-delimited. The two columns are site number and phase (my
phase coding conventions are defined in AppendixA). The program returns values for the
site founding index and occupation continuity index, as well as some general information
about the two phases selected. A sample run is shown below.
[/home/inti]> perl continuity.plInput file must be tab-delimited, and must contain 2
columns:1) Site, 2) Period
Name or path of input file: site-phase.TAB
1: Early Formative 12: Early Formative 23: Middle Formative4: Late Formative 15: Late Formative 26: Tiwanaku7: Early Pacajes8: Pacajes-Inka9: Late Pacajes
Calculate occupation continuity from:3
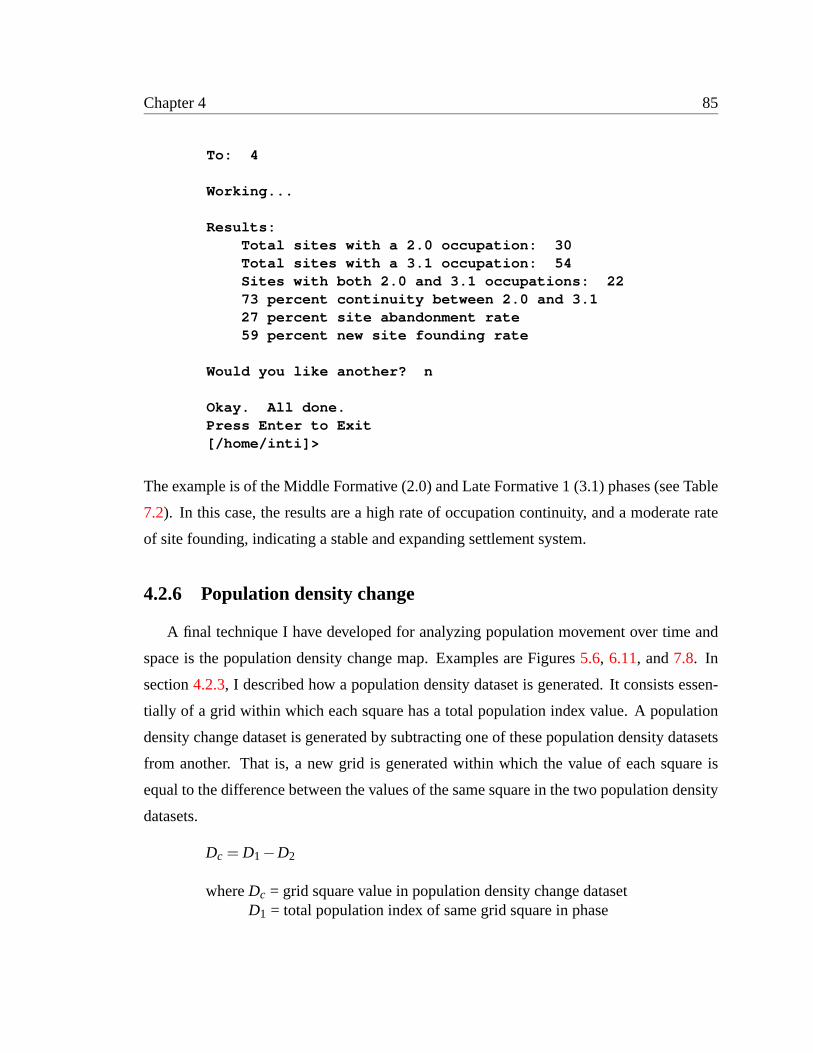
Chapter 4 85
To: 4
Working...
Results:Total sites with a 2.0 occupation: 30Total sites with a 3.1 occupation: 54Sites with both 2.0 and 3.1 occupations: 2273 percent continuity between 2.0 and 3.127 percent site abandonment rate59 percent new site founding rate
Would you like another? n
Okay. All done.Press Enter to Exit[/home/inti]>
The example is of the Middle Formative (2.0) and Late Formative 1 (3.1) phases (see Table
7.2). In this case, the results are a high rate of occupation continuity, and a moderate rate
of site founding, indicating a stable and expanding settlement system.
4.2.6 Population density change
A final technique I have developed for analyzing population movement over time and
space is the population density change map. Examples are Figures5.6, 6.11, and7.8. In
section4.2.3, I described how a population density dataset is generated. It consists essen-
tially of a grid within which each square has a total population index value. A population
density change dataset is generated by subtracting one of these population density datasets
from another. That is, a new grid is generated within which the value of each square is
equal to the difference between the values of the same square in the two population density
datasets.
Dc = D1−D2
whereDc = grid square value in population density change datasetD1 = total population index of same grid square in phase
Chapter 4 86
D2 = total population index of same grid square in previous phase
The resulting dataset is then used to produce a surface in the same manner as was done
with the population density datasets.
The population density change map is actually a very useful tool for visual inspection
of changes in population across space and through time. For example, Figure5.6 is a
settlement density change map for the Early Formative 2. The value of the z axis is the
grid square population index value for the EF2 phase minus the population index value
of the same grid square in the EF1 phase. It is immediately apparent that most sites in
this period experienced healthy growth, but that sometime late in the EF1 phase (before
the EF2 phase began) three sites experienced population declines. Two of these turn out
to have been abandoned (the ones near the tip of the peninsula), while one fissioned into
at least two separate sites (the one that lost the least population, roughly in the middle of
the peninsula). This example is discussed more thoroughly in Chapter5 . My intention
here is only to show the usefulness of the population density change map. Another very
striking example is Figure9.5, which eloquently captures the wholesale depopulation of
the peninsula in the Early Pacajes phase.
4.3 Caveat
Clearly all of the population indices, measures, and associated interpretive methods laid
out in this chapter are fraught with empirical and theoretical difficulty. The derivation of
population estimates or indices from surface data is a difficult and contentious undertaking
(cf. Fish and Kowalewski 1990, Tolstoy and Fish 1975). Nothing about it is straightfor-
ward. Like Flannery, though, I prefer to light one small candle rather than curse the dark-
ness (Flannery 1976a: 165). The method I have described in this chapter for generating
both sector and phase population indices produces values which are sufficiently propor-
tional to actual population to be useful, at least in the Titicaca Basin context. Some of the
patterns they reveal are very illuminating indeed, as I hope to show in the remainder of this
study.
87
Chapter 5
The Early Formative: initial settlement
and population growth
After 2000 B.C., there was a major change in the lifeways of Titicaca Basin peoples.
Browman notes “the adoption of new technologies such as ceramics, the development of
new techniques in architecture, and the increasing reliance upon a wide range of domes-
ticated plants” (Browman 1984:119). We refer to this time of early time of agricultural,
ceramic-using and occasionally village-dwelling peoples as the Early Formative Period.
This cultural and economic watershed, which occurred locally around 1500 B.C., also
marks the first definable occupation of the Taraco Peninsula.
There seems to have been no detectable occupation of the Taraco Peninsula during
the long preceramic or Archaic period of Titicaca Basin prehistory. In the entire survey
not a single aceramic debitage scatter nor a single Archaic style point was recovered.
Although this contrasts sharply with reports of intensive Archaic period occupations in
other parts of the Basin, it is consistent with the fact that Albarracín-Jordan and Mathews
(Albarracín-Jordan and Mathews 1990: 51-53) found only two isolated Archaic points in
their Tiwanaku Valley survey. Although a small number of Archaic period points were
recovered from the excavations at Chiripa, these were highly worn and were encountered
in Formative levels; they seem to have been collected and curated by Formative Period
inhabitants. In sum, there is no evidence for a measurable human presence on the Taraco
Chapter 5 88
Peninsula (indeed, in the Tiwanaku heartland) during the Archaic period.
There are several reasons why this might be the case. First, recall that the spine of the
Taraco Peninsula is formed by the Taraco Formation, a loose and poorly sorted deposit of
fluvial origin. The hills of the peninsula are covered with nodules of quartzite and chert,
and the entire area constituted an extensive quarry during the whole prehispanic period.
That is to say that the entire peninsula is a low-density debitage scatter. This would have
the effect of obscuring ephemeral Archaic period lithic scatters which might be identifiable
in a different geological context. This cannot account for the extreme rarity of Archaic
period projectile points, however.
Second, geologists have demonstrated (Abbott et al. 1997a, Abbott et al. 1997b) that
the little lake (Lago Wiñaymarka) was completely dry prior to about 1500 B.C. In the Ar-
chaic period, then , the peninsula would have been considerably colder and less hospitable
to agriculture than it is today, lacking as it would have the climatic amelioration effects of
the lake. Also, the area of the lake now covered with water would have been a vast pampa
or grassland. Since pastoralism seems to have been the primary focus of the economy, at
least in the later or terminal Archaic, it could be that the local inhabitants lived on these
pampas, perhaps near the small meandering rivers, as was the case in the Ilave valley. If
this was so, then the remains of their settlements and camps would now be inundated and
archaeologically invisible.
Although it is impossible to evaluate this archaeologically at present, it is possible
to imagine what could have happened when the lake abruptly rose to near-modern lev-
els around 1500 B.C. We may postulate a landscape populated by small pastoral groups
practicing a very extensive form of tuber agro-pastoralism on the vast pampas of what is
now Lake Wiñaymarka. The rise in lake level - which seems to have been relatively abrupt
- would have 1) eliminated a vast expanse of grazing land, 2) made available rich lacustrine
resources, in the form of fish and lake birds, and 3) created a climate more amenable to agri-
cultural production, as a result of the thermal effects of the lake. All of these changes would
have encouraged the development of a more sedentary fishing and agricultural economy by
simultaneously lowering the region’s carrying capacity for a primarily pastoral economy
Chapter 5 89
and raising it for a mixed lacustrine and agro-pastoral economy. Assuming that adjacent
grazing areas were already populated - thus limiting the possibility of outmigration - this
would have constituted a strong incentive for local populations to intensify their fishing
and agricultural activities. Furthermore, since the Taraco Peninsulais a peninsula, pastoral
groups inhabiting the entire surrounding pampa would have been forced onto what became
a narrow spit of land with very poor grazing potential. This is the sort of situation we might
imagine resulting in relatively dense populations (relative to the rest of the Titicaca Basin)
and a marked economic shift away from pastoralism and toward agriculture and lacustrine
fishing/collecting.
Testing of this model is, of course, impossible since sites of this terminal Archaic time
period - if they do exist - are submerged. It is nevertheless compelling since it explains
several otherwise anomalous archaeological facts. First is the lack of any evidence of an
Archaic period occupation on the Taraco Peninsula. In the scenario outlined above virtually
all such evidence would be inundated at the present time. Second, it explains the character
of the Early Formative occupation of the peninsula, which, as we shall see shortly, does not
correspond to what we might expect of an initial colonization of a region.
5.1 Phase definition
In my chronology the Early Formative is divided into two phases. The Early Forma-
tive 1 is equivalent to the Early Chiripa phase, while the Early Formative 2 is equiva-
lent to the Middle Chiripa phase. It is worth noting here that these two phases are used
here as defined by Lee Steadman (Steadman 1999) using data from recent excavations at
Chiripa (1992-1998) of the Taraco Archaeological Project (see papers inHastorf 1999).
They are therefore equivalent neither to the Early and Middle Chiripa phases of Kid-
der and Mohr (Mohr 1966, Chávez 1988), nor to Browman’s Condori and Llusco phases
(Browman 1978a, Browman 1980). Rather, they constitute new phase definitions based
upon an enlarged ceramic sample. Early and Middle Chiripa occupations were identified
using a frequency profile analysis of surface ceramics, as explained in detail in Chapter3.
Chapter 5 90
5.1.1 Early Chiripa
The Early Chiripa Phase is the earliest of the three Chiripa phases defined by Steadman
(Steadman 1999). Based on the Taraco Archaeological Project’s work, this phase has been
dated to approximately 1500 - 1000 B.C. (seeWhitehead 1999for dating of the Chiripa
phases). Ceramics of the Early Chiripa phase are mostly dark in color and tend to be
unslipped. Wiped finishes are more common in this phase than later, when burnishes pre-
dominate. 100% of the sherds from this phase are fiber-tempered, though the fiber seems
to be chopped finer than it is in later periods. Micaceous pastes predominate. The most
common forms are the short-necked olla and the neckless olla - the latter being unique to
this phase.
There are certain similarities between Early Chiripa ceramics as defined here and the
ceramics of Browman’s Condori phase. Among these we may number the use of mica-
ceous temper, the presence of the distinctive neckless olla - orolla sin cuello, see Fig-
ure 5.1 - vessel form, and the frequent occurrence of interior and exterior rim thickening
(Browman 1980). It seems likely that, despite some differences, Steadman’s Early Chiripa
and Browman’s Condori are describing similar and probably related assemblages.
It should be made clear at this point that the Early Chiripa of Karen Mohr Chávez
(Chávez 1988) is absolutely unrelated to the Early Chiripa phase as employed here. Early,
Middle and Late Chiripa were used by Chávez to describe the ceramics (Mohr 1966)
from Kidder’s Sub-Lower House Level, Lower House Level, and Upper House Level
(Kidder 1956, see alsoBandy 1999a), respectively. From recent excavations in the Chiripa
mound (Bandy 1999b), we know that the Lower House Level corresponds to the earlier part
of Steadman’s Late Chiripa. Therefore, Chávez’s Early Chiripa is probably contemporary
with Steadman’s Middle or even Late Chiripa. When I use Early Chiripa in this discussion
I am referring to the phase as defined by Steadman.
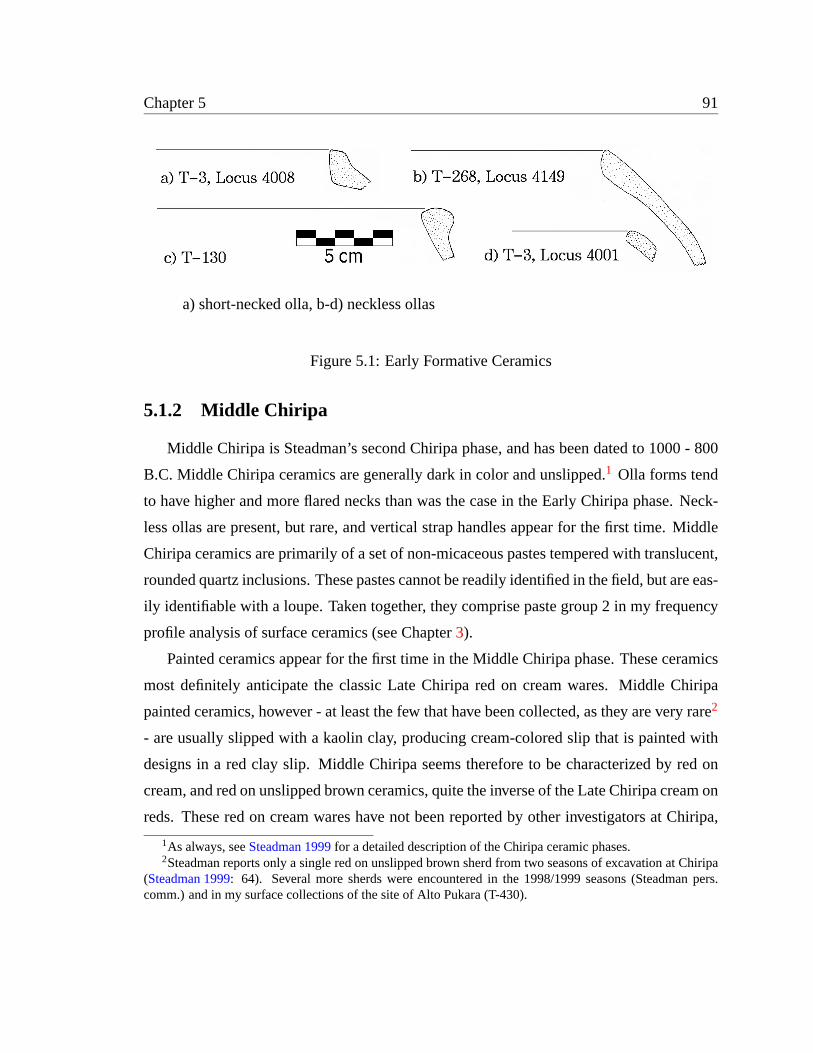
Chapter 5 91
a) short-necked olla, b-d) neckless ollas
Figure 5.1: Early Formative Ceramics
5.1.2 Middle Chiripa
Middle Chiripa is Steadman’s second Chiripa phase, and has been dated to 1000 - 800
B.C. Middle Chiripa ceramics are generally dark in color and unslipped.1 Olla forms tend
to have higher and more flared necks than was the case in the Early Chiripa phase. Neck-
less ollas are present, but rare, and vertical strap handles appear for the first time. Middle
Chiripa ceramics are primarily of a set of non-micaceous pastes tempered with translucent,
rounded quartz inclusions. These pastes cannot be readily identified in the field, but are eas-
ily identifiable with a loupe. Taken together, they comprise paste group 2 in my frequency
profile analysis of surface ceramics (see Chapter3).
Painted ceramics appear for the first time in the Middle Chiripa phase. These ceramics
most definitely anticipate the classic Late Chiripa red on cream wares. Middle Chiripa
painted ceramics, however - at least the few that have been collected, as they are very rare2
- are usually slipped with a kaolin clay, producing cream-colored slip that is painted with
designs in a red clay slip. Middle Chiripa seems therefore to be characterized by red on
cream, and red on unslipped brown ceramics, quite the inverse of the Late Chiripa cream on
reds. These red on cream wares have not been reported by other investigators at Chiripa,
1As always, seeSteadman 1999for a detailed description of the Chiripa ceramic phases.2Steadman reports only a single red on unslipped brown sherd from two seasons of excavation at Chiripa
(Steadman 1999: 64). Several more sherds were encountered in the 1998/1999 seasons (Steadman pers.comm.) and in my surface collections of the site of Alto Pukara (T-430).
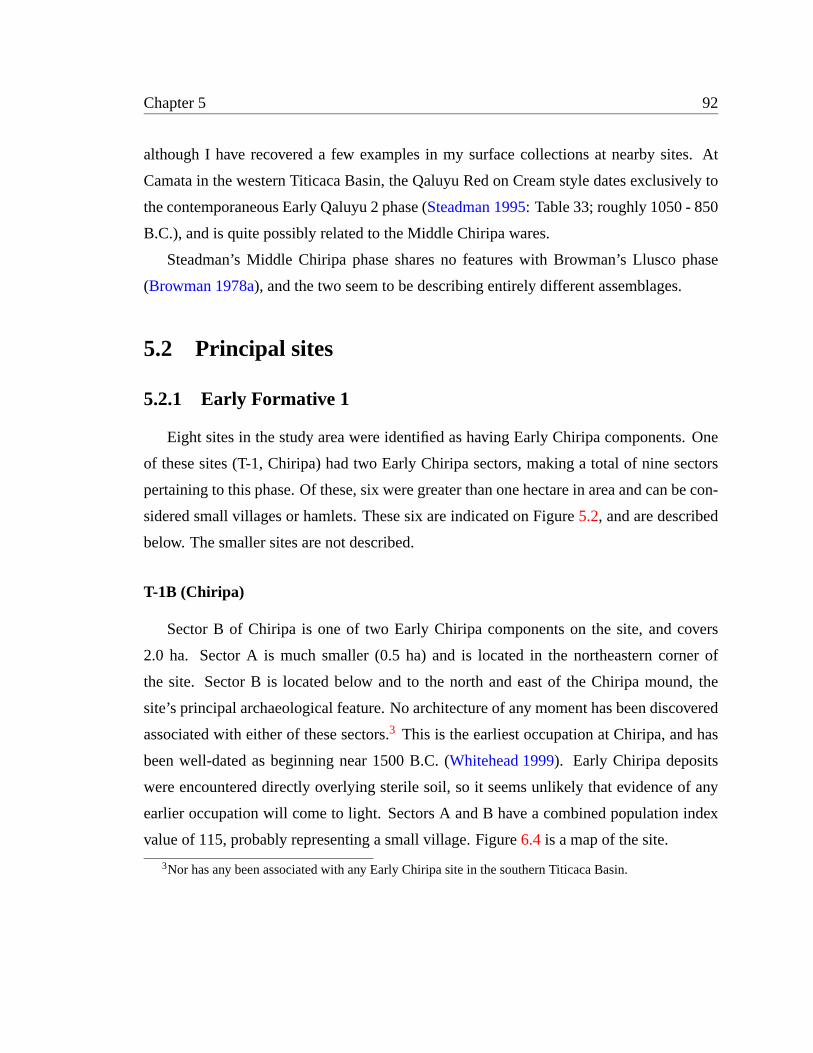
Chapter 5 92
although I have recovered a few examples in my surface collections at nearby sites. At
Camata in the western Titicaca Basin, the Qaluyu Red on Cream style dates exclusively to
the contemporaneous Early Qaluyu 2 phase (Steadman 1995: Table 33; roughly 1050 - 850
B.C.), and is quite possibly related to the Middle Chiripa wares.
Steadman’s Middle Chiripa phase shares no features with Browman’s Llusco phase
(Browman 1978a), and the two seem to be describing entirely different assemblages.
5.2 Principal sites
5.2.1 Early Formative 1
Eight sites in the study area were identified as having Early Chiripa components. One
of these sites (T-1, Chiripa) had two Early Chiripa sectors, making a total of nine sectors
pertaining to this phase. Of these, six were greater than one hectare in area and can be con-
sidered small villages or hamlets. These six are indicated on Figure5.2, and are described
below. The smaller sites are not described.
T-1B (Chiripa)
Sector B of Chiripa is one of two Early Chiripa components on the site, and covers
2.0 ha. Sector A is much smaller (0.5 ha) and is located in the northeastern corner of
the site. Sector B is located below and to the north and east of the Chiripa mound, the
site’s principal archaeological feature. No architecture of any moment has been discovered
associated with either of these sectors.3 This is the earliest occupation at Chiripa, and has
been well-dated as beginning near 1500 B.C. (Whitehead 1999). Early Chiripa deposits
were encountered directly overlying sterile soil, so it seems unlikely that evidence of any
earlier occupation will come to light. Sectors A and B have a combined population index
value of 115, probably representing a small village. Figure6.4 is a map of the site.
3Nor has any been associated with any Early Chiripa site in the southern Titicaca Basin.
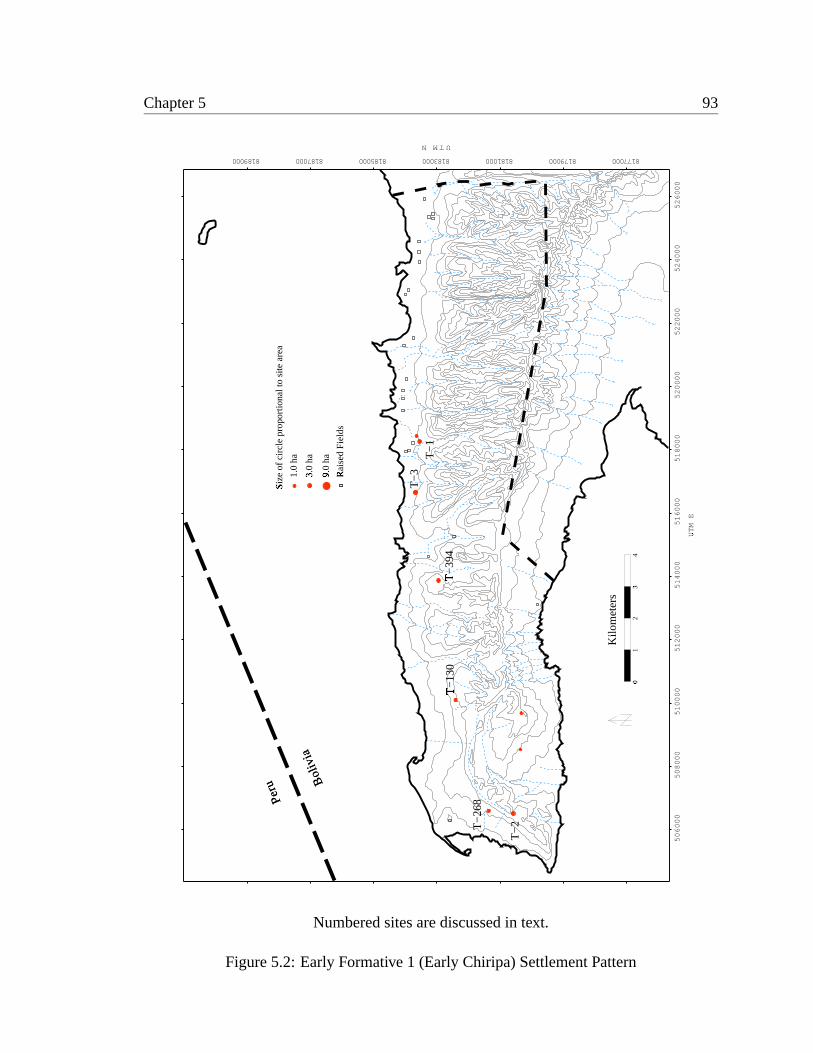
Chapter 5 93
0�
12
3�
4
Kilo
met
ers
1.0
ha
Rai
sed
Fie
lds
�3.0
ha
�
Peru B
oliv
ia
Siz
e of
circ
le p
ropo
rtio
nal t
o si
te a
rea
�
9.0
ha
�
506000
508000
510000
512000
514000
516000
518000
520000
522000
524000
526000
UTM E
�
UTMN
8770008179008110000818500818700819000 108818300008
T−
1
T−
394
�
T−
130
�
T−
268
T−
3
T−
2
Numbered sites are discussed in text.
Figure 5.2: Early Formative 1 (Early Chiripa) Settlement Pattern

Chapter 5 94
T-2A (Cerro Choncaya)
Cerro Choncaya is an Early and Middle Formative Period site that lies on the modern
boundary between the modern communities of Coa Kkollu to the East and San José to the
West, though the majority of the site lies in Coa Kkollu. It was discovered by myself and
several companions on a drive around the peninsula in 1996.4
The site itself comprises a dense scatter of ceramics and lithics covering 4.25 ha. Sector
A covers 3.0 ha. There is no indication of corporate architecture in any form at the site.
It is located on a low pass through the Taraco hills, a small saddle at approximately 3870
m.a.s.l. This location affords excellent views both of the lake itself and of the approaches
from the East and North-West. For this reason the site may be considered strategic, though
it is by no means defensive. No evidence of fortifications were encountered, and its location
in a saddle would have exposed the site to attack from adjacent hilltops. The site has been
cut by the modern road leading from Taraco to Santa Rosa. The road cut reveals no deep
deposits. This is unsurprising, considering the topographical location of the site, which
has exposed it to severe erosion. Apart from the road cut, little modern disturbance is in
evidence, and the site seems to be quite well-preserved. Very little modern material was
found; indeed, almost no material post-dating Late Chiripa is present on the site. The
Early Chiripa occupation has a population index value of 157; larger than Chiripa, and the
second-largest site in the Early Chiripa phase.
T-3A (Chiaramaya)
Chiaramaya is a major Formative Period site located approximately 1.5 km west of the
Chiripa site. The modern road cuts the site, as it does Chiripa. The modern school overlies
archaeological deposits, but the bulk of the site lies to the north of the road. Immediately
to the north of the road is a broad terrace, approximately 50 by 50 meters, and 3 meters
high on the downslope side. This terrace probably dates to the Late Chiripa phase, since its
configuration is very similar to that of the Chiripa mound at that time.
4Amanda Cohen and Bill Whitehead.

Chapter 5 95
The Early Chiripa occupation (sector A) extends approximately 200 meters north from
the road, covering 3.5 ha. It has a population index value of 186, and is the largest Early
Chiripa site discovered on the peninsula or indeed anywhere in the southern Titicaca Basin
to date.
Chiaramaya was first mentioned as an archaeological site by Portugal Zamora and Bus-
tamente in their report on their excavations at Chiripa (seeBandy 1999afor a discussion
of this expedition).5 Since then it has been mentioned by Clark Erikson in a brief report
on an informal survey he undertook in 1975 (Erickson 1975).6 The site itself has recently
been disturbed by construction of a community meeting hall on the main platform, and it
has been the subject of intense ownership disputes in recent years. It is also the site of
an annual ceramics fair, attracting potters and vendors from the area around Batallas. The
fair is widely attended by the inhabitants of nearby communities. For this reason the main
platform is covered with a quite dense scatter of modern, republican and colonial ceramics.
The Formative Period site nevertheless does seem to be well-preserved, and would be a
prime spot for excavation.
T-130A (Yanapata)
Yanapata is another major Formative Period site that lies on the boundary between the
modern communities of Nachoca and Ñacoca. The bulk of the site lies in Nachoca. It is
located at the base of the Taraco hills, approximately 200 meters to the south of the modern
road. The site covers 8.0 ha, and is visible from the road as an area of dark soil.
The site has a large terrace, 50 by 40 meters, similar to that described for Chiaramaya,
above. This terrace was apparently once faced with stone on its downslope side. One large
limestone pillar remains in place in approximately the center of the terrace wall. I was
informed by the landowner that a great deal of worked stone was pulled from this area and
taken by truck to Taraco to be used in repairs to the church there. Apart from stone-robbing,
5However, a brief reference in Padre Pedro Marabini’s 1920 article in theBoletín de la Sociedad Geográ-fica de La Pazmay also refer to Chiaramaya. Writing of Chiripa, he noted in passing another “cerrito” about2 kilometers away, in the direction of the lake. Since the lake seems to have been very low at this time, hemay have been referring to Chiaramaya, which is located 2 km to the east of Chiripa (Marabini 1920).
6He was a student at the time, working on Browman’s project in Chiripa.
Chapter 5 96
modern disturbance of the site in minimal, and is limited to a single house immediately to
the east of the main terrace.
Sector A covers a single hectare located south and west of the main terrace. With a
population index of 43, this is one of the smaller Early Chiripa sites.
T-268A (Sunaj Pata)
Sunaj Pata is located above the modern town of Santa Rosa, near the boundary between
the communities of Santa Rosa and San José. The entire site lies within San José, however.
The sherd scatter - which is very dense - covers 5.0 ha. Very little modern material is
present, and there is little modern disturbance apart from agricultural activities.
The site has two features which might be large artificial terraces, like those at Chiripa,
Chiaramaya and Yanapata. They are not sufficiently well-preserved to permit a positive
identification, however. Additionally, a large rectangular stain of ash, charcoal and burnt
earth is present in the northern portion of the site in a plowed field. Its dimensions (approx-
imately 20x20 m) and shape would suggest that it might be a sunken enclosure, similar
to the Llusco structure at Chiripa (seePaz Soría 1999). Again, this must be confirmed by
excavation. Some monumental construction at the site would seem to be suggested by the
presence of numerous large, worked blocks of non-local limestone in rockpiles resulting
from field-clearing in the northern part of the site.
Sector A extends over 1.25 ha and has a population index value of 56, similar in size to
sector A at Yanapata.
T-394A (Janko Kala)
Janko Kala is located on a prominent hill in the community of Zapana. It is cut by
the modern road as it crests the hill to the west of the schoolhouse and community hall.
Like most major Formative Period sites, it is visible from a distance as an area of darkly-
stained soil, standing out against the natural red. The name means ’white stone,’ after an
upright block of limestone located slightly offsite on a ridge to the Southwest. This block is
certainly imported and worked, and its presence would seem to indicate some form of cor-
Chapter 5 97
porate construction at the site. However, the site has been remodeled extensively by recent
agricultural activities, and it is impossible to identify a mound, platform or monumental
terrace with certainty. Test excavation, magnetometry, or a more detailed topographical
analysis would possibly find one or more terraces, as are present at Chiaramaya and else-
where.
The sherd scatter extends over 7.75 ha and is very dense. All periods are represented,
but especially notable are the Formative period and Late Horizon (Inka) occupations. Sec-
tor A covers 2.25 ha and has a population index value of 113.
5.2.2 Early Formative 2
Twenty-three sites in the study area were identified as having Middle Chiripa compo-
nents, a substantial increase over the nine Early Chiripa sites. Of these, ten were greater
than one hectare in area and can be considered small villages or hamlets. These ten sites
are labeled on Figure5.3, and are described below.
T-1C (Chiripa)
In the Middle Chiripa phase, Chiripa itself grows rapidly from a combined Early
Chiripa population index value of 115 to a Middle Chiripa value of 231 (4.25 ha). This
equates to an annual growth rate of 0.35% and a population doubling time of 199 years,
and is roughly even with - or a bit below - the average population growth rate for the phase
as a whole (see Table5.1).
In the case of Chiripa, as a result of the recent excavations, we can say a bit more
about this period than is possible at other Middle Chiripa sites. During the Middle Chiripa
phase - and probably early in the phase - a sunken court was constructed in the area of
the site we refer to as Santiago.7Figure 6.4 shows the northern and eastern wall of this
structure, in the Santiago area. This court, which we call the Choquehuanca structure, was
7Many of the details of early construction at Chiripa were revealed in the 1998/1998 field season. Thesehave yet to be published, though we did submit a fairly comprehensive report to the National GeographicFoundation (Hastorf et al. 1998).
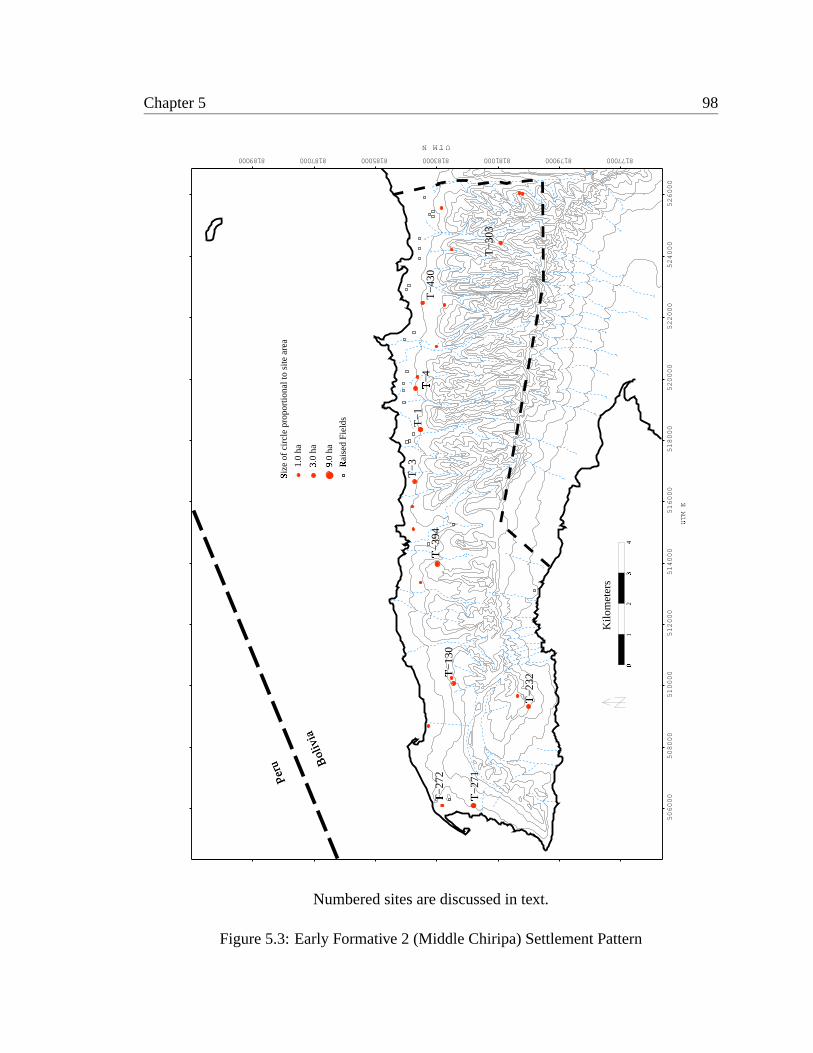
Chapter 5 98
0�
12
3�
4
Kilo
met
ers
1.0
ha
Rai
sed
Fie
lds
�3.0
ha
�
Peru B
oliv
ia
Siz
e of
circ
le p
ropo
rtio
nal t
o si
te a
rea
�
9.0
ha
�
506000
508000
510000
512000
514000
516000
518000
520000
522000
524000
526000
UTM E
�
UTMN
8770008179008110000818500818700819000 108818300008
T−
1
T−
394
�
T−
130
�
T−
232
�
T−
3
T−
271
�T−
272
�
T−
4
�
T−
430
T−
303
Numbered sites are discussed in text.
Figure 5.3: Early Formative 2 (Middle Chiripa) Settlement Pattern
Chapter 5 99
cut through Early and Middle Chiripa fill. Its walls were lined with unworked cobbles and
plastered with yellow clay (Dean and Kojan 1999). The floor was a prepared clay floor. In
plan, the structure is trapezoidal, wider to the south than to the north. It is approximately
14x14 m (Whitehead inHastorf et al. 1998), and has a shallow niche in the eastern wall
(Dean and Kojan 1999: Figures 10-11). It should be emphasized that this is the earliest
example of corporate architecture known from the Titicaca Basin and anticipates 2000
years of sunken court construction. In addition to the Choquehuanca structure, a large
adobe wall was excavated in 1998/1999 immediately to the east of the mound. This is the
area known as Montículo 1. This wall may or may not represent another complex of public
architecture (Bandy inHastorf et al. 1998). It does however, date to the Middle Chiripa
phase.
T-3B (Chiaramaya)
If Chiripa experienced normal growth in the Middle Chiripa phase, Chiaramaya experi-
enced a demographic decline. Sector B covers only 2.5 ha, with a population index of 127.
This represents an annual growth rate of -0.19%.
T-4A (Chiripa Pata)
Chiripa Pata is a large site located approximately 15 km east of Chiripa (T-1) on the
main road. It lies near the boundary of the modern communities of Chiripa and Pequery,
though the entire site falls within the boundaries of Chiripa. Running along a natural ridge,
the sherd scatter extends almost 300 m north of the road to thepampa. Several modern
houses are located on the site, and it has been extensively plowed for agriculture.
The site seems to have four very broad terraces descending from the road to the pampa.
On the uppermost of these terraces I observed large monolithic blocks of sandstone and
limestone, almost certainly indicating the presence of some sort of platform or sunken
court. No such structure could be discerned using surface indications, however. The
principal occupation of the site is during the Tiwanaku Period. It is to this time that the
monolithic blocks probably pertain. The first occupation at the site, however, is during the
Chapter 5 100
Middle Chiripa phase. The Middle Chiripa scatter at Chiripa Pata extends over 3.25 ha,
with a population index of 171.
While the Taraco Archaeological Project was working at Chiripa, we hear constant
reports of tombs opened by plowing at Chiripa Pata. I myself have seen several freshly
opened stone-lined cysts on the site, and mortuary inventories from several others. There
seem to be a large number of graves present at the site. Moreover, discussion with local
landowners led to the discovery that the cemeteries seem to be arranged in a ring around
the main body of the site. That is, tombs almost always appear around the fringes of the
sherd scatter. this observation is consistent with the structure of the Chen Chen site in
Moquegua (Bandy et al. 1996), which I helped map in 1995. This may or may not be a
broader Tiwanaku mortuary pattern, but the parallel is certainly suggestive.
Given the importance accorded both to mountains and to sightlines in the Andes gen-
erally, the location of Chiripa Pata may have been of some importance in the past. If
one walks from the West (Chiripa, Taraco or Santa Rosa) toward La Paz along the mod-
ern road,8 it is precisely as one enters the site of Chiripa Pata that one catches one’s first
glimpse of the peak of Illimani, the 6000+ meter peak overlooking the city.
A final historical note: in 1934 Wendell Bennett - in the same season in which he
excavated the famous Houses 1 and 2 on the Chiripa mound - excavated a test trench “at
the old Chiripa ranch, about one mile east of the present hacienda” (Bennett 1936: 415).
The ’old Chiripa ranch’ is almost certainly Chiripa Pata, especially as the only material
recovered there by Bennett pertained to the Tiwanaku Period.
T-130B (Yanapata)
Yanapata experienced rapid growth in the Middle Chiripa phase, with an annual pop-
ulation growth rate of 0.65%, almost twice that of Chiripa. Sector B extends over 3.0 ha
with a population index value of 157.
8This almost certainly follows the course of the prehistoric road since it intersects virtually every majorprehistoric site on the peninsula and in the Katari Basin.
Chapter 5 101
T-232A (Kala Uyuni)
Kala Uyuni is a very large site located in the community of Coa Kkollu. It occupies
the flanks of Cerro Achachi Coa Kkollu. The sherd scatter covers 15.25 ha between the
modern road (immediately to the south) and the flanks of the hills to the north. An active
spring is located at the base of the hill behind the site. There are a considerable number
of worked stones present on the site, most incorporated into modern agricultural rockpiles.
The site topography would seem to indicate some kind of platform/terrace complex in
approximately the center of the site and backing up against the hill. This may be a two-
tiered stepped platform, but it is impossible to define architecture with any confidence based
on the existing surface remains. A detailed topographical map and test excavations would
be required. This is a priority for future research on the peninsula. No stone sculpture of
any kind was observed or reported by the local landowners.
The principal occupation of this site is in the Late Formative 1 period. However, its first
occupation was in the Middle Chiripa phase. Sector A covers 2.5 ha and has a population
index value of 127. The Middle Chiripa occupation is probably deeply buried by later
deposits here, and is visible only as a thin sherd scatter on the surface.
T-271A (Sonaji)
A portion of this site is located under the modern town of Santa Rosa. The main archi-
tectural complex is a large platform, about 50 meters square, with terraces descending to
the lacustrine plain below. The platform itself is adjacent to the Santa Rosa cemetery. The
site lies on the boundary between the modern communities of San José and Santa Rosa.
The platform lies in San José.
The entire site covers approximately 13.75 ha. The main occupations are from the
Tiwanaku and Early Colonial Periods. However, the site’s first occupation dates from the
Middle Chiripa phase. The Middle Chiripa component, sector A, covers approximately 5.0
ha (population index value of 276), and therefore counts as the largest Middle Chiripa site
encountered in the survey. This occupation is deeply buried by later deposits, however, and
I am not entirely confident of its precise boundaries. This is a question to be resolved by
Chapter 5 102
subsurface testing. There can be no doubt, however, that this is a major Middle Chiripa
site.
T-272A (Kumi Kipa)
Kumi Kipa is located in the community of Santa Rosa, on the extreme tip of the Taraco
Peninsula. It is situated on a low ridge running north-south from the lakeshore. There are
two low mounds on the crest of this ridge that seem to be artificial. The southern one is
approximately 20 meters square, 2 meters and roughly rectangular. The northern feature is
much smaller and ovoid. It is quite possibly a recent agricultural rockpile. The principal
occupations at the site date to the Late Formative and Tiwanaku Periods. Sector A, however,
is a minor (1.0 ha, population index 43) Middle Chiripa site, probably associated with the
larger occupation at Sonaji (T-272).
T-303A (Quiswaran)
Quiswaran is located in the community of Queruni. It is unusual for Formative Period
sites in that it is not located on the edge of the lacustrine plain, but rather somewhat inland.
It is situated on the slopes of a ridge at the confluence of two largequebradas. On the
edge of the site is a large active spring which is currently being used to irrigate a small
agricultural area. This spring probably provided ample water for the prehistoric inhabitants
of the site.
The sherd scatter covers 3.0 hectares. Sector A, however (the Middle Chiripa occupa-
tion) covers only 1.75 ha. The site has been only minimally disturbed by agriculture and
the construction of one nearby house. On the whole, it is quite well-preserved.
The upper (southern) portion of the site contains a modest terrace/platform, about 30
meters square. This could well represent corporate architecture, albeit probably from a
later (Late Chiripa) phase.
Chapter 5 103
T-394B (Janko Kala)
Janko Kala grew at an annual rate of 0.39% during the Middle Chiripa phase, compa-
rable to Chiripa’s growth rate. Sector B covers 4.5 ha.
T-430A (Alto Pukara)
Alto Pukara is located immediately below (north of) the modern road, in the commu-
nity of Cala Cala. The principal occupation (covering 3.5 ha) pertains to the Late Chiripa
and Late Formative 1 phases. The Middle Chiripa occupation (Sector A) covers only 2.0
ha, and is the first occupation of the site. The sherd scatter extends from just north of the
modern road to the edge of thepampa. The site comprises three broad habitation terraces
rising from thepampa(see Figure6.5 for a rough map of the site). Above the habitation
terraces lies a smaller terrace/platform which probably represents some form of corporate
construction, similar to the Chiripa mound but more modest. This was excavated in 2000
by Robin Beck of northwestern University, and will be the subject of his forthcoming dis-
sertation. He uncovered two well-preserved structures fronting an open plaza, suggesting
an architectural complex conceptually similar to the Lower or Upper Houses of Chiripa,
though not identical.
The site is very well-preserved and its excavation has yielded excellent results.
5.3 Settlement and population
The first fact worthy of note, as mentioned in the introduction to this chapter, is that
the inhabitants of the Taraco Peninsula seem to have lived in relatively large settled vil-
lages from very early in the Early Chiripa phase. As may be see in Table5.1, the
average Early Chiripa sector population index is 77 (phase population index/number of
sites=1752/23=77). This probably represents an average of more than 10 households per
village. On the face of it, this is not a large number. Compared to other areas of the Titicaca
Basin at this time period, however, it is very high.
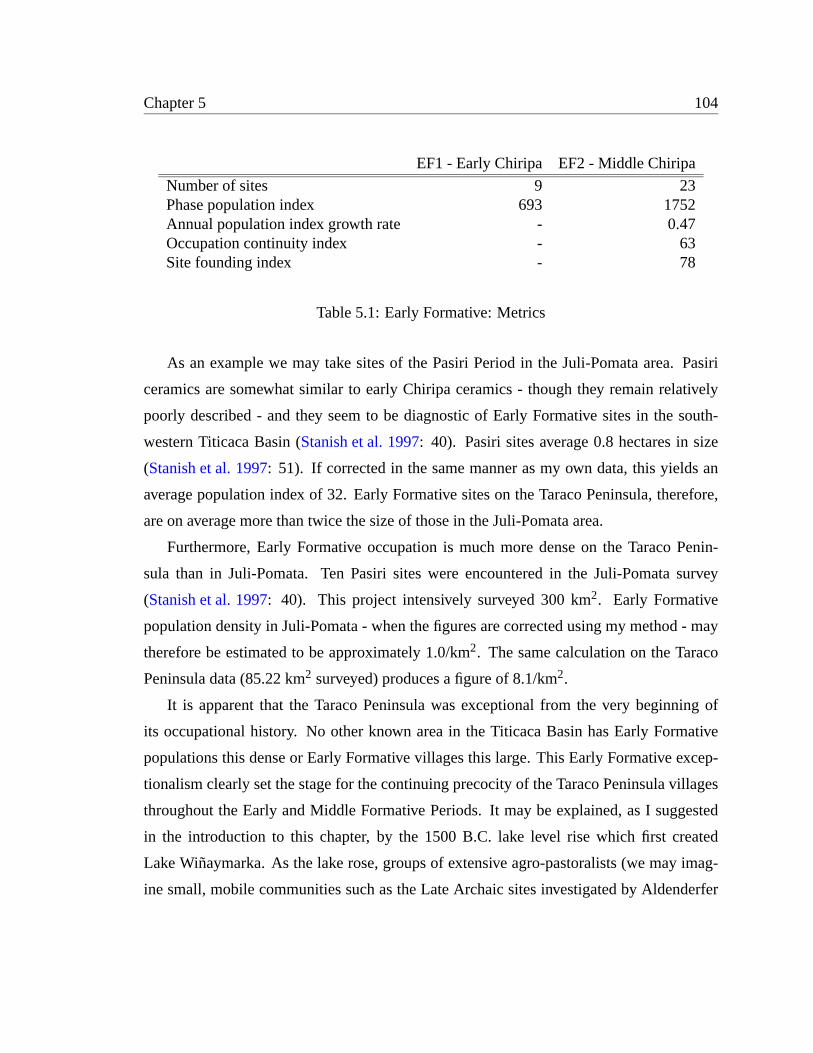
Chapter 5 104
EF1 - Early Chiripa EF2 - Middle Chiripa
Number of sites 9 23Phase population index 693 1752Annual population index growth rate - 0.47Occupation continuity index - 63Site founding index - 78
Table 5.1: Early Formative: Metrics
As an example we may take sites of the Pasiri Period in the Juli-Pomata area. Pasiri
ceramics are somewhat similar to early Chiripa ceramics - though they remain relatively
poorly described - and they seem to be diagnostic of Early Formative sites in the south-
western Titicaca Basin (Stanish et al. 1997: 40). Pasiri sites average 0.8 hectares in size
(Stanish et al. 1997: 51). If corrected in the same manner as my own data, this yields an
average population index of 32. Early Formative sites on the Taraco Peninsula, therefore,
are on average more than twice the size of those in the Juli-Pomata area.
Furthermore, Early Formative occupation is much more dense on the Taraco Penin-
sula than in Juli-Pomata. Ten Pasiri sites were encountered in the Juli-Pomata survey
(Stanish et al. 1997: 40). This project intensively surveyed 300 km2. Early Formative
population density in Juli-Pomata - when the figures are corrected using my method - may
therefore be estimated to be approximately 1.0/km2. The same calculation on the Taraco
Peninsula data (85.22 km2 surveyed) produces a figure of 8.1/km2.
It is apparent that the Taraco Peninsula was exceptional from the very beginning of
its occupational history. No other known area in the Titicaca Basin has Early Formative
populations this dense or Early Formative villages this large. This Early Formative excep-
tionalism clearly set the stage for the continuing precocity of the Taraco Peninsula villages
throughout the Early and Middle Formative Periods. It may be explained, as I suggested
in the introduction to this chapter, by the 1500 B.C. lake level rise which first created
Lake Wiñaymarka. As the lake rose, groups of extensive agro-pastoralists (we may imag-
ine small, mobile communities such as the Late Archaic sites investigated by Aldenderfer
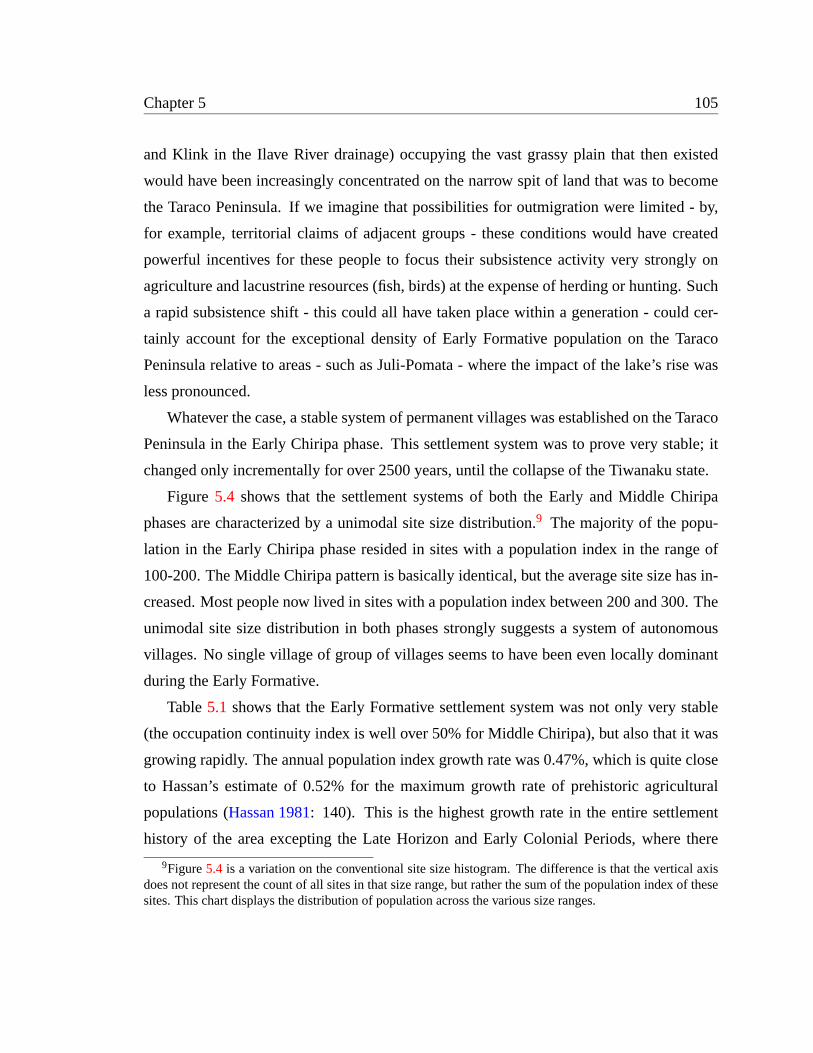
Chapter 5 105
and Klink in the Ilave River drainage) occupying the vast grassy plain that then existed
would have been increasingly concentrated on the narrow spit of land that was to become
the Taraco Peninsula. If we imagine that possibilities for outmigration were limited - by,
for example, territorial claims of adjacent groups - these conditions would have created
powerful incentives for these people to focus their subsistence activity very strongly on
agriculture and lacustrine resources (fish, birds) at the expense of herding or hunting. Such
a rapid subsistence shift - this could all have taken place within a generation - could cer-
tainly account for the exceptional density of Early Formative population on the Taraco
Peninsula relative to areas - such as Juli-Pomata - where the impact of the lake’s rise was
less pronounced.
Whatever the case, a stable system of permanent villages was established on the Taraco
Peninsula in the Early Chiripa phase. This settlement system was to prove very stable; it
changed only incrementally for over 2500 years, until the collapse of the Tiwanaku state.
Figure 5.4 shows that the settlement systems of both the Early and Middle Chiripa
phases are characterized by a unimodal site size distribution.9 The majority of the popu-
lation in the Early Chiripa phase resided in sites with a population index in the range of
100-200. The Middle Chiripa pattern is basically identical, but the average site size has in-
creased. Most people now lived in sites with a population index between 200 and 300. The
unimodal site size distribution in both phases strongly suggests a system of autonomous
villages. No single village of group of villages seems to have been even locally dominant
during the Early Formative.
Table5.1 shows that the Early Formative settlement system was not only very stable
(the occupation continuity index is well over 50% for Middle Chiripa), but also that it was
growing rapidly. The annual population index growth rate was 0.47%, which is quite close
to Hassan’s estimate of 0.52% for the maximum growth rate of prehistoric agricultural
populations (Hassan 1981: 140). This is the highest growth rate in the entire settlement
history of the area excepting the Late Horizon and Early Colonial Periods, where there
9Figure5.4 is a variation on the conventional site size histogram. The difference is that the vertical axisdoes not represent the count of all sites in that size range, but rather the sum of the population index of thesesites. This chart displays the distribution of population across the various size ranges.
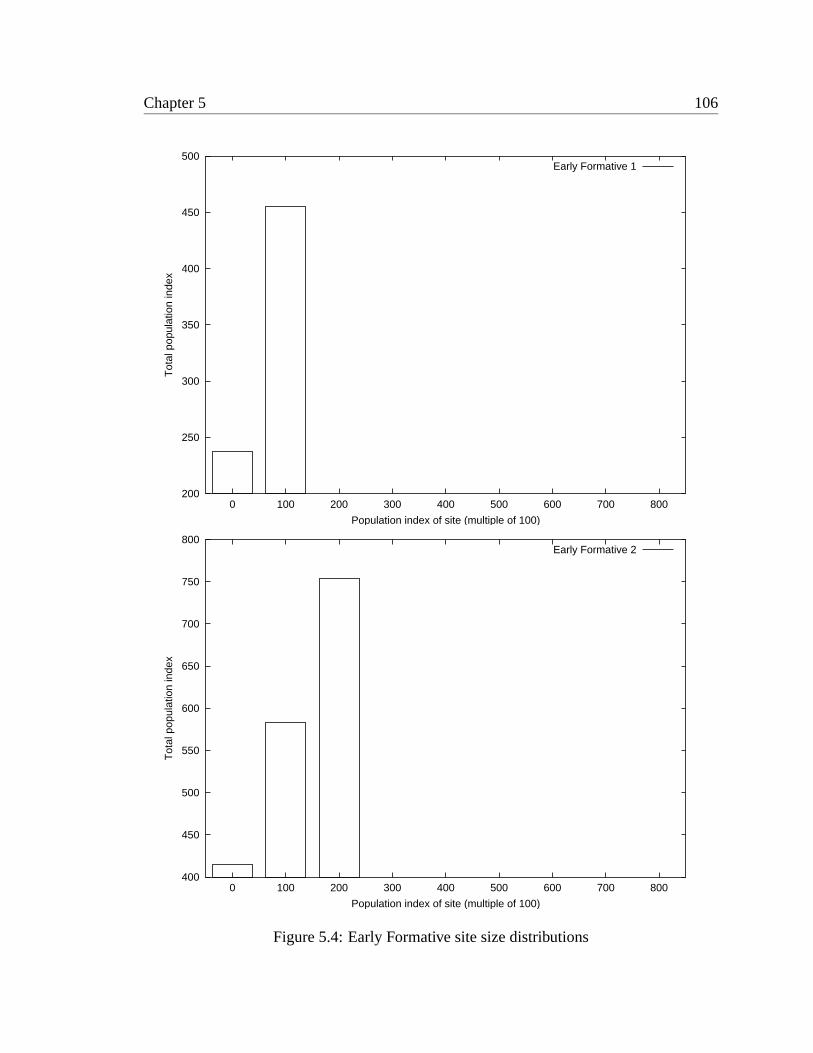
Chapter 5 106
200
250
300
350
400
450
500
0 100 200 300 400 500 600 700 800
Tot
al p
opul
atio
n in
dex
Population index of site (multiple of 100)
Early Formative 1
400
450
500
550
600
650
700
750
800
0 100 200 300 400 500 600 700 800
Tot
al p
opul
atio
n in
dex
Population index of site (multiple of 100)
Early Formative 2
Figure 5.4: Early Formative site size distributions
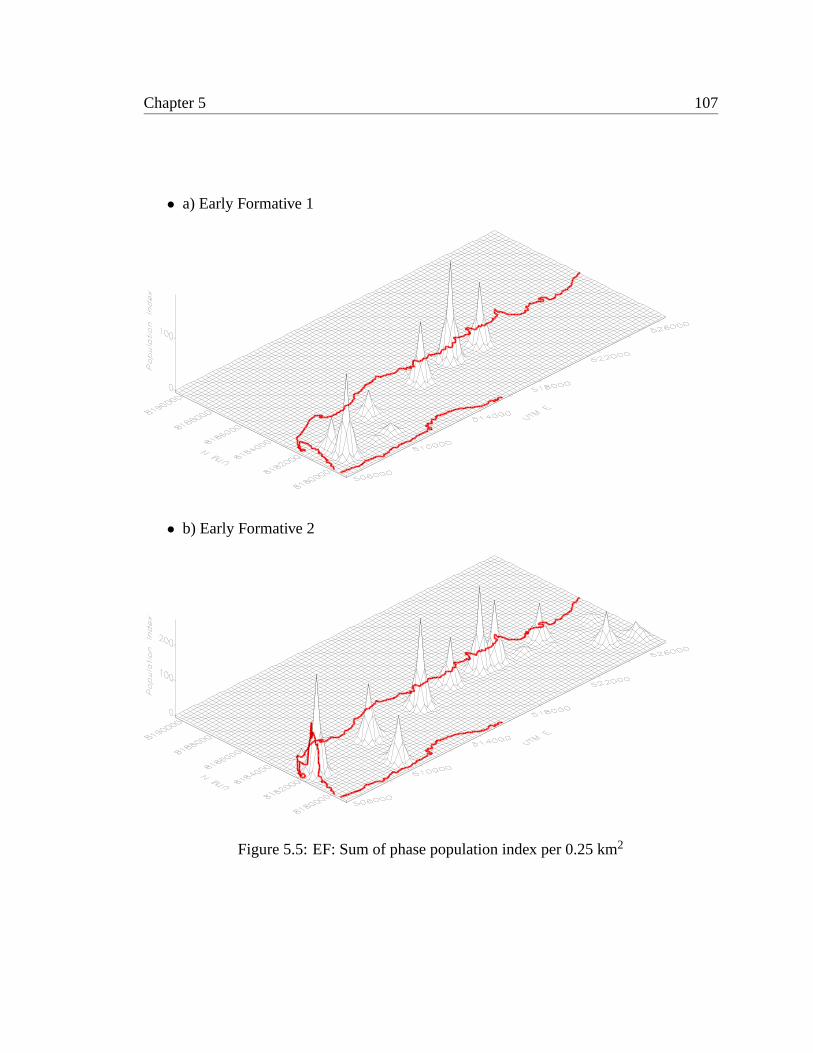
Chapter 5 107
• a) Early Formative 1
• b) Early Formative 2
Figure 5.5: EF: Sum of phase population index per 0.25 km2
Chapter 5 108
is clear evidence of widespread immigration. Additionally, the site founding index for the
Middle Chiripa phase is 78%, a very high value. The general picture that emerges from this
information is one of relatively small, autonomous villages growing rapidly and fissioning
when their population passes a certain critical threshold. Indeed, two such instances of
village fissioning seem to be observable in the Early Formative on the Taraco Peninsula.
Interestingly, the two villages in question were the two largest sites during the Early Chiripa
phase.
Figure 5.5 is not a settlement pattern map. Rather, it is a population density map.
The survey area has been divided into 0.25 km2 squares (squares 500 m on a side). The
population index values of all of the archaeological sectors falling within each square for a
particular time period are summed. This summed population index is represented by the z
axis. So higher spikes represent higher local population densities.
A visual inspection of Figure5.5a reveals two spikes in population density on the penin-
sula in the Early Chiripa phase. These correspond to the sites of Chiaramaya (T-3) and
Cerro Choncaya (T-2). By the Middle Chiripa phase, however, (5.5b) these two sites are no
longer the loci of highest population density on the peninsula. Cerro Choncaya has been
abandoned, and Chiaramaya has shrunk dramatically in size. Three new sites have come to
the fore: Chiripa (T-1), Janko Kala (T-394) and Sonaji (T-271).
Figure5.6 graphically represents the spatial shifts in population that occurred in the
Middle Chiripa phase. It was produced by subtracting the sum of Early Chiripa population
indices for a given 0.25 km2 block from the sum of Middle Chiripa population indices
for the same block. Essentially, it was produced by subtracting Figure5.5a from Figure
5.5b. The vertical axis therefore represents the number of hectares by which the cumulative
population index of the block increased or decreased during the Middle Chiripa phase. A
raised spike indicates a population increase in a block, which a sunken area represents a
decrease. A flat surface indicates no change.
Figure5.6shows that only three localities experienced population declines in the Mid-
dle Chiripa phase. These were the two sites of Cerro Choncaya and Chiaramaya (mentioned
above), together with the site of Sunaj Pata (T-268), located very near to Cerro Choncaya.
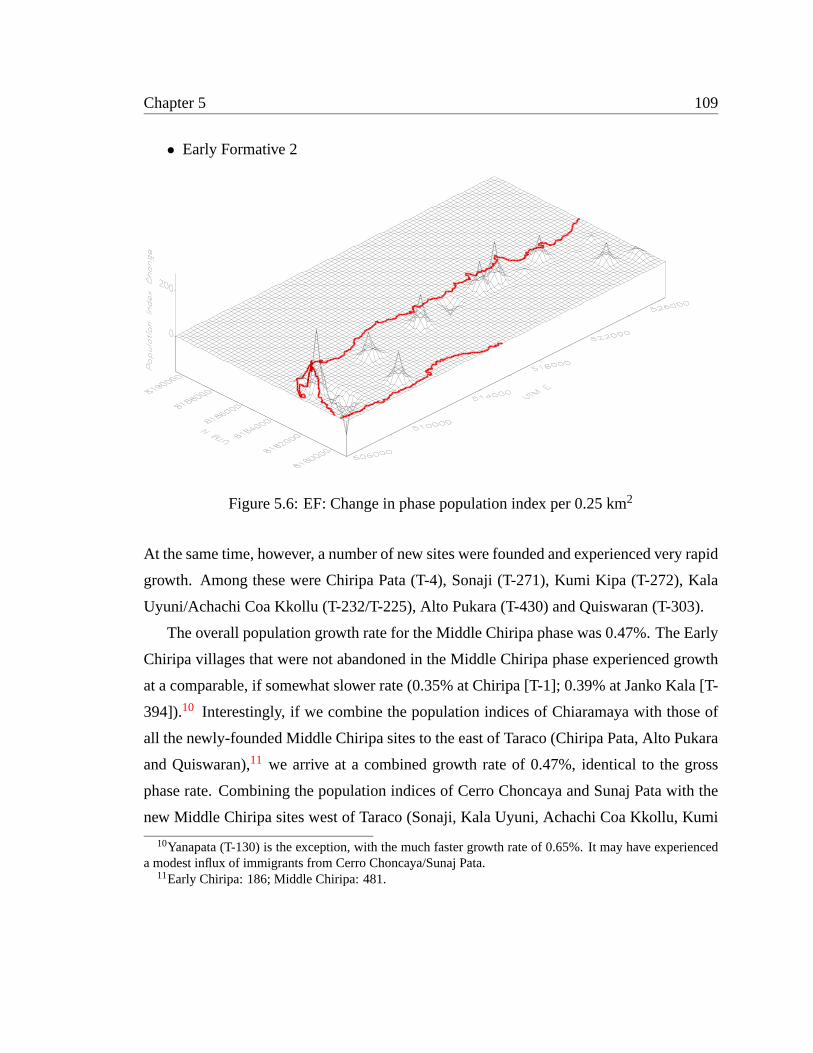
Chapter 5 109
• Early Formative 2
Figure 5.6: EF: Change in phase population index per 0.25 km2
At the same time, however, a number of new sites were founded and experienced very rapid
growth. Among these were Chiripa Pata (T-4), Sonaji (T-271), Kumi Kipa (T-272), Kala
Uyuni/Achachi Coa Kkollu (T-232/T-225), Alto Pukara (T-430) and Quiswaran (T-303).
The overall population growth rate for the Middle Chiripa phase was 0.47%. The Early
Chiripa villages that were not abandoned in the Middle Chiripa phase experienced growth
at a comparable, if somewhat slower rate (0.35% at Chiripa [T-1]; 0.39% at Janko Kala [T-
394]).10 Interestingly, if we combine the population indices of Chiaramaya with those of
all the newly-founded Middle Chiripa sites to the east of Taraco (Chiripa Pata, Alto Pukara
and Quiswaran),11 we arrive at a combined growth rate of 0.47%, identical to the gross
phase rate. Combining the population indices of Cerro Choncaya and Sunaj Pata with the
new Middle Chiripa sites west of Taraco (Sonaji, Kala Uyuni, Achachi Coa Kkollu, Kumi
10Yanapata (T-130) is the exception, with the much faster growth rate of 0.65%. It may have experienceda modest influx of immigrants from Cerro Choncaya/Sunaj Pata.
11Early Chiripa: 186; Middle Chiripa: 481.
Chapter 5 110
Kipa)12 produces a growth rate of 0.35%, identical to the growth rate of Chiripa, and similar
to the phase average.
To me, these figures strongly suggest a set of actual events; concrete population move-
ments. I would reconstruct them as follows:
• The village of Cerro Choncaya split into two groups. The first of these moved to the
east and founded the site of Kala Uyuni and its outlier Achachi Coa Kkollu. The
other group moved a short distance to the north and west, combining with the prior
population of Sunaj Pata to found Sonaji and its outlier Kumi Kipa.
• The village of Chiaramaya split into two or more groups. The first of these groups
moved to the east, leapfrogging over the adjacent site of Chiripa to found Chiripa
Pata. Smaller groups may have continued eastward and founded Alto Pukara and
Quiswaran. A small percentage of the Early Chiripa population of Chiaramaya re-
mained in the village, which continued to be occupied, though on a much-reduced
scale.
The fact that the two villages that fissioned in the Middle Chiripa phase were the two
largest in the Early Chiripa phase is almost certainly not a coincidence. This is exactly
what one might expect in a relatively lightly-populated and unbounded landscape. The
growth of villages led to internal strife and factional conflict (and all of the factors impli-
cated in Johnson’s term ’scalar stress’ [Johnson 1982]), resulting in village fissioning and
relocation. The data suggest that the critical threshold - in terms of my population index -
in the Middle Chiripa phase was something on the order of 150.13 When Early Formative
settlements surpassed this size, their inhabitants apparently chose to split the community
and relocate a portion of it, presumably as a response to increasing internal conflicts. This
is a very low threshold indeed, and in subsequent periods we will see it rise considerably as
12Early Chiripa: 230; Middle Chiripa: 464.13Interestingly, this is very close to Fletcher’s first C-limit of 1-2 ha for the transition from mobile hunter-
gatherers to sedentary villages (Fletcher 1995: 89-90). The villages were 3.0 ha (T-2, 2.39 ha corrected) and3.5 ha (T-3, 2.75 ha corrected) respectively before they fissioned. The Early Formative is the time that thisC-limit was overcome, so some village fissioning would be predicted by Fletcher’s model.

Chapter 5 111
the people of the Taraco Peninsula came to have fewer and fewer possibilities of relocation,
and became better equipped to minimize and resolve intracommunity conflicts.
112
Chapter 6
The Middle Formative: emerging
complexity
In the Middle Chiripa phase we witnessed the first appearance in the southern Tit-
icaca Basin of decorated serving ceramics and public architecture in the form of the
sunken court. The meaning of this remains obscure, of course, and cannot be estab-
lished on the basis of our present knowledge. However, we may suggest, following Hay-
den (Hayden and Gargett 1990, Hayden 1993, Hayden 1996a) and others - and ultimately,
of course, Mauss (Mauss 1967) - that the appearance of these things reflects the advent
of “competitive feasting”, an elaborate form of what Dietler calls “commensal politics”
(Dietler 1996, Dietler 1999). The core concept of commensal politics is that giving estab-
lishes obligation on the part of the recipient. This obligation may be later redeemed to the
original donor’s advantage. Thus, competitive feasting:
... ambitious [persons] try to give away as much food and as many goods aspossible in order to earn interest on their gifts and establish a debt hierarchy.Desirable foods and exotic decorative items were also given to supporters asrewards for their help in raising the capital for these feasts (Hayden 1993: 255).
The significance of competitive feasting in the Early and Middle Formative context is pre-
cisely that it represents a mechanism by which conflicts may be resolved and personal and
structural antagonisms pursued in a manner that is not destructive to the social body.
Chapter 6 113
The critical point to retain is that commensal hospitality centering around foodand drink distribution and consumption is a practice which, like the exchangeof gifts, serves to establish and reproduce social relations. This is why feastsare often viewed as mechanisms of social solidarity that serve to establish asense of community. (Dietler 2001)
It would not be at all surprising, then, if we were to see an intensification in the scale and
elaboration of commensal activities at the same time that villages are first experiencing the
stresses that arise when group size increases to unprecedented levels (cf.Johnson 1982). It
seems that the beginnings of such a process are evident in the Middle Chiripa phase.
As population increased, and as the landscape of the Taraco Peninsula began to fill up,
the difficulty and costs of village fissioning and relocation rose, while scale-related stresses
and conflicts also increased. This will become apparent when the overall demographic
patterns of the Middle Formative are discussed later in this chapter. This being the case,
it is not surprising that we witness an increase in the scale and elaboration of the hypo-
thetical correlates of competitive feasting. Decorated serving ceramics (bowls) become
common in the Late Chiripa phase, accounting for as much as 6.5% of some assemblages
(Steadman 1999: 66). Throughout the Late Chiripa phase we also see a steady increase
in the size and elaboration of public architectural complexes, as, I document at length in
section6.3.
Another significant point of this chapter is that political units integrating large popula-
tions over significant geographical areas - multi-community polities - had yet to emerge. I
make this statement in order to correct some common misconceptions regarding the nature
of the Chiripa political formation. I refer specifically to Browman’s concept of a “Chiripa
polity”1 integrating much of the southern Titicaca Basin. This conception of Upper House
Level-contemporary political organization has recently been echoed by Stanish, who sees
multi-community polities emerging earlier in the southern Titicaca Basin than in adjacent
areas, largely on the basis of his interpretation of the Chiripa sequence (Stanish et al. 1997:
11). Much of this chapter will be devoted to refuting this hypothesis, using the evidence of
1Browman’s most explicit formulation of this thesis has been in unpublished essays and conference pa-pers. However, there are clear references to a Chiripa polity in published sources (c.f.Browman 1981:414).
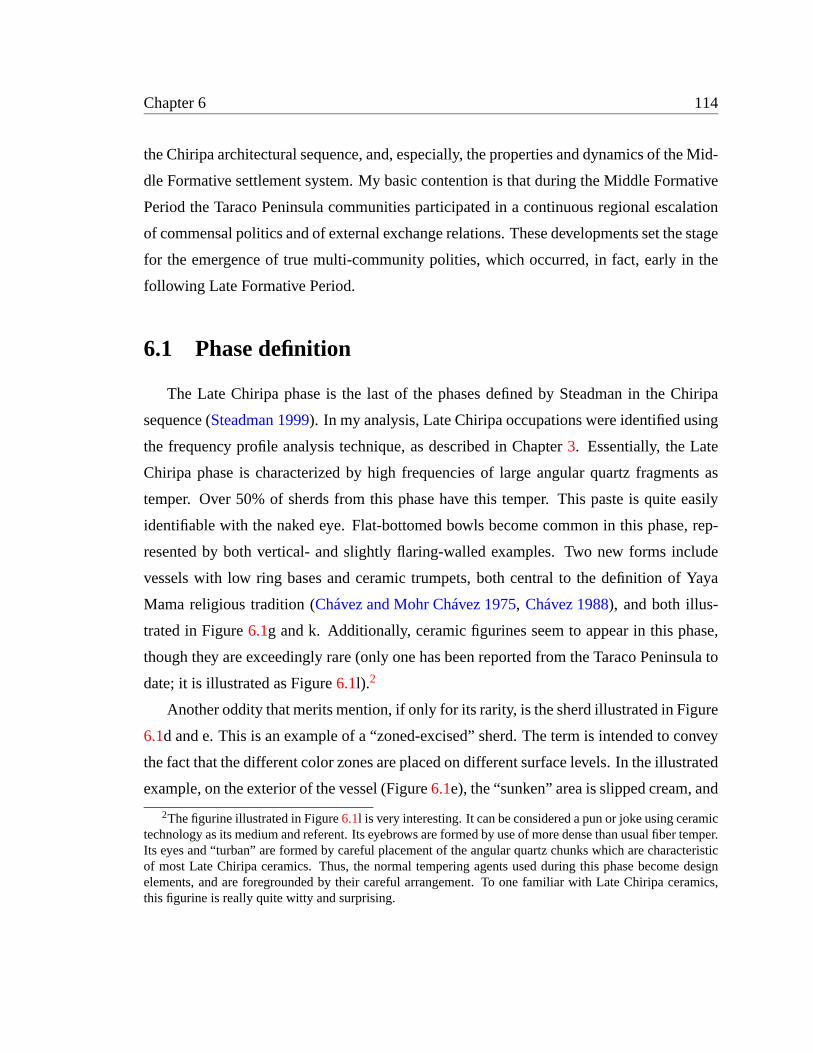
Chapter 6 114
the Chiripa architectural sequence, and, especially, the properties and dynamics of the Mid-
dle Formative settlement system. My basic contention is that during the Middle Formative
Period the Taraco Peninsula communities participated in a continuous regional escalation
of commensal politics and of external exchange relations. These developments set the stage
for the emergence of true multi-community polities, which occurred, in fact, early in the
following Late Formative Period.
6.1 Phase definition
The Late Chiripa phase is the last of the phases defined by Steadman in the Chiripa
sequence (Steadman 1999). In my analysis, Late Chiripa occupations were identified using
the frequency profile analysis technique, as described in Chapter3. Essentially, the Late
Chiripa phase is characterized by high frequencies of large angular quartz fragments as
temper. Over 50% of sherds from this phase have this temper. This paste is quite easily
identifiable with the naked eye. Flat-bottomed bowls become common in this phase, rep-
resented by both vertical- and slightly flaring-walled examples. Two new forms include
vessels with low ring bases and ceramic trumpets, both central to the definition of Yaya
Mama religious tradition (Chávez and Mohr Chávez 1975, Chávez 1988), and both illus-
trated in Figure6.1g and k. Additionally, ceramic figurines seem to appear in this phase,
though they are exceedingly rare (only one has been reported from the Taraco Peninsula to
date; it is illustrated as Figure6.1l).2
Another oddity that merits mention, if only for its rarity, is the sherd illustrated in Figure
6.1d and e. This is an example of a “zoned-excised” sherd. The term is intended to convey
the fact that the different color zones are placed on different surface levels. In the illustrated
example, on the exterior of the vessel (Figure6.1e), the “sunken” area is slipped cream, and
2The figurine illustrated in Figure6.1l is very interesting. It can be considered a pun or joke using ceramictechnology as its medium and referent. Its eyebrows are formed by use of more dense than usual fiber temper.Its eyes and “turban” are formed by careful placement of the angular quartz chunks which are characteristicof most Late Chiripa ceramics. Thus, the normal tempering agents used during this phase become designelements, and are foregrounded by their careful arrangement. To one familiar with Late Chiripa ceramics,this figurine is really quite witty and surprising.
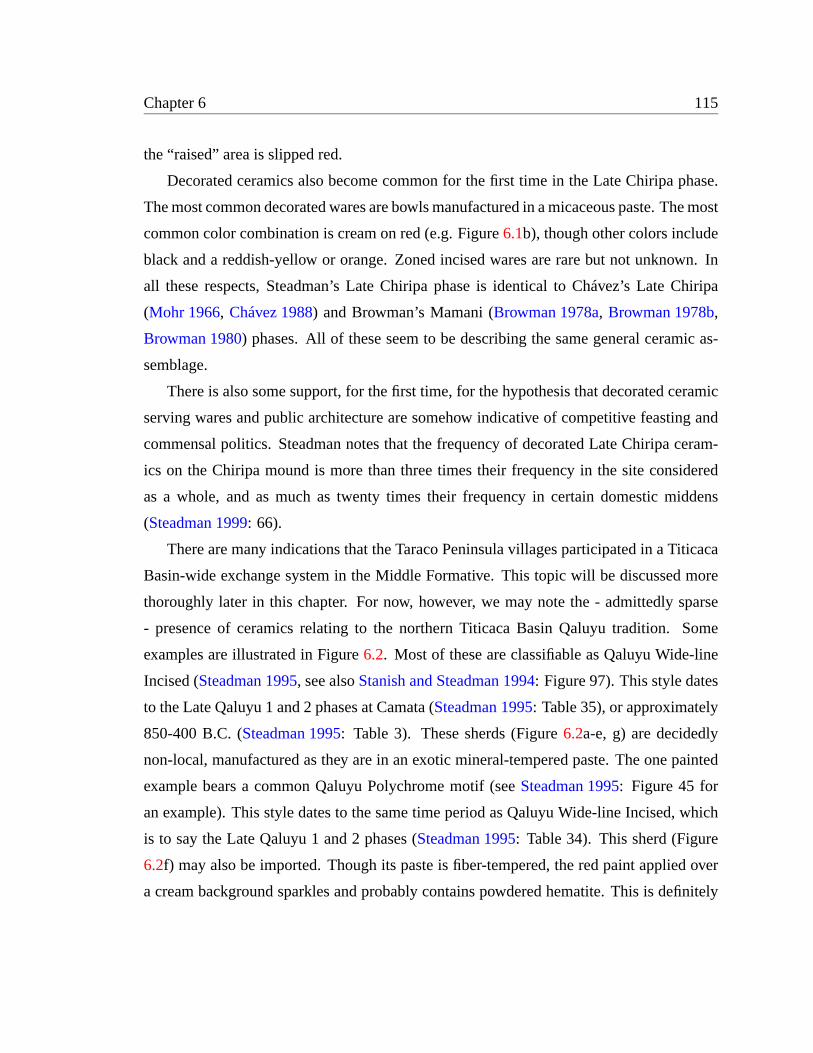
Chapter 6 115
the “raised” area is slipped red.
Decorated ceramics also become common for the first time in the Late Chiripa phase.
The most common decorated wares are bowls manufactured in a micaceous paste. The most
common color combination is cream on red (e.g. Figure6.1b), though other colors include
black and a reddish-yellow or orange. Zoned incised wares are rare but not unknown. In
all these respects, Steadman’s Late Chiripa phase is identical to Chávez’s Late Chiripa
(Mohr 1966, Chávez 1988) and Browman’s Mamani (Browman 1978a, Browman 1978b,
Browman 1980) phases. All of these seem to be describing the same general ceramic as-
semblage.
There is also some support, for the first time, for the hypothesis that decorated ceramic
serving wares and public architecture are somehow indicative of competitive feasting and
commensal politics. Steadman notes that the frequency of decorated Late Chiripa ceram-
ics on the Chiripa mound is more than three times their frequency in the site considered
as a whole, and as much as twenty times their frequency in certain domestic middens
(Steadman 1999: 66).
There are many indications that the Taraco Peninsula villages participated in a Titicaca
Basin-wide exchange system in the Middle Formative. This topic will be discussed more
thoroughly later in this chapter. For now, however, we may note the - admittedly sparse
- presence of ceramics relating to the northern Titicaca Basin Qaluyu tradition. Some
examples are illustrated in Figure6.2. Most of these are classifiable as Qaluyu Wide-line
Incised (Steadman 1995, see alsoStanish and Steadman 1994: Figure 97). This style dates
to the Late Qaluyu 1 and 2 phases at Camata (Steadman 1995: Table 35), or approximately
850-400 B.C. (Steadman 1995: Table 3). These sherds (Figure6.2a-e, g) are decidedly
non-local, manufactured as they are in an exotic mineral-tempered paste. The one painted
example bears a common Qaluyu Polychrome motif (seeSteadman 1995: Figure 45 for
an example). This style dates to the same time period as Qaluyu Wide-line Incised, which
is to say the Late Qaluyu 1 and 2 phases (Steadman 1995: Table 34). This sherd (Figure
6.2f) may also be imported. Though its paste is fiber-tempered, the red paint applied over
a cream background sparkles and probably contains powdered hematite. This is definitely
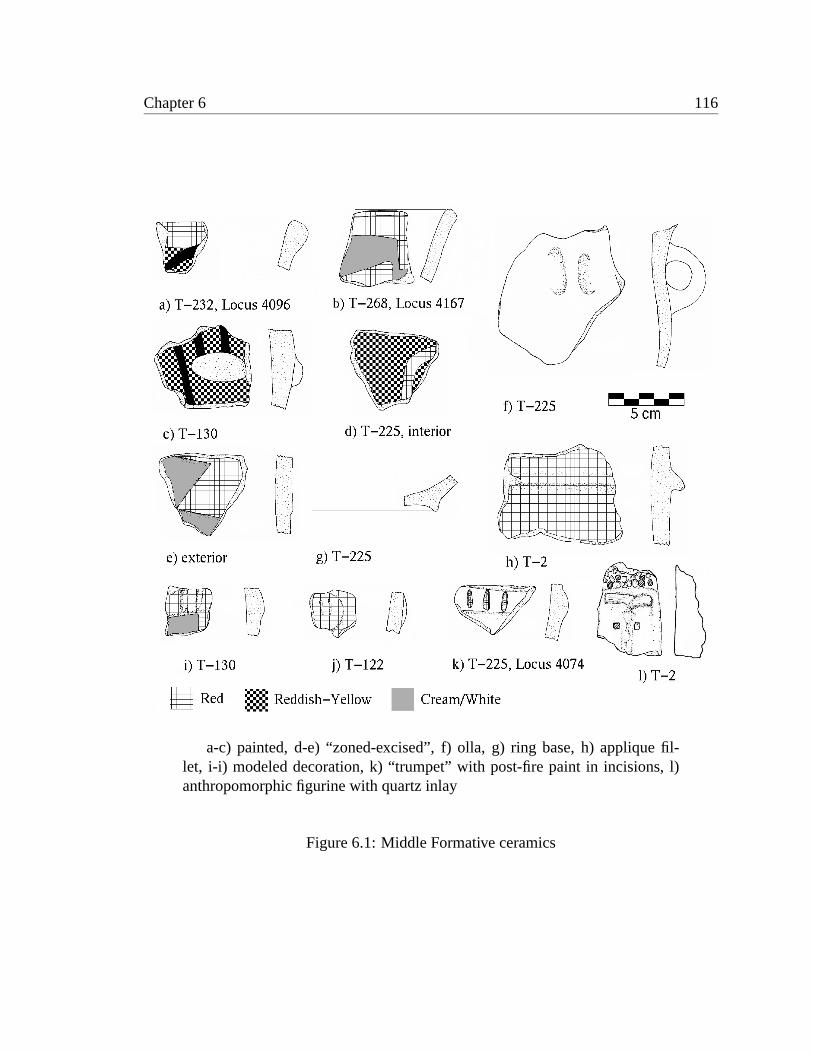
Chapter 6 116
a-c) painted, d-e) “zoned-excised”, f) olla, g) ring base, h) applique fil-let, i-i) modeled decoration, k) “trumpet” with post-fire paint in incisions, l)anthropomorphic figurine with quartz inlay
Figure 6.1: Middle Formative ceramics
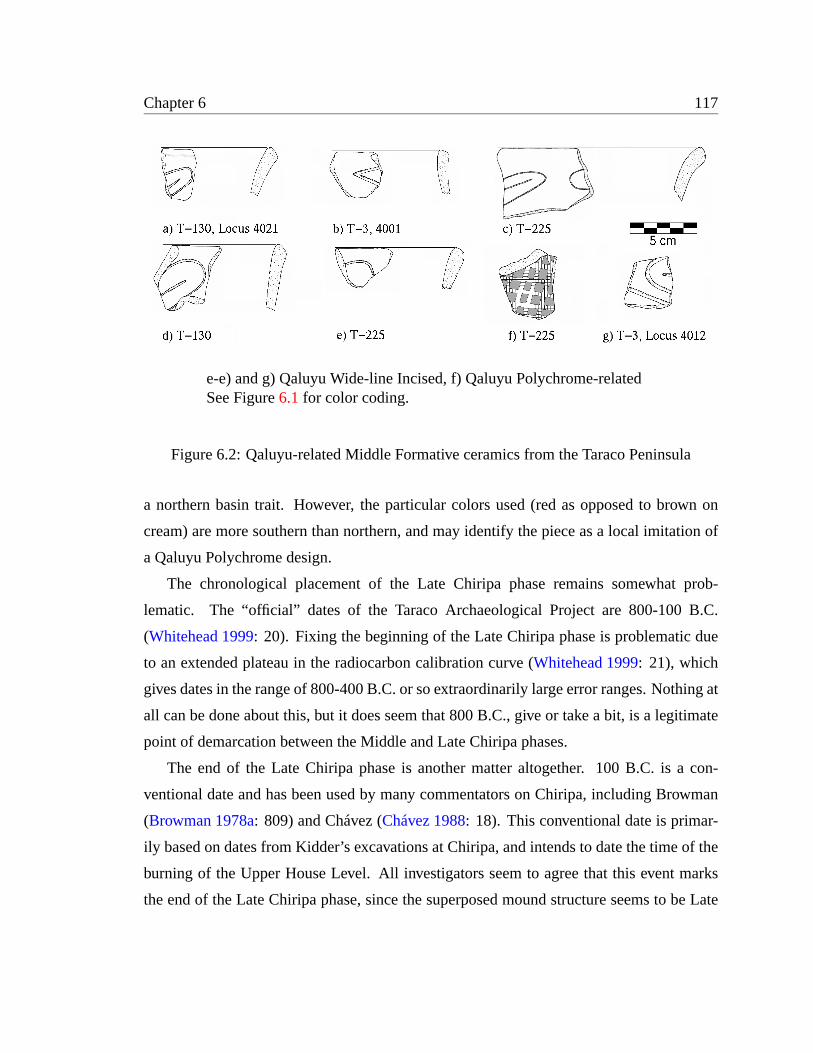
Chapter 6 117
e-e) and g) Qaluyu Wide-line Incised, f) Qaluyu Polychrome-relatedSee Figure6.1for color coding.
Figure 6.2: Qaluyu-related Middle Formative ceramics from the Taraco Peninsula
a northern basin trait. However, the particular colors used (red as opposed to brown on
cream) are more southern than northern, and may identify the piece as a local imitation of
a Qaluyu Polychrome design.
The chronological placement of the Late Chiripa phase remains somewhat prob-
lematic. The “official” dates of the Taraco Archaeological Project are 800-100 B.C.
(Whitehead 1999: 20). Fixing the beginning of the Late Chiripa phase is problematic due
to an extended plateau in the radiocarbon calibration curve (Whitehead 1999: 21), which
gives dates in the range of 800-400 B.C. or so extraordinarily large error ranges. Nothing at
all can be done about this, but it does seem that 800 B.C., give or take a bit, is a legitimate
point of demarcation between the Middle and Late Chiripa phases.
The end of the Late Chiripa phase is another matter altogether. 100 B.C. is a con-
ventional date and has been used by many commentators on Chiripa, including Browman
(Browman 1978a: 809) and Chávez (Chávez 1988: 18). This conventional date is primar-
ily based on dates from Kidder’s excavations at Chiripa, and intends to date the time of the
burning of the Upper House Level. All investigators seem to agree that this event marks
the end of the Late Chiripa phase, since the superposed mound structure seems to be Late
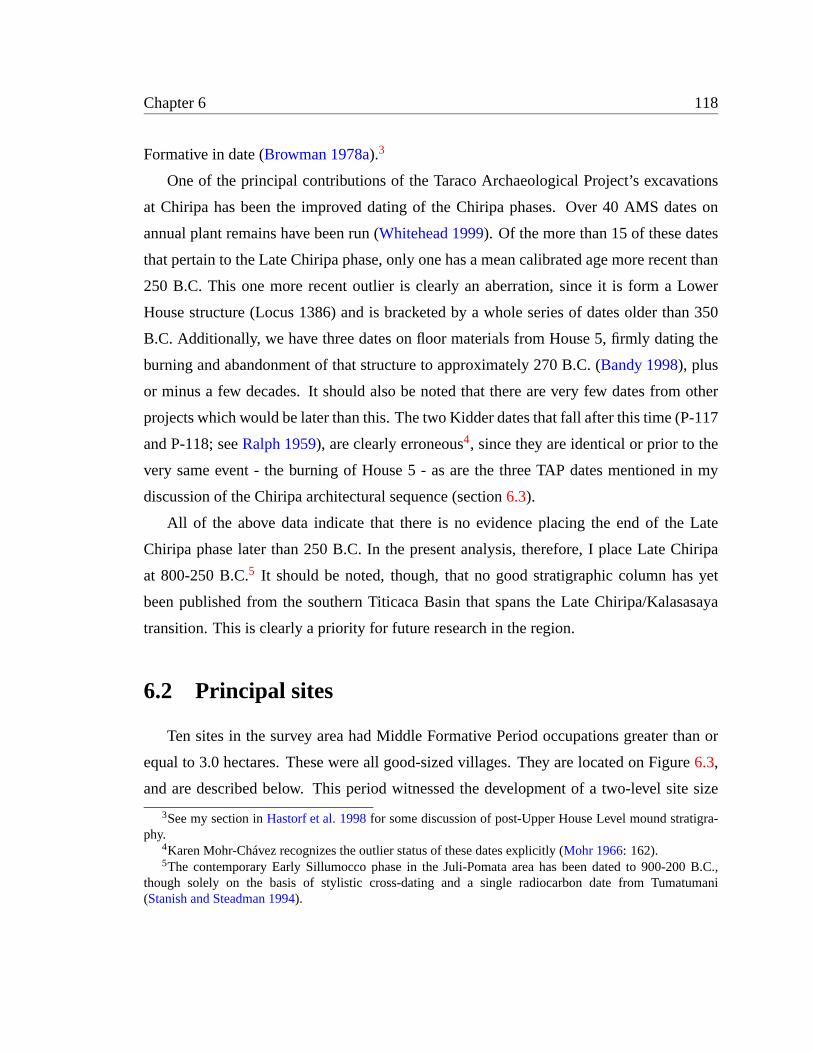
Chapter 6 118
Formative in date (Browman 1978a).3
One of the principal contributions of the Taraco Archaeological Project’s excavations
at Chiripa has been the improved dating of the Chiripa phases. Over 40 AMS dates on
annual plant remains have been run (Whitehead 1999). Of the more than 15 of these dates
that pertain to the Late Chiripa phase, only one has a mean calibrated age more recent than
250 B.C. This one more recent outlier is clearly an aberration, since it is form a Lower
House structure (Locus 1386) and is bracketed by a whole series of dates older than 350
B.C. Additionally, we have three dates on floor materials from House 5, firmly dating the
burning and abandonment of that structure to approximately 270 B.C. (Bandy 1998), plus
or minus a few decades. It should also be noted that there are very few dates from other
projects which would be later than this. The two Kidder dates that fall after this time (P-117
and P-118; seeRalph 1959), are clearly erroneous4, since they are identical or prior to the
very same event - the burning of House 5 - as are the three TAP dates mentioned in my
discussion of the Chiripa architectural sequence (section6.3).
All of the above data indicate that there is no evidence placing the end of the Late
Chiripa phase later than 250 B.C. In the present analysis, therefore, I place Late Chiripa
at 800-250 B.C.5 It should be noted, though, that no good stratigraphic column has yet
been published from the southern Titicaca Basin that spans the Late Chiripa/Kalasasaya
transition. This is clearly a priority for future research in the region.
6.2 Principal sites
Ten sites in the survey area had Middle Formative Period occupations greater than or
equal to 3.0 hectares. These were all good-sized villages. They are located on Figure6.3,
and are described below. This period witnessed the development of a two-level site size
3See my section inHastorf et al. 1998for some discussion of post-Upper House Level mound stratigra-phy.
4Karen Mohr-Chávez recognizes the outlier status of these dates explicitly (Mohr 1966: 162).5The contemporary Early Sillumocco phase in the Juli-Pomata area has been dated to 900-200 B.C.,
though solely on the basis of stylistic cross-dating and a single radiocarbon date from Tumatumani(Stanish and Steadman 1994).
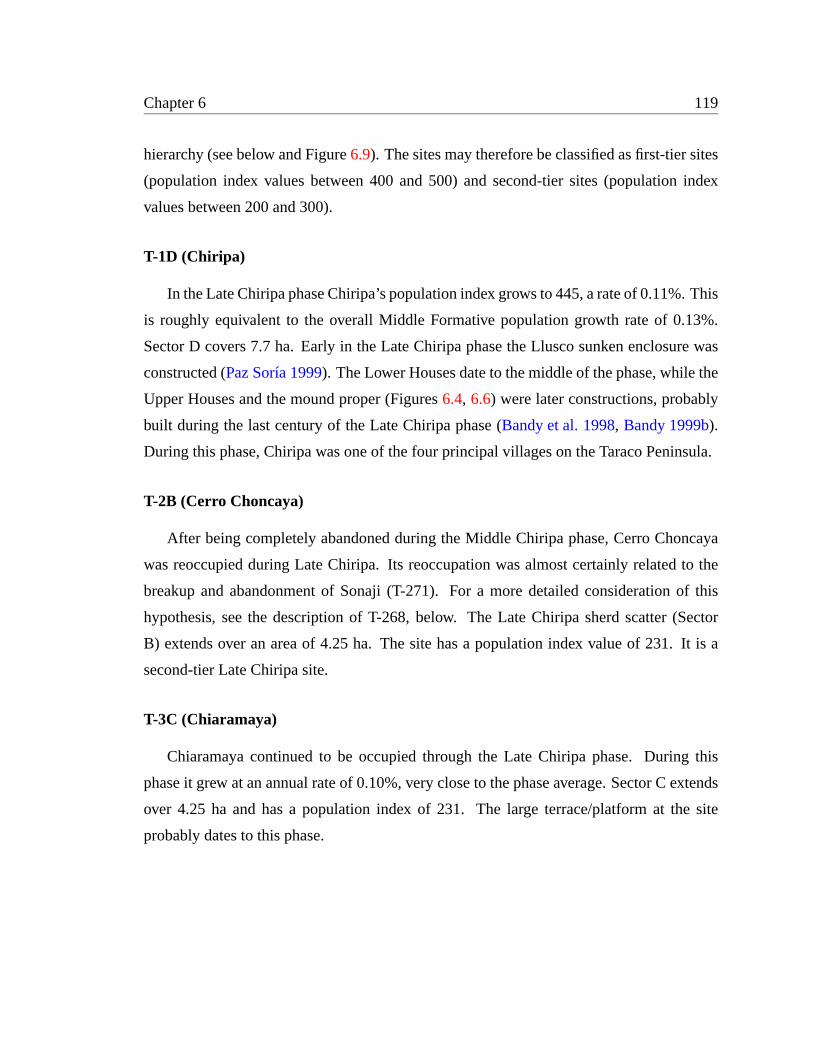
Chapter 6 119
hierarchy (see below and Figure6.9). The sites may therefore be classified as first-tier sites
(population index values between 400 and 500) and second-tier sites (population index
values between 200 and 300).
T-1D (Chiripa)
In the Late Chiripa phase Chiripa’s population index grows to 445, a rate of 0.11%. This
is roughly equivalent to the overall Middle Formative population growth rate of 0.13%.
Sector D covers 7.7 ha. Early in the Late Chiripa phase the Llusco sunken enclosure was
constructed (Paz Soría 1999). The Lower Houses date to the middle of the phase, while the
Upper Houses and the mound proper (Figures6.4, 6.6) were later constructions, probably
built during the last century of the Late Chiripa phase (Bandy et al. 1998, Bandy 1999b).
During this phase, Chiripa was one of the four principal villages on the Taraco Peninsula.
T-2B (Cerro Choncaya)
After being completely abandoned during the Middle Chiripa phase, Cerro Choncaya
was reoccupied during Late Chiripa. Its reoccupation was almost certainly related to the
breakup and abandonment of Sonaji (T-271). For a more detailed consideration of this
hypothesis, see the description of T-268, below. The Late Chiripa sherd scatter (Sector
B) extends over an area of 4.25 ha. The site has a population index value of 231. It is a
second-tier Late Chiripa site.
T-3C (Chiaramaya)
Chiaramaya continued to be occupied through the Late Chiripa phase. During this
phase it grew at an annual rate of 0.10%, very close to the phase average. Sector C extends
over 4.25 ha and has a population index of 231. The large terrace/platform at the site
probably dates to this phase.
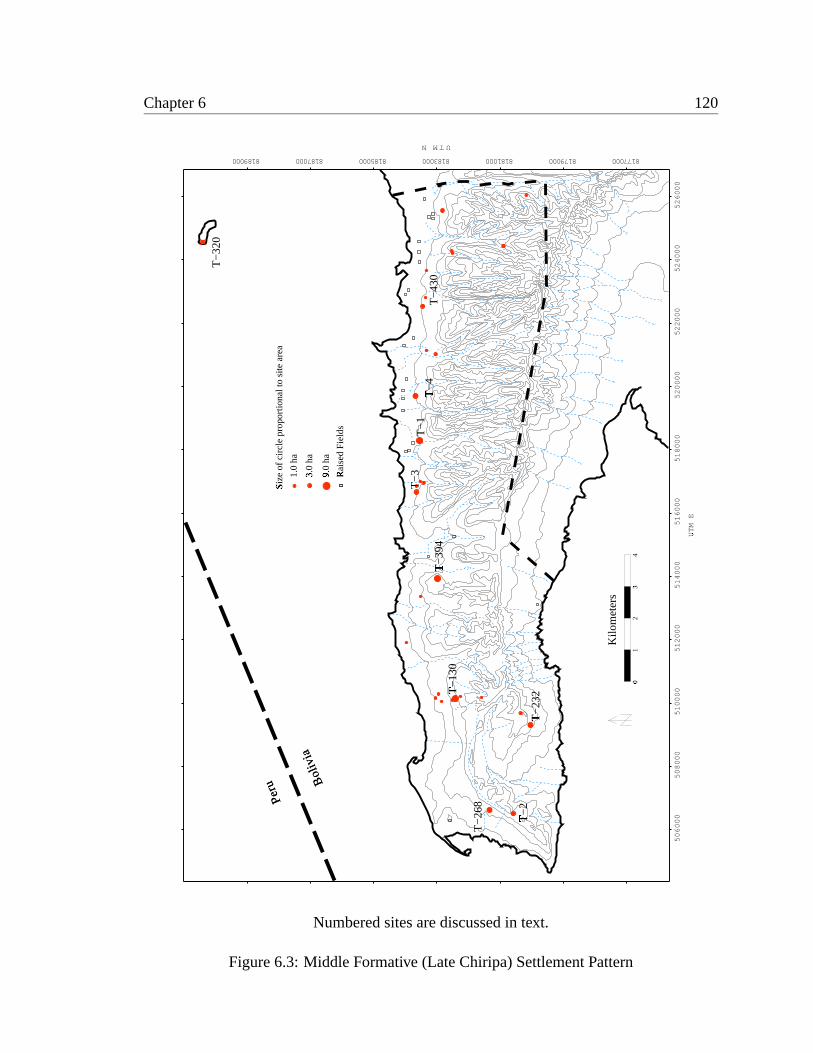
Chapter 6 120
0�
12
3�
4
Kilo
met
ers
1.0
ha
Rai
sed
Fie
lds
�3.0
ha
�
Peru B
oliv
ia
Siz
e of
circ
le p
ropo
rtio
nal t
o si
te a
rea
�
9.0
ha
�
506000
508000
510000
512000
514000
516000
518000
520000
522000
524000
526000
UTM E
�
UTMN
8770008179008110000818500818700819000 108818300008
T−
1
T−
394
�
T−
130
�
T−
232
�
T−
3
T−
268
T−
2
�
T−
4
�
T−
430
T−
320
Numbered sites are discussed in text.
Figure 6.3: Middle Formative (Late Chiripa) Settlement Pattern
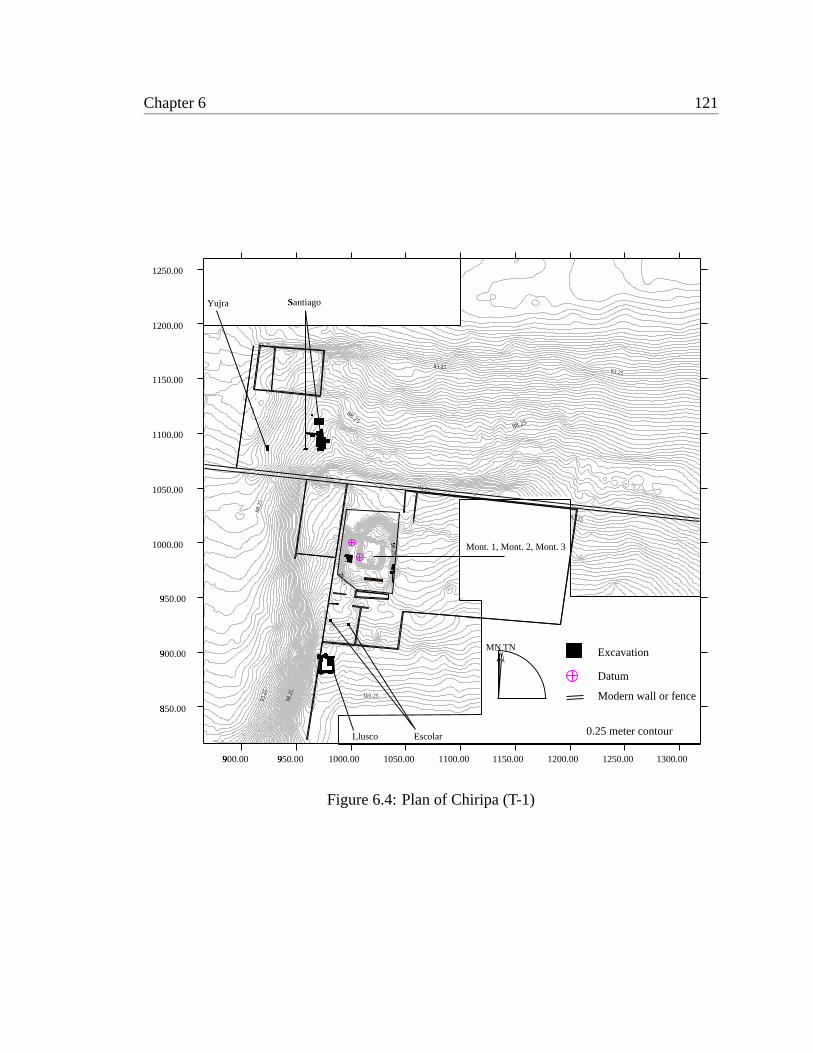
Chapter 6 121
83.25
93.2
5
98.2
5
88.2
5
103.25
98.25
�
98.25
�
83.25�
88.25
93.25
88.25
93.25
83.25
850.00�
950.00�
900.00�
1000.00
1100.00
1050.00
1200.00
1150.00
1250.00
1100.001000.00900.00�
950.00�
1050.00 1300.001200.001150.00 1250.00
Datum
Modern wall or fence
Excavation
0.25 meter contour
Mont. 1, Mont. 2, Mont. 3
Llusco Escolar
Yujra Santiago�
MNTN
Figure 6.4: Plan of Chiripa (T-1)
Chapter 6 122
T-4B (Chiripa Pata)
Chiripa Pata grew to 5.0 ha (population index: 277) in the Late Chiripa phase, an
annual rate of 0.08%, somewhat below the phase average. The upper terrace may or may
not represent a corporate construction similar to those at Chiripa, Chiaramaya, Yanapata,
Alto Pukara and elsewhere.
T-130D (Yanapata)
Sector D at Yanapata covers 7.50 ha, and has a population index of 429. Its Late Chiripa
growth rate was 0.14%. This is slightly higher than the phase average, but Yanapata’s
growth is no longer exceptional, as it was during the Middle Chiripa phase. At least one
large terrace platform is present at the site, and possibly two, which probably date to this
phase.
T-232B (Kala Uyuni)/T-225(Achachi Coa Kkollu)
In the Late Chiripa phase, these two sites should be considered as composing a single
community. Sector B at Kala Uyuni covers 5.25 ha, and seems to be a strictly domestic
occupation with no indications of corporate architecture as yet. Sector C at Achachi Coa
Kkollu covers 1.5 ha, and clearly has a terrace (with several large limestone pillars still in
evidence on the surface) and quite possibly a sunken court as well. This site would seem
to represent a ceremonial or public ritual area, containing as it does corporate architecture
and located as it is on a high hill overlooking the main body of the village below. It was
probably functionally equivalent to the large terrace/platforms at Chiaramaya, Chiripa and
Yanapata. This spot is still used for agricultural ritual. Recording it I met with a small
party of men digging up and upending one of the large limestone pillars from the Middle
Formative structure. Reportedly, flipping this pillar - known as ’the Colonel’ - brings rain.
This has been the custom in the community of Coa Kkollu as long as any of these men -
some quite elderly - could remember.
At any rate, the two nearby sectors have a combined population index value of 361,
Chapter 6 123
placing them among the first rank of Late Chiripa sites. In the Late Chiripa phase, they
grew together at an annual rate of 0.15%. This is faster than most sites of this period and
50% more than the phase average. The combined community may have received some
immigrants fleeing the fissioning of Sonaji (T-271), but this must remain hypothetical.
T-268B (Sunaj Pata)
After being completely abandoned during the Middle Chiripa phase, Sunaj Pata, like
Cerro Choncaya (T-2), was reoccupied during the Late Chiripa phase. Its reoccupation
was almost certainly related to the breakup and abandonment of Sonaji (T-271). The Late
Chiripa sherd scatter (Sector B) extends over an area of 5.0 ha. The site has a population
index value of 277. It is a second-tier Late Chiripa site. The (hypothetical) sunken court at
this site may be Late Chiripa in date.
The Middle Chiripa population index of Sonaji was 277, while the combined Late
Chiripa population index of Sunaj Pata and Cerro Choncaya if 508. This represents an
annual population index growth rate in the Late Chiripa phase of 0.11%, very close to the
phase average. I consider this to be strong evidence that the Middle Chiripa village of Son-
aji did indeed fission, and that it broke into two segments, one of which settled in Sunaj Pata
and the other at Cerro Choncaya. It is interesting that the community of Sonaji was initially
formed by a fusion of these two villages. It seems likely that the distinction between the
two groups was maintained even during their period of coresidence at Sonaji, and that this
distinction was the cleavage plane along which the village split at the beginning of the Late
Chiripa phase.
T-320A (Sikuya Oeste)
It is during the Late Chiripa phase that we have the first evidence for the occupation
of the island of Sikuya. This earliest site on the island, Sikuya Oeste, is heavily disturbed
by modern habitation. It lies directly underneath the modern town. There is no discernible
surface indication of any sort of platform or corporate architecture. However, any such
traces would almost certainly have been erased by the very intensive Late Horizon, Colo-

Chapter 6 124
nial, Republican and modern occupations of the site. Also, it was impossible to obtain good
surface collection from the site. It is therefore impossible for me to rule out the possibility
of an Early or Middle Chiripa occupation that I overlooked.
For the same reason, I am not overly confident of my estimate of the size of any of the
various occupations. Nevertheless, I estimate Sector A’s size at 3.0 ha. It is a second-tier
Late Chiripa phase site.
It should be noted that during the entire Early and Middle Formative Periods Sikuya
was not, in fact, an island (see Figures6.7and6.8). This site was, rather, another lakeshore
settlement, very like Chiripa and other contemporary sites.
T-394 (Janko Kala)
Janko Kala continued to grow steadily through the Late Chiripa phase. Sector C covers
7.5 ha and has a population index of 429. It is one of the four first-tier Late Chiripa sites.
The growth rate of Janko Kala in the Middle Formative was 0.09%, somewhat below the
phase average. It also seems to be the only one of the large MF villages which is lacking
clear evidence of public architecture.
T-430 (Alto Pukara)
Alto Pukara continued to be occupied into the Late Chiripa phase. Sector B grew to 3.25
ha (population index: 171), at an annual rate of 0.09%. This is comparable to the phase
average. It was probably in this phase that the site’s terrace/platform was constructed. This
feature is visible on Figure6.5 as a rectangular feature on the southern (upper) portion of
the site. Robin Beck’s work at this site will hopefully shed some light on its architectural
sequence.
6.3 Architectural evolution
As mentioned in the introduction to this chapter, there is evidence for a gradual and
continuous increase in the elaboration and scale of public architecture on the Taraco Penin-
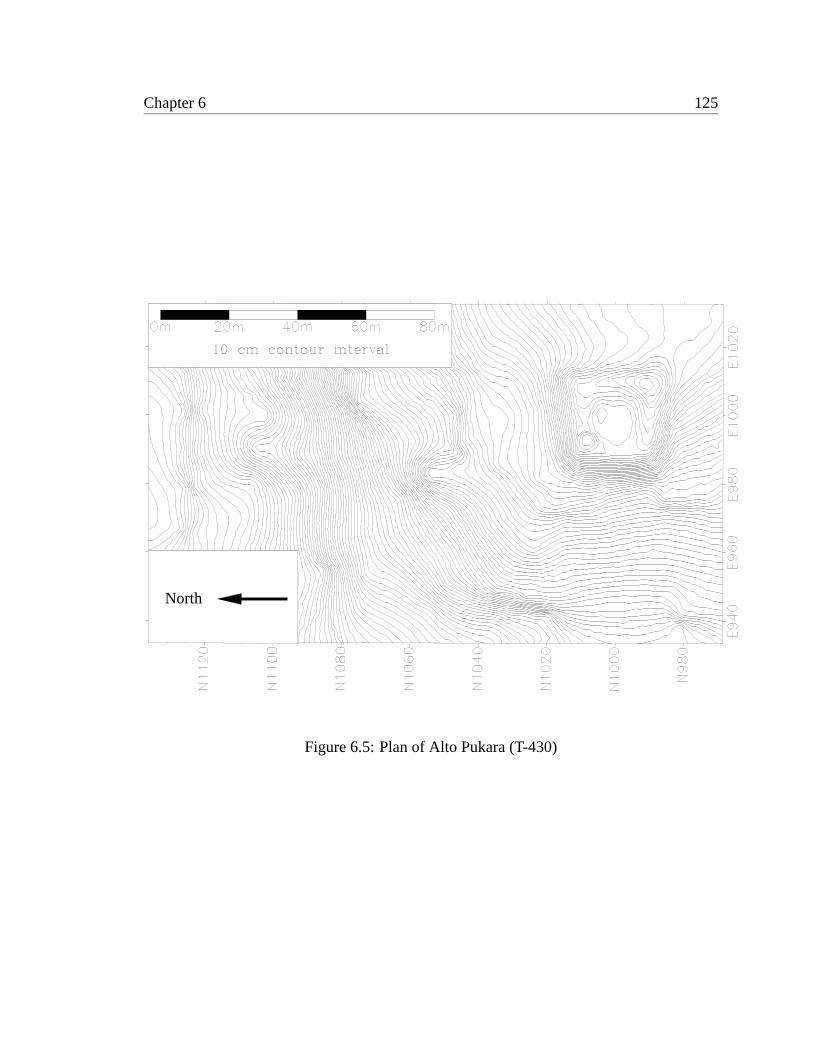
Chapter 6 125
North
Figure 6.5: Plan of Alto Pukara (T-430)
Chapter 6 126
sula during the Middle Formative Period. We have a fair grasp of the sequence at Chiripa,
so I will take it to be representative of similar sites on the peninsula.6
6.3.1 The Llusco Structure
Toward the beginning of Late Chiripa, the Middle Chiripa Choquehuanca structure
was abandoned and gradually filled with a Late Chiripa domestic midden (Whitehead in
Hastorf et al. 1998). At this time another sunken court structure was constructed to the
south of the mound, in the Llusco area (Paz inHastorf et al. 1998, Paz Soría 1999; see Fig-
ure6.4). This structure measured approximately 13x11 meters. The walls, like those of the
Choquehuanca structure, were made of unworked alluvial cobbles set in a mud mortar. The
structure had a prepared floor of compact white clay, and a subterranean drainage canal was
found in the northwest corner, the earliest example of a drainage feature associated with
a corporate construction. It was abandoned in approximately 600 B.C. There are no in-
dications of associated surface structures, though these would almost certainly have been
destroyed by modern plowing.
6.3.2 The Lower House Level
The third public architectural phase at Chiripa is what Kidder called the Lower House
Level (Kidder 1956).7 Before the 1996 excavations of TAP, this phase was known only
through the 1955 excavations of Kidder and Bolivian archaeological pioneer, Gregorio
Cordero Miranda. They - or rather, William Coe, the actual excavator - uncovered the
remains of two fieldstone structures below the location of Bennett"s Upper Houses 2 and
3, on the northwest corner of the mound. The details of this excavation have never been
properly published, though the structures seem to have been constructed of alluvial cob-
bles, as were the Upper Houses. In the 1996 TAP excavations, in a level stratigraphically
below the Upper House Level, I located the remains of at least three Lower House Level
6This discussion is largely a reprise of a presentation made by myself and colleagues at the 1998 meetingsof the Institute for Andean Studies in Berkeley, CA (Bandy et al. 1998).
7For a detailed discussion of pre-TAP excavations at Chiripa, seeBandy 1999a.
Chapter 6 127
structures. These three structures (seeBandy 1999b) were constructed primarily of adobe -
encountered as both bricks and astapia, or puddled adobe - and were superimposed one on
top of another. In one of these structures, walls were covered with a thin wash of red clay,
and the finds of small bits of red plaster on other floors suggests that this was the case with
the other structures, as well.
These three Lower House Level structures were built one on top of the other, the upper
portion of the existing structure being destroyed in order to make way for the walls of the
new one. The resulting rubble was used to create a platform for the construction of the
new structure. Apparently, the abandonment of one floor and the construction of another
was accompanied by a specific ritual practice. First, a thin cap of fill - generally derived
from midden or other cultural deposits, in one case sterile sand - was placed over the old
floor. On top of this fill level, a fire was kindled. Evidence of fire is present on top of
the fill levels covering at least six of the eight floors in the sequence. For the moment,
we interpret these burning events as elements of a standardized ritual practice associated
with the closing, or "killing," of an old floor, and the construction or opening of another.
Immediately following the termination of this"burning ritual," a new floor was constructed
of clean yellow clay. The floor was placed immediately on top of the ash deposit resulting
from the burning episode. This cycle was repeated at least eight times in the sequence of
structures, and would seem to indicate a long-term ritual use of the mound area long before
the construction of the Upper House Level.
The earliest of these three structures was constructed in approximately 600 BC, and
the last was abandoned in approximately 400 BC. (Bandy et al. 1998). This is based on a
series of seven radiocarbon dates taken from the Lower House Level sequence. It appears,
then, that the Lower House Level structures were occupied for approximately 200 years.
Given this fact, and the fact that there are eight floors in the sequence, we can suggest
that the proposed "burning ritual" - the replacement of a floor, and at times an entire struc-
ture, with another - took place at approximately 25-year intervals. The correspondence of
this figure with the length of human generations would seem to be more than mere co-
incidence, and I propose, though I am unable to demonstrate this, that the reconstruction
Chapter 6 128
of these special-purpose structures was associated with generational succession; perhaps
with the death of one leader and the naming of another8. Since there are various Lower
Houses, probably arranged in an enclosure around a sunken court, as suggested by Brow-
man (Browman 1978a: 808), this would in turn imply that each structure was associated
with a lineage or kin group, and that the “burning ritual” took place at the time of the death
of a lineage elder or leader. At present, this is entirely speculation. However, it does cast
an interesting light on later developments at the site.
6.3.3 The Upper House Level
After the final abandonment of the uppermost structures of the Lower House Level,
a thick layer of intentional fill was placed over their remains, creating a roughly level
earthen platform. This is the first example of true platform architecture at the site. It
should be noted, however, that there were no true “mounds” on the Taraco Peninsula until
the Late Formative period. The Chiripa mound in the Middle Formative was more properly
a monumental terrace. That is, it was a large roughly level terrace, the upslope side of
which was a ground level. As the terrace is located on a slope, however, and since the
structure was approximately 30 meters from north to south, the downslope side of the
terrace was probably elevated 2.5-3 meters above the natural ground surface.9 This was
still an imposing structure when viewed from downslope, and would have required steps
or a ladder to climb the facing wall. And these structures were built to be viewed from
downslope. In every well-preserved case the terrace is located in the highest area of the
site, with the bulk of the habitation areas located downslope.
8It should be noted that the wide error ranges of the dates in question make it impossible to have totalconfidence in this scenario. It remains, nevertheless, and intriguing possibility. SeeBandy 1999bfor moreon the problems of dating these structures.
9Browman recognizes but does not emphasize the fact that the Upper House level platform is located ona terrace and not on a true mound:
The temple was placed in the center of a larger mound... The larger moundmeasures 50 m on a side; three sides on a downhill slope were faced of andrevetted with a fieldstone wall up to 3 m high. (Browman 1981: 414)
Chapter 6 129
On top of this monumental terrace, the Upper House Level structures were built. This
almost certainly took place relatively soon after the abandonment of the Lower House Level
structures, or sometime around 400 B.C. The Upper House Level complex was first discov-
ered by Bennett, who excavated Houses 1 and 2 (Bennett 1936, see Figure6.6 for excava-
tion locations on the Chiripa mound). Other houses were subsequently excavated by Por-
tugal Zamora (Portugal Zamora 1940, Portugal Ortíz 1992) and by Kidder (Kidder 1956).
The houses excavated by Bennett have proven to be representative of all of the Upper
Houses so far discovered, as they seem to be highly standardized.
The Upper Houses are rectangular structures made of rounded cobbles set in a mud
mortar. The plan of the structures is unique, and may be appreciated on Figure6.6. The
structures are all double-walled, with an empty “bin space” between the inner and outer
walls. The bins were partitioned by a series of short crosswalls connecting the inner and
outer walls of the structures. Access to these bins was through elaborate windows or niches,
decorated with molded plaster step-fret motifs on their upper corners. The house were
colorfully plastered in red an yellow, as were the Lower House structures, and were almost
certainly thatched withtotora reeds. Apparently at least a part of the courtyard enclosed by
the structures was also surfaced with colored clay. Under the floors of at least some of the
structures were found numerous human burials (13 in the case of House 2 [Bennett 1936:
432-433]; none in House 1), frequently accompanied by wealth items including gold and
copper objects. Also uniquely, the Upper Houses seem to have been equipped with sliding
doors. To one side of the principal entryway of each structure is a deep, narrow groove
which would have held a recessed panel, probably of wood and reeds or cloth. These
panels could have been pulled from the grooves to close off the entrances.
The number of house in the Upper House complex has been the subject of some con-
troversy. Bennett originally estimated that there were 14 of the structures (Bennett 1936),
Kidder estimated 15 (Kidder 1956) and Browman went as far as 16 (Browman 1978a). It
is now possible to say with reasonable certainty that Bennett was in fact correct, and the
enclosure consisted of 14 structures with openings to the North and South.10 This is so
10And with this I hope to lay to rest Conklin’s erroneous reconstruction drawing of the Upper Housecomplex (Conklin 1991: 287-8) which has been popularized in Moseley’s generally excellent textbook
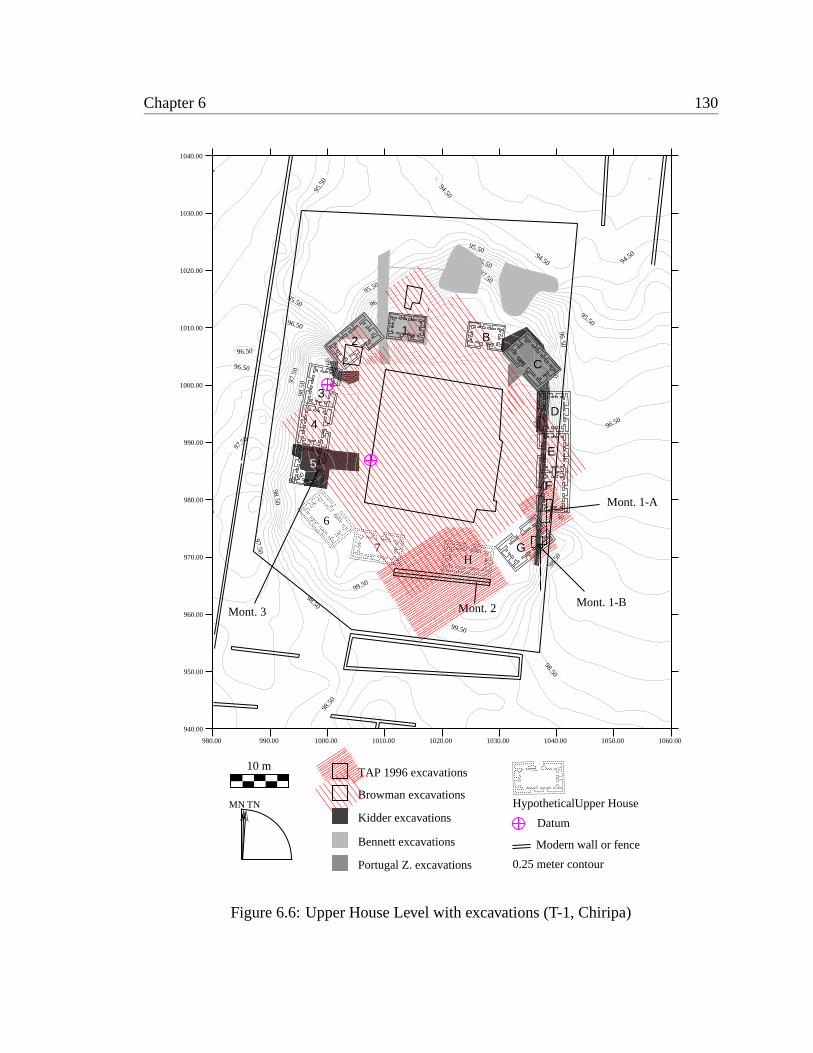
Chapter 6 130
99.50
99.5
0
99.50
99.50
99.5099.50
99.50
99.50
98.50
98.5
0
98.50
98.50
98.50
98.5
0
98.50
98.5
0
98.50
98.50
98.5
0
97.50
97.50
97.50
97.50
97.50
97.50
97.5
0
97.5
0
97.50
96.50
96.50
96.50
96.50
96.50
96.50
96.50
95.50
95.50
95.50
95.5095
.50
94.5094.50
94.50
10 m
1020.00
1010.00
1000.00
990.00
980.00
970.00
960.00
1040.00
1030.00
950.00
940.00
1060.001050.001040.001030.001020.001010.001000.00990.00980.00
Mont. 1-A
Mont. 1-BMont. 3 Mont. 2
TAP 1996 excavations
0.25 meter contour
MNTNBrowman excavations
HypotheticalUpper HouseKidder excavations
Bennett excavations
Portugal Z. excavations
Modern wall or fence
Datum
12
3
B
C
D
E
F
4
G
5
H
6
7
Figure 6.6: Upper House Level with excavations (T-1, Chiripa)
Chapter 6 131
because:
1. Bennett excavated Houses 1 and 2.
2. Portugal Zamora excavated House C, bringing the count to 3.
3. Kidder and Cordero Miranda excavated House 5 and portions of Houses 3 and 4,
bringing the count to 6.
4. Alan Sawyer, working on Kidder’s expedition, cleared House C, and exposed por-
tions of Houses B, D, E, F and G, bringing the count to 11.
5. Geophysical survey on the mound carried out by TAP in 1998 (Johnson in
Hastorf et al. 1998) clearly indicated the presence and positions of the as-yet un-
excavated Houses 6, 7 and H. This study also indicated that no structure was present
between Houses 7 and H. The enclosure was therefore open to the South. This con-
clusion was strengthened by excavations by myself and Christine Hastorf in the Mon-
tículo 2 area in 1996 (contra Bandy inHastorf et al. 1998) and 1999, which failed
to yield any evidence of a collapsed structure in this location. This brings the total
count to 14.
6. Karen Chávez (pers. comm. 1999) has pointed out that Bennett’s plans show that
the eastern wall of House 1 was in fact finished on the exterior. Therefore, it was not
connected to another house to the east, as, for example, Houses 4 and 5 are connected
and share a common exterior wall. This means that the enclosure was open to the
North, with no structure located between Houses 1 and B. The count remains at 14.
It should also be noted that, as shown in Figure6.6, the Upper House complex is in
the form of a trapezoid opening to the South. It is not, after all, a rectangular enclo-
sure. This is of particular interest, since the Choquehuanca structure is also trapezoidal
(Moseley 1992: Figure 59) and elsewhere (Conklin and Moseley 1988: Figure 5.6). I have the utmost re-spect for Conklin’s substantial contributions to Andean studies, but this particular reconstruction is clearlyincorrect.
Chapter 6 132
(Dean and Kojan 1999: Figure 10), and the Llusco structure may be.11 The trapezoidal
arrangement of the Upper Houses was portrayed correctly by Karen Chávez (Chávez 1988:
Figure 3), though she did not remark upon it. It is also interesting since the later Enclosure
2 at Pukara is likewise trapezoidal in plan (Chávez 1988: Figure 9), yet another point of
similarity between the Pukara Kalasasaya enclosures and the Chiripa Upper House com-
plex.
The labor and care invested in the construction of the platform, the fourteen structures,
and probably in the sunken court in the center of the enclosure (Browman 1978a) represents
a substantial elaboration of public architectural space above and beyond any Lower House
Level precedent.
The form and function of the Upper House Level structures has been considered most
systematically by Karen Chávez (Chávez 1988). She argues that the fact that the ’bins’ in
the structures take up close to half of the potential interior floor space indicate an unusual
focus on storage as opposed to habitation, while the very ornate decorations and elaborate
construction, together with ’ceremonial’ sculptural and iconographic associations, suggest
a non-domestic use. I agree completely with her on these points, and would add that her
reasoning has been confirmed by the very high frequencies of decorated pottery associated
with mound structures relative to quotidian domestic middens.12 It has become clear the
Bennett’s interpretation of the compound as a circular village - which was subsequently
echoed by Kidder and Browman (Browman 1981:414, Kidder 1956) - is untenable. The
Upper Houses are not houses after all. Chávez suggests rather that the Upper House com-
plex as a whole represents a “temple-storage complex” (Chávez 1988: 25).
I agree with Chávez’s assessment, and it is wholly compatible with my own views con-
cerning the intensification of competitive feasting and commensal politics throughout the
Middle Formative. I would add to her observations that the architecturally redundant nature
of the Upper House complex - multiple nearly identical structures, symmetrically arranged
- seems to suggest that the structures and the activities which were carried out in and around
11Several of the Llusco structure’s walls are too badly destroyed to allow a precise determination of itsplan. I believe it to have been rectangular, however.
12See my brief discussion in section6.1(alsoSteadman 1999: 66).
Chapter 6 133
them, represent a segmentary social structure. That is, each structure would be associated
with a lineage, kin group, or other kind of social segments of the village. If this is in fact
the case, then it is interesting to observe that while the Upper Houses themselves are all
basically identical, they differ in the number and in the richness of their associated buri-
als.13 Thus some structures have more burials than others, and some have none at all. The
burials from some structures contain more wealth items than burials from other structures.
If the structures were indeed associated with different lineages then this seems to indicate
that leaders and their constituencies had begun to differentiate, with some commanding
more wealth, labor, prestige and authority than others. Again, this is consistent with my
hypothesized intensification of commensal politics and status competition.
6.3.4 Other sites
No structure directly comparable to the Chiripa Upper House structures has been exca-
vated at any other site. It would be a mistake, however, to interpret this fact as indicating
the Chiripa was in some way exceptional during this period. On the contrary, three other
sites are of equal size in the Late Chiripa phase, and two of these have surface indications
of substantial corporate constructions.
A monumental terrace, very similar to the terrace on which Chiripa Upper House com-
plex was situated, is located at the site of Yanapata (T-130) . This terrace measures approx-
imately 50 by 40 meters, and is located against the base of the hill behind the site. That
is, it occupies a location within the site analogous to that of the Chiripa mound, with the
habitation areas mostly downslope. This terrace was apparently once faced with stone on
its downslope side. One large limestone pillar remains in place in approximately the center
of the terrace wall. I was informed by the landowner that a great deal of worked stone was
pulled from this area and taken by truck to Taraco to be used in repairs to the church there.
There is no indication of summit structures, but the top of the terrace has been extensively
damaged. It had recently been tractor-plowed for the first time when I visited in 1998,
13Upper House burials were excavated by Bennett (Bennett 1936), by Portugal Zamora(Portugal Ortíz 1992), and possibly by Kidder and Cordero Miranda in House 5 (Layman and Mohr 1965,see Table 1).
Chapter 6 134
exposing many large sherds and a few nearly-complete vessels. Some burned adobe was
also encountered, perhaps indicating burned structures. Nothing further can be said without
excavation, however. Based on its similarity to the Chiripa mound, I believe the Yanapata
terrace to be late Middle Formative in date.
The site of Achachi Coa Kkollu (T-225), which, as mentioned in Chapter5, seems to
have been a ceremonial precinct associated with Kala Uyuni (T-232), also has evidence of
corporate construction. It is located high on a hill overlooking the habitation sectors of
Kala Uyuni below. This site clearly contains a terrace, faced with limestone blocks, though
it is smaller than those at Yanapata and Chiripa. There may also be a sunken court present,
though this is uncertain. No summit structures are in evidence, though again I would not
expect them to be given the effects of millennia of erosion and agricultural tilling. The
stone-faced terrace almost certainly dates to the Late Chiripa phase, since this is the only
phase in which there is a substantial occupation of the site.
Some smaller Late Chiripa sites - those in the second tier of the settlement size hierar-
chy - have similar corporate constructions. Most notable is Chiaramaya (T-3), which has
a very large monumental terrace, perhaps as large as that of Chiripa. In 1998 I observed
informal excavations on this feature when the community constructed a new meeting hall.
Dense cultural debris was unearthed, including many large chunks of burned adobe. This
is suggestive of burned summit structures, though excavation or geophysical survey would
be necessary to confirm this. The form of this terrace, like that of the Yanapata terrace,
suggests contemporaneity with the Upper House complex.
Another similar terrace, though smaller, was found at the site of Alto Pukara (T-430).
This terrace is quite small, perhaps 20 x 20 meters. This feature was excavated in 2000
by Robin Beck (pers. comm. 2001). He encountered 2 structures arrayed on either side
of an open plaza area. The structures were detached, and although they did have interior
niches, lacked the bins, stepped entries and other elaborate features characteristic of the
Chiripa Upper House structures. It should be noted that no sunken court was encountered
in the plaza area. This group of structures may be contemporaneous with the Upper House
complex or slightly earlier. More details will be forthcoming in Beck’s dissertation.
Chapter 6 135
The site of Quiswarán (T-303) also seems to have a small terrace, perhaps similar to the
Alto Pukara feature. Verification will require excavation, however. Tilata (T-368) has a true
mound, though this probably dates to a later period of the site’s long occupation span. One
of the landowners at Tilata informed me that he had a sculpted stone piece in his house. I
was unable to view this at the time, however, since it was covered by his annual dung fuel
reserves, it being early winter. I have as yet not returned to photograph the piece.
Two other small sites potentially have sunken courts without terraces. At one of these,
Sunaj Pata (T-268), a possible court was identified by a rectangular stain in the topsoil
of a tractor-plowed field. This is the same manner in which we initially identified the
Llusco structure at Chiripa in 1992. Sunaj Pata has only Early Chiripa and Late Chiripa
occupations, so the court - if it is a court - is almost certainly Middle Formative in date.
The other, Millón Jawira (T-476), is a small but very dense scatter of which Late Chiripa is
the only Formative occupation. There is a rectangular sunken area near the middle of the
sherd scatter. Local residents informed me that very large stones are frequently removed
from this area while plowing.
It is clear, then, that terraces and sunken courts - and perhaps elaborate architectural
enclosures - are quite widespread in the Middle Formative. Even relatively minor sites
like Chiaramaya or Alto Pukara have impressive monumental architecture. The scale of
corporate features seems to coincide roughly with site size; larger sites have larger con-
structions.14 This is far from a neat correlation, however, and is complicated especially by
the case of Chiaramaya.
In short, there is no one site which is clearly exceptional in terms of the scale or elab-
oration of its public architecture in the Middle Formative. This realization directly contra-
dicts a common assumption in the literature that - due to its elaborate public architecture -
Chiripa was in some way exceptional for its time, a ceremonial center or locus of paramount
chiefly power. For example, Mathews, in his survey of the middle Tiwanaku Valley, noted
14The exception here, of course, is Janko Kala (T-394). This is one of the four principal Late Chiripasites on the peninsula, and yet it has no clearly discernible corporate constructions. The surface of the site isheavily disturbed, however. It may be that more careful topographic work will reveal features too subtle fordetection by the cursory investigation which I was able to undertake.
Chapter 6 136
that Middle Formative sites were not randomly distributed, but rather were clustered. Thus:
...the Chiripa-associated sites do not appear to be random settlements, butrather suggest a higher degree of settlement organization, possibly directedby the administrative leadership of Chiripa itself. The exact nature of theircontrol is unclear ... Given Chiripa’s manifestation of the earliest public ar-chitecture in the region, however ... a scenario of direct contiguous control ofthe Tiwanaku Valley by the Chiripa polity is not outside the pale of possibility.(Mathews 1992: 68)
Stanish arrives at a similar conclusion:
I argue that the construction of this major corporate architecture [the UpperHouse complex] correlated with the development of a complex chiefdom atChiripa. (Stanish et al. 1997: 115)
Browman sees Chiripa as a center similar in principle to Pukara and Tiwanaku:
Pucara dominated the area north of Lake Titicaca ... while first Chiripaand later Tiwanaku dominated the area immediately south of the lake.(Browman 1981: 413)
What has become clear from this investigation is that a number of other sites very like
Chiripa existed at the same time, and that Chiripa was in no way unique in having elaborate
public architecture. The preservation of the Middle Formative architecture at Chiripais
exceptional - owing to its burial and protection by a subsequent mound construction episode
- but on present evidence it seems as if the architecture itself was not unusual in the context
of the contemporaneous Taraco Peninsula villages. Chiripa was one - not first - of many.
6.4 Lake level change
Near the end of the period in which the Lower Houses were occupied, around 450 B.C.,
a very dramatic environmental event took place in the Southern Titicaca Basin. For reasons
that are not entirely clear, the level of the lake dropped to about 16 meters below its modern
level. This is the third low stand of Lago Wiñaymarka identified by Abbot and colleagues
Chapter 6 137
during the late Holocene (Abbott et al. 1997a: 179, also Figure 4; low and high lake stands
are indicated also in the right-hand column of Figure2.4). Using data from multiple cores
of lake bottom sediment, they have determined that the lake during this approximately 200
year period (450-250 B.C.) was 10-12 meters below overflow level, equivalent to 16-18
meters below the average modern lake level of 3810 m.a.s.l. This is probably related to a
prolonged drought, though factors other than reduced rainfall could produce extreme lake
level fluctuations.
At any rate, the effects of this event were dramatic. Since the southern part of Lake
Titicaca - Lago Wiñaymarka or the little lake - is very shallow - almost all of it is less than
20 meters deep - it became almost completely dry at this time. The lake that the visitor sees
today did not exist. In its place was an immense grassy plain, crossed by small, meandering
rivers and dotted with marshes.
Figure6.7 shows the reconstructed shorelines of Lago Wiñaymarka for its minimum
and maximum depths during the late Early Formative (Middle Chiripa) and the early Mid-
dle Formative Periods. The basic outlines of the lake were approximately those of today
(the modern shoreline is indicated on the figure by a dotted line). Figure6.8, however,
shows the lake’s reconstructed upper and lower shorelines during the latter two centuries
of the Middle Formative. At this time Lago Wiñaymarka was reduced to two small lakes,
one near the modern town of Yunguyu, and the other - still connected to the Lago Mayor,
since the Straits of Tiquina were not dry - near the Bolivian town of Achacachi.
The drying of the lake had three immediate effects on the local economy, apart from
the obvious agricultural effects of what may have been a severe drought:
1. Opportunities for fishing were greatly reduced. Although people still ate fish, they
either had to trade for them or had to travel quite substantial distances to fish in waters
which were much reduced in extent and certainly also in yield.
2. Vast new grazing lands were created, allowing for an increase in llama and alpaca
herding.
3. The possibility was created for llama caravan commerce directly between the Taraco
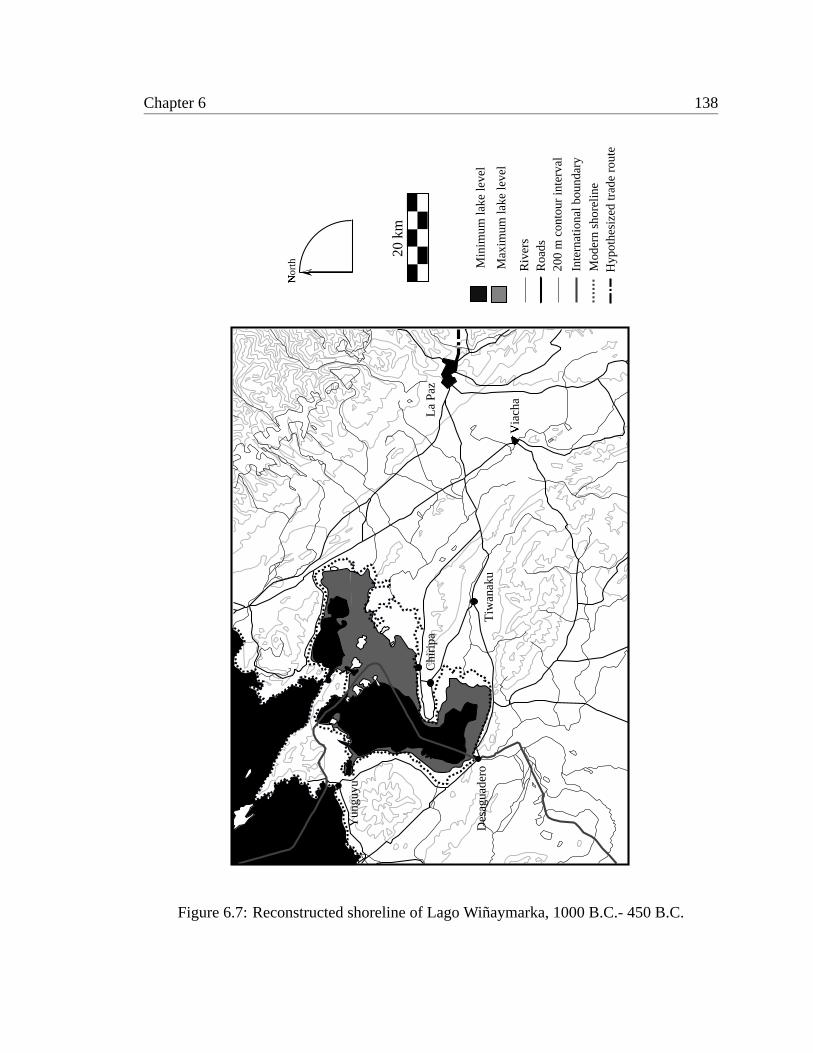
Chapter 6 138
Hyp
othe
size
d tr
ade
rout
e
Via
cha
�L
a Pa
z
Tiw
anak
u
Chi
ripa
Des
agua
dero
Yun
guyu
20 k
m
Riv
ers
Max
imum
lake
leve
l
200
m c
onto
ur in
terv
al
Inte
rnat
iona
l bou
ndar
y
Roa
ds
Nor
th
�
Min
imum
lake
leve
l
Mod
ern
shor
elin
e
Figure 6.7: Reconstructed shoreline of Lago Wiñaymarka, 1000 B.C.- 450 B.C.
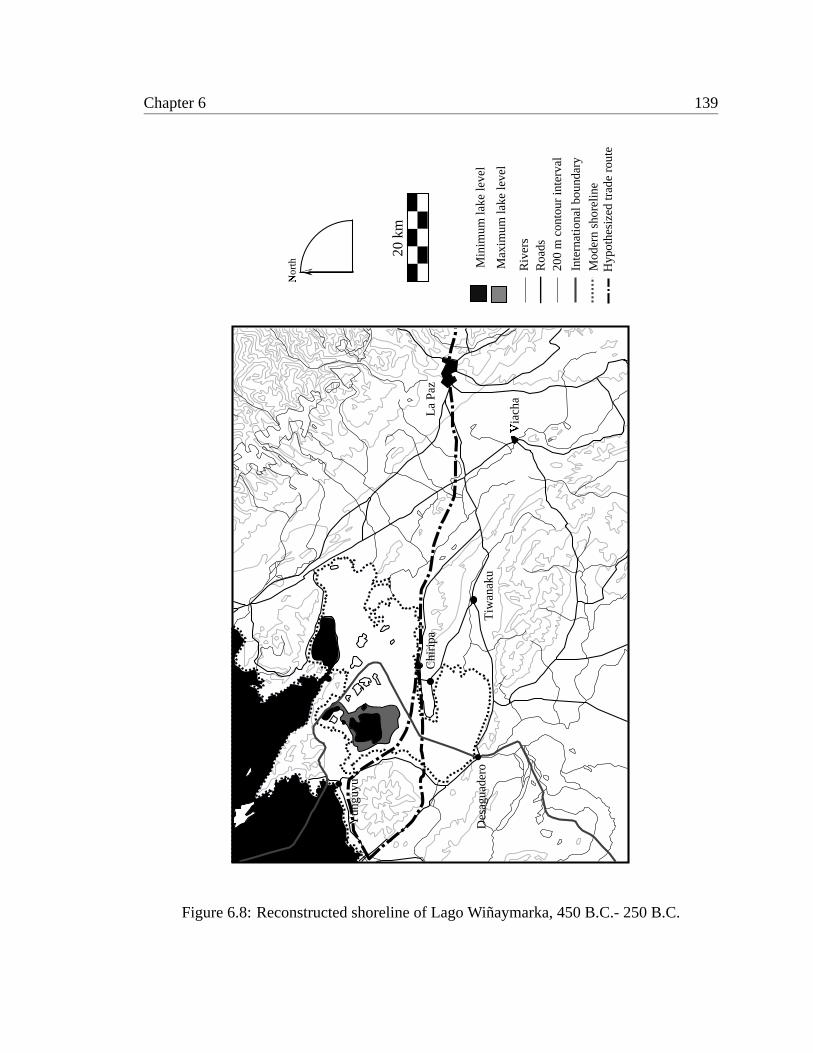
Chapter 6 139
Hyp
othe
size
d tr
ade
rout
e
Via
cha
�L
a Pa
z
Tiw
anak
u
Chi
ripa
Des
agua
dero
Yun
guyu
20 k
m
Riv
ers
Max
imum
lake
leve
l
200
m c
onto
ur in
terv
al
Inte
rnat
iona
l bou
ndar
y
Roa
ds
Nor
th
�
Min
imum
lake
leve
l
Mod
ern
shor
elin
e
Figure 6.8: Reconstructed shoreline of Lago Wiñaymarka, 450 B.C.- 250 B.C.
Chapter 6 140
Peninsula and the western side of the Basin. Since the little lake was mostly dry, it
was possible to walk directly from Chiripa to the Yunguyu area (see Figure6.8), and
from there to the important population centers to the south of modern Puno.
It seems clear the the inhabitants of the Taraco Peninsula at this time were forced to shift
the focus of their subsistence activities. We may suppose that the importance of fishing and
lacustrine collecting was greatly reduced, while herding and agriculture were intensified to
compensate. This assertion has yet to be demonstrated archaeologically. It is a reasonable
supposition given the drop in the lake level and concomitant contraction of the shoreline
of Lake Wiñaymarka (see Figure6.8). Further research is needed to verify this scenario,
however.
It is probable, then, that as agriculture was rapidly intensified - this shift may have taken
place over the course of a few decades or even less - fallow cycles were shortened and new
land, previously unworked, was brought under cultivation (Boserup 1965). This shift in
emphasis of the subsistence economy was undoubtedly a very significant event. Equally
significant, however, was the simultaneous expansion of trade relations within the Titicaca
Basin, and the increasing importance of the Taraco Peninsula communities within them.
6.5 Exchange
The Taraco Peninsula villages were engaged in long-distance trade and exchange from
the very beginning of settled life; that is, from the Early Chiripa phase. The evidence for
this early trade is the occurrence of three exotic materials in Early Formative Period (and
MF) contexts.
1. Cylindrical sodalite beads are frequently encountered as mortuary goods in both
Early and Middle Formative contexts. This material - often identified as lapis lazuli -
is occasionally found at Chiripa and at other sites in the form of unworked chunks as
well as finished beads. The source of this material remains unclear - Browman sug-
gests Cerro Sapo in Cochabamba (Browman 1981: 414) - but it is certainly exotic. In

Chapter 6 141
four seasons of excavations - from 1992 to 1999) only 108.6 grams of this material
were recovered at Chiripa, the majority of it from Early Chiripa contexts.
2. Obsidian is also found in both Early and Middle Formative contexts. It is clear
that obsidian was obtained in the form of finished bifaces since very little deb-
itage has been recovered, and virtually no cortex flakes. I have yet to perform
characterization studies on the obsidian recovered from Chiripa. Browman, how-
ever, reports materials from the Titicaca Basin source - recently located in the
Colca Valley near Arequipa and renamed the Chivay source (Brooks et al. 1997,
Burger et al. 1998, Burger et al. 2000) - and from another source which has yet to
be located (Browman 1981: 415). The Collca Valley is more than 300 km north-
west of Chiripa. Like sodalite, obsidian was imported in small quantities; we have
recovered no more than 87.1 g in four excavation seasons.
3. Finally, trace amounts of sea shell are also encountered, normally as tiny discoidal
beads in mortuary contexts. These shell beads also occur in both Early and Middle
Formative contexts, but are exceedingly rare. TAP has to date recovered only 5.3 g
of this material.
Small fragments of silver, copper, and gold are also found, though very infrequently. Nor-
mally these are located in burial contexts.
It is clear, then, that long-distance trade in mortuary and prestige items took place
as early as the Early Chiripa phase. Equally clear, however, is that this early exchange
involved very small quantities of the objects in question. This trading would seem to have
been very sporadic and infrequent. There is no evidence in the Early Formative Period
for the sort of regular caravan trade postulated by Browman (his “altiplano mode”; see
Browman 1981: 414-415).
6.5.1 Olivine Basalt
In the Middle Formative Period this earlier far-flung and low-intensity trading network
remained active. In addition, however, there is evidence for intensification of exchange
Chapter 6 142
within the Titicaca Basin itself, and probably also of trade with immediately adjacent re-
gions. This evidence takes the form of large quantities of a particular kind of rock, an
olivine basalt exotic to the Taraco Peninsula which was imported in the form of finished
agricultural hoes.15
In my analysis of the lithic artifacts from the TAP excavations, I designated the two
varieties of this olivine basalt as Raw Material Types (RMT) 61 and 65. Both are fine-
textured, homogeneous gray stones with few crystalline inclusions. Both include green-
colored olivine phenocrysts. RMT 61 is distinguished from RMT 65 by having larger and
more frequent olivine phenocrysts, but is otherwise identical. Both of these materials differ
from the more common andesite (RMT 62), which has a very similar color but contains
frequent plagioclase feldspar inclusions as well as some biotite, and is generally more
porous and coarse-grained. Feldspar is not present in the basalt materials. Titicaca Basin
archaeologists have normally grouped the olivine basalt and andesite as I have described
them here under the single term “andesite”. Thus, frequent references in the literature to
“andesite hoes” (cf.Steadman 1995, Seddon 1994b) are quite possibly references to what
I am calling olivine basalt. Other types of basalt are present at Chiripa, including a black,
vitreous variety, but these are less frequent and are not relevant to the present discussion.
Table6.1b shows the occurrence of this rock (olivine basalt) in unmixed proveniences
of the three Chiripa phases16 (counts of which are given in Table6.1a). It is clear, despite
a sub-optimal sample size, that the stone type in question occurs only in the Late Chiripa
phase. This corroborates my own rather more informal observation that this rock is a
Middle Formative marker throughout the southern and western Titicaca Basin, at dozens
of sites in the Chucuito, Ilave, Juli,17 Yunguyu and Desaguadero areas, as well as in the
15I would like to thank Sergio Chávez (pers. comm. 1999) for helping to show me the importance andwide distribution of this rock type.
16As identified by Lee Steadman (pers. comm. 2000). Note that the table only tallies artifacts fromceramically unmixed proveniences; the large majority of RMT 61 and 65 artifacts were recovered from plowzone and from mixed fill.
17Seddon reports that a “gray andesite”, quite possibly the same material I am discussing here, makes upupwards of 90% of the lithic sample at the Early and Late Sillumocco and Tiwanaku site of Tumatumani,near Juli (Stanish and Steadman 1994: 70). The mixed nature of the excavated fill deposits precludes anydetermination of when the material appeared and/or disappeared at the site.
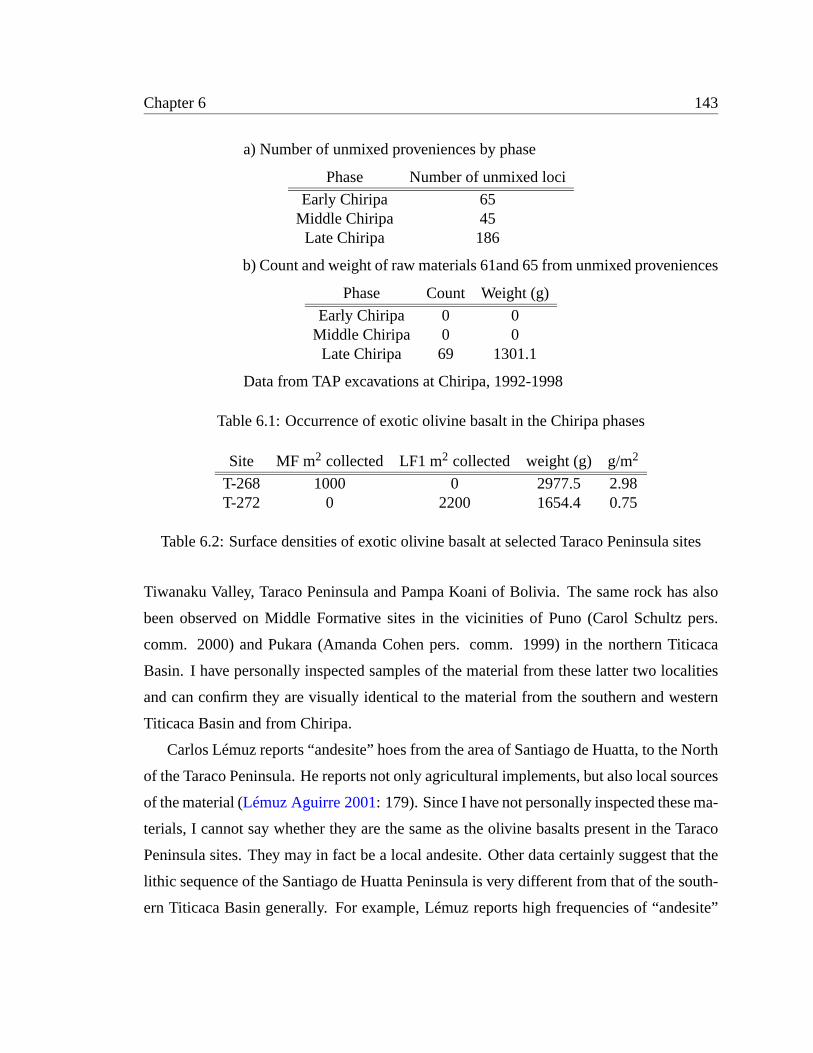
Chapter 6 143
a) Number of unmixed proveniences by phase
Phase Number of unmixed loci
Early Chiripa 65Middle Chiripa 45
Late Chiripa 186
b) Count and weight of raw materials 61and 65 from unmixed proveniences
Phase Count Weight (g)
Early Chiripa 0 0Middle Chiripa 0 0
Late Chiripa 69 1301.1
Data from TAP excavations at Chiripa, 1992-1998
Table 6.1: Occurrence of exotic olivine basalt in the Chiripa phases
Site MF m2 collected LF1 m2 collected weight (g) g/m2
T-268 1000 0 2977.5 2.98T-272 0 2200 1654.4 0.75
Table 6.2: Surface densities of exotic olivine basalt at selected Taraco Peninsula sites
Tiwanaku Valley, Taraco Peninsula and Pampa Koani of Bolivia. The same rock has also
been observed on Middle Formative sites in the vicinities of Puno (Carol Schultz pers.
comm. 2000) and Pukara (Amanda Cohen pers. comm. 1999) in the northern Titicaca
Basin. I have personally inspected samples of the material from these latter two localities
and can confirm they are visually identical to the material from the southern and western
Titicaca Basin and from Chiripa.
Carlos Lémuz reports “andesite” hoes from the area of Santiago de Huatta, to the North
of the Taraco Peninsula. He reports not only agricultural implements, but also local sources
of the material (Lémuz Aguirre 2001: 179). Since I have not personally inspected these ma-
terials, I cannot say whether they are the same as the olivine basalts present in the Taraco
Peninsula sites. They may in fact be a local andesite. Other data certainly suggest that the
lithic sequence of the Santiago de Huatta Peninsula is very different from that of the south-
ern Titicaca Basin generally. For example, Lémuz reports high frequencies of “andesite”
Chapter 6 144
hoes through the Tiwanaku period, by which time stone agricultural implements had largely
disappeared from Taraco Peninsula and Tiwanaku valley sites (Lémuz Aguirre 2001: 179-
181).
The TAP excavation data demonstrate convincingly that RMT 61 and 65 did not occur
in the Early Formative. No comparable data exist to show whether or not the material was
present in the area in the subsequent Late Formative Period. This would require excavation
of comparable volumes of intact LF deposits. However, I can say that surface densities
of RMT 61 and 65 on non-MF sites is much lower than on MF sites. As an example, we
may compare the cases of Sunaj Pata (T-268) and Kumi Kipa (T-272). These two sites
are located with a few kilometers of one another on tip of the peninsula near the town of
Santa Rosa (see Figures6.3 and7.3). The former has a significant MF occupation, but
no LF1 occupation. The latter is the opposite, with no MF material, but a substantial LF1
sector. Both sites were systematically surface collected. As may be appreciated in Table
6.2, the surface density of RMT 61 and 65 is almost four times higher at the MF site than
at the LF1 site.18 This would seem to indicate that trade in this rock type either diminished
significantly or ceased altogether in the LF1 period.
Long-distance exchange in the Early Formative seems to have involved small numbers
of very small items: finished obsidian projectile points and beads of shell and sodalite. The
quantity of RMT 61 and 65 hoes that was imported to the Taraco Peninsula in the Middle
Formative represents a volumetric increase of several orders of magnitude over the goods
imported through the Early Formative exchange system.19
18Recall that this rock is found in the form of hoes, mostly broken. Since the “use locus” of hoes isagricultural fields, we can expect that much of the breakage and discard of these tools took place off-site,outside of the village. The inhabitants of Sunaj Pata in the MF were almost certainly farming the area thatwas later to be the village of Kumi Kipa. It is therefore not surprising to find broken hoes in that area. Indeed,they are found over the entire peninsula, on- and off-site.
19The total weight of RMT 61 and 65 excavated from Chiripa by TAP is 5361.8 g. This compares to 87.1g of obsidian, 108.6 g of sodalite and 5.3 g of shell, as detailed earlier.
Chapter 6 145
6.5.2 Estimating total olivine basalt imports
It is possible to estimate the total amount of RMT 61 and 65 present on the surface
of the Taraco Peninsula. By doing so we can perhaps measure the degree of intensity of
exchange in this time period.
1) on-site surface olivine basalt quantity
S= W∗TC
where W = total RMT 61 and 65 weight (kg) = 23.43 kg
T = total MF habitation area (ha) = 65.84 ha
C = total collected MF habitation area (ha) = 0.97 ha
Total on-site surface weight of RMT 61 and 65 is therefore estimated to be 1590 kg, or
approximately 1.6 metric tons.
2) on-site subsurface olivine basalt quantity
Altogether at Chiripa TAP excavated an area of approximately 496 m2, and recovered
4979 g of RMT 61 and 65 from those units. The same units yielded 383 g of the material
from the surface. This produces a surface density of 0.77g/m2, or 7.7 kg/ha, significantly
lower than that calculated for the peninsula as a whole in step 1 (24.2 kg/ha), and a sur-
face/subsurface ratio of 0.08. Using this ratio produces an estimate of 19875 kg or 19.9
metric tons of on-site subsurface RMT 61 and 65 on the Taraco Peninsula.
It may be that the surface of Chiripa has been relatively more cleared than the surface
of other sites. This is probably the case, since some of the areas we excavated included
a soccer field and the surface of the Chiripa mound. These would necessarily have fewer
materials evident on the surface than would a plowed field. We may therefore use the
peninsula-wide average surface density of 24.3 kg/ha to retrodict a total surface weight of
1200.3 g for the 496 m2 excavated at Chiripa. This produces a surface/subsurface ratio
Chapter 6 146
of 0.24, and a total on-site subsurface estimate of 6625 kg (6.6 metric tons) for the whole
Taraco Peninsula.
We may consider these numbers - 19.9 and 6.6 metric tons - as possible maximum and
minimum values.
3) off-site surface olivine basalt quantity
This number is very difficult to estimate, and at present it is impossible to produce a
reliable estimate. We must remember, though, that a significant amount of RMT 61 and 65
is found off-site, since the rock was used for agricultural hoes which were utilized - and
broken and discarded - primarily off-site. The only possibility of an estimate at the moment
comes from the three sites which were surface collected and did not have a MF occupation:
T-213, T-271 and T-272. Altogether at these sites I collected 6400 m2. These units yielded
a total of 4328.4 g of RMT 61 and 65, for a surface density of 0.67g/m2, or 6.7 kg/ha.
Since the total surveyed area of the Taraco Peninsula was approximately 9875 ha, this
would produce an estimate of 66162 kg of off-site surface RMT 61 and 65. However, all
three of these sites are located in prime agricultural land, and near to MF settlements. Only
about 25% of the surveyed area can be considered good agricultural land. I will therefore
revise this estimate to 16541 kg or 16.5 metric tons of total off-site surface RMT 61 and
65. It must be remembered, however, that this estimate is extremely vague and can in no
way be considered authoritative.
4) total olivine basalt quantity
I therefore estimate the total amount of exotic olivine basalt imported to the Taraco
Peninsula in the Middle Formative to be at an absolute minimum 8.2 metric tons (on-
site surface + minimum of on-site subsurface), probably more like 21.5 metric tons (on-
site surface + maximum on-site subsurface) and possibly as much as 38 metric tons (on-
site surface + maximum on-site subsurface + off-site surface). Given that whole hoes of
this material on the Taraco Peninsula weigh on average approximately 100 g, this would
translate to 82000, 215000 or 380000 hoes, respectively.
Chapter 6 147
6.5.3 Source of exotic olivine basalt
It is certain that the olivine basalt (RMT 61 and 65) that appears on the Taraco Peninsula
in the Middle Formative is of exotic origin. There is no such material present in either
the Taraco or the Kollu Kollu formations (see section2.1). Although its source cannot at
present be determined with certainty, I would like to venture an educated guess. The only
documented quarries of this raw material type are located in the vicinity of Chucuito, south
of Puno on the western side of Lake Titicaca. These quarries were discovered by Kirk Frye
in his dissertation research. The nearby sites of Incatunahuiri and Dos Suches are both
covered with literally hundreds of tons of hoes, debitage and manufacture failures of this
material (Frye and Steadman 2001). I have visited these sites, and can attest that the stone
there is visually identical to the RMT 61 and 65 objects from the Taraco Peninsula and
other areas.
Further evidence is provided by Steadman. In her excavations at Camata, located
somewhat south of Chucuito, and possibly within the Middle Formative political radius
of Incatunahuiri, she finds that hoes of this material - which she terms “gray andesite” -
first began to appear in limited quantities in the Early Qaluyu 2 phase (1050-850 B.C.)
(Steadman 1995: 32). This “gray andesite” became progressively more popular through
time at Camata, finally accounting for almost 90% of the lithic sample by the Pucara 2
phase (100 B.C. - 100 A.D.). This process began in the Middle Formative, in the Late
Qaluyu 1 phase (850-650 B.C.), roughly contemporary with the earlier part of Late Chiripa.
Steadman interprets the increased hoe production at Camata in the Middle Formative as
reflecting agricultural intensification and raised field construction (Steadman 1995: 41).
Given the data from the southern basin, however, I believe this intensified hoe produc-
tion reflects instead production for export to other areas of the Titicaca Basin, as part of a
regional exchange system.
Frye and Steadman (Frye and Steadman 2001) argue that Incatunahuiri was the produc-
tion center for these hoes, and an important hub of an exchange network extending across
the entire Titicaca Basin. Geochemical characterization of hoes from throughout the basin
will be necessary before this hypothesis can be proven conclusively, and I plan to undertake
Chapter 6 148
such a study in the very near future. For the moment, however, I will provisionally accept
Incatunahuiri as the source for the olivine basalt on the Taraco Peninsula sites.
6.5.4 Discussion
There is solid evidence, then, for a significant intensification in the Taraco Peninsula
communities’ participation in a regional exchange network in the Middle Formative. There
are also indications of the formation of something like a pan-Titicaca Basin exchange sys-
tem at this time, in which the inhabitants of the Taraco Peninsula took part. It is important,
however, to think about this exchange sphere in the larger context of the south-central An-
dean region.
It is possible that this olivine basalt was being traded from the western Basin. It was
certainly being imported from outside the Taraco Peninsula. Probably, though, it was only
a part of a much more elaborate trading system, other items of which have not been pre-
served in the Titicaca Basin environment. To the east of the Titicaca Basin, crossing the
Cordillera Blanca, lie a series of warm, humid, middle-elevation valleys known as theyun-
gas, or valles mesotermales. And beyond theyungaslies the rain forest itself, theselva.
These two areas, theyungasand theselva, are the source of a number of items which have
always been in demand in the cold, arid and high-altitudealtiplano (Browman 1981: 414,
Murra 1968, Murra 1985). Examples include cultivated and wild plants, such as coca, cot-
ton,ají (chili peppers) and a variety of hallucinogenic drugs. I should also mention various
animal products such as feline pelts20 and the brightly-colored plumage of tropical birds.
Today most trade between theyungasand the western Titicaca Basin passes through La
Paz to Tiwanaku and across the Desaguadero River at the Peru/Bolivia border (see Figure
2.1). If, however, the little lake were dry the shortest route would pass from La Paz through
the area of Chiripa and across the plains - now under water - to Yunguyu (Figure6.8).
Thus in the late Middle Formative (450-250 B.C.) the Taraco Peninsula may suddenly have
found itself located on a major trade route, one that, if it existed before this time, had
20The skirt on the Ponce Monolith in Tiwanaku (Ponce Sangines 1995: Figures 146-148) and the BennettMonolith currently in La Paz (Bennett 1934) almost certainly represent spotted feline pelts. Many Pukaratextiles also depict pelage markings using crosses, dots, or rhomboid shapes (Conklin 1983).
Chapter 6 149
previously passed by some distance to the south. Thus, the Taraco Peninsula communities
would have suddenly found themselves in a position of influence in a regional exchange
system. Local leaders - if they did not mount trading expeditions themselves - certainly
used their geographic importance to extract favorable terms from passing llama caravans,
and so gained increased access to exotic goods, from both theyungasand the western
Titicaca Basin.
The distribution of these exotic goods imported in large quantities - the olivine basalt
from Chucuito being the only archaeologically visible item - almost certainly became incor-
porated into the system of competitive generosity by which political influence was estab-
lished and maintained in these communities. As part of the same process, emerging leaders
in the Taraco Peninsula villages came to depend to a greater or lesser degree on social
contacts external to their own communities for the maintenance and reproduction of their
authority (Helms 1979, Helms 1993). We may imagine that the distribution of these ex-
otic hoes and other imported goods was incorporated into existing commensal institutions.
Feasting came to include “gifting” as well. This growing dependence of local leaders on
external exchange partners was to have significant repercussions, as I will discuss in the
following chapter.
6.6 Settlement and population
The Middle Formative settlement system of the Taraco Peninsula differs in several im-
portant ways from that of the Early Formative. Three of these differences are particularly
instructive. They are: 1) a reduction in the rate of population growth, 2) increased stability
in the settlement system and 3) the emergence of a two-level site size hierarchy. I will
discuss each of these in turn.
6.6.1 Decreasing population growth rate
It may be recalled that the population growth rate in the Early Formative, at 0.47%
annually, was quite high, close to some estimates of the maximum possible for agrarian
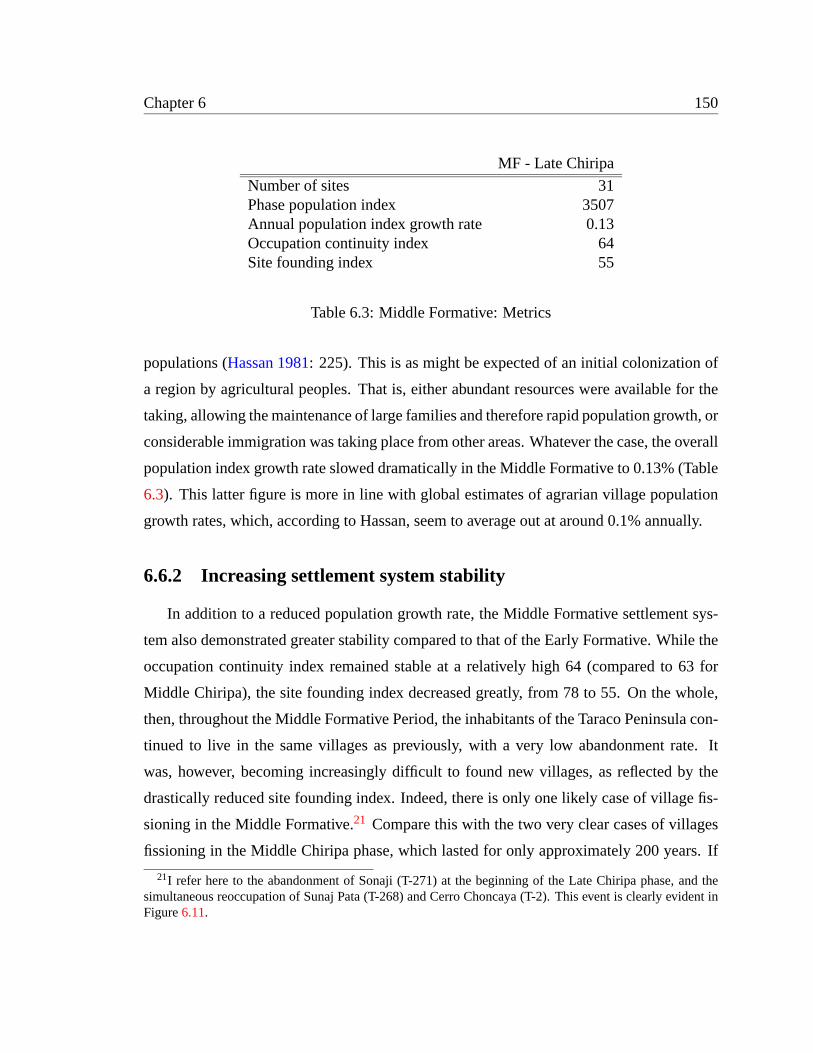
Chapter 6 150
MF - Late Chiripa
Number of sites 31Phase population index 3507Annual population index growth rate 0.13Occupation continuity index 64Site founding index 55
Table 6.3: Middle Formative: Metrics
populations (Hassan 1981: 225). This is as might be expected of an initial colonization of
a region by agricultural peoples. That is, either abundant resources were available for the
taking, allowing the maintenance of large families and therefore rapid population growth, or
considerable immigration was taking place from other areas. Whatever the case, the overall
population index growth rate slowed dramatically in the Middle Formative to 0.13% (Table
6.3). This latter figure is more in line with global estimates of agrarian village population
growth rates, which, according to Hassan, seem to average out at around 0.1% annually.
6.6.2 Increasing settlement system stability
In addition to a reduced population growth rate, the Middle Formative settlement sys-
tem also demonstrated greater stability compared to that of the Early Formative. While the
occupation continuity index remained stable at a relatively high 64 (compared to 63 for
Middle Chiripa), the site founding index decreased greatly, from 78 to 55. On the whole,
then, throughout the Middle Formative Period, the inhabitants of the Taraco Peninsula con-
tinued to live in the same villages as previously, with a very low abandonment rate. It
was, however, becoming increasingly difficult to found new villages, as reflected by the
drastically reduced site founding index. Indeed, there is only one likely case of village fis-
sioning in the Middle Formative.21 Compare this with the two very clear cases of villages
fissioning in the Middle Chiripa phase, which lasted for only approximately 200 years. If
21I refer here to the abandonment of Sonaji (T-271) at the beginning of the Late Chiripa phase, and thesimultaneous reoccupation of Sunaj Pata (T-268) and Cerro Choncaya (T-2). This event is clearly evident inFigure6.11.
Chapter 6 151
we calculate a rate of village fissioning in terms of events per century, we would say that
this rate fell dramatically in the Middle Formative, from 1.0/century (Middle Chiripa), to
0.18/century (Late Chiripa).
In fact, however, this would be to downplay the radical nature of the change. I suggested
earlier that in the Middle Chiripa phase there existed a settlement size threshold beyond
which fissioning became extremely likely. This threshold was empirically located, in terms
of my population index, at approximately 150, quite a small village.
The last instance of Formative Period village fissioning on the Taraco Peninsula seems
to have taken place at the beginning of the Late Chiripa phase. From that point on, the
existing villages continued to grow throughout the Middle Formative without fissioning or
relocating. This fact would seem to indicate that by early in the Middle Formative mecha-
nisms - institutions, practices - were developing to deal with the stresses and pressures that
arise in large, permanent villages.22 This was in fact a significant evolutionary milestone
in its own right.
Together, the decrease in the population growth rate and the increase in settlement sys-
tem stability can be taken as an indication that the landscape of the Taraco Peninsula was
beginning to fill up in the Middle Formative. That is to say that the territory of the penin-
sula was by this time claimed in its totality, and being utilized in some manner by its
inhabitants. The difficulty of village fissioning and relocation increased substantially in the
Middle Formative, tethering the local population to its villages.
6.6.3 Two-tiered site size hierarchy
The third significant fact about the Middle Formative settlement system is the emer-
gence of a two-tiered site size hierarchy. This can clearly be appreciated in Figure6.9,
which indicates a bimodal population distribution. This is plainly distinguishable from
the Middle Chiripa site size histogram, shown on the same figure for comparison. In the
Middle Formative Period, then, population was more or less equally distributed between a
group of larger villages with population index values of 350-450, and a group of smaller
22Which is to say that Roland Fletcher’s first C-Limit had been successfully overcome (Fletcher 1995).
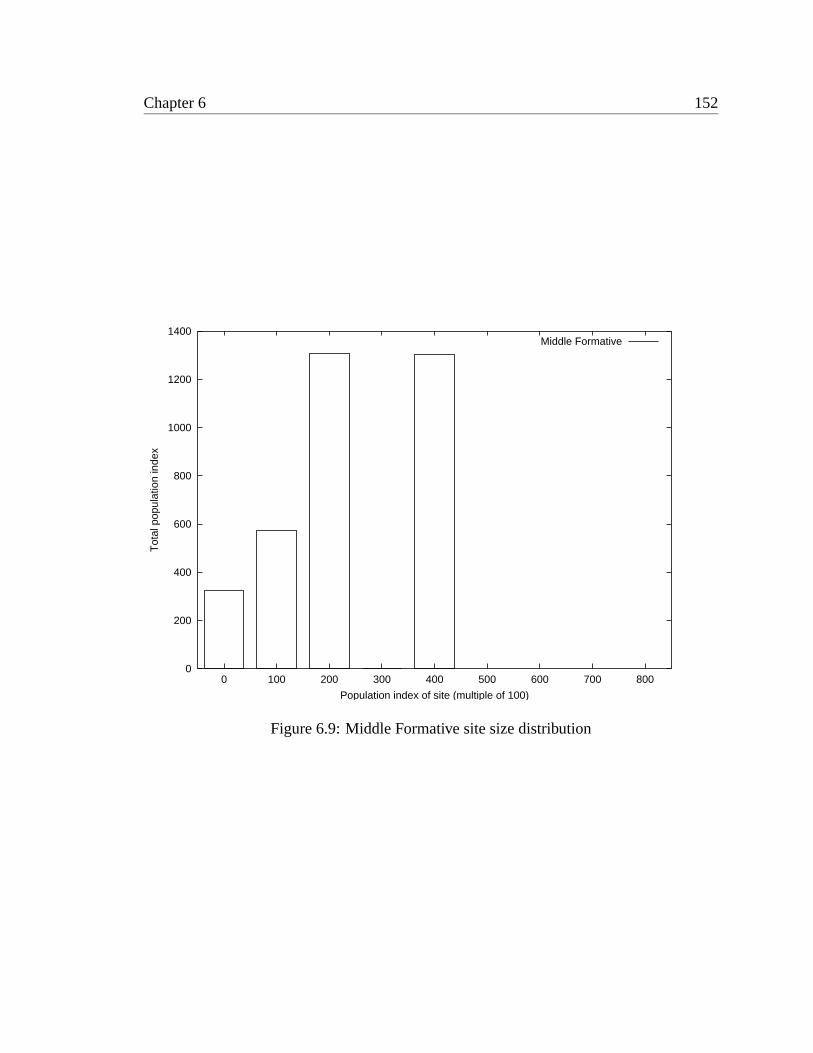
Chapter 6 152
0
200
400
600
800
1000
1200
1400
0 100 200 300 400 500 600 700 800
Tot
al p
opul
atio
n in
dex
Population index of site (multiple of 100)
Middle Formative
Figure 6.9: Middle Formative site size distribution
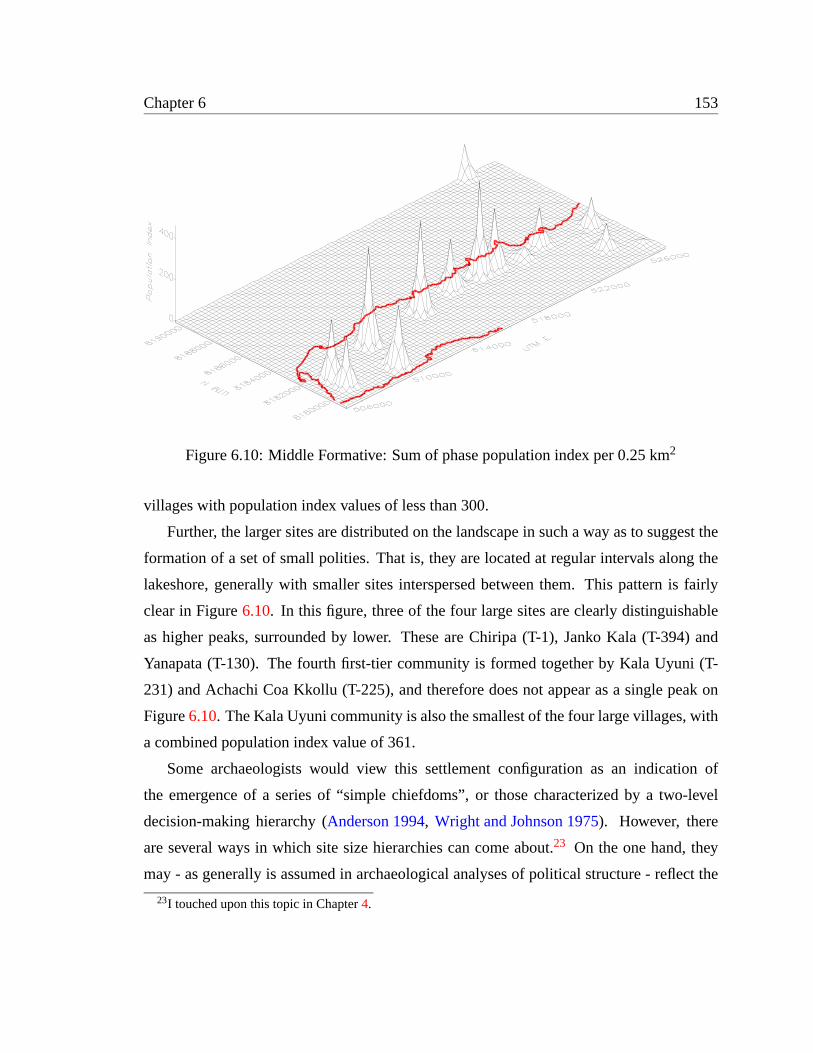
Chapter 6 153
Figure 6.10: Middle Formative: Sum of phase population index per 0.25 km2
villages with population index values of less than 300.
Further, the larger sites are distributed on the landscape in such a way as to suggest the
formation of a set of small polities. That is, they are located at regular intervals along the
lakeshore, generally with smaller sites interspersed between them. This pattern is fairly
clear in Figure6.10. In this figure, three of the four large sites are clearly distinguishable
as higher peaks, surrounded by lower. These are Chiripa (T-1), Janko Kala (T-394) and
Yanapata (T-130). The fourth first-tier community is formed together by Kala Uyuni (T-
231) and Achachi Coa Kkollu (T-225), and therefore does not appear as a single peak on
Figure6.10. The Kala Uyuni community is also the smallest of the four large villages, with
a combined population index value of 361.
Some archaeologists would view this settlement configuration as an indication of
the emergence of a series of “simple chiefdoms”, or those characterized by a two-level
decision-making hierarchy (Anderson 1994, Wright and Johnson 1975). However, there
are several ways in which site size hierarchies can come about.23 On the one hand, they
may - as generally is assumed in archaeological analyses of political structure - reflect the
23I touched upon this topic in Chapter4.
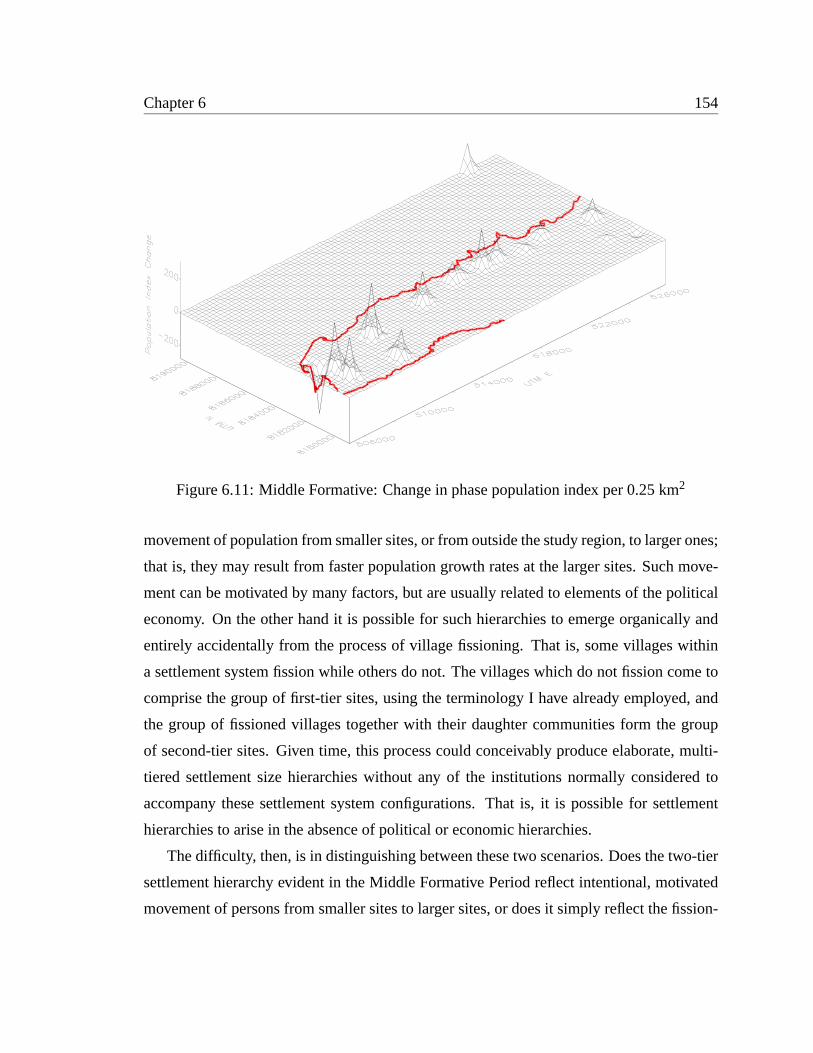
Chapter 6 154
Figure 6.11: Middle Formative: Change in phase population index per 0.25 km2
movement of population from smaller sites, or from outside the study region, to larger ones;
that is, they may result from faster population growth rates at the larger sites. Such move-
ment can be motivated by many factors, but are usually related to elements of the political
economy. On the other hand it is possible for such hierarchies to emerge organically and
entirely accidentally from the process of village fissioning. That is, some villages within
a settlement system fission while others do not. The villages which do not fission come to
comprise the group of first-tier sites, using the terminology I have already employed, and
the group of fissioned villages together with their daughter communities form the group
of second-tier sites. Given time, this process could conceivably produce elaborate, multi-
tiered settlement size hierarchies without any of the institutions normally considered to
accompany these settlement system configurations. That is, it is possible for settlement
hierarchies to arise in the absence of political or economic hierarchies.
The difficulty, then, is in distinguishing between these two scenarios. Does the two-tier
settlement hierarchy evident in the Middle Formative Period reflect intentional, motivated
movement of persons from smaller sites to larger sites, or does it simply reflect the fission-
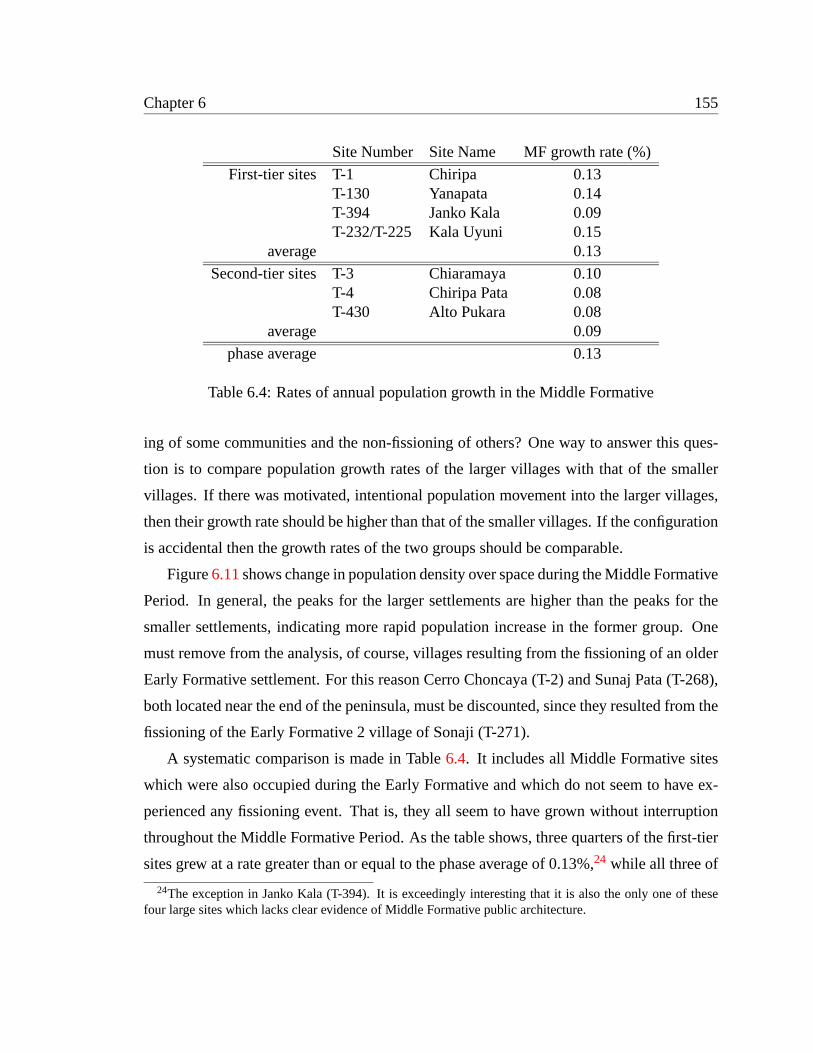
Chapter 6 155
Site Number Site Name MF growth rate (%)
First-tier sites T-1 Chiripa 0.13T-130 Yanapata 0.14T-394 Janko Kala 0.09T-232/T-225 Kala Uyuni 0.15
average 0.13
Second-tier sites T-3 Chiaramaya 0.10T-4 Chiripa Pata 0.08T-430 Alto Pukara 0.08
average 0.09
phase average 0.13
Table 6.4: Rates of annual population growth in the Middle Formative
ing of some communities and the non-fissioning of others? One way to answer this ques-
tion is to compare population growth rates of the larger villages with that of the smaller
villages. If there was motivated, intentional population movement into the larger villages,
then their growth rate should be higher than that of the smaller villages. If the configuration
is accidental then the growth rates of the two groups should be comparable.
Figure6.11shows change in population density over space during the Middle Formative
Period. In general, the peaks for the larger settlements are higher than the peaks for the
smaller settlements, indicating more rapid population increase in the former group. One
must remove from the analysis, of course, villages resulting from the fissioning of an older
Early Formative settlement. For this reason Cerro Choncaya (T-2) and Sunaj Pata (T-268),
both located near the end of the peninsula, must be discounted, since they resulted from the
fissioning of the Early Formative 2 village of Sonaji (T-271).
A systematic comparison is made in Table6.4. It includes all Middle Formative sites
which were also occupied during the Early Formative and which do not seem to have ex-
perienced any fissioning event. That is, they all seem to have grown without interruption
throughout the Middle Formative Period. As the table shows, three quarters of the first-tier
sites grew at a rate greater than or equal to the phase average of 0.13%,24 while all three of
24The exception in Janko Kala (T-394). It is exceedingly interesting that it is also the only one of thesefour large sites which lacks clear evidence of Middle Formative public architecture.
Chapter 6 156
the second-tier sites had growth rates below the phase average. The average growth rate of
the first-tier sites was 0.13%, 44% higher than the second-tier site average growth rate of
0.09%.
These data indicate that the two-tier settlement hierarchy observed in the Middle For-
mative was not, in fact, an accidental configuration, but rather resulted from the intentional
and motivated movement of people from the smaller sites to the larger sites. The rate of this
population transfer was slow, of course, but it was enough to materially affect the growth
rate of the two groups of sites. The meaning of this population flow is less than obvious.
However, it is very suggestive when considered in relation to the previously presented data
concerning the development of material culture, public architecture and exchange systems.
For the moment, however, we can suggest that during the Middle Formative Period re-
source concentration and distribution by community leaders and prominent individuals - as
discussed in Chapter4 - became, for the first time, a settlement determinant. This in turn
would suggest at least sporadic surplus flow from smaller to larger villages, and therefore
at least some level of political integration above the level of the individual village.
6.7 Discussion
To sum up the contents of this chapter, six key historical processes have been identified
during the Middle Formative Period:
1. a gradual elaboration of public architecture, culminating in the Upper House complex
at Chiripa and probably similar features at other sites,
2. the appearance of a Titicaca Basin-wide stone sculptural style (variously called Yaya
Mama [Chávez and Mohr Chávez 1975, Chávez 1988, Chávez and Chávez 1970,
Rowe and Donahue 1975] or Pajano [Portugal Ortíz 1981, Portugal Ortíz 1998]),
3. the appearance and elaboration of a complex of ceremonial artifacts, including ce-
ramic trumpets, ring-base burning bowls and decorated serving wares,25
25These first three points basically define what Chávez and Chávez have called ’the Yaya-Mama Religious
Chapter 6 157
4. an increase in the material wealth and therefore probably social status and power of
some individuals or social groups, as indicated by relatively wealthy burials in the
Upper House Level at Chiripa,
5. the probable emergence of a regional exchange system involving the Titicaca Basin
and the eastern valleys, theyungas, within which the Taraco Peninsula communities
were advantageously situated , especially after the 450 B.C. lake level fall, and
6. a modest movement of population from smaller villages to larger, producing a two-
tier site size hierarchy.
These processes are all interrelated, and in the manner of their articulation we may ap-
preciate something of the very significant social transformation which took place at this
time.
At the beginning of this chapter I proposed that the Middle Formative Period on the
Taraco Peninsula witnessed an intensification of commensal politics. The development of
a ceremonial complex including architectural, sculptural and ceramic elements was associ-
ated with this intensification of competitive feasting activity. This complex - which Chávez
and Chávez call the “Yaya-Mama Religious Tradition” (Chávez 1988) - essentially defines
the Titicaca Basin Middle Formative Period and comprised the ideological and social ma-
trix from which the later Pukara and Tiwanaku polities emerged.
The settlement dynamics outlined in this chapter and in Chapter5 point up some inter-
esting facts about the context in which the Yaya-Mama Religious Tradition emerged. In the
Middle Chiripa phase, the Taraco Peninsula villages began to reach a size which gave rise
to scale-related stresses and conflicts. These stresses caused a number of village fissioning
events in the Middle Chiripa phase and early in the Late Chiripa phase. The founding of
new villages, however, raised the costs of village fissioning and relocation by increasing
the distance groups would have to move in order to found a new village. The landscape, in
other words, was filling up. And as it filled up, the options of the members of the Taraco
Peninsula communities were reduced. No longer could they easily move a few kilometers
Tradition” (Chávez 1988).
Chapter 6 158
and found a new village. Instead, they might have to move as far as twenty kilometers, and
lose direct access to the lakeshore in the process. Therefore, local communities and their
members had a great incentive to find ways to reduce or mediate the scale-related stresses
to which their communities were being exposed.
What emerged, of course, was to become the Yaya-Mama Religious Tradition. The
process by which this ideological and sociological transformation was played out remains
- and may forever remain - obscure to the modern analyst. What seems certain, however,
was that the solution involved an intensification of ritual activity - and probably also of
an associated commensal politics - and the embedding of these politics into a cosmolog-
ical idiom of reciprocity and exchange. It is in this way that we come to see symbols of
natural fertility (Portugal Ortíz 1992, Portugal Ortíz et al. 1993) iconographically linked to
the generosity and largess of prominent community members, as manifested in ceremonial
competitive hospitality.
Whatever the precise nature of the solution, it is clear that it was successful in miti-
gating scale-related stresses in the Taraco Peninsula communities. One instance of village
fissioning can be shown to have occurred early in the Late Chiripa phase. Throughout the
remainder of the Middle Formative, however, the villages continued to grow at a regular
pace anddid not fission. This is despite the fact that many of them reached populations
well over four times what seems to have been the fission threshold during the Early Forma-
tive. Villages continued to grow, but they did not fission. Fletcher’s first C-limit had been
decisively overcome.
At the same time that the ideological/ceremonial complex of the incipient Yaya-Mama
Religious Tradition was successful in mitigating scale-related social friction, it also opened
up new opportunities for an expansion of the scope of status competition. Through the
sponsorship of community-wide ceremonial events embedded within the developing reli-
gious tradition, ambitious individuals (Hayden’s “accumulators,” or “Triple A individuals”
[Hayden and Gargett 1990, Hayden 1996b]) were able to increase the scale of their host-
ing and gift-giving activities, and thereby engender broader and deeper social obligations
among their neighbors and affines.
Chapter 6 159
This is not to say that the one led to the other in some deterministic fashion. It is rather
to say that this expansion of community ritual and probably also of commensal politics
served a perceived social need, and was therefore tolerated by the communities at large.
Over time, of course, this process took on a dynamic of its own, as the community ritual
occasions and their associated set of propositions about the world came to form an es-
tablished matrix of "rules and resources for action" (Giddens 1984); a ’structure.’ Thus a
process which had its roots in a perceived social problem and a convenient solution came
to take on a certain autonomy. Pauketat calls this process, by which individuals acting of
their own volition establish a structure which functions to limit their future autonomy, the
"tragedy of the commoners" (Pauketat 2000).
The earliest indications we have of this process appear in the Middle Chiripa phase, and
include the introduction of decorated serving ceramics, heretofore absent, and the construc-
tion of the first public architectural features, exemplified by the Choquehuanca structure at
Chiripa. These ceramics and structures were probably the product of early experimentation,
which was not entirely successful, as is shown by continuing village fissioning through the
early Late Chiripa phase. Early in the Middle Formative, however, the developing complex
of competitive ceremonialism and its associated ideological forms stabilized and was to
endure for more than 500 years, though with continual modifications and adjustments.
One of the adjustments of the system seems to have occurred around 450 B.C. when
the level of Lago Wiñaymarka dropped drastically (see Figure6.8). As I argued earlier,
this lake level drop could have led to a shift in the trade route between the western basin
and theyungas. The Taraco Peninsula communities suddenly found themselves occupying
a strategic position in a regional exchange network. We may imagine that the emerging
community elites of these villages exploited their relationships with extra-local exchange
partners to obtain significant quantities of exotic goods. The olivine basalt hoes - possibly
from Incatunahuiri - are the visible example of these goods, but we may suppose that other
exotic items were involved as well, such as coca, ají, feathers, animal pelts, precious metals
and hallucinogenic drugs.
Chapter 6 160
Thus, to the pre-existing system of competitive feasting and ritual sponsorship was
added the procurement and strategic distribution of desirable exotic goods. In other words,
a limited system of wealth finance was folded into the political economy. As has been
noted by other investigators (Earle 1997; D’Altroy and Earle 1985), the procurement and
control of exotic exchange items permits a degree of autonomy to an emerging elite not
possible in a pure system of commensality. The source of wealth no longer derives from
the labor of a single household or group of related households. Rather, astute dealings
with exchange partners can tap into a regional network of surplus production oriented to
exchange - a "collective power network" (seeMann 1986). This in turn permits a degree of
wealth differentiation not possible in a purely commensal system.
The political economy of the Taraco Peninsula communities was thereby transformed
in the middle of the Late Chiripa phase. Some individuals, families or lineages in some
villages were able to gain access to significant quantities of desirable exotic goods. These
goods were then distributed strategically, probably within the existing context of ceremo-
nial occasions and festivals, in order to increase the social leverage of the groups involved.
Relations of dependency were thus expanded in the Taraco Peninsula villages, allowing
certain groups and individuals to lay claim to the reciprocal labor services of their neigh-
bors. A portion of the surplus labor harnessed in this way was fed back into the system
via the construction of increasingly elaborate ceremonial facilities and related items of ma-
terial culture. This is documented by the increasing scale of labor investment in public
architecture, stone sculpture and ceremonial ceramics throughout the Middle Formative.
As discussed in Chapter4, through their disproportionate ability to collect and distribute
exotic items and agricultural surplus, certain individuals and groups came to function as
point resources on the social landscape, and in this way became a settlement determinant.
This accounts for the emergence of a two-tier site size hierarchy in the Middle Formative.
The inhabitants of the Taraco Peninsula communities were selecting the location of their
residences in order to increase their access to the developing system of competitive gen-
erosity. This produced the differential population growth rates of the various communities.
Those which were the place of residence of the more successful members of the emerging
Chapter 6 161
elite attracted population from the surrounding settlements. In the terminology of systems
theory, this was a positive feedback loop, since competitive success in this kind of system
is critically scale-dependent.
In this way, it was possible for a site size hierarchy to emerge on the Taraco Peninsula
in the absence of political integration.26 It is possible that as the villages in question in-
creasingly diverged in size that the larger villages began to assert coercive influence over
the smaller. At present it is impossible to confirm or deny this possibility. However, polit-
ical control and tributary relations were not the cause of the site size hierarchy, but rather
its consequence. Toward the end of the Middle Formative simple multi-community polities
may have emerged, with one or two smaller villages paying tribute to the leaders of an
adjacent larger village. This is another possibility which cannot at present be evaluated.
However it makes very little difference in terms of the overall historical trajectory.
I would like to offer a concluding observation: by including the procurement and strate-
gic distribution of exotic goods into the existing system of competitive generosity, the
emerging elites of the Taraco Peninsula exposed themselves to a new kind of risk (e.g.
Earle’s discussion of the economy as a source of social power [Earle 1997, Chapter 3]).
Any disruption of their access to these goods would undermine the basis of their legitimacy
and influence, and throw the entire political economy into crisis. This vulnerability was to
have very important ramifications in the following Late Formative Period, as I will discuss
in the following chapter.
26If I have not stated it explicitly enough, I will do so now: Chiripa (T-1) wasnot the seat of a complexchiefdom or multi-community polity in the Late Chiripa phase, or at any point in its history. There is positiveevidence to the contrary. This was an early interpretation which should now be laid to rest.
162
Chapter 7
The Late Formative: multi-community
polities and state formation
The Late Formative, as I define it here, refers to the period of time between the rise
of the Pukara polity in the northern Titicaca Basin and the beginning of the classic Ti-
wanaku period in the South. The rise of Pukara is usually dated to around 200 B.C. (see
Mujica 1987, alsoChávez 1988). This beginning of this period coincides neatly with the
transition from Late Chiripa to Kalasasaya ceramics in the South, which I have placed at
250 B.C. (see Chapter6 and below).
In the southern Titicaca Basin, the Late Formative period saw two major political and
cultural developments. The first of these was the rise of the first multi-community polities,
around 250 B.C. At this time the site of Kala Uyuni (T-232) on the Taraco Peninsula came
to dominate its immediate neighbors. The resulting social formation, the Taraco Peninsula
polity, was characterized by a three-tier site size hierarchy. Its formation coincided with
that of Pukara in the northern basin, and apparently also with that of Tiwanaku in the
Tiwanaku Valley. The Taraco Peninsula Polity - identified her for the first time - was
probably roughly the same size as the Tiwanaku polity during the earlier part of the Late
Formative. The formation of an unoccupied buffer zone between the Taraco Peninsula and
Tiwanaku polities would seem to indicate that they were competitors. The Taraco Peninsula
polity existed from 250 B.C. to approximately 300 A.D. This period will be referred to as
Chapter 7 163
the Late Formative 1 (LF1).
Around 300 A.D. the Tiwanaku polity, heretofore more or less an equal competi-
tor of the Taraco Peninsula polity, became suddenly dominant. Over the following two
centuries the site of Tiwanaku rapidly grew to cover approximately 1 km2. Ponce has
aptly termed this period the “estadio urbano temprano,” the early urban stage of Tiwanaku
(Ponce Sangines 1981). I refer to it here as the Late Formative 2 (LF2). The drastic increase
in the rate of population growth at Tiwanaku itself was paralleled by a more or less radical
depopulation of its hinterland. Though the radius of Tiwanaku’s initial political expansion
early in the LF2 is poorly defined, the Taraco Peninsula definitely fell within its orbit at this
time. The population of the peninsula as a whole decreased during this period for the first
time in the occupational history of the region. This population decline was near-universal
on the peninsula, with only a very few sites remaining constant or experiencing very slight
growth. This flow of population from the Taraco Peninsula - and other adjacent areas - into
Tiwanaku is one of the most interesting and perplexing events in Titicaca Basin prehistory,
and one of the most important for our understanding of Tiwanaku state formation. It will
be considered in as much detail as the limited data at our disposal allow. The LF2 ends
with the appearance of classic Tiwanaku ceramics throughout the Titicaca Basin around
500 A.D.
7.1 Phase definition
Late Formative ceramics in the southern Titicaca Basin were first identified by Wen-
dell Bennett in his excavations at Tiwanaku (Bennett 1934).1 In deep midden buried by
later deposits, Bennett identified a group of ceramics he called “Early Tiahuanaco”. These
consisted mostly of plainwares, together with “clay buttons” (Figure7.1v-w), bowls with
horizontal handles attached to the rim, and two sets of decorated wares which we now
call “Kalasasaya” and “Qeya.” Early Tiahuanaco levels were subsequently excavated by
Rydén and Kidder at Tiwanaku and elsewhere (Kidder 1956, Rydén 1947), though they
1In discussing Late Formative ceramic chronology, I will closely follow the work of John Janusek (seeespeciallyJanusek 2001for a recent statement; alsoJanusek 1994).
Chapter 7 164
contributed little to the definition of the phase. The Bennett sequence was later refined by
Dwight Wallace’s formal seriation (Wallace 1957).
Ponce Sanginés’s later chronology took the work of Bennett as a starting
point, but considerably modified and extended Bennett’s original phase definitions
(Ponce Sangines 1981). As far as the Late Formative is concerned, Ponce divided the
“Early Tiahuanaco” phase into three separate phases, Tiwanaku I, II, and III. While
Ponce’s sequence was explicitly designed around a conception of Tiwanaku political evo-
lution, and therefore was not strictly a ceramic chronology, he did note correlations be-
tween ceramic style and his broader cultural and political epochs. He correlated Ti-
wanaku I with the first of Bennett’s Early Tiahuanaco stylistic groups, the Kalasasaya style
(Ponce Sanginés 1976). This group was characterized by zoned-incised pieces, clearly re-
lated to the northern basin Pukara tradition. His Tiwanaku III was associated with Bennett’s
second group, Wallace’s Qeya style, distinguished by a distinctive vessel shape assemblage
and color palette.2 Ponce’s Tiwanaku II apparently contained only undecorated sherds, and
was poorly defined (Ponce Sangines 1981).
Recent investigators have tended to dismiss the Tiwanaku II phase as a fiction, while de-
bating the chronological relationship between the two stylistic groups of Early Tiahuanaco,
Tiwanaku I and III. The problem has been particularly acute for settlement research, since
decorated ceramics of both the Kalasasaya and Qeya styles are quite rare and are very in-
frequently encountered on the surface of sites. Further, in contrast to the earlier Chiripa and
later Tiwanaku decorated ceramics, the distribution of Late Formative decorated materials
- Kalasasaya and Qeya wares - seems to have been highly restricted. That is, they occur
only infrequently at major sites and political centers, and almost never at smaller habitation
sites. Reliance on this sequence for chronological control has been the source of ma-
jor problems for some recent Tiwanaku-area settlement surveys (Albarracín-Jordan 1992,
Albarracín-Jordan and Mathews 1990, Albarracín-Jordan 1996b, Mathews 1992).
Application of the Ponce Tiwanaku I-III sequence to regional settlement survey was so
problematic, in fact, that Mathews advocated a return to Bennett’s inclusive Early Tiahua-
2Ponce apparently never made this association himself. Rather, it seems to have been made by LuísLumbreras (Lumbreras 1974: 143-144; seeJanusek 2001).
Chapter 7 165
naco phase (Mathews 1992: Chapter 4). Based on his survey and limited excavations, he
suggested that Tiwanaku I and III were two components of a single “cultural stage,” and
that the categories had no real chronological significance. This interpretation was shared
by Albarracín-Jordan (Albarracín-Jordan 1992, Albarracín-Jordan and Mathews 1990).
More recent research, and more careful consideration of a range of datasets, has shown
Mathews’s conclusion to be incorrect. It is indeed possible to distinguish between earlier
and later ceramic complexes within the Late Formative. What is more, thanks to the work of
John Janusek (Janusek 2001) and Carlos Lémuz (Lémuz Aguirre 2001), it is now possible
to speak of differences in plainware pastes and vessel shape, in addition to changes in the
decorated wares.3 Following Janusek, I have divided the Late Formative into two phases,
the Late Formative 1 (LF1), which can be equated with Tiwanaku I at Tiwanaku, and the
Late Formative 2 (LF2), including Tiwanaku III and Qeya ceramics. While my own work
draws heavily on that of Janusek and Lémuz, I have adapted their sequences to the ends of
settlement research. What follows, then, will emphasize a few common plainware pastes
at the expense of a detailed seriation of attributes such as vessel form or firing.
In comparison to the Chiripa phases, the Late Formative phases are poorly-defined. This
is obviously a priority for future research in the region. It should be possible to subdivide
the LF1 at least, since Bermann’s work at Lukurmata has demonstrated substantial changes
in assemblage composition during this period (Bermann 1990, Bermann 1994, see also
Janusek 2001).4
7.1.1 Late Formative 1
Janusek dates the LF1 from 200 B.C. to 300 A.D. (Janusek 2001). I have used these
dates, while moving the initial date to 250 B.C. to accord with my hypothesized terminal
date for the Late Chiripa phase (see Section6.1).
3Janusek and Lémuz have apparently developed substantially similar Late Formative chronologies inde-pendently, Janusek using his materials from Tiwanaku and from the Katari Basin, and Lémuz using his datafrom the Santiago de Huatta Peninsula.
4Indeed, Janusek has suggested precisely such a division (Janusek 2001). I have found his formulation tobe difficult to apply to surface ceramic assemblages, however, and for this reason make no use of it here.
Chapter 7 166
I consider three groups of ceramics to be diagnostic of the LF1 phase. These are:
1. Kalasasaya style zoned-incised ceramics (Figure7.1a-l),
2. Kalasasaya style hemispherical bowls with red-painted rims (Figure7.2r-u), and
3. a distinctive fiber-tempered paste, termed Paste Group 6 in my analysis.
The Kalasasaya zoned-incised group is the most familiar, and the rarest, of the three. It was
first identified by Bennett at Tiwanaku (Bennett 1934). The best-known examples of the
style were excavated by Ponce from several tombs underlying the Kalasasaya structure at
Tiwanaku (Ponce Sanginés 1976); thus the name. Examples have been found at other sites
in the Tiwanaku heartland area by Mathews (Mathews 1992), Bermann (Bermann 1990),
Janusek (Janusek 2001), and myself (Figure7.1a-l). These vessels present a high burnish
on the exterior, and the incisions delimit color zones. Representations of geometric motifs
- most commonly the “step-fret” - predominate, and zoomorphic and anthropomorphic mo-
tifs exist as well. Designs are usually painted in black. The rest of the vessel is commonly
unslipped, but red slips are relatively common, and other slip colors are known.
Kalasasaya zoned-incised ceramics are very rare. The examples illustrated in Figure
7.1represent the majority of the specimens recovered in the survey, out of a sample, it will
be recalled, of almost 100,000 sherds. They are also very spatially restricted. Examples
were recovered from only four sites, of the 54 sites with documented LF1 occupations.
Most of these are from T-232 and T-272, the two largest sites during this phase. Another
two are from T-141, which seems to have included a relatively high-status LF1 cemetery.
This observation agrees with that of Janusek, who found that at the Katari Basin site of
Kirawi, 90% or more of elaborate decorated LF1 sherds were located in a single outdoor
midden (Janusek 2001). Thus these materials were concentrated at a regional scale - they
are found almost exclusively in the largest and most important sites - and on an intra-site
scale as well - they are located in very restricted contexts within individual sites. This is an
important observation, and a major departure from Middle Formative precedent.
The second group of diagnostic LF1 ceramics are small hemispherical bowls with red-
painted rims (Figure7.2r-u). These are commonly referred to as “Kalasasaya bowls.”
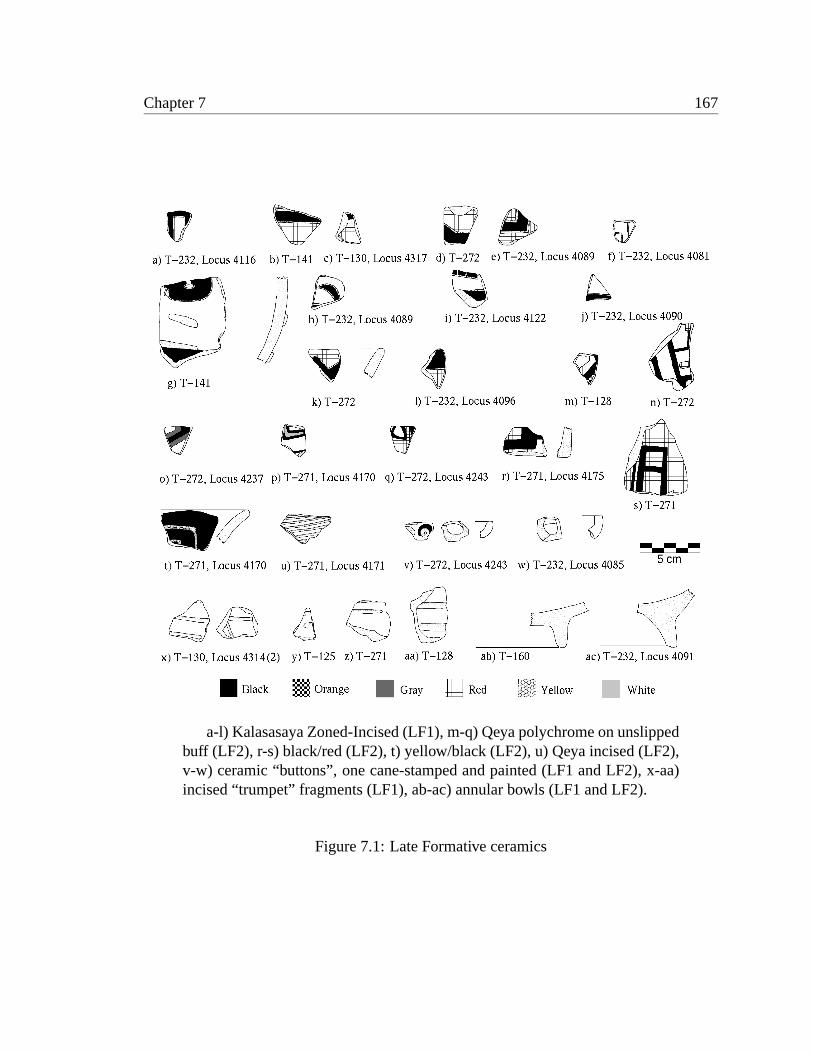
Chapter 7 167
a-l) Kalasasaya Zoned-Incised (LF1), m-q) Qeya polychrome on unslippedbuff (LF2), r-s) black/red (LF2), t) yellow/black (LF2), u) Qeya incised (LF2),v-w) ceramic “buttons”, one cane-stamped and painted (LF1 and LF2), x-aa)incised “trumpet” fragments (LF1), ab-ac) annular bowls (LF1 and LF2).
Figure 7.1: Late Formative ceramics

Chapter 7 168
Bermann calls these “chestnut bowls” (seeBermann 1994: Figure 5.4 for a photograph).
The examples I encountered on the Taraco Peninsula have a very fine, compact and light-
colored paste, often with small red mineral inclusions. In this they resemble the bowls from
Tiwanaku more than they do those from Lukurmata, which seem to be more brown. They
are often highly eroded, as the paste is usually very soft, with an almost soapy texture.
Rims are usually rounded and direct, though one flared-rim specimen was recovered (7.2r).
The bowls are typically painted on both the exterior and interior rim, though significant
variation exists in this regard. The paint employed is normally a very dark red, almost
purple (7.5 YR 3-4/4-6).
Kalasasaya bowls are much more common than are the zoned-incised sherds, and they
were found on virtually every site with a LF1 occupation. There is some evidence that
they were used in ritual or public consumption contexts. At Lukurmata, Bermann found
that in the second occupation Kalasasaya bowls were predominantly associated with a
single, elaborate outdoor hearth, to the exclusion of other more quotidian hearths nearby
(Bermann 1994: 72). Janusek makes a similar observation with respect to his excavations at
Kirawi (Janusek 2001). Bermann suggests the bowls were employed in “offering/prestation
activities” (Bermann 1994: 76).
The third group of diagnostic LF1 ceramics are those manufactured of my Paste Group
6. This is a semi-compact paste with a very finely-chopped fiber temper. This is easily
distinguished from Middle Formative fiber temper, which is invariably much more dense
and coarse. Sherds of this paste are normally oxidized - though they commonly have a
slightly reduced core - and are a red-brown color. Small gold mica fragments are also
present in quantity. Most distinctive, however, is the use of significant amounts of biotite
in the temper. The tiny black flecks in the red-brown matrix impart a very distinctive
appearance. Sherds of this paste are typically extremely eroded when encountered on the
surface, and are broken into small fragments.
This paste is extremely common in the LF1. All sites with Kalasasaya sherds also have
great quantities of Paste Group 6 on the surface. No site was located which simultaneously
had Kalasasaya ceramics and lacked Paste Group 6 sherds. I have used it as a diagnostic
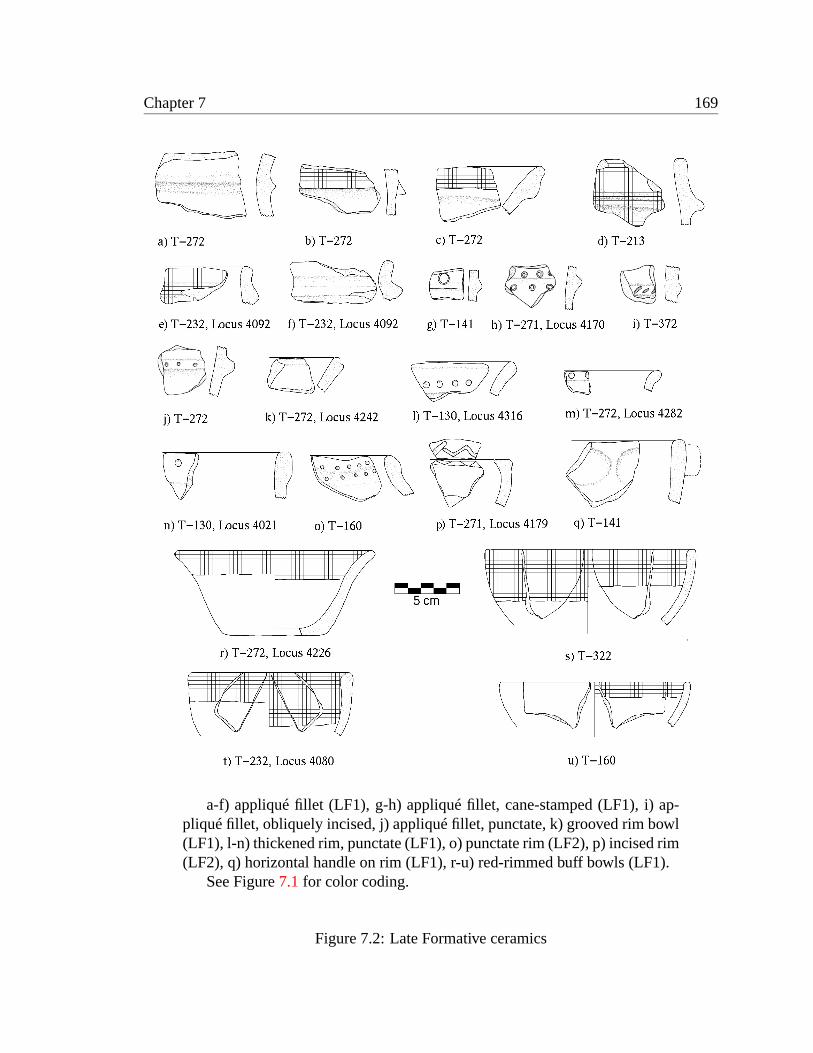
Chapter 7 169
a-f) appliqué fillet (LF1), g-h) appliqué fillet, cane-stamped (LF1), i) ap-pliqué fillet, obliquely incised, j) appliqué fillet, punctate, k) grooved rim bowl(LF1), l-n) thickened rim, punctate (LF1), o) punctate rim (LF2), p) incised rim(LF2), q) horizontal handle on rim (LF1), r-u) red-rimmed buff bowls (LF1).
See Figure7.1for color coding.
Figure 7.2: Late Formative ceramics
Chapter 7 170
for this reason.5 It is easily distinguishable from Middle Formative ceramics. While fiber-
tempered ceramics continued to be used in small quantities in the subsequent LF2, and
even into the Tiwanaku Period, they were much rarer in these later phases, and seem to
have been restricted to large storage vessels and annular bowls. In the LF1, by contrast,
Paste Group 6 was employed for ollas and jars, as well as for annular bowls. Further, the
distinctive biotite temper is lacking in the later phases.
If present at Lukurmata, Paste Group 6 has probably been included in Bermann’s
“Lorokea Fiber” type (Bermann 1990: 78). Paste Group 6 is much more specific than
Lorokea Fiber, however, since this type seems to simply aggregate all fiber-tempered sherds
recovered in Bermann’s excavations. Lorokea Fiber is a generic type and is therefore of
limited utility.
Finally, Carlos Lémuz’s Paste 18 is I think very similar to my own Paste Group 6.
Paste 18 is, according to Lémuz, “the paste most representative of the Early Pana phase”
(Lémuz Aguirre 2001: 162), his local LF1 phase designation for the Santiago de Huatta
Peninsula. It apparently occurs only in Early Pana contexts, disappearing in the LF2 and
Tiwanaku period. Paste 18 contains fiber temper, mica and, significantly, biotite, and is
fired in an oxidizing atmosphere. Paste 18 makes up less than 10% of the ceramic sample
from Lémuz’s excavations (Lémuz Aguirre 2001: 162); however I believe Paste Group 6
to be much more common than this on the Taraco Peninsula.
Several other ceramic attributes may be diagnostic of the LF1 phase, though they were
not employed as such in the present study. These include triangular (“pointed”) appliqué
fillets on the exterior of vessels (Figure7.2a-h). These fillets are frequently decorated with
oblique incision, cane-stamping (Figure7.2g-h;l see alsoLémuz Aguirre 2001: Figures
8.53a-b, 8.54a, d) or punctation. Many vessels with these fillets - apparently predominantly
large bowls - are also painted on the rim with the same dark red paint which is used on the
Kalasasaya bowls (Figure7.2b-e).6
5I should note that both Janusek and Lémuz have inspected my type collection of this paste and agree thatit dates to the LF1.
6Comparing the illustration in Figure7.2 to those provided by Mathews for his “Early Formative LateralBanded Incised” group (Mathews 1992: Figures 3.11-3.13b), I am forced to conclude that his LBI ceramicsdate, in fact, to the LF1 and that his column at T’ijini Pata (TMV-79) was at least partially stratigraphically
Chapter 7 171
Also common is a thickened vertical rim with punctation (Figure7.2l, n), horizontal
handles on the rim of large bowls (Figure7.2q), and latitudinally-grooved bowl rims (Fig-
ure 7.2k). These last three traits seem to also be present in the LF2, however, and are
therefore probably not diagnostic for the LF1.
Finally, it should be noted that the manufacture and use of ceramic “trumpets” contin-
ued into the LF1 (7.1x-aa; alsoBermann 1994, Figure 5.5c). These may easily be distin-
guished from the earlier MF trumpets by their lack of fiber temper and their very compact
paste. These do not seem to extend into the following LF2 period (witness their complete
absence in the LF2 levels at Iwawe [Burkholder 1997]), but this is not sufficiently certain
at present to allow them to confidently be employed as LF1 diagnostics.
7.1.2 Late Formative 2
Janusek dates the LF2 from 300 A.D. to 500 A.D. (Janusek 2001). I have retained these
dates in the present analysis.
Considered in ceramic terms, the shift from LF1 to LF2 consisted of the gradual disap-
pearance of the Kalasasaya red-rimmed bowls, the abrupt replacement of the Kalasasaya
zoned-incised complex with a new set of decorated ceramics grouped under the name
“Qeya”, and a partial change in plainware pastes.
I consider three groups of ceramics to be diagnostic for the LF2. They are:
1. Qeya polychrome ceramics,
2. Qeya incised ceramics, and
3. a distinctive thin, reduced micaceous ware I called Paste Group 13 in my ceramic
analysis.
Qeya polychrome ceramics were first noted by Bennett as a stylistic component within
his Early Tiahuanaco phase (Bennett 1934). The name “Qeya” was apparently attached
to the style by Dwight Wallace (Wallace 1957). It refers to the site of Qeya Qollu Chico
inverted.
Chapter 7 172
on the Isla del Sol, where Bandelier collected some specimens of the style early in the
century (Bandelier 1910; photographs of some specimens collected by Bandelier have been
published inBauer and Stanish 2001, Figures 4.4-4.8). The Qeya style is quite elaborate,
with a wide range of unusual vessel shapes and iconography. Forms include burnished,
scalloped annular bowls often with modeled feline heads on the rim,kero-like cups, and tall,
flaring-rim bowls calledescudillas. These vessels are frequently decorated with a variety
of geometric, zoomorphic and anthropomorphic motifs, including a front-faced figure with
rays radiating outward from the face, clearly prefiguring the Tiwanaku Gateway God motif.
Qeya polychrome ceramics were formally defined by Dwight Wallace (Wallace 1957).
Wallace characterized them as having a fine, light-colored paste, sometimes micaceous,
unslipped and painted in a variety of colors. Qeya ceramics also exist in a variety of un-
usual forms. From the perspective of the survey archaeologist, however, Qeya polychrome
ceramics may be summarized simply as “polychrome on unslipped buff”. Fragments of
these vessels are quite rare on the surface, and they seem to be restricted both regionally
and locally (that is, on both the intra- and inter-site scales), as was the case in the LF1.
Examples recovered from the survey are illustrated in Figure7.1m-q.
In addition to the polychrome on buff sherds, some black on red sherds are also present
in this phase (seeAlbarracín-Jordan 1996a: 131 and Figure 7.7; Figure7.1r-s).7 One yel-
low on black rim was recovered which is probably LF2 in date (Figure7.1t). These sherds
do not fall within Wallace’s definition of Qeya, but they do seem to pertain to the LF2.
Qeya incised ceramics were also identified by Wallace. These sherds display a
very closely-spaced pre-firing incision, typically comprised mostly of parallel lines.
This is a very widely distributed style, having been found in the Tiwanaku heartland
(Bermann 1990: Figure 77b, Bermann 1994: 135, Figure 9.5b; ), in the Juli area
(Stanish and Steadman 1994), at Camata (Steadman 1995: 392, Figure 70d), on the Santi-
ago de Huatta Peninsula (Lémuz Aguirre 2001: Figure 8.60d-f), and in the northern Tit-
icaca Basin and as far away as Cuzco (Chávez 1985). They are even more rare than
Qeya polychrome ceramics. Only one example was recovered during the survey (Fig-
7These sherds are distinguished from later Tiwanaku wares by the “fugitive” quality of the red slip and bya very fine, soft and light-colored paste.
Chapter 7 173
ure 7.1u). Flattened or “shelf” rims incised with parallel or zig-zag lines appear to be
distinctive of this phase as well (see Figure7.2p; alsoBurkholder 1997: 170 and Figures
6.10, 8.2), as do lobes on the rims of hyperboloid bowls, incised with 2-4 parallel lines
(Lémuz Aguirre 2001: Figure 8.55a-b).8
Since Qeya polychrome and Qeya incised ceramics are so rare, they cannot be used to
reliably define LF2 occupations in Taraco Peninsula sites. For this purpose it was necessary
to identify a plainware ceramic paste distinctive of the phase. Paste Group 13 serves the
same purpose for the LF2 as Paste Group 6 did for the LF1.
Paste Group 13 consists of thin, reduced sherds, brown to dark gray in color, mostly
of cooking ollas, which are tempered with a great quantity of mica. The density of mica
in these sherds is very high, and may be considered distinctive of the phase. Paste Group
13 did not comprise the majority of the LF2 ceramic assemblage. However, it was suf-
ficiently common to be useful as a temporal marker in surface collections. For example,
Janusek found that a “brown” paste and a “dense mica” temper characterized 14% of the
LF2 assemblage at the site of Kirawi on the Pampa Koani. He also notes that at this time
“ollas with thin walls and high densities of fine mica became common” (Janusek 2001). A
similar pattern may be observed at Tilata, in the Tiwanaku Valley. Further, Mathews notes
that the blackware of the “Kallamarka style” (Portugal Ortíz and Portugal Zamora 1977:
260) represents “a probable Tiwanaku III domestic ware” (Mathews 1992: 223). This last
assemblage may or may not correspond to what I have termed Paste Group 13. Finally,
Carlos Lémuz has stated that nearly 20% of LF2 (his ‘Pana Tardío’ phase) ceramics on the
Santiago de Huatta Peninsula can be classified as his Paste 12, which is “very dark” and
contains significant quantities of mica (Lémuz Aguirre 2001: 159).9
8It is my belief that Burkholder’s Huchani A, B and C styles all belong to the LF2 period. In her disser-tation, Burkholder places the Huchani materials from “some time after 1000 B.C. and ... before AD 600”(Burkholder 1997: 172, also 168, 170). The early end of this range is owing to a radiocarbon date (925±85B.C., calibrated) obtained by Albarracín-Jordan in his earlier excavations (seeAlbarracín-Jordan 1992: 148,Albarracín-Jordan 1996a: 133). It has since become apparent (though not yet in print, unfortunately) that thisdate is an anomalous outlier, and that the initial occupation of Iwawe actually dates to somewhere around300 A.D. If this is true, then the Huchani ceramics are LF2 in date, as indeed their stylistic attributes wouldsuggest.
9Curiously, however, no dark, micaceous paste is included in Burkholder’s catalog of wares from thesite of Iwawe (Burkholder 1997: Chapter 5). Since LF2 levels were clearly excavated (the Huchani styles,
Chapter 7 174
Summarizing the LF2 ceramic evidence, I am forced to admit that this phase is the most
tenuously identifiable. The truly diagnostic ceramics (the Qeya polychrome and incised
wares) are very rare indeed. The only apparently diagnostic plainware type (Paste Group
13) is uncommon, comprising - if I may extrapolate from Janusek’s excavation data10 - no
more than 10-20% of the total plainware assemblage. I believe that my definition of the
phase has been adequate to satisfactorily identify LF2 occupation components using mixed
surface assemblages. However, it is abundantly clear that much more work is required and
that the LF2 is the most problematic phase in the regional sequence.
7.2 Principal sites
7.2.1 Late Formative 1
Twelve sites were identified with LF1 occupations greater than or equal to 3.0 ha. These
are numbered on Figure7.3and are described below.
T-1E (Chiripa)
Like most of the old villages of the Taraco Peninsula, Chiripa shrunk during the LF1.
Sector E has a population index value of 353, while Sector D (MF) has a value of 445.
This represents a population index growth rate of -0.04% annually, the first time during its
history in which the population of Chiripa declined.
Monumental construction continued, however. The Upper House Level structures
(see section6.3) were burned and demolished at the beginning of the LF1, and a large
earthen mound was constructed over the resulting rubble. This mound is the mound that
is visible today at Chiripa. This mound was then faced with cut stone, and an elabo-
rate sunken court was constructed on top, again using large quantities of imported cut
Burkholder 1997Figures 6.8, 6.9, 6.10, 8.1, 8.2), as witness finds of Qeya polychrome (Burkholder 1997Figures 6.12, 8.4) and incised sherds, this must remain for the moment an unexplained anomaly.
10Janusek’s data agree with my own observations of the ware’s low frequency.
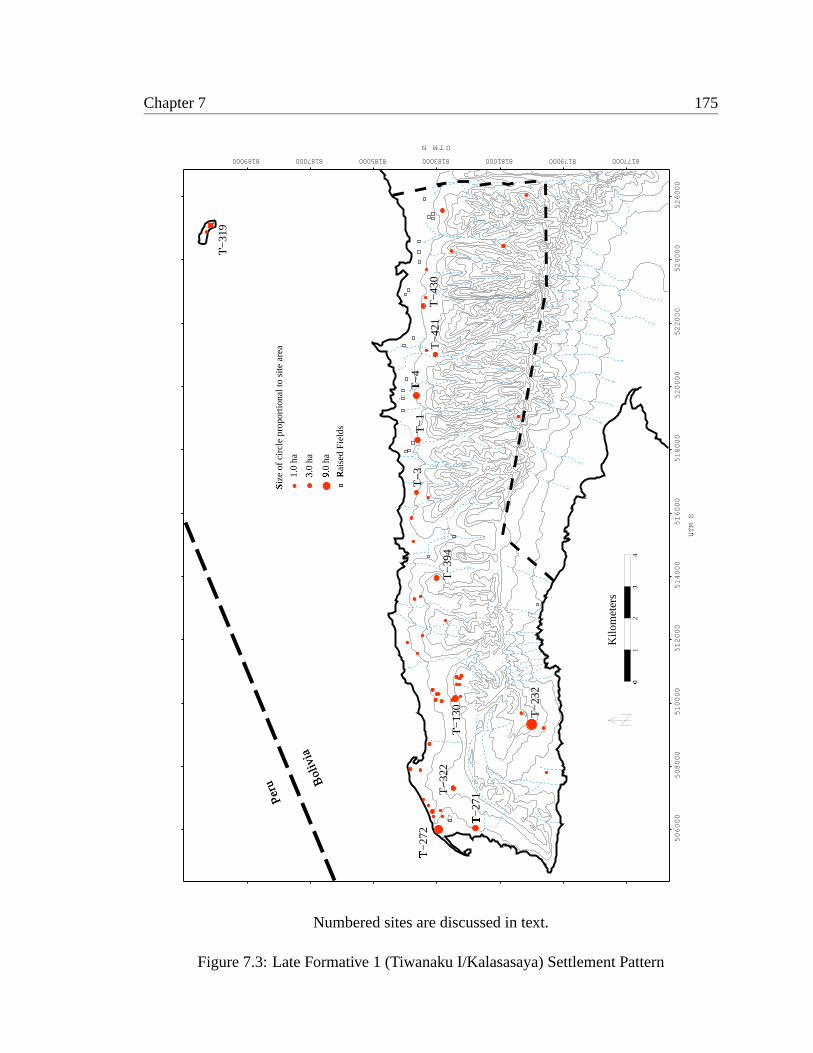
Chapter 7 175
0�
12
3�
4
Kilo
met
ers
1.0
ha
Rai
sed
Fie
lds
�3.0
ha
�
Peru B
oliv
ia
Siz
e of
circ
le p
ropo
rtio
nal t
o si
te a
rea
�
9.0
ha
�
506000
508000
510000
512000
514000
516000
518000
520000
522000
524000
526000
UTM E
�
UTMN
8770008179008110000818500818700819000 108818300008
T−
1
T−
394
T−
130
�
T−
232
T−
3
T−
271
�
T−
272
�
T−
4
�
T−
430
T−
319
�
T−
322
T−
421
Numbered sites are discussed in text.
Figure 7.3: Late Formative 1 (Tiwanaku I/Kalasasaya) Settlement Pattern
Chapter 7 176
stone (Bennett 1936). There were apparently summit structures associated with this mound
(Chávez 1988), though we know little about them.
T-3D (Chiaramaya)
The population of Chiaramaya also declined in the LF1. Sector D has a population
index value of 157 (3.0 ha), as opposed to 231 (4.25 ha) for Sector C (MF). This is an
annual population growth rate of -0.06%, similar to that of Chiripa (T-1).
T-4C (Chiripa Pata)
Chiripa Pata is one of the very few sites on the Taraco Peninsula which increased in
size during the LF1. Sector C has a population index value of 414 (7.25 ha), as opposed to
277 (5.0 ha) for sector B. This is equates to an annual growth rate of 0.07%, far less than
that of the principal LF1 sites (Kala Uyuni, T-232), and slightly below the phase average
of 0.08%, but still remarkable in a phase in which most sites lost population.
T-130E (Yanapata)
Yanapata also lost population in the LF1. Sector E has a population index value of 414
(7.25 ha), as opposed to 429 (7.5 ha) for the MF Sector D. This is a growth rate of -0.01%,
a slower decline than many sites (such as Chiripa), but a loss of population nevertheless.
T-232C (Kala Uyuni)/T-225D (Achachi Coa Khollu)
Kala Uyuni was probably the principal LF1 site on the Taraco Peninsula. It increased
from a combined MF population index of 362 (T-232B, T-225C) to a combined LF1 value
of 900, an annual growth rate of 0.17%. This is more than twice the phase average.
Kala Uyuni was the center of a multi-community polity encompassing all of the Taraco
Peninsula communities. I propose that it was a competitor of Tiwanaku and of Lukurmata,
at least the first of which seems to have been about the same size during the LF1. If this
is the case, we may expect significant public architecture at the site. No excavations have
Chapter 7 177
ever been undertaken here, however, so it is not possible to confirm or deny this hypothesis
at present.
T-271B (Sonaji)
After being abandoned in the MF, Sonaji was reoccupied in the LF1. Sector B has a
population index of 429 (6.75 ha), making it a very significant center indeed. I suggest that
it was associated with the nearby sites of Kumi Kipa (T-272) and Kollin Pata (T-322).
T-272B (Kumi Kipa)
Kumi Kipa, unoccupied in the Middle Formative, is colonized and comes to be a signif-
icant settlement during the LF1. Sector B has a population index of 647 (11.0 ha). There is
little evidence of public architecture, only two small mounds being in evidence. I suggest
that Kumi Kipa formed part of a larger site complex including T-271 (Sonaji) and T-322
(Kollin Pata). This group of sites will be referred to as the Santa Rosa group.
T-319A (Sikuya Este)
In the LF1 on the island of Sikuya population shifted to the eastern end of the island.
T-320 (Sikuya Oeste), occupied during the MF, was abandoned, the population relocating
to T-319. T-320A has a a population index value of 157, compared to 204 for T-319A (3.8
ha). This represents an annual population growth rate of 0.05%. While below the phase
average, this growth could suggest that Sikuya lay outside the radius of the LF1 Taraco
Peninsula polity.
It should be noted, though, that Sikuya was not at this point an island. Lower lake levels
(see below) mean that during the LF1 T-319 as a lakeshore settlement much like Chiripa,
Chiaramaya and others.
Chapter 7 178
T-322A (Kollin Pata)
Located in the community of Ñacoca near the modern town of Santa Rosa, Kollin Pata
is first occupied during the LF1. It eventually grew to be a significant Tiwanaku Period
site. The site itself is located on the top of and on the North-facing slopes of a low natural
rise above the lake. It lies to the North of the modern road. The site is intervisible with the
other major LF and Tiwanaku Period sites in the Santa Rosa area: Kumi Kipa (T-272) and
Sonaji (T-271).
The top of the natural hill on which the site is located seems to have been terraced,
forming a large mound. This feature may or may not have been of ceremonial significance,
and this issue will only be clarified by excavation.
Sector A extends over 3.50 ha and has a population index value of 186.
T-394D (Janko Kala)
Like the other old villages, Janko Kala experienced a population decline in the LF1.
Sector D has a population index value of 277 (5.0 ha), as opposed to 429 for the MF Sector
C, an annual population growth rate of -0.08%. This is the same rate at which Chiripa (T-1)
lost population in this period, suggesting that the two sites were subjected to similar sets of
pressures and possibly tribute exactions.
T-421E (Waka Kala)
Waka Kala had minor occupations during the Early and Middle Formative Periods. In
the LF1, however, it grew relatively rapidly into a moderate-sized village. The MF Sectors
B and C have a combined population index value of 73. By contrast, the LF1 Sector E has
a population index value of 201 (3.75 ha), an annual growth rate of 0.18%. Thus growth
rate is quite high and leads me to suggest that some of this population may have derived
from elsewhere, perhaps from some of the many Taraco Peninsula sites which declined in
population at this time.
The site itself is located on a North-facing slope above the lacustrine plain in the com-

Chapter 7 179
munity of Cala Cala, near the border with Pequery. The modern road to Taraco cuts across
the lowermost portion of the site. In the uppermost portion of the site, several hundred
meters to the South of the modern road, the remains of a sunken court structure may be
discerned. The principal occupation seems to have been Pacajes-Inka, covering 5.5 ha with
a very dense sherd scatter.
The sunken court is in the LF1 style, bearing some resemblance to the Semi-
Subterranean Temple at Tiwanaku. Like the Semi-Subterranean Temple, and like the con-
temporaneous sunken court at Chiripa, the Waka Cala court is internally faced with stone,
with large stone pillars placed at regular intervals. Some of these upright “monoliths” are
visible on the surface today. Another point of resemblance is the presence of tenoned head
sculptures. Two of these heads - one of sandstone and one of limestone - were observed by
the author in rockpiles near the sunken court. There are probably many more present below
the surface, as the structure has never been excavated. The heads are of the same style as
those found in the Semi-Subterranean Temple at Tiwanaku.
Finally, the Waka Kala structure is associated with a stone stela, the only one known
from the Taraco Peninsula. This is the stela which Portugal refers to as “el ídolo de
Cala Cala” (Portugal Ortíz 1981, Portugal Ortíz 1998: 102). This piece was discovered by
Maks Portugal Zamora in 1940, in the same field season in which he excavated at Chiripa
(Portugal Ortíz 1998: 102; see alsoBandy 1999a).
The stela is composed of a slab of red sandstone, approximately 60 cm wide by 40 cm
deep by more than 190 cm high. On it is represented a human figure viewed from the front
with arms extended alongside the body. The feet are represented with toes turned outward.
This human figure sports a “skirt”, an unusual feature in this style. Below the human
figure’s feet is a profile body, front-face feline, typical of this style. On either side of the
slab is carved an elongated serpent with the head facing upwards. The uppermost portion
of the stela, including what must have been the head of the human figure, has been broken
off. It most likely was the victim of decapitation at the hands of the colonialextirpación de
idolotría, as were countless such local sacred objects throughout the Andean region.
Chapter 7 180
T-430C (Alto Pukara)
Alto Pukara experienced slight growth during the LF1, its population index value in-
creasing from 171 (Sector B) to 186 (Sector C; 3.5 ha). This represents an annual growth
rate of 0.02%.
7.2.2 Late Formative 2
Eight sites were identified with LF2 occupations greater than or equal to 3.0 ha. These
are numbered on Figure7.4and are described below.
T-1F (Chiripa)
The population of Chiripa declined further in the LF2, as did that of virtually every site
on the Taraco Peninsula. Sector F has a population index value of 322 (5.75 ha), down
from 353 for the LF1 Sector E, an annual growth rate of -0.05%. This is not as precipitous
a decline as the phase average of -0.12%, but it is a decline nevertheless.
As far as public architecture is concerned, the mound and sunken court at Chiripa ap-
parently continued to be utilized into the phase. Browman found “a couple undisturbed
pockets” on the floor of the temple which yielded Tiwanaku III ceramics (Browman 1978a:
810).
T-4D (Chiripa Pata)
Sector D at Chiripa Pata has a population index value of 353 (6.25 ha), down from
414 for the LF1 Sector C. This is an annual growth rate of -0.08%, comparable to that of
Chiripa.
T-271C (Sonaji)
Sonaji experienced only slight depopulation during the LF2. Sector C has a population
index value of 368 (6.5 ha), as opposed to 383 for the LF1 Sector B. This is an annual
growth rate of -0.02%, less than half the rate of Chiripa. Most of that decline may be
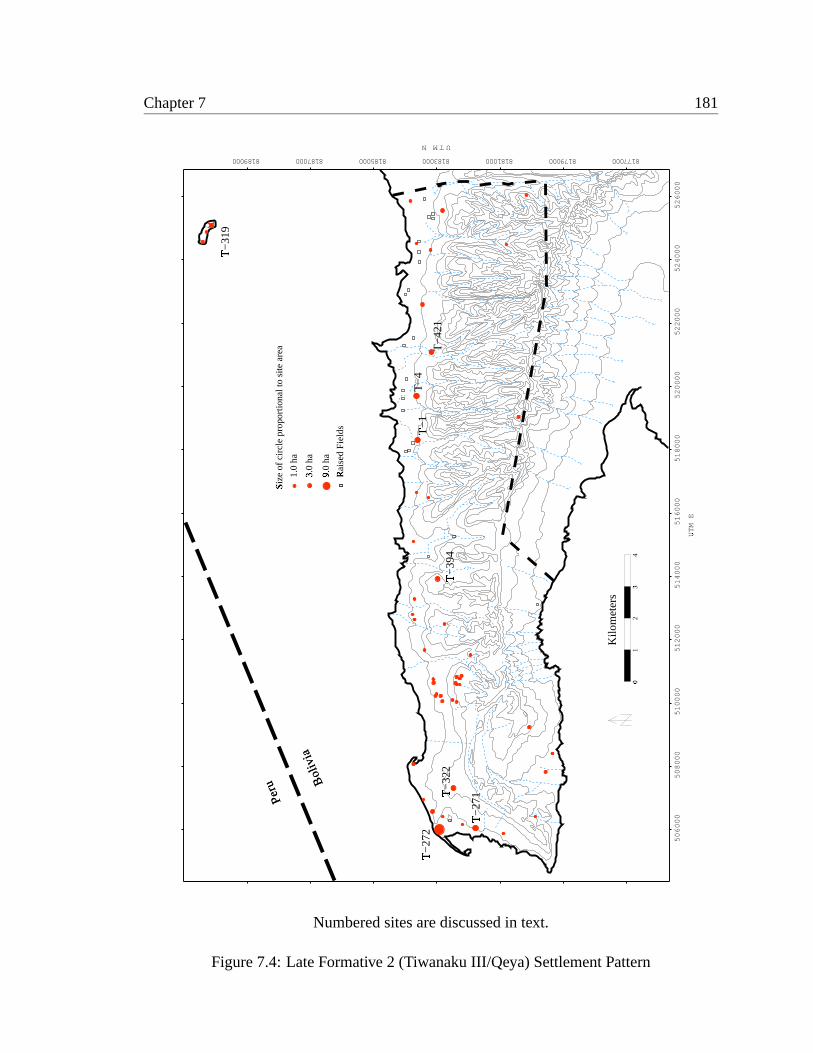
Chapter 7 181
0�
12
3�
4
Kilo
met
ers
1.0
ha
Rai
sed
Fie
lds
�3.0
ha
�
Peru B
oliv
ia
Siz
e of
circ
le p
ropo
rtio
nal t
o si
te a
rea
�
9.0
ha
�
506000
508000
510000
512000
514000
516000
518000
520000
522000
524000
526000
UTM E
�
UTMN
8770008179008110000818500818700819000 108818300008
T−
1�
T−
394
�
T−
271
�
T−
272
�
T−
4
T−
319
�
T−
322
�
T−
421
Numbered sites are discussed in text.
Figure 7.4: Late Formative 2 (Tiwanaku III/Qeya) Settlement Pattern
Chapter 7 182
attributed to a movement of population to adjacent sites which experienced growth, espe-
cially Kumi Kipa (T-272) and Kollin Pata (T-322).
In the LF2, and possibly during the LF1 as well, Sonaji seems to have been integrated
with Kumi Kipa and Kollin Pata, forming a single community. While the latter two sites
seem to have been primarily residential, with little evidence of elite or ceremonial architec-
ture, Sonaji itself seems to have been relatively specialized, as ceramics and architecture
seem to show. It may very well have been the residential locus of a local elite, as well as
the location of the principal public architectural complex on the Taraco Peninsula. This
situation remained unchanged into the Tiwanaku Period. The three sites of Sonaji, Kumi
Kipa and Kollin Pata will be referred to collectively as the Santa Rosa group (see sections
7.2.1, ).
T-272C (Kumi Kipa)
Kumi Kipa is one of the very few Taraco peninsula sites which experienced growth
during the LF2. Sector C has a population index value of 836 (13.75 ha), up from 821
for Sector B, for an annual growth rate of 0.01%. This is very slow growth, to be sure,
but in light of the generalized decline in population during the LF2 on the peninsula it is
noteworthy.
T-319B (Sikuya Este)
The LF2 occupation of Sikuya seems to have remained the same as for the LF1. That
is, it seems neither to have increased or decreased. Sector B has a population index value of
204, (3.8 ha) the same as Sector B. It must be remembered, however, that this site was not
systematically surface-collected, and these data are therefore less than absolutely reliable.
Also noteworthy is the fact that it is probably during the LF2 when the level of the lake
achieved and possibly surpassed modern levels for the first time, isolating Sikuya from the
mainland. Its long and sporadic history as an island had begun.
Chapter 7 183
T-322B (Kollin Pata)
Like Kumi Kipa, Kollin Pata also experienced growth during the LF2. Sector D has a
population index value of 246 (4.5 ha), up from 186 for Sector A. This is an annual growth
rate of 0.14%, by far the fastest growth of any site on the peninsula. As mentioned above,
it sees to have formed part of a single community together with Kumi Kipa and Sonaji,
described above.
T-394E (Janko Kala)
Like most Taraco Peninsula communities, Janko Kala experienced population decline
during this period. Sector E has a population index value of 246 (4.5 ha), down from 277
for Sector D, a rate of -0.06% per annum. This is comparable to Chiripa’s growth rate.
T-421F (Waka Kala)
Waka Kala is one of the few sites to have experienced growth during the LF2. Sector F
has a population index value of 246 (4.5 ha), up from 201 for the LF1 Sector E. This is an
annual growth rate of 0.10%. It is unknown whether or not its sunken court continued in
use at this time.
7.3 Lake level change
The beginning of the LF1 coincided with a dramatic rise in the level of Lago Wiñay-
marka. In the latter part of the Middle Formative, as discussed in Chapter6, the level of
the lake was 10-12 meters below its overflow level, or 16-18 meters below its modern av-
erage of 3810 m.a.s.l. (Figure6.8). Around 250 B.C., however, at the beginning of the
LF1, the lake level rose abruptly to approximately 1-7 m below its modern level, and re-
mained in this range for the next 350 years or so (Abbott et al. 1997a: 179 and Figure 4).
The reconstructed shoreline for Lago Wiñaymarka at these levels is presented in Figure
7.5. Around 100 A.D., late in the LF1, the lake level fell again to the same level as in the
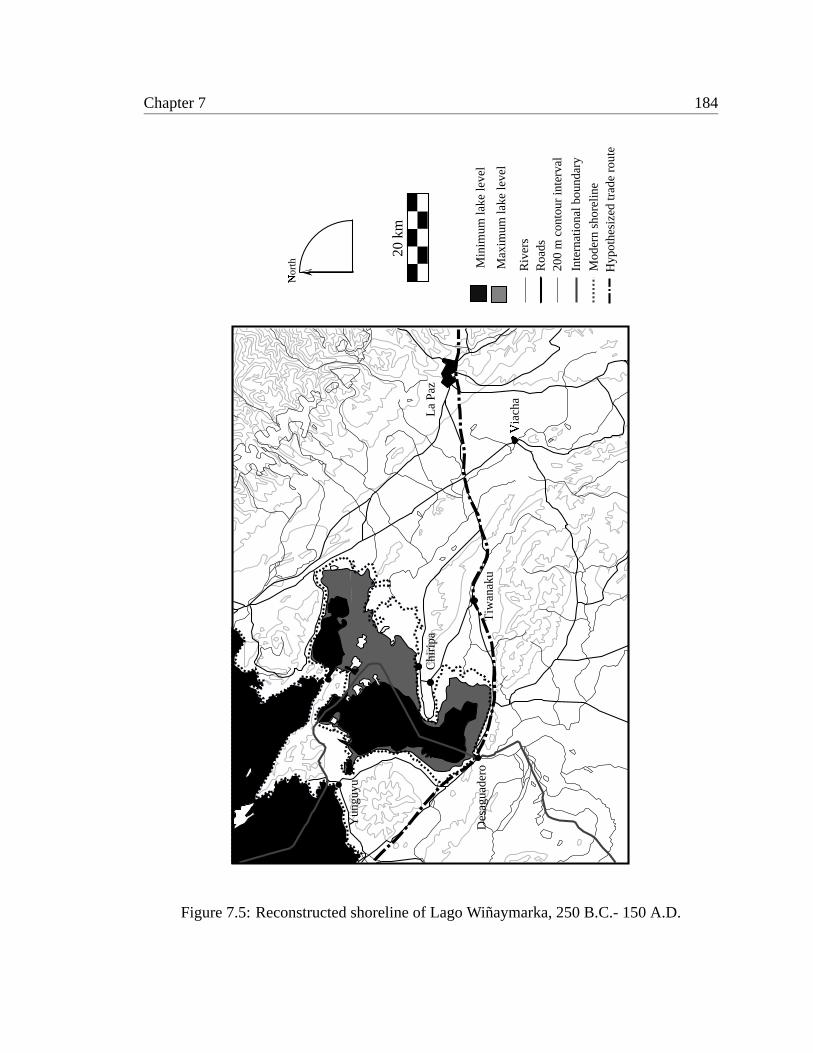
Chapter 7 184
Hyp
othe
size
d tr
ade
rout
e
Via
cha
�L
a Pa
z
Tiw
anak
u
Chi
ripa
Des
agua
dero
Yun
guyu
20 k
m
Riv
ers
Max
imum
lake
leve
l
200
m c
onto
ur in
terv
al
Inte
rnat
iona
l bou
ndar
y
Roa
ds
Nor
th
�
Min
imum
lake
leve
l
Mod
ern
shor
elin
e
Figure 7.5: Reconstructed shoreline of Lago Wiñaymarka, 250 B.C.- 150 A.D.

Chapter 7 185
later MF (illustrated in Figure6.8). This low stand, the fourth in Abbott et. al.’s sequence
(Abbott et al. 1997a: 179), lasted only about 200 years. At the end of this period, around
300 A.D., the lake level rose again, this time to modern levels or even slightly above. Lake
levels remained at this level throughout the LF2 and Tiwanaku Periods.
Thus, there were three main periods within the Late Formative from the standpoint of
lake levels.
1. Lake levels were relatively high (3803-3809 m.a.s.l.) from 250 B.C. to A.D. 100.
This represents the earlier portion of the LF1 period.
2. In the last two centuries of the LF1 (100-300 A.D.), lake levels dropped precipitously,
to 3792-3794 m.a.s.l.
3. Throughout the LF2 (300-500 A.D.) lake levels were higher, remaining above the
overflow level of the Desaguadero River and perhaps surpassing the modern average
(indicated by the dotted line on Figure7.5). The probable range for this period is
3804-3811 m.a.s.l. (Abbott et al. 1997a, Figure 4).
Perhaps more to the point, there were three principal changes in lake level:
1. A sharp rise ca. 250 B.C. (beginning of the LF1)
2. A sharp drop ca. 100 A.D. (middle of the LF1)
3. A sharp rise ca. 300 A.D. (LF1/LF2 transition)
As I pointed out in my discussion of the Middle Formative (Chapter6), it is an interesting
fact of southern Titicaca Basin prehistory that rises in lake level appear on the whole to
be more disruptive to local social systems than do drops in lake level. This generalization
certainly holds true in the case of the LF. The two rises in lake level correlate with signif-
icant changes in material culture and settlement. The first (250 B.C.) corresponds to the
transition from the MF to the LF1, and the second (300 A.D.) to the LF1 to LF2 transition.
The sharp decline in lake level around 100 A.D., on the other hand, does not seem to be
related to any significant cultural or social changes, at least not that I can distinguish at this
time.
Chapter 7 186
7.4 Exchange
The lake level rise in 250 B.C. seems to have been of particular significance. I argued
in Chapter6 that sometime in the later MF, around 450 B.C., Lago Wiñaymarka became
mostly dry. This fact made possible a shorter trade route between the Western Titicaca
Basin and theyungasthan the one used today (see Figure6.8). This shorter trade route
would have passed along the Taraco Peninsula. The new proximity of the Taraco Peninsula
villages to what undoubtedly was one of the principal regional trade routes is reflected in the
large amount of imported exotic goods in these settlements - archaeologically represented
mostly by imported stone hoes.
The lake level rise at the beginning of the LF1 (250 B.C.) would have had the effect
of of shifting the trade route back to its prior (and recent) path, passing through the Ti-
wanaku Valley and crossing the Desaguadero River - probably flowing for at least part of
the LF1 - at the modern Peru/Bolivia border. This had the effect of isolating the Taraco
Peninsula communities, and neutralizing any advantage which they may have gained from
their previously strategic location.
The fate of the MF exchange network in the LF1 and LF2 is a difficult issue. Since
MF exchange was identified primarily through basalt hoes - the most common exotic items
encountered archaeologically in the southern Titicaca Basin (see Chapter6) - it should
be interesting to analyze the frequency of lithic raw material on the LF1 in comparison
to the MF. However, the TAP excavations at Chiripa sampled no intact LF levels. The
only available data which bear on this question are Janusek’s excavations at various Pampa
Koani sites (Janusek 2001, Janusek and Kolata 2001). These are presented in Table7.1.
In the table, the “other” category, according to Janusek, consists primarily of “andesite
and basalt”. Since his excavations are located very near to the Taraco Peninsula I will
assume that the lithic assemblage is similar, and that the “other”category consists almost
entirely of imported basalt. Viewed this way, Janusek’s data indicate a dramatic decline in
imported lithic materials in the LF, from almost 40% of the entire assemblage in the MF, to
10% or less. This is entirely consistent with my own surface collection results, reported in
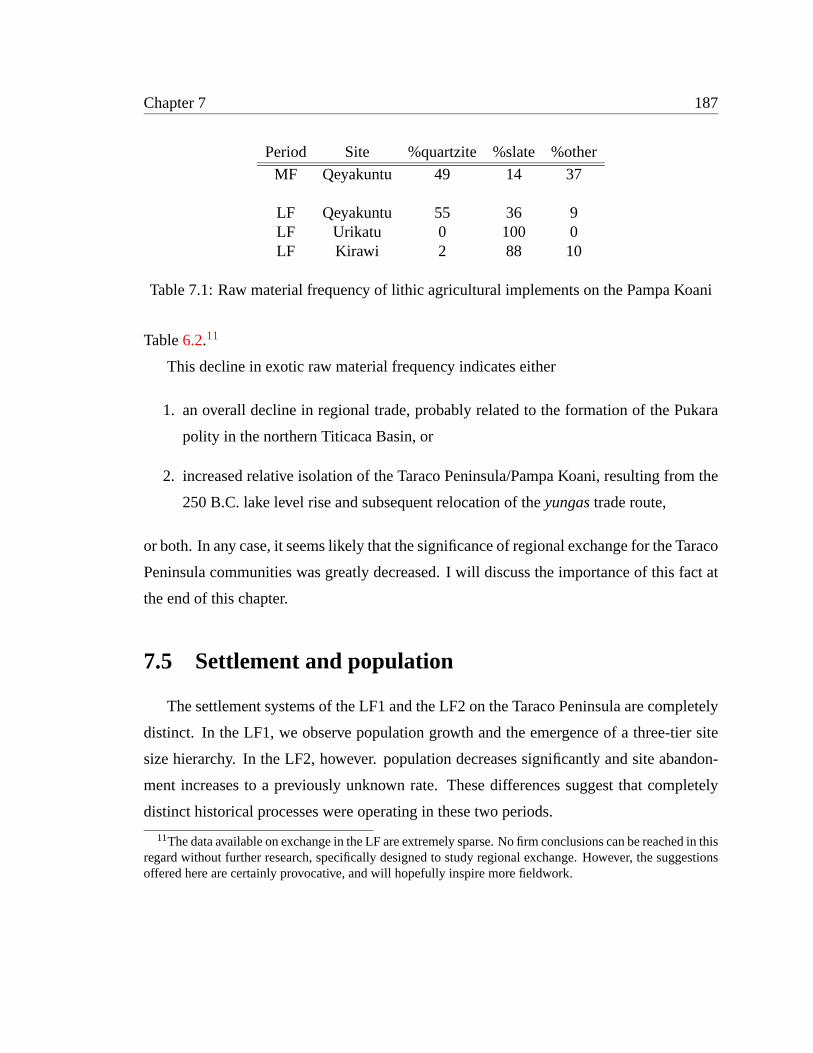
Chapter 7 187
Period Site %quartzite %slate %other
MF Qeyakuntu 49 14 37
LF Qeyakuntu 55 36 9LF Urikatu 0 100 0LF Kirawi 2 88 10
Table 7.1: Raw material frequency of lithic agricultural implements on the Pampa Koani
Table6.2.11
This decline in exotic raw material frequency indicates either
1. an overall decline in regional trade, probably related to the formation of the Pukara
polity in the northern Titicaca Basin, or
2. increased relative isolation of the Taraco Peninsula/Pampa Koani, resulting from the
250 B.C. lake level rise and subsequent relocation of theyungastrade route,
or both. In any case, it seems likely that the significance of regional exchange for the Taraco
Peninsula communities was greatly decreased. I will discuss the importance of this fact at
the end of this chapter.
7.5 Settlement and population
The settlement systems of the LF1 and the LF2 on the Taraco Peninsula are completely
distinct. In the LF1, we observe population growth and the emergence of a three-tier site
size hierarchy. In the LF2, however. population decreases significantly and site abandon-
ment increases to a previously unknown rate. These differences suggest that completely
distinct historical processes were operating in these two periods.
11The data available on exchange in the LF are extremely sparse. No firm conclusions can be reached in thisregard without further research, specifically designed to study regional exchange. However, the suggestionsoffered here are certainly provocative, and will hopefully inspire more fieldwork.
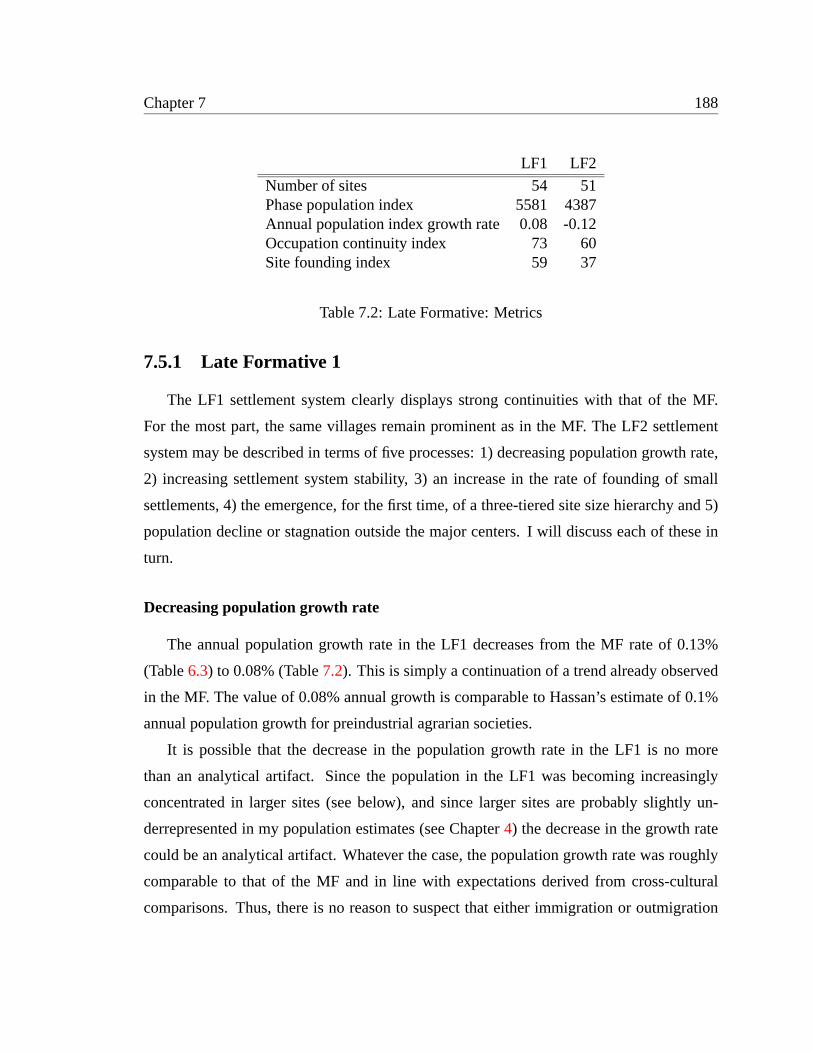
Chapter 7 188
LF1 LF2
Number of sites 54 51Phase population index 5581 4387Annual population index growth rate 0.08 -0.12Occupation continuity index 73 60Site founding index 59 37
Table 7.2: Late Formative: Metrics
7.5.1 Late Formative 1
The LF1 settlement system clearly displays strong continuities with that of the MF.
For the most part, the same villages remain prominent as in the MF. The LF2 settlement
system may be described in terms of five processes: 1) decreasing population growth rate,
2) increasing settlement system stability, 3) an increase in the rate of founding of small
settlements, 4) the emergence, for the first time, of a three-tiered site size hierarchy and 5)
population decline or stagnation outside the major centers. I will discuss each of these in
turn.
Decreasing population growth rate
The annual population growth rate in the LF1 decreases from the MF rate of 0.13%
(Table6.3) to 0.08% (Table7.2). This is simply a continuation of a trend already observed
in the MF. The value of 0.08% annual growth is comparable to Hassan’s estimate of 0.1%
annual population growth for preindustrial agrarian societies.
It is possible that the decrease in the population growth rate in the LF1 is no more
than an analytical artifact. Since the population in the LF1 was becoming increasingly
concentrated in larger sites (see below), and since larger sites are probably slightly un-
derrepresented in my population estimates (see Chapter4) the decrease in the growth rate
could be an analytical artifact. Whatever the case, the population growth rate was roughly
comparable to that of the MF and in line with expectations derived from cross-cultural
comparisons. Thus, there is no reason to suspect that either immigration or outmigration
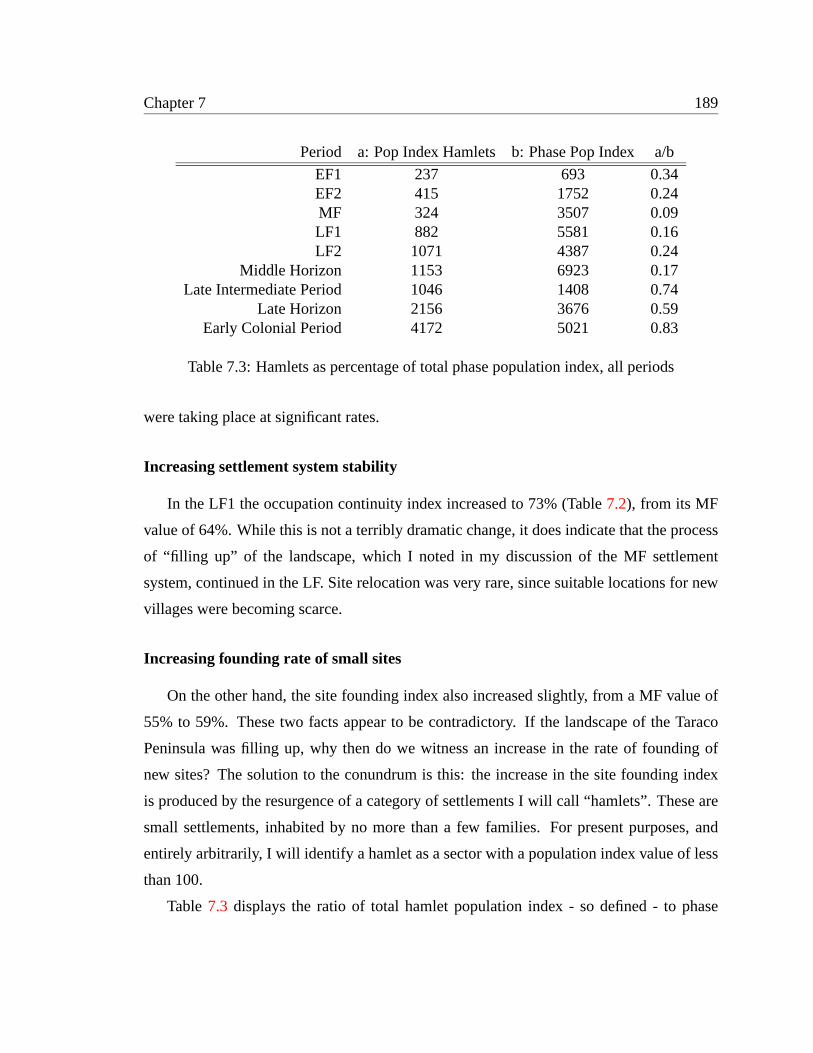
Chapter 7 189
Period a: Pop Index Hamlets b: Phase Pop Index a/b
EF1 237 693 0.34EF2 415 1752 0.24MF 324 3507 0.09LF1 882 5581 0.16LF2 1071 4387 0.24
Middle Horizon 1153 6923 0.17Late Intermediate Period 1046 1408 0.74
Late Horizon 2156 3676 0.59Early Colonial Period 4172 5021 0.83
Table 7.3: Hamlets as percentage of total phase population index, all periods
were taking place at significant rates.
Increasing settlement system stability
In the LF1 the occupation continuity index increased to 73% (Table7.2), from its MF
value of 64%. While this is not a terribly dramatic change, it does indicate that the process
of “filling up” of the landscape, which I noted in my discussion of the MF settlement
system, continued in the LF. Site relocation was very rare, since suitable locations for new
villages were becoming scarce.
Increasing founding rate of small sites
On the other hand, the site founding index also increased slightly, from a MF value of
55% to 59%. These two facts appear to be contradictory. If the landscape of the Taraco
Peninsula was filling up, why then do we witness an increase in the rate of founding of
new sites? The solution to the conundrum is this: the increase in the site founding index
is produced by the resurgence of a category of settlements I will call “hamlets”. These are
small settlements, inhabited by no more than a few families. For present purposes, and
entirely arbitrarily, I will identify a hamlet as a sector with a population index value of less
than 100.
Table 7.3 displays the ratio of total hamlet population index - so defined - to phase
Chapter 7 190
population index for each of the periods of Taraco Peninsula prehistory. The final column
of the table represents the percent of the estimated population of the peninsula during a
given period which was living in hamlets. Clearly, the percentage of the population living
in hamlets hit an all time low in the MF. This is probably due to the existence of multiple
competing polities on the peninsula (as discussed in Chapter6), a situation which probably
involved some degree of armed conflict and/or sporadic raiding. In such a context, living in
hamlets in the countryside is rather more hazardous than joining a larger village community.
In the LF1, however, the majority of the peninsula was politically unified (as I will argue
below), thus making hamlet living a tenable option once more. Thus, the evident resurgence
of the hamlet as a settlement category.
Three-tiered site size hierarchy
The EF2 settlement distribution was clearly unimodal, and the MF one was just as
plainly bimodal (Figure6.9). The LF1 settlement hierarchy, however, is more complex.
The LF1 settlement distribution, shown on Figure7.6, clearly displays two tiers of smaller
sites. The smallest group consists of sites with population index values of less than 200,
and the second group of sites have population index values between 200 and 500. How-
ever, there are two sites which are much too large to belong to either group. The larger of
the two is Kala Uyuni (T-232), with a LF1 population index value of 883. The smaller is
Kumi Kipa, with a population index of 647. Both of these sites grew much faster than any
other sites on the Taraco Peninsula during the LF1 (see Figure7.8a for a graphical repre-
sentation). In fact, the growth rates of each exceeds the probable natural rate of increase,
suggesting that considerable numbers of people moved to these locations from other vil-
lages on the peninsula. T-232 grew at an annual rate of 0.17% during the LF1. No growth
rate can be calculated for T-272, since its has no MF occupation. However, the Santa Rosa
group as a whole (T-268/T-271/T-272/T-322) grew at an annual rate of 0.29%12 in the LF1.
What then is the relation between the Santa Rosa group and Kala Uyuni? My proposal,
which must await evaluation by future excavations, is that the two are more sequential than
12The Santa Rosa group has collective population index values of 277 for the MF and 1216 for the LF1.
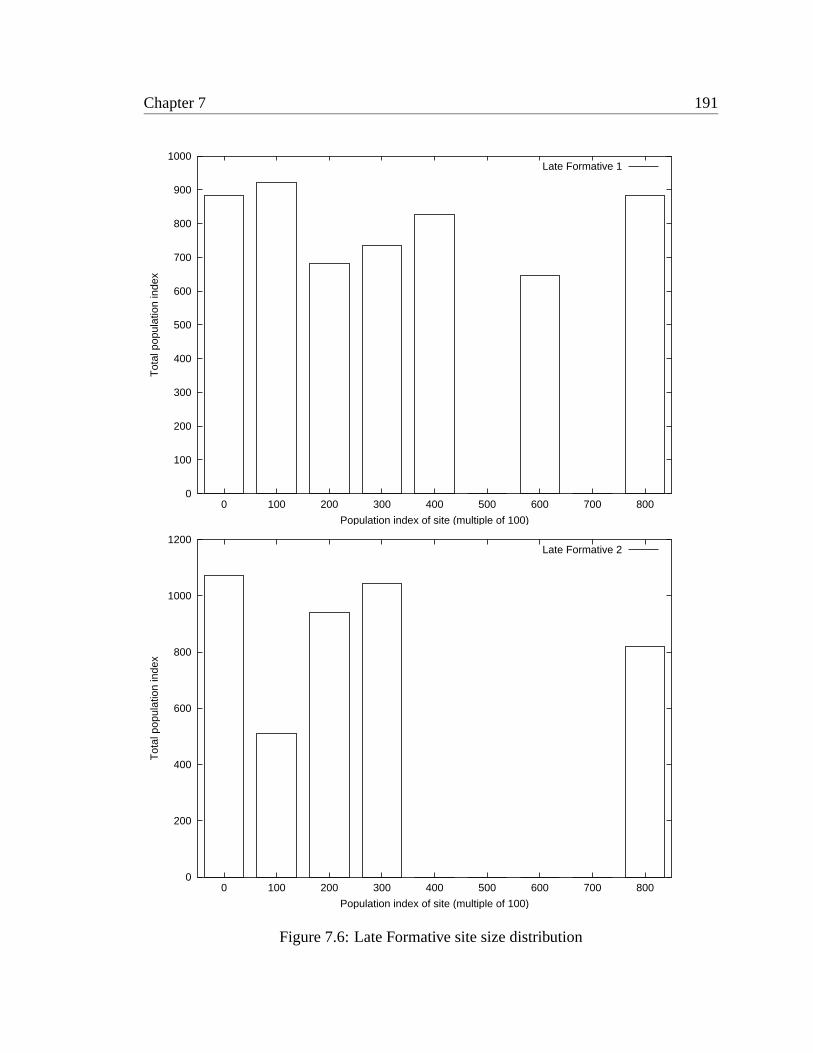
Chapter 7 191
0
100
200
300
400
500
600
700
800
900
1000
0 100 200 300 400 500 600 700 800
Tot
al p
opul
atio
n in
dex
Population index of site (multiple of 100)
Late Formative 1
0
200
400
600
800
1000
1200
0 100 200 300 400 500 600 700 800
Tot
al p
opul
atio
n in
dex
Population index of site (multiple of 100)
Late Formative 2
Figure 7.6: Late Formative site size distribution
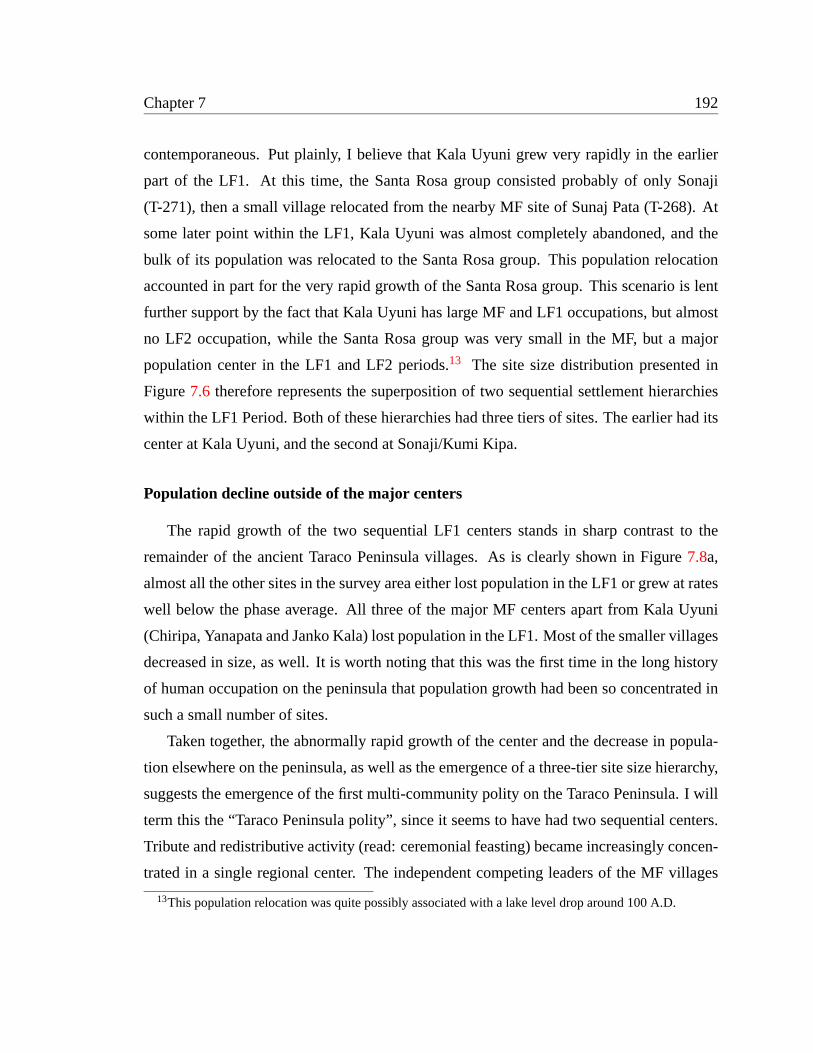
Chapter 7 192
contemporaneous. Put plainly, I believe that Kala Uyuni grew very rapidly in the earlier
part of the LF1. At this time, the Santa Rosa group consisted probably of only Sonaji
(T-271), then a small village relocated from the nearby MF site of Sunaj Pata (T-268). At
some later point within the LF1, Kala Uyuni was almost completely abandoned, and the
bulk of its population was relocated to the Santa Rosa group. This population relocation
accounted in part for the very rapid growth of the Santa Rosa group. This scenario is lent
further support by the fact that Kala Uyuni has large MF and LF1 occupations, but almost
no LF2 occupation, while the Santa Rosa group was very small in the MF, but a major
population center in the LF1 and LF2 periods.13 The site size distribution presented in
Figure7.6 therefore represents the superposition of two sequential settlement hierarchies
within the LF1 Period. Both of these hierarchies had three tiers of sites. The earlier had its
center at Kala Uyuni, and the second at Sonaji/Kumi Kipa.
Population decline outside of the major centers
The rapid growth of the two sequential LF1 centers stands in sharp contrast to the
remainder of the ancient Taraco Peninsula villages. As is clearly shown in Figure7.8a,
almost all the other sites in the survey area either lost population in the LF1 or grew at rates
well below the phase average. All three of the major MF centers apart from Kala Uyuni
(Chiripa, Yanapata and Janko Kala) lost population in the LF1. Most of the smaller villages
decreased in size, as well. It is worth noting that this was the first time in the long history
of human occupation on the peninsula that population growth had been so concentrated in
such a small number of sites.
Taken together, the abnormally rapid growth of the center and the decrease in popula-
tion elsewhere on the peninsula, as well as the emergence of a three-tier site size hierarchy,
suggests the emergence of the first multi-community polity on the Taraco Peninsula. I will
term this the “Taraco Peninsula polity”, since it seems to have had two sequential centers.
Tribute and redistributive activity (read: ceremonial feasting) became increasingly concen-
trated in a single regional center. The independent competing leaders of the MF villages
13This population relocation was quite possibly associated with a lake level drop around 100 A.D.
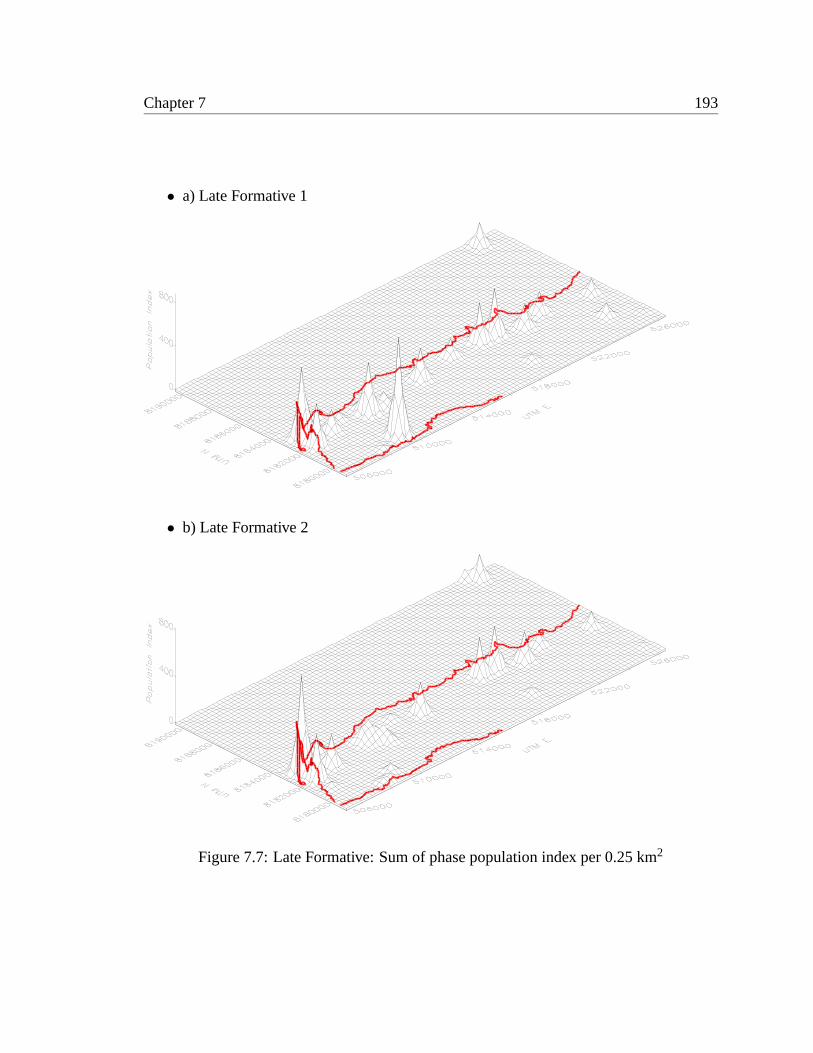
Chapter 7 193
• a) Late Formative 1
• b) Late Formative 2
Figure 7.7: Late Formative: Sum of phase population index per 0.25 km2
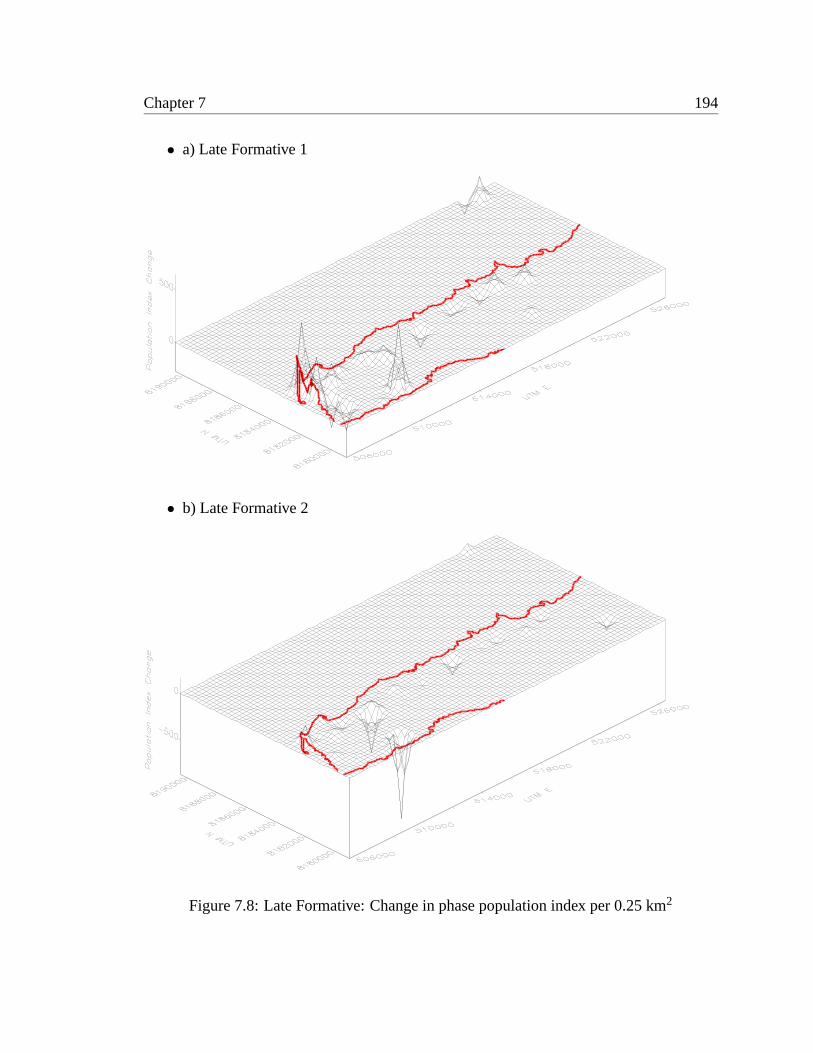
Chapter 7 194
• a) Late Formative 1
• b) Late Formative 2
Figure 7.8: Late Formative: Change in phase population index per 0.25 km2
Chapter 7 195
were usurped by a more concentrated and powerful group of elites who resided at a single
regional center. The mechanism by which this usurpation came about remains a mystery. It
may or may not have involved force of arms. In any case, the increased spatial concentra-
tion of surplus collection and redistribution came to be a powerful settlement determinant,
stimulating asymmetrical population growth.
This asymmetrical population growth need not have involved the active relocation of
entire families or communities As I mentioned in Chapter6, it could also be produced by
an asymmetry in post-marital residential preference over a long period of time. However,
in the case of the LF1 the fact that most smaller sites not only grew more slowly than the
center, but actually decreased in size, strongly suggests at least some active relocation of
established households from the smaller sites to the center.
Finally, there is one group of smaller sites within the project area which did not decrease
in size during the LF1. These sites are all located in the north-eastern corner of the survey
area, in the modern communities of Chiripa, Cala Cala, Huacullani and Sikuya. Considered
together, these sites14 have a collective population growth index value of 0.09% in the LF1.
This is roughly comparable to the phase average of 0.08%. This group of sites, then,
located on the eastern extremity of the survey area, does not seem to have experienced
depopulation during the LF1, as did almost all sites located closer to Kala Uyuni/Santa
Rosa. I interpret this fact as a relatively strong indication that these sites lay beyond the
direct political control of the Taraco Peninsula polity. Thus, a line drawn between the
“peaks” and the “troughs” on Figure7.8a may indicate a boundary of sorts for the Taraco
Peninsula polity. One of these independent sites is particularly interesting. Waka Kala (T-
421) grew at an annual rate of 0.18% during the LF1, twice the phase average. Moreover,
a public architectural complex was built on the site at this time, comprising a sunken court
and several pieces of stone sculpture at minimum.15 The construction of this architectural
complex may be another indication of the site’s political independence.
14Which include Chiripa Pata (T-4), Waka Kala (T-421), Alto Pukara (T-430) and what is now the islandof Sikuya (T-319/T-320). At the time, of course, Sikuya was not an island, but a lakeshore site, the lake levelbeing considerably lower than it is today (see Figure7.5).
15This site is discussed in considerably more detail earlier in this chapter.
Chapter 7 196
The existence of this small cluster of autonomous villages beyond the direct control of
the Taraco Peninsula polity suggests a heterogeneous social landscape during the LF1 - at
least at the regional scale - with occasional multi-community polities arising from a field
of competing autonomous villages and village clusters. Archaeological survey of a larger
contiguous area would allow us to discern exactly how common these polities were at this
time in the greater region. At present, we can say for certain that at least two existed in the
LF1 in the southern Titicaca Basin: the Taraco Peninsula polity, and the Tiwanaku polity.
Others may have existed as well;16 it is impossible to say given the current state of our
knowledge.
7.5.2 Late Formative 2
The changes in the Taraco Peninsula settlement system which took place in the LF2 can
only be described as catastrophic and unprecedented. For the first time the region’s history,
the entire peninsula suffered a population decline. The population index of the peninsula
as a whole increased at a rate of -0.12% annually. Figure7.8shows that population decline
took place across the entire peninsula. The only major village which was spared was the
Santa Rosa group, which grew at an annual rate of 0.08% during the LF2.
In other words, the asymmetrical population growth discussed for the LF1 period con-
tinued into the LF2, with the Santa Rosa group growing at a rate disproportionate to that
of the remainder of the Taraco Peninsula communities. Moreover, the three-tier site size
hierarchy first observed in the LF1 continued into the LF2 as well (see Figure7.6), with
basically the same sites occupying each tier.
The difference, however, is that in the LF2 the growth rates of both the center and
its tributary villages are much lower than in the LF1. This fact must be considered in
light of the phenomenal urban growth that took place in Tiwanaku at this time. In the
16In fact, I believe I encountered the center of such a polity in 2000 while traveling with Kirk Frye southof Yunguyu. At the site of Kanamarka/Lakaya (seeStanish et al. 1997:92-93 for a brief description andphotographs of part of the site). The LF1 component at the site seems to be at least 12 ha in area. An effigymound, in the form of a stylized catfish (approximately 60X25 meters), was evident on the surface, andzoned-incised Kalasasaya ceramics were observed by myself and my companions. This would be the centerof Stanish’s “southern Ccapia polity”.
Chapter 7 197
LF2, Tiwanaku grew to cover perhaps as much as 100 ha,17 and some of its principal
monuments, including the Kalasasaya and the Akapana, seem to have been constructed.
Tiwanaku’s population growth rate during the LF2 was probably in the range 1% annually.
Growth this rapid obviously implies an influx of population from the countryside. Thus,
although the settlement determinants on the Taraco Peninsula itself seem to have remained
roughly the same as in the LF1, the peninsula was incorporated into a larger system, that
of the expanding Tiwanaku polity. The Santa Rosa group no longer occupied the apex
of a three-tier site size hierarchy, but rather the second tier of a four-level hierarchy. It
had become a regional administrative center of a state. To the existing population growth
asymmetries was added a new factor: the draw of a rapidly-expanding urban center.
The population drawn from the Taraco Peninsula actually comprised a significant per-
centage of the population of LF2 Tiwanaku. The precise percentage can of course never be
known. However, if we apply the methods we have used in the Taraco Peninsula analysis
to the Tiwanaku case, we can produce a population index value of about 1000 for LF1
Tiwanaku, and 6500 for LF2 Tiwanaku. Given an annual rate of increase (r), an initial
population value (I), and a span of years (y), the final population (F) can be calculated as
follows:
F = I ∗e(ry)
If we assume that the baseline annual population growth rate was 0.10% (an average
of MF, LF1 and Tiwanaku population growth rates on the Taraco Peninsula), then the LF1
Tiwanaku population index value of 1000 would have produced a population index of 1221
over the 200 year LF2 period. Thus, Tiwanaku in the LF2 period gained about 5280 popu-
lation index units over and above what would have been produced by the natural increase
of its initial population. That is to say that about 52806500−1000or 96% of Tiwanaku’s LF2
population growth resulted from immigration.
Given an initial population of 5581(Table7.2), the natural increase of the Taraco Penin-
17This figure was produced by John Janusek using the soundings of Bennett, Kidder and the Wila Jawiraproject to define the boundaries of the LF2 ceramic distribution in the Tiwanaku urban core. It is obviouslytentative.
Chapter 7 198
sula population would have produced a final population of 6817 over the 200 year LF2
period. Therefore, the Taraco Peninsula, through population outmigration, probably to Ti-
wanaku, lost approximately 2430 population index units relative to what would have been
produced by the natural increase of its initial population index value. Therefore24305280 or
about 46% of Tiwanaku’s LF2 population influx can be attributed to a flow of population
from the Taraco Peninsula communities.18 Given that the Taraco Peninsula was probably
the locus of highest population density in the MF and LF1 in the entire southern Titicaca
Basin, this should come as no surprise.
7.6 Discussion
I argue in Chapter6 that in the Middle Formative access to exotic goods and extra-
local trading partners was incorporated into a local system of status competition on the
Taraco Peninsula. The peninsula’s position on a probable trade route from the western
Titicaca Basin to the lowland valleys oryungas(see Figure6.8) was used by local leaders
and groups to obtain exotic objects which were then strategically redistributed in public
ceremonial or commensal contexts. Around 250 B.C., at the beginning of the LF1, the lake
rose again to nearly modern levels. This would have interrupted the existing trade route,
which would then have shifted to the south through Desaguadero and the Tiwanaku Valley
(see Figure7.5).
While this relocation of the late MF trade route would certainly have had an impact on
the Taraco Peninsula communities, there is some evidence which suggests a more general
and profound disruption of the regional exchange system at this time. Though firm evi-
dence is lacking, it would seem that the olivine basalt hoes - the principal archaeological
marker of the late MF exchange system - does not merely become less common in the
LF1, but appears to vanish entirely. The dramatic increase in the frequency of quartzite and
slate hoes noted by Janusek represents nothing other than an increased use of local lithic
18I should emphasize that this estimate is anything but precise. However, it does underscore the tremendousimportance the incorporation of the Taraco Peninsula had in the process of Tiwanaku urbanization and stateformation.
Chapter 7 199
materials to replace the preferred but unobtainable basalt.
Of course, Incatunahuiri - the possible source of this basalt (see Chapter6) - was not
abandoned at this time, nor did hoe production cease there. This is clearly shown by the
fact that at the nearby site of Camata, hoes of this material actually become most com-
mon (almost 90% of all lithic material) in the Pucara 2 phase, around 100 B.C. - 100 A.D.
(Steadman 1995: 32). What happened to Incatunahuiri is that it fell under the influence
of the Titicaca Basin’s first urban center: the site of Pukara, located some 60 km north-
west of Lake Titicaca. Incatunahuiri in the Late Formative Period was closely affiliated
with Pukara. The hill on which it is located was remodeled, an imposing sunken court was
placed at its summit, and a number of large stone sculptures in the Pukara style were either
produced at the site or imported from elsewhere.19 The nature of the Pukara polity is poorly
understood, though research is under way to address the many questions with which it is
surrounded (Cohen 2001, Klarich and Craig 2001). What does seem clear, though, is that
Pukara was deeply involved in exchange networks connecting the Titicaca Basin to the Are-
quipa area (the principal source of obsidian; seeBurger et al. 1998, Burger et al. 2000), the
southern Peruvian (Bandy 1995, Feldman 1989, Feldman 1990, Goldstein 2000) and north-
ern Chilean (cf.Conklin 1983) coasts, and the eastern valleys (Plourde and Stanish 2001;
more generally seeMujica 1978, Mujica et al. 1983, Mujica 1985). It is possible that
Pukara exercised a monopoly on the obsidian trade, at least for a period of its history,
and it may have possessed or aspired to similar control of other commodities. Thus it may
be that Pukara actually discouraged exchange relations between its trading partners and
third parties. Put plainly, it is possible that in the LF1 period exchange between the south-
ern and western areas of the Titicaca Basin was actively suppressed by the Pukara polity.
Such a situation could potentially explain the sudden disappearance of olivine basalt from
the southern basin at this time. However, this scenario must remain hypothetical pending
further research.
This disruption of the late MF trade route and possibly of contact with the western
Titicaca Basin would have created a crisis for leaders whose power strategies had come
19The site and its sculpture were described by Alfred Kidder II, and more recent work has been done byKirk Frye (Frye and Steadman 2001;Kidder 1943).
Chapter 7 200
to depend on easy access to imported goods and non-local social contacts. If we assume
that the leaders of the various communities had all adopted broadly similar competitive
strategies in the late MF, then we can hypothesize a generalized crisis of political legitimacy
on the Taraco Peninsula at this time. What would such a crisis look like archaeologically?
First of all, we might expect artifacts associated with the older strategies to disappear. This
is precisely what happens with the Late Chiripa ritual feasting artifact complex. Second,
we would expect local leaders to search for other more appropriate strategies, and therefore
the appearance of new artifacts associated with these new institutions. This is exactly what
happens when the Kalasasaya ceramics appear in the southern basin; a new set of artifacts,
associated ideas and activities almost certainly resulting from imitation of Pukara ceramics
and sculpture from the northern Basin.
In addition, we would expect some leaders to emerge from the crisis more successfully
than others. This would mean that each community might have fewer leaders than before,
and that some sites might rise to local prominence, subjugating or extracting tribute from
their neighbors. This also seems to have taken place. Sometime early in the LF1,20 the site
of Kala Uyuni began to grow very rapidly, drawing population from the remainder of the
sites on the peninsula. Simultaneously, a movement of population took place away from
the large villages and into smaller farmsteads and hamlets. I interpret these facts, and the
resulting emergence of a three-tier site size hierarchy, as indicative of the emergence of a
multi-community polity centered at Kala Uyuni.21 This polity was quite small-scale; it’s
eastern border seems to have fallen between the sites of Chiripa (T-1) and Chiripa Pata
(T-4). In other words, there were many surrounding villages which were not tributary to
Kala Uyuni.
This political development was accompanied by a wholesale transformation of the en-
tire ceremonial complex which had characterized MF ceremonialism on the Taraco Penin-
sula and in adjacent areas. The characteristic Chiripa decorated ceramics, in continuous use
20There was probably a period of intense competition between and within the Taraco Peninsula communi-ties during the first decades of the LF1. Certainly, there was time for the community of Chiripa to constructa larger and more elaborate mound, sealing - and fortuitously preserving - the Upper House Level complex.This probably would not have happened had it been immediately subjugated to Kala Uyuni.
21These trends are discussed in detail earlier in this chapter.
Chapter 7 201
for over 600 years, were abruptly abandoned, replaced by the Kalasasaya complex. The lat-
ter includes significant imitation of the northern basin Pukara style. At the same time, the
sunken court complex was reinvented, incorporating for the first time the large upright pil-
lars that come to be characteristic of later Tiwanaku architecture. The association of stone
tenon heads with sunken courts also begins in this phase. The overall impression is of a
complete reinvention of ceremonial practices and political strategies. I propose that this
was in response to the political crisis resulting from the lake level rise and concomitant
shift in the trade route.
It was apparently also at this time (early in the LF1) that the site of Tiwanaku was first
substantially occupied.22 The Tiwanaku Valley had been home to a low-density popula-
tion from the Early Formative period (Albarracín-Jordan 1992, Albarracín-Jordan 1996a,
Albarracín-Jordan et al. 1993, Mathews 1992). However, in the LF1 the site of Tiwanaku
was founded on the valley floor23 and grew very rapidly to cover - by the end of the LF1
- something like 20 ha. This was comparable in size to the center of the Taraco Peninsula
polity. We may suppose that it was the center of a contemporaneous and competing polity,
employing the same basic ceramic, architectural and sculptural styles.
It is also informative to consider what happened in the Lower Tiwanaku Valley at
this time. This area lies exactly between Tiwanaku and Kala Uyuni and had been
home to a small but significant population in the MF. However it was almost completely
abandoned in the LFI (Albarracín-Jordan 1992, Albarracín-Jordan and Mathews 1990,
McAndrews et al. 1997). This seems to be a clear case of the formation of an unoccu-
pied buffer zone between competing polities, as has been documented in many parts of the
world.
The founding and rapid success of Tiwanaku and the Tiwanaku polity probably had
everything to do with the lake level rise and the shift to the south of the late MF trade
route. As Figure7.5makes clear, Tiwanaku was located precisely on the new trade route.
22There do appear to be several discontinuous MF occupations within boundaries of the later city of Ti-wanaku (Blom, Janusek pers. comm. 2001). Little is known of them, however, and they probably representhamlets or small villages.
23Virtually all EF and MF occupation in the Tiwanaku Valley was on the slopes of the flanking hills.
Chapter 7 202
Though the trade passing along this route may have been much reduced relative to its MF
level, as I discussed above, whatever exchange was taking place between the southwestern
Titicaca Basin and theyungasin the early LF1 passed through Tiwanaku. The misfortune
of the Taraco Peninsula communities was a positive boon to the inhabitants of the Upper
Tiwanaku Valley, and a crucial element in the founding and early growth of the Tiwanaku
polity. In fact, the site of Tiwanaku was quite possibly founded in a bid to control the new
trade route.
Around 100 A.D. the level of Lago Wiñaymarka dropped suddenly, and the majority
of the little lake again became dry (the shoreline was roughly the same as that indicated
in Figure6.8). Once again, the shortest route between the western Titicaca Basin and the
yungaspassed through the Taraco Peninsula, as it had during the late MF. Though the mag-
nitude of this trade was possibly reduced by the influence of the Pukara polity, a strategic
position on the trade route was probably still desirable to local elites.
Such a consideration was probably the reason that the center of the Taraco Peninsula
polity was relocated sometime during the LF1 from Kala Uyuni to the Santa Rosa group.24
This group of sites, including Sonaji (T-271), Kumi Kipa (T-272) and Kollin Pata (T-322),
is located precisely along the low lake stand trade route (Figures6.8 and7.3). The Santa
Rosa group eventually grew to cover 21 ha by the end of the LF1, roughly the same size as
Tiwanaku.
It may be that the Taraco Peninsula experienced a period of regional preeminence with
its capital at Santa Rosa. If so it was short-lived. Around 300 A.D., at the beginning of
the LF2, the level of the lake rose again, this time to modern levels. At this time, the site
of Tiwanaku began to grow very rapidly, averaging around 1% annually for the LF2. The
reasons for the process of urbanization are beyond the scope of the present study. We may
note, however, several factors which fall within the terrain covered in this chapter. First,
due to the rise in lake level, the trade route between the western basin and theyungasagain
passed through Tiwanaku. Second, the collapse of the northern basin Pukara polity, which
took place around this time, would have removed any barriers to exchange with the western
24If the principal occupations of Kala Uyuni and the Santa Rosa group are indeed sequential. The issue isaddressed earlier in this chapter.
Chapter 7 203
Titicaca Basin which may have existed in the LF1. Thus, activity on the trade route which
now passed through Tiwanaku was probably greatly intensified relative to LF1 levels.25
Whatever the reasons, Tiwanaku began to urbanize rapidly in the LF2. The Taraco
Peninsula was one of the regions from which population flowed into the new city. In fact, it
was the principal region, with as much as 46% of the population influx into Tiwanaku in the
LF2 coming from the Taraco Peninsula communities. This significant loss of population
to Tiwanaku suggests that at some point in the LF2 the Taraco Peninsula was incorporated
into the Tiwanaku polity.
What do we mean when we say “incorporated into the Tiwanaku polity?” The immedi-
ate image that is evoked is one of military and political domination. That is, that Tiwanaku
dominated the Taraco Peninsula militarily and extracted tribute from it. The flow of pop-
ulation from the Taraco Peninsula would then be caused by either forced relocation at the
behest of the conquering polity or a natural response to a shift in the availability of tribute
redistribution, or some combination of the two. This is an easy scenario to envision.
However, the military conquest scenario is incapable of explaining the population relo-
cation I have been discussing. This is so because at the end of the LF1, before the popula-
tion relocation began, the population of the Tiwanaku polity was probably less than13 that
of the Taraco Peninsula polity.26 It is difficult to imagine a polity of 1500 persons overcom-
ing one with a population of 5500 by force of arms, especially since we have no evidence
of any change in military technology at this time.27 In other words, Tiwanaku military
25Other factors were no doubt of equal or greater importance. Most significant, perhaps, was therise of raised field agriculture and its integration into strategies of statecraft and surplus extraction. TheTaraco Peninsula is entirely unsuited to raised field agriculture and the Tiwanaku Valley well-suited (seeBandy 1999c; Bandy 2001).
26The combined phase population index value of the Lower and Middle Tiwanaku Valley for the LF1 isaround 1100, as opposed to 5581 for the Taraco Peninsula. The phase population index of the Upper TiwanakuValley for the LF1 could not have been more than another 500-600, since there are very few Formative Periodsites in that part of the valley, and the largest one apparently covers only 1.5 ha (Albarracín-Jordan et al. 1993:77). These figures were produced using data collected by Albarracín-Jordan and his colleagues (Lower Ti-wanaku Valley:Albarracín-Jordan 1992, Middle Tiwanaku Valley:Mathews 1992, Upper Tiwanaku Valley:Albarracín-Jordan et al. 1993), and must be considered approximate.
27The only significant change in military technology in prehistory seems to have been the introductionof the bow and arrow, which Bruce Owen has shown to be both earlier and less important than had beenimagined (Owen 1998).
Chapter 7 204
superiority only became possibleafter the population relocation which it was supposed to
have explained.
All this is to say that military superiority was aneffectrather than acauseof the pop-
ulation movement in question. The actual cause of this population movement cannot at
present be established. Any hypothesis, however, must now take into account the fact that
people were moving to Tiwanaku in large numbers from surrounding areasin the absence
of military coercion. My favored explanation is that the leaders of the Tiwanaku polity in-
vented a new type of political economy in the LF2. This new political economy used raised
field agriculture and a polycyclicstrategy of staggered production cycles(Bandy 1999c)
to allow the extraction of a greater amount of surplus labor per person without interfer-
ing with the dryland subsistence activity of the commoner population (Bandy 2000). This
increased surplus extraction could then have been used to underwrite an intensification of
public ceremonialism and large scale feasting at the site of Tiwanaku itself, providing fur-
ther inducement to the inhabitants of adjacent areas to change their residence. This process
could have produced accelerating rates of immigration throughout the LF2, and the model
can account satisfactorily for the urbanization of Tiwanaku.
This scenario is a hypothesis which is in need of testing. Whatever its validity, it is clear
that by the end of the LF2, around 500 A.D., Tiwanaku was a city, and had become capable
of dominating the entire Titicaca Basin politically, economically and militarily. At some
point during the LF2 the Taraco Peninsula ceased to be an autonomous polity and became
a heartland province of the Tiwanaku state.
205
Chapter 8
The Middle Horizon: the mature
Tiwanaku state
The focus of this study is the Formative Period, and its demographic, political and eco-
nomic processes. These have been discussed in some detail in the previous three chapters.
Settlement data were of course collected for the post-Formative periods, as well. These data
pertaining to later time periods will be presented in Chapters8 through10. However, their
presentation will of necessity be abbreviated relative to the treatments of the Formative Pe-
riod phases. A complete review of issues relating to the Middle Horizon, Late Intermediate
Period and Late Horizon lies beyond the scope of this thesis.
The last chapter concluded with the observation that at some point during the LF2 the
Tiwanaku polity achieved a definitive regional preeminence, coming to dominate other
polities such as the Taraco Peninsula polity. A century or two after this occurrence, the
ceramic, textile architectural and sculptural styles of Tiwanaku underwent a radical trans-
formation. The change in ceramic styles has been described by Janusek and Kolata as
follows:
Ceramic patterns changed dramatically at the beginning of the Tiwanaku Pe-riod. Most notable was the adoption of red and black-slipped vessels by inhabi-tants of all sites in the Katari valley ... These included a wide variety of servingand ceremonial forms ... such askeros, tazones, andsahumadores. In addi-tion, largetinaja storage vessels appeared, most made of durable orange paste,
Chapter 8 206
and they composed significant proportions of ceramic assemblages at all sites.The widespread distribution and use of elaborate decorated wares contrastedsharply with the Late Formative. The appearance of entirely new ceramic as-semblages marked the adoption of entirely new technologies of manufacture,keyed to new daily practices and ideals ... Dramatic shifts in technology andin the widespread distribution of Tiwanaku-style vessels indicate that consid-erable changes in regional sociopolitical and economic patterns were afoot.(Janusek and Kolata 2001)
Just what these regional sociopolitical and economic changes might have been remains, of
course, a mystery. Kolata proposes that at this time “Tiwanaku’s growing economic and
political power transformed it from a locally-dominant force into an aggressive, predatory
state with a penchant for territorial expansion” (Kolata 1993: 243). This may be. It would at
any rate appear that a dramatic reorganization of the Tiwanaku polity took place around 500
A.D., and that this reorganization, whatever its specific motivation or character, produced
the changes we see in the various types of material culture at the site and within its sphere
of influence.
One of the domains of material culture which was dramatically affected was that of
decorated ceramics. In the Late Formative decorated ceramics were quite rare and their
distribution highly restricted. They seem to have been strictly associated with local and
regional elites. In the Tiwanaku Period, by contrast, certain kinds of decorated ceramics
- often displaying state-associated iconographic elements - achieved a level of ubiquity
rarely witnessed in prehistoric states.1 These vessels - principallykerosandtazones, two
varieties of flaring cup - are found in mortuary and domestic contexts representing all strata
of society; access to them seems to have been almost universal. This has the happy effect of
making surface identification of Tiwanaku period occupations a straightforward affair, as
explained in the following section. Also, though, this same ubiquity implies a more direct
connection between the Tiwanaku state apparatus and the commoner population itself. In
other words, the state may have been attempting to reduce the importance of regional elites,
such as - say - those of the old Taraco Peninsula polity. This suggestion finds unexpected
1Some classes of ceramics, typically the more elaborate and ornate forms, continued to have a restricteddistribution.
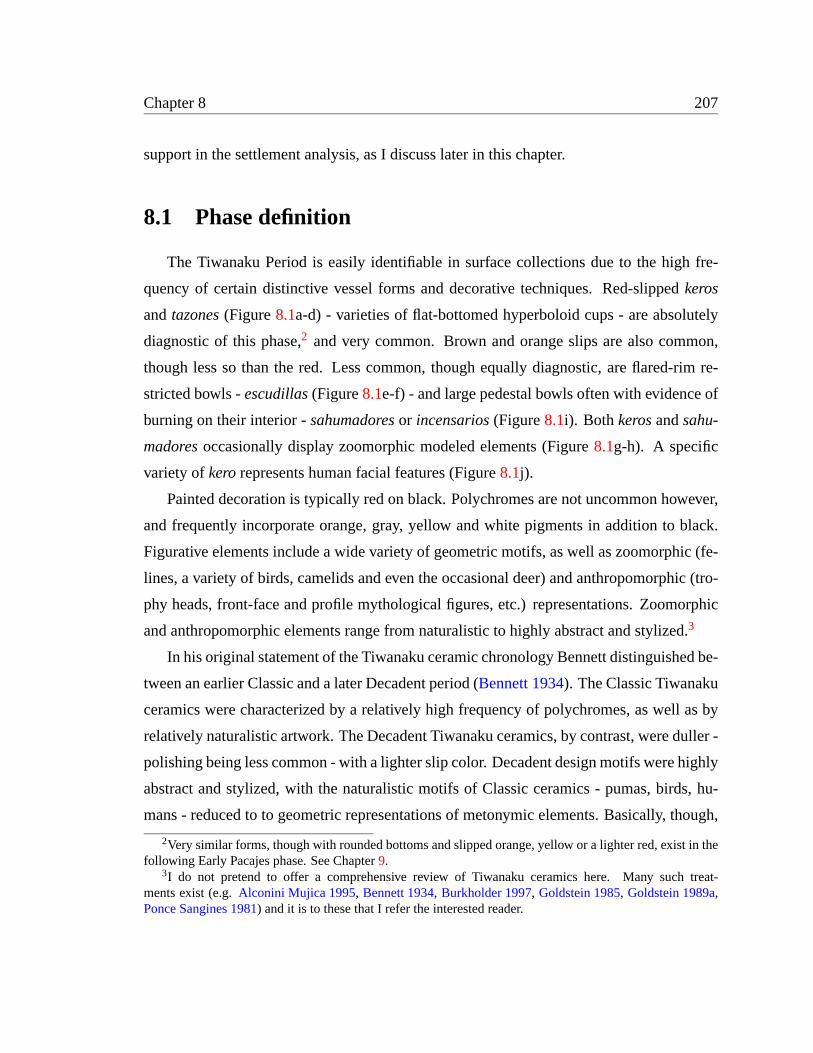
Chapter 8 207
support in the settlement analysis, as I discuss later in this chapter.
8.1 Phase definition
The Tiwanaku Period is easily identifiable in surface collections due to the high fre-
quency of certain distinctive vessel forms and decorative techniques. Red-slippedkeros
andtazones(Figure8.1a-d) - varieties of flat-bottomed hyperboloid cups - are absolutely
diagnostic of this phase,2 and very common. Brown and orange slips are also common,
though less so than the red. Less common, though equally diagnostic, are flared-rim re-
stricted bowls -escudillas(Figure8.1e-f) - and large pedestal bowls often with evidence of
burning on their interior -sahumadoresor incensarios(Figure8.1i). Both kerosandsahu-
madoresoccasionally display zoomorphic modeled elements (Figure8.1g-h). A specific
variety ofkerorepresents human facial features (Figure8.1j).
Painted decoration is typically red on black. Polychromes are not uncommon however,
and frequently incorporate orange, gray, yellow and white pigments in addition to black.
Figurative elements include a wide variety of geometric motifs, as well as zoomorphic (fe-
lines, a variety of birds, camelids and even the occasional deer) and anthropomorphic (tro-
phy heads, front-face and profile mythological figures, etc.) representations. Zoomorphic
and anthropomorphic elements range from naturalistic to highly abstract and stylized.3
In his original statement of the Tiwanaku ceramic chronology Bennett distinguished be-
tween an earlier Classic and a later Decadent period (Bennett 1934). The Classic Tiwanaku
ceramics were characterized by a relatively high frequency of polychromes, as well as by
relatively naturalistic artwork. The Decadent Tiwanaku ceramics, by contrast, were duller -
polishing being less common - with a lighter slip color. Decadent design motifs were highly
abstract and stylized, with the naturalistic motifs of Classic ceramics - pumas, birds, hu-
mans - reduced to to geometric representations of metonymic elements. Basically, though,
2Very similar forms, though with rounded bottoms and slipped orange, yellow or a lighter red, exist in thefollowing Early Pacajes phase. See Chapter9.
3I do not pretend to offer a comprehensive review of Tiwanaku ceramics here. Many such treat-ments exist (e.g.Alconini Mujica 1995, Bennett 1934, Burkholder 1997, Goldstein 1985, Goldstein 1989a,Ponce Sangines 1981) and it is to these that I refer the interested reader.
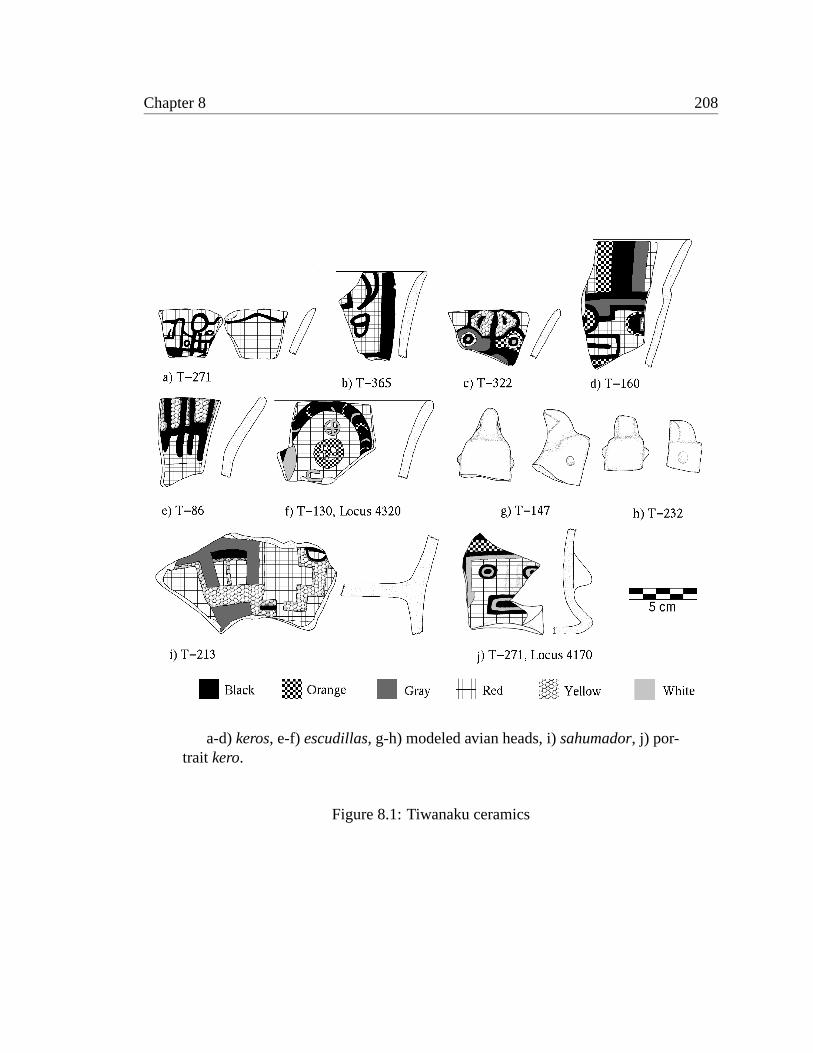
Chapter 8 208
a-d)keros, e-f) escudillas, g-h) modeled avian heads, i)sahumador, j) por-trait kero.
Figure 8.1: Tiwanaku ceramics
Chapter 8 209
the distinction between Classic and Decadent can be reduced to “a division of color treat-
ment into a rich, varied group and drab, restricted group” (Bennett 1934: 403). Modified
by Ponce (Ponce Sangines 1981), Bennett’s sequence has been generally adopted by more
recent archaeological researchers.4
Bennett himself noted that “... the mass distinction of truly Decadent wares and truly
Classic [is] an obvious one. However, detailed analysis proves embarrassing, because of
the absence of sharp distinctions at any point.” (Bennett 1934: 404-405)5 Here Bennett is
saying that the distinction between the two phases is only a matter of changing frequen-
cies of certain ceramic attributes. This presents a significant complication for settlement
archaeology, as I discussed already in Chapter3. When phases are distinguished only by at-
tribute frequency, some mathematical technique must be employed to analytically separate
the components of mixed surface assemblages. My treatment of the Chiripa ceramics is an
example of such a technique. In the absence of this kind of methodology, the identification
of components in complex mixed sites becomes difficult to the point of unreliability. Thus
Bennett’s Classic-Decadent sequence has been troublesome to settlement archaeologists
working in the Titicaca Basin.
Albarracín-Jordan, in his analysis of the settlement data from the Lower Tiwanaku
Valley (Albarracín-Jordan 1992, Albarracín-Jordan 1996a), seems to have few reservations
about identifying Tiwanaku IV as opposed to V components in mixed surface assemblages.
James Mathews, who collaborated with Albarracín-Jordan on the Tiwanaku Valley survey,
also attempted to distinguish Tiwanaku IV from V occupation sectors. However, he recog-
nized that the procedure was questionable6 and attempted - without success - to formulate
a more reliable methodology (Mathews 1992: 131-135).
Settlement archaeologists working in the Titicaca Basin but outside the Tiwanaku
4The Proyecto Wila Jawira has also produced the beginnings of a new Tiwanaku Period chronology,primarily through the work of Alconini and Janusek (seeAlconini Mujica 1995). This new chronologyhas yet to be applied successfully to mixed surface assemblages, however, or to settlement research (seeJanusek 2001, Janusek and Kolata 2001).
5Thanks to James Mathews for pointing out the importance of this passage (Mathews 1992: 128).6“... the distinction between uncontextualized Tiwanaku IV and V plainwares is a difficult (if not impos-
sible) task at present, we are unable to ascertain the relative intensity of each phase of occupation at thesesites with both types of decorated wares.” (Mathews 1992: 132)
Chapter 8 210
heartland have not attempted to distinguish earlier from later Tiwanaku occupa-
tions, but have instead grouped all Tiwanaku materials under the rubric of “ex-
pansive Tiwanaku” or simply “Tiwanaku” (Hyslop 1976, Stanish and Steadman 1994,
Stanish et al. 1997: 45). The same is true of more recent research in the Tiwanaku heart-
land (Albarracín-Jordan et al. 1993, Janusek 2001, Janusek and Kolata 2001). Thus, since
there exists no accepted method of identifying Tiwanaku IV or V occupations in mixed sur-
face assemblages, “[n]or is there a good consensus of what constitutes Tiwanaku IV versus
Tiwanaku V decorated wares” (Mathews 1992: 128), I have opted in the present study to
follow general practice and to combine all Tiwanaku IV and V style materials into a single
long Tiwanaku Period.
While the Tiwanaku decorated wares are highly distinctive and easily recognizable in
mixed surface assemblages, Tiwanaku plainwares are another matter altogether. The latter
seem to overlap significantly with both LF2 and Early Pacajes plainwares, making identifi-
cation difficult. For this reason plainwares were not used for the identification of Tiwanaku
occupations in the present study.
8.2 Principal sites
Seventeen sites were identified with Tiwanaku Period occupations greater than or equal
to 3.0 ha. These are numbered on Figure8.2and are described below.
T-1G (Chiripa)
During the Tiwanaku Period Chiripa grew steadily. Sector G has a population index
value of 523 (9.0 ha), as opposed to 322 for Sector F, an annual growth rate of 0.07%.
This is approximately equal to the Taraco Peninsula phase average (see Table8.1). In the
settlement hierarchy of the Taraco Peninsula, Chiripa clearly occupied the second tier, with
Yanapata (T-123/T-130), Titicachi (T-394/T-415) and Chiripa Pata (T-4).
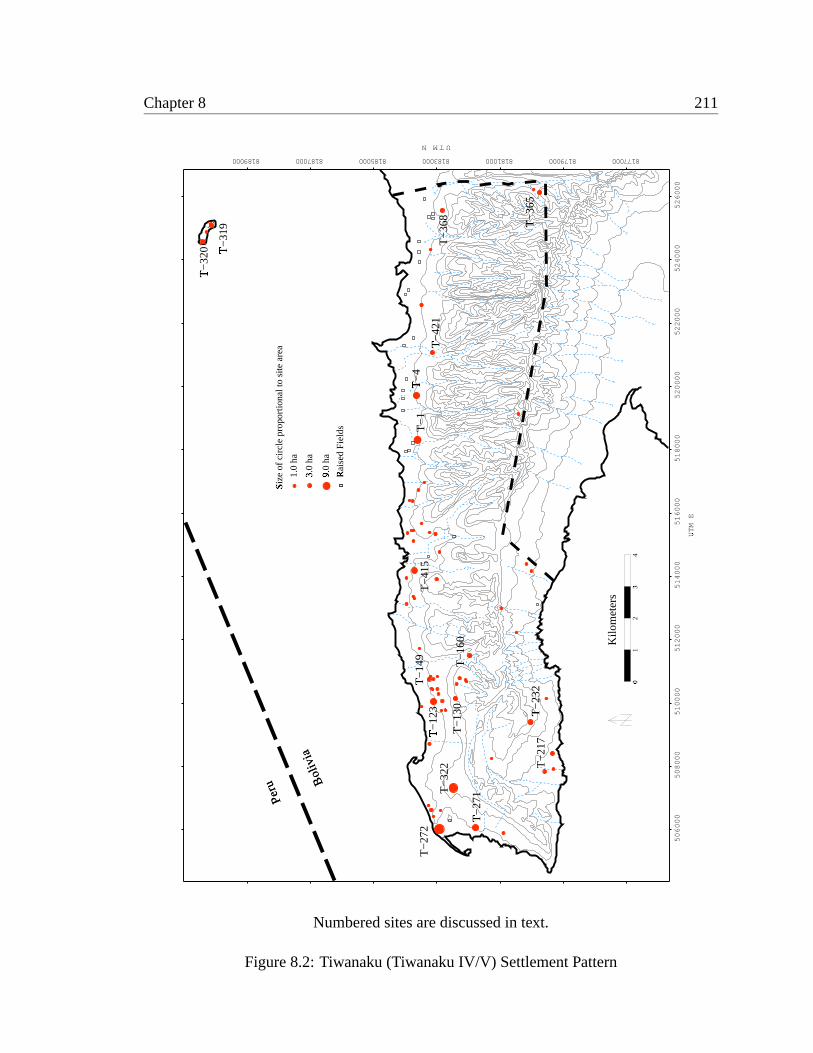
Chapter 8 211
0�
12
3�
4
Kilo
met
ers
1.0
ha
Rai
sed
Fie
lds
�3.0
ha
�
Peru B
oliv
ia
Siz
e of
circ
le p
ropo
rtio
nal t
o si
te a
rea
�
9.0
ha
�
506000
508000
510000
512000
514000
516000
518000
520000
522000
524000
526000
UTM E
�
UTMN
8770008179008110000818500818700819000 108818300008
T−
1T
−41
5
T−
130
T−
232
�
T−
368
T−
271
�
T−
272
T−
4
�
T−
319
�
T−
322
T−
421
�
T−
320
�
T−
217T
−12
3
�
T−
149
�
T−
160
T−
365
�
Numbered sites are discussed in text.
Figure 8.2: Tiwanaku (Tiwanaku IV/V) Settlement Pattern
Chapter 8 212
T-4E (Chiripa Pata)
Chiripa Pata experienced very slow growth at this time. Sector E has a population index
of 429 (7.5 ha), as opposed to 353 for the LF2 sector D. This is an annual growth rate of
0.03%, considerably below the phase average. The role of Chiripa Pata in Tiwanaku Period
Taraco Peninsula settlement hierarchy is uncertain. On the one hand, its large size seems
to indicate that it is the smallest of the second-tier sites, with Chiripa (T-1) and Yanapata
(T-123/T-130). On the other, its slow growth rate would place it with the tertiary villages.
T-123C (Yanapata Baja)
Considered as a single site, Yanapata Baja grew quite rapidly in the Tiwanaku Period.
Sector C has a population index of 429 (7.5 ha), and the site seems to have been unoccupied
during the preceding LF2. This growth is perhaps even more impressive when Yanapata
Baja is considered as part of the larger Yanapata group, together with T-130. Considered
as a whole, the estimated population of the Yanapata group grew from 17 (a hamlet) to
630 during the Middle Horizon, an annual growth rate of 0.56%. Growth this rapid clearly
indicates a population influx from outside the boundaries of the local community, and sug-
gests some form of population resettlement programme on the part of the Tiwanaku state
or its local representatives. Whatever the case, the Yanapata group was clearly one of the
secondary sites of the Taraco Peninsula at this time, together with Chiripa (T-1).
T-130F (Yanapata)
Yanapata grew rapidly, from an estimated population of 17 for Sector E to 201 (3.75 ha)
for Sector F. Together with Yanapata Baja (T-123, see description above), the site formed
part of the Yanapata group, one of the principal settlement loci of the Middle Horizon
Taraco Peninsula.
Chapter 8 213
T-149A
This site is a large sherd scatter located in the modern community of Nachoca. The
scatter covers some 3.4 ha of fallow fields downslope of the modern road, and West of the
modern church and school complex. Sherd density is generally very light to to a lack of
recent agricultural activity. The Tiwanaku Period occupation (Sector A) was the first on this
site, extending over the entire area. The sector has an estimated population of 180 persons,
thereby falling into group of tertiary settlement on the peninsula (those with population
indices below 300). No evidence of any form of corporate construction or ritual is visible.
T-160B (Pichuria K’ucha)
Pichuria K’ucha is a large sherd scatter located in the modern community of Nachoca.
The scatter is continuous and very dense, covering 4.25 ha. The site appears to be deeply
stratified. At the time of my visit, a large portion of the site had only recently been plowed
with a tractor for the first time. Large sherds and whole vessels had been exposed, together
with many features such as hearths and burials. The site clearly represents a medium-sized
Tiwanaku village, with a population index of 231 (Sector B). With the exception of the
tractor-plowing the site seems to be reasonably intact. Only one modern house (of two
stories) is located on the site itself.
The site is very unusual in one respect at least. It is located on a low terrace at the
confluence of two perennial watercourses, at the bottom of aquebradaand at a considerable
distance (> 2 km) from the lakeshore. It is one of only two sizable Tiwanaku sites on the
Taraco Peninsula (the other being T-365, below) which is not located on the lake-facing
slopes of the hills, and within 1 km of the lakeshore. The significance of this topographical
distinction is uncertain, but probably indicates agricultural intensification in less-desirable
locales.
There seems to have been a very ephemeral LF2 occupation on the site, as well (Sector
A). This was a small farmstead, with a population index of only 6.
Chapter 8 214
T-217B
This site comprises a medium-sized (3.0 ha) sherd scatter located on a low rise on
the lake plain in the community of Coa Kkollu. In regard to its topographical place-
ment, the site is somewhat different from most Tiwanaku sites on the Taraco Peninsula,
and is directly comparable to the slightly smaller (and nearby) T-213, and to the slightly
larger site of Iwawe or Ojepuko (TMV-150), in the adjacent community of Iwawe Grande
(Albarracín-Jordan 1992, Albarracín-Jordan 1996a, Burkholder 1997). Sector 217B, the
Tiwanaku occupation, has a population index of 157. A smaller LF2 occupation is also
present at the site (Sector A, population index 43).
A nearby Early Colonial hamlet (T-216) has a large (approximately 0.7 x 1.0 m) an-
desite block on the surface. This block is probably from T-217 originally. No other evi-
dence of stone working or construction is present on the surface.
T-232E (Kala Uyuni)
As mentioned in Chapter7, Kala Uyuni was the principal population center on the
Taraco Peninsula during at least part of the LF1. During the LF2 it was virtually abandoned,
an event probably associated with the incorporation of the peninsula into the Tiwanaku
polity. During the Tiwanaku Period, the site again grew rapidly, from a LF2 population
index of 70 (Sector D) to 291 (5.25 ha) in the Middle Horizon. This represents an annual
growth rate of 0.22%, much higher than the phase average and probably indicative of an
intentional repopulation of the locality. It was never again to be the principal settlement
on the peninsula, however, and can be considered a tertiary site in the Tiwanaku Period
settlement hierarchy.
T-271D (Sonaji)
Sonaji grew very slowly during the Tiwanaku Period. Sector D has a population index
value of 429 (7.5 ha), as opposed to 368 for the LF2 Sector C. This is an annual growth
rate of only 0.02%, well below the phase average. Judging by the fancy Tiwanaku ceramics
Chapter 8 215
present on the surface of the site, as well as from evidence of Tiwanaku Period monumental
construction, it would seem that Sonaji continues to serve as the locus of public ritual and
perhaps elite habitation for the Santa Rosa group (T-271/T-272/T-322; see sections7.2.1
and7.2.2).
The Santa Rosa group as a whole grew from a population index value of 1435 for the
LF2 to 1959 for the Tiwanaku Period. This is an annual growth rate of only 0.05% again
below the phase average of 0.08% (Table8.1). Thus the Tiwanaku Period settlement system
as a whole evidences a reduced importance of the largest sites on the peninsula, and higher
relative growth in the lower tiers of the hierarchy. This in turn indicates a transformation
of the political economy, as will be discussed at more length later in this chapter.
T-272D (Kumi Kipa)
Kumi Kipa is also a part of the Santa Rosa group, together with Sonaji (T-271) and
Kollin Pata (T-322). It experienced basically zero growth in the Tiwanaku Period. The
LF2 Sector C has a population index of 821, while Sector D has a value of 836 (14.0
ha). This is an annual growth rate of 0.00%. As was the case in the LF2 (see section
7.2.2), the ceramics at Kumi Kipa are on balance decidedly more utilitarian than those at
the nearby Sonaji, suggesting primarily domestic habitation and productive activity, and a
lack of public ritual.
T-319C (Sikuya Este)
This site seems not to have grown at all during the Tiwanaku Period. Sector C has a
population index value of 204 (3.8 ha), the same as that of the Sector B. This determination
is somewhat problematic, however, since the site was not systematically surface collected.
T-320C (Sikuya Oeste)
Sikuya Oeste experienced fairly rapid growth during the Tiwanaku Period. Sector C has
a population index value of 157 (3.0 ha), up from 70 for the LF2 Sector B. This is an annual
growth rate of 0.12%, considerably higher than the Taraco Peninsula phase average. Taking
Chapter 8 216
the two Sikuya sites (T-319/T-320) together, we observe an annual population growth rate
of 0.04% for the entire island. This is lower than the phase average and would seem to
indicate a degree of outmigration. Again, however, we must remember that population
index estimates for the Sikuya Oeste are complicated by considerable modern disturbance.
T-322C (Kollin Pata)
Kollin Pata belongs to the Santa Rosa group of sites, together with Sonaji (T-271) and
Kumi Kipa (T-272). Of these three sites, Kollin Pata was the only one to experience ap-
preciable growth during the Tiwanaku Period. Sector C has a population index value of
693 (11.73 ha), as opposed to 246 for the LF2 Sector B. This is an annual growth rate of
0.16%. This is twice the Taraco Peninsula phase average (see Table8.1). Like Kumi Kipa,
the ceramics seem to indicate a predominantly domestic occupation.
T-365A (Jacha Winto)
Jacha Winto is a substantial, dense sherd scatter, located on the slopes of a largeque-
brada in the modern community of Huacullani. The scatter covers 3.23 ha, with a popula-
tion index value of 170. Near the center of the site is a substantial terrace (50x50 m) which
may represent some for of corporate construction.
Like Titicachi (T-415), Jacha Winto is unusual in being a single component Tiwanaku
site. It is further distinguished by being only Tiwanaku Period village located more than
2 kilometers from the modern lakeshore. In fact, it lies almost 5 km from the lakeshore,
more than twice as far as the next most distant Tiwanaku village in the survey area (Pichuria
K’ucha, T-160). Thequebradain which the site is located is unusual in that it is the only
place between Taraco and Tambillo (a > 40 km stretch of the Taraco hills) that is a major
thoroughfare between the lakeshore and the Tiwanaku Valley. The modern road passes
through the community of Rosa Pata and connects Huacullani with the Tiwanaku Valley
town of Pillapi, and is passable by motor vehicles year-round. This was almost certainly an
important road in prehistory as well.
Jacha Winto has a third distinction: it is the only Tiwanaku site in the Taraco Peninsula
Chapter 8 217
survey area on which I found non-local Middle Horizon ceramics. One fragment of a ring-
footed vessel of the Mojocoya Tricolor style - possibly from the Cochabamba region - was
recovered from the surface. This specimen, not illustrated here, is almost identical to one
published by Janusek in his dissertation (Janusek 1994:Figure 10.26).
T-368E (Tilata)
Tilata is a small village site located in the modern community of Huacullani, not far
from the eastern boundary of the survey area. The sherd scatter covers 3.56 ha, and contains
ceramics from most periods in the regional sequence. It seems to have been continuously
occupied from the EF2 Period through the Late Horizon.
The site is located on the lower slopes of the hills, facing to the North. The lakeshore
is at present more than 1.5 km north of the site. The valley bottom adjacent to the site is
occupied by a large swampy area containing the remains of numerous raised field agricul-
tural features. Many of these were almost certainly worked during the Tiwanaku Period
occupation of Tilata.
Roughly in the center of the sherd scatter the is situated a substantial mound construc-
tion, some 50x50 m. Atop this mound, which is certainly prehispanic in date, is a mod-
ern house belonging to the current owner of the site. The house itself contains numerous
shaped stone blocks of both andesite and sandstone. These blocks were almost certainly
recovered from the remains of prehistoric structures. The andesite, at least, probably dates
to the Tiwanaku Period. This is a clear indication of at least a modest public architectural
construction at the site. This was almost certainly located on the mound itself.
The mound seems to have been used as a cemetery in post-Tiwanaku times, and a
number of looted stone cyst tombs are evident on the surface. The landowner showed me
several complete vessels he had encountered while working the fields, including a complete
Tiwanaku kero and a Late Horizon aryballoid vessel. He also informed me of a sculpted
stone plaque, which from his cursory description may date to the MF or LF1 Periods. The
piece was buried under a cache of dung fuel at the time of my visit, and I have been unable
as yet to return to document the specimen. I should also note that both Cesar Callisaya and
Chapter 8 218
John Janusek have informed me on separate occasions that they had visited the site some
years beforehand and had encountered stone tenon heads on the surface. I found none of
these during my own inspection, however.
The site was initially occupied during the EF2 Period. It grew slowly through the MF
and LF1 and LF2 Periods. Its growth continued during the Tiwanaku Period. Sector E
has a population index of 190, up from 131 for the LF2 Sector D, an annual growth rate
of 0.06%. This is somewhat below the phase average, though it must be remembered that
this particular site was not surface collected, and that these sector size determinations are
therefore provisional.
Finally, it must be noted that this site lies in the border zone between the Taraco Penin-
sula and the Pampa Koani. The Tiwanaku period city of Lukurmata (cf.Bermann 1990,
Bermann 1994, Janusek 1994) is in fact visible from the site. I imagine, though I can-
not at present demonstrate this, that Tilata fell within the economic and administra-
tive orbit of Lukurmata. Settlement determinants in the Pampa Koani at this time (see
Janusek and Kolata 2001) were very different from those on the Taraco Peninsula. In con-
sidering the settlement history of Tilata and nearby sites this fact cannot be forgotten.
T-415A (Titicachi)
This site is a large, dense sherd scatter located on the lower slopes of the hills very near
to the lakeshore in the modern community of Zapana. The scatter extends over 6.20 ha
(population index value: 349), and seems, very unusually, to represent a single-component
Tiwanaku Period occupation. No sherds of any other time periods were recovered after an
extensive review of the surface. The slope on which the site is located faces East.
There are two probable mound constructions on the site, though both have been dis-
turbed by plowing. One is located in the northern portion of the site, and the other in the
southern. Both measure approximately 30x30 m, and a more terraces than mounds. Both
stand about 2 m high on their downslope faces. The northern feature is rather uncertain,
its topographical features having been effaced by agricultural activity and lacking cut stone
on the surface. It could conceivable represent a more recent accumulation of stones result-

Chapter 8 219
ing from field clearing activity, The southern feature is undoubtedly a monumental terrace,
however, and several large cut stone blocks are present on the surface. One of these is of
limestone, the other of andesite.
Titicachi is located approximately 750 m north of the site of Janko Kala (T-394). Janko
Kala was a major center in the LF2, and earlier, but in the Tiwanaku Period was almost
abandoned. The population index of that site dropped from 246 for the LF2 Sector E to
a mere 84 for Sector F. At this precise time Titicachi was founded less than a kilometer
away. Titicachi, therefore, almost certainly represents a relocation of the community which
formerly occupied the site of Kanko Kala. Combining the population indices of the two
sites we can calculate an annual population index growth rate of 0.09% for the Tiwanaku
Period. This growth rate is only slightly higher than the phase average, and is directly
comparable to that of Chiripa at this time. We may consider this community a secondary
settlement locus, comparable to Chiripa (T-1) and Yanapata (T-123/T-130).
T-421G (Waka Kala)
Waka Kala is one of the few sites which experienced depopulation during the Tiwanaku
Period. Sector G has a population index value of 186 (3.5 ha), down from 246 for Sector
F. This represents an annual growth rate of -0.04%. The nearby site of Alto Pukara (T-430)
experienced an even more dramatic decline in population at this time, decreasing from 127
to 84, an annual growth rate of -0.06%. These two sites, very near to one another, fall
into an intermediate zone between the administrative spheres of Sonaji (the Santa Rosa
group) and the much larger and more important site of Lukurmata in the Pampa Koani. As
mentioned briefly above in my discussion of Tilata (T-368), the settlement processes taking
place on the Pampa Koani in the Tiwanaku Period seem to have been very different from
those on the Taraco Peninsula. This difference can, I believe, account for the apparently
anomalous decline in the population indices of these sites when compared to general pop-
ulation growth on the Taraco Peninsula at this time. I will take the up the matter again
shortly.
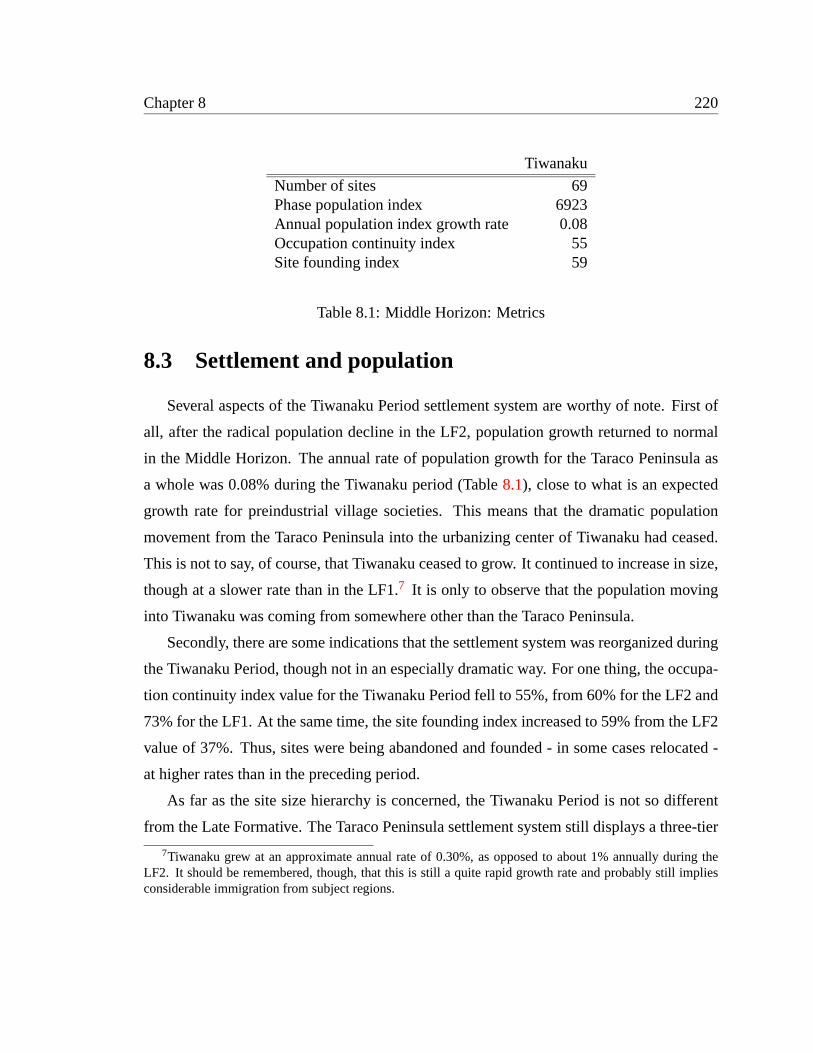
Chapter 8 220
Tiwanaku
Number of sites 69Phase population index 6923Annual population index growth rate 0.08Occupation continuity index 55Site founding index 59
Table 8.1: Middle Horizon: Metrics
8.3 Settlement and population
Several aspects of the Tiwanaku Period settlement system are worthy of note. First of
all, after the radical population decline in the LF2, population growth returned to normal
in the Middle Horizon. The annual rate of population growth for the Taraco Peninsula as
a whole was 0.08% during the Tiwanaku period (Table8.1), close to what is an expected
growth rate for preindustrial village societies. This means that the dramatic population
movement from the Taraco Peninsula into the urbanizing center of Tiwanaku had ceased.
This is not to say, of course, that Tiwanaku ceased to grow. It continued to increase in size,
though at a slower rate than in the LF1.7 It is only to observe that the population moving
into Tiwanaku was coming from somewhere other than the Taraco Peninsula.
Secondly, there are some indications that the settlement system was reorganized during
the Tiwanaku Period, though not in an especially dramatic way. For one thing, the occupa-
tion continuity index value for the Tiwanaku Period fell to 55%, from 60% for the LF2 and
73% for the LF1. At the same time, the site founding index increased to 59% from the LF2
value of 37%. Thus, sites were being abandoned and founded - in some cases relocated -
at higher rates than in the preceding period.
As far as the site size hierarchy is concerned, the Tiwanaku Period is not so different
from the Late Formative. The Taraco Peninsula settlement system still displays a three-tier
7Tiwanaku grew at an approximate annual rate of 0.30%, as opposed to about 1% annually during theLF2. It should be remembered, though, that this is still a quite rapid growth rate and probably still impliesconsiderable immigration from subject regions.

Chapter 8 221
0
200
400
600
800
1000
1200
0 100 200 300 400 500 600 700 800
Tot
al p
opul
atio
n in
dex
Population index of site (multiple of 100)
Tiwanaku
Figure 8.3: Middle Horizon site size distribution
site size hierarchy (Figure8.3), just as it had in the LF1 and LF2. In fact, the same sites,
roughly, occupy the same positions in the settlement hierarchy. The Santa Rosa group
(T-271/T-272/T-322) continues to be by far the largest population concentration on the
peninsula, with a total of more than 33 ha of occupation area. Chiripa (T-1), Yanapata (T-
123/T-130), Titicachi (T-394/T-415)8and Chiripa Pata (T-4) continue to occupy the second
tier. In addition, Tiwanaku itself became a primate center sometime in the LF2, alone
comprising a fourth, higher-level tier in the settlement hierarchy.
However, if we look carefully at the relative population growth rates of the various
levels in the Tiwanaku Period site size hierarchy (Table8.2), it becomes clear that in fact an
important change has taken place in relation to patterns observed in the Late Formative. It
will be recalled that in both phases of the LF, as discussed in Chapter7, an asymmetry was
8Titicachi being, of course, the new location of the major Formative Period village of Janko Kala.
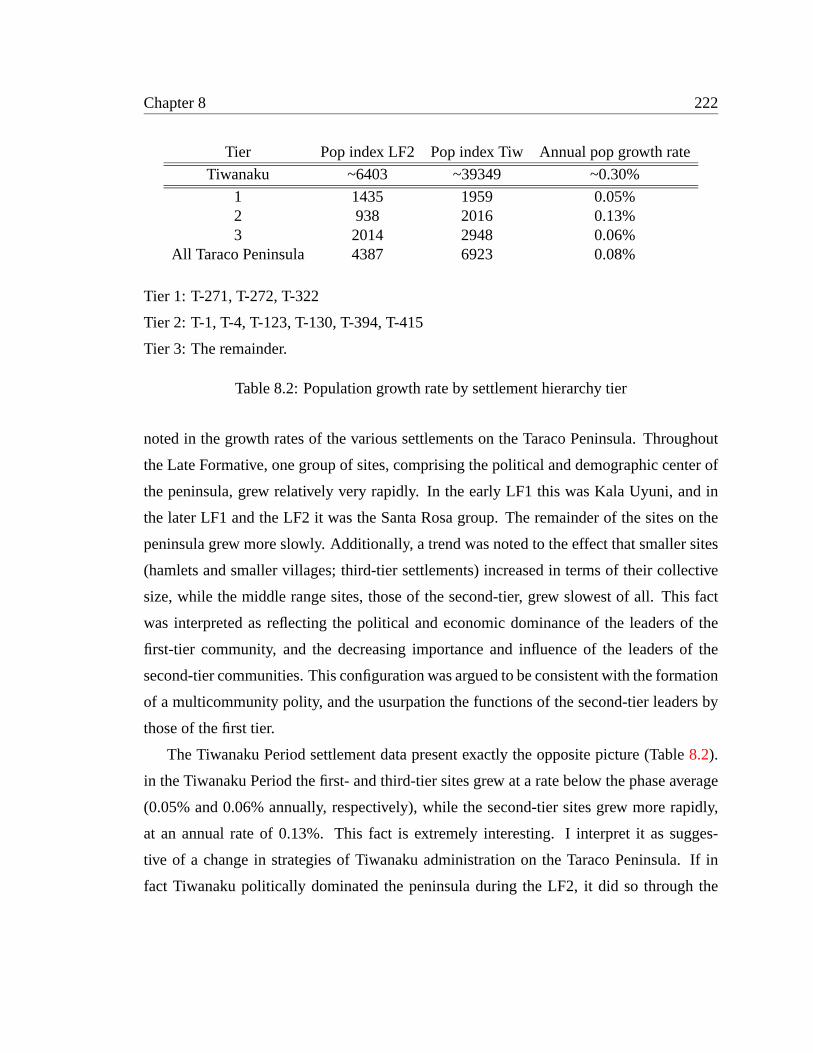
Chapter 8 222
Tier Pop index LF2 Pop index Tiw Annual pop growth rate
Tiwanaku ~6403 ~39349 ~0.30%
1 1435 1959 0.05%2 938 2016 0.13%3 2014 2948 0.06%
All Taraco Peninsula 4387 6923 0.08%
Tier 1: T-271, T-272, T-322
Tier 2: T-1, T-4, T-123, T-130, T-394, T-415
Tier 3: The remainder.
Table 8.2: Population growth rate by settlement hierarchy tier
noted in the growth rates of the various settlements on the Taraco Peninsula. Throughout
the Late Formative, one group of sites, comprising the political and demographic center of
the peninsula, grew relatively very rapidly. In the early LF1 this was Kala Uyuni, and in
the later LF1 and the LF2 it was the Santa Rosa group. The remainder of the sites on the
peninsula grew more slowly. Additionally, a trend was noted to the effect that smaller sites
(hamlets and smaller villages; third-tier settlements) increased in terms of their collective
size, while the middle range sites, those of the second-tier, grew slowest of all. This fact
was interpreted as reflecting the political and economic dominance of the leaders of the
first-tier community, and the decreasing importance and influence of the leaders of the
second-tier communities. This configuration was argued to be consistent with the formation
of a multicommunity polity, and the usurpation the functions of the second-tier leaders by
those of the first tier.
The Tiwanaku Period settlement data present exactly the opposite picture (Table8.2).
in the Tiwanaku Period the first- and third-tier sites grew at a rate below the phase average
(0.05% and 0.06% annually, respectively), while the second-tier sites grew more rapidly,
at an annual rate of 0.13%. This fact is extremely interesting. I interpret it as sugges-
tive of a change in strategies of Tiwanaku administration on the Taraco Peninsula. If in
fact Tiwanaku politically dominated the peninsula during the LF2, it did so through the
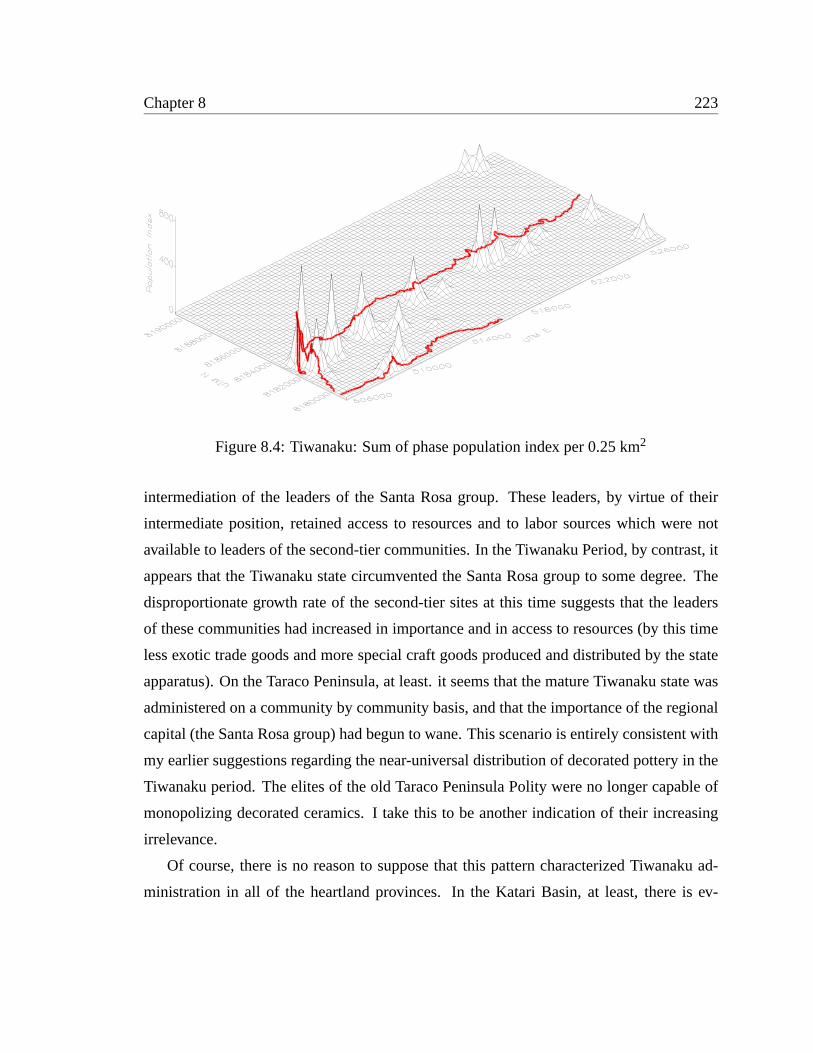
Chapter 8 223
Figure 8.4: Tiwanaku: Sum of phase population index per 0.25 km2
intermediation of the leaders of the Santa Rosa group. These leaders, by virtue of their
intermediate position, retained access to resources and to labor sources which were not
available to leaders of the second-tier communities. In the Tiwanaku Period, by contrast, it
appears that the Tiwanaku state circumvented the Santa Rosa group to some degree. The
disproportionate growth rate of the second-tier sites at this time suggests that the leaders
of these communities had increased in importance and in access to resources (by this time
less exotic trade goods and more special craft goods produced and distributed by the state
apparatus). On the Taraco Peninsula, at least. it seems that the mature Tiwanaku state was
administered on a community by community basis, and that the importance of the regional
capital (the Santa Rosa group) had begun to wane. This scenario is entirely consistent with
my earlier suggestions regarding the near-universal distribution of decorated pottery in the
Tiwanaku period. The elites of the old Taraco Peninsula Polity were no longer capable of
monopolizing decorated ceramics. I take this to be another indication of their increasing
irrelevance.
Of course, there is no reason to suppose that this pattern characterized Tiwanaku ad-
ministration in all of the heartland provinces. In the Katari Basin, at least, there is ev-
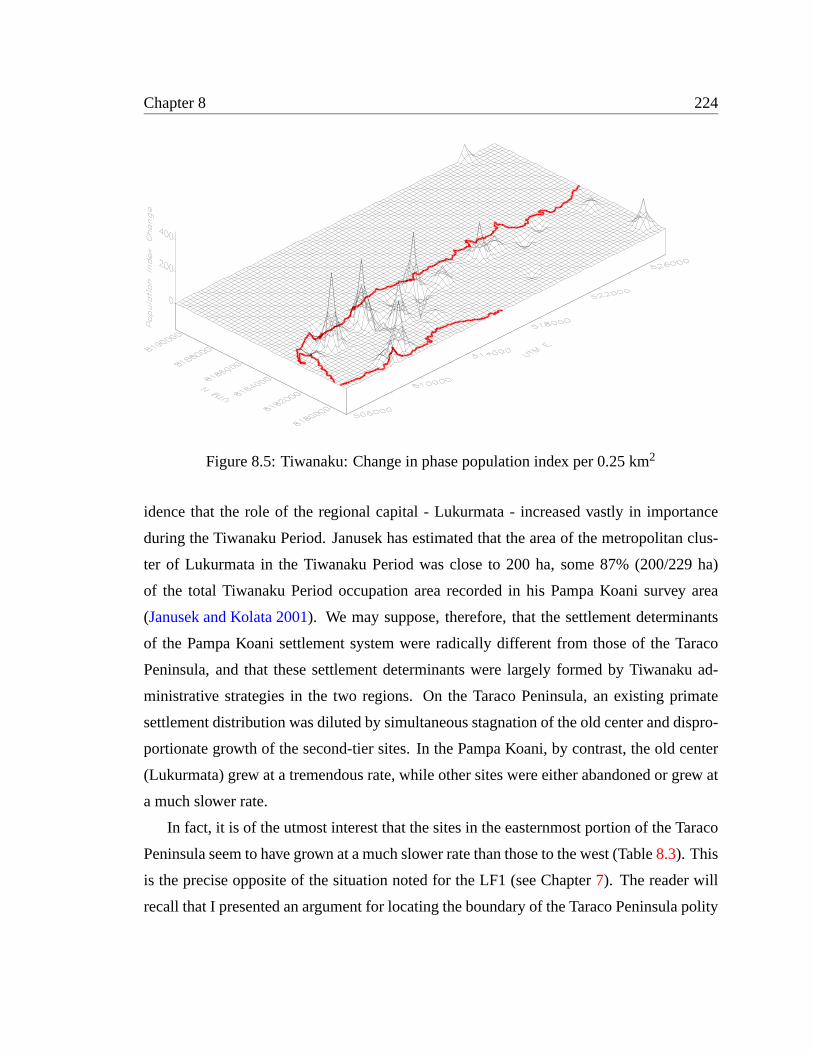
Chapter 8 224
Figure 8.5: Tiwanaku: Change in phase population index per 0.25 km2
idence that the role of the regional capital - Lukurmata - increased vastly in importance
during the Tiwanaku Period. Janusek has estimated that the area of the metropolitan clus-
ter of Lukurmata in the Tiwanaku Period was close to 200 ha, some 87% (200/229 ha)
of the total Tiwanaku Period occupation area recorded in his Pampa Koani survey area
(Janusek and Kolata 2001). We may suppose, therefore, that the settlement determinants
of the Pampa Koani settlement system were radically different from those of the Taraco
Peninsula, and that these settlement determinants were largely formed by Tiwanaku ad-
ministrative strategies in the two regions. On the Taraco Peninsula, an existing primate
settlement distribution was diluted by simultaneous stagnation of the old center and dispro-
portionate growth of the second-tier sites. In the Pampa Koani, by contrast, the old center
(Lukurmata) grew at a tremendous rate, while other sites were either abandoned or grew at
a much slower rate.
In fact, it is of the utmost interest that the sites in the easternmost portion of the Taraco
Peninsula seem to have grown at a much slower rate than those to the west (Table8.3). This
is the precise opposite of the situation noted for the LF1 (see Chapter7). The reader will
recall that I presented an argument for locating the boundary of the Taraco Peninsula polity
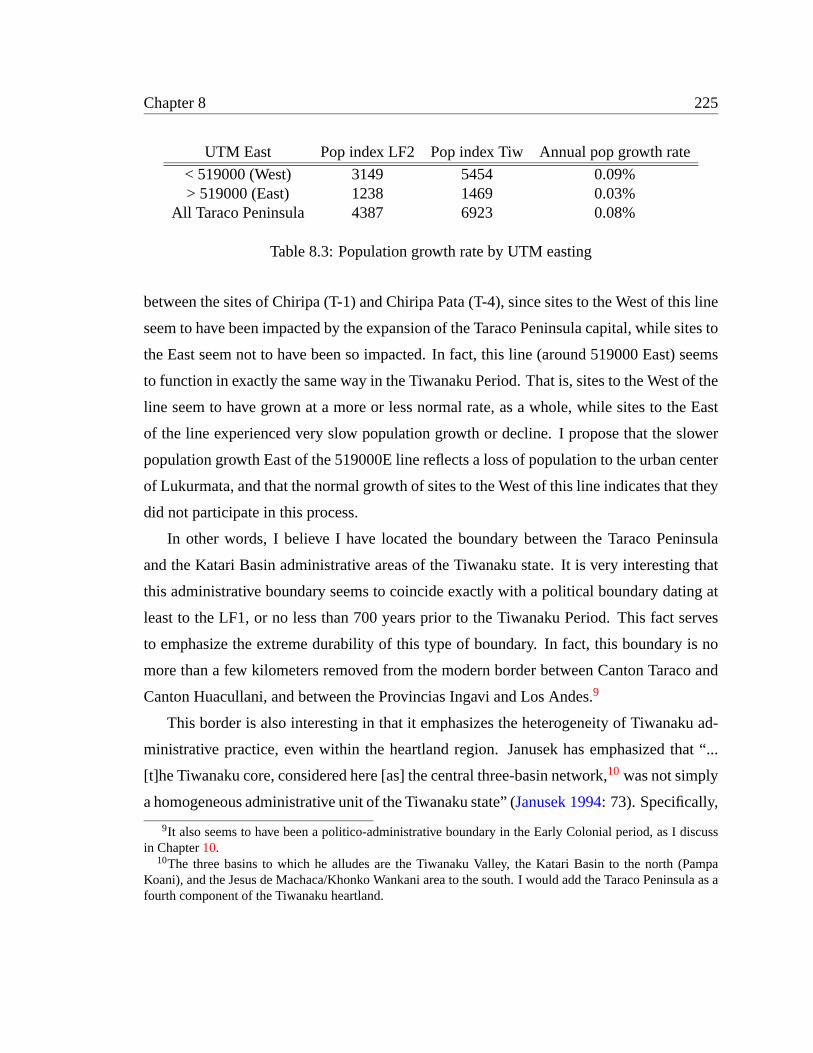
Chapter 8 225
UTM East Pop index LF2 Pop index Tiw Annual pop growth rate
< 519000 (West) 3149 5454 0.09%> 519000 (East) 1238 1469 0.03%
All Taraco Peninsula 4387 6923 0.08%
Table 8.3: Population growth rate by UTM easting
between the sites of Chiripa (T-1) and Chiripa Pata (T-4), since sites to the West of this line
seem to have been impacted by the expansion of the Taraco Peninsula capital, while sites to
the East seem not to have been so impacted. In fact, this line (around 519000 East) seems
to function in exactly the same way in the Tiwanaku Period. That is, sites to the West of the
line seem to have grown at a more or less normal rate, as a whole, while sites to the East
of the line experienced very slow population growth or decline. I propose that the slower
population growth East of the 519000E line reflects a loss of population to the urban center
of Lukurmata, and that the normal growth of sites to the West of this line indicates that they
did not participate in this process.
In other words, I believe I have located the boundary between the Taraco Peninsula
and the Katari Basin administrative areas of the Tiwanaku state. It is very interesting that
this administrative boundary seems to coincide exactly with a political boundary dating at
least to the LF1, or no less than 700 years prior to the Tiwanaku Period. This fact serves
to emphasize the extreme durability of this type of boundary. In fact, this boundary is no
more than a few kilometers removed from the modern border between Canton Taraco and
Canton Huacullani, and between the Provincias Ingavi and Los Andes.9
This border is also interesting in that it emphasizes the heterogeneity of Tiwanaku ad-
ministrative practice, even within the heartland region. Janusek has emphasized that “...
[t]he Tiwanaku core, considered here [as] the central three-basin network,10 was not simply
a homogeneous administrative unit of the Tiwanaku state” (Janusek 1994: 73). Specifically,
9It also seems to have been a politico-administrative boundary in the Early Colonial period, as I discussin Chapter10.
10The three basins to which he alludes are the Tiwanaku Valley, the Katari Basin to the north (PampaKoani), and the Jesus de Machaca/Khonko Wankani area to the south. I would add the Taraco Peninsula as afourth component of the Tiwanaku heartland.
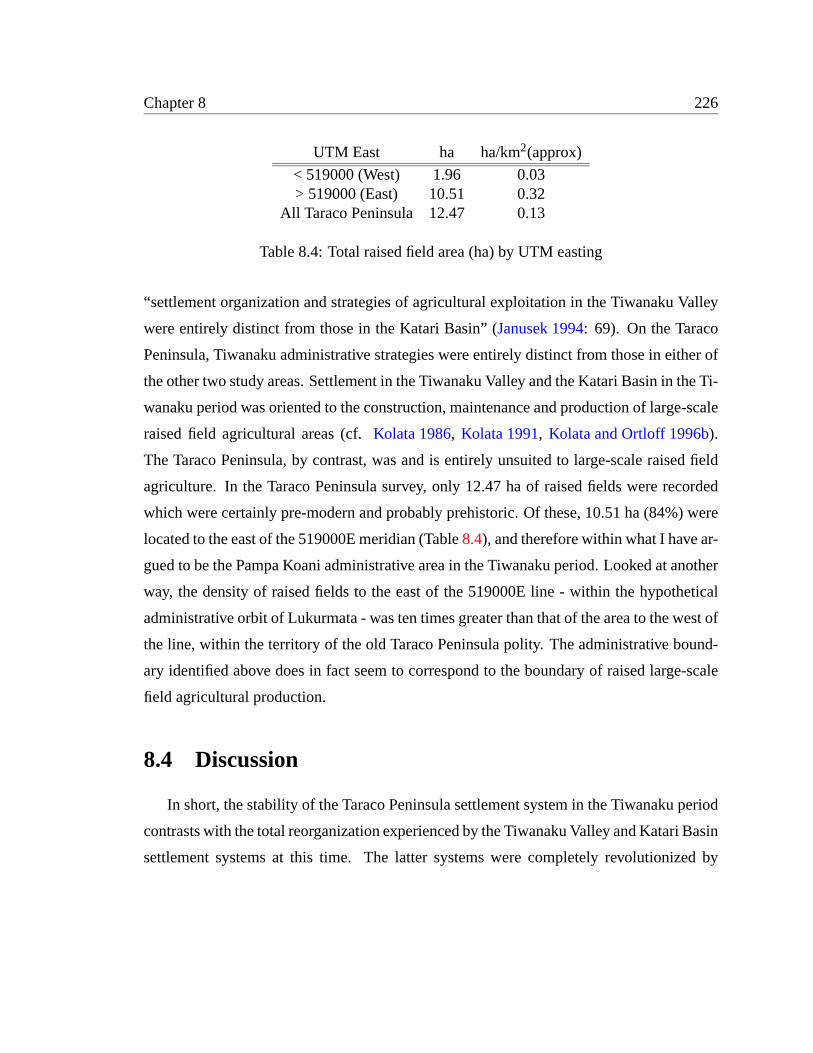
Chapter 8 226
UTM East ha ha/km2(approx)
< 519000 (West) 1.96 0.03> 519000 (East) 10.51 0.32
All Taraco Peninsula 12.47 0.13
Table 8.4: Total raised field area (ha) by UTM easting
“settlement organization and strategies of agricultural exploitation in the Tiwanaku Valley
were entirely distinct from those in the Katari Basin” (Janusek 1994: 69). On the Taraco
Peninsula, Tiwanaku administrative strategies were entirely distinct from those in either of
the other two study areas. Settlement in the Tiwanaku Valley and the Katari Basin in the Ti-
wanaku period was oriented to the construction, maintenance and production of large-scale
raised field agricultural areas (cf.Kolata 1986, Kolata 1991, Kolata and Ortloff 1996b).
The Taraco Peninsula, by contrast, was and is entirely unsuited to large-scale raised field
agriculture. In the Taraco Peninsula survey, only 12.47 ha of raised fields were recorded
which were certainly pre-modern and probably prehistoric. Of these, 10.51 ha (84%) were
located to the east of the 519000E meridian (Table8.4), and therefore within what I have ar-
gued to be the Pampa Koani administrative area in the Tiwanaku period. Looked at another
way, the density of raised fields to the east of the 519000E line - within the hypothetical
administrative orbit of Lukurmata - was ten times greater than that of the area to the west of
the line, within the territory of the old Taraco Peninsula polity. The administrative bound-
ary identified above does in fact seem to correspond to the boundary of raised large-scale
field agricultural production.
8.4 Discussion
In short, the stability of the Taraco Peninsula settlement system in the Tiwanaku period
contrasts with the total reorganization experienced by the Tiwanaku Valley and Katari Basin
settlement systems at this time. The latter systems were completely revolutionized by
Chapter 8 227
raised field agriculture.11 The Taraco Peninsula system was not. It retained the basic
structure that originated in the LF1, with the community boundaries and principal villages
essentially unchanged from the MF. This difference would seem to suggest that the Taraco
Peninsula was integrated into the Tiwanaku state and economy in very different way from
the other areas of the core region. This statement is necessarily vague; I can be no more
specific. Were the Taraco Peninsula communities involved in raised field production in
the Tiwanaku Valley and the Pampa Koani? Or were their state labor obligations of a
wholly different nature, involving dryland agriculture or non-agricultural activities? The
question of the peninsula’s relation to adjacent areas, and the nature of Tiwanaku state
tribute extraction, clearly merits further research.
11Other areas of the Titicaca Basin under Tiwanaku administration were not so radically changed as thecore region itself. An example is the Juli-Pomata area, where the basic Late Formative settlement configu-ration was unchanged in the Tiwanaku period (Stanish 1994, Stanish et al. 1997). The LF settlement systemwas already oriented to raised field production, and it continued to be so during the Tiwanaku period.
228
Chapter 9
The Late Intermediate Period: collapse
and demographic decline
Sometime at or before 1050 A.D. the level of Lago Wiñaymarka dropped to 7-
12 m below overflow level, or 12-18 m below its modern average of 3810 m.a.s.l.
(Abbott et al. 1997a: 179) and seems to have remained low until the arrival of the Inka
empire - and the Little Ice Age - in the Titicaca Basin around 1450 A.D. Kolata and his col-
leagues have argued that this drop coincides with a period of reduced rainfall which caused
the collapse of the Tiwanaku agricultural base - principally raised field production in their
view (Binford et al. 1997, Kolata and Ortloff 1996a, Ortloff and Kolata 1992).
Janusek summarizes this position as follows:
Recent paleo-ecological research strongly suggests that changing climatic con-ditions triggered a profound crisis in Tiwanaku political economy. Sedimentcores from Late Titicaca and paleo-environmental data from the Quelccayaice cap of southern Peru point to a substantial decrease in yearly precipita-tion around A.D. 1000, possibly leading to drought conditions in thealtiplanoand the collapse of intricate raised field agricultural systems. The timing ofthe ecological data corresponds well with the full scale ... urban depopulation[documented by] our excavations at Tiwanaku and Lukurmata. (Janusek 1994:384)
Janusek suggests that the late Tiwanaku period was characterized by increasing tensions
Chapter 9 229
between a centralizing tendency of the state and autonomous local sources of authority and
power. Stress on the agricultural base only served to exacerbate existing tensions between
state and local power sources, leading to a generalized crisis of the political economy and
to state collapse.
Whether or not the Tiwanaku state collapsed as a result of a massive, climatically-
induced agricultural failure - and this is by no means certain - collapse it did, and the event
took place sometime between 1000 and 1100 A.D. The collapse was perhaps more properly
a process than an event - though what is an event but a rapid process? - and seems to have
taken place over the course of as much as a century. It was certainly complete by 1100
A.D., and it is this date which I use here for the Tiwanaku/Early Pacajes transition. What
followed the Tiwanaku period was an entirely different social order.
After the decline of Tiwanaku, cities and urban civilizations disappeared in theLake Titicaca Basin for nearly 400 years. Central organization and manage-ment of intensive agriculture, craft production, long-distance trade, and othersources of wealth broke down. Across the south-central Andes, human pop-ulations dispersed across the landscape, and settled into smaller, defensiblesettlements. The demise of the Tiwanaku empire brought with it widespreadpolitical instability. (Kolata 1993: 299)
Kolata’s catastrophic vision of Tiwanaku state collapse certainly seems to be borne out by
the Taraco Peninsula settlement data. In addition, however, the Taraco data suggest that
the reorganization of the settlement system was accompanied by a general demographic
collapse on the peninsula. The end of the Middle Horizon brought about profound changes
in virtually all aspects of Titicaca Basin life.
9.1 Phase definition
The Early Pacajes phase began with the collapse of the Tiwanaku state around 1100
A.D. and ended with the appearance of Inka-related ceramics sometime around 1450 A.D.
The very distinctive ceramic assemblage was first recognized by Bennett, who referred
to it as “chullpa”, and later as “Khonko Black-on-Red” (Bennett 1934). Rydén termed
Chapter 9 230
the material “post-Decadent Tiahuanacu” (Rydén 1947: 101), in reference to Bennett’s
Tiwanaku sequence.1 However, the post-Tiwanaku phases in the southern Titicaca Basin -
the Pacajes phases - remained poorly-defined until 1990. In conducting and reporting on the
Tiwanaku Valley survey, Juan Albarracín -Jordan and James Mathews together documented
this ceramic sequence in enough detail for it to be useful to other investigators.2 I have used
their chronology in the present study. I have found it to be completely satisfactory, though
I will extend their ceramic descriptions somewhat, especially in regard to the Late Pacajes
phase (see Chapter10).
Both Albarracín -Jordan and Mathews note that Early Pacajes plainwares changed little
from their late Tiwanaku precursors.3 I found this to be the case, as well. Identification of
Early Pacajes occupations was therefore accomplished solely on the basis of decorated ce-
ramics. Only one Early Pacajes vessel form seems to have been commonly decorated. This
is the open bowl form, often with a slightly everted rim (Figure9.1). Though rim frag-
ments are frequently very similar to Tiwanaku periodkero/tazonrims, the Early Pacajes
bowls arenot hyperboloid, and are therefore formally distinct from the Tiwanaku hyper-
boloid forms. Mathews suggests that the disk base is also diagnostic of the Early Pacajes
phase (Mathews 1992: 187). This may be true, but I was unable to confirm or deny the
assertion.
Early Pacajes bowls typically display evidence of fine manufacture. They are normally
very thin, compact and well- and evenly-fired with a high exterior and interior burnish.
In fact, they appear quite similar to Tiwanaku ceramics in these respects. However, two
attributes clearly distinguish Early Pacajes decorated bowls. These are 1) slip color and 2)
decoration.
The surface color of Early Pacajes bowls tends to the yellow and orange, though red and
1I should also note that Stanish, in his report on a recent reconnaissance in the Desaguadero area, hasidentified a Late Intermediate Period style he terms Kelluyo. Kelluyo ceramics, as he illustrates them, areidentical to Early Pacajes ceramics as described here (Stanish et al. 1997: 46-47, 107-111 and Figures 22 and82), the inclusion of a solitary Late Pacajes sherd (Stanish et al. 1997, Figure 82, leftmost) notwithstanding.The term Kelluyo will not be employed in the present study.
2I refer to their joint report (Albarracín-Jordan and Mathews 1990), as well as to their respective disserta-tions (Albarracín-Jordan 1992, Mathews 1992) and subsequent publications (Albarracín-Jordan 1996a).
3Rydén also made this observation (Rydén 1947: 160).
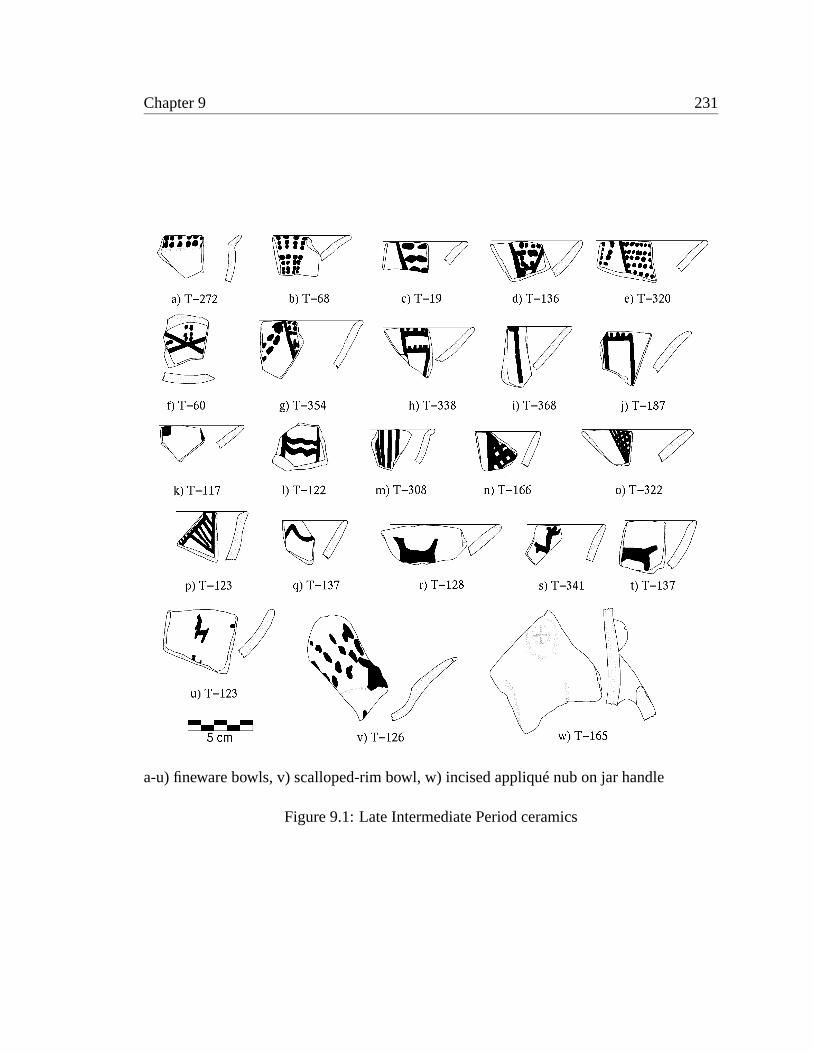
Chapter 9 231
a-u) fineware bowls, v) scalloped-rim bowl, w) incised appliqué nub on jar handle
Figure 9.1: Late Intermediate Period ceramics
Chapter 9 232
brown examples exist. This is in contrast to Tiwanaku period wares, whose slips were typi-
cally more red and brown. More absolutely diagnostic is the decoration of the bowls. In the
Early Pacajes phase, polychrome decoration disappears completely. Bowls are decorated
using a black - or occasionally dark brown - pigment over the slip. The elaborate iconogra-
phy of the Tiwanaku ceramics is absent, as well, with decoration consisting only of simple
geometric elements, such as dots (Figure9.1a-g), ticked or tabbed lines (Figure9.1h-k),
cross-hatching (Figure9.1n-o) and parallel lines (Figure9.1m, p).4 These elements are
often arranged in zones. The only exception is the occasional very simple representation of
profile camelids, rendered in a “stick figure” style (Figure9.1r-t).
Some of the geometric elements - particularly parallel lines and zoned hachure -
were part of a widespread decorative tradition which encompassed the entire Titicaca
Basin in the LIP; a tradition which included the western basin Pukarani Black-on-Red
(Stanish et al. 1997: 46,de la Vega M. 1990) and the northern basin Collao Black-on-Red
(Tschopik 1946: 21) styles also. The Early Pacajes material is distinguished from contem-
porary wares most especially by its fine manufacture.
The “stick figure” camelids are clearly antecedents of the more finely-executed ones
characteristic of the Late Horizon Saxamar style (see Figure10.1p-z), and seem to occur
in no other Titicaca Basin LIP ceramic style. This fact strongly suggests a direct connec-
tion between the Early Pacajes and Saxamar styles.5 That said, however, the Early Pacajes
“llamitas” are easily distinguished from Pacajes-Inka examples since the former “are de-
picted with thick brush strokes, contrasting with the slender llama figures of the subsequent
Pacajes-Inka period” (Albarracín-Jordan 1992: 273).
4Undulating lines are sometimes also present below the rims of the bowls (Figure9.1q), recalling a com-mon feature of Tiwanaku hyperboloid bowls (for example, Figure8.1a).
5Though other scholars have suggested that it indicates instead some degree of temporal overlap in theproduction of Early Pacajes and Saxamar ceramics (seeMathews 1992: 187, 194). I believe this argumentto be invalid, and will address it at more length in my discussion of the Pacajes-Inka phase in the followingchapter.
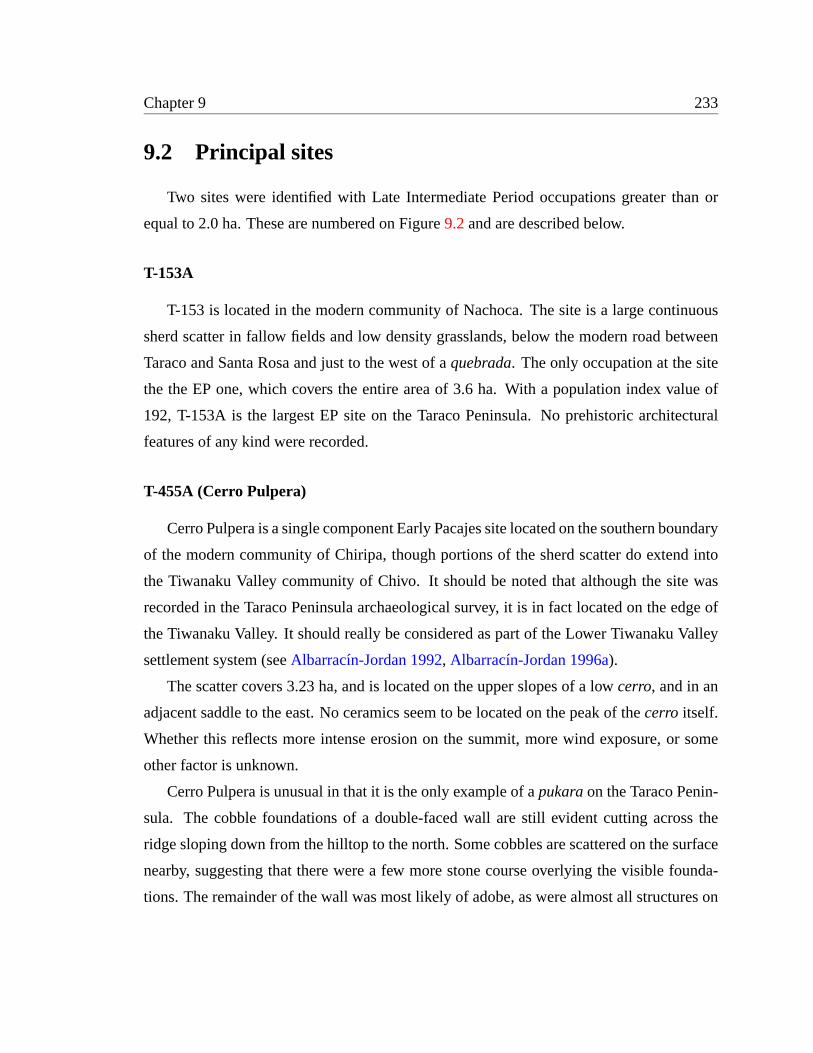
Chapter 9 233
9.2 Principal sites
Two sites were identified with Late Intermediate Period occupations greater than or
equal to 2.0 ha. These are numbered on Figure9.2and are described below.
T-153A
T-153 is located in the modern community of Nachoca. The site is a large continuous
sherd scatter in fallow fields and low density grasslands, below the modern road between
Taraco and Santa Rosa and just to the west of aquebrada. The only occupation at the site
the the EP one, which covers the entire area of 3.6 ha. With a population index value of
192, T-153A is the largest EP site on the Taraco Peninsula. No prehistoric architectural
features of any kind were recorded.
T-455A (Cerro Pulpera)
Cerro Pulpera is a single component Early Pacajes site located on the southern boundary
of the modern community of Chiripa, though portions of the sherd scatter do extend into
the Tiwanaku Valley community of Chivo. It should be noted that although the site was
recorded in the Taraco Peninsula archaeological survey, it is in fact located on the edge of
the Tiwanaku Valley. It should really be considered as part of the Lower Tiwanaku Valley
settlement system (seeAlbarracín-Jordan 1992, Albarracín-Jordan 1996a).
The scatter covers 3.23 ha, and is located on the upper slopes of a lowcerro, and in an
adjacent saddle to the east. No ceramics seem to be located on the peak of thecerro itself.
Whether this reflects more intense erosion on the summit, more wind exposure, or some
other factor is unknown.
Cerro Pulpera is unusual in that it is the only example of apukaraon the Taraco Penin-
sula. The cobble foundations of a double-faced wall are still evident cutting across the
ridge sloping down from the hilltop to the north. Some cobbles are scattered on the surface
nearby, suggesting that there were a few more stone course overlying the visible founda-
tions. The remainder of the wall was most likely of adobe, as were almost all structures on
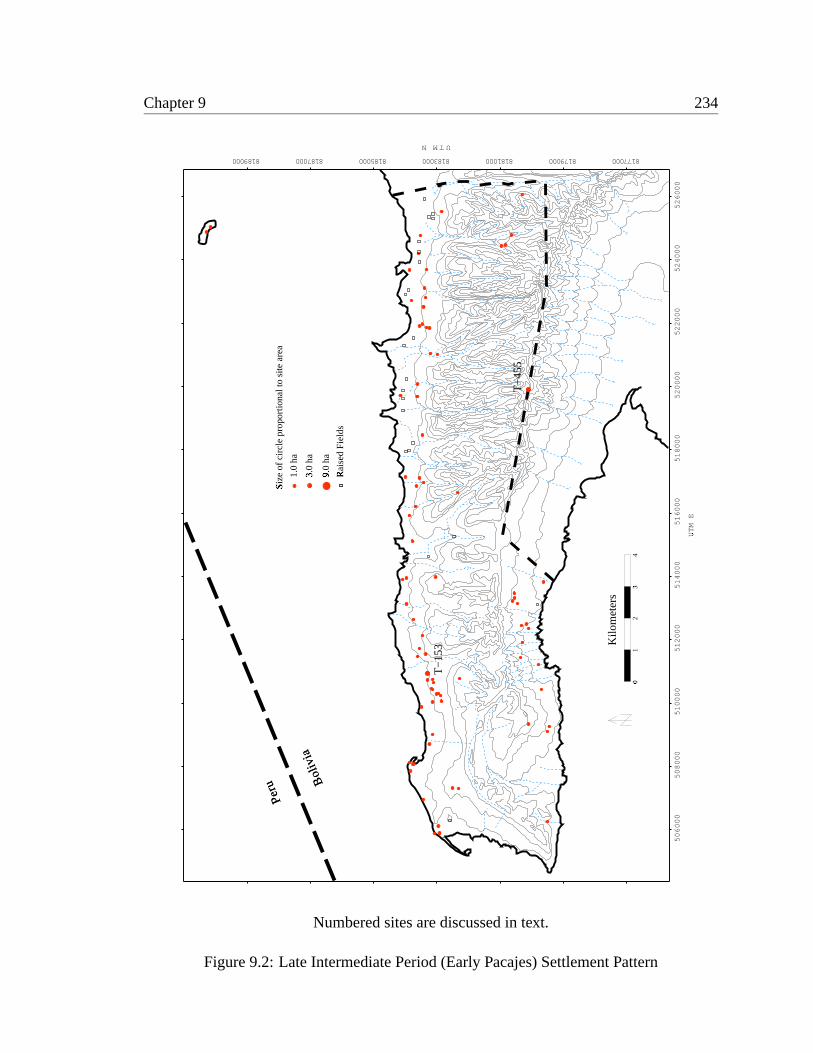
Chapter 9 234
0�
12
3�
4
Kilo
met
ers
1.0
ha
Rai
sed
Fie
lds
�3.0
ha
�
Peru B
oliv
ia
Siz
e of
circ
le p
ropo
rtio
nal t
o si
te a
rea
�
9.0
ha
�
506000
508000
510000
512000
514000
516000
518000
520000
522000
524000
526000
UTM E
�
UTMN
8770008179008110000818500818700819000 108818300008
T−
153
T−
455
Numbered sites are discussed in text.
Figure 9.2: Late Intermediate Period (Early Pacajes) Settlement Pattern

Chapter 9 235
the Taraco Peninsula in all prehistoric and historic period. The wall delimits the northern
edge of the ceramic scatter, and blocks access to the site from the northern ridge. This is
most definitely the point of easiest access, and it was for this reason that it was fortified.
Though the wall described above does qualify the site as apukara, there is no evidence
of other fortifications. It is only a weakly-fortified settlement. The southern approaches to
the site are very steep and require no further fortifications. However, approaches from the
east and west are relatively easy - though not so easy as the fortified north ridge - and show
no evidence of defensive features.
Certain areas of the site, especially the saddle to the east of the hilltop, have a high
surface ceramic density, indicating substantial habitation. Also, the site in general has a
higher than usual frequency of decorated serving bowls, suggesting that it was the residence
of a local leader of some kind, and a locus of ritual hospitality. With a population index
value of 170, it is the second-largest Early Pacajes site recorded on the peninsula. There is
no standing architecture.
9.3 Settlement and population
By any measure, the Tiwanaku/Early Pacajes transition was the most dramatic settle-
ment transformation in the history of human occupation on the Taraco Peninsula. Most
fundamentally, it marked the end of a 2500-year tradition of nucleated habitation and vil-
lage life that had persisted from the Early Chiripa phase. The ancient system of villages and
communities which persisted more or less intact throughout the Formative and Tiwanaku
periods disappeared completely. Every single one of the old Taraco Peninsula villages
was either abandoned in the Early Pacajes phase or was reduced to occupation by a few
dispersed households (for the example of Chiripa, seeBandy 1997).
All of the metrics I have been using to characterize the settlement system reflect this
dramatic change. Thus, the total number of sites in the Early Pacajes phase actually in-
creases relative to the preceding Tiwanaku period (Tables6.3and9.1). However, the phase
population index declines drastically from 6923 to 1408 at the same time. This decrease in
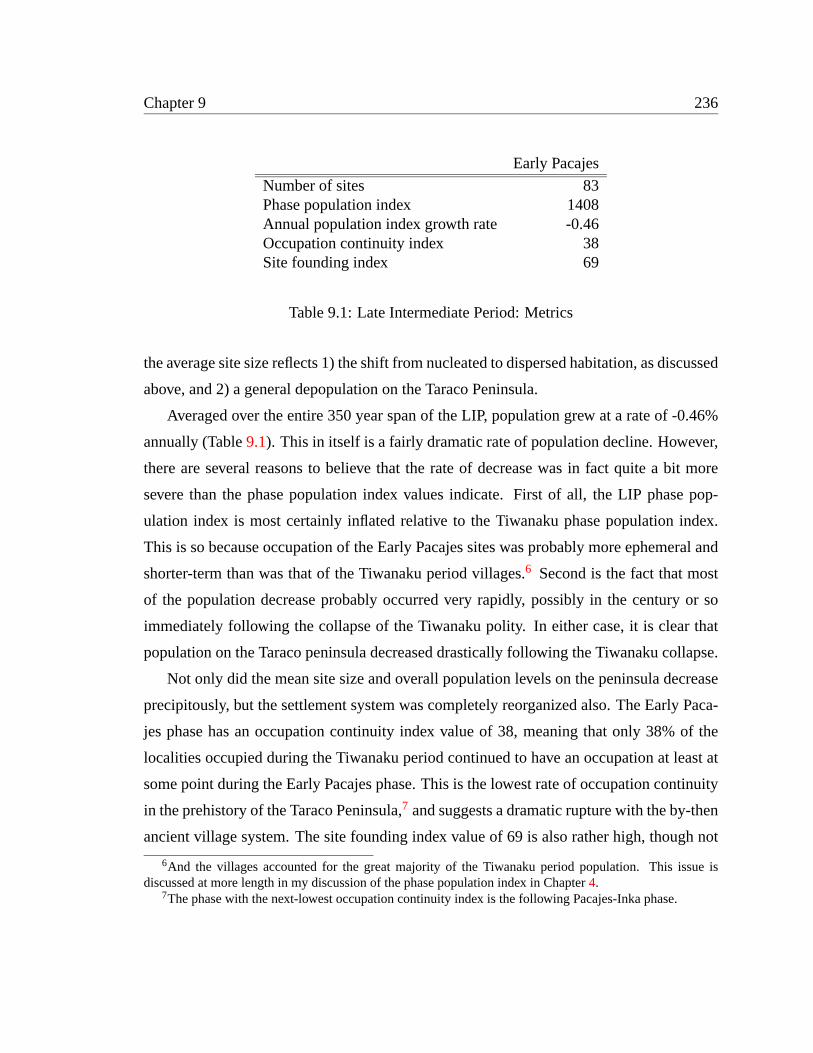
Chapter 9 236
Early Pacajes
Number of sites 83Phase population index 1408Annual population index growth rate -0.46Occupation continuity index 38Site founding index 69
Table 9.1: Late Intermediate Period: Metrics
the average site size reflects 1) the shift from nucleated to dispersed habitation, as discussed
above, and 2) a general depopulation on the Taraco Peninsula.
Averaged over the entire 350 year span of the LIP, population grew at a rate of -0.46%
annually (Table9.1). This in itself is a fairly dramatic rate of population decline. However,
there are several reasons to believe that the rate of decrease was in fact quite a bit more
severe than the phase population index values indicate. First of all, the LIP phase pop-
ulation index is most certainly inflated relative to the Tiwanaku phase population index.
This is so because occupation of the Early Pacajes sites was probably more ephemeral and
shorter-term than was that of the Tiwanaku period villages.6 Second is the fact that most
of the population decrease probably occurred very rapidly, possibly in the century or so
immediately following the collapse of the Tiwanaku polity. In either case, it is clear that
population on the Taraco peninsula decreased drastically following the Tiwanaku collapse.
Not only did the mean site size and overall population levels on the peninsula decrease
precipitously, but the settlement system was completely reorganized also. The Early Paca-
jes phase has an occupation continuity index value of 38, meaning that only 38% of the
localities occupied during the Tiwanaku period continued to have an occupation at least at
some point during the Early Pacajes phase. This is the lowest rate of occupation continuity
in the prehistory of the Taraco Peninsula,7 and suggests a dramatic rupture with the by-then
ancient village system. The site founding index value of 69 is also rather high, though not
6And the villages accounted for the great majority of the Tiwanaku period population. This issue isdiscussed at more length in my discussion of the phase population index in Chapter4.
7The phase with the next-lowest occupation continuity index is the following Pacajes-Inka phase.
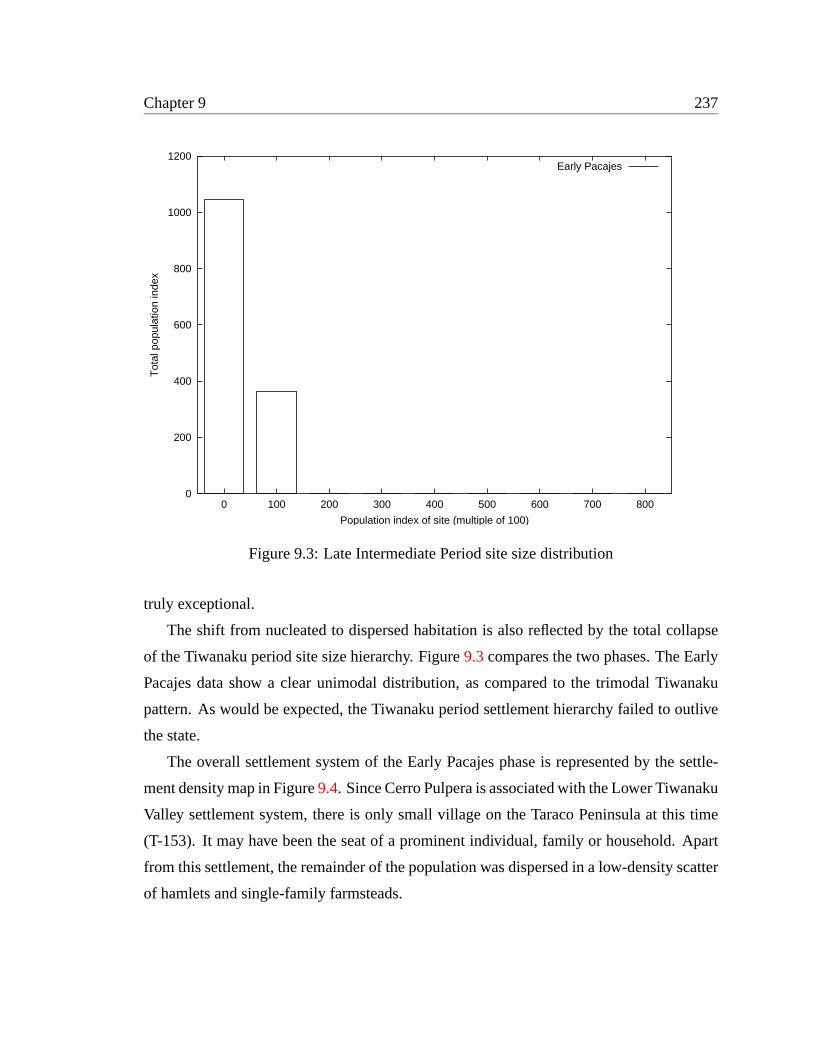
Chapter 9 237
0
200
400
600
800
1000
1200
0 100 200 300 400 500 600 700 800
Tot
al p
opul
atio
n in
dex
Population index of site (multiple of 100)
Early Pacajes
Figure 9.3: Late Intermediate Period site size distribution
truly exceptional.
The shift from nucleated to dispersed habitation is also reflected by the total collapse
of the Tiwanaku period site size hierarchy. Figure9.3compares the two phases. The Early
Pacajes data show a clear unimodal distribution, as compared to the trimodal Tiwanaku
pattern. As would be expected, the Tiwanaku period settlement hierarchy failed to outlive
the state.
The overall settlement system of the Early Pacajes phase is represented by the settle-
ment density map in Figure9.4. Since Cerro Pulpera is associated with the Lower Tiwanaku
Valley settlement system, there is only small village on the Taraco Peninsula at this time
(T-153). It may have been the seat of a prominent individual, family or household. Apart
from this settlement, the remainder of the population was dispersed in a low-density scatter
of hamlets and single-family farmsteads.
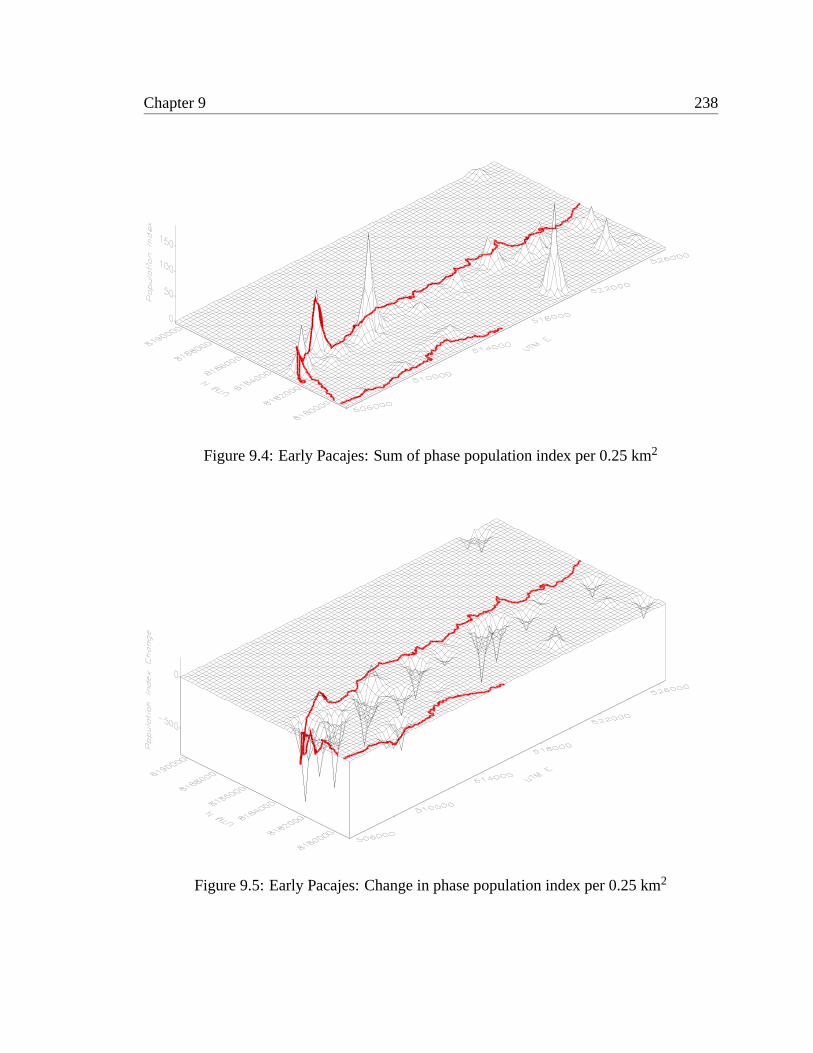
Chapter 9 238
Figure 9.4: Early Pacajes: Sum of phase population index per 0.25 km2
Figure 9.5: Early Pacajes: Change in phase population index per 0.25 km2
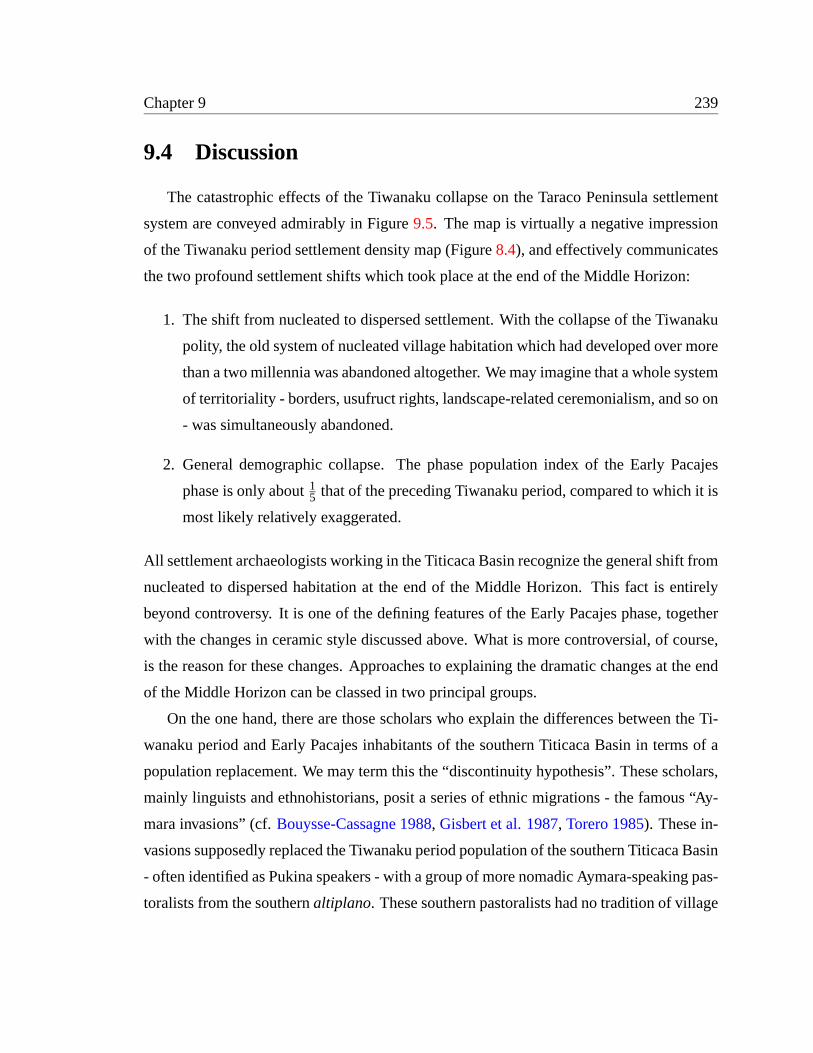
Chapter 9 239
9.4 Discussion
The catastrophic effects of the Tiwanaku collapse on the Taraco Peninsula settlement
system are conveyed admirably in Figure9.5. The map is virtually a negative impression
of the Tiwanaku period settlement density map (Figure8.4), and effectively communicates
the two profound settlement shifts which took place at the end of the Middle Horizon:
1. The shift from nucleated to dispersed settlement. With the collapse of the Tiwanaku
polity, the old system of nucleated village habitation which had developed over more
than a two millennia was abandoned altogether. We may imagine that a whole system
of territoriality - borders, usufruct rights, landscape-related ceremonialism, and so on
- was simultaneously abandoned.
2. General demographic collapse. The phase population index of the Early Pacajes
phase is only about15 that of the preceding Tiwanaku period, compared to which it is
most likely relatively exaggerated.
All settlement archaeologists working in the Titicaca Basin recognize the general shift from
nucleated to dispersed habitation at the end of the Middle Horizon. This fact is entirely
beyond controversy. It is one of the defining features of the Early Pacajes phase, together
with the changes in ceramic style discussed above. What is more controversial, of course,
is the reason for these changes. Approaches to explaining the dramatic changes at the end
of the Middle Horizon can be classed in two principal groups.
On the one hand, there are those scholars who explain the differences between the Ti-
wanaku period and Early Pacajes inhabitants of the southern Titicaca Basin in terms of a
population replacement. We may term this the “discontinuity hypothesis”. These scholars,
mainly linguists and ethnohistorians, posit a series of ethnic migrations - the famous “Ay-
mara invasions” (cf.Bouysse-Cassagne 1988, Gisbert et al. 1987, Torero 1985). These in-
vasions supposedly replaced the Tiwanaku period population of the southern Titicaca Basin
- often identified as Pukina speakers - with a group of more nomadic Aymara-speaking pas-
toralists from the southernaltiplano. These southern pastoralists had no tradition of village
Chapter 9 240
dwelling. In this way the discontinuity hypothesis is in fact able to explain the observed
shift from nucleated to dispersed habitation.
Proponents of the “continuity hypothesis” - including most archaeologists (cf.
Browman 1981: 417-418,Rydén 1947) - contend that the LIP inhabitants of the south-
ern Titicaca Basin - and by extension the modern population - were in fact descendants
of the builders of Tiwanaku, and that no invasion, migration or ethnic replacement took
place in the LIP. They point to evidence of continuity, such as the strong similarity of do-
mestic ceramic wares between the two phases. Most settlement archaeologists who have
worked in the Titicaca Basin fall into this camp (cf.Albarracín-Jordan 1996a: 294-296,
Janusek 1994: 380-383,Mathews 1992: 190-191,Stanish et al. 1997: 12-14, 118), though
all admit that the evidence is not at all conclusive.8
As we saw, the discontinuity hypothesis can explain the shift from nucleated to dis-
persed settlement by positing an invading Aymara horde unacquainted with village life.
One problem with the continuity hypothesis that has yet to be addressed by its proponents
is how exactly to explain this shift in settlement practice which is so crucial to understand-
ing the Tiwanaku collapse and the Early Pacajes phase. The problem in not even recognized
by most researchers, who seem to see the abandonment of the village system as a natural
8There are many types of evidence which do indicate continuity between the Tiwanaku period and theEarly Pacajes phase. One common argument, however, is absolutely invalid. Some investigators argue thatthe high rate of occupation continuity between Tiwanaku sites and Early Pacajes sites is evidence for thecontinuity hypothesis. An example from the Lower Tiwanaku Valley:
If Tiwanaku’s collapse was induced by foreign invaders with a distinct cul-tural background, one would expect to find substantial differences in settle-ment distribution and land use. On the contrary, the Early Pacajes settle-ment pattern suggests a continuous occupation of sites ... Approximately82% of the Tiwanaku V settlements exhibit an Early Pacajes occupation.[Albarracín-Jordan 1992: 310]
The fallacy here is this: given that the number of sites in the Lower Tiwanaku Valley increased threefold -from 137 to 441 - in the Early Pacajes phase, and that these new sites are located in nearly every possiblesettlement location, a high occupation continuity index is exactly what one would expect. Put another way, thereoccupation of a village site by a small farmstead, probably only ephemerally occupied, does not constitutethe kind of occupation continuity that Albarracín-Jordan perceives. It means only that “ ... Pacajes peoplesettled everywhere the Tiwanaku had been, and just about everywhere else” (Janusek and Kolata 2001).
Chapter 9 241
corollary of the collapse of the Tiwanaku administrative hierarchy. It is as if the village
system was in some way simply a material manifestation - a shadow or reflection - of a bu-
reaucratic structure, which naturally ceased to be when the institutions which generated it
dissipated. Of course, nothing could be further from the truth. The present study has clearly
demonstrated that the village system on the Taraco Peninsula originated in the Early For-
mative Period and persisted with only minimal modification for at least 1500 years prior
to Tiwanaku state formation. Therefore, there is no reason to suppose that Tiwanaku state
collapse would necessarily produce the wholesale abandonment of village life.
In considering the related problem of compact versus dispersed residential practices
in Mesoamerican settlements, Drennan has observed that it is in some ways more diffi-
cult to explain dispersed habitation than nucleated habitation (Drennan 1986). His dis-
cussion is enlightening and well worth reading for anyone interested in these issues. He
ends by explaining the dispersed settlement characteristic of Classic Maya cities - and
incidentally of Postclassic Basin of Mexico settlement also - with reference to intensive
forms of agriculture.9 His argument is that forms of agriculture characterized by “not just
large labor requirements, but the concentration of those requirements continually in a small
area ... [make] it desirable for a household to locate its residence at its agricultural plot”
(Drennan 1986: 287). He contends that dispersed settlement occurs when the advantages to
the household of proximity to its agricultural plot outweighs the advantages associated with
proximity to other households. Nucleated settlement is produced when the balance of the
advantage falls to proximity to other households. He specifically argues that ridged fields -
chinampas- and terraces are agricultural techniques which produced dispersed settlement
in Classic Maya and Late Postclassic Mexican highland contexts.
Given Drennan’s argument, it is particularly interesting to observe that Graffam has
constructed an argument that raised field agriculture did not end with the Tiwanaku col-
lapse, but was in fact intensified further (Graffam 1990). He argues that in the wake of the
Tiwanaku collapse individual households intensified production by incorporating raised
field agriculture and expanded camelid pastoralism into their existing household subsis-
9In doing so he is, of course, reversing the traditional Mayanist association between dispersed settlementand swidden agriculture.
Chapter 9 242
tence strategies. Increasing importance of raised field agriculture certainly could account
for a shift to dispersed settlement at the end of the Middle Horizon. Though most ar-
chaeologists interested in the Titicaca Basin seem to be skeptical of the empirical basis of
Graffam’s model, I think that it very easily explains the observed settlement shifts. For this
reason, I would suggest that we consider Graffam’s claims more carefully and systemati-
cally.
Another possibility is that the critical factor was not in fact the advantage associated
with proximity to an agricultural plot, but rather concretedisadvantagesassociated with
proximity to one’s neighbors. Drennan does not make this argument, but the scenario
follows naturally from his discussion. It is fairly easy to imagine that a large increase
in the size of a household’s herds might make life in a nucleated settlement problematic.
Pastoral communities typically are characterized by dispersed settlement worldwide. An
intensification of pastoralism could also account for the settlement shift.
Either of these two scenarios could also account for the dramatic decline of population
on the Taraco Peninsula, which was much more pronounced than in adjacent regions.10
This population decline could be explained by households relocating to adjacent regions,
such as the Pampa Koani and the Tiwanaku Valley, which are much better-suited forboth
raised field agriculture and pastoralism. The drop in the Taraco Peninsula population index
could also be explained - but only in part - by a large number of households moving out
onto the lake plain at this time. Remember that the lake level was much lower than today
throughout the Early Pacajes phase. Many Early Pacajespampasites would be inundated
today, and thereby excluded from the sample.11
I should emphasize that I am not constructing a defense of the continuity hypothesis,
though I do find that it explains the archaeological record more satisfactorily than does the
invasion scenario. Rather, I have presented two hypothetical explanations for the observed
shift from nucleated to dispersed habitation in the LIP, both related to changes in the do-
10This is discounting the abandonment of the city of Tiwanaku proper, of course11It is certainly the case that the Early Pacajes settlement pattern includes a much greater occupation of
thepampain adjacent regions such as the Katari Basin (Janusek and Kolata 2001) and the Tiwanaku Valley(Albarracín-Jordan 1992: 273, 277,Mathews 1992).
Chapter 9 243
mestic economy and both consistent with the continuity hypothesis. I consider these as
hypotheses to be tested by future research. I have also attempted to stress that any account
of the Early Pacajes phasemustexplain the observed shift from nucleated to dispersed
modes of settlement.
The issue of a catastrophic demographic collapse is not so much contentious among
archaeologists as it is avoided. The substantial increase in the number of sites in the Early
Pacajes phase is sometimes taken to indicate not only that there was no demographic col-
lapse, but also that population may, in fact, have increased relative to Tiwanaku period
levels.
... the increase in number of sites by some 150 percent over the preceding Ti-wanaku V period suggests not so much an overall population decrease in the[Middle Tiwanaku] valley with the collapse of Tiwanaku, but rather a popula-tion reorganization... [Mathews 1992: 188]
In general, it seems as though many Titicaca Basin archaeologists prefer to minimize the
“collapse” aspect of the Tiwanaku/Early Pacajes transition, and to emphasize instead the
“reorganization” or “political fragmentation” aspects. Janusek, for example, characterizes
the situation in this way:
... Tiwanaku “state collapse” materialized as mutually supportive processes ofpolitical fragmentation and cultural revolution among local segmentary units,involving the assertion of political autonomy by local leaders and the grad-ual adoption of new ideals, attitudes, social identities, and material culture.[Janusek 1994: 383]
If we accept the continuity hypothesis, this is no doubt a fair picture of at least some of
the cultural processes which were under way early in the Early Pacajes phase. However,
Janusek’s description serves to obscure the fact that the early LIP was a period of dra-
matic population decline and dislocation. Put plainly, it was a chaotic and dangerous time,
probably involving considerable localized conflict. population relocation and even famine.
As I discussed in Chapter4, using raw hectares as a population measure has the effect
of exaggerating the importance of small and ephemeral sites relative to large and permanent
villages or towns. In the context of the Tiwanaku/Early Pacajes transition, this means that
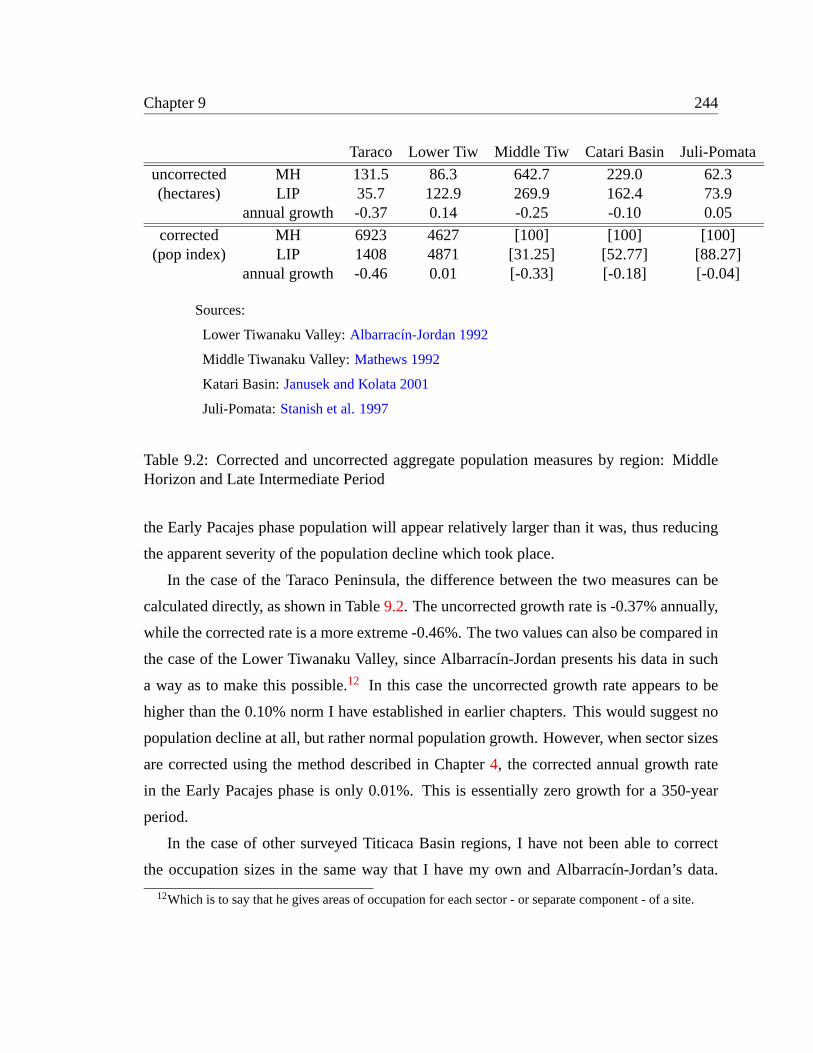
Chapter 9 244
Taraco Lower Tiw Middle Tiw Catari Basin Juli-Pomata
uncorrected MH 131.5 86.3 642.7 229.0 62.3(hectares) LIP 35.7 122.9 269.9 162.4 73.9
annual growth -0.37 0.14 -0.25 -0.10 0.05
corrected MH 6923 4627 [100] [100] [100](pop index) LIP 1408 4871 [31.25] [52.77] [88.27]
annual growth -0.46 0.01 [-0.33] [-0.18] [-0.04]
Sources:
Lower Tiwanaku Valley:Albarracín-Jordan 1992
Middle Tiwanaku Valley:Mathews 1992
Katari Basin:Janusek and Kolata 2001
Juli-Pomata:Stanish et al. 1997
Table 9.2: Corrected and uncorrected aggregate population measures by region: MiddleHorizon and Late Intermediate Period
the Early Pacajes phase population will appear relatively larger than it was, thus reducing
the apparent severity of the population decline which took place.
In the case of the Taraco Peninsula, the difference between the two measures can be
calculated directly, as shown in Table9.2. The uncorrected growth rate is -0.37% annually,
while the corrected rate is a more extreme -0.46%. The two values can also be compared in
the case of the Lower Tiwanaku Valley, since Albarracín-Jordan presents his data in such
a way as to make this possible.12 In this case the uncorrected growth rate appears to be
higher than the 0.10% norm I have established in earlier chapters. This would suggest no
population decline at all, but rather normal population growth. However, when sector sizes
are corrected using the method described in Chapter4, the corrected annual growth rate
in the Early Pacajes phase is only 0.01%. This is essentially zero growth for a 350-year
period.
In the case of other surveyed Titicaca Basin regions, I have not been able to correct
the occupation sizes in the same way that I have my own and Albarracín-Jordan’s data.
12Which is to say that he gives areas of occupation for each sector - or separate component - of a site.
Chapter 9 245
However, if we assume that the same relation pertains between average site sizes in the
Tiwanaku and Early Pacajes phases, then it is possible to calculate corrected annual growth
rates by another method.
The relation between corrected and uncorrected population values can be expressed in
the following equation.
TiwcEPc
= kTiwuEPu
whereTiwc = Tiwanaku period phase population indexTiwu = Tiwanaku period raw hectaresEPc = Early Pacajes phase population indexEPu = Early Pacajes raw hectaresk = a correction constant
It is a simple matter to derive the value ofk from this equation, as follows:
k = TiwcEPuTiwuEPc
Solving fork for the Taraco Peninsula and Lower Tiwanaku Valley data - the only two for
which we have complete corrected settlement datasets - generates values of 1.33 (Taraco
Peninsula) and 1.35 (Lower Tiwanaku Valley). These two values are very close to one
another indeed, a fact which I hope inspires at least a degree of confidence in the method. I
will assign a provisional value of 1.34 tok, obtained by averaging the two empirical values.
The corrected value for the Early Pacajes phase can therefore be obtained using the
following equation:
EPc = TiwcEPukTiwu
Inserting the value derived fork above, and using an arbitrary population index value
of 100 for the Tiwanaku period, a population index value for the Early Pacajes phase is
derived as follows:
Chapter 9 246
EPc = 1001.34
EPuTiwu
= 74.63 EPuTiwu
Note that the value obtained in this way is not an absolute one. It is only a percentage
of the corrected Tiwanaku period value, whatever that may be. However, it will suffice
for our present purposes, since we care only to calculate an annual percentage growth rate
for the Early Pacajes phase for the various regions in question. These growth rates are
presented in Table9.2 in brackets to indicate that they have been derived by the method
above. The empirical growth rates from the Taraco Peninsula and Lower Tiwanaku Valley
are presented without brackets.
When the “splash zone” effects of the shift from nucleated to dispersed habitation are
subtracted,13 the population decline in the Early Pacajes phase appears much more severe
than when uncorrected hectares are employed. Of the five regions sampled, not a single one
has positive population growth in the LIP.14 The Middle Tiwanaku Valley and the Katari
Basin experienced the most severe depopulations, excepting the Taraco Peninsula, as would
be expected given the disintegration of the cities of Tiwanaku and Lukurmata. In the Juli-
Pomata area, what Stanish characterizes as “a slight leveling” (Stanish et al. 1997: 60) in
the growth curve in the LIP is actually, when corrected for site size effects, a decline in
population, though a less severe one than in the Tiwanaku heartland. In fact, the general
basin-wide decline is probably even more severe than I have indicated, since I have failed
to correct for the effects of more ephemeral and generally shorter-term occupations in the
LIP.
Since all of the areas in question are low and near the lakeshore we may perhaps pos-
tulate a generalized movement of population away from the lakeshore and into higher and
more mountainous regions throughout the Late Intermediate Period in the entire Titicaca
Basin. It is perhaps not necessary to imagine large-scale warfare and famine as the causes
of the observed basin-wide depopulation. Whatever the case, though, the collapse of the
13Which is only to say that the raw hectare value has been corrected by one method or the other.14I consider the Lower Tiwanaku Valley to have zero population growth in this phase. This in itself is
remarkable, since we can imagine that the disintegration of the urban core of Tiwanaku would have produceda large group of migrants.

Chapter 9 247
Tiwanaku state was no simple rearticulation of its component segments, as has been sug-
gested. Neither was it a matter only of a political or cultural revolution. The Tiwanaku
collapse was not only a political collapse, but a demographic one as well.
248
Chapter 10
The Late Horizon and Early Colonial
Period: conquest and colonial
administration
The end of the Late Intermediate Period generally, and of the Early Pacajes phase lo-
cally, resulted from the rapid conquest of the Titicaca Basin by an upstart power from
the North: the Inka Empire. The Aymaraseñoriosof the Titicaca Basin were apparently
brought under Inka rule during the reign of the Inka emperor Pachacuti. The Taraco Penin-
sula was most likely annexed along with the remainder of the southern Titicaca Basin dur-
ing Pachacuti’s campaign following a revolt in Ayaviri in the northern basin. That is to
say that it was incorporated into the Inka empire some years after the northern basin was
subjugated. Rowe places this expedition sometime between 1438 (the crowning of Pacha-
cuti) and 1463, when Pachacuti handed over command of the armies to his son, Topa Inca
(Rowe 1946: 203, 206-207). These dates are naturally inexact, and I here follow Stanish in
dating the beginning of the Pacajes-Inka phase to 1450 A.D. (Stanish et al. 1997: 14; see
alsoBauer and Stanish 2001: 51-55,Julien 1982, Julien 1983).
The Late Horizon saw a reversal of some of the trends which had begun during the Early
Pacajes phase. Population began moving back to the lakeshore, and this resulted in very
Chapter 10 249
rapid population growth rates on the Taraco Peninsula. Also, some villages were founded
and a site size hierarchy reappeared. Both of these facts most likely reflect the organization
and imposition of the Inka administrative apparatus.
Inka rule came to an end in the Titicaca Basin in 1532, when the invading Spaniards
toppled the imperial dynasty and bureaucracy. However, the first decades after the Spanish
arrival were very chaotic ones. The first Spanish visit to the Titicaca Basin was in 1534,
when a small scouting party sent by Pizarro arrived at the lake. However, actual Spanish
control was not established for some time. As late as 1538 the Lupaqa mounted armed
resistance to Pizarro’s army at Desaguadero (Bouysee-Cassagne 1987: 27). For this reason,
I am using 1540 A.D. as the date for the beginning of the Late Pacajes phase, and the
end of the Pacajes-Inka phase. I am therefore according to the Pacajes-Inka phase a span
of 90 years. I follow Albarracín-Jordan in ending the Late Pacajes phase at 1600 A.D.
(Albarracín-Jordan 1992: 326),1 though in actuality we have no clear idea of when the
ceramic style ceased to be produced. This is a question for future research.2
10.1 Phase definition
As with the Early Pacajes phase, my definition of the later Pacajes phases closely fol-
lows the chronology formulated by Albarracín-Jordan and Mathews in the Tiwanaku Valley
survey (Albarracín-Jordan 1992, Mathews 1992). I have found their ceramics sequence to be
correct and, almost as importantly, easy to apply to mixed surface assemblages. I will ex-
tend their phase definitions only slightly to include features and decorative motifs which
they did not report. In particular, I will expand the decorative repertoire of the Late Pacajes
phase, of which I appear to have a much larger sample than did the authors of the original
descriptions.
1Though elsewhere in a figure caption he ends the phase at 1660 A.D. (Albarracín-Jordan 1996a: 310).No reason for this discrepancy has been given, to my knowledge. Mathews, perhaps wisely, mentions noterminal date at all, though a chronological diagram (Mathews 1992: 232) has the Late Pacajes phase endingat 1600 A.D.
2In fact, the entire question of the archaeology of the period of Spanish rule in the Titicaca Basin requiresmuch more study. Very little has been accomplished to date in this regard, though some work has been donein neighboring regions of the Andes (e.g.Van Buren et al. 1993, Van Buren 1999).
Chapter 10 250
The identification of the later Pacajes phases relies mainly on decorated wares. Deco-
rated diagnostic ceramics are abundant on the surface of Late Horizon and Early Colonial
sites in the study area, however, so this presented no practical difficulties.
10.1.1 Late Horizon
I identified four distinct Late Horizon ceramic styles on the Taraco Peninsula. These
are, in order of descending frequency of occurrence,
1. Saxamar (Pacajes-Inka),
2. Chucuito Black on Red (and Chucuito Polychrome),
3. Imperial Inka,
4. and Taraco Polychrome.
I identified no Urcusuyu Polychrome (Tschopik 1946: 32-33) in my collections. This is
rather surprising, given its predominantly southern distribution and possible association
with the Inka sanctuaries at Copacabana and theIsla del Sol(Julien 1993: 192-199).
By far the most common of these was a local Late Horizon style associated with
the Pacajes polity and/or ethnicity. The style has variously been termed “Pacajes-
Inka” (Albarracín-Jordan 1992, Albarracín-Jordan and Mathews 1990, Mathews 1992), Saxamar
(Browman 1985, Daulsberg H. 1960) and “llamita ware” (Graffam 1990). I prefer Saxa-
mar. Examples are illustrated in Figure10.1p-ae. Saxamar ceramics consist exclusively of
shallow bowls, plates or basins. These are typically slipped a deep red and polished to a
high burnish on both the interior and exterior. The paste is very fine, dense and well-fired.
Bowl or plate rims are usually direct and rounded, but often have a slight interior bevel.
Saxamar bowl rims are only very rarely flared, and never tapered. Therefore, slip color
and rim form alone are normally enough to distinguish Saxamar from Early Pacajes open
vessels.3
3Early Pacajes bowls are described in Chapter9. Their rims are often flared and almost always tapered.Their slip color tends to the orange or yellow, as opposed to the deep Saxamar reds.
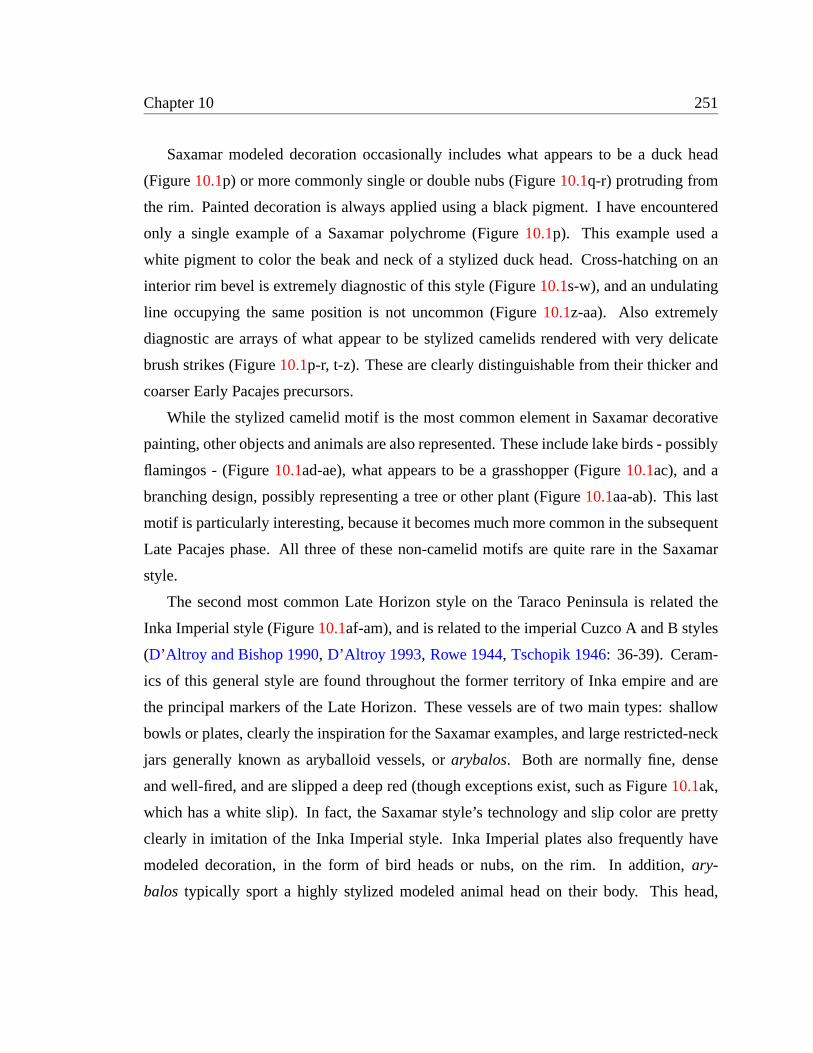
Chapter 10 251
Saxamar modeled decoration occasionally includes what appears to be a duck head
(Figure10.1p) or more commonly single or double nubs (Figure10.1q-r) protruding from
the rim. Painted decoration is always applied using a black pigment. I have encountered
only a single example of a Saxamar polychrome (Figure10.1p). This example used a
white pigment to color the beak and neck of a stylized duck head. Cross-hatching on an
interior rim bevel is extremely diagnostic of this style (Figure10.1s-w), and an undulating
line occupying the same position is not uncommon (Figure10.1z-aa). Also extremely
diagnostic are arrays of what appear to be stylized camelids rendered with very delicate
brush strikes (Figure10.1p-r, t-z). These are clearly distinguishable from their thicker and
coarser Early Pacajes precursors.
While the stylized camelid motif is the most common element in Saxamar decorative
painting, other objects and animals are also represented. These include lake birds - possibly
flamingos - (Figure10.1ad-ae), what appears to be a grasshopper (Figure10.1ac), and a
branching design, possibly representing a tree or other plant (Figure10.1aa-ab). This last
motif is particularly interesting, because it becomes much more common in the subsequent
Late Pacajes phase. All three of these non-camelid motifs are quite rare in the Saxamar
style.
The second most common Late Horizon style on the Taraco Peninsula is related the
Inka Imperial style (Figure10.1af-am), and is related to the imperial Cuzco A and B styles
(D’Altroy and Bishop 1990, D’Altroy 1993, Rowe 1944, Tschopik 1946: 36-39). Ceram-
ics of this general style are found throughout the former territory of Inka empire and are
the principal markers of the Late Horizon. These vessels are of two main types: shallow
bowls or plates, clearly the inspiration for the Saxamar examples, and large restricted-neck
jars generally known as aryballoid vessels, orarybalos. Both are normally fine, dense
and well-fired, and are slipped a deep red (though exceptions exist, such as Figure10.1ak,
which has a white slip). In fact, the Saxamar style’s technology and slip color are pretty
clearly in imitation of the Inka Imperial style. Inka Imperial plates also frequently have
modeled decoration, in the form of bird heads or nubs, on the rim. In addition,ary-
balos typically sport a highly stylized modeled animal head on their body. This head,
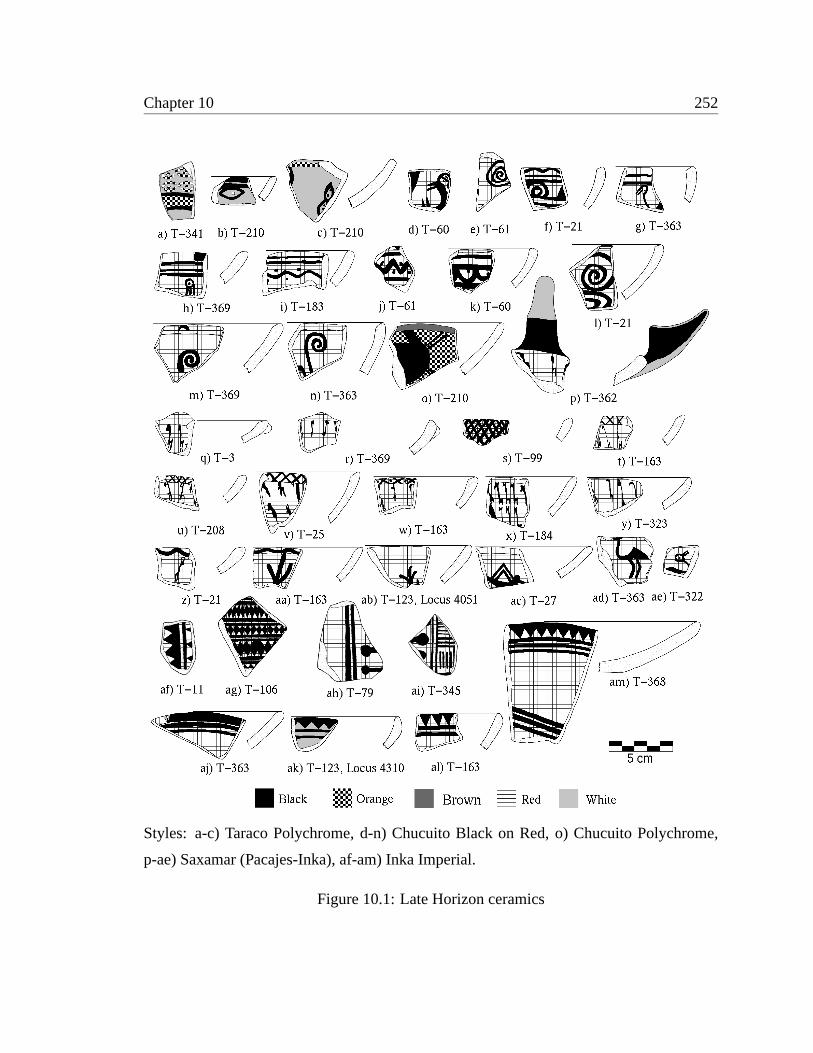
Chapter 10 252
Styles: a-c) Taraco Polychrome, d-n) Chucuito Black on Red, o) Chucuito Polychrome,
p-ae) Saxamar (Pacajes-Inka), af-am) Inka Imperial.
Figure 10.1: Late Horizon ceramics
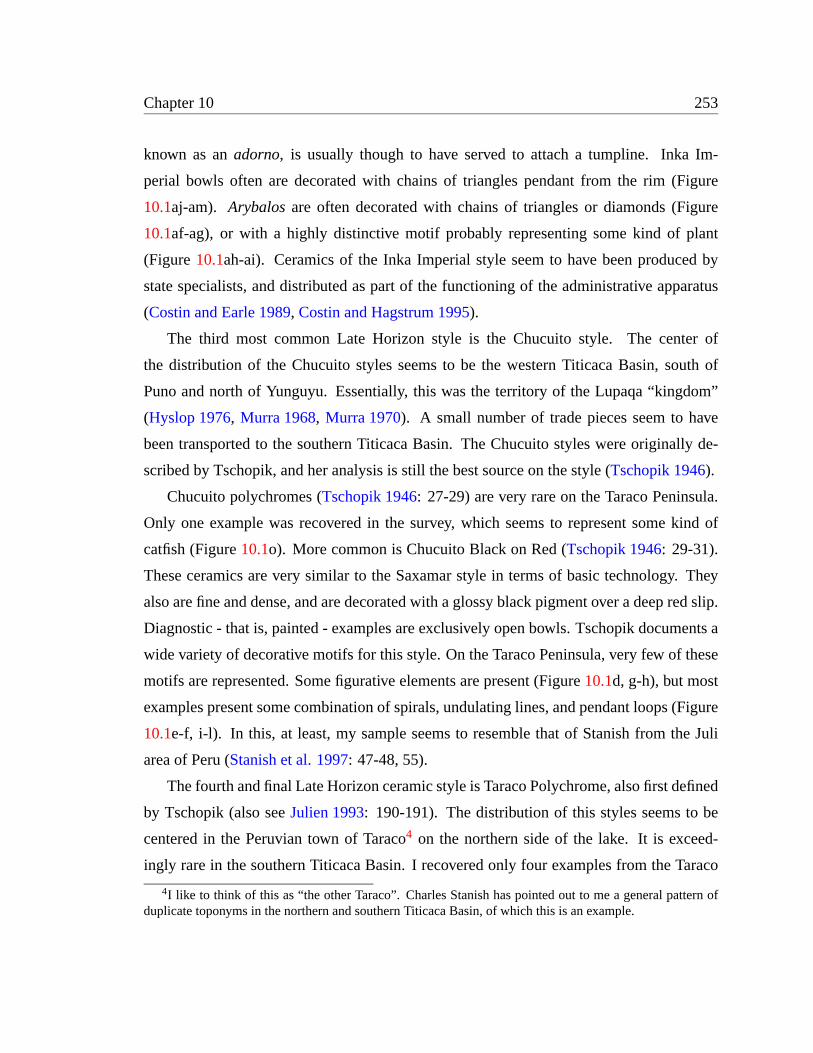
Chapter 10 253
known as anadorno, is usually though to have served to attach a tumpline. Inka Im-
perial bowls often are decorated with chains of triangles pendant from the rim (Figure
10.1aj-am). Arybalosare often decorated with chains of triangles or diamonds (Figure
10.1af-ag), or with a highly distinctive motif probably representing some kind of plant
(Figure10.1ah-ai). Ceramics of the Inka Imperial style seem to have been produced by
state specialists, and distributed as part of the functioning of the administrative apparatus
(Costin and Earle 1989, Costin and Hagstrum 1995).
The third most common Late Horizon style is the Chucuito style. The center of
the distribution of the Chucuito styles seems to be the western Titicaca Basin, south of
Puno and north of Yunguyu. Essentially, this was the territory of the Lupaqa “kingdom”
(Hyslop 1976, Murra 1968, Murra 1970). A small number of trade pieces seem to have
been transported to the southern Titicaca Basin. The Chucuito styles were originally de-
scribed by Tschopik, and her analysis is still the best source on the style (Tschopik 1946).
Chucuito polychromes (Tschopik 1946: 27-29) are very rare on the Taraco Peninsula.
Only one example was recovered in the survey, which seems to represent some kind of
catfish (Figure10.1o). More common is Chucuito Black on Red (Tschopik 1946: 29-31).
These ceramics are very similar to the Saxamar style in terms of basic technology. They
also are fine and dense, and are decorated with a glossy black pigment over a deep red slip.
Diagnostic - that is, painted - examples are exclusively open bowls. Tschopik documents a
wide variety of decorative motifs for this style. On the Taraco Peninsula, very few of these
motifs are represented. Some figurative elements are present (Figure10.1d, g-h), but most
examples present some combination of spirals, undulating lines, and pendant loops (Figure
10.1e-f, i-l). In this, at least, my sample seems to resemble that of Stanish from the Juli
area of Peru (Stanish et al. 1997: 47-48, 55).
The fourth and final Late Horizon ceramic style is Taraco Polychrome, also first defined
by Tschopik (also seeJulien 1993: 190-191). The distribution of this styles seems to be
centered in the Peruvian town of Taraco4 on the northern side of the lake. It is exceed-
ingly rare in the southern Titicaca Basin. I recovered only four examples from the Taraco
4I like to think of this as “the other Taraco”. Charles Stanish has pointed out to me a general pattern ofduplicate toponyms in the northern and southern Titicaca Basin, of which this is an example.
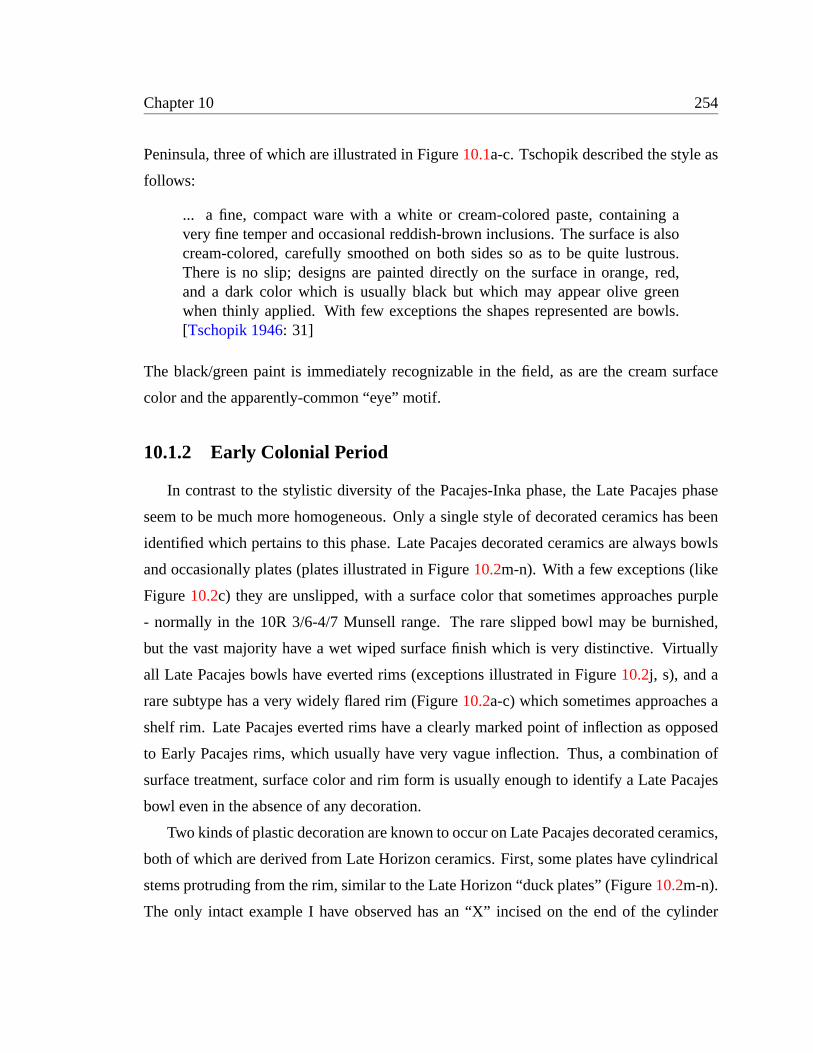
Chapter 10 254
Peninsula, three of which are illustrated in Figure10.1a-c. Tschopik described the style as
follows:
... a fine, compact ware with a white or cream-colored paste, containing avery fine temper and occasional reddish-brown inclusions. The surface is alsocream-colored, carefully smoothed on both sides so as to be quite lustrous.There is no slip; designs are painted directly on the surface in orange, red,and a dark color which is usually black but which may appear olive greenwhen thinly applied. With few exceptions the shapes represented are bowls.[Tschopik 1946: 31]
The black/green paint is immediately recognizable in the field, as are the cream surface
color and the apparently-common “eye” motif.
10.1.2 Early Colonial Period
In contrast to the stylistic diversity of the Pacajes-Inka phase, the Late Pacajes phase
seem to be much more homogeneous. Only a single style of decorated ceramics has been
identified which pertains to this phase. Late Pacajes decorated ceramics are always bowls
and occasionally plates (plates illustrated in Figure10.2m-n). With a few exceptions (like
Figure10.2c) they are unslipped, with a surface color that sometimes approaches purple
- normally in the 10R 3/6-4/7 Munsell range. The rare slipped bowl may be burnished,
but the vast majority have a wet wiped surface finish which is very distinctive. Virtually
all Late Pacajes bowls have everted rims (exceptions illustrated in Figure10.2j, s), and a
rare subtype has a very widely flared rim (Figure10.2a-c) which sometimes approaches a
shelf rim. Late Pacajes everted rims have a clearly marked point of inflection as opposed
to Early Pacajes rims, which usually have very vague inflection. Thus, a combination of
surface treatment, surface color and rim form is usually enough to identify a Late Pacajes
bowl even in the absence of any decoration.
Two kinds of plastic decoration are known to occur on Late Pacajes decorated ceramics,
both of which are derived from Late Horizon ceramics. First, some plates have cylindrical
stems protruding from the rim, similar to the Late Horizon “duck plates” (Figure10.2m-n).
The only intact example I have observed has an “X” incised on the end of the cylinder
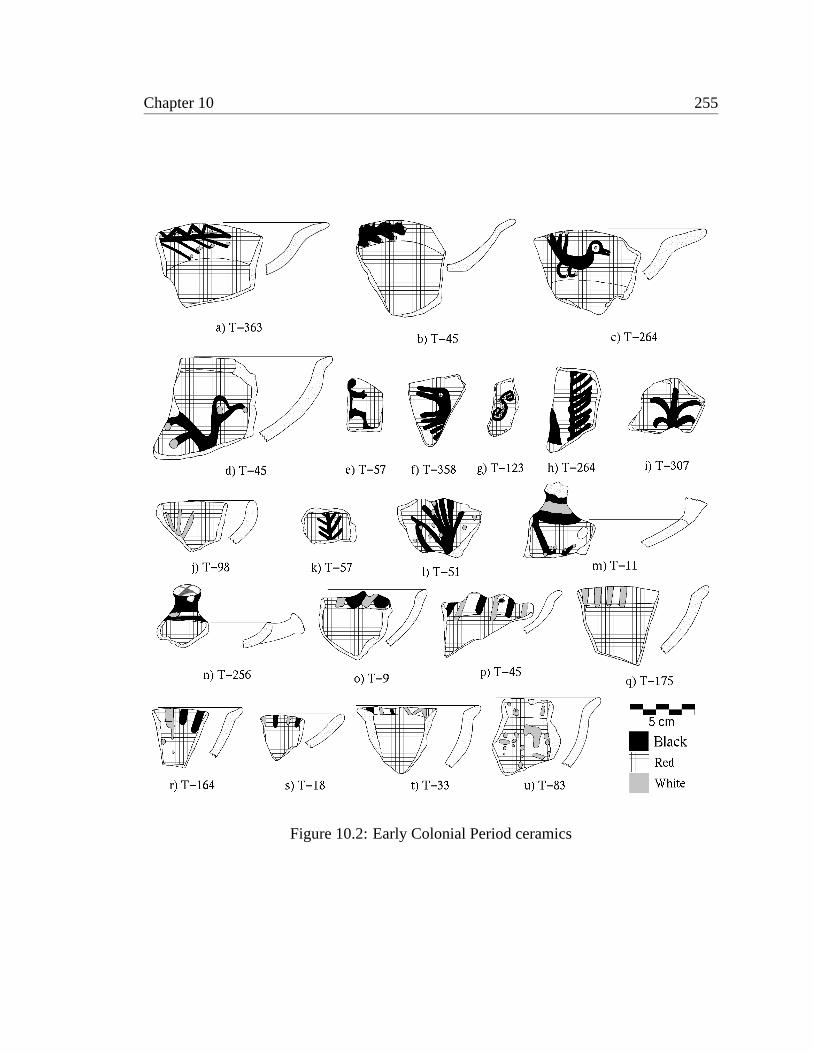
Chapter 10 255
Figure 10.2: Early Colonial Period ceramics
Chapter 10 256
(Figure10.2n). More common are a series of nubs or small protrusions modeled on the rim
of bowls (Figure10.2o-p), occurring in groups of two or three spaced regularly around the
circumference. These are occasionally perforated (Figure10.2p).
Late Pacajes painted decoration is frequently polychrome, and three pigments are em-
ployed. The first appears to be an organic pigment, which produces a black or occasionally
dark gray color over the red surface. The color area is normally quite diffuse, and its edges
poorly defined. The principal parts of any design are usually rendered using this pigment
(though see Figure10.2j for an exception). The second type of painted decoration is a
white pigment which is applied positively. It is normally used to embellish a design with
the addition of white dots (Figure10.2a-d, g, l-m).5 The third and rarest type of painted
decoration of a yellow pigment which is applied positively. It is used in exactly the same
manner as the white paint just described. The yellow pigment is often somewhat runny
(Figure10.2r, u), suggesting that it is either sloppily applied or that it has melted and run
during firing. It may be some kind of glaze, though I am uncertain on this point.
The white and yellow pigments never occur on the same vessel, which may suggest that
the yellow is simply a result of overfiring the white paint. Whatever the case, Late Pacajes
decorated ceramics are always either a monochrome Black on Red or a bichrome Black
and White on Red or Black and Yellow on Red.
The most common decorative motif consists of a series of shirt parallel lines pendant
from the interior rim of bowls (Figure10.2o-t). These may be black, white, or alternating
black and white. Also fairly common is a branching motif (Figure10.2i-m), probably
representing a tree or other plant and clearly derived from a similar Saxamar motif (Figure
10.1aa-ab), though the motif is also present in the Late Horizon Chucuito Black on Red
style (Tschopik 1946: 31). Less common decorative motifs include avian profile figures
(Figure10.1c-d), geometric designs (Figure10.1g-h), a possible quadruped (Figure10.1f)
and biped (Figure10.1e), and other figures which are not immediately identifiable (Figure
10.1a-b). The Late Pacajes ceramic decorative repertoire is apparently considerably more
5This is similar to a common decorative technique of the Sillustani Black and White on Red style from thenorthern Titicaca Basin (Tschopik 1946: 27), though this is apparently the only point of similarity betweenthe two styles.
Chapter 10 257
varied than has previously been suggested.6
10.1.3 Are the Pacajes phases temporally discrete?
As long as I am discussing the Pacajes ceramic phases, I am compelled to address an
issue that was raised by the original formulators of the Pacajes ceramic sequence. In their
survey report, Albarracín-Jordan and Mathews suggested that the Pacajes-Inka phase may
in fact have overlapped temporally with both the Early Pacajes and Late Pacajes phases
(Albarracín-Jordan and Mathews 1990, Figure 14). In this view, Pacajes-Inka phase ce-
ramics represented a foreign stylistic intrusion into the southern basin, which coexisted
with both late Early Pacajes ceramics and early Late Pacajes ceramics. Mathews argues
that certain ceramic attributes, such as disk bases and everted rims, are present in both
Early and Late Pacajes ceramics, but not in Pacajes-Inka ceramics.
In essence, this argument requires the assumption of the contemporaneousmanufacture of two distinct ceramic types, emerging from two separate cul-tural traditions, in the Tiwanaku Valley. Specifically, we need to posit thatthe Inka ceramic material represented a tradition that was superimposed overover the existing cultural matrix, rather than one which replaced it completely.Inka-Pacajaes could have represented an elite or sumptuary class of ceramicwhich was available only to certain elements of the indigenous Pacajaes soci-ety, possibly determined by position within the Inka administrative hierarchy ofindirect rule. At the same time, commoners continued to produce the diagnos-tic Early Pacajes wares described above, for everyday domestic consumption.[Mathews 1992: 194]
This is actually a straightforward hypothesis to test. If Mathews’s suggestion is correct,
then a high percentage of sites with Pacajes-Inka ceramics will also have Early Pacajes
ceramics on the surface. On the other hand, if Pacajes-Inka ceramics are partially con-
temporary with Late Pacajes ceramics, then a high percentage of sites with Pacajes-Inka
6Albarracín-Jordan, for example, characterizes Late Pacajes ceramics as “essentially a debilitated exten-sion of the previous local Pacajes-Inka style” (Albarracín-Jordan 1992: 327). Also, “[el] decorado se limitaa puntos negros y blancos, y en reducidos casos a líneas paralelas” (Albarracín-Jordan and Mathews 1990:175).
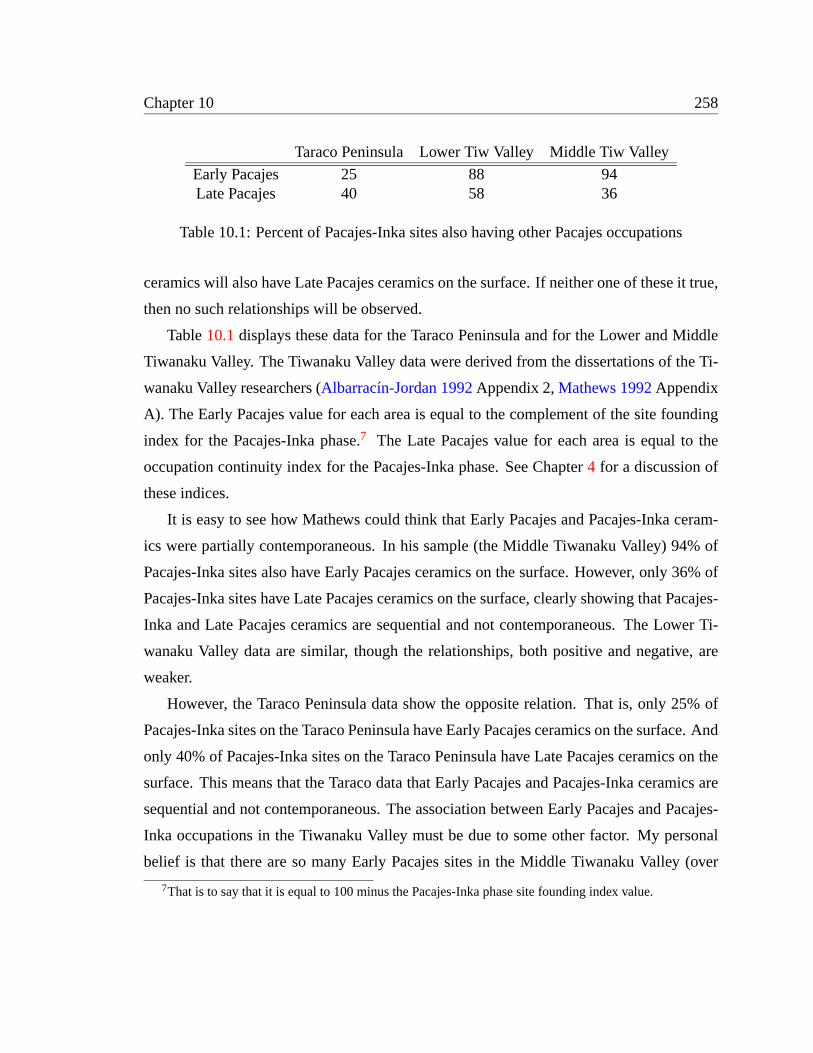
Chapter 10 258
Taraco Peninsula Lower Tiw Valley Middle Tiw Valley
Early Pacajes 25 88 94Late Pacajes 40 58 36
Table 10.1: Percent of Pacajes-Inka sites also having other Pacajes occupations
ceramics will also have Late Pacajes ceramics on the surface. If neither one of these it true,
then no such relationships will be observed.
Table10.1displays these data for the Taraco Peninsula and for the Lower and Middle
Tiwanaku Valley. The Tiwanaku Valley data were derived from the dissertations of the Ti-
wanaku Valley researchers (Albarracín-Jordan 1992Appendix 2,Mathews 1992Appendix
A). The Early Pacajes value for each area is equal to the complement of the site founding
index for the Pacajes-Inka phase.7 The Late Pacajes value for each area is equal to the
occupation continuity index for the Pacajes-Inka phase. See Chapter4 for a discussion of
these indices.
It is easy to see how Mathews could think that Early Pacajes and Pacajes-Inka ceram-
ics were partially contemporaneous. In his sample (the Middle Tiwanaku Valley) 94% of
Pacajes-Inka sites also have Early Pacajes ceramics on the surface. However, only 36% of
Pacajes-Inka sites have Late Pacajes ceramics on the surface, clearly showing that Pacajes-
Inka and Late Pacajes ceramics are sequential and not contemporaneous. The Lower Ti-
wanaku Valley data are similar, though the relationships, both positive and negative, are
weaker.
However, the Taraco Peninsula data show the opposite relation. That is, only 25% of
Pacajes-Inka sites on the Taraco Peninsula have Early Pacajes ceramics on the surface. And
only 40% of Pacajes-Inka sites on the Taraco Peninsula have Late Pacajes ceramics on the
surface. This means that the Taraco data that Early Pacajes and Pacajes-Inka ceramics are
sequential and not contemporaneous. The association between Early Pacajes and Pacajes-
Inka occupations in the Tiwanaku Valley must be due to some other factor. My personal
belief is that there are so many Early Pacajes sites in the Middle Tiwanaku Valley (over
7That is to say that it is equal to 100 minus the Pacajes-Inka phase site founding index value.
Chapter 10 259
500), that there is an Early Pacajes phase occupation of the vast majority of the sites of any
phase. That is, there is an Early Pacajes site in virtually every habitable location. Whatever
the case, this exercise has conclusively demonstrated that the three Pacajes phases are in
fact sequential and have no appreciable temporal overlap.
10.2 Principal sites
In the Pacajes-Inka and Late Pacajes phases villages reappear on the Taraco Penin-
sula after an absence during the Early Pacajes phase. However in both phases a dispersed
habitation mode predominates, with only a few villages situated in a landscape of small
farmsteads and hamlets. For this reason relatively few Pacajes-Inka and Late Pacajes sites
stand out enough to merit detailed description. Those that do are the larger ones, and they
are described below.
10.2.1 Late Horizon
Eight sites were identified with Late Horizon occupations greater than or equal to 2.0
ha. These are numbered on Figure10.3and are described below. Of these only the four
largest - with population index values from 187 to 368 - could truly be considered villages.
The rest are simply large hamlets or unusually dense concentrations of farmsteads, quite
possibly representing palimpsests of temporally discrete occupations.
T-97A (Leque Lequeri)
This is a fairly large, low density ceramic scatter covering about 2.08 ha in the modern
community of Iwawe Grande. It is located on the top and sides of a low ridge. Very few
modern materials are present. A small group of trees is present on the northern end of the
site. The site is now used for agriculture, and the surface consists of fallow and plowed
fields. Tractors have been used on the site.
In the upper portion of the site are located two large blocks of worked andesite. Since
the site is located only a little more than a kilometer from the substantial Tiwanaku site of
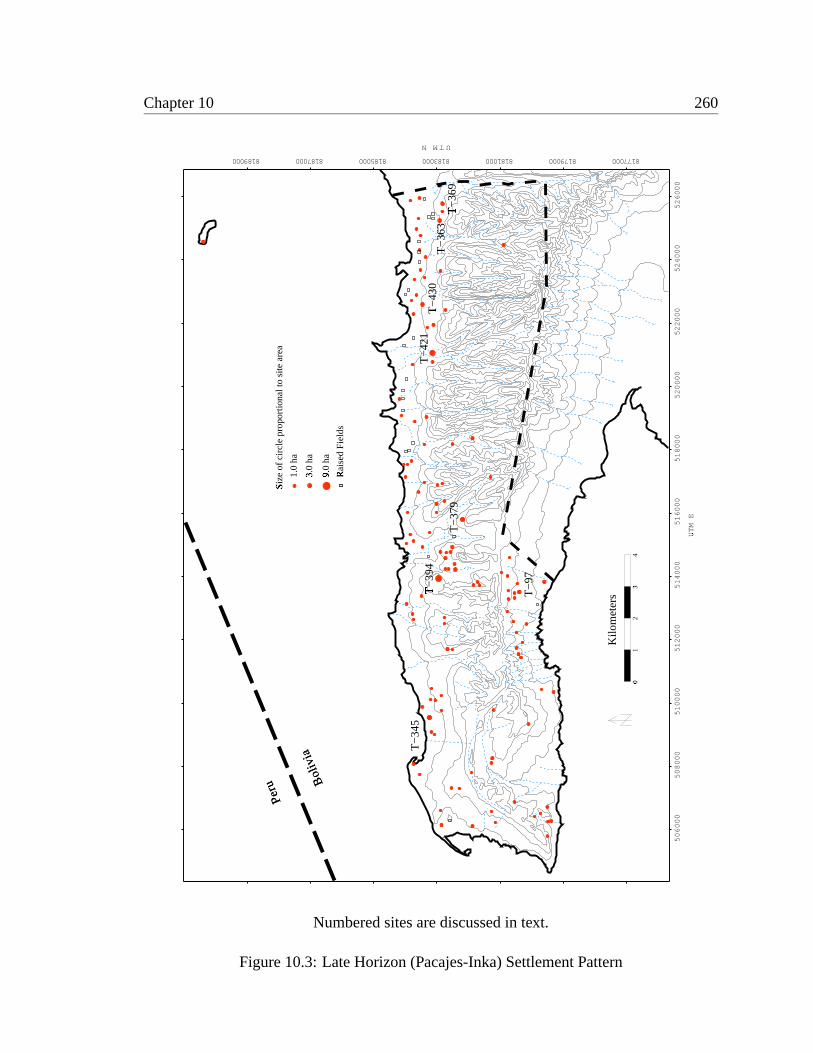
Chapter 10 260
0�
12
3�
4
Kilo
met
ers
1.0
ha
Rai
sed
Fie
lds
�3.0
ha
�
Peru B
oliv
ia
Siz
e of
circ
le p
ropo
rtio
nal t
o si
te a
rea
�
9.0
ha
�
506000
508000
510000
512000
514000
516000
518000
520000
522000
524000
526000
UTM E
�
UTMN
8770008179008110000818500818700819000 108818300008
T−
345
T−
97
T−
394
�
T−
379
T−
421
T−
430
�
T−
363
T−
369
�
Numbered sites are discussed in text.
Figure 10.3: Late Horizon (Pacajes-Inka) Settlement Pattern
Chapter 10 261
Iwawe - or Ojepuko - I assume the blocks were brought from there. There are no indications
of any kind of surface architecture.
The entire scatter contains Pacajes-Inka materials. It seems to have been a small LH
village, or a large hamlet, with a population index value of 103. The site also has a smaller
Late Pacajes occupation (sector B), covering only 1 ha. There is no pre-LH occupation at
the site, and very little modern material is present.
T-345A (Ollajaya Pata)
Ollajaya Pata is a large Pacajes-Inka site located in the modern community of Ñacoca.
The sherd scatter is quite dense and continuous, covering some 4.2 ha (population index:
228), and the soil is dark and stained with organic material. I would imagine that there are
preserved subsurface features and deposits. The site is located in the gentle slope immedi-
ately above the lakeshore. The locality is used for agriculture at present, and the modern
surface consists of plowed and fallow fields. A small group of springs is located nearly, in
aquebradato the west of the site itself.
This site would appear to be a small village, though large by post-Middle Horizon
standards. A small Late Pacajes farmstead (sector B) is also present on the site, covering
only 0.36 ha.
T-363A (Kala Puju Pata)
This site is located in the modern community of Huacullani. The scatter is continuous
and dense, covering 2.21 ha. Sector A, the LH occupation, has a population index value of
111. The site is located in the gentle slopes immediately above the Taraco-Tambillo road.
In fact, the road has disturbed the northern extreme of the site. Numerous springs are found
in the vicinity.
Sector B is a Late Pacajes farmstead, covering only 0.60 ha.
Chapter 10 262
T-369A
This site is very similar to Kala Puju Pata, described above. It is located less than 500
m to the east along the Taraco-Tambillo road, also in the community of Huacullani. Its
extension is almost the same, at 2.10 ha (population index value: 104). Immediately to the
north of the site, across the modern road, is a large swampy area, orpantanal.
A series of broad, low terraces cover the surface of the site. These could have been
habitation terraces, or may be more recent agricultural features. A small Late Pacajes
farmstead is also present at the site, as it the case with most sites on the Taraco Peninsula.
T-379A (Wankarani)
One of the few actual villages of the Pacajes-Inka phase, Wankarani is a dense scatter
located in the community of Zapana. The scatter is very dense, and the soil is quite dark
in color. The village is located in a small inland valley, on the nose of a ridge to the south
of the modern crossroads. It is quite near to a small river with year-round flow. Ceramic
styles present include Cuzco, Saxamar, and Chucuito.
The location is strategic in the sense that it allows control of traffic through a low pass
in the hills. This is the route of the modern road. In this respect Wankarani is situated iden-
tically to the modern town of Taraco, which is located nearby. Wankarani has a population
index value of 187 (3.52 ha).
T-394H (Janko Kala)
Janko Kala, the reader may recall, was one of the old Formative Period villages on the
Taraco Peninsula. It was one of the four principal Middle Formative villages, and remained
occupied through the Late Formative. It is described in more detail in Chapters5 and6.
The village was relocated to the site of Titicachi (T-415) in the Tiwanaku period, and was
abandoned in the Early Pacajes phase, In the Pacajes-Inka phase, the original site of the
village was reoccupied.
At 6.50 ha, sector H at Janko Kala is clearly the largest LH village on the Taraco Penin-
Chapter 10 263
sula. It has a population index value of 368. The site was probably the LH administrative
center of the Taraco Peninsula, and compares favorably in terms of size to other significant
Inka sites such as Guaqui. There can be no doubt, however, that it was subordinate to one
of the major Inka centers in the Tiwanaku Valley or the Katari Basin.
T-421J (Waka Kala)
Waka Kala is also a site with a long history. It was continuously - though not necessarily
densely - occupied from the LF2 though the Early Colonial period. The LH occupation at
the site, sector J, is the largest in its history. It covers 5.5 ha, and has a population index
value of 307, making it the second-largest Pacajes-Inka village on the peninsula.
T-430G (Alto Pukara)
Sector G at Alto Pukara was a large hamlet, covering 2.25 ha with a population index
value of 113. The LH occupation at this site is in no way remarkable.
10.2.2 Early Colonial Period
Five sites were identified with Early Colonial Period occupations greater than or equal
to 2.0 ha. These are numbered on Figure10.4 and are described below. Of these five,
only two - Sonaji and K’eyuan Pampa - can be considered as true villages, the remainder
representing large hamlets.
T-150A (Janko Kala)
T-150 should not be confused with the other Janko Kala (T-394). The two share a to-
ponym but are otherwise distinct. T-150 is located in the modern community of Nachoca.
The site has only one occupation component. The scatter is continuous , though low den-
sity, and covers 2.16 ha. It is located on the gentle slopes overlooking the lake plain, on a
low hill well to the north of the modern road. The site has a population index value of 107,
and is probably a large hamlet.
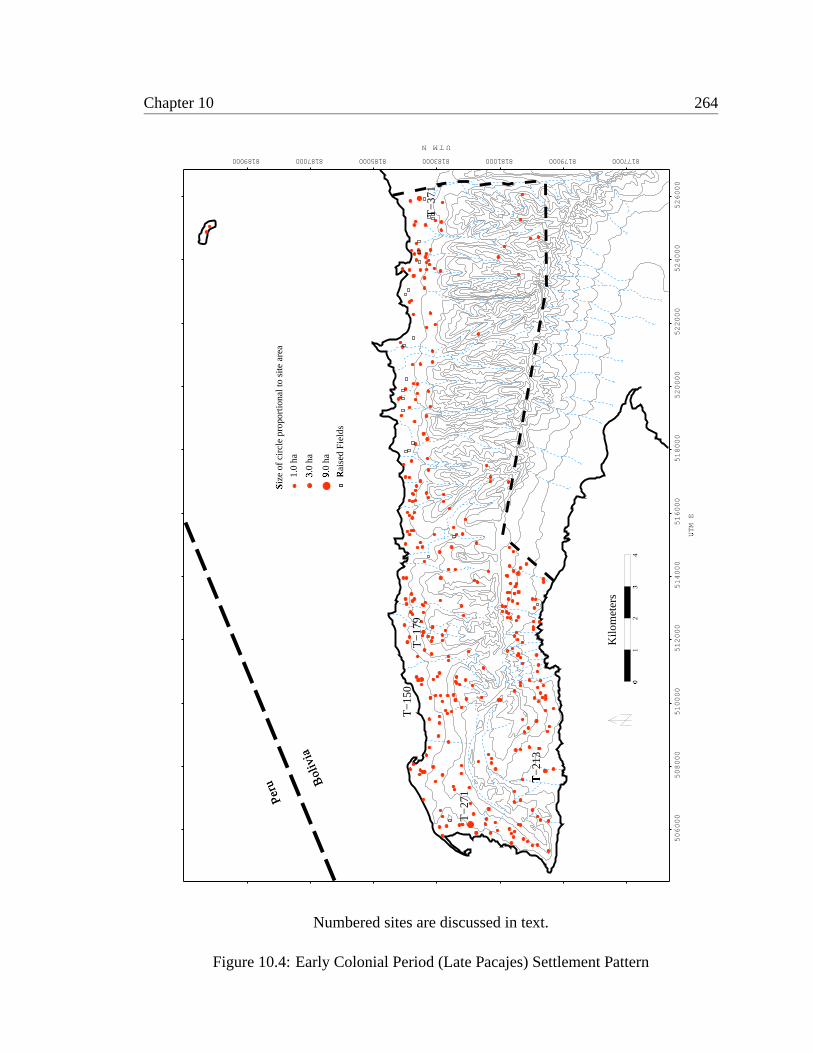
Chapter 10 264
0�
12
3�
4
Kilo
met
ers
1.0
ha
Rai
sed
Fie
lds
�3.0
ha
�
Peru B
oliv
ia
Siz
e of
circ
le p
ropo
rtio
nal t
o si
te a
rea
�
9.0
ha
�
506000
508000
510000
512000
514000
516000
518000
520000
522000
524000
526000
UTM E
�
UTMN
8770008179008110000818500818700819000 108818300008
T−
271
T−
213
�
T−
150
T−
179
T−
371
Numbered sites are discussed in text.
Figure 10.4: Early Colonial Period (Late Pacajes) Settlement Pattern
Chapter 10 265
T-179A (Taypi Circa)
Taypi Circa (also called Poque Pata) is located in the modern community of Nachoca
on the gentle slopes below (to the north of) the modern road. The scatter is continuous over
2.00 ha, and contains only Late Pacajes material. The site has a population index value of
98, qualifying as a large hamlet.
Andesite is present on the site, both as debitage and as ground stone. This is very
unusual for a single-component Late Pacajes site and suggests that another occupation
(probably Middle Horizon) is present though not evident in the surface assemblage. A
few Tiwanaku sherds were encountered, but were not sufficient to indicate an occupation
according to my methodology (see Chapter3).
T-213D (Oman Jawirmunta)
This was a minor Late Formative and Tiwanaku period site in the community of Coa
Kkollu. The scatter is located on a low mound in thepampa, probably a small tell. Sector
D is the site’s largest occupation, covering 2.50 ha with a population index value of 127. I
consider it a large hamlet.
T-271F-G (Sonaji)
Sonaji is without a doubt the largest and most important Late Pacajes site on the Taraco
Peninsula. Readers will recall that this site was first occupied in the Middle Chiripa phase,
and came to be the dominant site on the peninsula in the late LF1, continuing as an admin-
istrative period in the LF2 and Tiwanaku periods.
Sectors F and G, the Late Pacajes occupations, cover 1.25 and 7.00 ha respectively, with
a combined population index value of 455. These areas are somewhat approximate, since
a third to a half of the site lies beneath the modern town of Santa Rosa (under the church
certainly, and possibly under the plaza as well). The modern town of Santa Rosa therefore
seems to have been the principal village on the peninsula in the Early Colonial period. It
is also worth noting in this connection that the town of Taraco, the peninsula’s modern
Chapter 10 266
capitol, was not occupied at all in the Late Pacajes phase. Its preeminence evidently dates
to a later period.
To find this site, walk out of the plaza of Santa Rosa toward the lake. Ceramics will
become apparent immediately upon passing out of town.
T-371B (K’eyuan Pampa)
This site is a moderate-density ceramic scatter in the modern community of Huacullani.
It is situated on top of a low rise in the lake plain, well below the modern road, almost
exactly on the boundary of my survey area. Springs are to be found nearby and the T-370
raised field group is immediately adjacent.
Prior to the Late Pacajes phase the mound was occupied by a small Pacajes-Inka farm-
stead, Sector B, the much larger Late Pacajes occupation, is a moderate-density scatter
covering 3.99 ha with a population index value of 215. The site may be a small village, or
a palimpsest of overlapping successive farmsteads and hamlets. It is impossible to say.
10.3 Settlement and population
As Table10.2makes clear, the Pacajes-Inka and Late Pacajes phases were times of very
rapid growth on the Taraco Peninsula. During both phases the population of the peninsula
grew at a rate much faster than the expected rate of natural increase. This suggests consid-
erable immigration from other areas. If the peninsula experienced catastrophic depopula-
tion with the collapse of the Tiwanaku state, then the arrival of the Inka state reversed the
process.
10.3.1 Late Horizon
In the Pacajes-Inka phase, the population of the Taraco Peninsula grew at the very rapid
rate of 1.07% annually (Table10.2). It should be remembered that this is something like
ten times the rate of natural increase, and is roughly equivalent to the rate of growth of
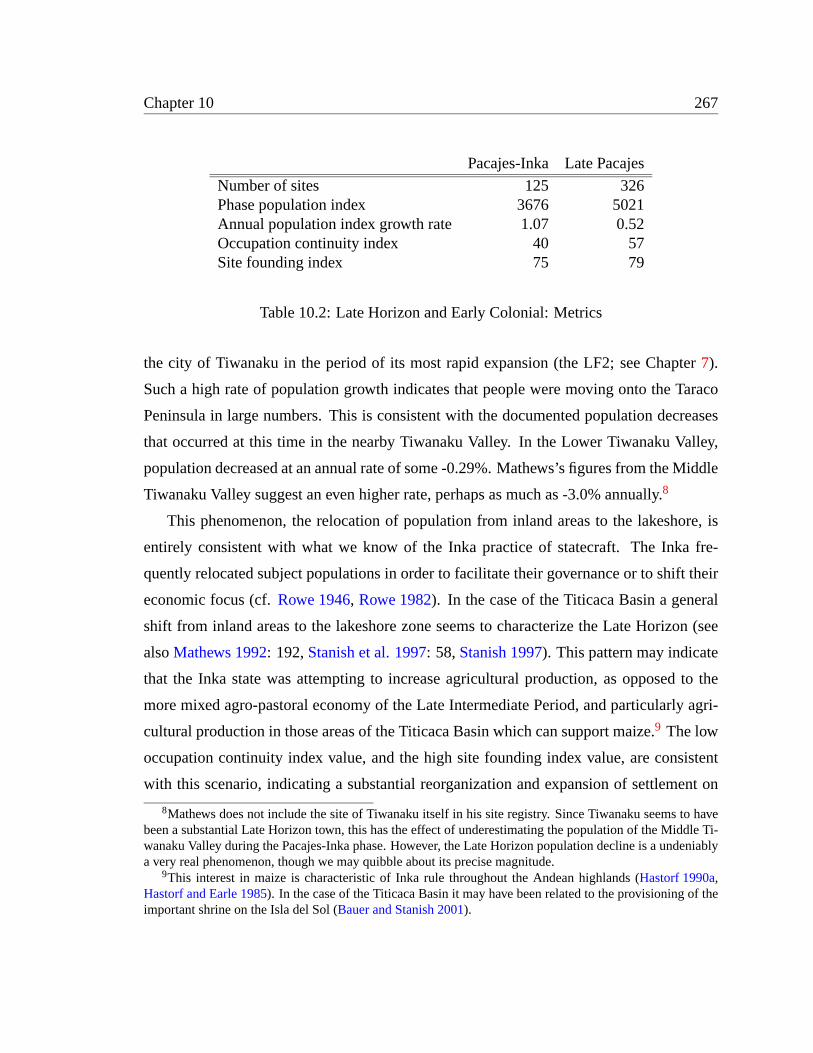
Chapter 10 267
Pacajes-Inka Late Pacajes
Number of sites 125 326Phase population index 3676 5021Annual population index growth rate 1.07 0.52Occupation continuity index 40 57Site founding index 75 79
Table 10.2: Late Horizon and Early Colonial: Metrics
the city of Tiwanaku in the period of its most rapid expansion (the LF2; see Chapter7).
Such a high rate of population growth indicates that people were moving onto the Taraco
Peninsula in large numbers. This is consistent with the documented population decreases
that occurred at this time in the nearby Tiwanaku Valley. In the Lower Tiwanaku Valley,
population decreased at an annual rate of some -0.29%. Mathews’s figures from the Middle
Tiwanaku Valley suggest an even higher rate, perhaps as much as -3.0% annually.8
This phenomenon, the relocation of population from inland areas to the lakeshore, is
entirely consistent with what we know of the Inka practice of statecraft. The Inka fre-
quently relocated subject populations in order to facilitate their governance or to shift their
economic focus (cf.Rowe 1946, Rowe 1982). In the case of the Titicaca Basin a general
shift from inland areas to the lakeshore zone seems to characterize the Late Horizon (see
alsoMathews 1992: 192,Stanish et al. 1997: 58,Stanish 1997). This pattern may indicate
that the Inka state was attempting to increase agricultural production, as opposed to the
more mixed agro-pastoral economy of the Late Intermediate Period, and particularly agri-
cultural production in those areas of the Titicaca Basin which can support maize.9 The low
occupation continuity index value, and the high site founding index value, are consistent
with this scenario, indicating a substantial reorganization and expansion of settlement on
8Mathews does not include the site of Tiwanaku itself in his site registry. Since Tiwanaku seems to havebeen a substantial Late Horizon town, this has the effect of underestimating the population of the Middle Ti-wanaku Valley during the Pacajes-Inka phase. However, the Late Horizon population decline is a undeniablya very real phenomenon, though we may quibble about its precise magnitude.
9This interest in maize is characteristic of Inka rule throughout the Andean highlands (Hastorf 1990a,Hastorf and Earle 1985). In the case of the Titicaca Basin it may have been related to the provisioning of theimportant shrine on the Isla del Sol (Bauer and Stanish 2001).
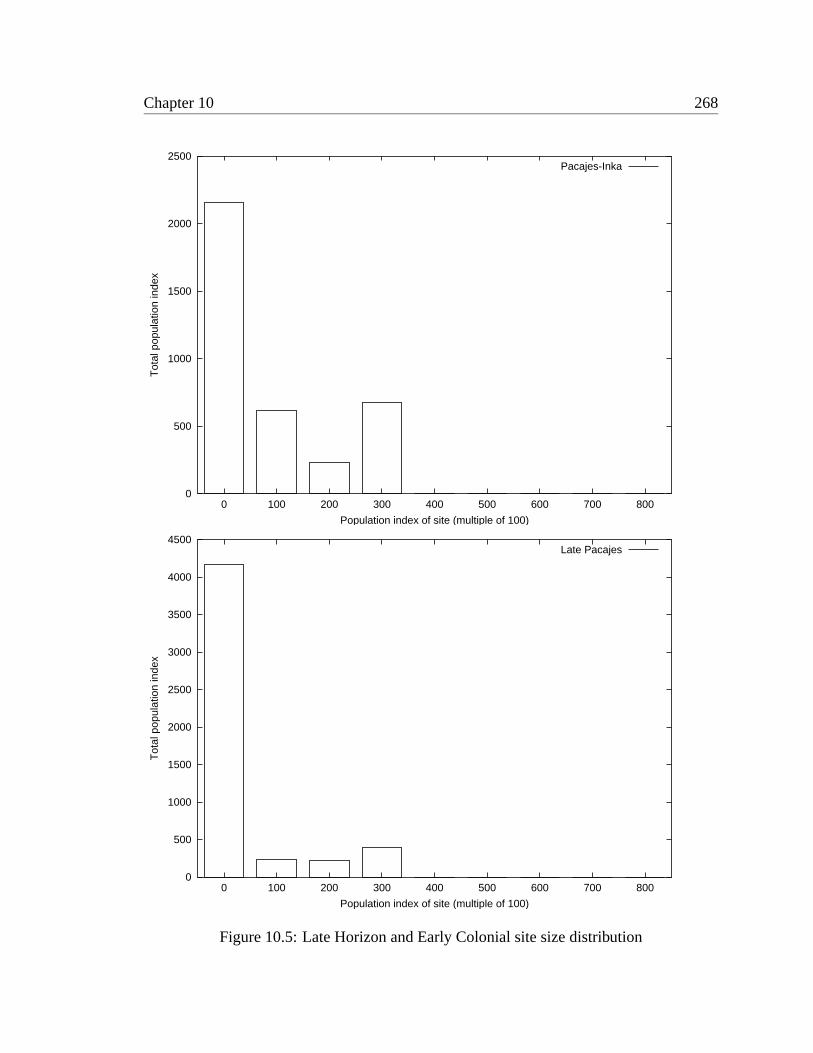
Chapter 10 268
0
500
1000
1500
2000
2500
0 100 200 300 400 500 600 700 800
Tot
al p
opul
atio
n in
dex
Population index of site (multiple of 100)
Pacajes-Inka
0
500
1000
1500
2000
2500
3000
3500
4000
4500
0 100 200 300 400 500 600 700 800
Tot
al p
opul
atio
n in
dex
Population index of site (multiple of 100)
Late Pacajes
Figure 10.5: Late Horizon and Early Colonial site size distribution
Chapter 10 269
the peninsula in the Late Horizon.
Whatever the case, the Pacajes-Inka settlement pattern clearly reflects reorganization
into an Inka provincial administrative area. In contrast to the Early Pacajes phase, in which
no site size hierarchy could be discerned (Figure9.3), the Pacajes-Inka phase has a clear
two-tier site size hierarchy. The top tier includes three sites with population index values
of 300-400. These are Janko Kala (T-394), Waka Kala (T-421) and Ollajaya Pata (T-345).
Of these Janko Kala is the largest. When considered together with nearby satellite villages
and hamlets,10 there is no doubt that it is the principal Late Horizon site on the peninsula.
The second-tier sites include a few smaller villages, and many hamlets and farmsteads.
This settlement hierarchy shows up nicely in the population density surface plot (Figure
10.6a). Three main peaks are evident, representing the three first-tier villages. The main
population concentration is clearly defined by the sites of Janko Kala and Wankarani and
the smaller sites located between them.
10.3.2 Early Colonial Period
In some respects the Late Pacajes settlement pattern is essentially very similar to the
Pacajes-Inka one. Population continued to grow, though at a slower rate (0.52% annually).
Even this reduced rate, however, strongly implies a continued influx of population onto the
peninsula, especially given simultaneous population declines in neighboring areas.11 The
site founding index continued to be high, indicating continued settlement expansion, while
average site size and the occupation continuity index remained relatively low, indicating
the continued predominance of dispersed and relatively short-term habitations. The Late
Pacajes site size hierarchy is also nearly identical to that of the Pacajes-Inka phase, as is
made clear in Figure10.5.
On the other hand, the Late Pacajes settlement system is quite different. Figure10.6b
is a density map of Late Pacajes population on the Taraco Peninsula. The preeminence of
the site of Sonaji (T-271) is clear. Figure10.7b shows the change in population density
10These include Wankarani (T-379).11Especially, of course, the Tiwanaku Valley (seeAlbarracín-Jordan 1992: 326-333,Mathews 1992: 194-
195).
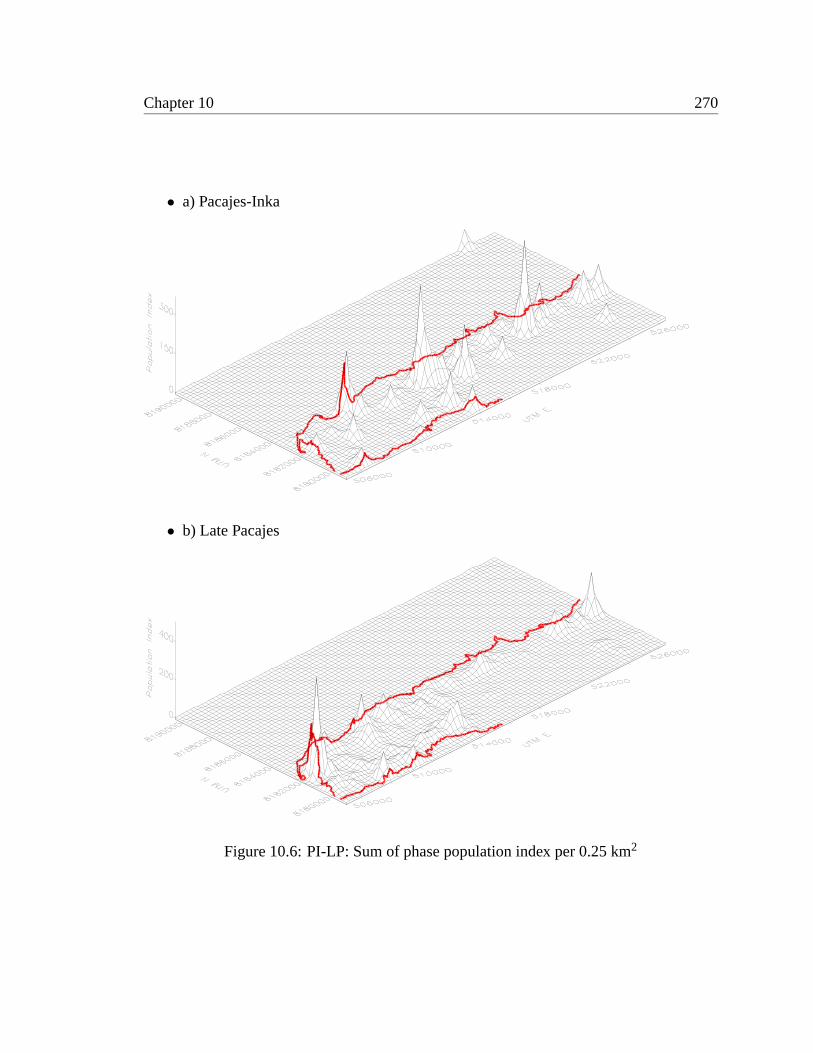
Chapter 10 270
• a) Pacajes-Inka
• b) Late Pacajes
Figure 10.6: PI-LP: Sum of phase population index per 0.25 km2
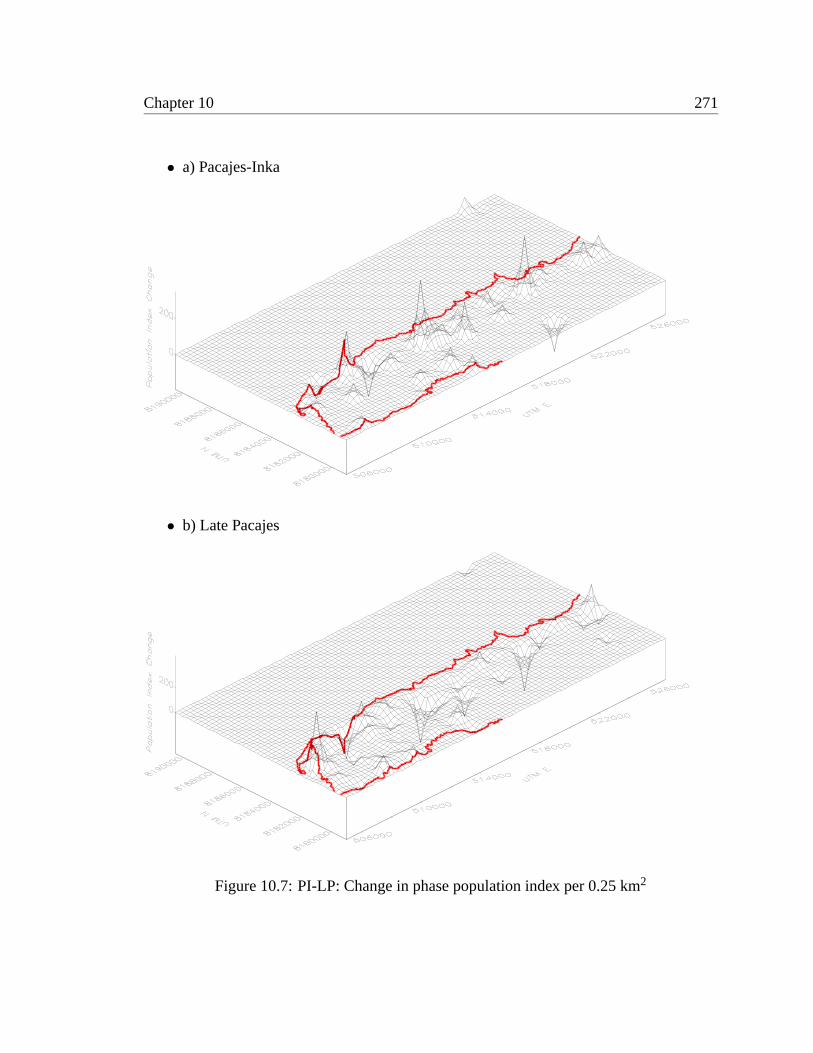
Chapter 10 271
• a) Pacajes-Inka
• b) Late Pacajes
Figure 10.7: PI-LP: Change in phase population index per 0.25 km2
Chapter 10 272
on the Taraco Peninsula from the Pacajes-Inka phase through the Late Pacajes phase. The
depressed areas represent the abandonment of every single one of the earlier Pacajes-Inka
phase villages described above. Thus, while the Late Pacajes site size hierarchy was a
two-tier one, as was that of the Late Horizon, all of the Pacajes-Inka phase villages were
abandoned and a new local center was established at the present location of the town of
Santa Rosa. This settlement (Sonaji [T-271]) was the sole village on the Taraco Peninsula
during the Late Pacajes phase. The remainder of the population - which was actually quite
substantial - lived in small hamlets and farmsteads scattered about the landscape.
10.4 Discussion
The Pacajes-Inka phase settlement data clearly suggest a policy of forced resettlement
on the part of the Inka empire. Large numbers of people were relocated from more inland
areas such as the Tiwanaku Valley to areas closer to the lakeshore - including the Taraco
Peninsula and various islands in the lake - which are much more agriculturally productive.
This reversed a very long-term trend of population movement away from the lakeshore to
inland locations. This inland migration began in the LF1 and continued through the end of
the LIP. This suggests a complete abandonment of raised field agriculture12 as well as either
a reduction in the importance of pastoralism or a reorganization of pastoral production. It
may be that under the umbrella of apax incaicagroups were able to live at a distance from
their herds. This would not really have been possible in the more bellicose and dangerous
environment of the LIP. Pacajes-Inka phase groups and families may have had large camelid
herds in inland areas which were tended by a rotating detail of herders.
This removal of the necessity for propinquity between a household and its animals also
removed what I have suggested was the original reason for the shift from nucleated to
dispersed habitation in the Early Pacajes phase (see discussion in Chapter9). Indeed, in
the Pacajes-Inka phase some villages were founded and a site size hierarchy appeared. I
hypothesize that these small villages represent the households of local leaders who par-
12If it has not in fact been abandoned earlier, at the beginning of the Early Pacajes phase, as I believe itwas.
Chapter 10 273
ticipated in the Inka administrative hierarchy together with those of their dependants and
retainers. Thus, the Inka went some way toward reestablishing the system of lakeshore
agricultural villages which had existed prior to the Tiwanaku collapse. However, the local
population still resided predominantly (probably more than 70%) in dispersed farmsteads.
On the whole, then, the Pacajes-Inka settlement pattern represents the reorganization
of the local population in order to increase agricultural production. This increase in agri-
cultural production may or may not have come at the expense of pastoral production, de-
pending on whether and in what ways management of camelid herds was modified. This
question goes well beyond the scope of the present discussion, however.
The Late Pacajes settlement pattern is in most ways a straightforward continuation of
the Pacajes-Inka pattern. The population continued to reside in dispersed households, with
a few small villages, and one substantial one (Sonaji [T-271]). All of the village locations
changed however. That is, all of the Pacajes-Inka phase villages were abandoned or reduced
to hamlet status, and new villages were founded. This seems to me to be further evidence
that the Pacajes-Inka “villages” were not in fact true villages but rather an agglomeration of
dependent households around a single wealthy or influential one. All such configurations
would have depended for their stability on continued privileged access to the workings of
the Inka administrative hierarchy. With the collapse of the Inka Empire these “villages”
would have dissolved into their component households. Seen in this light, Sonaji was
probably not a true Spanish “town” either, but rather a concentration of dependent and
attached households about a representative of the crown. That is, it was the same kind of
phenomenon as the Pacajes-Inka “villages”.
However, the Late Pacajes settlement pattern does display one peculiarity which was
absent from the Pacajes-Inka pattern, and which indicates a somewhat more heterogeneous
political landscape. This peculiarity is a radical change in site and population density evi-
dent in the settlement location (Figure10.4) and density (Figure10.6b) maps. These figures
show an area of very low site and population density between the 520000E and 522000E
meridians. The 3 km stretch has very few sites in the Late Pacajes period, and the ones
which are present are very small. Figures10.3and10.6a clearly show that this area was
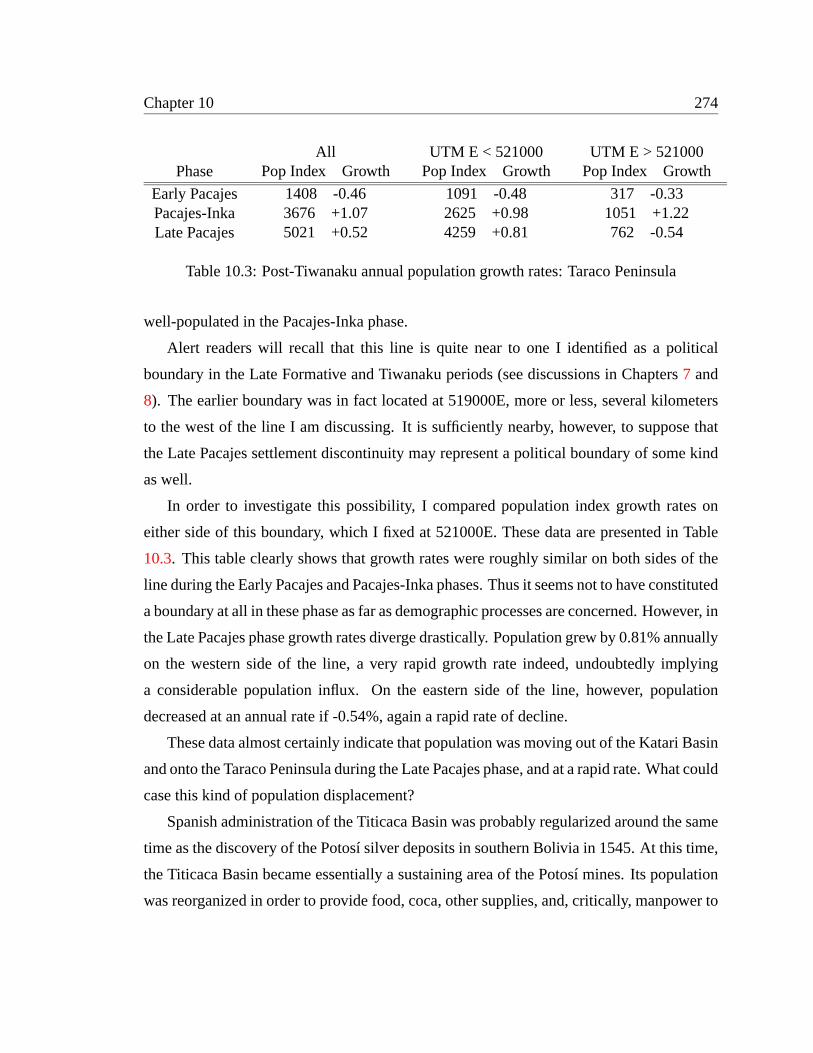
Chapter 10 274
All UTM E < 521000 UTM E > 521000Phase Pop Index Growth Pop Index Growth Pop Index Growth
Early Pacajes 1408 -0.46 1091 -0.48 317 -0.33Pacajes-Inka 3676 +1.07 2625 +0.98 1051 +1.22Late Pacajes 5021 +0.52 4259 +0.81 762 -0.54
Table 10.3: Post-Tiwanaku annual population growth rates: Taraco Peninsula
well-populated in the Pacajes-Inka phase.
Alert readers will recall that this line is quite near to one I identified as a political
boundary in the Late Formative and Tiwanaku periods (see discussions in Chapters7 and
8). The earlier boundary was in fact located at 519000E, more or less, several kilometers
to the west of the line I am discussing. It is sufficiently nearby, however, to suppose that
the Late Pacajes settlement discontinuity may represent a political boundary of some kind
as well.
In order to investigate this possibility, I compared population index growth rates on
either side of this boundary, which I fixed at 521000E. These data are presented in Table
10.3. This table clearly shows that growth rates were roughly similar on both sides of the
line during the Early Pacajes and Pacajes-Inka phases. Thus it seems not to have constituted
a boundary at all in these phase as far as demographic processes are concerned. However, in
the Late Pacajes phase growth rates diverge drastically. Population grew by 0.81% annually
on the western side of the line, a very rapid growth rate indeed, undoubtedly implying
a considerable population influx. On the eastern side of the line, however, population
decreased at an annual rate if -0.54%, again a rapid rate of decline.
These data almost certainly indicate that population was moving out of the Katari Basin
and onto the Taraco Peninsula during the Late Pacajes phase, and at a rapid rate. What could
case this kind of population displacement?
Spanish administration of the Titicaca Basin was probably regularized around the same
time as the discovery of the Potosí silver deposits in southern Bolivia in 1545. At this time,
the Titicaca Basin became essentially a sustaining area of the Potosí mines. Its population
was reorganized in order to provide food, coca, other supplies, and, critically, manpower to
Chapter 10 275
the mining operations. The founding of the city of La Paz in 1548 was part of this process.
Titicaca Basin groups were subjected to various administrative strategies -encomienda,
repartimiento, corregimiento- which served to enrich their conquerors and to impoverish
themselves.
Later in the colonial period - the mid-seventeenth century to be exact - Taraco was a
marka (seeAlbarracín-Jordan 1996aandAlbarracín-Jordan 1996bfor more detailed dis-
cussion of the concept) or town with eightayllu or communities under its jurisdiction.
In the Lower Tiwanaku Valley it included theayllu of Iwawe, Chivo, Pillapi, and Jawira
Pampa (Mamani Condori 1991: 22). Pillapi and Jawira Pampa are still communities today.
This allows us to locate the seventeenth century borders of Taraco as follows:
• on the South near the Tiwanaku River, or approximately 8172000 N, and
• on the East near the modern town of Pillapi, or approximately 524000 E.
It’s border on the northern side of the Taraco Hills is somewhat more obscure, but we can
with some reason locate it near the boundary between the modern cantons of Taraco and
Huacullani. This boundary is:
• between the modern communities of Pequery and Cala Cala, or approximately
521000 E.
Naturally, it is no coincidence that this is the same meridian identified above as a bound-
ary from population growth rates. The Late Pacajes settlement pattern clearly identified a
colonial period political boundary.
Of course, there is no guarantee that these were the boundaries of sixteenth century
(Late Pacajes) Taraco also. In fact, the town of Taraco did not yet exist in the sixteenth
century as far as I have been able to determine. Sonaji (T-271) was the only town on the
peninsula at this time. Further research will be necessary to confirm the sixteenth century
borders of what we now call Taraco. However, given the settlement data already discussed
it is not unreasonable to assume for the moment that it was the same as the seventeenth
century borders just defined.
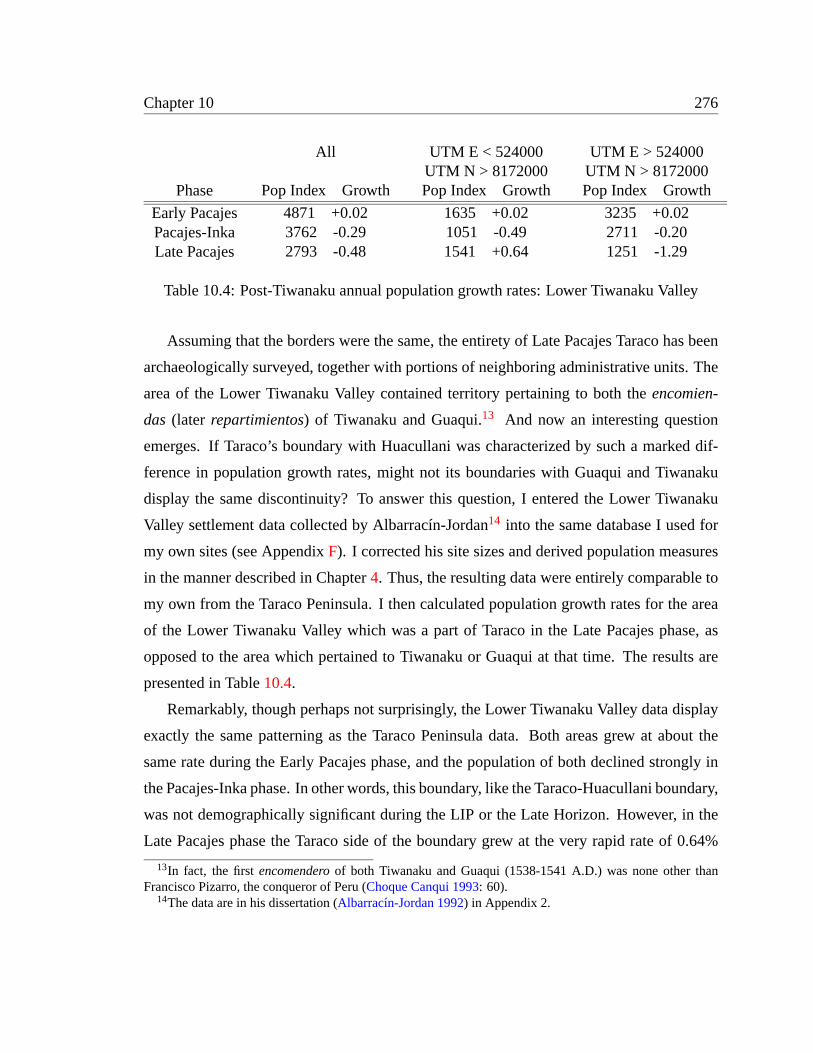
Chapter 10 276
All UTM E < 524000 UTM E > 524000UTM N > 8172000 UTM N > 8172000
Phase Pop Index Growth Pop Index Growth Pop Index Growth
Early Pacajes 4871 +0.02 1635 +0.02 3235 +0.02Pacajes-Inka 3762 -0.29 1051 -0.49 2711 -0.20Late Pacajes 2793 -0.48 1541 +0.64 1251 -1.29
Table 10.4: Post-Tiwanaku annual population growth rates: Lower Tiwanaku Valley
Assuming that the borders were the same, the entirety of Late Pacajes Taraco has been
archaeologically surveyed, together with portions of neighboring administrative units. The
area of the Lower Tiwanaku Valley contained territory pertaining to both theencomien-
das (later repartimientos) of Tiwanaku and Guaqui.13 And now an interesting question
emerges. If Taraco’s boundary with Huacullani was characterized by such a marked dif-
ference in population growth rates, might not its boundaries with Guaqui and Tiwanaku
display the same discontinuity? To answer this question, I entered the Lower Tiwanaku
Valley settlement data collected by Albarracín-Jordan14 into the same database I used for
my own sites (see AppendixF). I corrected his site sizes and derived population measures
in the manner described in Chapter4. Thus, the resulting data were entirely comparable to
my own from the Taraco Peninsula. I then calculated population growth rates for the area
of the Lower Tiwanaku Valley which was a part of Taraco in the Late Pacajes phase, as
opposed to the area which pertained to Tiwanaku or Guaqui at that time. The results are
presented in Table10.4.
Remarkably, though perhaps not surprisingly, the Lower Tiwanaku Valley data display
exactly the same patterning as the Taraco Peninsula data. Both areas grew at about the
same rate during the Early Pacajes phase, and the population of both declined strongly in
the Pacajes-Inka phase. In other words, this boundary, like the Taraco-Huacullani boundary,
was not demographically significant during the LIP or the Late Horizon. However, in the
Late Pacajes phase the Taraco side of the boundary grew at the very rapid rate of 0.64%
13In fact, the firstencomenderoof both Tiwanaku and Guaqui (1538-1541 A.D.) was none other thanFrancisco Pizarro, the conqueror of Peru (Choque Canqui 1993: 60).
14The data are in his dissertation (Albarracín-Jordan 1992) in Appendix 2.
Chapter 10 277
annually, which the population of the rest of the Lower Tiwanaku Valley declined even
more rapidly, at -1.29% annually.15
It appears, then, that in the Late Pacajes phase people were deserting theencomiendas
of Tiwanaku, Guaqui and Huacullani at a rapid rate, and were relocating to the territory of
Taraco. Albarracín-Jordan recognized that a general population decline took place in the
Late Pacajes phase in the Lower Tiwanaku Valley.
... no se puede ignorar la depressión demográfica que se presentó hacia comien-zos del siglo XVII. La minería de plata, en Potosí, se convirtió en principalfactor de desiquilibrio poblacional en la región. El Valle Bajo de Tiwanaku fueincorporado a la mit’a. Un gran número de tributarios fueron reclutados paratrabajar las minas de Potosí ... La versión española de la mit’a hizo que de 868tributarios, enlistados en el Repartimiento de Tiwanaku en 1583, solamenteresten nueve, en 1658... [Albarracín-Jordan 1996a: 313]
Albarracín-Jordan attributes the population decline to mit’a obligations in the Potosí
mines, and other onerous exactions of the colonial government and its representatives.
These processes are well-documented (cf.Choque Canqui 1993, Sanchez-Albornoz 1979,
Spalding 1984, Stern 1982) and relatively well-understood. Throughout the seventeenth
century extremely onerous labor exactions, as well as very poor working conditions and
a series of catastrophic epidemics, decimated indigenous populations throughout the An-
des.16
How, though, are we to understand the meteoric population growth on the Taraco Penin-
sula in this context? A clue is provided by the fact that Taraco was not, in the Early Colonial
period, given inencomiendato any private individual. Rather, the peninsula wastierra de
la corona, crown territory (Waldemar Espinoza Soriano, pers. comm.), and was ruled di-
rectly by the viceregal government. Though documentation for this period from Taraco has
never to my knowledge been published, it may be that conditions were more comfortable
under crown rule in the Late Pacajes phase than in any of the neighboringencomiendas.15This boundary is very dramatically visible on Albarracín-Jordan’s own settlement maps (e.g.
Albarracín-Jordan 1992Figure 15.2,Albarracín-Jordan 1996aFigure 12.2).16Though Stern has suggested that these population declines, while real, might not have actually been
so drastic as presented in official records. He documents a pervasive pattern of local groups hiding births,exaggerating deaths rates, and otherwise skewing population figures in order to reduce the tribute demandedby the colonial government (Stern 1982: 121-132).
Chapter 10 278
As Roberto Choque Canqui puts it, “[l]os pueblos de Waki y Tiwanaku estaban ‘tan
despoblados y perdidos sin gente por la mita’ porque muchos indios tributarios se han huido
... “ (Choque Canqui 1993: 83). If they were fleeing from Tiwanaku and Guaqui, perhaps
some at least were fleeing to Taraco. The anomalously high Late Pacajes population growth
rates may therefore be explained by an administrative anomaly: Taraco was ruled by the
crown, and surrounding areas byencomenderos. The possibility is certainly an intriguing
one and merits further research.
279
Chapter 11
The southern Titicaca Basin in the long
term
I began this report with an observation and with an objective. The observation was
that we know very little about the processes that led up to the formation of the Tiwanaku
state, and that this lack of information seriously hampers attempts to compare the Titicaca
Basin trajectory to that of other, better-documented areas of primary state formation, such
as Oaxaca or the Basin of Mexico. The objective, of course, was to provide an account
of long-term change in the southern Titicaca Basin in the centuries preceding Tiwanaku
state formation. Such an account was to be sensitive to the particularities of Titicaca Basin
ecology and history and still maintain a focus on cross-cultural developmental regularities
- Steward’s “phenomena of limited occurrence” - which permit comparisons with other
regional sequences.
That account was provided at some length in Chapters5 through8, with additional data
on later developments provided in Chapters9 and10. By way of conclusion, I would like
to discuss the broader outlines of the sequence as I have presented it, and reflect briefly on
some of the processes and events which shaped it. In the body of the thesis, my discus-
sion was organized by the southern Titicaca Basin ceramic chronology. The chronology,
obviously, is a fundamental factor structuring our understanding of prehistory. In this final
chapter, however, I would like to consider the social and evolutionary processes operating
Chapter 11 280
through time and to summarize the regional sequence in terms of what we might call social
evolutionary stages. Each stage may be distinguished from the others in terms of general
social processes.
11.1 Initial settlement, population growth
No evidence of an Archaic period or preceramic occupation was encountered in the sur-
vey. No aceramic sites nor even a single Archaic period projectile point were found. This
agrees with the results of many seasons of excavations at Chiripa; though we have found
Archaic period points, they seem to have been collected by the Formative period inhabi-
tants; no preceramic levels were encountered, despite the fact that we excavated to sterile in
a number of locations. This is probably due to the fact that Lago Wiñaymarka, was almost
completely dry prior to 1500 B.C., and the peninsula was no doubt considerably colder and
drier than it is today. It seems likely that whatever occupation there may have been of the
area would have been located near the meandering streams on the vast pampas. If so, then
they are all below the lake at the present time. It should also be mentioned that the entire
spine of the Taraco Peninsula was an extensive lithic quarry throughout prehistory, and is
thus covered by a low density lithic scatter. It is possible that the remains of short-term,
ephemeral aceramic encampments have been lost in this ubiquitous background scatter.
At any rate, the Taraco Peninsula was colonized at the beginning of the Early Chiripa
phase (EF1), beginning around 1500 B.C. when the lake rose suddenly to near-modern
levels. What is interesting about this colonization is that people were living from the very
beginning in nucleated settlements; small villages, with population index values typically
between 100 and 200. Four such villages were encountered in the survey, accounting for
82%1 of the total population in this period. In this, the Early Formative settlement of the
Taraco Peninsula contrasts strikingly with that of Juli-Pomata, where people at this time
seem to have lived in scattered farmsteads and small hamlets. Most of these early Taraco
Peninsula villages (all except Cerro Choncaya) continued to be occupied throughout the
1Combined EF1 population index of four villages with population index values > 100 = 571Phase population index for EF1 = 693

Chapter 11 281
Formative and indeed until the collapse of the Tiwanaku state. Already in the Early Chiripa
phase, then, we may observe a system of well-established communities that was to endure
for two millennia. This is a rather startling finding, not at all expected, and it distinguishes
the Taraco Peninsula from other areas of the Titicaca Basin for which we have comparable
data.
Of course, the EF1 phase population index represents the population of the peninsula at
theendof the EF1. Given the high rate of growth observed in the following LF2 phase, this
does not necessarily imply a large starting population. Given the 500 year span of the LF2,
and assuming that the EF1 population growth rate was the same as the EF2 rate (0.47%
annually), the EF1 phase population index of 693 could have been produced by an ini-
tial population of only 66. This would represent a starting population density of only 0.77
persons/km2. I would propose that this initial population was concentrated on the peninsula
by the 1500 B.C. lake level rise. That is, prior to the lake level rise they were practicing
a generalized and extensive agro-pastoralism in the vast grasslands on the Wiñaymarka
Basin. The sudden inundation of thepampaforced this population to concentrate on what
had become the Taraco Peninsula, and the territorial claims of neighboring groups pre-
vented many of them from relocating. The Taraco Peninsula is not good grazing land,
neither today nor in the past. The concentrated population was forced to adopt a sedentary
lifeway probably concentrating mainly on lacustrine resources with some intensification of
agricultural activity as well.
Sedentary populations normally have much higher population growth rates than do no-
madic or transhumant ones (cf.Hassan 1981: 221-229,Lee 1972, Sussman 1972). The
large village sizes and high regional population density of the EF1 Taraco Peninsula rel-
ative to other areas of the Titicaca Basin at this time is probably therefore a result of the
earlier establishment of a sedentary lifeway. And this in turn could simply have resulted
from their concentration on the Taraco Peninsula by the 1500 B.C. lake level rise. This
scenario goes a long way toward explaining the cultural and developmental precocity of
the Taraco Peninsula within the southern Titicaca Basin. This model would predict that
other long, narrow peninsulas surrounded by shallow water - at modern lake levels - would
Chapter 11 282
display evidence of a similar precocity. The area that immediately suggests itself for the
testing of this model is the Capachica Peninsula, in the northern Titicaca Basin. Virtually
no archaeological work has been done there, however.
The Middle Chiripa phase (EF2) begins around 1000 B.C., and comprises the latter
portion of the Early Formative period. No significant changes are evident in the settlement
pattern. The site size data continue to display a unimodal distribution, though the mode is
higher, with population index values between 200 and 300. Population grew rapidly - at
0.47% annually, close to some theoretically derived maxima for sedentary, non-industrial
agriculturalists - and most of the Early Chiripa villages continued to be occupied.
If site abandonment rates were low, though, the rate of founding of new sites was quite
high. This probably reflects a situation in which villages grew to a certain size and then
fissioned into two or more groups, due to scale-related social stresses and conflict. All of
these factors are included by Johnson in the term “scalar stress” (Johnson 1982). Three
such fissioning events are documented in the settlement data from the Taraco Peninsula.
1. Near the beginning of the EF2, around 1000 B.C., the village of Chiaramaya (T-3)
split into at least two groups and more likely three or four. One of these, probably
the largest, remained in place, while another founded the new site of Chiripa Pata
(T-4). Other smaller groups may have founded the sites of Alto Pukara (T-430) and
Quiswaran (T-303) at the same time. Chiaramaya had a maximum population index
value of 186 before this event.
2. Around the same time that Chiaramaya fissioned, the site of Cerro Choncaya (T-2)
broke into two groups. One of these moved to the East and founded the site of Kala
Uyuni (T-232) which was to become important in the LF1 period. The other segment
moved to the North and apparently combined with the population of a smaller village
- Sunaj Pata (T-268) - to form the new village of Sonaji (T-271). The site of the Cerro
Choncaya village was abandoned. Cerro Choncaya had a maximum population index
value of 157 before this event.
3. Near the end of the EF2, around 800 B.C., the site of Sonaji (T-271) - which had
Chapter 11 283
itself been the result of the earlier fissioning of Cerro Choncaya in event 2, above -
split into at least three groups. One of these reoccupied the site of Cerro Choncaya
(T-2), another reoccupied the site of Sunaj Pata (T-268), and another seems to have
moved further to the East and combined with the population of the existing village
of Yanapata (T-130). Sonaji attained a maximum population index value of 277
probably immediately prior to this event.
It is certainly worth noting that these three events are particularly conspicuous because they
took place very near to phase boundaries. They are therefore very visible archaeologically.
It is almost certain that other events than these took place during this time. It is probable in
fact that all of the new sites founded during the EF1 and EF2 resulted from similar events.
In other words, I believe that village fissioning was a fundamental process structuring the
development of the settlement system during the Early Formative. Since the sites are all
distributed along the paleolake terraces at the base of the Taraco Hills2 settlement growth
was linear. The pattern that resulted from this process (see Figures5.5a, b and6.10) is not
so different from those observed along river systems (Flannery 1976b, Reynolds 1976).
We have ascribed village fissioning to pressures and conflicts which increase as the
size of a community increases; that is, to “scalar stress”. This interpretation is supported
by the fact that the three communities which have been shown to have fissioned in the
Early Formative were the largest villages in each phase. Chiaramaya and Cerro Choncaya
were the two largest EF1 villages, while Sonaji was the single largest EF2 village. As the
process of village growth and fissioning progressed, however, the landscape began to fill
up. That is, the distance it would be necessary to move in order to found a new village
increased as time went on and as the landscape of the Taraco Peninsula became more and
more populated. Thus, the costs of community fissioning - which is simply to say the
difficulty and inconvenience associated with fissioning - increased through time. This is
probably why the maximum community size increased from less than 200 to almost 300 in
the course of the EF2.
As the larger communities were increasing to unprecedented sizes, scale-related
2See Chapter2 for a discussion of the geology of the Taraco Peninsula.
Chapter 11 284
stresses within those communities were also increasing. It was in such a context, in the
EF2, that an array of new material culture associated with public ceremony made its ap-
pearance. It was at this time that the earliest known sunken court was constructed at the site
of Chiripa. This structure - the Choquehuanca structure - was an open trapezoidal plaza,
excavated into the ground, lined with cobbles, and plastered with colored clay. It is associ-
ated with a higher than average percentage of serving wares (Steadman and Hastorf 2001),
suggesting that it was the site of public feasting activity; of what Dietler calls “commensal
politics” (Dietler 1996). At the same time we observe the first appearance of decorated
serving ceramics, probably implicated in the same range of activities.
The timing of the appearance of this early public ritual complex is almost certainly
not a coincidence. I interpret it as representing experimentation on the part of commu-
nity leaders and members attempting to discover ways to reduce scale-related stresses and
conflicts. The effort seems to have been at least partially successful, since only a few of
the largest sites did in fact fission in the EF2, and the “fission threshold” increased from
around 190 in the EF1 to almost 280 in the EF2. This early period of experimentation was
to be followed, in the Middle Formative, by the formalization of a complex of ritual ce-
ramics, architecture, and stone sculpture known as the “Yaya-Mama Religious Tradition”
(Chávez and Mohr Chávez 1975, Chávez 1988). That tradition, however, had its roots in
the experimental structures and ceramics which we have observed in the EF2, in the Mid-
dle Chiripa phase.
11.2 Autonomous villages, competitive ceremonialism
Population continued to grow in the Late Chiripa phase, though at a slower rate than in
the Early Formative. However several very interesting changes took place with regards to
settlement organization. First, the rate at which new sites were founded decreased dramat-
ically. The population was growing, but the old pattern of village growth and fissioning,
resulting in the foundation of new villages, seems to have become untenable in the Mid-
dle Formative. This suggests that the set of social forces and processes brought together
Chapter 11 285
by Carneiro under the rubric of “circumscription” had intensified further in this period
(Carneiro 1970, Carneiro 1988). This is only to say , as I did in the previous section, that
the costs of village fissioning increased to a point where alternative mechanisms of conflict
resolution and social integration were sought.
I am most decidedlynot suggesting that the subsistence potential of the Taraco Penin-
sula had been exhausted, or that the communities of the peninsula had begun to feud over a
scarce or strained resource base. Rather, I believe the principal factors to have been scale-
related conflicts and stresses which challenged the viability of communities exceeding a
population index value of a few hundred. Carneiro’s concept of circumscription accords
explanatory primacy to conflictbetweengroups,3 and the rapid and competitive increase in
the size of political groups as existing communities merge either through conquest or al-
liance. I am suggesting, on the contrary, that the important dynamic in this period of early
villages was conflictwithin villages and communities which intensified as the size of the
villages increased. While the landscape was largely empty, it was a simple matter for vil-
lages to fission, and to relocate to a nearby area which was similar in terms of the physical
environment to that of the parent community. Several such examples were described in my
discussion of the EF.
However, relocation costs increased as the landscape of the Taraco Peninsula filled up
with villages. In order to found a new village it would not be necessary either to appropri-
ate lands already claimed by another village - which would presumably involve fighting -
or to move off of the peninsula itself into the adjacent Katari and Tiwanaku Valleys, which
were still lightly-settled. However, the agricultural potential of these inland areas was not
so great as on the peninsula, and communities in these areas would have no direct access
to the lacustrine zone, which, I would argue, was always crucial to the subsistence strate-
gies of the Taraco Peninsula communities. Thus village fissioning became an increasingly
difficult and unattractive solution to scale-related stresses. This being the case, there was
no doubt experimentation with various techniques and strategies for resolving conflicts and
3Circumscription theory put succinctly: "...the major change we see in political structure, the changefrom village to chiefdom to state to empire, is the direct consequence of competition between societies"(Carneiro 1978: 209).

Chapter 11 286
increasing social solidarity. As I said, I believe the appearance of the first sunken courts
and decorated ceramics in the EF2 to represent exactly this type of experimentation.
Early in the MF, however, some stable solution was apparently produced. From this
point on village fissioning ceased on the Taraco Peninsula, and villages grew steadily to
sizes many times what had been the fissioning threshold in the Early Formative. Of course,
we have no clear idea what the exact nature of this solution might have been. Archaeolog-
ically, it is evident as the Yaya-Mama Religious Tradition. Its principal features include:
1. sunken courts and associated architecture,
2. decorated serving ceramics,
3. ceramic “trumpets”,
4. ceramic burning bowls, almost certainly used in ritual burning activity, and
5. a distinctive style of stone sculpture.
Of course, the Yaya-Mama Religious Tradition was actually produced and reproduced by
the actions and routinized practices of the members of the communities involved. The
material cultural features by which we define the Tradition are only the byproducts of the
actions of these people. The material features themselves, however, allow us to hazard
some guesses as to the nature of some of these practices. In particular, the presence of a
complex of decorated serving ceramics, which are moreover associated almost exclusively
with public architectural contexts, suggests the serving of food and drink in a public con-
text; in a word, feasting; in two, commensal politics. The sunken courts were probably
employed periodically for community-wide events involving the serving of food and drink.
We may imagine that a system of competitive generosity developed which allowed compe-
tition to take place in a way which actually increased the solidarity of the community as a
whole.
This process may have occurred more or less simultaneously in many parts of the
Titicaca Basin. Only one other settlement dataset has adequate temporal resolution in
Chapter 11 287
these early phases to permit useful comparison. Carlos Lémuz, in his signal study of
a portion of the Santiago de Huatta Peninsula, documents a 30% decrease in the num-
ber of sites in the Late Chiripa phase, together with a 60% increase in occupied site area
(Lémuz Aguirre 2001: 196). That is, average site size increased, and population became
increasingly concentrated in fewer sites, exactly the same process we have observed on
the Taraco Peninsula. I have yet to inspect Lémuz’s data carefully for evidence of site
fissioning in the Early Formative, but I would predict its presence.
It is particularly interesting that, after an early experimental phase in the EF2, the com-
plex of features which made up the Yaya-Mama Religious Tradition stabilized to a remark-
able degree and was adopted by communities throughout the Titicaca Basin. The Yaya-
Mama Religious Tradition, as a relatively stable configuration of practices, seems to have
been very portable, a sort of “cultural portmanteau.” It was adopted by many communities,
presumably for many different reasons. In this way, it was similar to early horizon styles
such as Chavín in the Central Andes and Olmec in Mesoamerica, though with a much more
restricted distribution.
Around 450 B.C., after the Yaya-Mama Religious Tradition had apparently become
established throughout the Titicaca Basin, the lake level dropped to about 16 meters below
its modern level. Since the Lago Wiñaymarka is very shallow - almost all of it is less than
20 meters deep - it became almost completely dry at this time. The lake we see today did
not exist. In its place was an immense grassy plain, crossed by small, meandering rivers
and dotted with marshes. The Desaguadero River was dry; the lake had no outlet.
There can be no doubt that this event had a significant impact on the Taraco Peninsula
communities. It is almost certain that the drying of the lake - and the resulting disappear-
ance of lacustrine resources such as fish and birds - forced a reorientation of the economies
of these communities, which were probably predominantly lake-oriented beforehand. Pas-
toralism no doubt became more common, since the former lake bed would have rapidly
become a vastpampa, ideal for grazing animals. Agriculture also probably became more
important. As important as these shifts in the subsistence economy, however, was a change
in the manner in which the Taraco Peninsula communities were integrated with the remain-
Chapter 11 288
der of the Titicaca Basin.
Since the little lake was mostly dry, it was possible to walk directly from the Taraco
Peninsula to the Copacabana/Yunguyu area, and from there to the important population
centers of the western Basin (Figure6.8). At this time trade with the western basin ex-
panded dramatically. The evidence for this is the large quantities of a particular lithic raw
material which is found almost exclusively in sites of this time period. This material, a
kind of olivine basalt, may come from outcroppings near Incatunahuiri, north of modern
Chucuito. It is certainly exotic to the Taraco Peninsula. It was used for the manufacture of
agricultural implements, principally hoes, and is much superior to the materials available
locally. This material appeared for the first time in Late Chiripa sites and virtually dis-
appeared when the lake level rose again, around 250 B.C. This stone was being imported
in very substantial quantities. In Chapter6 I calculated that perhaps as many as a quarter
million hoes of this material were imported to the Taraco Peninsula during the MF. And it
is virtually absent from the surface of any site from an earlier or later period.
It is clear that this rock is present on the Taraco Peninsula as a result of external ex-
change, possibly with the western basin. Probably, though, it was only a part of a much
more elaborate trading system, other items of which have not been preserved in the Titicaca
Basin environment. These could have included products of the lowlandyungasandselva,
including coca,ají, cotton, feathers, pelts, and hallucinogenic substances. Thus in the late
MF the Taraco Peninsula communities may suddenly have found themselves located on a
major trade route.
I would like to suggest that local leaders incorporated the acquisition and distribution
of desirable exotic goods - the aforementioned hoes being only the most visible example
- into the existing system of status competition and competitive generosity. That is to say
that a wealth finance strategy (seeD’Altroy and Earle 1985, Earle 1987b) was added to
the existing commensal system. Not coincidentally, it is also in this period - from 450
to 250 B.C. - that we see the first indications of wealthy graves at Chiripa (T-1). And
finally, it is precisely in this period of lowered lake levels that the well-known Upper House
Level complex was constructed at Chiripa. These are the famous double-walled structures

Chapter 11 289
first discovered by Bennett, located on a monumental artificial terrace. This complex was
clearly the most elaborate public architecture yet seen on the peninsula; the houses were
constructed around 380 B.C., shortly after the drying of the little lake. Similar terraces
were found at a number of contemporary sites, though these have yet to be excavated.
Also during the MF, perhaps in the latter half, a two-tiered site size hierarchy emerged
on the Taraco Peninsula. At the top were four large villages or small towns, each with
population index values between 350 and 450. These were the sites of Kala Uyuni (T-
232/T-225), Janko Kala (T-394), Yanapata (T-130) and Chiripa (T-1). What is interesting
is the fact that this site size hierarchy was produced by a difference in the growth rates of
different sites.
The four sites that by the end of the MF came to make up the first tier of the settlement
hierarchy grew at an average rate of 0.13% annually during the MF period. By contrast,
the smaller sites grew at an average rate of only 0.09% annually. I have argued that these
differential rates of population growth can be explained by small differentials in residen-
tial choices over time. These residential decisions in turn were affected by the distribution
of both staple goods - through public feasts - and imported materials - through public
prestations probably in ritual contexts. Essentially, I am suggesting that the inhabitants
of the Taraco Peninsula took into account the relative lavishness of each village’s system
of competitive generosity when deciding where to locate their residences. Over time, this
produced higher growth rates in communities with more lavish ceremonies. The lavish-
ness of ceremonies in turn would be correlated with the success of each village’s leaders in
external exchange relations and in the negotiation of internal community politics. Assum-
ing all of this to be true, then by this standard the most successful villages in the MF were
Kala Uyuni (0.15% annual growth; see Table6.4), Yanapata (0.14%), and Chiripa (0.13%).
Janko Kala in fact grew at the very slow rate of 0.09% annually, and is in the first tier of
the MF settlement hierarchy only because it was the second-largest village in the EF2 (the
largest, T-271, fissioned near the EF2/MF boundary). The fact that Janko Kala is also the
only one of these four large sites which lacks unambiguous evidence of MF public archi-
tecture would seem to support my interpretation. Also, Kala Uyuni’s MF exceptionalism
Chapter 11 290
may in part explain its success in the following Late Formative 1 period.
11.3 Multi-community polities, tributary relations
In the late MF, as I have just said, the inhabitants of the Taraco Peninsula were con-
fronted with new economic opportunities as a result of the drying of the little lake. Trade
and trade goods became incorporated into the competitive strategies of local leaders. How-
ever, early in the following Late Formative 1 period two things happened which served to
disrupt these strategies and thereby to provoke a generalized crisis of political legitimacy.
In the first place, around 250 B.C. the level of Lago Wiñaymarka rose again to near-
modern levels. This had the effect of shifting the trade route to theyungas- upon which
local leaders had come to depend during the two century period of low lake levels - to the
south, to pass through Desaguadero and the Tiwanaku Valley (see Figure7.5). This event
would certainly have reduced the access to the trade route enjoyed by the Taraco Peninsula
communities and eliminated any advantage they might have enjoyed due to to their strategic
location in this regard.
At approximately this same time - the timing is somewhat uncertain - the Pukara polity
came to dominate the northern portion of the Titicaca Basin. All evidence suggests that the
Pukara polity was deeply involved in the regional exchange system, and it is entirely pos-
sible that its leaders attempted to suppress direct exchange relations with areas not under
its control. It may be, then, that the Pukara polity attempted to eliminate the southern trade
route which had been so active during the Middle Formative and to channel all exchange be-
tween the western Titicaca Basin and theyungasthrough a northern route, perhaps passing
through the area of Huancané and Putina, which it controlled (Plourde and Stanish 2001).
Whatever the case, it is clear that trade with the western basin was disrupted in the LF1.
The evidence for this is the near-disappearance of the olivine basalt hoes which had been
so ubiquitous in the MF. The hoes were still being produced in the western basin, but the
southern basin communities no longer had access to them. This suggests some intentional
disruption of exchange relations between the two regions.
Chapter 11 291
In the early LF1, then, the Taraco Peninsula communities suddenly found themselves
with reduced access to a probably greatly reduced volume of exchange. A political crisis
seems to have ensued. In fact, this disruption of the political economy seems to have
occasioned much more significant social upheaval than did the earlier disruption of the
subsistence economy resulting from the drying of the lake. First of all, a true three-tiered
settlement hierarchy emerged on the Taraco Peninsula for the first time in the early LF1.
This was a result of the fact that Kala Uyuni (T-232/T-225), one of the four principal MF
villages, more than doubled in size, to a population index value of 901.4 At the same time
the other MF centers actually shrank slightly. I interpret this as indicating that the entire
Taraco Peninsula was unified into a single polity encompassing perhaps 100 km2 with
an overall population index value of around 5000. I have tentatively located the eastern
boundary of this polity between the sites of Chiripa (T-1) and Chiripa Pata (T-4) on the
northern side of the peninsula.5 This was the first true multi-community polity in the area.
If I am to interpret the rapid LF1 growth rate of Kala Uyuni in the same manner as I did
that of the large MF villages, I must understand it as resulting from a sustained residential
bias toward residence in Kala Uyuni. In the MF case, I suggested that biases in residential
choice resulted from an expansion of public ceremonialism in certain of the Taraco Penin-
sula villages. This expansion was underwritten by the increasing access of the leaders of
these communities to exotic trade goods as a result of their newly-found privileged posi-
tion on theyungastrade route. I have argued that access to theyungastrade decreased in
the LF1. How then did the leaders of Kala Uyuni underwrite the expansion of their own
ceremonial sponsorship and increase the number of their dependants? I would suggest that
they did so by extracting tribute from neighboring communities. That is, the acquisition of
exotic wealth items from trading partners was replaced, in the LF1, by the appropriation
of staple items from neighboring communities. Obviously, not all communities in a region
could succeed in such an enterprise. On the Taraco Peninsula, Kala Uyuni seems to have
won out. The establishment of some kind of regular tribute flow between communities
would have simultaneously increased the scale of ceremonialism sponsored by the Kala
4From a MF population index value of 361.5The boundary is located at approximately 519500E.
Chapter 11 292
Uyuni leadership, and reduced that of their tributary communities. It was this, then, that
would have produced, over time, 1) a systematic bias toward residence in Kala Uyuni, re-
sulting in 2) a higher population growth rate for Kala Uyuni than for tributary communities,
which lead to the formation of 3) a three-tier site size hierarchy.
This political development was accompanied by a wholesale transformation of the en-
tire ceremonial complex. The characteristic Chiripa decorated ceramics, in continuous use
for over 500 years, were abruptly abandoned, replaced by the Kalasasaya complex. The
latter includes significant imitation of the northern basin Pukara style. Given my sugges-
tion that the Taraco Peninsula Polity’s political economy was critically dependent on tribute
extracted by Kala Uyuni from neighboring communities, it is probably no coincidence that
martial themes, especially trophy head imagery and the figure of the “decapitator,” come to
be prominent in LF1 iconography (cf.Chávez 1992). At the same time, the sunken court
complex was reinvented, incorporating for the first time the large upright pillars that come
to be characteristic of later Tiwanaku architecture. The association of stone tenon heads
with sunken courts is also characteristic of this phase (again, possibly a martial theme).
The overall impression is of a complete reinvention of ceremonial practices and political
strategies. I propose that this was ultimately in response to the political crisis resulting from
the interruption of the Taraco Peninsula communities’ access to the trade route between the
western basin and theyungas.
The trade route to theyungasseems to have remained a settlement determinant, how-
ever reduced its volume may have been. At the same time that the lake level rose and the
trade route shifted, the site of Tiwanaku - which is located in what would have been the
new caravan route - began to grow rapidly. Prior to the LF1, the Middle Tiwanaku Valley
had been only lightly populated. However, by the end of the LF1 the site of Tiwanaku had
a population index value of somewhere around 1000. That is, it was as large as the center
of the Taraco Peninsula polity. This very rapid rate of growth would suggest that there was
some movement of population out of the Taraco Peninsula - where growth was a somewhat
slow 0.08% annually - and into the site of Tiwanaku. In the course of the LF1, Tiwanaku
almost certainly became the center of a multi-community polity of its own, probably com-
Chapter 11 293
peting with the Taraco Peninsula polity. The abandonment of the Lower Tiwanaku Valley in
the LF1 probably indicates the formation of an unpopulated buffer zone between these two
polities. Thus, while the Taraco Peninsula remained the demographic core of the southern
Titicaca Basin in the LF1, a movement of peoples inland had begun which was to continue
for more than 1000 years.
Late in the LF1, around 100 A.D., lake levels dropped again, and Lago Wiñaymarka
once more dried up. We have yet to identify a corresponding change in ceramic style, so
we are unable to say what the exact demographic, political and economic effects of this
drop were. We may imagine that the Taraco Peninsula polity once again came to enjoy
privileged access to theyungastrade, and that the flow of population to Tiwanaku was
stemmed, at least for a while. One effect may have been the relocation of the center of
the Taraco Peninsula polity. Though this is not certain, is seems as if Kala Uyuni was
abandoned sometime in the LF1 and its population relocated to a group of three sites on
the tip of the peninsula, near the modern town of Santa Rosa. These three sites are Sonaji
(T-271), Kumi Kipa (T-272), and Kollin Pata (T-322); I refer to them collectively as the
Santa Rosa group. By the end of the LF1 these three sites had a combined population index
value of 1217, probably larger than Tiwanaku, certainly larger than the old center of Kala
Uyuni. Thus, it may be that the 100 A.D. lake level drop made possible a brief rise in the
fortunes of the Taraco Peninsula polity and of its new center at the Santa Rosa group. The
flow of population to Tiwanaku may have slowed or even reversed during this 200 year
period. The respite was to be short-lived.
11.4 Tiwanaku dominance, state formation
Around 300 A.D., the beginning of the LF2, the lake rose again to modern levels or even
somewhat higher. Lake level was to remain high for the next 800 years. This lake level
rise coincided approximately with the collapse of the Pukara polity in the northern Titicaca
Basin. Thus, two things happened at approximately the same time: 1) theyungastrade
route shifted so that it once more passed through Desaguadero and the Tiwanaku Valley,
Chapter 11 294
and 2) any suppression of trade between the southern and western regions of the Titicaca
Basin on the part of the Pukara polity abruptly ceased.
These lake level shifts and the collapse of Pukara may or may not have been related, but
their combined effect seems to have been dramatic. Together, they would have produced
a situation in which the site of Tiwanaku controlled the route of an expanded southern
exchange system. If we continue in the explanatory vein established in the preceding sec-
tions, we could suppose that this strategic position with regard to an expanded volume of
traded goods gave the leaders of Tiwanaku a distinct advantage over those of neighboring
polities. That is to say, they became capable of collecting and - to say the same thing - re-
distributing a much greater quantity of both exotic and staple products than their neighbors.
The expanded volume of both staple and exotic goods under their control also would have
permitted the leadership of Tiwanaku to greatly expand the scale of the public ceremoni-
alism they sponsored. As a result, Tiwanaku began to attract immigration from adjacent
areas. This process is almost certainly responsible at least in part for its greatly increased
rate of population growth in the LF2. Tiwanaku grew by as much as 1% annually during
this period, an order of magnitude faster than what we have established as a normal rate of
increase.6
At the same time, the population of the Taraco Peninsula actually declined, the first time
this had happened in the Formative period. Other nearby areas such as the Katari Basin
and the Khonko Wankane area may have experienced depopulation as well. However, the
high population density of the Taraco Peninsula in the LF1 meant that it was the largest
population donor, probably accounting for almost 50% of Tiwanaku’s LF2 expansion.
During the LF2, Tiwanaku grew to cover about 1 km2, probably with a population of
more than five thousand. Thus, by the end of the Formative period - ca. 500 A.D. - it was
by far the largest site in the Titicaca Basin, and had probably become capable of dominat-
ing neighboring populations politically, economically and militarily. The most interesting
6It is interesting to note that the Santiago de Huatta Peninsula was beyond the radius of this LF2 demo-graphic effect (Lémuz Aguirre 2001: 202), population there increasing by more than 100% during this phase.So, apparently, was the Juli-Pomata area (Stanish et al.), though the LF chronology employed there makesno clear distinction between LF1 and LF2.
Chapter 11 295
fact about its early growth, however, is that it probably took place without resort to co-
ercion. When the large-scale population movement into Tiwanaku began, the Tiwanaku
Polity probably had a total population well below half that of the Taraco Peninsula Polity,
and was probably not its military equal. That is, Tiwanaku regional dominance was an
effectrather than acauseof the population movement we have been discussing.
I have just attempted to explain the remarkable LF2 growth of Tiwanaku as a result of
two significant changes in the Titicaca Basin environment: 1) a rise in lake level which
shifted the route of the southernyungastrade through Tiwanaku and away from the Taraco
Peninsula, and 2) an expansion in the activity of this southerly route due to the collapse of
the Pukara Polity which hypothetically suppressed external trade in its period of primacy
(see my discussion of this possibility in Chapter7). Can this really explain the unprece-
dented growth of Tiwanaku? The answer is not clear. After all, the trade route had shifted
before on a number of occasions, but never with an effect this dramatic. It is certainly
possible that the greater Late Formative population density in the southern basin, the west-
ern basin, and presumably in theyungasas well propelled the volume of exchange passing
through the southern route beyond some as-yet untheorized critical threshold. However, we
should also consider that some new process might have been at work, in combination with
those we have just described. I would like to propose that this new process was the incor-
poration of raised field agriculture into the political economies of Titicaca Basin polities,
and of the Tiwanaku Polity specifically.
There are various interpretations as to the manner in which raised field agriculture
was integrated into the Tiwanaku political economy. The majority view is that of Alan
Kolata, Clark Erickson, and their colleagues, which I have termed thehyperproduc-
tivity hypothesis(Erickson 1985, Erickson and Candler 1989, Kolata 1986, Kolata 1991,
Kolata and Ortloff 1989). These scholars hold that certain properties of raised fields in
the Titicaca Basin environment make possible very high yields and short - even zero -
fallow periods relative to the dryland techniques employed in the area both ethnohistori-
cally and historically. The most important of these properties are thought to be the use
of canal sediments as fertilizer, preventing soil nutrient depletion, and thermal effects
Chapter 11 296
of the water in the canals, which provides some protection against frost. My own view
(Bandy 1999c, Bandy 2000) is what I call thestaggered production cycle hypothesis. As I
conceive it, the importance of raised field agriculture was not its supposed hyperproductiv-
ity but rather the fact that splash irrigation using the water in the canals, perhaps combined
with their frost-ameliorating thermal properties, made it possible to cultivate raised fields
on an annual agricultural cycle which was offset by as much as two months from the normal
dryland agricultural cycle.
This theory is derived from the work of Jürgen Golte, which I regard as absolutely fun-
damental for understanding ancient Andean political economies (Golte 1980). In his slim
volume, Golte observes that in areas where the growing season is tightly circumscribed, as
in the Andean highlands, a labor scheduling problem arises. In such areas, planting and
harvest must take place at certain well-defined points in the annual cycle. There is very
little room for variation, since to plant too early would mean that the crops would fail for
want of rain, and to plant too late would not allow sufficient time for crops to mature be-
fore the onset of killing frosts. Since the most concentrated and intensive labor demands
of agricultural production occur at the time of the harvest, a productive unit - a household,
for example - may not plant more land than it is capable of harvesting within a short time
period; a month, say. In such situations groups often develop mechanisms for spreading
their subsistence labor more evenly throughout the year. The cultivation of winter wheat
is an example of such a strategy from temperate Europe. Golte calls these ‘estrategías
policíclicas’ - polycyclic strategies.
The most fundamental and ancient example of this sort of strategy in the Andes is
tuber agropastoralism itself. In this system, the timing of labor investment in the herds
is offset from the crunch periods of the agricultural cycle. In this way labor that cannot
be invested in agriculture is invested in herding, and vice versa. This results in a more
complete and efficient use of labor throughout the year than would be possible in either a
purely agricultural economy or in a purely pastoral one.
Another class of related examples are the agricultural systems of the highland valleys,
with which Golte is primarily concerned. In these environments, producers practice a form
Chapter 11 297
of microverticality, exploiting the agricultural properties of land at varying elevations. In
these different elevations, different crops may be planted, with differing growing seasons
and labor requirements. In this way a whole series of staggered agricultural cycles are
exploited, together with pastoralism in the puna grasslands, to spread productive labor
more evenly throughout the year. This is a technique for maximizing labor efficiency on
the household level.
In this connection, it is interesting to note that Golte singles out the Titicaca Basin
as an area in which the possibilities for polycyclic labor maximization are very limited.
This is because the circumlacustrine plain lacks the dramatic vertical relief of the valleys
and is therefore unsuitable to microverticality-oriented agricultural strategies. Herding and
fishing and more recently wage labor can make up for this to some extent. But, Golte points
out, opportunities for maximizing the use of agricultural labor throughout the year remain
extremely limited in the Titicaca Basin.
I would like to propose, however, that raised field agriculture represents exactly such a
strategy for the staggering of agricultural cycles and the maximization of labor efficiency,
and one specific to the Titicaca Basin. The key to this strategy would have been the water
in the canals, which, as Erickson has noted, would permit splash irrigation of the fields
(Erickson and Candler 1989) . This could have allowed planting to take place after the
danger of frosts had passed, but still well before the onset of the rainy season. This practice
has been observed by Erickson, and he concludes that splash irrigation of planting surfaces
with water from the canals can be accomplished with very little effort. Indeed, in one
drought year in Huatta, Peru, his raised fields produced good yields while surrounding
dryland fields failed completely, due solely to the fact that the raised fields were splash
irrigated as necessary (Erickson and Candler 1989).
The addition of such a new, offset agricultural cycle would have made it possible for
leaders or rulers to exact agricultural labor from the population at large while minimizing
the interference of this exaction with normal subsistence activities, and at the same time
to put into action a vast labor potential that could not otherwise have been applied to agri-
cultural production. This would have simultaneously 1) reduced conflicts between elite -
Chapter 11 298
and eventually state - labor demands and the subsistence interests of the populace and 2)
permitted a significantly higher rate of annual agricultural labor extraction and therefore of
annual surplus production.
Whatever the exact role raised field agriculture may have played in the Tiwanaku po-
litical economy, its centrality is generally accepted. The introduction of raised field agri-
culture would in any event have greatly increased the quantity of staple goods redistributed
by leaders or rulers, and would thereby have permitted a tremendous expansion of existing
systems of competitive ceremonialism. Such an expansion is exactly the kind of process
which could stimulate immigration and population movement, as I have argued in reference
to earlier time periods. Therefore, it is entirely possible that the LF2 growth of Tiwanaku
was due not only to its increased importance in the southern Titicaca Basin exchange sys-
tem, but also - and perhaps more importantly - to the integration of raised field agriculture
into its political economy.
I propose that perhaps the crucial factor in Tiwanaku’s early success was not its advan-
tageous positionviz a vizthe yungastrade, nor, at least initially, was it the influence of
its religious cult. Rather, the critical factor distinguishing Tiwanaku from other contem-
poraneous and competing centers was its proximity to the high density populations of the
Taraco Peninsula. After the 300 A.D. lake level rise, the Taraco Peninsula communities
found themselves in a landscape in which large-scale raised field agriculture was impos-
sible. They were circumscribed by the saline waters of Lake Titicaca, and no appropriate
marshy, freshwater landscapes were present within their borders. It is possible that dur-
ing the second half of the LF1 raised field agriculture was practiced to some extent on
the vast pampas that surrounded the Taraco Hills.7 If such activity did exist, however, it
was brought to an end by the 300 A.D. lake level rise. From the beginning of the LF2 the
Taraco Peninsula Polity was unable to participate in what seems to have been a general
basin-wide increase in the importance of raised field agriculture during the Late Formative
(seeStanish 1994, Stanish 1999). Its leaders were therefore at a competitive disadvantage
relative to those of the Tiwanaku Polity.
7There are rumors of inundated raised field groups in the vicinity of the Taraco Peninsula. I have beenunable to confirm these, however.
Chapter 11 299
Thus, as the importance of raised field agriculture in the Tiwanaku political economy
increased, and as the associated social technologies of labor organization and surplus ex-
traction were elaborated and improved, the inhabitants of Taraco Peninsula communities
began to exhibit a marked preference for relocation to Tiwanaku (Bandy 2000). This, then,
is a fact which distinguishes Tiwanaku from other Late Formative polities in the Titicaca
Basin. The developing political economy of Tiwanaku had a unique resource: an adjacent
area, densely populated whose inhabitants were unable to compete with the emerging Ti-
wanaku Polity on its own terms. That is, they could not build raised fields on their own
land, and could therefore be incorporated into the expanding Tiwanaku political economy
on a subordinate basis. No such geographical configuration existed in Juli-Pomata, and
perhaps nowhere else in the Titicaca Basin.
The incorporation of the Taraco Peninsula populations into the Tiwanaku political econ-
omy seems to have taken place in two distinct stages. The earlier stage, which took
place during the LF2 (300-500 A.D.), was characterized by population movement from
the Taraco Peninsula into the expanding proto-urban center of Tiwanaku. During this pe-
riod, the power and importance of Tiwanaku gradually waxed, while that of the Taraco
Peninsula Polity waned. However, it does not seem as if the Taraco Peninsula fell under
the direct political control of Tiwanaku until late in the LF2.
The later stage began with the political subjugation of the Taraco Peninsula Polity to
the Tiwanaku Polity. In this stage the depopulation of the Taraco Peninsula communities
ceased, and growth rates returned to normal or near-normal. However, we may assume
that the large population of the Taraco Peninsula was still an important source of labor for
the cultivation of the vast raised field complexes in the Tiwanaku Valley and the Pampa
Koani, and ongoing monumental construction in the civic-ceremonial core of Tiwanaku.
The Taraco Peninsula was at this point organized into a heartland province of the Tiwanaku
state. By this time Tiwanaku had emerged as the dominant power in the Titicaca Basin and
indeed in the entire South-Central Andes .
In this thesis I have identified several potential factors which contributed to Tiwanaku’s
emergence and eventual dominant position in South-Central Andean prehistory. In the
Chapter 11 300
final analysis, though, the principal factor which distinguished Tiwanaku from other Late
Formative Titicaca Basin centers may not have been an attribute of Tiwanaku itself; it may
simply have been that Tiwanaku was located adjacent to the Taraco Peninsula.
Thus, chance, physical geography and thelongue dureé, human agency and especially
residential decisions, and human genius and invention can all be seen to have played a role
in Tiwanaku state formation. Tiwanaku state formation is here argued to have resulted from
the rapid urbanization of the site of Tiwanaku during the LF2. This urbanization itself - in
my view - resulted principally from the dramatic success, quite possibly unanticipated, of
a political-economic strategy: the strategy of staggered production cycles.
11.5 Collapse, demographic decline, conquest
There are indications that the Tiwanaku state began to break down some time prior
to its actual collapse (Janusek 1994). However, around 1100 A.D. a dramatic lake level
drop took place (Abbott et al. 1997a: 179, Binford et al. 1997, Kolata and Ortloff 1996a,
Ortloff and Kolata 1992). This drop may or may not reflect severe drought conditions at
that time. Whatever the case, the local inhabitants reacted as they had reacted to such events
before. They reoriented their subsistence economy to emphasize camelid pastoralism in or-
der to make up for the disappearance of lacustrine resources and probably for worsening
agricultural conditions as well. It is also possible that individual households came to incor-
porate raised field agriculture into their subsistence strategies (Graffam 1990).
The latter possibility is especially intriguing when it is considered in light of my pro-
posal that the Tiwanaku political economy was fundamentally premised on a strategy of
staggered production cycles, in which state labor took place at a different point in the agri-
cultural cycle than did household subsistence labor. Household involvement in raised field
agriculture would have introduced scheduling conflicts between household subsistence ac-
tivity and state tribute demands. This would have undermined what I have suggested was
the fundamental political-economic strategy of Tiwanaku statecraft. This process could
quite plausibly have caused the collapse of the state itself.
Chapter 11 301
Tiwanaku state collapse, for a number of possible reasons (see Chapter9), involved
some very fundamental transformations of Titicaca Basin settlement systems. The village
system that originated in the Early Formative and persisted for more than two thousand
years was abandoned. Nucleated habitation and stable village life was replaced by dis-
persed residence in extended family farmsteads. These farmsteads were occupied for per-
haps one or two generations and were then abandoned. This manner of life has persisted to
the present day in Titicaca Basin communities.
Political life was similarly reinvented. Camelids and their secondary products seem to
have become the primary source of wealth, and so the political center of gravity shifted to
areas suitable for the raising of very large herds. Thus, the principal settlements and chiefly
centers in the Late Intermediate Period seem to have been located in higher elevation areas
of the basin, in contrast to the lakeshore demographic focus of the Formative and Tiwanaku
Periods (see Frye’s Appendix 2 inStanish et al. 1997; Kirk Frye personal communication),
with significant centers established at Tanka Tanka, Cutimbo, and other sites. In addition,
political entities seem to have become more fragmented and unstable. A state of more or
less constant warfare seems to have prevailed, as indicated by the building of fortifications -
pukaras- throughout the Titicaca Basin (cf.Hyslop 1976, Stanish et al. 1997). The Taraco
Peninsula was not suited for large-scale camelid herding, and no fortifiable prominences
exist. It was therefore a very marginal location in the LIP, and it is to this marginal status
that we may attribute the dramatic decline in population on the peninsula in this phase.
Sometime probably in the 15th century the Titicaca Basin was invaded by a new north-
ern power, the Inka empire. The divided and feuding Aymaraseñorioswere played off
against one another by the Inka generals. After a short campaign, the Aymara kingdoms
were violently subjugated to Inka rule. Thus began a long period of central Andean hege-
mony in the Titicaca Basin. Its populations were ruled first from Cuzco and later from
Lima. Sources of power, authority, prestige, and legitimacy were located far from the old
center of Tiwanaku. Quechua and Spanish began to replace Aymara throughout the south-
central Andean region. The long history of autonomous social and political evolution in
the Titicaca Basin had come to an end, and its people had become enmeshed in continental

Chapter 11 302
and later global relations of domination and dependence.
303
Bibliography
Abbott, M., Binford, M., Brenner, M., and Kelts, K. 1997a. A 3500 14C yr High-
Resolution Record of Water-Level Changes in Lake Titicaca, Bolivia-Peru.Quaternary
Research, 47:169–180.
Abbott, M., Seltzer, G., Kelts, K., and Southon, J. 1997b. Holocene Paleohydrology of
the Tropical Andes from Lake Records.Quaternary Research, 47:70–80.
Adams, R. 1965.Land Behind Baghdad: A History of Settlement on the Diyala Plain.
University of Chicago Press, Chicago.
Albarracín-Jordan, J. 1992.Prehispanic and Early Colonial Settlement Patterns in the
Lower Tiwanaku Valley, Bolivia. Unpublished ph.d. dissertation, Southern Methodist
University.
Albarracín-Jordan, J. 1996a.Tiwanaku: Arqueología Regional y Dinámica Segmentaria.
Editores Plural, La Paz.
Albarracín-Jordan, J. 1996b. Tiwanaku Settlement System: The Integration of Nested
Hierarchies in the Lower Tiwanaku Valley.Latin American Antiquity, 7(3):183–210.
Albarracín-Jordan, J. 1999.The Archaeology of Tiwanaku. Impresión P.A.P., La Paz.
Albarracín-Jordan, J., Lemúz, C., and Paz, J. 1993. Investigaciones en Kallamarca: Primer
Informe de Prospección.Textos Antropológicos, 6:11–123.
Bibliography 304
Albarracín-Jordan, J. and Mathews, J. 1990.Asentamientos Prehispánicos del Valle de
Tiwanaku, Vol. 1. Producciones CIMA, La Paz.
Alconini Mujica, S. 1995.Rito, Símbolo e Historia en la Pirámide de Akapana, Tiwanaku:
Un Análisis de Cerámica Ceremonial Prehispánica. Editorial Acción, La Paz.
Anderson, D. 1994. The Savannah River Chiefdoms. University of Alabama Press,
Tuscaloosa.
Argollo, J., Ticcla, L., Kolata, A., and Rivera, O. 1996. Geology, Geomorphology, and
Soils of the Tiwanaku and Catari River Basins. In Kolata, A., editor,Tiwanaku and
Its Hinterland: Archaeology and Paleoecology of an Andean Civilization, pages 57–88.
Smithsonian Institution Press, Washington, D.C.
Arnold, D. 1988.Matrilineal Practice in a Patrilineal Setting: Rituals and Metaphors of
Kinship in an Andean Ayllu. Unpublished ph.d. dissertation, Department of Anthropology,
University of London, London.
Ashmore, W. and Wilk, R. 1988. House and Household in the Mesoamerican Past. In
Wilk, R. and Ashmore, W., editors,Household and Community in the Mesoamerican
Past, pages 1–28. University of New Mexico Press, Albuquerque.
Atkinson, J. 1989.The Art and Politics of Wana Shamanship. University of California
Press, Berkeley.
Bandelier, A. 1910.The Islands of Titicaca and Koati. The Hispanic Society of America,
New York.
Bandy, M. 1995. The Early Ceramic Periods of Moquegua: A Reappraisal. Paper pre-
sented at the 60th annual meeting of the Society for American Archaeology, Minneapo-
lis,MN.
Bandy, M. 1997. Systematic Surface Collection. In Hastorf, C., S., B., Blom, D., Dean,
E., Goodman, M., Kojan, D., Montaño Aragon, M., Paz, J., Steadman, D., Steadman, L.,
Bibliography 305
and Whitehead, W., editors,Taraco Archaeological Project: 1996 Excavations at Chiripa,
Bolivia, pages 15–18. Report submitted to the Instituto Nacional de Arqueologia, Bolivia.
Bandy, M. 1998. Excavations on the Chiripa Mound. Paper presented at the 63rd annual
meeting of the Society for American Archaeology, Seattle, WA.
Bandy, M. 1999a. History of Investigations at the Site of Chiripa. In Hastorf, C., editor,
Early Settlement at Chiripa Bolivia, number 57 in Contributions of the University Of Cal-
ifornia Archaeological Research Facility, pages 9–16. Archaeological Research Facility,
Berkeley.
Bandy, M. 1999b. The Montículo Excavations. In Hastorf, C., editor,Early Settlement at
Chiripa Bolivia, number 57 in Contributions of the University Of California Archaeolog-
ical Research Facility, pages 43–50. Archaeological Research Facility, Berkeley.
Bandy, M. 1999c. Productivity and Labor Scheduling Aspects of Titicaca Basin Raised
Field Agriculture. Paper presented at the 64th annual meeting of the Society for American
Archaeology, Chicago, IL.
Bandy, M. 1999d. Systematic Surface Collection. In Hastorf, C., editor,Early Settlement
at Chiripa Bolivia, number 57 in Contributions of the University Of California Archaeo-
logical Research Facility, pages 23–28. Archaeological Research Facility, Berkeley.
Bandy, M. 2000. The Social Embededness of Southern Titicaca Basin Raised Field Agri-
culture. Paper presented at the 65th annual meeting of the Society for American Archae-
ology, Philadelphia,. PA.
Bandy, M. 2001. Environmental and Political Change in the Formative Period Titicaca
Basin. Paper presented at the 66th annual meeting of the Society for American Archaeol-
ogy, New Orleans, LA.
Bandy, M., Cohen, A., Goldstein, P., Cardona Rosas, A., and Oquiche Hernani, A. 1996.
The Tiwanaku Occupation of Chen Chen (M-1): Preliminary Report on the 1995 Salvage
Bibliography 306
Excavations. Paper presented at the 61st annual meeting of the Society for American
Archaeology, New Orleans, LA.
Bandy, M., Hastorf, C., Steadman, L., Whitehead, W., Dean, E., Kojan, D., and Paz, J.-L.
1998. Chiripa: Settlement, History and Ritual in the Titicaca Basin Formative. Paper
presented at the 38th meeting of the Institute for Andean Studies, Berkeley, CA.
Bauer, B. and Stanish, C. 2001.Ritual and Pilgrimage in the Ancient Andes. University
of Texas Press, Austin.
Bennett, W. 1933. Archaeological Hikes in the Andes.Natural History, 33(2):163–174.
Bennett, W. 1934.Excavations at Tiahuanaco. Number 34 in Anthropological Papers of
the American Museum of Natural History. American Museum of Natural History, New
York.
Bennett, W. 1936.Excavations in Bolivia. Number 35 in Anthropological Papers of the
American Museum of Natural History. American Museum of Natural History, New York.
Bennett, W. 1948. A Revised Sequence for the South Titicaca Basin.American Antiquity,
13(4):90–92.
Bermann, M. 1990. Prehispanic Household and Empire at Lukurmata, Bolivia. Un-
published ph.d. dissertation, Department of Anthropology, University of Michigan, Ann
Arbor.
Bermann, M. 1993. Continuity and Change in Household Life at Lukurmata. In Alden-
derfer, M., editor,Domestic Architecture, Ethnicity and Complementarity in the South-
Central Andes, pages 114–135. University of Iowa Press, Iowa City.
Bermann, M. 1994.Lukurmata: Household Archaeology in Prehispanic Bolivia. Prince-
ton, Princeton University Press.
Bermann, M. and Castillo, J. 1993. Jachakala: A New Archaeological Complex of the
Department of Oruro, Bolivia.Annals of the Carnegie Museum, 62(4):311–340.
Bibliography 307
Bermann, M., Goldstein, P., Stanish, C., and Watanabe, L. 1989. The Collapse of the
Tiwanaku State: A View from the Osmore Drainage. In Rice, D., Stanish, C., and Scarr,
P., editors,Ecology, Settlement and History in the Osmore Drainage, Peru, volume 545(ii)
of BAR International Series, pages 269–286. BAR, Oxford.
Bermann, M. and Graffam, G. 1989. Arquitectura residencial en las terrazas de lukurmata.
In Kolata, A., editor,Arqueología de Lukurmata, volume 2, pages 153–172. Producciones
Puma Punku, La Paz.
Binford, M. and Kolata, A. 1996. The Natural and Human Setting. In Kolata, A., editor,
Tiwanaku and Its Hinterland: Archaeology and Paleoecology of an Andean Civilization,
pages 23–56. Smithsonian Institution Press, Washington, D.C.
Binford, M., Kolata, A., Brenner, M., Janusek, J., Seddon, M., Abbott, M., and Curtis,
J. 1997. Climate Variation and the Rise and Fall of an Andean Civilization.Quaternary
Research, 47:235–248.
Boserup, E. 1965.The Conditions of Agricultural Growth: The Economics of Agrarian
Change Under Population Pressure. Aldine Atherton, Chicago.
Bourdieu, P. 1990.The Logic of Practice. Stanford University Press, Stanford.
Bouysee-Cassagne, T. 1987.La Identidad Aymara: Aproximación Histórica (Siglo XV,
Siglo XVI). Hisbol, La Paz.
Bouysse-Cassagne, T. 1988.Lluvias y Cenizas: Dos Pachakuti en la Historia. Hisbol, La
Paz, Bolivia.
Brooks, S., Glascock, M., and Giesso, M. 1997. Source of Volcanic Glass for Ancient
Tools. Nature, 386:449–450.
Browman, D. 1978a. The Temple of Chiripa (Lake Titicaca, Bolivia). In Matos Mendieta,
R., editor,El Hombre y La Cultura Andina, III Congreso Peruano, pages 807–813. Editora
Lasontay, Lima.
Bibliography 308
Browman, D. 1978b. Toward the Development of the Tiahuanaco (Tiwanaku) State. In
Browman, D., editor,Advances in Andean Archaeology, pages 327–349. Mouton, The
Hague.
Browman, D. 1980. Tiwanaku Expansion and Altiplano Economic Patterns.Estudios
Arqueológicos, 5:107–120.
Browman, D. 1981. New Light on Andean Tiwanaku.American Scientist, 69(4):408–419.
Browman, D. 1984. Tiwanaku: Development of Interzonal Trade and Economic Expan-
sion in the Altiplano. In Browman, D., Burger, R., and Rivera, M., editors,Social and
Economic Organization in the Prehispanic Andes, BAR International Series 194, pages
117–142. British Archaeological Reports, Oxford.
Browman, D. 1985. Cultural Primacy of Tiwanaku in the Development of Later Peruvian
States.Diálogo Andino, 4:59–71.
Burger, R., Asaro, F., Stross, F., and Salas, G. 1998. The Chivay Obsidian Source and the
Geological Origin of Titicaca Basin Type Obsidian Artifacts.Andean Past, 5:203–224.
Burger, R., Chavez, K., and Chavez, S. 2000. Through the Glass Darkly: Prehispanic
Obsidian Procurement and Exchange in Southern Peru and Northern Bolivia.Journal of
World Prehistory, 14(3):267–362.
Burkholder, J. 1997.Tiwanaku and the Anatomy of Time: A New Ceramic Chronology
from the Iwawe Site, Department of La Paz, Bolivia. Unpublished ph.d. thesis, Department
of Anthropology, Binghampton University, State University of New York.
Carneiro, R. 1970. A Theory of the Origin of the State.Science, 169:733–738.
Carneiro, R. 1973. Structure, Function, and Equilibrium in the Evolutionism of Herbert
Spencer.Journal of Anthropological Research, 29:77–95.
Bibliography 309
Carneiro, R. 1978. Political Expansion as an Expression of the Principle of Competitive
Exclusion. In Cohen, R. and Service, E., editors,Origins of the State: The Anthropology of
Political Evolution, pages 205–224. Institute for the Study of Human Issues, Philadelphia.
Carneiro, R. 1981. The Chiefdom: Precursor of the State. In Jones, G. and Kautz, R., ed-
itors,The Transition to Statehood in the New World, pages 37–79. Cambridge University
Press, Cambridge.
Carneiro, R. 1988. The Circumscription Theory: Challenge and Response.American
Behavioral Scientist, 31(4):497–511.
Carneiro, R. and Hilse, D. 1966. On Determining the Probable Rate of Population Growth
During the Neolithic.American Anthropologist, 68(1):179–181.
Chávez, K. 1985. Early Tiahuanaco-Ralated Ceremonial Burners from Cuzco, Peru.Diál-
ogo Andino, 4:137–178. Arica.
Chávez, K. 1988. The Significance of Chiripa in Lake Titicaca Basin Developments.
Expedition, 30(3):17–26.
Chávez, S. 1992.The Conventionalized Rules in Pucara Pottery Technology and Iconog-
raphy: Implications for Socio-Political Development in the Northern Lake Titicaca Basin.
Unpublished ph.d. dissertation, Department of Anthropology, Michigan State University.
Chávez, S. and Chávez, K. 1970. Newly Discovered Monoliths From the Highlands of
Puno, Peru.Expedition, 12(4):25–39.
Chávez, S. and Mohr Chávez, K. 1975. A Carved Stela from Taraco, Puno, Peru, and the
Definition of an Early Style of Stone Sculpture from the Altiplano of Peru and Bolivia.
Ñawpa Pacha, 13:45–83.
Choque Canqui, R. 1993.Sociedad y Economía Colonial en el Sur Andino. Hisbol, La
Paz.
Bibliography 310
Cohen, A. 2001. Results of a Settlement Pattern Survey in the Pucara Valley, Northern
Lake Titicaca Basin, Peru. Paper presented at the 66th annual meeting of the Society for
American Archaeology, New Orleans, LA.
Cohen, A., Bandy, M., and Goldstein, P. 1995. How Archaic is that Archipelago? The
Huaracane Tradition and the Antiquity of Vertical Control in the South Andes. Paper
presented at the 35th annual meeting of the Institute for Andean Studies, Berkeley, CA.
Conklin, W. 1983. Pucara and Tiahuanaco Tapestry: Time and Style in a Sierra Weaving
Tradition. Ñawpa Pacha, 21:1–44.
Conklin, W. 1991. Tiahuanaco and Huari: Architectural Comparisons and Interpreta-
tions. In Isbell, W. and McEwan, G., editors,Huari Administrative Structure: Prehis-
toric Monumental Architecture and State Government, pages 281–292. Dumbarton Oaks,
Washington D.C.
Conklin, W. and Moseley, M. 1988. The Patterns of Art and Power in the Early Inter-
mediate Period. In Keatinge, R., editor,Peruvian Prehistory, pages 145–163. Cambridge
University Press, Cambridge.
Costin, C. and Earle, T. 1989. Status Distinction and Legitimation of Power as Reflected
in Changing Patterns of Consumption in Late Prehispanic Peru.American Antiquity,
54(4):691–714.
Costin, C. and Hagstrum, M. 1995. Standardization, Labor Investment, Skill, and the Or-
ganization of Ceramic Production in Late Prehistoric Highland Peru.American Antiquity,
60(4):619–39.
Cowgill, G. 1972. Models, Methods and Techniques for Seriation. In Clarke, D., editor,
Models in Archaeology, pages 381–424. Methuen, London.
Cowgill, G. 1975. Population Presure as Non-Explanation.American Antiquity,
40(2):127–131.
Bibliography 311
D’Altroy, T. 1993. Provincial Power in the Inka Empire. Smithsonian Institution Press,
Washington D.C.
D’Altroy, T. and Bishop, R. 1990. The Provincial Organization of Inka Ceramic Produc-
tion. American Antiquity, 55(1):120–138.
D’Altroy, T. and Earle, T. 1985. Staple Finance, Wealth Finance, and Storage in the Inka
Political Economy.Current Anthropology, 26(2):187–206.
Daulsberg H., P. 1960. Contribución al Estudio de la Arqueología del Valle de Azapa.
In Matos Mendieta, R., editor,Antiguo Perú: Espacio y Tiempo, pages 273–296. Mejia
Baca, Lima.
de la Vega M., E. 1990. Estudio Arqueologico de Pucaras o Poblados Amurallados
de Cumbre en Territorio Lupaqa: El caso de Pucara Juli. Master’s thesis, Universidad
Catolica Santa Maria, Arequipa.
Dean, E. and Kojan, D. 1999. Santiago. In Hastorf, C., editor,Early Settlement at Chiripa
Bolivia, number 57 in Contributions of the University Of California Archaeological Re-
search Facility, pages 37–42. Archaeological Research Facility, Berkeley.
DeBoer, W., Kintigh, K., and Rostaker, A. 1996. Ceramic Seriation and Site Reoccupation
in Lowland South America.Latin American Antiquity, 7(3):263–278.
Dietler, M. 1996. Feasts and Commensal Politics in the Political Economy: Food, Power,
and Status in Prehistoric Europe. In Wiessner, P. and Schiefenhövel, W., editors,Food
and the Status Quest: An Interdisciplinary Perspective, pages 87–125. Berghahn Books,
Oxford.
Dietler, M. 1999. Rituals of Commensality and the Politics of State Formation in the
"Princely" Societies of Early Iron Age Europe. In Ruby, P., editor,Les Princes de la
Protohistoire et l’émergence de l’état, number 252 in Collection de l’École Française de
Rome, pages 135–152. Cahiers du Centre Jean Bérard, Naples.
Bibliography 312
Dietler, M. 2001. Theorizing the Feast: Rituals of Consumption, Commensal Politics,
and Power in African Contexts. In Dietler, M. and Hayden, B., editors,Feasts: Archae-
ological and Ethnographic Perspectives on Food, Politics, and Power, pages 65–114.
Smithsonian, Washington, D.C.
Dietler, M. and Herbich, I. 1998. Habitus, Techniques, Style: An Integrated Approach
to the Social Understanding of Material Culture and Boundaries. In Stark, M., editor,
The Archaeology of Social Boundaries, pages 232–263. Smithsonian Institution Press,
Washington, D.C.
Dobres, M.-A. and Robb, J., editors 2000.Agency in Archaeology. Routledge, London.
Drennan, R. 1986. Household Location and Compact Versus Dispersed Settlement in
Prehispanic Mesoamerica. In Wilk, R. and Ashmore, W., editors,House and Household in
the Mesoamerican Past, pages 273–293. University of New Mexico Press, Albuquerque.
Drennan, R. 1987. Regional Demography in Chiefdoms. In Drennan, R. and Uribe, C.,
editors,Chiefdoms in the Americas, pages 307–324. University Press of America.
Drennan, R. 1991. Prehispanic Chiefdom Trajectories in Mesoamerica, Central Amer-
ica, and Northern South America. In Earle, T., editor,Chiefdoms: Power, Economy and
Ideology, pages 263–287. Cambridge University Press, Cambridge.
Dunnell, R. 1971.Systematics in Prehistory. The Free Press, New York.
Dunnell, R. 1996. Evolutionary Theory and Archaeology. In O’Brien, M., editor,Evolu-
tionary Archaeology, pages 30–67. University of Utah Press, Salt Lake.
Earle, T. 1987a. Chiefdoms in Archaeological and Ethnohistorical Perspective.Annual
Review of Anthropology, 16:279–308.
Earle, T. 1987b. Specialization and the Production of Wealth: Hawaiian Chiefdoms and
Inka Power. In Brumfiel, E. and Earle, T., editors,Specialization, Exchange and Complex
Societies, pages 64–75. Cambridge University Press, Cambridge.
Bibliography 313
Earle, T. 1997.How Chiefs Come to Power: The Political Economy in Prehistory. Stan-
ford University Press, Stanford.
Erickson, C. 1975. Taraco Peninsula Site Survey. Unpublished ms.
Erickson, C. 1985. Applications of Prehistoric Andean Technology: Experiments in
Raised Field Agriculture, Huatta, Lake Titicaca, 1981-82. In Farrington, I., editor,Pre-
historic Intensive Agriculture in the Tropics, volume 232 (i) ofBAR International Series,
pages 209–232. BAR, Oxford.
Erickson, C. 1994. Methodological Considerations in the Study of Ancient Andean Field
Systems. In Miller, N. and Gleason, K., editors,The Archaeology of Garden and Field,
pages 111–152. University of Pennsylvania Press, Philadelphia.
Erickson, C. and Candler, K. 1989. Raised Fields and Sustainable Agriculture in the Lake
Titicaca Basin of Peru. In Browder, J., editor,Fragile Lands of Latin America: Strategies
for Sustainable Development, pages 230–248. Westview Press, Boulder.
Escalante Moscoso, J. 1994.Arquitectura Prehispánica en los Andes Bolivianos. Pruduc-
ciones Cima, La Paz.
Feinman, G. and Neitzel, J. 1984. Too Many Types: An Overview of Sedentary Prestate
Societies in the Americas. InAdvances in Archaeological Method and Theory, Vol. 7,
pages 39–102. Academic Press, New York.
Feldman, R. 1989. The Early Ceramic Periods of Moquegua. In Rice, D., Stanish, C., and
Scarr, P., editors,Ecology, Settlement and History in the Osmore Drainage, Peru, volume
545 (i) ofBAR International Series. BAR, Oxford.
Feldman, R. 1990. Ocupaciones del Período Cerámico Temprano en Moquegua.Gaceta
Arqueológica Andina, 18/19:65–74.
Fish, S. and Kowalewski, S. 1990. Introduction. In Fish, S. and Kowalewski, S., editors,
The Archaeology of Regions : A Case for Full-Coverage Survey, pages 1–5. Smithsonian
Institution Press, Washington, D.C.
Bibliography 314
Flanagan, J. 1989. Hierarchy in Simple "Egalitarian" Societies.Annual Review of Anthro-
pology, 18:245–66.
Flannery, K. 1976a. Evolution of Complex Settlement Systems. In Flannery, K., editor,
The Early Mesoamerican Village, pages 162–173. Academic Press, New York.
Flannery, K. 1976b. Linear Stream Patterns and Riverside Settlement Rules. In Flannery,
K., editor,The Early Mesoamerican Village, pages 173–180. Academic Press, New York.
Fletcher, R. 1995.The Limits of Settlement Growth. Cambridge University Press, Cam-
bridge.
Foley, R. 1981. A Model of Regional Archaeological Structure.Proceedings of the
Prehistoric Society, London, 47:1–17.
Fried, M. 1967.The Evolution of Political Society. Random House, New York.
Frye, K. and Steadman, L. 2001. Incatunahuiri: A Case for Early Socio-Political Com-
plexity in the Titicaca Basin. Paper presented at the 66th annual meeting of the Society
for American Archaeology, New Orleans, LA.
Giddens, A. 1984.The Constitution of Society. University of California Press, Berkeley.
Gisbert, T., Arze, S., and Cajiás, M. 1987.Arte Textil y Mundo Andino. Gisbert y Cía, La
Paz.
Goldstein, P. 1985. Tiwanaku Ceramics of the Moquegua Valley. Unpublished m.a. thesis,
Department of Anthropology, University of Chicago, Chicago.
Goldstein, P. 1989a.Omo: A Tiwanaku Provincial Center in Moquegua, Peru. Unpub-
lished ph.d. dissertation, Department of Anthropology, University of Chicago, Chicago.
Goldstein, P. 1989b. The Tiwanaku Occupation of Moquegua. In Rice, D., Stanish, C.,
and Scarr, P., editors,Ecology, Settlement and History in the Osmore Drainage, Peru,
volume 545(i) ofBAR International Series, pages 219–255. BAR, Oxford.
Bibliography 315
Goldstein, P. 1993a. House, Community, and State in the Earliest Tiwanaku Colony.
In Aldenderfer, M., editor,Domestic Architecture, Ethnicity and Complementarity in the
South-Central Andes, pages 25–41. University of Iowa Press, Iowa City.
Goldstein, P. 1993b. Tiwanaku Temples and State Expansion: a Tiwanaku Sunken-Court
Temple in Moquegua, Peru.Latin American Antiquity, 4(1):22–47.
Goldstein, P. 2000. Exotic Goods and Everyday Chiefs: Long-Distance Exchange and
Indigenous Sociopolitical Development in the South Central Andes.Latin American An-
tiquity, 11(4):335–361.
Golte, J. 1980.La Racionalidad de la Organización Andina. INDEA, Lima.
Graffam, G. 1990. Raised Fields Without Bureaucracy: An Archaeological Examina-
tion of Intensive Wetland Cultivation in the Pampa Koani Zone, Lake Titicaca, Bolivia.
Unpublished phd. dissertation, University of Toronto, Toronto.
Haggett, P. 1965.Location Analysis in Human Geography. Edward Arnold, London.
Hassan, F. 1981.Demographic Archaeology. Academic Press, New York.
Hastorf, C. 1990a. The Effect of the Inka State on Sausa Agricultural Production and
Crop Consumption.American Antiquity, 55(2):262–290.
Hastorf, C. 1990b. One Path to the Heights: Negotiating Political Inequality in the Sausa
of Peru. In Upham, S., editor,The Evolution of Political Systems, pages 146–176. Cam-
bridge University Press, Cambridge.
Hastorf, C., editor 1999.Early Settlement at Chiripa Bolivia. Number 57 in Contribu-
tions of the University Of California Archaeological Research Facility. Archaeological
Research Facility, Berkeley.
Hastorf, C. and Bandy, M. 1999. Excavation Methodology and Field Procedures. In
Hastorf, C., editor,Early Settlement at Chiripa Bolivia, number 57 in Contributions of the

Bibliography 316
University Of California Archaeological Research Facility, pages 29–30. Archaeological
Research Facility, Berkeley.
Hastorf, C., Bandy, M., Ayon, R., Dean, E., Doutriaux, M., Goddard, R., Johnson, D.,
Moore, K., Paz, J.-L., Steadman, L., and Whitehead, W. 1998. Taraco Archaeological
Project: 1998 Excavations at Chiripa, Bolivia. Report submitted to the National Geo-
graphic Society.
Hastorf, C. and Earle, T. 1985. Intensive Agriculture and the Geography of Political
Change in the Upper Mantaro Region of Central Peru. In Farrington, I., editor,Prehistoric
Intensive Agriculture in the Tropics, number 232 (ii) in International Series, pages 569–
596. BAR, Oxford.
Hayden, B. 1993.Archaeology: The Science of Once and Future Things. Freeman & Co,
New York.
Hayden, B. 1996a. Feasting in Prehistoric and Traditional Societies. In Wiessner, P. and
Schiefenhövel, W., editors,Food and the Status Quest: An Interdisciplinary Perspective,
pages 127–148. Berghahn Books, Oxford.
Hayden, B. 1996b. Thresholds of Power in Emergent Complex Societies. In Arnold,
J., editor,Emergent Complexity: The Evolution of Intermediate Socieities, number 9 in
Archaeological Series, pages 50–58. International Monographs in Prehistory, Ann Arbor.
Hayden, B. and Gargett, R. 1990. Big Man, Big Heart? A Mesoamerican View of the
Emergence of Complex Society.Ancient Mesoamerica, 1:3–20.
Heckenberger, M., Peterson, J., and Goés Neves, E. 1996. Village Size and Permanence
in Amazonia: Two Archaeological Examples from Brazil.Latin American Antiquity,
10(4):353–376.
Helms, M. 1979.Ancient Panama: Chiefs in Search of Power. University of Texas Press,
Austin.
Bibliography 317
Helms, M. 1993.Craft and the Kingly Ideal: Art, Trade, and Power. University of Texas
Press, Austin.
Higueras, A. 1995.Settlement Development in the Cochabamba Valley: Human-Lands
Relationships from the Formative to the Intermediate Period Occupations. Unpublished
ph.d. dissertation, Department of Anthropology, University of Pittsburgh.
Hyslop, J. 1976.An Archaeological Investigation of the Lupaqan Kingdom and its Ori-
gins. Unpublihed ph.d. dissertation, Columbia University, New York.
Janusek, J. 1994.State and Local Power in a Prehispanic Andean Polity: Changing
Patterns of Urban Residence in Tiwanaku and Lukurmata. Unpublished ph.d. dissertation,
Department of Anthropology, University of Chicago, Chicago.
Janusek, J. 2001. Vessels, Time, and Society: Toward a Chronology of Ceramic Style in
the Tiwanaku Heartland. In Kolata, A., editor,Tiwanaku and its Hinterland: Archaeolog-
ical and Paleoecological Investigations of an Andean Civilization, volume 2, chapter 3.
Smithsonian Institution Press, Washington D.C.
Janusek, J. and Kolata, A. 2001. Prehispanic Rural History in the Rio Katari Valley.
In Kolata, A., editor,Tiwanaku and its Hinterland: Archaeological and Paleoecological
Investigations of an Andean Civilization, volume 2, chapter 6. Smithsonian Institution
Press, Washington D.C.
Johnson, G. 1972. A Test of the Utility of Central Place Theory in Archaeology. In Ucko,
P., Tringham, R., and Dimbleby, G., editors,Man, Settlement, and Urbanism, pages 769–
785. G. Duckworth, London.
Johnson, G. 1977. Aspects of Regional Analysis in Archaeology.Annual Review of
Anthropology, 6:479–508.
Johnson, G. 1982. Organizational Structure and Scalar Stress. In Renfrew, C., Rowlands,
M., and Segraves, B., editors,Theory and Explanation in Archaeology. Academic Press,
New York.
Bibliography 318
Julien, C. 1982. Inca Decimal Administration in the Lake Titicaca Region. In Collier, G.,
Rosaldo, R., and Worth, J., editors,The Inca and Aztec States:1400-1800, pages 119–152.
Academic Press, New York.
Julien, C. 1983.Hatunqolla: A View of Inca Rule From the Lake Titicaca Basin, vol-
ume 15 ofPublications in Anthropology. University of California Press, Berkeley.
Julien, C. 1993. Finding a Fit: Archaeology and Ethnohistory of the Incas. In Malpass,
M., editor,Provincial Inca: Archaeological and Ethnohistorical Assessment of the Impact
of the Inca State, pages 177–233. University of Iowa Press, Iowa City.
Kidder, A. 1943. Some Early Sites in the Northern Lake Titicaca Basin. volume 27 (1) of
American Archaeology and Ethnology, Cambridge. Peabody Museum, Harvard Univer-
sity.
Kidder, A. 1956. Digging in the Lake Titicaca Basin.University Museum Bulletin,
20(3):16–29.
Klarich, E. and Craig, N. 2001. Geophysical Survey in the Lake Titicaca Basin: Uncover-
ing Domestic Architecture at the Upper Formative Center of Pucará, Peru. Paper presented
at the 66th annual meeting of the Society for American Archaeology, New Orleans, LA.
Kohler, T. and Blinman, E. 1987. Solving Mixture Problems in Archaeology: Analysis of
Ceramic Materials for Dating and Dmeographic Reconstruction.Journal of Anthropolog-
ical Archaeology, 6:1–28.
Kolata, A. 1982. Tiwanaku: Portrait of an Andean Civilization.Field Museum of Natural
History Bulletin, 53(8):15–24.
Kolata, A. 1986. The Agricultural Foundations of the Tiwanaku State: A View from the
Heartland.American Antiquity, 51(4):13–28.
Kolata, A. 1991. The Technology and Organization of Agricultural Production in the
Tiwanaku State.Latin American Antiquity, 2:99–125.
Bibliography 319
Kolata, A. 1993.The Tiwanaku. Blackwell, Cambridge.
Kolata, A. and Ortloff, C. 1989. Thermal Analysis of Tiwanaku Raised Field Systems in
the Lake Titicaca Basin of Bolivia.Journal of Archaeological Science, 16:233–262.
Kolata, A. and Ortloff, C. 1996a. Agroecological Perspectives on the Decline of the
Tiwanaku State. In Kolata, A., editor,Tiwanaku and Its Hinterland: Archaeology and
Paleoecology of an Andean Civilization, pages 181–202. Smithsonian Institution Press,
Washington, D.C.
Kolata, A. and Ortloff, C. 1996b. Tiwanaku Raised-Field Agriculture in the Lake Titicaca
Basin of Bolivia. In Kolata, A., editor,Tiwanaku and Its Hinterland: Archaeology and
Paleoecology of an Andean Civilization, pages 109–152. Smithsonian Institution Press,
Washington, D.C.
Kolata, A., Rivera, O., Ramírez, J., and Gemio, E. 1996. Rehabilitating Raised-Field
Agriculture in the Southern Lake Titicaca of Bolivia: Theory, Practice, and Results. In
Kolata, A., editor,Tiwanaku and Its Hinterland: Archaeology and Paleoecology of an
Andean Civilization, pages 203–230. Smithsonian Institution Press, Washington, D.C.
Kuper, A. 1988.The Invention of Primitive Society. Routledge, London.
Layman, F. and Mohr, K. 1965. Petrographic Analysis of Pottery from Chiripa, Bolivia.
Proceedings of the Pennsylvania Academy of Science, 39:220–225.
Lee, R. 1972. Population Growth and the Beginnings of Sedentary Life among the !Kung
Bushmen. In Spooner, B., editor,Population Growth: Anthropological Implications,
pages 327–350. MIT Press, Cambridge.
Lee, R. 1990. Primitive Communism and the Origin of Social Inequality. In Upham, S.,
editor,The Evolution of Political Systems, pages 225–246. Cambridge University Press,
Cambridge.
Bibliography 320
Lémuz Aguirre, C. 2001. Patrones de Asentamiento Arqueológico en la Península de
Santiago de Huatta, Bolivia. Tesis para optar al grado de licenciatura, Universidad Mayor
de San Andrés, La Paz, Bolivia.
Lennon, T. 1982.Raised Fields of Lake Titicaca, Peru: A Pre-Hispanic Water Manage-
ment System. Unpublished ph.d. dissertation, University of Colorado, Boulder.
Lennon, T. 1983. Pattern Analysis of Prehispanic Raised Fields of Lake Titicaca, Peru.
In Darch, J., editor,Drained Field Agriculture in Central and South America, volume 189
of BAR International Series, pages 183–200. BAR, Oxford.
Loomis, C. 1957.Community and Society. Harper and Row, New York.
Lumbreras, L. 1974.Peoples and Cultures of Ancient Peru. Smithsonian Institution Press,
Washington D.C.
Mamani Condori, C. 1991.Taraqu 1866-1935: Masacre, Guerra, y "Renovación" en
la Biografía de Eduardo L. Nina Qhispi. Ediciones Aruwiyiri, Taller de Historia Oral
Andina, La Paz.
Mann, M. 1986.The Sources of Social Power: A History of Power from the Beginning to
A.D. 1760. Cambridge University Press, Cambridge.
Manzanilla, L. 1992.Akapana: Una Pirámide en el Centro del Mundo. UNAM Instituto
de Investigaciones Antropológicas, Mexico City.
Marabini, P. 1920. Reliquias Arqueológicas a Orillas de Titicaca.Boletín de la Sociedad
Geográfica de La Paz, 49-50:1–10.
Marquardt, W. 1978. Advances in Archaeological Seriation. In Schiffer, M., editor,
Advances in Archaeological Method and Theory 1, pages 257–314. Academic Press, New
York.
Marx, K. 1963. The 18th Brumaire of Louis Bonaparte. International Publishers, New
York.
Bibliography 321
Mathews, J. 1992.Prehispanic Settlement and Agriculture in the Middle Tiwanaku Val-
ley, Bolivia. Unpublished ph.d. dissertation, Department of Anthropology, University of
Chicago, Chicago.
Mauss, M. 1967.The Gift: Forms and Functions of Exchange in Archaic Societies. W.
W. Norton & Company, New York.
Mayr, E. 1985. Darwin’s Five Theories of Evolution. In Kohn, D., editor,The Darwinian
Heritage, pages 755–772. Princeton University Press, Princeton.
McAndrews, T., Albarracín-Jordan, J., and Bermann, M. 1997. Regional Settlement Pat-
terns in the Tiwanaku Valley of Bolivia.Journal of Field Archaeology, 24:67–83.
Meggers, B. 1991. Cultural Evolution in Amazonia. In Rambo, A. and Gillogly, K.,
editors,Profiles in Cultural Evolution, number 85 in Anthropological Papers, pages 191–
216. Museum of Anthropology, University of Michigan, Ann Arbor.
Milisauskas, S. 1978.European Prehistory. Academic Press, New York.
Milner, G. and Oliver, J. 1999. Late Prehistoric Settlements and Wetlands in the Central
Mississippa Valley. In Billman, B. and Feinman, G., editors,Settlement Pattern Studies
in the Americas: Fifty Years Since Virú, pages 79–95. Smithsonian Institution Press.
Mohr, K. 1966. An Analysis of the Pottery of Chiripa, Bolivia: A Problem in Archaeolog-
ical Classification and Inference. Unpublished m.a. thesis, Department of Anthropology,
University of Pennsylvania, Philadelphia.
Montmollin, O. 1987. Forced Settlement and Political Centralization in a Classic Maya
Polity. Journal of Anthropological Archaeology, 6:220–262.
Moseley, M. 1992.The Incas and Their Ancestors. Thames and Hudson, New York.
Mujica, E. 1978. Nueva Hipótesis Sobre el Desarrollo Temprano del Altiplano del Titi-
caca y de sus Areas de Interracción.Arte y Arquelogía, 5-6:285–308.
Bibliography 322
Mujica, E. 1985. Altiplano-Coast Relationships in the South-Central Andes: From In-
direct to Direct Complementarity. In Masuda, S., Shimada, I., and Morris, C., editors,
Andean Ecology and Civilization, pages 103–140. University of Tokyo, Tokyo.
Mujica, E. 1987. Cusipata: Una Fase Pre-Pukara en la Cuenca Norte de Titicaca.Gaceta
Arqueológica Andina, 13:22–28.
Mujica, E., Rivera, M., and Lynch, T. 1983. Proyecto de Estudio sobre la Compleme-
nariedad Economica Tiwanaku en los Valles Occidentales del Centro-Sur Andio.Arica,
Chile. Chungara, 7:105–142.
Murra, J. 1968. An Aymara kingdom in 1567.Ethnohistory, 15:115–151.
Murra, J. 1970. Información Etnológica e Histórica Adicional Sobre el Reino Lupaqa.
Historia y Cultura, 4:49–61.
Murra, J. 1985. "El Archipielago Vertical" Revisited. In Masuda, S., Shimada, I., and
Morris, C., editors,Andean Ecology and Civilization, pages 3–14. University of Tokyo
Press, Tokyo.
Netting, R. 1989. Smallholders, Householders, Freeholders: Why the Family Farm Works
Well Worldwide. In Wilk, R., editor,The Household Economy: Reconsidering the Do-
mestic Mode of Production, pages 221–244. Westview Press, San Francisco.
Netting, R. 1990. Population, Permanent Agriculture, and Polities: Unpacking the Evo-
lutionary Portmanteau. In Upham, S., editor,The Evolution of Political Systems, pages
21–61. Cambridge University Press, Cambridge.
Nielsen, A. 1991. Trampling the Archaeological Record: An Experimental Study.Amer-
ican Antiquity, 56(3):483–503.
Oakland Rodman, A. 1992. Textiles and Ethnicity: Tiwanaku in San Pedro de Atacama,
North Chile.Latin American Antiquity, 3(4):316–340.
Bibliography 323
Oberg, K. 1955. Types of Social Structure among the Lowland Tribes of South and Central
America.American Anthropologist, 57:472–488.
Ortloff, C. and Kolata, A. 1992. Climate and Collapse: Agro-Ecological Perspectives on
the Decline of the Tiwanaku State.Journal of Archaeological Science, 20:195–221.
Owen, B. 1998. Bows and Spearthrowers in Southern Peru and Northern Chile: Evidence,
Dating, and Why it Matters. Paper presented at the 63rd Annual Meeting of the Society
for American Archaeology, Seattle, WA.
Parsons, J. 1968. An Estimate of Size and Population for Middle Horizon Tiahuanaco,
Bolivia. American Antiquity, 40:259–282.
Parsons, J. 1976. Settlement and Population History of the Basin of Mexico. In Wolf, E.,
editor,The Valley of Mexico: Studies in Prehispanic Ecology and Society, pages 69–100.
University of New Mexico Press, Albuquerque.
Pauketat, T. 2000. The Tragedy of the Commoners. In Dobres, M.-A. and Robb, J.,
editors,Agency in Archaeology, pages 113–129. Routledge, London.
Paz Soría, J. 1999. Excavations in the Llusco Area. In Hastorf, C., editor,Early Settlement
at Chiripa Bolivia, number 57 in Contributions of the University Of California Archaeo-
logical Research Facility, pages 31–36. Archaeological Research Facility, Berkeley.
Peebles, C. and Kus, S. 1977. Some Archaeological Correlates of Ranked Societies.
American Antiquity, 42:421–448.
Plourde, A. and Stanish, C. 2001. Formative Period Settlement Patterning in the
Huancane-Putina River Valley, Northeastern Titicaca Basin. Paper presented at the 66th
annual meeting of the Society for American Archaeology, New Orleans, LA.
Polanyi, K. 1944.The Great Transformation. Farrat and Rinehart, New York.
Ponce Sangines, C. 1957. Una Piedra Esculpida de Chiripa. In Ponce Sangines, C., editor,
Arqueología Boliviana, pages 119–138. Biblioteca Pacena, La Paz.
Bibliography 324
Ponce Sanginés, C. 1976.La Cerámica de la Época I de Tiwanaku, volume 18 ofCentro
de Investigaciones Arqueológicas Nueva Serie. Editorial Universo, La Paz.
Ponce Sangines, C. 1981.Tiwanaku: Espacio, Tiempo y Cultura. Ensayo de Síntesis
Arqueológica. Editorial Los Amigos del Libro, La Paz.
Ponce Sangines, C. 1995.Tiwanaku: 200 Años de Investigaciones Arqueológicos. Pro-
ducciones Cima, La Paz.
Portugal Ortíz, M. 1981. Expansion del Estilo Escultórico Pa-Ajanu.Arte y Arqueología,
7:149–159.
Portugal Ortíz, M. 1992. Aspectos de la Cultura Chiripa.Textos Antropológicos, 3:9–26.
Portugal Ortíz, M. 1998.Escultura Prehispánica Boliviana. Universidad Mayor de San
Andrés, Carrera de Arqueología - Antropología, La Paz.
Portugal Ortíz, M., Catacora, H., Inchausti, J., Murillo, A., Suñavi, G., Gutiérrez, R.,
Plaza, V., Winkler, W., Avilés, S., and Portugal, J. 1993. Excavaciones en Titimani (Tem-
porada II).Textos Antropológicos, 5:11–191.
Portugal Ortíz, M. and Portugal Zamora, M. 1977. Investigaciones Arqueológicas en el
Valle de Tiwanaku. InArqueología en Bolivia y Peru: Jornadas Peruano-Bolivianos de
Estudio Científico del Altiplano Boliviano y del Sur del Perú, volume 2, pages 243–283.
Casa Municipal de la Cultura "Franz Tamayo", La Paz.
Portugal Zamora, M. 1940. Los Hallazgos de la Hacienda Chiripa. Unpublished ms.
Price, B. 1978. Secondary State Formation: An Explanatory Model. In Cohen, R. and
Service, E., editors,Origins of the State: The Anthropology of Political Evolution, pages
161–186. Institute for the Study of Human Issues, Philadelphia.
Ralph, E. 1959. University of Pennsylvania Radiocarbon Dates III.American Journal of
Science Radiocarbon Supplement, 1:45–58.
Bibliography 325
Reynolds, R. 1976. Linear Settlement Systems on the Upper Grijalva River: The Appli-
cation of a Markovian Model. In Flannery, K., editor,The Early Mesoamerican Village,
pages 180–194. Academic Press, New York.
Roper, D. 1976. Lateral displacement of artifacts due to plowing.American Antiquity,
41(3):372–375.
Rowe, J. 1944.An Introduction to the Archaeology of Cuzco, volume 27 (2) ofAmerican
Archaeology and Ethnology. Peabody Museum, Harvard University, Cambridge.
Rowe, J. 1946. Inca Culture at the Time of the Spanish Conquest. In Steward, J., editor,
Handbook of South American Indians Vol. 2: The Andean Civilizations, pages 183–330.
Bureau of American Ethnology, Washington D.C.
Rowe, J. 1982. Inca Policies and Institutions Relating to the Cultural Unification of the
Empire. In Collier, G., Rosaldo, R., and Worth, J., editors,The Inca and Aztec States
1400-1800, pages 93–118. Academic Press, New York.
Rowe, J. and Donahue, J. 1975. The Donahue Discovery, an Ancient Stela Found Near
Ilave, Puno.Ñawpa Pacha, 13:35–44.
Rydén, S. 1947.Archaeological Researches in the Highlands of Bolivia. Elanders Bok-
tryckeri Aktiebolag, Göteborg.
Sahlins, M. 1958.Social Stratification in Polynesia. University of Washington Press,
Seattle.
Sahlins, M. 1963. Poor Man, Rich Man, Big-Man, Chief: Political Types in Melanesia
and Polynesia.Comparative Studies in Society and History, 5(3):285–303.
Sahlins, M. and Service, E., editors 1960.Evolution and Culture. University of Michigan
Press, Ann Arbor.
Sanchez-Albornoz, N. 1979.The Population of Latin America. University of California
Press, Berkeley.
Bibliography 326
Sanders, W. 1972. Population, Agricultural History, and Societal Evolution in Mesoamer-
ica. In Spooner, B., editor,Population Growth: Anthropological Implications, pages 101–
153. MIT Press, Cambridge.
Schlanger, S. 1985.Prehistoric Population Dynamics in the Dolores Area, Southwest-
ern Colorado. Unpublished ph.d. dissertation, Department of Anthropology, Washington
State University, Pullman.
Schlanger, S. 1988. Patterns of Population Movement and Long-Term Population Growth
in Southwestern Colorado.American Antiquity, 53(4):773–793.
Seddon, M. 1994a. Excavations in the Raised Fields of the Rio Catari Sub-Basin, Bolivia.
Unpublished m.a. thesis, Department of Anthropology, University of Chicago, Chicago.
Seddon, M. 1994b. Lithic Artifacts. In Stanish, C. and Steadman, L., editors,Archaeo-
logical Research at Tumatumani, Juli, Peru, number 23 in Fieldiana Anthropology, pages
65–71. Field Museum of Natural History, Chicago.
Service, E. 1962.Primitive Social Organization. Random House, New York.
Service, E. 1975.Origins of the State and Civilization. W. W. Norton and Company, New
York.
Service, E. 1978. Classical and Modern Theories of the Origins of Government. In Cohen,
R. and Service, E., editors,Origins of the State: The Anthropology of Political Evolution,
pages 212–34. Institute for the Study of Human Issues, Philadelphia.
Shennan, S. 1993. After Social Evolution: A New Archaeological Agenda? In Yoffee,
N. and Sherratt, A., editors,Archaeology Theory: Who Sets the Agenda, pages 53–59.
Cambridge University Press, Cambridge.
Smith, C., Denevan, W., and Hamilton, P. 1968. Ancient Ridges Fields in the Region of
Lake Titicaca.Geographical Journal, 134:353–366.
Bibliography 327
Spalding, K. 1984.Huarochirí: An Andean Society Under Inca and Spanish Rule. Stan-
ford University Press, Stanford.
Spencer, C. 1998. A Mathematical Model of Primary State Formation.Cultural Dynam-
ics, 10(1):5–20.
Spencer, H. 1862.First Principles. Williams & Norgate, London.
Spielman, K. 1986. Interdependence among Egalitarian Societies.Journal of Anthropo-
logical Archaeology, 5:279–312.
Stahle, D. and Dunn, J. 1982. An Analysis and Application of the Size Distribution of
Waste Flakes from the Manufacture of Bifacial Stone Tools.World Archaeology, 14:84–
97.
Stanish, C. 1989. Tamaño y Complejidad de los Asentamientos Nucleares de Tiwanaku.
In Kolata, A., editor,Arqueología de Lukurmata, Vol. 2, pages 41–57. CIAT, La Paz.
Stanish, C. 1994. The Hydraulic Hypothesis Revisited: Lake Titicaca Basin Raised Fields
in Theoretical Perspective.Latin American Antiquity, 5(4):312–332.
Stanish, C. 1997. Nonmarket Imperialism in the Prehispanic Andes: the Inca Occupation
of the Titicaca Basin.Latin American Antiquity, 8(3):195–216.
Stanish, C. 1999. Settlement Pattern Shifts and Political Ranking in the Lake Titicaca
Basin, Peru. In Billman, B. and Feinman, G., editors,Settlement Pattern Studies in the
Americas: Fifty Years Since Virú, pages 116–130. Smithsonian Institution Press.
Stanish, C., de la Vega, E., Steadman, L., Chávez Justo, C., Frye, K., Onofre Mamani,
L., Seddon, M., and Calisaya Chuquimia, P. 1997.Archaeological Survey in the Juli-
Desaguadero Region of Lake Titicaca Basin, Southern Peru. Fieldiana Anthropology.
Field Museum of Natural HIstory, Chicago.
Stanish, C., de la Vega M., E., Steadman, L., Frye, K., and Calisaya, P. Archaeological
Survey in the Juli-Pomata Region of the Titicaca Basin, Peru.
Bibliography 328
Stanish, C. and Steadman, L. 1994.Archaeological Research at Tumatumani, Juli, Peru.
Number 23 in Fieldiana Anthropology. Field Museum of Natural History, Chicago.
Stanish, C., Vega, E., and Frye, K. 1993. Domestic Architecture on Lupaqa Area Sites
in the Department of Puno. In Aldenderfer, M., editor,Domestic Architecture, Ethnicity
and Complementarity in the South-Central Andes, pages 83–93. University of Iowa Press,
Iowa City.
Steadman, L. 1995.Excavations at Camata: An Early Ceramic Chronology for the West-
ern Lake Titicaca Basin, Peru. Unpublished ph.d. dissertation, Department of Anthropol-
ogy, University of California, Berkeley.
Steadman, L. 1999. The Ceramics. In Hastorf, C., editor,Early Settlement at Chiripa Bo-
livia, number 57 in Contributions of the University Of California Archaeological Research
Facility, pages 61–72. Archaeological Research Facility, Berkeley.
Steadman, L. and Hastorf, C. 2001. Construction for the Ancestors: The Creation of
Territory and Society in the Middle Formative at Chiripa. Paper presented at the 66th
annual meeting of the Society for American Archaeology, New Orleans, LA.
Steponaitas, V. 1978. Location Theory and Complex Chiefdoms: A Mississippian Exam-
ple. In Snith, B., editor,Mississippian Settlement Patterns, pages 417–4453. Academic
Press, New York.
Steponaitas, V. 1991. Contrasting Patterns of Mississippian Development. In Earle, T.,
editor,Chiefdoms: Power, Economy and Ideology, pages 193–228. Cambridge University
Press, Cambridge.
Stern, S. 1982.Peru’s Indian Peoples and the Challenge of Spanish Conquest. University
of Wisconsin Press, Madison.
Steward, J. 1955.Theory of Culture Change. University of Illinois Press, Urbana.
Steward, J. and Faron, L. 1959.Native Peoples of South America. McGraw-Hill, New
York.
Bibliography 329
Sussman, R. 1972. Child Transport, Family Size, and Increase in Human Population
During the Neolithic.Current Anthropology, 13:258–259.
Tolstoy, P. and Fish, S. 1975. Surface and Subsurface Evidence for Community Size at
Coapexco, Mexico.Journal of Field Archaeology, 2:97–104.
Torero, A. 1985. Lenguas y Pueblos Altiplánicos en Torno al Siglo XIV.Revista Andina,
5(2):329–405.
Tschopik, M. 1946. Some Notes on the Archaeology of the Department of Puno, Peru.
volume 27 (3) ofAmerican Archaeology and Ethnology, Cambridge. Peabody Museum,
Harvard University.
Van Buren, M. 1999. Tarapaya: An Elite Spanish Residence near Colonial Potosí in
Comparative Perspective.Historical Archaeology, 33(2):108–122.
Van Buren, M., Burgi, P., and Rice, R. 1993. Torata Alta: A Late Highland Settlement
in the Osmore Drainage. In Aldenderfer, M., editor,Domestic Architecture, Ethnicity and
Complementarity in the South-Central Andes, pages 136–146. University of Iowa Press,
Iowa City.
Vranich, A. 1999. Interpreting the Meaning of Ritual Spaces: The Temple Complex of
Pumapunku, Tiwanaku, Bolivia. Unpublished ph.d. dissertation, Department of Anthro-
pology, University of Pennsylvania, Philadelphia.
Wallace, D. 1957.The Tiahuanaco Horizon Styles in the Peruvian Highlands. Unpub-
lished ph.d. dissertation, Department of Anthropology, University of California, Berkeley.
Weissleder, W. 1978. Aristotle’s Concept of Political Structure and the State. In Cohen,
R. and Service, E., editors,Origins of the State: The Anthropology of Political Evolution,
pages 187–204. Institute for the Study of Human Issues, Philadelphia.
Wenke, R. 1975.Imperial Investments and Agricultural Developments in Parthian and
Sussanian Khuzistan: 150 B.C. to A.D. 640. Unpublished ph.d. dissertation, University
of Michigan, Ann Arbor.
Bibliography 330
White, L. 1959.The Evolution of Culture. McGraw Hill, New York.
Whitehead, W. 1999. Radiocarbon Dating. In Hastorf, C., editor,Early Settlement at
Chiripa Bolivia, number 57 in Contributions of the University Of California Archaeolog-
ical Research Facility, pages 17–22. Archaeological Research Facility, Berkeley.
Whitelaw, T. and Davis, J. 1991. The Polis Center of Koressos. In Cherry, J., Davis, J.,
and Mantzourani, Z., editors,Landscape Archaeology as Long-Term History: Northern
Keos in the Cycladic Islands, number 16 in Monumenta Archaeologica, pages 266–284.
Institute of Archaeology, University of California, Los Angeles, Los Angeles.
Wilk, R. and Netting, R. 1984. Households: Changing Forms and Functions. In Netting,
R., Wilk, R., and Arnold, E., editors,Household: Comparative and Historical Studies of
the Domestic Group, pages 1–28. University of California Press, Berkeley.
Winter, M. 1976. Differential Patterns of Community Growth in Oaxaca. In Flannery, K.,
editor,The Early Mesoamerican Village, pages 227–234. Academic Press, New York.
Wise, K. 1993. Late Intermediate Period Architecture of Lukurmata. In Aldenderfer,
M., editor,Domestic Architecture, Ethnicity, and Complementarity in the South-Central
Andes, pages 103–113. University of Iowa Press, Iowa City.
Wolf, E. 1982. Europe and the People Without History. University of California Press,
Berkeley and Los Angeles.
Wright, H. and Johnson, G. 1975. Population, Exchange, and Early State Formation in
Southwestern Iran.American Anthropologist, 77:267–289.
Yoffee, N. 1993. Too Many Chiefs? (or, Safe Texts for the ’90s). In Yoffee, N. and
Sherratt, A., editors,Archaeology Theory: Who Sets the Agenda, pages 60–78. Cambridge
University Press, Cambridge.
331
Appendix A
Site and sector registry
Micro-environmental Zones:
SGZ - Springs and Grass ZoneLCZ - Lower Colluvial ZoneUCZ - Upper Colluvial Zone
SeeAlbarracín-Jordan and Mathews 1990and section2.3for explanations of these terms.
Phases
0.0 - Phase unknown0.1 - Unknown, definitely prehispanic1.1 - Early Formative 1: Early Chiripa1.2 - Early Formative 2: Middle Chiripa2.0 - Middle Formative: Late Chiripa3.1 - Late Formative 1: Tiwanaku I3.2 - Late Formative 2: Tiwanaku III4.0 - Tiwanaku: Tiwanaku IV-V5.1 - Early Pacajes5.2 - Pacajes-Inka5.3 - Late Pacajes
Area always reported in hectares.
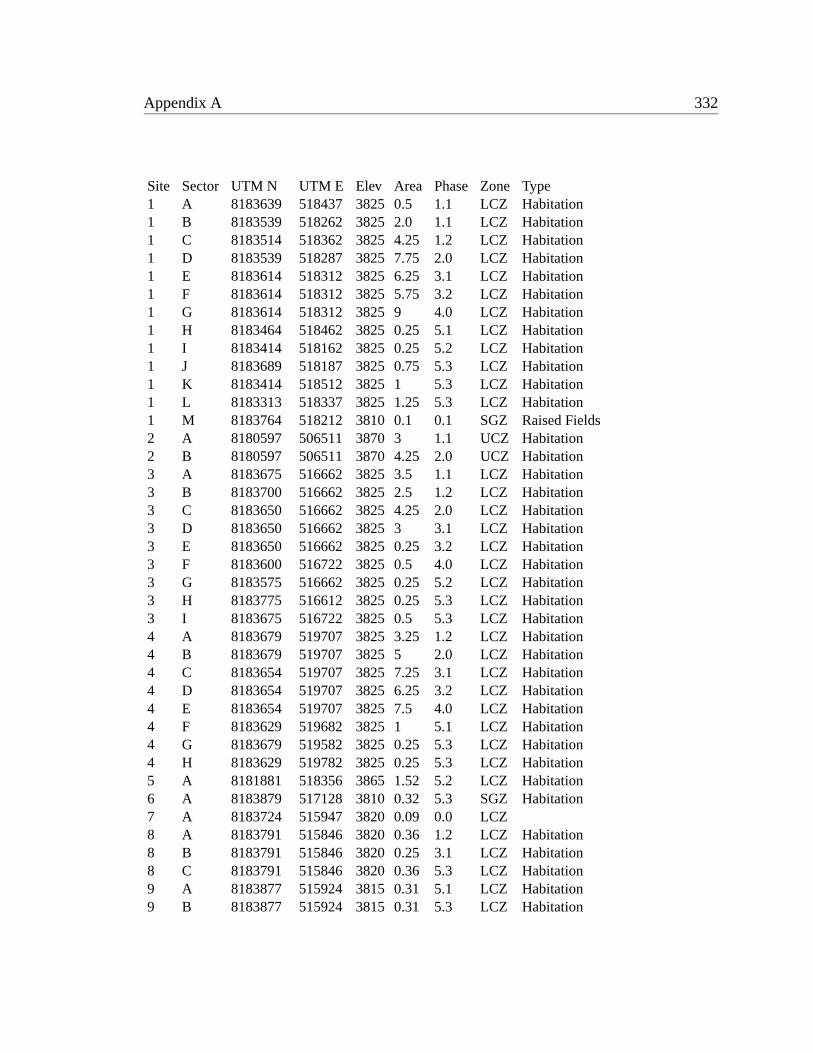
Appendix A 332
Site Sector UTM N UTM E Elev Area Phase Zone Type1 A 8183639 518437 3825 0.5 1.1 LCZ Habitation1 B 8183539 518262 3825 2.0 1.1 LCZ Habitation1 C 8183514 518362 3825 4.25 1.2 LCZ Habitation1 D 8183539 518287 3825 7.75 2.0 LCZ Habitation1 E 8183614 518312 3825 6.25 3.1 LCZ Habitation1 F 8183614 518312 3825 5.75 3.2 LCZ Habitation1 G 8183614 518312 3825 9 4.0 LCZ Habitation1 H 8183464 518462 3825 0.25 5.1 LCZ Habitation1 I 8183414 518162 3825 0.25 5.2 LCZ Habitation1 J 8183689 518187 3825 0.75 5.3 LCZ Habitation1 K 8183414 518512 3825 1 5.3 LCZ Habitation1 L 8183313 518337 3825 1.25 5.3 LCZ Habitation1 M 8183764 518212 3810 0.1 0.1 SGZ Raised Fields2 A 8180597 506511 3870 3 1.1 UCZ Habitation2 B 8180597 506511 3870 4.25 2.0 UCZ Habitation3 A 8183675 516662 3825 3.5 1.1 LCZ Habitation3 B 8183700 516662 3825 2.5 1.2 LCZ Habitation3 C 8183650 516662 3825 4.25 2.0 LCZ Habitation3 D 8183650 516662 3825 3 3.1 LCZ Habitation3 E 8183650 516662 3825 0.25 3.2 LCZ Habitation3 F 8183600 516722 3825 0.5 4.0 LCZ Habitation3 G 8183575 516662 3825 0.25 5.2 LCZ Habitation3 H 8183775 516612 3825 0.25 5.3 LCZ Habitation3 I 8183675 516722 3825 0.5 5.3 LCZ Habitation4 A 8183679 519707 3825 3.25 1.2 LCZ Habitation4 B 8183679 519707 3825 5 2.0 LCZ Habitation4 C 8183654 519707 3825 7.25 3.1 LCZ Habitation4 D 8183654 519707 3825 6.25 3.2 LCZ Habitation4 E 8183654 519707 3825 7.5 4.0 LCZ Habitation4 F 8183629 519682 3825 1 5.1 LCZ Habitation4 G 8183679 519582 3825 0.25 5.3 LCZ Habitation4 H 8183629 519782 3825 0.25 5.3 LCZ Habitation5 A 8181881 518356 3865 1.52 5.2 LCZ Habitation6 A 8183879 517128 3810 0.32 5.3 SGZ Habitation7 A 8183724 515947 3820 0.09 0.0 LCZ8 A 8183791 515846 3820 0.36 1.2 LCZ Habitation8 B 8183791 515846 3820 0.25 3.1 LCZ Habitation8 C 8183791 515846 3820 0.36 5.3 LCZ Habitation9 A 8183877 515924 3815 0.31 5.1 LCZ Habitation9 B 8183877 515924 3815 0.31 5.3 LCZ Habitation
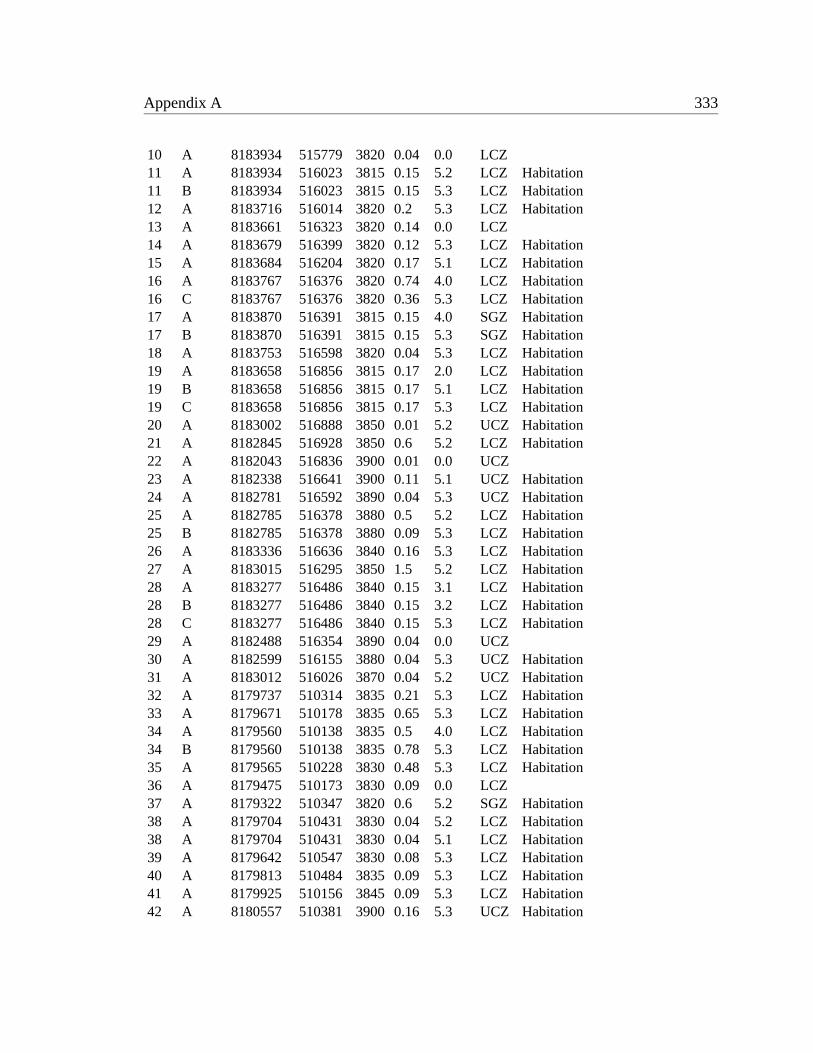
Appendix A 333
10 A 8183934 515779 3820 0.04 0.0 LCZ11 A 8183934 516023 3815 0.15 5.2 LCZ Habitation11 B 8183934 516023 3815 0.15 5.3 LCZ Habitation12 A 8183716 516014 3820 0.2 5.3 LCZ Habitation13 A 8183661 516323 3820 0.14 0.0 LCZ14 A 8183679 516399 3820 0.12 5.3 LCZ Habitation15 A 8183684 516204 3820 0.17 5.1 LCZ Habitation16 A 8183767 516376 3820 0.74 4.0 LCZ Habitation16 C 8183767 516376 3820 0.36 5.3 LCZ Habitation17 A 8183870 516391 3815 0.15 4.0 SGZ Habitation17 B 8183870 516391 3815 0.15 5.3 SGZ Habitation18 A 8183753 516598 3820 0.04 5.3 LCZ Habitation19 A 8183658 516856 3815 0.17 2.0 LCZ Habitation19 B 8183658 516856 3815 0.17 5.1 LCZ Habitation19 C 8183658 516856 3815 0.17 5.3 LCZ Habitation20 A 8183002 516888 3850 0.01 5.2 UCZ Habitation21 A 8182845 516928 3850 0.6 5.2 LCZ Habitation22 A 8182043 516836 3900 0.01 0.0 UCZ23 A 8182338 516641 3900 0.11 5.1 UCZ Habitation24 A 8182781 516592 3890 0.04 5.3 UCZ Habitation25 A 8182785 516378 3880 0.5 5.2 LCZ Habitation25 B 8182785 516378 3880 0.09 5.3 LCZ Habitation26 A 8183336 516636 3840 0.16 5.3 LCZ Habitation27 A 8183015 516295 3850 1.5 5.2 LCZ Habitation28 A 8183277 516486 3840 0.15 3.1 LCZ Habitation28 B 8183277 516486 3840 0.15 3.2 LCZ Habitation28 C 8183277 516486 3840 0.15 5.3 LCZ Habitation29 A 8182488 516354 3890 0.04 0.0 UCZ30 A 8182599 516155 3880 0.04 5.3 UCZ Habitation31 A 8183012 516026 3870 0.04 5.2 UCZ Habitation32 A 8179737 510314 3835 0.21 5.3 LCZ Habitation33 A 8179671 510178 3835 0.65 5.3 LCZ Habitation34 A 8179560 510138 3835 0.5 4.0 LCZ Habitation34 B 8179560 510138 3835 0.78 5.3 LCZ Habitation35 A 8179565 510228 3830 0.48 5.3 LCZ Habitation36 A 8179475 510173 3830 0.09 0.0 LCZ37 A 8179322 510347 3820 0.6 5.2 SGZ Habitation38 A 8179704 510431 3830 0.04 5.2 LCZ Habitation38 A 8179704 510431 3830 0.04 5.1 LCZ Habitation39 A 8179642 510547 3830 0.08 5.3 LCZ Habitation40 A 8179813 510484 3835 0.09 5.3 LCZ Habitation41 A 8179925 510156 3845 0.09 5.3 LCZ Habitation42 A 8180557 510381 3900 0.16 5.3 UCZ Habitation
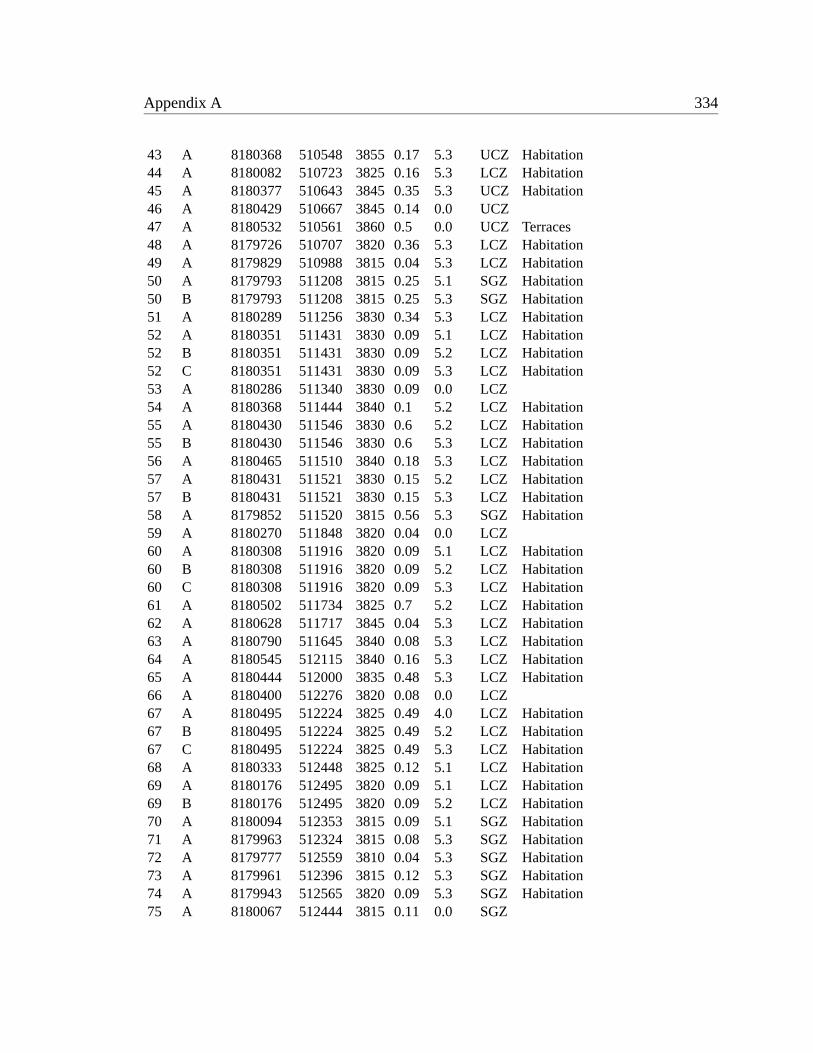
Appendix A 334
43 A 8180368 510548 3855 0.17 5.3 UCZ Habitation44 A 8180082 510723 3825 0.16 5.3 LCZ Habitation45 A 8180377 510643 3845 0.35 5.3 UCZ Habitation46 A 8180429 510667 3845 0.14 0.0 UCZ47 A 8180532 510561 3860 0.5 0.0 UCZ Terraces48 A 8179726 510707 3820 0.36 5.3 LCZ Habitation49 A 8179829 510988 3815 0.04 5.3 LCZ Habitation50 A 8179793 511208 3815 0.25 5.1 SGZ Habitation50 B 8179793 511208 3815 0.25 5.3 SGZ Habitation51 A 8180289 511256 3830 0.34 5.3 LCZ Habitation52 A 8180351 511431 3830 0.09 5.1 LCZ Habitation52 B 8180351 511431 3830 0.09 5.2 LCZ Habitation52 C 8180351 511431 3830 0.09 5.3 LCZ Habitation53 A 8180286 511340 3830 0.09 0.0 LCZ54 A 8180368 511444 3840 0.1 5.2 LCZ Habitation55 A 8180430 511546 3830 0.6 5.2 LCZ Habitation55 B 8180430 511546 3830 0.6 5.3 LCZ Habitation56 A 8180465 511510 3840 0.18 5.3 LCZ Habitation57 A 8180431 511521 3830 0.15 5.2 LCZ Habitation57 B 8180431 511521 3830 0.15 5.3 LCZ Habitation58 A 8179852 511520 3815 0.56 5.3 SGZ Habitation59 A 8180270 511848 3820 0.04 0.0 LCZ60 A 8180308 511916 3820 0.09 5.1 LCZ Habitation60 B 8180308 511916 3820 0.09 5.2 LCZ Habitation60 C 8180308 511916 3820 0.09 5.3 LCZ Habitation61 A 8180502 511734 3825 0.7 5.2 LCZ Habitation62 A 8180628 511717 3845 0.04 5.3 LCZ Habitation63 A 8180790 511645 3840 0.08 5.3 LCZ Habitation64 A 8180545 512115 3840 0.16 5.3 LCZ Habitation65 A 8180444 512000 3835 0.48 5.3 LCZ Habitation66 A 8180400 512276 3820 0.08 0.0 LCZ67 A 8180495 512224 3825 0.49 4.0 LCZ Habitation67 B 8180495 512224 3825 0.49 5.2 LCZ Habitation67 C 8180495 512224 3825 0.49 5.3 LCZ Habitation68 A 8180333 512448 3825 0.12 5.1 LCZ Habitation69 A 8180176 512495 3820 0.09 5.1 LCZ Habitation69 B 8180176 512495 3820 0.09 5.2 LCZ Habitation70 A 8180094 512353 3815 0.09 5.1 SGZ Habitation71 A 8179963 512324 3815 0.08 5.3 SGZ Habitation72 A 8179777 512559 3810 0.04 5.3 SGZ Habitation73 A 8179961 512396 3815 0.12 5.3 SGZ Habitation74 A 8179943 512565 3820 0.09 5.3 SGZ Habitation75 A 8180067 512444 3815 0.11 0.0 SGZ

Appendix A 335
76 A 8180476 512546 3830 0.09 0.0 LCZ77 A 8180501 512601 3835 0.24 5.3 LCZ Habitation78 A 8180439 512714 3835 0.8 5.3 LCZ Habitation79 A 8180601 512567 3840 0.4 5.2 LCZ Habitation80 A 8180685 512492 3840 0.16 0.0 LCZ81 A 8180780 512694 3850 0.09 5.3 LCZ Habitation82 A 8180742 512826 3845 0.2 5.3 LCZ Habitation83 A 8180680 512685 3840 0.08 5.3 LCZ Habitation84 A 8179932 513008 3820 0.33 5.3 SGZ Habitation85 A 8180961 512984 3825 0.8 4.0 LCZ Habitation86 A 8180795 512881 3845 0.41 5.2 LCZ Habitation86 B 8180795 512881 3845 0.41 5.3 LCZ Habitation87 A 8180838 513053 3840 0.14 5.3 LCZ Habitation88 A 8180931 513057 3855 0.54 5.3 LCZ Habitation89 A 8180931 512899 3860 0.2 5.3 LCZ Habitation90 A 8180758 513284 3845 0.16 5.2 LCZ Habitation90 B 8180758 513284 3845 0.16 5.3 LCZ Habitation91 A 8180614 513218 3835 0.09 5.1 LCZ Habitation91 B 8180614 513218 3835 0.09 5.3 LCZ Habitation92 A 8180546 513318 3835 0.33 5.1 LCZ Habitation92 B 8180546 513318 3835 0.33 5.2 LCZ Habitation93 A 8180454 513142 3830 0.16 5.1 LCZ Habitation93 B 8180454 513142 3830 0.16 5.3 LCZ Habitation94 A 8179823 513108 3820 0.13 0.1 SGZ Raised Fields95 A 8179880 513282 3820 0.12 5.3 SGZ Habitation96 A 8179990 513288 3825 0.09 5.3 SGZ Habitation97 A 8180417 513503 3835 2.08 5.2 LCZ Habitation97 B 8180417 513503 3835 1 5.3 LCZ Habitation98 A 8180565 513453 3835 0.04 5.3 LCZ Habitation99 A 8180562 513470 3835 0.26 5.1 LCZ Habitation99 B 8180562 513470 3835 0.26 5.2 LCZ Habitation99 C 8180562 513470 3835 0.26 5.3 LCZ Habitation100 A 8180700 513490 3845 0.16 5.3 LCZ Habitation101 A 8180761 513548 3850 0.27 5.2 LCZ Habitation102 A 8180772 513486 3855 0.24 5.3 LCZ Habitation103 A 8180678 513774 3845 0.56 5.3 LCZ Habitation104 A 8180636 513692 3845 0.09 0.0 LCZ105 A 8180518 513682 3840 1 5.3 LCZ Habitation106 A 8180480 513766 3840 0.44 5.2 LCZ Habitation106 B 8180480 513766 3840 0.2 5.3 LCZ Habitation107 A 8179626 513828 3815 0.16 5.1 SGZ Habitation107 B 8179626 513828 3815 1.7 5.2 SGZ Habitation107 C 8179626 513828 3815 0.16 5.3 SGZ Habitation
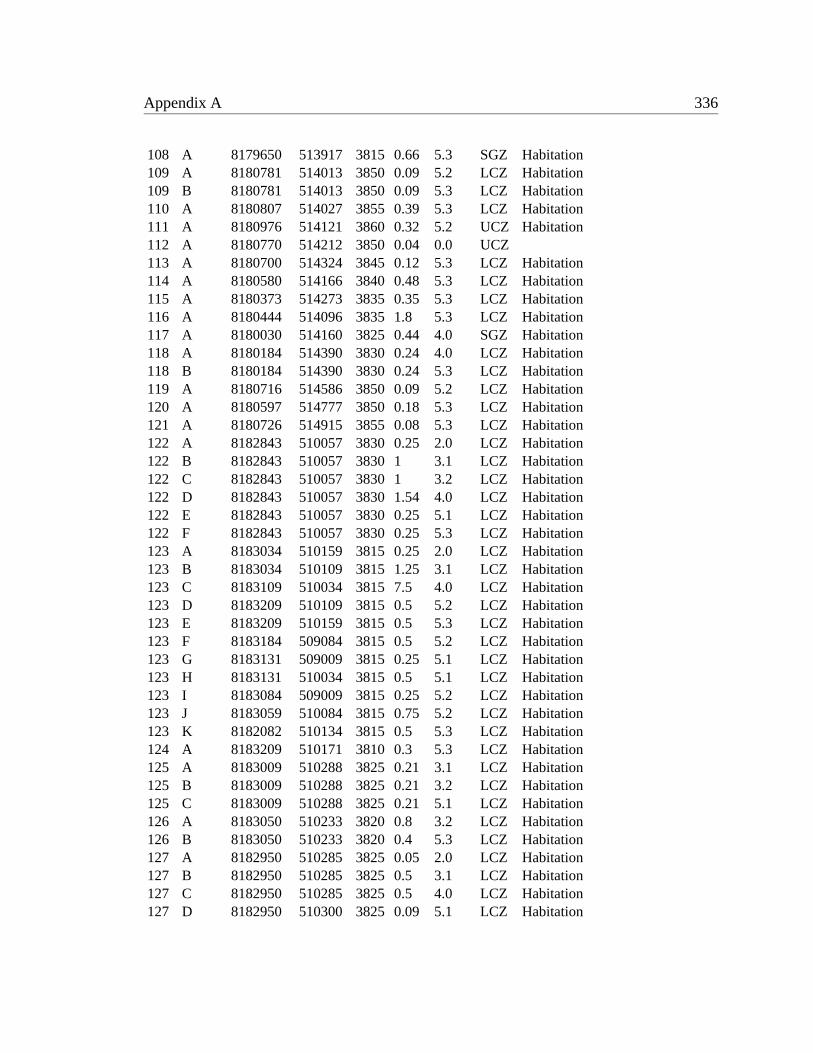
Appendix A 336
108 A 8179650 513917 3815 0.66 5.3 SGZ Habitation109 A 8180781 514013 3850 0.09 5.2 LCZ Habitation109 B 8180781 514013 3850 0.09 5.3 LCZ Habitation110 A 8180807 514027 3855 0.39 5.3 LCZ Habitation111 A 8180976 514121 3860 0.32 5.2 UCZ Habitation112 A 8180770 514212 3850 0.04 0.0 UCZ113 A 8180700 514324 3845 0.12 5.3 LCZ Habitation114 A 8180580 514166 3840 0.48 5.3 LCZ Habitation115 A 8180373 514273 3835 0.35 5.3 LCZ Habitation116 A 8180444 514096 3835 1.8 5.3 LCZ Habitation117 A 8180030 514160 3825 0.44 4.0 SGZ Habitation118 A 8180184 514390 3830 0.24 4.0 LCZ Habitation118 B 8180184 514390 3830 0.24 5.3 LCZ Habitation119 A 8180716 514586 3850 0.09 5.2 LCZ Habitation120 A 8180597 514777 3850 0.18 5.3 LCZ Habitation121 A 8180726 514915 3855 0.08 5.3 LCZ Habitation122 A 8182843 510057 3830 0.25 2.0 LCZ Habitation122 B 8182843 510057 3830 1 3.1 LCZ Habitation122 C 8182843 510057 3830 1 3.2 LCZ Habitation122 D 8182843 510057 3830 1.54 4.0 LCZ Habitation122 E 8182843 510057 3830 0.25 5.1 LCZ Habitation122 F 8182843 510057 3830 0.25 5.3 LCZ Habitation123 A 8183034 510159 3815 0.25 2.0 LCZ Habitation123 B 8183034 510109 3815 1.25 3.1 LCZ Habitation123 C 8183109 510034 3815 7.5 4.0 LCZ Habitation123 D 8183209 510109 3815 0.5 5.2 LCZ Habitation123 E 8183209 510159 3815 0.5 5.3 LCZ Habitation123 F 8183184 509084 3815 0.5 5.2 LCZ Habitation123 G 8183131 509009 3815 0.25 5.1 LCZ Habitation123 H 8183131 510034 3815 0.5 5.1 LCZ Habitation123 I 8183084 509009 3815 0.25 5.2 LCZ Habitation123 J 8183059 510084 3815 0.75 5.2 LCZ Habitation123 K 8182082 510134 3815 0.5 5.3 LCZ Habitation124 A 8183209 510171 3810 0.3 5.3 LCZ Habitation125 A 8183009 510288 3825 0.21 3.1 LCZ Habitation125 B 8183009 510288 3825 0.21 3.2 LCZ Habitation125 C 8183009 510288 3825 0.21 5.1 LCZ Habitation126 A 8183050 510233 3820 0.8 3.2 LCZ Habitation126 B 8183050 510233 3820 0.4 5.3 LCZ Habitation127 A 8182950 510285 3825 0.05 2.0 LCZ Habitation127 B 8182950 510285 3825 0.5 3.1 LCZ Habitation127 C 8182950 510285 3825 0.5 4.0 LCZ Habitation127 D 8182950 510300 3825 0.09 5.1 LCZ Habitation
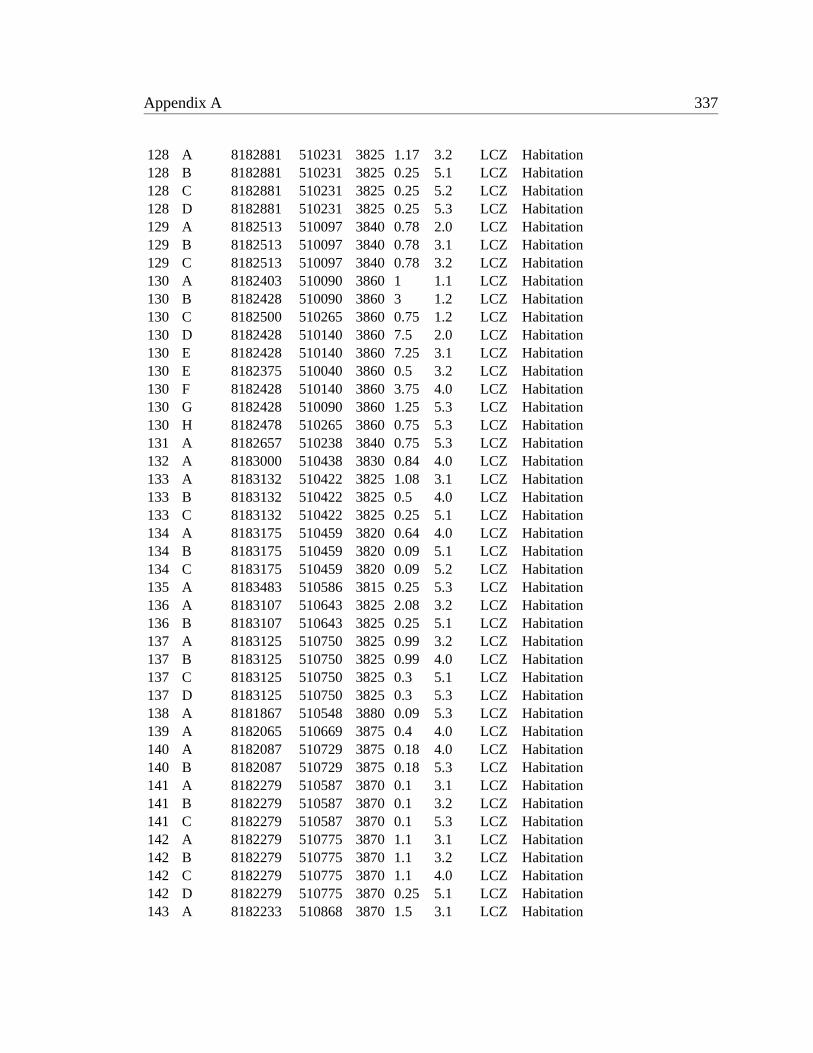
Appendix A 337
128 A 8182881 510231 3825 1.17 3.2 LCZ Habitation128 B 8182881 510231 3825 0.25 5.1 LCZ Habitation128 C 8182881 510231 3825 0.25 5.2 LCZ Habitation128 D 8182881 510231 3825 0.25 5.3 LCZ Habitation129 A 8182513 510097 3840 0.78 2.0 LCZ Habitation129 B 8182513 510097 3840 0.78 3.1 LCZ Habitation129 C 8182513 510097 3840 0.78 3.2 LCZ Habitation130 A 8182403 510090 3860 1 1.1 LCZ Habitation130 B 8182428 510090 3860 3 1.2 LCZ Habitation130 C 8182500 510265 3860 0.75 1.2 LCZ Habitation130 D 8182428 510140 3860 7.5 2.0 LCZ Habitation130 E 8182428 510140 3860 7.25 3.1 LCZ Habitation130 E 8182375 510040 3860 0.5 3.2 LCZ Habitation130 F 8182428 510140 3860 3.75 4.0 LCZ Habitation130 G 8182428 510090 3860 1.25 5.3 LCZ Habitation130 H 8182478 510265 3860 0.75 5.3 LCZ Habitation131 A 8182657 510238 3840 0.75 5.3 LCZ Habitation132 A 8183000 510438 3830 0.84 4.0 LCZ Habitation133 A 8183132 510422 3825 1.08 3.1 LCZ Habitation133 B 8183132 510422 3825 0.5 4.0 LCZ Habitation133 C 8183132 510422 3825 0.25 5.1 LCZ Habitation134 A 8183175 510459 3820 0.64 4.0 LCZ Habitation134 B 8183175 510459 3820 0.09 5.1 LCZ Habitation134 C 8183175 510459 3820 0.09 5.2 LCZ Habitation135 A 8183483 510586 3815 0.25 5.3 LCZ Habitation136 A 8183107 510643 3825 2.08 3.2 LCZ Habitation136 B 8183107 510643 3825 0.25 5.1 LCZ Habitation137 A 8183125 510750 3825 0.99 3.2 LCZ Habitation137 B 8183125 510750 3825 0.99 4.0 LCZ Habitation137 C 8183125 510750 3825 0.3 5.1 LCZ Habitation137 D 8183125 510750 3825 0.3 5.3 LCZ Habitation138 A 8181867 510548 3880 0.09 5.3 LCZ Habitation139 A 8182065 510669 3875 0.4 4.0 LCZ Habitation140 A 8182087 510729 3875 0.18 4.0 LCZ Habitation140 B 8182087 510729 3875 0.18 5.3 LCZ Habitation141 A 8182279 510587 3870 0.1 3.1 LCZ Habitation141 B 8182279 510587 3870 0.1 3.2 LCZ Habitation141 C 8182279 510587 3870 0.1 5.3 LCZ Habitation142 A 8182279 510775 3870 1.1 3.1 LCZ Habitation142 B 8182279 510775 3870 1.1 3.2 LCZ Habitation142 C 8182279 510775 3870 1.1 4.0 LCZ Habitation142 D 8182279 510775 3870 0.25 5.1 LCZ Habitation143 A 8182233 510868 3870 1.5 3.1 LCZ Habitation
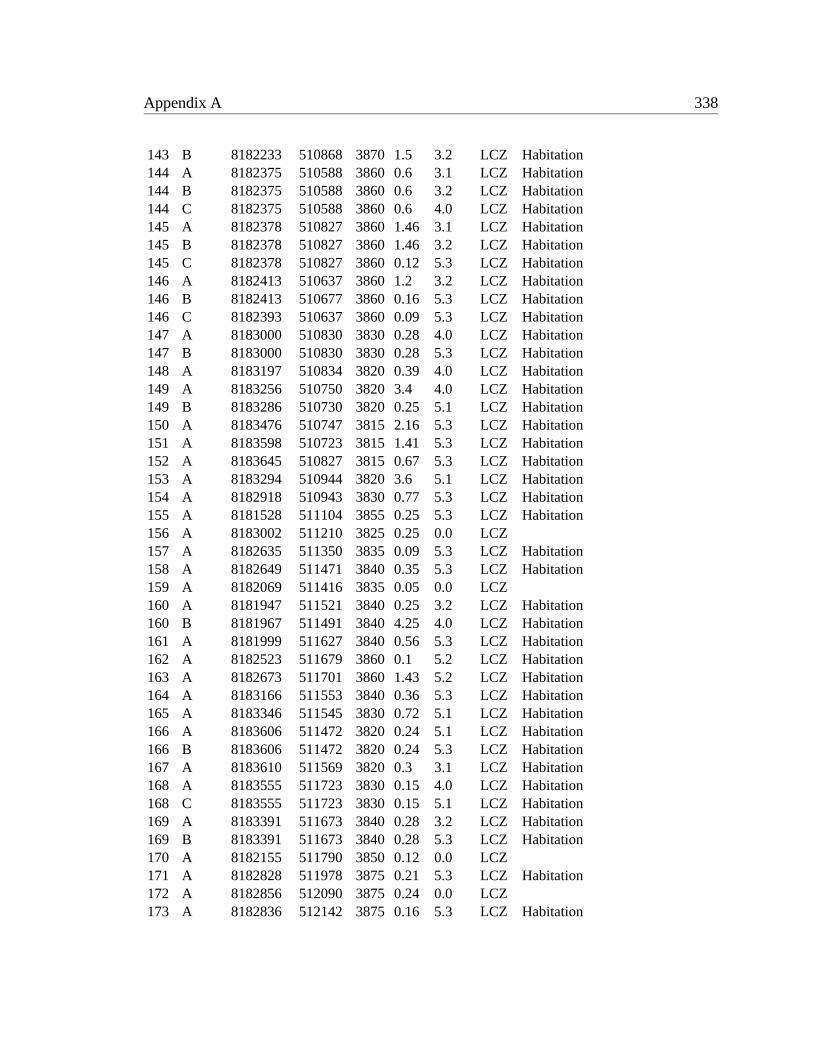
Appendix A 338
143 B 8182233 510868 3870 1.5 3.2 LCZ Habitation144 A 8182375 510588 3860 0.6 3.1 LCZ Habitation144 B 8182375 510588 3860 0.6 3.2 LCZ Habitation144 C 8182375 510588 3860 0.6 4.0 LCZ Habitation145 A 8182378 510827 3860 1.46 3.1 LCZ Habitation145 B 8182378 510827 3860 1.46 3.2 LCZ Habitation145 C 8182378 510827 3860 0.12 5.3 LCZ Habitation146 A 8182413 510637 3860 1.2 3.2 LCZ Habitation146 B 8182413 510677 3860 0.16 5.3 LCZ Habitation146 C 8182393 510637 3860 0.09 5.3 LCZ Habitation147 A 8183000 510830 3830 0.28 4.0 LCZ Habitation147 B 8183000 510830 3830 0.28 5.3 LCZ Habitation148 A 8183197 510834 3820 0.39 4.0 LCZ Habitation149 A 8183256 510750 3820 3.4 4.0 LCZ Habitation149 B 8183286 510730 3820 0.25 5.1 LCZ Habitation150 A 8183476 510747 3815 2.16 5.3 LCZ Habitation151 A 8183598 510723 3815 1.41 5.3 LCZ Habitation152 A 8183645 510827 3815 0.67 5.3 LCZ Habitation153 A 8183294 510944 3820 3.6 5.1 LCZ Habitation154 A 8182918 510943 3830 0.77 5.3 LCZ Habitation155 A 8181528 511104 3855 0.25 5.3 LCZ Habitation156 A 8183002 511210 3825 0.25 0.0 LCZ157 A 8182635 511350 3835 0.09 5.3 LCZ Habitation158 A 8182649 511471 3840 0.35 5.3 LCZ Habitation159 A 8182069 511416 3835 0.05 0.0 LCZ160 A 8181947 511521 3840 0.25 3.2 LCZ Habitation160 B 8181967 511491 3840 4.25 4.0 LCZ Habitation161 A 8181999 511627 3840 0.56 5.3 LCZ Habitation162 A 8182523 511679 3860 0.1 5.2 LCZ Habitation163 A 8182673 511701 3860 1.43 5.2 LCZ Habitation164 A 8183166 511553 3840 0.36 5.3 LCZ Habitation165 A 8183346 511545 3830 0.72 5.1 LCZ Habitation166 A 8183606 511472 3820 0.24 5.1 LCZ Habitation166 B 8183606 511472 3820 0.24 5.3 LCZ Habitation167 A 8183610 511569 3820 0.3 3.1 LCZ Habitation168 A 8183555 511723 3830 0.15 4.0 LCZ Habitation168 C 8183555 511723 3830 0.15 5.1 LCZ Habitation169 A 8183391 511673 3840 0.28 3.2 LCZ Habitation169 B 8183391 511673 3840 0.28 5.3 LCZ Habitation170 A 8182155 511790 3850 0.12 0.0 LCZ171 A 8182828 511978 3875 0.21 5.3 LCZ Habitation172 A 8182856 512090 3875 0.24 0.0 LCZ173 A 8182836 512142 3875 0.16 5.3 LCZ Habitation
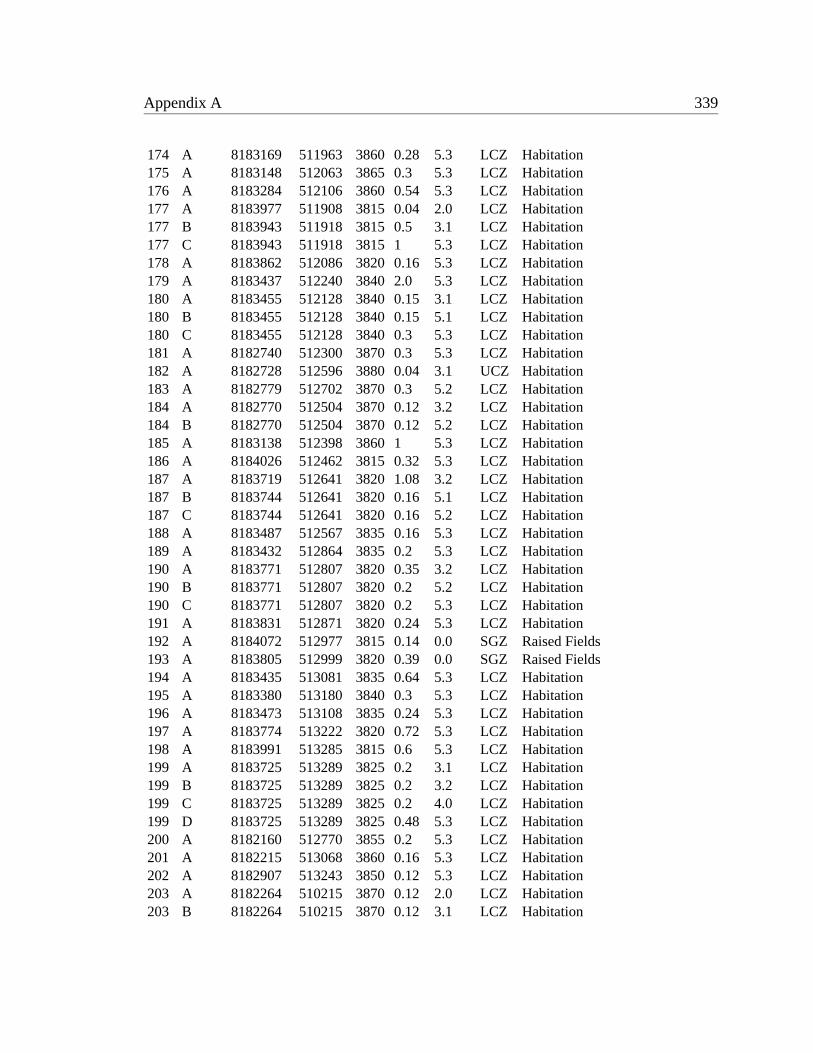
Appendix A 339
174 A 8183169 511963 3860 0.28 5.3 LCZ Habitation175 A 8183148 512063 3865 0.3 5.3 LCZ Habitation176 A 8183284 512106 3860 0.54 5.3 LCZ Habitation177 A 8183977 511908 3815 0.04 2.0 LCZ Habitation177 B 8183943 511918 3815 0.5 3.1 LCZ Habitation177 C 8183943 511918 3815 1 5.3 LCZ Habitation178 A 8183862 512086 3820 0.16 5.3 LCZ Habitation179 A 8183437 512240 3840 2.0 5.3 LCZ Habitation180 A 8183455 512128 3840 0.15 3.1 LCZ Habitation180 B 8183455 512128 3840 0.15 5.1 LCZ Habitation180 C 8183455 512128 3840 0.3 5.3 LCZ Habitation181 A 8182740 512300 3870 0.3 5.3 LCZ Habitation182 A 8182728 512596 3880 0.04 3.1 UCZ Habitation183 A 8182779 512702 3870 0.3 5.2 LCZ Habitation184 A 8182770 512504 3870 0.12 3.2 LCZ Habitation184 B 8182770 512504 3870 0.12 5.2 LCZ Habitation185 A 8183138 512398 3860 1 5.3 LCZ Habitation186 A 8184026 512462 3815 0.32 5.3 LCZ Habitation187 A 8183719 512641 3820 1.08 3.2 LCZ Habitation187 B 8183744 512641 3820 0.16 5.1 LCZ Habitation187 C 8183744 512641 3820 0.16 5.2 LCZ Habitation188 A 8183487 512567 3835 0.16 5.3 LCZ Habitation189 A 8183432 512864 3835 0.2 5.3 LCZ Habitation190 A 8183771 512807 3820 0.35 3.2 LCZ Habitation190 B 8183771 512807 3820 0.2 5.2 LCZ Habitation190 C 8183771 512807 3820 0.2 5.3 LCZ Habitation191 A 8183831 512871 3820 0.24 5.3 LCZ Habitation192 A 8184072 512977 3815 0.14 0.0 SGZ Raised Fields193 A 8183805 512999 3820 0.39 0.0 SGZ Raised Fields194 A 8183435 513081 3835 0.64 5.3 LCZ Habitation195 A 8183380 513180 3840 0.3 5.3 LCZ Habitation196 A 8183473 513108 3835 0.24 5.3 LCZ Habitation197 A 8183774 513222 3820 0.72 5.3 LCZ Habitation198 A 8183991 513285 3815 0.6 5.3 LCZ Habitation199 A 8183725 513289 3825 0.2 3.1 LCZ Habitation199 B 8183725 513289 3825 0.2 3.2 LCZ Habitation199 C 8183725 513289 3825 0.2 4.0 LCZ Habitation199 D 8183725 513289 3825 0.48 5.3 LCZ Habitation200 A 8182160 512770 3855 0.2 5.3 LCZ Habitation201 A 8182215 513068 3860 0.16 5.3 LCZ Habitation202 A 8182907 513243 3850 0.12 5.3 LCZ Habitation203 A 8182264 510215 3870 0.12 2.0 LCZ Habitation203 B 8182264 510215 3870 0.12 3.1 LCZ Habitation
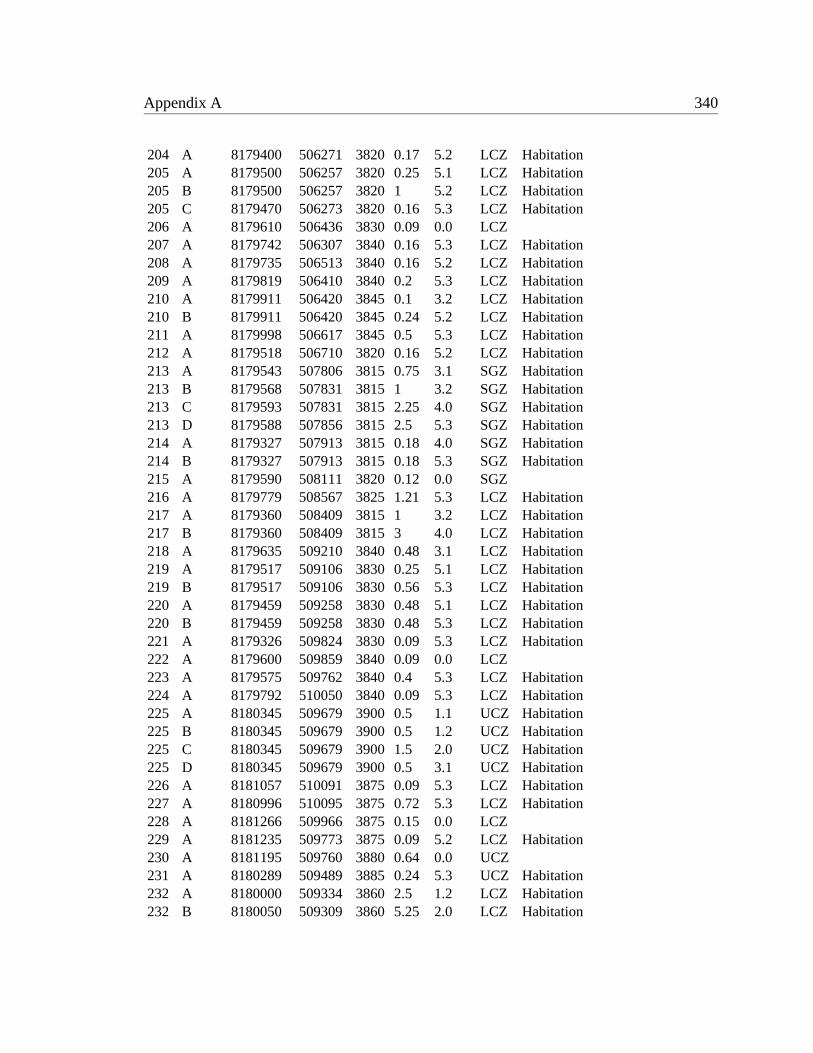
Appendix A 340
204 A 8179400 506271 3820 0.17 5.2 LCZ Habitation205 A 8179500 506257 3820 0.25 5.1 LCZ Habitation205 B 8179500 506257 3820 1 5.2 LCZ Habitation205 C 8179470 506273 3820 0.16 5.3 LCZ Habitation206 A 8179610 506436 3830 0.09 0.0 LCZ207 A 8179742 506307 3840 0.16 5.3 LCZ Habitation208 A 8179735 506513 3840 0.16 5.2 LCZ Habitation209 A 8179819 506410 3840 0.2 5.3 LCZ Habitation210 A 8179911 506420 3845 0.1 3.2 LCZ Habitation210 B 8179911 506420 3845 0.24 5.2 LCZ Habitation211 A 8179998 506617 3845 0.5 5.3 LCZ Habitation212 A 8179518 506710 3820 0.16 5.2 LCZ Habitation213 A 8179543 507806 3815 0.75 3.1 SGZ Habitation213 B 8179568 507831 3815 1 3.2 SGZ Habitation213 C 8179593 507831 3815 2.25 4.0 SGZ Habitation213 D 8179588 507856 3815 2.5 5.3 SGZ Habitation214 A 8179327 507913 3815 0.18 4.0 SGZ Habitation214 B 8179327 507913 3815 0.18 5.3 SGZ Habitation215 A 8179590 508111 3820 0.12 0.0 SGZ216 A 8179779 508567 3825 1.21 5.3 LCZ Habitation217 A 8179360 508409 3815 1 3.2 LCZ Habitation217 B 8179360 508409 3815 3 4.0 LCZ Habitation218 A 8179635 509210 3840 0.48 3.1 LCZ Habitation219 A 8179517 509106 3830 0.25 5.1 LCZ Habitation219 B 8179517 509106 3830 0.56 5.3 LCZ Habitation220 A 8179459 509258 3830 0.48 5.1 LCZ Habitation220 B 8179459 509258 3830 0.48 5.3 LCZ Habitation221 A 8179326 509824 3830 0.09 5.3 LCZ Habitation222 A 8179600 509859 3840 0.09 0.0 LCZ223 A 8179575 509762 3840 0.4 5.3 LCZ Habitation224 A 8179792 510050 3840 0.09 5.3 LCZ Habitation225 A 8180345 509679 3900 0.5 1.1 UCZ Habitation225 B 8180345 509679 3900 0.5 1.2 UCZ Habitation225 C 8180345 509679 3900 1.5 2.0 UCZ Habitation225 D 8180345 509679 3900 0.5 3.1 UCZ Habitation226 A 8181057 510091 3875 0.09 5.3 LCZ Habitation227 A 8180996 510095 3875 0.72 5.3 LCZ Habitation228 A 8181266 509966 3875 0.15 0.0 LCZ229 A 8181235 509773 3875 0.09 5.2 LCZ Habitation230 A 8181195 509760 3880 0.64 0.0 UCZ231 A 8180289 509489 3885 0.24 5.3 UCZ Habitation232 A 8180000 509334 3860 2.5 1.2 LCZ Habitation232 B 8180050 509309 3860 5.25 2.0 LCZ Habitation

Appendix A 341
232 C 8180000 509334 3860 14.75 3.1 LCZ Habitation232 D 8180100 509234 3860 1.5 3.2 LCZ Habitation232 E 8180050 509384 3860 5.25 4.0 LCZ Habitation232 F 8180100 509334 3860 0.25 5.1 LCZ Habitation232 G 8180100 509334 3860 0.25 5.2 LCZ Habitation232 H 8180125 509209 3860 0.5 5.3 LCZ Habitation232 I 8179850 509434 3860 1 5.3 LCZ Habitation233 A 8180234 509080 3860 0.26 5.3 LCZ Habitation234 A 8180986 508965 3870 0.25 0.0 LCZ235 A 8180075 508603 3835 0.42 5.3 LCZ Habitation236 A 8180364 508527 3840 0.2 1.1 LCZ Habitation236 B 8180364 508527 3840 0.2 5.3 LCZ Habitation237 A 8180507 508511 3840 0.75 5.3 LCZ Habitation238 A 8181374 508373 3850 0.2 5.3 LCZ Habitation239 A 8181267 508247 3850 0.09 4.0 LCZ Habitation239 B 8181267 508247 3850 1.32 5.2 LCZ Habitation239 C 8181267 508247 3850 0.09 5.3 LCZ Habitation240 A 8181701 508147 3855 0.09 5.3 LCZ Habitation241 A 8181287 508107 3845 0.64 5.2 LCZ Habitation241 B 8181287 508107 3845 0.09 5.3 LCZ Habitation242 A 8181147 507907 3840 0.85 5.3 LCZ Habitation243 A 8181912 507800 3870 0.09 5.2 UCZ Habitation244 A 8180290 507592 3820 0.25 5.3 LCZ Habitation245 A 8180558 507208 3840 0.16 5.3 LCZ Habitation246 A 8180353 506938 3845 0.25 5.3 LCZ Habitation247 A 8180549 506865 3855 0.35 5.2 LCZ Habitation247 B 8180549 506865 3855 0.35 5.3 LCZ Habitation248 A 8180910 505881 3820 0.88 3.2 LCZ Habitation248 B 8180910 505881 3820 0.88 4.0 LCZ Habitation249 A 8181168 506228 3830 0.41 5.2 LCZ Habitation249 B 8181168 506228 3830 0.41 5.3 LCZ Habitation250 A 8179426 505284 3830 0.19 0.0 LCZ251 A 8179520 505791 3860 0.14 5.2 UCZ Habitation252 A 8179494 505330 3835 0.13 5.3 LCZ Habitation253 A 8179832 505517 3835 0.2 5.3 LCZ Habitation254 A 8179987 505620 3840 0.04 0.0 LCZ255 A 8180136 505630 3830 0.07 5.3 LCZ Habitation256 A 8179996 505500 3830 0.16 5.3 LCZ Habitation257 A 8180276 505706 3835 0.37 5.3 LCZ Habitation258 A 8180442 506173 3845 0.03 5.3 LCZ Habitation259 A 8180370 506145 3850 0.14 5.3 LCZ Habitation260 A 8180543 505941 3835 0.33 5.3 LCZ Habitation261 A 8180661 505879 3830 0.44 5.3 LCZ Habitation
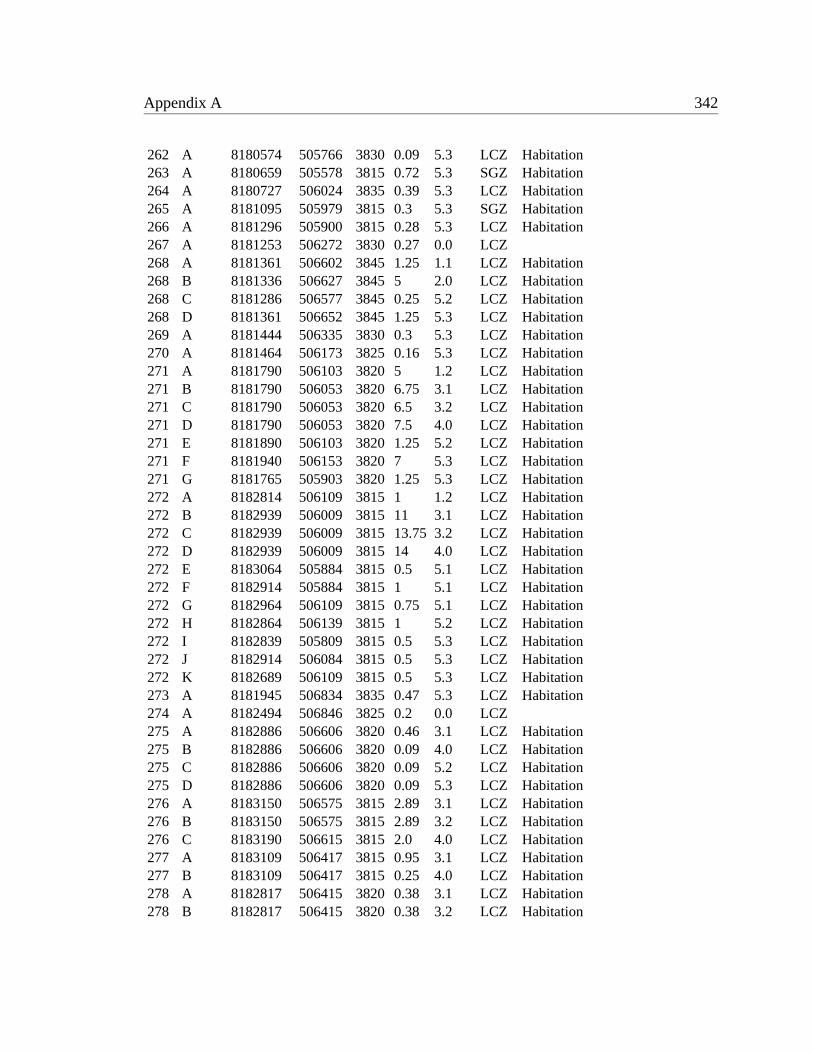
Appendix A 342
262 A 8180574 505766 3830 0.09 5.3 LCZ Habitation263 A 8180659 505578 3815 0.72 5.3 SGZ Habitation264 A 8180727 506024 3835 0.39 5.3 LCZ Habitation265 A 8181095 505979 3815 0.3 5.3 SGZ Habitation266 A 8181296 505900 3815 0.28 5.3 LCZ Habitation267 A 8181253 506272 3830 0.27 0.0 LCZ268 A 8181361 506602 3845 1.25 1.1 LCZ Habitation268 B 8181336 506627 3845 5 2.0 LCZ Habitation268 C 8181286 506577 3845 0.25 5.2 LCZ Habitation268 D 8181361 506652 3845 1.25 5.3 LCZ Habitation269 A 8181444 506335 3830 0.3 5.3 LCZ Habitation270 A 8181464 506173 3825 0.16 5.3 LCZ Habitation271 A 8181790 506103 3820 5 1.2 LCZ Habitation271 B 8181790 506053 3820 6.75 3.1 LCZ Habitation271 C 8181790 506053 3820 6.5 3.2 LCZ Habitation271 D 8181790 506053 3820 7.5 4.0 LCZ Habitation271 E 8181890 506103 3820 1.25 5.2 LCZ Habitation271 F 8181940 506153 3820 7 5.3 LCZ Habitation271 G 8181765 505903 3820 1.25 5.3 LCZ Habitation272 A 8182814 506109 3815 1 1.2 LCZ Habitation272 B 8182939 506009 3815 11 3.1 LCZ Habitation272 C 8182939 506009 3815 13.75 3.2 LCZ Habitation272 D 8182939 506009 3815 14 4.0 LCZ Habitation272 E 8183064 505884 3815 0.5 5.1 LCZ Habitation272 F 8182914 505884 3815 1 5.1 LCZ Habitation272 G 8182964 506109 3815 0.75 5.1 LCZ Habitation272 H 8182864 506139 3815 1 5.2 LCZ Habitation272 I 8182839 505809 3815 0.5 5.3 LCZ Habitation272 J 8182914 506084 3815 0.5 5.3 LCZ Habitation272 K 8182689 506109 3815 0.5 5.3 LCZ Habitation273 A 8181945 506834 3835 0.47 5.3 LCZ Habitation274 A 8182494 506846 3825 0.2 0.0 LCZ275 A 8182886 506606 3820 0.46 3.1 LCZ Habitation275 B 8182886 506606 3820 0.09 4.0 LCZ Habitation275 C 8182886 506606 3820 0.09 5.2 LCZ Habitation275 D 8182886 506606 3820 0.09 5.3 LCZ Habitation276 A 8183150 506575 3815 2.89 3.1 LCZ Habitation276 B 8183150 506575 3815 2.89 3.2 LCZ Habitation276 C 8183190 506615 3815 2.0 4.0 LCZ Habitation277 A 8183109 506417 3815 0.95 3.1 LCZ Habitation277 B 8183109 506417 3815 0.25 4.0 LCZ Habitation278 A 8182817 506415 3820 0.38 3.1 LCZ Habitation278 B 8182817 506415 3820 0.38 3.2 LCZ Habitation
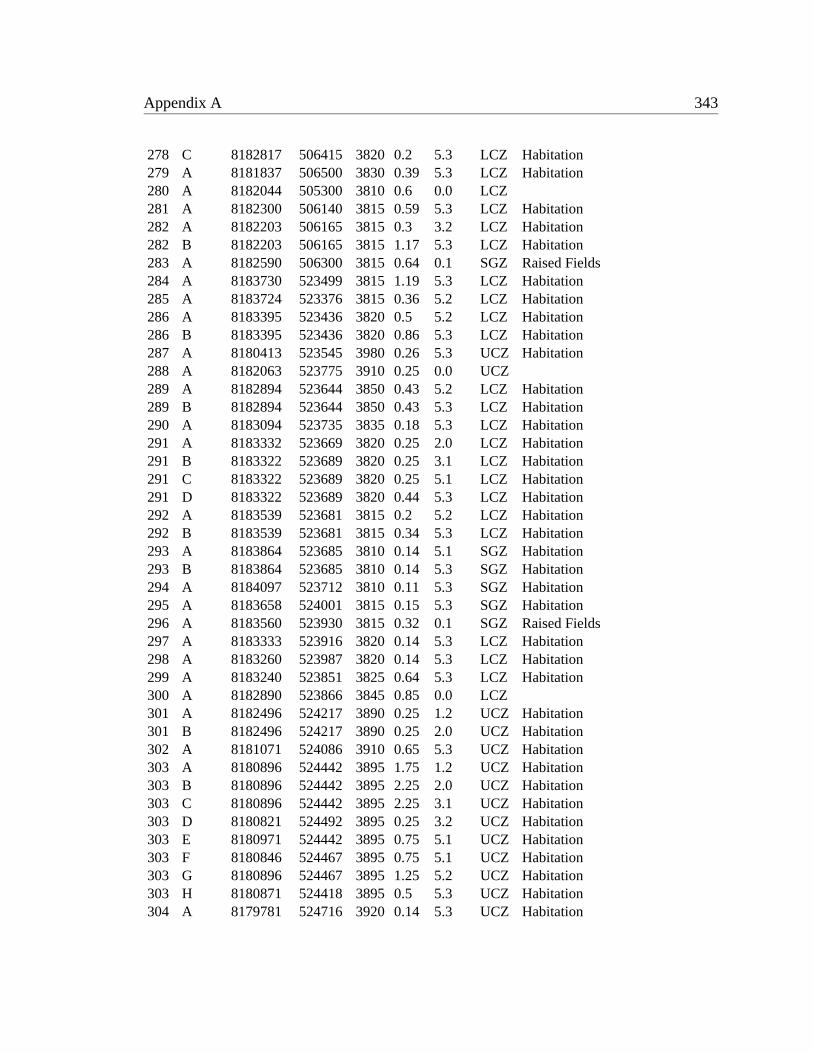
Appendix A 343
278 C 8182817 506415 3820 0.2 5.3 LCZ Habitation279 A 8181837 506500 3830 0.39 5.3 LCZ Habitation280 A 8182044 505300 3810 0.6 0.0 LCZ281 A 8182300 506140 3815 0.59 5.3 LCZ Habitation282 A 8182203 506165 3815 0.3 3.2 LCZ Habitation282 B 8182203 506165 3815 1.17 5.3 LCZ Habitation283 A 8182590 506300 3815 0.64 0.1 SGZ Raised Fields284 A 8183730 523499 3815 1.19 5.3 LCZ Habitation285 A 8183724 523376 3815 0.36 5.2 LCZ Habitation286 A 8183395 523436 3820 0.5 5.2 LCZ Habitation286 B 8183395 523436 3820 0.86 5.3 LCZ Habitation287 A 8180413 523545 3980 0.26 5.3 UCZ Habitation288 A 8182063 523775 3910 0.25 0.0 UCZ289 A 8182894 523644 3850 0.43 5.2 LCZ Habitation289 B 8182894 523644 3850 0.43 5.3 LCZ Habitation290 A 8183094 523735 3835 0.18 5.3 LCZ Habitation291 A 8183332 523669 3820 0.25 2.0 LCZ Habitation291 B 8183322 523689 3820 0.25 3.1 LCZ Habitation291 C 8183322 523689 3820 0.25 5.1 LCZ Habitation291 D 8183322 523689 3820 0.44 5.3 LCZ Habitation292 A 8183539 523681 3815 0.2 5.2 LCZ Habitation292 B 8183539 523681 3815 0.34 5.3 LCZ Habitation293 A 8183864 523685 3810 0.14 5.1 SGZ Habitation293 B 8183864 523685 3810 0.14 5.3 SGZ Habitation294 A 8184097 523712 3810 0.11 5.3 SGZ Habitation295 A 8183658 524001 3815 0.15 5.3 SGZ Habitation296 A 8183560 523930 3815 0.32 0.1 SGZ Raised Fields297 A 8183333 523916 3820 0.14 5.3 LCZ Habitation298 A 8183260 523987 3820 0.14 5.3 LCZ Habitation299 A 8183240 523851 3825 0.64 5.3 LCZ Habitation300 A 8182890 523866 3845 0.85 0.0 LCZ301 A 8182496 524217 3890 0.25 1.2 UCZ Habitation301 B 8182496 524217 3890 0.25 2.0 UCZ Habitation302 A 8181071 524086 3910 0.65 5.3 UCZ Habitation303 A 8180896 524442 3895 1.75 1.2 UCZ Habitation303 B 8180896 524442 3895 2.25 2.0 UCZ Habitation303 C 8180896 524442 3895 2.25 3.1 UCZ Habitation303 D 8180821 524492 3895 0.25 3.2 UCZ Habitation303 E 8180971 524442 3895 0.75 5.1 UCZ Habitation303 F 8180846 524467 3895 0.75 5.1 UCZ Habitation303 G 8180896 524467 3895 1.25 5.2 UCZ Habitation303 H 8180871 524418 3895 0.5 5.3 UCZ Habitation304 A 8179781 524716 3920 0.14 5.3 UCZ Habitation

Appendix A 344
305 A 8182531 524285 3885 0.3 2.0 LCZ Habitation305 B 8182531 524285 3885 0.3 3.1 LCZ Habitation306 A 8183060 524218 3830 0.16 0.0 LCZ307 A 8183200 524317 3820 0.25 3.2 LCZ Habitation307 B 8183200 524317 3820 0.35 4.0 LCZ Habitation307 C 8183200 524317 3820 0.25 5.3 LCZ Habitation308 A 8183339 524195 3815 0.6 5.3 LCZ Habitation309 A 8183568 524208 3815 0.16 5.1 SGZ Habitation309 B 8183568 524208 3815 0.16 5.3 SGZ Habitation310 A 8183570 524255 3810 0.08 0.1 SGZ Raised Fields311 A 8183572 524311 3815 0.22 5.2 SGZ Habitation311 B 8183572 524311 3815 0.22 5.3 SGZ Habitation312 A 8183709 524184 3810 0.09 5.3 SGZ Habitation313 A 8183811 524297 3810 0.23 5.3 SGZ Habitation314 A 8183574 524585 3810 1.26 0.1 SGZ Raised Fields315 A 8183660 524521 3810 0.13 3.2 SGZ Habitation315 B 8183660 524521 3810 0.13 5.3 SGZ Habitation316 A 8183356 524081 3815 0.4 5.2 LCZ Habitation316 B 8183356 524081 3815 0.63 5.3 LCZ Habitation317 A 8180054 524676 3910 0.35 5.3 UCZ Habitation318 A 8190287 524878 3810 0.33 3.1 LCZ Habitation318 B 8190287 524878 3810 0.33 3.2 LCZ Habitation318 C 8190287 524878 3810 0.15 4.0 LCZ Habitation318 D 8190287 524878 3810 0.15 5.1 LCZ Habitation318 E 8190287 524878 3810 0.15 5.3 LCZ Habitation319 A 8190140 525093 3810 3.8 3.1 LCZ Habitation319 B 8190140 525093 3810 3.8 3.2 LCZ Habitation319 C 8190140 525093 3810 3.8 4.0 LCZ Habitation319 D 8190140 525043 3810 0.5 5.1 LCZ Habitation319 E 8190180 525063 3810 0.25 5.3 LCZ Habitation320 A 8190398 524568 3810 3 2.0 LCZ Habitation320 B 8190398 524568 3810 1.5 3.2 LCZ Habitation320 C 8190398 524568 3810 3 4.0 LCZ Habitation320 D 8190398 524568 3810 1.5 5.2 LCZ Habitation321 A 8181991 507328 3850 0.56 5.3 LCZ Habitation322 A 8182493 507314 3845 3.5 3.1 LCZ Habitation322 B 8182493 507314 3845 4.5 3.2 LCZ Habitation322 C 8182493 507314 3845 11.73 4.0 LCZ Habitation322 D 8182493 507314 3845 0.25 5.1 LCZ Habitation322 E 8182553 507314 3845 0.25 5.2 LCZ Habitation322 F 8182450 507260 3845 0.25 5.3 LCZ Habitation322 G 8182493 507365 3845 0.25 5.3 LCZ Habitation323 A 8182306 507296 3845 0.25 5.1 LCZ Habitation
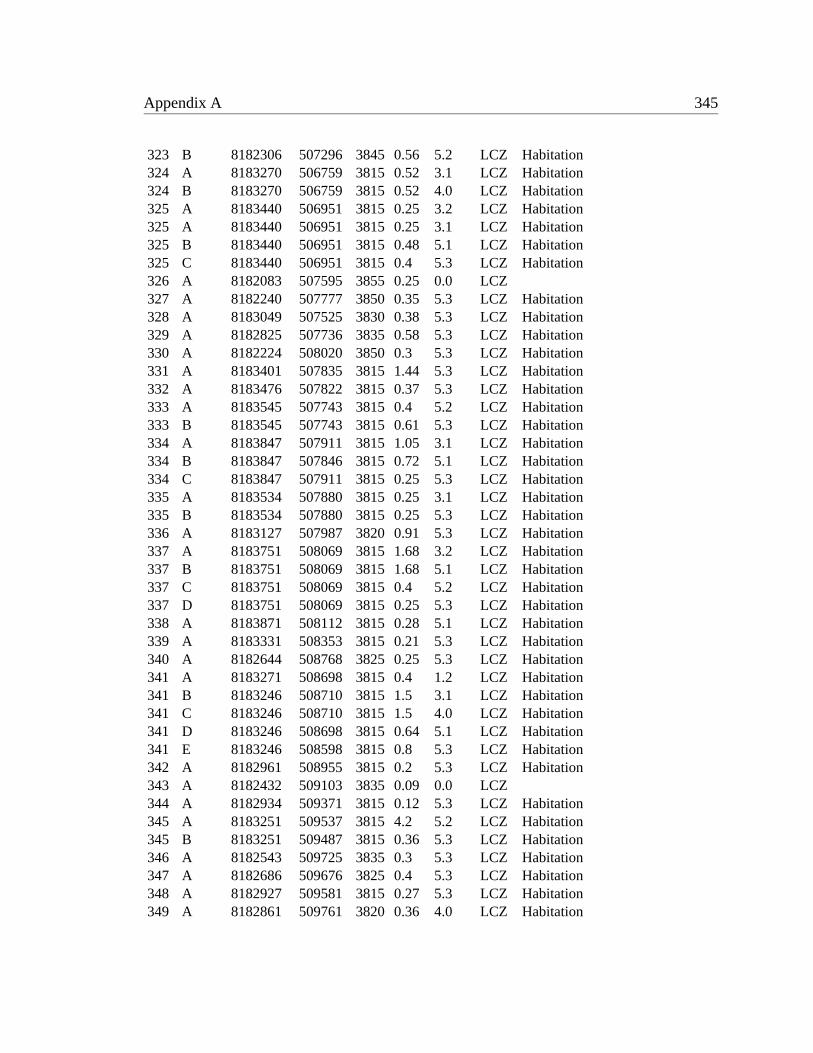
Appendix A 345
323 B 8182306 507296 3845 0.56 5.2 LCZ Habitation324 A 8183270 506759 3815 0.52 3.1 LCZ Habitation324 B 8183270 506759 3815 0.52 4.0 LCZ Habitation325 A 8183440 506951 3815 0.25 3.2 LCZ Habitation325 A 8183440 506951 3815 0.25 3.1 LCZ Habitation325 B 8183440 506951 3815 0.48 5.1 LCZ Habitation325 C 8183440 506951 3815 0.4 5.3 LCZ Habitation326 A 8182083 507595 3855 0.25 0.0 LCZ327 A 8182240 507777 3850 0.35 5.3 LCZ Habitation328 A 8183049 507525 3830 0.38 5.3 LCZ Habitation329 A 8182825 507736 3835 0.58 5.3 LCZ Habitation330 A 8182224 508020 3850 0.3 5.3 LCZ Habitation331 A 8183401 507835 3815 1.44 5.3 LCZ Habitation332 A 8183476 507822 3815 0.37 5.3 LCZ Habitation333 A 8183545 507743 3815 0.4 5.2 LCZ Habitation333 B 8183545 507743 3815 0.61 5.3 LCZ Habitation334 A 8183847 507911 3815 1.05 3.1 LCZ Habitation334 B 8183847 507846 3815 0.72 5.1 LCZ Habitation334 C 8183847 507911 3815 0.25 5.3 LCZ Habitation335 A 8183534 507880 3815 0.25 3.1 LCZ Habitation335 B 8183534 507880 3815 0.25 5.3 LCZ Habitation336 A 8183127 507987 3820 0.91 5.3 LCZ Habitation337 A 8183751 508069 3815 1.68 3.2 LCZ Habitation337 B 8183751 508069 3815 1.68 5.1 LCZ Habitation337 C 8183751 508069 3815 0.4 5.2 LCZ Habitation337 D 8183751 508069 3815 0.25 5.3 LCZ Habitation338 A 8183871 508112 3815 0.28 5.1 LCZ Habitation339 A 8183331 508353 3815 0.21 5.3 LCZ Habitation340 A 8182644 508768 3825 0.25 5.3 LCZ Habitation341 A 8183271 508698 3815 0.4 1.2 LCZ Habitation341 B 8183246 508710 3815 1.5 3.1 LCZ Habitation341 C 8183246 508710 3815 1.5 4.0 LCZ Habitation341 D 8183246 508698 3815 0.64 5.1 LCZ Habitation341 E 8183246 508598 3815 0.8 5.3 LCZ Habitation342 A 8182961 508955 3815 0.2 5.3 LCZ Habitation343 A 8182432 509103 3835 0.09 0.0 LCZ344 A 8182934 509371 3815 0.12 5.3 LCZ Habitation345 A 8183251 509537 3815 4.2 5.2 LCZ Habitation345 B 8183251 509487 3815 0.36 5.3 LCZ Habitation346 A 8182543 509725 3835 0.3 5.3 LCZ Habitation347 A 8182686 509676 3825 0.4 5.3 LCZ Habitation348 A 8182927 509581 3815 0.27 5.3 LCZ Habitation349 A 8182861 509761 3820 0.36 4.0 LCZ Habitation
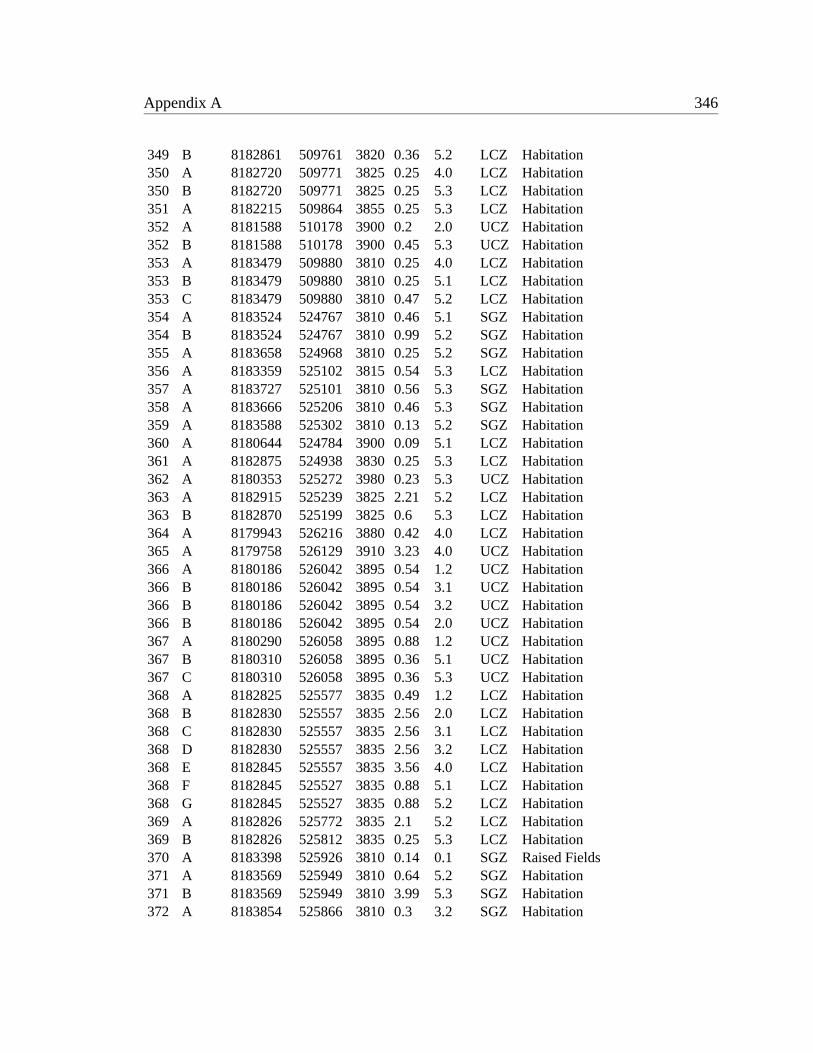
Appendix A 346
349 B 8182861 509761 3820 0.36 5.2 LCZ Habitation350 A 8182720 509771 3825 0.25 4.0 LCZ Habitation350 B 8182720 509771 3825 0.25 5.3 LCZ Habitation351 A 8182215 509864 3855 0.25 5.3 LCZ Habitation352 A 8181588 510178 3900 0.2 2.0 UCZ Habitation352 B 8181588 510178 3900 0.45 5.3 UCZ Habitation353 A 8183479 509880 3810 0.25 4.0 LCZ Habitation353 B 8183479 509880 3810 0.25 5.1 LCZ Habitation353 C 8183479 509880 3810 0.47 5.2 LCZ Habitation354 A 8183524 524767 3810 0.46 5.1 SGZ Habitation354 B 8183524 524767 3810 0.99 5.2 SGZ Habitation355 A 8183658 524968 3810 0.25 5.2 SGZ Habitation356 A 8183359 525102 3815 0.54 5.3 LCZ Habitation357 A 8183727 525101 3810 0.56 5.3 SGZ Habitation358 A 8183666 525206 3810 0.46 5.3 SGZ Habitation359 A 8183588 525302 3810 0.13 5.2 SGZ Habitation360 A 8180644 524784 3900 0.09 5.1 LCZ Habitation361 A 8182875 524938 3830 0.25 5.3 LCZ Habitation362 A 8180353 525272 3980 0.23 5.3 UCZ Habitation363 A 8182915 525239 3825 2.21 5.2 LCZ Habitation363 B 8182870 525199 3825 0.6 5.3 LCZ Habitation364 A 8179943 526216 3880 0.42 4.0 LCZ Habitation365 A 8179758 526129 3910 3.23 4.0 UCZ Habitation366 A 8180186 526042 3895 0.54 1.2 UCZ Habitation366 B 8180186 526042 3895 0.54 3.1 UCZ Habitation366 B 8180186 526042 3895 0.54 3.2 UCZ Habitation366 B 8180186 526042 3895 0.54 2.0 UCZ Habitation367 A 8180290 526058 3895 0.88 1.2 UCZ Habitation367 B 8180310 526058 3895 0.36 5.1 UCZ Habitation367 C 8180310 526058 3895 0.36 5.3 UCZ Habitation368 A 8182825 525577 3835 0.49 1.2 LCZ Habitation368 B 8182830 525557 3835 2.56 2.0 LCZ Habitation368 C 8182830 525557 3835 2.56 3.1 LCZ Habitation368 D 8182830 525557 3835 2.56 3.2 LCZ Habitation368 E 8182845 525557 3835 3.56 4.0 LCZ Habitation368 F 8182845 525527 3835 0.88 5.1 LCZ Habitation368 G 8182845 525527 3835 0.88 5.2 LCZ Habitation369 A 8182826 525772 3835 2.1 5.2 LCZ Habitation369 B 8182826 525812 3835 0.25 5.3 LCZ Habitation370 A 8183398 525926 3810 0.14 0.1 SGZ Raised Fields371 A 8183569 525949 3810 0.64 5.2 SGZ Habitation371 B 8183569 525949 3810 3.99 5.3 SGZ Habitation372 A 8183854 525866 3810 0.3 3.2 SGZ Habitation
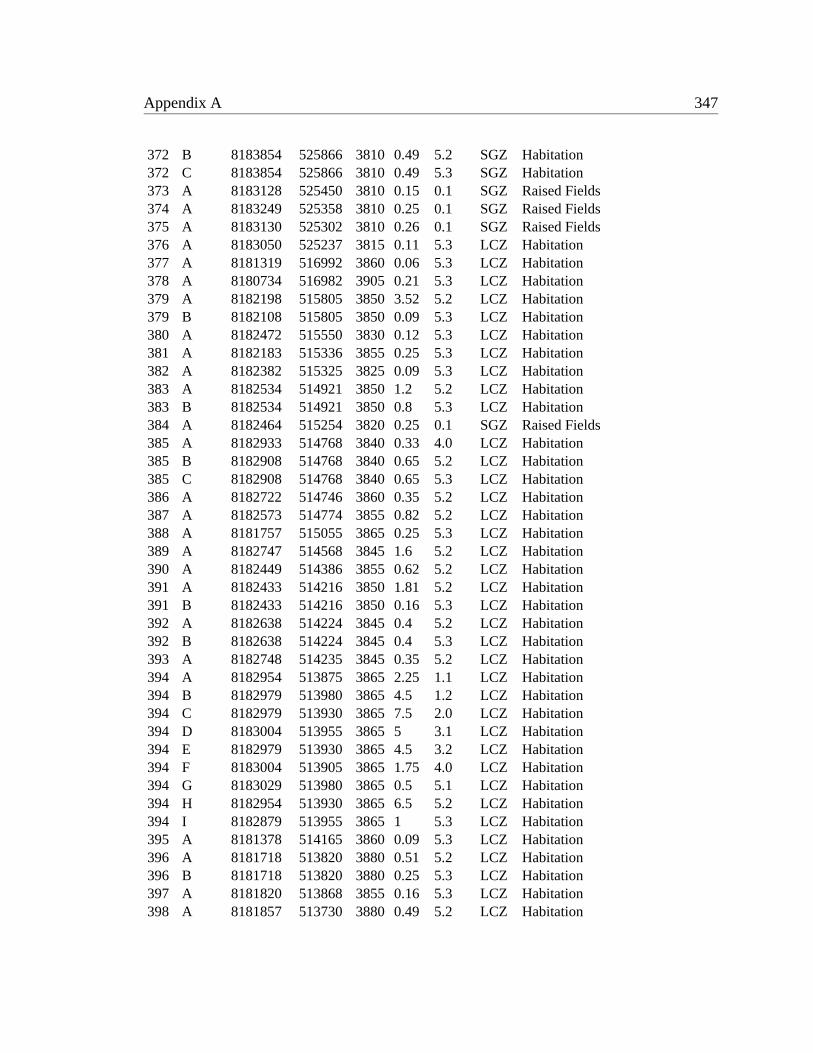
Appendix A 347
372 B 8183854 525866 3810 0.49 5.2 SGZ Habitation372 C 8183854 525866 3810 0.49 5.3 SGZ Habitation373 A 8183128 525450 3810 0.15 0.1 SGZ Raised Fields374 A 8183249 525358 3810 0.25 0.1 SGZ Raised Fields375 A 8183130 525302 3810 0.26 0.1 SGZ Raised Fields376 A 8183050 525237 3815 0.11 5.3 LCZ Habitation377 A 8181319 516992 3860 0.06 5.3 LCZ Habitation378 A 8180734 516982 3905 0.21 5.3 LCZ Habitation379 A 8182198 515805 3850 3.52 5.2 LCZ Habitation379 B 8182108 515805 3850 0.09 5.3 LCZ Habitation380 A 8182472 515550 3830 0.12 5.3 LCZ Habitation381 A 8182183 515336 3855 0.25 5.3 LCZ Habitation382 A 8182382 515325 3825 0.09 5.3 LCZ Habitation383 A 8182534 514921 3850 1.2 5.2 LCZ Habitation383 B 8182534 514921 3850 0.8 5.3 LCZ Habitation384 A 8182464 515254 3820 0.25 0.1 SGZ Raised Fields385 A 8182933 514768 3840 0.33 4.0 LCZ Habitation385 B 8182908 514768 3840 0.65 5.2 LCZ Habitation385 C 8182908 514768 3840 0.65 5.3 LCZ Habitation386 A 8182722 514746 3860 0.35 5.2 LCZ Habitation387 A 8182573 514774 3855 0.82 5.2 LCZ Habitation388 A 8181757 515055 3865 0.25 5.3 LCZ Habitation389 A 8182747 514568 3845 1.6 5.2 LCZ Habitation390 A 8182449 514386 3855 0.62 5.2 LCZ Habitation391 A 8182433 514216 3850 1.81 5.2 LCZ Habitation391 B 8182433 514216 3850 0.16 5.3 LCZ Habitation392 A 8182638 514224 3845 0.4 5.2 LCZ Habitation392 B 8182638 514224 3845 0.4 5.3 LCZ Habitation393 A 8182748 514235 3845 0.35 5.2 LCZ Habitation394 A 8182954 513875 3865 2.25 1.1 LCZ Habitation394 B 8182979 513980 3865 4.5 1.2 LCZ Habitation394 C 8182979 513930 3865 7.5 2.0 LCZ Habitation394 D 8183004 513955 3865 5 3.1 LCZ Habitation394 E 8182979 513930 3865 4.5 3.2 LCZ Habitation394 F 8183004 513905 3865 1.75 4.0 LCZ Habitation394 G 8183029 513980 3865 0.5 5.1 LCZ Habitation394 H 8182954 513930 3865 6.5 5.2 LCZ Habitation394 I 8182879 513955 3865 1 5.3 LCZ Habitation395 A 8181378 514165 3860 0.09 5.3 LCZ Habitation396 A 8181718 513820 3880 0.51 5.2 LCZ Habitation396 B 8181718 513820 3880 0.25 5.3 LCZ Habitation397 A 8181820 513868 3855 0.16 5.3 LCZ Habitation398 A 8181857 513730 3880 0.49 5.2 LCZ Habitation
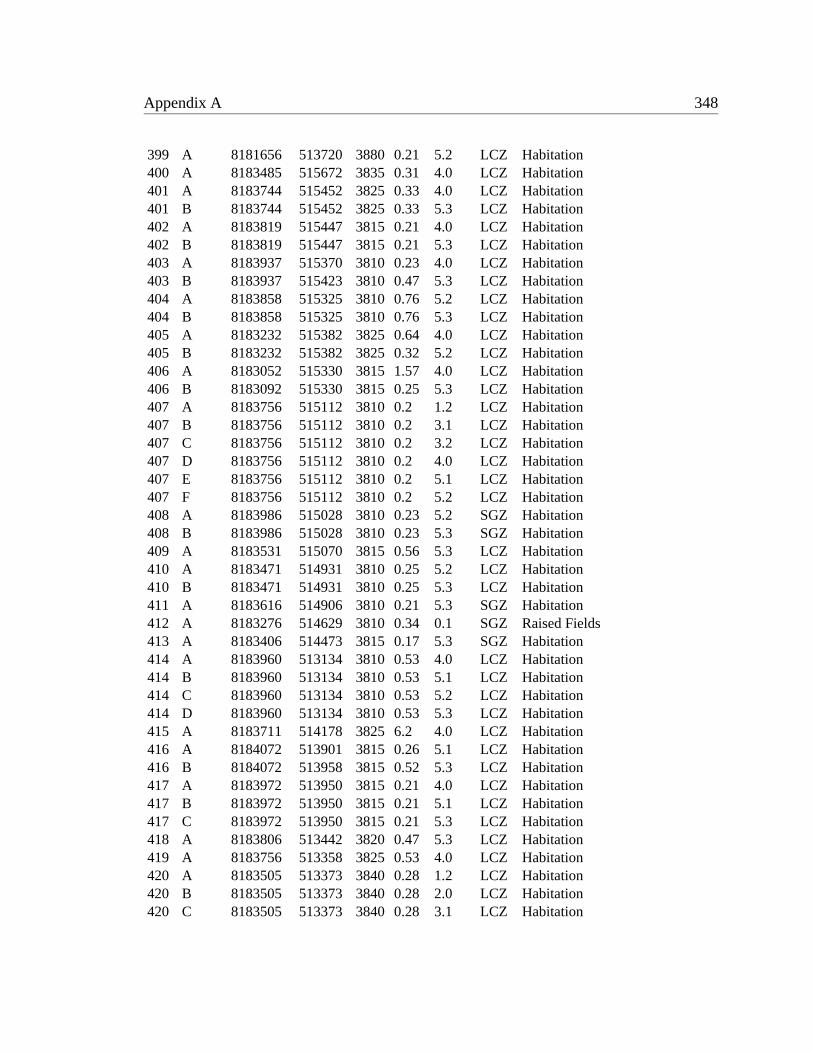
Appendix A 348
399 A 8181656 513720 3880 0.21 5.2 LCZ Habitation400 A 8183485 515672 3835 0.31 4.0 LCZ Habitation401 A 8183744 515452 3825 0.33 4.0 LCZ Habitation401 B 8183744 515452 3825 0.33 5.3 LCZ Habitation402 A 8183819 515447 3815 0.21 4.0 LCZ Habitation402 B 8183819 515447 3815 0.21 5.3 LCZ Habitation403 A 8183937 515370 3810 0.23 4.0 LCZ Habitation403 B 8183937 515423 3810 0.47 5.3 LCZ Habitation404 A 8183858 515325 3810 0.76 5.2 LCZ Habitation404 B 8183858 515325 3810 0.76 5.3 LCZ Habitation405 A 8183232 515382 3825 0.64 4.0 LCZ Habitation405 B 8183232 515382 3825 0.32 5.2 LCZ Habitation406 A 8183052 515330 3815 1.57 4.0 LCZ Habitation406 B 8183092 515330 3815 0.25 5.3 LCZ Habitation407 A 8183756 515112 3810 0.2 1.2 LCZ Habitation407 B 8183756 515112 3810 0.2 3.1 LCZ Habitation407 C 8183756 515112 3810 0.2 3.2 LCZ Habitation407 D 8183756 515112 3810 0.2 4.0 LCZ Habitation407 E 8183756 515112 3810 0.2 5.1 LCZ Habitation407 F 8183756 515112 3810 0.2 5.2 LCZ Habitation408 A 8183986 515028 3810 0.23 5.2 SGZ Habitation408 B 8183986 515028 3810 0.23 5.3 SGZ Habitation409 A 8183531 515070 3815 0.56 5.3 LCZ Habitation410 A 8183471 514931 3810 0.25 5.2 LCZ Habitation410 B 8183471 514931 3810 0.25 5.3 LCZ Habitation411 A 8183616 514906 3810 0.21 5.3 SGZ Habitation412 A 8183276 514629 3810 0.34 0.1 SGZ Raised Fields413 A 8183406 514473 3815 0.17 5.3 SGZ Habitation414 A 8183960 513134 3810 0.53 4.0 LCZ Habitation414 B 8183960 513134 3810 0.53 5.1 LCZ Habitation414 C 8183960 513134 3810 0.53 5.2 LCZ Habitation414 D 8183960 513134 3810 0.53 5.3 LCZ Habitation415 A 8183711 514178 3825 6.2 4.0 LCZ Habitation416 A 8184072 513901 3815 0.26 5.1 LCZ Habitation416 B 8184072 513958 3815 0.52 5.3 LCZ Habitation417 A 8183972 513950 3815 0.21 4.0 LCZ Habitation417 B 8183972 513950 3815 0.21 5.1 LCZ Habitation417 C 8183972 513950 3815 0.21 5.3 LCZ Habitation418 A 8183806 513442 3820 0.47 5.3 LCZ Habitation419 A 8183756 513358 3825 0.53 4.0 LCZ Habitation420 A 8183505 513373 3840 0.28 1.2 LCZ Habitation420 B 8183505 513373 3840 0.28 2.0 LCZ Habitation420 C 8183505 513373 3840 0.28 3.1 LCZ Habitation
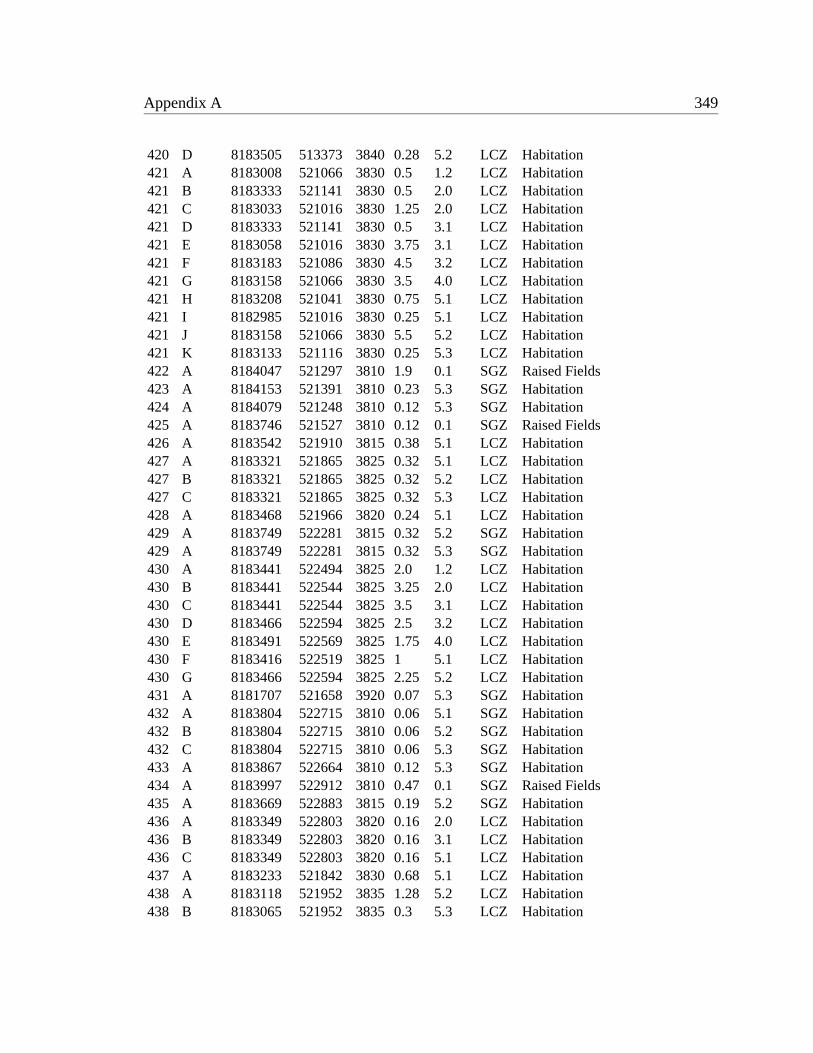
Appendix A 349
420 D 8183505 513373 3840 0.28 5.2 LCZ Habitation421 A 8183008 521066 3830 0.5 1.2 LCZ Habitation421 B 8183333 521141 3830 0.5 2.0 LCZ Habitation421 C 8183033 521016 3830 1.25 2.0 LCZ Habitation421 D 8183333 521141 3830 0.5 3.1 LCZ Habitation421 E 8183058 521016 3830 3.75 3.1 LCZ Habitation421 F 8183183 521086 3830 4.5 3.2 LCZ Habitation421 G 8183158 521066 3830 3.5 4.0 LCZ Habitation421 H 8183208 521041 3830 0.75 5.1 LCZ Habitation421 I 8182985 521016 3830 0.25 5.1 LCZ Habitation421 J 8183158 521066 3830 5.5 5.2 LCZ Habitation421 K 8183133 521116 3830 0.25 5.3 LCZ Habitation422 A 8184047 521297 3810 1.9 0.1 SGZ Raised Fields423 A 8184153 521391 3810 0.23 5.3 SGZ Habitation424 A 8184079 521248 3810 0.12 5.3 SGZ Habitation425 A 8183746 521527 3810 0.12 0.1 SGZ Raised Fields426 A 8183542 521910 3815 0.38 5.1 LCZ Habitation427 A 8183321 521865 3825 0.32 5.1 LCZ Habitation427 B 8183321 521865 3825 0.32 5.2 LCZ Habitation427 C 8183321 521865 3825 0.32 5.3 LCZ Habitation428 A 8183468 521966 3820 0.24 5.1 LCZ Habitation429 A 8183749 522281 3815 0.32 5.2 SGZ Habitation429 A 8183749 522281 3815 0.32 5.3 SGZ Habitation430 A 8183441 522494 3825 2.0 1.2 LCZ Habitation430 B 8183441 522544 3825 3.25 2.0 LCZ Habitation430 C 8183441 522544 3825 3.5 3.1 LCZ Habitation430 D 8183466 522594 3825 2.5 3.2 LCZ Habitation430 E 8183491 522569 3825 1.75 4.0 LCZ Habitation430 F 8183416 522519 3825 1 5.1 LCZ Habitation430 G 8183466 522594 3825 2.25 5.2 LCZ Habitation431 A 8181707 521658 3920 0.07 5.3 SGZ Habitation432 A 8183804 522715 3810 0.06 5.1 SGZ Habitation432 B 8183804 522715 3810 0.06 5.2 SGZ Habitation432 C 8183804 522715 3810 0.06 5.3 SGZ Habitation433 A 8183867 522664 3810 0.12 5.3 SGZ Habitation434 A 8183997 522912 3810 0.47 0.1 SGZ Raised Fields435 A 8183669 522883 3815 0.19 5.2 SGZ Habitation436 A 8183349 522803 3820 0.16 2.0 LCZ Habitation436 B 8183349 522803 3820 0.16 3.1 LCZ Habitation436 C 8183349 522803 3820 0.16 5.1 LCZ Habitation437 A 8183233 521842 3830 0.68 5.1 LCZ Habitation438 A 8183118 521952 3835 1.28 5.2 LCZ Habitation438 B 8183065 521952 3835 0.3 5.3 LCZ Habitation

Appendix A 350
439 A 8182735 522417 3850 0.15 1.2 UCZ Habitation439 B 8182735 522417 3850 0.15 5.2 UCZ Habitation440 A 8183199 522315 3830 0.23 5.3 LCZ Habitation441 A 8183392 523104 3825 0.28 5.1 LCZ Habitation441 B 8183392 523104 3825 0.28 5.3 LCZ Habitation442 A 8183906 523047 3810 2.64 0.1 SGZ Raised Fields443 A 8183773 520688 3820 0.69 5.2 LCZ Habitation443 B 8183773 520688 3820 0.25 5.3 LCZ Habitation444 A 8183969 520243 3810 0.42 0.1 SGZ Raised Fields445 A 8183630 520075 3825 0.16 1.2 LCZ Habitation445 B 8183630 520075 3825 0.16 5.1 LCZ Habitation445 C 8183630 520075 3825 0.16 5.3 LCZ Habitation446 A 8183739 520085 3815 0.11 5.3 LCZ Habitation447 A 8183521 520703 3825 0.19 5.3 LCZ Habitation448 A 8183136 520774 3835 0.83 5.2 LCZ Habitation448 B 8183136 520774 3835 0.25 5.3 LCZ Habitation449 A 8183986 519914 3810 0.3 5.3 SGZ Habitation450 A 8184078 519866 3810 0.72 0.1 SGZ Raised Fields451 A 8184151 519713 3810 1.14 5.1 SGZ Habitation451 B 8184151 519653 3810 0.55 5.3 SGZ Habitation452 A 8184080 519623 3810 0.43 0.1 SGZ Raised Fields453 A 8184205 519601 3810 0.28 5.2 SGZ Habitation453 B 8184205 519601 3810 0.28 5.3 SGZ Habitation454 A 8183274 519853 3840 0.24 5.3 LCZ Habitation455 A 8180121 519905 4000 3.23 5.1 UCZ Habitation456 A 8183868 519334 3810 0.31 5.3 LCZ Habitation457 A 8184070 519239 3810 1.35 0.1 SGZ Raised Fields458 A 8184129 519080 3810 0.57 5.2 SGZ Habitation458 B 8184129 519080 3810 0.57 5.3 SGZ Habitation459 A 8183219 519362 3850 0.3 5.3 LCZ Habitation460 A 8183335 519031 3840 0.88 5.2 LCZ Habitation460 B 8183335 519061 3840 0.36 5.3 LCZ Habitation461 A 8183704 518891 3815 0.8 5.2 LCZ Habitation461 B 8183704 518891 3815 0.8 5.3 LCZ Habitation462 A 8183889 517978 3810 0.08 0.1 SGZ Raised Fields463 A 8183975 517954 3810 0.42 0.1 SGZ Raised Fields464 A 8180423 519052 3985 1.19 3.1 UCZ Ceremonial464 B 8180423 519052 3985 1.19 3.2 UCZ Ceremonial464 C 8180423 519122 3985 0.55 4.0 UCZ Ceremonial465 A 8183808 517648 3810 0.17 5.2 SGZ Habitation465 B 8183808 517648 3810 0.17 5.3 SGZ Habitation466 A 8183935 517539 3810 0.15 5.2 SGZ Habitation467 A 8184052 517534 3810 0.37 5.2 SGZ Habitation
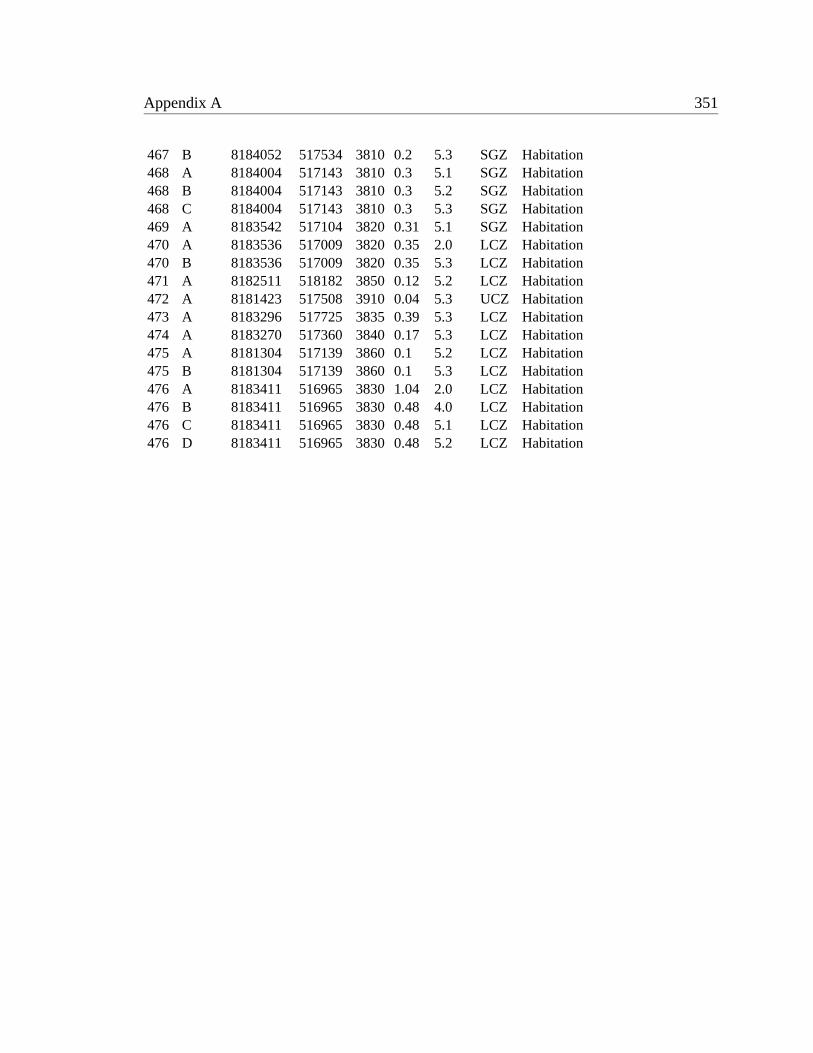
Appendix A 351
467 B 8184052 517534 3810 0.2 5.3 SGZ Habitation468 A 8184004 517143 3810 0.3 5.1 SGZ Habitation468 B 8184004 517143 3810 0.3 5.2 SGZ Habitation468 C 8184004 517143 3810 0.3 5.3 SGZ Habitation469 A 8183542 517104 3820 0.31 5.1 SGZ Habitation470 A 8183536 517009 3820 0.35 2.0 LCZ Habitation470 B 8183536 517009 3820 0.35 5.3 LCZ Habitation471 A 8182511 518182 3850 0.12 5.2 LCZ Habitation472 A 8181423 517508 3910 0.04 5.3 UCZ Habitation473 A 8183296 517725 3835 0.39 5.3 LCZ Habitation474 A 8183270 517360 3840 0.17 5.3 LCZ Habitation475 A 8181304 517139 3860 0.1 5.2 LCZ Habitation475 B 8181304 517139 3860 0.1 5.3 LCZ Habitation476 A 8183411 516965 3830 1.04 2.0 LCZ Habitation476 B 8183411 516965 3830 0.48 4.0 LCZ Habitation476 C 8183411 516965 3830 0.48 5.1 LCZ Habitation476 D 8183411 516965 3830 0.48 5.2 LCZ Habitation
352
Appendix B
Surface collection ceramic counts
For ceramic descriptions see the appropriate chapters. See Chapter3 for definitions and
explanation.
• Ch. 1 - Chiripa Paste Group 1
• Ch. 2 - Chiripa Paste Group 2
• Ch. 3 - Chiripa Paste Group 3
• Ch. O. - Chiripa Paste Group Other
• LF1 - Late Formative 1, Paste Groups 6 and 7
• LF2 - Late Formative 2, Paste Group 13
• Tiw - Tiwanaku
• EP - Early Pacajes
• PI - Pacajes-Inka
• LP - Late Pacajes
Note: Unclassified sherds are included in the totals, so the ‘Total’ column will often not be
equal to the sum of the other columns.
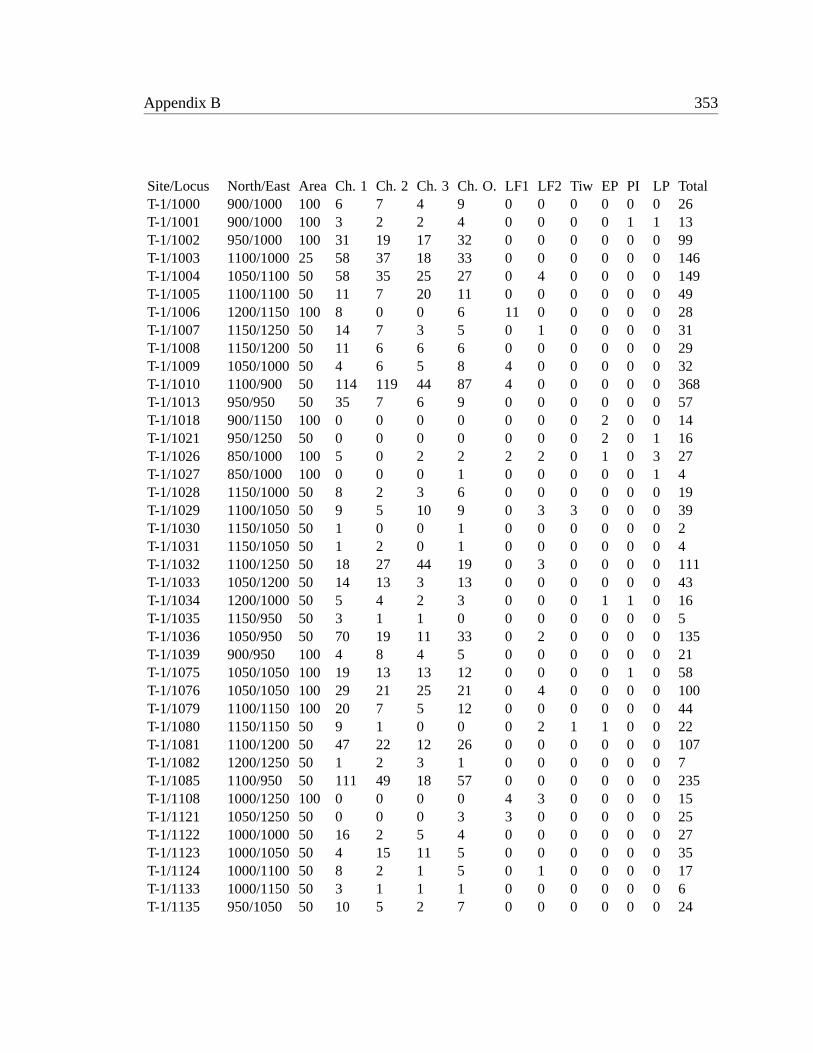
Appendix B 353
Site/Locus North/East Area Ch. 1 Ch. 2 Ch. 3 Ch. O. LF1 LF2 Tiw EP PI LP TotalT-1/1000 900/1000 100 6 7 4 9 0 0 0 0 0 0 26T-1/1001 900/1000 100 3 2 2 4 0 0 0 0 1 1 13T-1/1002 950/1000 100 31 19 17 32 0 0 0 0 0 0 99T-1/1003 1100/1000 25 58 37 18 33 0 0 0 0 0 0 146T-1/1004 1050/1100 50 58 35 25 27 0 4 0 0 0 0 149T-1/1005 1100/1100 50 11 7 20 11 0 0 0 0 0 0 49T-1/1006 1200/1150 100 8 0 0 6 11 0 0 0 0 0 28T-1/1007 1150/1250 50 14 7 3 5 0 1 0 0 0 0 31T-1/1008 1150/1200 50 11 6 6 6 0 0 0 0 0 0 29T-1/1009 1050/1000 50 4 6 5 8 4 0 0 0 0 0 32T-1/1010 1100/900 50 114 119 44 87 4 0 0 0 0 0 368T-1/1013 950/950 50 35 7 6 9 0 0 0 0 0 0 57T-1/1018 900/1150 100 0 0 0 0 0 0 0 2 0 0 14T-1/1021 950/1250 50 0 0 0 0 0 0 0 2 0 1 16T-1/1026 850/1000 100 5 0 2 2 2 2 0 1 0 3 27T-1/1027 850/1000 100 0 0 0 1 0 0 0 0 0 1 4T-1/1028 1150/1000 50 8 2 3 6 0 0 0 0 0 0 19T-1/1029 1100/1050 50 9 5 10 9 0 3 3 0 0 0 39T-1/1030 1150/1050 50 1 0 0 1 0 0 0 0 0 0 2T-1/1031 1150/1050 50 1 2 0 1 0 0 0 0 0 0 4T-1/1032 1100/1250 50 18 27 44 19 0 3 0 0 0 0 111T-1/1033 1050/1200 50 14 13 3 13 0 0 0 0 0 0 43T-1/1034 1200/1000 50 5 4 2 3 0 0 0 1 1 0 16T-1/1035 1150/950 50 3 1 1 0 0 0 0 0 0 0 5T-1/1036 1050/950 50 70 19 11 33 0 2 0 0 0 0 135T-1/1039 900/950 100 4 8 4 5 0 0 0 0 0 0 21T-1/1075 1050/1050 100 19 13 13 12 0 0 0 0 1 0 58T-1/1076 1050/1050 100 29 21 25 21 0 4 0 0 0 0 100T-1/1079 1100/1150 100 20 7 5 12 0 0 0 0 0 0 44T-1/1080 1150/1150 50 9 1 0 0 0 2 1 1 0 0 22T-1/1081 1100/1200 50 47 22 12 26 0 0 0 0 0 0 107T-1/1082 1200/1250 50 1 2 3 1 0 0 0 0 0 0 7T-1/1085 1100/950 50 111 49 18 57 0 0 0 0 0 0 235T-1/1108 1000/1250 100 0 0 0 0 4 3 0 0 0 0 15T-1/1121 1050/1250 50 0 0 0 3 3 0 0 0 0 0 25T-1/1122 1000/1000 50 16 2 5 4 0 0 0 0 0 0 27T-1/1123 1000/1050 50 4 15 11 5 0 0 0 0 0 0 35T-1/1124 1000/1100 50 8 2 1 5 0 1 0 0 0 0 17T-1/1133 1000/1150 50 3 1 1 1 0 0 0 0 0 0 6T-1/1135 950/1050 50 10 5 2 7 0 0 0 0 0 0 24
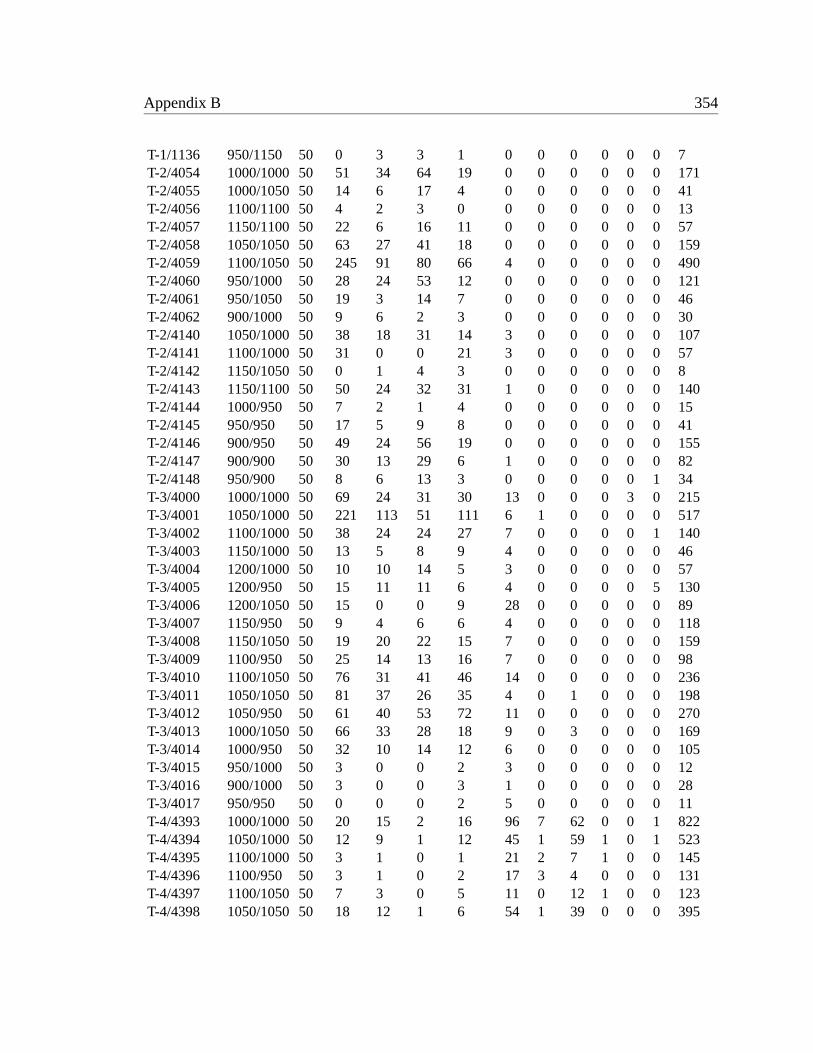
Appendix B 354
T-1/1136 950/1150 50 0 3 3 1 0 0 0 0 0 0 7T-2/4054 1000/1000 50 51 34 64 19 0 0 0 0 0 0 171T-2/4055 1000/1050 50 14 6 17 4 0 0 0 0 0 0 41T-2/4056 1100/1100 50 4 2 3 0 0 0 0 0 0 0 13T-2/4057 1150/1100 50 22 6 16 11 0 0 0 0 0 0 57T-2/4058 1050/1050 50 63 27 41 18 0 0 0 0 0 0 159T-2/4059 1100/1050 50 245 91 80 66 4 0 0 0 0 0 490T-2/4060 950/1000 50 28 24 53 12 0 0 0 0 0 0 121T-2/4061 950/1050 50 19 3 14 7 0 0 0 0 0 0 46T-2/4062 900/1000 50 9 6 2 3 0 0 0 0 0 0 30T-2/4140 1050/1000 50 38 18 31 14 3 0 0 0 0 0 107T-2/4141 1100/1000 50 31 0 0 21 3 0 0 0 0 0 57T-2/4142 1150/1050 50 0 1 4 3 0 0 0 0 0 0 8T-2/4143 1150/1100 50 50 24 32 31 1 0 0 0 0 0 140T-2/4144 1000/950 50 7 2 1 4 0 0 0 0 0 0 15T-2/4145 950/950 50 17 5 9 8 0 0 0 0 0 0 41T-2/4146 900/950 50 49 24 56 19 0 0 0 0 0 0 155T-2/4147 900/900 50 30 13 29 6 1 0 0 0 0 0 82T-2/4148 950/900 50 8 6 13 3 0 0 0 0 0 1 34T-3/4000 1000/1000 50 69 24 31 30 13 0 0 0 3 0 215T-3/4001 1050/1000 50 221 113 51 111 6 1 0 0 0 0 517T-3/4002 1100/1000 50 38 24 24 27 7 0 0 0 0 1 140T-3/4003 1150/1000 50 13 5 8 9 4 0 0 0 0 0 46T-3/4004 1200/1000 50 10 10 14 5 3 0 0 0 0 0 57T-3/4005 1200/950 50 15 11 11 6 4 0 0 0 0 5 130T-3/4006 1200/1050 50 15 0 0 9 28 0 0 0 0 0 89T-3/4007 1150/950 50 9 4 6 6 4 0 0 0 0 0 118T-3/4008 1150/1050 50 19 20 22 15 7 0 0 0 0 0 159T-3/4009 1100/950 50 25 14 13 16 7 0 0 0 0 0 98T-3/4010 1100/1050 50 76 31 41 46 14 0 0 0 0 0 236T-3/4011 1050/1050 50 81 37 26 35 4 0 1 0 0 0 198T-3/4012 1050/950 50 61 40 53 72 11 0 0 0 0 0 270T-3/4013 1000/1050 50 66 33 28 18 9 0 3 0 0 0 169T-3/4014 1000/950 50 32 10 14 12 6 0 0 0 0 0 105T-3/4015 950/1000 50 3 0 0 2 3 0 0 0 0 0 12T-3/4016 900/1000 50 3 0 0 3 1 0 0 0 0 0 28T-3/4017 950/950 50 0 0 0 2 5 0 0 0 0 0 11T-4/4393 1000/1000 50 20 15 2 16 96 7 62 0 0 1 822T-4/4394 1050/1000 50 12 9 1 12 45 1 59 1 0 1 523T-4/4395 1100/1000 50 3 1 0 1 21 2 7 1 0 0 145T-4/4396 1100/950 50 3 1 0 2 17 3 4 0 0 0 131T-4/4397 1100/1050 50 7 3 0 5 11 0 12 1 0 0 123T-4/4398 1050/1050 50 18 12 1 6 54 1 39 0 0 0 395
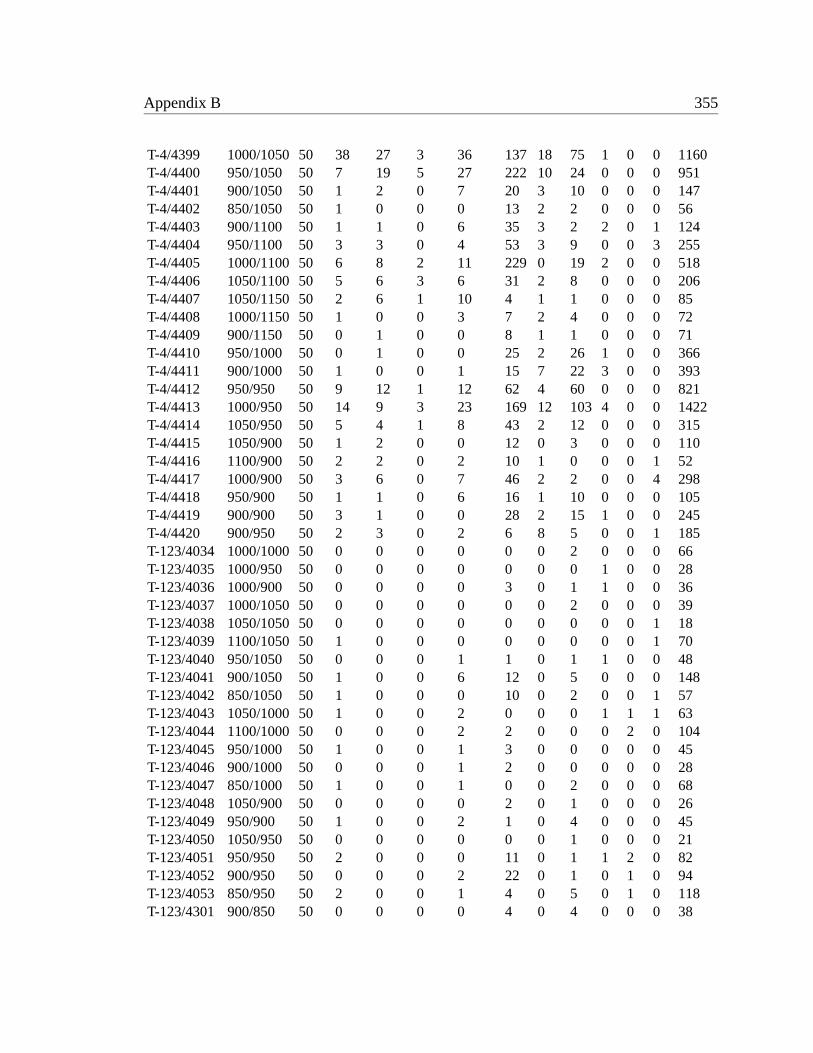
Appendix B 355
T-4/4399 1000/1050 50 38 27 3 36 137 18 75 1 0 0 1160T-4/4400 950/1050 50 7 19 5 27 222 10 24 0 0 0 951T-4/4401 900/1050 50 1 2 0 7 20 3 10 0 0 0 147T-4/4402 850/1050 50 1 0 0 0 13 2 2 0 0 0 56T-4/4403 900/1100 50 1 1 0 6 35 3 2 2 0 1 124T-4/4404 950/1100 50 3 3 0 4 53 3 9 0 0 3 255T-4/4405 1000/1100 50 6 8 2 11 229 0 19 2 0 0 518T-4/4406 1050/1100 50 5 6 3 6 31 2 8 0 0 0 206T-4/4407 1050/1150 50 2 6 1 10 4 1 1 0 0 0 85T-4/4408 1000/1150 50 1 0 0 3 7 2 4 0 0 0 72T-4/4409 900/1150 50 0 1 0 0 8 1 1 0 0 0 71T-4/4410 950/1000 50 0 1 0 0 25 2 26 1 0 0 366T-4/4411 900/1000 50 1 0 0 1 15 7 22 3 0 0 393T-4/4412 950/950 50 9 12 1 12 62 4 60 0 0 0 821T-4/4413 1000/950 50 14 9 3 23 169 12 103 4 0 0 1422T-4/4414 1050/950 50 5 4 1 8 43 2 12 0 0 0 315T-4/4415 1050/900 50 1 2 0 0 12 0 3 0 0 0 110T-4/4416 1100/900 50 2 2 0 2 10 1 0 0 0 1 52T-4/4417 1000/900 50 3 6 0 7 46 2 2 0 0 4 298T-4/4418 950/900 50 1 1 0 6 16 1 10 0 0 0 105T-4/4419 900/900 50 3 1 0 0 28 2 15 1 0 0 245T-4/4420 900/950 50 2 3 0 2 6 8 5 0 0 1 185T-123/4034 1000/1000 50 0 0 0 0 0 0 2 0 0 0 66T-123/4035 1000/950 50 0 0 0 0 0 0 0 1 0 0 28T-123/4036 1000/900 50 0 0 0 0 3 0 1 1 0 0 36T-123/4037 1000/1050 50 0 0 0 0 0 0 2 0 0 0 39T-123/4038 1050/1050 50 0 0 0 0 0 0 0 0 0 1 18T-123/4039 1100/1050 50 1 0 0 0 0 0 0 0 0 1 70T-123/4040 950/1050 50 0 0 0 1 1 0 1 1 0 0 48T-123/4041 900/1050 50 1 0 0 6 12 0 5 0 0 0 148T-123/4042 850/1050 50 1 0 0 0 10 0 2 0 0 1 57T-123/4043 1050/1000 50 1 0 0 2 0 0 0 1 1 1 63T-123/4044 1100/1000 50 0 0 0 2 2 0 0 0 2 0 104T-123/4045 950/1000 50 1 0 0 1 3 0 0 0 0 0 45T-123/4046 900/1000 50 0 0 0 1 2 0 0 0 0 0 28T-123/4047 850/1000 50 1 0 0 1 0 0 2 0 0 0 68T-123/4048 1050/900 50 0 0 0 0 2 0 1 0 0 0 26T-123/4049 950/900 50 1 0 0 2 1 0 4 0 0 0 45T-123/4050 1050/950 50 0 0 0 0 0 0 1 0 0 0 21T-123/4051 950/950 50 2 0 0 0 11 0 1 1 2 0 82T-123/4052 900/950 50 0 0 0 2 22 0 1 0 1 0 94T-123/4053 850/950 50 2 0 0 1 4 0 5 0 1 0 118T-123/4301 900/850 50 0 0 0 0 4 0 4 0 0 0 38
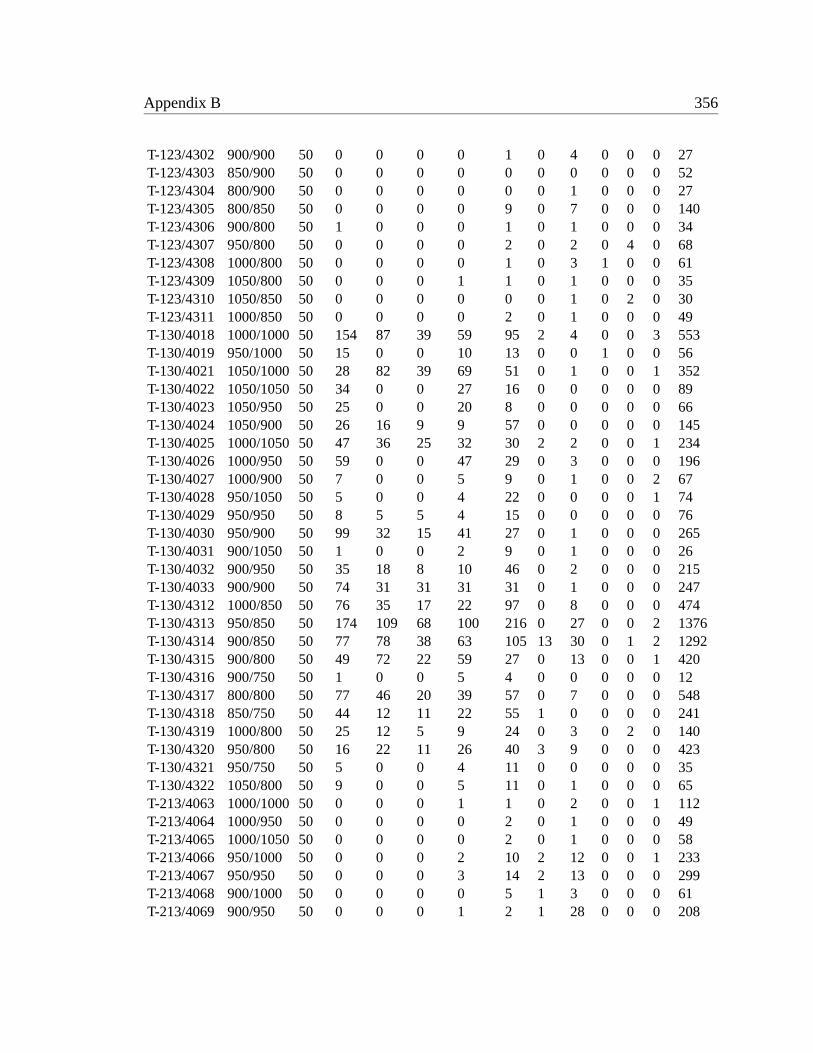
Appendix B 356
T-123/4302 900/900 50 0 0 0 0 1 0 4 0 0 0 27T-123/4303 850/900 50 0 0 0 0 0 0 0 0 0 0 52T-123/4304 800/900 50 0 0 0 0 0 0 1 0 0 0 27T-123/4305 800/850 50 0 0 0 0 9 0 7 0 0 0 140T-123/4306 900/800 50 1 0 0 0 1 0 1 0 0 0 34T-123/4307 950/800 50 0 0 0 0 2 0 2 0 4 0 68T-123/4308 1000/800 50 0 0 0 0 1 0 3 1 0 0 61T-123/4309 1050/800 50 0 0 0 1 1 0 1 0 0 0 35T-123/4310 1050/850 50 0 0 0 0 0 0 1 0 2 0 30T-123/4311 1000/850 50 0 0 0 0 2 0 1 0 0 0 49T-130/4018 1000/1000 50 154 87 39 59 95 2 4 0 0 3 553T-130/4019 950/1000 50 15 0 0 10 13 0 0 1 0 0 56T-130/4021 1050/1000 50 28 82 39 69 51 0 1 0 0 1 352T-130/4022 1050/1050 50 34 0 0 27 16 0 0 0 0 0 89T-130/4023 1050/950 50 25 0 0 20 8 0 0 0 0 0 66T-130/4024 1050/900 50 26 16 9 9 57 0 0 0 0 0 145T-130/4025 1000/1050 50 47 36 25 32 30 2 2 0 0 1 234T-130/4026 1000/950 50 59 0 0 47 29 0 3 0 0 0 196T-130/4027 1000/900 50 7 0 0 5 9 0 1 0 0 2 67T-130/4028 950/1050 50 5 0 0 4 22 0 0 0 0 1 74T-130/4029 950/950 50 8 5 5 4 15 0 0 0 0 0 76T-130/4030 950/900 50 99 32 15 41 27 0 1 0 0 0 265T-130/4031 900/1050 50 1 0 0 2 9 0 1 0 0 0 26T-130/4032 900/950 50 35 18 8 10 46 0 2 0 0 0 215T-130/4033 900/900 50 74 31 31 31 31 0 1 0 0 0 247T-130/4312 1000/850 50 76 35 17 22 97 0 8 0 0 0 474T-130/4313 950/850 50 174 109 68 100 216 0 27 0 0 2 1376T-130/4314 900/850 50 77 78 38 63 105 13 30 0 1 2 1292T-130/4315 900/800 50 49 72 22 59 27 0 13 0 0 1 420T-130/4316 900/750 50 1 0 0 5 4 0 0 0 0 0 12T-130/4317 800/800 50 77 46 20 39 57 0 7 0 0 0 548T-130/4318 850/750 50 44 12 11 22 55 1 0 0 0 0 241T-130/4319 1000/800 50 25 12 5 9 24 0 3 0 2 0 140T-130/4320 950/800 50 16 22 11 26 40 3 9 0 0 0 423T-130/4321 950/750 50 5 0 0 4 11 0 0 0 0 0 35T-130/4322 1050/800 50 9 0 0 5 11 0 1 0 0 0 65T-213/4063 1000/1000 50 0 0 0 1 1 0 2 0 0 1 112T-213/4064 1000/950 50 0 0 0 0 2 0 1 0 0 0 49T-213/4065 1000/1050 50 0 0 0 0 2 0 1 0 0 0 58T-213/4066 950/1000 50 0 0 0 2 10 2 12 0 0 1 233T-213/4067 950/950 50 0 0 0 3 14 2 13 0 0 0 299T-213/4068 900/1000 50 0 0 0 0 5 1 3 0 0 0 61T-213/4069 900/950 50 0 0 0 1 2 1 28 0 0 0 208
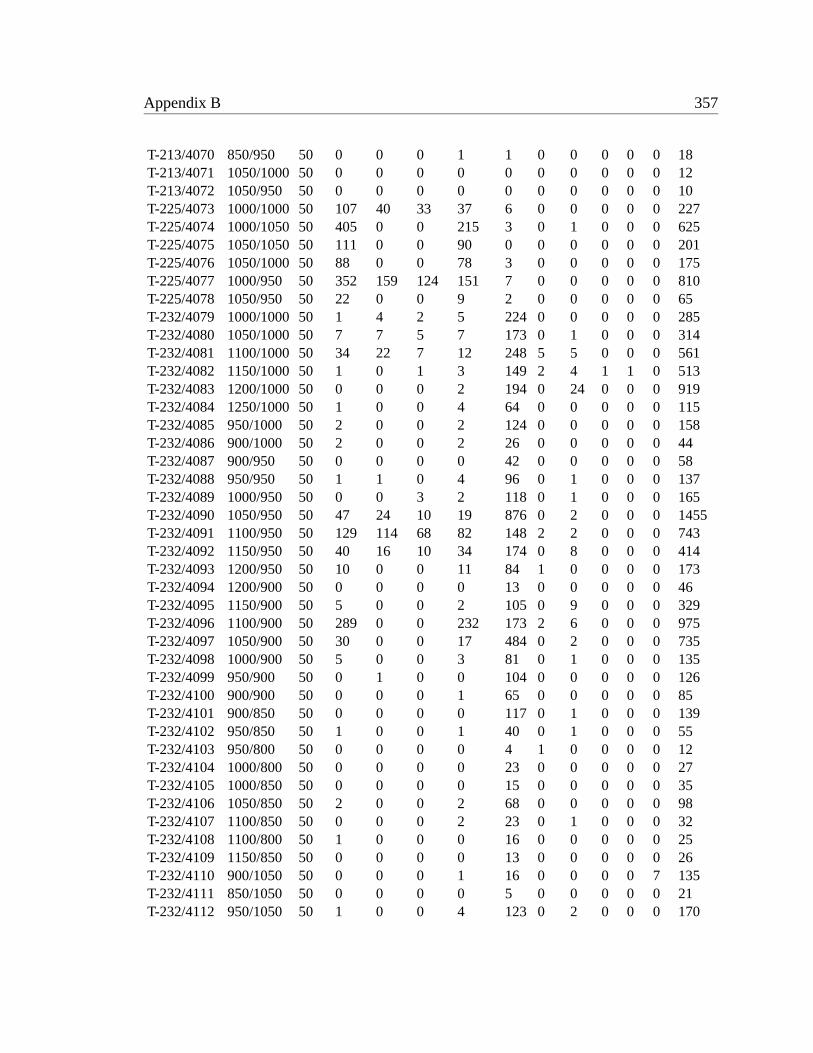
Appendix B 357
T-213/4070 850/950 50 0 0 0 1 1 0 0 0 0 0 18T-213/4071 1050/1000 50 0 0 0 0 0 0 0 0 0 0 12T-213/4072 1050/950 50 0 0 0 0 0 0 0 0 0 0 10T-225/4073 1000/1000 50 107 40 33 37 6 0 0 0 0 0 227T-225/4074 1000/1050 50 405 0 0 215 3 0 1 0 0 0 625T-225/4075 1050/1050 50 111 0 0 90 0 0 0 0 0 0 201T-225/4076 1050/1000 50 88 0 0 78 3 0 0 0 0 0 175T-225/4077 1000/950 50 352 159 124 151 7 0 0 0 0 0 810T-225/4078 1050/950 50 22 0 0 9 2 0 0 0 0 0 65T-232/4079 1000/1000 50 1 4 2 5 224 0 0 0 0 0 285T-232/4080 1050/1000 50 7 7 5 7 173 0 1 0 0 0 314T-232/4081 1100/1000 50 34 22 7 12 248 5 5 0 0 0 561T-232/4082 1150/1000 50 1 0 1 3 149 2 4 1 1 0 513T-232/4083 1200/1000 50 0 0 0 2 194 0 24 0 0 0 919T-232/4084 1250/1000 50 1 0 0 4 64 0 0 0 0 0 115T-232/4085 950/1000 50 2 0 0 2 124 0 0 0 0 0 158T-232/4086 900/1000 50 2 0 0 2 26 0 0 0 0 0 44T-232/4087 900/950 50 0 0 0 0 42 0 0 0 0 0 58T-232/4088 950/950 50 1 1 0 4 96 0 1 0 0 0 137T-232/4089 1000/950 50 0 0 3 2 118 0 1 0 0 0 165T-232/4090 1050/950 50 47 24 10 19 876 0 2 0 0 0 1455T-232/4091 1100/950 50 129 114 68 82 148 2 2 0 0 0 743T-232/4092 1150/950 50 40 16 10 34 174 0 8 0 0 0 414T-232/4093 1200/950 50 10 0 0 11 84 1 0 0 0 0 173T-232/4094 1200/900 50 0 0 0 0 13 0 0 0 0 0 46T-232/4095 1150/900 50 5 0 0 2 105 0 9 0 0 0 329T-232/4096 1100/900 50 289 0 0 232 173 2 6 0 0 0 975T-232/4097 1050/900 50 30 0 0 17 484 0 2 0 0 0 735T-232/4098 1000/900 50 5 0 0 3 81 0 1 0 0 0 135T-232/4099 950/900 50 0 1 0 0 104 0 0 0 0 0 126T-232/4100 900/900 50 0 0 0 1 65 0 0 0 0 0 85T-232/4101 900/850 50 0 0 0 0 117 0 1 0 0 0 139T-232/4102 950/850 50 1 0 0 1 40 0 1 0 0 0 55T-232/4103 950/800 50 0 0 0 0 4 1 0 0 0 0 12T-232/4104 1000/800 50 0 0 0 0 23 0 0 0 0 0 27T-232/4105 1000/850 50 0 0 0 0 15 0 0 0 0 0 35T-232/4106 1050/850 50 2 0 0 2 68 0 0 0 0 0 98T-232/4107 1100/850 50 0 0 0 2 23 0 1 0 0 0 32T-232/4108 1100/800 50 1 0 0 0 16 0 0 0 0 0 25T-232/4109 1150/850 50 0 0 0 0 13 0 0 0 0 0 26T-232/4110 900/1050 50 0 0 0 1 16 0 0 0 0 7 135T-232/4111 850/1050 50 0 0 0 0 5 0 0 0 0 0 21T-232/4112 950/1050 50 1 0 0 4 123 0 2 0 0 0 170
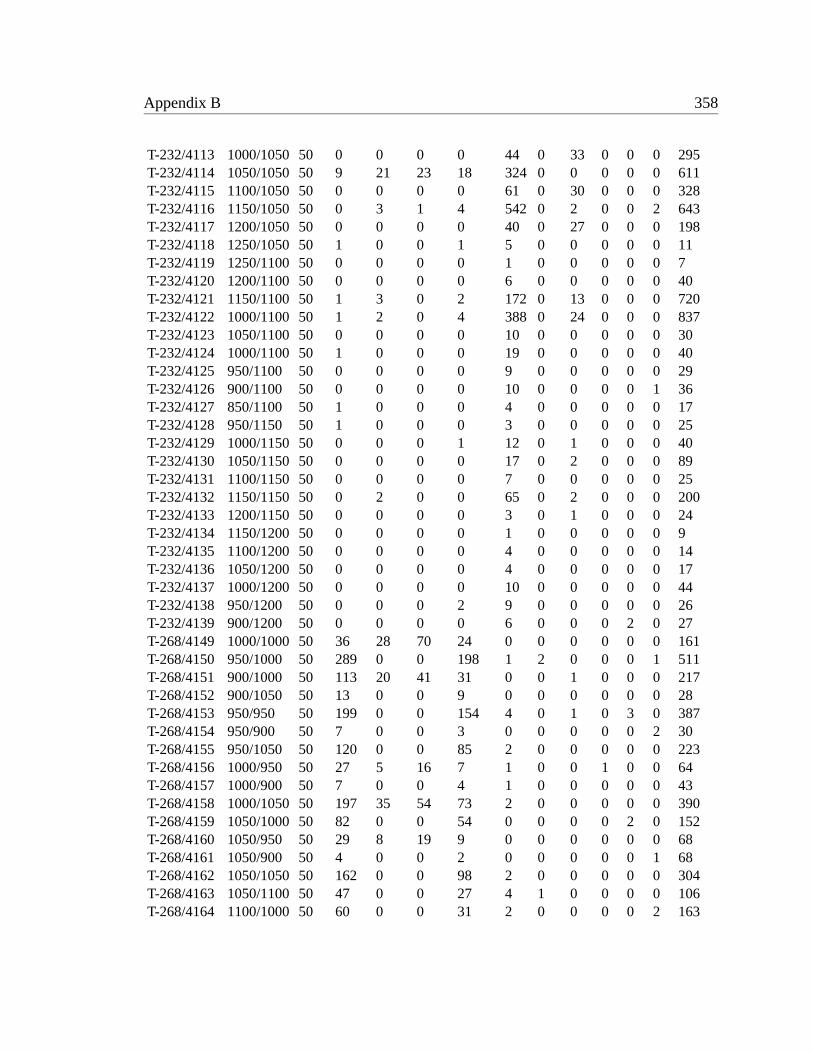
Appendix B 358
T-232/4113 1000/1050 50 0 0 0 0 44 0 33 0 0 0 295T-232/4114 1050/1050 50 9 21 23 18 324 0 0 0 0 0 611T-232/4115 1100/1050 50 0 0 0 0 61 0 30 0 0 0 328T-232/4116 1150/1050 50 0 3 1 4 542 0 2 0 0 2 643T-232/4117 1200/1050 50 0 0 0 0 40 0 27 0 0 0 198T-232/4118 1250/1050 50 1 0 0 1 5 0 0 0 0 0 11T-232/4119 1250/1100 50 0 0 0 0 1 0 0 0 0 0 7T-232/4120 1200/1100 50 0 0 0 0 6 0 0 0 0 0 40T-232/4121 1150/1100 50 1 3 0 2 172 0 13 0 0 0 720T-232/4122 1000/1100 50 1 2 0 4 388 0 24 0 0 0 837T-232/4123 1050/1100 50 0 0 0 0 10 0 0 0 0 0 30T-232/4124 1000/1100 50 1 0 0 0 19 0 0 0 0 0 40T-232/4125 950/1100 50 0 0 0 0 9 0 0 0 0 0 29T-232/4126 900/1100 50 0 0 0 0 10 0 0 0 0 1 36T-232/4127 850/1100 50 1 0 0 0 4 0 0 0 0 0 17T-232/4128 950/1150 50 1 0 0 0 3 0 0 0 0 0 25T-232/4129 1000/1150 50 0 0 0 1 12 0 1 0 0 0 40T-232/4130 1050/1150 50 0 0 0 0 17 0 2 0 0 0 89T-232/4131 1100/1150 50 0 0 0 0 7 0 0 0 0 0 25T-232/4132 1150/1150 50 0 2 0 0 65 0 2 0 0 0 200T-232/4133 1200/1150 50 0 0 0 0 3 0 1 0 0 0 24T-232/4134 1150/1200 50 0 0 0 0 1 0 0 0 0 0 9T-232/4135 1100/1200 50 0 0 0 0 4 0 0 0 0 0 14T-232/4136 1050/1200 50 0 0 0 0 4 0 0 0 0 0 17T-232/4137 1000/1200 50 0 0 0 0 10 0 0 0 0 0 44T-232/4138 950/1200 50 0 0 0 2 9 0 0 0 0 0 26T-232/4139 900/1200 50 0 0 0 0 6 0 0 0 2 0 27T-268/4149 1000/1000 50 36 28 70 24 0 0 0 0 0 0 161T-268/4150 950/1000 50 289 0 0 198 1 2 0 0 0 1 511T-268/4151 900/1000 50 113 20 41 31 0 0 1 0 0 0 217T-268/4152 900/1050 50 13 0 0 9 0 0 0 0 0 0 28T-268/4153 950/950 50 199 0 0 154 4 0 1 0 3 0 387T-268/4154 950/900 50 7 0 0 3 0 0 0 0 0 2 30T-268/4155 950/1050 50 120 0 0 85 2 0 0 0 0 0 223T-268/4156 1000/950 50 27 5 16 7 1 0 0 1 0 0 64T-268/4157 1000/900 50 7 0 0 4 1 0 0 0 0 0 43T-268/4158 1000/1050 50 197 35 54 73 2 0 0 0 0 0 390T-268/4159 1050/1000 50 82 0 0 54 0 0 0 0 2 0 152T-268/4160 1050/950 50 29 8 19 9 0 0 0 0 0 0 68T-268/4161 1050/900 50 4 0 0 2 0 0 0 0 0 1 68T-268/4162 1050/1050 50 162 0 0 98 2 0 0 0 0 0 304T-268/4163 1050/1100 50 47 0 0 27 4 1 0 0 0 0 106T-268/4164 1100/1000 50 60 0 0 31 2 0 0 0 0 2 163
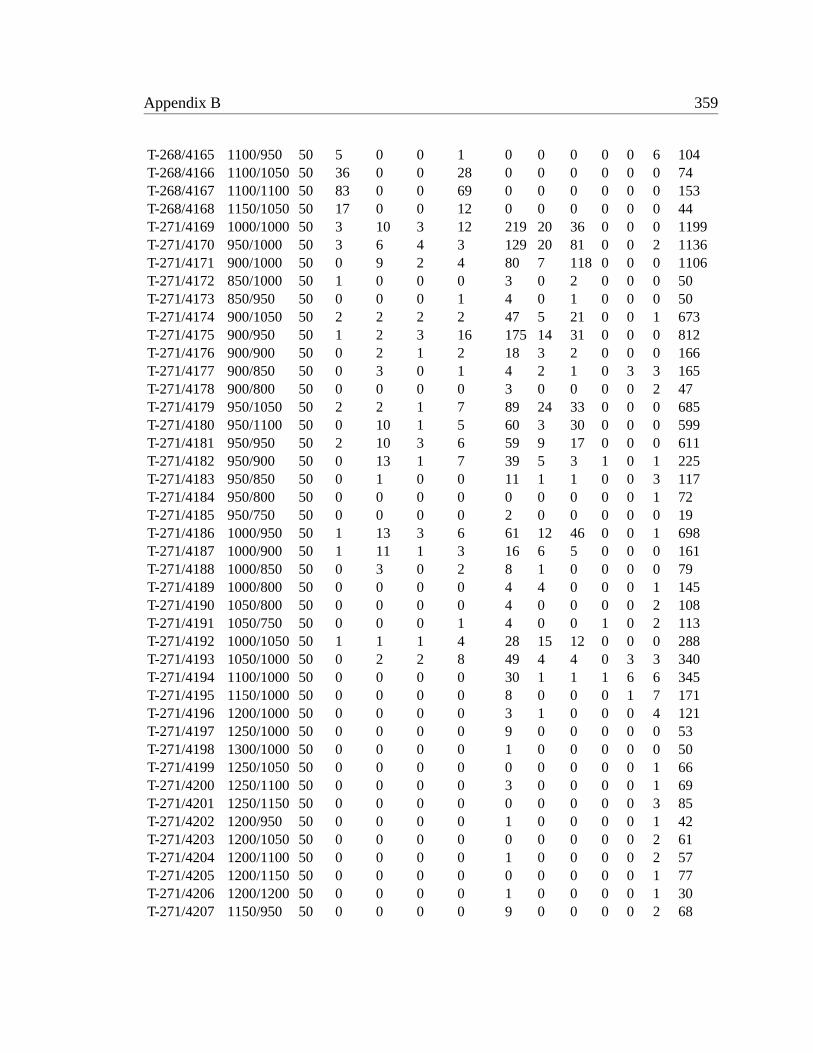
Appendix B 359
T-268/4165 1100/950 50 5 0 0 1 0 0 0 0 0 6 104T-268/4166 1100/1050 50 36 0 0 28 0 0 0 0 0 0 74T-268/4167 1100/1100 50 83 0 0 69 0 0 0 0 0 0 153T-268/4168 1150/1050 50 17 0 0 12 0 0 0 0 0 0 44T-271/4169 1000/1000 50 3 10 3 12 219 20 36 0 0 0 1199T-271/4170 950/1000 50 3 6 4 3 129 20 81 0 0 2 1136T-271/4171 900/1000 50 0 9 2 4 80 7 118 0 0 0 1106T-271/4172 850/1000 50 1 0 0 0 3 0 2 0 0 0 50T-271/4173 850/950 50 0 0 0 1 4 0 1 0 0 0 50T-271/4174 900/1050 50 2 2 2 2 47 5 21 0 0 1 673T-271/4175 900/950 50 1 2 3 16 175 14 31 0 0 0 812T-271/4176 900/900 50 0 2 1 2 18 3 2 0 0 0 166T-271/4177 900/850 50 0 3 0 1 4 2 1 0 3 3 165T-271/4178 900/800 50 0 0 0 0 3 0 0 0 0 2 47T-271/4179 950/1050 50 2 2 1 7 89 24 33 0 0 0 685T-271/4180 950/1100 50 0 10 1 5 60 3 30 0 0 0 599T-271/4181 950/950 50 2 10 3 6 59 9 17 0 0 0 611T-271/4182 950/900 50 0 13 1 7 39 5 3 1 0 1 225T-271/4183 950/850 50 0 1 0 0 11 1 1 0 0 3 117T-271/4184 950/800 50 0 0 0 0 0 0 0 0 0 1 72T-271/4185 950/750 50 0 0 0 0 2 0 0 0 0 0 19T-271/4186 1000/950 50 1 13 3 6 61 12 46 0 0 1 698T-271/4187 1000/900 50 1 11 1 3 16 6 5 0 0 0 161T-271/4188 1000/850 50 0 3 0 2 8 1 0 0 0 0 79T-271/4189 1000/800 50 0 0 0 0 4 4 0 0 0 1 145T-271/4190 1050/800 50 0 0 0 0 4 0 0 0 0 2 108T-271/4191 1050/750 50 0 0 0 1 4 0 0 1 0 2 113T-271/4192 1000/1050 50 1 1 1 4 28 15 12 0 0 0 288T-271/4193 1050/1000 50 0 2 2 8 49 4 4 0 3 3 340T-271/4194 1100/1000 50 0 0 0 0 30 1 1 1 6 6 345T-271/4195 1150/1000 50 0 0 0 0 8 0 0 0 1 7 171T-271/4196 1200/1000 50 0 0 0 0 3 1 0 0 0 4 121T-271/4197 1250/1000 50 0 0 0 0 9 0 0 0 0 0 53T-271/4198 1300/1000 50 0 0 0 0 1 0 0 0 0 0 50T-271/4199 1250/1050 50 0 0 0 0 0 0 0 0 0 1 66T-271/4200 1250/1100 50 0 0 0 0 3 0 0 0 0 1 69T-271/4201 1250/1150 50 0 0 0 0 0 0 0 0 0 3 85T-271/4202 1200/950 50 0 0 0 0 1 0 0 0 0 1 42T-271/4203 1200/1050 50 0 0 0 0 0 0 0 0 0 2 61T-271/4204 1200/1100 50 0 0 0 0 1 0 0 0 0 2 57T-271/4205 1200/1150 50 0 0 0 0 0 0 0 0 0 1 77T-271/4206 1200/1200 50 0 0 0 0 1 0 0 0 0 1 30T-271/4207 1150/950 50 0 0 0 0 9 0 0 0 0 2 68
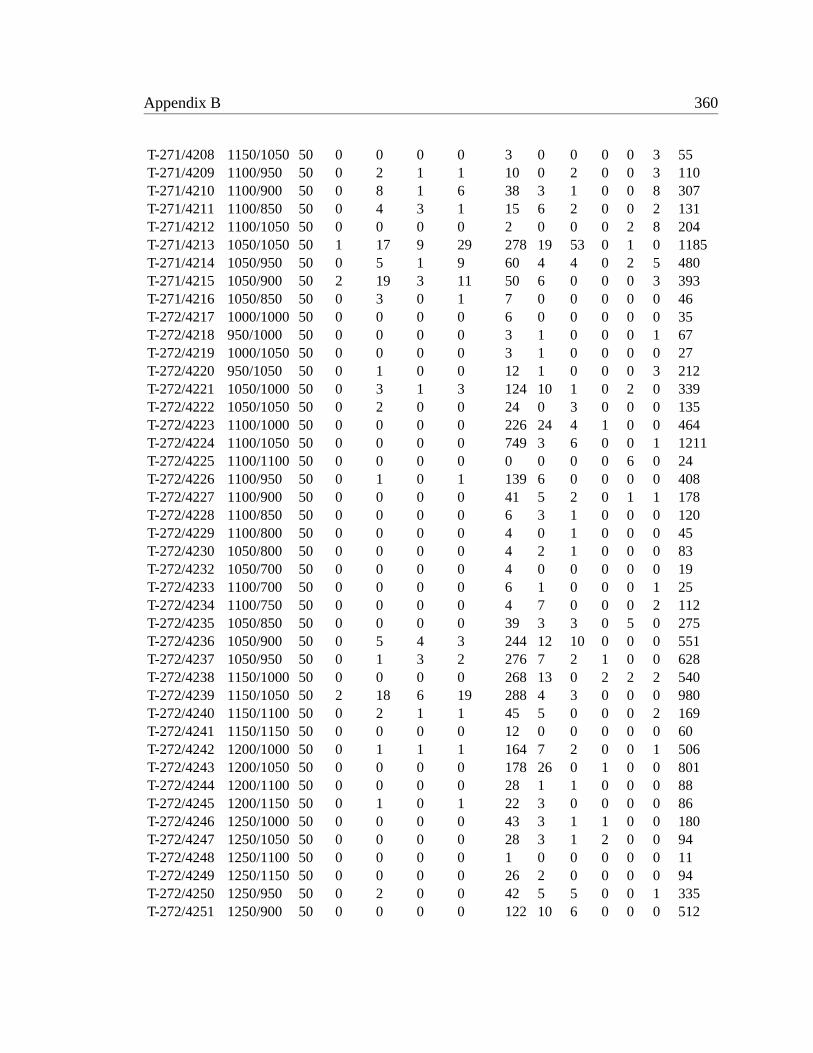
Appendix B 360
T-271/4208 1150/1050 50 0 0 0 0 3 0 0 0 0 3 55T-271/4209 1100/950 50 0 2 1 1 10 0 2 0 0 3 110T-271/4210 1100/900 50 0 8 1 6 38 3 1 0 0 8 307T-271/4211 1100/850 50 0 4 3 1 15 6 2 0 0 2 131T-271/4212 1100/1050 50 0 0 0 0 2 0 0 0 2 8 204T-271/4213 1050/1050 50 1 17 9 29 278 19 53 0 1 0 1185T-271/4214 1050/950 50 0 5 1 9 60 4 4 0 2 5 480T-271/4215 1050/900 50 2 19 3 11 50 6 0 0 0 3 393T-271/4216 1050/850 50 0 3 0 1 7 0 0 0 0 0 46T-272/4217 1000/1000 50 0 0 0 0 6 0 0 0 0 0 35T-272/4218 950/1000 50 0 0 0 0 3 1 0 0 0 1 67T-272/4219 1000/1050 50 0 0 0 0 3 1 0 0 0 0 27T-272/4220 950/1050 50 0 1 0 0 12 1 0 0 0 3 212T-272/4221 1050/1000 50 0 3 1 3 124 10 1 0 2 0 339T-272/4222 1050/1050 50 0 2 0 0 24 0 3 0 0 0 135T-272/4223 1100/1000 50 0 0 0 0 226 24 4 1 0 0 464T-272/4224 1100/1050 50 0 0 0 0 749 3 6 0 0 1 1211T-272/4225 1100/1100 50 0 0 0 0 0 0 0 0 6 0 24T-272/4226 1100/950 50 0 1 0 1 139 6 0 0 0 0 408T-272/4227 1100/900 50 0 0 0 0 41 5 2 0 1 1 178T-272/4228 1100/850 50 0 0 0 0 6 3 1 0 0 0 120T-272/4229 1100/800 50 0 0 0 0 4 0 1 0 0 0 45T-272/4230 1050/800 50 0 0 0 0 4 2 1 0 0 0 83T-272/4232 1050/700 50 0 0 0 0 4 0 0 0 0 0 19T-272/4233 1100/700 50 0 0 0 0 6 1 0 0 0 1 25T-272/4234 1100/750 50 0 0 0 0 4 7 0 0 0 2 112T-272/4235 1050/850 50 0 0 0 0 39 3 3 0 5 0 275T-272/4236 1050/900 50 0 5 4 3 244 12 10 0 0 0 551T-272/4237 1050/950 50 0 1 3 2 276 7 2 1 0 0 628T-272/4238 1150/1000 50 0 0 0 0 268 13 0 2 2 2 540T-272/4239 1150/1050 50 2 18 6 19 288 4 3 0 0 0 980T-272/4240 1150/1100 50 0 2 1 1 45 5 0 0 0 2 169T-272/4241 1150/1150 50 0 0 0 0 12 0 0 0 0 0 60T-272/4242 1200/1000 50 0 1 1 1 164 7 2 0 0 1 506T-272/4243 1200/1050 50 0 0 0 0 178 26 0 1 0 0 801T-272/4244 1200/1100 50 0 0 0 0 28 1 1 0 0 0 88T-272/4245 1200/1150 50 0 1 0 1 22 3 0 0 0 0 86T-272/4246 1250/1000 50 0 0 0 0 43 3 1 1 0 0 180T-272/4247 1250/1050 50 0 0 0 0 28 3 1 2 0 0 94T-272/4248 1250/1100 50 0 0 0 0 1 0 0 0 0 0 11T-272/4249 1250/1150 50 0 0 0 0 26 2 0 0 0 0 94T-272/4250 1250/950 50 0 2 0 0 42 5 5 0 0 1 335T-272/4251 1250/900 50 0 0 0 0 122 10 6 0 0 0 512
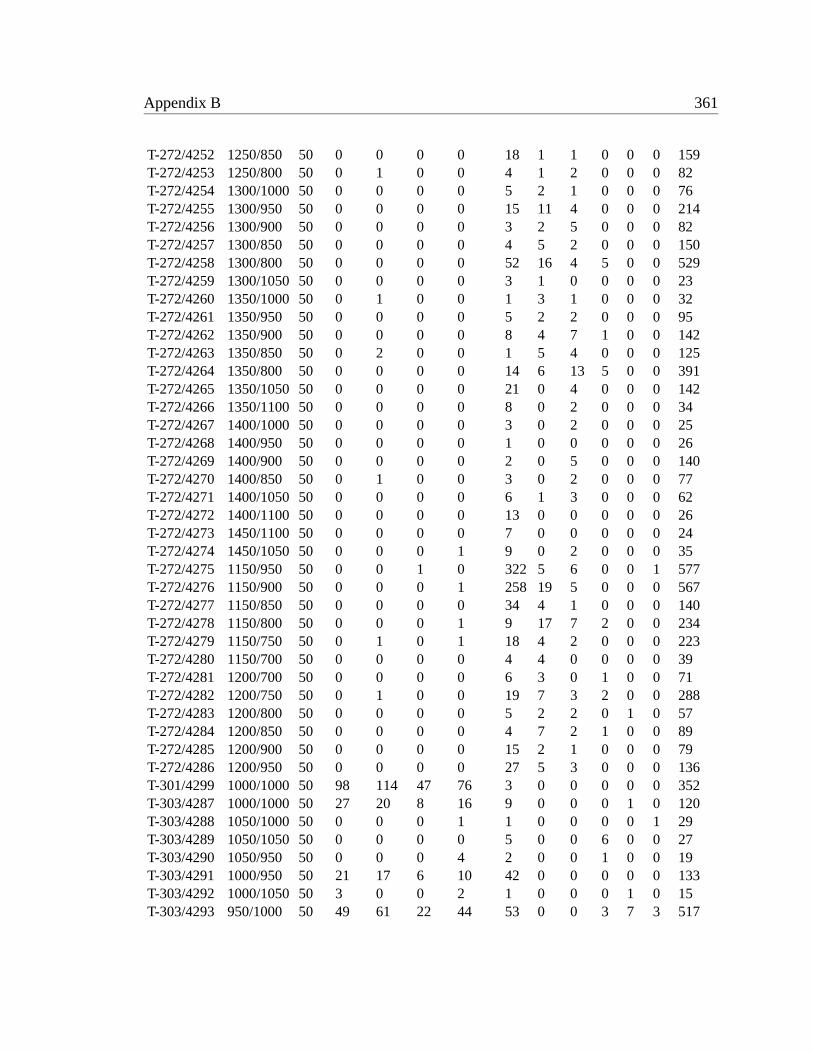
Appendix B 361
T-272/4252 1250/850 50 0 0 0 0 18 1 1 0 0 0 159T-272/4253 1250/800 50 0 1 0 0 4 1 2 0 0 0 82T-272/4254 1300/1000 50 0 0 0 0 5 2 1 0 0 0 76T-272/4255 1300/950 50 0 0 0 0 15 11 4 0 0 0 214T-272/4256 1300/900 50 0 0 0 0 3 2 5 0 0 0 82T-272/4257 1300/850 50 0 0 0 0 4 5 2 0 0 0 150T-272/4258 1300/800 50 0 0 0 0 52 16 4 5 0 0 529T-272/4259 1300/1050 50 0 0 0 0 3 1 0 0 0 0 23T-272/4260 1350/1000 50 0 1 0 0 1 3 1 0 0 0 32T-272/4261 1350/950 50 0 0 0 0 5 2 2 0 0 0 95T-272/4262 1350/900 50 0 0 0 0 8 4 7 1 0 0 142T-272/4263 1350/850 50 0 2 0 0 1 5 4 0 0 0 125T-272/4264 1350/800 50 0 0 0 0 14 6 13 5 0 0 391T-272/4265 1350/1050 50 0 0 0 0 21 0 4 0 0 0 142T-272/4266 1350/1100 50 0 0 0 0 8 0 2 0 0 0 34T-272/4267 1400/1000 50 0 0 0 0 3 0 2 0 0 0 25T-272/4268 1400/950 50 0 0 0 0 1 0 0 0 0 0 26T-272/4269 1400/900 50 0 0 0 0 2 0 5 0 0 0 140T-272/4270 1400/850 50 0 1 0 0 3 0 2 0 0 0 77T-272/4271 1400/1050 50 0 0 0 0 6 1 3 0 0 0 62T-272/4272 1400/1100 50 0 0 0 0 13 0 0 0 0 0 26T-272/4273 1450/1100 50 0 0 0 0 7 0 0 0 0 0 24T-272/4274 1450/1050 50 0 0 0 1 9 0 2 0 0 0 35T-272/4275 1150/950 50 0 0 1 0 322 5 6 0 0 1 577T-272/4276 1150/900 50 0 0 0 1 258 19 5 0 0 0 567T-272/4277 1150/850 50 0 0 0 0 34 4 1 0 0 0 140T-272/4278 1150/800 50 0 0 0 1 9 17 7 2 0 0 234T-272/4279 1150/750 50 0 1 0 1 18 4 2 0 0 0 223T-272/4280 1150/700 50 0 0 0 0 4 4 0 0 0 0 39T-272/4281 1200/700 50 0 0 0 0 6 3 0 1 0 0 71T-272/4282 1200/750 50 0 1 0 0 19 7 3 2 0 0 288T-272/4283 1200/800 50 0 0 0 0 5 2 2 0 1 0 57T-272/4284 1200/850 50 0 0 0 0 4 7 2 1 0 0 89T-272/4285 1200/900 50 0 0 0 0 15 2 1 0 0 0 79T-272/4286 1200/950 50 0 0 0 0 27 5 3 0 0 0 136T-301/4299 1000/1000 50 98 114 47 76 3 0 0 0 0 0 352T-303/4287 1000/1000 50 27 20 8 16 9 0 0 0 1 0 120T-303/4288 1050/1000 50 0 0 0 1 1 0 0 0 0 1 29T-303/4289 1050/1050 50 0 0 0 0 5 0 0 6 0 0 27T-303/4290 1050/950 50 0 0 0 4 2 0 0 1 0 0 19T-303/4291 1000/950 50 21 17 6 10 42 0 0 0 0 0 133T-303/4292 1000/1050 50 3 0 0 2 1 0 0 0 1 0 15T-303/4293 950/1000 50 49 61 22 44 53 0 0 3 7 3 517
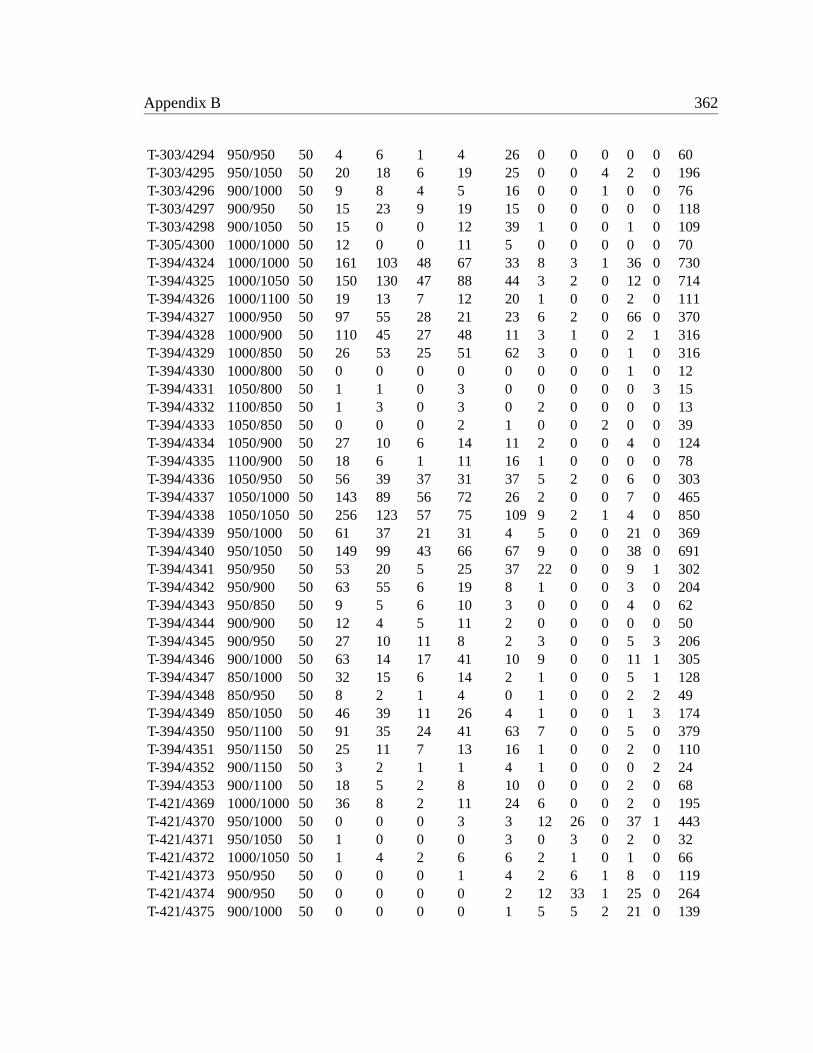
Appendix B 362
T-303/4294 950/950 50 4 6 1 4 26 0 0 0 0 0 60T-303/4295 950/1050 50 20 18 6 19 25 0 0 4 2 0 196T-303/4296 900/1000 50 9 8 4 5 16 0 0 1 0 0 76T-303/4297 900/950 50 15 23 9 19 15 0 0 0 0 0 118T-303/4298 900/1050 50 15 0 0 12 39 1 0 0 1 0 109T-305/4300 1000/1000 50 12 0 0 11 5 0 0 0 0 0 70T-394/4324 1000/1000 50 161 103 48 67 33 8 3 1 36 0 730T-394/4325 1000/1050 50 150 130 47 88 44 3 2 0 12 0 714T-394/4326 1000/1100 50 19 13 7 12 20 1 0 0 2 0 111T-394/4327 1000/950 50 97 55 28 21 23 6 2 0 66 0 370T-394/4328 1000/900 50 110 45 27 48 11 3 1 0 2 1 316T-394/4329 1000/850 50 26 53 25 51 62 3 0 0 1 0 316T-394/4330 1000/800 50 0 0 0 0 0 0 0 0 1 0 12T-394/4331 1050/800 50 1 1 0 3 0 0 0 0 0 3 15T-394/4332 1100/850 50 1 3 0 3 0 2 0 0 0 0 13T-394/4333 1050/850 50 0 0 0 2 1 0 0 2 0 0 39T-394/4334 1050/900 50 27 10 6 14 11 2 0 0 4 0 124T-394/4335 1100/900 50 18 6 1 11 16 1 0 0 0 0 78T-394/4336 1050/950 50 56 39 37 31 37 5 2 0 6 0 303T-394/4337 1050/1000 50 143 89 56 72 26 2 0 0 7 0 465T-394/4338 1050/1050 50 256 123 57 75 109 9 2 1 4 0 850T-394/4339 950/1000 50 61 37 21 31 4 5 0 0 21 0 369T-394/4340 950/1050 50 149 99 43 66 67 9 0 0 38 0 691T-394/4341 950/950 50 53 20 5 25 37 22 0 0 9 1 302T-394/4342 950/900 50 63 55 6 19 8 1 0 0 3 0 204T-394/4343 950/850 50 9 5 6 10 3 0 0 0 4 0 62T-394/4344 900/900 50 12 4 5 11 2 0 0 0 0 0 50T-394/4345 900/950 50 27 10 11 8 2 3 0 0 5 3 206T-394/4346 900/1000 50 63 14 17 41 10 9 0 0 11 1 305T-394/4347 850/1000 50 32 15 6 14 2 1 0 0 5 1 128T-394/4348 850/950 50 8 2 1 4 0 1 0 0 2 2 49T-394/4349 850/1050 50 46 39 11 26 4 1 0 0 1 3 174T-394/4350 950/1100 50 91 35 24 41 63 7 0 0 5 0 379T-394/4351 950/1150 50 25 11 7 13 16 1 0 0 2 0 110T-394/4352 900/1150 50 3 2 1 1 4 1 0 0 0 2 24T-394/4353 900/1100 50 18 5 2 8 10 0 0 0 2 0 68T-421/4369 1000/1000 50 36 8 2 11 24 6 0 0 2 0 195T-421/4370 950/1000 50 0 0 0 3 3 12 26 0 37 1 443T-421/4371 950/1050 50 1 0 0 0 3 0 3 0 2 0 32T-421/4372 1000/1050 50 1 4 2 6 6 2 1 0 1 0 66T-421/4373 950/950 50 0 0 0 1 4 2 6 1 8 0 119T-421/4374 900/950 50 0 0 0 0 2 12 33 1 25 0 264T-421/4375 900/1000 50 0 0 0 0 1 5 5 2 21 0 139
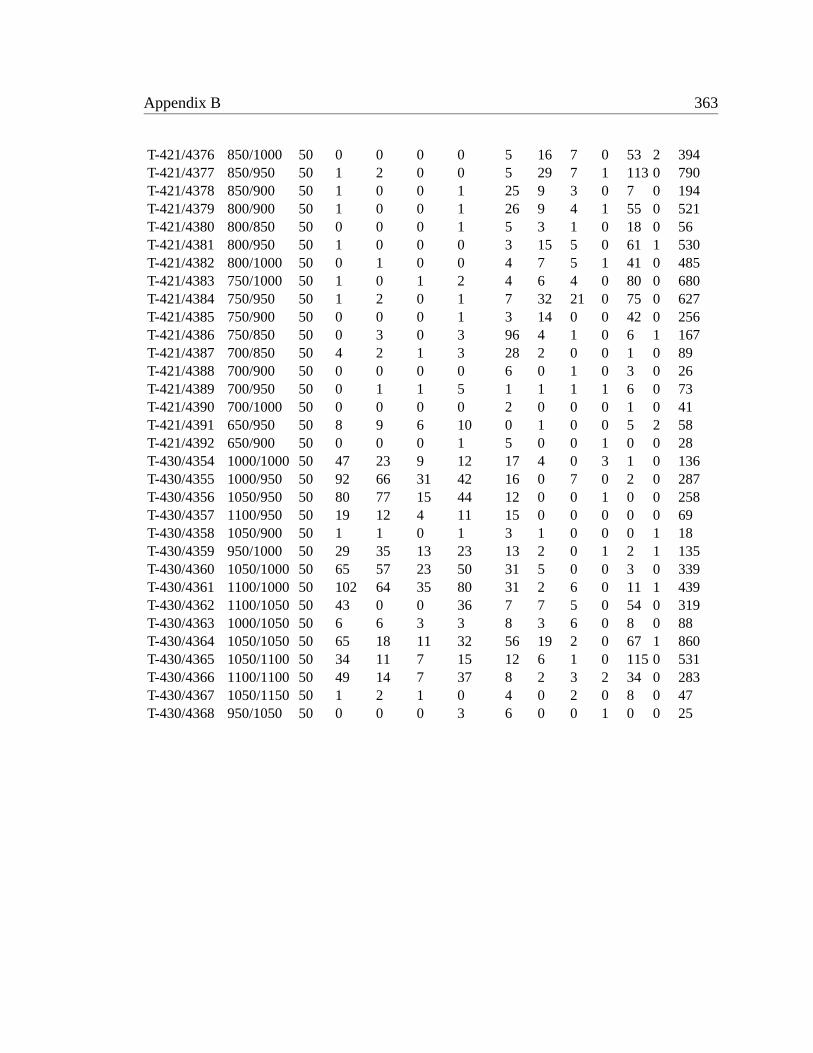
Appendix B 363
T-421/4376 850/1000 50 0 0 0 0 5 16 7 0 53 2 394T-421/4377 850/950 50 1 2 0 0 5 29 7 1 113 0 790T-421/4378 850/900 50 1 0 0 1 25 9 3 0 7 0 194T-421/4379 800/900 50 1 0 0 1 26 9 4 1 55 0 521T-421/4380 800/850 50 0 0 0 1 5 3 1 0 18 0 56T-421/4381 800/950 50 1 0 0 0 3 15 5 0 61 1 530T-421/4382 800/1000 50 0 1 0 0 4 7 5 1 41 0 485T-421/4383 750/1000 50 1 0 1 2 4 6 4 0 80 0 680T-421/4384 750/950 50 1 2 0 1 7 32 21 0 75 0 627T-421/4385 750/900 50 0 0 0 1 3 14 0 0 42 0 256T-421/4386 750/850 50 0 3 0 3 96 4 1 0 6 1 167T-421/4387 700/850 50 4 2 1 3 28 2 0 0 1 0 89T-421/4388 700/900 50 0 0 0 0 6 0 1 0 3 0 26T-421/4389 700/950 50 0 1 1 5 1 1 1 1 6 0 73T-421/4390 700/1000 50 0 0 0 0 2 0 0 0 1 0 41T-421/4391 650/950 50 8 9 6 10 0 1 0 0 5 2 58T-421/4392 650/900 50 0 0 0 1 5 0 0 1 0 0 28T-430/4354 1000/1000 50 47 23 9 12 17 4 0 3 1 0 136T-430/4355 1000/950 50 92 66 31 42 16 0 7 0 2 0 287T-430/4356 1050/950 50 80 77 15 44 12 0 0 1 0 0 258T-430/4357 1100/950 50 19 12 4 11 15 0 0 0 0 0 69T-430/4358 1050/900 50 1 1 0 1 3 1 0 0 0 1 18T-430/4359 950/1000 50 29 35 13 23 13 2 0 1 2 1 135T-430/4360 1050/1000 50 65 57 23 50 31 5 0 0 3 0 339T-430/4361 1100/1000 50 102 64 35 80 31 2 6 0 11 1 439T-430/4362 1100/1050 50 43 0 0 36 7 7 5 0 54 0 319T-430/4363 1000/1050 50 6 6 3 3 8 3 6 0 8 0 88T-430/4364 1050/1050 50 65 18 11 32 56 19 2 0 67 1 860T-430/4365 1050/1100 50 34 11 7 15 12 6 1 0 115 0 531T-430/4366 1100/1100 50 49 14 7 37 8 2 3 2 34 0 283T-430/4367 1050/1150 50 1 2 1 0 4 0 2 0 8 0 47T-430/4368 950/1050 50 0 0 0 3 6 0 0 1 0 0 25
364
Appendix C
Ceramic analysis program code
#! /usr/bin/perl#####################################This program, given percentages of the three Chiripa Paste#Groups in a given surface assemblage, will then compute the#most likely combination of the three phases that would result#in the observed frequencies.######################################First, define the three phase profiles. These may later be edited as desired.# Late Chiripa...%LC = (
’1’ => ’0.68’,’2’ => ’0.18’,’3’ => ’0.14’
);#Middle Chiripa...%MC = (
’1’ => ’0.07’,’2’ => ’0.75’,’3’ => ’0.18’
);#And Early Chiripa...%EC = (
’1’ => ’0.02’,’2’ => ’0.27’,’3’ => ’0.71’
);&do_one_unit;&warn_and_exit("\nDone...");#The following is the master subroutine that loops as long as the user wants#it to...sub do_one_unit {
&get_frequencies;#Now we get down to the meat and potatos...$permit_error = 0.01;
#displays results with errors <= than this value$BEST{’error’}=10000;
#sets initial ridiculuously high value for best matches errorprint "Matches with error less than or equal to ",$permit_error*100,":\n";print "LC%\tMC%\tEC%\terror\tLC\tMC\tEC\n";for $lc_percent (0..100) {
Appendix C 365
for $mc_percent (0..100-$lc_percent) {$lc=$lc_percent/100;$mc=$mc_percent/100;$ec_percent=100-$lc_percent-$mc_percent;$ec=$ec_percent/100;$PROFILE{’1’}=$LC{’1’}*$lc+$MC{’1’}*$mc+$EC{’1’}*$ec;$PROFILE{’2’}=$LC{’2’}*$lc+$MC{’2’}*$mc+$EC{’2’}*$ec;$PROFILE{’3’}=$LC{’3’}*$lc+$MC{’3’}*$mc+$EC{’3’}*$ec;$error1=abs($PROFILE{’1’}-$ASSEM{’1’});$error2=abs($PROFILE{’2’}-$ASSEM{’2’});$error3=abs($PROFILE{’3’}-$ASSEM{’3’});$error = ($error1 + $error2 + $error3)/3;$error_round = round($error,0.001);if ($error <= $permit_error) {
$lc_num=round($lc*$all,1);$mc_num=round($mc*$all,1);$ec_num=round($ec*$all,1);print "$lc_percent\t$mc_percent\t$ec_percent\t",
$error_round*100,"\t$lc_num\t$mc_num\t$ec_num\n";
}if ($error < $BEST{’error’}) {
$BEST{’error’}=$error_round;$BEST{’lc_percent’}=$lc_percent;$BEST{’mc_percent’}=$mc_percent;$BEST{’ec_percent’}=$ec_percent;$BEST{’lc_num’}=round($lc*$all,1);$BEST{’mc_num’}=round($mc*$all,1);$BEST{’ec_num’}=round($ec*$all,1);
}}
}print "\nBest match:\n";print "LC%\tMC%\tEC%\terror\tLC\tMC\tEC\n";print "$BEST{’lc_percent’}\t$BEST{’mc_percent’}\t
$BEST{’ec_percent’}\t",$BEST{’error’}*100,"\t$BEST{’lc_num’}\t$BEST{’mc_num’}\t$BEST{’ec_num’}\n\n";
print "Would you like to process another surface collection unit?(y/n)";
$reply=<STDIN>;if ($reply =~ /y/) {
&do_one_unit;}
}sub get_frequencies {
print "\nEnter Paste Group counts in the assemblage to be analyzed:\n";print "\tPaste Group 1: ";$first = <STDIN>;chop $first;print "\tPaste Group 2: ";$second = <STDIN>;chop $second;print "\tPaste Group 3: ";$third = <STDIN>;chop $third;print "\tAll others: ";$fourth = <STDIN>;chop $fourth;$three = $first + $second + $third;$all = $three + $fourth;$ASSEM{’1’}=round($first/$three,0.01);
Appendix C 366
$ASSEM{’2’}=round($second/$three,0.01);$ASSEM{’3’}=round($third/$three,0.01);print "\nSummary of data:\n";print "\t\tGroup 1\tGroup 2\tGroup 3\tOther\n";print "Count\t\t$first\t$second\t$third\t$fourth\n";print "% of Total\t",round($first/$all,0.01),"\t",
round($second/$all,0.01),"\t",round($third/$all,0.01),"\t",round($fourth/$all,0.01),"\n";
print "% of three\t",round($first/$three,0.01),"\t",round($second/$three,0.01),"\t",round($third/$three,0.01),"\n\n";
print "Press ENTER to continue\n";$trash= <STDIN>;
}sub warn_and_exit {
print "$_[0]\n";print "Press Enter to Exit\n";$trash=<STDIN>;exit (0);
}sub round {
my $num = $_[0];my $nearest = $_[1];if (mod($num,$nearest) >= $nearest/2) {
return $num-mod($num,$nearest)+$nearest;} else {
return $num-mod($num,$nearest);}
}sub mod {
my $num = $_[0];my $div = $_[1];my $times = int $num/$div;return $num-$times*$div;
}
367
Appendix D
Occupation density program code
#! /usr/bin/perl#####################################This program, given grid parameters and filenames via user input,#will parse a 3-column tab-delimited file, with the columns#being north, east and hectares, and output the results in a similar#3-column format. No headers in original file, please, and I’m not sure#what’ll happen if it’s fed a file not of this strict format, so don’t do it.#####################################print "Name or path of input file: ";$infile=<STDIN>;chop $infile;print "Name or path of output file: ";$outfile=<STDIN>;chop $outfile;$delim="\t";print "\nSelect an area for which to calculate occupation density:\n";print "\t1: Taraco Peninsula\n";print "\t2: Lower Tiwanaku Valley\n";print "\t3: Middle Tiwanaku Valley\n";print "\t4: Taraco Peninsula and Lower Tiwanaku Valley\n";print "\t5: Entire Tiwanaku Valley\n";print "\t6: Taraco Peninsula and Entire Tiwanaku Valley\n";print "Selection: ";$area=<STDIN>;chop $area;if ($area==1) {
$emin=505000;$nmin=8179000;$emax=526500;$nmax=8190500;
} elsif ($area==2) {$emin=514500;$nmin=8162000;$emax=528500;$nmax=8180500;
} elsif ($area==3) {$emin=527500;$nmin=8160500;$emax=540000;$nmax=8177500;
} elsif ($area==4) {
Appendix D 368
$emin=505000;$nmin=8162000;$emax=528500;$nmax=8190500;
} elsif ($area==5) {$emin=514500;$nmin=8160500;$emax=540000;$nmax=8180500;
} elsif ($area==6) {$emin=505000;$nmin=8160500;$emax=540000;$nmax=8190500;
} else {&warn_and_exit ("Area not defined.\n");
}print "\nGrid dimensions (meters): ";$grid=<STDIN>;chop $grid;print "\nWorking...\n\n";open (INFILE, "< $infile") || &warn_and_exit ("File $infile could not be opened. Aborted.");#First initialize the HoH data structure to zero for all grid points...$e_extent=($emax-$emin)/$grid;$n_extent=($nmax-$nmin)/$grid;for $i (0..$n_extent) {
for $j (0..$e_extent) {$DATA{$i * $grid + $nmin}{$j * $grid + $emin}=0;
}}#Then read in $infile and augument the HoH appropriately...while ($line = <INFILE>) {
chop $line;@data = split /$delim/, $line;$data[2] =~ s/,/\./;$rem=mod($data[0],$grid);if ($rem > $grid/2) {
$data[0]=$data[0]-$rem+$grid;} else {
$data[0]=$data[0]-$rem;}$rem=mod($data[1],$grid);if ($rem > $grid/2) {
$data[1]=$data[1]-$rem+$grid;} else {
$data[1]=$data[1]-$rem;}if (($data[0] < $nmin)||($data[0] > $nmax)||($data[1] < $emin)||($data[1] > $emax)) {
&warn_and_exit ("Data out of grid boundaries. Aborted.\nNorth:$data[0]\tEast: $data[1]\n");
}$temp=$DATA{$data[0]}{$data[1]};$temp=$temp+$data[2];$DATA{$data[0]}{$data[1]}=$temp;
}close INFILE;# Now all we have to do is print the output file...open (OUTFILE, "> $outfile") || &warn_and_exit ("File $outfile could not be
opened. Aborted.");for $i (0..$n_extent) {
for $j (0..$e_extent) {
Appendix D 369
$north=$i * $grid + $nmin;$east=$j * $grid + $emin;$DATA{$north}{$east} =~ s/\./,/;print OUTFILE "$north\t$east\t$DATA{$north}{$east}\n";
}}close OUTFILE;&warn_and_exit ("Okay. All done.\n");##########################################Passed a number and a divisor, gives the remainder. Just don’t pass it a#zero divisor...#########################################sub mod {
my $num = $_[0];my $div = $_[1];my $times = int $num/$div;return $num-$times*$div;
}sub warn_and_exit {
print "$_[0]\n";print "Press Enter to Exit\n";$trash=<STDIN>;exit (0);
}
370
Appendix E
Occupation continuity program code
#! /usr/bin/perl#####################################This program will parse a 2-column tab-delimited file, with the columns#being site and period (phase), and determine percentages of#occupation continuity between any two given phases. No headers in#original file, please, and I’m not sure what’ll#happen if it’s fed a file not of this strict format, so don’t do it.#####################################print "Input file must be tab-delimited, and must contain 2 columns: \n";print "\t1) Site, 2) Period\n";print "Name or path of input file: ";$infile=<STDIN>;chop $infile;$continue=1;while ($continue) {print "\n\t1: Early Formative 1\n";print "\t2: Early Formative 2\n";print "\t3: Middle Formative\n";print "\t4: Late Formative 1\n";print "\t5: Late Formative 2\n";print "\t6: Tiwanaku\n";print "\t7: Early Pacajes\n";print "\t8: Pacajes-Inka\n";print "\t9: Late Pacajes\n";print "Calculate occupation continuity from:";$phase1=<STDIN>;chop $phase1;print "To: ";$phase2=<STDIN>;chop $phase2;if ($phase1==1) {
$phase1=1.1; # Early Formative 1} elsif ($phase1==2) {
$phase1=1.2; # Early Formative 2} elsif ($phase1==3) {
$phase1=2.0; # Middle Formative} elsif ($phase1==4) {
$phase1=3.1; # Late Formative 1} elsif ($phase1==5) {
$phase1=3.2;# Late Formative 2} elsif ($phase1==6) {

Appendix E 371
$phase1=4.0; # Tiwanaku} elsif ($phase1==7) {
$phase1=5.1; # Early Pacajes} elsif ($phase1==8) {
$phase1=5.2; # Pacajes-Inka} elsif ($phase1==9) {
$phase1=5.3; # Late Pacajes} else {
&warn_and_exit ("Phase not defined.\n");}if ($phase2==1) {
$phase2=1.1;} elsif ($phase2==2) {
$phase2=1.2;} elsif ($phase2==3) {
$phase2=2.0;} elsif ($phase2==4) {
$phase2=3.1;} elsif ($phase2==5) {
$phase2=3.2;} elsif ($phase2==6) {
$phase2=4.0;} elsif ($phase2==7) {
$phase2=5.1;} elsif ($phase2==8) {
$phase2=5.2;} elsif ($phase2==9) {
$phase2=5.3;} else {
&warn_and_exit ("Phase not defined.\n");}print "\nWorking...\n\n";undef %SITES;#Now we take a first pass through the file to build a list of sites with#occupations in $phaseopen (INFILE, "< $infile");
|| &warn_and_exit ("File $infile could not be opened. Aborted.");while ($line = <INFILE>) {
chop $line;@data = split /\t/, $line;if ($data[1]==$phase1) {
$SITES{$data[0]}=0;}
}close INFILE;#Now a second pass to see which have occupations of $phase2...open (INFILE, "< $infile")
|| &warn_and_exit ("File $infile could not be opened. Aborted.");$phase2_sites=0;while ($line = <INFILE>) {
chop $line;@data = split /\t/, $line;if ($data[1]==$phase2) {
++$phase2_sites;}if (($data[1]==$phase2)&&(exists($SITES{$data[0]}))) {
$SITES{$data[0]}=1;}
}close INFILE;#Now report the results...
Appendix E 372
$sites=0;$continuities=0;foreach $site (keys %SITES) {
++$sites;if ($SITES{$site}) {
++$continuities;}
}print "Results:\n";print "\tTotal sites with a $phase1 occupation:\t$sites\n";print "\tTotal sites with a $phase2 occupation:\t$phase2_sites\n";print "\tSites with both $phase1 and $phase2 occupations:\t$continuities\n";$percent=&round($continuities*100/$sites,1);print "\t$percent percent continuity between $phase1 and $phase2\n";$new_sites=&round(($phase2_sites-$continuities)/$phase2_sites*100,1);$abandonment=&round(($sites-$continuities)*100/$sites,1);print "\t$abandonment percent site abandonment rate\n";print "\t$new_sites percent new site founding rate\n";print "Would you like another? ";$answer=<STDIN>;chop $answer;if ($answer =~ /n/) {
$continue=0;}}&warn_and_exit ("Okay. All done.\n");sub round {
my $num = $_[0];my $nearest = $_[1];if (mod($num,$nearest) >= $nearest/2) {
return $num-mod($num,$nearest)+$nearest;} else {
return $num-mod($num,$nearest);}
}sub mod {
my $num = $_[0];my $div = $_[1];my $times = int $num/$div;return $num-$times*$div;
}sub warn_and_exit {
print "$_[0]\n";print "Press Enter to Exit\n";$trash=<STDIN>;exit (0);
}

373
Appendix F
Settlement database schema
Table: site
Field Type Null Key Default Extra
site varchar(10) Yes Nullsector char(2) Yes Nullutm_north int(11) Yes Nullutm_east int(11) Yes Nullelevation int(11) Yes Nullarea float(5,2) Yes Nullphase char(3) Yes Nullzone varchar(255) Yes Nulltype varchar(255 Yes Nullprefix varchar(10) Yes Nullarea_corrected float(5,2) Yes Nullpop_index float(5,2) Yes Null
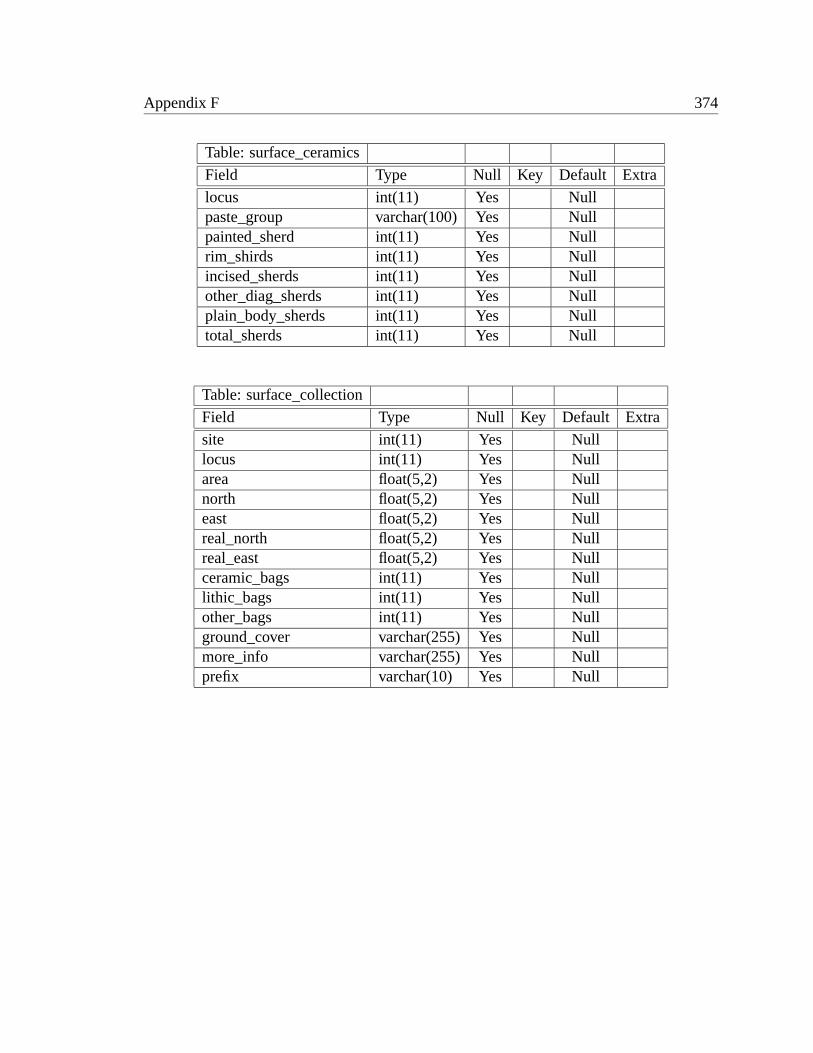
Appendix F 374
Table: surface_ceramics
Field Type Null Key Default Extra
locus int(11) Yes Nullpaste_group varchar(100) Yes Nullpainted_sherd int(11) Yes Nullrim_shirds int(11) Yes Nullincised_sherds int(11) Yes Nullother_diag_sherds int(11) Yes Nullplain_body_sherds int(11) Yes Nulltotal_sherds int(11) Yes Null
Table: surface_collection
Field Type Null Key Default Extra
site int(11) Yes Nulllocus int(11) Yes Nullarea float(5,2) Yes Nullnorth float(5,2) Yes Nulleast float(5,2) Yes Nullreal_north float(5,2) Yes Nullreal_east float(5,2) Yes Nullceramic_bags int(11) Yes Nulllithic_bags int(11) Yes Nullother_bags int(11) Yes Nullground_cover varchar(255) Yes Nullmore_info varchar(255) Yes Nullprefix varchar(10) Yes Null
Copyright © 2022 FDOKUMEN