Poor replication of candidate genes for major depressive disorder using genome-wide association data
51
NESDA-NTR GAIN Candidate gene replication study 1 Poor replication of candidate genes for major depressive disorder using genome-wide association data Fokko J Bosker PhD 1 *, Catharina A Hartman PhD 1 *, Ilja M Nolte PhD 2 *, Bram P Prins MSc 2 , Peter Terpstra PhD 2 , Danielle Posthuma PhD 3,4 , Tineke van Veen PhD 5 , Gonneke Willemsen PhD 3 , Roel H DeRijk PhD 5 , Eco J de Geus PhD 3 , Witte J Hoogendijk MD, PhD 6 , Patrick F Sullivan MD 7 , Brenda W Penninx PhD 1,5,6 , Dorret I Boomsma PhD 3 , Harold Snieder PhD 2 *, Willem A Nolen MD, PhD 1 * 1 Department of Psychiatry, University Medical Center Groningen, University of Groningen, The Netherlands 2 Unit of Genetic Epidemiology & Bioinformatics, Department of Epidemiology, University Medical Center Groningen, University of Groningen, The Netherlands 3 Department of Biological Psychology, Vrije Universiteit Amsterdam, The Netherlands 4 Depts of Medical and Functional Genomics, VU University Medical Center, Amsterdam, The Netherlands 5 Department of Psychiatry, Leiden University Medical Center. Leiden, The Netherlands 6 Department of Psychiatry, VU University Medical Center, Amsterdam, The Netherlands 7 Department of Genetics, University of North Carolina, Chapel Hill, NC, USA * These authors contributed equally Corresponding author: Fokko J Bosker: Department of Psychiatry, University Medical Center Groningen, University of Groningen, PO Box 30.001, 9700 RB Groningen, The Netherlands, email [email protected] Abstract: 292 words Text (excluding abstract, tables, figures, references): 4384 words Tables: 3 Figures: 4 References: 101 peer-00522166, version 1 - 30 Sep 2010 Author manuscript, published in "Molecular Psychiatry n/a, n/a (2010) n/a-n/a" DOI : 10.1038/mp.2010.38
-
Upload
independent -
Category
Documents
-
view
2 -
download
0
Transcript of Poor replication of candidate genes for major depressive disorder using genome-wide association data
NESDA-NTR GAIN Candidate gene replication study 1
Poor replication of candidate genes for major depressive disorder
using genome-wide association data
Fokko J Bosker PhD1*, Catharina A Hartman PhD1*, Ilja M Nolte PhD2*, Bram P Prins MSc2,
Peter Terpstra PhD2, Danielle Posthuma PhD3,4, Tineke van Veen PhD5, Gonneke Willemsen
PhD3, Roel H DeRijk PhD5, Eco J de Geus PhD3, Witte J Hoogendijk MD, PhD6, Patrick F
Sullivan MD7, Brenda W Penninx PhD1,5,6, Dorret I Boomsma PhD3, Harold Snieder PhD2*,
Willem A Nolen MD, PhD1*
1 Department of Psychiatry, University Medical Center Groningen, University of Groningen,
The Netherlands
2 Unit of Genetic Epidemiology & Bioinformatics, Department of Epidemiology, University
Medical Center Groningen, University of Groningen, The Netherlands
3 Department of Biological Psychology, Vrije Universiteit Amsterdam, The Netherlands
4 Depts of Medical and Functional Genomics, VU University Medical Center, Amsterdam,
The Netherlands
5 Department of Psychiatry, Leiden University Medical Center. Leiden, The Netherlands
6 Department of Psychiatry, VU University Medical Center, Amsterdam, The Netherlands
7 Department of Genetics, University of North Carolina, Chapel Hill, NC, USA
* These authors contributed equally
Corresponding author:
Fokko J Bosker: Department of Psychiatry, University Medical Center Groningen, University
of Groningen, PO Box 30.001, 9700 RB Groningen, The Netherlands, email
Abstract: 292 words Text (excluding abstract, tables, figures, references): 4384 words Tables: 3 Figures: 4 References: 101
peer
-005
2216
6, v
ersi
on 1
- 30
Sep
201
0Author manuscript, published in "Molecular Psychiatry n/a, n/a (2010) n/a-n/a"
DOI : 10.1038/mp.2010.38
NESDA-NTR GAIN Candidate gene replication study 2
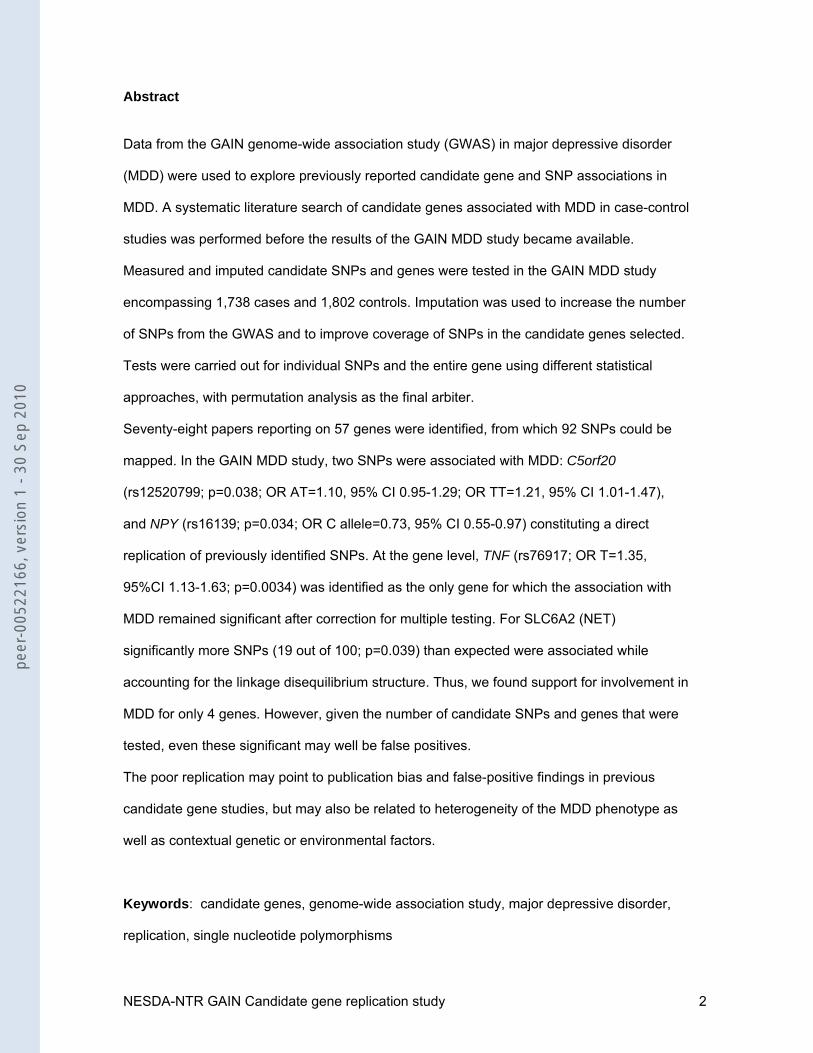
Abstract
Data from the GAIN genome-wide association study (GWAS) in major depressive disorder
(MDD) were used to explore previously reported candidate gene and SNP associations in
MDD. A systematic literature search of candidate genes associated with MDD in case-control
studies was performed before the results of the GAIN MDD study became available.
Measured and imputed candidate SNPs and genes were tested in the GAIN MDD study
encompassing 1,738 cases and 1,802 controls. Imputation was used to increase the number
of SNPs from the GWAS and to improve coverage of SNPs in the candidate genes selected.
Tests were carried out for individual SNPs and the entire gene using different statistical
approaches, with permutation analysis as the final arbiter.
Seventy-eight papers reporting on 57 genes were identified, from which 92 SNPs could be
mapped. In the GAIN MDD study, two SNPs were associated with MDD: C5orf20
(rs12520799; p=0.038; OR AT=1.10, 95% CI 0.95-1.29; OR TT=1.21, 95% CI 1.01-1.47),
and NPY (rs16139; p=0.034; OR C allele=0.73, 95% CI 0.55-0.97) constituting a direct
replication of previously identified SNPs. At the gene level, TNF (rs76917; OR T=1.35,
95%CI 1.13-1.63; p=0.0034) was identified as the only gene for which the association with
MDD remained significant after correction for multiple testing. For SLC6A2 (NET)
significantly more SNPs (19 out of 100; p=0.039) than expected were associated while
accounting for the linkage disequilibrium structure. Thus, we found support for involvement in
MDD for only 4 genes. However, given the number of candidate SNPs and genes that were
tested, even these significant may well be false positives.
The poor replication may point to publication bias and false-positive findings in previous
candidate gene studies, but may also be related to heterogeneity of the MDD phenotype as
well as contextual genetic or environmental factors.
Keywords: candidate genes, genome-wide association study, major depressive disorder,
replication, single nucleotide polymorphisms
peer
-005
2216
6, v
ersi
on 1
- 30
Sep
201
0
NESDA-NTR GAIN Candidate gene replication study 3
Introduction
Major depressive disorder (MDD) is a multi-factorial disease, with both genetic and
environmental factors likely to play a role in its etiology. The Netherlands Study of
Depression and Anxiety (NESDA; www.nesda.nl) and the Netherlands Twin Registry (NTR;
www.tweelingenregister.org) took part in the Genetic Association Information Network (GAIN;
http://www.fnih.org/GAIN) project to enable a genome-wide association study (GWAS) using
a 600K Perlegen chip 1. Within the GAIN MDD study 2 1862 participants with a diagnosis of
MDD and 1860 controls at low liability for MDD were selected for genome-wide genotyping.
A GWAS approach allows a hypothesis-free search for potential new susceptibility
genes. The downside of a GWAS is that a strict statistical adjustment for the large number of
single nucleotide polymorphisms (SNPs; in the GAIN MDD study 435,291 SNPs) is required
before associations can be considered significant on a genome-wide level 3 and replication of
such findings in independent cohorts is mandatory to exclude false positive findings 4.
Another potential use of a GWAS is to use the results for a large-scale replication
study of previous candidate gene studies. Application of such prior knowledge within the
context of a GWAS allows less stringent significance thresholds than those for the
hypothesis-free GWAS analysis 5, 6. So far, the role of candidate genes in MDD has been the
subject of many association studies. Unfortunately, there is little consistency between
candidate gene studies for multifactorial diseases such as MDD (e.g., 7, 8).
In the current study we attempted to replicate significant findings from previous
candidate gene studies in MDD. To this end we conducted a systematic review of the
literature and selected those genes that were reported to be significantly associated with
MDD at least once. The GWAS data from the GAIN MDD study were used to screen all the
identified candidate genes in two ways: 1) for association with the specific SNPs reported in
the literature; and 2) for association with any of the SNPs (genotyped or imputed) from the
Perlegen chip within the identified genes.
peer
-005
2216
6, v
ersi
on 1
- 30
Sep
201
0
NESDA-NTR GAIN Candidate gene replication study 4
Materials and methods
Selection of studies reporting on candidate genes
In order to prevent any bias from the results of the GAIN MDD study, we identified candidate
genes for MDD before the results from the GAIN MDD study became available. Therefore, a
so called “enhanced search” was performed in Medline® via Pubmed on September 1, 2007
using the following search terms: (("genes"[TIAB] NOT Medline[SB]) OR "genes"[MeSH
Terms] OR gene[Text Word]) OR ("genes"[MeSH Terms] OR genes[Text Word]) OR snp[All
Fields] OR ("single nucleotide polymorphism"[Text Word] OR "polymorphism, single
nucleotide"[MeSH Terms] OR snps[Text Word]) OR ("genetic polymorphism"[Text Word] OR
"polymorphism, genetic"[MeSH Terms] OR polymorphism[Text Word]) OR polymorphisms[All
Fields] AND ("major depressive disorder"[Text Word] OR "depressive disorder, major"[MeSH
Terms] OR major depression[Text Word]) AND "humans"[MeSH Terms]. This resulted in 641
hits. We additionally scrutinized the reference list of the meta-analysis of genetic studies on
MDD by Lopez-Leon and colleagues 9 that appeared on-line on 16 October, 2007, shortly
after the end date of our search, resulting in an additional 39 hits of possibly relevant papers.
These authors used somewhat broader search terms than we did, and their search ran until
June 2007; Therefore, as a final check, we searched the literature using their search terms
for the period June 2007-September 2007 not covered in their paper. This yielded an
additional 110 hits. Of all these papers we retrieved the abstracts, and if considered relevant,
the full paper.
In the next step, we selected all papers fulfilling the following five inclusion criteria: 1)
the study had to be a candidate gene case-control association study. Linkage and fine-
mapping studies were excluded; 2) the primary diagnosis of the patients in the candidate
gene study had to be MDD to enable comparison with the GAIN MDD study. Therefore, we
excluded studies involving patients (i) with a depressive episode in the course of bipolar
disorder, (ii) with a primary psychotic disorder such as schizophrenia and a secondary
depression, (iii) with a seasonal affective disorder not being MDD with a seasonal pattern,
peer
-005
2216
6, v
ersi
on 1
- 30
Sep
201
0
NESDA-NTR GAIN Candidate gene replication study 5
(iv) with a primary anxiety disorder (i.e. panic disorder, agoraphobia or social phobia) or
obsessive compulsive disorder and a secondary depression, and (v) with MDD plus an
additional specific comorbid disorder or condition, e.g. MDD plus alcoholism. However, we
allowed subgroups within MDD, e.g. MDD in women or in men, recurrent MDD, or early
onset MDD; 3) the sample of a specific study consisted of at least 30 patients with MDD and
30 healthy controls; 4) the findings on the association with MDD of any variant within the
candidate gene (either a SNP, a microsatellite marker or a haplotype) had reached a
statistical significance at the level of p < 0.05; and 5) the genetic association had to be with
the diagnosis of MDD and not with other aspects such as associated personality features
(e.g. neuroticism) or factors related to treatment response. This resulted in 78 papers.
In order not to miss potential true positive findings, we did not exclude candidate
genes with associated markers that had low allele frequencies or that deviated from Hardy-
Weinberg equilibrium. Two investigators (FB, CH) independently made a selection from the
initial list of papers using the abovementioned criteria. When both reached consensus, the
paper was included or excluded; in case of disagreement, consensus was obtained with
assistance of two other authors (WN, HS). As a final step, one author (IN) double checked
whether all selected papers fulfilled the aforementioned selection criteria 1 through 5. Figure
1 shows a flowchart of how we retrieved the 78 papers for the present study.
Bioinformatic tools
For many SNPs no reference SNP identification number (rs-id) was given in the original
papers, but codes based on position (e.g., 677C/T in MTHFR or Tyr129Ser in HTR3B) or
even own codes (e.g., s1-s5 in AVPR1B). In order to retrieve rs-ids for these SNPs, we used
searches in PubMed or in NCBI’s dbSNP database (http://www.ncbi.nlm.nih.gov/SNP/) using
the “Geneview” option in conjunction with NCBI’s MapViewer with the human genome
assembly build 37.1 (http://www.ncbi.nlm.nih.gov/projects/mapview/map). Six SNPs
remained that could not be easily found in this way. We contacted the corresponding authors
of the papers and used NCBI’s Primer-Blast and SNP-Blast
peer
-005
2216
6, v
ersi
on 1
- 30
Sep
201
0
NESDA-NTR GAIN Candidate gene replication study 6
(http://blast.ncbi.nlm.nih.gov/Blast.cgi) to map these SNPs using the provided primer
sequences.
Sample
The 1,862 MDD cases included in the GAIN MDD study were mainly from NESDA, a
longitudinal cohort study designed to be representative of individuals with depressive and/or
anxiety disorders 10 and were recruited from mental health care organizations (N=785),
primary care (N=603), and community samples (N=314). Additional cases came from the
NTR (N=160). Regardless of recruitment setting, similar inclusion and exclusion criteria were
used to select MDD cases. Inclusion criteria were a lifetime diagnosis of MDD according to
DSM-IV 11 as diagnosed via the Composite International Diagnostic Interview (CIDI Version
2.1.12), age 18-65 years, and self-reported western European ancestry. Persons who were
not fluent in Dutch and those with a primary diagnosis of a psychotic disorder, obsessive
compulsive disorder, bipolar disorder, or severe alcohol or substance use disorder were
excluded.
Most of the 1,860 control subjects were from the NTR (N=1,703) and additional
controls from NESDA (N=157). Longitudinal phenotyping in NTR includes assessment of
depressive symptoms (via multiple instruments), anxiety and neuroticism. Inclusion required
no report of MDD at any measurement occasion and never scoring high (>0.5 SD) on a
general factor score based on combined measures of neuroticism, anxiety and depressive
symptoms. Finally, controls and their parents were required to have been born in the
Netherlands or Western Europe. Only one control per family was selected. NESDA controls
had no lifetime diagnosis of MDD or an anxiety disorder as assessed by the CIDI and
reported low depressive symptoms at baseline. For more details see 2.
Genotyping
Perlegen Sciences (Mountain View, CA, USA) performed all genotyping according to strict
standard operating procedures. DNA samples from cases and controls were randomly
peer
-005
2216
6, v
ersi
on 1
- 30
Sep
201
0
NESDA-NTR GAIN Candidate gene replication study 7
assigned to plates, shipped to Perlegen and identified only by barcode. High-density
oligonucleotide arrays were used yielding 599,164 SNPs. Eight SNPs with duplicate numbers
were deleted and 73 mitochondrial SNPs were removed for later analysis. From the
remaining 599,083 SNPs on the Perlegen chip 435,291 passed quality control. Two hundred
eighty subjects were excluded because of various quality control issues leaving 1,738 cases
(93.4%) and 1,802 controls (96.9%) in the final analysis dataset. For more details see 2, 4.
Imputation
Not all SNPs selected from the literature were present on the genotyping array. Based on the
linkage disequilibrium (LD) structure between SNPs we followed an imputation procedure to
predict non-genotyped SNPs using the HapMap CEU data (release 22, build 36) as the
reference database. The imputation was performed by IMPUTE version 0.3.2 using the
default settings and the recommended number 11418 for the effective population size of
Caucasians 13. In this way we extended the genome-wide autosomal SNP dataset from
427,049 to 2,467,430 SNPs. For our candidate genes this meant an extension from 851 to
4,955 SNPs. However, the quality of the imputation was low for 85 SNPs (SNPTEST
proper_info <0.5). These SNPs were excluded leaving 4,870 SNPs for analysis. No SNP had
a minor allele frequency <1%.
Association test
Association between MDD and the autosomal SNP data was tested by means of a
frequentist case-control test provided in the software package SNPTEST version 1.1.4 using
allele dosages with sex as a covariate in order to adjust for the slight imbalance in
percentage of females between cases (69.6%) and controls (62%) 2, 4 and the “proper” option
to account for the uncertainty of the genotypes that were imputed 13. In addition, 7,988
genotyped SNPs on the X chromosome were analyzed in PLINK version 1.03 14 by means of
logistic regression with sex as a covariate. SNPs on the Y chromosome (n=15) and SNPs
mapped to ambiguous locations (n=239) were not analyzed.
peer
-005
2216
6, v
ersi
on 1
- 30
Sep
201
0
NESDA-NTR GAIN Candidate gene replication study 8
Odds ratios (ORs) and 95% confidence intervals (CIs) were calculated for the
significant candidate SNPs according to the disease model from the original article using
counted or estimated numbers for genotyped or imputed SNPs, respectively. In order to
establish true replication, we checked whether the effect was for the same allele and in the
same direction.
Permutation procedure
In order to facilitate interpretation of the significance of our findings for each SNP we
calculated three p-values by permutation: (i) a crude uncorrected significance; (ii) a gene-
wide significance (corrected for all SNPs in the gene), and (iii) an overall significance
(corrected for all SNPs in all selected genes). The crude uncorrected p-value was
determined as the fraction of permutations that yielded a p-value that was smaller than the
observed one. This p-value was determined in order to validate the permutation procedure
since it should be similar to the p-value calculated by SNPTEST or PLINK. The gene-wide
significance of a particular SNP was defined as the fraction of permutations that the p-value
of any SNP in the candidate gene concerned was smaller than the one observed for that
SNP. This procedure corrects the p-value for testing multiple SNPs within a gene. Based on
the rationale that each selected gene is a candidate for MDD (hypothesis-driven) no
correction for all SNPs in the entire gene set is necessary. Nonetheless, we also calculated
an overall significance (i.e., corrected for all SNPs in all candidate genes) by determining an
overall p-value for each SNP as the fraction of permutations for which any of the SNPs in any
of the candidate genes had a p-value smaller than the observed one. For each of the three p-
values we conducted 10,000 permutations. Case-control status was randomly permuted
within males and females separately, hence leaving the number of affected males and
females intact.
In addition to the three SNP specific p-values, we also determined whether the
number of SNPs within a candidate gene with an original p-value <0.05 based on SNPTEST
or PLINK (see above) was higher than expected. For each permutation the number of SNPs
peer
-005
2216
6, v
ersi
on 1
- 30
Sep
201
0
NESDA-NTR GAIN Candidate gene replication study 9
in each candidate gene that was significant at 0.05 was recorded. The fraction of
permutations with a higher number of significant SNPs than originally observed determined
the significance of the number of significant SNPs of that candidate gene. By permuting
case-control status the LD structure of the genes is preserved, that is, the resulting
significance is corrected for possible high correlation between SNPs. The number of
permutations for this test was 10,000 as well.
Results
Literature search
The 78 papers which resulted from our systematic literature search reported 115 statistically
significant differences between MDD cases and healthy controls in 57 genes: for 96 SNPs, 7
microsatellite markers (i.e., length polymorphisms), 11 haplotypes, and one protein
polymorphism in the haptoglobin gene 15 (Table 1). Twenty-nine SNPs were identified by an
rs-id, while 67 SNPs were only specified by a location code, restriction enzyme or author
designed code. For 64 of these 67 SNPs, rs-ids could be obtained, while two rs-ids were not
found (246G/A in CCKAR 16 and -7054C/A in DRD2 16). In addition, for SNP 1463G/A in
TPH2, others have tried to replicate the association, but the SNP appeared to be non-
existent 17, 18. Thus, we could map 93 SNPs.
For the 7 microsatellite markers no LD data with SNPs are known and hence we
cannot determine whether these are covered by any of the available SNPs in the
corresponding genes. Among them is the 5-HTTLPR 44 base pair deletion in the promoter
region of the serotonin transporter gene SLC6A4 (SERT), which has attracted considerable
attention in various previous candidate gene studies for MDD.
Association in the GAIN MDD data with specific SNPs from the literature
Sixty one of the 93 selected SNPs in the 57 candidate genes were either present (n= 18) on
the Perlegen array or could be imputed (n= 43). Four additional SNPs could be tagged by
peer
-005
2216
6, v
ersi
on 1
- 30
Sep
201
0
NESDA-NTR GAIN Candidate gene replication study 10
other available SNPs (Table 2). Two of these were not genotyped in the CEU population of
the HapMap Phase2 (release 22, build 36) project, but were available in the JPT and CHB
populations in which they showed high LD (r2=0.97 and 1.00, respectively) with at least one
other available SNP. The two other SNPs were genotyped in the CEU population and could
be tagged by available SNPs with r2=1, but were for unreported reasons not included in the
HapMap reference file used for the imputation procedure as provided on the website of the
imputation software package IMPUTE
(http://www.stats.ox.ac.uk/~marchini/software/gwas/impute.html). Twenty eight SNPs were
neither genotyped directly nor imputed nor could be tagged, hence were not available for
replication.
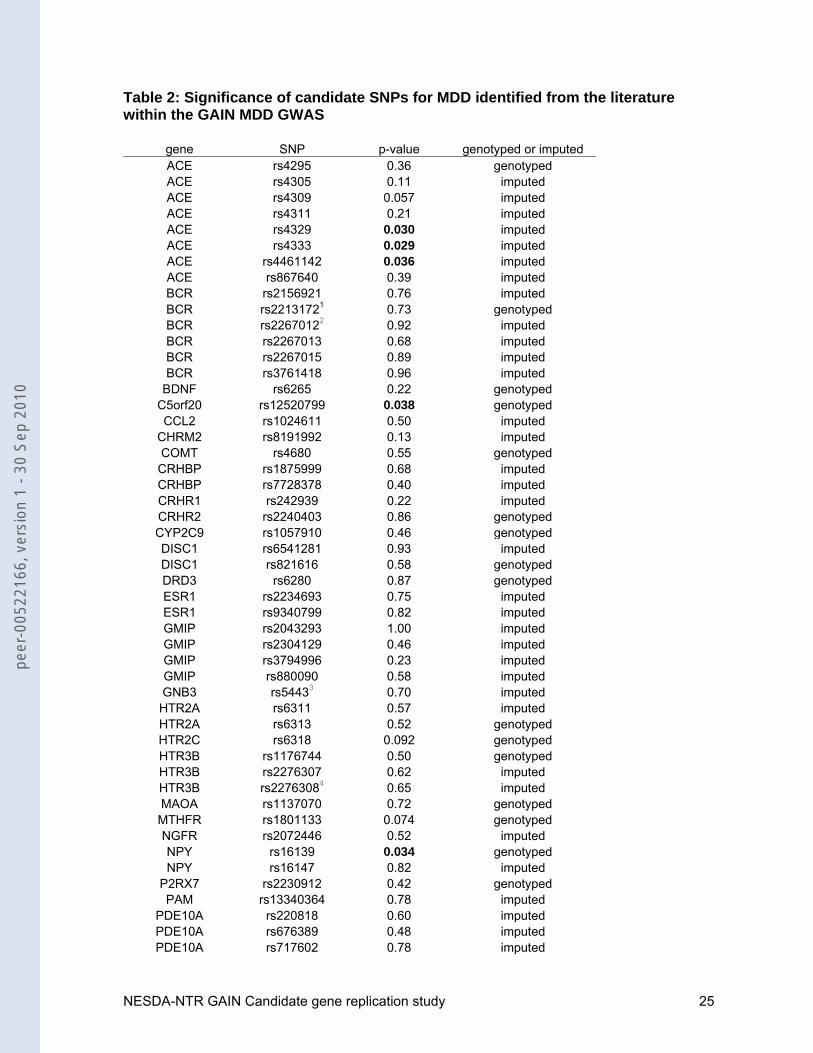
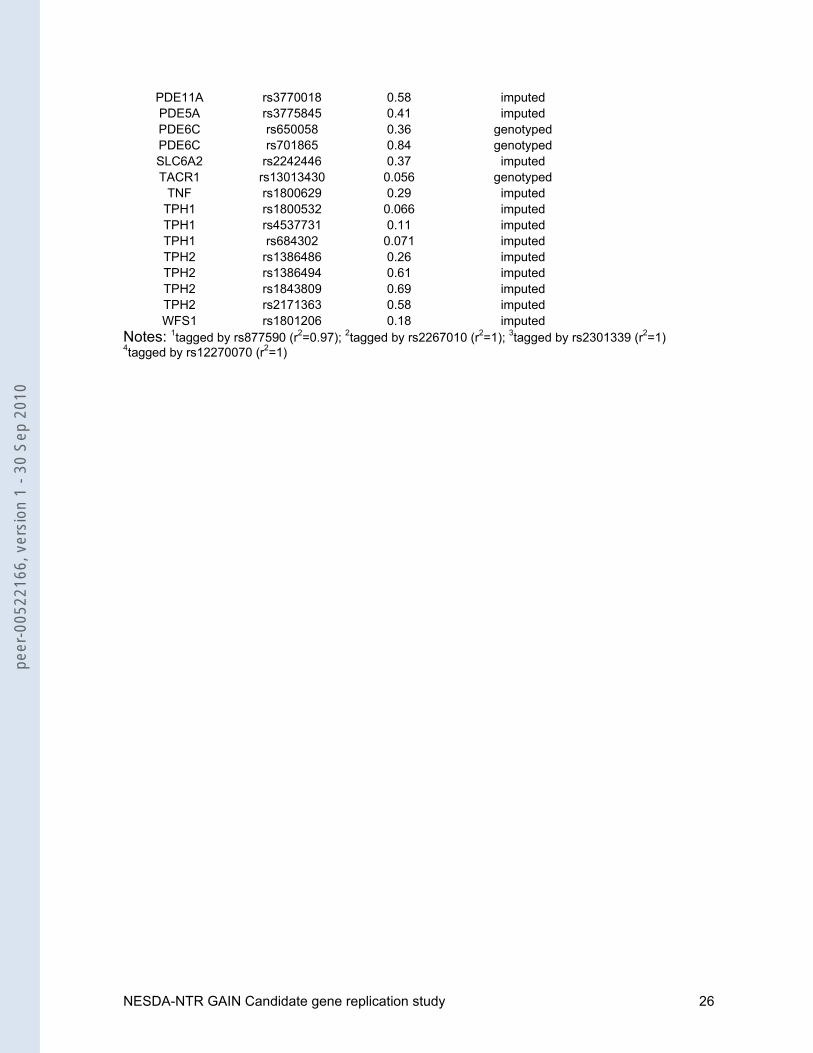
We investigated which of the 65 available or tagged SNPs could be confirmed in our
data (Table 2). SNPs rs12520799 in C5orf20 (DCNP1) (p=0.038; OR AT=1.10, 95% CI 0.95-
1.29; OR TT=1.21, 95% CI 1.01-1.47) and rs16139 in NPY (p=0.034; OR C allele=0.73, 95%
CI 0.55-0.97) replicated the reported effect in the literature. In addition, three SNPs in the
ACE gene selected from the literature, which were in strong LD with each other (r2=0.78-
1.00), were also significant in the GAIN MDD sample (rs4333: p=0.029; rs4329: p=0.030;
rs4461142: p=0.036). However these three SNPs showed effects in the opposite direction
compared to previous results 19 (Baghai, personal communication). Hence these SNPs do
not represent a true replication.
Candidate genes from the literature in the GAIN MDD study
As in different populations different SNPs might play a role, we also studied all SNPs present
on the genotyping array or available through imputation in an area from 5kb upstream to 5kb
downstream of each selected candidate gene in order to cover the promoter and 3’
untranslated region, respectively. Forty nine of the 57 genes were covered by one or more
SNPs that were present on the Perlegen chip. For another six genes no genotyped SNPs
were available but imputed ones were. Neither genotyped nor imputed SNPs were available
for two genes (AVPR1B and CHRFAM7A). In total 4,870 SNPs, of which 820 were
peer
-005
2216
6, v
ersi
on 1
- 30
Sep
201
0
NESDA-NTR GAIN Candidate gene replication study 11
genotyped and 4,019 were imputed, covered the 55 candidate genes ranging from 1 SNP for
AR to 642 SNPs for PDE11A (Figure 2). We noted a significant correlation of 0.75 between
gene size and the number of genotyped SNPs (including genes on the X chromosome) and a
correlation of 0.96 between gene size and total number of SNPs (excluding genes on the X
chromosome, since SNPs on the X chromosome were not imputed).
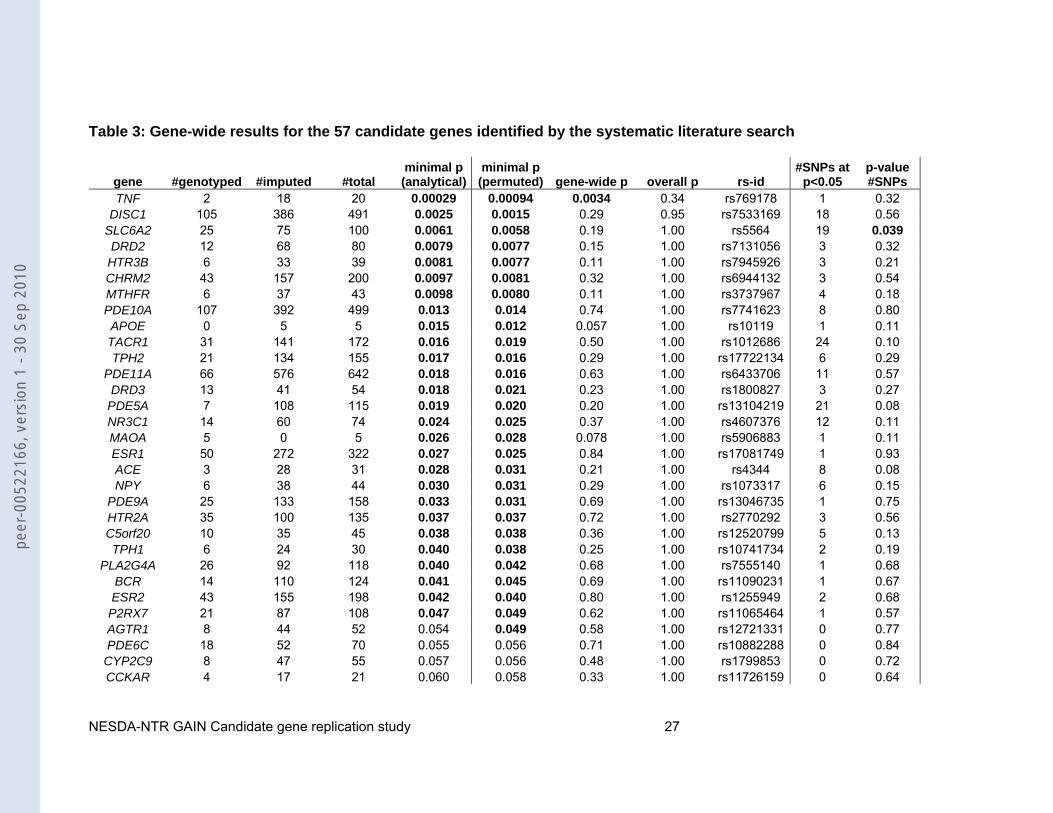
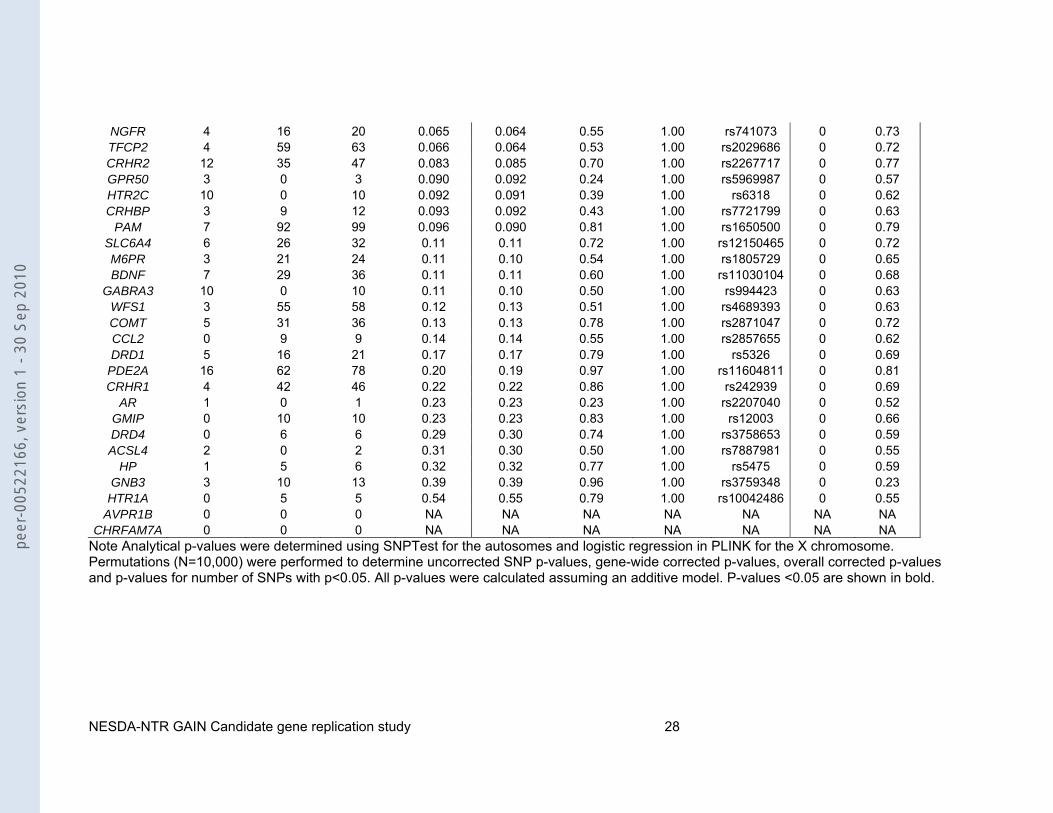
For 28 of the 55 genes one or more SNPs were found to be different between MDD
cases and healthy controls in the GAIN MDD GWA scan at a significance level of p<0.05
(Table 3). The remaining 27 genes were not associated with MDD as none of the SNPs
reached p<0.05. The smallest p-value was observed for SNP rs769178 in the TNF gene
region (p=0.00029; OR T allele =1.35, 95%CI 1.13-1.63). The minor allele T was observed in
8.0% of the MDD cases and 6.1% of the controls.
With genes covered by a large number of SNP markers, the expected minimal p-
value will decrease purely as a result of chance alone as a function of the number of SNPs.
Thus, we used gene-wide p-values from the permutation procedure that corrects for the
number of SNPs within a candidate gene and only SNP rs769178 in TNF remained
significant (p=0.0034) (Figure 3; Table 3. The second strongest associated SNP, which was
observed in DISC1 (rs7533169: p-value=0.0025), became non-significant after this correction
(gene-wide p-value=0.28), because in this gene there were 491 SNPs and apparently the
small p-value was observed purely based on chance. In addition to the gene-wide
significance, we also determined overall significance per SNP accounting for testing 4,870
SNPs in 55 candidate genes. In that case none of the SNPs remained significant, not even
the TNF SNP rs769178 (overall p=0.33).
The significance levels per SNP are one way of testing the true value of the selected
candidate genes. If many SNPs in a candidate gene are associated, this could also indicate
potential involvement of a gene in the disorder under study 20. We noticed for instance that in
the norepinephrine transporter SLC6A2 (NET) 19 of the 100 SNPs were significant at a level
of 0.05 (Table 3). The permutation procedure that tested whether the number of SNPs that
were significant at 0.05 was larger than expected, revealed that this finding for SLC6A2 was
peer
-005
2216
6, v
ersi
on 1
- 30
Sep
201
0
NESDA-NTR GAIN Candidate gene replication study 12
indeed significant (p=0.039). Figure 4 shows that the 19 SNPs are scattered in the right half
of the gene. Seventeen of them lie in three independent haplotype blocks and the other 2
SNPs are not in LD with the haplotype blocks or with each other. For none of the other
candidate genes this permutation test revealed a significant result.
Discussion
Several genome-wide linkage studies of MDD have been published (reviewed in 2) but the
GAIN MDD study is among the first genome-wide association studies (GWAS) in MDD 4, 21.
We used these GWAS data as a large scale replication of previously reported significant
findings from candidate gene studies in MDD. To this end, we first conducted a systematic
review of the literature and identified a total of 57 genes for which a significant association
with MDD has been reported at least once. Fifty-five of these genes could be included in our
replication study, with either genotyped or imputed SNPs available from the GWAS data.
With a sample size (1,738 cases and 1,802 controls ) by far exceeding all previous candidate
gene studies (with a mean sample size of 164 MDD cases and 252 controls, and only 1
study with > 1000 MDD cases and controls) 22, we found minimal support for involvement in
MDD for only 4 out of 55 candidate genes: C5orf20 (p=0.038), NPY (p=0.034), TNF
(p=0.0034), and SLC6A2 (p=0.039). Replication of these genes was based on three different
statistical approaches. First, the involvement of C5orf20 (rs12520799) and NPY (rs16139)
constituted a direct replication at SNP level of previously identified SNPs associated with
MDD. Second, studying the selected candidate genes for all SNPs present on the genotyping
array, TNF (rs76917) was identified as the only gene for which the association with MDD
remained gene-wide significant. Third, the potential involvement of SLC6A2 (NET) in MDD
was derived on the basis of a statistically significant number of SNPs (i.e., 19 out of 100)
associated with MDD within this gene, which could not be explained solely by high LD
between the SNPs. Note that the prior evidence in the selected studies for the involvement of
C5orf20, NPY, TNF, and SLC6A2 in MDD did not stand out as particularly strong, i.e. odds
ratios were mostly in the moderate range (minimum OR = 0.33; maximum OR = 2.41), and
peer
-005
2216
6, v
ersi
on 1
- 30
Sep
201
0
NESDA-NTR GAIN Candidate gene replication study 13
none of the p-values in these studies was smaller than p<0.001, not even for the largest
study on C5orf20 with a total sample size of 864. NPY was the one exception where the
allele was present in 6.3 % of the controls but not in the patients, thus suggesting a strong
effect (OR=0). However, this was based on only 51 patients 23-26.
An important question is why so few candidate genes were replicated by our GWAS,
while the sample size of our study was so much larger than any of the 78 selected candidate
gene studies. One possible - and in our opinion most likely - explanation is publication bias:
positive results have a better chance of being published than negative results. This would
also imply that many previously reported positive findings were actually false positive findings
(type 1 errors), probably amplified by insufficient correction for multiple testing. Testing this,
e.g. with funnel plots, is not appropriate for the approach followed here as our literature
search strategy did not include negative candidate gene studies. Second, given that MDD is
a rather heterogeneous disorder, and that it was diagnosed with different instruments across
studies, previous and current study samples may have differed phenotypically (see 27 for a
discussion of this point). A third explanation is that associations between genes and
etiologically complex diseases may depend on genetic (gene*gene interactions or epistasis)
and environmental (gene*environment interactions) contexts, which may differ in samples
from different populations 28. Thus, previous and current samples may have been different
genetically or in their contextual factors.
Given the modest support for the replicated candidate genes (one p-value <0.01,
three p-values <0.05) it is possible that even the four replications of our analysis are false
positive results. With the number of SNPs (n=65) been tested and under the null hypothesis
of no true associations of any of the candidate SNPs in previous studies, one would expect
three significant findings. Thus, it is possible that our two significant findings in C5orf20 and
NPY are false positive results. In addition, under a similar null hypothesis for the 55
candidate genes, two significant findings were expected implying that the single gene-wide
significant result of TNF might also be a false positive result. This is supported by the lack of
overall significance for the TNF SNP (p=0.33). And finally, also the significant finding for
peer
-005
2216
6, v
ersi
on 1
- 30
Sep
201
0
NESDA-NTR GAIN Candidate gene replication study 14
SLC6A2, the only gene showing a larger number of significant SNPs than expected, might be
a chance finding.
On the other hand, the above calculations may be too conservative when assuming
that at least some of the previously found associations of candidate genes with MDD were
true findings. In that case, our approach of replicating candidate genes is more or less
hypothesis-driven, thus not requiring the same multiple testing penalty as the genome-wide
approach4. Nonetheless, the few replications in our study are rather sobering and in order to
uncover whether the replicated SNPs and genes are truly associated to MDD confirmation in
independent samples is crucial. As such, meta-analytical results from the Psychiatric GWAS
Consortium are also eagerly awaited 29.
From the most recent meta-analysis of genetic studies on MDD, Lopez-Leon et al. 9
concluded that statistically significant evidence exists for six MDD susceptibility genes, i.e.,
APOE, DRD4, GNB3, MTHFR, SLC6A3, and SLC6A4. Our study offers little support for
these genes. Given our sample size we had 80% power to detect odds ratios of >1.15 for
allele frequencies >5% under an additive disease model. All of the above genes meet these
criteria. The association of GNB3 and MTHFR with MDD was directly tested but could not be
replicated in the GAIN MDD sample, although the effect of MTHFR showed a trend in the
expected direction (p=0.074; OR TT versus CC=1.14). In addition, APOE, DRD4, and
SLC6A4 were not associated with MDD in our study, but the previously identified genetic
variants were length polymorphisms instead of SNPs. Hence these could not directly be
tested and since it is unsure whether these variants are tagged by the SNPs in the
corresponding genes we cannot refute the associations. SLC6A3 was not identified in our
literature search as a candidate gene for MDD, because individual studies did not report
significant effects for this gene 30, 31 and it only reached significance in the pooled meta-
analysis. Post-hoc we also tested for significance in our sample and we did not find any
association (59 SNPs, most significant SNP: rs27072, P=0.096).
In the context of the non-replication of many of the selected candidate genes as
discussed earlier, two limitations of our study need to be noted. First, we did not have direct
peer
-005
2216
6, v
ersi
on 1
- 30
Sep
201
0
NESDA-NTR GAIN Candidate gene replication study 15
or indirect information on one third of the candidate SNPs as these were not present on the
genotyping chip and could not be imputed using the HapMap CEU data. Second, we were
unable to test candidate length polymorphisms previously associated with MDD. Among
these was the 44 base pair insertion/deletion polymorphism (or 5-HTTLPR) in the promoter
region of the serotonin transporter gene SLC6A4 (SERT). Length polymorphisms are often
difficult to tag with single SNPs because LD information between SNPs and length
polymorphisms is either unavailable or LD with SNPs is insufficiently strong 32. However, a
recent study by Wray and colleagues 33 identified a two-SNP haplotype proxy for 5HTTLPR.
In conclusion, the GWAS data of the GAIN MDD study failed to replicate all but four of
the previously reported candidate gene associations with MDD. However, given the number
of candidate SNPs and genes that were tested, even these significant may well be false
positives, implying that we found no replication at all. This might point to publication bias and
false-positive findings in previous studies, but also to heterogeneity of the MDD phenotype
as well as variations in contextual genetic or environmental factors.
peer
-005
2216
6, v
ersi
on 1
- 30
Sep
201
0

NESDA-NTR GAIN Candidate gene replication study 16
Conflict of interest: None
Acknowledgements: The authors would like to thank Ting Wu for making the flow diagram
in figure 1.
peer
-005
2216
6, v
ersi
on 1
- 30
Sep
201
0
NESDA-NTR GAIN Candidate gene replication study 17
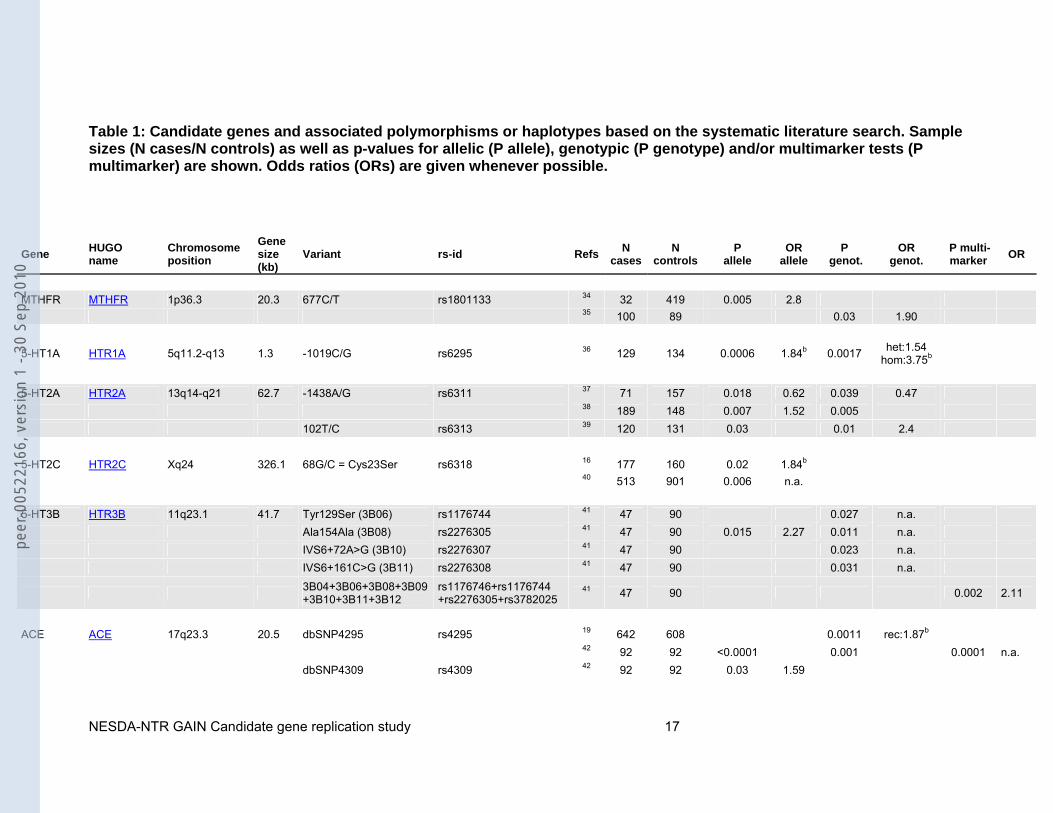
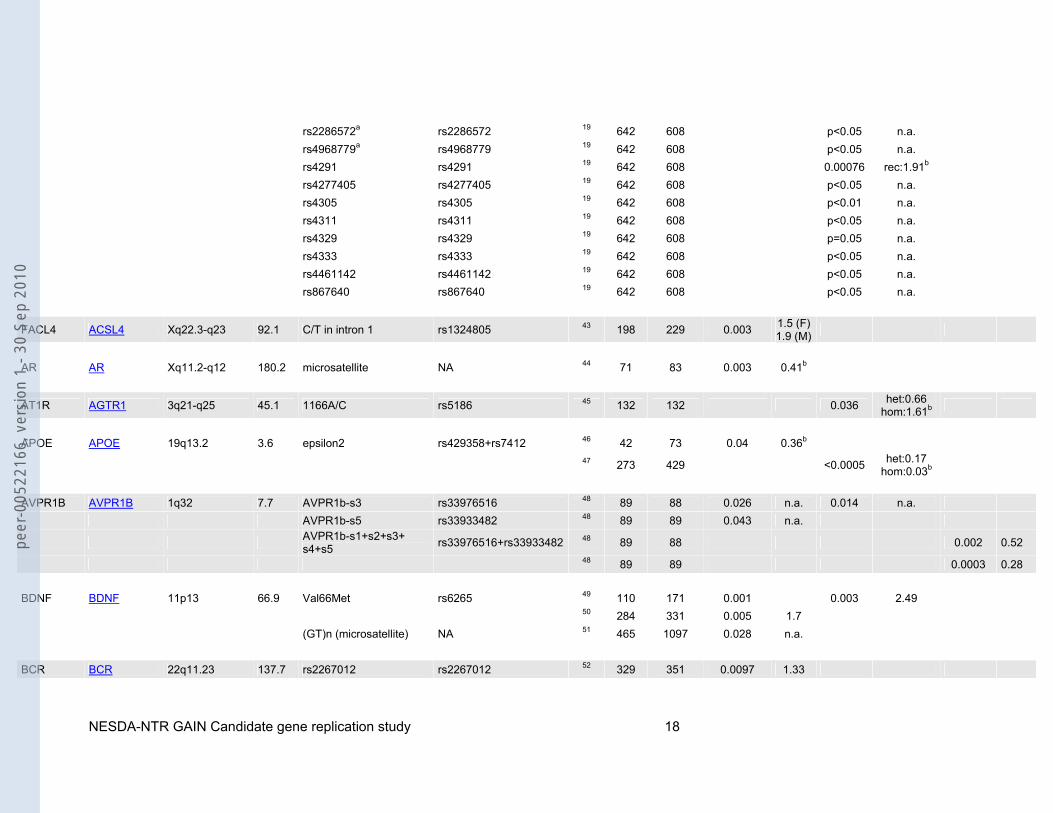
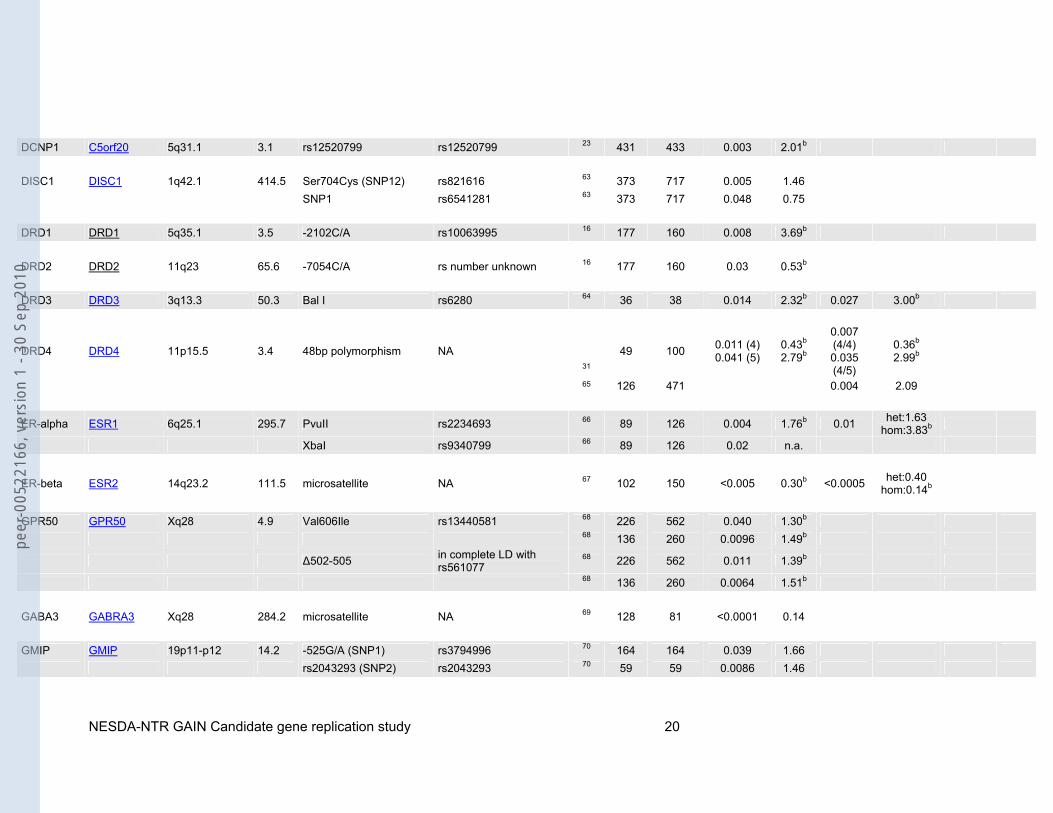
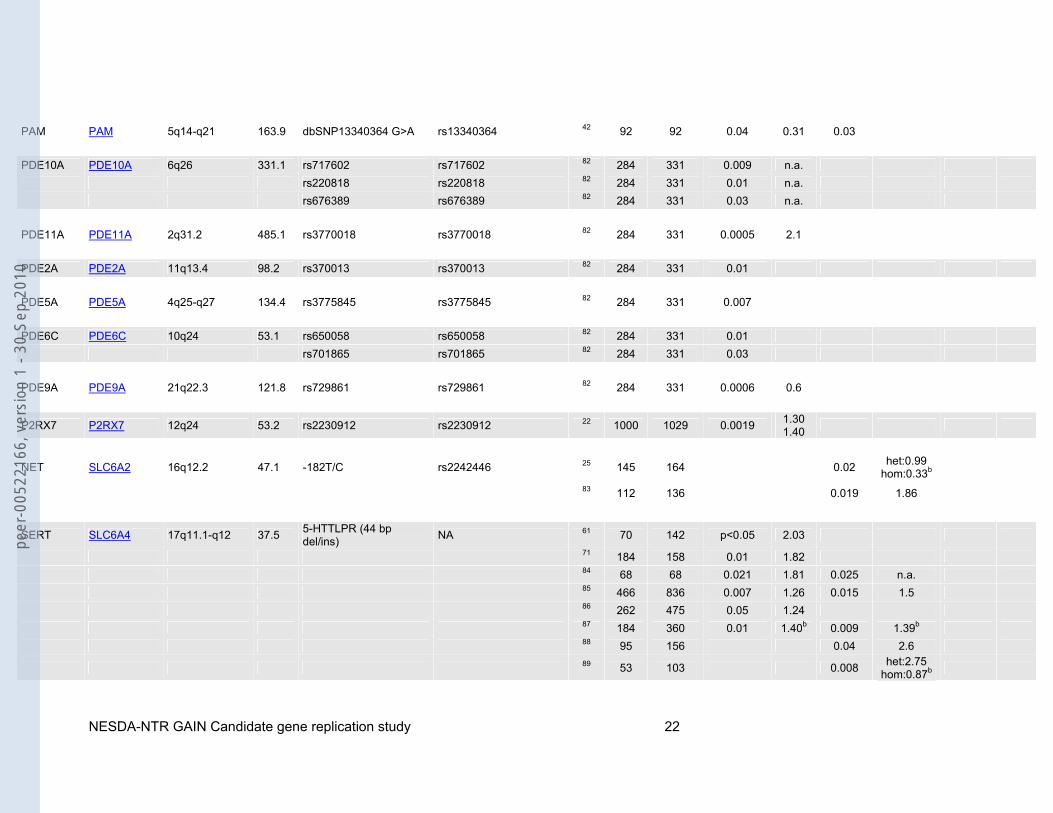
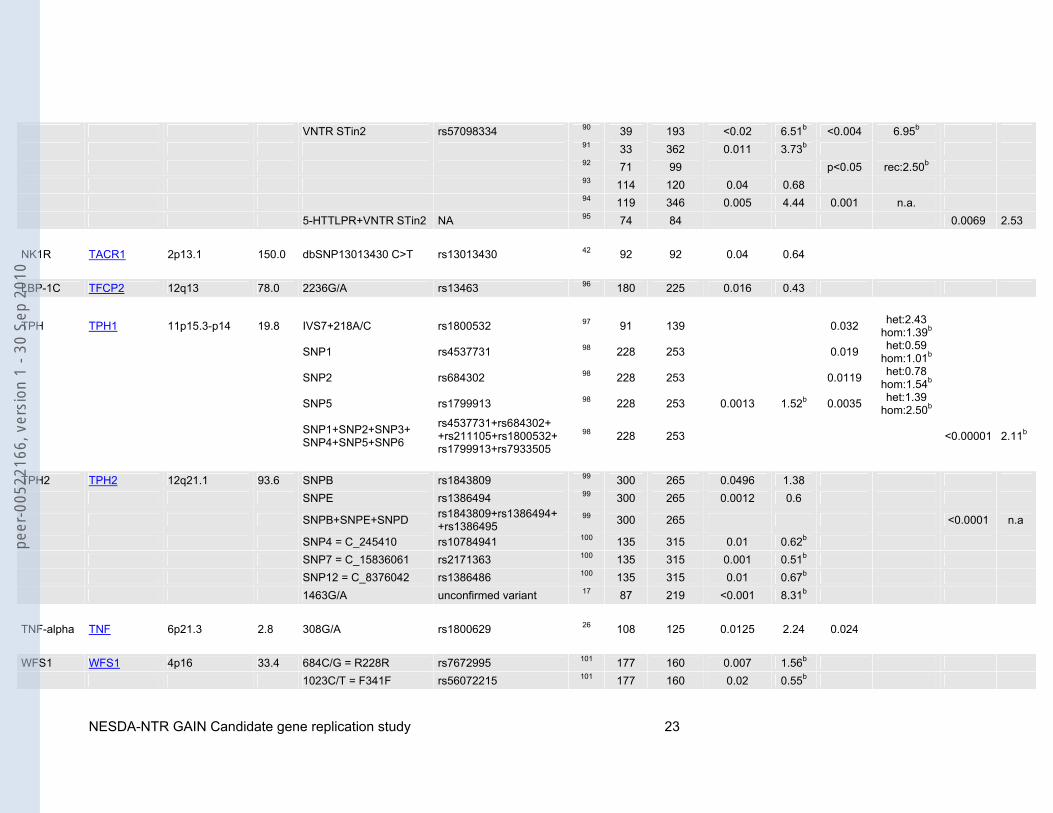
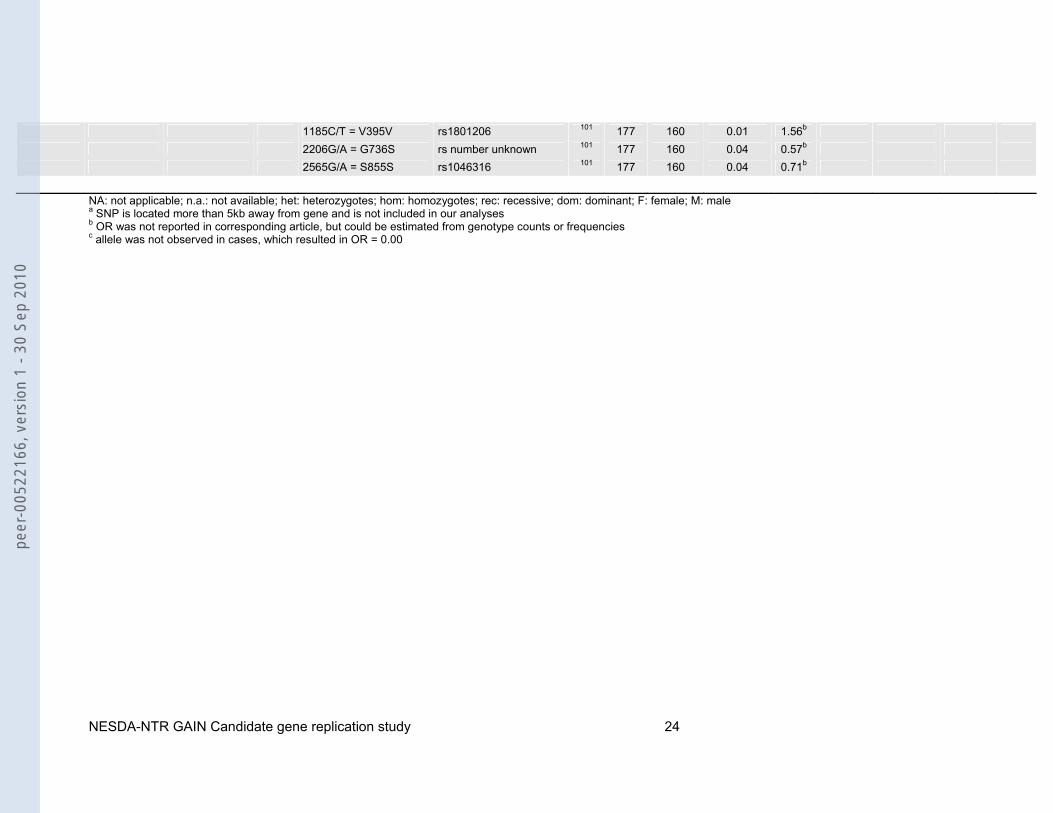
Table 1: Candidate genes and associated polymorphisms or haplotypes based on the systematic literature search. Sample sizes (N cases/N controls) as well as p-values for allelic (P allele), genotypic (P genotype) and/or multimarker tests (P multimarker) are shown. Odds ratios (ORs) are given whenever possible.
Gene HUGO name
Chromosome position
Gene size (kb)
Variant rs-id Refs N cases
N controls
P allele
OR allele
P genot.
OR genot.
P multi- marker
OR
MTHFR MTHFR 1p36.3 20.3 677C/T rs1801133 34 32 419 0.005 2.8 35 100 89 0.03 1.90
5-HT1A HTR1A 5q11.2-q13 1.3 -1019C/G rs6295 36 129 134 0.0006 1.84b 0.0017 het:1.54 hom:3.75b
5-HT2A HTR2A 13q14-q21 62.7 -1438A/G rs6311 37 71 157 0.018 0.62 0.039 0.47 38 189 148 0.007 1.52 0.005 102T/C rs6313 39 120 131 0.03 0.01 2.4 5-HT2C HTR2C Xq24 326.1 68G/C = Cys23Ser rs6318 16 177 160 0.02 1.84b 40 513 901 0.006 n.a. 5-HT3B HTR3B 11q23.1 41.7 Tyr129Ser (3B06) rs1176744 41 47 90 0.027 n.a. Ala154Ala (3B08) rs2276305 41 47 90 0.015 2.27 0.011 n.a. IVS6+72A>G (3B10) rs2276307 41 47 90 0.023 n.a. IVS6+161C>G (3B11) rs2276308 41 47 90 0.031 n.a.
3B04+3B06+3B08+3B09+3B10+3B11+3B12
rs1176746+rs1176744 +rs2276305+rs3782025
41 47 90 0.002 2.11
ACE ACE 17q23.3 20.5 dbSNP4295 rs4295 19 642 608 0.0011 rec:1.87b 42 92 92 <0.0001 0.001 0.0001 n.a. dbSNP4309 rs4309 42 92 92 0.03 1.59
peer
-005
2216
6, v
ersi
on 1
- 30
Sep
201
0
NESDA-NTR GAIN Candidate gene replication study 18
rs2286572a rs2286572 19 642 608 p<0.05 n.a. rs4968779a rs4968779 19 642 608 p<0.05 n.a. rs4291 rs4291 19 642 608 0.00076 rec:1.91b rs4277405 rs4277405 19 642 608 p<0.05 n.a. rs4305 rs4305 19 642 608 p<0.01 n.a. rs4311 rs4311 19 642 608 p<0.05 n.a. rs4329 rs4329 19 642 608 p=0.05 n.a. rs4333 rs4333 19 642 608 p<0.05 n.a. rs4461142 rs4461142 19 642 608 p<0.05 n.a. rs867640 rs867640 19 642 608 p<0.05 n.a.
FACL4 ACSL4 Xq22.3-q23 92.1 C/T in intron 1 rs1324805 43 198 229 0.003 1.5 (F)1.9 (M)
AR AR Xq11.2-q12 180.2 microsatellite NA 44 71 83 0.003 0.41b
AT1R AGTR1 3q21-q25 45.1 1166A/C rs5186 45 132 132 0.036 het:0.66 hom:1.61b
APOE APOE 19q13.2 3.6 epsilon2 rs429358+rs7412 46 42 73 0.04 0.36b
47 273 429 <0.0005 het:0.17 hom:0.03b
AVPR1B AVPR1B 1q32 7.7 AVPR1b-s3 rs33976516 48 89 88 0.026 n.a. 0.014 n.a. AVPR1b-s5 rs33933482 48 89 89 0.043 n.a.
AVPR1b-s1+s2+s3+ s4+s5 rs33976516+rs33933482 48 89 88 0.002 0.52
48 89 89 0.0003 0.28 BDNF BDNF 11p13 66.9 Val66Met rs6265 49 110 171 0.001 0.003 2.49 50 284 331 0.005 1.7 (GT)n (microsatellite) NA 51 465 1097 0.028 n.a. BCR BCR 22q11.23 137.7 rs2267012 rs2267012 52 329 351 0.0097 1.33
peer
-005
2216
6, v
ersi
on 1
- 30
Sep
201
0
NESDA-NTR GAIN Candidate gene replication study 19
rs3761418 rs3761418 52 329 351 0.012 1.32 rs2267013 rs2267013 52 329 351 0.044 1.27 rs2267015 rs2267015 52 329 351 0.023 1.30 rs2156921 rs2156921 52 329 351 0.031 1.29 rs2213172 rs2213172 52 329 351 0.031 1.28 COMT COMT 22q11.21 27.2 Val158Met rs4680 53 120 628 0.009 1.44 -287A>G rs2075507 54 30 467 0.046 1.79
-287A>G+rs737865 +Val158Met+rs165599 rs2075507+rs737865 54 30 467 0.0378 2.12
MCP1 CCL2 17q11.2-q12 1.9 -2518G/A rs1024611 55 90 114 0.004 1.83 0.027 1.87 CCKAR CCKAR 4p15.1-p15.2 9.0 246G/A rs number unknown 16 177 160 0.006 2.58b
-128G/T-246G/A- -608G/A-1266T/C
rs1799723-rs?- -rs1800856-rs1800857
16 177 160 0.002 6.68b
CHRM2 CHRM2 7q31-q35 148.4 1890A/T rs8191992 56 126 304 0.001 het:0.44 hom:0.47b
a7nAChR CHRFAM7A 15q13.1 32.4 2 bp deletion rs10581632 57 72 103 0.037 n.a. 0.027 2.14 CRH-BP CRHBP 5q11.2-q13.3 16.6 CRH-BPs02 rs7728378 58 89 88 0.042 0.031 CRH-BPs11 rs1875999 58 89 88 0.048 0.043
CRH-BPs17+s02 +s14+s11 rs3811939+rs7728378 58 89 88 0.00014 2.21
CRHR1 CRHR1 17q12-q22 51.5 rs242939 rs242939 59 206 195 0.0008 2.07b 0.0002 het:2.45 hom:1.18b
CRHR2 CRHR2 7p15.1 29.3 1047G/A rs2240403 60 89 89 0.04 2.14b 0.03 het:1.21 hom:2.06b
CYP2C9 CYP2C9 10q24 50.7 CYP2C9*3 rs1057910 61 70 142 <0.05 2.03 62 70 138 <0.01 2.61
peer
-005
2216
6, v
ersi
on 1
- 30
Sep
201
0
NESDA-NTR GAIN Candidate gene replication study 20
DCNP1 C5orf20 5q31.1 3.1 rs12520799 rs12520799 23 431 433 0.003 2.01b DISC1 DISC1 1q42.1 414.5 Ser704Cys (SNP12) rs821616 63 373 717 0.005 1.46 SNP1 rs6541281 63 373 717 0.048 0.75 DRD1 DRD1 5q35.1 3.5 -2102C/A rs10063995 16 177 160 0.008 3.69b DRD2 DRD2 11q23 65.6 -7054C/A rs number unknown 16 177 160 0.03 0.53b DRD3 DRD3 3q13.3 50.3 Bal I rs6280 64 36 38 0.014 2.32b 0.027 3.00b
DRD4 DRD4 11p15.5 3.4 48bp polymorphism NA 31
49 100 0.011 (4) 0.041 (5)
0.43b 2.79b
0.007 (4/4) 0.035 (4/5)
0.36b 2.99b
65 126 471 0.004 2.09
ER-alpha ESR1 6q25.1 295.7 PvuII rs2234693 66 89 126 0.004 1.76b 0.01 het:1.63 hom:3.83b
XbaI rs9340799 66 89 126 0.02 n.a.
ER-beta ESR2 14q23.2 111.5 microsatellite NA 67 102 150 <0.005 0.30b <0.0005 het:0.40 hom:0.14b
GPR50 GPR50 Xq28 4.9 Val606Ile rs13440581 68 226 562 0.040 1.30b 68 136 260 0.0096 1.49b
Δ502-505 in complete LD with rs561077
68 226 562 0.011 1.39b
68 136 260 0.0064 1.51b GABA3 GABRA3 Xq28 284.2 microsatellite NA 69 128 81 <0.0001 0.14 GMIP GMIP 19p11-p12 14.2 -525G/A (SNP1) rs3794996 70 164 164 0.039 1.66 rs2043293 (SNP2) rs2043293 70 59 59 0.0086 1.46
peer
-005
2216
6, v
ersi
on 1
- 30
Sep
201
0

NESDA-NTR GAIN Candidate gene replication study 21
rs2304129 (SNP3) rs2304129 70 59 59 0.0086 1.50 rs880090 (SNP4) rs880090 70 59 59 0.015 1.46 Gbeta3 GNB3 12p13 7.2 825C/T rs5443 71 184 158 0.001 2.21 72 106 133 0.012 2.14 73 78 111 0.004 1.67 0.008 n.a.
HP HP 16q22.1 6.4 genotyping based on phenotypes NA 15 72 200 0.04 0.68b 0.01 rec:0.45b
cPLA2-α PLA2G4A 1q25 160.1 BanI rs10798059 74 62 117 0.007 1.83 0.017 3.40 CD-MPR M6PR 12p13 9.3 C/T in 3’UTR of exon 7 rs3318 75 193 259 0.014 1.96 MAOA MAOA Xp11.3 90.7 uVNTR1 (microsatellite) NA 76 73 68 0.029 dom:0.47b 77 228 213 <0.001 77 133 110 0.009 2.39 0.008 n.a. 77 95 103 0.015 1.97 EcoRV2 rs1137070 78 78 104 0.01 2.3 uVNTR1+EcoRV2 NA 78 78 104 0.008 2.5 p75NTR NGFR 17q21-q22 19.7 S205L rs2072446 79 164 164 <0.05 0.54 NPY NPY 7p15.1 7.7 -399T/C rs16147 24 48 140 0.03 1.69b 1128T/C (Leu7Pro) rs16139 24 51 140 0.009 0.00b, c GR NR3C1 5q31.3 157.6 BclI rs41423247 80 170 374 0.03 1.8 ER22/23EK rs6189+rs6190 80 183 497 0.043 1.98 R23K rs6190 81 134 181 0.02 n.a. 0.02 n.a. -3211T/C (NR3C1-1) rs10482605 81 180 173 0.02 n.a. 0.02 n.a. -3211T/C+R23K rs10482605+rs6190 81 134 181 0.01 4.58 81 180 173 0.02 n.a.
peer
-005
2216
6, v
ersi
on 1
- 30
Sep
201
0
NESDA-NTR GAIN Candidate gene replication study 22
PAM PAM 5q14-q21 163.9 dbSNP13340364 G>A rs13340364 42 92 92 0.04 0.31 0.03 PDE10A PDE10A 6q26 331.1 rs717602 rs717602 82 284 331 0.009 n.a. rs220818 rs220818 82 284 331 0.01 n.a. rs676389 rs676389 82 284 331 0.03 n.a. PDE11A PDE11A 2q31.2 485.1 rs3770018 rs3770018 82 284 331 0.0005 2.1 PDE2A PDE2A 11q13.4 98.2 rs370013 rs370013 82 284 331 0.01 PDE5A PDE5A 4q25-q27 134.4 rs3775845 rs3775845 82 284 331 0.007 PDE6C PDE6C 10q24 53.1 rs650058 rs650058 82 284 331 0.01 rs701865 rs701865 82 284 331 0.03 PDE9A PDE9A 21q22.3 121.8 rs729861 rs729861 82 284 331 0.0006 0.6
P2RX7 P2RX7 12q24 53.2 rs2230912 rs2230912 22 1000 1029 0.0019 1.30 1.40
NET SLC6A2 16q12.2 47.1 -182T/C rs2242446 25 145 164 0.02 het:0.99 hom:0.33b
83 112 136 0.019 1.86
SERT SLC6A4 17q11.1-q12 37.5 5-HTTLPR (44 bp del/ins) NA 61 70 142 p<0.05 2.03
71 184 158 0.01 1.82 84 68 68 0.021 1.81 0.025 n.a. 85 466 836 0.007 1.26 0.015 1.5 86 262 475 0.05 1.24 87 184 360 0.01 1.40b 0.009 1.39b 88 95 156 0.04 2.6
89 53 103 0.008 het:2.75 hom:0.87b
peer
-005
2216
6, v
ersi
on 1
- 30
Sep
201
0
NESDA-NTR GAIN Candidate gene replication study 23
VNTR STin2 rs57098334 90 39 193 <0.02 6.51b <0.004 6.95b 91 33 362 0.011 3.73b 92 71 99 p<0.05 rec:2.50b 93 114 120 0.04 0.68 94 119 346 0.005 4.44 0.001 n.a. 5-HTTLPR+VNTR STin2 NA 95 74 84 0.0069 2.53 NK1R TACR1 2p13.1 150.0 dbSNP13013430 C>T rs13013430 42 92 92 0.04 0.64 LBP-1C TFCP2 12q13 78.0 2236G/A rs13463 96 180 225 0.016 0.43
TPH TPH1 11p15.3-p14 19.8 IVS7+218A/C rs1800532 97 91 139 0.032 het:2.43 hom:1.39b
SNP1 rs4537731 98 228 253 0.019 het:0.59 hom:1.01b
SNP2 rs684302 98 228 253 0.0119 het:0.78 hom:1.54b
SNP5 rs1799913 98 228 253 0.0013 1.52b 0.0035 het:1.39 hom:2.50b
SNP1+SNP2+SNP3+ SNP4+SNP5+SNP6
rs4537731+rs684302+ +rs211105+rs1800532+ rs1799913+rs7933505
98 228 253 <0.00001 2.11b
TPH2 TPH2 12q21.1 93.6 SNPB rs1843809 99 300 265 0.0496 1.38 SNPE rs1386494 99 300 265 0.0012 0.6
SNPB+SNPE+SNPD rs1843809+rs1386494+ +rs1386495
99 300 265 <0.0001 n.a
SNP4 = C_245410 rs10784941 100 135 315 0.01 0.62b SNP7 = C_15836061 rs2171363 100 135 315 0.001 0.51b SNP12 = C_8376042 rs1386486 100 135 315 0.01 0.67b 1463G/A unconfirmed variant 17 87 219 <0.001 8.31b TNF-alpha TNF 6p21.3 2.8 308G/A rs1800629 26 108 125 0.0125 2.24 0.024 WFS1 WFS1 4p16 33.4 684C/G = R228R rs7672995 101 177 160 0.007 1.56b 1023C/T = F341F rs56072215 101 177 160 0.02 0.55b
peer
-005
2216
6, v
ersi
on 1
- 30
Sep
201
0
NESDA-NTR GAIN Candidate gene replication study 24
1185C/T = V395V rs1801206 101 177 160 0.01 1.56b 2206G/A = G736S rs number unknown 101 177 160 0.04 0.57b 2565G/A = S855S rs1046316 101 177 160 0.04 0.71b
NA: not applicable; n.a.: not available; het: heterozygotes; hom: homozygotes; rec: recessive; dom: dominant; F: female; M: male a SNP is located more than 5kb away from gene and is not included in our analyses b OR was not reported in corresponding article, but could be estimated from genotype counts or frequencies c allele was not observed in cases, which resulted in OR = 0.00
peer
-005
2216
6, v
ersi
on 1
- 30
Sep
201
0
NESDA-NTR GAIN Candidate gene replication study 25
Table 2: Significance of candidate SNPs for MDD identified from the literature within the GAIN MDD GWAS
gene SNP p-value genotyped or imputed ACE rs4295 0.36 genotyped ACE rs4305 0.11 imputed ACE rs4309 0.057 imputed ACE rs4311 0.21 imputed ACE rs4329 0.030 imputed ACE rs4333 0.029 imputed ACE rs4461142 0.036 imputed ACE rs867640 0.39 imputed BCR rs2156921 0.76 imputed BCR rs22131721 0.73 genotypedBCR rs22670122 0.92 imputed BCR rs2267013 0.68 imputedBCR rs2267015 0.89 imputed BCR rs3761418 0.96 imputed
BDNF rs6265 0.22 genotyped C5orf20 rs12520799 0.038 genotyped CCL2 rs1024611 0.50 imputed
CHRM2 rs8191992 0.13 imputed COMT rs4680 0.55 genotyped CRHBP rs1875999 0.68 imputed CRHBP rs7728378 0.40 imputed CRHR1 rs242939 0.22 imputed CRHR2 rs2240403 0.86 genotyped CYP2C9 rs1057910 0.46 genotypedDISC1 rs6541281 0.93 imputed DISC1 rs821616 0.58 genotyped DRD3 rs6280 0.87 genotyped ESR1 rs2234693 0.75 imputed ESR1 rs9340799 0.82 imputed GMIP rs2043293 1.00 imputed GMIP rs2304129 0.46 imputed GMIP rs3794996 0.23 imputed GMIP rs880090 0.58 imputed GNB3 rs54433 0.70 imputed HTR2A rs6311 0.57 imputed HTR2A rs6313 0.52 genotyped HTR2C rs6318 0.092 genotyped HTR3B rs1176744 0.50 genotypedHTR3B rs2276307 0.62 imputed HTR3B rs22763084 0.65 imputed MAOA rs1137070 0.72 genotyped MTHFR rs1801133 0.074 genotyped NGFR rs2072446 0.52 imputed NPY rs16139 0.034 genotyped NPY rs16147 0.82 imputed
P2RX7 rs2230912 0.42 genotyped PAM rs13340364 0.78 imputed
PDE10A rs220818 0.60 imputed PDE10A rs676389 0.48 imputed PDE10A rs717602 0.78 imputed
peer
-005
2216
6, v
ersi
on 1
- 30
Sep
201
0
NESDA-NTR GAIN Candidate gene replication study 26
PDE11A rs3770018 0.58 imputed PDE5A rs3775845 0.41 imputed PDE6C rs650058 0.36 genotypedPDE6C rs701865 0.84 genotyped SLC6A2 rs2242446 0.37 imputed TACR1 rs13013430 0.056 genotyped
TNF rs1800629 0.29 imputed TPH1 rs1800532 0.066 imputed TPH1 rs4537731 0.11 imputed TPH1 rs684302 0.071 imputed TPH2 rs1386486 0.26 imputed TPH2 rs1386494 0.61 imputed TPH2 rs1843809 0.69 imputed TPH2 rs2171363 0.58 imputed WFS1 rs1801206 0.18 imputed
Notes: 1tagged by rs877590 (r2=0.97); 2tagged by rs2267010 (r2=1); 3tagged by rs2301339 (r2=1) 4tagged by rs12270070 (r2=1)
peer
-005
2216
6, v
ersi
on 1
- 30
Sep
201
0
NESDA-NTR GAIN Candidate gene replication study 27
Table 3: Gene-wide results for the 57 candidate genes identified by the systematic literature search
gene #genotyped #imputed #total minimal p (analytical)
minimal p (permuted) gene-wide p overall p rs-id
#SNPs at p<0.05
p-value #SNPs
TNF 2 18 20 0.00029 0.00094 0.0034 0.34 rs769178 1 0.32 DISC1 105 386 491 0.0025 0.0015 0.29 0.95 rs7533169 18 0.56
SLC6A2 25 75 100 0.0061 0.0058 0.19 1.00 rs5564 19 0.039 DRD2 12 68 80 0.0079 0.0077 0.15 1.00 rs7131056 3 0.32
HTR3B 6 33 39 0.0081 0.0077 0.11 1.00 rs7945926 3 0.21CHRM2 43 157 200 0.0097 0.0081 0.32 1.00 rs6944132 3 0.54 MTHFR 6 37 43 0.0098 0.0080 0.11 1.00 rs3737967 4 0.18 PDE10A 107 392 499 0.013 0.014 0.74 1.00 rs7741623 8 0.80 APOE 0 5 5 0.015 0.012 0.057 1.00 rs10119 1 0.11 TACR1 31 141 172 0.016 0.019 0.50 1.00 rs1012686 24 0.10 TPH2 21 134 155 0.017 0.016 0.29 1.00 rs17722134 6 0.29
PDE11A 66 576 642 0.018 0.016 0.63 1.00 rs6433706 11 0.57 DRD3 13 41 54 0.018 0.021 0.23 1.00 rs1800827 3 0.27
PDE5A 7 108 115 0.019 0.020 0.20 1.00 rs13104219 21 0.08 NR3C1 14 60 74 0.024 0.025 0.37 1.00 rs4607376 12 0.11 MAOA 5 0 5 0.026 0.028 0.078 1.00 rs5906883 1 0.11 ESR1 50 272 322 0.027 0.025 0.84 1.00 rs17081749 1 0.93 ACE 3 28 31 0.028 0.031 0.21 1.00 rs4344 8 0.08 NPY 6 38 44 0.030 0.031 0.29 1.00 rs1073317 6 0.15
PDE9A 25 133 158 0.033 0.031 0.69 1.00 rs13046735 1 0.75 HTR2A 35 100 135 0.037 0.037 0.72 1.00 rs2770292 3 0.56 C5orf20 10 35 45 0.038 0.038 0.36 1.00 rs12520799 5 0.13 TPH1 6 24 30 0.040 0.038 0.25 1.00 rs10741734 2 0.19
PLA2G4A 26 92 118 0.040 0.042 0.68 1.00 rs7555140 1 0.68 BCR 14 110 124 0.041 0.045 0.69 1.00 rs11090231 1 0.67 ESR2 43 155 198 0.042 0.040 0.80 1.00 rs1255949 2 0.68 P2RX7 21 87 108 0.047 0.049 0.62 1.00 rs11065464 1 0.57 AGTR1 8 44 52 0.054 0.049 0.58 1.00 rs12721331 0 0.77 PDE6C 18 52 70 0.055 0.056 0.71 1.00 rs10882288 0 0.84
CYP2C9 8 47 55 0.057 0.056 0.48 1.00 rs1799853 0 0.72 CCKAR 4 17 21 0.060 0.058 0.33 1.00 rs11726159 0 0.64
peer
-005
2216
6, v
ersi
on 1
- 30
Sep
201
0
NESDA-NTR GAIN Candidate gene replication study 28
NGFR 4 16 20 0.065 0.064 0.55 1.00 rs741073 0 0.73 TFCP2 4 59 63 0.066 0.064 0.53 1.00 rs2029686 0 0.72 CRHR2 12 35 47 0.083 0.085 0.70 1.00 rs2267717 0 0.77GPR50 3 0 3 0.090 0.092 0.24 1.00 rs5969987 0 0.57 HTR2C 10 0 10 0.092 0.091 0.39 1.00 rs6318 0 0.62 CRHBP 3 9 12 0.093 0.092 0.43 1.00 rs7721799 0 0.63
PAM 7 92 99 0.096 0.090 0.81 1.00 rs1650500 0 0.79 SLC6A4 6 26 32 0.11 0.11 0.72 1.00 rs12150465 0 0.72 M6PR 3 21 24 0.11 0.10 0.54 1.00 rs1805729 0 0.65 BDNF 7 29 36 0.11 0.11 0.60 1.00 rs11030104 0 0.68
GABRA3 10 0 10 0.11 0.10 0.50 1.00 rs994423 0 0.63 WFS1 3 55 58 0.12 0.13 0.51 1.00 rs4689393 0 0.63 COMT 5 31 36 0.13 0.13 0.78 1.00 rs2871047 0 0.72 CCL2 0 9 9 0.14 0.14 0.55 1.00 rs2857655 0 0.62 DRD1 5 16 21 0.17 0.17 0.79 1.00 rs5326 0 0.69
PDE2A 16 62 78 0.20 0.19 0.97 1.00 rs11604811 0 0.81 CRHR1 4 42 46 0.22 0.22 0.86 1.00 rs242939 0 0.69
AR 1 0 1 0.23 0.23 0.23 1.00 rs2207040 0 0.52 GMIP 0 10 10 0.23 0.23 0.83 1.00 rs12003 0 0.66 DRD4 0 6 6 0.29 0.30 0.74 1.00 rs3758653 0 0.59 ACSL4 2 0 2 0.31 0.30 0.50 1.00 rs7887981 0 0.55
HP 1 5 6 0.32 0.32 0.77 1.00 rs5475 0 0.59 GNB3 3 10 13 0.39 0.39 0.96 1.00 rs3759348 0 0.23
HTR1A 0 5 5 0.54 0.55 0.79 1.00 rs10042486 0 0.55 AVPR1B 0 0 0 NA NA NA NA NA NA NA
CHRFAM7A 0 0 0 NA NA NA NA NA NA NA Note Analytical p-values were determined using SNPTest for the autosomes and logistic regression in PLINK for the X chromosome. Permutations (N=10,000) were performed to determine uncorrected SNP p-values, gene-wide corrected p-values, overall corrected p-values and p-values for number of SNPs with p<0.05. All p-values were calculated assuming an additive model. P-values <0.05 are shown in bold.
peer
-005
2216
6, v
ersi
on 1
- 30
Sep
201
0
NESDA-NTR GAIN Candidate gene replication study 29
References 1. Manolio TA, Rodriguez LL, Brooks L, Abecasis G, Ballinger D, Daly M, et al. New models of
collaboration in genome-wide association studies: the Genetic Association Information Network. Nat Genet 2007;39:1045-1051.
2. Boomsma DI, Willemsen G, Sullivan PF, Heutink P, Meijer P, Sondervan D, et al. Genome-wide association of major depression: description of samples for the GAIN Major Depressive Disorder Study: NTR and NESDA biobank projects. Eur J Hum Genet 2008;16:335-342.
3. The Wellcome Trust Case-Control Consortium: Genome-wide association study of 14,000 cases of seven common diseases and 3,000 shared controls. Nature 2007;447:661-678.
4. Sullivan PF, de Geus EJ, Willemsen G, James MR, Smit JH, Zandbelt T, et al. Genome-wide association for major depressive disorder: a possible role for the presynaptic protein piccolo. Mol Psychiatry 2009;14:359-375.
5. Arking DE, Pfeufer A, Post W, Kao WH, Newton-Cheh C, Ikeda M, et al. A common genetic variant in the NOS1 regulator NOS1AP modulates cardiac repolarization. Nat Genet 2006;38:644-651.
6. Roeder K, Bacanu SA, Wasserman L, Devlin B. Using linkage genome scans to improve power of association in genome scans. Am J Hum Genet 2006;78:243-252.
7. Hirschhorn JN, Lohmueller K, Byrne E, Hirschhorn K. A comprehensive review of genetic association studies. Genet Med 2002;4:45-61.
8. Munafo MR. Candidate gene studies in the 21st century: meta-analysis, mediation, moderation. Genes Brain Behav 2006;5 Suppl 1:3-8.
9. Lopez-Leon S, Janssens AC, Gonzalez-Zuloeta Ladd AM, Del-Favero J, Claes SJ, Oostra BA, et al. Meta-analyses of genetic studies on major depressive disorder. Mol Psychiatry 2008;13:772-785.
10. Penninx BW, Beekman AT, Smit JH, Zitman FG, Nolen W, Spinhoven P, et al. The Netherlands Study of Depression and Anxiety (NESDA): Rationale, Objectives and Methods. Int J Methods Psychiatr Res 2008;17:121-140.
11. American Psychiatric Association: Diagnostic and Statistical Manual of Mental Disorders. Washington, DC: American Psychiatric Association; 1994.
12. World Health Organization: Composite International Diagnostic Interview (CIDI), Version 2.1. Geneva, Switzerland: World Health Organization; 1997.
13. Marchini J, Howie B, Myers S, McVean G, Donnelly P. A new multipoint method for genome-wide association studies by imputation of genotypes. Nat Genet 2007;39:906-913.
14. Purcell S, Neale B, Todd-Brown K, Thomas L, Ferreira MA, Bender D, et al. PLINK: a tool set for whole-genome association and population-based linkage analyses. Am J Hum Genet 2007;81:559-575.
15. Maes M, Delanghe J, Scharpe S, Meltzer HY, Cosyns P, Suy E, et al. Haptoglobin phenotypes and gene frequencies in unipolar major depression. Am J Psychiatry 1994;151:112-116.
16. Koks S, Nikopensius T, Koido K, Maron E, Altmae S, Heinaste E, et al. Analysis of SNP profiles in patients with major depressive disorder. Int J Neuropsychopharmacol 2006;9:167-174.
17. Zhang X, Gainetdinov RR, Beaulieu JM, Sotnikova TD, Burch LH, Williams RB, et al. Loss-of-function mutation in tryptophan hydroxylase-2 identified in unipolar major depression. Neuron 2005;45:11-16.
18. Blakely RD. Overview: a rare opportunity or just one less reason to be depressed. Neuron 2005;48:701-702; author reply 705-706.
19. Baghai TC, Binder EB, Schule C, Salyakina D, Eser D, Lucae S, et al. Polymorphisms in the angiotensin-converting enzyme gene are associated with unipolar depression, ACE activity and hypercortisolism. Mol Psychiatry 2006;11:1003-1015.
20. Arking DE, Khera A, Xing C, Kao WH, Post W, Boerwinkle E, et al. Multiple independent genetic factors at NOS1AP modulate the QT interval in a multi-ethnic population. PLoS One 2009;4:e4333.
21. Muglia P, Tozzi F, Galwey NW, Francks C, Upmanyu R, Kong XQ, et al. Genome-wide association study of recurrent major depressive disorder in two European case-control cohorts. Mol Psychiatry 2008.
22. Lucae S, Salyakina D, Barden N, Harvey M, Gagne B, Labbe M, et al. P2RX7, a gene coding for a purinergic ligand-gated ion channel, is associated with major depressive disorder. Hum Mol Genet 2006;15:2438-2445.
peer
-005
2216
6, v
ersi
on 1
- 30
Sep
201
0
NESDA-NTR GAIN Candidate gene replication study 30
23. Willis-Owen SA, Shifman S, Copley RR, Flint J. DCNP1: a novel candidate gene for major depression. Mol Psychiatry 2006;11:121-122.
24. Heilig M, Zachrisson O, Thorsell A, Ehnvall A, Mottagui-Tabar S, Sjogren M, et al. Decreased cerebrospinal fluid neuropeptide Y (NPY) in patients with treatment refractory unipolar major depression: preliminary evidence for association with preproNPY gene polymorphism. J Psychiatr Res 2004;38:113-121.
25. Inoue K, Itoh K, Yoshida K, Shimizu T, Suzuki T. Positive association between T-182C polymorphism in the norepinephrine transporter gene and susceptibility to major depressive disorder in a japanese population. Neuropsychobiology 2004;50:301-304.
26. Jun TY, Pae CU, Hoon H, Chae JH, Bahk WM, Kim KS, et al. Possible association between -G308A tumour necrosis factor-alpha gene polymorphism and major depressive disorder in the Korean population. Psychiatr Genet 2003;13:179-181.
27. Hek K, Mulder CL, Luijendijk HJ, van Duijn CM, Hofman A, Uitterlinden AG, et al. The PCLO gene and depressive disorders: replication in a population-based study. Hum Mol Genet 2009.
28. Martinez FD. Gene-environment interactions in asthma: with apologies to William of Ockham. Proc Am Thorac Soc 2007;4:26-31.
29. Psychiatric GWAS Consortium Steering Committee. A framework for interpreting genome-wide association studies of psychiatric disorders. Mol Psychiatry 2009;14:10-17.
30. Frisch A, Postilnick D, Rockah R, Michaelovsky E, Postilnick S, Birman E, et al. Association of unipolar major depressive disorder with genes of the serotonergic and dopaminergic pathways. Mol Psychiatry 1999;4:389-392.
31. Manki H, Kanba S, Muramatsu T, Higuchi S, Suzuki E, Matsushita S, et al. Dopamine D2, D3 and D4 receptor and transporter gene polymorphisms and mood disorders. J Affect Disord 1996;40:7-13.
32. Su S, Zhao J, Bremner JD, Miller AH, Tang W, Bouzyk M, et al. Serotonin Transporter Gene, Depressive Symptoms and Interleukin-6. Circ Cardiovasc Genet 2009;2:614-620.
33. Wray NR, James MR, Gordon SD, Dumenil T, Ryan L, Coventry WL, et al. Accurate, Large-Scale Genotyping of 5HTTLPR and Flanking Single Nucleotide Polymorphisms in an Association Study of Depression, Anxiety, and Personality Measures. Biol Psychiatry 2009;66:468-476.
34. Arinami T, Yamada N, Yamakawa-Kobayashi K, Hamaguchi H, Toru M. Methylenetetrahydrofolate reductase variant and schizophrenia/depression. Am J Med Genet 1997;74:526-528.
35. Kelly CB, McDonnell AP, Johnston TG, Mulholland C, Cooper SJ, McMaster D, et al. The MTHFR C677T polymorphism is associated with depressive episodes in patients from Northern Ireland. J Psychopharmacol 2004;18:567-571.
36. Lemonde S, Turecki G, Bakish D, Du L, Hrdina PD, Bown CD, et al. Impaired repression at a 5-hydroxytryptamine 1A receptor gene polymorphism associated with major depression and suicide. J Neurosci 2003;23:8788-8799.
37. Choi MJ, Kang RH, Ham BJ, Jeong HY, Lee MS. Serotonin receptor 2A gene polymorphism (-1438A/G) and short-term treatment response to citalopram. Neuropsychobiology 2005;52:155-162.
38. Choi MJ, Lee HJ, Lee HJ, Ham BJ, Cha JH, Ryu SH, et al. Association between major depressive disorder and the -1438A/G polymorphism of the serotonin 2A receptor gene. Neuropsychobiology 2004;49:38-41.
39. Du L, Bakish D, Lapierre YD, Ravindran AV, Hrdina PD. Association of polymorphism of serotonin 2A receptor gene with suicidal ideation in major depressive disorder. Am J Med Genet 2000;96:56-60.
40. Lerer B, Macciardi F, Segman RH, Adolfsson R, Blackwood D, Blairy S, et al. Variability of 5-HT2C receptor cys23ser polymorphism among European populations and vulnerability to affective disorder. Mol Psychiatry 2001;6:579-585.
41. Yamada K, Hattori E, Iwayama Y, Ohnishi T, Ohba H, Toyota T, et al. Distinguishable haplotype blocks in the HTR3A and HTR3B region in the Japanese reveal evidence of association of HTR3B with female major depression. Biol Psychiatry 2006;60:192-201.
42. Mendlewicz J, Oswald P, Claes S, Massat I, Souery D, Van Broeckhoven C, et al. Patient-control association study of substance P-related genes in unipolar and bipolar affective disorders. Int J Neuropsychopharmacol 2005;8:505-513.
43. Covault J, Pettinati H, Moak D, Mueller T, Kranzler HR. Association of a long-chain fatty acid-CoA ligase 4 gene polymorphism with depression and with enhanced niacin-induced dermal erythema. Am J Med Genet B Neuropsychiatr Genet 2004;127B:42-47.
peer
-005
2216
6, v
ersi
on 1
- 30
Sep
201
0
NESDA-NTR GAIN Candidate gene replication study 31
44. Su QR, Su LY, Su HR, Chen Q, Ren GY, Yin Y, et al. Polymorphisms of androgen receptor gene in childhood and adolescent males with first-onset major depressive disorder and association with related symptomatology. Int J Neurosci 2007;117:903-917.
45. Saab YB, Gard PR, Yeoman MS, Mfarrej B, El-Moalem H, Ingram MJ. Renin-angiotensin-system gene polymorphisms and depression. Prog Neuropsychopharmacol Biol Psychiatry 2007;31:1113-1118.
46. Holmes C, Russ C, Kirov G, Aitchison KJ, Powell JF, Collier DA, et al. Apolipoprotein E: depressive illness, depressive symptoms, and Alzheimer's disease. Biol Psychiatry 1998;43:159-164.
47. Fan PL, Chen CD, Kao WT, Shu BC, Lung FW. Protective effect of the apo epsilon2 allele in major depressive disorder in Taiwanese. Acta Psychiatr Scand 2006;113:48-53.
48. van West D, Del-Favero J, Aulchenko Y, Oswald P, Souery D, Forsgren T, et al. A major SNP haplotype of the arginine vasopressin 1B receptor protects against recurrent major depression. Mol Psychiatry 2004;9:287-292.
49. Hwang JP, Tsai SJ, Hong CJ, Yang CH, Lirng JF, Yang YM. The Val66Met polymorphism of the brain-derived neurotrophic-factor gene is associated with geriatric depression. Neurobiol Aging 2006;27:1834-1837.
50. Ribeiro L, Busnello JV, Cantor RM, Whelan F, Whittaker P, Deloukas P, et al. The brain-derived neurotrophic factor rs6265 (Val66Met) polymorphism and depression in Mexican-Americans. Neuroreport 2007;18:1291-1293.
51. Schumacher J, Jamra RA, Becker T, Ohlraun S, Klopp N, Binder EB, et al. Evidence for a relationship between genetic variants at the brain-derived neurotrophic factor (BDNF) locus and major depression. Biol Psychiatry 2005;58:307-314.
52. Hashimoto R, Okada T, Kato T, Kosuga A, Tatsumi M, Kamijima K, et al. The breakpoint cluster region gene on chromosome 22q11 is associated with bipolar disorder. Biol Psychiatry 2005;57:1097-1102.
53. Massat I, Souery D, Del-Favero J, Nothen M, Blackwood D, Muir W, et al. Association between COMT (Val158Met) functional polymorphism and early onset in patients with major depressive disorder in a European multicenter genetic association study. Mol Psychiatry 2005;10:598-605.
54. Funke B, Malhotra AK, Finn CT, Plocik AM, Lake SL, Lencz T, et al. COMT genetic variation confers risk for psychotic and affective disorders: a case control study. Behav Brain Funct 2005;1:19.
55. Pae CU, Yu HS, Kim TS, Lee CU, Lee SJ, Jun TY, et al. Monocyte chemoattractant protein-1 (MCP1) promoter -2518 polymorphism may confer a susceptibility to major depressive disorder in the Korean population. Psychiatry Res 2004;127:279-281.
56. Comings DE, Wu S, Rostamkhani M, McGue M, Iacono WG, MacMurray JP. Association of the muscarinic cholinergic 2 receptor (CHRM2) gene with major depression in women. Am J Med Genet 2002;114:527-529.
57. Lai IC, Hong CJ, Tsai SJ. Association study of nicotinic-receptor variants and major depressive disorder. J Affect Disord 2001;66:79-82.
58. Claes S, Villafuerte S, Forsgren T, Sluijs S, Del-Favero J, Adolfsson R, et al. The corticotropin-releasing hormone binding protein is associated with major depression in a population from Northern Sweden. Biol Psychiatry 2003;54:867-872.
59. Liu Z, Zhu F, Wang G, Xiao Z, Wang H, Tang J, et al. Association of corticotropin-releasing hormone receptor1 gene SNP and haplotype with major depression. Neurosci Lett 2006;404:358-362.
60. Villafuerte SM, Del-Favero J, Adolfsson R, Souery D, Massat I, Mendlewicz J, et al. Gene-based SNP genetic association study of the corticotropin-releasing hormone receptor-2 (CRHR2) in major depression. Am J Med Genet 2002;114:222-226.
61. Dorado P, Penas-Lledo EM, Gonzalez AP, Caceres MC, Cobaleda J, Llerena A. Increased risk for major depression associated with the short allele of the serotonin transporter promoter region (5-HTTLPR-S) and the CYP2C9*3 allele. Fundam Clin Pharmacol 2007;21:451-453.
62. LLerena A, Berecz R, Dorado P, Gonzalez AP, Penas LEM, De La Rubia A. CYP2C9 gene and susceptibility to major depressive disorder. Pharmacogenomics J 2003;3:300-302.
63. Hashimoto R, Numakawa T, Ohnishi T, Kumamaru E, Yagasaki Y, Ishimoto T, et al. Impact of the DISC1 Ser704Cys polymorphism on risk for major depression, brain morphology and ERK signaling. Hum Mol Genet 2006;15:3024-3033.
peer
-005
2216
6, v
ersi
on 1
- 30
Sep
201
0

NESDA-NTR GAIN Candidate gene replication study 32
64. Dikeos DG, Papadimitriou GN, Avramopoulos D, Karadima G, Daskalopoulou EG, Souery D, et al. Association between the dopamine D3 receptor gene locus (DRD3) and unipolar affective disorder. Psychiatr Genet 1999;9:189-195.
65. Serretti A, Lilli R, Di Bella D, Bertelli S, Nobile M, Novelli E, et al. Dopamine receptor D4 gene is not associated with major psychoses. Am J Med Genet 1999;88:486-491.
66. Tsai SJ, Wang YC, Hong CJ, Chiu HJ. Association study of oestrogen receptor alpha gene polymorphism and suicidal behaviours in major depressive disorder. Psychiatr Genet 2003;13:19-22.
67. Geng YG, Su QR, Su LY, Chen Q, Ren GY, Shen SQ, et al. Comparison of the polymorphisms of androgen receptor gene and estrogen alpha and beta gene between adolescent females with first-onset major depressive disorder and controls. Int J Neurosci 2007;117:539-547.
68. Thomson PA, Wray NR, Thomson AM, Dunbar DR, Grassie MA, Condie A, et al. Sex-specific association between bipolar affective disorder in women and GPR50, an X-linked orphan G protein-coupled receptor. Mol Psychiatry 2005;10:470-478.
69. Henkel V, Baghai TC, Eser D, Zill P, Mergl R, Zwanzger P, et al. The gamma amino butyric acid (GABA) receptor alpha-3 subunit gene polymorphism in unipolar depressive disorder: a genetic association study. Am J Med Genet B Neuropsychiatr Genet 2004;126B:82-87.
70. Tadokoro K, Hashimoto R, Tatsumi M, Kosuga A, Kamijima K, Kunugi H. The Gem interacting protein (GMIP) gene is associated with major depressive disorder. Neurogenetics 2005;6:127-133.
71. Cao MQ, Hu SY, Zhang CH, Xia DS. Study on the interrelationship between 5-HTTLPR/G-protein beta3 subunit (C825T) polymorphisms and depressive disorder. Psychiatr Genet 2007;17:233-238.
72. Lee HJ, Cha JH, Ham BJ, Han CS, Kim YK, Lee SH, et al. Association between a G-protein beta 3 subunit gene polymorphism and the symptomatology and treatment responses of major depressive disorders. Pharmacogenomics J 2004;4:29-33.
73. Zill P, Baghai TC, Zwanzger P, Schule C, Minov C, Riedel M, et al. Evidence for an association between a G-protein beta3-gene variant with depression and response to antidepressant treatment. Neuroreport 2000;11:1893-1897.
74. Pae CU, Yu HS, Kim JJ, Lee CU, Lee SJ, Lee KU, et al. BanI polymorphism of the cytosolic phospholipase A2 gene and mood disorders in the Korean population. Neuropsychobiology 2004;49:185-188.
75. Kolsch H, Ptok U, Majores M, Schmitz S, Rao ML, Maier W, et al. Putative association of polymorphism in the mannose 6-phosphate receptor gene with major depression and Alzheimer's disease. Psychiatr Genet 2004;14:97-100.
76. Schulze TG, Muller DJ, Krauss H, Scherk H, Ohlraun S, Syagailo YV, et al. Association between a functional polymorphism in the monoamine oxidase A gene promoter and major depressive disorder. Am J Med Genet 2000;96:801-803.
77. Yu YW, Tsai SJ, Hong CJ, Chen TJ, Chen MC, Yang CW. Association study of a monoamine oxidase a gene promoter polymorphism with major depressive disorder and antidepressant response. Neuropsychopharmacology 2005;30:1719-1723.
78. Du L, Bakish D, Ravindran A, Hrdina PD. MAO-A gene polymorphisms are associated with major depression and sleep disturbance in males. Neuroreport 2004;15:2097-2101.
79. Kunugi H, Hashimoto R, Yoshida M, Tatsumi M, Kamijima K. A missense polymorphism (S205L) of the low-affinity neurotrophin receptor p75NTR gene is associated with depressive disorder and attempted suicide. Am J Med Genet B Neuropsychiatr Genet 2004;129B:44-46.
80. van Rossum EF, Binder EB, Majer M, Koper JW, Ising M, Modell S, et al. Polymorphisms of the glucocorticoid receptor gene and major depression. Biol Psychiatry 2006;59:681-688.
81. van West D, Van Den Eede F, Del-Favero J, Souery D, Norrback KF, Van Duijn C, et al. Glucocorticoid receptor gene-based SNP analysis in patients with recurrent major depression. Neuropsychopharmacology 2006;31:620-627.
82. Wong ML, Whelan F, Deloukas P, Whittaker P, Delgado M, Cantor RM, et al. Phosphodiesterase genes are associated with susceptibility to major depression and antidepressant treatment response. Proc Natl Acad Sci U S A 2006;103:15124-15129.
83. Ryu SH, Lee SH, Lee HJ, Cha JH, Ham BJ, Han CS, et al. Association between norepinephrine transporter gene polymorphism and major depression. Neuropsychobiology 2004;49:174-177.
peer
-005
2216
6, v
ersi
on 1
- 30
Sep
201
0

NESDA-NTR GAIN Candidate gene replication study 33
84. Nobile M, Cataldo MG, Giorda R, Battaglia M, Baschirotto C, Bellina M, et al. A case-control and family-based association study of the 5-HTTLPR in pediatric-onset depressive disorders. Biol Psychiatry 2004;56:292-295.
85. Hoefgen B, Schulze TG, Ohlraun S, von Widdern O, Hofels S, Gross M, et al. The power of sample size and homogenous sampling: association between the 5-HTTLPR serotonin transporter polymorphism and major depressive disorder. Biol Psychiatry 2005;57:247-251.
86. Cervilla JA, Rivera M, Molina E, Torres-Gonzalez F, Bellon JA, Moreno B, et al. The 5-HTTLPR s/s genotype at the serotonin transporter gene (SLC6A4) increases the risk for depression in a large cohort of primary care attendees: the PREDICT-gene study. Am J Med Genet B Neuropsychiatr Genet 2006;141B:912-917.
87. Grunblatt E, Loffler C, Zehetmayer S, Jungwirth S, Tragl KH, Riederer P, et al. Association study of the 5-HTTLPR polymorphism and depression in 75-Year-Old nondemented subjects from the Vienna Transdanube Aging (VITA) study. J Clin Psychiatry 2006;67:1373-1378.
88. Munafo MR, Clark TG, Roberts KH, Johnstone EC. Neuroticism mediates the association of the serotonin transporter gene with lifetime major depression. Neuropsychobiology 2006;53:1-8.
89. Mann JJ, Huang YY, Underwood MD, Kassir SA, Oppenheim S, Kelly TM, et al. A serotonin transporter gene promoter polymorphism (5-HTTLPR) and prefrontal cortical binding in major depression and suicide. Arch Gen Psychiatry 2000;57:729-738.
90. Ogilvie AD, Battersby S, Bubb VJ, Fink G, Harmar AJ, Goodwim GM, et al. Polymorphism in serotonin transporter gene associated with susceptibility to major depression. Lancet 1996;347:731-733.
91. Liu W, Gu N, Feng G, Li S, Bai S, Zhang J, et al. Tentative association of the serotonin transporter with schizophrenia and unipolar depression but not with bipolar disorder in Han Chinese. Pharmacogenetics 1999;9:491-495.
92. Domotor E, Sarosi A, Balogh G, Szekely A, Hejjas K, Sasvari-Szekely M, et al. [Association of neurocognitive endophenotype and STin2 polymorphism in major depressive disorder]. Neuropsychopharmacol Hung 2007;9:53-62.
93. Bozina N, Mihaljevic-Peles A, Sagud M, Jakovljevic M, Sertic J. Serotonin transporter polymorphism in Croatian patients with major depressive disorder. Psychiatr Danub 2006;18:83-89.
94. Battersby S, Ogilvie AD, Smith CA, Blackwood DH, Muir WJ, Quinn JP, et al. Structure of a variable number tandem repeat of the serotonin transporter gene and association with affective disorder. Psychiatr Genet 1996;6:177-181.
95. Gutierrez B, Pintor L, Gasto C, Rosa A, Bertranpetit J, Vieta E, et al. Variability in the serotonin transporter gene and increased risk for major depression with melancholia. Hum Genet 1998;103:319-322.
96. Schahab S, Heun R, Schmitz S, Maier W, Kolsch H. Association of polymorphism in the transcription factor LBP-1c/CP2/LSF gene with Alzheimer's disease and major depression. Dement Geriatr Cogn Disord 2006;22:95-98.
97. Tan EC, Chan AO, Tan CH, Mahendran R, Wang A, Chua HC. Case-control and linkage disequilibrium studies of the tryptophan hydroxylase gene polymorphisms and major depressive disorder. Psychiatr Genet 2003;13:151-154.
98. Gizatullin R, Zaboli G, Jonsson EG, Asberg M, Leopardi R. Haplotype analysis reveals tryptophan hydroxylase (TPH) 1 gene variants associated with major depression. Biol Psychiatry 2006;59:295-300.
99. Zill P, Baghai TC, Zwanzger P, Schule C, Eser D, Rupprecht R, et al. SNP and haplotype analysis of a novel tryptophan hydroxylase isoform (TPH2) gene provide evidence for association with major depression. Mol Psychiatry 2004;9:1030-1036.
100. Zhou Z, Roy A, Lipsky R, Kuchipudi K, Zhu G, Taubman J, et al. Haplotype-based linkage of tryptophan hydroxylase 2 to suicide attempt, major depression, and cerebrospinal fluid 5-hydroxyindoleacetic acid in 4 populations. Arch Gen Psychiatry 2005;62:1109-1118.
101. Koido K, Koks S, Nikopensius T, Maron E, Altmae S, Heinaste E, et al. Polymorphisms in wolframin (WFS1) gene are possibly related to increased risk for mood disorders. Int J Neuropsychopharmacol 2005;8:235-244.
peer
-005
2216
6, v
ersi
on 1
- 30
Sep
201
0
NESDA-NTR GAIN Candidate gene replication study 34
Figure 1: Selection procedure of studies reporting on candidate genes. PM, PUBMED; LL, Lopez-Leon. Figure 2: Coverage by genotyped (black bar) and imputed (grey bar) SNPs and size (white circles) of the 57 selected candidate genes (above: genes with 50 or less SNPs, below: genes with more than 50 SNPs) Figure 3: Observed minimal p-value versus the expected minimal p-value based on the number of SNPs in the gene Figure 4: Association of SLC6A2 (NET) with MDD. Along the x-axis the location of all 100 SNPs within 5 kb of SLC6A2 is shown and the -log10(p-value) on the y-axis. Nineteen SNPs have a p-value <0.05, which is significantly more than expected (p=0.039). Seventeen of them lie in three haplotype blocks (squares, upward triangles [light grey], and downward triangles [dark grey]) (r2 values HapMap CEU: squares-upward triangles: 0.020, squares-downward triangles: 0.661, and upward triangles-downward triangles: 0.013). The other 2 (black diamonds) are not in LD with the haplotype blocks or with each other. The light grey line shows the recombination rate in this area (axis on the right).
peer
-005
2216
6, v
ersi
on 1
- 30
Sep
201
0
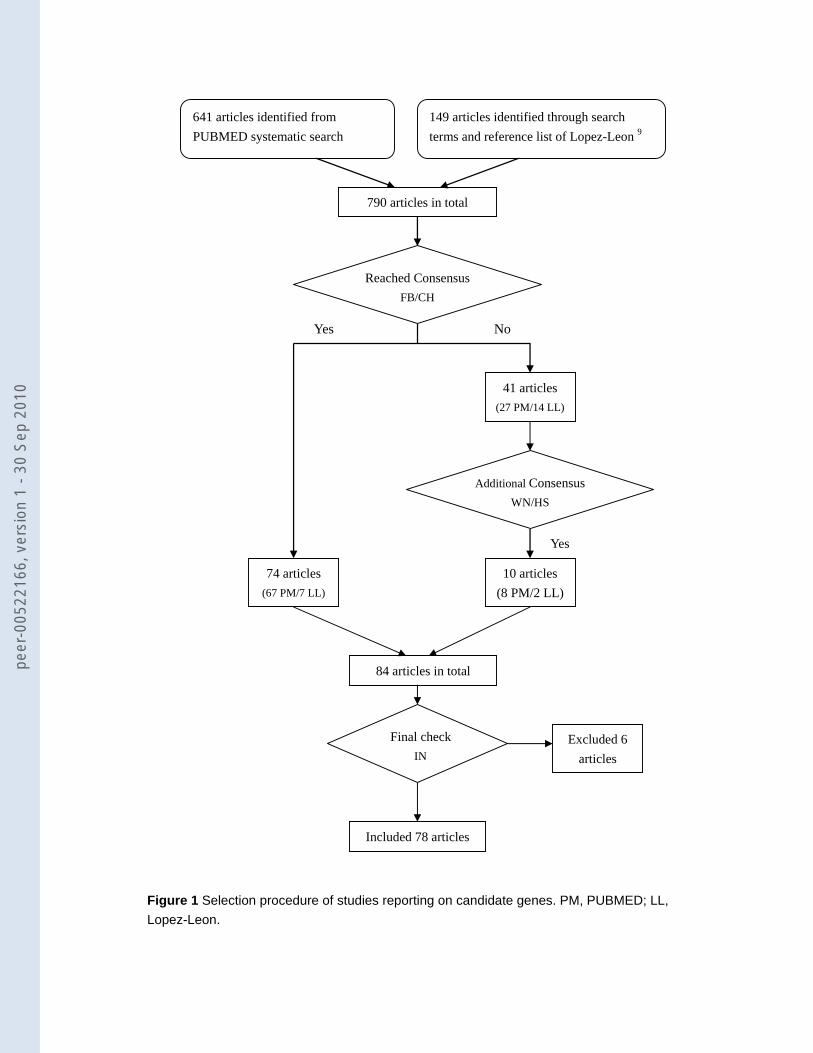
Figure 1 Selection procedure of studies reporting on candidate genes. PM, PUBMED; LL, Lopez-Leon.
641 articles identified from PUBMED systematic search
149 articles identified through search terms and reference list of Lopez-Leon 9
84 articles in total
Excluded 6 articles
Included 78 articles
790 articles in total
Yes
74 articles (67 PM/7 LL)
No
41 articles (27 PM/14 LL)
Reached Consensus FB/CH
Additional Consensus WN/HS
Yes
10 articles (8 PM/2 LL)
Final check IN
peer
-005
2216
6, v
ersi
on 1
- 30
Sep
201
0
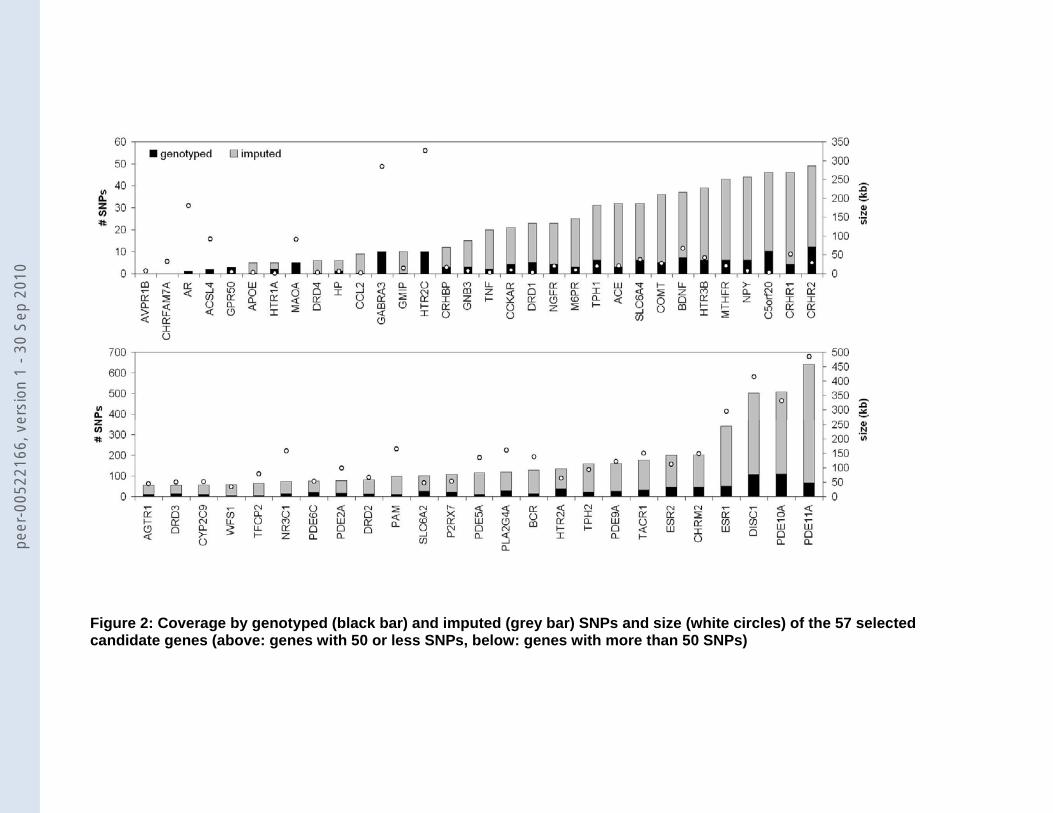
Figure 2: Coverage by genotyped (black bar) and imputed (grey bar) SNPs and size (white circles) of the 57 selected candidate genes (above: genes with 50 or less SNPs, below: genes with more than 50 SNPs)
peer
-005
2216
6, v
ersi
on 1
- 30
Sep
201
0

peer
-005
2216
6, v
ersi
on 1
- 30
Sep
201
0
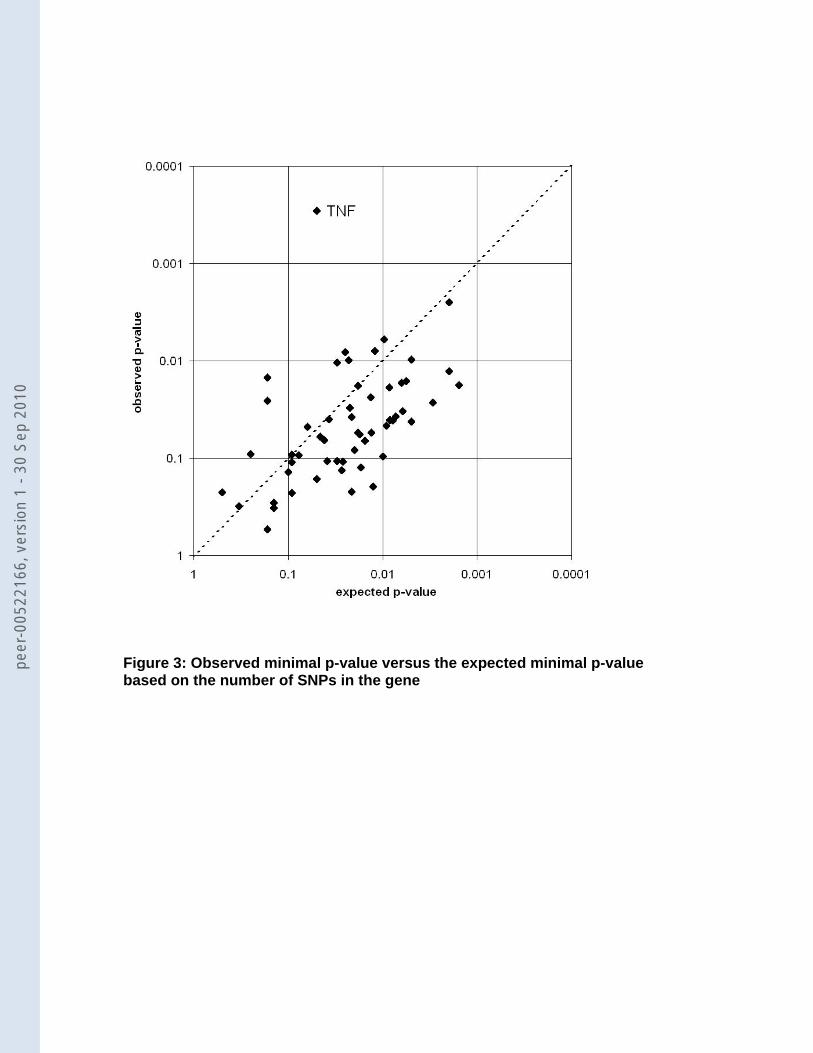
Figure 3: Observed minimal p-value versus the expected minimal p-value based on the number of SNPs in the gene
peer
-005
2216
6, v
ersi
on 1
- 30
Sep
201
0
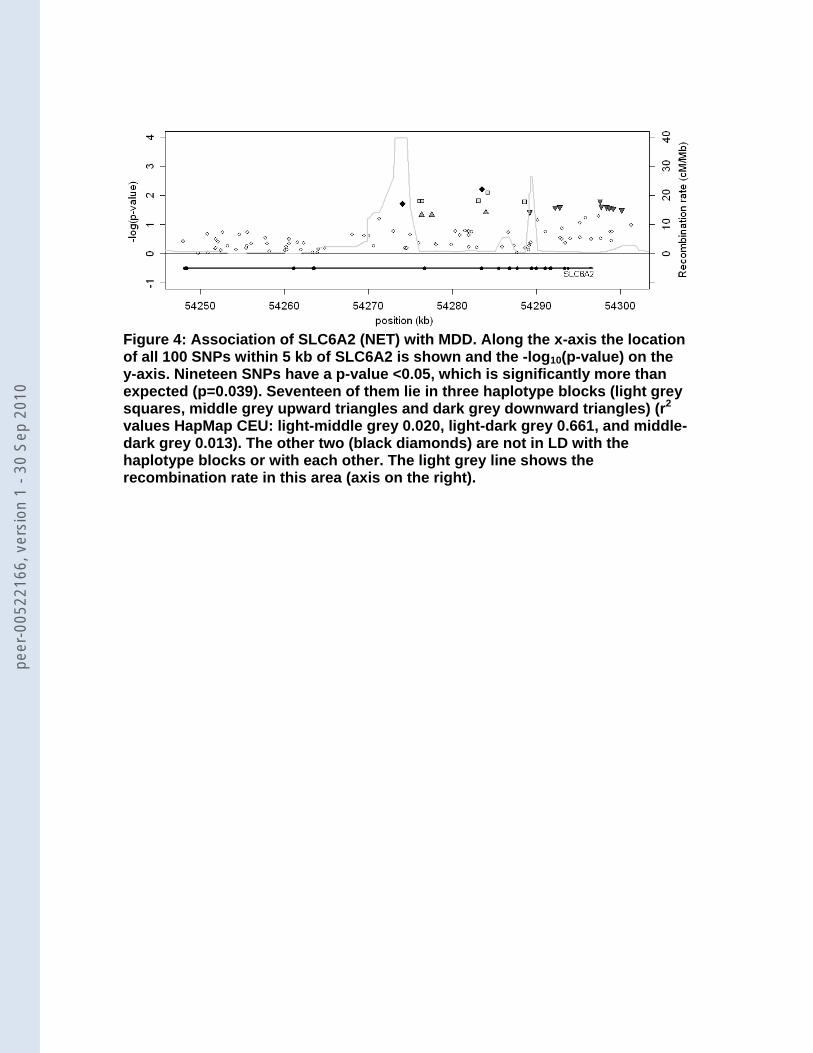
Figure 4: Association of SLC6A2 (NET) with MDD. Along the x-axis the location of all 100 SNPs within 5 kb of SLC6A2 is shown and the -log10(p-value) on the y-axis. Nineteen SNPs have a p-value <0.05, which is significantly more than expected (p=0.039). Seventeen of them lie in three haplotype blocks (light grey squares, middle grey upward triangles and dark grey downward triangles) (r2
values HapMap CEU: light-middle grey 0.020, light-dark grey 0.661, and middle-dark grey 0.013). The other two (black diamonds) are not in LD with the haplotype blocks or with each other. The light grey line shows the recombination rate in this area (axis on the right).
peer
-005
2216
6, v
ersi
on 1
- 30
Sep
201
0
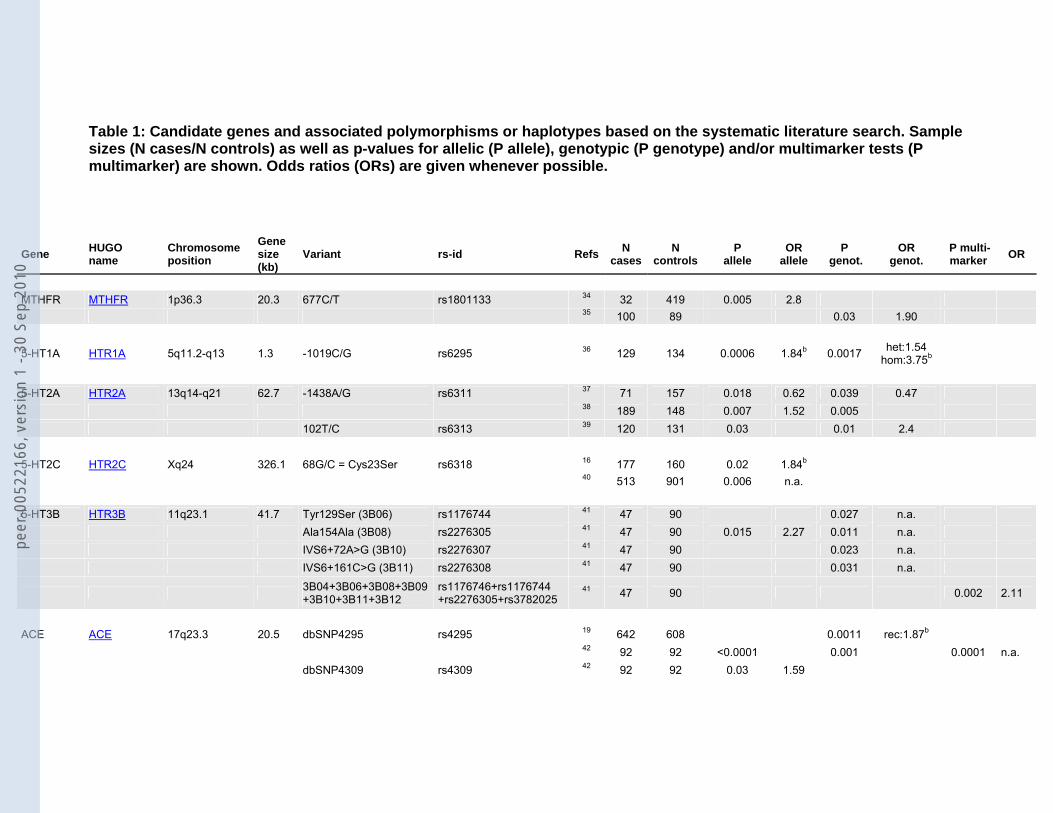
Table 1: Candidate genes and associated polymorphisms or haplotypes based on the systematic literature search. Sample sizes (N cases/N controls) as well as p-values for allelic (P allele), genotypic (P genotype) and/or multimarker tests (P multimarker) are shown. Odds ratios (ORs) are given whenever possible.
Gene HUGO name
Chromosome position
Gene size (kb)
Variant rs-id Refs N cases
N controls
P allele
OR allele
P genot.
OR genot.
P multi- marker
OR
MTHFR MTHFR 1p36.3 20.3 677C/T rs1801133 34 32 419 0.005 2.8 35 100 89 0.03 1.90
5-HT1A HTR1A 5q11.2-q13 1.3 -1019C/G rs6295 36 129 134 0.0006 1.84b 0.0017 het:1.54 hom:3.75b
5-HT2A HTR2A 13q14-q21 62.7 -1438A/G rs6311 37 71 157 0.018 0.62 0.039 0.47 38 189 148 0.007 1.52 0.005 102T/C rs6313 39 120 131 0.03 0.01 2.4 5-HT2C HTR2C Xq24 326.1 68G/C = Cys23Ser rs6318 16 177 160 0.02 1.84b 40 513 901 0.006 n.a. 5-HT3B HTR3B 11q23.1 41.7 Tyr129Ser (3B06) rs1176744 41 47 90 0.027 n.a. Ala154Ala (3B08) rs2276305 41 47 90 0.015 2.27 0.011 n.a. IVS6+72A>G (3B10) rs2276307 41 47 90 0.023 n.a. IVS6+161C>G (3B11) rs2276308 41 47 90 0.031 n.a.
3B04+3B06+3B08+3B09+3B10+3B11+3B12
rs1176746+rs1176744 +rs2276305+rs3782025
41 47 90 0.002 2.11
ACE ACE 17q23.3 20.5 dbSNP4295 rs4295 19 642 608 0.0011 rec:1.87b 42 92 92 <0.0001 0.001 0.0001 n.a. dbSNP4309 rs4309 42 92 92 0.03 1.59
peer
-005
2216
6, v
ersi
on 1
- 30
Sep
201
0
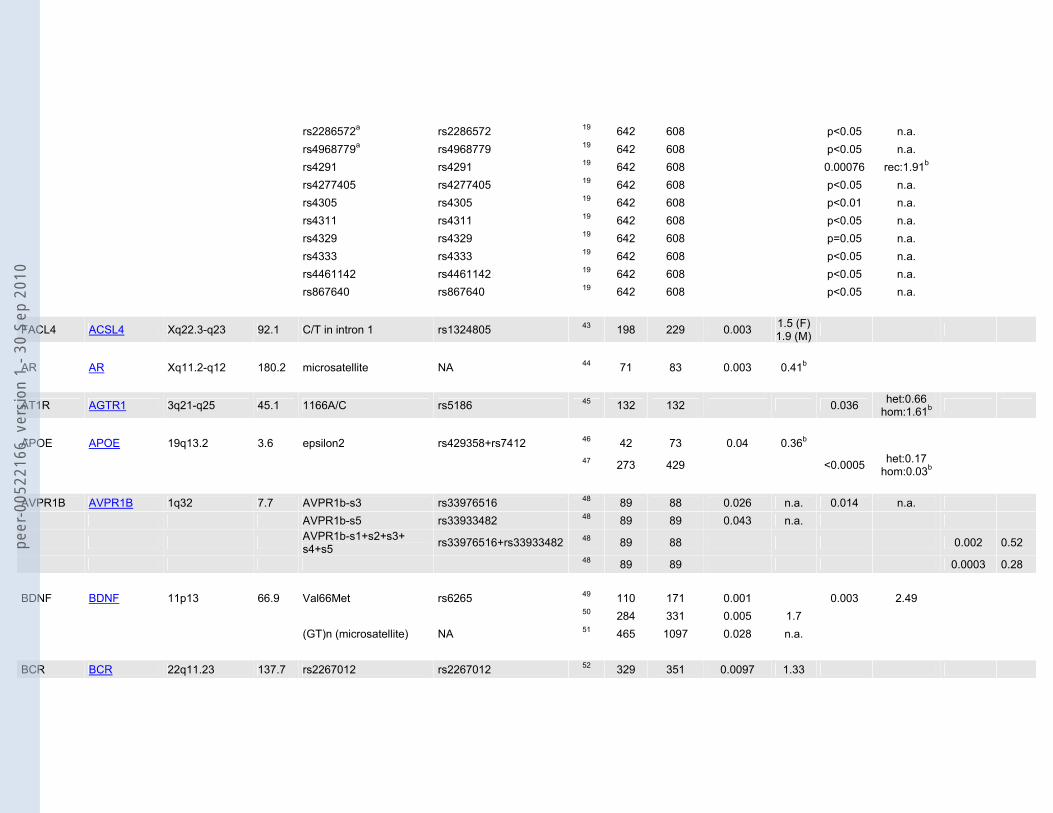
rs2286572a rs2286572 19 642 608 p<0.05 n.a. rs4968779a rs4968779 19 642 608 p<0.05 n.a. rs4291 rs4291 19 642 608 0.00076 rec:1.91b rs4277405 rs4277405 19 642 608 p<0.05 n.a. rs4305 rs4305 19 642 608 p<0.01 n.a. rs4311 rs4311 19 642 608 p<0.05 n.a. rs4329 rs4329 19 642 608 p=0.05 n.a. rs4333 rs4333 19 642 608 p<0.05 n.a. rs4461142 rs4461142 19 642 608 p<0.05 n.a. rs867640 rs867640 19 642 608 p<0.05 n.a.
FACL4 ACSL4 Xq22.3-q23 92.1 C/T in intron 1 rs1324805 43 198 229 0.003 1.5 (F)1.9 (M)
AR AR Xq11.2-q12 180.2 microsatellite NA 44 71 83 0.003 0.41b
AT1R AGTR1 3q21-q25 45.1 1166A/C rs5186 45 132 132 0.036 het:0.66 hom:1.61b
APOE APOE 19q13.2 3.6 epsilon2 rs429358+rs7412 46 42 73 0.04 0.36b
47 273 429 <0.0005 het:0.17 hom:0.03b
AVPR1B AVPR1B 1q32 7.7 AVPR1b-s3 rs33976516 48 89 88 0.026 n.a. 0.014 n.a. AVPR1b-s5 rs33933482 48 89 89 0.043 n.a.
AVPR1b-s1+s2+s3+ s4+s5 rs33976516+rs33933482 48 89 88 0.002 0.52
48 89 89 0.0003 0.28 BDNF BDNF 11p13 66.9 Val66Met rs6265 49 110 171 0.001 0.003 2.49 50 284 331 0.005 1.7 (GT)n (microsatellite) NA 51 465 1097 0.028 n.a. BCR BCR 22q11.23 137.7 rs2267012 rs2267012 52 329 351 0.0097 1.33
peer
-005
2216
6, v
ersi
on 1
- 30
Sep
201
0
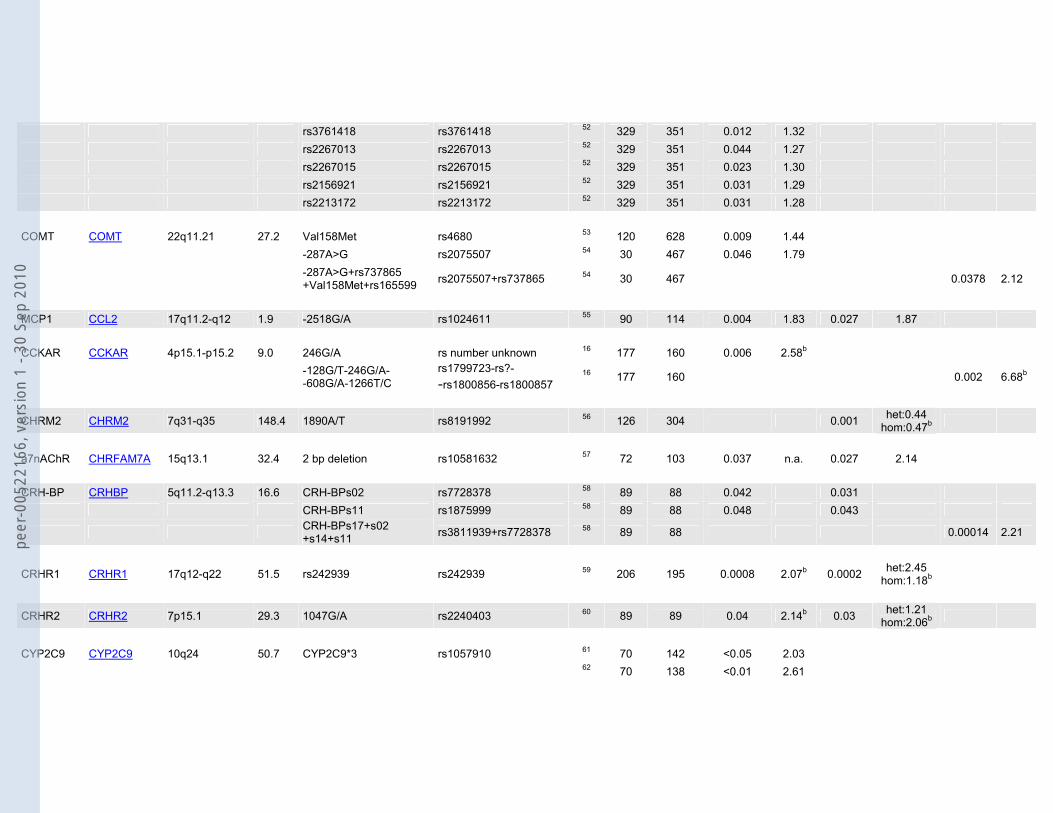
rs3761418 rs3761418 52 329 351 0.012 1.32 rs2267013 rs2267013 52 329 351 0.044 1.27 rs2267015 rs2267015 52 329 351 0.023 1.30 rs2156921 rs2156921 52 329 351 0.031 1.29 rs2213172 rs2213172 52 329 351 0.031 1.28 COMT COMT 22q11.21 27.2 Val158Met rs4680 53 120 628 0.009 1.44 -287A>G rs2075507 54 30 467 0.046 1.79
-287A>G+rs737865 +Val158Met+rs165599 rs2075507+rs737865 54 30 467 0.0378 2.12
MCP1 CCL2 17q11.2-q12 1.9 -2518G/A rs1024611 55 90 114 0.004 1.83 0.027 1.87 CCKAR CCKAR 4p15.1-p15.2 9.0 246G/A rs number unknown 16 177 160 0.006 2.58b
-128G/T-246G/A- -608G/A-1266T/C
rs1799723-rs?- -rs1800856-rs1800857
16 177 160 0.002 6.68b
CHRM2 CHRM2 7q31-q35 148.4 1890A/T rs8191992 56 126 304 0.001 het:0.44 hom:0.47b
a7nAChR CHRFAM7A 15q13.1 32.4 2 bp deletion rs10581632 57 72 103 0.037 n.a. 0.027 2.14 CRH-BP CRHBP 5q11.2-q13.3 16.6 CRH-BPs02 rs7728378 58 89 88 0.042 0.031 CRH-BPs11 rs1875999 58 89 88 0.048 0.043
CRH-BPs17+s02 +s14+s11 rs3811939+rs7728378 58 89 88 0.00014 2.21
CRHR1 CRHR1 17q12-q22 51.5 rs242939 rs242939 59 206 195 0.0008 2.07b 0.0002 het:2.45 hom:1.18b
CRHR2 CRHR2 7p15.1 29.3 1047G/A rs2240403 60 89 89 0.04 2.14b 0.03 het:1.21 hom:2.06b
CYP2C9 CYP2C9 10q24 50.7 CYP2C9*3 rs1057910 61 70 142 <0.05 2.03 62 70 138 <0.01 2.61
peer
-005
2216
6, v
ersi
on 1
- 30
Sep
201
0
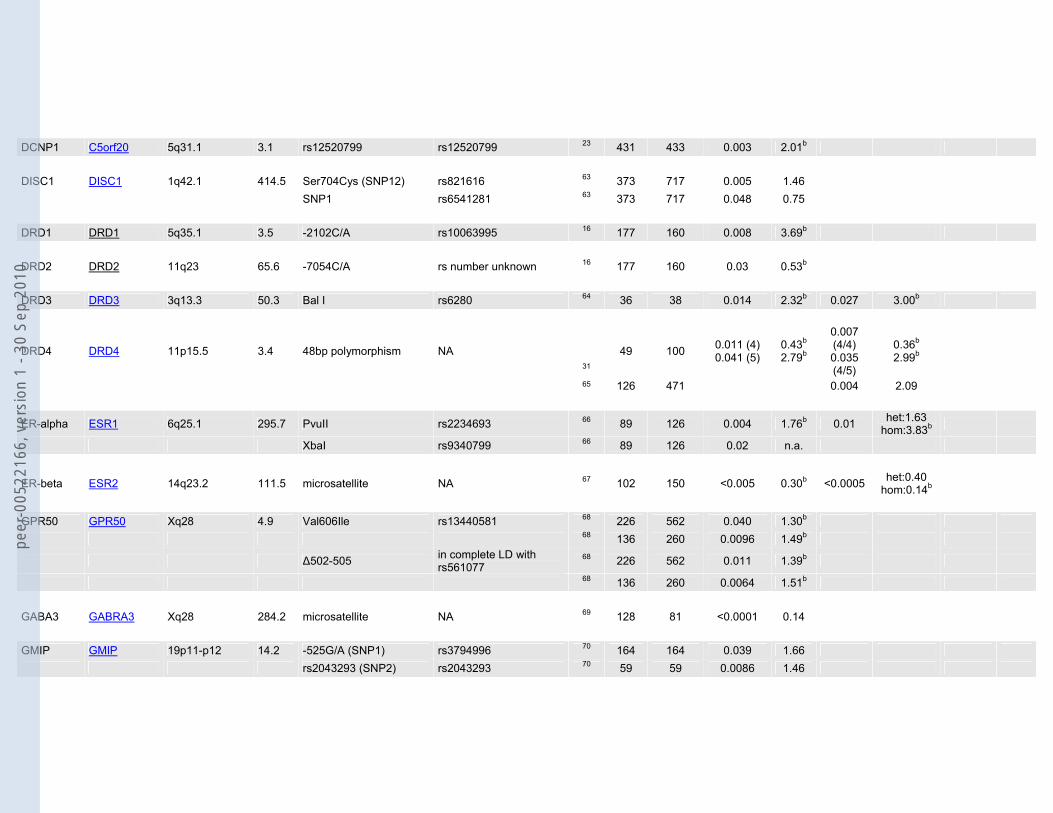
DCNP1 C5orf20 5q31.1 3.1 rs12520799 rs12520799 23 431 433 0.003 2.01b DISC1 DISC1 1q42.1 414.5 Ser704Cys (SNP12) rs821616 63 373 717 0.005 1.46 SNP1 rs6541281 63 373 717 0.048 0.75 DRD1 DRD1 5q35.1 3.5 -2102C/A rs10063995 16 177 160 0.008 3.69b DRD2 DRD2 11q23 65.6 -7054C/A rs number unknown 16 177 160 0.03 0.53b DRD3 DRD3 3q13.3 50.3 Bal I rs6280 64 36 38 0.014 2.32b 0.027 3.00b
DRD4 DRD4 11p15.5 3.4 48bp polymorphism NA 31
49 100 0.011 (4) 0.041 (5)
0.43b 2.79b
0.007 (4/4) 0.035 (4/5)
0.36b 2.99b
65 126 471 0.004 2.09
ER-alpha ESR1 6q25.1 295.7 PvuII rs2234693 66 89 126 0.004 1.76b 0.01 het:1.63 hom:3.83b
XbaI rs9340799 66 89 126 0.02 n.a.
ER-beta ESR2 14q23.2 111.5 microsatellite NA 67 102 150 <0.005 0.30b <0.0005 het:0.40 hom:0.14b
GPR50 GPR50 Xq28 4.9 Val606Ile rs13440581 68 226 562 0.040 1.30b 68 136 260 0.0096 1.49b
Δ502-505 in complete LD with rs561077
68 226 562 0.011 1.39b
68 136 260 0.0064 1.51b GABA3 GABRA3 Xq28 284.2 microsatellite NA 69 128 81 <0.0001 0.14 GMIP GMIP 19p11-p12 14.2 -525G/A (SNP1) rs3794996 70 164 164 0.039 1.66 rs2043293 (SNP2) rs2043293 70 59 59 0.0086 1.46
peer
-005
2216
6, v
ersi
on 1
- 30
Sep
201
0
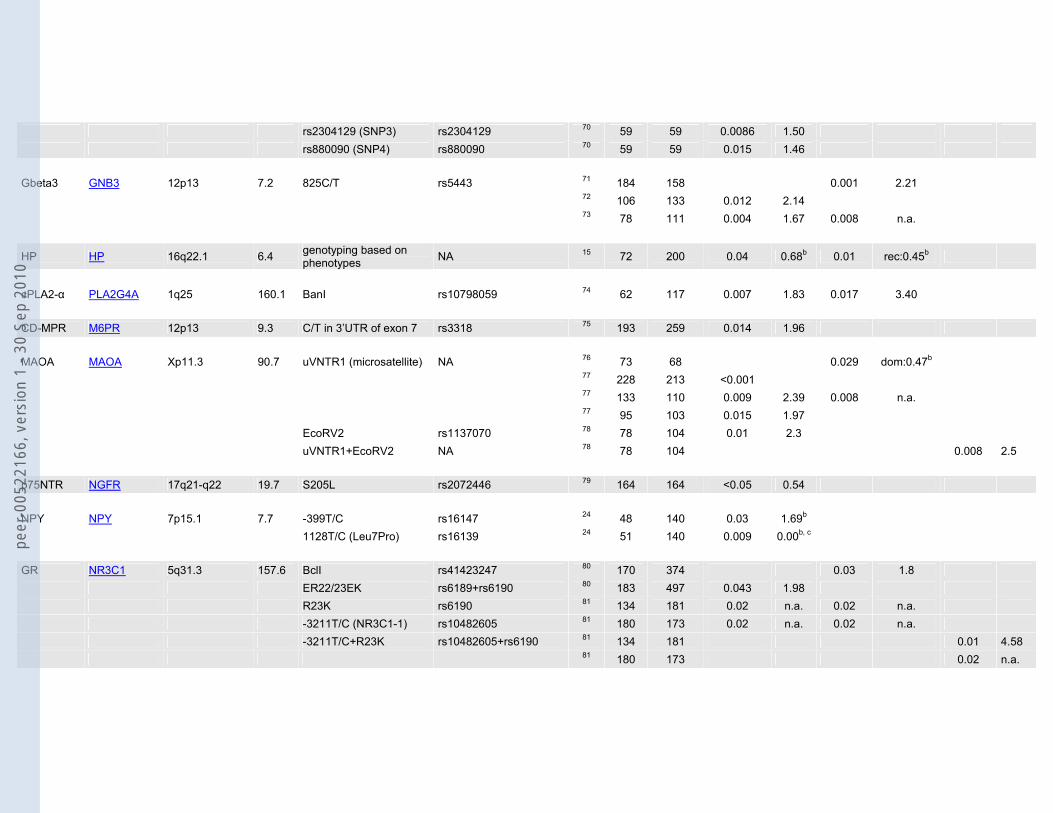
rs2304129 (SNP3) rs2304129 70 59 59 0.0086 1.50 rs880090 (SNP4) rs880090 70 59 59 0.015 1.46 Gbeta3 GNB3 12p13 7.2 825C/T rs5443 71 184 158 0.001 2.21 72 106 133 0.012 2.14 73 78 111 0.004 1.67 0.008 n.a.
HP HP 16q22.1 6.4 genotyping based on phenotypes NA 15 72 200 0.04 0.68b 0.01 rec:0.45b
cPLA2-α PLA2G4A 1q25 160.1 BanI rs10798059 74 62 117 0.007 1.83 0.017 3.40 CD-MPR M6PR 12p13 9.3 C/T in 3’UTR of exon 7 rs3318 75 193 259 0.014 1.96 MAOA MAOA Xp11.3 90.7 uVNTR1 (microsatellite) NA 76 73 68 0.029 dom:0.47b 77 228 213 <0.001 77 133 110 0.009 2.39 0.008 n.a. 77 95 103 0.015 1.97 EcoRV2 rs1137070 78 78 104 0.01 2.3 uVNTR1+EcoRV2 NA 78 78 104 0.008 2.5 p75NTR NGFR 17q21-q22 19.7 S205L rs2072446 79 164 164 <0.05 0.54 NPY NPY 7p15.1 7.7 -399T/C rs16147 24 48 140 0.03 1.69b 1128T/C (Leu7Pro) rs16139 24 51 140 0.009 0.00b, c GR NR3C1 5q31.3 157.6 BclI rs41423247 80 170 374 0.03 1.8 ER22/23EK rs6189+rs6190 80 183 497 0.043 1.98 R23K rs6190 81 134 181 0.02 n.a. 0.02 n.a. -3211T/C (NR3C1-1) rs10482605 81 180 173 0.02 n.a. 0.02 n.a. -3211T/C+R23K rs10482605+rs6190 81 134 181 0.01 4.58 81 180 173 0.02 n.a.
peer
-005
2216
6, v
ersi
on 1
- 30
Sep
201
0
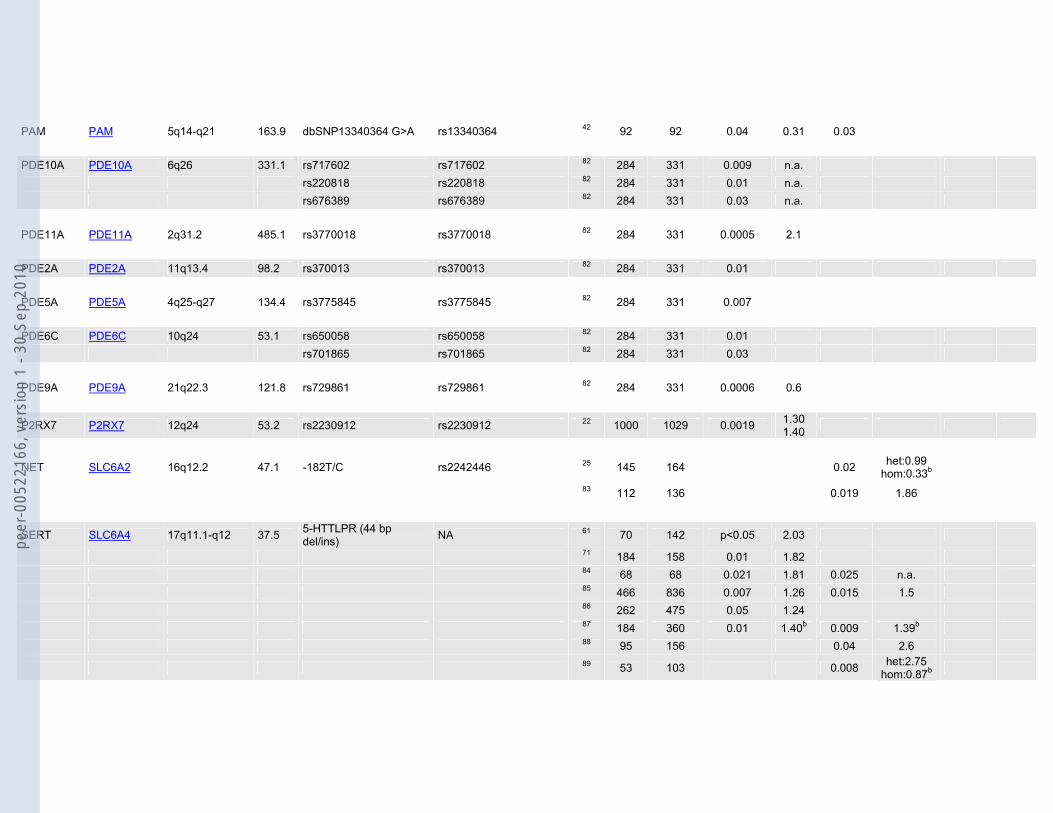
PAM PAM 5q14-q21 163.9 dbSNP13340364 G>A rs13340364 42 92 92 0.04 0.31 0.03 PDE10A PDE10A 6q26 331.1 rs717602 rs717602 82 284 331 0.009 n.a. rs220818 rs220818 82 284 331 0.01 n.a. rs676389 rs676389 82 284 331 0.03 n.a. PDE11A PDE11A 2q31.2 485.1 rs3770018 rs3770018 82 284 331 0.0005 2.1 PDE2A PDE2A 11q13.4 98.2 rs370013 rs370013 82 284 331 0.01 PDE5A PDE5A 4q25-q27 134.4 rs3775845 rs3775845 82 284 331 0.007 PDE6C PDE6C 10q24 53.1 rs650058 rs650058 82 284 331 0.01 rs701865 rs701865 82 284 331 0.03 PDE9A PDE9A 21q22.3 121.8 rs729861 rs729861 82 284 331 0.0006 0.6
P2RX7 P2RX7 12q24 53.2 rs2230912 rs2230912 22 1000 1029 0.0019 1.30 1.40
NET SLC6A2 16q12.2 47.1 -182T/C rs2242446 25 145 164 0.02 het:0.99 hom:0.33b
83 112 136 0.019 1.86
SERT SLC6A4 17q11.1-q12 37.5 5-HTTLPR (44 bp del/ins) NA 61 70 142 p<0.05 2.03
71 184 158 0.01 1.82 84 68 68 0.021 1.81 0.025 n.a. 85 466 836 0.007 1.26 0.015 1.5 86 262 475 0.05 1.24 87 184 360 0.01 1.40b 0.009 1.39b 88 95 156 0.04 2.6
89 53 103 0.008 het:2.75 hom:0.87b
peer
-005
2216
6, v
ersi
on 1
- 30
Sep
201
0
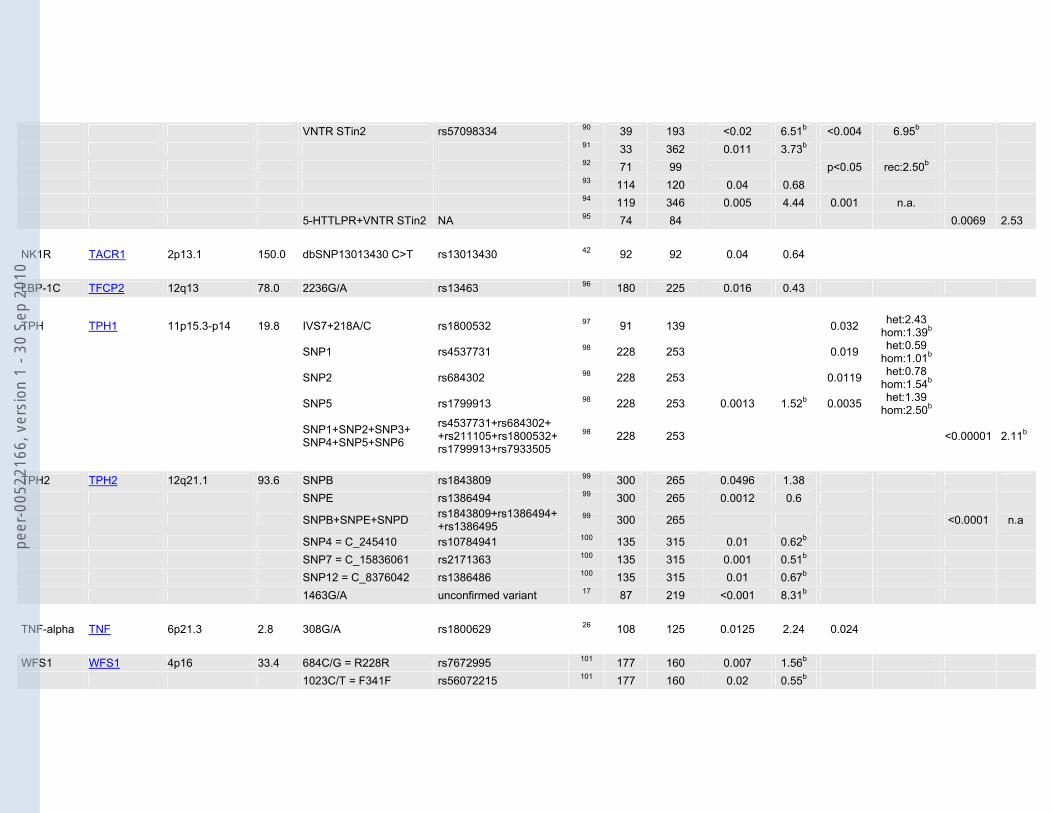
VNTR STin2 rs57098334 90 39 193 <0.02 6.51b <0.004 6.95b 91 33 362 0.011 3.73b 92 71 99 p<0.05 rec:2.50b 93 114 120 0.04 0.68 94 119 346 0.005 4.44 0.001 n.a. 5-HTTLPR+VNTR STin2 NA 95 74 84 0.0069 2.53 NK1R TACR1 2p13.1 150.0 dbSNP13013430 C>T rs13013430 42 92 92 0.04 0.64 LBP-1C TFCP2 12q13 78.0 2236G/A rs13463 96 180 225 0.016 0.43
TPH TPH1 11p15.3-p14 19.8 IVS7+218A/C rs1800532 97 91 139 0.032 het:2.43 hom:1.39b
SNP1 rs4537731 98 228 253 0.019 het:0.59 hom:1.01b
SNP2 rs684302 98 228 253 0.0119 het:0.78 hom:1.54b
SNP5 rs1799913 98 228 253 0.0013 1.52b 0.0035 het:1.39 hom:2.50b
SNP1+SNP2+SNP3+ SNP4+SNP5+SNP6
rs4537731+rs684302+ +rs211105+rs1800532+ rs1799913+rs7933505
98 228 253 <0.00001 2.11b
TPH2 TPH2 12q21.1 93.6 SNPB rs1843809 99 300 265 0.0496 1.38 SNPE rs1386494 99 300 265 0.0012 0.6
SNPB+SNPE+SNPD rs1843809+rs1386494+ +rs1386495
99 300 265 <0.0001 n.a
SNP4 = C_245410 rs10784941 100 135 315 0.01 0.62b SNP7 = C_15836061 rs2171363 100 135 315 0.001 0.51b SNP12 = C_8376042 rs1386486 100 135 315 0.01 0.67b 1463G/A unconfirmed variant 17 87 219 <0.001 8.31b TNF-alpha TNF 6p21.3 2.8 308G/A rs1800629 26 108 125 0.0125 2.24 0.024 WFS1 WFS1 4p16 33.4 684C/G = R228R rs7672995 101 177 160 0.007 1.56b 1023C/T = F341F rs56072215 101 177 160 0.02 0.55b
peer
-005
2216
6, v
ersi
on 1
- 30
Sep
201
0

1185C/T = V395V rs1801206 101 177 160 0.01 1.56b 2206G/A = G736S rs number unknown 101 177 160 0.04 0.57b 2565G/A = S855S rs1046316 101 177 160 0.04 0.71b
NA: not applicable; n.a.: not available; het: heterozygotes; hom: homozygotes; rec: recessive; dom: dominant; F: female; M: male a SNP is located more than 5kb away from gene and is not included in our analyses b OR was not reported in corresponding article, but could be estimated from genotype counts or frequencies c allele was not observed in cases, which resulted in OR = 0.00
peer
-005
2216
6, v
ersi
on 1
- 30
Sep
201
0
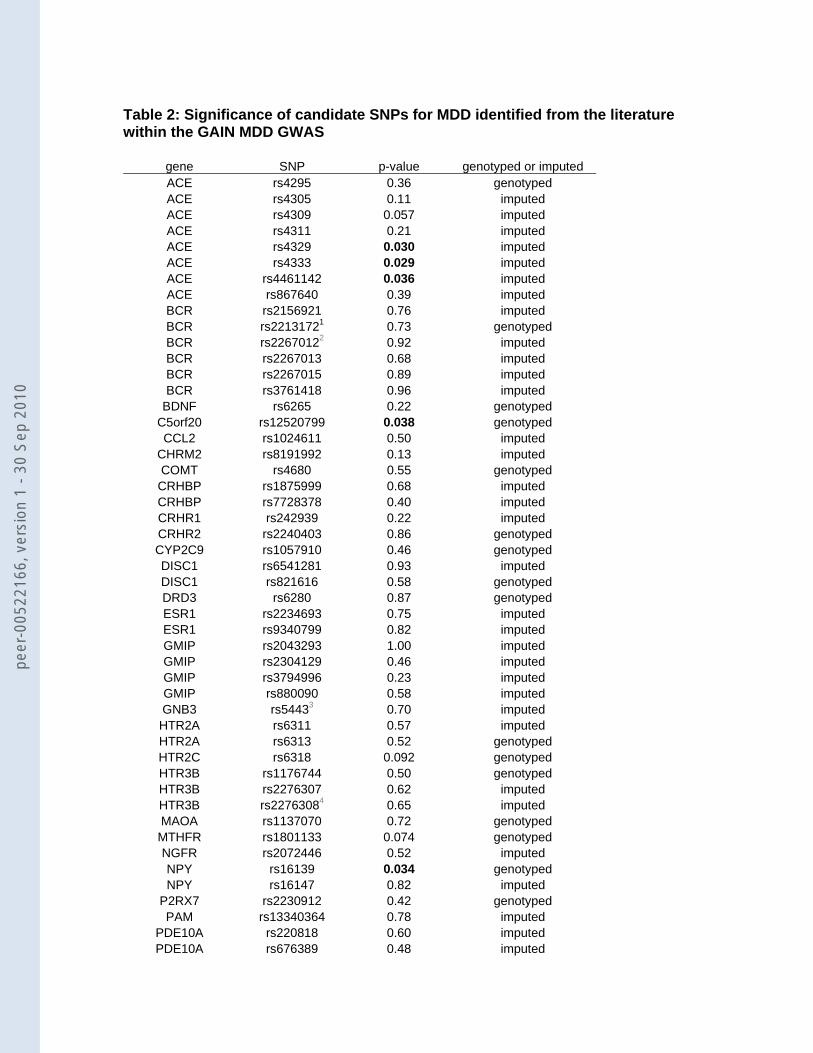
Table 2: Significance of candidate SNPs for MDD identified from the literature within the GAIN MDD GWAS
gene SNP p-value genotyped or imputed ACE rs4295 0.36 genotyped ACE rs4305 0.11 imputed ACE rs4309 0.057 imputed ACE rs4311 0.21 imputed ACE rs4329 0.030 imputed ACE rs4333 0.029 imputed ACE rs4461142 0.036 imputed ACE rs867640 0.39 imputed BCR rs2156921 0.76 imputed BCR rs22131721 0.73 genotyped BCR rs22670122 0.92 imputed BCR rs2267013 0.68 imputed BCR rs2267015 0.89 imputed BCR rs3761418 0.96 imputed
BDNF rs6265 0.22 genotyped C5orf20 rs12520799 0.038 genotyped CCL2 rs1024611 0.50 imputed
CHRM2 rs8191992 0.13 imputed COMT rs4680 0.55 genotyped CRHBP rs1875999 0.68 imputed CRHBP rs7728378 0.40 imputed CRHR1 rs242939 0.22 imputed CRHR2 rs2240403 0.86 genotyped CYP2C9 rs1057910 0.46 genotyped DISC1 rs6541281 0.93 imputed DISC1 rs821616 0.58 genotyped DRD3 rs6280 0.87 genotyped ESR1 rs2234693 0.75 imputed ESR1 rs9340799 0.82 imputed GMIP rs2043293 1.00 imputed GMIP rs2304129 0.46 imputed GMIP rs3794996 0.23 imputed GMIP rs880090 0.58 imputed GNB3 rs54433 0.70 imputed HTR2A rs6311 0.57 imputed HTR2A rs6313 0.52 genotyped HTR2C rs6318 0.092 genotyped HTR3B rs1176744 0.50 genotyped HTR3B rs2276307 0.62 imputed HTR3B rs22763084 0.65 imputed MAOA rs1137070 0.72 genotyped MTHFR rs1801133 0.074 genotyped NGFR rs2072446 0.52 imputed NPY rs16139 0.034 genotyped NPY rs16147 0.82 imputed
P2RX7 rs2230912 0.42 genotyped PAM rs13340364 0.78 imputed
PDE10A rs220818 0.60 imputed PDE10A rs676389 0.48 imputed
peer
-005
2216
6, v
ersi
on 1
- 30
Sep
201
0
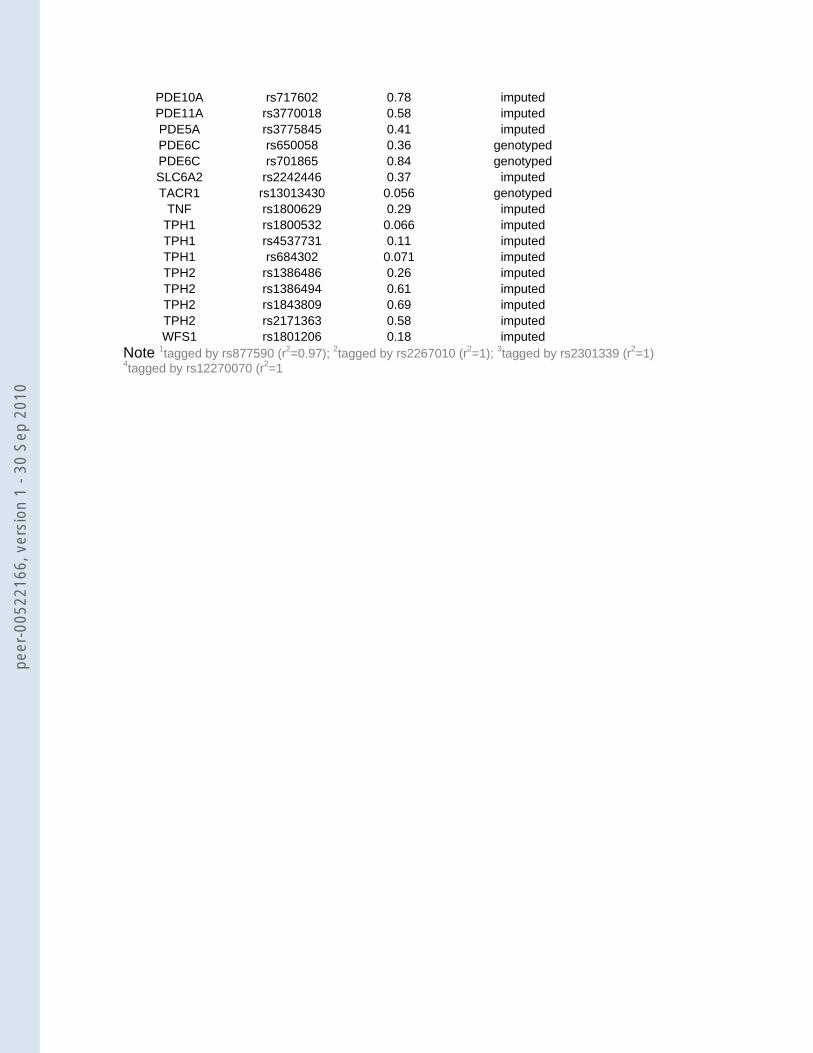
PDE10A rs717602 0.78 imputed PDE11A rs3770018 0.58 imputed PDE5A rs3775845 0.41 imputedPDE6C rs650058 0.36 genotyped PDE6C rs701865 0.84 genotyped SLC6A2 rs2242446 0.37 imputed TACR1 rs13013430 0.056 genotyped
TNF rs1800629 0.29 imputed TPH1 rs1800532 0.066 imputed TPH1 rs4537731 0.11 imputed TPH1 rs684302 0.071 imputed TPH2 rs1386486 0.26 imputed TPH2 rs1386494 0.61 imputed TPH2 rs1843809 0.69 imputed TPH2 rs2171363 0.58 imputed WFS1 rs1801206 0.18 imputed
Note 1tagged by rs877590 (r2=0.97); 2tagged by rs2267010 (r2=1); 3tagged by rs2301339 (r2=1) 4tagged by rs12270070 (r2=1
peer
-005
2216
6, v
ersi
on 1
- 30
Sep
201
0
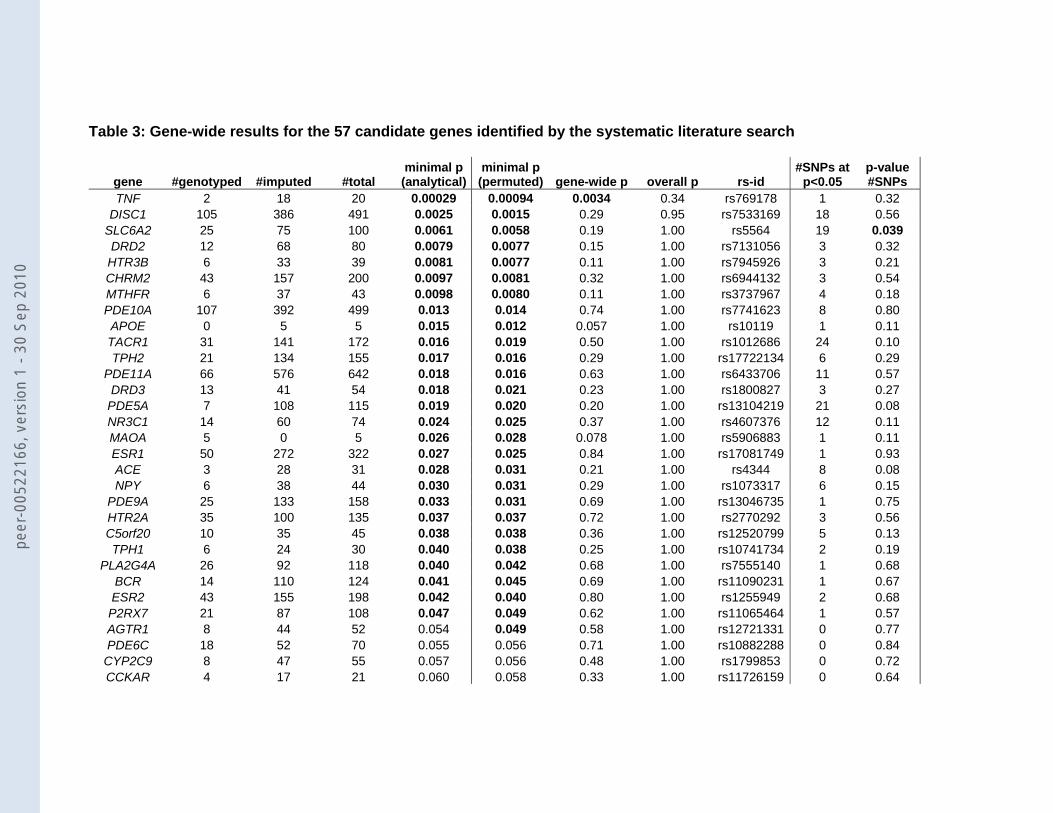
Table 3: Gene-wide results for the 57 candidate genes identified by the systematic literature search
gene #genotyped #imputed #total minimal p (analytical)
minimal p (permuted) gene-wide p overall p rs-id
#SNPs at p<0.05
p-value #SNPs
TNF 2 18 20 0.00029 0.00094 0.0034 0.34 rs769178 1 0.32 DISC1 105 386 491 0.0025 0.0015 0.29 0.95 rs7533169 18 0.56
SLC6A2 25 75 100 0.0061 0.0058 0.19 1.00 rs5564 19 0.039 DRD2 12 68 80 0.0079 0.0077 0.15 1.00 rs7131056 3 0.32
HTR3B 6 33 39 0.0081 0.0077 0.11 1.00 rs7945926 3 0.21CHRM2 43 157 200 0.0097 0.0081 0.32 1.00 rs6944132 3 0.54 MTHFR 6 37 43 0.0098 0.0080 0.11 1.00 rs3737967 4 0.18 PDE10A 107 392 499 0.013 0.014 0.74 1.00 rs7741623 8 0.80 APOE 0 5 5 0.015 0.012 0.057 1.00 rs10119 1 0.11 TACR1 31 141 172 0.016 0.019 0.50 1.00 rs1012686 24 0.10 TPH2 21 134 155 0.017 0.016 0.29 1.00 rs17722134 6 0.29
PDE11A 66 576 642 0.018 0.016 0.63 1.00 rs6433706 11 0.57 DRD3 13 41 54 0.018 0.021 0.23 1.00 rs1800827 3 0.27
PDE5A 7 108 115 0.019 0.020 0.20 1.00 rs13104219 21 0.08 NR3C1 14 60 74 0.024 0.025 0.37 1.00 rs4607376 12 0.11 MAOA 5 0 5 0.026 0.028 0.078 1.00 rs5906883 1 0.11 ESR1 50 272 322 0.027 0.025 0.84 1.00 rs17081749 1 0.93 ACE 3 28 31 0.028 0.031 0.21 1.00 rs4344 8 0.08 NPY 6 38 44 0.030 0.031 0.29 1.00 rs1073317 6 0.15
PDE9A 25 133 158 0.033 0.031 0.69 1.00 rs13046735 1 0.75 HTR2A 35 100 135 0.037 0.037 0.72 1.00 rs2770292 3 0.56 C5orf20 10 35 45 0.038 0.038 0.36 1.00 rs12520799 5 0.13 TPH1 6 24 30 0.040 0.038 0.25 1.00 rs10741734 2 0.19
PLA2G4A 26 92 118 0.040 0.042 0.68 1.00 rs7555140 1 0.68 BCR 14 110 124 0.041 0.045 0.69 1.00 rs11090231 1 0.67 ESR2 43 155 198 0.042 0.040 0.80 1.00 rs1255949 2 0.68 P2RX7 21 87 108 0.047 0.049 0.62 1.00 rs11065464 1 0.57 AGTR1 8 44 52 0.054 0.049 0.58 1.00 rs12721331 0 0.77 PDE6C 18 52 70 0.055 0.056 0.71 1.00 rs10882288 0 0.84
CYP2C9 8 47 55 0.057 0.056 0.48 1.00 rs1799853 0 0.72 CCKAR 4 17 21 0.060 0.058 0.33 1.00 rs11726159 0 0.64
peer
-005
2216
6, v
ersi
on 1
- 30
Sep
201
0
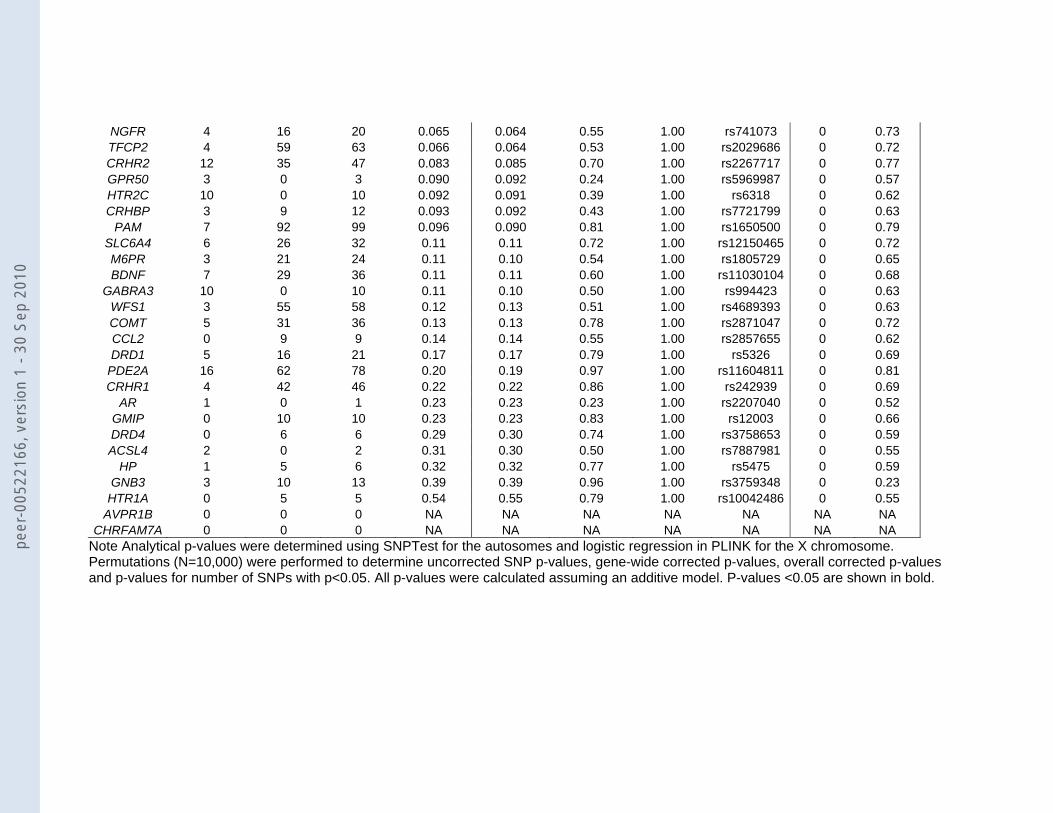
NGFR 4 16 20 0.065 0.064 0.55 1.00 rs741073 0 0.73 TFCP2 4 59 63 0.066 0.064 0.53 1.00 rs2029686 0 0.72 CRHR2 12 35 47 0.083 0.085 0.70 1.00 rs2267717 0 0.77GPR50 3 0 3 0.090 0.092 0.24 1.00 rs5969987 0 0.57 HTR2C 10 0 10 0.092 0.091 0.39 1.00 rs6318 0 0.62 CRHBP 3 9 12 0.093 0.092 0.43 1.00 rs7721799 0 0.63
PAM 7 92 99 0.096 0.090 0.81 1.00 rs1650500 0 0.79 SLC6A4 6 26 32 0.11 0.11 0.72 1.00 rs12150465 0 0.72 M6PR 3 21 24 0.11 0.10 0.54 1.00 rs1805729 0 0.65 BDNF 7 29 36 0.11 0.11 0.60 1.00 rs11030104 0 0.68
GABRA3 10 0 10 0.11 0.10 0.50 1.00 rs994423 0 0.63 WFS1 3 55 58 0.12 0.13 0.51 1.00 rs4689393 0 0.63 COMT 5 31 36 0.13 0.13 0.78 1.00 rs2871047 0 0.72 CCL2 0 9 9 0.14 0.14 0.55 1.00 rs2857655 0 0.62 DRD1 5 16 21 0.17 0.17 0.79 1.00 rs5326 0 0.69
PDE2A 16 62 78 0.20 0.19 0.97 1.00 rs11604811 0 0.81 CRHR1 4 42 46 0.22 0.22 0.86 1.00 rs242939 0 0.69
AR 1 0 1 0.23 0.23 0.23 1.00 rs2207040 0 0.52 GMIP 0 10 10 0.23 0.23 0.83 1.00 rs12003 0 0.66 DRD4 0 6 6 0.29 0.30 0.74 1.00 rs3758653 0 0.59 ACSL4 2 0 2 0.31 0.30 0.50 1.00 rs7887981 0 0.55
HP 1 5 6 0.32 0.32 0.77 1.00 rs5475 0 0.59 GNB3 3 10 13 0.39 0.39 0.96 1.00 rs3759348 0 0.23
HTR1A 0 5 5 0.54 0.55 0.79 1.00 rs10042486 0 0.55 AVPR1B 0 0 0 NA NA NA NA NA NA NA
CHRFAM7A 0 0 0 NA NA NA NA NA NA NA Note Analytical p-values were determined using SNPTest for the autosomes and logistic regression in PLINK for the X chromosome. Permutations (N=10,000) were performed to determine uncorrected SNP p-values, gene-wide corrected p-values, overall corrected p-values and p-values for number of SNPs with p<0.05. All p-values were calculated assuming an additive model. P-values <0.05 are shown in bold.
peer
-005
2216
6, v
ersi
on 1
- 30
Sep
201
0