polyolefin maleation in supercritical carbon dioxide and ...
185
University of Massachusetts Amherst University of Massachusetts Amherst ScholarWorks@UMass Amherst ScholarWorks@UMass Amherst Doctoral Dissertations 1896 - February 2014 1-1-1999 Heterogeneous polymer modification : polyolefin maleation in Heterogeneous polymer modification : polyolefin maleation in supercritical carbon dioxide and amorphous fluoropolymer supercritical carbon dioxide and amorphous fluoropolymer surface modification. surface modification. Heather J. Hayes University of Massachusetts Amherst Follow this and additional works at: https://scholarworks.umass.edu/dissertations_1 Recommended Citation Recommended Citation Hayes, Heather J., "Heterogeneous polymer modification : polyolefin maleation in supercritical carbon dioxide and amorphous fluoropolymer surface modification." (1999). Doctoral Dissertations 1896 - February 2014. 998. https://doi.org/10.7275/t22s-m079 https://scholarworks.umass.edu/dissertations_1/998 This Open Access Dissertation is brought to you for free and open access by ScholarWorks@UMass Amherst. It has been accepted for inclusion in Doctoral Dissertations 1896 - February 2014 by an authorized administrator of ScholarWorks@UMass Amherst. For more information, please contact [email protected].
-
Upload
khangminh22 -
Category
Documents
-
view
3 -
download
0
Transcript of polyolefin maleation in supercritical carbon dioxide and ...

University of Massachusetts Amherst University of Massachusetts Amherst
ScholarWorks@UMass Amherst ScholarWorks@UMass Amherst
Doctoral Dissertations 1896 - February 2014
1-1-1999
Heterogeneous polymer modification : polyolefin maleation in Heterogeneous polymer modification : polyolefin maleation in
supercritical carbon dioxide and amorphous fluoropolymer supercritical carbon dioxide and amorphous fluoropolymer
surface modification. surface modification.
Heather J. Hayes University of Massachusetts Amherst
Follow this and additional works at: https://scholarworks.umass.edu/dissertations_1
Recommended Citation Recommended Citation Hayes, Heather J., "Heterogeneous polymer modification : polyolefin maleation in supercritical carbon dioxide and amorphous fluoropolymer surface modification." (1999). Doctoral Dissertations 1896 - February 2014. 998. https://doi.org/10.7275/t22s-m079 https://scholarworks.umass.edu/dissertations_1/998
This Open Access Dissertation is brought to you for free and open access by ScholarWorks@UMass Amherst. It has been accepted for inclusion in Doctoral Dissertations 1896 - February 2014 by an authorized administrator of ScholarWorks@UMass Amherst. For more information, please contact [email protected].


HETEROGENEOUS POLYMER MODIFICATION: POLYOLEFIN MALEATION IfSUPERCRITICAL CARBON DIOXIDE AND AMORPHOUS FLUOROPOLYMER
SURFACE MODIFICATION
A Dissertation Presented
by
HEATHER J. HAYES
Submitted to the Graduate School of the
University of Massachusetts Amherst in partial fulfillment
of the requirements for the degree of
DOCTOR OF PHILOSOPHY
September 1999
Polymer Science and Engineering
HETEROGENEOUS POLYMER MODIFICATION: POLYOLEFIN MALEATION INSUPERCRITICAL CARBON DIOXIDE AND AMORPHOUS FLUOROPOLYMER
SURFACE MODIFICATION
A Dissertation Presented
by
HEATHER J. HAYES
Approved as to style and content by:
Thomas J. McCarthy, Chair
Polymer Science and Engineering

To Lee
Digitized by the Internet Archive
in 2014
https://archive.org/details/heterogeneouspolOOhaye

ACKNOWLEDGMENTS
I have many people that I would like to acknowledge for their assistance,
friendship, and kindness during the time I spent at UMass.
An advisor as intelligent, fair, and caring as Tom McCarthy can be found
nowhere but PS&E at UMass. He has given me a leash just long enough to let me feel
that I learned an incredible amount of science and leadership on my own and just short
enough to keep me from wandering down research and educational pathways to failure.
Tom was not the only guiding figure in my research life here. My committee was
composed of two other renowned advisors, Dick Farris and Paul Lahti. Professor Farris
patiently discussed adhesion and mechanical property testing with me. Professor Lahti
was an excellent critic of my proposal and interjected much chemical knowledge. The
three proved to be open and welcoming both individually and collectively.
Another, less official, advisor should be named here. Jack Hirsch served many
roles in my UMass life, including technical advisor, friend, and confidant, allowing me to
vent frustrations and excitement without passing judgement. Jack also welcomed and
introduced a range of topics to discuss, which I always enjoyed.
The past and current members of the McCarthy group should obviously be
acknowledged as they enhanced my UMass experience greatly. Wei initiated me into the
ways of the group. Juha, Vipavee, Raul, Jim, Zhaohui, and Susan shared invaluable
advice concerning research both specific to my work and general to the department. Rick
was not only a great 603 lab partner who kept my pace slower and more deliberate, but he
is also a fun and knowledgeable classmate and friend. Ed and Kelyn (whose names are
v

always said as if they are one) were fantastic labmates. Discussions of research and life
will be greatly missed with those two although I'm certain they will be life-long friends.
Chuntao deserves a special line of acknowledgement for helping me extensively over the
past year, filling my liquid nitrogen trap and even terminating a number of reactions for
me. What a guy! I am grateful to both Jeff and Chuntao for thoughtful discussions of
their research and my own. Research shouldn't happen in a vacuum. It can't
successfully. Alex has pushed me to reflect on many things (especially the English
language) in great detail, which I appreciate along with his sincerity and candor. The
other group members with whom I've had many unique and interesting discussions
deserve mention: Didem, Xinqiao, Terry, Gene, Meng, Chris, and Tim.
I would like to acknowledge several staff and faculty members who have helped
me in big and small ways with research and bureaucracy. Thanks are owed to John,
Charlie, Andre, Alan, Hoagland, Eileen, Schmidt-Rohr, Greg, and Lesser.
Friends outside the group have contributed a great deal to the success of this
thesis and my enjoyment while here at UMass, as well. I have truly enjoyed many
cookouts and adventures with Lee and Elbert. Greg has been my Newman Center buddy
since my first year here. I wish Susan and him much luck. Finally, my fellow classmates
have been great friends (partly because of our shared suffering through the first year). I'd
especially like to acknowledge Yuanqiao, Wei Guo, and Gus.
The PSE Club was a fun endeavor for me. Professor Farris was a great supporter
and catalyst. Jenny, Matt, and Bob were three of the hardest workers in getting the club
to become what we had envisioned. I hope someone jumpstarts it once again.
vi

My family has been my biggest supporter. Their unending and limitless faith in
my abilities has left me with the feeling that I can do anything. Thanks Mom, Dad, Scott,
Grandma, Pops, Mom-Mom, and Pop-Pop!
Finally, I want to thank Lee: my husband, soul mate, and best friend. He has kept
me grounded through all the stressful times, and has made me smile and even laugh when
I was at my lowest points. Thanks Lee, you are my sunshine! Three sticks.
vii

ABSTRACT
HETEROGENEOUS POLYMER MODIFICATION: POLYOLEFIN MALEATION DsSUPERCRITICAL CARBON DIOXIDE AND AMORPHOUS FLUOROPOLYMER
SURFACE MODIFICATION
SEPTEMBER 1999
HEATHER J. HAYES, B.S., THE UNIVERSITY OF NORTH CAROLINAAT CHAPEL HILL
M.S., UNIVERSITY OF MASSACHUSETTS AMHERST
Ph.D., UNIVERSITY OF MASSACHUSETTS AMHERST
Directed by: Professor Thomas J. McCarthy
Three distinct heterogeneous polymer modification reactions are explored in this
work. The first is a bulk reaction commonly conducted on polyolefins - the free radical
addition of maleic anhydride. This reaction was run using supercritical carbon dioxide
(SC CO2) as the solvent. The second was the chemical surface modification of an
amorphous fluorocopolymer of tetrafluoroethylene and a perfluorodioxole monomer
(Teflon AF). Several reactions were explored to reduce the surface of the
fluorocopolymer for the enhancement of wettability. The last modification was also on
Teflon AF and involved the physical modification of the surface through the transport
polymerization of xylylene in order to synthesize a novel bilayer membrane.
The bulk maleation of poly-4-methyl-l-pentene (PMP) was the focus of the first
project. SC C02 was utilized as both solvent and swelling agent to promote this
heterogeneous reaction and led to successful grafting of anhydride groups on both PMP
and linear low density polyethylene. Varying the reaction conditions and reagent
viii

concentrations allowed optimization of the reaction. The grafted anhydride units were
found to exist as single maleic and succinic grafts, and the PMP became crosslinked upon
maleation.
The surface of a fluoropolymer can be difficult to alter. An examination of three
reactions was made to determine the reactivity of Teflon AF: sodium naphthalenide
treatment (Na-Nap), aluminum metal modification through deposition and dissolution,
and mercury/ammonia photosensitization. The fluorocopolymer with the lower
perfluorodioxole percentage was found to be more reactive towards modification with the
Na-Nap treatment. The other modification reactions appeared to be nearly equally
reactive toward both fluorocopolymers. The functionality of the Na-Nap-treated surface
was examined in detail with the use of several derivatization reactions.
In the final project, an asymmetric gas separation membrane was synthesized
using Teflon AF as the highly permeable support layer and chemical vapor deposited
poly(p-xylylene) (PPX) as the thin selective layer. This bilayer membrane has oxygen
and nitrogen permeability values close to those predicted by the series resistance model.
To enhance the weak adhesive bond between Teflon AF and PPX, Na-Nap reduction was
used to modify the Teflon AF surface prior to the vapor deposition polymerization of di-
p-xylylene monomer.
ix

TABLE OF CONTENTS
Page
ACKNOWLEDGMENTSv
ABSTRACTVlll
LIST OF TABLES
LIST OF FIGURES ••
A VII
LIST OF SCHEMESxxii
CHAPTER
1. OVERVIEW|
2. BULK FREE RADICAL MALEATIONS OF POLYOLEFINS USINGSUPERCRITICAL CARBON DIOXIDE 6
Introduction 6
Supercritical Fluids 6
Grafting Chemistry 10
Phase Behavior 12
CO2 Solubility in Polymers 12
Maleic Anhydride Solubility in SC C02 15
Partitioning 16
Experimental 17
Materials 17
Methods 19
Phase Behavior 19
Maleations 21
Characterization 21
Mass Uptake Experiments 22
Swelling Experiments 23
Results and Discussion 23
Substrates 24
x

Poly(4-Methyl- 1 -Pentene) 24Low Density Polyethylene 25Poly(trifluoroethylene) 26
Phase Behavior26
Carbon Dioxide Solubility in PMP 27Maleic Anhydride Solubility in SC C02 29Maleic Anhydride Solubility in PMP Swollen with SC C02 30Initiator Solubility in SC C02 3
1
Structure Analysis 32
Spectroscopy 32Crosslinking 38Crystallinity 41
Experimental Variables 45
Temperature Effects 46Kinetics 49Reactant concentrations 52
Conclusions 55
3. SURFACE CHEMISTRY OF POLY(TETRAFLUOROETHYLENE-CO-BIS-2,2-TRIFLUOROMETHYL-4,5-DIFLUORO-l,3-DIOXOLE) (TEFLON AF).. 57
Introduction 57
Reactions on Fluoropolymers 57
Teflon AF 58
Surface Analytical Techniques 60
Contact Angle and Wettability 61
X-Ray Photoelectron Spectroscopy 63
Attenuated Total Reflectance Infrared Spectroscopy 64
Modification Reactions for Teflon AF 66
Sodium Naphthalide Reductions 67
Aluminum Deposition/Dissolution 69
Mercury/Ammonia Photosensitization 70
Probing the Chemical Reactivity of Reduced Surfaces 72
xi

Reactions with Unsaturated Surfaces 72
Bromination72
Hydroboration "73
Reactions with Oxygen-Containing Functionality 74
Carbonyls 74Alcohols 75Carboxylic Acids 75
Etchants 76
Experimental 77
Instrumentation 77Materials 7gGeneral Procedures 80
Casting Uniform Films 80Surface Modifications 8
1
Sodium Naphthalide Reduction (Red-AF) 81
Aluminum Deposition/Dissolution (Al dep/diss) 83
Mercury/Ammonia Photosensitization (Hg*/NH3 ) 83
Reactivity of Modified Surfaces 84
Oxidation 85
Bromination of Red-AF 85
Hydroboration of Red-AF 85
Addition of 2,4-Dinitrophenylhydrazine to Red-AF 86
Acylation of Red-AF with Heptafluorobutyryl Chloride.. 87
Addition of l,r-Carbonyldiimidazole to Red-AF 87
Results and Discussion 88
Teflon AF Modifications 89
Sodium Naphthalide Reduction 90
Aluminum Deposition/Dissolution 97
Mercury/Ammonia Photosensitization 100
Chemical Reactivity of Na-Nap Reduced Teflon AF 104
xii

Reactions with Unsaturation1 04
Bromination 104Hydroboration 106
Oxidation of Red-AF 110Reactions with Oxygen-Containing Functionality Ill
2,4-Dinitrophenylhydrazine Addition 11
1
Acylation of Red-AF 1 1
5
Addition of U'-Carbonyldiimidazole to Red-AF 117
Conclusions 118
Note 120
4. SYNTHESIS OF AN ASYMMETRIC GAS SEPARATION MEMBRANEBASED ON TEFLON AF AND POLY(P-XYLYLENE) 121
Introduction 121
Gas Separation Membranes 121
Asymmetric Gas Separation Membranes 124
Poly(p-xylylene) Film Formation and Membrane Properties 125
Polymer / Polymer Adhesion 1 28
Experimental 130
Materials 130
Methods 131
Poly(p-xylylene) Deposition 131
Design of Vapor Deposition Apparatus 131
Transport Polymerization of Di-p-Xylylene 132
Gas Permeability 133
Design of Gas Permeability Apparatus 133
Measuring Permeability 135
Double Cantilever Beam Adhesion Tests 137
Results and Discussion 137
Deposition of PPX and PPXC 137
xiii

Permeability of Bilayer Membranes 140
Adhesion between Teflon AF and PPX 143
Conclusions 145
Note 146
APPENDICES
A. ABBREVIATIONS 147
B . SUPPLEMENTAL DATA FOR CHAPTER 3 151
BIBLIOGRAPHY 154
xiv

LIST OF TABLES
Table nPage
2.1.Physical Properties Comparison for Liquids, Supercritical Fluids, and
Gases o
2.2. NMR Peak Assignments for PMP from DEPT and C-H COSYExperiments
j g
2.3. PMP and PMP-g-MAH Tetragonal Unit Cell d-Spacings from X-RayCompared to Calculated Values 43
2.4. Half-Lives for Initiators Used in SC C02 Maleation of PMP. (Values80
were measured in hours in benzene.) 45
3.1. Physical Properties of Teflon AF Copolymers.'06
59
3.2. Critical Surface Tension Values for Common Polymeric Surfaces and1 08
Liquid Surface Tensions for Liquid Probe Fluids 62
3.3. Red-AF Contact Angle Measured after Various Reaction Times 93
3.4. Contact Angle Data for Teflon AF Modifications 97
3.5. XPS 75° Takeoff Angle Data for Teflon AF Modifications 98
3.6. XPS 75° Takeoff Angle Results of Bromination of Red-AF 106
3.7. XPS 75° Takeoff Angle Results for Hydroboration and Oxidation of Red-
AF '. 108
3.8. Contact Angle Data for Hydroborated and Oxidized Red-AF 109
3.9. XPS 75° Takeoff Angle Data for Red-AF Derivatized with DNPH 113
xv

3.10. XPS 75° Takeoff Angle Data for Red-AF Derivatized with HFBC 116
3.11. XPS 75° Takeoff Angle Data for Red-AF Derivatized with CDI 118
3.12. Summary of Derivative Reactions on Red-AF from XPS Results 120
4.1 . Critical Temperature and Sieving Diameter for Several Common104
Gases 122
4.2. Permeability and Selectivity of PPX-Based Polymers 126
4.3. Permeability Data for Teflon AF-Based Membranes (Barrer) 142
4.4. AF-PPX Composite Bond Strengths Determined from DCB Tests 145
B. 1 . Contact Angle Measurements after Derivatization Reactions on Teflon
AF Reduced 1 0 Minutes with Na-Nap 1 5
1
B.2. Contact Angle Measurements after Derivatization Reactions on Teflon
AF Reduced 4 Hours with Na-Nap 151
B.3. UV/Vis Absorbance at 320 nm of Red-AF Derivatives 152
B.4. XPS 75° Takeoff Angle Data of Teflon AF from Compact Membrane
Systems after Hg*/NH3 Treatment 152
xvi
LIST OF FIGURES
FiSure Page
2.1.Density ofC02 as a Function of Pressure and Temperature.
36
9
2.2. Density p and solubility parameter 5 as a function of pressure for SCCO2 at40°C.
33
13
2.3. Tg depression of polystyrene" (PS) and poly(methyl methacrylate)
62 '63
(PMMA) with dissolved C02 14
352.4. Phase diagram for maleic anhydride in C02 16
2.5. Partitioning of Naphthalene between C02 and C02-Swollen Silicone
Rubber 17
2.6. NMR spectrum ofPMP (x denotes solvent peak) 18
2.7. Mass uptake ofC02 in PMP (4h 60 °C, 0.69 g/mL C02) showing initial
Fickian diffusion 28
2.8. Effect of soak time on mass uptake ofC02 in PMP (60 °C, 0.69g/mLC02) 28
2.9. Phase behavior ofMAH in SC C02 (0.5 M MAH, 0.61 and 0.65 g/mLC02) 29
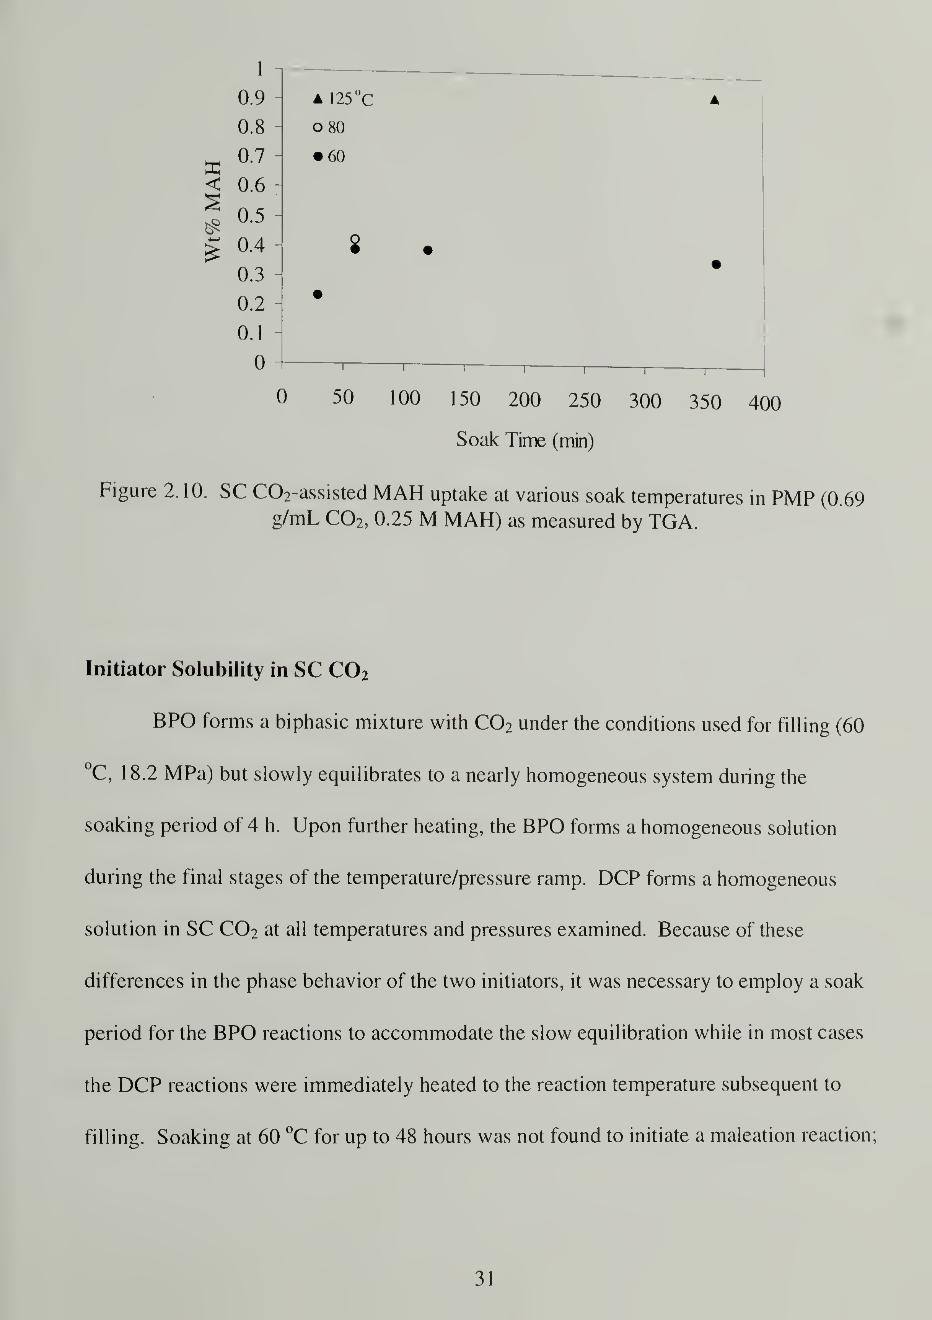
2.10. SC C02-assisted MAH uptake at various soak temperatures in PMP(0.69 g/mL C02 , 0.25 M MAH) as measured by TGA 31
2.1 1 . Calibration curves for PMP maleations relating elemental analysis
results from combustion (•) and pyrolysis (o) to normalized infrared
data 33
xvii

3. ATR-IR spectra of PMP (a) and PMP-g-MAH (b) compared withtransmittance spectrum of PMP-g-MAH (c)
2. 14. Percentage of sample insoluble in 60 °C CC14 as a function of reactioninitiator concentration (125 °C, 0.67 g/mL C02 ) 39
2. 1 5. Swelling portions of PMP-g-MAH samples insoluble in 60 °C CC14 as afunction of initiator concentration (relative to MAH) (top) andanhydride grafted(bottom) 40
2. 1 6. DSC thermogram for unreacted PMP and PMP-g-MAH (1st
and 2nd
heating) 42
2. 17. X-ray diffractogram of oriented PMP 43
2. 1 8. DSC thermogram of unreacted LLDPE and 1
st
and 2nd
heating of SCC02-maleated LLDPE 44
2. 19. Effect of temperature on the degree of maleation using BPO (4 h soak,
24 h reaction) and DCP (2 h soak, 1 h reaction) as initiators with a 60°C soak, 0.25 M MAH, 0.04 M initiator, and 0.67 g/mL C02 46
2.20. TR spectra of LLDPE samples maleated in SC C02 (0.06 M MAH, 0.04
M DCP, 2h 60 °C soak, 3 h reaction, 0.60 g/mL C02) 48
2.2 1 . Anhydride grafted determined from combustion analyses of LLDPE-g-
MAH samples prepared in SC C02 (0.06 M MAH, 0.04 M DCP, 2 h
60 °C soak, 3 h reaction, 0.60 g/mL C02) 49
2.22. IR spectra of PMP-g-MAH as a function of reaction time (125 °C, 0.67
g/mL C02 , 0.25 M MAH, 0.04 M DCP) 50
xviii

2.23. Kinetics of the SC C02 maleation reaction at 125 °C, 0.67 g/mL usingDCP (2 h soak, 0.25 M MAH) and BPO (4 h soak, 0.5 M MAH) asinitiators with a 60 °C soak and 0.04 M initiator concentration 5
1
2.24. Effect of initiator concentration (relative to MAH) on SC C02
maleations using BPO (4 h soak, 1 h reaction, 0.25 M MAH) and DCP(no soak, 2 h reaction, 0.06 M MAH) as initiators with a 60 °C soakand a 1 25 °C reaction at 0.67 g/mL C02 53
2.25. Effect of [MAH] on DCP-initiated reactions with a 2-h reaction at 125
°C, 0.04 M DCP, and 0.69 g/mL C02 54
2.26. Effect of C02 density on DCP-initiated reactions with a 2-h reaction at
125 °C, 0.06 M MAH, and 0.04 M DCP 55
3.1. DSC trace for Teflon AF 1600 with Tg=149 °C 79
3.2. XPS 75° takeoff angle spectra (carbon Is region) of Teflon AF 1600
(bottom) and 2400 (top) 88
3.3. UV/Vis spectra of Teflon AF (0 h) and Teflon AF reduced with Na-Nap
(lOmin and4h) 90
3.4. UV/Vis absorbance at 320 nm for Na-Nap reductions of Teflon AF 91
3.5. Teflon AF mass loss upon reduction and subsequent oxidation 92
3.6. XPS 15° takeoff angle data for Teflon AF reduced with Na-Nap 94
3.7. XPS 75° takeoff angle data for Teflon AF reduced with Na-Nap 94
3.8. XPS 75° takeoff angle spectrum of the silicon 2p peak observed in many
of the red-AF spectra 95
3.9. XPS 75° takeoff angle spectrum (carbon Is region) of Na-Nap reduced
Teflon AF 2400 96
xix
•
XPS75 takeoff angle spectrum (carbon Is region) for modified TeflonAF-reduced with Na-Nap 10 min (a) and 4 h (b), 72 h Hg*/NH, (c)and Al dep/diss (d)
g 3 W '
99
.ATR-IR spectra of Teflon AF-unmodified, reduced with Na-Nap (4 h)and reduced with Hg*/NH3 (72 h) ]m
3.12. ATR-IR spectra of Hg*/NH 3 photosensitized AF 1600 after a 10-hexposure (a) and then washed with solvents (b) and after a 72-hexposure (c). AF 2400 after a 10-h Hg*/NH3 photosensitization (d) 103
3.13. UV absorbance at 320 nm for derivatizations of Na-Nap reduced TeflonAF - brominated (Red/Br2 ), hydroborated (Red/BH3 ), andhydroborated and then oxidized with NaOH/HOOH (Red/BH 3/Oxid) 105
3.14. XPS 75° takeoff angle spectra (oxygen 1 s region) of Teflon AF after 4-hreduction (bottom) and then 2 1 -h hydroboration (middle) and then
NaOH/HOOH oxidation (top) 109
3.15. UV/Vis spectra of Teflon AF reduced with Na-Nap (10 min and 4 h)
and then derivatized with DNPH] \2
3.16. XPS 75o takeoff angle spectrum (nitrogen Is region) of 4-h red-AFlabeled with DNPH
1 14
3.17. ATR-IR spectra of red-AF derivatized with DNPH (top) or HFBC(bottom) 115
3.18. ATR-IR spectrum of red-AF reacted with borane, oxidized with
NaOH/HOOH, and then derivatized with HFBC 1 17
4. 1 . Effect of PPX layer thickness on permeability and permselectivity of a
bilayer membrane of Teflon AF (51 um) and PPX 127
4.2. AFM image of powder deposition of PPX 138
4.3. AFM micrograph of a scored, PPX-coated silicon wafer revealing a film
thickness of 0.25 |um 139
xx

4.4. Kinetics of nitrogen permeability of composite membranes141
4.5. Kinetics of oxygen permeability of composite membranes]4]
4.6. Compliance curve for double cantilever beams used in adhesion tests 144
B. 1
.
ATR-IR spectrum of red-AF derivatized with HFBC and then CDI 153
xxi

LIST OF SCHEMES
Scheme nPage
1.1. Polymer Modification in SC C02 2
1 .2. Polymer Surface Modification and Subsequent Derivatization Reactions 4
1.3. Modification through Transport Polymerization Producing a Bilayer
Membrane 5
2.1. High Pressure View Cell Designed for Phase Behavior Measurements 20
2.2. SCC02 maleationofPMP 23
3.1. Chemical Structure of Teflon AF 59
3.2. Contact Angle Measurement by the Sessile Drop Method 61
3.3. X-Ray Photoelectron Spectroscopy 63
3.4. Mechanism of Fluoropolymer Reduction using Na-Nap 68
98
3.5. Hg/NH3 Photosensitization of Perfluoro-2-methylpentane 71
3.6. Addition of DNPH to a Carbonyl to Form a Hydrazone , 74
3.7. Reaction Scheme for Labeling Carboxylic Acids using 1,1'-
122
Carbonyldiimidazole 76
3.8. Reaction Set-up for Na-Nap Reductions 82
3.9. Design of Mercury/Ammonia Photosensitization Apparatus 84
xxii

4. 1
.
Series Resistance Model for Asymmetric Gas Separation Membranes1 24
4.2. Mechanism of DPX Vapor Deposition Polymerization, 26
4.3. Double Cantilever Beam Test"*** •••• 1 29
4.4. Vapor Deposition Polymerization Apparatusj 3 ,
4.5. Diagram of the Gas Permeability Apparatus Used in this Work 134
xxiii
CHAPTER 1
OVERVIEW
Heterogeneous modification chemistry can be significantly more complex than
chemistry run in homogeneous media. The complexities arise in part as a result of the
partitioning of reagents between the different phases of the system including the
interphase region and the newly formed, modified phases. Sterics and concentration
effects can often play an important role in forbidding or enhancing reactions that are well
characterized in the more flexible and accessible solution phase. Heterogeneous
modification reactions can be grouped into the two broad categories of bulk and surface
reactions. This work explores three distinct approaches to heterogeneous polymer
modification—one bulk and two types of surface reactions.
Bulk modification reactions abound industrially and are used most often to
functionalize or otherwise chemically alter commodity polymers forming new and/or less
expensive materials. 1 The vulcanization of natural rubber is a prime example of a bulk
modification that serves to create a new product. The process incorporates sulfur
chemistry to crosslink the rubber, enhancing the mechanical properties and long-term
stability. In chromatography, the functionalization of crosslinked polystyrene is often
required to alter the stationary phase for better separation. Similarly, beaded supports can
be modified for use as ion exchange resins. Finally, one cannot avoid mention of one of
the first polymer modifications explored, that of cellulose derivatization. Because
cellulose is plentiful in nature (cotton, wood pulp, etc), chemically altering it has been a
convenient way of creating new materials instead of synthesizing entirely new polymers.
I

Cellulose is almost completely intractable being soluble only in solvents like N-
methylpyrrolidinone at elevated temperatures, so cellulose modification reactions must be
heterogeneous, at least initially. Cellulose acetate and cellulose nitrate are two very
common examples of heterogeneously modified cellulose.
The first project (Chapter 2) incorporates the use of supercritical carbon dioxide
(SC C02 ) to conduct another common heterogeneous reaction—the free radical maleation
of polyolefins. SC C02 aids the delivery of the reactants into the bulk of the fluid-
swollen polymer by a rapid dissolution and transport. The maleation is then thermally
initiated resulting in the grafting of the anhydride onto the polyolefin chain. This
polymer modification using SC C02 can be generally represented by Scheme 1.1.
sc co2 /
Reactants
Polymer
Soak Vent
Scheme 1.1. Polymer Modification in SC C02
Using elemental analysis and infrared spectroscopy, the free radical maleation of
poly(4-methyl-l-pentene) (PMP) was followed as the conditions were optimized to
achieve high degrees of maleation. A detailed examination of two initiators—benzoyl
peroxide and dicumyl peroxide—was undertaken. Both time and temperature were found
to effectively control the degree of maleation, and reactant concentrations were varied to
more fully understand the reaction. As is observed in other heterogeneous polyolefin
2

maleations, the maleated PMP was found to be crosslinked in the systems studied. The
majority of this work was presented at an ACS meeting* and was later published.3
Surface modifications are equally important reactions and, as with the bulk
reactions, generally are used to impart functionality. Polymer surface modifications are
enlisted when the bulk properties of the material are desirable but the surface
characteristics are not. Often, surface modifications serve to enhance wettability,
reactivity, biocompatibility, or adhesion. Some of the first and most extensively studied
surface reactions were investigated by the textile industry to enhance gloss, adhesivity,
dyeability, and/or wettability of polymer fibers. 1 Some of the most widely used surface
modification techniques are wet chemical oxidation of polyolefins, UV irradiation of
nylons, plasma treatments, flame treatments, and fluorination or halogenation. 1 The last,
unlike the others, is used most often for the purpose of decreasing wettability or
increasing the barrier properties of a polymeric material.
Chapter 3 covers the first surface modification undertaken in this work, the
chemical surface modification of DuPont's amorphous fluoropolymer, Teflon AF. This
fluoropolymer is a copolymer of bis-2,2-trifluoromethyl-4,5-difluoro-l,3-dioxole and
tetrafluoroethylene. The presence of this bulky perfluorodioxole prevents the
crystallization of the tetrafluoroethylene thus producing an amorphous copolymer that
retains some of the most desirable properties of poly(tetrafluoroethylene) including
extremely low surface free energy and dielectric constant with the added benefits of
optical clarity and solubility (increased processability).
This work focuses on enhancing the surface wettability of Teflon AF (65 mol%
dioxole). Several methods of modification were employed including sodium
3
naphthalenide (Na-Nap) reduction, mercury/ammonia photosensitization, and aluminum
deposition followed by dissolution in aqueous base. The chemical nature of the Na-Nap-
reduced fluorocopolymer surface was determined in addition to the reaction depth
kinetics. The surface functionality was probed using several derivatization reactions that
labeled the surface for XPS and ATR-IR analyses. The procedure is illustrated in
Scheme 1 .2 where modification most likely produces a surface of gradient modification,
and the derivatization introduces functional group labels (L) identifiable by the
spectroscopic analyses. A paper is forthcoming covering this work.
Modification
Reaction
Derivatization
Scheme 1 .2. Polymer Surface Modification and Subsequent Derivatization Reactions
The final project (Chapter 4) describes a surface modification of Teflon AF in
which a second polymer is polymerized on the fluorocopolymer surface, making this
polymer modification more physical than chemical. The resulting bilayer composite can
serve as an asymmetric gas separation membrane. The amorphous Teflon AF is highly
permeable to gases (again as a result of the presence of the bulky perfluorodioxole
monomer) but does not prove to be selective enough towards the separation of oxygen
from an oxygen/nitrogen gas mixture such as air. Di-p-xylylene (DPX or also 2,2-
paracyclophane) was transport polymerized onto a thin film of the Teflon AF to make a
model membrane (Scheme 1.3). The vapor deposition polymerization of DPX forms a
4
PPX
Teflon AFTransport
Polymerization
Scheme 1 .3. Modification through Transport Polymerization Producing a Bilayer
Membrane.
well-controlled, uniform poly(p-xylylene) (PPX) layer. PPX is a much more highly
selective membrane material although it suffers from a significantly reduced
permeability. Combining the two polymers proved to allow the creation of a more highly
selective yet permeable gas separation membrane, but adhesion between the two
polymers was found to be weak. The work in the second project led to a well-defined,
modified Teflon AF surface to which the PPX easily adhered, likely because of covalent
bonds. This work will be presented at an upcoming ACS meeting.4
5

CHAPTER 2
BULK FREE RADICAL MALEATIONS OF POLYOLEFINS USINGSUPERCRITICAL CARBON DIOXIDE
Introduction
Maleated polyolefins find wide use industrially as compatibilizers in blends
between polar and non-polar polymers and as adhesion promoters in many systems1
including glass fiber-reinforced composites and other inorganic-filled polymer
composites. 5 -7 The free radical maleation reaction is facile, lending functionality to
commodity polyolefins and enhancing their worth. This work seeks to breathe new life
into this old process by applying a new approach to the synthesis of maleated polyolefins.
We have used supercritical carbon dioxide (SC C02) as the solvent and swelling agent for
this heterogeneous reaction.
SC C02 , while a poor solvent for most polymers, dissolves and diffuses readily in
them. This fact makes attractive the idea of running a reaction inside the SC C02-
swollen polymer to make novel polymers or as a means of creating a less toxic alternative
to current solvent-based processes. Several students in the McCarthy group have
examined related systems including in situ blend formation 8 "1
1
and metal nanocluster
deposition. 12 This work was the first in the group and among the first overall to conduct
a detailed examination of the SC C02-assisted modification of a polymer.
Supercritical Fluids
John Hyatt 13 was the first to report the use of SC C02 as a solvent to run chemical
reactions. Since then, several groups have taken advantage of the useful and unique
6

properties of SC C02 to pursue its use in many areas of polymer synthesis and
processing.'4-.7 Mark McHugh at Johns Hopkins University has focused ^phase behavior and solubility of polymers in a variety of supercritical fluids. '4,1 6,1 8-21
Joe DeSimone at UNC Chapel Hill has investigated the replacement of toxic solvents
with SC C02 for polymer synthesis. 22"2* This work has led tQ a recently announced
collaboration between UNC and DuPont to make fluoropolymers in SC C02 rather than
water and chlorofluorocarbon solvents. 25 Keith Johnston at the University of Texas,
Austin, has explored the glass transition temperature and solute partitioning in SC C02-
swollen polymers. 26"^ Eric Beckman at the University of Pittsburgh has pioneered work
using SC C02 as a blowing agent for the synthesis of microcellular foams. 30 "32 These are
a few of the major players in the field of polymers and SC C02 whose work has proven
useful and relevant to our work here at UMass. A large amount of fascinating research
today is centered on combining supercritical fluids and polymeric synthesis, processing,
and/or characterization.
Table 2. 1 is a general comparison of the physical properties of liquids,
supercritical fluids, and gases. The relatively high densities coupled with the low
viscosity and high diffusivity of fluids make them attractive for many different uses.
Two popular commercial processes utilizing supercritical fluids are low density
polyethylene synthesis in supercritical ethylene and decaffeination of coffee beans with
SC C02 extraction. 18 These processes are preferred over lower pressure alternatives in
spite of the cost associated with running higher pressure reactors because of the
solubility, toxicity, and diffusivity benefits.
7

Table 2. 1.
Physical Properties Comparison for Liquids, Supercritical Fluids, and Gases
Diffusivity2
J
D (cm7sec)
Viscosity
v (cps)
Densitv
P (g/mL)
Slirf^PP Tpneirmo Lii i att l CI lolUI 1
Yc (dyn/cm)Liquid 10
s
1 0.7-1.6 20-50Supercritical Fluid io-
310"3 0.2-0.8 0
Gas 101
IO"5
10"3 0
Utilizing carbon dioxide in its supercritical state is largely feasible because of its
relatively low cost and the accessibility of the critical point of 31.1 °C and 1070 psi (7.38
MPa). The density of a supercritical fluid is highly tunable in the critical region (Figure
2.1 ) which in turn corresponds to an ability to tune solvent quality (Figure 2.2). This
ability has led to the use of supercritical fluids for extraction 18'33 and studies of the effect
of solvent quality on reaction rates. 13 '34 '35 Solvent quality cannot be adjusted through
such a range by any other means aside from completely changing the solvent. SC CO2 is
often touted as being an environmentally benign solvent making it one of the few
attractive solvents for use in industry today. In fact, due to its ease of removal and low
toxicity, many consider SC C02 processes to be "solvent-free" although the fluid
performs the same role as that of a solvent.
8

0 10 20 30 40 50Pressure (MPa)
Figure 2. 1.Density of C02 as a function of pressure and temperature. 36
The McCarthy research group has investigated the use of SC C02 to conduct
reactions inside solid polymer substrates. This has included a new way to formulate
blends or semi-interpenetrating networks of polystyrene with many other polymer
substrates. 8 "1 1.37.38 The group has also examined the formation of polymer-metal
nanocomposites 12 -37 and microcellular foams39 using SC C02 . The work proposed here
is the first in the group and one of the first overall examinations of a reaction on a
polymer conducted in SC C0 2 . Others have examined polymer modification reactions in
the fluid in limited detail including polyethylene oxidation40 and photochemical C-H
activation,41 biopolymer derivatization 42 the dyeing of fibers 43 and polyvinyl alcohol)
and poly(2-hydroxypropylmethacrylate) modification 44 but no one has reported the
examination of polymer modifications using SC C02 to the extent that we have here.
9

Grafting Chemistry
The free radical grafting of maleic anhydride onto polyethylene and
polypropylene dates back to the early 1960s .45 interest in blending polyethylene with
nylon led to the realization that the mechanical integrity of such blends is greatly
enhanced when using a small amount of maleated polyethylene as a compatibilizer. The
terminal amino groups of the nylon chain react efficiently with the anhydride to create a
graft copolymer of the two dissimilar polymers. This graft then stabilizes the interface of
the polymers in the blend.46 47 Other unsaturated anhydride monomers have been
examined in addition to maleic anhydride, but they were found to be less effective due to
lower reactivity toward the amine.
The free radical grafting of maleic anhydride onto polyolefins can be conducted
homogeneously in solution at elevated temperatures (1 10-170 °C) 48 "54 Common solvent
choices for this reaction include xylenes, dichlorobenzenes, and biphenyl. The degree of
maleation can be controlled to relatively high degrees of maleation and the products have
been reported to contain maleic anhydride oligomers connected to the polyolefin chain. 54
Some dispute the presence of oligomer formation citing reasons of more facile side
reactions48,50 and maleic anhydride ceiling temperature51 -55 as preventing such an
occurrence. In general, maleic anhydride is considered to be difficult to homopolymerize
to high molecular weight, but under many conditions the oligomeric grafts can form on
polyolefin chains.
The commercial maleated polyolefins are synthesized in the absence of solvent to
avoid the creation of additional waste streams and to simplify the processing. 7 -56 59 This
is generally accomplished through reactive extrusion although batch processing is also
10

used, particularly when maleating the low molecular weight paraffins. The reactions can
be run without the addition of peroxide intiators due to the high temperatures used;
however, an initiator is often added as a catalyst. In either case, efficient mixing is
essential due to the insolubility of maleic anhydride in molten polyolefins. This
insolubility leads to the reaction being heterogeneous and limits the degree of maleation
to approximately 1 mo\% for extruder maleations and approximately 7 mol% for batch
maleations of low molecular weight polyolefins.60
The resulting heterogeneously maleated polyolefins are generally crosslinked or
have a reduced molecular weight as a result of competing side reactions that occur in this
radical process. One can imagine the large number of possible side or terminating
reactions possible once a radical is introduced to the chain. Radicals are highly reactive
and are known to abstract hydrogens, combine, fragment, or add to unsaturated bonds.
With the homopolymerization of maleic anhydride being slow or even disfavored under
most conditions, the likelihood of the other reactions increases. In general, grafting is
initiated through H-abstraction from the polymer by the initiator. The radical on the
chain can then add to an MAH monomer. In the case of polyethylene, radical-radical
combination predominates leading to a crosslinked system. For polypropylene, the
abstraction of a backbone hydrogen by the initiator leads quickly to P-scission of the
polymer chain56 (especially for isotactic polypropylene). 50 Chain-end grafting of the
anhydride can then occur leading to an anhydride-terminated polypropylene which forms
a block rather than graft copolymer upon reaction with nylon. Either the reduction in the
molecular weight or crosslinking can become detrimental to the mechanical integrity and
processibility of the maleated product if it is extensive.
11

Phase Behavior
Because these reactions—the maleation of polyolefins in SC C02-are known to
be heterogeneous, it is important to gain an understanding of the phase behavior of the
system being studied. Heterogeneous reactions are significantly more complex than the
corresponding homogeneous reactions, 1 Partitioning of reagents between the different
phases can play a very large role in the rate and degree of reaction. Multiple phases may
exist including intermediate phases, as there are often no sharp boundaries defining the
different regions. Perhaps the largest contributor to the complexity of a heterogeneous
modification is the changing partitioning of reagents as the nature of the polymer or a
region of a polymer changes on reaction. Reactions can become hindered or enhanced as
a reaction proceeds and could not be expected to follow the normal reaction rate
expression of rate = k [A]x[B] y as a result of this.
CO? Solubility in Polymers
As was mentioned earlier, the solubility parameter of a fluid is related to its
density; thus, adjusting pressure and/or temperature can vary the solubility parameter as
shown in Figure 2.2. However, SC C02 is not a very good solvent. Its solubility
parameter reaches 7.3 (cal/cm ) at 40.5 MPa and 40 °C which is comparable to that of
hexane at 25 °C. 18 In general, SC CO2 will dissolve many small molecules but is capable
of easily solvating few polymers. Among the short list of soluble polymers are
polydimethylsiloxanes, atactic hydrocarbon polymers, polyacrylates, polymethacrylates
with long hydrocarbon branches, and many fluorinated polymers. 16*19
12

6
50)
tu
E 42 S
o
0
5
Ap
6 8
Pressure (MPa)
10
0.7
0.6
0.5 D
0.4 |.
0.33̂
o.2 e
0.1
0
Figure 2.2. Density p and solubility parameter 8 as a function of C02 pressure at 40 °C. 33
While C02 is not a very powerful solvent, it is capable of dissolving in polymers.
This fact is demonstrated nicely by the depression of the glass transition temperature
upon exposing a polymer to SC C02 .
61 "63 Figure 2.3 shows this Tgdepression as a
function of C02 dissolved in polystyrene and poly(methyl methacrylate); C02 acts
unremarkably as a plasticizer. The fact that C02 is capable of dissolving to some extent
in nearly all polymers is a result of its rather high critical temperature (relative to other
gases). The high critical temperature leads to a high condensability, which in turn leads
to a high solubility.64 This concept is discussed in more detail in Chapter 4. Typical
mass uptake values range from 1-2% for poly(tetrafluoroethylene) to as much as 24% for
poly(methyl methacrylate) at 33 °C and -8.1 MPa. 65
13

0 10 20 30 40 50 60
cc (SIP) C02/g polymer
Figure 2.3. Tgdepression of polystyrene63 (PS) and poly(methyl methacrylate)62 -63
(PMMA) with dissolved C02 .
The diffusion coefficient of C02 plays an important role in reactions conducted
inside solid polymer substrates. The magnitude of this parameter dictates whether the
reaction is mass transfer- or reaction rate-limited. In order to calculate the diffusion
coefficient of a gas or supercritical fluid in a polymer, the mass loss as a function of the
square root of time is plotted after the sample is removed from the fluid. 66 Extrapolation
of the initial portion of this curve (if linear) to zero time yields the amount of gas/fluid
absorbed in the polymer prior to removal. Varying the soak period for the polymer in
contact with the fluid and using the following equation yields an estimation of the
diffusion coefficient.
D = [(M t/Minf) n
mI 2 (t
1/2/(h/2)]
2(1.1)
14

where Mtis the mass uptake of the sample at time t, Minf is the maximum uptake
achievable, and h is the sample thickness. This equation is valid for a sample of plane
geometry neglecting diffusion at the sample edges. A diffusion coefficient greater than
1 1 210" cm /s should be free of mass transfer limitations assuming a typical free radical
reaction (D tr = 1013-10" cm 2
/s).37 Others have found that the diffusion coefficient of
C02 and the C02-assisted diffusion of small molecules in polymers can easily reach 10"7-
(S 210" cm /s. 1037,66,67 This means that a reaction in a fluid-swollen polymer should behave
kinetically similar to one run in a homogeneous medium provided the partitioning is
relatively unchanged as the reaction proceeds.
Maleic Anhydride Solubility in SC CQ2
The solubility of maleic anhydride (MAH) in SC C02 is essential for the success
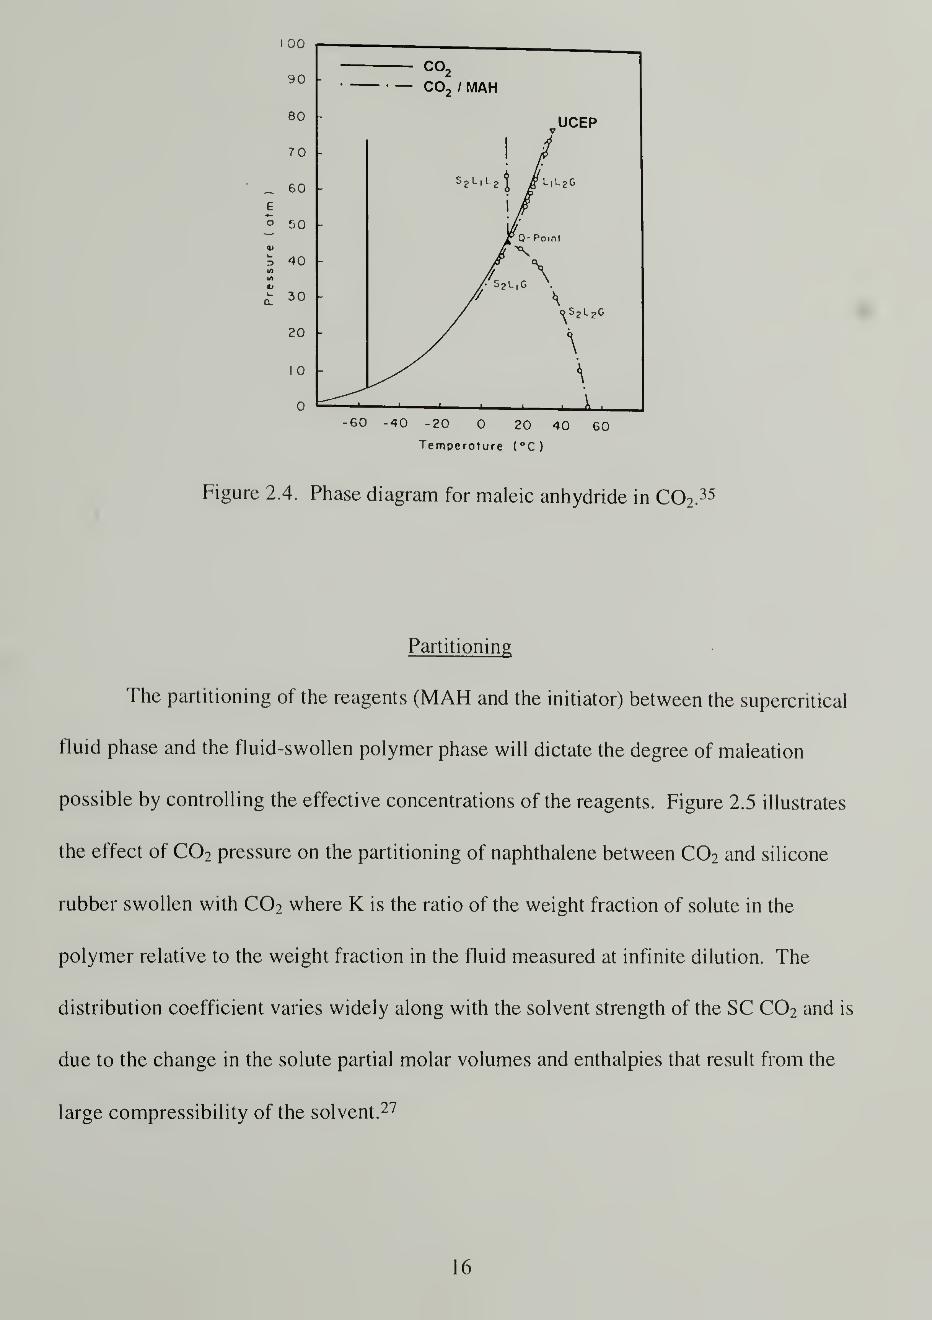
of the proposed maleations. Paulaitis and Alexander35 reported the phase diagram of the
MAH/C02 system (Figure 2.4) in examining the Diels-Alder cycloaddition of maleic
anhydride and isoprene. The phase diagram was generated at low concentrations of
MAH in C02 but effectively reveals an upper critical end point (UCEP) of 35.8 °C and 78
atm (7.9 MPa) which is only slightly above the critical point of C02 alone. The
maleation reactions require higher concentrations of MAH, so the solubility in SC C02
was explored for the conditions used. (See the Results and Discussion section.)
15
uu
co290 co2 / MAH
80 _
UPFP
701 /1 fy
o uS 2 L
iL? 9 P L,L 2 G0 £f
E 1 >fa 50
F Q- Pointdi_
40^
«/>
t/>
«jA A
a 30 /52L|G
\
20\
1 /"*!
1 0 l
\
0
-60 -40 -20 0 20 40 60
Temperature ( °C )
Figure 2.4. Phase diagram for maleic anhydride in C02 .
35
Partitioning
The partitioning of the reagents (MAH and the initiator) between the supercritical
fluid phase and the fluid-swollen polymer phase will dictate the degree of maleation
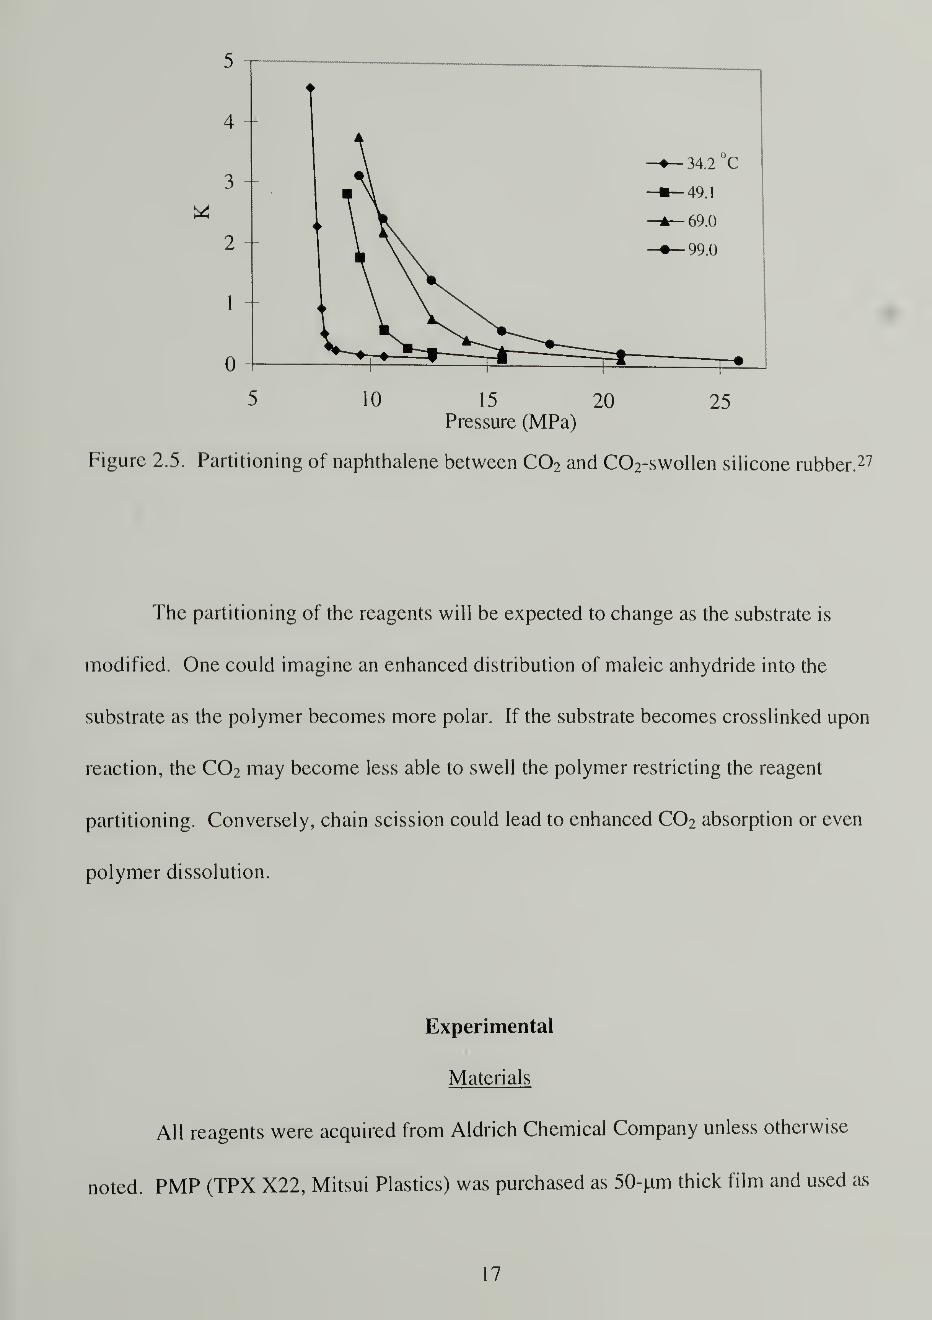
possible by controlling the effective concentrations of the reagents. Figure 2.5 illustrates
the effect of C02 pressure on the partitioning of naphthalene between C02 and silicone
rubber swollen with C02 where K is the ratio of the weight fraction of solute in the
polymer relative to the weight fraction in the fluid measured at infinite dilution. The
distribution coefficient varies widely along with the solvent strength of the SC C0 2 and is
due to the change in the solute partial molar volumes and enthalpies that result from the
large compressibility of the solvent. 27
16
5
4 +
3
2
0
10 15 20Pressure (MPa)
—34.2 C
•—49.1
A— 69.0
—99.0
25
Figure 2.5. Partitioning of naphthalene between C0 2 and C02-swollen silicone rubber. 27
The partitioning of the reagents will be expected to change as the substrate is
modified. One could imagine an enhanced distribution of maleic anhydride into the
substrate as the polymer becomes more polar. If the substrate becomes crosslinked upon
reaction, the CO2 may become less able to swell the polymer restricting the reagent
partitioning. Conversely, chain scission could lead to enhanced CO2 absorption or even
polymer dissolution.
Experimental
Materials
All reagents were acquired from Aldrich Chemical Company unless otherwise
noted. PMP (TPX X22, Mitsui Plastics) was purchased as 50-um thick film and used as
17
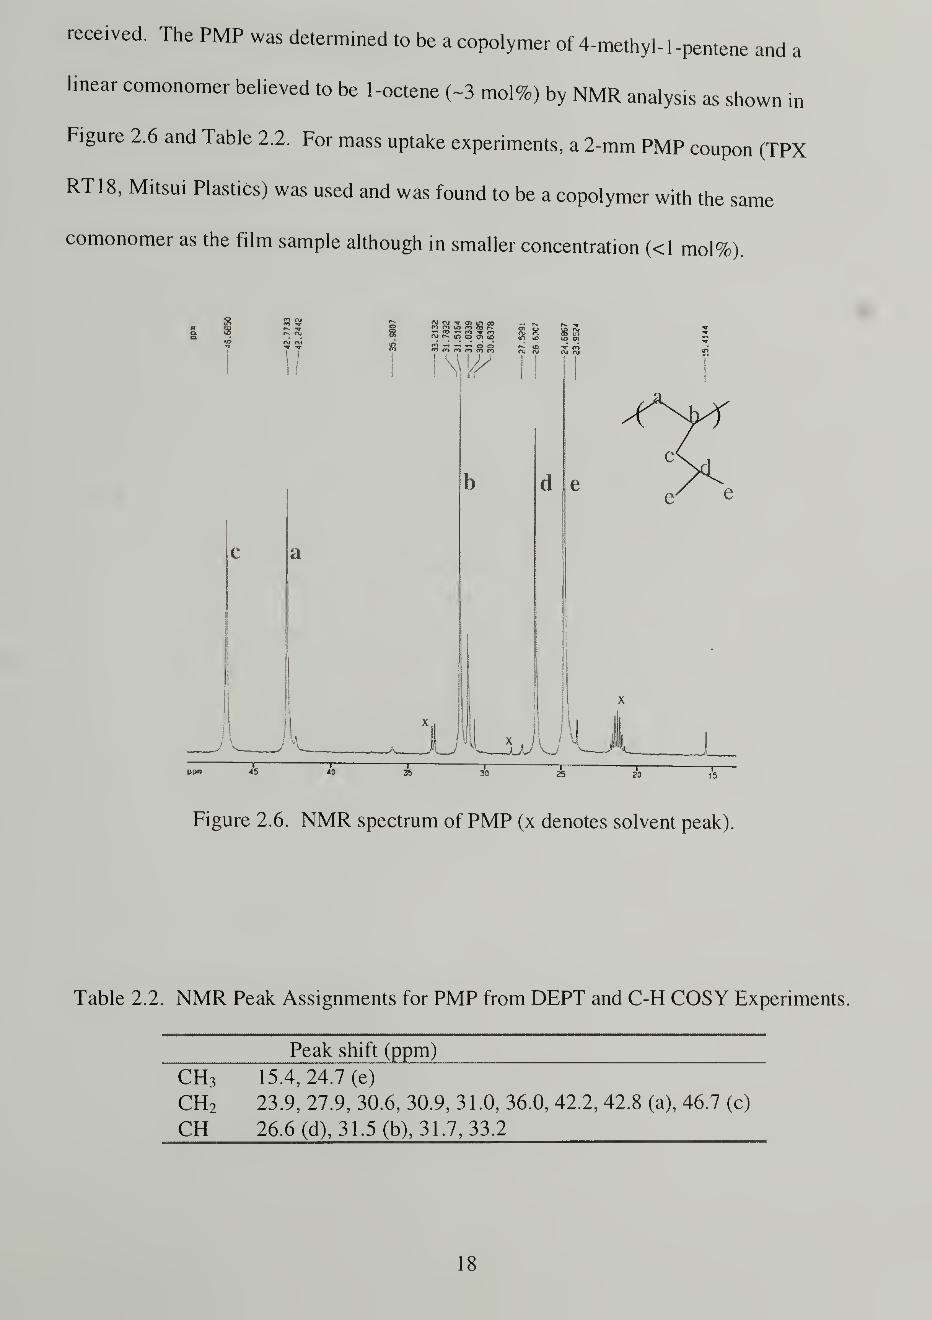
received. The PMP was determined to be a copolymer of 4-methyl- 1 -pentene and a
linear comonomer believed to be 1-octene (~3 mol%) by NMR analysis as shown in
Figure 2.6 and Table 2.2. For mass uptake experiments, a 2-mm PMP coupon (TPX
RT18, Mitsui Plastics) was used and was found to be a copolymer with the same
comonomer as the film sample although in smaller concentration (<1 mol%).
j
S 2
( I
a
A
aj f\j tt oi in co*n fy t£) en a> f->— co —j tn f mftj ^> m o tfi <o
rn m m (t%r-s. to
£ 3id en
* 30
Figure 2.6. NMR spectrum of PMP (x denotes solvent peak)
Table 2.2. NMR Peak Assignments for PMP from DEPT and C-H COSY Experiments.
Peak shift (ppm)
CH3 15.4, 24.7 (e)
CH2 23.9, 27.9, 30.6, 30.9, 31.0, 36.0, 42.2, 42.8 (a), 46.7 (c)
CH 26.6 (d), 31.5 (b), 31.7, 33.2
18

Linear low density polyethylene (LLDPE) was acquired from Dow Chemical in
the form of pellets (Dowlex 2553). The LLDPE was reported to have a softening
temperature of 94 °C and a density of 0.935 g/mL. The pellets were compression molded
into a 76x76x0.8 mm plaque at 150-175 °C for the initial maleation screening
experiments. The plaque was calendered to -80 urn thickness for the experiments
reported here.
MAH was recrystallized twice from chloroform. Benzoyl peroxide (BPO) and
dicumyl peroxide (DCP) were found to be >97% pure by NMR and were used as
received. Carbon dioxide (Coleman grade 99.99%, Merriam Graves) was passed through
activated alumina and Q-5 catalyst (Englehard Industries) to insure purity throughout the
system by removing water and oxygen, respectively. Carbon tetrachloride and acetone
(HPLC Grade, Fisher) were used as received. Commercial samples of maleated
polyethylenes were obtained from Quantum Chemical Company (PX-360) and DuPont
Canada (Fusabond "E"-MB 226D).
Methods
Phase Behavior
A determination of phase behavior was made visually using a 316 stainless steel
view cell (7.6 cm long x 1.75 cm i.d.) with a volume of 14 mL shown in Scheme 2.1.
The cell was sealed on each end with teflon o-rings (Marco Rubber #2-1 16) and 1"
diameter sapphire windows. Brass rings were used on the external side of the windows to
protect the sapphire from the stainless steel endcaps. An Omega PX602 pressure
transducer with DP460 digital readout was used to monitor the pressure. The cell was
19

fitted with an aluminum jacket with 6.4 mm diameter cartridge heaters and T-type
thermocouples used with an Omega CN76000 temperature controller. A 100DM high
pressure syringe pump (Isco) fitted with a heating/cooling jacket delivered the C02 into
the vessel.
Pressure Transducer
TC00 inlet
Cartridge Heaters
/Aluminum Jacket
Thermocouples
Stainless Steel
Vessel
Scheme 2. 1 . High Pressure View Cell Designed for Phase Behavior Measurements
The view cell containing the reagent(s) was filled with a given density of SC C02
and heated well beyond the dissolution point. The system was then cooled slowly, and
the point at which the cell became too cloudy to see the thermocouple was termed the
"cloud point." The cell was reheated and a "clearing point" was noted which was always
lower than the cloud point. More CO2 was added and the process was repeated.
20

were
Maleations
Reactions were run in 316 stainless steel, high-pressure reaction vessels that
machined from 2.22-cm hexagonal stock (10.2-cm long x 1.1 1-cm i.d.). The vessels,
tapped with l4" NPT threads, were plugged on one end and fitted with an 1/8" high
pressure needle valve on the other giving the vessels a total volume of approximately 8
mL each. The vessels were charged with PMP, MAH, and either BPO or DCP, purged
with nitrogen, and heated to 60 °C before adding SC C02 via the Isco pump. The vessels
were soaked at 60 °C for 4 h prior to heating to the reaction temperature of 125 °C in the
case of the BPO-initiated experiments to allow for equilibration of the reagents into the
PMP film. For the DCP-initiated reactions, the vessels were often immediately heated to
125 °C subsequent to filling. At the end of the reaction period, the vessels were quenched
under cold, running water, and the pressure was released into the hood. The samples
were rinsed in acetone for ~5 min to remove unreacted reagents. (A 24-h soak in
refluxing acetone and a 24-h soxhlet extraction with toluene yielded the same result.)
Characterization
Transmission and attenuated total reflectance (ATR) infrared spectroscopic
experiments were conducted using a Bio-Rad 175C FTIR. Direct transmission analyses
of the 50 (im films were run on the PMP and grafted samples. A 45° germanium internal
reflection element was used for the ATR-IR measurements.
Differential scanning calorimetry (DSC) measurements were conducted on a TA
Instruments 2000 DSC under 50 mL/min nitrogen flow at a heating rate of 10 °C/min.
The heat of fusion value used in calculations of PMP crystallinity was 61 .9 J/g. 68
21
Thermal gravimetric analysis (TGA) was earned out with a TA Instruments TGA 2950 at
a heating rate of 10 »C/min to 480 °C under nitrogen. Galbraith Laboratories performed
elemental analyses.
1
3
C-NMR analysis of the virgin PIMP was conducted on a Bruker 500 MHz NMR
at 50 °C using carbon tetrachloride and 5 % d l(rp-xylene as the solvent. Reagent purity
was determined in d6-acetone utilizingl
H- and13C-NMR spectra obtained using a Bruker
300 MHz NMR.
For x-ray analysis, an evacuated Statton camera operating with Ni-filtered Cu Ka
radiation was used. The wavelength of the radiation is 1 .5418 A and the camera length
used was 4.89 cm. Heating over a hot plate and stretching the softened film to 3-5 times
the initial length oriented the PMP films. Several oriented films were overlaid for x-ray
analysis.
Mass Uptake Experiments
The determination of C02 solubility in PMP under conditions similar to that of
the reaction was conducted following the work of Berens. 66 PMP samples weighing
approximately 1 g were cut from the 2-mm thick coupon. The samples were placed in
high-pressure reaction vessels, heated to 60 °C, and pressurized to 18.2 MPa (0.69 g/mL)
CO2. After a given soak period, the samples were quickly removed from the vessels and
placed on a balance interfaced to a computer. The mass loss (CO2 desorption) was
recorded as a function of time. Extrapolation to zero time in a graph of mass loss with
the square root of time gave the amount of CO2 in the polymer at the end of the soak
period. (See the CO2 Solubility in Polymers section on page 12.)
22

Swelling Experiments
Grafted samples (-50 mg) were soaked in 5 mL of carbon tetrachloride for one
hour at 60 °C. The gels were removed from the solutions, placed in tared vials and
weighed. The gels were then dried in vacuo and weighed once again. The degree of
swelling was calculated as the mass of solvent per mass of polymer (g/g) in the gel.
A schematic of the main reaction studied in this work is shown in Scheme 2.2. The
maleated poly(4-methyl-l-pentene) (PMP) is crosslinked and contains anhydride grafts
Results and Discussion
+
MAH
PMP
RO-ORSC-C02
125 °C
Oif
+ Crosslinked Polymer
A °h(o
Scheme 2.2. SC C02 maleation of PMP.
23

believed to exist as single units on the chain. The majority of the work presented in this
chapter was conducted on PMP. A few reactions will be presented for linear low density
polyethylene (LLDPE) and poly(trifluoroethylene) (PTrFE).
Substrates
The choice of a substrate for reaction with maleic anhydride required several
considerations. The substrate needed to be olefinic such that a direct comparison could
be made between the common commercial processes and that proposed in this work.
Second, the polymer needed to be in the form of a thin film in order to measure the
degree of maleation easily using direct infrared analysis. Finally, and most importantly,
the polymer substrate needed to be permeable to SC C02 and the reagents in order to
allow reaction to occur throughout the bulk of the material. Using substrates with low
crystallinity was expected to maximize the modification since reaction would most likely
occur only in the amorphous domains. 10 '37
Poly(4-Methyl-l-Pentene)
Poly(4-methyl-l-pentene) (PMP) was the substrate of choice for maleation
reactions in SC C0 2 . This polymer meets the above criteria and allows for additional
investigation of crystalline region modification due to its unique crystalline density. The
crystalline domain of PMP is less dense than that of the amorphous at room temperature
and pressure (0.828 g/mL versus 0.838 g/mL). 69 Above 58 °C, this trend reverses, and
the amorphous phase becomes less dense than the crystalline.70 Others have already
shown that both the crystalline and amorphous regions of PMP are permeable to low
24
pressure C02 .
71 They found that diffusion in the crystalline domain is 25-30% of the rate
in the amorphous domain at 35 °C and up to 2.2 MPa. If the reagents are also capable of
diffusing into the PMP crystal, then the modification is also expected to occur there.
One of the reasons for selecting PMP as a substrate material is the existence of
tertiary carbons along the backbone and side-chain of the polymer. Substitution is
expected to occur preferentially at these carbons due to the weaker tertiary C-H bonds
and the creation of a more stable tertiary radical. Using NMR to analyze the product, the
site of substitution could be determined. The tertiary carbons also lend the maleated
PMP to comparison with maleated polypropylene. Polypropylene undergoes chain
scission upon radical reaction with maleic anhydride, yet polyethylene maleation is
dominated by crosslinking. Analysis of the PMP after maleation revealed a
predominance of crosslinking in the SC CO2 maleation of this substrate.
Watkins, a former member of the McCarthy group, used PMP as a substrate for
polymer/metal nanocluster composite synthesis in SC C02 .
12 While he did not quantify
the amount of C02 uptake in the polymer, the substrate was found to be very useful for
running these reactions. Based on his work and the investigations of low pressure C02
diffusion into PMP, this substrate was expected to yield highly maleated product.
Low Density Polyethylene
As a means of comparison, linear low density polyethylene (LLDPE) was also
maleated using the SC C02 maleation reaction proposed. The LLDPE was exposed to
reaction conditions found to optimize the PMP maleation. Comparisons will be made in
several sections of the text between these two polyolefins.
25

Poly(trifluoroethylene)
The maleation of partially fluorinated polymers—specifically the alternating
copolymer of ethylene and tetrafluoroethylene (ETFE)—is industrially interesting as
many of these polymers find use as wire insulator material. Such applications require
sufficient adhesion between the insulator and the metal wire to improve the integrity of
the coated wires where delamination can lead to catastrophic failure.72 A means of
promoting this adhesion is through grafting of anhydride groups onto the fluoropolymer.
The effectiveness of using the SC CO2 maleation to effect this grafting was
screened using poly(trifluoroethylene) (PTrFE ) in collaboration with another group
member. 73 Because of the favorable interactions between CO2 and fluorinated polymers,
the modification of PTrFE was expected to be facile. It was found that after tedious
separation of the grafted polymer from unreacted species, the PTrFE was very lightly
maleated. This degree of maleation was sufficient to promote adsorption to a clean
silicon wafer, thus the maleation of partially fluorinated polymers including ETFE using
SC C02 is expected to be quite promising.
Phase Behavior
As mentioned in the beginning of this chapter, the partitioning of the reagents will
play a large role in determining the effectiveness of these maleic anhydride grafting
reactions. The phase behavior of the individual components is presented below.
26

over
Carbon Dioxide Solubility in PMP
Carbon dioxide uptake experiments were conducted to determine the kinetics of
C02 absorption and the equilibrium sorbed mass in PMP under our reaction conditions.
Figure 2.8 shows the results of these experiments conducted at 60 °C and 18.2 MPa
6 h. The equilibrium mass uptake was found to be 17.6 % and the diffusion coefficient is
estimated as 4.5x10"6 cm 2
/sec, from the initial slope of a plot ofM/Mmf vs. t'
/2
/A from
equation 1 . 1
,
74 Other semicrystalline polymers studied in our labs (high density
polyethylene 10, poly(chlorotrifluoroethylene),9 and poly(tetrafluoroethylene) 11
) have C02
mass uptakes of 3-4 % and diffusivities on the order of 10~6-10~ 8 cm2/sec under similar
conditions. PMP is capable of swelling quickly and significantly with carbon dioxide.
Attempts were made to measure the solubility of C02 in PMP at 125 °C, but desorption
was too fast to measure.
A representative C02 desorption curve is shown in Figure 2.7 (responsible for the
4 h desorption point in Figure 2.8). We assume that the initial linearity of the mass loss
as a function of the square root of time indicates Fickian kinetics for desorption of C02
from PMP, but the curvature at longer times is pronounced and likely indicates non-
Fickian behavior after the initial desorption period. As mentioned earlier, C02 is soluble
in the crystalline domains and diffuses from these regions at a lower rate; thus, we expect
that some of the curvature results from a combination of the diffusion from both the
amorphous and crystalline regimes.
27

MOhD
0 10 15
Time1/2
(sec)1/2
20 25 30
Figure 2.7. Mass uptake of C02 in PMP (4h 60 °C, 0.69 g/mL C02) showing initial
Fickian diffusion.
M4—
»
Ot/3
0 100 300 400200
Soak Time (minutes)
Figure 2.8. Effect of soak time on mass uptake of C02 in PMP (60 °C, 0.69g/mL C02 )
28
Maleic Anhydride Solubility in SC C02
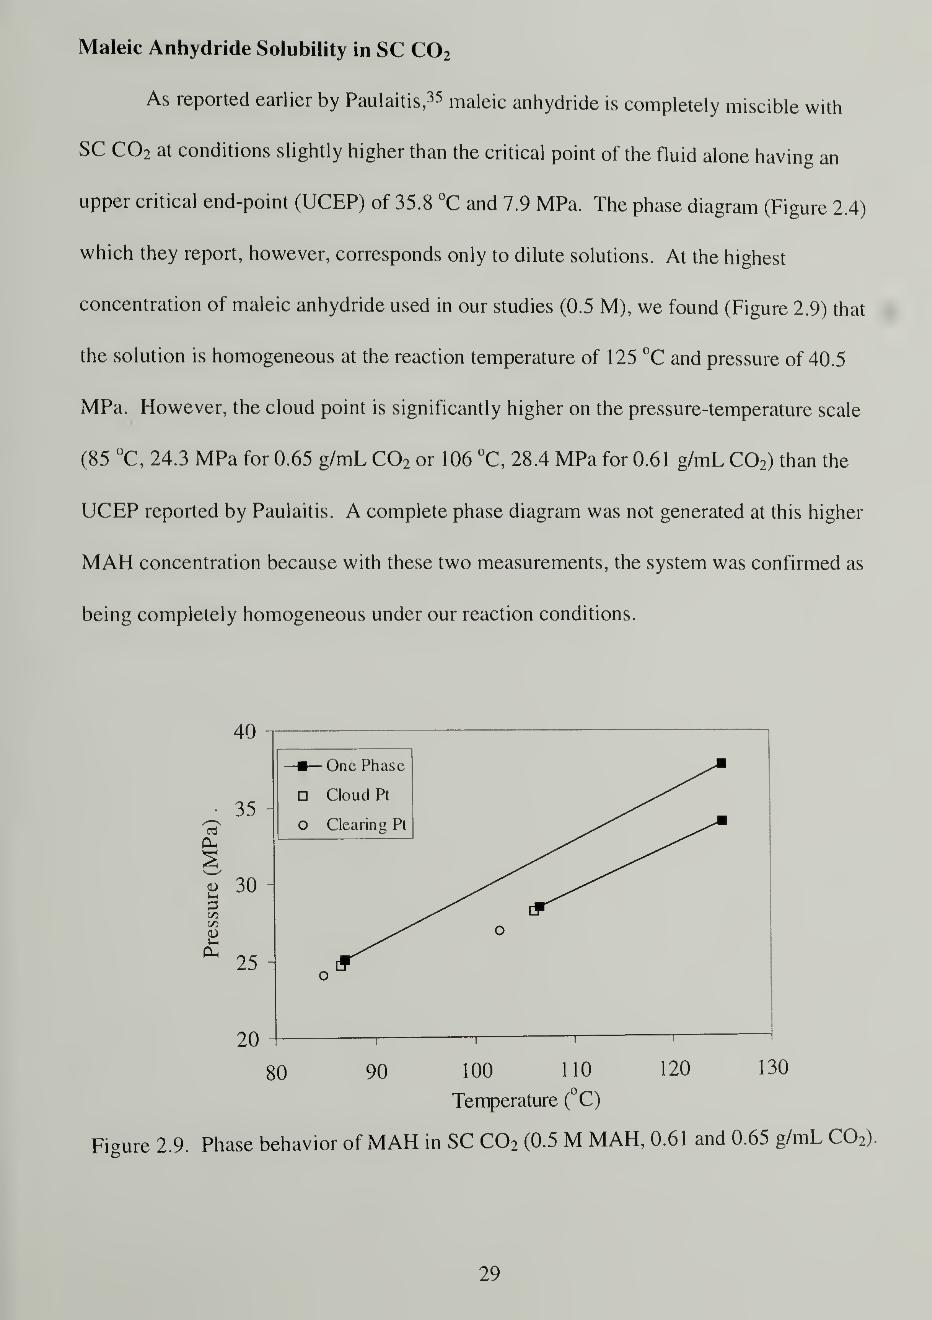
As reported earlier by Paulaitis, 35 maleic anhydride is completely miscible with
SC C02 at conditions slightly higher than the critical point of the fluid alone having an
upper critical end-point (UCEP) of 35.8 °C and 7.9 MPa. The phase diagram (Figure 2.4)
which they report, however, corresponds only to dilute solutions. At the highest
concentration of maleic anhydride used in our studies (0.5 M), we found (Figure 2.9) that
the solution is homogeneous at the reaction temperature of 125 °C and pressure of 40.5
MPa. However, the cloud point is significantly higher on the pressure-temperature scale
(85 °C, 24.3 MPa for 0.65 g/mL C02 or 106 °C, 28.4 MPa for 0.61 g/mL C0 2 ) than the
UCEP reported by Paulaitis. A complete phase diagram was not generated at this higher
MAH concentration because with these two measurements, the system was confirmed as
being completely homogeneous under our reaction conditions.
on
40
35
30
25
20
One Phase
Cloud Pt
o Clearing Pt
o
o
> 1 H '1
80 90 130100 110 120
Temperature ( C)
Figure 2.9. Phase behavior of MAH in SC C02 (0.5 M MAH, 0.61 and 0.65 g/mL C02)
29

Maleic Anhydride Solubility in PMP Swollen with SC C02
MAH solubility in the fluid-swollen PMP was measured gravimetrically with
TGA after exposure of a PMP sample to 0.25 M MAH in SC C02 at 60 °C. Figure 2. 10
shows the resulting uptake values of 0.4 wt%. These are an order of magnitude below the
expected values based on the grafting experiments (see below). We ascribe this
discrepancy to two factors: 1 ) a difference in partitioning of the reagent at the higher
reaction temperature of 125 °C compared to the measurement temperature of 60 °C and 2)
the desorption of maleic anhydride from PMP during depressurization. Uptake
measurements conducted at higher temperatures yielded higher uptake values, but the
problem of desorption from CC»2-swollen PMP could not be avoided and appears to be
the limiting factor in achieving reasonable uptake values.
Attempts at measuring MAH uptake in the 50-um thick PMP films yielded no
measurable MAH. From the phase behavior experiments of MAH in SC CO?, we know
that MAH is in the form of a fluid-swollen liquid when it becomes immiscible with SC
C02 . This means that the MAH remains extremely mobile during the majority of the
depressurization. We believe both from these data as well as from maleation experiments
with variable soaking times that the MAH partitions rapidly into the PMP with a
solubility much higher than that measured.
30
I
5
0.9 125 °C
0.8 o 80
0.7 • 60
0.6
0.5
0.4
0.3 -
0.2•
0.1
0 1
0 50 100 150 200 250 300 350 400
Soak Time (min)
Figure 2.10. SC C02-assisted MAH uptake at various soak temperatures in PMP (0.69g/mL C02 , 0.25 M MAH) as measured by TGA.
Initiator Solubility in SC C02
BPO forms a biphasic mixture with C02 under the conditions used for filling (60
°C, 18.2 MPa) but slowly equilibrates to a nearly homogeneous system during the
soaking period of 4 h. Upon further heating, the BPO forms a homogeneous solution
during the final stages of the temperature/pressure ramp. DCP forms a homogeneous
solution in SC C02 at all temperatures and pressures examined. Because of these
differences in the phase behavior of the two initiators, it was necessary to employ a soak
period for the BPO reactions to accommodate the slow equilibration while in most cases
the DCP reactions were immediately heated to the reaction temperature subsequent to
filling. Soaking at 60 °C for up to 48 hours was not found to initiate a maleation reaction;
31

therefore, this difference in the treatment of initiators was not expected to create any
discrepancies in the comparison of data.
Determinations of initiator solubility in the substrate under SC CO, conditions
were unsuccessful. Uptakes could not be determined by direct gravimetric analysis
because of a small substrate mass loss after exposure to the fluid. This mass loss was
observed in the uptake experiment even after a SC C02 extraction was performed. Use of
TGA was not a viable option since the thermal initiator dissociates and then reacts with
the substrate as temperature is increased. An NMR analysis was attempted based on
dissolution of the substrate material after exposure to the initiator/fluid solution, but this
resulted in undetectable levels of initiator. A lengthy dissolution and analysis at elevated
temperatures was required for the PMP solvation.
Structure Analysis
The characterization of the maleated polymers is focused on four areas
—
determination of the degree of anhydride incorporated, nature of the grafted anhydride,
estimation of crosslinking, and effect on the crystalline structure. The first two analyses
are best determined with the use of spectroscopy, the third with the use of swelling
experiments, and the latter through a combination of thermal and x-ray experiments.
Spectroscopy
A calibration curve can be generated to quantify the degree of maleation of the
PMP through a combination of elemental analysis and infrared spectroscopy (Figure
32

2. 1 1 ). The two sets of data shown compare the determination of oxygen in the sample by
direct pyrolysis and by indirect combustion analyses where one must assume that the
sample is composed only of carbon, hydrogen, and oxygen. (The oxygen content is
calculated by difference.) The combustion analysis proved to be more consistent having
a better least squares fit to the curve. In addition, the pyrolysis tests yielded data that
were rather close to the lower detection limit of the analysis (0.5 wt.% oxygen). These
factors led to the decision to use the combustion curve as the calibration curve for
quantifying PMP maleations. The secondary y-axis of Figure 2.1 1 indicates the molar
percentage of anhydride units grafted relative to PMP repeat units determined using the
combustion data. We emphasize that the degree of maleation is much larger in these
0
O
CD
>^<
CD
-0.7
0.2 0.4 0.6 0.8 1
Normalized IR Intensity (A
1
90o- 1690/A
1
4 1 0 - 1 3 1 o)
Figure 2.1 1. Calibration curves for PMP maleations relating elemental analysis results
from combustion (•) and pyrolysis (o) to normalized infrared data.
33

samples than is observed in commercially maleated LLDPE samples. Values of less than
1 .2 mol% were determined from elemental analyses by combustion for the commercial
samples that we obtained.
The infrared spectrum of a maleated polyolefin substrate (Figure 2.12) reveals the
existence of the anhydride carbonyl symmetric and asymmetric stretching bands at -1790
and - I860 cm"1
, respectively, in addition to a -1220 cm'1
peak corresponding to the C-O
stretch.45 A simple ratio of the area of the carbonyl relative to the area of a peak unique
to the substrate provides the necessary data for the calibration—the abscissa of Figure
2.11. For PMP, the "substrate peak" used was that of the CH3 bending region which lies
between 1410 and 1310 cm"1
. Once generated, the calibration curve can be used in
conjunction with any subsequent IR data without the need for elemental analysis.
Addition of a KOH solution followed by back titration with acid can also yield the molar
concentration of grafted groups although unreacted base trapped in the polymer can lead
to erroneous results. For this reason, only elemental analyses were used for calibration.
One of the first issues encountered in examining samples using IR was that the
1715 cm"1
peak was occasionally present. We identified this peak as a carboxylic acid
formed from hydrolysis of the anhydride. Figure 2.12 reveals our successful
eliminatation of the peak such that the integration of the anhydride region for
quantification relied on only anhydride groups. Heating the sample under vacuum for
several days reduced the intensity of the acid peak only slightly, but heating under
nitrogen purge proved to effectively reduce it. The 1788 cm"1
anhydride stretch was
observed to increase as the acid peak disappeared.
34

'SI
S-
0.8
0.6
<0.4
0.2
0
2100 1900 1700 1500 1300
Wavenumbers (cm" )
Figure 2. 1 2. IR of the reduction of the 1 7 1 5 cm"1
hydrolysis peak through heating undernitrogen purge for 0 h (bottom), 18 h (middle), and 72 h (top) at 105 °C.
IR has been used to determine the amount of single succinic anhydride relative to
poly(maleic anhydride) grafted. 56 This can be achieved through curve fitting the
carbonyl anhydride region. Poly(maleic anhydride) is reported to have a 20 cm"1
half
bandwidth IR absorbance at 1784 cm"1
, while succinic anhydride is narrower (10 cm1
half bandwidth) and located at 1792 cm"1
. Attempts at curve fitting resulted in two peaks
present in all of the IR spectra, but the exact positioning and breadth could not be
determined unambiguously. The relative intensity of the two peaks varies a small amount
from sample to sample and sometimes even within a given sample, but no correlation
could be derived. The assignment of the peaks could lead to the determination that short
chain oligomers (2-3 units) are present as grafts, or the determination could be made that
35

some grafts exist as maleic anhydride units while others are succinic anhydride. The
latter explanation is favored due to the following argument.
Upon hydrolysis, the succinic anhydride groups open to form p-carboxylic acids
that absorb at 1715 cm"1
. Dehydration should cause reversion to the fully cyclized
species; however, if oligomeric anhydrides were initially present, the dehydration would
be incomplete due to cyclization between acids from neighboring anhydrides. (Lone acid
groups would exist between anhydride groups and would be incapable of dehydration.)75
Because Figure 2. 12 reveals that complete recyclization is possible, the grafts are thought
to be single anhydride units.
In addition to IR, C-NMR can be useful in determining both percent grafting
and also the nature of the grafted species,76 provided the sample is soluble at reasonable
temperatures. The NMR spectrometers available in the department are capable of
temperatures up to 105 °C. From the chemical shift of the carbon atoms, a determination
can be made about graft positioning on the PMP molecule—backbone or side-chain.
Plus, the presence of single or oligomeric succinic anhydride groups can be made. 54 77
All attempts at NMR analysis were unsuccessful due to an inability to effectively
dissolve polymer samples with reasonably high degrees of grafted anhydride. Solid state
,3C-NMR was attempted as well, but the sensitivity was too low to make any "solid"
conclusions.
36

0.25
0.2
oi 0.15E—1
<on
< o.i
0.05
0
2200 2000 1800 1600
Wavenumbers (cm" )
1400 1200
>a"
s
Figure 2. 13. ATR-IR spectra of PMP (a) and PMP-g-MAH (b) compared with the
transmittance spectrum of PMP-g-MAH (c).
The next issue to address using infrared spectroscopy was whether or not this
heterogeneous maleation is surface-selective. Figure 2.13 indicates that the free radical
grafting in SC CO? is indeed a bulk, non-surface-selective reaction. This assessment is
made by comparing the peak intensities of the 1788 cm"1
symmetric anhydride stretching
band in spectra of a sample analyzed by both transmission and ATR-IR. The
transmission spectrum samples the entire 50-^im grafted film while the ATR-IR spectrum
assesses only the outermost 1-2 |im of the sample. (See the explanation of ATR-IR in
Chapter 3.) The peaks due to the anhydride are of nearly identical intensity to those in
the transmission spectrum indicating a slightly higher degree of maleation (even after
running an ATR correction to adjust the spectrum for the dependence of the signal on
37
wavelength). The 1715 cm 1
hydrolysis peak is expected to be more pronounced in the
ATR-IR spectrum considering the surface was in contact with air and thus would be m<
easily hydrolyzed. The presence of this peak accounts for the lower intensity of the
anhydride peak in the ATR-IR spectrum. Also shown is the ATR-IR spectrum of the
unreacted PMP film. The peak due to oxidation is more pronounced than in the
transmission spectrum, which again is expected for a surface oxidation caused by air
exposure.
Crosslinking
While the degree of maleation can be easily controlled with the proper choice of
initiator, temperature, and time, as will be shown later, there is a drawback to this system.
As with many polyolefin maleation reactions, especially extruder maleations,
crosslinking can be a competing reaction. In the case of increasing initiator
concentration, it was expected that along with increased maleation, increased crosslinking
would result. As shown in Figures 2.14 and 2.15, this is indeed the case. The
crosslinking was gauged using solubility and swelling experiments with carbon
tetrachloride as the solvent. (For PMP, good solvents include carbon tetrachloride at 60
°C, refluxing THF, and xylenes above 100 °C.) With higher degrees of crosslinking,
more of the sample is insoluble and the insoluble gel is less able to swell with solvent.
38

JO
ocM
0 10 20 30
Initiator (mol%)
40 50
Figure 2. 14. Percentage of sample insoluble in 60 °C CC14 as a function of reaction
initiator concentration (125 °C, 0.67 g/mL C02).
In these samples, a decrease is observed in the swelling (Figure 2.15), which
corresponds to increasing crosslink density with increasing amounts of initiator present in
the reaction. The plateau, which is especially pronounced in the BPO data beginning at
23 mol%, is attributed to a plateau in the concentration of BPO in the SC C02-swollen
PMP. This is discussed in detail below. The discrepancy in the DCP and BPO data is a
result of differing degrees of maleation as is illustrated in the collapsed graph also shown
in Figure 2.15. This indicates that the degree of crosslinking is independent of initiator
identity.
39

200
1bJO
"o
C
00
0 5 10 15 20 25 30 35 40 45
Initiator (mol%)
200 r
180
1601
o 140 -
120 -
cu_> 100 --
o
80 -wb/j
60 -13
40 -
20 --
0 -
0 0.5 1 1.5 2 2.5 3 3.5 4 4.5 5
Grafted Anhydride (mol %)
Figure 2. 15. Swelling portions of PMP-g-MAH samples insoluble in 60 °C CC14 as a
function of initiator concentration (relative to MAH) (top) and anhydride grafted
(bottom).
The crosslinks are probably caused by radical-radical combination during the
formation of the maleated polymer; however, it is possible that the insolubility is a result
40
of the changing polarity of the overall polyme^ or of physical crosslinking brought
about by polar anhydride-anhydride interactions. Attempts to dissolve the insoluble
portions of the maleated polymer samples in a carbon tetrachloride:dimethylacetamide
solution (2:1by volume) proved unsuccessful, suggesting that the crosslinks are not
completely of polar origin.
Crystallinity
Because the crystalline phase of PMP is of low density and is known to allow
C02 to diffuse into it, an examination of the effect of maleation on this phase is of great
interest. A reduction in the sample crystallinity would be expected if the maleic
anhydride is capable of grafting to polymer chains in the crystal. 78 Determining the
amount of disruption in the sample crystallinity can be made through the use of DSC.
The AHf reported for PMP is 61 .9 J/g68 with most commercial samples having a
crystallinity of the order 20-80% depending on both the degree of comonomer
copolymerized with the 4-methyl-l-pentene and the thermal history. Exposure to the
reaction conditions in the absence of the reagents may be enough to alter the crystallinity
through an annealing or quenching effect, and thus was examined as well.
DSC analysis (Figure 2.16) shows that upon maleation, the crystallinity drops
slightly (from 27% to 24%) but recovers upon second heating. Two distinct endotherms
emerge from the initial broad peak of the substrate material upon maleation: one, a broad
peak at lower melting temperature and the other, a much sharper peak with a melting
point nearly identical to virgin PMP. The separation of the initial endotherm into two
peaks could be the result of the formation of a new crystalline phase (PMP is known to be
41

polymorphic)?? or to the creation of two distinct populations of more and less perfect
crystals of the same overall unit cell.
0.6 i
0.5
-0.4
J -0.3
-0.2
-0.1
0
100 25 1 50 175 200
Temperature (°C)
225 250
Figure 2. 16. DSC thermogram for unreacted PMP and PMP-g-MAH (1st
and 2nd
heating).
The predominant crystal structure for PMP is the 7 2 helix packed into a tetragonal
unit cell of size a = b = 1 3.80 A and c = 1 8.66 A.80 Exposure to the SC C02 reaction
conditions can potentially alter the crystalline unit cell due to reaction. 78 X-ray
diffraction is the best measure of any crystalline unit cell changes. From the diffraction
pattern of an oriented polymer sample (Figure 2.17), the d-spacings and (hkl)
assignments can be made for the PMP before and after modification.
42
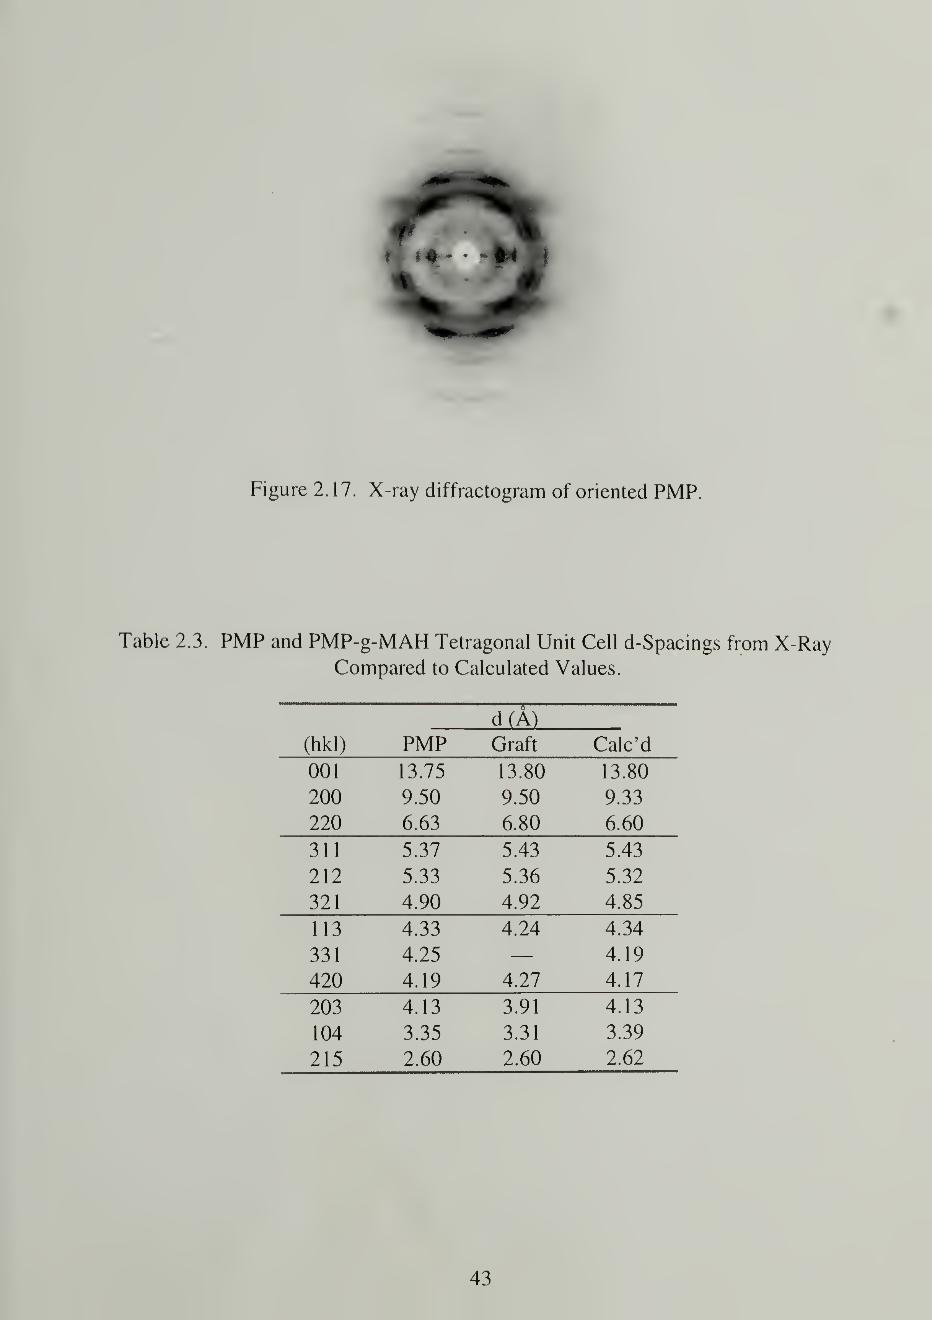
Figure 2. 17. X-ray diffractogram of oriented PMP.
Table 2.3. PMP and PMP-g-MAH Tetragonal Unit Cell d-Spacings from X-RayCompared to Calculated Values.
d(A)
(hkl) PMP Graft Calc'd
001 13.75 13.80 13.80
200 9.50 9.50 9.33
220 6.63 6.80 6.60
311 5.37 5.43 5.43
212 5.33 5.36 5.32
321 4.90 4.92 4.85
113 4.33 4.24 4.34
331 4.25 4.19
420 4.19 4.27 4.17
203 4.13 3.91 4.13
104 3.35 3.31 3.39
215 2.60 2.60 2.62
43
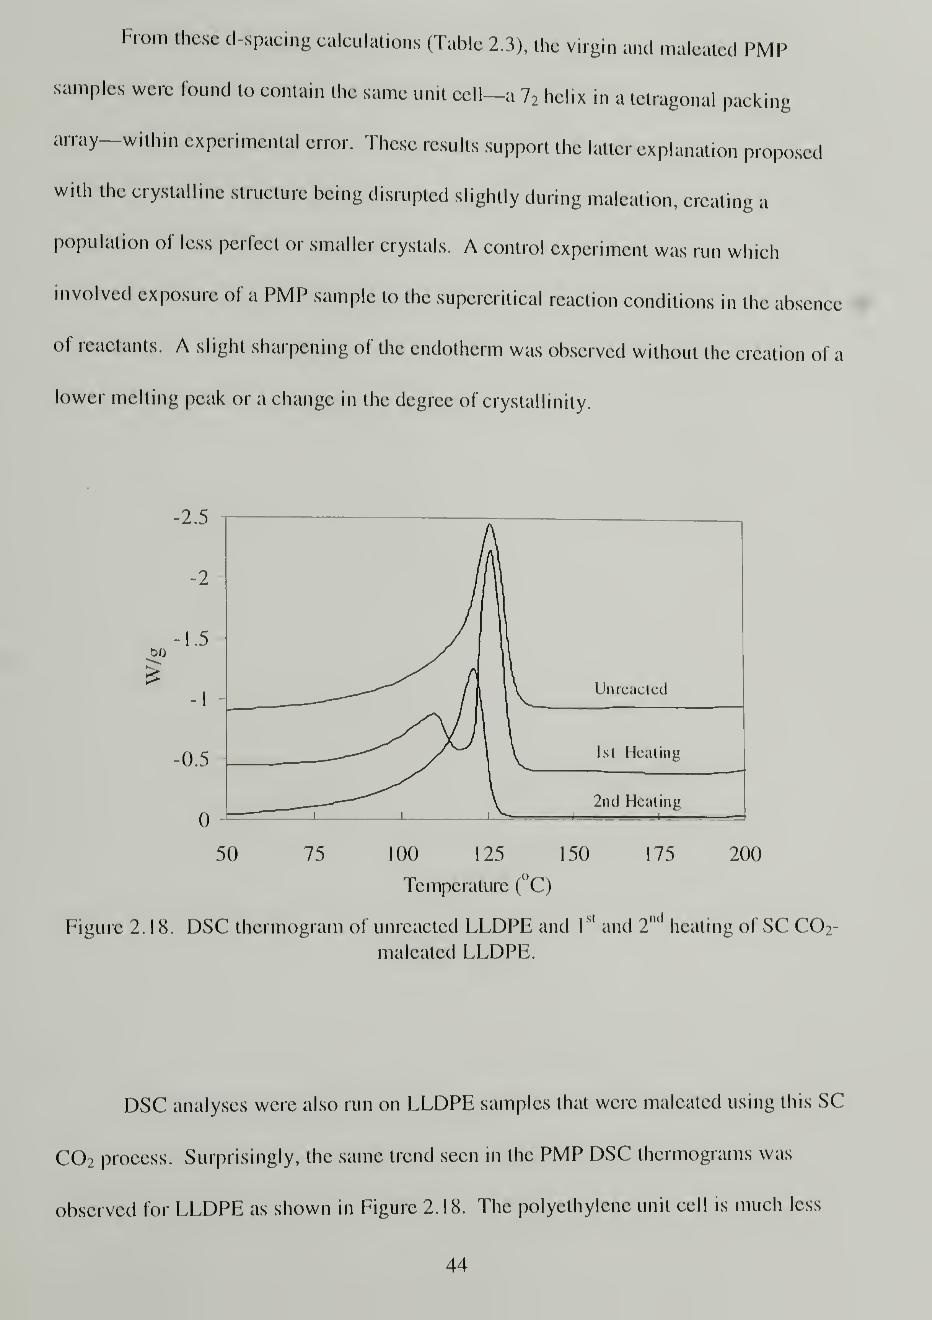
From these d-spacing calculations (Tabic 2.3), the virgin and maleated PMP
samples were found to contain the same unit cell—a 7 2 helix in a tetragonal packing
array—within experimental error. These results support the latter explanation proposed
with the crystalline structure being disrupted slightly during malcation, creating a
population of less perfect or smaller crystals. A control experiment was run which
involved exposure of a PMP sample to the supercritical reaction conditions in the absence
Temperature ( C)
Figure 2. 18. DSC thermogram of unreacted LLDPE and I
s' and 2
,ul
heating of SC C02-
malealed LLDPE.
DSC analyses were also run on LLDPE samples that were maleated using this SC
C02 process. Surprisingly, the same trend seen in the PMP DSC thermograms was
observed for LLDPE as shown in Figure 2.18. The polyethylene unit cell is much less
44

accessible to C02 and is generally thought to be impenetrable by solvents. The disrupted
crystallites may result from reaction occurring at the surface of the crystals. The
crystallinity decreased after modification from 50% to 41% using a AHf value of 8.0
kJ/mol. 81 Upon second heating after a slow cool, the crystallinity increased slightly to
43%.
Experimental Variables
Below, a comparison is made between the two initiators, BPO and DCP, which
have both been explored as initiators for maleation reactions in other systems. Jois and
Harrison6 reported that when comparing initiator efficiency in MAH grafting reactions,
DCP is a much better choice than BPO; 2,2'-azobisisobutyronitrile (AIBN), as an
initiator, is the least effective. Preliminary studies in our labs with AIBN as well as those
with DCP and BPO are in agreement with their findings. In addition, the half-lives of
these initiators are quite different. At 125 °C, the reaction temperature used in the SC
Table 2.4. Half-Lives for Initiators Used in SC C02 Maleation of PMP. (Values were
measured in hours in benzene.)82
Temp (°C) AIBN BPO DCP70 4.8 7.3
85 1.4
100 0.12 0.33
115 13
130 1.7
145 0.28
45

C02 maleation reactions, the half-lives are orders of magnitude apart with AIBN
decomposing in less than half the time BPO requires (a few minutes) and DCP requiring
hours (Table 2.4). AIBN was found to be an inadequate initiator at temperatures ranging
from 60 °C to 1 25 °C and will not be discussed beyond what is mentioned here.
Temperature Effects
The effect of temperature on the maleation reactions was explored as a screening
experiment to determine the ideal reaction temperature for these systems. Figure 2.19
illustrates the effect. It should be emphasized that the BPO reactions were run over a 24-
h time period to allow for complete reaction of the initiator at all temperatures, while for
the DCP reactions, a 1-h reaction was allowed.
oB
<D
a
'CT3>i£ZC<
5.0
4.0
3.0
2.0 --
1.0
0.0
85 90 95 100 105 110 115 120
Temperature (°C)
125 130 135
Figure 2. 19. Effect of temperature on the degree of maleation using BPO (4 h soak, 24 h
reaction) and DCP (2 h soak, 1 h reaction) as initiators with a 60 °C soak, 0.25 M MAH,
0.04 M initiator, and 0.67 g/mL C02 .
46
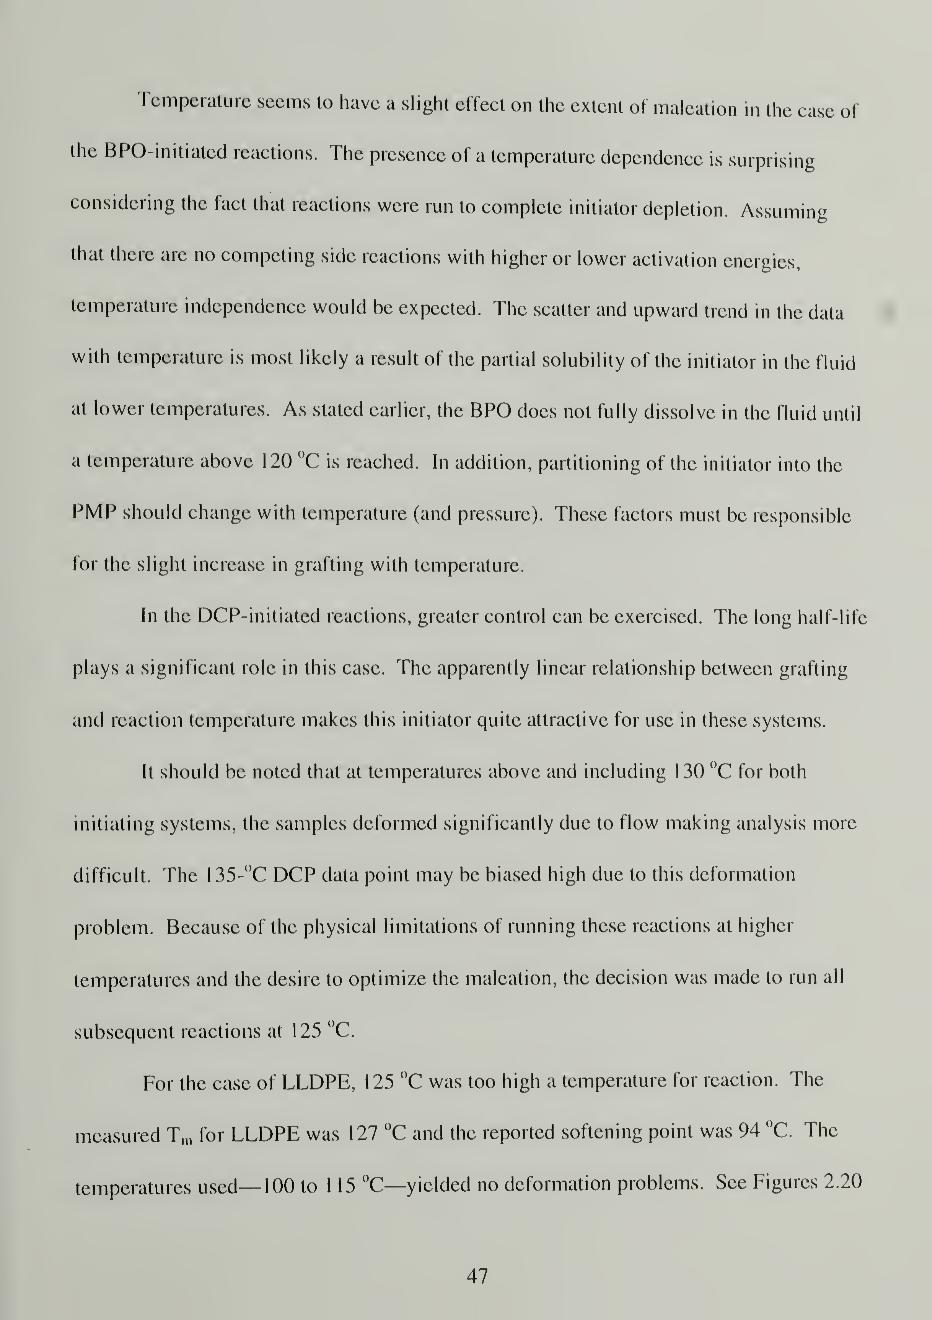
Temperature seems to have a slight effect on the extent of maleation in the case of
the BPO-initiated reactions. The presence of a temperature dependence is surprising
considering the fact that reactions were run to complete initiator depletion. Assuming
that there are no competing side reactions with higher or lower activation energies,
temperature independence would be expected. The scatter and upward trend in the data
with temperature is most likely a result of the partial solubility of the initiator in the fluid
at lower temperatures. As stated earlier, the BPO does not fully dissolve in the fluid until
a temperature above 120 °C is reached. In addition, partitioning of the initiator into the
PMP should change with temperature (and pressure). These factors must be responsible
for the slight increase in grafting with temperature.
In the DCP-initiatcd reactions, greater control can be exercised. The long half-life
plays a significant role in this case. The apparently linear relationship between grafting
and reaction temperature makes this initiator quite attractive for use in these systems.
It should be noted that at temperatures above and including 130 °C for both
initiating systems, the samples deformed significantly due to flow making analysis more
difficult. The 1 35-°C DCP data point may be biased high due to this deformation
problem. Because of the physical limitations of running these reactions at higher
temperatures and the desire to optimize the maleation, the decision was made to run all
subsequent reactions at 125 °C.
For the case of LLDPE, 125 "C was too high a temperature for reaction. The
measured Tm for LLDPE was 127 °C and the reported softening point was 94 °C. The
temperatures used— 100 to 1 15 °C—yielded no deformation problems. See Figures 2.20
47

and 2.21. After a 3 h reaction at 1 15 °C, the grafting reached -0.7 mol% anhydride.
While a direct comparison cannot be made with the PMP reactions due to the temperature
intolerance of LLDPE, the reactions appear to be comparable. PMP achieved a grafting
of 0.8 mole % anhydride after 1 h at 120 °C.
C/3
0
H105 "c „ ^ J
2200 2000 1 800 1600 400
Wavenumbers (cm" )
1200 1000
Figure 2.20. IR spectra of LLDPE samples maleated in SC C02 (0.06 M MAH, 0.04 MDCP, 2 h 60 °C soak, 3 h reaction, 0.60 g/mL C02 ).
The elemental analysis results graphed in Figure 2.21 reveal an erroneous
minimum at 105 °C. In comparison with the infrared data, the anhydride intensity
appears to be equivalent for the 100 and 105 °C experiments. The oxygen content from
combustion analyses were close to the limits of the test; therefore, only the 120 °C data
can be considered truly accurate.
48
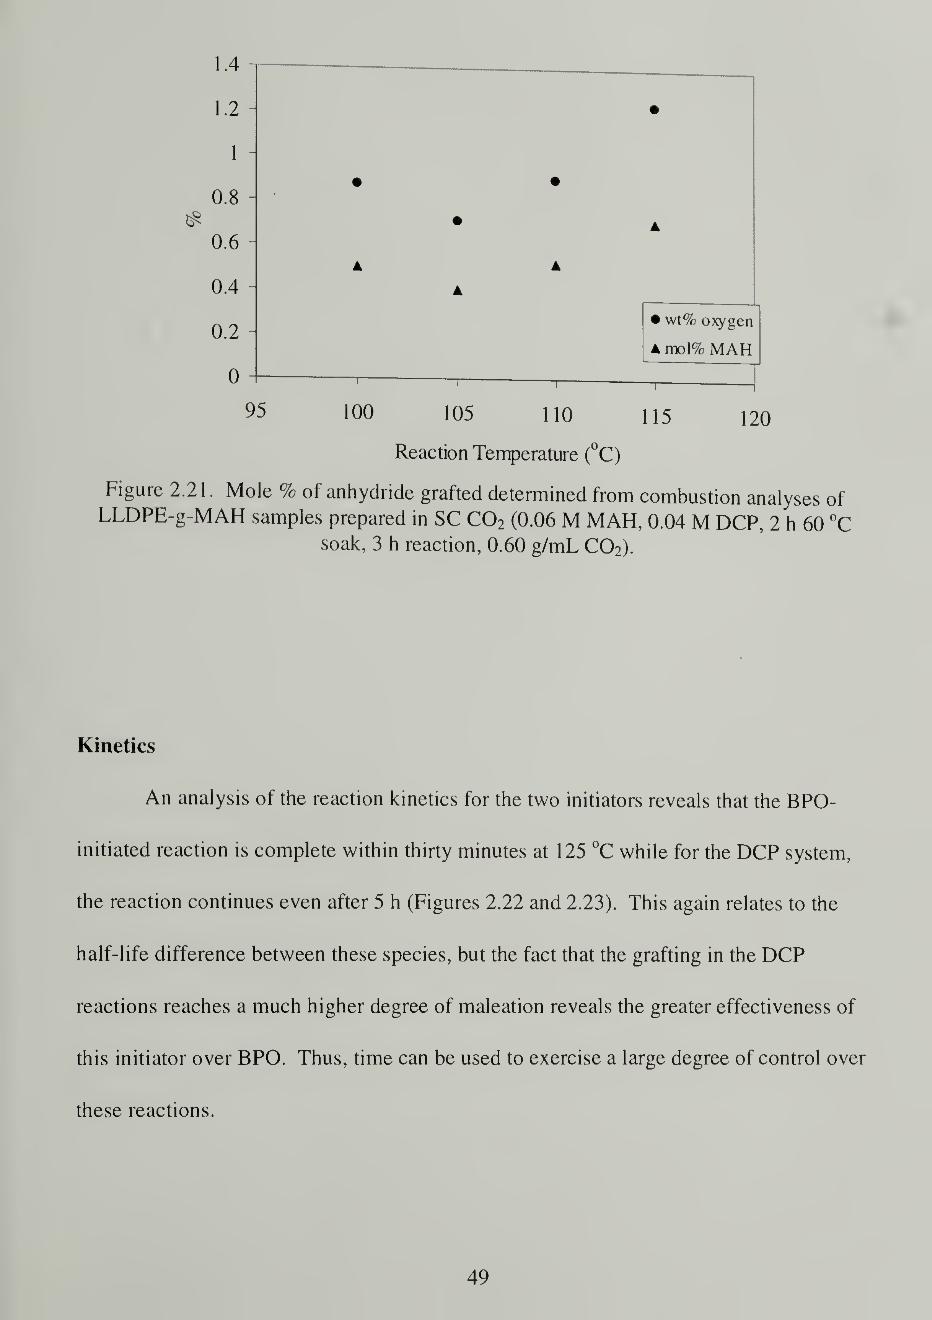
1.4
1.2
1
0.8
0.6
0.4
0.2
0
95
• wt% oxygen
A mol% MAH
100 105 110 115
Reaction Temperature (°C)
120
Figure 2.21.Mole % of anhydride grafted determined from combustion analyses of
LLDPE-g-MAH samples prepared in SC C02 (0.06 M MAH, 0.04 M DCP, 2 h 60 °Csoak, 3 h reaction, 0.60 g/mL C02 ).
Kinetics
An analysis of the reaction kinetics for the two initiators reveals that the BPO-
initiated reaction is complete within thirty minutes at 125 °C while for the DCP system,
the reaction continues even after 5 h (Figures 2.22 and 2.23). This again relates to the
half-life difference between these species, but the fact that the grafting in the DCP
reactions reaches a much higher degree of maleation reveals the greater effectiveness of
this initiator over BPO. Thus, time can be used to exercise a large degree of control over
these reactions.
49
2000 1 800 1 600 1 400 1 200 1 000 800 600
Wavenumbers (cm"1
)
Figure 2.22. IR spectra of PMP-g-MAH as a function of reaction time (125 °C, 0.67
g/mL C02 , 0.25 M MAH, 0.04 M DCP).
The 0-h spectrum in Figure 2.22 corresponds to unreacted PMP. There is a
ketonic peak at 1740 cm"1
that results from air oxidation of the film. Figure 2.13 contains
the ATR-IR spectrum of unmodified PMP. A comparison of the spectra reveals the large
difference in the amount of oxidation between the surface and the bulk of the film. In
either case, however, the maleic anhydride content is significantly higher than the degree
of film oxidation. The sinusoidal baseline results from refraction of the IR beam off the
perfectly smooth unmodified PMP film.
A major point can be made with the infrared spectra in Figure 2.22. A peak at
725 cm"1
grows in the spectra with increasing anhydride content. This is a cis stretching
vibration associated with unsaturation. The presence of this peak indicates that at least
some of the grafted units are unsaturated, which accounts for the two peaks observed in
the anhydride stretching region between 1780 and 1795 cm"1
. Coupling this observation
50

with hydrolysis arguments made earlier, we can state confidently that the grafted units ai
single anhydride groups attached to the polyolefin with some being maleic (unsaturated)
grafts while others are succinic (saturated).
7.0 -r
0 0 15 20 25 30 35 40 45 50
Reaction Time (h)
Figure 2.23. Kinetics of the SC C02 maleation reaction at 125 °C, 0.67 g/mL using DCP(2 h soak, 0.25 M MAH) and BPO (4 h soak, 0.5 M MAH) as initiators with a 60 °C soak
and 0.04 M initiator concentration.
The longer reaction time data for the DCP-initiated reactions shown in Figure
2.23 are puzzling. Two explanations can be proposed to explain the apparent decrease in
grafting for longer reactions. The first is that some of the sample dissolves as the amount
of anhydride increases. The more highly maleated polymer chains would be expected to
dissolve while the less maleated would remain. The fact that a mass gain corresponding
to the degree of maleation was observed means that this explanation is unlikely. The
second explanation relates to extinction coefficients. Because the extinction coefficient
51

depends on the polarizability, which in turn depends on the local environment of the
vibrational species, the extinction coefficient can be expected to change with high
degrees of maleic anhydride incorporation. Again, the gravimetric analysis disputes the
validity of this. We do not feel that these explanations are adequate, yet no other logical
arguments could be made.
Reactant concentrations
It is expected5 7 that with increased initiator concentration, the percentage of
grafting should increase. While Figure 2.24 concurs with this expectation, plateaus are
observed in these experiments at higher concentrations. This is because the initiator
efficiency decreases as a result of the greater concentration of radicals generated at a
given time. Also, the fluid-swollen PMP becomes saturated with initiator at a high
enough concentration such that further increases in initiator concentration in the fluid
have no effect on the concentration in the fluid-swollen polymer. The latter explanation
is supported by the swelling experiments (Figure 2.15) that indicate that the degree of
crosslinking of the films increases and then plateaus with increased initiator
concentration as well.
52

5.0
~ 4.0o6
a 3.0c3
o"2'C
>>
q<
2.0 -
1.0
0.0 4
0 10 15 20 25 30
Initiator (mol%)
35 40 45
Figure 2.24. Effect of initiator concentration (relative to MAH) on SC C02 maleationsusing BPO (4 h soak, 1 h reaction, 0.25 M MAH) and DCP (no soak, 2 h reaction, 0.06 M
MAH) as initiators with a 60 °C soak and a 125 °C reaction at 0.67 g/mL C02 .
We note that there is a difference in the reaction conditions for the two initiator
systems graphed. In the case of the DCP data, the reactions were run for only two hours
(see Figure 2.23) with a low MAH concentration, while the BPO data were acquired
using samples that had been reacted for one hour (completion) with a higher
concentration of MAH . The differences in the MAH concentration are perhaps the most
significant difference in the two sets of data. The figure, therefore, serves only as a
comparison of trends within each data set. The error bars on the DCP data are the result
of an error analysis study conducted on these samples. They represent the standard
deviation of 4-8 infrared spectra taken at random points along the films.
As with initiator concentration, increasing the MAH content shows an increase in
grafting, but, as shown in Figure 2.25, the effect appears to maximize and then decrease
53
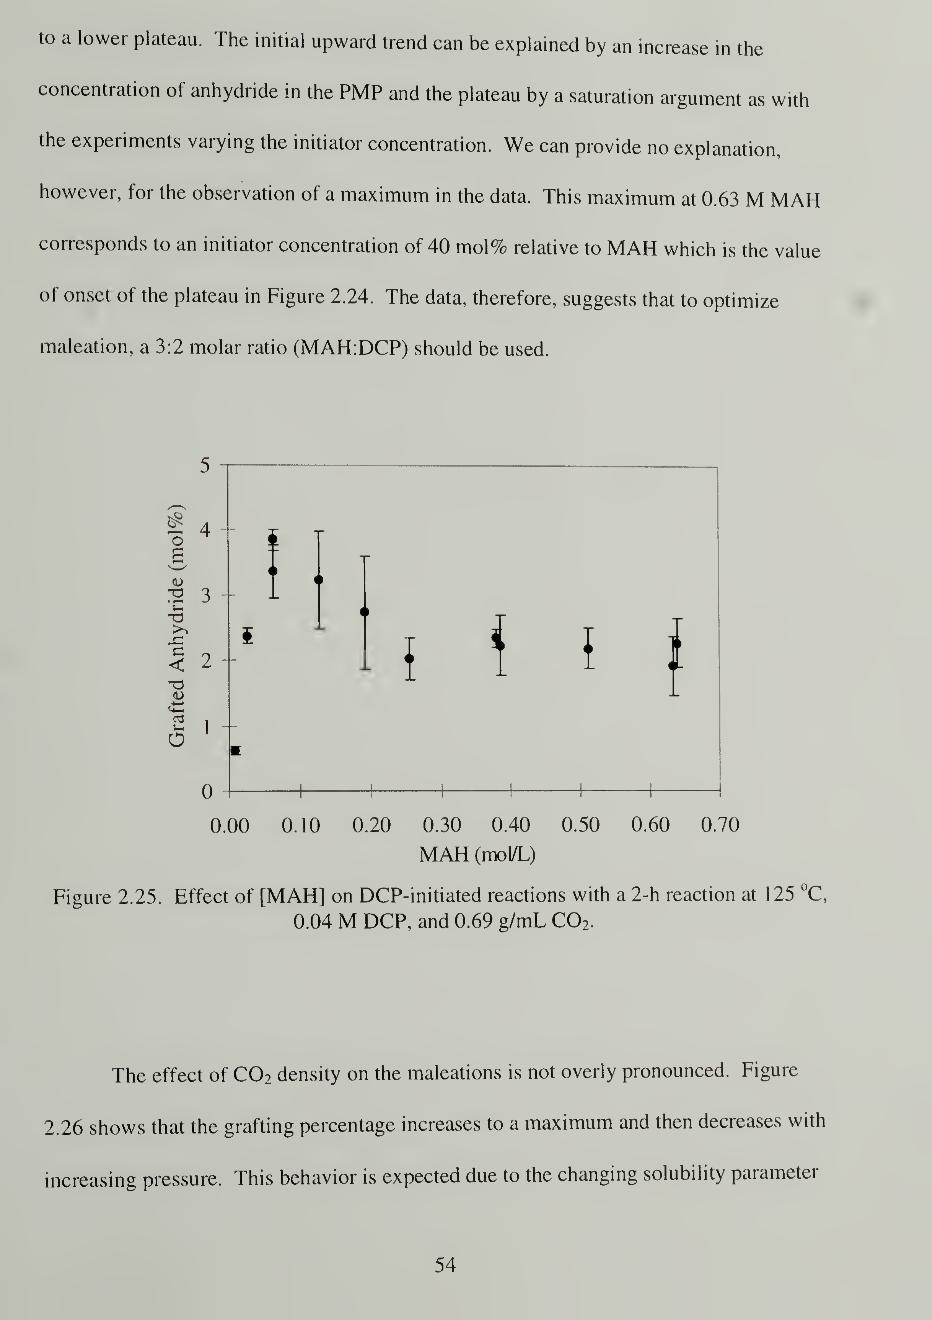
to a lower plateau. The initial upward trend can be explained by an increase in the
concentration of anhydride in the PMP and the plateau by a saturation argument as with
the experiments varying the initiator concentration. We can provide no explanation,
however, for the observation of a maximum in the data. This maximum at 0.63 M MAH
corresponds to an initiator concentration of 40 mol% relative to MAH which is the value
of onset of the plateau in Figure 2.24. The data, therefore, suggests that to optimize
maleation, a 3:2 molar ratio (MAH:DCP) should be used.
0.00 0.10 0.20 0.30 0.40 0.50
MAH (mol/L)
0.60 0.70
Figure 2.25. Effect of [MAH] on DCP-initiated reactions with a 2-h reaction at 125 °C,
0.04 M DCP, and 0.69 g/mL C02 .
The effect of C02 density on the maleations is not overly pronounced. Figure
2.26 shows that the grafting percentage increases to a maximum and then decreases with
increasing pressure. This behavior is expected due to the changing solubility parameter
54
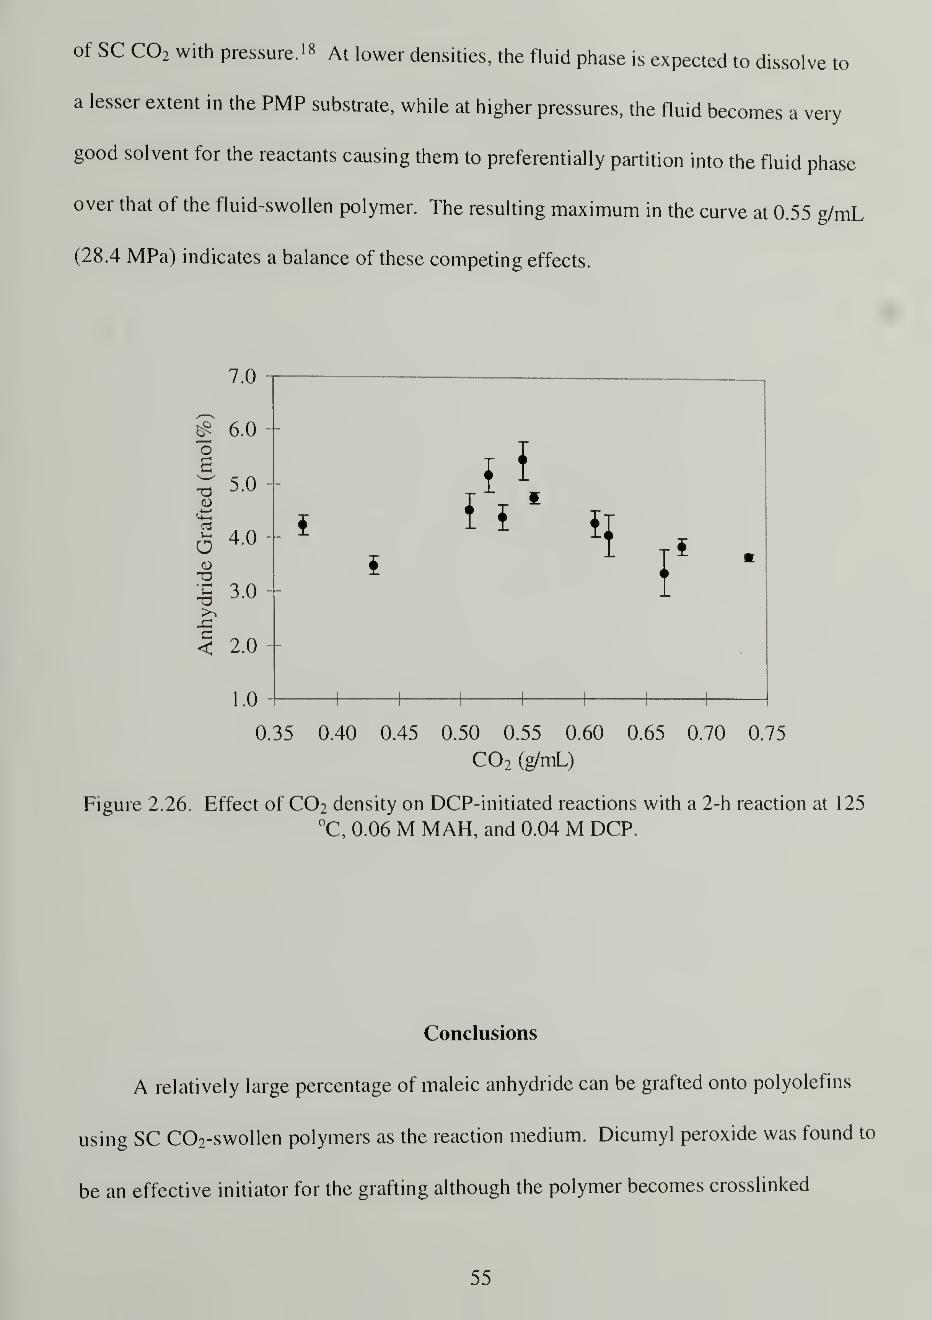
of SC C02 with pressure. is At lower densities, the fluid phase is expected to dissolve to
a lesser extent in the PMP substrate, while at higher pressures, the fluid becomes a very
good solvent for the reactants causing them to preferentially partition into the fluid phase
over that of the fluid-swollen polymer. The resulting maximum in the curve at 0.55 g/mL
(28.4 MPa) indicates a balance of these competing effects.
o6-a
a
c
c<
7.0
6.0
5.0
4.0
3.0
2.0
1.0
0.35 0.40 0.45 0.50 0.55 0.60 0.65 0.70 0.75
C02 (g/mL)
Figure 2.26. Effect of CO2 density on DCP-initiated reactions with a 2-h reaction at 125
°C, 0.06 M MAH, and 0.04 M DCP.
Conclusions
A relatively large percentage of maleic anhydride can be grafted onto polyolefins
using SC C02-swollen polymers as the reaction medium. Dicumyl peroxide was found to
be an effective initiator for the grafting although the polymer becomes crosslinked
55

apparently proportionately to the degree of anhydride incorporated. The grafts are single
units of succinic and maleic anhydride as determined from infrared analysis. Optimum
maleation of PMP can be achieved with a 20-h, 125-°C reaction using 0.55 g/mL C02
and an MAH:DCP ratio of 3:2. This modification reaction disrupts crystallinity slightly
by breaking up the size of some of the crystallites.
56

CHAPTER 3
SURFACE CHEMISTRY OF POLY(TETRAFLUOROETHYLENE-CO-BIS-2 2-
TRIFLUOROMETHYL-4,5-DIFLUORO-l,3-DIOXOLE) (TEFLON AF)
Introduction
Fluoropolymers possess unique properties that make them attractive for many
applications. These properties include a low dielectric constant, low surface tension, high
temperature stability, and solvent resistance making them amenable for use in such
applications as electronics, cooking, seals, and packaging. These properties come about,
in part, due to the high dissociation energy of the C-F bond (-116 kcal/mol) and the low
cohesive energy density. In this work, the chemical surface modification of an
amorphous fluorocopolymer made by DuPont—Teflon AF—was carried out. This
fluorocopolymer is of interest because of its low surface energy, high optical clarity, and
high gas permeability. Relatively little work had been conducted on the surface
chemistry of this polymer before this investigation.
Reactions on Fluoropolymers
The surface modification of fluoropolymers is of great use to those who desire the
ability to promote adhesion to the polymer while maintaining the bulk properties of the
material. In addition to adhesion promotion, modification reactions also provide a
reactive handle through which chemistry can be applied to alter the surface properties of
the polymer, enhancing biocompatibility or wettability, for example.
Fluoropolymer surface modification chemistry is often harsh and not well
controlled because of the need to use strong reducing agents, radiation sources, or other
57

radical chemistry. The wet chemical reduction of fluoropolymers can be achieved
through the use of solvated alkali metals such as sodium naphthalenide in THF,83"85
sodium or lithium in liquid ammonia, 86 '87 sodium benzophenone,88 alkyl lithium
reduction and alkylation,89 and alkali metal amalgams.90 Our group has also reported the
wet chemical reduction of poly(tetrafluoroethylene) using benzoin dianion in dimethyl
sulfoxide91—considered a "mild" reducing agent.
Radiative means of modification include plasma,92"95 corona discharge, UV in the
presence of organic electron donors,96 -97 mercury photosensitization,98 and ion or
electron beams. These high energy modifications are perhaps the least well-controlled
but are often most convenient commercially, because often, solvents are not required,
simplifying the processing.
Other means of fluoropolymer modification include flame treatment,
electrochemical reduction,99 - 100 arenethiolate substitution, 101 and aluminum deposition
followed by dissolution. 102 Some of these modification reactions will be discussed in
more detail below.
Teflon AF
DuPont's amorphous fluoropolymer, Teflon AF, is a random copolymer of
tetrafluoroethylene and bis-2,2-trifluoromethyl-4,5-difluoro-l,3-dioxole (Scheme 3.1).
Teflon AF is a unique polymer in that it has one of the highest fractional free volumes 103
of any polymeric system making it very permeable to gases. In fact, the permeability of
this copolymer is comparable to that of polytrimethylsilylpropyne (PTMSP), 104 which
58

was known to be an unrivaled polymer in terms of permeability until Teflon AF was
introduced by DuPont in 1990. '05 Equaily impressive is the low surface tensjon of^
Scheme 3. 1 . Chemical Structure of Teflon AF.
fluorocopolymer. With a surface tension below that of poly(tetrafluoroethylene), Teflon
AF has one of the most non-wettable surfaces known to date. Table 3.1 details some of
the properties of the two commercially available copolymers of Teflon AF.
Table 3. 1 . Physical Properties of Teflon AF Copolymers. 106
AF 1600 AF 2400
x (molar ratio of dioxole) 0.65 0.87
Density (g/cm3) 1.744 1.595
Tg (°C) 160 240
Surface energy (dynes/cm) 15.7 15.6
Refractive index 1.31 1.29
Dielectric constant 1.93 1.90
Permeability 103 (Barrer)
Oxygen 170 1140
Nitrogen 55 554
Carbon Dioxide 530 2600
FFV,i03 % 32.0 37.4
59

One should also note that the dielectric constant is very low making the polymer a
good insulator. The high Tg and high thermal stability (stable in air up to -350 °C) also
make it very attractive; thus, Teflon AF is being marketed as an ideal material for
electronics applications. Often, to be useful in such applications, bondability to its
surface is essential.
This project examined the reactivity of the Teflon AF surface towards some
common fluoropolymer reducing agents. These include reduction with sodium
napthalenide radical anion complex, aluminum metal-assisted fluoride elimination, and
mercury/ammonia photosensitization. The samples reduced with sodium naphthalenide
were derivatized with common functional group labeling reactions. Determining the
surface reactivity and subsequent surface functionality introduced has led to a better
understanding of the reduction chemistry and was helpful in realizing the additional goal
of creating a more wettable surface to create a new bilayer membrane (Chapter 4).
Surface Analytical Techniques
In order to determine the chemical nature of the surface of a polymer, three
techniques, in particular, prove to be quite useful—dynamic contact angle analysis, x-ray
photoelectron spectroscopy (XPS), and attenuated total reflectance infrared (ATR-IR)
spectroscopy. These are listed in order of most to least sensitive toward the functionality
at the surface with contact angle probing the uppermost angstroms and ATR-IR
producing a spectrum containing information of a depth 1-2 |Lim into the sample.
60

Contact Angle and Wettability
The balance of energies which exists at a solid surface in contact with a liquid
results in a measurable angle between the tangent of the liquid droplet at the contact point
and the surface of the sample. This relationship is described by Young's equation and is
illustrated in Scheme 3.2. Throughout this text, references to contact angle will refer to
this "sessile drop" method. Other means of gathering the surface tension data through
different contact angle measuring geometries include Wilhelmy plate, capillary rise, and
and DuNouy ring methods, for example. 107
Vapor ^v Y LV
LjHt^^T^ YsvYoung's Eqn
^" * Ysv - Ysl = Ylv cos 9
Solid
Scheme 3.2. Contact Angle Measurement by the Sessile Drop Method
More information can be gathered about the surface through the use of dynamic
contact angle (as opposed to static) measurements in which liquid is added to (advancing)
and withdrawn from (receding) the drop during the measurement of the angle. The
advancing angle gives information about the surface functional groups and the surface
energy of a fresh surface that has not had time to be altered by the probe fluid through
surface reconstruction or fluid absorption. The receding angle and resulting hysteresis
from the advancing angle gives information about the heterogeneity of the surface—both
chemical and physical (i.e. roughness). Together, much information can be gained about
61
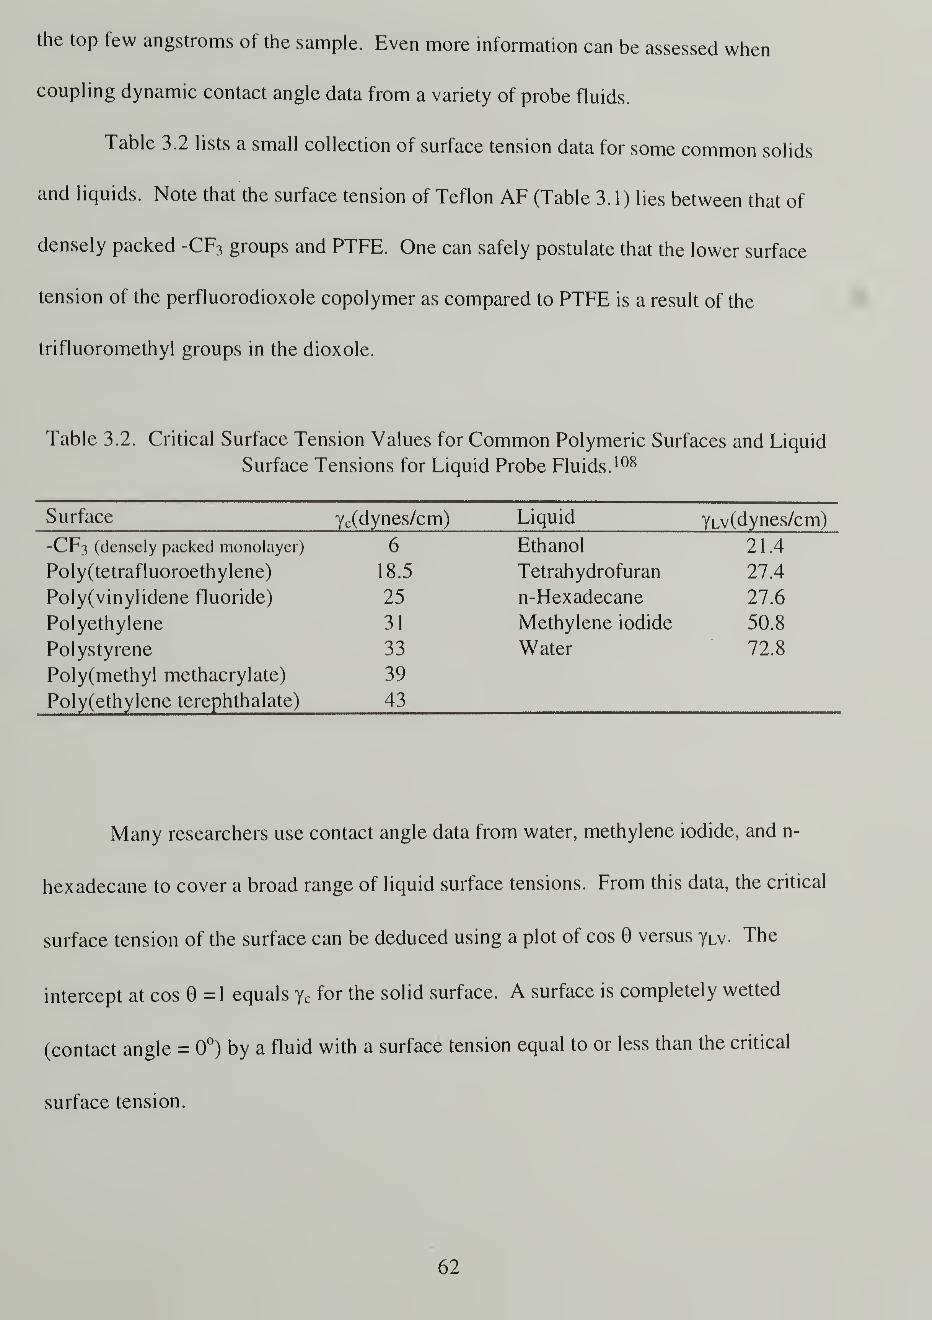
the top few angstroms of the sample. Even more information can be assessed when
coupling dynamic contact angle data from a variety of probe fluids.
Table 3.2 lists a small collection of surface tension data for some common solids
and liquids. Note that the surface tension of Teflon AF (Table 3.1) lies between that of
densely packed -CF3 groups and PTFE. One can safely postulate that the lower surface
tension of the perfluorodioxole copolymer as compared to PTFE is a result of the
trifluoromethyl groups in the dioxole.
Table 3.2. Critical Surface Tension Values for Common Polymeric Surfaces and Liquid
Surface Tensions for Liquid Probe Fluids. 108
Surface yc(dynes/cm) Liquid YLv(dynes/cm)
-CF3 (densely packed monolayer) 6 Ethanol 21.4
Poly(tetrafluoroethylene) 18.5 Tetrahydrofuran 27.4
Poly(vinylidene fluoride) 25 n-Hexadecane 27.6
Polyethylene 31 Methylene iodide 50.8
Polystyrene 33 Water 72.8
Poly(methyl methacrylate) 39
Poly(ethylene terephthalate) 43
Many researchers use contact angle data from water, methylene iodide, and n-
hexadecane to cover a broad range of liquid surface tensions. From this data, the critical
surface tension of the surface can be deduced using a plot of cos 0 versus yLv- The
intercept at cos 6 =1 equals yc for the solid surface. A surface is completely wetted
(contact angle = 0°) by a fluid with a surface tension equal to or less than the critical
surface tension.
62

X-Ray Photoelcctron Spectroscopy
X-ray photoelectron spectroscopy (XPS) 107 relies on the use of x-rays to eject
core electrons from the elements in a sample's surface. The energy of the ejected
photoelectron is measured as kinetic energy (Ek ) and is equal to the impinging energy
(hv) less the binding energy (Eb) of the electron. This binding energy depends on the
atom and atomic orbital from which the electron had come as well as the oxidation state
of the element. Scheme 3.3 illustrates the process of XPS and defines the key
parameters. For polymeric samples which often act as insulators, the sample surface can
become positively charged causing the measured kinetic energy to be slightly lower than
expected due to a larger effective binding energy.
X-Ray Source
hv
Detector
emitted
plu >t oe lections VE
k= hv - Eb
Scheme 3.3. X-Ray Photoelectron Spectroscopy.
The basic expression for the peak intensity N,,k observed for an electron from the
klh
shell of atom /' is
Nj,k = I,, pi CJi,k A.,k tj.k
where [0 is the incident x-ray flux, p, is the volume density of atom i, a,. k is the
differential photoionization cross section, A,,k is the mean free path for the electron, and
63

Tijk is the instrument transmission or throughput function. Both I0 and xi k are instrument
constants although I0 drifts somewhat with time. The other three parameters are
dependent on the sample.
The differential photoionization cross section aik is composed of two factors the
total photoionization cross section (or sensitivity factor) and an angular asymmetry
factor. The sensitivity factor for each atom was calculated by Scofield in 1976 107 and
depends on the probability of the given orbital interacting with the x-ray photons. The
angular asymmetry is dependent on the instrument geometry and the atomic orbital.
The mean free path Al k is essential to understanding surface modification
reactions. This parameter relates to the sampling depth of the analysis for a given sample
and depends on factors such as density and homogeneity of the sample surface. A basic
expression of the XPS signal is
N= N„e-h/(AsinG)
where h is the depth of the signal and 9 is the takeoff angle as defined in Scheme 3.3.
When h = 3(A sin 9), 95% of the observed signal originates from this depth of the
sample. This thickness is commonly referred to as the sampling depth of XPS for a given
atom in a given sample. Typical carbon Is electron mean free path values for polymers
are on the order of 10 - 45 A yielding sampling depths from 8 - 35 A when 9=15° and
30- 130 A when 9 = 75°.
Attenuated Total Reflectance Infrared Spectroscopy
Attenuated total reflectance infrared spectroscopy (ATR-IR) 107 is also commonly
referred to as internal reflectance infrared spectroscopy or IR-IRS. ATR-IR produces an
64
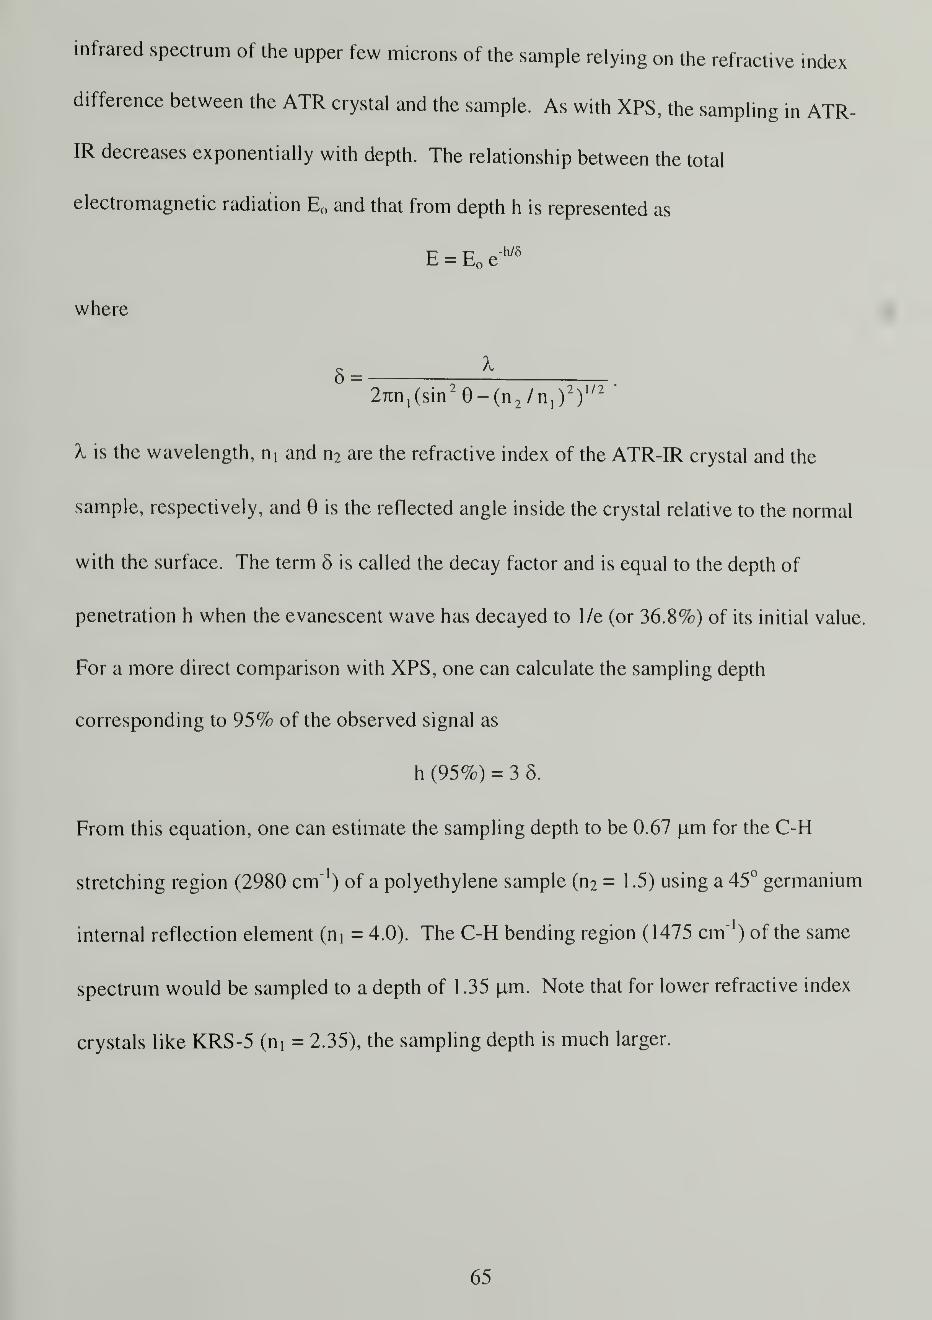
infrared spectrum of the upper few microns of the sample relying on the refractive index
difference between the ATR crystal and the sample. As with XPS, the sampling in ATR-
IR decreases exponentially with depth. The relationship between the total
electromagnetic radiation E0 and that from depth h is represented as
E = E0 e"h/8
where
5 = -1.
2Tm1
(sin29-(n
2/n
1)
2
)
1/2
X is the wavelength, m and n 2 are the refractive index of the ATR-IR crystal and the
sample, respectively, and 0 is the reflected angle inside the crystal relative to the normal
with the surface. The term 5 is called the decay factor and is equal to the depth of
penetration h when the evanescent wave has decayed to 1/e (or 36.8%) of its initial value.
For a more direct comparison with XPS, one can calculate the sampling depth
corresponding to 95% of the observed signal as
h (95%) = 3 5.
From this equation, one can estimate the sampling depth to be 0.67 u,m for the C-H
stretching region (2980 cm"1
) of a polyethylene sample (n 2 = 1.5) using a 45° germanium
internal reflection element (m = 4.0). The C-H bending region (1475 cm"1
) of the same
spectrum would be sampled to a depth of 1 .35 um. Note that for lower refractive index
crystals like KRS-5 (m = 2.35), the sampling depth is much larger.
65

Modification Reactions for Teflon AF
While the reduction of Teflon AF with sodium naphthalenide (Na-Nap) was
studied in detail, this project also involved the screening of two other potential
modification reactions of Teflon AF. Aluminum metal deposition was examined because
it had been suggested as an effective Teflon AF modifier. 109 '! 10 Mercury/ammonia
photosensitization shows promise theoretically because of the presence of tertiary carbon
atoms in the molecule, which are required according to the promoters of this means of
perfluorinated, saturated, small molecule functionalization. 109 - 1 1
1
All three modification
reactions were investigated to make Teflon AF more wettable since limited research on
Teflon AF surface modification has been reported in the literature.
The successful modification of Teflon AF 2400 (87 mole % dioxole) was reported
using vacuum UV irradiation.94 The samples were irradiated downstream from a helium
microwave plasma with and without a LiF filter (used to remove photons of wavelength
less than 104 nm). They found a reduction in water contact angle to 0A = 38° and 9R = 2°
without the use of the LiF filter. These values were much lower than the contact angle
data for PTFE or PFA (copolymer of TFE and perfluoroalkoxy monomers) exposed to
the same conditions. Nitrogen was incorporated in the samples in addition to oxygen, but
a thorough analysis of the surface was not conducted. The conclusion was made that
Teflon AF appeared to undergo ring cleavage rather than the crosslinking that was
observed with PTFE and PFA.
Teflon AF 1600 was reportedly modified using reactive ion milling. 112 A reactive
ion beam of Ar and 02 was used, and it was found that Teflon AF is stable to active
oxygen even at 300 °C. The reported mechanism of this etching requires ion
66

bombardment and is enhanced by the presence of the active oxygen and by increased
temperature.
The only reference to wet chemical Teflon AF surface modification found was an
attempt at reduction using alkali metal reducing agents by researchers at DuPont. They
were able to modify only polymers containing at least 80 mole % TFE monomer. They
stated, "in our hands, Teflon-AF is unreactive even toward much stronger reducing
reagents such as sodium naphthalene and sodium benzophenone radical anions, as gauged
by visual appearance and contact angle studies." 113
From these few reported modifications of Teflon AF, little information is gained
concerning the nature of the modified surface and the origin of the reaction. This work
presents data that leads to a better understanding of Teflon AF reactivity and the origins
of this reactivity.
Sodium Naphthalenide Reductions
Sodium naphthalenide (Na-Nap) is the most common wet chemical,
fluoropolymer reducing agent in use due to its effective reducing power combined with
its relative ease of handling and stability. 84 ' 1 14 - 1 15 Scheme 3.4 details the mechanism of
the reduction, which involves the single electron transfer (SET) from the radical anion
Na-Nap to the fluoropolymer chain. The elimination of fluoride forms the stable salt NaF
leaving a radical on the chain. A further SET followed by P-elimination of fluoride
results in unsaturation along the fluoropolymer backbone. This is an autocatalytic
process creating a polymer that is modeled as a conjugated system of sp" and sp
hybridized carbon atoms.
67
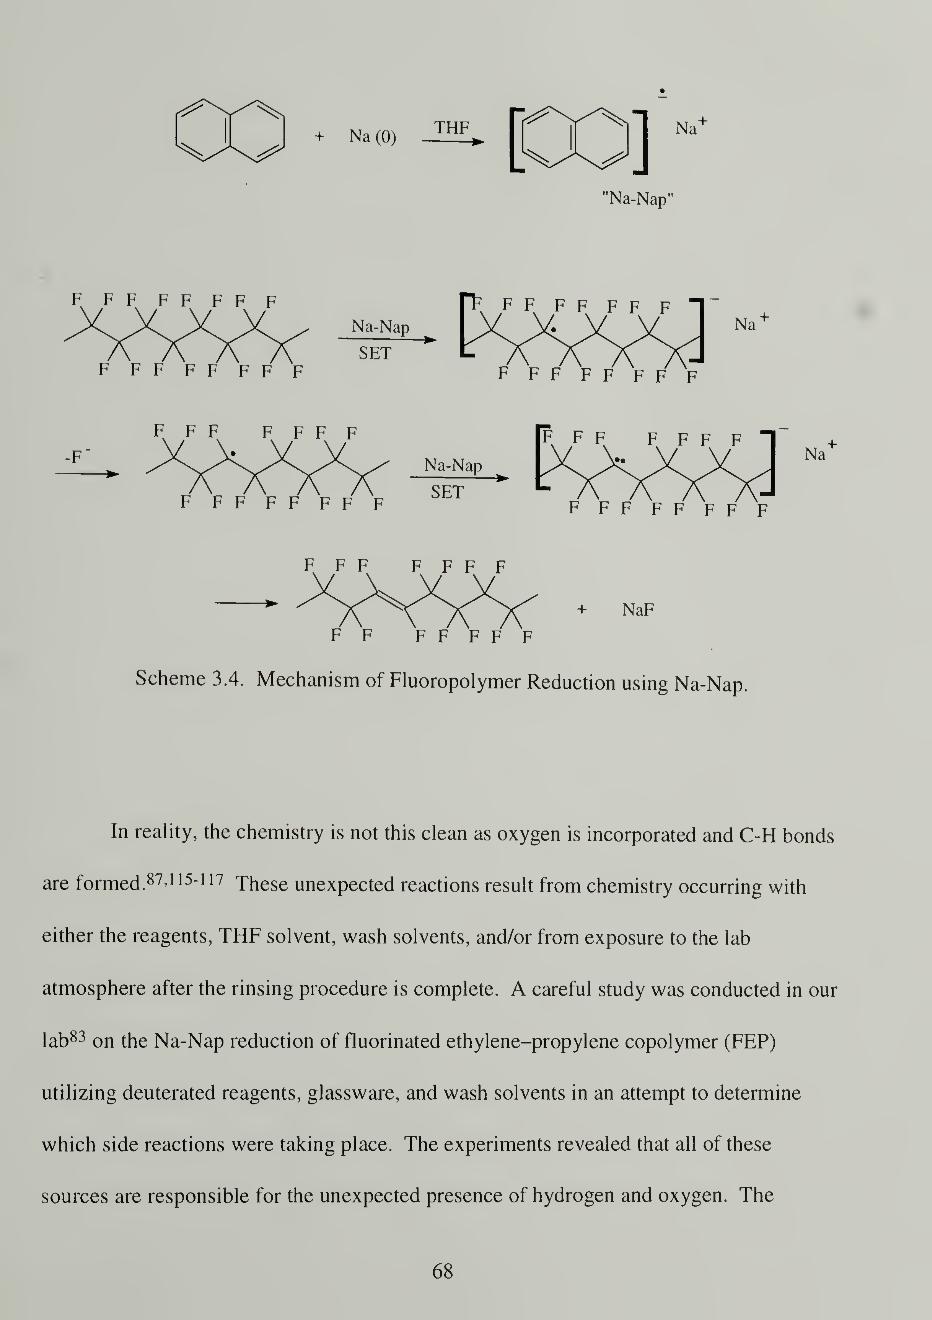
"Na-Nap"
F FF FF FF F "F F F F F FNa-Nap
SET
F F
FFFFFFFFNa
FFFFFFFF
F F F F F F F
Na-Nap
FFFFFFFF SET
Na
FFFFFFFF
F F F F F F F
+ NaF
F F F F F F F
Scheme 3.4. Mechanism of Fluoropolymer Reduction using Na-Nap
In reality, the chemistry is not this clean as oxygen is incorporated and C-H bonds
are formed. 87-
1 15 -' 17 These unexpected reactions result from chemistry occurring with
either the reagents, THF solvent, wash solvents, and/or from exposure to the lab
atmosphere after the rinsing procedure is complete. A careful study was conducted in our
lab83 on the Na-Nap reduction of fluorinated ethylene-propylene copolymer (FEP)
utilizing deuterated reagents, glassware, and wash solvents in an attempt to determine
which side reactions were taking place. The experiments revealed that all of these
sources are responsible for the unexpected presence of hydrogen and oxygen. The
68

instability of the reduced FEP or PTFE surface is visually apparent as the dark brown or
black reduced sample lightens immediately on exposure to the lab environment
sometimes returning to a white appearance. 1 18
In the case of FEP reduction by Na-Nap, the modified layer was found to form
rapidly. The modified layer thickness was determined to be approximately 45 or 300 A
thick after a 30-min reaction with 0.2 M Na-Nap in THF at -78 or 0 °C, respectively. 83
The depth of reaction can be determined by a gravimetric analysis using an oxidation
reaction to etch away the reduced fluoropolymer. The oxidation reaction will be
described later. The reactivity of the reduced fluoropolymer and an idea of the nature of
the chemical bonds formed can be determined using derivatization reactions that target
specific functional groups. Again, this will be described later in this chapter.
Aluminum Deposition/Dissolution
Metal deposition is another common means of fluoropolymer modification.
Although it is not generally considered a chemical modification, metal deposition can
lead to a chemical modification as in the metal vapor deposition of aluminum onto PTFE
followed by the dissolution of the aluminum with aqueous base. 102 ' 119 The
fluoropolymer surface after this deposition/dissolution is more hydrophilic with
advancing water contact angles on the order of 70°. The modification was found to
result in the incorporation of C-O and C-H bonds but no unsaturation to a depth of 2.5-
3.0 nm as determined by XPS. Multiple deposition/dissolution cycles (at least three)
were found to be necessary to achieve reasonable degrees of modification.
69

A previous member of the McCarthy group also took this approach. 120 Brennen
found that annealing metallized poly(vinylidene fluoride) for up to 10 hours at 60 °C in
the presence of the lab atmosphere enhanced the modification. She also found that it was
important to deposit a thin metal layer in order to allow the subsequent oxygen treatment
of air annealing to be effective in reaching the interface. An aluminum layer of 30 nm
compared to one with 60 nm was found to render twice as much oxygen present in the
outer layers of the film. The modification was found to yield carbon-oxygen bonds that
were presumed to be primarily carboxylic acid groups confined to the upper ~4 nm of the
fluoropolymer surface.
Researchers at RPI reported the modification of Teflon AF 1600 with
aluminum. 109 They did not examine the functionalization of AF through dissolution of
the aluminum layer, however. They reported a 3 nm thick deposition of Al followed by
analysis of the buried interface by XPS. The presence of AIF3 was found with the
fluorine source being identified as the -CF3 groups of the Teflon AF from XPS analysis
and a Gibbs free energy calculation that revealed a -135.4 kcal/mol favorable reaction.
The other C-F bonds, according to the calculation, were slightly less likely to allow
fluoride abstraction. While surface functionalization was not pursued in their work,
based on these results, introduction of oxygen functionality to the Teflon AF surface was
expected by us to be facile.
Mercury/Ammonia Photosensitization
Crabtree98 - 1 1
1
has recently examined the gas phase surface modification of PTFE
by mercury photosensitization, which is reported in two papers that focus primarily on
70

small molecule saturated fluorocarbons. Scheme 3.5 is a small molecule example of how
the reaction is thought to occur. A complex is formed between mercury and ammonia in
the gas phase that is excited by a UV light source. This excited state complex reduces the
saturated fluorocarbon. Double bonds form and then react with the ammonia gas as if the
reaction were not irradiated. Thus, an unsaturated fluorocarbon such as perfluoro-2-
methyl-2-pentene exposed to ammonia produces the same product.
CFK NC NH2 CFv>P rT7
Hg/hy/NH* \ / NH 3 \C h-Ch 2 ** > < + C=CF/ \ 95% / \ / \CF3 CF2—CF3 NC CF2—CF3 CF/ CF2—CF3
Scheme 3.5. Hg*/NH 3 Photosensitization of Perfluoro-2-methylpentane.98
Exposure of a PTFE sample to mercury vapor and ammonia gas in a quartz tube
with 254 nm UV irradiation was reported to produce a surface with a water contact angle
of 50° and an infrared spectrum containing a weak C=NH stretching band.98 The authors
postulate that while the reaction is facile on small molecule tertiary carbons, it must be
capable of reacting slowly with the secondary C-F bonds present in PTFE. By analogy, a
somewhat more rapid reaction should occur on Teflon AF, which has two tertiary carbons
for each dioxole monomer.
The mechanism is thought to involve a single electron transfer from an excited
Hg(NH 3-NH 3 ) complex and the subsequent loss of fluoride. 1 1
1
Once unsaturation is
present in the molecule, the ammonia can react to form the carbon-nitrogen single,
double or triple bonds observed creating amines, imines, or nitriles. After washing the
71

surface with water and THF, the authors found that the carbon-nitrogen bonds
disappeared, presumably due to the instability of this functionality on fluorinated
systems.
Probing the Chemical Reactivity of Reduced Surfaces
The reduced fluoropolymer surface is generally characterized as having a low
water advancing contact angle (high surface energy) and an XPS spectrum with oxygen
and little to no fluorine present which is in marked contrast to the unmodified
fluoropolymer. An oxidation can be run on this surface removing the modified layer to
determine the depth of modification. In order to determine the chemical structure and
reactivity of the reduced surface, derivatization reactions can be run yielding the relative
amounts of alkene, alkyne, carbonyl, hydroxyl, and carboxylic acid present.
Reactions with Unsaturated Surfaces
According to the mechanism shown in Scheme 3.4, the reduced fluoropolymer
surface should contain a large degree of unsaturation. Two convenient means of
determining the amount of C=C and C=C bonds are bromination and hydroboration.
Both provide XPS labels to make analysis straightforward.
Bromination
Bromine in the form of a gas or as a solution in carbon tetrachloride reacts readily
with unsaturation in a molecule proceeding via both an electrophilic and free radical
72

mechanism. 121 Historically, bromination reactions have been used to determine if
molecules contain unsaturation. Reactions are generally run in the absence of light (hv)
to prevent the free radical mechanism from competing. The electrophilic addition of
bromine is reported to be more rapid and complete on an alkyne than on a difluorinated
alkene and most rapid on alkenes with carbon-hydrogen bonds. 1 17121 In fact, bromine
does not add to tetrafluoroethylene; only nucleophiles and radicals can add to TFE. Thus,
bromination may prove useful in determining the relative amount of non-fluorinated sp2
and sp hybridized carbon atoms. The bromine incorporation can be followed by XPS and
ideally by a reduction of the C=C region of the ATR-IR spectrum.
Hydroboration
The hydroboration of the reduced surface with a room temperature borane-THF
complex followed by oxidation with basic peroxide at 0 °C yields an hydroxylated
surface. 91 This surface can then be labeled easily with heptafluorobutyryl chloride (next
section) to determine the amount of hydroxyl functionality on the derivatized surface.
Borane adds to double and triple bonds following Markovnikov's rule. Boron is more
electropositive than hydrogen, so the addition appears to be anti-Markovnikov (with
boron adding to the least substituted carbon). Hydroboration is more effective than
bromination and would therefore be expected to reduce all of the alkene functionality
present. However, this reaction is expected to reduce carboxylic acids, aldehydes, and
ketones to alcohols, as well. 121
Fluorinated alkenes, upon hydroboration followed by oxidation, yield an unstable
alcohol that rapidly eliminates forming a ketone which can be labeled (next section).
73

Alkyne functionality generally reacts only once with the borane, again yielding a ketone
upon oxidation (unless the alkyne is terminal in which case a primary alcohol results).
XPS analysis of the sample prior to oxidation was examined in addition to the
examination after oxidation and labeling to estimate the borane present and provide an
additional measure of unsaturation.
Reactions with Oxygen-Containing Functionality
Carbonyls
2,4-Dinitrophenylhydrazine (DNPH) reacts with aldehydes and ketones when
catalyzed by acid to form the hydrazone. 121 See Scheme 3.6. This is the first step in the
Wolff-Kishner reduction of aldehydes and ketones; however, the Wolff-Kishner reaction
requires the presence of base to complete the reduction. The addition of the hydrazone
can be followed easily by UV (368 nm broad peak) and IR (1617 cm'1
aromatic
absorbance and loss of -1700 cm'1
carbonyl intensity). The addition of the nitrogen-
containing species can also be easily observed using XPS.
Scheme 3.6. Addition of DNPH to a Carbonyl to Form a Hydrazone.
74
The derivatization of the reduced fluoropolymer using DNPH can be quantified
by several techniques and compared to obtain an accurate description of the presence of
carbonyl functionality in the modified region. The quantification of the IR and UV data
requires that the extinction coefficients for the phenyl hydrazone be known. They are
1350 M 'cm"1
for the 1617 cm 1
IR band and 21,600M'W for the UV absorbance at
368 nm. 1 17 Use of these extinction coefficients assumes that the local environment for
the labeled, reduced fluoropolymer is the same as the environment of the small molecule
used to obtain these values. This assumption may be too great to allow quantification,
but quantifying this reaction with both UV and IR would allow the ability to determine
relative amounts of the other functional groups through the use of the infrared data. XPS
data will be independently quantifiable and also more accurate. Effective derivatization
may not be possible throughout the ATR-IR sampling depth due to problems of reactant
diffusion into the modified surface.
Alcohols
Following the procedure used by Chen, 122 surface hydroxyl groups can be
esterified by reaction with heptafluorobutyryl chloride (HFBC) in THF. The product of
this acylation has a distinct IR absorbance at 1778 cm"1
and is identifiable in the XPS
spectrum with the reintroduction of fluorine to the reduced fluoropolymer surface. One
should note that it is possible to add the acyl halide to double and triple bonds, but the
HFBC favors reaction with the alcohol. The addition to the unsaturation would be easily
identifiable by the presence of chlorine in the XPS and has not been seen previously. 83 -91
75

Carboxylic Acids
The labeling of carboxylic acids first requires the protection of any hydroxyl
functionality followed by reaction with U'-carbonyldiimidazole (CDI).i22 The
protection with HFBC and subsequent CDI reaction is shown in Scheme 3.7. Chen found
3HFBC / THF
2h, RTOH
3
0
OH
O
N Nw NwN
xI—0^C 3F7
THF, 4 h, RT
O
LA
3H
N NWu
O^XiF
Scheme 3.7. Reaction Scheme for Labeling Carboxylic Acids using 1 ,
1
Carbonyldiimidazole. 1 22
this to be a clean labeling reaction for differentiating alcohols and carboxylic acids on
modified polyethylene terephthalate) (PET) surfaces. The introduction of the nitrogen
atoms serves as a convenient XPS label while the imidazole functional group can be
easily observed in the infrared spectrum.
Etchants
A solution of potassium chlorate (KCIO3) in concentrated sulfuric acid yields a
strong etchant that oxidizes the reduced portion of the fluoropolymer, completely
removing it from the surface. This provides an easy way to determine the depth of the
reduction reaction through a difference in the mass before and after reduction/oxidation.
The relationship is given in the following equation where M v is the mass of the virgin
76

material, M0 is the mass of the sample after reduction and oxidation, p is the density of
the fluoropolymer, and A is the surface area of the sample.
Mv-Moreaction depth =
PA
Often the oxidation leaves a higher energy surface relative to the virgin material,
resulting from the presence of partially reduced polymer chains at the interface of the
modified and unmodified fluoropolymer prior to oxidation. This was found to be a
convenient way to make carboxylic acid-functionalized FEP with only the top few
angstroms of the surface being modified. 123
Experimental
In the following sections, references to vacuum drying imply the use of a liquid
nitrogen-trapped vacuum line pumped to reduced pressures (-15 mTorr) with a
mechanical oil pump. All reactions were run using airless techniques (nitrogen purge or
blanket and use of cannula for liquid transfer) unless otherwise specified.
Instrumentation
X-ray photoelectron spectra (XPS) were acquired using a Physical Electronics
5 1 00 spectrometer with Mg Ka excitation ( 1 5.0 kV, 400 W). Spectra were recorded at
two takeoff angles, 15° and 75°, from the sample plane to the detector optics at reduced
pressures of ~5 x 10" 8 Torr. Atomic concentration data was determined using sensitivity
77

factors obtained from samples of known composition: C, s , 0.250; 0, s , 0.660; F, s , 1 .000;
N ls , 0.420; Si 2s , 0.260; Na ls , 2.300; B ls , 0.130; and Br3d , 0.830.
Contact angle measurements were made with a Rame-Hart telescopic goniometer
using a Gilmont syringe with a 24-gauge Hat-tipped needle. Purified water and distilled
hexadecane were used as probe fluids. Both advancing and receding contact angles were
measured with the advancing angle taken as fluid was added to the drop and the receding
taken as fluid was withdrawn.
Attenuated total reflectance infrared spectra (ATR-IR) were acquired using a Bio-
Rad 175C FTIR with 2 cm"1
resolution. A 45° germanium internal reflection element
with a refractive index of 4.0 was used. UV/Vis spectra were acquired on a Perkin Elmer
Lambda 2 UV/Vis spectrometer.
Materials
Teflon AF 1600 and 2400 were acquired from DuPont in the form of powder and
were used as received. DSC analysis was the only method easily available to verify the
composition of the fluorocopolymers. Figure 3.1 shows the DSC thermogram of the
Teflon AF 1600 used in the following experiments. The reported Tgfor a 65 mol%
dioxole copolymer is 160 °C. Because our measured Tgof 149 °C is slightly lower, the
Teflon AF given to us is likely a copolymer with a lower percentage of the dioxole.
Teflon AF 2400 was melt-pressed into a plaque at 270 °C. The Teflon AF 1600 was
either melt-pressed at 1 80 °C or cast from solution as described below using perfluoro-2-
butyltetrahydrofuran purchased from Lancaster. Bone dry carbon dioxide (Merriam
Graves) was used as received. House nitrogen was used as the purge gas.
78

-0.14j
-0.15
I-° 16
I -0.17
E8 -0.18
X-0.19
-0.2
50 100 150 200 250 300
Tenrrperature (°C)
Figure 3.1 . DSC trace for Teflon AF 1600 with T„=149 °C.
Naphthalene was recrystallized twice from methanol solution forming sheet-like,
white crystals. Tetrahydrofuran (THF) was distilled under nitrogen over sodium-
benzophenone. Pharmco Products ethanol (99.5%), Aldrich methanol (99+%), and
Fisher n-heptane (HPLC grade, 99.4%) were all used as received. The water used was
taken from a Millipore Milli-Q water system that utilizes the building's reverse osmosis
water and purifies it further through filtration and ion exchange. The water had a
measured resistivity of 18.2 MQ.
79

cm
General Procedures
Casting Uniform Films
Creating Teflon AF 1600 film substrates of uniform thickness proved to be quite
difficult. Initially, the films were compression molded at 250 °C into a 7.6x7.6x0.025
form. The resulting films were rather rough, so it was decided that the films should be
cast from solution. A 5-wt% solution of the fluorocopolymer in perfluoro-2-
butyltetrahydrofuran (f-BTHF) was used. The best way to insure uniform thickness was
to float a 10-cm diameter silicon wafer on a pool of mercury. This kept the wafer
perfectly level. The solution was poured onto the wafer and covered with a glass dish to
allow slow evaporation of the fluorinated solvent.
After several days, the coated wafer was removed from the mercury and was
placed in a vacuum oven. The film was dried under vacuum overnight, heated under
vacuum to 105 °C for 8-16 h, and then cooled again to room temperature while still under
vacuum. The film was floated off the wafer in water and cut into pieces of a size larger
than needed for the experiments. Finally, the pieces of Teflon AF 1600 were extracted
with 5.7 MPa C02 to constant weight to remove the remaining f-BTHF. In general, three
extractions were required. C02 extractions conducted after each of the above steps
revealed that after four days of casting, 13-wt% solvent remained, and after vacuum
drying, 3-wt% f-BTHF still remained. The CO2 extractions caused the films to warp
rather significantly if they were conducted immediately after casting, thus the need for
the vacuum treatment while they were still on the wafer.
80
Surface Modifications
Sodium Naphthalenide Reduction (Red-AB
Solution Preparation. Naphthalene was placed in a dry, nitrogen-purged, round-
bottomed flask and purged for 10 minutes. THF was added via cannula. An excess of
sodium, stored in oil, was chipped from the block, removed from the oil with tweezers,
rinsed with hexane over a nitrogen-purged flask, and cut into smaller pieces before being
dropped into the naphthalene/THF solution under heavy N 2 purge. A dark green solution
grew from the freshly cut faces of the sodium until the entire flask was filled with the
dark green color. The solution was stirred for 1-3 h under a nitrogen blanket to allow
complete complexation of the sodium with the naphthalene (Na-Nap). The solution was
then transferred via cannula to a round-bottomed flask equipped with a rotaflo stopcock
for storage. The remaining sodium was reacted slowly with progressively wetter solvents
until no solid was visible. Two different Na-Nap solutions were made during the work in
this chapter. The first was 0.098 M, and the second was 0.15 M as determined by
titration.
Titration of Na-Nap. 124 A 0. 1 M, nitrogen-purged solution of acetic acid in THF
was prepared for titration of the Na-Nap. Some of the titration solution was added to a 15
mL, graduated, volumetric, Schlenk tube. To another Schlenk flask, was added the Na-
Nap solution to be titrated. Under a minimum nitrogen flow, the Na-Nap was titrated
until a pale green color was obtained. This was taken as the endpoint of the titration.
After 3-5 measurements, the concentration was calculated as the average of the values.
81

Solvent/N
inlet
I
14/20
24/40
A
10 cm
To oil bubbler
Waste
Scheme 3.8. Reaction Set-up for Na-Nap Reductions
Reduction of Teflon AF with Na-Nap. In general, two pieces of Teflon AF
(~ 1 .5x 1 .5 cm) were place in a Schlenk tube (Scheme 3.8), and purged for 15 minutes
with nitrogen. The Na-Nap solution was added to the Schlenk via cannula until the
solution completely submerged the samples (~7 mL). During reaction, the stopcock was
closed to seal the flask. After reaction, the Na-Nap was removed and the light brown
films were rinsed thoroughly 4 times with THF, once with THF:water ( 1 : 1), 4 times with
water, and once again with THF all via cannula under N2 purge. This was necessary to
remove the residual NaF, NaOH, and naphthalene.
82
Aluminum Deposition/Dissolution (Al dcp/diss)
Teflon AF films were coated with a 20-nm thick aluminum layer using a
Thermionics Evaporator with a Maxtek deposition controller. After deposition, the
metallic films were annealed in a glassware oven at 95 °C for 15.5 h. The aluminum was
dissolved in an 8 M NaOH solution. The aluminum disappeared almost instantly, but the
films were soaked for an additional 10 min to insure complete removal. The modified
side of the films was more easily wetted by the aqueous solution. The films were then
rinsed thoroughly with water and dried under vacuum overnight.
Mercury/Ammonia Photosensitization (Hg*/NH0
A drop of mercury was placed in the bottom of a long quartz tube. Teflon AF or
FEP film samples were threaded onto a long cannula. Scheme 3.9 shows the
experimental set-up for this reaction. The system was purged with nitrogen for ~2 h
before being purged with ammonia gas (Aldrich, 99.99+%). Once a slow flow rate of
NH3 was established, the low pressure (254 nm) mercury lamps were used to irradiate the
samples. The lamps had an intensity of -70 mJ/cnTmin (see Note). After reaction, the
light orange-yellow films were carefully removed from the cannula. Some films were
rinsed twice with water, twice with THF, and twice with methylene chloride. Then, all of
the films were vacuum-dried overnight.
83
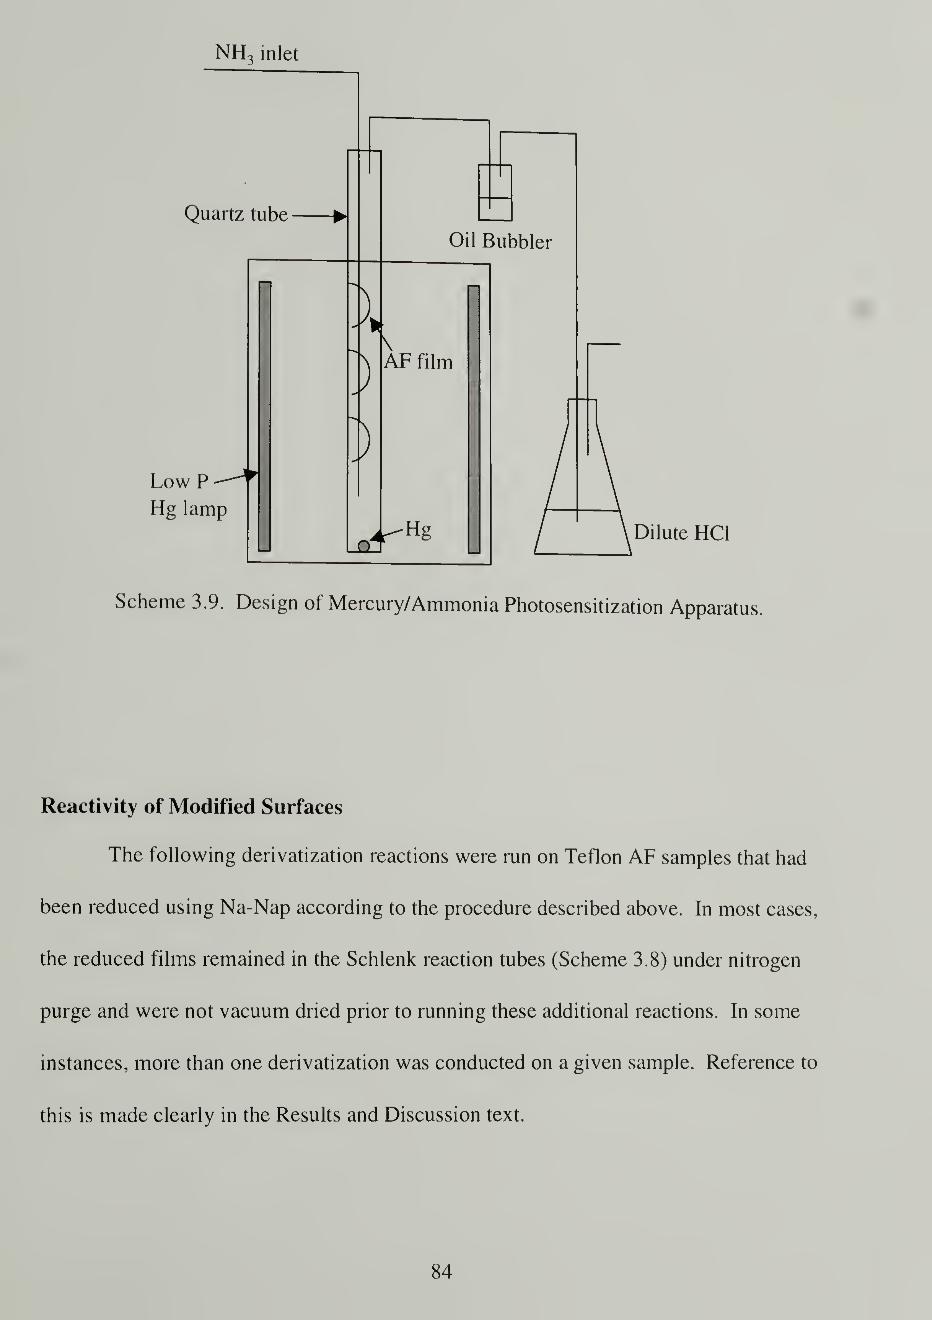
NH3 inlet
Quartz tube
LowHg lamp
Oil Bubbler
KAF film
Hg Dilute HC1
Scheme 3.9. Design of Mercury/Ammonia Photosensitization Apparatus
Reactivity of Modified Surfaces
The following derivatization reactions were run on Teflon AF samples that had
been reduced using Na-Nap according to the procedure described above. In most cases,
the reduced films remained in the Schlenk reaction tubes (Scheme 3.8) under nitrogen
purge and were not vacuum dried prior to running these additional reactions. In some
instances, more than one derivatization was conducted on a given sample. Reference to
this is made clearly in the Results and Discussion text.
84

Oxidation
A solution of 1.00 g potassium chlorate (KC103 ) in 50 mL sulfuric acid (H2S04 )
was prepared. Some smoke was observed as the dark red-orange solution was made.
The oxidizing solution was added to scintillation vials containing the reduced Teflon AF
samples. Reaction was allowed to proceed in air for 21 h after which the now colorless
films were rinsed 3 times with water and 3 times with THF. The films were dried under
vacuum overnight and were extracted to constant mass with C02 if the samples were used
in a gravimetric analysis. The extraction removed approximately 0.25 wt% material
believed to be THF. For the sensitive gravimetric analysis, this mass was substantial.
Bromination of Red-AF
Approximately 0.3 mL bromine was added via pipette to a Schlenk tube
containing the reduced Teflon AF films and 3-5 mL carbon tetrachloride making a dark
red solution. No special care was taken to exclude the lab environment. The Schlenk
tubes were sealed and placed in a darkened 0-°C circulator overnight. The reaction
vessels were removed from the water bath and the orange-yellow films were rinsed 4
times with carbon tetrachloride, 3 times with methylene chloride, and several times with
THF before being vacuum-dried overnight. The solvent washes removed the majority of
the color; vacuum drying removed the rest.
Hydroboration of Red-AF
A 1 .0 M solution of borane in THF (Aldrich) was added via cannula to the
Schlenk tubes containing reduced Teflon AF. Some bubbling occurred, presumably due
85

to residual water in the vessel from the rinses following reduction. A 4 h reaction period
was allowed for samples which had only been reduced with Na-Nap for 10 minutes. 4 h
reductions with Na-Nap were treated with 21 h hydroborations.
After hydroboration, the films were rinsed thoroughly with THF. Some samples
were placed on the vacuum line overnight while others were oxidized with a 1 : 1 solution
Of 30% hydrogen peroxide and 3. 1 M sodium hydroxide for 1-3 h. After oxidation, the
films were rinsed twice each with dilute NaOH, water, dilute HC1, water, and THF before
being vacuum-dried overnight.
Addition of 2,4-Dinitrophenylhydrazine to Red-AF
A small amount of water (~1 mL) was added to 0.23 g 2,4-dinitrophenylhydrazine
(DNPH ) ( Aldrich). Most of the DNPH dissolved creating a red-orange solution.
Concentrated HC1 (~1 mL) was added to the suspension causing the color to lighten to a
light orange and some solid precipitated. Ethanol (~4 mL) was then added causing the
solution color to darken, but approximately 1/3 of the initial DNPH solid remained
undissolved. The suspension was transferred to a Schlenk flask containing 20 mL
ethanol. This procedure came from a reference 1 17 and is not recommended for future
DNPH solution preparation due to the formation of the precipitate.
For derivatization reaction, a film of Teflon AF was reduced as described above.
The final THF rinse was omitted, and the bright orange DNPH solution was added
directly to the Schlenk while maintaining an oxygen-free atmosphere. Reaction was
allowed to proceed for 1 .5 h for the 10-min reduced Teflon AF and overnight for the 4-h
reduced Teflon AF. After the reaction period, the DNPH solution was removed via
So

cannula, and the reacted films were rinsed thoroughly with ethanol over a period of 40
min. The films were rinsed twice with n-heptane and with THF and were then vacuum-
dried overnight.
Acylation of Red-AF with Heptafluorobutvrvl Chloride
An ampule containing 5 g heptafluorobutyryl chloride (HFBC) was added to a
round-bottomed flask with -30 mL THF. The solution was purged with nitrogen before
transferring it to a Schlenk flask for storage. Reactions on reduced or otherwise modified
Teflon AF surfaces were conducted by adding enough HFBC solution to fully cover the
films. After reaction periods of 2 h for 10-min reduced Teflon AF to 24 h for more
extensively modified surfaces, the labeling solution was removed and the films rinsed
with THF, methanol, and n-heptane. The films were then dried on the vacuum line
overnight.
Addition of 1 , 1 '-Carbonyldiimidazole to Red-AF
In most cases, the reaction to label acid functionality using 1,1'-
carbonyldiimidazole (CDI) followed an HFBC reaction (above) to block reaction of the
CDI with surface hydroxyl groups. The CDI solution was prepared by transferring 0.75 g
CDI to a Schlenk tube in a glove box. 33.5 mL THF was then added making a 0. 14 M
solution.
Reactions with CDI required the addition of the solution to a Schlenk flask
containing the films to be derivatized. The reaction was allowed to proceed overnight.
87

The CDI solution was then removed via cannula, and the films were rinsed 4 times with
THF and twice with n-heptane. The films were vacuum-dried overnight.
Results and Discussion
The modification and labeling reactions of Teflon AF were followed primarily by
the techniques of XPS and contact angle and, to a lesser extent, UV/Vis and ATR-IR.
The carbon 1 s photoelectron spectra of unmodified Teflon AF 1600 and 2400 are shown
in Figure 3.2. There are at least four different carbon atoms that combine to form this
lineshape. The highest binding energy peak is assigned to the most electronegative -CF3
moiety of the dioxole. In general, aliphatic C-H carbon atoms have peak maxima around
286 eV binding energy making them easily distinguishable from the substrate.
303 301 299 297 295 293 291 289 287 285 283
Binding Energy. eV
Figure 3.2. XPS 75° takeoff angle spectra (carbon Is region) of Teflon AF 1600 (bottom)
and 2400 (top).
88

An elemental composition can be determined using XPS although the depth
dependence may alter the values slightly. From the XPS 75° takeoff angle data, Teflon
AF 1600 has a composition of C32.5F57O10.5, and Teflon AF 2400 has a composition of
C31.8F54.5On .7. The theoretical values are C33.3F55.7On and C33.3F54.1O12.6 for the 1600 (65
mol% dioxole) and 2400 (87 mol% dioxole) copolymers, respectively. The lower carbon
values and higher fluorine observed in the XPS analyses indicate that the -CF3 groups of
the dioxole are closest to the surface of the sample. As mentioned in the experimental
section, the Teflon AF 1600 acquired from DuPont is thought to have a lower percentage
of the perfluorodioxole than reported, based on the DSC results. The XPS results support
this although not conclusively.
The advancing (0a) and receding (Or) contact angle data for Teflon AF 1600 and
2400 are 1 2 17105" and 1 3 1798° (0A /9R ) for water and 69761° and 69739° for n-
hexadecane, respectively. The larger hysteresis observed with Teflon AF 2400 is a result
of the sample being melt-pressed as opposed to solution-cast. (A melt-pressed plaque is
very rough.) The large 9a values for both water and hexadecane are indicative of surface
-CF3 groups. This concurs with the conclusion drawn from XPS analysis.
Teflon AF Modifications
The majority of the modifications discussed in this chapter were performed on
Teflon AF 1600 (henceforth called simply Teflon AF). Comparison is made in several
instances with the modification of Teflon AF 2400. Comparisons are also made with
89

similar reactions performed on other fluoropolymers—especially polytetrafluoroethylene
(PTFE) and fluorinated ethylene-propylene copolymer (FEP).
Sodium Naphthalenide Reduction
Upon exposure of Teflon AF to a solution of sodium naphthalenide complex in
THF (Na-Nap), the fluorocopolymer is readily reduced as evidenced by visual
appearance as well as all the other techniques used to evaluate the reduction. Figure 3.3
shows the change in the UV/Vis absorbance of a film after 10-min and 4-h reductions
with Na-Nap. The film darkens to a light brown color, apparently the result of the
introduction of conjugated unsaturation to the film surface.
0.35
200 300 400 500 600 700 800 900
Wavelength (nm)
Figure 3.3. UV/Vis spectra of Teflon AF (0 h) and Teflon AF reduced with Na-Nap (10
min and 4 h).
90

Figure 3.4 shows the effect of reaction kinetics on this UV absorbance where it
can be seen that even up to 48 h the film continues to be reduced. The reaction does
seem to be self-limiting, however, as the intensity change of the absorbance with reaction
is initially large, but decreases with longer reaction times.
0.5
0.4
aco 0.3(N
C/3 0.2
<
0.1
0
0 5 10 15 20 25 30 35 40 45 50
Reaction Time (h)
Figure 3.4. UV/Vis absorbance at 320 nm for Na-Nap reductions of Teflon AF.
Exposure of the reduced surface to a strong oxidizant (KCIO3/H2SO4) effectively
removes the modified layer and serves as a convenient way to determine the depth of the
modification using a gravimetric analysis. Figure 3.5 shows the results of this analysis.
90% of the mass loss occurs upon reduction of the film with only a small amount of
additional mass loss after oxidation. The calculated reaction depth for the Na-Nap
reduction is -200 nm using the equation presented in the experimental section of this
text.
91

E
0.15
0.125
0.1
J 0.075COc/i
0.05
0.025
0 *
0
oxidized
• reduced
300
250
200 aV,
150 Z3g
100 -
50
0
5 10 15 20 25 30 35 40 45 50
Reaction Time (h)
Figure 3.5. Teflon AF mass loss upon reduction and subsequent oxidation.
These results indicate that while the reaction is confined to the top 200 nm of the
film within the first 2 hours of reaction, the reduction proceeds for at least 48 hours
(Figure 3.4). The fact that no further mass loss is observed while increased UV
absorbance occurs means that the additional reaction must be in the form of
rearrangements to form the conjugation most likely responsible for the UV spectrum.
Table 3.3 illustrates the change in the dynamic contact angle with Na-Nap
exposure. Both the water and hexadecane values decrease substantially after just 10 min
of reaction. The large hysteresis in the water contact angle data indicates that the surface
is either chemically or physically heterogeneous and perhaps both.
92
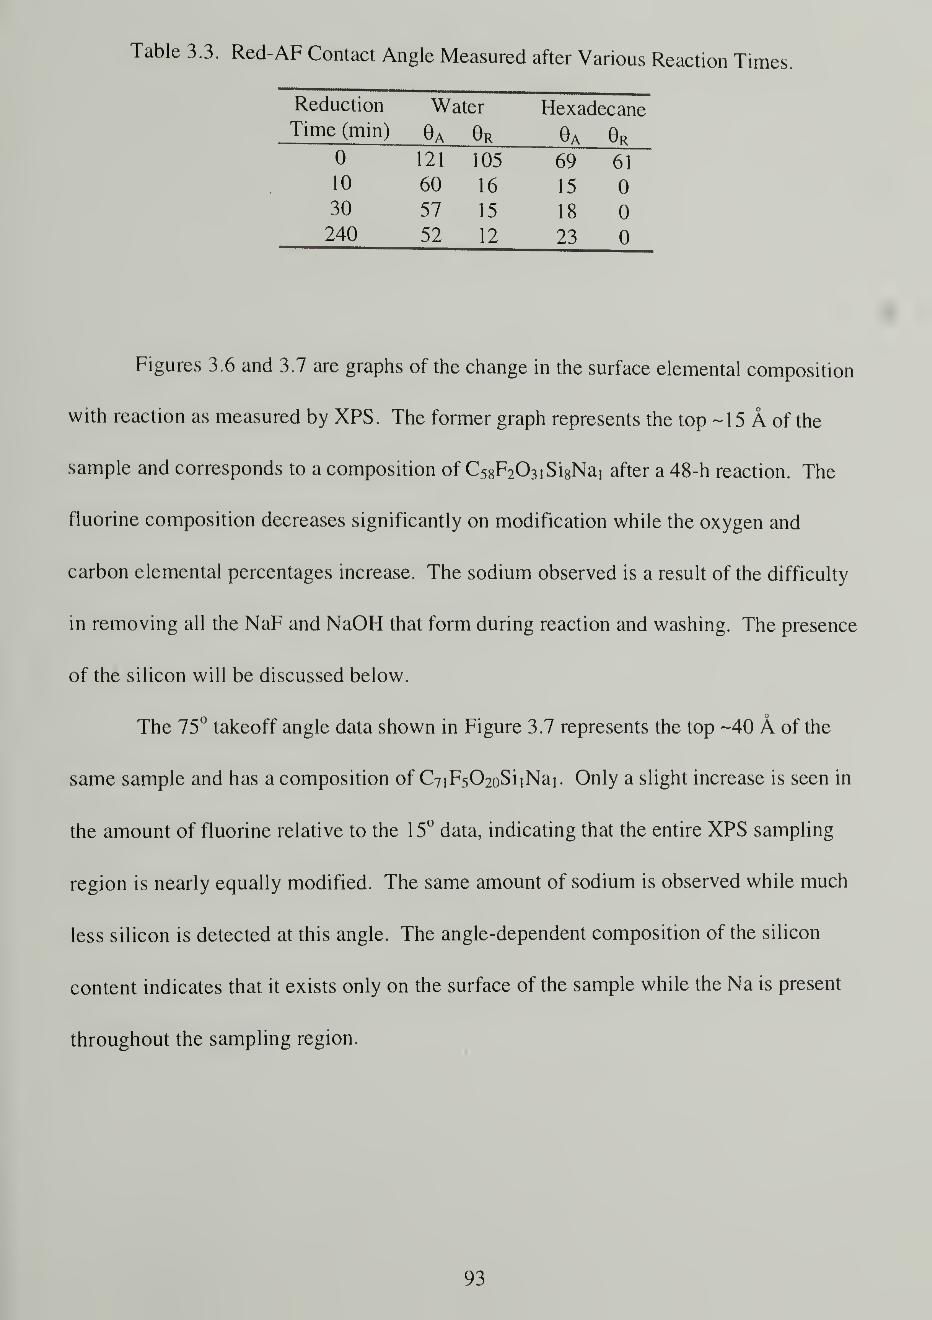
Table 3.3. Red-AF Contact Angle Measured after Various Reaction Times.
Reduction Water ocAducCaneTime ( min")* * * ^* l 1 11111 /
0 121 105 69 61
10 60 16 15 030 57 15 18 0240 52 12 23 0
Figures 3.6 and 3.7 are graphs of the change in the surface elemental composition
with reaction as measured by XPS. The former graph represents the top -15 A of the
sample and corresponds to a composition of C58F203 iSi 8Nai after a 48-h reaction. The
fluorine composition decreases significantly on modification while the oxygen and
carbon elemental percentages increase. The sodium observed is a result of the difficulty
in removing all the NaF and NaOH that form during reaction and washing. The presence
of the silicon will be discussed below.
The 75° takeoff angle data shown in Figure 3.7 represents the top -40 A of the
same sample and has a composition of CyiFsC^oSiiNai. Only a slight increase is seen in
the amount of fluorine relative to the 15° data, indicating that the entire XPS sampling
region is nearly equally modified. The same amount of sodium is observed while much
less silicon is detected at this angle. The angle-dependent composition of the silicon
content indicates that it exists only on the surface of the sample while the Na is present
throughout the sampling region.
93

0
*
2 3 4
Reduction Time (h)
— -C
-o
-F—
Na
X Si
Figure 3.6. XPS 15" takeoff angle data for Teflon AF reduced with Na-Nap
0 I
—--c
-o
-F
A Na
X Si
2 3 4 5 6
Reduction Time (h)
Figure 3.7. XPS 75° takeoff angle data for Teflon AF reduced with Na-Nap.
Figure 3.8 is an XPS multiplex spectrum of the silicon 2p peak observed in the
red-AF samples. From the binding energy, one can determine the nature of the silicon.
94

Initially, the silicon was thought to have arisen from a silicon grease contamination
resulting from the use of silicon grease on the reaction vessels joints; however, this type
of silicon would have a binding energy of 100-101 eV. Because the intensity of the
silicon peak is centered at 104 eV, the silicon must originate from a more highly oxidized
silicon such as silicic acid (Si(OH)4 ). Silicic acid is not isolable, but the stable Si02 ,
which results from silicic acid condensation, is quite common. The source of this silica
must be the glassware in which the Na-Nap solution is stored as well as the reaction
vessels. Any introduction of water into either system leads to reaction with Na-Nap
forming NaOH. This base could easily etch the glass forming this silicic acid. Had this
silicon source been identified earlier, the samples would have been rinsed with base prior
to XPS analysis. As a result of the contaminant, the 75° takeoff angle data will be used
for all sample analyses to minimize the effect. The amount of silicon contamination is
listed in all tables of XPS data.
115 0 113 0 111.0 105.0 107.0 105.0 103.0 101.0 33.0 V.O 950
HHDIHC EtCKGY. tV
Figure 3.8. XPS 75° takeoff angle spectrum of the silicon 2p peak observed in many of
the red-AF spectra.
95

Teflon AF 2400 was also reduced with Na-Nap. Significantly longer reaction
times were required to effect similar results. After a 24-h reaction, the water contact
angles decreased to 123752° from 131798°. This decrease is not nearly as significant as
that observed for Teflon AF 1 600 after even just a 10 min reaction. The carbon 1 s
spectrum is shown in Figure 3.9. The spectrum clearly has a new, lower binding energy
peak at 287 eV. (Compare this with Figure 3.2.) The elemental composition for this
reduced Teflon AF 2400 is C4.sF4oOnNa2 .
300 0 ?98.0 296.0 2*1.0 232.0 290.0 288.0 288.0 281.0 282.0 280.0
ftlMHNG I NfRCY. eV
Figure 3.9. XPS 75° takeoff angle spectrum (carbon Is region) of Na-Nap reduced
Teflon AF 2400.
Reduction of other fluoropolymers with Na-Nap has been reported extensively in
the literature. 83 -84 -
125 PTFE reduction was found to react rapidly and corrosively at -78
°C for short reaction times. A conducting reduced layer is thought to be responsible for
the pitting observed in these samples. Due to the trifluoromethyl branches in FEP, the
Na-Nap reduction is much more controllable because of an inability to form the
96
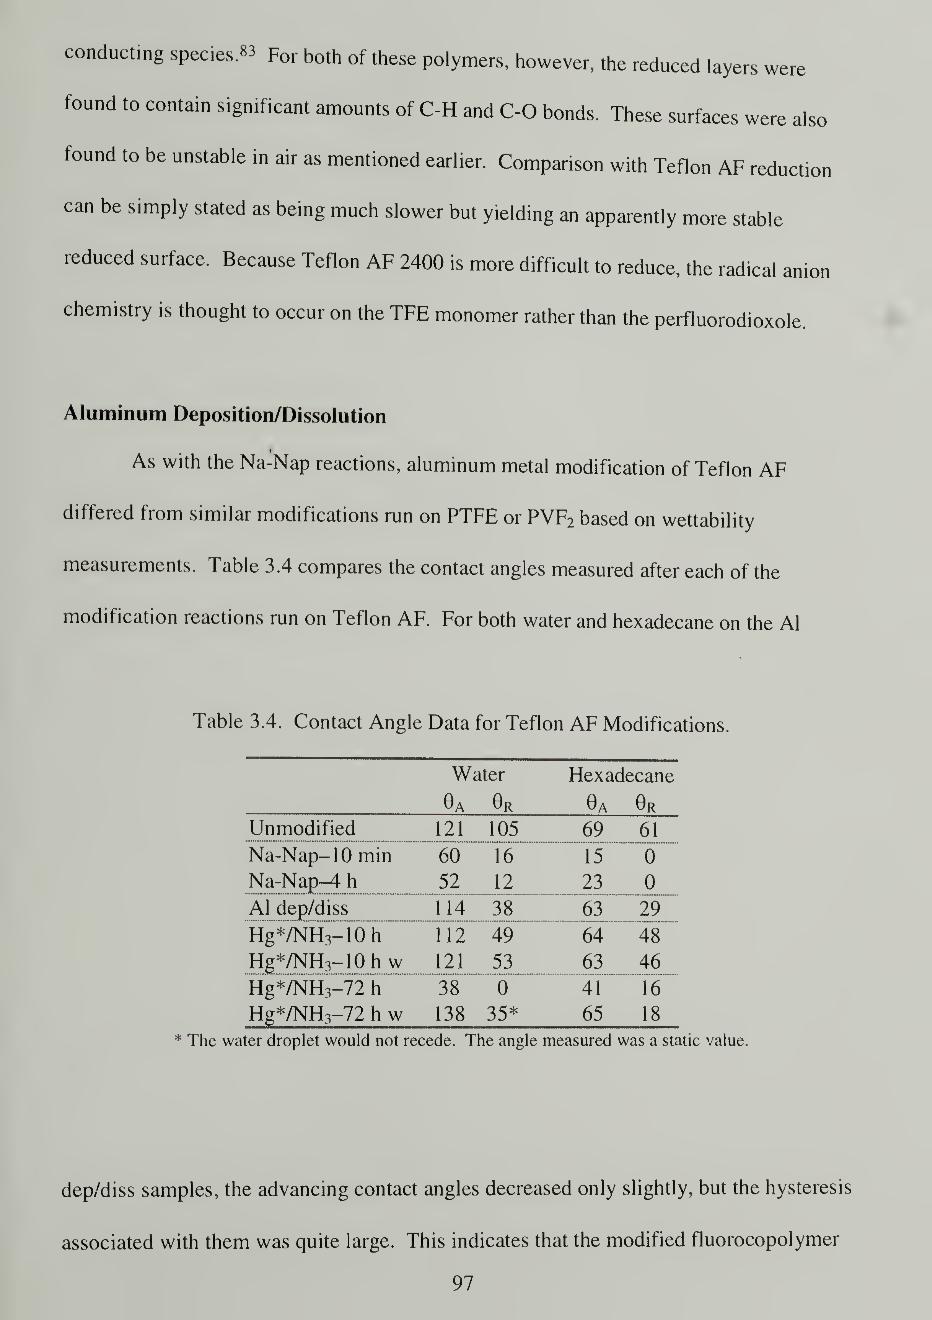
wereconducting species.83 For both of these polymers, however, the reduced layers
found to contain significant amounts of C-H and C-0 bonds. These surfaces were also
found to be unstable in air as mentioned earlier. Comparison with Teflon AF reduction
can be simply stated as being much slower but yielding an apparently more stable
reduced surface. Because Teflon AF 2400 is more difficult to reduce, the radical
chemistry is thought to occur on the TFE monomer rather than the perfluorodioxole.
anion
Aluminum Deposition/Dissolution
As with the Na-Nap reactions, aluminum metal modification of Teflon AF
differed from similar modifications run on PTFE or PVF2 based on wettability
measurements. Table 3.4 compares the contact angles measured after each of the
modification reactions run on Teflon AF. For both water and hexadecane on the Al
Table 3.4. Contact Angle Data for Teflon AF Modifications
Water Hexadecane
eA eR eA eR
Unmodified 121 105 69 61
Na-Nap- 10 min 60 16 15 0
Na-Nap-4 h 52 12 23 0
Al dep/diss 114 38 "63 29
Hg*/NH3-10h 112 49 64 48
Hg*/NH3-10h w 121 53 63 46
Hg*/NH3-72 h 38 0 41 16
Hg*/NH 3-72 h w 138 35* 65 18
* The water droplet would not recede. The angle measured was a static value
dep/diss samples, the advancing contact angles decreased only slightly, but the hysteresis
associated with them was quite large. This indicates that the modified fluorocopolymer
97
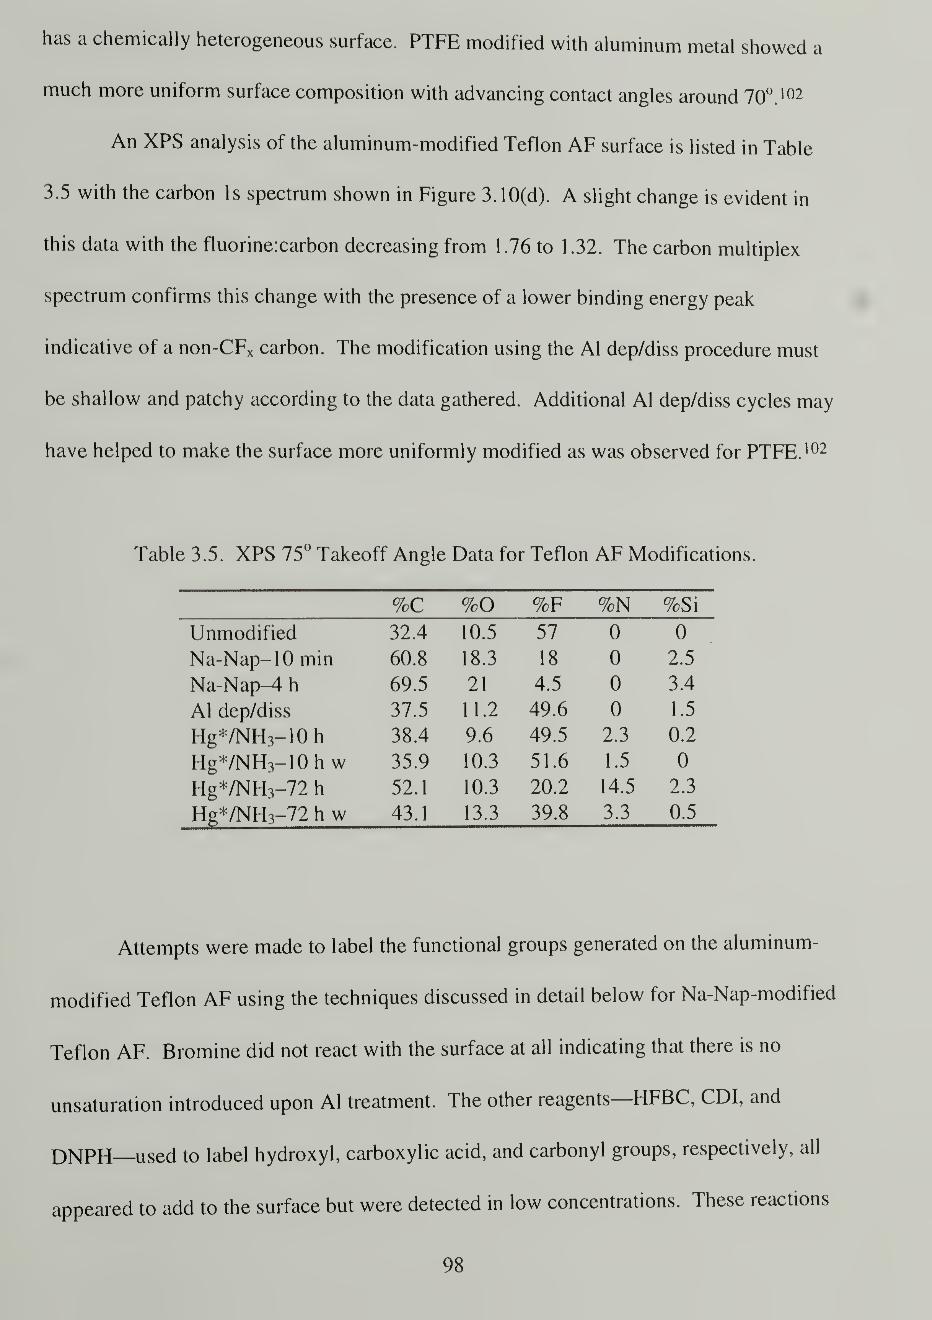
has a chemically heterogeneous surface. PTFE modified with aluminum metal showed a
much more uniform surface composition with advancing contact angles around 70°. 102
An XPS analysis of the aluminum-modified Teflon AF surface is listed in Table
3.5 with the carbon Is spectrum shown in Figure 3.10(d). A slight change is evident in
this data with the fluorine:carbon decreasing from 1.76 to 1.32. The carbon multiplex
spectrum confirms this change with the presence of a lower binding energy peak
indicative of a non-CFx carbon. The modification using the Al dep/diss procedure must
be shallow and patchy according to the data gathered. Additional Al dep/diss cycles may
have helped to make the surface more uniformly modified as was observed for PTFE. 102
Table 3.5. XPS 75° Takeoff Angle Data for Teflon AF Modifications.
%C %0 %F %N %Si
Unmodified 32.4 10.5 57 0 0
Na-Nap-10 min 60.8 18.3 18 0 2.5
Na-Nap^ h 69.5 21 4.5 0 3.4
Al dep/diss 37.5 11.2 49.6 0 1.5
Hg*/NHH0h 38.4 9.6 49.5 2.3 0.2
Hg*/NH 3-10h w 35.9 10.3 51.6 1.5 0
Hg*/NH 3-72 h 52.1 10.3 20.2 14.5 2.3
Hg*/NH3-72 h w 43.1 13.3 39.8 3.3 0.5
Attempts were made to label the functional groups generated on the aluminum-
modified Teflon AF using the techniques discussed in detail below for Na-Nap-modified
Teflon AF. Bromine did not react with the surface at all indicating that there is no
unsaturation introduced upon Al treatment. The other reagents—HFBC, CDI, and
DNPH—used to label hydroxyl, carboxylic acid, and carbonyl groups, respectively, all
appeared to add to the surface but were detected in low concentrations. These reactions
98
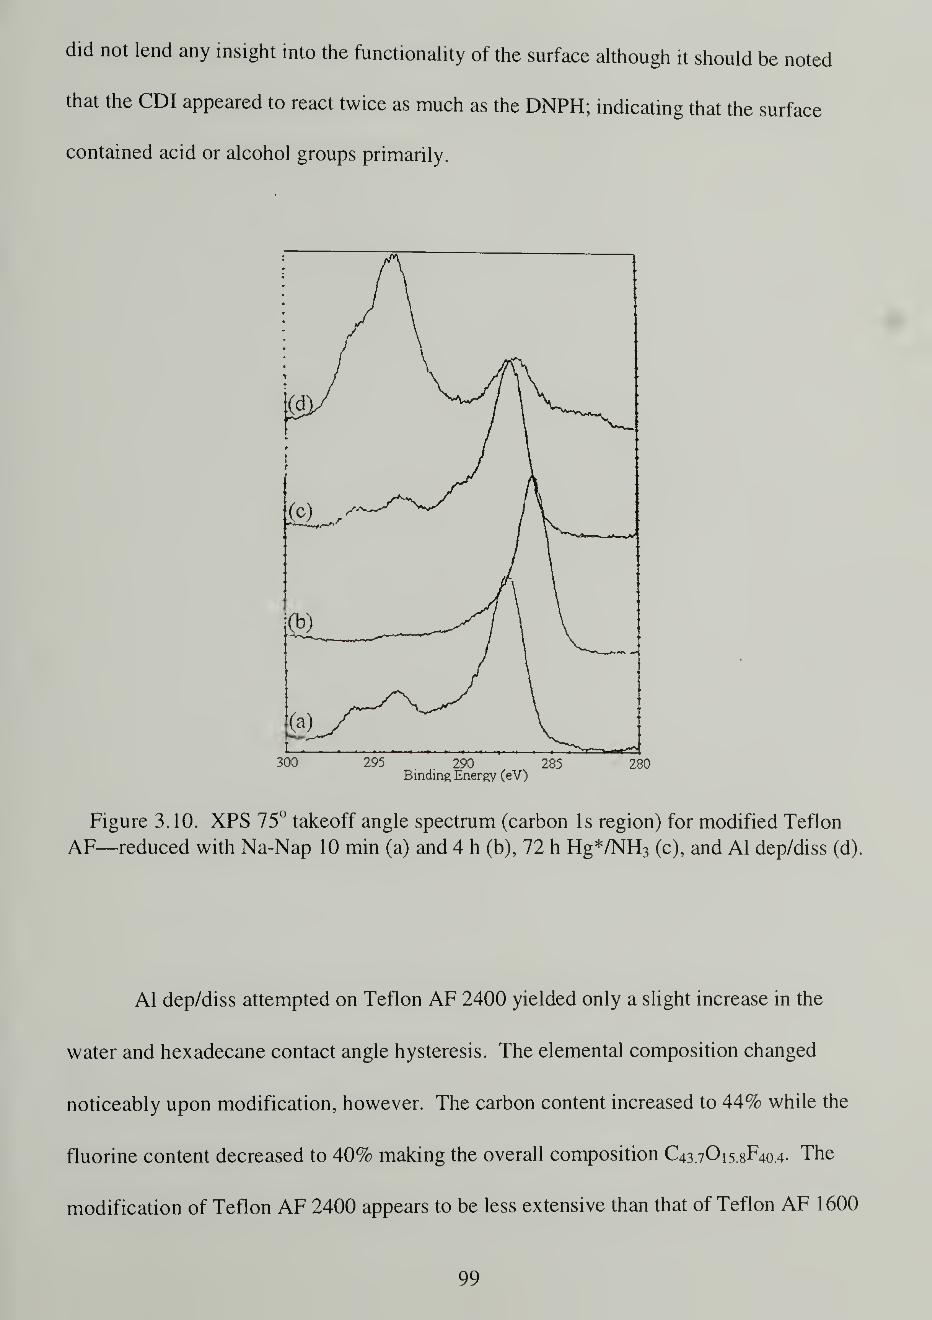
did not lend any insight into the functionality of the surface although it should be noted
that the GDI appeared to react twice as much as the DNPH; indicating that the surface
contained acid or alcohol groups primarily.
300 295 290 285 280Binding Energy (eV)
Figure 3.10. XPS 75° takeoff angle spectrum (carbon Is region) for modified Teflon
AF—reduced with Na-Nap 10 min (a) and 4 h (b), 72 h Hg*/NH3 (c), and Al dep/diss (d).
Al dep/diss attempted on Teflon AF 2400 yielded only a slight increase in the
water and hexadecane contact angle hysteresis. The elemental composition changed
noticeably upon modification, however. The carbon content increased to 44% while the
fluorine content decreased to 40% making the overall composition C43.7O15.8F40.4. The
modification of Teflon AF 2400 appears to be less extensive than that of Teflon AF 1 600
99

as determined by the contact angle data and more extensive from the XPS data. The
dioxole monomer units with the -CF3 groups may be responsible for the modification as
was postulated. 109
Mercury/Ammonia Photosensitization
The mercury/ammonia photosensitization (Hg*/NH3 ) reactions were also
successful. The reaction times chosen were based on the work of Burdeniuc and
Crabtree 1 1
1
in modifying PTFE. The contact angle results are shown in Table 3.4. Four
samples were analyzed—samples exposed to Hg*/NH3 for 10 and 72 hours and samples
that were washed with water, THF, and methylene chloride (Hg*/NH3 w). The water
contact angle data indicates that the surface has become quite hydrophilic upon 72-h
modification. The hexadecane data, however, show that the surface is more lyophobic
than expected but has a substantial hysteresis. This means that the surface remains
patchy (chemically heterogeneous) to the hexadecane probe although the water sees a
hydrophilic, high surface energy solid.
The washing step significantly affects the contact angle results. After a 10-h
reaction, washing the sample causes an increase in the water contact angle, but the
hexadecane value remains relatively unchanged. The results from the 72-h reaction are
more pronounced. The solvent wash leaves a very patchy surface with high advancing
and low receding contact angle values for both probe fluids. Some of the modified layer
appears to be washed away upon rinsing the sample. The contact angle data for the
unwashed samples may be complicated by dissolution of part of the sample.
From XPS (Table 3.5), a large incorporation of nitrogen into the Teflon AF
surface is observed. The 72-h carbon Is spectrum (Figure 3.10) is similar to that of the
100

Na-Nap sample after a 10-min reduct,on. Some C-F species are obviously still present in
the top -40 A, but the majority of the carbon is involved in other types of bonds. A
shoulder can be seen in the carbon spectrum of the Hg*/NH 3 sample at 290.5 eV which
may correspond to an imine carbon. Washing the samples clearly causes a decrease in
the percentages of nitrogen and carbon and an increase in the fluorine component. Thus,
both XPS and contact angle results reveal that some of the modified layer is removed
upon solvent wash.
0.2
0.15
3 o.i
0.05
0
4000 3500 3000 2500 2000
Wavenumbers (cm"1
)
1500 000
Figure 3.1 ATR-IR spectra of Teflon AF—unmodified, reduced with Na-Nap (4 h),
and reduced with Hg*/NH3 (72 h).
The ATR-IR spectra of the Na-Nap and Hg*/NH3 modified Teflon AF samples
are shown in Figure 3.1 1. The 2100-2700 cm"1
peaks correspond to overtones of the
strongly absorbing C-F stretching region (1050-1350 cm"1
) of the unmodified Teflon AF.
The rather broad peaks in both spectra between 1350 and 1770 cm"1
and between 2800
and 3500 cm"1
are the result of the modification reactions. The higher wavenumber
101

region reveals that both modification reactions introduce some C-H stretching vibrations
(2850-3000 cm 1
) as well as O-H or N-H bands (3200-3500 cm 1
broad peaks). The most
interesting region is that around 1500 cm 1
. The Na-Nap spectrum has a peak maximum
at 1664 cm"1
while the Hg*/NH3 spectrum has a 1656 cm"1
maximum. Both possess 1410
cm ' Peaks while the Hg*/NH 3 sample has more definition in this region including an
absorbance at 1 5 1 5 cm"1
. It is thought that the infrared spectra for the two different
modifications, while apparently similar, originate from rather different species. Both
samples may possess a large degree of unsaturation, accounting for the similarity in the
lower wavenumber region, but the Na-Nap sample is expected to have oxygen
functionality (carbonyls, alcohols, and acids) while the Hg*/NH3 sample should contain
nitrogen functionality (amines, imines, and nitriles).
Burdeniuc 1 1
1
claims that the mercury/ammonia-treated surface is hydrolytically
unstable as evidenced by ATR-IR experiments before and after a solvent wash. Our
results concur somewhat with their observations. The water contact angle increased after
washing with solvents while the hexadecane contact angle remained unchanged. XPS
reveals that nitrogen is removed from the surface and that the C:F ratio decreases from
0.78 to 0.70 indicating that some of the modified layer was removed as a result of the
solvent wash. The ATR-IR spectrum (Figure 3.12) shows that the solvent wash removes
the 1665 cm"1
absorbance leaving lower intensity 1700 and 1740 cm"1
peaks along with
the 1400-1550 cm"1
broad peaks. If an imine is indeed responsible for the 1665 cm-1
absorbance, and the solvent wash merely causes hydrolysis, one would expect to see an
increase in the carbonyl region of the infrared. Instead, the imine appears to be mostly
washed away. The broad N-H stretching region above 3000 cm-1 also disappears
102
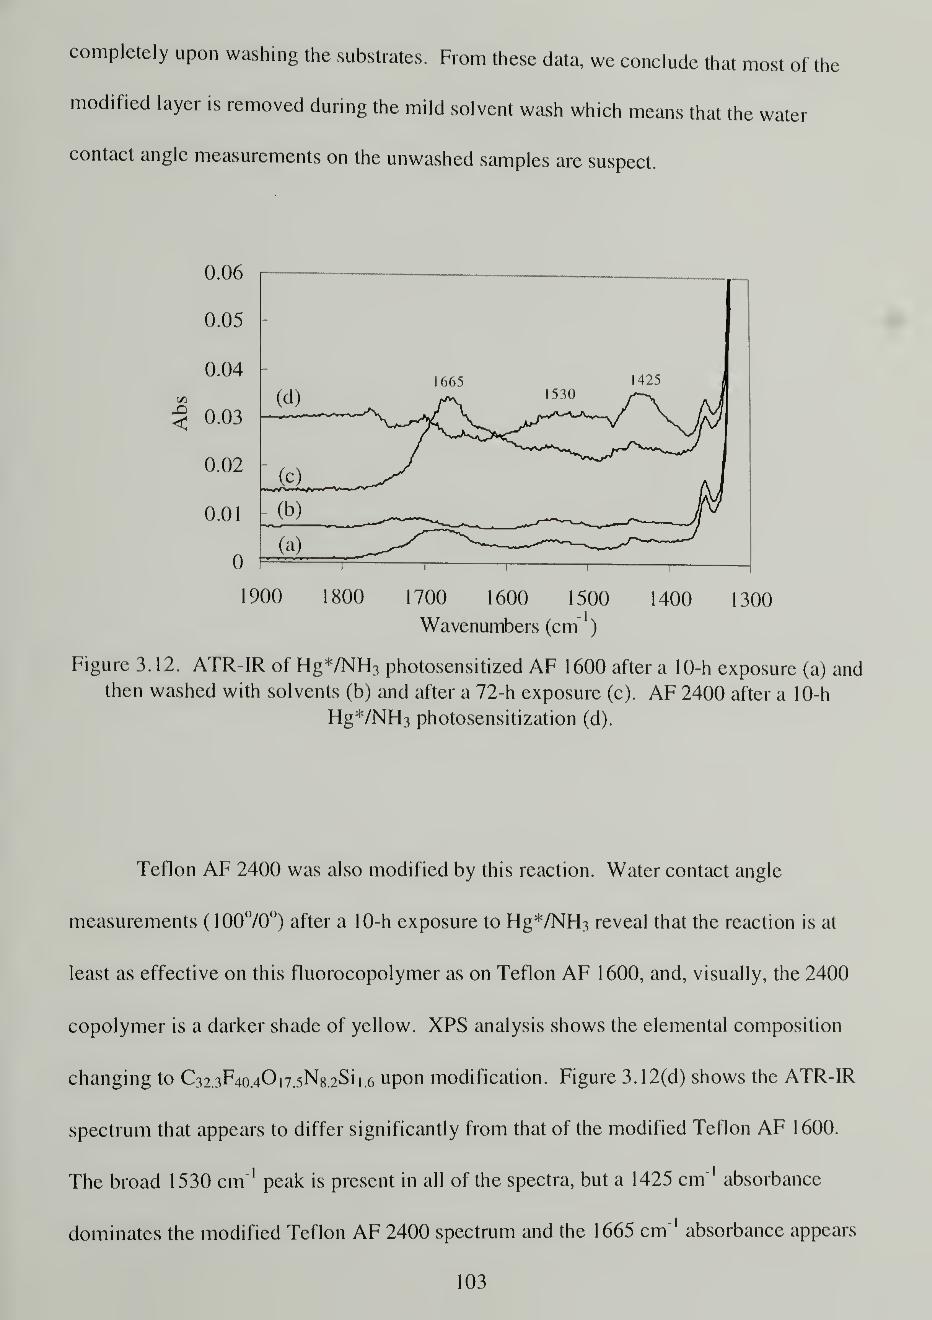
completely upon washing the substrates. From these data, we conclude that most of the
modified layer is removed during the mild solvent wash which means that the water
contact angle measurements on the unwashed samples are suspect.
<
<)()() 800 700 600 1500 400 300
Wavenumbers (cm" )
Figure 3. 12. ATR-IR of Hg*/NH 3 photosensitized AF 1600 after a 10-h exposure (a) andthen washed with solvents (b) and after a 72-h exposure (c). AF 2400 after a 10-h
Hg*/NH^ photosensitization (d).
Teflon AF 2400 was also modified by this reaction. Water contact angle
measurements (10070°) after a 10-h exposure to Hg*/NH3 reveal that the reaction is at
least as effective on this fluorocopolymer as on Teflon AF 1600, and, visually, the 2400
copolymer is a darker shade of yellow. XPS analysis shows the elemental composition
changing to C32.3F40.4O17.5Ns.2Si1.6 upon modification. Figure 3.12(d) shows the ATR-IR
spectrum that appears to differ significantly from that of the modified Teflon AF 1600.
The broad 1530 cm'1
peak is present in all of the spectra, but a 1425 cm"1
absorbance
dominates the modified Teflon AF 2400 spectrum and the 1665 cm"1
absorbance appears
103

to be absent. Because the Teflon AF 2400 was in the form of a compression-molded
plaque, it was much rougher and the ATR-IR spectrum has a poorer signal-to-noise ratio
that may be partly responsible for the odd observations.
Chemical Reactivity of Na-Nap Reduced Teflon AF
The above information concerning the change in the contact angle, XPS, UV, and
ATR-IR upon Na-Nap reduction of Teflon AF is quite revealing, but to better understand
this reaction, the chemical reactivity of red-AF needed to be examined. Several labeling
reactions were explored to help quantify the type and amount of functional groups
present in the reduced surface. These reactions were approached as a means to label
functional groups, but because of the nature of the reduced surface, the reactions cannot
necessarily be expected to react completely analogously to the small molecule model
reactions that occur in a homogeneous solution.
Reactions with Unsaturation
Bromination
The addition of bromine across a double or triple bond is thought to be a
straightforward way to determine whether unsaturation is present. Because the films
become brown on reduction and because this coloration is thought to be primarily due to
conjugated unsaturation, visual appearance backed up with UV measurement can tell
much information about the quenching of the conjugation.
Bromination of the sample does not cause the sample to return to being colorless.
Figure 3.13 quantifies that observation by showing the reduction in the 320 nm UV
104

absorbance upon bromination. The intensity of the 10-min reduced sample decreases
slightly, and the 4-h reduced sample is reduced by only 35%, thus the conjugation is not
disrupted much upon bromination. Halogenation of polymers is an effective means of
enhancing their barrier properties, '26 so it is possible that the bromine labeling is self-
limiting. It is also possible that the reduced surface contains aromatic or otherwise
unreactive carbons which bromine cannot effectively oxidize.91
0.16
0.14
0.12
1 0.1
§ 0.08
0.06<
0.04
0.02
0
• Red
Rcd/Br2 •ARed/BH3
XRed/BH3/Oxid
•
•
1
11 1
—
X1
1 1 1 ? 1
0 0.5 .5 2 2.5 3
Reduction Time (h)
3.5 4.5
Figure 3.13. UV absorbance at 320 nm for derivatizations of Na-Nap reduced Teflon
AF-brominated (Red/Br2 ), hydroborated (Red/BFh), and hydroborated and then oxidized
with NaOH/HOOH (Red/BH 3/Oxid).
The XPS data is consistent for both the short and longer reaction times with 13%
of the carbon in the top -40 A labeled by bromine after a 10-min reduction and 14%
labeled after a 4-h reduction. The fact that the amount of bromine is nearly the same for
both samples while the available carbon atoms for reaction increases (as evidenced by the
increase in carbon: fluorine) indicates that the surface functionality changes with longer
105

reaction times. This observation is in contrast to the UV data where a greater percentag
of the 4-h sample reacts with bromine than the 10-min sample. The reaction depth
experiments illustrated in Figure 3.5 also indicate that there is a difference in the two
samples. After ten minutes, the reaction is still in its initial stages, but after four hours,
the reaction is confined to the 200-nm depth with rearrangements and reduction
chemistry continuing to occur.
Table 3.6. XPS 75° Takeoff Angle Results of Bromination of Red-AF.
Modification %C %0 %F %Br %Si
Unmodified 32.4 10.5 57.0 0 0
Red |() m in 60.8 18.3 18.0 0 2.5
Red4h 69.5 21.0 4.5 0 3.4
Redio min-Br2 66.1 18.1 5.8 8.4 1.2
Red4 h-Br2 65.0 20.4 3.0 9.1 2.4
Bromination was expected to reduce the 1650 cm" infrared absorbance, but any
change was not noticeable enough to draw any conclusions about such an occurrence.
This is further evidence that the reaction with bromine was limited most likely by the
halogenation of surface unsaturation.
Hydroboration
Reaction of red-AF with borane-THF is another convenient and popular method
of labeling unsaturation in a sample (somewhat less selectivly than bromination). Borane
is expected to add easily to alkenes and alkynes of all types, but also reacts with ketones,
aldehydes, and carboxylic acids reducing them all to alcohols. Again, observation of the
106

change in the UV absorbance should reveal much about the extent of the reaction. Figure
3.13 shows this change upon hydroboration and subsequent oxidation.
The oxidation step converts the carbon-boron bonds formed from reaction into
alcohols. One would expect the UV intensity to decrease completely upon reaction with
BH 3 and remain unchanged after oxidation. The results do not follow this expectation.
The hydroboration does cause a decrease in the 320-nm absorbance, but the intensity
does not reach zero. Instead, it appears that half of the unsaturation is quenched in the
10-min sample and two-thirds is quenched in the 4-h sample. The oxidation step has
little-to-no effect on the 10-min sample, yet causes a significant quenching of the signal
for the 4-h sample. Obviously, the two samples differ. The 10-min sample seems to
behave as expected. The fact that the UV intensity is not completely quenched may be
the result of alkyne groups that reduce only once to the alkene or some unsaturation that
is unreactive towards borane. In the case of the 4-h reduced sample, the hydroboration
appears to be incomplete although a 21-h reaction was utilized. Apparently, the
oxidation reaction was more effective in quenching the unreacted portions of the sample.
From the XPS data (Table 3.7), several interesting trends can be noted. First, the
amount of oxygen in these samples is quite high indicating that the hydroboration
procedure may have led to some premature oxidation of C-B bonds. Second, the boron
content is higher in the 10-min reduced sample. This is further evidence of the difference
in the functionality of the 10-min and 4-h samples as was also postulated in the
bromination reactions. Finally, the fluorine content increases after oxidation in both
samples. From the UV data, an increase was expected in the 4-h sample due to the large
change observed between borane treatment and exposure to the oxidizing solution, but
107

the 10-min sample had appeared to be unchanged by oxidation. It seems that the
NaOH/HOOH oxidation was too strong for the modified polymer layer, and instead of
simply oxidizing the functional groups to alcohols, much of the reduced layer was reacted
away from the fluorocopolymer surface. The fact that some boron remains on the surface
even after oxidation may point to the oxidation reaction not running to completion
although 1-3 h reaction times were employed.
Table 3.7. XPS 75° Takeoff Angle Results for Hydroboration and Oxidation of Red-AF.
%C %0 %F %B %Si
Red io min 60.8 18.3 18.0 0 2.5
Red4 h 69.5 21.0 4.5 0 3.4
Red K) ,njn-BH3 53.0 28.6 5.2 11.6
.......^Rcd4h-BH 3 67.3 20.9 3.1 8.3 0.1
Rediom.n-BHrOxid 493" 15.7 34.0 0.5 0
Red4h-BHrOxid 44.2 18.3 33.2 3.5 0.4
Contact angle measurements of the 10-min modified surfaces indicate that
although the fluorine content increases after oxidation, the surface remains hydrophilic.
Table 3.8 shows the water contact angle decreases for both samples after reaction with
borane, but oxidation produces very different results even though the XPS data are
similar. The 4-h reduced Teflon AF sample after hydroboration/oxidation is almost as
hydrophobic and lyophobic as the unmodified sample. The hysteresis observed for both
water and hexadecane probes must result from some surface chemical heterogeneity.
108

Table 3.8. Contact Angle Data for Hydroborated and Oxidized Red-AF.
Water (0J0n \ nexaciecane (,t)A/t/R)
AVWVJ H) min fin0/ ifi° ZZ /u
Rpd/i u ZJ /u
Red io min-BH^ 45714°' 1470°
Red4 h-BH 3 48711° 1670°
Red io min-BH3-Oxid 58718° 1770°
Red4h-BH3-Oxid 1 1 5763° 59737°
Figure 3.14 displays the change in the XPS oxygen peak as a result of these
reactions on the 4-h, Na-Nap-treated sample. Clearly after oxidation, at least two distinct
types of oxygen exist in the surface of the sample. The lower binding energy peaks are
515.0 513.0 511.0 539.0 537.0 535.0 533.0 531.0 529.0 527.0 525.0
Binding Energy, eV
Figure 3.14. XPS 75° takeoff angle spectra (oxygen Is region) of Teflon AF after 4-
reduction (bottom) and then 21-h hydroboration (middle) and then NaOH/HOOH
oxidation (top).
109

associated with the functional groups created upon reduction, while the higher binding
energy peak comes from the oxygen atoms in the perfluorodioxole. This further proves
that functionality still exists on this surface and that the oxidation reaction did not
completely remove this layer.
Oxidation of Red-AF
The oxidation reaction that was used to create the data in Figure 3.5 (reaction
depth determination) was presented as though the removal of the oxidized layer was a
given. The oxidizant used was KC103/H2S04 which is strong enough to oxidize
graphite. 1 16 The oxidation discussed above, however, is much milder. 3.1 M sodium
hydroxide with hydrogen peroxide was not expected to completely etch the reduced
fluorocopolymer. Control reactions were run to determine if the milder oxidation was as
effective at removing the entire reduced layer as the strong etchant used earlier. In fact, it
is. After oxidation with either etchant, the fluorocopolymer surface is characterized as
having a lower fluorinexarbon ratio than unmodified Teflon AF (1.76). The water
contact angle becomes 121778° and F:C is 1.68 after the basic oxidation.
Correspondingly, with acid etch, the contact angle increases to 1 19777°, and F:C
decreases to 1.70. Control reactions run on unmodified Teflon AF yielded no change in
mass but the contact angle hysteresis increased somewhat to 123798° from 1217105°.
The increased hysteresis in the water contact angle data probably results from an
increase in sample roughness brought about upon removal of the Na-Nap reduced
portions of the fluorocopolymer. The fact that the F:C ratio decreases after either basic or
acidic oxidation is a strong indicator that the reduction occurs primarily on the TFE
110
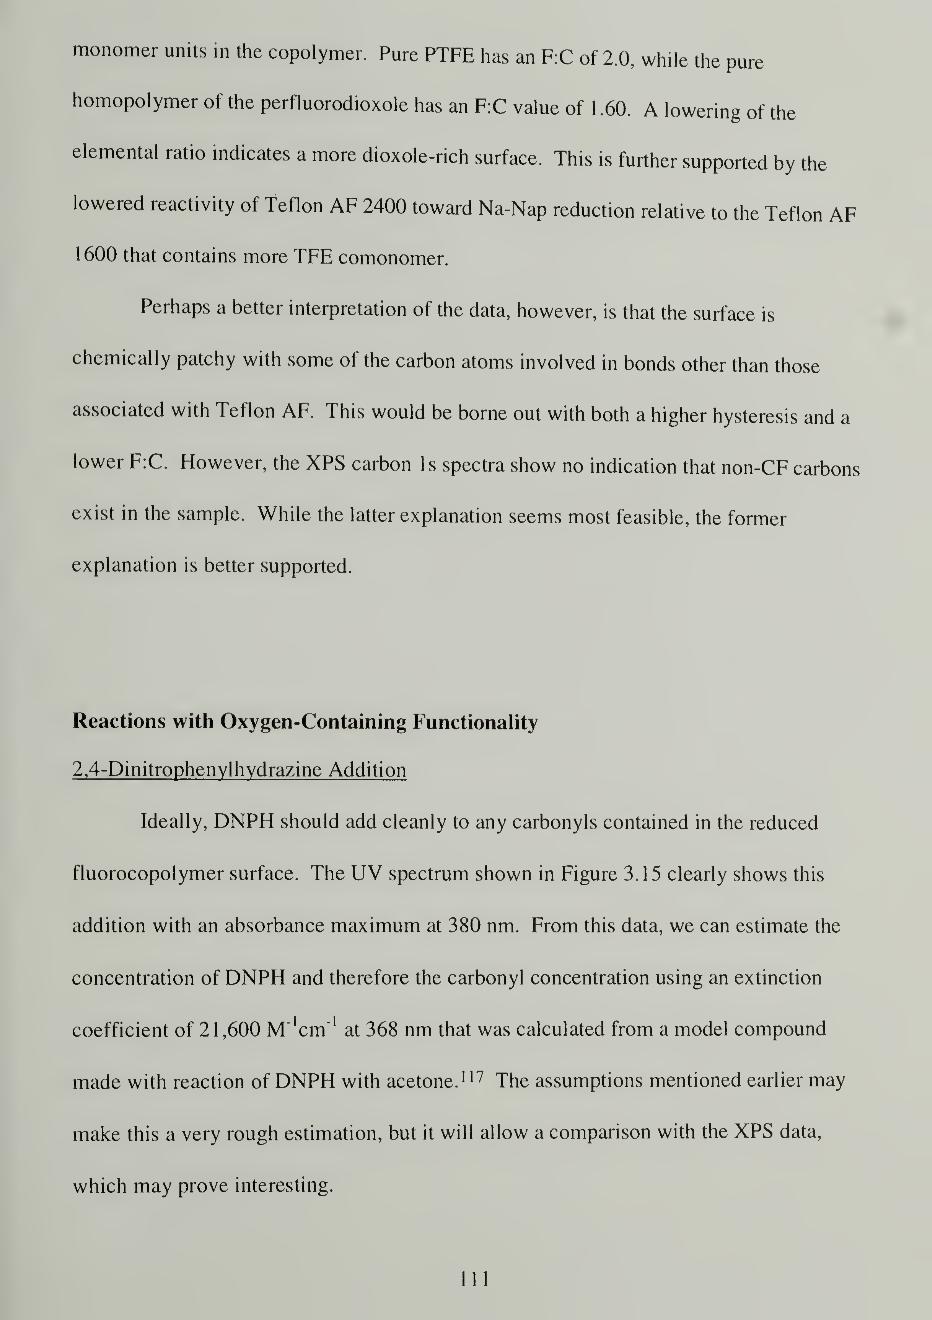
monomer units in the copolymer. Pure PTFE has an F:C of 2.0, while the pure
homopolymer of the perfluorodioxole has an F:C value of 1 .60. A lowering of the
elemental ratio indicates a more dioxole-rich surface. This is further supported by the
lowered reactivity of Teflon AF 2400 toward Na-Nap reduction relative to the Teflon AF
1 600 that contains more TFE comonomer.
Perhaps a better interpretation of the data, however, is that the surface is
chemically patchy with some of the carbon atoms involved in bonds other than those
associated with Teflon AF. This would be borne out with both a higher hysteresis and a
lower F:C. However, the XPS carbon Is spectra show no indication that non-CF carbons
exist in the sample. While the latter explanation seems most feasible, the former
explanation is better supported.
Reactions with Oxygen-Containing Functionality
2,4-Dinitrophenylhydrazine Addition
Ideally, DNPH should add cleanly to any carbonyls contained in the reduced
fluorocopolymer surface. The UV spectrum shown in Figure 3. 15 clearly shows this
addition with an absorbance maximum at 380 nm. From this data, we can estimate the
concentration of DNPH and therefore the carbonyl concentration using an extinction
coefficient of 21 ,600 M'crn"1
at 368 nm that was calculated from a model compound
made with reaction of DNPH with acetone. 1 17 The assumptions mentioned earlier may
make this a very rough estimation, but it will allow a comparison with the XPS data,
which may prove interesting.
Ill

0.35
0.3i
1/5
X)<
0.05
0.25
0. 1
5
0.2
0.1
200 300 400 500 600 700 800 900
Wavelength (nm)
Figure 3.15. UV/Vis spectra of Teflon AF reduced with Na-Nap (10 min and 4 h) andthen derivatized with DNPH.
We can use Beer's Law (A = cbc) to estimate the DNPH concentration in the
samples. A is the difference between the DNPH-derivatized UV absorbance and the
absorbance of red-AF at 368 nm. c is the extinction coefficient defined above, b is the
path length taken to be 400 nm (from the reaction depth studies of Figure 3.5). c is the
concentration in which we are interested. From this equation, the 10-min data has a
carbonyl concentration of 0.068 M and the 4-h data has a concentration of 0.089 M.
From the XPS data in Table 3.9, the carbonyl concentration can best be
represented as a fraction of the total number of carbon atoms. With XA of the nitrogen
atoms corresponding to one carbonyl, the percentage of carbonyl carbons can be
calculated. The result from the 10-min data is a concentration of 1.6% carbonyls relative
to total carbons. After a 4-h reduction, 3.0% were found to be carbonyl carbons. To
compare with the concentrations calculated from the UV data, we have to assume a molar
112
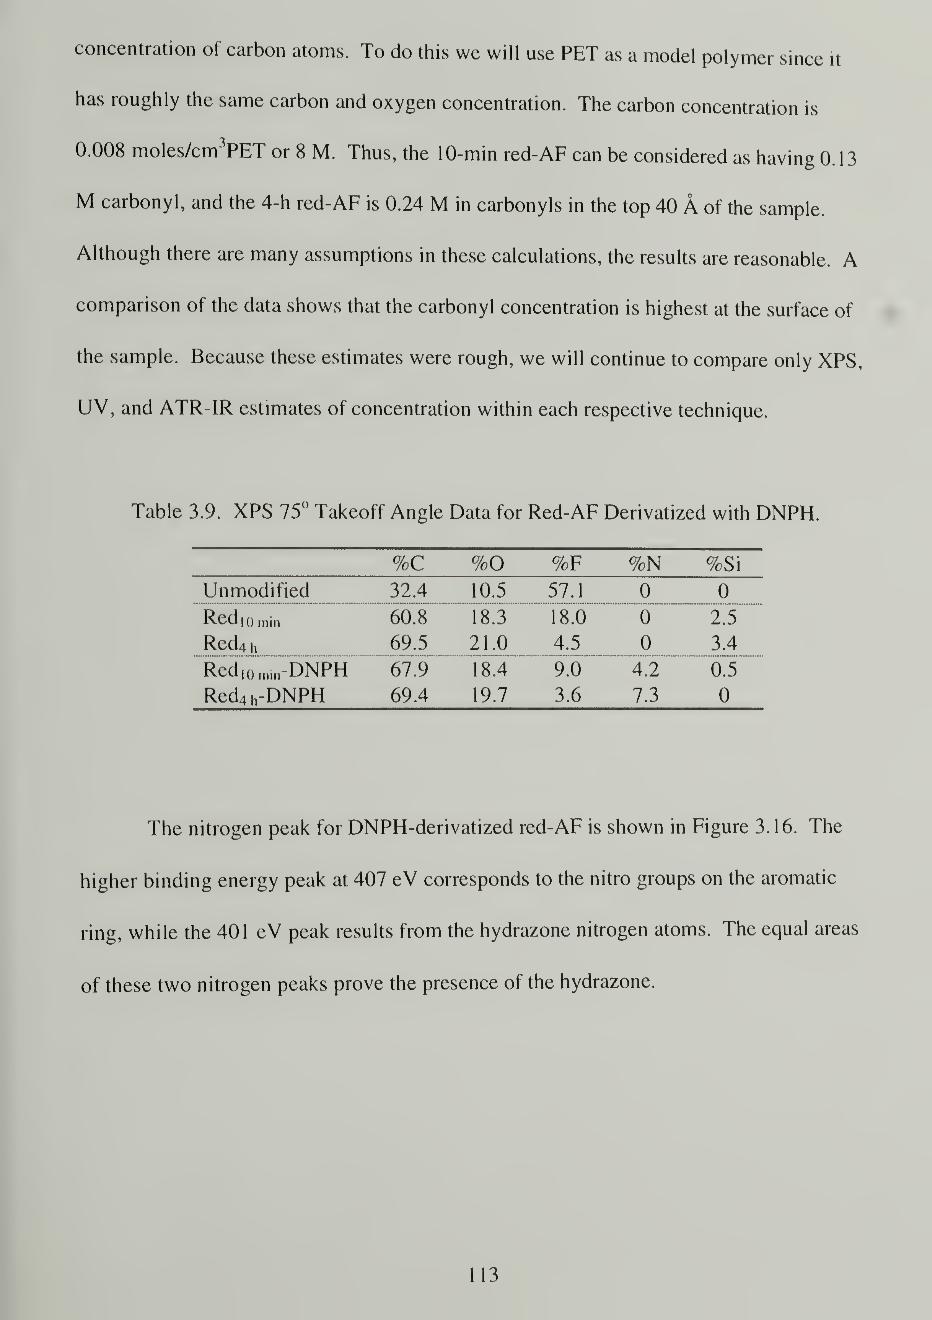
concentration of carbon atoms. To do this we will use PET as a model polymer since it
has roughly the same carbon and oxygen concentration. The carbon concentration is
0.008 moles/cm3PET or 8 M. Thus, the 10-min red-AF can be considered as having 0. 1
3
M carbonyl, and the 4-h red-AF is 0.24 M in carbonyls in the top 40 A of the sample.
Although there are many assumptions in these calculations, the results are reasonable. A
comparison of the data shows that the carbonyl concentration is highest at the surface of
the sample. Because these estimates were rough, we will continue to compare only XPS,
UV, and ATR-IR estimates of concentration within each respective technique.
Table 3.9. XPS 75° Takeoff Angle Data for Red-AF Derivatized with DNPH.
%C %0 %F %N %Si
Unmodified 32.4 10.5 57.1 0 0
Red |0 , n jn 60.8 18.3 18.0 0 2.5
Red41,
69.5 21.0 4.5 0 3.4
Red 1()min-DNPH 67.9 18.4 9.0 4.2 0.5
Red4 h-DNPH 69.4 19.7 3.6 7.3 0
The nitrogen peak for DNPH-derivatized red-AF is shown in Figure 3.16. The
higher binding energy peak at 407 eV corresponds to the nitro groups on the aromatic
ring, while the 401 eV peak results from the hydrazone nitrogen atoms. The equal areas
of these two nitrogen peaks prove the presence of the hydrazone.
113
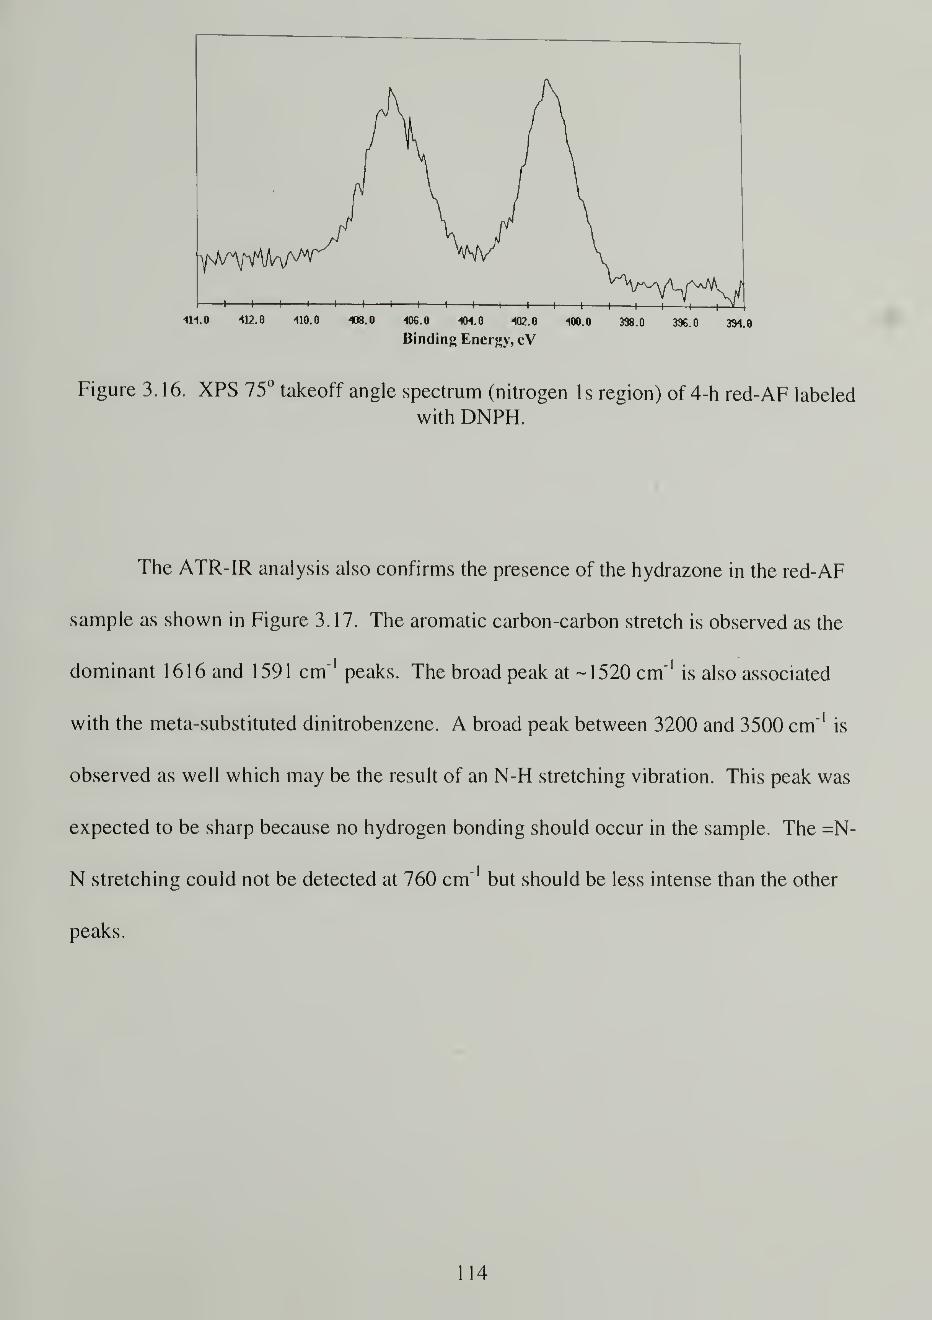
4H.B -112.6 110.0 4J8.0 106.0 101.0 102.0 100.0 398.0 396.0 3M.0
Binding Energy, cV
Figure 3. 16. XPS 75° takeoff angle spectrum (nitrogen Is region) of 4-h red-AF labeled
with DNPH.
The ATR-IR analysis also confirms the presence of the hydrazone in the red-AF
sample as shown in Figure 3.17. The aromatic carbon-carbon stretch is observed as the
dominant 1616 and 1591 cm"1
peaks. The broad peak at ~ 1520 cm"1
is also associated
with the meta-substituted dinitrobenzene. A broad peak between 3200 and 3500 cm"1
is
observed as well which may be the result of an N-H stretching vibration. This peak was
expected to be sharp because no hydrogen bonding should occur in the sample. The =N-
N stretching could not be detected at 760 cm"1
but should be less intense than the other
peaks.
114

0.05
0.04
£ 0.03 -
<0.02
0.01
0
1900 1800 1700 1600 1500 1400 1300
Wavenumbers (cm1
)
Figure 3.17. ATR-IR spectra of red-AF derivatized with DNPH (top) or HFBC (bottom).
Acylation of Red-AF
The reaction of heptafluorobutyryl chloride (HFBC) with the reduced surface
labels all hydroxy! functional groups. The ATR-IR spectrum of this labeled surface was
expected to be as predominant as that seen for the DNPH labeling because of the large
extinction coefficient associated with the ester carbonyl stretch. Figure 3.17 shows the
HFBC-labeled red-AF. A very small peak at -1770 cm 1
can be seen in the HFBC
spectrum indicating that little HFBC reacts. This means that the hydroxyl concentration
in red-AF is small.
In contrast to the ATR-IR data, the XPS results show an increase in the fluorine
content of 15% upon acylation with HFBC for the same 4-h sample. This would indicate
that 18% of the oxygen atoms in the red-AF surface are hydroxyl groups. For the 10-min
red-AF sample the percentage is much lower with only 2% of the oxygen atoms being
labeled as -OH groups. Some chlorine is observed in the XPS that can be associated
115

with unreacted HFBC or more likely with side products that were not removed (HC1 for
example). It may also be likely that the CI atoms are the result of the addition of HFBC
to unsaturated carbons. The fact that a larger percentage of chlorine was observed at the
75° takeoff angle than at 15° favors the presence of trapped HC1, though.
Table 3.10. XPS 75° Takeoff Angle Data for Red-AF Derivatized with HFBC
%C %0 %F %C1 %SiUnmodified 32.4 10.5 57.1 0 0Reducedi o min 60.8 18.3 18.0 2.5Reduced4 h 69.5 21.0 4.5 0 3.4
Red i()min-HFBC 62.1 15.2 20.3 0.7 1.5
Red4h-HFBC 62.7 14.3 19.8 1.1 1.7
With a much larger grafting percentage of HFBC observed at the surface of the
sample than deeper into the bulk, a couple of explanations should be discussed. First, the
HFBC may be unable to penetrate into the reduced layer to react with deeper hydroxyl
groups. Because THF swells the reduced layer (as evidenced by mass gains upon
exposure to THF), the likelihood of this explanation is slim. Second, the hydroxyl groups
may be concentrated at the surface. Assuming that the hydroxyl functionality is
introduced through the water rinsing steps or air exposure, this may be likely.
The HFBC-labeling reaction was run on another sample thought to have enhanced
hydroxyl content—red-AF that had been hydroborated and then oxidized. Figure 3. 18 is
the ATR-IR spectrum of this multiple derivatization. As expected, the 1790 cm"1
ester
peak is quite pronounced. The XPS results were used to quantify the amount of reaction
which should have labeled all alkene, carboxylic acid, alcohol, and carbonyl groups since
116

they are all susceptible to reaction with borane forming hydroxyl groups upon oxidation.
36% of the oxygen atoms in the 10-min red-AF spectrum after oxidation were labeled
with HFBC. From the XPS of the 4-h red-AF, only 1 8% of the oxygen was labeled.
Much of the sample was etched upon oxidation (as mentioned earlier), so this difference
is not surprising and can be considered somewhat meaningless.
in
<
1900 1800 1700 1600 1500 1400 1300
Wavenumbers (cm1
)
Figure 3. 18. ATR-IR spectrum of red-AF reacted with borane, oxidized with
NaOH/HOOH, and then derivatized with HFBC.
Addition of l,r-Carbonyldiimidazole to Red-AF
As mentioned in the introduction, labeling carboxylic acid groups requires the
protection of hydroxyl groups that would otherwise likely react with CDI. This was done
through the aforementioned acylation with HFBC prior to reaction with CDI. The
results, shown in Table 3.1 1, show a significant incorporation of the imidazole into the
117
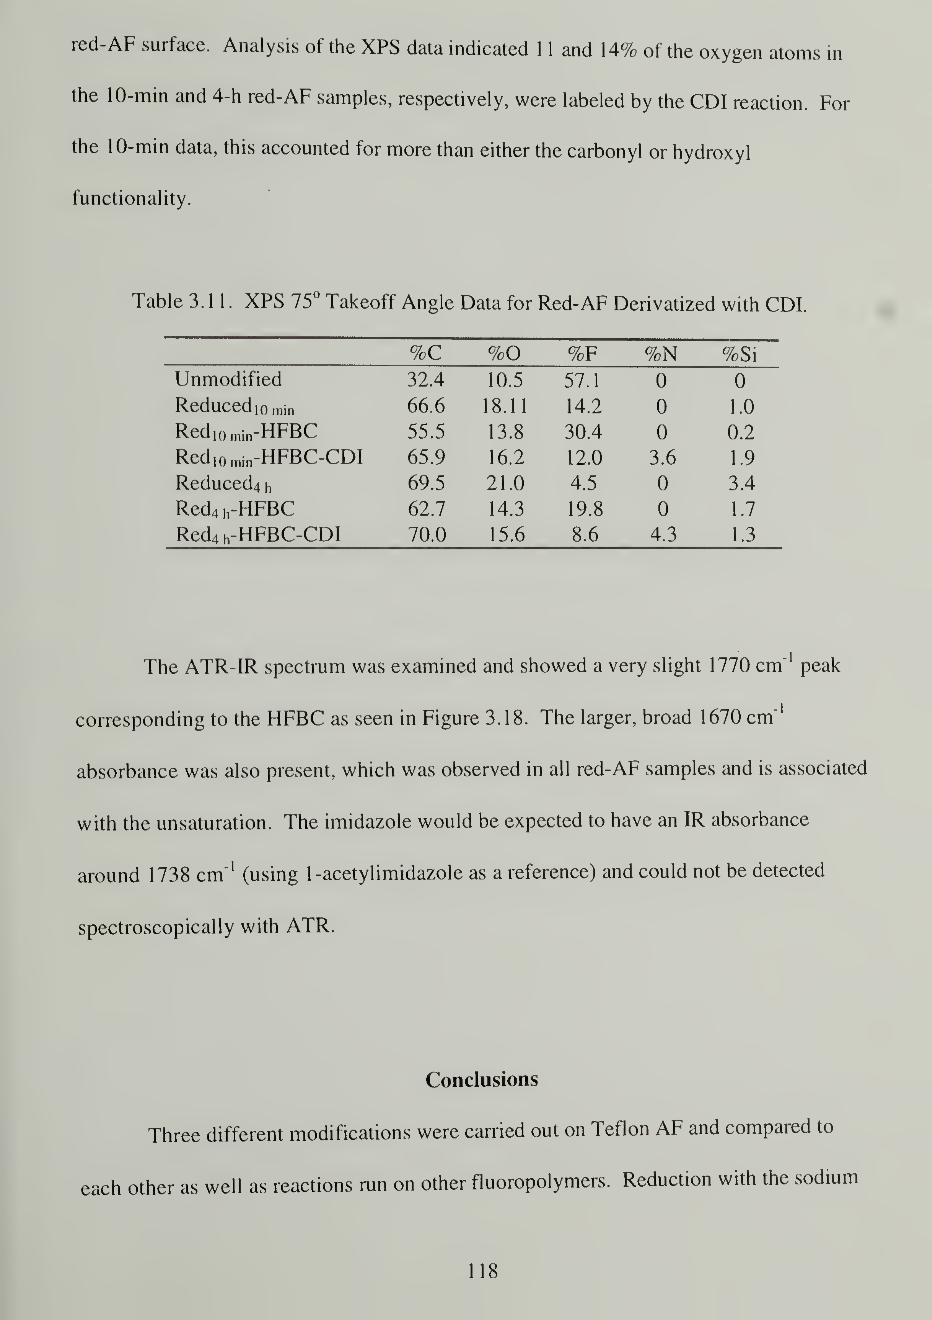
red-AF surface. Analysis of the XPS data indicated 1 1 and 14% of the oxygen atoms in
the 10-min and 4-h red-AF samples, respectively, were labeled by the CDI reaction. For
the 10-min data, this accounted for more than either the carbonyl or hydroxyl
functionality.
Table 3.11. XPS 75° Takeoff Angle Data for Red-AF Derivatized with CDI.
%C %0 %F %N %SiUnmodified 32.4 10.5 57.1 0 0
Reduced io min 66.6 18.11 14.2 0 1.0
Red„, inin-HFBC 55.5 13.8 30.4 0 0.2
Red| ()IIlin-HFBC-CDI 65.9 16.2 12.0 3.6 1.9
Reduced4 h 69.5 21.0 4.5 «Q 3.4
Red4 h-HFBC 62.7 14.3 19.8 0 1.7
Red4 h-HFBC-CDI 70.0 15.6 8.6 4.3 1.3
The ATR-IR spectrum was examined and showed a very slight 1770 cm"1
peak
corresponding to the HFBC as seen in Figure 3.18. The larger, broad 1670 cm"1
absorbance was also present, which was observed in all red-AF samples and is associated
with the unsaturation. The imidazole would be expected to have an IR absorbance
around 1738 cm"1
(using 1-acetylimidazole as a reference) and could not be detected
spectroscopically with ATR.
Conclusions
Three different modifications were carried out on Teflon AF and compared to
each other as well as reactions run on other fluoropolymers. Reduction with the sodium
118

naphthalenide radical-anion produced light brown samples. The reduction was found to
be self-limiting with only the top 200 nm of the film being reduced. Modification with
aluminum metal produced a surface with a large water contact angle hysteresis. The
reaction was highly surface-selective with only a small change in the surface elemental
composition. Mercury/ammonia photosensitization proved to be surprisingly facile.
Much of the modified surface was rinsed away with a water/THF/methylene chloride
wash, but the remaining functionality maintained some patchy hydrophilic surface
character. All of these results were in line with observations made on PTFE and other
fluoropolymers.
These three modification reactions were also run on Teflon AF 2400. The Na-
Nap reaction was substantially less effective towards affecting a change in the surface
composition and wettability as compared to the copolymer with the lower dioxole
content. The Hg*/NH3 and Al dep/diss reactions, however, seem to be effective on both
types of Teflon AF. We believe that the perfluorodioxole monomer participates in these
reactions.
The Na-Nap reduced Teflon AF 1600 was examined in great detail using
derivatization reactions seeking to label the different functional groups present. Table
3.12 summarizes these results. For most labeling reactions, the samples reduced for 10
minutes had comparable or less functionality than the corresponding 4-h samples. The
only exception to this (BH3/Oxid/HFBC) came about due to the highly reactive oxidation
reaction run that removed much of the modified layer.
119

Table 3.12. Summary of Derivative Reactions on Red-AF from XPS Results.
Derivatization Functional Group Red-AFio min Red-AF4 h
Br2 c=c, c=c 13% of C 14%ofCBH3 c=c, oc 22% of C 25%ofCDNPH c=o 7.4% of 0 15% of OHFBC -OH 2.2% of 0 18% of 0
BH 3/Oxid/HFBC C=C,COOH, OH, C=0 36% of 0 18% of OCDI -COOH 11% of 0 14% of 0
Most of the reduced fluorocopolymer was found to contain unsaturated bonds.
The unsaturation caused the light brown appearance due to conjugation of these double
and triple bonds. All of the oxygen-containing functional groups were indeed present on
the surface of the reduced fluorocopolymer, but ATR-IR analysis found little hydroxyl
and carboxylic acid species in a high enough concentration to easily detect. From the
data in Table 3.12, 21% of the oxygen from the 10-min red-AF was labeled and 47%
from the 4-h red-AF was labeled. Analysis of the oxygen Is XPS peaks for these
samples reveals that 66% of the 10-min and all of the 4-h oxygen atoms are of lower
binding energy than the oxygen atoms associated with virgin Teflon AF. Assuming that
the lower binding energy oxygen atoms fall into one of the functional group categories
examined, a fairly large percentage of them were labeled.
Note
Dr. Thomas Thurn-Albrecht of Prof. Tom Russell's research group measured the
UV lamp intensity using an IL 390B Light Bug.
120

CHAPTER 4
SYNTHESIS OF AN ASYMMETRIC GAS SEPARATION MEMBRANE BASEDON TEFLON AF AND POLY(P-XYLYLENE)
Introduction
Polymeric gas separation membranes were first introduced commercially in
1979 104,127 Their relative importance has grown significantly in the past two decades
with the current push to try to make them more efficient. The two main parameters to
consider when evaluating a membrane are the permeability of the gases through it and the
permselectivity of the membrane toward separating the feed gas into a rich phase of the
desired component.
Both Teflon AF and poly(p-xylylene) bring useful properties to the table in terms
of their respective permeability and selectivity. Teflon AF (as mentioned earlier and
illustrated in Table 3.1) is highly permeable to gases but has somewhat low selectivity
values (oxygen/nitrogen selectivity, a(02/N2) ~ 2-3). Poly(p-xylylene) (PPX) and its
derivatives in marked contrast have a low gas permeability but a fairly high selectivity
especially towards oxygen as compared to nitrogen (a^/N?) ~ 5-30). These polymers
were combined to produce the ideal membrane—a composite of the two.
Gas Separation Membranes
Gas separation membranes can be classified into the two categories of porous and
non-porous. Porous membranes offer the ability to separate gases based on their size and
can be further characterized by the type of flow that the gas molecules undergo in order
to permeate the material—viscous or knudsen. 128 Viscous flow occurs when the pore
121

diameter is much greater than the mean free path of the gas. Knudsen flow results when
the diameter is much less than the gas mean free path. In this study, however, the interest
lies in those membranes that are non-porous or dense materials. Dense membranes offer
the ability to separate gases of like size. Some common polymers used as dense gas
separation membranes include polysulfone, cellulose acetate, polyimides, polyamides,
and polycarbonates. 104
In solid polymers, the permeation of gases is governed by a solution-diffusion
mechanism. In fact, the permeation P is simply the product of these,
P = SD
where S is the thermodynamic solubility term and D is the kinetic diffusivity. The
solubility of a gas in a polymer is described by Henry's law dissolution and Langmuir
adsorption64 and is directly dependent on the condensibility of the gas. High critical
temperatures correspond to higher condensibility and, therefore, higher solubility. The
diffusivity term, however, favors the most mobile molecule, which is best quantified by
the sieving diameter for the gas (Table 4.1). The small sieving diameter difference of
o
0. 1 8 A between oxygen and nitrogen leads to great difficulty in separating these two
gases. Conversely, sieving diameter differences of the order of 1 .0 A as with hydrogen
and ethylene, can lead to relatively easy separation.
Table 4. 1 . Critical Temperature and Sieving Diameter for Several Common Gases.
He H2 C02 Ar o2 N 2 C2H4
Molecular Weight (Daltons) 4.0 2.0 44 40 32 2S 28
Critical Temp, Tc (°C) -268 -240 31.3 -122 129 -119 -147 9.3 18
o
Sieving Diameter (A) 2.6 2.89 3.3 3.4 3.46 3.64 3.9
122
As an aside, comments relating to the previous projects presented should be made
here concerning carbon dioxide. C02 would be expected to be less permeable in a given
polymer than oxygen because of its larger molecular weight, but its permeability is
actually much greater due to both the high critical temperature, giving rise to high
solubility, and small sieving diameter. Therefore, the successful use of C02 in both
Chapter 2 as a solvent in the heterogeneous maleation reactions and Chapter 3 for
extractions of the difficult-to-remove fluorinated solvent f-BTHF is well founded. Also,
a reviewer of the maleation paper3 suggested argon as a possible alternative to C02 in the
modification reactions run. A comparison of these two gases can be made using Table
4. 1 . The sieving diameters of Ar and C02 are almost identical but the critical
temperatures differ significantly. From this data, one would expect that C02 dissolves
more readily in polymers and, accordingly, that molecules dissolve more readily in C02 .
This is, in fact, observed. 129 While the gases behave similarly, C02 is clearly a better
solvent.
Membranes are used to achieve some degree of separation of two or more gases.
The selectivity (or more precisely permselectivity) ai7jof the membrane is given as
at/J
= P, /Pj
where P is the permeability of the membrane to gases i and j. Optimizing the selectivity
is the most important aspect of improving current membrane technology. A somewhat
low permeability can in fact be overcome by increasing the surface area of the
membrane. Membrane configurations like the hollow fiber accomplish this effectively.
123
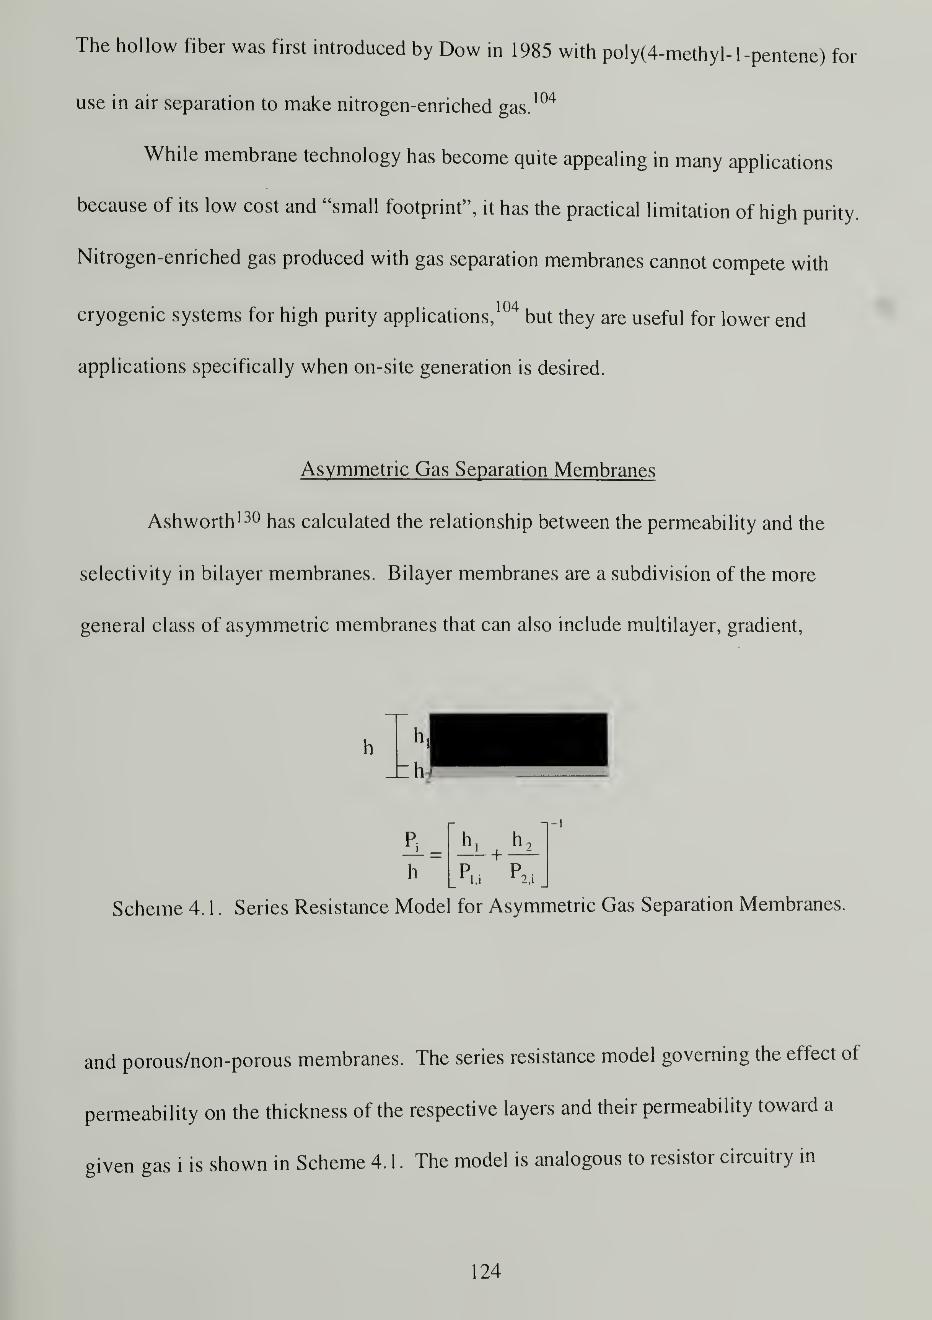
The hollow fiber was first introduced by Dow in 1985 with poly(4-methyl-l-pentene) for
use in air separation to make nitrogen-enriched gas.104
While membrane technology has become quite appealing in many applications
because of its low cost and "small footprint", it has the practical limitation of high purity.
Nitrogen-enriched gas produced with gas separation membranes cannot compete with
cryogenic systems for high purity applications,104
but they are useful for lower end
applications specifically when on-site generation is desired.
Asymmetric Gas Separation Membranes
Ashworth 130 has calculated the relationship between the permeability and the
selectivity in bilayer membranes. Bilayer membranes are a subdivision of the more
general class of asymmetric membranes that can also include multilayer, gradient,
Scheme 4. 1 . Series Resistance Model for Asymmetric Gas Separation Membranes.
and porous/non-porous membranes. The series resistance model governing the effect of
permeability on the thickness of the respective layers and their permeability toward a
given gas i is shown in Scheme 4. 1 . The model is analogous to resistor circuitry in
124

electronic models. The relationship between the permeability and the selectivity was
shown to be linear, and is described by the equation 130
P,."' -P p 'p 1 _p >p -'
P1
_P P -i P'r
i.ir
2,i n,j -r2.i
"I "I
Thus, a balance can be achieved when combining two membrane materials with different
permeability and selectivity values. In our case, the highly permeable Teflon AF is used
as a support for a thinner, more selective PPX. The resulting composite membrane has a
slightly lowered permeability relative to the amorphous fluoropolymer with a selectivity
nearly equal to that of the PPX.
Poly(p-xvlvlene) Film Formation and Membrane Properties
The formation of a uniform PPX layer on the fluoropolymer support can be easily
realized by the vapor deposition polymerization of the stable dimer di-p-xylylene (DPX)
using the Gorham method. 131 - 132 This is a solvent-free condensation polymerization that
proceeds through the activation of the monomer followed by its condensation onto any
surface held below 30 °C (Scheme 4.2). Upon condensation, the monomer rapidly
polymerizes forming the
125

£3DPX (s)
sublimationi
160-200 oc< 1 Torr
pyrolysis*
600-650 °C< 1 Torr
DPX (g)
PX
condensation/polymerization
<30 oC<1 Torr
PPX
Scheme 4.2. Mechanism of DPX Vapor Deposition Polymerization.
highly crystalline and uniform PPX film. The film thickness and uniformity can be
controlled by the amount of dimer sublimed and the rate of deposition (pressure and
temperature of the sublimation).
Table 4.2. Permeability and Selectivity of PPX-Based Polymers.
Permeability 133 (Barrers)
C02 o2 N2 a(02/N2)
PPX 1.28 0.23 0.046 5.09
PPXC 0.046 0.043 0.0060 7.20
PPXD 1 0.078 0.19 0.027 7.10
PPX-Br 0.039 0.024 0.0006 33
*units: 1 Barrer = 10K) cm 3
(STP) cm / (cm2s cmHg)
Substituted poly(p-xylylene)s can also be prepared by this method from the
corresponding substituted dimers. Table 4.2 lists the membrane properties of some of
these substituted PPXs where PPXC and PPXD are the mono- and para di-chloro-
126
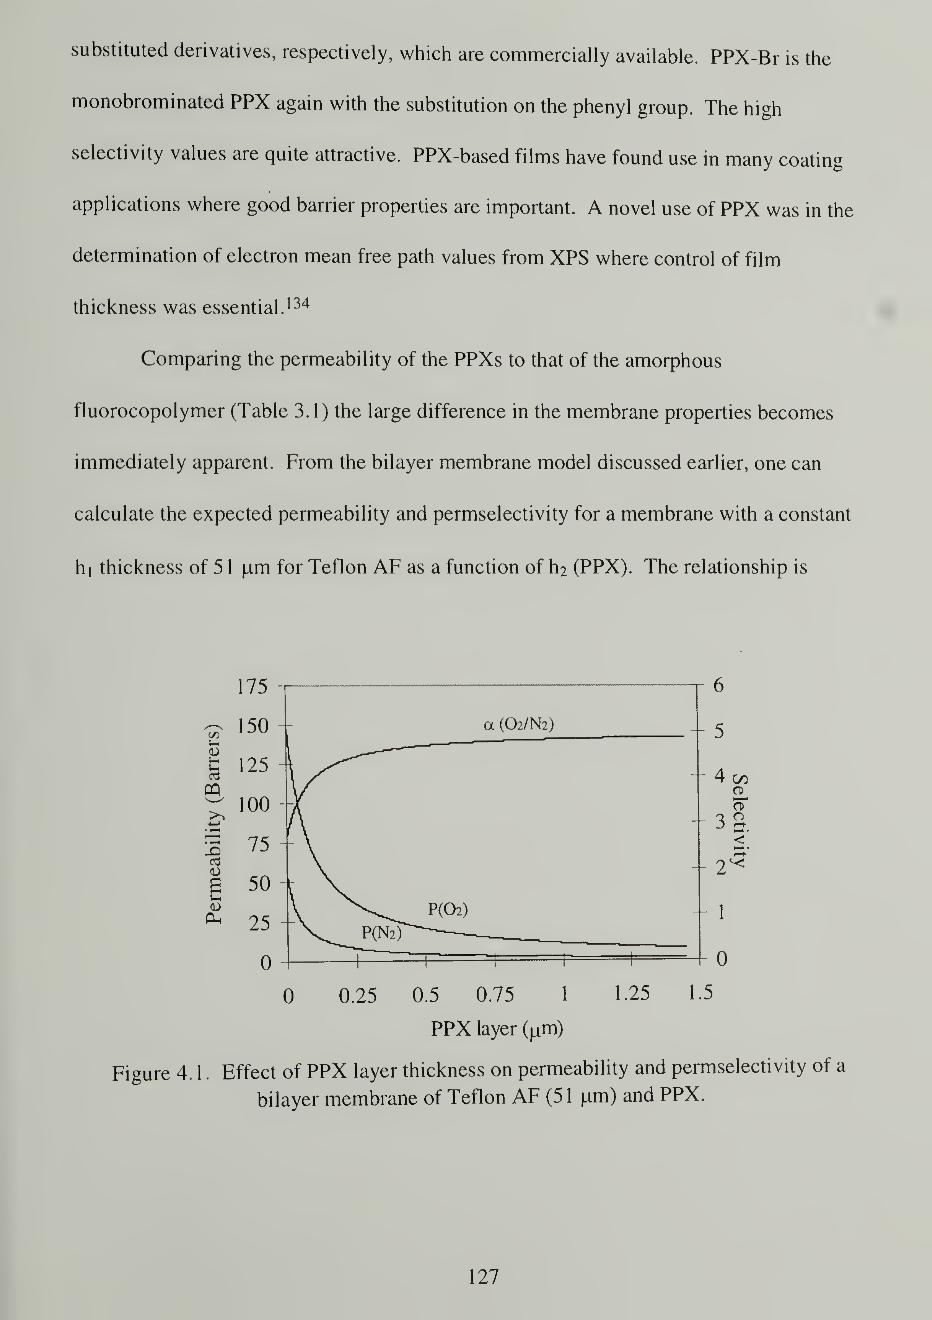
substituted derivatives, respectively, which are commercially available. PPX-Br is the
monobrominated PPX again with the substitution on the phenyl group. The high
selectivity values are quite attractive. PPX-based films have found use in many coating
applications where good barrier properties are important. A novel use of PPX was in the
determination of electron mean free path values from XPS where control of film
thickness was essential. 134
Comparing the permeability of the PPXs to that of the amorphous
fluorocopolymer (Table 3.1) the large difference in the membrane properties becomes
immediately apparent. From the bilayer membrane model discussed earlier, one can
calculate the expected permeability and permselectivity for a membrane with a constant
h, thickness of 5 1 fim for Teflon AF as a function of Y12 (PPX). The relationship is
0 0.25 0.5 0.75 1
PPX layer (^m)
1.25 1.5
Figure 4. 1 . Effect of PPX layer thickness on permeability and permselectivity of a
bilayer membrane of Teflon AF (5 1 urn) and PPX.
127

graphed in Figure 4. 1.Obviously, a compromise is essential when designing the
desirable bilayer membrane. While the selectivity increases dramatically with increasing
PPX thickness, the permeability values correspondingly drop. The model predicts that a
improved selectivity (a(02/N2)~4.6) is achievable without losing much gas permeability
(P(02)~37 Barrer) with a 0.25 urn PPX layer.
Polymer / Polymer Adhesion
The fluoropolymer surface modification work discussed in Chapter 3 can be
applied to this project creating a wettable surface to which the PPX can adhere.
Otherwise, the PPX would be expected to easily delaminate from the low surface energy
surface of Teflon AF. It should bind rather strongly to the reduced fluoropolymer surface
due to the higher surface energy. 135 Also, the presence of unsaturation could promote
some chemical bonding between the PPX and the reduced Teflon AF. To quantify these
assumptions, a double cantilever beam (DCB) test of adhesion was selected as a good
measure of the adhesive bond.
There exist problems inherent in the common types of adhesion tests that relate to
the dissipative energy released as a result of plastic and/or viscoelastic deformation of the
polymers. The resulting calculated adhesive strength is biased high by as much as an
order of magnitude for the peel adhesion test and by a smaller factor for the DCB test. 136
A relative comparison between the adhesion for the modified and unmodified Teflon AF
would still be valid with either of these tests, however.
128
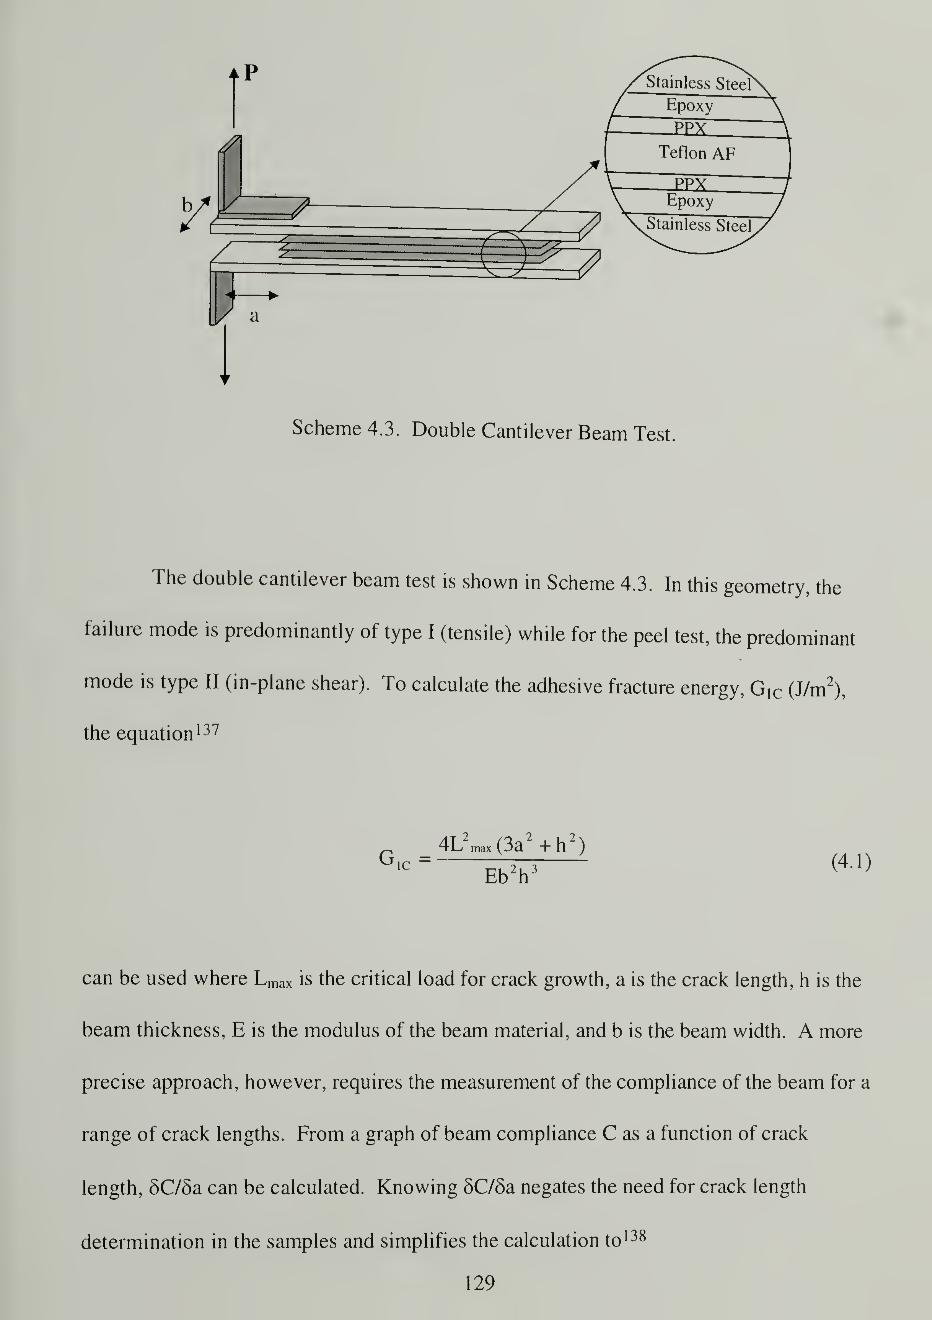
«l
V a
Scheme 4.3. Double Cantilever Beam Test.
The double cantilever beam test is shown in Scheme 4.3. In this geometry, the
failure mode is predominantly of type I (tensile) while for the peel test, the predominant
mode is type II (in-plane shear). To calculate the adhesive fracture energy, Gi C (J/m2),
the equation 137
4L2
max (3a2 +h 2
)G '<=- EbV(4I)
can be used where Lmax is the critical load for crack growth, a is the crack length, h is the
beam thickness, E is the modulus of the beam material, and b is the beam width. A more
precise approach, however, requires the measurement of the compliance of the beam for a
range of crack lengths. From a graph of beam compliance C as a function of crack
length, 5C/Sa can be calculated. Knowing 5C/§a negates the need for crack length
determination in the samples and simplifies the calculation to 138
129

(4.2)
This equation will be used for determination of the fracture toughness of the PPX-AF
interface.
Experimental
Materials
Teflon AF 1600 (Dupont) was cast from a 5% w/w solution in perfluoro-2-
butyltetrahydrofuran (Lancaster) onto a silicon wafer floating on mercury. After several
days of slow casting, the film-coated wafer was vacuum dried (1 day at room temperature
and 1 day at 100 °C). The uniform AF film was floated off the wafer and extracted three
times (to constant weight) with 5.72 MPa carbon dioxide (bone dry grade, Merriam
Graves) to remove the -3% w/w residual solvent. Failure to remove all of the solvent
would result in inflated gas permeability values. 139 2,2-Paracyclophane (Aldrich) and
chlorinated di-p-xylylene (courtesy of Specialty Coating Systems) were used as received.
For permeability measurements, Merriam Graves prepurified grade nitrogen and extra
dry grade oxygen were used.
130

Methods
Poly(p-xylylene) Deposition
Design of Vapor Deposition Apparatus
An apparatus had to be either designed or purchased to create the uniform PPX
films. While commercial devices are available through Specialty Coating Systems, their
expense made them impractical. A device was easily assembled (Scheme 4.4) using a
high temperature tube furnace and a quartz tube capable of withstanding the high
temperatures (up to 700 °C) required for monomer activation. The sublimation can be
controlled using any of the aforementioned parameters including amount of dimer
charged, pressure, and time of deposition, as well as sublimation, pyrolysis, and substrate
temperatures.
To Vac
(-100 mTorr)
tDeposition
<30 °C
Pyrolysis
600-650 °C
Sublimation
140-180 °C
Cold trap
Scheme 4.4. Vapor Deposition Polymerization Apparatus.
131
Gravimetrics and deposition onto silicon wafers followed by ellipsometric
measurement were used to determine the film thickness. A Rudolph Research
ellipsometer with a helium-neon laser and a 70° angle of incidence was used. The
refractive index values for PPX and PPXC are 1.661 and 1.639, respectively. 133 Atomic
force microscopy (AFM) is useful for analyzing the film uniformity and provided a third
measure of film thickness by scoring a film-coated silicon wafer. A Digital Nanoscope
AFM with a silicon nitride tip was used in tapping mode to acquire height contrast
between the PPX film and the scored region (silicon wafer surface).
A 10 cm diameter silicon wafer was cut into ~(1.2 cm)2pieces. The wafers were
then cleaned thoroughly using a piranha bath that consisted of 70 parts sulfuric acid and
30 parts 30% hydrogen peroxide. After cleaning, the wafers were rinsed thoroughly with
1 8.2-MQ water and stored under water in a sealed vial.
Transport Polymerization of Di-p-Xylylene
The home-built reactor was used for the vapor deposition polymerization of DPX
and DPXC (chloro-substituted DPX). The DPX was pressed into pellet form to better
control the rate of sublimation. Glass baffles were added to the quartz tube to prevent
line-of-sight deposition, which usually resulted in powder formation. The substrates
were taped to or placed on the sample holder in the deposition chamber such that the
Teflon AF film or the silicon wafer, respectively, were coated uniformly on one side.
The same Teflon AF membrane was used for most of the experiments by removing the
previously applied PPX coating using adhesive tape. This prevented the introduction of
132
errors caused by variations in Teflon AF film thickness. Films used in the adhesion tests
were coated on both sides by suspending the films in the deposition chamber.
The reactor was purged thoroughly with nitrogen prior to deposition. Typical
PPX deposition experiments involved a pressure of -100 mTorr and temperatures of 160
°C for the sublimation and 600-610 °C for the pyrolysis. For PPXC deposition, the
sublimation temperature used was 140 °C with 615-645 °C pyrolysis temperatures.
Thickness was determined by coating a silicon wafer positioned next to the AF substrate
and measuring PPX thickness on the wafer using ellipsometry and AFM as mentioned
above.
Gas Permeability
Design of Gas Permeability Apparatus
The measurement of the permeability of the membranes was conducted using a
modified version (Scheme 4.5) of the gas permeability apparatus used and described by
Levasalmi. 140 The measurement of permeability requires a determination of the flux
across the membrane (equation 4.3). This can be best accomplished by modifying the
current set-up to include a computer interfaced to the differential pressure transducer.
The use of the computer also allows the simultaneous measurement of the temperature of
the system during data acquisition. A K-type thermocouple (TC) was employed for
temperature measurement. Large temperature variations were known to exist in the labs
over a 24-h period, and with permeability being temperature dependent, the temperature
variations could affect the results.
133

5 3
Scheme 4.5. Diagram of the Gas Permeability Apparatus Used in this Work.
The diffusion apparatus consists of a Millipore 25 mm membrane cartridge with a
21 .5 mm diameter o-ring forming a seal around the membrane. The exposed surface area
A is then defined as 3.63 cm 2. The transducer (Celesco Products DP31) was calibrated to
measure pressure differentials up to 0.25 psi (0.0017 MPa) using a 0-20 Torr Hastings
vacuum gauge and a Pfeiffer-Balzers TCP-121 turbo pump. This pump was also used for
achieving the 0-MPa downstream pressure during permeability measurements. The
diaphragm of the transducer is capable of withstanding pressures as large as 0.5 psid, but
a larger pressure drop across the membrane is required for efficient permeability
measurement. Thus, with valves 2 and 6 closed, a large pressure drop can be applied
across the membranes while the pressure differential measured by the transducer
corresponds to the pressure increase downstream relative to the initial downstream
134
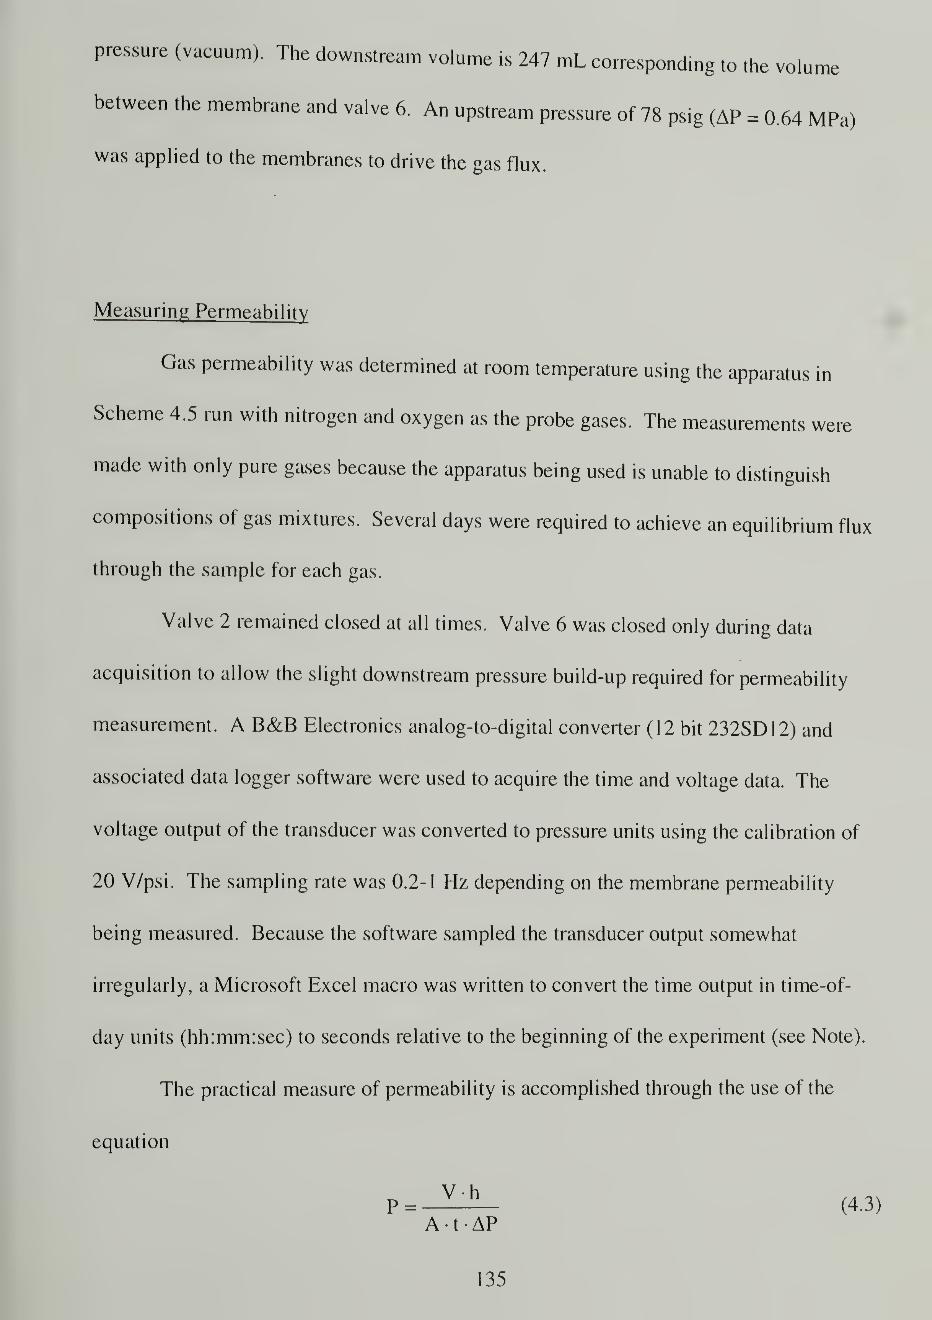
pressure (vacuum). The downstream volume is 247 mL corresponding to the volume
between the membrane and valve 6. An upstream pressure of 78 psig (AP = 0.64 MPa)
was applied to the membranes to drive the gas flux.
Measuring Permeability
Gas permeability was determined at room temperature using the apparatus in
Scheme 4.5 run with nitrogen and oxygen as the probe gases. The measurements were
made with only pure gases because the apparatus being used is unable to distinguish
compositions of gas mixtures. Several days were required to achieve an equilibrium flux
through the sample for each gas.
Valve 2 remained closed at all times. Valve 6 was closed only during data
acquisition to allow the slight downstream pressure build-up required for permeability
measurement. A B&B Electronics analog-to-digital converter (12 bit 232SD12) and
associated data logger software were used to acquire the time and voltage data. The
voltage output of the transducer was converted to pressure units using the calibration of
20 V/psi. The sampling rate was 0.2-1 Hz depending on the membrane permeability
being measured. Because the software sampled the transducer output somewhat
irregularly, a Microsoft Excel macro was written to convert the time output in time-of-
day units (hh:mm:sec) to seconds relative to the beginning of the experiment (see Note).
The practical measure of permeability is accomplished through the use of the
equation
V-^±- (4.3)
A • t AP
135

where V is the volume of gas (cm3(STP)) which permeates after time t (s), h is the
membrane thickness (cm), A is the surface area (cm2
) exposed to the upstream pressure,
and AP is the pressure drop (cmHg) across the film. The design of the permeability
apparatus shown in Scheme 4.4 requires that the low-pressure side of the membrane be
under vacuum. Utilizing the lowest possible pressure on the downstream side of the
membrane is required in order to remove the partial pressure effects on the gas
permeation. This added factor would complicate the determination of selectivity because
the effect depends on the identity of the probe gas. 104
Analysis of the data required that the slope of the pressure versus time (in
seconds) be graphed. The slope was then converted into units of moles per second using
the ideal gas law. Multiplying by the ideal gas constant for standard temperature and
pressure (STP: 0 °C, 1 atm) of 22.414 L/mol led to the volume of gas (cm3(STP))
permeating the membrane per second. Now, equation 4.3 can be enlisted to determine
permeability: V/t was calculated as described above, A is 3.63 cm2, h is the membrane
thickness, and AP is 481 cmHg (0.64 MPa). The units of P are in Barrer—
cm 3(STP)cm/cm
2sec-cmHg.
The permeability calculation was calibrated with two 50-u.m thick PMP films
connected in series. After two weeks, the permeability measured was 11.1 Barrer. The
literature value is 13.1 Barrer. 140 Because of this difference, the values measured
according to the above procedure were multiplied by a factor of 1 . 1 8. The slight error in
these measurements can be accounted for by the finite uncertainty of the values of the
applied AP, the voltage to pressure conversion (20 V/psi), the downstream volume of the
136

apparatus (247 mL), and the surface area exposed. All of these are iustrumeu, constants
that the 1 . 1 8 correction factor accurately adjusts.
Double Cantilever Beam Adhesion Tests
Stainless steel shim stock (1 1 mil) was cut to form the beams for the adhesion
tests. The beam dimensions were 7.62x 1 .27x0.028 cm. Hinges were attached to one end
of each beam to provide a flexible appendage to which the Instron chucks could be
clamped. A 5-minute epoxy was used to bind the composites to the beams. Double stick
tape provided the necessary clamping of the beams for the compliance versus crack
length measurements. A model 1 123 Instron with Testworks for Windows (version 3.0)
software and a 10-kg load cell calibrated with a 500-g weight was used to acquire the
data. Each experiment yielded a value for the compliance (C) and the maximum load at
break (Lmax ).
Results and Discussion
Deposition of PPX and PPXC
Achieving uniform films of PPX and PPXC was found to be somewhat of an art.
The lowest possible sublimation temperatures were needed to keep a slow and steady
supply of activated monomer. A thorough nitrogen purge and evacuation/nitrogen back-
fill helped prevent incorporation of oxygen and degradation of the monomer in the
pyrolysis zone. The baffles placed at the exit of the pyrolysis zone were essential for the
137

prevention of powder deposition on the surface of the silicon wafers and the Teflon AF
substrate (Figure 4.2). This powder deposition was found to occur as a line-of-sight
process that was prevented to a lesser extent than the baffles by the placement of the
samples in the bottom of the deposition glassware as opposed to being d,rectly along the
path between the pyrolysis zone and the cold trap.
m
1
ftJ*
4M> H10.0
Figure 4.2. AFM image of powder deposition of PPX
Once the technique was mastered, the coated silicon wafers displayed brilliant
colors representative of the thickness of the PPX coating. AFM revealed that the films
were quite smooth having an AFM-calculated RMS roughness of 2.1 nm. The largest
peaks or pits were found to be 8 nm. AFM and ellipsometry were used jointly to identify
the precise thickness of the film. An AFM image is shown in Figure 4.3 with the film
thickness determined as the vertical distance from the central groove to the edge plateaus
138
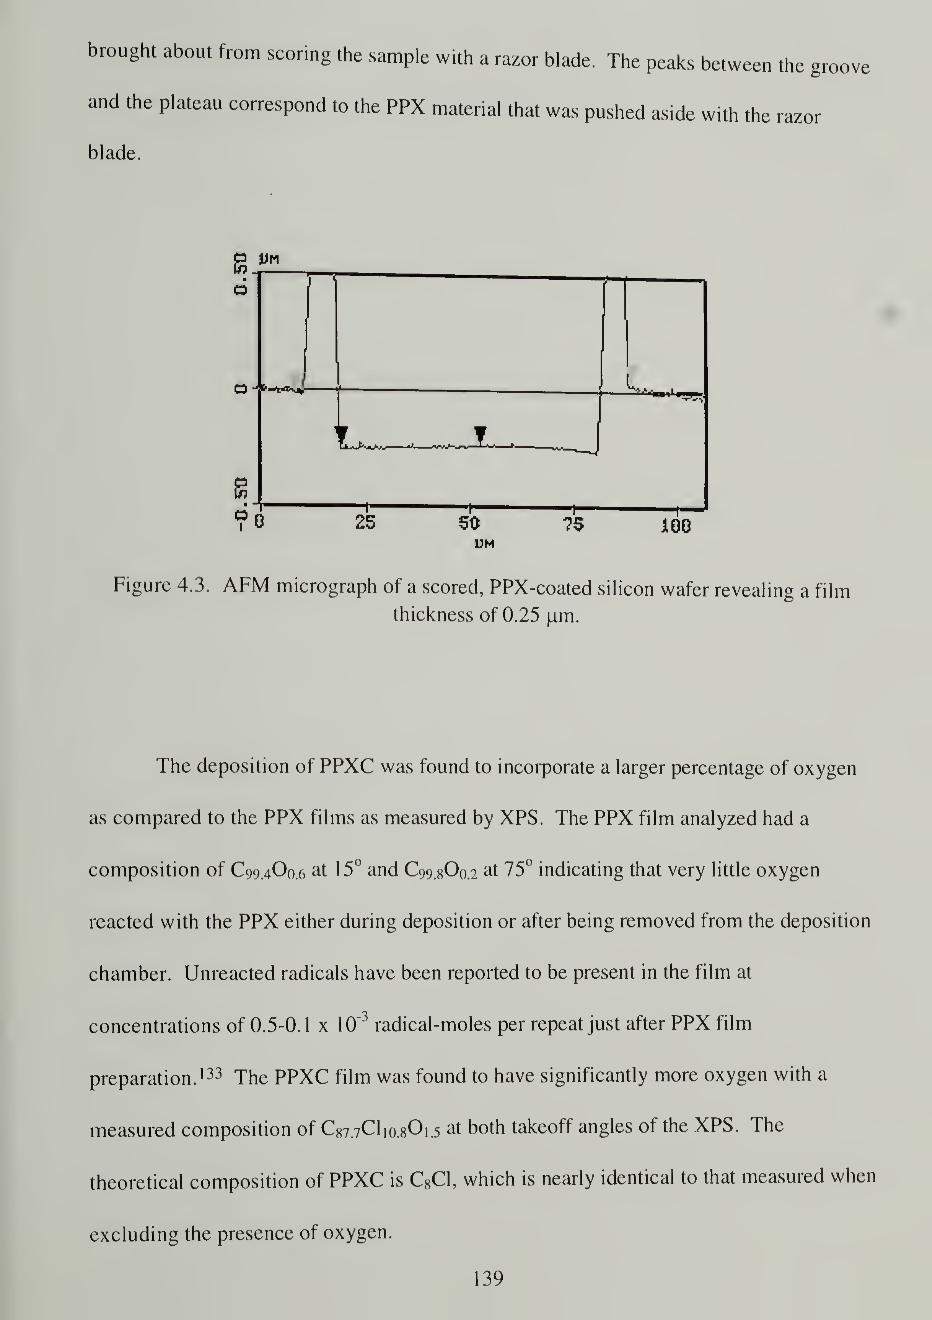
brought about from scoring the sample with a razor blade. The peaks between the groove
and the plateau correspond to the PPX material that was pushed aside with the razor
blade.
"I
DM
-t-75
Figure 4.3. AFM micrograph of a scored, PPX-coated silicon wafer revealing a film
thickness of 0.25 u.m.
The deposition of PPXC was found to incorporate a larger percentage of oxygen
as compared to the PPX films as measured by XPS. The PPX film analyzed had a
composition of C99.4O0.6 at 15° and C99.8O0.2 at 75° indicating that very little oxygen
reacted with the PPX either during deposition or after being removed from the deposition
chamber. Unreacted radicals have been reported to be present in the film at
concentrations of 0.5-0.1 x 10"3 radical-moles per repeat just after PPX film
preparation. 133 The PPXC film was found to have significantly more oxygen with a
measured composition of C87.7CI10.80 1.5 at both takeoff angles of the XPS. The
theoretical composition of PPXC is C8C1, which is nearly identical to that measured when
excluding the presence of oxygen.
139

Permeability of Ri layer Membranes
Three composite membranes were studied in this work. Two utilized PPX as the
selective layer, and one was made with PPXC. A film of Teflon AF reduced for 10
minutes with sodium naphthalenide was also examined. Figures 4.4 and 4.5 show the
equilibration of the composite membranes to constant permeability values. Several days
were required to reach an equilibrium flux, and several more days were needed to
establish that the equilibrium was indeed achieved.
The equilibration of the nitrogen permeability in the membranes (Figure 4.4) is
faster than the oxygen equilibration (Figure 4.5). Also, opposing trends are observed.
For nitrogen, the permeability plateaus are at a value below the initial measurement,
while for oxygen, the plateaus are at a higher value. This observation can be easily
explained. Any oxygen and carbon dioxide in the film prior to analysis make it more
permeable than nitrogen does alone, so these gases must first be displaced before an
accurate P(N?) can be determined. Likewise, for the oxygen permeability data, nitrogen
present in the film decreases the oxygen flux, and must be displaced before a true P(Oi)
can be recorded. The difference in the number of days to equilibration comes about from
the ease of displacement of the contaminant gases with the nitrogen permeability data
equilibrating faster than the oxygen data. Also, it was more difficult to maintain a
constant oxygen pressure with the regulators used, so constant adjustments had to be
made which may have slowed equilibration.
140
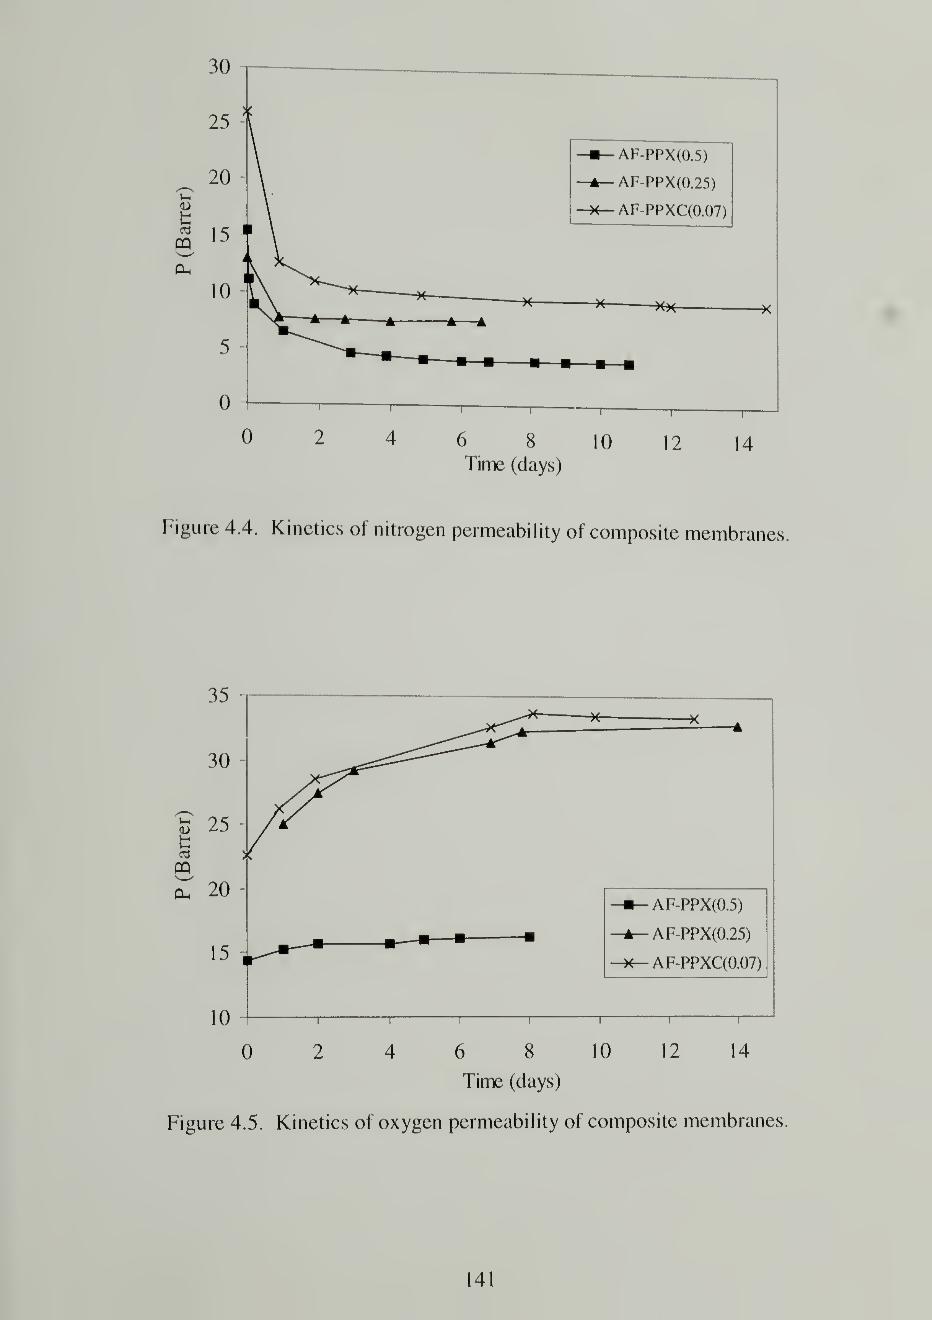
2 4 6 8 10 12 14Time (days)
Figure 4.4. Kinetics of nitrogen permeability of composite membranes.
35
15
0
0
*-AF-PPX(0.5)
-A— AF-PPX(0.25)
*-AF-PPXC(0.()7)
142 4 6 8 10 12
Time (days)
Figure 4.5. Kinetics of oxygen permeability of composite membranes
141

The values for oxygen and nitrogen permeability measured in this work are
summarized in Table 4.3. The literature values for Teflon AF permeability (Table 3.1:
P(O2)=170 Barrer and P(N 2)=55 Barrer) are slightly different from those measured here.
This is best explained by the earlier conclusion that the Teflon AF 1600 we were given
has a slightly lower dioxole comonomer composition than that reported. The difference
must be slight, however, as indicated by the small difference in the measured
permeability.
Table 4.3. Permeability Data for Teflon AF-Based Membranes (Barrer).
P(02 ) P(N 2) a(02/N2)
Teflon AF 1 600 149 55.5 2.7
AF(51 nm)-PPX(0.5 urn) 16.3 3.94 4.1
AF (5 1 um)-PPX (0.25 urn) 32.2 7.56 4.3
AF (5 1 um)-PPXC (0.07 urn) 35.0 9.22 3.8
Red-AF(lOmin) 127 45.3 2.8
The series resistance model predicts decreased permeability and improved
selectivity relative to Teflon AF when forming bilayer composites with PPX. Table 4.3
shows that this is observed. The model also predicts, however, that the selectivity should
be larger for the membrane with a thicker PPX layer. Instead our data indicates that the
thinner and more permeable PPX membrane also has the higher selectivity. The values
calculated from the model using our Teflon AF permeability measurements for oxygen
and nitrogen permeability with a 0.5-um thick PPX layer are 20.5 and 4.37 Barrer,
respectively. The selectivity should then be 4.7 with the thicker PPX layer. For a 0.25
\m PPX layer, P(02 ) should be 35.9 Barrer, and P(N 2 ) should be 8.07 Barrer giving a
142

selectivity of 4.4. The permeability and selectivity values measured for these bilayer
composites are lower on average than that expected.
For the composite made with PPXC, the agreement with the theoretical values is
slightly worse. From the series resistance model P(02) is 25.9 Barrer and P(N2 ) is 4.06
Barrer giving a selectivity of 6.4. Because higher permeability and lower selectivity is
observed for the thin PPXC bilayer, pinholes likely exist in the film. Attempts at
preparing a second PPXC-AF membrane were met with difficulty. The art of PPXC
formation was apparently not mastered although it has been reported that PPXC films of
less than 8 (j.m thickness inherently contain pinholes. 128 Our films were 0.07 u,m thick.
The final set of data in Table 4.3 is quite important to the entire focus of this
work. Reducing the Teflon AF sample using sodium naphthalenide complex for 10
minutes barely reduces the permeability. This is promising, indicating that effective
composite membranes with high adhesive joint strengths can be made with Teflon AF
and PPX or its derivatives.
Adhesion between Teflon AF and PPX
The composite membranes formed from the transport polymerization of DPX on
Teflon AF were expected to have a weak boundary layer due to the incompatibility of the
two polymers. More specifically, the low surface free energy of fluoropolymers leads to
low wettability. The work discussed in Chapter 3 concerning reduction chemistry of
Teflon AF should prove useful in generating more stable composite membranes. To
143
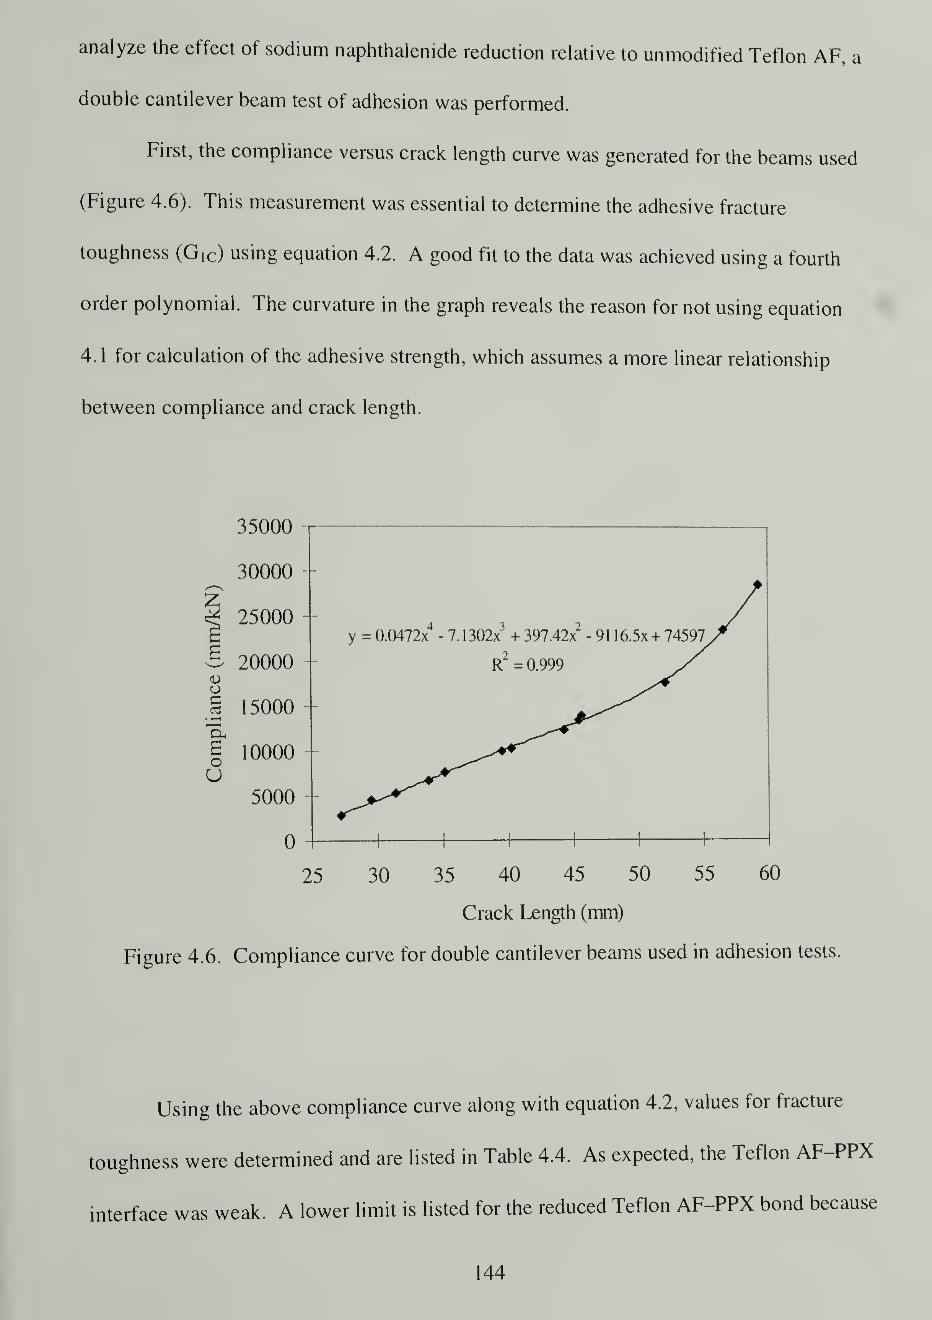
analyze the effect of sodium naphthalenide reduction relative to unmodified Teflon AF, a
double cantilever beam test of adhesion was performed.
First, the compliance versus crack length curve was generated for the beams used
(Figure 4.6). This measurement was essential to determine the adhesive fracture
toughness (Gj C ) using equation 4.2. A good fit to the data was achieved using a fourth
order polynomial. The curvature in the graph reveals the reason for not using equation
4. 1 for calculation of the adhesive strength, which assumes a more linear relationship
between compliance and crack length.
35000 -|
1
30000 -
25 30 35 40 45 50 55 60
Crack Length (mm)
Figure 4.6. Compliance curve for double cantilever beams used in adhesion tests.
Using the above compliance curve along with equation 4.2, values for fracture
toughness were determined and are listed in Table 4.4. As expected, the Teflon AF-PPX
interface was weak. A lower limit is listed for the reduced Teflon AF-PPX bond because
144
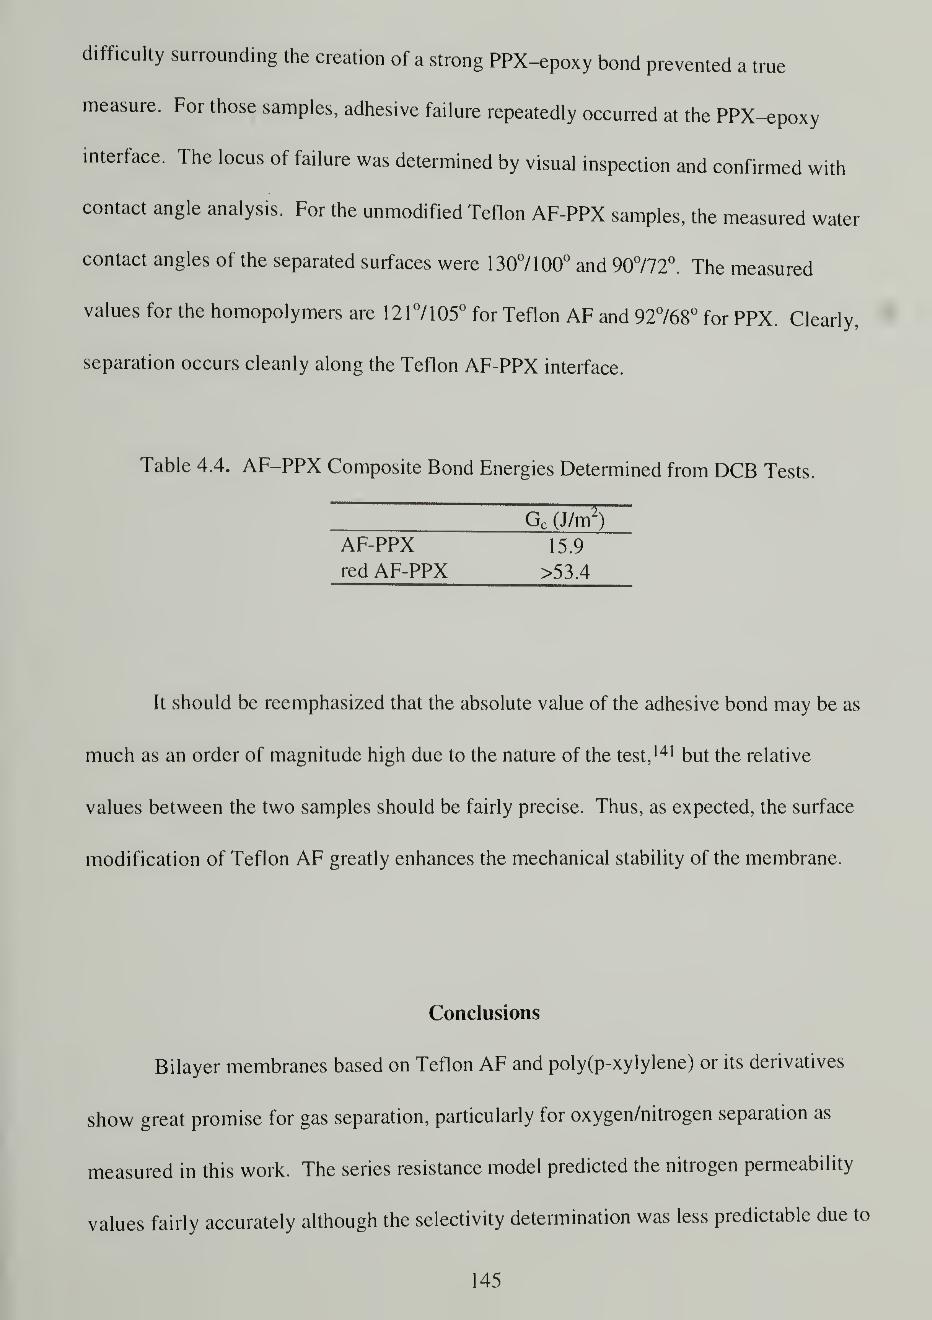
difficulty surrounding the creation of a strong PPX^poxy bond prevented a true
measure. For those samples, adhesive failure repeatedly occurred at the PPX-^poxy
interface. The locus of failure was determined by visual inspection and confirmed with
contact angle analysis. For the unmodified Teflon AF-PPX samples, the measured water
contact angles of the separated surfaces were 1 307100° and 90772°. The measured
values for the homopolymers are 1217105° for Teflon AF and 92768° for PPX. Clearly,
separation occurs cleanly along the Teflon AF-PPX interface.
Table 4.4. AF-PPX Composite Bond Energies Determined from DCB Tests.
Gc (J/m2
)
AF-PPX 15.9
red AF-PPX >53.4
It should be reemphasized that the absolute value of the adhesive bond may be as
much as an order of magnitude high due to the nature of the test, 141 but the relative
values between the two samples should be fairly precise. Thus, as expected, the surface
modification of Teflon AF greatly enhances the mechanical stability of the membrane.
Conclusions
Bilayer membranes based on Teflon AF and poly(p-xylylene) or its derivatives
show great promise for gas separation, particularly for oxygen/nitrogen separation as
measured in this work. The series resistance model predicted the nitrogen permeability
values fairly accurately although the selectivity determination was less predictable due to
145

greater discrepancies in the oxygen permeability data. The enhancement of the strength
of the Teflon AF-PPX interface by reducing the Teflon AF with sodium naphthalenide
prior to the transport polymerization of DPX was found to be substantial.
Note
Andre Mel'cuk wrote a macro to convert the Microsoft Excel data file from the B&B
Electronics software. The raw data contained the time information in the form of
hh:mm:sec according to the time of day each data point was acquired. The macro
converted this information into seconds with the first data point equal to 0 seconds. If the
experiment ran for over 24 hours, the macro was able to account for this as well without
resetting. To run the macro (called "process.xls"), the time column in the Excel file must
be formatted as "text" not "general".
146
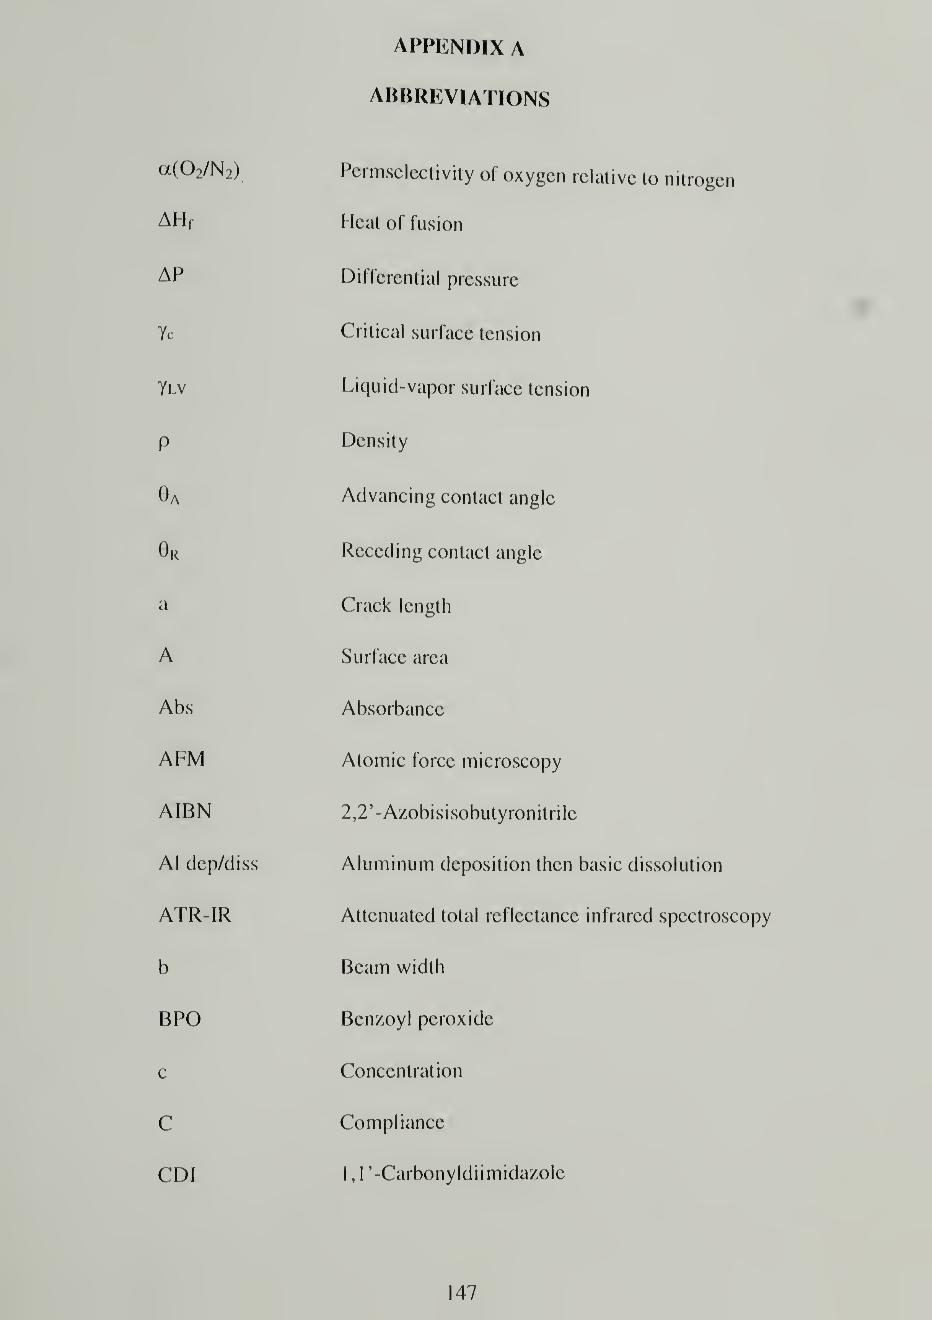
APPENDIX A
ABBREVIATIONS
a(02/N 2 ) Permselectivity of oxygen relative to nitrogen
AH( Heat of fusion
AP Differential pressure
Yc Critical surface tension
Yi-v Liquid-vapor surface tension
p Density
9a Advancing contact angle
0r Receding contact angle
a Crack length
A Surface area
Abs Absorbance
Ai ;M Atomic force microscopy
AIBN 2,2'-Azobisisobutyronitrile
AI dep/diss Aluminum deposition then basic dissolution
ATR-IR Attenuated total reflectance infrared spectroscopy
b Beam width
BPO Benzoyl peroxide
c Concentration
C Compliance
CDI I , I '-Carbonyldiimidazole
147
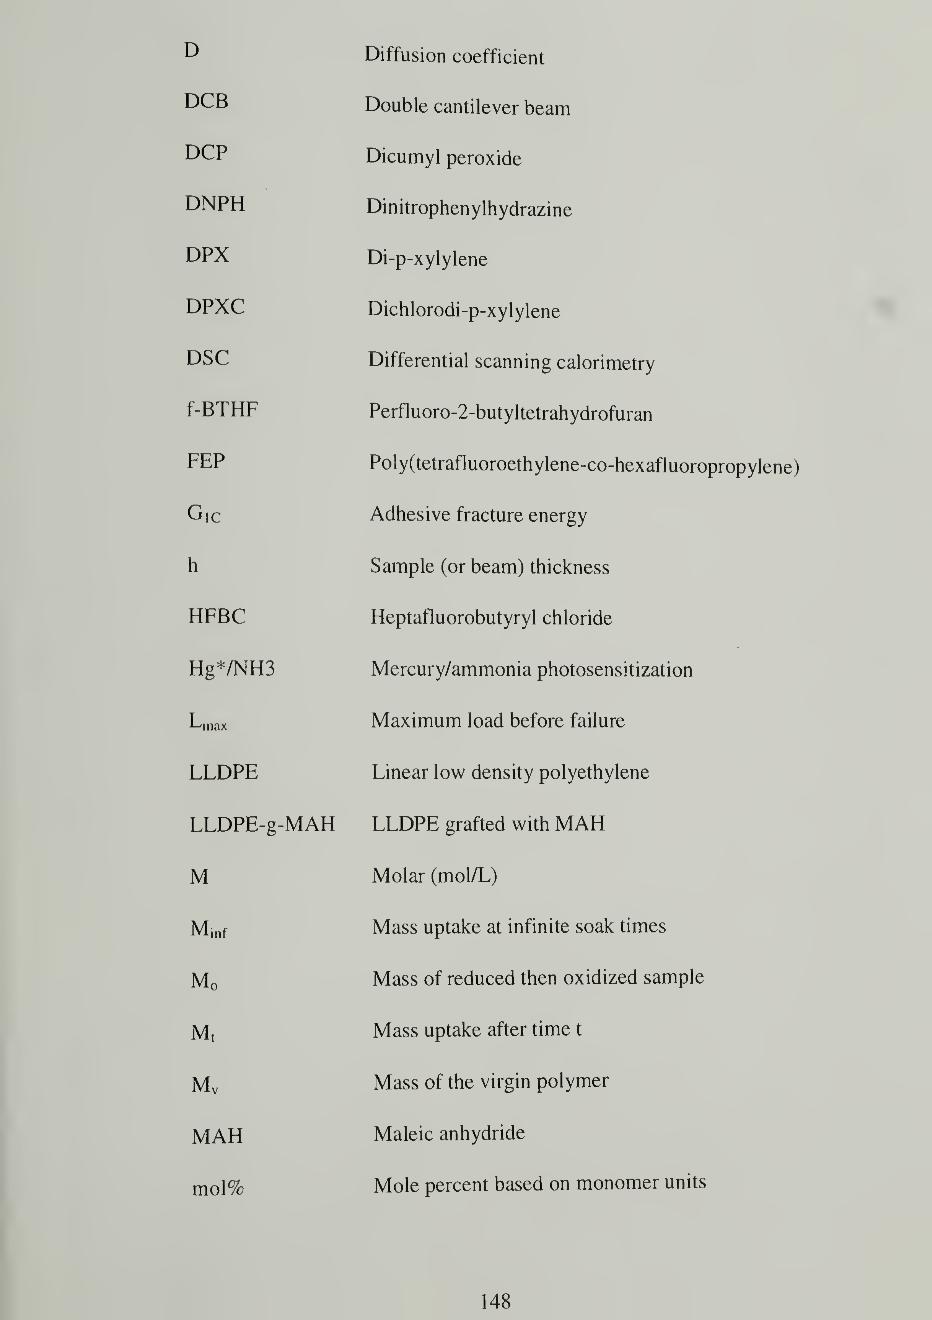
L> Diffusion coefficient
DCB Double cantilever beam
DCP Dicumyl peroxide
DNPH Dinitrophenylhydrazine
DPX Di-p-xylylene
DPXC Dichlorodi-p-xylylene
DSC Differential scanning calorimetry
f-BTHF Perfluoro-2-butyltetrahydrofuran
FEP Poly(tetrafluoroethylene-co-hexafluoropropylene)
Gic Adhesive fracture energy
h Sample (or beam) thickness
HFBC Heptafluorobutyryl chloride
Hg*/NH3 Mercury/ammonia photosensitization
Lmax Maximum load before failure
LLDPE Linear low density polyethylene
LLDPE-g-MAH LLDPE grafted with MAH
M Molar (mol/L)
Minf Mass uptake at infinite soak times
M0 Mass of reduced then oxidized sample
Mt
Mass uptake after time t
Mv Mass of the virgin polymer
MAH Maleic anhydride
mol% Mole percent based on monomer units
148

Mpa Megapascals
Na-Nap Sodium naphthalide in THF
P(N2) Nitrogen permeability
P(02) Oxygen permeability
PET Poly(ethylene terephthalate)
PMP Poly(4-methyl-l-pentene)
PMP-g-MAH PMP grafted with MAH
PPX Poly(p-xylylene)
PPX-Br Poly(bromo-p-xylylene)
PPXC Poly(chloro-p-xylylene)
psi Pounds per square inch pressure
psia Absolute pressure in psi (atmospheric pressure = 14.7 psia)
psid Differential pressure in psi
PTFE Poly(tetrafluoroethylene)
PTrFE Poly(trifluoroethylene)
PVF2 Poly(vinylidene fluoride)
red AF Teflon AF reduced with Na-Nap
RT Room temperature
SC C02 Supercritical carbon dioxide
SET Single electron transfer
STP Standard temperature and pressure (0 °C, 1 atm)
t Glass transition temperature
Teflon AF p0ly(tetrafluoroethylene-co-bis-2,2-trifluoromethyl-4,5-
difluoro-l,3-dioxole)
149
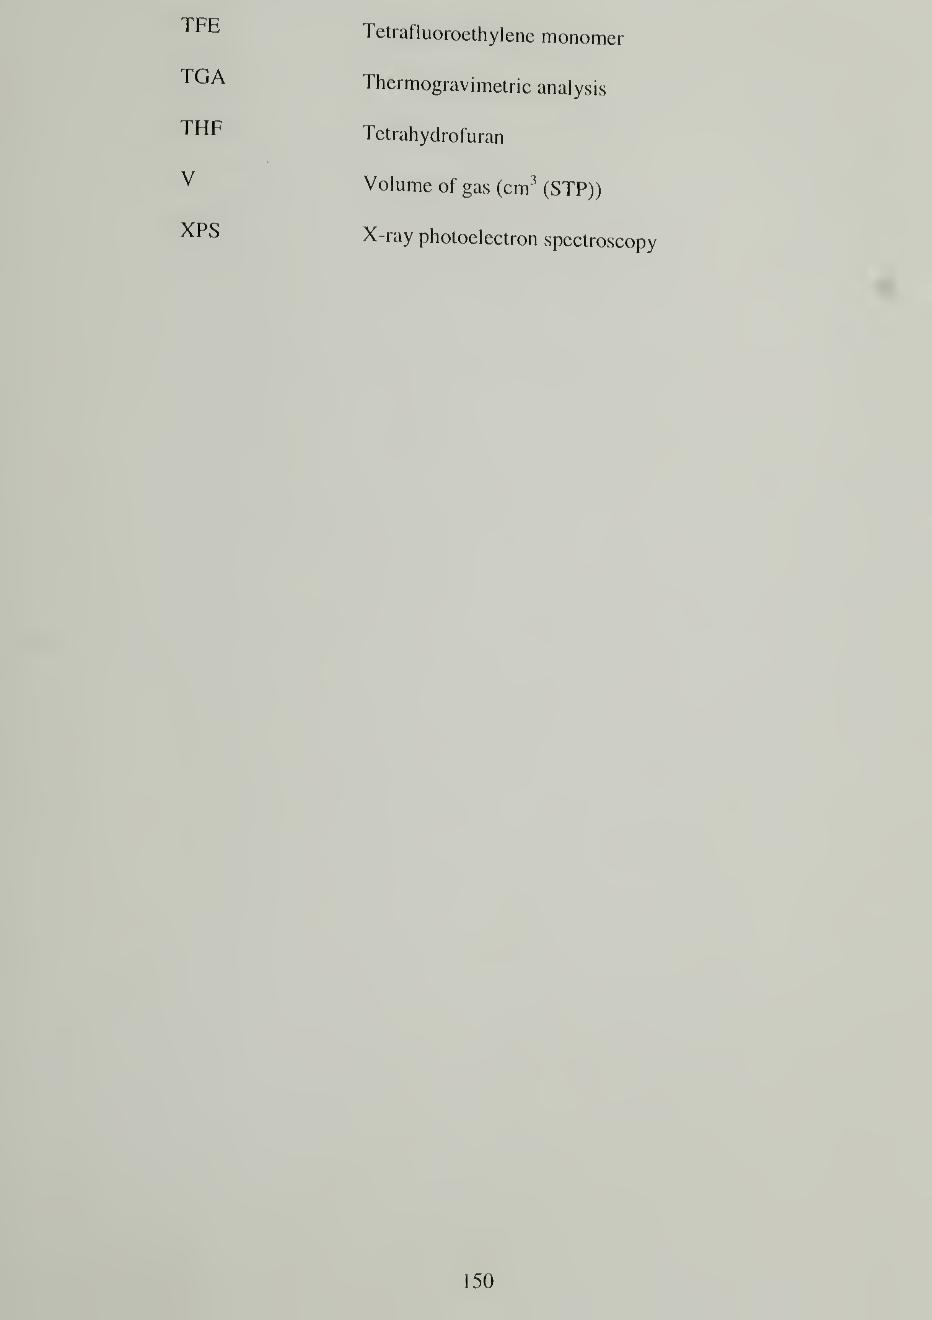
Tetrafluoroethylene monomer
Thermogravimetric analysis
Tetrahydrofuran
Volume of gas (cm3(STP))
X-ray photoelectron spectroscopy
150

APPENDIX B
SUPPLEMENTAL DATA FOR CHAPTER 3
Table B. 1.Contact Angle Measurements after Derivatization Reactions on Teflon AF
Reduced 10 Minutes with Na-Nap.
Water Hexadecane
Oa/Or) Oa/Or)Unmodified 1217 105° 657 61°
Red- 10 min 60/16 22/0Br2 70/28 16/0BH3 45/14 14/0BH3/Oxid 58/18 17/0Base Oxid 121 111 64/46Acid Oxid 118/70DNPH 73/24 19/0HFBC 85/18 22/0BH 3/Oxid/HFBC 118/67 58/43HFBC/CDI 71 / 17 15/0
Table B.2. Contact Angle Measurements after Derivatization Reactions on Teflon AFReduced 4 Hours with Na-Nap.
Water Hexadecane
(eA/eR) (Oa/Gr)
Unmodified 1217105° 65761°
Red^lh 52/12 23/0
Br2 74/29 19/0
BH3 48/11 16/0
BH3/Oxid 115/63 59/37
Base Oxid 121/78 65/50
Acid Oxid 119/77
DNPH 73/28 20/ 15
HFBC 75/29 31/0
BH3/Oxid/HFBC
HFBC/CDI 66/16 17/0
151

Table B.3. UV/Vis Absorbance at 320 nm of Red-AF Derivatives.
R-edio ,n j n Red4hUnmodified 0 0Reduced 0.055 0.146
Br2 0.049 0.096
BH3 0.046 0.028
BH 3/Oxid 0.023 0.014
Base Oxid 0.003 0.005
Acid Oxid * *
DNPH 0.060 0.146
HFBC 0.060 0.147
BH^/Oxid/HFBC 0.004 *
HFBC/CDI
^Samples appeared completely colorless.
Table B.4. XPS 75° Takeoff Angle Data of Teflon AF from Compact Membrane
Systems after Hg*/NH^ Treatment.
AF 1 600 AF 2400
Carbon 50.6 60.3
Oxygen 9.7 10.9
Nitrogen 14.7 19.2
Fluorine 24.9 9.6
152

0.018
0.015
0.012
1 0.009
0.006
0.003
0
1900 1800 1700 1600 1500 1400 1300
Wavenumbers (cm1
)
Figure B. 1 . ATR-IR spectrum of red-AF derivatized with HFBC and then CDI
153

BIBLIOGRAPHY
1)
Jagur-Grodzinski, J.Heterogeneous Modification of Polymers; Wiley & Sons-
Chichester, 1997.
2) Hayes, H. J.; McCarthy, T. J. Polym. Prepr. (Am. Chem. Soc. Div. Polym Chem )
1997,38,426.
3) Hayes, H. J.; McCarthy, T. J. Macromolecules 1998, 31, 4813.
4) Hayes, H. J.; McCarthy, T. J. PMSE Prepr. (Am. Chem. Soc. Div. Polym MaterSci. Eng.) 1999, 80, In Press.
5) Chung, T. C. New Advances in Polyolefins; Chung, T. C, Ed.; Plenum Press-New York, 1993, pp 248.
6) Jois, Y. H. R.; Harrison, J. B. J.M.S. -Rev. Macromol. Chem. Phys. 1996 C36(3)433.
7) Naqvi, M. K.; Choudhary, M. S. J.M.S. -Rev. Macromol. Chem. Phys. 1996,
C36(3), 601.
8) Watkins, J. J.; McCarthy, T. J. Macromolecules 1994, 27, 4845.
9) Watkins, J. J.; McCarthy, T. J. Macromolecules 1995, 28, 4067.
10) Kung, E. K.; Lesser, A. J.; McCarthy, T. J. Macromolecules 1998, 31, 4160.
11 ) Rajagopalan, P.; McCarthy, T. J. Macromolecules 1998, 31, 4791
.
12) Watkins, J. J.; McCarthy, T. J. Chem. Mater. 1995, 7, 1991.
1 3) Hyatt, J. A. J. Org. Chem. 1984, 49, 5097.
14) Subramaniam, B.; McHugh, M. A. Ind. Eng. Chem. Process Des. Dev. 1986, 25,
1.
15) Savage, P. E.; Gopalan, S.; Mizan,T. I.; Martino, C. J.; Brock, E. E.A.I.Ch.E. J.
1995, 41, 1723.
1 6) McHugh, M. A.; Krukonis, V. J. In Encyclopedia ofPolymer Science and
Engineering; 2nd ed.; Mark, Bikales, Overberger and Menges, Eds. John Wiley &Sons: New York, 1989; Vol. 16, p 368 - 399.
17) Canelas, D. A.; DeSimone, J. M. Adv. Polym. Sci. 1997, 133, 103-140.
1 8) McHugh, M. A.; Krukonis, V. J. Supercritical Fluid Extraction; 2nd ed.;
Butterworth-Heinemann: Boston, 1994.
154

19) Rindfleisch, F.; DiNoia, T.; McHugh, M. J. Phys. Chem. 1996, 100, 15581.
20) Tuminello, W. H.; Dee, G. T.; McHugh, M. A. Macromolecules 1995, 28, 1 506.
21) Mertdogan, C. A.; Byun, H.-S.; McHugh, M. A.; Tuminello, W. H.Macromolecules 1996, 29, 6548.
22) Mistele, C; Thorp, J.; DeSimone, J. M. J. Macromol. ScL Pure Appl Chem1996, 33, 953.
23) DeSimone, J. M.; Guan, Z.; Eisbernd, C. S. Science 1992, 257, 945.
24) DeSimone, J. M.; Maury, E. E.; Menceloglu, Y. Z.; McClain, J. B.; Romack, T.J.; Combes, J. R. Science 1994, 265, 356.
25) McCoy, M., "DuPont, UNC R&D effort yields results" in Chemical andEngineering News, April 26, 1999, p. 10.
26) Otake, K.; Webber, S. E.; Munk, P.; Johnston, K. P. Langmuir 1997, 13, 3047.
27) Shim, J.-J.; Johnston, K. P. A.l.Ch.E. J. 1991, 37, 607.
28) Condo, P. D.; Paul, D. R.; Johnston, K. P. Macromolecules 1994, 27, 365.
29) Condo, P. D.; Sanchez, I. C; Panayioutou, C. G.; Johnston, K. P. Macromolecules
1992, 25,6119.
30) Goel, S. K.; Beckman, E. J. Polymer 1992, 24, 1410.
31) Goel, S. K.; Beckman, E. J. J. Polym. Eng. Sci. 1994, 34, 1 137.
32) Goel, S. K.; Beckman, E. J. J. Polym. Eng. Sci. 1994, 34, 1 148.
33) King, J. W. PMSE Prepr. (Am. Chem. Soc. Div. Polym. Mater. Sci. Eng.) 1984,
57, 707.
34) Aida, T.; Squires, T. G. In Supercritical Fluids: Chemical and Engineering
Principles and Applications; Squires, T. G. and Paulaitis, M. E., Eds.;ACS
Symposium Series 329; American Chemical Society: Washington, D.C., 1987, p
58.
35) Paulaitis, M. E.; Alexander, G. C. Pure & Appl. Chem. 1987, 59, 61.
36) Newitt, D. M.; Pai, M.; Kuloor, N.; Huggill, J. In Thermodynamic Functions of
Gases; Din, F., Ed. Butterworths: London, 1956; Vol. 1, p 102-134.
37) Watkins, J. J., Ph. D. Dissertation, University of Massachusetts, 1997.
38) Arora, K. A.; Lesser, A. J.; McCarthy, T. J. Macromolecules 1999, 32, 2562.
155

39) Arora, K. A.; Lesser, A. J.; McCarthy, T. J. Macromolecules 1998, 31, 4614.
40) Dispenza, C; Filardo, G.; Silvestri, G.; Spadaro, G. Colloid Polym. Sci 1997275,390.
41) Jobling, M.; Howdle, S. M.; Poliakoff, M. J. Chem. Soc, Chem. Commun 19901762.
42) Yalpani, M. Polymer 1993, 34, 1 102.
43) Ozcan, A. S.; Clifford, A. A.; Bartle, K. D. Dyes Pigments 1998, 36, 103.
44) Kerschner, J. L.; Jureller, S. H.; Harris, R. PMSE Prepr. (Am. Chem. Soc. DivPolym. Matl. Sci. Eng.) 1996, 74, 246.
45) Gabara, W.; Porejko, S. J. Polym. Sci.: Part A- 1 1967, 5, 1547.
46) Bidaux, J.-E.; Smith, G. D.; Bernet, N.; Manson, J. -A. E. Polymer 1996, 37, 1 129.
47) Roberts, D. H.; Constable, R. C; Thiruvengada, S. Polym. Eng. Sci. 1997, 37,
1421.
48) Gaylord, N. G.; Mehta, R.; Deshpande, A. B. In New Advances in Polyolefins;
Chung, T. C, Ed. Plenum Press: New York, 1993, p 1 15.
49) Braun, D.; Eisenlohr, U. Angew. Makromol. Chem. 1976, 55, 43.
50) Ruggeri, G.; Aglietto, M.; Petragnani, A.; Ciardelli, F. Eur. Polym. J. 1983, 79,
863.
51 ) Russell, K. E. J. Polym. Sci.: Part A: Polym. Chem. 1995, 33, 555.
52) Porejko, S.; Gabara, W.; Kulesza, J. J. Polym. Sci.: Part A- 1 1967, 5, 1563.
53) de Vito, G.; Lanzetta, N.; Maglio, G.; Malinconico, M.; Musto, P.; Palumbo, R. J.
Polym. Sci: Polym. Chem. Ed. 1984, 22, 1335.
54) Heinen, W.; Rosenmoller, C. H.; Wenzel, C. B.; de Groot, H. J. M.; Lugtenburg,
J.; van Duin, M. Macromolecules 1996, 29, 1151.
55) Sipos, A.; McCarthy, J.; Russell, K. J. Polym. Sci.: Part A 1989, 27, 3353.
56) de Roover, B.; Sclavons, M.; Carlier, V.; Devaux, J.; Legras, R.; Momtaz, A. J.
Polym. Sci.: Part A: Polym. Chem. 1995, 33, 829.
57) Gaylord, N.; Mehta, R.; Mohan, D. R.; Kumar, V. J. Appl. Polym. Sci. 1992, 44,
1941.
58) Gaylord, N. G.; Mehta, M. J. Polym. Sci.: Polym. Lett. Ed. 1982, 20, 481.
156
59) Aglietto, M.; Bertani, R.; Ruggeri, G.; Segre, A. L. Macromolecules 1990 231928.
60) Heath, D. R., Allied Signal, personal communication.
61) Handa, Y. P.; Kruus, P.; O'Neill, M. J. Poly. Sci.: Part B: Polym Phys 1996, 34,2635.
62) Chiou, J. S.; Barlow, J. W.; Paul, D. R. J. Appl. Polym. Sci. 1985, 30, 2633.
63) Wissinger, R. G.; Paulaitis, M. E. J. Polym. Sci. Polym. Phys. 1991, 29, 63 1
.
64) Sada, E.; Kumazawa, H.; Yakushiji, H.; Bamba, Y.; Sakata, K.; Wang, S.-T. Ind.
Eng. Chem. Res. 1987, 26, 433.
65) Wissinger, R.; Paulaitis, M. J. Polym. Sci.: Part B. 1987, 25, 2497.
66) Berens, A. R.; Huvard, G. S.; Korsmeyer, R. W.; Kunig, F. W. J. Appl Polym. Sci.
1992, 46, 23 1
.
67) Paulaitis, M. E.; Krukonis, V. J.; Kurnik, R. T.; Reid, R. C. Rev. Chem. Eng.
1983, /, 179.
68) Zoller, P.; Starkweather, H. W.; Jones, G. A. J. Polym. Sci., Polym. Phys. 1986,
24, 1451.
69) Lopez, L. C.; Wilkes, G. L.; Stricklen, P. M.; White, S. A. J.M.S. - Rev.
Macromol. Chem. Phys. 1992, C32, 301.
70) Tanigami, T.; Yamaura, K.; Matsuzawa, S.; Miyasaka, K. Polym. J. 1986, 18, 35.
71) Puleo, A. C.; Paul, D. R.; Wong, P. K. Polymer 1989, 30, 1357.
72) Stewart, C, DuPont, personal communication.
73) Phuvanartnuruks, V., Ph. D. Dissertation, University of Massachusetts Amherst,
1997.
74) Crank, J. The Mathematics of Diffusion; 2nd ed.; Oxford University Press: New
York, 1975.
75) Gallucci, R., General Electric Plastics Division, personal communication.
76) Rojas, B.; Fatou, J.; Martinez, M.; Laguna, O. Eur. Polym. J. 1997, 33, 725.
77) Regel, W. Makromol. Chem. 1981, 182, 237.
78) Wang, Y.; Ji, D.; Yang, C.; Zhang, H.; Qin, C.; Huang, B. J. Appl. Polym. Sci.
1994, 52, 1411.
157

79) De Rosa, C; Capitani, D.; Cosco, S. Macromolecules 1997, 30, 8322.
80) Frank, F. C; Keller, A.; O'Connor, A. Phil. Mag. 1959, 8, 200.
81) Brandrup, J.; Immergut, E. H.; Grulke, E. A. Polymer Handbook; 4th ed.; JohnWiley and Sons: New York, 1999.
82) Odian, G. Principles of Polymerization; 3rd ed.; John Wiley and Sons: New York1991.
83) Bening, R. C; McCarthy, T. J. Macromolecules 1990, 23, 2648.
84) Nelson, E. R.; Kilduff, T. J.; Benderly, A. A. Ind. Eng. Chem. 1958, 50, 329.
85) Huang, C.-Y.; Chiang, W.-Y. Angew. Makromol. Chem. 1993, 209, 9.
86) Chakrabarti, N.; Jacobus, J. Macromolecules 1988, 27, 301 1.
87) Dwight, D. W.; Riggs, W. M. J. Colloid Interface Sci. 1974, 47, 650.
88) Marsella, J. A.; Gilicinski, A. G.; Coughlin, A. M.; Pez, G. P. J. Org. Chem.1992, 57, 2856.
89) Hlavaty, J.; Kavan, L.; Bastl, Z. Angew. Makromol. Chem. 1996, 238, 165.
90) Jansta, J.; Dousek, F. P.; Riha, J. J. Appl. Polym. Sci. 1975, 19, 3201.
91) Costello, C. A.; McCarthy, T. J. Macromolecules 1987, 20, 2819.
92) Morra, M.; Occhiello, E.; Garbassi, F. Langmuir 1989, 5, 872.
93) Yasuda, H. Plasma Polymerization; Academic Press: New York, 1985.
94) Matienzo, L. J.; Zimmerman, J. A.; Egitto, F. D. J. Vac. Sci. Technol. A 1994, 72,
2662.
95) Kang, E. T.; Tan, K. L.; Kato, K.; Uyama, Y.; Dcada, Y. Macromolecules 1996,
29, 6872.
96) Allmer, K.; Feiring, A. E. Macromolecules 1991, 24, 5487-5488.
97) Noh, I.; Chittur, K.; Goodman, S. L.; Hubbell, J. A. J. Polym. Sci.: Part A- 1 1997,
35, 1499-1514.
98) Burdeniuc, J.; Chupka, W.; Crabtree, R. H. J. Am. Chem. Soc. 1995, 777, 101 19.
99) Barker, D. J.; Brewis, D. M.; Dahm, R. H. /. Mater. Sci. 1979, 14, 749.
158

fu^^ ^0mbellas 'C; Du
J ardin 'E.; Thiebault, A.; Delamar, M; Kanoufi F
Shanahan, M. Polymer 1997, 55, 3295-3305.
MacNicol, D. D.; Robertson, C. D. Nature 1988, 332, 59.
McKeown, N. B.; Kalman, P. G.; Sodhi, R.; Romaschin, A. D.; Thompson MLangmuir 1991,7,2146.
'
Alentiev, A. Y.; Yampolskii, Y. P.; Shantarovich, V. P.; Nemser, S M Plate NA. J. Membr. Sci. 1997, 126, 123.
Koros, W. J.; Fleming, G. K. J. Membr. Sci. 1993, 83, 1.
Resnick, P. R. Polym. Prepr. (Am. Chem. Soc, Div. Polym. Chem.) 1990, 31, 312
Product informationfrom Du Pontfor Teflon AF 1600 and 2400, 1989.
Andrade, J. D. Surface Chemistry and Physics; Plenum Press: New York 1985-Vol. I.
Zisman, W. A. Contact Angle Wettability and Adhesion; Zisman, W. A., Ed.;
American Chemical Society: Washington, D.C., 1964; Vol. 43, pp 389.
'
Wu, P.; Yang, G.-R.; Ma, X.; Lu, T.-M. Appl. Phys. Lett. 1994, 65, 508.
Wu, P.; Lu, T.-M. Appl Phys. Lett. 1997, 7/, 2710.
Burdeniuc, J.; Siegbahn, P.; Crabtree, R. New J. Chem. 1998, 22, 503.
Denhoff, M.; Gao, M. J. Electron. Mater. 1997, 26, 941.
Hung, M.-H.; Burch, R. R. J. Appl. Polym. Sci. 1995, 55, 549.
Benderly, A. A. J. Appl. Polym. Sci. 1962, 6, 221.
Rye, R. R.; Kelber, J. A. Appl. Surf. Sci. 1987, 29, 397.
Bening, R. C., Ph. D. Dissertation, University of Massachusetts, 1990.
Ha, K.; McClain, S.; Suib, S. L.; Garton, A. J. Adhesion 1991, 33, 169.
Costello, C, Ph. D. Dissertation, University of Massachusetts, 1987.
Roberts, R. F.; Ryan, F. W.; Schonhorn, H.; Sessler, G. M.; West, J. E. J. Appl.
Polym. Sci. 1976, 20, 255.
Brennen, J., Ph. D. Dissertation, University of Massachusetts, 1991.
159

March, J. Advanced Organic Chemistry- 4th ed.; John Wiley & Sons: New York,1 992
.
Chen, W., Ph. D. Dissertation, University of Massachusetts, 1997.
Shoichet, M. S.; McCarthy, T. J. Macromolecules 1991, 24, 982.
Oku, A.; Harada, K.; Yagi, T.; Shirahase, Y. J. Am. Chem. Soc. 1983, 105, 4400.
Costello, C. A.; McCarthy, T. J. Macromolecules 1984, 17, 2940.
Levasalmi, J.-M.; McCarthy, T. J. Macromolecules 1995, 28, 1733.
Spillman, R. W.; Sherwin, M. B. Chemtech 1990, June, 378.
Tanioka, A.; Fukushima, N.; Hasegawa, K.; Miyasaka, K.; Takahashi, N. J. AnplPolym. Sci. 1994, 54, 219.
Liang, S.; Tilotta, D. C. Anal. Chem. 1998, 70, 616.
Ashworth, A. J. J. Memhr. Sci. 1992, 71, 169.
Greiner, A.; Mang, S.; Schafer, O.; Simon, P. Acta Polymerica 1997, 48, 1.
Gorham, W. J. Polym. Sci.: Part A- J 1966, 4, 3027-3039.
Alexandrova, L.; Vera-Graziano, R. In Polymeric Materials Encyclopedia;
Salamone, Ed. CRC Press: New York, 1 996, p 7 1 80-7 1 89.
Clark, D. T.; Thomas, H. R. J. Polym. Sci.: Polym. Chem. 1977, 15, 2843.
Mathieson, I.; Brewis, D.; Sutherland, I. J. Adhesion 1994, 46, 49.
Fleming, R. J., Ph. D. Dissertation, University of Massachusetts, 1995.
In Annual Book ofASTM Standards 1994; Vol. 14.80, p 218-224.
Williams, J. G. Fracture Mechanics of Polymers; Ellis Horwood Limited:
Chichester, England, 1984.
Pinnau, I.; Toy, L. G. J. Memhr. Sci. 1996, 109, 125-133.
Levasalmi, J.-M., Ph. D. Dissertation, University of Massachusetts, 1996.
Goldfarb, J. L.; Farris, R. J. J. Adhesion 1991, 35, 233-244.
160