Policy-Note.pdf - World Bank Document
29
CLOSING THE GAP: GENDER, TRANSPORT, AND EMPLOYMENT IN MUMBAI 1 CLOSING THE GAP: GENDER, TRANSPORT, AND EMPLOYMENT IN MUMBAI MOBILITY AND TRANSPORT CONNECTIVITY SERIES Policy Note 2021 Public Disclosure Authorized Public Disclosure Authorized Public Disclosure Authorized Public Disclosure Authorized
-
Upload
khangminh22 -
Category
Documents
-
view
12 -
download
0
Transcript of Policy-Note.pdf - World Bank Document
CLOSING THE GAP: GENDER, TRANSPORT, AND EMPLOYMENT IN MUMBAI1
CLOSING THE GAP: GENDER, TRANSPORT, AND EMPLOYMENT IN MUMBAI
MOBILITY AND TRANSPORT CONNECTIVITY SERIES
Policy Note 2021
Pub
lic D
iscl
osur
e A
utho
rized
Pub
lic D
iscl
osur
e A
utho
rized
Pub
lic D
iscl
osur
e A
utho
rized
Pub
lic D
iscl
osur
e A
utho
rized

MOBILITY AND TRANSPORT CONNECTIVITY SERIES
© 2021 The World Bank 1818 H Street NW, Washington DC 20433 Telephone: 202-473-1000; Internet: www.worldbank.org
Rights and Permissions
The material in this work is subject to copyright. Because The World Bank encourages dissemination of its knowledge, this work may be reproduced, in whole or in part, for noncommercial purposes as long as full attribution to this work is given.
Attribution—Please cite the work as follows: “World Bank. 2021. Closing the Gap: Gender, Transport, and Employment in Mumbai. © World Bank.”
Disclaimer—This work is a product of the staff of The World Bank with external contributions. The findings, interpretations, and conclusions expressed in this work do not necessarily reflect the views of The World Bank, its Board of Executive Directors, or the governments they represent. The World Bank does not guarantee the accuracy of the data included in this work. The boundaries, colors, denominations, and other information shown on any map in this work do not imply any judgment on the part of The World Bank concerning the legal status of any territory or the endorsement or accep-tance of such boundaries.
All queries on rights and licenses, including subsidiary rights, should be addressed to World Bank Publications, The World Bank Group, 1818 H Street NW, Washington, DC 20433, USA; fax: 202-522-2625; e-mail: [email protected].
Cover photo credits: Nielsen (India) Private Limited

CLOSING THE GAP: GENDER, TRANSPORT, AND EMPLOYMENT IN MUMBAI
ContentsAcknowledgements ..........................................................................................................................................................................................................4
Foreword ................................................................................................................................................................................................................................5
Summary ................................................................................................................................................................................................................................6Gender Differences in Mobility Patterns .........................................................................................................................................................7Effect on Women’s Labor Force Participation ................................................................................................................................................9
Background and Motivation ........................................................................................................................................................................................ 10
The Survey ...........................................................................................................................................................................................................................14
Results ................................................................................................................................................................................................................................. 17Gender Differences in Mobility Patterns ..................................................................................................................................................... 18The “Pink Tax” on Women’s Mobility ............................................................................................................................................................. 23Factors Determining Women’s Likelihood of Joining the Labor Force ................................................................................................. 24
Conclusion ......................................................................................................................................................................................................................... 26
References ........................................................................................................................................................................................................................ 28
Phot
o cr
edits
: Nie
lsen
(Ind
ia) P
rivat
e Li
mite
d
MOBILITY AND TRANSPORT CONNECTIVITY SERIES4
AcknowledgementsThis note was prepared by a team led by Muneeza Alam (World Bank), which includes Maureen Cropper (University of Maryland), Matías Herrera Dappe (World Bank), and Palak Suri (University of Maryland).
The authors are grateful to Shomik Mehndiratta and Karla Gonzalez Carvajal for their support and guidance. They also thank peer reviewers Maria Beatriz Orlando, Judy Baker, and Karla Dominguez Gonzalez for their comments and Gerald Paul Ollivier and Aiga Stokenberga for their views and comments.
The authors gratefully acknowledge the Mumbai Metropolitan Region Development Authority (MMRDA) for sup-porting this study and Atul Agarwal for liaising with MMRDA.
The authors are also grateful to Benjamin P. Stewart and Thomas Joshua Julio Gertin for help with GIS analysis, Jack (Jianguo) Ma for help with sample design for the 2019 survey, Nathalie Picarelli for help with questionnaire design, and Tema Alawari Kio-Michael for administrative support. Data collection for the 2019 survey was done by Nielsen (India) Private Limited.
Financial support from the Umbrella Facility for Gender Equality is gratefully acknowledged.
Photo credits: Simone D. McCourtie

CLOSING THE GAP: GENDER, TRANSPORT, AND EMPLOYMENT IN MUMBAI5
ForewordWomen in both lower- and higher-income countries face many mobility challeng-es. Constraints stemming from a lack of access to transport and mobility shape all women’s individual access to public services—especially to education and health. In turn, this lack of access to markets, employment, and skills affects their livelihoods, carrying implications for the intergenerational transfer of poverty, or wealth and asset generation—and influencing not only the women’s quality of life, but also that of their families.
Transport provides many benefits both men and women should enjoy equally. However, current approaches to transport planning, management, and opera-tions, generally benefit women less than men. As compared to men, women tend to commute over shorter distances, make more non-work-related trips, use pub-lic transport and taxi services more often than men, and frequently travel accom-panied by children. A transport system designed to be equitable would cater to the mobility needs of both men and women.
Guangzhe ChenRegional Director for Infrastructure South Asia, World Bank
Over the past decade, the World Bank has actively engaged with the Government of India in the urban transport space, working together to create an environment conducive to women’s use of public transit systems. Realizing this more inclusive transit environment has involved collecting gender disaggregated data on users and nonusers of public trans-portation in 12 Indian urban centers—which have formed the basis of gender action plans for improving bus trans-port in select cities—while also incorporating women’s infrastructure needs, such as toilets, into depots and terminal designs, installing closed-circuit television (CCTV) cameras on buses, and setting up complaint handling systems for addressing safety and security concerns of women. In recent times, the World Bank has deepened our engagement with India’s urban transport space. For example, in Chennai, our partnership is supporting the establishment of a gender lab aimed at enhancing women’s safety in public space and public transport, along with a gender-informed mobility system designed to enhance women’s access to economic, educational, and social opportunities.
This policy note, strives to improve our understanding of the specific mobility choices, needs, and experiences of women in the Greater Mumbai Region of India. It examines how the mobility patterns of men and women differ from each other, how they have evolved over time in Mumbai, and whether lack of access to mass transit has limited women’s access to jobs. Several important policy findings emerge from the note, including the need for improving public transit and walk-ability, and integrating the various transport modes across Mumbai.
Finally, this note seeks to help policy makers in Mumbai and other cities improve the design of public transit—and the overall transportation system—to better cater to the needs of female riders.

Until recently, transport planning and design were regarded as gender neu-tral—that is, they were assumed to bene-fit men and women equally. There is now increasing recognition that women expe-rience mobility differently from men.
This study examines women’s mobility choices and experiences in the Greater Mumbai Region (GMR) by documenting the differences in men and women’s mobility patterns and the changes in these patterns as the city has devel-oped. It also explores whether the lack of access to mass transit limits women’s labor force participation in the GMR.
Summary
Photo credits: Nielsen (India) Private Limited

CLOSING THE GAP: GENDER, TRANSPORT, AND EMPLOYMENT IN MUMBAI7
Gender Differences in Mobility Patterns
Even when commuting for the same purpose, howev-er, men and women choose different modes to reach their destinations. Women who commute to work are more likely to walk or travel by public transit than men: In 2019, 39 percent of women reported walking and 32 percent reported using public transit (rail or public bus) as their primary commute mode. In contrast, only 28 percent of men reported walking and 24 percent reported using public transit (table 1). Women were also more likely to commute by auto-rickshaw (14 per-cent) than by two-wheeler (9 percent) or car (4 percent).
The study finds persistent differences in the mobility patterns of men and women. These differences partly reflect differences in household responsibilities and labor force participation rates (only one-fifth of wom-en in Mumbai were employed in 2019). In 2019, 80 percent of men’s but only 17 percent of women’s trips were work related. Half of women’s trips were for shop-ping or transporting children to and from school or tuition centers.
Foot
Bicycle
Train
Bus
Auto-rickshaw
Taxi
Two-wheeler
Own car
Someone else’s car
Main Commute Mode2004
Men Women2019 2004 2019
40.5% 28.1% 52.2% 38.9%
3.4% 1.1% 0.0% 0.2%
24.0% 16.9% 24.3% 20.3%
16.5% 7.5% 15.5% 11.4%
1.8% 7.8% 3.0% 14.4%
0.2% 1.4% 0.0% 1.9%
9.4% 31.5% 1.1% 8.9%
2.9% 4.7% 1.6% 2.1%
0.2% 0.6% 0.2% 1.5%
Other 1.1% 0.4% 2.2% 0.4%
Table 1: Main commute mode to work, by gender, 2004 and 2019 (percent)

MOBILITY AND TRANSPORT CONNECTIVITY SERIES8
Mass transit within the GMR appears not to have kept pace with the needs and expectations of the popula-tion. Between 2004 and 2019, the level of satisfaction with rail and bus transportation fell precipitously within the GMR (figure 1). Satisfaction with reliability, conve-nience, safety, and frequency declined; satisfaction with the level of crowding either stayed the same (for buses) or improved slightly (for rail). The substantial reduction in the level of user satisfaction with bus and rail ser-vices undoubtedly contributed to the shift from public to private transportation (especially two-wheelers and auto-rickshaws) between 2004 and 2019.
Dissatisfaction with the quality of public transit is evi-dent in the decline in ridership. In 2004, both men and women made about 40 percent of work trips by bus
or rail. In 2019, just 32 percent of work trips by women and just 24 percent of work trips by men were by bus or rail. This reduction was accompanied by an increase in the use of two-wheelers and auto-rickshaws by both men and women. Men shifted largely to commuting to work by two-wheelers, and women shifted to using auto-rickshaws or taxies, which tend to be more expen-sive per trip than two-wheelers. In addition, a larger share of women has continued to walk to work.
Adoption of private, and arguably faster, modes of transport has been slower for women than for men. Thus, there appears to be a surcharge or “pink tax” on women’s mobility as they continue to use slower modes of and/or pay a higher price than men to reach similar destinations.
0 10 20 30 40 50 60 70 80
Reliability
Crowding
Convenience
Safety
Frequency
0 10 20 30 40 50 60 70 80
Reliability
Crowding
Convenience
Safety
Frequency
(a) Percentage Respondents Satisfied with Rail (b) Percentage Respondents Satisfied with Bus
2004 2019
Figure 1: Level of satisfaction with rail and bus transit, 2004 and 2019

CLOSING THE GAP: GENDER, TRANSPORT, AND EMPLOYMENT IN MUMBAI9
Gendered social norms play a large role in determining women’s labor force participation. Transport appears to be only one of the barriers to women’s participa-tion in the labor force. In 2019, 31 percent of surveyed women reported commuting as a barrier to working (the remaining respondents did not see it as a barri-er). Less than 4 percent of women surveyed indicated that transport was a commuting barrier for work, with location of public transit stops, time, cost and safety as major constraints. In contrast, 13 percent of women said that childcare responsibilities were a barrier to commut-ing for work, and 19 percent of women indicated that domestic duties were a barrier to commuting for work.
A transportation system that does not explicitly recog-nize gender differences in usage can exacerbate gen-der inequalities and limit women’s access to economic opportunities. In contrast, a transportation system that allows women to combine household responsibilities with economic activity, can enhance women’s likeli-hood of participating in the labor force. The existence of a pink tax on women’s mobility and the salient role of women in childcare suggests that policy measures focused on improving public transit and walkability in Mumbai and providing daycare facilities at key locations could differentially benefit women.
Several important policy findings emerge from this study:
• Creating a walking-friendly street network and pro-viding affordable micro-mobility solutions (like scoot-ers and bicycles) could differentially benefit women, given their reliance on walking.
• Improving the reliability, convenience, safety. and frequency of bus and rail services could differentially benefit women, given their reliance on public transit.
• Taking a network approach to the routing and tim-ing of rail and bus systems could better integrate public transit options and make public transit a more attractive option.
• Providing safe and affordable childcare services at suitable locations (possibly at or close to rail stations) could enhance women’s labor force participation.
Effect on Women’s Labor Force Participation

Background and Motivation
Photo credits: Simone D. McCourtie

CLOSING THE GAP: GENDER, TRANSPORT, AND EMPLOYMENT IN MUMBAI11
Since the turn of the 21st century, South Asia has expe-rienced a substantial increase in its urban population. Between 2001 and 2011, the region’s urban population grew by about 130 million (more than the entire popu-lation of Japan). It is projected to grow by another 250 million by 2030 (Ellis and Roberts 2016).
Several factors—including inadequate provision of housing, infrastructure, and basic urban services—are constraining the potential of the region’s cities to fully realize the benefits of urbanization. An unintended con-sequence of rapid urbanization is the creation and exac-erbation of unequal access to, and use of, opportunities for different segments of the population (the rich and poor, people living in city centers and people living on the periphery, men and women, and so on). Poor infra-structure and limited transport services constrain mobil-ity for everyone; additional socio-cultural constraints can exacerbate the negative effects for women. A well-es-tablished body of literature on the travel behavior of women in both developed and developing countries finds that women are responsible for a disproportion-ate share of the household’s transport burden (because of their responsibilities within the household) and have more limited access to transport (Peters 2002).
Several studies link access to transportation with access to jobs. A World Bank study of three Latin American cit-ies provides qualitative evidence that transport deficien-cies are a burden for low-income women. Combined with socio-cultural factors, this burden significantly constrains women’s ability to make mobility and work choices (World Bank 2020).
Quiros, Mehndiratta, and Ochoa (2014) study the travel behavior of men and women in Buenos Aires, Argen-tina. Consistent with the literature, they find that male commuters travel farther and at faster speeds than women but that travel times for men and women are
about equal. This finding implies that women access fewer economic opportunities, even though they are spending the same amount of time commuting as men. Quiros, Mehndiratta, and Ochoa estimate the increase in jobs that would be available to women liv-ing in different areas of the city were they to travel at speeds equal to men. They find that men with children have access to more than 80 percent more jobs than do women with children.
Few studies quantitatively document the evolution of men and women’s mobility patterns or explore the causal role transport networks play in women’s access to economic opportunities. Two recent studies that do so evaluate the labor market impacts of providing bus rapid transit (BRT) in two cities with limited public transit options, Lima, Peru and Lahore, Pakistan. In Lima, intro-duction of a BRT line and an elevated light rail (Metro Line 1) connecting peripheral areas of the city to major employment centers increased employment rates for women living near the new infrastructure (Martinez and others 2018). These investments provided faster and more secure transit in a city reliant on informal public transit. Introduction of a metro bus system in Lahore with subsidized fares increased the share of commut-ers taking public transit by 24 percent (Majid, Malik, and Vyborny 2018). Women were also more likely than men to use the system, holding other factors constant (Zol-nik, Malik, and Irvin-Erickson 2018).
It is difficult to generalize from the experiences in Lima and Lahore to Mumbai. Unlike those cities, Mumbai has an extensive rail system, and female labor force partici-pation in Lima is much higher than in Mumbai.
No studies appear to have examined the quantitative effect of transport options on the likelihood of female labor force participation in India. A few studies assess female travel behavior. They include a study of the

MOBILITY AND TRANSPORT CONNECTIVITY SERIES12
transport patterns of women in the slums of Delhi (Anand and Tiwari 2006), a study linking the effect of the perceived risk of street harassment on women’s human capital attainment in Delhi (Borker 2021); a qual-itative study of women’s mobility challenges in Mum-bai (World Bank 2011); a study of the user experience of female railway users in Mumbai (Bhide, Kundu, and Tiwari 2016); and a study that examines women and girls’ perspectives of urban mobility in 11 Indian cities (Ola Mobility Institute 2019).
For years female labor force participation rates in urban India have been among the lowest in the world (Chatterjee, Rama, and Murgai 2015). Low labor force participation is of concern from the standpoint of both economic growth and women’s agency inside and outside the household. Poor transportation infrastruc-ture—in particular, lack of affordable, accessible, and safe public transit—may limit women’s access to jobs. It may also reduce female labor force participation by making it difficult for women to combine work- and family-related travel.
This study addresses two sets of questions:
• How do men and women’s mobility patterns differ, and how have they evolved over time in Mumbai?
• Does lack of access to mass transit limit women’s access to jobs?
To answer these questions, we surveyed 3,024 random-ly selected households in the Greater Mumbai Region (GMR) in January–March 2019 (box 1). The survey asked a male and a female respondent in each household about their labor market experience, their commuting behavior, and their perceptions of the accessibility of public transit in Mumbai. Respondents who were not working were asked about barriers to employment. Each respondent also filled out a travel diary describing trips made during a 24-hour period.
Box 1 The Greater Mumbai Region
The GMR, the core of the Mumbai metropolitan area, had a population of about 12.5 million peo-ple in 2011 and an area of 468 square kilometers, making it one of the most densely populated areas in the world. Between 2001 and 2011, the popula-tion of the GMR grew at a rate of about 0.4 percent a year—less than the national average. The lower rate reflects a declining rate of migration into the city and the more rapid growth of the Mumbai met-ropolitan area. The Mumbai metropolitan area is one of the world’s largest, with a population in 2011 of 20.7 million (http://pibmumbai.gov.in/scripts/detail.asp?releaseId=E2011IS3). The city faces enor-mous challenges, including shortages of land, hous-ing, infrastructure, and social services, provision of which has not kept up with growing demands.
The Municipal Corporation of Greater Mumbai has divided the city into six zones, each with distinctive characteristics. The southern tip of the city (zone 1) is the traditional city center. Zone 3 is a newer com-mercial and employment center. Zones 4, 5, and 6, each served by a different railway line, constitute the suburban area. Most jobs are concentrated in zones 1–3, although there has been increasing dis-persion in the distribution of jobs to the suburbs.
Urban development and urban transport are man-aged by the Mumbai Metropolitan Regional Devel-opment Authority (MMRDA), a regional planning agency under the Department of Urban Develop-ment. The urban transport network is linear along the peninsula. Two national rail lines —the Western Railway (WR) and the Central Railway (CR)—serve Mumbai. They also provide suburban commuter rail services. Three urban arterial roads run through crowded urban areas, also running linearly. Cross-road links are less developed.

CLOSING THE GAP: GENDER, TRANSPORT, AND EMPLOYMENT IN MUMBAI13
This study builds on the work of Baker and others (2005), who conducted a household mobility survey in 2004 of a representative sample of 5,000 households in the GMR but did not analyze differences in men and women’s mobility patterns. This study builds on that work by administering a similar survey to a represen-tative set of households in the GMR (thus developing a repeated cross-section) and analyzing the differences in men and women’s mobility patterns in Mumbai in 2019 and the changes in these differences between 2004 and 2019.1 In this manner, the study contributes to the literature comparing the travel behavior of men and women by examining how these patterns change as a city develops.
1 The selection of Mumbai for the study was driven partly by the existence of an earlier household mobility survey that could be disaggregated by gender and combined with a fresh wave of a household mobility survey to create a repeated cross-section to understand changes in mobility patterns by men and women over time.
Photo credits: Nielsen (India) Private Limited
The Survey
Photo credits: Simone D. McCourtie

CLOSING THE GAP: GENDER, TRANSPORT, AND EMPLOYMENT IN MUMBAI15
In each household, the questionnaire was adminis-tered to a man and a woman between the ages of 18 and 45 in the GMR. The two respondents were chosen based on whether they were the primary or secondary earners in the household. Where no man or woman in the house was working, then a member of the same gender who was looking for work was selected as a respondent. If no member of that gender was looking for work, then a member of the same gender who was knowledgeable about the household and “involved in household decision making” was selected.
The following information was collected: (a) demo-graphic composition and educational achievement of all household members; (b) geographic location and char-acteristics of households; (c) activities (employment, schooling) undertaken by each household member; (d) household assets and sources of income; (e) assess-ment of quality and availability of transport services and barriers to use of transport; (f) distances to edu-cational and health facilities; (g) description of typical trips (work trips taken by each respondent and typical school trips taken by children in the household); and (h) willingness of the two main respondents to work if not currently employed. In addition, each of the main respondents kept a travel diary for 24 hours, in which they were supposed to record, for all trips taken on the chosen day, the destination, purpose, and time of day the trip originated; the distance traveled; the mode(s) chosen; the duration of the trip; and the out-of-pocket cost. Travel dairies were collected for all individuals who took at least one trip outside the home. Trip data were collected for 3,020 men and 2,717 women. The ques-tionnaire was a modified version of the questionnaire administered during a 2004 household survey (Bak-er and others 2005), with additional questions added about female labor force participation. The survey was pre-tested and administered by Nielsen India, Pvt. Ltd.
Figure 2: Map of sampled households, by monthly income and zone
The distribution of households by zone mirrors the population of the GMR. Sixty-three percent of house-holds lived in their current home for more than 10 years (with 41 percent living in the same home since birth). Among households that did not live in the same house since birth, 88 percent moved from within the same neighborhood (37 percent) or from another neighborhood in Mumbai (51 percent).

MOBILITY AND TRANSPORT CONNECTIVITY SERIES16
Median household size was four people (only 8 per-cent of households had six or more members), and 40 percent of households had at least one child under the age of 10. Monthly household income categories were chosen to mirror those in the 2004 household sur-vey. Forty-four percent of households had an average monthly income of INR 25,000 or more. Figure 2 pro-vides the locations of the sample households and their household incomes.
Because of the focus of the survey on employment and commuting, the survey targeted respondents between the ages of 18 and 45.2 For 82 percent of households, the main respondent was also the household head; 3 percent of households were headed by women. Nine-ty-eight percent of male and 21 percent of female respondents worked for pay. In general, men had more years of education than women: 29 percent men and 18 percent of women had a college or post-graduate degree. Among respondents who were working, a larg-er percentage of men than women described them-selves as skilled workers, although a larger percentage of women described themselves as self-employed pro-fessionals (table 2).
2 Two of the 6,048 respondents were 55 years old.
Table 2: Characteristics of survey respondents (percent of total)
Category Men Women Age group 18–24 7.1 11.125–29 16.4 23.630–34 20.3 18.835–39 18.2 22.240–45 38 24.3Observations 3,024 3,024Work status Work outside home 87.9 15.6Work from home 10.6 5.3Not working 1.5 79.1Observations 3,024 3,024Occupation Unskilled worker 16.6 25.9Skilled worker 40.2 31.9Petty trader 3.6 0.6Self-employed professional 4.1 9.2Clerical worker/salesperson 4.2 8.4Supervisor 15.3 11.9Self-employed worker 16.1 12.2Observations 2,978 633

Results
Photo credits: Nielsen (India) Private Limited

MOBILITY AND TRANSPORT CONNECTIVITY SERIES18
Three broad results emerge from this study:3
• The mobility patterns of men and women differ in several important ways that reflect differences in the division of labor within households.
• These differences in mobility patterns and the evo-lution of these patterns point to an implicit “pink tax” on female mobility.
• Transport is only one of the barriers to women’s labor force participation—and not the most import-ant one.
Gender Differences in Mobility Patterns The travel patterns of women and men in Mumbai differ, and the differences reflect differences in house-hold responsibilities and labor force participation (table 3). Based on the travel diary data, in 2019, 80 percent of trips by men but only 17 percent of trips by women were work related. Shopping accounted for 41 percent of trips by women but just 6 percent for men. Another 9 percent of women’s trips were for transporting children to and from school or tuition centers. These figures are consistent with information from travel surveys in other countries (Ng and Acker 2018). They reflect the low labor force participation of women in Mumbai, where only one-fifth of women are employed.
3 For the empirical analyses supporting these results, see Alam and others (2021).
Table 3: Purpose of trips made on typical day, by gender, 2019 (percent of total)
Purpose of trip Men Women Work (regular workplace) 77.0 16.7Work (off-site meeting, conference, sales call)
2.8 0.3
Drop off/pick up children from school 0.2 8.2Drop off/pick up children from tuition centers
0.1 0.8
Go to hospital, clinic, or doctor 2.6 5.4Shop for groceries, clothes, or other household goods
6.1 40.9
Outing (for example, movies, lunch, din-ner, park, sports)
3.5 10.3
Socialize (for example, visit friends or relatives)
5.4 11.4
Visit government office or religious place 0.6 2.1Attend school/college as a student 0.2 0.3Personal services (for example, bank, dry cleaning, beauty parlor, mechanic)
1.1 2.7
Other 0.4 1.0Observations 3,105 2,790Individuals 3,020 2,717Petty trader 3.6 0.6Self-employed professional 4.1 9.2Clerical worker/salesperson 4.2 8.4Supervisor 15.3 11.9Self-employed worker 16.1 12.2Observations 2,978 633
Source: Travel diaries of survey respondents. Note: Almost all (99 percent) of the trips were round trips.

CLOSING THE GAP: GENDER, TRANSPORT, AND EMPLOYMENT IN MUMBAI19
Table 4: Main commute mode for typical work trip, by gender, 2004 and 2019
Men WomenMain commute mode 2004 2019 2004 2019
Foot 40.5 28.1 52.2 38.9
Bicycle 3.4 1.1 0.0 0.2
Rail 24.0 16.9 24.3 20.3
Bus 16.5 7.5 15.5 11.4
Auto-rickshaw 1.8 7.8 3.0 14.4
Taxi 0.2 1.4 0.0 1.9
Own two-wheeler 9.4 31.5 1.1 8.9
Own car 2.9 4.7 1.6 2.1
Someone else’s car 0.2 0.6 0.2 1.5
Other 1.1 0.4 2.2 0.4
Observations 5,171 2,658 629 473
Note: This table is based on the responses of respondents who work outside the home and for whom the main mode of transportation was known. For 2019, it includes responses of the main respondent of the survey only; for 2004, it includes the responses of all household members who were working at the time of the survey. The survey asked for up to three modes of transport. The main mode is defined as the motorized mode on which the respondent spends the most time on his or her typical work trip duration. The main mode is defined as a nonmotorized mode (foot or bicycle) if that was the only commute mode reported, with precedence given to bicycle if both foot and bicycle were reported. In the 2004 survey, in cases where there was more than one potential main commute mode, precedence was given to transport choices that were less representative on the aggregate level. No such possibility arose in the 2019 round.
Among people in Mumbai who were employed, women were more likely than men to work from home. In the 2019 sample, 21 percent of women were employed, and one-quarter of them worked from home. In con-trast, 99 percent of men were employed, and only 11 percent of them worked from home (see table 2). Wom-en who did commute for work were more likely to walk or travel by public transit than men: In 2019, 39 percent of women reported walking and 32 percent reported using the rail or public bus as their primary commute mode (table 4). The comparable figures for men were 28 percent (walking) and 24 percent (public transit). Women were also more likely to commute by auto-rick-shaw (14 percent) than by two-wheeler (9 percent) or car (3 percent). In contrast, 32 percent of male com-muters reported their main mode as a two-wheeler and
5 percent reported commuting by car. These statistics for 2019, together with the fact that the average com-mute time was about the same for men and women (24 minutes), suggest that men, on average, commuted farther than women.
Splitting the 2019 sample by income—comparing households with monthly income of Rs. 25,000 or less with households with monthly income of more than Rs. 25,000—reveals important differences in the com-mute mode choices of men and women. Women from households with monthly income above Rs. 25,000 (henceforth referred to as higher-income households) are more likely to rely on rail as a means of getting to work than women from households that have a month-ly income of Rs. 25,000 or less (henceforth referred to

MOBILITY AND TRANSPORT CONNECTIVITY SERIES20
as lower-income households). In contrast, men from higher-income households are less likely to use the rail. Relative to men and women from lower-income households, both men and women from higher-income households are less likely to walk to work or use the bus to get to work. Men from higher-income house-holds are more likely than men from lower-income households to use two-wheelers to commute to work. In contrast, women from higher-income households are more likely than women in lower-income households to use auto-rickshaw to commute to work.
The commuting patterns of men and women in Mum-bai mirror patterns seen in other cities. Studies in devel-oping and developed countries show that, on average, working women work closer to home than do men (Crane 2007). On average, they also travel shorter dis-tances per trip than men. However, they also travel at
slower speeds: Women are more likely to walk or take public transit than men, implying that they do not nec-essarily have shorter travel times (Ng and Acker 2018). Women’s preferences for commuting by auto-rickshaw rather than two-wheeler have also been noted in stud-ies in Jakarta and Manila (Ng and Acker 2018).
Mumbai’s public transit infrastructure and services have not kept pace with the expectations of users (figure 3). As a result, both men and women have increasingly switched to private modes of transportation.
User satisfaction with bus and rail services was assessed across five dimensions: reliability of service, crowding, convenience of routes, safety of service, and frequency of service, measured on a three-point scale (satisfied, neutral, or unsatisfied).
Figure 3: Perceptions of bus and rail quality, 2004 and 2019
2004Reliabilityof service
Crowdingin buses
Convenienceof service
Safety ofservice
Satisfaction withfrequency
2019 2004 2019 2004 2019 2004 2019 2004 2019
100%
90%
80%
70%
60%
50%
40%
30%
20%
10%
0%
Neutral NeutralUnsatisfied
Perc
enta
ge o
f res
pond
ents
(a) Bus Service
63
31
6
32
58
10
35
31
35
35
52
12
70
24
5
35
53
12
67
26
7
25
60
16
59
28
13
28
50
22
CLOSING THE GAP: GENDER, TRANSPORT, AND EMPLOYMENT IN MUMBAI21
2004Reliabilityof service
Crowdingin rail
Convenienceof service
Safety ofservice
Satisfaction withfrequency
2019 2004 2019 2004 2019 2004 2019 2004 2019
100%
90%
80%
70%
60%
50%
40%
30%
20%
10%
0%
Neutral NeutralUnsatisfied
Perc
enta
ge o
f res
pond
ents
(b) Rail Service
63
30
7
33
56
11
18
20
62
36
47
18
70
24
5
36
53
11
47
32
21
28
57
15
78
18
3
39
51
10
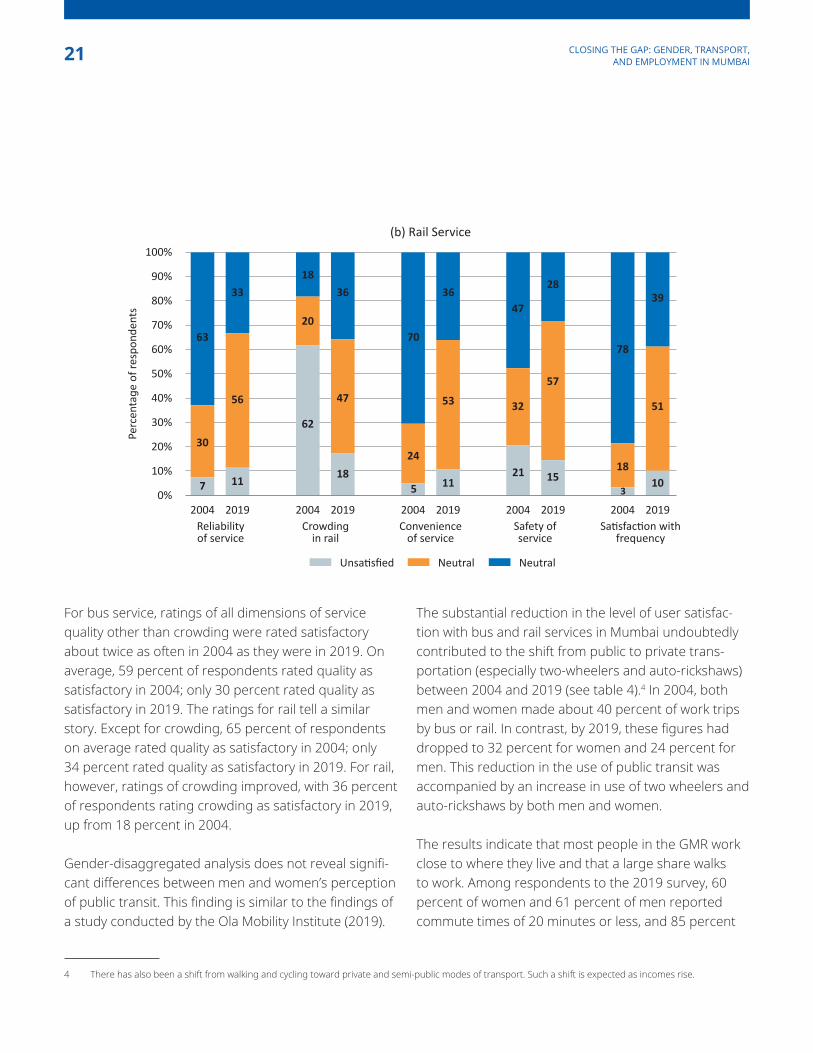
For bus service, ratings of all dimensions of service quality other than crowding were rated satisfactory about twice as often in 2004 as they were in 2019. On average, 59 percent of respondents rated quality as satisfactory in 2004; only 30 percent rated quality as satisfactory in 2019. The ratings for rail tell a similar story. Except for crowding, 65 percent of respondents on average rated quality as satisfactory in 2004; only 34 percent rated quality as satisfactory in 2019. For rail, however, ratings of crowding improved, with 36 percent of respondents rating crowding as satisfactory in 2019, up from 18 percent in 2004.
Gender-disaggregated analysis does not reveal signifi-cant differences between men and women’s perception of public transit. This finding is similar to the findings of a study conducted by the Ola Mobility Institute (2019).
4 There has also been a shift from walking and cycling toward private and semi-public modes of transport. Such a shift is expected as incomes rise.
The substantial reduction in the level of user satisfac-tion with bus and rail services in Mumbai undoubtedly contributed to the shift from public to private trans-portation (especially two-wheelers and auto-rickshaws) between 2004 and 2019 (see table 4).4 In 2004, both men and women made about 40 percent of work trips by bus or rail. In contrast, by 2019, these figures had dropped to 32 percent for women and 24 percent for men. This reduction in the use of public transit was accompanied by an increase in use of two wheelers and auto-rickshaws by both men and women.
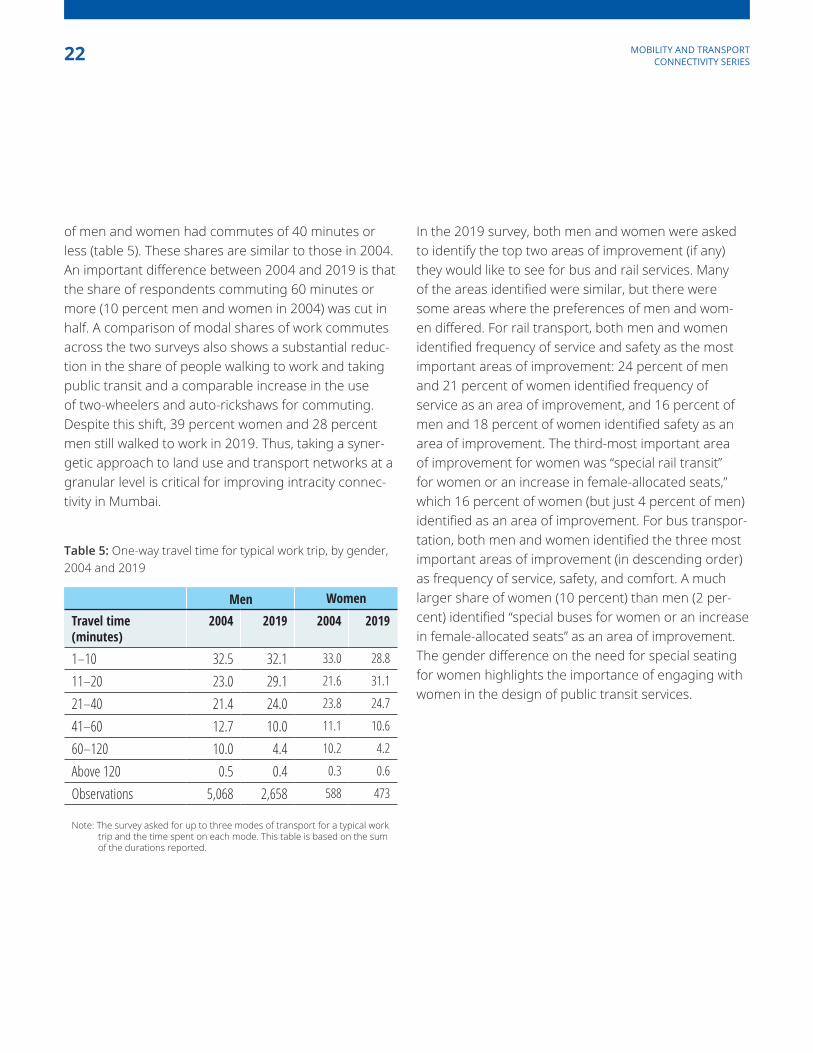
The results indicate that most people in the GMR work close to where they live and that a large share walks to work. Among respondents to the 2019 survey, 60 percent of women and 61 percent of men reported commute times of 20 minutes or less, and 85 percent
MOBILITY AND TRANSPORT CONNECTIVITY SERIES22
of men and women had commutes of 40 minutes or less (table 5). These shares are similar to those in 2004. An important difference between 2004 and 2019 is that the share of respondents commuting 60 minutes or more (10 percent men and women in 2004) was cut in half. A comparison of modal shares of work commutes across the two surveys also shows a substantial reduc-tion in the share of people walking to work and taking public transit and a comparable increase in the use of two-wheelers and auto-rickshaws for commuting. Despite this shift, 39 percent women and 28 percent men still walked to work in 2019. Thus, taking a syner-getic approach to land use and transport networks at a granular level is critical for improving intracity connec-tivity in Mumbai.
In the 2019 survey, both men and women were asked to identify the top two areas of improvement (if any) they would like to see for bus and rail services. Many of the areas identified were similar, but there were some areas where the preferences of men and wom-en differed. For rail transport, both men and women identified frequency of service and safety as the most important areas of improvement: 24 percent of men and 21 percent of women identified frequency of service as an area of improvement, and 16 percent of men and 18 percent of women identified safety as an area of improvement. The third-most important area of improvement for women was “special rail transit” for women or an increase in female-allocated seats,” which 16 percent of women (but just 4 percent of men) identified as an area of improvement. For bus transpor-tation, both men and women identified the three most important areas of improvement (in descending order) as frequency of service, safety, and comfort. A much larger share of women (10 percent) than men (2 per-cent) identified “special buses for women or an increase in female-allocated seats” as an area of improvement. The gender difference on the need for special seating for women highlights the importance of engaging with women in the design of public transit services.
Table 5: One-way travel time for typical work trip, by gender, 2004 and 2019
Men Women
Travel time (minutes)
2004 2019 2004 2019
1–10 32.5 32.1 33.0 28.8
11–20 23.0 29.1 21.6 31.1
21–40 21.4 24.0 23.8 24.7
41–60 12.7 10.0 11.1 10.6
60–120 10.0 4.4 10.2 4.2
Above 120 0.5 0.4 0.3 0.6
Observations 5,068 2,658 588 473
Note: The survey asked for up to three modes of transport for a typical work trip and the time spent on each mode. This table is based on the sum of the durations reported.
CLOSING THE GAP: GENDER, TRANSPORT, AND EMPLOYMENT IN MUMBAI23
The “Pink Tax” on Women’s Mobility There are important differences in the ways men and women have changed their mobility patterns over time. Women continue to either use slower modes of transport than men and/or to pay more than men to reach similar destinations—a phenomenon known as the pink tax.5
Men and women expressed similar levels of satisfac-tion/dissatisfaction with bus and rail transportation in 2019, and there was a marked decline in satisfaction levels for both men and women between the two sur-veys. The share of working people that took the bus or rail was higher among women (32 percent) than men (24 percent) (see table 4). Similarly, despite the shift between 2004 and 2019 toward motorized transport, 39 percent of working women continued to walk to work (compared with only 28 percent of men). These shares imply that adoption of private, and arguably fast-er, modes of transport has been slower among wom-en than among men. Between 2004 and 2019, both men and women shifted toward private or semi-pri-vate modes of transportation. Men shifted toward two-wheelers, and women shifted to auto-rickshaws or taxies, which tend to be more expensive (per trip) than two-wheelers. That men and women have reacted dif-ferentially to decreasing satisfaction with public transit in Mumbai is consistent with there being a pink tax on women’s mobility.
5 The pink tax refers to the extra amount that women pay for certain products (such as used cars, personal care products, and clothing) and services (such as mortgages and dry cleaning). The pink tax on mobility refers to the fact that women may have to pay a higher price to reach the same destinations because of gender-specific needs that are not addressed by the transport system. For example, failure of public transit systems to address constraints/barriers that women face, such as lack of security, induces women to choose safer but more expensive modes of transport, thereby imposing a tax or surcharge on women’s mobility.
6 Observed differences in willingness to pay (or lack thereof) between men and women are determined by a myriad of factors, including income levels and control over income and assets.
This pink tax affects the number and potentially types of jobs that men and women can access once they enter the labor force. Willingness-to-pay data were not collected as part of the study. However, the existence of a pink tax suggests that, all else equal, women would be willing to pay more than men for better-quality mass transit system in Mumbai.6
The existence of a pink tax suggests that policy mea-sures focused on improving public transit and walkabil-ity and integrating transport modes in Mumbai could differentially benefit women. Although modal integra-tion of rail, bus, road, and nonmotorized transport in Mumbai (including integrated fares) would benefit both men and women, it is likely to benefit women more. Improving the physical integration of a city requires sustained coordination between transport and urban authorities.
Similarly, enhancing the walkability of Mumbai by cre-ating a walking-friendly street network and providing affordable micro-mobility solutions in Mumbai (such as scooters) could also differentially benefit women, given their reliance on walking. The World Bank’s 2020 Handbook for Gender-Inclusive Urban Planning and Design stresses the need to avoid creating mega-blocks when developing a walking-friendly street network and

MOBILITY AND TRANSPORT CONNECTIVITY SERIES24
suggests that the median urban block length should be 100–150 meters. It also suggests designing sidewalks in a way that accommodates the specific mobility needs of women. For example, sidewalks should be designed to accommodate families walking together, with room for others to pass, and use materials that are easily traversed.
Given that women are more reliant on public transit than men, measures that improve the reliability, con-venience, safety, and frequency of bus and rail services would also differentially benefit women. Taking a net-work approach to the routing and timing of the rail and bus systems would better integrate public transit options and make public transit a more attractive option.
Table 3: Women’s attitudes about employment and barriers to employment
Category Percent Commuting is barrier to working No 69.4 Yes 30.6Commuting is a barrier becauseOf domestic duties 19.1Of child care duties 12.7Trips are long 3.9Public transit stop is far 3.7Family does not prefer 2.5Commuting is unsafe 1.6Commuting is expensive 1.1Observations 2,388
Note: Multiple responses were permitted.
Factors Determining Women’s Likelihood of Joining the Labor Force
To understand the role of transport in affecting wom-en’s likelihood of working, the 2019 survey asked all 2,388 female respondents who were not working whether they saw commuting as a barrier to work-ing. The results suggest that gendered social norms play a large role in determining women’s labor force participation.
About a third of nonworking women (31 percent) saw commuting as a barrier to working (table 6). The main reasons cited were domestic duties (19 percent) and childcare duties (13 percent).7 A much smaller share of women reported transportation as a barrier: “pub-lic transit stops are far” (3.7 percent), “trips are long” (3.9 percent), “commuting is expensive” (1.1 percent), and “commuting is unsafe” (1.6 percent). Among non-working women, 11 percent said they would be willing to work part- or full-time if offered a job and 8 percent said they would be willing to commute to work.
7 Respondents could select multiple barriers to commuting for work if needed.
CLOSING THE GAP: GENDER, TRANSPORT, AND EMPLOYMENT IN MUMBAI25
These results suggest that transport is only one of the many barriers to women’s likelihood of participating in the workforce—and not the most important one. In contrast, the International Labour Office (ILO 2017) reports lack of access to transport as the single most important barrier to female labor force participation in developing countries. It estimates that it reduces female labor force participation probability by more than 16 percentage points.8 As Mumbai is one of the safer cities for women to be in public spaces—the Solo Woman Traveler Survey 2013 rated it the safest city in India for women traveling alone —it is likely that trans-port is viewed as less of a barrier to women’s likelihood of joining the labor force in Mumbai than elsewhere. Given the multitude of barriers women face in com-muting to work (transport related barriers as well as childcare-related barriers), providing safe and afford-able childcare services could be one way to enhance women’s labor force participation in Mumbai. Providing childcare services at or close to metro stops is one pos-sible solution.
Establishing a causal link between transport options and employment is difficult, as the decision of where to live and work are often jointly made. The study examines the link between access to public transit and employment, holding constant factors typically found to play a role in explaining female employment. Holding constant edu-cation, age, the presence of young children, spouse’s income, and the zone in which the household lives, distance to the nearest rail station is not significantly related to the probability that a woman works outside the home. However, restricting the sample to wom-en whose residential location is arguably exogenous to their employment decision reveals some evidence that transport acts as a barrier to female labor force
8 Work and family balance; lack of affordable childcare; and abuse, harass-ment, and discrimination reduce female labor participation probability by 2.6, 4.8, and 4.2 percentage points, respectively, according to the study.
participation. When the sample is restricted to women who live in households in which the primary respondent to the survey (often the husband) has lived in the same house since birth, being more than a 20-minute walk from a rail station reduces the probability that a woman works by about 4.5 percentage points. Conditional on working, it also increases the probability that a woman works from home by 8.3 percentage points. Thus, wom-en who live farther from a rail station are more likely to work from home than to commute to work.

Conclusion
Photo credits: Simone D. McCourtie

CLOSING THE GAP: GENDER, TRANSPORT, AND EMPLOYMENT IN MUMBAI27
Women and men in Mumbai exhibit different travel patterns, which partly reflect differences in their house-hold responsibilities and labor force participation. Most men’s trips are work related. In contrast, half of wom-en’s trips are for shopping or transporting children to and from school or tuition centers.
Among people who are employed, women are more likely than men to work from home. Women who do commute for work are more likely than men to walk or travel by public transit. Women are more likely than men to commute by auto-rickshaw; men are more likely to commute by two-wheeler or car. Given that aver-age commute times are about the same for men and women, the different modal choices suggest that men commute farther than women on average. This finding implies that there is a “pink tax” on women’s mobility, as women pay a surcharge (in terms of time and/or mon-ey) to access the same destinations as men. Given wom-en’s reliance on public modes of transport and walking, policy measures that improve public transit, walkability within the city, and modal integration across transport modes in Mumbai could differentially benefit women.
For both bus and rail services, there was a substan-tial reduction in the level of user satisfaction between 2004 and 2019, with satisfaction with the reliability, convenience, and frequency of service all declining. The decline almost certainly contributed to the shift from public to private transportation (especially two-wheelers and auto-rickshaws) between 2004 and 2019.9
Previous studies of Mumbai’s bus and rail system identi-fied specific aspects in the design of these services that could be improved to enhance the user experience of women. A 2011 World Bank study identified the need for an off-peak women’s daily pass, women-only bus
9 There has also been a shift from walking and cycling toward private/semi-public modes of transport. Such a shift is typically expected as incomes rise.
doors, women’s toilets, gender training of bus conduc-tors, and women conductors and drivers to improve the user experience of women with the bus system. Bhide, Kundu, and Tiwari (2016) identified specific design mea-sures (such as improving the evenness of platforms, better locating hand poles at the doors, providing hand straps, and improving lighting at stations) that can improve women’s user experience with the rail system.
The analysis in this study suggests that transport is only one of the barriers to women’s likelihood of participat-ing in the work force. About a third (31 percent) of the women surveyed cited commuting as a barrier to work-ing. But less than 4 percent indicated that transport was a barrier. Much larger shares cited domestic duties (19 percent) and childcare responsibilities (13 percent) as barriers to commuting to work. Given the multitude of barriers that women face in commuting, providing safe and affordable childcare services at suitable loca-tions in Mumbai (possibly at or close to rail stations) could enhance women’s labor force participation. More broadly, transportation solutions that allow women to combine domestic duties and childcare responsibilities with labor force participation, can enhance women’s engagement in the economy.

MOBILITY AND TRANSPORT CONNECTIVITY SERIES28
ReferencesAlam, M. M., M. Cropper, M. Herrera Dappe, and P. Suri. 2021. “Closing the Gap: Gender, Transport and Employment in
Mumbai.” Policy Research Working Paper, World Bank, Washington, DC.
Anand, A., and G. Tiwari. 2006. “A Gendered Perspective of the Shelter–Transport–Livelihood Link: The Case of Poor Women in Delhi.” Transport Reviews 26 (1): 63–80.
Baker, J., R. Basu, M. Cropper, S. Lall, and A. Takeuchi. 2005. “Urban Poverty and Transport: The Case of Mumbai.” Policy Research Working Paper 3693, World Bank, Washington, DC.
Bhide, A., R. Kundu, and P. Tiwari. 2016. Engendering Mumbai’s Suburban Railway System. Tata Institute of Social Sciences.
Borker, G. 2021. “Safety First: Perceived Risk of Street Harassment and Educational Choices of Women.” Policy Research Working Paper, World Bank, Washington, DC.
Chatterjee, U., R. Murgai, and M. Rama. 2015. “Job Opportunities along the Rural-Urban Gradation and Female Labor Force Participation in India.” Policy Research Working Paper 7412, World Bank, Washington, DC.
Crane, R. 2007. “Is There a Quiet Revolution In Women’s Travel? Revisiting the Gender Gap in Commuting.” Journal of the American Planning Association 73 (3): 298–316.
Ellis, P., and M. Roberts. 2016. Leveraging Urbanization in South Asia: Managing Spatial Transformation for Prosperity and Livability. South Asia Development Matters. Washington, DC: World Bank.
ILO (International Labour Office). 2017. World Employment and Social Outlook: Trends for Women 2017. Geneva.
Majid, H., A. Malik, and K. Vyborny. 2018. Infrastructure Investments and Public Transport Use: Evidence from Lahore, Pakistan. International Growth Center.
Martinez, D., O.A. Mitnik, E. Salgado, L. Scholl, and P. Yañez-Pagans. 2019. “Connecting to Economic Opportunity? The Role of Public Transport in Promoting Women’s Employment in Lima.” Journal of Economics, Race, and Policy. https://doi.org/10.1007/s41996-019-00039-9.
Ng, W.S., and A. Acker. 2018. Understanding Urban Travel Behaviour by Gender for Efficient and Equitable Transport Policies. International Transport Forum Discussion Paper.
Ola Mobility Institute. 2019. What Do Women and Girls Want from Urban Mobility Systems?
Peters, D. 2002 “Gender and Transport in Less Developed Countries.” Background paper for the expert workshop “Gender Perspectives for Earth Summit 2002: Energy, Transport, Information for Decision-Making,” Berlin, January 10–12.
Quiros, T., S. Mehndiratta, and C. Ochoa. 2014. Gender, Travel and Job Access: Evidence from Buenos Aires. Washington, DC: World Bank. http://siteresources.worldbank.org/INTURBANTRANSPORT/Resources/2014-Feb-5-Gender-and-Mobility.pdf.
World Bank. 2011. A Gender Assessment of Mumbai’s Public Transport. Washington, DC. http://documents.worldbank.org/curated/en/857731468269134420/A-gender-assessment-of-Mumbais-public-transport.
———. 2020. Handbook for Gender-Inclusive Urban Planning and Design. Washington, DC.
———. 2020. What Makes Her Move? A Study of Women’s Agency in Mobility in Three LAC Cities. Washington, DC.
Zolnik, E.J., A. Malik, and Y. Irvin-Erickson. 2018. “Who Benefits from Bus Rapid Transit? Evidence from the Metro Bus System (MBS) in Lahore.” Journal of Transport Geography 71: 139–49.