Monograph of the Staphylinidae of Crete (Greece). Part II ...

PM10 and PM2.5 Levels in the Eastern Mediterranean(Akrotiri Research Station, Crete, Greece)
M. Lazaridis & L. Dzumbova & I. Kopanakis &
J. Ondracek & T. Glytsos & V. Aleksandropoulou &
A. Voulgarakis & E. Katsivela & N. Mihalopoulos &
K. Eleftheriadis
Received: 31 July 2007 /Accepted: 26 October 2007 /Published online: 21 November 2007# Springer Science + Business Media B.V. 2007
Abstract Particulate matter measurements (PM10,PM2.5) using a beta radiation attenuation monitor wereperformed at the Akrotiri research station (May 2003–March 2006) on the island of Crete (Greece). Themean PM10 concentration during the measuring period(05/02/03–03/09/04) was equal to 35.0±17.7 μg/m3
whereas the mean PM2.5 concentration (03/10/04–04/02/06) was equal to 25.4±16.5 μg/m3. The aerosolconcentration at the Akrotiri station shows a largevariability during the year. Mean concentrations of
particulate matter undergo a seasonal change charac-terised by higher concentrations during summer [PM10,38.7±10.8 μg/m3 (2003); PM2.5, 27.9±8.7 μg/m3
(2004) and 27.8±9.7 μg/m3 (2005)] and lowerconcentrations during winter [PM10, 28.7±22.5 μg/m3 (2003/2004); PM2.5, 21.0±13.0 μg/m3 (2004/2005)and 21.4±21.9 μg/m3 (2005/2006)]. Comparativemeasurements of the PM10 concentration between thebeta radiation attenuation monitor, a standardized lowvolume gravimetric reference sampler and a lowvolume sequential particulate sampler showed thatPM10 concentrations measured by the beta radiationattenuation monitor were higher than values given bythe gravimetric samplers (mean ratio 1.17±0.11 and1.21±0.08, respectively). Statistical and back trajectoryanalysis showed that elevated PM concentrations(PM10, 93.8±49.1 μg/m3; PM2.5: 102.9±59.9 μg/m3)are associated to desert dust events. In additionregional transport contributes significantly to theaerosol concentration levels whereas low aerosolconcentrations were observed during storm episodes.
Keywords Aerosol measurements .
Back trajectory analysis . Crete . PM10. PM2.5
1 Introduction
Long-range transboundary transport is responsible fora significant fraction of the particulate pollution inEuropean cities (WHO/UN 1999; EC 2004; EMEP
Water Air Soil Pollut (2008) 189:85–101DOI 10.1007/s11270-007-9558-y
M. Lazaridis (*) : L. Dzumbova : I. Kopanakis :J. Ondracek : T. Glytsos :V. Aleksandropoulou :A. VoulgarakisDepartment of Environmental Engineering,Technical University of Crete,University Campus,73100 Chania, Greecee-mail: [email protected]
E. KatsivelaDepartment of Natural Resources and Environment,Technological Educational Institute of Chania,73100 Chania, Greece
N. MihalopoulosDepartment of Chemistry, University of Crete,71003 Voutes, Heraklion, Greece
K. EleftheriadisInstitute of Nuclear Technology and Radiation ProtectionN.C.S.R. Demokritos,15310 Ag. Paraskevi, Attica, Greece

2003, 2006). A major part of this contribution issecondary particulate matter (PM) in the form ofsulphate, nitrate, ammonium and organic aerosolsformed by the oxidation of sulphur dioxide, nitrogenoxides and organic gaseous species. Recent scientificefforts are focused on the quantification of particulatematter emissions, the long-range transport of primaryparticulate matter and the formation of secondaryorganic particulate matter from natural and anthropo-genic emissions (EC 2004; EMEP 2006). Especially,on the PM phenomenology in Europe two studieshave been published (Van Dingenen et al. 2004;Putaud et al. 2004). However, an aspect that ismissing in the above studies is the quantification ofparticulate matter emissions from natural sources,such as sea-salt aerosol emissions and Aeolian dusttransport from the Sahara in Southern Europe.
As published earlier (EMEP 2006), there is aconsistent pattern in the geographical variability ofPM concentrations in Europe consisting of compara-ble lower concentrations of particulate matter in thefar north, high concentrations in central Europe and ofhigher concentrations in southern and centralcountries. This is due to elevated anthropogenicemissions in central Europe as well as due todifferences in the weather conditions (e.g. rainfalls,solar radiation) and the vegetation in southerncountries. Moreover, this variability results fromcontinuing high emissions of anthropogenic gaseousand aerosol pollutants in Southern Europe and of veryreactive unsaturated hydrocarbons (including iso-prene) of natural emissions (Hoffman et al. 1997). Inaddition, in our study area, the Mediterranean, seaspray and North African desert dust contributesignificantly to the aerosol load at specific timeperiods: sea-salt during winter and summer time anddust during spring and autumn. These natural partic-ulate emissions are involved in heterogeneous reac-tions with anthropogenic gaseous pollutants and canmodify the processes leading to gas-to-particle con-version (Millan et al. 1997; Rodriguez et al. 2002;Bardouki et al. 2003).
At the north of the Mediterranean Sea a number ofhighly populated European countries exist withindustrial, semi-industrial, and rural economies,whilst to the south is Africa. A detailed windtrajectory analysis shows that more than 60% of airmasses, which arrive in the Eastern Mediterranean,come from the north–northwest (N–NW) and 13–16%
from the Sahara (Guerzoni et al. 1990; Mihalopouloset al. 1997). Air masses from the N–NW containparticles related to industrial and urban inputs; thosefrom Sahara carry predominantly mineral dust. Trans-port of desert dust occurs mostly during the springand summer and causes non-continuous crustalaerosol pulses to the Mediterranean area (Bergamettiet al. 1989). On the other hand, precipitationscavenging during the rainy season from October toMay reduces aerosol concentrations (Dulac et al.1987). The summer time is characterised by low-inversion layers, and strong sunlight, causing photo-chemical smog. Moreover, forest fires, which occurduring the summer months in the Mediterraneanregion, increase black carbon and organic aerosolmass as well as fine particle emissions. Thus, theMediterranean Sea constitutes an area where atmo-spheric particles originating from continental naturaland anthropogenic sources, marine sources and gas-to-particle conversion exist simultaneously. Further-more, specific meteorological conditions result inhigh temporal variability of aerosol concentrations.It should be noted that the meteorological conditionsin the Mediterranean area are also quite influential forthe Central and Southern European weather (Millan etal. 1997; Kallos et al. 1998).
Most of the studies on the chemical composition ofMediterranean particulate aerosol have been con-ducted in the western and north-western region (e.g.Bergametti et al. 1989; Dulac et al. 1987) or on theeastern coast including Turkey and Israel (Luria et al.1996; Maenhaut et al. 1999; Koçak et al. 2004).However, relatively few studies have been undertakenin the southern part of the Eastern Mediterranean andGreece (Mihalopoulos et al. 1997; Danalatos andGlavas 1999; Zerefos et al. 2002; Bardouki et al.2003; Gerasopoulos et al. 2006; Lazaridis et al. 2006).
Notably, there is scarce information concerningcontinuous aerosol measurement studies to reveal theatmospheric composition and variability of particu-late matter and its contribution to air quality andhuman health in the Mediterranean area. On thisbasis, continuous aerosol measurements were startedduring 2003 at the Akrotiri research monitoringstation on the western part of the island of Crete(Greece). In the current study the focus is on theambient levels of PM10 and PM2.5 and the influenceof African desert dust outbreaks on the particulatematter concentrations.
86 Water Air Soil Pollut (2008) 189:85–101

2 Material and Methods
2.1 Site Description
Continuous PM10 and PM2.5 concentrations weremeasured at the Akrotiri monitoring station which issituated at an urban background/semi-rural area on theisland of Crete, Greece, mid-distance between Athensand the northern African coast at the Akrotiripeninsula. The Akrotiri station (35°31′48″N, 24°03′36″E) is a coastal site (distance from the sea is 2 kmfor the northern and western directions, 3.3 km for thesouthern and 11.5 km eastward), approximately 5 kmnorth-eastward away of the city of Chania at anelevation of 137 m from sea level. Therefore, theurban traffic of the city of Chania can affect theconcentrations at the station only when the air massesarrive from south-western directions. The region ischaracterized by a complicated topography (flatsurface at the station area, rough rocky surface withsmall mounds around the station and a small gulch100 m eastern and 300 m northern from the station;steep rocky bulge at 7 km northern-eastward with fivegorges and lowland area where the airport andfarmland are situated at 6 km eastward), whereasstrong winds, long sunny and humid periods exist.The station was established during 2002 and belongsto the Laboratory of Atmospheric Aerosols of theDepartment of Environmental Engineering of theTechnical University of Crete.
2.2 PM Measurements
Continuous measurements of PM10 and PM2.5 wereperformed in time period between 2003 and 2006 (05/02/03–03/09/04 for PM10 and 03/10/04–04/02/06 forPM2.5) at the Akrotiri research station. However, theJuly 2003 PM10 data and the October–November2004 PM2.5 data are missing due to technicalproblems in the station. Concentrations of PM10 andPM2.5 were measured using an automatic betaradiation attenuation monitor (FH 62 I-R Beta gauge,ESM Andersen Instruments GmbH, Erlangen, Ger-many). In addition to PM measurements, ozone andmeteorological data (wind speed and direction, tem-perature and humidity) were collected on continuousbasis. Ambient ozone concentration was measuredusing Ambient O3 monitor (APOA 360, Horiba,Japan), while the meteorological conditions were also
monitored (wind speed sensor 4034BG; wind direc-tion sensor 4122BG; combined temperature/humiditysensor in shelter 3030.BG; Theodor Friedrichs andCo., Germany).
Simultaneous PM10 measurements between theautomatic beta radiation attenuation monitor and twomanual gravimetric samplers were performed toexamine the equivalence of beta monitor results togravimetric reference method. The gravimetric sam-plers were represented by a sequential particulatesampler (FH 95 SEQ, THERMO Electron Corpora-tion, Erlangen, Germany) and a standardized gravi-metric reference sampler (N.C.S.R. Demokritos,Athens, Greece) equivalent to the reference methodaccording to European standard EN 12341:1998(CEN 1998). The distance among the sampling inletsof the three above mentioned instruments was 1 meterbetween each other and the inlets were placed 4 mabove the ground level. The measurement wasperformed during July and August 2006 and itconsisted of 32 simultaneous 24-h samplings.
The automatic beta attenuation monitor with asampling flow rate 1 m3/h was equipped with PM10
head and an automatic heating system. The samplingtube was heated a few degrees above the ambienttemperature to prevent the water condensation. Par-ticles were collected on glass fiber filter tape (GF 3516,40 mm/42 m, Schleicher and Schuell, Germany). Glassfiber filters are known for producing positive artefactsby absorbing acidic acids such as SO2 and HNO3.
The sequential particulate sampler consists of aLVS-PM10 sampling inlet (at sampling flow rate2.3 m3/h), a flow control unit and a storage magazinecontaining 16 filter cassettes, which was programmedto change the filters automatically every 24 h. Theglass fiber filters (GF10, Schleicher and SchuellMicroScience GmbH, Germany) were used for theparticle collection.
The flow rate of the gravimetric reference samplerwas 1.3 m3/h and it was controlled by a criticalorifice. PTFE membrane filters with 1 μm pore size(Whatman International Ltd., Maidstone, England)were used for the gravimetric reference sampler.
During the continuous measurements of PM10 andPM2.5, the data from the automatic beta radiationattenuation monitor were collected by a data loggerevery 15 min and the daily averages were calculated.During the comparative measurement period, thesequential sampler (07/04/06–08/04/06) and the gravi-
Water Air Soil Pollut (2008) 189:85–101 87

metric reference sampler (07/20/06–08/04/06) wereoperated with a 24-h sampling period having a starttime at 15:00 local time. The 24-h averaged values(starting at 15:00) from the beta radiation attenuationmonitor were used for comparison with the sequentialsampler and the gravimetric reference sampler.
The filters with sampled PM for both gravimetricinstruments were stored in closed Petri dishes andequilibrated for 24 h at room temperature and relativehumidity of a weighing room before and aftersampling. A Sartorius balance (Sartorius CP 225D,Sartorius AG, Goettingen, Germany) with massresolution of 0.01 mg was used for the weighing ofthe filters.
It should be noted that the simultaneous measure-ments were not sufficient for obtaining a correctionfactor for PM10 since further intercomparison withconcentrations measured with reference gravimetricequipment must be performed to demonstrate equiv-alence of beta concentration measurements to refer-ence method (EC 2002). Therefore, the betaattenuation monitor concentrations are presented asmeasured.
2.3 Back Trajectory Modelling
Trajectories were obtained using the HYSPLIT4 Model(Hybrid Single-Particle Lagrangian Integrated Trajec-tory), developed by the Air Resources Laboratory of theNational Oceanic and Atmospheric Administration(NOAA; Draxler and Rolph 2003; Rolph 2003). Thethree-dimensional trajectories were computed for thecoordinates 35.53N, 24.06E which are the coordinatesof the Akrotiri station, at 12 UTC (CoordinatedUniversal Time) for each day of measurements. Thetrajectories were 120 h (5 days) long. The wind datawere retrieved from NOAA [archived (FNL) meteoro-logical data] and had a time resolution of 6 h andspatial resolution of 191×191 km2.
2.4 Statistical Analysis
The effect of air masses arriving at the sampling siteto PM concentration was examined by performingstatistical analysis on the back-trajectory modellingresults and the PM concentration data for each day ofthe measuring period. Four sectors have been usedcorresponding the north-west (NW), north-east (NE),south-west (SW) and south-east (SE) directions. Each
trajectory was divided into 120 segments and eachsegment has been assigned to one of the aforemen-tioned sectors. Therefore maps for the origin of the airmasses were constructed (the maps are presented insection 3.4.2 of the manuscript). The length of eachbar in the maps is proportional to the frequency of airmasses originating from the specific wind sector aspercent (%) of total (vertical axis), whereas the colourcorresponds to particulate matter levels of the airoriginating from that sector (concentration in micro-gram per cubic meter).
The long range dust transport events were detectedin the PM time series. More specifically, we examinedthe PM time series for potential desert dust events ondays with particulate concentration peaks and dayshaving average concentration higher than the monthlyaveraged value. The prevailing sector for the origin ofair masses should correspond to the Southern (Saharaand Sahel deserts) or Western (desert dust event overwestern Mediterranean) direction for a desert dustevent to occur in the area of the station. In addition, formajor desert dust events, the concentration peak shouldbe observed also at the urban background/semi-ruralFinokalia station, which is located at the eastern part ofCrete or at the Heraklion station, located in an urbanarea close to Finokalia (Gerasopoulos et al. 2006). Theback-trajectory modelling results and satellite imagesfrom Terra/MODIS were used to confirm theoccurrence of a dust event. PM concentrationsinfluenced by desert dust events were subtracted fromthe dataset and concentrations without dust eventswere calculated.
In addition, a non-metric Multi DimensionalScaling (MDS) analysis has been applied to theparticulate matter concentration and meteorologicaldata in order to detect and explain the observedsimilarities between the data for each day of measure-ments (Clarke and Gorley 2001; Clarke and Warwick1994). In the MDS analysis the observed similaritymatrix between the days of measurements (samples)is analysed and represented in two dimensions. Thevalue of stress shows the extent to which the MDSplot provides a good representation of the similaritymatrix of data. The MDS analysis was appliedseparately for the available PM10 and PM2.5 concen-tration data. The similarity matrix was generated,using the Bray–Curtis index of dissimilarity. Then theMDS algorithm was applied and the MDS bubbleplots were constructed.
88 Water Air Soil Pollut (2008) 189:85–101

3 Results and Discussion
3.1 Comparative PM10 Measurements
In Europe as well as in the US, manual gravimetricmethods have been defined as reference methods forparticulate matter measurements (CEN 1998; USGovernment 1991). Therefore, online measurementdevices (e.g. beta radiation attenuation monitor) mustbe examined for equivalence with gravimetric refer-ence methods under various measurement conditions(Salminen and Karlsson 2003; Gehrig et al. 2005).
Comparison between PM10 concentrations mea-sured by the beta radiation attenuation monitor, thesequential low volume sampler and the gravimetricreference sampler was performed in the periodbetween 07/04/06–08/04/06 (Fig. 1) in order toexamine the equivalence of beta monitor results togravimetric reference method. The differences be-tween the PM10 concentration values given by theonline instrument and the two offline gravimetricinstruments were within 20% for almost the wholemeasuring period. The ratio of the beta radiationattenuation monitor concentrations to the sequentialsampler concentrations for the whole measuringperiod was 1.21±0.08, while the ratio between thebeta radiation attenuation monitor and the referencesampler was 1.17±0.11. During the period of simul-taneous measurements the relative humidity, temper-ature and wind speed averages were 64.4±8.0%(49.4–78.3%), 25.1±1.9°C (21.8–28.0°C), 2.9±0.9 m/s (1.8–5.9 m/s), respectively. To the range ofconditions under which the measurements were
conducted the beta attenuation monitor is known ofproviding concentrations higher than the referencegravimetric method due to water absorption byparticles and condensation of evaporation loss fromparticles on the beta monitor filter (heated inlet to40°C; Chang et al. 2001; Sillanpää et al. 2002). Thebeta radiation attenuation monitor filter is not condi-tioned before the particulate matter mass concentra-tion detection but rather analysed almost immediatelywhen it is sampled. On the other hand, in the case ofoffline gravimetric instruments, the particulate mattersampling took 24 h and the filters were analyzed up to16 days (15 days of sampling and 1 day equilibratingthe filter in weighing room) after collection for thefirst filter from the filter magazine of the sequentialsampler. Therefore, the higher values measured by thebeta radiation attenuation monitor in comparison tothe sequential sampler can be caused also by losses onthe filters for the gravimetric measurement due to theevaporation of volatile compounds (Saarikoski 2005)and the positive artifacts of the glass fiber filterswhich are maximized during the summer since SO2
and HNO3 concentrations are elevated.
3.2 PM10 Measurements
The daily averaged concentrations for PM10 duringthe measuring period from 05/02/03 to 03/09/04 arepresented in Fig. 2a. The mean concentration of PM10
for the whole measuring period 2003/2004 was 35.0±17.7 μg/m3 (Table 1). There is a large variability ofthe daily averaged PM10 concentrations mainly duringthe summer and autumn period with concentrations
10
20
30
40
50
60
07/0
4/06
07/0
6/06
07/0
8/06
07/1
0/06
07/1
2/06
07/1
4/06
07/1
6/06
07/1
8/06
07/2
0/06
07/2
2/06
07/2
4/06
07/2
6/06
07/2
8/06
07/3
0/06
08/0
1/06
08/0
3/06
08/0
5/06
08/0
7/06
Date
Mas
s c
once
ntra
tion
(µg
/m3 )
PM10 Sequential Sampler Beta attenuation monitor PM10 Low Volume Sampler
Fig. 1 Comparativemeasurements of PM10
concentrations by the betaattenuation monitor (FH 62I-R), the low volume se-quential sampler (FH 95SEQ) and the gravimetricreference sampler (N.C.S.R.Demokritos, Athens,Greece). Error bars indicateminimum and maximumcounts (±SD)
Water Air Soil Pollut (2008) 189:85–101 89

ranging from 15 to 100 μg/m3. During the winterperiod 2003/2004 the daily mean PM10 concentra-tions were in general lower and the variability smaller(26.8±13.7 μg/m3). However, on the 02/27/04 amajor desert dust event lead to an average daily
PM10 level of 193.2±125.9 μg/m3. The PM10 levelson 02/27/04 between 19:00–21:00 reached more than400 μg/m3 with the highest value of 495 μg/m3 at20:00, which is a very high concentration even fordesert dust episodes (Rodriguez et al. 2002). The days
0
50
100
150
200
250
1-M
ay
-03
31
-May
-03
1-J
ul-
03
31
-Ju
l-0
3
31
-Au
g-0
3
1-O
ct-
03
31
-Oct-
03
1-D
ec-0
3
31
-Dec-0
3
31
-Jan
-04
2-M
ar-
04
Date
Date
PM
10 c
once
ntra
tion
(g/
µm
3 )
Desert dust events
West and north-west winds
n.d.
n.d.0
10
20
30
40
50
60
70
80
May
03
Jun
03
Jul
03
Au
g 0
3
Sep
03
Oct
03
No
v 0
3
Dec 0
3
Jan
04
Feb
04
PM
10 c
once
ntra
tion
(µ
g/m
3 )
y = 0.41x + 8.28
R2 = 0.68
0
50
100
150
200
0 50 100 150 200 250 300 350 400
PM10 Heraklion (µg/m3)
PM
10 A
krot
iri (
µg/
m3 )
1:1
a
b
c
Fig. 2 a Daily mean PM10
concentrations in the timeperiod between 05/02/03–03/09/04 and b monthlymean PM10 concentrationsduring May 2003–February2004 at the Akrotiri researchstation by the beta radiationattenuation monitor FH 62I-R (n.d. not determined).Error bars indicate mini-mum and maximum counts(±SD). c Correlation be-tween PM10 concentrationsat the Akrotiri and Hera-klion stations
90 Water Air Soil Pollut (2008) 189:85–101

with major desert dust events are indicated in Fig. 2a(six episodes with duration from 17 h to approximately5 days and 1 h concentration averages from 60.5–495 μg/m3; 06/30/03, 10/06/03, 10/20/03–10/24/03,02/24/04, 02/26/04–02/28/04, 03/02/04). However, themeasurements showed 26 temporally short dust epi-sodes (2–6 h) with maximum 1 h averaged concentra-tion of 180 μg/m3. North Western winds during themeasuring period, which in general result to regionaldiminished particulate matter levels in the observationarea, are also indicated in Fig. 2a. The lowest dailyPM10 value during the measuring period was observedon 02/13/04 (10.0±3.3 μg/m3) during a storm event. Insome cases, high PM10 concentrations (e.g. 82.9 μg/m
3
on 09/01/03) were also associated with elevated O3
levels (corresponding concentration 0.062 ppm) at thestation during regional transport from the CentralEurope and coincident desert dust event over Crete.
In addition, days with PM10 concentration exceed-ing the 24-h limit value of 50 μg/m3 are depicted inFig. 2a. During the period May–October 2003 thelimit was exceeded on approximately 20% of the dayswhereas during the period November 2003–January2004 no exceedances occurred. In October 2003 (33%of days) and February 2004 (21% of days) themajority of exceedances occurred due to the increasedfrequency of desert dust events.
In Table 1 averaged values of temperature, relativehumidity and air velocity are presented. The PM10
concentration values were not correlated with thevalues of the meteorological parameters. However,PM10 concentrations were correlated with temperature(R2=0.63) when the values influenced by desert dustevents were omitted from the dataset.
Figure 2b shows the monthly averaged PM10
concentrations during the period May 2003–February2004. The monthly averaged PM10 concentrationswithout the desert dust episodes are also depicted inFig. 2b with the semi-continuous line. Τhe July 2003data are missing due to technical problems in thestation (indicated with n.d. in Fig. 2b). Elevated PM10
levels were observed in October 2003 and February2004 with monthly averaged concentrations equal to45.7±21.4 μg/m3 and 40.0±35.8 μg/m3, respectively.The reason for the elevated concentrations during thesemonths was the outbreak of a number of desert dustepisodes in the area. Subtracting the desert dustepisodes from the data the maximum monthly averagedconcentration was observed during the September 2003and was 36.1±12.2 μg/m3 (Fig. 2b, semi-continuousline). The lowest monthly mean concentrations weremeasured during the winter period, in particular fromNovember 2003 to January 2004 (Fig. 2b), when nomajor desert dust event took place (Fig. 2a).
Table 1 PM10 and PM2.5 concentration and meteorological parameters statistics at the Akrotiri station
Component Time period (data capture %) Averaged valuea SDb Min ± SDc Max ± SDc
PM10 (μg/m3) 2003/2004 (84)d 35.0 17.7 10.0±3.3 193.2±125.9
2003 (81) 35.7 14.3 10.9±4.1 97.6±23.1PM2.5 (μg/m
3) 2004/2006 (85.4)e 25.4 16.5 10.6±3.4 282.4±270.02004 (65.5) 26.1 11.1 11.4±3.9 98.4±95.22005 (95.1) 25.6 17.5 10.6±3.4 282.4±270.0
Temperature (°C)f 2003/2004 19.2 5.9 2.1±2.3 32.0±2.72004/2006 18.7 5.8 5.7±0.3 35.9±0.8
RH (%)f 2003/2004 70.0 11.8 32.3±2.7 96.4±1.62004/2006 69.4 10.3 29.8±3.5 98.7±1.8
Air velocity (m/s)f 2003/2004 3.4 1.7 1.3±0.7 10.8±2.02004/2006 3.7 1.7 1.2±0.7 12.7±3.2
a Value averaged over time periodb Standard deviationc Based on daily averaged values during the time perioddMeasuring period for PM10 (05/02/03–03/09/04)eMeasuring period for PM2.5 (03/10/04–04/02/06)f Only for periods with available concurrent PM concentrations.
Water Air Soil Pollut (2008) 189:85–101 91

The annual mean PM10 concentration for the year2003 (based on 8-months measurements) at theAkrotiri station was 35.7±14.3 μg/m3. Although thelevels of PM10 at the station are lower than the EUannual limit value for the protection of human health(40 μg/m3), exceed the EU 2010 limit value of 20 μg/m3 of PM10. However, PM10 concentrations areprobably lower than measured according to the resultsfrom the comparison with the reference gravimetricmethod results. The mean concentration of PM10 forthe whole measuring period 2003/2004 (9-monthsperiod; 35.0±12.4 μg/m3) corresponds to the annualmean concentration of PM10 at the urban background/semi-rural Finokalia station, for the year 2004/2005(28±30 μg/m3) and at the rural Erdemli station(36.4±27.8 μg/m3) but are significantly higher thanconcentrations at rural stations in western Mediterra-nean (18–30 μg/m3) and continental Europe (7–25 μg/m3; Gerasopoulos et al. 2006 and referencestherein; Koçak et al. 2007 and references therein).Concurrent measurements of PM10 at the Finokaliaand Akrotiri stations were not taken during the period2003/2004 and therefore it was not possible todirectly compare the evolution of concentrations atthe two stations. However, measurements fromHeraklion station were available for the period 05/06/03–03/09/04 (63±37 μg/m3). The PM10 concen-trations at the Akrotiri station were lower than theconcentrations observed at Heraklion station and alsowere correlated as depicted in Fig. 2c (R2=0.68).
3.3 PM2.5 Measurements
PM2.5 measurements were performed from 03/10/04 to04/02/06 using the automatic beta attenuation monitorequipped with a PM2.5 pre-impactor. The daily aver-ages of PM2.5 concentrations are shown in Fig. 3a. Theaverage PM2.5 concentration during the whole measur-ing period was 25.4±16.5 μg/m3. In addition, theannual mean concentrations of ΡΜ2.5 for the measuringperiod March 2004–March 2005 and March 2005–March 2006 was 25.5±11.7 μg/m3 and 25.3±19.2 μg/m3, respectively. The above concentrations are ratherhigh compared to other rural background stations inthe Mediterranean (Koçak et al. 2007 and referencestherein). On a calendar year basis, the PM2.5 annualconcentration averages measured at Akrotiri stationwere 26.1±11.1 μg/m3 for the year 2004 (based on 10-months measurements) and 25.6±17.5 μg/m3 for the
year 2005 and exceeded the US EPA annual limit valueof 15 μg/m3 and the WHO AQG value of 10 μg/m3
(WHO 2006). However, as for PM10 concentrations,the actual PM2.5 concentrations are probably lowerthan measured.
As for PM10 concentrations, there are specific periodsduring which the daily PM2.5 concentration reached highvalues as a result of desert dust intrusion in the area.Similar observations regarding the effect of desert dustepisodes to the PM2.5 levels have been reported in theliterature (Rodriguez et al. 2004). The days with highPM2.5 concentration corresponding to desert dust eventsand their intensity are depicted in Fig. 3a (03/27/04, 03/28/04, 05/05/04, 05/06/04, 07/12/04, 01/26/05, 01/27/05,02/15/05, 03/28/05, 04/11/05, 04/17/05, 02/24/06 and02/28/06). The most intensive desert dust episodescaused a considerable reduction in the visibility (04/17/05, 02/24/06). Especially during the desert dust events ofthe period January–March 2005 (01/26/05, 01/27/05, 02/15/05 and 03/28/05), the back trajectory analysis showedthat the air masses passed over northern Africa close tothe ground for many hours (between 36 h and more than72 h) prior to arriving to the monitoring station. On the01/26/05 the 24 h averaged PM2.5 concentration was79.5±35.6 μg/m3 (maximum value 167 μg/m3), whereason the 02/15/05 the average 24 h PM2.5 concentrationreached 54.6±46.1 μg/m3 (maximum value 215 μg/m3),on 03/28/05 92.5±93.6 μg/m3 (maximum value348 μg/m3), and on 04/17/05 281.6±270.7 μg/m3
(maximum 15 min value over 780 μg/m3).Figure 3b shows the monthly averaged PM2.5
concentration from March 2004 to March 2006. Itcan be observed from the Fig. 3b that during the winterperiod (December 2004, January 2005, December 2005and January 2006) the PM2.5 concentrations were lowerthan during the spring (e.g. April 2005) and thesummer period (e.g. July 2005). This trend is inagreement with the PM10 measurements and thepublished PM data for urban background/semi-ruralenvironments in the Mediterranean area (Rodriquez etal. 2002). In Fig. 3b the semi-continuous line corre-sponds to monthly averaged PM2.5 concentrationswithout the desert dust events. The results show thatdesert dust events can increase the monthly averagedPM2.5 concentrations by a factor of 1.1 to 1.2 duringthe period from January to May. Especially for April2005 and February 2006, the value of this factor is 1.5due to the occurrence of the most intensive desert dustepisodes (04/17/05, 02/24/06).
92 Water Air Soil Pollut (2008) 189:85–101

Contrary to PM10 concentrations, the PM2.5 levelsat the Akrotiri station were not correlated with theconcentrations of PM10 at the Finokalia (R2=0.25)and Heraklion (R2=0.31) stations during the period03/10/04–09/30/05 (period with concurrent measure-ments; Fig. 3c). However, on 04/17/05 elevated PM
concentrations were measured at all sites due to theintensive Saharan dust episode. This indicates thatsources from the same location, in this case regionaltransport of Saharan dust from North Africa, con-tribute significantly to the elevated PM levels inCrete.
0
20
40
60
80
Mar
04
Ap
r 0
4
May
04
Jun
04
Jul
04
Au
g 0
4
Sep
04
Oct
04
No
v 0
4
Dec 0
4
Jan
05
Feb
05
Mar
05
Ap
r 0
5
May
05
Jun
05
Jul
05
Au
g 0
5
Sep
05
Oct
05
No
v 0
5
Dec 0
5
Jan
06
Feb
06
Mar
06
PM
2.5
conc
entr
atio
n (µ
g/m
3 )
n.d.
0
100
200
300
400
500
600
10
-Mar-
04
10
-May
-04
10
-Ju
l-0
4
9-S
ep
-04
9-N
ov
-04
9-J
an
-05
11
-Mar-
05
11
-May
-05
11
-Ju
l-0
5
10
-Sep
-05
10
-No
v-0
5
10
-Jan
-06
12
-Mar-
06
Date
Date
PM
2.5
conc
entr
atio
n (µ
g/m
3 )
Desert dust events
n.d.
y = 0.26x + 13.54
R2 = 0.31
y = 0.22x + 18.91
R2 = 0.25
0
50
100
150
200
250
300
0 50 100 150 200 250 300 350 400 450 500
PM10 Heraklion & Finokalia (µg/m3)
PM
2.5
Akr
otir
i (µ
g/m
3 )
Heraklion FinokaliaLinear (Heraklion) Linear (Finokalia)
1:1
a
b
c
Fig. 3 a Daily mean PM2.5
concentrations in period be-tween 10/03/04–02/04/06and b mean monthly PM2.5
concentrations duringMarch 2004–March 2006 atthe Akrotiri research station(Crete, Greece) by the betaradiation attenuation moni-tor FH 62 I-R (n.d. notdetermined). Error bars in-dicate minimum and maxi-mum counts (±SD).c Correlation between PM10
concentrations at the Akro-tiri and Heraklion stations
Water Air Soil Pollut (2008) 189:85–101 93
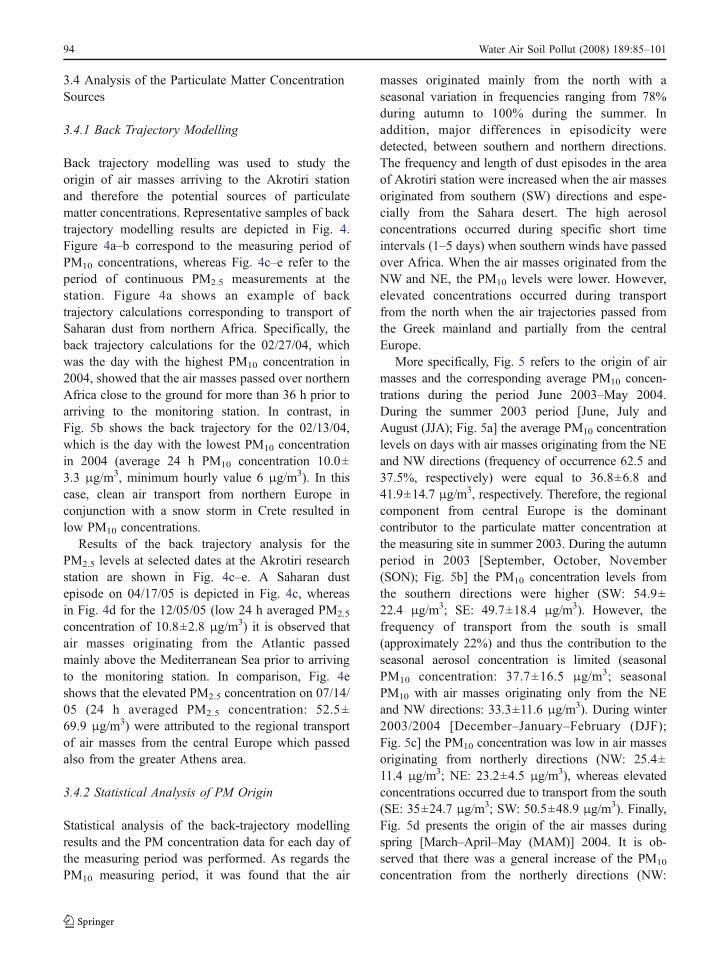
3.4 Analysis of the Particulate Matter ConcentrationSources
3.4.1 Back Trajectory Modelling
Back trajectory modelling was used to study theorigin of air masses arriving to the Akrotiri stationand therefore the potential sources of particulatematter concentrations. Representative samples of backtrajectory modelling results are depicted in Fig. 4.Figure 4a–b correspond to the measuring period ofPM10 concentrations, whereas Fig. 4c–e refer to theperiod of continuous PM2.5 measurements at thestation. Figure 4a shows an example of backtrajectory calculations corresponding to transport ofSaharan dust from northern Africa. Specifically, theback trajectory calculations for the 02/27/04, whichwas the day with the highest PM10 concentration in2004, showed that the air masses passed over northernAfrica close to the ground for more than 36 h prior toarriving to the monitoring station. In contrast, inFig. 5b shows the back trajectory for the 02/13/04,which is the day with the lowest PM10 concentrationin 2004 (average 24 h PM10 concentration 10.0±3.3 μg/m3, minimum hourly value 6 μg/m3). In thiscase, clean air transport from northern Europe inconjunction with a snow storm in Crete resulted inlow PM10 concentrations.
Results of the back trajectory analysis for thePM2.5 levels at selected dates at the Akrotiri researchstation are shown in Fig. 4c–e. A Saharan dustepisode on 04/17/05 is depicted in Fig. 4c, whereasin Fig. 4d for the 12/05/05 (low 24 h averaged PM2.5
concentration of 10.8±2.8 μg/m3) it is observed thatair masses originating from the Atlantic passedmainly above the Mediterranean Sea prior to arrivingto the monitoring station. In comparison, Fig. 4eshows that the elevated PM2.5 concentration on 07/14/05 (24 h averaged PM2.5 concentration: 52.5±69.9 μg/m3) were attributed to the regional transportof air masses from the central Europe which passedalso from the greater Athens area.
3.4.2 Statistical Analysis of PM Origin
Statistical analysis of the back-trajectory modellingresults and the PM concentration data for each day ofthe measuring period was performed. As regards thePM10 measuring period, it was found that the air
masses originated mainly from the north with aseasonal variation in frequencies ranging from 78%during autumn to 100% during the summer. Inaddition, major differences in episodicity weredetected, between southern and northern directions.The frequency and length of dust episodes in the areaof Akrotiri station were increased when the air massesoriginated from southern (SW) directions and espe-cially from the Sahara desert. The high aerosolconcentrations occurred during specific short timeintervals (1–5 days) when southern winds have passedover Africa. When the air masses originated from theNW and NE, the PM10 levels were lower. However,elevated concentrations occurred during transportfrom the north when the air trajectories passed fromthe Greek mainland and partially from the centralEurope.
More specifically, Fig. 5 refers to the origin of airmasses and the corresponding average PM10 concen-trations during the period June 2003–May 2004.During the summer 2003 period [June, July andAugust (JJA); Fig. 5a] the average PM10 concentrationlevels on days with air masses originating from the ΝEand ΝW directions (frequency of occurrence 62.5 and37.5%, respectively) were equal to 36.8±6.8 and41.9±14.7 μg/m3, respectively. Therefore, the regionalcomponent from central Europe is the dominantcontributor to the particulate matter concentration atthe measuring site in summer 2003. During the autumnperiod in 2003 [September, October, November(SON); Fig. 5b] the PM10 concentration levels fromthe southern directions were higher (SW: 54.9±22.4 μg/m3; SE: 49.7±18.4 μg/m3). However, thefrequency of transport from the south is small(approximately 22%) and thus the contribution to theseasonal aerosol concentration is limited (seasonalPM10 concentration: 37.7±16.5 μg/m3; seasonalPM10 with air masses originating only from the ΝEand ΝW directions: 33.3±11.6 μg/m3). During winter2003/2004 [December–January–February (DJF);Fig. 5c] the PM10 concentration was low in air massesoriginating from northerly directions (NW: 25.4±11.4 μg/m3; NE: 23.2±4.5 μg/m3), whereas elevatedconcentrations occurred due to transport from the south(SE: 35±24.7 μg/m3; SW: 50.5±48.9 μg/m3). Finally,Fig. 5d presents the origin of the air masses duringspring [March–April–May (MAM)] 2004. It is ob-served that there was a general increase of the PM10
concentration from the northerly directions (NW:
94 Water Air Soil Pollut (2008) 189:85–101

Fig. 4 Back trajectories cal-culated by the HYSPLIT4model (Draxler and Rolph2003; Rolph 2003) fora 27th February 2004,b 13th February 2004,c 17th April 2005, d 5thDecember 2005 and e 14thJuly 2005. In the upper partof the figure a map with thepath the air parcel took ispresented, and at the lowerpart a vertical view of itsmovement at different alti-tudes (meters above modelground level)
Water Air Soil Pollut (2008) 189:85–101 95

30.3±9.8 μg/m3; NE: 39.4±8.3 μg/m3). Regarding thedirection of air masses arriving to the station the mostdominant was the NE with frequency of occurrenceapproximately 50% and the NW with frequency of41.7%. The air masses originating from the southdirection had elevated PM10 levels (SE: 55.8 μg/m3,2.8%; SW: 55.8±14.4 μg/m3, 5.5%).
In comparison, Fig. 6a–d present the mean fre-quency distribution of the PM2.5 concentrations at theAkrotiri research station during spring (2004, 2005and 2006), summer (2004 and 2005), autumn (2004and 2005) and winter (2004/2005 and 2005/2006)periods, respectively. The comparison of the origin ofthe air masses and the corresponding average PM10
(summer 2003–spring 2003/2004) and PM2.5 (spring2004–winter 2005/2006) concentrations showed sig-nificant differences. The average PM2.5 concentra-tions from SW direction were the highest during thespring, summer and winter periods (spring period,SW: 42.1±51.2 μg/m3; summer period, SW: 34.3±
10.1 μg/m3; winter period, SW: 28.9±35.4 μg/m3),whereas during the autumn period the highest averagePM2.5 concentrations originated from NE (autumnperiod, NE: 27.3±11 μg/m3). The frequency percent-age of the air masses with the highest PM2.5
concentrations from SW direction was 12.9% duringspring, 3.4% during summer and 22.9% during winterand during the autumn period the frequency percent-age of the air masses from NE direction was 54.2%.In contrast, the highest average PM10 concentrationswere measured from northern directions duringsummer 2003 (NW: 41.9±14.7 μg/m3; NE: 36.9±6.8 μg/m3; frequency 100%).
However, there were some similarities between theorigin of the air masses and the correspondingaverage PM10 (summer 2003–spring 2003/2004) andPM2.5 (spring 2004–winter 2005/2006) concentra-tions. The fraction of air masses originating fromnortherly directions was also for the PM2.5 concen-trations the most dominant with frequency of occur-
Fig. 5 For the a summer2003 period (JJA), b au-tumn 2003 period (SON),c winter 2003/2004 period(DJF), and d spring 2003/2004 period (MAM). Thevertical axis of the plotshows the frequency of thecorresponding air mass ori-gin as percent (%) of total.The colour code shows theconcentration in microgramper cubic meter
96 Water Air Soil Pollut (2008) 189:85–101

rence varying from 68.6–96.3%. As for PM10 (springand winter periods of 2003), the PM2.5 concentrationsoriginating from southerly directions during the springand the winter period were in some cases higher(spring period, SE: 27.5±10.2 μg/m3, SW: 42.1±51.2 μg/m3, winter period, SE: 23.4±6.6 μg/m3, SW:28.9±35.4 μg/m3) than from northerly directions(spring period, NW: 23.4±8 μg/m3, NE: 23.5±7.8 μg/m3; winter period, NW: 17.9±4.9 μg/m3, NE:17.8±4.6 μg/m3). Koçak et al. (2007) have also foundthat during spring the concentration of PM is elevatedin the eastern Mediterranean (Erdemli coastal ruralstation) due to frequent desert dust events. In addition,on an annular basis the most dominant direction ofarrival of air masses at the station was the northern(PM10: 2003, 87.3%; 2004, 80%; PM2.5: 2004, 88.1%;2005; 84.9%; 2006, 74.7%). This is in agreement withwind trajectory analyses in the region performed byGuerzoni et al. (1990) which concluded that morethan 60% of air masses which arrive in the easternMediterranean come from the N–NW and 13–16%
from the Sahara. However, as previously publishedfor the rural Finokalia station in western Crete(Gerasopoulos et al. 2006), the maximum concen-trations for both PM10 and PM2.5 were observedwhen air masses originated from SW directions(Saharan dust outbreaks; PM10: 2003, 50±22.6 μg/m3;2004, 58±49.8 μg/m3; PM2.5: 2004, 31.9±16.6 μg/m3;2005, 33±42 μg/m3; 2006, 34.9±48.3 μg/m3). Thelower concentrations were mainly observed when airmasses originated from the NE direction (PM10: 2003,33.6±9 μg/m3; 2004, 27.4±11.8 μg/m3; PM2.5: 2004,24.1±8.3 μg/m3; 2005, 26.8±10.1 μg/m3; 2006, 17.9±4.4 μg/m3).
3.4.3 Non-metric Multi Dimensional Scaling (MDS)Analysis
The MDS analysis results are presented as bubble plotsin Fig. 7, separately for the available PM10 and PM2.5
concentration data. The circles (bubbles) in Fig. 7a andb represent the samples whereas the diameter of each
Fig. 6 Origin of the airmasses and correspondingaverage PM2.5 concentration(μg/m3) for the a spring2004, 2005 and 2006 period(MAM), b summer 2004and 2005 period (JJA),c autumn 2004 and 2005period (SON), and d winter2004/2005 and 2005/2006period (DJF). The verticalaxis of the plot shows thefrequency of thecorresponding air mass ori-gin as percent (%) of total.The colour code shows theconcentration in microgramper cubic meter
Water Air Soil Pollut (2008) 189:85–101 97

circle is proportional to the particulate matter concen-tration during each day. Bubbles that are groupedtogether (clusters) represent days with similar charac-teristics with respect to particulate matter concentrationand meteorological parameters. In addition, the repre-sentation of the similarity of samples in Fig. 7a and b issatisfactory as depicted by the low stress values (0.09for PM10 and 0.12 for PM2.5).
In Fig. 7a where all the 24 h averaged values ofPM10 are shown, the appearance of three clusters is
evident. The right cluster corresponds to high concen-trations and is well correlated with desert dust episodes(rare events). The cluster to the left correlates withtransfer from western and north-western directions andon two days with snow fall events when the concen-trations are very low (rare events). Finally, the middlecluster represents particulate matter concentrations thatare most common in the area. We can thereforeconclude that the average 24 h PM10 values fall inone of three distinctive clusters. The high PM10 events
Fig. 7 Non-metric multi-dimensional scaling (MDS)analysis bubble plot for theambient concentration ofa 24 h-averaged PM10 be-tween April 2003 andMarch 2004 and b 24 h-averaged PM2.5 betweenMarch 2004 and April 2006,at the Akrotiri researchstation
98 Water Air Soil Pollut (2008) 189:85–101

(from 77 to 190 μg/m3) have similarity with theoutbreaks of African desert dust, the low PM events(from 14 to 19 μg/m3) with the winter storm events(11 μg/m3), whereas the major part of the data (from20 to 70 μg/m3) can be organized in a third clusterwhere the air masses originate from north-westerly andnorth-easterly directions. In comparison, the results ofthe MDS analysis for the PM2.5 concentrations arepresented in Fig. 7b. Also in this case, most of thePM2.5 concentrations fall in a dominant category withvalues ranging from 12 to 64 μg/m3, whereas the rightcluster represents days with desert dust events (rareevents; concentrations ranging from 53 to 282 μg/m3).
4 Conclusions
Three-year (May 2003–March 2006) particulate mat-ter measurements (PM10, PM2.5) using a beta radia-tion attenuation monitor were performed at theAkrotiri research station on the west part of the islandof Crete (Greece) in combination with statistical andback trajectory analysis. The average concentration ofPM10 for the whole measuring period (May 2003–February 2004) was 35.0±17.7 μg/m3, whereas theaverage PM2.5 concentration during the whole mea-suring period (March 2004–February 2006) was25.4±16.5 μg/m3. The concentrations of particulatematter undergo a seasonal change characterised by asummer maximum [PM10: 38.7±10.8 μg/m3 (2003);PM2.5: 27.9±8.7 μg/m3 (2004) and 27.8±9.7 μg/m3
(2005)] with lower concentrations during winter(PM10: 28.7±22.5 μg/m3 (2003/2004); PM2.5: 21.0±13.0 μg/m3 (2004/2005) and 21.4±21.9 μg/m3 (2005/2006)]. In addition, comparative measurements of thePM10 concentration between the beta radiation atten-uation monitor, a standardized gravimetric referencesampler and a low volume sequential particulatesampler showed that PM10 concentrations measuredby the beta radiation attenuation monitor were slightlyhigher than values given by the reference sampler.Especially, the mean ratio of beta radiation attenuationmonitor to the standardized gravimetric referencesampler of all results was 1.17±0.11, whereas themean ratio of beta radiation attenuation monitor to thesequential low volume sampler was 1.21±0.08.
Statistical analysis together with back trajectorystudies of the PM data revealed the importance of longrange and regional transport contribution to the ambient
PM levels at the Akrotiri research station. During themeasuring period approximately 15% of air massesarrived at the station from the south (North Africa,Cyprus and South West Asia region on the shore of theMediterranean Sea) whereas the majority ((NE: 33.6%;NW: 51.2%)) of air masses arrived from the north(Greek mainland and central Europe). The ambientPM10 and PM2.5 concentrations at the Akrotiri researchstation show a large variability with elevated concen-trations during desert dust episodes [PM10: 93.8±49.1 μg/m3 (05/02/03–03/09/04); PM2.5: 102.9±59.9 μg/m3 (03/10/04–04/02/06)], whereas low PM10
and PM2.5 concentration levels are observed duringwinter when storm episodes and transport from thewest Mediterranean Sea and the Atlantic region occur(lower than 20 and 15 μg/m3 for PM10 and PM2.5,respectively). Transport from the Greek mainland andthe European continent contributes significantly to theparticulate matter levels in the area since the prevailingwind direction is northerly throughout the measurementperiod. The particulate matter concentrations at Akrotiriduring transport from northerly direction were elevated(daily averaged concentrations; PM10: ~40 μg/m3;PM2.5: ~33 μg/m3) but considerably lower than theconcentrations during outbreaks of African desert dust.
Acknowledgement This work was supported by the GreekMinistry of Education and Religion and the European Union,under grant “Puthagoras-II”. The authors gratefully acknowl-edge the NOAA Air Resources Laboratory (ARL) for theprovision of the HYSPLIT transport and dispersion model(http://www.arl.noaa.gov/ready.html) used in this publication.
References
Bardouki, H., Liakakou, H., Economou, C., Sciare, J., Smolík, J.,Ždímal, V., et al. (2003). Chemical composition of sizeresolved atmospheric aerosols in the eastern Mediterraneanduring summer and winter. Atmospheric Environment, 37,195–208.
Bergametti, G., Dutot, A.-L., Buat-Ménard, P., Losno, R., &Remoudaki, E. (1989). Seasonal variability of the elemen-tal composition of atmospheric aerosol particles over thenorthwestern Mediterranean. Tellus, 41B, 353–361.
CEN (1998). Air Quality. determination of the PM10 fraction ofsuspended particulate matter. Reference method and fieldtest procedure to demonstrate reference equivalence ofmeasurement methods. Brussels, EN 12341:1998.
Chang, C. T., Tsai, C. J., Lee, C. T., Chang, S. Y., Cheng, M.T., & Chein, H. M. (2001). Differences in PM10 concen-trations measured by β-gauge monitor and hi-vol sampler.Atmospheric Environment, 35, 5741–5748.
Water Air Soil Pollut (2008) 189:85–101 99

Clarke, K. R., & Gorley, R. N. (2001). Primer v5: User manual/tutorial, primer-E, Plymouth, UK.
Clarke, K. R, & Warwick, R. M. (1994). Change in marinecommunities: An approach to statistical analysis andinterpretation (MDS). Plymouth Marine Laboratory.
Danalatos, D., &Glavas, S. (1999). Gas phase nitric acid, ammoniaand related particulate matter at a Mediterranean coastal site,Patras, Greece. Atmospheric Environment, 33, 3417–3425.
Draxler, R. R., & Rolph, G. D. (2003). HYSPLIT (Hybridsingle-particle Lagrangian integrated trajectory). Modelaccess via NOAA ARL READY Website (http://www.arl.noaa.gov/ready/hysplit4.html), NOAA Air Resources Lab-oratory, Silver Spring, MD.
Dulac, F., Buat-Ménard, P., Arnold, M., Ezat, U., & Martin, D.(1987). Atmospheric input of trace metals to the westernMediterranean Sea: 1. Factors controlling the variability ofatmospheric concentrations. Journal of GeophysicalResearch, 92D, 8437–8453.
EC Working Group on Particulate Matter (2002). Guidance tomember states on PM10 monitoring and intercomparisonswith the reference method. Draft final report. RetrievedSeptember 20, 2007 from http://www.ec.europa.eu/environment/air.
EMEP (2003). In: K. Tørseth, Ø., Hov (Eds.) The EMEPmonitoring strategy 2004–2009. Background documentwith justification and specification of the EMEP monitor-ing programme, 2004–2009. Norwegian Institute for AirResearch. EMEP/CCC–Report 9/2003. Retrieved fromhttp://www.emep.int/.
EMEP (2006). In: W. Aas, K. E. Yttri (Eds.) Measurements ofparticulate matter: Status report 2006. EMEP Report 4/2006. Retrieved from http://www.emep.int/.
European Commission (2004). Second position paper onparticulate matter. CAFE Working Group on ParticulateMatter (final draft version, April 2004). Retrieved January15, 2007 from http://www.ec.europa.eu/environment/air/cafe/pdf/working_groups/2nd_position_paper_pm.pdf.
Gehrig, R., Hueglin, Ch., Schwarzenbach, B., Seitz, T., &Buchmann, B. (2005). A new method to link PM10
concentrations from automatic monitors to the manualgravimetric reference method according to EN12341.Atmospheric Environment, 39, 2213–2223.
Gerasopoulos, E., Kouvarakis, G., Babasakalis, P., Vrekoussis,M., Putaud, J. P., & Mihalopoulos, N. (2006). Origin andvariability of particulate matter (PM10) mass concentra-tions over the Eastern Mediterranean. Atmospheric Envi-ronment, 40, 4679–4690.
Guerzoni, S., Correggiari, I., & Miserocchi, S. (1990). Wind-blown particles from ships and land-based stations in theMediterranean Sea: A review of trace metal sources. WaterPollution Research Reports, 20, 377–386.
Hoffmann, T., Odum, J. R., Bowman, F., Collins, D., Klockow,D., Flagan, R. C., et al. (1997). Formation of organicaerosols from oxidation of biogenic hydrocarbons. Journalof Atmospheric Chemistry, 26, 189–222.
Kallos, G., Kotroni, V., Lagouvardos, K., & Papadopoulos A.(1998). On the long-range transport of air pollutants fromEurope to Africa, GRL, 25, 619–622.
Koçak, M., Kubilay, N., & Mihalopoulos, N. (2004). Ioniccomposition of the lower tropospheric aerosols in a NE
Mediterranean site: Implication regarding sources and long-range transport. Atmospheric Environment, 38, 2067–2077.
Koçak, M., Mihalopoulos, N., & Kubilay, N. (2007). Contri-butions of natural sources to high PM10 and PM2.5 eventsin the eastern Mediterranean. Atmospheric Environment,41, 3806–3818.
Lazaridis, M., Eleftheriadis, K., Smolik, J., Colbeck, I., Kallos,G., Drossinos, Y., et al. (2006). Dynamics of fine particlesand photo-oxidants in the Eastern Mediterranean (SUB-AERO). Atmospheric Environment, 40, 6214–6228.
Luria, M., Peleg, M., Sharf, G., Tov-Alper, D. S., Spitz, N., BenAmi, Y., et al. (1996). Atmospheric sulfur over the eastMediterranean region. Journal of Geophysical Research,101D, 917–930.
Maenhaut, W., Ptasinski, J., & Cafmeyer, J. (1999). Detailed masssize distributions of atmospheric aerosol species in the Negevdesert, Israel, during ARACHNE-96. Nuclear Instrumentsand Methods in Physics Research Section B, 150, 422–427.
Mihalopoulos, N., Stephanou, E., Kanakidou, M., Pilitsidis, S.,& Bousquet, P. (1997). Tropospheric aerosol ioniccomposition in the Eastern Mediterranean region. Tellus,49B, 314–326.
Millan, M. M., Salvador, R., Mantilla, E., & Kallos, G. (1997).Photooxidant dynamics in the Mediterranean basin insummer: Results from European research projects. Journalof Geophysical Research, 102D, 8811–8824.
Putaud, J. P., Raes, F., Van Dingenen, R., Bruggemann, E.,Facchini, M. C., Decesari, S., et al. (2004). A Europeanaerosol phenomenology – 2: chemical characteristics ofparticulate matter at kerbside, urban, rural and backgroundsites in Europe. Atmospheric Environment, 38, 25679–2595.
Rodriguez, S., Querol, X., Alastuey, A., & Mantilla, E. (2002).Origin of high summer PM10 and TSP concentrations atrural sites in Eastern Spain. Atmospheric Environment, 36,3101–3112.
Rodriguez, S., Querol, X., Alastuey, A., Viana, M. M., &Alarcon, M. (2004). Comparative PM10–PM2.5 sourcecontribution study at rural, urban and industrial sitesduring PM episodes in Eastern Spain. The Science of theTotal Environment, 328, 95–113.
Rolph, G. D. (2003). Real-time environmental applications anddisplay system (READY) Website. NOAA Air ResourcesLaboratory, Silver Spring, MD. Retrieved from http://www.arl.noaa.gov/ready/hysplit4.html.
Saarikoski, S., Mäkälä, T., Aalto, P. P., Hillamo, R., andKulmala, M. (2005. September). Comparison of severalinstruments for measuring the PM1 mass in a backgroundarea, Finland. Paper presented at the European AerosolConference 2005, Ghent, Belgium.
Salminen, K., & Karlsson, V. (2003). Comparability of low-volume PM10 sampler with β-attenuation monitor inbackground air. Atmospheric Environment, 37, 3707–3712.
Sillanpää, M., Saarikoski, S., Koskentalo, T., Hillamo, R., andKerminen, V.-M. (2002). PM10 monitoring and intercom-parison with the reference sampler in Helsinki Report.Retrieved July 20, 2007 from http://www.fmi.fi/kuvat/FINal_PM_Report.pdf.
US Government (1991). Reference method for the determina-tion of particulate matter as PM10 in the atmosphere. Codeof federal regulations 40, Part 50, Appendix J.
100 Water Air Soil Pollut (2008) 189:85–101

Van Dingenen, R., Raes, F., Putaud, J. P., Baltensperge, U.,Charron, A., Facchini, M. C., et al. (2004). A Europeanaerosol phenomenology – 1: Physical characteristics ofparticulate matter at kerbside, urban, rural and backgroundsites in Europe. Atmospheric Environment, 38, 2561–2577.
WHO (2006). WHO Air quality guidelines for particulatematter, ozone, nitrogen dioxide and sulphur dioxide.Global update 2005. Geneva, World Health Organization.
WHO/UN (1999). Health risk of particulate matter from longrange transboundary air pollution. Bilthoven, WorldHealth Organization/United Nations.
Zerefos, C. S., Kourtidis, K., Melas, D., Balis, D., Zanis, P.,Katsaros, L., et al. (2002). Photochemical activity andsolar ultraviolet radiation (PAUR) modulation factors: Anoverview of the project. Journal of Geophysical Research,18D, 8134–8148.
Water Air Soil Pollut (2008) 189:85–101 101
Copyright © 2022 FDOKUMEN