PM 10 and Heavy Metals in Suburban and Rural Atmospheric Environments of Northern India
29
1 2 3 4 5 6 7 8 9 10 11 12 13 14 15 16 17 18 19 20 21 22 23 24 25 26 27 28 29 30 31 32 33 34 35 36 37 38 39 40 41 42 43 44 45 46 47 48 49 50 51 52 53 54 55 56 57 58 59 60 61 62 63 64 65 1 PM 10 and heavy metals in sub-urban and rural atmospheric environments of Northern India Vandana Tyagi 1 , B.R. Gurjar 1,* , Namita Joshi 2 , Prashant Kumar 3 1 Department of Civil Engineering, Indian Institute of Technology Roorkee, Roorkee # 247667, INDIA 2 Department of Environmental Science, Kanya Gurukula Mahavidyalaya, Gurukul Kangri Vishwavidyalaya, Haridwar # 249 404, INDIA 3 Faculty of Engineering and Physical Sciences, Division of Civil, Chemical and Environmental Engineering, University of Surrey, Guildford GU2 7XH, UK * Corresponding author: B.R. Gurjar (Email: [email protected], [email protected]; Fax: (+91 1332) 275568, 273560) Abstract This study assesses the ambient air concentration of PM 10 and heavy metals at six different sites (including three sub-urban and three rural) in Roorkee, India. Monthly measurements were carried out continuously between January and March 2007 at all the sites. PM 10 concentrations at the rural sites ranged from 37-959 μg/m³ as compared to 151-422 μg/m³ at sub-urban sites. These concentrations were well above the CPCB (Central Pollution Control Board, Delhi) standards during all sampling months, except February. Conversely, lowest PM 10 concentration during February, were due to removal of particles by heavy rain (Karar et al., 2006) before the sampling days. In case of heavy metals, highest concentrations were 2.04, 30, 0.80, 7.13 and 15.6 ng/m³ for Cr, Fe, Mn, Zn and Al respectively at rural sites as compared to 0.28, 0.37 and 0.02 ng/m³ for Ni, Cu and Cd, respectively at an industrial site. Main sources of PM 10 and heavy metals at sub-urban sites were road dust, traffic exhaust, tire abrasion, industrial emissions and oil lubricants use at vehicle-servicing centre. Heavy metals and PM 10 at the rural sites came from coal and wood burning, sugar mill and brick furnace emissions, fertilizers use in farming, agricultural activity, road construction activity and the dust from long range transport along with naturally occurring re-suspended dust. Among all, wood burning was identified as the
-
Upload
independent -
Category
Documents
-
view
0 -
download
0
Transcript of PM 10 and Heavy Metals in Suburban and Rural Atmospheric Environments of Northern India
1 2 3 4 5 6 7 8 9 10 11 12 13 14 15 16 17 18 19 20 21 22 23 24 25 26 27 28 29 30 31 32 33 34 35 36 37 38 39 40 41 42 43 44 45 46 47 48 49 50 51 52 53 54 55 56 57 58 59 60 61 62 63 64 65
1
PM10 and heavy metals in sub-urban and rural atmospheric environments of
Northern India
Vandana Tyagi1, B.R. Gurjar
1,*, Namita Joshi
2, Prashant Kumar
3
1Department of Civil Engineering, Indian Institute of Technology Roorkee, Roorkee #
247667, INDIA 2Department of Environmental Science, Kanya Gurukula Mahavidyalaya, Gurukul Kangri
Vishwavidyalaya, Haridwar # 249 404, INDIA 3Faculty of Engineering and Physical Sciences, Division of Civil, Chemical and
Environmental Engineering, University of Surrey, Guildford GU2 7XH, UK
*Corresponding author: B.R. Gurjar (Email: [email protected], [email protected];
Fax: (+91 1332) 275568, 273560)
Abstract
This study assesses the ambient air concentration of PM10 and heavy metals at six different
sites (including three sub-urban and three rural) in Roorkee, India. Monthly measurements
were carried out continuously between January and March 2007 at all the sites. PM10
concentrations at the rural sites ranged from 37-959 µg/m³ as compared to 151-422 µg/m³
at sub-urban sites. These concentrations were well above the CPCB (Central Pollution
Control Board, Delhi) standards during all sampling months, except February. Conversely,
lowest PM10 concentration during February, were due to removal of particles by heavy rain
(Karar et al., 2006) before the sampling days. In case of heavy metals, highest
concentrations were 2.04, 30, 0.80, 7.13 and 15.6 ng/m³ for Cr, Fe, Mn, Zn and Al
respectively at rural sites as compared to 0.28, 0.37 and 0.02 ng/m³ for Ni, Cu and Cd,
respectively at an industrial site. Main sources of PM10 and heavy metals at sub-urban sites
were road dust, traffic exhaust, tire abrasion, industrial emissions and oil lubricants use at
vehicle-servicing centre. Heavy metals and PM10 at the rural sites came from coal and
wood burning, sugar mill and brick furnace emissions, fertilizers use in farming,
agricultural activity, road construction activity and the dust from long range transport along
with naturally occurring re-suspended dust. Among all, wood burning was identified as the
*ManuscriptClick here to download Manuscript: VT_BRG_NJ_RSPMHM_From_PK2.doc
PKumar
Typewritten Text
Cite this article as: Tyagi, V., Gurjar, B.R., Joshi, N., Kumar, P., 2012. PM10 and heavy metals in sub–urban and rural atmospheric environments of northern India. ASCE Journal of Hazardous, Toxic and Radioactive Waste 16, 175-182.
1 2 3 4 5 6 7 8 9 10 11 12 13 14 15 16 17 18 19 20 21 22 23 24 25 26 27 28 29 30 31 32 33 34 35 36 37 38 39 40 41 42 43 44 45 46 47 48 49 50 51 52 53 54 55 56 57 58 59 60 61 62 63 64 65
2
most significant source of elevated PM10 concentrations at rural sites. As opposed to the
PM10 that remains a concern, concentrations of all heavy metals were found to be far below
the standard limits prescribed by WHO and EPA. It is therefore recommended that an
integrated assessment of air pollution and health risk should be carried out in these rural
and sub-urban areas.
Keywords: Air quality; Pollution; Particulate matter; Heavy metal; Roorkee; India.
1. Introduction
Anthropogenic emissions of air pollutants (like PM- Particulate Matter and heavy
metals) that are linked with rapid urbanization and industrialization in developing countries
is severely affecting the environment and human health (Lee et al., 2006). In India, air
pollution has become a major concern at all levels. According to Goyal and Sidhartha.
(2003), Ahmed et al. (2006) some of the key anthropogenic activities are industrial,
agricultural, transportation, construction and burning of cooking fuels. Consequently, India
is facing progressive deterioration in air quality due to growing levels of particulate matter,
heavy metals and other air pollutants in ambient environment (Agrawal et al., 2002).
The ambient air PM consists of a core to which various chemicals like acids, metals,
aromatic organic compounds, bacterial endotoxins and allergens, may get adsorbed. The
amount of these chemicals increase with the reduction in size of particulate matter
(Konarski et al., 2006). Exposure to these particles leads to increased health problems, high
mortality rates and adverse changes in climatic conditions (Sun et al., 2004; Ahmed et al.,
2006). Although the level of air pollutants (like heavy metals, PM and GHGs) are high in
megacities and industrial areas but their effect is widespread rather than localized (Gurjar et
al., 2008). Guttikunda et al. (2003) found that, though Asian megacities cover < 2% of the

1 2 3 4 5 6 7 8 9 10 11 12 13 14 15 16 17 18 19 20 21 22 23 24 25 26 27 28 29 30 31 32 33 34 35 36 37 38 39 40 41 42 43 44 45 46 47 48 49 50 51 52 53 54 55 56 57 58 59 60 61 62 63 64 65
3
land area, but they emit 16% of the total anthropogenic sulphur in Asia. Konarski et al.
(2006) stated that concentrations of Cr and Pb were almost 20 times higher at the urban
site- Legnica, in comparison to the rural environment. Rural areas adjacent to cities are also
exposed increasingly to various air pollutants (Gomiscek et al., 2004), besides having their
own pollution sources such as biomass burning, resuspended road dust and emissions from
fertilized agriculture fields. A study by Parikh (2001) reported that biomass burning could
contribute up to 10–100 times more concentrations of PM10 than modern fuels in rural
areas. This is mainly due to low thermal, combustion and heat transfer efficiencies of the
biomass.
Along with the PM, an emerging issue is the role of ingested dust to metal toxicity in
humans due to the tendency of metals to bio–accumulate (Lee et al., 2006, Figueroa et al.,
2006; http://www.lentech.com/feedback2.htm). According to Cloquet et al. (2006), Lee and
Chang (2000), Konarski et al. (2006), Gomiscek et al. (2004) and WHO (2003), the major
sources of heavy metals and the PM are vehicular and industrial emissions in the urban and
sub-urban areas, respectively. Konarski et al. (2006) recently performed a study in Poland,
in which they compared the heavy metals between a town- Legnica and a rural site in sub-
urbs of Krakow. None of the heavy metals were detected higher in the rural areas. A
number of studies focusing on heavy metals and their sources report that Cu, Zn and Cd are
mainly derived from car emissions, tire abrasion, combustion of fuels and lubricants,
incineration and industrial emissions (Fergusson et al., 1991; Figueroa et al., 2006; Jaradat
et al., 1998) – the sources, which are not generally found in rural areas.
So far, no study concerning air pollution at Northern part (especially Roorkee) of India has
been carried out. The present study fills this data gap besides assessing the PM10 and heavy
1 2 3 4 5 6 7 8 9 10 11 12 13 14 15 16 17 18 19 20 21 22 23 24 25 26 27 28 29 30 31 32 33 34 35 36 37 38 39 40 41 42 43 44 45 46 47 48 49 50 51 52 53 54 55 56 57 58 59 60 61 62 63 64 65
4
metal levels in selected study areas along with comparing them with the WHO and EPA air
pollution standards. The data collected in this study can not only be utilized to validate air
quality models in this rapidly developing area, but also be crucial to compare with data sets
in other similar part of India or the world.
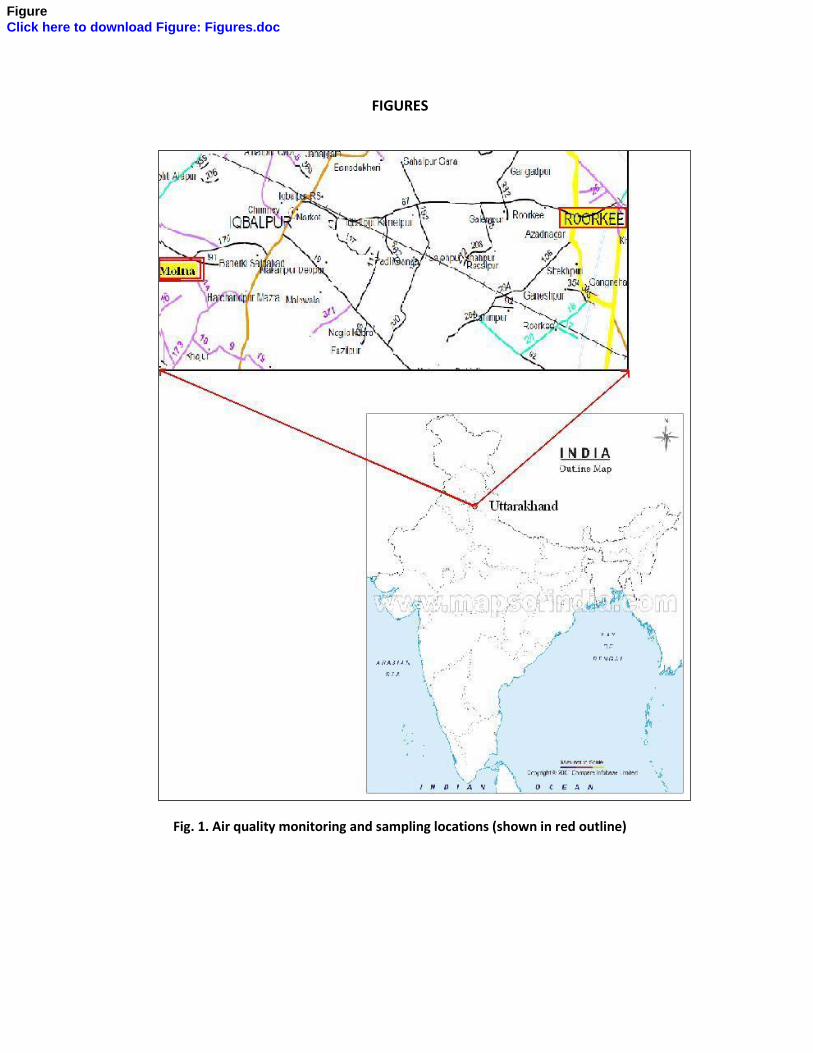
2. Methodology
2.1 Study Areas
Figure 1 shows the study areas and the sampling locations in Roorkee and Molna.
Monthly measurements were carried out at all the three sub-urban sites in Roorkee and at
the same number of rural sites in Molna (about 14 kms away from Roorkee) for January,
February and March 2007, respectively. Roorkee (29 51' N and 77 53' E) is a sub-urban
town in Uttarakhand of Northern India. As seen in Fig.1, sampling locations in Roorkee
includes Ganeshpur (S1), Civil lines (S2) and Ramnagar (S3), representing residential,
commercial and industrial areas, respectively. It is 172 km north of the Indian capital New
Delhi, located on bank of Ganga canal, and about 274 above mean sea level. Roorkee was
once known for its clean environment, but rapid industrialization is changing its air quality
from a clean to polluted place. According to Indian Census, 2001, Roorkee had a
population of 252 784, which is now increasing rapidly due to migration, establishment of
industries (e.g. glass, cement and footwear, etc.) and excellent educational institutes in and
around this area. Molna includes three different sampling locations representing
agricultural field (R1), residential area (R2) and school (R3) (see Fig. 1).
2.2 Data collection
A sampling period covering morning and evening between 8 and 10 hours in each
measurement day was selected (except for the commercial and industrial sites, where
1 2 3 4 5 6 7 8 9 10 11 12 13 14 15 16 17 18 19 20 21 22 23 24 25 26 27 28 29 30 31 32 33 34 35 36 37 38 39 40 41 42 43 44 45 46 47 48 49 50 51 52 53 54 55 56 57 58 59 60 61 62 63 64 65
5
sampling was done continuously for 8 to 10 hours). Respirable Dust Sampler (RDS-
Envirotech, APM 460BL) was used to measure PM10 (and heavy metals- Cr, Fe, Mn, Ni,
Zn, Al, Cu, Cd) in the size range of 0.5 to 10 microns by passing air at a high flow-rate of
0.9 to 1.5 m3/ minute through high efficiency filter papers (Whatman's GF- 8’X 10’’).
The amount of PM10 collected was determined by measuring the change in weight
of the filter paper (Ahmed et al., 2006; Nautiyal et al., 2007). For the determination of
metal concentrations present in the atmosphere, one quarter of the exposed filter paper was
cut into small pieces and digested completely with concentrated nitric acid (HNO3). After
successful completion of the digestion process a colorless solution was observed. The excess
acid is boiled off and the dry material is re-dissolved in 2.5 ml of HNO3 and 10 ml of double
distilled water by gentle heating. The solution obtained is cooled and diluted to 100 ml in a
graduated flask by triple washing with metal free water and filtered the total (Khillare et al.,
2004; Gaghate and Hasan, 1999). Solution was then analyzed using ICP-MS for
identification of metal concentrations.
3. Results and Discussion
3.1 Assessment of PM10 and heavy metals at sub-urban sites in Roorkee
Table 1 summarizes monthly variations in the levels of heavy metals and PM10 during the
sampling period.
3.1.1 Variations in PM10 levels
The observations revealed that, at the S1 site, PM10 concentrations were less in
morning (262, 195, 151 µg/m3) as compared to evening (420, 199, 338 µg/m
3) during
January, February and March, respectively. This could be due to accumulation of pollutants
as vehicular load increases with time and reaches to peak in the evening. Unfortunately, no
1 2 3 4 5 6 7 8 9 10 11 12 13 14 15 16 17 18 19 20 21 22 23 24 25 26 27 28 29 30 31 32 33 34 35 36 37 38 39 40 41 42 43 44 45 46 47 48 49 50 51 52 53 54 55 56 57 58 59 60 61 62 63 64 65
6
data was available for comparison between morning and evening concentrations of S2 and
S3 sites, as continuous sampling was carried out for 8 to 10 hours. PM10 values were less in
the month of February in comparison to January and March for all the three sub-urban sites
(Table 1). Heavy rainfall in February before sampling was considered the possible reason.
Karar et al. (2006) found that PM10 concentration were less during June in comparison to
other months, probably due to washout of the particles, in similarity to our findings of
February month (Table 1). Sun et al. (2004), found that in the winter aerosol samples the
maximum average mass concentrations of PM10 were 446.1, 573.2 and 631.9 µg/m3 at the
traffic, industrial and residential sites in Beijing, respectively. These values were compared
to the maximum PM10 concentrations of our sites which were 341.3µg/m3 at S1 (residential
site), 329.6 µg/m3 at S2 (compared to the traffic site) and 422.9 µg/m
3 at S3 (compared to
industrial site) of sub-urban area– all these concentrations were less from the findings of
Sun et al. (2004). As Roorkee is a very small town comparatively to highly developed
megacity Beijing, hence the sources are more in Beijing in comparison to Roorkee.
3.1.2 Concentrations of heavy metals
At all sites, highest concentrations of all the heavy metals were measured in January
at S1 (Table 1). This may be attributed to the proximity of highway and existence of car and
two wheeler-servicing centers located at both sides of the residential (S1) sampling point
(Table 1). In February and March (Table 1), heavy metals concentrations were found
slightly higher at S3 (though variations were observed during March) than at S1 or S2 sites.
This could be because of various industrial activities, heavy flow of vehicles, badly
maintained roads and constructional activities in the area. During the three months study
period, highest concentrations of Cr and Zn were found at S1 site during January, which
was 1.33 and 6.59 ng/m3, respectively. This increase may be due to the emission of these
1 2 3 4 5 6 7 8 9 10 11 12 13 14 15 16 17 18 19 20 21 22 23 24 25 26 27 28 29 30 31 32 33 34 35 36 37 38 39 40 41 42 43 44 45 46 47 48 49 50 51 52 53 54 55 56 57 58 59 60 61 62 63 64 65
7
metals from tire abrasions and use of oil lubricants at the service centers. Presence of such
sources and their association with increased Cr and Zn concentrations comply with the
findings of Figueroa et al. (2006), Li et al. (2001) and Bhaskar et al. (2008). A similar
study by Karar et al. (2006) found vehicle exhausts as a source of Cr that appears to be the
case in our study as its concentrations were more at S1 sub-urban site having heavy flow of
traffic in comparison to the other two sites (Table 1). Another study on heavy metals by
Jaradat et al. (1998) found ambient concentrations of Cu and Zn at roadsides of Jordan in
the 0.26–0.60 and 0.12–0.38 µg/m3, respectively. In our study concentrations found at S2
sub-urban sites ranged from 0.0002- 0.0004 µg/m3 for Cu and 0.003-0.004 µg/m
3 for Zn;
less from the findings of Jaradat et al. (1998).
Highest concentrations of Fe (20.81 ng/m3), Mn (0.69 ng/m
3), Ni (0.29 ng/m
3), Al (13.89
ng/m3), Cu (0.37 ng/m
3) and Cd (0.02 ng/m
3) were observed at S3 site. This was expected
because of presence of heavy metals in industrial emissions. The same was also observed
by Sun et al. (2004), Cloquet et al. (2006) and Li et al. (2001) in their studies. Bhaskar et al.
(2008) observed that concentrations of heavy metals in Madurai city ranged between 0.12
and 2.26 µg/m3 for Fe, 0.08 and 16.51 µg/m
3 for Zn, and between 0.001 and 0.029 µg/m
3
for Cd, respectively. These values are relatively higher than those observed in our study
(Table 1). The reason behind the concentrations might be the fact that Madurai, being
popularly known as the city of temples, has high traffic density.
3.2 Assessment of PM10 and heavy metals at rural sites in Molna
The selected sites of rural area vary in structural, social and atmospheric
environment. Variations in the levels of heavy metals and PM10 during January to March
2007 were determined and described as follows:
1 2 3 4 5 6 7 8 9 10 11 12 13 14 15 16 17 18 19 20 21 22 23 24 25 26 27 28 29 30 31 32 33 34 35 36 37 38 39 40 41 42 43 44 45 46 47 48 49 50 51 52 53 54 55 56 57 58 59 60 61 62 63 64 65
8
3.2.1 Variations in PM10
The results revealed that during the entire study period highest PM10 concentration
(avg. 668.6 µg/m3) was found at the R2 site (Table 2). The possible reasons may be the
burning of wood and dung cakes, which are traditional fuels for cooking in rural areas of
India and burning of dry wood that is used for body heating purposes. These arguments are
in line with the findings of Balakrishnan et al. (2002), they found that biomass combustion
resulted in PM10 concentrations ranging between 500 and 2,000 μg/m3. The second highest
PM10 concentration was found at R1 (453 µg/m3). As seen in Table 2, highest PM10
concentration at R1 site during March may be attributed to the road construction near the
site. PM10 concentrations were the lowest in February as compared to January and March
for all the sampling sites that may be due to the rainfall before every sampling campaign
(Table 2). The increased PM10 concentration at R3 in March was about 304.3 µg/m3; it was
primarily due to combustion of diesel as fuel in tractors that are used for irrigating water in
the crops as the site was very close to agricultural land. Furthermore, the use of biomass
fuels (i.e. woods, dung cakes) increases during winters resulting in additional source of
PM10 in rural areas. All sites had higher PM10 concentrations during evening hours in
comparison to the morning sampling hours. For instance, during February, PM10
concentrations during evening at the R1 and R2 sites were 63 and 163 µg/m3, in comparison
to morning concentrations of 37 and 115µg/m3 respectively. On the contrary, PM10
concentrations at the R3 site in February were less during evening (97µg/m3) in comparison
to the morning hours (103 µg/m3), as the agricultural work is more during morning hours.
3.2.2 Concentrations of heavy metals
As seen in Table 2, on comparison of heavy metals on a monthly basis among three
sites (i.e. R1, R2 and R3) in rural areas, it was found that average concentration was highest
1 2 3 4 5 6 7 8 9 10 11 12 13 14 15 16 17 18 19 20 21 22 23 24 25 26 27 28 29 30 31 32 33 34 35 36 37 38 39 40 41 42 43 44 45 46 47 48 49 50 51 52 53 54 55 56 57 58 59 60 61 62 63 64 65
9
at R1 during January and March (except Cr). The reason might be combustion of fuel
during road construction activities, which were going on during that period (Sun et al.,
2004), mud-covered road in front of the school (Bhaskar et al., 2009; Yue et al., 2007).
Concentrations of some heavy metals including Cr, Ni and Zn during January, and Zn, Al,
Cd during February were the largest at R3 site; this could be due to use of these heavy
metals in fertilizers, and coal and waste combustion
(http://www.lenntech.com/periodic/elements/cu.htm) at a distance of 2 Km from the field.
On the whole, largest concentrations of Cr (2.04 ng/m3), Fe (30 ng/m
3), Mn (0.82 ng/m
3),
Ni (0.19 ng/m3), Al (15.64 ng/m
3), Cu (0.21 ng/m
3) and Cd (0.01 ng/m
3) were found at the
R1 site during February and March. The sources are described in the above lines of same
section. Maximum concentration of Zn (7.13 ng/m3) was found at the R3 site. The R2 site
showed least concentrations of heavy metals. The source identified for increased
concentration of Al and other metals was the road construction going on nearby the R1 site,
as identified by Sun et al. (2004). Presence of Cd at the rural sites (0.004 to 0.01ng/m3)
may be due to the wood and coal combustion, as was also reported by Gomiscek et al.
(2004) in their study where they found Cd in 0.07 to 0.87 ng/m3. Resuspension of road dust
and natural origin of these heavy metals could also be identified as some of the factors for
existence of the heavy metals at rural sites (Yue et al., 2007).
Morning and evening concentration of heavy metals were compared for rural sites. It was
observed that during February and March most of the heavy metals were higher during
evening in comparison to morning hours. During January variations were observed with
most of the metals showing significant decline during evening, the reason of which was not
clear.
3.3 Inter–comparison between rural and sub-urban sites
3.3.1 PM10
1 2 3 4 5 6 7 8 9 10 11 12 13 14 15 16 17 18 19 20 21 22 23 24 25 26 27 28 29 30 31 32 33 34 35 36 37 38 39 40 41 42 43 44 45 46 47 48 49 50 51 52 53 54 55 56 57 58 59 60 61 62 63 64 65
10
The total average value for the concentration of PM10 was higher at the sub-urban
area (313.6 µg/m³) as compared to the rural sites (283.4µg/m³). Monthly averaged values
indicate highest PM10 concentrations during January at the R2 site of rural area (668.6
µg/m³) followed by S3 site (422.9 µg/m³) of sub-urban area. Reasons for this have been
given earlier in Section 3.1.1. In February, maximum PM10 concentrations were at the sub-
urban site (Fig. 2) while varying concentrations were observed for all the sampling sites of
rural and sub-urban area during March. Hence, we can conclude that PM10 concentration is
highly affected by use of biomass fuels as the existence of this source was the main
difference between sub–urban and rural sites. Presence of sugar mill and a brick furnace
situated at a distance of 3 and 7 kms away from the village towards the sub-urban site,
contribute to both the selected locations.
3.3.2. Heavy Metals
However, WHO and EPA have no standards for average trimonthly concentrations,
yet for inter-comparison of sub-urban and rural sites, heavy metals concentration were
averaged over three months. Uppermost concentration of Cr (1.16 ng/m³), Fe (20.39 ng/m³)
and Mn (0.60 ng/m³) was observed at school, while concentrations of Ni (0.16 ng/m³), Al
(11.60 ng/m³), Cu (0.29 ng/m³) and Cd (0.15 ng/m³) were highest at the S3 site. Highest
average concentration of Zn (5.26 ng/m³) was at R3, which might be due to its use in
fertilizers. No significant impact of rain was observed on the concentrations of heavy
metals during February sampling, which implies that heavy metals are not washed away
with rain as PM10 does. Similar results were observed by Karar et al. (2006).
During March, average concentrations of all heavy metals were highest at the school,
except Cd and Cu, which were highest at the S2 site (Fig. 3 a, b, c, d). Possible reasons
1 2 3 4 5 6 7 8 9 10 11 12 13 14 15 16 17 18 19 20 21 22 23 24 25 26 27 28 29 30 31 32 33 34 35 36 37 38 39 40 41 42 43 44 45 46 47 48 49 50 51 52 53 54 55 56 57 58 59 60 61 62 63 64 65
11
could be road construction, along with resuspension of road dust and long range
transported dust.
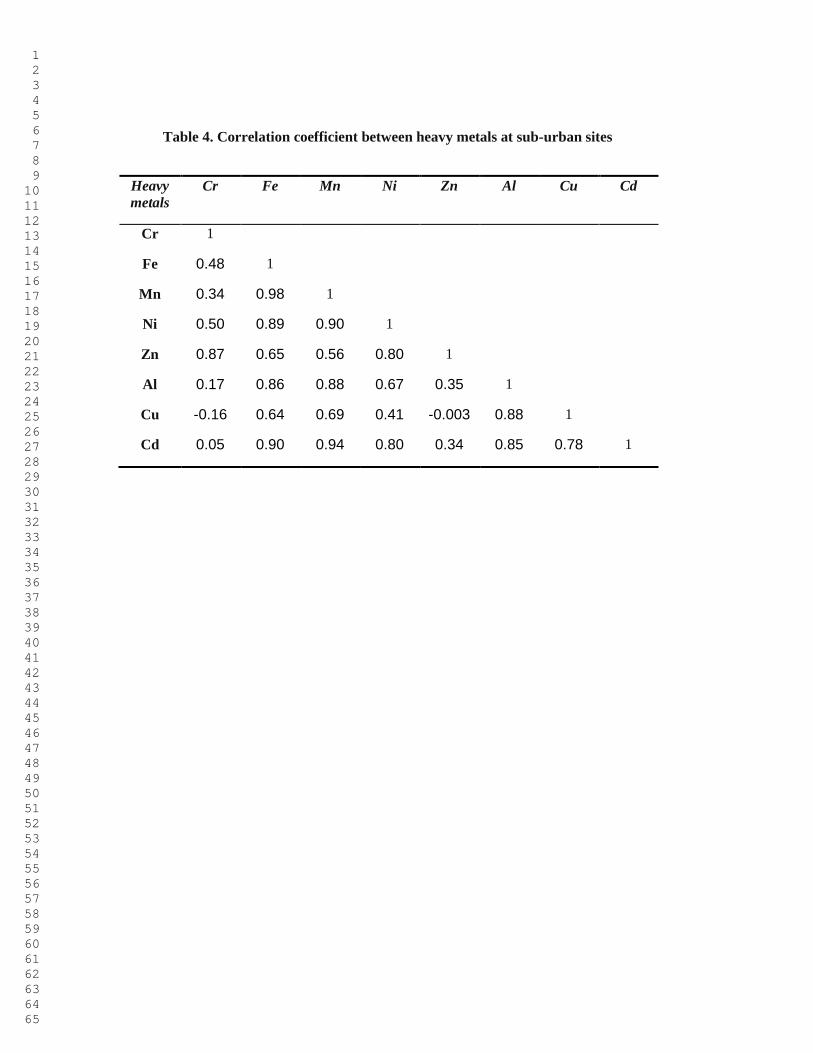
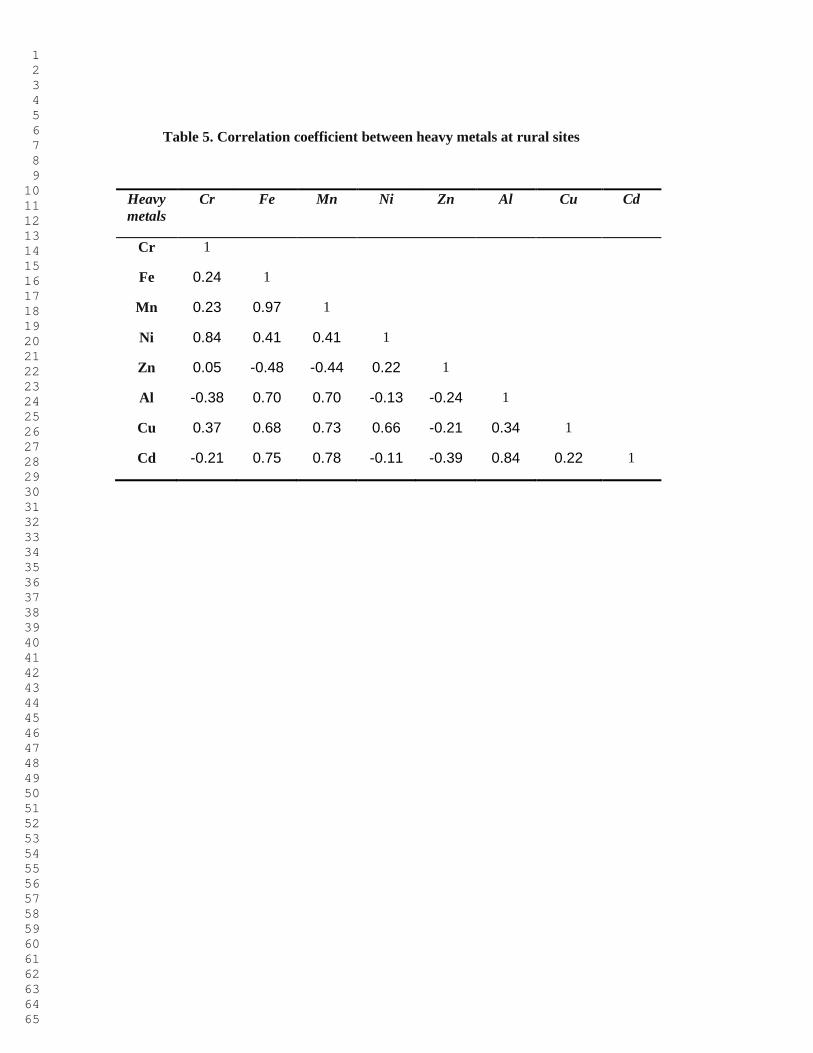
3.4. Correlation coefficient of heavy metals
Correlation is a single number that describes the degree of relationship between two
variables. By using this technique, we can identify the common sources for different
pollutants by obtaining the correlation value. For identifying the relationship between various
heavy metals, this matrix of correlation coefficient is generated for both sub-urban and rural
sites (Tables 4 and 5).
In general, strong and positive correlations were observed between heavy metals for the sub-
urban sites. For example, Fe had a strong correlation with all the heavy metals except Cr
(Table 4). Possible reason for this could be their origin from combustion of fossil fuel in
transport vehicles and re-suspension of road dust, as it was a major source at all the sub-urban
sites. Negative correlations were observed only between Cr–Cu and Cu-Zn (Table 4). Based
on this correlation value it seems that the source of Cu is different from that of Cr and Zn.
The sources of Cu could either be landfills and waste disposal, industries or vehicles
(http://www.lenntech.com/periodic/elements/cu.htm).
In case of rural sites, most of the heavy metals showed negative correlation. For example, Zn
had a negative correlation with Fe, Mn, Al and Cu, with a slight positive relationship with Cr
(0.05) and Ni (0.22). It was observed that Ni, Cr, Mn and Zn showed negative correlation
with almost all the heavy metals except Cr and Ni. The sources of the above three metals can
be identified as coal combustion, soil dust and vehicle exhaust, (Yue et al., 2007). Fe and Mn
showed a strong correlation with Al, Cu and Cd, the possible source of these heavy metals
might be combustion of fossil fuels (Yue et al., 2007,
http://www.lenntech.com/periodic/elements/cu.htm).
1 2 3 4 5 6 7 8 9 10 11 12 13 14 15 16 17 18 19 20 21 22 23 24 25 26 27 28 29 30 31 32 33 34 35 36 37 38 39 40 41 42 43 44 45 46 47 48 49 50 51 52 53 54 55 56 57 58 59 60 61 62 63 64 65
12
4. Summary and conclusions
Measurements of PM10 and heavy metals were carried out at three sub-urban sites
and three rural sites between January and March 2007. The aim of the study was (i) to
compare the concentration of PM10 and heavy metals pollution in these areas, (ii) to
identify the sources of PM10 and heavy metals, and (iii) to assess the present standards of
air quality as compared with WHO, EPA and CPCB guidelines. Following conclusions
were drawn:
This is conspicuous from the study that PM10 concentrations are much higher than
the proposed CPCB standards for ambient particulate levels of rural and urban
areas. Only in February, concentrations of PM10 at the rural sites were under the
prescribed limits, due to rainfall before the sampling days. This shows the influence
of meteorological conditions on the pollutants, as PM10 is washed with rain leading
to less concentration in the air.
All the heavy metals concentrations of the sub-urban and rural sites were observed
under the prescribed limits proposed by WHO and EPA; CPCB do not have
standards for it.
Main sources identified for the heavy metals and PM10 at the rural sites were: coal
and wood burning, emissions from sugar mill, resuspended dust, use of fertilizers in
farming, agricultural activity, emissions from brick furnace, road construction
activity and the dust from long range transport along with naturally occurring re-
suspended dust. Among all, wood burning was identified as one of the most
significant source of elevated PM10 concentrations at the rural sites. However, this is
the cheapest energy source in rural areas having low energy efficiency but its effect
on atmospheric air pollution and deforestation are the highest. It is highly
1 2 3 4 5 6 7 8 9 10 11 12 13 14 15 16 17 18 19 20 21 22 23 24 25 26 27 28 29 30 31 32 33 34 35 36 37 38 39 40 41 42 43 44 45 46 47 48 49 50 51 52 53 54 55 56 57 58 59 60 61 62 63 64 65
13
recommended to discourage the wood burning activity in order to limit rising PM10
concentrations and deforestation.
Main sources of PM10 at sub-urban sites were road dust, traffic exhaust, tire abrasion,
industrial emissions and use of oil lubricants at the vehicle-servicing centre.
Since the sampling was carried out during the three winter months (i.e. January,
February and March), low temperature and wind speed also favored the
accumulation of pollutants, resulting in high concentrations during these months.
Modest differences in concentrations of PM10 and heavy metals between the sub-
urban and rural sites could most probably be the result of transport of pollutants at
the rural site from the nearby brick furnace, sugar mill and coal combustion in brick
furnaces which were active nearby the rural area during sampling.
Though this study covers a short duration for measurements, but this is the first study of its
kind representing sub-urban and rural areas of northern India. The results presented could be
highly beneficial for future air quality measurements. Due to practical constraints, only a
limited number of air pollutants are considered. Long term studies on an annual basis are
required to identify the sources and concentrations of various air pollutants throughout the
year. Added research in setting up pollution management and pollution control techniques is
also warranted. These efforts will not only benefit the well being of humans, environment
and our natural resources, it will also help the air quality management community and
regulatory authorities to design effective mitigation measures.
Acknowledgements
This research work has been supported by the Max Planck Society (Munich, Germany) and
Max Planck Institute for Chemistry (Mainz, Germany), through the Max Planck Partner

1 2 3 4 5 6 7 8 9 10 11 12 13 14 15 16 17 18 19 20 21 22 23 24 25 26 27 28 29 30 31 32 33 34 35 36 37 38 39 40 41 42 43 44 45 46 47 48 49 50 51 52 53 54 55 56 57 58 59 60 61 62 63 64 65
14
Group for Megacities & Global Change at IIT Roorkee (India). We thank Mr. Ajay Singh
Nagpure and Dr. Ragini Kumari for their valuable suggestions.
References
Agrawal, M., Singh, B., Rajput, M., Marshall, F., Bell, J.N.B., 2003. Effect of air pollution
on peri-urban agriculture: a case study. Environmental Pollution 126, 323-329.
Ahmed, G.U., Masum, M. K., 2006. Status of ambient air quality in the urban and rural areas
of Chittagong, Bangladesh. Green pages. http://www.eco-web.com/edi/060805.html.
Anozie, A.N., Bakare, A.R., Sonibare, J.A., Oyebisi, T.O., 2004. Evaluation of cooking
energy cost, efficiency, impact on air pollution and policy in Nigeria. Energy,
doi:10.1016/j.energy.2006.07.004.
Bhaskar, B. V., Jeba Rajasekhar, R. V., Muthusubramanian, P., Kesarkar A. P., 2009. Ionic
and heavy metal composition of respirable particulate in Madurai, India. Environmental
Monitoring and Assessment, doi: 10.1007/s10661-009-0895-8.
Cloquet, C., Carignan, J., Libourel, G., (2006). Atmospheric pollutant dispersion around an
urban area using trace metal concentrations and Pb isotopic compositions in epiphytic
lichens. Atmospheric Environment 40, 574–587.
NAAQS, National Ambient air quality standards by CPCB.
www.cpcb.nic.in/National_Ambient_Air_Quality_Standards.php
Figueroa, Meza-Diana., Villanueva, M., Parra, la De Luisa, M., 2006. Heavy metals
distribution in dust from elementary schools in Hermosillo, Sonora, Mexico. Atmospheric
Environment, doi:10.1016/j.atmosenv.2006.08.034.
Fergusson, Jack E., Kim, Nicholas D., 1991. Trace elements in street and house dusts:
sources and speciation. Science of the Total Environment 100, 125-150.

1 2 3 4 5 6 7 8 9 10 11 12 13 14 15 16 17 18 19 20 21 22 23 24 25 26 27 28 29 30 31 32 33 34 35 36 37 38 39 40 41 42 43 44 45 46 47 48 49 50 51 52 53 54 55 56 57 58 59 60 61 62 63 64 65
15
Gaghate, D.G., Hasan M.Z., 1999. Ambient lead levels in urban areas. Bulletin of
Environmental Contamination and Toxicology 62, 403-408.
Gomiscek, B., Frank, A., Puxbaum, H., Stopper, S., Preining, O., Hauck, H., 2004. Case
study analysis of PM burden at an urban and rural site during the AUPHEP project.
Atmospheric Environment 38, 3935-3948.
Goyal, P., Sidhartha 2003. Present scenario of air quality in Delhi: a case study of CNG
implementation. Atmospheric Environment 37, 5423-5431.
Gurjar B.R., Butler, T.M., Lawrence, M.G., Lelieveld, J., 2008. Evaluation of emissions and
air quality in megacities. Atmospheric Environment 42, 1593–1606.
Guttikunda, S.K., Carmichael, G.R., Calori, G., Eck, C., Woo, J.H., 2003. The contribution of
megacities to regional sulfur pollution in Asia. Atmospheric Environment 37, 11–22.
Haritash, A. K., Kaushik, C. P., 2007. Assessment of seasonal enrichment of heavy metals in
respirable suspended particulate matter of a sub-urban Indian city. Environmental
Monitoring and Assessment 128, 411–420.
IS: 4167: Indian Standard: Glossary of terms relating to Air Pollution (First Revision,
Reaffirmed 1992). IS 4167-1980, Bureau of Indian Standards, New Delhi.
Jaradat, Qasem M., Momani, Kamal A., 1998. Contamination of roadside soil, plants and air
with heavy metals in Jordan, A comparative study. Turkish Journal of Chemistry 23, 209-
220.
Karar, K., Gupta, A. K., Kumar, A., Biswas A.K., 2006. Characterization and identification
of the sources of chromium, zinc, lead, cadmium, nickel, manganese and iron in PM10
particulates at the two sites of Kolkata, India. Environmental Monitoring and Assessment
120, 347–360.
Karar, K., Gupta A.K., 2007. Source apportionment of PM10 at residential and industrial sites
of an urban region of Kolkata, India. Atmospheric Research 84, 30–41.
1 2 3 4 5 6 7 8 9 10 11 12 13 14 15 16 17 18 19 20 21 22 23 24 25 26 27 28 29 30 31 32 33 34 35 36 37 38 39 40 41 42 43 44 45 46 47 48 49 50 51 52 53 54 55 56 57 58 59 60 61 62 63 64 65
16
Khillare. P.S., Balachandran S, Meena B. R., 2004. Spatial and temporal variation of heavy
metals in atmospheric aerosol of Delhi. Environmental Monitoring and Assessment 90, 1-
21.
Konarski, P., Haluszka,J., Cwil, M., 2006. Comparison of urban and rural particulate air
pollution characteristics obtained by SIMS and SSMS. Applied Surface Science 252,
7010 - 7013.
Lee, S.L. Celine., Li, Dong- Xiang., Zhang, G., Li, jun., ding, Jun- Ai., Wang, T., 2006.
Heavy metals and Pb isotopic composition of aerosols in urban and suburban areas of
Hong Kong and Guangzhou, South China- Evidence of the long-range transport of air
contaminants. Atmospheric Environment (doi:10.1016/j.atmosenv.2006.07.035).
Li, Xiangdong., Poon, Chi-sun., Liu, Pui Sum., 2001. Heavy metal contamination of urban
soils and street dusts in Hong Kong. Applied Geochemistry 16, 1361–1368.
Namdeo, A., Bell, M.C., 2004. Characteristics and health implications of fine and coarse
particulates at roadside, urban background and rural sites in UK. Environment
International 31, 565-573.
Nautiyal, J.,. Garg, M. L., Kumar, M. S., Khan, A.A., Thakur, J. S., Kumar, R., 2007. Air
Pollution and Cardiovascular Health in Mandi-Gobindgarh, Punjab, India - A Pilot Study.
International Journal of Environmental Research and Public Health 4(4), 268-282.
Parikh, J., Balakrishna, K., Laxmi, V., Biswas, H., 2001. Exposure from cooking with
Biofuels: pollution monitoring and analysis for rural Tamil Nadu, India. Energy 26, 949-
962.
Querol, X., Alastuey, A., Rodriguez, S., Viana, M.M., Artinano, B., Salvador, P., Mantilla,
E., Garcia do Santos, S., Patier, R. F., Rosa, J. de La., Campa, A. Sanchez de La.,
Menendez, M., Gil, J.J., 2004. Levels of particulate matter in rural, urban and industrial
sites in Spain. Science of the Total Environment 334– 335, 359–376.
1 2 3 4 5 6 7 8 9 10 11 12 13 14 15 16 17 18 19 20 21 22 23 24 25 26 27 28 29 30 31 32 33 34 35 36 37 38 39 40 41 42 43 44 45 46 47 48 49 50 51 52 53 54 55 56 57 58 59 60 61 62 63 64 65
17
Siegel, Frederic. R., 2002. Environmental geochemistry of potentially toxic metals. Pafge no.
101. ISBN-3-540-42030-4. Springer- Verlag Berlin Heidelberg New York.
Sun, Y., Zhuang, G., Wang, Y., Han, L., Guo, J., Dan, Mo., Zhang W, Zhang., Wang, Z.,
Hao, Z., 2004. The air borne particulate pollution in Beijing- concentration, composition,
distribution and sources. Atmospheric Environment 38, 5991-6004.
Yue, W., Li, X., Liu, J., Li, Y., Zhang, G., Li, Y., 2007. Source tracing of chromium-,
manganese-, nickel- and zinc-containing particles (PM10) by micro-PIXE spectrum.
Journal of Radioanalytical and Nuclear Chemistry, Vol. 274, No.1, 115–121.
1 2 3 4 5 6 7 8 9 10 11 12 13 14 15 16 17 18 19 20 21 22 23 24 25 26 27 28 29 30 31 32 33 34 35 36 37 38 39 40 41 42 43 44 45 46 47 48 49 50 51 52 53 54 55 56 57 58 59 60 61 62 63 64 65
TABLES
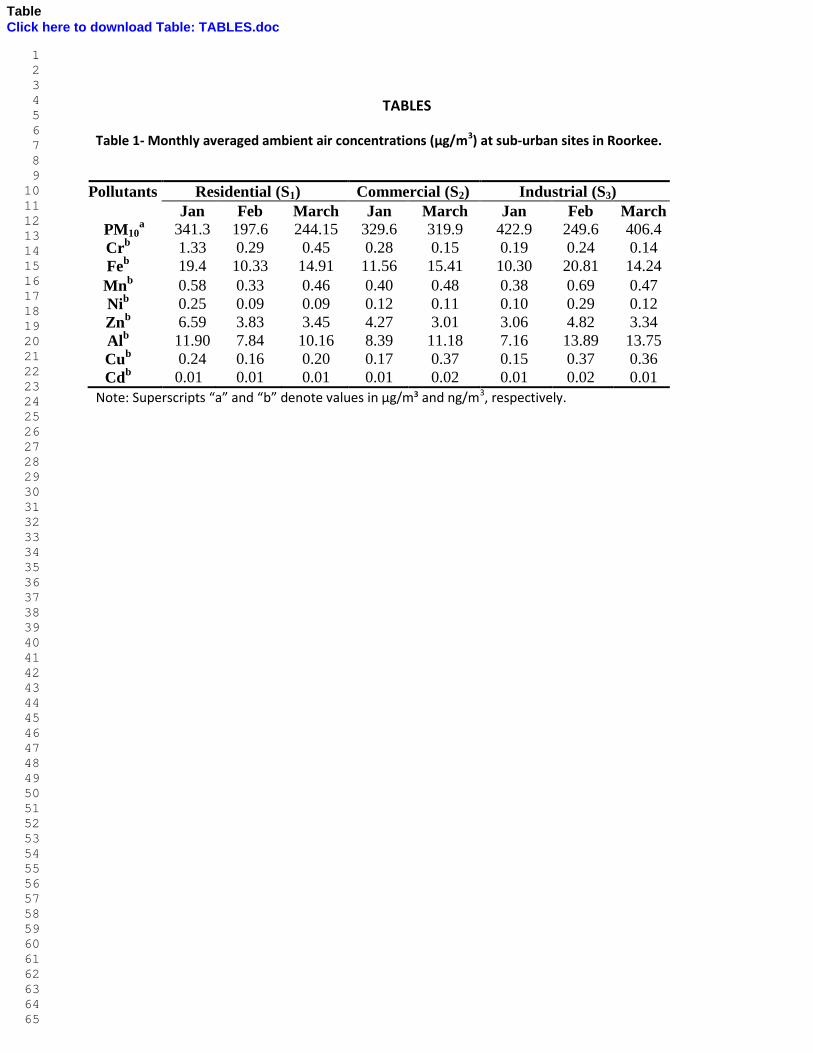
Table 1- Monthly averaged ambient air concentrations (µg/m3) at sub-urban sites in Roorkee.
Pollutants Residential (S1) Commercial (S2) Industrial (S3)
Jan Feb March Jan March Jan Feb March
PM10a 341.3 197.6 244.15 329.6 319.9 422.9 249.6 406.4
Crb 1.33
0.29 0.45 0.28 0.15 0.19 0.24 0.14
Feb 19.4 10.33 14.91 11.56 15.41 10.30 20.81 14.24
Mnb 0.58 0.33 0.46 0.40 0.48 0.38 0.69 0.47
Nib 0.25 0.09 0.09 0.12 0.11 0.10 0.29 0.12
Znb 6.59 3.83 3.45 4.27 3.01 3.06 4.82 3.34
Alb 11.90 7.84 10.16 8.39 11.18 7.16 13.89 13.75
Cub 0.24 0.16 0.20 0.17 0.37 0.15 0.37 0.36
Cdb 0.01 0.01 0.01 0.01 0.02 0.01 0.02 0.01
Note: Superscripts “a” and “b” denote values in µg/m³ and ng/m3, respectively.
TableClick here to download Table: TABLES.doc
1 2 3 4 5 6 7 8 9 10 11 12 13 14 15 16 17 18 19 20 21 22 23 24 25 26 27 28 29 30 31 32 33 34 35 36 37 38 39 40 41 42 43 44 45 46 47 48 49 50 51 52 53 54 55 56 57 58 59 60 61 62 63 64 65
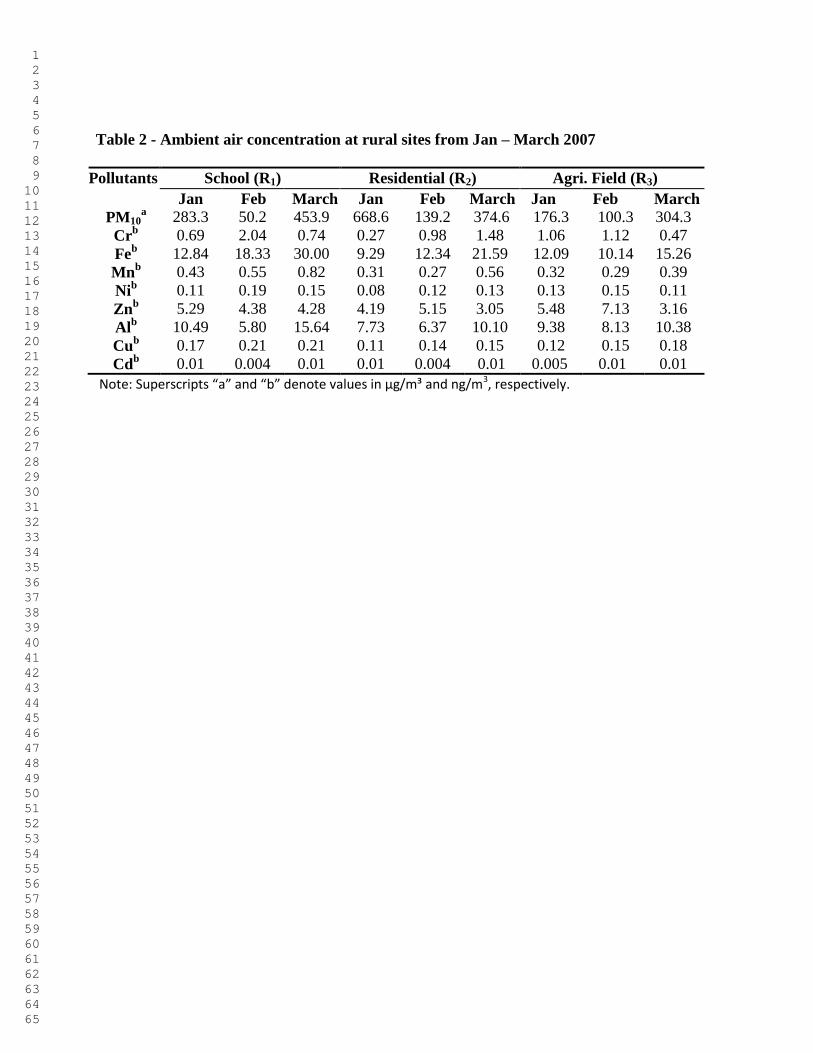
Table 2 - Ambient air concentration at rural sites from Jan – March 2007
Pollutants School (R1) Residential (R2) Agri. Field (R3)
Jan Feb March Jan Feb March Jan Feb March
PM10a 283.3 50.2 453.9 668.6 139.2 374.6 176.3 100.3 304.3
Crb 0.69 2.04 0.74 0.27 0.98 1.48 1.06 1.12 0.47
Feb 12.84 18.33 30.00 9.29 12.34 21.59 12.09 10.14 15.26
Mnb 0.43 0.55 0.82 0.31 0.27 0.56 0.32 0.29 0.39
Nib 0.11 0.19 0.15 0.08 0.12 0.13 0.13 0.15 0.11
Znb 5.29 4.38 4.28 4.19 5.15 3.05 5.48 7.13 3.16
Alb 10.49 5.80 15.64 7.73 6.37 10.10 9.38 8.13 10.38
Cub 0.17 0.21 0.21 0.11 0.14 0.15 0.12 0.15 0.18
Cdb 0.01 0.004 0.01 0.01 0.004 0.01 0.005 0.01 0.01
Note: Superscripts “a” and “b” denote values in µg/m³ and ng/m3, respectively.
1 2 3 4 5 6 7 8 9 10 11 12 13 14 15 16 17 18 19 20 21 22 23 24 25 26 27 28 29 30 31 32 33 34 35 36 37 38 39 40 41 42 43 44 45 46 47 48 49 50 51 52 53 54 55 56 57 58 59 60 61 62 63 64 65
Table 4. Correlation coefficient between heavy metals at sub-urban sites
Heavy
metals
Cr Fe Mn Ni Zn Al Cu Cd
Cr 1
Fe 0.48 1
Mn 0.34 0.98 1
Ni 0.50 0.89 0.90 1
Zn 0.87 0.65 0.56 0.80 1
Al 0.17 0.86 0.88 0.67 0.35 1
Cu -0.16 0.64 0.69 0.41 -0.003 0.88 1
Cd 0.05 0.90 0.94 0.80 0.34 0.85 0.78 1
1 2 3 4 5 6 7 8 9 10 11 12 13 14 15 16 17 18 19 20 21 22 23 24 25 26 27 28 29 30 31 32 33 34 35 36 37 38 39 40 41 42 43 44 45 46 47 48 49 50 51 52 53 54 55 56 57 58 59 60 61 62 63 64 65
Table 5. Correlation coefficient between heavy metals at rural sites
Heavy
metals
Cr Fe Mn Ni Zn Al Cu Cd
Cr 1
Fe 0.24 1
Mn 0.23 0.97 1
Ni 0.84 0.41 0.41 1
Zn 0.05 -0.48 -0.44 0.22 1
Al -0.38 0.70 0.70 -0.13 -0.24 1
Cu 0.37 0.68 0.73 0.66 -0.21 0.34 1
Cd -0.21 0.75 0.78 -0.11 -0.39 0.84 0.22 1
1 2 3 4 5 6 7 8 9 10 11 12 13 14 15 16 17 18 19 20 21 22 23 24 25 26 27 28 29 30 31 32 33 34 35 36 37 38 39 40 41 42 43 44 45 46 47 48 49 50 51 52 53 54 55 56 57 58 59 60 61 62 63 64 65
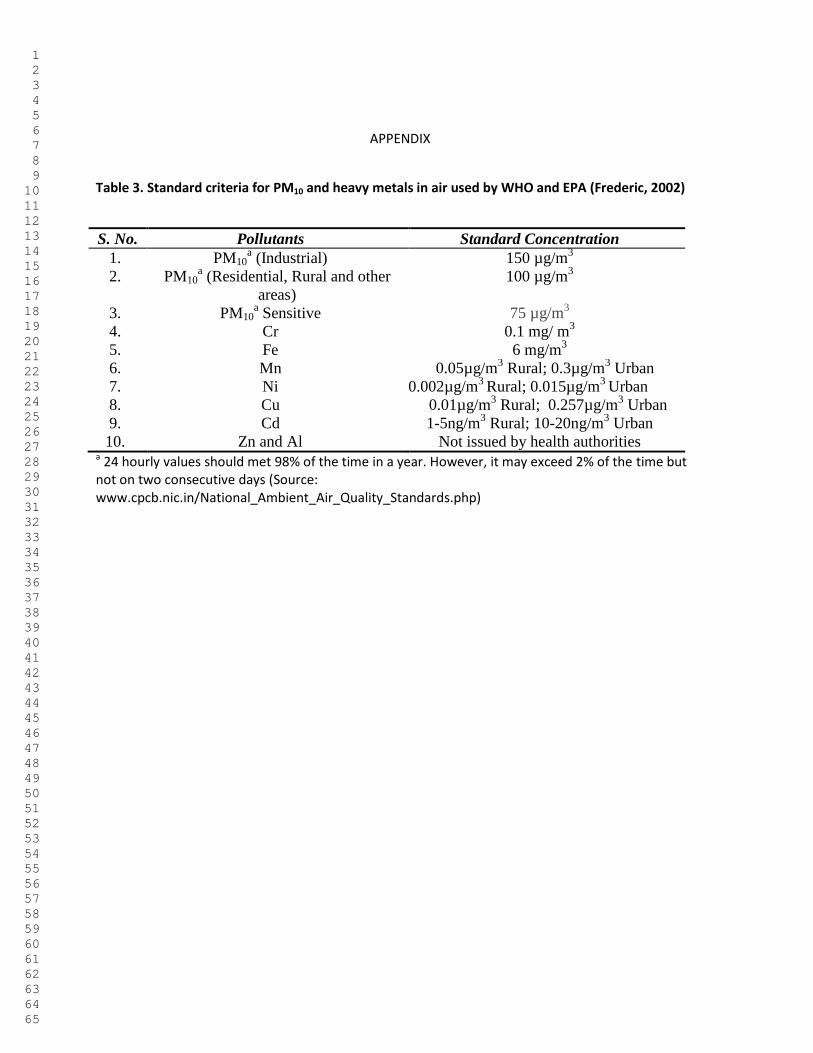
APPENDIX
Table 3. Standard criteria for PM10 and heavy metals in air used by WHO and EPA (Frederic, 2002)
S. No. Pollutants Standard Concentration
1. PM10a (Industrial) 150 µg/m
3
2.
PM10a (Residential, Rural and other
areas)
100 µg/m3
3. PM10a Sensitive 75 µg/m
3
4. Cr 0.1 mg/ m3
5. Fe 6 mg/m3
6. Mn 0.05µg/m3 Rural; 0.3µg/m
3 Urban
7. Ni 0.002µg/m3
Rural; 0.015µg/m3
Urban
8. Cu 0.01µg/m3 Rural; 0.257µg/m
3 Urban
9. Cd 1-5ng/m3 Rural; 10-20ng/m
3 Urban
10. Zn and Al Not issued by health authorities a 24 hourly values should met 98% of the time in a year. However, it may exceed 2% of the time but not on two consecutive days (Source: www.cpcb.nic.in/National_Ambient_Air_Quality_Standards.php)
FIGURES
Fig. 1. Air quality monitoring and sampling locations (shown in red outline)
FigureClick here to download Figure: Figures.doc
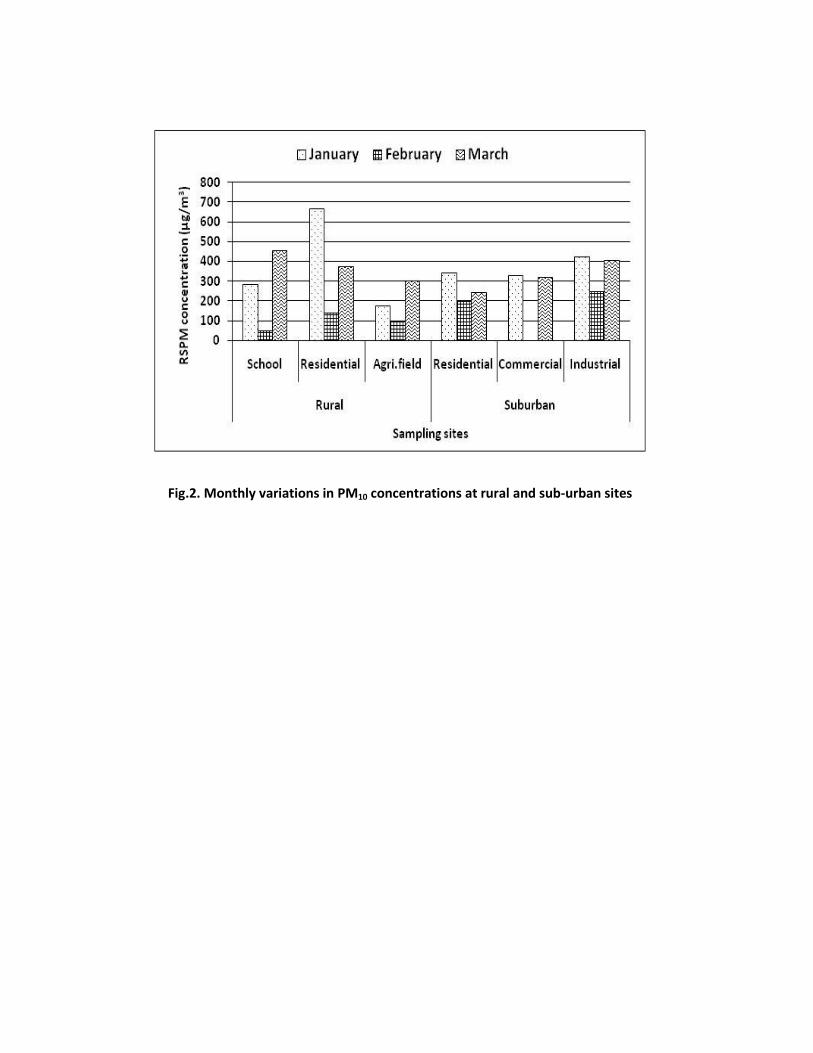
Fig.2. Monthly variations in PM10 concentrations at rural and sub-urban sites
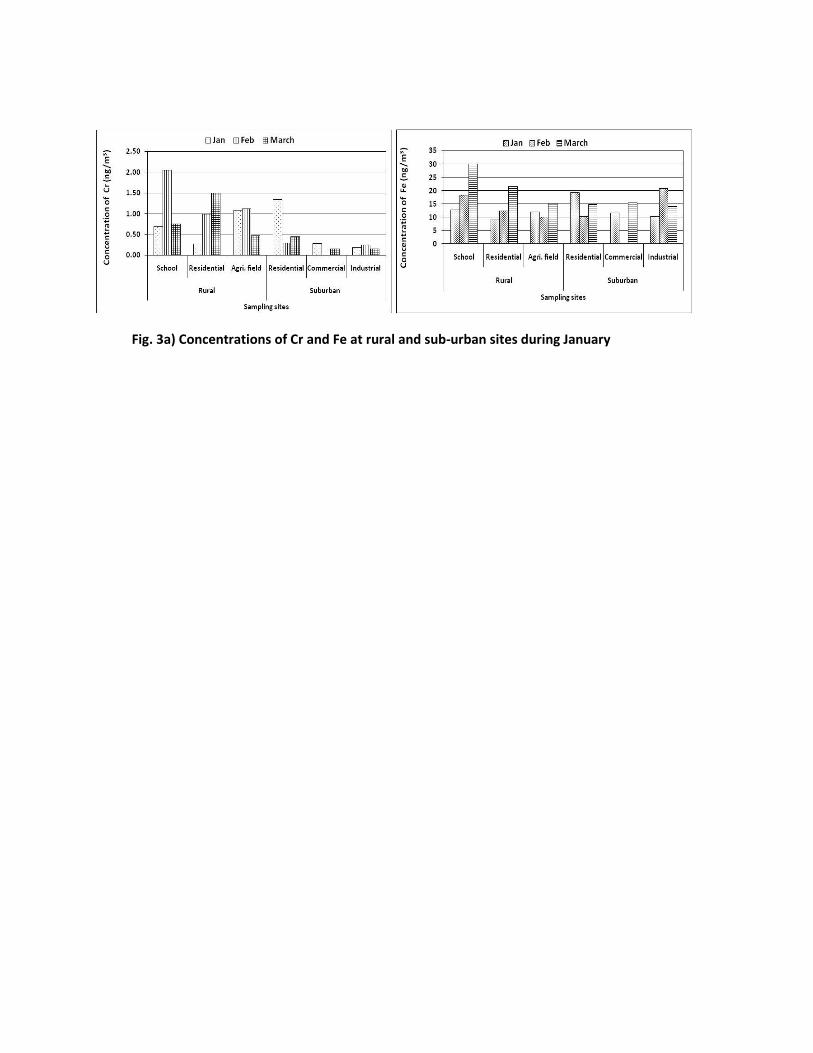
Fig. 3a) Concentrations of Cr and Fe at rural and sub-urban sites during January
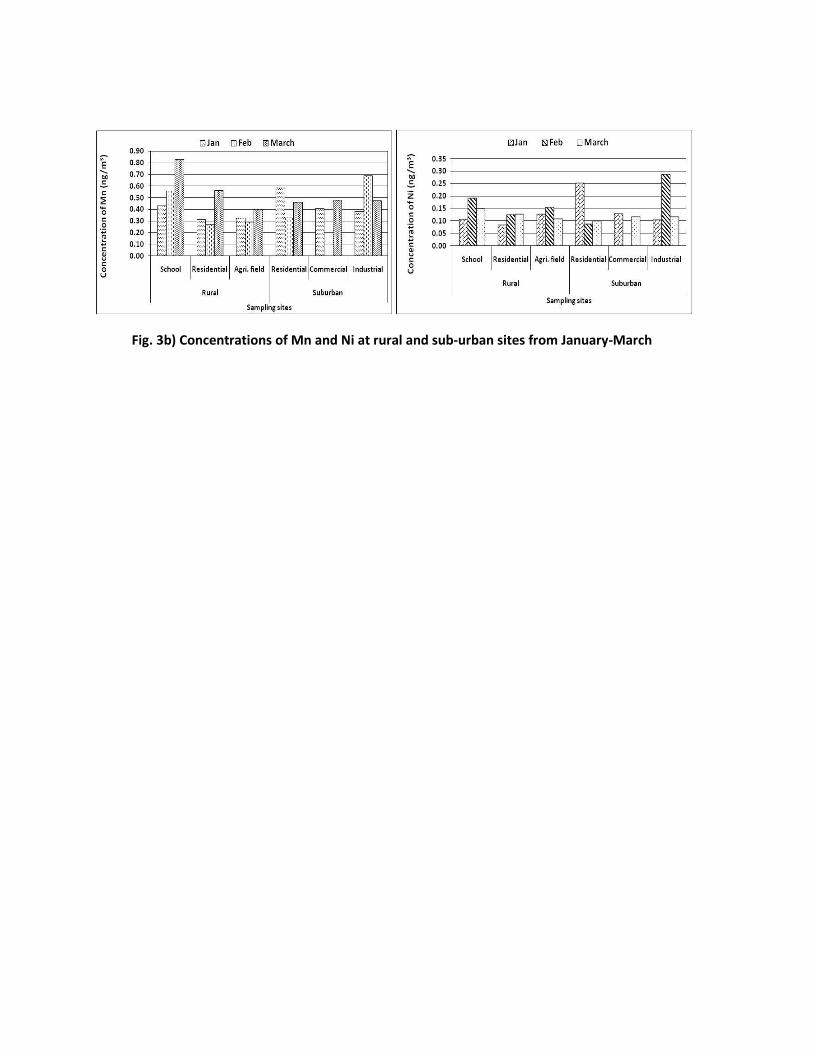
Fig. 3b) Concentrations of Mn and Ni at rural and sub-urban sites from January-March
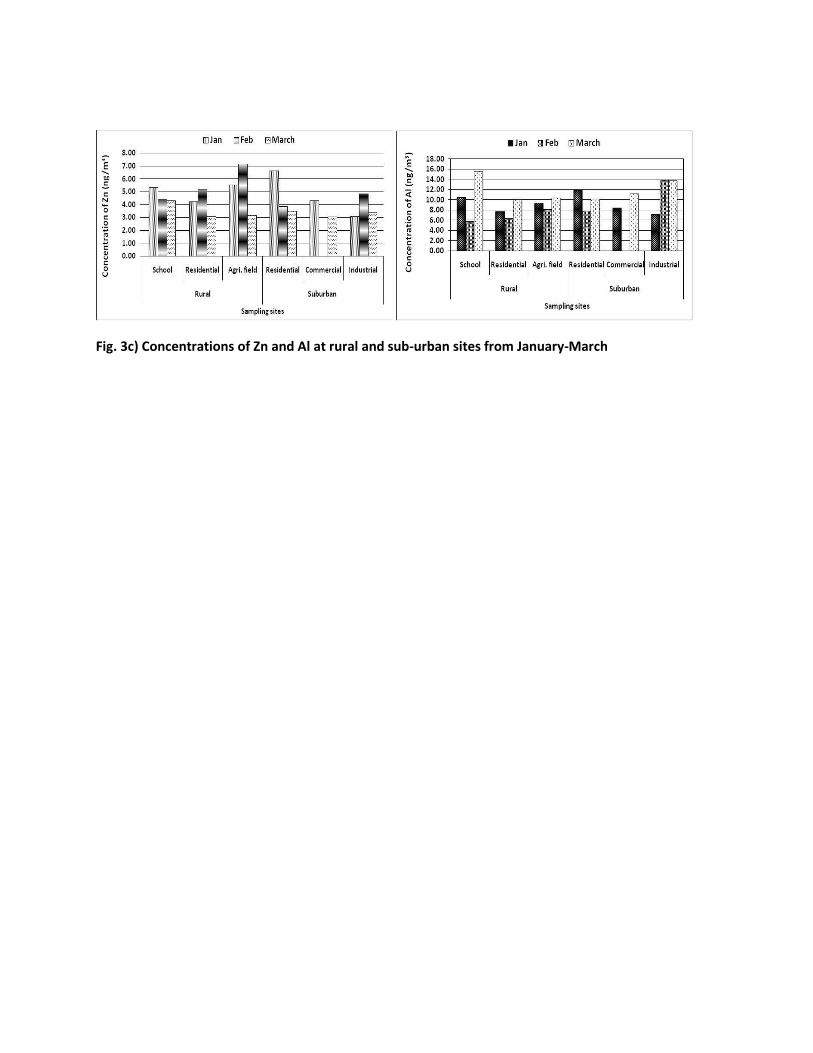
Fig. 3c) Concentrations of Zn and Al at rural and sub-urban sites from January-March
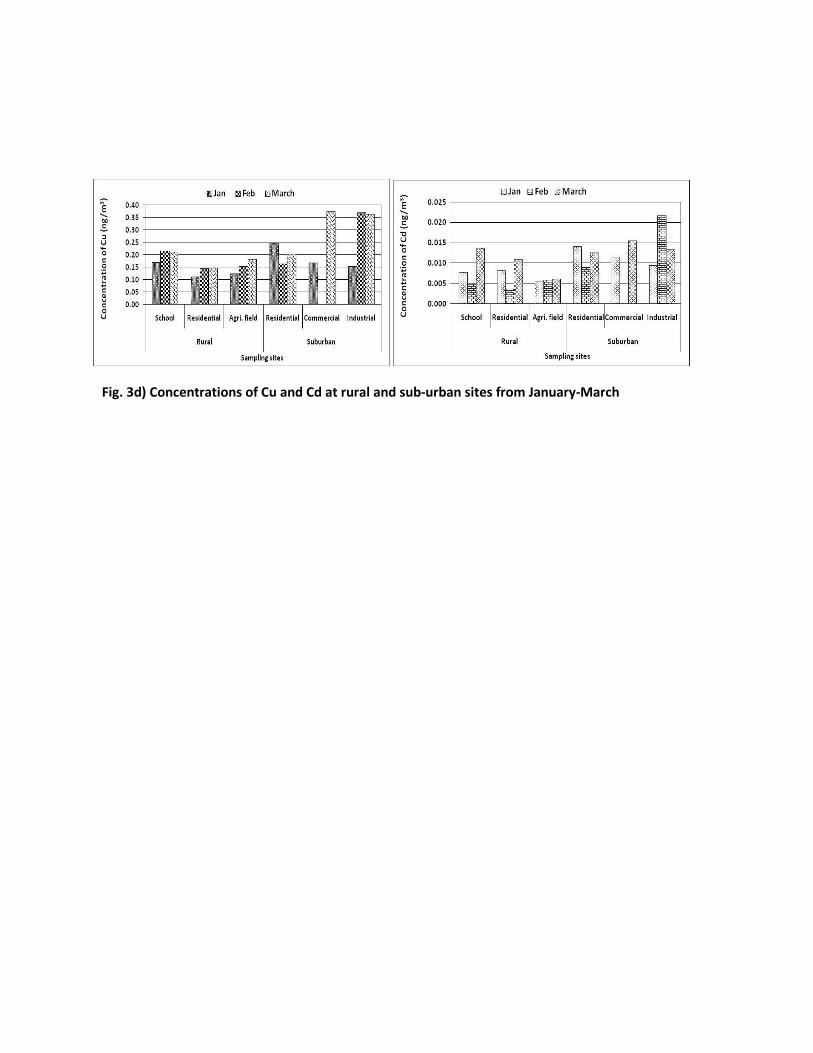
Fig. 3d) Concentrations of Cu and Cd at rural and sub-urban sites from January-March
FIGURES CAPTIONS
Fig. 1. Air quality monitoring and sampling locations (shown in red outline)
Fig. 2. Monthly variations in PM10 concentrations at rural and sub-urban sites
Fig. 3a) Concentrations of Cr and Fe at rural and sub-urban sites during January
Fig. 3b) Concentrations of Mn and Ni at rural and sub-urban sites from January-March
Fig. 3c) Concentrations of Zn and Al at rural and sub-urban sites from January-March
Fig. 3d) Concentrations of Cu and Cd at rural and sub-urban sites from January-March
Figure Captions List