PLEASE SCROLL DOWN FOR ARTICLE Journal of Travel & Tourism Marketing Usability of Chinese...
18
PLEASE SCROLL DOWN FOR ARTICLE This article was downloaded by: [Hong Kong Polytechnic University] On: 30 December 2009 Access details: Access Details: [subscription number 909944559] Publisher Routledge Informa Ltd Registered in England and Wales Registered Number: 1072954 Registered office: Mortimer House, 37- 41 Mortimer Street, London W1T 3JH, UK Journal of Travel & Tourism Marketing Publication details, including instructions for authors and subscription information: http://www.informaworld.com/smpp/title~content=t792306980 Usability of Chinese Destination Management Organization Websites Shanshan Qi a ; Rob Law a ; Dimitrios Buhalis b a School of Hotel & Tourism Management, The Hong Kong Polytechnic University, Hung Hom, Kowloon, Hong Kong b School of Service Management, Bournemouth University, Poole, Dorset BH12 5BB, UK To cite this Article Qi, Shanshan, Law, Rob and Buhalis, Dimitrios(2008) 'Usability of Chinese Destination Management Organization Websites', Journal of Travel & Tourism Marketing, 25: 2, 182 — 198 To link to this Article: DOI: 10.1080/10548400802402933 URL: http://dx.doi.org/10.1080/10548400802402933 Full terms and conditions of use: http://www.informaworld.com/terms-and-conditions-of-access.pdf This article may be used for research, teaching and private study purposes. Any substantial or systematic reproduction, re-distribution, re-selling, loan or sub-licensing, systematic supply or distribution in any form to anyone is expressly forbidden. The publisher does not give any warranty express or implied or make any representation that the contents will be complete or accurate or up to date. The accuracy of any instructions, formulae and drug doses should be independently verified with primary sources. The publisher shall not be liable for any loss, actions, claims, proceedings, demand or costs or damages whatsoever or howsoever caused arising directly or indirectly in connection with or arising out of the use of this material.
-
Upload
independent -
Category
Documents
-
view
0 -
download
0
Transcript of PLEASE SCROLL DOWN FOR ARTICLE Journal of Travel & Tourism Marketing Usability of Chinese...

PLEASE SCROLL DOWN FOR ARTICLE
This article was downloaded by: [Hong Kong Polytechnic University]On: 30 December 2009Access details: Access Details: [subscription number 909944559]Publisher RoutledgeInforma Ltd Registered in England and Wales Registered Number: 1072954 Registered office: Mortimer House, 37-41 Mortimer Street, London W1T 3JH, UK
Journal of Travel & Tourism MarketingPublication details, including instructions for authors and subscription information:http://www.informaworld.com/smpp/title~content=t792306980
Usability of Chinese Destination Management Organization WebsitesShanshan Qi a; Rob Law a; Dimitrios Buhalis b
a School of Hotel & Tourism Management, The Hong Kong Polytechnic University, Hung Hom,Kowloon, Hong Kong b School of Service Management, Bournemouth University, Poole, Dorset BH125BB, UK
To cite this Article Qi, Shanshan, Law, Rob and Buhalis, Dimitrios(2008) 'Usability of Chinese Destination ManagementOrganization Websites', Journal of Travel & Tourism Marketing, 25: 2, 182 — 198To link to this Article: DOI: 10.1080/10548400802402933URL: http://dx.doi.org/10.1080/10548400802402933
Full terms and conditions of use: http://www.informaworld.com/terms-and-conditions-of-access.pdf
This article may be used for research, teaching and private study purposes. Any substantial orsystematic reproduction, re-distribution, re-selling, loan or sub-licensing, systematic supply ordistribution in any form to anyone is expressly forbidden.
The publisher does not give any warranty express or implied or make any representation that the contentswill be complete or accurate or up to date. The accuracy of any instructions, formulae and drug dosesshould be independently verified with primary sources. The publisher shall not be liable for any loss,actions, claims, proceedings, demand or costs or damages whatsoever or howsoever caused arising directlyor indirectly in connection with or arising out of the use of this material.

USABILITY OF CHINESE DESTINATIONMANAGEMENT ORGANIZATION WEBSITES
Shanshan QiRob Law
Dimitrios Buhalis
ABSTRACT. Information Communication Technology (ICT) has had a large impact ontourism industry. In Mainland China (hereafter known as China), the increasing popularity ofInternet applications to its tourism industry is evident by the rapid growth of Chinese tourismwebsites. In 2005, e-tourism in China has reached an income of RMB12.5 billion orUS$1.63 billion, showing that although a small percentage of Chinese use the Internet, theironline consumption is still considerable. While the e-tourism market seems promising, thereexist a limited number of prior studies on website evaluations in the context of China. Thisresearch explores usability, a contemporary issue of website design, and focuses on theprovincial Destination Management Organization (DMO) websites in China. Research findingsinclude a checklist of criteria for assessing DMO website usability. Findings showed thatChina’s DMO websites had medium problems, and the best and worst performing destinationswere Beijing and Ningxia. In addition, the usability indices had no significant relationship withwebsite performance and level of tourism regional development which was represented by totaltourism income in the destination. Findings of this study would be of interest to readers forbetter understanding the current development of DMO websites in China. Industrialpractitioners may consider adopting a similar approach to evaluate their websites.
KEYWORDS. DMO, China, usability, website, tourism
The growth of Information Communica-tion Technology (ICT), especially the Internet,has had a great impact on the tourismindustry. In order to obtain market advan-tages and to better reach its responsibilities,governments together with stakeholders haveestablished Destination Management Organi-zation (DMO) websites to promote their
service/products globally (Buhalis, 2003,2005; Hanna & Millar, 1997; Tunnard &Haines, 1999; World Tourism OrganizationBusiness Council [WTOBC], 2001, 2005).Since the primary responsibility of DMOs isto introduce, promote, market, and branddestinations around the world; websites canhelp destinations achieve DMOs’ marketing
Journal of Travel & Tourism Marketing, Vol. 25(2) 2008Available online at http://www.haworthpress.com# 2008 by The Haworth Press. All rights reserved.
182 doi: 10.1080/10548400802402933
The authors are grateful to the constructive comments offered by the three anonymous reviewersabout an earlier version of this article.
This project was partly supported by a research grant funded by the Hong Kong PolytechnicUniversity (A-PG87).
Shanshan Qi (E-mail: [email protected]) is Research Assistant, and Rob Law (E-mail:[email protected]) is Associate Professor, both at the School of Hotel & TourismManagement, The Hong Kong Polytechnic University, Hung Hom, Kowloon, Hong Kong.Dimitrios Buhalis is Professor, School of Service Management, Bournemouth University, Poole,Dorset BH12 5BB, UK (E-mail: [email protected]).
Downloaded By: [Hong Kong Polytechnic University] At: 13:27 30 December 2009

objectives, which include increasing visitors’satisfaction and strengthening their experi-ence, maintaining and improving the prosper-ity of a local community on a long-term basis,developing partnership between public andprivate sectors, and bringing benefits to boththe supply and demand sides (Buhalis, 2000,2003; Pike, 2005; Ritchie & Crouch, 2003).
The tourism industry in China has grownrapidly in recent years. According to theUnited Nations World Tourism Organiza-tion (UNWTO), China will become theworld’s most popular destination by 2020(‘‘China A Top Tourist Destination by2020,’’ 2004; Qi, Buhalis, & Law, 2007;Wang, Yu, & Avgoustis, 2005). In addition,China has become the second largest countryin terms of Internet users. According to thestatistical results of China Internet NetworkInformation Center [CNNIC] (2007), therewould be 162 million Internet users in Chinaat the end of June 2007, and this included3.9% online users who made travel reserva-tions. Additionally, the number of newInternet users has increased 25 million ascompared to the same period in the previousyear. Therefore, the huge potential inChina’s e-tourism industry, together withthe growing popularity of the Internet,necessitate the emerging need for furtherdevelopment of China’s online travel mar-ket. Cui (2002) indicated that e-tourism is amajor means for China’s tourism industry toparticipate in market competition. Tourismadministrative departments and tourismenterprises should thus pay close attentionto the developmental trends of China’s e-business. They should also urge the con-struction of China’s e-tourism fundamental
frames and application environments inorder to sustain healthy development (Cui;Ma, Buhalis, & Song, 2003).
E-TOURISM IN CHINA
At present, China has more than 5,000travel and tourism websites that provideusers the necessary information on food,accommodation, tours, transportation,shopping, and entertainment for specificdestinations (Cui, 2002; Hu, Zeng, & He,2006; Zhou & Shi, 2005). In general, thereare four types of tourism informationwebsites in China, and Table 1 details thesetypes.
Websites of the first type have a govern-ment background and are monitored bylocal tourism administrations such as localprovincial DMOs in Guangdong, Beijing,and Yunnan. These websites can provide ane-business platform for both tourists andtourism enterprises. In contrast, travel infor-mation websites are monitored by InternetContent Providers (ICPs), and these websitespresent commercial tourism information. Anexample of this kind of websites is Ctrip(Xiecheng), which is the largest online travelagent in China. The third type includes travelpackage selling websites, which are managedby tourism operators and facilitate sellingtheir products. Examples of these websitesinclude Qinglv Online and Kunlun Online.The last category comprises gateway net-work station websites that are developed bynetwork companies. These websites arededicated to provide brief introduction totourists on popular tourism spots, tour
TABLE 1. Types of China’s Tourism Websites
Categories Scope and Mode of Operation Examples
Government background Managed by the local government, and to promote
and introduce destinations.
Shandong Tourism Website Guilin
Tourism Website
Travel information website Held by Internet Content Providers (ICPs), present
commercial tourism information.
Xiecheng Tourism Website, Chinese
Tourism Business Hotline
Travel package selling Managed by tourism operators to sell their products Qinglv Online, Kunlun Online
Gateway network stations Network companies provide tourism information on
their websites.
Sina, 163, Sohu, and Yahoo websites
Qi, Law, and Buhalis 183
Downloaded By: [Hong Kong Polytechnic University] At: 13:27 30 December 2009

routes, transportation information, hotelbookings, comprehensive knowledge ontourism, and travel diaries. Examples ofthese websites include Sina, 163.net, Sohu,and Yahoo.cn (Liu, 2004; Wang, 2000; Wei,2006; Yang, 2001; Zhou & Shi, 2005).Compared with other commercial travelwebsites, destination marketing websites areusually managed by the government sector(Buhalis, 2003; Kotler, Bowen, & Makens,2003), the duty of a DMO website is not onbusiness benefits, it is focused on increasinga destination’s visitation and sales of itsdestination products (So & Morrison, 2004;WTOBC, 2001). Therefore, in order to betterdevelop and promote tourism destinations,most DMOs have established their ownwebsites for marketing and bookings(WTOBC, 2001, 2005). This way of websitedevelopment efforts directly applies toDMOs in China (Wei, 2006; Wu, 2006;Zhou & Shi, 2005). Hence, a DMO websitecan reflect the real situation in a destinationwithout any commercial descriptions. In thisresearch, the DMO websites of 31 Chinesekey provinces and independent cities wereselected for analysis. Research findings areexpected to contribute to reflect the generalperformance and problems of e-tourism ineach destination. Additionally, findingswould be beneficial for DMOs from usingInformation and Communication Techno-logies (ICTs) for promotion, as well asenabling China’s DMOs to better under-stand the performance of their websites.This, in turn, can assist China to cope withthe emerging e-tourism market.
RESEARCH OBJECTIVES
Although there are many prior studies ontourism website analysis, only a few of themfocused on website usability evaluation orDestination Marketing Systems. In addition,prior studies on China’s tourism websiteswere only attempted by a few researchers. Inorder to fill this research gap, this researchmakes an attempt to establish a checklist ofcriteria for assessing DMO website usability.
Utilizing the checklist, website developershave a set of preset standards to benchmarkwhen they try to improve destination web-sites. This study is to apply this benchmark ofwebsite evaluation to investigate the usabilityperformance of DMO websites in China.
LITERATURE REVIEW
It is commonly known that the goal of aDMO website is to integrate its onlineactivities with its marketing and visitorservicing strategies. In order to establish asuccessful DMO website, designers shouldabide to the criteria for successful websites(Benckendorff & Black, 2000; Kaplanidou &Vogt, 2004; Morrison, Taylor, Morrison, &Morrison, 1999; WTOBC, 2005). Manyprior studies thus indicated that the design,especially its ease of use, is of paramountimportance for a successful website (AuYeung & Law, 2003, 2006; Douglas &Mills, 2004; Elges, 2004; Nielsen, 2003;Nielsen & Norman, 2000; Olive, 2002).Nielsen (2003) defined usability as thequality attribute that evaluates how easy auser interface is to use. The word usabilityalso refers to the methods for improving awebsite’s ease of use at the design stage. Thisimplies that website usability deals with notonly how to make sure everything on the siteworks but also how quickly and easilyvisitors are able to use the site. Nielsen(1993) also pointed out that usability hasmultiple components which are usuallyassociated with five usability attributesincluding ease to learn, ease to use, memor-ability, low error rates, and customer satis-faction. Hence, in order to improve theefficiency and visitation of a DMO website,usability should be recognized as a criticalsuccess factor in DMO website evaluation.According to Mills and Morrison (2000), thecritical success factors of a DMO websitecould be categorized into four groups—namely technical quality, customer perspec-tive, website attractiveness, and marketingeffectiveness. These four categories are sum-marized in Table 2.
184 JOURNAL OF TRAVEL & TOURISM MARKETING
Downloaded By: [Hong Kong Polytechnic University] At: 13:27 30 December 2009

Some prior studies have been performedthat focused on measuring the usabilityperformance of a website by different usabil-ity evaluation methods (UEMs). TheseUEMs underpin the two characteristics ofusability evaluation. First, usability is mani-fold and thus the measurements should bevariegated. Secondly, usability is a subjectiveassessment which is based on users’ personaljudgment (Agarwal & Venkatesh, 2002;Mack & Nielsen, 1994). Morrison, Taylor,and Douglas (2004) further suggested thatthe ultimate measure of the success oftourism and hospitality websites is theirreturn on investment (ROI). They concluded
that private sector websites’ effectiveness canbe measured against the transactions andrevenue they have generated. However as anonprofit and government sector, DMOwebsites rarely have direct online sales.This, in turn, renders the ongoing difficultyin accurately measuring ROIs of the web-sites. As such, a better way to evaluate thesewebsites would be through benchmarking,which will enable them to compare theirperformance against their peers.
In order to achieve the objectives of thisresearch, the researchers chose to use aheuristic evaluation method. The importanceof a heuristic evaluation is that it can help
TABLE 2. Critical Success Factors for DMO Websites
Dimension Successful Criteria
Technical Qualification N Loading time
N Link popularity
N Webpage spelling
N Browser compatibility
N Effective application of HTML
N Website accessibility
Factor: Provide service to disabled people
Consumer Perspective N Easy to use
Factors: Easy-to-remember URL links; Limited vertical and horizontal scrolling; Internal
search engine facility
N Easy to navigate through
Factors: A home button on all pages; Navigation menu/index; Site map; Availability of FAQ;
Friendly user interface
N Easy to obtain contact info
Factors: Mailing address; E-mail address; Telephone numbers; Fax numbers
Website Attractiveness N Clear website structure
Factor: Standard forms; Uncluttered pages
N Interface, visual appeal
Factors: Text readability; Multimedia images; Fantastic graphic layout;
Comfortable website colors
N Destination Information Perspective
Factors: Destination attractions; Accommodation information; Local news; Destination
activities; Pricing; Meeting planning; Information for trip planners; General travel links
Marketing Effectiveness N Market segmentation/ target marketing
Factor: Different groups of tourists
N Marketing research and database
Factors: Hyperlinks to partner organizations
N Marketing information
Factors: Timely information; Multiple foreign languages and special interest for international
travelers; Contact information gathered from visitors; On-line reservation; On-line
transaction information
N Marketing strategies
Factors: Travel stories and reviews; Bulletin board and chat rooms
Summarized from: Benckendorff & Black (2000); Douglas & Mills (2004); Feng et al. (2003); Ham (2004); Ismail et al. (2002); Kaplanidou &Vogt, (2004); Kim & Lee (2004); Morrison et al. (2004) ; Oertel, Thio, & Feil (2001); So & Morrison (2004); WTOBC, (2001, 2005).
Qi, Law, and Buhalis 185
Downloaded By: [Hong Kong Polytechnic University] At: 13:27 30 December 2009

researchers find usability problems in a userinterface design and the revealed problemscan then be addressed in the subsequentimprovement processes (Nielsen 1994;Nielsen & Molich, 1990). In addition, themethod was originated from the mostpopular method used to examine websitepertinent problems (Nielsen, 1993). Moreimportantly, there are only a limited numberof prior studies in the existing tourism andhospitality literature which used a modifiedheuristic evaluation method to evaluatewebsite usability in the hospitality industry.Au Yeung and Law (2003, 2006) adopted amodified heuristic evaluation method toevaluate the usability of Hong Kong hotelwebsites. This research adopted Au Yeungand Law’s (2003, 2006) modified heuristicmethod to evaluate the China’s DMOwebsites. Generally speaking, this evaluationmethod requires a small group of evaluators,with each evaluator working individuallyand the researcher is in-charge of collectingand analyzing data. Moreover, evaluatorsshould be familiar with the products andagree with a set of usability principles beforethe evaluation begins (Nielsen, 1992; Nielsen& Landauer, 1993; Nielsen & Molich, 1990).
The recent tourism literature comprisesmany studies on China’s emerging eTourism(Li & Lu, 2006; Wei, Li, Wang, & Guo, 2006;Wen & Zhang, 2006; Yang, 2001; Zhang,2005). These prior studies had indicated thatChina’s e-tourism market generally has threemain problems, including:
1. level of tourism network’s informationis low, ununiformly developed, and haslarge discrepancy in different regions;
2. tourism websites’ construction level islow and these websites often imitateforeign ones; and
3. organizations lack the experts who hadthe right knowledge in e-business(Wang, 2000; Yang, 2001; Zhou &Shi, 2005
In spite of the growing popularity ofDMO websites in China, the existing litera-ture has only a couple of published articles
that are related to China’s DMO websites. Intheir study, Feng, Morrison, and Ismail(2003) compared marketing strategies, webpage design, marketing information, andtechnical qualities of DMO websites inChina and the United States from a quali-tative point of view instead using of ascientific approach. In addition, Qi et al.(2007) initially examined the design ofChina’s DMO websites but their findingswere limited to a general description. Thisresearch extends Qi et al.’s (2007) work bymodifying Au Yeung and Law’s (2003, 2006)usability evaluation model to Chinese DMOwebsites. Different from the previous study,findings of this research should enable read-ers to determinate what the tourists, ITprofessionals, and tourism employees arelooking for from DMO websites. It can alsohelp website developers sense how to satisfyand better serve different types of users.More importantly, this research attempts toinvestigate the relationship of usability per-formance and provincial tourism income. Inorder to explore the correlation betweenwebsite performance and regional tourismdevelopment, the 31 key Chinese provincesand autonomous municipalities were classi-fied into two groups of destinations withhigh and low tourism incomes based on TheYear Book of China Tourism Statistics(China National Tourism Administration[CNTA], 2006). Naturally, one might expectthat higher tourism revenues in a regionshould be related to better website usabilityperformance.
METHODOLOGY
This exploratory research endeavors toachieve a better understanding of China’sDMO websites and to produce useful eva-luation results for improvement. In thisstudy, a modified heuristic evaluationmethod was adopted. The examinationapproach was divided into four stages of:(a) finding out the key criteria for DMOwebsites’ usability, (b) identifying andevaluating the 31 Chinese provincial and
186 JOURNAL OF TRAVEL & TOURISM MARKETING
Downloaded By: [Hong Kong Polytechnic University] At: 13:27 30 December 2009

autonomous municipal DMO websites, (c)calculating hazard indices of China’s DMOwebsite usability, and (d) analyzing China’sDMO website performance and offeringsuggestions for further development.
Questionnaires and Respondents
To develop a comprehensive instrument,new usability criteria were established toevaluate Chinese DMO websites’ usability.These criteria included 30 attributes thatcombine DMO websites’ success factors withwebsite usability hazard criteria. The websiteusability hazard criteria were selected fromthe study of Nielsen (2000, 2003) andAbeleto (Sprengers, 2004). In addition, thesuccess factors for DMO websites wereselected from published articles (Douglas &Mills, 2004; Ismail, Labropoulos, Mills, &Morrison 2002; Kaplanidou & Vogt, 2004;So & Morrison, 2004; WTOBC, 2001, 2005).All of these criteria were based on theirapplicability to the travel destination indus-try. For instance, the criteria of ‘‘No relevantlinks (airport, travel agencies)’’ and ‘‘poordestination information presentation’’ wererelated to the examination of the perfor-mance of destination websites.
These criteria were divided into fivedimensions as proposed by Abeleto(Sprengers, 2004). These dimensionsincluded: (a) Language, which refers to thechoice of words used to present informationon the web, (b) Layout that relates to howelements are visually rendered on the webpage, (c) Information Architecture that isrelated to how the content and features of awebsite are arranged, (d) User Interface andNavigation, which determine the ease ofnavigating through content, and (e) Generalthat refers to download speed, generalpractice of design, and maintenance.
Two questionnaires were developed in thisresearch in mid-2006. The first questionnaireaimed at working out the usability criteriafor DMO websites according to respondents’perceptions and ratings of the usabilityhazard criteria of DMO websites. Using aconvenient sample, the first questionnaire
was sent by e-mail to three groups ofconsumers, travel industry professionals,and IT professionals, who had prior experi-ence of using DMO websites. Thirty peoplewere included in each of these groups, whorepresented the users and designers of DMOwebsites. The second questionnaire was toevaluate the 31 Chinese provincial andautonomous municipal DMO websites. Inthis research, 12 users of Chinese DMOwebsites participated in the evaluation. Ineach group there were two evaluators whowere responsible for evaluating five or sixwebsites. Although Nielsen (2003) had pro-posed used five users to evaluate a website,such an attempt was for evaluating iterativedesign, and is thus considered unnecessary inthis study for evaluating developed websiteswith an established instrument. According toWan (2002), using two assessors to evaluate awebsite can solve the problem of personalbias. Cappel and Huang (2007) echoed such aclaim, and evaluated 500 company websitesby two evaluators. During the website evalua-tion, two evaluators shared their experienceand discussed their point of view and one ofthe authors was present during the evaluationto answer queries. The evaluation results werethen used to calculate usability hazard indicesfor all DMO websites. Each DMO websitehad its own score that reflects the usabilityperformance in each dimension.
The Modeling Process
As previously stated, this research adoptsAu Yeung and Law’s (2003, 2006) modifiedheuristic evaluation model on the selectedDMO websites. In the first questionnaire,respondents were required to rate eachusability criterion according to their percep-tions on the negative impact to a DMOwebsite. The criteria were ranked from themost offensive to the least offensive withineach dimension. The respondents were alsorequested to weigh the relative importance oftheir responses so that an Importance Indexfor each usability criterion within a dimen-sion can be calculated according toEquation (1) as listed below. In addition,
Qi, Law, and Buhalis 187
Downloaded By: [Hong Kong Polytechnic University] At: 13:27 30 December 2009

the percentage of relative importance indexof the each criterion is from a specificdimension. Therefore, the sum of relativeImportance Indices within a dimensionequals 100%.
Importance Indexr~ T :Pð Þz E:Qð Þ
z IT :Rð Þð1Þ
T~Tr
.Xn
r~1Tr~The percentage of stan-
dard r in its category from the perception ofconsumers.P~
Pmi~1 Pi=m~weighted percentage of
consumers’ opinions.T?P 5 weighted percentage of criterion r inconsumers’ opinion.E~Er
�Pnr~1 Er~percentage of standard r
in its category from the perspective of travelindustry professionals.Q~
Pmi~1 Qi=m~weighted percentage of
travel industry professionals’ opinion.E?Q 5 weight of criterion r in travel industryprofessionals’ opinion.IT~ITr
�Pnr~1 Tr~percentage of standard r
in its category from the perspective of ITprofessionals.R~
Pmi~1 Ri=m~weighted percentage of IT
professionals’ opinion.IT?R 5 weighted percentage of criterion r inIT professionals’ opinion.x 5number of respondents in the consumersgroup.y 5number of respondents in the travelindustry professionals group.z 5number of respondents in the IT profes-sional group.m 5total number of respondents; where m 5
x + y + z.n 5number of criteria within a dimension.T 5 mean score for the rth criteriongenerated from customers; r 5 1, 2, …, n.Er~mean score for the rth criterion gener-ated from travel industry professionals; r 5
1, 2, …, n.ITr~mean score for the rth criterion gener-ated from IT professionals; r 5 1, 2, …, n.Pi 5 relative importance of responses fromthe tourist group generated from the ith
respondent; i 5 1, 2, …,m; where P + Q +R5 100%.
Qi 5 relative importance of responses fromthe tourism employee group generated fromthe ith respondent; i 5 1, 2, …,m; where P +Q + R5 100%.Ri 5 relative importance of responses fromthe IT professional group generated from theith respondent; i 5 1, 2, …m; where P + Q +R5 100%.Ir 5importance index of criterion r; r 5 1, 2,…, n.
Based on these importance indices a newchecklist of criteria for DMO website usabil-ity was established. Naturally, the higher acriterion’s score is, the more important it isfor a DMO website from the respondents’perspective.
The Website Sampling and EvaluationProcess
Thirty-one DMO websites were selectedfor all provinces and autonomous municipa-lities in China. As previously discussed, amodified evaluation method was adopted inthis research. The evaluators were requestedto evaluate DMO websites based on a 5-pointrating scale (Sekaran, 2003). The scale used inthis research included ‘‘no problem on thiscriterion,’’ ‘‘minor problems,’’ ‘‘medium pro-blems,’’ ‘‘major problems,’’ and ‘‘destructiveproblems.’’ In order to reduce the chance ofvariability, the evaluation was conducted inthe same location. For each DMO websiteand in each criterion, a mean rating score wascalculated based on the result of groupevaluation. Usability Hazards Indices werecalculated by Equations 2 to 4.
Usability Hazard Index of criterionr
~ Sr{1� ��
I�5ð2Þ
Index of dimesion~C1zC2zC3
z � � �zCn
ð3Þ
Usability Hazard Index of a
Chinese DMO website~Xn
i~1Ui
ð4Þ
n 5number of criteria within a dimension i, i5 1, 2, …, 5.
188 JOURNAL OF TRAVEL & TOURISM MARKETING
Downloaded By: [Hong Kong Polytechnic University] At: 13:27 30 December 2009

Sr~mean rating score for the rth criterion; r5 1, 2, …, n.Ir 5importance index of criterion r; r 5 1, 2,…,n.Cr 5usability hazard index of criterion r; r 5
1, 2, …, n.Ui 5usability hazard index of dimension i, i5 1, 2, …, 5.D5usability hazard index of a DMO website.
Equation parses. Parameter Sr refers to themean rating score of each criterion. The scaleranged from 1 to 5. Therefore, equation(Sr21)*Ir*5 undergoes the following computa-tion process.
Firstly, if the rating score is 1, it implies thereis ‘‘no problem’’ in the criterion. So Sr-1 wasused to verify values ranging from 0 to 4.Secondly, (Sr21)*Ir*5 was used to get Crwhich has a value of 0 to 20. In this way, everydimension’s minimum value is 0 and maximumvalue is 20. The five dimensions’ total valuethus ranges from 0 to 100. In total, the usabilityhazard index of a DMO website was generatedwith minimum score ‘‘0’’ to maximum score‘‘100.’’ Lower scores mean fewer problemswere found on the website, and higher scoresimply more problems. In order to presentbetter evaluation results for different destina-tion categories, the results of usability hazardindex can be divided into four levels using anequal percentile approach. Usability hazardindices with scores in the range of 0 to 25belong to level 1 that means minor problemswere found on this website. Usability hazardindices with a score ranging from 25.01 to 50belong to level 2, which means mediumproblems were found on the website. A scoreof 50.01 to 75 is at level 3 that shows majorproblems were found on a website. Lastly, anindex of 75.01 to 100 is at level 4 that impliesdestructive problems were found on a website.
FINDINGS AND ANALYSIS
Different Opinions from Different Groups
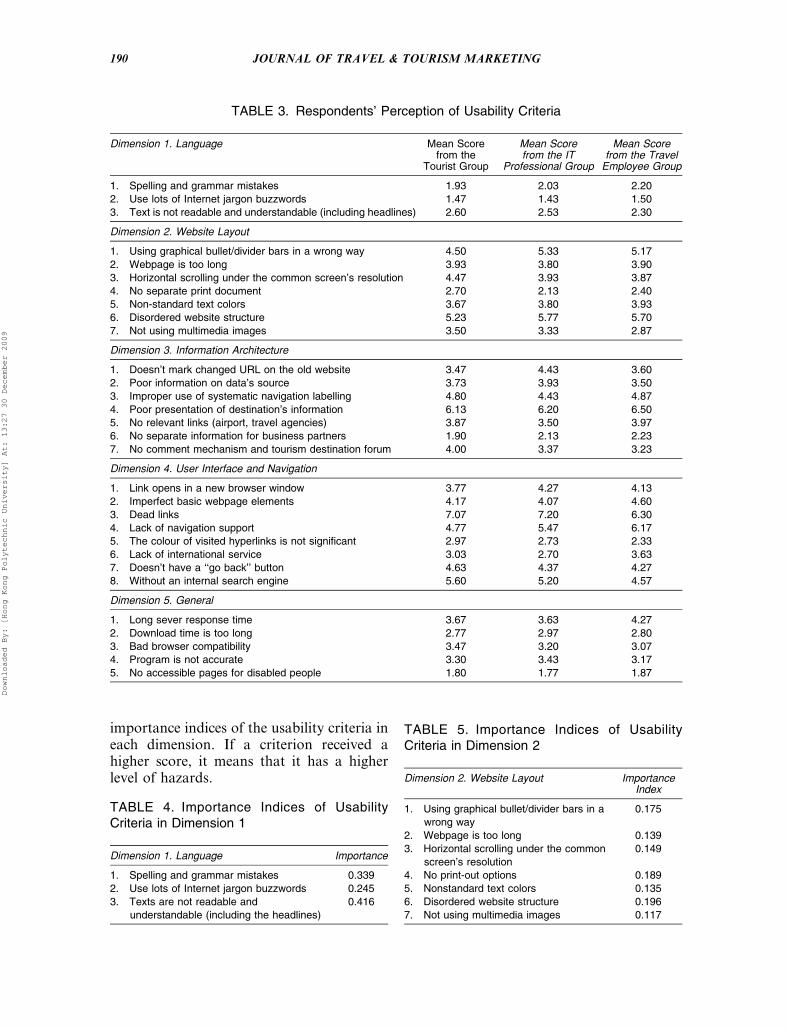
The findings of importance indices ofusability criteria were collected from three
different groups of respondents includingconsumers, IT professionals, and travelindustry professionals. Table 3 shows theopinions of different groups of respondentsfor each dimension and criterion. Accordingto Table 3, the criteria that are related towebsite service and pertinent standards onwebsite operation were scored higher thanothers. This means that the respondents paidmore attention to these website usabilitycriteria. Nonetheless, the perspectives ofusability criteria are still different amongthe three groups. The consumer group hadhigher scores for criteria on website’s ‘‘easeof use’’ and ‘‘service functions.’’ Forinstance, the criteria of ‘‘without an internalsearch engine’’ and ‘‘doesn’t have a ‘go back’button’’ received the highest scores ascompared to the other groups. This, in turn,leads to the connotation that these criteriaare more important to this group of respon-dents and they will affect their impression onwebsite usability performance. In addition,respondents in the IT professional groupseemed to care more about the performanceof websites’ technological functions. Toillustrate, the criteria of ‘‘dead links’’ and‘‘program not accurate’’ received the highestscores as compared to other groups. Such afinding could be due to the influence of thesecriteria to respondents’ impression. Lastly,the travel industry professional group paidmore attention to websites’ general perfor-mance, service functions, and targetingmarket. Criteria such as ‘‘poor presentationof destination information,’’ ‘‘no separateinformation for business partners,’’ and‘‘lacking of international service’’ all gotthe highest scores as compared to othergroups.
Results of Importance Indices
On the basis of the successfully completedquestionnaires from consumers, travel indus-try professionals, and IT professionals, theimportance indices of the five dimensions arepresented in Tables 4 to 8.
The following analysis is based on therespondents’ general perceptions about
Qi, Law, and Buhalis 189
Downloaded By: [Hong Kong Polytechnic University] At: 13:27 30 December 2009
importance indices of the usability criteria ineach dimension. If a criterion received ahigher score, it means that it has a higherlevel of hazards.
TABLE 3. Respondents’ Perception of Usability Criteria
Dimension 1. Language Mean Scorefrom the
Tourist Group
Mean Scorefrom the IT
Professional Group
Mean Scorefrom the Travel
Employee Group
1. Spelling and grammar mistakes 1.93 2.03 2.20
2. Use lots of Internet jargon buzzwords 1.47 1.43 1.50
3. Text is not readable and understandable (including headlines) 2.60 2.53 2.30
Dimension 2. Website Layout
1. Using graphical bullet/divider bars in a wrong way 4.50 5.33 5.17
2. Webpage is too long 3.93 3.80 3.90
3. Horizontal scrolling under the common screen’s resolution 4.47 3.93 3.87
4. No separate print document 2.70 2.13 2.40
5. Non-standard text colors 3.67 3.80 3.93
6. Disordered website structure 5.23 5.77 5.70
7. Not using multimedia images 3.50 3.33 2.87
Dimension 3. Information Architecture
1. Doesn’t mark changed URL on the old website 3.47 4.43 3.60
2. Poor information on data’s source 3.73 3.93 3.50
3. Improper use of systematic navigation labelling 4.80 4.43 4.87
4. Poor presentation of destination’s information 6.13 6.20 6.50
5. No relevant links (airport, travel agencies) 3.87 3.50 3.97
6. No separate information for business partners 1.90 2.13 2.23
7. No comment mechanism and tourism destination forum 4.00 3.37 3.23
Dimension 4. User Interface and Navigation
1. Link opens in a new browser window 3.77 4.27 4.13
2. Imperfect basic webpage elements 4.17 4.07 4.60
3. Dead links 7.07 7.20 6.30
4. Lack of navigation support 4.77 5.47 6.17
5. The colour of visited hyperlinks is not significant 2.97 2.73 2.33
6. Lack of international service 3.03 2.70 3.63
7. Doesn’t have a ‘‘go back’’ button 4.63 4.37 4.27
8. Without an internal search engine 5.60 5.20 4.57
Dimension 5. General
1. Long sever response time 3.67 3.63 4.27
2. Download time is too long 2.77 2.97 2.80
3. Bad browser compatibility 3.47 3.20 3.07
4. Program is not accurate 3.30 3.43 3.17
5. No accessible pages for disabled people 1.80 1.77 1.87
TABLE 4. Importance Indices of UsabilityCriteria in Dimension 1
Dimension 1. Language Importance
1. Spelling and grammar mistakes 0.339
2. Use lots of Internet jargon buzzwords 0.245
3. Texts are not readable and
understandable (including the headlines)
0.416
TABLE 5. Importance Indices of UsabilityCriteria in Dimension 2
Dimension 2. Website Layout ImportanceIndex
1. Using graphical bullet/divider bars in a
wrong way
0.175
2. Webpage is too long 0.139
3. Horizontal scrolling under the common
screen’s resolution
0.149
4. No print-out options 0.189
5. Nonstandard text colors 0.135
6. Disordered website structure 0.196
7. Not using multimedia images 0.117
190 JOURNAL OF TRAVEL & TOURISM MARKETING
Downloaded By: [Hong Kong Polytechnic University] At: 13:27 30 December 2009

Dimension 1—Language. This dimensionpresents the usage of language on a website.As indicated in Table 4, the importanceindex of ‘‘texts are not readable and under-standable’’ has the highest score among allcriteria in this dimension. This implies that‘‘texts are not readable and understandable’’is a major hazardous criterion for websiteusability. On the other hand, the criterion of
‘‘Internet jargons’’ is less hazardous ascompared to other criteria.
Dimension 2—Website Layout. Thisdimension refers to the layout and graphicsused on a website and how the elements arevisually displayed. As indicated in Table 5,the importance index of ‘‘disordered websitestructure’’ has the highest index score, butthe ‘‘not using multimedia images’’ criterionscored the lowest in this dimension. Thisshows that the respondents expect a clearwebsite layout that can offer an explicit andclear web context. On the other hand, therespondents were less concerned whether theinformation on the web was presentedtogether with pictures, videos, and othermultimedia.
Dimension 3—Information Architecture.This category refers to how a websitearranges its content and features. It isobvious in Table 6 that the importance indexof ‘‘poor presentation of destination’s infor-mation’’ scored the highest among all criteriain this dimension. In addition, the importantindex of ‘‘no separate information for busi-ness partners’’ was scored the lowest. Thisindicates that the respondents would like tohave rich and colorful information about adestination that includes information onshopping areas, attractions, transportation,pricing, general travel information, andrestaurants. Failed destination informationpresentation may generate a very poor imageto the usability performance of a destinationwebsite. In contrast, respondents were lessconcerned with whether the website con-tained information for business partners.
Dimension 4—User Interface and Naviga-tion. This dimension is to show how easyit is for a user to navigate through adestination website. As shown in Table 7,the importance indices of ‘‘dead links’’ and‘‘the color of visited hyperlinks is notsignificant’’ were scored the highest andlowest, respectively. This means dead websiteinternal links will disappoint respondentsand negatively affect their opinions on the
TABLE 6. Importance Indices of UsabilityCriteria in Dimension 3
Dimension 3. Information Architecture ImportanceIndex
1. Doesn’t mark changed URLs on the old
website
0.134
2. Poor information on data’s source 0.133
3. Improper use of systematic navigation
labeling
0.169
4. Poor presentation of destination’s
information
0.225
5. No relevant links (airports, travel agencies) 0.136
6. No separate information for business
partners
0.073
7. No comment mechanism and tourism
destination forum
0.130
TABLE 7. Importance Indices of UsabilityCriteria in Dimension 4
Dimension 4. User Interface and Navigation ImportanceIndex
1. Links open in a new browser window 0.111
2. Imperfect basic webpage elements 0.118
3. Dead links 0.191
4. Lacking of navigation support 0.148
5. The color of visited hyperlinks is not
significant
0.076
6. Lacking of international service 0.087
7. Doesn’t have a ‘‘Go Back’’ button 0.124
8. Without an internal search engine 0.145
TABLE 8. Importance Indices of UsabilityCriteria in Dimension 5
Dimension 5. General ImportanceIndex
1. Long sever responding time 0.255
2. Download time is too long 0.185
3. Bad browser compatibility 0.219
4. Program is not accurate 0.220
5. No accessible pages for disabled people 0.121
Qi, Law, and Buhalis 191
Downloaded By: [Hong Kong Polytechnic University] At: 13:27 30 December 2009

website. However, the respondents thoughtthat the color of visited hyperlinks wasrelatively unimportant.
Dimensions 5—General Criteria. Thisdimension determines the general perceptionof a website including server’s respondingtime, download time, browser compatibility,program accuracy, and website accessibilityfor disable people. As reflected in Table 8,the importance index of ‘‘long sever respond-ing time’’ was scored the highest in thisdimension. This indicates that the respon-dents would not wait too long when they aretrying to open a webpage. Still, the accessi-bility for disabled users did not seem to be amajor concern.
Overall Usability Hazard Indices ofChina’s DMO Websites
The results in general usability hazardindices are shown in Tables 9 to 14. Asindicated in Table 9, the language dimensionwas scored 3.681. This value shows that
TABLE 9. Usability Hazard Indices of ChineseDMO Websites in Dimension 1
Dimension 1. Language UsabilityHazard
1. Spelling and grammar mistakes 1.695
2. Use lots of Internet jargon buzzwords 0.040
3. Texts are not readable and understandable
(include the headlines)
1.946
Dimension total 3.681
TABLE 10. Usability Hazard Indices of ChineseDMO Websites in Dimension 2
Dimension 2. Website Layout UsabilityHazards Index
1. Using graphical bullet/divider bars in
a wrong way
0.395
2. Webpage is too long 1.076
3. Horizontal scrolling under the common
screen’s resolution
0.096
4. No print-out options 1.120
5. Nonstandard text colors 0.697
6. Disordered website structure 1.201
7. Not using multimedia images 0.642
Dimension total 5.227
TABLE 11. Usability Hazard Indices of ChineseDMO Websites in Dimension 3
Dimension 3. Information Architecture UsabilityHazards
Index
1. Doesn’t mark changed URLs on the old
website
1.340
2. Poor information on data’s source 1.030
3. Improper use of Systematic navigation
labeling
0.273
4. Poor presentation of destination’s information 0.980
5. No relevant links (airports, travel agencies) 0.680
6. No separate information for Business partners 0.365
7. No comment mechanism and tourism
destination forum
0.671
Dimension total 5.339
TABLE 12. Usability Hazard Indices of ChineseDMO Websites in Dimension 4
Dimension 4. User Interface and Navigation UsabilityHazards Index
1. Links open in a new browser window 0.895
2. Imperfect basic webpage elements 0.571
3. Dead links 1.140
4. Lacking of navigation support 0.477
5. The color of visited hyperlinks is not
significant
0.785
6. Lacking of international service 1.235
7. Doesn’t have a ‘‘Go Back’’ button 0.920
8. Doesn’t have an internal search engine 1.169
Dimension total 7.192
TABLE 13. Usability Hazard Indices of ChineseDMO Websites in Dimension 5
Dimension 5. General UsabilityHazards Index
1. Long sever responding time 1.357
2. Download time is too long 1.208
3. Bad browser compatibility 0.071
4. Program not accurate 0.958
5. No accessible pages for disabled people 2.098
Dimension total 5.692
TABLE 14. Usability Hazard Indices of ChineseDMO Websites
Dimensions UsabilityHazards Index
Dimension 1. Language 3.681
Dimension 2. Website Layout 5.227
Dimension 3. Information Architecture 5.339
Dimension 4. User Interface and Navigation 7.192
Dimension 5. General 5.692
Industry performance 27.131
192 JOURNAL OF TRAVEL & TOURISM MARKETING
Downloaded By: [Hong Kong Polytechnic University] At: 13:27 30 December 2009

minor problems were found in this dimen-sion. China’s DMO websites should usemore simple words to make their texts morereadable.
Table 10 shows that the usability hazardindex in Dimension 2 ‘‘website layout’’ is5.227, which is much lower than the maximalscore of 20. This finding demonstrates thatthe DMO websites have medium problems inthis dimension. As revealed by the data, theusability criterion of ‘‘disordered websitestructure’’ was scored 1.201 and is thehighest in this dimension. China’s DMOwebsite developers should; therefore, paymore attention to websites’ structures.
Table 11 shows that the usability hazardindex in Dimension 3 of ‘‘informationarchitecture’’ was scored 5.339, implyingthat China’s provincial DMO websites havemedium problems in this dimension. Inaddition, the attribute of ‘‘doesn’t markchanged URLs on the old website’’ wasscored the highest in this dimension. TheDMO website developers in China shouldpresent a new link on the old website when aweb address has been changed.
Table 12 presents the usability hazardindex of Dimension 4. In the research, ‘‘userinterface and navigation’’ has an index of7.192, which is the highest among alldimensions. In other words, this dimensionhas the worst performance on China’s DMOwebsites as compared to other dimensions.In addition, the criterion of ‘‘lacking ofinternational service’’ was scored the highest.China’s DMO websites should provide moreinternational services such as to improve thequality of the websites’ English version andto present their content in other languages.
In Table 13, the usability hazard index forDimension 5, ‘‘general,’’ was scored 5.692.This indicates that medium problems werefound on the websites. The attribute that hasthe worst performance was ‘‘no accessiblepages for disabled people’’ which was scored2.098. In other words, the websites did notprovide the necessary service to physicallychallenged users.
The DMO website usability hazard indicesin each dimension are shown in Table 14.
The sum of the five dimensions’ usabilityhazard indices, which is the industrialperformance, was scored 27.131. As pre-viously indicated, this finding belongs tolevel 2, which implies medium problems werefound on China’s DMO websites. Abeleto(Sprengers, 2004) stated that mediumhazards can cause the loss of visitors if thesefactors cannot be improved. It is unlikemajor hazards that can lead to criticaldamage on a website.
Results of Different Categories ofDestinations in China
All usability hazard indices were listed inTable 15 and Table 16. In order to explorethe correlation between website performanceand regional tourism development, the 31key Chinese provinces and autonomousmunicipalities were classified into twogroups according to their total tourismincome in 2005 (CNTA, 2006). Sixteenregions were classified as high tourismincome which means the total tourismincome in each of these regions was morethan RMB6 billion, the median value of allregions. The remaining 15 regions were thenclassified as low tourism income group.
According to Table 15, the overall hazardindex for the high tourism income regionswas 26.822, indicating medium problemswere found on these websites. The regionthat had the best usability performance isBeijing that had an overall score of 15.740;whereas the regions that had the worstusability performance are Sichuan andHebei provinces—both received the samescore of 33.160. Guangdong province hadthe highest tourism income, but its usabilityhazard index was 32.460. For the websites ofhigh tourism income, Dimensions 1 and 5had the least and the worst problems,respectively.
There were 15 regions in the low tourismincome group (Table 16). The average usabil-ity hazard index was 27.712, which meansthat these tourism websites had mediumproblems. The website of Anhui provincehad the least problem (scored at 21.488), and
Qi, Law, and Buhalis 193
Downloaded By: [Hong Kong Polytechnic University] At: 13:27 30 December 2009

TABLE 15. Usability Hazard Indices of Destinations High Tourism Income More Than 6 BillionRMB
Dimension 1. Language 2. WebsiteLayout
3. InformationArchitecture
4. UserInterface and
Navigation
5. General UsabilityHazard Index ofDMO Websites
Total TourismIncome Billion
RMBProvince
Hena 3.775 7.425 6.415 7.990 6.813 32.018 6,131,777,100
Hunan 3.775 6.738 5.125 6.160 11.220 33.018 6,134,438,100
Guangxi 3.775 5.390 2.670 5.435 6.280 23.550 6,380,689,800
Hubei 3.775 4.660 4.460 7.830 7.013 27.738 6,726,849,100
Fujian 3.775 6.375 8.675 6.755 7.013 32.593 6,767,746,600
Hebei 3.775 5.930 7.680 7.855 7.920 33.160 6,958,152,900
Guizhou 3.775 2.510 0.670 3.965 7.470 18.390 7,026,761,700
Yunnan 5.000 5.925 7.575 4.730 4.620 27.850 8,122,685,700
Liaoning 3.775 6.730 2.640 5.350 9.020 27.515 9,519,912,100
Sichuan 3.775 5.930 7.680 7.855 7.920 33.160 12,049,831,600
Shandong 3.775 5.545 3.690 7.545 3.520 24.075 12,519,310,200
Zhejiang 3.775 3.685 4.050 4.505 2.438 18.453 20,370,141,100
Jiangsu 3.775 6.235 4.715 3.080 3.713 21.518 22,392,006,100
Shanghai 3.775 4.575 4.915 7.425 7.140 27.830 31,453,633,300
Beijing 3.775 3.290 2.685 3.075 2.915 15.740 40,115,447,400
Guangdong 3.775 9.885 3.400 7.480 7.920 32.460 72,054,044,100
Average 3.851 5.677 4.815 6.047 6.432 26.822
Note. The overall usability hazard index: 0.00–25.00 5 level 1, which means minor problems were found on this website; 25.01–50.00 5 level2, which means medium problems were found on this website; 50.01–75.00 5 level 3, which means major problems were found on thiswebsite; 75.01–100.00 5 level 4, which means destructive problems were found on this website.
TABLE 16. Usability Hazard Indices of Destinations with Tourism Income Lower Than 6 BillionRMB
Dimensions 1. Language 2. WebsiteLayout
3. InformationArchitecture
4. UserInterface and
Navigation
5. General Usability HazardIndex of DMO
Websites
TotalTourism Income
Billion RMBProvince
Tibet 3.775 4.950 4.425 3.865 4.620 21.635 381,225,500
Qinghai 3.775 5.550 6.915 8.300 3.345 27.885 404,049,300
Ningxia 3.775 6.425 7.295 13.615 7.920 39.030 815,818,000
Nei Menggu 1.695 2.290 9.450 8.415 2.420 24.270 1,648,154,400
Gansu 3.775 7.115 8.785 6.420 4.620 30.715 1,798,769,200
Jilin 1.695 4.325 8.505 9.935 2.420 26.880 2,324,890,600
Heilongjiang 3.775 3.310 3.595 7.290 5.720 23.690 3,238,843,000
Tianjin 3.775 4.035 4.640 7.225 6.040 25.715 3,463,862,700
Jiangxi 3.775 5.925 8.015 11.445 5.720 34.880 3,653,787,600
Hainan 3.775 5.540 2.670 6.540 3.713 22.238 3,851,726,200
Xinjiang 3.775 7.878 6.455 10.515 4.445 33.068 4,431,841,300
Shaanxi 3.775 3.665 4.430 9.535 10.120 31.525 4,439,593,700
Anhui 3.775 5.360 3.795 5.945 2.613 21.488 4,489,361,200
Chongqing 3.775 3.985 4.000 5.915 5.720 23.395 4,967,020,800
Shanxi 3.775 3.200 9.455 9.145 3.695 29.270 5,004,382,900
Average 3.498 4.903 6.162 8.273 4.876 27.712
Note. The overall usability hazard index: 0.00–25.00 5 level 1, which means minor problems were found on this website; 25.01–50.00 5 level2, which means medium problems were found on this website; 50.01–75.00 5 level 3, which means major problems were found on thiswebsite; 75.01–100.00 5 level 4, which means destructive problems were found on this website.The foreign exchange rate was from Bank of China (2007).
194 JOURNAL OF TRAVEL & TOURISM MARKETING
Downloaded By: [Hong Kong Polytechnic University] At: 13:27 30 December 2009

the website that had the worst performanceis Ningxia province (scored at 39.030).Moreover, Dimensions 1 and 4 on DMOwebsites for low tourism income regions hadthe least and the worst problems, respec-tively.
In addition, the research findings alsoindicate the worst and the best performingdestinations. The best one is Beijing and theworst one is Ningxia. On Beijing’s website,the lowest score was 15.74, and the averagedimension score was around 3. The bestperforming dimension was InformationArchitecture. Additionally, the worst per-forming dimension on Beijing’s website wasLanguage. The Beijing DMO website devel-oper should improve the choice of words topresent information. On Ningxia’s DMOwebsite, the overall score was 39.03, andmost dimensions on the website scored morethan 6. Naturally, website developers ofNingxia should seriously consider makingimprovement in these dimensions. The mostcrucial improvement is, perhaps, to makebetter the dimension of User Interface andNavigation. Otherwise, users will simplyleave this website due to its poor structure.Also, it is important to arrange the websitecontent and features, and to make allelements aligned properly in an easy tounderstand way. Lastly, the DMO ofNingxia has been improved on its Generalperformance that related to the downloadspeed, general practice of design, and main-tenance.
Moreover, an attempt to find the correla-tion between tourism income and websiteusability performance was made. Thisresearch used Mann-Whitney U test, anindependent sample nonparametric test, toexamine the existence of significant differ-ence between the two groups of regions withdifferent levels of tourism income and their
websites’ usability performance (Table 17).Empirical findings showed that there is nosignificant difference between the high andlow tourism income groups and the websiteusability performance. In other words, thelevel of tourism development, which ismeasured by total tourism income, did notseem to significantly influence the websiteusability performance.
IMPLICATIONS ANDCONCLUSIONS
This study has adopted a modified heur-istic usability evaluation method to examinethe usability performance of 31 Chineseprovincial and autonomous municipalDMO websites. Research findings indicatethat the overall usability performance ofChina’s DMO websites was 27.131, indicat-ing these websites had medium problems.Although different regions have developedtheir DMO websites, usability does not seemto be incorporated into the website develop-ment process. This is evident by the fact thatthe overall usability performance of theanalyzed websites exhibited medium pro-blems.
According to the research findings, DMOwebsite designers should not only focus onthe problems of website usability but alsopay attention to what users are looking for.Based on the research findings, ChineseDMO users demand high quality websiteswhich are user-friendly. Tourism practi-tioners can determine, on the basis of theevaluated importance criteria, which attri-butes and criteria require more efforts onongoing improvement. In order to enhanceusers’ satisfaction of DMO websites, tourismpractitioners should improve their websitenavigation systems. In this way, users’ self
TABLE 17. Mann-Whitney U Test Results
High Tourism IncomeDestinations (n 5 16)
Low Tourism IncomeDestination (n 5 15)
Z Sig
Usability Hazard Index 26.822 27.712 20.158 0.892
Qi, Law, and Buhalis 195
Downloaded By: [Hong Kong Polytechnic University] At: 13:27 30 December 2009

searching will become more efficient.Moreover, providing clear website structureand more readable text on web pages cansurely help improve Chinese DMO usabilityperformance. As well, when a website haschanged its URL, clear information aboutthe new address should be presented.
An expected outcome for the relationshipbetween usability performance and regionaltourism revenues could be the existence of anegative relationship. That is, lower revenuecould render less satisfactory website perfor-mance. However, findings of this researchdid not show such a relationship. Still, allregions should continuously devote theirresources on ongoing website improvement.
Since a consensus has not been reached onwhat the best criteria and practices are,Morrison et al. (2004, p. 246) stated that ‘‘itis impossible at this point to pinpoint thestate of the art in Website evaluation fortourism and hospitality.’’ Still, findings ofthis study can offer some useful implicationsto tourism managers. First, tourism man-agers can apply, and possibly further modify,the approach to measure their websites’performance. The numeric scores would bevital for practitioners to understand howappealing their websites are to users, todetermine within-sector performance, and tojudge a website’s performance versus itspeer. Additionally, the approach presentedin this study appears repeatable, measurable,and has the potential to form a long-termmetric that would assist refinement of an e-tourism program. Also, research outcomeswill offer further insights on setting new e-metric standards and creating new e-metricsto measure a tourism business’s achievement.
A successful DMO website should notonly serve as a data repository of destinationinformation. It should also serve as an easy-to-use platform. This research; therefore, canbe regarded as a benchmark for furtheranalysis of the usability of DMO websitesusing quantitative modeling techniques.Findings of this research can also help travelwebsite developers in general and DMOwebsite developers in particular on designand the subsequent promotion.
The usability evaluation model, after all, isperception based, which renders its difficultyto generalize the findings. Longitudinal andrepeated studies can, and should, be able toeliminate any potential bias. Also, althoughthis research had evaluated 31 DMO web-sites in China, the country’s fast develop-ment certainly deserves ongoing researchendeavors on evaluating its tourism websiteson a regular basis. In addition to conductinga longitudinal study of the DMO websites,other destination websites can be evaluatedin future studies. Another future researchpossibility is to compare and contrastdifferent groups of DMO websites in differ-ent countries and using other separationmethods such as per capita income andnumber of tourist attractions.
REFERENCES
Agarwal, R., & Venkatesh, V. (2002). Assessing a
firm’s web presence: A heuristic evaluation proce-
dure for the measurement of usability. Information
Systems Research, 13(2), 168-186.
Au Yeung, T., & Law, R. (2003). Usability evaluation
of Hong Kong hotel websites. In A. J. Frew, M.
Hitz, & P. O’Connor (Eds.), Information and
communication technologies in tourism 2003 (pp.
261-269). Wien: Springer.
Au Yeung, T., & Law, R. (2006). Evaluation of usability:
A study of hotel web sites in Hong Kong. Journal of
Hospitality & Tourism Research, 30(4), 1-22.
Bank of China. (2007). Foreign exchange rate.
Retrieved February 2, 2007, from http://www.boc.
cn/cn/common/whpj.html
Benckendorff, P. J., & Black, M. L. (2000).
Destination marketing on the Internet: A case
study of Australian regional tourism authorities.
Journal of Tourism Studies, 10(1), 11-21.
Buhalis, D. (2000). Marketing the competitive destina-
tion of the future. Tourism Management, 21(1), 97-
116.
Buhalis, D. (2003). E-tourism: Information technology
for strategic tourism management. Englewood Cliff,
NJ: Prentice Hall.
Buhalis, D. (2005). Information technology in tourism.
In C. Cooper, J. Fletcher, D. Gilbert, A. Fyall, & S.
Wanhill (Eds.), Tourism: Principles and practice
(pp. 702-730). London: Pearson.
Cappel, J. J., & Huang, Z. (2007). A usability analysis
of company websites. Journal of Computer
Information Systems, 48(1), 117-123.
196 JOURNAL OF TRAVEL & TOURISM MARKETING
Downloaded By: [Hong Kong Polytechnic University] At: 13:27 30 December 2009

China a top tourist destination by 2020. (2004, May
13). China Daily News. Retrieved July 15, 2006,
from http://www.chinadaily.com.cn/english/doc/
2004-05/13/content_330514.htm
China Internet Network Information Center. (2007).
Statistical report on the Internet development in
China. China: Author.
China National Tourism Administration. (2006). The
year book of China tourism statistics. Beijing: China
Tourism Press.
Cui, F. J. (2002). The innovation and development of
Chinese tourism destination. China: China Tourism
Publishing Company.
Douglas, A., & Mills, J. E. (2004). Staying afloat in the
tropics: Allying a structural equation model
approach to evaluating national tourism organiza-
tion website in the Caribbean. In R. Law & J. Mills
(Eds.), Handbook of consumer behaviour, tourism,
and the Internet (pp. 269-293). New York: Haworth.
Elges, M. (2004). Why worry about web site usability?
Credit Union Executive Newsletter, 30(19), 8.
Feng, R., Morrison, A. M., & Ismail, A. J. (2003). East
versus West: A comparison of online destination
marketing in China and the USA. Journal of
Vacation Marketing, 10(1), 43-56.
Ham, S. (2004). Developing a content analysis evalua-
tion approach for the examination of limited-
service lodging properties. Journal of Travel &
Tourism Marketing, 17(2/3), 295-308.
Hanna, J. R. P., & Millar, R. J. (1997). Promoting
tourism on the Internet. Tourism Management,
18(7), 469-470.
Hu, X. Q., Zeng, H., & He, Y. M. (2006). Impact of e-
tourism on Chinese tourism industry and future
developing suggestion. Market Modernization, 478,
94-95.
Ismail, J. A., Labropoulos, T., Mills, J. E., &
Morrison, A. (2002). A snapshot in time: The
marketing of culture in European Union NTO web
sites. Tourism Culture & Communication, 3(3), 165-
179.
Kaplanidou, K., & Vogt, C. (2004). Destination
marketing organization websites (DMOs) evaluation
and design: What you need to know? Retrieved
February 18, 2007, from Michigan State University
Web site: http://www.travelmichigannews.org/
Research.htm
Kim, W. G., & Lee, H. Y. (2004). Comparison of web
service quality between online travel agencies and
online travel suppliers. Journal of Travel & Tourism
Marketing, 17(2/3), 105-116.
Kotler, P., Bowen, J., & Makens, J. (2003). Marketing
for hospitality and tourism. Upper Saddle River, NJ:
Prentice Hall.
Li, Y. L., & Lu, Z. (2006). Comparative analysis of
Chinese and American tourism websites and the
prediction model of virtual distance attenuation.
Human Geography, 21(6), 115-118.
Liu, B. Y. (2004). Development, integration and
utilization of tourist information resources.
Library Tribune, 24(23), 145-147.
Ma, J., Buhalis, D., & Song, H. (2003). The adoption
of ICTs & Internet in China and impact to tourism
industry structure. International Journal of
Information Management, 23(6), 451-467.
Mack, R. L., & Nielsen, J. (1994). Executive summary.
In J. Neielsen & R. L Mack (Eds.), Usability
inspection methods (pp. 1-22). New York: John
Wiley & Sons.
Mills, J. E., & Morrison, A. M. (2000). Updated
Balanced Score Card Instrument. Retrieved January
15, 2007, from http://www.htmresearch.atfreeweb.
com/BSC
Morrison, A. M., Taylor, S., & Douglas, A. (2004).
Website evaluation in tourism and hospitality: The
art is not yet stared. Journal of Travel & Tourism
Marketing, 17(2/3), 233-251.
Morrison, A. M., Taylor, S., Morrison, A. J., &
Morrison, A. D. (1999). Marketing small hotels on
the World Wide Web. Information Technology &
Tourism, 2(2), 97-113.
Nielsen, J. (1992, May 3–7). Finding usability pro-
blems through heuristic evaluation. Proceedings
ACM CHI’92 Conference, Monterey, CA (pp. 373-
380). New York: ACM. Retrieved February 26,
2007, from http://portal.acm.org/citation.cfm?id5
142834&dl5GUIDE&coll5GUIDE&CFID5
77231111&CFTOKEN521603516
Nielsen, J. (1993). Usability engineering. London:
Academic Press.
Nielsen, J. (1994). Heuristic evaluation. In J. Nielsen &
R. L. Mack (Eds.), Usability inspection methods
(pp. 25-62). New York: John Wiley & Sons.
Nielsen, J. (2000). Designing web usability: The practice
of simplicity. New York: New Riders.
Nielsen, J. (2003). Usability 101: Introduction to
usability. Retrieved October 6, 2007, from http://
www.useit.com/alertbox/20030825.html
Nielsen, J., & Landauer, T. K. (1993, April 24–29). A
mathematical model of the finding of usability
problems. Proceedings of ACM INTERCHI’93
Conference, Amsterdam, The Netherlands (pp. 206-
213). New York: ACM. Retrieved February 26,
2007, from http://portal.acm.org/citation.cfm?id5
169059.169166
Nielsen, J., & Molich, R. (1990, April 1–5). Heuristic
evaluation of user interfaces. Proceedings of ACM
CHI’90 Conference, Seattle, WA (pp. 249-256). New
York: ACM. Retrieved February 26, 2007, from
http://portal.acm.org/citation.cfm?id597281&
dl5GUIDE&coll5GUIDE&CFID577231111&
CFTOKEN521603516
Qi, Law, and Buhalis 197
Downloaded By: [Hong Kong Polytechnic University] At: 13:27 30 December 2009

Nielsen, J., & Norman, D. A. (2000, February 14).
Usability on the Web isn’t a luxury. Information
Week, 773, 65-69.
Oertel, B., Thio, S. L., & Feil, T. (2001).
Benchmarking tourism destination in the
European Union. In P. J. Sheldon, K. W. Wooer,
& D. R. Fesenmaier (Eds.), Information and
communication technology in tourism 2001 (pp.
234-243). New York: Spring-Verlag Wien.
Olive, E. G. (2002). Usability: Marking the web work.
Intercom, 49(9), 8-10.
Pike, S. (2005). Destination marketing organisations.
Oxford: Elsevier.
Qi, S. S., Buhalis, D., & Law, R. (2007). Evaluation of
the usability of Chinese provincial DMO websites.
In M. Sigala, L. Mich, & J. Murphy (Eds.),
Information and communication technologies in
tourism 2007 (pp. 267-278). Vienna: Springer.
Ritchie, J. R. B., & Crouch, G. I. (2003). The
competitive destination. Oxford: CABI Publishing.
Sekaran, U. (2003). Research methods for business: A
skill building approach (4th ed.). New York: John
Wiley & Sons.
So, S. I., & Morrison, A. M. (2004). Internet market-
ing in tourism in Asia: An evaluation of the
performance of East Asian National Tourism
Organization Web Sites. Journal of Hospitality &
Leisure Marketing, 11(4), 93-118.
Sprengers, J. (2004). Objective evaluation of likely
usability hazards—Preliminaries for user testing.
Retrieved July 15, 2006, from http://www.abeleto.
nl/resources/articles/objective1.html
Tunnard, C. R., & Haines, P. (1999). Destination
marketing systems—A new role for tourist board
marketing in the information age. Journal of
Vacation Marketing, 1(4), 43-56.
Wan, C.-S. (2002). The web sites of international
tourist hotels and tour wholesalers in Taiwan.
Tourism Management, 23(2), 155-160.
Wang, S., Yu, T., & Avgoustis, S. (2005). The ‘‘The
Top City’’ Rating System: A case study of China’s
NTO functions. China Tourism Research, 1(2), 374-
384.
Wang, X. (2000). The status of Chinese e-tourism
developing in future. Social Scientist, 15(3), 50-54.
Wei, F. Y., Li, W. X., Wang, J., & Guo, J. F. (2006).
Research and development of tourism information
system based on web service and Microsoft NET
framework. Geomatics & Spatial Information
Technology, 29(4), 57-58.
Wei, M. (2006). Analysis on the usage of electronic
information technology in China’s tourism. Journal
of Kaifeng University, 20(4), 9-12.
Wen, Z. B., & Zhang, W. (2006). A study of China’s e-
tourism. Commercial Economics Review, 2, 13-15.
World Tourism Organization Business Council.
(2001). E-business for tourism, practical guidelines
for destinations and businesses. Madrid, Spain:
Author.
World Tourism Organization Business Council.
(2005). Evaluating and improving websites, the
destination web watch. Madrid, Spain: Author.
Wu, J. (2006). Chinese tourism: A case study of
Dunhuang—The Chinese travel destination of e-
Tourism development and analysis. Study of the
Productive Force, 1, 152-154.
Yang, L. (2001). A study on the problems and counter-
measures in development of China’s tourism
electronic business. Tourism Tribute, 16(6), 40-42.
Zhang, J. (2005). A case study of Shanghai Spring &
Autumn National Tourism administration—
Analysis of the successful case on large travel
agencies’ development of e-Tourism. Technoe-
conomics & Management Research, 6, 60-61.
Zhou, Y., & Shi, Y. (2005). The current situation of
Chinese e-tourism development and marketing
strategy and advises. Economics, 7, 117-118.
SUBMITTED: July 9, 2007FINAL REVISION SUBMITTED:
October 10, 2007ACCEPTED: October 22, 2007
REFEREED ANONYMOUSLY
198 JOURNAL OF TRAVEL & TOURISM MARKETING
Downloaded By: [Hong Kong Polytechnic University] At: 13:27 30 December 2009