Are nicotinoids protonated on the pyridine or the amino nitrogen in the gas phase?
Upload
leidenunivCategory
view
0download
0
This article appeared in a journal published by Elsevier. The attachedcopy is furnished to the author for internal non-commercial researchand education use, including for instruction at the authors institution
and sharing with colleagues.
Other uses, including reproduction and distribution, or selling orlicensing copies, or posting to personal, institutional or third party
websites are prohibited.
In most cases authors are permitted to post their version of thearticle (e.g. in Word or Tex form) to their personal website orinstitutional repository. Authors requiring further information
regarding Elsevier’s archiving and manuscript policies areencouraged to visit:
http://www.elsevier.com/copyright
Author's personal copy
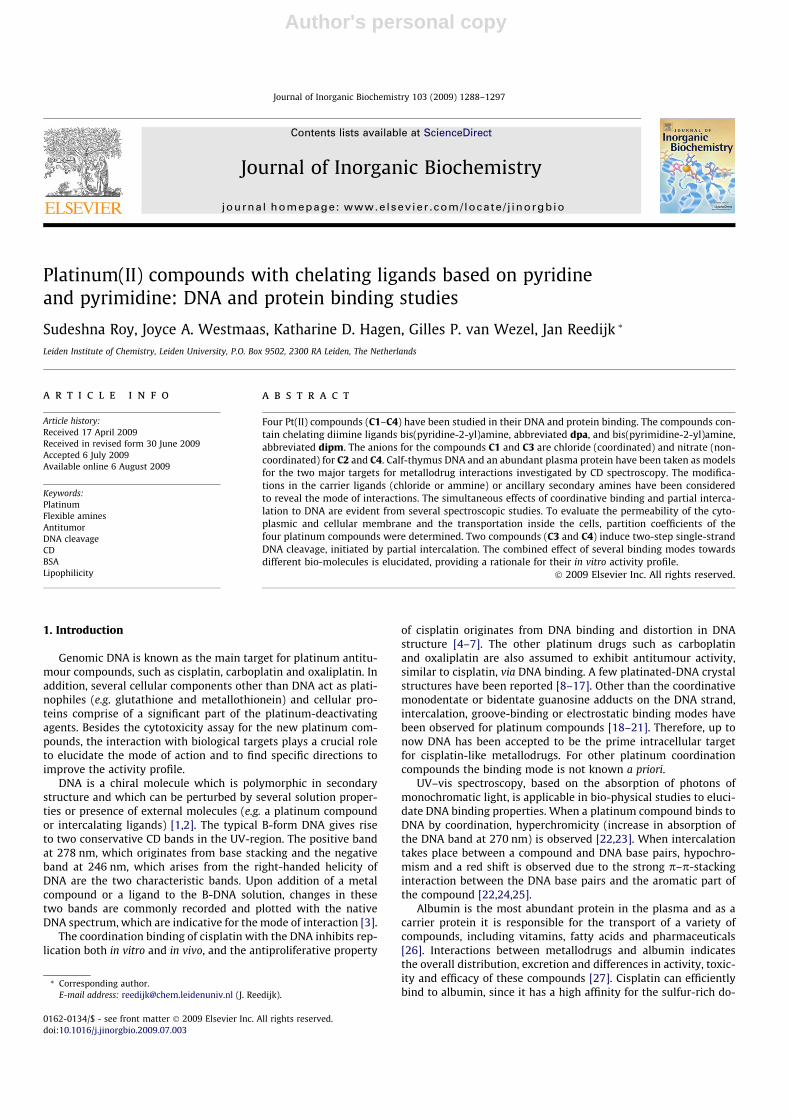
Platinum(II) compounds with chelating ligands based on pyridineand pyrimidine: DNA and protein binding studies
Sudeshna Roy, Joyce A. Westmaas, Katharine D. Hagen, Gilles P. van Wezel, Jan Reedijk *
Leiden Institute of Chemistry, Leiden University, P.O. Box 9502, 2300 RA Leiden, The Netherlands
a r t i c l e i n f o
Article history:Received 17 April 2009Received in revised form 30 June 2009Accepted 6 July 2009Available online 6 August 2009
Keywords:PlatinumFlexible aminesAntitumorDNA cleavageCDBSALipophilicity
a b s t r a c t
Four Pt(II) compounds (C1–C4) have been studied in their DNA and protein binding. The compounds con-tain chelating diimine ligands bis(pyridine-2-yl)amine, abbreviated dpa, and bis(pyrimidine-2-yl)amine,abbreviated dipm. The anions for the compounds C1 and C3 are chloride (coordinated) and nitrate (non-coordinated) for C2 and C4. Calf-thymus DNA and an abundant plasma protein have been taken as modelsfor the two major targets for metallodrug interactions investigated by CD spectroscopy. The modifica-tions in the carrier ligands (chloride or ammine) or ancillary secondary amines have been consideredto reveal the mode of interactions. The simultaneous effects of coordinative binding and partial interca-lation to DNA are evident from several spectroscopic studies. To evaluate the permeability of the cyto-plasmic and cellular membrane and the transportation inside the cells, partition coefficients of thefour platinum compounds were determined. Two compounds (C3 and C4) induce two-step single-strandDNA cleavage, initiated by partial intercalation. The combined effect of several binding modes towardsdifferent bio-molecules is elucidated, providing a rationale for their in vitro activity profile.
� 2009 Elsevier Inc. All rights reserved.
1. Introduction
Genomic DNA is known as the main target for platinum antitu-mour compounds, such as cisplatin, carboplatin and oxaliplatin. Inaddition, several cellular components other than DNA act as plati-nophiles (e.g. glutathione and metallothionein) and cellular pro-teins comprise of a significant part of the platinum-deactivatingagents. Besides the cytotoxicity assay for the new platinum com-pounds, the interaction with biological targets plays a crucial roleto elucidate the mode of action and to find specific directions toimprove the activity profile.
DNA is a chiral molecule which is polymorphic in secondarystructure and which can be perturbed by several solution proper-ties or presence of external molecules (e.g. a platinum compoundor intercalating ligands) [1,2]. The typical B-form DNA gives riseto two conservative CD bands in the UV-region. The positive bandat 278 nm, which originates from base stacking and the negativeband at 246 nm, which arises from the right-handed helicity ofDNA are the two characteristic bands. Upon addition of a metalcompound or a ligand to the B-DNA solution, changes in thesetwo bands are commonly recorded and plotted with the nativeDNA spectrum, which are indicative for the mode of interaction [3].
The coordination binding of cisplatin with the DNA inhibits rep-lication both in vitro and in vivo, and the antiproliferative property
of cisplatin originates from DNA binding and distortion in DNAstructure [4–7]. The other platinum drugs such as carboplatinand oxaliplatin are also assumed to exhibit antitumour activity,similar to cisplatin, via DNA binding. A few platinated-DNA crystalstructures have been reported [8–17]. Other than the coordinativemonodentate or bidentate guanosine adducts on the DNA strand,intercalation, groove-binding or electrostatic binding modes havebeen observed for platinum compounds [18–21]. Therefore, up tonow DNA has been accepted to be the prime intracellular targetfor cisplatin-like metallodrugs. For other platinum coordinationcompounds the binding mode is not known a priori.
UV–vis spectroscopy, based on the absorption of photons ofmonochromatic light, is applicable in bio-physical studies to eluci-date DNA binding properties. When a platinum compound binds toDNA by coordination, hyperchromicity (increase in absorption ofthe DNA band at 270 nm) is observed [22,23]. When intercalationtakes place between a compound and DNA base pairs, hypochro-mism and a red shift is observed due to the strong p–p-stackinginteraction between the DNA base pairs and the aromatic part ofthe compound [22,24,25].
Albumin is the most abundant protein in the plasma and as acarrier protein it is responsible for the transport of a variety ofcompounds, including vitamins, fatty acids and pharmaceuticals[26]. Interactions between metallodrugs and albumin indicatesthe overall distribution, excretion and differences in activity, toxic-ity and efficacy of these compounds [27]. Cisplatin can efficientlybind to albumin, since it has a high affinity for the sulfur-rich do-
0162-0134/$ - see front matter � 2009 Elsevier Inc. All rights reserved.doi:10.1016/j.jinorgbio.2009.07.003
* Corresponding author.E-mail address: [email protected] (J. Reedijk).
Journal of Inorganic Biochemistry 103 (2009) 1288–1297
Contents lists available at ScienceDirect
Journal of Inorganic Biochemistry
journal homepage: www.elsevier .com/locate / j inorgbio
Author's personal copy
mains. Consequently, this leads to Pt–methionine adducts, whichmay act as a platinum reservoir for subsequent DNA platination.Therefore, elucidation of protein-platinum compound interactionto explain the in vivo efficacy or deactivation of Pt-containing drugsis important [28].
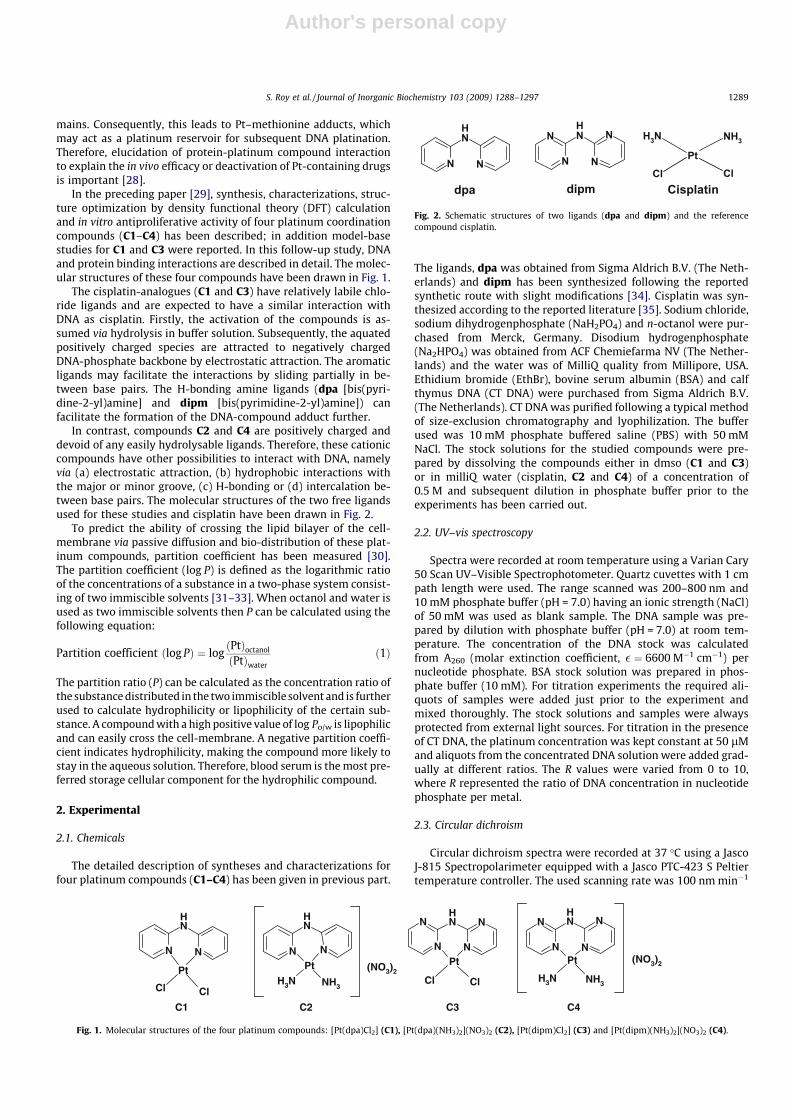
In the preceding paper [29], synthesis, characterizations, struc-ture optimization by density functional theory (DFT) calculationand in vitro antiproliferative activity of four platinum coordinationcompounds (C1–C4) has been described; in addition model-basestudies for C1 and C3 were reported. In this follow-up study, DNAand protein binding interactions are described in detail. The molec-ular structures of these four compounds have been drawn in Fig. 1.
The cisplatin-analogues (C1 and C3) have relatively labile chlo-ride ligands and are expected to have a similar interaction withDNA as cisplatin. Firstly, the activation of the compounds is as-sumed via hydrolysis in buffer solution. Subsequently, the aquatedpositively charged species are attracted to negatively chargedDNA-phosphate backbone by electrostatic attraction. The aromaticligands may facilitate the interactions by sliding partially in be-tween base pairs. The H-bonding amine ligands (dpa [bis(pyri-dine-2-yl)amine] and dipm [bis(pyrimidine-2-yl)amine]) canfacilitate the formation of the DNA-compound adduct further.
In contrast, compounds C2 and C4 are positively charged anddevoid of any easily hydrolysable ligands. Therefore, these cationiccompounds have other possibilities to interact with DNA, namelyvia (a) electrostatic attraction, (b) hydrophobic interactions withthe major or minor groove, (c) H-bonding or (d) intercalation be-tween base pairs. The molecular structures of the two free ligandsused for these studies and cisplatin have been drawn in Fig. 2.
To predict the ability of crossing the lipid bilayer of the cell-membrane via passive diffusion and bio-distribution of these plat-inum compounds, partition coefficient has been measured [30].The partition coefficient (log P) is defined as the logarithmic ratioof the concentrations of a substance in a two-phase system consist-ing of two immiscible solvents [31–33]. When octanol and water isused as two immiscible solvents then P can be calculated using thefollowing equation:
Partition coefficient ðlog PÞ ¼ logðPtÞoctanol
ðPtÞwaterð1Þ
The partition ratio (P) can be calculated as the concentration ratio ofthe substance distributed in the two immiscible solvent and is furtherused to calculate hydrophilicity or lipophilicity of the certain sub-stance. A compound with a high positive value of log Po/w is lipophilicand can easily cross the cell-membrane. A negative partition coeffi-cient indicates hydrophilicity, making the compound more likely tostay in the aqueous solution. Therefore, blood serum is the most pre-ferred storage cellular component for the hydrophilic compound.
2. Experimental
2.1. Chemicals
The detailed description of syntheses and characterizations forfour platinum compounds (C1–C4) has been given in previous part.
The ligands, dpa was obtained from Sigma Aldrich B.V. (The Neth-erlands) and dipm has been synthesized following the reportedsynthetic route with slight modifications [34]. Cisplatin was syn-thesized according to the reported literature [35]. Sodium chloride,sodium dihydrogenphosphate (NaH2PO4) and n-octanol were pur-chased from Merck, Germany. Disodium hydrogenphosphate(Na2HPO4) was obtained from ACF Chemiefarma NV (The Nether-lands) and the water was of MilliQ quality from Millipore, USA.Ethidium bromide (EthBr), bovine serum albumin (BSA) and calfthymus DNA (CT DNA) were purchased from Sigma Aldrich B.V.(The Netherlands). CT DNA was purified following a typical methodof size-exclusion chromatography and lyophilization. The bufferused was 10 mM phosphate buffered saline (PBS) with 50 mMNaCl. The stock solutions for the studied compounds were pre-pared by dissolving the compounds either in dmso (C1 and C3)or in milliQ water (cisplatin, C2 and C4) of a concentration of0.5 M and subsequent dilution in phosphate buffer prior to theexperiments has been carried out.
2.2. UV–vis spectroscopy
Spectra were recorded at room temperature using a Varian Cary50 Scan UV–Visible Spectrophotometer. Quartz cuvettes with 1 cmpath length were used. The range scanned was 200–800 nm and10 mM phosphate buffer (pH = 7.0) having an ionic strength (NaCl)of 50 mM was used as blank sample. The DNA sample was pre-pared by dilution with phosphate buffer (pH = 7.0) at room tem-perature. The concentration of the DNA stock was calculatedfrom A260 (molar extinction coefficient, � ¼ 6600 M�1 cm�1) pernucleotide phosphate. BSA stock solution was prepared in phos-phate buffer (10 mM). For titration experiments the required ali-quots of samples were added just prior to the experiment andmixed thoroughly. The stock solutions and samples were alwaysprotected from external light sources. For titration in the presenceof CT DNA, the platinum concentration was kept constant at 50 lMand aliquots from the concentrated DNA solution were added grad-ually at different ratios. The R values were varied from 0 to 10,where R represented the ratio of DNA concentration in nucleotidephosphate per metal.
2.3. Circular dichroism
Circular dichroism spectra were recorded at 37 �C using a JascoJ-815 Spectropolarimeter equipped with a Jasco PTC-423 S Peltiertemperature controller. The used scanning rate was 100 nm min�1
N
N
N
N
NH
Pt
Cl Cl
N
N
N
N
NH
Pt
H3N NH3
(NO3)2
N N
NH
PtH3N NH3
N N
NH
Pt
Cl Cl
(NO3)2
C1 C3 C4C2
Fig. 1. Molecular structures of the four platinum compounds: [Pt(dpa)Cl2] (C1), [Pt(dpa)(NH3)2](NO3)2 (C2), [Pt(dipm)Cl2] (C3) and [Pt(dipm)(NH3)2](NO3)2 (C4).
N N
NH
N
N
N
N
NH
Cl Cl
H3N NH3Pt
dpa dipm Cisplatin
Fig. 2. Schematic structures of two ligands (dpa and dipm) and the referencecompound cisplatin.
S. Roy et al. / Journal of Inorganic Biochemistry 103 (2009) 1288–1297 1289
Author's personal copy
with a response time of 1 s. Spectra were recorded at standard sen-sitivity (100 mdeg) with a data-pitch of 0.5 nm in the continuousmode. The scanning range was 320–220 nm (for DNA) or 300–180 nm (for BSA). All the spectra are the average of four conse-quent accumulations. The cuvettes used were Hellma precisioncells made of Quartz Suprasil of 2 mm path length. The baselinewas corrected using a reference of 10 mM PBS. The sample volumein the cuvettes was kept fixed at 700 lL.
A typical sample containing DNA/protein and metal compoundin phosphate buffer was incubated at 37 �C and the spectra werecollected at the given time intervals. In addition the free ligandswere also investigated under similar conditions. As reference com-pounds, cisplatin and ethidium bromide (EthBr) were also followedfor similar time- and concentration-dependent experiments.
2.4. DNA binding studies
Supercoiled uX174 phage DNA (20 lM base pairs end concen-tration) was incubated with varying concentrations of the relevantcompounds in 10 mM phosphate buffer (pH = 7). All reactions con-tained a compound:CuSO4:ascorbic acid ratio of 4:1:16, unlessotherwise noted. Ascorbic acid and CuSO4 together (without addedcompound) result in unfolding of the DNA and therefore this mix-ture was used as control for all experiments. The compounds alonedo not cleave when incubated with DNA. Samples were incubatedin the dark at 37 �C for 30 min. After incubation, the reaction wasquenched by the addition of DNA loading buffer containing 1 mMof the Cu(I) chelator BCDA (bathocuproine disulfonic acid). Sam-ples were run on a 1% agarose gel in TAE buffer, stained with EthBr,and imaged with a BioRad ChemiDoc XRS apparatus.
2.5. Partition coefficient measurement
The partition coefficient was determined by a typical water/n-octanol biphasic partition method. The samples were prepared ata concentration of 50 lM in 0.15 M saline by weighing out theappropriate amount of the platinum compounds and adding thesolvents. These conditions were found sufficient to prevent rapidhydrolysis of C1 and C3. In all cases 3 mL of saline solution wasmixed with 3 mL of saline saturated n-octanol. This biphasic solu-tion mixture was shaken overnight by an automatic shaker and la-ter centrifuged at 13,000 rpm for 15 min. Then 1 mL aliquots ofboth layers (top layer: n-octanol and bottom layer: aqueous) werecollected separately. The aqueous sample was diluted 20-fold andthe total platinum content was determined by ICP-OES (induc-tively coupled plasma–optical emission spectroscopy). The n-octa-nol samples were injected to a FAAS and the total platinum contentwas determined. Each experiment was duplicated and results havebeen averaged.
The platinum concentration of samples in octanol was deter-mined using a graphite-oven flameless atomic absorption spectro-scope (FAAS), Perkin–Elmer 3100 AAS apparatus, equipped with aplatinum hollow cathode lamp and an AS-60 graphite-oven auto-sampler. All the measurements were repeated in triplicate andfor each measurement 20 lL of sample was injected directly. Thefurnace was purged with argon gas and before starting a new sam-ple the equipment was washed thoroughly with 1% HNO3 solution.The furnace was programmed as mentioned below: drying 200 �Cfor 100 s, ashing 1300 �C for 60 s (first cycle) and 20 �C for 15 s(second cycle), atomization and measurement 2650 �C/5 s, purging2600 �C/5 s. The wavelength of the lamp is 265.9 nm with a slitwidth of 0.70 nm.
The platinum concentration of samples in the aqueous phasewas determined by ICP-OES. Measurements were carried out usinga VISTA-MPX CCD Simultaneous ICP-OES instrument equippedwith a Varian SPS 3 auto sampler. The samples were diluted 20-
fold using a 3% HNO3 solution and 3 mL of sample was injected.The wavelength used was 214.424 nm and each measurementwas performed in duplicate. The average values of both phase mea-surements have been calculated for the final log P values.
3. Results and discussion
3.1. General comments
In the present study four platinum compounds (C1–C4) arestudied for their mode of action, which have several differencesin structures and properties (both chemically and electronically),with the aim to investigate the bio-physical properties andin vitro cytostatic activities. The changes in the ancillary ligands in-duce modifications of the chemical properties of the Pt complexeswhich should affect their interaction with different biological tar-gets. These results are useful to correlate the bio-physical studieswith in vitro cytotoxicity data.
3.2. UV–vis titration with Calf Thymus DNA
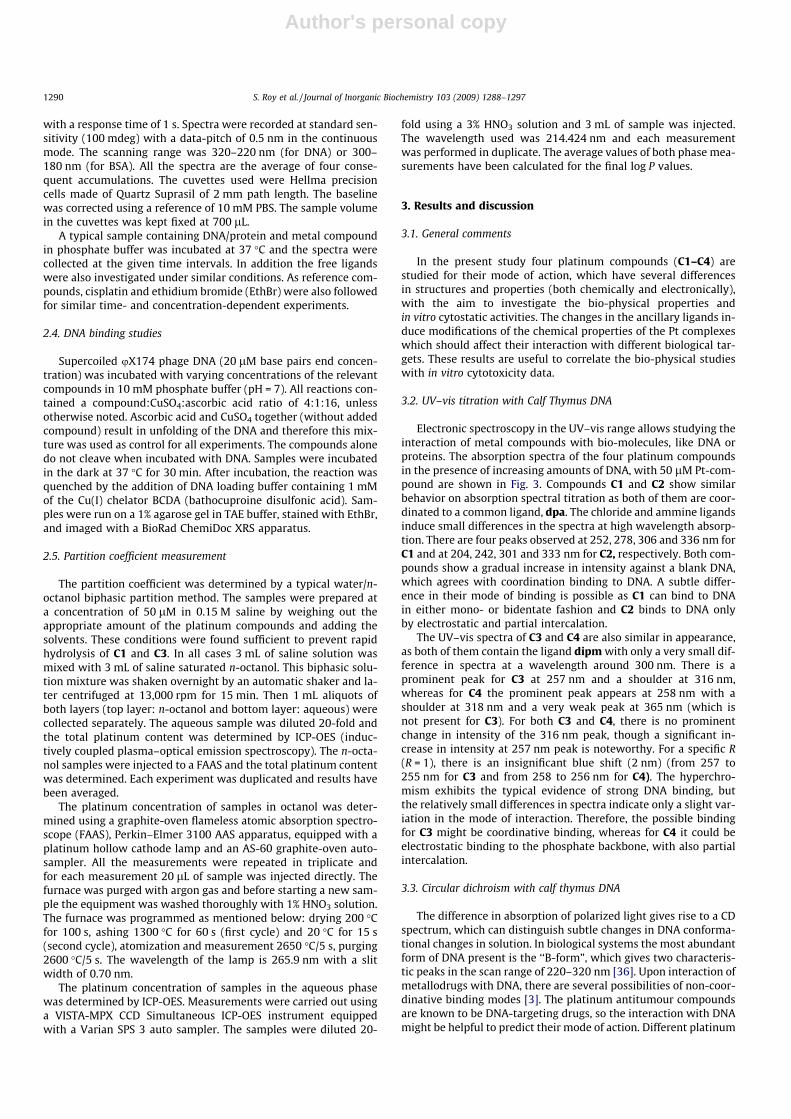
Electronic spectroscopy in the UV–vis range allows studying theinteraction of metal compounds with bio-molecules, like DNA orproteins. The absorption spectra of the four platinum compoundsin the presence of increasing amounts of DNA, with 50 lM Pt-com-pound are shown in Fig. 3. Compounds C1 and C2 show similarbehavior on absorption spectral titration as both of them are coor-dinated to a common ligand, dpa. The chloride and ammine ligandsinduce small differences in the spectra at high wavelength absorp-tion. There are four peaks observed at 252, 278, 306 and 336 nm forC1 and at 204, 242, 301 and 333 nm for C2, respectively. Both com-pounds show a gradual increase in intensity against a blank DNA,which agrees with coordination binding to DNA. A subtle differ-ence in their mode of binding is possible as C1 can bind to DNAin either mono- or bidentate fashion and C2 binds to DNA onlyby electrostatic and partial intercalation.
The UV–vis spectra of C3 and C4 are also similar in appearance,as both of them contain the ligand dipm with only a very small dif-ference in spectra at a wavelength around 300 nm. There is aprominent peak for C3 at 257 nm and a shoulder at 316 nm,whereas for C4 the prominent peak appears at 258 nm with ashoulder at 318 nm and a very weak peak at 365 nm (which isnot present for C3). For both C3 and C4, there is no prominentchange in intensity of the 316 nm peak, though a significant in-crease in intensity at 257 nm peak is noteworthy. For a specific R(R = 1), there is an insignificant blue shift (2 nm) (from 257 to255 nm for C3 and from 258 to 256 nm for C4). The hyperchro-mism exhibits the typical evidence of strong DNA binding, butthe relatively small differences in spectra indicate only a slight var-iation in the mode of interaction. Therefore, the possible bindingfor C3 might be coordinative binding, whereas for C4 it could beelectrostatic binding to the phosphate backbone, with also partialintercalation.
3.3. Circular dichroism with calf thymus DNA
The difference in absorption of polarized light gives rise to a CDspectrum, which can distinguish subtle changes in DNA conforma-tional changes in solution. In biological systems the most abundantform of DNA present is the ‘‘B-form”, which gives two characteris-tic peaks in the scan range of 220–320 nm [36]. Upon interaction ofmetallodrugs with DNA, there are several possibilities of non-coor-dinative binding modes [3]. The platinum antitumour compoundsare known to be DNA-targeting drugs, so the interaction with DNAmight be helpful to predict their mode of action. Different platinum
1290 S. Roy et al. / Journal of Inorganic Biochemistry 103 (2009) 1288–1297
Author's personal copy
drugs react with DNA at different modes of binding [37], so CDstudies may support the prediction of the mode of interaction.
The CD spectra were recorded at a constant DNA concentrationof 100 lM and different molar ratios of the metal compounds (10–1000 lM). The value of R is defined as the concentration ratio ofDNA to metal compound (or ligands), which varied from 10 to0.1 depending on the concentration of platinum compounds orthe ligands. After the measurements at time zero, incubation at37 �C over a 24 h time period and measurements at several inter-vals have been performed. A long incubation time was allowed tofavor sufficient time span for the slow activation via hydrolysisfor C1 and C3.
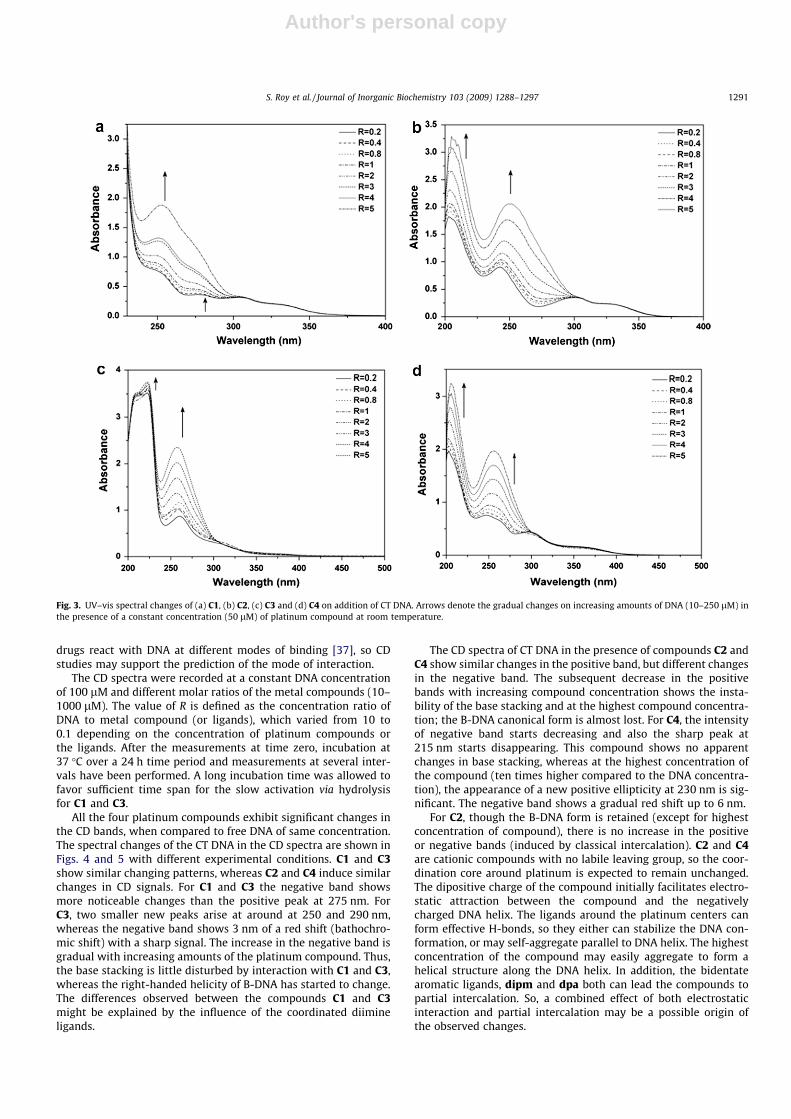
All the four platinum compounds exhibit significant changes inthe CD bands, when compared to free DNA of same concentration.The spectral changes of the CT DNA in the CD spectra are shown inFigs. 4 and 5 with different experimental conditions. C1 and C3show similar changing patterns, whereas C2 and C4 induce similarchanges in CD signals. For C1 and C3 the negative band showsmore noticeable changes than the positive peak at 275 nm. ForC3, two smaller new peaks arise at around at 250 and 290 nm,whereas the negative band shows 3 nm of a red shift (bathochro-mic shift) with a sharp signal. The increase in the negative band isgradual with increasing amounts of the platinum compound. Thus,the base stacking is little disturbed by interaction with C1 and C3,whereas the right-handed helicity of B-DNA has started to change.The differences observed between the compounds C1 and C3might be explained by the influence of the coordinated diimineligands.
The CD spectra of CT DNA in the presence of compounds C2 andC4 show similar changes in the positive band, but different changesin the negative band. The subsequent decrease in the positivebands with increasing compound concentration shows the insta-bility of the base stacking and at the highest compound concentra-tion; the B-DNA canonical form is almost lost. For C4, the intensityof negative band starts decreasing and also the sharp peak at215 nm starts disappearing. This compound shows no apparentchanges in base stacking, whereas at the highest concentration ofthe compound (ten times higher compared to the DNA concentra-tion), the appearance of a new positive ellipticity at 230 nm is sig-nificant. The negative band shows a gradual red shift up to 6 nm.
For C2, though the B-DNA form is retained (except for highestconcentration of compound), there is no increase in the positiveor negative bands (induced by classical intercalation). C2 and C4are cationic compounds with no labile leaving group, so the coor-dination core around platinum is expected to remain unchanged.The dipositive charge of the compound initially facilitates electro-static attraction between the compound and the negativelycharged DNA helix. The ligands around the platinum centers canform effective H-bonds, so they either can stabilize the DNA con-formation, or may self-aggregate parallel to DNA helix. The highestconcentration of the compound may easily aggregate to form ahelical structure along the DNA helix. In addition, the bidentatearomatic ligands, dipm and dpa both can lead the compounds topartial intercalation. So, a combined effect of both electrostaticinteraction and partial intercalation may be a possible origin ofthe observed changes.
Fig. 3. UV–vis spectral changes of (a) C1, (b) C2, (c) C3 and (d) C4 on addition of CT DNA. Arrows denote the gradual changes on increasing amounts of DNA (10–250 lM) inthe presence of a constant concentration (50 lM) of platinum compound at room temperature.
S. Roy et al. / Journal of Inorganic Biochemistry 103 (2009) 1288–1297 1291
Author's personal copy
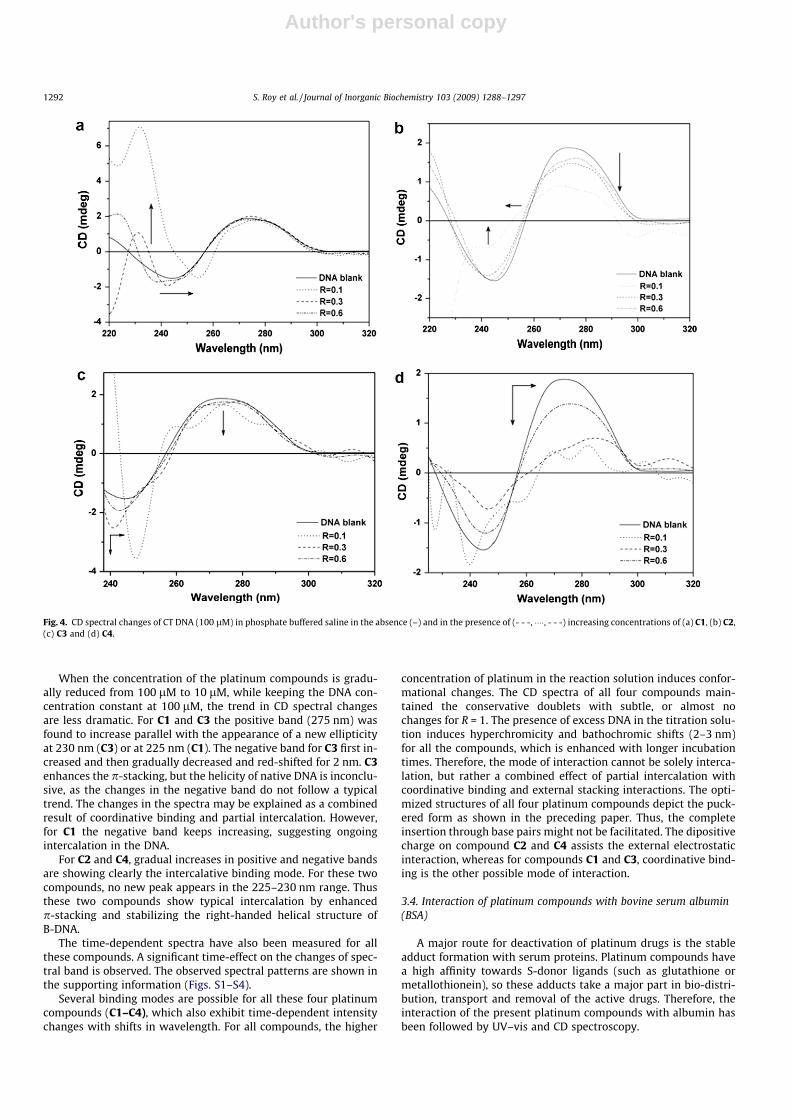
When the concentration of the platinum compounds is gradu-ally reduced from 100 lM to 10 lM, while keeping the DNA con-centration constant at 100 lM, the trend in CD spectral changesare less dramatic. For C1 and C3 the positive band (275 nm) wasfound to increase parallel with the appearance of a new ellipticityat 230 nm (C3) or at 225 nm (C1). The negative band for C3 first in-creased and then gradually decreased and red-shifted for 2 nm. C3enhances the p-stacking, but the helicity of native DNA is inconclu-sive, as the changes in the negative band do not follow a typicaltrend. The changes in the spectra may be explained as a combinedresult of coordinative binding and partial intercalation. However,for C1 the negative band keeps increasing, suggesting ongoingintercalation in the DNA.
For C2 and C4, gradual increases in positive and negative bandsare showing clearly the intercalative binding mode. For these twocompounds, no new peak appears in the 225–230 nm range. Thusthese two compounds show typical intercalation by enhancedp-stacking and stabilizing the right-handed helical structure ofB-DNA.
The time-dependent spectra have also been measured for allthese compounds. A significant time-effect on the changes of spec-tral band is observed. The observed spectral patterns are shown inthe supporting information (Figs. S1–S4).
Several binding modes are possible for all these four platinumcompounds (C1–C4), which also exhibit time-dependent intensitychanges with shifts in wavelength. For all compounds, the higher
concentration of platinum in the reaction solution induces confor-mational changes. The CD spectra of all four compounds main-tained the conservative doublets with subtle, or almost nochanges for R = 1. The presence of excess DNA in the titration solu-tion induces hyperchromicity and bathochromic shifts (2–3 nm)for all the compounds, which is enhanced with longer incubationtimes. Therefore, the mode of interaction cannot be solely interca-lation, but rather a combined effect of partial intercalation withcoordinative binding and external stacking interactions. The opti-mized structures of all four platinum compounds depict the puck-ered form as shown in the preceding paper. Thus, the completeinsertion through base pairs might not be facilitated. The dipositivecharge on compound C2 and C4 assists the external electrostaticinteraction, whereas for compounds C1 and C3, coordinative bind-ing is the other possible mode of interaction.
3.4. Interaction of platinum compounds with bovine serum albumin(BSA)
A major route for deactivation of platinum drugs is the stableadduct formation with serum proteins. Platinum compounds havea high affinity towards S-donor ligands (such as glutathione ormetallothionein), so these adducts take a major part in bio-distri-bution, transport and removal of the active drugs. Therefore, theinteraction of the present platinum compounds with albumin hasbeen followed by UV–vis and CD spectroscopy.
Fig. 4. CD spectral changes of CT DNA (100 lM) in phosphate buffered saline in the absence (–) and in the presence of (- - -, ����, - - -) increasing concentrations of (a) C1, (b) C2,(c) C3 and (d) C4.
1292 S. Roy et al. / Journal of Inorganic Biochemistry 103 (2009) 1288–1297
Author's personal copy
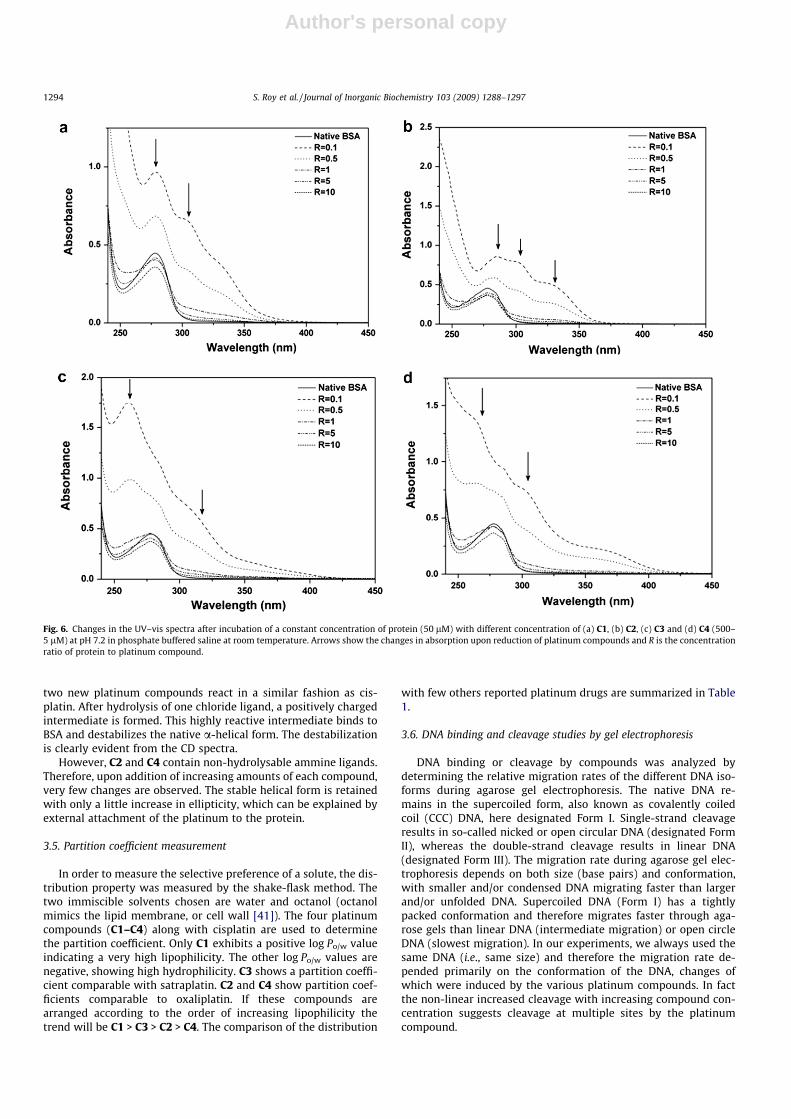
In the absorption spectral titration, 10 lM BSA was used anddifferent amounts of platinum compounds (concentrations variedfrom 1 lM to 100 lM) were added as described above for theDNA binding. This was followed by a thorough mixing beforerecording the spectrum. Five different ratios of BSA:platinum com-pound (R = 0.1, 0.5, 1, 5 and 10) were compared with the nativeBSA spectrum at room temperature at pH = 7.2 (no platinum com-pound present and the BSA concentration is 10 lM). The spectralchanges are dramatic with higher concentration of the compound.For C1 and C2, the three set of peaks appear at 279, 305, 336(shoulder) nm and 285, 303, 330 nm, respectively. Hypochromismis observed when the Pt concentration is decreased gradually.
Three peaks are appearing at 261, 286 (shoulder), 314 nm for C3and at 265, 285 (shoulder) and 307 (shoulder) nm for C4. Thesepeaks gradually increase with increasing concentration of the plat-inum compounds. When R is 1–10 (R is concentration ratio of pro-tein to metal compound), the spectra return to the shape of nativeBSA with hypochromism for the peak at 279 nm (see Fig. 6).
As a reference compound, cisplatin was also tested for bindingto BSA (Fig. S6). The known preferred binding site of cisplatin onBSA is methionine-298, but multiple binding at cysteine and tyro-sine residues has also been reported [38,39]. After prolonged incu-bation 20 mol of platinum was found to bind to 1 mol of protein.The four novel platinum compounds thus agree with the bindingmode of cisplatin as reported in the literature [27,40]. Therefore,a higher concentration of the platinum compound in the solutioninduces hyperchromicity indicating stronger binding. Conversely,
hypochromicity is evident with lower platinum concentrations[40].
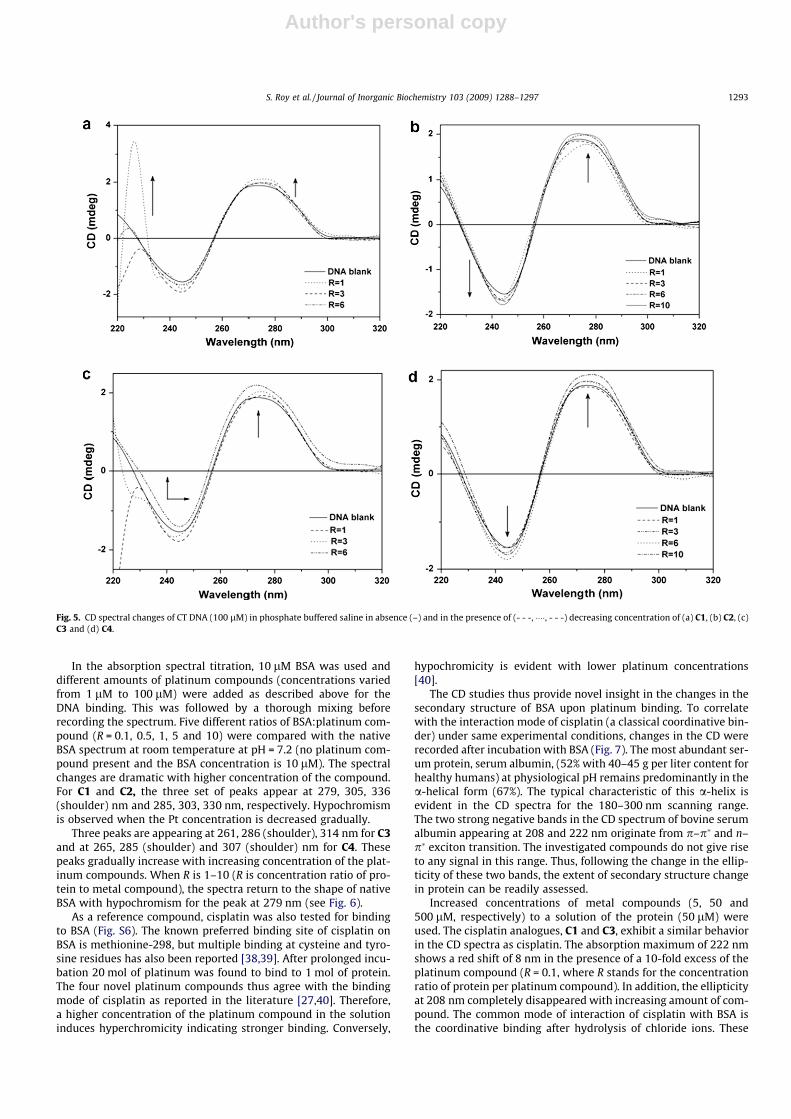
The CD studies thus provide novel insight in the changes in thesecondary structure of BSA upon platinum binding. To correlatewith the interaction mode of cisplatin (a classical coordinative bin-der) under same experimental conditions, changes in the CD wererecorded after incubation with BSA (Fig. 7). The most abundant ser-um protein, serum albumin, (52% with 40–45 g per liter content forhealthy humans) at physiological pH remains predominantly in thea-helical form (67%). The typical characteristic of this a-helix isevident in the CD spectra for the 180–300 nm scanning range.The two strong negative bands in the CD spectrum of bovine serumalbumin appearing at 208 and 222 nm originate from p–p� and n–p� exciton transition. The investigated compounds do not give riseto any signal in this range. Thus, following the change in the ellip-ticity of these two bands, the extent of secondary structure changein protein can be readily assessed.
Increased concentrations of metal compounds (5, 50 and500 lM, respectively) to a solution of the protein (50 lM) wereused. The cisplatin analogues, C1 and C3, exhibit a similar behaviorin the CD spectra as cisplatin. The absorption maximum of 222 nmshows a red shift of 8 nm in the presence of a 10-fold excess of theplatinum compound (R = 0.1, where R stands for the concentrationratio of protein per platinum compound). In addition, the ellipticityat 208 nm completely disappeared with increasing amount of com-pound. The common mode of interaction of cisplatin with BSA isthe coordinative binding after hydrolysis of chloride ions. These
Fig. 5. CD spectral changes of CT DNA (100 lM) in phosphate buffered saline in absence (–) and in the presence of (- - -, ����, - - -) decreasing concentration of (a) C1, (b) C2, (c)C3 and (d) C4.
S. Roy et al. / Journal of Inorganic Biochemistry 103 (2009) 1288–1297 1293
Author's personal copy
two new platinum compounds react in a similar fashion as cis-platin. After hydrolysis of one chloride ligand, a positively chargedintermediate is formed. This highly reactive intermediate binds toBSA and destabilizes the native a-helical form. The destabilizationis clearly evident from the CD spectra.
However, C2 and C4 contain non-hydrolysable ammine ligands.Therefore, upon addition of increasing amounts of each compound,very few changes are observed. The stable helical form is retainedwith only a little increase in ellipticity, which can be explained byexternal attachment of the platinum to the protein.
3.5. Partition coefficient measurement
In order to measure the selective preference of a solute, the dis-tribution property was measured by the shake-flask method. Thetwo immiscible solvents chosen are water and octanol (octanolmimics the lipid membrane, or cell wall [41]). The four platinumcompounds (C1–C4) along with cisplatin are used to determinethe partition coefficient. Only C1 exhibits a positive log Po/w valueindicating a very high lipophilicity. The other log Po/w values arenegative, showing high hydrophilicity. C3 shows a partition coeffi-cient comparable with satraplatin. C2 and C4 show partition coef-ficients comparable to oxaliplatin. If these compounds arearranged according to the order of increasing lipophilicity thetrend will be C1 > C3 > C2 > C4. The comparison of the distribution
with few others reported platinum drugs are summarized in Table1.
3.6. DNA binding and cleavage studies by gel electrophoresis
DNA binding or cleavage by compounds was analyzed bydetermining the relative migration rates of the different DNA iso-forms during agarose gel electrophoresis. The native DNA re-mains in the supercoiled form, also known as covalently coiledcoil (CCC) DNA, here designated Form I. Single-strand cleavageresults in so-called nicked or open circular DNA (designated FormII), whereas the double-strand cleavage results in linear DNA(designated Form III). The migration rate during agarose gel elec-trophoresis depends on both size (base pairs) and conformation,with smaller and/or condensed DNA migrating faster than largerand/or unfolded DNA. Supercoiled DNA (Form I) has a tightlypacked conformation and therefore migrates faster through aga-rose gels than linear DNA (intermediate migration) or open circleDNA (slowest migration). In our experiments, we always used thesame DNA (i.e., same size) and therefore the migration rate de-pended primarily on the conformation of the DNA, changes ofwhich were induced by the various platinum compounds. In factthe non-linear increased cleavage with increasing compound con-centration suggests cleavage at multiple sites by the platinumcompound.
Fig. 6. Changes in the UV–vis spectra after incubation of a constant concentration of protein (50 lM) with different concentration of (a) C1, (b) C2, (c) C3 and (d) C4 (500–5 lM) at pH 7.2 in phosphate buffered saline at room temperature. Arrows show the changes in absorption upon reduction of platinum compounds and R is the concentrationratio of protein to platinum compound.
1294 S. Roy et al. / Journal of Inorganic Biochemistry 103 (2009) 1288–1297

Author's personal copy
Fig. 7. Changes in CD spectra after incubation of a constant concentration of protein (50 lM) with different concentration of (a) C1, (b) C2, (c) C3 and (d) C4 (500–5 lM) at pH7.2 in phosphate buffered saline at room temperature.
Table 1Comparison of partition coefficient values for several reported platinum compounds using known methodology in water/n-octanol [31–33].
Studied compounds Structure log P Reported compounds Structure log P
C1, [Pt(dpa)Cl2]
N N
NH
PtCl Cl
0.11 Cisplatin Pt
Cl
H3N
H3N
Cl
�2.53
C2, [Pt(dpa)(NH3)2](NO3)2
N N
NH
PtNH3 NH3
(NO3)2
�1.33 CarboplatinPt
O
O
H3N
H3N
O
O
�2.3
C3, [Pt(dipm)Cl2]N
N
N
N
NH
Pt
Cl Cl
�0.47 Oxaliplatin PtO
O
O
O
N
N
�1.65
C4, [Pt(dipm)(NH3)2](NO3)2N
N
N
N
NH
PtNH3 NH3
(NO3)2
�1.74 Satraplatin
NPt
O
O
Cl
H3N Cl
O
O
�0.16
S. Roy et al. / Journal of Inorganic Biochemistry 103 (2009) 1288–1297 1295
Author's personal copy
Two platinum compounds (C3 and C4) were tested for theirDNA cleavage properties, using supercoiled uX174 phage DNA inphosphate buffer at 37 �C. A typical sample contained 20 lMDNA (in base pairs) in the absence or in the presence of increasingamount of compounds or reducing agents. All the samples wereincubated for 0.5 h with exclusion of light.
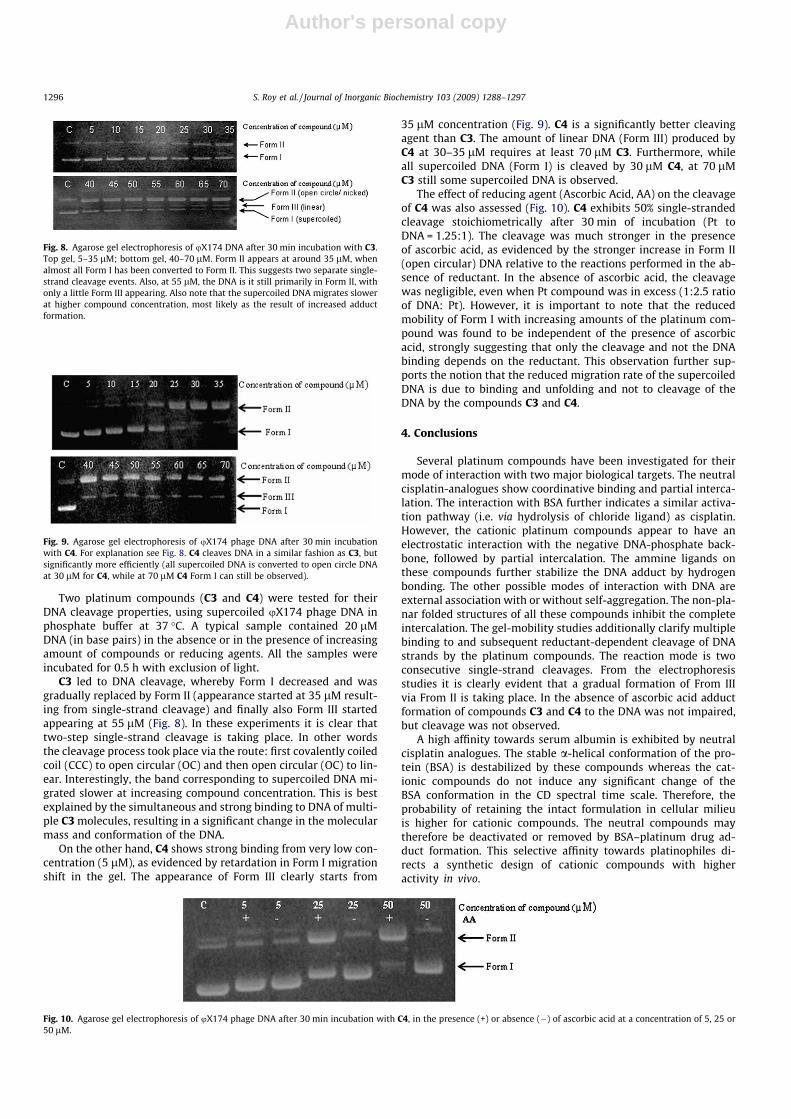
C3 led to DNA cleavage, whereby Form I decreased and wasgradually replaced by Form II (appearance started at 35 lM result-ing from single-strand cleavage) and finally also Form III startedappearing at 55 lM (Fig. 8). In these experiments it is clear thattwo-step single-strand cleavage is taking place. In other wordsthe cleavage process took place via the route: first covalently coiledcoil (CCC) to open circular (OC) and then open circular (OC) to lin-ear. Interestingly, the band corresponding to supercoiled DNA mi-grated slower at increasing compound concentration. This is bestexplained by the simultaneous and strong binding to DNA of multi-ple C3 molecules, resulting in a significant change in the molecularmass and conformation of the DNA.
On the other hand, C4 shows strong binding from very low con-centration (5 lM), as evidenced by retardation in Form I migrationshift in the gel. The appearance of Form III clearly starts from
35 lM concentration (Fig. 9). C4 is a significantly better cleavingagent than C3. The amount of linear DNA (Form III) produced byC4 at 30–35 lM requires at least 70 lM C3. Furthermore, whileall supercoiled DNA (Form I) is cleaved by 30 lM C4, at 70 lMC3 still some supercoiled DNA is observed.
The effect of reducing agent (Ascorbic Acid, AA) on the cleavageof C4 was also assessed (Fig. 10). C4 exhibits 50% single-strandedcleavage stoichiometrically after 30 min of incubation (Pt toDNA = 1.25:1). The cleavage was much stronger in the presenceof ascorbic acid, as evidenced by the stronger increase in Form II(open circular) DNA relative to the reactions performed in the ab-sence of reductant. In the absence of ascorbic acid, the cleavagewas negligible, even when Pt compound was in excess (1:2.5 ratioof DNA: Pt). However, it is important to note that the reducedmobility of Form I with increasing amounts of the platinum com-pound was found to be independent of the presence of ascorbicacid, strongly suggesting that only the cleavage and not the DNAbinding depends on the reductant. This observation further sup-ports the notion that the reduced migration rate of the supercoiledDNA is due to binding and unfolding and not to cleavage of theDNA by the compounds C3 and C4.
4. Conclusions
Several platinum compounds have been investigated for theirmode of interaction with two major biological targets. The neutralcisplatin-analogues show coordinative binding and partial interca-lation. The interaction with BSA further indicates a similar activa-tion pathway (i.e. via hydrolysis of chloride ligand) as cisplatin.However, the cationic platinum compounds appear to have anelectrostatic interaction with the negative DNA-phosphate back-bone, followed by partial intercalation. The ammine ligands onthese compounds further stabilize the DNA adduct by hydrogenbonding. The other possible modes of interaction with DNA areexternal association with or without self-aggregation. The non-pla-nar folded structures of all these compounds inhibit the completeintercalation. The gel-mobility studies additionally clarify multiplebinding to and subsequent reductant-dependent cleavage of DNAstrands by the platinum compounds. The reaction mode is twoconsecutive single-strand cleavages. From the electrophoresisstudies it is clearly evident that a gradual formation of From IIIvia From II is taking place. In the absence of ascorbic acid adductformation of compounds C3 and C4 to the DNA was not impaired,but cleavage was not observed.
A high affinity towards serum albumin is exhibited by neutralcisplatin analogues. The stable a-helical conformation of the pro-tein (BSA) is destabilized by these compounds whereas the cat-ionic compounds do not induce any significant change of theBSA conformation in the CD spectral time scale. Therefore, theprobability of retaining the intact formulation in cellular milieuis higher for cationic compounds. The neutral compounds maytherefore be deactivated or removed by BSA–platinum drug ad-duct formation. This selective affinity towards platinophiles di-rects a synthetic design of cationic compounds with higheractivity in vivo.
Fig. 8. Agarose gel electrophoresis of uX174 DNA after 30 min incubation with C3.Top gel, 5–35 lM; bottom gel, 40–70 lM. Form II appears at around 35 lM, whenalmost all Form I has been converted to Form II. This suggests two separate single-strand cleavage events. Also, at 55 lM, the DNA is it still primarily in Form II, withonly a little Form III appearing. Also note that the supercoiled DNA migrates slowerat higher compound concentration, most likely as the result of increased adductformation.
Fig. 9. Agarose gel electrophoresis of uX174 phage DNA after 30 min incubationwith C4. For explanation see Fig. 8. C4 cleaves DNA in a similar fashion as C3, butsignificantly more efficiently (all supercoiled DNA is converted to open circle DNAat 30 lM for C4, while at 70 lM C4 Form I can still be observed).
Fig. 10. Agarose gel electrophoresis of uX174 phage DNA after 30 min incubation with C4, in the presence (+) or absence (�) of ascorbic acid at a concentration of 5, 25 or50 lM.
1296 S. Roy et al. / Journal of Inorganic Biochemistry 103 (2009) 1288–1297

Author's personal copy
The partition coefficients for platinum compounds are in a com-parable range with clinically approved drugs, except C1[Pt(dpa)Cl2]. This compound is clearly lipophilic and thus will befacilitated significantly to cross the cellular membrane. The otherthree compounds are hydrophilic and are more likely to accumu-late in the blood plasma. Both cationic compounds show lipophil-icity in the range of oxaliplatin. Thus, lipophilicity tests can providea rough idea of the behavior of a compound in vivo, but no straight-forward correlation can be drawn between lipophilicity and in vivoanticancer activity.
In the preceding article (dealing with the synthesis, model-basestudies, DFT calculation and in vitro growth inhibition studiesagainst seven human tumor cells), it has been reported that themost active compound in these series is C3, Pt(dipm)Cl2. The cat-ionic compounds, C2 and C4, however, exhibit selective activityagainst breast cancer cell line EVSA-T. In order to explain and cor-relate the low growth inhibition ability of these compounds, thebioavailability along with DNA and BSA interaction has been inves-tigated. The three compounds (except C1) being lipophobic proba-bly face lower transport to the cells and greater accumulation inthe serum. The lipophilicity of C1 should facilitate facile transportinside the cells, however; the strong proteinophilic behavior maylimit the amount of active component for the DNA. The other neu-tral compound, C3, in spite of its hydrophilic property, can crossthe cellular membrane and induce the growth inhibition. The cat-ionic compounds being hydrophilic would also have slower affinityto cross the cell-membrane. These compounds (C2 and C4) haveadditional ammine ligands which would enhance the DNA adduct.This assumption is proved by electrophoresis studies. The limitedactivity against the cancer cells thus could be reasoned by revers-ible DNA damage and easily reparable cleavage products. All fourcompounds interact with purified DNA (a primary cellular target),but the cellular processing is yet to be investigated to explain theantitumor activity and to modify the ligand structure for a betterantitumor active compound.
Acknowledgements
Johnson-Matthey (Reading, UK) is gratefully thanked for theirgenerous loan scheme of K2PtCl4. The support and sponsorshipprovided by COST Actions D39/0006/02 and D39/0005/11, allowingexchange of preliminary results and discussion, is sincerelyacknowledged.
Appendix A. Supplementary material
Supplementary data associated with this article can be found, inthe online version, at doi:10.1016/j.jinorgbio.2009.07.003.
References
[1] W.C. Johnson, in: K. Nakanishi, N. Berova, R.W. Woody (Eds.), CircularDichroism: Principles and Applications, VCH Publishers Inc., New York, 1994.
[2] G. Snatzke, Circular Dichroism: Principles and Applications, VCH, 1994.
[3] A.D. Richards, A. Rodger, Chem. Soc. Rev. 36 (2007) 471–483.[4] J.A. Rice, D.M. Crothers, A.L. Pinto, S.J. Lippard, Proc. Natl. Acad. Sci. U. S. A. 85
(1988) 4158–4161.[5] J.M. Teuben, C. Bauer, A.H.J. Wang, J. Reedijk, Biochemistry 38 (1999) 12305–
12312.[6] A.L. Pinto, S.J. Lippard, Biochim. Biophys. Acta 780 (1984) 167–180.[7] J.J. Roberts, A.J. Thomson, Prog. Nucleic Acid Res. Mol. Biol. 22 (1979) 71–133.[8] J. Reedijk, A.M.J. Fichtinger-Schepman, J.H.J. Denhartog, Inorg. Chim. Acta 79
(1983) 252–253.[9] E.D. Scheeff, J.M. Briggs, S.B. Howell, Mol. Pharmacol. 56 (1999) 633–643.
[10] S.E. Sherman, D. Gibson, A.H.J. Wang, S.J. Lippard, Science 230 (1985) 412–417.
[11] S.E. Sherman, D. Gibson, A.H.J. Wang, S.J. Lippard, J. Am. Chem. Soc. 110 (1988)7368–7381.
[12] S.E. Sherman, S.J. Lippard, Chem. Rev. 87 (1987) 1153–1181.[13] E.G. Talman, W. Bruning, J. Reedijk, A.L. Spek, N. Veldman, Inorg. Chem. 36
(1997) 854–861.[14] B.K. Teo, P. Eisenberger, J. Reed, J.K. Barton, S.J. Lippard, J. Am. Chem. Soc. 100
(1978) 3225–3227.[15] C.J. Van Garderen, M.J. Bloemink, E. Richardson, J. Reedijk, J. Inorg. Biochem. 42
(1991) 199–205.[16] Y.S. Wu, K.R. Koch, V.R. Abratt, H.H. Klump, Arch. Biochem. Biophys. 440 (2005)
28–37.[17] D.Z. Yang, S. Van Boom, J. Reedijk, J.H. Van Boom, N. Farrell, A.H.J. Wang, Nat.
Struct. Biol. 2 (1995) 577–586.[18] G.M. Blackburn, M.J. Gait, Nucleic Acids in Chemistry and Biology, Oxford
University Press, New York, 1996.[19] M. Cusumano, M.L. Di Pietro, A. Giannetto, F. Nicolo, E. Rotondo, Inorg. Chem.
37 (1998) 563–568.[20] D. Gibson, K.F. Gean, R. Benshoshan, A. Ramu, I. Ringel, J. Katzhendler, J. Med.
Chem. 34 (1991) 414–420.[21] K.W. Jennette, J.T. Gill, J.A. Sadownick, S.J. Lippard, J. Am. Chem. Soc. 98 (1976)
6159–6168.[22] L.M. Chen, J. Liu, J.C. Chen, C.P. Tan, S. Shi, K.C. Zheng, L.N. Ji, J. Inorg. Biochem.
102 (2008) 330–341.[23] S. Kashanian, M.B. Gholivand, F. Ahmadi, A. Taravati, A.H. Colagar,
Spectrochim. Acta A 67 (2007) 472–478.[24] S. Kemp, N.J. Wheate, D.P. Buck, M. Nikac, J.G. Collins, J.R. Aldrich-Wright, J.
Inorg. Biochem. 101 (2007) 1049–1058.[25] M. Cusumano, M.L. Di Pietro, A. Giannetto, P.A. Vainiglia, Eur. J. Inorg. Chem.
(2005) 278–284.[26] N.S. Quiming, R.B. Vergel, M.G. Nicolas, J.A. Villanueva, J. Health Sci. 51 (2005)
8–15.[27] A.R. Timerbaev, C.G. Hartinger, S.S. Aleksenko, B.K. Keppler, Chem. Rev. 106
(2006) 2224–2248.[28] M.J. Bloemink, J.M.J. Perez, R.J. Heetebrij, J. Reedijk, J. Biol. Inorg. Chem. 4
(1999) 554–567.[29] S. Roy, J.A. Westmaas, F. Buda, J. Reedijk, J. Inorg. Biochem. 103 (2009) 1278–
1287.[30] J.A. Platts, S.P. Oldfield, M.M. Reif, A. Palmucci, E. Gabano, D. Osella, J. Inorg.
Biochem. 100 (2006) 1199–1207.[31] Y.A. Lee, Y.K. Chung, Y.S. Sohn, J. Inorg. Biochem. 68 (1997) 289–294.[32] D. Screnci, M.J. McKeage, P. Galettis, T.W. Hambley, B.D. Palmer, B.C. Baguley,
Brit. J. Cancer 82 (2000) 966–972.[33] W.S. Ye, L.G. Lou, W.P. Liu, Y. Yu, X. Chen, S.Q. Hou, W.Q. Gao, Y. Liu, Bioorg.
Med. Chem. Lett. 17 (2007) 2144–2147.[34] W.B. Yao, K. Kavallieratos, S. de Gala, R.H. Crabtree, Inorg. Chim. Acta 311
(2000) 45–49.[35] V.Y. Kukushkin, A. Oskarsson, L.I. Elding, N. Farrell, Inorg. Synth. 32 (1998)
141–144.[36] V.I. Ivanov, L.E. Minchenk, A.K. Schyolki, A.I. Poletaye, Biopolymers 12 (1973)
89–110.[37] J.P. Macquet, J.L. Butour, Eur. J. Biochem. 83 (1978) 375–387.[38] A.I. Ivanov, J. Christodoulou, J.A. Parkinson, K.J. Barnham, A. Tucker, J.
Woodrow, P.J. Sadler, J. Biol. Chem. 273 (1998) 14721–14730.[39] J.F. Neault, H.A. Tajmir-Riahi, Biochim. Biophys. Acta, Protein Struct. Mol.
Enzymol. 1384 (1998) 153–159.[40] T. Peleg-Shulman, D. Gibson, J. Am. Chem. Soc. 123 (2001) 3171–3172.[41] A. Ghezzi, M. Aceto, C. Cassino, E. Gabano, D. Osella, J. Inorg. Biochem. 98
(2004) 73–78.
S. Roy et al. / Journal of Inorganic Biochemistry 103 (2009) 1288–1297 1297
Copyright © 2022 FDOKUMEN


![Metal complexes of [1,2,4]triazolo-[1,5-a]pyrimidine derivatives](https://static.fdokumen.com/doc/165x107/6334de1325325924170043c9/metal-complexes-of-124triazolo-15-apyrimidine-derivatives.jpg)