PLANNING AND DESIGN OF MULTI STAR HOTEL - IJARSE
14
255 | Page PLANNING AND DESIGN OF MULTI STAR HOTEL Ambati Sai Krishna 1 , P Nagireddy 2 . 1* M.Tech Student, Newton’s Institute of Science & Technology, Macherla, India. 2* Assistant Professor, Newton’s Institute of Science & Technology, Macherla, India. ABSTRACT The business and tourist sector flourishing in Hyderabad city, we planned and designed the construction of the main building of a multi star caravansary of approved Indian standards to fulfill the needs of the current situation. In our project, Park Hyatt, Banjara Hills, we have aimed to satisfy the basic requirements of a multi star caravansary. Allocating the available space for different functions the entire structure was developed. The structure was then analyzed and designed in STAAD PRO. Park Hyatt, Banjara Hills, A luxury hotel that combines business with pleasure, style with substance, form with function. Centrally located in the upscale Banjara Hills, our 5-star luxury hotel offers personalized services and unforgettable experiences to business travelers and discerning local guests. With 209 spaciously appointed rooms, three award winning restaurants, technology friendly meeting spaces and a Nizami themed Spa, luxury at its best awaits to create seamless experiences for you. Park Hyatt Hyderabad offers free onsite parking facilities for up to 500 vehicles. Built across on an area of 32,256 square metres (347,200 sq ft) the construction of the hotel started in 2006. Owned by Gayatri Hi-tech Hotels and managed by Hyatt , the hotel was inaugurated on 29 April 2012 costing Rs 7 billion approximately. The Hotel has 185 rooms, 24 suites on the first six floors and 42 furnished service apartments called The Residence on the two upmost floors. Each of the hotel’s guestrooms are among th e largest in Hyderabad , measuring at least 463 square feet. The lobby is designed with sparkling water feature and plants that surround a 35-foot tall white abstract sculpture. Park Hyatt Hyderabad is the first hotel in India to feature Hyatt’s residential-style meeting concept named The Manor. The total meetings and events facilities measure more than 1,600 square metres (17,000 sq ft). Accommodating a range of dining the hotel has a Lobby Lounge – The Living Room , The Dining Room – All Day Dining Restaurant, Tre-Forni Bar & Restaurant - Northern Italian Cuisine , Oriental Bar & Kitchen – South East Asian Cuisine . The Hotel is also equipped with Spa & Fitness Facilities. I INTRODUCTION Hyderabad City progressing at a very quick pace within the commercial sector, major comes are undertaken to quench the forth returning wants. Technology soaring heights, its impact is clearly visible during this tiny, beautiful city.
-
Upload
khangminh22 -
Category
Documents
-
view
4 -
download
0
Transcript of PLANNING AND DESIGN OF MULTI STAR HOTEL - IJARSE
255 | P a g e
PLANNING AND DESIGN OF MULTI STAR HOTEL
Ambati Sai Krishna1, P Nagireddy
2.
1* M.Tech Student, Newton’s Institute of Science & Technology, Macherla, India.
2* Assistant Professor, Newton’s Institute of Science & Technology, Macherla, India.
ABSTRACT
The business and tourist sector flourishing in Hyderabad city, we planned and designed the
construction of the main building of a multi star caravansary of approved Indian standards to fulfill the needs of
the current situation.
In our project, Park Hyatt, Banjara Hills, we have aimed to satisfy the basic requirements of a multi
star caravansary. Allocating the available space for different functions the entire structure was developed. The
structure was then analyzed and designed in STAAD PRO. Park Hyatt, Banjara Hills, A luxury hotel that
combines business with pleasure, style with substance, form with function. Centrally located in the upscale
Banjara Hills, our 5-star luxury hotel offers personalized services and unforgettable experiences to business
travelers and discerning local guests. With 209 spaciously appointed rooms, three award winning restaurants,
technology friendly meeting spaces and a Nizami themed Spa, luxury at its best awaits to create seamless
experiences for you. Park Hyatt Hyderabad offers free onsite parking facilities for up to 500 vehicles.
Built across on an area of 32,256 square metres (347,200 sq ft) the construction of the hotel started in
2006. Owned by Gayatri Hi-tech Hotels and managed by Hyatt, the hotel was inaugurated on 29 April 2012
costing Rs 7 billion approximately.
The Hotel has 185 rooms, 24 suites on the first six floors and 42 furnished service apartments called
The Residence on the two upmost floors. Each of the hotel’s guestrooms are among the largest in Hyderabad,
measuring at least 463 square feet. The lobby is designed with sparkling water feature and plants that surround
a 35-foot tall white abstract sculpture. Park Hyatt Hyderabad is the first hotel in India to feature Hyatt’s
residential-style meeting concept named The Manor.
The total meetings and events facilities measure more than 1,600 square metres (17,000 sq ft).
Accommodating a range of dining the hotel has a Lobby Lounge – The Living Room, The Dining Room – All
Day Dining Restaurant, Tre-Forni Bar & Restaurant - Northern Italian Cuisine, Oriental Bar & Kitchen –
South East Asian Cuisine. The Hotel is also equipped with Spa & Fitness Facilities.
I INTRODUCTION
Hyderabad City progressing at a very quick pace within the commercial sector, major comes are
undertaken to quench the forth returning wants. Technology soaring heights, its impact is clearly visible during
this tiny, beautiful city.

256 | P a g e
Hyderabad City, a blend of beauty and technology, has become a major attraction for both tourists and
business entrepreneurs. Though, towards the core, that is heavily charged with which means and activity, the
suburbs of this city are within the progress of clinging to the standards. With the functioning of the Rajiv
Gandhi International airport at shamshabad, India’s second largest, the requirement for hotels of approved
standards and hospitality arose in its proximity. Since accessibility is that the key for not only practical but also
psychological reasons, the choice of site should suite the acceptable wants.
Our project, the planning and design of the main building of a 5 star hotel, has aimed toward filling this
void. The project was developed so as to include the analysis and design a part of civil engineering. Our project
is that the accomplishment of the structural design of the main building of the hotel, Park Hyatt, Banjara Hills.
Structural Analysis
LOAD CALCULATIONS
The different loads on the structure are taken based on the relevant Indian Standard Specifications BIS
1987. The following loads were considered for the design.
LIVE LOAD
Banquet hall 5
Other areas 3
DEAD LOAD
Dead load for concrete 25
Dead load for brick wall 22
STRUCTURAL DESIGN
The design of the structural members is done using the limit state method of design. This method is
selected for doing the design, mainly due to the fact that it considers a factor of safety for the design with which
the members are designed. The design of members by this method is commonly practiced now-a-days mainly
due to its reliability over the working stress method. All designs are done according to the provisions of the
Bureau of Indian Standards.
DESIGN OF SLABS
DATA: Two way slab
Suitable span: 12.2m
Limiting criterion: Deflection
Rebar: 2.94Kg/m2
PT; 3.87Kg/m2
MATERIAL PROPERTIES:

257 | P a g e
Concrete:
Fc28 = Compressive strength on concrete 28 days
Fcd = Design value for compressive strength on concrete
= 0.6× Fc28 = 21N/mm2
Pre-stressing steel:
Ap = cross sectional area of pj steel 146mm2
Fpy = yield strength of PT steel 1570N/mm2
Fpu = characteristics strength of PT steel 1770N/mm2
Pre-tensioning steel:
Ep = modulus of elasticity of pre stressing steel 1.95×10⁵N/mm
2
(Very low relaxation 3%)
Admissible stressing 0.75 fpu
Reinforcing steel:
Fsy = yield strength of reinforcing steel is 460N/mm2
Long-term losses (assumed to be 10%)
DESIGN:
Determination of slab thickness:
Assumption l/h = 35
Self weight of slab g = yc×h
L = length of slab 8.4
h = 0.24m
Yc = volumetric weight of concrete = 2.5KN/m3
g = 6 KN/m3
q = 5 KN/m3
(g+q)/g = 6+5/6 =1.83
(l/h as a function (g+q)/g)
For value of 1.83 on y-axis l/h is coming to 36
0.233 Which is approximately 0.24
Determination of pre-stress:
µ = it is transfer component from pre stressing/ unit length (g+q)/g =1.83 based on previous calculation
Pre stress in longitudinal direction:
For 1.83 the u/g value is 1.3
u = 8.34KN/m2
K = woober’s coefficient = (0.24×10³) / (8.4
2×25) = 0.136
h = 0.274
Length of slab =8.4

258 | P a g e
yc = 25
εc = concrete tensile stress = 1000
Pre tensioning force:
Sag of tendon parabola
P = 413KN/m
P = 7.8×413 for a width of 78mts
P = 3221 KN/strand
PI= pre tensioning force per strand
PI =Ap × fpu×0.7×10⁻³
Ap = 416mm2
Fpu = 1770N/mm2
PI = 181KN
STRANDS:
No. of strands = p/pi = 413/pi = 17.8 (say 18)
18 strands of dia 15mm on 78mt width
For 7.4mt width = 7.4/7.8×17.8 = 16.88
17 mono strands of dia 15mm of 7.4mt width
On 6.6mt width = 6.6/7.8×17.8 = 15.1
16 mono strands of dia 15mm of 6.6mt width
For 2.4mt width = 2.4/7.8×17.8 = 5.5
6 mono strand of dia of 15mm on 2.4mt width
Transverse direction:
g+q/g = 1.83
K =0.24×1000/7.82×25
K = 0.158
On design chart 2 for k value of 0.158 and (g+q/g) value of 1.83 the value of u/g is found be 1.41
u = 8.46KN/m2
P = 3.85KN/m
On 8.4mt width p =8.4×385
P = 32334KN
Pc = 181KN
No. of strands Np = p/pi = 3234/181 =17.9
259 | P a g e
18 mono strands of dia 15mm on 8.4mt width
On 7.2mt width np =7.2/8.4×7.9 = 15.3
16 mono strands of dia 15mm on 7.2mt width
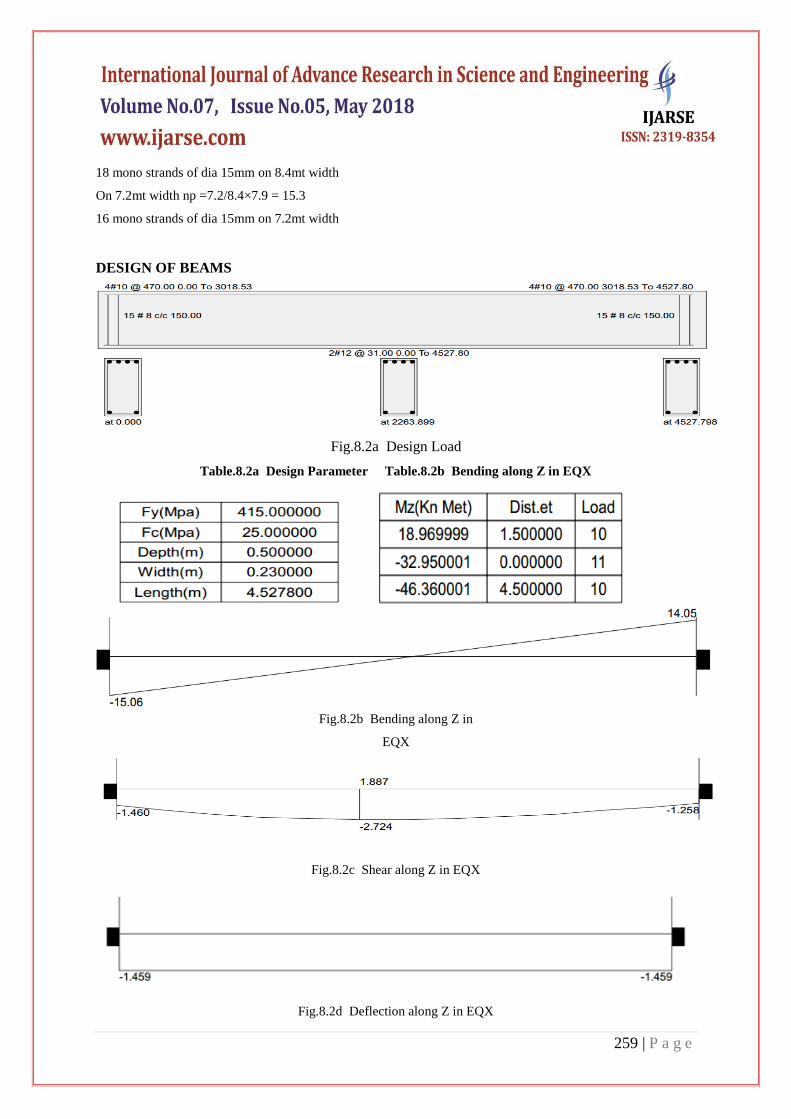
DESIGN OF BEAMS
Fig.8.2a Design Load
Table.8.2a Design Parameter Table.8.2b Bending along Z in EQX
Fig.8.2b Bending along Z in
EQX
Fig.8.2c Shear along Z in EQX
Fig.8.2d Deflection along Z in EQX

260 | P a g e
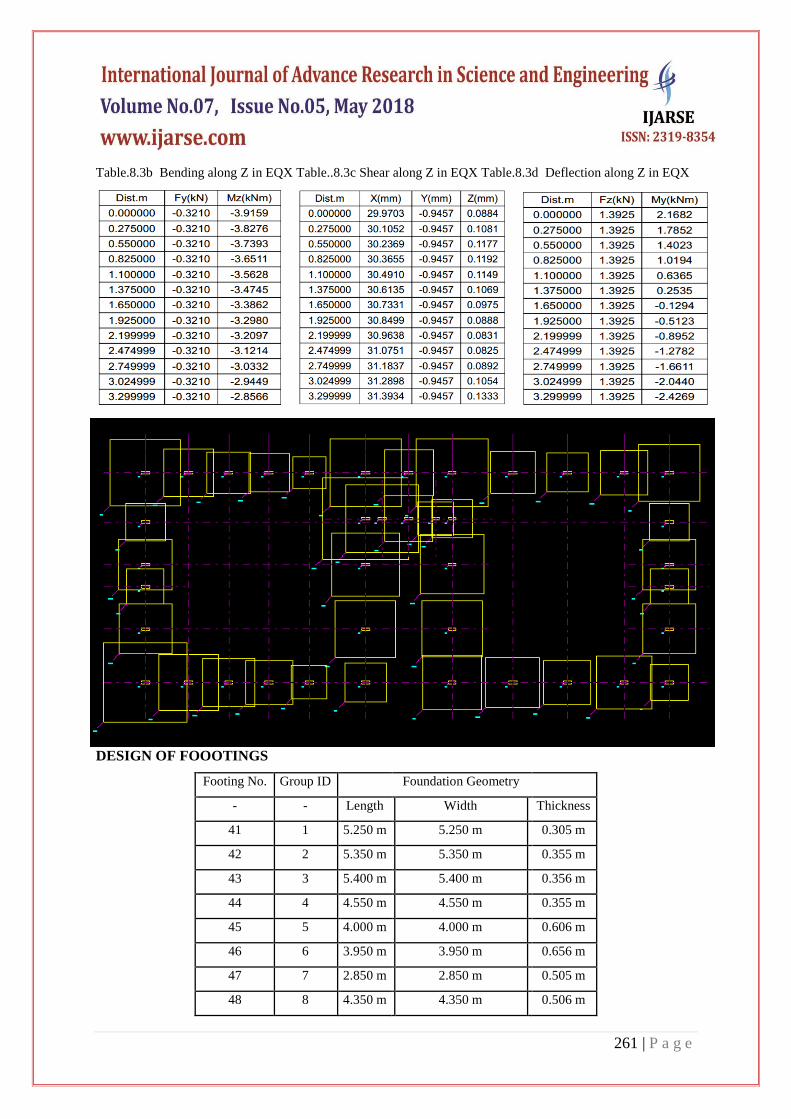
Table.8.2c Shear along Z in EQX Table.8.2c Shear along Z in EQX Table8.2d Deflection along Z in EQX
DESIGN OF COLUMNS
Fig.8.3b Bending along Z in EQX
Fig.8.3c Shear along Z in EQX
Fig.8.3d Deflection along Z in EQX
261 | P a g e
Table.8.3b Bending along Z in EQX Table..8.3c Shear along Z in EQX Table.8.3d Deflection along Z in EQX
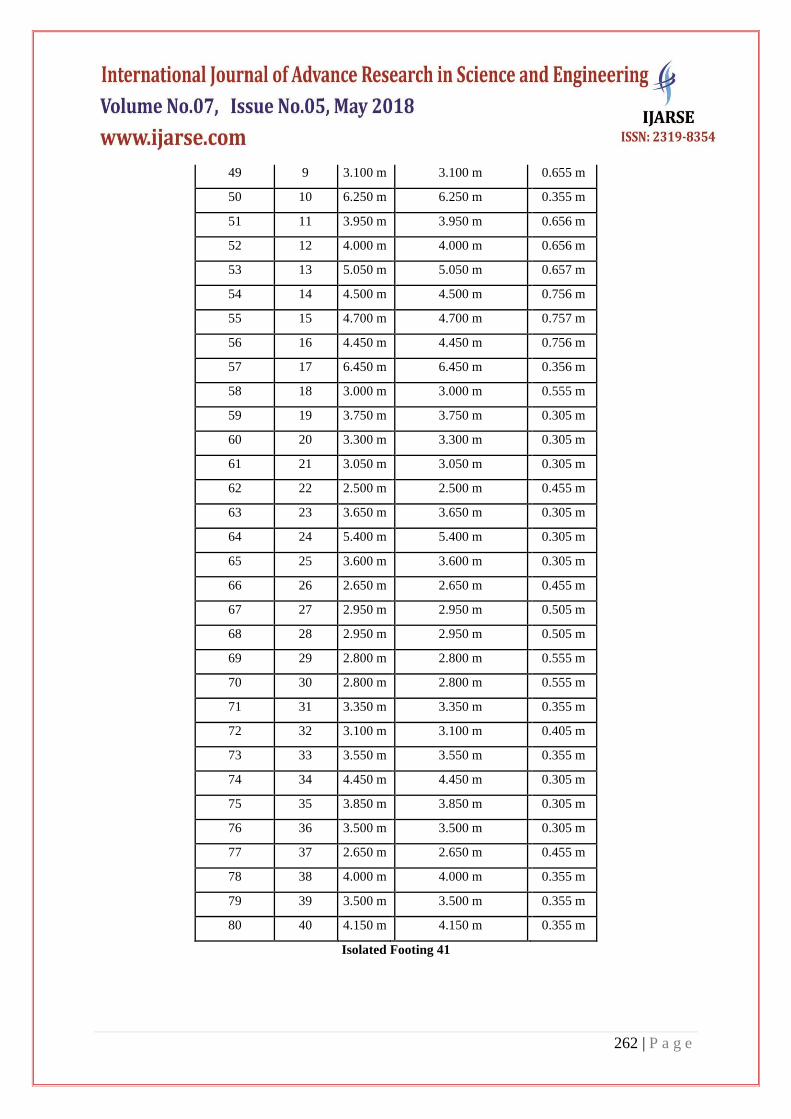
DESIGN OF FOOOTINGS
Footing No. Group ID Foundation Geometry
- - Length Width Thickness
41 1 5.250 m 5.250 m 0.305 m
42 2 5.350 m 5.350 m 0.355 m
43 3 5.400 m 5.400 m 0.356 m
44 4 4.550 m 4.550 m 0.355 m
45 5 4.000 m 4.000 m 0.606 m
46 6 3.950 m 3.950 m 0.656 m
47 7 2.850 m 2.850 m 0.505 m
48 8 4.350 m 4.350 m 0.506 m
262 | P a g e
49 9 3.100 m 3.100 m 0.655 m
50 10 6.250 m 6.250 m 0.355 m
51 11 3.950 m 3.950 m 0.656 m
52 12 4.000 m 4.000 m 0.656 m
53 13 5.050 m 5.050 m 0.657 m
54 14 4.500 m 4.500 m 0.756 m
55 15 4.700 m 4.700 m 0.757 m
56 16 4.450 m 4.450 m 0.756 m
57 17 6.450 m 6.450 m 0.356 m
58 18 3.000 m 3.000 m 0.555 m
59 19 3.750 m 3.750 m 0.305 m
60 20 3.300 m 3.300 m 0.305 m
61 21 3.050 m 3.050 m 0.305 m
62 22 2.500 m 2.500 m 0.455 m
63 23 3.650 m 3.650 m 0.305 m
64 24 5.400 m 5.400 m 0.305 m
65 25 3.600 m 3.600 m 0.305 m
66 26 2.650 m 2.650 m 0.455 m
67 27 2.950 m 2.950 m 0.505 m
68 28 2.950 m 2.950 m 0.505 m
69 29 2.800 m 2.800 m 0.555 m
70 30 2.800 m 2.800 m 0.555 m
71 31 3.350 m 3.350 m 0.355 m
72 32 3.100 m 3.100 m 0.405 m
73 33 3.550 m 3.550 m 0.355 m
74 34 4.450 m 4.450 m 0.305 m
75 35 3.850 m 3.850 m 0.305 m
76 36 3.500 m 3.500 m 0.305 m
77 37 2.650 m 2.650 m 0.455 m
78 38 4.000 m 4.000 m 0.355 m
79 39 3.500 m 3.500 m 0.355 m
80 40 4.150 m 4.150 m 0.355 m
Isolated Footing 41

263 | P a g e
Fig.8.7 Isolated Footing
Input Values
Footing Geometry
Design Type: Calculate Dimension
Footing Thickness (Ft): 305.000 mm
Footing Length - X (Fl): 1000.000 mm
Footing Width - Z (Fw): 1000.000 mm
Eccentricity along X (Oxd): 0.000 mm
Eccentricity along Z (Ozd): 0.000 mm
Column Dimensions
Column Shape: Rectangular
Column Length - X (Pl): 0.600 m
Column Width - Z (Pw): 0.230 m
Pedestal
Include Pedestal? No
Pedestal Shape: N/A
Pedestal Height (Ph): N/A
Pedestal Length - X (Pl): N/A
Pedestal Width - Z (Pw): N/A

264 | P a g e
Design Parameters
Concrete and Rebar Properties
Unit Weight of Concrete: 30.000 KN/m3
Strength of Concrete: 30.000 N/mm2
Yield Strength of Steel: 415.000 N/mm2
Minimum Bar Size: Ø8
Maximum Bar Size: Ø16
Minimum Bar Spacing: 50.000 mm
Maximum Bar Spacing: 300.000 mm
Pedestal Clear Cover (P, CL): 50.000 mm
Footing Clear Cover (F, CL): 50.000 mm
Soil Properties
Soil Type : Drained
Unit Weight : 22.000 kN/m3
Soil Bearing Capacity : 200.000 kN/m2
Sliding and Overturning
Coefficient of Friction: 0.500
Factor of Safety against Sliding: 1.500
Factor of Safety against Overturning: 1.500
Design Calculations Footing Size
Initial Length ( ) = 1.000 m
Initial Width ( ) = 1.000 m
Uplift force due to buoyancy = 0.000 KN
Effect due to adhesion = 0.000 KN
Area from initial length and width, = 1.000 m2
Min. area required from bearing pressure, Amin = P / qmax = 3.470 m2
Note: Amin is an initial estimation.
P = Critical Factored Axial Load (without self weight/buoyancy/soil).
= Respective Factored Bearing Capacity.
Final Footing Size
Length (L2) = 5.250 m Governing Load Case : # 1
Width (W2) = 5.250 m Governing Load Case : # 1
Depth (D2) = 0.305 m Governing Load Case : # 1
Area (A2) =27.563m2

265 | P a g e
ANALYSIS AND DESIGN USING STAAD
DETAILS OF THE ANALYSIS SOFTWARE
STAAD for windows is comprehensive structural engineering software that addresses all aspects of
engineering-model development, analysis, design, verification and visualization. Staad for windows is based on
the principles of finite element analysis and is available in a “concurrent engineering” profile. It is capable of
analyzing and designing structures consisting of both frames and shell elements. Following are the main options
available from the concurrent graphics environment.
STAAD Analysis and design
STAAD PRE Graphical input generator
STAAD POST Graphical post processing
STAAD INTDES Interactive design of structural components
STAAD uses a command language based input format which can be created through a text editor or through
STAAD PRE, graphical or through CAD, based formats.
Analysis facilities available in STAAD are:
1. Stiffness Analysis-based on the matrix displacement method.
2. Second Order Analysis
i. P-Delta Analysis-incorporates secondary loading.
ii. Non Linear Analysis-incorporates both secondary loading and geometric stiffness
correction.
3. Dynamic Analysis-solution of free vibration problems response spectrum analysis and fixed vibration
analysis.
IDEALIZATION OF STRUCTURE
All the beams and columns of the main building of our hotel were included as prismatic members with
six degrees of freedom (3D beam elements). The columns at the foundation level were assumed to be pinned.
LOAD COMBINATION
The load on beams from slabs from slabs has been considered as uniformly distributed on the entire
span. This loading was arrived at by considering equivalent uniformly distributed load from the triangular or
trapezoidal pattern in the case of one-way slabs. In this case dead load, live load, wind load and their
combination has been considered. The load cases 1, 2 and 3 correspond to dead load, live load and wind load
respectively. Load cases 4 and 5 correspond to combination of dead load and live load, dead load and wind load.
The intensities of wind load are calculated from the IS: 875(Part-3). The whole structure was analyzed for these
6 different loading conditions and the design was carried out based on the most critical loading condition.
The analysis result consists of member end forces, which includes shear forces and bending moments,
deflection of members, support reactions etc.

266 | P a g e
The analysis turned out well with the deflection of the structure within the permissible limits. The
member forces, support displacements and support reactions obtained are given in tables.
SEISMIC PARAMATERS
FROM IS 1893 (PART-1)-2002
Zone Factor (Z) (Seismic Zone 3 – Table-2Clause 6.4.2) = 0.1
Importance factor (I) (Table-6 Clause 6.4.2) = 1.0
Response Reduction Factor (R) (Table 7 Clause 6.4.2) = 5.0
Structural Soil (SS) (Fig 2 type 1 Rock or Hard soil) = 1.0
Structure Type (ST) (RC Frame Building) = 1.0
Damping Ratio (Dmp) = 0.05
COLLAPSE LOAD COMBINATIONS (KN/M)
1. 1.5 (DL +LL) 2. 1.5 (DL+EQ X)
3. 1.5 (DL+EQ Z) 4. 1.2 (DL+LL+EQ X)
5. 1.2 (DL+LL+EQ Z) 6. 0.9 DL+1.5 EQ X
7. 0.9 DL + 1.5 EQ Z 8. 1.0 (DL + LL)
9. 1.5(DL + WL X) 10. 1.5 (DL + WL Z)
11. 1.2 (DL + LL + WL X) 12. 1.2 (DL + LL + WL Z)
13. 0.9 DL + 1.5 WL X 14. 0.9 DL + 1.5 WLZ
SERVICEABILITY LOAD COMBINATIONS
To examine the Sway and Drift in different columns of the building by using Serviceability load combinations
are as follows:
1. 1.0 (DL + EQ X) 2. 1.0 (DL – EQ X)
3. 1.0 (DL + EQ Z) 4. 1.0 (DL – EQ Z)
5. 1.0 (DL + WL X) 6. 1.0 (DL – WL X)
7. 1.0 (DL + WL Z) 8. 1.0 (DL – WL Z)
9. DL + 0.8 (LL + EQ X) 10. DL + 0.8 (LL – EQ X)
11. DL + 0.8 (LL + EQ Z) 12. DL + 0.8 (LL – EQ Z)
13. DL + 0.8 (LL + WLX) 14. DL + 0.8 (LL – WLX)
15. DL + 0.8 (LL + WLZ) 16. DL + 0.8 (LL – WLZ)
Member End Forces
Units Force - KN ,
Length - m

267 | P a g e
Staad output

268 | P a g e
REFERENCES
[1] (Aalami and Jurgens 2003) Aalami, Bijan O., and Jennifer D. Jurgens. “Guidelines for the Design of Post-
Tensioned Floors.” Concrete International. 25.3 (2003) 77-83.
[2] (Aalami and Kelley 2001) Aalami, Bijan O., and Gail S. Kelley “Structural Design of Post-Tensioned
Floors.” Concrete International. 23.1 (2001) 31-36.
[3] (American Concrete Institute 2005) American Concrete Institute. Building Code Requirements for
Structural Concrete and Commentary. 2005.
[4] (Bondy 2001) Bondy, Kenneth. “Post-Tensioned Concrete: Five Decades of American Building
Construction.” Concrete Construction. (Dec. 2001) 1-6. (Bromley 2009) Bromley, Pete. Jones Concrete.
Phoenix, AZ. “P-T slab.” E-mail to the author. 15 June 2009.
[5] (Cross 2009) Cross, Ramsey. Dalco Industries. Denver, CO. “Re: Cost Estimate.” E-mail to the author. 14
May 2009.
[6] (Curry 2009) Curry, Paul. Harris Rebar. Phoenix, AZ. Telephone interview. 19 May 2009.
[7] (Dickinson 2009) Dickinson, Billy. Dywidag-Systems International. Atlanta, GA. “Re: Cost Estimate.” E-
mail to the author. 28 April 2009.
[8] (Dietrich 2009) Dietrich, Robb. Dywidag-Systems International. Chicago, IL “Re: Cost Estimate.” E-mail
to the author. 8 May 2009.


![Prosiding[Halal Hotel]](https://static.fdokumen.com/doc/165x107/6345e46cdf19c083b10845eb/prosidinghalal-hotel.jpg)