Plankton metabolic processes and its significance on dissolved organic carbon pool in a tropical...
10
Research papers Plankton metabolic processes and its significance on dissolved organic carbon pool in a tropical brackish water lagoon Vishnu Vardhan Kanuri a,n , Pradipta R. Muduli a,d , R.S. Robin a , B. Charan Kumar b , A. Lovaraju b , D. Ganguly a , Sivaji Patra a , G. Nageswara Rao c , A.V. Raman b , B. R. Subramanian a a ICMAM Project Directorate, Ministry of Earth Sciences, NIOT Campus, Pallikaranai, Chennai-600100, India b Marine Biology Laboratory, Department of Zoology, Andhra University, Visakhapatnam-530013, India c Department of Inorganic and Analytical Chemistry, Andhra University, Visakhapatnam-530013, India d Wetland research and training centre (WRTC), Chilika Development Authority, Ministry of Environment and Forest, Govt. of Odisha, Barkul, Balugan,Orissa- 752030, India article info Article history: Received 13 July 2012 Received in revised form 27 February 2013 Accepted 3 April 2013 Available online 18 April 2013 Keywords: New production Extracellular release Dissolved organic carbon Photosynthesis Bacterial metabolism Chilika Lagoon abstract Efforts have been made to investigate the variability in the photosynthetically derived dissolved organic carbon (DOC P ) and particulate organic carbon (POC P ) at 11 locations during two seasons in a Asia's largest brackish water coastal ecosystem (Chilika Lagoon, India), together with the quantitative importance of DOC P as a substrate to the heterotrophic pelagic bacteria. The rates of DOC P and POC P ranged between 15.8–77.8 μgCL −1 d −1 and 82.01–296.41 μgCL −1 d −1 during pre-monsoon, 12.9–69.2 μgCL −1 d −1 and 62.5–182.3 μgCL −1 d −1 during monsoon, respectively. The mean primary production (TPP ¼POC P +DOC P ) in the lagoon during pre-monsoon and monsoon were found to be 267.21 and 160.95 μgCL −1 d −1 , respectively, and their corresponding mean DOC P rates were about 19% and 23.33%, indicated that even in the semi-enclosed coastal waters the TPP was significantly underestimated, if the dissolved products of photosynthesis are not taken into account. Heterotrophic bacteria assimilated the non-humic components of the DOC P at higher rates (up to 85% of the released non-humic fraction of DOC P ) than the humic components. Annually, DOC P satisfied 30% of bacterial carbon requirement for their metabolic activities in the lagoon. In spite of the relatively high percentage of extracellular release (PER) values observed during monsoon, the measured DOC P rates were much lower than the estimated bacterial carbon requirement, suggesting a weak coupling between phytoplankton exudation and bacterial metabolism. In addition to phytoplankton exudes, the heterotrophic bacteria may satisfy with other sources (autochthonous/allochthonous) of dissolved organic carbon to achieve their carbon requirement. & 2013 Elsevier Ltd. All rights reserved. 1. Introduction River dominated ocean margins are the most dynamic and productive environments along the coastal oceans. Organic matter plays a significant role in providing substrate for the microbial food web in these systems. The chief sources of organic matter to these environments are allochthonous materials exported from the land through rivers and autochthonous production of organic matter by algae through photosynthesis and intertidal vegetation. The organic matter in some oligotrophic lakes is derived mainly from allochthonous source, whereas phytoplankton photosynth- esis is responsible for the most organic matter source in eutrophic lakes (Saunders et al., 1980) and in the ocean (Williams and Gordon, 1970; Meyers-Schulte and Hedges, 1986). The source of dissolved organic carbon is important for the trophic ecology of plankton, as it provides a linkage between primary and bacterial production through the cycling of organic carbon by the microbial loop (Ducklow and Carlson, 1992; Legendre and Rassoulzadegan, 1996). Despite of its importance, many estuaries, lagoons and bays have been studied intensively regarding the dynamics of dissolved organic carbon (Cai et al., 1998; Canuel, 2001; Cifuentes and Eldridge, 1998; Cifuentes et al., 1988; Harvey and Mannino, 2001). In the present era with ever increasing atmospheric CO 2 , it is necessary to find out several sinks and reservoirs that can store carbon for a considerable period of time. In this respect the dissolve organic carbon dynamics in the open ocean as well as the coastal ecosystems could be useful for a significant storage of photosynthe- tically sequestered organic matter for a stipulated time span. Prim- ary producers supply intermittently new, potentially labile dissol- ved organic carbon to aquatic systems (Kirchman et al., 1991; Contents lists available at SciVerse ScienceDirect journal homepage: www.elsevier.com/locate/csr Continental Shelf Research 0278-4343/$ - see front matter & 2013 Elsevier Ltd. All rights reserved. http://dx.doi.org/10.1016/j.csr.2013.04.006 n Corresponding author. Tel.: +91 9092675499 (mobile). E-mail address: [email protected] (V. Vardhan Kanuri). Continental Shelf Research 61–62 (2013) 52–61
-
Upload
andhrauniversity -
Category
Documents
-
view
2 -
download
0
Transcript of Plankton metabolic processes and its significance on dissolved organic carbon pool in a tropical...

Continental Shelf Research 61–62 (2013) 52–61
Contents lists available at SciVerse ScienceDirect
Continental Shelf Research
0278-43http://d
n
CorrE-m
journal homepage: www.elsevier.com/locate/csr
Research papers
Plankton metabolic processes and its significance on dissolved organiccarbon pool in a tropical brackish water lagoon
Vishnu Vardhan Kanuri a,n, Pradipta R. Muduli a,d, R.S. Robin a, B. Charan Kumar b,A. Lovaraju b, D. Ganguly a, Sivaji Patra a, G. Nageswara Rao c, A.V. Raman b, B.R. Subramanian a
a ICMAM Project Directorate, Ministry of Earth Sciences, NIOT Campus, Pallikaranai, Chennai-600100, Indiab Marine Biology Laboratory, Department of Zoology, Andhra University, Visakhapatnam-530013, Indiac Department of Inorganic and Analytical Chemistry, Andhra University, Visakhapatnam-530013, Indiad Wetland research and training centre (WRTC), Chilika Development Authority, Ministry of Environment and Forest, Govt. of Odisha, Barkul, Balugan,Orissa-752030, India
a r t i c l e i n f o
Article history:Received 13 July 2012Received in revised form27 February 2013Accepted 3 April 2013Available online 18 April 2013
Keywords:New productionExtracellular releaseDissolved organic carbonPhotosynthesisBacterial metabolismChilika Lagoon
43/$ - see front matter & 2013 Elsevier Ltd. Ax.doi.org/10.1016/j.csr.2013.04.006
esponding author. Tel.: +91 9092675499 (mobail address: [email protected] (V. V
a b s t r a c t
Efforts have been made to investigate the variability in the photosynthetically derived dissolved organiccarbon (DOCP) and particulate organic carbon (POCP) at 11 locations during two seasons in a Asia's largestbrackish water coastal ecosystem (Chilika Lagoon, India), together with the quantitative importance ofDOCP as a substrate to the heterotrophic pelagic bacteria. The rates of DOCP and POCP ranged between15.8–77.8 μg C L−1 d−1 and 82.01–296.41 μg C L−1 d−1 during pre-monsoon, 12.9–69.2 μg C L−1 d−1 and62.5–182.3 μg C L−1 d−1 during monsoon, respectively. The mean primary production (TPP¼POCP+DOCP)in the lagoon during pre-monsoon and monsoon were found to be 267.21 and 160.95 μg C L−1 d−1,respectively, and their corresponding mean DOCP rates were about 19% and 23.33%, indicated that evenin the semi-enclosed coastal waters the TPP was significantly underestimated, if the dissolved productsof photosynthesis are not taken into account. Heterotrophic bacteria assimilated the non-humiccomponents of the DOCP at higher rates (up to 85% of the released non-humic fraction of DOCP) thanthe humic components. Annually, DOCP satisfied 30% of bacterial carbon requirement for their metabolicactivities in the lagoon. In spite of the relatively high percentage of extracellular release (PER) valuesobserved during monsoon, the measured DOCP rates were much lower than the estimated bacterialcarbon requirement, suggesting a weak coupling between phytoplankton exudation and bacterialmetabolism. In addition to phytoplankton exudes, the heterotrophic bacteria may satisfy with othersources (autochthonous/allochthonous) of dissolved organic carbon to achieve their carbon requirement.
& 2013 Elsevier Ltd. All rights reserved.
1. Introduction
River dominated ocean margins are the most dynamic andproductive environments along the coastal oceans. Organic matterplays a significant role in providing substrate for the microbialfood web in these systems. The chief sources of organic matter tothese environments are allochthonous materials exported fromthe land through rivers and autochthonous production of organicmatter by algae through photosynthesis and intertidal vegetation.The organic matter in some oligotrophic lakes is derived mainlyfrom allochthonous source, whereas phytoplankton photosynth-esis is responsible for the most organic matter source in eutrophiclakes (Saunders et al., 1980) and in the ocean (Williams and
ll rights reserved.
ile).ardhan Kanuri).
Gordon, 1970; Meyers-Schulte and Hedges, 1986). The source ofdissolved organic carbon is important for the trophic ecology ofplankton, as it provides a linkage between primary and bacterialproduction through the cycling of organic carbon by the microbialloop (Ducklow and Carlson, 1992; Legendre and Rassoulzadegan,1996). Despite of its importance, many estuaries, lagoons and bayshave been studied intensively regarding the dynamics of dissolvedorganic carbon (Cai et al., 1998; Canuel, 2001; Cifuentes andEldridge, 1998; Cifuentes et al., 1988; Harvey and Mannino, 2001).
In the present era with ever increasing atmospheric CO2, it isnecessary to find out several sinks and reservoirs that can storecarbon for a considerable period of time. In this respect the dissolveorganic carbon dynamics in the open ocean as well as the coastalecosystems could be useful for a significant storage of photosynthe-tically sequestered organic matter for a stipulated time span. Prim-ary producers supply intermittently new, potentially labile dissol-ved organic carbon to aquatic systems (Kirchman et al., 1991;

V.V. Kanuri et al. / Continental Shelf Research 61–62 (2013) 52–61 53
Sondergaard et al., 1985) and recognized as a major process in globalbiogeochemical cycles (Myklestad, 2000). Attempts have been madeduring the past four decades by several researchers to understand (1)the partitioning of phytoplankton-derived organic matter (i.e., parti-culate organic matter vs. dissolved organic matter (DOM)), (2) thetimescales of transformations between particulate and dissolvedpools, and (3) ultimately the fate of fixed organic matter. Thephytoplankton cells are permeable to a variety of organic compounds(Bjornsen, 1988), release ∼0 to 30% or even more according to theenvironmental conditions during their exponential and stationaryphases of growth, likely to be a significant source for the DOM.Highly productive shallow coastal ecosystems, produced DOM mayaccumulate on several timescales, ranging from days to months(Williams, 1995; Alvarez-Salgado et al., 2001; Hill and Wheeler.,2002).
The nature of dissolved organic carbon derived from phyto-plankton is highly complex, but major fractions include carbohy-drates (Biersmith and Benner, 1998), followed by N-compounds,namely protein, polypeptides, lipids, and amino acids (Hamanakaet al., 2002; Myklestad, 2000; Wakeham et al., 1997; Lee et al.,2004). It can be considered that proteins are more labile thancarbohydrates as evident from the decrease in the ratio of proteinsto carbohydrates in sinking particle with depth in oceanic system(Wakeham et al., 1997; Lee et al., 2004). Romera-Castillo et al.(2010) confirmed that variable amounts of fluorescent protein-likeand humic-like substances (colored dissolved organic matter) werereleased in axenic cultures of four phytoplankton species. Accumu-lation of these autochthonous DOM indicates that a fraction of the Cfixed by phytoplankton will act as a substrate and an energy sourcefor natural assemblages of pelagic heterotrophic bacteria (labileDOM) (Ogawa et al., 2001; Carlson, 2002). Part of the releasedcarbon, however, resists bacterial attack and remains in watercolumn for long time (non-labile DOM) (Hansell and Carlson,1998; Hama et al., 2004). Chrost and Faust (1983) calculated thatbacterioplankton consumes 18–77% of phytoplankton extra cellularrelease (DOCP). However, the new carbon pool is usually smallcompared to more refractory carbon pools and is thus difficult todistinguish. For understanding the qualitative and quantitative
1
2
3
4
6 5
8500 00’0”E 85015’0”E
190 3
0’0”
N
190 4
5’0”
N
200 0
’0”N
Fig. 1. Map of Chilika Lagoon showing 11 represen
dissolved organic carbon pool sizes in natural environment, bacter-ial production and respiration are the best available indicators.
Investigations on DOCP from different axenic algal/cultures havebeen made to determine their variable responses under differentenvironmental conditions (Myklestad, 1995; Descy et al., 2002;Wetz and Wheeler, 2007). Also, several studies concentrated on thekinetics (Lancelot, 1979) of DOCP during time series observations forthe cultures during different phase of the plankton growth and effectof temperature, light (Lancelot, 1983; Zlotnik and Dubinsky, 1989,Verity et al., 1991, Karl et al., 1998) and nutrients (Myklestad, 1977;Obernosterer and Herndl, 1995; Lopez-Sandoval et al., 2010)on DOCP.
Studies on DOCP and its importance on the dissolved organiccarbon pool are scarce in the tropical environments. Hence, apioneering attempt was made in this regard, to quantifying theDOCP organic matter and its role on DOM pool in a tropical coastalLagoon, Chilika. Earlier studies by Gupta et al. (2008) showed therole of Chilika lagoon as source of CO2 to the atmosphere driven bystrong heterotrophic activity via transforming riverine organiccarbon to CO2. Apart from the riverine allochthonous dissolvedorganic carbon, autochthonous processes could play a major roleto determine the sink source strength of the lagoon. Therefore, thepresent study was aimed to quantify and understand the roleof autochthonous dissolved organic carbon (DOCP) in the highlyheterotrophic system. Also the characterization and relative imp-ortance of different DOCP fractions as bacterial substrate and theirrole in the re-mineralization process were examine to be quanti-fied in the lagoon water.
2. Materials and methods
2.1. Study area
Chilika Lagoon, a shallow (∼2 m) brackish water lagoon on theeast coast of India, is situated about 350 km south of Kolkata(Fig. 1). The lagoon is pear shaped and covers a total area of about1000 km2 during monsoon (August–October), which is reduced by
10
9
7
8
11
85030’0”E 85045’0”E
tative stations (denoted with solid red circles).

V.V. Kanuri et al. / Continental Shelf Research 61–62 (2013) 52–6154
nearly 60% during pre-monsoon (April–May) when evaporation farexceeds precipitation (Gupta et al., 2008). The northern sector ischaracterized by increasing amounts of turbidity, poor watertransparency, high nutrient levels and low salinity evidently as aresult of proximity of rivers emptying into the system. On theother hand, the southern sector remained comparatively salinethroughout the year. Seawater exchange takes place predomi-nantly through outer channel although there is a discrete connec-tion (through Palur canal) further south in Rambha Bay. Thelagoon has huge catchments, nearly 4146 km2, with an averagerainfall of 1238 mm (in 72 rainy days) lasting through June–September (summer monsoon) and November–December (wintermonsoon); nearly 75% of it occurs during summer monsoon withpeak intensity in August. Fifty-two rivers/rivulets drain enormousfreshwater into the lagoon together with significant loads ofnutrients and suspended matter resulting in appreciable changesin hydrological conditions seasonally and annually.
2.2. Experimental design and study site
Two individual observations were made in Chilika lagoonduring May (peak pre-monsoon) and October (peak monsoon)2009 for 11 hydrologically different stations. On the basis of earlierstudies by Gupta et al. (2008) and Muduli et al. (2012) themonitored stations were classified into four different sectors i.e.south (stns.1, 2, 3), central (stns.4, 5, 6), north (stns. 7, 8, 9) and, theouter channel (stns.10, 11) (Fig. 1) to cover contrasting physico-chemical conditions along with the DOCP and its importance as asubstrate to the pelagic heterotrophic bacteria.
2.3. Sampling and analysis:
Sub-surface (0.3 m) water samples were collected using 5 LNiskin bottle for measuring temperature, pH, salinity, dissolvedoxygen (DO), chlorophyll a (Chl-a), nutrients, primary productionand suspended particulate matter (SPM). Secchi disk depth wasmeasured, which represented the light availability in the lagoonwater column. Salinity was measured by using standard argento-metric titration (Grasshoff et al., 1999). pH was measured by usingthe Metrohm (Switzerland) pH meter (accuracy 70.005). DO wasmeasured using the Winkler's titration method of Carrit andCarpenter (1966). The analytical precision, expressed as standarddeviation, was 70.07% for DO. Nitrate, nitrite, ammonia andphosphate analyses were carried on filtered water followingstandard spectrophotometric procedure (Grasshoff et al., 1999).The precisions of the nitrate+nitrite, ammonia and phosphatewere 70.02, 70.02 and 70.01 μM, respectively. About 150 mlof water samples were filtered through pre-weighed 0.22 mmpolycarbonate filters (Millipore), dried at 401 C and reweighed.The difference between two weights was taken as suspendedmatter content (mg l−1). All these analyses were completed within12 h of sampling at the shore-based laboratory set up in INS-Chilika. A 150 ml of water sample was filtered through GF/Ffilters (Whatman). Chl-a in the filtered sample was first extractedwith 90% acetone, at 4 1C in dark for 24 h, and then spectro-photometrically analyzed (Parsons et al., 1984).
2.3.1. Dissolved organic carbon and particulate organic carbonanalysis
Samples for dissolved organic carbon and particulate organiccarbon were collected in 100 ml glass bottles (pre-combusted at450 1C for 4 h) and kept in ice. In the laboratory, known volumes ofsamples were filtered through 25 mm Whatman GF/F filters (pre-combusted at 450 1C for 4 h) which were then oven dried at 60 1Cfor 12 h and stored at −20 1C for particulate organic carbon
analysis. The filtrates were acidified to pH 3–4 using 1% phosphoricacid and stored in pre-combusted 10 ml air-tight glass tubes atabout 10 1C until dissolved organic carbon analysis was performed.Dissolved organic carbon in these samples was estimated follow-ing the high-temperature catalytic oxidation method using a TOCanalyzer (Shimadzu TOC-VCPH). The accuracy of dissolved organiccarbon measurements, where checked with Certified ReferenceMaterial (supplied by Dr. D. Hansell, University of Miami, USA) andinternal standards prepared using potassium hydrogen phthalate(1 and 5 mg l−1), was within 71%. Particulate organic carbon inthe filters (decarbonated by HCl fumes) was analyzed using anElemental Analyzer (Thermo Finningan, Flash EA1112) with L-cystine as standard and the precision of analysis checked againstNIST 1941b was found to be within 70.1%.
2.3.2. Dissolved organic carbon fractionationFiltered samples were collected in a 250 ml pre-combusted
glass bottles and were acidified (pH∼2) with 0.1 N HCl and kept ato4 1C until analysis (1 Month) for the quantification of humic(HDOC) and non-humic (NHDOC) fraction of dissolved organiccarbon. Quantification of these two fractions was made throughtheir adsorption on macro porous non-ionic resin at different pH.To fractionate the dissolved organic carbon non-ionic amberliteXAD-8 resin (Sigma-Aldrich 40-60mesh) was used. At first, XAD-8resin was cleaned-up, conditioned according to Thurman andMalcolm (1981). It was then packed into a glass column and wasrinsed alternatively (3 times) with 0.1 M NaOH and 0.1 M HCl justbefore application of sample. The column capacity factor (k′) wasmaintained at 50 to separate the humic substances using XAD-8resin. After the conditioning was over, three blanks were collectedfrom the final washings with 0.1 M HCl. 200 ml of the filteredsample was allowed to pass through the XAD-8 column at aconstant flow rate (Q) of about 1 ml/min. A 25 ml of elute (whichcontains only non-humic dissolved organic carbon), was collectedfor the DOC (non-humic) analysis. Eluted non-humic DOC wasanalyzed using high the temperature catalytic combustion (HTCO)method using Shimadzu TOC-V analyzer. Difference in total dis-solved organic carbon and NHDOC represented the HDOC fraction.
2.3.3. Primary production, percentage of extracellular release,characterization of PDO14C and bacterial mineralization of PDO14C
Samples were gently sieved through a 100 mm-pore-size net toremove macro zooplankton and subsequently deck incubated for24 h. (Light+dark) at insitu temperature with 1 ml of 5 mCi H14CO3
−
(BARC) in triplicate 300 ml transparent glass bottles (pre washedwith HCl and Milli-Q water). 0.25 ml of aliquot for counting totaladded 14C activity was removed from each incubated bottle with a0.25 ml pipette and placed in a 25 ml scintillation vial containing0.25 ml ethanolamine (Sigma). These sample mixtures were keptat room temperature until subsequent liquid scintillation analysis.After 24 h., 150 ml of incubated sample from each bottle wasfiltered through Millipore membrane filter (47 mm diameter) ofpore size 0.22 mm by maintaining the vacuum levels ≤70 mm Hg.The filtrates were collected in 250 ml glass bottles (pre combustedat 450 1C) and the pH was adjusted to≤3 by using 0.1 N HCl.Inorganic fraction of 14C was removed by adding 5 ml of 20% HCland then purging with ultra-pure zero grade air (compressedatmospheric air, CO2 conc. o0.1 ppm). Acidified filtrates werethen preserved in cool condition (o4 1C) for the quantificationand characterization of photosynthetically derived DO14C. Thefilter was placed in a 20 ml scintillation vial after rinsing withMilli-Q water, acidified with 0.25 ml 0.5 N HCl (to remove theinorganic fraction) and kept at room temperature until subsequentprocessing for particulate primary productivity (POCP).

V.V. Kanuri et al. / Continental Shelf Research 61–62 (2013) 52–61 55
The POCP sample vials were uncapped in a fume hood, andallowed to dry overnight at ICMAM laboratory at Chennai. A 10 mlaliquot of liquid scintillation cocktail was added to each of thedried filters. 10 ml of liquid scintillation cocktail and 2.5 ml Milli-Qwater were added to the each vial containing 0.25 ml sample and0.25 ml ethanolamine. The mixtures were shaken vigorously andcounted in a Liquid Scintillation Counter (Beta Wallac, Model 1409DSA) at Marine biotechnology laboratory, NIOT, Chennai.
The release of organic matter by phytoplankton (DOCP) atlagoon water was determined by a modified method describedby Sundh and Bell (1992), Mague et al. (1980), Anderson andZeutschel (1970). Fifty ml of the acidified filtrate (obtained fromthe deck incubated 24 h) water was used for measurement ofDOCP. Each sample was bubbled with ultra-pure zero grade air(250 ml/min) for at least 15 min that resulted complete removal ofinorganic 14C. Aliquots (2 ml) of the acidified filtrate were thentransferred directly to 20-ml scintillation vials containing 10 ml ofa scintillation cocktail solution and counted with a Liquid Scintil-lation Beta Counter (Beta Wallac, Model 1409 DSA). For thecharacterization of DO14CP, 100 ml of the acidified sample waspassed through XAD-8 Column (Procedure was discussed in theDOM fractionation) and elute was collected for the non-humic 14Cfraction measurement (Sundh and Bell, 1992), followed by liquidscintillation analysis. The difference in total DO14CP and non-humic DO14CP results the humic DO14CP.
Another 150 ml aliquot was allowed to pass through a 2 mmMillipore membrane filter following the classification [Phytoplank-ton (42 μm), bacteria (0.2–2 μm) and dissolved fractions (o0.2μm)] by Sundh and Bell (1992) to remove the phytoplankton butnot the bacteria. The filtrates containing the heterotrophic bacter-ioplankton and DO14CP were subsequently re-incubated in dark-ness at 25 1C for 24 h, to allow continuous bacterial utilization ofDO14CP, then the incubated sample was filtered through 0.22 mmMillipore membrane filter to remove the bacteria. Ten ml of filtratewas acidified with 0.1 N HCl and purged with ultra-pure zerograde air for 15 min, for the removal of Inorganic 14C. An aliquot(2 ml) the acidified samples was transferred to 20-ml scintillationvial containing 10 ml cocktail and counted by Liquid ScintillationCounter (Beta Wallac, Model 1409 DSA) for the estimation ofbacterial assimilation of DO14CP. One hundred ml of the filtratewas passed through XAD-8 column for the characterization of theHS and NHS composition and subsequently analyzed by scintilla-tion counter. Carbon incorporation and release were calculatedfollowing Mague et al. (1980).
2.3.4. Bacterial abundance (BA), bacterial production (BP) bacterialrespiration (BR) and bacterial growth efficiency (BGE)
Bacterial abundance was estimated following the acridineorange direct count method (Hobbie et al., 1977). Briefly, sampleswere immediately preserved in 2% buffered formaldehyde. A kno-wn amount of the sample stained with acridine orange (0.01%)was passed through 0.22 mm black polycarbonate Nucleporemembrane filter (Whatman) and enumerated using an epifluores-cence microscope (Olympus BX 41, Japan). Counting was done intriplicate with 20 fields for each sample and expressed in numberL−1. BP was measured by the incorporation of the tritiated thym-idine (3H-TdR) into bacterial DNA (Fuhrman and Azam, 1982). Theconcentration of labeled thymidine required to saturate the uptakewas evaluated by measuring the uptake over a series of thymidineconcentration ranging from 5 to 30 nM (specific activity: 52 Ci m-mol−1; BARC, Mumbai, India). From the experiment, the saturationconcentration was found to be 10 nM. The extent of isotopicdilution was measured by adding known concentrations (5–30nM) of unlabeled thymidine with labeled addition. The experi-ments revealed a relatively low contribution of exogenous unla-beled thymidine. Based on these results, we used isotopic dilution
of 2, in agreement with the value reported by Simon and Azam(1989), Roland and Cole (1999) and Ram et al. (2007) for thelabeled compounds. Thirty milliliters of sample (in triplicate)along with a 2% buffered formalin-killed control was incubatedwith 3H-TdR at a final concentration of 10 nM and incubatedunder ambient temperature in the dark for 1 h. TdR incorporationwas then arrested by adding 2% buffered formalin. Samples werefiltered through a 0.22 mm membrane filter (Whatman) [pre-soaked in 5% trichloroacetic acid (TCA)], extracted in cold 5% TCAand rinsed with 80% ethanol. The dried filters were placed inscintillation vials, 5 ml of dioxin-based scintillator (SRL) was addedand the radioactivity was measured using liquid scintillationcounter (Beta Wallac, Model 1409 DSA). BP calculated as molTdRincorporated into DNA was converted to number of bacterial cellsproduced by applying a conversion factor (1.96�1018 cells mol−1)and to carbon by using a conversion factor of 2.0�10−14 g C cell−1
(Lee and Fuhrman, 1987). Bacterial carbon demand (BCD) wascalculated as the sum of BR and BP (Lopez-Sandoval et al., 2010).
To estimate the bacterial respiration, samples were filteredsequentially through 2 mm polycarbonate membrane filters (Milli-pore). Filtrates were collected in six 300 ml BOD bottles. The timezero control samples (in triplicates) were immediately fixed withWinkler's reagents. Another set of samples (in triplicates) wasmaintained at 25 1C temperature in the dark for 24 h beforefixation. The change in DO concentrations between initial andafter incubation was measured as bacterial respiration. The meta-bolic rates measured using changes in DO concentrations wereconverted to carbon respired assuming a respiratory quotient (RQ)of 1 (Biddanda et al., 1994; Laws, 1991). BGE was calculated as theslope of bacterial production versus the sum of bacterial produc-tion and bacterial respiration and expressed as a percentage.
2.3.5. Statistical analysisStatistical analysis of the water quality among the stations along
with the seasonal and spatial variations was studied through the useof Analysis of Variance (ANOVA), Analysis of Covariance (ANOCOVA)and Multiple Analysis of Variance (MANOVA). To determine theinterrelationship between biological and non-biological parametersPearson correlation coefficients were derived. Model I – log–logregression analysis (ordinary least square [OLS]), Model II—reducedmajor axis analysis (RMA) was performed on DOCP and POCP in orderto attain normality and homoscedasticity. Stepwise multiple regres-sion analysis was performed to understand the relative importanceof different parameters over the percentage of extracellular release(PER), by considering PER as dependent variable and temperature,salinity, secchi depth and NO3–N as independent variable. All thesestatistical analyses were carried out by using statistical softwarePrimer 6.0, PASW 18.0, and Minitab16.1.
3. Results
3.1. Hydrographic characteristics of the lagoon
Water temperature across the lagoon varied between 28.3and 31.6 1C. The mean lagoon temperature during monsoon (29.470.92 1C) remained relatively lower compared to pre-monsoon(30.2271.08 1C). The seasonal salinity fluctuation was in accordanceto the river discharge with fairly high saline conditions in pre-monsoon (19.62710.84) followed by a sharp decrease to 3.473.7during monsoon. The distribution of salinity in pre-monsoon showedthe existence of very low saline (1.57) waters in the northeast lagoonindicating the importance of freshwater supply through northeastrivers whereas salinity in other regions in the lagoon ranged between10 and 35. Drastic changes, however, ensued during monsoon when

V.V. Kanuri et al. / Continental Shelf Research 61–62 (2013) 52–6156
freshwater conditions prevailed in the northern lagoon and its effectextended up to the central sector and outer channel (salinity 0.5–3.7).Simultaneously, however, the southern lagoon continued to remainrelatively saline (8.871.37) with a marginal difference from pre-monsoon salinity (15.8772.6). Effect of fresh water laden particulatematter was evident from a sharp decrease in secchi disc transparencyfrom pre-monsoon (0.6370.18 m) to monsoon (0.3970. 24 m).Variation in secchi depth was associated with the distribution ofSPM (r¼−0.610) in the lagoon with higher values observed duringmonsoon (62.42742.92 mg l−1) compared to pre-monsoon(48.16732.74 mg l−1). Exceptional high SPM was recorded in thenorthern sector during monsoon (92.89745.20 mg l−1) when thefresh water input wasmaximum. During this season, heavy suspendedloads brought by rivers resulted in brown turbid waters in thenorthern stations, whereas the southern and central stations wererelatively free from such effects and displayed deeper secchi depth.
Mean dissolve inorganic nitrogen (DIN) and phosphate (DIP)concentration during pre-monsoon, in the lagoon was found to be1.2370.7 μM and 0.3070.27 μM, respectively, and with a meanN/P ratio of 6.61 and the relative percentage of NO3–N in total DINwas found to be 58%. With inputs from huge river runoff, boththese nutrients showed an increase in their concentrations duringOctober (monsoon) and their respective mean concentration were6.5072.45 and 0.7370.24 μM. The relative percentage of NO3–Nin total DIN was found to be 64%. Although in monsoon the N/Pratios (mean 9.31) found higher than those of the pre-monsoon,overall the lagoon showed a limitation of DIN with respect the Redfield ratio. Between the two seasons, relatively higher DO val-ues were recorded in pre-monsoon. The lagoon remained highlysupersaturated with dissolved oxygen (∼130%) in pre-monsoon,whereas moderate under-saturation was recorded in monsoon(81%). Spatial variations of salinity, secchi depth, N/P ratio and DO,during pre-monsoon and monsoon in the lagoon are shown inFig. 2a and b.
0.0
0.5
1.0
1.5
0
10
20
30
40
50
Southern Central Northern OC
Southern Central Northern OC
SD (m
)
Salin
ity
Sal.monsoon Sal. Pre-monsoonSD pre-monsoon SD monsoon
0
3
6
9
12
15
0
10
20
30
40
50
1 2 3 4 5 6 7 8 9 10 11
1 2 3 4 5 6 7 8 9 10 11
DO
(mg/
L)
N/P
N/P monsoon N/P pre-monsoonDO pre-monsoon DO monsoon
Fig. 2. Spatial variations of (a) salinity and secchi depth (b) N/P ratio and DO,superimposed continuous lines(pre-monsoon) and dotted lines (monsoon).
3.2. Distribution of dissolved organic carbon, particulate organiccarbon, and chlorophyll-a (Chl-a)
Dissolved organic carbon showed a non-conservative behaviorduring both the seasons. Mean DOC concentration was higher duringpre-monsoon (327.757199.56 mmol kg−1) followed by ∼1.5 foldsreduction during monsoon (194.83753.27 mmol kg−1). Irrespectiveof seasons central sector showed higher dissolved organic carbonconcentrations compared to rest of the lagoon. Concentrations ofparticulate organic carbon showed a wide spatial and temporalgradient in the lagoon. POC concentrations were markedly higher(1513.57480.1 mmol kg−1) during the monsoon with exceptionalhigh values in the northern sector (1947.67110.89 mmol kg−1). TheChl-a concentration decreased between pre-monsoon (25.42726.52 mg l−1) and monsoon (8.1675.18 mg l−1), with highest valuesin the central stations (46.0731.4 and 14.4772.55 mg l−1 in therespective seasons). The Chl-a for southern lagoon during pre-monsoon (7.2975.29 mg l−1) was nearly two fold higher than mon-soon (3.870.45 mg l−1). These results indicated the dominance ofland derived particulate organic carbon introduced into the lagoonduring monsoon.
3.3. Particulate production (POCP), extracellular release orphotosynthetically derived dissolved organic carbon (DOCP) andpercent extracellular release (PER)
Primary production in the lagoon during both pre-monsoonand monsoon followed the similar spatial pattern with highestvalues recorded at the central sector (284.2175.92 and 158.18726.85 μg C l−1d−1, respectively) followed by northern sector(243.58757.55 and 134.0275.38 μg C l−1d−1, respectively), outerchannel (199.26798.59 and 105.24760.4 μg C l−1d−1, respec-tively) and southern sector (131.39744.45 and 90.05719.76μg C l−1d−1, respectively). Spatial and temporal changes in DOCP
production rates closely resembled the distribution of primaryproduction (Fig. 3a and b) in the lagoon. Highest DOCP production(77.83 μg C l−1d−1) was recorded during the pre-monsoon at sta-tion 6 (central sector), whereas the lowest (12.98 μg C l−1d−1) wasin monsoon at station 11 (outer channel). The relative significanceof DOCP with respect to TPP, expressed as a PER [calculated asDOCP/(POCP+DOCP)], remained within a relatively constrainedrange from 12.8 to 28.6% during the study period with an annualaverage of 20.3%, and no marked seasonal variations wereobserved. The mean primary production (TPP¼POCP+DOCP) inthe lagoon during pre-monsoon and monsoon were found to be267.21 and 160.95 μg C L−1d−1 respectively, and their correspond-ing mean DOCP rates were found to be19% and 23.33%. Spatialdistribution of PER in two different seasons is shown in Fig.3a andb. To examine the relation between TPP and PER a Log POCP vs. LogDOCP was plotted for both the seasons. The model II slope formonsoon season was significantly 41 (Clarke's T-test, n¼11,p¼0.0079o0.01) (Fig. 4b). Whereas, the slope of the linearregression (Model II slope), was not significantly different from1 (Clarke's T-test, n¼11, p¼0.0501o0.05) during pre-monsoon(Fig. 4a) suggests that the release of recent photosynthate indissolved form is a normal function of actively growing phyto-plankton. As far as temporal variability is concerned, no clearrelationship between PER and TPP was observed, as evidencedfrom the fact that, the slopes of the linear regression between thelogarithms of integrated POC and DOC production (Model II slope:1.232 in the present study, Fig. 4c) did not vary significantly from 1,which was similar to the observation (0.91) by Teira et al. (2003b).
The stepwise regression analysis between PER and physico-chemical parameters revealed that the independent factors alltogether explained 57.6% of PER variability. All these parametersshowed negative feedbacks, towards PER variability with the

V.V. Kanuri et al. / Continental Shelf Research 61–62 (2013) 52–61 57
highest contribution from secchi depth (26.8%) followed bysalinity (22%):
PER¼ 38:1−0:0513 Salinity−0:475 Temperature
−5:16 Secchi depth−0:348 Nitrate ð1Þ
3.4. Humic (H) and non-humic (NH) fraction in bulk dissolvedorganic carbon and DOCP
During pre-monsoon the contribution of humic substances to thebulk dissolved organic carbon (allochthonous) ranged between 18.91and 88.3% with an average of 40.06723.43% which further increasedto 52.56721.75% during monsoon (range 11.41–79.9%). Mean phyto-plankton DOCP (after 24 h) during pre-monsoon and monsoon werefound to be 51.21724.68 and 37.56717.40 mg C L−1. The variation inhumic and non-humic fraction of DOCP (autochthonous) between thetwo seasons was found negligible in spite of 28% decrease in itsconcentration from pre-monsoon to monsoon. The mean percentageof non-humic substances in DOCP during pre-monsoon and monsoon
0
5
10
15
20
25
30
0
50
100
150
200
250
300
350
400
1 2 3 4 5 6 7 8 9 10 11
PER
(%)
Dis
s. o
r Par
t. Pr
od.(µ
g C
/L/d
)
St.No.
1 2 3 4 5 6 7 8 9 10 11
St.No.
Pre-Monsoon Diss.Prod. Part.Prod. PER
0
5
10
15
20
25
30
0
50
100
150
200
250
300
350
400
PER
(%)
Dis
s. o
r Par
t. Pr
od.(µ
g C
/L/d
)
Monsoon Diss.Prod. Part.Prod. PER
Fig. 3. Spatial variations of particulate production (Part. Prod.) (POCP) of POC anddissolved production (Diss.Prod.) (DOCP). Superimposed dotted lines are percen-tage of extracellular release (PER) A) Pre-monsoon and B) Monsoon.
y = 1.3939x - 1.5636 R2 = 0.9463
1.001.101.201.301.401.501.601.701.801.902.00
1.80 2.00 2.20 2.40 2.60
Log
DO
CP
(µg
C L
-1d-1
)
Log
DO
CP
(µg
C L
-1d-1
)
Log POCP (µg C L-1d-1) Log POCP
y = 1.518x - 1.6R2 = 0.9642
1.001.101.201.301.401.501.601.701.801.90
1.70 1.90
Fig. 4. Regression plots of Log (POCP) vs. Log (DOCP)
were 79.8675.95% (range 71.82–89.95%) and 79.5878.7% (range62.56–91.45%), respectively. Percentage contributions of non-humicfraction of DOCP were higher in the outer channel which wascharacterized by sea water influence.
3.5. Bacterial abundance (BA), bacterial production (BP) bacterialrespiration (BR) and bacterial growth efficiency (BGE)
Bacterial abundance exhibited spatial and temporal variabilityranging from 0.56 to 1.99�109 cells L−1 with higher valuesobtained during monsoon. High positive correlation was observedbetween BA and DOCP (po0.01, r¼0.548 n¼22), POC (po0.05,r¼0.512 n¼22). Among the two seasons, BP was lower duringpre-monsoon (45.33711.09 mg C m−3 d−1) compared to monsoon(110.95743.37 mg C m−3 d−1). Irrespective of seasons, both BAand BP recorded highest in the northern sector, with a gradualdecrease towards the southern sector. Bacterial respiration (BR)ranged between 31.26 and 231.32 mg C m−3 d−1 in pre-monsoonand between 47.4 and 380.4 mg C m−3 d−1 in monsoon. Strongpositive correlation for both BR (po0.01, r¼0.58 n¼22) and BP(po0.001, r¼0.87 n¼22) with POC was observed. Relativelyhigher BR and BP during monsoon compared to pre-monsooncorresponded to a two fold increase in BCD. The mean BCD valuesin the lagoon during pre-monsoon and monsoon were calculatedto be 115763.4 and 243.357119.72 mg m3 d−1, respectively. BGEranged from 18 to 60% with a majority (90%) of the measurementsfall between 35 to 60%. The average BGE in pre-monsoon andmonsoon were 44% (713) and 47% (710), respectively. The two-way ANOVA showed a significant spatial and temporal variation inBP (po0.01), whereas, BA showed seasonal variation (po0.01)and no such variation were observed for BGE and BR.
A two-way MANOVA test was performed considering theseason and sector as independent factors, and the biological para-meters as dependent factors (secchi depth, salinity, temp. pH, DO,Nitrate, Chl-a DOCP, POCP, TPP, BR, BP, BA, BCD, and BGE). Theresults revealed an insignificant multivariate main effect for theseason and sector, Wilks′ λ¼0.000, F (2.384)¼3.9, p40.05 andpower to detect the effect was 0.530. The results of two-wayANOVA for the dependent variables are shown in Table 1.
3.6. Decomposition of humic (BDHS) and non-humic (BDNHS) DOCPfractions by heterotrophic bacteria (HB)
Noticeable variation in heterotrophic decomposition of DOCP
fractions was recorded after 24 h of incubation of the lagoonwater.During pre-monsoon around 79.8% of initial non humic fraction(average 40.27 mg C l−1) and 15.76% of initial humic fraction (aver-age 10.94 mg C l−1) got decomposed within the incubation period(24 h), whereas during monsoon these two decomposed fractionswere recorded to be 89.35% and 19.97% of the initial concentra-tions, respectively. In spite of higher phytoplankton DOC concen-tration during pre-monsoon than monsoon, a higher fraction of
y = 1.1239x - 0.8722 R2 = 0.8303
1.70 1.90 2.10 2.30 2.50 2.701.001.101.201.301.401.501.601.701.801.902.00
Log
DO
CP
(µg
C L
-1d-1
)
(µg C L-1d-1) Log POCP (µg C L-1d-1)
185
2.10 2.30 2.50
(a) Pre-monsoon, (b) monsoon and (c) annual.

Table
1Tw
o-way
ANOVAan
dF-test
forselected
specifichy
dro-biologicalparam
eters.
WT
pH
Sal.
Secchidep
thDO
Nitrate
Chl-a
POC P
DOCP
TPP
BR
BHP
BA
BGE
BCD
Intercep
t0.01
(346
07.58)
0.01
(947
9.43
)0.01
78.84)
0.01
(182
.44)
0.01
(750
.19)
0.01
(25.87
)0.01
(21.54
)0.01
(321
.33)
0.01
(218
.16)
0.01
(300.89
)0.01
(41.81
)0.01
(684
.71)
0.01
(644.65
)0.01
(254
.95)
0.01
(116
.81)
Season
0.02
(7.67)
0.38
(0.84)
0.01
(42.58
)0.02
(8.5)
0.01
(27.62
)0.52
(0.44)
0.03
(6.47)
0.01
(24.41
)0.04
(5.4)
0.01
(19)
0.07
(3.9)
0.01
(121
.89)
0.12
(2.79)
0.57
(0.35)
0.01
(14.83
)Se
ctor
0.39
(1.09)
0.33
(1.28)
0.14
(2.23)
0.03
(4.27)
0.05
(3.56)
0.11
(2.45)
0.12
(2.37)
0.01
(7.13)
0.01
(11.47
)0.01
(8.22)
0.14
(2.21)
0.01
(19.59
)0.01
(14.09
)0.84
(0.3)
0.02
(4.75)
SeasonVs.
Sector
0.01
(6.49)
0.05
(3.4)
0.03
(4.18)
0.49
(0.86)
0.26
(1.53)
0.39
(1.09)
0.31
(1.34)
0.4(1.08)
0.63
(0.61)
0.45
(0.94)
0.84
(0.29)
0.01
(11.03
)0.56
(0.74)
0.77
(0.4)
0.37
(1.15)
(WT:
water
temperature,Sa
l.:salin
ity,
DO:dissolved
oxyg
en,Ch
l-a:
chloroph
yll-a,
POCP:particu
late
production,DOCP:dissolved
production,TP
P:totalprimaryproduction,BR:ba
cterialresp
iration,BP:
bacterialproduction,
BA:ba
cterialab
undan
ce,B
GE:
bacterialgrow
thefficien
cy,B
CD:ba
cterialcarbon
dem
and).Values
indicates
thesign
ificance
leve
ls(P-value)
andtheva
lues
inparen
thesis
indicates
theF-va
lue,
sign
ificantva
lues
arerepresented
inbo
ld.
V.V. Kanuri et al. / Continental Shelf Research 61–62 (2013) 52–6158
DOCP was consumed by bacteria in monsoon than pre-monsoon.These results were well in accordance with the enhanced BA, BPand BR during monsoon.
4. Discussions
4.1. Inter-relations between DOCP, POCP and PER
Dissolved organic carbon behaves non-conservatively in thecoastal and marine environments and known to be largely con-tributed by phytoplankton. Besides phytoplankton exudation thereare several mechanisms involved in the release of dissolvedorganic substances to the marine environment (Nagata, 2000),which alters their non-conservative nature. Due to the paucity ofthe data on DOCP and PER in the tropical Indian waters, an attempthas been made to establish a meaningful comparison between thepresent data set and the few existing reports on the seasonalvariability of DOCP in coastal marine environments. The averagePER values reported by Larsson and Hagstrom (1979) (8%), Magueet al. (1980) (8%) and Lignell (1990) (5%), were significantly lowerthan the values recorded in the present study (20%). This dis-crepancy in PER could be due to the type of filter used: 0.2 μmpolycarbonate filters (this study) versus GF/C or F filters. LowerPER values reported in those studies might have caused byunderestimating the real rates of release, because of adsorptionof labeled dissolved organic carbon to the filters (Maske andGarcia-Mendoza, 1994; Karl et al., 1998; Moran et al., 1999).The results of the present study were similar to the valuesreported (i.e. 19%, with the identical filters used) at the coastalwaters of the Ria de Vigo (Maran et al., 2005; Lopez-Sandovalet al., 2010) but relatively lower than that (37%) reported by Teiraet al. (2003a), from the coastal waters of NW Iberian Peninsula.
The present study deviated from the methodology adopted byTeira et al. (2003a) in terms of the incubation period (2 h) whichminimize concurrent bacterial consumption of DOCP. Although thePER reported from this study was in the range obtained by them8–65% during the entire study period. Considering a substantialheterotrophic consumption of derived dissolved organic carbon(on average, 30–50%) (Biddanda et al., 1994; Moran and Estrada,2002) during the incubation period, the results of this study couldbe viewed as net DOCP. The present data can be discussed withthat of Lopez-Sandoval and Fern´andez (2011) as they havefollowed the identical methodology (24 h incubation and the samekind of filters) from the oligotrophic waters of the MediterraneanSea. The mean PER value (37%) reported by Lopez-Sandoval andFern´andez (2011) was significantly higher than the value pre-sented in this study which can be explained by the fact that Chilikawaters varied vastly from the oligotrophic Mediterranean Sea. Theinter-seasonal consistency of PER in this study could be due tomeso to eutrophic nature of the system with mean POCP rangesbetween 100 and 15000 mg C m−2 d−1 (Maran et al., 2005).
A convenient way to explore the relationship between DOCP
and POCP is to plot the logarithms of the two variables againsteach other and to calculate the best fit to a linear model (Bainesand Pace, 1991). If the slope of the log-log regression of DOCP onPOCP is not significant from 1; it means that PER is constant acrossthe observed range of primary production and, if different from 1,indicates PER increases or decreases, with productivity. In LogPOCP vs. Log DOCP plot, a slope of 41 is interpreted to indicatethat PER tends to increase with increasing productivity and vice-versa (Maranon et al., 2004). In the present study the formercondition prevailed during monsoon, and later condition prevailedduring pre-monsoon suggests that the release of recent photo-synthate in dissolved form is a normal function of actively growingphytoplankton.
V.V. Kanuri et al. / Continental Shelf Research 61–62 (2013) 52–61 59
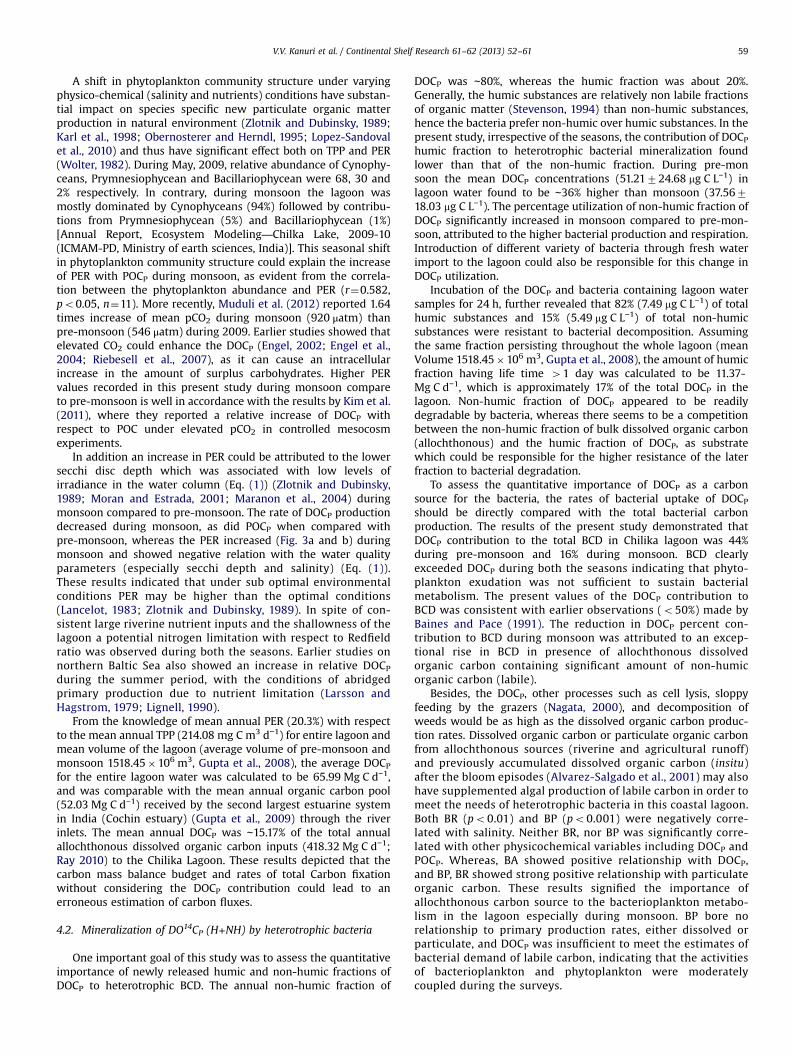
A shift in phytoplankton community structure under varyingphysico-chemical (salinity and nutrients) conditions have substan-tial impact on species specific new particulate organic matterproduction in natural environment (Zlotnik and Dubinsky, 1989;Karl et al., 1998; Obernosterer and Herndl, 1995; Lopez-Sandovalet al., 2010) and thus have significant effect both on TPP and PER(Wolter, 1982). During May, 2009, relative abundance of Cynophy-ceans, Prymnesiophycean and Bacillariophycean were 68, 30 and2% respectively. In contrary, during monsoon the lagoon wasmostly dominated by Cynophyceans (94%) followed by contribu-tions from Prymnesiophycean (5%) and Bacillariophycean (1%)[Annual Report, Ecosystem Modeling—Chilka Lake, 2009-10(ICMAM-PD, Ministry of earth sciences, India)]. This seasonal shiftin phytoplankton community structure could explain the increaseof PER with POCP during monsoon, as evident from the correla-tion between the phytoplankton abundance and PER (r¼0.582,po0.05, n¼11). More recently, Muduli et al. (2012) reported 1.64times increase of mean pCO2 during monsoon (920 μatm) thanpre-monsoon (546 μatm) during 2009. Earlier studies showed thatelevated CO2 could enhance the DOCP (Engel, 2002; Engel et al.,2004; Riebesell et al., 2007), as it can cause an intracellularincrease in the amount of surplus carbohydrates. Higher PERvalues recorded in this present study during monsoon compareto pre-monsoon is well in accordance with the results by Kim et al.(2011), where they reported a relative increase of DOCP withrespect to POC under elevated pCO2 in controlled mesocosmexperiments.
In addition an increase in PER could be attributed to the lowersecchi disc depth which was associated with low levels ofirradiance in the water column (Eq. (1)) (Zlotnik and Dubinsky,1989; Moran and Estrada, 2001; Maranon et al., 2004) duringmonsoon compared to pre-monsoon. The rate of DOCP productiondecreased during monsoon, as did POCP when compared withpre-monsoon, whereas the PER increased (Fig. 3a and b) duringmonsoon and showed negative relation with the water qualityparameters (especially secchi depth and salinity) (Eq. (1)).These results indicated that under sub optimal environmentalconditions PER may be higher than the optimal conditions(Lancelot, 1983; Zlotnik and Dubinsky, 1989). In spite of con-sistent large riverine nutrient inputs and the shallowness of thelagoon a potential nitrogen limitation with respect to Redfieldratio was observed during both the seasons. Earlier studies onnorthern Baltic Sea also showed an increase in relative DOCP
during the summer period, with the conditions of abridgedprimary production due to nutrient limitation (Larsson andHagstrom, 1979; Lignell, 1990).
From the knowledge of mean annual PER (20.3%) with respectto the mean annual TPP (214.08 mg C m3 d−1) for entire lagoon andmean volume of the lagoon (average volume of pre-monsoon andmonsoon 1518.45�106 m3, Gupta et al., 2008), the average DOCP
for the entire lagoon water was calculated to be 65.99 Mg C d−1,and was comparable with the mean annual organic carbon pool(52.03 Mg C d−1) received by the second largest estuarine systemin India (Cochin estuary) (Gupta et al., 2009) through the riverinlets. The mean annual DOCP was ∼15.17% of the total annualallochthonous dissolved organic carbon inputs (418.32 Mg C d−1;Ray 2010) to the Chilika Lagoon. These results depicted that thecarbon mass balance budget and rates of total Carbon fixationwithout considering the DOCP contribution could lead to anerroneous estimation of carbon fluxes.
4.2. Mineralization of DO14CP (H+NH) by heterotrophic bacteria
One important goal of this study was to assess the quantitativeimportance of newly released humic and non-humic fractions ofDOCP to heterotrophic BCD. The annual non-humic fraction of
DOCP was ∼80%, whereas the humic fraction was about 20%.Generally, the humic substances are relatively non labile fractionsof organic matter (Stevenson, 1994) than non-humic substances,hence the bacteria prefer non-humic over humic substances. In thepresent study, irrespective of the seasons, the contribution of DOCPhumic fraction to heterotrophic bacterial mineralization foundlower than that of the non-humic fraction. During pre-monsoon the mean DOCP concentrations (51.21724.68 mg C L−1) inlagoon water found to be ∼36% higher than monsoon (37.56718.03 mg C L−1). The percentage utilization of non-humic fraction ofDOCP significantly increased in monsoon compared to pre-mon-soon, attributed to the higher bacterial production and respiration.Introduction of different variety of bacteria through fresh waterimport to the lagoon could also be responsible for this change inDOCP utilization.
Incubation of the DOCP and bacteria containing lagoon watersamples for 24 h, further revealed that 82% (7.49 mg C L−1) of totalhumic substances and 15% (5.49 mg C L−1) of total non-humicsubstances were resistant to bacterial decomposition. Assumingthe same fraction persisting throughout the whole lagoon (meanVolume 1518.45�106 m3, Gupta et al., 2008), the amount of humicfraction having life time 41 day was calculated to be 11.37-Mg C d−1, which is approximately 17% of the total DOCP in thelagoon. Non-humic fraction of DOCP appeared to be readilydegradable by bacteria, whereas there seems to be a competitionbetween the non-humic fraction of bulk dissolved organic carbon(allochthonous) and the humic fraction of DOCP, as substratewhich could be responsible for the higher resistance of the laterfraction to bacterial degradation.
To assess the quantitative importance of DOCP as a carbonsource for the bacteria, the rates of bacterial uptake of DOCP
should be directly compared with the total bacterial carbonproduction. The results of the present study demonstrated thatDOCP contribution to the total BCD in Chilika lagoon was 44%during pre-monsoon and 16% during monsoon. BCD clearlyexceeded DOCP during both the seasons indicating that phyto-plankton exudation was not sufficient to sustain bacterialmetabolism. The present values of the DOCP contribution toBCD was consistent with earlier observations (o50%) made byBaines and Pace (1991). The reduction in DOCP percent con-tribution to BCD during monsoon was attributed to an excep-tional rise in BCD in presence of allochthonous dissolvedorganic carbon containing significant amount of non-humicorganic carbon (labile).
Besides, the DOCP, other processes such as cell lysis, sloppyfeeding by the grazers (Nagata, 2000), and decomposition ofweeds would be as high as the dissolved organic carbon produc-tion rates. Dissolved organic carbon or particulate organic carbonfrom allochthonous sources (riverine and agricultural runoff)and previously accumulated dissolved organic carbon (insitu)after the bloom episodes (Alvarez-Salgado et al., 2001) may alsohave supplemented algal production of labile carbon in order tomeet the needs of heterotrophic bacteria in this coastal lagoon.Both BR (po0.01) and BP (po0.001) were negatively corre-lated with salinity. Neither BR, nor BP was significantly corre-lated with other physicochemical variables including DOCP andPOCP. Whereas, BA showed positive relationship with DOCP,and BP, BR showed strong positive relationship with particulateorganic carbon. These results signified the importance ofallochthonous carbon source to the bacterioplankton metabo-lism in the lagoon especially during monsoon. BP bore norelationship to primary production rates, either dissolved orparticulate, and DOCP was insufficient to meet the estimates ofbacterial demand of labile carbon, indicating that the activitiesof bacterioplankton and phytoplankton were moderatelycoupled during the surveys.

V.V. Kanuri et al. / Continental Shelf Research 61–62 (2013) 52–6160
5. Conclusion
The mean DOCP for the entire Chilika Lagoon was found to be65.99 Mg C d−1. On an annual basis the average DOCP was 20% ofTPP, which satisfies about 30% of carbon requirement by hetero-topic bacteria in the lagoon. Spatial and temporal changes in DOCP
production rates closely resembled the distribution of primaryproduction. DOCP of Chilika lagoon was characterized by thedominance of non-humic substances (80%) over its humic counter-part (20%). Non-humic fraction of DOCP appeared to be readilydegradable by bacteria, whereas the humic fraction has relativelyhigher life time. This study revealed that phytoplankton–bacter-ioplankton coupling in the lagoon during pre-monsoon (highproductivity season) season was moderate and got weaken withthe introduction of allochthonous inputs during monsoon (lowproductivity season). These processes play a major role in theestimations of the carbon budgets of the lagoon. Weak couplingbetween bacterial metabolism and phytoplankton exudation inmonsoon indicated that additional sources of dissolved organiccarbon (both autochthonous and allochthonous), are needed tosustain the bacterial metabolic activities in the lagoon.
Acknowledgments
The authors are grateful to The Secretary, Ministry of EarthSciences, and Government of India for the financial support andfacilities during the study period. We are grateful to the Indian Navy(INS Chilika) in particular, for providing all logistic support duringthe course of this investigation. We are thankful to research staffs ofAndhra University for the field support and generous help. Thanksare also extended to NIOT for providing the facility to use theScintillation Counter for 14C sample analysis. This study is a part ofMoES–ICMAM's comprehensive project “Ecosystem modeling forChilika Lake”.
Appendix A. Supporting information
Supplementary data associated with this article can be found inthe online version at http://dx.doi.org/10.1016/j.csr.2013.04.006.
References
Alvarez-Salgado, X.A., Gago, J., Mı´guez, B.M., Pe´rez, F.F., 2001. Net ecosystemproduction of dissolved organic carbon in a coastal upwelling system: the Rı´ade Vigo. Iberian margin of the North Atlantic Journal Limnology and Oceano-graphy 46, 35–147.
Anderson, G.C., Zeutschel, R.P., 1970. Release of dissolved organic matter by marinephytoplankton in coastal and offshore areas of the Northeast Pacific Ocean.Limnology and Oceanography 15, 402–407.
Baines, S.B., Pace, M.L., 1991. The production of dissolved organic matter byphytoplankton and its importance to bacteria: patterns across marine andfreshwater systems. Limnology and Oceanography 36, 1078–1090.
Biddanda, B., Opsahl, S., Benner, R., 1994. Plankton respiration and carbon fluxthrough bacterioplankton on the Louisiana shelf. Limnology and Oceanography39, 1259–1275.
Biersmith, A., Benner, R., 1998. Carbohydrates in phytoplankton and freshlyproduced dissolved organic matter. Marine Chemistry 63, 131–144.
Bjornsen, P.K., 1988. Phytoplankton exudation of organic matter: Why do healthycells do it? Limnol. Oceanography 33, 151–155.
Cai, W.J., Wang, Y., Hodson, R.E., 1998. Acid-base properties of dissolved organicmatter in the estuarine waters of Georgia, USA. Geochimica et CosmochimicaActa 62, 473–483.
Canuel, E.A., 2001. Relations between river flow, primary production and fatty acidcomposition of particulate organic matter in San Francisco and ChesapeakeBays: a multivariate approach. Organic Geochemistry 32, 563–583.
Carlson, C.A., 2002. Production and removal processes. In: Hansell, D.A., Carlson, C.A.(Eds.), Biogeochemistry of Marine Dissolved Organic Matter. Academic Press, SanDiego, C. A., pp. 91–152.
Carrit, D.E., Carpenter, J.H., 1966. Recommendation procedure for Winkler analysesof sea water for dissolved oxygen. Journal of Plankton Research 24, 313–318.
Chrost, R.H., Faust, M.A., 1983. Organic carbon release by phytoplankton: itscomposition and utilization by bacterioplankton. Journal of Plankton Research5, 477–493.
Cifuentes, L.A., Eldridge, P.M., 1998. A mass and isotope balance model of DOCmixing in estuaries. Limnology and Oceanography 43, 1872–1882.
Cifuentes, L.A., Sharp, J.H., Fogel, M.L., 1988. Stable carbon and nitrogen isotopebiogeochemistry in the Delaware Estuary. Limnology and Oceanography 33,1102–1115.
Descy, J.P., Leporcq, B., Viroux, L., Francois, C., Servais, P., 2002. Phytoplanktonproduction, exudation and bacterial reassimilation in the River Meuse(Belgium). Journal of Plankton Research 24, 161–166.
Ducklow, H.W., Carlson, C.A., 1992. Oceanic bacterial production. Advances inMicrobial Ecology 12, 113–181.
Engel, A., 2002. Direct relationship between CO2 uptake and transparent exopoly-mer particles production in natural phytoplankton. Journal of PlanktonResearch 24, 49–53.
Engel, A., Delille, B., Jacquet, S., Riebesell, U., Rochelle-Newall, E., Terbruggen, A.,Zondervan, I., 2004. Transparent exopolymer particles and dissolved organiccarbon production by Emiliania huxleyi exposed to different CO2 concentra-tions: a mesocosm experiment. Aquatic Microbial Ecology 34, 93–104.
Fuhrman, J.A., Azam, F., 1982. Thymidine incorporation as a measure of hetero-trophic bacterioplankton production in marine surface waters: evaluation andfield results. Marine Biology 66, 109–120.
Grasshoff, K., Ehrhardt, M., Kremling, K, 1999. Methods of Sea water analysis, 3rdedition. VerlagChemie, Weinheim, Germany89–224.
Gupta, G.V.M., Sarma, V.V.S.S., Robin, R.S., Raman, A.V., Jaikumar, M., Rakesh, M.,Subramanian, B.R., 2008. Influence of net ecosystem metabolism in transferringriverine organic carbon to atmospheric CO2 in a tropical coastal lagoon (Chilikalake, India). Biogeochemistry (87), 265–285.
Gupta, G.V.M., Thottathil, S.D., Balachandran, K.K., Madhu, N.V., Madeswaran, P.,Nair, S., 2009. CO2 supersaturation and net heterotrophy in a tropical estuary(Cochin, India): influence of Anthropogenic effect. Ecosystems (12), 1145–1157.
Hama, T., Yanagi, K., Hama., J., 2004. Decrease in molecular weight of photosyn-thetic products of marine phytoplankton during early diagenesis. Limnologyand Oceanography 49, 471–481.
Hamanaka, J., Tanoue, E., Hama, T., Handa, N., 2002. Production and export ofparticulate fatty acids, carbohydrates and combined amino acids in theeuphotic zone. Marine Chemistry 77, 55–69.
Hansell, D.A., Carlson, C.A., 1998. Net community production of dissolved organiccarbon. Global Biogeochemical Cycles 12, 443–453.
Harvey, H.R., Mannino, A., 2001. The chemical composition and cycling of particulateand macromolecular dissolved organic matter in temperate estuaries as revealedby molecular organic tracers. Organic Geochemistry 32, 527–542.
Hill, J.K., Wheeler., P.A., 2002. Organic carbon and nitrogen in the northernCalifornia current system: comparison of offshore, river plume and coastallyupwelled waters. Progress in Oceanography 53, 369–387.
Hobbie, J.E., Daley, R.J., Jasper, S., 1977. Use of Nuclepore filters for counting bacteriaby fluorescent microscopy. Applied and Environmental Microbiology 33,1225–1228.
Karl, D.M., Hebel, D.V., Björkman, K., Letelier., R.M., 1998. The role of dissolvedorganic matter release in the productivity of the oligotrophic North PacificOcean. Limnology and Oceanography 43, 1270–1286.
Kim, J.M., Lee, K., Shin, K., Yang, E.J., Engel, A., Karl, D.M., Kim, H.C., 2011. Shifts inbiogenic carbon flow from particulate to dissolved forms under high carbondioxide and warm ocean conditions. Geophysical Research Letters 38, L08612,http://dx.doi.org/10.1029/2011GL047346.
Kirchman, D.L, Suzuki, Y., Garside, C., Ducklow, H.W., 1991. High turnover rates ofdissolved organic carbon during a spring phytoplankton bloom. Nature, London352, 612–614.
Lancelot, C., 1979. Gross excretion rates of natural marine phytoplankton andheterotrophic uptake of excreted products in the Southern North Sea, asdetermined by short term kinetics. Marine Ecology Progress Series 1, 179–186.
Lancelot, C., 1983. Factors affecting phytoplankton extracellular release in theSouthern Bight of the North Sea. Marine Ecology Progress Series 12, 115–121.
Larsson, U., Hagstrom, A., 1979. Phytoplankton exudate release as an energy sourcefor the growth of pelagic bacteria. Marine Biology 52, 199–206.
Laws, E.A., 1991. Photosynthetic quotients, new production and net communityproduction in the open ocean. Deep-Sea Research 38, 143–167.
Lee, C., Wakeham, S.G., Arnosti, C., 2004. Particulate organic matter in the sea: acomposition conundrum. AMBIO 8, 565–575.
Lee, S., Fuhrman, J.A., 1987. Relationships between biovolume and biomass ofnaturally derived marine bacterioplankton. Applied and Environmental Micro-biology 531298–1303
Legendre, L., Rassoulzadegan, F., 1996. Food-web mediated export of biogeniccarbon in oceans. Marine Ecology Progress Series 145, 179–193.
Lignell, R., 1990. Excretion of organic carbon by phytoplankton: its relation to algalbiomass, primary productivity and bacterial secondary productivity in theBaltic Sea. Marine Ecology Progress Series 68, 85–99.
Lopez-Sandoval, D.C., Fern´andez, A., Mara~n´on, E., 2011. Dissolved and particulateprimary production along a longitudinal gradient in the Mediterranean Sea.Biogeosciences 8, 815–825.
Lopez-Sandoval, D., Emilio Maranon, Fernandez, A.J., Gonzalez, J., Gasol, J.M.,Lekunberri, I., Varela, M., Calvo-D´ıaz, A., Mora´n, X.A.G.A´., lvarez-Salgado, X.A.,Figueiras, F.G., 2010. Particulate and dissolved primary production by contrasting

V.V. Kanuri et al. / Continental Shelf Research 61–62 (2013) 52–61 61
phytoplankton assemblages during mesocosm experiments in the Rı'a de Vigo(NW Spain). Journal of Plankton Research 32 (9), 1231–1240.
Mague, T.H., Friberg, E., Hughes, D.J., Morris, I., 1980. Extracellular release of carbonby marine phytoplankton; a physiological approach. Limnology and Oceano-graphy 25, 262–279.
Maran, õ´n,E., Cermen, õ,P., Pe´rez, V., 2005. Continuity in the photosyntheticproduction of dissolved organic carbon from eutrophic to oligotrophic waters.Marine Ecology Progress Series (299), 7–17.
Maranon, E., Cermeno, P., Fernandez, E., Rodriguez, J., Zabala, L., 2004. Significanceand mechanisms of photosynthetic production of dissolved organic carbon in acoastal eutrophic ecosystem. Limnology and Oceanography 49, 1652–1666.
Maske, H., Garcia-Mendoza., E., 1994. Adsorption of dissolved organic matter to theinorganic filter substrate and its implications for C uptake measurements.Applied and Environmental Microbiology 60, 3887–3897.
Meyers-Schulte, K.J., Hedges, J.I., 1986. Molecular evidence for a terrestrial compo-nent of organic matter dissolved in ocean water. Nature 321, 6l–63.
Moran, X.A.G., Estrada, M., 2001. Short-term variability of photosynthetic para-meters and particulate and dissolved primary production in the Alboran Sea(NW Mediterranean). Marine Ecology Progress Series 212, 53–67.
Moran, X.A.G., Estrada, M., 2002. Phytoplanktonic DOC and POC production in theBransfield and Gerlache Straits as derived from kinetic experiments of 14Cincorporation. Deep-Sea Research II 49, 769–786.
Moran, X.A.G., Gasol, J.M., Arin, L., Estrada, M., 1999. A comparison between glassfiber and membrane filters for the estimation of phytoplankton POC and DOCproduction. Marine Ecology Progress Series 187, 31–41.
Muduli, P.R., Vishnu Vardhan, Kanuri, Robin, R.S., Charan Kumar, B., Sivaji, Patra,Raman, A.V., Nageswarara Rao, G., Subramanian, B.R., 2012. Spatio-temporalvariation of CO2 emission from Chilika Lake, a tropical coastal lagoon on theeast coast of India. Estuarine, Coastal and Shelf Science 113, 305–313.
Myklestad, S.M., 2000. Dissolved organic carbon from phytoplankton. In: Wan-gersky, P (Ed.), The Handbook of Environmental Chemistry [D]. Mar.Chem..Springer-Verlag, Berlin, pp. 111–148.
Myklestad, S., 1977. Production of carbohydrates by marine phytoplanktonicdiatoms. Influence of N–P ratio in growth medium on assimilation ratio,growth rate and production of cellular and extracellular carbohydrates byChaetoceros affinis var willei (Gran) husted and Sceletonema costatum (Grev)cleve. Journal of Experimental Marine Biology 29, 161–179.
Myklestad, S.M., 1995. Release of extracellular products by phytoplankton withspecial emphasis on polysaccharides. Science and Total Environment 165,155–164.
Nagata, T., 2000. Production mechanisms of dissolved organic matter. In: Kirchman,D.L. (Ed.), Microbial ecology of the oceans. Wiley-Liss, New York, pp. 121–152.
Obernosterer, I., Herndl, G.J., 1995. Phytoplankton extracellular release and bacter-ial growth: dependence on the inorganic N:P ratio. Marine Ecology ProgressSeries 116, 247–257, http://dx.doi.org/10.3354/meps116247.
Ogawa, H., Amagai, Y., Koike, I., Kaiser, K., Benner, R., 2001. Production of refractorydissolved organic matter by bacteria. Science 292, 917–920.
Parsons, T.R., Maita, Y., Lalli, C.M. (Eds.), 1984. A Manual of Chemical and BiologicalMethods for Sea Water Analysis. Pergamon Press, New York.
Ram, A.S.P., Nair, S., Chandramohan, D., 2007. Bacterial growth efficiency in atropical estuary: seasonal variability subsidized by allochthonous carbon.Microbial Ecology 53, 591–599.
Ray, A.K., 2010. Biogeochemical fluxes of carbon and nitrogen from Chilika lake,East Coast of India. Ph.D. Thesis, Anna University, Tamilnadu, India. pp. 106.
Riebesell, U., Schulz, K.G., Bellerby, R.G.J., Botros, M., Fritsche, P., Meyerhofer, M.,Neill, C., Nondal, G., Oschlies, A., Wohlers, J., Zollner, E., 2007. Enhancedbiological carbon consumption in a high CO2 ocean. Nature 450, 545–549.
Roland, F., Cole, J.J., 1999. Regulation of bacterial growth efficiency in a large turbidestuary. Aquatic Microbial Ecology 20, 31–38.
Romera-Castillo, C., Sarmento, H., Alvarez-Salgado, X.A., Gasol, J.M., Marrase, C.,2010. Production of chromophoric dissolved organic matter by marine phyto-plankton. Limnology and Oceanography 55 (1), 446–454.
Saunders, G.W., Cummins, K.W., Gak, D.Z., Pieczynska, E., Straskrabova, V., Wetzel, R.G.,1980. Organic matter and decomposers. In: Le Cren, ED, Lowe-McConnel, RH(Eds.), The functioning of freshwater ecosystems, 22. Cambridge University Press,Cambridge, IBP, pp. 341–392.
Simon, M., Azam, F., 1989. Protein content and protein synthesis rates of planktonicmarine bacteria. Marine Ecology Progress Series 51, 201–213.
Sondergaard, M., Riemann, B.J., Orgensen, N.O.G., 1985. Extracellular organic carbon(EOC) released by phytoplankton and bacterial production. Oikos 45, 323–332.
Stevenson, F.J., 1994. Humus Chemistry, Genesis, Composition, Reactions, 2nd ed..John Wiley & Sons, New York.
Sundh, I., Bell, R.T., 1992. Extracellular dissolved organic carbon released fromphytoplankton as a source of carbon for heterotrophic bacteria in lakes ofdifferent humic content. Hydrobiologia 229, 93–106.
Teira, E., Abalde, J., Lvarez-Osorio, M.T.A., 2003a. Planktonic carbon budget in acoastal wind-driven upwelling system (NW Iberian Peninsula). Marine EcologyProgress Series 265, 31–43.
Teira, E., Pazo´, J.M.J., Quevedo, M., Fuentes, M.V., Niell, F.X., Fernande, z, E., 2003b.Rates of dissolved organic carbon production and bacterial activity in theeastern North Atlantic Subtropical Gyre during summer. Marine EcologyProgress Series 249, 53–67.
Thurman, E.M., Malcolm, R.L., 1981. Preparative isolation of aquatic humic sub-stances. Environmental Science and Technology 15, 463–466.
Verity, P.G., Smayda, T.J., Sakshaug, E., 1991. Photosynthesis, excretion and growthrates of Phaeocystis colonies and solitary cells. Polar Research 10, 117–128.
Wakeham, S.G., Lee, C., Hedges, J., Hernes, P.J., Peterson., M.L., 1997. Molecularindicators of diagenetic status in marine organic matter. Geochimica etCosmochimica Acta 61, 5363–5369.
Wetz, M.S., Wheeler, P.A., 2007. Release of organic matter by coastal diatoms.Limnology and Oceanography 52, 798–807.
Williams, P.J.L., 1995. Evidence for the seasonal accumulation of carbon-richdissolved organic material, its scale in comparison with changes in particulatematerial and the consequential effect on net C/N assimilation ratios. MarineChemistry 51, 17–29.
Williams, P.M., Gordon, L.I., 1970. Carbon-13:Carbon-12 ratios in dissolved andparticulate organic matter in the sea. Deep-Sea Research 17, 19–27.
Wolter, K., 1982. Bacterial incorporation of organicsubstances released by naturalphytoplankton populations. Marine Ecology Progress Series 7, 287–295.
Zlotnik, I., Dubinsky, Z., 1989. The effect of light and temperature on DOC excretionby phytoplankton. Limnology Oceanography 34, 831–839.