Picture of Our Health Hamilton County, Tennessee
90
Picture of Our Health Hamilton County, Tennessee 2010 Community Health Data Profile Chattanooga-Hamilton County Health Department & Regional Health Council February 2010
-
Upload
khangminh22 -
Category
Documents
-
view
0 -
download
0
Transcript of Picture of Our Health Hamilton County, Tennessee
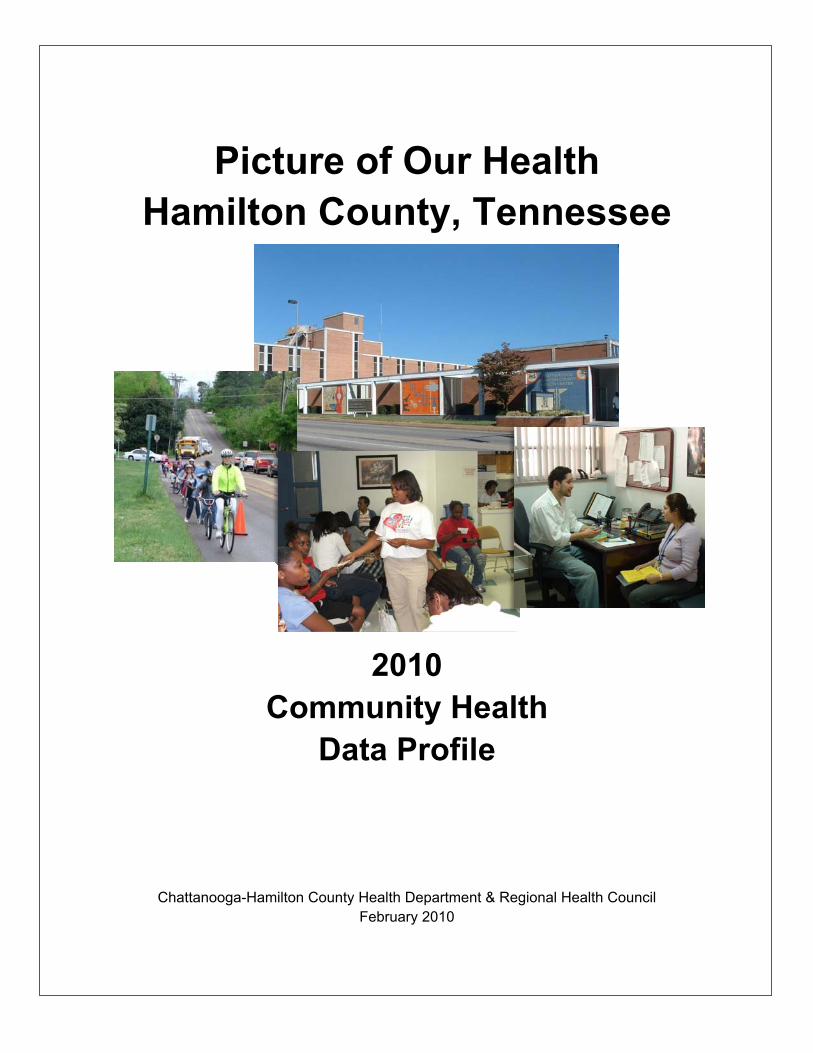
Picture of Our Health
Hamilton County, Tennessee
2010
Community Health Data Profile
Chattanooga-Hamilton County Health Department & Regional Health Council February 2010

Hamilton County Health Data Profile 2
ChattanoogaHamilton County Health Department & Regional Health Council
Health Department Mission:
To do all we can to assure a healthy community
Health Department Vision: Healthy people in healthy communities
Health Department Values:
Compassion Integrity Diversity
Excellence Respect
Core Functions of the Health Department:
Prevention Education Promotion
Policy Development Assurance
Outreach Protection
Assessment and Planning Monitoring/Surveillance Regulatory Compliance
Regional Health Council Mission: To serve as the lead community-based organization designated by the Tennessee Department of
Health to be responsible for community health assessment, regional health planning, and the provision of input regarding funding decisions for health and health-related initiatives which result
in the improvement of community health.
Regional Health Council Vision: Every person will have the opportunity to experience optimal health as a result of renewing our
commitment to redesign our community, one person, one neighborhood, one institution, and one system at a time through the cooperation of all people.
Regional Health Council Values:
Spiritual Well-Being Strong Families and Neighborhoods
Economic Prosperity Cultural Diversity and Inclusiveness Emotional and Physical Well-Being
Educational Opportunities and Achievements Safe and Healthy Environment with Supportive Institutions

Hamilton County Health Data Profile 3
This report was prepared by: Community Health Services, Office of Assessment and Planning
921 East 3rd Street Chattanooga, TN 37403
(423) 209-8093 http://health.hamiltontn.org
For more information about the data in this report: Contact the Office of Assessment and Planning, Chattanooga-Hamilton County Health Department at (423) 209-8093. Suggested citation for this report: Chattanooga-Hamilton County Health Department, Office of Assessment and Planning. Picture of Our Health, Hamilton County, Tennessee; February 2010.

Hamilton County Health Data Profile 4
AcknowledgementsThe Picture of Health for Hamilton County was published in February 2010 by the Chattanooga-Hamilton County Health Department, in partnership with the Regional Health Council. This report was published under the leadership of Howard Roddy, Chair of the Regional Health Council. The primary author of this report is Kasey Poole Decosimo, program manager in Assessment and Planning at the Chattanooga-Hamilton County Health Department, with significant contributions from Sarah Stuart Sloan, David Hunter, and Sabrina Novak. Contributions were also provided by Dr. Tim Aldrich, Liang Wang, Rachel Swafford, Uchenna Egenti, and Varaprasad Ilapogu of East Tennessee State University, College of Public Health, Department of Biostatistics and Epidemiology. This report was reviewed by the following Regional Health Council Health Futures Committee members:
Dr. Deborah Poteet-Johnson, Chair Becky Barnes
Dr. Ronald Blankenbaker Pat Branham
Rae Bond Phyllis Casavant
Earl Medley Howard Roddy
This report was reviewed and edited by the following Health Department staff:
Becky Barnes, Administrator Dr. Valerie A. Boaz, Health Officer
Tammy Burke, Clinical Services Director Sarah Stuart Sloan, Epidemiologist
Cathy Cowart, Health Promotion Supervisor Bonnie Deakins, Environmental Health Director Sabrina Novak, Environmental Health Scientist
Tom Rucci, Case Management Services Director Marti Smith, Administrative Services Director
William Ulmer, Community Health Services Director
The Chattanooga-Hamilton County Health Department would also like to acknowledge partners for their help with acquiring data and providing data assistance:
Governor’s Office of Children’s Care Coordination Tennessee Department of Health, Office of Health Statistics
Tennessee Department of Health, Cancer Registry

Hamilton County Health Data Profile 5
February 11, 2010 Dear Colleague, I am pleased to present the Picture of Health for Hamilton County 2010. This report includes selected health status indicators for monitoring progress toward achieving goals outlined by the national Healthy People 2010 objectives. These objectives challenge both public health and our community to increase the span and quality of life, reduce health disparities, and ensure access to preventive health services for all residents. The last Picture of Health for Hamilton County was published in 2006. The health status indicators presented in this report have been expanded to include injury and violence, mental health and alcohol use, and infectious diseases such as tuberculosis and influenza. You will find in this report, progress in public health prevention and challenges to work on as we move forward. Hamilton County has come a long way in the areas of tobacco cessation, childhood immunizations, and teen pregnancy. Challenges ahead include obesity, sexually transmitted diseases and HIV/AIDS, and health disparities in infant mortality. Hamilton County is positioned with a strong and active Regional Health Council with a commitment to prioritize health needs, make recommendations, and develop partnerships to foster collaborative efforts that will address our community’s needs. I believe this report is an important tool to evaluate the health of Hamilton County residents, and will help guide our efforts in health promotion and preventive services. I would like to thank all of our partners, especially our Regional Health Council, for their hard work and contributions to the work of prevention. Through their support we continue to make progress in ensuring the health of our community.
Sincerely,
Becky Barnes Administrator

Hamilton County Health Data Profile 6
Introduction The 2010 Picture of Health for Hamilton County, Tennessee report is a collection of public health data used to provide a broad overview of the health of Hamilton County residents. The data used in this report comes from a variety of public health data systems, including: U.S. Census, vital records, cancer registry, hospitalizations, reportable infectious diseases, and surveys such as the Adult Behavioral Risk Factor Surveillance Survey. Hamilton County data will be compared to selected Healthy People 2010 objectives to track local progress towards achieving health-related goals. Healthy People 2010 is a comprehensive set of disease prevention and health promotion objectives for the nation to achieve over the first decade of the new century. Created by scientists both inside and outside of government, the objectives identify a wide range of public health priorities and specific, measurable objectivesi. The purpose of this report is to present a comprehensive condition of Hamilton County’s health that can be compared to state and national trends. The findings of Picture of Health for Hamilton County, Tennessee may identify populations or communities to target interventions in public health practice, the delivery of health care, and public policy. Lastly, we hope that this report will encourage Hamilton County residents to continue to work towards healthy behaviors and lifestyles to prevent disease and premature death. Core Principals of Public Health Since 1921, the Chattanooga-Hamilton County Health Department has been providing public health services to residents of Hamilton County. Public health is the science of protecting and improving the health of communities. The ten Essential Public Health Services provide a fundamental guiding framework that describes public health activities and responsibilities of local public health systemsii: 1. Monitor health status to identify community
health problems. 2. Diagnose and investigate health problems
and health hazards in the community. 3. Inform, educate, and empower people
about health issues. 4. Mobilize community partnerships to identify
and solve health problems. 5. Develop policies and plans that support
individual and community health efforts. 6. Enforce laws and regulations that protect
health and ensure safety. 7. Link people to needed personal health
services and assure the provision of health care when otherwise unavailable.
8. Assure a competent public health and personal healthcare workforce.
9. Evaluate effectiveness, accessibility, and quality of personal and population-based health services.
10. Research for new insights and innovative solutions to health problems.
The assessment of Hamilton County’s health provided in this document is one of three major steps in public health, with policy development and assurance to follow.
Hamilton County Health Data Profile 7
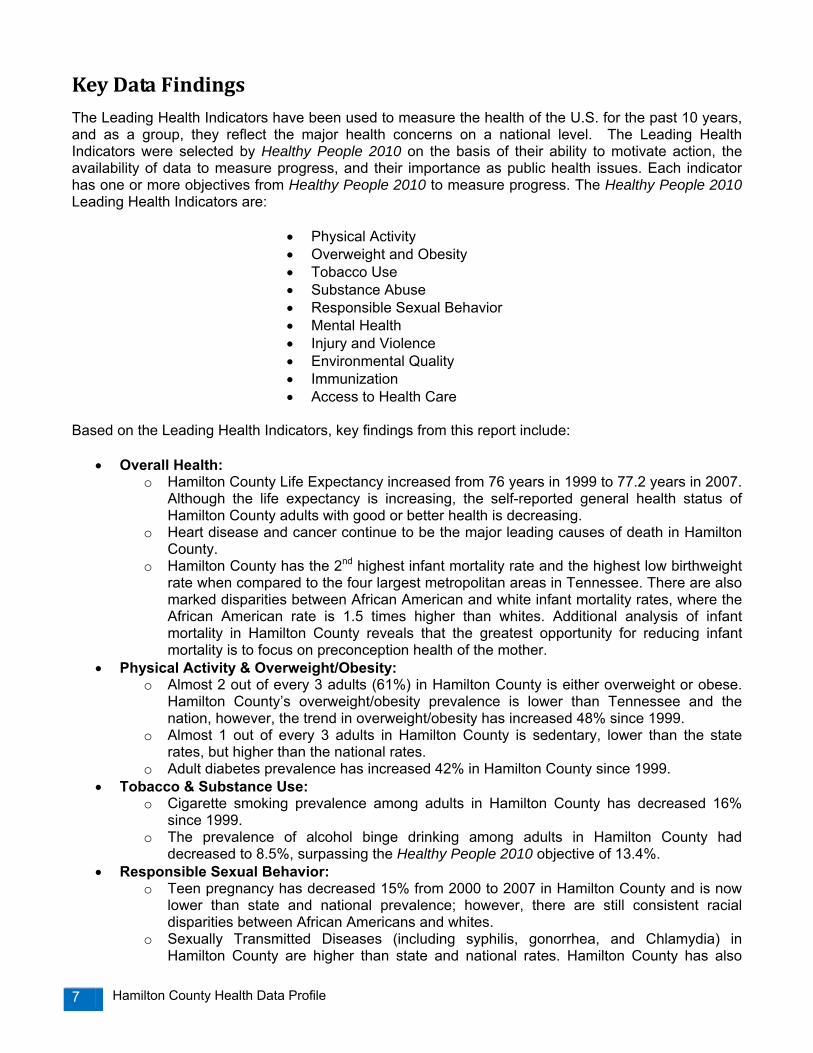
Key Data Findings
The Leading Health Indicators have been used to measure the health of the U.S. for the past 10 years, and as a group, they reflect the major health concerns on a national level. The Leading Health Indicators were selected by Healthy People 2010 on the basis of their ability to motivate action, the availability of data to measure progress, and their importance as public health issues. Each indicator has one or more objectives from Healthy People 2010 to measure progress. The Healthy People 2010 Leading Health Indicators are:
• Physical Activity • Overweight and Obesity • Tobacco Use • Substance Abuse • Responsible Sexual Behavior • Mental Health • Injury and Violence • Environmental Quality • Immunization • Access to Health Care
Based on the Leading Health Indicators, key findings from this report include:
• Overall Health: o Hamilton County Life Expectancy increased from 76 years in 1999 to 77.2 years in 2007.
Although the life expectancy is increasing, the self-reported general health status of Hamilton County adults with good or better health is decreasing.
o Heart disease and cancer continue to be the major leading causes of death in Hamilton County.
o Hamilton County has the 2nd highest infant mortality rate and the highest low birthweight rate when compared to the four largest metropolitan areas in Tennessee. There are also marked disparities between African American and white infant mortality rates, where the African American rate is 1.5 times higher than whites. Additional analysis of infant mortality in Hamilton County reveals that the greatest opportunity for reducing infant mortality is to focus on preconception health of the mother.
• Physical Activity & Overweight/Obesity: o Almost 2 out of every 3 adults (61%) in Hamilton County is either overweight or obese.
Hamilton County’s overweight/obesity prevalence is lower than Tennessee and the nation, however, the trend in overweight/obesity has increased 48% since 1999.
o Almost 1 out of every 3 adults in Hamilton County is sedentary, lower than the state rates, but higher than the national rates.
o Adult diabetes prevalence has increased 42% in Hamilton County since 1999. • Tobacco & Substance Use:
o Cigarette smoking prevalence among adults in Hamilton County has decreased 16% since 1999.
o The prevalence of alcohol binge drinking among adults in Hamilton County had decreased to 8.5%, surpassing the Healthy People 2010 objective of 13.4%.
• Responsible Sexual Behavior: o Teen pregnancy has decreased 15% from 2000 to 2007 in Hamilton County and is now
lower than state and national prevalence; however, there are still consistent racial disparities between African Americans and whites.
o Sexually Transmitted Diseases (including syphilis, gonorrhea, and Chlamydia) in Hamilton County are higher than state and national rates. Hamilton County has also
Hamilton County Health Data Profile 8
seen a 33% increase in rates since 2000, most likely attributed to recently expanded testing efforts conducted locally to identify untreated cases.
• Mental Health: o 8.2% of adults in Hamilton County reported Frequent Mental Distress which is defined as
14 or more days of stress, depression, and problems with emotions in the past month. o The suicide rate for Hamilton County was 13% lower than the state rate in 2007. The
suicide rate was 42% higher among white residents when compared to their African American peers.
• Injury & Violence: o The motor vehicle death rate in Hamilton County has decreased 19% since 1999 and is
lower than state and national rates. o Homicides in Hamilton County are also lower than state and national rates; however,
deaths by homicide among African Americans in Hamilton County are over 3 times higher than whites.
• Immunization: o In 2008, there was an increase in the percent of children under age two with
“immunizations complete” in Hamilton County, rising from 85.1% in 2004 to 87.6%, which was higher than the statewide coverage level of 82.3%.
o The percent of adults over the age of 65 receiving the influenza vaccine increased 10% since 1999, and is higher than state and national rates.
• Access to Healthcare: o Although higher than state and national prevalence, the percent of adults in Hamilton
County with health insurance decreased 4% from 1999 to 2007. Overall, there has been progress made in the areas of life expectancy, smoking, binge drinking, teen pregnancy, deaths from motor vehicle crashes, and immunizations. Areas for improvement include infant mortality, overweight/obesity and associated lifestyle behaviors, sexually transmitted diseases, healthcare access, and overall racial health disparities. Additional findings for health issues that were not categorized by the Leading Health Indicators include HIV/AIDS and the increasing number of cases disproportionately affecting African American women and Latinos, the increasing rates of Alzheimer’s Disease deaths, and the reduction of rabies cases among animals in Hamilton County. The Leading Health Indicators with local, state, and national rates, as well as Healthy People 2010 objectives, are summarized in the table below.

Hamilton County Health Data Profile 9
Table of Leading Health Indicators & Healthy People 2010 Objectives
Leading Health Indicators
Hamilton
1999
Hamilton
2007
TN
2007
U.S. 2007
Healthy People
2010 Target Overall Health
Life expectancy 76 77.2 76.1 77.7* n/a
General Health Status “Good or Better” 80.4% 78.6% 79.5% 85.1% n/a
Infant Mortality rate per 1,000 7.9 9.7 8.3 6.7* 4.5
Physical Activity & Overweight/Obesity Overweight and obesity, adults 41% 60.8% 67.4% 63% 40% Physical inactivity, adults 22% 29.3% 34.5% 22.6% 20% Diabetes prevalence, adults 7.4% 10.5% 11.9% 8.0% n/a High Blood Cholesterol, adults 29.5% 29.8% 34.2% 37.6% 17% Hypertension, adults 25.8% 37.1% 33.8% 27.8% 14% Tobacco & Substance Use Current Smokers, adults 27% 22.6% 24.3 19.8% 12% Binge drinkers, adults 11% 8.5% 9.2% 15.8% 13.4% Responsible Sexual Behavior Teen Pregnancy (10-17 yrs) rate per 1,000 15.6 13.2 13.9 21.4** n/a Sexually Transmitted Diseases (Syphilis, Gonorrhea, Chlamydia) rate per 100,000
674.6†
894.1 663.0 482.3* n/a
Mental Health Suicide rate per 100,000 10.9 12.1 13.7 11.1* 5.0 Injury & Violence Motor Vehicle Crash Death rate per 100,000 14.5 11.8 20.9 14.6* 9.2 Homicide death rate per 100,000 6.1 5.4 7.7 6.2* 3.0 Immunization Children Under 2 Immunized 85.1% 87.6%^ 82.3%^ 80% 90% Influenza Vaccine, adults 65+ 68% 74.6% 70.1% 72% 90% Access to Healthcare Persons with health insurance 91.9% 88.4% 85.3% 85.8% 100% Sources: 1999 and 2007 Behavioral Risk Surveillance Surveys. Tennessee Department of Health Vital Statistics. ^ 2008 data *2006 data **2005 data †2000 data
Hamilton County Health Data Profile 10
Priority Area Recommendations The Chattanooga-Hamilton County Regional Health Council is the lead community-based organization designated by the Tennessee Department of Health to be responsible for community health assessment, regional health planning, and the provision of input regarding funding decisions for health and health related initiatives. The Regional Health Council has prioritized community health needs based on data and information collection efforts. In 2009, the Council revised its priority areas. The 2010-2013 Strategic Priority Areas are:
• Addictions & Dependency • Health Care Reform • Infant Mortality • Obesity, Diet, & Lack of Exercise • Preventive Care • School Health • Tobacco
Each Strategic Priority Area has a dedicated Regional Health Council subcommittee or associated committee to develop partnerships to foster collaborative efforts for addressing the needs of each health issue within the County as well as sub-population groups. Chairs of these subcommittees were asked to develop recommendations for addressing their Strategic Priority Area. Their recommendations are as follows:
• Addictions and Dependency, Dr. Thomas Miller, Chair: The mission of the Addictions and Dependency subcommittee is to evaluate and mobilize community resources for various addictions including multiple drug use and alcohol. To help reduce addictions and dependencies in Hamilton County, this subcommittee provided the following recommendations:
o Promote greater awareness of substance abuse issues among residents of Hamilton County through use of a strategic prevention framework methodology and other proven means.
o Use “National Recovery Month” to partner with prevention and treatment providers and other stakeholders to sponsor events or activities that help de-stigmatize illness of addiction, and make known treatment resources.
o Partner and collaborate with the Hamilton County (Drug) Coalition regarding selected prevention initiatives.
o Advocate for training for vendors who are granted licenses for the sale of alcoholic beverages and promote the inclusion in this training of local Beer Board officials, enforcement officers and other appropriate personnel.
o Advocate for better venues for the public to report concerns to the local Beer Board and other appropriate agencies regarding establishments that sell alcoholic beverages.
o Support more formal partnerships among agencies that license vendors and those that regulate, monitor and enforce policies, ordinances and laws relating to the sale and consumption of alcoholic beverages.
• Health Care Reform, Howard Roddy, Chair:
The mission of the Health Care Reform subcommittee is to identify community partners and resources to advocate for health care reform, including affordability, accessibility, and coverage for uninsured Americans. To improve our health care delivery system, this subcommittee provided the following recommendations:
o Advocate for the inclusion of prevention and wellness strategies in health reform legislation to prevent premature death and significant health care costs attributable to chronic disease.
Hamilton County Health Data Profile 11
o Promote affordable, quality health care coverage for all Americans. o Advocate for insurance coverage of pre-existing conditions. o Advocate for adequate provider payment from insurance companies. o Support health information technology initiatives that improve quality of patient care. o Advocate for federal fiscal reimbursement of costs associated with TennCare expansion. o Promote consumer choice of medical providers and health plans. o Encourage the youth of Hamilton County to pursue public health and health care
careers.
• Infant Mortality, Rae Bond, Chair of Core Leadership Group: The mission of the Hamilton County Core Leadership Group is to educate and mobilize the community around factors that lead to poor birth outcomes, establish priorities within the community, and create community partnerships that will coordinate, collaborate, implement and evaluate evidence-based practices that will improve birth outcomes for Hamilton County. To improve birth outcomes in Hamilton County, the Core Leadership Group provided the following recommendations:
o Promote and increase preconception health knowledge to both the community and to medical providers.
o Increase awareness and education within the community about crucial mental and physical development that occurs in the final weeks of pregnancy, about potential health risks of late pre-term deliveries, and communicating with your physician the importance of not delivering prior to 39 weeks.
o Educate the medical community about infant mortality, preconception health, and the problem of late preterm births. Increase adherence to American College of Obstetricians and Gynecologists (ACOG) guidelines to deliver babies no earlier than 39 weeks of gestation unless medically indicated.
o Mobilize a network to connect social service providers working to improve birth outcomes.
o Investigate transportation barriers and potential solutions for women seeking prenatal care.
• Obesity, Diet and Lack of Exercise, Becky Barnes, Chair of Step ONE Operations:
The mission of Step ONE is to create a culture in Hamilton County where residents choose to practice good nutrition and exercise regularly. From 2010 through 2013, there are three strategies that Step ONE will be focusing on to meet its goal of cultural change: increasing the health knowledge of our citizen and leaders, providing an environment suitable to sustaining healthy lifestyles, and implementing policies capable of supporting healthy environments in the workplace, home, schools, neighborhoods, and faith-based institutions. From evidence in research and best practices, the Step ONE Operations committee provided the following recommendations to approach cultural change. We will be a healthier community if: o All county residents have equal access to affordable healthy foods and equal
opportunities for regular physical activity. o All employers create healthy work environments by implementing policies that support
healthy food options while discouraging unhealthy foods and by creating office policies that support employees taking actions to improve health habits regarding diet, physical activity/exercise, and smoking cessation.
o City and County leaders choose to design communities for active living including walking paths, bike lanes, parks and recreation centers, ensures all residents have equal access and opportunities for active living, and implements a health impact assessment policy for all new community plans or revised community plans.
o Restaurants provide healthy menu options and public policies are created to support restaurants that choose to do so.
Hamilton County Health Data Profile 12
o Vending machine policies are implemented requiring that healthy snack selections are provided in all public vending machines.
o The Hamilton County Department of Education implements policies designed to involve students of all grades in 30 minutes of physical activity every day, and work with the communities to increase access to playgrounds outside of school hours for children.
o Physicians and other providers candidly confront overweight/obesity in children and adults, nutrition, physical activity/exercise issues with their patients as a routine part of their practice, and follow-up with their patients.
o The Health Department will work with planning agencies, health care providers, businesses, faith-based institutions, and community organizations to connect resources, build partnerships, and advocate for policy and environmental changes designed to create a culture in Hamilton County where residents choose to eat healthy, are physically active, and will ensure all residents have equal access to healthy affordable food and opportunities to be physically active regardless of race, socioeconomic status, education, or sex.
• Preventive Health Services, Eva Dillard, Chair:
The mission of the Preventive Health Services subcommittee is to mobilize community resources for health promotion and wellness. To promote prevention, this subcommittee provided the following recommendations:
o Identify existing preventive health resources available to address the top four chronic disease risk factors of Hamilton County residents and determine if services need to be expanded or if new services are needed.
o Identify where gaps in preventive health service exist. o Work with appropriate organizations and agencies to identify potential partnerships to
ensure that adequate preventive health services and activities are available. o Provide education and awareness activities regarding preventive health services and
screenings for Hamilton County residents and develop a calendar of health fairs, screenings, and continuing education activities provided for lay residents and professionals.
• School Health, Sheryl Rogers, Chair: The mission of the School Health subcommittee is to evaluate health issues affecting children’s school performance and promote partnerships and resources available to address those issues. To improve our children’s health, the School Health subcommittee provided the following recommendations:
o Explore the creation of a pilot school-based health clinic within a public high school within the Hamilton County Public School System and report findings to the Regional Health Council at that time.
o Advocate for improved health policies and practices within the Hamilton County Public School System and within private schools, and recognize schools that support good health practices, including regular exposure to good nutritional and physical education activities for students and their families.
o Work to inform, educate and empower the families of Hamilton County school children about the risks associated with overweight and obesity, as well as well as about the increase in prevalence of diabetes and asthma.
o Assist in working to link families to the nutritional services provided by the Department of Education, the Health Department, and other service providers.
o Support the work of existing collaborations and activities through the Partnership for Healthy Living (Step ONE) as they advocate for increased participation in physical activity and good nutritional practices among children and families of Hamilton County.
Hamilton County Health Data Profile 13
o Advocate for the continued monitoring and tracking of BMI, cardiovascular fitness, and chronic health conditions of youth in Hamilton County schools as initiated by the Coordinated School Health Program of the Hamilton County Department of Education.
• Tobacco, Jim Folkner, Chair: The mission of the Tobacco subcommittee is to evaluate and mobilize community resources for tobacco cessation. To help reduce tobacco use in Hamilton County, the Tobacco subcommittee provided the following recommendations:
o Promote efforts through June 2010 and annually thereafter to eliminate secondhand smoke by supporting the “Chattanooga Clean Air for All” initiative that seeks to educate partners (daycares, all area car seat providers, hospitals and others) with the goal of ultimately eliminating parental smoking in autos and their homes.
o Support efforts to reduce the initiation of tobacco use by youth by supporting Campaign for a Healthy and Responsible Tennessee (CHART) efforts for bringing about legislative action on the tobacco excise tax and opportunities for youth education.
o Work to reduce tobacco related disparities by working with project “Chattanooga Clean Air for All” and other initiatives in underserved areas, and by working with other organizations and services (Head Start, WIC, car seat classes, etc.) that target underserved populations.
o Continue efforts to reduce the incidence of the distribution of tobacco products to youth at public venues and events that are not adult only activities or places.
Hamilton County Health Data Profile 14
Contents Chapter 1: Demographics & Social Determinants of Health ...................................................................16
Age Distribution...................................................................................................................................17 Race & Ethnicity ..................................................................................................................................17 Educational Attainment .......................................................................................................................18 Poverty ................................................................................................................................................18
Chapter 2: General Health Status...........................................................................................................21 Leading Causes of Death ................................................................................................................22
Morbidity..............................................................................................................................................25 Chapter 3: Maternal and Infant Health....................................................................................................26
Trends in Births ...................................................................................................................................26 Late or No Prenatal Care ....................................................................................................................26 Labor Induction & Cesarean Births .....................................................................................................29 Teen Births..........................................................................................................................................29 Low Birthweight Births.........................................................................................................................30 Infant Mortality.....................................................................................................................................31 Summary of Birth Outcomes ...............................................................................................................32 Perinatal Periods of Risk.....................................................................................................................34
Chapter 4: Chronic Diseases..................................................................................................................37 Heart Disease .....................................................................................................................................37 Cancer.................................................................................................................................................38
Lung Cancer ....................................................................................................................................41 Breast Cancer..................................................................................................................................41 Colorectal Cancer............................................................................................................................42 Prostate Cancer...............................................................................................................................42
Chronic Lower Respiratory Diseases..................................................................................................43 Stroke..................................................................................................................................................44 Alzheimer’s Disease............................................................................................................................45 Diabetes ..............................................................................................................................................46
Chapter 5: Risk Factors for Chronic Diseases........................................................................................48 Hypertension ...................................................................................................................................48 High Blood Cholesterol ....................................................................................................................48 Overweight and Obesity ..................................................................................................................48 Physical Activity and Exercise .........................................................................................................50 Fruit and Vegetable Consumption ...................................................................................................50 Tobacco Use ...................................................................................................................................51
Summary of Chronic Disease Risk Factors.........................................................................................52 Chapter 6: Injury and Violence................................................................................................................53
Motor Vehicle Crashes ....................................................................................................................53 Domestic Violence...........................................................................................................................54
Chapter 7: Mental Health and Alcohol Use.............................................................................................55 Alcohol Use .....................................................................................................................................55
Chapter 8: Access to Health Care ..........................................................................................................56 Prevention and Screening...................................................................................................................56

Hamilton County Health Data Profile 15
Chapter 9: Communicable Diseases ......................................................................................................58 Reportable Diseases...........................................................................................................................59
Hepatitis...........................................................................................................................................60 Sexually Transmitted Diseases .......................................................................................................60 Influenza-Like Illness Activity in Hamilton County ...........................................................................66 Childhood Immunizations ................................................................................................................67
Chapter 10: Environmental Health..........................................................................................................68 Asthma ................................................................................................................................................68 Air Quality............................................................................................................................................69
Radon ..............................................................................................................................................70 Water Quality ......................................................................................................................................70 Lead ....................................................................................................................................................71 Rabies .................................................................................................................................................71
Chapter 11: Regional Health Council Strategic Priorities .......................................................................74 Accomplishments of the Regional Health Council...............................................................................76
Appendix.................................................................................................................................................81 Hamilton County Zip Code Reference Map.........................................................................................82 Chattanooga-Hamilton County Health Department Organizational Chart...........................................83 Chattanooga-Hamilton County Regional Health Council ....................................................................84
2010 Regional Health Council Members .........................................................................................84 Committees and Subcommittees.....................................................................................................85
Data Sources and Where to Find Data ...............................................................................................87 Technical Notes and Terms ................................................................................................................88
References .............................................................................................................................................89

Hamilton County Health Data Profile 16
Chapter 1: Demographics & Social Determinants of Health Population characteristics can help describe communities and provide a context for trends in health outcomes. Currently, Hamilton County’s population is estimated by the U.S. Census Bureau’s American Community Survey at approximately 327,138, an increase of 6% since 2000 (Table 1). Social determinants of health, such as educational attainment and poverty, have a substantial impact on a broad range of behavioral risks and health outcomes. Persons living below the poverty level have slightly increased since 2000, and African Americans are more likely to live below poverty than their white peers (27.4% vs. 9.2%). Educational attainment has increased since 2000.
Table 1. Demographic Quick Facts Hamilton County
2000 Hamilton County
2005-2007* Tennessee 2005-2007*
Population 307,896 327,138 6,214,888
Population under 5 years 6% 6.1% 6.7%
Population under 18 years 23.2% 22.6% 24.1%
Population over 65 years 13.8% 14.1% 12.7%
Median Age 37.4 39.1 37.2
Persons 5+ living with a disability 21.1% 17.3% 18.8%
Race
White 76.3% 75.7% 79.2%
African American/Black 20.1% 20.2% 16.6%
Asian 1.3% 1.7% 1.3%
American Indian/Alaskan Native 0.3% 0.2% 0.03%
Native Hawaiian/Pacific Islander 0.1% 0.05% 0.03%
Some other race 0.8% 1.06% 1.3%
Two or more races 1.1% 1.10% 1.2%
Ethnicity, 2000 (only year data available)
Hispanic/Latino by origin 1.8% (2000) n/a n/a
Education, persons 25+
Less than high school 19.3% 15.7% 19.1%
High School graduate 80.7% 84.3% 80.9%
Bachelor’s degree or higher 23.9% 25.7% 21.7%
Economic Indicators
Unemployed (Population 16 and Over) 3.5% 7.2% 7.1%
Median household income $38,930 $44,384 $41,821
Persons living below poverty 12.1% 13% 15.9%
Children (18 or under) living below poverty 17% 19.1% 22.4%
Home ownership rate 64.5% 64.2% 63.6% Sources: U.S. Census Bureau: 2000 Census and 2005-2007 American Community Survey (*estimates only)
Hamilton County Health Data Profile 17
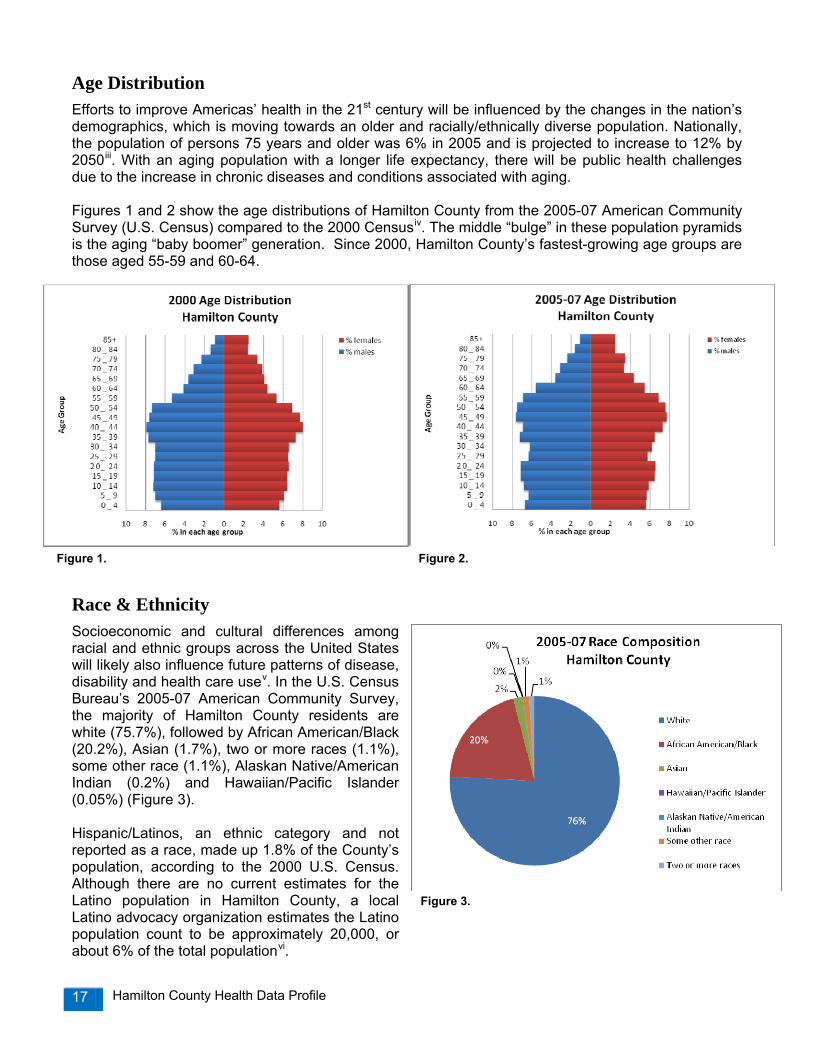
Age Distribution Efforts to improve Americas’ health in the 21st century will be influenced by the changes in the nation’s demographics, which is moving towards an older and racially/ethnically diverse population. Nationally, the population of persons 75 years and older was 6% in 2005 and is projected to increase to 12% by 2050iii. With an aging population with a longer life expectancy, there will be public health challenges due to the increase in chronic diseases and conditions associated with aging. Figures 1 and 2 show the age distributions of Hamilton County from the 2005-07 American Community Survey (U.S. Census) compared to the 2000 Censusiv. The middle “bulge” in these population pyramids is the aging “baby boomer” generation. Since 2000, Hamilton County’s fastest-growing age groups are those aged 55-59 and 60-64.
Race & Ethnicity Socioeconomic and cultural differences among racial and ethnic groups across the United States will likely also influence future patterns of disease, disability and health care usev. In the U.S. Census Bureau’s 2005-07 American Community Survey, the majority of Hamilton County residents are white (75.7%), followed by African American/Black (20.2%), Asian (1.7%), two or more races (1.1%), some other race (1.1%), Alaskan Native/American Indian (0.2%) and Hawaiian/Pacific Islander (0.05%) (Figure 3). Hispanic/Latinos, an ethnic category and not reported as a race, made up 1.8% of the County’s population, according to the 2000 U.S. Census. Although there are no current estimates for the Latino population in Hamilton County, a local Latino advocacy organization estimates the Latino population count to be approximately 20,000, or about 6% of the total populationvi.
Figure 1. Figure 2.
Figure 3.
Hamilton County Health Data Profile 18
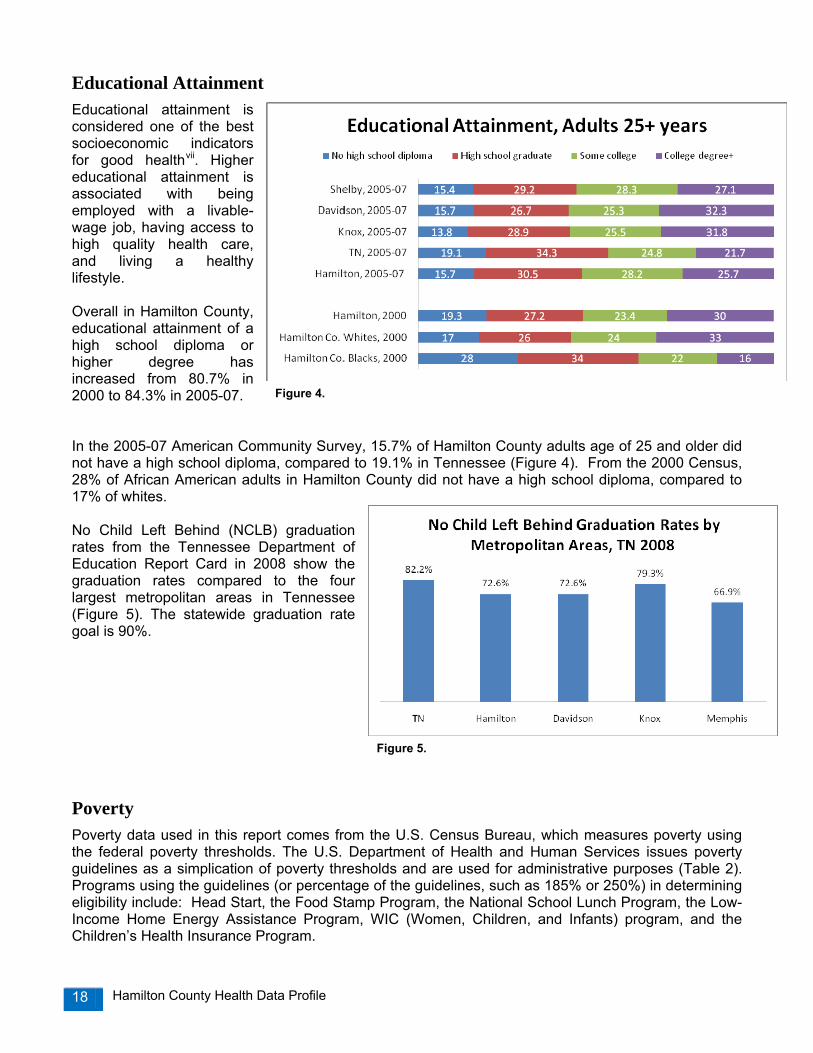
Educational Attainment Educational attainment is considered one of the best socioeconomic indicators for good healthvii. Higher educational attainment is associated with being employed with a livable-wage job, having access to high quality health care, and living a healthy lifestyle. Overall in Hamilton County, educational attainment of a high school diploma or higher degree has increased from 80.7% in 2000 to 84.3% in 2005-07. In the 2005-07 American Community Survey, 15.7% of Hamilton County adults age of 25 and older did not have a high school diploma, compared to 19.1% in Tennessee (Figure 4). From the 2000 Census, 28% of African American adults in Hamilton County did not have a high school diploma, compared to 17% of whites. No Child Left Behind (NCLB) graduation rates from the Tennessee Department of Education Report Card in 2008 show the graduation rates compared to the four largest metropolitan areas in Tennessee (Figure 5). The statewide graduation rate goal is 90%.
Poverty Poverty data used in this report comes from the U.S. Census Bureau, which measures poverty using the federal poverty thresholds. The U.S. Department of Health and Human Services issues poverty guidelines as a simplication of poverty thresholds and are used for administrative purposes (Table 2). Programs using the guidelines (or percentage of the guidelines, such as 185% or 250%) in determining eligibility include: Head Start, the Food Stamp Program, the National School Lunch Program, the Low-Income Home Energy Assistance Program, WIC (Women, Children, and Infants) program, and the Children’s Health Insurance Program.
Figure 4.
Figure 5.
Hamilton County Health Data Profile 19
Table 2. 2009/2010 HHS Poverty Guidelines
Persons in Family or Household
48 U.S. States & D.C. Gross Yearly Income
Gross Monthly
Income
Approximate
Hourly Income 1 $10,830 $903 $5.21 2 $14,570 $1,214 $7.00 3 $18,310 $1,526 $8.80 4 $22,050 $1,838 $10.60 5 $25,790 $2,149 $12.40 6 $29,530 $2,461 $14.20 7 $33,270 $2,773 $16.00 8 $37,010 $3,084 $17.79
For each additional person, add:
+$3,740
+$312
+$1.80
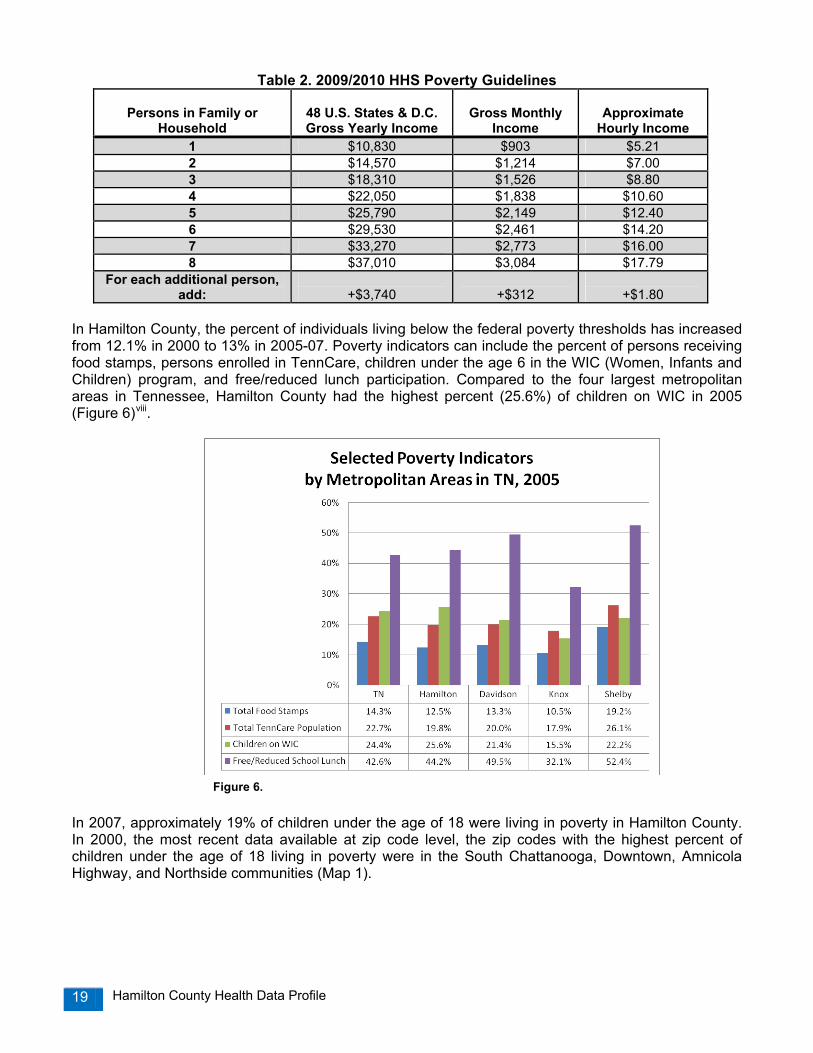
In Hamilton County, the percent of individuals living below the federal poverty thresholds has increased from 12.1% in 2000 to 13% in 2005-07. Poverty indicators can include the percent of persons receiving food stamps, persons enrolled in TennCare, children under the age 6 in the WIC (Women, Infants and Children) program, and free/reduced lunch participation. Compared to the four largest metropolitan areas in Tennessee, Hamilton County had the highest percent (25.6%) of children on WIC in 2005 (Figure 6)viii.
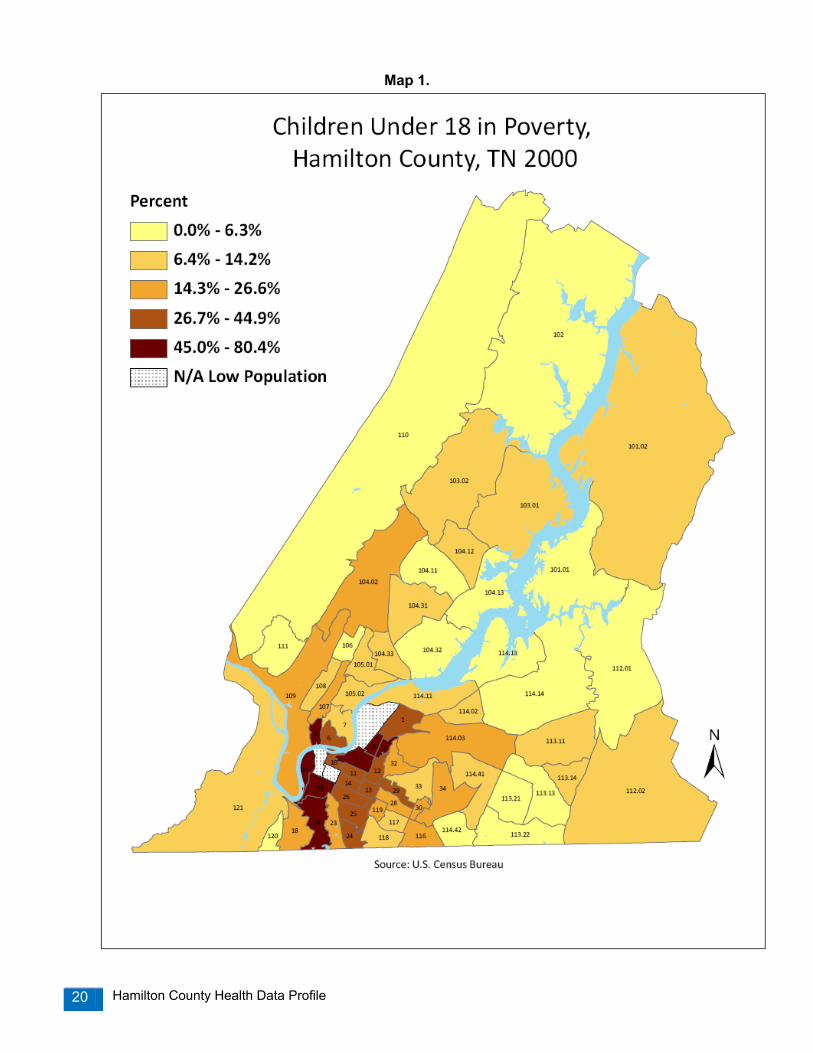
In 2007, approximately 19% of children under the age of 18 were living in poverty in Hamilton County. In 2000, the most recent data available at zip code level, the zip codes with the highest percent of children under the age of 18 living in poverty were in the South Chattanooga, Downtown, Amnicola Highway, and Northside communities (Map 1).
Figure 6.
Figure 6.
Hamilton County Health Data Profile 20
Map 1.
Hamilton County Health Data Profile 21
Chapter 2: General Health Status Life expectancy at birth is the average number of years a person born in 2007 would live if the current ages specific death rates remained unchanged over that person’s lifetime. Hamilton County residents born in 2007 are expected to live an average of 77.2 years, an increase of 1.2 years from 2004 (76 years). The life expectancy of African Americans in Hamilton County is 72.2 years, which is 6.2 years less than the average life expectancy of whites in Hamilton County (78.4 years). Health status from the adult Behavioral Risk Factor Surveillance System is used to track health-related quality of life. Concerns of the aging population, the burden of chronic disease, health behavior trends, and health care access have led to interest in monitoring overall population health and wellness. Even though Hamilton County residents have one of the highest life expectancies when compared to the State and other metropolitan areas, their self-reporting of “Excellent” health is one of the lowest (Table 3).
Table 3. General Health Status Indicators of Hamilton County and Metropolitan Areas Hamilton TN Davidson Knox Shelby
Death Rate* 897.1 938.2 888.2 872.6 946.3 Life Expectancy† 77.2 76.1 76.5 77.4 75.1 Self-Reported Health "Excellent" Percent^ 14.5 20.3 31.5 21.3 15.9 Hospitalizations Rate** 113.5 121.3 114.2 108.4 107.7 *Age Adjusted per 100,000 population 2004-2006 **Short-term discharges (newborns excluded) rate per 1,000 population, 2006 ^2007 Behavioral Risk Factor Surveillance Survey †2007 resident life expectancy (Tennessee Department of Health)
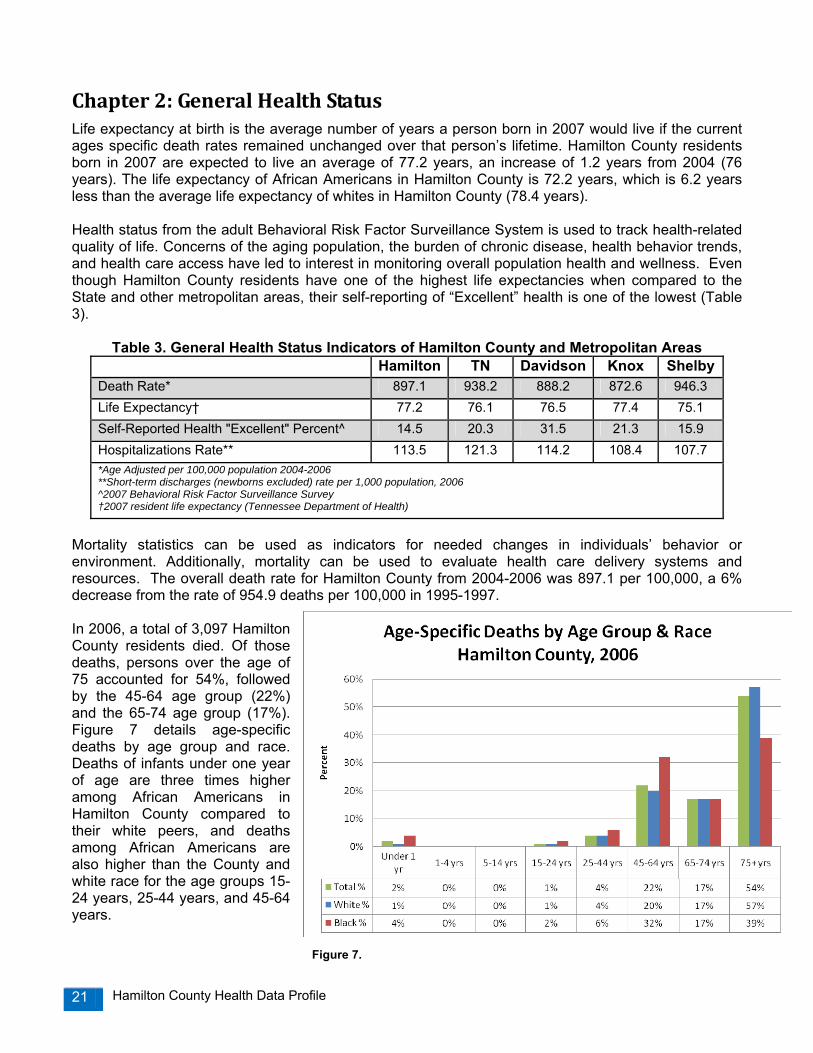
Mortality statistics can be used as indicators for needed changes in individuals’ behavior or environment. Additionally, mortality can be used to evaluate health care delivery systems and resources. The overall death rate for Hamilton County from 2004-2006 was 897.1 per 100,000, a 6% decrease from the rate of 954.9 deaths per 100,000 in 1995-1997. In 2006, a total of 3,097 Hamilton County residents died. Of those deaths, persons over the age of 75 accounted for 54%, followed by the 45-64 age group (22%) and the 65-74 age group (17%). Figure 7 details age-specific deaths by age group and race. Deaths of infants under one year of age are three times higher among African Americans in Hamilton County compared to their white peers, and deaths among African Americans are also higher than the County and white race for the age groups 15-24 years, 25-44 years, and 45-64 years.
Figure 7.
Hamilton County Health Data Profile 22
Leading Causes of Death Like the U.S., heart disease is the leading cause for death in Hamilton County, followed by cancer. Chronic Lower Respiratory Disease, or CLRD, is a group of diseases that affects the airways and lungs. CLRD includes emphysema and chronic bronchitis, which are primarily caused by cigarette smoking. Overall, the age-adjusted rates of leading causes of death in Hamilton County have decreased since 2001-2003, except Alzheimer’s Disease, accidents, and nephritis (inflammation of the kidney) (Table 4).
Table 4. Leading Causes of Death in Hamilton County, Rates per 100,000, 2004-2006 Rank Cause of Death Category Age-adjusted Rate
Per 100,000 population
% Change from 2001-03
1 Heart Disease 226.1 -8.4% 2 Cancer 202.2 -4.8% 3 Chronic Lower Respiratory Diseases 59.1 -3.3% 4 Stroke 58.5 -12.2% 5 Alzheimer's Disease 52.2 +54% 6 Accidents 40.6 +18.4% 7 Diabetes Mellitus 26.3 -13.5% 8 Influenza and Pneumonia 16.0 -21.6% 9 Intentional Self Harm (Suicide) 10.9 -1% 10 Nephritis 9.9 +13.8%
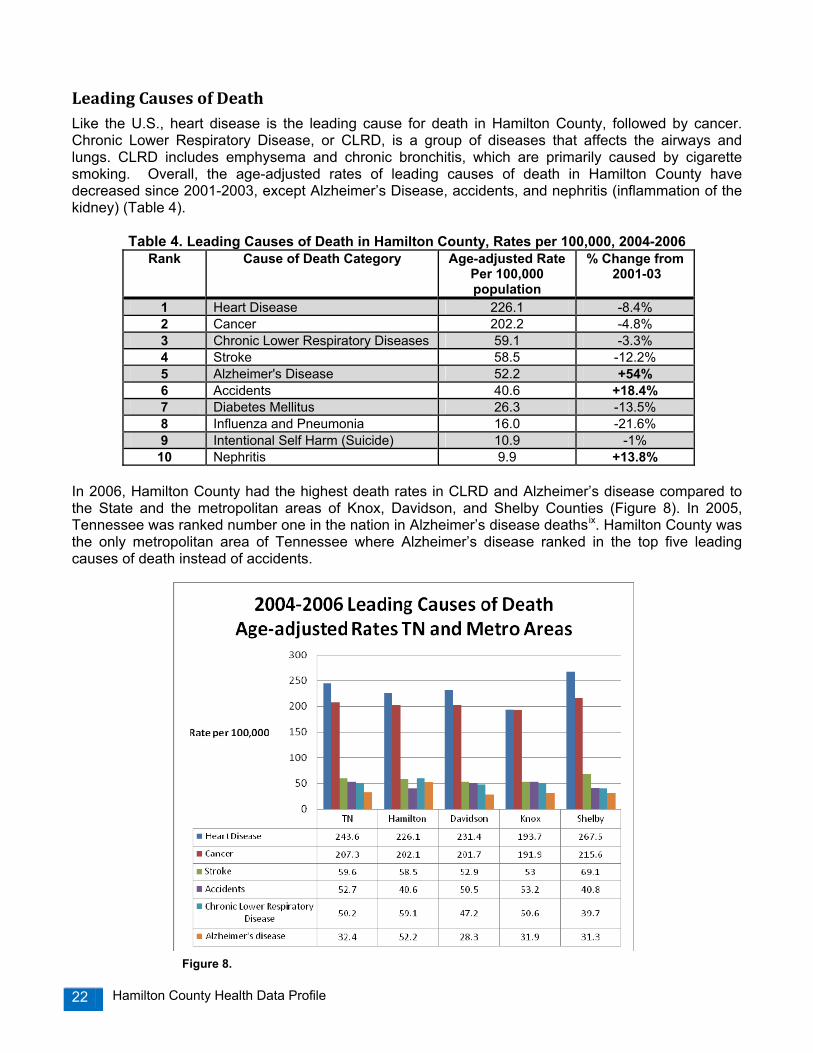
In 2006, Hamilton County had the highest death rates in CLRD and Alzheimer’s disease compared to the State and the metropolitan areas of Knox, Davidson, and Shelby Counties (Figure 8). In 2005, Tennessee was ranked number one in the nation in Alzheimer’s disease deathsix. Hamilton County was the only metropolitan area of Tennessee where Alzheimer’s disease ranked in the top five leading causes of death instead of accidents. Figure 8.

Hamilton County Health Data Profile 23
In examining trends of leading causes of death in Hamilton County, death rates for heart disease have decreased since 2000, while cancer and CLRD rates have remained relatively constant. Death rates from stroke have decreased slightly and deaths from Alzheimer’s disease have begun to increase (Figure 9).
The leading causes of death in Hamilton County were categorized by age group for the year 2006. Disorders related to low birth weight (babies born less than 2500 grams or 5.5 lbs) was the leading cause for infant under one year of age, and unintentional injury (including deaths from motor vehicle crashes), was the leading cause of death for Hamilton County residents under the age of 44 years. Cancer was the leading cause of death among adults ages 45-64 and heart disease among adults ages 65 and older (Table 5).
Table 5. Leading Causes of Death by Age Group with Rates, Hamilton County, 2006
Rank TOTAL Age <1 1-4 5-14 15-24 25-44 45-64 65+
1 Heart
Disease (261.3)
Disorders related to Low Birth Weight
(1.6)
Unintentional Injury (15.6)
Unintentional Injury (6.0)
Unintentional Injury (45.6)
Unintentional Injury (39.5)
Cancer (249.0)
Heart Disease (1,423.5)
2
Cancer (232.0)
Congenital Anomalies
(1.3)
Homicide
(4.5)
Cancer (3.4)
Homicide
(10.6)
Heart Disease (26.0)
Heart Disease (200.8)
Cancer (1,132.7)
3
Chronic Lower
Respiratory Disease (67.3)
SIDS (1.1)
0
Homicide
(1.7)
Suicide (10.6)
Cancer (20.2)
Chronic Lower
Respiratory Disease (42.6)
Alzheimer’s Disease (429.3)
4
Stroke (67.2)
Maternal Pregnancy
Complications (0.4)
0
0
Cancer
(3.3)
Suicide (13.2)
Unintentional Injury (39.0)
Stroke (403.5)
5
Alzheimer’s
Disease (61.2)
Intrauterine hypoxia and
birth asphyxia (0.4)
0
0
Heart Disease
(3.3)
HIV (8.9)
Stroke (34.7)
Chronic Lower
Respiratory Disease (390.5)
Figure 9.
Hamilton County Health Data Profile 24
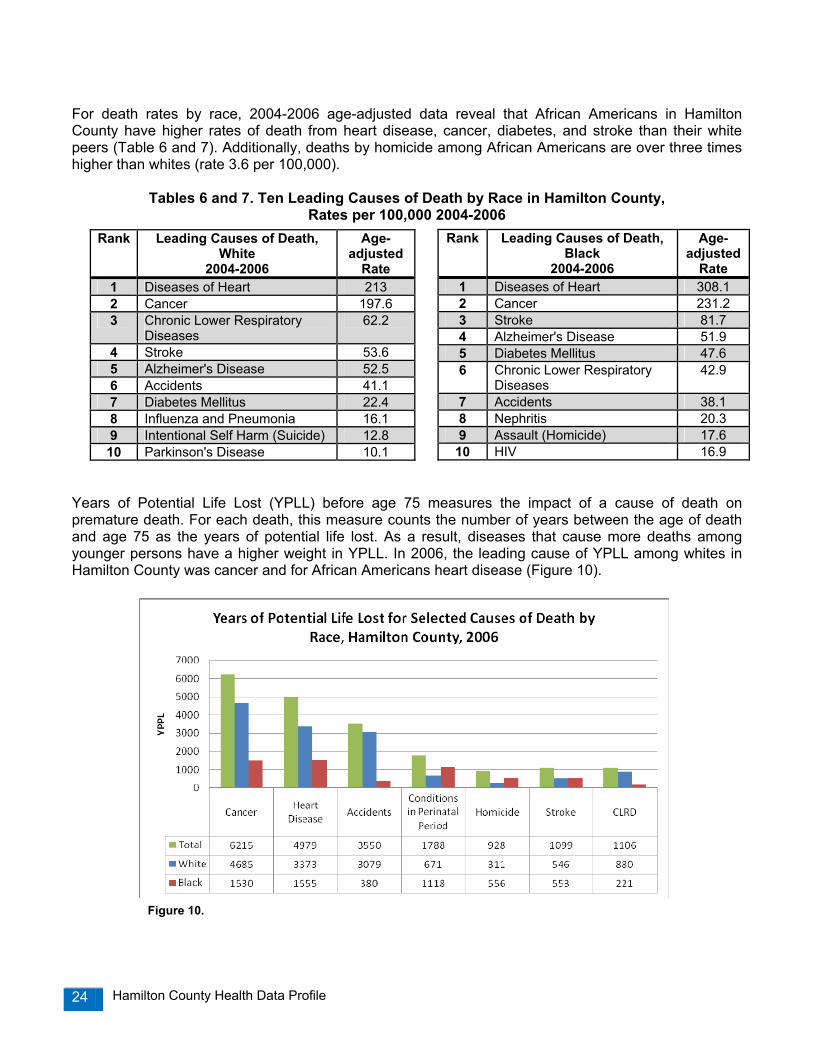
For death rates by race, 2004-2006 age-adjusted data reveal that African Americans in Hamilton County have higher rates of death from heart disease, cancer, diabetes, and stroke than their white peers (Table 6 and 7). Additionally, deaths by homicide among African Americans are over three times higher than whites (rate 3.6 per 100,000).
Tables 6 and 7. Ten Leading Causes of Death by Race in Hamilton County, Rates per 100,000 2004-2006
Years of Potential Life Lost (YPLL) before age 75 measures the impact of a cause of death on premature death. For each death, this measure counts the number of years between the age of death and age 75 as the years of potential life lost. As a result, diseases that cause more deaths among younger persons have a higher weight in YPLL. In 2006, the leading cause of YPLL among whites in Hamilton County was cancer and for African Americans heart disease (Figure 10).
Rank Leading Causes of Death, White
2004-2006
Age-adjusted
Rate 1 Diseases of Heart 213 2 Cancer 197.6 3 Chronic Lower Respiratory
Diseases 62.2
4 Stroke 53.6 5 Alzheimer's Disease 52.5 6 Accidents 41.1 7 Diabetes Mellitus 22.4 8 Influenza and Pneumonia 16.1 9 Intentional Self Harm (Suicide) 12.8 10 Parkinson's Disease 10.1
Rank Leading Causes of Death, Black
2004-2006
Age-adjusted
Rate 1 Diseases of Heart 308.1 2 Cancer 231.2 3 Stroke 81.7 4 Alzheimer's Disease 51.9 5 Diabetes Mellitus 47.6 6 Chronic Lower Respiratory
Diseases 42.9
7 Accidents 38.1 8 Nephritis 20.3 9 Assault (Homicide) 17.6
10 HIV 16.9
Figure 10.

Hamilton County Health Data Profile 25
Table 8 summarizes leading causes of deaths in comparison to Tennessee, the U.S., and the Healthy People 2010 target objectives.
Table 8. Causes of Death Summary, Rates per 100,000
Morbidity The leading causes of hospitalizations come from the Tennessee Department of Health’s Hospital Discharge Data System. Hospitalizations are the number of discharges from the short term hospitals by first listed diagnosis. Newborns and childbirths were excluded. Overall, there were 35,538 inpatient discharges in Hamilton County in 2006. Approximately 18.2% of those hospitalizations were paid by TennCare and 47.8% paid by Medicare. Self-paid hospitalizations were 4.9% of the total and 0.2% was “free care”. The leading causes of short-term hospitalizations in Hamilton County during 2006 are listed in Table 9.
Table 9. Leading Causes of Hospitalizations in Hamilton County, 2006*
In 2006, the leading cause of hospitalizations among children ages birth through 18 years was respiratory disease (total of 269), for adults ages 19 to 64 years, digestive system disease (2,149), and for adults over the age of 65, heart disease (2,637). For emergency room visits, Hamilton County was ranked 41, almost in the middle of the state rankings in 2006, with 155,458 resident Emergency Room visits (rate of 496 per 1,000).
Cause of Death Hamilton Co. Rate
2004-2006
Tennessee Rate2004-2006
U.S. Rate 2006
Healthy People 2010 Target
Heart Disease 226.1 243.6 211.0 162.0 Cancer 202.2 207.3 187.0 158.6 Stroke 58.5 59.6 45.8 50.0 Chronic Lower Respiratory Disease 59.1 50.2 43.2 62.3 Accidents/Unintentional Injury 40.6 52.7 40.6 17.1 Alzheimer’s Disease 52.2 32.4 24.2 n/a Diabetes 26.3 29.5 24.2 45.0 Influenza and Pneumonia 16.0 26.1 18.8 n/a Homicide 6.7 7.8 6.2 2.8 Sources: Tennessee Department of Health and National Center for Health Statistics (CDC)
Number Rate per 1,000
All Causes 35,538 113.5
Heart Disease 4,414 14.1 Digestive System Disease 3,805 12.1 Respiratory Disease 3,300 10.5 Injury and Poisoning 3,089 9.9 Musculoskeletal/Tissue Disease 2,128 6.8 *Newborns and childbirths excluded; Source: TN Department of Health

Hamilton County Health Data Profile 26
Chapter 3: Maternal and Infant Health Trends in Births Tracking trends in births helps support effective social planning and allocation of resources across generations, and tracking age-specific and race/ethnicity specific trends provides information on the divergent needs of different population groupsx. In 2007, there were 4,332 resident births in Hamilton County compared to 3,772 births in 1997. The primary payment source for resident births was Medicaid or TennCare (47.3%), followed by private insurance (45.2%), and self-pay (4.6%). The birth rate (defined as the number of births per 1,000 women of reproductive age) increased by 23% from 1997 to 2007 (Figure11). From 2004 to 2007, the Hamilton County zip codes with the highest number of births were East Brainerd (37421) and Hixson (37343). One out of every five births occurs in these combined areas. Late or No Prenatal Care Prenatal care is important for the health of both the infant and the mother. Mothers who do not receive prenatal care are three times more likely to give birth to a low weight baby (less than 5.5 lbs), and their baby is five times more likely to die before its first birthdayxi. Prenatal care provides opportunities for health care providers to educate mothers on important health behaviors such as diet and nutrition, exercise, immunizations, weight gain, and abstaining from drugs and alcoholxii. Prenatal care can also help parents learn about nutrition for their newborn, the benefits of breastfeeding, as well as illness and injury prevention. From 2004 to 2007 in Hamilton County, 262 residents did not receive any prenatal care during their pregnancy. Late prenatal care is defined as accessing prenatal care after the first trimester. Approximately one-third (33%) of all Hamilton County births received late prenatal care, and half of all infant deaths (51%) were born to mothers who received no or late prenatal care. The Healthy People 2010 objective is to have 90% of women receive prenatal care in the first trimester of pregnancy. The following map displays births with late or no prenatal care (Map 2).
Figure 11.

Hamilton County Health Data Profile 27

Hamilton County Health Data Profile 28
Map 2.
37410
37416N
Source: TN Department of Health
37409
37350
37419
37405
37412
37411
37351
37415
37377
37379
37341
3731137302
37353
37363
37336
37308
37373
Percent Late or No Prenatal Care00-25.6%25.6%-34.7%37.4%-44.9%44.9%-57.1%57.1%
Percent of Hamilton County Births withLate or No Prenatal Care by Zip Code, 2004‐2007
37343
37421
37403
37408
37407
37338
37406
37402
37404
Hamilton County Health Data Profile 29
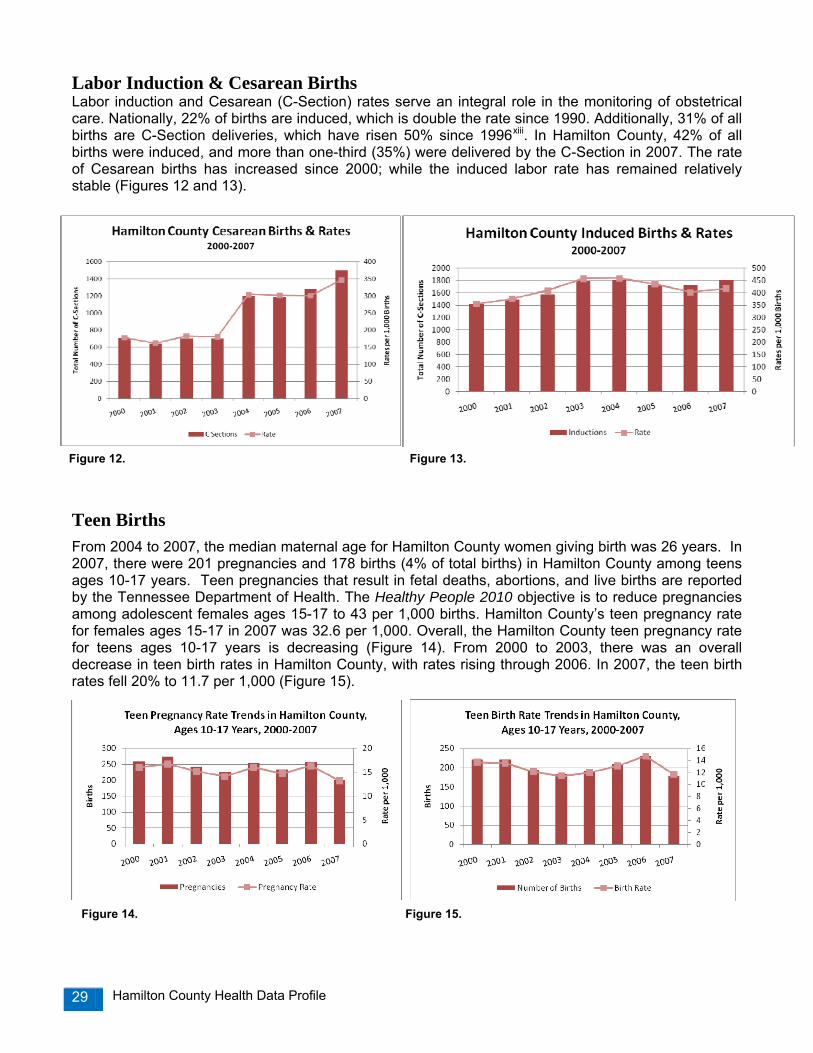
Labor Induction & Cesarean Births Labor induction and Cesarean (C-Section) rates serve an integral role in the monitoring of obstetrical care. Nationally, 22% of births are induced, which is double the rate since 1990. Additionally, 31% of all births are C-Section deliveries, which have risen 50% since 1996xiii. In Hamilton County, 42% of all births were induced, and more than one-third (35%) were delivered by the C-Section in 2007. The rate of Cesarean births has increased since 2000; while the induced labor rate has remained relatively stable (Figures 12 and 13).
Teen Births From 2004 to 2007, the median maternal age for Hamilton County women giving birth was 26 years. In 2007, there were 201 pregnancies and 178 births (4% of total births) in Hamilton County among teens ages 10-17 years. Teen pregnancies that result in fetal deaths, abortions, and live births are reported by the Tennessee Department of Health. The Healthy People 2010 objective is to reduce pregnancies among adolescent females ages 15-17 to 43 per 1,000 births. Hamilton County’s teen pregnancy rate for females ages 15-17 in 2007 was 32.6 per 1,000. Overall, the Hamilton County teen pregnancy rate for teens ages 10-17 years is decreasing (Figure 14). From 2000 to 2003, there was an overall decrease in teen birth rates in Hamilton County, with rates rising through 2006. In 2007, the teen birth rates fell 20% to 11.7 per 1,000 (Figure 15).
Figure 12. Figure 13.
Figure 14. Figure 15.
Hamilton County Health Data Profile 30
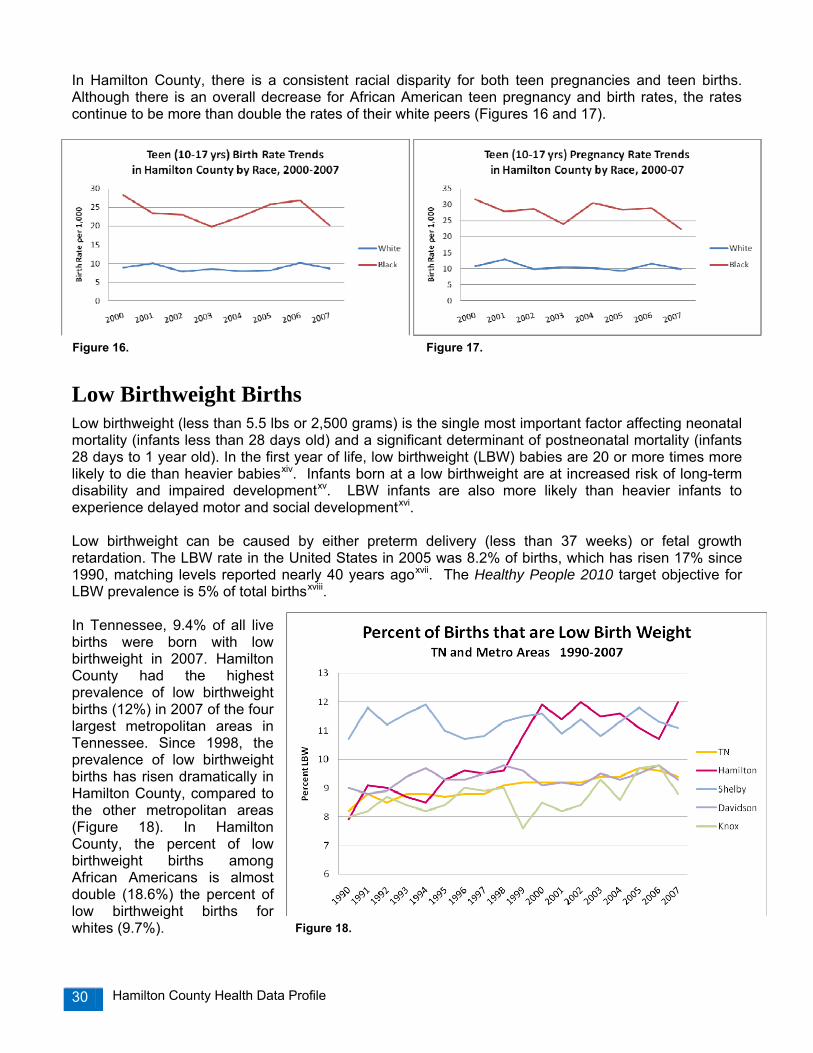
In Hamilton County, there is a consistent racial disparity for both teen pregnancies and teen births. Although there is an overall decrease for African American teen pregnancy and birth rates, the rates continue to be more than double the rates of their white peers (Figures 16 and 17).
Low Birthweight Births Low birthweight (less than 5.5 lbs or 2,500 grams) is the single most important factor affecting neonatal mortality (infants less than 28 days old) and a significant determinant of postneonatal mortality (infants 28 days to 1 year old). In the first year of life, low birthweight (LBW) babies are 20 or more times more likely to die than heavier babiesxiv. Infants born at a low birthweight are at increased risk of long-term disability and impaired developmentxv. LBW infants are also more likely than heavier infants to experience delayed motor and social developmentxvi. Low birthweight can be caused by either preterm delivery (less than 37 weeks) or fetal growth retardation. The LBW rate in the United States in 2005 was 8.2% of births, which has risen 17% since 1990, matching levels reported nearly 40 years agoxvii. The Healthy People 2010 target objective for LBW prevalence is 5% of total birthsxviii. In Tennessee, 9.4% of all live births were born with low birthweight in 2007. Hamilton County had the highest prevalence of low birthweight births (12%) in 2007 of the four largest metropolitan areas in Tennessee. Since 1998, the prevalence of low birthweight births has risen dramatically in Hamilton County, compared to the other metropolitan areas (Figure 18). In Hamilton County, the percent of low birthweight births among African Americans is almost double (18.6%) the percent of low birthweight births for whites (9.7%).
Figure 18.
Figure 16. Figure 17.

Hamilton County Health Data Profile 31
Infant Mortality Infant mortality is an important health measure that not only reflects the current health status of a community or population, but also is a measure of the overall social development of a community, including maternal care, quality of and access to care, socioeconomic conditions, and public health interventions. The infant mortality rate (IMR) is the rate at which babies less than one year of age die. In 2006, the infant mortality rate for the United States was 6.71 deaths per 1,000 live births. The United States was ranked 29th in the world in infant mortality in 2004, with the U.S. international ranking falling from 12th in 1960 to 23rd in 1990 and 29th in 2004xix. In 2006, Tennessee’s infant mortality rate was ranked 45th in the nation (8.7 per 1,000), with only five states with higher rates. Overall, the trend in infant mortality rates in Hamilton County has been decreasing over time. However, the disparity gap between African American and white infant mortality has shown some increase in the past 10 years (Figure 19). The Healthy People 2010 objective for the U.S. infant mortality rate is 4.5 infant deaths per 1,000 live birthsxx. The current U.S. rate is about 50% higher than the goal. The goal of the Tennessee Department of Health is to reduce infant mortality in Tennessee to an incidence of no more than 7.0 infant deaths per 1,000 live births by the year 2010. In 2007, Hamilton County had the 2nd highest infant mortality rate (9.7 per 1,000 live births) of the four largest metropolitan areas in Tennessee. In Hamilton County, the African American infant mortality rate is 1.5 times higher than the white rate, and racial disparities are seen across all metropolitan areas (Figure 20). Of the babies who died in Hamilton County from 2004 to 2007, the following risk factors were identified:
• 68% were born preterm (less than 37 weeks completed gestation) • 60% were born very low birthweight (less than 3.3 lbs or 1,500 g) • 61% were born to unmarried mothers • 59% were born to mothers who reported smoked during pregnancy • 51% were born to mothers who received no or late prenatal care (after the 1st trimester) • 38% were born to mothers who had less than a high school education • 7% were born to teen mothers
Figure 20.
Figure 19.

Hamilton County Health Data Profile 32
From 2004 to 2007 in Hamilton County, there were five zip codes with rates higher than 14.5 per 1,000: 37403 (Downtown/E 3rd St), 37408 (Downtown/Main St), 37407 (Eastlake), 37406 (East Chattanooga), 37402 (Downtown) (Map 3). Summary of Birth Outcomes The table below summarizes Hamilton County birth outcomes by race and ethnicity from 2000 to 2007. Hispanic/Latino ethnicity births have increased 75% from 2000-2003 to 2004-2007. The overall infant mortality rate has decreased 14%, with decreases among whites, African Americans and Hispanic/Latinos. There also has been an overall decrease in low birthweight births and teen births.
Table 10. Summary of Hamilton County Birth Outcomes 2000-2003 2004-2007 % Change Total Births and Percentage of Total
White 11,425 (71.9%) 11,932 (72.1%) 0.3% Black/AA 4,077 (25.7%) 4,212 (25.5%) -0.8%
Hispanic/Latino Ethnicity* 868 (5.5%) 1,592 (9.6%) 75% Hamilton County 15,895 16,539 4.1%
Infant Mortality Rate (IMR) per 1,000 White 7.4 6.0 19%
Black/AA 20.1 18.8 -7% Hispanic/Latino Ethnicity* 10.4 9.4 -10%
Hamilton County 10.9 (173 deaths) 9.4 (156 deaths) -14% Low Birthweight Births
White 9.2% 9% -2% Black/AA 18.5% 18.2% -2%
Hispanic/Latino Ethnicity* 11.2% 8.4% -25% Hamilton County 11.7% 11.4% -3%
Teen Births (10-17 years) White 3.5% 3.2% -9%
Black/AA 10% 9.9% -1% Hispanic/Latino Ethnicity* 7.6% 5.5% -28%
Hamilton County 5.2% 4.9% -6% Source: TN Department of Health *Hispanic/Latino ethnicity are small numbers and subject to unstable rates

Hamilton County Health Data Profile 33
Map 3.
37407
37408
3740237403
37406
37421
37343
Hamilton County Infant Mortality Rate per 1,000 Births by Zip Code, 2004‐2007
Infant Mortality Rate00 - 6.36.3 - 10.410.4 - 14.514.5 - 36.1
37373
37338
37308
37336
37363
37353
3730237311
37341
37379
37377
37415
37351
37411
37412
37405
37419
37350
37409
37404
Source: TN Department of Health
N37416
37410

Hamilton County Health Data Profile 34
Perinatal Periods of Risk The traditional methods for assessing infant mortality in a community may not directly lead to action and prevention activities. The Perinatal Periods of Risk (PPOR) approach, provided by University of Nebraska and CityMatCH (a national Maternal and Child Health organization), gives newer insight into infant and fetal deaths in two ways: 1) the analysis includes fetal deaths, which is an important perinatal health indicator, but is not regularly included when examining infant deaths and 2) PPOR divides the overall fetal-infant mortality rate of a community into four periods aimed at prevention: • Maternal Health/Prematurity (infant and fetal deaths weighing
less than 1,500g/ 3.3 lbs) • Maternal Care (fetal deaths weighing 1,500g or more ) • Newborn Care (neonatal deaths weighing 1,500g or more) • Infant Health (postneonatal deaths weighing 1,500g or more)
The PPOR mapping of fetal-infant mortality into these four periods of risk enables communities to identify and further investigate periods where there are the greatest opportunities for local impact. The PPOR analysis compares fetal-infant mortality rates of a community to a reference group that has the “best” birth outcomes. The reference group used is a group of births in the U.S. to non-Hispanic white women who are 20 or more years of age with 13 or more years of education. The PPOR analysis then calculates excess deaths from the target and comparison groups to determine the target community’s “opportunity gap”. In Phase I of the PPOR analysis, Hamilton County fetal-infant mortality rates are sorted and mapped into four periods of risk: Maternal Health/Prematurity, Maternal Care, Newborn Care, and Infant Health. Mapping the fetal-infant mortality rate will identify periods of risk with the most deaths and highest rates in Hamilton County. Using comparison groups (target vs. reference) will estimate excess deaths and the community’s opportunity gap.
Data from 2001 to 2005 was analyzed in November 2008 for the Infant Mortality Reduction Initiative and the local March of Dimes Chapter. From 2001-2005, there were 195 fetal and infant deaths in Hamilton County and 19,614 total resident in-state births. The fetal and infant deaths in Hamilton County are mapped into the four periods of risk. The overall fetal-infant mortality rate in Hamilton County is 9.9 per 1,000 births (Figure 21). The periods of risk with the highest rates are the Maternal Health/Prematurity (4.8 per 1,000) and Infant Health (2.4 per 1,000), suggesting that the greatest potential for reduction of Hamilton County’s fetal-infant mortality rate is in the Maternal Health/Prematurity period followed by the Infant Health period.
Figure 21.

Hamilton County Health Data Profile 35
According to CityMatCH, focusing on preconception health, health behaviors, and specialized perinatal care can help reduce mortality in the Maternal Health/Prematurity group. Focusing on Sudden Infant Death Syndrome prevention, injury prevention, and breastfeeding can help reduce mortality in the Infant Health groupxxi. From 2001 to 2005, there were 112 white fetal and infant deaths and 76 African American deaths. PPOR fetal-infant mortality maps were created for race sub-populations to explore disparities or “gaps”. There is a disparity when comparing fetal-infant mortality rates between whites and African Americans in Hamilton County. The African American fetal-infant mortality rate is 15.3 compared to the white rate of 7.9 (Figure 22). Identifying “opportunity gaps” are an important part of the PPOR methodology. To identify potential opportunity gaps, the next step in mapping fetal-infant mortality is to calculate excess deaths by comparing the target population of Hamilton County to a reference group. Excess deaths are measures of the potential reduction in infant and fetal deaths in Hamilton County, or an estimate of “preventable deaths”. Excess fetal-infant mortality rates are calculated by subtracting the U.S. reference population from the target population for each of the periods of risk. The excess fetal-infant mortality rate for Hamilton County compared to the national reference group is 4.2 per 1,000 births (Figure 23).
Comparing Hamilton County to a U.S. reference group with optimal birth outcomes helps target deaths that could be prevented. With an excess fetal-infant mortality rate of 4.2, a total of 82 excess, or preventable, fetal and infant deaths occurred in Hamilton County from 2001 to 2005.
Figure 22.
Figure 23.
Hamilton County Health Data Profile 36
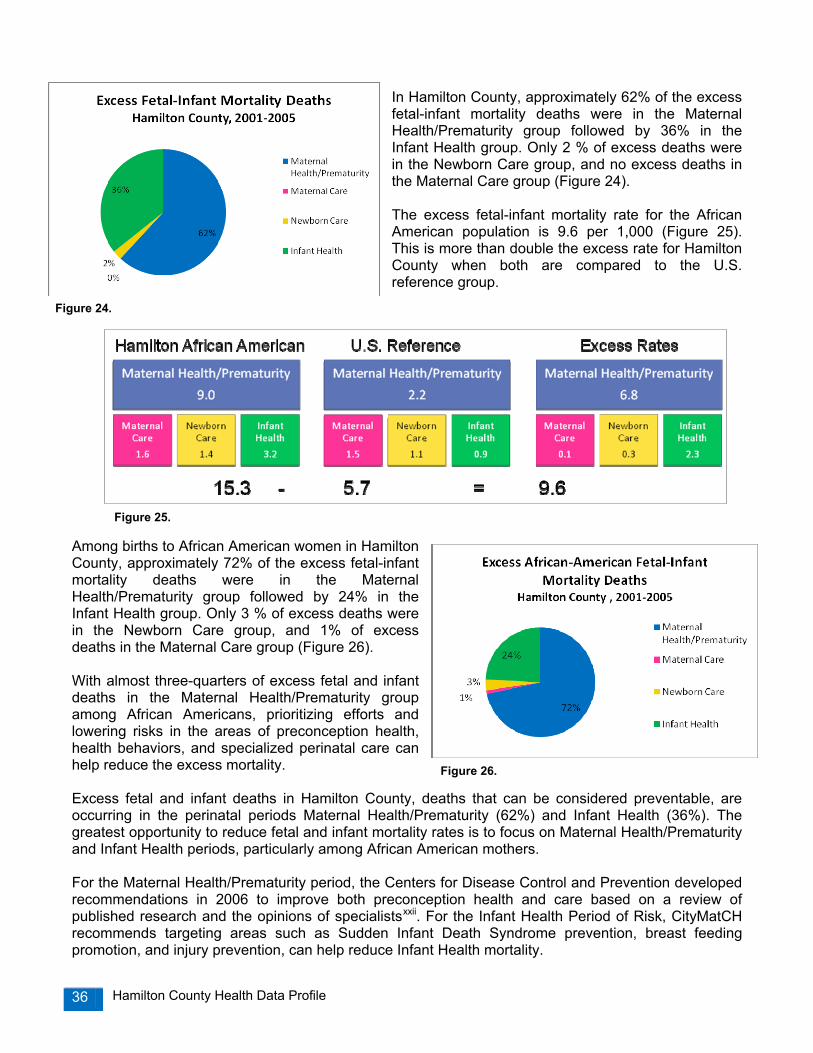
In Hamilton County, approximately 62% of the excess fetal-infant mortality deaths were in the Maternal Health/Prematurity group followed by 36% in the Infant Health group. Only 2 % of excess deaths were in the Newborn Care group, and no excess deaths in the Maternal Care group (Figure 24). The excess fetal-infant mortality rate for the African American population is 9.6 per 1,000 (Figure 25). This is more than double the excess rate for Hamilton County when both are compared to the U.S. reference group.
Among births to African American women in Hamilton County, approximately 72% of the excess fetal-infant mortality deaths were in the Maternal Health/Prematurity group followed by 24% in the Infant Health group. Only 3 % of excess deaths were in the Newborn Care group, and 1% of excess deaths in the Maternal Care group (Figure 26). With almost three-quarters of excess fetal and infant deaths in the Maternal Health/Prematurity group among African Americans, prioritizing efforts and lowering risks in the areas of preconception health, health behaviors, and specialized perinatal care can help reduce the excess mortality. Excess fetal and infant deaths in Hamilton County, deaths that can be considered preventable, are occurring in the perinatal periods Maternal Health/Prematurity (62%) and Infant Health (36%). The greatest opportunity to reduce fetal and infant mortality rates is to focus on Maternal Health/Prematurity and Infant Health periods, particularly among African American mothers. For the Maternal Health/Prematurity period, the Centers for Disease Control and Prevention developed recommendations in 2006 to improve both preconception health and care based on a review of published research and the opinions of specialistsxxii. For the Infant Health Period of Risk, CityMatCH recommends targeting areas such as Sudden Infant Death Syndrome prevention, breast feeding promotion, and injury prevention, can help reduce Infant Health mortality.
Figure 24.
Figure 25.
Figure 26.

Hamilton County Health Data Profile 37
Chapter 4: Chronic Diseases Chronic diseases, such as heart disease, cancer, stroke, chronic lower respiratory disease (CLRD), and diabetes are the leading causes of death and disability in the United States. These diseases account for approximately 70% of all deaths nationally and 64% of deaths in Hamilton County. Chronic diseases are generally characterized by multiple risk factors, long development period, prolonged course of illness, and increased onset with age. Although chronic diseases are among the most common and costly health problems, they are also among the most preventable. Adopting healthy lifestyles such as eating nutritious foods, being physically active, and avoiding tobacco use can prevent or control the devastating effects of these diseasesxxiii. Heart Disease Cardiovascular or heart disease includes specific heart conditions, including coronary heart disease which can lead to heart attacks. Heart disease is the leading cause of death in the U.S. and is a major cause of disability. The mortality rate of heart disease in the U.S. was 211 per 100,000 population. In 2007, approximately 800 residents in Hamilton County died from heart disease, with a rate of 240 per 100,000 population. The Healthy People 2010 objective is to reduce that rate to 162 deaths per 100,000. From 1997 through 2007, the overall trend of heart disease mortality in Hamilton County has seen a statistically significant decrease, and the gap between Hamilton County’s rate and the state rate has narrowed (Figure 27). Overall, heart disease mortality is lower in Hamilton County than the State in the race and gender groups, with the exception of African American males (Figure 28). Data analyzed by students from the East Tennessee State University College of Public Health find that from 2001 to 2005, premature death (less than age 65) rates for heart disease in Hamilton County are higher among African Americans than the state as a whole. For heart disease, as with many other chronic diseases, the higher rates among African Americans are becoming an indicator of disparities for health care access and for evidence of delays with health care seeking. Figure 28.
Figure 27.

Hamilton County Health Data Profile 38
According to the Tennessee Hospital Discharge Data System, 4,414 Hamilton County residents were hospitalized with heart disease in 2006, including 737 residents for heart attack. From 2004 to 2006, African Americans in Hamilton County experienced higher rates of short-term hospitalizations from heart disease than their white peers (Figure 29). Acute Myocardial Infarction, or heart attack, represents the largest fraction of heart disease. Congestive heart failure, whose mortality rates are rising, is more associated with persons over age 75, while heart attacks are much more of a premature cause of death (ages 40-65) than has been examined previously. Mortality from heart attacks is rapid, but also greatly preventable if the patient can reach specialty care within 90 minutes of symptomsxxiv. From 2001 to 2005, premature deaths from heart attack were higher among males for both Hamilton County and Tennessee. Hamilton County deaths for premature heart attacks were consistently lower than the state, except for African American females, whose rate was equal to the state (Figure 30). Cancer Cancer is the 2nd leading cause of death for residents of Hamilton County, and the leading cause of death for residents ages 45-64 years. The Healthy People 2010 objective is to reduce the overall cancer mortality rate to 159.9 per 100,000. Lung, Breast, Prostate, and Colon cancers account for over half of the cancer incidence in Hamilton County.
Figure 29.
Figure 31.
Figure 30.
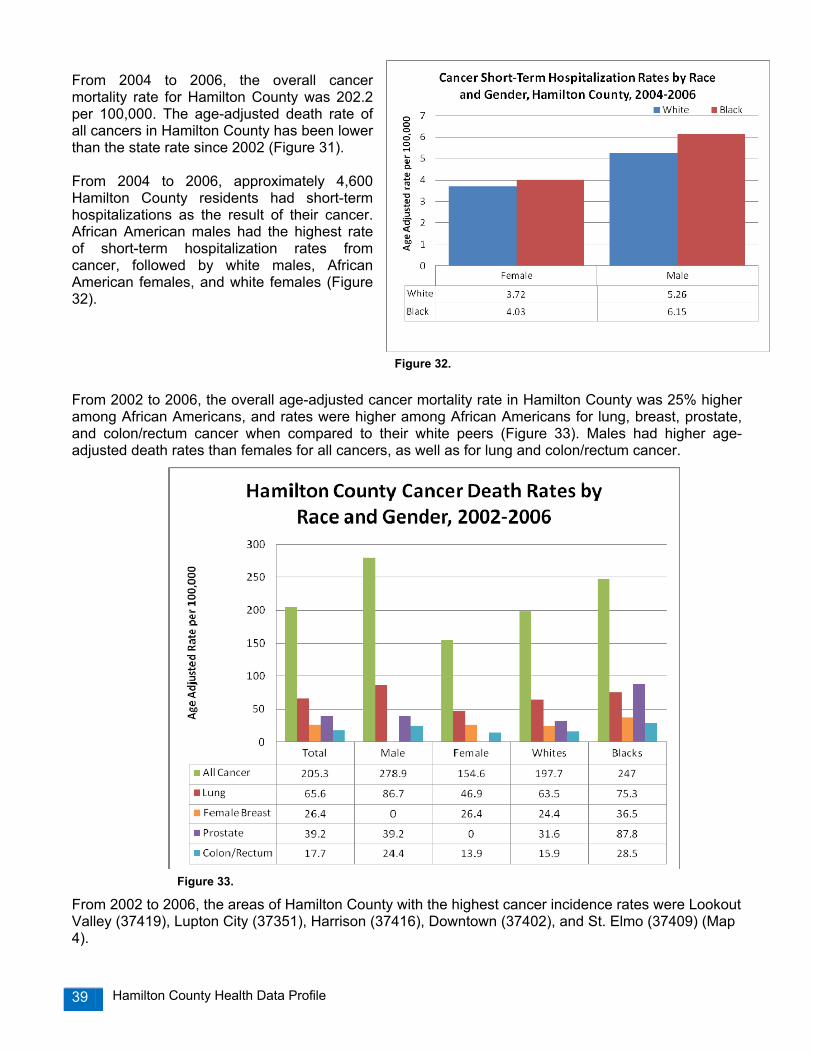
Hamilton County Health Data Profile 39
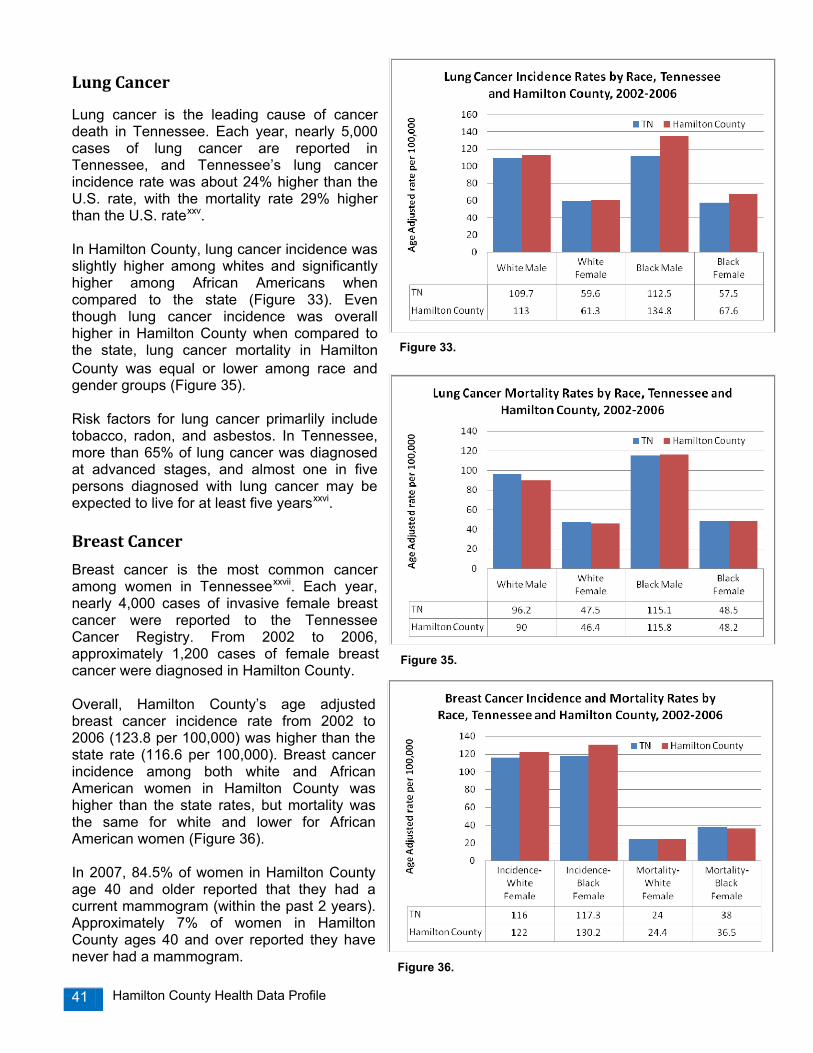
From 2004 to 2006, the overall cancer mortality rate for Hamilton County was 202.2 per 100,000. The age-adjusted death rate of all cancers in Hamilton County has been lower than the state rate since 2002 (Figure 31). From 2004 to 2006, approximately 4,600 Hamilton County residents had short-term hospitalizations as the result of their cancer. African American males had the highest rate of short-term hospitalization rates from cancer, followed by white males, African American females, and white females (Figure 32). From 2002 to 2006, the overall age-adjusted cancer mortality rate in Hamilton County was 25% higher among African Americans, and rates were higher among African Americans for lung, breast, prostate, and colon/rectum cancer when compared to their white peers (Figure 33). Males had higher age-adjusted death rates than females for all cancers, as well as for lung and colon/rectum cancer.
From 2002 to 2006, the areas of Hamilton County with the highest cancer incidence rates were Lookout Valley (37419), Lupton City (37351), Harrison (37416), Downtown (37402), and St. Elmo (37409) (Map 4).
Figure 33.
Figure 32.

Hamilton County Health Data Profile 40
Map 4.
37409
37403
37350
37402
37407
37404
37416
37406
37411
37412
37419
37405
37415
3734337377
37421
3731137302
37353
37363
37341
37336
37308
37379
37338
37373
Source: Tennessee Department of Health, Office of Cancer Surveillance.2000 U.S Census
Cancer incidence with missing Zip Codes were excluded.
Zip Codes with highest rates:37419: Lookout Valley37351: Lupton City37416: Chattanooga/Harrison37402: Downtown37409: St. Elmo
N
Cancer Incidence Rates by Hamilton County Zip Code 2002‐2006, rate per 100,000
Cancer Incidence 2002-200620.2 - 848.9849 - 1953.41953.5 - 2459.52459.6 - 2756.72756.8 - 3727.83727.9- 6893.4
37408
37410
Hamilton County Health Data Profile 41
Lung Cancer
Lung cancer is the leading cause of cancer death in Tennessee. Each year, nearly 5,000 cases of lung cancer are reported in Tennessee, and Tennessee’s lung cancer incidence rate was about 24% higher than the U.S. rate, with the mortality rate 29% higher than the U.S. ratexxv. In Hamilton County, lung cancer incidence was slightly higher among whites and significantly higher among African Americans when compared to the state (Figure 33). Even though lung cancer incidence was overall higher in Hamilton County when compared to the state, lung cancer mortality in Hamilton County was equal or lower among race and gender groups (Figure 35). Risk factors for lung cancer primarlily include tobacco, radon, and asbestos. In Tennessee, more than 65% of lung cancer was diagnosed at advanced stages, and almost one in five persons diagnosed with lung cancer may be expected to live for at least five yearsxxvi. Breast Cancer
Breast cancer is the most common cancer among women in Tennesseexxvii. Each year, nearly 4,000 cases of invasive female breast cancer were reported to the Tennessee Cancer Registry. From 2002 to 2006, approximately 1,200 cases of female breast cancer were diagnosed in Hamilton County. Overall, Hamilton County’s age adjusted breast cancer incidence rate from 2002 to 2006 (123.8 per 100,000) was higher than the state rate (116.6 per 100,000). Breast cancer incidence among both white and African American women in Hamilton County was higher than the state rates, but mortality was the same for white and lower for African American women (Figure 36). In 2007, 84.5% of women in Hamilton County age 40 and older reported that they had a current mammogram (within the past 2 years). Approximately 7% of women in Hamilton County ages 40 and over reported they have never had a mammogram.
Figure 33.
Figure 35.
Figure 36.
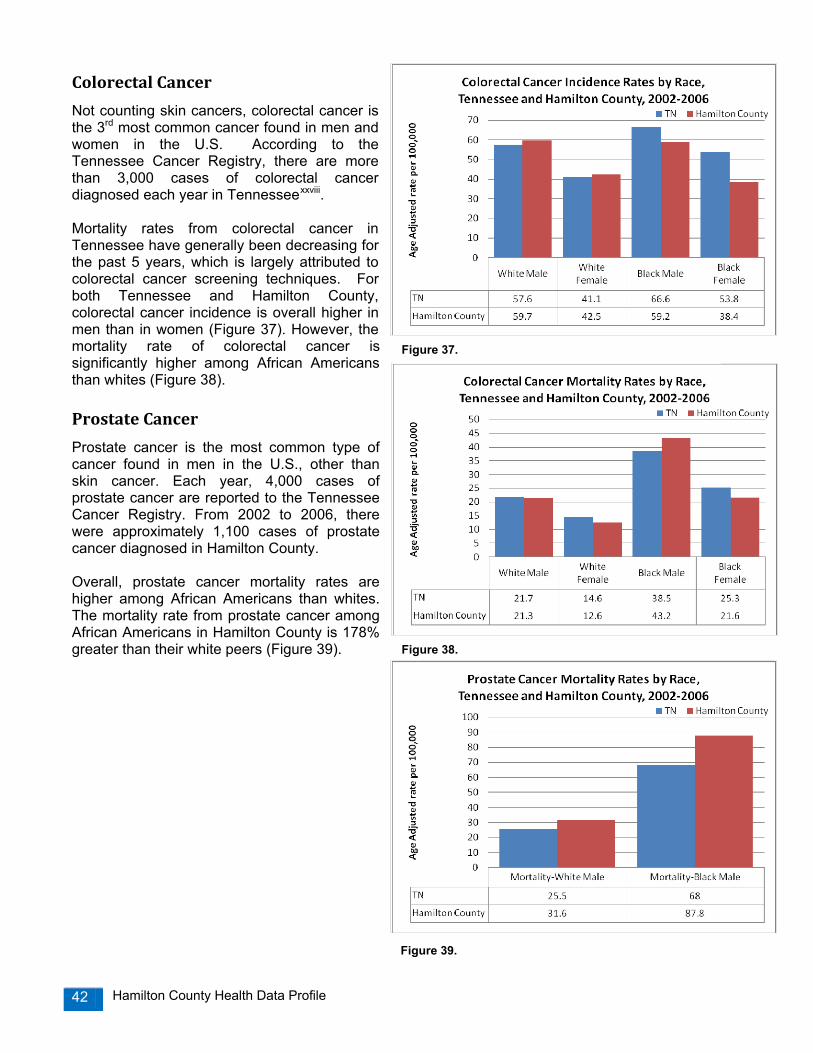
Hamilton County Health Data Profile 42
Colorectal Cancer
Not counting skin cancers, colorectal cancer is the 3rd most common cancer found in men and women in the U.S. According to the Tennessee Cancer Registry, there are more than 3,000 cases of colorectal cancer diagnosed each year in Tennesseexxviii. Mortality rates from colorectal cancer in Tennessee have generally been decreasing for the past 5 years, which is largely attributed to colorectal cancer screening techniques. For both Tennessee and Hamilton County, colorectal cancer incidence is overall higher in men than in women (Figure 37). However, the mortality rate of colorectal cancer is significantly higher among African Americans than whites (Figure 38). Prostate Cancer
Prostate cancer is the most common type of cancer found in men in the U.S., other than skin cancer. Each year, 4,000 cases of prostate cancer are reported to the Tennessee Cancer Registry. From 2002 to 2006, there were approximately 1,100 cases of prostate cancer diagnosed in Hamilton County. Overall, prostate cancer mortality rates are higher among African Americans than whites. The mortality rate from prostate cancer among African Americans in Hamilton County is 178% greater than their white peers (Figure 39).
Figure 37.
Figure 38.
Figure 39.

Hamilton County Health Data Profile 43
Chronic Lower Respiratory Diseases Chronic Lower Respiratory Diseases (CLRD) is the 4th leading cause of death in the U.S. and the 3rd leading cause of death in Hamilton County. From 2004 to 2006, the CLRD mortality rate for Hamilton County was 59.1 per 100,000. The Healthy People 2010 objective is to reduce CLRD deaths to 62.3 per 100,000, which has been met. From 1997 to 2005, CLRD mortality in Hamilton County increased. In 2006, the mortality rate fell towards the state rate (Figure 40). Overall, CLRD mortality is higher in Hamilton County when compared to the state for all race and gender groups (Figure 41). White males and females have higher CLRD mortality than their African American peers. Table 11 provides age-adjusted mortality rates for some common CLRD diseases, including asthma, emphysema, and bronchitis.
Table 11. CLRD Disease Age-adjusted Mortality Rates per 100,000, 2004-2006
Age-adjusted Mortality Rates Hamilton County TN Asthma 1.32 1.26 Emphysema 2.81 4.94 Bronchitis (Chronic and Unspecified) 0 0.26
Figure 40.
Figure 41.

Hamilton County Health Data Profile 44
Stroke Stroke is the 3rd leading cause of death nationally and the 4th leading cause of death for residents of Hamilton County. From 2004 to 2006, the stroke mortality for Hamilton County was 58.5 per 100,000. The Healthy People 2010 objective is to reduce mortality rates to 50 per 100,000. Overall, stroke mortalities in Hamilton County have been decreasing since 1999 (Figure 42). From 2004 to 2006, age-adjusted death rates for stroke in Hamilton County are similar to the state rates, where African Americans have higher death rates, especially males (Figure 43). Additionally, African Americans have higher rates of hospitalizations from stroke (Figure 44). Data from the Tennessee Stroke Registry was analyzed by students from the East Tennessee State University College of Public Health. Overall, there are many fewer premature stroke deaths (less than 65 years old) than there are overall stroke deaths in Tennessee and Hamilton County. In comparing the premature stroke mortality pattern by race and gender from 2001 to 2005, white women in Hamilton County have a statistically significant lower difference from the state rate than they do for all strokes (p<0.05). Overall stroke mortality for white women is 6.5% lower than the state, and for premature stroke mortality, 38.1% lower than the state. By contrast, white males in Hamilton County have a significantly higher premature stroke mortality rate when compared to the state.
Figure 44.
Figure 43.
Figure 42.
Figure 43.

Hamilton County Health Data Profile 45
Alzheimer’s Disease Alzheimer's disease, the most common form of dementia among older adults, affects parts of the brain that control thinking, remembering and making decisions. It can seriously impair a person's ability to complete daily activities. Alzheimer’s Disease is the 6th leading cause of death in the U.S. and the 5th leading cause of death in Hamilton County. In 2006, a total of 185 residents in Hamilton County died from Alzheimer’s Disease. From 2004 to 2006, the mortality rate from Alzheimer’s Disease in Hamilton County was 52.7 per 100,000. From 1996 to 2005, the Alzheimer’s mortality rate for both Hamilton County and Tennessee has increased significantly (Figure 45). The Alzheimer’s mortality rate did fall in Hamilton County from 2005 to 2006. Overall, Alzheimer mortality rates in Hamilton County are significantly higher than the state rates for both race and gender (Figure 46). Within Hamilton County, mortality rates are highest among white females, followed by almost equal rates for black males and black females. As U.S. adults live longer, the prevalence of Alzheimer's disease, which doubles every 5 years after age 65, also is expected to increasexxix.
Figure 45.
Figure 46.

Hamilton County Health Data Profile 46
Diabetes Diabetes is a serious public health risk because diabetes increases the risk of heart disease and stroke and can cause serious complications such as kidney failure, blindness, amputations, nerve damage, and premature death. Diabetes is one of the most costly of all chronic diseases, with $116 billion spent nationally in 2007 on direct health care costs for people with diabetesxxx.
From 2004 to 2006, the diabetes mortality rate in Tennessee was 29.5 per 100,000 compared to 26.3 in Hamilton County. The Healthy People 2010 objective for diabetes is to reduce the overall mortality rate to 45 deaths per 100,000 population. From 1996 to 2006, the overall trend of diabetes mortality in Hamilton County has increased slightly (Figure 47). According to the Tennessee Hospital Discharge Data System, 765 Hamilton County residents were hospitalized with diabetes in 2006. Of those patients, 6% were ages birth through 18 years, 73% ages 19 to 64 years, and 21% ages 65 or older. Overall, hospitalizations from diabetes were two times higher among African Americans than their white peers (Figure 48). Data from the 2007 Behavioral Risk Factor Surveillance System (BRFSS) ranks Tennessee as number one in the nation for diabetes prevalence, with an estimated 542,000 adult residents 18 years and older currently living with the disease. Since 1997, the percent of adults with diabetes tripled in Tennessee, from 4% in 1997 to 12% in 2007 (Figure 49).
Figure 47.
Figure 49.
Figure 48.

Hamilton County Health Data Profile 47
In Tennessee, diabetes prevalence reported by the BRFSS is consistently higher among African-Americans (15.5%) compared to whites (11.6%). In addition, adults in Tennessee with household incomes less than $25,000 per year were more likely to have diabetes (35.3%) as were adults with less than a high school education (17.2%). In 2007, approximately 11% of Hamilton County adults reported that they had diabetes. Of those adults who have diabetes, 84% were categorized as overweight or obese, and 55% had not had any physical activity or exercise in the past month.
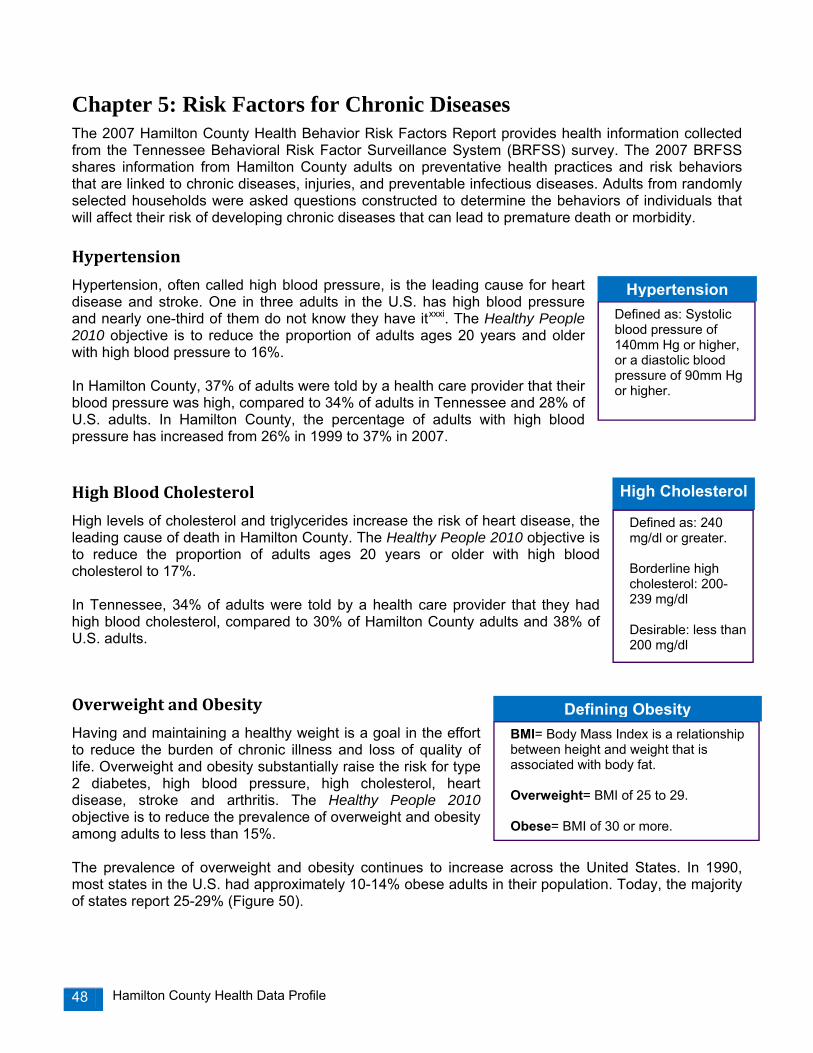
Hamilton County Health Data Profile 48
Chapter 5: Risk Factors for Chronic Diseases The 2007 Hamilton County Health Behavior Risk Factors Report provides health information collected from the Tennessee Behavioral Risk Factor Surveillance System (BRFSS) survey. The 2007 BRFSS shares information from Hamilton County adults on preventative health practices and risk behaviors that are linked to chronic diseases, injuries, and preventable infectious diseases. Adults from randomly selected households were asked questions constructed to determine the behaviors of individuals that will affect their risk of developing chronic diseases that can lead to premature death or morbidity. Hypertension
Hypertension, often called high blood pressure, is the leading cause for heart disease and stroke. One in three adults in the U.S. has high blood pressure and nearly one-third of them do not know they have itxxxi. The Healthy People 2010 objective is to reduce the proportion of adults ages 20 years and older with high blood pressure to 16%. In Hamilton County, 37% of adults were told by a health care provider that their blood pressure was high, compared to 34% of adults in Tennessee and 28% of U.S. adults. In Hamilton County, the percentage of adults with high blood pressure has increased from 26% in 1999 to 37% in 2007. High Blood Cholesterol
High levels of cholesterol and triglycerides increase the risk of heart disease, the leading cause of death in Hamilton County. The Healthy People 2010 objective is to reduce the proportion of adults ages 20 years or older with high blood cholesterol to 17%. In Tennessee, 34% of adults were told by a health care provider that they had high blood cholesterol, compared to 30% of Hamilton County adults and 38% of U.S. adults.
Overweight and Obesity
Having and maintaining a healthy weight is a goal in the effort to reduce the burden of chronic illness and loss of quality of life. Overweight and obesity substantially raise the risk for type 2 diabetes, high blood pressure, high cholesterol, heart disease, stroke and arthritis. The Healthy People 2010 objective is to reduce the prevalence of overweight and obesity among adults to less than 15%. The prevalence of overweight and obesity continues to increase across the United States. In 1990, most states in the U.S. had approximately 10-14% obese adults in their population. Today, the majority of states report 25-29% (Figure 50).
Defining ObesityBMI= Body Mass Index is a relationship between height and weight that is associated with body fat. Overweight= BMI of 25 to 29. Obese= BMI of 30 or more.
HypertensionDefined as: Systolic blood pressure of 140mm Hg or higher, or a diastolic blood pressure of 90mm Hg or higher.
High Cholesterol
Defined as: 240 mg/dl or greater. Borderline high cholesterol: 200-239 mg/dl Desirable: less than 200 mg/dl
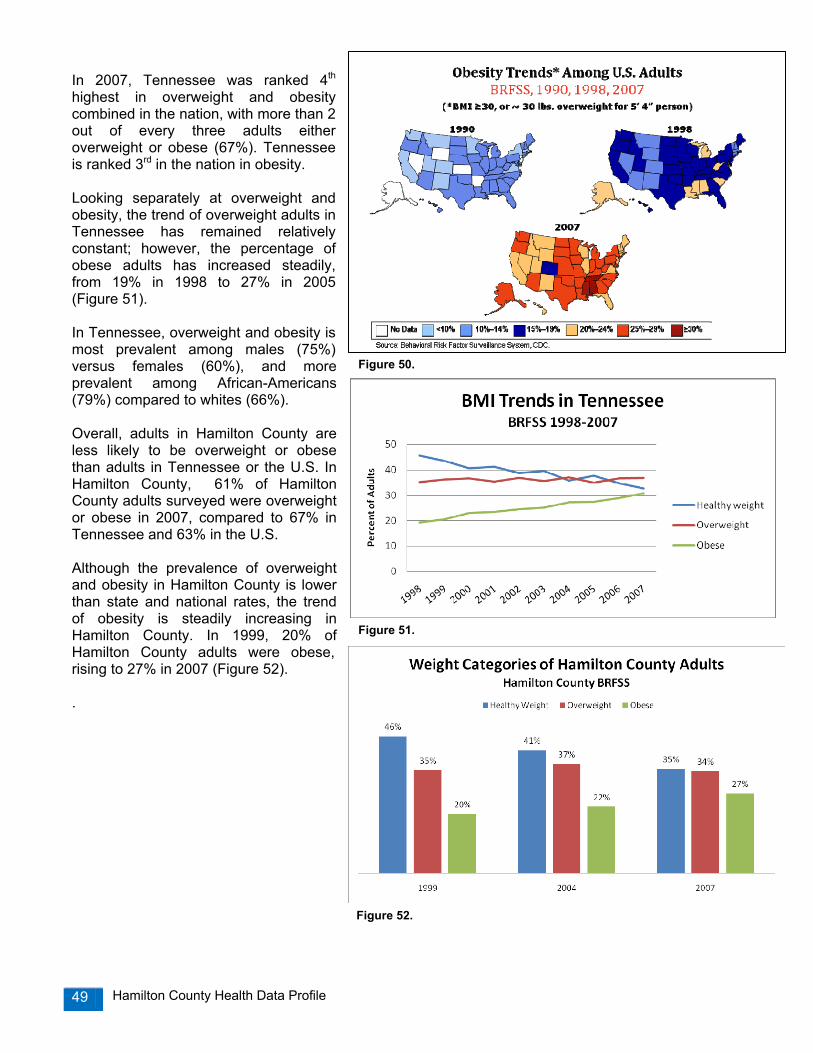
Hamilton County Health Data Profile 49
In 2007, Tennessee was ranked 4th highest in overweight and obesity combined in the nation, with more than 2 out of every three adults either overweight or obese (67%). Tennessee is ranked 3rd in the nation in obesity. Looking separately at overweight and obesity, the trend of overweight adults in Tennessee has remained relatively constant; however, the percentage of obese adults has increased steadily, from 19% in 1998 to 27% in 2005 (Figure 51). In Tennessee, overweight and obesity is most prevalent among males (75%) versus females (60%), and more prevalent among African-Americans (79%) compared to whites (66%). Overall, adults in Hamilton County are less likely to be overweight or obese than adults in Tennessee or the U.S. In Hamilton County, 61% of Hamilton County adults surveyed were overweight or obese in 2007, compared to 67% in Tennessee and 63% in the U.S. Although the prevalence of overweight and obesity in Hamilton County is lower than state and national rates, the trend of obesity is steadily increasing in Hamilton County. In 1999, 20% of Hamilton County adults were obese, rising to 27% in 2007 (Figure 52). .
Figure 52.
Figure 50.
Figure 51.
Figure 52.

Hamilton County Health Data Profile 50
Physical Activity and Exercise
Regular physical activity and exercise can help reduce the risk of cardiovascular disease, type 2 diabetes, colon and breast cancers, and osteoporosis. The Centers for Disease Control and Prevention (CDC) recommends adults achieve either a minimum of 30 minutes of moderate physical activity at least 5 days a week or a minimum of 20 minutes of vigorous physical activity (such as jogging or running) at least 3 days a week. The CDC also recommends that adults incorporate resistance, strength-building and weight bearing activities 2 days a week. Despite the proven benefits of physical activity, the CDC reports that more than 50% of American adults do not get enough physical activity to provide health benefits, and almost one-quarter of adults are not active at all in their leisure time. In Hamilton County, approximately 30% of adults are not active in their leisure time, compared to 32% of adults in Tennessee and 22% of adults in the U.S. The Healthy People 2010 objective is to increase the proportion of adults who engage regularly, preferably daily, in moderate physical activity for at least 30 minutes per day to 50%.
In Hamilton County, 24% of adults meet the moderate physical activity recommendations of 30 minutes a day at least 5 days a week, and 17% of adults meet the vigorous physical activity recommendations of 20 minutes a day at least 3 days a week. Overall, more than one in three (35%) adults surveyed in Hamilton County met either the moderate or vigorous physical activity recommendations. Adults in Hamilton County who have high cholesterol, diabetes, high blood pressure, and were obese were less likely to meet the moderate or vigorous physical activity recommendations (Figure 53).
Fruit and Vegetable Consumption
The Dietary Guidelines for Americans recommends individuals eat 5 to 9 servings of fruits and vegetables each day for better health. Persons who eat generous amounts of fruits and vegetables as part of a healthful diet are likely to have reduced risk for chronic diseases, type 2 diabetes, stroke, and certain cancersxxxii. The Healthy People 2010 objectives are to increase the proportion of persons ages 2 years and older who consume at least two daily servings of fruit to 75%, and increase the proportion of persons who consume at least three daily servings of vegetables (with at least one-third being dark green or orange vegetables) to 50%.
Figure 53.
Figure 54.

Hamilton County Health Data Profile 51
In Hamilton County, the percentage of adults who eat 5 or more fruits and vegetables per day has steadily increased from 11% in 1999 to 28% in 2007 (Figure 54). In 2007, 26% of Tennessee adults reported eating 5 or more fruits and vegetables per day, compared to 24% of adults in the U.S. Tobacco Use
Tobacco use is the most preventable cause of premature mortality and morbidity in the United States and Tennessee. Smoking is a major risk factor for lung cancer, stroke, and heart disease, while smoke-less tobacco can increase the risk of oral and esophageal cancers. Second-hand smoke is associated with increased risk of lung cancer and heart disease in nonsmoking adults. In Tennessee, approximately 1,200 premature deaths occur each year because of second-hand smoke. The prevalence of current smokers in the U.S. has slowly fallen since 1997, from 23% to 20% in 2007. In Tennessee, there has not been a substantial decrease in smoking since 1997 (Figure 55). The 2007 Hamilton County BRFSS survey was conducted prior to enforcement of the Tennessee Non-Smoker’s Protection Act (October, 1, 2007), which prohibits smoking in all enclosed public places, including restaurants, workplaces, hotels/motels, malls, health care and education facilities, and childcare facilities. In 2007, prior to the Tennessee Non-Smokers Protection Act, approximately 22.6% of Hamilton County adults were current smokers, compared to 24.3% in Tennessee and 19.8% in the U.S. (Figure 56). Of Hamilton County current smokers, 57% have tried to quit smoking one day or longer in the past year. Smoking during pregnancy is associated with many adverse outcomes for infants, such as premature birth, low birthweight, still birth, and infant mortalityxxxiii. Mothers who are exposed to second hand smoke are also more likely to have low birthweight babiesxxxiv. In Hamilton County, 16.3% of women smoked during pregnancy in 2006, the second highest percentage of the four largest metropolitan areas in Tennessee (Figure 57).
Figure 55.
Figure 56.
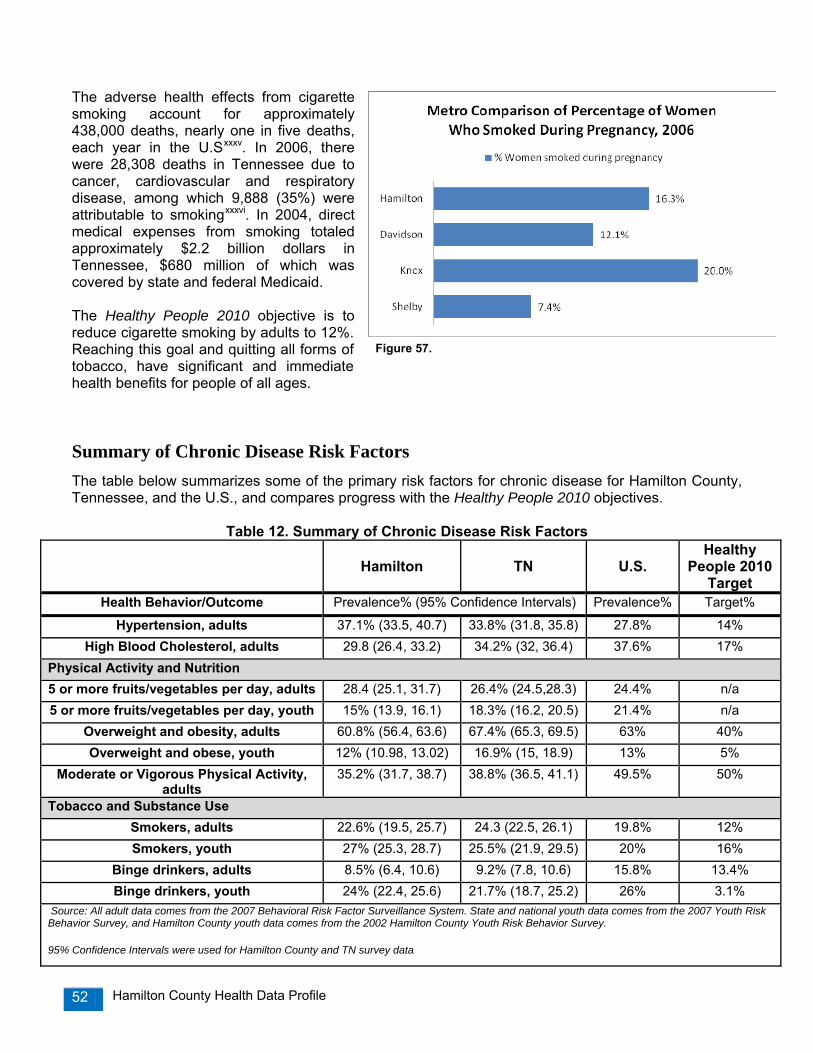
Hamilton County Health Data Profile 52
The adverse health effects from cigarette smoking account for approximately 438,000 deaths, nearly one in five deaths, each year in the U.Sxxxv. In 2006, there were 28,308 deaths in Tennessee due to cancer, cardiovascular and respiratory disease, among which 9,888 (35%) were attributable to smokingxxxvi. In 2004, direct medical expenses from smoking totaled approximately $2.2 billion dollars in Tennessee, $680 million of which was covered by state and federal Medicaid. The Healthy People 2010 objective is to reduce cigarette smoking by adults to 12%. Reaching this goal and quitting all forms of tobacco, have significant and immediate health benefits for people of all ages.
Summary of Chronic Disease Risk Factors The table below summarizes some of the primary risk factors for chronic disease for Hamilton County, Tennessee, and the U.S., and compares progress with the Healthy People 2010 objectives.
Table 12. Summary of Chronic Disease Risk Factors
Hamilton
TN
U.S.
Healthy People 2010
Target Health Behavior/Outcome Prevalence% (95% Confidence Intervals) Prevalence% Target%
Hypertension, adults 37.1% (33.5, 40.7) 33.8% (31.8, 35.8) 27.8% 14% High Blood Cholesterol, adults 29.8 (26.4, 33.2) 34.2% (32, 36.4) 37.6% 17%
Physical Activity and Nutrition 5 or more fruits/vegetables per day, adults 28.4 (25.1, 31.7) 26.4% (24.5,28.3) 24.4% n/a 5 or more fruits/vegetables per day, youth 15% (13.9, 16.1) 18.3% (16.2, 20.5) 21.4% n/a
Overweight and obesity, adults 60.8% (56.4, 63.6) 67.4% (65.3, 69.5) 63% 40% Overweight and obese, youth 12% (10.98, 13.02) 16.9% (15, 18.9) 13% 5%
Moderate or Vigorous Physical Activity, adults
35.2% (31.7, 38.7) 38.8% (36.5, 41.1) 49.5% 50%
Tobacco and Substance Use Smokers, adults 22.6% (19.5, 25.7) 24.3 (22.5, 26.1) 19.8% 12% Smokers, youth 27% (25.3, 28.7) 25.5% (21.9, 29.5) 20% 16%
Binge drinkers, adults 8.5% (6.4, 10.6) 9.2% (7.8, 10.6) 15.8% 13.4% Binge drinkers, youth 24% (22.4, 25.6) 21.7% (18.7, 25.2) 26% 3.1%
Source: All adult data comes from the 2007 Behavioral Risk Factor Surveillance System. State and national youth data comes from the 2007 Youth Risk Behavior Survey, and Hamilton County youth data comes from the 2002 Hamilton County Youth Risk Behavior Survey. 95% Confidence Intervals were used for Hamilton County and TN survey data
Figure 57.

Hamilton County Health Data Profile 53
Chapter 6: Injury and Violence In Hamilton County, injuries killed more residents between the ages of one and 44 than any other cause of death. The majority of injuries in the U.S. are unintentional injuries, such as motor vehicle crashes. Suicide and homicide are examples of intentional injuries. The majority of deaths from injuries were from motor vehicle crashes and suicides in Hamilton County (Figure 58). One goal of Healthy People 2010 is to “reduce injuries, disabilities and deaths due to unintentional injuries and violence.” In 2006, a total of 933 resident deaths occurred in Tennessee from firearm injuries, with intentional self-harm (60.7%) and assault (35.2%) as the primary causes. Motor vehicle crashes and accidental falls totaled in over $66 million in hospital charges in Hamilton County, according to the Tennessee Hospital Discharge Data System in 2006 (Table 13).
Table 13. Resident Hospital Discharge Data for Injuries in Hamilton County, 2006 Persons
Hospitalized
Charges Motor Vehicle Crashes 4,741 $28,573,281 Suicide 467 $3,442,577 Assault 1,806 $5,539,873 Accidental Falls-All Ages AccidentalFalls-65+
11,112 3,022
$38,018,467 $20,478,605
Firearm Accidents 79 $734,653
Poisonings 285 n/a
Motor Vehicle Crashes In 2006, a total of 133 Hamilton County residents died from unintentional injuries, with 41% dying in motor vehicle crashes. In 2006, there were 4,741 hospitalizations from motor vehicle crashes and 54 deaths in Hamilton County. The 2006 motor vehicle death rate for Hamilton County was of 17.2 deaths per 100,000 population, compared to the state rate of 22.6 per 100,000. The Healthy People 2010 objective for deaths from motor vehicle accidents is 8.0 per 100,000. One-third of the fatal motor vehicle crashes in 2006 were alcohol related in Hamilton County. According to the Tennessee Department of Safety’s Tennessee Traffic Crash Data report,
Figure 59.
Figure 58.
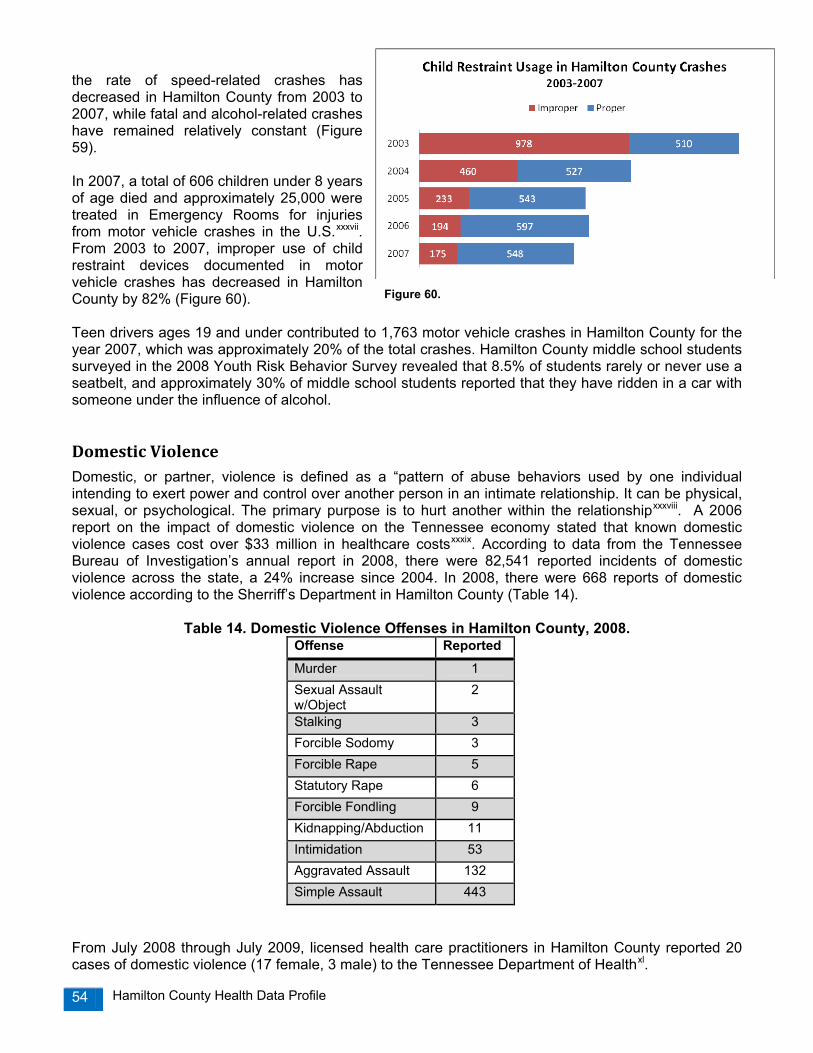
Hamilton County Health Data Profile 54
the rate of speed-related crashes has decreased in Hamilton County from 2003 to 2007, while fatal and alcohol-related crashes have remained relatively constant (Figure 59). In 2007, a total of 606 children under 8 years of age died and approximately 25,000 were treated in Emergency Rooms for injuries from motor vehicle crashes in the U.S.xxxvii. From 2003 to 2007, improper use of child restraint devices documented in motor vehicle crashes has decreased in Hamilton County by 82% (Figure 60). Teen drivers ages 19 and under contributed to 1,763 motor vehicle crashes in Hamilton County for the year 2007, which was approximately 20% of the total crashes. Hamilton County middle school students surveyed in the 2008 Youth Risk Behavior Survey revealed that 8.5% of students rarely or never use a seatbelt, and approximately 30% of middle school students reported that they have ridden in a car with someone under the influence of alcohol.
Domestic Violence Domestic, or partner, violence is defined as a “pattern of abuse behaviors used by one individual intending to exert power and control over another person in an intimate relationship. It can be physical, sexual, or psychological. The primary purpose is to hurt another within the relationshipxxxviii. A 2006 report on the impact of domestic violence on the Tennessee economy stated that known domestic violence cases cost over $33 million in healthcare costsxxxix. According to data from the Tennessee Bureau of Investigation’s annual report in 2008, there were 82,541 reported incidents of domestic violence across the state, a 24% increase since 2004. In 2008, there were 668 reports of domestic violence according to the Sherriff’s Department in Hamilton County (Table 14).
Table 14. Domestic Violence Offenses in Hamilton County, 2008. Offense Reported Murder 1 Sexual Assault w/Object
2
Stalking 3 Forcible Sodomy 3 Forcible Rape 5 Statutory Rape 6 Forcible Fondling 9 Kidnapping/Abduction 11 Intimidation 53 Aggravated Assault 132 Simple Assault 443
From July 2008 through July 2009, licensed health care practitioners in Hamilton County reported 20 cases of domestic violence (17 female, 3 male) to the Tennessee Department of Healthxl.
Figure 60.

Hamilton County Health Data Profile 55
Chapter 7: Mental Health and Alcohol Use
Poor mental health is a major source of distress, disability, and social burden. In any given year, as many as one in five adults in the United States have a mental disorderxli. Frequent Mental Distress (FMD) is defined as 14 or more days of stress, depression, and problems with emotions in the past month. According to the 2007 Hamilton County Behavioral Risk Factor Surveillance System, 8.2% of adults in Hamilton County reported Frequent Mental Distress, and females were 80% more likely to report FMD.
According to the Tennessee Department of Health Hospital Discharge Data System, a total of 1,125 Hamilton County residents were hospitalized in 2006 for mental disorders, psychosis, and alcohol dependence syndrome (Table 15).
Table 15. Mental Health Hospitalizations in Hamilton County, 2006, rate per 1,000 population
In Hamilton County, a total of 38 residents died from suicide in 2007, with a rate of 12.1 per 100,000. The suicide rate among whites for 2007 was 13.2, which was 42% higher than the rate for African Americans at 7.7. Alcohol Use
According to the Behavioral Risk Factor Surveillance System, over one-half of adults in the U.S. report having at least one drink of alcohol within the past 30 days. Although light to moderate alcohol drinking may have beneficial health effects on the heart; heavy or excessive alcohol drinking can lead to increased risk of unintentional injuries or health problems such as liver disease, high blood pressure or certain forms of cancervi. Excessive alcohol use is the third leading lifestyle-related cause of death in the U.S. From 2001 to 2005, there were approximately 79,000 deaths annually as a result of excessive alcohol usexlii. Two Healthy People 2010 objectives are to decrease the proportion of adults engaging in binge drinking of alcoholic beverages to 13.4%, and to reduce the proportion of adults who exceed guidelines for low-risk drinking to 50%. Binge drinking is defined as consuming 5 or more alcoholic beverages on one occasion for males and 4 or more drinks for females. In Hamilton County and Tennessee, approximately 9% of adults reported binge drinking, substantially lower than the national rate of 15.8%. Heavy drinking is defined by drinking 2 or more drinks per day for men and 1 or more drinks per day for women. In 2007, approximately 4% of Hamilton County adults were assessed as heavy drinkers, compared to 3% for adults in Tennessee and 5% for adults in the U.S.
Hamilton County Tennessee Number Rate Number Rate
Mental Disorders 605 1.9 29,301 4.9 Psychosis 477 1.5 23,336 3.9 Alcohol Dependence Syndrome 43 0.1 1,250 0.2
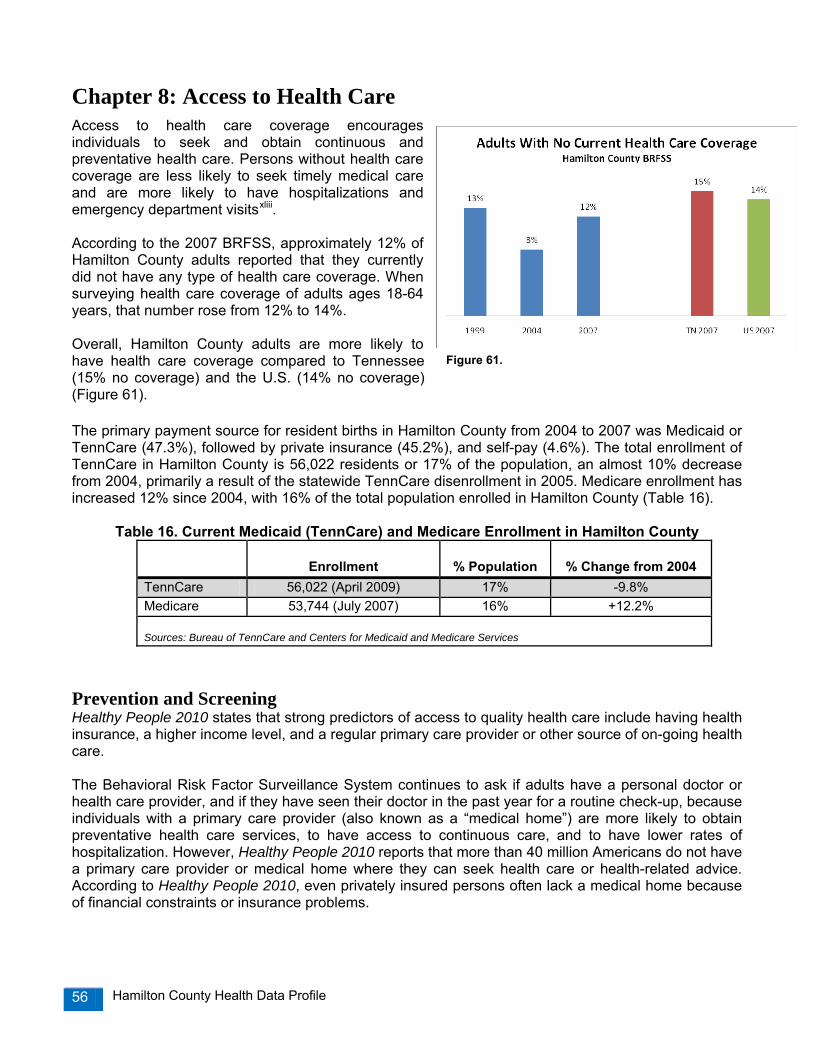
Hamilton County Health Data Profile 56
Chapter 8: Access to Health Care Access to health care coverage encourages individuals to seek and obtain continuous and preventative health care. Persons without health care coverage are less likely to seek timely medical care and are more likely to have hospitalizations and emergency department visitsxliii. According to the 2007 BRFSS, approximately 12% of Hamilton County adults reported that they currently did not have any type of health care coverage. When surveying health care coverage of adults ages 18-64 years, that number rose from 12% to 14%. Overall, Hamilton County adults are more likely to have health care coverage compared to Tennessee (15% no coverage) and the U.S. (14% no coverage) (Figure 61). The primary payment source for resident births in Hamilton County from 2004 to 2007 was Medicaid or TennCare (47.3%), followed by private insurance (45.2%), and self-pay (4.6%). The total enrollment of TennCare in Hamilton County is 56,022 residents or 17% of the population, an almost 10% decrease from 2004, primarily a result of the statewide TennCare disenrollment in 2005. Medicare enrollment has increased 12% since 2004, with 16% of the total population enrolled in Hamilton County (Table 16).
Table 16. Current Medicaid (TennCare) and Medicare Enrollment in Hamilton County
Enrollment
% Population
% Change from 2004 TennCare 56,022 (April 2009) 17% -9.8% Medicare 53,744 (July 2007) 16% +12.2% Sources: Bureau of TennCare and Centers for Medicaid and Medicare Services
Prevention and Screening Healthy People 2010 states that strong predictors of access to quality health care include having health insurance, a higher income level, and a regular primary care provider or other source of on-going health care. The Behavioral Risk Factor Surveillance System continues to ask if adults have a personal doctor or health care provider, and if they have seen their doctor in the past year for a routine check-up, because individuals with a primary care provider (also known as a “medical home”) are more likely to obtain preventative health care services, to have access to continuous care, and to have lower rates of hospitalization. However, Healthy People 2010 reports that more than 40 million Americans do not have a primary care provider or medical home where they can seek health care or health-related advice. According to Healthy People 2010, even privately insured persons often lack a medical home because of financial constraints or insurance problems.
Figure 61.
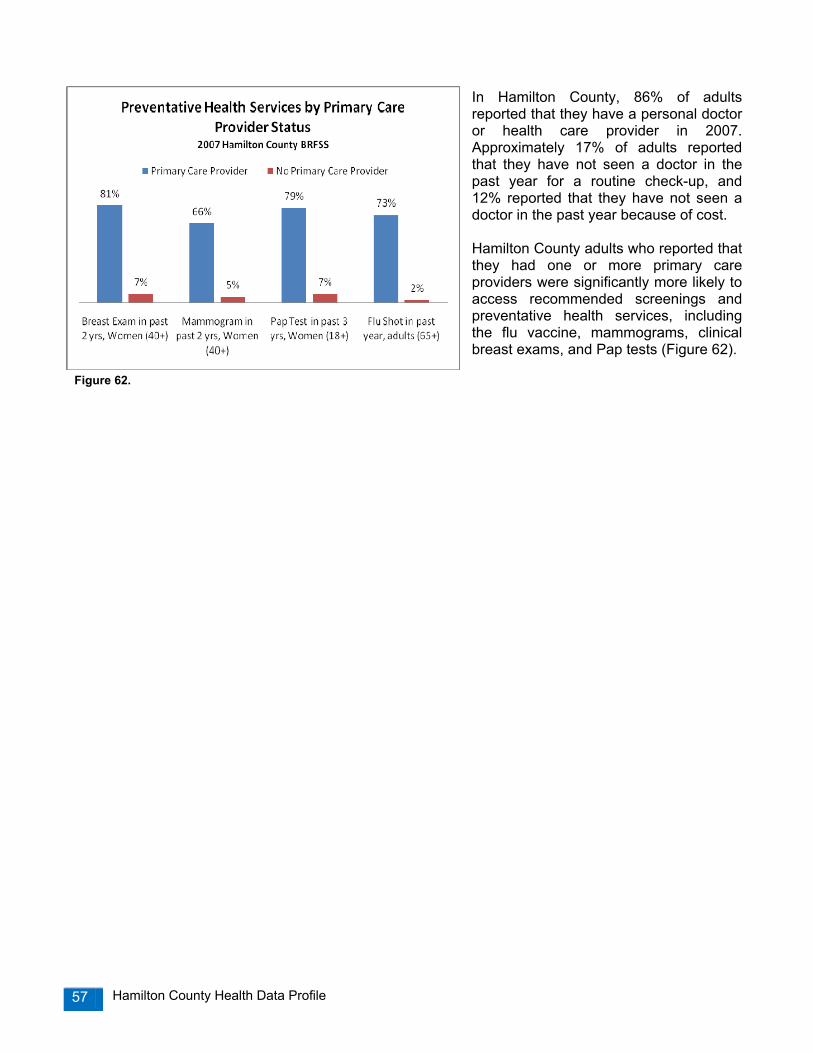
Hamilton County Health Data Profile 57
In Hamilton County, 86% of adults reported that they have a personal doctor or health care provider in 2007. Approximately 17% of adults reported that they have not seen a doctor in the past year for a routine check-up, and 12% reported that they have not seen a doctor in the past year because of cost. Hamilton County adults who reported that they had one or more primary care providers were significantly more likely to access recommended screenings and preventative health services, including the flu vaccine, mammograms, clinical breast exams, and Pap tests (Figure 62).
Figure 62.

Hamilton County Health Data Profile 58
Chapter 9: Communicable Diseases The Epidemiology Program at the Chattanooga-Hamilton County Health Department collects and analyzes information on certain communicable diseases for the purposes of determining disease impact, assessing trends in disease occurrence, characterizing affected populations, prioritizing control efforts, and evaluating prevention strategies. In Tennessee, four designated categories of communicable diseases are reported to local health departments by all hospitals, physicians, laboratories, and other persons knowing of or suspecting a case in accordance to the regulations of the Tennessee Department of Health. The list of Notifiable Diseases in Tennessee was last revised in 2004. Category 1: Immediate telephonic reporting required followed with a written report Anthrax Botulism 1. Foodborne 2. Wound Diphtheria Disease Outbreaks 1. Foodborne 2. Waterborne 3. All Other Encephalitis, Arboviral 1. California/LaCrosse serogroup 2. Eastern Equine 3. St. Louis 4. Western Equine Group A Strep Invasive Disease Group B Strep Invasive Disease Haemophilus influenzae Invasive Disease Hantavirus Disease Hepatitis - Type A acute Listeriosis Measles
Meningococcal Disease Meningitis - Other Bacterial Mumps Pertussis Plague Poliomyelitis Prion Disease 1. Creutzfeldt-Jakob Disease 2. Variant Creutzfeldt-Jakob Disease Rabies - Human Rubella & Congenital Rubella Syndrome Severe Acute Respiratory Syndrome (SARS) Staph aureus Vancomycin nonsen-all forms Tuberculosis - all forms Typhoid Fever West Nile Infections 1. West Nile Encephalitis 2. West Nile Fever
Possible Bioterrorism Indicators
Anthrax Plague Venezuelan Equine Encephalitis Smallpox Botulism Q Fever Staph enterotoxin B pulmonary poisoning Viral Hemorrhagic Fever Brucellosis Ricin poisoning Tularemia
Category 2: Only written report required Botulism - infant
Brucellosis Campylobacteriosis Chanchroid Chlamydia trachomatis Cholera Cyclospora Cryptosporidiosis Ehrlichia chaffeensis Ehrlichia ewingii Anaplasma phagocytophilum Human ehrlichiosis/anaplasmosis-undetermined Escherichia coli 0157:H7 Giardiasis (acute) Gonorrhea Guillain-Barre Syndrome Hemolytic Uremic Syndrome
Hepatitis, Viral 1. Type B acute 2. HBsAg positive pregnant female 3. HBsAg positive infant 4. Type C acute Influenza - weekly casecount Legionellosis Leprosy (Hansen Disease) Lyme Disease Malaria Psittacosis Rabies - Animal Rocky Mountain Spotted Fever Salmonellosis - other than S. typhi Shiga-like Toxin positive stool Shigellosis
Staph aureus Methicillin Resistant - Invasive Strep pneumoniae Invasive Disease 1. Penicillin resistant 2. Penicillin sensitive Syphilis Tetanus Toxic Shock Syndrome 1. Staphylococcal 2. Streptococcal Trichinosis Vancomycin Resistant Enterococci Invasive Varicella deaths Vibrio infections Yellow Fever Yersiniosis
Category 3: Requires special confidential reporting to designated health department personnel Acquired Immunodeficiency Syndrome (AIDS) Human Immunodeficiency Virus (HIV). Category 4: Laboratories required to report all blood lead test results Physicians required to report all blood lead test results ≥ 10 µg/dl
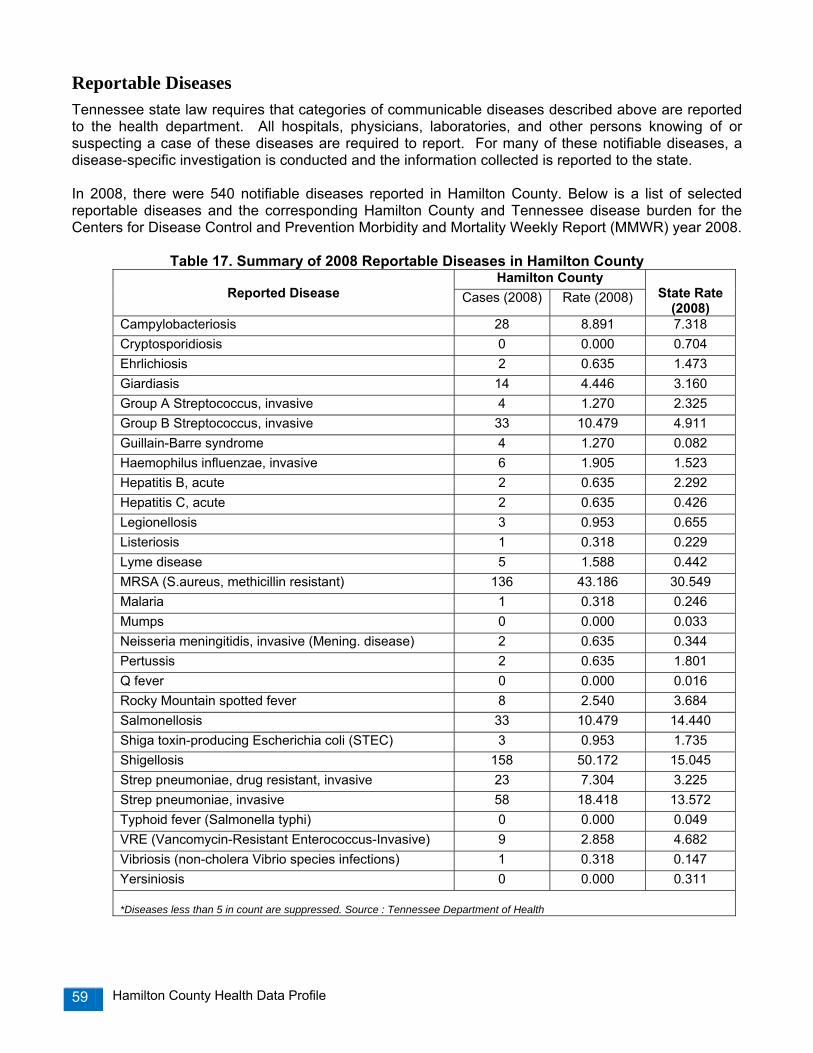
Hamilton County Health Data Profile 59
Reportable Diseases Tennessee state law requires that categories of communicable diseases described above are reported to the health department. All hospitals, physicians, laboratories, and other persons knowing of or suspecting a case of these diseases are required to report. For many of these notifiable diseases, a disease-specific investigation is conducted and the information collected is reported to the state. In 2008, there were 540 notifiable diseases reported in Hamilton County. Below is a list of selected reportable diseases and the corresponding Hamilton County and Tennessee disease burden for the Centers for Disease Control and Prevention Morbidity and Mortality Weekly Report (MMWR) year 2008.
Table 17. Summary of 2008 Reportable Diseases in Hamilton County Hamilton County
Reported Disease Cases (2008) Rate (2008)
State Rate (2008)
Campylobacteriosis 28 8.891 7.318 Cryptosporidiosis 0 0.000 0.704 Ehrlichiosis 2 0.635 1.473 Giardiasis 14 4.446 3.160 Group A Streptococcus, invasive 4 1.270 2.325 Group B Streptococcus, invasive 33 10.479 4.911 Guillain-Barre syndrome 4 1.270 0.082 Haemophilus influenzae, invasive 6 1.905 1.523 Hepatitis B, acute 2 0.635 2.292 Hepatitis C, acute 2 0.635 0.426 Legionellosis 3 0.953 0.655 Listeriosis 1 0.318 0.229 Lyme disease 5 1.588 0.442 MRSA (S.aureus, methicillin resistant) 136 43.186 30.549 Malaria 1 0.318 0.246 Mumps 0 0.000 0.033 Neisseria meningitidis, invasive (Mening. disease) 2 0.635 0.344 Pertussis 2 0.635 1.801 Q fever 0 0.000 0.016 Rocky Mountain spotted fever 8 2.540 3.684 Salmonellosis 33 10.479 14.440 Shiga toxin-producing Escherichia coli (STEC) 3 0.953 1.735 Shigellosis 158 50.172 15.045 Strep pneumoniae, drug resistant, invasive 23 7.304 3.225 Strep pneumoniae, invasive 58 18.418 13.572 Typhoid fever (Salmonella typhi) 0 0.000 0.049 VRE (Vancomycin-Resistant Enterococcus-Invasive) 9 2.858 4.682 Vibriosis (non-cholera Vibrio species infections) 1 0.318 0.147 Yersiniosis 0 0.000 0.311 *Diseases less than 5 in count are suppressed. Source : Tennessee Department of Health

Hamilton County Health Data Profile 60
During 2008, there were high rates of Shigellosis in Hamilton County. Shigellosis is a disease caused by bacteria called Shigella. Most people infected with Shigella develop diarrhea (often bloody diarrhea), fever, and stomach cramps a day or two after being exposed to the bacteria, these symptoms usually last 5 to 7 days. In some persons, especially young children and the elderly, the diarrhea can be so severe that the patient needs medical attention. Some persons who are infected may have no symptoms at all, but may still pass the Shigella bacteria to others.
Hepatitis Hepatitis, an inflammation of the liver, is primarily caused by three different viruses: hepatitis A virus (HAV), hepatitis B virus (HBV), or hepatitis C virus (HCV). These unrelated viruses can cause similar symptoms, but they are spread by different modes of transmission and can affect the liver differently. Safe and effective vaccines have been available for hepatitis B since 1981 and for hepatitis A since 1995; however, there is currently no vaccine available for protection against hepatitis Cxliv. Hepatitis B and C can begin as acute infections, but in some people the virus can persist and result in chronic infection. In the U.S., hepatitis B and C are a leading cause of chronic liver disease and hepatocelluar cancer. Trend rates from 2000 to 2008 for acute hepatitis A, B, and C rates for Hamilton County are shown in Figure 63. Hepatitis A and C rates have slightly decreased, while there was a spike in the rate for Hepatitis B in 2007.
Sexually Transmitted Diseases Sexually Transmitted Diseases (STDs) refer to more than 25 infectious organisms transmitted primarily through sexual activity. STDs can cause reproductive health problems, fetal and perinatal health problems, and cancer. STD prevention as an essential primary care strategy is integral to improving reproductive health. Data used on STDs is derived from the nationally notifiable diseases Chlamydia, gonorrhea, and syphilis. When compared to the four largest metropolitan areas in Tennessee, Hamilton County has the 2nd highest STD rate (Table 18).
Figure 63.
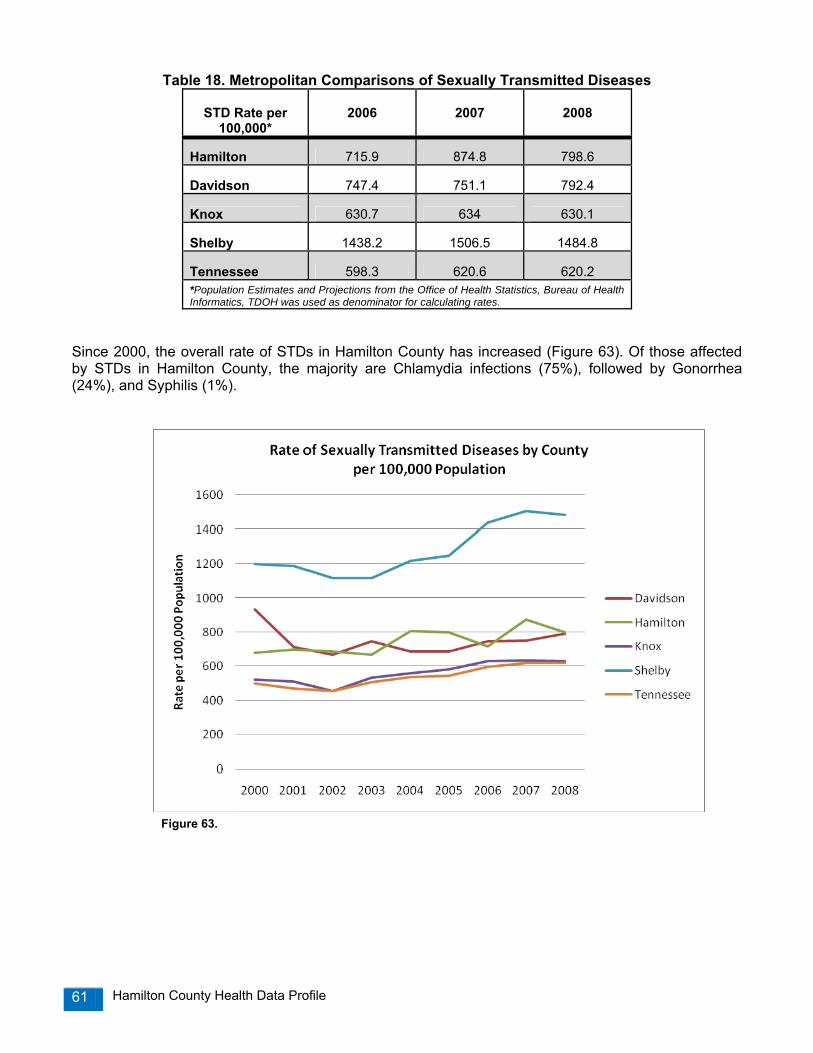
Hamilton County Health Data Profile 61
Table 18. Metropolitan Comparisons of Sexually Transmitted Diseases
STD Rate per 100,000*
2006
2007
2008
Hamilton 715.9 874.8 798.6
Davidson 747.4 751.1 792.4
Knox 630.7 634 630.1
Shelby 1438.2 1506.5 1484.8
Tennessee 598.3 620.6 620.2
*Population Estimates and Projections from the Office of Health Statistics, Bureau of Health Informatics, TDOH was used as denominator for calculating rates.
Since 2000, the overall rate of STDs in Hamilton County has increased (Figure 63). Of those affected by STDs in Hamilton County, the majority are Chlamydia infections (75%), followed by Gonorrhea (24%), and Syphilis (1%).
Figure 63.
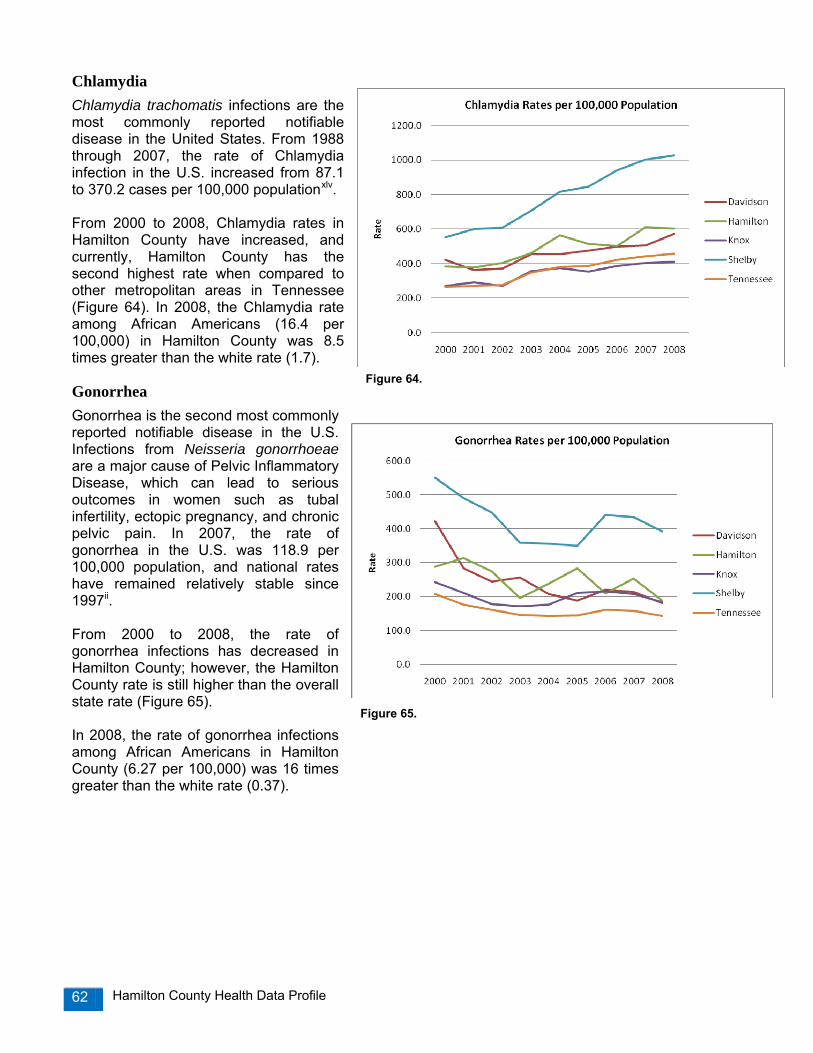
Hamilton County Health Data Profile 62
Chlamydia Chlamydia trachomatis infections are the most commonly reported notifiable disease in the United States. From 1988 through 2007, the rate of Chlamydia infection in the U.S. increased from 87.1 to 370.2 cases per 100,000 populationxlv. From 2000 to 2008, Chlamydia rates in Hamilton County have increased, and currently, Hamilton County has the second highest rate when compared to other metropolitan areas in Tennessee (Figure 64). In 2008, the Chlamydia rate among African Americans (16.4 per 100,000) in Hamilton County was 8.5 times greater than the white rate (1.7).
Gonorrhea Gonorrhea is the second most commonly reported notifiable disease in the U.S. Infections from Neisseria gonorrhoeae are a major cause of Pelvic Inflammatory Disease, which can lead to serious outcomes in women such as tubal infertility, ectopic pregnancy, and chronic pelvic pain. In 2007, the rate of gonorrhea in the U.S. was 118.9 per 100,000 population, and national rates have remained relatively stable since 1997ii. From 2000 to 2008, the rate of gonorrhea infections has decreased in Hamilton County; however, the Hamilton County rate is still higher than the overall state rate (Figure 65). In 2008, the rate of gonorrhea infections among African Americans in Hamilton County (6.27 per 100,000) was 16 times greater than the white rate (0.37).
Figure 64.
Figure 65.

Hamilton County Health Data Profile 63
Syphilis Syphilis, caused by the bacterium Treponema pallidum, can cause significant complications if untreated and can facilitate the transmission of HIV. Untreated early syphilis in pregnant women results in perinatal death in up to 40% of cases, and if acquired during the four years preceding pregnancy, may lead to infection of the fetus in 80% of casesii. Although the rate of primary and secondary syphilis in the U.S. decreased 90% from 1990 to 2000, the national rate has begun to annually increase between 2001 and 2007 ii. Hamilton County’s syphilis rates have been consistently lower than the overall state rates; however, Hamilton County’s syphilis rates have slightly increased from 2000 to 2008 (Figure 66). The rate of primary, secondary, and early latent cases of syphilis is double among African Americans in Hamilton County (0.08 per 100,000) when compared to their white peers (0.04).
HIV/AIDS AIDS, or Acquired Immunodeficiency Syndrome, is the final stage of HIV infection (Human Immunodeficiency Virus). The Centers for Disease Control and Prevention estimates that more than one million people (approximately 1,106,400 adults and adolescents) are living with HIV in the U.Sxlvi and approximately one in five people are unaware of their infectionsxlvii. In 2007, there were 44 new HIV/AIDS infections in Hamilton County, the lowest since 2002 (Figure 67). Cumulatively, there are 1,325 persons living with HIV/AIDS in Hamilton County through 2007.
Figure 66. *Includes Primary, Secondary, Early Latent and Late Latent Cases
Figure 67.

Hamilton County Health Data Profile 64
The total number of HIV/AIDS cases through 2007 in Hamilton County are among whites (50%), African Americans (47%), Hispanics (2%), and other races (1%). Newly diagnosed HIV/AIDS cases in 2007 were among whites (46%), African Americans (43%), and Hispanics and other races (11%), which is a shift from the demographic trend of the cummulative cases (Figure 68 and 69).
Trends have changed when comparing the demographics of cummulative HIV/AIDS cases to new cases in 2007. An increasing number of HIV/AIDS cases are occuring among African American females (Figures 70 and 71).
The map of HIV/AIDS cases in Hamilton County shows a concentration of four zip codes with cases above 100: East Chattanooga (37404 and 37406), Brainerd (37411), and East Brainerd (37421). These cases include all persons who have contracted HIV/AIDS infections, living or deceased (Map 5).
Figure 68. Figure 69.
Figure 70. Figure 71.

Hamilton County Health Data Profile 65
Map 5.
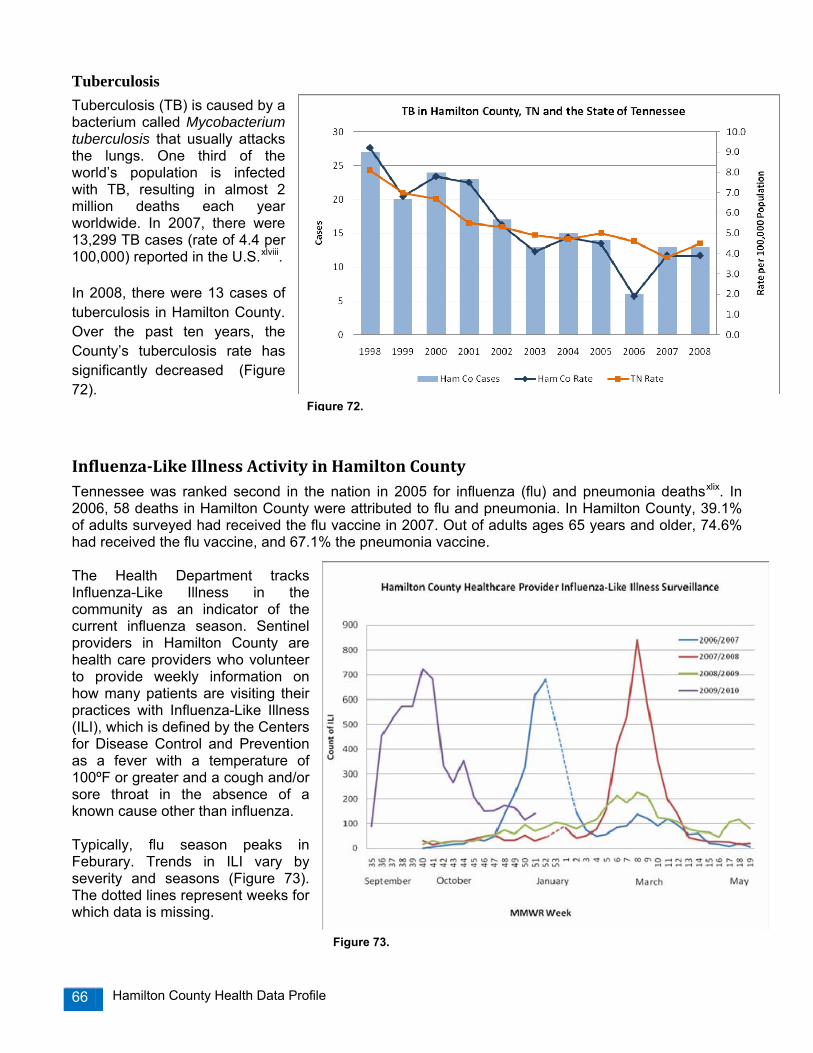
Hamilton County Health Data Profile 66
Tuberculosis Tuberculosis (TB) is caused by a bacterium called Mycobacterium tuberculosis that usually attacks the lungs. One third of the world’s population is infected with TB, resulting in almost 2 million deaths each year worldwide. In 2007, there were 13,299 TB cases (rate of 4.4 per 100,000) reported in the U.S.xlviii. In 2008, there were 13 cases of tuberculosis in Hamilton County. Over the past ten years, the County’s tuberculosis rate has significantly decreased (Figure 72).
InfluenzaLike Illness Activity in Hamilton County Tennessee was ranked second in the nation in 2005 for influenza (flu) and pneumonia deathsxlix. In 2006, 58 deaths in Hamilton County were attributed to flu and pneumonia. In Hamilton County, 39.1% of adults surveyed had received the flu vaccine in 2007. Out of adults ages 65 years and older, 74.6% had received the flu vaccine, and 67.1% the pneumonia vaccine. The Health Department tracks Influenza-Like Illness in the community as an indicator of the current influenza season. Sentinel providers in Hamilton County are health care providers who volunteer to provide weekly information on how many patients are visiting their practices with Influenza-Like Illness (ILI), which is defined by the Centers for Disease Control and Prevention as a fever with a temperature of 100ºF or greater and a cough and/or sore throat in the absence of a known cause other than influenza. Typically, flu season peaks in Feburary. Trends in ILI vary by severity and seasons (Figure 73). The dotted lines represent weeks for which data is missing.
Figure 72.
Figure 73.

Hamilton County Health Data Profile 67
Childhood Immunizations Immunizations can prevent disability and death from infectious diseases. Immunizations can also help control the spread of disease in communities. Even though most infants and toddlers have received all recommended vaccines by age 2, many under-immunized children remain, leaving the potential for outbreaks of disease. The Tennessee Department of Health’s annual survey of immunization status of 24-month old children tracks progress towards achieving on-time immunization with each routinely recommended vaccine for that population. The goal for the Tennessee Department of Health’s Immunization Program is to have 90% of Tennessee’s children under age two to be completely immunized with each of the 6 vaccines which protect against the following 10 diseases: diphtheria, tetanus and pertussis (combined as DTaP); polio (IPV); measles, mumps and rubella (combined as MMR); Haemophilus influenzae type B (Hib); hepatitis B (Hep B); and chicken pox (Varicella). In 2008, there was an increase of children under the age two in Hamilton County to have “immunizations complete”, increasing from 85.1% in 2004 to 87.6%l. Statewide, Hamilton County had the highest immunizations complete estimate; however, no regional result was statistically significantly higher or lower than the statewide coverage level of 82.3% (Figure 74). Figure 75 shows the percentages of children with immunizations complete categorized by race and TennCare enrolled in Hamilton County. Statewide, the difference of immunizations complete between white and black children was not statistically significant; however, there is a racial disparity in flu immunization, where white children are more likely to receive the flu vaccine than their black peers (31.3% vs. 15.4%). Vaccines required by Tennessee law for school entry (K-12th grade) in 2009 include:
• DTP/DTaP/DT 4 or 5 doses, one of which must be given on or after the fourth birthday.
• Polio (OPV/IPV) 3 or 4 doses of OPV or IPV, one of which must be given on or after the fourth birthday. However, if a combination of IPV/OPV is used, all 4 doses are needed regardless of age.
• MMR 2 doses. 1st dose required on or after 1st birthday or later; 2nd dose 4 weeks or longer after first dose.
• Hepatitis B 3 doses of Hepatitis B vaccine are required for entry into kindergarten, and 2 or 3 doses (depending on the type of vaccine given) for entry into 7th grade.
• Varicella 1 dose given on or after the first birthday for kindergarten only; a parent or physician diagnosed history of chickenpox is acceptable in lieu of vaccine for purposes of the requirement.
Figure 74.
Figure 75.

Hamilton County Health Data Profile 68
Chapter 10: Environmental Health Environmental factors play a central role in human development, health, and disease. The environment, including infectious agents, is one of three primary factors, along with genetic factors and personal behaviors that affect human healthi.
Asthma Asthma and chronic obstructive pulmonary disease (COPD) are among the ten leading chronic conditions causing constricted activityi. Asthma is a disease that affects the lungs and causes repeated episodes of wheezing, breathlessness, chest tightness, and nighttime or early morning coughing. Asthma can be triggered by a variety of environmental causes, including second hand smoke, dust mites, outdoor air pollution, cockroach allergens, pets, and mold. The Behavior Risk Factor Surveillance System reports on adult asthma prevalence. In 2007 survey, 9.7% of Hamilton County adults reported that they were told by a doctor that they have asthma, compared to 12.4% in Tennessee and 13.1% in the U.S. (Table 19).
Table 19. Adult Asthma Prevalence
Asthma hospitalizations are considered an indicator for problems accessing primary care, finding affordable medications, correct use of medications, and home treatment equipment. The Healthy People 2010 objectives are to reduce the rate of asthma hospitalizations in three age categories: children under 5 (250 per 100,000), ages 5 to 64 (77 per 100,000) and ages 65 and older (110 per 100,000). According to the Tennessee Department of Health Hospital Discharge Data System, 299 Hamilton County residents were hospitalized for asthma in 2006, including 42 children under the age of 18, 193 adults ages 19-64, and 64 adults ages 65 and older. From 2000 to 2006, overall asthma hospitalizations in Hamilton County have slightly increased, while hospitalizations among children from birth to 18 years have declined (Figure 76). Among all age groups, asthma hospitalizations are consistently higher among adults over the age of 65 years.
Hamilton County TN US Year 2004 2007 2007 2007
Adult Prevalence 12.2% 9.7% 12.4% 13.1%
Figure 76.

Hamilton County Health Data Profile 69
Air Quality Poor air quality continues to be a widespread public health and environmental problem in the United States, and can cause respiratory disease development such as asthma, lung cancer, chronic obstructive pulmonary disease, as well as long term damage to cardiovascular systemsi. Air pollution also reduces visibility, damages crops and buildings, and deposits pollutants on the soil and in bodies of water where they affect the chemistry of the water and the organisms living there. The Environmental Protection Agency (EPA) regulates nationwide air quality for six pollutants: ground-level ozone, particle pollution, lead (Pb), nitrogen dioxide, carbon monoxide, and sulfur dioxide. Of the six air pollutants, Hamilton County is only required to monitor ozone and particle pollution. The Hamilton County Air Pollution Control Bureau (APCB) administers local air pollution control laws that are intended to achieve and maintain levels of air quality as well as protect human health and safetyli. The APCB maintains seven monitoring sites throughout the county, and reports on the daily air quality using the Air Quality Index, which is a scale designed by the EPA to standardize the method for reporting air quality nationwide. In Hamilton County, the daily air quality level is determined by either the ozone or the particulate concentration; whichever is higher on that day. The Air Quality Index measures the amount of pollutants in the outdoor air from a score of 0 to 500: good (0-50), moderate (51-100), unhealthy for sensitive people (101-150), unhealthy (151-200), very unhealthy (201-300), and hazardous (301-500)lii. Although there have been significant air quality improvements nationwide, the EPA reports that approximately 158.5 million people in U.S. live in counties that exceeded national ambient air quality standards in 2007liii. Outdoor air quality has improved in Hamilton County, but federal EPA standards continue to increase. Hamilton County was in compliance with all of the federal standards from 1989-2004, and then became out of compliance for particle pollution (Map 6).
Map 6. EPA Map of Population Density in Counties with Air Quality Concentrations
Above Any Level of the Primary Pollutants, 2007.
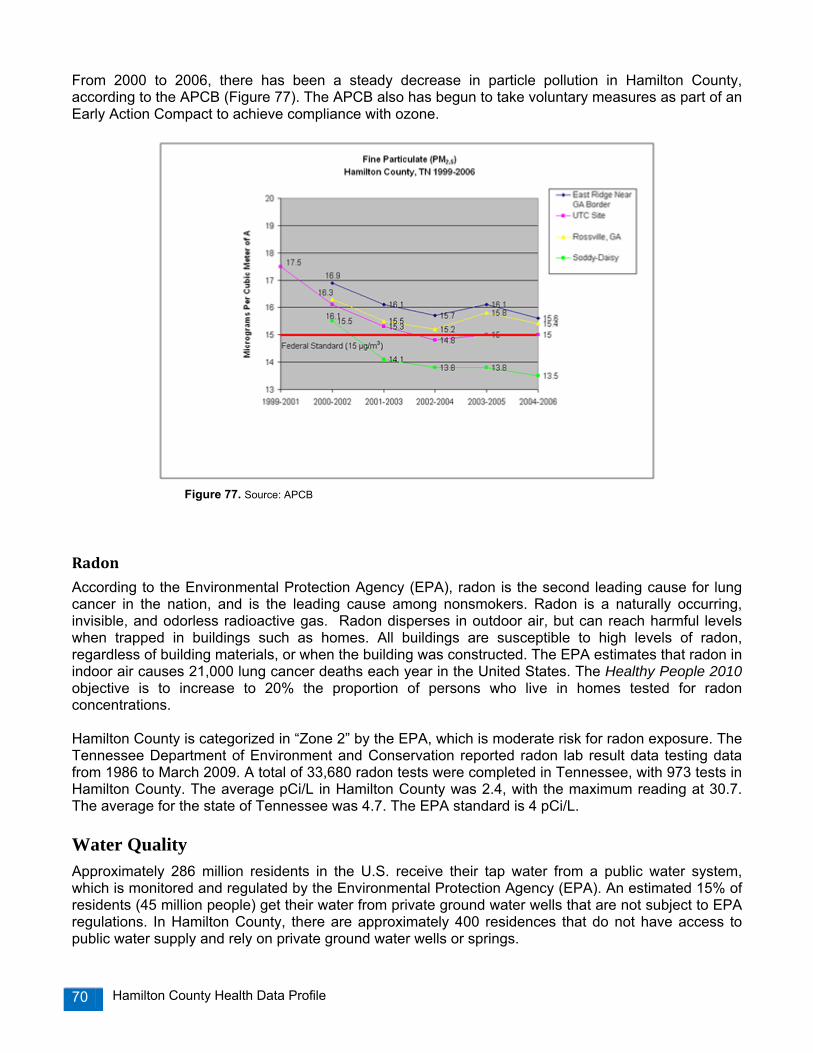
Hamilton County Health Data Profile 70
From 2000 to 2006, there has been a steady decrease in particle pollution in Hamilton County, according to the APCB (Figure 77). The APCB also has begun to take voluntary measures as part of an Early Action Compact to achieve compliance with ozone.
Radon
According to the Environmental Protection Agency (EPA), radon is the second leading cause for lung cancer in the nation, and is the leading cause among nonsmokers. Radon is a naturally occurring, invisible, and odorless radioactive gas. Radon disperses in outdoor air, but can reach harmful levels when trapped in buildings such as homes. All buildings are susceptible to high levels of radon, regardless of building materials, or when the building was constructed. The EPA estimates that radon in indoor air causes 21,000 lung cancer deaths each year in the United States. The Healthy People 2010 objective is to increase to 20% the proportion of persons who live in homes tested for radon concentrations. Hamilton County is categorized in “Zone 2” by the EPA, which is moderate risk for radon exposure. The Tennessee Department of Environment and Conservation reported radon lab result data testing data from 1986 to March 2009. A total of 33,680 radon tests were completed in Tennessee, with 973 tests in Hamilton County. The average pCi/L in Hamilton County was 2.4, with the maximum reading at 30.7. The average for the state of Tennessee was 4.7. The EPA standard is 4 pCi/L.
Water Quality Approximately 286 million residents in the U.S. receive their tap water from a public water system, which is monitored and regulated by the Environmental Protection Agency (EPA). An estimated 15% of residents (45 million people) get their water from private ground water wells that are not subject to EPA regulations. In Hamilton County, there are approximately 400 residences that do not have access to public water supply and rely on private ground water wells or springs.
Figure 77. Source: APCB

Hamilton County Health Data Profile 71
The Oral Health Services program of the Tennessee Department of Health, in collaboration with the Tennessee Department of Environment and Conservation, continue an active statewide community water fluorination program. Currently, 312 public water systems in Tennessee distribute fluorinated water to 5.24 million residents. In 2006, the Tennessee Department of Health estimated that 93.7% of residents who drink water from public water systems in Tennessee are receiving fluorinated water, compared with only 69.2% nationally, passing the Healthy People 2010 objective of 75%liv. In Hamilton County, the following public water systems provide fluorinated water: Eastside Utility District, Grindstone Estates Mobile Home Park, Hixson Utility District, Mowbray Mountain Utility District, Sale Creek Utility District, Signal Mountain Water System, Soddy-Daisy Falling Water Utility District, Tennessee-American Water System, Union Fork-Bakewell Utility District, and Walden’s Ridge Utility District.
Lead Lead poisoning can affect nearly every system in the body. Because lead poisoning often occurs with no obvious symptoms, it frequently goes unrecognized. Lead poisoning can cause learning disabilities, behavioral problems, and, at very high levels, seizures, coma, and even death. Approximately 250,000 U.S. children aged 1-5 years have blood lead levels greater than 10 micrograms of lead per deciliter of blood, the level at which the Centers for Disease Control and Prevention recommends public health actions be initiatedlv. The Healthy People 2010 objective is to eliminate elevated lead blood levels in children by 2010. The Health Department conducts required reporting of confirmed elevated lead blood levels in children ages 6 months to 6 years to the Tennessee Department of Health. In addition, the Health Department provides case management for children identified with elevated lead blood levels, including educational and nutritional counseling. In 2008, there were 10 reported cases of children with elevated lead blood levels in Hamilton County (Table 20).
Table 20. Reported Children in Hamilton County with Elevated Lead Blood Levels of ≥10 ug/dl
2006 2007 2008 Cases 9 cases 9 cases 10 cases
% of State Cases 7.3 5.5 7.7
Rabies Rabies is caused by a virus that affects the nervous system of humans and other mammals, and is primarily transmitted through the bite of a rabid animal. The usual mode of rabies transmission is by the introduction of saliva containing rabies virus into a bite wound. Rabies infects the central nervous system, causing encephalopathy and ultimately death. Over the past century, rabies in the U.S. has changed dramatically, from the majority of cases being reported in domestic animals, to now where more than 90% of cases are reported in wildlife. The majority of rabies cases occur in raccoons, skunks, bats and foxes. The number of rabies-related human deaths in the U.S. has declined from more than 100 cases annually 100 years ago to one or two per year.
Although human rabies deaths are rare, the estimated public health costs associated with disease detection, prevention, and control have risen, exceeding $300 million annuallylvi. These costs include the vaccination of domestic animals, animal control programs, maintenance of rabies laboratories, and medical costs, such as those incurred for rabies post exposure prophylaxis (PEP). The tables below summarize animal encounter investigations and animal rabies vaccinations.

Hamilton County Health Data Profile 72
Table 21. Animal Encounter Investigations by the Health Department Rabies Control Program 2006 2007 2008 Dog Exposures 651 653 544 Cat Exposures 180 154 186 Wildlife Exposures 111 116 88 Other Domestic 2 2 4 Total Investigations
944
925
822
Table 22. Reported Animal Rabies Vaccinations
2006 2007 2008 Dog Vaccinations 47,796 44,865 46,000 Cats Vaccinations 18,575 18,696 20,064 Other Domestics 465 175 190 Total Vaccinations 66,371 63,561 66,064
Table 23. Percentage of Dogs and Cats Vaccinated for Rabies in Hamilton County
2006 2007 2008 Dogs 64% 56% 54% Cats 22% 20% 21%
In 2008, the Health Department reported 1 raccoon and 2 bats with positive tests for rabies. Overall, rabies prevalence in Hamilton County has been decreasing since 2004 (Map 7).

Hamilton County Health Data Profile 73
Map 7. 2004-2008 Rabies Data in Hamilton County

Hamilton County Health Data Profile 74
Chapter 11: Regional Health Council Strategic Priorities In addtition to assessing the leading health priorities in Hamilton County, the Health Department also sought to engage community health leaders in identifying priority community health and quality of life issues. The Chattanooga-Hamilton County Regional Health Council (RHC) is the lead community-based organization designated by the Tennessee Department of Health to be responsible for community health assessment, regional health planning and the provision of input regarding funding decisions for health and health related initiatives. The vision of the RHC is to redesign Hamilton County, one person, one neighborhood, one institution, and one system at a time through the cooperation of all people so that every resident will reach his/her economic, social, spiritual, mental, emotional and physical potential. The responsibility of the Regional Health Council is to monitor the health status of residents and recommend strategies, with the involvement of physicians, hospital managers, mental health providers, allied health professionals and others, to assure the health of persons residing in Hamilton County. Specific responsibilities include:
1. Assessing the health status of the community, through the collection and analysis of secondary epidemiological data, and primary data sources, such as behavior risk surveys and stakeholder surveys.
2. Prioritizing the health needs identified from data and information collection efforts. 3. Developing a community health plan which includes recommendations for strategies that
address community health needs. This includes the enumeration of goals, objectives and outcome measures, as well as recommendations for interventions.
4. Identifying key resources and the development of partnerships to foster collaborative efforts at addressing the needs of community residents, including sub-population groups, such as children, the elderly, minorities, or groups suffering from specific diseases or conditions.
5. The provision of local input in decision-making processes regarding the allocation of state and federal funding to area agencies and institutions, and the evaluation of programs and services supported by such state and federal funding.
The local RHC consists of health leaders from the fields of academia, business, hospital administration, insurance industry, local government, medicine (physicians, nurses), mental health, non-profits, and communtiy advocates. In January 2009, twenty-five RHC members were asked by the Health Department to take a survey on the health status of Hamilton County. The response rate for the survey was 64%, with sixteen Council members responding. Elements of the survey were taken from the Mobilizing for Action through Planning and Partnerships (MAPP) approachlvii. Overall, the majority of RHC members (56.3%) rated Hamilton County as an “unhealthy” community, followed by 25% rating Hamilton County as “somewhat healthy”. RHC members responded that the three most important factors for a “Healthy Community”, factors which most improve the quality of life, as:
1. Healthy behaviors and lifestyles 2. Good place to raise a family/good schools 3. Access to health care
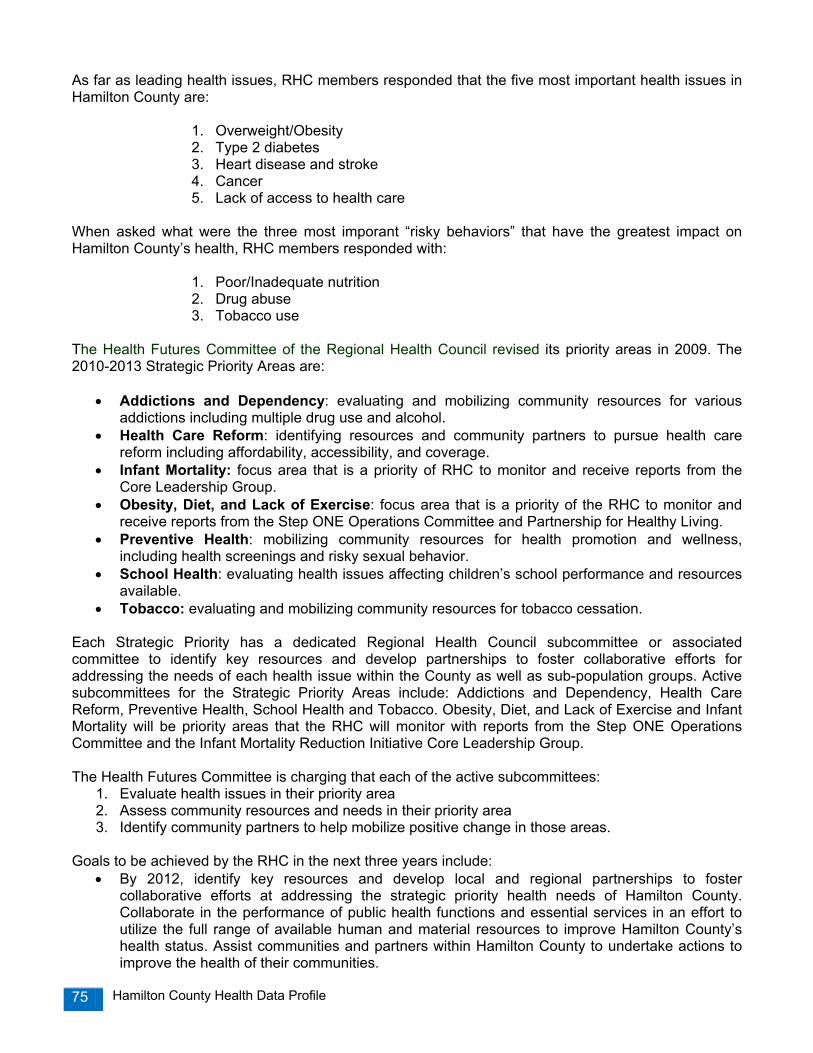
Hamilton County Health Data Profile 75
As far as leading health issues, RHC members responded that the five most important health issues in Hamilton County are:
1. Overweight/Obesity 2. Type 2 diabetes 3. Heart disease and stroke 4. Cancer 5. Lack of access to health care
When asked what were the three most imporant “risky behaviors” that have the greatest impact on Hamilton County’s health, RHC members responded with:
1. Poor/Inadequate nutrition 2. Drug abuse 3. Tobacco use
The Health Futures Committee of the Regional Health Council revised its priority areas in 2009. The 2010-2013 Strategic Priority Areas are:
• Addictions and Dependency: evaluating and mobilizing community resources for various addictions including multiple drug use and alcohol.
• Health Care Reform: identifying resources and community partners to pursue health care reform including affordability, accessibility, and coverage.
• Infant Mortality: focus area that is a priority of RHC to monitor and receive reports from the Core Leadership Group.
• Obesity, Diet, and Lack of Exercise: focus area that is a priority of the RHC to monitor and receive reports from the Step ONE Operations Committee and Partnership for Healthy Living.
• Preventive Health: mobilizing community resources for health promotion and wellness, including health screenings and risky sexual behavior.
• School Health: evaluating health issues affecting children’s school performance and resources available.
• Tobacco: evaluating and mobilizing community resources for tobacco cessation. Each Strategic Priority has a dedicated Regional Health Council subcommittee or associated committee to identify key resources and develop partnerships to foster collaborative efforts for addressing the needs of each health issue within the County as well as sub-population groups. Active subcommittees for the Strategic Priority Areas include: Addictions and Dependency, Health Care Reform, Preventive Health, School Health and Tobacco. Obesity, Diet, and Lack of Exercise and Infant Mortality will be priority areas that the RHC will monitor with reports from the Step ONE Operations Committee and the Infant Mortality Reduction Initiative Core Leadership Group. The Health Futures Committee is charging that each of the active subcommittees:
1. Evaluate health issues in their priority area 2. Assess community resources and needs in their priority area 3. Identify community partners to help mobilize positive change in those areas.
Goals to be achieved by the RHC in the next three years include:
• By 2012, identify key resources and develop local and regional partnerships to foster collaborative efforts at addressing the strategic priority health needs of Hamilton County. Collaborate in the performance of public health functions and essential services in an effort to utilize the full range of available human and material resources to improve Hamilton County’s health status. Assist communities and partners within Hamilton County to undertake actions to improve the health of their communities.
Hamilton County Health Data Profile 76
• By 2012, raise public awareness about the importance of a healthy lifestyle, to encourage
residents to take responsibility for their health and quality of life. Awareness initiatives will specifically target addictions and dependency, health care reform, preventative care, and school health, and the elimination of racial and ethnic disparities in these areas.
• By 2012, create strategic partnerships and develop critical capacity building for identifying potential solutions and approaches to address each of the Strategic Priority Areas in the area of policy and environmental change.
Accomplishments of the Regional Health Council Since 1994, the Regional Health Council has invested in identifying programs, partnerships, and resources that address the health needs of the community. The timeline summarizes key health planning efforts lead by the Regional Health Council. 1994 Health officials and leaders in Hamilton County began openly to discuss the many changes that
were becoming evident in the health indicators for the population of Hamilton County. Community leaders, executives from local hospitals, and the Health Department began to meet to talk about the health status of the community.
1995 Before formal “community development” initiatives were launched statewide by the Bureau of
Health, key players representing the business community, higher education, health insurer groups, and others joined the small group of leaders who had been convened earlier to review and discuss the health status of the community. Their discussions were motivated by a growing interest in determining the health needs of our County residents and the need to identify resources that are required to address those needs.
The Metropolitan Council for Community Services convened the groups to move forward the review of health needs and the identification of resources. The Metropolitan Council (referred to herein after as the Community Health Task Force or Task Force) organized the Greater Chattanooga Community Health Task Force. The purpose of this task force was to initiate efforts that would result in an improvement in the health of the residents of Hamilton County. An assessment process conducted by the Community Health Task force included the analysis of data and information gathered from three sources: (1) a community profile analysis as documented by Metropolitan Council for Community Services in their research report entitled Life in Hamilton County: Indicators of Community Well-Being, (2) an inventory of health resources and services, and (3) a telephone survey of 816 adults, age 18 and over, from randomly selected households in Hamilton County. The findings that emerged from the analysis of data and information led the Task Force to conclude that personal choices and decisions, and the behavior of people are the primary determinants of premature death among residents of Hamilton County. These conclusions prompted the Task Force to establish a two-fold strategy to improve health among area residents: (1) reduce risks, and (2) expand opportunities.
1996 In October the Advisory Board of the Chattanooga-Hamilton County Health Department was
reorganized. The duties and responsibilities of the board were expanded and assigned to the newly established Chattanooga-Hamilton County Regional Health Council, (herein after referred to as the Regional Health Council).

Hamilton County Health Data Profile 77
1997 The Community Health Task Force assumed a lead role in planning a data collection project that would yield the identification of important issues and the needs of youth residing in Hamilton County.
1998 The Regional Health Council and the Health Department gave support to the Community Health
Task Force for their lead role in conducting a survey of all Hamilton County public high school students. A survey instrument developed by the Centers for Disease Control and Prevention was used. The survey was conducted during the Spring of 1998. In August, 1998, the Task Force published a report on the findings of the youth survey, entitled A Report on Risky Behaviors among Teens in Hamilton County’s Public High Schools.
1999 The Board of Directors for the Metropolitan Council for Community Services dissolved the
Community Health Task Force, in recognition of the mission and scope of work of the newly established local Regional Health Council. The newly formed Regional Health Council subsequently established a Community Health Planning Committee. This Committee initiated processes and work that furthered the efforts already begun by the Community Health Task Force and the Metropolitan Council for Community Services. The goal of the Community Health Planning Committee was established to: engage in an on-going community diagnosis process with respect to assessing the health status of residents in Hamilton County, and to recommend strategies for addressing the needs that emerged from the on-going community diagnosis process.
The Regional Health Council established five health priorities based on the findings from research conducted in 1995 by the Metropolitan Council for Community Services and the Community Health Task Force. These findings (which emerged from primary and secondary data) were included in a Community Health Plan Document that was developed and printed in June 1999. The Council began the process for a reassessment of the Hamilton County population. The Council partnered with the Metropolitan Council for Community Services to conduct an Adult Risk Behavior Survey. A network of organizations, institutions and agencies funded this project. The survey was administered in the Fall of 1999.
2000 The Regional Health Council formed subcommittees around each of the five health priority
areas. Each subcommittee consisted of representatives from other organizations and the lay community. Each developed strategies for reducing risky behaviors that contribute to premature death or disability.
The findings of the Adult Risk Behavior Survey were released through a series of ten health briefings and press conferences throughout the year, beginning in February 2000.
2001 The Regional Health Council Health Priority Subcommittees continued to implement their
respective community strategies through awareness, education, and advocacy initiatives.
The Regional Health Council initiated planning for a repeat survey of Hamilton County public and private high school students in the Spring 2002. A major fundraising strategy was developed and implemented by the Council to generate funds to support the proposed survey project.
2002 The Regional Health Council under an arrangement with the Community Research Council
(formerly the Metropolitan Council for Community Services) administered the Youth Survey in 2002. The survey was administered in all Hamilton County public high school and in three private high schools. The findings were made public in October 2002 in a report entitled Choices: A report on Risky Behaviors among Hamilton County Teens.
Hamilton County Health Data Profile 78
The Community Health Plan for Hamilton County was also revised in 2002, and released to the public in January 2003.
2003 Data revealed that Hamilton County has been experiencing a disproportionately high rate of low
birth weight births and infants deaths among its population. A Low Birth Weight Task Force was created to study the local problem and attempt to determine the causes of this phenomenon.
“Obesity, Diet and Exercise” has been the leading health priority of the Regional Health Council since 1999. A Health Priority Committee that had been meeting since 1999 explored the development of strategies that could be launched for programs of various magnitudes. In the Fall of 2003, the Health Futures Committee conceived the idea of a county-wide initiative that would target all residents in order to promote positive lifestyle changes and healthy living practices. With an eye on the Council’s health priority area, along with a commitment from County Mayor Claude Ramsey and the Health Department, it was determined that a County-wide obesity initiative would be launched. Plans were initiated to organize this major initiative.
2004 The Council adopted a “Consensus Message”, as recommended by its Addictions and
Dependency Subcommittee, which recognizes alcohol and drug addiction as a disease. This action supports the public health approach to addressing these conditions locally which are prevalent within our population.
The Adult Behavior Risk Factor Surveillance Survey was conducted with the oversight of the Information Development Committee. Kenneth Robinson, M.D., Commissioner of the Tennessee Department of Health attended a Hamilton County Regional Health council meeting. He praised the organization for its work and pledged support for its planning processes and efforts to develop strategies to address local health concerns.
The county-wide obesity initiative was formally named “Step ONE: Optimize with Nutrition and Exercise”. Several public events were held to acquaint the public with the project and the behavior changes advocated by the initiative.
The Council’s Low Birth Weight (LBW) Task Force continued to study the suspected causative factors for LBW in Hamilton County. A multi-agency coalition, with all local hospitals represented, along with the Health Department, the March of Dimes, and other organizations continued to intensely explore this health problem.
2005 The Regional Health Council completed a self-assessment to determine its strengths and
weaknesses. The Council received high marks for having a clear mission, progress on meeting its goals and objectives as an organization, and for having a consensus among its members for having clearly defined priority areas. The lowest scores were in areas associated with Council members’ active and consistent involvement at the committee and subcommittee level.
Health Department staff initiated the planning process for updating the Community Health Plan document for Hamilton County. The Council’s Health Futures and Planning Committee provided input and oversight for this process.
Acting upon a recommendation from the Council’s Addiction and Dependency Subcommittee, the Council went on record in support of the creation of a Drug Court in Hamilton County. With federal funding support, an Adult Drug Court was ultimately created in Hamilton County to divert those charged with simple drug offenses only might be given the opportunity for treatment and rehabilitation.

Hamilton County Health Data Profile 79
Step ONE Initiative gathered baseline data using surveys of area restaurants, faith-based institutions and other groups. The “Health Care Task Force for the Hispanic and Latino Populations” was created by the Council. This body was organized to identify, study, and address the issues associated with the availability of healthcare providers to serve local Spanish speaking residents in Hamilton County.
After the Regional Health Council’s Risky Sexual Behavior Subcommittee researched issues associated with the high incidence of teen pregnancy and sexually transmitted diseases in Hamilton County, the committee collaborated with public school officials to plan for a pilot health education program that would supplement the current curriculum and provide more beneficial age-specific information to students around sexuality issues in hopes of reversing undesirable trends. A change in key school personnel and the resources sought to support this initiative however caused the project to be postponed.
The Health Department received a grant for approximately $18,000 from the March of Dimes, to establish focus groups to identify and review the issues associated with low birthweight from a community perspective. Later in 2005, at the recommendation of the Low Birth Weight Task Force, the Council transitioned this working group to the auspices of the March of Dimes as a way of sustaining the efforts at developing and implementing strategies to address the problems locally.
2006 The Community Health Plan for Hamilton County was revised in 2005, and released to the public in September 2006.
The Regional Health Council voted to endorse the Promotores de Salud model, an evidence-based model that uses lay health educators to serve as bridges between healthcare providers and Hispanics who lack adequate access to the system. La Paz de Dios, a local non-profit services agency, agreed to take the lead in implementing this model in Hamilton County.
2007 The Step ONE Initiative received a $50,000 grant from the Junior League of Chattanooga with a
focus on childhood obesity. The three-year grant targeted three areas: family/home, schools, and local restaurants. Step ONE also hosted a National Association of Counties (NACo) forum on childhood obesity.
Therese Yeiser Smith, a public health prevention fellow from the Centers for Disease Control and Prevention, presented an epidemiological profile of the Hispanic/Latino population in Hamilton County.
The Regional Health Council voted to support the Tennessee Non-Smoker’s Protection Act of 2007 (HB2336, SB2255). Council members also attended a press conference for the Smoke-Free Tennessee coalition’s tour in support of the Governor’s legislation in April 2007. The Tennessee Non-Smoker’s Protection Act became effective October 1, 2007, prohibiting smoking in all enclosed public places, including restaurants, workplaces, hotels/motels, malls, health care and education facilities, and childcare facilities. In June 2007, the Council re-activated the Tobacco Subcommittee to advocate planning for services, interventions, prevention programs and policies that encourage and support behavior change regarding tobacco use.
2008 After the success of the NACo childhood obesity forum, Step ONE created the Partnership for Healthy Living, a network created to raise awareness of the importance and benefits of healthy living within Hamilton County and to identify and encourage partnership linkages within the community that address healthy living.
Hamilton County Health Data Profile 80
Hamilton County Mayor Claude Ramsey received an award from the Tennessee Medical
Association, recognizing him for his contribution to the improvement and advancement of health in the Chattanooga area through the Step ONE program.
The Chattanooga-Hamilton County Health Department partnered with the Tennessee
Department of Health to administer the 2007 Adult Behavioral Risk Factor Surveillance Survey. The results of this survey were released to the public in September.
The Bureau of Health Services for the Tennessee Department of Health transferred the
oversight of the Community Prevention Initiative program, formerly contracted out by the Regional Health Council, to the Department of Mental Health and Developmental Delays.
The March of Dimes Low Birthweight Taskforce requested that the Perinatal Periods of Risk (PPOR) approach be updated for Hamilton County. In November, the PPOR report on infant mortality and low birthweight was released to the public.
2009 The Regional Health Council completed an assessment survey, seeking member’s opinions on
health issues, risky behaviors, and strategic priorities. Hamilton County Mayor Claude Ramsey received a Healthy Community Leadership Award
given by the Robert Wood Johnson Foundation for his commitment to moving Hamilton County residents towards better health by partnering with the Regional Health Council and Health Department on the Step ONE Initiative.
Smoke Free Chattanooga, the Tobacco subcommittee, and the Health Department partnered to
host a planning meeting on local tobacco prevention efforts. The meeting was conducted by the Centers for Disease Control and Prevention, the National Association of Local Boards of Health, and the National Association of Counties.
The Addictions and Dependency subcommittee launched a media campaign for May 2-9, 2009
entitled, “Not In My House: Prescription Drug Misuse Campaign.” The Health Screenings subcommittee in partnership with 100 Black Men of Chattanooga
organization hosted the 14th Annual Men’s Health Event, which included prostate screenings and general health screenings to over 120 participants.
The Information Development Committee was reactivated to plan for the next Youth Risk Behavior Survey for both public and independent high schools in Hamilton County.
The Regional Health Council voted to approve the 2010-2013 Strategic Priority Areas, including:
Addictions and Dependency, Health Care Reform, Infant Mortality, Obesity, Diet and Lack of Exercise, Preventive Health, School Health, and Tobacco. All priority areas became active subcommittees of the Council except Infant Mortality, which will report through the Core Leadership Group and Obesity, Diet and the Lack of Exercise, which will report through the Step ONE Operations committee. The Council charged each active subcommittee to evaluate health issues for the priority area, assess community resources and needs in the priority area, and identify community partners in the priority area to help pursue positive change.
Step ONE was awarded a four-year Healthy Kids, Healthy Communities grant from the Robert
Wood Johnson Foundation. The grant partnership will focus the resources of lead agency Step ONE and key allies in the effort to eliminate childhood obesity in the East and South side communities of Chattanooga.

Hamilton County Health Data Profile 81
Appendix
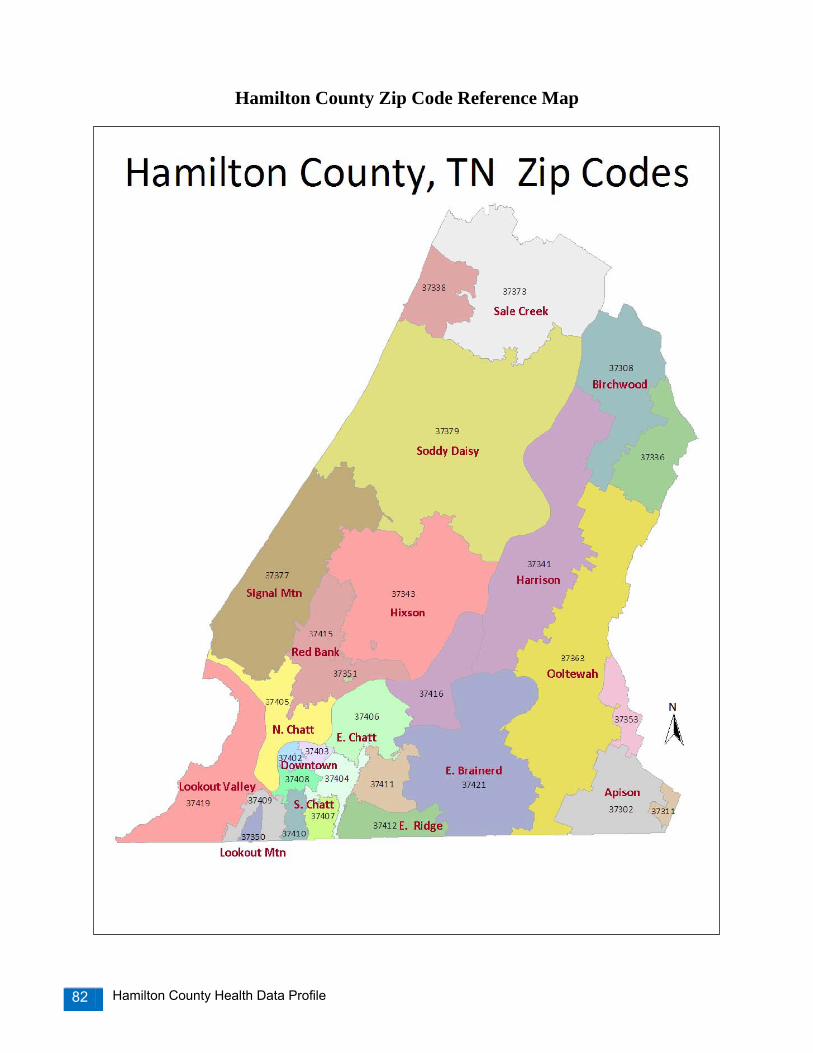
Hamilton County Health Data Profile 82
Hamilton County Zip Code Reference Map
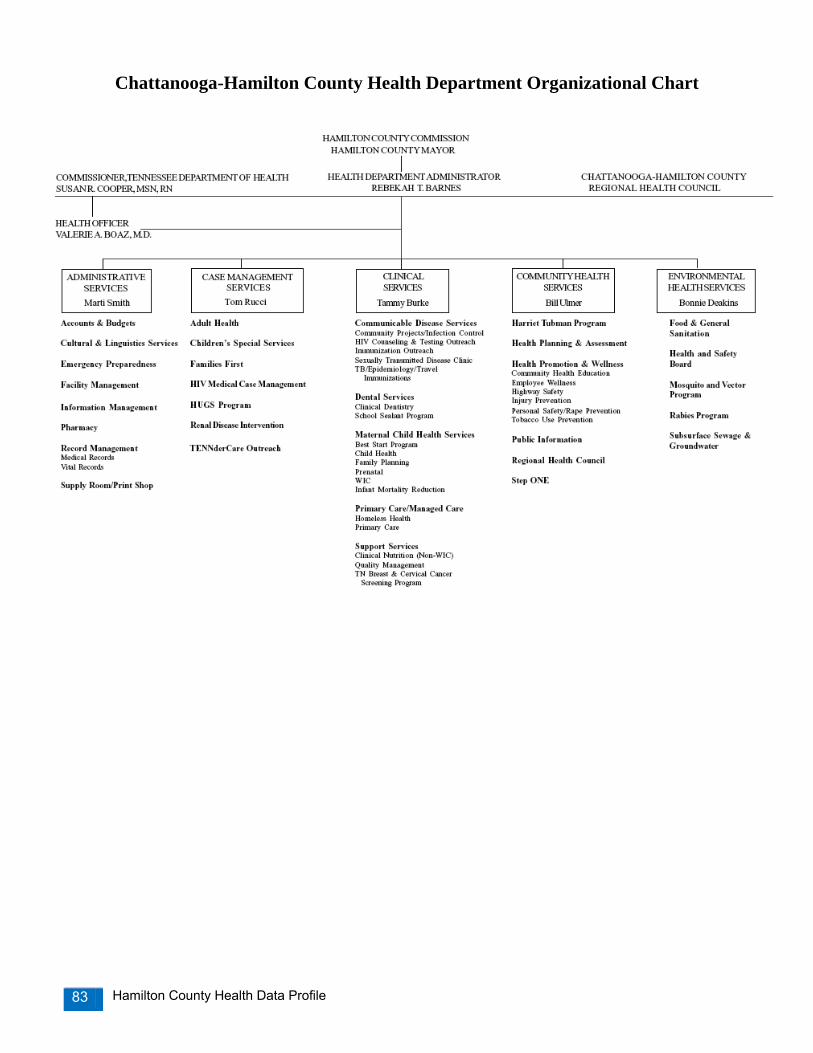
Hamilton County Health Data Profile 83
Chattanooga-Hamilton County Health Department Organizational Chart

Hamilton County Health Data Profile 84
Chattanooga-Hamilton County Regional Health Council
2010 Regional Health Council Members
Howard Roddy, Chair Memorial Health Care System
Phyllis Casavant, Ed. D, Co-Chair S. E. Tenn. Area Agency on Aging
Chris Anderson
Bluff View Art District
Ronald Blankenbaker, M.D. UT College of Medicine, Health Science Center
Rae Young Bond
Chattanooga-Hamilton County Medical Society
Pat Branham, MEd, RN, CCM UNUM Corporation
Pastor Ron Cook
Rock Island Baptist Church
Eva Dillard United Way
Greg Ezell
Minister
Jim Folkner Businessman
Roger Forgey
Erlanger Health Systems
Vicky Gregg (Represented by: Dr. David Moroney)
BlueCross BlueShield
Bill Hicks Southside/Dodson Ave. Community Health
Centers
Glenda Hood Community Advocate
Mai Bell Hurley Former City Councilwoman
Susan Kirk
TN Dept. of Human Services
Melony Magoon, RN, FNP Moccasin Bend Mental Health Institute
Earl Medley
Fortwood Center, Inc.
Thomas P. Miller, M.D. Specialists in Pain Management
Brenda Nunn, RN, BA, CCM
UNUM Corporation
Carlos Parra, Ph. D Southern Adventist University
Deborah Poteet-Johnson, M.D.
Psychotherapy Alternatives
Sean Richards, Ph. D University of Tennessee at Chattanooga
Manuel Rico
Chattanooga City Council
Sheryl Rogers, RN Hamilton County Department of Education
Ex-Officio Members
Mayor Claude Ramsey Hamilton County
Becky Barnes
Chattanooga- Hamilton County Health Dept
Valerie Boaz, M.D. Chattanooga-Hamilton County Health Dept.
Hamilton County Health Data Profile 85
Committees and Subcommittees A. Executive Committee This Committee is composed of all officers and all committee chairpersons. This committee is charged with reviewing issues that are important to the Council by providing initial insight prior to presentation to the full Council. The Council must subsequently ratify decisions made by this committee. B. By-Laws Committee This Committee is responsible for developing and facilitating modifications to the By- Laws and for submitting recommendations for changes to the Council for consideration. C. Nominating Committee This Committee is responsible for recommending a slate of officers to the Council for an election. Should a Council officer be unable to complete the elected term, the Nominating Committee shall recommend to the Council someone to fill the unexpired term. D. Health Futures and Health Planning Committee This Committee is responsible for initiating and maintaining an on-going community diagnosis process whereby the health and health related needs of the residents of Hamilton County are assessed. This Committee is also responsible for recommending health priorities and strategies that can address the priority areas. The work of this Committee is recorded in a “Community Health Plan Document” which is revised every three years. This Committee is also responsible for up-dating the vision statement for the health of Hamilton County residents when needed. This committee conducts its work by engaging in a series of activities that bring together groups of residents who broadly represent cross sections of the city and county, in order to craft or refine a health vision statement for adoption by the Council, and for subsequent adoption by residents, businesses, community organizations, the faith community, and government entities throughout Chattanooga and Hamilton County. E. Health Priority Subcommittees The following subcommittees to the larger planning committee referenced above, were established to address each of the health priorities identified as a result of needs assessment processes engaged in the Fall of 2009. Each subcommittee is to identify a set of ideas, strategies and action steps for addressing the particular priority throughout Hamilton County. The health priority areas and subcommittees are as follows: Addictions and Dependency, Health Care Reform, Preventive Health, School Health and Tobacco. Obesity, Diet, and Lack of Exercise and Infant Mortality will be priority areas that the RHC will monitor with reports from the Step ONE Operations Committee and the Infant Mortality Reduction Initiative Core Leadership Group. F. Information Development Committee This Committee is responsible for planning and implementing community-based surveys and other data/information gathering activities. It also has responsibility for reviewing and analyzing the results of the community-wide behavior risk surveys conducted by the Council in concert with other community agencies and technical resources. The typical surveys conducted include the Adult Behavior Risk Factor Survey and the Youth Behavior Risk Factor Survey using Centers for Disease Control and Prevention survey instruments. This committee assists with interpreting the survey results and findings in preparation for public release. G. Communications Committee This Committee is responsible for planning, preparing and facilitating the release of findings and related information from various studies and other data gathering processes. This committee appropriately packages information for public release. This Committee is also responsible for assisting with the development and implementation of community health information strategies and prevention campaigns as vehicles to promote community-wide statements adopted by the Council.

Hamilton County Health Data Profile 86
H. Operations Committee for the Step ONE: Optimize with Nutrition and Exercise Initiative The Step ONE Initiative is a county-wide effort to address the problem of obesity in our community and promote physical fitness and healthy lifestyles. The Hamilton County Health Department has partnered with the Mayor of Hamilton County, and the Hamilton County Regional Health Council to launch this initiative. The Operations Committee is responsible for all program planning and implementation activities.

Hamilton County Health Data Profile 87
Data Sources and Where to Find Data Centers for Disease Control and Prevention
• National Center for Health Statistics: http://www.cdc.gov/nchs/default.htm • CDC WONDER Data Reports and Systems: http://wonder.cdc.gov/ • Behavioral Risk Factor Surveillance System: http://www.cdc.gov/brfss/index.htm • Health, United States. 2007: http://www.cdc.gov/nchs/data/hus/hus07.pdf
Hamilton County Government
• Air Pollution Control Bureau, Air Quality Reports: http://www.pollutionsolution.org/ • Behavioral Risk Factor Surveillance Survey Report:
http://health.hamiltontn.org/docs/CHS/2007%20Hamilton%20County%20Health%20Behavior%20Risk%20Factors%20Report.pdf
• County Health Plans: o 2006: http://rhc.hamiltontn.org/docs/HamiltonCountyHealthPlan2006.pdf o 2002: http://rhc.hamiltontn.org/images/healthplan2002.pdf
• Hamilton County GIS, Map Maker: http://gis.hamiltontn.gov/mapmaker/home.asp • Infant Mortality Report: http://health.hamiltontn.org/docs/CHS/PPOR%20Report%202008.pdf • Influenza-Like Illness Surveillance: http://health.hamiltontn.org/Epidemiology/default.aspx • Rabies Map 2004-2008: http://gis.hamiltontn.gov/maprequests/rabies/rabies_map.pdf • Youth Risk Behavior Survey, 2002: http://health.hamiltontn.org/docs/CHS/2002YRBSChoices.pdf
Tennessee Department of Health
• Behavioral Risk Factor Surveillance Survey: http://health.state.tn.us/statistics/brfss.htm • Cancer Registry: http://health.state.tn.us/TCR/index.htm • Communicable and Environmental Disease Services Annual Reports: http://health.state.tn.us/ceds/reports.htm • Hospital Discharge Data: http://health.state.tn.us/statistics/specialprojects.htm#hdds • Vital Statistics: http://health.state.tn.us/statistics/vital.htm
Tennessee Institute of Public Health
• 2007 Health Rankings Index: http://www.state.tn.us/tniph/ U.S. Census Bureau
• 2000 Census: http://www.census.gov/ Other:
• Annie E. Casey Foundation, Kids Count Data Profiles: http://www.kidscount.org/datacenter/databook.jsp • Kaiser Family Foundation, State Health Facts: http://www.statehealthfacts.org/ • March of Dimes Peristats: http://www.marchofdimes.com/peristats/ • Ochs Center for Metropolitan Studies, 2008 State of Chattanooga Region Report on Health:
http://www.ochscenter.org/documents/SOCRR2008_health.pdf • Tennessee Department of Education, Youth Risk Behavior Survey: www.k-12.state.tn.us/yrbs/ • U.S. Department of Health and Human Services, Healthy People 2010: http://www.healthypeople.gov/

Hamilton County Health Data Profile 88
Technical Notes and Terms Age-Adjusted Mortality Rate: Number of deaths per 100,000 age-adjusted population. Behavioral Risk Factor Surveillance System (BRFSS): The BRFSS is an annual, CDC-funded, state-administered, random-digit-dialed telephone survey of the U.S. non-institutionalized population, 18 years of age and older, which gathers self-reported data on certain health conditions and behavioral risk factors. For BRFSS data, the terms “white” and “black” refer to persons of non-Hispanic origin only, and the terms “Hispanic” and “non-Hispanic” refer to ethnicity regardless of race. In 2007, there were a total of 700 interviews conducted in Hamilton County. A weighting formula created by the Tennessee Department of Health was applied to this data to account for geographic location, high density areas, number of telephones in a household and demographic distribution of the random sample, to reflect population estimates for Hamilton County. Birth Rate: The ratio of live births in an area to the population of that area; expressed per 1000 population per year. Body Mass Index (BMI) = Weight in pounds x 703 (Height in inches) x (Height in inches) For adults, a BMI > 25 is considered overweight. For adults, a BMI > 30 is considered obese. Data Suppression: Diseases or conditions less than 5 counts in Hamilton County were not presented in responsibility to protect the confidentiality and privacy of the population while also adequately presenting information and data concerning conditions that affect public health. Healthy People 2010: Nationwide health promotion and disease prevention plan that was developed by the U.S. Department of Health and Human Services. Hispanic Origin: Hispanic origin refers to persons whose ancestry, national group, lineage, heritage, or country of birth originated from a Spanish speaking country or culture. Hospital Discharge Data: Quarterly, each hospital licensed by the Tennessee Department of Health reports by law selected information on each inpatient discharged during the period for inclusion in the Hospital Discharge Data System. Additionally, data from each emergency room visit and ambulatory surgery performed at the hospital are submitted. Excluded from reporting are federal hospitals and mental health facilities licensed by the Department of Mental Health and Developmental Disabilities. Also excluded, except where specified, are newborn discharge data. Infant Mortality Rate: Number of infant deaths under one year of age per 1,000 live births. Low Birthweight: A live birth weighing less than 2,500 grams (5 pounds, 8 ounces). Pregnancies: Pregnancy data comes from the Tennessee Department of Health. This information was based on data extracted from the Certificates of Live Birth, Reports of Fetal Deaths, and Induced Termination of Pregnancy Reports sent to Vital Records of the Tennessee Department of Health. This data covers only events that occurred to Tennessee residents. Youth Risk Behavior Survey (YRBS): The Tennessee YRBS collects self-reported data on tobacco use and other behaviors related to leading causes of morbidity and mortality among Tennessee public high school students (grades 9 through 12). A detailed description of the survey and additional survey results can be found at http://www.k-12.state.tn.us/yrbs/ and at http://www.cdc.gov/HealthyYouth/yrbs/index.htm. For YRBS data, the terms “white” and “black” refer to persons of non-Hispanic origin, and the term “Hispanic” refers to ethnicity regardless of race.
Hamilton County Health Data Profile 89
References i U.S. Department of Health and Human Services. Healthy People 2010. Available at :http://www.healthypeople.gov/ ii Public Health Functions Steering Committee, Members (July 1995): American Public Health Association· Association of Schools of Public Health· Association of State and Territorial Health Officials· Environmental Council of the States· National Association of County and City Health Officials· National Association of State Alcohol and Drug Abuse. iii U.S. Department of Health and Human Services. Health, United States; 2007. iv U.S. Census Bureau. http://www.census.gov v U.S. Department of Health and Human Services (2007). Health, United States; 2007. vi La Paz de Dios, Chattanooga, TN. vii M A Winkleby, D E Jatulis, E Frank and S P Fortmann (1992). Socioeconomic status and health: how education, income, and occupation contribute to risk factors for cardiovascular disease. American Journal of Public Health, Vol. 82, Issue 6 816-820, 1992. viii Tennessee Commission on Children and Youth. Tennessee’s Kids Count: The State of the Child in Tennessee. Nashville, TN; 2007. ix National Center for Health Statistics. NCHS State Profiles; 2009. x Child Trends Data Bank. Birth and Fertility Rates; 2005. Available online at: http://www.childtrendsdatabank.org/indicators/79BirthRates.cfm. xi Bright Futures. (2002). Bright Futures: Guidelines for Health Supervision of Infants, Children, and Adolescents. (2nd ed., rev.) Edited by Morris Green and Judith S. Palfrey. Arlington, VA: National Center for Education in Maternal and Child Health. Available online at: http://www.brightfutures.org/bf2/pdf/index.html xii National Institute of Child Health and Human Development. Care Before and During Pregnancy - Prenatal Care. Available Online at: http://www.nichd.nih.gov/womenshealth/research/pregbirth/prenatal_care.cfm . xiii Joyce A. Martin, M.P.H.; Brady E. Hamilton, Ph.D.; Paul D. Sutton, Ph.D.; Stephanie J. Ventura, M.A.; Fay Menacker, Dr. P.H.; Sharon Kirmeyer, Ph.D.; and T.J. Mathews, M.S., Division of Vital Statistics. Births: Final Data for 2006. National Vital Statistics Reports. Vol 57, no. 7. Hyattsville, MD: National Center for Health Statistics. 2009. xiv Wilcox A. (2001). A Short History of Low Birthweight. National Institute of Environmental Health Sciences Epidemiology Branch. Available online at: http://eb.niehs.nih.gov/bwt/subchist.htm. xv Hack, M., Klein, NK, Taylor, HG. (1995). Long-term developmental outcomes of low birth weight infants. In: The Future of Children: Low Birth Weight. Vol. 5(1):19-34. Los Altos, CA: Center for the Future of Children. The David and Lucile Packard Foundation. Available online at: http://www.futureofchildren.org/pubs-info2825/pubs-info.htm?doc_id=79872. xvi Hediger, M L., Overpeck, M.D., Ruan, W.J., and Troendle, J.F. (2002). Birthweight and gestational age effects on motor and social development. Pediatric and Prenatal Epidemiology, 16:33-46. xvii Martin JA, Hamilton BE, Sutton PD, Ventura SJ, Menacker F, Kirmeyer S, Munson MS. (2007). Births: Final Data for 2005. National Vital Statistics reports, Vol 56, no. 6. Hyattsville, MD: National Center for Health Statistics. 2007. xviii U.S. Department of Health and Human Services. Healthy People 2010, 2nd ed. With Understanding and Improving Health and Objectives for Improving Health, 2 vols. Washington, DC: U.S. Government Printing Office, November 2000. xixMacDorman M, Mathews MS. (2008). Recent Trends in Infant Mortality in the United States. NCHS data brief, no 9. Hyattsville, MD: National Center for Health Statistics. 2008. Available online at: http://www.cdc.gov/nchs/data/databriefs/db09.htm. xx U.S. Department of Health and Human Services. Healthy People 2010, 2nd ed. With Understanding and Improving Health and Objectives for Improving Health, 2 vols. Washington, DC: U.S. Government Printing Office, November 2000. xxi Perinatal Periods of Risk. CityMatCH: University of Nebraska Medical Center, Centers for Disease Control and Prevention, the National March of Dimes Birth Defects Foundation, the Health Resources Services Administration/Maternal and Child Health Bureau. Available online at: http://www.citymatch.org/ppor_index.php. xxii Johnson K, Posner SF, Biermann J, Cordero JF, Atrash HK, Parker CS, Boulet S, Curtis MG.(2006). Recommendations to Improve Preconception Health and Health Care --- United States: A Report of the CDC/ATSDR Preconception Care Work Group and the Select Panel on Preconception Care. Morbidity and Mortality Weekly Report. Centers for Disease Control and Prevention. April 21, 2006 / 55(RR06);1-23. Available online at: http://www.cdc.gov/mmwr/preview/mmwrhtml/rr5506a1.htm. xxiii Centers for Disease Control and Prevention (August 2007). National Center for Chronic Disease Prevention and Health Promotion. Available online at http://www.cdc.gov/nccdphp/. xxiv East Tennessee State University College of Public Health. Report of the Tennessee Stroke Registry, 2009. xxv Tennessee Department of Health, Office of Cancer Surveillance. Lung Cancer Facts and Figures, Tennessee, 2001-2005. xxvi Tennessee Department of Health, Office of Cancer Surveillance. Lung Cancer Facts and Figures, Tennessee, 2001-2005. xxvii Tennessee Department of Health, Office of Cancer Surveillance. Female Breast Cancer Facts and Figures, Tennessee, 2001-2005. xxviii Tennessee Department of Health, Office of Cancer Surveillance. Colorectal Cancer Facts and Figures, Tennessee, 2002-2006. xxix Centers for Disease Control and Prevention. Morbidity and Mortality Weekly Report. Public Health and Aging: Trends in Aging --- United States and Worldwide. February 14, 2003 / 52(06);101-106.

Hamilton County Health Data Profile 90
xxx Centers for Disease Control and Prevention. National Diabetes Fact Sheet; 2007. Available online at: http://www.cdc.gov/diabetes/pubs/pdf/ndfs_2007.pdf xxxi American Heart Association. Available online at: www.americanheart.org xxxii U.S. Department of Health and Human Services and U.S. Department of Agriculture. Dietary Guidelines for Americans 2005. 6th ed., Washington, DC: U.S. Government Printing Office, January 2005. xxxiii 1Center for Disease Control and Prevention: Tobacco Use and Pregnancy. Available online at: http://www.cdc.gov/reproductivehealth/TobaccoUsePregnancy/index.htm Mathews, T.J. “Smoking During Pregnancy in the 1990s,” National Vital Statistics Reports, Vol 49, No. 7. Hyattsville, MD: National Center for Health Statistics, 2001. http://www.cdc.gov/nchs/data/nvsr/nvsr49/nvsr49_07.pdf xxxiv 3The Health Consequences of Involuntary Exposure to Tobacco Smoke: A Report of the Surgeon General. (2006). U.S. Department of Health and Human Services. Available online at: http://www.surgeongeneral.gov/library/secondhandsmoke/factsheets/factsheet2.html. xxxv CDC. Health Effects of Cigarette Smoking. Available online at: http://www.cdc.gov/tobacco/data_statistics/fact_sheets/health_effects/health_effects.htm xxxvi Tennessee Department of Health. The Burden of Tobacco in Tennessee. Nashville, TN; 2008. xxxvii Centers for Disease Control and Prevention. MMWR. September 11, 2009 /58 (35); 978-979. xxxviii Knox County 4th Circuit Court, Judge Bill Swann. Available online at: http://knoxcountyorg/4cc/domestic_violence.php. xxxix Tennessee Economic Council on Women. The Impact of Domestic Violence on the Tennessee Economy. State of Tennessee. January 2006. xl Tennessee Department of Health Domestic Violence Reporting Data System
2009 Annual Report. Available online at: http://health.state.tn.us/Downloads/DomesticViolenceReport2009.pdf xli Centers for Disease Control and Prevention. MMWR. October 22, 2004 / 53(41);963-966. xlii CDC. Alcohol and Public Health. Available online at: http://www.cdc.gov/alcohol/ xliii Committee on the Consequences of Uninsurance, Institute of Medicine (2002). Care Without Coverage: Too Little, Too Late. The National Academies Press. xliv Daniels D, Grytdal S, and A Wasley. Surveillance for Acute Viral Hepatitis, United States, 2007. MMWR. Centers for Disease Control and Prevention; 2009 (58):SS-3. xlv Centers for Disease Control and Prevention. Sexually Transmitted Disease Surveillance, United States, 2007.Atlanta, GA: U.S. Department of Health and Human Services; December 2008. xlvi Campsmith ML, Rhodes P, Hall HI, and T Green. HIV Prevalence Estimates-United States, 2006. MMWR. Centers for Disease Control and Prevention; 2008 (57(39)): 1073-1076. xlvii Marks G, Crepaz N, Janssen R. Estimating sexual transmission of HIV from persons aware and unaware that they are infected with the virus in the USA. AIDS. 2006;20:1447-1450. xlviii Centers for Disease Control and Prevention. Basic TB Facts; 2009. Available online at: http://www.cdc.gov/tb/topic/basics/default.htm xlix National Center for Health Statistics. NCHS State Profiles; 2009. l Tennessee Immunization Program. Results of the 2008 Immunization Status Survey of 24-Month-Old Children in Tennessee. Tennessee Department of Health. Nashville, TN: December 2008. li Hamilton County Air Pollution Control Bureau. Available online at: http://www.apcb.org/ lii Maynard R, Krewski D, Burnett RT, Samet J, Brook JR, Granville G, Craig L. Health and air quality: directions for policy-relevant
research. J Toxicol Environ Health A. 66(16-19):1891-904, 2003. liii Environmental Protection Agency. National Air Quality-Status and Trends through 2007; 2008. Available online at: http://www.epa.gov/air/airtrends/2008/ liv Tennessee Department of Health. Tennessee’s Community Water Fluoridation. Division of Oral Health Services. Available online at: http://health.state.tn.us/oralhealth/CWF.html lv Centers for Disease Control and Prevention. Childhood Lead Poisoning. Available online at: http://www.cdc.gov/lead/ lvi Centers for Disease Control and Prevention. About Rabies; 2007. Available online at: http://www.cdc.gov/rabies/about.html lvii National Association of County and City Health Officials. Mobilizing for Action through Planning and Partnerships: Achieving Healthier Communities through MAPP, A User’s Handbook.