Physical capacity and body composition in 13-16 year old ...
13
Baltic Journal of Health and Physical Activity Baltic Journal of Health and Physical Activity Volume 11 Issue 4 Article 6 2019 Physical capacity and body composition in 13-16 year old soccer Physical capacity and body composition in 13-16 year old soccer players during three-year training cycle players during three-year training cycle Anna Konieczna Department of Physical Education and Sport, Maritime University in Gdynia, Poland Lukasz Radziminski Department of Health Promotion, Gdansk University of Physical Education and Sport in Gdansk, Poland Jacek Paszulewicz Department of Health Promotion, Gdansk University of Physical Education and Sport in Gdansk, Poland Guillermo F. Lopez-Sanchez Department of Sport Sciences, University of Murcia, Spain Paul Dragos Department of Physical Education, Sport and Physical Therapy, University of Oradea, Romania See next page for additional authors Follow this and additional works at: https://dcgdansk.bepress.com/journal Part of the Health and Physical Education Commons, Sports Medicine Commons, Sports Sciences Commons, and the Sports Studies Commons Recommended Citation Recommended Citation Konieczna A, Radzimiński L, Paszulewicz J, Lopez-Sanchez GF, Dragos P, Jastrzębski Z. Physical capacity and body composition in 13–16-year-old soccer players during three-year training cycle. Balt J Health Phys Act. 2019;11(4):47-57. doi: 10.29359/BJHPA.11.4.06 This Article is brought to you for free and open access by Baltic Journal of Health and Physical Activity. It has been accepted for inclusion in Baltic Journal of Health and Physical Activity by an authorized editor of Baltic Journal of Health and Physical Activity.
-
Upload
khangminh22 -
Category
Documents
-
view
2 -
download
0
Transcript of Physical capacity and body composition in 13-16 year old ...

Baltic Journal of Health and Physical Activity Baltic Journal of Health and Physical Activity
Volume 11 Issue 4 Article 6
2019
Physical capacity and body composition in 13-16 year old soccer Physical capacity and body composition in 13-16 year old soccer
players during three-year training cycle players during three-year training cycle
Anna Konieczna Department of Physical Education and Sport, Maritime University in Gdynia, Poland
Lukasz Radziminski Department of Health Promotion, Gdansk University of Physical Education and Sport in Gdansk, Poland
Jacek Paszulewicz Department of Health Promotion, Gdansk University of Physical Education and Sport in Gdansk, Poland
Guillermo F. Lopez-Sanchez Department of Sport Sciences, University of Murcia, Spain
Paul Dragos Department of Physical Education, Sport and Physical Therapy, University of Oradea, Romania
See next page for additional authors
Follow this and additional works at: https://dcgdansk.bepress.com/journal
Part of the Health and Physical Education Commons, Sports Medicine Commons, Sports Sciences
Commons, and the Sports Studies Commons
Recommended Citation Recommended Citation Konieczna A, Radzimiński L, Paszulewicz J, Lopez-Sanchez GF, Dragos P, Jastrzębski Z. Physical capacity and body composition in 13–16-year-old soccer players during three-year training cycle. Balt J Health Phys Act. 2019;11(4):47-57. doi: 10.29359/BJHPA.11.4.06
This Article is brought to you for free and open access by Baltic Journal of Health and Physical Activity. It has been accepted for inclusion in Baltic Journal of Health and Physical Activity by an authorized editor of Baltic Journal of Health and Physical Activity.

Physical capacity and body composition in 13-16 year old soccer players during Physical capacity and body composition in 13-16 year old soccer players during three-year training cycle three-year training cycle
Authors Authors Anna Konieczna, Lukasz Radziminski, Jacek Paszulewicz, Guillermo F. Lopez-Sanchez, Paul Dragos, and Zbigniew Jstrzebski
This article is available in Baltic Journal of Health and Physical Activity: https://dcgdansk.bepress.com/journal/vol11/iss4/6

www.balticsportscience.com
Physical capacity and body composition in 13–16-year-old soccer players during three-year training cycle
Anna Konieczna2 ABEFG, Łukasz Radzimiński2 CE, Jacek Paszulewicz2 EF, Guillermo F. Lopez-Sanchez3 EF, Paul Dragos4 EF, Zbigniew Jastrzębski2 ADE
1 Department of Physical Education and Sport, Maritime University in Gdynia, Poland
2 Department of Health Promotion, Gdansk University Physical Education and Sport in Gdansk, Poland
3 Department of Sport Sciences, University of Murcia, Murcia, Spain
4 Department of Physical Education, Sport and Physical Therapy, University of Oradea, Oradea, Romania
article details Article statistics: Word count: 3,532; Tables: 2; Figures: 4; References: 54 Received: November 2019; Accepted: December 2019; Published: December 2019 Full-text PDF: http://www.balticsportscience.com Copyright © Gdansk University of Physical Education and Sport, Poland Indexation: Celdes, Clarivate Analytics Emerging Sources Citation Index (ESCI), CNKI Scholar (China National Knowledge
Infrastructure), CNPIEC, De Gruyter - IBR (International Bibliography of Reviews of Scholarly Literature in the Humanities and Social Sciences), De Gruyter - IBZ (International Bibliography of Periodical Literature in the Humanities and Social Sciences), DOAJ, EBSCO - Central & Eastern European Academic Source, EBSCO - SPORTDiscus, EBSCO Discovery Service, Google Scholar, Index Copernicus, J-Gate, Naviga (Softweco, Primo Central (ExLibris), ProQuest - Family Health, ProQuest - Health & Medical Complete, ProQuest - Illustrata: Health Sciences, ProQuest - Nursing & Allied Health Source, Summon (Serials Solutions/ProQuest, TDOne (TDNet), Ulrich’s Periodicals Directory/ulrichsweb, WorldCat (OCLC)
Funding: This research received no specific grant from any funding agency in the public, commercial, or not-for-profit sectors. Conflict of interests: Authors have declared that no competing interest exists. Corresponding author: Dr hab. Zbigniew Jastrzębski, Gdansk University of Physical Education and Sport – Health Promotion; K. Górskiego 1
Gdańsk 80-336, Poland; e-mail: [email protected] Open Access License: This is an open access article distributed under the terms of the Creative Commons Attribution-Non-commercial 4.0
International (http://creativecommons.org/licenses/by-nc/4.0/), which permits use, distribution, and reproduction in any medium, provided the original work is properly cited, the use is non-commercial and is otherwise in compliance with the license.
Authors’ Contribution:A Study DesignB Data CollectionC Statistical AnalysisD Data InterpretationE Manuscript PreparationF Literature SearchG Funds Collection
Baltic Journal of Health and Physical Activity 2019; 11 (4): 47-57Journal of Gdansk University of Physical Education and Sporte-ISSN 2080-9999
47
ORIGINAL
doi: 10.29359/BJHPA.11.4.06
abstract Background: The aim of the study was to show changes in aerobic and anaerobic capacity and body composition of
adolescent soccer players in a three-year training cycle.
Material and methods: 16 footballers aged 13.4 ±0.25 years took part in the study. Measurements of aerobic fitness were performed with the Cooper and PWC170 tests, and anaerobic fitness with the Wingate test. Body composition measurements were made with an electronic scale.
Results: During the three-year training period, significant changes in PWC170 and VO2max were observed depending on the stage of adolescence and the training process. Relative values of anaerobic capacity indicators: total work and maximal power over a three-year period increased significantly (Wt from x̄ = 228.2 ±19.2 J/kg to x̄ = 263.2 ± 19.9 J/kg; Pmax from x̄ = 9.19 ± 0.86 W/kg to x̄ = 10.98 ± 0.55 W/kg.
Conclusions: Adolescent soccer players have shown significant changes in their exercise capacity and body composition during the three years of the training process. Correlations between selected anaerobic fitness indices and fat free mass were significantly positive.
Key words: long term training, soccer players.

Szczesna-Kaczmarek ABlood K+ concentration balance after prolonged submaximal exercise...Balt J Health Phys Act 2014; 1(1): 233-244
48www.balticsportscience.com
introduction The aerobic energy system is dominant during a soccer match and the most commonly it is determined by VO2max parameter. According to Hoff [1] and Reilly [2], it strongly correlates with the distance covered during the match. Its higher value allows the player to run longer and faster and get involved in more actions on the pitch [3]. Helgerud et al. [4] confirm that aerobic fitness has an impact on young players’ performance. High aerobic capacity allows maintaining a high work rate for a long time during the match and minimizing deterioration in technical performance during the match [5]. It also helps players recover better from high-intensity actions and intermittent exercise after high-intensity efforts and intermittent activities typical of playing football [6]. Anaerobic capacity is used during very short bursts of moderate to intense effort that can directly affect the outcome of a match. The total duration of high intensity efforts is on average 7 min during the entire match [7]. On average, players perform one sprint or acceleration during one minute [8]. The average sprint duration is 2–4 s, and 90% of all sprints are shorter than 20 m [8–10]. In turn, 45% of all goals scored are preceded by a linear sprint, usually without a defender or a ball [11]. For this reason, the anaerobic fitness of the body is an extremely important element of the player's efficiency and may determine the winning or losing result of a match [12].
Gil et al. [13] draw attention to the mutual relations between physiological requirements and the player's body composition and emphasize the importance of this factor for the effectiveness of the game. Other authors have also shown that higher levels of body fat can negatively affect performance as body mass must be moved against gravity and additional metabolic energy is required to displace the excess [13–16]. In addition, Rienzi et al. [17] say that excessive body fat not only causes earlier fatigue changes that reduce the effectiveness of action, but is also associated with deterioration in skills, an increased risk of injury and reduced possibilities of training program implementation and adaptation. In contrast, Mills et al. [18] and Carling and Orhant [19] draw attention to the need to consider the problem of body fat in terms of the position occupied on the pitch, not a uniform level for the whole team, as proposed by Willmore [20]. Moreover, Leao et al. [21] found that anthropometric pattern is observed across the maturation process in each tactical position.
Most of the tests in the field of physical efficiency and body composition concern adult elite soccer players. There is little data on adolescent players, especially with regard to multi-year training cycles. Therefore, the purpose of this work is to show changes in the indicators of aerobic and anaerobic physical fitness and body composition in footballers aged 13–16 in a three-year training cycle and the correlation that exists between them.
material and methods 25 young soccer players aged 13–16 participated to the study. However, for different reasons (club changing, illness, etc.) only 16 players completed all the tests during the three-year training period. Participants were recruited from a secondary school of a soccer profile. During this period, measurements were made on nine dates: at the beginning, mid and end of each of the annual training cycles. During the first study, the average age was x̄ =13.4 ±0.25 years and the last x̄ =16.1 ±0.25 years. The average body weight value was x̄ =46.2 ±7.10 kg and x̄ =60.5 ±8.36 kg, respectively, and the body height x̄ =157.8 ±6.55 cm and =172 ± 6.39 cm. Players involved in the research were part of the same team and participated in the competition of local junior leagues.
Konieczna A, Radzimiński L, Paszulewicz J, Lopez-Sanchez GF, Dragos P, Jastrzębski Z.Physical capacity and body composition in 13–16-year-old soccer playersBalt J Health Phys Act. 2019;11(4):47-57

Szczesna-Kaczmarek ABlood K+ concentration balance after prolonged submaximal exercise...Balt J Health Phys Act 2014; 1(1): 233-244
49www.balticsportscience.com
Parents gave written consent for the subjects to participate in training, sports competitions and control tests. Every six months the competitors underwent periodic medical examinations and had valid athlete's health cards. The Bioethics Committee at the Regional Medical Chamber in Gdańsk approved the research (KB-3/12).
measurements of aerobic fitness PWC170 test (Physical Work Capacity)The subjects were loaded with a cycloergometer twice for 5 minutes, successively, without rest. The intensity of the effort was selected so that the player’s heart rate was about 130 bpm during the first effort and 150 bpm during the second one. At the last minute of each 5-minute operation, the heart rate (HR) was recorded using a Polar Vantage Sport-tester (Finland). Monark bicycle ergometer type E-818 (Sweden) was used to load the drivers with work. The PWC170 index was determined indirectly by extrapolation using a computer program [22, 23].
Cooper testParticipants were familiarized with the test procedures. After a 5–10 minute warm-up, the subjects ran on the athletics track of an athletics stadium with a gravel surface. They started the test from the starting position from the place with the sound signal. The running time was 12 min. Based on the length of the distance covered, the approximate amount of maximum oxygen intake VO2max (ml/kg/min) was calculated according to the formula: VO2max = (distance in meters – 504.9)/44.73 [24].
measurements of aerobic capacity Wingate testThe study used a 30-second version of the lower limb test on a Monark 824-E cycloergometer and the MCE V.2.0 computer program. Study participants were informed about how the test was performed. Before starting the test, they performed a 10-minute warm-up by pedaling on a cycloergometer at a frequency of 60 rpm with a load of 1.2 W/kg. Additionally, between 7 and 10 minutes of riding they performed three 5-second, rapid accelerations. The interval between the warm-up and the Wingate test lasted 10 minutes. At that time, the subjects performed stretching and loosening exercises for the muscles of the upper and lower extremities. The attempt began with a verbal "start" command and consisted of reaching the maximum pace of pedaling as soon as possible and maintaining it for the longest possible time within 30 seconds. After completing the test, the subject continued pedaling for one minute with a load of 0.5 W/kg and a frequency of 60/min, and then rested in the supine position for 4 minutes (to avoid orthostatic reaction) [25, 26].
anthropometric measurements The measurements were taken in the laboratory in the morning. The subjects did not participate in training or any physical activity at least 24 hours before the measurement. On the day preceding the study, a uniform, easily digestible diet was recommended that did not burden the body. Time from eating the last meal was a minimum of 2 hours. Participants were informed about the method of measurement and its purpose.
Baltic Journal of Health and Physical Activity 2019; 11 (4): 47-57e-ISSN 2080-9999

50www.balticsportscience.com
Baltic Journal of Health and Physical Activity 2014; 1(1): 1-4Journal of Gdansk University of Physical Education and Sporte-ISSN 2080-9999
statistical analysis Statistical analysis was performed using Statistica version 13.3 (Tulsa, OK, USA, 2016). Statistical inference began by checking compliance with the normal distribution at 95% confidence using the Shapiro-Wilk test. The significance of differences between subsequent tests was checked using analysis of variance for repeated measurements (ANOVA). To indicate which results differ from each other, Tukey's post-hoc reasonably significant difference (RIR) test was used. Feature correlation was demonstrated by calculating the Pearson linear correlation coefficient. Values of r ≥ |0.5| were considered significant. The strength of compounds was assessed according to the scale: r < 0.3 weak correlation; 0.30 ≤ r ≤ 0.60 moderate correlation; r > 0.60 strong correlation. The differences were defined as statistically significant for p < 0.05 [28].
results The level of aerobic capacity of soccer players in a three-year training cycle, determined by the PWC170 index, can be considered stable. Only between the third and fourth measurements a statistically significant difference was observed in the average values of this indicator. Its lowest value x̄ = 13.7 ±3.38 kgm/kg/min was calculated in the fourth series of tests and the highest one in the second x̄ = 18.9 ±4.44 kgm/kg/min (Fig. 1).
1 2 3 4 5 6 7 8 9
Consecutive tests
6
8
10
12
14
16
18
20
22
24
26
28
PW
C17
0 [K
gm/k
g/m
in]
*3-4
Median 25%-75% Min-Max
Fig. 1. Quarter deviations and range of PWC170 results in soccer players in a 3-year training cycle
*statistically significant differences at p < 0.05)
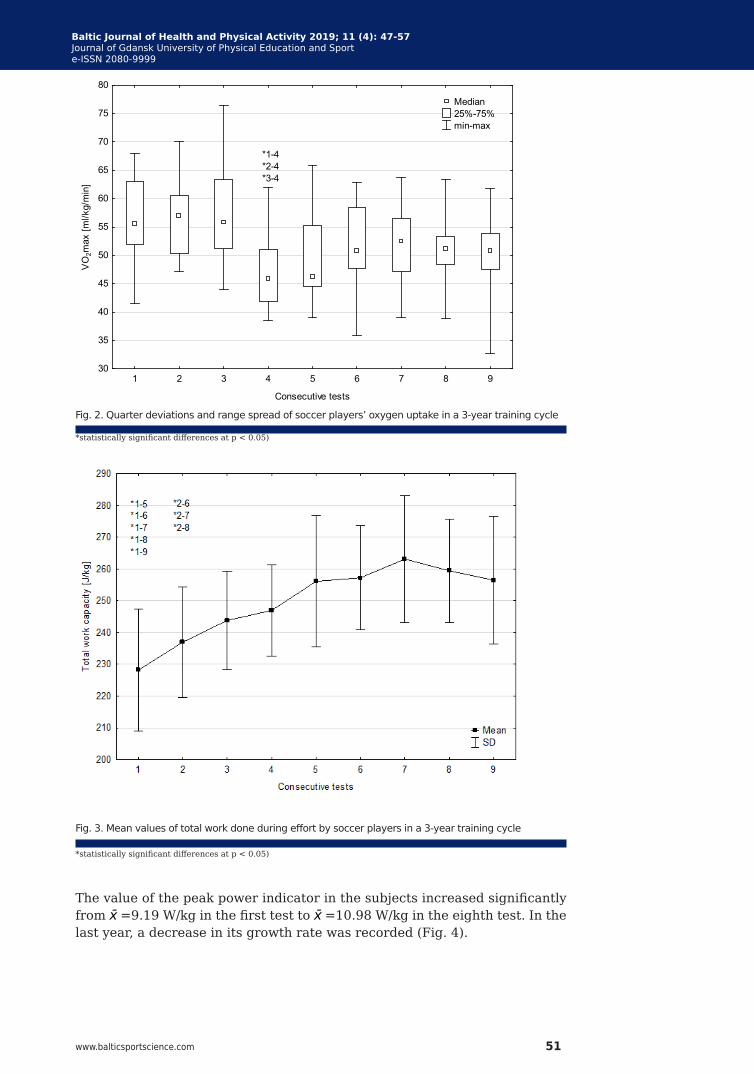
In terms of the VO2max index, statistically significant differences were observed only in the first year of football training. Its value was the lowest in the fourth x̄ =47.3 ±7.05 ml/kg/min and the highest in the second series of tests x̄ =56.1 ±7.06 ml/kg/min (Fig. 2).
The biggest improvement in the rate of work done for young soccer players was observed in the first year of training. For the other study dates, the differences in results were statistically significant. In the first study, the participants obtained the lowest value of work x̄ =228.2 J/kg and the highest in the seventh one x̄ =263.2 J/kg (Fig. 3).
Konieczna A, Radzimiński L, Paszulewicz J, Lopez-Sanchez GF, Dragos P, Jastrzębski Z.Physical capacity and body composition in 13–16-year-old soccer playersBalt J Health Phys Act. 2019;11(4):47-57
51www.balticsportscience.com
Baltic Journal of Health and Physical Activity 2014; 1(1): 1-4Journal of Gdansk University of Physical Education and Sporte-ISSN 2080-9999
1 2 3 4 5 6 7 8 9
Consecutive tests
30
35
40
45
50
55
60
65
70
75
80V
O2m
ax [m
l/kg/
min
]
Median 25%-75% min-max
*1-4 *2-4 *3-4
Fig. 2. Quarter deviations and range spread of soccer players’ oxygen uptake in a 3-year training cycle
*statistically significant differences at p < 0.05)
Fig. 3. Mean values of total work done during effort by soccer players in a 3-year training cycle
*statistically significant differences at p < 0.05)
The value of the peak power indicator in the subjects increased significantly from x̄ =9.19 W/kg in the first test to x̄ =10.98 W/kg in the eighth test. In the last year, a decrease in its growth rate was recorded (Fig. 4).
Baltic Journal of Health and Physical Activity 2019; 11 (4): 47-57Journal of Gdansk University of Physical Education and Sporte-ISSN 2080-9999

52www.balticsportscience.com
Baltic Journal of Health and Physical Activity 2014; 1(1): 1-4Journal of Gdansk University of Physical Education and Sporte-ISSN 2080-9999
Fig. 4. Mean values of peak power in soccer players in a 3-year training cycle
*statistically significant differences at p < 0.05)
Table 1. The percentage of fat mass and mean active muscle mass values in soccer players over a 3-year training period
Parameter Statistical Year I Year II Year III
Test I Test II Test III Test IV Test V Test VI Test VII Test VIII Test IX
% FM x̄ 9.4*1-3 8.7 7.2*3-4 9.7 8.7 9.2 8.9 8.9 8.5
SD 1.92 2.31 2.12 2.25 2.24 2.04 2.87 2.65 3.11
FFM [kg] x̄ 41.8*1-,6,7,8,9 44.0*2-,6,7,8,9 46.0*3-8,9 46.4*4-8,9 50.0 50.4 51.4 54.3 55.2
SD 5.89 5.68 5.94 5.65 5.72 5.64 5.60 5.31 6.79
* statistically significant differences at p < 0.05
Based on the analysis of correlation of the FM index (%) and the indicators of aerobic and anaerobic fitness in athletes, only a moderate, positive relationship with J/kg in the last year of their training was demonstrated (r = 0.50). In contrast, the mass of active tissue (FFM) in the subjects' body positively correlated with anaerobic capacity indices, increasing the strength of the compound over time (r = 0.70 for total work and r = 0.57 and r = 0.79 for maximal power). There was no significant relationship between this somatic parameter and the aerobic capacity expressed as PWC170 index, and the oxygen uptake (Table 2).
Table 2. Correlation coefficient values defining the dependence of fat and active mass parameters on selected capacity and fitness indicators at the end of each of the three years of training of young soccer players
VariableFM [%] FFM [kg]
Test I Test II Test III Test I Test II Test III
Physical capacity
PWC170 [kgm/kg/min] 0.03 -0.01 0.45 -0.12 0.41 0.38
VO2max [ml/kg/min] 0.17 0.12 -0.24 -0.22 -0.30 -0.46
Wt [J/kg] 0.05 -0.01 0.50* 0.44 0.41 0.70*
Pmax [W/kg] 0.10 -0.13 0.32 0.57* 0.57* 0.79*
Konieczna A, Radzimiński L, Paszulewicz J, Lopez-Sanchez GF, Dragos P, Jastrzębski Z.Physical capacity and body composition in 13–16-year-old soccer playersBalt J Health Phys Act. 2019;11(4):47-57

53www.balticsportscience.com
Baltic Journal of Health and Physical Activity 2014; 1(1): 1-4Journal of Gdansk University of Physical Education and Sporte-ISSN 2080-9999
discussion Long-term studies of the exercise capacity of young soccer players are rarely described in the literature. Our research concerned a three-year training period in a group of 13–16-year-old soccer players. Based on the results of the study, it can be concluded that the discussed oxygen performance of the players did not change significantly, and the greatest improvement in results was observed in the range of their maximal power. This could probably be a result of both the training loads used and the significant increase in their active muscle mass.
Considering the changes in the VO2max in relation to body weight, we observed stable levels of our competitors. These results are consistent with Malina et al. [29] which in longitudinal studies showed that the relative values of VO2max (mL/kg/min) in boys reaches a maximum at around 8 years of age and remain relatively stable during puberty [30]. The lack of significant differences in the VO2max level is in this case related to an increase in the subjects’ body weight during puberty [29, 31, 32]. Welsman et al. [31] report that in boys aged 8–18 years this indicator is at the level of 48 to 50 ml/kg/min. In the soccer players we examined, the values were similar at the beginning of the three-year training period and higher at the end (from 47.3 ±7.05 to 56.9 ±8.76 ml/kg/min). It was probably a result of relatively high training loads to which the players observed by us were subjected (8 training units per week). For comparison, the value of the VO2max index of leading European soccer players is even higher and amounts to 55–67 ml/kg/min [33]. However, Ekblom [34] report that 60–65 ml/kg/min is a sufficient value to play at an international level.
PWC170 discussed by us is another indicator characterizing the level of aerobic fitness. The players in our study obtained similar relative values as the group of footballers - youngsters (17.1 ±3.65 kgm/kg/min), but lower than the cadets (19.0 ±2.47 kgm/kg/min), juniors (18.3 ±2.51 kgm/kg/min) or seniors (20.7 ±2.89 kgm/kg/min) tested by Jastrzębski et al. [35].
According to Inbar and Bar-Or [36] in contrast to the relative values of VO2max, indicators of anaerobic capacity (maximal power and total work) recorded during the Wingate test show a steady increase in males during childhood with a rapid increase during puberty. It is associated, among others, with the development of muscle tissue under the influence of sex hormones of a maturing organism. Further weight gain causes inhibition of the relative growth rate [36]. Similar results were obtained by Cempla and Bawelski [37], showing a rapid, over 15% increase in the maximal power (Pmax) in boys aged 12 to 13 years. Also Nikolaidis [38] gives significantly lower Pmax values for boys at the lower stage of adolescence.
In the discussed three-year period of football training, the soccer players examined by us obtained similar maximal power values to Greek players 9.56 ±0.68 W/kg tested by Nikolaidis [38]. Bar-Or and Rowland [39] explain the low power values obtained by children as the likely effect of low muscle mass per unit body weight, as well as worse glycolytic abilities and immature neuromuscular coordination. These factors weaken during adolescence and disappear during adulthood. In our research, however, in the last year of training, a reduction in the value of the total work index (J/kg) in the Wingate test was observed. This could have been the result of changes in the intensity and volume of training loads towards aerobic exercises.
Baltic Journal of Health and Physical Activity 2019; 11 (4): 47-57Journal of Gdansk University of Physical Education and Sporte-ISSN 2080-9999

54www.balticsportscience.com
Baltic Journal of Health and Physical Activity 2014; 1(1): 1-4Journal of Gdansk University of Physical Education and Sporte-ISSN 2080-9999
During adolescence, in addition to physiological changes, there are also structural changes in the human body. The values of the percentage of body fat in the footballers we examined during the three years of observation are from 7.2 ±2.12% to 9.7 ±2.25%, with lower values recorded at the end of each annual training cycle than at the beginning of the annual cycles, after the summer break.
There were large discrepancies in FAT (%) scores in youth playing soccer: from 10.6 ±1% to 13.6 ±1.2% in French footballers aged 11.5–18 years and from 15.8 ±3.75% to 16.61 ±5.22% in Greek footballers aged 13–16 years. In addition, among the studies there is no agreement as to the direction of changes in body fat content during the adolescent period. Both upward and downward trends were found here [40].
During the three-year training period in the studied soccer players, the amount of active mass, whose main component is the muscle tissue, was systematically increasing. Here the direction of changes was consistent throughout the research period. Probably, this was due to ontogenic development of the subjects. Nikolaidis and Karydis [40] showed a positive correlation between the subjects’ age and FFM in adolescent male soccer players aged 12-20 years. Carling and Orhant [20], on the other hand, showed a positive effect of training loads on the increase of active mass. Interestingly, they showed FFM increases between the beginning and the end of the season but no differences in this indicator across three consecutive seasons [20]. The obtained results of this indicator in the young footballers examined by us suggest that FFM increases both within one cycle and the entire three-year training period occurred as a result of both body development and applied training loads.
The best known relationships between physique and physical fitness relate to body fat. The authors agree that the adipose tissue has a strong negative impact on almost all football activities by treating adipose tissue as passive during activities where body mass must be lifted repeatedly against gravity [40–45]. Not only high values, but also a very low level of fatness associated with malnutrition negatively affects footballer's performance causing metabolic dysfunction [46, 47]. That is why it is necessary to look for the optimal fat condition, ensuring effective operation on the pitch [48]. However, with the growing problem of overweight and obesity in society, including children and adolescents, the stabilization of FM at a low level is becoming a major problem in order to maintain a high level of football skills. In the footballers we examined, no statistically significant correlation was found between body fat (FM%) and aerobic fitness indexes (VO2max and PWC170), and the relationships were both positive and negative. Probably it was associated with low body fat levels. Nikolaidis [41] showed a negative effect of body fat on aerobic power (r = -0.21, p = 0.029) in Greek soccer players aged 16–18 years. The weak impact of body fat on the aerobic fitness of young footballers is also confirmed by Fragoso et al. [49]. The authors noticed differences in the correlation of fatness with VO2max. In turn, Till et al. [50] suggest a significant effect of the adipose tissue on VO2max, while Mustelin et al. [51] did not show a relationship between these variables. In our studies, there were no statistically significant correlations of active mass (FFM) with indicators of aerobic fitness. Since these relationships are usually negative, it can be assumed that the increase in muscle mass may have had a significant impact on the level of the VO2max relative to body weight.
Konieczna A, Radzimiński L, Paszulewicz J, Lopez-Sanchez GF, Dragos P, Jastrzębski Z.Physical capacity and body composition in 13–16-year-old soccer playersBalt J Health Phys Act. 2019;11(4):47-57

55www.balticsportscience.com
Baltic Journal of Health and Physical Activity 2014; 1(1): 1-4Journal of Gdansk University of Physical Education and Sporte-ISSN 2080-9999
During the three-year study period, no significant correlation was found between the subjects’ body fat content and anaerobic fitness indicators, with one exception for the total work in the Wingate test (r = 0.50, p < 0.05). This is probably due to the low level of body fat throughout the study period. Nikolaidis [41] showed a negative relationship between BF% and Pmax in 16–18-year-old footballers (r = -0.20, p = 0.044). Maciejczyk et al. [49] confirm such relationships by examining groups of athletes with similar BMI but different tissue composition (BF/lean BM). The authors showed a negative effect of body fat on Pmax.
While the adipose tissue is passive, power generation depends primarily on muscle tissue, which is the main component of active mass (FFM). Therefore, in our studies, the results of young footballers showed significant positive correlations between the size of active tissue (FFM) and the results of the Wingate test throughout the study period, and this relationship was most strongly observed at the age of 16. This is probably a result of increased growth of muscle mass during puberty [53]. Similar correlations were demonstrated by Nikolaidis [38] in the Ppeak obtained in the Wingate (WanT) test with fat free mass (r = 0.94, p, 0.001, R2 = 0.88) in adolescent soccer players. Positive correlations between these indicators are also confirmed by Malina and Bielicki [30] and Falk and Bar-Ora [54].
The results of this study concerned a three-year training period of 13–16-years-old soccer players. From the sport education point of view, this age is particularly important due to the maturation process. Furthermore, the level of aerobic and anaerobic capacity and technical-tactical skills achieved by the players at this time is similar to adults. Current research shows the changes of the physiological and anthropometric parameters in this crucial period. Although, longitudinal projects are always very demanding to the participants and researchers, the results of such studies may be very applicable for coaches working with young players.
conclusions 1. In young football players, during a three-year training period, aerobic
fitness expressed in absolute terms increased during the adolescence, while relatively to body weight it remained unchanged.
2. A significant increase in young players’ anaerobic capacity was observed during the three-year period of football training.
3. The body fat percentage of soccer players was subject to fluctuations with a changeable direction, and the lean mass systematically increased.
4. There were no significant correlations between the indicators of aerobic fitness with the amount of fat and lean mass of the examined players, and the level of their anaerobic capacity did not show a relationship with fat tissue but significantly positively correlated with their active mass.
references [1] Hoff J. Training and testing physical capacities for elite soccer players. J Sports Sci. 2005;23:573-82.
https://doi.org/10.1080/02640410400021252[2] Reilly T. Energetics of high-intensity exercise (soccer) with particular reference to fatigue. J Sport
Sci. 1997;15:257-263. https://doi.org/10.1080/026404197367263[3] Stolen T, Chamari K, Castagna C, Wisloff U. Physiology of soccer: An update. Sports Med 2005;35(6):501-
536. https://doi.org/10.2165/00007256-200535060-00004[4] Helgerud J, Engen LC, Wisloff U, Hoff J. Aerobic endurance training improves soccer performance.
Med Sci Sports Exerc. 2001;33(11):1925-1931. https://doi.org/10.1097/00005768-200111000-00019
Baltic Journal of Health and Physical Activity 2019; 11 (4): 47-57Journal of Gdansk University of Physical Education and Sporte-ISSN 2080-9999

56www.balticsportscience.com
Baltic Journal of Health and Physical Activity 2014; 1(1): 1-4Journal of Gdansk University of Physical Education and Sporte-ISSN 2080-9999
[5] da Silva A, Ferreira AJ, Kaminagakura EI. Comparative analysis between maximum oxygen uptake and anthropometric profile in soccer players and referees. Arch Med Deporte 2014;31(3):165-169.
[6] Reilly T. Energetics of high-intensity exercise (soccer) with particular reference to fatigue. J Sport Sci. 1997;15:257-263. https://doi.org/10.1080/026404197367263
[7] Bangsbo J, Norregaard L, Thorsoe F. Activity profile of competition soccer. Can J Sport Sci. 1991;16:110-116.
[8] Ingebrigsten J, Dalen T, Hjelde GH, Wisloff U. Acceleration and sprinting profiles of a professional elite football team in match play. Eur J Sport Sci. 2015;15:101-110. https://doi.org/10.1080/17461391.2014.933879
[9] Rampinini E, Coutts AJ, Castagna C, Sassi R, Impellizzeri FM. Variation in top level soccer match performance. Int J Sports Med. 2007;28:1018-1024. https://doi.org/10.1055/s-2007-965158
[10] Vigne G, Gaudino C, Rogowski I, Alloati G, Hautier C. Activity profile in elite Italian soccer team. Int J Sports Med. 2003;31:304-310. https://doi.org/10.1055/s-0030-1248320
[11] Faude O, Koch T, Meyer T. Straight sprinting is the most frequent action in goal situations in professional soccer. J Sports Sci. 2012;30:625-631. https://doi.org/10.1080/02640414.2012.665940
[12] Haugen T, Tonnenssen E, Hisdal J, Seiler S. The role and development of sprinting speed in soccer. Int J Sports Physio Perform. 2014;9:432-441. https://doi.org/10.1123/ijspp.2013-0121
[13] Gil S, Gil J, Irazusta A, Ruiz F, Irazusta J. Anthropometric and physiological profile of successful young soccer players. In: Science and Football V. In: ReilyT, Cabri J, Araujo D, editors. The Proceedings of the fifth World Congress on Science and Football. Abingdon, UK: Routledge, Taylor and Francis Group; 2005, 434-441.
[14] Reilly T. Physiological Profile of the Player. In: Orejan J, editor. Football (Soccer). Oxford, USA: Blackwell Scientific Publications; 1994, 78-94.
[15] Bangsbo J, Krustrup P, Mohr M. Physical capacity of high-level soccer players in relation to playing position. J Sports Sci. 2004;22(6):523-524
[16] Ostojic SM. Changes in Body Fat Content of Top-Level Soccer Players. J Sports Sci Med 2002;01:54-55.[17] Rienzi E, Drust B, Reilly T, Carter JEL, Martin A. Investigation of anthropometric and work-rate profiles
of elite South American international soccer players. J Sports Med Phys Fitness. 2000;40(2):162-169.[18] Mills C, Croix MDS, Cooper SM. The importance of measuring body composition in professional
football players: A commentary. Sport Exerc Med Open J. 2017;3(1):24-29. https://doi.org/10.17140/SEMOJ-3-144
[19] Carling C, Orhant E. Variation in body composition in professional soccer players: interseasonal and intraseasonal changes and the effects of exposure time and player position. J Strength Cond Res. 2010; 24(5):1332-1339. https://doi.org/10.1519/JSC.0b013e3181cc6154
[20] Willmore JH. Body composition in sport and exercise: Directions for future research. Med Sci Sports Exerc. 1983;15(1):21-31. https://doi.org/10.1249/00005768-198315010-00007
[21] Leao C, Camoes M, Clemente FM, Nikolaidis PT, Lima R, Bezerra P, Rosemann T, Knechtle B. Anthropometric profile of soccer players as a determinant of position specificity and methodological issues of body composition estimation. Int J Environ Res Public Health. 2019; 16(13):2386. https://doi.org/10.3390/ijerph16132386
[22] Halicka-Ambroziak H, Jusiak R, Martyn A, Opaszowski B, Szarska I, Tyszkiewicz M, Wit B. Wskazowki do cwiczeń z fizjologii dla studentow wychowania fizycznego [Tips for exercises in physiology for students of Physical Education]. Warszawa: Wydawnictwo Uczelniane AWF; 1983. Polish.
[23] Jastrzebski Z. Kontrola treningu w piłce ręcznej [Training control in handball]. Gdansk: Wydawnictwo Uczelniane AWFiS; 2004. Polish.
[24] Cooper KH. Bewegungstraining. Frankfurt: Fisher Verlag; 1978. German.[25] Bar-Or O. Le test anaerobic de Wingate, caracteristiques et applications. Symbioses FRANCE, 1981;
3:157-172. French.[26] Jastrzebski Z. Proba okreslenia norm dla wybranych wskaznikow mechanicznych w tescie Wingate u
pilkarzy noznych [Determining of the norms of the chosen Wingate test mechanical indexes for football players]. In: Trening sportowy na przelomie wiekow [Sports training at the turn of the centuries] Warszawa: Wydawnictwo AWF; 2002. Polish.
[27] Bergman P, Janusz A. Bioelektryczna metoda okreslania składu ciała czlowieka [Bioelectric method of body composition analysis]. In: Biologia populacji ludzkich wspolczesnych i pradziejowych [Biology of contemporary and ancient populations] Słupsk: WSP; 1992. Polish.
[28] Stanisz A. Przystępny kurs statystyki z zastosowaniem STATISTICA PL na przykladach z medycyny [The accessible course in Statistica with the use of STATISTICA PL based on the medical examples] Kraków: StatSoft; 2006. Polish.
[29] Malina RM, Bouchard C, Bar-Or O. Growth, Maturation and Physical Activity. Champaign, Illinois: Human Kinetics; 2004.
[30] Malina RM, Bielicki T. Growth and maturation of boys active in sports: longitudinal observations from Wroclaw growth study. Ped Exerc Sci. 1992;4(1):68-77. https://doi.org/10.1123/pes.4.1.68
[31] Welsman JR, Armstrong N, Kirby BJ, Nevill AM, Winter EM. Scaling Peak VO2 for differences for body size. Med. Sci Sports Exerc. 1996;28:259-265. https://doi.org/10.1097/00005768-199602000-00016
[32] Williams J, Armstrong N, Crichton N, Winter E. Changes in peak oxygen uptake with age and sexual maturation in boys: Physiological fact or statistical anomaly. In: Coudert J, Van Praagh E, editors. Children and Exercise XVI. Paris: Masson; 1992, 35-37.
[33] Hoff J, Helgerud J. Endurance and Strength Training for Soccer Players. Physiological Considerations. J Sports Med. 2004;34(3):165-180. https://doi.org/10.2165/00007256-200434030-00003
Konieczna A, Radzimiński L, Paszulewicz J, Lopez-Sanchez GF, Dragos P, Jastrzębski Z.Physical capacity and body composition in 13–16-year-old soccer playersBalt J Health Phys Act. 2019;11(4):47-57

57www.balticsportscience.com
Baltic Journal of Health and Physical Activity 2014; 1(1): 1-4Journal of Gdansk University of Physical Education and Sporte-ISSN 2080-9999
[34] Ekblom B. Applied physiology of soccer. Sports Med. 1986;3:50-60. https://doi.org/10.2165/00007256-198603010-00005
[35] Jastrzębski Z, Szutowicz M, Ziemnicka M. Analiza wskaźników wydolności fizycznej u piłkarzy nożnych różnych grup wiekowych [Analysis of physical capacity in soccer players of different age groups]. Trener. 2001;4:16-21. Polish.
[36] Inbar O, Bar-Or O. Anaerobic characteristics in male children and adolescents. Med Sci Sports Exerc. 1986;18:264-9. https://doi.org/10.1249/00005768-198606000-00002
[37] Cempla J, Bawelski M. Rozwojowe zmiany wskaźnika obrazującego relację beztlenowej do tlenowej mocy wysiłku [Maturation related changes of anaerobic to aerobic power ratio]. Antropomotoryka. 1998;18:49-56.
[38] Nikolaidis PT. Anaerobic power across adolescence in soccer players. Human Movement. 2011;12(4):342-347. https://doi.org/10.2478/v10038-011-0039-1
[39] Bar-Or O, Rowland TW. Pediatric Exercise Medicine. Champaign: Human Kinetics; 2004.[40] Nikolaidis PT, Karydis NV. Physique and body composition in soccer players across adolescence.
Asian J Sports Med. 2011;2(6):75-82. https://doi.org/10.5812/asjsm.34782[41] Nikolaidis PT. Physical fitness is inversely related with body mass index and body fat percentage in
soccer players aged 16-18 years. Med Pregl. 2012 Nov-Dec;65(11-12):470-5. https://doi.org/10.2298/MPNS1212470N
[42] Rienzi E, Drust B, Reilly T. Carter JE, Martin A. Investigation of anthropometric and work-rate profiles of elite South American international soccer players. J Sports Med Phys Fitness. 2000;40:162-9.
[43] Żebrowska A, Żyła D, Kania D, Langfort J. Anaerobic and aerobic performance of elite female and male snowboarders. J Hum Kinet. 2012;34:81-88. https://doi.org/10.2478/v10078-012-0066-9
[44] Żebrowska A, Gąsior Z, Langfort J. Serum IGF-I and hormonal responses to incremental exercise in athletes with and without left ventricular hypertrophy. J Sport Sci Med. 2009;8:67-76.
[45] Żebrowska A, Hall B, Kochańska-Dziurowicz A, Janikowska G. The effects of high intensity physical exercise and hypoxia on glycemia, angiogenic biomarkers, and cardiorespiratory function in patients with type 1 diabetes. Adv Clin Exp Med. 2018;27(2):207-216. https://doi.org/10.17219/acem/66354
[46] Stewart AD. Athletic morphology: approaches and limitations using dual C-ray absorptiometry and anthropometry. In: Marfell-Jones M, Stewart A, Olds T. editors. Kinanthropometry IX. Proceeding of the 9th International Conference of the International Society for the Advancement of Kinanthropometry. Univerity of South Australia: Routledge; 2006, 53-63.
[47] le Gall F, Carling C, Williams M, Reilly T. Anthropometric and fitness characteristics of international, professional and amateur graduate soccer players from an elite youth academy. J Sci Med Sport. 2010;13(1):90-95. https://doi.org/10.1016/j.jsams.2008.07.004
[48] Mills C, Croix MDS, Cooper SM. The importance of Measuring Body Composition in Professional Football Players: A Commentary. Sport Exerc Med Open J. 2017;3(1):24-29. https://doi.org/10.17140/SEMOJ-3-144
[49] Fragoso I, Vieira F, Canto L, Mil-Homens P, Capela C, Oliveira N, Barroso A, Oliveira A. The importance of chronological and maturational age on the strength and speed of soccer players during adolescence. In: Reilly T, Cabri J, Araujo D, editors. Sciences and Football V. The proceedings of the Fifth World Congress on Sciences and Football. London: Routledge; Taylor and Francis Group; 2005, 429-433.
[50] Till K, Cobley S, O'Hara J, Brightmore A, Cooke C, Chapman C. Using anthropometric and performance characteristics to predict selection in junior UK Rugby League players. J Sci Med Sport. 2011;14:264-269. https://doi.org/10.1016/j.jsams.2011.01.006
[51] Mustelin L, Latvala A, Pietilainen KH, Piirila P, Sovijarvi AR, Kujala UM, Rissanen A, Kaprio J. Associations between sports participation, cardiorespiratory fitness, and adiposity in young adult twins. J Appl Physiol. 2011;110: 681-686. https://doi.org/10.1152/japplphysiol.00753.2010
[52] Maciejczyk M, Więcek M, Szymura J, Szygula Z, Brown LE. Influence of Increased Body Mass and Body Composition on Cycling Anaerobic Power. J Strength Cond Res. 2015;29(1):58-65. https://doi.org/10.1519/JSC.0000000000000727
[53] Reilly T, Bangsbo J, Franks A. Anthropometric and physiological predispositions for elite soccer. J Sports Sci. 2000;18:669-683. https://doi.org/10.1080/02640410050120050
[54] Falk B, Bar-Or O. Longitudinal changes in peak aerobic and anaerobic mechanical power of circumpubertal boys. Ped Exerc Sci. 1993;5(4):318-31. https://doi.org/10.1123/pes.5.4.318
Cite this article as: Konieczna A, Radzimiński L, Paszulewicz J, Lopez-Sanchez GF, Dragos P, Jastrzębski Z.Physical capacity and body composition in 13–16-year-old soccer players during three-year training cycleBalt J Health Phys Act. 2019;11(4):47-57doi: 10.29359/BJHPA.11.4.06
Baltic Journal of Health and Physical Activity 2019; 11 (4): 47-57Journal of Gdansk University of Physical Education and Sporte-ISSN 2080-9999