Phenolic profiles of andean mashua ( Tropaeolum tuberosum Ruíz & Pavón) tubers: Identification by...
14
Analytical, Nutritional and Clinical Methods Phenolic profiles of andean mashua (Tropaeolum tuberosum Ruı ´z & Pavo ´ n) tubers: Identification by HPLC-DAD and evaluation of their antioxidant activity Rosana Chirinos a,b , David Campos a, * , Nora Costa a , Carlos Arbizu c , Romina Pedreschi a,1 , Yvan Larondelle b a Instituto de Biotecnologı ´a (IBT), Universidad Nacional Agraria La Molina – UNALM, Av. La Molina s/n, Lima 12, Peru b Unite ´ de Biochimie de la Nutrition, Institut des Sciences de la Vie & Universite ´ Catholique de Louvain, Croix du Sud 2, Bte 8, B-1348 Louvain-La-Neuve, Belgium c International Potato Center, Av. La Molina s/n, Lima 12, Peru Received 16 January 2007; received in revised form 19 May 2007; accepted 12 July 2007 Abstract Qualitative high performance liquid chromatography with diode array detection (HPLC-DAD) was performed to characterize non- anthocyanin phenolic compounds in three different coloured mashua genotypes. The ORAC antioxidant activity contribution in the tubers related to the type of phenolic compounds present was also evaluated. Phenolic compounds were analysed by separating them into four main fractions: fraction I obtained by means of a liquid–liquid partition with ethyl acetate and fractions II, III and IV obtained by elution on a Sephadex LH-20 column. Fraction I revealed the presence of gallic acid, gallocatechin, procyanidin B 2 and epigalloca- techin. Other phenolic compounds such as hydroxycinnamic and hydroxybenzoic acid derivatives, rutin and/or myricetin derivatives were also present in fraction I. Fraction II was mainly composed of epicatechin, hydroxycinnamic and hydroxybenzoic acid derivatives. Fraction III presented mainly anthocyanins for the purple coloured mashua tubers and rutin, hydroxycinnamic acid and hydroxybenzoic acid derivatives for the yellow coloured genotype. Fraction IV was composed of proanthocyanidins. Alkaline and acid hydrolysis of the different fractions revealed the presence of gallocatechin, epicatechin, p-coumaric acid, o-coumaric acid, cinnamic acid, protocatechuic acid, rutin and quercetin as the main phenolic moieties present. The proanthocyanidin fractions were the major contributors to the ORAC antioxidant activity of the mashua tubers for two of the three genotypes (34.7–39.2%). The results obtained in the present study confirm that mashua tubers constitute a promising source of antioxidant phenolics and could potentially be considered as a functional food with beneficial health effects. Ó 2007 Elsevier Ltd. All rights reserved. Keywords: Mashua; Tropaeolum tuberosum Ruı ´z & Pavo ´n; Phenolic profiles; Proanthocyanidins; HPLC-DAD; Sephadex LH-20 chromatography; Liquid–liquid partition; Antioxidant properties 1. Introduction Mashua (Tropaeolum tuberosum Ruı ´z & Pavo ´n) is an indigenous Andean edible tuber cultivated for centuries from Venezuela to Argentina. Peru is generally believed to be the largest Andean producer. These tubers present a marked diversity in morphology and colour, which varies from cream to dark purple. Mashua diets are reputed to have beneficial health effects. Folk medicinal use of mashua claims, among others, health improvements related to kid- ney and liver pain, skin eczemas, and prostate disorders (Grau, Nieto, & Hermann, 2003). Health promoting 0308-8146/$ - see front matter Ó 2007 Elsevier Ltd. All rights reserved. doi:10.1016/j.foodchem.2007.07.024 * Corresponding author. Tel./fax: +511 3495642. E-mail address: [email protected] (D. Campos). 1 Present address: Katholieke Universiteit Leuven, Belgium. www.elsevier.com/locate/foodchem Food Chemistry 106 (2008) 1285–1298 Food Chemistry
-
Upload
independent -
Category
Documents
-
view
1 -
download
0
Transcript of Phenolic profiles of andean mashua ( Tropaeolum tuberosum Ruíz & Pavón) tubers: Identification by...

www.elsevier.com/locate/foodchem
Food Chemistry 106 (2008) 1285–1298
FoodChemistry
Analytical, Nutritional and Clinical Methods
Phenolic profiles of andean mashua (Tropaeolum tuberosumRuız & Pavon) tubers: Identification by HPLC-DAD and evaluation
of their antioxidant activity
Rosana Chirinos a,b, David Campos a,*, Nora Costa a, Carlos Arbizu c,Romina Pedreschi a,1, Yvan Larondelle b
a Instituto de Biotecnologıa (IBT), Universidad Nacional Agraria La Molina – UNALM, Av. La Molina s/n, Lima 12, Perub Unite de Biochimie de la Nutrition, Institut des Sciences de la Vie & Universite Catholique de Louvain, Croix du Sud 2,
Bte 8, B-1348 Louvain-La-Neuve, Belgiumc International Potato Center, Av. La Molina s/n, Lima 12, Peru
Received 16 January 2007; received in revised form 19 May 2007; accepted 12 July 2007
Abstract
Qualitative high performance liquid chromatography with diode array detection (HPLC-DAD) was performed to characterize non-anthocyanin phenolic compounds in three different coloured mashua genotypes. The ORAC antioxidant activity contribution in thetubers related to the type of phenolic compounds present was also evaluated. Phenolic compounds were analysed by separating theminto four main fractions: fraction I obtained by means of a liquid–liquid partition with ethyl acetate and fractions II, III and IV obtainedby elution on a Sephadex LH-20 column. Fraction I revealed the presence of gallic acid, gallocatechin, procyanidin B2 and epigalloca-techin. Other phenolic compounds such as hydroxycinnamic and hydroxybenzoic acid derivatives, rutin and/or myricetin derivativeswere also present in fraction I. Fraction II was mainly composed of epicatechin, hydroxycinnamic and hydroxybenzoic acid derivatives.Fraction III presented mainly anthocyanins for the purple coloured mashua tubers and rutin, hydroxycinnamic acid and hydroxybenzoicacid derivatives for the yellow coloured genotype. Fraction IV was composed of proanthocyanidins. Alkaline and acid hydrolysis of thedifferent fractions revealed the presence of gallocatechin, epicatechin, p-coumaric acid, o-coumaric acid, cinnamic acid, protocatechuicacid, rutin and quercetin as the main phenolic moieties present. The proanthocyanidin fractions were the major contributors to theORAC antioxidant activity of the mashua tubers for two of the three genotypes (34.7–39.2%). The results obtained in the present studyconfirm that mashua tubers constitute a promising source of antioxidant phenolics and could potentially be considered as a functionalfood with beneficial health effects.� 2007 Elsevier Ltd. All rights reserved.
Keywords: Mashua; Tropaeolum tuberosum Ruız & Pavon; Phenolic profiles; Proanthocyanidins; HPLC-DAD; Sephadex LH-20 chromatography;Liquid–liquid partition; Antioxidant properties
1. Introduction
Mashua (Tropaeolum tuberosum Ruız & Pavon) is anindigenous Andean edible tuber cultivated for centuries
0308-8146/$ - see front matter � 2007 Elsevier Ltd. All rights reserved.
doi:10.1016/j.foodchem.2007.07.024
* Corresponding author. Tel./fax: +511 3495642.E-mail address: [email protected] (D. Campos).
1 Present address: Katholieke Universiteit Leuven, Belgium.
from Venezuela to Argentina. Peru is generally believedto be the largest Andean producer. These tubers presenta marked diversity in morphology and colour, which variesfrom cream to dark purple. Mashua diets are reputed tohave beneficial health effects. Folk medicinal use of mashuaclaims, among others, health improvements related to kid-ney and liver pain, skin eczemas, and prostate disorders(Grau, Nieto, & Hermann, 2003). Health promoting

1286 R. Chirinos et al. / Food Chemistry 106 (2008) 1285–1298
properties of mashua tubers may be related to the presenceof antioxidant phenolic compounds (Campos et al., 2006;Chirinos et al., 2007).
A recent study aiming at comparing the antioxidantpotential of certain Andean crops including coloured pota-toes, olluco and oca showed that mashua tubers presentedthe highest antioxidant activity (Campos et al., 2006). Evenmore, purple coloured mashua tubers presented eight toten times higher antioxidant activity than the yellow col-oured mashua tubers. This higher antioxidant activitywas suspected to be correlated with the high anthocyanincontent. Later, Chirinos et al. (2006) found that anthocya-nins from mashua were the major contributors to the totalantioxidant activity for only one of the three purple mas-hua tubers, suggesting that other phenolics present areplaying a major role in the antioxidant power of mashuatubers. The major anthocyanins found in the different mas-hua genotypes were delphinidin di- and tri-glycosides acyl-ated with acetic acid. Cyanidins and pelargonidins werealso found in minor quantities.
Phenolic compounds are important antioxidants,because of their high redox potentials. They act as reducingagents, hydrogen donors, singlet oxygen quenchers and asmetal chelating agents (Tsao & Deng, 2004). Health-relatedeffects of phenolic compounds such as antibacterial (Ezo-ubeiri et al., 2005; Proestos, Boziaris, Nychas, & Komaitis,2004), antimutagenic (Pedreschi & Cisneros-Zevallos,2007), anticarcinogenic (Kahkonen & Heinonen, 2003;Loo, 2003), antithrombotic and vasodilatory activities(Cook & Samman, 1996; Wang, Cao, & Prior, 1997) havebeen reported. The cited beneficial effects have been relatedto their antioxidant properties. The number, type and con-centration of phenolics in plants exhibit extreme diversity.Phenolic compounds vary in structure: hydroxybenzoicand hydroxycinnamic acids have a single-ring structurewhile flavonoids comprise three ring structures and canbe further classified into anthocyanins, flavan 3-ols, flav-ones, flavanones and flavonols. Some flavonoids such asflavan 3-ols can be found in the form of dimers, trimersand polymers (Tsao & Deng, 2004). In plants, phenolicsmainly occur as glycosylated forms through o-glycosidicbonds with a number of different sugars such as glucose,galactose, rhamnose, arabinose, xylose and rutinose (Juste-sen, Knuthsen, & Leth, 1998). In addition, phenolic com-pounds also present acylations with phenolic or aliphaticacids, which complicates the identification task.
High performance liquid chromatography (HPLC) isthe method of choice for the analysis of phenolic com-pounds, because of its versatility, precision and relativelylow cost (Parejo, Viladomat, Bastida, & Codina, 2004;Robards, 2003). Most frequently, reversed-phase (RP)C18 columns, a binary solvent system containing acidifiedwater and a polar organic solvent (acetonitrile or metha-nol) and UV–Vis diode array detection (DAD) are usedand so far constitute a crucial and reliable tool in the rou-tine analysis of plant phenolic compounds (Naczk & Shah-idi, 2004). However, the complexity of the phenolic
mixtures present in plant materials requires a preliminaryclean-up and fractionation of the crude extracts (Prior,Lazarus, Cao, Muccitelli, & Hammerstone, 2004; Robards,2003;Rodriguez-Saona & Wrolstad, 2001; Sun, Leandro,da Silva, & Spranger, 1998). In addition, phenolic extractsrequire in many cases a hydrolysis pre-treatment, although,significant phenolic losses may occur due to decompositionof some phenolic compounds (Robards, 2003; Sakakibara,Honda, Nakagawa, Ashida, & Kanazawa, 2003).
To our knowledge, the nature and/or concentration ofnon-anthocyanin phenolic compounds present in mashuatubers have not been reported yet. Since the phenolic com-pounds are most likely involved in the health-related prop-erties associated with this tuber, their characterisation isundoubtedly an absolute requirement. In that framework,the objectives of this study were (1) to identify and quantifythe main non-anthocyanin phenolic compounds present inthree different coloured mashua genotypes using HPLC-DAD and (2) to evaluate the contribution of the differentphenolic fractions to the ORAC antioxidant activity ofthe mashua tubers.
2. Materials and methods
2.1. Sample material
Three different coloured mashua (Tropaeolum tubero-
sum, Ruız&Pavon) genotypes: ARB 5241 (peel/flesh, pur-ple/yellow), DP 0224 (peel/flesh, purple/purple) and ARB5576 (peel/flesh, yellow/yellow) were selected with the pur-pose of evaluating if differences in colour have an influencein their respective phenolic profiles. The genotypes werekindly provided by the International Potato Center (CIP,Lima, Peru) in May 2005. Mashua tubers were harvestedat 7.5 months of maturity stage (full maturity). Harvestedtubers were immediately lyophilised and stored at �20 �C.
2.2. Reagents and standards
Trolox (6-hydroxy-2,5,7,8-tetramethyl chroman-2-car-boxylic acid), fluorescein sodium salt, 2 N Folin–Ciocalteureagent, and q-dimethylaminocinnamaldehyde (DMACA)were purchased from Sigma Chemicals Co. (St. Louis,MO); 2,20-aziobis (2-amidinopropane) dihydrochloride(AAPH) was purchased from WAKO Chemicals Industries(Orokama, Japon). Phenolic acids (p-coumaric, o-couma-ric, protocatechuic, ferulic, gallic, caffeic, chlorogenic, p-hydroxybenzoic), flavonols (quercetin, rutin, myricetin,kaempherol), flavones (chrysin) and flavanones (naringe-nin) were purchased from Sigma Chemicals Co. (St. Louis,MO). Flavan 3-ols (cathechin, epicathechin, gallocathe-chin, epigallocatechin gallate) and procyanidins (procyani-din B1 and B2) were purchased from ChromaDexTM (SantaClara, CA). Sugar standards (D-glucose, L-rhamnose, D-galactose) and organic acids (malic, fumaric, acetic) werepurchased from Sigma Chemicals Co. (St. Louis, MO).HPLC-grade acetonitrile and other solvents and reagents
R. Chirinos et al. / Food Chemistry 106 (2008) 1285–1298 1287
were purchased from Merck (Darmstadt, Germany). Silicagel 60 F254 plates from Merck (Darmstadt, Germany) wereused in the separation and identification of sugars by thinlayer chromatography.
2.3. Sample preparation
Approximately 5.0 g of lyophilised mashua sample wasplaced in a screw-cap vial wrapped with aluminum foil andextracted with 300 ml of 0.1% HCl in a solvent mixture(MeOH/acetone/water, 45/45/10, v/v/v). The mixture wasvortexed and flushed with nitrogen for 3 min. The vial wasallowed to stand in a water bath at room temperature for60 min under agitation (200 rpm). Then, the extract was cen-trifuged at 27,000g for 10 min at 4 �C and the supernatantwas collected. The pellet was submitted to a second extractionof 15 min with 150 ml of solvent mixture. The supernatantswere combined and evaporated in a rotary evaporator at38 �C. The residue was diluted with acidified water (0.01%HCl, v/v) for later phenolic fractionation and identification.
2.4. Fractionation of phenolic extracts
Three different approaches were used for the fraction-ation of phenolic compounds from mashua: solid-phaseextraction (SPE) using a C18 Sep-pak cartridge (10 g,35 cc, Waters, Milford, MA, USA) (Rodriguez-Saona &Wrolstad, 2001), liquid–liquid partition with ethyl acetate(Kennedy, 2002) and Sephadex LH-20 (Sigma, St. Louis,MO) column chromatography (Prior et al., 2004). Twentyfive milliliter of extract were passed through a C18 Sep-pakcartridge previously activated with methanol and acidifiedwater (0.01% HCl). Phenolics were adsorbed onto the col-umn. Sugars, acids, and other polar compounds wereeluted with 70 ml of acidified water (0.01% HCl). The phe-nolic fraction was then eluted with 100 ml of acidifiedmethanol (0.01% HCl). The methanol was then removedunder vacuum (38 �C), and the residue was re-dissolvedin 8 ml of Milli-Q water and referred to as purified mashuaextract. Six ml of the purified mashua extract were submit-ted to a partition with 12 ml of ethyl acetate. Partitionincluded a 20 min agitation (200 rpm) under darkness.Then, the mixture was let to stand until two phases wereobserved and the organic phase was collected. A secondpartition was performed under the same conditions. Theorganic phases were assembled and evaporated to dryness.This fraction is referred to as fraction I. The remainingaqueous phase was lyophilised and then dissolved in 6 mlof 20% methanol. Two ml of this obtained extract were fur-ther applied on a Sephadex LH-20 column (470 � 15 mmi.d.). Elution was carried out with 120 ml of 20% metha-nol/water (v/v) followed by 400 ml of 60% methanol/water(v/v) and finally by 600 ml of 60% acetone/water (v/v) at aflow rate of 1 ml/min. This fractionation process wasrepeated three times. The three eluates were collected sepa-rately for antioxidant activity evaluation and phenolicsidentification. These fractions are referred to as fraction
II, fraction III and fraction IV and were concentratedunder vacuum (38 �C) and then freeze-dried. At a laterstage, part of freeze-dried fractions was re-resuspended inHPLC-grade methanol for HPLC-DAD analysis. All frac-tions obtained were flushed with nitrogen and were storedat �20 �C until analyses. Total recoveries of phenolic com-pounds and ORAC antioxidant activity were calculatedbased on the basis of a mass balance. Percentage recoverywas obtained by taking into account the initial phenolicand ORAC values of the sample submitted to the fraction-ation process and the obtained phenolic and ORAC valuesin each fraction.
2.5. Alkaline and acid hydrolysis of phenolic fractions
The fractions obtained as described above were saponi-fied following the protocol used by Llorach, Gil-Izquierdo,Ferreres, and Tomas-Barberan (2003). The purpose of thisprocedure was to release acyl groups potentially present onthe phenolic compounds. Hydrolysis was performed byadding 1 ml 4 N NaOH per mg of dried fraction and themixture was kept for 16 h in a screw-cap test tube, undera nitrogen atmosphere. Concentrated HCl was added (yel-low colour change, pH 1.0) to the alkaline hydrolysis prod-uct and the resulting mixture was directly analysed byHPLC-DAD.
The fractions were acid-hydrolysed following the proto-col proposed by Hertog, Holman, and Venema (1992). A20 mg sample of dried fraction was hydrolysed using 5 mlof a 50% methanol acidified solution (1.2 M HCl) for 2 hat 90 �C. The solution was then adjusted to a final volumeof 15 ml with 50% methanol and was cooled to room tem-perature. The purpose of this step was to release sugar mol-ecules from the phenolic compounds.
2.6. HPLC-DAD analysis of phenolic compounds
The phenolic compound profiles were determinedaccording to the procedure proposed by Tsao and Yang(2003), with slight modifications. The purified phenolicextracts or fractions, treated or not with acid or basic solu-tions, as described above, were separated using a reversed-phase HPLC column on a Waters 2695 Separation Module(Waters, Milford, MA) equipped with an autoinjector, a996 photodiode array detector (DAD) and the Empowersoftware. Spectral data were recorded from 200 to 700nm during the whole run. An X-terra RP18 (5 lm,250 � 4.6 mm) column (Waters, Milford, MA) and a4.6 mm � 2.0 mm guard column were used for phenolicseparation at 30 �C. The mobile phase was composed ofsolvent (A) water:acetic acid (94:6, v/v, pH 2.27) and sol-vent (B) acetonitrile. The solvent gradient was as follows:0–15% B in 40 min, 15–45% B in 45 min, and 45–100% Bin 10 min. A flow rate of 0.5 ml/min was used and 20 llof sample were injected. Samples and mobile phases werefiltered through a 0.22 lm Millipore filter, type GV (Milli-pore, Bedford, MA) prior to HPLC injection. Each extract/

1288 R. Chirinos et al. / Food Chemistry 106 (2008) 1285–1298
fraction was analysed in triplicate. Phenolic compoundswere identified and quantified by comparing their retentiontime and UV–visible spectral data to known previouslyinjected standards.
2.7. Study of the hydrolysis products (organic acids andsugars)
The organic acids released after alkaline hydrolysis weredetermined by HPLC-DAD according to the methodologyproposed by Cawthray (2003). Organic acids were sepa-rated through reversed-phase HPLC on a Waters 2695 Sep-aration Module equipped with an autoinjector, a 996photodiode array detector (DAD) and the Empower soft-ware. Spectral data from 190 to 400 nm were recorded dur-ing the whole run. An AtlantisTM C18 (5 lm, 150 � 4.6 mm)column (Waters, Milford, MA) and a 4.6 mm � 2.0 mmguard column were used at 30 �C. The mobile phase con-sisted of 93% 25 mM KH2PO4 adjusted to pH 2.5 with con-centrated ortho-phosporic acid and 7% methanol. A flowrate of 1 ml/min for 30 min was used and 20 ll of samplewere injected. Detection of organic acids was recorded at210 nm. Each hydrolyzate was analysed in triplicate.
The sugars released after acid hydrolysis were evaluatedby qualitative TLC analysis according to the methodologyproposed by Toba and Adachi (1978). A small amount(5 ll) of concentrated hydrolysate was applied to the silicagel 60 F254 plates. Sugars were separated using propa-nol:water (85:15, v/v) as solvent. The presence of separatedsugars was detected by submerging the prepared TLCplates in diphenylamine–aniline–phosphate revealing solu-tion. Sugars were identified by comparing their Rf valuesto known sugar standards run in parallel.
2.8. Oxygen radical absorbance capacity (ORAC) assay
The hydrophilic antioxidant activity of the purified mas-hua extracts and their fractions were determined using theORAC assay. ORAC analyses were performed in a 96-wellmicroplate fluorometer (Ascent F.L. Fluoroscan, Labsys-tem, Finland) and were adapted from the proceduresdescribed by Ou, Hampsch-Woodill, and Prior (2001)Huang, Ou, Hampsch-Woodill, Flanagan, and Prior(2002). AAPH, a water-soluble azo compound, was usedas a peroxyl radical generator. Trolox, a water solubletocopherol analogue, was used as the standard and fluores-cein as a fluorescent probe. Fluorescence filters were usedfor an excitation wavelength of 485 nm and an emissionwavelength of 520 nm. Briefly, 25 ll of PBS buffer pH 7.4(blank), Trolox standard or diluted sample in PBS bufferat pH 7.4 were mixed with 250 ll of 55 nM fluoresceinand incubated for 10 min at 37 �C before automatic injec-tion of 25 ll AAPH solution (153 nM). Fluorescence wasmeasured every minute for 50 min. The final ORAC valueswere calculated using the net area under the decay curvesand were expressed as lmol of Trolox Equivalents (TE)/gmashua fresh weight (FW).
2.9. Determination of total phenolics
Total phenolics in purified mashua extracts and theirfractions were determined with the Folin–Ciocalteu reagentby the method of Singleton and Rossi (1965) using gallicacid as a standard. Absorbance was measured at 755 nmand the results were expressed as mg gallic acid equivalents(GAE)/100 g mashua FW.
2.10. Statistical analysis
Quantitative data are presented as mean values with therespective standard deviation values corresponding to threereplicates. Antioxidant capacity, total phenolic and totalflavan 3-ol results were processed by the one-way analysisof variance (ANOVA). A Duncan test was used to deter-mine significant differences. Differences at p < 0.05 wereconsidered as significant. SPSS for Windows 14.0 (SPSS,Chicago, IL, USA) was used for all statistical tests.
3. Results and discussion
3.1. Phenolic profiles of mashua extracts
Phenolic profiles at 280 nm for the three mashua geno-types evaluated are presented in Fig. 1. HPLC-DAD pro-files for the purple mashua genotypes ARB 5241 and DP0224 contained roughly the same type of phenolic com-pounds, even though differences in concentration of eachindividual compound were observed (data not shown). Inboth genotypes, anthocyanins (referred to as ‘‘A” inFig. 1) appeared to be the main phenolics present. The yel-low mashua genotype ARB 5576 presented a slightly differ-ent phenolic profile in comparison to the purple colouredmashua genotypes. An almost total absence of peaks withretention times from 31 to 50 min (mashua anthocyaninretention time) was observed. Peaks in the retention timerange from 51 to 62 min characterised the phenolic profilefor this genotype.
We introduced a phenolic fractionation step for themashua extracts in order to facilitate the identification ofthe phenolic compounds and to evaluate the ORAC anti-oxidant activity associated with each fraction. The frac-tionation method performed yielded four fractions(referred to as fractions I, II, III and IV) which were charac-terised at 280,320,360 and 520 nm to allow a tentativeidentification of the predominant phenolic compounds(Table 1). The chromatograms obtained at 280 nm for eachfraction of the ARB 5241 and ARB 5576 mashua geno-types are shown in Fig. 2a and b, respectively. Data regard-ing the DP 0224 genotype are not shown, because of theirsimilarity to the ARB 5241 genotype.
3.1.1. Fraction I analysisPhenolics from fraction I were obtained using ethyl ace-
tate in a liquid–liquid partition. The use of this method hasbeen proposed in many studies (Kennedy, 2002; Krasteva,

Fig. 1. HPLC-DAD phenolic profiles for the three mashua genotypes recorded at 280 nm. (p/y) purple peel/yellow flesh, (p/p) purple peel/purple flesh,(y/y) yellow peel/yellow flesh. A: anthocyanin.
R. Chirinos et al. / Food Chemistry 106 (2008) 1285–1298 1289
Nikolova, Danchev, & Nikolov, 2004; Pedreschi & Cisner-os-Zevallos, 2007). Krasteva et al. (2004) mentioned thatthe affinity of flavonols for ethyl acetate is due to theirhydrophobic character, whereas Kennedy (2002) pointedout that removal of monomeric flavan 3-ols is possible withliquid–liquid extraction using ethyl acetate. Flavonols andphenolic acids from purple corn were recovered using ethylacetate (Pedreschi & Cisneros-Zevallos, 2007).
The HPLC chromatograms recorded at 280 nm for frac-tions I for the ARB 5241 and ARB 5576 mashua genotypesare shown in Fig. 2a and b. In both chromatograms we candistinguish a whole set of different compounds, which werenot observed in the initial extracts, possibly due to a co-elu-tion of phenolic compounds during the initial separation.Fractions I contained a variety of different phenolic com-pounds such, as flavan 3-ols, phenolic acids and flavonols(Table 1). Peaks 1,2,5,7–9,13,16–18, 20,22 and 25–26 werecommon to all mashua genotypes, whereas peaks 27–36were present only in the yellow coloured mashua genotype.Peaks identified in fractions I corresponded to gallic acid(peak 1), gallocatechin (peak 2), epigallocatechin (peak 5)
and procyanidin B2 (peak 9). Identification was based onretention times and UV–Vis spectral data compared to pre-viously injected known standards. The major not identifiedphenolics in this fraction showed UV–Vis spectral charac-teristics similar to phenolic acids such as o-coumaric acid,p-coumaric acid, p-hydroxybenzoic acid and cinnamicacids, flavan 3-ols such as epicatechin, gallocatechin andepigallocatechin and flavonols such as rutin and myricetin.
In order to obtain additional information on the glyco-sylation and acylation patterns, basic and acid hydrolysisprocesses were performed. After alkaline hydrolysis, thechromatographic profiles for fractions I showed that peaks1,2,5,20 and 24 remained constant, whereas peaks 3,4,6–19, 21–23, and 25–27 for the purple coloured mashuagenotypes and peaks 7–9,13,16–18,22,25–37 for the yellowcoloured mashua genotype disappeared with the subse-quent appearance of new peaks. The new appearing peaksdid not correspond to any of the well-known standards butdisplayed similar UV–Vis spectral characteristics than theinitial phenolics found in the fractions I (data not shown).Disappearance of phenolics after basic hydrolysis indicated
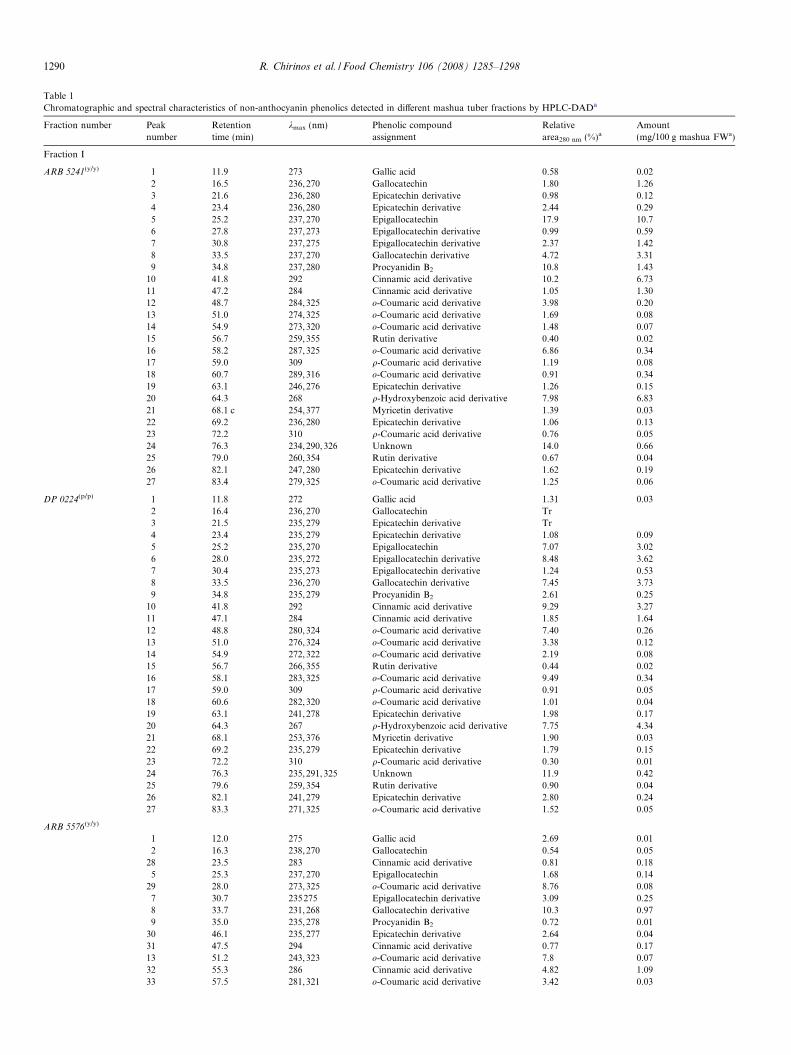
Table 1
Chromatographic and spectral characteristics of non-anthocyanin phenolics detected in different mashua tuber fractions by HPLC-DADa
Fraction number Peak
number
Retention
time (min)
kmax (nm) Phenolic compound
assignment
Relative
area280 nm (%)aAmount
(mg/100 g mashua FWa)
Fraction I
ARB 5241(y/y) 1 11.9 273 Gallic acid 0.58 0.02
2 16.5 236,270 Gallocatechin 1.80 1.26
3 21.6 236,280 Epicatechin derivative 0.98 0.12
4 23.4 236,280 Epicatechin derivative 2.44 0.29
5 25.2 237,270 Epigallocatechin 17.9 10.7
6 27.8 237,273 Epigallocatechin derivative 0.99 0.59
7 30.8 237,275 Epigallocatechin derivative 2.37 1.42
8 33.5 237,270 Gallocatechin derivative 4.72 3.31
9 34.8 237,280 Procyanidin B2 10.8 1.43
10 41.8 292 Cinnamic acid derivative 10.2 6.73
11 47.2 284 Cinnamic acid derivative 1.05 1.30
12 48.7 284,325 o-Coumaric acid derivative 3.98 0.20
13 51.0 274,325 o-Coumaric acid derivative 1.69 0.08
14 54.9 273,320 o-Coumaric acid derivative 1.48 0.07
15 56.7 259,355 Rutin derivative 0.40 0.02
16 58.2 287,325 o-Coumaric acid derivative 6.86 0.34
17 59.0 309 q-Coumaric acid derivative 1.19 0.08
18 60.7 289,316 o-Coumaric acid derivative 0.91 0.34
19 63.1 246,276 Epicatechin derivative 1.26 0.15
20 64.3 268 q-Hydroxybenzoic acid derivative 7.98 6.83
21 68.1 c 254,377 Myricetin derivative 1.39 0.03
22 69.2 236,280 Epicatechin derivative 1.06 0.13
23 72.2 310 q-Coumaric acid derivative 0.76 0.05
24 76.3 234,290,326 Unknown 14.0 0.66
25 79.0 260,354 Rutin derivative 0.67 0.04
26 82.1 247,280 Epicatechin derivative 1.62 0.19
27 83.4 279,325 o-Coumaric acid derivative 1.25 0.06
DP 0224(p/p) 1 11.8 272 Gallic acid 1.31 0.03
2 16.4 236,270 Gallocatechin Tr
3 21.5 235,279 Epicatechin derivative Tr
4 23.4 235,279 Epicatechin derivative 1.08 0.09
5 25.2 235,270 Epigallocatechin 7.07 3.02
6 28.0 235,272 Epigallocatechin derivative 8.48 3.62
7 30.4 235,273 Epigallocatechin derivative 1.24 0.53
8 33.5 236,270 Gallocatechin derivative 7.45 3.73
9 34.8 235,279 Procyanidin B2 2.61 0.25
10 41.8 292 Cinnamic acid derivative 9.29 3.27
11 47.1 284 Cinnamic acid derivative 1.85 1.64
12 48.8 280,324 o-Coumaric acid derivative 7.40 0.26
13 51.0 276,324 o-Coumaric acid derivative 3.38 0.12
14 54.9 272,322 o-Coumaric acid derivative 2.19 0.08
15 56.7 266,355 Rutin derivative 0.44 0.02
16 58.1 283,325 o-Coumaric acid derivative 9.49 0.34
17 59.0 309 q-Coumaric acid derivative 0.91 0.05
18 60.6 282,320 o-Coumaric acid derivative 1.01 0.04
19 63.1 241,278 Epicatechin derivative 1.98 0.17
20 64.3 267 q-Hydroxybenzoic acid derivative 7.75 4.34
21 68.1 253,376 Myricetin derivative 1.90 0.03
22 69.2 235,279 Epicatechin derivative 1.79 0.15
23 72.2 310 q-Coumaric acid derivative 0.30 0.01
24 76.3 235,291,325 Unknown 11.9 0.42
25 79.6 259,354 Rutin derivative 0.90 0.04
26 82.1 241,279 Epicatechin derivative 2.80 0.24
27 83.3 271,325 o-Coumaric acid derivative 1.52 0.05
ARB 5576(y/y)
1 12.0 275 Gallic acid 2.69 0.01
2 16.3 238,270 Gallocatechin 0.54 0.05
28 23.5 283 Cinnamic acid derivative 0.81 0.18
5 25.3 237,270 Epigallocatechin 1.68 0.14
29 28.0 273,325 o-Coumaric acid derivative 8.76 0.08
7 30.7 235275 Epigallocatechin derivative 3.09 0.25
8 33.7 231,268 Gallocatechin derivative 10.3 0.97
9 35.0 235,278 Procyanidin B2 0.72 0.01
30 46.1 235,277 Epicatechin derivative 2.64 0.04
31 47.5 294 Cinnamic acid derivative 0.77 0.17
13 51.2 243,323 o-Coumaric acid derivative 7.8 0.07
32 55.3 286 Cinnamic acid derivative 4.82 1.09
33 57.5 281,321 o-Coumaric acid derivative 3.42 0.03
1290 R. Chirinos et al. / Food Chemistry 106 (2008) 1285–1298

Table 1 (continued)
Fraction number Peak
number
Retention
time (min)
kmax (nm) Phenolic compound
assignment
Relative
area280 nm (%)aAmount
(mg/100 g mashua FWa)
16 58.5 271,325 o-Coumaric acid derivative 3.08 0.03
17 59.2 312 q-Coumaric acid derivative 3.42 0.04
18 60.3 278,313 o-Coumaric acid derivative 2.16 0.02
34 63.5 269 q-Hydroxybenzoic acid derivative 6.16 0.81
20 64.6 268 q-Hydroxybenzoic acid derivative 5.93 0.77
22 69.5 236,281 Epicatechin derivative 3.98 0.06
35 73.0 268 q-Hydroxybenzoic acid derivative 1.22 0.16
24 76.7 244,290,327 Unknown 11.1 0.10
25 78.1 259,370 Rutin derivative 1.58 0.02
36 79.9 259,369 Rutin derivative 1.69 0.02
26 82.4 236,280 Epicatechin derivative 2.21 0.04
37 83.6 241,277 Epicatechin derivative 1.31 0.02
Fraction II
ARB 5241 1 11.5 273 Gallic acid 5.23 0.43
10 17.8 284 Cinnamic acid derivative 1.86 0.26
20 18.2 294 q-Coumaric acid derivative 1.63 0.10
30 22.0 231,280 Epicatechin derivative 65.8 16.6
40 52.1 235,280 Epicatechin derivative Tr
50 61.0 253,276 Protocatechuic or vanillic acid derivativeb 23.6 3.65
60 63.0 252, 276 Protocatechuic or vanillic acid derivativeb 1.11 0.17
70 63.8 278 Cinnamic acid derivative Tr
80 67.2 255, 272 Protocatechuic or vanillic acid derivativeb 0.46 0.07
DP 0224 1 11.6 273 Gallic acid 4.71 0.35
10 17.8 281 Cinnamic acid derivative 1.45 0.35
20 18.2 292 q-Coumaric acid derivative 2.01 0.08
30 22.2 231,280 Epicatechin derivative 45.9 8.63
40 52.1 235,280 Epicatechin derivative 4.04 0.75
50 61.1 254,273 Protocatechuic or vanillic acid derivativeb 30.3 4.20
60 63.1 252, 277 Protocatechuic or vanillic acid derivativeb 2.46 0.34
70 63.8 278 Cinnamic acid derivative 4.13 0.66
80 67.7 236, 278 Protocatechuic or vanillic acid derivativeb 4.93 0.68
ARB 5576 90 10.8 274 Gallic acid derivative 17.6 0.33
1 11.4 272 Gallic acid 20.0 0.38
10 17.6 283 Cinnamic acid derivative 2.97 0.02
20 18.1 293 q-Coumaric acid derivative 3.96 0.06
30 22.0 235,280 Epicatechin derivative 17.9 1.14
100 51.7 285 Cinnamic acid derivative 3.78 0.07
110 54.2 254,273 Protocatechuic or vanillic acid derivativeb 2.99 0.10
50 69.8 254,274 Protocatechuic or vanillic acid derivativeb 21.6 0.75
120 62.8 253,274 Protocatechuic or vanillic acid derivativeb 2.77 0.10
70 63.6 279 Cinnamic acid derivative 4.84 0.04
Fraction III
ARB 5576 1 11.6 273 Gallic acid 26.6 0.46
100 22.3 230,280 Epicatechin derivative 11.0 5.53
200 30.4 294,321 o-Coumaric acid derivative 12.5 1.51
300 53.7 251,277 Protocatechuic acid derivative 5.17 0.17
400 55.8 252,274 Protocatechuic acid derivative 14.3 0.47
500 58.2 256,352 Rutin derivative 6.75 0.53
600 58.7 256, 356 Rutin derivative 7.15 0.54
700 63.5 256,355 Rutin derivative 16.5 1.29
Fraction IV
ARB 5241 Peak detected at the end of the chromatogram
DP 0224 Peak detected at the end of the chromatogram
ARB 5576 Peak detected at the end of the chromatogram
a Mean of three repetitions.b Quantified as protocatechuic acid. (p/y) purple peel/yellow flesh, (p/p) purple peel/purple flesh, (y/y) yellow peel/yellow flesh. Tr: Traces. Flavan 3-ols and their derivatives
(epigallocatechin, gallocatechin, epicatechin and proanthocyanidin B2) and hydroxybenzoic acid derivatives (gallic acid, protocatechuic acid, p-hydroxybenzoic acid) were
quantified at 280 nm using their corresponding standard aglycon. Hydroxycinnamic acid derivatives (o-coumaric acid, q-coumaric acid, cinnamic acid) were quantified at
320 nm using their corresponding standard aglycon. Flavonol derivatives (myricetin and rutin) were quantified at 360 nm using their corresponding standard aglycon.
Unknown compounds were quantified as o-coumaric acid.
R. Chirinos et al. / Food Chemistry 106 (2008) 1285–1298 1291
the presence of acylations in their molecular structures. Thepresence of aliphatic acids (malic, fumaric and acetic) in thedifferent fractions could however not be detected by theHPLC method performed.
The acid hydrolysis showed that peaks 1,5,13 and 24remained constant, whereas peaks 2–4,6–23 and 25–27for the purple coloured mashua genotypes and peaks2,7–9,16–18,20–22,26–36 for the yellow coloured mashua

1292 R. Chirinos et al. / Food Chemistry 106 (2008) 1285–1298
genotype disappeared. Based on their UV–Vis spectral dataand their retention time, the appearance of gallocatechin,epicatechin, o-coumaric acid and quercetin was confirmedfor the yellow and purple coloured mashua fractions. Addi-tionally, myricetin, delphinidin and cyanidin were presentin the purple coloured mashua fractions. The other pro-duced peaks by hydrolysis could not be identified. Delphin-idin and cyanidin appeared as aglycones due to traces ofmashua anthocyanins in this fraction. Quercetin couldhave been formed from rutin (quercetin 3-o-rutinoside).Acid hydrolysis indicated that sugar molecules could beattached to phenolics in this fraction. Only the presence
Fig. 2. Chromatographic profiles at 280 nm for fractions I, II, III, and IVA: anthocyanin. The identification and quantification of the different peak nu
of released glucose was confirmed with the qualitativeTLC analysis of sugars in all genotypes (data not shown).
On the basis of the results of the acid and alkalinehydrolyses, the different peaks present in fraction I weretentatively identified as gallocatechin derivative (peak 8),epigallocatechin derivatives (peaks 3,4,6,7), epicatechinderivatives (peaks 3,4,19,22,26,29,36), o-coumaric acidderivatives (peaks 12–14, 16,18,27,28,33), p-coumaricderivatives (peaks 17, 23), cinnamic acid derivatives (peaks10,11,27,30,31), p-hydroxybenzoic acid derivatives (peaks20,33,34) myricetin derivatives (peak 21) and rutin deriva-tives (peaks 15,25,35). Finally, the total amount of flavan
obtained from ARB 5241 (a) and ARB 5576 (b) mashua genotypes.mbers is presented in Table 1.

Fig. 2 (continued)
R. Chirinos et al. / Food Chemistry 106 (2008) 1285–1298 1293
3-ols, hydroxycinnamic acids, hydroxybenzoic acids andflavonols for ARB 5241, DP 0224 and ARB 5576 geno-types were �18.1, 11.5 and 1.5,�9.2,5.8 and 1.9,�6.8, 4.3and 1.6 and �0.09, 0.09 and 0.04 mg/100 g FW, respec-tively (Table 1).
3.1.2. Fraction II analysis
The water-soluble phenolics of mashua tubers were sub-mitted to fractionation by means of a Sephadex LH-20 gelpermeation chromatography as described by Chirinos et al.(2006), Kantz and Singleton (1990) and Prior et al. (2004).The purpose of this step was the separation of these pheno-lic compounds and avoidance of interfering substances in
further analyses. Fraction II was obtained by means ofan elution with 20% MeOH/water (v/v). Prior et al.(2004) indicated the collection of phenolic acids with thiseluent. The HPLC chromatograms obtained at 280 nmfor fractions II of the ARB 5241 and ARB 5576 mashuagenotypes are shown in Fig. 2a and b. Fractions II wereindeed composed mainly by phenolic acids (Table 1). Atotal of nine (1 and, 10–80) and ten (1,10–30, 50, 70 and, 90–120) representative peaks were found for the purple and yel-low coloured mashua genotypes, respectively. Only gallicacid was identified in this fraction for all the genotypes.Small quantities of anthocyanins (A) were eluted in thisfraction in the case of the purple coloured mashua geno-

1294 R. Chirinos et al. / Food Chemistry 106 (2008) 1285–1298
types. Other phenolics in this fraction showed UV–Visspectral characteristics similar to epicatechin and phenolicacids, such as p-coumaric acid, protocatechuic or vanillicacid and cinnamic acid. Vanillic acid has similar UV spec-tral characteristics to protocatechuic acid and since thisstandard was not evaluated in this study, there is a possibil-ity of presence of vanillic acid in this fraction. Alkalinehydrolysis showed the disappearance of peaks 10, 20, 40–80
and appearance of new peaks. Peak 1 (gallic acid) and peak30 (epicatechin derivative) remained constant. The newpeaks that appeared after the alkaline hydrolysis did notcorrespond to any of the phenolic standards run butshowed UV–Vis spectral characteristics similar to the ini-tial phenolics found in the non-hydrolysed fraction II (datanot shown). No aliphatic acid was detected by the HPLCmethod used.
Acid hydrolysis yielded new peaks. None of the peaksobtained after the acid hydrolysis corresponded to the phe-nolic standards evaluated. Only gallic acid remained in thisfraction and peak 30 was slightly displaced to the left. Thepresence of released glucose in fractions II was confirmedwith the TLC analysis for all the genotypes (data notshown).
On the basis of the results of the acid and alkalinehydrolyses, the different peaks present in fraction II weretentatively identified as epicatechin derivatives (peaks30, 40), cinnamic acid derivatives (peaks 10, 70, 100), p-couma-ric acid derivatives (peaks 20), and protocatechuic or vanil-lic acid derivatives (peaks 50, 60, 80, 110, 120). The totalamount of flavan 3-ols, hydroxycinnamic and hydroxyben-zoic acids for the ARB 5241, DP 0224 and ARB 5576 geno-types were �16.6, 9.3 and 1.1,�0.3, 1.1 and 0.1 and�4.3,5.5 and 1.6 mg/100 g FW, respectively (Table 1).
3.1.3. Fraction III analysis
Fraction III was obtained by means of an elution with60% MeOH/water (v/v) during the sephadex LH-20 gelpermeation chromatography. Prior et al. (2004) recovereda high quantity of anthocyanins from blueberry and cran-berry (67–100%), as well as chlorogenic acid (92.8%) andrutin (72.0%) with this eluent. The HPLC chromatogramsobtained at 280 nm for fractions III corresponding to theARB 5241 and ARB5576 mashua genotypes are shown inFig. 2a and b. Fractions III for the purple coloured mashuagenotypes were composed mainly by anthocyanins (A).Identification of mashua anthocyanins has been performedin a previous study (Chirinos et al., 2006).
The chromatographic profiles for fraction III of the yel-low coloured mashua ARB 5576 genotype indicated thepresence of 8 predominant peaks (peaks 1 and 100–700). Peak1 corresponded to gallic acid detected in fraction II. TheUV–Vis spectral data for peaks 100–700 presented similarcharacteristics to epicatechin, o-coumaric acid, proto-catechuic acid and rutin (Table 1). Alkaline hydrolysisrevealed the presence of cinnamic acid and a rutin deriva-tive. Peaks 1,100 and 200 remained constant. Acid hydrolysisrevealed the presence of protocatechuic acid, quercetin and
one peak, which could not be identified. In summary, thedifferent peaks that appeared in fraction III for the yellowcoloured mashua genotype were tentatively identified as anepicatechin derivative (peak 100), an o-coumaric acid deriv-ative (peak 200), protocatechuic acid derivatives (peaks300, 400) and rutin derivatives (peaks 500–700). The totalamount of flavan 3-ols, hydroxycinnamic and hydroxyben-zoic acids and flavonols for ARB 5576 genotype were�5.5, 1.5,1.1 and 2.3/100 g FW, respectively (Table 1).
3.1.4. Fraction IV analysis
Recoveries of polymeric polyphenols corresponding toproanthocyanidins have been achieved using SephadexLH-20 gel permeation chromatography in different stud-ies (Kantz & Singleton, 1990; Kennedy, 2002; Prioret al., 2004; Skrede, Worlstad, & Durst, 2000). In thepresent work, fraction IV was eluted from the SephadexLH-20 column with 60% acetone/water (v/v). Under thesame conditions, Kantz and Singleton (1990) obtained aprocyanidin-rich fraction from grape tissue extracts.Accordingly, procyanidins from blueberry were recoveredfrom the Sephadex LH-20 column by eluting with 70%(v/v) aqueous acetone (Gu et al., 2002; Skrede et al.,2000). The use of 66% aqueous acetone to remove pro-anthocyanidins from various plant sources using a Toyo-pearl HW-40F column has also been recommended(Kennedy, 2002).
The chromatographic profiles for fractions IV showedabsence of representative peaks between retention timesfrom 10 to 85 min (Fig. 2a and b). A single peak appearedat the end of the chromatograms for all the mashua geno-types, indicating that the compounds of fraction IV arepoorly separated by means of reversed-phase HPLC andpresent thus lypophilic characteristics. Accordingly, Adam-son et al. (1999) indicated that the analysis of procyanidinsusing reversed-phase HPLC with UV detection at 280 nmis ineffective in separating the higher oligomers (>trimer)and as a result these compounds elute as a large unresolvedpeak. This peak does very likely correspond to a collectionof polymeric polyphenols belonging to the proanthocyani-din family. The proanthocyanidins are composed of mix-tures of oligomers and polymers containing flavan 3-olunits; among them the most common are the procyanidins,which consist exclusively of (epi)catechin and their gallicesters and of the prodelphinidins, which consist of (epi)gal-locatechin and their galloylated derivatives (Gu et al.,2002).
After alkaline hydrolysis of fraction IV, one representa-tive peak (peak 1000) was obtained for all the genotypes eval-uated (Fig. 3a1 and b1). Peak 1000 could not be identifiedwith any of the phenolic standards evaluated. However,this peak showed UV–Vis spectral data characteristics ofthe members of the flavan 3-ol phenolic family (kmax
239.4,275.2 nm). In a previously reported study, it wasshown that the conversion of proanthocyanidins fromgrape skin to known subunits (epigallocatechin, catechin)was associated to a dramatic degradation of proanthocy-
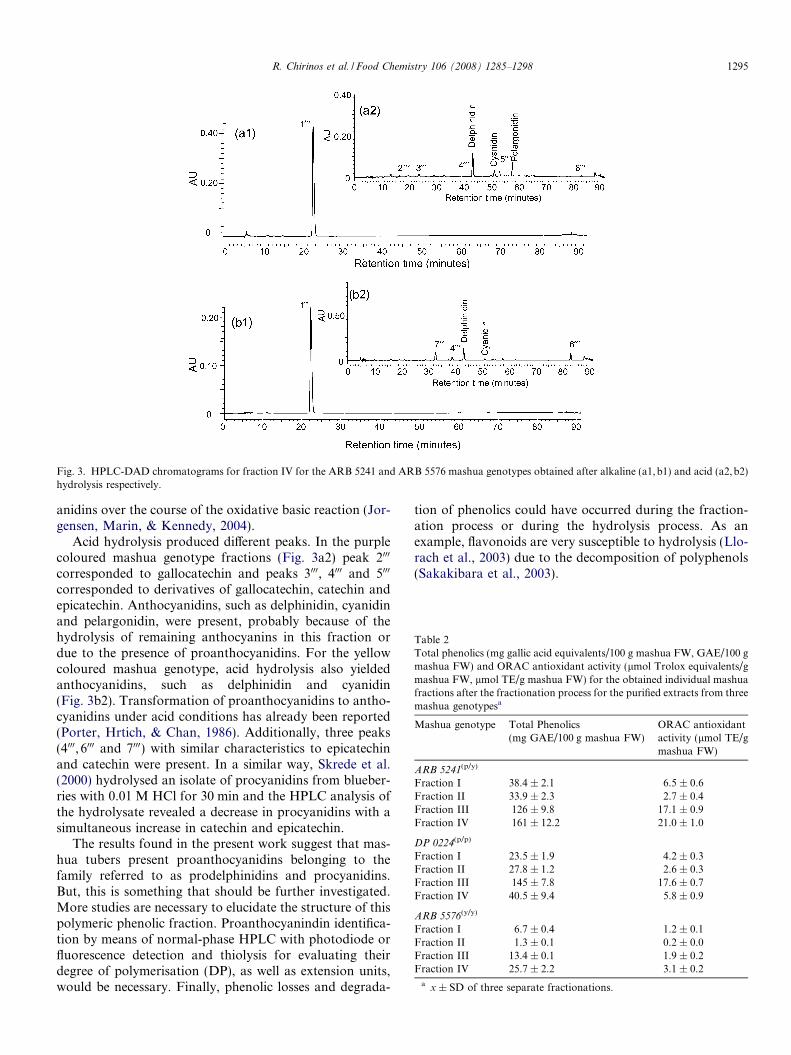
Table 2Total phenolics (mg gallic acid equivalents/100 g mashua FW, GAE/100 gmashua FW) and ORAC antioxidant activity (lmol Trolox equivalents/gmashua FW, lmol TE/g mashua FW) for the obtained individual mashuafractions after the fractionation process for the purified extracts from threemashua genotypesa
Mashua genotype Total Phenolics(mg GAE/100 g mashua FW)
ORAC antioxidantactivity (lmol TE/gmashua FW)
ARB 5241(p/y)
Fraction I 38.4 ± 2.1 6.5 ± 0.6Fraction II 33.9 ± 2.3 2.7 ± 0.4Fraction III 126 ± 9.8 17.1 ± 0.9Fraction IV 161 ± 12.2 21.0 ± 1.0
DP 0224(p/p)
Fraction I 23.5 ± 1.9 4.2 ± 0.3Fraction II 27.8 ± 1.2 2.6 ± 0.3Fraction III 145 ± 7.8 17.6 ± 0.7Fraction IV 40.5 ± 9.4 5.8 ± 0.9
ARB 5576(y/y)
Fraction I 6.7 ± 0.4 1.2 ± 0.1Fraction II 1.3 ± 0.1 0.2 ± 0.0Fraction III 13.4 ± 0.1 1.9 ± 0.2Fraction IV 25.7 ± 2.2 3.1 ± 0.2
a x ± SD of three separate fractionations.
Fig. 3. HPLC-DAD chromatograms for fraction IV for the ARB 5241 and ARB 5576 mashua genotypes obtained after alkaline (a1,b1) and acid (a2,b2)hydrolysis respectively.
R. Chirinos et al. / Food Chemistry 106 (2008) 1285–1298 1295
anidins over the course of the oxidative basic reaction (Jor-gensen, Marin, & Kennedy, 2004).
Acid hydrolysis produced different peaks. In the purplecoloured mashua genotype fractions (Fig. 3a2) peak 2000
corresponded to gallocatechin and peaks 3000, 4000 and 5000
corresponded to derivatives of gallocatechin, catechin andepicatechin. Anthocyanidins, such as delphinidin, cyanidinand pelargonidin, were present, probably because of thehydrolysis of remaining anthocyanins in this fraction ordue to the presence of proanthocyanidins. For the yellowcoloured mashua genotype, acid hydrolysis also yieldedanthocyanidins, such as delphinidin and cyanidin(Fig. 3b2). Transformation of proanthocyanidins to antho-cyanidins under acid conditions has already been reported(Porter, Hrtich, & Chan, 1986). Additionally, three peaks(4000, 6000 and 7000) with similar characteristics to epicatechinand catechin were present. In a similar way, Skrede et al.(2000) hydrolysed an isolate of procyanidins from blueber-ries with 0.01 M HCl for 30 min and the HPLC analysis ofthe hydrolysate revealed a decrease in procyanidins with asimultaneous increase in catechin and epicatechin.
The results found in the present work suggest that mas-hua tubers present proanthocyanidins belonging to thefamily referred to as prodelphinidins and procyanidins.But, this is something that should be further investigated.More studies are necessary to elucidate the structure of thispolymeric phenolic fraction. Proanthocyanindin identifica-tion by means of normal-phase HPLC with photodiode orfluorescence detection and thiolysis for evaluating theirdegree of polymerisation (DP), as well as extension units,would be necessary. Finally, phenolic losses and degrada-
tion of phenolics could have occurred during the fraction-ation process or during the hydrolysis process. As anexample, flavonoids are very susceptible to hydrolysis (Llo-rach et al., 2003) due to the decomposition of polyphenols(Sakakibara et al., 2003).

1296 R. Chirinos et al. / Food Chemistry 106 (2008) 1285–1298
3.2. Total phenolics and ORAC antioxidant activity of
mashua fractions
The total phenolic contents were 395, 262 and 52.2 mgGAE/100 g FW, respectively for the ARB 5241, DP 0224and ARB 5576 mashua genotypes. The purple colouredmashua genotypes presented 5 to 7-fold higher phenoliccontents as compared to the yellow coloured mashua geno-type. The total phenolic contents for the purple genotypesis in the same range as the contents reported for apples,cherries, plums, strawberry, broccoli and cabbages (211–347,339,366,368,284–286 and 203–321 mg GAE/100 gFW, respectively) (Wu et al., 2004), but higher than the val-ues found in grapes, beans, onions, potatoes and sweetpotatoes (145–175,96,74–126, 122–179 and 74–120 mgGAE/100 g FW, respectively) (Wu et al., 2004). MeanORAC antioxidant activities of 60.5,37.6 and 7.9 lmolTE/g FW were found for the ARB 5241, DP 0224 andARB 5576 genotypes, respectively. The highest ORAC
9.7 8.69.0 10.66.7
2.4
0
10
20
30
40
50
60
ARDPAR
10.7
4.4
11.27.0
14.6
2.6
0
10
20
30
40
50
60
Fr
9.7 8.69.0 10.66.7
2.4
0
10
20
30
40
50
60
Fraction I Fraction II
ARB 5241DP 0224ARB 5576
10.7
4.4
11.27.0
14.6
2.6
0
10
20
30
40
50
60
Fraction I Fraction II
Con
tribu
tion
to to
tal p
heno
lic c
onte
nt (%
)C
ontri
butio
n to
OR
AC a
ntio
xida
nt a
ctiv
ity (%
)
b
a
Fig. 4. Phenolic fraction contribution (%) to the total phenolics content (a) aValues above the bars indicate the contribution (%) of the individual phenolicvalues ± SD for three replicates.
value (60.5 lmol TE/g FW) is even higher than the valuesreported for blackberry, raspberry, strawberry, red cab-bage, red potato and sweet potato (52.4,47.6, 35.4,14.3,13.1 and 8.5 lmol TE/g FW, respectively). The highestORAC values were obtained for the ARB 5241 genotype,the same one that showed the highest total phenoliccontent.
The obtained values for total phenolics and ORAC anti-oxidant activity for each fraction after fractionation pro-cess of the purified mashua extracts are shown in Table 2.After fractionation, most of the phenolics were present infractions III (13.4–126.4 mg GAE/100 g FW) and fractionsIV (25.7–160.7 mg GAE/100 g FW). Minor quantities ofphenolics were found in fractions I and II. Fraction IIIfor genotype DP 0224 and fraction IV for the genotypesARB 5241 and ARB 5576 presented the highest contribu-tion to the total phenolics (55.4, 40.8 and 49.7%, respec-tively, Fig. 4a). Since the DP 0224 mashua genotype isthe one with the highest anthocyanin content (Campos
32
40.8
55.4
15.4
25.6
49.7
Fr Fraction IV
28.2
34.7
46.6
15.3
24.9
39.1
Fr Fr
32
40.8
55.4
15.4
25.6
49.7
Fraction III
28.2
34.7
46.6
15.3
24.9
39.1
Fraction III Fraction IV
nd to the total ORAC antioxidant activity (b) in purified mashua tuber.fractions for each one of the evaluated characteristics. Bars indicate mean
R. Chirinos et al. / Food Chemistry 106 (2008) 1285–1298 1297
et al., 2006; Chirinos et al., 2006) and considering that themashua anthocyanins are mainly recovered by means of a60% methanol/water mixture applied on the Sephadex LH-20 column (Chirinos et al., 2006), it is very likely that thehigher phenolic recovery in fraction III for DP 0224 geno-type is related to the high anthocyanin content. The HPLCprofile at 280 nm for fraction III (Fig. 2a) showed thatanthocyanins are the major phenolics present in this frac-tion. The presence of proanthocyanidins in fraction IV(HPLC analysis described above) could be related to thehighest values of phenolics in this fraction for the geno-types ARB 5241 and ARB 5576.
Fraction IV for the ARB 5576 and ARB 5241 genotypespresented the highest ORAC values (21.0 and 3.1 lmol TE/g FW) followed by fraction III (17.1 and 1.9 lmol TE/gFW), fraction I (6.5 and 1.2 lmol TE/g FW) and finallyby fraction II (2.7 and 0.2 lmol TE/g FW) (Table 2). TheDP 0224 mashua genotype presented the following orderin terms of ORAC values: fraction III (17.6 lmol TE/gFW) > fraction IV (5.8 lmol TE/g FW) > fraction I(4.2 lmol TE/g FW) > fraction II (2.6 lmol TE/g FW).In brief, fraction III for genotype DP 0224 and fractionIV for the genotypes ARB 5241 and ARB 5576 presentedthe highest contribution to the ORAC antioxidant activity46.6, 34.7 and 39.1%, respectively (Fig. 4b). Thus, themajor contribution to the ORAC antioxidant activityappears to be related to the proanthocyanidin content forthe ARB 5241 and ARB 5576 mashua genotypes and tophenolics belonging to the anthocyanin family for the DP0224 genotype. Interestingly, fraction III appeared as thesecond best contributor to the ORAC antioxidant activityfor the yellow coloured mashua genotype. This findingcould be related to the combined presence of flavonols(rutin type), flavan 3-ols (epicatechin type) and phenolicacids (o-coumaric, protocatechuic and gallic acid) (Table1) found in this fraction. Losses during the fractionationprocess for total phenolics and ORAC values were 8.9–9.7% and 18.2–21.8%, respectively.
The relationship between phenolic content and ORACantioxidant activity was determined in the four fractions.Fractions I, II, III and IV presented a good correlationcoefficient of 0.9983,0.9801,0.9891 and 0.9976, respec-tively, for ORAC values vs. phenolics. These results sug-gest that phenolic compounds were directly responsiblefor the ORAC antioxidant activity in all fractions. Theratios of antioxidant activity to phenolics (lmol TE/mgGAE) were in the range 16.9–17.9, 8.0–15.4,12.1–14.6 and12.1–14.3 for fractions I, II, III and IV, respectively. Valuesin the same range have been reported for catechin, epicat-echin, gallocatechin and gallic acid (20.5, 10.2,11.5, and4.26 lmol TE/mg) (Yilmaz & Toledo, 2004) and for quer-cetin 3-glucoside, myricetin 3-arabinoside and p-coumaricacid (13.4, 14.4 and 8.6 lmol TE/mg) (Zheng & Wang,2003). We have found values of 51.9, 47.7,35.4, 9.6, 27.7and 30.9 lmol TE/mg for the catechin, epicatechin, epigal-locatechin, gallic acid, rutin and quercetin standards,respectively.
4. Conclusions
In conclusion, this is the first study focused on the iden-tification and quantification of mashua non-anthocyaninphenolics. The compounds found in the different genotypesinvestigated were gallic acid, gallocatechin, epigallocate-chin, procyanidin B2 and epigallocatechin derivatives, dif-ferent hydroxycinnamic and hydroxybenzoic acidderivatives and rutin and/or myricetin derivatives. Differ-ences among genotypes were basically in the proportionof individual phenolics, as well as in the identity of minorpeaks. The sequential use of liquid–liquid partition usingethyl acetate and of chromatography using SephadexLH-20 was an efficient technique to fractionate mashuaphenolics and to purify mashua proanthocyanidins. Pro-anthocyanidins significantly contributed to the total anti-oxidant activity of the mashua tubers but other phenolicssuch as phenolic acids, flavan 3-ols monomers, flavonolsand anthocyanins are also contributors to the antioxidantcapacity of this tuber. Proanthocyanidins of mashua tubersshould thus be further studied.
Acknowledgements
The authors thank the International Potato Center(Lima, Peru) for providing the mashua genotypes. This re-search was supported by the CUI project of the BelgianCooperation Universitaire au Developpement (CUD, Bel-gium) and by the Consejo Nacional de Ciencia y Tec-nologıa (CONCYTEC, Peru).
References
Adamson, G. E., Lazarus, S. A., Mitchell, A. E., Prior, R. L., Cao, G.,Jacobs, P. H., et al. (1999). HPLC method for the quantificatin ofprocyanidins in cocoa and chocolate samples and correlation to totalantioxidant capacity. Journal of Agricultural and Food Chemistry, 47,4184–4188.
Campos, D., Noratto, G., Chirinos, R., Arbizu, C., Roca, W., & Cisneros-Zevallos, L. (2006). Antioxidant capacity and secondary metabolites infour species of andean tuber crops: Native potato (Solanum sp.),mashua (Tropaeolum tuberosum Ruiz&Pavon), oca (Oxalis tuberosa
Molina) and olluco (Ullucus tuberosum). Journal of the Science of Food
and Agricultural, 86, 1481–1488.Cawthray, G. R. (2003). An improved reversed-phase liquid chromato-
graphic method for the analysis of low-molecular mass organic acids inplant root exudates. Journal of Chromatography A, 1011, 233–240.
Chirinos, R., Campos, D., Arbizu, C., Rees, J-F., Rogez, H., Larondelle,Y., et al. (2007). Effect of genotype, maturity stage and post-harveststorage on phenolic compounds, carotenoid content and antioxidantcapacity, of andean mashua tubers (Tropaeolum tuberosum Ruiz &Pavon). Journal of the Science of Food and Agricultural, 87,437–446.
Chirinos, R., Campos, D., Betalleluz, I., Giusti, M. M., Schwartz, S. J.,Quingguo, T., et al. (2006). High-Performance liquid chromatographywith photodiode array detection (HPLC-DAD)/ HPLC–Mass Spec-trometry (MS) profiling of anthocyanins from andean mashua tubers(Tropaeolum tuberosum Ruız & Pavon) and their contribution to theoverall antioxidant activity. Journal of Agricultural and Food Chem-
istry, 54, 7089–7097.

1298 R. Chirinos et al. / Food Chemistry 106 (2008) 1285–1298
Cook, N. C., & Samman, S. (1996). Flavonoids-chemistry, metabolism,cardioprotective effects, and dietary sources. Journal of Nutrition
Biochemistry, 7, 66–76.Ezoubeiri, A., Gadhi, C. A., Fdil, N., Benharref, A., Jana, M., &
Vanhaelen, M. (2005). Isolation and antimicrobial activity of twophenolic compounds from Pulicaria odora L.. Journal of Ethnophar-
macology, 99(2), 287–292.Grau, A., Ortega. R., Nieto, C., & Hermann, M. Mashua (Tropaeolum
tuberosum Ruız & Pav.). (2003). In Jan, M., & Engels, M., (Vol. Eds.),Promoting the conservation and use of underutilized and neglected crops,
Vol. 25., International Potato Center, Lima, Peru/International PlantGenetic Resources Institute, Rome, Italy.
Gu, L., Kelm, M., Hammerstone, J. F., Beecher, G., Cunningham, D.,Vannozi, S., et al. (2002). Fractionation of polymeric procyanidinsfrom lowbush blueberry and quantification of procyanidins in selectedfoods with an optimised normal-phase HPLC–MS fluorescent detec-tion method. Journal of Agricultural and Food Chemistry, 50,4852–4860.
Hertog, M. G. L., Holman, P. C. H., & Venema, D. P. (1992).Optimization of a quantitative HPLC determination of potentiallyanticarcinogenic flavonoids in vegetables and fruits. Journal of
Agricultural and Food Chemistry, 40, 1591–1598.Huang, D., Ou, B., Hampsch-Woodill, M., Flanagan, J. A., & Prior, R. L.
(2002). High-throughput assay of oxygen radical absorbance capacity(ORAC) using a multichannel liquid handling system coupled with amicroplate fluorescence reader in 96-well format. Journal of Agricul-
tural and Food Chemistry, 50, 4437–4444.Jorgensen, E. M., Marin, A. B., & Kennedy, J. A. (2004). Analysis of the
oxidative degradation of proanthocyanidins under basic conditions.Journal of Agricultural and Food Chemistry, 52, 2292–2296.
Justesen, U., Knuthsen, P., & Leth, T. (1998). Quantitative analysis offlavonols, flavones, and flavanones in fruits, vegetables and beveragesby high-performance liquid chromatography with photo-diode arrayand mass spectrometric detection. Journal of Chromatography A, 799,101–110.
Kahkonen, M. P., & Heinonen, M. (2003). Antioxidant activity ofanthocyanins and their aglycons. Journal of Agricultural and Food
Chemistry, 51, 628–633.Kantz, K., & Singleton, V. L. (1990). Isolation and determination of
polymeric polyphenols using Sephadex LH-20 and analysis of grapetissue extracts. American Journal of Enology and Viticulture, 41,223–228.
Kennedy, J. A. (2002). Proanthocyanidins. Extraction, purification anddetermination of subunit composition by HPLC. In Current Protocols
in Food Analytical Chemistry (pp. 1–11). New York: John Wiley andSons, 2002, Unit I 1.4.
Krasteva, I., Nikolova, I., Danchev, N., & Nikolov, S. (2004). Phyto-chemical analysis of ethyl acetate extract from Astragalu corniculatusBieb. and brain antihypoxic activity. Acta Pharmacologica, 54,151–156.
Llorach, R., Gil-Izquierdo, A., Ferreres, F., & Tomas-Barberan, F. A.(2003). HPLC-DAD-MS/MS ESI characterisation of unusual highlyglycosylated acylated flavonoids from cauliflower (Brassica oleracea L.var. botrytis) agroindustrial byproducts. Journal of Agricultural and
Food Chemistry, 51, 3895–3899.Loo, G. (2003). Redox-sensitive mechanisms of phytochemical-mediated
inhibition of cancer cell proliferation. Journal of Nutrition Biochem-
istry, 14, 64–73.Naczk, M., & Shahidi, F. (2004). Extraction and analysis of phenolics in
food. Journal of Chromatography A, 1054, 11–95.Ou, B., Hampsch-Woodill, M., & Prior, R. L. (2001). Development and
validation of an improved oxygen radical absorbance capacity assayusing fluorescein as the fluorescent probe. Journal of Agricultural and
Food Chemistry, 49, 4619–4626.
Parejo, I., Viladomat, F., Bastida, J., & Codina, C. (2004). Developmentan validation of a high-performance liquid chromatographic methodfor the analysis of antioxidative phenolic compounds in fennel using anarrow bore reversed phase C18 column. Analytica Chimica Acta, 512,271–280.
Pedreschi, R., & Cisneros-Zevallos, L. (2007). Phenolic profiles of andeanpurple corn (Zea mays L.). Food Chemistry, 100, 956–963.
Porter, L. J., Hrtich, L. N., & Chan, B. G. (1986). The conversion ofprocyanidins and prodelphinidins to cyanidin and delphinidin. Phy-
tochemistry, 25, 223–230.Prior, R. L., Lazarus, S. A., Cao, G., Muccitelli, H., & Hammerstone, J.
(2004). Identification of procyanidines and anthocyanins in blueberriesand cranberries (Vaccinium Spp.) using high-performance liquidchromatography/mass spectrometry. Journal of Agricultural and Food
Chemistry, 49, 1270–1276.Proestos, C., Boziaris, I. S., Nychas, G.-J. E., & Komaitis, M. (2004).
Analysis of flavonoids and phenolic acids in Greek aromatic plants:Investigation of their antioxidant capacity and antimicrobial activity.Food Chemistry, 95, 664–671.
Robards, K. (2003). Strategies for the determination of bioactive phenolsin plants, fruit and vegetables. Journal of Chromatography A, 1000,657–691.
Rodriguez-Saona, L. E., & Anthocyanins Wrolstad, R. E. (2001).Extraction, isolation and purification of anthocyanins. In R. E.Wrolstad (Ed.), Current protocols in food analytical chemistry
(pp. 1–11). New York: John wiley and Sons, Unit F 1.1.Sakakibara, H., Honda, Y., Nakagawa, S., Ashida, H., & Kanazawa, K.
(2003). Simultaneous determination of all polyphenols in vegetables,fruits, and teas. Journal of Agricultural and Food Chemistry, 51,571–581.
Singleton, V. L., & Rossi, J. A. (1965). Colorimetry of total phenolics withphosphomolybedic–phosphotungstic acid reagents. American Journal
of Enology and Viticulture, 16, 144–158.Skrede, G., Worlstad, R. E., & Durst, R. W. (2000). Changes in
anthocyanins and polyphenolics during juice processing of highbushblueberries (Vaccinium corymbosum L.). Journal of Food Technology,
65, 357–364.Sun, B., Leandro, C., da Silva, R. J. M., & Spranger, I. (1998). Separation
of grape and wine proanthocyanidins according to their degree ofpolymerisation. Journal of Agricultural and Food Chemistry, 46,1390–1396.
Toba, T., & Adachi, S. (1978). Specific colour reaction for the detection of1,2-linked reducing disaccharides on paper and thin-layer chromato-grams. Journal of Chromatography, 154, 110–112.
Tsao, R., & Deng, Z. (2004). Separation procedures for naturallyoccurring antioxidant phytochemicals. Journal of Chromatography B,
812, 85–99.Tsao, R., & Yang, R. (2003). Optimization of a new mobile phase to know
the complex and real polyphenolic composition: towards a totalphenolic index using high-performance liquid chromatography. Jour-
nal of Chromatography A, 1018, 29–40.Wang, H., Cao, G., & Prior, R. L. (1997). Oxygen radical absorbing
capacity of anthocyanins. Journal of Agricultural and Food Chemistry,
45, 304–309.Wu, X., Beecher, G. R., Holden, J. M., Haytowitz, D. B., Gebhardt, S. E.,
& Prior, R. L. (2004). Lipophilic and hydrophilic antioxidantcapacities of common foods in the United States. Journal of Agricul-
tural and Food Chemistry, 52, 4026–4037.Yilmaz, Y., & Toledo, R. T. (2004). Major flavonoids in grape seeds and
skins: Antioxidant capacity of catechin, epicatechin, and gallic acid.Journal of Agricultural and Food Chemistry, 52, 255–260.
Zheng, W., & Wang, S. (2003). Oxygen radical absorbing capacity ofphenolics in blueberries, cranberries, chokeberries, and lingonberries.Journal of Agricultural and Food Chemistry, 51, 502–509.