Ontology - Based Context - Dependent Personalization Technology
Upload
independentCategory
view
0download
0
Data Mining and Knowledge Discovery, 5, 11–32, 2001c© 2001 Kluwer Academic Publishers. Manufactured in The Netherlands.
Personalization of SupermarketProduct Recommendations
R.D. LAWRENCE [email protected]. ALMASI [email protected]. KOTLYAR [email protected]. VIVEROS [email protected]. DURI [email protected] T.J. Watson Research Center, P.O. Box 218, Yorktown Heights, New York 10598, USA
Editors: Ron Kohavi and Foster Provost
Abstract. We describe a personalized recommender system designed to suggest new products to supermarketshoppers. The recommender functions in a pervasive computing environment, namely, a remote shopping systemin which supermarket customers use Personal Digital Assistants (PDAs) to compose and transmit their orders tothe store, which assembles them for subsequent pickup. The recommender is meant to provide an alternativesource of new ideas for customers who now visit the store less frequently. Recommendations are generated bymatching products to customers based on the expected appeal of the product and the previous spending of thecustomer. Associations mining in the product domain is used to determine relationships among product classesfor use in characterizing the appeal of individual products. Clustering in the customer domain is used to identifygroups of shoppers with similar spending histories. Cluster-specific lists of popular products are then used asinput to the matching process.
The recommender is currently being used in a pilot program with several hundred customers. Analysis ofresults to date have shown a 1.8% boost in program revenue as a result of purchases made directly from the listof recommended products. A substantial fraction of the accepted recommendations are from product classes newto the customer, indicating a degree of willingness to expand beyond present purchase patterns in response toreasonable suggestions.
Keywords: recommender systems, personalization, collaborative filtering, data mining, clustering, associations,pervasive computing
1. Introduction
We describe a personalized recommender system designed to suggest new products tosupermarket shoppers based upon their previous purchase behavior. The recommendersystem has been implemented as part of the “SmartPad” remote shopping system (Kotlyaret al., 1999) developed by IBM and Safeway Stores plc, a major supermarket retailer inthe UK. This remote shopping system allows customers to prepare their shopping lists ona personal digital assistant (PDA) device such as a PalmPilot and transmit their order forsubsequent pickup at the store without having to walk the aisles of the store. Althoughthis latter feature is viewed as a convenience by a number of shoppers, it does removethe opportunity to suggest new or previously unpurchased products via special displays
12 LAWRENCE ET AL.
in the store and so forth. The personalized recommendation system was developed as asubstitute “spontaneous purchase” mechanism for this remote shopping system in a weakly-connected “pervasive computing” environment. The recommendations are computed onthe server, and delivered to an individual customer’s PDA; obviously, the recommendationscould also be delivered via more conventional mechanisms such as a web browser, electronicmail, or postal mail.
A number of web-based personalized recommender systems have been proposed recently(Resnick and Varian, 1997; Shardanand and Maes, 1995; Konstan et al., 1997; Borcherset al., 1998; Aggarwal et al., 1999; Personalization Summit, 1999). Personalization worksby filtering a candidate set ofitems(such as products or web pages) through some rep-resentation of apersonal profile. Two main paradigms for the filtering have emerged:content-basedandcollaborative.
A content-based filteringsystem recommends items based on their similarity to what agiven person has liked in the past. Typically, both items and profiles are represented asvectors in the space offeaturesand their similarity is computed via a standard distancemetric, such as cosine coefficient. This approach has its roots in the vector-based model ofInformation Retrieval (IR), where text documents and user queries (or preferences) are bothrepresented as vectors in the space of keywords or phrases, often referred to asterms. Thecoordinates of the vectors depend on the discriminating value of the respective terms. Forexample, if we were to recommend web pages from a site that reports news in the computerindustry, then the term “computer” has low discriminating value, since it likely occurs inmost of the pages. The term “product recommender” is likely to have high discriminatingvalue, since we expect only a subset of pages to refer to product recommenders. A standardmetric, called TFIDF (“term frequency/inverse document frequency”) is used in the IRliterature to quantify discriminating value of document features (see Salton, 1989; Saltonand McGill, 1983 textbooks for details).
In order to use content-based filtering in recommending grocery products, we must definethe space of features. We started with product taxonomy that was available in the Safewaydatabase. As discussed in Section 3.2 below, the taxonomy divides products in coarse-grain classes, such as “Pet foods”, and, further, into sub-classes, such as “Canned DogFood”. We can directly use the classes and sub-classes as features of products and personalprofiles. A person indicates interest in a particular feature by buying products within thecorresponding class or sub-class. Products to be recommended can then be determined bycomputing a measure of distance between vectors representing personal preferences andvectors representing products.
The above strategy suffers from the problem ofoverspecialization(Balabanovic andShoham, 1997): it provides us with no rigorous basis for introducing shoppers to newkinds of products beyond those classes and sub-classes that they already buy. For example,a person who buys dog food might also be interested in carpet cleaners, but we have noway of gauging this interest. We can solve this problem by assigning an implicit featuresuch as “appeals to dog owners” to both products. This demonstrates both the flexibilityand weakness of content-based filtering systems. As new information about relationshipsbetween products becomes available it can be incorporated by defining new features. But,for this same reason, it might not be possible to use a content-based filtering system without
PERSONALIZATION OF SUPERMARKET PRODUCT RECOMMENDATIONS 13
human intervention, since we have to recognize the need to introduce new features intocontent.
Collaborative filtering1 aims to sidestep the problem of feature design by recommendingitems that other people, who are similar to the person in question, have liked. A collaborativefiltering system, such as Ringo (Shardanand and Maes, 1995) and GroupLens (Konstanet al., 1997), works by collecting explicit user ratings of items in question (e.g., movies,CDs or USENET postings). Users are then compared based on how similar their ratingsare, and they are recommended items favored by other people with similar interests. Tocompute these “word-of-mouth” recommendations, it has been suggested in the literatureto use clusters in the space of user profiles in order to define prototypical profiles (Ungarand Foster, 1998).
Viewed broadly, collaborative filtering suggests using the information about a group,which can be the whole population of users or a cluster, in order to produce individualrecommendations. In our recommender system we use two sources of such information.First, we applyassociations mining(Agrawal and Srikant, 1994) to customer purchasedata in order to derive relationships between product classes and sub-classes. Since theserelationships are based on actual purchases, we expect to identify additional product-classrelationships (e.g., purchasers of dog-food products also buy carpet cleaners) that are notcaptured by the product taxonomy (or even by more sophisticated keyword matching).Second, we useclustering(Everitt, 1993) to assign customers into groups with similarinterests, based on prior purchase patterns. By itself, content-based filtering does notincorporate information about the relative popularity of products among other customers.For this reason, we use the cluster analysis to build ranked lists of the most popular productsamong customers assigned to each cluster; recommendations for a specific customer arethen drawn from products popular among other members of the customer’s cluster.
In summary, our recommender system uses content-based filtering at its core, with theideas from collaborative filtering utilized both to refine the content model and to makerecommendations dependent on shared interests within customer clusters.
The organization of this paper is as follows. Section 2 provides a brief overview ofthe overall SmartPad system, with an emphasis on those aspects relevant to recommendersystems. Details of the recommender system are provided in Section 3, while Section 4describes the associations mining and clustering analyses. Section 5 describes early resultsand user feedback obtained to date from a field trial of the system, and Section 6 providesan overall summary.
2. The SmartPad remote shopping system
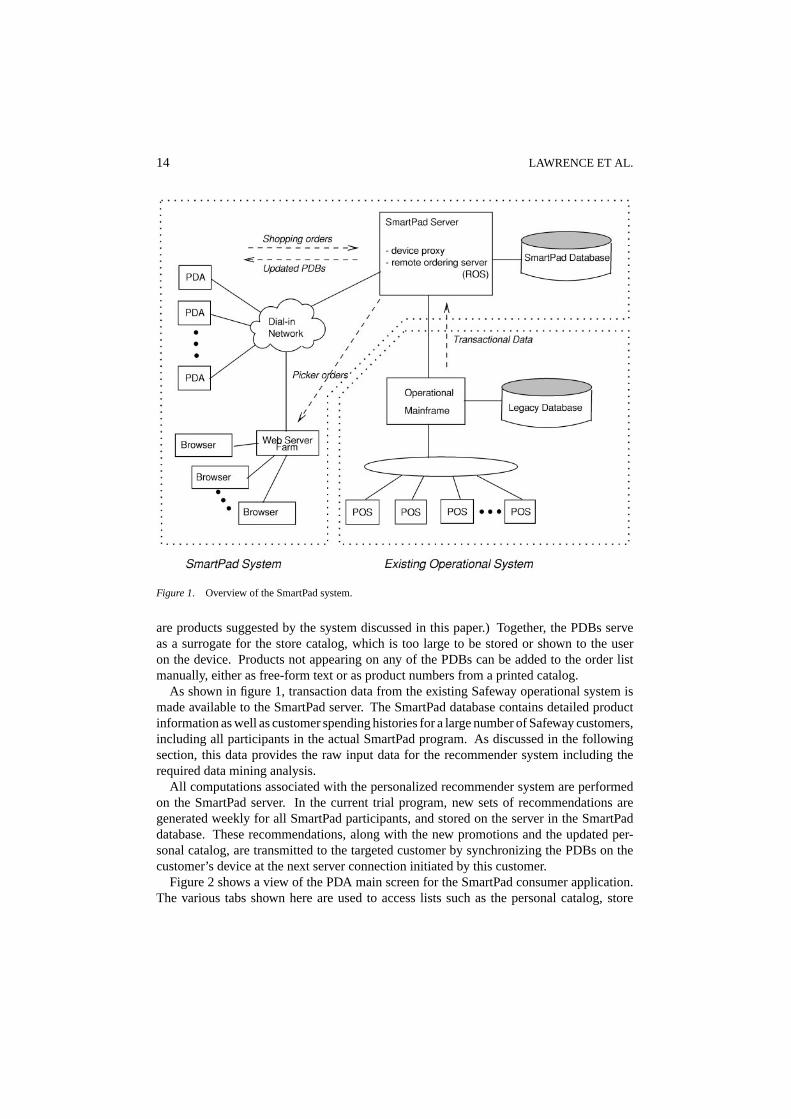
Figure 1 provides an overview of the SmartPad environment (Kotlyar et al., 1999). Theoverall system consists of a network of mobile devices (PDAs) connected to the SmartPadserver through a dial-in service. Each customer participating in the program is issued a PDAwhich runs a consumer application enabling the user to build a shopping list and send it tothe server. Products in the order are chosen from three personal databases (PDBs) storedon the PDAs: personal catalog, recommendations, and promotions. (Promotions refer todiscounted products offered by the participating Safeway store, while recommendations
14 LAWRENCE ET AL.
Figure 1. Overview of the SmartPad system.
are products suggested by the system discussed in this paper.) Together, the PDBs serveas a surrogate for the store catalog, which is too large to be stored or shown to the useron the device. Products not appearing on any of the PDBs can be added to the order listmanually, either as free-form text or as product numbers from a printed catalog.
As shown in figure 1, transaction data from the existing Safeway operational system ismade available to the SmartPad server. The SmartPad database contains detailed productinformation as well as customer spending histories for a large number of Safeway customers,including all participants in the actual SmartPad program. As discussed in the followingsection, this data provides the raw input data for the recommender system including therequired data mining analysis.
All computations associated with the personalized recommender system are performedon the SmartPad server. In the current trial program, new sets of recommendations aregenerated weekly for all SmartPad participants, and stored on the server in the SmartPaddatabase. These recommendations, along with the new promotions and the updated per-sonal catalog, are transmitted to the targeted customer by synchronizing the PDBs on thecustomer’s device at the next server connection initiated by this customer.
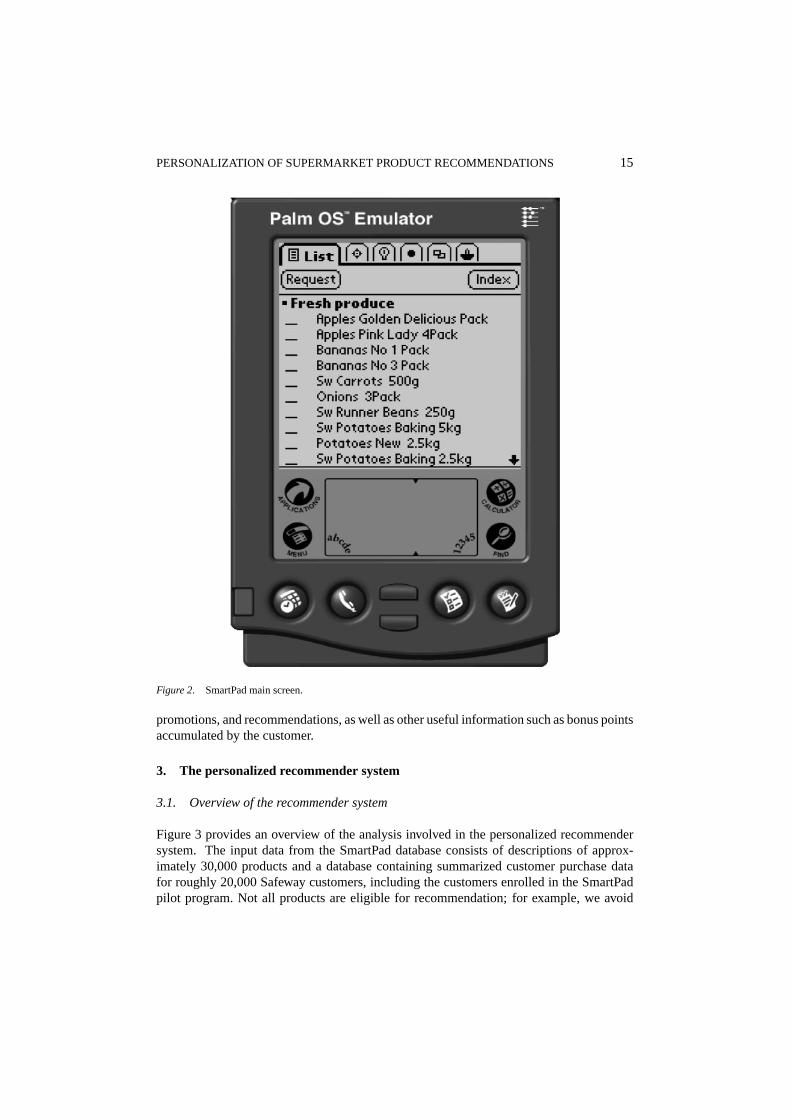
Figure 2 shows a view of the PDA main screen for the SmartPad consumer application.The various tabs shown here are used to access lists such as the personal catalog, store
PERSONALIZATION OF SUPERMARKET PRODUCT RECOMMENDATIONS 15
Figure 2. SmartPad main screen.
promotions, and recommendations, as well as other useful information such as bonus pointsaccumulated by the customer.
3. The personalized recommender system
3.1. Overview of the recommender system
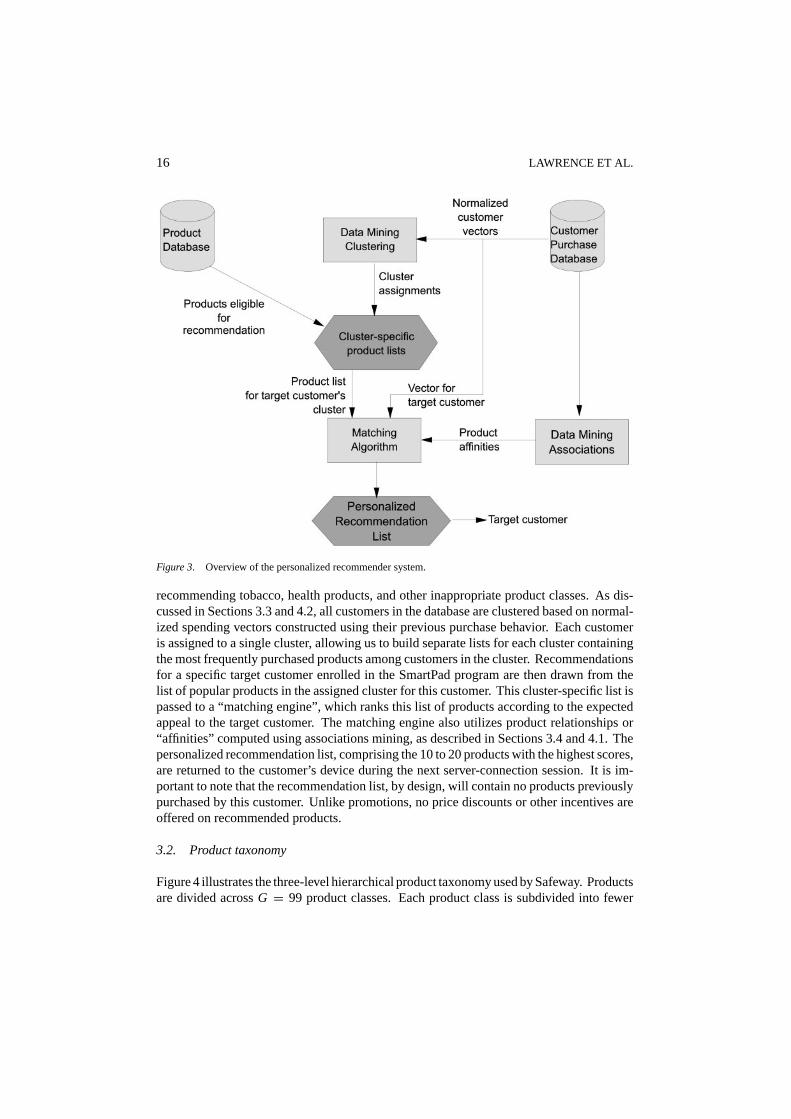
Figure 3 provides an overview of the analysis involved in the personalized recommendersystem. The input data from the SmartPad database consists of descriptions of approx-imately 30,000 products and a database containing summarized customer purchase datafor roughly 20,000 Safeway customers, including the customers enrolled in the SmartPadpilot program. Not all products are eligible for recommendation; for example, we avoid
16 LAWRENCE ET AL.
Figure 3. Overview of the personalized recommender system.
recommending tobacco, health products, and other inappropriate product classes. As dis-cussed in Sections 3.3 and 4.2, all customers in the database are clustered based on normal-ized spending vectors constructed using their previous purchase behavior. Each customeris assigned to a single cluster, allowing us to build separate lists for each cluster containingthe most frequently purchased products among customers in the cluster. Recommendationsfor a specific target customer enrolled in the SmartPad program are then drawn from thelist of popular products in the assigned cluster for this customer. This cluster-specific list ispassed to a “matching engine”, which ranks this list of products according to the expectedappeal to the target customer. The matching engine also utilizes product relationships or“affinities” computed using associations mining, as described in Sections 3.4 and 4.1. Thepersonalized recommendation list, comprising the 10 to 20 products with the highest scores,are returned to the customer’s device during the next server-connection session. It is im-portant to note that the recommendation list, by design, will contain no products previouslypurchased by this customer. Unlike promotions, no price discounts or other incentives areoffered on recommended products.
3.2. Product taxonomy
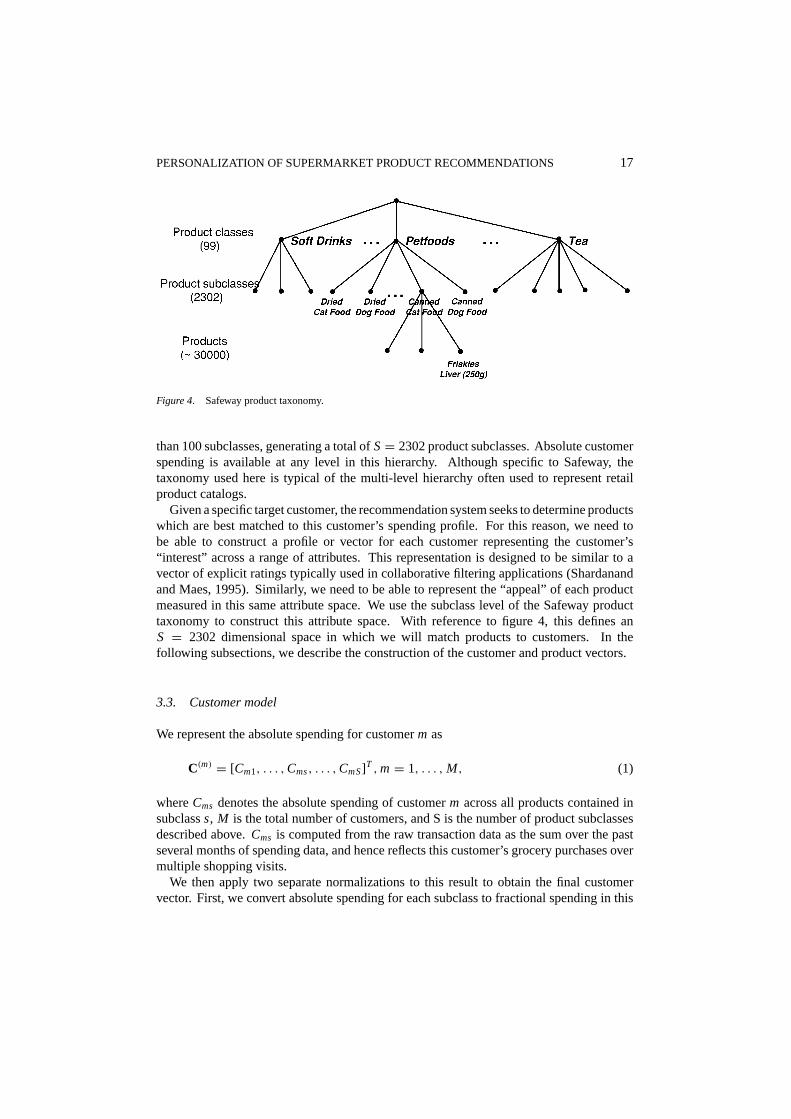
Figure 4 illustrates the three-level hierarchical product taxonomy used by Safeway. Productsare divided acrossG = 99 product classes. Each product class is subdivided into fewer
PERSONALIZATION OF SUPERMARKET PRODUCT RECOMMENDATIONS 17
Figure 4. Safeway product taxonomy.
than 100 subclasses, generating a total ofS= 2302 product subclasses. Absolute customerspending is available at any level in this hierarchy. Although specific to Safeway, thetaxonomy used here is typical of the multi-level hierarchy often used to represent retailproduct catalogs.
Given a specific target customer, the recommendation system seeks to determine productswhich are best matched to this customer’s spending profile. For this reason, we need tobe able to construct a profile or vector for each customer representing the customer’s“interest” across a range of attributes. This representation is designed to be similar to avector of explicit ratings typically used in collaborative filtering applications (Shardanandand Maes, 1995). Similarly, we need to be able to represent the “appeal” of each productmeasured in this same attribute space. We use the subclass level of the Safeway producttaxonomy to construct this attribute space. With reference to figure 4, this defines anS = 2302 dimensional space in which we will match products to customers. In thefollowing subsections, we describe the construction of the customer and product vectors.
3.3. Customer model
We represent the absolute spending for customerm as
C(m) = [Cm1, . . . ,Cms, . . . ,CmS]T ,m= 1, . . . ,M, (1)
whereCms denotes the absolute spending of customerm across all products contained insubclasss, M is the total number of customers, and S is the number of product subclassesdescribed above.Cms is computed from the raw transaction data as the sum over the pastseveral months of spending data, and hence reflects this customer’s grocery purchases overmultiple shopping visits.
We then apply two separate normalizations to this result to obtain the final customervector. First, we convert absolute spending for each subclass to fractional spending in this
18 LAWRENCE ET AL.
subclass by normalizing to this customer’s total spending over the period:
Cms= Cms∑s′=1,...,S Cms′
(2)
The resultingfractional spendingvector characterizes this customer’s interest in each sub-class relative to other subclasses. Since commonly purchased subclasses such as freshvegetables will tend to dominate the fractional spending, it is also useful to take the ratioof the individual customer’s fractional spending in a subclass to the mean value for thissubclass taken over all other customers:
ˆCms= Cms
1M
∑m′=1,...,M Cm′s
(3)
Thisnormalized fractional spendingthus quantifies the customer’s interest in this subclassrelative to the customer database as a whole, normalized such that entries equal to 1 implyan average level of interest in a subclass relative to all other customers.
3.4. Product model
We use the following notation to represent the product classifications illustrated in figure 4:
S(n) ≡ the product subclass number for the productn
C(s) ≡ the product class for the product subclasss(4)
For brevity, we will use “C(n)” instead of “C(S(n))” to denote the class that productnbelongs to.
Each productn = 1, . . . , N is represented by anS-dimensional vectorP(n), and hencehas the same dimensionality as the customer vectors discussed in the previous section. Theindividual entriesP(n)
s , s= 1, . . . , S, reflect the “affinity” the product has to the subclasss,i.e., the extent to which this product will appeal to a customer with an interest in thissubclass. The simplest solution is to set the entries of the vectorP(n) as:
P(n)s =
{1 if s= S(n)0 otherwise
(5)
This captures the affinity between different products in a subclass: a purchase of a product ina subclass implies an interest in other products in the same subclass. This simple form leadsto straightforward content-based filtering: if you purchased from this product subclass, youwill receive recommendations only for other products within this subclass. Clearly, thiseliminates the possibility of “cross-selling” potentially interesting products outside of thisimmediate subclass.
More specifically, Eq. (5) ignores other possible kinds of affinity between products:
1. affinities between products that belong to the same class (but to different subclasses),and
PERSONALIZATION OF SUPERMARKET PRODUCT RECOMMENDATIONS 19
2. affinities that are derived from data-mining analysis such as associations mining (Agrawaland Srikant, 1994) performed independently at both the class and subclass level.
Case (1) is also content-based filtering since only product-taxonomy information is used.However, case (2) incorporates associations derived from “global” customer behavior, andhence reflects aspects of collaborative filtering. In order to account for the first kind ofaffinity, we have heuristically chosen to setP(n)
s = 0.5 for every subclasss that is in thesame class as the productn. To account for the second kind, we setP(n)
s = 0.5 for everyassociationC(n) H⇒ C(n′) between the class of the productn and the class of productn′.We also compute associations at the subclass level, and use these as described below to setaffinities between associated subclasses.
Some examples of the use of associations to specify the product vector are as follows. Ifthe use of bacon strongly implies the use of eggs (i.e., bacon and eggs are associated classes),then the vector for a particular bacon product will receive a 0.5 in the entries that correspondto all subclasses of the class “Eggs” (e.g., “Eggs/Large” or “Eggs/Medium”). Also, if thereis a strong association between the subclasses “Bacon/LowFat” and “Eggs/Whites”, thenthe vector for the particular low-fat bacon product will receive a 1.0 in the entry for thesubclass “Egg/Whites”. Given the class-level association between “Bacon” and “Eggs”,the vector for a particular low-fat bacon product will also receive contributions (0.25) inthe entries associated withall subclasses with “Eggs”.
Overall, the formula for the entries in the product vector is:
P(n)s =
1.0 if s= S(n) (within same subclass)
1.0 if S(n) H⇒ s (within associated subclass)
0.5 if C(s) = C(n) (subclass within same class)
0.25 if C(n) H⇒ C(s) (within subclass of associated class)
0 otherwise
(6)
The multipliers for subclass associations were set higher than those at the product classlevel in order to encourage customers to try popular new products outside their currentshopping pattern, but not too far outside. The results in Section 5 seem to indicate that thisintended effect was indeed achieved.
3.5. Matching algorithm
In the preceeding sections, we have developed descriptions of customers and products inthe vector space defined by product subclasses. The final step in the recommendationprocess [see figure 3] is to score each candidate product for a specific customer and selectthe best matches. This score should reflect the degree of similarity between the customervector and each product vector. Possible metrics include Pearson correlation (Shardanandand Maes, 1995), Euclidian distance (Shardanand and Maes, 1995), and cosine projection(Salton, 1989). As noted in Salton (1989), the choice among these methods is heuristic, andwe chose cosine projection based on inspection of the generated recommendations. Hence,the scoreσmn between customerm and productn is computed using a cosine coefficient
20 LAWRENCE ET AL.
between the corresponding vectors,C(m) andP(n):
σmn = ρnC(m) · P(n)‖C(m)‖‖P(n)‖ , (7)
where the· operator denotes inner (dot) product:
x · y =∑
i
xi yi , (8)
‖x‖ =∑
i
|xi |, (9)
andρn is a modulation factor discussed below. Both customer and product vectors aresparse, and we use this sparse structure to minimize the number of arithmetic operationsnecessary to evaluate Eq. (7).
If ρn ≡ 1 forn = 1, . . . , N in Eq. (7), all products in a product subclass will have identicalscores for a specific customer since the product vectors are constructed at the subclass level.Hence,ρn can be used as a “tie-breaker” to differentiate products. In general,ρn can reflectthe desire to “push” one product over another, for example, due to higher inventories, profitmargins, or other market conditions. Since we have product profit margins available, weinitially computed this factor as
ρn =[
P Mn
P M
]α, (10)
whereP Mn is the profit margin associated with productn, P M is the mean value over allproducts, andα is an empirical factor designed to control the overall influence. However,we discovered that more profitable items were not necessarily more popular, and we chosenot to implement this feature in the production system. Instead, we break ties by randomsampling from up to 5 products with the top scores within a specific product subclass.In order to distribute the recommendations across product classes, we limit the numberof recommendations for each customer to 1 product per product subclass, and 2 productsper product class. In the end, we return a list of approximately 10 to 20 products to thecustomer’s PDA as described in Section 2; this number is determined primarily by the sizeof the display on the PDA device.
Previously bought products are excluded from the recommend list, since the recommenderis meant to broaden each customer’s purchase patterns. It is also worth noting that thelist of the most popular products in each product subclass is a dynamic list, created byperiodic querying of the transaction database. This prevents recommending seasonal itemsat inappropriate times of the year. Since recommendations are generated on a weekly basis,the list of candidate products could also be updated weekly; in practice, we do it monthly,with an optional weekly edit to comb out special situations such as Easter candy the weekafter Easter. It should also be noted that several of the 99 product classes, such as Petroland Tobacco, are excluded from the recommender by design.
PERSONALIZATION OF SUPERMARKET PRODUCT RECOMMENDATIONS 21
4. Data mining analysis
Intelligent Miner for Data (Intelligent Miner, 1998) was used to perform the associa-tions mining and clustering analysis shown in figure 3. Customer transaction data wereused as input to both calculations, but, naturally, the data were formatted and normalizeddifferently.
4.1. Associations mining
As discussed in Section 3.5, associations mining is used to compute the product affinitiesnecessary to construct the product vectors in Eq. (6). We used Intelligent Miner’s “apriori”associations algorithm (Agrawal and Srikant, 1994) to extract associations (independently)among the 99 product classes and also among the 2302 product subclasses shown in figure 4.The raw input data for this analysis was 8 weeks of product-level transaction data for 8000customers with above-average spending. In order to compute product-class associations,the transactions were first binned according to product class, and then aggregated over time.The final input table consisted of (customer ID, product-class ID) tuples, each representing aproduct class in which the customer has purchased over this 8-week period. An analogousprocedure was used to extract associations at the product-subclass level. Note that ourobjective here differs from conventional market-basket analysis in which associations arecomputed among products purchased as part of the same transaction.
Consistent with the form of Eq. (6), we computed only simple associations containing asingle item in both the body and the head of the rule, e.g., A⇒B. For several reasons, weneeded to limit the number of rules we used to about 100 from each of the two levels. Thesereasons included clarity of understanding as well as computational complexity, especiallyin the case of the product-class rules, since the recommender algorithm assumes that all thesubclasses within two related classes are also related via affinities. We used a combinationof thresholds on the support, confidence, and lift of a rule to achieve this filtering.2 Afterexperimenting with several datasets and inspecting the resulting rules, we chose a combina-tion of minimum support in the 1% – 4% range, minimum confidence of 30% to 40%, andminimum lift of 2 to 3. Although heuristic, these choices produced a reasonable number ofassociations for the various Safeway datasets we examined. Applications to other purchasedata may require different limits on these parameters.
The associations analysis is performed periodically as a “batch” process. Rules meetingthe filtering criterion are stored in the SmartPad database (see figure 1) for subsequentaccess during the computation of the personalized recommendations.
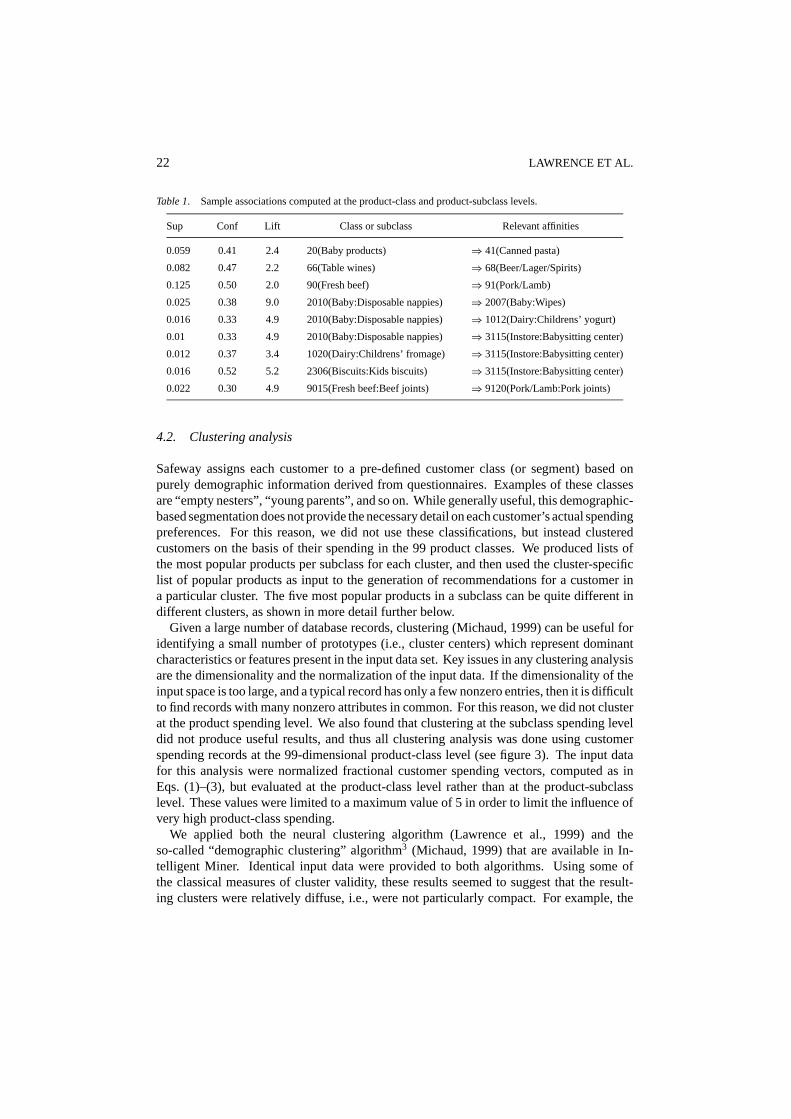
Table 1 shows a subset of affinities computed at the product-class and subclass levels. Therule head is on the right, so the textual format of the first rule is “5.9% of all customers buyboth baby products and canned pasta. When a customer buys baby products, the customeralso buys canned pasta in 41% of the cases, which is 2.4 times the rate one would expect ifthe sales of these two were statistically independent”. In tags of the form “Baby:DisposableNappies”, the items before and after the colon refer to product class and product subclass,respectively. The numbers preceeding these classes are actual class and subclass numbers;we will refer to these in the discussion of specific recommendations in Section 5.1.
22 LAWRENCE ET AL.
Table 1. Sample associations computed at the product-class and product-subclass levels.
Sup Conf Lift Class or subclass Relevant affinities
0.059 0.41 2.4 20(Baby products) ⇒ 41(Canned pasta)
0.082 0.47 2.2 66(Table wines) ⇒ 68(Beer/Lager/Spirits)
0.125 0.50 2.0 90(Fresh beef) ⇒ 91(Pork/Lamb)
0.025 0.38 9.0 2010(Baby:Disposable nappies) ⇒ 2007(Baby:Wipes)
0.016 0.33 4.9 2010(Baby:Disposable nappies) ⇒ 1012(Dairy:Childrens’ yogurt)
0.01 0.33 4.9 2010(Baby:Disposable nappies) ⇒ 3115(Instore:Babysitting center)
0.012 0.37 3.4 1020(Dairy:Childrens’ fromage) ⇒ 3115(Instore:Babysitting center)
0.016 0.52 5.2 2306(Biscuits:Kids biscuits) ⇒ 3115(Instore:Babysitting center)
0.022 0.30 4.9 9015(Fresh beef:Beef joints) ⇒ 9120(Pork/Lamb:Pork joints)
4.2. Clustering analysis
Safeway assigns each customer to a pre-defined customer class (or segment) based onpurely demographic information derived from questionnaires. Examples of these classesare “empty nesters”, “young parents”, and so on. While generally useful, this demographic-based segmentation does not provide the necessary detail on each customer’s actual spendingpreferences. For this reason, we did not use these classifications, but instead clusteredcustomers on the basis of their spending in the 99 product classes. We produced lists ofthe most popular products per subclass for each cluster, and then used the cluster-specificlist of popular products as input to the generation of recommendations for a customer ina particular cluster. The five most popular products in a subclass can be quite different indifferent clusters, as shown in more detail further below.
Given a large number of database records, clustering (Michaud, 1999) can be useful foridentifying a small number of prototypes (i.e., cluster centers) which represent dominantcharacteristics or features present in the input data set. Key issues in any clustering analysisare the dimensionality and the normalization of the input data. If the dimensionality of theinput space is too large, and a typical record has only a few nonzero entries, then it is difficultto find records with many nonzero attributes in common. For this reason, we did not clusterat the product spending level. We also found that clustering at the subclass spending leveldid not produce useful results, and thus all clustering analysis was done using customerspending records at the 99-dimensional product-class level (see figure 3). The input datafor this analysis were normalized fractional customer spending vectors, computed as inEqs. (1)–(3), but evaluated at the product-class level rather than at the product-subclasslevel. These values were limited to a maximum value of 5 in order to limit the influence ofvery high product-class spending.
We applied both the neural clustering algorithm (Lawrence et al., 1999) and theso-called “demographic clustering” algorithm3 (Michaud, 1999) that are available in In-telligent Miner. Identical input data were provided to both algorithms. Using some ofthe classical measures of cluster validity, these results seemed to suggest that the result-ing clusters were relatively diffuse, i.e., were not particularly compact. For example, the
PERSONALIZATION OF SUPERMARKET PRODUCT RECOMMENDATIONS 23
demographic clustering method, which seeks to maximize the Condorcet criterion4 for clus-ter quality, produced an overall Condorcet criterion of 0.56 for 9 clusters, but did so byputting 97% of the records in one cluster. Neural clustering produced clusters that weremuch more uniform in size, but the Condorcet criterion was in the range of 0.1 to 0.2, andvalues of the modified Dunn’s index5 used in Bezdek (1998) were in the range 0.3 to 0.8compared with the values between 1 and 2 that they obtain for “good” clusters.
However, these cluster validity measures tend to favor categorical data with a relativelysmall number of attributes, and may be less relevant for our continuous data and relativelylarge number of attributes. There is a good deal of overlap in people’s spending, for under-standable reasons. One group of people may have extraordinary spending in baby productsand none in tobacco, and another may be just the reverse, but both groups presumably needpaper towels, milk, bread, lettuce, and many other everyday necessities. For this reason,it seems plausible to evaluate the clusters in terms of their dominant attributes, rather thanstrictly by their compactness and distinctiveness relative to other clusters.
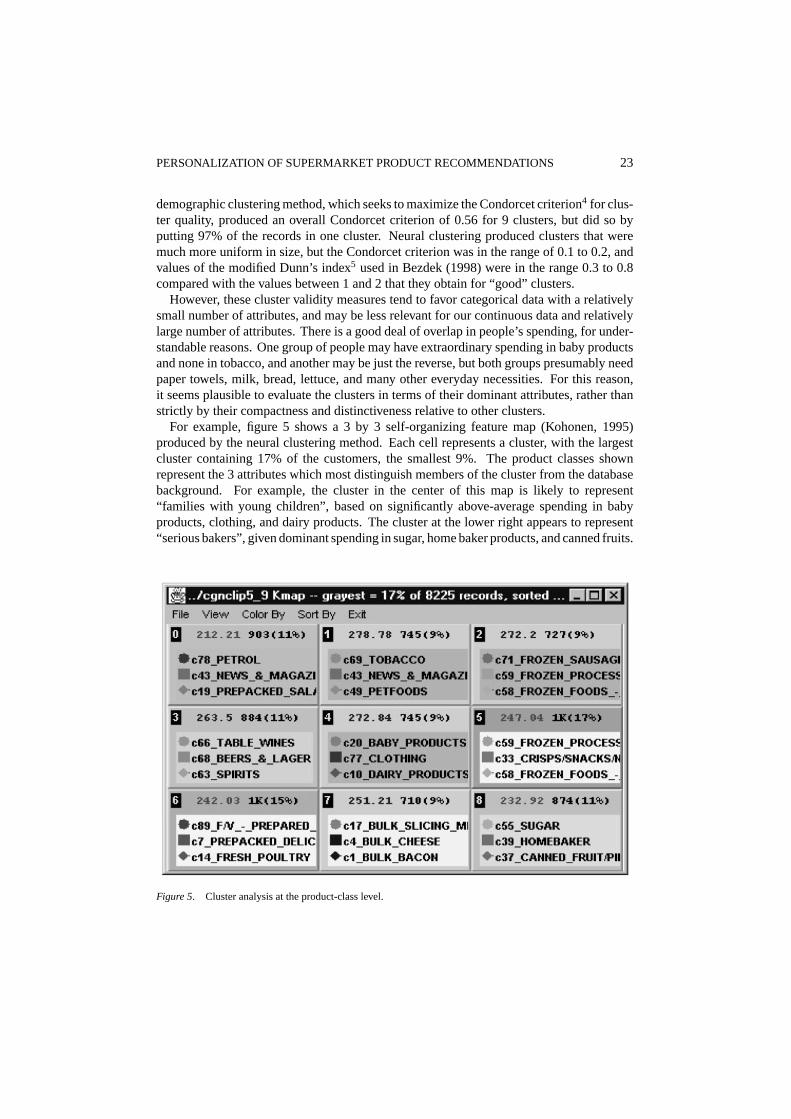
For example, figure 5 shows a 3 by 3self-organizing feature map (Kohonen, 1995)produced by the neural clustering method. Each cell represents a cluster, with the largestcluster containing 17% of the customers, the smallest 9%. The product classes shownrepresent the 3 attributes which most distinguish members of the cluster from the databasebackground. For example, the cluster in the center of this map is likely to represent“families with young children”, based on significantly above-average spending in babyproducts, clothing, and dairy products. The cluster at the lower right appears to represent“serious bakers”, given dominant spending in sugar, home baker products, and canned fruits.
Figure 5. Cluster analysis at the product-class level.
24 LAWRENCE ET AL.
Table 2. Summary of cluster characteristics.
Most significant Cluster-shareCluster number Fraction of records product class Cluster share enrichment
0 0.11 Petrol 0.24 2.2
1 0.09 Tobacco 0.50 5.6
2 0.09 Frozen sausage 0.67 7.4
3 0.11 Wines 0.39 3.5
4 0.09 Baby products 0.56 6.2
5 0.17 Frozen foods 0.24 1.4
6 0.15 Fresh vegetables 0.25 1.7
7 0.09 Bulk sliced meat 0.34 3.8
8 0.11 Sugar 0.22 2.0
The clusters in the upper left focus on specific non-food items, e.g., petrol,6 tobacco, andwines/beer/spirits. Feature maps generated with more clusters show increasing refinementsin these customer purchase patterns.
Table 2 summarizes these same 9 clusters, showing the most significant product classwhich defines the cluster, as well as the fraction of total customers assigned to this cluster.We define the “cluster share” of a product class as the spending in that product class by acluster of customers divided by the total spending in that product class:
Cluster share in classi =∑
m∈ clusterCmi∑m= 1,...,M Cmi
, (11)
whereCmi is the absolute spending for customerm in product classi . The enrichment incluster share is defined as the ratio of cluster share divided by the fraction of the customerpopulation which is in the cluster. For example, cluster number 4 is characterized byspending in baby products: the 9% of the customers in this cluster generated 56% of thetotal database spending for baby products, an enrichment by a factor 6.2. Popular productsamong members of this cluster are likely to be quite different than the most frequentlypurchased products among members of the “tobacco” cluster shown as cluster 1 in Table 2.
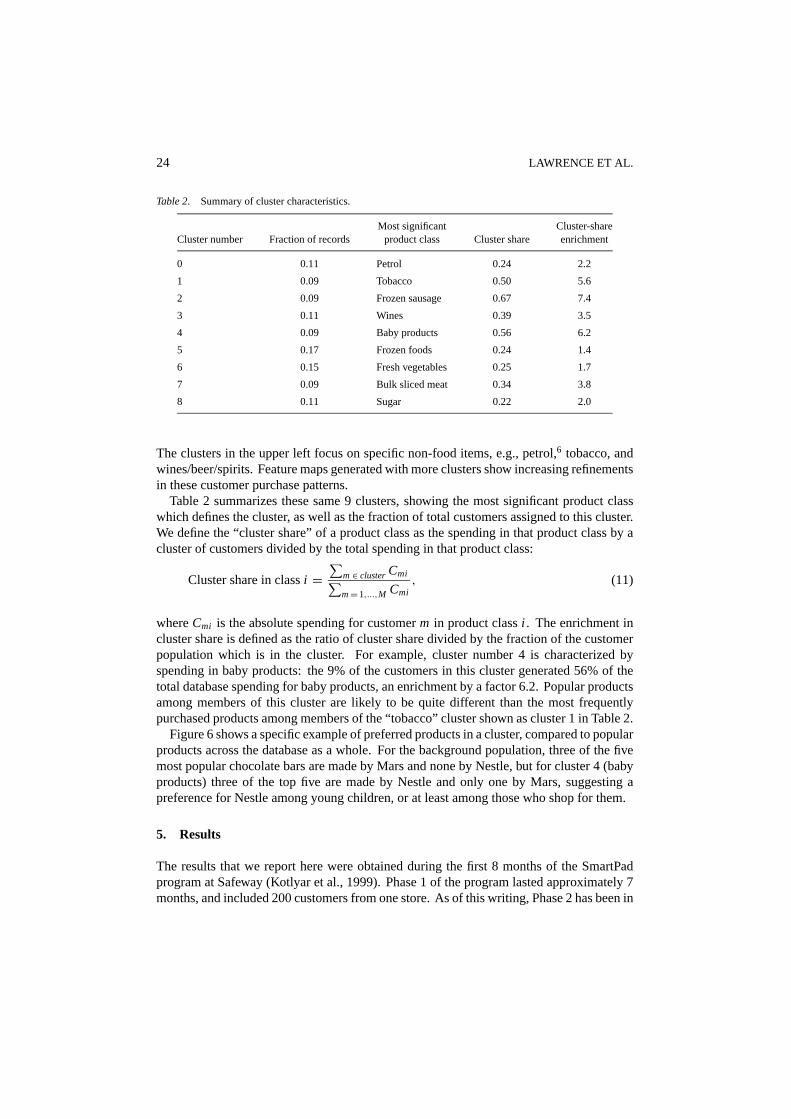
Figure 6 shows a specific example of preferred products in a cluster, compared to popularproducts across the database as a whole. For the background population, three of the fivemost popular chocolate bars are made by Mars and none by Nestle, but for cluster 4 (babyproducts) three of the top five are made by Nestle and only one by Mars, suggesting apreference for Nestle among young children, or at least among those who shop for them.
5. Results
The results that we report here were obtained during the first 8 months of the SmartPadprogram at Safeway (Kotlyar et al., 1999). Phase 1 of the program lasted approximately 7months, and included 200 customers from one store. As of this writing, Phase 2 has been in
PERSONALIZATION OF SUPERMARKET PRODUCT RECOMMENDATIONS 25
Figure 6. Cluster-specific product preferences.
progress for approximately two months, and includes a second participating Safeway store.Different versions of the recommender were used in the two phases. In this section, we firstshow a sample recommendation list and describe how the use of data mining influences itscontent. We then describe our experience with the first version of the recommender, thelessons we learned and consequent changes we made, and the performance of the currentversion. Full implementation of the cluster-specific input lists was not completed for thesefield tests: the input to the matching process was constructed using popular products withina single cluster consisting of all customers in the database.
5.1. Analysis of a sample recommendation list
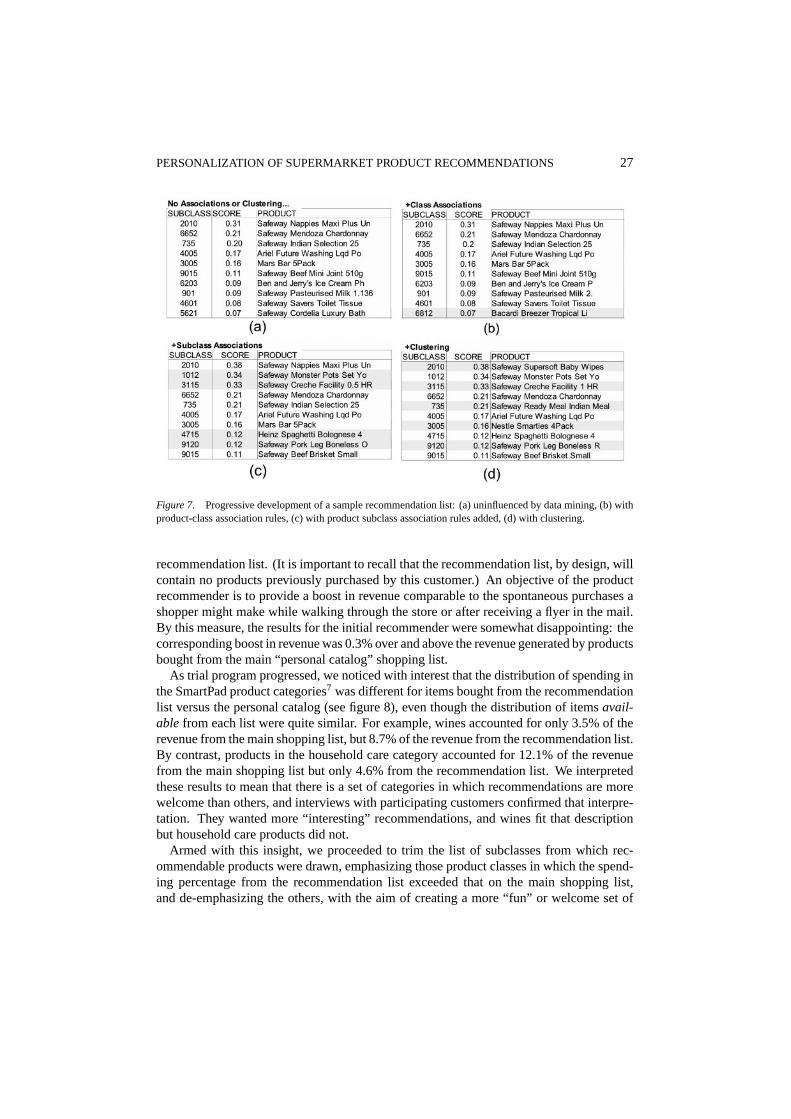
Table 3 shows the fractional spending at the product subclass level for a customer who hasspending in the “baby-products” subclasses. Figure 7(d) shows the recommendation listgenerated on the basis of this spending profile. The figure also traces the development ofthis recommendation list through four stages:
(a) As it would appear without the use of either data-mining associations or clustering, i.e.,on the basis of content-based filtering alone.
(b) As it would appear if we only used association rules from the product class level. Notethe appearance of an item from subclass 6812 due to a boost in its score resulting fromthe association rule in Table 1 between class 68 and 66, several of whose subclassesare present in the spending list in Table 3.
(c) As it would appear using association rules from both the class and subclass levels,but without clustering. Four new products have appeared in the top ten as a result ofproduct subclass association rules found in Table 1. Note that the product that appeared

26 LAWRENCE ET AL.
Table 3. Sample customer fractional spending at the product subclass level.
Subclass number Spending fraction Subclass name
7801 0.077 PETROL:PETROL
2010 0.058 DISPOSABLE NAPPIES:BABY PRODUCTS
735 0.046 INTERNATIONAL:PREPACKED DELICATESS
6652 0.035 WHITE ENGLISH:TABLE WINES
3005 0.032 CHOCOLATE:CONFECTIONERY
7734 0.027 GIRLS PAJAMAS:CLOTHING
4005 0.026 LIQUIDS:HOME LAUNDRY/LIQUID
6203 0.021 LUXURY ICE CREAM:ICE CREAM
9015 0.021 BEEF JOINTS:FRESH BEEF
4001 0.017 SOAP/DETERGENTS POWD:HOME LAUNDRY/LIQUID
2001 0.016 BABY FOOD DRY:BABY PRODUCTS
901 0.015 S/W FULL CREAM MILK:MILK
8004 0.015 ENT UK VIDEO:HOME ENTERTAINMENT
7741 0.015 BOYS BRIEFS:CLOTHING
7733 0.015 BOYS PAJAMAS:CLOTHING
6651 0.015 WHITE SOUTH AFRICA:TABLE WINES
4601 0.014 TOILET TISSUE:PAPER PRODUCTS
905 0.013 S/W SEMI SKIMMED MIL:MILK
6670 0.013 WHITE—NORTH AMERIC:TABLE WINES
2007 0.012 BABY WIPES:BABY PRODUCTS
in (b) has disappeared. However, although not shown in this figure, the score for theproduct from subclass 9120 was influenced by association rules from both the productclass and subclass levels.
(d) As it appears when the products for the top ten product subclasses are chosen from thelist of popular products for the cluster that this customer falls into, namely, cluster 4 infigure 5. Note in particular the appearance of the Nestle candy bar instead of the Mars,consistent with the cluster preferences shown in figure 6.
The much greater effect of subclass association rules (figure 7(c) versus (b)), whichresults from the choice of values in Eq. (6), is reflected in the statistics for the full set ofrecommendation lists as well: on average, 33% of the items on a recommendation list arein product subclasses that are new to the customer (no spending in the subclass within thepast 3 months) and 16% are in product classes new to the customer.
5.2. Results for phase 1
During Phase 1 of the trial, a total of 1957 complete orders were processed by the Smart-Pad system. Of these, 120 orders (6.1%) contained at least 1 product chosen from the
PERSONALIZATION OF SUPERMARKET PRODUCT RECOMMENDATIONS 27
Figure 7. Progressive development of a sample recommendation list: (a) uninfluenced by data mining, (b) withproduct-class association rules, (c) with product subclass association rules added, (d) with clustering.
recommendation list. (It is important to recall that the recommendation list, by design, willcontain no products previously purchased by this customer.) An objective of the productrecommender is to provide a boost in revenue comparable to the spontaneous purchases ashopper might make while walking through the store or after receiving a flyer in the mail.By this measure, the results for the initial recommender were somewhat disappointing: thecorresponding boost in revenue was 0.3% over and above the revenue generated by productsbought from the main “personal catalog” shopping list.
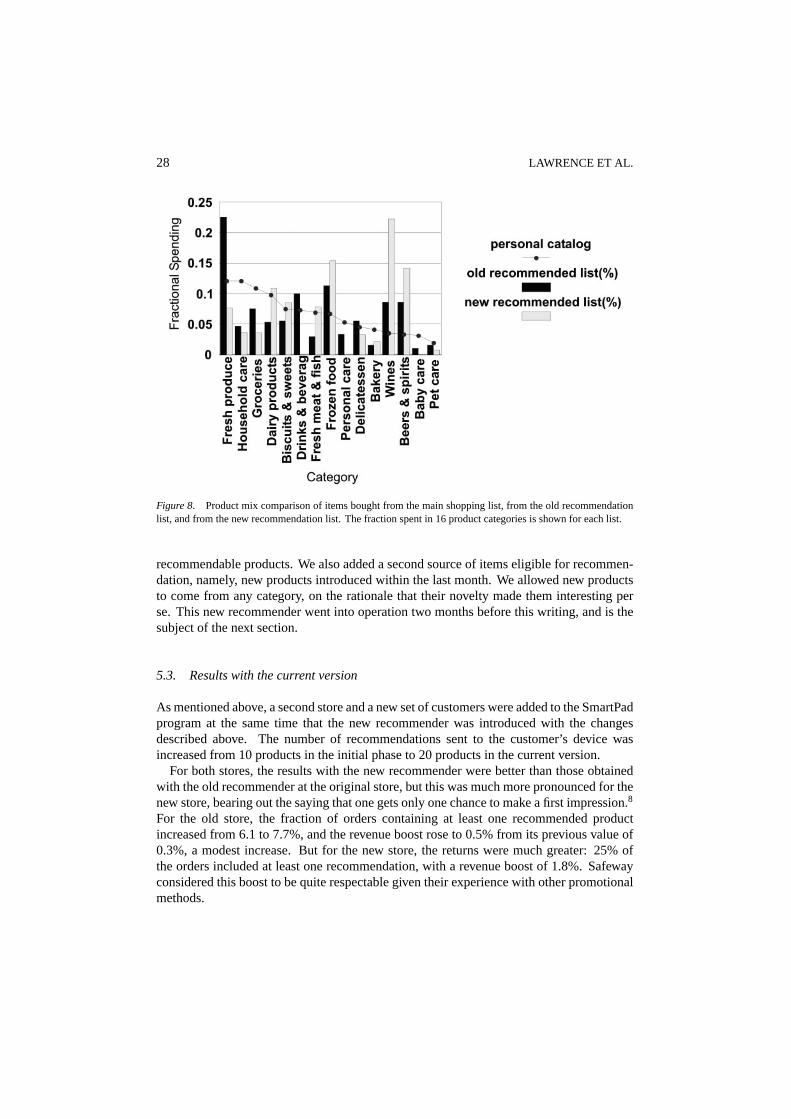
As trial program progressed, we noticed with interest that the distribution of spending inthe SmartPad product categories7 was different for items bought from the recommendationlist versus the personal catalog (see figure 8), even though the distribution of itemsavail-able from each list were quite similar. For example, wines accounted for only 3.5% of therevenue from the main shopping list, but 8.7% of the revenue from the recommendation list.By contrast, products in the household care category accounted for 12.1% of the revenuefrom the main shopping list but only 4.6% from the recommendation list. We interpretedthese results to mean that there is a set of categories in which recommendations are morewelcome than others, and interviews with participating customers confirmed that interpre-tation. They wanted more “interesting” recommendations, and wines fit that descriptionbut household care products did not.
Armed with this insight, we proceeded to trim the list of subclasses from which rec-ommendable products were drawn, emphasizing those product classes in which the spend-ing percentage from the recommendation list exceeded that on the main shopping list,and de-emphasizing the others, with the aim of creating a more “fun” or welcome set of
28 LAWRENCE ET AL.
Figure 8. Product mix comparison of items bought from the main shopping list, from the old recommendationlist, and from the new recommendation list. The fraction spent in 16 product categories is shown for each list.
recommendable products. We also added a second source of items eligible for recommen-dation, namely, new products introduced within the last month. We allowed new productsto come from any category, on the rationale that their novelty made them interesting perse. This new recommender went into operation two months before this writing, and is thesubject of the next section.
5.3. Results with the current version
As mentioned above, a second store and a new set of customers were added to the SmartPadprogram at the same time that the new recommender was introduced with the changesdescribed above. The number of recommendations sent to the customer’s device wasincreased from 10 products in the initial phase to 20 products in the current version.
For both stores, the results with the new recommender were better than those obtainedwith the old recommender at the original store, but this was much more pronounced for thenew store, bearing out the saying that one gets only one chance to make a first impression.8
For the old store, the fraction of orders containing at least one recommended productincreased from 6.1 to 7.7%, and the revenue boost rose to 0.5% from its previous value of0.3%, a modest increase. But for the new store, the returns were much greater: 25% ofthe orders included at least one recommendation, with a revenue boost of 1.8%. Safewayconsidered this boost to be quite respectable given their experience with other promotionalmethods.
PERSONALIZATION OF SUPERMARKET PRODUCT RECOMMENDATIONS 29
We were reasonably successful in meeting our goal of encouraging shoppers to try newthings but not drastically new things: 51% of the acceptances from the recommendationlists corresponded to subclasses in which the shopper had spent no money in the previousthree months, but only 4% corresponded to new product classes. For the recommendationlists themselves, 33% of the recommended products on average were from subclasses theshopper had not spent in before, and 16% were from product classes that were new to thecustomer. Outside the environment of the recommender, the rate of trying new subclassesis substantially lower, and the rate of trying new product classes is practically zero.
5.4. Distributions of computed scores
In order to quantify the impact of the recommender system, it would have been useful tohave a control group of customers who received “placebo” recommendations, such as alist of randomly chosen products. This approach was not feasible, however, since we weredealing with a live system with real customers doing real shopping. Another approach wouldbe to compute the ratio of accepted recommendations to total recommendations offered.However, looking at the recommendation list is voluntary on the part of the customer(it involves clicking the “light bulb” tab in figure 2), and we have no way of knowingwhether the customer actually looked at the list of recommended products.9
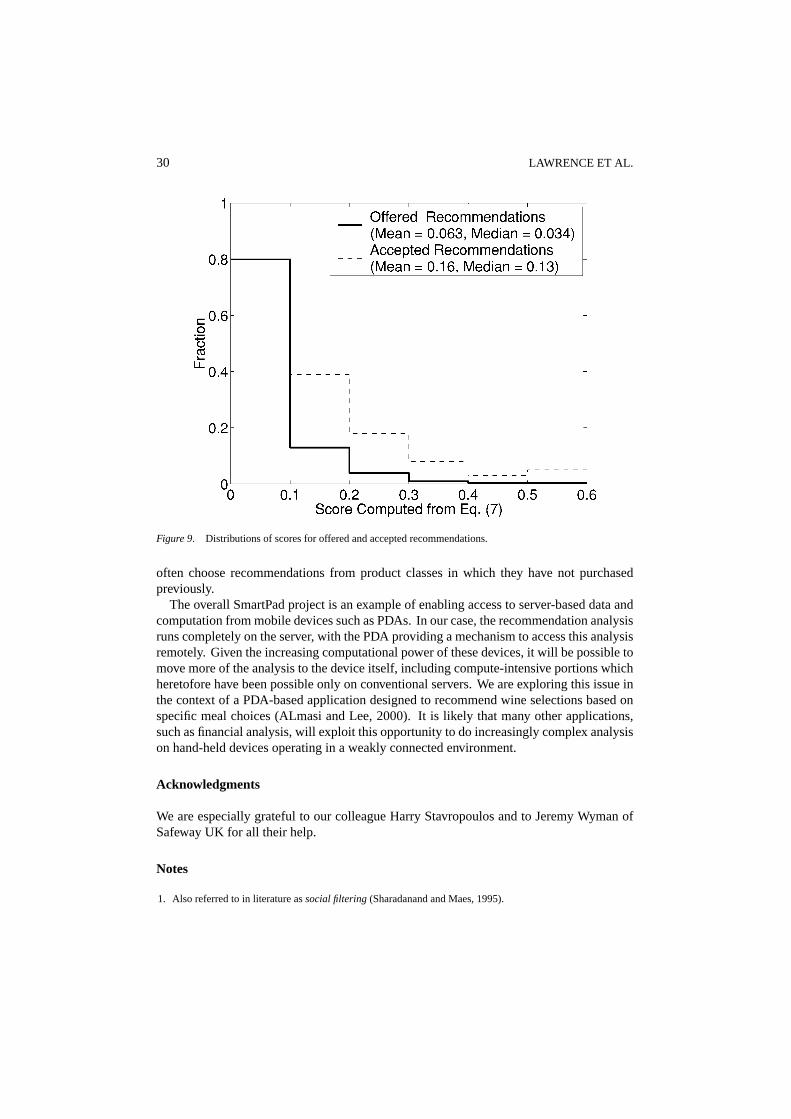
A related issue is the extent to which recommendations with higher scores are acceptedpreferentially over recommendations with lower scores. We address this issue by comparingthe distribution of scores computed from Eq. (7) for accepted recommendations with theanalogous distribution for offered recommendations. The results are shown in figure 9.The scores for the accepted recommendations are based on 243 products accepted from 183distinct recommendation lists. The distribution for the offered recommendations is takenfrom approximately 20,000 recommendations made to the customers who accepted at leastone recommendation during the pilot program.
Figure 9 shows that the scores of the accepted recommendations are higher than thescores of a large number of offered recommendations. For example, 80% of the productsplaced onto the recommendation lists have scores below 0.1, but only 25% of the acceptedrecommendations fall in this lower bin. The mean and median scores for the offeredrecommendations are 0.063 and 0.034, respectively, while the mean and median scoresfor the accepted recommendations are 0.16 and 0.13. The difference between the twomeans, 0.10, falls well within the 95% confidence interval (0.090, 0.105) computed usingStudent’st-test for the difference between means (Robbins and Van Ryzin, 1975). Theseresults suggest that the score computed using Eq. (7) is indeed a useful indicator of apreviously unbought product’s appeal to the targeted customer.
6. Summary and future work
We have described a product recommendation system developed as part of an overall per-vasive computing solution for grocery shopping. The recommendation algorithm combinesaspects of content and collaborative filtering to rate new products for a customer based ontheir prior purchase behavior. Analysis of results obtained during a field test of the systemhave shown revenue boosts of roughly 1 to 2%, with the interesting observation that people
30 LAWRENCE ET AL.
Figure 9. Distributions of scores for offered and accepted recommendations.
often choose recommendations from product classes in which they have not purchasedpreviously.
The overall SmartPad project is an example of enabling access to server-based data andcomputation from mobile devices such as PDAs. In our case, the recommendation analysisruns completely on the server, with the PDA providing a mechanism to access this analysisremotely. Given the increasing computational power of these devices, it will be possible tomove more of the analysis to the device itself, including compute-intensive portions whichheretofore have been possible only on conventional servers. We are exploring this issue inthe context of a PDA-based application designed to recommend wine selections based onspecific meal choices (ALmasi and Lee, 2000). It is likely that many other applications,such as financial analysis, will exploit this opportunity to do increasingly complex analysison hand-held devices operating in a weakly connected environment.
Acknowledgments
We are especially grateful to our colleague Harry Stavropoulos and to Jeremy Wyman ofSafeway UK for all their help.
Notes
1. Also referred to in literature associal filtering(Sharadanand and Maes, 1995).
PERSONALIZATION OF SUPERMARKET PRODUCT RECOMMENDATIONS 31
2. Given the rule A⇒B, where A and B are itemsets and T is the total number of customers, thesupportfor therule, S(A⇒B), is the percentage of customers who have spent in both A and B; theconfidencein the rule isS(A⇒B)/S(A), and thelift is S(A⇒B)/(S(A)*S(B)). The lift is the ratio of actual confidence to the expectedconfidence, where the latter is computed assuming that A and B are statistically independent. Support and liftare symmetric in A and B; confidence is not.
3. The word “demographic” here refers to a particular clusteringalgorithm that was applied to customers’spending data, whereas its use above in “demographic-based segmentation” refers to the demographicdata(age etc.) that were used as the basis for creating those segments.
4. The Condorcet criterion (Michaud, 1999) is the difference of two factors, one of which measures how similarthe records within a cluster are, while the other measures how different the records within a cluster are fromall records not in the cluster. For perfect clustering, the first factor is 1.0 and the second is 0.0.
5. Dunn’s index is the ratio of intercluster distance to cluster diameter. We computed it using the approximationcalledν53 in Bezdek (1998).
6. The clustering is based on customer spending in all 99 product classes, even though a few classes such aspetrol and tobacco are excluded from our lists of recommendable products. We found, for example, thattobacco purchasers also buy more and stronger deodorizers and a different set of wines than non-tobaccopurchasers.
7. The 16 SmartPad product categories are a superset of the 99 Safeway product classes, minus those classes likepetrol and tobacco that are not available via SmartPad.
8. It is also possible that SmartPad participants in the new store were inherently more inclined to accept recom-mendations than those from the original store. We note that the demographics of the two stores are similar.
9. Late in the pilot program, a capability was added to the PDA which tagged whether a customer submitting anorder had actually looked at the recommendation list.
References
Agrawal, R. and Srikant, R. 1994. Fast algorithms for mining association rules. In Proc. of the 20th Int’l Conferenceon Very Large Databases, Santiago, Chile, Sept. 1994.
Aggarwal, C.C., Wolf, J.L., Wu, K-L., and Yu, P.S. 1999. Horting hatches an egg: A new graph-theoretic approachto collaborative filtering. In KDD-99 Proceedings, pp. 201–212.
Almasi, G.S. and Lee, A.J. 2000. A PDA-based personalized recommender agent. In Proc. Fifth InternationalConf. on the Practical Application of Intelligent Agent and Multi Agent Technology, Manchester, England,pp. 299–309, April 2000.
Balabanovic, M. and Shoham, Y. 1997. Fab: Content-based, collaborative recommendation. Communications ofthe ACM, 40(3):66–72.
Bezdek, J.C. and Pal, N.R. 1998. Some new indexes of cluster validity. IEEE Transactions on Systems, Man, andCybernetics—Part B: Cybernetics, 28(3):301–315.
Borchers, A., Herlocker, J., Konstan, J., and Riedl, J. 1998. Ganging up on information overload. Computer,31(4):106-108.
Everitt, B.S. 1993. Cluster Analysis, London: Edward Arnold.First Annual Personalization Summit. 1999. www.personalization.com, San Francisco, Nov. 15–16, 1999.Intelligent Miner for Data. www.ibm.com/software/data/iminer/fordata.Kohonen, T. 1995. Self-Organizing Maps. Springer-Verlag.Konstan, J., Miller, B., Maltz, D., Herlocker, J., Gordon, L.R., and Riedl, J. 1997. GroupLens: Applying collabo-
rative filtering to usenet news. Communications of ACM, 40(3).Kotlyar V., Viveros, M.S., Duri, S.S., Lawrence, R.D., and Almasi, G.S. 1999. A case study in information delivery
to mass retail markets. In Proceedings of the 10th International Conference on Database and Expert SystemsApplications (DEXA), Florence, Italy, Aug./Sept. 1999, Springer-Verlag. Lecture Notes in Computer Science,vol. 1677.
Lawrence, R.D., Almasi, G.S., and Rushmeier, H.E. 1999. A scalable parallel algorithm for self-organizing mapswith applications to sparse data mining problems. Data Mining and Knowledge Discovery, 3:171–195.
Michaud, P. 1999. Clustering techniques. Future Generation Computer Systems, 13(2).
32 LAWRENCE ET AL.
Resnick, P. and Varian, H.R. 1997. Recommender systems. Communications of the ACM, 40(3):56–58. Also seeother articles in this special issue.
Robbins, H. and Van Ryzin, J. 1975. Introduction to Statistics. Scientific Research Associates, Inc..Salton, J. 1989. Automatic Text Processing: The Transformation, Analysis and Retrieval of Information By
Computer. Reading, MA: Addison-Wesley.Salton, J. and McGill, M.J. 1983. Introduction to Modern Information Retrieval. New York: McGraw-Hill.Shardanand, U. and Maes, P. 1995. Social information filtering: Algorithms for automating word of mouth.
In Proc. CHI 95, ACM Press, pp. 202–209.Ungar, L.H. and Foster, D.P. 1998. Clustering methods for collaborative filtering. In Proceedings of 1998 AAAI
Workshop on Recommender Systems. Available as AAAI Technical Report WS-98-08.
Richard D. Lawrence is a Research Staff Member and Manager, Deep Computing Applications, at the IBM T.J.Watson Research Center. He received the B.S. degree from Stanford University in Chemical Engineering, andthe Ph.D. degree from University of Illinois in Nuclear Engineering. Prior to joining IBM Research in 1990, heheld research positions in the Applied Physics Division at Argonne National Laboratory and at Schlumberger-DollResearch. His current work is in the development of high-performance data mining applications in the areas offinancial analysis and product recommendation systems.
George S. Almasiis a Research Staff Member at the IBM T.J. Watson Research Center. He received his Ph.D.in electrical engineering from the Massachusetts Institute of Technology. He has a variety of technical andmanagement experiences in memory technology, display systems, and parallel computing, and is co-author ofthe book “Highly Parallel Computing”. His recent interests have been in high-performance parallel applications,including datamining, the visualization of its results, and its application in personal recommender systems. He iscurrently at work on a visualizer for Blue Gene, a supercomputer designed to perform protein folding.
Vladimir Kotlyar is currently with CrossGain Corporation of Redmond, WA. Prior to joining CrossGain, Dr.Kotlyar was a Research Staff Member at the IBM T.J. Watson Research Center. He received his Ph.D. inComputer Science from Cornell University in 1998. His main interest is performance optimization of dataintensive applications.
Marisa Viveros is a senior manager of the Pervasive Computing Solutions group at the IBM T.J. Watson ResearchCenter. She is responsible for the creation of emerging applications in the areas of wireless technology, pervasivedevices, and their seamless integration in business environments. Her research areas include data managementfor mobile computing, business applications, data mining, and parallel databases.
Sastry S. Duri is an Advisory Software Engineer at the IBM T. J. Watson Research Center, where his researchinterests include e-business, mobile commerce, and pervasive computing applications. Duri received his B.Tech.in electronics and communications from Regional Engineering College, Warangal, India, the M.S. in computerscience from Indian Institute of Technology, Madras, India, and his Ph.D. in electrical engineering and computersciences from the University of Illinois at Chicago.
Copyright © 2022 FDOKUMEN