Personality and Intelligence Interact in the Prediction of ... - MDPI
18
Intelligence Journal of Article Personality and Intelligence Interact in the Prediction of Academic Achievement Sebastian Bergold * and Ricarda Steinmayr Department of Psychology, Technical University Dortmund, Emil-Figge-Straße 50, 44227 Dortmund, Germany; [email protected] * Correspondence: [email protected]; Tel.: +49-231-7552834; Fax: +49-231-7555875 Received: 23 March 2018; Accepted: 7 May 2018; Published: 10 May 2018 Abstract: Personality predicts academic achievement above and beyond intelligence. However, studies investigating the possible interaction effects between personality and intelligence when predicting academic achievement are scarce, as is the separate investigation of broad personality factors versus narrow personality facets in this context. Two studies with 11th grade students (Study 1: N = 421; Study 2: N = 243) were conducted to close this research gap. The students completed the Intelligence-Structure-Test 2000 R measuring general reasoning ability, and a well-established personality inventory based on the Five Factor Model. Academic achievement was operationalized via Grade Point Average. Using hierarchical regression and moderation analyses, Study 1 revealed that Conscientiousness interacted with intelligence when predicting academic achievement: there was a stronger association between intelligence and academic achievement when students scored higher on the Conscientiousness scale. Study 2 confirmed the findings from Study 1 and also found a moderation effect of Neuroticism (stronger association between intelligence and academic achievement with lower values on the Neuroticism scale). Analyses at the facet level revealed much more differentiated results than did analyses at the domain level, suggesting that investigating personality facets should be preferred over investigating personality domains when predicting academic achievement. Keywords: personality factors; personality facets; Big Five; intelligence; personality-intelligence interface; academic achievement; grade point average 1. Introduction Since the improvement of learning is the central goal of Educational Psychology, the investigation of factors contributing to academic achievement is among its most important issues. Many predictors of academic achievement have already been investigated, but no source of variance has been found to be as strong as the student him- or herself [1]. Among the student predictors, cognitive ability is surely the most important one, setting the stage for what is theoretically possible for the student to achieve [2,3]. However, non-cognitive factors such as personality traits might also exert an influence on academic achievement given their influence on the student’s work approach [4]. More precisely, they might decide upon how well a student manages to convert his or her intelligence into academic achievement, that is, they might interact with intelligence in the prediction of academic achievement. Hitherto, however, only a little attention has been paid to possible interaction effects between personality and intelligence in forming academic achievement. Therefore, in two studies, we aimed to investigate the interaction effects between personality traits and intelligence in the prediction of adolescents’ grade point average (GPA). Moreover, we examined whether the investigation of personality facets instead of broader personality factors in the interaction with intelligence would provide more nuanced results than the investigation of broad factors only. J. Intell. 2018, 6, 27; doi:10.3390/jintelligence6020027 www.mdpi.com/journal/jintelligence
-
Upload
khangminh22 -
Category
Documents
-
view
1 -
download
0
Transcript of Personality and Intelligence Interact in the Prediction of ... - MDPI

IntelligenceJournal of
Article
Personality and Intelligence Interact in the Predictionof Academic Achievement
Sebastian Bergold * and Ricarda Steinmayr
Department of Psychology, Technical University Dortmund, Emil-Figge-Straße 50, 44227 Dortmund, Germany;[email protected]* Correspondence: [email protected]; Tel.: +49-231-7552834; Fax: +49-231-7555875
Received: 23 March 2018; Accepted: 7 May 2018; Published: 10 May 2018�����������������
Abstract: Personality predicts academic achievement above and beyond intelligence. However,studies investigating the possible interaction effects between personality and intelligence whenpredicting academic achievement are scarce, as is the separate investigation of broad personalityfactors versus narrow personality facets in this context. Two studies with 11th grade students (Study 1:N = 421; Study 2: N = 243) were conducted to close this research gap. The students completedthe Intelligence-Structure-Test 2000 R measuring general reasoning ability, and a well-establishedpersonality inventory based on the Five Factor Model. Academic achievement was operationalizedvia Grade Point Average. Using hierarchical regression and moderation analyses, Study 1 revealedthat Conscientiousness interacted with intelligence when predicting academic achievement: therewas a stronger association between intelligence and academic achievement when students scoredhigher on the Conscientiousness scale. Study 2 confirmed the findings from Study 1 and alsofound a moderation effect of Neuroticism (stronger association between intelligence and academicachievement with lower values on the Neuroticism scale). Analyses at the facet level revealed muchmore differentiated results than did analyses at the domain level, suggesting that investigatingpersonality facets should be preferred over investigating personality domains when predictingacademic achievement.
Keywords: personality factors; personality facets; Big Five; intelligence; personality-intelligenceinterface; academic achievement; grade point average
1. Introduction
Since the improvement of learning is the central goal of Educational Psychology, the investigationof factors contributing to academic achievement is among its most important issues. Many predictors ofacademic achievement have already been investigated, but no source of variance has been found to beas strong as the student him- or herself [1]. Among the student predictors, cognitive ability is surely themost important one, setting the stage for what is theoretically possible for the student to achieve [2,3].However, non-cognitive factors such as personality traits might also exert an influence on academicachievement given their influence on the student’s work approach [4]. More precisely, they mightdecide upon how well a student manages to convert his or her intelligence into academic achievement,that is, they might interact with intelligence in the prediction of academic achievement. Hitherto,however, only a little attention has been paid to possible interaction effects between personality andintelligence in forming academic achievement. Therefore, in two studies, we aimed to investigate theinteraction effects between personality traits and intelligence in the prediction of adolescents’ gradepoint average (GPA). Moreover, we examined whether the investigation of personality facets insteadof broader personality factors in the interaction with intelligence would provide more nuanced resultsthan the investigation of broad factors only.
J. Intell. 2018, 6, 27; doi:10.3390/jintelligence6020027 www.mdpi.com/journal/jintelligence
J. Intell. 2018, 6, 27 2 of 18
1.1. Intelligence and Personality as Predictors of Academic Achievement
When it comes to the prediction of academic achievement, there is no doubt that generalintelligence (g) is the most powerful single predictor [3,5]. This is even true if academic achievementis operationalized via grades instead of academic achievement tests. Correlations between generalintelligence and grades most often range from r = 0.3 to r = 0.5, depending on different factors suchas the school subject, years of education, or the selectivity of the sample [2,5,6]. The importance ofintelligence notwithstanding, a maximum correlation of r = 0.5 means, on the other hand, that thepredictive power of intelligence never exceeds 25% variance explained. Therefore, still, other variablesmust be at work contributing to academic achievement.
After being abandoned for most of the second half of the last century, there has been a renewedinterest in personality as a predictor of academic achievement. Especially the Big Five: Neuroticism(N), Extraversion (E), Openness to Experience (O), Agreeableness (A), and Conscientiousness (C) [7],have been scrutinized. N might negatively relate to academic achievement because individuals scoringhigh on N questionnaires also display higher values on performance anxiety questionnaires, which is,in turn, detrimental to achievement [8]. E and A comprise some characteristics—such as talkativeness(E) or compliance (A)—that might bring out academic behavior that is valued by teachers and leads tobetter achievement, for example, high engagement and cooperation within learning groups or highparticipation in class [9]. Students high in O might benefit because they have, on average, higherscores on tests of intelligence, verbal skills, and general knowledge [10]. Furthermore, they use moreeffective in-depth learning strategies than individuals low in O [11]. Finally, C should be related toacademic achievement, because students scoring high on C questionnaires are stronger oriented towardachievement and more ambitious, better organized, more reliable, and more self-disciplined [12,13].
In the meantime, a number of studies have mostly established small but nevertheless non-trivialcorrelations between certain personality dimensions and grades [12,14–21]. Taking the emergingevidence together, Poropat [22] revealed in his meta-analysis, small but consistent correlations betweengrades and some of the Big Five. The strongest correlation was found for C (r = 0.19), followed byO (r = 0.10) and A (r = 0.07), whereas there were no correlations with N and E. At least similar resultswere reported by O’Connor and Paunonen [9]. In another meta-analysis investigating the role of theBig Three, Poropat [23] noted significant but (very) small correlations between academic achievementand Psychoticism (r = −0.06), N (r = −0.06), and E (r = 0.02).
Importantly, the correlations between academic achievement and personality (especially C)still held when intelligence was controlled for [20,24–28]. This seems even to be true if academicachievement is operationalized via a standardized academic achievement test [29] and if personalitydimensions are other-rated instead of self-rated [30]. Thus, both personality and intelligence playan important, unique role in the prediction of academic achievement. Therefore, theoretical modelsseeking to explain academic achievement should consider both personality and intelligence.
To sum up, there have been consistent correlations found for some personality traits, whereas therewere zero correlations for other personality traits. However, zero correlations do not necessarily meanthat those personality traits are not important for academic achievement. O’Connor and Paunonen [9]argued that investigating personality facets instead of broad personality domains might give a clearerpicture of the association between personality and academic achievement [31,32]. In two studieswith university students, Paunonen and Ashton [33,34] found support for this claim: Achievement,Understanding, and Play as facets of C, O, and E, respectively, predicted GPA (0.17 ≤ |r| ≤ 0.26).When the facets were combined with the respective other facets of the broader personality factors,these factors provided a weaker prediction of GPA in both studies (0.01 ≤ |r| ≤ 0.21). Therefore, eventhough broad traits might seem unrelated to academic achievement, at first sight, certain facets ofthese personality traits might still be very useful in the prediction of academic achievement.
J. Intell. 2018, 6, 27 3 of 18
1.2. The Interaction between Intelligence and Personality in Predicting Academic Achievement
Some of the models predicting academic achievement assume that intelligence and personalitypredict academic achievement independently of each other, that is, both constructs’ contribution toacademic achievement is seen as additive [35]. However, older theories predicting performance fromintelligence and motivation suggested that both constructs should interact with each other in an ordinalmanner [36,37]. More precisely, they stated that on the one hand, the association between performanceand intelligence should be moderated by motivation. If motivation is low, intelligence should matterless for performance than when motivation is high because smart individuals with low motivationmight waste their intellectual abilities instead of investing it in performance. On the other hand, theassociation between performance and motivation should be moderated by intelligence. If intelligenceis low, motivation should matter less for performance than when intelligence is high, because evenhigh motivation might be futile in the face of missing ability [38].
Since motivation and personality are related [12,39,40], there is the hypothesis that performanceis an interactive function of intelligence and personality, as well [41,42]. Whereas intelligencedescribes the limiting conditions academic performance depends on [2], personality—just likemotivation—describes how one approaches a task [43]. Therefore, personality might moderate therelationship between intelligence and academic achievement (or intelligence might moderate therelation between personality and academic achievement) [41]. Following traditional performancetheories, it should be especially likely to find an interaction between intelligence and personality traitsthat are related to achievement motivation.
Studies investigating the interaction between intelligence and personality in the prediction ofperformance mainly focused on C or its facet Achievement Striving, due to their close relation toachievement motivation. Rather mixed results were found for C: Di Domenico and Fournier [24],as well as Ziegler et al. [21], found that C interacted with intelligence in the prediction of GPA.The higher C was, the higher the relation between intelligence and GPA, suggesting that studentsscoring high on C questionnaires might make their cognitive ability more fruitful through hard andaccurate work than students scoring low on C questionnaires. On the other hand, studies predictingjob performance did not find such an interaction [38,44,45].
The results concerning Achievement Striving, however, seem to be more homogenous. Moststudies found a significant interaction between Achievement Striving and intelligence when predictingacademic achievement [21,42] (in the study by Ziegler et al. [21], this interaction effect was only foundwhen the sample was split according to academic achievement. There was an ordinal interactioneffect in high performers and a rather semi-ordinal interaction effect in low performers, cancelingeach other out when regarding the entire sample). Other facets of C such as Competence, Dutifulness,and Self-Discipline are also related to achievement motivation [12,46,47] and might therefore alsointeract with intelligence in the prediction of academic achievement.
Not only C and its facets, but also the other Big Five dimensions and their facets are related toachievement motivation [40,46]. Therefore, they might also interact with intelligence in the predictionof academic achievement. However, an explicit prediction with regard to an interaction of ability anda Big Five personality domain (besides C) or facet has only been made with regard to N [48,49] andO, but this has rarely been investigated. Zhang and Ziegler [50] found that there was an associationbetween figural reasoning and academic achievement only for students with average and belowaverage scores on the O questionnaire. However, figural reasoning did not matter for academicachievement when O scores were above average, indicating a buffer effect of high O against lowfigural reasoning ability. Similar results were found by Ziegler et al. [51] for O and fluid intelligencewhen predicting vocabulary. Heaven and Ciarrochi [18] found that O to ideas (Intellect) among 7thgraders only marginally predicted GPA 3 years later, but there was a significant interaction betweenIntellect and intelligence: The association between Intellect and GPA was stronger for students withhigher scores on the intelligence test (+0.5 SD). For students with lower scores on the intelligence test(−0.5 SD), there was no association.
J. Intell. 2018, 6, 27 4 of 18
However, as studies concerning the other Big Five than C are scarce, there is a further needfor studies investigating the joint effect of personality domains (besides C) and intelligence thatalso consider a possible interaction between the personality domain and intelligence. Moreover,possible interaction effects between the personality facets and intelligence in the prediction of academicachievement have not sufficiently been clarified yet. It might be that possible interactions betweenbroad personality factors and intelligence do not apply to all facets related to the respective broadfactor. At the same time, some facets might exhibit much stronger interaction effects with intelligencethan the broad factor.
1.3. Aims of the Present Investigation
The aims of our investigation were twofold and, therefore, we conducted two studies. As afirst step, we investigated the possible interaction effects between intelligence and the Big Five inpredicting academic achievement (Study 1). We expected an interaction effect between intelligenceand C. However, we did not limit our investigation to C, but also expanded our view to theother Big Five dimensions, which have so far been somewhat neglected as compared to C. Due totheir relation to achievement motivation, they might interact with intelligence in the predictionof academic achievement, as well. In Study 2, we first tested the replicability of the resultsfrom Study 1. Then, we investigated whether the inspection of personality facets (as opposed tobroad personality factors) in interaction with intelligence provided more differentiated results whenpredicting academic achievement.
2. Study 1
2.1. Materials and Methods
2.1.1. Sample and Procedure
N = 421 students (Mage = 16.43 years, SDage = 0.55; 208 girls) from 5 different high schools(Gymnasiums) in Germany took part. The Gymnasium is the highest track in Germany’s secondaryschool system. It leads to the Abitur, which allows for university enrollment. All students attended11th grade. The students can be considered as the typical population of the Gymnasium in Germany(that is, the majority being Caucasian from medium to high socioeconomic status homes).
Testing took place during a regular school day and was conducted in groups of about 20 students.Trained students and research assistants administered the tests according to standardized instructions.Participation was voluntary, and students were allowed to take part only if their parents had completedwritten consent forms.
2.1.2. Measures
Intelligence. We administered the basic module of the Intelligence-Structure-Test 2000 R [52].The IST 2000 R basic module measures reasoning ability using verbal, numerical, and figural material.The composite score out of these 3 domains indicates general reasoning ability, which is very closelyrelated to general intelligence (g). Therefore, it can be used as a proxy for general intelligence.
Personality. We assessed the Big Five (Neuroticism, Extraversion, Openness to Experience,Agreeableness, and Conscientiousness) with the German version of the NEO-FFI [53]. This instrumentconsists of 60 items, covering each of the Big Five with 12 items. Answers on the items ranged from0 (strong disagreement) to 4 (strong agreement). Reliabilities in the present study were α = 0.85 for N,α = 0.78 for E, α = 0.68 for O, α = 0.77 for A, and α = 0.85 for C.
Academic achievement. To operationalize academic achievement, we used the Grade Point Averages(GPAs) from the students’ report cards obtained 3 months after testing. The report cards were providedby the schools. In Germany, grades range from 1 (outstanding performance) to 6 (complete failure).
J. Intell. 2018, 6, 27 5 of 18
The data set and the code book for Study 1 can be obtained as described in the section“Supplementary Materials”.
2.1.3. Analyses
We first inspected descriptive statistics and intercorrelations for all variables under study. We thenperformed a hierarchical regression analysis for every personality trait separately, using SPSS 25.0.To this end, we centered both intelligence and the respective personality trait before entering them intothe regression model. First, we predicted GPA from intelligence only (Step 1). In Step 2, we added eachof the Big Five separately to inspect their incremental predictive value above and beyond intelligence.Finally, we added the interaction term between intelligence and the respective personality trait(product of the centered predictors) to test for a possible interaction effect (Step 3). If the interaction effectwas statistically significant, we performed a simple slope analysis using the program “Interaction”,version 1.7.2211 [54]. Additionally, we calculated confidence bands and regions of significance todetermine at which moderator levels the association between intelligence and GPA became statisticallysignificant (α = 0.05) or insignificant, respectively [55].
2.2. Results
2.2.1. Descriptive Statistics and Intercorrelations
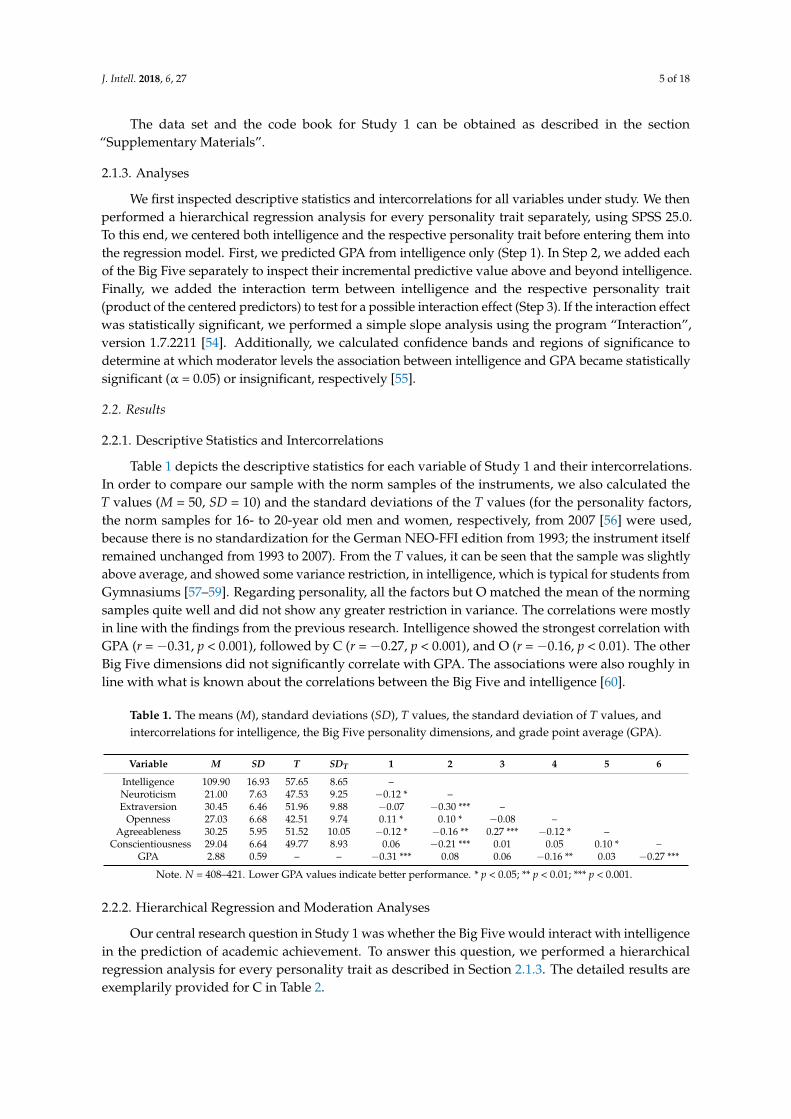
Table 1 depicts the descriptive statistics for each variable of Study 1 and their intercorrelations.In order to compare our sample with the norm samples of the instruments, we also calculated theT values (M = 50, SD = 10) and the standard deviations of the T values (for the personality factors,the norm samples for 16- to 20-year old men and women, respectively, from 2007 [56] were used,because there is no standardization for the German NEO-FFI edition from 1993; the instrument itselfremained unchanged from 1993 to 2007). From the T values, it can be seen that the sample was slightlyabove average, and showed some variance restriction, in intelligence, which is typical for students fromGymnasiums [57–59]. Regarding personality, all the factors but O matched the mean of the normingsamples quite well and did not show any greater restriction in variance. The correlations were mostlyin line with the findings from the previous research. Intelligence showed the strongest correlation withGPA (r = −0.31, p < 0.001), followed by C (r = −0.27, p < 0.001), and O (r = −0.16, p < 0.01). The otherBig Five dimensions did not significantly correlate with GPA. The associations were also roughly inline with what is known about the correlations between the Big Five and intelligence [60].
Table 1. The means (M), standard deviations (SD), T values, the standard deviation of T values, andintercorrelations for intelligence, the Big Five personality dimensions, and grade point average (GPA).
Variable M SD T SDT 1 2 3 4 5 6
Intelligence 109.90 16.93 57.65 8.65 –Neuroticism 21.00 7.63 47.53 9.25 −0.12 * –Extraversion 30.45 6.46 51.96 9.88 −0.07 −0.30 *** –
Openness 27.03 6.68 42.51 9.74 0.11 * 0.10 * −0.08 –Agreeableness 30.25 5.95 51.52 10.05 −0.12 * −0.16 ** 0.27 *** −0.12 * –
Conscientiousness 29.04 6.64 49.77 8.93 0.06 −0.21 *** 0.01 0.05 0.10 * –GPA 2.88 0.59 – – −0.31 *** 0.08 0.06 −0.16 ** 0.03 −0.27 ***
Note. N = 408–421. Lower GPA values indicate better performance. * p < 0.05; ** p < 0.01; *** p < 0.001.
2.2.2. Hierarchical Regression and Moderation Analyses
Our central research question in Study 1 was whether the Big Five would interact with intelligencein the prediction of academic achievement. To answer this question, we performed a hierarchicalregression analysis for every personality trait as described in Section 2.1.3. The detailed results areexemplarily provided for C in Table 2.

J. Intell. 2018, 6, 27 6 of 18
Table 2. The hierarchical regression of grade point average on centered intelligence and conscientiousness.
Variable B β p R2 ∆R2
Step 1 0.094Intelligence −0.01 −0.31 <0.001
Step 2 0.158 0.063 **Intelligence −0.01 −0.29 <0.001
Conscientiousness −0.27 −0.25 <0.001
Step 3 0.167 0.009 *Intelligence −0.01 −0.29 <0.001
Conscientiousness −0.26 −0.25 <0.001Intelligence × Conscientiousness −0.01 −0.10 0.03
Note. N = 408. Lower GPA values indicate better performance. * p < 0.05; ** p < 0.001.
C predicted the GPA above and beyond intelligence (β = −0.25, p < 0.001). It also interacted withintelligence in predicting GPA (βIA = −0.10, p = 0.03). The interaction term explained an additional 1%of the GPA variance (∆R2 = 0.009). The simple slope analysis revealed that the association betweenintelligence and GPA was stronger when C was higher (see Figure 1, left side). In the group withhigher scores on C (+1 SD), there was a strong association between intelligence and GPA (t = −6.19,p < 0.001). In the group with lower scores on C (−1 SD), the association between intelligence and GPAwas weaker (t = −3.03, p = 0.003). The centered C scores ranged from −17.04 to 17.96. The regionof significance began at a C score of −7.97 (see Figure 1, right side). This means that for studentswho displayed higher scores on C than −7.97, the correlation between intelligence and GPA becamestatistically significant (p < 0.05).
Figure 1. The regression of academic achievement (GPA) on intelligence at high, mean, and low scoreson Conscientiousness (on the left) as well as confidence bands and region of significance (on the right).The dotted line marks the score of the moderator at which the association between GPA and intelligencebecomes statistically significant (p < 0.05).
O predicted the GPA above and beyond intelligence (β = −0.13, p = 0.005) but did not interactwith intelligence in the prediction of GPA. As could be expected from their very low correlationswith GPA (see Table 1), the other Big Five dimensions N, E, and A did not predict GPA incrementally.At least for A, however, there was a small interaction effect with intelligence (βIA = −0.08, p = 0.09,∆R2 = 0.006), indicating a stronger association between intelligence and GPA when scores on A werehigh (t = −5.69, p < 0.001) than when scores on A were low (t = −3.77, p < 0.001).
J. Intell. 2018, 6, 27 7 of 18
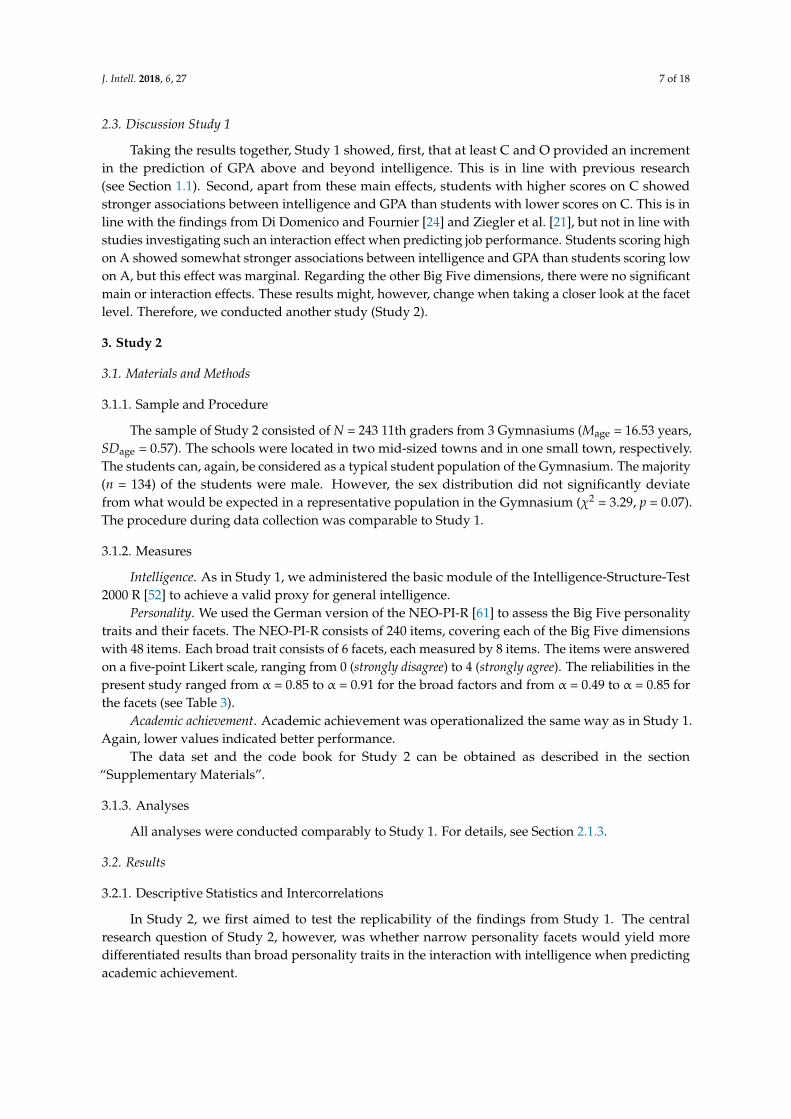
2.3. Discussion Study 1
Taking the results together, Study 1 showed, first, that at least C and O provided an incrementin the prediction of GPA above and beyond intelligence. This is in line with previous research(see Section 1.1). Second, apart from these main effects, students with higher scores on C showedstronger associations between intelligence and GPA than students with lower scores on C. This is inline with the findings from Di Domenico and Fournier [24] and Ziegler et al. [21], but not in line withstudies investigating such an interaction effect when predicting job performance. Students scoring highon A showed somewhat stronger associations between intelligence and GPA than students scoring lowon A, but this effect was marginal. Regarding the other Big Five dimensions, there were no significantmain or interaction effects. These results might, however, change when taking a closer look at the facetlevel. Therefore, we conducted another study (Study 2).
3. Study 2
3.1. Materials and Methods
3.1.1. Sample and Procedure
The sample of Study 2 consisted of N = 243 11th graders from 3 Gymnasiums (Mage = 16.53 years,SDage = 0.57). The schools were located in two mid-sized towns and in one small town, respectively.The students can, again, be considered as a typical student population of the Gymnasium. The majority(n = 134) of the students were male. However, the sex distribution did not significantly deviatefrom what would be expected in a representative population in the Gymnasium (χ2 = 3.29, p = 0.07).The procedure during data collection was comparable to Study 1.
3.1.2. Measures
Intelligence. As in Study 1, we administered the basic module of the Intelligence-Structure-Test2000 R [52] to achieve a valid proxy for general intelligence.
Personality. We used the German version of the NEO-PI-R [61] to assess the Big Five personalitytraits and their facets. The NEO-PI-R consists of 240 items, covering each of the Big Five dimensionswith 48 items. Each broad trait consists of 6 facets, each measured by 8 items. The items were answeredon a five-point Likert scale, ranging from 0 (strongly disagree) to 4 (strongly agree). The reliabilities in thepresent study ranged from α = 0.85 to α = 0.91 for the broad factors and from α = 0.49 to α = 0.85 forthe facets (see Table 3).
Academic achievement. Academic achievement was operationalized the same way as in Study 1.Again, lower values indicated better performance.
The data set and the code book for Study 2 can be obtained as described in the section“Supplementary Materials”.
3.1.3. Analyses
All analyses were conducted comparably to Study 1. For details, see Section 2.1.3.
3.2. Results
3.2.1. Descriptive Statistics and Intercorrelations
In Study 2, we first aimed to test the replicability of the findings from Study 1. The centralresearch question of Study 2, however, was whether narrow personality facets would yield moredifferentiated results than broad personality traits in the interaction with intelligence when predictingacademic achievement.
J. Intell. 2018, 6, 27 8 of 18
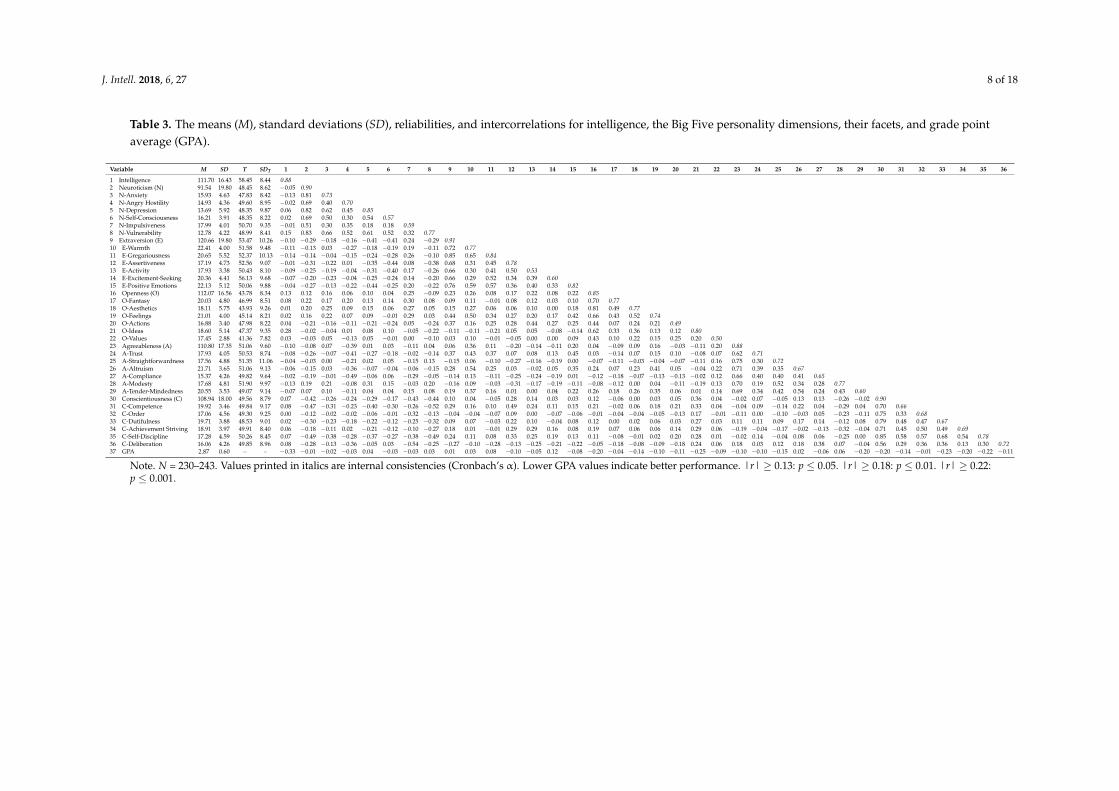
Table 3. The means (M), standard deviations (SD), reliabilities, and intercorrelations for intelligence, the Big Five personality dimensions, their facets, and grade pointaverage (GPA).
Variable M SD T SDT 1 2 3 4 5 6 7 8 9 10 11 12 13 14 15 16 17 18 19 20 21 22 23 24 25 26 27 28 29 30 31 32 33 34 35 36
1 Intelligence 111.70 16.43 58.45 8.44 0.882 Neuroticism (N) 91.54 19.80 48.45 8.62 −0.05 0.903 N-Anxiety 15.93 4.63 47.83 8.42 −0.13 0.81 0.734 N-Angry Hostility 14.93 4.36 49.60 8.95 −0.02 0.69 0.40 0.705 N-Depression 13.69 5.92 48.35 9.87 0.06 0.82 0.62 0.45 0.856 N-Self-Consciousness 16.21 3.91 48.35 8.22 0.02 0.69 0.50 0.30 0.54 0.577 N-Impulsiveness 17.99 4.01 50.70 9.35 −0.01 0.51 0.30 0.35 0.18 0.18 0.598 N-Vulnerability 12.78 4.22 48.99 8.41 0.15 0.83 0.66 0.52 0.61 0.52 0.32 0.779 Extraversion (E) 120.66 19.80 53.47 10.26 −0.10 −0.29 −0.18 −0.16 −0.41 −0.41 0.24 −0.29 0.9110 E-Warmth 22.41 4.00 51.58 9.48 −0.11 −0.13 0.03 −0.27 −0.18 −0.19 0.19 −0.11 0.72 0.7711 E-Gregariousness 20.65 5.52 52.37 10.13 −0.14 −0.14 −0.04 −0.15 −0.24 −0.28 0.26 −0.10 0.85 0.65 0.8412 E-Assertiveness 17.19 4.73 52.56 9.07 −0.01 −0.31 −0.22 0.01 −0.35 −0.44 0.08 −0.38 0.68 0.31 0.45 0.7813 E-Activity 17.93 3.38 50.43 8.10 −0.09 −0.25 −0.19 −0.04 −0.31 −0.40 0.17 −0.26 0.66 0.30 0.41 0.50 0.5314 E-Excitement-Seeking 20.36 4.41 56.13 9.68 −0.07 −0.20 −0.23 −0.04 −0.25 −0.24 0.14 −0.20 0.66 0.29 0.52 0.34 0.39 0.6015 E-Positive Emotions 22.13 5.12 50.06 9.88 −0.04 −0.27 −0.13 −0.22 −0.44 −0.25 0.20 −0.22 0.76 0.59 0.57 0.36 0.40 0.33 0.8216 Openness (O) 112.07 16.56 43.78 8.34 0.13 0.12 0.16 0.06 0.10 0.04 0.25 −0.09 0.23 0.26 0.08 0.17 0.22 0.08 0.22 0.8517 O-Fantasy 20.03 4.80 46.99 8.51 0.08 0.22 0.17 0.20 0.13 0.14 0.30 0.08 0.09 0.11 −0.01 0.08 0.12 0.03 0.10 0.70 0.7718 O-Aesthetics 18.11 5.75 43.93 9.26 0.01 0.20 0.25 0.09 0.15 0.06 0.27 0.05 0.15 0.27 0.06 0.06 0.10 0.00 0.18 0.81 0.49 0.7719 O-Feelings 21.01 4.00 45.14 8.21 0.02 0.16 0.22 0.07 0.09 −0.01 0.29 0.03 0.44 0.50 0.34 0.27 0.20 0.17 0.42 0.66 0.43 0.52 0.7420 O-Actions 16.88 3.40 47.98 8.22 0.04 −0.21 −0.16 −0.11 −0.21 −0.24 0.05 −0.24 0.37 0.16 0.25 0.28 0.44 0.27 0.25 0.44 0.07 0.24 0.21 0.4921 O-Ideas 18.60 5.14 47.37 9.35 0.28 −0.02 −0.04 0.01 0.08 0.10 −0.05 −0.22 −0.11 −0.11 −0.21 0.05 0.05 −0.08 −0.14 0.62 0.33 0.36 0.13 0.12 0.8022 O-Values 17.45 2.88 41.36 7.82 0.03 −0.03 0.05 −0.13 0.05 −0.01 0.00 −0.10 0.03 0.10 −0.01 −0.05 0.00 0.00 0.09 0.43 0.10 0.22 0.15 0.25 0.20 0.5023 Agreeableness (A) 110.80 17.35 51.06 9.60 −0.10 −0.08 0.07 −0.39 0.01 0.03 −0.11 0.04 0.06 0.36 0.11 −0.20 −0.14 −0.11 0.20 0.04 −0.09 0.09 0.16 −0.03 −0.11 0.20 0.8824 A-Trust 17.93 4.05 50.53 8.74 −0.08 −0.26 −0.07 −0.41 −0.27 −0.18 −0.02 −0.14 0.37 0.43 0.37 0.07 0.08 0.13 0.45 0.03 −0.14 0.07 0.15 0.10 −0.08 0.07 0.62 0.7125 A-Straightforwardness 17.56 4.88 51.35 11.06 −0.04 −0.03 0.00 −0.21 0.02 0.05 −0.15 0.13 −0.15 0.06 −0.10 −0.27 −0.16 −0.19 0.00 −0.07 −0.11 −0.03 −0.04 −0.07 −0.11 0.16 0.75 0.30 0.7226 A-Altruism 21.71 3.65 51.06 9.13 −0.06 −0.15 0.03 −0.36 −0.07 −0.04 −0.06 −0.15 0.28 0.54 0.25 0.03 −0.02 0.05 0.35 0.24 0.07 0.23 0.41 0.05 −0.04 0.22 0.71 0.39 0.35 0.6727 A-Compliance 15.37 4.26 49.82 9.64 −0.02 −0.19 −0.01 −0.49 −0.06 0.06 −0.29 −0.05 −0.14 0.13 −0.11 −0.25 −0.24 −0.19 0.01 −0.12 −0.18 −0.07 −0.13 −0.13 −0.02 0.12 0.66 0.40 0.40 0.41 0.6528 A-Modesty 17.68 4.81 51.90 9.97 −0.13 0.19 0.21 −0.08 0.31 0.15 −0.03 0.20 −0.16 0.09 −0.03 −0.31 −0.17 −0.19 −0.11 −0.08 −0.12 0.00 0.04 −0.11 −0.19 0.13 0.70 0.19 0.52 0.34 0.28 0.7729 A-Tender-Mindedness 20.55 3.53 49.07 9.14 −0.07 0.07 0.10 −0.11 0.04 0.04 0.15 0.08 0.19 0.37 0.16 0.01 0.00 0.04 0.22 0.26 0.18 0.26 0.35 0.06 0.01 0.14 0.69 0.34 0.42 0.54 0.24 0.43 0.6030 Conscientiousness (C) 108.94 18.00 49.56 8.79 0.07 −0.42 −0.26 −0.24 −0.29 −0.17 −0.43 −0.44 0.10 0.04 −0.05 0.28 0.14 0.03 0.03 0.12 −0.06 0.00 0.03 0.05 0.36 0.04 −0.02 0.07 −0.05 0.13 0.13 −0.26 −0.02 0.9031 C-Competence 19.92 3.46 49.84 9.17 0.08 −0.47 −0.31 −0.23 −0.40 −0.30 −0.26 −0.52 0.29 0.16 0.10 0.49 0.24 0.11 0.15 0.21 −0.02 0.06 0.18 0.21 0.33 0.04 −0.04 0.09 −0.14 0.22 0.04 −0.29 0.04 0.70 0.6632 C-Order 17.06 4.56 49.30 9.25 0.00 −0.12 −0.02 −0.02 −0.06 −0.01 −0.32 −0.13 −0.04 −0.04 −0.07 0.09 0.00 −0.07 −0.06 −0.01 −0.04 −0.04 −0.05 −0.13 0.17 −0.01 −0.11 0.00 −0.10 −0.03 0.05 −0.23 −0.11 0.75 0.33 0.6833 C-Dutifulness 19.71 3.88 48.53 9.01 0.02 −0.30 −0.23 −0.18 −0.22 −0.12 −0.25 −0.32 0.09 0.07 −0.03 0.22 0.10 −0.04 0.08 0.12 0.00 0.02 0.06 0.03 0.27 0.03 0.11 0.11 0.09 0.17 0.14 −0.12 0.08 0.79 0.48 0.47 0.6734 C-Achievement Striving 18.91 3.97 49.91 8.40 0.06 −0.18 −0.11 0.02 −0.21 −0.12 −0.10 −0.27 0.18 0.01 −0.01 0.29 0.29 0.16 0.08 0.19 0.07 0.06 0.06 0.14 0.29 0.06 −0.19 −0.04 −0.17 −0.02 −0.13 −0.32 −0.04 0.71 0.45 0.50 0.49 0.6935 C-Self-Discipline 17.28 4.59 50.26 8.45 0.07 −0.49 −0.38 −0.28 −0.37 −0.27 −0.38 −0.49 0.24 0.11 0.08 0.33 0.25 0.19 0.13 0.11 −0.08 −0.01 0.02 0.20 0.28 0.01 −0.02 0.14 −0.04 0.08 0.06 −0.25 0.00 0.85 0.58 0.57 0.68 0.54 0.7836 C-Deliberation 16.06 4.26 49.85 8.96 0.08 −0.28 −0.13 −0.36 −0.05 0.03 −0.54 −0.25 −0.27 −0.10 −0.28 −0.13 −0.25 −0.21 −0.22 −0.05 −0.18 −0.08 −0.09 −0.18 0.24 0.06 0.18 0.03 0.12 0.18 0.38 0.07 −0.04 0.56 0.29 0.36 0.36 0.13 0.30 0.7237 GPA 2.87 0.60 – – −0.33 −0.01 −0.02 −0.03 0.04 −0.03 −0.03 0.03 0.01 0.03 0.08 −0.10 −0.05 0.12 −0.08 −0.20 −0.04 −0.14 −0.10 −0.11 −0.25 −0.09 −0.10 −0.10 −0.15 0.02 −0.06 0.06 −0.20 −0.20 −0.14 −0.01 −0.23 −0.20 −0.22 −0.11
Note. N = 230–243. Values printed in italics are internal consistencies (Cronbach’s α). Lower GPA values indicate better performance. |r| ≥ 0.13: p ≤ 0.05. |r| ≥ 0.18: p ≤ 0.01. |r| ≥ 0.22:p ≤ 0.001.
J. Intell. 2018, 6, 27 9 of 18
Descriptive statistics for each variable of Study 2 as well as their intercorrelations are shownin Table 3. Comparably to Study 1, the sample was above average, and showed some variancerestriction, in intelligence. All personality domains but O showed means that were comparable to thenorm sample. N, O, and C showed slight degrees of variance restriction. Of the facets, most meanswere comparable to the norm sample (with some notable deviations only for E-Excitement-Seeking,O-Aesthetics, O-Feelings, and O-Values). Eleven of the 30 facets also showed some restriction invariance. As in Study 1, intelligence showed the strongest correlation with GPA (r = −0.33, p < 0.001),but there were also some notable correlations between personality and GPA. In the following, we willreport the results for each domain and its facets in a separate paragraph.
3.2.2. Neuroticism and Its Facets
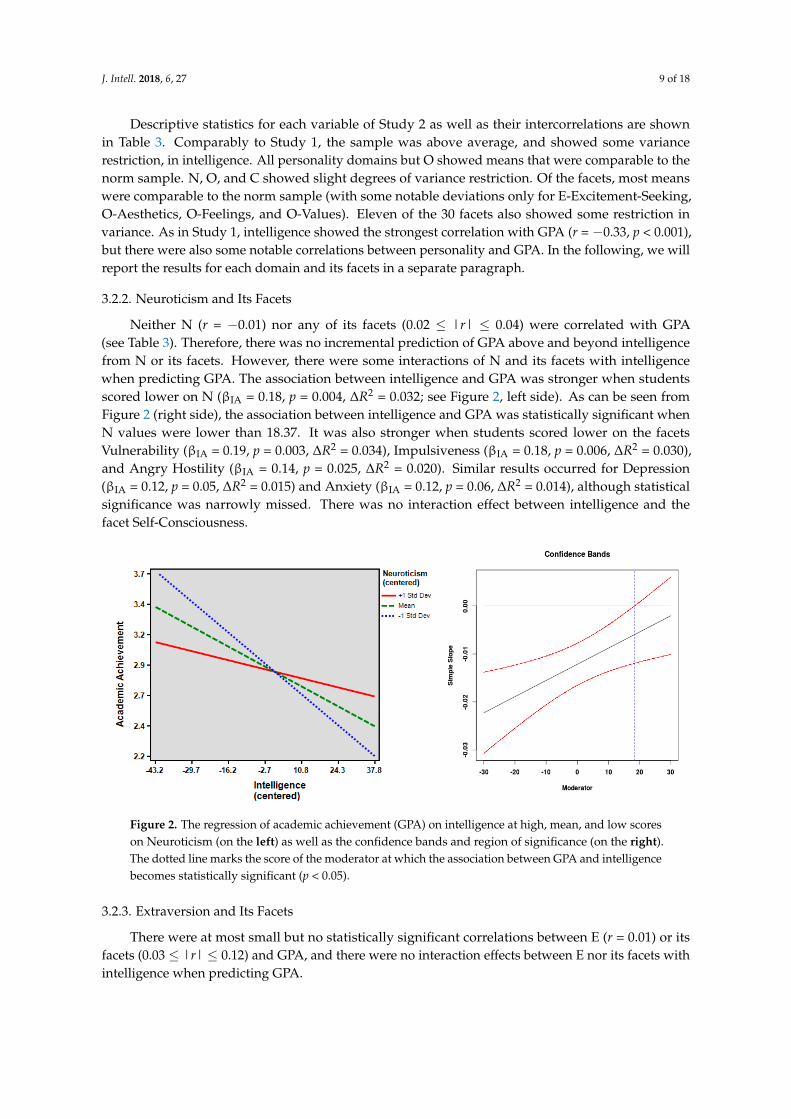
Neither N (r = −0.01) nor any of its facets (0.02 ≤ |r| ≤ 0.04) were correlated with GPA(see Table 3). Therefore, there was no incremental prediction of GPA above and beyond intelligencefrom N or its facets. However, there were some interactions of N and its facets with intelligencewhen predicting GPA. The association between intelligence and GPA was stronger when studentsscored lower on N (βIA = 0.18, p = 0.004, ∆R2 = 0.032; see Figure 2, left side). As can be seen fromFigure 2 (right side), the association between intelligence and GPA was statistically significant whenN values were lower than 18.37. It was also stronger when students scored lower on the facetsVulnerability (βIA = 0.19, p = 0.003, ∆R2 = 0.034), Impulsiveness (βIA = 0.18, p = 0.006, ∆R2 = 0.030),and Angry Hostility (βIA = 0.14, p = 0.025, ∆R2 = 0.020). Similar results occurred for Depression(βIA = 0.12, p = 0.05, ∆R2 = 0.015) and Anxiety (βIA = 0.12, p = 0.06, ∆R2 = 0.014), although statisticalsignificance was narrowly missed. There was no interaction effect between intelligence and thefacet Self-Consciousness.
Figure 2. The regression of academic achievement (GPA) on intelligence at high, mean, and low scoreson Neuroticism (on the left) as well as the confidence bands and region of significance (on the right).The dotted line marks the score of the moderator at which the association between GPA and intelligencebecomes statistically significant (p < 0.05).
3.2.3. Extraversion and Its Facets
There were at most small but no statistically significant correlations between E (r = 0.01) or itsfacets (0.03 ≤ |r| ≤ 0.12) and GPA, and there were no interaction effects between E nor its facets withintelligence when predicting GPA.

J. Intell. 2018, 6, 27 10 of 18
3.2.4. Openness and Its Facets
There were some notable findings with regard to O and its facets: O was significantly correlatedwith GPA (r = −0.20, p = 0.002), and so were Ideas (r = −0.25, p < 0.001) and Aesthetics (r = −0.14,p = 0.028), but not the other facets (Actions, Fantasy, Feelings, and Values; −0.04 ≤ r ≤ −0.11).When intelligence was controlled for, O (β = −0.16, p = 0.009), Ideas (β = −0.18, p = 0.005), and Aesthetics(β = −0.14, p = 0.023) still predicted GPA. However, they did not interact with intelligence. Instead,there was an interaction between intelligence and Actions: Intelligence was associated stronger withGPA when students scored lower on Actions (βIA = 0.14, p = 0.024, ∆R2 = 0.020).
3.2.5. Agreeableness and Its Facets
The correlation between A and GPA (r = −0.10) was not statistically significant, but it wasin the same range as found by Poropat [22]. Two of the facets significantly correlated with GPA,namely Tender-Mindedness (r = −0.20, p = 0.003) and Straightforwardness (r = −0.15, p = 0.026).The correlations between the other facets (Altruism, Compliance, Modesty, and Trust) and GPA rangedfrom r = −0.10 to r = 0.06 (n.s.). When controlling for intelligence, slight suppression effects becameapparent: the predictive value of A (β = −0.13, p = 0.035), Tender-Mindedness (β = −0.22, p < 0.001),and Straightforwardness (β = −0.16, p = 0.008) slightly increased, as was the case for Trust, which aftercontrolling for intelligence narrowly reached statistical significance (β = −0.13, p = 0.041). Althoughthe interaction effect between A and intelligence in predicting GPA was not statistically significant,it was comparable to the effect observed in Study 1 (βIA = −0.09, p = 0.171, ∆R2 = 0.007). Of the facets,Compliance (βIA = −0.16, p = 0.009, ∆R2 = 0.027) and Altruism (βIA = −0.13, p = 0.043, ∆R2 = 0.016)displayed interaction effects with intelligence. The association between intelligence and GPA wasstronger when students scored higher on A (marginal), Compliance, and Altruism, respectively.
3.2.6. Conscientiousness and Its Facets
Again, C showed the strongest associations with GPA of all Big Five. Correlations with GPA werer = −0.20 (p = 0.002) for C and comparable in size for most of its facets (Dutifulness: r = −0.23, p < 0.001;Self-Discipline: r = −0.22, p = 0.001; Achievement Striving: r = −0.20, p = 0.003; Competence: r = −0.14,p = 0.035). It was not significant for Deliberation (r = −0.11) and Order (r = −0.01). When controllingfor intelligence, nearly all of the significant predictions held (C: r = −0.19, p = 0.002; Dutifulness:r = −0.24, p < 0.001; Self-Discipline: r = −0.20, p = 0.001; Achievement Striving: r = −0.18, p = 0.004;Competence: r = −0.12, p = 0.064). C and all facets except from Order significantly interacted withintelligence: Intelligence was more predictive of GPA when students scored higher on C (βIA = −0.18,p = 0.004, ∆R2 = 0.031), Competence (βIA = −0.14, p = 0.026, ∆R2 = 0.019), Dutifulness (βIA = −0.16,p = 0.010, ∆R2 = 0.024), Achievement Striving (βIA = −0.13, p = 0.040, ∆R2 = 0.016), Self-Discipline(βIA = −0.14, p = 0.020, ∆R2 = 0.020), and Deliberation (βIA = −0.18, p = 0.004, ∆R2 = 0.031).
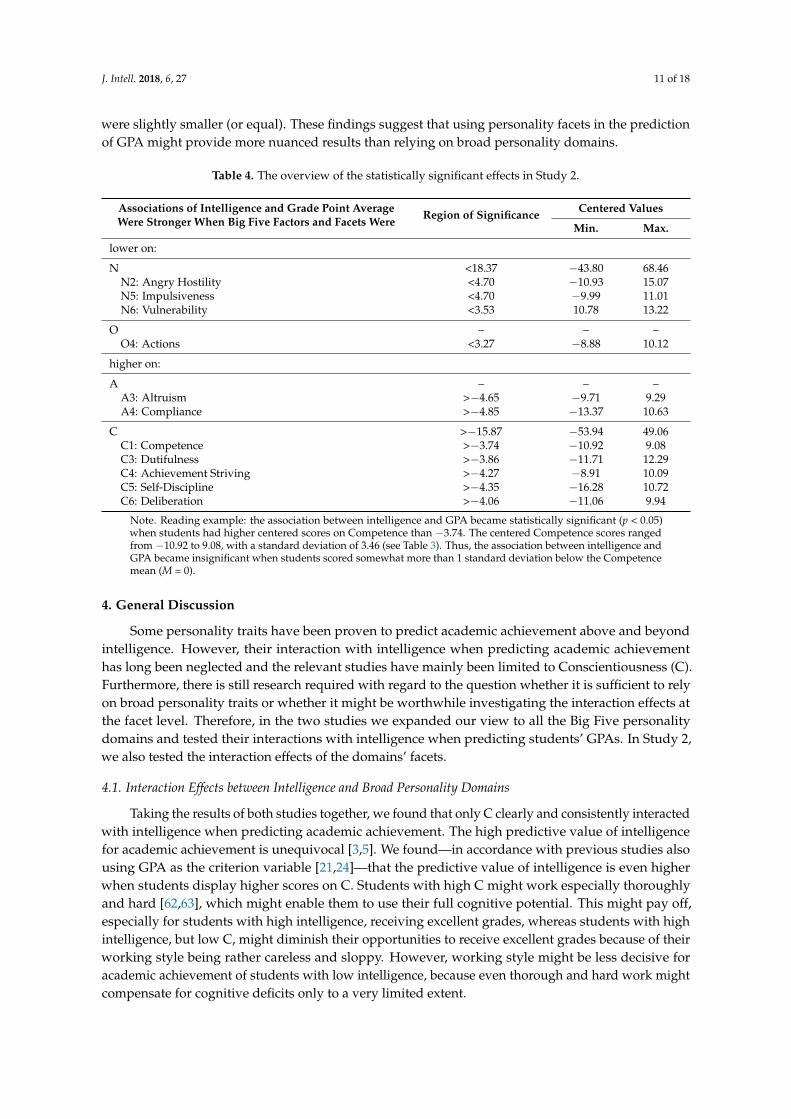
Table 4 provides an overview of the statistically significant results from Study 2. Table 4 alsocomprises the regions of significance of the association between intelligence and GPA. It also presentsthe minimum and maximum values of the centered moderator scores in order to facilitate theclassification of the regions of significance.
3.3. Discussion Study 2
To sum up, with regard to the broad domains, we found C and N to interact with intelligence in theprediction of academic achievement. The interaction of A was statistically marginal, but consistent withStudy 1. With regard to the facets, most interaction effects we found referred to facets which belongedto a broad domain for which we had found an interaction effect, as well. However, of those domains,only some facets showed an interaction effect whereas others did not. In some cases (especially for Oand A), their effects were stronger than the effect of the respective domain, whereas in other cases, they
J. Intell. 2018, 6, 27 11 of 18
were slightly smaller (or equal). These findings suggest that using personality facets in the predictionof GPA might provide more nuanced results than relying on broad personality domains.
Table 4. The overview of the statistically significant effects in Study 2.
Associations of Intelligence and Grade Point AverageWere Stronger When Big Five Factors and Facets Were Region of Significance Centered Values
Min. Max.
lower on:
N <18.37 −43.80 68.46N2: Angry Hostility <4.70 −10.93 15.07N5: Impulsiveness <4.70 −9.99 11.01N6: Vulnerability <3.53 10.78 13.22
O – – –O4: Actions <3.27 −8.88 10.12
higher on:
A – – –A3: Altruism >−4.65 −9.71 9.29A4: Compliance >−4.85 −13.37 10.63
C >−15.87 −53.94 49.06C1: Competence >−3.74 −10.92 9.08C3: Dutifulness >−3.86 −11.71 12.29C4: Achievement Striving >−4.27 −8.91 10.09C5: Self-Discipline >−4.35 −16.28 10.72C6: Deliberation >−4.06 −11.06 9.94
Note. Reading example: the association between intelligence and GPA became statistically significant (p < 0.05)when students had higher centered scores on Competence than −3.74. The centered Competence scores rangedfrom −10.92 to 9.08, with a standard deviation of 3.46 (see Table 3). Thus, the association between intelligence andGPA became insignificant when students scored somewhat more than 1 standard deviation below the Competencemean (M = 0).
4. General Discussion
Some personality traits have been proven to predict academic achievement above and beyondintelligence. However, their interaction with intelligence when predicting academic achievementhas long been neglected and the relevant studies have mainly been limited to Conscientiousness (C).Furthermore, there is still research required with regard to the question whether it is sufficient to relyon broad personality traits or whether it might be worthwhile investigating the interaction effects atthe facet level. Therefore, in the two studies we expanded our view to all the Big Five personalitydomains and tested their interactions with intelligence when predicting students’ GPAs. In Study 2,we also tested the interaction effects of the domains’ facets.
4.1. Interaction Effects between Intelligence and Broad Personality Domains
Taking the results of both studies together, we found that only C clearly and consistently interactedwith intelligence when predicting academic achievement. The high predictive value of intelligencefor academic achievement is unequivocal [3,5]. We found—in accordance with previous studies alsousing GPA as the criterion variable [21,24]—that the predictive value of intelligence is even higherwhen students display higher scores on C. Students with high C might work especially thoroughlyand hard [62,63], which might enable them to use their full cognitive potential. This might pay off,especially for students with high intelligence, receiving excellent grades, whereas students with highintelligence, but low C, might diminish their opportunities to receive excellent grades because of theirworking style being rather careless and sloppy. However, working style might be less decisive foracademic achievement of students with low intelligence, because even thorough and hard work mightcompensate for cognitive deficits only to a very limited extent.
J. Intell. 2018, 6, 27 12 of 18
Whereas we found no interaction between Neuroticism (N) and intelligence in Study 1, we foundin Study 2 that among students with lower scores on N, there was a stronger relation betweenintelligence and GPA than among students with higher scores on N. The difference in results betweenStudy 1 and Study 2 might be explained by the fact that N was assessed more comprehensively inStudy 2 than in Study 1, using the NEO-PI-R instead of the NEO-FFI. The found effect in Study 2 is inline with the proposition by Zeidner [49] that N should lower the correlation between intelligence andachievement because a high N should hamper highly-abled students from fulfilling their potential,whereas N should be less decisive for students with low ability.
As became apparent, however, the interaction effect in Study 2 was semi-ordinal, that is, highN was not always detrimental to students’ grades, but partly even advantageous: Among studentswith lower intelligence test scores, those with higher scores on N had better grades than those withlower scores on N (whereas it was the expected to be the other way around for students with higherintelligence test scores). Against this background, it is interesting to note that there are sometimespositive correlations found between N and academic achievement [64].
How can it be explained that N seems to work differently for students with different ability levels?The most often negative correlation found between N and academic achievement is usually explainedby performance anxiety and its negative effects on performance [8,65]. The cognitive component“worry” is especially detrimental to achievement, because it requires cognitive capacities so thatthese capacities cannot be devoted to the task anymore [66,67]. Importantly, performance anxietyis especially impeding when students work on difficult tasks [8,49], possibly because the cognitivecapacities occupied by worry would be badly needed for these tasks. Difficult tasks in a test, in turn,have a high discriminatory power at the upper end of the grading scale. Simply put, solving or notsolving very difficult tasks in a test might decide upon whether a highly-abled student receives an Aor a B. Thus, a highly-abled student with a high N (high impediment by worry) will probably receivethe B, whereas a highly-abled student with a low N (no impediment by worry) will probably receivethe A.
However, for a student with low ability, the question would rather be whether he or she receives,say, a D or an E. Tasks with discriminatory power in this range of the grading scale will be much easierand probably better to solve by memorization than by thinking. That is where the beneficial side ofperformance anxiety might come into play: Performance anxiety can motivate students to prepare for atest extensively (not to say excessively) because their primary objective is to avoid failure [8]. In doingso, students with high-performance anxiety tend to prefer surface learning strategies over elaboration inorder to avoid gaps in knowledge [8], but this approach should be sufficient (or even particularly useful)for solving tasks with low difficulty. Furthermore, the performance anxiety component “emotionality”increases the physiological arousal, which is—at least to a certain extent—useful when workingon rather easy tasks [8,68]. Therefore, a low-ability student with high N might prepare extensivelyfor the test, have an optimal arousal level during the test, and finally pass it with a D, whereasa low-ability student with low N might take the preparation for the test (too) lightly, have a (too)low arousal level during the test, and finally fail it. Future studies should test the semi-ordinalinteraction effect for its replicability. However, there already is support coming from the studyby Sung, Chao, and Tseng [69]. In this study among 9th graders with above-average scores on astandardized academic achievement test, there was a negative correlation between performanceanxiety and academic achievement, whereas, among students with below-average scores, there wasa positive correlation between both constructs. Ziegler et al. [21] also found that the moderationeffects of personality (in their case, Achievement Striving) depend on the performance level. In linewith this finding, LaHuis et al. [70] found a quadratic relation between Conscientiousness and jobperformance. Therefore, Ziegler et al. [21] suggested that future studies should pay more attentionto the performance level when investigating interaction effects of personality and intelligence in theprediction of performance. Our findings for N lead to the same recommendation.
J. Intell. 2018, 6, 27 13 of 18
In contradiction to the study by Zhang and Ziegler [50], Openness (O) did not moderate therelation between intelligence and academic achievement. Age differences between the samples appearrather unlikely as a valid explanation for this discrepancy because the age difference was only 1 year.It might be due to cultural differences, since the sample of Zhang and Ziegler [50] consisted ofChinese students, whereas our sample was German. On the other hand, Ziegler et al. [51] investigatedadolescents and psychology students from Germany, too, and found an interaction effect between Oand intelligence when predicting vocabulary. Maybe the selectivity of our samples (students from theGymnasium) hindered us from finding the moderating effect of O. Indeed, there was some variancerestriction in O at least in Study 2.
Additionally, the role of Agreeableness (A) as a moderator of the relation between intelligence andacademic achievement seems notable. Although its interaction with intelligence remained statisticallynon-significant, we replicated it in both size and direction. Whereas in Study 1, the interaction wassemi-ordinal, it was ordinal in Study 2. In Study 2, A did not matter for students with low ability,but it did matter for students with high ability: students with high A received better grades thanstudents with low A. It is possible that when teachers have to decide which grade at the high end ofthe grading scale a student gets, A might impact their judgment. A likely influences students’ workingbehavior, for example, their cooperation in class and in group work, which might create a positiveimage of the student in the teacher’s view. This positive image could, in turn, influence the teacher’sjudgment of the student’s academic ability in terms of a halo effect [71,72]. Since grading also has thefunction of disciplining students [73], it is also possible that the teacher deliberately awards desirablebehavior with good grades. However, if this explanation holds true, then why is this not also thecase for students with low ability? In Study 1, high A was even detrimental to academic achievementamong low-ability students. Possibly, A has a differential impact on students’ behavior, depending ontheir intelligence. As conjectured above, A might cause desirable learning behavior in students withhigh intelligence. However, as lower intelligence is accompanied by lower behavioral engagement inschool [74], students with low intelligence might “invest” their A rather in cooperative behavior that isnot related to learning and might even disturb the lessons, for example, activities with friends duringthe lessons. Those behaviors would probably not be valued by the teacher and they are not beneficialfor learning, either, both of which would result in worse grades. However, as the interaction effectwas not statistically significant in both studies, one should not over-interpret it. Future studies shouldfurther investigate this effect using larger sample sizes before final conclusions can be drawn.
However, it already seems that certain facets of A are more important than A as a whole, as Acomprises some facets which showed a stronger interaction with intelligence than A itself. This alreadypoints to the assumption that it might be worthwhile to go down to the facet level when investigatingthe interaction between intelligence and personality in predicting academic achievement.
4.2. Interaction Effects between Intelligence and Narrow Personality Facets
We mostly found significant interaction effects at the facet level if the respective trait had displayedan interaction effect. However, the investigation of interaction effects at the facet level revealed morenuanced results than the analyses at the domain level: not every facet of a certain domain interactedwith intelligence and some facets showed greater interaction effects than the domain itself. Thus,facets give us a clearer picture of how personality and intelligence interact in predicting academicachievement. More precisely, taking a look at the facet level gives us insights into which facets are thedriving factors behind an interaction effect at the domain level.
With regard to N, the interaction effect was mainly due to Vulnerability, Impulsiveness,and Angry Hostility. Depression and Anxiety contributed to a somewhat more limited degree, whereasSelf-Consciousness did not contribute to the interaction effect of N. This finding is interesting, as the lineof reasoning made above about the interaction effect of N primarily referred to anxiety as the drivingfactor behind the interaction effect. Anxiety indeed plays a role, but there seem also to be other facetsof N at work. Interestingly, the facets’ interaction effects with intelligence were semi-ordinal. Among
J. Intell. 2018, 6, 27 14 of 18
students with high ability, the facets impacted grades negatively as could be expected. However, amongstudents with low ability, high values in these facets were beneficial for academic achievement.
The findings were even more nuanced with regard to O and A. Whereas effects at the domainlevel were either modest (A) or even non-existent (O), analyses at the facet level showed that A and Owere nevertheless relevant after a sort: interactions between intelligence and Compliance, Altruism,and O to Actions, respectively, were statistically and practically significant (and the nature of theinteraction effects was again semi-ordinal). Against this background, it should again be rememberedthat grades do not only reflect a student’s ability but also to some degree the student’s behavior asperceived by the teacher. Some facets (such as Compliance, Altruism, and O to Actions) might beviewed by the teacher as especially relevant behavior in the classroom and might, therefore, exhibit agreater influence on grade assignments than other facets (for example, Modesty, O to Fantasy, Feelings,or Values).
For C, then again, nearly all facets (Competence, Dutifulness, Achievement Striving, Self-Discipline,Deliberation), except Order, contributed to a roughly equal extent to the interaction effect at the domainlevel, indicating no great difference in the results between the domain and the facet level. Thus, nearlyall facets of C seem to be important for academic achievement. Comparable to Study 1, most interactioneffects were rather ordinal in nature: when students had higher scores on the intelligence test, C and itsfacets mattered. When students had lower intelligence test scores, they did not. This is largely in line withprevious research on Achievement Striving [21,42]. However, whereas Ziegler et al. [21] found interactioneffects only when they split up the data set according to achievement level, we found an interaction effectacross the entire sample. In so doing, we confirmed the assumption that also the other facets of C shouldshow interaction effects because of their relation to achievement motivation [12,46,47,75]. It might beinteresting for future studies to examine whether C and its facets would still interact with intelligencein the prediction of academic achievement if achievement motivation was controlled for. AlthoughSteinmayr and Spinath [12] found that C did not predict GPA above and beyond the need for achievement,our findings suggest that achievement motivation might not be the only cause of C’s interaction withintelligence, given the interaction effect found for Deliberation. Interestingly, Deliberation provided theonly semi-ordinal interaction effect of C, suggesting that this facet might indeed work differently fromthe other facets.
Taken together, we found that (1) C consistently interacts with intelligence in the prediction ofacademic achievement, but that (2) taking a closer look at the facet level tells us that the other Big Five(except E) are in part also relevant. Thus, investigations at the facet level provide us with more detailedand nuanced information on the interaction between personality and intelligence when predictingacademic achievement.
4.3. Limitations and Future Directions
Although our results are in favor of a more in-depth view of personality traits, one caveat shouldbe noted, as it might also be relevant for future studies: the comparability of the results from differenthierarchical levels, such as broad domains versus narrow facets, is limited. Typically, the reliabilities offacet scales are lower than those of the domain scales. This was also the case in our study. Therefore,the chance to detect effects at the facet level is smaller than at the domain level. This might lowerthe chance also for future studies to replicate facet level effects. Accordingly, the facet effects in ourstudy might somewhat underestimate the “true” facet effects. Therefore, the future studies might useanalyses with latent variables to exclude the measurement error.
One point that might also have suppressed the effects to at least some extent is the variancerestriction in some of the variables. Especially in Study 2, there was a variance restriction in N, O, and Cas well as in some of the personality facets. There was also some variance restriction in intelligence,which might explain why the correlation between intelligence and academic achievement was amongthe lower bound of correlations usually reported in other studies. Thus, the found effects can probably
J. Intell. 2018, 6, 27 15 of 18
be seen as lower bound estimates. In the case of O, the variance restriction might even have hinderedus from identifying any effect (see above).
Another important note is that we used grades as an operationalization of academic achievement.As already noted, grades do not only reflect ability aspects (for example, did you correctly solveproblems in the exam? Did you give the right answers?), but also non-cognitive aspects (for example,did you improve during the term? Did you show commitment to do so?). Thus, grades might bea better criterion to detect interactions between intelligence and personality than the pure abilitycriteria such as scholastic achievement tests. This might also explain why studies predicting jobperformance did not find any interactions between personality and intelligence [44,45]. Future studiesmight, therefore, compare the predictability of grades and scholastic achievement tests by interactionsof personality and intelligence. They might also consider other criteria that comprise even strongernon-cognitive components than do grades [2]. In this case, we would expect that interaction effectswould be even stronger than in our study.
Importantly, the impact of ability on our grades becomes weaker and the impact of personalitybecomes stronger during school time [76]. Whereas Lievens et al. [76] found this result for medicalschool, it might also apply to primary and secondary education. Therefore, longitudinal studies orcross-sequential studies focusing on different age groups might find different results than we didfor adolescents. For elementary school children, for example, interaction effects between personalityand intelligence might be weaker, whereas, for older students than those used in the present study,they might be stronger.
5. Conclusions
Despite these limitations, our study showed that broad personality traits, and among themespecially C, as well as some of their facets, interact with intelligence in the prediction of academicachievement as measured by GPA. Paying special attention to the facet level brings more differentiatedand nuanced results to light than relying on the broad personality traits only. In this respect, not only C,but also parts of N, O, and A interact with intelligence. All in all, the interaction effects were numerous.Therefore, future theoretical and practical endeavors to explain academic achievement should morestrongly integrate non-linear relations between personality and academic achievement.
Supplementary Materials: Both anonymized data sets in ASCII format as well as the code books are madepublicly available at PsychData, the repository of the Leibniz Institute for Psychology Information (ZPID)(doi:10.5160/psychdata.srra08pe02). Both data files can be obtained upon request sent to the ZPID. Test materialscannot be made publicly available due to copyrights.
Author Contributions: R.S. conceived the investigation; research assistants collected the data; R.S. and S.B. analyzedthe data; based on an earlier version, S.B. wrote most of the present manuscript; R.S. revised the manuscript.
Acknowledgments: We thank the schools that supported this study and the students who made the study possibleby their participation.
Conflicts of Interest: The authors declare no conflict of interest.
References
1. Hattie, J. Visible Learning: A Synthesis of over 800 Meta-Analyses Relating to Achievement; Routlege: London, UK,2009; ISBN 9780415476171.
2. Ackerman, P.L.; Chamorro-Premuzic, T.; Furnham, A. Trait complexes and academic achievement: Old andnew ways of examining personality in educational contexts. Br. J. Educ. Psychol. 2011, 81, 27–40. [CrossRef][PubMed]
3. Jensen, A.R. The g Factor: The Science of Mental Ability; Praeger: Westport, CT, USA, 1998; ISBN 9780275961039.4. Von Stumm, S.; Furnham, A.F. Learning approaches: Associations with Typical Intellectual Engagement,
intelligence and the Big Five. Pers. Individ. Differ. 2012, 53, 720–723. [CrossRef]5. Kuncel, N.R.; Hezlett, S.A.; Ones, D.S. Academic performance, career potential, creativity, and job performance:
Can one construct predict them all? J. Pers. Soc. Psychol. 2004, 86, 148–161. [CrossRef] [PubMed]

J. Intell. 2018, 6, 27 16 of 18
6. Laidra, K.; Pullmann, H.; Allik, H. Personality and intelligence as predictors of academic achievement:A cross-sectional study from elementary to secondary school. Pers. Individ. Differ. 2007, 42, 441–451. [CrossRef]
7. Costa, P.T.; McCrae, R.R. The NEO-PI Personality Inventory; Psychological Assessment Ressources:Odessa, FL, USA, 1985.
8. Zeidner, M. Test Anxiety: The State of the Art; Plenum: New York, NY, USA, 1998; ISBN 9780306457296.9. O’Connor, M.C.; Paunonen, S.V. Big Five personality predictors of post-secondary academic performance.
Pers. Individ. Differ. 2007, 43, 971–990. [CrossRef]10. Ackerman, P.L.; Heggestad, E.D. Intelligence, personality, and interests: Evidence for overlapping traits.
Psychol. Bull. 1997, 121, 219–245. [CrossRef] [PubMed]11. Blickle, G. Personality traits, learning strategies, and performance. Eur. J. Pers. 1996, 10, 337–352. [CrossRef]12. Steinmayr, R.; Spinath, B. Predicting school achievement from motivation and personality. Z. Pädagog. Psychol.
2007, 21, 207–216. [CrossRef]13. Steinmayr, R.; Spinath, B. Sex differences in school achievement: What are the roles of personality and
achievement motivation? Eur. J. Pers. 2008, 22, 185–209. [CrossRef]14. Blanch, A.; Aluja, A. A regression tree of the aptitudes, personality, and academic performance relationship.
Pers. Individ. Differ. 2013, 54, 703–708. [CrossRef]15. Caprara, G.V.; Vecchione, M.; Alessandri, G.; Gerbino, M.; Barbaranelli, C. The contribution of personality
traits and self-efficacy beliefs to academic achievement: A longitudinal study. Br. J. Educ. Psychol. 2011, 81,78–96. [CrossRef] [PubMed]
16. Furnham, A.; Monsen, J. Personality traits and intelligence predict academic school grades.Learn. Individ. Differ. 2009, 19, 28–33. [CrossRef]
17. Furnham, A.; Nuygards, S.; Chamorro-Premuzic, T. Personality, assessment methods and academicperformance. Instr. Sci. 2013, 41, 975–987. [CrossRef]
18. Heaven, P.C.L.; Ciarrochi, J. When IQ is not everything: Intelligence, personality and academic performanceat school. Pers. Individ. Differ. 2012, 53, 518–522. [CrossRef]
19. Mayer, J.D.; Skimmyhorn, W. Personality attributes that predict cadet performance at West Point. J. Res. Pers.2017, 66, 14–26. [CrossRef]
20. Steinmayr, R.; Bipp, T.; Spinath, B. Goal orientations predict academic performance beyond intelligence andpersonality. Learn. Individ. Differ. 2011, 21, 196–200. [CrossRef]
21. Ziegler, M.; Knogler, M.; Bühner, M. Conscientiousness, achievement striving, and intelligence asperformance predictors in a sample of German psychology students: Always a linear relationship?Learn. Individ. Differ. 2009, 19, 288–292. [CrossRef]
22. Poropat, A.E. A meta-analysis of the Five-Factor model of personality and academic performance.Psychol. Bull. 2009, 135, 322–338. [CrossRef] [PubMed]
23. Poropat, A.E. The Eysenckian personality factors and their correlations with academic performance. Br. J.Educ. Psychol. 2011, 81, 41–58. [CrossRef] [PubMed]
24. Di Domenico, S.I.; Fournier, M.A. Able, ready, and willing: Examining the additive and interactive effectsof intelligence, conscientiousness, and autonomous motivation on undergraduate academic performance.Learn. Individ. Differ. 2015, 40, 156–162. [CrossRef]
25. Di Fabio, A.; Palazzeschi, L. Beyond fluid intelligence and personality traits in scholastic success: Traitemotional intelligence. Learn. Individ. Differ. 2015, 40, 121–126. [CrossRef]
26. Powell, C.; Nettelbeck, T.; Burns, N.R. The incremental validity of intellectual curiosity and confidencefor predicting academic performance in advanced tertiary students. Pers. Individ. Differ. 2017, 116, 51–56.[CrossRef]
27. Rikoon, S.H.; Brenneman, M.; Kim, L.E.; Khorramdel, L.; MacCann, C.; Burrus, J.; Roberts, R.D. Facets ofconscientiousness and their differential relationships with cognitive ability factors. J. Res. Pers. 2016, 61,22–34. [CrossRef]
28. Rosander, P.; Bäckström, M.; Stenberg, G. Personality traits and general intelligence as predictors of academicperformance: A structural equation modelling approach. Learn. Individ. Differ. 2011, 21, 590–596. [CrossRef]
29. Lechner, C.; Danner, D.; Rammstedt, B. How is personality related to intelligence and achievement?A replication and extension of Borghans et al. and Salkever. Pers. Individ. Differ. 2017, 111, 86–91. [CrossRef]
30. Poropat, A.E. Other-rated personality and academic performance: Evidence and implications.Learn. Individ. Differ. 2014, 34, 24–32. [CrossRef]

J. Intell. 2018, 6, 27 17 of 18
31. Kausel, E.E.; Slaughter, J.E. Narrow personality traits and organizational attraction: Evidence for thecomplementary hypothesis. Organ. Behav. Human Decis. Process. 2011, 114, 3–14. [CrossRef]
32. Lounsbury, J.W.; Sundstrom, E.; Loveland, J.L.; Gibson, L.W. Broad versus narrow personality traits inpredicting academic performance of adolescents. Learn. Individ. Differ. 2002, 14, 65–75. [CrossRef]
33. Paunonen, S.V.; Ashton, M.C. Big five predictors of academic achievement. J. Res. Pers. 2001, 35, 78–90.[CrossRef]
34. Paunonen, S.V.; Ashton, M.C. On the prediction of academic performance with personality traits:A replication study. J. Res. Pers. 2013, 47, 778–781. [CrossRef]
35. Chamorro-Premuzic, T.; Arteche, A. Intellectual competence and academic performance: Preliminaryvalidation of a model. Intelligence 2008, 36, 564–573. [CrossRef]
36. Campbell, J.P. Psychometric theory. In Handbook of Industrial and Organizational Psychology; Dunnette, M.D., Ed.;Rand McNally: Chicago, IL, USA, 1976; pp. 185–222, ISBN 9780528629129.
37. Maier, N.R.F. Psychology in Industry, 3rd ed.; Houghton Mifflin: Boston, MA, USA, 1965; ISBN 9780245573705.38. Sackett, P.R.; Gruys, M.L.; Ellingson, J.E. Ability-personality interactions when predicting job performance.
J. Appl. Psychol. 1998, 83, 545–556. [CrossRef]39. Elliot, A.J.; Thrash, T.M. Achievement Goals and the Hierarchical Model of Achievement Motivation.
Educ. Psychol. Rev. 2001, 13, 139–156. [CrossRef]40. Judge, T.A.; Ilies, R. Relationship of personality to performance motivation: A meta-analytic review.
J. Appl. Psychol. 2002, 87, 797–807. [CrossRef] [PubMed]41. Cattell, R.B. Intelligence: Its Structure, Growth and Action; North-Holland: Amsterdam, The Netherlands, 1987;
ISBN 9780080866895.42. Hollenbeck, J.R.; Brief, A.P.; Whitener, E.M.; Pauli, K.E. An empirical note on the interaction of personality
and aptitude in personnel selection. J. Manag. 1988, 14, 441–451. [CrossRef]43. Caspi, A.; Roberts, B.W.; Shiner, R.L. Personality development: Stability and change. Annu. Rev. Psychol.
2005, 56, 453–484. [CrossRef] [PubMed]44. Mount, M.K.; Barrick, M.R.; Strauss, J.P. The joint relationship of conscientiousness and ability with
performance: Test of the interaction hypothesis. J. Manag. 1999, 25, 707–721. [CrossRef]45. Perry, S.J.; Hunter, E.M.; Witt, L.A.; Harris, K.J. P = f (conscientiousness × ability): Examining the facets of
conscientiousness. Human Perform. 2010, 23, 343–360. [CrossRef]46. Bipp, T.; Steinmayr, R.; Spinath, B. Personality and achievement motivation: Relationship among Big Five
domain and facet scales, achievement goals, and intelligence. Pers. Individ. Differ. 2008, 44, 1454–1464.[CrossRef]
47. Trautwein, U.; Lüdtke, O.; Roberts, B.W.; Schnyder, I.; Niggli, A. Different forces, same consequence:Conscientiousness and competence beliefs are independent predictors of academic effort and achievement.J. Pers. Soc. Psychol. 2009, 97, 1115–1128. [CrossRef] [PubMed]
48. Kanfer, R.; Ackerman, P.L.; Heggestad, E.D. Motivational skills & self-regulation for learning: A traitperspective. Learn. Individ. Differ. 1996, 8, 185–209. [CrossRef]
49. Zeidner, M. Personality trait correlates of intelligence. In International Handbook of Personality and Intelligence;Saklofske, D.H., Zeidner, M., Eds.; Plenum: New York, NY, USA, 1995; ISBN 9780306447495.
50. Zhang, J.; Ziegler, M. Interaction effects between openness and fluid intelligence predicting scholasticperformance. J. Intell. 2015, 3, 91–110. [CrossRef]
51. Ziegler, M.; Danay, E.; Heene, M.; Asendorpf, J.; Bühner, M. Openness, fluid intelligence, and crystallizedintelligence: Toward an integrative model. J. Res. Pers. 2012, 46, 173–183. [CrossRef]
52. Liepmann, D.; Beauducel, A.; Brocke, B.; Amthauer, R. Intelligence-Structure-Test 2000 R, extended ed.;Hogrefe: Göttingen, Germany, 2007.
53. Borkenau, P.; Ostendorf, F. NEO Five-Factor Inventory by Costa and McCrae; Hogrefe: Göttingen, Germany, 1993.54. Soper, D.S. Interaction! Available online: https://www.danielsoper.com/Interaction/default.aspx (accessed on
11 April 2018).55. Preacher, K.J.; Curran, P.J.; Bauer, D.J. Computational tools for probing interactions in multiple linear
regression, multilevel modeling, and latent curve analysis. J. Educ. Behav. Stat. 2006, 31, 437–448. [CrossRef]56. Borkenau, P.; Ostendorf, F. NEO Five-Factor Inventory by Costa and McCrae, 2nd ed.; Hogrefe:
Göttingen, Germany, 2007.
J. Intell. 2018, 6, 27 18 of 18
57. Bergold, S.; Wirthwein, L.; Rost, D.H.; Steinmayr, R. What happens if the same curriculum is taught in fiveinstead of six years? A quasi-experimental investigation of the effect of schooling on intelligence. Cognit. Dev.2017, 44, 98–109. [CrossRef]
58. Steinmayr, R.; Beauducel, A.; Spinath, B. Do sex differences in a faceted model of fluid and crystallizedintelligence depend on the method applied? Intelligence 2010, 38, 101–110. [CrossRef]
59. Steinmayr, R.; Bergold, S.; Margraf-Stiksrud, J.; Freund, P.A. Gender differences on general knowledge tests:Are they due to differential item functioning? Intelligence 2015, 50, 164–174. [CrossRef]
60. Rammstedt, B.; Danner, D.; Martin, S. The association between personality and cognitive ability: Goingbeyond simple effects. J. Res. Pers. 2016, 62, 39–44. [CrossRef]
61. Ostendorf, F.; Angleitner, A. NEO Personality Inventory by Costa and McCrae, revised ed.; Hogrefe:Göttingen, Germany, 2004.
62. Flunger, B.; Trautwein, U.; Nagengast, B.; Lüdtke, O.; Niggli, A.; Schnyder, I. A person-centered approach tohomework behavior: Students’ characteristics predict their homework learning type. Contemp. Educ. Psychol.2017, 48, 1–15. [CrossRef]
63. Jensen, J.M.; Patel, P.C. Predicting counterproductive work behavior from the interaction of personality traits.Pers. Individ. Differ. 2001, 51, 466–471. [CrossRef]
64. De Feyter, T.; Caers, R.; Vigna, C.; Berings, D. Unraveling the impact of FFM personality traits onacademic performance: The moderating and mediating effects of self-efficacy and academic motivation.Learn. Individ. Differ. 2012, 22, 439–448. [CrossRef]
65. Hembree, R. Correlates, causes, effects, and treatment of test anxiety. Rev. Educ. Res. 1988, 58, 47–77. [CrossRef]66. Dutke, S.; Stöber, J. Test anxiety, working memory, and cognitive performance: Supportive effects of
sequential demands. Cognit. Emot. 2001, 15, 381–389. [CrossRef]67. Owens, M.; Stevenson, J.; Norgate, R.; Hadwin, J.A. Processing efficiency theory in children: Working
memory as a mediator between trait anxiety and academic performance. Anxiety Stress Coping 2008, 21,417–430. [CrossRef] [PubMed]
68. Cassady, J.C.; Johnson, R.E. Cognitive test anxiety and academic performance. Contemp. Educ. Psychol. 2002,27, 270–295. [CrossRef]
69. Sung, Y.-T.; Chao, T.-Y.; Tseng, F.-L. Reexamining the relationship between test anxiety and learningachievement: An individual-differences perspective. Contemp. Educ. Psychol. 2016, 46, 241–252. [CrossRef]
70. LaHuis, D.M.; Martin, N.R.; Avis, J.M. Investigating nonlinear conscientiousness-job performance relationsfor clerical employees. Human Perform. 2005, 18, 199–212. [CrossRef]
71. Bergold, S. Zur diagnostischen Kompetenz von Lehrkräften bei der Identifikation begabter Schülerinnenund Schüler [On teachers’ diagnostic competencies when identifying gifted students]. Bild. Erzieh. 2014, 67,219–236. [CrossRef]
72. Dompnier, B.; Pansu, P.; Bressoux, P. An integrative model of scholastic judgments: Pupils’ characteristics,class context, halo effect and internal attributions. Eur. J. Psychol. Educ. 2006, 21, 119–133. [CrossRef]
73. Tent, L.; Birkel, P. Zensuren [Grades]. In Handwörterbuch Pädagogische Psychologie; Rost, D.H., Ed.; Beltz:Weinheim, Germany, 2010; pp. 949–958, ISBN 9783621276900.
74. Steinmayr, R.; Weidinger, A.F.; Wigfield, A. Does students’ grit predict their school achievement above andbeyond their personality, motivation, and engagement? Contemp. Educ. Psychol. 2018, 53, 106–122. [CrossRef]
75. Bipp, T.; Steinmayr, R.; Spinath, B. A functional look at goal orientations: Their role for self-estimates ofintelligence and performance. Learn. Individ. Differ. 2012, 22, 280–289. [CrossRef]
76. Lievens, F.; Ones, D.S.; Dilchert, S. Personality scale validities increase throughout medical school.J. Appl. Psychol. 2009, 94, 1514–1535. [CrossRef] [PubMed]
© 2018 by the authors. Licensee MDPI, Basel, Switzerland. This article is an open accessarticle distributed under the terms and conditions of the Creative Commons Attribution(CC BY) license (http://creativecommons.org/licenses/by/4.0/).