
PERFORMANCE MANAGEMENT IN THE FRENCH SYSTEM OF SECONDARY-TEACHER TRAINING
19
PERFORMANCE MANAGEMENT IN THE FRENCH SYSTEM OF SECONDARY-TEACHER TRAINING GUY TCHIBOZO Abstract – The present study focuses on performance analysis and performance man- agement in teacher training in France. After a brief summary of the French system of secondary-teacher training, determinants affecting performance are analyzed. The analysis shows that three determinants – the number of external competitors, the size of a department and the number of posts to be filled by recruitment examinations – are crucial to the performance of a training department. The analysis reveals, how- ever, that although a department’s performance may be related to its size, efficiency and inefficiency limits have to be taken into account in growth strategies. Zusammenfassung – DIE FRAGE DES VERWALTENS VON LEISTUNG IM FRANZO ¨ SISCHEN SYSTEM DER LEHRERAUSBILDUNG FU ¨ R DIE SE- KUNDARSTUFE – Die vorliegende Studie nimmt die Analyse von Leistung und das Verwalten von Leistung in der Lehrerausbildung in Frankreich in den Blickpunkt. Nach einer kurzen Zusammenfassung des franzo¨ sischen Systems der Lehrerausbildung fu¨ r die Sekundarstufe werden Determinanten analysiert, welche die Erfolgsrate beeinflussen. Die Analyse zeigt, dass drei Determinanten – die Anzahl der externen Mitbewerber, die Gro¨ ße der Abteilung und die Anzahl der Stellen, die durch Einstellungspru¨ fungen zu be- setzen sind – ausschlaggebend fu¨ r die Erfolgsraten einer Ausbildungsabteilung sind. Die Analyse verdeutlicht gleichwohl, dass Effektivita¨ ts- sowie Ineffektivita¨ tsgrenzen in Wachstumsstrategien beru¨ cksichtigt werden mu¨ ssen, auch wenn die Erfolgsrate einer Ab- teilung mit ihrer Gro¨ ße in Verbindung gebracht werden kann. Re´ sume´ – LA PROBLE ´ MATIQUE DE LA GESTION DES PERFORMANCES DANS LE SYSTEME FRANC¸ AIS DE LA FORMATION DES ENSEIGNANTS DU SECONDAIRE – L’e´tude se concentre sur l’analyse de la performance et sur la gestion de la performance dans la formation d’enseignants en France. Apre`s un bref re´ sume´ du syste`me Franc¸ais de formation des enseignants du secondaire, diffe´rents de´terminants affectant la performance de succe`s sont analyse´s. L’analyse montre que trois de´terminants – le nombre de compe´titeurs externes, la taille de la Pre´paration et le nombre de postes a` pourvoir dans les examens de recrutement – sont cruciaux pour la performance de succe`s d’une Pre´paration. L’analyse re´ve`le cependant que, bien que le succe`s d’une Pre´paration puisse eˆtre mis en relation avec sa taille, les limites d’effi- cacite´ et d’inefficacite´ doivent eˆtre prises en compte dans les strate´gies de croissance. Resumen – EL TEMA DE LA GESTIO ´ N DEL RENDIMIENTO EN EL SISTEMA FRANCE ´ S DE LA FORMACIO ´ N DE DOCENTES DE LA EDUCACIO ´ N SE- CUNDARIA – Este estudio se centra en el ana´lisis del rendimiento y de la gestio´n del rendimiento en la formacio´n de docentes en Francia. Despue´s de presentar un breve resumen del sistema france´s de formacio´n de docentes de ensen˜anza secundaria, el autor analiza factores determinantes que afectan el nivel de rendimiento. Este an- a´lisis muestra que tres de estos factores: el nu´mero de competidores externos, el tama- International Review of Education (2005) 51:3–21 Ó Springer 2005 DOI 10.1007/s11159-005-0589-6
Transcript of PERFORMANCE MANAGEMENT IN THE FRENCH SYSTEM OF SECONDARY-TEACHER TRAINING

PERFORMANCE MANAGEMENT IN THE FRENCH SYSTEM OF
SECONDARY-TEACHER TRAINING
GUY TCHIBOZO
Abstract – The present study focuses on performance analysis and performance man-agement in teacher training in France. After a brief summary of the French system ofsecondary-teacher training, determinants affecting performance are analyzed. Theanalysis shows that three determinants – the number of external competitors, the sizeof a department and the number of posts to be filled by recruitment examinations –are crucial to the performance of a training department. The analysis reveals, how-ever, that although a department’s performance may be related to its size, efficiencyand inefficiency limits have to be taken into account in growth strategies.
Zusammenfassung – DIE FRAGE DES VERWALTENS VON LEISTUNG IMFRANZOSISCHEN SYSTEM DER LEHRERAUSBILDUNG FUR DIE SE-KUNDARSTUFE – Die vorliegende Studie nimmt die Analyse von Leistung und dasVerwalten von Leistung in der Lehrerausbildung in Frankreich in den Blickpunkt. Nacheiner kurzen Zusammenfassung des franzosischen Systems der Lehrerausbildung fur dieSekundarstufe werden Determinanten analysiert, welche die Erfolgsrate beeinflussen. DieAnalyse zeigt, dass drei Determinanten – die Anzahl der externen Mitbewerber, dieGroße der Abteilung und die Anzahl der Stellen, die durch Einstellungsprufungen zu be-setzen sind – ausschlaggebend fur die Erfolgsraten einer Ausbildungsabteilung sind. DieAnalyse verdeutlicht gleichwohl, dass Effektivitats- sowie Ineffektivitatsgrenzen inWachstumsstrategien berucksichtigt werden mussen, auch wenn die Erfolgsrate einer Ab-teilung mit ihrer Große in Verbindung gebracht werden kann.
Resume – LA PROBLEMATIQUE DE LA GESTION DES PERFORMANCESDANS LE SYSTEME FRANCAIS DE LA FORMATION DES ENSEIGNANTSDU SECONDAIRE – L’etude se concentre sur l’analyse de la performance et sur lagestion de la performance dans la formation d’enseignants en France. Apres un brefresume du systeme Francais de formation des enseignants du secondaire, differentsdeterminants affectant la performance de succes sont analyses. L’analyse montre quetrois determinants – le nombre de competiteurs externes, la taille de la Preparation etle nombre de postes a pourvoir dans les examens de recrutement – sont cruciaux pourla performance de succes d’une Preparation. L’analyse revele cependant que, bien quele succes d’une Preparation puisse etre mis en relation avec sa taille, les limites d’effi-cacite et d’inefficacite doivent etre prises en compte dans les strategies de croissance.
Resumen – EL TEMA DE LA GESTION DEL RENDIMIENTO EN EL SISTEMAFRANCES DE LA FORMACION DE DOCENTES DE LA EDUCACION SE-CUNDARIA – Este estudio se centra en el analisis del rendimiento y de la gestiondel rendimiento en la formacion de docentes en Francia. Despues de presentar unbreve resumen del sistema frances de formacion de docentes de ensenanza secundaria,el autor analiza factores determinantes que afectan el nivel de rendimiento. Este an-alisis muestra que tres de estos factores: el numero de competidores externos, el tama-
International Review of Education (2005) 51:3–21 � Springer 2005DOI 10.1007/s11159-005-0589-6

no de un instituto de formacion docente y el numero de puestos a cubrir por oposici-ones, son decisivos para el exito de un instituto de formacion docente. Sin embargo,el mismo analisis revela que pese a que el nivel de exito de un instituto de formaciondeba relacionarse con su tamano, al delinearse las estrategias de crecimiento deberantomarse en cuenta los lımites de eficiencia e ineficiencia.
In France, secondary teachers are public-sector employees. Becoming a second-ary teacher is subject to passing a competitive public-entry examination. Prepa-ration for this examination is provided by Exam Preparation Departmentswithin the framework of University Institutes for Teacher Training (InstitutsUniversitaires de Formation des Maıtres [IUFM]. These departments areassessed on the basis of their students’ performance in the exams. This meansthat according to the number of successful candidates, or according to the passrate, additional funding might be awarded or not, and a department with apoor performance rate might even be closed down. Therefore, it is importantfor department heads to know which factors affect success performance on theexam, and which strategies could help improve it.
Very few studies have been published to date on this topic in the interna-tional academic literature. The present contribution should be relevant to read-ers interested in teacher preparation, in performance analysis, performancemanagement and performance assessment in higher education, and especiallyto readers interested in the French educational system. This study begins byproviding a brief introduction to the French system of secondary-teacherrecruitment. It then describes the method of analysis. In closing, the results arepresented and conclusions for performance management are drawn.
General background of the French system of secondary-teacher recruitment
Teacher-recruitment examinations are organized by the Ministry of Educa-tion. About 110 different examinations, corresponding to as many different
4 Guy Tchibozo

teaching specializations, are organized annually. Every year approximately70,000 examinees take these examinations (Valette 2002, 2003). To sit for anexam, examinees must have a Bachelor’s degree; they can choose betweenpreparing themselves and attending preparatory courses within IUFM Depart-ments. Such preparatory programs last one year, and comprise the first partof the IUFM curriculum.
The 110 exams can be divided into four categories. Type 1, called Certificatd’aptitude au professorat de l’enseignement du second degre (CAPES), comprisesthe examinations for teacher candidates in general education. There are about30 specializations in this category: Philosophy, Literature, History and Geog-raphy, Economics, Documentation Techniques, foreign languages (Arabic,Chinese, English, German, Greek, Hebrew, Italian, Portuguese, Russian andSpanish), regional languages (Basque, Breton, Catalan, Corsican, Creole, Occi-tan, and Tahitian), classical languages (Ancient Greek and Latin), Mathemat-ics, Physics, Chemistry, Earth and Life Sciences, Music and Fine Arts.
Type 2, called Certificat d’aptitude au professorat de l’enseignement tech-nique (CAPET), comprises the examinations for teacher candidates in techni-cal education. There are about 40 specializations in this group, includingmanagement, accounting, tourism, technology, bio-technology, medicalimaging, multimedia technologies, engineering (including various specializa-tions), computer science, environmental science, water-resources management,horticulture, decorative arts, cosmetic and make-up artistry.
The examinations for teacher candidates in vocational training are groupedinto the third type, called Certificat d’aptitude au professorat de lycee profes-sionnel (CAPLP). There are about 40 specializations in this group, includinghairdressing, paramedic studies, graphic arts, industrial art and design, officeadministration, secretarial training, sales, transportation, and auto mechanics.
Finally, the fourth type, Certificat d’aptitude au professorat d’educationphysique et sportive (CAPEPS), is the examination for those wishing tobecome physical education and sports teachers.
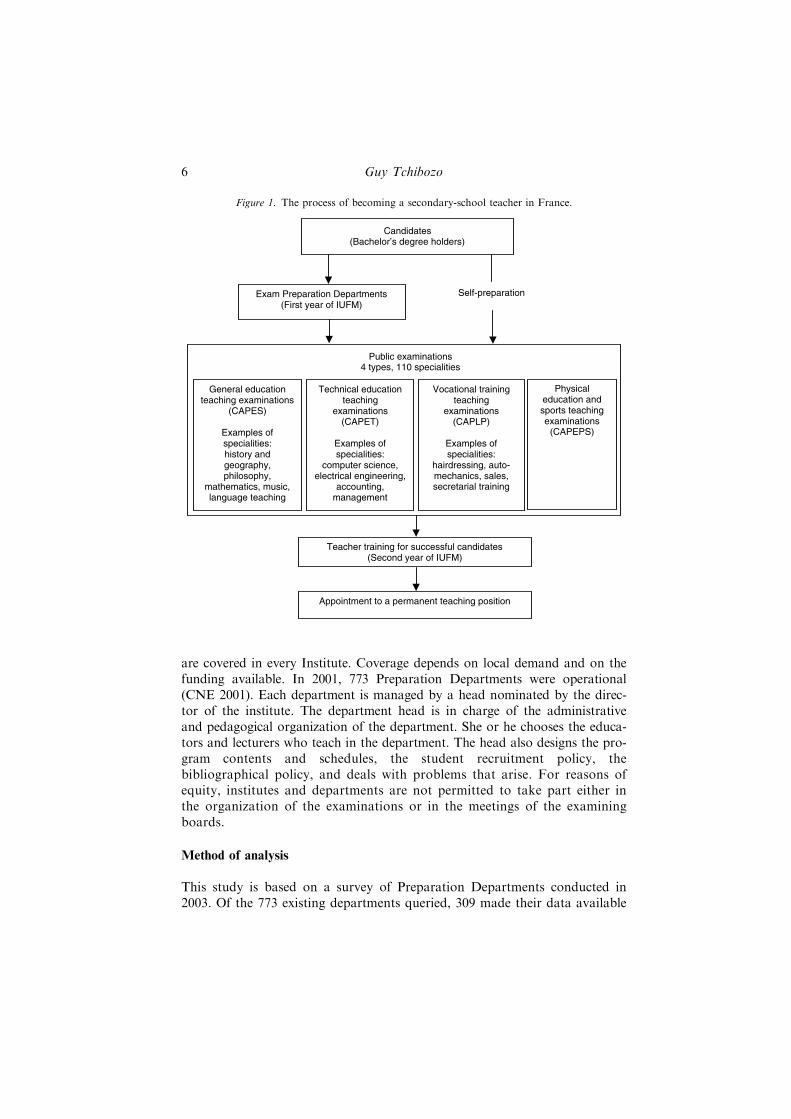
The passing rates for these examinations are quite low: About 12,000candidates out of the 70,000 (i.e., less than 20%) pass the exams every year.Successful examinees are offered teacher training for one year, which comprisesthe second year of the IUFM. With few exceptions, all trainees admitted to thisstage become qualified secondary-school teachers, and subsequently receiveappointments to permanent teaching positions. Figure 1 provides a generaloverview of the system.
The French IUFM system was created in 1990. Different authors havedescribed the origins and institutional organization of this system (Asher andMalet 1996; Bonnet 1996; Brisard and Hall 2001; Caldwell and Mailhos2002; Cornu 2002; Holyoake 1993; Zay 1997). There are 31 Institutesthroughout the country and overseas (in Wallis and Futuna, Reunion, NewCaledonia, Martinique, French Polynesia, French Guiana, and Guadeloupe).
Each institute contains several Exam Preparation Departments, eachdepartment preparing specifically for one examination. Not all specializations
5The French System of Secondary-Teacher Training
are covered in every Institute. Coverage depends on local demand and on thefunding available. In 2001, 773 Preparation Departments were operational(CNE 2001). Each department is managed by a head nominated by the direc-tor of the institute. The department head is in charge of the administrativeand pedagogical organization of the department. She or he chooses the educa-tors and lecturers who teach in the department. The head also designs the pro-gram contents and schedules, the student recruitment policy, thebibliographical policy, and deals with problems that arise. For reasons ofequity, institutes and departments are not permitted to take part either inthe organization of the examinations or in the meetings of the examiningboards.
Method of analysis
This study is based on a survey of Preparation Departments conducted in2003. Of the 773 existing departments queried, 309 made their data available
Candidates (Bachelor’s degree holders)
Exam Preparation Departments (First year of IUFM)
Self-preparation
General education teaching examinations
(CAPES)
Examples ofspecialities: history and geography, philosophy,
mathematics, music, language teaching
Technical education teaching
examinations(CAPET)
Examples of specialities:
computer science, electrical engineering,
accounting, management
Vocational training teaching
examinations(CAPLP)
Examples of specialities:
hairdressing, auto-mechanics, sales,secretarial training
Physical education and sports teaching examinations
(CAPEPS)
Public examinations 4 types, 110 specialities
Teacher training for successful candidates (Second year of IUFM)
Appointment to a permanent teaching position
Figure 1. The process of becoming a secondary-school teacher in France.
6 Guy Tchibozo

for the analysis. These data cover the period from 1992 to 2002. The samplefor this study includes 40% of the existing departments and 60% of theexisting specializations.
Sample representativeness
To check the representativeness of the sample, some of its main characteristicswere compared with those of the entire population of Preparation Departments.Characteristics of the entire population can be found in the CNE national eval-uation document (2001: 75–91). As can be seen in Table 1, the characteristics ofthe sample are generally very close to those of the global population.
The sample can therefore be seen as representative. However, examina-tions for smaller specializations, with few posts to fill and few examinees, areunder-represented. For example, some examinations for language teaching(e.g., Danish, Japanese, Vietnamese, Tahitian or Swedish) and some highlyspecialized technical or vocational teaching exams (e.g., industrial engineer-ing specialization in glass and ceramics) generally offer fewer than 10 postsper year and attract fewer than 20 examinees. Small and highly specializeddepartments preparing for such small and highly specialized examinationsare under-represented in the sample. Therefore, the results obtained will notnecessarily be valid for such departments.
Factors of performance
The data obtained cover six possible factors of performance. The first factoris the total number of examinees nationally. This factor is expected to have a
Table 1. Comparison between the sample and the population of Preparation Depart-ments
Comparison criteria Population Sample
Average size of departments (students registeredper department)
44 47
Percentage of departments preparing for generaleducation teaching
49.80% 49.19%
Percentage of departments preparing for technicaleducation teaching
22.25% 23.30%
Percentage of departments preparing for vocationaltraining teaching
24.19% 24.27%
Percentage of departments preparing for physical ed.and sports teaching
3.75% 3.23%
Average national number of candidates per examination 1073 1485Average number of posts filled per examination 173 252Average number of successful candidates per department 10.42 10.88Average pass rate per department 29.9% 30.81%
7The French System of Secondary-Teacher Training

negative influence on the exam success of all departments: The higher thenumber of examinees at an exam, the lower the expected average perfor-mance of Preparation Departments on this exam.
The second factor is the department size, which is synonymous with thenumber of candidates registered in the department. This factor is expected tohave a positive influence on exam success: The higher the number of candi-dates registered in a department, the higher the probability that this depart-ment has good candidates.
The third factor is the number of posts to be filled. Before each examina-tion, the Ministry of Education determines the exact number of posts to befilled in each specialization. This factor is expected to have a positive influ-ence on exam success: The higher the number of posts to be filled, the higherthe chance of success. However, the number of posts finally filled can be dif-ferent from the number initially set. This discrepancy is due to decisions ofthe examining boards. Each exam has its own specific examining board.Examining boards are independent: The head of the board is nominated bythe Minister of Education, but once nominated, the head chooses othermembers of the board and is free to implement his or her own policy. Thus,a board can decide that there are not enough good candidates to fill allposts. On the contrary, it can decide that there are many more good candi-dates than posts to be filled, and negotiate with the Ministry to obtain addi-tional posts.
The fourth influencing factor is the type of examination. In fact, each ofthe four categories has a specific style of examination tests. General educa-tion exams (Type 1) are rather academic and essentially consist of essay writ-ing and lecturing. Technical education exams (Type 2) very often consist ofcase studies. Vocational training exams (Type 3) are often organized aroundreal work situations. Finally, tests in physical education and sports (Type 4)are very practical. Therefore, the type of examination is expected to have aninfluence on a department’s success.
The fifth influencing factor is the examination specialization. To someextent, type and specialization are linked: A specialization is often associ-ated with only one type of examination. However, this is far from being asystematic rule. For example, in most engineering specializations, teachingexams are structured in both technical and in vocational formats. There-fore, specialization can exert an autonomous influence, which results fromthe fact that examining boards are independent. Thus, boards decide whichselection criteria will be used. A board can decide to use not only academiccriteria, but also extra-academic standards such as social or geographicalequity criteria.
The final factor is the location of a department. Location is expected tohave an influence on exam success because each department has its ownstaff, organization and pedagogical methods.
8 Guy Tchibozo

Performance indicators
To measure success of a department, quantitative indicators have been used.Five different possible indicators were considered:
� the department’s pass rate, which is the ratio
y1 ¼Number of successful candidates from a department
Number of candidates from this department who were effectively present at the exam
� the number of successful candidates from a department (y2)� the department’s share in the total number of successful candidates, which
is the ratio:
y3 ¼Number of successful candidates from a department
Total number of successful candidates on this exam
� the department’s share in the total number of successful candidates relatedto its share in the total number of registered candidates (weighted share inthe number of successful candidates y4)
� the department’s share in the total number of successful candidates relatedto its share in the total number of candidates effectively present at theexam (weighted share in the number of successful candidates y5).
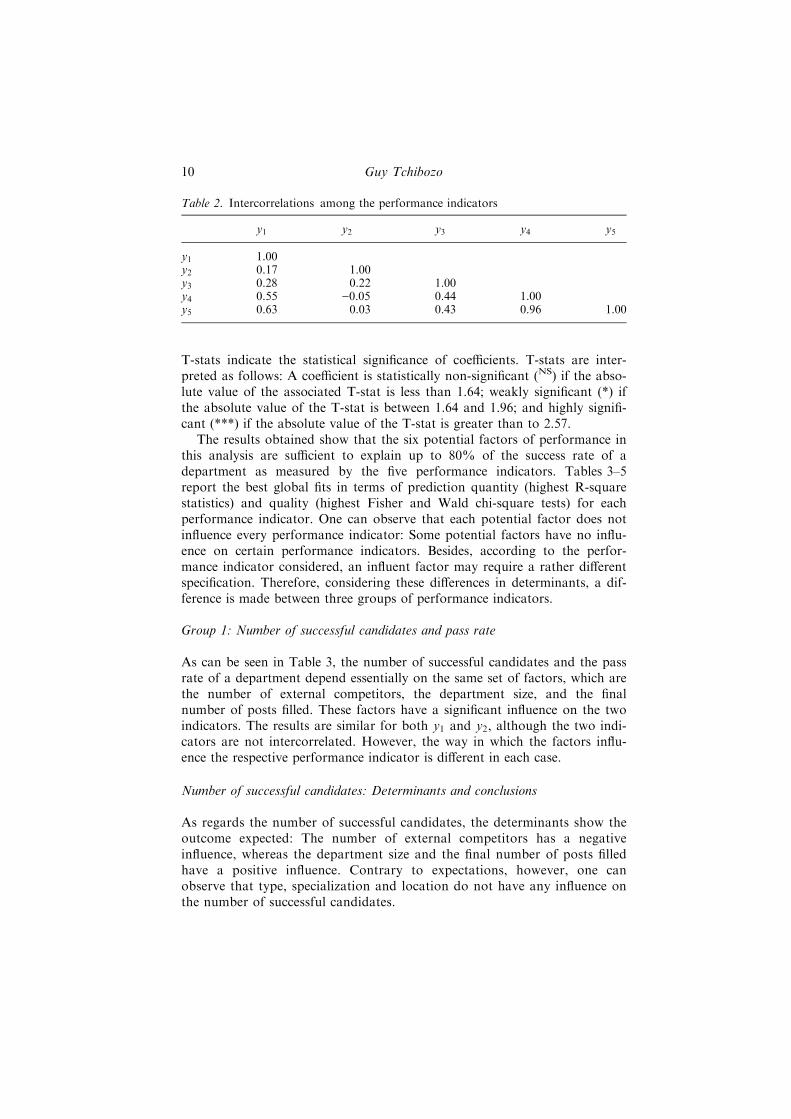
The reason for considering several indicators is that it is important to detectwhether the relationships observed between the factors and a department’sperformance depend on the indicator used. Moreover, if different indicatorswere to give similar results, it would be important to know whether these indi-cators are intercorrelated. To check this, the matrix of correlations was com-puted. Table 2 shows that y1, y2 and y3 can be considered non-intercorrelated(correlation coefficients inferior to 0.3), whereas y4 and y5 are stronglyintercorrelated (coefficient superior to 0.7). The indicator y2 is not correlatedwith other indicators. Finally, y1 and y3 can be considered to be weakly corre-lated with y4 and y5 (coefficients contained between 0.3 and 0.7).
Therefore, one may expect that indicators y1, y2 and y3 each lead to spe-cific results, while the group composed of indicators y4 and y5 should lead toa fourth set of specific results. Annex A provides further details.
Results and conclusions
Each of the five performance indicators has been regressed on the potentialdeterminants. Tables 3–5 report the coefficients of the regressions. Each coeffi-cient is associated with a Student test statistic (T-stat), noted in parentheses.
9The French System of Secondary-Teacher Training
T-stats indicate the statistical significance of coefficients. T-stats are inter-preted as follows: A coefficient is statistically non-significant (NS) if the abso-lute value of the associated T-stat is less than 1.64; weakly significant (*) ifthe absolute value of the T-stat is between 1.64 and 1.96; and highly signifi-cant (***) if the absolute value of the T-stat is greater than to 2.57.
The results obtained show that the six potential factors of performance inthis analysis are sufficient to explain up to 80% of the success rate of adepartment as measured by the five performance indicators. Tables 3–5report the best global fits in terms of prediction quantity (highest R-squarestatistics) and quality (highest Fisher and Wald chi-square tests) for eachperformance indicator. One can observe that each potential factor does notinfluence every performance indicator: Some potential factors have no influ-ence on certain performance indicators. Besides, according to the perfor-mance indicator considered, an influent factor may require a rather differentspecification. Therefore, considering these differences in determinants, a dif-ference is made between three groups of performance indicators.
Group 1: Number of successful candidates and pass rate
As can be seen in Table 3, the number of successful candidates and the passrate of a department depend essentially on the same set of factors, which arethe number of external competitors, the department size, and the finalnumber of posts filled. These factors have a significant influence on the twoindicators. The results are similar for both y1 and y2, although the two indi-cators are not intercorrelated. However, the way in which the factors influ-ence the respective performance indicator is different in each case.
Number of successful candidates: Determinants and conclusions
As regards the number of successful candidates, the determinants show theoutcome expected: The number of external competitors has a negativeinfluence, whereas the department size and the final number of posts filledhave a positive influence. Contrary to expectations, however, one canobserve that type, specialization and location do not have any influence onthe number of successful candidates.
Table 2. Intercorrelations among the performance indicators
y1 y2 y3 y4 y5
y1 1.00y2 0.17 1.00y3 0.28 0.22 1.00y4 0.55 )0.05 0.44 1.00y5 0.63 0.03 0.43 0.96 1.00
10 Guy Tchibozo

Table
3.Regressionsofthenumber
ofsuccessfulcandidatesandpass
rate
per
department
Variables
Regressionsofthenumber
ofsuccessfulcandidates(N
=1981)
Regressionsofthepass
rate
(N=
1926)
Fixed-effects
model
Random-effects
model
OLS
Fixed-effects
model
Random-effects
model
OLS
Number
ofactual
)1.44e)
03***
)3.14e)
03***
)0.0045***
)4.59e)
05***
)6.89e)
05***
)8.85e)
05***
externalcompetitors
()7.16)
()16.91)
()11.28)
()6.35)
()13.18)
()21.53)
Departmentsize
0.1455***
0.2043***
0.1947***
)1.2e)
03***
)4.85e)
04**
2.4e)
05NS
(15.31)
(23.48)
(10.75)
()3.55)
()2.06)
(0.2)
Marginaleff
ectof
)1.67e)
04***
)9.82e)
05***
2.61e)
07NS
1.06e)
06***
6.44e)
07**
1.65e)
07NS
departmentsize
()14.64)
()8.63)
(0.007)
(2.62)
(2.04)
(1.03)
Finalnumber
of
0.025***
0.025***
0.027***
4.23e)
04***
3.84e)
04***
4.34e)
04***
positionsfilled
(24.77)
(28.62)
(17.38)
(11.68)
(15.42)
(22.77)
Examinationtype
–)0.34NS
0.1946NS
–0.002
NS
)0.009NS
()0.43)
(0.405)
(0.13)
()1.43)
Examination
–0.56NS
0.04NS
–0.002***
0.003***
specialization
(1.39)
(1.62)
(3.16)
(8.48)
Locationof
–)0.13NS
)0.25***
–)9.9e)
04NS
)0.001NS
department
()1.11)
()5.91)
()0.37)
()0.75)
Constant
)1.42**
)0.56NS
1.24**
0.28***
0.25***
0.25***
()2.48)
()0.45)
(2.16)
(13.62)
(9.03)
(18.15)
R2
0.54
0.75
0.793
0.10
0.22
0.23
Hausm
an
205>
v2 5%
5ðÞ¼
11
15:9>
v2 5%
5ðÞ¼
11
Note:T-statisticsare
inparentheses.
NSNon-significant.
*Significantatthe10%
level.
**Significantatthe5%
level.
***Significantatthe1%
level.
11The French System of Secondary-Teacher Training

The results of both fixed-effects and random-effects models are similar.However, the result of the Hausman test shows that the random-effectsmodel is not consistent and should be rejected. According to the R-squarestatistic of the ordinary least squares (OLS) estimates, these three factorsexplain up to 80% of the variation of the number of successful candidates.
Possible limits on the positive influence of department size on exam per-formance were also investigated. The intention was to know if a point existsbeyond which the growth of a department has a decreasing positive influ-ence, or even a negative influence, on the number of successful candidates.Theoretically, such an ‘efficiency limit’ is conceivable and would be explainedby the fact that growth creates increasing difficulties in material organizationand coordination. In order to determine the marginal effect of increasing
Table 4. Regressions of a department’s share in the total number of successful candi-dates (N = 1981)
Variables Fixed-effectsmodel
Random-effectsmodel
OLS
Number of external actual 8.62e)07NS 3.45e)07NS 4.23e)07NS
competitors (0.97) (0.49) (1.12)
Deptartment weight in the 1.4711*** 1.7239*** 1.70***national number of actualcandidates
(23.10) (38.71) (15.17)
Marginal effect of department )0.78*** )0.88*** )0.633***weight (X2C2) ()12.90) ()16.97) ()5.22)
Initial number of posts )2.24e)06NS )5.09e)06* )6.37e)06***to be filled ()0.72) ()1.88) ()4.41)
Examination type – 0.003NS 0.001*(0.86) (1.74)
Examination specialization – 2.26e)04NS 2.57e)04***(1.20) (4.02)
Location of department – )7.8e)04NS )8.28e)04***0.001NS ()1.37) ()3.79)
Constant (0.59) )0.008NS )0.0063*0.73 ()1.42) ()1.67)
R2 0.74 0.75Hausman 95 > v25% 5ð Þ ¼ 11
Note: T-statistics are in parentheses.NS Non-significant.* Significant at the 10% level.** Significant at the 5% level.*** Significant at the 1% level.
12 Guy Tchibozo

Table
5.Regressionsofthedepartment’sweightedsharesin
thetotalnumber
ofsuccessfulcandidatesy4andy5(N
=1498).
Variables
Regressionsofy4
Regressionsofy5
Fixed-effects
model
Random-effects
model
OLS
Fixed-effects
model
Random-effects
model
OLS
Number
ofexternalactual
)3.05e)
06NS
)1.76e)
05NS
7.17NS
2.96e)
05NS
1.43e)
05NS
1.49e)
05NS
competitors
()0.05)
()0.41)
(0.31)
(0.90)
(0.55)
(0.92)
Departmentweightin
thenational
)45.79***
)21.22***
)6.18
NS
)26.21***
)9.23**
)1.18NS
number
ofregisteredcandidates
()4.89)
()3.16)
()1.38)
()4.44)
()2.29)
()0.44)
Marginaleff
ectofdepartmentweight
277.02***
122.76**
20.11NS
161.28***
55.17*
0.29NS
(3.51)
(2.41)
(0.78)
(3.24)
(1.81)
(0.01)
Finalnumber
ofpositionsfilled
)3.42
NS
)6.34e)
04***
)8.53***
)8.24e)
05NS
)2.44e)
04*
)3.06e)
04***
()1.07)
()2.84)
()6.68)
()0.41)
()1.79)
()3.64)
Examinationtype
–0.09NS
0.06NS
–0.047NS
0.03NS
(0.6)
(1.14)
(0.55)
(0.88)
Examinationspecialization
–0.015**
0.019***
–0.009**
0.011***
(2.01)
(5.00)
(2.18)
(5.09)
Locationofdepartment
–)0.05**
)0.04***
–)0.03**
)0.02***
()2.26)
()2.73)
()2.56)
()3.07)
Constant
2.98***
2.62***
2.32***
1.83***
1.62***
1.46***
(12.43)
(9.09)
(13.06)
(12.12)
(9.73)
(13.42)
R2
0.03
0.11
0.12
0.0057
0.07
0.07
Hausm
an
13>
v2 5%
5ðÞ¼
11
15:3>
v2 5%
5ðÞ¼
11
Note:T-statisticsare
inparentheses.
NSNon-significant.
*Significantatthe10%
level.
**Significantatthe5%
level.
***Significantatthe1%
level.
13The French System of Secondary-Teacher Training
size, the squared size was inserted in the regressions. If an efficiency limitexists, the coefficient of the quadratic variable must be negative.
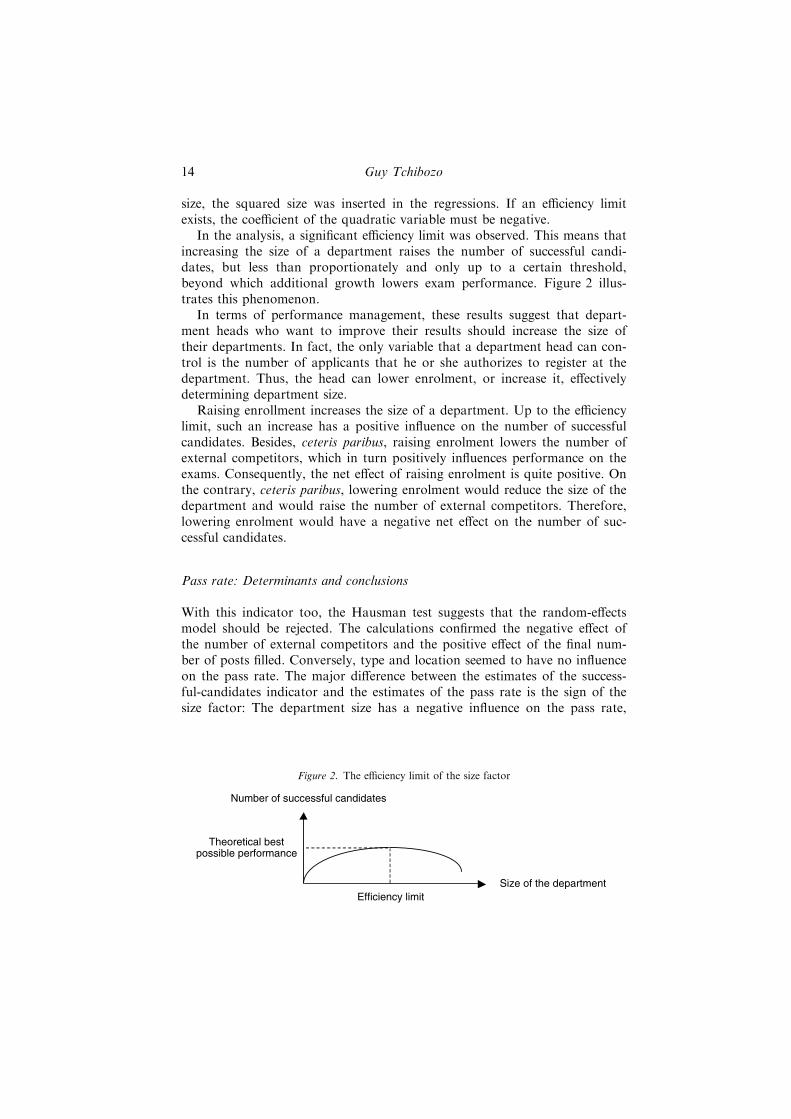
In the analysis, a significant efficiency limit was observed. This means thatincreasing the size of a department raises the number of successful candi-dates, but less than proportionately and only up to a certain threshold,beyond which additional growth lowers exam performance. Figure 2 illus-trates this phenomenon.
In terms of performance management, these results suggest that depart-ment heads who want to improve their results should increase the size oftheir departments. In fact, the only variable that a department head can con-trol is the number of applicants that he or she authorizes to register at thedepartment. Thus, the head can lower enrolment, or increase it, effectivelydetermining department size.
Raising enrollment increases the size of a department. Up to the efficiencylimit, such an increase has a positive influence on the number of successfulcandidates. Besides, ceteris paribus, raising enrolment lowers the number ofexternal competitors, which in turn positively influences performance on theexams. Consequently, the net effect of raising enrolment is quite positive. Onthe contrary, ceteris paribus, lowering enrolment would reduce the size of thedepartment and would raise the number of external competitors. Therefore,lowering enrolment would have a negative net effect on the number of suc-cessful candidates.
Pass rate: Determinants and conclusions
With this indicator too, the Hausman test suggests that the random-effectsmodel should be rejected. The calculations confirmed the negative effect ofthe number of external competitors and the positive effect of the final num-ber of posts filled. Conversely, type and location seemed to have no influenceon the pass rate. The major difference between the estimates of the success-ful-candidates indicator and the estimates of the pass rate is the sign of thesize factor: The department size has a negative influence on the pass rate,
Number of successful candidates
Size of the department Efficiency limit
Theoretical bestpossible performance
Figure 2. The efficiency limit of the size factor
14 Guy Tchibozo

and its marginal effect is positive. This means that the pass rate and thenumber of successful candidates do not obey the same dynamics. In otherwords, instead of an efficiency limit, an ‘inefficiency limit’ can be observed:Beneath a certain threshold, increasing the department size simultaneouslydecreases the performance, while beyond this threshold increasing the sizeraises the performance (Figure 3). The efficiency limit in terms of the numberof successful candidates and the inefficiency limit in terms of the pass rate donot necessarily correspond. According to the coefficients of the estimates,and given the unexplained part of the variation of performance indicators, itis possible to compute that for the whole sample, the average departmentsizes corresponding to the greatest possible number of successful candidatesand to the lowest possible pass rate are approximately 435 and 566 people,respectively.
These numerical values are mentioned simply to illustrate the phenome-non of an (in)efficiency limit. In fact, the actual size of departments variesaccording to the specialization. Departments preparing for examinations inwhich only a few posts are to be filled (e.g., regional language teachingexams) are small, while the biggest departments (e.g., those that prepare can-didates for history and geography teaching exams) can enroll more than 700students. Therefore, the right numerical values have to be calculated for eachspecialization.
The inefficiency limit suggests that only large departments have sufficientmeans to overcome the increasing organizational difficulties which resultfrom growth strategy and lower pass rates.
Two conclusions can be drawn from these observations. First, a depart-ment head who is targeting the pass rate as a performance indicator shouldcalculate the inefficiency limit, beyond which increasing the size will have apositive influence. Then the head has to set the department size beyond theinefficiency limit. However, the minimum size might be out of reach, forexample, for institutional reasons. Limits of the physical premises, a shortageof lecturers in the area or a low student enrollment can make a large depart-ment unfeasible. If this is the case, reducing the department size below the
Pass rate
Size of the department Inefficiency
limit(566)
Number of successful candidates
Pass rate and numberof successful candidates
Efficiency limit (435)
Figure 3. The efficiency and inefficiency limits of the size factor
15The French System of Secondary-Teacher Training

inefficiency limit can be an alternative solution, since reducing the sizeimproves the pass rate.
The second conclusion is that, as can be seen from the differences indynamics of the pass rate and number of successful candidates, the choice ofa performance indicator is important. It is necessary for heads to understandthe relevance of this choice.
In fact, a performance indicator has three main functions. First, perfor-mance indicators are the criteria on the basis of which the policy and theefficiency of departments can be assessed. Assessment is important because itdetermines funding. Therefore, assessment has to be conducted in full publicview, on the basis of criteria that should be precise, stable and well knownto both partners (departments and assessment institutions). Good perfor-mance indicators have to meet these characteristics. If this is the case, assess-ment will be accepted as reliable and fair.
The second function of a performance indicator is to be the goaltowards which the entire performance policy of a department is designed.Once the performance indicator has been chosen, the whole policy of thedepartment should be designed in order to achieve the best possible perfor-mance according to this indicator, which thus becomes a kind of ‘referenceindicator’. The implication is that department heads have a good under-standing of the dynamics of the indicator chosen, such as whether an effi-ciency or inefficiency limit exists or not. Insofar as it is based on thedepartment’s reference indicator, the assessment of the department policyand results will be relevant.
The third function of a performance indicator is to shape the communica-tion policy of the department. Those in which no student is registered will beclosed down. Therefore, departments which intend to continue their activityneed to attract new prospective examinees every year. However, as van Zan-ten (2001) has shown for secondary education, the main factor that potentialapplicants take into consideration is a department’s exam performance.Therefore, performance indicators play a major role in communication poli-cies implemented towards potential applicants.
Group 2: Share in the total number of successful candidates
This third indicator is the only one in this group. It has been isolated becauseits determinants are different from those of the other performance indicators.
As can be seen from Table 4, a department’s share in the total number ofsuccessful candidates in a given year depends essentially on the department’sweight in the total number of candidates nationally. The other variables haveno significant influence. An efficiency limit (concave or inverted U-shapecurve) can be observed: Increasing the department’s weight first increases thedepartment’s share in the total number of successful candidates before finallyhaving a negative influence beyond the efficiency limit. The results of bothmodels are similar, but the Hausman test shows that only the fixed-effects
16 Guy Tchibozo

model is consistent. According to the R-square statistic of the OLS estimates,the weight factor explains up to 75% of the variation of a department’s sharein the total number of successful candidates. This means that a departmenthead who intends to improve exam performance in terms of this indicatorwould have to increase the weight of his or her department in the nationalnumber of actual candidates up to the efficiency limit.
Group 3: Share in the total number of successful candidates related to share inthe total number of candidates registered for or effectively present at the exam
As stated above, indicators y4 and y5 are strongly intercorrelated. As can beseen from Table 5, the best fits for performance indicators y4 and y5 showthat the available potential factors explain only a small part (no more than12%) of these indicators. However, these estimates show that the weight ofthe department in the national number of registered candidates is a signifi-cant determinant of indicators y4 and y5. An inefficiency limit (convex orU-shape curve) of the weight factor can be observed. This can be seen fromboth fixed-effects and random-effects models. However, the Hausman testshows that only the fixed-effects model is consistent. This means thatimproving a department’s success on the exams in terms of these indicatorsis subject to increasing the department’s weight in the national number ofregistered candidates beyond the inefficiency limit.
Conclusion
In a system of teacher recruitment based on a rigorous selection of candi-dates (as is the case in France), candidate preparation turns into a matter ofstrategy. The institutions in charge of candidate preparation have to devisestrategies to maximize the chances of success on the exams. Two main con-clusions can be drawn from the French Preparation Department model ofperformance management.
The first conclusion is that the choice of an indicator for performancemeasurement is critical. Each performance indicator depends on specificdeterminants and obeys a specific dynamic. Therefore, the best strategydepends on the indicator chosen. In addition, relevant department communi-cation with future potential applicants as well as the effective evaluation of adepartment’s performance by assessment institutions should be based on theindicator chosen. As a consequence, it is important that before choosing aperformance indicator, department heads have a good knowledge of whatdifferent indicators exist and what the determinants, dynamics and policyimplications of the various indicators look like.
The second conclusion is that a large amount of information is now avail-able concerning three performance indicators used by the IUFM: The
17The French System of Secondary-Teacher Training

number of successful candidates, the share of the total number of successfulcandidates, and the pass rate.
The number of successful candidates from a given department depends onthis department’s size, on the total pool of candidates outside the department,and on the number of posts filled by the recruitment examination. Raising thedepartment’s size thus increases the number of successful candidates. However,this positive effect of growth is limited by an efficiency ceiling: Beyond a cer-tain size, likely due to increasing difficulties in organization, growth decreasesthe number of successful candidates. This means that for a department headwho chooses the number of successful candidates as the reference indicator,the best strategy for increasing success consists of increasing the number ofstudents enrolled until the efficiency limit is reached but not surpassed.
The share of a department in the total number of successful candidatesessentially depends on this department’s weight in the national number ofactual candidates. Raising the weight also increases the departmental shareof the total number of successful candidates. Here, too, the positive effect ofgrowth is limited by an efficiency barrier: Beyond a certain weight, additionalenrollment by the department reduces the share of the total number ofsuccessful candidates.
The third indicator is the pass rate. The pass rate of a department isaffected by the same determinants as the number of successful candidates,but the dynamic is different: The positive effect of growth begins only after aminimum size has been reached. Below this minimum size, a growth strategyis inefficient and even decreases the department’s pass rate. This implies thatthe best strategy for increasing success consists of first bringing the depart-ment size to the minimum level required by the pass-rate dynamic. However,when the minimum size is out of reach, an alternative option for improvingthe pass rate consists of reducing the department size.
This analysis has essentially focused on performance management. Thequestion of the rate of failure in teacher-recruitment examinations has notbeen considered. However, the global rate of failure in French secondary-tea-cher-recruitment examinations is quite high: at least 80% every year. Never-theless, unsuccessful candidates have various alternative choices. They can,for example, become teachers in private schools, or take the public teacherexams again and again for years, since there is no time limit. They can alsotry to pass other civil service entry examinations. But what is certain is thatthe high rate of failure does not make the public teacher recruitment examin-ations less attractive. Various reasons could explain this: social prestige, alack of alternative opportunities in the labor market, a certain freedom atwork which makes it possible for teachers to combine professional careerwith social and family life, and job security (Cros and Obin 2003: 32–33).But, however that may be, given budgetary constraints, the main concerns ofthe Ministry of Education and of the IUFM are how to select the best candi-dates and how to manage performance, rather than what to do with unsuc-cessful candidates. This situation is clearly different from those prevailing in
18 Guy Tchibozo
other countries such as the United Kingdom, Finland, Australia or the Uni-ted States, where one of the main concerns is how to attract new teachersand retain them in the educational system. But the situation in France is notso different from that of other countries such as Korea, Italy and Spain. Inthese countries, despite competitive recruitment examinations, secondaryteaching still attracts a great number of candidates. In such contexts, it is nec-essary to establish rigorous processes for the selection of candidates, and thisin turn can generate competition and create a need for preparation strategies.
Acknowledgments
Thanks are due to the directors and statistics officers of the IUFM ofAix-Marseille, Bretagne, Creteil, Franche-Comte, Guyane, La Reunion,Lyon, Nantes, Paris and Reims for information and data; to Dr. TheophileAzomahou for statistical help; to Mrs. Sarah Sands for language editing;and to the referees of the International Review of Education for theirconstructive and stimulating comments as well as to the Executive Editorand his staff.
Annex A: Technical note
Variables
Concerning the first three potential factors, alternative specifications havebeen taken into account. For the national number of candidates sitting for anexamination, four specifications have been considered alternatively:
� the national number of candidates registered for this examination (calledX1A);
� the national number of actual candidates, which are the candidates regis-tered for and present at the exam (X1B);
� the national number of external registered competitors, which are the candi-dates outside the department who are registered for the exam (X1C); and
� the national number of external actual competitors, which are the candi-dates outside the department who are registered for and present at theexam (X1D).
The size of a department can be represented by
� either the number of departmental candidates, which are the candidatesregistered in this department (department size, named X2A);
� or the weight of this department in the national number of registered can-didates (X2B ¼ X2A/X1A);
� or the weight of this department in the national number of actual candi-dates (X2C ¼ X2A/X1B).
19The French System of Secondary-Teacher Training

The number of posts to fill at an examination can be defined as
� the initial number of posts officially announced before the beginning ofthe examination (X3A);
� or the final number of positions effectively filled at the end of the exami-nation (X3B);
� or the initial number of positions per departmental candidate (X3C =X3A/X2A);
� or the final number of positions per departmental candidate (X3D =X3B/X2A).
Statistical model
The links between factors and performance are investigated by means of lin-ear-regression models. Panel-data-regression models are used (Baltagi 2001).The use of panel-data statistics is justified by the fact that the data used inthis study constitute a panel of several individuals (the departments)observed during several periods (11 years from 1992 to 2002). Two primarymodels of panel-data statistical analysis could be used: the model withfixed-effects (FEM) and the model with random-effects (REM). The resultsof these two models are presented in this study. Hausman’s test is run tocompare these results and select the best model. For comparison purposes,the OLS estimates are also presented. In the OLS regression, White’s estima-tor is used because of its robustness to heteroscedasticity of unknown form.
References
Asher, Colin, and Regis Malet. 1996. The IUFM and Initial Teacher Training inFrance: Socio-Political Issues and the Cultural Divide. Journal of Education forTeaching 22(3): 271–281.
Baltagi, Badi H. 2001. Econometric Analysis of Panel Data. Chichester: Wiley.
Bonnet, Gerard. 1996. The Reform of Initial Teacher Training in France. Journal ofEducation for Teaching 22(3): 249–270.
Brisard, Estelle, and Ken Hall. 2001. Tradition and Progress in Initial Teacher Edu-cation in France Since the 1990s. Journal of Education for Teaching 27(2): 187–197.
Caldwell, John A. W., and Marie-France Mailhos. 2002. Reform of a Major TeacherEducation Reform: Evaluation and New Directions after a Decade of the FrenchIUFM. Asia-Pacific Journal of Teacher Education and Development 5(2): 29–64.
Comite national d’evaluation [CNE]. 2001. Les IUFM au tournant de leur premieredecennie – Panorama et perspectives. Paris: CNE.
Cornu, Bernard. 2002. Teacher Training and Teacher Recruitment: Trends and Reformsin France. Asia-Pacific Journal of Teacher Education and Development 5(2): 65–74.
20 Guy Tchibozo

Cros, Francoise, and Jean-Pierre Obin. 2003. Attracting, Developing and RetainingEffective Teachers – Country Background Report for France. Paris: OECD.
Holyoake, John. 1993. Initial Teacher Training: The French View. Journal of Educa-tion for Teaching 19(2): 215–226.
Valette, Catherine. 2002. Les concours de recrutement des enseignants du seconddegre – Session 2000. Note d’information 02.41: 6 pages. Published by the FrenchMinistry of Education. Available at: ftp://trf.education.gouv.fr/pub/edutel/dpd/ni0241.pdf, accessed 25 August 2004.
Valette, Catherine. 2003. Les concours de recrutement des enseignants du seconddegre – Session 2001. Note d’information 03.17: 6 pages. Published by the FrenchMinistry of Education. Available at: ftp://trf.education.gouv.fr/pub/edutel/dpd/ni0317.pdf, 25 August 2004.
Van Zanten, Agnes. 2001. Le role des evaluations dans les strategies concurrentiellesdes etablissements et dans les strategies de choix des parents en France et en Grande-Bretagne. In: Evaluer les politiques educatives, ed. by Lise Demailly, 31–46. Bruxelles:De Boeck Universite.
Zay, Danielle. 1997. How To Make Research Useful For Schools? The Emergence ofResearchers–Practitioners Partnerships through Teacher Education Reform in France.Paper presented at the Annual Meeting of the American Educational Research Asso-ciation, Chicago, 24–28 March.
The author
Guy Tchibozo holds a doctorate in Economics and has been an associateprofessor at Louis Pasteur University (Strasbourg) since 1996. He is cur-rently Chairman of the Department for the Training of Secondary Teachersin Economics Education at the University Institute for Teacher Trainingthere. His teaching and research address the relationship between educationand work, especially school-to-work transition analysis, with particularemphasis on teacher-preparation analysis.
Contact address: E-mail: [email protected].
21The French System of Secondary-Teacher Training