“PERFORMANCE EVALUATION OF URBAN CO-OPERATIVE BANK - A CASE STUDY OF DEVGIRI URBAN CO-OPERATIVE...
131
1 “PERFORMANCE EVALUATION OF URBAN CO- OPERATIVE BANK - A CASE STUDY OF DEVGIRI URBAN CO-OPERATIVE BANKS LTD. AURANGABAD” DISSERTATION SUBMITTED TO DR.BABASAHEB AMBEDKAR MARATHWADA UNIVERSITY, AURANGABAD. FOR THE DEGREE OF MASTER OF PHILOSOPHY IN DEPARTMENT OF COMMERCE BY MR. KALE BILAS SAKHARAM UNDER THE GUIDANCE OF PROF. M. A. LOKHANDE PROFESSOR AND HEAD, DEPARTMENT OF COMMERCE, DR.BABASAHEB AMBEDKAR MARATHWADA UNIVERSITY, AURANGABAD.
Transcript of “PERFORMANCE EVALUATION OF URBAN CO-OPERATIVE BANK - A CASE STUDY OF DEVGIRI URBAN CO-OPERATIVE...

1
“PERFORMANCE EVALUATION OF URBAN CO-
OPERATIVE BANK - A CASE STUDY OF DEVGIRI URBAN
CO-OPERATIVE BANKS LTD. AURANGABAD”
DISSERTATION SUBMITTED
TO
DR.BABASAHEB AMBEDKAR MARATHWADA UNIVERSITY,
AURANGABAD.
FOR THE DEGREE OF
MASTER OF PHILOSOPHY
IN
DEPARTMENT OF COMMERCE
BY
MR. KALE BILAS SAKHARAM
UNDER THE GUIDANCE OF
PROF. M. A. LOKHANDE
PROFESSOR AND HEAD, DEPARTMENT OF COMMERCE,
DR.BABASAHEB AMBEDKAR MARATHWADA UNIVERSITY,
AURANGABAD.
2
2013-2014
DECLARATION
I hereby declare that this research entitled “Performance Evaluation of
Urban Co-operative Banks – A case Study of Devgiri Urban Co-
operative Banks Ltd. Aurangabad” Submitted for the award of the
Master Of Philosophy degree in the faculty of commerce, to the Dr.
Babasaheb Ambedkar Marathwada University, Aurangabad is of
original nature. I further declare that best of my knowledge and belief
this research work has not been submitted earlier for the award of any
degree of this or any other university.
Date: - / / 2014 (Kale Bilas Sakharam).
Place: - Aurangabad (Research Student)

3
CERTIFICATE
This is to certify that the dissertation entitled “Performance Evaluation
of Urban Co-operative Banks - A case Study of Devgiri Urban Co-
operative Banks Ltd. Aurangabad” is the bonafide research work was
carried out by Kale Bilas Sakharam student of M.Phil department of
commerce under the my supervision Dr.Babasaheb Ambedkar
Marathwada University, Aurangabad, during the year 2013-14 in partial
fulfillment of the requirements for the award of the degree of Master of
Philosophy and that the dissertation has not found any other similar title.
Date: - / /2014. Guide
Place: - Aurangabad. Prof. M.A. Lokhande.

4
ACKNOWLEDGEMENT
First of all I am thankful to my research guide Prof. M. A. Lokhande under whose
guidance this study was conducted. It was on account of his encouragement and
suggestions that this work has come up in the present from.
I am also thankful to Dr. Sayyed Azharuddin, Dr. Veena R. Humbe, Dr. Vilas
Epper, Dr. N.S.Rathi, Dr. J.R.Suryawanshi of Department of Commerce,
Dr.Babasaheb Ambedkar Marathwada University, Aurangabad for their guidance
as and when needed for the completion of this study.
I am deeply indebted to my father Sakharam Kale and Mother Smt. Sukhashalabai
Kale, Limbaji, Vilas, Kailas (Brother) for their good blessing and continue
encouragement to my education and without whose blessing I could never have
stood in my life.
I am very thankful to my friends Kaldate Krishna, Ughade Ashok, Jagdale
Rameshwar, Chate Hanumant, Dabhade Vishawanath, Kaldate Madhukar,
Dombale Sunil, Tonde Adinath, Hake Deepak and Dhawle Nitin who help me in
completing the present study and to those friends whose good wishes were with
me.
I am thankful to Akade Abhishek, Pawar Mama, Raju Lokhande and Gaikawad
Mama non teaching staff members of Dept of commerce, Dr. B. A. M. U, A ‘Bad.
Lastly, I am thankful to all of them who have directly and indirectly helped me in
completing the present study.
Date: - / / 2014. Kale Bilas Sakharam
Place: - Aurangabad. (Research Student)

5
Table of Contents
Chapter No. Particular Page No.
Declaration II
Certificate III
Acknowledgements IV
List of Tables V
List of Charts & Diagrams VI
I Introduction 01-24
II Research Methodology & Literature Review 25-68
III Analysis and Interpretation of Data 69-102
IV Observations and Suggestions 103-110
Bibliography 111-115
Abbreviations 116-117

6
LIST OF TABLES
Table No Name of Tables Page No.
1.1 Urban Co-operative Bank in Maharashtra 20
1.2 Grade wise Distribution of UCBs in Maharashtra 21
1.3 Comparative Statistics of Cooperative Societies In Maharashtra 23-24
3.1 Growth Trend of capital/Liability position of DUCB 71-72
3.2 Growth Trend of Asset/Property position of DUCB 72-73
3.3 Per year Share of the Total Fund of Liability 74-75
3.4 Per year Share of the Total Fund of Asset 75-76
3.5 Capital Adequacy 76-77
3.6 Mixer of Bank Deposits on 2008-2013 (Share of Total fund Deposits) 77-78
3.7 Net Growth and Mixer of Bank Deposits on 2008-2013. 79-80
3.8 Short term liquidity position of DUCB 81
3.9 Working Capital 82
3.10 Fixed Assets to Proprietary Fund Ratio 83
3.11 Debt Equity Ratio 84
3.12 Fixed Asset to Current Asset 85
3.13 Working Capital to Net Worth 86
3.14 Solvency Ratio 87
3.15 Fixed Asset to Net worth Ratio 88
3.16 Earning Per Shares (EPS). 89
3.17 Proprietary Ratio. 90
3.18 Profitability Ratio 91
3.19 Non Performing Assets Ratio 92
3.20 Price Earnings Ratio 93
3.21 Dividend Yield Ratio 94
3.22 Dividend Payout Ratio 95
3.23 Interests on Deposits 96
3.24 Interests on Loan 97
3.25 Interests on Investment 98
3.26 Growth trend of Net Profit 99
3.27 Comparative 5 year growth of DUCBA 100-102

7
LIST OF DIGRAMS AND CHARTS
Chart No Name of Diagrams and Charts Page No.
3.1 Growth Trend of capital/Liability position of DUCB 71-72
3.2 Growth Trend of Asset/Property position of DUCB 72-73
3.3 Per year Share of the Total Fund of Liability 74-75
3.4 Per year Share of the Total Fund of Asset 75-76
3.5 Capital Adequacy 76-77
3.6 Mixer of Bank Deposits on 2008-2013 (Share of Total fund Deposits) 77-78
3.7 Net Growth and Mixer of Bank Deposits on 2008-2013. 79-80
3.8 Short term liquidity position of DUCB 81
3.9 Working Capital 82
3.10 Fixed Assets to Proprietary Fund Ratio 83
3.11 Debt Equity Ratio 84
3.12 Fixed Asset to Current Asset 85
3.13 Working Capital to Net Worth 86
3.14 Solvency Ratio 87
3.15 Fixed Asset to Net worth Ratio 88
3.16 Earning Per Shares (EPS). 89
3.17 Proprietary Ratio. 90
3.18 Profitability Ratio 91
3.19 Non Performing Assets Ratio 92
3.20 Price Earnings Ratio 93
3.21 Dividend Yield Ratio 94
3.22 Dividend Payout Ratio 95
3.23 Interests on Deposits 96
3.24 Interests on Loan 97
3.25 Interests on Investment 98
3.26 Growth trend of Net Profit 99
8
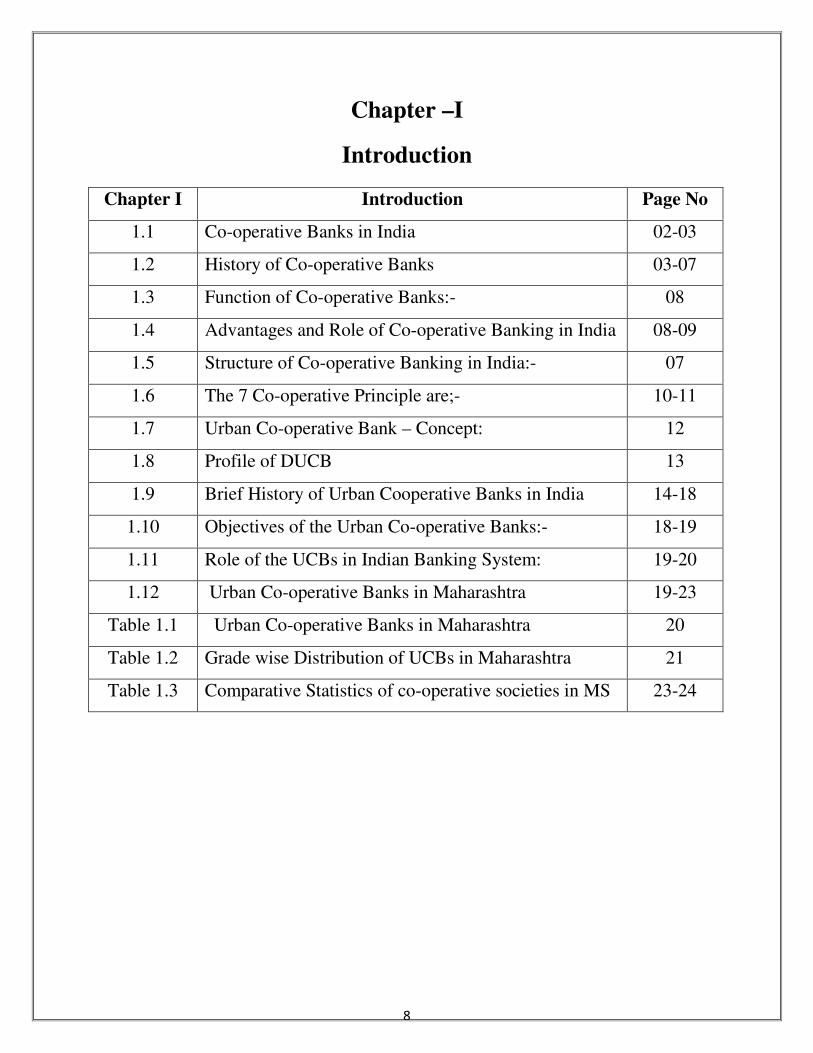
Chapter –I
Introduction
Chapter I Introduction Page No
1.1 Co-operative Banks in India 02-03
1.2 History of Co-operative Banks 03-07
1.3 Function of Co-operative Banks:- 08
1.4 Advantages and Role of Co-operative Banking in India 08-09
1.5 Structure of Co-operative Banking in India:- 07
1.6 The 7 Co-operative Principle are;- 10-11
1.7 Urban Co-operative Bank – Concept: 12
1.8 Profile of DUCB 13
1.9 Brief History of Urban Cooperative Banks in India 14-18
1.10 Objectives of the Urban Co-operative Banks:- 18-19
1.11 Role of the UCBs in Indian Banking System: 19-20
1.12 Urban Co-operative Banks in Maharashtra 19-23
Table 1.1 Urban Co-operative Banks in Maharashtra 20
Table 1.2 Grade wise Distribution of UCBs in Maharashtra 21
Table 1.3 Comparative Statistics of co-operative societies in MS 23-24
9
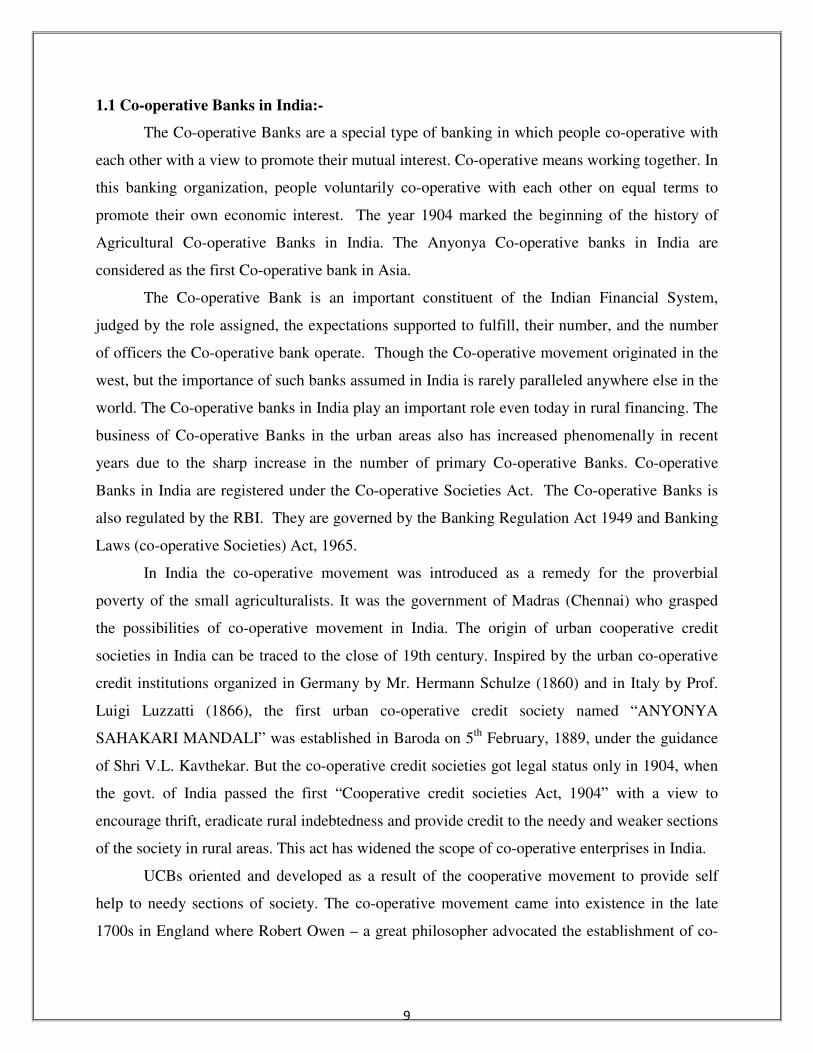
1.1 Co-operative Banks in India:-
The Co-operative Banks are a special type of banking in which people co-operative with
each other with a view to promote their mutual interest. Co-operative means working together. In
this banking organization, people voluntarily co-operative with each other on equal terms to
promote their own economic interest. The year 1904 marked the beginning of the history of
Agricultural Co-operative Banks in India. The Anyonya Co-operative banks in India are
considered as the first Co-operative bank in Asia.
The Co-operative Bank is an important constituent of the Indian Financial System,
judged by the role assigned, the expectations supported to fulfill, their number, and the number
of officers the Co-operative bank operate. Though the Co-operative movement originated in the
west, but the importance of such banks assumed in India is rarely paralleled anywhere else in the
world. The Co-operative banks in India play an important role even today in rural financing. The
business of Co-operative Banks in the urban areas also has increased phenomenally in recent
years due to the sharp increase in the number of primary Co-operative Banks. Co-operative
Banks in India are registered under the Co-operative Societies Act. The Co-operative Banks is
also regulated by the RBI. They are governed by the Banking Regulation Act 1949 and Banking
Laws (co-operative Societies) Act, 1965.
In India the co-operative movement was introduced as a remedy for the proverbial
poverty of the small agriculturalists. It was the government of Madras (Chennai) who grasped
the possibilities of co-operative movement in India. The origin of urban cooperative credit
societies in India can be traced to the close of 19th century. Inspired by the urban co-operative
credit institutions organized in Germany by Mr. Hermann Schulze (1860) and in Italy by Prof.
Luigi Luzzatti (1866), the first urban co-operative credit society named “ANYONYA
SAHAKARI MANDALI” was established in Baroda on 5th
February, 1889, under the guidance
of Shri V.L. Kavthekar. But the co-operative credit societies got legal status only in 1904, when
the govt. of India passed the first “Cooperative credit societies Act, 1904” with a view to
encourage thrift, eradicate rural indebtedness and provide credit to the needy and weaker sections
of the society in rural areas. This act has widened the scope of co-operative enterprises in India.
UCBs oriented and developed as a result of the cooperative movement to provide self
help to needy sections of society. The co-operative movement came into existence in the late
1700s in England where Robert Owen – a great philosopher advocated the establishment of co-
10
operative communities to mitigate the sufferings of the exploited class in the wake of the
industrial revolution. But the modern co-operative movement began in 1844 near Manchester,
England when 28 flannel weavers established “The Rochadale Society of Equitable Pioneers” to
increase their wages.
1.2 History of Co-operative Banks:-
Robert Owen (1771-1858) fathered the co-operation movement. A Welshman who made
his fortune in the cotton trade. Owen believed in putting his workers in a good environment with
access to education for themselves and their children. These ideas were put into effect
successfully in the cotton mills of New Lanark, Scotland. It was here that the first co-operative
store was opened. Spurred on by the success of this, he had the idea of forming “Villages of co-
operation” where workers would drag themselves out of poverty by growing their own food,
making their own clothes and ultimately becoming self – governing. He tried to form such
communities in Orbison in Scotland and in New Harmony, Indiana in the United States of
America, but both communities failed. Although, Owen inspired the co-operative movements,
others such as Dr. William King (1786 – 1865) took his ideas and made them more workable and
practical. King believed in starting small, and realized that the working classes would need to set
up cooperatives for themselves, so he saw his role as one of instruction. He founded a monthly
periodical called The Co-operator, the first edition of which appeared on May 1, 1828. This gave
a mixture of co-operative philosophy and practical advice about running a shop using co-
operative principles. King advised people not to cut themselves off from society, but rather to
form a society within a society and to start with a shop because, “We must go to shop every day
to buy food and necessaries – why then should we not go to our own shop?” He proposed
sensible rules, such as having a weekly account audit, having three trustees and not having
meetings in pubs (to avoid the temptation of drinking profits). A few poor weavers joined
together to form the Rochdale Equitable Pioneers Society at the end of 1843. The Rochdale
Pioneers, as they became know, set out the Rochdale Principles in 1844 which form the basis of
co-operative movement today.
Co-operative communities are now wide spread with one of the largest and most
successful examples being at Mondragon in Basque country of Spain. Co-operatives were also
successful in Yugoslavia under Tito where workers council gained a significant role in
management. In many European countries, co-operative institutions have a predominant market

11
share in the retail banking and insurance businesses. The Indian co-operative movement was
initiated by the government. It spread and diversified with the encouragement and support of the
government. Its present condition on is also to a great extent because of the intrusive
involvement of and interference by the government.
The history of co-operative movement in India is broadly divided into two phases.
That means co-operative movement has passed into two phases. They are-
1) Co –operative movement in pre-independence era.
2) Co-operative movement in post–independence era.
These two phases are briefly discussed below:-
i) Co-operative Movement in pre-independence era:
The pages of Indian history cite many evidences of co-operative activities from earliest
times. However, the first recorded activity began in 1904 when this movement was officially set
up by the British Government. Before that in the year 1892, Derrick Nicholson, tried to find out
ways and means to establish institutions so as to help the agricultural sector. He gave the
suggestions for setting of co-operative societies. Within that decade, India faced a terrible famine
in 1899.
The Government appointed the Second Famine Commission 1901 to suggest measures
for the victims. The commission recommended for a number of development activities and
setting up of new institution. The most important among them was the strong recommendation
for organisation of co-operative societies. The Government had accepted many of the
recommendations and in 1904 “co operative societies Act” were passed. The aim was to help the
rural farmers and artisans by providing short term and long term loans.
These credit societies were organised on the basis of two models, one for rural area and
other for urban area. For the former these were organised on Reinfusion Model while for the
latter it was Schulze Delitzsch Bank Model. Due to this Act a number of Co-operative Societies
grew up in rural area, but they could not function effectively. The major defects were.
i) There was no provision for setting up of Non credit Co-operative Societies in rural area.

12
ii) No special Central agency was created for financing and supervising the activities of
these societies.
iii) The division of the Credit Co-operative Societies into two types rural and urban stood as
a barrier since no specific arrangements could be done for either due to the overlapping
nature of such classification.
The year 1928 saw a worldwide economic depression. The prices of agricultural
commodities fell down to a great extent and unemployment along with other economic crisis
grew up. The creditors had no way to repay the loan. This brought many co-operative societies in
to a standstill position.
In year 1933, the Reserve Bank of India was set up. The bank took some initiative to
recognise the co-operative movement. It had a separate department for a co-operative credit. It
helped to keep the movement alive which was gradually decaying.
In 1937, the popular Congress Government came to power in several states. The popular
leaders took much more initiative in organising and extending this movement. But much
progress could not do due to outbreak of Second World War. During this time, the ministry
resigned. It was left in the hands of British Government again. But the war itself gave a boost to
co-operative societies. The war brought a sudden increase in the prices of agricultural products
and other food grains.
The rural farmer got extra economic gains. Non credit societies grew up. The working
capital of co-operative societies also increased. The number of different credit and non credit co-
operatives increased rapidly. The co-operative movement gathered momentum. The all India Co-
operative planning Committee in 1945 also worked al lot in this direction.
ii) Co-operative movement in Post independence Era:
After independence for the first 3 years i.e. up to no significant development could be
made. It was mainly due to the problem created by partition and absence of concrete programme
for national re-organisation. However, the leaders of free India could the importance of co-
operative movement for a successful democracy importance was given to strengthen co-

13
operative structure of country and various provisions were made through different Five Year
Plan.
The co-operative movement completed its 50 years dump the first plan. The Golden
Jubilee was celebrated throughout the country with much excitement. This made the people feel
the importance of such a movement. Attention was given to utilise the credit in productive
activities.
The First Plan also recommended for training of personnel's and setting up of Co-
operative Marketing Societies.
The Second Plan laid down proposals for extending co operative activity into various
fields. It gave special emphasis on the warehousing co operatives at the State and Central level.
The Third Plan brought still new areas under Co operative societies. The co operative
society for sugarcane, cotton, spinning, milk supply was proposed. Some concrete steps were
taken to train the personnel's. The co operative training College at Pune and many regional
centres were established to train the workers.
The Fourth Plan emphasised for consolidation of co-operative system. The new
programme for high yielding crops was started. Different credit societies were organised to serve
these programmes.
The Fifth Plan made special provisions for improvement of Central Banks and no viable
primary agricultural societies, re-organising marketing as well as consumer societies. It also
recommended for establishment of Farmer’s Service Societies.
The Sixth Plan laid down a point programme for co-operative societies. It aimed at
transforming the primary village societies to multipurpose societies.
i) To reconstruct the policies and of co-operative so that it can bring about economic
development of people.
ii) To extend co-operative activities to the fields of food processing, poultry farming, dairy
farming, fishery and many other related fields.

14
iii) To give necessary training and guidance for developing skilled the efficient personnel's.
The Seventh Plan has also given more importance on the growth and expansion of co
operative societies to ensure public participation to achieve its main objective i.e. the movement
towards social justice has to be faster and there must be a sharper focus on employment and
poverty alleviation.
1.3 Functions of Co-operative Banks:-
Co-operative Banks basis functions is to provide credit facility to the farmers, artisans,
workers engaged in cottage and small scale industries and other such areas going on in the rural
areas. Cooperative banks also perform the basic function of banking but they differ from
commercial Banks in the following aspects.
1. Commercial Banks are joint stock companies under the company’s act of 1956 or public
sector banks under a separate act of a parliament whenever as co-operative banks were
establishment under the co-operative society’s acts of different states.
2. Commercial Banks structural is branch banking structure whereas co-operative Banks
have a there tier setup, with state co-operative banks at apex level, central District
cooperative banks at district level and primary cooperative Societies at rural level.
3. Only some of the sections of banking regulation act of 1949, are applicable to co-
operative Banks, regulating only in partial control by RBI of Cooperative Banks.
4. Cooperative banks functions on the principle of co-operative and not entirely on
commercial parameters.
5. Cooperative banks in India finance the rural areas under.
- Farming, Cattle, Milk, Hat chery, Personal Finance, Cooperative banks in India finance the
urban areas under, Self employment, Small scale units, and consumer finance.

15
1.4 Advantages or Role of Co-operative Banking in India:-
1. Co-operative Banks give loans to the farmers and artisans at low rate of interest who are
thus saved of the exploitation by the Mahajans. Loans are available only for productive
purposes. Wasteful expenditure is, therefore, avoided.
2. Co-operative Banks give loans to the farmers to buy good seeds, fertilisers and cattle.
These banks also help in the consolidation of land holdings and removal of irrigation and
transport constraints. As a result, agricultural production tends to increase.
3. As a result of co-operative baking income of the farmers has tended to rise, as also their
standards of living in India, co-operative Banks are required to spend 10% of their profit
on rural development. Co-operative Banks thus are an important force behind the rural
up liftmen.
4. Co-operative Banking encourages thrift. Also, small savings of the people are gainfully
used by this.
1.5 Structure of Co-operative Banking in India:-
The Co-operative Banking structure in India is divided into following main 5 Categories.
- Primary Agricultural Credit Societies.
- District Central Co-operative Banks
- State Co-operative Banks or Apex Banks.
- Land Development Banks or State Co-operative Agricultural and Rural.
- Primary Urban Co-operative Banks.
Co-operative banks function on the basis of 'no-profit no-loss'. Co-operative banks, as a
principle, do not pursue the goal of profit maximization. Therefore, these banks do not focus on

16
offering more than the basic banking services. So, co-operative banks finance small borrowers in
industrial and trade sectors, besides professional and salary classes.
• Some cooperative banks in India are more forward than many of the state and private
sector banks.
• According to NAFCUB (National Federation of Urban Co-operative Banks and Credit
Societies Ltd), the total deposits and lending of cooperative banks in India is much more
than old private sector banks and also some new public sector banks.
• This exponential growth of co-operative banks in India is attributed mainly to their much
better local reach, personal interaction with customers, and their ability to catch the
nerve of the local clientele.
Although they are not better than private banks in terms of facilities provided, their interest
rates are definitely competitive. For example, the interest rates on auto loans are anywhere less
than 5%-7% than that offered by private banks.
However, unlike private banks, the documentation process is lengthy if not stringent and
getting a loan approved quickly is rather difficult. The criteria for getting a loan from a UCB are
less stringent than for a loan from a commercial bank. For instance, when taking an education
loan, it does not matter whether the course you are going for is recognized or not.
So, it makes better sense to bank with UCBs today, what with the rates some offer being the
best in the industry. And with the risk of a run minimized, they are almost on an equal footing
with commercial banks when it comes to vying for your attention. However, to get a loan, you
have to be a member of the SCB: own its shares worth at least 2.5 per cent of the loan amount, or
a maximum of Rs. 25,000. This amount earns a return of 12-20 per cent.
According to the International Co-operative Alliance Statement of co-operative identity, a
co-operative is an autonomous association of persons united voluntarily to meet their common
economic, social, and cultural needs and aspirations through a jointly-owned and democratically-
controlled enterprise. Co-operatives are based on the values of self-help, self-responsibility,
democracy, equality, equity and solidarity. In the tradition of their founders, co-operative

17
members believe in the ethical values of honesty, openness, social responsibility and caring for
others.
1.6 The 7 co-operative principles are:
1. Voluntary and open membership
2. Democratic member control
3. Member economic participation
4. Autonomy and independence
5. Education, training and information
6. Co-operation among Co-operatives
7. Concern for Community
A co-operative bank is a financial entity which belongs to its members, who are at the
same time the owners and the customers of their bank. Co-operative banks are often created by
persons belonging to the same local or professional community or sharing a common interest.
Co-operative banks generally provide their members with a wide range of banking and financial
services (loans, deposits, banking accounts...).
Co-operative banks differ from stockholder banks by their organization, their goals, their
values and their governance. In most countries, they are supervised and controlled by banking
authorities and have to respect prudential banking regulations, which put them at a level playing
field with stockholder banks. Depending on countries, this control and supervision can be
implemented directly by state entities or delegated to a co-operative federation or central body.
Even if their organizational rules can vary according to their respective national legislations,
Co-operative banks share common features:
Customer's owned entities: in a co-operative bank, the needs of the customers meet the
needs of the owners, as co-operative bank members are both. As a consequence, the first aim of a

18
Co-operative bank is not to maximize profit but to provide the best possible products and
services to its members. Some co-operative banks only operate with their members but most of
them also admit non-member clients to benefit from their banking and financial services.
Democratic member control: co-operative banks are owned and controlled by their
members, who democratically elect the board of directors. Members usually have equal voting
rights, according to the co-operative principle of "one person, one vote".
Profile allocation: in a co-operative bank, a significant part of the yearly profit, benefits
or surplus is usually allocated to constitute reserves. A part of this profit can also be distributed
to the co-operative members, with legal or statutory limitations in most cases. Profit is usually
allocated to members either through a patronage dividend, which is related to the use of the co-
operatives products and services by each member, or through an interest or a dividend, which is
related to the number of shares subscribed by each member.
Co-operative banks are deeply rooted inside local areas and communities. They are
involved in local development and contribute to the sustainable development of their
communities, as their members and management board usually belong to the communities in
which they exercise their activities. By increasing banking access in areas or markets where
other banks are less present - SMEs, farmers in rural areas, middle or low income households in
urban areas - co-operative banks reduce banking exclusion and foster the economic ability of
millions of people. They play an influential role on the economic growth in the countries in
which they work in and increase the efficiency of the international financial system. Their
specific form of enterprise, relying on the above-mentioned principles of organization, has
proven successful both in developed and developing countries.
A word of caution: Only approach those co-operative banks which have a good history.
Since, a lot of co-operative banks have political interests, providing social help is not one of their
priorities sometime.

19
1.7 Urban Co-operative Bank – CONCEPT:
As the name suggests, a bank operating in urban areas on the basis of co-operative
principles is known as Urban Co-operative Bank. There was no well defined concept of an Urban
Co-operative Bank before 1939. Initially UCBs were organized as credit societies in India and
later converted into Urban Banks. It was the Mehta Bhansali Committee (1939) which made the
first attempt to define an Urban Co-operative Bank. Subsequently in 1966, when banking laws
were made applicable to co-operative banks, provision of section 5 [CCV] of Banking
Regulation Act 1949 [As applicable to cooperative societies (AACS)] defined an Urban Co-
operative Bank as a Primary Cooperative
Bank other than a Primary Agricultural Credit Society –
1. The primary objective or principal business of which is the transaction of banking
business,
2. The paid up share capital and reserves of which are not less than one lakh rupees,
3. The by – laws of which do not permit admission of any other co-operative society as a
member.
Provided that this sub – clause shall not apply to the admission of a co-operative
bank as a member by reason of such a Co-operative Bank subscribing to the share capital of such
Co-operative society out of fund provided by the State Government for the purpose.
In short, UCBs are Primary Co-operative Banks organized on Co-operative basis,
operating in metropolitan, urban and semi – urban areas to cater the needs of specific types or
groups of members pertaining to certain class of community, small scale industrial units, trade,
professions, etc. They are of two types: a unit banking type and branch banking type.
Besides providing main banking service to their customers, they also provide various
other banking and subsidiary services to their customers and have developed a nice market for
them to survive.

20
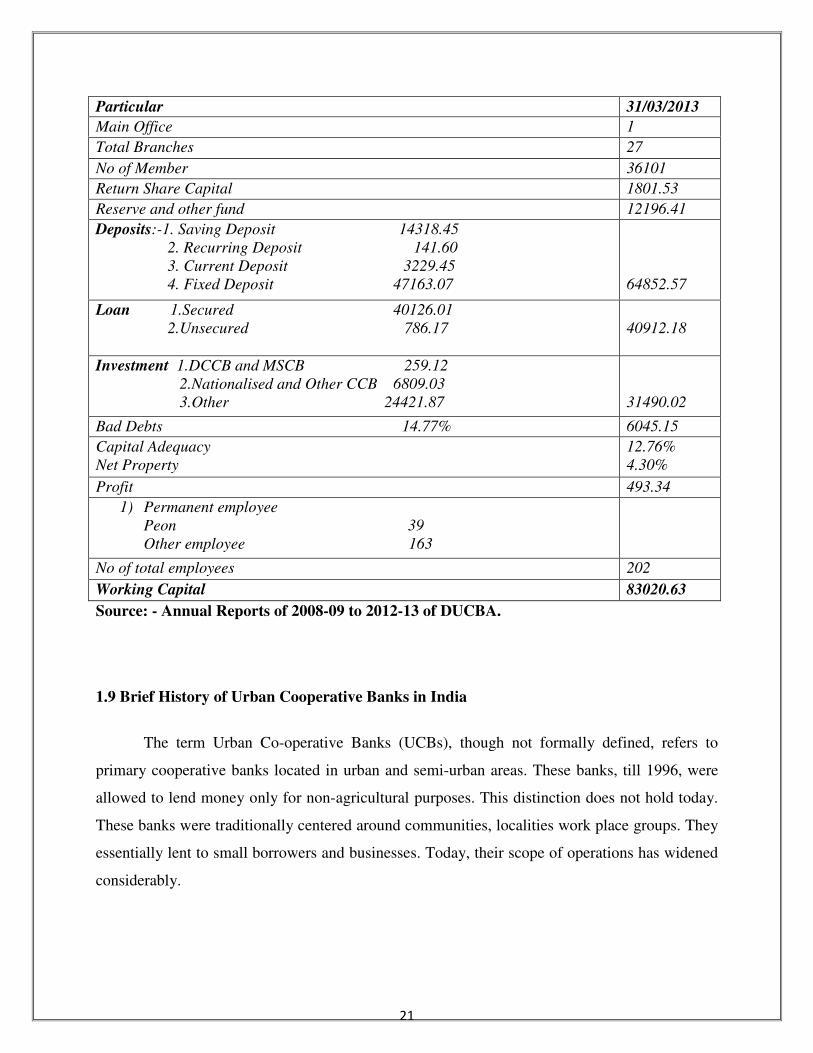
1.8 Profile of Devgiri Urban Co-operative Bank Ltd. Aurangabad
Name of Bank :- Devgiri Urban Cooperative Bank Ltd. Aurangabad
Address :- Earth Complex, Kesarsinghpura, Adalat
Road, Aurangabad-431 001.
Registration No :- AGD/BNK/215/84,
And Date 24/01/1984.
Permission of RBI :- UBD/BNK/312/p,
No and Date 18/05/1984.
Area :- Whole Maharashtra state (In Lakh)
21
Source: - Annual Reports of 2008-09 to 2012-13 of DUCBA.
1.9 Brief History of Urban Cooperative Banks in India
The term Urban Co-operative Banks (UCBs), though not formally defined, refers to
primary cooperative banks located in urban and semi-urban areas. These banks, till 1996, were
allowed to lend money only for non-agricultural purposes. This distinction does not hold today.
These banks were traditionally centered around communities, localities work place groups. They
essentially lent to small borrowers and businesses. Today, their scope of operations has widened
considerably.
Particular 31/03/2013
Main Office 1
Total Branches 27
No of Member 36101
Return Share Capital 1801.53
Reserve and other fund 12196.41
Deposits:-1. Saving Deposit 14318.45
2. Recurring Deposit 141.60
3. Current Deposit 3229.45
4. Fixed Deposit 47163.07
64852.57
Loan 1.Secured 40126.01
2.Unsecured 786.17
40912.18
Investment 1.DCCB and MSCB 259.12
2.Nationalised and Other CCB 6809.03
3.Other 24421.87
31490.02
Bad Debts 14.77% 6045.15
Capital Adequacy
Net Property
12.76%
4.30%
Profit 493.34
1) Permanent employee
Peon 39
Other employee 163
No of total employees 202
Working Capital 83020.63

22
The origins of the urban cooperative banking movement in India can be traced to the
close of nineteenth century when, inspired by the success of the experiments related to the
cooperative movement in Britain and the cooperative credit movement in Germany such
societies were set up in India. Cooperative societies are based on the principles of cooperation, -
mutual help, democratic decision making and open membership. Cooperatives represented a new
and alternative approach to organization as against proprietary firms, partnership firms and joint
stock companies which represent the dominant form of commercial organization.
The Beginnings
The first known mutual aid society in India was probably the ‘Anyonya Sahakari
Mandali’ organized in the erstwhile princely State of Baroda in 1889 under the guidance of
Vithal Laxman also known as Bhausaheb Kavthekar. Urban co-operative credit societies, in their
formative phase came to be organized on a community basis to meet the consumption oriented
credit needs of their members. Salary earners’ societies inculcating habits of thrift and self help
played a significant role in popularizing the movement, especially amongst the middle class as
well as organized labour. From its origins then to today, the thrust of UCBs, historically, has
been to mobilize savings from the middle and low income urban groups and purvey credit to
their members - many of which belonged to weaker sections.
The enactment of Cooperative Credit Societies Act, 1904, however, gave the real impetus
to the movement. The first urban cooperative credit society was registered in Canjeevaram
(Kanjivaram) in the erstwhile Madras province in October, 1904. Amongst the prominent credit
societies were the Pioneer Urban in Bombay (November 11, 1905), the No.1 Military Accounts
Mutual Help Co-operative
Credit Society in Poona (January 9, 1906). Cosmos in Poona (January 18, 1906), Gokak
Urban (February 15, 1906) and Belgaum Pioneer (February 23, 1906) in the Belgaum district,
the Kanakavli-Math Co-operative Credit Society and the Varavade Weavers’ Urban Credit
Society (March 13, 1906) in the South Ratnagiri (now Sindhudurg) district. The most prominent
amongst the early credit societies was the Bombay Urban Co-operative Credit Society,
sponsored by Vithaldas Thackersey and Lallubhai Samaldas established on January 23, 1906.

23
The Cooperative Credit Societies Act, 1904 was amended in 1912, with a view to broad
basing it to enable organization of non-credit societies. The Maclagan Committee of 1915 was
appointed to review their performance and suggest measures for strengthening them. The
committee observed that such institutions were eminently suited to cater to the needs of the
lower and middle income strata of society and would inculcate the principles of banking amongst
the middle classes. The committee also felt that the urban cooperative credit movement was
more viable than agricultural credit societies. The recommendations of the Committee went a
long way in establishing the urban cooperative credit movement in its own right.
In the present day context, it is of interest to recall that during the banking crisis of 1913-
14, when no fewer than 57 joint stock banks collapsed, there was a there was a flight of deposits
from joint stock banks to cooperative urban banks. Maclagan Committee chronicled this event
thus:
“As a matter of fact, the crisis had a contrary effect, and in most provinces, there was a
movement to withdraw deposits from non-cooperatives and place them in cooperative
institutions, the distinction between two classes of security being well appreciated and a
preference being given to the latter owing partly to the local character and publicity of
cooperative institutions but mainly, we think, to the connection of Government with Cooperative
movement”.
Under State Purview
The constitutional reforms which led to the passing of the Government of India Act in
1919 transferred the subject of “Cooperation” from Government of India to the Provincial
Governments. The Government of Bombay passed the first State Cooperative Societies Act in
1925 “which not only gave the movement its size and shape but was a pace setter of cooperative
activities and stressed the basic concept of thrift, self help and mutual aid.” Other States
followed. This marked the beginning of the second phase in the history of Cooperative Credit
Institutions.

24
There was the general realization that urban banks have an important role to play in
economic construction. This was asserted by a host of committees. The Indian Central Banking
Enquiry Committee (1931) felt that urban banks have a duty to help the small business and
middle class people. The Mehta-Bhansali Committee (1939), recommended that those societies
which had fulfilled the criteria of banking should be allowed to work as banks and recommended
an Association for these banks. The Co-operative Planning Committee (1946) went on record to
say that urban banks have been the best agencies for small people in whom Joint stock banks are
not generally interested. The Rural Banking Enquiry Committee (1950), impressed by the low
cost of establishment and operations recommended the establishment of such banks even in
places smaller than taluka towns.
The first study of Urban Co-operative Banks was taken up by RBI in the year 1958-59.
The Report published in 1961 acknowledged the widespread and financially sound framework of
urban co-operative banks; emphasized the need to establish primary urban cooperative banks in
new centers and suggested that State Governments lend active support to their development. In
1963, Varde Committee recommended that such banks should be organized at all Urban Centers
with a population of 1 lakh or more and not by any single community or caste. The committee
introduced the concept of minimum capital requirement and the criteria of population for
defining the urban centre where UCBs were incorporated.
Duality of Control
However, concerns regarding the professionalism of urban cooperative banks gave rise to
the view that they should be better regulated. Large cooperative banks with paid-up share capital
and reserves of Rs.1 lakh were brought under the perview of the Banking Regulation Act 1949
with effect from 1st March, 1966 and within the ambit of the Reserve Bank’s supervision. This
marked the beginning of an era of duality of control over these banks. Banking related functions
(viz. licensing, area of operations, interest rates etc.) were to be governed by RBI and
registration, management, audit and liquidation, etc. governed by State Governments as per the

25
provisions of respective State Acts. In 1968, UCBS were extended the benefits of Deposit
Insurance.
Towards the late 1960s there was much debate regarding the promotion of the small scale
industries. UCBs came to be seen as important players in this context. The Working Group on
Industrial Financing through Co-operative Banks, (1968 known as Damry Group) attempted to
broaden the scope of activities of urban co-operative banks by recommending that these banks
should finance the small and cottage industries. This was reiterated by the Banking Commissions
(1969).
The Madhavdas Committee (1979) evaluated the role played by urban co-operative banks
in greater details and drew a roadmap for their future role recommending support from RBI and
Government in the establishment of such banks in backward areas and prescribing viability
standards.
The Hate Working Group (1981) desired better utilization of banks' surplus funds and
that the percentage of the Cash Reserve Ratio (CRR) & the Statutory Liquidity Ratio (SLR) of
these banks should be brought at par with commercial banks, in a phased manner. While the
Marathe Committee (1992) redefined the viability norms and ushered in the era of liberalization,
the Madhava Rao Committee (1999) focused on consolidation, control of sickness, better
professional standards in urban co-operative banks and sought to align the urban banking
movement with commercial banks.
A feature of the urban banking movement has been its heterogeneous character and its
uneven geographical spread with most banks concentrated in the states of Gujarat, Karnataka,
Maharashtra, and Tamil Nadu. While most banks are unit banks without any branch network,
some of the large banks have established their presence in many states when at their behest
multi-state banking was allowed in 1985. Some of these banks are also Authorized Dealers in
Foreign Exchange
Recent Developments

26
Over the years, primary (urban) cooperative banks have registered a significant growth in
number, size and volume of business handled. As on 31st March, 2003 there were 2,104 UCBs
of which 56 were scheduled banks. About 79 percent of these are located in five states, - Andhra
Pradesh, Gujarat, Karnataka, Maharashtra and Tamil Nadu. Recently the problems faced by a
few large UCBs have highlighted some of the difficulties these banks face and policy endeavors’
are geared to consolidating and strengthening this sector and improving governance.
1645 Urban Cooperative Bank with more than 8150 branches across India. The aggregate
deposit exceeded Rs. 2.00 lakh crores.
Source: Adapted from a paper by O.P. Sharma, formerly of the History Cell.
1.10 Objectives of the Urban Co-operative Banks:-
The UCBs are generally considered as “Small People’s Bank” and they are organized for
promoting thrift and co-operation among the lower and middle strata of the society. The
objectives of the UCBs are summarized in two categories, which are as follow:
[A] Principal objectives:
(i) To promote thrift, self help and mutual co-operation among the members,
(ii) To mobilize resources i.e. to borrow funds form members and non members to utilize for
giving loans to their members,
(iii) To provide credit to the members at reasonable rates for productive purposes,
(iv) To undertake collection of bills drawn, cheques, drafts, etc. accepted or endorsed by
members and approved constituents, to remit funds and to discount cheques and bills of
approved members subject to rules and by laws on their behalf,
(v) To arrange for safe custody of valuables and documents of members and constituents,
and
(vi) To provide all other banking and subsidiary services.
[B] Subsidiary Objectives:
(i) To give possible help and necessary guidance to traders, artisans etc. who are members of
the bank,

27
(ii) To do every kind of trust and agency business and particularly do the work of investment
of funds, sale of properties and of recovery and acceptance of money,
(iii) To undertake every kind of banking and sharaffi business and also give bank guarantee
and letters of credit on behalf of members.
1.11 Role of the UCBs in Indian Banking System:
The performance of the co-operative banking sector as a whole has attracted considerable
attention in recent years. Today they have become an important constituent of the Indian
financial system and cover a large segment of society because of their “PROMPT,
PERSONALIZED AND COURTEOUS SERVICE”. They take the responsibility of covering the
unmonitored sector neglected by commercial banks and are called “purveyors of credit to small
and medium enterprises”. They provide service with no bars of castes, creed, religion, language,
etc. and thus spread the feeling of “Unity in Diversity”. Some UCBs operate beyond their state of
registration and are governed by the Multi State Co-operative Societies Act, 1984. In addition to
their traditional retail banking business, some have also taken up diversified activities like stock
investment scheme, opening and maintenance of nonresident and ordinary rupee accounts,
merchant banking etc. They owe responsibility not only towards customers but also towards
employees and society.
Primary (Urban) co-operative banks play an important role in meeting the growing credit
needs of urban and semi – urban areas. UCBs mobilize savings from the middle and lower
income groups and purvey credit to small borrowers, including weaker sections of the society.
The number of UCBs stood at 1872 at the end of March 2005, including 79 salary earners banks
and 119 Mahila banks. Total no. of scheduled UCBs was 55 at the end of March 2005.
Scheduled UCBs are under closer regulatory and supervisory framework of the Reserve Bank.
Various entities in the urban co-operative banking sector display a high degree of
heterogeneity in terms of deposits / assets base, areas of operation and nature of business. In
view of its importance, it is imperative that the sector emerges as a sound and healthy network of
jointly owned, democratically controlled and professionally managed institutions. In order to
achieve these objectives, the Reserve Bank took a series of policy initiatives in 2004-05. The
most significant initiative in this regard the vision Document and Medium Term Frame work
(MTF) for UCBs. With a view to protecting depositors interest and avoid contagion on the one
hand, and enabling UCBs to provide useful service to local communities and public at large on

28
the other, a draft vision document was prepared and placed in public domain for eliciting
comments. Based on the feedback received from different quarters, the necessary modifications
were carried out in the vision documents to involve as the medium – term frame work for the
sector.
1.12 Urban Co-Operative Banks in Maharashtra:-
Urban Co-Operative banks are an important part of the financial system in Maharashtra.
Despite of being a Bank registered under the Banking Regulation Act 1949, these institutions are
necessarily " the Co-Operative societies and are registered under the Maharashtra Co-Operative
Societies Act 1960." The Co-Operative Banks were established over 100 years ago and were
brought under the purview of Reserve Bank of India, by amending the Banking Regulation Act
1949 vide the amendment in the year 1966. Role of Maharashtra in Urban Co-Operative
Banking sector.
Table 1.1 Urban Co-operative Banks in Maharashtra as on (Rs in Crores)
Source: - maharashtra.gov.in
Note: - Figure in brackets indicates percentage to all India total.
Reserve Bank of India conducts regular inspection of UCBs. They have developed
gradation system for UCBs whereby banks are classified into 4 grades on the basis of CRAR,
Profit/Loss & N.P.A.s. Gradation of UCBs in Maharashtra is as follows :-
Table 1.2 Grade wise Distribution of UCBs in Maharashtra
Grade 31/3/200 8 31/3/20 09 31/3/2010 31/3/2011
Grade I 200 255 274 301
Grade II 190 139 128 105
31/3/2011 India Maharashtra Percentage
Urban Co-Operative Banks (Nos) 1645 539 32.77%
Scheduled banks (Nos) 53 38 71.70%
Non scheduled banks (Nos) 1592 501 31.47%
Multistate banks (Nos) 42 23 54.76%
Share Capital (Rs) 6267 2700 43.08%
Own funds (Rs) 26260 12200 46.46%
Deposits (Rs) 212031 138124 64.14%
Advances (Rs) 136341 90260 66.20%

29
Grade III 99 101 87 78
Grade IV 114 82 64 55
Total
603
577
553
539
Source: - maharashtra.gov.in
Reserve Bank of India impose directions like restriction on declaration of dividend,
reduction of exposure limit etc. for the grade III & grade IV banks.
It needs to strengthen these banks. In March 2005, the Reserve Bank prepared a draft
Vision document for UCBs which, inter alia, discussed the problems of the sector and
highlighted the issue of dual regulatory mechanism which restricted the ability of the
Reserve Bank in handling the weaknesses of entities in the sector. In order to address the
problem of dual control, Vision document proposed the adoption of a consultative
approach for deciding the future set up of weak and sick banks in State.
Objectives:-
1. To rationalize the existing regulatory and supervisory approach keeping in view the
heterogeneous character of entities in the sector.
2. To facilitate focused and continuous system of supervision through enhanced use of
technology.
3. To enhance professionalism and improve the quality of governance in UCBs by
providing training for skill up-gradation as also by including large depositors in the
decision making process / management of banks.
4. To put in place a mechanism that addresses the problems of dual control, given the
present legal framework, and the time consuming process in bringing requisite legislative
changes.
5. To put in place a consultative arrangement for identifying weak but potentially viable
entities in the sector and provide a framework for their being nurtured back to health
including, if necessary, through a process of consolidation.
6. To identify the unviable entities in the sector and provide an exit path for such entities.

30
In terms of the Vision document, the Reserve Bank and the State Government have signed MOU
on 13/12/2006 to ensure greater convergence of approach of the two agencies entrusted with the
regulation and supervision of UCBs. As part of the MOU, it was decided to set up State level
Task Force for Co-operative Urban Banks (TAFCUB) comprising representatives of the Reserve
Bank, State Government and federation/association of UCBs.
The TAFCUB was entrusted.
1) To identify and draw a time bound action plan for the revival of potentially viable Urban
Co-Operative banks and non disruptive exit for non viable UCBs.
2) To facilitate human resource development and IT initiatives in UCBs.
Since 4th January 2007, aprox. 10 to 12 banks were discussed in each meeting. In these
TAFCUB meetings approximately 400 Urban coop. Banks were discussed. After taking detailed
review of these banks, necessary suggestions / directions were issued such as Liquidation,
Appointment of Administrator & exploration for Merger etc.
41 weak Co-Operative banks were merged into financially sound Co-Operative banks thereby
deposits of Approx.3100 crores were secured.
96 banks are taken into liquidation of which depositors of 84 banks are given their deposits back
through insurance claims. In case of remaining banks the preparation of claims are in progress.
Co-Operative banking in India has made substantial progress in dissemination of banking
services based on Co-Operative principles. In view of the special thrust on financial inclusion,
Co-Operative banking has acquired renewed significance in the Indian financial system. The
focus of the recent policy measures, therefore, has once again shifted to the strengthening of Co-
operative banking in India.
Table 1.3 Comparative Statistics of Co-operative Societies in Maharashtra (Rs in Crores)
Particular 2006-07 2007-08 2008-09 2009-10 2010-11
No. Of Societies 200740
-
205553
(02.39%)
212344
(03.30%)
218320
(02.81%)
244306
(11.90%)
No. of Members(Lakh) 476 505 517 542 539

31
- (06.09%) (02.37%) (04.83%) (-0.56%)
Share Capital 12565
-
12809
(01.94%)
14969
(16.86%)
15015
(00.30%)
20543
(36.82%)
Deposits 99792
-
104162
(04.37%)
118024
(13.31%)
128579
(08.94%)
132490
(03.04%)
Working Capital 202207
-
205110
(01.44%)
236401
(15.26%)
246162
(04.13%)
244834
(-0.56%)
Loan & Advances(Net) 82450
-
88166
(06.93%)
82556
(-6.37%)
78190
(-5.29%)
100681
(28.76%)
Sty’s In Profit
i. Number
ii. Profit (Amt)
62880
-
2067
-
63147
(00.42%)
2135
(03.29%)
67950
(07.61%)
2787
(30.54%)
68021
(00.10%)
7212
(158.77%)
70363
(03.44%)
3661
(-49.24%)
Sty In Loss
i. Number
ii. Loss(Amt)
51575
-
3361
-
55257
(07.14%)
4051
(20.53%)
58387
(05.67%)
3558
(-12.17%)
60215
(03.13%)
3569
(00.30%)
59636
(-0.97%)
4526
(26.81%)
Source: - co-operative movement at a Glance in Maharashtra, various issues.
Note: - 1. Figure in the brackets shows the percentage growth over the previous year.
2. The year 2006-07 is an assumed as base year.
The above table 1 shows the comparative statistics of the co-operatives in the state of
Maharashtra during last five years have growth remarkable. The number of societies stood at
2,05,553 in 2007-08, and increased position 2,44,306 in 2010-11, the growth in number of co-
operative was 02.39% to 11.90 % respectively during the over the previous year. Working
capital shown progress in amount as it was Rs. 2,05,110 crores in 2007-08, increased put Rs.
2,44,834 crores in 2010-11, but growth percentage showed decreased 1.44% to -0.56%
respectively during over the previous year. Net advanced by co-operatives showed little progress
Rs. 88,166 crores 2007-08 increased Rs. 1,00,681 crores in 2010-11, there was positive growth
6.93% in 2007-08, increased 28.76% in 2010-11. Number of cooperatives in profit increased
from 62,147 in 2007-08 to increase Rs. 70,363 in 2010-11, amount of profit was Rs. 2,135 crores

32
in 2007-08 increased put Rs. 3,661 crores in 2010-11, shows positive progress 0.42% to 3.44%.
Number of societies in loss increased from 55,257 in 2007-08 to increase 59,636 in 2010-11,
percentage of societies in loss decreased by 7.14% in 2006-07 to -0.97 % in 2010-11. However
the amount of loss increased from Rs. 4,051 crores in 2007-08 to Rs. 4,526 crores in 2010-11,
but the percentage increased from 20.53% in 2007-08 to 26.81 % in 2010-11, shows a good sign.
References:-
1. Upendra Rai (2011):-“Banking Awareness”, Arihant publications (India)
Limited, ISBN-978-81-8348-908-9.
2. Dr.K.V.S.N, Jawahar Babu, B.Muniraja Selkhar,(2012):-“ The Emerging Urban Co-
Operative Banks (Ucbs) In India”, IOSR Journal of Business and Management
(IOSRJBM)ISSN: 2278-487X Volume 2, Issue 5 (July-Aug. 2012), PP 01-05.
3. www.rbi.org.in
4. B. D. Patil (2013): “Growth and Progress of Co-Operative Movement In
Maharashtra”, Online International Interdisciplinary Research Journal, ISSN2249-9598,
Volume-III, Issue-VI, Nov-Dec2013
Chapter -II

33
Research Methodology and Literature Review
(A) Research Methodology:-
Chapter II Research Methodology and Literature Review
Page No
A 2.1 Meaning of Research 26
2.2 Objective Of Study 27
2.3 Period of the Study 27
2.4 Data Collection 27-28
2.5 Scope of the Study 28
2.6 Concept of Performance Evaluation 28-29
2.7 Concept of Financial Statement 29-30
2.58 Balance Sheet 30-31
2.9 Income Statement 31-32
2.10 Statement of Retaining Earning 32
2.11 Statement of Sources and Uses of Funds 32
2.12 The Concept of Financial Analysis 32-33
2.13 Significance of Financial Analysis 33
2.14 Comparative Financial Statement Analysis 33
2.15 Trend Analysis 34
2.16 Ratio Analysis 34-41
2.17 Fund Flow Analysis 41-42
B Literature Review 43-68

34
2.1 MEANING OF RESEARCH
Research in common parlance refers to a search for knowledge. Once can also define research as
a scientific and systematic search for pertinent information on a specific topic. In fact, research is
an art of scientific investigation. The Advanced Learner’s Dictionary of Current English lays
down the meaning of research as “a careful investigation or inquiry specially through search for
new facts in any branch of knowledge.”1 Redman and Mory define research as a “systematized
effort to gain new knowledge.”2 Some people consider research as a movement, a movement
from the known to the unknown. It is actually a voyage of discovery. We all possess the vital
instinct of inquisitiveness for, when the unknown confronts us, we wonder and our
inquisitiveness makes us probe and attain full and fuller understanding of the unknown. This
inquisitiveness is the mother of all knowledge and the method, which man employs for obtaining
the knowledge of whatever the unknown, can be termed as research.
Research is an academic activity and as such the term should be used in a technical sense.
According to Clifford Woody research comprises defining and redefining problems, formulating
hypothesis or suggested solutions; collecting, organizing and evaluating data; making deductions
and reaching conclusions; and at last carefully testing the conclusions to determine whether they
fit the formulating hypothesis. D. Slazenger and M. Stephenson in the Encyclopedia of Social
Sciences define research as “the manipulation of things, concepts or symbols for the purpose of
generalizing to extend, correct or verify knowledge, whether that knowledge aids in construction
of theory or in the practice of an art.”3 Research is, thus, an original contribution to the existing
stock of knowledge making for its advancement. It is the pursuits of truth with the help of study,
observation, comparison and experiment. In short, the search for knowledge through objective
and systematic method of finding solution to a problem is research. The systematic approach
concerning generalization and the formulation of a theory is also research. As such the term
‘research’ refers to the systematic method.
2.2 Objectives of the Study

35
To examine the profitability and operating efficiency regarding saving and advances of the
Urban Co-operative Banks.
1. To review the progress of UCBs in Maharashtra.
2. To study the financial position of DUCBA.
3. To study the growth trend of DUCBA.
4. To study the advancing patterns in the DUCBA.
5. To make suggestions for improving profitability.
2.3 Period of Study: -
The present study covers the span of five year i.e. from 2009- 2013 this period of selected
for study because the complete data for the entire period is available. This period is considered
adequate to study trends and conclusions.
2.4 DATA COLLECTION:-
In order to complete the research study data has been collected through the annual report of the
Devgiri Urban Cooperative Bank Ltd Aurangabad.
I) Primary Data:-
Primary Data collected by the Annual Reports of Devgiri Urban Cooperative
Bank Ltd in Aurangabad.
II) Secondary Data:-
For the purpose of the secondary data were collection by the sources such as Books,
journals, Reports, Magazines, News paper, Thesis, Dissertation and government and Non
government publication related to the topic of the study. In relation to secondary data
collection the e-media also helped, like internet, web sites, email etc, these are facilitate to
finding the secondary data.

36
(III) Data Analysis:-
For the purpose of analyzing the data it has been complied and tabulated in a systematic
manner. As per the need of the study i.e. graphs, charts, and statistical and mathematical tools
has been used.
2.5 Scope of the Study:-
1. Operational Scope:-
The focus of the study is on evaluating the financial performance of DUCB.
2. Geographical Scope:-
The study is considered to the Aurangabad where in DUCB is operating.
3. Temporary Scope: - The study covers five years period i.e. 2008-09 to 2012-13.
2.6 Concept of Performance Evaluation -
Business enterprise are created for achieving one or more objectives profit motive being
the most dominant among all objectives for accomplishing its objectives efficiently and
effectively, the firm needs resources which must be optimally utilized. The firm faces the
question of the use and allocation of resources at two levels first at the macro level, the firm has
to compete for purposes with other firms in the capital market. The Criterion used by the capital
market to allocate resources is efficiency, which is conventionally measured in terms of profit. A
firm would thus succeed to obtain funds from the capital market if it has been profitable in the
past or has a profit making potential in the future. The capital market consists of investors
individuals and institutional who decided about the allocation of funds to the firm on the basis of
information regarding the financial performance of the firm. Accounting through its financial
reports furnishes this information to investor's financial reports or statement in the form of
balance sheet and profit and loss account inform investors how the firm has performed.

37
The firm has been able to gather resources from the capital market at the Micro level if its
internal operations, it has to decide allocation of resources to its various projects; activities and
assets. The firm needs relevant information for making decisions of internal use of resources.
Financial information is needed by investor's creditors, management, Govt., and society.
Financial information is required to predict, compare, and evaluate the firm earnings obviate.
The financial information includes the financial statement, Balance sheet, profit and loss
account income statement etc. From the financial information which have been received from
the financial statement and tested the profitability and efficiently of firm or enterprises which is
called performance appraisal. The accounting system identities and gathers relevant data from
the financial statement. The process of data accumulation involves recording and analysis of
economic events financial statement also performance the measurement function. The firm
performs apprised from the financial statement financial statement is a basic of the enterprise
which is used for investors and outsiders to take decision and valued it. Thus performance
appraisal of the firm can be done by the financial statement.
2.7 Concept of Financial Statements: -
The term financial statements have a very ancient historical background. It is as old as the
term Accountancy. But it did not enjoy any significance during the last few decades because the
scope of business was limited as ownership and management consisted of the self same group of
business who was responsible for the fruits of their business. With liberalization and
globalization in the world today, financial statements are increasingly studied and used by
various classes of people who are directly or indirectly related and interested primarily in the
short term liquidity of the firms and its ability to need the debts as and when they full due, long
term lenders are concerned about the ability of the firm to service its debts over the next three to
ten years; while shareholders and potentials investors are interested in the yield and safety of
their funds. Importance of financial statement has also increased due to government regulations,
awareness about. The American Institutes of Certified Public Chartered Accountant states that
''Financial statement reflect a combination of recorded facts, accounting conventions and
personal judgments and the judgments and conventions applied affect them materially the social
rights among consumers and labor union, increasing insecurity of investors funds etc.'' However

38
now it is obligatory for every organization to prepare financial statements as per the annual
report.
But in the modern accounting system ''The statement of retained earnings, ''Earning Per
Shares” (EPS) and statement of change in financial position” are also considered as important
financial statements. It is very well known that the financial statements basically refer to balance
sheet and profit and loss account or income statement, of course these two basic statement are
supported by a number of schedule, annexure supplement statements explanatory notes,
footnotes etc. Therefore all these financial statements are having good amount of their
importance in the annual accounts of an organization. These statements are prepared on the basis
of the transactions that have taken place during the accounting period.
As financial statements are the final products of accounting work, done during the
financial period, they can be termed as summarized reports of accounting transactions. They are
prepared for the purpose o presenting a periodic review of the progress made by the enterprise or
management. ''The Financial Statement reflects a combination of recorded facts, accounting
conventions and personal judgments, and the judgments and conventions applied affect them
materially.'' Thus financial statements are the supported statements are a mirror image of the
position of an enterprise regarding earning, profit ability to operate in future, change in it's owns
goals and attain at targeted level. Thus they portray a picture of success or failure of the business
that reflects the effectiveness and efficiency of management. In short financial statements are the
pillars of accounting systems.
2.8 Balance sheet:-
The concept of Balance sheet is an old as the concept of accounting. The first balance
sheet was prepared in 1340 (2). Balance sheet is one of the most significant financial statements
the It indicates the financial condition or the state of affairs of a business at a Particular moment
of time Balance sheet contains information about resources and obligations of a business entity
and about its owners interest in the business at a particular point of time. Assets and Liabilities
are shown in the balance sheet. It also indicates the properties and obligations of a business
entity. It is based on the equation.
Net Assets = Total Assets – Total Liabilities

39
It provides a snapshot of the financial position of the firm at the close of the firm’s
accounting period. In joint stock companies, the balance sheet is prepared as per section 211 of
companies’ act 1956, In banking sector however it is prepared as prescribed in the third schedule
under section 29 of Banking Regulation Act 1949 but in Co-Operative banking sector there is no
any format is prescribed by the Banking Regulations act 1949.
According to I.M. Pandey following are three important functions of Balance sheet
(a) It gives a summary of the firm’s assets and liabilities.
(b) It is a measure of the firm’s liquidity.
(c) It is a measure of the firm’s solvency.
A balance sheet contains information about the assets liabilities and owner’s interest in
the business at a particular point of time. Suppose a balance sheet of a firm prepared as on 31st
March 2003 reveals the financial position on this specific date “The balance sheet is a statement
which reports the values of properties owned by the enterprise and claims of creditors and
owners against these properties.” Thus balance sheet is a statement of assets, liabilities and
owner’s equities at their respective book values of a business firm as on a specific date. In short
it can be said that a balance sheet is a “Status Report” indicating the financial condition of an
enterprise. It can be prepared in horizontal vertical or step format.
2.9 Income Statement: -
Income statement termed as a profit and loss Account is a financial statement. A balance
sheet as discussed above indicates firm’s financial position at a specific date. Hence it is
considered as a very significant statement by bankers and lenders. But it fails to indicate whether
firm is making profit or losing money. Therefore creditors and financial analysts have recently
started paying more attention to earning capacity of the firm which is reflected by profit and loss
account or income statement. It is a scoreboard of the firm’s performance during a period of
time. It is a flow statement.
According to Guthman H.G. “The statement of profit and loss is the condensed and
classified record of the gains and losses causing change in the owner's interest for a period of
time” Income statement indicates the result of business operations during two balance sheet

40
dates. This net result of may be favorable or unfavorable. If favorable the result, is net profit and
if unfavorable the result, is net loss. In other words it is a summary report of income and
expenses incurred in the regular course of business during a particular accounting period. The
income statement shows the incomes and expenses of a business enterprise over a period of time
and then gives final figures representing the amount of profit or loss for the accounting period. It
is the performance report of an enterprise indicating change in income and expenses due to
business operations conducted during a particular accounting period and suggest a long range
view of a business and shows where it is leading to. The income statement can also be presented
in a vertical or horizontal form.
2.10 Statement of Retained Earning: -
Statement of retained earning indicates the cause and magnitude of changes in the
retained earnings of the concur during the year. It begins with the amount of accumulated profits
and concludes with the amount of undistributed earnings. It is prepared to show the amount of
profits transferred to reserves, payment of interim dividend, proposed dividend and
appropriations. It follows the income statement and provides a link between the income
statement and the balance sheet.
2.11 Statement of Sources and Uses of Funds: -
It is a statement summarizing the financing and investing activities of an enterprise
indicating where the financial resources have come from and where they have gone. It measures
the changes that occur in assets, liabilities and other accounting aspects of business operations
and trace the reasons for such changes.
2.12 The Concept of Financial Analysis:-
Financial statements are only the means of providing general information regarding
operational results and financial position of a business. These statements merely contain
financial data about business events which do not reveal any significant conclusions such as
efficiency of the management, strength and weakness of the firm, index of future progress etc.
The analysis is done by properly establishing the relationship between the items of balance sheet

41
and profit and loss account. The first task of financial analysis to determine the information
contained in the financial statement. The second step is to arrange information in a way to
highlights significant relationship. The final step is interpretation and drawing of inferences and
conclusions. Thus financial analysis is the process of selection, reviewing and evaluation of the
accounting information.
2.13 Significance of Financial Analysis: -
The Basic limitations of the traditional financial statements comprising the balance sheet
and the profit and loss account is that they do not give all the information related to the financial
operations of a firm. Nevertheless they provide some extremely useful information to the extent
that the balance sheet is a mirror of the financial position on a particular date in terms of the
structure of assets, liabilities and owner’s equity and so on and the profit and loss account shows
the result of operations during the year. Thus the financial statements provide a summarized
view of the financial position and operations of a firm. Therefore; much can be learnt about a
firm from a careful examination of its financial statements as invaluable documents performance
report. The analysis of financial statement is, thus an important aid to financial analysis. The
focus of financial analysis is on key figures in the financial statements and the significant
relationship that exist between them
2.14 Comparative Financial Statement Analysis: -
Comparative financial statements are statements of financial position of a concern so
designed as to facilitate comparison of different accounting variables and thereby draw useful
conduciveness. According to the M.R. Agrawal “Comparative financial statements are those
statements which summarize and present related accounting data for a number of years
incorporating therein the changes (absolute or relative or both) in individual item.10 In these
statements, the financial data for two or more years are placed and presented in adjacent
columns. So that it may provide a true perspective in order to facilitate period comparison. It is
also comparative financial statements are usually prepared with special columns indicating
absolute data for each of the period and changes in it terms of rupees as well as in terms of
percentages. The comparative financial statements is to ascertain the changes accruing year by
42
year in each item of assets, liabilities and net worth shown in the financial statements of a
business firm and whether such changes are favorable or adverse.
1.15 Trend Analysis: -
A study based on trend percentage is known as trend analysis. Trend analysis indicates
the trend of progress during past several years. Trend percentages are helpful in making a
comparative study of financial statements for several years as it indicates increase or decrease in
an item along with the magnitude of change in percentage. According to R. A. Kennedy and S.
Y. Mc Mullen “For the purpose of financial appraisal, an effective use of financial ratios can be
made by observing the behavior of ratios over period of time”.11 As one of the management
tools, the importance of looking into tendency of events between financial statements prepared at
different period cannot be lost sight of where the business was? Where the business is ? And
where the business will be? All these uses being clearly revealed through trend analysis.
According to M.R. Agrawal “The trend analysis is the method of analyzing financial position of
a business on the basis of changes in the items of financial statement of successive years in
comparison a specific date or period commencement of study.
2.16 Ratio Analysis: -
Analysis of financial statement based on ratios is known as ratio analysis. Ratio analysis
is a technique of presenting internal and external events affecting the business transaction
relating to its operations, operating results and attainment of pre-determined goals and objectives
of a business in brief and summary form.
According to Belverd-E-Needless “Ratio guides or short cuts that are useful in
evaluating the financial position and operations of a company and in comparing them with
previous years or with other companies. The primary purpose of ratio is to point out areas for
further investigations. They should be used in connection with a general understanding of the
company and its environment.
Various Ratios;-
Current Ratio:-

43
The current ratio is balance-sheet financial performance measure of company liquidity. The
current ratio indicates a company's ability to meet short-term debt obligations. The current ratio
measures whether or not a firm has enough resources to pay its debts over the next 12 months.
Potential creditors use this ratio in determining whether or not to make short-term loans. The
current ratio can also give a sense of the efficiency of a company's operating cycle or its ability
to turn its product into cash. The current ratio is also known as the working capital ratio.
Calculation (formula)
The current ratio is calculated by dividing current assets by current liabilities:
The current ratio = Current Assets / Current Liabilities
Both variables are shown on the balance sheet (statement of financial position)
Norms and Limits
The higher the ratio, the more liquid the company is. Commonly acceptable current ratio is 2; it's
a comfortable financial position for most enterprises. Acceptable current ratios vary from
industry to industry. For most industrial companies, 1.5 may be an acceptable current ratio. Low
values for the current ratio (values less than 1) indicate that a firm may have difficulty meeting
current obligations. However, an investor should also take note of a company's operating cash
flow in order to get a better sense of its liquidity. A low current ratio can often be supported by a
strong operating cash flow.
If the current ratio is too high (much more than 2), then the company may not be using its current
assets or its short-term financing facilities efficiently. This may also indicate problems in
working capital management. All other things being equal, creditors consider a high current ratio
to be better than a low current ratio, because a high current ratio means that the company is more
likely to meet its liabilities which are due over the next 12 months.
Fixed Assets to Net Worth:-
Fixed assets to net worth is a ratio measuring the solvency of a company. This ratio indicates
the extent to which the owners' cash is frozen in the form of fixed assets, such as property, plant,

44
and equipment, and the extent to which funds are available for the company's operations (i.e. for
working capital).
Calculation (formula)
Fixed assets to Net Worth = Net fixed assets / Net worth
Norms and Limits
Fixed assets to net worth ratio 0.75 or higher is usually undesirable, as it indicates that the firm is
vulnerable to unexpected events and changes in the business climate. But the term "fixed assets"
(non-GAAP term) has different interpretations so it's difficult to use and compare this ratio. That
is why we prefer to use similar ratio "Non-current assets to net worth" implicating IFRS term
"Non-current assets".
Working Capital:-
Working capital is the amount by which the value of a company's current assets exceeds its
current liabilities. Also called net working capital. Sometimes the term "working capital" is used
as synonym for "current assets" but more frequently as "net working capital", i.e. the amount of
current assets that is in excess of current liabilities. Working capital is frequently used to
measure a firm's ability to meet current obligations. It measures how much in liquid assets a
company has available to build its business. Working capital is a common measure of a
company's liquidity, efficiency, and overall health. Decisions relating to working capital and
short term financing are referred to as working capital management. These involve managing the
relationship between an entity's short-term assets (inventories, accounts receivable, cash) and its
short-term liabilities.
Calculation (formula)
Working capital (net working capital) = Current Assets - Current Liabilities
Both variables are shown on the balance sheet (statement of financial position).

45
Norms and Limits
The number can be positive (acceptable values) or negative (unsafe values), depending on how
much debt the company is carrying. Positive working capital generally indicates that a company
is able to pay off its short-term liabilities almost immediately. In general, companies that have a
lot of working capital will be more successful since they can expand and improve their
operations.
Companies with negative working capital may lack the funds necessary for growth. Analysts are
sensitive to decreases in working capital; they suggest a company is becoming overleveraged, is
struggling to maintain or grow sales, is paying bills too quickly, or is collecting receivables too
slowly. Though in some businesses (such as grocery retail) working capital can be negative (such
business is being partly funded by its suppliers)
Debt-to-Equity Ratio:-
The debt-to-equity ratio (debt/equity ratio, D/E) is a financial ratio indicating the relative
proportion of entity's equity and debt used to finance an entity's assets. This ratio is also known
as financial leverage.
Debt-to-equity ratio is the key financial ratio and is used as a standard for judging a company's
financial standing. It is also a measure of a company's ability to repay its obligations. When
examining the health of a company, it is critical to pay attention to the debt/equity ratio. If the
ratio is increasing, the company is being financed by creditors rather than from its own financial
sources which may be a dangerous trend. Lenders and investors usually prefer low debt-to-equity
ratios because their interests are better protected in the event of a business decline. Thus,
companies with high debt-to-equity ratios may not be able to attract additional lending capital.
Calculation (formula)

46
A debt-to-equity ratio is calculated by taking the total liabilities and dividing it by the
shareholders' equity:
Debt-to-equity ratio = Liabilities / Equity
Both variables are shown on the balance sheet (statement of financial position).
Norms and Limits
Optimal debt-to-equity ratio is considered to be about 1, i.e. liabilities = equity, but the ratio is
very industry specific because it depends on the proportion of current and non-current assets.
The more non-current the assets (as in the capital-intensive industries), the more equity is
required to finance these long term investments.
For most companies the maximum acceptable debt-to-equity ratio is 1.5-2 and less. For large
public companies the debt-to-equity ratio may be much more than 2, but for most small and
medium companies it is not acceptable. US companies show the average debt-to-equity ratio at
about 1.5 (it's typical for other countries too).
In general, a high debt-to-equity ratio indicates that a company may not be able to generate
enough cash to satisfy its debt obligations. However, a low debt-to-equity ratio may also indicate
that a company is not taking advantage of the increased profits that financial leverage may bring.
Net Worth:-
Net worth is the difference between a company's total assets and its liabilities. Net worth is also
known as stockholders' (or owners') equity. In accounting and financial analysis the term "net
worth" is also equivalent to the term "net assets".
Net Assets:-
The term "net assets" is the alternative term for "equity" (i.e. the total assets of a business minus
its total liabilities). It is also equivalent to term "net worth". The term is not widely used in the
business community versus the other mentioned terms.

47
Return on investment (ROI) is performance measure used to evaluate the efficiency of
investment. It compares the magnitude and timing of gains from investment directly to the
magnitude and timing of investment costs. It is one of most commonly used approaches for
evaluating the financial consequences of business investments, decisions, or actions.
If an investment has a positive ROI and there are no other opportunities with a higher ROI, then
the investment should be undertaken. A higher ROI means that investment gains compare
favorably to investment costs.
ROI is an important financial metric for:
• asset purchase decisions (such as computer systems, machinery, or service vehicles)
• approval and funding decisions for projects and programs of different types (for example
marketing programs, recruiting programs, and training programs)
• Traditional investment decisions (for example management of stock portfolios or the use
of venture capital).
Calculation (Formula)
To calculate return on investment, the benefits (or returns) of an investment are divided by the
costs of the investment. The result can be expressed as a percentage or a ratio.
Return on Investment (ROI) = (Gains from Investment – Cost of Investment) / Cost of
Investment
It should be noted that the definition and formula of return on investment can be modified to suit
the circumstances -it all depends on what is included as returns and costs. For example to
measure the profitability of a company the following formula can be used to calculate return on
investment.
Return on Investment = Net profit after interest and tax / Total Assets
Norms and Limits

48
One drawback of ROI is that it by itself says nothing about the likelihood that expected returns
and costs will appear as predicted. Neither does it say anything about the risk of an investment.
ROI simply shows how returns compare to costs if the action or investment brings the expected
results. Therefore, a good investment analysis should also measure the probabilities of different
ROI outcomes. It is important to consider both the ROI magnitude and the risks that go with it.
Return on Capital Employed (ROCE):-
Return on capital employed (ROCE) is a measure of the returns that a business is achieving from
the capital employed, usually expressed in percentage terms. Capital employed equals a
company's Equity plus Non-current liabilities (or Total Assets − Current Liabilities), in other
words all the long-term funds used by the company. ROCE indicates the efficiency and
profitability of a company's capital investments.
ROCE should always be higher than the rate at which the company borrows otherwise any
increase in borrowing will reduce shareholders' earnings, and vice versa; a good ROCE is one
that is greater than the rate at which the company borrows.
Calculation (formula)
ROCE = EBIT / Capital Employed = EBIT / (Equity + Non-current Liabilities) = EBIT / (Total
Assets - Current Liabilities)
A more accurate variation of this ratio is return on average capital employed (ROACE), which
takes the average of opening and closing capital employed for the time period.
One limitation of ROCE is the fact that it does not account for the depreciation and amortization
of the capital employed. Because capital employed is in the denominator, a company with
depreciated assets may find its ROCE increases without an actual increase in profit.
EBIT (Earnings before Interest and Taxes):-
EBIT (Earnings before Interest and Taxes) is a measure of a entity's profitability that excludes
interest and income tax expenses. Interest and taxes are excluded because they include the effect
49
of factors other than the profitability of operations. EBIT (also called operating profit) shows an
entity's earning power from ongoing operations.
Calculation (formula)
EBIT = Profit (loss) + Finance costs + Income tax expense
Used List of Ratios:-
1. Fixed Assets to Proprietary Fund Ratio
Fixed Assets to Proprietary Fund Ratio= Fixed Asset/Proprietor’s Fund.
2. Working Capital to Net Worth
Working Capital to Net Worth = Working Capital/Net Worth
3. Solvency Ratio
Solvency Ratio = Total Assets/Total Liabilities
4. Fixed Assets to Net worth Ratio
Fixed Asset to Net worth Ratio = Fixed Asset/ Net Worth
5. Earning Per Shares (EPS).
Earning per Shares (EPS) = Net Profit after Tax and Interest/Number of Equity Shares
6. Proprietary Ratio.
Proprietary Ratio = Shareholders’ funds/Total tangible assets.
7. Profitability Ratio
Profitability Ratio= Operating Profit/ Capital employed*100
8. Price Earnings Ratio
Price Earnings Ratio = Market Price Per Share/Earning Per Share
9. Dividend Yield Ratio
Dividend Yield Ratio = Dividend per Share/Market Value per Share

50
2.17 Funds Flow Analysis: -
In financial statements, balance sheet shows assets, liabilities and equity of the firm at a
certain moment of time. Profit and loss account depicts operating results over a period of time.
Fund Flow analysis is an analysis of sources and uses of funds. It highlights the changes in the
financial composition of an undertaking between two dates. As per Accounting Standard Board
of ICAI “A statement which summaries for the period covered by it the changes in financial
position including the sources from which the funds were obtained by the enterprise and the
specific uses to which the funds were applied. Thus funds flow statement is not a statement of
financial position at a particular date, but it is a report of financial operations, changes, flows and
movement of funds. It is an important financial technique widely used by financial analysis,
investors and bankers for judging.
(i) The financial strength of an enterprise.
(ii) The effectiveness of its financial policies
(iii) An understanding regarding the ability of a concern to use funds effectively in its best
interest.
According to techniques such as Ratio Analysis Trend analysis, comparative statement
analysis and common size Analysis have been used for the purpose of study.
(B) Review of Literature:-
Introduction:-
In view of the fact that the present study is primarily related with the contribution
of the Devgiri urban Co-operative Bank Ltd Aurangabad.
The literature on co-operative credit is plenty, studies on the organization and
management of Devgiri urban co-operative bank Ltd. is peripheral. Volumes of literature
on co-operative expert committee and researchers. Most of the studies focused their
attention of working of different levels of co-operative were written by many co-
operators, administrators, study teams, expert committees and researchers. Most of the
studies focused their attention working of the DUCB. These studies have been made on
the basis of data collected from secondary sources. All these studies may be termed as

51
reports of enquiry committees, research studies of institutions and studies of researchers.
The review of literature is dividend in to different categories.
1. Agale Sudhir Vasantrao (2012) aptly observed that the number of DCCBs increased in
the Maharashtra during the study period from 30 to 31. The number of branches
decreased during the period was 3,718 in the year 2001 to 3,646 in the year 2007. The
total number of member of DCCBs also shows the decreasing position during the period
from 100 per cent to 90.97 per cent. The amount of Share Capital of DCCBs shows the
increase in the percentage that 100 per cent to 173.37 per cent. It is interesting to note
that the share of government in the share capital was decreased from 100 per cent to
58.34 per cent during the study period. The progress of owned funds shows by the table
that the own funds of DCCBs increased from 100 per cent to 262.33 per cent during the
seven years period. The growth seen from the table in the deposits was 100 per cent to
154.83 per cent during the period 2001-2007. The working capital also shows the growth
from 100 per cent in the year 2001 to 167.65 per cent in the year 2007.
2. Divekar. D.A. (2013), observed that the UCBs of our country in general and UCBs from
Pune in particular need to realize that they need to quickly adopt CBS else they will be
unable to keep pace with the technological advancement happening around, especially in
Banking and financial sector of India (BFSI). Government of India and RBI have
observed of CBS, UCBs do not integrate well in banking system of India and therefore,
RBI has issued a circular to UCBs directing to complete CBS implementation before 31St
Dec 2013.
The Scenario of CBS implementation in Pune based UCBs in encouraging over
60 percent UCBs are yet to go for CBS, Same is the case with introduction of E-delivery
Channels and Para-Banking service. Meeting line-line specified by RBI itself would be
gigantic task due to complexity of the CBs project. Introduction of E-delivery Channels
would be possible only after successful implementation of CBS.
It is high time that management of UCBs in Pune have their strategies in Pune to
introduce CBs in their respective banks either through their own resources or through
financial assistance from NABARD, NCDC etc. They can even comes together to set-up
common data centre and disaster Recovery site in order to minimize investment of

52
setting- up of such infrastructure and share computing as well as human resources to
manage such advanced it infrastructure.
3. V. Alagu Pandian and R.K. Sharma (2013) aptly observed that the analyzed data
shows that there is no significant difference between all sample selected variables of
District Cooperative Banks and Urban Cooperative Banks in Dehradun. The reference
period is 2007-08 to 2011-12, during this period both the bank results registered
uniformity. Even though, among the two samples selected banks many years in difference
sample selected variables registered negative growth also. It is not much influence to the
impact of significance difference between DCB and Urban Cooperative Bank in
Dehradun. Because, when result fit through Mann – Whitney – U- Test and based on that
given rank number, the researcher easily assess the significance difference between two
banks. The growth rate of interest income, total income, interest expended, total
expenditure, and net profit of DCB in Dehradun and Urban Cooperative Bank in
Dehradun.
4. Jayashree R. Kotnal (2013):- DR. L. C. Mulguand (2013) I observed that concludes
total deposits have been increases in my study. On the contrary the rate of interest is
falling every year. The Bank has adopted production oriented and need based leading
policy and has been making specific efforts for providing credit facilities for person’s
falls under the category of priority sector and weaker sections. The bank as to make such
schemes and policies that increases in deposit ratio. That attracts the more number of
people to be a member of bank. That increases the share capital of the bank.
This will help the bank to widen its operations in the coming year. Further the
bank has already computerized its operations for quick and satisfactory services. It is to
be noted that the depositors are aware of computerization of banking operations. Far and
away the prize that life offers is the chance to work hard at something worth doing, being
a student of master of commerce my experience for SHRI SHIDDHESHWAR CO-
OPERATIVE BANK., was very much useful.
5. Ms. Shachi Pareek (2012) aptly observed that the above analysis reveals that the UCBs
in Jaipur are in a positive state of health with satisfactory level of profitability. Even
being small in size, they have got a great potential to cater the marginal clients. The pace

53
with which these banks are able to reduce the burden is higher than the pace of increasing
the spread. The same will help in lifting their profits automatically.
UCBs in Jaipur should undertake some promotional campaigns to attract more
clients and thus broaden their customer base. This will help in increasing their deposits
and will increase the interest income too. Further, the consistent increase in non-fund
income should be ensured by these banks, so that the burden can be easily reduced. The
outperforming UCBs should be set as a "benchmark", against which the performance of
other UCBs should be measured. This will increase the competitiveness of these banks
and will thus improve their profitability performance.
6. Dr. Padmaja, B., Dr. BhanuKiran, C. and Dr. Rama Prasada Rao, C. H (2013) I
observed that The Anantapur Urban Co-operative Bank has witnessed decrease in
membership during this period 2005-06 to 2009-10 with a negative growth rate of 13.33
percent and the share capital during this period shows -5.41 percent of negative
compound rate, with a not significant value. So H1: There is no significant growth of
Share Capital in the Anantapur UCB. is accepted Deposit mobilation Is an important
activity of the bank. The deposits have increased from Rs.1246 lakhs to Rs.2653 lakhs,
with 112.92 percent during these 5 years. The deposits of Anantapur Urban Co-operative
Bank increased by 2 times. The total deposits of the Anantapur Urban Co-operative Bank
have shown a high growth. The fixed deposits and special deposits constitute 90 percent
in its total deposits. The increase in the volume of deposits during the decade has been
higher due to the adoption of daily saving deposit scheme; the deposits have increased by
2 times in 5 years. The proportion of saving deposits has grown considerably, and the
recurring deposits and the current deposits have recorded a marginal growth rate. The
total deposit of Anantapur Urban Co-operative Bank represents 93 percent to 95 percent
of its working capital. It recorded a compound growth rate of 16.31 with a more
significant’ value. So H2: There is no significant growth of deposit mobilization during
study with regard to Anantapur Urban Cooperative Bank Is rejected. During this period,
it has been witnessed that the Anantapur UCB is self reliant, and has not depended upon
outside sources. As far as the total advances are concerned Jewel loans form the highest
percentage followed by mortgage loans and deposit loans. The other loans form a small

54
percentage of total loans and advances. The percentage of jewel loans increased during
the period.
7. Subrahmanya Bhat. K. M/ Dr.I Bhanu Murthy (2012) The purpose and objectives of
cooperatives provide the framework for cooperative corporate governance. Co-operatives
are organized groups of people and jointly managed and democratically controlled
enterprises. They exist to serve their members and depositors and produce benefits for
them. Co-operative corporate governance is therefore about ensuring cooperative
relevance and performance by connecting members, management and the employees to
the policy, strategy and decision-making processes. The adoption of technology required
banks to re-engineer processes, network branches and introduce alternate delivery
channels such as internet banking, phone banking and mobile banking, data warehousing
and data mining, customer relationship management, integrated treasury management,
human resource management and the implementation of core banking solutions. In
addition, many initiatives of the regulator such as ECS, RTGS and NEFT also lead to
overall technology adoption by banks. New private sector banks are providing very good
services to their customers. So growth rate in advances, investments, deposits as well as
net profits is very high in case of private sector banks. Most of the customers of state co-
op bank are visiting branches occasionally or 3-4 times during a month.
8. Dr. M. Nallusamy (2012):- That for finding the performance of the banking sector,
evidence found from its profitability of the bank. Profitability has been an important
criterion to evaluate the overall efficiency of a bank’s operations. Being a relative
measure, it is devoid of the pitfalls associated with interpretation of term ‘profit’. Even if
one ignores the past year or peer aspect of measuring profitability, it is still the best
indicator of efficiency of banking operations. The concept of profitability is used and
interpreted the same way both in a business firm and a banking company. Bank’s
profitability has assumed greater importance in the changing scenario of autonomy to
banks and financial reforms. Profitability in banking parlance demotes the efficiency with
which a bank deploys its total resources to optimize its profit and thus serves an index of
asset utilization and managerial effectiveness. The present paper attempts to explore the
relationship between bank profitability and its determinants. Since there are many
55
variables affecting profitability, a model giving the most critical variables / ratios has
been developed by using Multiple Discriminate Analyses.
9. Ms Geeta Sharma and Dr Ganesh Kawadia (2011) The A combination of financial
restructuring and institutional reforms can only help urban cooperative banks to improve
the efficiency. Moreover the objective of financial restructuring must be to induce
regulatory, 17 legal and administrative changes considering cooperatives member-centric,
democratic, autonomous and self-reliant institutions. Polarization and bureaucratization is
running through the warp and woof of the UCBs. Their combined effect led to
governance and managerial failure leading in turn to severe financial impairment. The
very concept of banking is undergoing change in the present competitive environment
and the conventional framework for management with which UCBs are comfortable is
not sufficient. Good corporate governance is critical to efficient functioning of an entity
and more so for a banking entity. The framework for good governance and professional
management in urban cooperative banks should essentially emanate from the guiding
principles and the given legal framework in different countries.
10. VIDYA PITRE (2003):- There cannot be two opinions on the service rendered by UCBs
to meet the credit needs of the small borrower. In future, for sustaining and spreading the
network, they would continue to draw upon the resources of the state and central
governments and RBI. At present, there is scope for its spread with its concentration in a
few states. The share of urban population is increasing. The growth of the services sector
and advent of information technology has opened new frontiers. Micro finance, that is,
SHGs, is another area where a group of persons can be directly linked. Insurance is
another identified area for this sector. The large and growing market in India that is
untapped provides profitable avenues apart from challenges in terms of social
commitments; a large part, where interest rates as high as 100 per cent are still prevalent.
They can play the role of facilitators in the transmission of knowledge,
information with regard to the market and new technology-related development from
metropolitan to semi-urban centres. They can educate unemployed youth, who, for
instances, could get guidance and support from them. So instead of seeking help from
outside agencies for acquiring capability in order to compete with other banking groups

56
globally, UCBs should focus on different market/clientele, that is, the unorganized
market, which is local in character.
11. Heiko Hesse and Martin Čihák (2007) The findings in this paper indicate that
cooperative banks in advanced economies and emerging markets have higher z-scores
than commercial banks and (to a smaller extent) savings banks, suggesting that
cooperative banks are more stable. This finding, perhaps somewhat surprising at first, is
due to much lower volatility of the cooperative banks’ returns, which more than offsets
their relatively lower profitability and capitalization. We suggest that this observed lower
variability of returns, and therefore the higher z-scores, may be caused by the fact that
cooperative banks in normal times pass on most of their returns to customers, but are able
to recoup that surplus in weaker periods. To some extent, this result can also reflect the
mutual support mechanisms that many cooperative banks have created. The finding about
the higher z-scores in cooperative banks is quite robust with respect to modifications in
the measurement of volatility and z-scores.
It also remains valid if one distills the “pure” impact of the cooperative nature of a
bank, by using regression analysis and adjusting for differences in bank size, loan to asset
ratios, income diversity, and other factors with potential impact on individual bank’s
stability. Using the regression analysis, we also find that a higher share of cooperative
banks increases stability (measured by z-score) of an average bank in the same banking
system. The impacts differ by the groups of banks, however. High presence of
cooperative banks appears to weaken commercial banks, in particular those commercial
banks that are already weak to start with. This finding is consistent with Goodhart’s
(2004) hypothesis that the presence of non-profit-maximizing entities can pull down
stability of other financial institutions. This empirical result can be explained by the fact
that a higher cooperative bank presence means less space for weak commercial banks in
the retail market and therefore their greater reliance on less stable revenue sources such
as corporate banking or investment banking.
12. Narayana Gowd Talla, Anand Bethapudi and Reddeppa Reddy G, (2009) The
Dharmavaram Urban Co-operative Bank was setup in the early 20th century (1907), and
completed 103 years, (2010). As such, the membership has improved phenomenally over
the years. The share capital, reserves, owned funds, deposits; working capital, loans and

57
advances and the percentage of over dues have increased during the period. Ho1 is not
accepted which means that there is a significant growth in reserves of DUCB. Ho2: There
is no significant in the growth of deposit mobilization during study with regard to
Dharmavaram Urban Cooperative Bank is not accepted .Therefore there is a significant
growth in the deposit mobilization during study in DUCB. Ho3: There is no significant
growth in the loans and advances during the study with regard to Dharmavaram Urban
Co-operative Bank is not accepted which indicates that there is a significant growth in
loans and advances during the study period with regard to DUCB. Ho4: There is no
significant growth in the Total income of Dharmavaram Urban Co-operative n Bank
during the study is not accepted which indicates that there is a significant increase in
growth of Total income of DUCB. Ho5: There is no significant in the increase in the
growth of total expenditure with reference to Dharmavaram Urban Co-operative Bank is
not accepted which shows that there is significant increase in growth of Total expenditure
with reference to DUCB.Ho6: There is no significant in the growth of Share Capital in
the DUCB is accepted which indicates that even there is significant growth in the
membership of DUCB, but there is no significant growth in the increase of its share
capital. Moreover, there is a significant growth in the increase of working capital of
DUCB. There is also significant growth in increase of overdue of DUCB which is a great
concern for the bank. There is no significant growth in the increase of net profit and
earnings per share of the DUCB.
13. DR.SEEMA SANT; DR P.T CHAUDHARI (2012)The analysis of different financial
ratio of UCBs operating in Greater Mumbai and Jalgaon suggest that the technological
changes have significantly improved the productivity and profitability margins of these
banks. Further, the statistics indicate that the performance of UCBs in Greater Mumbai is
significantly better than the performance of UCBs in Jalgaon. Moreover, with the
advancement of communication technology the UCBs have been successful in reducing
their burden ratio and credit-deposit ratio over the time.
14. Dr. Sandip K. Bhatt, Dharmendra P. Patel (2013) Now, it is very much clear that co-
operative banks have very much importance in sustainable development. Without the
help of co-operative banks, millions of people in India would be lacking the much
needful financial support. Co-operative banks take active part in local communities and

58
local development with a stronger commitment and social responsibilities. These banks
are best vehicles for taking banking to doorsteps of common people, unbanked people in
urban and rural areas. Their presence in the social, economic and democratic structure of
the country is essential to bring about harmonious development and that perhaps is the
best justification for nurturing them and strengthening their base. These banks are sure to
win the race because they are from the people, by the people and of the people. Urban
Co-operative Bank is very important role for the sustainable development of India. UCBs
through various facilities provided to the society. This bank has also financially helped
for various sectors. i.e. Education, Health, Social Work, Agriculture, Rural Development,
Wedding Function, Cottage and Small Scale Industries, Retail Traders, Wholesale Trade
etc. The banks also finance the weaker sections.
15. Dr R.Renuka and C Elamathi (2013) The in sum, reforms pertaining to the urban co-
operative and short-term rural co-operative sectors seem to have set in motion a process
of revival in these sectors. As regards the urban co-operative sector, the improvement in
financial performance and health is better established by now; for the short-term rural co-
operative sector, the revival is more fragile and yet to spread across all regions in the
country and all tiers of the sector. In the coming years, it needs to be seen whether the
revival is sustained and broad-based. Further, it is imperative to pave the way for a
revival of the long-term rural co-operative sector given the vital role played by these
institutions in stepping up capital formation in Indian agriculture.
16. N. Babitha Thimmaiah, Jnaneshwar Pai Maroor and Shainy V.P (2013) The Indian
Banking industry (Public sector) is facing two problems. 1. Inefficiency 2. Competition
from private players. These problems can be tackled effectively by giving energy
boosters like training and development, motivation of employees and by creating super
ordinate goals viz survival. So in banking services all concerned decision makers have to
take care of following and four pillars.
1. Target Market-Serve each segment uniquely
2. Understand real customer needs.
3. Integrated marketing-All bank employees are required to work as a team towards
customer satisfaction

59
4. Profit through customer satisfaction. Similarly Bankers should take care of 7 ps
of Bank Service Marketing Mix. Product and price: In the light of competition
from shares, stock, commodities, bankers should invest this in such a way that
competitive rate of return can be offered; Promotion: Use Mouth publicity,
Public relations, sponsorship; Place: Location decision should be taken
scientifically and in the light of competition; People: Selection of people and
retention strategies should be taken by following marketing orientation i.e. first
In banks line of visibility for customers is very important. so all bank work seen
by customers should be well planned and it should be without chaos. Interactions
with customers should be very effective; Physical evidence: Environment and
physical setting should be very attractive.
17. Gupta Jyoti, Jain Suman (2012)
1. Majority (32% as per the study) of the respondent were having housing loan from
this bank.
2. Most (64% as per the study) of the people prefer to take long term loan which is
more than 3 years.
3. There is a very simple procedure followed by bank for loan.
4. Easy repayment and less for malities are the main factors determining customer’s
selection of loans.
5. Quality of services provided by the staff is satisfactory because bank is catering
to a small segment only and the customers are properly dealt with.
6. Customers are satisfied with the mode of repayment of installments.
7. Average time for the processing of loan is less i.e. approx 7 days.
The financial performances of Urban Cooperative Banks (UCBs) improved in
2010-11 though there are some concerns with regard to some of the UCBs reporting
negative CRAR. Within the rural cooperative sector, State Cooperative Banks (StCBs)
and District Central Cooperative Banks (DCCBs) reported profits but the ground level
institutions, i.e., Primary Agricultural Credit Societies (PACS) continued incurring huge
losses. The financial performance of long term cooperatives was found to be even weaker
than their short term counterparts. Also, it was observed that the branch network of

60
cooperatives, though widespread across the country, continued to be concentrated in
certain regions. Moreover, the network of cooperatives was not broad based in the north-
eastern region of the country. This suggests that efforts need to be taken to improve
banking penetration in the north-eastern part of the country along with improving the
financial health of the ground level cooperative institutions
18. Dr. Rasal R. G. (2011) In brief the sample household has a mixed feeling about the
performance of the PACS. They agree the PACS are doing right work, the management is
democratic but the majority of the sample households felt a high rate of interest of co-
operative loans. Complicating lending procedures of PACS and the discriminatory
policies of different section of societies are major drawback.
19. DAS SANJAY KANTI (2012) The in conclusion, MCAB is one of the top most
cooperative banking institutions in Meghalaya and renders services towards the common
people as friend, philosopher and guide. The bank earned consistent profit during the
years from inception except a few years. The C-D ratio of the bank is 24.7 in 2010 and
the CAGR of profit is 30.84%. The poor recovery rate and over dues to demand ratio are
the main problem of the bank. Again, decrease in the rate of NPAs as percentage of loan
outstanding is one of the positive aspect of MCAB. Further, the deposits of the MCAB
are composed of demand & time deposits and demand deposits contribute major share of
total deposits. The bank forwarded loans and advances to the common man in the form of
crop loans, allied agricultural loans, SGSY loans and other small beneficiaries. However,
155 of the total loans & advances are forwarded towards the farmers & SGSY
beneficiaries. Further by analyzing the descriptive statistics, it is also observed that the
correlation between profits is significantly & positively associated with borrowings,
reserves, own fund, deposits & loan and advances which are considered as a positive
aspect of cooperative banking.
Finally, operational efficiency and financial ratios like deposits to staff, net profit
to staff, loan outstanding to staff, spread to staff etc are shown the positive aspect of
accounting efficiency of the bank. In fine, it can be said that MCAB in India are the true
friends of farmers in particular and rural population in general. They have played
significant role in the development of rural economy of India. But as per literature and
studies done by various researchers, MCAB are facing various problems and challenges

61
such as dual control, poor financial base, less focus on deposit mobilization, poor
infrastructural facilities, lake of professionalism, low level of technology up gradation
and poor recovery performance etc. But SCBs are very important financial institutions
and are equally important of Govt. of India that is financial inclusion. But for making
these banks efficient, the above said challenges should be addressed and solved.
20. Dr E. Gnanasekaran, Dr. M. Anbalgan, N. Abdul Nazar,(2012) The overall financial
performance of the UCB’s in all fronts namely, Membership, Share Capital, Deposits,
Loans and Advances, Profit and Reserve Funds, Working capital, Over dues, Loans
issued etc., are showing a significantly and undistrubing trend through the application of
different statistical tools applied in the study.
Therefore it may be undoubtfuly concluded that the UCB’s are the road of
progress. This also clear that, the UCB’s is enjoying a predominant position in the
banking industry occupied in eighth place in the banking institution serving in Vellore
District.
21. Mr. Badhe Durgesh Ashok (2011) It is very much clear that co-operative banks have
very much importance in sustainable development. Without the help of co-operative
banks, millions of people in India would be lacking the much needful financial support.
Co-operative banks take active part in local communities and local development
with a stronger commitment and social responsibilities. These banks are best vehicles for
taking banking to doorsteps of common people, unbanked people in urban and rural
areas. Their presence in the social, economic and democratic structure of the country is
essential to bring about harmonious development and that perhaps is the best justification
for nurturing them and strengthening their base. These banks are sure to win the race
because they are from the people, by the people and of the people.
Urban Co-operative Bank is very important role for the sustainable development
of India. UCBs through various facilities provided to the society. This bank has also
financially helped for various sectors. i.e. Education, Health, Social Work, Agriculture,
Rural Development, Wedding Function, Cottage and Small Scale Industries, Retail
Traders, Wholesale Trade etc. The banks also finance the weaker sections.
22. Dr. Deshmukh Purushottam Vishnu (2013) The Development through cooperation is a
basic principle of corporation movement; it has contributed considerably in the

62
development of Maharashtra specifically Western Maharashtra. With the help of
cooperation society can change economic and social life. As the bargaining power is the
soul of new economic policy, it has posed new challenges before the Indian common man
.On the other hand role of government is constantly minimizing. The Indian
Governments are implementing policies in the favor of Multinational companies,
capitalists and the rich. This leads to serious question whether Indian Consumer and
producer will survive in the era of globalization? The solution to this question is in the
cooperation movement, as it has a bright history. The advent of the Special Economic
Zones, Mall, and Chain Marketing of multinational companies is creating new problems
in India. However, Indian Cooperative sector has the potential of offering new remedies
for these problems. However, the Indian cooperative sector is presently suffering from
some problems. The Indian cooperative banking is one such sector. The performance of
Indian cooperative banking sector on the basis of income, expenditure, NPA, borrowers
etc has been focused.
23. B Munirajasekhar and B Sudheer (2013) the technologically laggard Cooperative
banks should realize that the economic class and age composition of their customers is
already not favorable. It would obviously be difficult for laggard cooperative banks to
attract new young customers if they do not increase their investments on IT in right
direction with cautious approach. It is now high time for the decision makers in
cooperative banks to realize the need to enlarge the base of computerization and see that
the real benefits are delivered at all the levels, customers and stakeholders of the bank.
The decision makers have to work out a definitive time frame for technological
advancement in their respective banks with complete involvement in monitoring,
controlling and evaluating the progress with set parameters.
24. Dr.K.V.S.N, Jawahar Babu, B.Muniraja Selkhar (2012) this study reveals that budget
preparation was carried out in the branches of the bank and that manager are the
personnel responsible for the preparation and implementation of budget. It also revealed
that the bank has a budget committee and that on the average budgets are actualized.
Budget failure according to respondents was caused by poor implementation and
forecasting. There was a significant relationship between budget and control mechanism

63
in the banking industry and there was also a significant relationship between budget
preparation and budget implementation in the banking industry.
25. Gowd Talla Narayana, Bethapudi Anand, and Reddy Reddeppa (2011)The
Dharmavaram Urban Co-operative Bank was setup in the early 20th century (1907), and
completed 103 years, (2010). As such, the membership has improved phenomenally over
the years. The share capital, reserves, owned funds, deposits; working capital, loans and
advances and the percentage of over dues have increased during the period. Ho1 is not
accepted which means that there is a significant growth in reserves of DUCB. Ho2: There
is no significant in the growth of deposit mobilization during study with regard to
Dharmavaram Urban Cooperative Bank is not accepted .Therefore there is a significant
growth in the deposit mobilization during study in DUCB. Ho3: There is no significant
growth in the loans and advances during the study with regard to Dharmavaram Urban
Co-operative Bank is not accepted which indicates that there is a significant growth in
loans and advances during the study period with regard to DUCB. Ho4: There is no
significant growth in the Total income of Dharmavaram Urban Co-operative n Bank
during the study is not accepted which indicates that there is a significant increase in
growth of Total income of DUCB. Ho5: There is no significant in the increase in the
growth of total expenditure with reference to Dharmavaram Urban Co-operative Bank is
not accepted which shows that there is significant increase in growth of Total expenditure
with reference to DUCB.Ho6: There is no significant in the growth of Share Capital in
the DUCB is accepted which indicates that even there is significant growth in the
membership of DUCB, but there is no significant growth in the increase of its share
capital. Moreover, there is a significant growth in the increase of working capital of
DUCB.
26. Gaurav Kumar Gupta and Sanjeev Gupta (2013):- The objective of the present study
is to analyze the financial performance of Urban Cooperative Bank (UCB) in Lakhimpur
Kheri district of U.P. The results of the study show that though the bank has shown
reasonable growth in terms of advances and deposits but it is felt by us that it could have
done much better had it not followed an over cautious approach in lending policy and
would have gone for required expansion.

64
27. DR. VILAS BHIKAJI KHANDARE (2012):-Credit Supply was started in India
through primary cooperative societies as per the cooperative act of 1904. The origin of
urban credit movement in India can be traced to the close of Nineteeth century. The urban
cooperative banks should be tried to do for the small traders, small merchants and the
middle class population of the city. The owned capital working capital, deposits, the
loans and advances, Reserves and paid up share capital of urban cooperative banks in
Beed district shows on an a average positive growth rates during the study period. The
increasing share of reserves and decreasing share of paid up share capital in total owned
funds indicates the increasing self reliance of urban cooperative banks in Beed district. It
is observed from the study that the female customers are only 8.5 percent and farmers are
5 percent in four selected urban cooperative banks in Beed district.
The 71 percent customers of these banks said loan procedure is complicated. The
facility of clearing and transfer services is availed by 74 percent customers. It is observed
that 90 percent customers expected electricity bill facilities, 80 percent expected A.T.M.
services and 7.5 percent passport services. It is observed that the maximum customers
take loan for professional purposes. 63 percent customers utilize demand draft service; 18
percent customers utilize locker facility. Overdraft facility utilized by only 6 percent
customers.
28. K. Ravichandran,V. Alagu Pandian,(2013) The Visvesvarya Urban Cooperative bank
is one leading urban cooperative bank in Karnataka and got best urban cooperative bank
award in Karnataka continuously for four years from 2004 to 2007. The share capital and
reserve fund has made positive growth and the owned and the working capital held by the
bank have made steady progress. Net profits of Visvesvarya urban co-operative bank
during the year 2006-07 to 2010-11. The result shows that except during the year 2009-
10 remaining four years positive ne t profit growth could be observed. Among the five
year period highest per cent could observed during the year 2010-11 i.e., 39.79 per cent.
29. Ramesh Chander, Jai Kishan Chandel (2010) However District Central Co-operative
Banks (DCCBs) play pivotal role in the rural banking system yet failure/bankruptcy of
these banks raise many doubts about their viability and sustenance. In the present study
financial efficiency and performance of four DCCBs operating in Gurgaon division have
been identified and analyzed on five parameters viz. profitability, liquidity, solvency,

65
efficiency and risk. The results reveal that banks performed better on one parameter but
weaken on other which led to dwindling situation. Mahendergarh CCB has performed
well on profitability, liquidity and risk parameters but declined on efficiency and
solvency parameters. Rewari needs to make improvements on all parameters but it
performed well on liquidity. The profitability and efficiency have been quite better in
Faridabad, but it should improve on all other fronts. Except liquidity, the Gurgaon has to
make improvements on all other fronts. The derivation from the Z-score analysis reveal
that all the banks have been declined to become a part of weak performance or
bankruptcy zone. Long term sustenance and efficient operations have been big questions
before these banks. Overall score depicts that Mahendergarh CCB has been the best and
Gurgaon the worst one. In fact all the banks have been suffering from financial
mismanagement and underutilization of resources, so these banks should change their
vision and bring competitiveness besides transparency in their working to sustain and
become vivacious co-operative credit institutions.
30. S. Thyagarajan (2009) the bank envisions a future where financial services are
available to all the women who aspire to make life better for themselves and future
generations. The hallmark of the operations of the organizational structure is that the
bank has been able to invest in businesses built around local women's traditional skills,
giving them an ownership stake in activities in which they had previously been labourers.
One outstanding feature in the business model of the Mann Deshi is that it uses
microfinance and financial literacy as safety nets to increase disaster resilience among the
rural poor women. An outcome of this holistic approach is that around 127000 women in
the rural Maharashtra have been benefited from the services of Mann Deshi and started
controlling the finances, conducting businesses, acquire property rights, and break caste
barriers. The entire family of each of these women now began to reap the full benefits as
more money is spent on children, education and household necessities.
31. Padmini E.V.K (1997) the present study leads to the conclusion that though funds
mobilization is done reasonably well in most DCBs; sufficient attention is not given for
efficient utilization of these funds. Among the DCBs studied, a few DCBs like those of
Ernakulum and Kottayam performed adequately well while the others lag behind. Lack of

66
professionalization and poor management practices seems to be responsible for this
situation.
32. Dr.K.V.S.N Jawahar Babu (2012) Urban Cooperative Banking is a key sector in the
Indian Banking scene, which in the recent years has gone through a lot of turmoil.
Though some UCBs have shown credible performance in the recent years, a large number
of banks have shown discernible signs of weakness. The operational efficiency is
unsatisfactory and characterized by low profitability, ever growing non-performing assets
(NPA) and relatively low capital base. Also urban cooperative banks have not been able
to service the growing credit requirements of clients or the newer demands for loans in
the field of personal finance. In the interest of healthy competition, the urban cooperative
banks should be encouraged to grow. Thus a few bad eggs should not curb the growth of
a key banking entity.
33. Dr. S. Mayilvaganan, E. Soundararajan, (2013).Co-operative occupies an important
position in the Indian financial system. Co-operatives were the first formal institutions to
be conceived and developed to purvey credit to rural India. Thus far co-operatives have
been a key instrument of financial inclusion in reaching out to the last mile in rural areas.
The urban counterparts of rural co-operatives the Urban Co-operative Banks (UCBs) too
have traditionally been an important channel of financial inclusion for the middle and low
income sections in the semi-urban and urban area. The state and central Governments
could recognize that the UCBs are not just co-operative societies but they are essentially
banking entities whose management structure is that of a co-operative. Recently, the
UCBs have increasingly started adopting the three-pronged financial inclusion strategies
used by commercial banks – Banking Correspondents (BC), “no-frill” accounts and
promoting microfinance activities. Once again, their local nature gives them an advantage
over their national rivals in executing these moves better. UCBs enjoy an undeniable
edge in the area of relationship banking.
34. Alok Goyal and Harvinder Kaur (2011) Urban Cooperative Banks are the important
constituent of Indian banking system. These banks have expanded their operations over
the last two decades. It was found in the present study that the situation of NPA in banks
has improved over the period of study. But in 2007-08, the NPA in these banks have
grown in comparison of the previous year. In general, it may be concluded that the

67
position of NPA has improved considerably. Most of the Urban Cooperative Banks have
CRAR ratio of more than 9 percent. It was also find in the study that ROA exhibited in
the years 2008-09 and 2009-10 and actual ROA deviated from its potential throughout
the decade.
35. Deshmukh Jagdish and Somalkar Prakash (2010) aptly observed that Co-operation is
a better choice as compared to the Corporate Sector if run on trust, honesty and
confidence. The Government and Reserve Bank should sponsor this field in the interest
of the common man.
The UCBs should bring in mind that they should firstly survive in the present
world of competition and then grow. They should accept the challenge and succeed by
giving better customer service at a competitive cost. UCBs should diversify its activity in
non-interest income sector also to increase their profitability and expand their customer
base. There is a need for exchange of information and experience between the various
UCBs working in the area.
No doubt the future of UCBs is bright but at the same time it is challenging. For
every UCB coordination between management, customers and regulators is an important
aspect. The experienced and enlightened Board of Directors will make the management
efficient. The future is a capacity building exercise, characterized by conversation,
consolidation, competition, cost consciousness and customer orientation.
36. Dr. R. B.Teli (2005) “Performance evaluation of urban co-operative bank in Kolhapur
district”. The researcher has made the study of performance evaluation of urban
cooperative banks in Kolhapur district. The researcher considered the progress of
different indicators of VCBS in Kolhapur district showed considerable growth in their
membership, share capital reserves, owned funds, deposit, loan and net profit. But at the
same time there is an increase in overdue and number of banks made losses and thus,
there is an urgent need for further investigation of the working of UCBS in Kolhapur
district.
37. Dr. B. S. Gite (2005): “Performance evaluation of Mahila Urban Co-operative Banks in
Parbhani District.” He has made a study evaluation of profitability of selected Mahila
Urban Co-operative Banks (Mahila UCBs) in Parbhani District. His study is confined to
the profitability position of selected Mahila Urban Co-operative Banks in Parbhani

68
District, profit during the period under study, but the rate of increased in the net profit is
flexible according to administrative division and type of bank. Mahila UCBs is a step
forward towards freedom of woman and woman empowerment particularly in a
backward area like Parbhani district of Marathwada region; this is a good sign of woman
entrepreneurship. The two Mahila UCBs have shown notable performance. This is also a
new dimension of co-operative activities in the banking sector.
38. Miss. Banishree Das and Nirod Palai (2006): “Problem and prospects of the co-
operative movement in India under the globalization regime.” This paper presented in
IXV international economy history congress, Hel-Sinki (2006) session 72. This paper
intends to analyze the problems and prospects of co-operative sector in India under free
markets. The paper focuses on several petals and shortcoming like poor infrastructure,
lack of quality management, over dependence on government, dormant membership, non
conduct of elections, lack of strong human resources policy, absence of professionalism
etc.
39. B. D. Patil (2013) The Maharashtra state is the pioneer and rank first in the growth of
co-operative movement in India. The co-operative credit societies and co-operative banks
in Maharashtra are playing key role in the growth of agriculture expansion of rural
development and social and cultural activities. The co-operative movement as the best
source through which to apply it for rural development, people’s empowerment and
poverty alleviation programmed. The basic nature of the co-operative societies is to
encourage the ‘values of self help, democracy, equality and solidarity. Co-operative
members believe in the ethical values of honesty, openness and social responsibility and
carrying for others.
Co-operative movement basically an actives with a common goal, co-operation
refers to the formation of nonprofit economic enterprises for the benefit of their members.
Indian Government launched the movement with the enactment of the cooperative
societies Act 1904. According to the Act of 1904, the co-operative societies were to be
established in every district and were required to be managed by members on democratic
lines. The supreme authority was vested in the general meeting, which consisted of all the
members. All decisions as to liabilities, loans, investments, interests, etc. were to be
adopted at the general meeting. During the early years of the movement, the societies

69
were financed either by loans from government or from private person and deposits made
by members. The government loan up to a certain sum was normally interest free. The
village-based agricultural credit societies started giving loans to deserving members.
Co-operative movement in Maharashtra is based on the remarkable developments
in co-operative societies and co-operative banks. Various institutions in the above fields
are playing vital role in the process of economical, political and social development of
Maharashtra. Maharashtra state is one of the leading states in the co-operative movement
in India. Co-operative in State of Maharashtra have made a tremendous development
during the last four and half decade, several types of co-operative societies and banks
stated in Maharashtra with mission to provide overall services to their members and after
all to serve for the nation. In order to development the socio-economic conditions of the
rural society’s co-operatives have no challenge. Co-operatives have spread over all in
40. Rai Upendra (2011) The co-operative Bank is an important constituent of the Indian
Financial System, judged by the role assigned, the expectations supposed to fulfill, their
number, and the number of offices the Co-operative bank operate. Though the
cooperative movement original in the west, but the importance of such banks assumed in
India play an important role even today in rural financing. The business of Co-operative
Bank in the urban areas also has increased phenomenally in recent years due to the sharp
increase in the number of primary Co-operative Banks. Cooperative Banks in India are
registered under the Co-operative Societies Act. The Co-operative Bank is also regulated
by the RBI. They are governed by the Banking Regulations Act 1949 and Banking Laws
(Co-operative Societies Act. 1965.)
41. Roy Partho Partim (2001): Management of Urban Cooperative Banks, Himalaya
Publishing House, Mumbai. The cooperative credit movement has changed the rural and
urban life of the people. The separate regulations in 1984 for the development of UCB’s
but after liberalization of licensing policy the UCB’s are facing hurdles in their function.
UCB’s suffered the problems of productivity, efficiency and accountability of Non
Performing Assets. The Reserve Banks of India and Government must Reserve take
strong measures to strengthen UCB, otherwise the survival of UCB will become difficult.
It is seen that all the UCB in Maharashtra have earned more net profit.
70
42. Mr. Katkade Maruti Baburao(2010): Share capital:- it has been concluded that the total
authorized share capital the beginning was more in case of comparison of these four
banks reveals that the 10 year average paid up share capital of the those banks. In case of
percentage average growth is concerned the growth of share capital of the banks DNSB
show highest percentage of average growth and VUCB show lowest percentage of
average growth in above four banks.
Reserve fund and other reserve: It has been concluded that the total reserve fund the
beginning was more. The comparison of these four banks reveals that the 10 year average
Reserve fund of banks. DNSB show the highest percentage and VUCB show the lowest
percentage of average growth in above four banks.
43. Ratnaparkhe Santosh Dattatray (2011): The analysis of the source of funds and the
loans and advances performance of the bank combined with the historical profile of the
clearly demonstrates the strength and commitment. The business indicators of the bank
starting from the own fund to the total funds and the percentage of recovery
nonperforming assets clearly shown the performances of the Bombay Mercantile Co-
operative bank ltd. Aurangabad.
With the kind of the Board the management and the committed work force from
the senior management to the level management, the bank is expected to improve their
performance further to reach newer highest in the coming days and play the critical role
in the development of the Economy of nation.
44. Aghav M.P. (2009): Co-operative movement has completed 100 years. During this
period the movement has faced ups & down and today it has to face cut throat
competitions from public and private sector still co-operative sector still exist. In total co-
operative movement DCC Banks plays important role in rural development schemes. All
DCCBs works according to the in to the instruction and direction of Nabard. The total
activities of loan investment is depend upon external funds like and borrowings deposits,
as well as internal funds like paid- up capital, Reserve. Higher the total funds, soundness
of the bank exists. The DCCBs are expected to increase lines DCCBs viz. Jalna,
Osmanabad and sometime on Nanded which not encouraging science at all.

71
Select References:-
(A) Research Methodology
1. Dr.S.N. Maheshwari (2009):-“Financial Management”, Sultan chand & sons Education
Publication/publisher New Delhi.
2. Reddy, Appannaiah, Satyaprasad (2007):- “Financial Management”, Himalaya
Publication House.
3. Kulkarni P.V and Satyaprasad (2009):- “Financial Management”, Himalaya
Publishing House, Ramdoor, Dr. Bhalerao Marg, Girgaon, Mumbai-400 004.
4. Dr. Vijay Upagade , Dr Arvind Shende (2013):-“Research Methodology”, S. Chand &
Company Pvt. Ltd. Ram Nagar, New Delhi-110055.
5. Dr. Pradip Agalave (2010);-“Social Research”, Shri Sai Publication, 1 Bhagwaghar,
Complex, Dharampeth, Nagpur.
6. Dr. A. K. Phophalia:- “ Modern Research Methodology”, Paradise Publications Jaipur.
7. Dr. N.S.S. Nehru (2012):- “Research Methodology”, APH Publications corporation
Ansari Road, Dary Gans- New Delhi.
8. Dr. A. K. Singhal:-“A text Book of Accounting for managers for management students”,
JBC publications & distribution New Delhi-11022.
(B) Literature Review:-
1. Agale Sudhir Vasantrao (2012):- “Progress of District Central Cooperative Banks in
Maharashtra”, International Referred Research Journal, February, 2012. ISSN- 0975-3486,
RNI-RAJBIL 2009/30097; VoL.III ISSUE-29.
2. D.A. Divekar (2013):- Banking System UCBs in Pune, Journal of Co-operative
management, Vol.No.48 No.1 ISSN No.0302-7767.

72
3. V. Alagu Pandian and R.K. Sharma (2013):-“VSRD International Journal of Business
and Management Research”, Vol. III Issue IX, ISSN: 2231-248X, p-ISSN: 2319-2194
VSRD International Journals.
4. Jayashree R. Kotnal, DR. L. C. Mulguand (2013):- CASE STUDY OF SHREE
SIDDESHWAR CO-OPERATIVE BANK, BIJAPUR, and Asian Journal of
Multidimensional Research Vol.2 Issue 3, March 2013, ISSN 2278-4853.
5. Ms. Shachi Pareek (2012):-“Urban Co-operative Banks in Jaipur District International
Indexed & Referred Research Journal”, June, 2012. ISSN- 0975-3486, RNI-RAJBIL
2009/30097.
6. Dr. Padmaja, B., Dr. BhanuKiran, C. and Dr. Rama Prasada Rao, C. H (2013).
“Financial Performance of Anantapur Urban Cooperative Bank, International Journal of
Current Research”, Vol. 5, Issue, 06.
7. Subrahmanya Bhat. K. M/ Dr.I Bhanu Murthy(2012):-“ Financial Performance of
“The Goa State Co-operative Bank Ltd”, Indian Journal of Research, Volume: 1 | Issue: 9 |
September 2012 ISSN - 2250-1991.
8. Dr. M. Nallusamy (2012):-“Financial Performance Of The Salem District Central Co-
Operative Bank”, Volume: 1 | Issue: 9 | September 2012 ISSN - 2250-1991.
9. Ms Geeta Sharma and Dr Ganesh Kawadia (2011):-“Indian Urban Cooperative
Banking Sector for Better Survival”, Volume: 1 | Issue: 9 | September 2011 ISSN - 2250-
1991.
10. VIDYA PITRE (2003):- “Urban Cooperative Banks: Issues and Prospects”, Economic
and Political Weekly April 12, 2003, Volume: 3 | Issue: 8 | Aug 2013 | ISSN - 2249-555X.

73
11. . Heiko Hesse and Martin Čihák (2007):-“Cooperative Banks and Financial Stability”,
2007 International Monetary Fund WP/07/2.
12. Narayana Gowd Talla, Anand Bethapudi and Reddeppa Reddy G(2009):-
“Analytical Study on Financial Performance UCB”, VOLUME NO.2, ISSUE NO.8,
ISSN 2277-1166.
13. DR. SEEMA SANT*; DR P.T CHAUDHARI (2012);- “A study of the profitability of
urban cooperative banks” zenith international journal of multidisciplinary research vol.2
issue 5, may 2012, Issn 2231 5780.
14. Dr. Sandip K. Bhatt, Dharmendra P. Patel (2013):- “ROLE OF URBAN CO-
OPERATIVE BANKS IN SUSTAINABLE DEVELOPMENT OF INDIA”, VOLUME:
1/ISSUE: 4/ JULY 2013/ ISSN 2320 – 7620.
15. Dr R.Renuka and C.Elamathi (2013):- “Development of Cooperative Banking in India”,
Volume: 3 | Issue: 8 | Aug 2013 | ISSN - 2249-555X.
16. N. Babitha Thimmaiah1, Jnaneshwar Pai Maroor2 and Shainy V.P (2013):-“Global
Journal of Management and Business Studies.ISSN 2248-9878 Volume 3, Number 3
(2013).
17. Jyoti Gupta, Suman Jain (2012):- “ study on Cooperative Banks in India with special
reference to Lending Practices”, International Journal of Scientific and Research
Publications, Volume 2, Issue 10, October 2012 1 ISSN 2250-3153.
18. Dr. R. G. Rasal (2011):- “Performance of District Central Cooperative Banks During Post-reform
period with special reference to Ahmednagar District Central Cooperative Bank”, Indian Streams
Research JournalVol - I, ISSUE - V [July 2011]: Economic ISSN:-2230-7850.
19. SANJAY KANTI DAS (2012):-“Operational and Financial Performance Analysis Of
meghalaya Cooperative Apex Bank”, Volume 2, Issue 3 (March, 2012) ISSN 2231‐4288.
74
20. (Dr) E. Gnanasekaran, Dr. M. Anbalgan, N. Abdul Nazar,(2012):-“ A study on the
Urban Cooperative Banks Success and growth in Vellore District – Statistical Analysis”,
International Journal of Advanced Research, Volume 2, Issue 3, March 2012 ISSN: 2277
128X.
21. Mr. Durgesh Ashok Badhe (2011):-“Role of Urban Co-operative Banks in Sustainable
Development of India”, Research Student, Department of Economics, Solapur University,
Solapur.
22. Dr. Purushottam Vishnu Deshmukh,(2013):-“The Performance of Cooperative Banking
in India”, Volume : 3 | Issue : 5 | May 2013 | ISSN - 2249-555X.
23. B Munirajasekhar and B Sudheer,(2013):-“Core Banking Solutions in Urban
Cooperative Banks- Issues and Challenges”, B Munirajasekhar et al./ Elixir Fin. Mgmt. 55
(2013) 12820-12824.
24. Dr.K.V.S.N, Jawahar Babu, B.Muniraja Selkhar,(2012):-“ The Emerging Urban Co-
Operative Banks (Ucbs) In India”, IOSR Journal of Business and Management
(IOSRJBM)ISSN: 2278-487X Volume 2, Issue 5 (July-Aug. 2012), PP 01-05.
25. Narayana Gowd Talla, Anand Bethapudi, and Reddeppa Reddy G.(2011):- “An
Analytical Study On Financial Performance Of Dharmavaram Urban Cooperative Bank,
A.P, and India”, Abhinav National Monthly Refereed Journal Of Research In Commerce
& Management, VOLUME NO.2, and ISSUE NO.8 ISSN 2277-1166.
26. Gaurav Kumar Gupta and Sanjeev Gupta (2013):- “Financial performance of Urban
Cooperative Bank (UCB) in Lakhimpur Kheri district of U.P.” International Journal of
Commerce and Business Management, Volume 6 | Issue 1 | April, 2013 | 134-137.
27. DR. VILAS BHIKAJI KHANDARE (2012):-“Some Issues In Customers Services of
Urban Cooperative Banks: A Case Study of Beed District” International Journal of Social
Science & Interdisciplinary Research, Vol.1 Issue 10, October 2012, ISSN 2277 3630.

75
28. K. Ravichandran,V. Alagu Pandian,(2013):- “An Economic Analysis Of Visvesvarya
Urban Cooperative Bank”, International Journal of Management and Social Sciences
Research (IJMSSR) ISSN: 2319-4421 Volume 2, No. 1, January 2013.
29. Ramesh Chander, Jai Kishan Chandel (2010):- “Financial Viability and Performance
Evaluation of Co-Operative Credit Institutions in Haryana (India)”, International Journal
of Computing and Business Research (IJCBR) Volume 1, N. 1 December – 2010.
30. S. Thyagarajan (2009): -“Women's Co-Operative Bank Promoting and Practicing
Financial Inclusion of Rural Poor Women”, Member of Faculty, College of Agricultural
Banking, Reserve Bank of India, Pune 411016.
31. Padmini E.V.K (1997):-“Funds Management of District Co-Operative Banks In Kerala”,
Cochln University f Science and Technology Cach I N - 682 022, KERALA 1997
32. Dr.K.V.S.N Jawahar Babu (2012):-“Performance Evaluation of Urban Cooperative
Banks In India”, IOSR Journal of Business and Management (IOSRJBM) ISSN: 2278-
487X Volume 1, Issue 5 (July-Aug. 2012.
33. Dr. S. Mayilvaganan, E. Soundararajan, (2013):- “Urban Co-Operative Banks in India
– an Overview”, Volume: 2 | Issue: 8 | Aug 2013 ISSN - 2250-1991.
34. Alok Goyal and Harvinder Kaur (2011):- “Performance evaluation of urban cooperative
banks in India”, Alok Goyal et al Elixir Mgmt. Arts 31 (2011) 1966-1973, ISSN.2229-
712X.
35. Deshmukh Jagdish and Somalkar Prakash (2010):- “Urban Co-Operative Banks – Past,
Present & Future Scenario”, Abhinav national monthly refereed journal of research in
commerce & management, VOLUME NO.2, ISSUE NO.1 ISSN 2277-1166.

76
36. Dr. R. B. Teli (2005): Performance evaluation of urban co-operative bank in Kolhapur
district”, The Maharashtra Co-operative Quarterly, sept-kjune-2000.
37. Dr. B. S. Gite (2005): “Performance evaluation of Mahila Urban Co-operative Banks in
Parbhani District”.
38. Miss Banishree Das and Nirod Kumar palai (2006):” Problem and prospects of the co-
operative movement in India under the globalization regime”. Paper presented in IXV
international economy history congress, Hel-Sinki (2006 Session 72.
39. B. D. Patil (2013): “Growth and Progress of Co-Operative Movement In Maharashtra”,
Online International Interdisciplinary Research Journal, {Bi-Monthly}, ISSN2249-9598,
Volume-III, Issue-VI, Nov-Dec2013.
40. Rai Upendra (2011):-“Banking Awareness”, Arihant publications (India) Limited,
ISBN-978-81-8348-908-9, page no. 102-114.
41. Roy Partho Partim (2001): Management of Urban Co-operative Banks, Himalaya
Publishing house, Mumbai.
42. Mr. Katkade Maruti Baburao (2010): “An Evaluation study of financial performance
and non Performing Asset of Urban Co-operative banks in Beed District”, December -
2010.
43. Ratnaparkhe Santosh Dattatray (2011): “A Study on Financial Performance Appraisal
of loans & Advances of Bombay Mercantile Co-operative Banks Ltd. Aurangabad.
44. Aghav M.P. (2009): “An evaluatory study of financial management of district central co-
operative banks in Marathwada (1997-2007).

77
Chapter -III
Analysis and Interpretation of Data
Chapter
III
Name of Table/Digram and Charts Page No.
3. Introduction 70
3.1 Growth Trend of capital/Liability position of DUCB 71-72
3.2 Growth Trend of Asset/Property position of DUCB 72-73
3.3 Per year Share of the Total Fund of Liability 74-75
3.4 Per year Share of the Total Fund of Asset 75-76
3.5 Capital Adequacy 76-77
3.6 Mixer of Bank Deposits on 2008-2013 (Share of Total fund Deposits) 77-78
3.7 Net Growth and Mixer of Bank Deposits on 2008-2013. 79-80
3.8 Short term liquidity position of DUCB 81
3.9 Working Capital 82
3.10 Fixed Assets to Proprietary Fund Ratio 83
3.11 Debt Equity Ratio 84
3.12 Fixed Asset to Current Asset 85

78
3.13 Working Capital to Net Worth 86
3.14 Solvency Ratio 87
3.15 Fixed Asset to Net worth Ratio 88
3.16 Earning Per Shares (EPS). 89
3.17 Proprietary Ratio. 90
3.18 Profitability Ratio 91
3.19 Non Performing Assets Ratio 92
3.20 Price Earnings Ratio 93
3.21 Dividend Yield Ratio 94
3.22 Dividend Payout Ratio 95
3.23 Interests on Deposits 96
3.24 Interests on Loan 97
3.25 Interests on Investment 98
3.26 Growth trend of Net Profit 99
3.27 Comparative 5 year growth of DUCBA 100-102
3. Introduction:-
Concept of Analysis and Interpretation of Financial Statement:-
Financial statements are indicators of the two significance factors:
(I) Profitability, and
(II) Financial Soundness.
Analysis and interpretation of financial statements, therefore refers to such a treatment of
the information contained in the Income statement and the Balance sheet so as to afford full
diagnosis of the profitability and financial soundness of the business.
A distinction here can be made between the two terms ‘Analysis means methodical
classifications of the data given in the financial statements. The figures given in the financial
statement will not help one unless they are put in a simplified form. For example, all items
relating o ‘Current Asset’ are put at one place while all items relating to ‘Current liabilities’ are

79
put at another place. The term ‘Interpretation’ means explaining the meaning and significance of
the data so simplified.
However, both ‘Analysis and Interpretation’ are complementary to each other.
Interpretation requires Analysis, while Analysis is useless without Interpretation. Most of the
authors have used the term ‘Analysis’ only to cover the meanings of both analysis and
interpretation, since analysis involves interpretation. According to Myres, “Financial statement
analysis is largely a study of the relationship among the various financial factors in a business as
disclosed by a single set of statements and a study of the trend of these factors as shows as in a
series of statements”. For the sake of convince, we have also used the term “Financial statement
analysis” throughout the chapter to cover both analysis and Interpret
Table 3.1 Growth Trends of Capital/Liabilities position of DUCBA.
(Rs. In Crores)
Year Share Capital Reserve Fund
& Surplus
Long term
liability
Current
liability
Total
2008-09
110006350.00
938578160.00
3585876667.00
649076621.00
5283537798.00
2009-10
124554775.00
(13.23%)
989679792.00
(05.44%)
4079804833.00
(13.77%)
801143868.00
(23.42%)
5995183086.00
(13.47%)
2010-11
143819700.00
(15.46%)
1072806372.00
(08.40%)
4589870549.00
(12.50%)
892431431.00
(11.39%)
6698928052.00
(11.73%)
2011-12
155166925.00
(07.89%)
1180710890.00
(10.05%)
5283417336.00
(15.11%)
1233909855.00
(38.26%)
7853205006.00
(17.23%)
2012-13
180153350.00
(16.10%)
1268974917.00
(07.48%)
6485257105.00
(22.75%)
1501976592.00
(21.72%)
9436361964.00
(20.15%)
Source:- Annual Reports of 2008-09 to 2012-13 of DUCBA.
Chart 3.1 Growth Trend of Capital/Liabilities position of DUCBA.

80
Source:- Annual Reports of 2008-09 to 2012-13 of DUCBA
Note: - 1. The year 2008-09 is an assumed as base year.
2. The figure in bracket indicates percentage over the previous year.
Findings:-
1. It is seen from the table 3.1 that the share capital and Reserve funds accounted
combined18.66% of the net growth of DUCB of the year 2009-10, as compared to the
year 2008-09. It is indicated that was an increase (i.e. 23.58%) the net growth of the
DUCB of the year of the end 2012-13.
2. It is revealed from table 3.1 that the long term liability of DUCB accounted 13.77% of
the DUCB during 2009-10, as compared to the year 2008-09. It is shown that was a high
growth (i.e. 22.75%) of the long term liability of the DUCB during the end of year 2012-
13.
3. It is disclosed from table 3.1 that the current liability of DUCB accounted 23.42% of
during the 2009-10, as compared to the year 2008-09. It is focused that was a slight
decline (i.e. 21.72%) in the end of year 2012-13.

81
4. It is appears from the table 3.1 that the total of DUCB accounted 13.46% of during 2009-
10, as compared to the year 2008-09. It is indicated that was high growth of (i.e. 20.15%)
in the end of year 2012-13.
Table 3.2 Growth Trend Asset/Property position of DUCBA
(Rs. In Crores)
Year Fixed Asset Investment Current Asset Total
2008-09
Base year
2347956823.00
1922425558.00
1013155417.00
5283537798.00
2009-10
2821752721.00
(20.18%)
2013136262.00
(04.72%)
1160294103.00
(14.52%)
5995183086.00
(13.47%)
2010-11
3226722631.00
(14.35%)
2088314588.00
(03.73%)
1383890827.00
(19.27%)
6698928052.00
(11.73%)
2011-12
3586753064.00
(11.16%)
2412045196.00
(15.50%)
1854406746.00
(33.10%)
7853205006.00
(17.23%)
2012-13
4091218372.00
(14.07%)
3149001651.00
(30.55%)
2196141941.00
(18.43%)
9436361964.00
(20.15%)
Source:- Annual Reports of 2008-09 to 2012-13 of DUCBA.
Chart. 3.2 Growth Trend Asset/Property position of DUCBA
Source:- Annual Reports of 2008-09 to 2012-13 of DUCBA
Note:- 1. The year 2008-09 is an assumed as base year.

82
2. The figure in bracket indicates percentage over the previous year.
Findings: -
1. It appears from table 3.2 that the fixed assets of the DUCB accounted 20.18% net growth
of the DUCB during the year of 2009-10, as compared to the year 2008-09. It is indicated
that was a growth of the DUCB of the fixed asset is decline (i.e. 14.07%) during the end
of the year 2012-13.
2. It is revealed from table 3.2 that the Investment of the DUCB accounted 04.72% net
growth of the DUCB during the year of 2009-10, as compared to the year 2008-09. It is
shown that was a growth trend of the DUCB of the high increase (i.e. 30.55%) during the
year 2012-13.
3. It is disclosed from table 3.2 that the current asset of DUCB accounted 14.52% of during
the 2009-10, as compared to the year 2008-09. It is focused that was an increase (i.e.
18.43%) in the end of year 2012-13.
4. It is appears from the table 3.2 that the total of DUCB accounted 13.47% of during 2009-
10, as compared to the year 2008-09. It is indicated that was high growth of (i.e. 20.15%)
in the end of year 2012-13.
Table 3.3 Position of total fund of DUCB (Liabilities) (Rs in Crores)
Year Share Capital Reserve Fund
& Surplus
Long term
liability
Current
liability
Total
2008-09
110006350.00
(02.08%)
938578160.00
(17.76%)
3585876667.00
(67.81%)
649076621.00
(12.28%)
5283537798.00
(100.00%)
2009-10
124554775.00
(02.08%)
989679792.00
(16.51%)
4079804833.00
(68.05%)
801143868.00
(13.36%)
5995183086.00
(100.00%)
2010-11
143819700.00
(02.15%)
1072806372.00
(16.01%)
4589870549.00
(68.52%)
892431431.00
(13.32%)
6698928052.00
(100.00%)
2011-12
155166925.00
(01.98%)
1180710890.00
(15.03%)
5283417336.00
(67.28%)
1233909855.00
(15.71%)
7853205006.00
(100.00%)
2012-13
180153350.00
(01.90%)
1268974917.00
(13.45%)
6485257105.00
(68.73%)
1501976592.00
(15.92%)
9436361964.00
(100.00%)
Source:- Annual Reports of 2008-09 to 2012-13 of DUCBA
Table 3.3 Position of total fund of DUCB (Liabilities)

83
Source:- Annual Reports of 2008-09 to 2012-13 of DUCBA .
Note: - 1. The figure in bracket indicates percentage over the previous year.
Findings: -
1. It appears from table 3.3 that Share Capital and Reserve Fund accounted combined
19.81% of the total funds with DUCB during 2009-10, compared to the year 2008-09.
The same constituted 17.82% of the aggregate funds during 2008-09. It indicated that
was a slight decline (i.e. 15.35%) in the share of share capital & Reserve funds at the end
of 2012-13.
2. It seen from table 3.3 that Long term Liability accounted 67.81% of the total funds with
DUCB during the year 2009-10, as compared to the year 2008-09. It indicated that was a
slight increase (i.e. 68.73%) in the share of long term liability during the year 2012-13.
3. It disclosed from table 3.3 that the Current Liability accounted 12.28% of the total fund
of DUCB during the year 2009-10, as compared to the year 2008-09. It shown that was a
position of current liability increase (i.e. 15.92%) share of DUCB in the year 2012-13.
Table 3.4 Position of total fund of DUCB (Assets)
Year Fixed Asset Investment Current Asset Total

84
2008-09
Base year
2347956823.00
(44.44%)
1922425558.00
(36.38%)
1013155417.00
(19.18%)
5283537798.00
(100.00%)
2009-10
2821752721.00
(47.07%)
2013136262.00
(33.58%)
1160294103.00
(19.35%)
5995183086.00
(100.00%)
2010-11
3226722631.00
(48.17%)
2088314588.00
(31.17%)
1383890827.00
(20.66%)
6698928052.00
(100.00%)
2011-12
3586753064.00
(46.00%)
2412045196.00
(31.00%)
1854406746.00
(23.00%)
7853205006.00
(100.00%)
2012-13
4091218372.00
(43.36%)
3149001651.00
(33.37%)
2196141941.00
(23.27%)
9436361964.00
(100.00%)
Table 3.4 Position of total fund of DUCB (Assets)
Source: - Annual Reports of 2008-09 to 2012-13 of DUCBA.
Note: - 1. The figure in bracket indicates percentage over the previous year
Findings: -
1. It appears from table 3.4 that Fixed Asset accounted 44.44% of the total funds with
DUCB during 2009-10, as compared to the year 2008-09. It indicated that was a position
of DUCB slight decline (i.e. 43.36%) in the share of Fixed Asset of the end of year 2012-
13.
2. It seen from table 3.4 that Investment accounted 36.38% of the total funds of the DUCB
during 2009-10, as compared to the year 2008-09. It indicated that was a slight decline
(i.e. 33.37%) in the share of Investment during the year 2012-13.

85
3. It disclosed from table 3.4 that the Current Asset accounted 19.18% of the total fund of
DUCB during the year 2009-10, as compared to the year 2008-09. It shown that was a
position of Current Asset increase share (i.e.23.27%) of DUCB in the end of year 2012-
13.
Table 3.5 Capital Adequacy position of DUCB (In lakh)
Sr.
No
Particular 2008-09 2009-10 2010-11 2011-12 2012-13
01 Tyre-1. Capital 3127.68
(-)
3852.26
(23.16%)
3033.98
(-22%)
3074.94
(01.35%)
3853.85
(25.33%)
02 Tyre-2 Capital 788.68
(-)
782.39
(-01%)
1107.55
(41.55%)
1256.10
(13.41%)
1325.61
(05.53%)
03 Total(A+B)Capital 3916.36
(-)
4634.65
(18.35%)
4141.53
(-10.64%)
4331.04
(04.57%)
5179.46
(19.58%)
04 Total Risk Load
on Property
24028.03
(-)
31197.45
(29.83%)
35120.07
(12.57%)
34936.90
(-01%)
40581.53
(16.15%)
05 CRAR 16.30% 14.86% 11.79% 12.40% 12.76%
Source:- Annual Reports of 2008-09 to 2012-13 of DUCBA
Table 3.5 Capital Adequacy position of DUCB (In lakh)

86
Source:- Annual Reports of 2008-09 to 2012-13 of DUCBA.
Note: - 1. The year 2008-09 is an assumed as base year.
2. The figure in bracket indicates percentage over the previous year.
Findings: - It was disclosed from the table 3.5 that Capital Adequacy accounted 16.30% t of
DUCB during the year 2008-09. As compared to the year of 2012-13, it indicated that was a
slight decline from (16.30% to 12.76%) of the end of year 2012-13.
Table 3.6 Mixer of Bank Deposits on 2008-2013(Share of Total fund Deposits) (In Lakh)
Sr.
No
Type of Deposits 2008-09 2009-10 2010-11 2011-12 2012-13
01 Current Deposits 1548.00
(4.32%)
2191.89
(5.37%)
3042.31
(6.63%)
2208.39
(4.18%)
3229.45
(4.98%)
02 Saving Deposits 8274.67
(23.07%)
10411.30
(25.52%)
13109.65
(28.56%)
13041.71
(24.68%)
14318.45
(22.08%)
03 Fixed Deposits 26036.10
(72.61%)
28194.86
(69.11%)
29746.75
(64.81%)
38584.01
(71.14%)
47304.94
(72.94%)
3589.00 40798.00 45899.00 52834.00 64853.00
Total (100.00%) (100.00%) (100.00%) (100.00%) (100.00%)
Source: - Annual Reports of 2008-09 to 2012-13 of DUCBA

87
Table 3.6 Mixer of Bank Deposits on 2008-2013(Share of Total fund Deposits) (In Lakh)
Source: - Annual Reports of 2008-09 to 2012-13 of DUCBA
Note:- 1. The year 2008-09 is an assumed as base year.
2. The figure in bracket indicates percentage over the total fund.
Findings: -
1. It disclosed from the table 3.6 that Current Deposits accounted 4.32% to the total deposit
of DUCB during the year 2008-09. As compared to the year of 2012-13, it indicated that
was a slight increase the share of current deposit (i.e. 4.98%) of the end of year 2012-13.
2. It seen from the table 3.6 that the saving Deposits accounted 23.07% of the total fund
DUCB during the year 2008-09. As compared to the year 2012-13, it shown that was a
slight decline the share of saving deposit (i.e. 22.08%) of the end of the year 2012-13.

88
3. It revealed from the table 3.6 that the Fixed Deposits accounted 72.61% of the total fund
DUCB during the year 2008-09. As compared to the year 2012-13, it shown that was a
slight change the share of saving deposit (i.e. 72.94%) of the end of the year 2012-13.
Table 3.7 Net Growth and Mixer of Bank Deposits on 2008-2013. (In Lakh)
Sr.
No
Type of
Deposits
2008-09 2009-10 2010-11 2011-12 2012-13 Total
01 Current
Deposits
1548.00
(-)
2191.89
(41.60%)
3042.31
(38.79)
2208.39
(27.42%)
3229.45
(46.23%)
12220
(99.00%)
02 Saving
Deposits
8274.67
(-)
10411.30
(25.82%)
13109.65
(25.91%)
13041.71
(-0.52%)
14318.45
(09.78%)
59156
(61.00%)
03 Fixed
Deposits
26036.10
(-)
28194.86
(08.29%)
29746.75
(05.50%)
38584.01
(29.70%)
47304.94
(22.60%)
169867
(66.09%)
Source: - Annual Reports of 2008-09 to 2012-13 of DUCBA
Chart 3.7 Net Growths and Mixer of Bank Deposits on 2008-2013. (In Lakh)

89
Source: - Annual Reports of 2008-09 to 2012-13 of DUCBA.
Note:- 1. The year 2008-09 is an assumed as base year.
2. The figure in bracket indicates percentage over the previous year.
Findings: -
1. The Fixed Deposits was in the year 2008-09 is Rs 26036.10 lakhs and in the year 2012-
13 is Rs 47304.94 lakhs. There is increasing Rs. 21208.84 lakhs and percentage is
81.69%%. It is good sign of capital growth. The fixed deposits showed an increasing
trend during previous year (table 3.7).
2. The Saving Deposits was in the year 2008-09 is Rs 8274.67lakhs and in the year 2012-13
is Rs 14318.45 lakhs. There is increasing Rs. 6043.78 lakhs and percentage is 73.04%%.
It is good sign of capital growth. The saving deposits showed an increasing trend during
previous year (table 3.7).
3. The Current Deposits was in the year 2008-09 is Rs 1548.00 lakhs and in the year 2012-
13 is Rs 3229.45 lakhs. There is increasing Rs. 1681.45 lakhs and percentage is
108.62%%. It is good sign of capital growth. The current deposits showed an increasing
trend during previous year (table 3.7).

90
Table 3.8 Short term liquidity position of DUCB
Source: - Annual Reports of 2008-09 to 2012-13 of DUCBA.
Chart 3.8 Short term liquidity position of DUCB
Year Particular Ratio
2008-09 1031155417.00
649076621.00 1.59
2009-10 1160294103.00
801143868.00 1.45
2010-11 1383890827.00
892431431.00 1.55
2011-12 1854406746.00
1233909855.00 1.50
2012-13 2196141941.00
1501976592.00 1.46
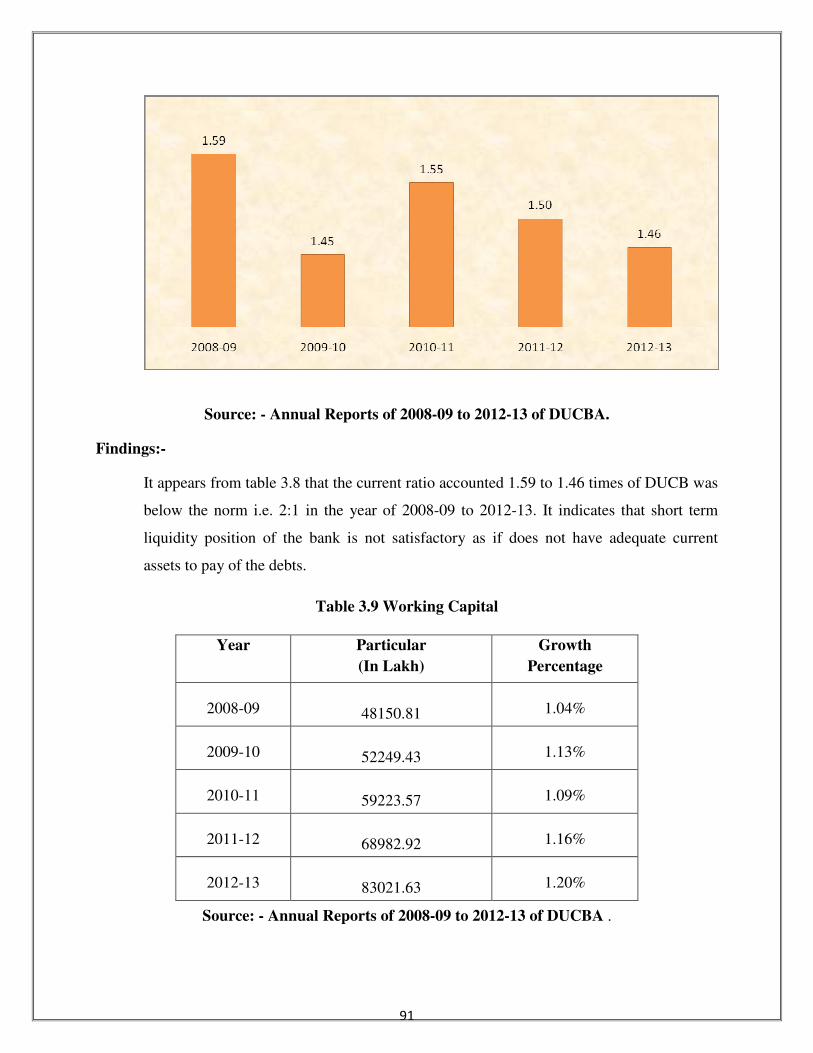
91
Source: - Annual Reports of 2008-09 to 2012-13 of DUCBA.
Findings:-
It appears from table 3.8 that the current ratio accounted 1.59 to 1.46 times of DUCB was
below the norm i.e. 2:1 in the year of 2008-09 to 2012-13. It indicates that short term
liquidity position of the bank is not satisfactory as if does not have adequate current
assets to pay of the debts.
Table 3.9 Working Capital
Source: - Annual Reports of 2008-09 to 2012-13 of DUCBA .
Year Particular
(In Lakh)
Growth
Percentage
2008-09
48150.81 1.04%
2009-10
52249.43 1.13%
2010-11
59223.57 1.09%
2011-12
68982.92 1.16%
2012-13
83021.63 1.20%

92
Chart 3.9 Working Capital
Source: - Annual Reports of 2008-09 to 2012-13 of DUCBA.
Note: - The 2007-08 is an assumed as base year
Findings: -
It disclosed from table 3.9 that the working capital accounted 1.04% in the year 2008-09
and 1.20% in the year 2012-13. The growth of percentage is that 0.16% in the
last/previous year 2007-08
Table 3.10 Fixed Assets to Proprietary Fund Ratio
Fixed Assets to Proprietary Fund Ratio= Fixed Asset/Proprietor’s Fund.

93
Source: - Annual Reports of 2008-09 to 2012-13 of DUCBA
Chart 3.10 Fixed Assets to Proprietary Fund Ratio
Source: - Annual Reports of 2008-09 to 2012-13 of DUCBA.
Findings: - It appears from table 3.10 that the fixed asset to proprietary funds ratio accounted
2.24 times in the year 2008-09 and 2.82 in the year 2012-13 of DUCB.The increasing growth of
the percentage by 0.58 in the preceding year
Table 3.11 Debt Equity Ratio
Year Particular Ratio
2008-09 2347956823.00
1048584510.00 2.24
2009-10 2821752721.00
1114234567.00 2.53
2010-11 3226722631.00
1216626072.00 2.65
2011-12 3586753064.00
1335877815.00 2.68
2012-13 4091218372.00
1449128267.00 2.82

94
Source: - Annual Reports of 2008-09 to 2012-13 of DUCBA
Chart 3.11 Debt Equity Ratios
Source: - Annual Reports of 2008-09 to 2012-13 of DUCBA
Findings:-
It seen from table 3.11 that the debt equity ratio accounted 3.42 in the year 2008-09 and
4.47 in the year 2012-13 of DUCB was above the norm i.e. 1:1.The increasing growth of
percentage by 1.05 in the last year.
Year Particular Ratio
2008-09 3585876667.00
1048584510.00 3.42
2009-10 4079804833.00
1114234567.00 3.66
2010-11 4589870549.00
1216626072.00 3.77
2011-12 5283417336.00
1335877815.00 3.95
2012-13 6485257105.00
1449128267.00 4.47

95
Table 3.12 Fixed Assets to Current Asset
Source: - Annual Reports of 2008-09 to 2012-13 of DUCBA.
Chart 3.12 Fixed Assets to Current Asset
Source: - Annual Reports of 2008-09 to 2012-13 of DUCBA.
Findings: -
It seen from table 3.12 that the fixed asset to current asset accounted 2.32 of DUCB in
the year of 2008-09. It indicates that short term liquidity position of the bank is satisfactory as if
DUCB have adequate position to pay of the debts (i.e. 1.86) in the year 2012-13.
Year Particular Ratio
2008-09 2347956823.00
1013155417.00 2.32
2009-10 2821752721.00
1160294103.00 2.43
2010-11 3226722631.00
1383890827.00 2.33
2011-12 3586753064.00
1854406746.00 1.93
2012-13 4091218372.00
2196141941.00 1.86

96
Table 3.13 Working Capital to Net Worth
Source: - Annual Reports of 2008-09 to 2012-13 of DUCBA.
Chart 3.13 Working Capital to Net Worth
Source: - Annual Reports of 2008-09 to 2012-13 of DUCBA.
Findings:-
It disclosed from table 3.13 that the working capital to net worth accounted 0.35 of
DUCB in the year of 2008-09. It indicates that short term liquidity position of the bank is
satisfactory as if DUCB have adequate position to pay of the debts (i.e.0.48) in the year 2012-13.
Year Particular Ratio
2008-09 364078796.00
1048584510.00 0.35
2009-10 359150235.00
1114234567.00 0.32
2010-11 491459396.00
1216626072.00 0.40
2011-12 620496891.00
1335877815.00 0.46
2012-13 694165349.00
1449128267.00 0.48

97
Table 3.14 Solvency Ratio
Source: - Annual Reports of 2008-09 to 2012-13 of DUCBA.
Chart 3.14 Solvency Ratio
Source: - Annual Reports of 2008-09 to 2012-13 of DUCBA.
Findings:-
It revealed from table 3.14 that the solvency ratio accounted 0.79 of DUCB in the year of
2008-09. It indicates that short term liquidity position of the bank is satisfactory as if DUCB
have adequate position to pay of the debts (i.e.0.79) in the year 2012-13
Year Particular Ratio
2008-09 3361112240.00
4234953288.00 0.79
2009-10 3982046824.00
4880948701.00 0.82
2010-11 4610613458.00
5482301980.00 0.84
2011-12 5441159810.00
6517327191.00 0.83
2012-13 6287360313.00
7987233697.00 0.79

98
Table 3.15 Fixed Assets to Net worth Ratio
Source: - Annual Reports of 2008-09 to 2012-13 of DUCBA .
Chart 3.15 Fixed Assets to Net worth Ratio
Source: - Annual Reports of 2008-09 to 2012-13 of DUCBA .
Findings:-
It appears from table 3.15 that the fixed assets to net worth ratio accounted 2.24 to 2.82
times of DUCB were above the norm i.e. 0.75 in the year of 2008-09 to 2012-13. It indicates that
short term liquidity position of the bank is not satisfactory as if does not have adequate current
assets to pay of the debts.
Year Particular Ratio
2008-09 2347956823.00
1048584510.00 2.24
2009-10 2821752721.00
1114234567.00 2.53
2010-11 3226722631.00
1216626072.00 2.65
2011-12 3586753064.00
1335877815.00 2.68
2012-13 4091218372.00
1449128267.00 2.82
2008-09 2009-10 2010-11 2011-12 2012-13
2.242.53
2.65 2.682.82

99
Table 3.16 Earning Per Shares (EPS).
Source: - Annual Reports of 2008-09 to 2012-13 of DUCBA.
Chart 3.16 Earning per Shares (EPS).
Source: - Annual Reports of 2008-09 to 2012-13 of DUCBA.
Findings:-
It can be seen from the table 3.16 that earning per share accounted Rs. 7 of the DUCB in
the year 2008-09. In the year 2009-10 to 2010-11 earnings per share gone through the high
growth(i.e. 6.28) from Rs 6.27 to Rs. 12.55 and year 2011-12 there was a slight decline (i.e
1.31) from 12.55 to Rs. 11.24 of the DCUB.
Year Particular EPS(Rs)
2008-09 29748798.00
4400254.00 07.00
2009-10 31227544.00
4982191.00 06.27
2010-11 72199974.00
5752788.00 12.55
2011-12 6973718.00
6206677.00 11.24
2012-13 49333879.00
7206134.00 07.00

100
Table 3.17 Proprietary Ratio.
Source: - Annual Reports of 2008-09 to 2012-13 of DUCBA.
Chart 3.17 Proprietary Ratios.
Source: - Annual Reports of 2008-09 to 2012-13 of DUCBA.
Findings: -
Year Particular Ratio
2008-09 1048584510.00
2347956823.00 0.45
2009-10 1114234567.00
2821752721.00 0.41
2010-11 1216626072.00
3226722631.00 0.38
2011-12 1335877815.00
3586753064.00 0.37
2012-13 1449128267.00
4091218372.00 0.35

101
It appears from table 3.17 that the proprietary ratio accounted 0.45 in the year 2008-09
and 0.35 in the year 2012-13. The decreased growth percentage of proprietary position was 0.10
in the previous year.
Table 3.18 Profitability Ratio
Source: - Annual Reports of 2008-09 to 2012-13 of DUCBA.
Chart 3.18 Profitability Ratio
Source: - Annual Reports of 2008-09 to 2012-13 of DUCBA
Findings:-
Year Particular Ratio
2008-09 85983207.00*100
3361112240.00 2.5%
2009-10 74338261.00*100
3982046824.00 1.8%
2010-11 115322863.00*100
4610613458.00 2.5%
2011-12 124862998.00*100
5441159810.00 2.3%
2012-13 116562847.00*100
6287360313.00 1.8%

102
It seen from table 3.18 that Profitability position of 2.50% in the year 2008-09 and
2.80% in the year 2012-13. The increased growth percentage of profitability position of
the bank was 0.30% in the last year.
Table 3.19 Non Performing Assets Ratio
Source: - Annual Reports of 2008-09 to 2012-13 of DUCBA
Chart 3.19 Non Performing Assets Ratio
Year Particular
(In Lakh)
Percentage
Growth
2008-09
325.41 1.67%
2009-10
90.10 0.37%
2010-11
57.53 0.20%
2011-12
903.13 2.91%
2012-13
1534.03 4.30%

103
Source: - Annual Reports of 2008-09 to 2012-13 of DUCBA.
Note: - The 2007-08 is an assumed as base year
Findings: - It appears from table 3.19 that Non Performing Ratio accounted 1.67% of DUCB
in the year of 2008-09. It indicates that position of the bank is not good for the DUCB that was
increased from 1.67% to 4.30% of the DUCB in the end of the year 2012-13.
Table 3.20 Price Earnings Ratio
Source: - Annual Reports of 2008-09 to 2012-13 of DUCBA.
Chart 3.20 Price Earnings Ratio
Year Particular
Ratio
2008-09
25/7 3.57
2009-10
25/6.27 3.99
2010-11
25/12.55 1.99
2011-12
25/11.24 2.22
2012-13
25/7 3.57

104
Source: - Annual Reports of 2008-09 to 2012-13 of DUCBA.
Findings:-
It disclosed from table 3.20 that Price Earnings Ratio accounted 3.57 of DUCB in
the year of 2008-09. It indicates that earning position of the bank is not good for the
DUCB that was from 3.57 to 3.57 that is equal of the DUCB in the end of the year 2012-
13.
Table 3.21 Dividend Yield Ratio
Source: - Annual Reports of 2008-09 to 2012-13 of DUCBA.
Chart 3.21 Dividend Yield Ratios
Year Particular
Percentage
Growth
2008-09
10/25x100 40%
2009-10
10/25x100 40%
2010-11
12/25x100 48%
2011-12
12/25x100 48%
2012-13
12/25x100 48%

105
Source: - Annual Reports of 2008-09 to 2012-13 of DUCBA.
Findings: -
It seen from table 3.21 that Dividend Yield Ratio accounted 40% of DUCB in the year of
2008-09. It indicates that position of the bank is good for the DUCB that was increased from
40% to 48% of the DUCB in the end of the year 2012-13.
Table 3.22 Dividend Payout Ratio
Source: - Annual Reports of 2008-09 to 2012-13 of DUCBA.
Chart 3.22 Dividend Payout Ratios
Year Particular
Ratio
2008-09
10/7 1.43
2009-10
10/6.27 1.59
2010-11
12/12.55 0.96
2011-12
12/11.24 1.07
2012-13
12/7 1.71

106
Source: - Annual Reports of 2008-09 to 2012-13 of DUCBA.
Findings:-
It seen from table 3.22 that Dividend Payout Ratio accounted 1.43 of DUCB in the year
of 2008-09. It indicates that position of the bank is better for the DUCB that was increased from
1.43 to 1.71 of the DUCB in the end of the year 2012-13.
Table 3.23 Interest on Deposits
Source: - Annual Reports of 2008-09 to 2012-13 of DUCBA.
Year Particular
(In Lakh)
Percentage
Growth
2008-09
2539.86 1.02%
2009-10
2912.23 1.15%
2010-11
2638.52 0.91%
2011-12
3292.36 1.25%
2012-13
4650.12 1.19%

107
Chart 3.23 Interest on Deposits
Source: - Annual Reports of 2008-09 to 2012-13 of DUCBA.
Note: - The 2007-08 is an assumed as base year.
Findings: - It disclosed from table 3.23 that Interest on Deposits accounted 1.02% of DUCB in
the year of 2008-09. It indicates that position of the bank that was increased from 1.02% to
1.19% of the DUCB in the end of the year 2012-13.
Table 3.24 Interest on Loan
Source: - Annual Reports of 2008-09 to 2012-13 of DUCBA
Year Particular
(In Lakh)
Percentage
Growth
2008-09
3165.66 1.22%
2009-10
2848.88 0.90%
2010-11
3504.47 1.23%
2011-12
4479.96 1.28%
2012-13
5012.27 1.19%

108
Chart 3.24 Interest on Loan
Source: - Annual Reports of 2008-09 to 2012-13 of DUCBA
Note: - The 2007-08 is an assumed as base year
Findings: - It reveals from table 3.24 that Interest on Loan accounted 1.22% of DUCB in the
year of 2008-09. It indicates that position of the bank is better for the DUCB that was decreased
from 1.22% to 1.19% of the DUCB in the end of the year 2012-13
Table 3.25 Interest on Investment
Source: - Annual Reports of 2008-09 to 2012-13 of DUCBA
Year Particular
(In Lakh)
Percentage
Growth
2008-09
1312.22 1.12%
2009-10
1611.14 1.23%
2010-11
1337.03 0.83%
2011-12
1390.34 1.04%
2012-13
2469.85 1.78%

109
Chart 3.25 Interest on Investment
Source: -Annual Reports of 2008-09 to 2012-13 of DUCBA.
Note: - The 2007-08 is an assumed as base year
Findings: - It reveals from table 3.25 that Interest on Investment accounted 1.12% of DUCB in
the year of 2008-09. It indicates that position of the bank is better for the DUCB that was
increased from 1.12% to 1.78% of the DUCB in the end of the year 2012-13.
Table 3.26 Growth trends of Net Profit
Year Particular
(In Lakh)
Percentage
Growth
2008-09
297.49 0.47%
2009-10
312.27 1.05%
2010-11
722.00 2.31%
2011-12
697.37 0.97%
2012-13
493.34 0.71%

110
Source: - Annual Reports of 2008-09 to 2012-13 of DUCBA.
Chart 3.26 Net Profit
Source: - Annual Reports of 2008-09 to 2012-13 of DUCBA.
Note: - The 2007-08 is an assumed as base year
Findings: - It seen from table 3.26 that Net Profit Ratio accounted 0.47% of DUCB in the year
of 2008-09. It indicates that position of the bank is better for the DUCB that was increased from
0.47% to 0.71 % of the DUCB in the end of the year 2012-13.
Table 3.27 Financial Performance of DUCB (As on 31st March 2013)

111
Source: - Annual Reports of 2008-09 to 2012-13 of DUCBA.
Note - 1. The year 2007-08 is an assumed as base year.
2. The figure in bracket indicates percentage over the previous year.
Findings:-
(Rs in Lakh) Sr. No Particular
2009 2010 2011 2012 2013
1 Paid- up Capital 1100.06
(1.06%)
1245.55
(1.13%)
1438.20
(1.15%)
1551.67
(1.08%)
1801.53
(1.16%)
2 Reserve fund 9088.29
(1.03%)
9584.52
(1.05%)
10006.06
(1.04%)
11109.74
(1.11%)
12196.41
(1.10%)
3 Investment 19224.26
(1.05%)
20131.37
(1.05%)
20883.15
(1.04%)
24120.45
(1.16%)
31490.02
(1.31%)
4 Issued Loan 23479.57
(1.05%)
28217.53
(1.20%)
32267.23
(1.14%)
35867.53
(1.11%)
40912.18
(1.14%)
5 Deposits 35858.77
(1.05%)
40798.05
(1.14%)
45898.71
(1.13%)
52834.17
(1.15%)
64852.57
(1.23%)
6 Net Non-
Performing Debt
325.41
(1.67%)
90.10
(0.37%)
57.53
(0.20%)
903.13
(2.91%)
1534.03
(04.30%)
7 Reserve for bad
debts
4617.34
(0.89%)
5661.08
(1.23%)
6843.01
(1.21%)
9527.20
(1.39%)
11331.06
(1.19%)
8 Priority Debts 15399.16
(1.03%)
16590.71
(1.08%)
17623.19
(1.06%)
15743.91
(0.89%)
24957.96
(1.59%)
9 Working Capital 48150.81
(1.04%)
54249.43
(1.13%)
59223.57
(1.09%)
68982.92
(1.16%)
83020.63
(1.20%)
10 Net Profit 297.49
(0.47%)
312.27
(1.05%)
722.00
(2.31%)
697.37
(0.97%)
493.34
(0.71%)
11 Interest on
Deposits
2539.86
(1.02%)
2912.23
(1.15%)
2638.52
(0.91%)
3292.36
(1.25%)
4650.12
(1.41%)
12 Interest on Loan 3165.66
(1.22%)
2848.88
(0.90%)
3504.47
(1.23%)
4479.96
(1.28%)
5012.27
(1.19%)
13 Income on
investment
1312.22
(1.12%)
1611.14
(1.23%)
1337.03
(0.83%)
1390.34
(1.04%)
2469.85
(1.78%)
14 Other Income 130.40
(0.75%)
136.26
(1.04%)
400.72
(2.94%)
168.50
(0.42%)
382.34
(2.27%)
15 Per employee
Income
373.20
(1.12%)
398.93
(0.80%)
457.11
(1.15%)
451.82
(0.99%)
523.49
(1.16%)
16 Capital Adequacy 16.30%
14.86% 11.79% 12.40% 12.76%

112
1. It appears from the table 3.27 that the paid up capital accounted 1.06% of the DUCB in
the year 2008-09. It indicated that was a paid up capital position of the DUCB increased
from 1.06% to 1.16% that is good for the DUCB of the year 2012-13.
2. It seen from the table 3.27 that the Reserve funds accounted 1.03% of the DUCB in the
year 2008-09. It indicated that was a Reserve funds position of the DUCB increased from
1.03% to 1.10% that is good for the DUCB of the year 2012-13.
3. It disclosed from the table 3.27 that an Investment accounted 1.05% of the DUCB in the
year 2008-09. It indicated that was an Investment position of the DUCB increased from
1.05% to 1.31% that is good for future of the DUCB of the year 2012-13.
4. It reveals from the table 3.27 that an Issued loan accounted 1.05% of the DUCB in the
year 2008-09. It indicated that was an Issued loan position of the DUCB increased from
1.05% to 1.14% that is good for future of the DUCB of the year 2012-13.
5. It reveals from the table 3.27 that the Deposits accounted 1.05% of the DUCB in the year
2008-09. It indicated that was a Deposits position of the DUCB increased from 1.05% to
1.23% that is good for future of the DUCB of the year 2012-13.
6. It observed from table 3.27 that the Non Performing Assets accounted 1.67% of the
DUCB in the year 2008-09. It shows that was growing the position from 1.67% to 4.30%
the Non Performing Assets of the DUCB in the end of year 2012-13.
7. It appears from the table 3.27 that the Reserve for Bad Debts accounted 0.89% of the
DUCB in the year 2008-09. It indicated that was Reserve for Bad Debts position of the
DUCB increased from 0.89% to 1.19% that is not good for the DUCB of the year 2012-
13.
8. It seen from the table 3.27 that the Priority Debts accounted 1.03% of the DUCB in the
year 2008-09. It indicated that was a Reserve funds position of the DUCB increased from
1.03% to 1.59% that is not good for the DUCB of the year 2012-13.

113
9. It disclosed from the table 3.27 that Working Capital accounted 1.04% of the DUCB in
the year 2008-09. It indicated that was an Investment position of the DUCB increased
from 1.04% to 1.20% that is good for future of the DUCB of the year 2012-13.
10. It reveals from the table 3.27 that the Net Profit accounted 0.47% of the DUCB in the
year 2008-09. It indicated that was a Net Profit position of the DUCB increased from
0.47% to 0.71% that is better for future of the DUCB of the year 2012-13.
11. It observed from table 3.27 that the Interest on Deposits accounted 1.02% of the DUCB
in the year 2008-09. It shows that was growing the position from 1.02% to 1.41% the
Interest on Deposits of the DUCB in the end of year 2012-13.
12. It appears from the table 3.27 that the Interest on loan accounted 1.22% of the DUCB in
the year 2008-09. It indicated that was Interest on Loan position of the DUCB slight
decline from 1.22% to 1.19% that is not good for the DUCB of the year 2012-13.
13. It seen from the table 3.27 that the Income on Investment accounted 1.12% of the DUCB
in the year 2008-09. It indicated that was an Income on Investment position of the DUCB
increased from 1.12% to 1.78% that is good for the DUCB of the year 2012-13.
14. It disclosed from the table 3.27 that Other Income accounted 0.75% of the DUCB in the
year 2008-09. It indicated that was an Other Income position of the DUCB increased
from 0.75% to 2.27% that is good for future of the DUCB of the year 2012-13.
15. It observed from table 3.27 that the Per Employee Income accounted 1.12% of the DUCB
in the year 2008-09. It shows that was growing the position of Employee from 1.12% to
1.16% the Per Employee Income of the DUCB in the end of year 2012-13.
16. It reveals from the table 3.27 that the Capital adequacy accounted 16.30% of the DUCB
in the year 2008-09. It indicated that was a Capital adequacy position of the DUCB
Decline from 16.30% to 12.76% that is not better for future of the DUCB of the year
2012-13.
Reference:

114
1. Five Year Annual report 2008-09 to 2012-13 of the Devgiri Urban Co-operative Bank
Ltd Aurangabad.
Chapter -IV
Observations and Suggestions
Chapter IV Observations and Suggestions Page No
4.1 Observations and Suggestions 104-110
Bibliography 111-115
Abbreviation 116-117

115
4.1 Observations and Suggestions:
Co-operative banks have been playing a crucial role in financing rural as well as
urban clients for their ventures. They also are instrumental in mobilizing deposits,
transfer of money and serving the people in number of ways. Urban cooperative banks
have a special role to play in urban areas for supporting entrepreneurs, businessmen and
other needy people by way of providing various financial services.
The following observations and suggestions are summarized as under:
1. The major observation of the study is that the co-operatives in the state of Maharashtra
during last five years have grown remarkably. The number of societies stood at 2, 05,553
in 2007-08, and increased to 2, 44,306 in 2010-11. The growth in number of co-
operatives was 2.39% to 11.90 % respectively during the five years period. Working
capital shown progress in amount as it was Rs. 2,05,110 crores in 2007-08, increased put
Rs. 2,44,834 crores in 2010-11, but growth percentage showed decreased 1.44% to -
0.56% respectively during over the previous year. Net advanced by co-operatives showed
little progress Rs. 88,166 crores 2007-08 increased Rs. 1,00,681 crores in 2010-11, there
was positive growth 6.93% in 2007-08, increased 28.76% in 2010-11. Number of
cooperatives in profit increased from 62,147 in 2007-08 to increase Rs. 70,363 crores in
2010-11, amount of profit was Rs. 2,135 crores in 2007-08 increased put Rs. 3,661 crores
in 2010-11, shows positive progress 0.42% to 3.44%. Number of societies in loss

116
increased from 55,257 in 2007-08 to increase 59,636 in 2010-11, percentage of societies
in loss decreased by 7.14% in 2006-07 to -0.97 % in 2010-11. However the amount of
loss increased from Rs. 4,051 crores in 2007-08 to Rs. 4,526 crores in 2010-11, but the
percentage increased from 20.53% in 2007-08 to 26.81 % in 2010-11, shows a good sign
(table 1.3).
In this regard, Urban Cooperative banks in the state of Maharashtra playing major role in
urban as well as rural also. UCB performance of the last five year No. of societies, No. of
Member, Share capital, deposits, Working capital, loan & advances and profit also
increasing year by year.
2. It was seen that the share capital and Reserve funds accounted combined18.66% and
23.58% of the aggregate funds of the bank in the year 2009-10 and 2012-13 respectively.
The net growth of share capital and Reserve fund combined was 4.92% in the previous
year (table 3.1).
It should be noted that the bulk of the contribution to share capital and Reserve fund is
made by the member institutions.
3. The data analysis revealed that the long term liability of DUCB accounted 13.77% and
22.75% of the aggregate funds in the year 2009-10 and 2012-13 respectively. The net
growth of long term liability was 8.98% in the five year study of bank in the preceding
year (table 3.1).
The growth in long term liabilities of the indicates that the bank is expanding its business
operations with the increased funds
4. During five year of the study the combination of current liability accounted 23.42% in the
year 2009-10 and 21.72% in the year 2012-13.The decreased percentage growth of
current liability was 1.70% in the year of five year study period (table 3.1).
The current liability growth rate is not that much of satisfactory but bank should decrease
this growth rate also.

117
5. The Fixed assets the DUCB accounted 20.18% of total assets in the year 2008-09 and
14.07% in the year 2012-13. The decrease in assets can be attributed to restructuring of
the bank assets (table 3.2).
It is suggested that the bank should improve the asset position of the bank.
6. During five year of the study the combination of current asset accounted 14.52% in the
year 2008-09 of the year to year growth and 18.43% in the year 2012-13.The increased
percentage growth was 3.91% in the study of the period (table 3.2).
The growth of the current asset position of the DUCB it is satisfactory, but it is suggested
that the bank should take proper care of the bank’s Assets.
7. The Capital Adequacy of the five year study indicated decreasing growth trend. Capital
adequacy Ratio accounted 16.30% to 12.76% during the year 2008-09 to 2012-13. The
decreased growth of the capital adequacy was 3.54% in the last year (table 3.5).
The rate of the capital adequacy it is not satisfactory, so it may be suggested that bank
should improve the position of capital adequacy by issuing additional equity capital.
8. One of the major observations of the study is that Current Deposits, savings deposits and
term deposits had shown positive growth over the period of five years. However, the
growth in deposits was not satisfactory. Current deposits grew between 0.66-4.98%.(table
3.6).
In this regard, it may be suggested that the bank should encourage tradesmen and
businessmen to open current accounts with the bank.
9. The saving Deposits accounted 23.07% of the total fund in the year 2008-09 and 22.08%
in the year 2012-13. The decreased percentage growth was 0.99% in the last year (table
3.6).
It is focused that saving deposit it is not satisfactory, but bank should focus on how to
increase the saving deposit of the bank.

118
10. The discloser of the study is that the Fixed Deposits was accounted 72.61% of the total
fund in the year 2008-09 and 72.94% in the year 2012-13. The increased percentage
growth was 0.33% in the five year study period (table 3.6).
It is observed that fixed deposit of the bank is not that much of better that purpose bank
should take proper care of the fixed asset of the bank.
11. It was appeared that the current ratio accounted 1.59 to 1.46 times of DUCB was below
the norm i.e. 2:1 in the year of 2008-09 to 2012-13. It indicates that short term liquidity
position of the bank is not satisfactory as if does not have adequate current assets to pay
of the debts (table 3.8).
With regard to the short term liquidity of DUCB it is suggested that the bank should take
proper care of current asset management and liquidity position is maintained at
satisfactory level
12. The working capital ratio indicated increasing growth trend of working capital accounted
1.04% to 1.20% of DUCB in the year of 2008-09 to 2012-13 respectively.(Table 3.9)
It could be understood that the bank is able to mobilize working capital more than 1.2
times of the average working capital of the DUCB.
13. During five years of the study the composition of the fixed asset to proprietary funds
position increasing growth trend of accounted 2.24 to 2.82 times of DUCB in the year of
2008-09 to 2012-13. In this five year study fixed asset to proprietary fund increase 0.58
(table 3.10).
It can be concluded that the assets of the DUCB bank is sufficient to cover its liabilities.
14. It was seen that the debt equity ratio growth trends accounted 3.42 in the year 2008-09
and 4.47 in the year 2012-13. The norm of debts equity ratio i.e. 1:1. It indicates that
short term liquidity position of the bank is not satisfactory as if does not have adequate
position to pay of the debts in the year 2012-13(table 3.11).
119
It is observed that the position of the debt equity ratio of the bank is not satisfactory. It is
suggested that the bank should decrease the growth of debts equity ratio position of the
bank.
15. It was disclosed that the fixed asset to current asset ratio indicated decreasing growth
trend of assets accounted 2.32 to 1.86 of DUCB during the year of 2008-09 to 2013
respectively (table 3.12).
In this regard, it is suggested that the bank should find out the ways and means to
increase the share of the fixed asset and current asset of the unit.
16. The working capital to net worth accounted 0.35 of DUCB in the year of 2008-09 and
0.48 in the year 2012-13. It indicates that short term liquidity position of the bank is less
contribution of the unit in the year 2012-13 (table 3.13).
The working capital position of the bank is satisfactory. It is suggested that the bank
should take proper care of the working capital.
17. One of the major observations of the study solvency ratio accounted 0.79 of DUCB in the
year of 2008-09 and 0.79 in the year 2012-13. It indicates that solvency position of the
bank equal (i.e. 0.79 to 0.79) to during five year 2008-09 to 2012-13 (table 3.14).
It is suggested that the bank should find out the ways and means to increase the share of
the asset as compared to the liability that is better for the bank.
18. The earnings per share Rs. 7 in the year 2008-09 and 7 in the year 2012-13. In this five
year study period bank not improve his position of the bank was an equal (table 3.16).
In this observation, it is suggested that the bank should find out the causes behind that
and that causes convert in to earning and improve the share of bank.
19. With regard to the Profitability position of the unit under the study. It was observed that
profitability position by 2.50% in the year 2008-09 and 1.80% in the year 2012-13. The
indicated that the profitability position decreasing 0.70% (table 3.18).
120
In this regard, bank should take proper care of the profitability position of the bank. It is
suggested bank should extend the loan facility to the customers.
20. One of the major observations of the study is that Non-Performing Asset position of the
unit indicated the high growth by 1.67% to 4.30% of the DUCB in the year of 2008-09 to
2012-13 respectively (table 3.19).
As per observation, the position of the Non-performing asset it is not satisfactory. It is
suggested that the bank should take proper care of the assets of the DUCB and reduce
NPAs.
21. The Price Earnings position of the unit under study had shown growth by Rs. 3.57 in the
year 2008-09 and Rs 3.57 in the year 2012-13. In this five year period of the study price
earning position of the DUCB was equal (table 3.20).
It may be suggested that the bank should find out the ways to increase the share of Price
earning position substantially in order to strengthen the financial position of the bank.
22. The Dividend Yield position during five years of the study it was 40% in the year of
2008-09 and 48% in the year o 2012-13. In this five year period dividend yield position
increasing 8% (table 3.21).
In place of distributing dividends, it is suggested that the bank should reinvest profits to
strengthen working capital position.
23. The Dividend Payout position was1.43 in the year 2008-09 and 1.71 in the year 2012-13.
In this five year period dividend payout position increased was 0.28 (table 3.22).
It is should be suggested that the DUCB shows a satisfactory growth rate.
24. Interest on Deposits was in the year 2008-09 is Rs 2539.86 lakhs and in the year 2012-
13 is Rs 4650.12 lakhs. There is increasing Rs. 2110.26 lakhs and percentage is 83.09%.
It is not good sign of capital growth. The interest on deposits showed an increasing trend
during last year (table 3.23).

121
In this observation, interest on deposit of the bank it should focus on decreasing the
interest on deposit.
25. Interest on Loan was in the year 2008-09 is Rs 3165.66 lakhs and in the year 2012-13 is
Rs 5012.27 lakhs. There is increasing Rs. 1846.61 lakhs and percentage is 58.33%. It is
good sign of capital growth. The interest on loan showed an increasing trend during last
year (table 3.24).
Although the rate of in interest on deposit has increased, the bank should try to obtain
more funds through acceptance of deposits.
26. Interest on Investment was in the year 2008-09 is Rs 1312.22 lakhs and in the year 2012-
13 is Rs 2469.85 lakhs. There is increasing Rs. 1157.63 lakhs and percentage is 88.22%.
It is good sign of capital growth. The interest on Investment showed an increasing trend
during last year (table 3.25).
The growth of investment of DUCB bank is satisfactory. However good investment
opportunities can be explored for gainful investment considering calculating risk factors.
27. Net profit was in the year 2008-09 is Rs 297.49 lakhs and in the year 2012-13 is Rs
493.34 lakhs. There is increasing Rs. 195.85 lakhs and percentage is 65.83%. It is good
sign of capital growth. The net profit showed an increasing trend during last year (table
3.26).
Net Profit of the DUCB shows a satisfactory growth rate. It is suggested that the Bank
should try to keep the same trend in future.
28. Paid up share capital was in the year 2008-09 to 2012-13 there is increasing Rs 1801.53
lakhs from 1100.06 lakhs. The share capital of bank shown an increasing Rs 701.47 lakhs
and percentage is 63.77%. It is good sign of capital growth. The share of the bank had
shown an increasing trend during the last year (table 3.27).
Share capital is the foundation of financial structure of the bank. Therefore it is suggested
that bank should try strengthen the equity base.

122
29. Reserve fund was in the year 2008-09 is Rs 9088.29 lakhs and in the year 2012-13 is Rs
12196.41 lakhs. There is increasing Rs. 3108.12 lakhs and percentage is 34.20%. It is
good sign of capital growth. The reserve fund showed an increasing trend during last year
(table 3.27).
Reserve fund also contribute the net worth of the bank and therefore it is suggested that
the bank should add to for reserve fund to meet the need of capital.
30. The Deposits was in the year 2008-09 is Rs 35858.77 lakhs and in the year 2012-13 is Rs
64852.57 lakhs. There is increasing Rs. 28999.80 lakhs and percentage is 80.86%. It is
good sign of capital growth. The Issued loan showed an increasing trend during previous
year (table 3.27).
In this regard, it may be suggested that the bank should find out the ways and means to
increase the share of deposits substantially in order to strengthen the financial position of
the bank.
31. It was observed that the Reserve for Bad Debts was shown growth by the 0.30% of the
unit in the year 2007-08. It indicated that was Reserve for Bad Debts position of the unit
was not good for the bank (Table 3.27).
Ii is suggested that the bank should find out the ways to reduce bad debts in order to
improve financial position of the bank.
32. During five years of the study that was Priority Debts had shown growth by 0.56% in
over the previous year i.e. 2007-08. The priority Debts of the unit had less contribution of
the total income of the bank (table 3.27).
It can be concluding that there is need to concentrate on priority sector while formulating
credit policy of DUCB.
33. It was disclosed that Other Income of the unit under study had shown growth by 1.52%
in over the preceding year i.e. 2007-08. The income from other sources of the bank had
less contribution in the total income of the bank (table 3.27).
123
In this regard, it may be suggested that the bank should find out the ways and means to
increase the share of other income substantially in order to strengthen the financial
position of the bank.
34. It was observed that the Per Employee Income of the unit under study had shown a very
meager growth by 0.04% in over the previous year i.e. 2007-08. The per employee
income of the bank was not satisfactory (table 3.27).
It may be suggested that the bank should find out the ways to increase the income of per
employee in order to strengthen the financial position of the bank.
Bibliography:-
1. Upendra Rai (2011):-“Banking Awareness”, Arihant publications (India)
Limited, ISBN-978-81-8348-908-9.
2. Dr.K.V.S.N, Jawahar Babu, B.Muniraja Selkhar,(2012):-“ The Emerging Urban Co-
Operative Banks (Ucbs) In India”, IOSR Journal of Business and Management
(IOSRJBM)ISSN: 2278-487X Volume 2, Issue 5 (July-Aug. 2012), PP 01-05.
3. www.rbi.org.in
4. B. D. Patil (2013): “Growth and Progress of Co-Operative Movement In
Maharashtra”, Online International Interdisciplinary Research Journal, ISSN2249-9598,
Volume-III, Issue-VI, Nov-Dec2013.
5. Dr.S.N. Maheshwari (2009):-“Financial Management”, Sultan chand &
sons Education Publication/publisher New Delhi.
6. Reddy, Appannaiah, Satyaprasad (2007):- “Financial Management”,
Himalaya Publication House.

124
7. Kulkarni P.V and Satyaprasad (2009):- “Financial Management”,
Himalaya Publishing House, Ramdoor, Dr. Bhalerao Marg, Girgaon, Mumbai-400 004.
8. Dr. Vijay Upagade , Dr Arvind Shende (2013):-“Research
Methodology”, S. Chand & Company Pvt. Ltd. Ram Nagar, New Delhi-110055.
9. Dr. Pradip Agalave (2010);-“Social Research”, Shri Sai Publication, 1
Bhagwaghar, Complex, Dharampeth, Nagpur.
10. Dr. A. K. Phophalia:- “ Modern Research Methodology”, Paradise
Publications Jaipur.
11. Dr. N.S.S. Nehru (2012):- “Research Methodology”, APH Publications
corporation Ansari Road, Dary Gans- New Delhi.
12. Dr. A. K. Singhal:-“A text Book of Accounting for managers for
management students”, JBC publications & distribution New Delhi-11022.
13. Agale Sudhir Vasantrao (2012):- “Progress of District Central
Cooperative Banks in Maharashtra”, International Referred Research Journal, February,
2012. ISSN- 0975-3486, RNI-RAJBIL 2009/30097; VoL.III ISSUE-29.
14. D.A. Divekar (2013):- Banking System UCBs in Pune, Journal of Co-
operative management, Vol.No.48 No.1 ISSN No.0302-7767.
15. V. Alagu Pandian and R.K. Sharma (2013):-“VSRD International
Journal of Business and Management Research”, Vol. III Issue IX, ISSN: 2231-248X, p-
ISSN: 2319-2194 VSRD International Journals.
16. Jayashree R. Kotnal, DR. L. C. Mulguand (2013):- CASE STUDY OF
SHREE SIDDESHWAR CO-OPERATIVE BANK, BIJAPUR, and Asian Journal of
Multidimensional Research Vol.2 Issue 3, March 2013, ISSN 2278-4853.
17. Ms. Shachi Pareek (2012):-“Urban Co-operative Banks in Jaipur District
International Indexed & Referred Research Journal”, June, 2012. ISSN- 0975-3486, RNI-
RAJBIL 2009/30097.

125
18. Dr. Padmaja, B., Dr. BhanuKiran, C. and Dr. Rama Prasada Rao, C.
H (2013).“Financial Performance of Anantapur Urban Cooperative Bank, International
Journal of Current Research”, Vol. 5, Issue, 06.
19. Subrahmanya Bhat. K. M/ Dr.I Bhanu Murthy(2012):-“ Financial
Performance of “The Goa State Co-operative Bank Ltd”, Indian Journal of Research,
Volume: 1 | Issue: 9 | September 2012 ISSN - 2250-1991.
20. Dr. M. Nallusamy (2012):-“Financial Performance Of The Salem District
Central Co-Operative Bank”, Volume: 1 | Issue: 9 | September 2012 ISSN - 2250-1991.
21. Ms Geeta Sharma and Dr Ganesh Kawadia (2011):-“Indian Urban
Cooperative Banking Sector for Better Survival”, Volume: 1 | Issue: 9 | September 2011
ISSN - 2250-1991.
22. VIDYA PITRE (2003):- “Urban Cooperative Banks: Issues and
Prospects”, Economic and Political Weekly April 12, 2003, Volume: 3 | Issue: 8 | Aug 2013 |
ISSN - 2249-555X.
23. Heiko Hesse and Martin Čihák (2007):-“Cooperative Banks and
Financial Stability”, 2007 International Monetary Fund WP/07/2.
24. Narayana Gowd Talla, Anand Bethapudi and Reddeppa Reddy
G(2009):-“Analytical Study on Financial Performance UCB”, VOLUME NO.2, ISSUE
NO.8, ISSN 2277-1166.
25. DR. SEEMA SANT*; DR P.T CHAUDHARI (2012);- “A study of the
profitability of urban cooperative banks” zenith international journal of multidisciplinary
research vol.2 issue 5, may 2012, Issn 2231 5780.
26. Dr. Sandip K. Bhatt, Dharmendra P. Patel (2013):- “ROLE OF
URBAN CO-OPERATIVE BANKS IN SUSTAINABLE DEVELOPMENT OF INDIA”,
VOLUME: 1/ISSUE: 4/ JULY 2013/ ISSN 2320 – 7620.
27. Dr R.Renuka and C.Elamathi (2013):- “Development of Cooperative
Banking in India”, Volume: 3 | Issue: 8 | Aug 2013 | ISSN - 2249-555X.

126
28. N. Babitha Thimmaiah1, Jnaneshwar Pai Maroor2 and Shainy V.P
(2013):-“Global Journal of Management and Business Studies.ISSN 2248-9878 Volume 3,
Number 3 (2013).
29. Jyoti Gupta, Suman Jain (2012):- “ study on Cooperative Banks in India
with special reference to Lending Practices”, International Journal of Scientific and Research
Publications, Volume 2, Issue 10, October 2012 1 ISSN 2250-3153.
30. Dr. R. G. Rasal (2011):- “Performance of District Central Cooperative
Banks During Post-reform period with special reference to Ahmednagar District Central
Cooperative Bank”, Indian Streams Research JournalVol - I, ISSUE - V [July 2011]:
Economic ISSN:-2230-7850.
31. SANJAY KANTI DAS (2012):-“Operational and Financial Performance
Analysis Of meghalaya Cooperative Apex Bank”, Volume 2, Issue 3 (March, 2012) ISSN
2231‐4288.
32. (Dr) E. Gnanasekaran, Dr. M. Anbalgan, N. Abdul Nazar,(2012):-“
A study on the Urban Cooperative Banks Success and growth in Vellore District – Statistical
Analysis”, International Journal of Advanced Research, Volume 2, Issue 3, March 2012
ISSN: 2277 128X.
33. Mr. Durgesh Ashok Badhe (2011):-“Role of Urban Co-operative Banks
in Sustainable Development of India”, Research Student, Department of Economics, Solapur
University, Solapur.
34. Dr. Purushottam Vishnu Deshmukh,(2013):-“The Performance of
Cooperative Banking in India”, Volume : 3 | Issue : 5 | May 2013 | ISSN - 2249-555X.
35. B Munirajasekhar and B Sudheer,(2013):-“Core Banking Solutions in
Urban Cooperative Banks- Issues and Challenges”, B Munirajasekhar et al./ Elixir Fin.
Mgmt. 55 (2013) 12820-12824.
127
36. Dr.K.V.S.N, Jawahar Babu, B.Muniraja Selkhar,(2012):-“ The
Emerging Urban Co-Operative Banks (Ucbs) In India”, IOSR Journal of Business and
Management (IOSRJBM)ISSN: 2278-487X Volume 2, Issue 5 (July-Aug. 2012), PP 01-05.
37. Narayana Gowd Talla, Anand Bethapudi, and Reddeppa Reddy
G.(2011):- “An Analytical Study On Financial Performance Of Dharmavaram Urban
Cooperative Bank, A.P, and India”, Abhinav National Monthly Refereed Journal Of
Research In Commerce & Management, VOLUME NO.2, and ISSUE NO.8 ISSN 2277-
1166.
38. Gaurav Kumar Gupta and Sanjeev Gupta (2013):- “Financial
performance of Urban Cooperative Bank (UCB) in Lakhimpur Kheri district of U.P.”
International Journal of Commerce and Business Management, Volume 6 | Issue 1 | April,
2013 | 134-137.
39. DR. VILAS BHIKAJI KHANDARE (2012):-“Some Issues In Customers
Services of Urban Cooperative Banks: A Case Study of Beed District” International Journal
of Social Science & Interdisciplinary Research, Vol.1 Issue 10, October 2012, ISSN 2277
3630.
40. K. Ravichandran,V. Alagu Pandian,(2013):- “An Economic Analysis Of
Visvesvarya Urban Cooperative Bank”, International Journal of Management and Social
Sciences Research (IJMSSR) ISSN: 2319-4421 Volume 2, No. 1, January 2013.
41. Ramesh Chander, Jai Kishan Chandel (2010):- “Financial Viability and
Performance Evaluation of Co-Operative Credit Institutions in Haryana (India)”,
International Journal of Computing and Business Research (IJCBR) Volume 1, N. 1
December – 2010.
42. S. Thyagarajan (2009): -“Women's Co-Operative Bank Promoting and
Practicing Financial Inclusion of Rural Poor Women”, Member of Faculty, College of
Agricultural Banking, Reserve Bank of India, Pune 411016.

128
43. Padmini E.V.K (1997):-“Funds Management of District Co-Operative
Banks In Kerala”, Cochln University f Science and Technology Cach I N - 682 022,
KERALA 1997
44. Dr.K.V.S.N Jawahar Babu (2012):-“Performance Evaluation of Urban
Cooperative Banks In India”, IOSR Journal of Business and Management (IOSRJBM) ISSN:
2278-487X Volume 1, Issue 5 (July-Aug. 2012.
45. Dr. S. Mayilvaganan, E. Soundararajan, (2013):- “Urban Co-Operative
Banks in India – an Overview”, Volume: 2 | Issue: 8 | Aug 2013 ISSN - 2250-1991.
46. Alok Goyal and Harvinder Kaur (2011):- “Performance evaluation of
urban cooperative banks in India”, Alok Goyal et al Elixir Mgmt. Arts 31 (2011) 1966-1973,
ISSN.2229-712X.
47. Deshmukh Jagdish and Somalkar Prakash (2010):- “Urban Co-
Operative Banks – Past, Present & Future Scenario”, Abhinav national monthly refereed
journal of research in commerce & management, VOLUME NO.2, ISSUE NO.1 ISSN 2277-
1166.
48. Dr. R. B. Teli (2005): Performance evaluation of urban co-operative bank
in Kolhapur district”, The Maharashtra Co-operative Quarterly, sept-kjune-2000.
49. Dr. B. S. Gite (2005): “Performance evaluation of Mahila Urban Co-
operative Banks in Parbhani District”.
50. Miss Banishree Das and Nirod Kumar palai (2006):” Problem and
prospects of the co-operative movement in India under the globalization regime”. Paper
presented in IXV international economy history congress, Hel-Sinki (2006 Session 72.
51. B. D. Patil (2013): “Growth and Progress of Co-Operative Movement In
Maharashtra”, Online International Interdisciplinary Research Journal, {Bi-Monthly},
ISSN2249-9598, Volume-III, Issue-VI, Nov-Dec2013.
52. Rai Upendra (2011):-“Banking Awareness”, Arihant publications (India)
Limited, ISBN-978-81-8348-908-9, page no. 102-114.

129
53. Roy Partho Partim (2001): Management of Urban Co-operative Banks,
Himalaya Publishing house, Mumbai.
54. Mr. Katkade Maruti Baburao (2010): “An Evaluation study of financial
performance and non Performing Asset of Urban Co-operative banks in Beed District”,
December -2010.
55. Ratnaparkhe Santosh Dattatray (2011): “A Study on Financial
Performance Appraisal of loans & Advances of Bombay Mercantile Co-operative Banks Ltd.
Aurangabad.
56. Aghav M.P. (2009): “An evaluatory study of financial management of
district central co-operative banks in Marathwada (1997-2007).
57. Five Year Annual report 2008-09 to 2012-13 of the Devgiri Urban Co-operative Bank Ltd
Aurangabad.
Abbreviation:-
RBI : Reserve Bank of India
UCB : Urban Co-operative Banks
DCCBs : District Central Co-operative Banks

130
SCB : State Co-operative Banks
CCB : Central Co-operative Banks.
NABARD : National Bank for Agricultural and Rural Development
PACBS : Primary Agricultural Credit Banks
CRR : Cash Reserve Ratio
SLR : Statutory Liquidity Ratio
HP : House Power
MT : Medium Term
ST : Short Term
LT : Long Term
MBD : Meeting of Board of Director
MLC : Meeting of Loan Committee
MLRC : Meeting of Loan Recovery Committee
MEC : Meeting of Employee Committee
MAIC : Meeting of Audit and Inspection Committee
MPC : Meeting of Purchase Committee
MIC : Meeting of Investment Committee
MALC : Meeting of Asset and Liability Committee
MSAC : Meeting of Settlement Committee
FD : Fixed Deposits
SD : Saving Deposits
CD : Current Deposits
FA : Fixed Asset
CA : Current Asset
FL : Fixed Liability
131
CL : Current Liability
SC : Share Capital
LTL : Long term Liability
RF&S : Reserve Fund & Surplus
CCO : Cash Credit Overdraft
RF : Reserve Fund
Div : Dividend
EWF : Employee Welfare Fund
MWF : Member Welfare Fund
BF : Building Fund
CF : Charity Fund
DAF : Deferred Asset Fund
AIF : Ascending of Invent Fund
CRAR : Capital Adequacy Ratio