Performance Contracting, Organizational Environment and ...
14
International Journal of Education and Research Vol. 3 No. 10 October 2015 501 Performance Contracting, Organizational Environment and Quality of Service Delivery at Selected Kenyan Public Universities Dr Philip Wambua Peter 1 , Dr Gorrety Ofafa 2 , Dr Samuel Otor 2 1 Business Administration Department, Kenyatta University, PO Box 43844 00100 Nairobi, Kenya; Email: [email protected] 2 Business Administration Department, Kenyatta University, PO Box 43844 00100 Nairobi, Kenya; Email: [email protected] 3 Department of Environment, Kenyatta University, PO Box 43844 00100 Nairobi, Kenya: Email:[email protected] Abstract Many organizations lack clear objectives and incentives on performance contracting, and contracting in such an environment demands the use of other performance measures. Effective monitoring may allow the government and organizations to capture the benefits of performance contracting while avoiding its pitfalls. The problems that have inhibited the performance of government agencies have been identified as excessive controls, frequent political interference, poor management and multiplicity of principals. Specifically the study sought to establish organizational factors contribution to service delivery in public universities in Kenya. descriptive design was used to describe some aspects of performance contracting and make directional predictions on its effects on the quality of service delivery by university lecturers in consideration of the environment they operate in. Empirical evidence was collected from three (3) public universities with a total population of 848 lecturers of which 142 staff members were randomly selected as respondents to the study. In most of the cases, Pearson Rho test supported at 90% confidence interval and above that there was a significant relationship between the working environment and the quality of service delivered in public universities of Kenya. However, for a few cases, it did not confirm the existence of such a strong relationship between the dependent variables and all the predictors. 1.Introduction Contracting, argued Donahue (1989), ‘can clarify the public purpose by passing mandates through the focusing filter of explicit contracts’. He notes that contracts should be created based on outputs that are: (a) linked to the mission; (b) easy to measure, understand, and reproduce; and (c) facilitate benchmarking. Contracting for results, he observes, ‘is hard to do well if results cannot be measured,’ and yet, he continues, the inability of public agencies to measure results is notoriously common. To make performance contracting work, a public agency needs good measures of performance Behn, 1997a). After both parties to the contract understand how to produce ordinary performance, it is time to create stretch targets – production targets that stretch the capabilities and the intellects of those working(Tully, 1994). Performance contracting requires one to be prepared to learn, change, improve, and learn some more(US General Accounting Office, 1997). Performance contracting may encourage innovation in cost cutting but not in service delivery(O’Hare et al.,1990).. Performance contracting must rely on outcomes. Everyone knows the fundamental principle of performance contracting. Government should not pay for inputs, or processes, or activities, but for outcomes (Clark 1995). Nowadays, states spend more attention, time, and money on performance measurement and evaluation in the public sector than ever before (OECD, 1999; Pollitt and Bouckaert, 2000; Power, 1997). Results-based management is the ‘talk of the day’ at all levels of the public sector: local, regional, national, and even supranational. The increased attention to performance assessment in the public sector coincides with the rise of administrative reform (Power,1997). In the education sector, for example, Rand researchers Brewer, Gates, and Goldman, cited in the January 21, 2001, edition of the Times Higher Education Supplement,that in the United States, too much focus on criteria, benchmarks, and other evaluative tools has led to mediocre institutions mimicking the outward appearance of
-
Upload
khangminh22 -
Category
Documents
-
view
2 -
download
0
Transcript of Performance Contracting, Organizational Environment and ...

International Journal of Education and Research Vol. 3 No. 10 October 2015
501
Performance Contracting, Organizational Environment and Quality of Service Delivery at Selected Kenyan Public Universities
Dr Philip Wambua Peter1, Dr Gorrety Ofafa2, Dr Samuel Otor2
1 Business Administration Department, Kenyatta University, PO Box 43844 00100 Nairobi, Kenya; Email: [email protected] 2 Business Administration Department, Kenyatta University, PO Box 43844 00100 Nairobi, Kenya; Email: [email protected] 3 Department of Environment, Kenyatta University, PO Box 43844 00100 Nairobi, Kenya: Email:[email protected]
Abstract Many organizations lack clear objectives and incentives on performance contracting, and contracting in such an environment demands the use of other performance measures. Effective monitoring may allow the government and organizations to capture the benefits of performance contracting while avoiding its pitfalls. The problems that have inhibited the performance of government agencies have been identified as excessive controls, frequent political interference, poor management and multiplicity of principals. Specifically the study sought to establish organizational factors contribution to service delivery in public universities in Kenya. descriptive design was used to describe some aspects of performance contracting and make directional predictions on its effects on the quality of service delivery by university lecturers in consideration of the environment they operate in. Empirical evidence was collected from three (3) public universities with a total population of 848 lecturers of which 142 staff members were randomly selected as respondents to the study. In most of the cases, Pearson Rho test supported at 90% confidence interval and above that there was a significant relationship between the working environment and the quality of service delivered in public universities of Kenya. However, for a few cases, it did not confirm the existence of such a strong relationship between the dependent variables and all the predictors.
1.Introduction Contracting, argued Donahue (1989), ‘can clarify the public purpose by passing mandates through the focusing filter of explicit contracts’. He notes that contracts should be created based on outputs that are: (a) linked to the mission; (b) easy to measure, understand, and reproduce; and (c) facilitate benchmarking. Contracting for results, he observes, ‘is hard to do well if results cannot be measured,’ and yet, he continues, the inability of public agencies to measure results is notoriously common. To make performance contracting work, a public agency needs good measures of performance Behn, 1997a). After both parties to the contract understand how to produce ordinary performance, it is time to create stretch targets – production targets that stretch the capabilities and the intellects of those working(Tully, 1994). Performance contracting requires one to be prepared to learn, change, improve, and learn some more(US General Accounting Office, 1997). Performance contracting may encourage innovation in cost cutting but not in service delivery(O’Hare et al.,1990).. Performance contracting must rely on outcomes. Everyone knows the fundamental principle of performance contracting. Government should not pay for inputs, or processes, or activities, but for outcomes (Clark 1995). Nowadays, states spend more attention, time, and money on performance measurement and evaluation in the public sector than ever before (OECD, 1999; Pollitt and Bouckaert, 2000; Power, 1997). Results-based management is the ‘talk of the day’ at all levels of the public sector: local, regional, national, and even supranational. The increased attention to performance assessment in the public sector coincides with the rise of administrative reform (Power,1997). In the education sector, for example, Rand researchers Brewer, Gates, and Goldman, cited in the January 21, 2001, edition of the Times Higher Education Supplement,that in the United States, too much focus on criteria, benchmarks, and other evaluative tools has led to mediocre institutions mimicking the outward appearance of

ISSN: 2411-5681 www.ijern.com
502
prestigious universities rather than improving their teaching. Bayer (2000) mentions that higher education institutes that are unjustly given a high rank (because of measurement errors) will start to attract more highly qualified students and in the longer run indeed improve their performance. However, the opposite might also be true. The performance paradox refers to a weak correlation between performance indicators and performance itself (Meyer and Gupta, 1994; Meyer and Shaughnessy,1993). This phenomenon is caused by the tendency of performance indicators to run down overtime. 2. Methodology 2.1. Research Philosophy, Design and Sampling 2.1.1. Research Philosophy and Design The study adopted an epistemological approach towards implementing the conceptual framework to investigate the nature, practices and limits of human knowledge on performance contracting in public universities of Kenya. This research philosophy was anchored within a descriptive design. A descriptive design helps to answer questions concerning the current status of the subjects under study (Mugenda and Mugenda, 2003).Descriptive studies are aimed at finding out ‘what is’. Descriptive research can include multiple variables for study(Borg and Gall,1996).Description emerges following creative exploration and serves to organize the findings in order to fit them with explanations and then test or validate these explanations (Krathwoh,1998). Kothari (2009) points out that descriptive research studies are concerned with specific predictions, narration of facts and characteristics concerning individuals, groups or situations. 2.1.2. The Target Population The target population comprised the seven (7) public universities duly recognized and operating in the year 2012. The academic staff focused on ranged from tutorial fellows to professors. The total number of academic staffers in the universities were five thousand six hundred and thirty (5630) (Table 1). The researcher chose this category of staff since the main function of these institutions of higher learning is research, dissemination of knowledge and community work and the academic staffers are the formulators, implementers and monitors. Table 1:Universities’ Teaching Staff member’s schedule
UNIVERSITY Year of inception Staff Members No.
Nairobi 1964 1429 Kenyatta 1985 879 Moi 1984 1286 Egerton 1987 543 Maseno 1991 320 Jkuat 1994 633 MasindeMuliro 2007 540 Total 5630
2.1.3 Sampling Design The researcher used a multistage random sampling that encompassed a purposeful sampling of public universities and a random sampling of academic teaching members of staff from the main campuses (not satellite campuses) (Table 2). Table 2: Teaching academic staff schedule of selected universities
University School Total Pop. Target (15%)
Actual Respondents
Kenyatta University
Humanities and Social Sciences Business Education Sub-Total
205 74 151 430
31 11 23 65
19 20 27 66

International Journal of Education and Research Vol. 3 No. 10 October 2015
503
Moi University
Arts and Social Sciences Business and Economics Education Sub-Total
121 72 114 307
18 11 17 46
27 11 17 55
Maseno University
Humanities and Social Sciences Business and Economics Education Sub-Total
49 30 32 111
7 5 5 17
10 6 5 21
Total 848 127 142
Table 2 reflects that the researcher purposefully picked three state-run universities whose total number of teaching staff was two thousand four hundred and eighty five (2485).The three universities constituted two of the oldest and one among the new, and also in different geographical setups. These universities were Kenyatta University, Moi University and Maseno University. Kenyatta University the following was considered, schools (15) which make up 62 academic departments. In Moi University the following was considered, schools (14) consisting of 74 academic departments while in Maseno the following was considered ,schools (12) and one(1) faculty which make up 54 departments. The researcher chose the biggest schools and faculties in terms of student population as evidenced by the proposed Joint Admissions Board (JAB) admission of undergraduate students in the academic year 2012/2013.These schools in Moi university, were school of business and economics, school of education and school of arts and social sciences, while in Kenyatta university it was school of business, school of education and school of humanities and social sciences and in Maseno University it was school of business and economics, school of education and school of humanities and social sciences. The respondents to the questionnaire were picked using simple random sampling and a total number of 142 respondents was realized from 180 questionnaires issued to the study population of 848 academic staffers and this represented a proportion of 16.74%. 2.2. Data Collection 2.2.1. Procedures for data collection This study was mainly done using primary data collected through self-administration of a questionnaire, which was dropped to each respondent and picked later. Where additional information was required by the researcher, semi-structured interviews were conducted. The questionnaire consisted of both open-ended and closed-ended questions. Respondents to self-administered questionnaires are relatively unlikely to answer questions to please you or because they believe certain responses are more socially desirable (Mark et al., 2003).The researcher used both qualitative and quantitative data. Qualitative data was appropriate since meanings were based on expression through words and analysis was through conceptualization, while quantitative data was appropriate since meanings were derived from numbers and analysis was done through use of diagrams and statistics. This information was coded and analyzed with the use of statistical package for social sciences (SPSS). 2.2.2. Validity of Research Instrument In relating the measuring instrument to the general theoretical framework so as to determine whether the instrument was tied to the concepts and the theoretical assumptions the researcher employed construct validity as advocated by Cronbach (1955). The researcher used clear wording of the questions by employing terms that are likely to be familiar to, and understood by the respondents. Content validity was done to ascertain clarity and simplicity, the researcher sought experts and supervisor’s opinion to ascertain whether the content of the research instrument was up to standard, after which he administered it to the respondents. 2.2.3. Reliability of Research Instrument Reliability can be assessed by posing the following questions: will the measures yield the same results on other occasions? Will similar observations be reached by other observers? And whether there is transparency in how sense was made from raw data? (Easterby-Smith et al.2002).According to Tabachnick and Fidel (2001), reliability relates to
ISSN: 2411-5681 www.ijern.com
504
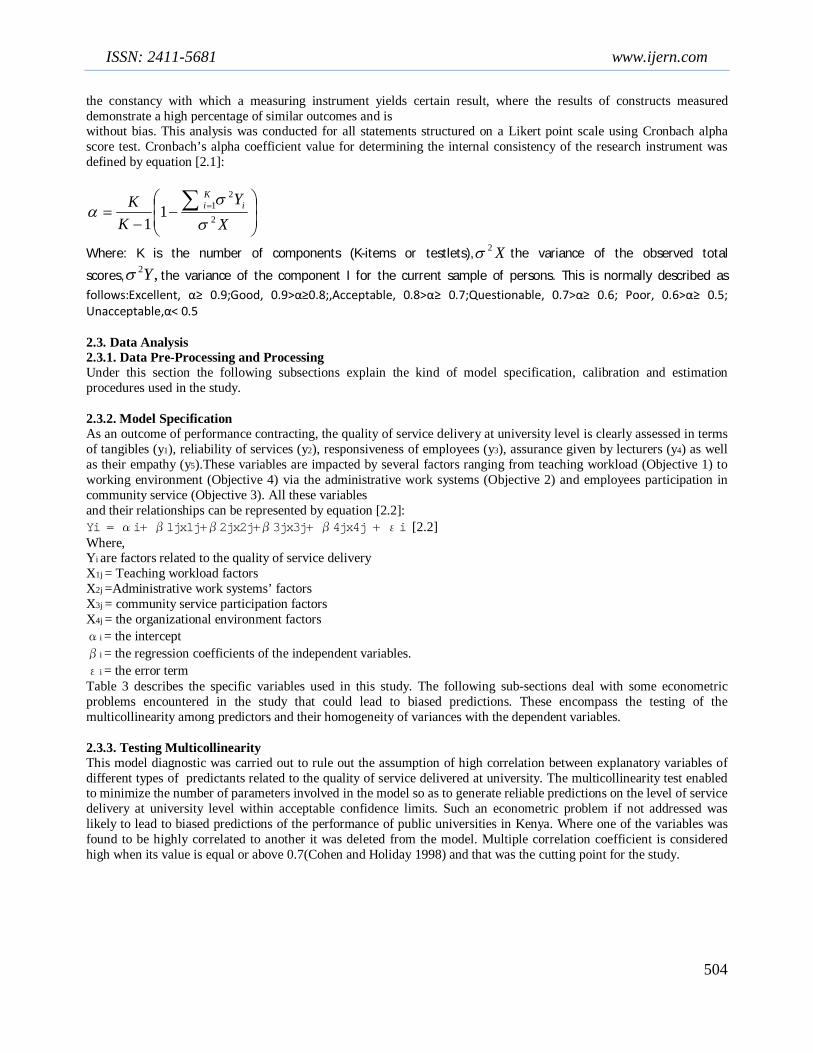
the constancy with which a measuring instrument yields certain result, where the results of constructs measured demonstrate a high percentage of similar outcomes and is without bias. This analysis was conducted for all statements structured on a Likert point scale using Cronbach alpha score test. Cronbach’s alpha coefficient value for determining the internal consistency of the research instrument was defined by equation [2.1]:
XY
KK i
Ki
2
211
1
Where: K is the number of components (K-items or testlets), X2 the variance of the observed total
scores, ,2Y the variance of the component I for the current sample of persons. This is normally described as follows:Excellent, α≥ 0.9;Good, 0.9>α≥0.8;,Acceptable, 0.8>α≥ 0.7;Questionable, 0.7>α≥ 0.6; Poor, 0.6>α≥ 0.5; Unacceptable,α< 0.5 2.3. Data Analysis 2.3.1. Data Pre-Processing and Processing Under this section the following subsections explain the kind of model specification, calibration and estimation procedures used in the study. 2.3.2. Model Specification As an outcome of performance contracting, the quality of service delivery at university level is clearly assessed in terms of tangibles (y1), reliability of services (y2), responsiveness of employees (y3), assurance given by lecturers (y4) as well as their empathy (y5).These variables are impacted by several factors ranging from teaching workload (Objective 1) to working environment (Objective 4) via the administrative work systems (Objective 2) and employees participation in community service (Objective 3). All these variables and their relationships can be represented by equation [2.2]: Yi = αi+ β1jx1j+β2jx2j+β3jx3j+ β4jx4j + εi [2.2] Where, Yi are factors related to the quality of service delivery X1j = Teaching workload factors X2j =Administrative work systems’ factors X3j = community service participation factors X4j = the organizational environment factors αi = the intercept βi = the regression coefficients of the independent variables. εi = the error term Table 3 describes the specific variables used in this study. The following sub-sections deal with some econometric problems encountered in the study that could lead to biased predictions. These encompass the testing of the multicollinearity among predictors and their homogeneity of variances with the dependent variables. 2.3.3. Testing Multicollinearity This model diagnostic was carried out to rule out the assumption of high correlation between explanatory variables of different types of predictants related to the quality of service delivered at university. The multicollinearity test enabled to minimize the number of parameters involved in the model so as to generate reliable predictions on the level of service delivery at university level within acceptable confidence limits. Such an econometric problem if not addressed was likely to lead to biased predictions of the performance of public universities in Kenya. Where one of the variables was found to be highly correlated to another it was deleted from the model. Multiple correlation coefficient is considered high when its value is equal or above 0.7(Cohen and Holiday 1998) and that was the cutting point for the study.

International Journal of Education and Research Vol. 3 No. 10 October 2015
505
2.3.4. Homogeneity of Variances In spite of conducting the test of multicollinearity, an independent test for equal variances between the predictant and its predictors was necessary to rule out any assumption of heterogeneity, which may possibly increase the presence of heteroskedasticity of errors in the error term. The rejection of heterogeneity gave justification to the use of normal distributions, namely the F and t tests. This hypothetical homogeneity of variances was derived from Levene’s test which is an independent test of homogeneity of variances. Heuristic method was later used to cluster the observed variables for inferring hypothesis test. 2.3.5. Model Estimation This stage of the study dealt with the identification of a specific model that could measure the level of service delivery at university level. Hence, five categories of factors related to the quality of service delivery at university
were selected, and their corresponding causes (or variables) identified. The selected model can be represented by a system of equations defined by the algebraic description below [2.3]: Y= A+BX [2.3] Where, Y = vector of predictants related to the level of service delivery X = Matrix of predictors of the level of service delivery B = Matrix parameters of the relevant predictors A = vector of the model intercepts. The full regression model of the level of service delivery may be written as follows [2.4] Multiple logistic regressions (probit, logit or tobit) of these predictants by their relevant predictors were conducted to estimate the regression parameters for each category of dependent variables (predictants). The latter were embedded in the Multivariate Generalized Linear Model (GLM) procedure, which was run to that effect using the SPSS software package. 2.3.6. Model Evaluation and Validation In establishing the goodness of fit of the model and to rule out the presence of bias in the prediction a diagnostic check-up was conducted. Pearson’s Rho test was used to establish the correlation of various variables. To get an appropriate set of parameters that determine the strength of ties between subjects within the variables input and in order to measure in the regression strength the coefficient of determination (R2), the Beta weight and the F and t statistics were employed.

ISSN: 2411-5681 www.ijern.com
506
3. Results and Discussion 3.1. Key descriptive of the sample The researcher in this part wished to find out how the various scenarios of the organizational environment related to service delivery in public universities. The researcher covered the following areas to achieve the intended objective: Freedom to initiate, Processes strengthening, Individual autonomy, Academics automation, Resource utilization, Customer service, Focused planning, Cost management and Risks take freedom and showed their relationship to performance contracting and the level to which efficiency and effectiveness affected service delivery. The findings are reflected in the following pages,figures and tables 3.2 Most important factors of the organizational environment at university
The most important factors included: Better customer service (69%) and Better utilization of academic resources (68%). However, they also showed concern for Strengthening academic process (65%), granting more freedom to initiate new academic programmes (64%), enhancing automation of academic work (63%) and individual autonomy (61%). Finally, though lecturers had different views about performance contracting, they unanimously agreed that Responsiveness (82%), Assurance (82%), Reliability (81%), Empathy (76%) and Tangibles (73%) were adequate measures for quality of service.

International Journal of Education and Research Vol. 3 No. 10 October 2015
507
Status Frequency Percent Importance
Better customer service 97 69.4 AA
Better utilization of academic resources 96 68.4 AA
Strengthening of academic process 90 64.8 A
Freedom to initiate academic programmes 89 63.6 A
Great automation of academic work 88 63.3 A
Enhanced individual autonomy 85 61.1 A
TOTAL VALID 138 100 Source: Field Data (Researcher 2013) Notes: A= Moderate (50-64.9%), AA= High (65-79.9%), AAA=Great(80-100%).
3.3 Test of Multicollinearity between Predictors Pearson test displayed, at 90% confidence interval and above, very significant correlations between all the predictors (Table 8). In most of the cases, the study ignored the existence of a multicollinearity problem in the regression of the working environment factors for quality of service delivery to their corresponding predictors, since the latter did not display a Pearson correlation equal to or above 0.7, except for the relationship between Better customer service(Contri6) and Focused and deliberate planning(Contri 7).
3.4 Test of Homogeneity of Variances The Levene’s test confirmed the assumption of homogeneity of variances between Responsiveness(EmploWS 13) and Assurance(EmploWS 14) with their corresponding predictors, thus upholding a strong relation between these two categories (Table 4).However, this test nullified the hypothesis of equality of error variances between the other dependent variables and their corresponding predictors. Therefore, the study confirmed the assumption that responsiveness and assurance contribute to the level of service delivery in public universities by easing their employee’s working environment

ISSN: 2411-5681 www.ijern.com
508
Table 3: Specific variables for analyzing performance contracting at university level
Predicant: Quality of service delivery at university measured by:
Predictors
Objective 1:
Teaching workload
Objective 2:
Administrative work systems
Objective 3:
Community service
Objective 4:
Organisational environment
EmploWS 11 Tangibles Increase in demand
of courses offered PerCTS
13 Employee recognition EmploWS1 Well paid employees EmploC
SS 1 Initiation of new academic programmesContri 1
Emplo WS 12 Reliability Increase in student
enrollment PerCTS
14 Employee training Emplo WS 2
Continous employee training
EmploCSS 2
Strengthening of academic processes Contri 2
EmploWS 13 Responsiveness Timely graduation PerCTS
15 Development of employees
Emplo WS 3
Rigorous employee development programme
EmploCSS 3
Enhancement of individual autonomy Contri 3
EmploWS 14 Assurance
Effective and efficient teaching methodologies
PerCTS 16
Improved working facilities
Emplo WS 4
Employee with better working facilities
EmploCSS 4
Greater automation of academic work Contri 4
EmploWS 15 Empathy Reduction in
customer complaints PerCTS
17 Competitive medical cover
Emplo WS 5
Employee promoted for achieving targets
EmploCSS 5
Better utilization of academic resources Contri 5
Increase in customer compliments
PerCTS 18
Better employee working relations
Emplo WS 6 Best worker awards EmploC
SS 6 Bettercustomer service Contri 6
Increase in number of graduates
PerCTS 19
Working rules and regulations
Emplo WS 7 Transferring of employeesEmploC
SS 7 Focused and deliberate planning Contri 7
Timely examinations
PerCTS 20
Competitive take home package
Emplo WS 8 A fully paid leave of absenceEmploC
SS 8 Better unit cost management Contri 8
Timely release of results
PerCTS 21
Out-of-office team building activities
Emplo WS 9
Award of scholarly titles for academic work
EmploCSS 9
Freedom to take and manage risks Contri 9
Assignment of other duties
Emplo WS 10
Supporting dependants in educational programmes
EmploCSS 10
Source: Methodology(Researcher 2013)

International Journal of Education and Research Vol. 3 No. 10 October 2015
509
Table 4: Results of Levene's test of equality of error variances a,b,c
Variables F df1 df2 Sig. Observation Tangibles contribute to quality of service offered at the university 2.841 118 13 0.019 Heterogeneity
Reliability contribute to quality of service offered at the university 1.896 118 13 0.096 Heterogeneity
Responsiveness contributes to quality of service offered at the university 1.038 118 13 0.509 Homogeneity
Assurance contribute to quality of service offered at the university 1.491 118 13 0.212 Homogeneity
Empathy contribute to quality of service offered at the university 3.218 118 13 0.011 Heterogeneity
Source: Field Data (Researcher 2013)
Notes: a.Tests the null hypothesis that the error variance of the dependent variable is equal across groups b.Method: Weighted Least Squares Regression - Weighted by Age c. Design: Intercept + Contri_1 + Contri_2 + …. + Contri_9
3.5. Model Estimation and Regression Strength Testing
Table 5 presents the correlation matrix of dependent variables measuring the quality of service delivery in public universities versus selected independent variables from the working environment. In most of the cases, Pearson Rho test supported at 90% confidence interval and above that there was a significant relationship between the working environment and the quality of service delivered in public universities ofKenya. However, for a few cases, it did not confirm the existence of such a strong relationship between the dependent variables and all the predictors. Table 5: Correlation between quality of service delivery and organizational factors
Parameter Responsiveness Assurance
Contri 1 0.033 -0.029
Contri 2 -0.07 -0.101
Contri 3 -0.064 -0.015
Contri 4 0.09 -0.045
Contri 5 0.094 -0.069
Contri 6 0.123* -0.074
Contri 7 0.216** 0.031
Contri 8 0.066 -0.088
Contri 9 0.032 -0.024
Source: Field Data (Researcher 2013) Notes
***. Correlation is significant at the 0.01 level (2-tailed). **. Correlation is significant at the 0.05 level (2-tailed). *. Correlation is significant at the 0.1 level (2-tailed). Method: Pearson Correlation
For instance, Pearson correlation test failed to demonstrate that the enhancement of individual autonomy (Contri 3) and,

ISSN: 2411-5681 www.ijern.com
510
focused and deliberate planning (Contri 7) had a bearing on the quality of service delivery measured by the level of tangibles, reliability and empathy. Also, service delivery by the level of tangibles was delinked to a better utilization of academic resources (Contri 5), while responsiveness was not directly related to better customer service (Contri 6) and to focused and deliberate planning(Contri 7). Consequently, a regression of the contribution of the above predictants to the level of service delivery in public universities was possibly strong if these isolated predictors could be strengthened in the employee’s working environment.The tests of between-subjects effects proved beyond any doubt that the level of service delivery at university was significantly related to the working environment of the teaching members of staff selected in key universities of Kenya. Table 6. depicts that “responsiveness” (Adjusted R2= 0.140; F= 1.557; Sig.= 0.047) and “assurance” (Adjusted R2= 0.118; F= 1.458; Sig.= 0.076) as key moderators of the level of service delivery at selected public universities. Table 6:Between-subjects effects for service delivery and organizational factors
Parameter Responsivenessa. Assuranceb.
F Sig. F Sig. Freedom to initiate 1.171 0.329 0.626 0.645 Processes strengthening 1.1 0.362 0.471 0.757 Individual autonomy 0.83 0.510 0.877 0.481 Academics automation 0.888 0.474 0.304 0.875 Resource utilization 0.161 0.957 0.371 0.829 Customer service 1.737 0.149 0.994 0.415 Focused planning 3.071** 0.020 1.7 0.157 Cost management 0.703 0.592 2.908** 0.026 Risks take freedom 0.37 0.829 1.52 0.203
Corrected Model 1.557** 0.047 1.458* 0.076 Source: Field Data (Researcher 2013) Notes:
a. R Squared = .390 (Adjusted R Squared = .140) b. R Squared = .375 (Adjusted R Squared = .118) *Significance at 10%; Confidence intervals of 90% **Significance at 5%; Confidence intervals of 95% ***Significance at 1%; Confidence intervals of 99%
Organizational parameters that were found significant for explaining the level of service delivery included “focused planning” and “cost management”(Table 7). They were significant at 95% confidence intervals in creating an enabling organizational environment that was conducive for academic teaching. Organizational factors that were enabling “Assurance” for high levels of service delivery at the selected universities mainly included “better unit cost management”, which was ranked from “fairly” to “highly” important. “Focused planning” was also significant but invaluable for most of employees for enabling both “Responsiveness” and “Assurance”. Thus, it can be concluded that employees’ assurance contributes to high levels of service delivery by enabling “better unit cost management” to enhance service efficiency.

International Journal of Education and Research Vol. 3 No. 10 October 2015
511
Table 7: Parameter estimate for level of service delivery by organizational factor
Parameter Responsiveness Assurance
t Sig. t Sig.
Focused planning[=1] -2.376** 0.020 -2.15** 0.034
Focused planning[=3] -0.559 0.578 -0.778 0.439
Cost management[=1] 1.527 0.130 2.144** 0.035
Cost management[=2] 0.206 0.837 2.645*** 0.01
Cost management[=3] 0.052 0.959 3.123*** 0.002
Cost management[=4] 0.027 0.978 2.401** 0.018
Source: Field Data (Researcher 2013) Notes:
*Significance at 10%; Confidence intervals of 90%***Significance at 1%; Confidence intervals of 99% **Significance at 5%; Confidence intervals of 95% ***Significance at 1%; Confidence intervals of 99%
3.6 Recommendations by Respondents The researcher engaged the respondents to give their views of performance contracting by giving them an opportunity to put their suggestions on the improvement of performance contracting in respect of service delivery in public universities working environment. The respondents suggestions are captured and presented in figure. 1
Figure 1: Suggestions to improve performance contracting and service delivery Source: Field Data (Researcher 2013)

ISSN: 2411-5681 www.ijern.com
512
Table 8: Correlation among organizational factors affecting service delivery
Variable Contri
1
Contri
2
Contri
3
Contri
4
Contri
5
Contri
6
Contri
7
Contri
8
Contri
9
Initiation of new academic programmes 1.000
Strengthening of academic processes 0.533*** 1.000
Enhancement of individualautonomy 0.483*** 0.510*** 1.000
Greater automation of academic work 0.593*** 0.512*** 0.568*** 1.000
Better utilization of academic resources 0.574*** 0.508*** 0.556*** 0.675*** 1.000
Better customer service 0.440*** 0.377*** 0.473*** 0.619*** 0.675*** 1.000
Focused and deliberate planning 0.456*** 0.429*** 0.506*** 0.618*** 0.643*** 0.746*** 1.000
Better unit cost management 0.521*** 0.381*** 0.327*** 0.551*** 0.484*** 0.567*** 0.655*** 1.000
Freedom to take and manage risks 0.467*** 0.477*** 0.489 0.543*** 0.521*** 0.466*** 0.480*** 0.501*** 1.000
Source: Field Data (Researcher 2013)
Notes: *** All correlations are significant at the 0.01 level (2-tailed). Method: Pearson Correlation

International Journal of Education and Research Vol. 3 No. 10 October 2015
513
3.7 Discussion on Organizational Environmental Factors
It is noted that there is an inherent tension, between pay for activity and pay for results(Donahue,1989). Performance contract only specifies what results should be produced, and gives one the flexibility to determine how best to produce and then pays only when it has been successful. Stability of resources enhances the motivating effect of contracts. The political top; must respect the operational autonomy of the contracted individuals and central units should be provided with strategic management and monitoring capacities in order to play their role(Bouckaert and Balk 1999). Performance contract management should be accompanied by a performance-oriented change in organizational structure and management culture. Management instruments, focusing on performance and costs in the field of human resources and financial management, should be developed in an integrated way. There is need for a good definition of outputs and solid performance measure. Performance contracting must be complemented by other instruments of control such as ombudsman, quality charters, and regulations concerning transparency and openness. Performance contract management should be embedded in a trust-based relationship between the government, the organization and the individual. The organization and the individual should receive a maximum amount of autonomy within the limits of the control capacities of the government. This implies a correct use of incentives and sanctions. Evaluations should involve the two contracting parties. There should be regular overall evaluations and audits of benefits and drawbacks of the implemented contract in order to learn from these experiences (Bouckaert and Balk 1999). 4. Summary and Conclusion
University lecturers showed concern for strengthening academic process (65%), granting more freedom to initiate new academic programmes (64%), enhancing automation of academic work (63%) and individual autonomy (61%).However, employees’ assurance contributed at 5% significant level to high levels of service delivery by enabling “better unit cost management” to enhance service efficiency. The most important organizational factors included: better customer service (69%) and better utilization of academic resources (68%). The objective of this study was to establish the relationship between organizational environment and the level of service delivery in public universities in Kenya. The study concluded that, greater automation of academic work, better utilization of academic resources, better customer care and better unit cost management were key contributors to level of service delivery. The absence of “more focused and deliberate planning”, and to some extent, that of “greater automation of academic work”, could be a threat to creating a working environment that is conducive for high levels of service delivery. Thus, it can be concluded that employees contribute to high levels of service delivery when there is an enabling working environment that enhances the efficiency of their work. It was also noted that freedom to initiate new academic programmes, enhancement of individual autonomy, strengthening of academic processes and freedom to take and manage risks were not significant in contributing to the level of service delivery. This can be explained by the fact that universities are run and managed on a daily basis by well established committees and boards which are governed by university charters, mission statements, vision statements, core mandate, rules, regulations and policy statements.
ISSN: 2411-5681 www.ijern.com
514
REFERENCES
Bayer,A.E.(2000).The American Academic Profession. Professionalism in graduate teachingand mentoring. Baltimore:
Johns Hopkins University press
Behn,R.D.(1997a).Broken Windows and Production Targets.Governing.10(6): 68.
Borg,W.R and Gall,J.P(1996).Educational Research: An Introduction (6th ed.). NewYork: Longman.
Bouckaert, G, and Balk W (1999). Public productivity measurement, Disease and Cures.Public Productivity and
Management Review.
Clark, B.R. (1995).’Leadership and innovation in universities: From theory to practice’, Tertiary Education and
Management, Vol. 1(1): 7-11.
Cohen,L. &Holiday,M.(1998).Practical statistics for students. London ,Paul Chapman
Cronbanch,Lee J. (1955).Construct Validity in psychological tests. Psychological Bulleting,Vol 52(4): 281-302.
Donahue, J.D.(1989).The Privatization decision. Public ends, Private means. New York: Basic Books.
Easterby-Smith,M,ThorpeR.and Lowe A(2002).Management research; An introduction (2nd
ed.).London: Sage Publications.
Kothari, C.R. (2009). Research methodology, methods and techniques, New age international publisher, New Delhi.
Krathwoh, D.R. (1998).Methods of Educational and Social Science Research: An
IntergratedApproach(2nd ed.).New York: Longman.
Mark S, Phillip, L. and Adrian, T.H. (2003).Research Methods for Business students. Delhi:Pearson Education Limited.
Meyer, M.W and Gupta, V. (1994).The performance paradox. Research in organizational behavior 16: 309-369.
Meyer, M.W and Shaughnessy,O. (1993).Organizational design and the performance paradox. In: R. Swedberg
(Ed).Explorations in economic sociology, pp 249-278. New York: Russel Sage foundation.
Mugenda, O. and Mugenda, A. (2003).Research methods. Quantitative and Qualitative methods. Nairobi: Rev ed.
O’Hare,M., Leone,R. and Zegans, M.(1990).The privatization of imprisonment; A Managerial perspective. New
Brunswick, NJ: Rutgers University press.
OECD.(1999). In Search of Results: Performance Management Practice. Paris,France.
Power, M. (1997). The audit society. Oxford: Oxford university press
Tabachnick Barbara G.and Linda S. Fidell(2001).Computer-assisted Research Design and Analysis. Allyn and
Bacon, Jan 1, 2001
Tully, S.(1994).Why to go for Stretch targets. Fortune, 145-158.
US General Accounting Office.(1997).Privatization: Lessons learned by state and local government. Washington DC,
USA.