
The Healthcare Beliefs and Trust in Healthcare Providers of ...
Upload
independentCategory
view
2download
0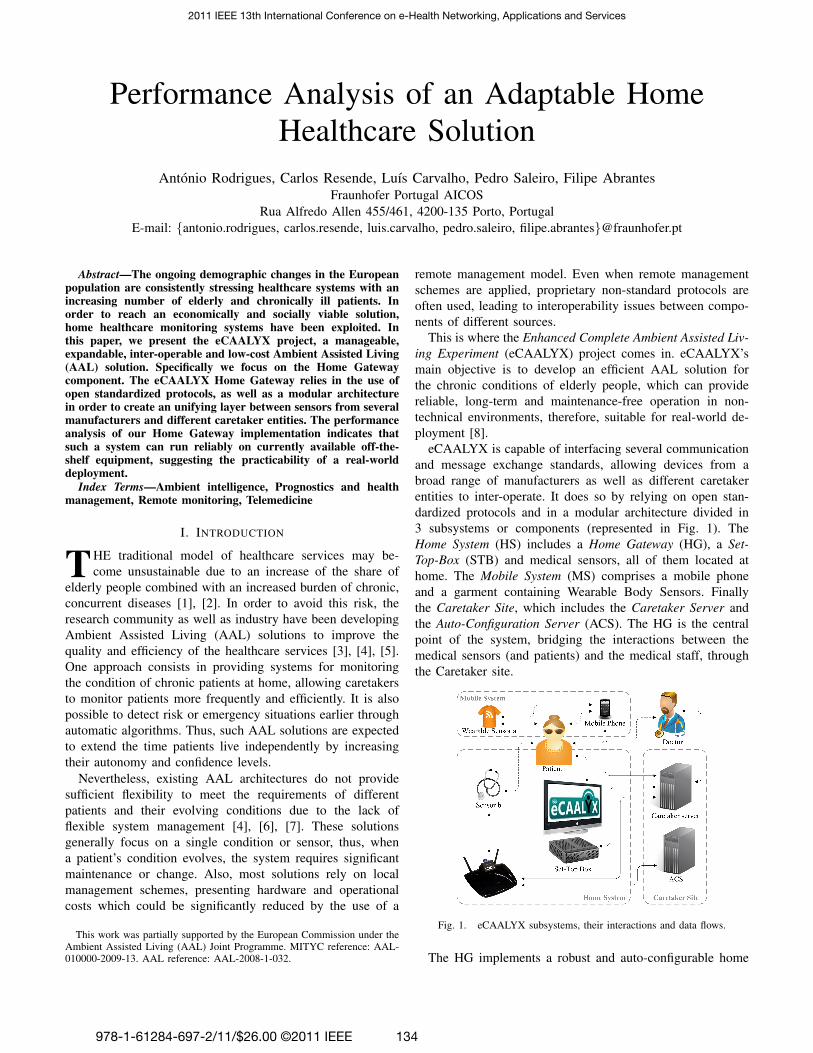
Performance Analysis of an Adaptable HomeHealthcare Solution
Antonio Rodrigues, Carlos Resende, Luıs Carvalho, Pedro Saleiro, Filipe AbrantesFraunhofer Portugal AICOS
Rua Alfredo Allen 455/461, 4200-135 Porto, PortugalE-mail: {antonio.rodrigues, carlos.resende, luis.carvalho, pedro.saleiro, filipe.abrantes}@fraunhofer.pt
Abstract—The ongoing demographic changes in the Europeanpopulation are consistently stressing healthcare systems with anincreasing number of elderly and chronically ill patients. Inorder to reach an economically and socially viable solution,home healthcare monitoring systems have been exploited. Inthis paper, we present the eCAALYX project, a manageable,expandable, inter-operable and low-cost Ambient Assisted Living(AAL) solution. Specifically we focus on the Home Gatewaycomponent. The eCAALYX Home Gateway relies in the use ofopen standardized protocols, as well as a modular architecturein order to create an unifying layer between sensors from severalmanufacturers and different caretaker entities. The performanceanalysis of our Home Gateway implementation indicates thatsuch a system can run reliably on currently available off-the-shelf equipment, suggesting the practicability of a real-worlddeployment.
Index Terms—Ambient intelligence, Prognostics and healthmanagement, Remote monitoring, Telemedicine
I. INTRODUCTION
THE traditional model of healthcare services may be-come unsustainable due to an increase of the share of
elderly people combined with an increased burden of chronic,concurrent diseases [1], [2]. In order to avoid this risk, theresearch community as well as industry have been developingAmbient Assisted Living (AAL) solutions to improve thequality and efficiency of the healthcare services [3], [4], [5].One approach consists in providing systems for monitoringthe condition of chronic patients at home, allowing caretakersto monitor patients more frequently and efficiently. It is alsopossible to detect risk or emergency situations earlier throughautomatic algorithms. Thus, such AAL solutions are expectedto extend the time patients live independently by increasingtheir autonomy and confidence levels.
Nevertheless, existing AAL architectures do not providesufficient flexibility to meet the requirements of differentpatients and their evolving conditions due to the lack offlexible system management [4], [6], [7]. These solutionsgenerally focus on a single condition or sensor, thus, whena patient’s condition evolves, the system requires significantmaintenance or change. Also, most solutions rely on localmanagement schemes, presenting hardware and operationalcosts which could be significantly reduced by the use of a
This work was partially supported by the European Commission under theAmbient Assisted Living (AAL) Joint Programme. MITYC reference: AAL-010000-2009-13. AAL reference: AAL-2008-1-032.
remote management model. Even when remote managementschemes are applied, proprietary non-standard protocols areoften used, leading to interoperability issues between compo-nents of different sources.
This is where the Enhanced Complete Ambient Assisted Liv-ing Experiment (eCAALYX) project comes in. eCAALYX’smain objective is to develop an efficient AAL solution forthe chronic conditions of elderly people, which can providereliable, long-term and maintenance-free operation in non-technical environments, therefore, suitable for real-world de-ployment [8].
eCAALYX is capable of interfacing several communicationand message exchange standards, allowing devices from abroad range of manufacturers as well as different caretakerentities to inter-operate. It does so by relying on open stan-dardized protocols and in a modular architecture divided in3 subsystems or components (represented in Fig. 1). TheHome System (HS) includes a Home Gateway (HG), a Set-Top-Box (STB) and medical sensors, all of them located athome. The Mobile System (MS) comprises a mobile phoneand a garment containing Wearable Body Sensors. Finallythe Caretaker Site, which includes the Caretaker Server andthe Auto-Configuration Server (ACS). The HG is the centralpoint of the system, bridging the interactions between themedical sensors (and patients) and the medical staff, throughthe Caretaker site.
Fig. 1. eCAALYX subsystems, their interactions and data flows.
The HG implements a robust and auto-configurable home
2011 IEEE 13th International Conference on e-Health Networking, Applications and Services
978-1-61284-697-2/11/$26.00 ©2011 IEEE 134

healthcare system that (1) is efficiently manageable at largescale and suitable for long-term monitoring; (2) is easilyexpandable and thus adaptable to the changing condition(s) ofpatients suffering from co-morbidity; (3) integrates currentlydeployed equipment and standards, and in the end results ina commercially viable solution; (4) uses commercial off-the-shelf (COTS) equipment, making the solution proposed byeCAALYX inherently economic and, therefore, affordable tothe majority of the population.
The HG’s most basic functionality consists in the collec-tion of vital sign measurement data from medical sensors.Regarding the more complex capabilities of the HG subsystem,manageability and scalability, we propose to apply and adaptstandard network management protocols — namely, the CPEWan Management Protocol (CWMP) [9] — to e-health, andwill address the performance tests of such features in thefuture. For the manageability and scalability issues, the serviceenabler (e.g. Telecom operator) manages the devices of thehome healthcare system as another subsystem of the homefrom the technical point of view. All medical information fromthe patient flows directly between the Home Gateway and theCaretaker Server. This allows for autonomic configuration andoperation of the system. As far as expandability is concerned,we designed the system so that it is completely modular andagnostic of sensor technologies, health information standards,conditions or pathologies. With this approach, our system canbe custom tailored to the needs of a specific patient andeasily adapted to the changing needs of an evolving condition.The HG is based on open standards and deployed on COTSequipment, making it commercially interesting from the pointof view of both the end user and service provider. However,this brings along additional challenge of making the equipmentretain its normal functions while performing the eCAALYXsystem tasks.
This paper focuses on the software which runs on the HG,separating its core message into two main distinct parts: (1) thedescription of its internal architecture and (2) its performanceanalysis while engaged in the basic functionalities it provides,on a COTS home router. The paper is organized as follows:Section II describes similar architectures and their differencesto eCAALYX. Section III describes the internals of the HGcomponent. Section IV describes a set of tests whose results,shown and analyzed in the same section, allowed us to evaluatethe performance of the proposed HG architecture. Finally,Section V concludes the document.
II. RELATED WORK
Although some e-health solutions start to appear, there isstill no agreed standard on many of the interfaces used in allthe architectures. We can find many different approaches tothis problem.
In [10], the authors discuss the possible usage modelsfor e-health systems, distinguishing between two use cases:wellness and disease management as well as independentliving and remote monitoring. The first case is applicable forthe control of chronic illnesses, such as asthma or diabetes,
where the patient takes an active role and changes behaviorsand/or medications according to medical feedback. The secondone applies to the passive monitoring on the conditions ofpatients like elderly living alone, acting as an early-warningmechanism to deteriorating conditions. The eCAALYX projectfits between these two notions, as we explore both passivesensors (ECG, etc) and medical feedback (video conference).The authors also present the architecture of an e-health system(wireless wellness monitor project). The described architectureconsists of a home server based on the OSGi framework. Thedevices (health sensors) connect to this server using a deviceproxy, and to the proxy through either a RS-232 cable or aproprietary Radio Frequency technology.
A similar architecture for an e-health system is describedin [11]. This system is comprised of three main components,namely, a home medical server, vital sensing units and per-sonal terminals. A home medical server is a small computerdedicated to collect data from sensors and transfer them toa remote medical server using an Internet connection ona Wi-Fi interface. This unit is also capable of performingsome processing on the data acquired by the vital sensingunits. A vital sensing unit is a small, dedicated circuit with aBluetooth interface and a digital signal processing unit. Thisunit connects several sensors using UART connectors, whichcan be worn by the patient. All sensing units and the homeserver connect with Bluetooth technology, forming a PersonalArea Network (PAN), which allows data to be downloaded tothe server. Finally, a personal terminal is any Internet-enableddevice from which the patient can check its own vital signalsand data.
The eCAALYX approach is fundamentally different fromthese two. We focus on using equipment the patient alreadyhas at home (e.g. home gateway) and integrating it with theexisting infrastructure (e.g. Telecom operator). This eliminatesthe need for a dedicated computer installed at the patient’shome. In addition, the eCAALYX approach is flexible enoughto allow sensors using different communication technologies,not restricting the system to a single interface.
In [12], Blount et al. describe the Personal Care Connect(PCC) project, a remote health monitoring platform based onopen standards in every interface needed. Proprietary solutionsare used as a last resort where there are no other commerciallyavailable alternatives. The PCC includes a hub as the centralpoint of the system. It registers and caches measurements andsends the data to a server on the Internet. Medical personnelthen has access to this information. The hub is implementedin Java, due to portability, and, in this case is instantiated ina GPRS-enabled PDA.
Healthcare sensors used in this system are generally wear-able sensors, which use (preferably) Bluetooth to connect tothe PCC hub. This is very similar to the eCAALYX system.However, the hub is a mobile device and the patients are notallowed to use it for any other purpose, meaning they have itas a dedicated health care device. In contrast, in eCAALYX,the hub equivalent part is the Home Gateway of the patient.
The PCC hub software is implemented using agents fol-
135
lowing a blackboard communication model, meaning thateach agent will publish and receive events. Every part of thesystem is implemented as an agent: there is an HTTP agentresponsible for sending the measured values to the remoteserver; audio alert and a user interface agents to interactwith the patients; device agents for every configured sensor,functioning as a driver for each particular sensor. This makesa very modular architecture, as these agents can be replaced toaccommodate new devices and protocols, allowing the systemto be customized and adaptable to the changing conditions ofevery patient.
Similarly, in eCAALYX, the HG is designed in such away that every component can be replaced with another oneimplementing the same functionality, but using a differentprotocol, or communicating with a different sensor. This isfurther detailed in section III.
In PCC, the patient must use a web interface to login, whichtriggers the download of the necessary library files to the hub.No further actions of remote management are mentioned. Incontrast, eCAALYX is designed to use remote managementstandards to automatically deploy the necessary libraries andmanage subsequent events (failures and updates), without theneed of user intervention.
One other approach very similar to eCAALYX is introducedin [13], the OSAmI-D project. Here, the authors present ageneric and expandable platform based on OSGi Framework[14]. Here, the author try to solve the same problem of havingtoo many protocols for communicating with medical sensors,as well as different medical-information storage protocols.OSAmI-D makes use of OSGi bundles to dynamically installand uninstall software on a home gateway device, ranging frommedical sensor drivers to system management and diagnosticutilities.
The authors extend default OSGi device integration func-tionalities, by adding an additional layer abstraction to copewith sensors having different access technologies. This makesit possible for the system to automatically manage the driversneeded to communicate with the available sensors.
The eCAALYX system has similar functionalities, but itrelies in a widely deployed and tested remote managementinfrastructure already used by the Telecom operators. At thesame time, eCAALYX is targeted at COTS equipment, whichhas limited computational resources, not suitable for a Javabased framework, such as OSGI.
III. ECAALYX HOME GATEWAY
The Home Gateway is the central component of the HomeSystem, depicted in Fig. 1, acting as a broker between themedical sensors (also internal to the HS) and the Caretakerservers. Additionally, it analyses and processes data collectedby the medical sensors, producing minor conclusions whichare sent to the Caretaker servers, along with the measured data.The HG is also remotely managed and monitored, allowingsystem reconfiguration and monitoring at any time, without lo-cal intervention. All communications with the remote servers,both the ACS and Caretaker, are protected using a secure
connection through HTTPS, guaranteeing the confidentialityof the transferred data.
A. Architecture overview
The Caretaker servers hold special entities — Observa-tion Patterns — which consist of different sets of medicalinstructions specific to a given remotely monitored patient.The first stage of an Observation Pattern building processis directly performed by a medical doctor. Using a human-readable format, the doctor defines rules such as (1) the typesof medical sensors to be prescribed to a specific patient, (2)the quantity of data to be collected by each sensor, (3) theperiodicity of the data collections as well as (4) simple dataevaluation templates — Observations — which are used totrigger alert states (e.g. ‘If the weight value is larger than80 kg, launch alert status’). The design of the Observationentity allows it to be easily aggregated with other Observationinstances, allowing the doctors to combine and cross-relatedata from multiple vital signs into one single evaluation. Thesecond stage of the process can be viewed as the translation ofthe human-readable set of rules to a flexible machine-readableformat, intelligible to the HG. These are then used by the HGto (1) correctly operate the medical sensors present at homeand (2) producing Conclusions — the outcome of a processedObservation, which may be to trigger an alert state — usingthe data collected by the sensors as input.
The Auto-Configuration Server (ACS) holds the informationnecessary for the system to operate following a zeroconfprinciple — no configuration input is necessary by the patients— thus ensuring that every patient can be shipped the sameHG equipment, which is then customized to the specificpatient’s needs. The ACS is running the CWMP, defined inthe Broadband Forum’s TR-069 [9], for remote managementand troubleshooting.
The CWMP protocol uses data models to define the param-eters that are required from the HG (and consequently that canbe configured from the ACS). It is possible to define extensionsto the CWMP data models through vendor-specific extensions.In eCAALYX we define extensions to the data model of anInternet Gateway Device to adapt it to e-health systems. Thisdata model ensures that the HG get the correct configurationfor every sensor in the system, as well as the information aboutthe Caretaker servers used.
By using CWMP, the Caretaker can easily change andupdate the configuration of the HG and the existing sensors— for instance, if a sensor’s driver needs to be updated, theCaretaker would need to upload this new driver to the databaseonly once and the information would reach every HG usingthis sensor model in a short time interval. The other use ofCWMP — troubleshooting — is useful to a timely detectionof a failure or misconfiguration in the system.
B. Home Gateway
Due to its high degree of configuration, the HG system ismodular and agnostic to specific medical sensors, data formats
136
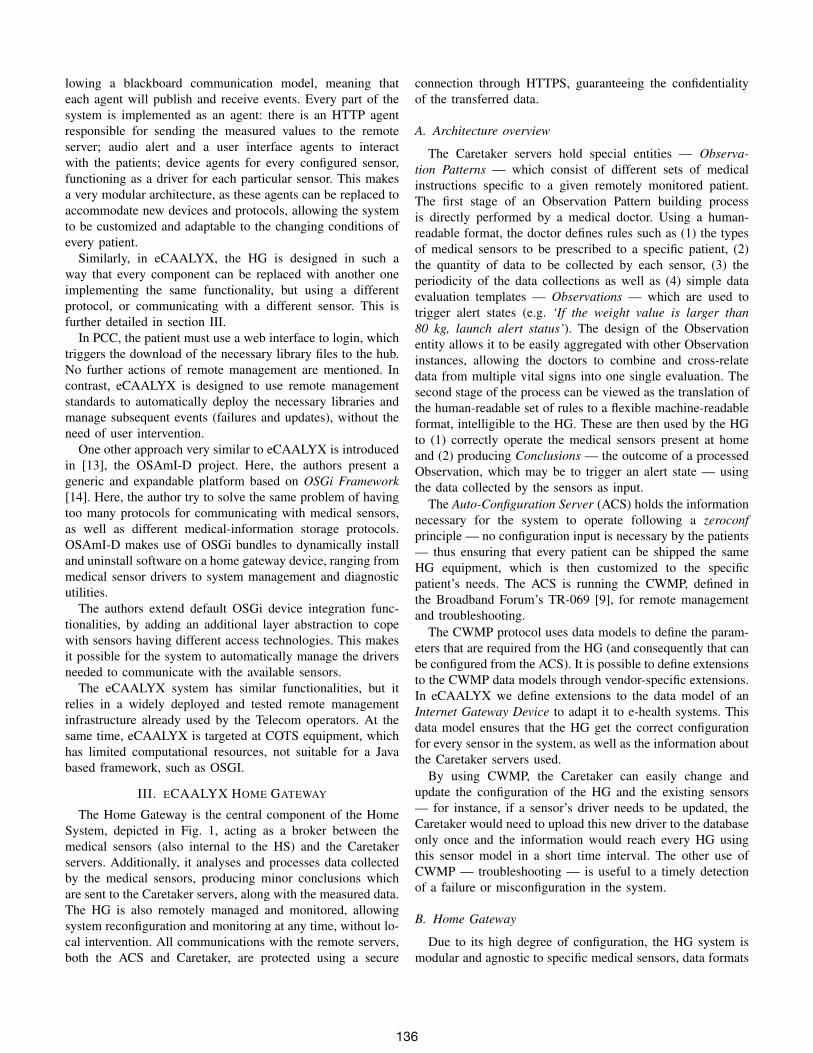
Fig. 2. eCAALYX Home Gateway architecture, including its interactions with external entities.
and/or Caretaker protocols. The HG performs three main sys-tem tasks — (1) communication with the Caretaker servers andpre-processing of medical data, (2) communication with themedical sensors, and (3) remote management and monitoringof the system — using three main software modules — SensorManager, Caretaker Manager and CPE Manager — depictedin Fig. 2. Each one of the modules is responsible for a singlemain task.
1) CPE Manager: The CPE Manager is in the heart ofthe HG and is responsible for two tasks [15]: handling theremote management capabilities of the system; monitoring allthe components of the HG system and reporting failures andmisconfigurations.
When deployed, all HG equipments have the same infor-mation in them, i.e, they are not configured or customized tothe patients needs. As such, the CPE Manager is responsiblefor performing the bootstrap process by contacting the ACSand getting the necessary configurations. These include thedefinitions and parameters for every medical sensor that isprescribed to the patient associated to the device; the sensorlibrary files used by the Sensor Manager process; the pa-rameters needed by the Caretaker Manager to communicatewith the Caretaker servers associated with this patient. Afterthis bootstrap process is finished, the CPE Manager gets newconfigurations and definitions by periodically contacting theACS (as defined in the CWMP protocol).
At the same time, the CPE Manager continuously monitorsthe state of the other components of the HG, including theCaretaker and Sensor Managers, the connections with theremote servers, the state of all the sensors, as well as the stateof the gateway itself. In the event something goes wrong, theHG establishes a session to the ACS as soon as possible andreports the errors.
Although we describe and implemented the system withCWMP in mind, we designed the system in such way that wecan replace CWMP with other remote management protocol,as long as it performs similar functions. For this, we need onlyto replace the CWMP library, keeping all other parts of thesystem.
2) Caretaker Manager: The Caretaker Manager communi-cates with the Caretaker servers, retrieving the ObservationPatterns associated with a given patient and translating theircontents into instructions which are intelligible to the SensorManager. These instructions are then used by the latter tointeract with the medical sensors. In addition, it also uses theObservation Pattern information to pre-process the medicaldata, which may trigger alert messages to be sent to theCaretaker servers, along with the actual data. The communi-cation with the Caretaker servers relies on a scheme basedon independent modules, implemented as plugin softwarelibraries which can be loaded at runtime by the CaretakerManager. This abstraction layer allows the Caretaker Managerto (1) communicate with multiple Caretaker servers and (2)comply with practically any type of communication protocol,such as HL7 2.4 [16] or EDI [17]. These plugin libraries followa reference design which allows each instance to be easilyadjusted to a certain communication protocol and/or a datamodel specific to a given Caretaker server.
3) Sensor Manager: The Sensor Manager coordinatesthe operations of the medical sensors prescribed to a givenpatient. It cross-relates the technical specifications of thesensors, received from the CPE Manager (e.g. communicationtechnology, MAC address, etc.) and a list of vital signs to bemonitored, along with the respective monitoring instructions,received from the Caretaker Manager. These monitoringinstructions are comprised in special entities — Triggers —containing information about the vital sign it refers to, thesensor which measures the vital sign, the required durationfor a measurement, etc. The Sensor Manager then starts eachindividual sensor handling thread, employing a referencedesign for dynamically loaded libraries, which work asplugin sensor drivers. This scheme allows the system tocommunicate with multiple medical sensors in parallel and,most importantly, with virtually any type of sensor (as long asthe physical communication interface is available, the pluginlibrary can handle the high level communication protocol).The system is prepared to handle this loading process atruntime, whenever an update is necessary (e.g. automatically
137
triggered when a new medical sensor is prescribed, a vitalsign instruction is changed, etc.). While collecting data relatedto a given vital sign, the Sensor Manager keeps this stateuntil the respective Triggers (i.e. monitoring instructions)are satisfied. At this point, the collected data is sent to theCaretaker Manager, in order to be pre-processed and sent tothe Caretaker servers.
Despite being task independent, the software modules needto share information between each other. Fig. 2 presents themessages exchanged between the software modules. In short,they allow (1) the CPE Manager to order the Sensor Managerto update its sensor list and/or plugin sensor drivers, (2) theCPE Manager to trigger Caretaker information updates onthe Caretaker Manager, and (3) the Sensor and CaretakerManagers to exchange sensor information (configurations andmeasurements).
C. Implementation
The HG has been tested and deployed in four differ-ent COTS router models — Linksys WRT160NL, NetgearWNR3500L, ASUS WL500W and Ubiquiti Routerstation Pro— all of them running OpenWRT [18] as the operating system.Three different Bluetooth-enabled medical sensors have beenused: a weight scale (BS 9930 BT body scale [19]), anECG sensor (BT 3/6 ECG sensor [20]) and a glucometer(MyGlucoHealth Meter [21]). Since none of the router modelshas a native Bluetooth interface, a USB Bluetooth adapteris used (Bluetooth 2.1 USB CN-516 Micro Adapter). Theeffort spent in integrating COTS technology is intentional, asit contributes to decrease the cost of the HG solution, makingit affordable to the majority of the target population.
The three software modules composing the HG system weredeveloped in C++ programming language. Each one runs asan independent process, employing an inter-process commu-nication (IPC) mechanism based on TCP sockets. As men-tioned above, the HG system is highly configurable througha set of configuration files and plugin software libraries. Theconfiguration files are based on XML, so the library libxml2is also used to parse these files and extract the configurationinformation needed to setup the HG system. The plugin soft-ware library scheme is based on a dynamic loading mechanismprovided by the libdl library, which allows computer programson UNIX-like systems to load/unload libraries at runtime.
The implementation of the Bluetooth interface betweenthe Sensor Manager and the medical sensors is based onthe BlueZ stack [22]. The HG interaction with the externalCaretaker servers is based on Web Services, employing SOAPas the communication protocol, using the libxml2, libcurl andlibopenssl libraries.
IV. PERFORMANCE ANALYSIS
The eCAALYX Home Gateway has been subjected to aperformance evaluation whose main objectives were: (1) tovalidate the implementation of the proposed architecture; (2)to understand its performance limits and thus the limits of
its applicability in real life and (3) to assess the scalabilityof the current implementation, in order to prepare it for fieldtrials with real patients. The implementation of the proposedarchitecture is a work in progress, and due to this fact thescope of this performance evaluation is constrained to internalcomponents of the system, namely the Sensor and CaretakerManagers.
We defined our own figure of merit as the amount of usefulwork produced by the system vs. the time consumed to achieveit. Since the only well-defined variable that can be measuredis time, we measured the time the system takes to perform afixed amount of useful work, in this case, core functions ofthe HG system.
A. Defining ‘Useful Work’
The following HG core tasks have been defined as the unitsof useful work to be produced by the system, tasks which havealready been described in Section III:
1) Completing the gathering of a measurement from amedical sensor, i.e. satisfying a Trigger;
2) Processing an Observation;For the first task, the Trigger time T is considered, i.e. the
amount of time comprehended between (1) the instant whena connection to a sensor is established and (2) the instantthe collected measurement is sent to the Caretaker Manager.The Sensor Manager is responsible for all operations whichoccur during this period of time. T is measured under differentcircumstances: (1) different number of concurrent Triggers;and (2) different Trigger durations. Note that the concepts ofTrigger duration — the required period of time to be spentcollecting measurements before a Trigger is considered to besatisfied — and Trigger time are different.
The second task — Observation processing — entirelyallocated to the Caretaker Manager, occurs immediately aftera measurement session. Therefore, the Observation time O isdefined as the time difference between (1) the instant when theCaretaker Manager receives a measurement from the SensorManager and (2) the instant when one or more Observationsassociated with that measurement are processed, i.e. theirrespective Conclusions are produced. O is measured under thesame circumstances as T : (1) different number of concurrentTriggers; and (2) different Trigger durations. Notice that, inthis case, there is a 1 : 1 relationship between a Trigger andan Observation, i.e. N concurrent Triggers, when satisfied, willproduce N concurrent Observation processing procedures.
B. Monitoring Side Effects
Analyzing performance introduces intrusion in the normalbehavior of the monitored device. Depending on the metrics,there are some monitoring techniques, such as performanceprofiling and tracing [23]. Though, none of them is entirelypassive and therefore intrusion can result in performancedegradation [24]. Consequently, the challenge is to determinethe exact amount of overhead introduced by the monitoringin order to have an accurate measure, which means to assessthe ‘true’ performance of the system. The HG implementation
138
incorporates a logging system, where each task or event isan entry in the logs. Each entry contains an identification ofthe task/event, a timestamp and a text description of the task/event. Therefore, it is possible to measure the time necessaryto perform a given task. If we consider the log entries as partof the system, we can assume a performance analysis withoutintrusion in the regular functioning of the HG.
C. Experimental Setup
The Trigger time T and Observation time O, variablesintroduced earlier in this section, have been measured underthree different sets of circumstances, i.e. three different testprocedures:
1) Varying the Trigger’s specified duration D,for a number of sessions N = 20, withD ∈ {30, 40, 50, ..., 120} s;
2) Varying the number of concurrent measurement ses-sions, N , with a fixed Trigger duration D = 30 s,for N ∈ {5, 10, 20, 30, 40, 50};
3) Varying the BT 3/6 ECG sensor sampling rate F ,for a fixed numbers of sessions N = 20, witha fixed pre-determined duration D = 30 s, withF ∈ {100, 500} Hz.
Different values of rounds R have been defined for each testprocedure, as an effort to increase the statistical significanceof the results. Because each sample represents a single triggerbeing served, different values of samples are obtained fordifferent values of N , specifically N × R samples for eachN . Therefore, R = 10 has been defined for tests 1 and 3(200 samples for each value of D or F ) and R = 30 for test2, which for the worst case, N = 5, produces a sample sizeof 150. The BT 3/6 ECG sensor has been kept at a constantdistance from the HG, with no obstacles in between, for allthe tests.
Although the system has been deployed in four differentCOTS router models, the Linksys WRT160NL has been cho-sen as the platform to run the HG software on this evaluationscenario. A BT 3/6 ECG sensor has been used as the generatorof measurements, since it is capable of producing a continuousstream of values, as opposed to discrete sensors such as theBS 9930 BT body scale or the MyGlucoHealth meter. TheBT 3/6 ECG sensor collects ECG data from two channels, 16bits each, with sampling rates of 100 Hz or 500 Hz [20]. Thisresults in transmission rates of 400 or 2000 bytes per second.For the purposes of this performance evaluation, we only treatthe instantaneous heart rate (expressed in beats per minute)values which are transmitted along with the ECG data. TheObservations used in the tests were simple (no aggregationshave been employed). These were relative to heart rate, withvariable measurement durations (as specified by each test) andcapable of producing simple Conclusions, e.g. ‘If heart ratelarger than 80 bpm, launch alert’.
D. Experimental Results and Analysis
The results are shown in the form of a box plot, which al-lows the condensation of different types of descriptive statistics
— sample minimum, lower quartile, median, upper quartileand sample maximum — into one single chart. Since we donot make any assumptions about the statistical distribution ofboth T and O, a box plot — which is non-parametric —presents itself as an adequate way to depict our results.
20
40
60
80
100
120
140
160
20 40 60 80 100 120
Tri
gger
tim
e, T
(s)
Trigger duration, D (s)
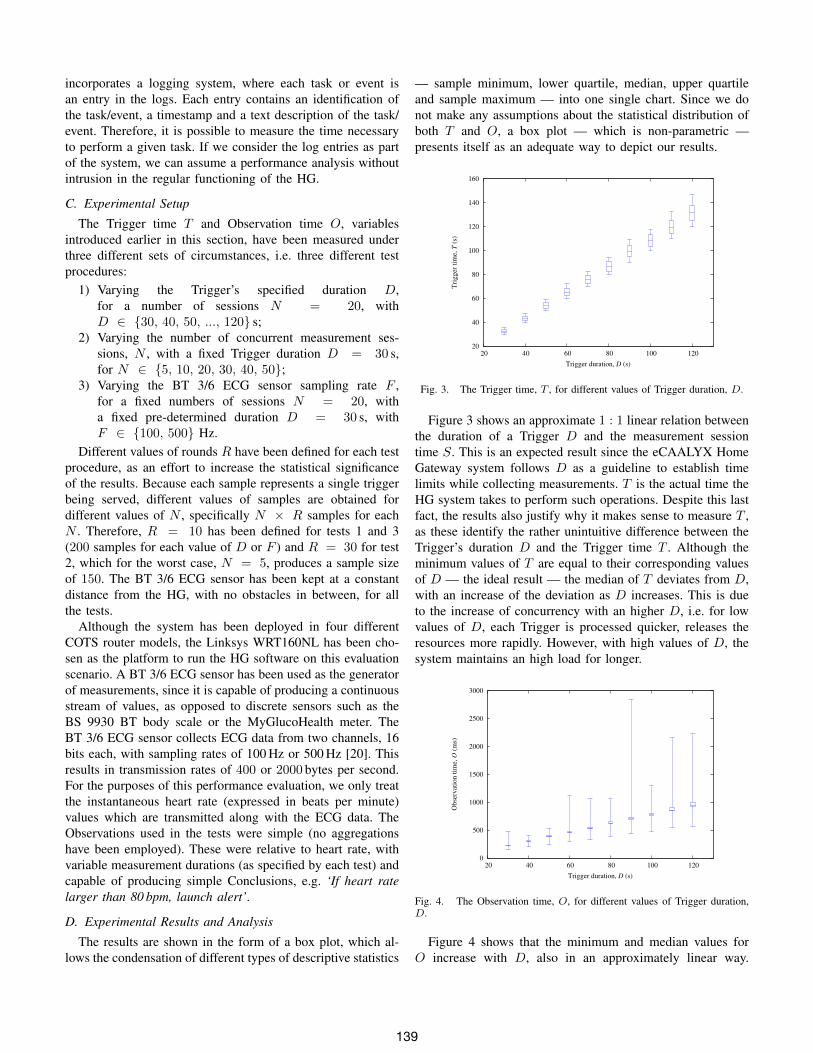
Fig. 3. The Trigger time, T , for different values of Trigger duration, D.
Figure 3 shows an approximate 1 : 1 linear relation betweenthe duration of a Trigger D and the measurement sessiontime S. This is an expected result since the eCAALYX HomeGateway system follows D as a guideline to establish timelimits while collecting measurements. T is the actual time theHG system takes to perform such operations. Despite this lastfact, the results also justify why it makes sense to measure T ,as these identify the rather unintuitive difference between theTrigger’s duration D and the Trigger time T . Although theminimum values of T are equal to their corresponding valuesof D — the ideal result — the median of T deviates from D,with an increase of the deviation as D increases. This is dueto the increase of concurrency with an higher D, i.e. for lowvalues of D, each Trigger is processed quicker, releases theresources more rapidly. However, with high values of D, thesystem maintains an high load for longer.
0
500
1000
1500
2000
2500
3000
20 40 60 80 100 120
Obse
rvat
ion t
ime,
O (
ms)
Trigger duration, D (s)
Fig. 4. The Observation time, O, for different values of Trigger duration,D.
Figure 4 shows that the minimum and median values forO increase with D, also in an approximately linear way.
139

The chart shows that 50% of the sampled values of O fallwithin a fairly narrow interval of time (the maximum width— 70 ms — occurs for D = 120 s). Figure 4 also showsthat the distribution of O is positively skewed, as the centralbox of the plot seems to be shifted to the lower whisker,for most values of D. This tendency is more evident forD ≥ 60 s. 75% of O (lower whisker to top of upperquartile) seem to be constrained in time intervals which aresmaller than those of the 25% top values of O (at least forD = 30 s and D ≥ 60 s). Although the 75% intervalsget wider with D, these seem to do it proportionally. Thesame does not happen for the 25% top values of O, whichcan be seen as delay events of the Observation processingprocedure. The maximum magnitude for such delay events,i.e. the sample maximum, seems to be difficult to predictbased on the variation it presents for different values of D.Again, this can be explained by the increase of concurrencyin the system. The kernel scheduler decides when processesget access to the CPU and for how long, which results ina non-deterministic distribution of process execution times.This means that with more processes running concurrently forlonger, some processes might be getting no access to the CPUfor a long time, which would effectively increase the maximumvalue unpredictably.
From this test we can see that the HG system is capableof maintaining the delay of a measure in a reasonable amounteven with 20 Triggers of a duration of 2 minutes — whichare rather high values for a real world deployment. This meansthat, under normal operation, the system would be capable ofdelivering all measures in a timely manner.
25
30
35
40
45
50
0 10 20 30 40 50
Tri
gger
tim
e, T
(s)
Number of concurrent Triggers, N
Fig. 5. The Trigger time, T , for different numbers of concurrent measurementsessions, N .
Figures 5 and 6 show the results of test 2. Figure 5 shows anincrease on the measurement session time S when the numberof concurrent triggers N increases. With a direct analysis thiscould be seen as an unexpected result, because the Triggerduration D is kept constant so the session time S should alsobe constant. However, the concurrency phenomena referred intest 1 is also applied in this case. So, due to an increase on thenumber of processes to attend, the system is kept in a highload during a larger period of time and some processes do
0
500
1000
1500
2000
2500
3000
0 10 20 30 40 50
Obse
rvat
ion t
ime,
O (
ms)
Number of concurrent Triggers N
Fig. 6. The Observation time, O, for different numbers of concurrentmeasurement sessions, N .
not get access to the CPU during a longer period. RegardingFig. 6, the minimum, lower and upper quartile values ofO (i.e. 75% of the sampled values) are constrained in anarrow interval of possible time values for all N , specificallyOlower75% ⊂ [139.3, 236.5]ms. This is an expected result,since the size of the measurements which are input to theObservations is always the same, unlike test 1.
As previously referred cases of delay events, already iden-tified in test 1, can also be seen on test 2, with a clearmanifestation for N = 40. This behavior can also beexplained by the reasons given above. Although now we arekeeping D the same, we are increasing N , which has the sameeffect of an escalation in concurrency in the system. In fact,one can see that for N = 20 in test 2 and D = 30 s in test1, both tests are subjected to the exact same conditions, andindeed the results are similar.
25
30
35
40
45
50
55
60
65
100 500 100 500 0
200
400
600
800
1000
1200
1400
1600
1800
2000
Tri
gg
er t
ime,
O (
s)
Ob
serv
atio
n t
ime,
O (
ms)
Sampling Freq. (Hz)
Trigger TimeObservation Time
Fig. 7. The Observation time, O, and Trigger time T for different BT 3/6ECG sensor sampling frequencies, F .
Fig. 7 shows the results obtained on test 3. Regardingthe Trigger time, T — left part of the plot — we can seethat the system presents an increase of T when F is setto 500Hz. This behavior is verified despite keeping T in30 s, because an increase on the sampling rate of the sensororiginates an increase on the amount of data passed to the
140

Caretaker Manager and processed by it. Additionally, it canbe seen that for 100Hz 50% of the values are symmetricallydistributed between 31.4 s and 34.2 s, while for 500Hz themedian approached the upper quartile.
In the right side of Fig. 7 we can see the behavior of O whenF increases. As with the Trigger time, T , the increase of theamount of data passed to the Caretaker Manager increases thetime it takes to process it, which by the definition of O resultsin an increase of its value. To increase the figure readability,the maximum values of O are not plotted, due to their highmagnitudes. These take the values of 13400ms and 44500msfor the cases of 100Hz and 500Hz, respectively.
Specifically, despite the high maximum value of 13.4 s forthe 100Hz test, the Olower75% ⊂ [154.0, 235.6]ms. Thisbehavior disappears on the 500Hz tests, where results are moredispersed through a large interval, Olower75% ⊂ [0.7, 11.6] s.
V. CONCLUSION AND FUTURE WORK
Existing home healthcare solutions need to overcome re-mote management and interoperability issues in order toimprove flexibility, reliability and usability. By doing so, thesesystems are taking a step in the direction of mass-deployment.
In this paper we presented the architecture and performanceevaluation of the eCAALYX Home System, an adaptablehome healthcare solution that addresses the aforementionedlimitations. Our approach relies in the use of open standardizedprotocols serving as a base for plugging in several othercommunication and message exchanging protocols.
The eCAALYX Home Gateway performance evaluationallowed us to assess its performance limits and the scalabilityof the current implementation. The results show the proposedsystem is capable of handling multiple measure gatheringprocedures from a medical sensor, in parallel (up to 50), forcollection periods up to 2minutes, which are reasonable valuesfor a real world deployment. These results also show thesuitability of the concepts introduced by our architecture —Observation Patterns, Observations, Triggers — to work as aremote monitoring solution.
The next step of the eCAALYX project involves usabilityand robustness evaluation in real-world conditions throughfield trials with elderly patients. The trials are scheduled forthe second semester of 2011.
ACKNOWLEDGMENT
The authors would like to acknowledge the valuable support,input and ideas provided by both the eCAALYX project con-sortium and Fraunhofer Portugal AICOS executive director,Prof. Dr.-Ing Dirk Elias.
REFERENCES
[1] Eurostat, “Ageing Characterises the Demographic Perspectives of theEuropean Societies,” Statistics in Focus, vol. 72/2008, 2008.
[2] A. Braun, A. Constantelou, V. Karonou, A. Ligtvoet, J. Burgelman, andM. Cabrera, “eHealth in the Context of a European Ageing Society: AProspective Study,” Tech. Rep. EUR 21377 EN, 2004.
[3] E. Lupu, N. Dulay, M. Sloman, J. Sventek, S. Heeps, S. Strowes,K. Twidle, S.-L. Keoh, and A. Schaeffer-Filho, “AMUSE: AutonomicManagement of Ubiquitous e-Health Systems,” Concurr. Comput.:Pract. Exper., vol. 20, pp. 277–295, March 2008.
[4] R. Carroll, R. Cnossen, M. Schnell, and D. Simons, “Continua: An Inter-operable Personal Healthcare Ecosystem,” IEEE Pervasive Computing,vol. 6, pp. 90–94, 2007.
[5] J. Yao, R. Schmitz, and S. Warren, “A Wearable Point-of-Care Systemfor Home use that Incorporates Plug-and-Play and Wireless Standards,”Information Technology in Biomedicine, IEEE Transactions on, vol. 9,no. 3, pp. 363 –371, 2005.
[6] M. Galarraga, L. Serrano, I. Martinez, P. de Toledo, and M. Reynolds,“Telemonitoring Systems Interoperability Challenge: An Updated Re-view of the Applicability of ISO/IEEE 11073 Standards for Interop-erability in Telemonitoring,” in Engineering in Medicine and BiologySociety, 2007. EMBS 2007. 29th Annual International Conference ofthe IEEE, 2007, pp. 6161 –6165.
[7] M. Martinez-Espronceda, I. Martınez, J. Escayola, L. Serrano, J. Trigo,S. Led, and J. Garcıa, “Standard-based Digital Homecare Challenge: Ad-vances of ISO/IEEE11073 for u-Health,” in ICMCC Digital HomecareBook, E. Al, Ed. Springer, 2009.
[8] (2010, Dec) Enhanced Complete Ambient Assisted Living Experiment.[Online]. Available: http://ecaalyx.org/
[9] “TR-069 Amendment 2, CPE WAN Management Protocol,”Broadband Forum, Tech. Rep., 2007.
[10] I. Korhonen, J. Parkka, and M. Van Gils, “Health monitoring in thehome of the future,” Engineering in Medicine and Biology Magazine,IEEE, vol. 22, no. 3, pp. 66 – 73, 2003.
[11] F. Ichihashi and Y. Sankai, “Development of a portable vital sensingsystem for home telemedicine,” in Engineering in Medicine and BiologySociety, 2007. EMBS 2007. 29th Annual International Conference of theIEEE, 2007, pp. 5872 –5877.
[12] M. Blount, V. M. Batra, A. N. Capella, M. R. Ebling, W. F. Jerome, S. M.Martin, M. Nidd, M. R. Niemi, and S. P. Wright, “Remote health-caremonitoring using personal care connect,” IBM Systems Journal, vol. 46,no. 1, pp. 95 –113, 2007.
[13] E. Zeeb, G. Moritz, W. Thronicke, M. Lipprandt, A. Hein, F. Muller,J. Kruger, O. Dohndorf, A. Litvina, C. Fiehe, I. Luck, F. Golatowski, andD. Timmermann, “Generic platform for advanced e-health applications,”in Proceedings of the IEEE 12th International Conference on E-HealthNetworking, Applications and Services (HealthCom 2010). Lyon,France: IEEE Computer Society, 2010.
[14] O. Alliance, “OSGi Service Platform, Core Specification, Release 4,Version 4.2,” OSGi Alliance, Tech. Rep., September 2009.
[15] P. Saleiro, F. Abrantes, D. Elias, F. Sousa, M. Cruz-Martin, andA. Aguilar, “Reusing the telecom infrastructure to deploy efficient andadaptable home healthcare solutions,” AALIANCE conference, March2010.
[16] R. H. Dolin, L. Alschuler, C. Beebe, P. V. Biron, S. L. Boyer, D. Essin,E. Kimber, T. Lincoln, and J. E. Mattison, “The HL7 Clinical DocumentArchitecture,” Journal of the American Medical Informatics Association,vol. 8, no. 6, pp. 552–569, 2001.
[17] J. R. Vest and J. Jasperson, “What should we measure? Conceptualizingusage in health information exchange,” Journal of the American MedicalInformatics Association, vol. 17, no. 3, pp. 302–307, 2010.
[18] OpenWrt.org. (2010, Dec) OpenWrt - Wireless Freedom. [Online].Available: http://openwrt.org/
[19] Corscience GmbH & Co. KG. (2010, Dec) Telemedicine- Sensors: Body Scale BS 9930 BT/GPRS. [Online].Available: http://www.corscience.de/en/medical-engineering/products-systems/telemedicine/sensors/scales.html
[20] ——. (2010, Dec) BT PC ECG Sensor - BT 3/6 andBT 12. [Online]. Available: http://www.corscience.de/en/medical-engineering/products-systems/ecg-devices/bt-pc-ecg-device.html
[21] MyGlucoHealth. (2010, Dec) MyGlucoHealth Wireless Meter. [Online].Available: http://www.myglucohealth.net/myglucohealth-wireless.html
[22] (2010, Dec) BlueZ - Official Linux Bluetooth Protocol Stack. [Online].Available: http://www.bluez.org/
[23] A. D. Malony and S. S. Shende, “Overhead compensation in per-formance profiling,” in Euro-Par 2004 Parallel Processing, ser. Lec-ture Notes in Computer Science, M. Danelutto, M. Vanneschi, andD. Laforenza, Eds. Springer Berlin / Heidelberg, 2004, vol. 3149,pp. 119–132.
[24] A. D. Malony, “Performance observability,” Ph.D. dissertation, Cham-paign, IL, USA, 1990, aAI9114332.
141
Copyright © 2022 FDOKUMEN