People, politics, and globalization - Open Knowledge Repository
488
Edited by Justin Yifu Lin and Boris Pleskovic ABCDE 2009 Annual World Bank Conference on Development Economics Global People, Politics, and Globalization Public Disclosure Authorized Public Disclosure Authorized Public Disclosure Authorized Public Disclosure Authorized
-
Upload
khangminh22 -
Category
Documents
-
view
1 -
download
0
Transcript of People, politics, and globalization - Open Knowledge Repository
Edited by
Justin Yifu Lin and Boris Pleskovic
A B C D E
2 0 0 9
Annual World Bank Conference on
Development Economics
Global
People, Politics, and Globalization
Pub
lic D
iscl
osur
e A
utho
rized
Pub
lic D
iscl
osur
e A
utho
rized
Pub
lic D
iscl
osur
e A
utho
rized
Pub
lic D
iscl
osur
e A
utho
rized
wb350881
Typewritten Text
55539


People, Politics, and
Globalization

Edited by
Justin Yifu Lin andBoris Pleskovic
Annual World Bank Conference
on Development Economics—Global
2009
People, Politics, and
Globalization
Washington, D.C.

© 2010 The International Bank for Reconstruction and Development / The World Bank1818 H Street, NWWashington, DC 20433Telephone 202-473-1000Internet www.worldbank.orgE-mail [email protected]
All rights reserved.
1 2 3 4 :: 13 12 11 10
This volume is a product of the staff of the International Bank for Reconstruction and Development / TheWorld Bank. The findings, interpretations, and conclusions expressed in this volume do not necessarilyreflect the views of the Executive Directors of The World Bank or the governments they represent.
The World Bank does not guarantee the accuracy of the data included in this work. The boundaries,colors, denominations, and other information shown on any map in this work do not imply any judgment on the part of The World Bank concerning the legal status of any territory or the endorsement or acceptance of such boundaries.
Rights and PermissionsThe material in this publication is copyrighted. Copying and/or transmitting portions or all of thiswork without permission may be a violation of applicable law. The International Bank for Reconstruction and Development / The World Bank encourages dissemination of its work andwill normally grant permission to reproduce portions of the work promptly.
For permission to photocopy or reprint any part of this work, please send a request with completeinformation to the Copyright Clearance Center Inc., 222 Rosewood Drive, Danvers, MA 01923, USA;telephone: 978-750-8400; fax: 978-750-4470; Internet: www.copyright.com.
All other queries on rights and licenses, including subsidiary rights, should be addressed to theOffice of the Publisher, The World Bank, 1818 H Street NW, Washington, DC 20433, USA; fax: 202-522-2422; e-mail: [email protected].
Edited by Justin Yifu Lin and Boris Pleskovic
Professional affiliations identified in this volume, unless otherwise noted, are as of the time of theconference, June 9–11, 2008.
ISBN: 978-0-8213-7722-2eISBN: 978-0-8213-8059-8DOI: 10.1596/978-0-8213-7722-2ISSN: 1813-9477
Contents
ABOUT THIS BOOK ix
INTRODUCTION 1Justin Yifu Lin and Boris Pleskovic
OPENING ADDRESS 11Trevor Manuel
OPENING ADDRESS 13Justin Yifu Lin
OPENING ADDRESS 15Thabo Mbeki
KEYNOTE ADDRESS 23Michael Spence
KEYNOTE ADDRESS 33Bassma Kodmani
KEYNOTE ADDRESS 41Sunil Kant Munjal
Trade and Investment
Trade and Economic Performance: Does Africa’s Fragmentation Matter? 51Paul Collier and Anthony J. Venables
Protectionist Policies and Manufacturing Trade Flows in Africa 77Lawrence Edwards
COMMENT
Beata Smarzynska Javorcik 109
v
v i | CONTENTS
Crisscrossing Globalization: The Phenomenon of Uphill Skill Flows 115Aaditya Mattoo and Arvind Subramanian
COMMENT
Beata Smarzynska Javorcik 141
Migration, Remittances, and the Transitionfrom Foreign Aid
The Aid-Migration Trade-off 147Jean-Paul Azam and Ruxanda Berlinschi
COMMENT
Melvin D. Ayogu 169
Are Remittances More Effective Than Aid for Improving Child Health?An Empirical Assessment Using Inter- and Intracountry Data 173Lisa Chauvet, Flore Gubert, and Sandrine Mesplé-Somps
COMMENT
Melvin D. Ayogu 205
The Role of Emigration and Emigrant Networks in Labor MarketDecisions of Nonmigrants 209Jinu Koola and Çaglar Özden
COMMENT
Jean-Luc Demonsant 226
Higher Education and High-Technology Industry
The Role of Higher Education in High-Technology Industrial Development:What Can International Experience Tell Us? 233Sachi Hatakenaka
COMMENT
Erik Sander 266
African Higher Education and Industry: What Are the Linkages? 275Akilagpa Sawyerr and Boubakar Barry
COMMENT
Shahid Yusuf 294
An Arrested Virtuous Circle? Higher Education and High-TechnologyIndustries in India 297Rakesh Basant and Partha Mukhopadhyay
COMMENT
Pankaj Chandra 346
CONTENTS | v i i
Human Development
Health and Socioeconomic Status: The Importance of Causal Pathways 355Duncan Thomas
The Household Impacts of Treating HIV/AIDS in Developing Countries 385Markus Goldstein, Joshua Graff Zivin, and Harsha Thirumurthy
COMMENTS
T. Paul Schultz 406John Strauss 412
Political Economy
When Is Public Expenditure Pro-Poor? 419Francisco Rodríguez
The Political Economy of Public Service Provision in South Asia 443Lakshmi Iyer
COMMENT
Ashutosh Varshney 463
CLOSING REMARKS 467Alan Gelb
CLOSING REMARKS 471Fundi Tshazibana

About This Book
The Annual World Bank Conference on Development Economics is a forum for discussion and debate of important policy issues facing developing countries. The conferences emphasize the contribution that empirical economic research can make tounderstanding development processes and to formulating sound development policies.Conference papers are written by researchers in and outside the World Bank. The conference series was started in 1989. Conference papers are reviewed by the editorsand are also subject to internal and external peer review. Some papers were revised afterthe conference, to reflect the comments made by discussants or from the floor, whilemost discussants’ comments were not revised. As a result, discussants’ comments mayrefer to elements of the paper that no longer exist in their original form. Unless other-wise noted, participants’ affiliations identified in this volume are as of the time of theconference, June 9–11, 2008.
The planning and organization of the June 2008 conference was a joint effort bythe Government of South Africa and the World Bank. We gratefully acknowledgetimely and valuable contributions made by the all the members of the Steering Committee and several anonymous reviewers. We would also like to thank Alan Gelband Aehyung Kim for their insightful advice and Leita Jones, conference organizer,whose excellent organizational skills helped to ensure a successful conference. Finally,we thank the editorial staff for pulling this volume together, especially Stuart Tucker,Mark Ingebretsen, and Nora Leah Ridolfi from the Office of the Publisher.
ix

Introduction
JUSTIN YIFU LIN AND BORIS PLESKOVIC
The Annual Bank Conference on Development Economics (ABCDE) brings fresh,innovative perspectives to key problems of development. By providing a forum inwhich policy makers, academics and leading researchers focus on a common theme,ABCDE plays an important role in advancing debate and shaping the internationaldevelopment agenda.
The 2009 ABCDE, held June 9–11, 2008, in Cape Town, South Africa, was devotedto “People, Politics, and Globalization.” The program included a strong dose ofempirical research on the experience of developing countries in all regions of theglobe. Speakers addressed such subjects as trade and investment, higher educationand high-technology industry, migration and remittances, the interaction betweenhealth and economic development, and the political economy of public expenditures.
This volume includes selected papers from the conference, as well as keynoteaddresses by Michael Spence, chairman of the Commission on Growth and Develop-ment and 2001 Nobel laureate for economics; Bassma Kodmani, executive directorof the Arab Reform Initiative; and Sunil Kant Munjal, chairman of Hero Corporate Service Ltd., the services division of the Indian automotive concern.
Keynote Addresses
In his address “Rethinking Growth: Learning from Experience and Adapting to NewChallenges,” Michael Spence discusses the subject of sustained, high, inclusivegrowth and summarizes the findings of the Commission on Growth and Develop-ment. The commission, under Spence’s chairmanship, has gathered new insights intothe fundamental dynamics of sustained high growth and has identified the policymeasures that appear to underpin such growth.
1
Justin Yifu Lin is Chief Economist and Senior Vice President for Development Economics at the World Bank. BorisPleskovic is Research Manager for Development Economics at the World Bank.
Annual World Bank Conference on Development Economics 2009, Global © 2010 The International Bank for Reconstruction and Development / The World Bank

2 | JUSTIN YIFU L IN AND BORIS PLESKOVIC
Spence observes that in all of human history, only 13 economies have grown at anaverage annual rate of 7 percent or more for 25 years or longer—and all of theseinstances of sustained high growth occurred after 1950. The commission has dis-sected these cases to display their essential features and common characteristics, someof which derive from basic economics and others from effective government.
According to Spence, the single most important shared characteristic of the13 high-growth economies is engagement with the global economy. Rather than gen-erating new knowledge, these countries mastered existing knowledge and applied itin certain industries. Once they had developed a competitive advantage, they tookadvantage of the huge elastic demand offered by the global open economy, whichallowed them to grow as quickly as they could invest.
The commission has documented that these countries also maintained macroeco-nomic stability and had high levels of saving, which spurred investment. Spenceobserves that a high national saving rate—20 percent and higher—has been commonamong the high-growth countries. In most cases, he notes, competitive market mech-anisms, labor mobility, and rapid urbanization have been crucial.
The commission’s most surprising finding, says Spence, concerns the importanceof noneconomic factors, particularly political leadership and effective governance.The key factor of policy success seems to have been adherence to a consistent growthstrategy. The successful economies did not all have the same type of government, butthey all had political leadership that focused on improving the lives of members ofsociety as a whole. Political leadership that focused on its own interests or on theinterests of a particular group did not achieve sustained high growth. Among otheringredients of successful policy, Spence lists sustained investment in three areas: infra-structure, health and early childhood nutrition, and education.
The commission’s findings do not include specific policy prescriptions. The commission did look at special challenges that face certain developing countries,including many countries in Africa. Small states, for example, have little ability todiversify their economies, and they face high costs with regard to government andpublic services. Countries rich in natural resources have a mixed record. Spence notesthat because of the peculiar geography inherited from the colonial period, manyAfrican countries are small, many are landlocked, and although some have a rich natural resource base, others are resource poor. Middle-income countries, for theirpart, may experience difficulty moving from labor-intensive industry to industryfueled by knowledge, innovation, and human capital.
Bassma Kodmani presents an overview of the Middle East, juxtaposing certaingrim political and economic realities against real achievements in recent years thatseem to be moving the Arab region into a new era. She cites a number of long-termdangers—the Arab-Israeli conflict, the humanitarian disaster in Darfur, the war inIraq, the depletion of water resources, and agricultural dependency—but also pointsto high rates of economic growth in most countries in the region and to importantgovernance reforms. Kodmani observes, however, that reforms have slowed in thelast couple of years because of reluctance to shift power decisively from governmentto society at large. She maintains that it is time to adopt a new democratic paradigm
INTRODUCTION | 3
based on strong and accountable public institutions and on such fundamental prin-ciples as liberty, respect for human rights, the rule of law, and social justice.
Kodmani perceives a new awakening of Arab societies. Independent media haveemerged and are forging horizontal links among citizens. Both the marginalized seg-ments of society and elites are challenging governments and are launching protests.Kodmani argues that the existence of independent media has made governmentsmuch more reluctant to suppress such movements. Generally speaking, she asserts,these movements have been very positive in that they are centered on social and polit-ical issues, not issues of identity or religion, and they are calling for peaceful, grad-ual change through legal means. Still, she warns, major social and political unrest ispossible.
In Kodmani’s view, Middle Eastern society fears abrupt change and instability, andthat fear is reinforced by the situation in Iraq, the threat from extremist groups suchas those connected to Al Qaeda, and sectarian tensions in the region. As a conse-quence, political protest has generally remained peaceful, even though the space forlegal protest is tightly restricted. This is true of Islamist movements, as well as secu-lar social movements. For three decades Islamists have built social networks and havemade inroads into political life, and they are now demanding a share of power. Butthe taking of power by force has been limited to conflict areas such as Lebanon andPalestine.
Kodmani argues that reforms in the Arab world are not sustainable without anunderlying shift to a democratic paradigm. Only by recognizing this and creating aspace for citizens to develop a home-grown agenda will a transition to a better futurebe possible. Specifically, Kodmani sees a need for a systemic approach towardreform, greater social accountability, and mechanisms for linking reform measures“from above” to the demands of society. She gives examples of two areas in whichlocal groups have been modestly effective but foreign donors and multilateral insti-tutions have not: security reform and gender issues. What is most important, Kod-mani argues, is for Arab societies to be trusted to chart their own way, even if theychoose a path with which foreign partners are not entirely comfortable.
In his keynote speech, Sunil Kant Munjal traces India’s history of successfulreform. Since 1991, India has opened with remarkable speed to the global economy,but it has followed its own unique path. Indeed, Munjal states, it could not be oth-erwise, as there is no precedent for a democratic country with a population of 1 bil-lion transforming itself into an outward-facing market economy.
Munjal emphasizes the crucial role of innovation in India’s miraculous progress.India, he says, has learned much along the way—mostly from its own mistakes, butalso from the outside world. With respect to the latter, Munjal emphasizes the roleof India’s “brain bank” of overseas Indians. India, he adds, continues to need foreigncapital, but most of all, it needs the knowledge and networks that accompany for-eign capital.
In addition to a great capacity for low-cost innovation, Munjal observes, India hasa long history as a trading nation. That history was interrupted for several decadesafter the country became independent in 1947, when it embraced central planning

4 | JUSTIN YIFU L IN AND BORIS PLESKOVIC
and began building dams, power plants, and steel plants. This direction may havebeen right at the time, says Munjal, but India held on to central planning for far toolong. Only in 1991 did it make a dramatic and fateful move toward the market. Sincethen, India has firmly reestablished itself as a trading nation and has actively reachedout to establish trade relations with many countries. Munjal gives many examples ofsuccess stories—in productivity, infrastructure development, and so forth—and citessome remarkable statistics: an average Indian today can spend twice what he or shecould spend in 1985, and in the next 20 years the average Indian will be able to spendfour times as much as now.
Still, Munjal remarks, many problems remain: labor regulation is still too rigid,physical infrastructure is often lacking, and red tape and corruption persist. Munjalalso points to striking regional differences within India and to the failure of the cen-tral and state governments to adequately provide basic social services such as primaryeducation and health care. He notes that the private sector has stepped in to help—in education and training; rural infrastructure, electrification, irrigation, drinkingwater supply, and many other areas—but that the private sector cannot be a substi-tute for government.
Trade and Investment
Paul Collier and Anthony Venables examine the economic consequences—especiallythe effects on trade—of the political fragmentation of Sub-Saharan Africa into 50-some states, mostly small. By contrast, in South Asia 95 percent of the populationlives in just three countries: India, Pakistan, and Bangladesh.
Sub-Saharan Africa and South Asia are populated on the same scale (roughly,1 billion people in each) and as recently as 1980 had broadly similar levels of incomeand human development. Since then, however, the economic performance of the tworegions has diverged sharply. Africa’s share of world gross domestic product (GDP)declined in the 1980s and 1990s, while South Asia’s nearly doubled. In 1980 Africa’sshare of world exports was nearly four times that of South Asia.
Collier and Venables show that political geography has been a major factor in theregions’ striking divergence over the last three decades. The political fragmentationof Sub-Saharan Africa pushes small national economies toward peasant agricultureand other economic activities in which scale is not so important. In addition, theauthors observe, small markets by their nature tend to be less competitive than largerones: monopolies, oligopolies, and rent-seeking are more common and make invest-ment less attractive.
International borders, largely the legacy of colonialism, have led to an unequal distribution of natural advantages such as mineral wealth, coastlines, and naturalharbors. Countries that are small, resource poor, or landlocked are at a tremendouseconomic disadvantage. Borders pose a formidable barrier to trade and labor mobil-ity and restrict the region’s ability to pool risk and absorb external shocks. LargeAsian countries do not face barriers of this sort, and internal migration and urban-ization have played an important role in their rapid growth.

INTRODUCTION | 5
Collier and Venables point out that whereas the rise of large industrial clusters inAsia has fueled high productivity and growth, Africa’s failure to develop such clus-ters has had major negative effects on economic performance. The authors attributethis failure to the small size of African cities (relative to Asian cities), which derivesin large part from Africa’s political fragmentation.
Collier and Venables conclude that Africa would benefit greatly from political andeconomic integration. Previous efforts at integration have not yielded fruit in Africa,but the application of lessons from other world regions could help. The authors sug-gest that political and economic integration should go hand in hand; that integrationis more likely to succeed if it grows from a small core of states, none of which is dom-inant; and that the economic agenda should be much broader than just trade policy,touching on integrated infrastructure, integrated investment and taxation rules, andso forth. Because these other areas of cooperation are much more likely to generatemutual gains than are trade agreements, their economic consequences reinforcerather than undermine the political process.
Lawrence Edwards adds to the debate on trade policy in Africa, where trade hasdeclined dramatically over recent decades. Analyzing the effects of tariff liberaliza-tion on trade flows in Africa since 1990, Edwards paints a mixed picture. Drawingon sector-level data, he reaches three conclusions: (a) tariff liberalization has takenplace in many countries, but African countries are still marginalized in terms of worldtrade; (b) the effect of tariff liberalization has had a very small, but positive, effect onmanufacturing trade flows; and (c) tariff liberalization has had a negative effect onthe manufacturing trade balance, but again the effect is very small.
Edwards presents data showing a considerable reduction in tariffs since the early1990s. He observes, however, that African economies began from a high level andthat their tariffs are still high relative to countries elsewhere in the world. He notesthat other studies of trade liberalization in Africa have provided evidence of a wors-ening trade balance, which can lead to an external constraint on growth. Export per-formance in Sub-Saharan Africa showed no growth in the 1990s, and althoughexports have grown sharply since 2000, much of the increase is attributable tothe boom in commodity prices. Edwards does, however, find some improvement incompetitiveness.
Aaditya Mattoo and Arvind Subramanian discuss what may be a new phenome-non: “uphill skills flows”—the export of skills, embodied in highly sophisticatedgoods and services or foreign direct investment, from poor to wealthy countries. Theauthors provide evidence of a marked increase in uphill skills flows between 1991and 2005, including such recent notable examples as the takeover of the U.K. auto-motive firm Jaguar by the Indian car maker Tata, Brazil’s export of aircraft, andIndia’s export of services to developed countries.
The authors provide evidence that outflows of foreign direct investment (FDI) tocountries richer than the country of origin increased from 45 percent in 2003 to morethan 70 percent in 2007. They find a similar pattern in the export of sophisticated,skill-intensive goods: the share rose from about 1 percent in 1980 to 10 percent in2006. Uphill flows from China, Malaysia, and Mexico were a big part of thisincrease.

6 | JUSTIN YIFU L IN AND BORIS PLESKOVIC
The authors posit some tentative hypotheses that might explain uphill skills flows.Certain countries—such as India and South Africa—may for historical reasons be fol-lowing atypical development patterns that emphasize technical capabilities and giverise to pockets of skill-intensive industry. It is also possible that some firms, even indeveloping countries, are so productive that they succeed in entering markets indeveloped countries. And, trade barriers may favor uphill skills flows, as rich coun-tries typically raise barriers against low-skill products rather than skill-intensiveproducts.
Migration, Remittances, and the Transition from Foreign Aid
Jean-Paul Azam and Ruxanda Berlinschi argue that there is a trade-off between for-eign aid and migration. It can be demonstrated empirically, they assert, that richcountries in fact use aid to reduce immigration from poor countries.
On the basis of a review of the literature on the economic effects of immigration,Azam and Berlinschi conclude that the effect on wages in the receiving country,whether positive or negative, is small but that remittances from migrants are now oneof the main sources of external finance for developing countries. The authors pointto a sizable constituency in rich countries that pressures governments to raise barri-ers against immigration. They then raise the questions of whether foreign aid reducesimmigration and whether that is an unstated aim of foreign aid.
It has been demonstrated again and again in recent years, Azam and Berlinschiclaim, that foreign aid rarely succeeds in reducing poverty or fostering growth inpoor countries. The authors ask what benefits, then, bilateral donors actually getfrom foreign aid and suggest that reduced immigration may be one. Applying econo-metric methods to data from 1995–2003, they conclude that foreign aid is an effec-tive tool for reducing migration to rich countries and that donors are in fact using aidas a policy tool for that purpose. Their further analysis shows that uncoordinatedbilateral aid is just as effective as coordinated multilateral aid.
Lisa Chauvet, Flore Gubert, and Sandrine Mesplé-Somps analyze the impact ofremittances and foreign aid on infant and child mortality. Despite the increasing mag-nitude of remittances (in 36 of 153 developing countries, remittances exceed officialaid), there has been little examination of their relative effects on human development,as measured by infant and child mortality.
The authors’ analysis of panel data on 109 developing countries and cross-countryquintile-level data on 47 developing countries shows that remittances have a sig-nificant positive effect on children’s health but that the effect is stronger in therichest households. The researchers discern no effect on the poorest households.When migration by physicians is included in the overall analysis of the costs andbenefits of migration, the positive effects are weakened because the migration ofphysicians harms the overall state of children’s health. The researchers also showthat foreign aid to the health sector has little effect on health outcomes in devel-oping countries.
INTRODUCTION | 7
Jinu Koola and Çaglar Özden examine the effect of migration on employmentin the sending country. In their view, previous studies showing that migrationdecreases employment in sending countries—possibly because those who stay behindreceive remittances and have less incentive to work—do not fully recognize thedynamics of migration. In fact, they argue, if workers have the opportunity to workin wealthier countries, their opportunity cost simply becomes higher. Consequently,if they do not make a high enough salary on the local market, they stop working andprepare to emigrate.
Working with panel data from two linked household surveys conducted in theIndian state of Kerala in 1998 and 2003, the authors present evidence that the dropin employment in the country of origin is more likely ascribable to the opportuni-ties provided by migration networks that have been established in receiving coun-tries by the migrants’ families and communities. In 2003, according to the data,nearly 10 percent of Kerala’s workforce—1.84 million people—was living andworking in Persian Gulf countries; another million had already emigrated and hadreturned. Analysis of the panel data shows that social and communal networks,which can facilitate migration and lower its cost, are among the main determinantsof migration.
Higher Education and High-Technology Industry
Sachi Hatakenaka examines the role that universities have played in the developmentof high-technology industries in a broad range of economies—the United States;Japan; Finland; Taiwan, China; the Republic of Korea; Ireland; India; Israel; andChina—and draws lessons for higher education systems in other countries. In allthese cases, the production of a critical mass of scientists and engineers was a pre-requisite for the birth of high-technology industry, but it happened in different ways.Whereas some economies produced generic scientists and engineers, others providedspecialized training with an emphasis on a narrower set of practical skills.
Hatakenaka develops an analytical framework differentiating higher educationinstitutions along three dimensions: responsiveness to changing practical and indus-trial needs; the degree of commitment to fundamental science; and the level of selec-tivity in recruiting students and staff (in other words, whether the institution is anelite one or is, instead, open to the broader society).
Although institutions of all types have facilitated the development of high- technology industry, “responsive” institutions appear to play a much more proactiveand direct role in helping such industry emerge and evolve, through a variety ofmodalities—education, research, spin-offs, science parks, licensing, and enrichmentthrough international experience. Such institutions, Hatakenaka observes, do notseem to emerge naturally. In all cases, governments have played a critical role infounding them and in influencing their missions and orientation.
Hatakenaka comments that in many cases it was crucial that science and technol-ogy had a champion or champions on the national stage. Yet, she adds, in the nine
8 | JUSTIN YIFU L IN AND BORIS PLESKOVIC
economies under discussion, it has proved difficult to maintain a national commit-ment to science and technology over time.
Akilagpa Sawyerr and Boubakar Barry explore the relationship between knowl-edge production and economic development in the context of a strikingly differentset of countries: those of Sub-Saharan Africa (excluding South Africa). Because theSub-Saharan context differs so markedly from that of countries such as those repre-sented in the Hatakenaka study, Sawyerr and Barry focus on small and medium-sizeindustry. Indeed, the authors remark, the region has little industry that is truly hightechnology.
Sawyerr and Barry look at the supply of knowledge generated by African universi-ties, as well as the demand for this knowledge by industry, and enumerate weaknessesin both supply and demand. The authors observe that now, as in colonial times,African industry is dominated by low-level processing of natural resources and theproduction of simple consumer goods. This sort of activity, unlike high technologyindustry, does not feel keen pressure for new knowledge and therefore does notdemand industry-relevant research from African institutions. In spite of a few com-mendable attempts to build bridges between universities and industry, enterprisesshow little awareness of the importance of science and technology to competitiveness.
Moreover, on the supply side, say the authors, African universities are orientedaway from science and technology and have little understanding of what industryneeds. African universities do not offer proper postgraduate training in technicalfields and are certainly not graduating the numbers of PhDs required for high- technology industries to take off. Generally, Sawyerr and Barry assert, universities inSub-Saharan Africa have suffered for many years from neglect and lack of funding.Clearly, the universities are not up to the task of lifting African industry to a globallycompetitive level.
Sawyerr and Barry emphasize the need for a supportive public policy frameworkto strengthen both the supply and demand sides. They recommend that each countryestablish an “observatory,” involving industry, government, universities, and tech-nology institutions, to assist in understanding the issues and in building consensus. Asecond recommendation is to revitalize and strengthen Africa’s universities. Thisprocess should include a special program for the strengthening of staff quality, as wellas research and graduate study in carefully selected priority areas. To give the entireprocess the necessary weight and visibility, it must be championed at the highestpolitical levels.
Human Development
Duncan Thomas comments on the close relationship between socioeconomic statusand health. Poverty has been correlated with poor health again and again in studiesaround the world, but what to make of this correlation is still a matter of dispute.Thomas asserts that causality probably runs in both directions: poverty causes poorhealth, and poor health causes poverty. But, he notes, there may also be unobservedunderlying factors that affect both health and socioeconomic status.
INTRODUCTION | 9
Thomas cites several recent studies showing that early childhood nutrition hasa major impact on human capital formation (cognitive development, schooling,employment, and so on) and on economic productivity throughout life, beginningwith school attendance. The evidence in these studies is drawn from various histori-cal periods and from different parts of the world: contemporary rural life in Zimbabwe and Guatemala; the Spanish flu pandemic in the United States in 1918–20;malnutrition in the Netherlands during World War II; the Chinese famine of1959–1961; and the 1974 floods in Bangladesh. Although the impact of disease isnot as well researched as that of nutrition, it is nevertheless clear that successful treat-ment of infectious diseases is likely to have very significant positive externalities—forexample, its effect on school attendance—and is in many cases inexpensive.
Markus Goldstein, Joshua Graff Zivin, and Harsha Thirumurthy analyze house-hold survey data from several African countries to develop a fuller picture of the eco-nomic effects of a particular health treatment—antiretroviral therapy for adultsinfected with HIV. A number of studies provide compelling evidence of the efficacyof antiretroviral therapy, which has been delivered on a much larger scale in Africain recent years.
Households with one or more adults suffering from HIV/AIDS are likely to with-draw their children from school, reduce food consumption, and increase children’slabor, among other effects. Once the parent dies, the children are, of course, in aneven worse position.
The authors’ study clearly documents short-run benefits to the households ofpatients receiving antiretroviral treatment, including increased work hours, improvednutrition, and better school attendance. The research team demonstrates that thebenefits from increased labor productivity alone outweigh the cost of treatment andthat households in which the health of an HIV-stricken adult is improved have amuch better chance of coping with poverty. According to the authors, only about30 percent of the people in Sub-Saharan Africa who need this sort of treatment getit, which means that about 4 million persons are falling between the cracks. Thestudy provides an added rationale for scaling up treatment programs; when viewedas investments, they offer long-term economic returns to society.
The authors observe that although the short-term effects of the therapy are largeand positive, much less is known about the long-term effects. Still, it is safe to saythat antiretroviral therapy can be a critical tool for avoiding large intergenerationaleconomic effects from HIV/AIDS.
Political Economy
Using panel data from the World Bank (548 country-year estimates from 100 coun-tries) and the International Monetary Fund’s Government Finance Statistics, FranciscoRodríguez creates a new indicator for evaluating how the relation between povertyreduction and growth is affected by government spending and the extent to which agiven country’s fiscal policy favors the poor.
Rodríguez begins by asking what makes growth “inclusive.” To answer this ques-tion, he grapples with two sets of issues in political economy: the conditions under
10 | JUSTIN YIFU L IN AND BORIS PLESKOVIC
which the poor can contribute to economic growth, and the conditions under whichthey can benefit from growth. He emphasizes the importance of evaluating not only theeffect of public spending levels on the poor but also how these effects are linked to theeconomy’s growth rate. To tackle these issues, Rodríguez develops a new measurederived directly from the effect of various fiscal policies on the level of poverty. Ratherthan rely on a priori theoretical assumptions, he constructs an empirically groundedestimate of how state actions affect the poor under varying economic conditions.
Rodríguez’s calculations demonstrate a highly significant interaction betweenexpenditures and changes in income, implying that government spending under con-ditions of growth will reduce poverty more quickly and make shared growth morelikely. His empirical work shows that the optimal mix of policies will depend on acountry’s level of income and that certain policies which protect the poor under cer-tain conditions may harm them if those conditions change.
Lakshmi Iyer examines the quality of public service provision in South Asiancountries and provides a useful survey of the theoretical and empirical literaturerelated to collective action and provision of public goods.
Iyer observes that school enrollment is low in developing countries generally andis lower still in South Asia. She notes, however, that rates vary widely among thecountries of South Asia and even within countries: for instance, nearly every villagein the Indian state of Kerala has a school, but only 39 percent of villages in Biharhave one. Moreover, educational quality varies widely across countries and withincountries. Iyer cites statistics showing that on any given day 15 percent of teachersare absent in India’s Maharashtra State, as are 42 percent in Jharkhand State.
Parents everywhere want their children to be educated, but not all groups areeffective in demanding public services. Iyer provides empirical evidence that this is thecase in South Asia: for example, access to education and other public services is bet-ter in areas with a higher population of Brahmins (the elite of India’s caste system).
Among the factors that appear to limit the ability of local groups in South Asia toeffectively demand public services are social heterogeneity, unequal land distribution,and small group size. Iyer’s empirical analysis demonstrates that social heterogeneity,whether related to ethnicity, religion, or caste, makes groups in South Asia less ableto demand adequate public services. Moreover, she contends, South Asia exhibitsmany of the same colonial patterns as in other parts of the world: areas with highlyunequal land distribution tend to suffer from poor provision of public services.
Finally, Iyer calls attention to the remarkable rise in the number of private schoolsin rural areas of South Asia and asks whether private provision could be a solutionto problems with quality of services. Although private schools perform better, Iyernevertheless gives three reasons why the state must remain the provider of health andeducation services: (a) private schools are, so far, limited to larger and wealthier vil-lages and do not provide universal coverage; (b) they are more expensive than pub-lic schools, and many poorer households already say they cannot afford to send theirchildren even to public schools; and (c) a study from Pakistan suggests that privateschools cannot function without teachers educated by local public schools.

Opening Address
TREVOR MANUEL
The theme of this conference, “People, Politics, and Globalization,” is very appro-priate. You may have seen this morning’s newspaper headline, “City Refugees in Suicide Bid.” Let me sketch for you the context. Three weeks ago, South Africa witnessed the horrid spectacle of poor-on-poor violence, when groups of young people in some cities turned on their neighbors, who happened to be foreign nation-als. In Cape Town, fortunately, no deaths resulted, but around 10,000 people—thisis a disputed number—were displaced from their homes. A group of Somalis that metwith the United Nations on Saturday insisted that although they had been offeredrefugee status in South Africa, they would prefer to receive asylum somewhere in theNorthern Hemisphere. And because the United Nations could not support them inthis way, some of them chose to take the suicide route yesterday, by plunging into thesea. It is a terrible story, but it speaks to the heart of our theme.
The government has been resolute in admitting foreign nationals into South Africaas part of our commitment to African development. Many people have been displaced; Somalis have been displaced because of the failed state in their country.And the challenges of globalization are everywhere with us. Just over six years ago,we gathered at Monterrey, Mexico, to agree on a partnership that we ferventlybelieved would alter the course of economic development into the future. Africanleaders endorsed this theme and introduced a program for continental transforma-tion: the New Partnership for Africa’s Development (NEPAD). Acting on these commitments, many countries moved toward more stable macroeconomic outcomes,improved their capacity to deliver services, and announced pro-growth, pro-pooreconomic and regulatory policies. These achievements have given many countriestheir first opportunity to reap the benefits of both tough economic policies and globalization.
11
At the time of the conference, Trevor Manuel was South Africa’s Minister of Finance. He is now head of the NationalPlanning Commission.
Annual World Bank Conference on Development Economics 2009, Global © 2010 The International Bank for Reconstruction and Development / The World Bank

12 | TREVOR MANUEL
There have been significant research initiatives, such as the Commission on GlobalPublic Goods and, just recently, the Commission for Growth and Development. AndI am pleased to see with us the chair of the Commission for Growth and Development,Professor Michael Spence, and the deputy chair, Danny Leipziger. The commission hasundertaken a thorough analysis of high-growth patterns between 1950 and 2005 inan attempt to understand the features of such growth, the measure of interactionbetween countries, and the impact on the living standards of people in high-growthcountries. Among the commission’s observations is the reality of growing income disparities across the world occasioned by technology change, shifting relative prices,and globalization itself. The commission report draws attention to a finding of the2007 Pew Global Attitudes Project survey: that support for globalization is flagging,especially among citizens of developed and some developing countries.
The questions before this conference have to do with how to sustain the momen-tum of growth and ensure that the benefits of growth are far more inclusive than theyhave been to date. Emphasis should also be placed on that tangible set of global com-mitments that measure progress against want, the United Nations Millennium Devel-opment Goals. Our discussions are framed by the reality of rapidly rising prices forfood and fuel and persistent difficulties in the financial sector. These three Fs resultin a convergence that threatens to roll back many of the recent gains with respect toeach of the dimensions of our theme: people, politics, and globalization.
Although this conference is not intended to conclude with a declaration, we knowthat the shared observations that will emerge are keenly awaited. This year will seethe United Nations advance further in its discussions of food security under the Millennium Development Goals and of financing for development. None of us canafford to ignore the harsh realities that threaten to erode the gains that we have, untilnow, taken for granted. The moment calls for us to dig deep within ourselves andadvance a new, rational set of ideas to be pursued by thinkers and policy makerseverywhere.
Allow me now to introduce the brand-new chief economist of the World Bank,Justin Lin, who took up his position on June 2, 2008, and who will share with us hisobservations on the challenges before us.
Opening Address
JUSTIN YIFU LIN
Mr. President, Minister Manuel, Professor Spence, ladies and gentlemen: good morning. As Mr. Manuel just mentioned, I am the new chief economist of the WorldBank. In effect, this is my first public lecture as chief economist. At the outset,I would like to express my sincere thanks to the government of South Africa for itshospitality and its great contribution to the conference today. I also want to take thisoccasion to thank the organizers of this conference. You bring a wide range of inter-esting topics to each of our discussions. I am pleased to welcome to the conferencetoday the 950 participants from 70 countries. Some of them are from academia andare going to give us their insights about the process of development. But, equallyimportant, we have many participants from the policy sectors, the private sector, andcivil society. Your participation will enrich our discussions.
This is the first time that the Annual Bank Conference on Development Economicshas been held in Africa. We know that Africa is at a very important stage of devel-opment. In the past decade 11 countries, representing more than half the populationof Africa, enjoyed an average annual growth rate of 5.5 percent. That is the best performance since the 1970s. And, a more important number, 7 of those 11 countriesare not oil exporters. This shows that Africa, like other places, is a land of hope. Certainly, it is our obligation to find a way to sustain this growth.
The title of this conference is “Politics, People, and Globalization.” From my pointof view, these are the three most important dimensions of economic developmentbecause people constitute the purpose of development. It is our dream to have a worldfree of poverty. It is also our goal to give people the freedom to choose, the opportu-nity for prosperity. But people are not only the end of development; they are also themeans, because the world’s wealth is created by people, especially people with new,good ideas.
13
Justin Yifu Lin is Chief Economist and Senior Vice President for Development Economics of the World Bank.
Annual World Bank Conference on Development Economics 2009, Global © 2010 The International Bank for Reconstruction and Development / The World Bank

14 | JUSTIN YIFU L IN
People alone, however, cannot create wealth. They need to have the opportunityto work, the incentive to work, and the ability to work. Whether they will have theopportunities, incentives, and abilities very much depends on the government. Mistakes can be made. In a developing country with little capital, a lot of resources,and a large population, if the government adopts a mistaken policy of encouragingthe development of very capital-intensive sectors, even though its intentions are good,not enough jobs will be created for the people. Moreover, firms in those capital- intensive sectors are not going to be viable, leading to government protection, andfinally generating distortions that hurt peoples’ incentive to work. In that kind of situation, the best of intentions may lead to failed policies and bad results.
Mistakes can be avoided. If the government adopts a policy of building up marketinstitutions to facilitate the country in exploring its comparative advantage it can setthe stage for economic development and job creation and enable people to share thebenefits of development. Even then, the government has to provide education andhealth services so that people will have the abilities to participate. What I like tostress is the importance of the role of the government in the process of development.As Arthur Lewis observed, looking at history, a successful country always has a veryintelligent government. The government can fail by doing too much or too little, andthat depends greatly on the political process in the country. So, we also need to lookat politics.
In our modern world, a country cannot isolate itself. A country has a much betteropportunity to prosper if it integrates itself into the world economy through the globalization process. This is demonstrated by the successful East Asian economiesand by China after its transition in 1979. Certainly, globalization opens opportuni-ties, but it also poses a new kind of challenge. These include the food crisis that weobserve today and the financial turmoil that we see in the United States. In this kindof situation, a country also needs to manage the globalization process, and the globalcommunity needs to cooperate to find a new framework for integrating developingcountries into the globalization process.
I am sure that the discussion in the coming two and a half days will enhance ourinsight on this important topic, contribute to our understanding of the nature andprocess of development, and enable us to approach the goal of a world withoutpoverty.

Opening Address
THABO MBEKI
Dr. Lin, Trevor Manuel, Professor Spence, distinguished delegates, and ladies andgentlemen: I am indeed honored to welcome you to the Annual Bank Conference onDevelopment Economics, and we are very proud to host you here in Cape Town, inSouth Africa, and, indeed, in Africa for the first time. I would like to think that youhave among you many South African and African development economists who areengaged in a very important subject: the challenges of development on our continent.
The overarching theme of the conference is “People, Politics, and Globalization,”but it is fair that what will be discussed under that topic are the three challenges ofglobalization, investment, and growth; human development for equitable growth;and the political economy of shared growth. These are interesting subjects.
I come among you today as one of those much-maligned human animals describedas politicians. Some in this audience will, perhaps subconsciously, see in the talkinghead currently standing at this podium an example of what in the United States cameto be known as carpetbaggers. Whatever might be the truth in this regard, I wouldlike to say that my government and I are indeed intensely interested in the outcomesof this important conference. The simple reason is that the matters on the agenda ofthe conference—globalization, investment, economic growth, human development,equitable growth, and shared growth—are matters of deep interest to all Africans,and I dare say, even to whoever might fit the contemporary edition of the peculiarlyAfrican carpetbagger.
This morning I was reading a recent article by Jan-Peter Olters, who is describedas a World Bank representative in Montenegro. You would never think that theWorld Bank would have a representative in Montenegro, but it has. Among otherthings, Olters wrote,
The recognition of both globalization’s inherent potential and the accompanying risk hasbecome the starting point in the ongoing policy dialogue between national governments
15
At the time of the conference, Thabo Mbeki was president of South Africa.
Annual World Bank Conference on Development Economics 2009, Global © 2010 The International Bank for Reconstruction and Development / The World Bank
16 | THABO MBEKI
and international financial organizations. In Robert Zoellick’s words: “It is the vision ofthe World Bank Group to contribute to an inclusive and sustainable globalization—toovercome poverty, enhance growth with care for the environment, and create individualopportunity and hope.” The World Bank’s emphasis on social inclusion—apart fromreasons valid in themselves—stems from global experiences that social tension and largeincome inequalities lead to lower rates of potential growth, weaken political cohesion,contribute to environmental degradation, and add considerable costs to societies interms of forgone opportunities. The principal challenge of economic policy making thusconsists of increasing the overall productivity of invested capital and employed laborwith the instruments that governments have at their disposal: public institutions, laws,regulations, and mechanisms ensuring their rules-based application.1
As I read this, I remembered my own education in economics at an English universitymore than 40 years ago, when the economics faculty sought to drill into our heads asound understanding of development economics. I recall that we learned to besupremely skeptical of the teachings of such economists as Peter Bauer and MiltonFriedman, who, as I remember, were presented to us as what some today would char-acterize as “market fundamentalists,” opposed to the very notion of developmenteconomics.
What was happening then and later was captured subsequently by an African public intellectual, Thandika Mkandawire, at the time director of the United NationsResearch Institute for Social Development (UNRISD):
For two decades, starting from the beginning of the mid-1970s, the status of develop-ment economics in both academia and policy circles was not enviable. . . . The “pioneers” of development economics were forced into a defensive posture as they fended off accusations of providing the intellectual scaffolding for dirigisme, which hadfailed, as well as of downplaying the role of the market.
The “death” of development economics was not merely an academic “paradigm shift.”It was given official sanction by the United States government. The U.S. representativeto the Asian Development Bank was reported . . . to have announced that the “UnitedStates completely rejects the idea that there is such a thing as development economics.” . . .Development economics became, as John Toye remarks, “an Orwellian un-thing” in theeyes of the most powerful nation. The Spartan certainty of the ascendant neoliberalismas to what was required left no room for specialized knowledge of the problems of devel-opment. Mrs. Thatcher’s strident “there is no alternative” was echoed in internationalfinancial organizations through a standardized set of policies that was applicable to alleconomies.2
With regard to the Peter Bauer of my student years, Wikipedia has this to say:
Bauer revolutionized thinking about the determinants of economic advance. Indeed, theWorld Bank, in its 1997 World Development Report, reflected the point of view Bauerhad been advocating for years, stating that the notion that “good advisers and technicalexperts would formulate good policies, which good governments would then implementfor the good of society” was outdated: “The institutional assumptions implicit in thisworld view were, as we all realize today, too simplistic. . . . Governments embarked onfanciful schemes. Private investors, lacking confidence in public policies or in the stead-fastness of leaders, held back. Powerful rulers acted arbitrarily. Corruption becameendemic. Development failed, and poverty endured.”
OPENING ADDRESS | 17
For Bauer, the essence of development was the expansion of individual choices, and therole of the state to protect life, liberty, and property so that individuals can pursue theirown goals and desires. Limited government, not central planning, was his mantra. Bauerplaced himself firmly in the tradition of the great classical liberals.
I must presume that this conference has convened here in Cape Town because youhave made the determination that the proclamation about the death of developmenteconomics, including the apostolic pronouncements in the 1997 World DevelopmentReport, amount to nothing more than an opportunistic advertisement by a commer-cial funeral undertaker driven by the objective to maximize his or her profit, as wouldany self-respecting carpetbagger.
At the same time, it may be that you consider the fact that I have raised the ques-tions I have about development economics as being somewhat arcane or archaic. Letme explain myself.
As I have already said, I have to earn my keep as an African politician. Almost bydefinition, and especially because I represent desperately poor communities thatabsolutely cannot lift themselves out of poverty without the assistance of the richcountries of our universe, I have an obligation to implement the advice of those with-out whose support my people cannot achieve progress and the necessary advance-ment toward meeting the celebrated Millennium Development Goals.
The advice I get, which I must accept, is conveyed by well-funded and immenselyeducated civil society organizations and a very vocal media, which together serve asthe vox populi and therefore the vox dei. The message is very simple and straight-forward: Long live Peter Bauer!
To celebrate Peter Bauer without this being stated explicitly, which in any casewould make no sense except to the helpless and trapped cognoscenti, we are told thatwe must limit state intervention in the economy and expand individual choice as partof the process of the great flowering of open democratic systems and the attendantand resultant putative exponential growth and development of the economy.
We are told that, more broadly, we must aim to build a minimalist state thatshould focus on providing such public goods as the protection of life, liberty, property, and the environment, leaving all else to the market, except to the extent thatthe state must intervene as a regulator to correct the imperfect functioning of themarket.
We are also told that we must create maximum space for domestic and interna-tional entrepreneurs to invest and make profits, understanding that this will releasethe immanent national energies that will create the wealth required to achieve theobjectives stated by World Bank president Robert Zoellick: “to overcome poverty,enhance growth with care for the environment, and create individual opportunityand hope.”
We are also told that we must trust and follow the advice we get from good advis-ers and technical experts, which, as a good government, we would then implementfor the good of society, provided that what the advisers and experts advise is consis-tent with the preceding prescripts.
18 | THABO MBEKI
We are also told that we must always bear in mind that, given the fact of global-ization, we will fail to attract the foreign direct investment we desperately need—especially given that we are too poor to generate the investment capital needed toachieve the required rates of growth—unless we abide by the rules set by the inter-national capital markets and recognize that we are competing with other possibleinvestment destinations.
We are told also that we must take into account the fact that the overwhelmingbulk of investable capital in the world is privately owned. Foreign investment forgrowth and development will therefore not come from official development assis-tance funds but from private investors whose central goal is not understandingunique national public imperatives but identifying profitable business opportunities.
But above all, we must take into account the fundamental demands of the globaleconomy: privatize, deregulate, open up to free trade.
I am confident that the development economists and other participants presenthere today understand very well that the prescripts I have mentioned do not fullyaddress the overall theme and subthemes of this conference on “People, Politics, andGlobalization.”
The point I am making, however, is that the dominant, immediate, and materialvoice that bears on the African politician, including the talking head that is standingat this podium, is the voice that proclaims, insistently, Long live Peter Bauer!
There are some in organized global human society who strive to achieve preemi-nence as authentic voices of the people by claiming that, without fear or favor, theypresent truth to power. In many instances, many of them fail to understand that thepower against which they pose as heroes and heroines is little more than a subsidiaryformation in a global power system whose pinnacle funds others who pride them-selves on the claim of representing so-called civil society and enables them to devotetheir considerable energies to a fight that targets shadows and the powerless.
I am convinced that gathered in this hall today, at the very southern end of theAfrican continent, are thinking human beings who will help us better understandwhat we need to do to liberate ourselves from poverty and underdevelopment, refus-ing to be influenced by propaganda and supposedly universal truths, which in manyinstances are illusions born of smoke and mirrors and intimidation.
Given the sphere of human activity in which I am inevitably and necessarilyinvolved every day, I cannot avoid the conclusion that we are involved in titanic bat-tles on two broad fronts of an epoch-making war. One of these battles pursues theobjective of winning material and, therefore, objective short- and medium-term vic-tories on the broad front of the struggle against poverty and underdevelopment in thecountries of the South and globally.
The goal of the other struggle is to win a critically important subjective and pop-ular ideological and political contest, victory in which would enable all humanity todeploy the enormous human and material resources demonstrably available withinglobal human society and so ensure the achievement of the historic objectives ofdevelopment economics, as broadly defined by Nobel laureate Amartya Kumar Sen.With regard to this latter battle, I firmly believe that contemporary human societydisposes of sufficient intellectual, capital, scientific, technological, innovative, and
OPENING ADDRESS | 19
vocational skills to close the major fracture in global human society. By that, I meanpoverty in the midst of plenty and a process of globalization that emphasizes andentrenches wealth inequalities rather than universal progress toward the goal of amore equal and prosperous human society.
As an African, and given the agenda you have set yourselves, I would like to suggest that you have convened here at the Cape Town International ConferenceCentre to consider what should be done to secure success on both the war fronts wehave identified. It is for this reason that I have said that my government and I areintensely interested in the outcomes of the conference.
To have any meaning, development economics must relate not to the logicalintegrity of theoretical paradigms, important as this might be, but to the central taskof achieving human development. Since life does not stand still to allow for philoso-phers to contemplate reality, this conference, even within the context of its agenda,will, I hope, consider a variety of matters that are of major importance to the peoplesof Africa and other developing communities elsewhere in the world.
As you know, there are some immediate and critically important challenges weface as a country and continent, and there are questions you must help us answer.
One is: what interventions should we undertake to respond to the high and risingprices of food and fuel? Given the unavoidable inflationary impact of this priceincrease, which will inevitably reduce standards of living, in particular, of the poor,what immediate, medium-term, and long-term measures, including agricultural policies, should we institute to guarantee long-term and affordable food security?
What contingency measures should we take to adapt to the consequences of climate change?
How much reliance should we place on the prospects for implementing the Comprehensive African Agricultural Development Programme (CAADP) and, thus,insulating Africa from the threat of food shortages and unaffordable food prices?
Will the outcomes of the recent Global Summit of the Food and AgricultureOrganization (FAO) in Rome help address these issues?
How long will the commodity boom last? How should we, as Africans, takeadvantage of this boom to guarantee ourselves sustainable development even whencommodity prices decline?
What practical measures should be instituted globally to integrate Africa furtherinto the world economy, other than as a producer and exporter of raw materials?How can we attract investments that will enable Africa to export greater volumes ofmanufactured, value-added products? What measures should we take if the globaleconomy experiences a significant slowdown that negatively affects African exportsand investment flows into Africa?
All of us recognize the critical importance of building the necessary humanresource base to drive the process of sustainable African development to which weare all committed. We must therefore pose the question: what should be done toachieve this objective?
We also accept that, as can easily be demonstrated with regard to other regions ofthe world since the end of World War II and earlier, Africa needs the support of thedeveloped world to achieve take-off. What should be done to strengthen this
20 | THABO MBEKI
development partnership and overcome irrational and persistent Afro-pessimism?What should be done to implement the now universally accepted vision and pro-grams of the New Partnership for Africa’s Development (NEPAD), which is funda-mental to the realization of the Millennium Development Goals as they relate toAfrica?
We have all observed the recent exciting growth trends in Africa. For some, thismay appear to be the result of the passing effects of a commodity price boom. Theseobservers may expect African economies to slow and run into difficulty at the end ofthis boom, much as many countries, including South Africa, did after the boom ofthe 1960s and early 1970s. But I am certain that those of us who have looked moreclosely at Africa’s development have seen evidence that the current opportunity tobenefit from the commodity boom will not be frittered away, as it was before, at leastnot by all countries. There are various pieces of evidence that the current growthacceleration in Africa will be sustained by a number of countries, and perhaps byenough to ensure that the continental momentum is maintained.
I am certain of the capacity of the conference delegates to think independently andto carry out their own investigations relatively uninfluenced by the mass media,enabling them to understand the reality that the African continent is involved in ahistorical structural process focused on its sustained and progressive political, eco-nomic, and social transformation. Necessarily, development economics must be anintegral part of this process. I trust that the fact that the ABCDE Conference is meet-ing in Africa for the first time will inspire all the participants to take it as their spe-cial obligation to intervene in the African development process so as to add impetusto our continental drive to end our condition as the wretched of the earth.
In the article that I cited earlier, Olters wrote, “The World Bank’s emphasis onsocial inclusion—apart from reasons valid in themselves—stems from global experi-ences that social tension and large income inequalities lead to lower rates of poten-tial growth, weaken political cohesion, contribute to environmental degradation, andadd considerable costs to societies in terms of forgone opportunities.”
You will recognize that I quoted this earlier. The African, and perhaps global,development challenge is about eradicating poverty, lessening income inequalitiesand other inequalities, strengthening social inclusion and political cohesion, reducingenvironmental degradation, and improving the capacity of individuals and society totake advantage of all opportunities to achieve development.
In his 1998 Nobel lecture, “The Possibility of Social Choice,” Amartya Sen said:
If there is a central question that can be seen as the motivating issue that inspires socialchoice theory, it is this: how can it be possible to arrive at cogent aggregative judgmentsabout the society (for example, about “social welfare,” or “the public interest,” or“aggregate poverty”), given the diversity of preferences, concerns, and predicaments ofthe different individuals within the society? How can we find any rational basis for making such aggregative judgments as “the society prefers this to that,” or, “the societyshould choose this over that,” or “this is socially right”? Is reasonable choice at all possible, especially since, as Horace noted a long time ago, there may be “as many preferences as there are people”?3
This learned paragraph from a treatise by a Nobel laureate seeks to communicate themessage that it is possible, in the celestial world of pure intellectual discourse, to posit

OPENING ADDRESS | 21
a circumstance of coterminous expression of billions of different individual thoughtsabout the same thing, equal in number to all living human beings. At a certain level,especially within the context of an extreme solipsistic view, this is, of course, a logi-cal possibility, but practically, within the objective world of social existence, it con-stitutes an impossible proposition.
Nevertheless, it offers to all of us gathered here the possibility of advancing anentirely theoretical paradigm: that we have no intellectual obligation to take anyposition on any of the important matters on the agenda of the conference becausethere are as many preferences as there are people, and therefore, there is no logicalpossibility of making any rational policy proposals as a conference.
The immediate reality, however, is that all of us, whatever our social circum-stances, know that the poor are knocking at the gate. If this gate does not openbecause we who have the key are involved in the challenging effort to consider themeaning and implications of social choice theory, among other intellectual pursuits,the masses will break down the gate. They will do this to challenge us to join thempractically to answer the question: what should be done to give effect to the humandignity that is due to those whom the modern social order, in all countries, doesindeed define as the wretched of the earth?
I believe that is the fundamental question this Annual Bank Conference on Devel-opment Economics must strive to answer. I wish you success in your deliberations,and I formally declare this important conference open.
Thank you very much.
Notes
1. Jan-Peter Olters, “On the Agenda: Inclusive Globalization.” World Bank News andBroadcast. http://go.worldbank.org/6OX5CZ3RN0. Originally published in Monitor(19 [911]: 32–33) April 4, 2008 as “Tema dana: globalizacija na korist svih.”
2. Thandika Mkandawire, “The Need to Rethink Development Economics.” Draft paperprepared for discussion at the United Nations Research Institute for Social Development(UNRISD) meeting on “The Need to Rethink Development Economics,” September 7–8,2001, Cape Town, South Africa. http://www.unrisd.org/80256B3C005BCCF9/(httpPublications)/CE9095BA4A739828C1256BC90047D402?OpenDocument.
3. Amartya Sen, “The Possibility of Social Choice.” Nobel lecture, December 8, 1998. http://nobelprize.org/nobel_prizes/economics/laureates/1998/sen-lecture.pdf.

Keynote Address
MICHAEL SPENCE
Good morning, ladies and gentlemen. It is an honor for me to be here at this con -ference. I first have to apologize for my appearance. My bag and I parted companysome time yesterday. There is a saying that clothes make the man. If that is true, thenmy name is Roberto Zagha—at least for half of my body, the better-dressed half.
What I would like to do today is to take a relatively high-speed tour of the reportof the Commission on Growth and Development entitled The Growth Report: Strate-gies for Sustained Growth and Inclusive Development (CGD 2008). We have with ustoday the vice chairman, Danny Leipziger; the secretary, Roberto Zagha; and TrevorManuel, South Africa’s minister of finance and an important member of the commis-sion. We have been working for just over two years. The commission members are,you will note, predominantly political or policy people, very senior, and very experi-enced in developing countries. There are a couple of exceptions. I am one, and RobertSolow is another. But the members’ experience was intended to be an important partof the work of the commission. We focused on what we called inclusive sustained highgrowth. We asked two things. How does sustained high growth work; that is, whatare the fundamental dynamics? What are the policies, investments, and politicalunderpinnings that enable this kind of growth? And we defined “sustained” to mean“over several decades.” We used a benchmark of 25 years or more, and we arbitra rilypicked a 7 percent growth because output or income doubles every 10 years at thatrate. I will talk more about the important concept of inclusiveness later.
Our primary target audience is basically political and policy leaders in developingcountries. Our hope when we started this process was that we would be able to pro-vide some useful insights and perhaps a framework that would help in setting policypriorities and developing growth strategies in the specific country context. Now,
23
Michael Spence is a senior fellow at the Hoover Institution and is the Philip Knight Professor Emeritus at Stanford University, both in Stanford, CA. In 2001, he was awarded the Nobel prize for economics. He is currently chairman ofthe Commission on Growth and Development.
Annual World Bank Conference on Development Economics 2009, Global© 2010 The International Bank for Reconstruction and Development / The World Bank
24 | MICHAEL SPENCE
nobody really cares about growth as such; my family doesn’t get up in the morningand think, growth is what really matters in the world. But growth does seem to bean important enabler of things people really do care about. Bassma Kodmani, in herkeynote address, spoke about the importance of poverty reduction and the achieve-ment of the Millennium Development Goals, and there are other very basic thingsthat people care about—their families’ health, and their capacity to be productivelyemployed or to be creative, innovative, and entrepreneurial. Things like that are fun-damental reasons for being interested in growth as an instrument.
We went about this in a fairly straightforward way. We asked our colleagues ininstitutions like the World Bank and in academic institutions to try, in a whole varietyof policy areas, to give us an assessment of what we do and do not know. We discov-ered that there are many areas in which we lack the complete knowledge that wouldenable us to give confident policy advice, and we decided to talk about that. We held12 workshops, with many members of the commission participating, and learnedfrom them. It was a fascinating experience. We prepared a set of 25 country case stud-ies, and we produced a relatively short commission report (CGD 2008) highlightingthe essential features of growth dynamics and the key policy ingredients that seem tounderpin it. We are also publishing working papers and workshop proceedings thatare in-depth attempts to understand various policy areas that relate directly to growth.
We started out intending to be practical and nonideological; none of us wanted todebate some historical divide. We went into the undertaking with considerable humil-ity, with the understanding that our knowledge of growth is not complete and that ourknowledge of development—that parallel process whereby societies and economiesacquire capabilities that were not there before—is even less complete. We realized thatin the course of growing, countries and institutions are learning from experience andadapting; it is a process and not just the application of a static formula.
The report is therefore not a set of policy prescriptions; it is a frame of referencethat attempts to get at two elements: the growth dynamics, and the leadership andpolicies and politics that support them. We believe very firmly that actual growthstrategies have to be set at the country level and have to be context specific.
We therefore looked at countries that had actually experienced sustained highgrowth. Only 13 economies are in that category, and those growth episodes have alloccurred post–World War II, since 1950. The countries are rather diverse in size,location, and form of government. We believe that India and Vietnam are probablypretty close to achieving sustained high growth because of growth acceleration; it isa matter of time. And there may be many more. I think that the hope in this room isthat the accelerations in growth, on a much broader front, that we have witnessed inthe last 5 to 10 years may actually turn into sustained high growth.
Characteristics of Sustained-High-Growth Economies
We attempted to summarize what we thought were the common characteristics ofsustained high growth. The first set consists of the fundamental economics, and thesecond set has more to do with politics and government.
KEYNOTE ADDRESS | 25
The single most important shared characteristic of the successful economies (and,of course, there are many, many differences among them) is that they are engagedwith the global economy. They took advantage of its knowledge, and they benefitedfrom the catch-up effect, the increase in both the size and the scope of potential out-put, that comes from not having to develop all that knowledge but being able toimport it.
Second, the successful countries took advantage of the huge elastic global demandthat allows a country to grow about as fast as investments can be made and areas inwhich the country has competitive advantage can be found. The successful countriesall maintained their macroeconomic stability. Almost every time I am interviewed, Iam asked whether the report is, or is intended as, an attack on the Washington con-sensus. And the answer is, no. There are some differences in philosophy and spirit,but there is no question that a stable macroeconomic environment and a number ofother items in the Washington consensus are critical for sustaining the kind of invest-ment that supports high growth.
The third obvious characteristic is that these economies had very high levels ofsaving and investment—on the order of 25 percent of gross domestic product (GDP)or more for overall saving and investment and 5 to 7 percent for the public sectorcomponent. They are also—and I think it is important to focus on the microeconomicaspects here—market economies that make use of price signals, decentralization, andincentives and in which reasonable definitions of property exist and determineresource allocation.
They are also economies in the process of structural transformation, which is achaotic process—what Schumpeter called creative destruction. Therefore, there is agreat deal of competition and a lot of incremental productive employment creation.Later on in the process, there is a fair amount of destruction as well, as the sectorsthat are the driving forces of growth become uncompetitive because of changes inincomes and relative prices.
These high-growth economies are characterized by resource mobility, especiallylabor mobility, and by rapid urbanization. A fair amount of the report consists of justtrying to describe these trends. There are policies and investments (education, forexample) that support resource mobility and policies (such as limiting competition)that interfere with it. The report talks about both.
I have learned a tremendous amount from my colleagues on the commission andfrom my fellow academics in the course of these two years. But what perhaps sur-prised me most was how important are leadership, effective political governance, andeffective government. They make it possible to implement as well as develop policies.Political leadership is absolutely crucial. Difficult choices have to be made. One concerns the general approach to growth. A second has to do with a kind of consensus-building process. At saving and investment rates of 25 percent of GDP and more, verysignificant intertemporal choices are being made about when consumption is going tooccur. That requires a credible game plan which people can sign up for, and which theywill sign up for if they believe it will benefit their children and grand children. Achiev-ing some degree of consensus and support for growth-oriented strategies is a non trivialpart of the process, not only of starting but also of sustaining growth.

26 | MICHAEL SPENCE
We do not have complete knowledge of the impact of our policies. We need to exper-iment. If something is not working well, we need to stop doing it, fairly quickly. Isometimes use the metaphor of navigating with an incomplete map. The full transi-tion from relatively poor to advanced-country income levels takes a long time (overhalf a century) even at high growth rates and much longer when things slow down.
Underpinnings of Growth
Without trying to summarize the report, let me give you some quick assessments ofsome of the things we thought were important underpinnings of sustained highgrowth.
Even though everybody thinks knowledge and the catch-up effect are important,we know less about them than we should. This is an area in which productive researchcould be undertaken. We do know that channels exist which are important. One is for-eign direct investment. Foreign direct investment is not usually a large fraction of totalinvestment. Its importance does not come mainly from relaxing a constraint on invest-ment but, primarily, from the importation of productive knowledge, technology, andknow-how, including knowledge of the global supply chains, that accompany theinvestment. There are other channels—foreign education, training, experience, andparticipation in a network—which are also vitally important in advanced countriesthat are growing by virtue of collectively generating new knowledge.
On the demand side, basically from a developing-country point of view, the globalmarket is essentially limitless. On the supply side, in the early stages of growth youhave surplus labor, meaning labor that is somewhat underemployed in traditional sec-tors. This combination produces a period in which you have what a theorist wouldcall a linear growth model. You don’t turn the prices against you, and you don’t turnthe supply, the price of labor, against you by drawing it away from the traditional sec-tors. Another way to think about this is that the opportunity cost in the early-stagehigh-growth mode of using resources in high-growth sectors is relatively low.
Leadership is crucial. The model or strategy has to be basically right. There areexamples of very well-intentioned leadership that simply picked the wrongapproach—for example, a closed-economy model or an import-substitution model.But communication is also terribly important.
We are often asked what form of government is most conducive to growth. Ouranswer is that it is not the form of government or governance that is crucial forgrowth. The high-growth countries exhibit a considerable variety of forms of gov-ernment. What does seem to matter, and what they do seem to have in common, is apolitical leadership that has as one of its main objectives making the lives of prettymuch everybody in the country better off. Alternatively, if you look at countries thatfail or exhibit poor economic performance, it is very frequently because the govern-ment is representing either its own interests or those of some subgroup. That findingled us to believe in the crucial importance of inclusiveness.
Structural transformation and competition are, I think, pretty well understood,but a fair amount of policy in both the developing world and the developed world
KEYNOTE ADDRESS | 27
interferes with this kind of dynamics. There have been intellectual rationales for suchpolicies. For example, in relatively small countries the argument would be that thecountry has to restrict competition in order to take advantage of scale economies.That sounds plausible, but it is a static argument, and when you look empirically, thedynamic effect of competition and of entry and exit on productivity growth is so bigthat it simply overwhelms the static efficiency gains. So, structural transformationthat allows competition to work is important. And then the question is, what aboutpeople whose jobs may disappear? The answer is that ways have to be found to pro-tect people in the course of transitions, but without doing so by protecting the com-panies they work for or the jobs that they are currently in. That is difficult but notimpossible to do.
Inclusiveness is essential. Inclusiveness for us has three dimensions. One is incomeequality and reasonable amounts of equity. People understand that markets do notproduce equitable outcomes; that is not what drives a market system. And they willaccept that up to a point. But they apparently will not accept excessive incomeinequality. People also will not accept inequality of opportunity. Unlike ex postincome equality, where people will tolerate some degree of inequality, equality ofopportunity is essential, and its absence is highly toxic. Systematic exclusion on thebasis of class, income, religion, ethnicity, tribal affiliation, or gender will lead to polit-ical conflict and distraction or worse. The coherence of policy and the sustained commitment that are needed for growth will be lost. It is not strictly economics thatdisrupts or derails the growth process. Finally, as I mentioned before, you need toprotect people through the transitions, or they end up being sideswiped by the micro-economic dynamics. At a high growth rate, that happens a lot, and it is not a minorconcern.
I don’t believe there is a great deal of controversy about high saving and investmentrates. What is interesting is how difficult it is to actually achieve those rates, especiallyon the public sector side. The pattern of government consumption’s crowding outinvestment on the public sector side is widespread in the developing world, and so itdeserves to be a focus. In China and India, saving and investment rates were highthroughout the transformation. The rates in China were fairly high right at the startof the reforms, in 1980; it was not a case of rates rising once people had enoughincome.
Health is something people care about, quite independent of any effects on growthor productivity. But one channel seemed to us to be strikingly important for growthand equity, and that was early childhood nutrition and stimulation. Experts told usthat a failure in this area produces a nearly permanent reduction in children’s ability toacquire cognitive and noncognitive skills in school. That struck us as a very long-termproblem for growth, and a deeply unfair situation that, if widespread, would mate-rially diminish the accumulation of human capital and the growth potential of thesociety.
There is not much controversy about the importance of education, but we didfocus on some issues in this area. One is that education is normally measured byyears of schooling or by enrollments. That is not crazy, but years of schooling is aninput, and measuring just that is not enough. According to the experts, research

28 | MICHAEL SPENCE
appears to suggest that there is extremely high variance in the output—the actualacquisition of cognitive skills and education. And so a very high priority, and not aneasy task, is the improvement of the quality of education in many countries. Anotherissue: What do the primary, secondary, and tertiary portfolios look like at variousstages of growth? Do you focus on primary first, then secondary, then tertiary? Theanswer appears to be, no, or only partly. That is to say you need all three, althoughthe relative size of the investment in each component will shift as incomes rise. Generally, the share of investment going to secondary and tertiary will rise withincomes. But the key point is that the starting point is not zero. Having said that, thetime path of the shares in the high-growth cases varies considerably and that seemsnot to impair growth. The portfolio needs to make sense and not go to the extremes,but it does not have to be optimized.
Labor markets are very complicated in developing countries, with formal andinformal sectors and barriers to mobility of a wide variety of kinds. Labor marketsare extremely important because problems there affect the fundamental dynamicsthat involve movement of labor from less productive to more productive jobs. In asurplus labor environment, the incentives for incumbents in the formal sector do notinclude enthusiasm for reforms that create extra competition from either the tradi-tional or the other informal sectors. It seems to us that it is therefore often politicallyvery difficult to reform, in a simple way, the labor market so as to expand access. Andtherefore, we suggest experimenting with a separate track, a different route for people who are, in many countries, trapped or cut off from the growing and moremodern sectors. Sometimes that trapping occurs because of underinvestment inhuman capital and other factors, so I don’t want to suggest that labor market rigid-ity is the only problem. But it is a problem that merits creative policy discussionbecause it is so pervasive.
Everybody knows the world is now 50 percent urban. Urbanization is the physi-cal process that accompanies the structural transformation of the economy. It ischaotic, and it sometimes has ugly sides that may make people want to resist it. Butresisting urbanization is not a good idea from the point of view of growth. And sothe question becomes, how can urbanization be made as effective a process as possi-ble, as unchaotic as possible? The main challenge is finding sources of finance forbuilding the urban infrastructure that is required—sewer systems, water systems, andso on—because the normal financing mechanisms that we are used to thinking aboutare not available in the early stages of growth. For example, municipal bond marketsdo not exist in early-stage developing countries.
The notion of growing first and dealing with the local environment—air and waterquality and the like—later struck the commission as a very bad idea. First, thatapproach sets off a process of capital accumulation that needs to be undone later, andit is very expensive if the wrong houses are built, the wrong industries develop, andso on. It biases the structural evolution of the economy. Second, “grow first” almostalways has an adverse distributional effect. That is, the worst effects of degradedenvironmental conditions are felt by the poor.
On energy, there is a very widespread pattern (that does not include South Africa)of subsidization. This is understandable in political-economy terms, but it is a

KEYNOTE ADDRESS | 29
very bad strategy that is becoming worse as the cost of energy rises. The commissiontook a clear stance on energy subsidies, which is that they basically have to go—notwithstanding the political difficulties and the merits of an argument for maintaining subsidies for the most vulnerable parts of the population. The resourcesthat go into energy subsidies ought to be directed toward remedying underinvestmenton the public sector side, in infrastructure and education, for example. And at theseenergy prices, with all the other attendant problems, energy subsidies are much toocostly. Furthermore, it is almost surely true that any component of a successful globalprogram to mitigate climate change and global warming is going to have an energy-efficiency component. Commitment to a sensible approach to global climate changewill require that energy subsidies disappear anyway.
We tackled things that are really controversial, complex, and unsettled. We didn’tshy away from them; decision makers don’t get to shy away from them. You eitherhave a market-determined exchange rate in the global capital markets or you aremanaging it in some way, but it is not a choice you can put off. We tried to approachthe controversies, and the divergence of opinions within the commission itself, bytalking about the risks and benefits of various kinds of policy actions. I hope we haveproduced at least a useful guide to decision making.
Country Challenges and Transnational Cooperation
We focused on four categories of countries that we thought had important and ratherspecific challenges: Sub-Saharan Africa, small states, resource-rich countries, andmiddle-income countries. The African countries constituted one group, certainly notbecause they are similar, but because the continent has a very peculiar configurationand set of characteristics—many people living in landlocked countries, and manycountries with large amounts of resource wealth. In Africa, effectively building outinfrastructure is, for the most part, not something that can be done by a single country. We focused on small countries, defined as those with 2 million or fewer peo-ple. Small states have many problems, including lack of economic diversification andhuge per capita costs of governance. They tend to solve those problems effectivelywhen they pool resources. In resource-rich countries, resource wealth, which shouldbe an asset, has too often turned out to be a liability in political terms. This, too, issomething that could be turned around.
The middle-to-high-income transition countries are really very different in policyterms, in what drives the economy. A middle-income country is starting to be aneconomy whose dynamism and growth are driven mainly by capital, human capital,and knowledge-intensive sectors in the economy, including services. A necessary pol-icy shift is to give up the growth engines inherited from the earlier stages of growth.They have to be allowed to decline and disappear, and rising incomes reduce andeliminate the comparative advantage. That turns out to be harder than it sounds. Oneof the most common mistakes is finding a formula that works and then following itfor too long.

30 | MICHAEL SPENCE
Trends and Policy Agendas
The report ends with some topics that I believe we all think are terribly important—global trends that affect the opportunities and strategies of developing countries. Oneis a clear pattern of declining enthusiasm for globalization, as measured by severalsurveys, including the Pew survey in October 2007. There is a lot of talk about protectionism. People attribute many of the problems they have with income distri-bution to globalization even when it is not the only explanation. But in general, ourconclusion was that we have devoted far too little attention to things like income dis-tribution and equity and protecting people during the transition. I don’t think thisproblem is going to go away; in fact, it seems likely that it will get worse. It is not aclosely guarded secret that the rising price of energy is, in part, driven by rapidlyincreasing global demand. And global demand is rising rapidly because of developing-country demand. The energy price issue is one that requires domestic policy attention in a wide range of countries, including the advanced ones.
China and India have grown quickly, and China, in particular, is big enough tohave actually changed the relative price of manufactured goods. There is a wide-spread question in the developing world: is the old growth strategy, based on labor-intensive, optimal use of the labor asset, going to work? Some people think that itwill not. The commission concluded that if the relative price of manufactured goodshas gone down, perhaps the social return to the old strategy will not be as high, butthat doesn’t necessarily invalidate it.
In the 1980s, Bill Cline and others raised what is sometimes called the adding-upquestion: if everybody follows the same strategy of focusing on comparative advan-tage in the labor-intensive sectors in the early stages of growth, can the global econ-omy absorb all that product? That question has been reviewed by Bill and others (seeCline 2008), and the general feeling is that it is less of a problem than people thought.But there are new versions of the question that I will come to in a minute.
Clearly—and nobody really anticipated this very effectively—we are in a period inwhich the relative prices of commodities in general are changing very quickly. Thathas caused all kinds of problems. Underlying this is a real change in the world, andit has to do with growth, not just numbers of people. The population of advancedand rapidly growing economies was about a billion 30 years ago; it is 4 billion now,and the number is rising. So, it is going to be a different world, with very differentlevels of demand for energy and much greater pressure on the environment.
On the food price front, the report observes that there is an emergency responseproblem for poor people in a wide range of countries. That has to take priority.Assuming that protecting those people from what amounts to a large effective loss ofincome can be accomplished fairly quickly, the balkanization that has occurred in thefood markets through export restrictions and the like has to be undone. The reasonis that we need the high prices and the openness of the global market to induce a verylarge supply response in the case of food—as in the case of energy. Nothing that Ihave heard or read or that the commission was aware of suggests that we are any-where near our productive potential with respect to food. So I think if this problem
KEYNOTE ADDRESS | 31
is managed correctly, the supply elasticity is big enough in the long run that the prob-lem actually might go away. That is, we could go back to a situation where the rela-tive price of food is not so high. In the meantime, we have the food emergency anda very difficult inflation problem all over the world, and it is worse in developingcountries because the poorer a country is, the larger is the fraction of GDP going tofood (and, I might add, energy).
On the energy front it is a little different. Energy prices, in my judgment, areunlikely to go back to anything like the levels we saw before. (I didn’t want to implythat food prices will definitely return to the old levels, but I think they could easilygo down.) The elasticity of energy supply is limited, so we are going to have to beton a large demand elasticity, drawing on energy conservation and alternative energysources. This may be the ultimate adding-up question in the global economy. Ifdemand does not respond to high prices, global growth will eventually slow, and theopportunities for developing countries will be substantially reduced as a result. Thecommission believes it would be unwise to think of what we are seeing now in termsof high price volatility as a one-time event. We are going into a world in which wewill be facing relative price volatility for some time. An important part of a newgrowth strategy is going to have to be appropriate risk-mitigation strategies.
I will skip over demographics and aging except to note that the world (includingmany parts of the developing world) is getting older but the poorer parts of the devel-oping world are getting younger. And so there are two problems: Is global growthgoing to slow because of the aging effect? And what is happening in the younger andpoorer parts of the world? Our answer is that global growth does not necessarilyhave to slow down because of the aging, although policies and behavior will have toadapt to sustain growth. But in the low-growth parts of the global economy, there isa huge mismatch between where labor is available and where it is in demand. Thatis sometimes called the youth unemployment problem, and the commission suggeststhat there is no logical solution except for labor to move from excess-supply envi-ronments to high-demand locations. The implication is that we probably ought tospend some time thinking carefully about migration patterns that actually work,meaning that people are properly protected, and so on.
Many of you have thought a great deal about global warming. World carbon diox-ide emissions are about 4.8 tons per capita per year. The scientists tell us that a safeper capita output would be about 2.3 tons per year. In energy-inefficient countries,the United States and Canada are at 20.6 tons per person per year. Europe withgreater energy efficiency is in the 6-to-10-ton range. France is low because it has a lotof nuclear energy. China and the rest of the developing world are essentially at orbelow the current estimated “safe” level. But their total emissions are large becauseof the sizes of their populations. If growth in the global economy just stopped,we would have to reduce emissions globally by a factor of 2. But with growth inthe developing world, global per capita emissions will double over the next 50 yearsin the absence of mitigation. So, how do we mitigate global warming and at thesame time accommodate the growth of the developing world? The report begins toaddress this problem by suggesting ways of getting started. But a lot more work is

32 | MICHAEL SPENCE
needed to create a shared understanding of the paths we collectively need to followto achieve safe levels of CO2 emissions globally several decades out. This sharedunderstanding will have to include differentiated roles for advanced and developingcountries if it is going to achieve broad acceptance in the developing world.
The last section of the report deals with global governance. In brief, it says thatwe are increasingly interdependent in multiple dimensions, with large implicationsfor potential financial market turmoil, infectious disease, product safety, energyprices, demand and growth, and global warming. In all of these areas there are globalagendas to deal with. It is a major challenge for the next generation. It is going to bedifficult; nobody has a blueprint; and in the meantime there are new and rising risksin the global economy that accompany this interdependence and that need to beaddressed with a view to development strategy.
And with that I will stop. Thank you for your attention.
References
CGD (Commission on Growth and Development). 2008. The Growth Report: Strategies forSustained Growth and Inclusive Development. Washington, DC: Commission on Growthand Development. http://www.growthcommission.org/index.php?option=com_content&task=view&id=96&Itemid=169.
Cline, William. 2008. “Exports of Manufactures and Economic Growth: The Fallacy of Composition Revisited.” Working Paper 36, Commission on Growth and Development,Washington, DC.
Keynote Address
BASSMA KODMANI
I have chosen to speak about the challenges involved in emerging from authoritari-anism in the Middle East, while maintaining security. My perspective will be one thatstarts from the current reality (a grim situation, constituting a regression from whatseemed to be a more hopeful picture two years ago) and goes on to focus on realachievements that appear difficult to reverse and that are moving the Arab regioninto a new era, provided these progressive trends are protected.
The last four years have seen a convergence of serious, long-term dangers:
• The Arab-Israeli conflict exploded once more in the summer of 2006. A disasterbordering on genocide is taking place in Darfur. The war in Iraq is causing hugeanxiety across the region, particularly among Iraq’s neighbors.
• Water resources are being rapidly depleted. This situation carries the seeds of con-flict not only between states but also within countries, as the distribution of waterbecomes a major new source of inequality between rich and poor.
• Among the world’s regions, the Middle East is the most dependent on imports offood staples. It buys one-quarter of all cereals traded globally.
The fact that the United Nations Development Programme (UNDP) has taken humansecurity as the central theme of its recent Arab Human Development Report is anindication of these mounting and converging threats. Yet, at the same time, mostcountries in the region are witnessing high economic growth rates. And during thepast five years, the key word in the mouth of Arab leaders has been “reform.”
There is much ambiguity and misunderstanding around that word. Retrospec -tively, we can consider the ambiguity constructive because it has allowed govern-ments to integrate the concept into their discourse and to engage in importantchanges—administrative modernization, the introduction of new legislation, the
33
Bassma Kodmani is executive director of the Arab Reform Initiative, a network of independent research and policy institutes.
Annual World Bank Conference on Development Economics 2009, Global © 2010 The International Bank for Reconstruction and Development / The World Bank
34 | BASSMA KODMANI
rationalization of some practices, and a host of measures that governments felt wouldyield benefits for economic growth, the country’s image abroad, and foreign invest-ments; satisfy outside partners; and renew their own control over society. Nor did“reform,” as construed, require commitment by leaders to yield any of their prerog-atives or to relate to their societies in a different way.
The motto of reform and good governance allowed governments and “societies”to travel some way along the road toward introducing change. But in the past twoyears there has been a general feeling that we are stumbling over a set of serious obsta-cles that we are endeavoring to identify and analyze. Were these impediments inevitable?Were they the results of circumstances, or of specific flaws in the approach?
Some of the obstacles are traceable to external factors resulting from old and newsources of insecurity over which we may have limited control. But the current stale-mate is largely attributable to a reluctance on the part of governments and of somekey outside players to formulate the objectives more boldly and to opt clearly forshifting some amount of power to societies.
We should not have been surprised by the resistance of old authoritarian politicalsystems or by their resilience and capacity for adjustment, which seem to assure theruling elites perpetuity.
I believe that the situation is ripe for formulating objectives more frankly. We needto shift to a new paradigm that states explicitly the objective of democratic transfor-mation. This does not require agreement on the exact outcome in terms of the modelof democracy desirable in each national context. The definition I want to use here isbased on very basic principles. From there, we can outline a common framework anddevelop the practical tools that derive from it. The key principles are—in addition tobuilding strong and accountable public institutions—respect for rights and freedoms,the rule of law, and equity and social justice. These are not new, but the emphasishere is on the interconnectedness between them. I will provide some practical considerations for making this framework operational.
To begin with, I discuss a major change that has occurred: the awakening of Arabsocieties. The timid progress that has been made was followed, however, by setbacks.I explore the reasons for these setbacks—fears within societies, and the top-down,government-to-government institutional approach that has been espoused so far inorder to foster change. Finally, I argue that there can be no sustainable reforms with-out democracy. Although many believe this to be true, the debate has focused more onthe definition of democracy than on which strategies to adopt, which actors toempower, and which institutions to promote.
The Awakening of Societies
A remarkable change has been the opening up of public space and the emergence ofindependent media. The new media—satellite television channels and, more impor-tant, local media, the Internet, and blogs—play a key role in establishing horizontallinks among citizens. Such links had already existed in the social sphere (traditional

KEYNOTE ADDRESS | 35
civil society is strong, although not identified as such by international agencies), butnot in the political sphere. Independent media are now creating those links, which areamong the first conditions for political mobilization.
Societies are learning to challenge governments: they go on strike even whenthe law forbids strikes, and they organize demonstrations and sit-ins to protestprice increases, lack of water, or loss of land. The protests are initiated by twotypes of actor: the poor and marginalized and the elites who give priority topolitical demands—constitutional reforms, free and fair elections, the abrogationof emergency laws, freedom of expression, the independence of the judiciary, andso on. Faced with such protests, governments are reluctant to suppress the move-ments, which they know are now covered by local and international televisioncameras.
There are two very positive aspects about these movements. First, the expressionsof discontent and the mobilization crystallize around social and political issues andmuch less around issues of identity and religion. Second, these movements, whethergrassroots or elite based, are calling for peaceful, gradual change through legal meansand a process controlled by the state.
Governments are trying to close down these new spaces for expression and mobi-lization, but the protest movements are not receding. In fact, they are increasing withthe deteriorating social conditions. In the face of the unbridled rise in prices of vitalproducts, governments have come up with short-term solutions, at best. The specterof major social and political unrest is looming.
The region has to cope with economic deprivation that affects at least 80 percentof the overall Arab population. Of 320 million Arabs, only about 5 to 20 percent atmost (or about 50 million) benefited from the second oil boom in the first decade ofthe twenty-first century. The rest are poor, and their poverty has either increased orhas failed to diminish, as has begun to occur in many emerging countries of the globalSouth. In addition to economic deprivation, social and political disenfranchisement isincreasing.
These increased hardships are fueling the protest movements, but they are not theinitial trigger. The reasons for the awakening are structural and will probably be dif-ficult to reverse. Peoples’ state of mind is changing. The sense of powerlessness iswaning, and it is widely recognized that the change in peoples’ minds is a key driverof democratic transition, as has been witnessed over the past 30 years, first in south-ern Europe, then in Latin America and in Eastern and Central Europe.
What Societies Fear
As unhappy as societies are with their governments, they seek to protect state institutions and the stability of the political system. Scenes of instability in theirimmediate environment act as a deterrent against fostering abrupt change and shapethe attitudes of opposition forces. Radical groups advocating violence find little support within society. In the Arab Republic of Egypt, for example, some jihadist

36 | BASSMA KODMANI
groups that had used violence in the past have repented and have conducted publicself- criticism. It is remarkable that political protest has remained peaceful so far, eventhough openings for legal protest are tightly restricted.
The more we advance on the path of liberal economic development withoutexplicit social contracts, the more vital do alternative networks of solidarity becomefor ever-larger numbers of vulnerable groups. These community-based support sys-tems that help meet people’s basic needs and avert social explosions are almost allfaith based—Muslim (Sunni or Shia), but also Christian.
I have deliberately refrained from specifying the Islamist movements as a sourceof fear because Islamists are not seen as a danger by the large majority of the popu-lation. Islamists are not viewed as alien; they are a product of the social fabric, andthey embody the values of the people. They have pursued a three-decade-long trajec-tory of building social networks and developing a political culture based on religiousmessages. They have evolved into political actors that are now knocking on the doorof the state and demanding their share of power. When they do not get a response inthe form of a political opening, they may be tempted to force their way in to conquertheir share of power. But this outcome has been the exception rather than the rule; itis directly related to a context of conflict in which the movement is militarized and isleading a resistance movement. (Examples are Hezbollah in Lebanon and Hamas inPalestine, which turned their arms inward.) In other contexts, Islamists are joiningmultiparty coalitions, taking an active role in parliaments, and negotiating portfoliosin government. This is true in Bahrain, the Arab Republic of Egypt, Jordan, Kuwait,Morocco, the Syrian Arab Republic, Tunisia, and the Republic of Yemen.
A much more serious source of fear for governments and societies alike is thethreat to the stability and integrity of states as national entities that emanates fromconflict situations in neighboring countries and from violent extremist groups (forexample, transnational jihadists networks connected to Al Qaeda). The Iraqi situa-tion is the most recent and the most serious source of insecurity. Countries to thesouth of Iraq (Saudi Arabia and the smaller Gulf states) fear a Shia state in the southof the country, while countries to the north (Syria and Turkey) fear the emergence ofa Kurdish state in northern Iraq.
Despite such fears, we have not seen any serious schemes by Arab governments toaddress the issue of sectarian diversity within their own boundaries. Saudi Arabia hasonly recently announced a plan for the development of its northeastern province,where the Shia are concentrated. The budget is US$300 million—an amount that isunlikely to change the conditions of the inhabitants in any significant way or convincethem that their government cares to make them equal citizens, like the rest of the pop-ulation. More tragic is the behavior of Arab governments toward the crisis in Darfurand their protective attitude vis-à-vis the Sudanese government responsible for theatrocities. Arab governments have not acknowledged that sectarian coexistence is anintegral part of maintaining human security, although we can clearly see that it is pre-cisely on such issues that human security and national security intersect.
Political authorities are not regulating intercommunal relations so as to build harmonious relations between communities, and societies are not equipped or

KEYNOTE ADDRESS | 37
empowered to address the problem. Other institutions within society—mainly reli -gious institutions, Christian and Muslim alike—often take on this role, for which theyare intrinsically ill-equipped.
Unsustainability of Governance Reforms without Democracy
The only way out of this intricate predicament, I would argue, lies in the approachtoward domestic change. We need to shift from the objective of reforms in gover-nance to a more straightforward paradigm of democratic transformation as a way toopen new options and expand the arsenal of instruments that can be mobilized.Acknowledging this will open the way for a holistic approach to change in the Arabworld. There is a danger of losing a sense of the big questions that the numerous technical and institutional programs and measures collectively try to answer. Withcareful attention to strategies and modes of operation, we need to embark on thisconceptual shift toward democratic transformation as an achievement of societies,without diluting it. Only when sharp contours are defined can we derive effectivestrategies.
But promoting democratic transformation is first and foremost about opening aspace in which citizens can develop a home-grown agenda and about accepting thefact that societies will develop their own creative paths of transition. It may well bethat international organizations and outside donors will have as much to learn fromArab experiences (once success is achieved) as they have to offer in terms of experi-ences with patterns of democratization. For outside players to contribute in a con-structive way to such processes, a number of suggestions can be made concerning theactivities to develop, the actors to involve, and the strategies to promote:
• Devise mechanisms to link measures for reforming public institutions from abovewith efforts to respond to demands by societies, particularly respect for rights andfreedoms and for equity and social justice.
• Focus on systems of governance, on processes, and on the quality of the relation-ship between the ruling elite and society, rather than basing assessments on bench-marks that governments have learned to meet without changing the reality of theirrelation to their citizens.
• Support the establishment of monitoring tools at all stages of the process, from thedrive toward and the desire for participation in decision making through the actualdecision-making process, the implementation of policies, the design of guaranteesfor their implementation, and the assessment of their impact.
• Engage in focused research to identify areas in which the performance of publicinstitutions can be changed through policy measures undertaken by governmentsand outside partner governments or institutions, as opposed to changes that canonly occur through the participation of societal forces acting from below.
• Assist social groups to develop monitoring tools to track variations (negative orpositive) in the status of democracy, with a view to intervening in the formulationof policies. A key area for initial efforts in this direction is to encourage groups
38 | BASSMA KODMANI
within societies to push their governments for access to information as a right.Legislation (freedom of information acts) and sustained pressure from citizengroups will gradually erode the culture of secrecy within most government institutions.
Practical Examples
Two concrete examples of an approach from below are described next.
Security Sector Reform
Security sector reform in the Arab world has been on the agenda of many foreigndonors and multilateral institutions for the last three to five years. Yet societies areoften unaware of such programs and are developing strategies of their own thatremain largely disconnected from the approach taken by outside donors. The challenges in developing an indigenous agenda for security sector reform by foreignpartners are threefold:
1. The current approach is strongly influenced by post-conflict situations in otherparts of the world or in the Middle East itself (Palestine, Iraq, Lebanon) and is illsuited to countries that are undergoing comprehensive reform processes but arenot emerging from a conflict.
2. The approach is largely technical, even though the area is one in which politicalconsiderations dominate because security institutions form the backbone of thepolitical regimes and determine complex domestic equilibriums and, ultimately,the survival of the political systems.
3. The approach is driven from above and relies on the goodwill of governments thathave learned to take what is offered by foreign partners (for example, training pro-grams in human rights for their police forces) without linking these programs toan overall ethical code of conduct for their security institutions.
Meanwhile, societies are developing their own ways of pressuring governments con-cerning the behavior of security forces. In Morocco, human rights groups and groupsadvocating for the rule of law have seized the opportunity opened by the monarchythrough the creation of the Equity and Reconciliation Commission to push for a public debate on the practices of the security institutions. The results are remarkable,as these groups have succeeded in maintaining their momentum and in opening sensitive files that have remained totally secret for several decades.
In Egypt, where the government did not initiate anything from above comparableto the Moroccan opening, a public debate on the practices of security agencies hasbeen forced on the government thanks to independent media (newspapers and television channels), new technologies (documentation of abuses of detainees’human rights through mobile phones, blogs, and Web sites), and the work of a few

KEYNOTE ADDRESS | 39
filmmakers who have produced films that have been widely seen and discussed acrossthe country. The debate is now open and ongoing. It is exposing the security sectorand creating resentment within its ranks at being put in the forefront of the govern-ment’s struggle against citizens, and it is forcing the government to investigate someof the most embarrassing cases of human rights violations.
Although this is a process of trial and error, societies are gradually developingstrategies that amount to the beginning of what can be called a home-grown agendafor reforming the most opaque institutions of authoritarianism.
Gender Programs
Gender is arguably the area that has received the greatest attention and the most generous funding from foreign partners. Yet most programs have been focused on asmall group of women in each country, often from the elite and connected with orco-opted by the first ladies. Although these programs have the blessing of the governments, they are not always successful in fostering significant change, since theyrarely challenge the social order. Experience shows that female academics from theelite and scholars in general have rarely proposed alternative, more socially groundedvisions of gender issues distinct from those offered by Western institutions.
The case of the Khul’a law enacted in 2002 in Egypt is one of the most tellingexamples of a successful home-grown strategy. The legislation was the result of aquiet 15-year struggle by a group of widely respected female and male jurists, soci-ologists, and civil society representatives who worked closely with religious scholarsfrom the conservative Islamic institution Al Azhar to reach agreement on the inter-pretation of an old principle enshrined in Islamic sacred texts. The law amounted toa silent revolution in Egyptian society, as it allowed tens of thousands of women toobtain divorces and custody of their children, after decades of unsuccessful proce-dures in courts. The law was far from ideal, and the process for reaching this out-come was lengthy, but it seemed that this was the price for building a consensus andlegitimacy allowing the law to be enforced. It was done by working from within society, integrating social realities and beliefs, working from Islamic sacred texts, andbringing along key actors such as the religious establishment.
A second area in need of revisiting within many donor-driven programs on genderis that these programs tend to be designed to eschew political issues, and they oftenpromote certain rights for women specifically without integrating the larger socialand political context. Although every woman in the Arab world will agree that herstatus as a woman needs to be improved and her rights protected, many of the mostpopular figures among Arab women are those active in the larger struggles for thecivil and political rights of citizens. These women are members of political parties orsocial movements. They have constituencies and credibility to preserve, and they areoften reluctant to be associated with donors’ strategies, which they see as potential-ly weakening their own strategy—one that seeks to challenge the government in abolder fashion. Again, we see the need to trust societies to produce their own leadersand strategies.

40 | BASSMA KODMANI
Conclusion
The heat around the democracy promotion agenda has receded. Now is probably theright time to say that it should not be abandoned; otherwise, foreign partner gov-ernments and organizations run the risk of being perceived as opportunists who wereattracted to a fantasy of the former U.S. administration, like a noisy toy that capturedtheir attention for a short while. The moment is probably auspicious for renewingefforts toward democratization.
But there are conditions that have to be met if these efforts are to succeed. A keyrequirement is to trust the societies. Gradual change toward democracy is mainlyabout creating a different type of relationship between a government and its citizens.Foreign donors need to constantly question their strategies to ensure that they are notincreasing governments’ distrust of (and sometimes contempt for) their citizens.Accountability is first and foremost to be promoted vis-à-vis the citizenry rather thanforeign donors (as the recent debate on the sovereign wealth funds of the Gulf Stateshas shown, for example).
Societies might well produce social and political models that foreign partners arenot entirely comfortable with. But this is probably inevitable, and accepting theinevitable is the only way to make the best of it so as to tame radical groups and softenanti-foreign attitudes and ideas through constant engagement.

Keynote Address
SUNIL KANT MUNJAL
I am honored to be invited to address this annual conference. I consider myself fortu-nate to be here, for a variety of reasons. South Africa is known as the country wherethe founding father of the Indian nation, Mahatma Gandhi, took his first public stand.This is also the land of Nelson Mandela, who showed that peaceful protest is as powerful a tool as war for winning an argument or a case. I also count myself fortu-nate to be among so many economists, and all varieties of economists.
That reminds me of a story I heard the other day about an architect, a surgeon,and an economist. The surgeon said, “Look, we are the most important profession.God is a surgeon, because the very first thing God did was to extract Eve fromAdam’s rib.” The architect said, “No. God is an architect. He made the world inseven days from complete chaos.” And the economist said, “Who do you think created the chaos?”
So, you are certainly very important people. I must admit that I never studied tobe an economist. I probably should have. I am told that this is the only professionwhere you can say “trickle-down theory” with a serious face.
The theme for this conference seems extremely apt for the world today. Certainly,for us in India it is very relevant. I was, however, surprised to get the invitation to theconference because although India is important, my understanding was that this is aconference normally addressed by government functionaries or senior economists. SoI shall try not to talk just about industry but to present an overall view.
Whatever you hear about India is true—and, conversely, the exact opposite is alsotrue at the same time. India is not a simple country by any standard. It is said that inthe course of a lifetime one might just begin to understand what India is about. Andthat is as true for we who live in India, as well. India is a country that can launchrockets and satellites but at the same time has around 200 million people who live in
41
Sunil Kant Munjal is the chairman of several enterprises, including Hero Corporate Services, and is the president of theMedical College and Hospital, India. He is a member of the Prime Minister’s Council of Trade and Industry in India.
Annual World Bank Conference on Development Economics 2009, Global © 2010 The International Bank for Reconstruction and Development / The World Bank.
42 | SUNIL KANT MUNJAL
abject poverty. Close to half the population of Mumbai, which is considered India’sbig financial center, is living in shanties. We have 28 states, 22 languages officiallyrecognized by the government of India, and thousands of dialects spoken across thenation. People in different parts of India wear different clothes, speak different lan-guages, eat different food, and even look different. Very often, for some of us, whenwe travel across the country, the only common languages are cricket and Indianmovies and, of course, every now and then, English.
The economic historian Angus Maddison has estimated that five centuries agoIndia was one of two countries in the world that accounted for nearly half of theworld’s gross domestic product (GDP). Attracted by India’s prosperity, Columbus setout and lost his way and got to America. Who knows, if he had had a good compass,he would have probably found his way to India before the British did, and I mightnot be here giving this speech today. The British spent a little over 200 years in India,and they ruled India. When they arrived, India had about 21 percent of world tradeand Great Britain, as it was then known, had 1 percent. In 1947, when the Britishleft, India had 1 percent of world trade and Great Britain had 21 percent. So you cansee what has happened to India. Many talk of this as the rise and fall and now therise of India again.
Our first prime minister, Jawaharlal Nehru, said, “A moment comes which comesbut rarely in history when we step out from the old into the new. When an age endsand when the soul of a nation, long suppressed, finds utterance.” It did not quite hap-pen after 1947, when India became independent. India chose as its broad philosophya strange oxymoron, a socialist democracy. We borrowed from the Russian model ofthe five-year plans, and the government built power plants, steel plants, and dams.That was probably necessary at the time because no private enterprise or individualwas allowed to accumulate enough wealth to invest in such projects. But the government probably did not step back quickly enough. The 20 or 30 years of thispolicy became a very difficult time for private enterprise.
In 1991 India made a dramatic move toward market reforms. Our current primeminister, who was then finance minister, in many ways was the leading architect ofthis reform program. It is popularly believed that India did not go happily towardreform. It went kicking and screaming, but we were in a situation where foreignexchange reserves were only enough for a few days of imports. In fact, India had tosend out a planeload of gold as a pledge to be able to raise international currencyto continue to pay for its imports. To India’s credit, it has never, ever defaulted onany global commitment. I think that is saying something for a country that has gonethrough many crises.
What is not so well known outside is that many of the reform programs thatwere kicked off in 1991 had actually been discussed, debated, and written up in the1980s—which is probably why implementation was easier than one would haveimagined. Don’t forget, it was a dramatic turnaround of policy from what we hadhad until then.
So, what has happened to the simplicities of reform in India? India’s trade-to-GDPratio has doubled over the past seven years, to almost 50 percent. As a trading nation,India is now firmly established at the top table of the World Trade Organization

KEYNOTE ADDRESS | 43
(WTO), and trade agreements are currently in the pipeline with at least 10 potentialpartners, ranging from the Association of Southeast Asian Nations (ASEAN) to theEuropean Union, the United States, and Canada. We already have signed agreementswith Singapore, Sri Lanka, Thailand, and a host of other nations. In fact, my last triphere was when India signed what is known as the IBSA agreement between India,Brazil, and South Africa—three nations spread across different parts of the globe thatare at a somewhat similar stage of evolution of their economies. All three are large, allthree are complex, and all three are trying to reach across to see how we can buildbridges between us. India is a keen participant in the WTO discussions (in fact, somesay, too keen.
But the reality, often not recognized, is that India is a nation in which 72 percent ofthe people live in rural areas and 54 percent depend on agriculture as their primarysource of income. Agriculture contributes less than 18 percent of GDP, so a lot of thesepeople are just subsisting on the farming they do; it is not really trade or business forthem. The government therefore finds that it has a responsibility to protect that sec-tion of the population, and it is a large number of people. (Percentages are deceptivesometimes; don’t forget, this is a country of more than 1 billion people.)
We are keen to build a global world trade order, but in the meantime India, likemany other nations, is reaching out rapidly and building bilateral, trilateral, and othertrade relationships. Savings are now almost 35 percent of GDP, a jump of 8 percent-age points in less than six years. The investment ratio stands at 36 percent, up from22 percent in 2004, and many profess that it will rise to 50 percent in the not too distant future.
The interesting thing is not just what is happening inside India; it concerns Indiansoutside India. Boris Pleskovic and I were talking about how he has helped manySlovenians residing outside Slovenia to get together and build a kind of platform. Ifyou look at how Indians have performed across the globe, you will find that amongmany of Fortune 500 companies, the chief executive officer level or the top tier ofmanagement will always have a few Indians. Among the major successful banks,many of the movers and shakers are Indians. In North America the largest single ethnic group of doctors is Indian.
Someone sent me an e-mail the other day that referred to NRIs, nonresident Indians.At one time NRIs was said to mean “not required Indians,” but that perception is dra-matically changing as India’s economic situation improves. I think in many ways Indiais maturing as a nation, both politically and socially. It is reaching out to its people out-side, trying to build a bridge. The e-mail that I mentioned said that 33 percent of thepeople working in Microsoft are Indians; the number at Intel is similar. The figure thatsurprised me was for the U.S. National Aeronautics and Space Agency (NASA), whichhas about 20 percent Indians, and this is really high-technology work. These individu-als have gone out and done exceedingly well. So the question arises, why was it that20 years ago Indians were doing well but India was not? It really had to do with thefacilitating environment that we had built—or, rather, the nonfacilitating environmentthat we had built—through regulations. That is what began to change in 1991. Theimpact is such that I understand the national dish of the United Kingdom is now chicken tikka masala. So it is not just the doctors that we are exporting.
44 | SUNIL KANT MUNJAL
India is working overtime to reduce its infrastructure deficit. Some problems per-sist today, but we are better off than we were 10 or 15 years ago. The main problemsare lack of physical infrastructure, continued red tape in decision making in govern-ment, and corruption in public life. And it is interesting, when you look around, youfind that this is almost a standard feature of emerging economies. The good thing isthat in spite of all its diversity, in spite of its fair share of problems and its lack ofphysical infrastructure, India has continued to build growth at a rate that has gottenbetter, decade on decade. At one time, India was known as a nation that had whatwas called, rather uncomplimentarily, the “Hindu growth rate” of 2.5 to 3.5 percent.Every decade since, growth has gone up by at least a couple of percentage points. Asof now, we have had four years of nearly 9 percent growth, though recently issuednumbers show that growth will be between 7.8 and 8.5 percent. If you are used to9 percent and you are aiming for 9.5 percent or higher, a growth rate of 8.5 percentcan be experienced as a slowdown, and it can actually begin to hurt.
Let me tell you a few more success stories, and then I will talk about what isunique about India’s journey. An average Indian today can potentially spend doublewhat he or she could spend in 1985. In the next 20 years, he or she will be able tospend four times as much as now. By the end of this decade, India is expected to havean urban population of 173 million—more than the population of several Europeannations put together. This is significant because urbanization rises with GDP per capita in a hockey stick fashion. And it has been seen in many economies that themoment you start to hit US$700–US$800 per capita income, the income rise is sus-tained and that, fortunately or unfortunately, leads to higher urbanization. There-fore, we need to focus not just on the 600,000 villages to improve rural areas but alsoon rapidly growing the urbanization that is required.
A large section of our workforce has become productive, much more productive,in these last 15 years. Our dependency ratio has decreased from 1.3 to 0.8. This haspartially to do with the demographics of the country: 54 percent of all Indians arebelow age 30, and 30 percent are below age 15. Over the next 20 years or so, asthe entire developed world falls short of people in the working-age group by roughly41 million to 42 million people, India will add almost the same number to the working-age pool. So, there is a dramatic opportunity in the form of more work moving toIndia and more people moving out of India, but the current state of global politics prohibits that movement in many ways because of increasing concerns over securityand nationalism, as we have heard in two of the sessions at this conference. ProfessorSpence, for example, observed that many nations, including many champions of glob-alization, are turning more nationalistic than they have been for a long time.
Mahatma Gandhi once said, “I do not want my house to be walled in on all sidesand my windows to be stuffed. I want the cultures of all the lands to be blown aboutmy house freely. But I refuse to be blown off my feet by any.” This, in many ways,sums up the uniqueness of India. India opens itself to global influences to look atwhat is happening in the West and in the East, but it chooses to follow its own uniquepath. I suppose this is partly because no rulebook has been written for a democracywith a billion people trying to turn into a market economy. The other part is that weare a young, new economy, but we are a 5,000-to-7,000-year-old civilization, with

KEYNOTE ADDRESS | 45
strong likes, strong dislikes, and a very strong culture. And this has been seen bymany of the global companies that came into India. Many came to India saying, “Wehave a standard set of products and services that is wonderfully honed to serve all theglobal markets,” and in many cases they fell flat on their faces. They did not allowfor the customers’ preferences, which were engrained through many generations.McDonald’s made a change in their menu for the first time, I am told, when theycame to India. And they were so successful with this change that they carried out thispractice in many other nations, adapting to local tastes, flavors, and recipes. There isa whole host of examples of like this.
The big move that has happened in India is that the pattern of reform is movingfrom the central government to the state governments. The central governmentbacked off from many of its regular activities by stepping back, by reforming, and byreducing licensing requirements for industry and other economic activities. Many ofthese changes were readily adapted by state governments, as well, but not by all. Infact, in an interesting recent article an expert observed that if you draw a line approx-imately from the north to the south of India, between two cities he named, the areasto the left and right of the line are like two different countries. The left side, whichis mostly the south, the west, and parts of northern India, is where the major growth istaking place. But although the economic numbers are high, literacy numbers are stilllow, and that is one of the issues that continue to dog India as a nation.
There was a wonderful session this morning on higher education, and I knowsome of the Indian experts who are in this audience addressed that session. At the topend, India has done exceedingly well in education; people who have gone into avion-ics or aeronautics or software engineering or medicine obviously must have receiveda good education. Yet the numbers are not nearly enough for the size of our popula-tion. Now, this was a role clearly marked out for the government. Governments arerequired to take care of primary education, primary health care, security, monetarypolicy, and the like. Nevertheless, the government has not had the wherewithal toprovide sufficient education to all the people, so the private sector willy-nilly steppedin and started playing a role.
But the private sector cannot substitute for the government. There is a need for thegovernment of the day—whichever it is. In the last 15 years we have had a series ofcoalition governments, with sometimes as many as 12, 14, or 18 parties in govern-ment together. These governments have been made up of parties from the extremeleft to the extreme right and every color in between. The good thing is that all of themwent down the same path of reform and of viewing growth as the only answer to allIndia’s ills. The not-so-good thing is that they focused on the easy part of the reform.(I am saying easy now; obviously it didn’t look easy when they were doing it.) Someof the work is still to be done. Also, the government did a wonderful job of trying tomanage both the revenue deficit and the fiscal deficit, going as far as to write an actof parliament binding itself to improve the fiscal situation. They have done prettywell, barring the current problem that the whole world is seeing with high inflationand high prices for oil, food, and other base materials. The government also backedoff from spending in some areas in which they ought to be spending—some of themajor infrastructure projects. There are many private players, both Indian and

46 | SUNIL KANT MUNJAL
global, who are building airports, ports, highways, roads, power plants, and so on inIndia. But it is necessary to ensure that the government remains a key player, not onlyin areas such as infrastructure but also in ensuring that independent regulation is setup which will allow the private sector and the new model of public-private enter-prises to work well together.
In a diverse nation like India, consensus is required not just through a spectrum ofpolitical parties but also involving all sections of society. We have a very vibrantdemocracy. We have one of the world’s freest presses. We have an active executive,judiciary, and civil society, and awareness among people in India is very high—somuch so that one of our recent Nobel laureates, Professor Amartya Sen, wrote abook about it, The Argumentative Indian. It is said that the difference between Indiaand China is that while in China, you make a decision today and start implementa-tion tomorrow, in India you make a decision and the debate starts tomorrow—andthat debate could take months or years. That is a reality we live with. The good thingis that we have learned that it is possible even with such diversity to build consensusand to take action through consensus.
Sean Casey, the very successful baseball player, said “All the world’s a stage. Andmost of us are desperately unrehearsed.” India, clearly, is one of those cases. We arelearning by making our own mistakes. I doubt that we can actually learn from any-body else’s, or from experts like the World Bank. Very often one hears criticism fromwithin India that the World Bank tries to give everybody a standard prescription. Thereality is that in India, a standard prescription is not going to work. And that hasbeen proved over and over again.
It is therefore important that all international, multilateral organizations learn towork with India and with Indians, who have built this expertise of consensus. In fact,we could provide expertise to many nations on how to run an election. (We knowwhat has happened in countries like the United States and others.) India has, ofcourse, done a tremendous job in this area. We have elected 2.2 million representa-tives in what we call the panchayati raj—village-level local self-government. Of theserepresentatives, more than 30 percent are women. I do not know of any nation in theworld that has come anywhere close to this truly democratic exercise. So, there is atremendous amount of strength in how India functions as a nation. Europeans, forexample, can take a lesson from India in how so much diversity actually works welltogether and still continues to be a nation.
Our big issue is how to tackle poverty. Many people agree that our only answer isgrowth. Trickle-down growth, however, is not fast enough. People will not wait twogenerations, especially when they can see others who have become exceedingly suc-cessful, very wealthy. And India is producing many billionaires and millionaires. Thepoor will have patience only to some extent, which is why some of us, who wouldnormally have objected, actively participated with the government to design four tofive direct intervention programs, including programs on skill building, education,rural infrastructure, electrification, drinking water, and irrigation. These are some ofthe real and serious major issues that we have in India as a nation.
What we have done in India over a short period of time appears to be almost mirac-ulous. There are many success stories that one can talk about, in telecommunications,

KEYNOTE ADDRESS | 47
for example. From having the highest-priced wireless service in the world, India hasgone to having the lowest-priced service. In three years’ time India will have 95 percentgeographic wireless coverage, which will be a unique distinction across the world. Notmany years ago India probably had 2.5 million telephone connections. Now it addsbetween 8 million and 10 million new connections every month, which is more thanthe population of many small nations.
We have done similar things in innovation. On the plane trip to the conference,I heard someone mentioned Amul, which is the brand name of a cooperative of dairyfarmers. Hundreds of thousands of dairy farmers provide milk every day to thisorganization, which does the processing, the value adding, the distribution, and thebranding. India is the world’s largest producer of milk and this is our largest organ-ization. It is made up of millions of people. And there are other examples of innova-tion that has taken place in a very Indian way. Jaipur Foot is an organization thatmakes prosthetics. It is unique in the sense that a foot which in the United Stateswould cost US$8,000 costs US$40 when supplied by Jaipur Foot, and its functional-ity is at least 200–300 percent better than can be found in the best organizations andbest institutions in the United States. This is just one example of how India is build-ing a low-cost economy that can function. Of course, we realize that cost and lowwages cannot be permanent advantages. Therefore, value-added productivity, effi-ciency, and research are the new watchwords in India. And we are conscious that weneed to pursue these goals while ensuring that we do not pollute as much as manynations did while they were undergoing their development.
India’s capital utility efficiency is fairly high right now. A recent McKinsey &Company report stated that for every US$1,000 spent, India is able to get 20–22 per-cent more than in China on the physical infrastructure that is being built. That isimportant because we are very short of funding. Of course, unlike the case in manycountries, much of the capital for infrastructure is coming from within India. But wedo need foreign capital, along with knowledge and networks. That, in fact, is ourgreatest need today. But India is actively investing overseas, as well. In fact, India isnow the second-largest foreign investor in the United Kingdom. We are also invest-ing in countries such as France, Germany, Italy, the United States, and a host of otherplaces. India is uniquely positioned to serve as a lesson for many others who areattempting to dramatically change their economies. We are one of the rare economiesthat evolved directly from being an agrarian economy to being a service economy.More than 50 percent of India’s economy is services—which is why some of us arepushing very hard to grow the manufacturing sector faster so as to be able to providemany more jobs for the millions of young Indians who are entering the job marketevery year.
India has been able to learn much from the rest of the world. But really, the bestlearning comes from making your own mistakes and at the same time being cautiouswhen you need to be. We carried out a very calibrated opening up of the capitalaccount, for example. Many experts across the world objected to the slow pace. Butnow some of them are saying, “Hey, hang on here. These guys did not suffer likesome of the other economies when they went through an extreme crisis. So maybethere is something here that is being done right.”

48 | SUNIL KANT MUNJAL
India offers a unique opportunity, to both Indians and the global population, towork in India and with India. We have learned many lessons, and we still have muchto learn. But one thing we have learned is that if you have the right attitude, the rightframe of mind, you are going to be able to find the right answers. I spoke of Mumbaia little while ago. Mumbai has an area called Dharavi that is probably the world’slargest shantytown—certainly Asia’s largest shantytown. Just now, while driving tothe conference, I saw a shantytown right outside Cape Town. What was unique wasthat every home had a color television, most of the people living there had cell phonesand other electronic gadgets, and most of them also had jobs. The India of the futurethat we hope to see is not one of shantytowns but of color televisions, jobs, and continuous prosperity, and concern for those around us.

Trade and Investment


Trade and Economic Performance: Does Africa’s Fragmentation Matter?
PAUL COLLIER AND ANTHONY J. VENABLES
Most of the population of South Asia lives in one megacountry with a populationgreater than that of the whole of Sub-Saharan Africa. By contrast, the population ofSub-Saharan Africa is spread across more than 50 countries. Does this political frag-mentation have economic consequences? We suggest that both private economicactivity and the provision of public goods benefit from powerful scale economies thatconfer advantages on the South Asian model. Paradoxically, although Africa has agreater need than other regions for supranational power structures, it has made farless progress toward regional unity.
Sub-Saharan Africa and South Asia have many features in common and many thatare strikingly different. They each contain roughly 1 billion people, and in 1980, theirper capita incomes and human development indicator levels were broadly similar. ButSouth Asia is dominated by India, a unified state of 1,130 million people, and Pakistan and Bangladesh, each with more than 150 million. By contrast, Africa, witha total population 60 percent the size of South Asia’s, is divided into 54 states. Ofthese, even the largest, Nigeria, is smaller than the smallest of the big three SouthAsian countries and has a mere 14 percent of the region’s population, whereas Indiacontains 74 percent of the population of South Asia. About 95 percent of SouthAsians live in the big three, but the three largest countries of Africa account for only28 percent of Africa’s population. Indeed, the average African state has a populationof only 17 million people, one-sixty-sixth the size of India’s. Does this matter?
The economic performance of the two regions has diverged sharply since 1980,as illustrated in figure 1. The regions had similar gross domestic products (GDPs) in1980, but whereas Africa’s share of world GDP declined until the late 1990s, South
51
Paul Collier is director of the Centre for the Study of African Economies (CSAE) and professor of economics, OxfordUniversity. Anthony J. Venables is director of the Oxford Centre for the Analysis of Resource Rich Economies(OxCarre) and professor of economics at Oxford University.
Annual World Bank Conference on Development Economics 2009, Global © 2010 The International Bank for Reconstruction and Development / The World Bank.
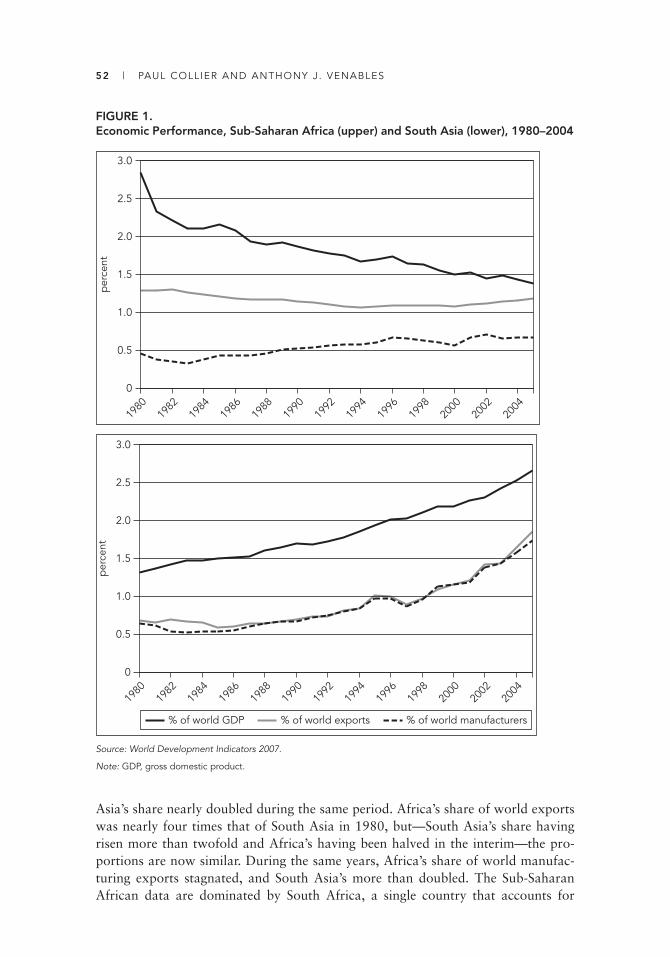
52 | PAUL COLLIER AND ANTHONY J. VENABLES
Asia’s share nearly doubled during the same period. Africa’s share of world exportswas nearly four times that of South Asia in 1980, but—South Asia’s share havingrisen more than twofold and Africa’s having been halved in the interim—the pro-portions are now similar. During the same years, Africa’s share of world manufac-turing exports stagnated, and South Asia’s more than doubled. The Sub-SaharanAfrican data are dominated by South Africa, a single country that accounts for
FIGURE 1. Economic Performance, Sub-Saharan Africa (upper) and South Asia (lower), 1980–2004
0
0.5
3.0
1.5
1.0
2.5
2.0
1980
1982
1984
1986
1988
1992
1994
1996
1998
1990
2000
2004
2002
per
cent
0
0.5
3.0
1.5
1.0
2.5
2.0
1980
1982
1984
1986
1988
1992
1994
1996
1998
1990
2000
2004
2002
per
cent
% of world GDP % of world exports % of world manufacturers
Source: World Development Indicators 2007.
Note: GDP, gross domestic product.
TRADE AND ECONOMIC PERFORMANCE | 53
around 20 percent of regional GDP, and the performance of the rest of Africa is, onaverage, worse.
There are numerous reasons for this divergence, but in this paper we focus on oneset of issues: has Africa’s fragmentation into numerous small states contributed to itsrelatively poor performance?
The relationship between country size and economic performance has been ana-lyzed by a number of authors, with mixed findings. Recent work by Rose on a sampleof 208 economies (some, such as the Isle of Man, not independent) led him to the conclusion that an economy’s population “has no significant consistent impact on itswell-being” (Rose 2006, 501). By contrast, the growth literature has come up with evi-dence for a positive relationship between country size and growth. A 2005 article byAlesina, Spolaore, and Wacziarg provides a succinct summary of findings. The authorshypothesize that economic growth should be positively associated with country sizeand openness and negatively associated with the interaction of these two factors. In asample of 104 countries, they find that these relationships are present and statistically significant. Furthermore, they are quantitatively significant: “for a country at themedian level of openness ([the Republic of] Korea) the effect of multiplying the coun-try’s size by 10 would be to raise annual growth by 0.33 percentage points” (Alesina,Spolaore, and Wacziarg 2005, 1530; see also Alcalá and Ciccone 2003).
A lack of consensus in these cross-country studies is perhaps unsurprising. On vari-ous measures of per capita income, small countries are both at the top (Luxembourg andLichtenstein) and the bottom (Burundi) of the ranking. Our approach is not to under-take aggregate cross-country studies but, rather, to investigate the impact of fragmenta-tion into separate states in a more microfounded way. We will focus on Africa and willoften compare it with South Asia and with India, in particular. Why is it that a frag-mented (sub-) continent might be at a disadvantage relative to a more unified one?
Conceptually, three distinct mechanisms generate costs of fragmentation. The firstis that natural advantages are likely to be unevenly distributed among countries. Thesecond concerns the loss of scale economies, at the level of the firm, the city, and thecountry as a whole. The third has to do with the loss of public goods as the scale ofpolitical cooperation is reduced. We will examine each in turn.
Natural advantages such as oil deposits and natural harbors are unequally dis-tributed across space. If a continent is politically fragmented, the likelihood thatnatural advantages will be unevenly distributed among countries increases. Evi-dently, this implies inequalities among countries. Of greater pertinence for thisinquiry is that these inequalities are likely to imply inefficiencies: average incomeis reduced by fragmentation. This effect occurs if there are diminishing returns tohaving a natural advantage, in which case the aggregate benefits from naturewould be greater the more equally shared are these advantages. Natural advan-tages may be fixed or transient, and we consider each category. As examples offixed differences in natural advantage, we apply Collier’s (2007) classification ofcountries into resource rich, re source scarce, coastal, and landlocked. Transientdifferences arise as countries experience idiosyncratic shocks, with some countriesbenefiting and others possibly losing. We look at the exposure to export priceshocks generated by the structure of commodity exports and the fact that politicalfragmentation might reduce risk pooling.
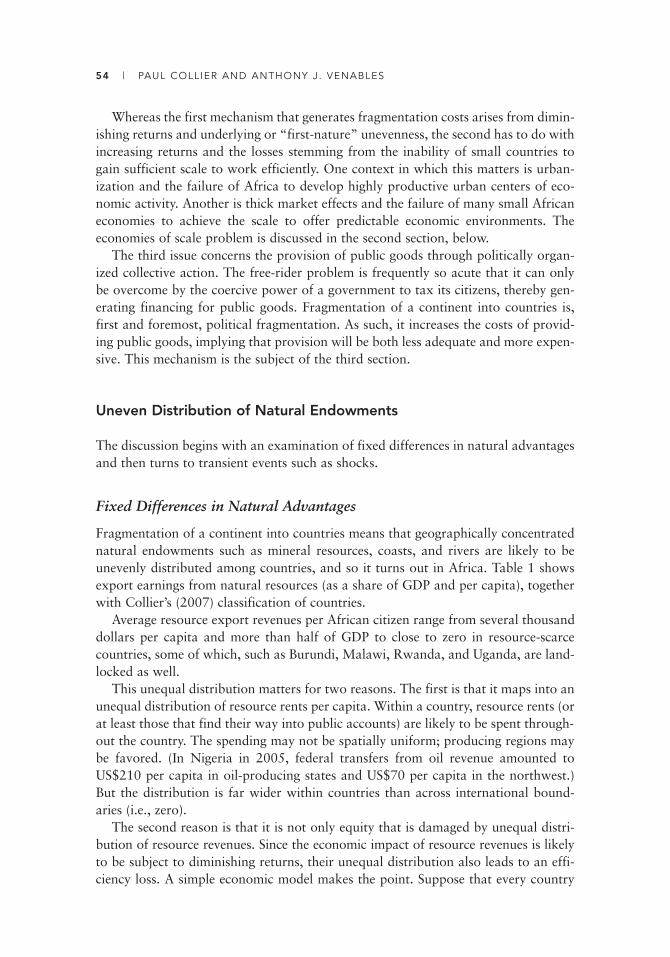
54 | PAUL COLLIER AND ANTHONY J. VENABLES
Whereas the first mechanism that generates fragmentation costs arises from dimin-ishing returns and underlying or “first-nature” unevenness, the second has to do withincreasing returns and the losses stemming from the inability of small countries togain sufficient scale to work efficiently. One context in which this matters is urban-ization and the failure of Africa to develop highly productive urban centers of eco-nomic activity. Another is thick market effects and the failure of many small Africaneconomies to achieve the scale to offer predictable economic environments. Theeconomies of scale problem is discussed in the second section, below.
The third issue concerns the provision of public goods through politically organ-ized collective action. The free-rider problem is frequently so acute that it can onlybe overcome by the coercive power of a government to tax its citizens, thereby gen-erating financing for public goods. Fragmentation of a continent into countries is,first and foremost, political fragmentation. As such, it increases the costs of provid-ing public goods, implying that provision will be both less adequate and more expen-sive. This mechanism is the subject of the third section.
Uneven Distribution of Natural Endowments
The discussion begins with an examination of fixed differences in natural advantagesand then turns to transient events such as shocks.
Fixed Differences in Natural Advantages
Fragmentation of a continent into countries means that geographically concentratednatural endowments such as mineral resources, coasts, and rivers are likely to beunevenly distributed among countries, and so it turns out in Africa. Table 1 showsexport earnings from natural resources (as a share of GDP and per capita), togetherwith Collier’s (2007) classification of countries.
Average resource export revenues per African citizen range from several thousanddollars per capita and more than half of GDP to close to zero in resource-scarcecountries, some of which, such as Burundi, Malawi, Rwanda, and Uganda, are land-locked as well.
This unequal distribution matters for two reasons. The first is that it maps into anunequal distribution of resource rents per capita. Within a country, resource rents (orat least those that find their way into public accounts) are likely to be spent through-out the country. The spending may not be spatially uniform; producing regions maybe favored. (In Nigeria in 2005, federal transfers from oil revenue amounted toUS$210 per capita in oil-producing states and US$70 per capita in the northwest.)But the distribution is far wider within countries than across international bound-aries (i.e., zero).
The second reason is that it is not only equity that is damaged by unequal distri-bution of resource revenues. Since the economic impact of resource revenues is likelyto be subject to diminishing returns, their unequal distribution also leads to an effi-ciency loss. A simple eco nomic model makes the point. Suppose that every country

55
TABLE 1. “First-Nature” Geography in Sub-Saharan Africa: Natural Resource Exportsand Country Classification
Value of exports of fuels, ores, and metals
As percent Per capita Collier (2007)
Country (year) of GDP (U.S. dollars) classification
Equatorial Guinea (2005) 93.92 14,591 Resource richAngola (2005) 72.16 1,471 Resource richCongo, Rep. (2005) 71.46 1,182 Resource richGabon (2006) 55.90 4,071 Resource richChad (2005) 44.47 258 LandlockedNigeria (2004) 40.94 214 Resource richBotswana (2005) 34.74 1,977 Resource richGuinea (2006) 24.40 88 Resource richCongo, Dem. Rep. (2006) 24.34 34 Resource richMauritania (2005) 19.79 123 Newly resource richMozambique (2005) 18.71 62 Newly resource richZambia (2005) 18.32 116 Resource richSudan (2005) 13.50 102 Newly resource richCôte d’Ivoire (2005) 12.52 108 CoastalMali (2004) 10.65 46 LandlockedCameroon (2005) 9.40 89 Coastal; formerly
resource richSierra Leone (2005) 9.40 20 CoastalSouth Africa (2005) 6.81 351 CoastalZimbabwe (2005) 5.75 15 LandlockedNiger (2005) 4.55 12 LandlockedKenya (2004) 4.52 21 CoastalSenegal (2005) 4.30 30 CoastalTogo (2004) 3.90 13 CoastalNamibia (2006) 3.11 97 CoastalGhana (2005) 2.50 12 CoastalMadagascar (2006) 1.70 5 CoastalCentral African Republic (2005) 1.62 5 LandlockedTanzania (2005) 1.58 5 CoastalCape Verde (2006) 0.87 19 CoastalSwaziland (2002) 0.81 9 LandlockedUganda (2005) 0.66 2 LandlockedEthiopia (2004) 0.54 0.7 LandlockedBurundi (2005) 0.34 0.3 LandlockedRwanda (2005) 0.33 0.8 LandlockedBurkina Faso (2004) 0.31 1.2 LandlockedMauritius (2005) 0.17 9 CoastalBenin (2005) 0.11 0.6 CoastalMalawi (2005) 0.05 0.1 LandlockedLiberia CoastalGuinea-Bissau (1995) 0.44 0.9 CoastalGambia, The (2003) 0.05 0.1 CoastalComoros (1997) 0.03 0.1 CoastalDjibouti (1990) 0.01 0.1 Coastal
Source: World Development Indicators 2007.
Note: Diamond exports are included in the calculations for Angola, Botswana, the Democratic Republic of Congo,Guinea, and Zimbabwe. Gold exports are included for the Democratic Republic of Congo, Guinea, and Ethiopia. ForMali, export value of fuels, ores, and metals consists solely of gold; for Sierra Leone, it consists solely of diamonds.

56 | PAUL COLLIER AND ANTHONY J. VENABLES
consumes and produces a single good that is nontradable. Production of the gooduses foreign exchange (imported oil or equipment) and domestic labor in fixed pro-portions. The only source of foreign exchange is resource revenues, and labor is infixed supply. Real income in such an economy is illustrated in figure 2, in whichresource revenue is measured on the horizontal axis. If resource exports are less thanR*, production is foreign exchange constrained, and real income is given by theupward-sloping section of the line (with slope equal to the foreign exchange contentper unit of GDP). If natural resource earnings are greater than R*, the economy islabor constrained, thus fixing income; further resource earnings beyond this point aresimply accumulated as foreign assets. As a simplest case, suppose that one economyhas no resource revenue (i.e., it is at point A) and another has resource revenue andis at point B. The average income of the two countries is at the midpoint between Aand B. Merger of the two economies would exactly double the income, as illustrated.
This is a very clear-cut example. What insights does it provide into reality? Thereare two key elements to the argument. The first is that shortage of foreign exchangeconstrains production in economies that lack resource earnings. Many resource-scarce and landlocked African economies have extremely low shares of exports inGDP—less than 15 percent in eight of these countries. Accessing world markets hasbeen particularly difficult for this group, and they are heavily aid dependent. If theywere located within a single country, such areas would earn the resources to finance“imports” through intracountry trade. The argument must therefore turn on the factthat barriers to trade created by international borders are an order of magnitudegreater than within-country trade barriers, and there is plenty of evidence that this isthe case.
The classic studies of the barriers created by international borders, comparedwith within-country trade costs, are based on trade between Canada and the United
FIGURE 2. Income Loss from Uneven Distribution of Resources
average income ofA and B if merged
foreign exchangeconstrained
labor constrained
R*A
BGDP
GDP
resource exports
average income ofA and B if separate
Source: Authors’ elaboration.

TRADE AND ECONOMIC PERFORMANCE | 57
States. McCallum (1995) and Helliwell (1997) show that exports by Canadianprovinces to other Canadian provinces are about 20 times larger than their exportsto U.S. states at the same distance. According to one study, the U.S.–Canada borderis 7,000 miles wide, in the sense that it chokes off trade as much as would 7,000 milesof borderless distance. African borders are generally much more difficult to navigatethan is the border between the United States and Canada. Limão and Venables(2001) find that poor infrastructure is particularly important in choking off tradebetween African countries. The implication is that resource-scarce, landlockedregions face more acute problems in financing imports as separate nations than theywould as regions of a larger country.
The second part of the argument contained in figure 2 is that at some point thereare diminishing returns to resource earnings. In the example given, the economyreached full employment, and no more labor was available to produce furtherincome. But the argument is more general. What are the sources of diminishingreturns to the value of resource revenues in resource-rich African economies? Often,there are constraints on the supply of particular nontradable services, such as con-struction services or specific labor skills. Spending bids up the price of these inputsbut does not buy additional real services. More generally, spending from resourcerevenues will be met by a combination of increased output and crowding out of otherexpenditures. The expenditures that are crowded out might be exports, giving rise to“Dutch disease.”1 Alternatively, monetary and exchange rate policy might be used tomitigate Dutch disease, in which case crowding out will affect domestic activities,quite likely investment. If these activities are particularly valuable (as would be thecase if they are initially operating at a suboptimal level), crowding them out mayactually reduce income.
The key point for the present argument is that the smaller are resource revenues relative to the economy as a whole, the more favorable will be the balance betweenincreased income versus crowding out of other expenditures. If two countries aremerged, the supply curve of the merged country is the horizontal sum of the supplycurve of each separately, so a given increase in demand will lead to a larger quantityincrease and a smaller price increase in the merged economy than in a separate one. Thisargument focuses on income and expenditure, but other aspects of the “resource curse”(e.g., political-economy issues) may also exhibit increasing marginal cost, possiblymeaning that the benefits of resource revenue do not just flatten out with respect toresource revenue but turn negative at the margin. In this case, the citizens of both coun-tries would gain from the merger and a sharing of the economic impact of revenues.
It is not just natural resources that are unequally divided between countries; accessto the coast is, too. Coastal economies in developing countries are much better placedto engage in producing manufactures for world markets than are landlocked coun-tries, and such activities are important drivers of growth (Jones and Olken 2005;Commission on Growth and Development 2008). These differential opportunitiesmean, once again, that the fragmentation of a region into separate countries may cre-ate both spatial inequalities and efficiency losses. A simple economic framework is help-ful. Suppose that economies can produce a good in which there are diminishing returnsto labor—say, in agriculture, where a fixed supply of land generates diminishing

58 | PAUL COLLIER AND ANTHONY J. VENABLES
returns. Figure 3 illustrates two such economies. The total labor force is the lengthof the horizontal axis, and workers are equally divided between countries, withworkers in coastal economy C measured from the left-hand origin and those in land-locked economy L measured from the right. The value of marginal product of work-ers in each country is given by the downward-sloping lines, with the slope reflectingthe diminishing returns to labor. If this were all, wages in each country would beequal (and low, W0) at the intersection of these lines.
Suppose, however, that C, the coastal economy, can also undertake an exportactivity for the world market that does not run into diminishing returns. Given pro-ductivity levels, this activity can pay wage W*. Some of the labor in the coastal econ-omy will then move to this sector, and wages will rise until they reach W*. Country L,however, is landlocked and is unable to access this source of employment, so it is leftwith wage W0. Fragmentation into two political units means a fixed division of thelabor force between countries, and the lack of migration between C and L createsinequality (the gap between W0 and W*), as well as a loss of efficiency and realincome. Within a single economy, there would be internal migration of labor from Lto C, so that the division of the total workforce would move in line with the hori-zontal arrows in the figure. Migrants would gain and would also bid up wages forthose remaining until all workers received W*. Although landowners (owners of thesector-specific factor) in L would lose, there is an overall real income gain from themigration equal to the shaded triangle. Furthermore, if the export activity hadincreasing returns to scale rather than constant returns, the expanded employmentwould increase productivity and the wage, raising income in both C and L.
What insights does this offer? Some Asian economies have witnessed massivemigration to regions (usually, although not necessarily, coastal) that have succeededin building up sectors supplying world markets. The best example is west-to-east
FIGURE 3. Returns to Labor in Coastal (C) and Landlocked (L) Economies
W*
W0
W*
labor in L
wage in C, WCwage in L, WL
labor in C
Source: Authors’ elaboration.
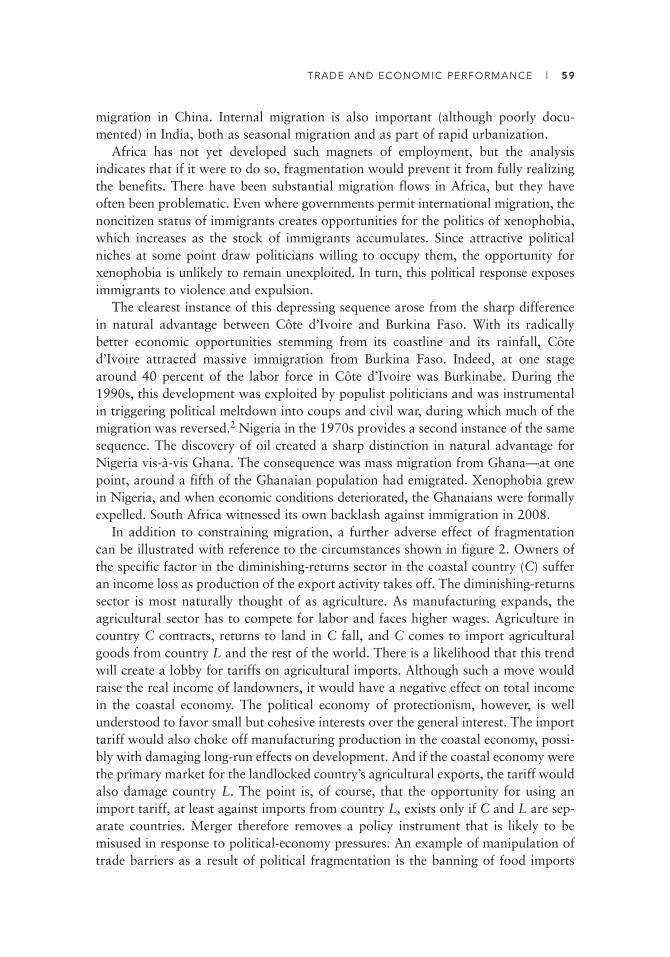
TRADE AND ECONOMIC PERFORMANCE | 59
migration in China. Internal migration is also important (although poorly docu-mented) in India, both as seasonal migration and as part of rapid urbanization.
Africa has not yet developed such magnets of employment, but the analysis indicates that if it were to do so, fragmentation would prevent it from fully realizingthe benefits. There have been substantial migration flows in Africa, but they haveoften been problematic. Even where governments permit international migration, thenoncitizen status of immigrants creates opportunities for the politics of xenophobia,which increases as the stock of immigrants accumulates. Since attractive politicalniches at some point draw politicians willing to occupy them, the opportunity forxenophobia is unlikely to remain unexploited. In turn, this political response exposesimmigrants to violence and expulsion.
The clearest instance of this depressing sequence arose from the sharp differencein natural advantage between Côte d’Ivoire and Burkina Faso. With its radically better economic opportunities stemming from its coastline and its rainfall, Côted’Ivoire attracted massive immigration from Burkina Faso. Indeed, at one stagearound 40 percent of the labor force in Côte d’Ivoire was Burkinabe. During the1990s, this development was exploited by populist politicians and was instrumentalin triggering political meltdown into coups and civil war, during which much of themigration was reversed.2 Nigeria in the 1970s provides a second instance of the samesequence. The discovery of oil created a sharp distinction in natural advantage forNigeria vis-à-vis Ghana. The consequence was mass migration from Ghana—at onepoint, around a fifth of the Ghanaian population had emigrated. Xenophobia grewin Nigeria, and when economic conditions deteriorated, the Ghanaians were formallyexpelled. South Africa witnessed its own backlash against immigration in 2008.
In addition to constraining migration, a further adverse effect of fragmentationcan be illustrated with reference to the circumstances shown in figure 2. Owners ofthe specific factor in the diminishing-returns sector in the coastal country (C) sufferan income loss as production of the export activity takes off. The diminishing-returnssector is most naturally thought of as agriculture. As manufacturing expands, theagricultural sector has to compete for labor and faces higher wages. Agriculture incountry C contracts, returns to land in C fall, and C comes to import agriculturalgoods from country L and the rest of the world. There is a likelihood that this trendwill create a lobby for tariffs on agricultural imports. Although such a move wouldraise the real income of landowners, it would have a negative effect on total incomein the coastal economy. The political economy of protectionism, however, is wellunderstood to favor small but cohesive interests over the general interest. The importtariff would also choke off manufacturing production in the coastal economy, possi-bly with damaging long-run effects on development. And if the coastal economy werethe primary market for the landlocked country’s agricultural exports, the tariff wouldalso damage country L. The point is, of course, that the opportunity for using animport tariff, at least against imports from country L, exists only if C and L are sep-arate countries. Merger therefore removes a policy instrument that is likely to be misused in response to political-economy pressures. An example of manipulation oftrade barriers as a result of political fragmentation is the banning of food imports

60 | PAUL COLLIER AND ANTHONY J. VENABLES
from Uganda by President Daniel arap Moi of Kenya in the early 1990s in responseto lobbying by business interests that were holding large stocks of food.
Time-Variant Differences in Natural Advantage: Export Volatility
The economic advantages and disadvantages of a particular location at a particulardate are shaped partly by fixed geography and partly by the impact of short-runshocks. The arguments we have developed above apply to these transient effects, aswell as to the permanent ones. Shocks create unevenness between areas, and the abil-ity to spread their impact (i.e., to pool risk), with both distributional and efficiencyimplications, is impeded by fragmentation into national units.
Collier and Goderis (2008a, 2008b, 2009) investigate the consequences of com-modity export shocks for GDP valued at constant prices. This method abstracts fromthe income effect accruing directly from changes in the terms of trade and focuses onthe consequences for real output. The authors find that shocks have asymmetricaleffects on growth: adverse shocks significantly reduce output, but positive shocks donot have significant effects. The effect of adverse shocks is substantial. For example,for a typical African country whose commodity exports are initially around 35 per-cent of GDP, the consequence of a 30 percent fall in export prices would be to reducegrowth in the following year by 3.6 percentage points. More generally, given the fre-quency of shocks and their cost, it is possible to estimate the discounted present valueof the output losses that they generate. Using a 3 percent discount rate, the cost forindividual countries is sometimes large: for example, for Nigeria it is 13 percent ofone year’s GDP. Yet summed over the entire continent, country by country, the costis modest, around 4 percentage points of one year’s GDP.3
For this paper we investigated whether these costs would have been reduced hadAfrica been divided into fewer polities.4 We examined the consequences of a UnitedAfrica, which provides an upper bound to the analysis, and of political regroupinginto four regional blocs. We found that a United Africa would have reduced the costsby a mere 0.6 percentage points of the region’s GDP. The gains from regional group-ings are more variable, the largest being from a United West Africa, where theywould amount to 1.7 percentage points of GDP.
The main reason why the effect is so limited is that the scope for risk pooling inAfrica is modest. Virtually all countries are commodity exporters, and not only arethe prices of most commodities highly correlated, but a single commodity, oil, dom-inates Africa’s exports. In a United Africa, around 65 percent of commodity exportswould be oil. Hence, pooling has little effect on the size of the average shock. Thekey potential gain therefore comes not from reducing the average size of shocks butfrom changing their distribution. Most African countries do not export oil, so that aUnited Africa would have fewer enormous shocks and more moderate-size shocksthan in the distribution of country-specific shocks. Whether such redistribution mat-ters depends on the precise relationship between the size of shocks and their costs.The original specification of the work by Collier and Goderis is linear, and the costsof a shock are thus required to be proportionate to the size of the shock. In that case,redistributions that do not affect the average make no difference.

TRADE AND ECONOMIC PERFORMANCE | 61
For this paper we therefore investigated whether the true structure of costs is non-linear, rising more than proportionately with the size of the shock, as seemed inher-ently likely. We found little basis for a nonlinear relationship. For example, when thesquare of the size is added to the regression, although the coefficient is negative, it isnot close to significance. We conclude that, given Africa’s export structure, the scopefor reducing the cost of shocks through greater political unity is modest. But, as wewill argue next, Africa’s export structure may itself be a consequence of political fragmentation. Manufacturing and service exports benefit from scale economies thatare less important for primary commodities. If political fragmentation has frustratedthese scale economies, it may have locked Africa into dependence on primary com-modity exports.
Scale, Density, and Increasing Returns
The preceding section pointed to diminishing returns as a source of loss for a frag-mented continent with uneven distribution of resources or of shocks. We now turnto increasing returns and the cost of opportunities forgone by small countries. Wefocus first on a microeconomic mechanism that we think is particularly important inmany small African countries—the fact that markets are too thin to be competitive.This constitutes a major obstacle to investment, both because of high prices for cap-ital goods and, more fundamentally, because of vulnerability to opportunistic behav-ior. We then discuss how the microeconomic advantages of scale combine to producea positive relationship between city size and productivity and suggest that fragmen-tation has created an African city structure which is ill suited to reap these produc-tivity effects.
Competition and the Operation of Markets
Small economies are likely to have high levels of monopoly power. That makes thembad places for new investments. Incumbent firms have little incentive to expand out-put or to innovate, and they have strong incentives to deter entry and innovation bynewcomers. Monopoly raises the prices of many intermediate goods, as well as offinal output, thereby raising costs. And, most important, monopoly creates thepotential for opportunistic behavior in transactions and thereby creates a difficultbusiness environment, even for the monopolists themselves.
Evidently, a small market is likely to be less competitive than a large one because,given some firm-level economies of scale, fewer firms will operate. The effect will beparticularly pronounced in sectors that are closed to trade. For example, the typicalAfrican economy has a very highly concentrated banking sector—often, four banksdominate lending, and this is a sufficiently small number to enable collusive oligop-oly. The limited nature of the market also leads to a concentration of risk: banks areexposed to a high covariance of the risk of default.
Transport is another sector that is sheltered from international competition andthat is often highly cartelized. A recent study (Teravaninthorn and Raballand 2008)
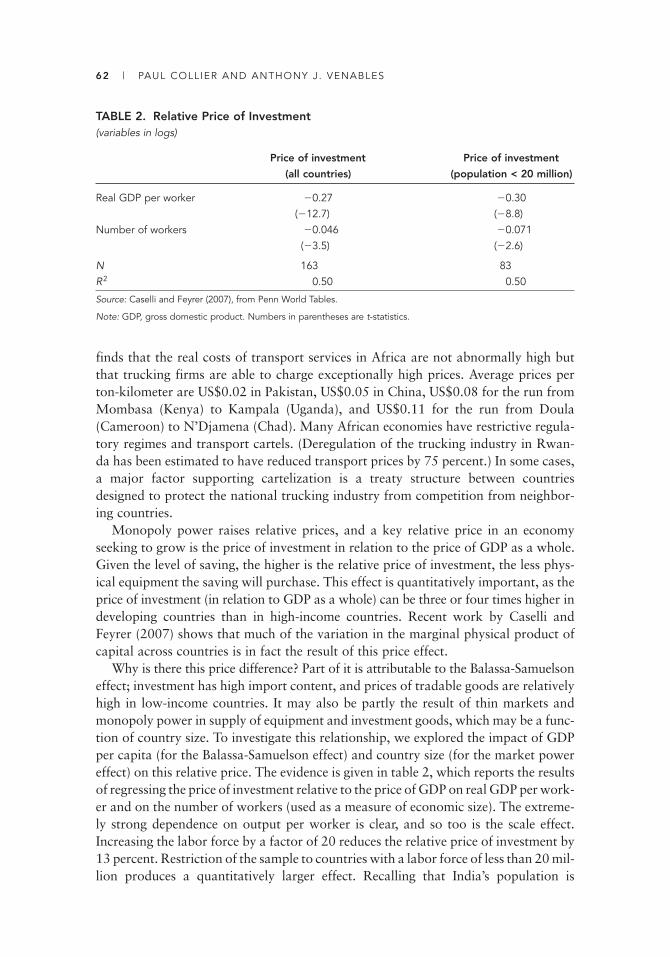
62 | PAUL COLLIER AND ANTHONY J. VENABLES
finds that the real costs of transport services in Africa are not abnormally high butthat trucking firms are able to charge exceptionally high prices. Average prices perton-kilometer are US$0.02 in Pakistan, US$0.05 in China, US$0.08 for the run fromMombasa (Kenya) to Kampala (Uganda), and US$0.11 for the run from Doula(Cameroon) to N’Djamena (Chad). Many African economies have restrictive regula-tory regimes and transport cartels. (Deregulation of the trucking industry in Rwan-da has been estimated to have reduced transport prices by 75 percent.) In some cases,a major factor supporting cartelization is a treaty structure between countriesdesigned to protect the national trucking industry from competition from neighbor-ing countries.
Monopoly power raises relative prices, and a key relative price in an economyseeking to grow is the price of investment in relation to the price of GDP as a whole.Given the level of saving, the higher is the relative price of investment, the less phys-ical equipment the saving will purchase. This effect is quantitatively important, as theprice of investment (in relation to GDP as a whole) can be three or four times higher indeveloping countries than in high-income countries. Recent work by Caselli andFeyrer (2007) shows that much of the variation in the marginal physical product ofcapital across countries is in fact the result of this price effect.
Why is there this price difference? Part of it is attributable to the Balassa-Samuelsoneffect; investment has high import content, and prices of tradable goods are relativelyhigh in low-income countries. It may also be partly the result of thin markets andmonopoly power in supply of equipment and investment goods, which may be a func-tion of country size. To investigate this relationship, we explored the impact of GDPper capita (for the Balassa-Samuelson effect) and country size (for the market powereffect) on this relative price. The evidence is given in table 2, which reports the resultsof regressing the price of investment relative to the price of GDP on real GDP per work-er and on the number of workers (used as a measure of economic size). The extreme-ly strong dependence on output per worker is clear, and so too is the scale effect.Increasing the labor force by a factor of 20 reduces the relative price of investment by13 percent. Restriction of the sample to countries with a labor force of less than 20 mil-lion produces a quantitatively larger effect. Recalling that India’s population is
TABLE 2. Relative Price of Investment(variables in logs)
Price of investment Price of investment
(all countries) (population < 20 million)
Real GDP per worker �0.27 �0.30(�12.7) (�8.8)
Number of workers �0.046 �0.071(�3.5) (�2.6)
N 163 83R2 0.50 0.50
Source: Caselli and Feyrer (2007), from Penn World Tables.
Note: GDP, gross domestic product. Numbers in parentheses are t-statistics.

TRADE AND ECONOMIC PERFORMANCE | 63
66 times larger than that of the average African country, which has a workforce of lessthan 10 million, the implications for differences in the price of capital are substantial.
Thin markets and the resulting monopoly power increase the price of capital goods,but they have further pernicious effects. One is that they create an incentive for incum-bent firms to actively pursue strategies that deter the entry of new firms. (Strategiesfor entry deterrence may include the use of predatory pricing or the purchase of polit-ical influence.) From the perspective of firms that are already operating in a sector, ifone firm devotes resources to keeping new entrants out of the sector, that is a publicgood. From the perspective of society as a whole, however, such behavior is evidentlyundesirable. In an industry with many existing firms, the free-riding problem impliesthat the returns to any one firm from such antisocial behavior are limited. But in asmall market with an incumbent monopolist, all the benefits to the existing industryare internalized, and so the incentive to keep out new competitors is maximized.
Small and thin markets are unattractive places to invest because investors are vul-nerable to “holdup”—opportunistic behavior by other firms with which they have todo business. Holdup refers to the possibility that once an investment has been sunk,the investor will face a monopsonistic purchaser of the output of the investment.Even if the purchaser and investor entered an agreement before the investment wasundertaken, the purchaser may subsequently act opportunistically, breaking theagreement and offering a lower price. The investor will anticipate the possibility ofholdup and so may not make the investment in the first place. One way to overcomethe holdup problem is to make the ex ante contract legally binding, but even in coun-tries with strong legal systems, it is often impossible to write a contract with a degreeof completeness that will rule out such opportunistic behavior. The other way is tomake sure that there are many alternative uses for the output of the project. This ispartly a matter of the specificity of the investment (it might be a machine for makingspecialist parts demanded by a single manufacturer) and partly a matter of the sizeof the market in which the output is sold. Holdup is likelier the fewer are the peoplecompeting for the output.
This suggests that in small economies the threat of holdup may be a major deter-rent to investment. In agriculture, returns to investment are reduced if there is amonopsonistic grain merchant. In manufacturing, having few potential purchasers ofoutput deters investment. The consequence is coordination failure: there is no incen-tive to enter on one side of the market until the other side has more firms, and viceversa. And in a small economy, even the return to the worst option—liquidating theinvestment—may be reduced by thin markets for secondhand capital equipment. Distress sales are likely to be more coincident because smaller economies are lessdiversified, further depressing the expected price. The holdup phenomenon appliesnot only to goods markets but also to labor markets; the incentive to undergo train-ing is reduced if the skill acquired can only be sold to one employer.
These arguments point to the fact that smallness does not just create static monop-oly or monopsony power but also creates a fundamentally more risky business environment. Entry of new producers will be deterred by predatory behavior byincumbents and by the scarcity of outside options and the consequent vulnerabilityto predatory and opportunistic behavior.

64 | PAUL COLLIER AND ANTHONY J. VENABLES
Productivity and City Size
Productivity tends to be higher in large (or dense) clusters of economic activity. Thisis why cities form. Firms and workers locate to gain the benefits of this productivityadvantage, despite the congestion costs and other diseconomies associated with largecities. A number of mechanisms drive this productivity effect. Some are narrowlytechnical—for example, the fact that dense activity economizes on transport costsand improves communications (and possible learning externalities) among firms, andbetween firms and workers. Others have to do with the impact of size on marketstructure and the intensity of competition, as discussed above. Still others concernpolitical economy: a city with a large business sector is likely to have a strong busi-ness lobby, producing a business-friendly investment climate. The quantitative evi-dence of the productivity effect of city size comes largely from studies of cities indeveloped countries. Rosenthal and Strange (2004) report a consensus view that adoubling of city size is associated with a productivity increase of about 3 to 8 per-cent. This is a large effect: a size increase from 100,000 workers in a city to 3 millionis predicted to increase productivity by more than 30 percent. Au and Henderson(2006) find even larger results for Chinese cities, where they estimate that movingfrom a city of 100,000 workers to one of 1.3 million workers raises productivity by80 percent, although beyond this scale weak diminishing returns cut in.
In this section we investigate the effects of Africa’s fragmentation on its city struc-ture and argue that fragmentation has a negative impact on city size, producing a citystructure that is weak compared with the structure in an integrated country such asIndia. We have argued elsewhere that Africa’s failure to develop large clusters of eco-nomic activity has had major implications for its economic performance. Africa’s fail-ure to enter world markets for manufactured exports is best understood by lookingat the location of productive clusters of activity (Collier and Venables 2007). ManyAsian cities have already gained a head start in these sectors and have grown highlyproductive clusters, creating a barrier for new entrants. Asia’s initial advantage overAfrica, when Asia first penetrated the global market for manufactures in the 1980s,may have been modest. Quite probably, the reasons for Africa’s initial disadvantagehave evaporated; for example, in the 1980s much of coastal Africa was beset by con-flict (as in Mozambique) or poor economic policies (as in Ghana). But as clustershave developed in Asia, the resulting scale economies have given that region a newand more formidable advantage. Africa may have missed the boat on industrializa-tion, unless trade policies of the Organisation for Economic Co-operation and Devel-opment (OECD) artificially create an offsetting temporary advantage for Africanmanufactures that pump-primes the formation of clusters.
Does the political fragmentation of Africa have any bearing on this? The obviousfact is that small countries generally have smaller cities, so some productivity bene-fits are forgone. We first investigate this point by employing a cross-country regres-sion to explore the determinants of city size. We use a large dataset of world citiesand take as the dependent variable the population of the jth-ranked city in country i.We work with the top five cities in each country, which yields (with some missing values for very small countries) 521 observations. The explanatory variables are
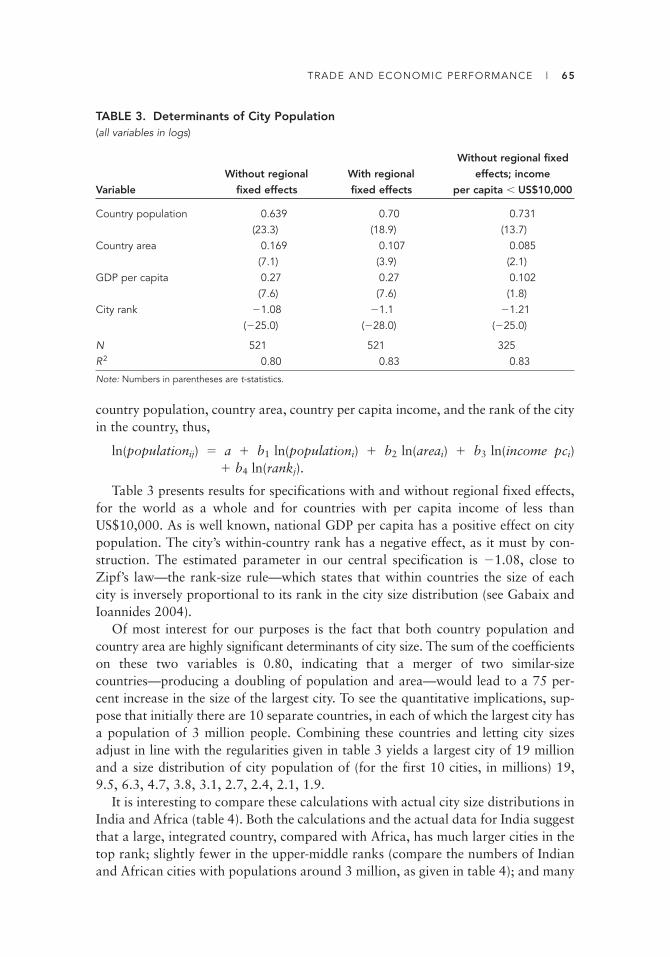
TRADE AND ECONOMIC PERFORMANCE | 65
country population, country area, country per capita income, and the rank of the cityin the country, thus,
ln(populationij) � a � b1 ln(populationi) � b2 ln(areai) � b3 ln(income pci) � b4 ln(rankj).
Table 3 presents results for specifications with and without regional fixed effects,for the world as a whole and for countries with per capita income of less thanUS$10,000. As is well known, national GDP per capita has a positive effect on citypopulation. The city’s within-country rank has a negative effect, as it must by con-struction. The estimated parameter in our central specification is �1.08, close toZipf’s law—the rank-size rule—which states that within countries the size of eachcity is inversely proportional to its rank in the city size distribution (see Gabaix andIoannides 2004).
Of most interest for our purposes is the fact that both country population andcountry area are highly significant determinants of city size. The sum of the coefficientson these two variables is 0.80, indicating that a merger of two similar-size countries—producing a doubling of population and area—would lead to a 75 per-cent increase in the size of the largest city. To see the quantitative implications, sup-pose that initially there are 10 separate countries, in each of which the largest city hasa population of 3 million people. Combining these countries and letting city sizesadjust in line with the regularities given in table 3 yields a largest city of 19 millionand a size distribution of city population of (for the first 10 cities, in millions) 19,9.5, 6.3, 4.7, 3.8, 3.1, 2.7, 2.4, 2.1, 1.9.
It is interesting to compare these calculations with actual city size distributions inIndia and Africa (table 4). Both the calculations and the actual data for India suggestthat a large, integrated country, compared with Africa, has much larger cities in thetop rank; slightly fewer in the upper-middle ranks (compare the numbers of Indianand African cities with populations around 3 million, as given in table 4); and many
TABLE 3. Determinants of City Population(all variables in logs)
Without regional fixed
Without regional With regional effects; income
Variable fixed effects fixed effects per capita � US$10,000
Country population 0.639 0.70 0.731(23.3) (18.9) (13.7)
Country area 0.169 0.107 0.085(7.1) (3.9) (2.1)
GDP per capita 0.27 0.27 0.102(7.6) (7.6) (1.8)
City rank �1.08 �1.1 �1.21(�25.0) (�28.0) (�25.0)
N 521 521 325R2 0.80 0.83 0.83
Note: Numbers in parentheses are t-statistics.
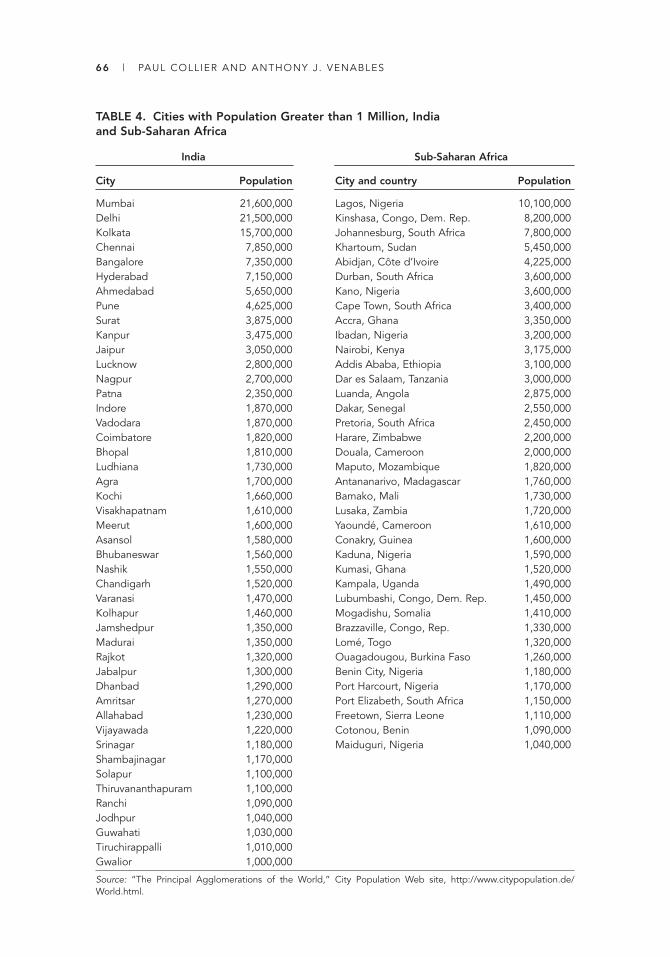
TABLE 4. Cities with Population Greater than 1 Million, India and Sub-Saharan Africa
India Sub-Saharan Africa
City Population City and country Population
Mumbai 21,600,000 Lagos, Nigeria 10,100,000Delhi 21,500,000 Kinshasa, Congo, Dem. Rep. 8,200,000Kolkata 15,700,000 Johannesburg, South Africa 7,800,000Chennai 7,850,000 Khartoum, Sudan 5,450,000Bangalore 7,350,000 Abidjan, Côte d’Ivoire 4,225,000Hyderabad 7,150,000 Durban, South Africa 3,600,000Ahmedabad 5,650,000 Kano, Nigeria 3,600,000Pune 4,625,000 Cape Town, South Africa 3,400,000Surat 3,875,000 Accra, Ghana 3,350,000Kanpur 3,475,000 Ibadan, Nigeria 3,200,000Jaipur 3,050,000 Nairobi, Kenya 3,175,000Lucknow 2,800,000 Addis Ababa, Ethiopia 3,100,000Nagpur 2,700,000 Dar es Salaam, Tanzania 3,000,000Patna 2,350,000 Luanda, Angola 2,875,000Indore 1,870,000 Dakar, Senegal 2,550,000Vadodara 1,870,000 Pretoria, South Africa 2,450,000Coimbatore 1,820,000 Harare, Zimbabwe 2,200,000Bhopal 1,810,000 Douala, Cameroon 2,000,000Ludhiana 1,730,000 Maputo, Mozambique 1,820,000Agra 1,700,000 Antananarivo, Madagascar 1,760,000Kochi 1,660,000 Bamako, Mali 1,730,000Visakhapatnam 1,610,000 Lusaka, Zambia 1,720,000Meerut 1,600,000 Yaoundé, Cameroon 1,610,000Asansol 1,580,000 Conakry, Guinea 1,600,000Bhubaneswar 1,560,000 Kaduna, Nigeria 1,590,000Nashik 1,550,000 Kumasi, Ghana 1,520,000Chandigarh 1,520,000 Kampala, Uganda 1,490,000Varanasi 1,470,000 Lubumbashi, Congo, Dem. Rep. 1,450,000Kolhapur 1,460,000 Mogadishu, Somalia 1,410,000Jamshedpur 1,350,000 Brazzaville, Congo, Rep. 1,330,000Madurai 1,350,000 Lomé, Togo 1,320,000Rajkot 1,320,000 Ouagadougou, Burkina Faso 1,260,000Jabalpur 1,300,000 Benin City, Nigeria 1,180,000Dhanbad 1,290,000 Port Harcourt, Nigeria 1,170,000Amritsar 1,270,000 Port Elizabeth, South Africa 1,150,000Allahabad 1,230,000 Freetown, Sierra Leone 1,110,000Vijayawada 1,220,000 Cotonou, Benin 1,090,000Srinagar 1,180,000 Maiduguri, Nigeria 1,040,000Shambajinagar 1,170,000Solapur 1,100,000Thiruvananthapuram 1,100,000Ranchi 1,090,000Jodhpur 1,040,000Guwahati 1,030,000Tiruchirappalli 1,010,000Gwalior 1,000,000
Source: “The Principal Agglomerations of the World,” City Population Web site, http://www.citypopulation.de/World.html.
66 | PAUL COLLIER AND ANTHONY J. VENABLES

TRADE AND ECONOMIC PERFORMANCE | 67
more medium-size to large cities (e.g., with populations between 1 million and2 million).
This analysis suggests that the smaller size of African cities stems in large partfrom the fragmentation of the region. The preceding discussion and the evidencefrom developed-country studies (as summarized by Rosenthal and Strange 2004) sug-gest that city size may have had an adverse effect on the productivity of African manufacturing. Although size is not the only determinant of urban productivity,Africa’s fragmentation and consequent urban structure may have impeded the devel-opment of major international manufacturing centers of the type that contributes tothe performance of high-growth economies.
Political Economy of Public Goods
Above, we considered those advantages of being a large country that arise fromgreater diversity and greater geographic concentration of private economic activities.We now consider those that arise from government activities. A core function of agovernment is to supply public goods. By definition, public goods are subject to scaleeconomies. The distinctive aspect of public goods that ensures scale economies isthat consumption is nonrival—one person’s consumption does not reduce that ofanother person. Many public goods, however, also have more conventional scaleeconomies: their production technology has high fixed costs that can be spread overmore consumers as scale is expanded. A radio station displays both types of scaleeconomy: listening is nonrival, and once the fixed costs of transmission have beenincurred, the number of hours broadcast per day is subject to much lower variablecosts.
As the number of consumers is progressively increased to the point at which itincludes all the world’s inhabitants, relatively few goods still have unrealizedeconomies of scale. At some point, consumption ceases to be nonrival, and technolog-ical scale economies are exhausted. Conceptually, we can order all the goods thatmight potentially be provided publicly according to the minimum size at which allscale economies are realized. Along this ranking, we find first those goods that are non-rival only within the locality, then the nation, then the region, and, finally, globally.
The supply of public goods generates acute collective action problems that, exceptin a few cases, require coercive powers of taxation to overcome effectively. The high-est level at which such powers are found is the nation. Hence, in practice, those scaleeconomies that occur beyond the level of the nation-state are generally not realized.
The failure to realize such economies is widely lamented in discussions of theunderprovision of global public goods (Barrett 2007) and regional public goods(Cook and Sachs 1999). It has a powerful corollary through its implications for dif-ferences in country size. Since there are some public goods that are global, a fortiorithere must be many more for which the minimum efficient size lies somewhere with-in the huge population range implied by the difference between the smallest Africancountry and India. Within this range, the smaller is the country, the fewer goods canefficiently be supplied at the level of the nation-state. This consideration is reinforced
68 | PAUL COLLIER AND ANTHONY J. VENABLES
when population is replaced by GDP as the size metric. Public goods are economicactivities, and the relevant metric for scale is more likely to be the size of the econo-my than the size of the population. Since Africa is now the poorest region, its typicalnational economy is even tinier than is suggested by the size of its population. Theeconomy of Luxembourg is roughly the same size as that of the five countries of theEast African Community combined.
It might seem that nations could be too large as well as too small for the efficientsupply of public goods. If different communities have distinctive preferences for pub-lic goods, provision may work better if political decision units are small and so canreflect these differences. There is, however, an asymmetry. Once the optimal scale hasbeen reached, a large state can always replicate this scale by decentralizing supply tosubnational authorities. In other words, once all the scale economies have beenreaped, further expansion can be under conditions of constant returns to scale. Statesthat are too small do not have an equivalent option: a national government can chooseto pass authority down, but it does not have the power to pass authority up. A largenation thus has an advantage over a small nation, and this advantage may becomevery pronounced by the time we reach the tiny states that are common in Africa.
We now analyze the provision of three public goods that are fundamental to pros-perity: security, economic policy, and infrastructure.
Security
Security is the clearest case of a public good that is subject to scale economies farbeyond the size of the typical small African state. Like radio, security benefits fromboth types of scale economy. Over a wide range, defense is nonrival—the same armythat defends one community from rebellion can defend a proximate community.Over a very wide range, it benefits from scale economies: big armies usually defeatlittle armies, a proposition formalized in contest success functions. The sheer powerof scale economies in security has repeatedly been revealed in the expansion ofempires. Once a power gets a military advantage over its neighbors, it can expandalmost without limit if it chooses to do so. Rome, the Mongol Empire, Russia, andthe nineteenth-century European empires demonstrate that big is safe.
The incidence of warfare in Africa has been far higher than in India, and differ-ences in scale in part account for this. Evidently, political union would have reducedthe incidence of international war, but almost all of Africa’s wars have been internal,and so the key issue is how union would have affected this risk. Statistical analysis ofthe risk of civil war finds that whereas population significantly increases the risk, theeffect is substantially less than proportionate: a territory under a single polity has alower risk than the combined risk for two polities were the single state split in half(Collier, Hoeffler, and Rohner 2009). The case for scale, however, is complicated bythe trade-off with ethnic diversity. In general, in order to make a polity larger, it isnecessary to take in additional social groups, and so diversity increases. Unfortu-nately, diversity heightens the risk of civil war. Were Africa to have been split intofewer countries, the adverse effect stemming from diversity might have more thanoffset the benefit from greater scale. The issue has recently been analyzed by
TRADE AND ECONOMIC PERFORMANCE | 69
Wigstrom (2008), who has carefully investigated how mergers between neighboringAfrican countries would affect ethnic diversity. It transpires that in some casesAfrica’s borders are so arbitrary that ethnic diversity would actually be reduced bymerger. In these instances the scale and the diversity effects of political union workin the same direction, lessening the risk of civil war. Even were diversity to increase,Wigstrom finds that over a wide range, had Africa been divided into fewer inde-pendent polities, it would have had a lower risk of civil war. Although his analysis isof course hypothetical and cannot take into account many aspects of politics, it omitsthe consequences for peace of the economic benefits of scale discussed above. Sinceboth the level and growth of income significantly reduce the risk of civil war, theseeconomic effects of political union would have reinforced the effects discussed here.
The small scale of African polities not only increases the incidence of war; itincreases military spending while at peace. Because large armies tend to defeat smallarmies, small states tend to compensate by spending a higher fraction of GDP on themilitary. Furthermore, although a country can increase its own security by spendingmore on its army, this reduces the security of neighboring countries that feel threat-ened. Evidently, in response to a perceived increase in threat, the neighboring coun-try will need to increase its own military spending, producing an arms race. Theessence of an arms race is that, if we think of military spending as producing securi-ty, an increase in spending by one country reduces the average productivity butincreases the marginal productivity of its neighbor’s spending. Collier and Hoeffler(2007) establish that neighborhood arms races have been common around the devel-oping world. For the present paper we have used their results to simulate the reduc-tion in average African military spending had there been a United Africa. We set theincidence of civil war equal to that estimated by Wigstrom (2008), eliminate theeffect of neighborhood arms races, and set all other variables at their average actualvalues for the continent. The predicted level of military spending falls by a quarter,from 3.2 to 2.4 percent of GDP (calculation by Anke Hoeffler).
Good Economic Policies and Governance
A second fundamental public good is the provision of sound economic policies andaccountable government. The choice between good and bad policies is typically deter-mined by a complex mix of influences. Among them are the interests of the elite, thepolitical power of ordinary citizens, the degree to which both elites and citizensunderstand basic economic issues and so grasp how their interests are best served bypolicies, and, finally, the capacity of the civil service to design and implement policies.
Scale may enter here through various routes. For example, the quality of the civilservice can be higher in a larger society simply because it can be more selective. Thereis around 50 times more competition to become permanent secretary in the ministryof finance in India than in Africa, and so the quality will, on average, be higher.
Another scale effect is that, paradoxically, a larger society can be better informedabout economic issues than a small one. The key reason is the scale economies in thecommercial media—radio, television, newspapers, and magazines. A large marketwill permit more media outlets to exist than a small market will. Serious discussion
70 | PAUL COLLIER AND ANTHONY J. VENABLES
of economic issues within a society is highly dependent on the existence of specialistmedia. India has such media, but in Africa, only South Africa comes anywhere closeto providing a market in which specialist journals are viable. For example, the Indi-an newspaper the Economic Times has a circulation of 1.2 million, which is suffi-cient to finance a staff of economically qualified journalists. With the same densityof circulation, an economics newspaper in Zambia would have a circulation of lessthan 10,000 and so would not be viable. Without a specialist media, discussion inthe society is likely to be less sophisticated, and the pace at which social learningtakes place will be slower. In effect, the society needs a critical mass of educated cit-izens before social learning can be rapid. This may help explain why India reformedits economic policies before Africa did.
A distinct reason why larger states may be able to reform faster is a corollary oftheir greater need to decentralize authority: more public goods reach the level at whichdecentralization is the efficient form of organization. Such decentralized authorityintroduces variation in strategies, and this in turn represents a source of learning. Smallsocieties can, of course, choose to replicate the same degree of decentralization, but theincreased opportunities for learning come at the expense of forgone scale economiesin provision. India, with its federal structure, has clearly had a very wide range ofexperimentation, with some states pioneering in the provision of social services andothers in encouragement of foreign investment. Indeed, the equivalent of learning canoccur even if successful experiments are not copied. People and firms will choose torelocate to attractive areas, and this gradually shifts the weighted average of policiesacross the nation toward the most successful. Potentially, Africa’s equivalent is that itsdivision into so many nations enables policy variation at the national level. It is notclear, however, that a small country is in any better position to learn from other nationsthan is a large country. (India has clearly learned a great deal from China.)
A related scale effect is the switch from discretion to rules in decision making. Atits best, an intimate organization can tailor each decision to the needs of the individ-ual and the circumstance; decisions can be personalized. As the organization becomeslarger, this style of decision making breaks down because micromanagement becomesoverburdened and is replaced by rule-based procedures. Rule-based decisions are seldom as good as first-best discretionary decisions, but they are far better than eitherpatronage-driven or idiosyncratic decisions. They also enable the government to havea credible commitment technology that may even dominate the best discretionarypolicies by providing an escape from the time-consistency problem. Hence, we mightexpect that public decisions in large societies lie within a narrower range than thosein small societies. This is closely analogous to the difference between autocracy anddemocracy. Autocrats have the discretion either to be very good or very bad, whereasdemocracies are rule bound. Besley and Kudamatsu (2007) compared the economicoutcomes for these two types of government and indeed found that democracy trun-cates the distribution at both extremes.
These effects of scale are plausible, but is there any evidence that they actuallymatter? Chauvet and Collier (2008) analyze the preconditions for policy turnaroundin countries that initially had very poor economic policies and governance, using theWorld Bank measure of economic policy and governance, the country policy and

TRADE AND ECONOMIC PERFORMANCE | 71
institutional assessment (CPIA). This is a subjective, ordinal rating and thus has obvi-ous drawbacks, but most of the controversies in economic policy concern the higherrange of these ratings, and policies and governance that are very poor are oftenunmistakable. Chauvet and Collier define a turnaround as the passage from a ratingbelow a very low threshold to one above a benchmark that, although substantiallyhigher, is still modest in relation to the rating of most developing countries. Theauthors’ universe is all low-income countries over the period 1977–2005. From thisgroup they select those countries in which for at least four consecutive years eco-nomic policies and governance were below the threshold. They find that populationsize is one of the preconditions for a turnaround that is statistically significant: thelarger is the population, the higher is the probability that a country that initiallyranked below the threshold will achieve a sustained turnaround. Equivalentlyexpressed, large countries appear to experience more rapid social learning.
For this paper we have used the coefficients of the Chauvet-Collier model to esti-mate how long India, on the one hand, and the average African country, on the other,would have taken to reform from a common initial position of poor policies to a com-mon improved position. We create two artificial countries, “India” and “Zambia.”Both are identical in all characteristics except population; all other characteristics areset at the sample mean. “India” has the population of India, and “Zambia” has thepopulation of the average African country, both entered into the regression as logs. Weset their initial CPIA scores at 2.5, indicating very poor policies, and ask how long itwould take to reach a score of 3.5. Since the regression model is log-linear, the conse-quences of the huge differences in population are likely to be exaggerated; the regres-sion line is trying to explain the countries within the range and is likely to fail at theextremes. Nevertheless, the predicted difference in the pace of reform is striking:“India” is predicted to bounce out of bad policies into reasonable ones in only 6 years,whereas “Zambia” is predicted to take around 60 years (calculation by Lisa Chauvet).
Infrastructure
Transport and power infrastructure are public goods with such strong scaleeconomies that the typical African polity is too small to exhaust them. Indeed, Africastill depends on the transport infrastructure created during the period when its pres-ent polities were united into a few empires. Quite possibly, from the perspective oftransport infrastructure, the key feature of colonialism was not that the empires wereruled externally but that they temporarily united Africa into a few large polities. Themost obvious problem generated by political division is that many countries are land-locked. As shown by Limão and Venables (2001), the transport costs faced by land-locked countries are strongly affected by the infrastructure spending of their coastalneighbors. Evidently, these benefits to the landlocked are externalities from the per-spective of the coastal countries; they are not internalized into the decision calculus,and so spending is suboptimal.
The failure to internalize costs and benefits, however, extends far more widelythan the plight of the landlocked. The recent discovery of large iron ore depositsin Guinea by Rio Tinto Zinc is a telling example. The exploitation of the deposits

72 | PAUL COLLIER AND ANTHONY J. VENABLES
evidently requires investment in a mine, but the pertinent issue is the necessary invest-ment in transport infrastructure. Fortuitously, as a legacy from the age of empires, arailway already links the deposit with a deepwater port, Buchanan. But Buchanan isin Liberia, and the government of Guinea does not want to find itself subject to aholdup problem vis-à-vis the government of Liberia. It has therefore insisted that thetransport link be entirely within Guinea, which requires the construction of a new,dedicated railway and a new deepwater port. This decision has more than doubledthe total investment needed for the project, adding around US$4 billion. Evidently,these additional costs will be fully passed on; the government has agreed with RioTinto Zinc that it will absorb them through a reduced flow of royalty payments.Hence, the costs are ultimately borne by the people of Guinea. The decision is alsocostly to the people of Liberia; in particular, the port of Buchanan loses what mayhave been its key opportunity for scale economies.
The generation of electric power is also more costly if the market for power ispolitically segmented. Not only is the generation of power subject to scale economies,but noncoincident peaks in demand cannot be pooled. The resulting volatility indemand leads to installation of capacity that is idle most of the time and to energyrationing. Energy is a fundamental input into both resource extraction and manu-facturing. The recent power cuts in South Africa are reducing investment in resourceextraction, and high energy costs risk making manufacturing uncompetitive.
Potentially, the highest costs of political division arise from the interactionsbetween transport and power. The resource extraction sector is highly intensive inboth, especially in Africa, where mineral deposits are often far from the coast. If, asin Guinea, the ore is exported unprocessed, it has a low value-to-weight ratio, and sotransport costs are high. Processing would reduce weight and therefore transportcosts, but very large energy inputs are required. In Africa the obvious source of non-exportable energy is hydropower; the key input is rainfall on high ground, somethingthe continent has in abundance. This nontradable energy can potentially be trans-mitted to resource extraction sites and used to process ore that is then cheaply trans-ported to the coast. The exploitation of such synergies may yield huge payoffs, butthey would also entail huge investments. Unfortunately, almost all such opportuni-ties in Africa involve crossing frontiers between sovereign states. This returns us tothe holdup problem discussed above, but with an added dimension. The holdupproblem within a state can, at least in part, be addressed by law: the difficulty is thatof writing a contract sufficiently complete to cover all eventualities. The holdupproblem between states is radically more severe because the whole domain of inter-national law is fragile. Essentially, the concept of national sovereignty constitutes abarrier to the enforcement of any contract entered into by states.
Policy Implications: The Need for Integration
In aggregate, Africa is less populous and poorer than India, yet it is subdivided intoaround 50 independent states. We have suggested that this radical political subdivi-sion of an already small economy has inflicted a wide range of costs on African

TRADE AND ECONOMIC PERFORMANCE | 73
citizens. The benefits of smoothing, with respect to both temporary shocks andunderlying natural differences, are forgone. In the private economy, manufacturingand services have the potential for large-scale economies that are frustrated by polit-ical fragmentation. This skews Africa’s comparative advantage toward those sectorsand modes of production in which scale is less important, notably peasant agricul-ture. In the public sector, the lack of scale raises the costs of a wide range of publicgoods and thus accentuates the problem of undersupply intrinsic to low-incomeeconomies. These losses to the private and public economies are mutually reinforc-ing: low private incomes reduce state revenues and compound the underprovision ofpublic goods, while the lack of public goods further reduces private incomes.
The evident implication is that Africa needs a process of political integration. Suchprocesses have been common in other regions; over the last two centuries many stateshave chosen to create legal structures at the regional level that curtailed their ownsovereignty. During the nineteenth century, power within the United States graduallyshifted from the individual states to the federation. This shift in the locus of decisionmaking is even detectable in language: before the American Civil War the term “theUnited States of America” was treated as a plural noun, but afterward it became sin-gular. In the 1940s, the territories of British India decided that on independence theywould divide into only two large polities, India and Pakistan, instead of reverting tothe many small states that had preceded colonization. During the last half- century,the European Union has gradually expanded to 27 states that have agreed to limitsovereignty across a wide range of economic decisions.
Unlike Indian politicians, African politicians chose to dissolve the federationsforged by the empires: the colonial map of Africa was far less fragmented than thecurrent configuration, with Nigeria (Africa’s largest country) the sole exception. Post-colonial political fragmentation enormously increased opportunities for the politicalclass, multiplying by 50 the number of ministers required to govern the territory.
African governments have launched many initiatives aimed at greater regionalintegration. These include, at the political level, the Organization for African Unityand its successor, the African Union, and, at the economic level, an array of sub-regional trade arrangements too numerous to list. Yet the practical achievement interms of economic integration falls far short of other regions. This is brought out bya comparison of Burundi with California, Maharashtra (India), and Germany.Viewed as economic units, California, Maharashtra, and Germany are each over ahundred times as large as Burundi. Yet as measured by autonomy in fiscal policy,monetary policy, trade policy, exchange rate policy, and the scope for judicial appealagainst the government, the government of Burundi has radically more power thanthe governments of the other three. Since Burundi is such a small economic unit, itscitizens’ need for a supranational authority is much greater than is the case for Californians, Maharashtrans, and Germans, yet they have much less resort to one.
One reason why African efforts at greater political and economic integration haveto date yielded so little may be that these efforts have themselves not been inte grated.The approach to political integration has been by means of a pan-African entity, theAfrican Union, which is so diverse as to be unwieldy. For example, it includes North
74 | PAUL COLLIER AND ANTHONY J. VENABLES
Africa, which identifies more closely with the Middle East than with Africa, and itrequires agreement among 53 sovereign governments for any action.
By contrast, the approach to economic integration has been too limited, predom-inantly involving subregional trade agreements. These deals are so numerous anduncoordinated that they are mutually incompatible: governments have signed up tocommitments that simply cannot all be met. This situation generates confusion andundermines the credibility of trade policies. More fundamentally, subregional tradedeals between low-income countries give rise to economic forces that are likely to cre-ate severe political tensions. As Venables (2003) shows, they generate economicdivergence, with the poorest members of the integration scheme losing in relation tothe least-poor members. This is in stark contrast to regional integration arrangementsbetween high-income countries, which generate forces for convergence. Indeed, evenVenables’s analysis probably underestimates the forces of divergence released byregional integration among low-income countries, since it rests only on the implica-tions of comparative advantage. The forces unleashed by the scale economies dis-cussed above imply further forces for divergence—with, for example, the economi-cally largest cities, such as Nairobi, Johannesburg, and Lagos, gaining at the expenseof initially smaller cities in their respective regions. Hence, the politics of Africa’s subregional trade schemes are almost inevitably going to be fraught.
A more promising alternative would be to learn from three aspects of successfulintegration in other regions. First, political and economic integration should go handin hand; supranational entities have to acquire real sovereignty over particulardomains of economic activity. For example, currently, despite the many subregionaltrade arrangements, each African country has been negotiating individually bothwith the World Trade Organization (WTO) and, for economic partnership agreements(EPAs), with the European Union. By contrast, the trade policies of each member country of the European Union are genuinely locked in common, and so negotiation atthe WTO and for the EPAs is conducted by the European Commission rather than byeach member country individually.
Second, integration is easier if it grows from a small core of states among whichnone is too dominant. In Europe integration started with just 6 countries and hasprogressively expanded to 27. The United States grew from a core of 13 foundingstates to its present total of 50. In Africa the most promising such nucleus is the EastAfrican Community (EAC), which has a core of three similarly sized states and hasalready added two new members. The EAC has the advantage that it is buildingpolitical institutions which might acquire real sovereignty over some aspects of poli-cy, alongside steps toward economic integration.
Third, the economic agenda should be considerably broader than trade policy.There is scope for common rules on a wide range of economic policies—for exam-ple, on investment and taxation, which would enhance credibility. There is room forthe provision of common infrastructure; the East African Community used to run anintegrated rail system, and power generation and distribution would be better han-dled at the subregional level. Unlike trade agreements, these other areas of policycooperation are likely to generate mutual gains, so that the economic consequenceswill reinforce rather than undermine the political process.

TRADE AND ECONOMIC PERFORMANCE | 75
Finally, we might note that the political stresses produced by poverty have tendedto be perverse. What is needed is a stronger impetus toward unity, but poverty is afertile breeding ground for xenophobia and division. During 2008, there were riotsin Johannesburg against immigration from Zimbabwe, as well as de facto ethnic par-tition in Kenya. The vision of African unity pioneered by Kwame Nkrumah andJulius Nyerere is in need of serious revival.
Notes
The authors thank Mauro Caselli, Lisa Chauvet, Anke Hoeffler, Hyesung Kim, and Jean-LouisWarnholz for statistical analyses.
This work was supported by the BP-funded Oxford Centre for the Analysis of Resource RichEconomies (OxCarre) and by the Centre for the Study of African Economies (CSAE). Thisresearch benefited from funding by the UK Department for International Development (DFID)as part of the iiG, a research programme to study how to improve institutions for pro-poorgrowth in Africa and South-Asia. The views expressed are not necessarily those of DFID.
1. “Dutch disease” takes its name from the supposed effects of North Sea natural gas dis-coveries on the Netherlands economy.
2. See Collier (2009) for a detailed account of this sequence.
3. These output loss costs are likely to be underestimates because they omit longer-termeffects. Collier and Goderis (2008a) find that unless governance is good, dependence oncommodity exports has adverse effects on long-term growth. The mismanagement ofvolatility may be one of the routes by which poor governance has these adverse long-termeffects.
4. Benedikt Goderis undertook the substantial work involved in these recalculations.
References
Alcalá, Francisco, and Antonio Ciccone. 2003. “Trade, Extent of the Market, and EconomicGrowth 1960–66.” Economics Working Paper 765, Department of Economics and Business, Universitat Pompeu Fabra, Barcelona, Spain. http://www.econ.upf.edu/en/research/onepaper.php?id=765.
Alesina, Alberto, Enrico Spolaore, and Romaine Wacziarg. 2005. “Trade, Growth and the Sizeof Countries.” In Handbook of Economic Growth, ed. Philippe Aghion and StevenDurlauf. Amsterdam: North-Holland.
Au, Chun-Chung, and J. Vernon Henderson. 2006. “Are Chinese Cities Too Small?” Reviewof Economic Studies 73 (3): 549–76.
Barrett, Scott. 2007. Why Cooperate? The Incentive to Supply Global Public Goods. Oxford,U.K.: Oxford University Press.
Besley, Timothy J., and Masayuki Kudamatsu. 2007. “Making Autocracy Work.” CEPR Dis-cussion Paper 6371, Centre for Economic Policy Research, London.
Caselli, Francesco, and James Feyrer. 2007. “The Marginal Product of Capital.” QuarterlyJournal of Economics 122 (2, May): 535–68.
Chauvet, Lisa, and Paul Collier. 2008. “What Are the Preconditions for Turnarounds in FailingStates?” Conflict Management and Peace Science 25 (4, September): 332–48.

76 | PAUL COLLIER AND ANTHONY J. VENABLES
Collier, Paul. 2007. The Bottom Billion: Why the Poorest Countries Are Failing and What CanBe Done about It. Oxford, U.K.: Oxford University Press.
———. 2009. Wars, Guns, and Votes: Democracy in Dangerous Places. New York: Harper-Collins.
Collier, Paul, and Benedikt Goderis. 2008a. “Commodity Prices, Growth, and the NaturalResource Curse: Reconciling a Conundrum.” Centre for the Study of African Economies,Oxford University, Oxford, U.K.
———. 2008b. “Structural Policies for Shock-Prone Commodity Exporters.” Centre for theStudy of African Economies, Oxford University, Oxford, U.K.
———. 2009. “Does Aid Mitigate External Shocks?” Review of Development Economics 13(3): 429–51.
Collier, Paul, and Anke Hoeffler. 2007. “Unintended Consequences: Does Aid Promote ArmsRaces?” Oxford Bulletin of Economics and Statistics 69 (1): 1–28.
Collier, Paul, Anke Hoeffler, and Dominic Rohner. 2009. “Beyond Greed and Grievance: Fea-sibility and Civil War.” Oxford Economic Papers 61 (1, January): 1–27.
Collier, Paul, and Anthony J. Venables. 2007. “Rethinking Trade Preferences: How Africa CanDiversify Its Exports.” World Economy 30 (8, August): 1326–45.
Commission on Growth and Development. 2008. The Growth Report: Strategies for Sus-tained Growth and Inclusive Development. Washington, DC: World Bank.
Cook, Lisa D., and Jeffrey Sachs. 1999. “Regional Public Goods in International Assistance.”In Global Public Goods: International Cooperation in the 21st Century, ed. Inge Kaul,Isabelle Grunberg, and Marc Stern. New York: United Nations Development Programmeand Oxford University Press.
Gabaix, X., and Y. Ioannides. 2004. “The Evolution of City Size Distributions.” In Handbookof Urban and Regional Economics. Vol. 4, Cities and Geography, ed. J. Vernon Hender-son, and Jacques-François Thisse. Amsterdam: North-Holland.
Helliwell, John F. 1997. “National Borders, Trade and Migration.” Pacific Economic Review2 (3): 165–85.
Jones, Ben, and Ben Olken. 2005. “The Anatomy of Start-Stop Growth.” NBER WorkingPaper 11528. National Bureau of Economic Research, Cambridge, MA.
Limão, Nuno, and Anthony J. Venables. 2001. “Infrastructure, Geographical Disadvantage,Transport Costs and Trade.” World Bank Economic Review 15 (3): 451–79.
McCallum, John. 1995. “National Borders Matter: Canada–U. S. Regional Trade Patterns.”American Economic Review 85 (3): 615–23.
Rose, Andrew K. 2006. “Size Really Doesn’t Matter: In Search of a National Scale Effect.”Journal of the Japanese and International Economies 20 (4, December): 482–507.
Rosenthal, S. S., and W. C. Strange. 2004. “Evidence on the Nature and Sources of Agglom-eration Economies.” In Handbook of Urban and Regional Economics. Vol. 4, Cities andGeography, ed. J. Vernon Henderson and Jacques-François Thisse. Amsterdam: North-Holland.
Teravaninthorn, Supee, and Gaël Raballand. 2008. Transport Prices and Costs in Africa: AReview of the International Corridors. Washington, DC: World Bank.
Venables, Anthony J. 2003. “Winners and Losers from Regional Integration Agreements.”Economic Journal 113 (490, October): 747–61.
Wigstrom, Christian. 2008. “Does Size Matter?” Master of philosophy thesis, Oxford Uni-versity, Oxford, U.K.
World Bank. 2007. World Development Indicators 2007. Washington, DC: World Bank.

Protectionist Policies and Manufacturing Trade Flows in Africa
LAWRENCE EDWARDS
It is well known that Africa’s share of world trade is declining. Policy prescriptionsvary widely, covering tariff liberalization, policies to facilitate output growth, andimprovements in trade-related infrastructure and institutions. This study evaluatestrade performance and tariff liberalization in Sub-Saharan African countries since theearly 1990s. It also estimates the impact of tariff liberalization on manufacturing tradeflows in Africa and other developing countries between 1990 and 2004, using sector-level data and direct measures of tariff protection. Three key results emerge. First,African countries continue to be marginalized in world trade, although there is evi-dence of improved competitiveness, particularly in manufacturing. Second, tariff lib-eralization, starting in the early 1990s, has had a positive effect on manufacturingtrade flows, but its contribution to the overall growth of trade has been small. Africancountries are no different from other developing countries in this regard. Third, tariffliberalization in developing countries is often associated with a worsening manufac-turing trade balance, but this is not necessarily so in Africa.
The marginalization of Africa in world trade is well recognized. Early evidence from aWorld Bank research program in the mid-1990s (Amjadi and Yeats 1995; Amjadi,Reincke, and Yeats 1996; Ng and Yeats 1996) found that Sub-Saharan Africa’s share inworld trade declined dramatically between the 1950s and the early 1990s, from morethan 3 percent to less than 1 percent. Views on the source of this deterioration vary widely.Policy prescriptions alternatively emphasize tariff liberalization (Amjadi, Reincke, andYeats 1996; Ng and Yeats 1996), policies to facilitate output growth (Rodrik 1997), andimprovements in trade-related infrastructure and institutions (Limão and Venables 2001;Wilson, Mann, and Otsuki 2005; Djankov, Freund, and Pham 2006).
This paper focuses, in particular, on the effect of tariff liberalization on trade per-formance in Sub-Saharan Africa. It begins with a comparative analysis of trade flowsand trade liberalization in Africa during the 1990s. This was a period of considerable
77
Lawrence Edwards is an associate professor at the School of Economics, University of Cape Town, South Africa.
Annual World Bank Conference on Development Economics 2009, Global © 2010 The International Bank for Reconstruction and Development / The World Bank.
78 | LAWRENCE EDWARDS
tariff reform for many developing and middle-income economies. How Africa faredrelative to its counterparts is explored in some detail.
Next, the contribution of tariff liberalization to changes in manufactured exports,manufactured imports, and the trade balance in developing economies, includingAfrica, between 1990 and 2004 is estimated. The focus on manufacturing partlyreflects data constraints but also the emphasis in the literature on the associationbetween manufacturing and growth acceleration, externalities, learning by doing,and returns to scale. An important focus of the paper is the effect of tariff liberaliza-tion on export performance through reductions in the cost of inputs. Manufacturinggoods, which are relatively import intensive and are often more dependent onprocessed inputs than primary products, are more suitable for such an analysis.
Where the paper makes a contribution in this field is that the empirical analysisdraws on sector-level data (28 manufacturing sectors) and direct measures of tariffprotection, as opposed to aggregate data and dummy variables for liberalization periods. Three key results emerge. First, African countries continue to be marginalizedin world trade—even though there is evidence of improved competitiveness, particu-larly in manufacturing, and many countries in the region have experienced consider-able tariff liberalization, despite only limited offers in the Uruguay Round of the General Agreement on Tariffs and Trade (GATT).
Second, tariff liberalization has had a statistically significant and positive effect onmanufacturing trade flows in developing countries, but its contribution to overallgrowth in trade has been small. Africa is no different from other developing coun-tries in this regard, although high import tariffs on intermediate and capital inputscontinue to restrict exports from several countries of the continent.
Third, tariff liberalization is often associated with a worsening manufacturing tradebalance in developing countries (although the evidence for Africa is weaker). The effect,however, is small, so tariff liberalization is unlikely to lead to a substantial increase inthe trade deficit or to the emergence of an external constraint on growth.
The next section reviews the existing empirical literature on the effect of trade bar-riers on trade performance in developing economies. A comparative analysis of tradeflows and trade reform in Africa and other developing economies from the early1990s follows. Various estimates are then presented of the relationship between tradeliberalization and manufactured exports, manufactured imports, and the trade bal-ance for 50 economies, including 30 developing economies (10 in Africa), over theperiod 1990 to 2004. The paper concludes with a summary of the key findings andsome policy recommendations.
Trade Barriers and Trade Performance in Developing Economies
In traditional trade theory, tariff barriers restrict trade flows. The effect of tariffs onimports is intuitive: by increasing the relative price of imported goods, tariffs induceconsumption shifts toward domestically produced substitutes. The negative effect ofimport tariffs on export performance is not as well appreciated, yet as Lerner (1936)
PROTECTIONIST POLICIES AND MANUFACTURING TRADE FLOWS IN AFRICA | 79
pointed out, an import tariff can have an impact on export volumes equivalent tothat of an export tax. By conferring protection on import-competing sectors, importtariffs draw resources toward these sectors and away from other sectors of the economy, including those that export.
Import barriers, particularly on intermediate inputs, also raise production costs andreduce the profitability of export production. This is expected to be particularlyimportant for exports of manufactured products, which use a high proportion ofintermediate and capital goods in the production process, compared with goods pro-duced in the primary sector. The fragmentation and global outsourcing of productionprocesses also require that manufacturing firms be integrated into global value chains,which, in turn, necessitates cheap access to imported intermediate inputs. Tariff liberalization is therefore expected to stimulate both import and export volumes.
To some extent, these relationships are born out by the empirical evidence, includ-ing that for Africa.1 Rodrik (1997), for example, estimates that a 10 percentage pointreduction in trade taxes is associated with a 17 percentage point increase in the ratioof trade to gross domestic product (GDP) in a sample of 37 Sub-Saharan Africancountries over the period 1964–94. Although he emphasizes the relatively greaterimportance of per capita income and geography as determinants of the region’s tradeflows, these results suggest that, on average, taxes on international trade (exportsplus imports) in the early 1990s were associated with a 12 percentage point reduc-tion in the ratio of total trade of goods and services to GDP in Sub-Saharan Africancountries—a large value compared with the average trade-to-GDP ratio of 68 percentfor these countries over the same period.2
Another relevant study is that of Santos-Paulino and Thirlwall (2004), who eval-uate the effects of trade liberalization on aggregate import and export growth and thetrade balance, using a pooled sample of 22 developing countries covering the mid-1970s to late 1990s. Import and export taxes, measured using collection duties,reduce import and export growth, but the effect is marginal. By far the largest impacton growth of trade volumes and the trade balance in their estimates is attributed tothe dummy variable used to signify periods of trade liberalization. Africa is found tobe particularly sensitive to trade liberalization, with import growth rising by 8.4 per-centage points (as against an average of 6.19 percentage points for all countries) andexport growth rising by a lower 3.58 percentage points (compared with 1.56 per-centage points for all countries).
Liberalization is therefore associated with a worsening of the trade balance indeveloping countries, which can lead to an external constraint on growth. The esti-mates suggest that the trade balance in developing countries worsens by more than2 percent of GDP during liberalization periods. Similar estimates (2.8 percent of GDP)are found by the United Nations Conference on Trade and Development (UNCTAD1999), using a sample of 16 developing countries over the period 1970–95. By con-trast, Parikh and Stirbu (2004) find a more mixed set of results, with the trade balanceimproving during liberalization in 10 of the 29 developing countries for which signif-icant results are obtained. There is, therefore, substantial heterogeneity in the responseof trade flows to liberalization across developing countries.
80 | LAWRENCE EDWARDS
These studies have some serious limitations. The first is the use of a dummy vari-able to estimate the effect of liberalization on trade flows. This holds as well forother studies in this field (Papageorgiou, Michaely, and Choksi 1991; Greenawayand Sapsford 1994; Bleaney 1999). Trade liberalization periods are frequentlyaccompanied by numerous other policy reforms, the effect of which will also beattributed to the dummy variable. The result may be to bias estimates of exportgrowth from trade liberalization downward and those for import growth upward ifimproved confidence in the country leads to capital inflows and an appreciation ofthe currency, as was experienced in a number of developing countries (Bleaney 1999;UNCTAD 1999).
Dummy variables also do not adequately account for trade liberalization involv-ing different protection instruments (tariffs, nontariff barriers, export taxes, andtrade subsidies) or variations in the pace and depth of reform across countries. Def-inition of the commencement of the liberalization period therefore depends cruciallyon the definition of liberalization employed and on the aspects of the reform processthat are emphasized (Santos-Paulino 2005).
A second limitation of these studies is that the mechanisms through which liber-alization influences trade flows, particularly exports, are not adequately specified inthe trade functions estimated. For example, the effects of lower tariffs on imports,particularly on intermediate inputs, are not included in many of the export relation-ships. Yet the available evidence suggests that the effect of input tariffs on export vol-umes can be large. Collier and Venables (2007) estimate that the waiver on the ruleof origin for textile inputs for some Sub-Saharan African countries is a significantsource of the quadrupling of apparel exports to the United States in response to theAfrican Growth and Opportunity Act (AGOA). Edwards and Lawrence (2008) ana-lyze 44 manufacturing sectors in South Africa from 1990 to 2002 and find thatreductions in input costs from liberalization contributed significantly to improvedexport growth, particularly of noncommodity manufactures.
This leads to the third limitation. Trade liberalization has nonuniform effectsacross sectors of the economy. The export sector consists of heterogeneous firms andindustries, and the effect of liberalization on export performance is expected to dif-fer among them. Yet the bulk of the studies, in particular the cross-country studies,analyze aggregate export performance. It could be extremely misleading to drawimplications from the aggregate cross-country studies about the likely impact of lib-eralization on developing economies without taking account of structural and com-positional differences between countries. There is a need, therefore, to supplementthe aggregate analysis with firm- or sector-level studies.
Trade Policy Reform and Trade Performance in Africafrom the Early 1990s
This section evaluates Africa’s export performance and trade policy reform in the1990s. The discussion provides the background for the empirical analysis that follows.
PROTECTIONIST POLICIES AND MANUFACTURING TRADE FLOWS IN AFRICA | 81
Export Performance
The source of Africa’s marginalization in world trade prior to the 1990s was two-pronged: “[Africa] experienced declining market shares for its major exports which,in turn, were of declining relative importance in world trade” (Ng and Yeats 1996, 8).To evaluate post-1990 trends, a similar decomposition is conducted using country-level data obtained from the World Development Indicators (WDI) database andproduct-level data from the United Nations Commodity Trade Statistics Database(Comtrade), SITC rev. 2, at the three-digit level.3 Only countries for which data areavailable in both periods are included in the analysis.
Figure 1 presents a comparative perspective of merchandise exports from Sub-Saharan Africa in current prices and in constant prices between 1990 and 2006. Thedata are obtained from the WDI and cover 99 countries, 37 of which are in Sub-Saharan Africa. The country sample accounts for between 70 and 75 percent of thetotal available value of exports in each period; for Sub-Saharan Africa the figure is93–97 percent. Sub-Saharan Africa is split into the Southern African Customs Union(SACU) and the rest of Sub-Saharan Africa (RSSA). The latter group is further sub-divided into low-income and middle-income countries.4
The continued marginalization of Sub-Saharan Africa in world trade during the1990s is clearly depicted in figure 1. Export performance in all the country groupingsfor Sub-Saharan Africa was poor in relation to world performance during the decade,whether exports are measured in nominal or in real terms. By contrast, from 2000 on,the value of Sub-Saharan African exports (in U.S. dollars) grew sharply, and by 2006the figure had almost tripled. Much of this growth is related to the commodity priceboom. For example, the very strong export growth experienced by middle-incomeSub-Saharan Africa outside the SACU is almost entirely assignable to the oil-richcountries of Equatorial Guinea and Angola, which experienced an oil price boom.Measured in volume, Sub-Saharan Africa’s export performance after 2000 is substan-tially weaker.5
As a consequence, whereas Sub-Saharan Africa’s share of world exports in valueterms was around 2.7 percent in both 1990 and 2006, in volume terms its sharedeclined from 2.6 to 1.6 percent over the period. The marginalization of Sub- SaharanAfrica in world exports is more drastic when the region is compared with other devel-oping countries. Sub-Saharan Africa’s share of developing-country exports fallsfrom 15.6 to 8.0 percent when current U.S. dollar values are used and from 13.8 to5.2 percent when export volume data (in 2000 prices) are used.
The substantial heterogeneity in export performance across countries within Sub-Saharan Africa can be seen in figure 2, which presents average annual growth in mer-chandise export volumes by country between 1990 and 2006. In most countries ofthe region, export growth was relatively poor, exceeding the world average (7 per-cent per year) in 11 cases and the developing-country average of 11 percent per yearin only 4 cases—Mozambique, Lesotho, Sudan, and Uganda.
Further insights into the source of the region’s marginalization in world trade canbe obtained through a more disaggregated analysis of trade flows. Table 1 presents aconstant-market-shares analysis in which export growth is decomposed into changes

82 | LAWRENCE EDWARDS
FIGURE 1. Merchandise Exports: World and Sub-Saharan Africa, 1990–2006
0
100
800
200
400
300
700
600
500
1990 1992 1994 1996 1998 2002 2004 20062000
1990
= 1
00
current prices
0
100
600
200
400
300
500
1990
= 1
00
constant prices
RSSA, middle income RSSA, low income SACUWorld Developing countries excluding SSA
1990 1992 1994 1996 1998 2002 2004 20062000
Source: Own calculations using data from World Development Indicators database.
Note: RSSA, rest of Sub-Saharan Africa; SACU, Southern African Customs Union; SSA, Sub-Saharan Africa. Export volumes are converted to values using 2000 prices in U.S. dollars.
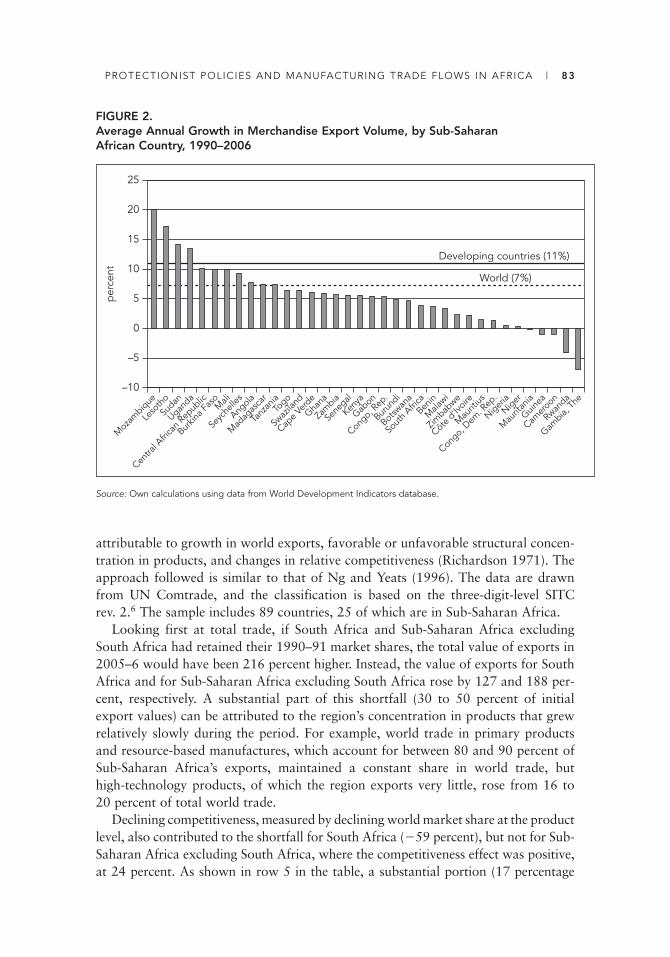
PROTECTIONIST POLICIES AND MANUFACTURING TRADE FLOWS IN AFRICA | 83
attributable to growth in world exports, favorable or unfavorable structural concen-tration in products, and changes in relative competitiveness (Richardson 1971). Theapproach followed is similar to that of Ng and Yeats (1996). The data are drawnfrom UN Comtrade, and the classification is based on the three-digit-level SITCrev. 2.6 The sample includes 89 countries, 25 of which are in Sub-Saharan Africa.
Looking first at total trade, if South Africa and Sub-Saharan Africa excludingSouth Africa had retained their 1990–91 market shares, the total value of exports in2005–6 would have been 216 percent higher. Instead, the value of exports for SouthAfrica and for Sub-Saharan Africa excluding South Africa rose by 127 and 188 per-cent, respectively. A substantial part of this shortfall (30 to 50 percent of initialexport values) can be attributed to the region’s concentration in products that grewrelatively slowly during the period. For example, world trade in primary productsand resource-based manufactures, which account for between 80 and 90 percent ofSub-Saharan Africa’s exports, maintained a constant share in world trade, but high-technology products, of which the region exports very little, rose from 16 to20 percent of total world trade.
Declining competitiveness, measured by declining world market share at the productlevel, also contributed to the shortfall for South Africa (�59 percent), but not for Sub-Saharan Africa excluding South Africa, where the competitiveness effect was positive,at 24 percent. As shown in row 5 in the table, a substantial portion (17 percentage
FIGURE 2. Average Annual Growth in Merchandise Export Volume, by Sub-SaharanAfrican Country, 1990–2006
Moza
mbique
5per
cent
Developing countries (11%)
World (7%)
0
–5
–10
10
20
15
25
Leso
tho
Sudan
Uganda
Centra
l Afri
can R
epub
lic
Burkin
a Fas
oM
ali
Seyc
helle
s
Angola
Mad
agas
car
Tanz
aniaTo
go
Swaz
iland
Cape V
erde
Ghana
Zambia
Sene
gal
Kenya
Gabon
Congo, R
ep.
Burun
di
Botswan
a
Sout
h Afri
caBen
in
Mala
wi
Zimbab
we
Côte d
'Ivoire
Mau
ritius
Congo, D
em. R
ep.
NigeriaNiger
Mau
ritan
ia
Guinea
Camer
oon
Rwanda
Gambia,
The
Source: Own calculations using data from World Development Indicators database.

84 | LAWRENCE EDWARDS
points) of the improved competitiveness effect for that subgroup has been driven by arestructuring of exports toward rapidly growing products.
The results for manufacturing are more positive. The world market share of SouthAfrica and for Sub-Saharan Africa excluding South Africa rose during the period, asreflected in the 290–300 percent increase in export value compared with the 222 per-cent increase in world trade. Although poor product composition reduced growth, itwas more than offset by improvements in competitiveness and by structural shiftstoward rapidly growing products (row 10).
The trends in Sub-Saharan African trade identified by Ng and Yeats (1996) in thefour decades prior to 1990 are thus only partly replicated in the subsequent period.Although exports continue to be concentrated in products with stagnant shares in
TABLE 1. Constant-Market-Shares Analysis: Sources of Export Growth, WorldRegions and Sub-Saharan Africa, 1990–91 to 2005–6 (change as percent of 1990–91 values, in U.S. dollars, except as otherwise specified)
Developing High-income South Sub-Saharan Africa,
countries (OECD) Africa excluding South Africa
All products1. Total change 492 155 127 1882. Product composition effect �7 �2 �30 �523. Competitiveness effect 283 �58 �59 244. World growth effect 216 216 216 2165. Competitiveness in growing 196 �41 �38 17
commodities
Initial trade value (billions of 404 2,453 24 19U.S. dollars)
Manufacturing6. Total change 680 157 300 2907. Product composition effect �12 �2 �22 �618. Competitiveness effect 464 �63 99 1289. World growth effect 222 222 222 222
10. Competitiveness in growing 325 �45 64 95commodities
Initial trade value (billions of 241 2,138 8 6U.S. dollars)
Source: Own calculations using UN Comtrade data at the three-digit Standard International Trade Classification (SITC)level and initial period shares as weights.
Note: Low-income, middle-income, and developing-country results include Sub-Saharan Africa. The decompositionis calculated as
�q � s0 �Q � [�i
si0
�Qi � s0 �Q ] � �i
Qi1
�si,
where q is total exports of the focus country, s is the export share of the focus country, Q is total exports, the sub-script i refers to commodity, and the superscripts 0 and 1 refer to initial and final periods. The first term on the right-hand side is the world growth effect, the second term is the commodity effect, and the final term is the competitiveeffect. See Richardson (1971) for some of the shortcomings of this approach.
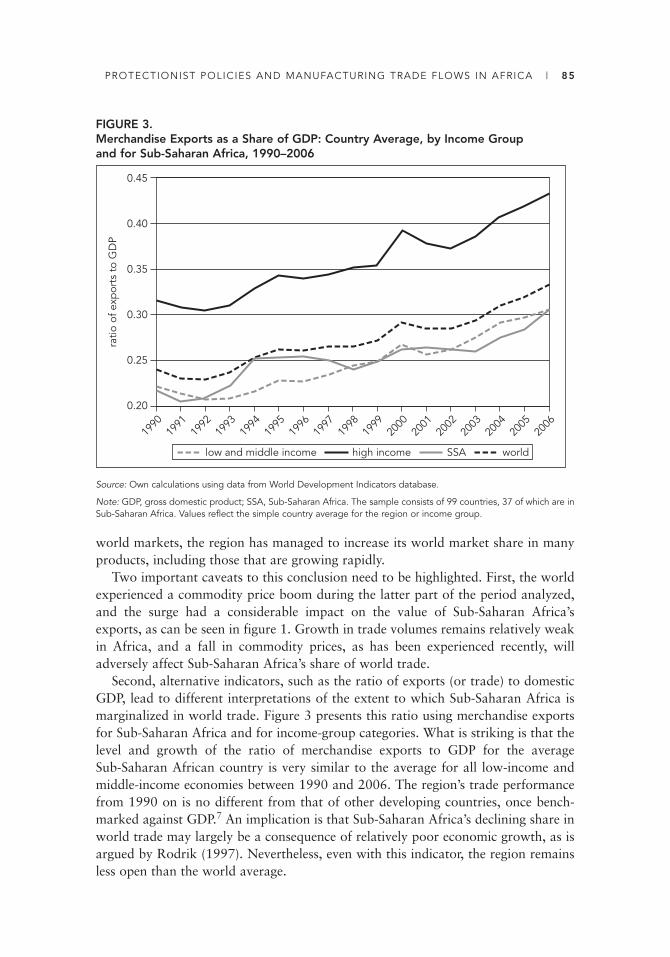
PROTECTIONIST POLICIES AND MANUFACTURING TRADE FLOWS IN AFRICA | 85
world markets, the region has managed to increase its world market share in manyproducts, including those that are growing rapidly.
Two important caveats to this conclusion need to be highlighted. First, the worldexperienced a commodity price boom during the latter part of the period analyzed,and the surge had a considerable impact on the value of Sub-Saharan Africa’sexports, as can be seen in figure 1. Growth in trade volumes remains relatively weakin Africa, and a fall in commodity prices, as has been experienced recently, willadversely affect Sub-Saharan Africa’s share of world trade.
Second, alternative indicators, such as the ratio of exports (or trade) to domesticGDP, lead to different interpretations of the extent to which Sub-Saharan Africa ismarginalized in world trade. Figure 3 presents this ratio using merchandise exportsfor Sub-Saharan Africa and for income-group categories. What is striking is that thelevel and growth of the ratio of merchandise exports to GDP for the average Sub-Saharan African country is very similar to the average for all low-income and middle-income economies between 1990 and 2006. The region’s trade performancefrom 1990 on is no different from that of other developing countries, once bench-marked against GDP.7 An implication is that Sub-Saharan Africa’s declining share inworld trade may largely be a consequence of relatively poor economic growth, as isargued by Rodrik (1997). Nevertheless, even with this indicator, the region remainsless open than the world average.
FIGURE 3. Merchandise Exports as a Share of GDP: Country Average, by Income Groupand for Sub-Saharan Africa, 1990–2006
0.20
0.45
0.25
0.40
0.35
0.30
1990
1992
1994
1996
1998
2002
2004
2006
2000
1991
1993
1995
1997
1999
2003
2005
2001
ratio
of e
xpor
ts t
o G
DP
low and middle income high income SSA world
Source: Own calculations using data from World Development Indicators database.
Note: GDP, gross domestic product; SSA, Sub-Saharan Africa. The sample consists of 99 countries, 37 of which are inSub-Saharan Africa. Values reflect the simple country average for the region or income group.
86 | LAWRENCE EDWARDS
Tariff Reform
Comparisons of protection across countries are fraught with difficulties. Theseinclude the lack of consistent protection data over time, problems in calculating advalorem equivalents for non–ad valorem tariff rates and nontariff barriers, and various biases associated with the aggregation process (Anderson and Neary 1994).Nonetheless, an evaluation of protection using nominal tariff data is possible andallows for an instructive comparative analysis of trade reform across countries.
To pursue such an analysis, detailed most favored nation (MFN) and applied tariffdata are obtained for 115 countries from UNCTAD’s Trade Analysis and Informa-tion System (TRAINS) database for the period 1990 to 2006. The countries are madeup as follows: low income, 26; lower middle income, 33; upper middle income,31; high income countries not members of the Organisation for Economic Co- operation and Development (OECD), 14; and OECD countries, 11. The sampleincludes 29 African countries, some of which are North African. Only those coun-tries in which average protection in both periods can be calculated are included.8
An important limitation is that the tariff rates do not include ad valorem equiva-lents for non–ad valorem tariff rates. This limitation mainly affects agriculture, wherenon–ad valorem tariffs are used extensively, but it remains an important caveataffecting the interpretation of the data.
Figure 4 shows the maximum, minimum, and simple average MFN tariff for various country groups for two periods: 1990–95 and 2004–6. The simple countryaverage rather than the import-weighted average of the corresponding measure forthe individual countries is presented. This avoids domination by any individual country—for example, South Africa in Africa, India in the low-income group, andChina in the lower-middle-income group. The country-level observation is theimport-weighted average tariff for the periods 1990–95 and 2004–6.
A number of observations can be drawn from the data. There has been a con-siderable reduction in average MFN tariffs for all income groups since the early1990s. Low-income economies experienced relatively large decreases in the aver-age MFN tariff, from 22 to 12.3 percent. Middle-income economies saw slightlysmaller declines in MFN protection, although the initial tariffs were far lower thanin low-income economies. MFN tariffs also fell in African economies, from 19 to13 percent, despite the meager offers made in the Uruguay Round to reducebound rates (Wang and Winters 1998). The decline in protection is roughly equiv-alent to that in middle-income economies but is less than in the average low-income economy.
The average change hides substantial variation in the extent of tariff liberalizationacross countries. As shown in figure 4, the spread of tariff rates across countriesdeclined in almost all groups, including Africa. The narrowing of the range is great-est for low-income countries, as a result of substantial reductions in the average tariffin Bangladesh, which fell from 76 to 18.2 percent over the period.
The extent of liberalization across African economies also varies widely. Figure 5presents the estimated percentage change in MFN tariffs for the sample of Africaneconomies. The extent of liberalization is calculated as (t1 � t0)�(1 � t0), where t1

PROTECTIONIST POLICIES AND MANUFACTURING TRADE FLOWS IN AFRICA | 87
and t0 refer to tariff rates in the final and initial periods, respectively. This is there-fore an estimate of the percentage change in the tariff-inclusive border price.
Large decreases (greater than 10 percent) in the import-weighted average MFNtariff are found in Morocco, Libya, Mauritius, and Côte d’Ivoire. These economieshad average protection rates in excess of 20 percent and up to 45 percent, in the caseof Morocco in 1990–91. By 2004–6 average protection had fallen to 19 percent inMorocco, 12 percent in Nigeria, and less than 10 percent in the others.
Protection also rose in a number of African economies, with particularly largeincreases (more than 5 percent) for the Seychelles. Smaller increases were experiencedin Ghana, Madagascar, and the Central African Republic. Some of this increasereflects changes in tariff rates, but shifts in the composition of import weights and thetariffication of nontariff barriers also affect the average.
Overall, more than half (16) of the 29 African economies that were studied expe-rienced tariff reductions greater than the simple country average of all 115 countriesin the sample (3.9 percent). This indicates that many African economies have openedup considerably from the early 1990s. The decline in tariffs, however, comes off ahigh base, and current protection rates remain relatively high. The average level of
FIGURE 4. Maximum, Minimum, and Average Country Tariff by Region and Period, MostFavored Nation (MFN) Tariffs. 1990–95 and 2004–6
0
80
70
60
50
40
30
20
10
1990
–95
low income
2004
–6
1990
–95
lower middleincome
upper middleincome
2004
–6
1990
–95
2004
–6
1990
–95
high income(OECD)
2004
–6
1990
–95
Africa
2004
–6
MFN
tar
iff
maximum
minimum
average
Source: UNCTAD Trade Analysis and Information System (TRAINS) database and own calculations.
Note: OECD, Organisation for Economic Co-operation and Development; UNCTAD, United Nations Conference onTrade and Development. The sample consists of 115 countries for which data are available for both periods. The Africasample includes North African countries.

88 | LAWRENCE EDWARDS
MFN protection, at 13.1 percent for African economies in 2004–6, exceeds that oflow-income economies (12.3 percent), middle-income economies (9.2–10.2 percent),and OECD countries (3.1 percent); see table 2. This is also the case at the disaggre-gated country level. Average protection exceeds the simple country average of all low-income and middle-income economies (10.5 percent) in 19 of the 29 Africaneconomies in the sample.9
Up to now, the focus has been on MFN rates. Table 2 presents data on levels ofand changes in applied tariffs that include preferences granted under the various pref-erential trade agreements. The data show more extensive liberalization from the early1990s in response to the implementation of various preferential trade agreementsduring this period. Current applied rates are lower than MFN rates. The difference,however, does not appear substantial and does not alter any of the conclusions drawnon the basis of the MFN rates.
The aggregate data, again, hide considerable variation in protection at the sectorlevel. Of particular interest for this paper is the extent to which liberalization reducesthe cost of accessing key intermediate inputs. To evaluate this, table 2 presents thesimple average tariff and change in tariffs on consumer, intermediate, and capitalgoods for Sub-Saharan Africa and by income group. The end-use categorization isbased on the broad economic category (BEC) classification of the United Nations
FIGURE 5. Change in Import-Weighted Most Favored Nation (MFN) Tariff, Selected AfricanCountries, 1990–95 to 2004–6
5
per
cent
0
–15
all economies (–3.9%)–5
–10
–20
10
Seyc
helle
s
Centra
l Afri
can R
epub
lic
Mad
agas
car
Ghana
Congo, R
ep. o
f
Camer
oonM
ali
Gab
on
Equato
rial G
uinea
Mala
wi
Egypt,
Arab R
ep.
Algeria
Chad
Tunis
ia
Tanz
ania
Zimbab
we
Sout
h Afri
ca
Zambia
Uganda
Rwanda
Ethiopia
Moza
mbique
Burkin
a Fas
o
Kenya
Nigeria
Côte d
’Ivoire
Mau
ritius
Libya
Moro
cco
Source: UNCTAD Trade Analysis and Information System (TRAINS) database.
Note: UNCTAD, United Nations Conference on Trade and Development.

89
TABLE 2. Simple Average Protection by End Use, Country Income Groups and Sub-Saharan Africa, 1990–95 and 2004–6(percent)
Capital goods Consumption goods Intermediate goods Passenger vehicles Total
1990–95 2004–6 Change 1990–95 2004–6 Change 1990–95 2004–6 Change 1990–95 2004–6 Change 1990–95 2004–6 Change
Mean import-weighted tariff, MFNLow income 19.4 8.6 �7.7 28.6 18.4 �7.0 20.4 11.4 �6.6 48.9 28.2 �11.1 22.1 12.3 �7.3Lower middle
income 13.2 6.7 �5.3 21.3 17.4 �2.6 13.9 8.7 �4.2 41.9 28.2 �6.5 15.3 10.2 �4.1Upper middle
income 11.5 6.0 �4.7 17.6 15.5 �1.9 10.3 6.3 �3.6 32.4 23.9 �4.9 12.6 9.2 �2.9OECD 4.6 1.6 �2.9 9.9 5.8 �3.7 4.2 2.2 �1.9 9.4 5.7 �3.2 5.8 3.1 �2.5Sub-Saharan
Africa 16.2 8.0 �6.6 25.3 21.6 �2.5 17.2 11.1 �5.0 43.3 25.3 �11.1 19.0 13.1 �4.8
Simple average applied tariffLow income 18.6 8.2 �7.5 27.0 16.4 �7.4 19.3 9.7 �7.2 47.1 27.2 �10.6 21.0 10.8 �7.6Lower middle
income 12.7 6.0 �5.5 20.4 14.7 �4.0 13.3 7.1 �5.1 40.7 25.5 �7.4 14.7 8.6 �5.0Upper middle
income 11.3 4.6 �5.7 17.1 12.4 �4.2 10.1 4.4 �5.1 32.3 18.4 �9.3 12.3 7.0 �4.7OECD 3.9 1.2 �2.6 8.0 4.4 �3.3 3.4 1.8 �1.6 9.0 4.9 �3.6 4.7 2.4 �2.2Sub-Saharan
Africa 16.1 7.7 �6.8 24.8 20.0 �3.4 16.8 9.4 �6.0 43.2 24.9 �11.3 18.7 11.8 �5.6
Source: Own calculations using data from UNCTAD Trade Analysis and Information System (TRAINS).
Note: MFN, most favored nation; OECD, Organisation for Economic Co-operation and Development; UNCTAD, United Nations Conference on Trade and Development.
90 | LAWRENCE EDWARDS
Statistics Division. Passenger vehicles (BEC 51) are included as a separate item becausethey are both an intermediate good and a final consumer good.
The data show that the decline in tariffs from the early 1990s in African coun-tries has been concentrated in capital and intermediate inputs. There was little lib-eralization of tariffs on consumer goods; they declined from 25.3 to 21.6 percent,which would have raised effective protection on consumer goods in many of theAfrican countries sampled. Despite reductions of MFN tariffs on capital and inter-mediate goods, tariffs on these products remain high (8.0 and 11.1 percent, respec-tively). The tariffs continue to tax production and impose a barrier to exports, par-ticularly of manufactured goods, where inputs constitute a relatively high proportionof overall production costs. The impact on Africa may be particularly large becausedomestic alternatives to imported inputs are not available. For example, World BankEnterprise Survey data indicate that between 30 and 65 percent of inputs purchasedby African manufacturing exporters are imported (Edwards, Rankin, and Schöer2008). Although exporters have access to import duty rebate schemes in someAfrican countries, utilization of these schemes by firms is low (Chandra et al. 2001;Clarke 2005).
Summary
In conclusion, Africa presents a mixed picture with regard to trade flows and liber-alization from 1990 on. The share of Sub-Saharan Africa in world exports continuedto decline from the 1990 level when measured in volume terms but remained stablewhen measured in current U.S. dollars. Although an unfavorable product concentra-tion adversely affected export growth, there is evidence of improved competitiveness,and the region has increased its world market share in many products, includingmanufactured products and products that are growing rapidly in world trade. Inaddition, export performance in the average Sub-Saharan African economy is no different from that of other developing countries when evaluated using the ratio ofmerchandise exports to GDP. The results for the post-1990 period therefore differfrom those found by Ng and Yeats (1996) for the period prior to the early 1990s.
In terms of protection, Sub-Saharan African economies have made reasonableprogress in reducing MFN rates and simplifying their tariff structures. The extent oftariff liberalization exceeded the world average for over half of the African countriesanalyzed. Liberalization, however, occurred from a high initial base, and average tar-iffs remain relatively high, even on key intermediate and capital inputs. These maycontinue to pose a barrier to export growth.
Econometric Analysis of the Effect of Tariff Barriers on Manufacturing Trade in Developing Economies
This section estimates the impact of tariff liberalization from 1990 to 2004 on man-ufactured exports, manufactured imports, and the trade balance in African and otherdeveloping countries. The focus on manufacturing trade is restrictive in the case of
PROTECTIONIST POLICIES AND MANUFACTURING TRADE FLOWS IN AFRICA | 91
Africa, where manufacturing accounts for only 20–25 percent of exports; a high pro-portion of these exports is also resource based. The concentration on manufacturingin part reflects data constraints regarding the availability of tariff data for primarysectors over time. However, there are additional reasons why it is important.
Growth in manufacturing is closely associated with growth accelerations in devel-oping countries, including those in Sub-Saharan Africa (Pattillo, Gupta, and Carey2005; Johnson, Ostry, and Subramanian 2007). The potential for output growth inmanufacturing production is often greater than for agricultural and resource-basedexports, which encounter diminishing returns to scale because of limited endow-ments (Collier and Venables 2007). Furthermore, diversification into manufacturingproduction helps insulate resource-based economies from volatile natural resourceprices and politically and economically disruptive rent-seeking behavior (Sachs andWarner 1999). Finally, manufactured exports are likely to grow faster than primaryexports as the global economy expands because their income elasticity of demand ishigher (Elbadawi 2001). As a consequence, policies to stimulate growth of manufac-tured exports in Sub-Saharan Africa have frequently been recommended (WorldBank 2000).
This does not imply that improved economic growth cannot or should not beachieved through expansion of primary product exports, as has been done in, forexample, Chile. The recent commodity price boom and growth in China provide animportant opportunity for African economies to expand trade in primary commodi-ties. Moreover, there is substantial scope for technical progress in agriculture, oftenmore so than in manufacturing (Martin and Mitra 2001). Nevertheless, continuedgrowth in manufactures will need to form part of the overall strategy for improvingeconomic growth. Mayer and Fajarnes (2008), for example, show that if incomegrowth in Sub-Saharan Africa is to achieve the Millennium Development Goals(MDGs), a ninefold increase in the region’s manufactured exports will be needed.
Data
The main database used is the trade, production, and protection database producedby Nicita and Olarreaga (2006). It provides information on trade flows, variousmeasures of tariff protection, and production for 28 three-digit ISIC rev. 2 manufac-turing sectors from 1976 on.10
The analysis in this section draws on a sample of 30 developing countries (ofwhich 6 are in Sub-Saharan Africa and 4 in North Africa) and 20 OECD economiesover the period 1990–2004. Country selection is based on the availability of tariffdata. Countries were included only if at least six years (four years for African coun-tries) of tariff data were initially available in the period 1990–2004. To ensure asmuch coverage as possible, the MFN tariff data were then updated using Harmo-nized System (HS) six-digit-level tariff schedules obtained from the country pages onthe World Trade Organization (WTO) Web site. Tariff data for South Africa for theentire period were obtained from Edwards (2005). Tariffs for missing periods thatwere bounded by available tariff data in the preceding and subsequent years were

92 | LAWRENCE EDWARDS
interpolated using simple averages. Overall, this yielded an average of 10 years of tariff data for each developing country.
The database has some important limitations (Nicita and Olarreaga 2006). It isnot balanced, and data are missing for many countries in the early 1990s. The tariffdata do not include estimates of ad valorem equivalents for specific and other non–advalorem rates. This is particularly problematic for agricultural products but is expectedto be less of a problem for manufacturing, on which this paper concentrates. Non-tariff barriers are also omitted. The analysis in this paper thus focuses entirely ondirect tariff measures, and the potentially important effects of nontariff barriers areignored.
Additional variables relevant for the study were included in the database. Theyinclude a consumer price index (CPI)–based real effective exchange rate (REER)index, obtained from the International Monetary Fund’s International Financial Sta-tistics, and updated industrial production indexes obtained from the Instat databaseof the United Nations Industrial Development Organization (UNIDO).11 To captureforeign demand effects, a sector-level export-weighted foreign GDP (gdpf ) index iscalculated as
gdpfijt �∑10
k
�kij GDPk
t (1)
where GDP is valued in constant 2000 prices and �kij is the average share of exports
of product i in country j to each of the top 10 trading partners (k) over the period2001 to 2002.
Finally, a variable to capture the effect of tariff liberalization on the cost of pro-duction is constructed. This variable, termed input tariff cost (tcost), is constructedas follows:
tcostijt �∑n
a nij tnt (2)
where t is the tariff rate and anij is the quantity of intermediate input n used in the pro-
duction of one unit of i in country j. The value of tcost is therefore a measure of theproportion of total costs accounted for by tariffs on intermediate inputs.
An input-output table for the United States consisting of 17 aggregated manufac-turing sectors, based on the three-digit ISIC rev. 2 code, is used to calculate the inputcoefficients (an
ij). The input-output table is obtained from Nicita and Olarreaga(2006). The tariff data used to construct tcost are aggregated to be consistent withthis classification.12
There are various caveats regarding the variable tcost. Most important, tariff pro-tection on agricultural and mining inputs is not included because the input-outputtable used does not contain input shares for these sectors. This is expected to particu-larly affect tcost values for agricultural product–intensive manufacturing sectors.Measurement of protection in the agricultural sector is, however, difficult given theextensive use of nontariff barriers and specific tariffs in the sector. Protection on mining products is generally low throughout the period and is not expected to have a
PROTECTIONIST POLICIES AND MANUFACTURING TRADE FLOWS IN AFRICA | 93
substantial impact on tcost. A second limitation is that the variable excludes dutyrebates on inputs that may be granted to exporters.
Despite the limitations, this database has a number of advantages. First, it includesdirect measures of tariff protection. Second, sectoral data are included, enabling amore disaggregated analysis of the effect of trade liberalization on trade flows. Third,the inclusion of tcost allows for an alternative specification of the export relationshipthat captures the effect of tariff liberalization on input costs. Finally, the databasecovers a period in which considerable liberalization and changes in trade flows haveoccurred in many economies. This variation in the data lends itself to econometricanalysis.
Some of the key data related to trade flows, tariffs, and tcost are presented inannex table A.1. The trends in trade flows and tariff liberalization are consistent withthe more detailed analysis presented earlier. Average tariffs fell in all country groups,including Africa, although tariff protection remains relatively high in that region.Tariff liberalization also reduced average production costs (tcost) in many countries,with particularly large decreases in the low-income country group (from 14 to 7 per-cent) and the lower-middle-income group (11 to 3.3 percent). The decline is reason-ably widespread, with 43 of the 51 countries sampled experiencing lower productioncosts from liberalization. Of the 30 developing economies covered, production costsdecreased in 23 between the early 1990s and 2004.
As noted earlier, manufacturing trade volumes increased for many economies from1990 on, with relatively slower growth experienced in Africa. Aggregate importgrowth was also high, but it lagged export growth for low-income and lower-middle-income regions. The effect is an improvement in the real manufacturing trade balancein 21 of the 30 developing countries in the sample. The improvements in the tradebalance for many of the developing countries point to a potentially important differ-ence from the studies of Santos-Paulino and Thirlwall (2004) and UNCTAD (1999),where the trade balance worsened after liberalization.
Manufactured Exports
A simple reduced-form imperfect substitution model, as discussed by Goldstein andKhan (1985), is used to estimate the export relationship. The estimated equationtakes the form:
ln(x)ijt � �0 � �1 ln(gdpf )ijt � �2 ln(reer)jt
� �3 ln(prod)ijt � �4 ln(tcost)ijt � �ijt , � � 0, (3)
where x denotes export volumes, gdpf is foreign GDP, reer is the real effectiveexchange rate, prod is an index of real industrial production (a proxy for produc-tive capacity), and tcost is a measure of input costs associated with tariff protection.The subscripts i, j, and t represent sector, country, and time, respectively.13
Various methods are used to estimate the relationship. One option is to pool thedata and estimate the relationship using ordinary least squares (OLS). A shortcom-ing of this method is that time-invariant characteristics of sectors and countries are
94 | LAWRENCE EDWARDS
likely to be correlated with the explanatory variables, leading to biased estimates. Inan attempt to deal with this problem, two approaches are followed.
In model A, dummy variables for country (cntryj), sector (isici), and year (�t) areincluded in the OLS regressions. Omitted variable bias may nevertheless persist. Forexample, low tariffs on mining sectors in Africa reflect a comparative advantage inthese sectors arising from a relative abundance of natural resources. The high exportsof these products will erroneously be attributed to the tariff variable in the estimates.Furthermore, as noted earlier, countries frequently implement other reforms, such ascapital account liberalization, concurrently with tariff liberalization. To avoid thesebiases, model B includes country-by-sector specific effects (cntryisicij) and country-by-year specific effects (ctryyearjt). The error component of equation (3) is thereforespecified as
�ijt � �t � cntryisicij � ctryyearjt � �ijt. (4)
The results for the export relationship are presented in table 3. Separate estimates arepresented for the full sample of countries and for developing countries. To investigatethe African trade relationship, two additional regressions are estimated. First, a dummyvariable for Africa (�1) is interacted with the tariff variable in the developing-countryregressions. Second, the export relationship is estimated for the Africa sample alone.All relationships are estimated using both mirror export data and own-country reported data. Note that in model B the reer variable is dropped because it correlatesperfectly with ctryyearjt.
Looking at the results for all countries (columns 1 and 5), the estimated exportrelationship appears to be well defined, with a high R2 and a number of significantvariables of the correct sign. Export volumes respond positively to rising foreignincome, a depreciation of the real effective exchange rate, and increased domesticproductive capacity. Except for the reer, the estimated elasticities for these variablesare largely unaffected by the choice of mirror export or own-export data.
Turning to the trade liberalization variable, mirror export volumes are found to beresponsive to tcost, and the estimated elasticity declines from �0.385 for model A(column 1) to �0.137 for model B (column 5). The latter, the preferred estimate, sug-gests that a 10 percent reduction in the input-weighted average manufacturing tariffraises manufactured export volumes by 1.37 percent. The results for tcost using ownexports in model A are generally similar, but the relationship is not robust to theinclusion of the country-by-sector and country-by-year fixed effects.
The stability of the relationship across regions can be seen in the developing-country and Africa results. There is some variation in the estimated relationshipsacross country groups and across different models. The relationship betweenexport volumes and reer, foreign GDP, and industrial production in developingcountries (columns 2 and 6) is generally similar to the full sample results. Risingprotection, measured using tcost, is also found to affect export performance neg-atively, and the coefficients are not significantly different from those of the fullsample.
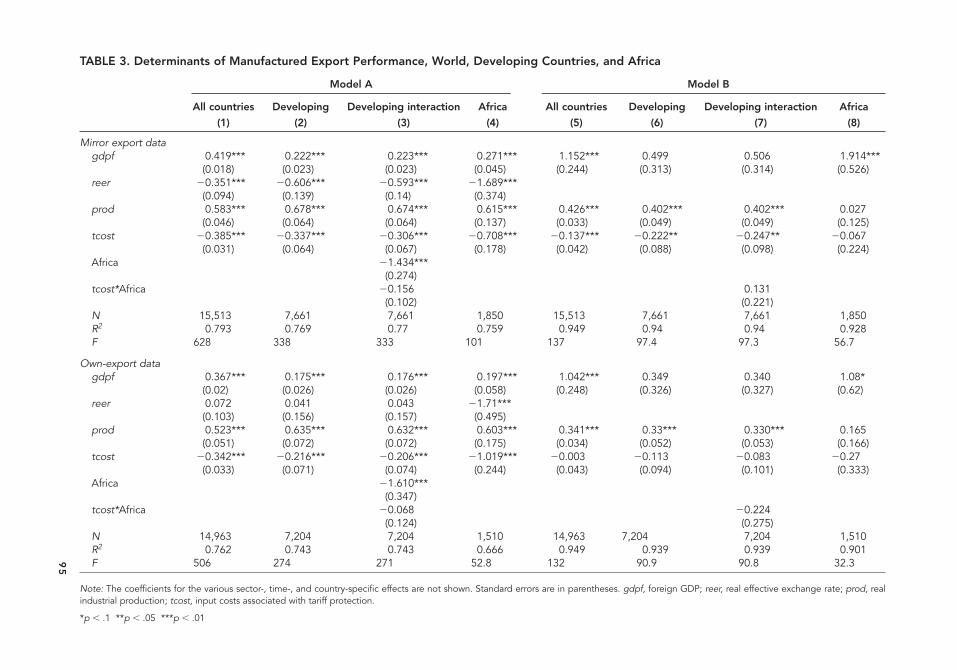
95
TABLE 3. Determinants of Manufactured Export Performance, World, Developing Countries, and Africa
Model A Model B
All countries Developing Developing interaction Africa All countries Developing Developing interaction Africa
(1) (2) (3) (4) (5) (6) (7) (8)
Mirror export datagdpf 0.419*** 0.222*** 0.223*** 0.271*** 1.152*** 0.499 0.506 1.914***
(0.018) (0.023) (0.023) (0.045) (0.244) (0.313) (0.314) (0.526)reer �0.351*** �0.606*** �0.593*** �1.689***
(0.094) (0.139) (0.14) (0.374)prod 0.583*** 0.678*** 0.674*** 0.615*** 0.426*** 0.402*** 0.402*** 0.027
(0.046) (0.064) (0.064) (0.137) (0.033) (0.049) (0.049) (0.125)tcost �0.385*** �0.337*** �0.306*** �0.708*** �0.137*** �0.222** �0.247** �0.067
(0.031) (0.064) (0.067) (0.178) (0.042) (0.088) (0.098) (0.224)Africa �1.434***
(0.274)tcost*Africa �0.156 0.131
(0.102) (0.221)N 15,513 7,661 7,661 1,850 15,513 7,661 7,661 1,850R2 0.793 0.769 0.77 0.759 0.949 0.94 0.94 0.928F 628 338 333 101 137 97.4 97.3 56.7
Own-export datagdpf 0.367*** 0.175*** 0.176*** 0.197*** 1.042*** 0.349 0.340 1.08*
(0.02) (0.026) (0.026) (0.058) (0.248) (0.326) (0.327) (0.62)reer 0.072 0.041 0.043 �1.71***
(0.103) (0.156) (0.157) (0.495)prod 0.523*** 0.635*** 0.632*** 0.603*** 0.341*** 0.33*** 0.330*** 0.165
(0.051) (0.072) (0.072) (0.175) (0.034) (0.052) (0.053) (0.166)tcost �0.342*** �0.216*** �0.206*** �1.019*** �0.003 �0.113 �0.083 �0.27
(0.033) (0.071) (0.074) (0.244) (0.043) (0.094) (0.101) (0.333)Africa �1.610***
(0.347)tcost*Africa �0.068 �0.224
(0.124) (0.275)N 14,963 7,204 7,204 1,510 14,963 7,204 7,204 1,510R2 0.762 0.743 0.743 0.666 0.949 0.939 0.939 0.901F 506 274 271 52.8 132 90.9 90.8 32.3
Note: The coefficients for the various sector-, time-, and country-specific effects are not shown. Standard errors are in parentheses. gdpf, foreign GDP; reer, real effective exchange rate; prod, realindustrial production; tcost, input costs associated with tariff protection.
*p .1 **p .05 ***p .01

96 | LAWRENCE EDWARDS
Looking at the export relationship in Africa, none of the interaction terms incolumns 3 and 7 are significant, suggesting that the effect of tariff protection onexports in Africa is no different from that for other developing economies. Theresults for model A using the Africa sample (column 4) are also similar to those forthe full sample of developing countries, although African exports of manufacturedgoods appear to be more than twice as sensitive to the reer. Lower input costs fromtrade liberalization are relatively strongly associated with improved export perform-ance in the Africa sample. However, most of the results for the Africa sample becomeinsignificantly different from zero once country-by-sector and country-by-year fixedeffects are included in the model (column 8, model B), and only foreign GDP remainssignificant.14
Much of Africa’s export performance therefore appears to be explained by factorsother than tariff protection. This may reflect the relatively low share of manufactur-ing trade in total trade in African countries, as well as a dependence on resource-based products within manufacturing. Exports of resource-based products are lesslikely to be influenced by tariffs on inputs than are downstream products that use arelatively high proportion of manufactured inputs in the production process. Never-theless, the results for the pooled sample of developing countries suggest that asAfrica deepens its manufacturing base, continued protection, particularly on inputs,will constrain export growth.
A more detailed analysis of the contribution of tariff liberalization to exportgrowth in developing countries from 1992–95 to 2003–4 is presented in table 4. Thedecomposition is based on two estimated tcost elasticities for developing countries:�0.222 and �0.337. Export volumes in the average developing economy grew by110 percent over the period. Production costs associated with tariffs fell by 47 per-cent for the average economy, which translates roughly into an 11–16 percentincrease in export volume, depending on the tcost elasticity selected. For the averageAfrican economy, the decline in tcost is associated with an increase in export volumeranging from 11 to 17 percent. This is equivalent to 14 to 20 percent of the changein total exports in the average African economy over this period. Thus, although liberalization raises export volumes, its contribution to overall export growth in the1990s appears to be relatively small.
TABLE 4. Contribution of Tariff Liberalization to Changes in Manufactured ExportVolumes, for Africa and by Income Group, 1992–95 to 2003–4
Average ln change Estimated change in exports
Country group tcost Exports Elasticity 1 (�0.222) Elasticity 2 (�0.337)
Africa �0.49 0.82 0.11 0.17Low income �0.73 1.12 0.17 0.25Lower middle income �0.47 1.18 0.11 0.16Upper middle income �0.28 0.99 0.06 0.09Developing �0.47 1.10 0.11 0.16
Note: Export and tcost values reflect the simple country average.
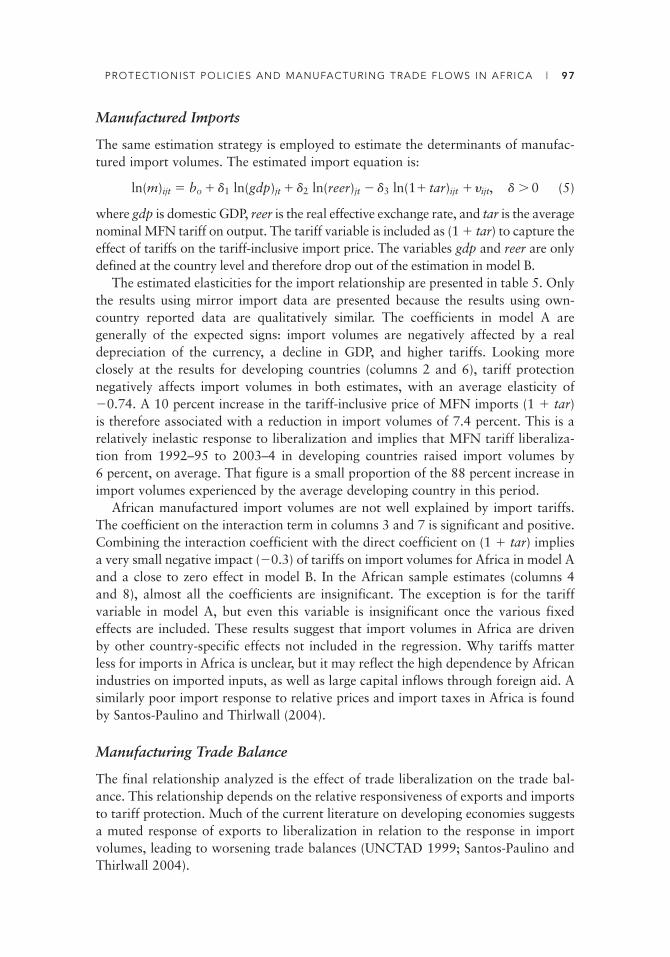
PROTECTIONIST POLICIES AND MANUFACTURING TRADE FLOWS IN AFRICA | 97
Manufactured Imports
The same estimation strategy is employed to estimate the determinants of manufac-tured import volumes. The estimated import equation is:
ln(m)ijt � bo � d1 ln(gdp)jt � d2 ln(reer)jt � d3 ln(1� tar)ijt � �ijt, d � 0 (5)
where gdp is domestic GDP, reer is the real effective exchange rate, and tar is the averagenominal MFN tariff on output. The tariff variable is included as (1 � tar) to capture theeffect of tariffs on the tariff-inclusive import price. The variables gdp and reer are onlydefined at the country level and therefore drop out of the estimation in model B.
The estimated elasticities for the import relationship are presented in table 5. Onlythe results using mirror import data are presented because the results using own-country reported data are qualitatively similar. The coefficients in model A are generally of the expected signs: import volumes are negatively affected by a realdepreciation of the currency, a decline in GDP, and higher tariffs. Looking moreclosely at the results for developing countries (columns 2 and 6), tariff protectionnegatively affects import volumes in both estimates, with an average elasticity of�0.74. A 10 percent increase in the tariff-inclusive price of MFN imports (1 � tar)is therefore associated with a reduction in import volumes of 7.4 percent. This is arelatively inelastic response to liberalization and implies that MFN tariff liberaliza-tion from 1992–95 to 2003–4 in developing countries raised import volumes by6 percent, on average. That figure is a small proportion of the 88 percent increase inimport volumes experienced by the average developing country in this period.
African manufactured import volumes are not well explained by import tariffs.The coefficient on the interaction term in columns 3 and 7 is significant and positive.Combining the interaction coefficient with the direct coefficient on (1 � tar) impliesa very small negative impact (�0.3) of tariffs on import volumes for Africa in model Aand a close to zero effect in model B. In the African sample estimates (columns 4and 8), almost all the coefficients are insignificant. The exception is for the tariff variable in model A, but even this variable is insignificant once the various fixedeffects are included. These results suggest that import volumes in Africa are drivenby other country-specific effects not included in the regression. Why tariffs matterless for imports in Africa is unclear, but it may reflect the high dependence by Africanindustries on imported inputs, as well as large capital inflows through foreign aid. Asimilarly poor import response to relative prices and import taxes in Africa is foundby Santos-Paulino and Thirlwall (2004).
Manufacturing Trade Balance
The final relationship analyzed is the effect of trade liberalization on the trade bal-ance. This relationship depends on the relative responsiveness of exports and importsto tariff protection. Much of the current literature on developing economies suggestsa muted response of exports to liberalization in relation to the response in import volumes, leading to worsening trade balances (UNCTAD 1999; Santos-Paulino andThirlwall 2004).

98
TABLE 5. Determinants of Manufactured Import Volumes, by Country Group and for Africa
Model A Model B
All countries Developing Developing interaction Africa All countries Developing Developing interaction Africa
(1) (2) (3) (4) (5) (6) (7) (8)
reer 0.544*** 0.767*** 0.773*** �0.035(0.06) (0.086) (0.086) (0.206)
gdp 1.23*** 0.757*** 0.664*** 0.00(0.102) (0.155) (0.157) (0.427)
1 � tar �0.513*** �0.714*** �1.121*** �0.931*** �0.478*** �0.765*** �1.450*** 0.096(0.087) (0.11) (0.145) (0.16) (0.146) (0.166) (0.222) (0.262)
Africa 0.205(0.538)
Africa*(1 � tar) 0.808*** 1.546***(0.189)
(0.334)N 16,855 8,666 8,666 2,293 16,855 8,666 8,666 2,293R2 0.846 0.821 0.822 0.804 0.935 0.925 0.93 0.912F 978 534 528 167 107 83 89.2 53
Note: The coefficients for the various sector-, time-, and country-specific effects are not shown. Standard errors are in parentheses. Values for reer and gdp are only defined at the country level anddrop out of the estimations in model B.
*p .1 ***p .01
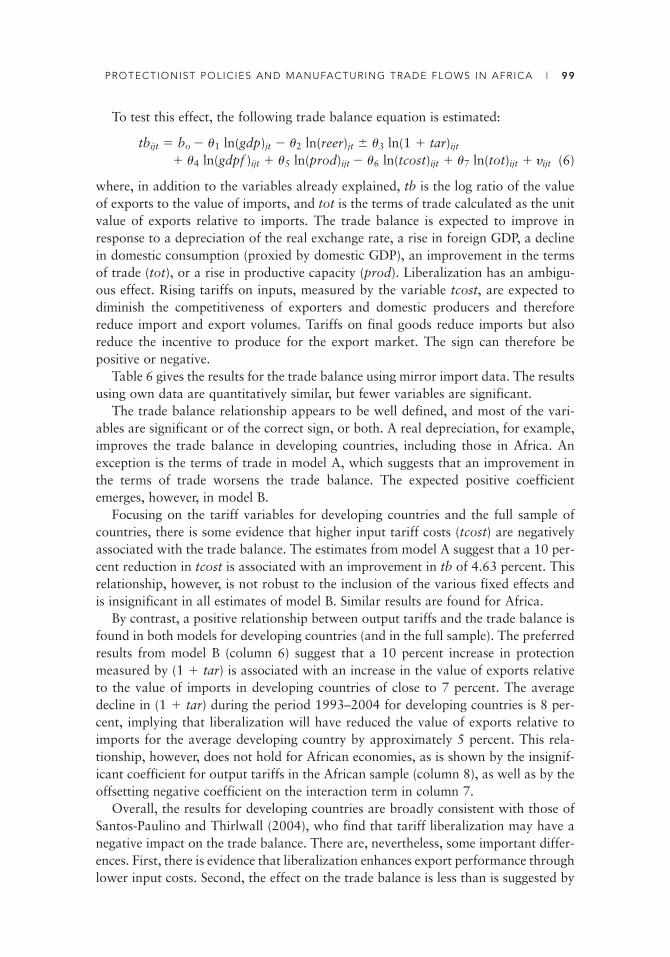
PROTECTIONIST POLICIES AND MANUFACTURING TRADE FLOWS IN AFRICA | 99
To test this effect, the following trade balance equation is estimated:
tbijt � bo � �1 ln(gdp)jt � �2 ln(reer)jt �3 ln(1 � tar)ijt
� �4 ln(gdpf )ijt � �5 ln(prod)ijt � �6 ln(tcost)ijt � �7 ln(tot)ijt � �ijt (6)
where, in addition to the variables already explained, tb is the log ratio of the valueof exports to the value of imports, and tot is the terms of trade calculated as the unitvalue of exports relative to imports. The trade balance is expected to improve inresponse to a depreciation of the real exchange rate, a rise in foreign GDP, a declinein domestic consumption (proxied by domestic GDP), an improvement in the termsof trade (tot), or a rise in productive capacity (prod). Liberalization has an ambigu-ous effect. Rising tariffs on inputs, measured by the variable tcost, are expected todiminish the competitiveness of exporters and domestic producers and thereforereduce import and export volumes. Tariffs on final goods reduce imports but alsoreduce the incentive to produce for the export market. The sign can therefore be positive or negative.
Table 6 gives the results for the trade balance using mirror import data. The resultsusing own data are quantitatively similar, but fewer variables are significant.
The trade balance relationship appears to be well defined, and most of the vari-ables are significant or of the correct sign, or both. A real depreciation, for example,improves the trade balance in developing countries, including those in Africa. Anexception is the terms of trade in model A, which suggests that an improvement inthe terms of trade worsens the trade balance. The expected positive coefficientemerges, however, in model B.
Focusing on the tariff variables for developing countries and the full sample ofcountries, there is some evidence that higher input tariff costs (tcost) are negativelyassociated with the trade balance. The estimates from model A suggest that a 10 per-cent reduction in tcost is associated with an improvement in tb of 4.63 percent. Thisrelationship, however, is not robust to the inclusion of the various fixed effects andis insignificant in all estimates of model B. Similar results are found for Africa.
By contrast, a positive relationship between output tariffs and the trade balance isfound in both models for developing countries (and in the full sample). The preferredresults from model B (column 6) suggest that a 10 percent increase in protectionmeasured by (1 � tar) is associated with an increase in the value of exports relativeto the value of imports in developing countries of close to 7 percent. The averagedecline in (1 � tar) during the period 1993–2004 for developing countries is 8 per-cent, implying that liberalization will have reduced the value of exports relative toimports for the average developing country by approximately 5 percent. This rela-tionship, however, does not hold for African economies, as is shown by the insignif-icant coefficient for output tariffs in the African sample (column 8), as well as by theoffsetting negative coefficient on the interaction term in column 7.
Overall, the results for developing countries are broadly consistent with those ofSantos-Paulino and Thirlwall (2004), who find that tariff liberalization may have anegative impact on the trade balance. There are, nevertheless, some important differ-ences. First, there is evidence that liberalization enhances export performance throughlower input costs. Second, the effect on the trade balance is less than is suggested by
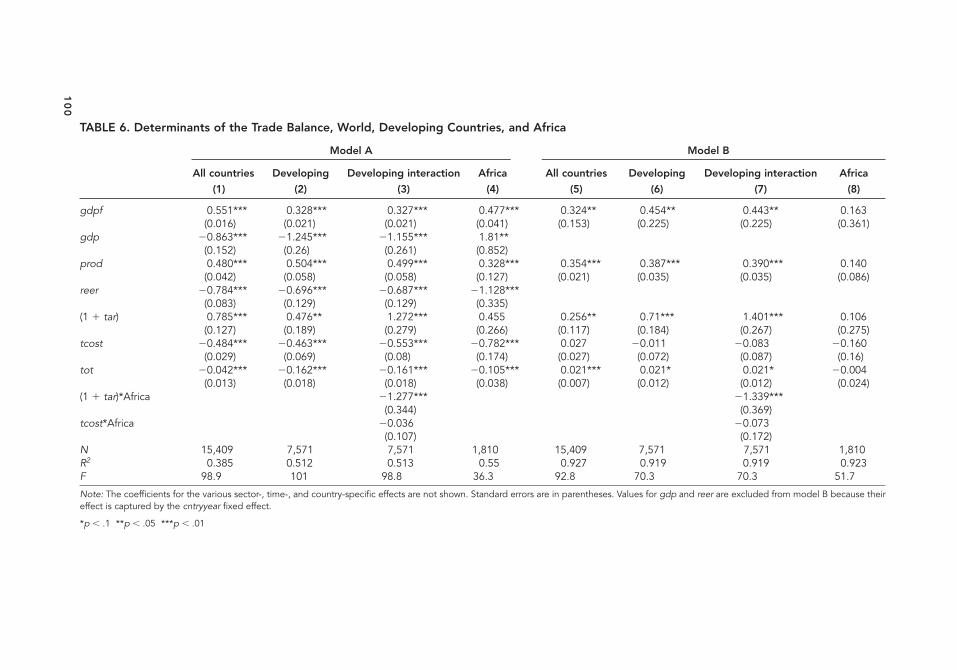
10
0
TABLE 6. Determinants of the Trade Balance, World, Developing Countries, and Africa
Model A Model B
All countries Developing Developing interaction Africa All countries Developing Developing interaction Africa
(1) (2) (3) (4) (5) (6) (7) (8)
gdpf 0.551*** 0.328*** 0.327*** 0.477*** 0.324** 0.454** 0.443** 0.163(0.016) (0.021) (0.021) (0.041) (0.153) (0.225) (0.225) (0.361)
gdp �0.863*** �1.245*** �1.155*** 1.81**(0.152) (0.26) (0.261) (0.852)
prod 0.480*** 0.504*** 0.499*** 0.328*** 0.354*** 0.387*** 0.390*** 0.140(0.042) (0.058) (0.058) (0.127) (0.021) (0.035) (0.035) (0.086)
reer �0.784*** �0.696*** �0.687*** �1.128***(0.083) (0.129) (0.129) (0.335)
(1 � tar) 0.785*** 0.476** 1.272*** 0.455 0.256** 0.71*** 1.401*** 0.106(0.127) (0.189) (0.279) (0.266) (0.117) (0.184) (0.267) (0.275)
tcost �0.484*** �0.463*** �0.553*** �0.782*** 0.027 �0.011 �0.083 �0.160(0.029) (0.069) (0.08) (0.174) (0.027) (0.072) (0.087) (0.16)
tot �0.042*** �0.162*** �0.161*** �0.105*** 0.021*** 0.021* 0.021* �0.004(0.013) (0.018) (0.018) (0.038) (0.007) (0.012) (0.012) (0.024)
(1 � tar)*Africa �1.277*** �1.339***(0.344) (0.369)
tcost*Africa �0.036 �0.073(0.107) (0.172)
N 15,409 7,571 7,571 1,810 15,409 7,571 7,571 1,810R2 0.385 0.512 0.513 0.55 0.927 0.919 0.919 0.923F 98.9 101 98.8 36.3 92.8 70.3 70.3 51.7
Note: The coefficients for the various sector-, time-, and country-specific effects are not shown. Standard errors are in parentheses. Values for gdp and reer are excluded from model B because theireffect is captured by the cntryyear fixed effect.
*p .1 **p .05 ***p .01

PROTECTIONIST POLICIES AND MANUFACTURING TRADE FLOWS IN AFRICA | 101
the authors’ estimates, particularly those based on dummy variables for the trade lib-eralization period. Third, there does not appear to be a negative relationship betweenprotection and the trade balance in Africa, although these estimates are generallypoor.
Other Factors
The results presented indicate that tariff liberalization enhanced manufacturing tradeflows in developing countries, including Africa, between 1990 and 2004, but not bymuch. This finding suggests a limited supply response to the changing incentives aris-ing from tariff liberalization. There is much evidence to support this view. In a com-prehensive review of economic performance in Africa, Collier and Gunning (1999)argue that distorted product and credit markets, high risk, inadequate social capital,inadequate infrastructure, and poor public services are key factors inhibiting Africanfirms’ investment responses to opportunities.
Microlevel institutions that affect the cost of exporting are also important (Johnson,Ostry, and Subramanian 2007). For example, it takes, on average, 40 days to exportfrom a Sub-Saharan African country, but only 11 days for OECD countries. A com-bination of factors is responsible: excessive tariff bands, a lack of electronic docu-mentation, undue numbers of required documents, inefficient customs systems, poorroads, port congestion, and corruption at the border (World Bank 2005). The avail-able empirical evidence indicates that many of these factors are important determi-nants of Africa’s export performance and firm productivity (Limão and Venables2001; Clarke 2005; Eifert, Gelb, and Ramachandran 2005; Wilson, Mann, and Otsuki2005; Djankov, Freund, and Pham 2006). Higher transaction costs associated withweak institutions and infrastructure facilities are found to be particularly detrimen-tal to exports of manufactured products (Collier 2000; Elbadawi 2001; World Bank2000).15
Conclusion
Sub-Saharan Africa’s share of world export volumes has continued to decline since1990. Yet there are signs of improvement. The post-2000 commodity price boom hasbenefited Africa, and Sub-Saharan Africa’s share in the value of world exports in2006 was equivalent to its share in 1990 despite the relatively poor growth in exportvolumes. There is evidence of improved competitiveness in some manufacturing sec-tors, and when measured relative to GDP, export performance in Sub-Saharan Africamatches that of other developing countries. There are, therefore, some important differences in the post-1990 period from the period prior to 1990 analyzed by Ngand Yeats (1996).
Some of the difference in export performance can be attributed to the progressmany Sub-Saharan African countries have made in lowering tariffs since the early1990s. The econometric estimates presented in this paper indicate that tariff liberal-ization stimulates manufactured export volumes in developing countries. A key
102 | LAWRENCE EDWARDS
mechanism through which export performance is enhanced is through decreases inthe cost of production inputs.
A policy response to stimulate manufactured exports would therefore be to reducetariffs on key production inputs. Implementation of such a policy, however, involvesa number of difficulties. Whether products are inputs or final goods is not alwaysclear cut. Lower tariffs on inputs increase effective protection in downstream sectors,which may raise the overall level of distortions in the economy. An alternative optionis comprehensive liberalization that includes reductions in tariffs on final goods. Forexample, an across-the-board reduction in tariffs reduces input costs without leadingto further increases in effective protection. Improvements in duty-drawback mecha-nisms available in Africa would further reduce the antiexport bias of protection.
African economies will also need to consider the possible implications of furthertariff liberalization for the manufacturing trade balance. The estimates presentedshow that lower tariffs are associated with increased import volumes and a worsen-ing of the manufacturing trade balance in developing countries. The growth inexports from liberalization is often exceeded by growth in imports, and if this leadsto a shortage of foreign currency, the growth process may be constrained. The prob-lem may not be as acute in Africa as in other developing countries, as the relation-ship between protection and the trade balance was not significant in the preferredestimates. In general, the estimated import and trade balance relationships for Africawere poor.
Nevertheless, the trade balance results suggest that liberalization policies need tobe enhanced through complementary policies that stimulate export growth. Forexample, a depreciation of the currency is shown to have strong positive effects onthe trade balance, particularly through the export channel. Although tariff liberal-ization is expected to depreciate the currency and thus offset some of the importeffect, in many developing countries the currency appreciated in response to otherreforms implemented (Bleaney 1999; UNCTAD 1999). The appropriate sequencingof reforms to minimize the possibility of unexpected currency appreciation needs tobe considered. Other empirical literature indicates that improvements in trade-related infrastructure and institutions can have a substantial impact on exportgrowth in Africa.

10
3
ANNEX TABLE A.1. Manufacturing Trade and Tariffs, Selected Countries, Early 1990s to 2004(percent)
Average annual Average MFN tariff
growth, 1990–2004 (import weighted) Average tariff-related input cost
Share of Exports
Income group trade, 2004 Imports (mirror) 1990–95 2001–4 Change 1990–95 2001–4 Change
Low income 2.1 8.3 11.7 34.2 18.7 �11.6 14.1 7.0 �50.7Bangladesh 0.1 7.6 14.7 82.4 18.9 �34.8 43.0 12.7 �70.4Côte d’Ivoire 0.0 3.4 2.3 23.0 10.8 �9.9 6.9 3.6 �47.6Ghana 0.0 8.4 �0.4 11.1 13.4 2.1 4.3 7.1 64.9India 1.1 12.1 12.6 60.7 28.5 �20.0 23.8 10.8 �54.6Indonesia 0.7 4.6 11.7 13.9 6.1 �6.9 5.4 2.2 �59.5Kenya 0.0 5.3 9.6 25.5 13.1 �9.9 9.4 5.7 �39.5Uganda 0.0 6.3 7.6 16.7 6.5 �8.7 5.8 2.5 �57.6
Lower middle income 12.9 14.2 17.3 25.0 8.7 �13.1 11.1 3.3 �70.3Algeria 0.2 5.5 �0.7 15.9 13.5 �2.0 2.7 6.1 121.3Bolivia 0.0 7.2 7.7 9.7 9.0 �0.6 3.5 3.1 �11.7China 9.9 17.9 18.8 30.9 8.4 �17.2 12.4 3.3 �73.4Colombia 0.2 9.0 11.0 11.7 11.3 �0.3 4.2 4.3 2.6Ecuador 0.1 10.8 10.9 11.0 11.0 0.0 3.8 3.6 �3.3Egypt, Arab Rep. of 0.1 2.0 12.2 23.8 12.8 �8.9 9.8 6.2 �36.3El Salvador 0.1 13.7 18.7 10.8 9.7 �1.0 6.0 5.9 �1.1Morocco 0.2 7.5 8.7 59.6 25.1 �21.6 25.1 12.0 �52.4Peru 0.1 9.6 8.8 15.8 9.4 �5.5 6.2 4.0 �34.8Philippines 0.8 11.8 15.8 17.0 3.2 �11.8 6.8 1.2 �82.3Sri Lanka 0.1 8.1 12.6 27.4 7.5 �15.6 13.7 2.4 �82.3Tunisia 0.2 6.6 11.1 27.9 23.2 �3.7 11.3 10.7 �5.3Turkey 1.1 11.9 15.3 7.9 4.8 �2.9 3.6 2.3 �36.4
(continued)

10
4
Upper middle income 11.6 11.5 11.5 11.9 9.5 22.1 4.2 3.2 �22.6Argentina 0.4 17.0 7.6 12.6 13.8 1.0 3.8 4.1 6.9Brazil 1.0 9.2 8.0 17.9 11.8 �5.2 5.4 4.3 �20.5Chile 0.3 8.2 9.1 10.9 6.8 �3.7 4.4 2.7 �38.2Korea, Rep. of 3.4 8.3 11.6 9.5 5.3 �3.9 3.5 1.9 �44.5Malaysia 1.9 9.4 13.5 9.7 5.1 �4.2 4.0 2.0 �48.7Mauritius 0.0 3.7 4.7 26.2 10.4 �12.6 11.6 5.7 �50.8Mexico 2.8 15.7 13.4 12.1 14.9 2.5 4.6 5.6 21.1Poland 1.1 36.3 15.2 10.5 9.8 �0.7 3.6 3.6 0.2South Africa 0.6 8.1 8.7 16.3 8.9 �6.4 4.0 1.9 �52.2Uruguay 0.0 7.2 3.7 9.8 13.0 2.9 3.5 4.6 32.0
OECD 73.5 6.2 5.8 6.0 3.1 �2.7 1.9 1.0 �46.4
Africa 1.4 6.2 7.5 24.6 14.1 �8.5 7.6 4.9 �35.5
Source: Updated data based on trade, production, and protection database (Nicita and Olarreaga 2006).
Note: MFN, most favored nation; OECD, Organisation for Economic Co-operation and Development.
ANNEX TABLE A.1. (Continued)
Average annual Average MFN tariff
growth, 1990–2004 (import weighted) Average tariff-related input cost
Share of Exports
Income group trade, 2004 Imports (mirror) 1990–95 2001–4 Change 1990–95 2001–4 Change

PROTECTIONIST POLICIES AND MANUFACTURING TRADE FLOWS IN AFRICA | 105
Notes
1. See Santos-Paulino (2005) for a review of studies relating to Africa and other developingeconomies.
2. The calculations were based on World Development Indicators (WDI) data. The averageratio of taxes on international trade to total trade in goods and services in Sub-SaharanAfrica was 10.3 percent between 1990 and 1995.
3. SITC is the Standard International Trade Classification.
4. Economies are divided according to 2006 gross national income per capita. The groupsare as follows: low income, US$905 or less; lower middle income, US$906–US$3,595;upper middle income, US$3,596–US$11,115; and high income, US$11,116 or more.Developing countries include all low-income and middle-income economies.
5. These results contrast starkly with those of Morrissey and Mold (2006), who argue thatAfrican exports perform relatively well when analyzed in terms of volume.
6. Home-reported export data for most Sub-Saharan African countries are notoriously poor(Yeats 1990), and mirrored export data were used for the earlier period. Because of unre-liable data over time, the following categories were excluded from the analysis: 286 (oresand concentrates of uranium); 323 (coal briquettes; coke and semicoke; lignite or peat;retort carbon); 333 (crude petroleum and oils obtained from bituminous minerals); 334(petroleum products, refined); and 688 (uranium depleted in U235). Exports from oil-exporting economies are thus underreported.
7. The gravity models of Foroutan and Pritchett (1993) and Coe and Hoffmaister (1999)yield consistent results. Foroutan and Pritchett, for example, find that intra-African tradein manufactures in the early 1980s is unusually high in relation to that of low-income andmedium-income countries, given Africa’s characteristics. A recent extension of this workby Subramanian and Tamirisa (2003) finds consistent results for anglophone Africa butnot for francophone Africa, which is found to trade less than predicted.
8. To maximize the number of available countries, the average for 1996–2000 instead of for1990–95 is used for 38 of the countries, and data for 2001–3 rather than 2004–6 are usedfor 11 of the countries.
9. The focus on the average tariff ignores other indicators of protection. According to 2006tariff data obtained from the WTO’s World Tariff Profiles 2006 (WTO 2006), Sub- Saharan African countries, on average, have lower binding coverage (50.6 percent of linesversus 82 percent for all countries), higher bound rates (60 versus 35 percent); a lowerproportion of lines subject to duty-free rates (15.2 versus 23.4 percent), and a higher pro-portion of international tariff spikes, that is, tariff lines with duties less than 15 percent(37.6 versus 20.4 percent). In other dimensions, the structure of tariffs is far simpler inAfrica than in other developing economies. The average number of tariff lines is lower;there are far fewer distinct duties (51 versus 412); and the proportion of tariff lines withnon–ad valorem rates is a quarter of the average for all countries (0.5 versus 2 percent).
10. ISIC stands for International System of Industrial Classification.
11. Real effective exchange rate data were not available for Argentina, Bangladesh, Brazil, theArab Republic of Egypt, El Salvador, India, Indonesia, Kenya, the Republic of Korea,Mauritius, Mexico, Peru, Senegal, or Turkey. CPI-based REER indexes for these countrieswere calculated using CPI indexes, exchange rate data (from IMF, International Financial Statistics, various years), and bilateral export weights of the top 10 export partners.
12. The average sectoral tariff is used to calculate the production costs associated with tariffprotection. An alternative approach is to calculate average tariffs on intermediate and capital goods using the broad economic categories (BEC) classification.

106 | LAWRENCE EDWARDS
13. It is possible that industrial production is itself a function of exports. In an attempt to dealwith possible endogeneity bias, lagged values of prod were included in alternative esti-mates. The results are largely unchanged.
14. To test the sensitivity of the results to choice of tariff variable, additional estimates wereconducted using the simple average MFN tariff on output and tcost calculated usingimport-weighted applied rates that account for tariff preferences. The results using theaverage MFN tariff on output are poor, but those using tcost calculated with applied ratesare similar.
15. See also Wood and Mayer (2001), who emphasize the role of endowments relative toinfrastructure.
References
Amjadi, Azita, and Alexander Yeats. 1995. “Have Transport Costs Contributed to the Rela-tive Decline of Sub-Saharan African Exports? Some Preliminary Empirical Evidence.” Policy Research Working Paper 1559, International Trade Division, World Bank, Washington, DC.
Amjadi, Azita, Ulrich Reincke, and Alexander Yeats. 1996. “Did External Barriers Cause theMarginalization of Sub-Saharan Africa in World Trade?” Policy Research Working Paper1586, International Trade Division, World Bank, Washington, DC.
Anderson, James E., and Peter Neary. 1994. “Measuring the Restrictiveness of Trade Policy.”World Bank Economic Review 8 (2, May): 151–69.
Bleaney, Michael. 1999. “Trade Reform, Macroeconomic Performance and Export Growth inTen Latin American Countries, 1979–95.” Journal of International Trade and EconomicDevelopment 8 (1): 89–105.
Chandra, Vandana, Lalita Moorty, Jean-Pascal Nganou, Bala Rajaratnam, and Kendall Schaefer. 2001. “Constraints to Growth and Employment in South Africa: Evidence fromthe Small, Medium and Micro Enterprise Firm Survey.” World Bank Informal DiscussionPapers on Aspects of the South African Economy 15, Southern Africa Department, WorldBank, Washington, DC.
Clarke, George. 2005. “Beyond Tariffs and Quotas: Why Don’t African Manufacturers ExportMore?” Policy Research Working Paper 3617, World Bank, Washington, DC.
Coe, David, and Alexander Hoffmaister. 1999. “North-South Trade: Is Africa Unusual?” Journal of African Economies 8 (2, July): 228–56.
Collier, Paul. 2000. “Africa’s Comparative Advantage.” In Industrial Development and Policyin Africa, ed. H. Jalilian, M. Tribe, and J. Weiss. Cheltenham, U.K.: Edward Elgar.
Collier, Paul, and Jan Willem Gunning. 1999. “Explaining African Economic Performance.”Journal of Economic Literature 37 (March): 64–111.
Collier, Paul, and Anthony J. Venables. 2007. “Rethinking Trade Preferences: How Africa CanDiversify Its Exports.” World Economy 30 (8, August): 1326–45.
Djankov, Simeon, Caroline Freund, and Cong Pham. 2006. “Trading on Time.” PolicyResearch Working Paper 3909, World Bank, Washington, DC.
Edwards, Lawrence. 2005. “Has South Africa Liberalised Its Trade?” South African Journalof Economics 73 (4): 754–75.
Edwards, Lawrence, and Robert Z. Lawrence. 2008. “South African Trade Policy Matters:Trade Performance and Trade Policy.” Economics of Transition 16 (4): 741–68.
PROTECTIONIST POLICIES AND MANUFACTURING TRADE FLOWS IN AFRICA | 107
Edwards, Lawrence, Neil Rankin, and Volker Schöer. 2008. “South African Exporting Firms:What Do We Know and What Should We Know?” Journal of Development Perspectives4 (1): 93–118.
Eifert, Benn, Alan Gelb, and Vijaya Ramachandran. 2005. “Business Environment and Com-parative Advantage in Africa: Evidence from the Investment Climate Data.” WorkingPaper 56, Center for Global Development, Washington, DC.
Elbadawi, Ibrahim A. 2001. “Can Africa Export Manufactures? The Role of Endowment,Exchange Rates, and Transaction Costs.” In Policies to Promote Competitiveness in Man-ufacturing in Sub-Saharan Africa, ed. Augustin Nsouli, Kwasi Fosu, and AristomeneVaroudakis. Paris: Organisation for Economic Co-operation and Development.
Foroutan, Faezeh, and Lant Pritchett. 1993. “Intra–Sub-Saharan African Trade: Is It Too Little?” Journal of African Economies 2 (1): 74–105.
Goldstein, Morris, and Mohsin Khan. 1985. “Income and Price Effects in Foreign Trade.” InHandbook of International Economics, vol. 2, ed. Ronald W. Jones, and Peter B. Kenen.Amsterdam: North-Holland.
Greenaway, David, and David Sapsford. 1994. “What Does Liberalisation Do for Exports andGrowth?” Review of World Economics 130: 157–74.
IMF (International Monetary Fund). Various years. International Financial Statistics. Washington, DC: IMF.
Johnson, Simon, Jonathan Ostry, and Arvind Subramanian. 2007. “The Prospects for Sus-tained Growth in Africa: Benchmarking the Constraints.” IMF Working Paper WP/07/52,International Monetary Fund, Washington, DC.
Lerner, Abba P. 1936. “The Symmetry between Import and Export Taxes.” Economica 3:306–13.
Limão, Nuno, and Anthony J. Venables. 2001. “Infrastructure, Geographical Disadvantage,Transport Costs, and Trade.” World Bank Economic Review 15 (3): 451–79.
Martin, Will, and Devashish Mitra. 2001. “Productivity Growth and Convergence in Agricul-ture versus Manufacturing.” Economic Development and Cultural Change 49 (2):403–22.
Mayer, Jörg, and Pilar Fajarnes. 2008. “Tripling Africa’s Primary Exports: What, How andWhere?” Journal of Development Studies 44 (1): 80–102.
Morrissey, Oliver, and Andrew Mold. 2006. “Explaining Africa’s Export Performance— Taking a New Look.” Center for Global Trade Analysis, Department of Agricultural Economics, Purdue University, West Lafayette, IN. https://www.gtap.agecon.purdue.edu/resources/download/2643.pdf.
Ng, Francis, and Alexander Yeats. 1996. “Open Economies Work Better: Did Africa’s Protec-tionist Policies Cause Its Marginalization in World Trade?” Policy Research WorkingPaper 1636, World Bank, Washington, DC.
Nicita, Alessandro, and Marcelo Olarreaga. 2006. “Trade, Production and Protection1976–2004.” World Bank Economic Review 21 (1): 165–71.
Papageorgiou, Demetris, Michael Michaely, and Armeane M. Choksi. 1991. Liberalizing Foreign Trade. Oxford: Basil Blackwell.
Parikh, Ashok, and Corneliu Stirbu. 2004. “Relationship between Trade Liberalisation, Eco-nomic Growth and Trade Balance: An Econometric Investigation.” HWWA DiscussionPaper 282, Hamburgisches Welt-Wirtschafts-Archiv, Hamburg.
Pattillo, Catherine, Sanjeev Gupta, and Kevin Carey. 2005. “Sustaining Growth Accelerationsand Pro-Poor Growth in Africa.” IMF Working Paper WP/05/195, International MonetaryFund, Washington, DC.

Richardson, J. David. 1971. “Constant-Market-Shares Analysis of Export Growth.” Journalof International Economics 1 (2): 227–39.
Rodrik, Dani. 1997. “Trade Policy and Economic Performance in Sub-Saharan Africa.” NBERWorking Paper 6562, National Bureau of Economic Research, Cambridge, MA.
Sachs, Jeffrey D., and Andrew M. Warner. 1999. “The Big Rush, Natural Resource Booms andGrowth.” Journal of Development Economics 59 (1): 43–76.
Santos-Paulino, Amelia. 2005. “Trade Liberalisation and Economic Performance: Theory andEvidence for Developing Countries.” World Economy 28 (6): 783–821.
Santos-Paulino, Amelia, and Anthony P. Thirlwall. 2004. “The Impact of Trade Liberalisationon Exports, Imports and the Balance of Payments of Developing Countries.” EconomicJournal 114 (February): F50–F72.
Subramanian, Arvind, and Natalia T. Tamirisa. 2003. “Is Africa Integrated in the Global Econ-omy?” IMF Staff Papers 50 (3): 352–72.
UNCTAD (United Nations Conference on Trade and Development). 1999. Trade and Devel-opment Report, 1999. Geneva: United Nations.
Wang, Zhen K., and Alan L. Winters. 1998. “Africa’s Role in Multilateral Trade Negotiations:Past and Future.” Journal of African Economies 7 (Suppl. 1): 1–33.
Wilson, John S., Catherine Mann, and Tsunehiro Otsuki. 2005. “Assessing the Benefits ofTrade Facilitation: A Global Perspective.” World Economy 28 (6): 841–71.
Wood, Adrian, and Jörg Mayer. 2001. “Africa’s Export Structure in a Comparative Perspec-tive.” Cambridge Journal of Economics 25 (3): 369–94.
World Bank. 2000. Can Africa Claim the 21st Century? Washington, DC: World Bank.
———. 2005. Doing Business 2005. Washington, DC: World Bank.
WTO (World Trade Organization). 2006. World Tariff Profiles, 2006. Geneva: WTO.
Yeats, Alexander. 1990. “On the Accuracy of Economic Observations: Do Sub-Saharan TradeStatistics Mean Anything?” World Bank Economic Review 4 (2): 135–56.
108 | LAWRENCE EDWARDS

Comment on “Protectionist Policies and Manufacturing Trade Flows in Africa,” by Lawrence Edwards
BEATA SMARZYNSKA JAVORCIK
Lawrence Edwards has written a useful paper that provides answers to three impor-tant questions. First, it finds that African countries continue to be marginalized inworld trade. Second, it shows that own-tariff liberalization has helped African coun-tries increase exports but that the effect has been relatively small. And third, it con-cludes that tariff liberalization has not worsened the trade balance in the countriesconsidered.
Although providing those answers is valuable, the natural next step in the analy-sis is to examine the causes of this state of the world. In this discussion, I would liketo highlight some factors that in my view are worth exploring.
Looking Back
Disappointing export performance by African economies has often been attributed tothree factors: (a) geography—remote location relative to major export markets andlack of access to the sea, and thus to cheap sea transport; (b) high internal transportcosts as a result of underdeveloped road and port infrastructure and to inefficiency andpoor governance in the customs service; and (c) protectionism in export markets—although this last has diminished in recent years. Edwards does review in detail thearguments for why each of these factors should matter, but it would be interesting tolook back and quantify to what extent each has affected Africa’s export performance.
Looking Ahead
It might be even more interesting to look ahead and consider two factors that arelikely to influence Africa’s trade in the years to come: global production chains andethnic networks. This discussion will focus on each factor in turn.
109
Beata Smarzynska Javorcik is a reader in economics at the University of Oxford and a research affiliate with the Centrefor Economic Policy Research, London.
Annual World Bank Conference on Development Economics 2009, Global © 2010 The International Bank for Reconstruction and Development / The World Bank

110 | BEATA SMARZYNSKA JAVORCIK
Global Production Chains
Technological advances in information and logistics systems, leading to a decline intransport and communication costs and accompanied by a lowering of tariffs andother barriers to trade, have changed the economic landscape facing nations, indus-tries, and individual firms. Multinational corporations have served as the key agentsin this transformation by creating international production and distribution net-works that span the globe and actively interact with each other. In fact, estimates sug-gest that about two-thirds of all world trade in the latter half of the 1990s involvedmultinational corporations (UNCTAD 2002, 153).
Although so far the participation of African countries in the network trade associ-ated with multinational corporations has been limited, participation in global produc-tion networks could create valuable opportunities for African producers, particularly inthe apparel and food sectors.
It is helpful for the purpose of this discussion to follow Gereffi (1999) and classifynetworks into buyer-driven and producer-driven global commodity chains. Producer-driven networks are often coordinated by large multinationals. They are vertical, mul-tilayered arrangements, usually with a direct ownership structure that includes parents,subsidiaries, and subcontractors. They tend to exist in capital- and technology- intensivesectors that are often dominated by global oligopolies, such as aircraft, automobiles,and heavy machinery.
Integration of a country into producer-driven networks usually requires significantinflows of foreign direct investment (FDI). This is illustrated in figure 1, which
FIGURE 1. Foreign Direct Investment (FDI) and Exports of Producer-Driven-Network Products,Selected Countries, 2003(U.S. dollars)
1
2
3
4
5
6
7
8
0 2 4 6 8logarithm of network exports per capita, 2003
log
arith
m o
f FD
I sto
ck in
man
ufac
turin
gp
er c
apita
, end
-200
3
Albania
Armenia
Azerbaijan
Belarus
Bulgaria Croatia
Czech Republic
Estonia
Hungary
Kazakhstan
Kyrgyz Republic
LatviaLithuania
Macedonia, FYRMoldova
Poland
Romania
Russia
Serbia and Montenegro Slovak Republic
Slovenia
Ukraine
Source: Javorcik and Kaminski 2006.
Note: Macedonia, FYR, Former Yugoslav Republic of Macedonia.
COMMENT ON EDWARDS | 111
depicts FDI stock and network exports (both expressed in per capita terms) in Eastern European and Central Asian countries, many of which have been very suc-cessful in joining global production chains. Given the meager success of Africa inattracting FDI inflows, producer-driven networks are likely to play a limited rolein Africa’s exports in the near future.
In contrast to producer-driven commodity chains, buyer-driven networks mayoffer greater promise to African countries. Buyer-driven networks are organized bylarge retailers, branded marketers, and branded manufacturers and do not necessar-ily require large FDI inflows. The products are designed and marketed by the buyer.They are typically labor-intensive consumer goods such as apparel, footwear, furni-ture, and processed food products. Buyer-driven commodity chains are characterizedby highly competitive locally owned and globally dispersed production systems. Prof-its do not come from scale, volume, and technological advantage but, rather, frommarket research, design, and marketing. Buyer-driven production networks in thefood and apparel sectors may be particularly relevant to African countries.
Global food markets have undergone a rapid transformation in recent years, driv-en by changes in consumer demand, increased concern about food safety, and the riseof modern retail systems. Two trends in the food industry during the past twodecades are worth mentioning. The first is the consolidation of food retailing. In2001 just 30 grocery retail chains jointly took in more than US$1 trillion in revenue,accounting for about 10 percent of global food sales. Within this group, the top10 retailers constituted 57 percent of the combined total (World Bank 2005, 27). Thesecond trend is the increasing reliance of major retail chains on their own agents forsourcing and thus the declining importance of wholesale markets. Whereas in thepast wholesale and terminal markets were responsible for 20 or more percent of foodsales, their share of sales in industrial countries has dropped to about 10 percent(World Bank 2005, 27).
The consolidation of food retailing has given market leaders extraordinary mar-ket and purchasing power and has resulted in a strong tendency toward global sourc-ing, the introduction of preferred-supplier arrangements, supply chain integrationand rationalization, and lower average prices, but also lower variability in prices forcontract or program suppliers (World Bank 2005). In addition, it has led to the emer-gence of numerous private sector codes of practice or other technical protocols thatnowadays tend to play a dominant role in the market.
There are several advantages of being a supplier servicing a supermarket chain.These include higher margins than in wholesale transactions, more consistent andmore predictable demand, access to detailed information on changing developmentsand requirements within the market, detailed guidelines for operations and goodpractice, and the ability to enhance one’s reputation by being a supplier to a majorretail chain (Jaffee 2003). In the South African context, Barrientos and Kritzinger(2004) found that producers selling fruit to U.K. and European supermarkets wereable to obtain more stable outlets for their produce. For instance, most supermarketsnegotiated purchases six months in advance. Moreover, producers servicing super-markets on average received better prices than those selling on the open market.
112 | BEATA SMARZYNSKA JAVORCIK
But compliance with the standards imposed by supermarkets is costly. It requiresinvestment in machinery and facilities (for instance, cold storage and stainless steeltables); improvements in sanitation levels, worker hygiene, and skills; and investmentin obtaining a formal certification—for example, for Hazard Analysis and CriticalControl Points (HACCP) systems. Such investment may be beyond the reach ofsmaller producers, who are often credit constrained. Supplying supermarkets mayalso involve an increase in variable costs, such as expenditure on microbiological test-ing. Timeliness is another important aspect of serving supermarket chains. If a ship-ment is delayed along the way and misses its vessel in the port, taking the next ves-sel might not be an option because the delay may result in deterioration of productquality and the shipment may no longer meet the required standard.
The apparel industry is another sector in which production is increasingly distrib-uted across low-income countries by buyers searching for cheaper labor. As a resultof Africa’s preferential access to foreign markets, a significant amount of such pro-duction was moved from newly industrialized countries in Asia to Africa. Foreigndirect investment from Asia, induced by the quota system of the Multifibre Arrange-ment (MFA) and the U.S. African Growth and Opportunity Act (AGOA), enabledrapid growth of the African apparel sector. One beneficiary was Lesotho, which,thanks to its cheap labor costs, was an ideal host for Asian capital seeking to avoidthe textile quotas constraining exports from their home countries. Other African pro-ducers benefited from AGOA, which allows African countries that practice goodgovernance and demonstrate respect for human rights to enjoy duty-free access to theU.S. market. In 2004, Sub-Saharan African exports of apparel to the United Statesexceeded US$1.5 billion (ILO 2005).
The expiration on January 1, 2005, of the MFA, which had set quotas on world-wide textile and apparel exports and had given preferences to many developingAfrican countries, unleashed a new wave of Chinese sales on the world market. TheILO, in its analysis of the post-MFA environment, reported that textile and apparelexports under the AGOA fell to US$270 million in the first quarter of 2005,as against US$361 million a year earlier. The 25 percent reduction contrasts with a19 percent increase in China’s exports for the same period (ILO 2005).
After the expiration of the MFA, some Asian companies that had invested inAfrica to take advantage of the quota began moving back to China in search ofcheaper labor. Between January and March 2005, Kenya exported US$60 million oftextile and clothing products to the United States. That was 13 percent, or US$9 mil-lion, less than the exports during the same period in 2004. Between October 2004and May 2005, a loss of 6,000 out of 39,000 jobs was reported. In Lesotho, wherethe garment sector had accounted for more than 90 percent of the country’s exportsand was by far the largest single employer, 6,650 (out of 56,000) workers were ter-minated at the end of 2004, and 10,000 more were moved to short-term contracts(ILO 2005).
Are these trends in the apparel sector likely to continue, or have they alreadystopped? What factors can explain why some African countries have been more suc-cessful than others in becoming suppliers to large food retailers? Many African policymakers would find answers to these and related research questions useful.

COMMENT ON EDWARDS | 113
Ethnic Networks
A growing literature has documented a positive link between the presence of ethnicnetworks and international trade. The main premise of this literature is that interna-tional transactions are plagued with informal trade barriers, in addition to formaltrade barriers such as transport costs and tariffs. These informal barriers include thedifficulties associated with accessing information on potential market opportunities,consumer tastes, and the trustworthiness of buyers and with the enforcement of con-tracts across international borders. As argued by Gould (1994), Head and Ries(1998), Rauch and Trindade (2002), and Combes, Lafourcade, and Mayer (2005),the presence of people with the same ethnic or national background on both sides ofa border may alleviate these problems. Their language skills and familiarity with aforeign market can lower communication costs. They can provide valuable informa-tion about market structure, consumer preferences, business ethics, and commercialcodes, and their social links may decrease the costs of negotiating and enforcing acontract. In sum, business and social networks that span international borders canhelp overcome many contractual and informational barriers and stimulate interna-tional transactions.
Yet the actual and potential benefits of social networks have not been examinedin the African context. Do African producers find it easier to export their goods toChinese and Indian markets not only because of product suitability but also thanksto the presence of Chinese and Indian diasporas in their countries? Have African pro-ducers been able to benefit from the presence of their nationals in industrial-countrymarkets?
In sum, although buyer-driven production chains and ethnic networks may pro-vide new export opportunities that can be harnessed by African producers and arethus worthy of researchers’ attention, they should not divert our attention from thebasics. High internal transport costs resulting from underdeveloped infrastructureand poorly functioning customs services may still be the first-order obstacle prevent-ing African producers from exploiting new export opportunities.
References
Barrientos, Stephanie, and Andrienetta Kritzinger. 2004. “Squaring the Circle: Global Production and the Informalization of Work in the Food Sector.” Journal of InternationalDevelopment 16 (1): 81–92.
Combes, Pierre-Philippe, Miren Lafourcade, and Thierry Mayer. 2005. “The Trade-CreatingEffects of Business and Social Networks: Evidence from France.” Journal of InternationalEconomics 66 (1): 1–29.
Gereffi, Gary. 1999. “International Trade and Industrial Upgrading in the Apparel Commod-ity Chain.” Journal of International Economics 48 (1): 37–70.
Gould, David M. 1994. “Immigrant Links to the Home Country: Empirical Implications forU.S. Bilateral Trade Flows.” Review of Economics and Statistics 76: 302–16.
Head, Keith, and John Ries. 1998. “Immigration and Trade Creation: Econometric Evidencefrom Canada.” Canadian Journal of Economics 31 (1): 47–62.

114 | BEATA SMARZYNSKA JAVORCIK
ILO (International Labour Organization). 2005. “Promoting Fair Globalization in Textilesand Clothing in a Post-MFA Environment.” Presented at the Tripartite Meeting on Pro-moting Fair Globalization in Textiles and Clothing in a Post-MFA Environment, Geneva.
Jaffee, Steven. 2003. “From Challenge to Opportunity. Transforming Kenya’s Fresh VegetableTrade in the Context of Emerging Food Safety and Other Standards in Europe.” Agricul-ture and Rural Development (ARD) Discussion Paper 1, World Bank, Washington, DC.
Javorcik, Beata S., and Bart Kaminski. 2006. “Linkages between Foreign Direct Investmentand Trade Flows.” In From Disintegration to Reintegration: Eastern Europe and the For-mer Soviet Union in International Trade, ed. Harry Broadman. Washington, DC: WorldBank.
Rauch, James, and Vitor Trindade. 2002. “Ethnic Chinese Networks in International Trade.”Review of Economics and Statistics 84 (1, February): 116–30.
UNCTAD (United Nations Conference on Trade and Development). 2002. World InvestmentReport: Transnational Corporations and Export Competitiveness. New York and Geneva:United Nations.
World Bank. 2005. “Food Safety and Agricultural Health Standards: Challenges and Oppor-tunities for Developing Country Exports.” Report 31207, Poverty Reduction and Economic Management (PREM) Trade Unit, and Agricultural and Rural DevelopmentDepartment, World Bank, Washington, DC.

Crisscrossing Globalization: The Phenomenon of Uphill Skill Flows
AADITYA MATTOO AND ARVIND SUBRAMANIAN
This paper documents an unusual and possibly significant phenomenon: the exportof skills embodied in goods, services, or capital from poorer to richer countries. Wefirst present a set of stylized facts. Using a measure that combines the sophisticationof a country’s exports with the average income level of destination countries, weshow that the performance of a number of developing countries, notably China,Mexico, and South Africa, matches that of much more advanced countries such asJapan, Spain, and the United States. Creating a new combined dataset on foreigndirect investment (FDI) that covers greenfield investment as well as mergers andacquisitions, we show that flows of FDI to member countries of the Organisation forEconomic Co-operation and Development from developing countries such as Brazil,India, Malaysia, and South Africa, as a share of those countries’ gross domestic prod-uct, are as large as flows from countries such as Japan, the Republic of Korea, andthe United States. Then, taking the work of Hausmann, Hwang, and Rodrik (2007)as a point of departure, we suggest that it is not just the composition of exports buttheir destination that matters. In both cross-sectional and panel regressions, using arange of controls, we find that a measure of uphill flows of sophisticated goods is significantly associated with better growth performance. These results suggest theneed for a deeper analysis of whether development benefits might derive not fromdeifying comparative advantage but from defying it.
The phenomenon of uphill flows of capital has been subject to much scrutiny inrecent years (see, for example, Bernanke 2006; Prasad, Rajan, and Subramanian2007; Caballero, Farhi, and Gourinchas 2008). Much of this literature has focusedon financial flows (or foreign savings). Indeed, Caballero and his coauthors (2008)
115
Aaditya Mattoo is lead economist in the International Trade Group of the World Bank’s Development EconomicsResearch Group. Arvind Subramanian is a senior fellow at the Peterson Institute for International Economics and theCenter for Global Development in Washington, DC, and is senior research professor at Johns Hopkins University.
Annual World Bank Conference on Development Economics 2009, Global © 2010 The International Bank for Reconstruction and Development / The World Bank

116 | AADITYA MATTOO AND ARVIND SUBRAMANIAN
attempt to explain why developing countries export savings while simultaneouslyimporting foreign direct investment (FDI). The assumption has been that the onlygravity-defying flow is finance.
But a number of recent high-profile developments raise the possibility of uphillflows in other dimensions. These flows run counter to the predictions of standardtrade models in which developing countries primarily export unskilled products andare recipients of FDI. Examples are the takeover of the U.K.’s Jaguar company by aprominent Indian enterprise (Tata); the acquisition of IBM by China’s Lenovo;Brazil’s success in exporting small commercial aircraft to industrial countries; and thegrowing exports of skilled services from India and Israel to markets in member coun-tries of the Organisation for Economic Co-operation and Development (OECD).
These developments have two things in common. The first is that skills, embodiedin goods, services, or capital (in the form of entrepreneurial and managerial skills asso-ciated with FDI), are being exported. The second is that these embodied skills areexported from poorer to richer countries. On its own, the first feature, although inter-esting, would not necessarily run counter to the predictions of standard trade models.For example, if China were exporting sophisticated goods to and investing in Africa,that would not be inconsistent with their relative endowments. It is the movement ofsophisticated goods and FDI from China to countries that have relatively more skillsand capital that is noteworthy from a trade perspective. This paper is a first stab at doc-umenting and understanding this unusual, and possibly significant, phenomenon.
How significant is the phenomenon? Figure 1 plots a measure combining thesophistication of a country’s exports and the average income level of the countriesthat are destinations for sophisticated exports against per capita income for the years1991 and 2005. (See the section “Consequences of Uphillness,” below, for a precisedefinition of uphill exports.) Two features are noteworthy. First, there is an upwardshift of the curve between the two time periods, suggesting that exogenous factors—perhaps technology—are increasing the propensity of countries, especially those atlower income levels, to export sophisticated goods to rich trading partners. Particu-lar striking is that in 2005 the performance of a number of developing countries,including China, Malaysia, Mexico, the Philippines, and South Africa, surpassed inthis respect the 1991 performance of a number of industrial countries with much higherper capita incomes. Even more striking is that a few developing countries (China,Mexico, and South Africa) match the contemporary performance of Japan, Portugal,Spain, and the United States.
Figure 2 presents a similar picture for outward flows of FDI, including both merg-ers and acquisitions (M&A) and greenfield investments.1 On the vertical axis are FDIoutflows from selected countries to OECD countries as a share of the sending coun-try’s gross domestic product (GDP), averaged over the period 2003–07. This meas-ure of uphill FDI flows is plotted against the sending country’s per capita income.Flows of FDI to OECD countries from developing countries such as Brazil, India,Malaysia, and South Africa as a share of their GDP are as large as flows from countriessuch as Japan, the Republic of Korea, and the United States.
Taken together, these charts provide evidence of the “precociousness” of somedeveloping countries in exporting skills in a manner associated with countries at much

CRISSCROSSING GLOBALIZATION | 117
higher levels of development. This phenomenon, of course, has not gone unnoticed. Anumber of studies have recently emphasized the growing sophistication of the exportand production base of developing countries. For example, Schott (2007) has shownthat China’s export profile is becoming increasingly similar to that of many OECDcountries (see also Hummels and Klenow 2005; Schott 2005). Ramamurti and Singh(2009) have documented FDI flows from developing to industrial countries.
A related literature has focused on the direction of these export flows, but in amore normative context. For example, Samuelson (2004) and Krugman (2008) haveexamined the consequences of growth of U.S. imports of manufactured goods pro-duced in developing countries that compete with domestic U.S. production. Therehas also been some discussion in the popular press of inward flows of FDI fromdeveloping countries (for example, in connection with the Dubai Port episode), butit is primarily related to security issues. These are perspectives—even paranoidones—on uphill flows from the top of the hill. The vast literature on the effects ofglobal integration, through trade in goods and FDI, has focused primarily on flowsto developing countries. For example, Coe, Helpman, and Hoffmaister (1997) high-lighted the effect of technology diffusion through imports of capital goods on thegrowth of developing countries, and Lumenga-Neso, Olarreaga, and Schiff (2001)
FIGURE 1.Exports of Sophisticated Goods by Selected Economies, 1991 and 2005
Source: United Nations Commodity Trade Statistics database (Comtrade).
Note: GDP, gross domestic product; PPP, purchasing power parity. The figure plots a measure that combines thesophistication of a country’s exports and the average income level of the destination countries for these exports (seethe text). The plot lines represent the fit of the relationship between this measure and per capita GDP in 1991 and2005. The fit is based on a larger sample of countries than those identified in the figure. The country abbreviationsare BRA, Brazil; CHL, Chile; CHN, China; ESP, Spain; GBR, United Kingdom; HUN, Hungary; IDN, Indonesia; IND,India; IRL, Ireland; ISR, Israel; KOR, Republic of Korea; MEX, Mexico; MYS, Malaysia; PHL, the Philippines; PRT, Portugal; THA, Thailand; USA, United States; and ZAF, South Africa.
exp
ort
sop
hist
icat
ion
and
inco
me
of d
estin
atio
n co
untr
ies
6 7 9log per capita GDP (constant PPP dollars)
118 10
20
19
18
21
BRACHL
CHN
DEU
ESP
FRAGBR
IDNIND
IRL
ISRJPN
KORMEX
MYS
PHL
PRTTHA
USA
BRA CHL
CHNDEU
ESPFRAGBR
HUN
IDNIND
IRL
ISR JPN
KOR
MEX
MYSPHL PRTTHA
USAZAF
1991 2005 CHI 1991 observations CHI 2005 observations

118 | AADITYA MATTOO AND ARVIND SUBRAMANIAN
emphasized the impact of direct and indirect imports from industrial countries. Thereis also a large literature documenting the effects of inward FDI (Borensztein, De Gregorio, and Lee 1998; Haskel, Pereira, and Slaughter 2002).
Recently, Hausmann, Hwang, and Rodrik (2007) looked at the effects of thesophistication of a country’s export profile on its own growth (see also Burgess andVenables 2004). In a similar vein, Feenstra and Kee (2004) examine whether diversityof export production can have productivity-enhancing effects. The effects of outwardflows of FDI and skilled exports, and of the destination of these flows, have receivedless attention.
Why should the destination of trade and FDI flows matter? Javorcik (2004) hasshown that selling to foreign-owned firms located in a country has positive upstreamproductivity effects because of the possibility of induced technological and manage-rial improvements. In principle, these benefits can also arise from sales to foreignfirms located abroad. Recently, De Loecker (2007), working with microdata onSlovenian firms, has demonstrated that productivity gains are higher for firmsexporting toward high-income regions. Moreover, exports of goods to high-incomedestinations are frequently associated with participation in global production chainsthat confer important benefits (Hoekman and Javorcik 2006).
FIGURE 2.Defying Comparative Advantage: Foreign Direct Investment, 2003–07
Sources: Thomson Financial SDC Platinum database and Financial Times FDI Intelligence database.
Note: GDP, gross domestic product; PPP, purchasing power parity. The figure plots FDI outflows from a country toOECD countries as a share of its GDP (averaged over the period 2003–07) against its per capita income. The samplecomprises selected industrial and emerging-market countries. The economies shown are ARG, Argentina; BRA, Brazil;CHL, Chile; CHN, China; DEU, Germany; ESP, Spain; FRA, France; GBR, United Kingdom; HUN, Hungary; IDN,Indonesia; IND, India; IRL, Ireland; ISR, Israel; ITA, Italy; JPN, Japan; KOR, Republic of Korea; MEX, Mexico; MUS,Mauritius; MYS, Malaysia; PAK, Pakistan; PHL, the Philippines; POL, Poland; PRT, Portugal; ROM, Romania; SAU, SaudiArabia; SGP, Singapore; THA, Thailand; TUR, Turkey; USA, United States; and ZAF, South Africa.
FDI o
utflo
ws
to O
ECD
cou
ntrie
sas
a s
hare
of G
DP
(per
cent
)
7 9log per capita GDP (2003 PPP dollars)
118 10
0.04
0.03
0.01
0.02
0.00
0.05
ARGBGR BRA
CHL
CHN
DEU
ESP
FRA
GBR
HUNIDN
IND
IRLISR
ITA
JPNKORMEX
MYSPANPHL
POL
PRT
ROM
SAU
SGP
THA TUR
USA
ZAF

CRISSCROSSING GLOBALIZATION | 119
In this paper we first present some new data on developing-country exports ofservices, goods, and FDI and assess the extent to which these are going to richercountries. We then undertake a preliminary exploration of the consequences of uphillflows of embodied skills for growth of the source country. Here, we follow closelythe work of Hausmann, Hwang, and Rodrik (2007).
Data
Our focus in this paper is on the direction of flows of embodied skills. For the threeareas—FDI, goods, and services—for which we present some broad data, we need toexplain how we define or illustrate the flow of skills.
Our FDI data come from two sources. The Thomson Financial SDC Platinumdatabase provides data on FDI taking the form of mergers and acquisitions. TheFinancial Times FDI Intelligence database provides similar data on greenfield invest-ments. These databases are described in detail in the annex to this article.
Our trade data come from the United Nations World Integrated Trade Solution(WITS) database. We collected data at the five-digit level, largely because finer data—say, at the six-digit level—really become available only in the late 1980s, and we areinterested in checking whether the phenomenon of uphill flows is a feature of the his-torical data. For computational reasons, we collected data for every five-year inter-val and restricted the sample to countries that together account for about 90 percentof world trade.2
We draw on Hausmann, Hwang, and Rodrik (2007) to characterize skill-intensiveproducts. These authors calculate a measure called PRODY, which is a weighted sumof the per capita GDP of countries exporting a given product and, thus, represents theincome level associated with each of these goods. In this paper, we define—admittedly,arbitrarily—skill-intensive products as those that are either above the median level orin the top 25th percentile of PRODY for all products defined at the five-digit level ofaggregation for 1990.
Our services data come from the Balance of Payments Statistics database of theInternational Monetary Fund (IMF) and from the U.S. Bureau of Economic Analysis.
Stylized Facts on Uphillness
We first present some basic facts about flows of embodied skills.
Foreign Direct Investment
The share in world FDI exports of non-OECD countries for which data are availablefor the period 2003–07 is shown in figure 3. This share goes up from about 20 to25 percent over the period under consideration.
These figures show how developing countries are becoming increasing exporters ofFDI, but they do not indicate the direction of the flows. Figure 4 isolates the direction

120 | AADITYA MATTOO AND ARVIND SUBRAMANIAN
FIGURE 3.Share of Non-OECD Countries in World FDI Exports, 2003–07
Sources: Thomson Financial SDC Platinum database and Financial Times FDI Intelligence database.
15
17
27
19
21
23
25
2003 20052004 2006
per
cent
2007
FIGURE 4.Share of Non-OECD Countries in World FDI Exports to OECD Countries, 2003–07
Sources: Thomson Financial SDC Platinum database and Financial Times FDI Intelligence database.
8
9
15
10
11
12
13
14
2003 20052004 2006
per
cent
2007
CRISSCROSSING GLOBALIZATION | 121
of flow of these skills by depicting the share of non-OECD countries in FDI exportsto OECD countries and so provides a measure of uphill flows at the global level. Thisshare increased from about 9 percent in 2003 to close to 15 percent in 2007.
Exports of Goods
We repeat this exercise for exports of sophisticated goods and find a similar pattern.The average income level of world exports of sophisticated products declined by asimilar percent—about 10 percent—but over a slightly longer period (figure 5).Unlike the case of FDI, China is a big contributor to the decrease in the income ofthe source country for world exports of sophisticated products. Exclusion of Chinareduces the decline by nearly 5 percent (figure 5, panel b).
In figure 6, we calculate the uphill flows of sophisticated products from non-OECD countries. For each country, the amount of exports of sophisticated goods toricher countries as a share of the country’s total sophisticated exports is the magni-tude of uphill flows. These exports are added for all non-OECD countries. Thisshare was about 1 percent in 1980; it was about 0.5 percent for highly sophisticated products (HSPs).3 The share increased to 10 percent in 2006 (over 3 percent forHSPs).4 As shown in figure 7, uphill flows were pronounced for China, Malaysia,and Mexico but much less so for Brazil and India.
Services
In services, we focus on exports of services other than transport and travel, that is,the category “other commercial” (in the United States, “other private”) services,which includes most skill-intensive business services. Again, we find a decline, albeitslow, in the average income level of services exporters (figure 8). This trend suggeststhat developing countries are becoming increasingly important exporters of skilledservices.
Unfortunately, bilateral data on services trade are available only for OECD coun-tries, so it is not possible to construct measures of uphill flows analogous to those forgoods and FDI.5 However, bilateral data available for the United States show that forsome developing countries (for example, India and Malaysia), services exports as ashare of GDP are flowing uphill (figure 9)
Country Heterogeneity
Although the phenomenon of uphill flows appears to characterize several developingcountries, there is heterogeneity across them. It is not the case, for example, thatcountries that see uphill flows of sophisticated exports also see uphill flows of FDI.For example, in figure 10, uphill FDI flows are plotted against uphill sophisticatedexports for 22 important emerging market countries for which data are available.There seems to be little correlation between the two. Indeed, there appear to be fourdistinct categories: (a) countries such as Israel and Malaysia do well on both counts;
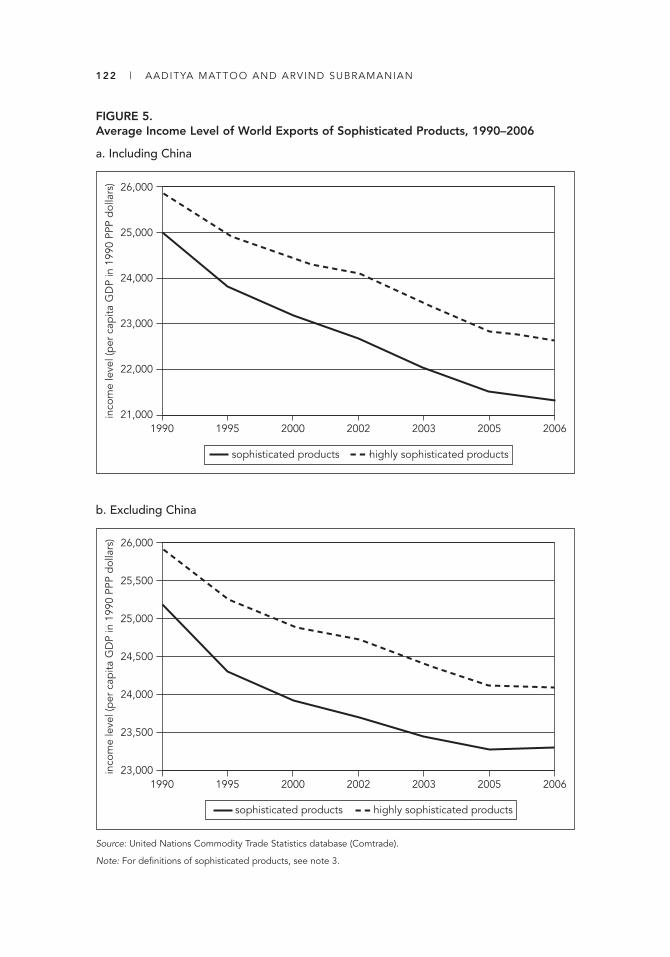
122 | AADITYA MATTOO AND ARVIND SUBRAMANIAN
FIGURE 5.Average Income Level of World Exports of Sophisticated Products, 1990–2006
a. Including China
Source: United Nations Commodity Trade Statistics database (Comtrade).
Note: For definitions of sophisticated products, see note 3.
21,000
22,000
26,000
23,000
24,000
25,000
1990 20001995 2003
inco
me
leve
l (p
er c
apita
GD
P in
199
0 PP
P d
olla
rs)
20062002 2005
sophisticated products highly sophisticated products
23,000
23,500
26,000
24,000
24,500
25,000
25,500
1990 20001995 2003
inco
me
leve
l (p
er c
apita
GD
P in
199
0 PP
P d
olla
rs)
20062002 2005
highly sophisticated productssophisticated products
b. Excluding China

FIGURE 6.Uphill Flows of Sophisticated Exports from Non-OECD Countries, 1990–2006
Source: United Nations Commodity Trade Statistics database (Comtrade).
Note: For each country, the measure of uphill flows is exports of sophisticated goods to countries richer than the country itself as a share of its total sophisticated exports. These are added for all non-OECD countries.
0.0
2.0
14.0
4.0
6.0
8.0
12.0
10.0
0.0
0.5
3.5
4.0
1.0
1.5
2.0
3.0
2.5
1980 19901985 2004
per
cent
percent
20062000 20021995 2005
highly sophisticated products (right-hand scale)
sophisticated products (left-hand scale)
FIGURE 7.Uphill Flows of Sophisticated Exports as a Share of Source Country GDP, 1980–2005
Source: United Nations Commodity Trade Statistics database (Comtrade).
Note: The measure of uphill flows is the value of exports of sophisticated products as a share of a country’s GDP (allmeasured in current dollars).
per
cent
age
of G
DP
0.15
1980 1985 1990 1995 20052000
0.10
0.05
0.00
Korea, Rep. ofIndia China Brazil Malaysia Mexico

124 | AADITYA MATTOO AND ARVIND SUBRAMANIAN
FIGURE 8.Average Income Level of Exporters of Other Private Services, 1995–2006
Source: IMF Balance of Payments Statistics data.
Note: The “other private services” category comprises services other than transport and travel and covers most skill-intensive business services. We compute the weighted average of per capita GDP of the exporting countries, with theweights being the share of each country in total exports of other private services.
ind
ex
0.61
1995 2000 2005
0.59
0.60
0.58
0.57
FIGURE 9.Exports to the United States of Other Private Services as a Share of Source CountryGDP, 1992–2006
Source: U.S. Bureau of Economic Analysis.
Note: See note to figure 8.
per
cent
of G
DP
0.006
1990 1995 2000 2005
0.004
0.002
0.000
India China Brazil Malaysia Korea, Rep. of Mexico

CRISSCROSSING GLOBALIZATION | 125
FIGURE 10.Uphill Flows of FDI and Exports of Sophisticated Goods, Averages for 2003–07
a. FDI
Sources: United Nations Commodity Trade Statistics database (Comtrade), Thomson Financial SDC Platinum database,and Financial Times FDI Intelligence database.
Note: In the first panel, uphill outflows of FDI, measured as FDI outflows of a country to countries with a higher per capitaGDP purchasing power parity (PPP) than itself, and exports of sophisticated goods are expressed as a share of a coun-try’s GDP. Uphill outflows of FDI in manufacturing and exports of sophisticated goods are expressed as a share of a coun-try’s GDP. The economies shown are ARG, Argentina, BGR, Bulgaria; BRA, Brazil; CHL, Chile; CHN, China; HUN, Hun-gary; IDN, Indonesia; IND, India; ISR, Israel; KOR, Republic of Korea; MEX, Mexico; MYS, Malaysia; PAN, Panama; PHL,the Philippines; POL, Poland; ROM, Romania; THA, Thailand; TUR, Turkey; TWN, Taiwan, China; and ZAF, South Africa.
0.00
0.04
0.03
0.02
0.01
per
cent
age
of G
DP
0.10 0.110.010.00
uphill exports of sophisticated goods
IND
IDN
CHL POL
MEX CHN
BGR
ZAF
ISR
MYS
THATWN
HUN
KOR
PHL
ROM
BRA
TURPANARG
0.000
0.020
0.015
0.010
0.005
per
cent
age
of G
DP
0.10 0.110.050.00uphill exports of sophisticated goods
IND
IDN
CHL
POL BGRCHN
ZAFMEXKOR
ISR
MYS
THA
TWN
HUN
PHL
ROM
BRATUR
ARG
b. FDI in Manufacturing
126 | AADITYA MATTOO AND ARVIND SUBRAMANIAN
(b) Brazil and India have significant uphill flows of FDI but relatively small uphillexports of sophisticated goods; (c) China and some East Asian economies (Thailandand Taiwan, China) and Eastern European countries (Hungary) are exactly the oppo-site of Brazil and India, with large uphill export flows but limited FDI flows; and (d) some countries such as Chile, Poland, and Romania, score low on both counts.
Notwithstanding the above, success in exporting sophisticated goods could beassociated with a greater likelihood of investing in manufacturing. But this does notturn out to be the case. The best examples are Brazil and India, which are not biguphill exporters of sophisticated goods but score well on FDI in manufacturing (seepanel b of figure 10).
Preston Curves
How recent is this phenomenon of uphill flows? We cannot carry out meaningful his-torical comparisons for FDI because the data do not allow us to go so far back, butwe can attempt to answer this question for exports of sophisticated goods.
To do this, we relate uphill flows to the level of per capita GDP of a country forthree points in time (1986, 1996, and 2005) that are sufficiently far apart to allowchanges to express themselves (figure 11). The noteworthy point that emerges is thatthe relationship shifts markedly upward in the most recent period for which we havedata.6 The shift implies that over time, uphill flows are becoming more commonacross the income spectrum. We also find that the fit of the relationship betweenuphill flows and income tightens over time, suggesting that higher-income countriesare likely to see more uphill flows.
Consequences of Uphillness
An obvious question is, do uphill flows matter for economic growth? Hausmann,Hwang, and Rodrik (2007) have argued that the structure of exports does matter forgrowth. In particular, countries that produce more sophisticated goods (defined asthose produced by richer countries) are shown to be more likely to grow faster. But thefocus of this paper is not so much the sophistication of exports as whether a country’sexport pattern defies comparative advantage. As argued earlier, it would not be sur-prising or at odds with the predictions of the standard trade models if a poor countryexported relatively sophisticated goods to countries poorer than itself. We are there-fore interested not only in the sophistication of exports, but also in their destination.
To pursue this question of whether comparative advantage–defying (alternatively,“uphill”) exports have growth consequences, we adopt the basic cross-nationalregression methodology deployed by Hausmann, Hwang, and Rodrik (2007). Ourresults for the pure cross-section are presented in tables 1 and 2, and the panel regres-sions are contained in tables 3 and 4. We calculate two measures of uphill exports.In the first, we combine the Hausmann, Hwang, and Rodrik indicator of sophistica-tion (EXPY) with a measure of the average income level of the destination countriesreceiving such sophisticated exports; specifically, we add the log of the EXPY meas-ure and the log of the average income level of destination countries, and call thisUPHILL1. This is the measure used in tables 1 and 3.7

FIGURE 11.Uphill Flows of Sophisticated Exports and Per Capita GDP, Selected Economies,1986, 1996, and 2005
a. Without controls for area, population, and remoteness
Source: United Nations Commodity Trade Statistics database (Comtrade).
Note: PPP = purchasing power parity. Uphill flows are measured as the average income level of all the destination coun-tries that receive a country’s sophisticated exports (defined here as above-median PRODY exports), where the weightsare each destination country’s share in total exports of the sending country. The sample is kept constant for all threeperiods. Panel b includes, for each year for which the relationship is plotted, controls for area, population, and remote-ness, all in log terms. Remoteness, drawn from Berthelon and Freund (2008), is measured as j ≠ k where D is distanceand there are k foreign countries.
remotej �1
aN
k
GDPk
Dij
9.0
9.5
10.5
10.0
6 87 109
uphi
ll flo
ws
of s
ophi
stic
ated
exp
orts
log of per capita GDP (constant PPP dollars)11
1986 1996 2005
9.4
9.6
10.4
9.8
10.0
10.2
7 98 1110
uphi
ll flo
ws
of s
ophi
stic
ated
exp
orts
log of per capita GDP (constant PPP dollars)
12
1986 1996 2005
b. With controls for area, population, and remoteness
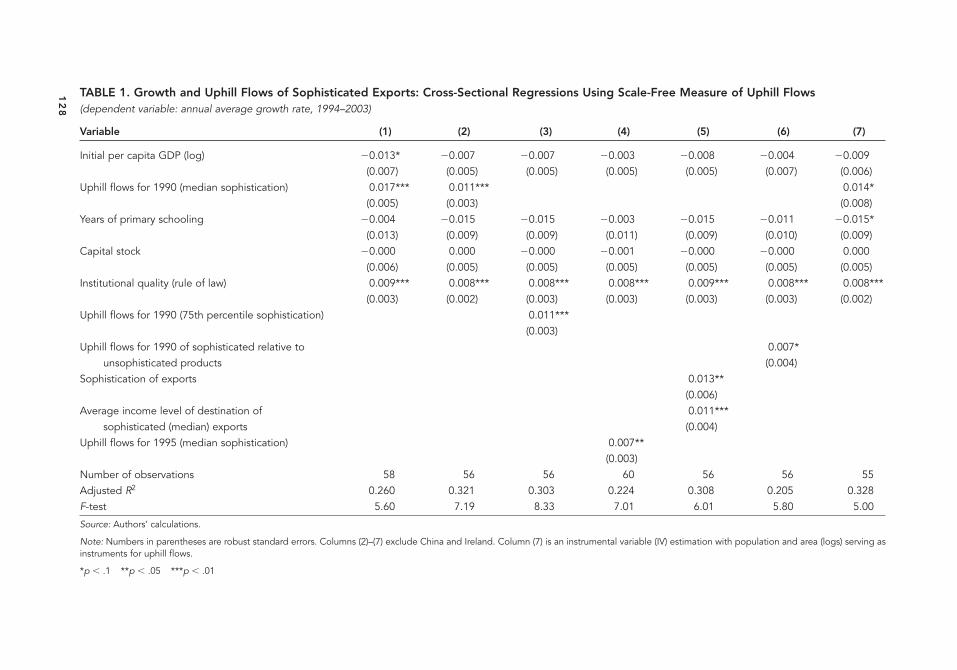
TABLE 1. Growth and Uphill Flows of Sophisticated Exports: Cross-Sectional Regressions Using Scale-Free Measure of Uphill Flows(dependent variable: annual average growth rate, 1994–2003)
Variable (1) (2) (3) (4) (5) (6) (7)
Initial per capita GDP (log) �0.013* �0.007 �0.007 �0.003 �0.008 �0.004 �0.009(0.007) (0.005) (0.005) (0.005) (0.005) (0.007) (0.006)
Uphill flows for 1990 (median sophistication) 0.017*** 0.011*** 0.014*(0.005) (0.003) (0.008)
Years of primary schooling �0.004 �0.015 �0.015 �0.003 �0.015 �0.011 �0.015*(0.013) (0.009) (0.009) (0.011) (0.009) (0.010) (0.009)
Capital stock �0.000 0.000 �0.000 �0.001 �0.000 �0.000 0.000(0.006) (0.005) (0.005) (0.005) (0.005) (0.005) (0.005)
Institutional quality (rule of law) 0.009*** 0.008*** 0.008*** 0.008*** 0.009*** 0.008*** 0.008***(0.003) (0.002) (0.003) (0.003) (0.003) (0.003) (0.002)
Uphill flows for 1990 (75th percentile sophistication) 0.011***(0.003)
Uphill flows for 1990 of sophisticated relative to 0.007*unsophisticated products (0.004)
Sophistication of exports 0.013**(0.006)
Average income level of destination of 0.011***sophisticated (median) exports (0.004)
Uphill flows for 1995 (median sophistication) 0.007**(0.003)
Number of observations 58 56 56 60 56 56 55Adjusted R2 0.260 0.321 0.303 0.224 0.308 0.205 0.328F-test 5.60 7.19 8.33 7.01 6.01 5.80 5.00
Source: Authors’ calculations.
Note: Numbers in parentheses are robust standard errors. Columns (2)–(7) exclude China and Ireland. Column (7) is an instrumental variable (IV) estimation with population and area (logs) serving asinstruments for uphill flows.
*p � .1 **p � .05 ***p � .01
12
8

CRISSCROSSING GLOBALIZATION | 129
A particular issue with the Hausmann, Hwang, and Rodrik approach and ouradaptation of it is that the measures of sophistication and uphillness are not scaled. Forexample, these authors’ EXPY measure captures the sophistication of an economy’sexport basket without taking account of the importance, relative to the size of aneconomy, of the exports of these products. The use of a scale-free measure entails botha benefit and a limitation. The benefit is econometric; there is less endogeneity bias.
The downside is that the economic intuition is less clear. Our uphill measure, too,is scale free, capturing the importance of uphill flows in the export basket but nottheir economywide importance.
We accordingly calculate a second measure, which is the share of exports ofsophisticated products flowing uphill as a share of GDP. We calculate uphillness bysimply adding up the exports that a country sends to trading partners richer thanitself. This is called UPHILL2 and is used in tables 2 and 4.
In column 1 of table 1, we present the basic results with controls for human cap-ital, physical capital, and institutions. Our measure of uphill flows is positively signedand statistically significant at the 1 percent confidence level. We find that China andIreland are clear outliers. So in column 2 we drop them and find that the resultsremain unchanged. The coefficient suggests that a 1 percent increase in uphill flows
TABLE 2. Growth and Uphill Flows of Sophisticated Exports: Cross-Sectional Regressions, Sophisticated Exports to Richer Countries, Scaled by GDP(dependent variable: annual average growth rate, 1994–2003)
Variable (1) (2) (3)
Initial per capita GDP (log) �0.001 �0.000 �0.000(0.005) (0.005) (0.005)
Downhill export flows of sophisticated (median) �0.099** �0.087** �0.112**products (as share of GDP) (0.047) (0.035) (0.050)
Uphill export flows of sophisticated (median) 0.263*** 0.122** 0.096*products (as share of GDP) (0.080) (0.048) (0.048)
Years of primary schooling �0.001 �0.009 �0.009(0.017) (0.013) (0.013)
Capital stock �0.003 �0.001 �0.000(0.006) (0.004) (0.004)
Institutional quality (rule of law) 0.010*** 0.010*** 0.010***(0.003) (0.003) (0.003)
Exports of nonsophisticated (median) 0.024products (share of GDP) (0.022)
Number of observations 61 59 59Adjusted R2 0.314 0.236 0.235F-test 6.17 7.90 7.89
Source: Authors’ calculations.
Note: Numbers in parentheses are robust standard errors. Columns (2) and (3) exclude China and Ireland.
*p � .1 **p � .05 ***p � .01
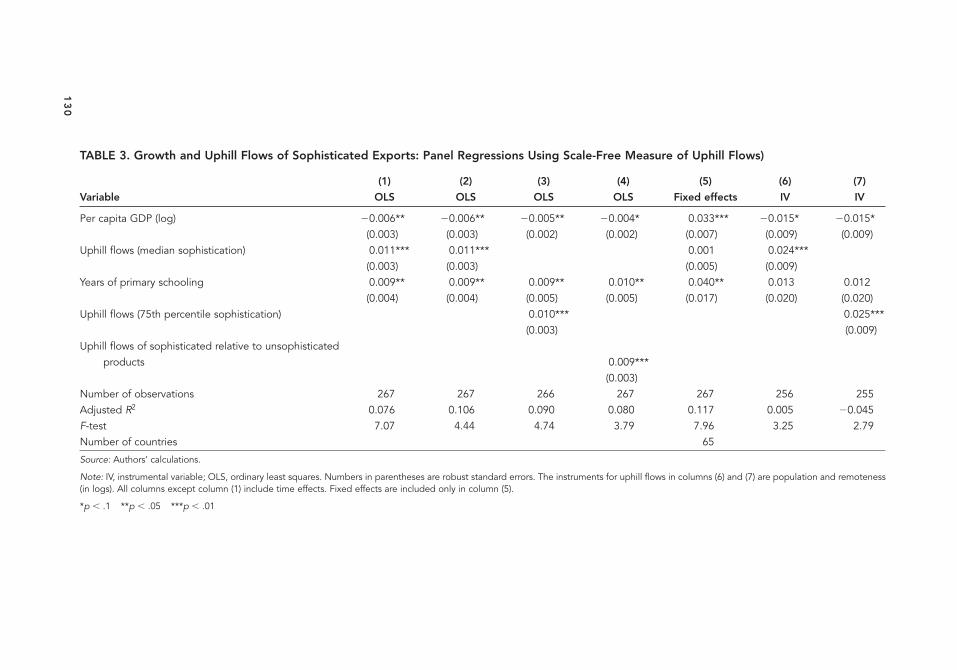
13
0
TABLE 3. Growth and Uphill Flows of Sophisticated Exports: Panel Regressions Using Scale-Free Measure of Uphill Flows)
(1) (2) (3) (4) (5) (6) (7)
Variable OLS OLS OLS OLS Fixed effects IV IV
Per capita GDP (log) �0.006** �0.006** �0.005** �0.004* 0.033*** �0.015* �0.015*(0.003) (0.003) (0.002) (0.002) (0.007) (0.009) (0.009)
Uphill flows (median sophistication) 0.011*** 0.011*** 0.001 0.024***(0.003) (0.003) (0.005) (0.009)
Years of primary schooling 0.009** 0.009** 0.009** 0.010** 0.040** 0.013 0.012(0.004) (0.004) (0.005) (0.005) (0.017) (0.020) (0.020)
Uphill flows (75th percentile sophistication) 0.010*** 0.025***(0.003) (0.009)
Uphill flows of sophisticated relative to unsophisticated products 0.009***
(0.003)Number of observations 267 267 266 267 267 256 255Adjusted R2 0.076 0.106 0.090 0.080 0.117 0.005 �0.045F-test 7.07 4.44 4.74 3.79 7.96 3.25 2.79Number of countries 65
Source: Authors’ calculations.
Note: IV, instrumental variable; OLS, ordinary least squares. Numbers in parentheses are robust standard errors. The instruments for uphill flows in columns (6) and (7) are population and remoteness(in logs). All columns except column (1) include time effects. Fixed effects are included only in column (5).
*p � .1 **p � .05 ***p � .01
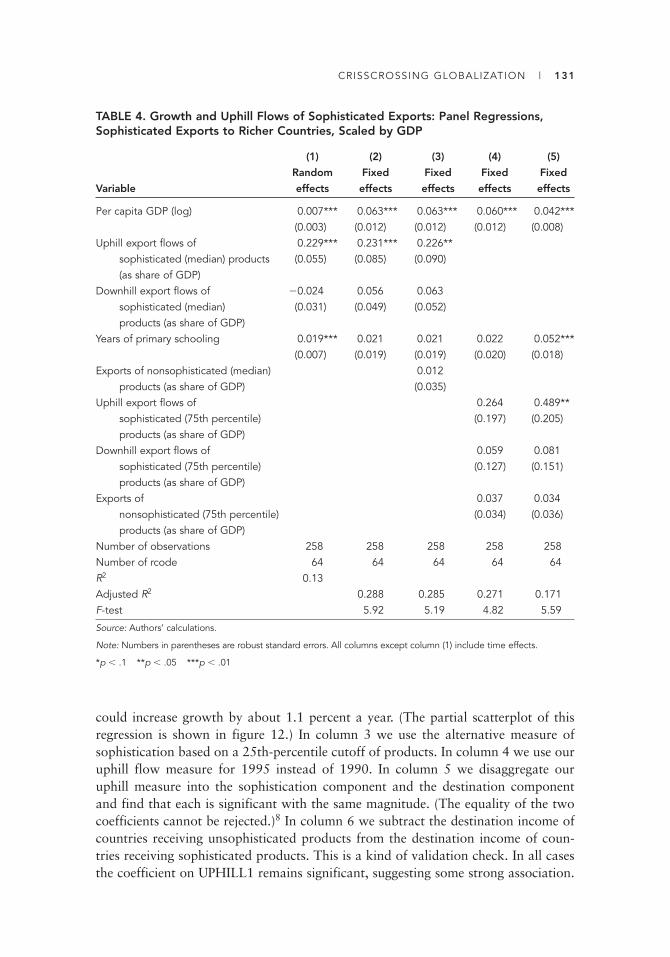
CRISSCROSSING GLOBALIZATION | 131
TABLE 4. Growth and Uphill Flows of Sophisticated Exports: Panel Regressions,Sophisticated Exports to Richer Countries, Scaled by GDP
(1) (2) (3) (4) (5)
Random Fixed Fixed Fixed Fixed
Variable effects effects effects effects effects
Per capita GDP (log) 0.007*** 0.063*** 0.063*** 0.060*** 0.042***(0.003) (0.012) (0.012) (0.012) (0.008)
Uphill export flows of 0.229*** 0.231*** 0.226**sophisticated (median) products (0.055) (0.085) (0.090)(as share of GDP)
Downhill export flows of �0.024 0.056 0.063sophisticated (median) (0.031) (0.049) (0.052)products (as share of GDP)
Years of primary schooling 0.019*** 0.021 0.021 0.022 0.052***(0.007) (0.019) (0.019) (0.020) (0.018)
Exports of nonsophisticated (median) 0.012products (as share of GDP) (0.035)
Uphill export flows of 0.264 0.489**sophisticated (75th percentile) (0.197) (0.205)products (as share of GDP)
Downhill export flows of 0.059 0.081sophisticated (75th percentile) (0.127) (0.151)products (as share of GDP)
Exports of 0.037 0.034nonsophisticated (75th percentile) (0.034) (0.036)products (as share of GDP)
Number of observations 258 258 258 258 258Number of rcode 64 64 64 64 64R2 0.13Adjusted R2 0.288 0.285 0.271 0.171F-test 5.92 5.19 4.82 5.59
Source: Authors’ calculations.
Note: Numbers in parentheses are robust standard errors. All columns except column (1) include time effects.
*p � .1 **p � .05 ***p � .01
could increase growth by about 1.1 percent a year. (The partial scatterplot of thisregression is shown in figure 12.) In column 3 we use the alternative measure ofsophistication based on a 25th-percentile cutoff of products. In column 4 we use ouruphill flow measure for 1995 instead of 1990. In column 5 we disaggregate ouruphill measure into the sophistication component and the destination componentand find that each is significant with the same magnitude. (The equality of the twocoefficients cannot be rejected.)8 In column 6 we subtract the destination income ofcountries receiving unsophisticated products from the destination income of coun-tries receiving sophisticated products. This is a kind of validation check. In all casesthe coefficient on UPHILL1 remains significant, suggesting some strong association.
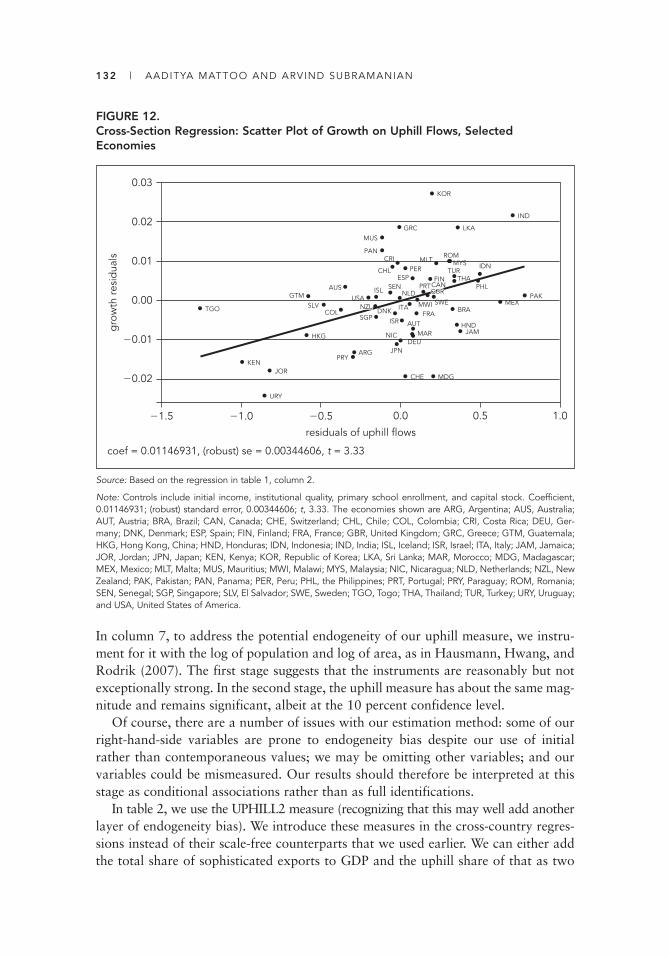
132 | AADITYA MATTOO AND ARVIND SUBRAMANIAN
In column 7, to address the potential endogeneity of our uphill measure, we instru-ment for it with the log of population and log of area, as in Hausmann, Hwang, andRodrik (2007). The first stage suggests that the instruments are reasonably but notexceptionally strong. In the second stage, the uphill measure has about the same mag-nitude and remains significant, albeit at the 10 percent confidence level.
Of course, there are a number of issues with our estimation method: some of ourright-hand-side variables are prone to endogeneity bias despite our use of initialrather than contemporaneous values; we may be omitting other variables; and ourvariables could be mismeasured. Our results should therefore be interpreted at thisstage as conditional associations rather than as full identifications.
In table 2, we use the UPHILL2 measure (recognizing that this may well add anotherlayer of endogeneity bias). We introduce these measures in the cross-country regres-sions instead of their scale-free counterparts that we used earlier. We can either addthe total share of sophisticated exports to GDP and the uphill share of that as two
FIGURE 12.Cross-Section Regression: Scatter Plot of Growth on Uphill Flows, SelectedEconomies
Source: Based on the regression in table 1, column 2.
Note: Controls include initial income, institutional quality, primary school enrollment, and capital stock. Coefficient,0.01146931; (robust) standard error, 0.00344606; t, 3.33. The economies shown are ARG, Argentina; AUS, Australia;AUT, Austria; BRA, Brazil; CAN, Canada; CHE, Switzerland; CHL, Chile; COL, Colombia; CRI, Costa Rica; DEU, Ger-many; DNK, Denmark; ESP, Spain; FIN, Finland; FRA, France; GBR, United Kingdom; GRC, Greece; GTM, Guatemala;HKG, Hong Kong, China; HND, Honduras; IDN, Indonesia; IND, India; ISL, Iceland; ISR, Israel; ITA, Italy; JAM, Jamaica;JOR, Jordan; JPN, Japan; KEN, Kenya; KOR, Republic of Korea; LKA, Sri Lanka; MAR, Morocco; MDG, Madagascar;MEX, Mexico; MLT, Malta; MUS, Mauritius; MWI, Malawi; MYS, Malaysia; NIC, Nicaragua; NLD, Netherlands; NZL, NewZealand; PAK, Pakistan; PAN, Panama; PER, Peru; PHL, the Philippines; PRT, Portugal; PRY, Paraguay; ROM, Romania;SEN, Senegal; SGP, Singapore; SLV, El Salvador; SWE, Sweden; TGO, Togo; THA, Thailand; TUR, Turkey; URY, Uruguay;and USA, United States of America.
TGO
KEN
URY
JOR
HKG
GTMSLV
COL
AUS
PRYARG
USA
SGP
ISL
MUS
PAN
SEN
CHL
DNK
JPN
CRI
GRC
NLD
NIC
ISR
PER
CHE
ITA
MAR
ESP
DEU
AUTFRA
MWI
PRT
SWE
FINCAN
KOR
MDG
MLT MYSROM
BRA
TUR
HND
LKA
JAM
THAPHL
IDN
MEX
IND
PAK
gro
wth
res
idua
ls
�1.5 �1.0 0.0
residuals of uphill flows
1.0�0.5 0.5
0.00
�0.01
�0.02
0.03
0.02
0.01
GBRGBR
NZLNZL
coef = 0.01146931, (robust) se = 0.00344606, t = 3.33
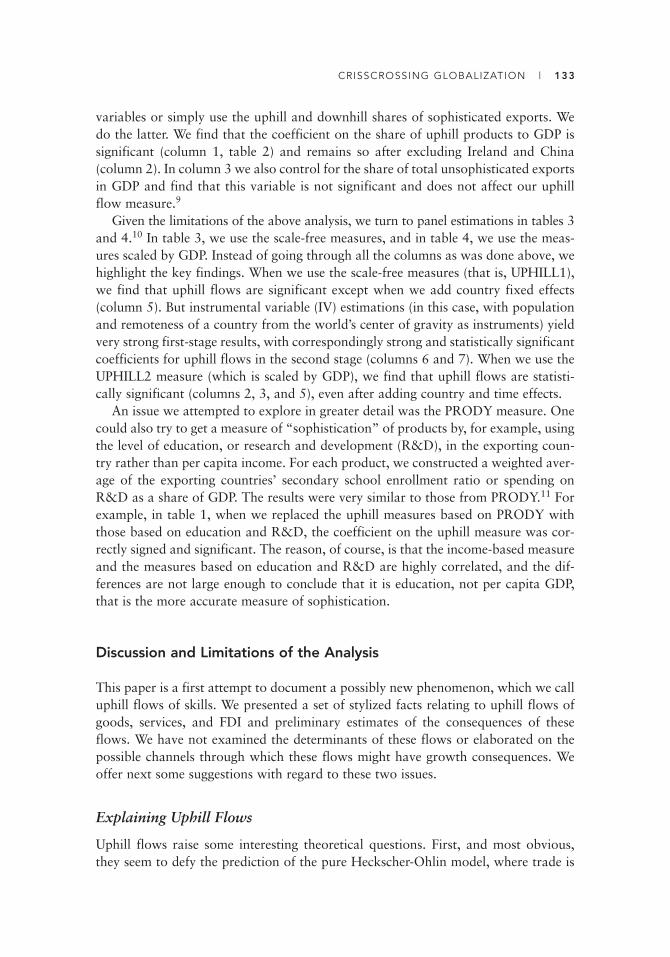
CRISSCROSSING GLOBALIZATION | 133
variables or simply use the uphill and downhill shares of sophisticated exports. Wedo the latter. We find that the coefficient on the share of uphill products to GDP issignificant (column 1, table 2) and remains so after excluding Ireland and China (column 2). In column 3 we also control for the share of total unsophisticated exportsin GDP and find that this variable is not significant and does not affect our uphillflow measure.9
Given the limitations of the above analysis, we turn to panel estimations in tables 3and 4.10 In table 3, we use the scale-free measures, and in table 4, we use the meas-ures scaled by GDP. Instead of going through all the columns as was done above, we highlight the key findings. When we use the scale-free measures (that is, UPHILL1),we find that uphill flows are significant except when we add country fixed effects(column 5). But instrumental variable (IV) estimations (in this case, with populationand remoteness of a country from the world’s center of gravity as instruments) yieldvery strong first-stage results, with correspondingly strong and statistically significantcoefficients for uphill flows in the second stage (columns 6 and 7). When we use theUPHILL2 measure (which is scaled by GDP), we find that uphill flows are statisti-cally significant (columns 2, 3, and 5), even after adding country and time effects.
An issue we attempted to explore in greater detail was the PRODY measure. Onecould also try to get a measure of “sophistication” of products by, for example, usingthe level of education, or research and development (R&D), in the exporting coun-try rather than per capita income. For each product, we constructed a weighted aver-age of the exporting countries’ secondary school enrollment ratio or spending onR&D as a share of GDP. The results were very similar to those from PRODY.11 Forexample, in table 1, when we replaced the uphill measures based on PRODY withthose based on education and R&D, the coefficient on the uphill measure was cor-rectly signed and significant. The reason, of course, is that the income-based measureand the measures based on education and R&D are highly correlated, and the dif-ferences are not large enough to conclude that it is education, not per capita GDP,that is the more accurate measure of sophistication.
Discussion and Limitations of the Analysis
This paper is a first attempt to document a possibly new phenomenon, which we calluphill flows of skills. We presented a set of stylized facts relating to uphill flows ofgoods, services, and FDI and preliminary estimates of the consequences of theseflows. We have not examined the determinants of these flows or elaborated on thepossible channels through which these flows might have growth consequences. Weoffer next some suggestions with regard to these two issues.
Explaining Uphill Flows
Uphill flows raise some interesting theoretical questions. First, and most obvious,they seem to defy the prediction of the pure Heckscher-Ohlin model, where trade is

134 | AADITYA MATTOO AND ARVIND SUBRAMANIAN
determined by relative factor endowments. Second, although such flows could beseen as a manifestation of intraindustry trade, driven by economies of scale andimperfect competition, this type of trade has typically been predicted between coun-tries at similar levels of development (Helpman and Krugman 1985).
Two possible explanations for uphill flows—one domestic and one international—suggest themselves. Within developing countries, for example, there could be atypi-cal patterns of development as a result of historical factors and policy actions. Twogood examples are India and South Africa, both of which have exhibited skill-intensivepatterns of development (see Amin and Mattoo 2006; Kochhar et al. 2006). In theIndian case, this was because higher education was favored at the expense of basiceducation, while in South Africa, apartheid and labor market policies played a role.Recent research shows that some of these larger developing countries are investingproportionately more in technical education than are poorer or richer countries(Sequeira 2003). If such policies are then overlaid on regional disparities, it is possi-ble for pockets to emerge within developing countries that are sufficiently endowedwith skills or are sufficiently developed to explain the observed patterns of “criss-crossing globalization.” In other words, the inconsistency of uphill flows with theorymay be more apparent than real if we were to think of countries like China and Indianot as single units but as heterogeneous economic units (or regions) with widely differing relative factor endowments (Subramanian 2007).
It is also possible for the relevant heterogeneity to emerge at the firm level. Forexample, Melitz (2003) allows for firm-level heterogeneity in productivity and fixedcosts of exporting and shows that only the most productive firms export. Helpman,Melitz, and Yeaple (2004) demonstrate, in turn, that among the firms that serve for-eign markets, only the most productive engage in FDI. It is conceivable that somefirms, even in developing countries, are so productive that they can incur the fixedcosts of exporting and investing abroad. Furthermore, if the fixed costs of penetrat-ing foreign markets vary across destinations—say, by per capita income of the desti-nation country—it is possible for productivity differences across developing countryfirms to result in the phenomenon of “uphill” flows that we document.
External policies could be another cause of uphill flows. One factor may have beeninternational patterns of protection, in particular, rich-country barriers against importsof less-skill-intensive products, and developing-country barriers against imports ofmore-skill-intensive products. Thus, the larger developing countries may have beeninhibited from exploiting their natural comparative advantage by exporting less-skill-intensive products to richer countries and more-skill-intensive products to poorer coun-tries. Put differently, if there is learning by doing, it may be that increases in uphillsophisticated exports have been possible because protection allowed domestic produc-ers to catch up with foreign producers in terms of competitiveness.
Uphill Flows and Growth
Standard theories of trade—Heckscher-Ohlin, intraindustry, and even the new het-erogeneous firm–based models—primarily see the gains from trade in static welfare

CRISSCROSSING GLOBALIZATION | 135
rather than dynamic growth (Bernard et al. 2007). Our results are more in the spiritof endogenous growth theories, which see trade as affecting the incentives and oppor-tunities for dynamic benefits such as technology acquisition and learning by doing.
Although a large part of the benefits of trade has traditionally been seen as accessto imports and inward FDI, there is a growing recognition that exports and outwardFDI may also confer important benefits.
We have not examined in any detail the channels through which uphill exportsof sophisticated goods and services affect overall economic performance. Onepossibility is that our measure of destination may actually capture a finer degreeof product differentiation, in horizontal or vertical terms. For example, Schott(2005) established that even when developing-country exports fall within thesame product categories as rich-country exports, they tend to have lower unitvalues and may be located lower on quality ladders. In other words, what weidentify as uphill flows may just be an alternative or complementary measure forproduct quality and sophistication. Our findings could then be seen as adding tothe evidence that such quality matters for economic performance (Hausmann,Hwang, and Rodrik 2007).
Another possibility is that final exports of sophisticated goods by a country mayreflect merely its comparative advantage in the final assembly stage rather than a deepersophistication in its production processes. For example, a significant proportion ofChina’s uphill exports of sophisticated goods contains imports of sophisticated com-ponents from rich countries. On the one hand, this could indicate that we are mis-measuring sophistication. On the other hand, our measure could capture the extent ofa country’s participation in modern global production chains, which confer benefits interms of knowledge of markets, just-in-time capability, improved production technol-ogy, and so on. Thus, what we capture—imperfect though it undoubtedly is—mayprovide clues about an additional channel through which the impact of global inte-gration is felt. As noted at the outset of this paper, there is now increasing evidencesupporting the existence of these channels (Javorcik 2004). In principle, these benefitscan also arise from sales to foreign firms located abroad.
Furthermore, uphill flows could affect growth through induced changes in economy-wide skill acquisition and, hence, in long-run endowments, creating a self-reinforcingand virtuous cycle. India again provides a relevant example. Educational attainmentin India, especially at the primary and secondary levels, was disappointing until theearly 1990s. In the past 15 years, however, educational indicators have improvedmarkedly. Although greater government attention has been important, a key changehas been increased demand for education because of higher returns to human capital,which in turn is a consequence of increased skill-intensive and uphill specialization.(The derived demand for skills and, hence, education is arguably a function not justof what is sold, but also to whom it is sold.) This demand has elicited a supplyresponse, largely from the private sector, that has led to a more rapid spread of edu-cation and skills (Kremer et al. 2006).
In summary, if there are benefits from uphill flows, in some circumstances signif-icant development benefits might derive not from deifying comparative advantage,but from defying it.

136 | AADITYA MATTOO AND ARVIND SUBRAMANIAN
Annex. Data on Foreign Direct Investment
To what extent do we see uphill flows of foreign direct investment (FDI) in the avail-able data, and how have these flows changed in recent years? To pursue this ques-tion, we examined merger and acquisition (M&A) FDI data from the ThomsonFinancial’s SDC Platinum database from January 1995 to December 2007 and dataon greenfield investment from the Financial Times FDI Intelligence, which is a privateorganization that compiles proprietary data on such investments.
Data Sources
The World Investment Report (WIR) database of the United Nations Conference onTrade and Development (UNCTAD) includes coverage of both total FDI and M&Ainflows and outflows for each country, but the published dataset does not breakdown these flows on a bilateral basis—data on countries of origin are not availablefor inflows, and data on destination countries are not provided for outflows.Although some UNCTAD-based datasets used by other researchers have endeavoredto create this bilateral breakdown, these datasets generally examine FDI stocks ratherthan flows and have reliable data across a broad range of countries for only a fewyears, generally between 2003 and 2005.
By contrast, reasonably comprehensive and highly granular coverage is availablefor M&A and greenfield FDI in the form of commercial financial databases. Suchdatabases report information at the individual transaction level, enabling analysis onthree principal axes: source countries of flows, destination countries of flows, andindustry sectors of flows. For this analysis, the SDC Platinum database was chosenfor its comprehensive dataset, including hundreds of thousands of cross-borderM&A transactions from 1985 up to the present.
The FDI Intelligence database produced by the Financial Times has tracked green-field foreign direct investment throughout the world since 2003. Greenfield directinvestment is defined as the expansion or creation of physical facilities in any locationother than the headquarters of a company. For each greenfield investment project, thedatabase has the actual or estimated investment in dollars terms and the actual or estimated jobs created from the project. Every project is assigned to a source marketand a destination market and is also disaggregated to the level of an industry sector,industry cluster, or business activity, in increasing order of disaggregation. The databaseis continuously updated and currently holds data on more than 78,800 projects.
For the purposes of the paper, we focused on the period 2003–07. Taken at theindustry sector level, this period gives 35,045 source-destination-industry observationstotaling US$4.3 trillion in value. Collapsing across industry sectors to arrive at aggre-gate numbers for source markets yields 9,263 bilateral greenfield investment projectsover this period, for a total of 132 source markets and 184 destination markets.
Combining the greenfield FDI data with the M&A data from the Thomson Finan-cial SDC Platinum database yields 10,457 bilateral recorded investment projects ineither or both categories, with a total value over the whole period of US$7.5 trillion.

CRISSCROSSING GLOBALIZATION | 137
Timeframe
In seeking to examine uphill flows of FDI, we note that the years of greatest interestare evidently the most recent ones. Whereas the major East Asian countries have hada significant presence as exporters of FDI for some time, only since the turn of themillennium have the four BRIC countries (Brazil, Russia, India, and China) joinedthem in this regard, and only since 2002 have net FDI outflows for these four coun-tries combined amounted to more than 2 percent of total world FDI flows. Major oil-exporting countries such as Mexico, Saudi Arabia, and the United Arab Emirateshave joined these ranks even more recently. The overall period chosen for analysis forthis study was thus that covering the years from 2003 to 2007, inclusive.
Data Coverage
For the purpose of M&A analysis, only completed transactions where transactionvalue was disclosed and recorded, and where the stake acquired in the target com-pany met or exceeded 10 percent, were included. Accurate recording of transactionvalues is clearly essential to any calculation of flows, while stakes below 10 percentare considered too small to be classified as FDI under most definitions. Including onlydisclosed-value transactions eliminates a little over half the transactions recorded inthe database, since many transactions are for unlisted companies or for other reasonsdo not face strict disclosure requirements. The dataset resulting from those selectioncriteria includes some 37,963 deals totaling US$8.4 trillion in value.
Comparison of the dataset resulting from this selection with M&A data and totalFDI data provided in aggregate form in UNCTAD’s WIR demonstrates that the over-all transaction coverage provided by the SDC Platinum database over this time periodis strong. Only between 2000 and 2002 is the total value of M&A transactionsreported in the SDC database below that reported in the WIR; in those years, cover-age remains above 80 percent, while in all the remaining years, the SDC dataset cap-tures a bigger total transaction volume than that reported by the WIR.
Although the overall volume of transactions captured by the SDC-based dataset ishigher than that reported by UNCTAD, for certain years and certain categories thecoverage is lower. Thus, whereas—compared with UNCTAD—SDC data reporthigher M&A FDI inflows into OECD countries (see below for notes on countrygroupings) for all years except 2000–2002, the OECD outflow volumes reported areroutinely lower than those reported by UNCTAD.
Country Groupings and Data Overview
OECD membership was the principal determinant used to distinguish between devel-oped and emerging countries. Although Mexico and the Republic of Korea are nowboth OECD members, for the purposes of this analysis both were included in theemerging-countries grouping rather than the OECD grouping. Offshore financialcenters and Mauritius were excluded from the analysis.

138 | AADITYA MATTOO AND ARVIND SUBRAMANIAN
Notes
The authors are grateful to Brad Jensen, Dani Rodrik, Tony Venables, Daniel Xie, and, espe-cially, our discussant Beata Javorcik for valuable comments; to Marko Klasnja and JanakMayer for outstanding research assistance; and to Francis Ng for his generous statistical help.Janak Mayer prepared the annex to this paper. The research for this paper is supported in partby the governments of Norway, Sweden, and the United Kingdom through the MultidonorTrust Fund for Trade and Development.
1. Data for M&A and greenfield investments are from different sources, as described in theannex.
2. In subsequent work, we plan to increase the sample to cover most countries.
3. There are two definitions of sophisticated products. The first covers exports that lie abovethe median value of PRODY (described in the text), calculated for 1990. The second cov-ers exports that lie in the top 25th percentile of PRODY values (highly sophisticated prod-ucts, or HSPs). For each definition, we compute the weighted average per capita GDP ofthe exporting countries, with the weights being the share of each country in the totalexports of sophisticated products.
4. Of course, this development could simply reflect the fact that richer countries, which aremore likely to demand sophisticated goods, have grown faster than poorer countries. Butduring this period, the non-OECD countries in our sample grew substantially faster thanthe OECD countries.
5. It is, in principle, possible to combine OECD data and the IMF Balance of Payments Sta-tistics to obtain an estimate of the share of exports of skilled services by developing coun-tries directed toward OECD countries. However, significant inconsistencies in the datafrom those two sources prevent meaningful comparison.
6. The finding of an upward shift holds true when we estimate the relationship (a) withoutkeeping the sample constant across time periods; (b) after controlling for a country’s area,population, and remoteness from the world’s center of gravity; and (c) using alternativemeasures of the uphillness of flows. Also, when we estimated the Preston relationships ina formal panel context, we found the coefficient on the 2005 dummy to be positive andstatistically significant.
7. As a referee pointed out, in principle, it may not be necessary to make such a drastic distinction between sophisticated and unsophisticated goods. We could arrange goodsalong a continuum from less to more sophisticated on the basis of their PRODY values.A continuous measure of uphill exports of sophisticated goods could then be given by aweighted average of the product of the PRODY value of an export and the income levelof the destination country, where the weight is exports of the product to a particular des-tination as a share of total exports (that is, the sum of exports of all products to all desti-nations). In notational form, such a measure would be
where Pi is the PRODY value of product i and Yj is the per capita income level of the des-tination country j. This measure is analogous to an interaction between EXPY and theaverage income level of all exports. It turns out to be highly correlated (0.93) with EXPYbecause there is relatively little variation in the average income level of all exports. Wetherefore use our uphill measure, which has a binary definition of sophistication and is lesscorrelated with EXPY.
aia
j
xij
aia
jxij
PiYj

CRISSCROSSING GLOBALIZATION | 139
8. The equality of these components provides additional econometric justification for com-bining them, as we have done in UPHILL1.
9. Population and area, which were decent instruments for our UPHILL1 measure, werepoor instruments for the UPHILL2 measure, precluding the possibility of instrumentalvariable (IV) estimations.
10. In this panel, we retained Ireland and China because they made no difference to theresults.
11. The results are available from the authors on request.
References
Amin, Mohammad, and Aaditya Mattoo. 2006. “Do Institutions Matter More for Services?”Policy Research Working Paper 4032, World Bank, Washington, DC.
Bernanke, Ben S. 2006. “Global Economic Integration: What’s New and What’s Not?” Fed-eral Reserve Board, Washington, DC. http://www.federalreserve.gov/boarddocs/speeches/2006/20060825/default.htm.
Bernard, Andrew B., J. Bradford Jensen, Stephen J. Redding, and Peter K. Schott. 2007. “Firmsin International Trade.” Journal of Economic Perspectives 21 (3): 105–30.
Berthelon, Matias, and Caroline Freund. 2008. “On the Conservation of Distance in Interna-tional Trade.” Journal of International Economics 75 (2): 310–20.
Borensztein, Eduardo, José De Gregorio, and Jong-Wha Lee. 1998. “How Does Foreign DirectInvestment Affect Growth?” Journal of International Economics 45 (June): 115–35.
Burgess, Robin, and Anthony J. Venables. 2004. “Toward a Microeconomics of Growth.” Policy Research Working Paper 3257, World Bank, Washington, DC.
Caballero, Ricardo J., Emmanuel Farhi, and Pierre-Olivier Gourinchas. 2008. “An EquilibriumModel of ‘Global Imbalances’ and Low Interest Rates.” American Economic Review 98(1, March): 358–93.
Coe, David T., Elhanan Helpman, and Alexander W. Hoffmaister. 1997. “North-South R&DSpillovers.” Economic Journal 107: 134–49.
De Loecker, Jan. 2007. “Do Exports Generate Higher Productivity? Evidence from Slovenia.”Journal of International Economics 73 (9, September): 69–98.
Feenstra, Robert, and Hiau Looi Kee. 2004. “Export Variety and Country Productivity.” Policy Research Working Paper 3412, World Bank, Washington, DC.
Haskel, Jonathan E., Sonia C. Pereira, and Matthew J. Slaughter. 2002. “Does Inward ForeignDirect Investment Boost the Productivity of Domestic Firms?” NBER Working Paper8724, National Bureau of Economic Research, Cambridge, MA.
Hausmann, Ricardo, Jason Hwang, and Dani Rodrik. 2007. “What You Export Matters.”Journal of Economic Growth 12 (1, March): 1–25.
Helpman, Elhanan, and Paul R. Krugman. 1985. Market Structure and Foreign Trade:Increasing Returns, Imperfect Competition, and the International Economy. Cambridge,MA: MIT Press.
Helpman, Elhanan, Marc J. Melitz, and Stephen R. Yeaple. 2004. “Export versus FDI withHeterogeneous Firms.” American Economic Review 94 (1, March): 300–16.
Hoekman, Bernard M., and Beata Smarzynska Javorcik, eds. 2006. Global Integration andTechnology Transfer. Houndsmills, Basingstoke, Hampshire, U.K.: Palgrave Macmillan;Washington, DC: World Bank.
140 | AADITYA MATTOO AND ARVIND SUBRAMANIAN
Hummels, David, and Peter Klenow. 2005. “The Variety and Quality of a Nation’s Exports.”American Economic Review 95 (3, June): 704–23.
Javorcik, Beata S. 2004. “Does Foreign Direct Investment Increase the Productivity of Domes-tic Firms? In Search of Spillovers through Backward Linkages.” American EconomicReview 94 (3): 605–27.
Kochhar, Kalpana, Utsav Kumar, Raghuram Rajan, Arvind Subramanian, and Ioannis Tokat-lidis. 2006. “India’s Pattern of Development: What Happened, What Follows?” Journal ofMonetary Economics 53 (5, July): 981–1019.
Kremer, Michael, Nazmul Chaudhury, F. Halsey Rogers, Karthik Muralidharan, and JeffreyHammer. 2006. “Teacher Absence in India: A Snapshot.” Journal of the European Economic Association 3 (2–3): 658–67.
Krugman, Paul R. 2008. “Trade and Wages Reconsidered.” Brookings Papers on EconomicActivity 2008 (1): 103–54.
Lumenga-Neso, Olivier, Marcelo Olarreaga, and Maurice Schiff. 2001. “On ‘Indirect’ Trade-Related Research and Development Spillovers.” Policy Research Working Paper 2580,World Bank, Washington, DC.
Melitz, Marc. 2003. “The Impact of Trade on Intra-Industry Reallocations and AggregateIndustry Productivity.” Econometrica 71 (November): 1695–725.
Prasad, Eswar, Raghuram G. Rajan, and Arvind Subramanian. 2007. “Foreign Capital andEconomic Growth.” Brookings Papers on Economic Activity 2007 (1): 153–230.
Ramamurti, Ravi, and Jitendra V. Singh. 2009. “Indian Multinationals: Generic Internation-alization Strategies.” In Emerging Multinationals in Emerging Markets, ed. Ravi Rama-murti and Jitendra V. Singh. Cambridge, U.K.: Cambridge University Press.
Samuelson, Paul A. 2004. “Where Ricardo and Mill Rebut and Confirm Arguments of Main-stream Economists Supporting Globalization.” Journal of Economic Perspectives 18 (3):135–46.
Schott, Peter K. 2005. “Across-Product versus Within-Product Specialization in InternationalTrade.” Quarterly Journal of Economics 119 (2, May): 647–78.
———. 2007. “The Relative Sophistication of Chinese Exports.” Economic Policy 53: 5–49.
Sequeira, Tiago Neves. 2003. “High-Tech Human Capital: Do the Richest Countries Invest theMost?” B. E. Journal of Macroeconomics, Topics in Macroeconomics 3 (1). http://www.bepress.com/bejm/topics/vol3/iss1/art13/.
Subramanian, Arvind. 2007. “Precocious India.” Business Standard (New Delhi), August 14.http://www.petersoninstitute.org/publications/opeds/oped.cfm?ResearchID=792.
Comment on “Crisscrossing Globalization:The Phenomenon of Uphill Skill Flows,” byAaditya Mattoo and Arvind Subramanian
BEATA SMARZYNSKA JAVORCIK
Aaditya Mattoo and Arvind Subramanian have written an enjoyable and thought-provoking paper that challenges the reader to question some basic economic theoriesand conventional wisdom.
In the first part of their study, the authors document a new phenomenon in whichskills embodied in goods, services, or capital (in the form of entrepreneurial and man-agerial skills associated with foreign direct investment) flow from poor to rich coun-tries. They call this phenomenon uphill flows. The existence of uphill flows maycome as a surprise, as it appears to contradict one of the basic theorems of interna-tional trade, which predicts that developing countries, where unskilled labor is abun-dant and skilled labor is scarce relative to the industrial world, will specialize inunskilled labor–intensive exports.
The second part of the paper argues that there is a positive link between uphillexport flows and economic growth in exporting countries. In other words, theauthors contend that economic growth is affected not just by the product composi-tion of exports (as claimed by Hausmann, Hwang, and Rodrik 2007), but also by thetype of destination market.
The paper is likely to stimulate lively discussion on the link between the quality ofexports and export markets and economic growth. Let me start the debate by posinga few questions under the following headings: (a) Are uphill flows real, or are they astatistical illusion? (b) Do uphill flows really contradict economic theory? (c) Uphillexports and growth: so what?
Are Uphill Flows Real, or Are They a Statistical Illusion?
There are several reasons why uphill export flows may not be “real.” The first is thathigh skill intensity of developing country exports may simply reflect reliance of
141
Beata Smarzynska Javorcik is a reader in economics at the University of Oxford and a research affiliate with the Centrefor Economic Policy Research, London.
Annual World Bank Conference on Development Economics 2009, Global © 2010 The International Bank for Reconstruction and Development / The World Bank

142 | BEATA SMARZYNSKA JAVORCIK
producers on skill-intensive imported inputs. For instance, China may import elec-tronic components and assemble them into computers that are then exported to theUnited States. Although the authors would classify such exports as uphill flows, inreality they would contain little input of Chinese skilled labor. This possibility can beeasily checked because China’s trade statistics explicitly designate “processingimports” as imports of intermediate inputs to be used to produce products solely forexport and define “processing exports” as exports that use these imported inputs.Trade figures confirm the high import content of skilled labor–intensive exports fromChina. For instance, in 2004 processing exports constituted 96 percent of Chineseexports of office and computing machinery. In communications equipment, the cor-responding figure was 86 percent, and in medical, precision, and optical instruments,it was 76 percent (Dean and Lovely 2008).
The second reason why uphill exports may create a misleading impression is thatmultinational enterprises from industrial economies are responsible for a large shareof export flows from developing to developed countries. In China foreign investmententerprises accounted for nearly a third of industrial output produced in 2001. In thesame year, manufacture of electronic components ranked second among Chinese sec-tors in terms of entry of foreign investment enterprises (Amiti and Javorcik 2008).Uphill exports associated with multinational enterprises may to a large extentembody knowledge produced in the developed-country headquarters of these enter-prises, rather than intangible assets created in the exporting country.
The third difficulty posed by the definition of uphill flows stems from the large dif-ferences in regional characteristics observed within developing countries, which putinto question the wisdom of treating a country like China as a unit of analysis. Thecoastal regions of China may be more similar to developed than developingeconomies, so should exports from these regions really be classified as uphill flows?
Do Uphill Flows Really Contradict Economic Theory?
The recent increase in foreign direct investment (FDI) from developing to developedcountries is part of the uphill flows documented by the authors. On the surface,exports of capital from capital-scarce developing countries to capital-abundantindustrial countries appear to contradict economic theory. But there are three simplereasons why this contradiction may not stand up to scrutiny.
First, the apparent contradiction disappears when we reinterpret FDI undertaken bydeveloping country firms as imports of intangible assets rather than as exports of cap-ital. For instance, Tata’s acquisition of Jaguar may be viewed as a purchase of technol-ogy and a brand name. Lenovo’s acquisition of IBM production facilities may be con-sidered a purchase of trademarks (ThinkPad), reputation, and distribution channels.Such “knowledge-sourcing” FDI, undertaken in order to import intangible assets to(relatively knowledge-scarce) developing countries, is consistent with economic theory.
Second, export of capital may be a necessary complement to export of unskilledlabor–intensive or natural resource–intensive products. For example, when a large

COMMENT ON MATTOO AND SUBRAMANIAN | 143
Indian outsourcing company, WIPRO, acquired American and European consultingfirms, it purchased a client base in those markets in the hope of leveraging its exportsof information technology and back-office services from India. Similarly, Gazprom’sacquisition of stakes in oil distribution systems seems to be a natural step comple-menting its oil exports.
Third, many highly publicized acquisitions undertaken in industrial countries bydeveloping-country interests have been made by sovereign wealth funds and are notnecessarily driven solely by market forces. (Political considerations may play a role.)Our economic theories simply do not apply to these cases.
Uphill Exports and Growth: So What?
The positive relationship between economic growth and uphill exports documentedby the authors makes it really tempting to advise policy makers, “Export sophisti-cated goods to rich countries, and your country will grow faster.” Yet doing so is akinto saying, “Practice bodybuilding, and you will become the next governor of California.” Arnold Schwarzenegger was indeed a bodybuilder, but his highly suc-cessful Hollywood career and marriage into the Kennedy family may have beenequally (if not more) important to his bid for political office.
Even if we believe in a causal link from uphill export flows to economic growth,what is a “rich-country export good”? (Sophisticated exports are defined as productsthat tend to be exported by rich countries.) Even if a poor country exports a goodclassified in the same product category as a good exported by a rich country, the twocan be very different. For instance, men’s cotton shirts imported by the United Statesfrom Japan are roughly 30 times as expensive as the identically classified variety orig-inating in the Philippines (Schott 2004). Thus, ideally we would like to isolate char-acteristics of export goods that stimulate growth. Are such products characterized bylong quality ladders? Speed of innovation? Or skill content?
Furthermore, in order to provide meaningful policy advice, we need to understandthe mechanism through which a certain type of export can lead to faster economicgrowth. After all, saying “All you need to do to become the next governor of Californiais to win the election” is not terribly helpful. One possibility is that the ability to servedeveloped-country markets creates an incentive for developing-country producers toincrease the quality of their export products. This leads to additional investment intechnology and physical assets, buildup of knowledge, and knowledge spillovers.Another possibility is that sophisticated buyers in developed countries transfer knowl-edge to developing-country producers.
Patterns observed in Mexico after the North American Free Trade Agreement(NAFTA) came into effect are consistent with the above scenarios (Iacovone andJavorcik 2008). The data suggest that entry of Mexican producers into export mar-kets is preceded by increased investment in physical assets. There is also evidence sug-gesting that high-quality products are more likely to be exported (where quality ismeasured as the ratio of the domestic unit value obtained by a given producer for a
144 | BEATA SMARZYNSKA JAVORCIK
given product in a given time period to the average unit value of the same productobserved in the same time period).
An important implication of the paper by Mattoo and Subramanian is the needfor further work aiming to understand how (if at all) learning from exporting takesplace. The link between uphill flows and economic growth documented in theirstudy suggests that such learning may occur only for some types of products andexport markets—which could explain why the literature on this topic has produced conflicting results.
References
Amiti, Mary, and Beata S. Javorcik. 2008. “Trade Costs and Location of Foreign Firms inChina.” Journal of Development Economics 85 (1–2): 129–49.
Dean, Judith, and Mary Lovely. 2008. “Trade Growth, Production Fragmentation, andChina’s Environment.” NBER Working Paper 13860, National Bureau of EconomicResearch, Cambridge, MA.
Hausmann, Ricardo, Jason Hwang, and Dani Rodrik. 2007. “What You Export Matters.”Journal of Economic Growth 12 (1): 1–25.
Iacovone, Leonardo, and Beata S. Javorcik. 2008. “Shipping Good Tequila Out: Investment,Domestic Unit Value and Entry of Multi-Product Plants into Export Markets.” Universityof Oxford, Oxford, U.K.
Schott, Peter. 2004. “Across-Product versus Within-Product Specialization in InternationalTrade.” Quarterly Journal of Economics 119 (2, May): 647–78.
Migration, Remittances,and the Transition fromForeign Aid

The Aid-Migration Trade-off
JEAN-PAUL AZAM AND RUXANDA BERLINSCHI
This paper highlights an empirically significant trade-off between the aid flows deliv-ered by donor countries and the inflows of migrants that they receive from develop-ing countries. It draws the implications for aid policy from a simple game-theoreticmodel, after reviewing the recent literature on the effects and motivations of foreignaid to developing countries. The paper is part of the recent effort by economists,goaded by the dead end in which the “aid-ineffectiveness” literature had cornereditself, to discover the hidden agenda behind foreign aid.
Are migrants a blessing or a curse? In rich countries, the threat of an invasion by poormigrants from the South is evoked time and again, especially before important elec-tions. It seems that a sizable constituency exists for exerting pressure on governmentswith a view to inducing them to erect legal barriers against immigration. Some north-ern European countries that were once very liberal in this respect have recently wit-nessed the emergence of a National Front–type movement, with a fairly aggressiveattitude toward immigration. This phenomenon can be observed even in countrieswhere unemployment is negligible, as in the Netherlands. At the same time, there arevoices cautioning that keeping migrants at bay is nothing like a free good.
Borjas (1995), for example, analyzes the benefits accruing to the receiving coun-try in a competitive general equilibrium framework. His model indicates that nativesbenefit from immigration because of the production complementarities that existbetween immigrant workers and other factors of production and that these benefitsare larger when immigrants’ assets are sufficiently different from the stock of nativeproductive inputs. A different argument is used by Ortega (2000) in a dynamic labor
147
Jean-Paul Azam is director of the Atelier de Recherche Quantitative Appliquée au Développement Économique(ARQADE), Toulouse School of Economics, University of Toulouse. He is a researcher with the Institut d’EconomieIndustrielle (IDEI) at the University of Toulouse and a senior member at the Institut Universitaire de France. RuxandaBerlinschi is a lecturer at the Toulouse School of Economics. Comments by participants at the ABCDE conference aregratefully acknowledged. In particular, the authors thank the discussant, Melvin Ayogu. Jennifer Hunt and DeveshKapur also offered helpful comments.
Annual World Bank Conference on Development Economics 2009, Global © 2010 The International Bank for Reconstruction and Development / The World Bank.
148 | JEAN-PAUL AZAM AND RUXANDA BERLINSCHI
market model with multiple equilibria. In this model, immigration tilts the bargain-ing strength in favor of firms, with a positive impact on employment and wages.
Other benefits have been identified outside the labor market. Gubert (2003) pre -sents a striking calculation: if France accepted just 60,000 more Malian migrants, andif the new migrants had the same propensity to send remittances home as those cur-rently living in France, total remittances would be equivalent to the aid that France iscurrently sending to Mali. This is a negligible number for a receiving country whosepopulation is more than a thousand times larger than the number cited. The addedmigration would also help trim public expenditures, as many fewer police would beneeded for tracking illegal migrants, and the French aid administration could also becut sizably were the aid flow to be reduced correspondingly. Remittances are the keybenefit that developing countries receive from the outflows of migrants that they sendto rich countries every year. Klein and Harford (2005) demonstrate that remittancesare now one of the main sources of external finance for developing countries, and onethat is growing steadily, with a fairly smooth time profile. Remittances have becomeat least as important as foreign aid for many developing countries.
From this kind of calculation, it is clear that the opportunity cost of fighting immi-gration in rich countries is sizable. Anti-immigration constituencies must thereforeperceive considerable detrimental effects on their countries to convince them toaccept these costs. Yet quantitative research has found that the externalities perceivedby these constituencies are difficult to confirm statistically.
This paper attempts to discover the main determinants of the inflow of migrantsinto rich countries, with a view toward identifying whether there are policy tools,apart from visa control, that governments of the North can (and do) use to curbimmigration. The analysis is best seen as part of a research program that seeks to dis-cover the true agenda behind foreign aid, which the so-called aid-ineffectiveness lit-erature has shown to be different from the proclaimed goal of boosting growth andfighting poverty in the recipient country.
The next sections review studies on the effects and determinants of migration, andthe aid-ineffectiveness debate is briefly discussed. In the subsequent sections a simplegame-theoretic model is sketched, and several testable predictions are derived. Anempirical analysis then shows that aid does indeed belong to the toolbox used by rich-country governments to control immigration. The final section contains conclusions.
Impacts of Immigration Flows
The effects of immigrant flows on host countries have been widely studied in the eco-nomics literature. Most of the research on this topic has looked at the impact on thelabor market and, in particular, on the wages and employment rates of the receivingcountry’s natives. The simplest economic model of labor market equilibrium suggeststhat immigration is liable to create a pecuniary externality, as an increase in the laborsupply resulting from the inflow of immigrants will lead to lower wages or, in thepresence of wage rigidities, to higher unemployment. In reality, this negative effectmay be mitigated by adjustments in the labor market; for example, firms may moveto regions where labor is becoming cheaper, thus increasing labor demand there, or
THE AID-MIGRATION TRADE-OFF | 149
natives may move away from the regions where the migrants have arrived. Moreover,in choosing their destination, migrants take into account expected future wages andpossible demand shocks not observed by the econometrician (Borjas 2003). For thesereasons, measuring the effect of migrants on wages is a difficult empirical exercise,and there is no general consensus on this question.
Using data from U.S. decennial censuses for 1960–90 and from the 1998–2001current population surveys, Borjas (2003) finds that immigration has a considerablenegative impact on the wages of native workers. Card (2001) shows that immigra-tion flows in the late 1980s in U.S. cities with large immigrant populations reducedthe relative employment rates of low-skilled natives by up to 1 percent and their relative wages by no more than 3 percent. Friedberg and Hunt (1995) review theexisting theoretical and empirical literature on the impact of immigrants on hostcountries’ wages and growth and conclude that the impact on natives’ wages is verysmall. Longhi, Nijkamp, and Poot (2005), on the basis of their meta-analysis of18 empirical studies of this type, conclude that there is a robust negative and statis-tically significant, but small, impact of immigrants on natives’ wages and that thisimpact is larger in Europe than in the United States.
Other types of externality have been discussed in the context of immigration.Besides its effects on the economy, immigration also has demographic and politicaleffects on the host countries. Given that immigrant populations are generally youngerthan the natives and have higher fertility rates, immigration may offer a way ofdecreasing the age-dependency ratio in industrial countries.
Turning to the political point of view, some countries may worry that immigrantsthreaten their national identity and their ethnic and cultural stability. The creation byFrench President Nicolas Sarkozy of a Ministry of Immigration, Integration andNational Identity is a response to this type of anxiety. There are also fears of infil-tration by potential terrorists or drug traffickers (Neumayer 2006). These politicalconcerns seem to play a role at least as important as the economic impacts describedabove in determining decisions by immigration authorities. Neumayer (2006) showsthat the poorer, the less democratic, and the more exposed to armed political conflicta country is, the more its citizens are likely to be subject to visa restrictions. The sameis true for nationals of countries that were the origins of terrorist attacks.
It thus seems that migrants from the poorest countries are less welcome thanmigrants from rich countries. Since the poorest countries are also the most importantrecipients of foreign aid, it is natural to ask whether foreign aid is used to reduceimmigration from them.
Other arguments against immigration are based on its effect on the source coun-tries. One of the most important consequences of out-migration for the country oforigin is the flow of remittances received by migrants’ families and friends. Remit-tances are undoubtedly an essential means of reducing poverty and insuring the pop-ulation against risks. In many developing countries, remittances are a larger andmore stable source of finance than official development assistance. But remittancesdo not have only positive consequences. As Kapur (2004) notes, in some cases theyhave been an important source of funding for terrorism and civil wars. In Somalia,for example, a large proportion of the remittances supported arms purchases forrural guerrillas; in Armenia diaspora remittances boosted tough nationalist regimes

150 | JEAN-PAUL AZAM AND RUXANDA BERLINSCHI
and complicated efforts to solve regional conflicts; and the regime of the DemocraticPeople’s Republic of Korea has been strengthened through access to scarce foreigncurrency resources. Kapur also cites the creation of a culture of dependency among,and lower labor market participation by, the population that did not migrate, aswell as the risk of a “Dutch disease” phenomenon if remittances are spent largely on nontradable goods such as housing and land.1
Some empirical findings shed light on the relative impacts of economic and othervariables on public opinion in receiving countries, and on the influence of public opin-ion on immigration policies. Scheve and Slaughter (2001), using a direct measure ofthe U.S. population’s preferences concerning immigration, obtained from the 1992National Election Studies, show that less-skilled workers are significantly more likelyto prefer limitation of immigrant inflows into the United States. Mayda (2006)employs individual-level survey datasets, as well as aggregate data on internationalmigration, to study attitudes toward immigrants and how these attitudes influencemigration policies. She finds that skilled individuals are more likely to be pro- immigration in countries where the relative skill composition of natives vis-à-vis immi-grants is high. Other influences on attitudes toward migration are concern about theimpact of immigration on crime rates, individual perceptions of the cultural effect offoreigners, racist feelings, and the size of inflows of asylum seekers. Mayda observesthat countries with higher per capita gross domestic product (GDP) are, on average,less open to immigration, after allowing for the influence of individual-level variables.A study by O’Rourke and Sinnott (2006), using a cross-country dataset to investigatethe determinants of individual attitudes toward immigration, indicates that these attitudes reflect economic interests, as well as nationalist sentiment. The authors showthat among labor market participants, the highly skilled are less opposed to immigra-tion than the low skilled; this effect is larger in richer countries than in poorer ones andin countries with greater equality than in countries with more inequality. Among thosewho are not in the labor force, noneconomic factors are much more important thaneconomic considerations in determining attitudes toward migration.
Facchini and Mayda (2008) use a sample of 34 countries which were included inthe 1995 and 2003 rounds of the International Social Survey Programme to show thatvoters’ negative opinions toward migration explain the restrictive migration policiesin place in most destination countries. They demonstrate that countries in which themedian voter is more opposed to migration tend to implement more restrictive poli-cies. Thus, it seems that besides the impact of immigrants on the economy, citizens ofrich countries worry about immigrants’ being a threat to security, national identity,and ethnic and cultural stability.
The Determinants of Immigration Flows
Many arguments have been advanced explaining, without necessarily justifying, whygovernments of the global North want to curb immigration into their countries. Thekey question is whether they actually do anything about it: are there policy handles

THE AID-MIGRATION TRADE-OFF | 151
that they use to reduce inflows? Visa quotas allow only an imperfect control of immigration flows. Many industrial countries have family reunification laws thatlead to chain immigration, and many countries have signed asylum and refugee pro-tection treaties that oblige them to accept some of these uprooted people. Accordingto data from the United Nations High Commissioner for Refugees (UNHCR), about560,000 asylum applications were received by 28 industrial countries in 2000, andabout 1 mil lion asylum seekers were awaiting a decision. Moreover, visa quotas donot reduce the number of illegal entrants, as discussed forcefully by de Haas (2006).Hatton and Williamson (2002) note that about 300,000 illegal immigrants enter theUnited States every year, and 400,000 to 500,000 enter Western Europe. Illegal aliensare estimated to add 10 or 15 percent to the foreign-born stock in countries of theOrganisation for Economic Co-operation and Development (OECD). Thus, the visainstrument alone is not a sufficient solution if the desired immigration level is lowerthan the observed one or the one expected to prevail in the future if no other meas-ure is adopted.
The rich empirical literature aimed at discovering the determinants of immigrationflows has produced a good crop of convergent findings. For example, Mayda (2007),using a panel of bilateral migration flows to 14 OECD countries by country of originbetween 1980 and 1995, finds that income improvements in the destination countries, as well as the share of the young population in the country of origin, havepositive and significant effects on emigration rates and that distance between thecountries and migration quotas have negative effects. Similar results are found byJennissen (2003), who studied the economic determinants of net immigration inWestern Europe for the period 1960–98, using net migration flows as a dependentvariable. He finds that destination GDP per capita, existing migrant stock, and theeducational level of the population have positive effects and that unemployment rateshave a negative effect on net migration flows. Hatton and Williamson (2002) pre senta quantitative assessment of the economic and demographic fundamentals that driveworld migration across historical periods and around the world, using data on aver-age net immigration rates over five-year periods from 1970–75 to 1995–2000 for80 countries. The authors find that the share of the population age 15–29 in thereceiving country has a negative effect on its immigration rates and that the immi-grant stock has a positive effect on net immigration. They also document that a risein domestic income relative to the world and to the region both increase a country’snet immigration. Lucas (2005) examines the causes and consequences of migrationfrom lower-income countries. Neumayer (2005), using a panel on the annual num-ber of asylum seekers in Western European countries by country of origin between1982 and 1999, finds that human rights abuses, political violence, and state failureare important determinants of asylum migration and that democracy has a significantbut nonlinear effect. Economic conditions in the countries of origin are also animportant determinant of the number of asylum seekers coming to Western Europe.Neumayer suggests that generous development assistance and the opening of pro-tected European markets to imports from the sending countries could ease migrationpressure—a view that de Haas (2006) criticizes forcefully.

152 | JEAN-PAUL AZAM AND RUXANDA BERLINSCHI
Surprisingly few quantitative studies exist on the link between aid and migration.From the above-cited literature, income differentials appear to be one of the maindeterminants of the supply of immigrants. Because foreign aid is a transfer thatreduces, at least at the margin, these differentials, it is natural to ask whether foreignaid reduces immigration. Castles (2003) characterizes the migration policies pursuedby the United Kingdom and the European Union as generally unsuccessful and claimsthat reducing North-South inequality is a key to effective migration management.Morrison (1982) argues that the most promising way for development assistance toinfluence migration in the short-to-medium run is through employment-generatingactivities and, in the long run, by reducing population growth and improving incomedistribution. In fact, for countries with very low incomes, foreign aid could actuallyincrease emigration rates in the short run because of a possible migration-hump phe-nomenon. Rotte and Vogler (2000), using a panel of data on international migrationto Germany from 86 countries between 1981 and 1995, study the influences of eco-nomic, demographic, and political factors on inflows to Germany and find no sig-nificant effect from aid. Berthélemy, Beuran, and Maurel (2009) estimate the two-way impact of aid and migration using cross-country data and find a positive impactof aid on migration in a simultaneous-equation system.
Searching for the Hidden Agenda behind Foreign Aid
The academic literature on foreign aid has been at times quite paradoxical. It caughtthe public’s attention under the generic name of the “aid-ineffectiveness” literature;Easterly (2006) surveyed it in an influential review aimed at a broad audience. Theaid-ineffectiveness literature shows quite consistently that foreign aid is not very suc-cessful at boosting growth and reducing poverty in recipient countries. The contribu-tors to this body of work end up expressing severe criticism of the international com-munity, which appears unable to pursue its proclaimed objective. The World Bank’srecent slogan, “Our Dream: A World Free of Poverty,” seems bound to remain just adream. This conclusion appears to challenge the standard methodology of economicsat a fundamental level. How is it that the international community has consistentlyspent zillions of dollars in foreign aid for nearly six decades without being “effec-tive”? Are there no error-correction mechanisms that can put an end to this “massivewaste”? But the apparent paradox only concerns a small share of the academic liter-ature on aid and is the result of some hasty interpretation of the findings.
The Aid-Ineffectiveness Puzzle
The root cause of the turmoil is that some economists have taken at face value thedeclared objectives of foreign aid. The stated objective has always been to boost eco-nomic growth in the recipient country. For a long time, aid was focused on filling the“saving gap”—the allegedly insufficient national saving flow that was supposed toafflict poor countries. Collier (2007) suggests that the change in emphasis which

THE AID-MIGRATION TRADE-OFF | 153
occurred in the 1980s and 1990s, from economic growth to poverty alleviation, wasthe result of a public relations campaign aimed at harnessing electoral support infavor of foreign aid from all sides of the political spectrum in rich countries. Aca-demic economists, however, soon started to blow the whistle, demonstrating thatthere was not much empirical support for the view that foreign aid was promotinggrowth in poor countries or reducing significantly the incidence of poverty.
A much-cited paper by Boone (1996) triggered a wave of debate on aid ineffec-tiveness by showing that no significant impact of aid on growth could be found incross-country regressions. In a highly influential paper, Burnside and Dollar (2000)argue forcefully that in analyzing the effect of aid, due account must be taken of het-erogeneity among recipient countries. The authors favor an index of the quality ofmacroeconomic policies as their heterogeneity parameter because their findings sug-gest that aid boosts growth when it is given to countries that have a sound macro-economic policy framework. Similarly, Svensson (1999) presents cross-countryregression findings showing that aid is more effective in affecting growth in moredemocratic countries. In the same vein, Kosack and Tobin (2006) find that foreign aidand democracy have a positive impact on economic growth and human development,provided that there is a minimum level of human capital in the recipient country.
Nevertheless, the dominant diagnosis is that, in general, with some noteworthyexceptions, aid is not boosting growth. Some authors blame the failure of aid on themisconceived approach of conditionality (see, for example, Collier 1997). A numberof theorists propose clever schemes for fixing aid (see Svensson 2000, 2003; Azamand Laffont 2003). Another influential response has been to claim that aid has notbeen effective because there has not been enough of it—what was needed was a “bigpush” to lift people out of the “poverty trap.” This view was forcefully supported bySachs (2005); Collier (2007) espoused a more subtle variant.
These findings and the response that they triggered raise a more fundamentalmethodological issue: do they mean that aid is ineffective, or does the true agenda ofaid differ from the much-publicized goals of fostering growth and alleviating poverty?The proper methodology of economics is based on revealed-preference theory:instead of trying to assess the effectiveness of foreign aid by looking at the extent towhich it achieves its stated objective, we should try to infer its true agenda from itsactual achievements. When people spend zillions of dollars over decades, they mustcertainly have achieved a measure of success that justifies the continuation of thisexpenditure flow. Some economists have tried to discover the hidden agenda of for-eign aid by looking at the determinants of its allocation across countries. Their resultssuggest that the impact of foreign aid on growth and development is probably notthe crucial determinant of its allocation. For example, Burnside and Dollar (2000)find that the quality of the macroeconomic policies pursued by a given country doesnot make the country more likely to receive more aid, although it does makes aidmore “effective.” Similarly, Svensson (1999) presents cross-country regression analy-sis showing that although aid is more effective at promoting growth in more demo-cratic countries, those countries are not more favored as aid recipients. This findingsuggests that aid allocation is governed by other considerations, hinting again thatthere is a hidden agenda aside from the generous drive to alleviate poverty.
154 | JEAN-PAUL AZAM AND RUXANDA BERLINSCHI
Donors’ Revealed Preferences
The political dimension of aid allocation is further analyzed by Alesina and Dollar(2000), who find that the colonial past and strategic alliances are the main determi-nants of the amount of aid received by poor countries. They also show, however, thatin the time-series dimension, democratization is often followed by increased aid,although there is no significant static effect of democracy. By contrast, Berthélemyand Tichit (2004), in a panel data analysis covering 137 aid recipients and 22 bilat-eral donors during the period 1980–99, find a significant positive impact of the Free-dom House index of civil liberty and political rights. This finding is confirmed in alater study using a different estimation method (Berthélemy 2006). The latter twostudies bring out quite strongly that in allocating aid, most bilateral donors seem tobe guided by their self-interest and, in particular, by their commercial relationships.Fleck and Kilby (2006a) show that commercial concerns play an important part indetermining the allocation of U.S. bilateral aid across countries, particularly when thepresident and/or Congress are conservative. The results reported by Fleck and Kilby(2006b) suggest that the validity of such a diagnosis can be extended to the case ofthe World Bank, whose aid allocation behavior is significantly influenced by U.S.trade and political interests. One may wonder, however, whether trade flows are per-fectly exogenous, at least as far as bilateral donors are concerned. Although mostdonors have formally ruled out tied aid, toward the end of the 1960 to 1997 sampleperiod considered by Fleck and Kilby (2006a), some implicit and subtle ways of tyingaid probably continued in operation. Moreover, aid helps finance the trade deficit ofdeveloping countries, and this certainly increases imports from industrial countries,which are also the main donors. This effect is even more likely toward the end of theperiod of analysis, as trade liberalization was a prominent feature of the reform pro-grams supported by foreign aid under the influence of the Bretton Woods institu-tions. Hence, some reverse causation between aid and trade may be present, chan-neled by various mechanisms, so that the above findings might be misleading.
Chauvet (2002) looks at the relationship between aid allocation across countriesand various kinds of “sociopolitical instabilities”—referring to events that reflectpolitical troubles in the recipient countries. She distinguishes three types: (a) eliteinstability, including coups d’état, revolutions, and major government crises; (b) violentinstability, including political assassinations, guerrilla warfare, and civil wars; and(c) social instability, such as strikes, demonstrations, and riots. She shows that thesethree types of event have different effects on the allocation of aid, depending also onthe kind of aid. Instabilities of types (a) and (b) have a positive impact, suggestingthat aid flows are directed to governments that are under political threat, while type(c) has a negative effect, showing that aid shies away from threats directed morespecifically at the economy. These results suggest that donors give aid to recipientgovernments in response to political motivations, with a kind of conservative benttoward providing support to incumbent governments. Economic issues such asgrowth and poverty alleviation seem to play only a secondary role, in that govern-ments facing greater “social instability”—the likely response of some constituenciesto economic hardship—are somehow punished by getting less aid money. This whole

THE AID-MIGRATION TRADE-OFF | 155
line of empirical research tries to infer from the determinants of aid allocation acrosscountries what donors are really trying to achieve, but it fails to test directly for theimpact of aid on the presumed objectives.
Alesina and Weder (2002) use a slightly different empirical strategy, lookingdirectly at the effect of aid on some potential objectives of the donors. They showthat the level of corruption plaguing the recipient government does not significantlyaffect the allocation of aid across countries but that there is a significant effect in theother direction. Their results suggest that an increase in aid this year increases thelevel of corruption next year—what they call the “voracity effect.” They thus con-clude that donors do not care at all about corruption in the recipient country. Simi-larly, Azam and Delacroix (2006) and Azam and Thelen (2008) look directly at theeffects of aid on some potential objectives of the donors while taking due account ofreverse causation. Using such a structural econometric approach, they show that aidis effective at fighting terrorism and that donors allocate aid across countries with aview to pursuing this objective.
Our paper represents a further attempt at identifying a donor objective, by testingwhether aid is actually used to reduce migration from poor countries.
Implications of the Aid-Migration Trade-off
A very simple model is sufficient for capturing the main issues raised by the potentialtrade-off between aid and migration when rich countries wish to use aid policy toreduce migration inflows. It is most likely that (assuming the aid is effective in thefirst place) there are some spillovers, insofar as the aid given by one donor mightreduce simultaneously migration outflows from the recipient country in the directionof both the donor country and other destinations. This means that some free ridingis bound to occur unless donors coordinate their actions. The model discussed nextillustrates this point.
The Model
Assume that there are three countries in the world: two donor countries, labeled 1and 2, whose level of affluence potentially attracts migrants, and a developing coun-try, whose flows of migrants to each donor country are designated n1 and n2. Thedonors have the possibility of giving aid to the poor country, with a view to reduc-ing the flow of migrants that they receive from it. Two main mechanisms can explainwhy aid can have a negative impact on the migration flow. First, the aid can help cre-ate an improved economic situation in the recipient country by supporting produc-tive investments and creating jobs. Second, the aid can provide an inducement to therecipient government to try to deter out-migration, if the assistance is conditional onthe adoption of policy measures aimed at reducing outflows. For example, financialincentives can be created in favor of returning migrants, thus reducing the net out-flow, other things being equal, or migration-prone groups can be targeted with spe-cific actions. In Mali and Senegal, for example, the Soninke ethnic group is the most

156 | JEAN-PAUL AZAM AND RUXANDA BERLINSCHI
migration prone because of the well-established diaspora that they can rely on (seeAzam and Gubert 2006). A codevelopment project has been implemented withFrench aid money with a view to reducing migration by members of this group bydeveloping attractive programs in their region of origin.
Let a1 and a2 denote aid flows from countries 1 and 2, respectively. Assume thatthe inflow of migrants in donor country 1 is governed by the following function:
n1 � f (a1, a2, �). (1)
We assume that the impacts of the two aid flows on n1 are negative, reflecting the aid-migration trade-off that we want to analyze. The negative impact of a country’s ownaid flow is quite obvious, as discussed above, but the cross-effect deserves additionalcomment. If either aid flow has a positive effect on the level of economic activity andthe creation of jobs that might reduce the attractiveness of migration for nationalsfrom the developing country, then it cannot be assumed that this will affect only theoutflow directed at each donor country separately; there is necessarily some spilloveron the outflow to the other country. In the limit, it could be argued that only the totalaid flow, a1 � a2, matters for the outflows of migrants, if the two aid flows have thesame impact on the recipient economy. The more general specification embedded inequation (1), however, allows for some finer targeting by donor countries, whichmight devise policies that mainly affect the migration flow heading in their own indi-vidual directions. This could be done, for example, by targeting a specific ethnicgroup that is connected to an important diaspora in one of the donor countries. Theparameter � captures the set of the other variables that are liable in either country toaffect the outflow of migrants. By permuting the subscripts 1 and 2, we can readilygenerate the equivalent function to equation (1) for donor country 2.
Assume then that country 1 is prepared to incur the cost of providing aid if the aidshows some effectiveness in reducing the migration flow in its direction. This is cap-tured by assuming that country 1 seeks to minimize the following loss function:
mina1,n1L(a1, n1, �), (2)
which is increasing and convex in its first two arguments. This captures the facts thataid entails a cost for the donating country, by using up some fiscal revenues, and that,for whatever reason, that country’s government tends to feel that its country isattracting too many migrants. The shift parameter � captures the contextual vari-ables that are liable to affect the government’s feelings about immigration, such aselections or other political determinants. A similar function is assumed to govern thechoices made by country 2.
Nash-Equilibrium Aid and Migration Flows
If the two countries determine their aid policies without any coordination betweenthem, the aid flows and the migration flows will be determined by the Nash equilib-rium of the game. This is the standard equilibrium concept in noncooperative gametheory, which assumes that each player takes the other one’s equilibrium choice asgiven.
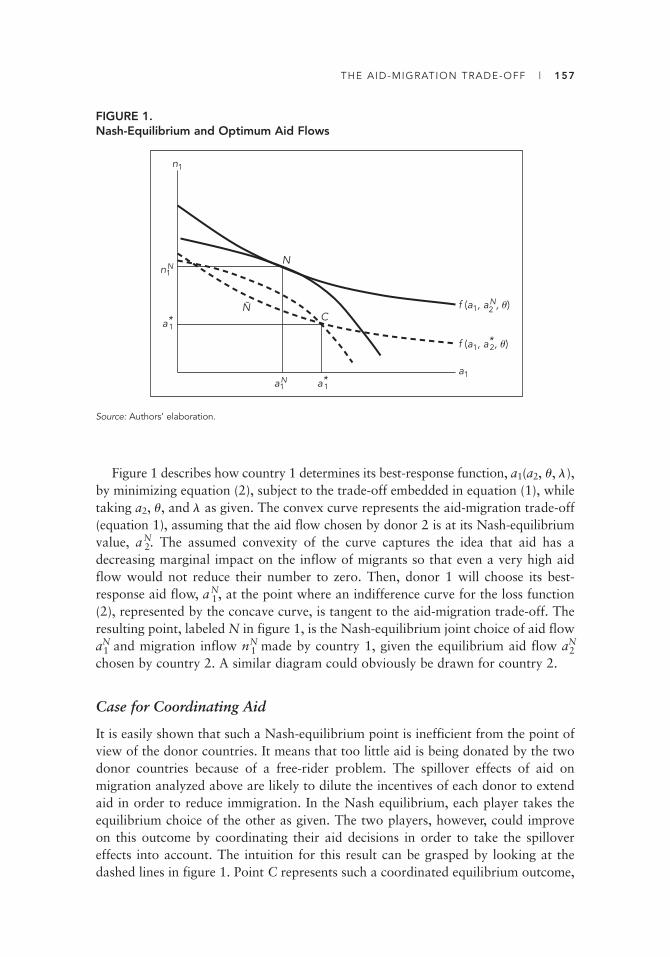
THE AID-MIGRATION TRADE-OFF | 157
Figure 1 describes how country 1 determines its best-response function, a1(a2, �, �),by minimizing equation (2), subject to the trade-off embedded in equation (1), whiletaking a2, �, and � as given. The convex curve represents the aid-migration trade-off(equation 1), assuming that the aid flow chosen by donor 2 is at its Nash-equilibriumvalue, aN
2. The assumed convexity of the curve captures the idea that aid has adecreasing marginal impact on the inflow of migrants so that even a very high aidflow would not reduce their number to zero. Then, donor 1 will choose its best-response aid flow, aN
1, at the point where an indifference curve for the loss function(2), represented by the concave curve, is tangent to the aid-migration trade-off. Theresulting point, labeled N in figure 1, is the Nash-equilibrium joint choice of aid flowaN
1 and migration inflow nN1 made by country 1, given the equilibrium aid flow aN
2
chosen by country 2. A similar diagram could obviously be drawn for country 2.
Case for Coordinating Aid
It is easily shown that such a Nash-equilibrium point is inefficient from the point ofview of the donor countries. It means that too little aid is being donated by the twodonor countries because of a free-rider problem. The spillover effects of aid onmigration analyzed above are likely to dilute the incentives of each donor to extendaid in order to reduce immigration. In the Nash equilibrium, each player takes theequilibrium choice of the other as given. The two players, however, could improveon this outcome by coordinating their aid decisions in order to take the spillovereffects into account. The intuition for this result can be grasped by looking at thedashed lines in figure 1. Point C represents such a coordinated equilibrium outcome,
FIGURE 1.Nash-Equilibrium and Optimum Aid Flows
Source: Authors’ elaboration.
a*1
a*1
Ñ C
N
n1
a1a1
N
f (a1, a2N, �)
f (a1, a*2, �)
n1N
158 | JEAN-PAUL AZAM AND RUXANDA BERLINSCHI
as can be demonstrated by the following argument. Notice that if donor 2 increasesits aid flow relative to aN
2 , the aid-migration trade-off facing donor country 1 movesdownward, to a position illustrated by the dashed convex curve corresponding toa2* � aN
2 . This downward shift reflects the spillover effect of country 2’s aid flow inreducing the inflow of migrants into country 1, for a given level of aid donated bycountry 1. Then, in the coordinated equilibrium, donor 1 will reciprocate theincreased aid given by donor 2 at a point such as C, where a1* � aN
1. Point C is locatedon a lower indifference curve than point N—thus corresponding to a lower value ofthe loss function (2)—and so donor 1 is better off in this coordinated equilibriumpoint than in the Nash equilibrium. This occurs even though donor 1 spends moremoney on aid, because it receives a lower inflow of migrants in return. A similar diagram could obviously be drawn for donor country 2.
Figure 1 also suggests that such a coordinated equilibrium requires a highly cred-ible ability by the players to commit irreversibly in order to overcome the temptationto renege ex post. Once player 2 has engaged a2* so that the aid-migration trade-offhas shifted downward to the dashed line f (a1, a2*, �), player 1 is tempted to reduce itsown contribution by moving leftward along the trade-off in order to reach an evenlower indifference curve of its loss function—for example, point
~N. Anticipating this,
player 2 might then be deterred from increasing its own aid flow in the first place.This is the essence of the free-rider problem, which was popularized in the form ofthe well-known “prisoner’s dilemma.” Both donor countries need to have a credibleway of tying their own hands if a coordinated outcome is to come about. As a mat-ter of fact, we can observe in the real world that the donor community is expendingconsiderable effort to make its pledged contributions credible, using methods rang-ing from the international definition of the Millennium Development Goals to thecreation of powerful aid-dependent constituencies in their own countries (perhaps bytying aid to the advantage of some powerful firms or by creating an overstaffed aidadministration). Nevertheless, unless we are prepared to assume that donor countriesare coordinating perfectly their aid policies regarding the reduction of migrationinflows, this free-riding problem suggests that the aid flows that we observe in thereal world are probably below their optimal values.
The foregoing short theoretical analysis of the implications of the aid-migrationtrade-off rests heavily on the assumptions that such a trade-off does exist in the realworld and that there are some spillovers such that the aid given by one country islikely to affect the inflow of migrants entering another country. The empirical exer-cises offered in the next section aim at testing whether these two assumptions aresupported by the data.
Empirical Results
A quick look at figure 2 does not seem very promising for the aid-migration trade-off hypothesis. This figure traces the yearly flow of immigrants into, and the totalofficial development assistance (ODA) disbursements by, the members of the OECD’s
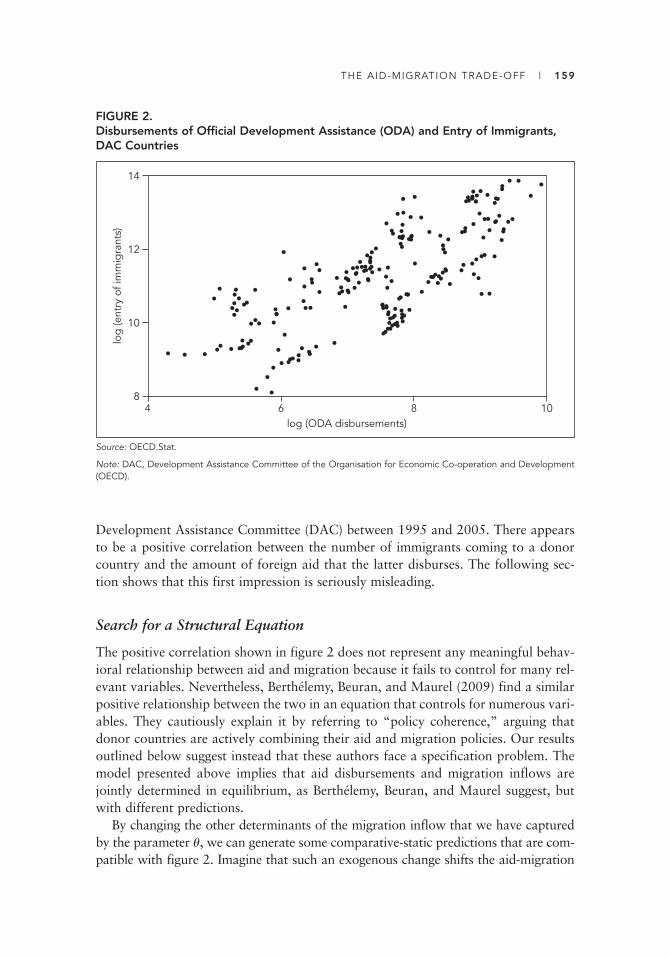
THE AID-MIGRATION TRADE-OFF | 159
Development Assistance Committee (DAC) between 1995 and 2005. There appearsto be a positive correlation between the number of immigrants coming to a donorcountry and the amount of foreign aid that the latter disburses. The following sec-tion shows that this first impression is seriously misleading.
Search for a Structural Equation
The positive correlation shown in figure 2 does not represent any meaningful behav-ioral relationship between aid and migration because it fails to control for many rel-evant variables. Nevertheless, Berthélemy, Beuran, and Maurel (2009) find a similarpositive relationship between the two in an equation that controls for numerous vari-ables. They cautiously explain it by referring to “policy coherence,” arguing thatdonor countries are actively combining their aid and migration policies. Our resultsoutlined below suggest instead that these authors face a specification problem. Themodel presented above implies that aid disbursements and migration inflows arejointly determined in equilibrium, as Berthélemy, Beuran, and Maurel suggest, butwith different predictions.
By changing the other determinants of the migration inflow that we have capturedby the parameter �, we can generate some comparative-static predictions that are com-patible with figure 2. Imagine that such an exogenous change shifts the aid-migration
FIGURE 2.Disbursements of Official Development Assistance (ODA) and Entry of Immigrants,DAC Countries
Source: OECD.Stat.
Note: DAC, Development Assistance Committee of the Organisation for Economic Co-operation and Development(OECD).
log
(ent
ry o
f im
mig
rant
s)
4 6 8log (ODA disbursements)
10
12
10
8
14
160 | JEAN-PAUL AZAM AND RUXANDA BERLINSCHI
trade-off upward. Then it is most likely that the equilibrium points N or C will moveto the northeast, that is, upward and to the right, indicating that both the aid disbursedand the migration inflow increase simultaneously. The reason for such shifts is that ifmore migrants are forthcoming for a given aid flow, the donor country will respondboth by increasing its aid flows somewhat and by allowing a bit more migrationbecause the marginal impact of aid on migration is decreasing. The latter effect entailsan increase in the marginal cost of reducing immigration through increased foreign aid.This mental experiment suggests two things that a correct empirical analysis shouldtake into account: (a) it is crucial to include the correct control variables in the migra-tion equation in order to identify correctly the aid-migration trade-off, and (b) the aidflow itself is probably endogenous, and this endogeneity should also be controlled for.Because it is well known that most econometric methods for controlling for endogene-ity entail a potential loss of efficiency, we first present the results without taking thisproblem into account. We then test whether this estimation procedure gives rise to asignificant endogeneity bias in a second stage. This two-step approach allows us to perform two tests of interest with one equation—that is, to test (a) whether aid has asignificant negative impact on the inflow of migrants, and (b) whether donors areactively using foreign aid as a policy response aimed at reducing the migration inflowsthat they face.
Because of obvious availability problems, we are working with data on the num-ber of legal migrants when what we are really interested in is the total number ofmigrants. The latter is what our aid-migration trade-off is likely to govern. Butbecause we are applying panel-data techniques, using country fixed effects, we canhope to learn a lot about total migrants from our econometric analysis. The followingargument explains why.
Assume that the number of legal migrants is a random fraction of their total num-ber, which reflects, among other things, the immigration-restriction policy enforcedby the destination country. Then, because we are working with the logarithm ofthe number of legal migrants, the mean value of that random fraction feeds into thecountry fixed effect, while the deviations relative to that mean are feeding intothe residuals. Formally, if nL is the number of legal migrants and n is the total numberof migrants, we can assume that:
nL � �(G, �)n, (3)
where G is a set of variables that captures the immigration-restriction policy stanceof the government and 0 � �(G, �) � 1 is the random share of legal migrants,depending on the exogenous shock variable �. Then, by taking the logarithm of equation (3), we get
Log nL � Log �(G, �) � Log n. (4)
Therefore, unless the restriction policy pursued by each government has changeddrastically over our relatively short sample period, which spans 1995–2003, it shouldbe well controlled for by the country fixed effects. This assumes that, with respect toimmigration-restriction policy, there is more variation across countries than within

THE AID-MIGRATION TRADE-OFF | 161
each country over time. Then our equations explaining the logarithm of the numberof legal migrants should, in fact, tell us a great deal about the total number ofmigrants entering each country.
Table 1 presents the results of four regression equations that explain the inflow oflegal migrants from low-income and lower-middle-income countries into donorcountries. This restriction is meant to capture the idea that donor countries are not
TABLE 1. Regression Results on Flows of Legal Migrants from Low-Income andLower-Middle-Income Countries
Variable (1) (2) (3) (4)
Unemployment rate �0.30*** �0.18*** �0.30*** �0.14**(0.09) (0.08) (0.09) (0.08)
Social expenditures (percent of GDP) 0.32*** 0.30*** 0.32*** 0.34***(0.09) (0.09) (0.09) (0.10)
Log of per capita GDP 0.54 9.53*** 0.54 14.80***(1.42) (2.82) (1.42) (4.97)
Log of stock of foreign population 0.19 0.57 0.17 0.91*(0.57) (0.50) (0.59) (0.47)
Log of official development assistance 0.46 �3.68*** 0.43 �5.15***(ODA) disbursements (0.32) (1.15) (0.28) (1.66)
Log of multilateral disbursements — — 0.10 �1.43(0.27) (0.90)
Endogeneity bias, ODA — 4.47*** — 5.90***(1.26) (1.73)
Endogeneity bias, multilateral — — — 1.50disbursements (0.96)
Number of observations 118 117 118 116F-test 9.50 9.84 7.87 7.64
Source: Authors’ calculations.
Note: GDP, gross domestic product. The dependent variable is the log of the inflow of migrants from low-income andlower-middle-income countries. All explanatory variables are characteristics of the destination country, and they arelagged once. The data on flow of migrants, social expenditures, stock of foreign population, ODA disbursements, andmultilateral aid disbursements are taken from OECD.Stat. The data on GDP per capita and unemployment rates aretaken from the World Development Indicators. The sample consists of the 22 donor countries of the DevelopmentAssistance Committee (DAC) of the Organisation for Economic Co-operation and Development (OECD)for 1995–2003, with the exceptions of New Zealand, for which the stock of foreign population is missing, and Australia and Canada, for which this information is available for only one point in time. Country fixed effects havebeen used but are not reported, to save space. Numbers in parentheses are robust standard errors. The instrumentsused for ODA and multilateral disbursements are the log of public expenditures on order and security, fromOECD.Stat, and the percentage of right-wing members in parliament in the destination country, from “Partiesand Elections,” http://www.parties-and-elections.de, and Université de Sherbrooke, “World Perspective,” http://per-spective.usherbrooke.ca/bilan/BMEncyclopedie/BMEncycloListePays.jsp. The log of government revenues (fromOECD.Stat) is added as an instrument for equation (4). Their reduced-form impacts on the aid variables are presentedin annex table A.1.
*Significant at the 10 percent level.
**Significant at the 5 percent level.
***Significant at the 1 percent level.

162 | JEAN-PAUL AZAM AND RUXANDA BERLINSCHI
viewing the inflows of migrants from other rich countries in the same way as they doinflows from poorer countries. We also performed all the estimations with the totalinflows, yielding mostly similar but sometimes significantly different results. In par-ticular, the income tax rate is significant for migrants from rich countries, but it doesnot matter for migrants from poorer countries.
In columns (1) and (3) of table 1, no attempt is made to control for endogeneity;that is done in columns (2) and (4). The method used for performing this control isbased on the standard Hausman test and is further discussed below. All the explana-tory variables are lagged once. This procedure potentially helps mitigate any remain-ing endogeneity problems, in particular those that might affect the various controlvariables, and it also provides some information about any potential time lag in theresponse of migration flows to changes in incentives.
Four control variables are included, of which three consistently prove highly sig-nificant. The unemployment rate is highly significant, reflecting the deterrent effectof a depressed labor market in the host country. When the probability of finding ajob is low in the destination country, migrants seem to postpone their travel or evento cancel it. The social expenditures policy pursued by the target country is an impor-tant attraction factor, and it is significant in all the columns. Industrial countries thatspend more on social items such as health and education are obviously more attrac-tive to migrants than countries with a more conservative policy stance. Then, we finda strange result for per capita GDP in columns (1) and (3), where it seems to have anegligible impact on the inflow of migrants. This counterintuitive result suggests thepresence of an estimation problem. Fortunately, this effect is not robust to the cor-rection of the endogeneity bias affecting the impact of aid, as this coefficient becomespositive and significant in columns (2) and (4). It thus seems that the impacts of thebusiness cycle and national income on immigration are fully captured by the unem-ployment rate and GDP per capita.
Finally, the existing stock of foreign population already residing in the country ofdestination is only significant at the 10 percent level in equation (4). This variable ismeant to reflect the well-known network effects that play a key role in the migrationprocess in many studies. For example, Azam and Gubert (2006) demonstrate thatsuch an effect can explain an ethnic bias in migration. They show that two ethnicgroups living in the same region of the Senegal River valley, in western Mali, and thusfacing the same economic conditions, have very different migration patterns. Theauthors use historical evidence to document that the group with a long history of out-migration is sending a much higher fraction of its population abroad than the groupwithout such a migration history. The established diaspora from the first group servesas a bridgehead that reduces the costs of migration for the prospective new migrantsfrom that same group by helping them find jobs and accommodations and by pro-viding the informal credit and insurance services that migrants’ networks are knownfor delivering to their members. Our findings reported above suggest that such aneffect is not very strong at the country level, once the impact of foreign aid is takeninto account. The stock of foreign population in the destination country is probablytoo coarse a measure to capture this effect.

THE AID-MIGRATION TRADE-OFF | 163
Testing for the Impact of Aid
The test variables capture the aid disbursed by the donor countries. To gain someinsight into the relative effectiveness of various aid flows, we use the log of ODAdisbursements by the destination country and test whether multilateral aid dis-bursements have a differential impact by introducing that variable in addition toODA. Arguably, the multilateral aid variable captures a much better coordinatedaid policy than ODA, which includes considerable bilateral aid. This interpretationreflects the idea that the principal donors have a say in the way the World Bank andother multilateral donor agencies determine multilateral aid disbursements and thatthey also have a clear opportunity to coordinate their decisions regarding these dis-bursements at board meetings or in the corridors. The model presented above sug-gests that coordinated aid flows could have some multiplier effects, as they imply aquid pro quo by other donors. It turns out that ODA disbursements represent themost significant aid variable coming out of our regressions (2) and (4), with thepredicted negative sign. This is consistent with our theoretical framework, whichsuggests that foreign aid is probably an effective tool for reducing the inflow ofmigrants into rich countries. The model, however, also raises the question whethercoordinated aid is a more powerful tool against immigration than uncoordinatedaid. General ODA, which includes both bilateral aid and the contributions chan-neled through the Bretton Woods entities and other multilateral institutions, couldbe less effective than multilateral aid taken separately. Our findings, however, donot support the differential impact hypothesis. This suggests that, in fact, donorcountries somehow manage to coordinate their bilateral and multilateral aid flowsequally well.
The technique applied in columns (2) and (4) for controlling for endogeneity isderived from the standard Hausman test. Two auxiliary reduced-form equations areestimated for log of ODA and log of multilateral aid, which are assumed endogenousin the theoretical framework presented above, using the log of public expenditureson order and security, the percentage of right-wing members in parliament, and thelog of government revenues (in equation 4 only) as instruments, in addition to thefour exogenous variables in table 1. These variables are regarded as the contextualvariables captured by � in equation (2). The first-stage reduced-form equations arepresented in annex table A.1. The residuals from these equations are then included, inaddition to the aid variables themselves, in columns (2) and (4), and their estimatedcoefficients provide estimates of the endogeneity biases for each variable. Inclusion ofthese residuals in the equations provides an additional benefit, as it corrects the esti-mated coefficients of the aid variables themselves for the endogeneity bias that affectsthem in the uncontrolled equation. This justifies the discussion presented above of theestimated coefficients of these aid variables.
For the tests performed at columns (2) and (4), the residuals are obviously lagged.The corresponding estimates of the endogeneity biases are presented in table 1 underthat entry. Moreover, this procedure yields the correct estimates for the coefficients ofthe variables themselves, as mentioned above. In column (2), where ODA only is

164 | JEAN-PAUL AZAM AND RUXANDA BERLINSCHI
included, we find that the latter is strongly significant, and the exogeneity assumptionis rejected at the 1 percent level. The correct interpretation of this test as an endo-geneity test is not immediate. The specification of the immigration function in columns(1) through (4) assumes that the inflow of migrants responds to incentives with a one-year lag. The endogeneity test performed in columns (2) and (4) assumes that the government in the donor country adjusts its aid flow in year t � 1 on the basis of itsforecast that a component of the random shock will affect the immigration flow inyear t; this forecast is presumed to be based on some information that is not availableto the econometrician. For example, the government may be using a lead indicatorbased on the number of visa applications in year t � 1 that will only show up as actu-al migration in the subsequent year, and this is a piece of information that we have notbeen able to include in our estimated equations. Similarly, the government of the hostcountry might be aware of sociological or institutional changes affecting a resident dias-pora that are likely to affect the latter’s ability to attract new migrants, but this issomething the econometrician does not know. The reduced-form equation for aidreflects in its residuals this anticipation by the government in year t � 1. The latter isthen necessarily correlated with the random shock occurring in year t, by construc-tion, if our behavioral assumption correctly captures the way the donor governmentis forming its expectations.
The two aid variables are included in column (4). Only ODA is found to be sig-nificant and endogenous. Hence, ODA might not be worse than multilateral aid afterall, suggesting that donors have found various methods for obtaining the requiredcoordination for their other aid flows. After all, many of them have been in this lineof business for about six decades, so that the aid game might safely be approximatedby an infinite-horizon repeated game. It is known that this kind of setting is likely tofoster cooperation between the players. Our findings thus suggest that donor countriesare doing a good job of equalizing the marginal impact of each kind of aid flow,so that aggregation of flows into a single ODA variable is legitimate for econometricpurposes.
In the foregoing econometric exercise, two key results seem robust: (a) foreignaid has a significant negative impact on migration inflows into donor countries, and(b) donors are actively using aid as a policy tool for reducing immigration. The thirdresult that we tested, concerning the effectiveness of aid flows coordinated throughmultilateral institutions in relation to that of other aid flows, leads us to reject theview that bilateral aid is less effective.
Conclusion
This paper has investigated the assumption that donor countries employ foreign aidpartly as a tool for controlling inflows of migrants. A brief theoretical analysis wasused to bring out the main predictions that can be derived from such an assumption.
THE AID-MIGRATION TRADE-OFF | 165
The model helped us identify the potential free-rider problem raised by the assumptionand suggested that donors must find a coordinated equilibrium if they want to opti-mize the impact of their aid as a means of reducing immigration. Such a coordinatedequilibrium requires donors to find a way of tying their own hands in order to maketheir commitment not to renege ex post on their pledged disbursements credible. Wesuggested that in the real world, donors are, in fact, using various mechanisms to cre-ate this credible commitment, ranging from the international definition of the Millen-nium Development Goals to the formation of powerful aid-dependent constituenciesin their own countries. Techniques for developing the latter in the real world include,among other methods, the tying of aid to benefit powerful firms and the creation ofan overstaffed aid administration. In addition, donors have created international aidinstitutions, such as the World Bank, whose job is precisely to coordinate at least someof the aid flows.
The empirical tests performed using a panel of data from most DAC membercountries show that our assumed aid-migration trade-off is indeed supported by thedata. The empirical approach used to produce these findings is based on two require-ments brought out by the theoretical analysis. First, it is important to include in theestimations various control variables, which are likely to affect both immigrationflows and aid disbursement flows. Second, due account must be taken of the factthat governments choose jointly the level of foreign aid that they deliver and the in-migration that they permit, so that the former must be regarded as endogenous in theeconometric analysis. The findings of our econometric exercises provide robust sup-port for these two predictions. We further tested whether the amount of aid disbursedthrough a coordination mechanism, which we have proxied by multilateral aid dis-bursements, is any more effective than the other aid flows, here captured by ODAdisbursements. Our results suggest that total ODA is not performing any worse thanits multilateral aid component, but this might reflect econometric problems, as thesetwo variables are strongly correlated with one another. Our econometric exercisesfail to support the view that there is a significant free-rider problem with bilateralaid flows and hence that there is significant underprovision of aid. Nevertheless, ourtests of this assumption do not seem very powerful, and further investigation of thisissue is warranted. In particular, a finer disaggregation of aid flows might be requiredto perform a convincing analysis of the free-rider problem. This points the way forfuture research.
Note
1. A large inflow of foreign currency drives up a country’s exchange rate, which handicapsthe sale of other exports and impairs the ability of domestic products to compete withimports. “Dutch disease” takes its name from the supposed effects of North Sea naturalgas discoveries on the Netherlands economy.

166 | JEAN-PAUL AZAM AND RUXANDA BERLINSCHI
References
Alesina, Alberto, and David Dollar. 2000. “Who Gives Aid to Whom and Why?” Journal ofEconomic Growth 5 (March): 33–63.
Alesina, Alberto, and Beatrice Weder. 2002. “Do Corrupt Governments Receive Less ForeignAid?” American Economic Review: Papers and Proceedings 92 (4): 1126–37.
Azam, Jean-Paul, and Alexandra Delacroix. 2006. “Aid and the Delegated Fight against Terrorism.” Review of Development Economics 10 (2): 330–44.
Azam, Jean-Paul, and Flore Gubert. 2006. “Migrants’ Remittances and the Household inAfrica: A Review of Evidence.” Journal of African Economies 15 (Suppl. 2): 426–62.
Azam, Jean-Paul, and Jean-Jacques Laffont. 2003. “Contracting for Aid.” Journal of Devel-opment Economics 70 (1): 25–58.
Azam, Jean-Paul, and Véronique Thelen. 2008. “The Roles of Foreign Aid and Education inthe War on Terror.” Public Choice 135 (3–4): 375–97.
Berthélemy, Jean-Claude. 2006. “Bilateral Donors’ Interest vs. Recipients’ DevelopmentMotives in Aid Allocation: Do All Donors Behave the Same?” Review of DevelopmentEconomics 10 (2, May): 179–94.
ANNEX TABLE A.1. First-Stage Reduced-Form Equations
Log of ODA Log of ODA
disbursements disbursements Log of multilateral
for eq. (2) for eq. (4) disbursements
Log of public expenditure on 0.21*** 0.21*** 0.09order and security (0.07) (0.08) (0.11)
Percentage of right-wing �0.003 �0.002 0.01***members in parliament (0.002) (0.002) (0.003)
Log of government revenues �0.06 �0.33*(0.14) (0.19)
Unemployment rate 0.03 0.03 �0.01(0.02) (0.02) (0.02)
Social expenditures �0.009 �0.01 0.02(percent of GDP) (0.013) (0.01) (0.02)
Log of per capita GDP 1.87*** 1.95*** 1.10***(0.36) (0.38) (0.42)
Log of stock of foreign 0.04 0.05 0.23**population (0.08) (0.09) (0.59)
N 159 156 156F-test 48.59 39.86 17.31Source: Authors’ calculations.
Note: GDP, gross domestic product; ODA, official development assistance.
*Significant at the 10 percent level.
**Significant at the 5 percent level.
***Significant at the 1 percent level.
THE AID-MIGRATION TRADE-OFF | 167
Berthélemy, Jean-Claude, and Ariane Tichit. 2004. “Bilateral Donors’ Aid Decisions—AThree-Dimensional Panel Analysis.” International Review of Economics and Finance13 (3): 253–74.
Berthélemy, Jean-Claude, Monica Beuran, and Mathilde Maurel. 2009. “Aid and Migration:Substitutes or Complements?” World Development (in press). http://dx.doi.org/10.1016/j.worlddev.2009.02.002.
Boone, Peter. 1996. “Politics and the Effectiveness of Foreign Aid.” European EconomicReview 40: 289–329.
Borjas, George J. 1995. “The Economic Benefits from Immigration.” Journal of EconomicPerspectives 9 (2): 3–22.
———. 2003. “The Labor Demand Curve Is Downward Sloping: Reexamining the Impact ofImmigration on the Labor Market.” Quarterly Journal of Economics 118 (4): 1335–74.
Burnside, Craig, and David Dollar. 2000. “Aid, Policies, and Growth.” American EconomicReview 90 (4): 847–68.
Card, David. 2001. “Immigrant Inflows, Native Outflows, and the Local Labor MarketImpacts of Higher Immigration.” Journal of Labor Economics 19 (1): 22–64.
Castles, Stephen. 2003. “Why Migration Policies Fail.” Ethnic and Racial Studies 27 (2): 205–27.
Chauvet, Lisa. 2002. “Socio-Political Instability and the Allocation of International Aid byDonors.” European Journal of Political Economy 19: 33–59.
Collier, Paul. 1997. “The Failure of Conditionality.” In Perspectives on Aid and Development,ed. Catherine Gwinn and Joan M. Nelson. Policy Essay 22. Washington, DC: OverseasDevelopment Council.
———. 2007. The Bottom Billion: Why the Poorest Countries Are Failing and What Can BeDone about It. Oxford: Oxford University Press.
de Haas, Hein. 2006. “Turning the Tide? Why ‘Development Instead of Migration’ PoliciesAre Bound to Fail.” IMI Working Paper 2, International Migration Institute, Oxford.
Easterly, William. 2006. The White Man’s Burden. Why the West’s Efforts to Aid the RestHave Done So Much Ill and So Little Good. New York: Penguin Press.
Facchini, Giovanni, and Anna Maria Mayda. 2008. “From Individual Attitudes towardsMigrants to Migration Policy Outcomes: Theory and Evidence.” Economic Policy 23 (56):651–713.
Fleck, Robert K., and Christopher Kilby. 2006a. “How Do Political Changes Influence USBilateral Aid Allocation? Evidence from Panel Data.” Review of Development Economics10 (2): 210–23.
———. 2006b. “World Bank Independence: A Model and Statistical Analysis of US Influence.” Review of Development Economics 10 (2): 224–40.
Friedberg, Rachel M., and Jennifer Hunt. 1995. “The Impact of Immigrants on Host CountryWages, Employment and Growth.” Journal of Economic Perspectives 9 (2): 23–44.
Gubert, Flore. 2003. “Ces immigrés qui font vivre le Mali.” Libération 10 (February 19).
Hatton, Timothy J., and Jeffrey G. Williamson. 2002. “What Fundamentals Drive WorldMigration?” NBER Working Paper 9159, National Bureau of Economic Research, Cambridge, MA.
Jennissen, Roel. 2003. “Economic Determinants of Net International Migration in WesternEurope.” European Journal of Population 19 (2, June): 171–98.
Kapur, Devesh. 2004. “Remittances: The New Development Mantra?” G-24 Discussion PaperSeries 29, United Nations Conference on Trade and Development (UNCTAD), New York.

168 | JEAN-PAUL AZAM AND RUXANDA BERLINSCHI
Klein, Michael, and Tim Harford. 2005. The Market for Aid. Washington, DC: InternationalFinance Corporation.
Kosack, Stephen, and Jennifer Tobin. 2006. “Funding Self-Sustaining Development: The Roleof Aid, FDI and Government in Economic Success.” International Organization 60 (1):205–43.
Longhi, Simonetta, Peter Nijkamp, and Jacques Poot. 2005. “A Meta Analytic Assessment ofthe Effect of Immigration on Wages.” Journal of Economic Surveys 19 (3): 451–77.
Lucas, Robert E. B. 2005. International Migration and Economic Development: Lessons fromLow-Income Countries. Cheltenham, UK: Edward Elgar Publishing.
Mayda, Anna Maria. 2006. “Who Is against Immigration? A Cross-Country Investigation ofIndividual Attitudes toward Immigrants.” Review of Economics and Statistics 88 (3):510–30.
———. 2007. “International Migration: A Panel Data Analysis of the Determinants of Bilateral Flows.” CEPR Discussion Paper 6289, Centre for Economic Policy Research,Oxford.
Morrison, Thomas K. 1982. “The Relationship of U.S. Aid, Trade and Investment to Migra-tion Pressures in Major Sending Countries.” International Migration Review 16 (1): 4–26.
Neumayer, Eric. 2005. “Bogus Refugees? The Determinants of Asylum Migration to WesternEurope.” International Studies Quarterly 49 (3): 389–410.
———. 2006. “Unequal Access to Foreign Spaces: How States Use Visa Restrictions to Regulate Mobility in a Globalized World.” Transactions of the Institute of British Geographers 31 (1): 72–84.
O’Rourke, K. H., and Richard Sinnott. 2006. “The Determinants of Individual Attitudestowards Immigration.” European Journal of Political Economy 22 (4): 838–61.
Ortega, Javier. 2000. “Pareto-Improving Immigration in an Economy with Equilibrium Unemployment.” Economic Journal 110: 92–112.
Rotte, Ralph, and Michael Vogler. 2000. “The Effects of Development on Migration: Theoretical Issues and New Empirical Evidence.” Journal of Population Economics13 (3): 485–508.
Sachs, Jeffrey D. 2005. The End of Poverty: How We Can Make It Happen in Our Lifetime.London: Penguin Books.
Scheve, Kenneth F., and Matthew J. Slaughter. 2001. “Labor Market Competition and Indi-vidual Preferences over Immigration Policy.” Review of Economics and Statistics 83 (1):133–45.
Svensson, Jakob. 1999. “Aid, Growth and Democracy.” Economics and Politics 11 (3):275–97.
———. 2000. “When Is Foreign Aid Policy Credible? Aid Dependence and Conditionality.”Journal of Development Economics 61 (1): 61–84.
———. 2003. “Why Conditional Aid Does Not Work and What Can Be Done about It?”Journal of Development Economics 70 (2): 381–402.
Comment on “The Aid-Migration Trade-off,” by Jean-Paul Azam and Ruxanda Berlinschi
MELVIN D. AYOGU
Jean-Paul Azam and Ruxanda Berlinschi have highlighted an inconvenient butimportant concern about foreign aid to developing countries. Starting from theassumption that aid is driven by the purely altruistic motive of improving the lot ofthe less fortunate, the literature on the impact of aid to needy countries suggests thatsuch assistance has been largely ineffective—yet this does not seem to have dampenedthe flow of aid over time. An awkward question arises: if aid is known to be ineffec-tive but continues to be delivered, either the donors are irrational, or there are other,not yet revealed, reasons for giving. Azam and Berlinschi, on the grounds of therevealed-preference principle and empirical data, argue that part of the hidden aidagenda is to reduce the number of immigrants entering donor countries from devel-oping countries. Although the dataset covers legal migration only and does notexplicitly classify immigrants by income level, nonetheless the discussion suggeststhat the target groups to be discouraged are the poor and the unskilled, desperate forwork. The paper thus can be viewed as part of the strand of aid literature that seeksto rescue the “aid-ineffectiveness” literature from its current embarrassment.
The Aid-Migration Theses
The authors set out to test three propositions. The first is that donor countries useforeign aid partly to control immigration from recipient countries. This is the hiddenagenda hypothesis. By controlling for the influence of drivers of aid flows other thanimmigration and for drivers of immigration other than aid flows, the authors attemptto isolate the effect of aid flows on migration flows.
The second test is motivated by the insight afforded by the theoretical frameworkelaborated in the paper. According to this model, although donor countries that
169
Melvin D. Ayogu is professor of economics and dean, Faculty of Commerce, University of Cape Town, South Africa.
Annual World Bank Conference on Development Economics 2009, Global © 2010 The International Bank for Reconstruction and Development / The World Bank.
170 | MELVIN D. AYOGU
extend bilateral aid to poor countries secretly nurture the desire to stem migrationflows from the beneficiaries of their financial assistance, their actions generate aninferior outcome for themselves. The paper suggests that donors should better coor-dinate their efforts in order to achieve what they really desire. But it would be polit-ically incorrect for donors to collude openly to curb the flow of migrants from thevery countries that they seek to assist, particularly given that migration is a mecha-nism for poverty reduction, and the active espousal of such an agenda in a consor-tium would certainly be incompatible with the rhetoric of globalization. As a resultof these implied discomforts, rich countries seek other, more subtle ways to achievecoordination at a supranational level.
The third proposition concerns the relative effectiveness of the various multilateralinstitutions as coordinating mechanisms for the secret desires of donor countries.
Empirical Evidence
The paper finds that aid matters significantly in curbing migration flows. The cleverconstruction of the test for this proposition enables the authors to implicitly identifydonors’ true objectives. Thus, by showing the presence of reverse causation betweenflows of assistance and of migrants, they establish that the level of immigrationaffects “giving.” In addition, the paper finds empirical confirmation for the secondproposition: that coordinated aid is relatively more effective in curbing immigration.On the third proposition, the evidence is inconclusive, and there is as yet no establishedtheory that marshals the relative strengths and challenges of competing alternativemultilateral institutions and helps predict in rank order those that are most effectiveas coordinating mechanisms. (Easterly and Pfutze 2008 recently exploited the ques-tion about the ranking of aid agencies, using a set of criteria viewed as crucial for efficient aid delivery.)
Conclusion
The theme of this year’s conference is rightly about people and politics, which, pre-sumably, is what globalization is all about. Years ago, in 2000, Dani Rodrik askedwhether trade can be global while politics remains local. Jurisdictional boundarieslocalize economic activities and define borders that then define trade as either nationalor international. Underpinning Rodrik’s insightful analysis are concerns about likelyfuture trends in the range of immigration policies toward people from poor countriesand people with different religious and ideological persuasions. U.S. immigration policy of the recent past was an issue among Latino voters in the 2008 U.S. presi-dential election and, in fact, became one of the few issues on which candidates BarackObama and John McCain were in agreement. In Europe concern is voiced about howimmigration policy affects the career prospects of foreign soccer players in Europeanleagues and what would be an appropriate policy stance on this issue. France, SouthAfrica, and the United Kingdom have all experienced their versions of xenophobia in
COMMENT ON AZAM AND BERLINSCHI | 171
recent memory. In the light of the times in which we live, the issues raised by Azamand Berlinschi cannot be ignored. Their results suggest the need for more studies atthe micro level, with a focus on institutions.
The authors do seem to have given us an example of aid that works. If foreign aidcan generate a desired policy outcome when the agenda is hidden, why not when theobjective is open? How can foreign aid be effective in furthering the hidden agenda(revealed preference) but ineffective in promoting declared objectives? And, howmuch can we rely on evidence from eight years of data in a history of compassionateor not-so-compassionate giving that spans more than three decades?
Perhaps the real message here is that transparency in the aid business is overdue.Easterly and Pfutze (2008) emphasized the same message. Transparency can engen-der the correct attribution or decomposition of aid into its various goals (hidden andcovert), opening a prospect for transforming the entire aid-ineffectiveness puzzle intoan understandable picture.
Finally, I have to acknowledge with a great deal of satisfaction that, as a by- product,Azam’s and Berlinschi’s paper provides support for the push by recipient countries forbetter donor coordination with a view to improving absorptive capacity (see, forinstance, Birdsall, Williamson, and Deese 2002; de Renzio 2005; Ayogu 2006).
References
Ayogu, Melvin. 2006. “Can Africa Absorb More Aid?” In Aid, Debt Relief and Developmentin Africa: African Development Report 2006, ed. African Development Bank, 25–40.New York: Oxford University Press.
Birdsall, Nancy, John Williamson, and Brian Deese. 2002. Delivering on Debt Relief: FromIMF Gold to a New Aid Architecture. Washington, DC: Center for Global Developmentand Institute for International Economics, http://www.iie.com.
de Renzio, Paolo. 2005. “Scaling Up versus Absorptive Capacity: Challenges and Opportuni-ties for Reaching the MDGs in Africa.” ODI Briefing Paper, London.
Easterly, William, and Tobias Pfutze. 2008. “Where Does the Money Go? Best and Worst Practices in Foreign Aid.” Journal of Economic Perspectives 22 (2): 29–52.
Rodrik, Dani. 2000. “How Far Will International Economic Integration Go?” Journal of Economic Perspectives 14 (1): 177–86.

Are Remittances More Effective ThanAid for Improving Child Health? An Empirical Assessment Using Inter- and Intracountry Data
LISA CHAUVET, FLORE GUBERT, AND SANDRINE MESPLÉ-SOMPS
This paper analyzes the respective impacts of aid and remittances on human development as measured by infant and child mortality rates. Panel data on a set of109 developing countries and cross-country quintile-level data on a sample of47 developing countries are alternatively used. In addition to assessing the extent towhich health aid and remittances contribute to reducing child health disparitiesbetween countries, the paper addresses two other questions: What is the net effect ofmigration, after accounting for the brain drain of health workers? What is the effec-tive impact of aid and remittances on intracountry child health disparities? Ourresults tend to show that remittances significantly improve child health and that theimpact of health aid is nonlinear, suggesting that aid to the health sector is more effec-tive in the poorest countries. By contrast, medical brain drain, as measured by theexpatriation rate of physicians, is found to have a harmful impact on health out-comes. The net impact of migration on human development is therefore weakened.Finally, remittances seem to be much more effective in improving health outcomes forchildren belonging to the richest households, whereas neither pro-poor nor antipooreffects are found for health aid.
Poverty reduction is increasingly put forward as the main objective of official devel-opment assistance (ODA) to developing countries. National leaders and the interna-tional community have pledged to meet by 2015 a series of poverty reduction targetsknown as the Millennium Development Goals (MDGs).1 The pursuit of these goalscalls for dramatic increases in infrastructure finance and in the provision of basicservices to the population of the developing world that ODA alone cannot achieve.The Monterrey consensus, which emerged from the United Nations InternationalConference on Financing for Development in that city in 2002, highlighted the need
173
Lisa Chauvet, Flore Gubert, and Sandrine Mesplé-Somps are researchers with the Institute of Research for Development(IRD), DIAL, Paris. Flore Gubert is also associate professor at the Paris School of Economics.
Annual World Bank Conference on Development Economics 2009, Global © 2010 The International Bank for Reconstruction and Development / The World Bank.
174 | L ISA CHAUVET, FLORE GUBERT, AND SANDRINE MESPLÉ-SOMPS
to find new sources of financing, and the idea that more private funds should beinvested in developing countries has received strong support since then.
Given this context and an ever-increasing volume of flows from migrants, inter-national migrant remittances have attracted considerable attention in recent years.According to the latest World Bank estimates (see Ratha et al. 2007), recordedremittances to developing countries reached US$240 billion in 2007. The actualmagnitude is even larger when transfers through informal channels are taken intoaccount. In 36 out of 153 developing countries, remittances are larger than all cap-ital flows, public and private, and voices have already been raised here and there tocall for progressive replacement of official aid by remittances.
Little is known, however, about the respective effectiveness of aid and remit-tances in alleviating poverty. Despite a burgeoning literature examining the impactof ODA on aggregate welfare, there exists, to our knowledge, almost no studiesanalyzing to what extent aid and remittances may be substitutes or how they arerelated to inequality and poverty reduction. Exceptions include the work of Chauvetand Mesplé-Somps (2007), who analyze the distributive impact of trade flows, foreign direct investment (FDI), official aid, and migrants’ remittances using BrancoMilanovic’s World Income Distribution database (Milanovic 2005). The authorsfind that FDI increases intracountry disparities and that remittances tend todecrease them. They also find that trade and aid have a nonlinear relationship withincome distribution.
The objective of our paper is to fill this knowledge gap by analyzing the respectiveimpacts of aid and remittances on human development as measured by infant andchild mortality rates. To what extent do aid and remittances help reduce child healthdisparities between countries? What are their respective impacts on child health dis-parities within countries? How do remittances compare with aid when migrationcosts (in the form of “brain drain”) are accounted for?
We choose basic indicators of human welfare instead of a monetary measure ofpoverty for three reasons. First, comparable cross-country data on monetary pover-ty over time are extremely scarce. Second, child health figures prominently among theMDGs. Donors have committed themselves to reducing by two-thirds the mortalityrate among children under age 5 (goal 4), and to this end, they have devoted anincreasing share of official aid to the health sector. There is, however, very littleempirical evidence on the effect of increased aid flows on health outcomes in recipi-ent countries. Whether donors are right to prioritize the health sector in the intra-country allocation of aid is thus an unanswered question that needs to be addressed.Third, the relationship between migration and health is increasingly emphasized inthe microeconomic literature, and donor agencies regularly report the success of mostof their projects and programs in the health sector. It is therefore interesting to inves-tigate whether successful health interventions from the donors’ side or the migrants’side at the micro level translate into improved health outcomes at the macro level andwhether Paul Mosley’s micro-macro paradox also applies to the health sector(Mosley 1987).
We follow Mishra and Newhouse (2007) and use aid allocated to the health sec-tor, instead of aggregate aid, in our empirical analyses. Our implicit assumption is
ARE REMITTANCES MORE EFFECTIVE THAN AID? | 175
that not all types of aid can reasonably be expected to affect health outcomes andthat narrowing the aid variable should help us better measure the impact (if any) ofofficial development assistance on basic indicators of human development.
Our empirical strategy relies on two econometric exercises. We first examine therespective impacts of aid, remittances, and medical brain drain on child health indicators, using panel data on a sample of 109 developing countries. We explorewhether aid and remittances contribute to improving health outcomes and whetherthe brain drain of health workers vitiates the positive impact of remittances. Thisfirst econometric exercise raises substantial methodological issues such as measure-ment errors and endogeneity of our core explanatory variables, which we try toaddress. Keeping in mind the inherent weaknesses of this macro approach, oureconometric results indicate that both remittances and health aid significantlyreduce infant and child mortality rates but that the effect of health aid is nonlinear,suggesting that aid to the health sector is likely to be more effective in the poorestcountries. Medical brain drain, as measured by the expatriation rate of physicians,is found to have a harmful impact on health outcomes. The net impact of migrationon human development is thus diminished.
We then assess the respective effectiveness of aid and remittances in lesseninghealth disparities within countries, using cross-country quintile-level data. Theresults of this second econometric exercise show that remittances are effective inreducing infant and child mortality rates, but only for the richest quintiles. Thisfinding suggests that although remittances contribute to better mean health out-comes in recipient countries, they tend to increase intracountry health inequality.The impact of health aid, by contrast, is hardly ever significant in our within-countryregressions.
The next section contains a review of the macroeconomic literature on the impactsof aid and remittances on poverty and inequality. The data, method of estimation,and results of the cross-country and intracountry analyses are presented in the sub-sequent two sections, followed by concluding remarks and a discussion of the policyimplications of the findings.
Effects of Aid and Remittances on Poverty and Inequality: A Review of the Literature
From the early 1960s to the mid-1990s, the literature investigating the macroeco-nomic impact of aid focused on the link between aid and growth. The emerging pic-ture from this literature is that aid can enhance growth but that this result is veryfragile and is highly dependent on the choice of data, sample composition, and esti-mation methods (Roodman 2007). The adoption of the United Nations MillenniumDeclaration in 2000 and the obligation accepted by donors to financially supportdeveloping countries’ efforts to achieve the eight Millennium Development Goals by2015 have progressively shifted the focus from the aid-growth nexus to the relation-ship between aid flows and welfare or poverty indicators. This relationship is exam-ined next, after which the effects of remittances are explored.

176 | L ISA CHAUVET, FLORE GUBERT, AND SANDRINE MESPLÉ-SOMPS
Poverty and Inequality Impacts of Aid
The few existing studies on the impacts of aid on poverty and inequality have adoptedstandard cross-country growth regression approaches, replacing growth with anindicator of welfare or poverty as the dependent variable (see, for example, Boone1996; Mosley, Hudson, and Verschoor 2004; Gomanee, Girma, and Morrissey 2005;Gomanee et al. 2005). Because comparable cross-country data on poverty over timeare extremely scarce, most studies have concentrated on the effectiveness of aid inimproving human development indicators such as the infant mortality rate, theunder-five mortality rate, life expectancy, and primary schooling.
In a famous paper, Boone (1996) finds no evidence that aid succeeds in improvinghuman development indicators in recipient countries. Although aid could theoreticallyreduce infant mortality either through an increase in private consumption or throughgreater provision of public services to the poor, his results suggest that it increases thesize of recipient governments but has no impact on basic measures of human develop-ment indicators. Pushing his analysis further, Boone investigates whether his resultvaries depending on the political regime. He finds some evidence that liberal politicalregimes, all else being equal, have lower infant mortality rates, which may reflectgreater willingness of these systems to deliver public services to the poor.
Boone’s paper has been much criticized, on two grounds. In the first place, someauthors have argued that the welfare impact of aid is not direct but operates throughits effect on the amount of government spending allocated to social areas. Boone’sregressions would thus be inappropriately specified. Mosley, Hudson, and Verschoor(2004) estimate a system of three equations, with poverty, aid, and pro-poor expen-diture as their dependent variables. They find that aid is associated with higher levelsof pro-poor spending and that such spending is associated with lower poverty head-counts. Aid is also found to increase health spending, which in turn reduces infantmortality. Gomanee, Girma, and Morrissey (2005) reach the same type of conclusion,using quantile regressions. In a companion paper, however, Gomanee et al. (2005)find evidence that aid improves welfare indicators and that this effect works pre-dominantly through direct impacts.
The second criticism is that although it may be true that aggregate aid has no impacton health, particular types of aid, including health aid, are effective in improvinghuman development indicators (see, for example, Masud and Yontcheva 2005;Michaelowa and Weber 2007; Mishra and Newhouse 2007; Dreher, Nunnenkamp,and Thiele 2008). Mishra and Newhouse (2007), in particular, rely on a large datasetcovering 118 countries between 1973 and 2004 to measure the effect of health aid oninfant mortality. They estimate both ordinary least squares (OLS) regressions and a sys-tem of moment equations using the generalized method of moments (GMM) and findthat increased health aid is associated with a statistically significant reduction in infantmortality. The estimated effect of health aid is small, however; since doubling health aidwithin a country would reduce infant mortality in the next five-year period by only 2 percent. In addition, the authors do not find any significant impact of overall aid.
Masud and Yontcheva (2005) use data on assistance from nongovernmentalorganizations (NGOs) and on bilateral aid to assess the effectiveness of these financial

ARE REMITTANCES MORE EFFECTIVE THAN AID? | 177
flows on two social indicators, infant mortality and adult illiteracy. Their underly-ing assumption is that NGOs intervene at the grassroots level and may be moreeffective in alleviating poverty than other types of assistance. Using an unbalancedpanel of 58 countries from 1990 to 2001, they find that health expenditure per capita reduces infant mortality, as does greater NGO aid per capita. By contrast,they do not find any significant impact of total bilateral aid on infant mortality. Theauthors then list a number of reasons why NGO aid might work better than bilat-eral aid in reducing infant mortality. First, NGO aid would be allocated moretoward countries with high infant mortality rates, while bilateral aid would favorcountries with lower infant mortality. Second, NGOs would have more direct linksto the poor and vulnerable, which would make them more efficient. Third, in linewith Boone (1996), aid transiting through recipient governments could be divertedfor the benefit of wealthy elites. Pushing their analysis further, the authors find noevidence of a positive impact of NGO or bilateral aid on the share of spending onhealth care in total expenditure.
The few existing studies examining the links between aid and aggregate welfare asmeasured by human development indicators do not permit clear conclusions. Somepapers find no impact at all; others find evidence that aid decreases infant mortalityrates, directly, or indirectly, through higher levels of pro-poor spending. This lack ofconsensus in the macroeconomic literature is surprising, given the number of suc-cessful health interventions financially supported by international assistance (Levineand the What Works Working Group 2004).
Poverty and Inequality Impacts of Remittances
Despite the increasing size of remittances, empirical macroeconomic evidence on theimpacts of these financial flows on poverty and inequality is even scarcer than thatrelated to aid. Here again, the scarcity of evidence stems mainly from the lack of reli-able and comparable cross-country data on several of the relevant variables, such asemigration rate by country and amounts remitted, and from the absence of the longseries that are required if use is to be made of the latest macroeconometric tools. Con-sequently, the empirical literature is confined largely to a few case studies of villagesor countries based on microeconometric data (see, for example, Leliveld 1997;Lachaud 1999; Adams 2004, 2006).
At the cross-national level, to our knowledge, only four recent studies have lookedat the poverty impact of remittances: Adams and Page (2005); World Economic Out-look (IMF 2005); Gupta, Pattillo, and Wagh (2007); and Acosta et al. (2008). Despitestrong microeconomic evidence for a positive impact of remittances on education andhealth (see, for example, Kanaiaupuni and Donato 1999; Cox-Edwards and Ureta 2003;Hildebrandt and McKenzie 2005; Mansuri 2007), no one has ever investigated theimpact of remittances on human development indicators at a macroeconomic level.
Adams and Page (2005) use a panel of 71 low-income and middle-income coun-tries for which data on migration, remittances, poverty, and inequality are availableand test whether countries that produce more international migration or receive
178 | L ISA CHAUVET, FLORE GUBERT, AND SANDRINE MESPLÉ-SOMPS
more international remittances have less poverty. After instrumenting for thepotential endogeneity of remittances, they find that a 10 percent increase in percapita official remittances leads to a 3.5 percent decline in the share of people livingin poverty. Using a broader sample of 101 countries, IMF (2005) provides furtherevidence that remittances have an effect on poverty. The effect, however, is rathersmall; on average, a 2.5 percentage point increase in the ratio of remittances togross domestic product (GDP) is associated with a less than 0.5 percentage pointdecrease in poverty. As argued by the authors, this (disappointing) result couldstem from the fact that average income and inequality, along with remittances,are included as regressors. Since these variables are themselves likely to be influ-enced by remittances, the true impact of remittances on poverty could actually belarger.
Using a sample of 76 countries in which Sub-Saharan Africa is substantially rep-resented, Gupta, Pattillo, and Wagh (2007) adopt the same methodology as that ofAdams and Page (2005) and model poverty as a function of mean income, somemeasures of income distribution, and remittances. Their findings indicate that a 10 percent rise in remittances is associated with a decrease of about 1 percent in theincidence of poverty. In the case of Sub-Saharan Africa, however, their results suggestthat the impact of poverty on migration and remittances is greater than the impactof remittances on poverty.
Finally, Acosta et al. (2008) use both cross-country and household survey data toassess the impact of remittances on growth, poverty, and inequality in Latin America.Their cross-country estimates suggest that remittances have a positive and statisticallysignificant effect on growth, on average, but that they tend to increase the level ofincome inequality. For the average Latin American country, however, the effect is dif-ferent; an increase in remittances tends to be associated with lower levels of inequal-ity. Turning to the authors’ microeconometric analyses, their findings suggest that theeffects of remittances on poverty and inequality vary strongly across Latin Americancountries, depending on whether recipients are concentrated at the bottom or at thetop of the distribution of nonremittance income.
In what follows, our aim is to provide additional insights into the question ofwhether aid and remittances, as sources of external financing, are effective in improv-ing child health outcomes.
Impact of Aid and Remittances on Health Outcomes: A Cross-Country Analysis
This section assesses the impact of health aid and remittances on child health out-comes, using panel data on a sample of 109 countries from 1987 to 2004. (For a listof countries in the sample, see annex table A.1.) After a brief presentation of theempirical strategy and a description of the data, the results of our baseline modelare discussed. The analysis is then pushed further by testing for nonlinearities in theaid-health relationship and investigating the effect of the medical brain drain onhealth outcomes.

ARE REMITTANCES MORE EFFECTIVE THAN AID? | 179
Model and Data
To explore the relative impacts of aid and migration on child health indicators, weestimate a model of the following form:
lnHealthi,t � �i � �t � � ln Xi,(t�1,t�4) � � lnRemittancesi,(t�1,t�4)
� � ln Health aidi,(t�1,t�4) � �i,t. (1)
Healthi,t is either the under-five mortality rate or the infant mortality rate fromWorld Development Indicators (World Bank 2006). The under-five mortality rate is theprobability (per 1,000 live births in a given year) that a newborn baby will die beforereaching age 5, if subject to current age-specific mortality rates. The infant mortalityrate is the number of infants dying before reaching age 1, per 1,000 live births.
Since our dependent variables are bounded, we use a logarithmic transformation.To ease interpretation of our results and account for potential nonlinearities, all ourindependent variables are also log-linearized.
We measure Health aidi,t using aid commitments to the health sector as defined bythe Country Reporting System (CRS) of the Organisation for Economic Co-operationand Development (OECD).2 The main advantage of the CRS is that its data on aidcommitments are highly disaggregated by purpose (sector). Its main disadvantage isthat the data are only reliable for recent years—as reflected in figure 1 by the largeunderreporting of aid in the CRS data compared with data from the Development
health aid, constant 2000 U
.S. dollars
1986 1988 1990 1992 1994 1996 1998 2000 2002 20040.00E+00
2.00E+10
4.00E+10
6.00E+10
8.00E+10
1.00E+11
1.20E+11
1.40E+11 1.00E+10
9.00E+09
8.00E+09
7.00E+09
6.00E+09
5.00E+09
4.00E+09
3.00E+09
2.00E+09
1.00E+09
0.00E+00
total aid commitments, DAC total aid commitments, CRStotal remittances health aid commitments, CRS
tota
l aid
and
rem
ittan
ces,
cons
tant
200
0 U
.S. d
olla
rs
FIGURE 1.Total Aid, Remittances, and Health Aid, 1986–2004
Source: Development Assistance Committee (DAC) of the Organisation for Economic Co-operation and Development(OECD); Country Reporting System (CRS), OECD; World Development Indicators 2006 (World Bank 2006).
180 | L ISA CHAUVET, FLORE GUBERT, AND SANDRINE MESPLÉ-SOMPS
Assistance Committee (DAC) of the OECD. As noted by Mishra and Newhouse(2007), the extent of underreporting varies by sector, donor, and time period. Missingdata are therefore omitted from the sample rather than treated as zero health aid. Werestrict our sample to relatively recent observations, starting in the mid-1980s.3 Figure 1shows that the share of aid commitments to the health sector has gradually increasedsince the 1980s, when it was about 2 percent of total commitments; it is now about 5 per-cent. This increase in health aid reflects the switch in donors’ priorities, notably, from aidfor infrastructure to aid for social sectors, which reflects the adoption of the MillenniumDevelopment Goals.
The CRS also provides a disaggregation of disbursements by sector. Unfortunately,disbursements are even more underreported than commitments. As an alternative vari-able for Health aidi,t, we proxy aid disbursements in the health sector by weightingtotal net disbursements with the share of health commitments in total commitments.Health aidi,t is expressed in per capita constant terms, using the DAC deflator.
The term Remittancesi,t is defined as current transfers by migrants who are employedfor more than a year in another country in which they are considered residents (WorldBank 2006). We use the same deflator for remittances as for aid in order to transformthis variable into per capita constant terms. As shown in figure 1, workers’ remittanceshave been increasing in both absolute and relative terms since the mid-1980s; then, theyaccounted for only about 60 percent of total aid commitments, but since 2000 theyhave represented more than 200 percent of aid commitments, reflecting the growingimportance of this financing for developing economies. The growth in remittances ispartly attributable to the rise in the number of international migrants worldwide, butit also indicates that in recent years people have been shifting from informal to formalchannels for sending funds. This potentially important source of measurement erroris addressed in our econometric analysis. First, we include a time trend in our list ofregressors in order to capture the increasing trend in remittances. Second, we controlfor unobservable heterogeneity among countries, hoping to account for some omittedvariables that could explain simultaneously the increasing trend in remittances andthe decreasing trend in child and infant mortality. Finally, this latter issue is also tack-led through the instrumentation of remittances (see the next subsection).
Following the existing literature on cross-country determinants of child health out-comes, equation (1) controls for a set of relevant socioeconomic variables, Xi,t. Begin-ning with the work of Ravallion (1993) and Pritchett and Summers (1996), a consen-sus has emerged concerning the negative relationship between child mortality andnational income. Female education, measured either by educational attainment or byilliteracy rates, has also been shown to be negatively correlated with child mortality(Filmer and Pritchett 1999; Anand and Bärnighausen 2004; Fay et al. 2005; McGuire2006; Ravallion 2007). We express income per capita in purchasing power parity (PPP)constant terms (World Bank 2006) and measure female education by average years ofschooling of the female population age 15 and older (Barro and Lee 2000).
Anand and Bärnighausen (2004) show that the density of human resources in thehealth sector is significantly correlated with child health indicators. We proxy humanresources for health with the number of physicians (per 1,000 inhabitants), fromDocquier and Bhargava (2007).
ARE REMITTANCES MORE EFFECTIVE THAN AID? | 181
Other cross-country determinants of child health have been identified in the liter-ature, such as the size of the population (Mishra and Newhouse 2007), the share ofurban population (Fay et al. 2005; Masud and Yontcheva 2005; Ravallion 2007),inequality indicators (Filmer and Pritchett 1999; Fay et al. 2005; McGuire 2006;Ravallion 2007), and poverty rates (Anand and Bärnighausen 2004), but none weresignificant in our analysis. Two other variables—ethnic fragmentation and whetherthe country is predominantly Muslim—were also significantly correlated with infantmortality in Filmer and Pritchett (1999) and McGuire (2006). Both are time invari-ant and could not be introduced in our fixed-effects analysis.
Finally, there has been an intense debate concerning the impact of public spendingon health outcomes. Because our core independent variable is health aid and theimpact of health aid goes through the route of public spending, we exclude the pub-lic spending variable from our analysis. Another reason is that when public spendingis introduced into the regressions, we lose half of the countries in the sample.
Equation (1) is estimated on a panel of 109 developing countries, among them39 Sub-Saharan countries, from 1987 to 2004. (See annex table A.1 for the countrylist.) Child health data are for every four or five years (1990, 1995, 2000, and 2004).The right-hand-side variables are averaged over three years, from t – 1 to t – 4, andare measured in logarithms. This is true for all variables except education because theBarro and Lee (2000) database on education is for every five years and is availableonly up to 2000. We therefore use the 2000 level of education to explain 2004 healthoutcomes, and so on. We control for unobservable heterogeneity with country fixedeffects, �. We also include time dummies �t.
Endogeneity of Aid, Remittances, and Income
There are two potential sources of endogeneity of aid and remittances to child healthindicators. First, aid and remittances are given purposively, and both donors andmigrants are likely to take into account the child health situation when allocating theirflows. Even if aid is determined at the macro level and remittances are determined atthe micro level, both are likely to reflect, to some extent, the chances of survival ofchildren. Second, there could be some omitted variables that affect aid, remittances,and child health. For example, natural disasters are likely to induce both a deteriora-tion of child health indicators and increased inflows of aid and remittances.
We therefore instrument health aid and workers’ remittances.4 As instruments forhealth aid, we use a set of variables that capture historical and cultural relationshipsbetween developing countries and donor or destination countries. These variables aremore likely to be exogenous to child health than any characteristics of recipient ororigin countries. Specifically, we use the total aid budget of the five main donorsweighted by the cultural distance between receiving and donor or destination coun-tries (measured by whether they have the same religion) and by the geographic dis-tance (distance to Washington, Brussels, and Tokyo).5 As an instrument for healthaid, we use health aid lagged twice. Workers’ remittances are instrumented using theratio of broad money supply (M2) to GDP because countries that are more financially

182 | L ISA CHAUVET, FLORE GUBERT, AND SANDRINE MESPLÉ-SOMPS
developed have been found to receive larger remittances. Income per capita is alsoendogenous to health indicators (Pritchett and Summers 1996; Filmer and Pritchett1999). It is instrumented using twice-lagged income per capita.
We also suspected education to be endogenous to health indicators. We tested thishypothesis, and it turned out that the exogeneity of education could not be rejectedby our test. This result is partly explained by the fact that education in t � 5 (or t � 4)is used to explain health outcomes in t.
The excludability and relevance of our instruments being legitimate concerns here,tests for their validity (Sargan test of overidentification, test of underidentification,test of weak instruments, partial R-squared) were systematically performed.6
Estimation of the Baseline Model
Our estimation of the baseline model proceeds in three steps. Equation (1) is firstestimated with simple OLS. We then introduce country fixed effects to take intoaccount unobservable heterogeneity in our sample. Finally aid, remittances, andincome are instrumented using two-stage least squares (2SLS), including countryfixed effects and time fixed effects.7 Instrumentation equations are provided inannex table A.2.
Regressions (1) through (6) in table 1 present the estimations of the baseline modelwhen the dependent variable is either the under-five mortality rate or the infant mor-tality rate. Income per capita is highly significant and tends to reduce child mortality.The impact is quite strong: the coefficients of income in regressions (3) and (6) suggestthat a 1 percent increase in income reduces child mortality by around 0.59 percentand infant mortality by about 0.50 percent. The coefficients of income per capita areinterestingly close to the coefficients found by Pritchett and Summers (1996) in theirinstrumental variables (IV) estimation of infant mortality (around 0.3), using a differentset of instruments. They are even closer for the fixed-effect estimations (0.31 in Pritchettand Summers 1996).
Surprisingly, the number of physicians is not significant in table 1 except in OLS esti-mations. When significant, it is negative, suggesting that a larger number of doctorsimplies lower child and infant mortality rates. Anand and Bärnighausen (2004) find astrong impact of doctor and nurse density on various health indicators, which in theircase is more robust than in our regressions. Only in OLS estimations does female edu-cation have a significant impact on child and infant mortality rates. In table 1 the neg-ative impact of the time dummies (1990 is the omitted time dummy) reflects thedecreasing trend in child and infant mortality rates over the last two decades.
Finally, aid and remittances both have a negative coefficient in regressions (1)through (6), but, contrary to Mishra and Newhouse (2007), we find no significantimpact of health aid at this stage of our empirical analysis. By contrast, remittancesare found to be strongly significant in most regressions, with the expected sign. Wheninstrumented, the coefficient of remittances is multiplied more than fourfold: a 1 per-cent increase in remittances decreases child mortality by 0.12 percent and infant mortality by 0.10 percent.
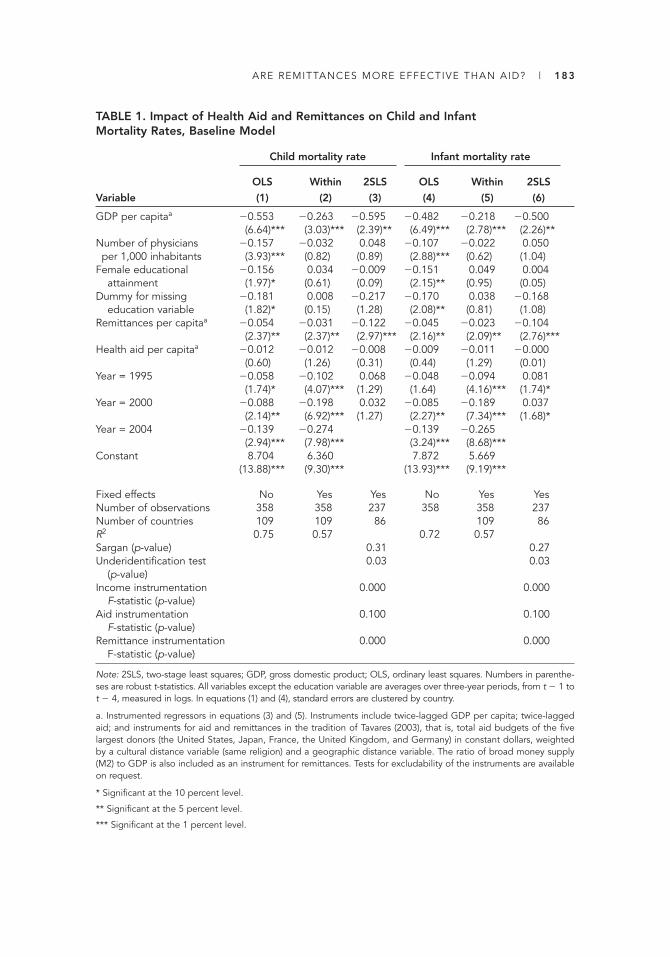
ARE REMITTANCES MORE EFFECTIVE THAN AID? | 183
TABLE 1. Impact of Health Aid and Remittances on Child and Infant Mortality Rates, Baseline Model
Child mortality rate Infant mortality rate
OLS Within 2SLS OLS Within 2SLS
Variable (1) (2) (3) (4) (5) (6)
GDP per capitaa �0.553 �0.263 �0.595 �0.482 �0.218 �0.500(6.64)*** (3.03)*** (2.39)** (6.49)*** (2.78)*** (2.26)**
Number of physicians �0.157 �0.032 0.048 �0.107 �0.022 0.050per 1,000 inhabitants (3.93)*** (0.82) (0.89) (2.88)*** (0.62) (1.04)
Female educational �0.156 0.034 �0.009 �0.151 0.049 0.004attainment (1.97)* (0.61) (0.09) (2.15)** (0.95) (0.05)
Dummy for missing �0.181 0.008 �0.217 �0.170 0.038 �0.168education variable (1.82)* (0.15) (1.28) (2.08)** (0.81) (1.08)
Remittances per capitaa �0.054 �0.031 �0.122 �0.045 �0.023 �0.104(2.37)** (2.37)** (2.97)*** (2.16)** (2.09)** (2.76)***
Health aid per capitaa �0.012 �0.012 �0.008 �0.009 �0.011 �0.000(0.60) (1.26) (0.31) (0.44) (1.29) (0.01)
Year = 1995 �0.058 �0.102 0.068 �0.048 �0.094 0.081(1.74)* (4.07)*** (1.29) (1.64) (4.16)*** (1.74)*
Year = 2000 �0.088 �0.198 0.032 �0.085 �0.189 0.037(2.14)** (6.92)*** (1.27) (2.27)** (7.34)*** (1.68)*
Year = 2004 �0.139 �0.274 �0.139 �0.265(2.94)*** (7.98)*** (3.24)*** (8.68)***
Constant 8.704 6.360 7.872 5.669(13.88)*** (9.30)*** (13.93)*** (9.19)***
Fixed effects No Yes Yes No Yes YesNumber of observations 358 358 237 358 358 237Number of countries 109 109 86 109 86R2 0.75 0.57 0.72 0.57Sargan (p-value) 0.31 0.27Underidentification test 0.03 0.03
(p-value)Income instrumentation 0.000 0.000
F-statistic (p-value)Aid instrumentation 0.100 0.100
F-statistic (p-value)Remittance instrumentation 0.000 0.000
F-statistic (p-value)
Note: 2SLS, two-stage least squares; GDP, gross domestic product; OLS, ordinary least squares. Numbers in parenthe-ses are robust t-statistics. All variables except the education variable are averages over three-year periods, from t � 1 tot � 4, measured in logs. In equations (1) and (4), standard errors are clustered by country.
a. Instrumented regressors in equations (3) and (5). Instruments include twice-lagged GDP per capita; twice-laggedaid; and instruments for aid and remittances in the tradition of Tavares (2003), that is, total aid budgets of the fivelargest donors (the United States, Japan, France, the United Kingdom, and Germany) in constant dollars, weightedby a cultural distance variable (same religion) and a geographic distance variable. The ratio of broad money supply(M2) to GDP is also included as an instrument for remittances. Tests for excludability of the instruments are availableon request.
* Significant at the 10 percent level.
** Significant at the 5 percent level.
*** Significant at the 1 percent level.

184 | L ISA CHAUVET, FLORE GUBERT, AND SANDRINE MESPLÉ-SOMPS
Nonlinearities in the Aid-Health Relationship
As a next step in our analysis, we explore in greater detail the relationship betweenhealth aid and child health indicators. So far, we find no significant impact of healthaid commitments. A relative consensus, however, has emerged in the literature: thataggregate aid disbursements affect macroeconomic outcomes such as economicgrowth in a nonlinear way.8 Similarly, the impact of health aid on health outcomesmay be nonlinear. The nonlinearity may be attributable to constrained absorptivecapacity. Constrained absorptive capacity in the health sector may be proxied throughan interaction of health aid with income per capita; health aid would be relativelymore effective in richer countries because of their greater capacity to absorb aid.
To explore this kind of nonlinearity in the health-aid relationship, we estimate anequation of the following form:
lnHealthi,t � �i � �t � � ln Xi,(t�1,t�4) � � ln Remittancesi,(t�1,t�4)
� �1 ln Health aidi,(t�1,t�4) � �2 ln Health aidi,(t�1,t�4). ln Incomei,(t�1,t�4) � �i,t, (2)
where lnHealth aid.lnIncome is an interaction variable of aid with income per capita.It is instrumented using the same set of instruments as those for health aid andincome per capita.
The results are presented in columns (1) and (2) of table 2. The absorptive capacityhypothesis is not supported by our results. The impact of health aid is nonlinear, butthe nonlinearity suggests that aid to the health sector is more effective in poorer coun-tries. The threshold in income per capita corresponding to a switch to harmful aid isaround US$4,100 per capita (in PPP). Figure 2 depicts the effect of aid on child mor-tality rates below and above this income threshold, respectively. The threshold is quitehigh and implies that most African countries belong to the decreasing part of the rela-tionship between health aid and health outcomes. Aid increases the child mortalityrate in 8 of the 35 Sub-Saharan African countries in our sample: Botswana, CapeVerde, Gabon, Mauritius, Namibia, the Seychelles, South Africa, and Swaziland. Inthe remaining 27 African countries, aid tends to improve child health indicators.
It is worth noting that our baseline specification implies that we capture the directeffects of aid and remittances on child health indicators. Another channel throughwhich aid and remittances could affect health outcomes is their impact on GDP percapita. Since GDP per capita is included among our set of regressors, this indirectimpact is not taken into account. Assuming that both remittances and aid tend toimprove income, we therefore probably underestimate the impact of these sources offinancing on child health indicators.
An alternative way of testing the constrained absorptive capacity hypothesis is tointroduce the square of health aid into the regression. A quadratic relationshipbetween health aid and health indicators would reflect marginal decreasing returns to aid: after a given threshold of aid received, an additional dollar of aid is less effec-tive because the country no longer has the capacity to absorb it. Aid squared is neversignificant when introduced into any of the regressions.9 Moreover, its sign is negative,as is that of health aid. The absence of a quadratic relationship between health aid andhealth outcomes confirms our previous finding of no absorptive capacity constraints

ARE REMITTANCES MORE EFFECTIVE THAN AID? | 185
on aid to the health sector. Health aid seems to be more effective where the prospectsfor improvements in health indicators are higher, that is, in poorer countries.
Finally, we explore whether the results using health aid disbursements are similarto those with aid commitments.10 Regressions (1) and (3) of table 3 reproduce thebaseline model; health aid disbursements are not significantly different from zero. Inregressions (2) and (4), health disbursements interacted with income are significant,
TABLE 2. Nonlinearity in the Health-Aid Relationship, Two-Stage Least Squares(2SLS) with Fixed Effects
Child mortality rate Infant mortality rate
(1) (2)
GDP per capitaa �0.355 �0.264(1.41) (1.16)
Number of physicians per 1,000 inhabitants 0.023 0.026(0.40) (0.49)
Female educational attainment �0.063 �0.050(0.53) (0.45)
Dummy for missing education variable �0.305 �0.255(1.39) (1.26)
Remittances per capitaa �0.115 �0.097(2.72)*** (2.46)**
Health aid per capitaa �0.839 �0.815(1.87)* (1.99)**
Health aid per capita � income per capitaa 0.100 0.098(1.85)* (1.98)**
Year = 1995 0.071 0.084(1.24) (1.62)
Year = 2000 0.044 0.049(1.69)* (2.09)**
Fixed effects Yes YesNumber of observations 237 237Number of countries 86 86Sargan (p-value) 0.31 0.25Underidentification test (p-value) 0.04 0.04Income instrumentation F-statistic (p-value) 0.00 0.00Aid instrumentation F-statistic (p-value) 0.10/0.12 0.10/0.12Remittances instrumentation F-statistic (p-value) 0.00 0.00
Note: GDP, gross domestic product. Numbers in parentheses are robust t-statistics. All variables except the educa-tion variable are averages over three-year periods, from t � 1 to t � 4, measured in logs.
a. Instrumented regressors. Instruments include twice-lagged GDP per capita; twice-lagged aid; and instruments foraid and remittances in the tradition of Tavares (2003), that is, total aid budgets of the five largest donors (the UnitedStates, Japan, France, the United Kingdom, and Germany) in constant dollars, weighted by a cultural distance vari-able (same religion) and a geographic distance variable. The ratio of broad money supply (M2) to GDP is also includ-ed as an instrument for remittances. Tests for excludability of the instruments are available on request.
* Significant at the 10 percent level.
** Significant at the 5 percent level.
*** Significant at the 1 percent level.

186 | L ISA CHAUVET, FLORE GUBERT, AND SANDRINE MESPLÉ-SOMPS
confirming our previous finding. The resulting income threshold, US$4,000, is closeto the one corresponding to regressions that include commitments.
Medical Brain Drain
Our baseline model suggests that migrants’ remittances help improve health out-comes in developing countries. We now turn to analysis of the counterpart of workers’remittances—the impact of the brain drain induced by migration on health outcomes
log
(chi
ld m
orta
lity)
4.9
–4 –2–3 –1 0log (health aid per capita)
21 3 44.0
4.1
4.2
4.3
4.4
4.5
4.6
4.7
4.8
FIGURE 2.Impact of Health Aid on Child Mortality
log
(chi
ld m
orta
lity)
4.4
–8 –4–6 –2 0log (health aid per capita)
2 43.0
4.0
4.2
3.2
3.4
3.6
3.8
Source: Authors’ calculations.
Income per capita (PPP) less than US$4,100
Income per capita (PPP) greater than US$4,100
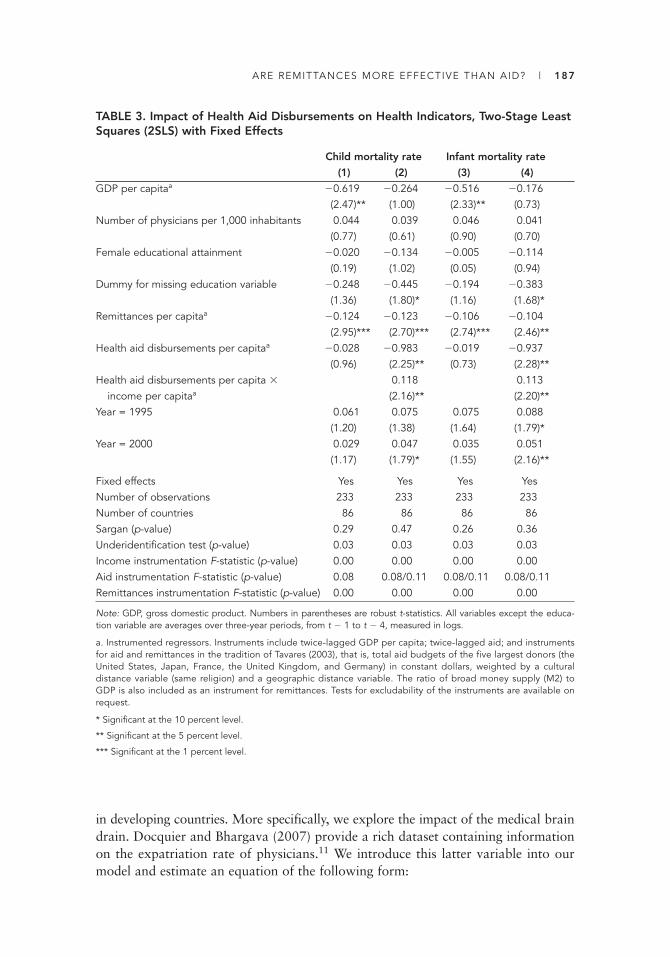
ARE REMITTANCES MORE EFFECTIVE THAN AID? | 187
in developing countries. More specifically, we explore the impact of the medical braindrain. Docquier and Bhargava (2007) provide a rich dataset containing informationon the expatriation rate of physicians.11 We introduce this latter variable into ourmodel and estimate an equation of the following form:
TABLE 3. Impact of Health Aid Disbursements on Health Indicators, Two-Stage LeastSquares (2SLS) with Fixed Effects
Child mortality rate Infant mortality rate
(1) (2) (3) (4)
GDP per capitaa �0.619 �0.264 �0.516 �0.176(2.47)** (1.00) (2.33)** (0.73)
Number of physicians per 1,000 inhabitants 0.044 0.039 0.046 0.041(0.77) (0.61) (0.90) (0.70)
Female educational attainment �0.020 �0.134 �0.005 �0.114(0.19) (1.02) (0.05) (0.94)
Dummy for missing education variable �0.248 �0.445 �0.194 �0.383(1.36) (1.80)* (1.16) (1.68)*
Remittances per capitaa �0.124 �0.123 �0.106 �0.104(2.95)*** (2.70)*** (2.74)*** (2.46)**
Health aid disbursements per capitaa �0.028 �0.983 �0.019 �0.937(0.96) (2.25)** (0.73) (2.28)**
Health aid disbursements per capita � 0.118 0.113income per capitaa (2.16)** (2.20)**
Year = 1995 0.061 0.075 0.075 0.088(1.20) (1.38) (1.64) (1.79)*
Year = 2000 0.029 0.047 0.035 0.051(1.17) (1.79)* (1.55) (2.16)**
Fixed effects Yes Yes Yes YesNumber of observations 233 233 233 233Number of countries 86 86 86 86Sargan (p-value) 0.29 0.47 0.26 0.36Underidentification test (p-value) 0.03 0.03 0.03 0.03Income instrumentation F-statistic (p-value) 0.00 0.00 0.00 0.00Aid instrumentation F-statistic (p-value) 0.08 0.08/0.11 0.08/0.11 0.08/0.11Remittances instrumentation F-statistic (p-value) 0.00 0.00 0.00 0.00
Note: GDP, gross domestic product. Numbers in parentheses are robust t-statistics. All variables except the educa-tion variable are averages over three-year periods, from t � 1 to t � 4, measured in logs.
a. Instrumented regressors. Instruments include twice-lagged GDP per capita; twice-lagged aid; and instrumentsfor aid and remittances in the tradition of Tavares (2003), that is, total aid budgets of the five largest donors (theUnited States, Japan, France, the United Kingdom, and Germany) in constant dollars, weighted by a cultural distance variable (same religion) and a geographic distance variable. The ratio of broad money supply (M2) toGDP is also included as an instrument for remittances. Tests for excludability of the instruments are available onrequest.
* Significant at the 10 percent level.
** Significant at the 5 percent level.
*** Significant at the 1 percent level.

188 | L ISA CHAUVET, FLORE GUBERT, AND SANDRINE MESPLÉ-SOMPS
lnHealthi,t � �i � �t � � ln Xi,(t�1,t�4) � � lnRemittancesi,(t�1,t�4)
� �MedicalBrainDraini,(t�1,t�4) � �l lnHealth aidi,(t�1,t�4) � �2 ln Healthaidi,(t�1,t�4). lnIncomei,(t�1,t�4) � �i,t, (3)
where MedicalBrainDraini,(t�1,t�4) is the expatriation rate of physicians averagedover a three-year subperiod and transformed in logarithms. Health outcomes andmedical brain drain may be correlated with omitted variables such as the quality ofhealth infrastructure. We therefore instrument this variable using the same set ofinstruments as for aid and remittances.
Regressions (1) and (2) of table 4 present the results when medical brain drain isintroduced into the analysis. The coefficient of medical brain drain is highly signifi-cant and has the expected positive sign: a 1 percent increase in the rate of expatria-tion of physicians increases child and infant mortality rates by around 0.5 percent.The expatriation of human resources in the health sector has a direct, harmful effecton health outcomes in developing countries.12
Interestingly, the medical brain drain does not really affect the impact of health aidon health outcomes. The threshold of income for which the relationship between aidand child health switches from negative to positive remains similar to that found intable 2, between US$4,700 and US$5,000, and the slope does not change greatly:from �0.815 it goes to about �1, suggesting that the health-improving impact of aidis not altered when the medical brain drain is taken into account.
Intracountry Empirical Assessment
In this section, we investigate the intracountry impact of aid and remittances on childhealth indicators by analyzing to what extent these transfers are targeted to the poor-est (or are not). The discussion begins with a description of the data and the empiri-cal strategy and ends with comments on our main findings.
Model and Data
We use the World Bank’s comprehensive Health, Nutrition, and Population (HNP)database, in which development indicators from Demographic and Health Surveys(DHSs) are compiled by asset quintiles within countries (Gwatkin et al. 2007). Assetquintiles are computed using the first principal component in an analysis of the cor-relations between various consumer durables and other household characteristics,following a method proposed by Filmer and Pritchett (2001).
Few studies have used the HNP database to analyze the determinants of childhealth outcomes. To our knowledge, the first is Fay et al. (2005). Using a sample of39 countries and a country random-effect model, the authors assert that apart fromtraditional variables—such as GDP per capita, assets, education, and direct healthinterventions—better access to basic infrastructure services has an important impacton infant and child mortality and on the incidence of stunting. Ravallion (2007)questions the robustness of their results and criticizes their empirical strategy onthree points. First, the model of Fay et al. (2005) is a linear model, but a logarithmicfunctional form would have been more appropriate, given that the dependent

ARE REMITTANCES MORE EFFECTIVE THAN AID? | 189
TABLE 4. Medical Brain Drain and Health Outcomes, Two-Stage Least Squares (2SLS)with Fixed Effects
Child mortality rate Infant mortality rate
(1) (2)
GDP per capitaa �0.486 �0.389(1.77)* (1.56)
Number of physicians per 1,000 inhabitants 0.379 0.365(2.50)** (2.67)***
Female educational attainment �0.205 �0.185(0.99) (0.98)
Dummy for missing education variable �0.536 �0.476(1.49) (1.45)
Remittances per capitaa �0.134 (0.114(2.54)** (2.35)**
Health aid per capitaa �1.067 �1.033(2.02)** (2.14)**
Health aid per capita � income per capitaa 0.125 0.122(1.99)** (2.12)**
Medical brain drain (MBD)a 0.504 0.481(2.61)*** (2.75)***
Year = 1995 0.093 0.105(1.33) (1.64)
Year = 2000 0.086 0.089(2.39)** (2.75)***
Fixed effects Yes YesNumber of observations 237 237Number of countries 86 86Sargan (p-value) 0.99 0.99Underidentification test (p-value) 0.07 0.07Income instrumentation F-statistic (p-value) 0.00 0.00Aid instrumentation F-statistic (p-value) 0.10/0.12 0.10/0.12Remittances instrumentation F-statistic (p-value) 0.00 0.00MBD instrumentation F-statistic (p-value) 0.01 0.01
Note: GDP, gross domestic product. Numbers in parentheses are robust t-statistics. All variables except the educa-tion variable are averages over three-year periods, from t �1 to t � 4, measured in logs.
a. Instrumented regressors. Instruments include twice-lagged GDP per capita; twice-lagged aid; and instrumentsfor aid and remittances in the tradition of Tavares (2003), that is, total aid budgets of the five largest donors (theUnited States, Japan, France, the United Kingdom, and Germany) in constant dollars, weighted by a cultural dis-tance variable (same religion) and a geographic distance variable. The ratio of broad money supply (M2) to GDPis also included as an instrument for remittances. Tests for excludability of the instruments are available onrequest.
* Significant at the 10 percent level.
** Significant at the 5 percent level.
*** Significant at the 1 percent level.

190 | L ISA CHAUVET, FLORE GUBERT, AND SANDRINE MESPLÉ-SOMPS
variables are bounded. Second, by estimating a random-effect model, the authorsimplicitly assume that their country fixed effects are not correlated with the regres-sors. This is a strong assumption because many sources of latent heterogeneity acrosscountries are suspected. Finally, there may be a strong presumption of bias arisingfrom the omission of within-country differences in women’s schooling. Using exact-ly the same data but estimating a fixed-effect model that includes female educationand variables in log-linear form, Ravallion (2007) fails to detect any significantimpact of infrastructure access on child health outcomes. His findings suggest a sig-nificant effect of access to health care and female educational attainment on childhealth.13 The study by Fielding, McGillivray, and Torres (2008) employs the samedata. It examines, using a system of simultaneous equations, the relationshipsbetween four MDG-related variables (health, educational status, access to water, andaccess to sanitation) and aid; the authors also explore the impact of aid on these vari-ables. They find that although aid is effective overall, the poorest subgroups withineach country are typically not the primary beneficiaries of the inflows.
In what follows, we use an updated HNP database in which some countries havemultiple-year data. (See annex table A.3 for a listing.) This temporal dimension of thepanel makes it possible to assess the impact of country-specific variables that varyover time, such as GDP per capita, aid, and remittances, in a model that includescountry fixed effects. The dataset covers 47 developing countries, of which 25 are inSub-Saharan Africa, with five asset quintiles for each country-year, yielding a total of380 observations.
Table 5 provides summary statistics on the main variables of interest. It suggeststhat there are strong within-country health disparities that are correlated with assetinequality. Households belonging to the poorest asset quintile have the highest meaninfant and child mortality rates; child mortality is almost twice as high for the poor-est quintile as for the richest one. A similar gap can be observed in the female schoolcompletion rate, which varies from 29.15 for the poorest quintile to 76.34 for therichest. It is worth noting that the differences in mean health indicators between thepoorest and richest quintiles are always smaller than the ranges across countrieswithin each quintile.
The intracountry model to be estimated is very similar to the cross-country modelpresented in the preceding section in the sense that control variables are roughly thesame and are expressed in log-linear form. The baseline model may therefore be writ-ten as follows:
lnHealthj,i,t � �i � �lnXi,(t�1,t�4) � �lnXj,i,t � � lnHealth aidi,(t�1,t�4)
� � lnRemiti,(t�1,t�4) � ∑5
j�2
�jqj � ∑5
j�2
�j qj *lnHealth aidi,(t�1,t�4)
� ∑5
j�2
�j qj *lnRemiti,(t�1,t�4) � �j,i,t, (4)
where j is the quintile index and qj are quintile dummy variables.14
Vector Xi,(t�1,t�4) includes GDP per capita in PPP constant terms and the numberof physicians per 1,000 inhabitants. These variables are averaged over three years,
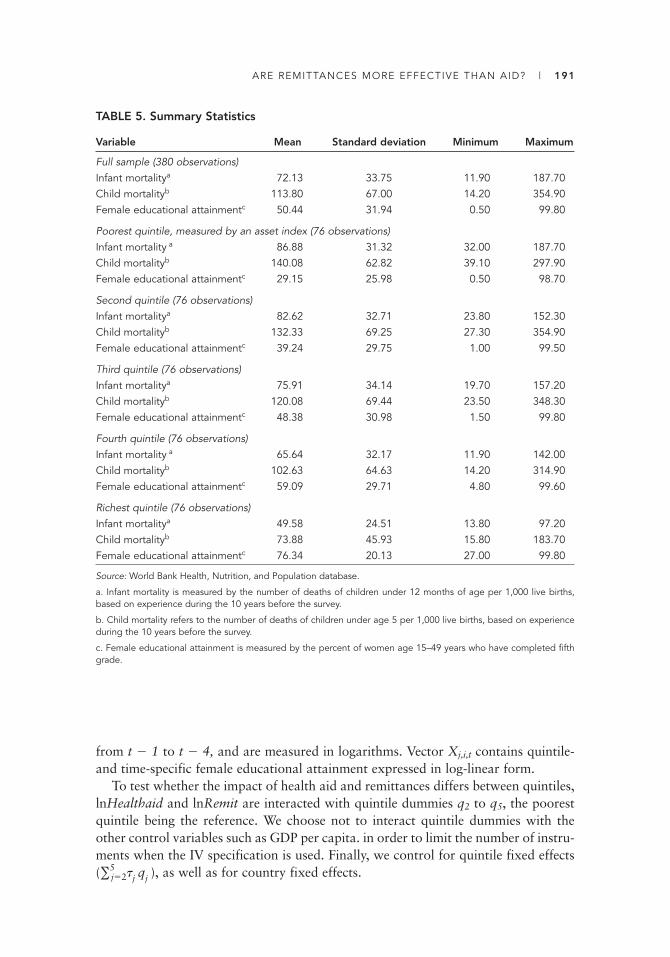
ARE REMITTANCES MORE EFFECTIVE THAN AID? | 191
from t � 1 to t � 4, and are measured in logarithms. Vector Xj,i,t contains quintile-and time-specific female educational attainment expressed in log-linear form.
To test whether the impact of health aid and remittances differs between quintiles,lnHealthaid and lnRemit are interacted with quintile dummies q2 to q5, the poorestquintile being the reference. We choose not to interact quintile dummies with theother control variables such as GDP per capita. in order to limit the number of instru-ments when the IV specification is used. Finally, we control for quintile fixed effects(∑5
j�2�j qj ), as well as for country fixed effects.
TABLE 5. Summary Statistics
Variable Mean Standard deviation Minimum Maximum
Full sample (380 observations)Infant mortalitya 72.13 33.75 11.90 187.70Child mortalityb 113.80 67.00 14.20 354.90Female educational attainmentc 50.44 31.94 0.50 99.80
Poorest quintile, measured by an asset index (76 observations)Infant mortality a 86.88 31.32 32.00 187.70Child mortalityb 140.08 62.82 39.10 297.90Female educational attainmentc 29.15 25.98 0.50 98.70
Second quintile (76 observations)Infant mortalitya 82.62 32.71 23.80 152.30Child mortalityb 132.33 69.25 27.30 354.90Female educational attainmentc 39.24 29.75 1.00 99.50
Third quintile (76 observations)Infant mortalitya 75.91 34.14 19.70 157.20Child mortalityb 120.08 69.44 23.50 348.30Female educational attainmentc 48.38 30.98 1.50 99.80
Fourth quintile (76 observations)Infant mortality a 65.64 32.17 11.90 142.00Child mortalityb 102.63 64.63 14.20 314.90Female educational attainmentc 59.09 29.71 4.80 99.60
Richest quintile (76 observations)Infant mortalitya 49.58 24.51 13.80 97.20Child mortalityb 73.88 45.93 15.80 183.70Female educational attainmentc 76.34 20.13 27.00 99.80
Source: World Bank Health, Nutrition, and Population database.
a. Infant mortality is measured by the number of deaths of children under 12 months of age per 1,000 live births,based on experience during the 10 years before the survey.
b. Child mortality refers to the number of deaths of children under age 5 per 1,000 live births, based on experienceduring the 10 years before the survey.
c. Female educational attainment is measured by the percent of women age 15–49 years who have completed fifthgrade.

192 | L ISA CHAUVET, FLORE GUBERT, AND SANDRINE MESPLÉ-SOMPS
As in the cross-country analysis, endogeneity of aid, remittances, and income iscontrolled for using an IV specification. The education variable has also been foundto be endogenous to health indicators. This is probably because education is meas-ured by the contemporaneous school completion rate. Instruments include laggedGDP per capita, the ratio of broad money supply (M2) to GDP, lagged health aid percapita, and total aid budgets for France, Japan, the United Kingdom, and the UnitedStates in constant dollars. We also include among the instruments lagged GDP percapita and lagged health aid per capita interacted with quintiles q2 to q5.
Estimation Results
The intracountry impact of aid and remittances on child health is assessed using childand infant mortality rates. We proceed in two steps. First, the baseline model is esti-mated without including any interaction terms between health aid and remittances,on the one hand, and quintile dummies, on the other hand (table 6). We then addthese interaction terms to our set of regressors (table 7). Even though controlling forendogeneity and countries’ unobserved heterogeneity is likely to provide more reli-able results, as in regressions (3) and (6) of table 1, tables 6 and 7 also present theresults of simple OLS and fixed-effects regressions.
As suggested by table 6, the impact of our control variables is quite similar to thatfound using our cross-country specification. GDP per capita, for instance, tends todecrease infant and child mortality rates. The coefficient of this variable suggests thatan increase of 1 percent in GDP per capita reduces child and infant mortality by about0.6 percent. As in the previous specification, the number of physicians per 1,000 inhab-itants is found to have no significant effect on child health outcomes. Female educationis found to have a negative impact on the child mortality rate but not on the infant mor-tality rate. This result is in accordance with our previous results but not with those ofRavallion (2007), who found a significant negative impact of female education what-ever child health indicators were chosen. This lack of robust impact may come aboutbecause the education variable we use is less precise than that employed by Ravallion;we use the percentage of women age 15–49 who have completed the fifth grade, where-as Ravallion (2007) uses the average number of years of female schooling.
Turning to our variables of interest, estimation results suggest that remittances andhealth aid have no impact at all. Adding interaction terms substantially alters the pic-ture. As suggested by table 7, migrants’ remittances are now significant, and theirimpact on child health outcomes is found to be stronger for the richest quintiles thanfor the poorest ones. Remittances and remittances interacted with quintile dummiesare jointly significant in the child and infant mortality equations. The impact ofremittances on health indicators for the poorest quintiles is nil (column 3), whereasit is stronger for the middle and upper classes, at about 0.11, 0.16, and 0.23 for quin-tiles 3, 4, and 5, respectively. Overall, this result suggests that remittances tend toincrease health disparities within countries.
By contrast, neither an antipoor nor a pro-poor effect is detected for health aid.This finding contrasts with that of Fielding, McGillivray, and Torres (2008), whoestimate a system of simultaneous equations on several welfare measures, including
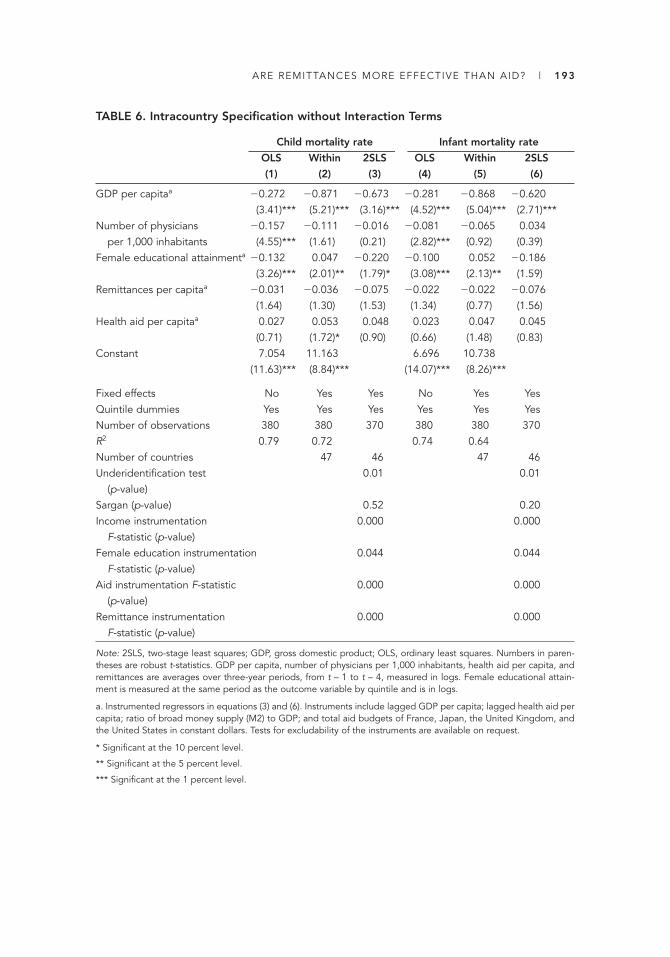
ARE REMITTANCES MORE EFFECTIVE THAN AID? | 193
TABLE 6. Intracountry Specification without Interaction Terms
Child mortality rate Infant mortality rate
OLS Within 2SLS OLS Within 2SLS
(1) (2) (3) (4) (5) (6)
GDP per capitaa �0.272 �0.871 �0.673 �0.281 �0.868 �0.620(3.41)*** (5.21)*** (3.16)*** (4.52)*** (5.04)*** (2.71)***
Number of physicians �0.157 �0.111 �0.016 �0.081 �0.065 0.034per 1,000 inhabitants (4.55)*** (1.61) (0.21) (2.82)*** (0.92) (0.39)
Female educational attainmenta �0.132 0.047 �0.220 �0.100 0.052 �0.186(3.26)*** (2.01)** (1.79)* (3.08)*** (2.13)** (1.59)
Remittances per capitaa �0.031 �0.036 �0.075 �0.022 �0.022 �0.076(1.64) (1.30) (1.53) (1.34) (0.77) (1.56)
Health aid per capitaa 0.027 0.053 0.048 0.023 0.047 0.045(0.71) (1.72)* (0.90) (0.66) (1.48) (0.83)
Constant 7.054 11.163 6.696 10.738(11.63)*** (8.84)*** (14.07)*** (8.26)***
Fixed effects No Yes Yes No Yes YesQuintile dummies Yes Yes Yes Yes Yes YesNumber of observations 380 380 370 380 380 370R2 0.79 0.72 0.74 0.64Number of countries 47 46 47 46Underidentification test 0.01 0.01
(p-value)Sargan (p-value) 0.52 0.20Income instrumentation 0.000 0.000
F-statistic (p-value)Female education instrumentation 0.044 0.044
F-statistic (p-value)Aid instrumentation F-statistic 0.000 0.000
(p-value)Remittance instrumentation 0.000 0.000
F-statistic (p-value)
Note: 2SLS, two-stage least squares; GDP, gross domestic product; OLS, ordinary least squares. Numbers in paren-theses are robust t-statistics. GDP per capita, number of physicians per 1,000 inhabitants, health aid per capita, andremittances are averages over three-year periods, from t – 1 to t – 4, measured in logs. Female educational attain-ment is measured at the same period as the outcome variable by quintile and is in logs.
a. Instrumented regressors in equations (3) and (6). Instruments include lagged GDP per capita; lagged health aid percapita; ratio of broad money supply (M2) to GDP; and total aid budgets of France, Japan, the United Kingdom, andthe United States in constant dollars. Tests for excludability of the instruments are available on request.
* Significant at the 10 percent level.
** Significant at the 5 percent level.
*** Significant at the 1 percent level.
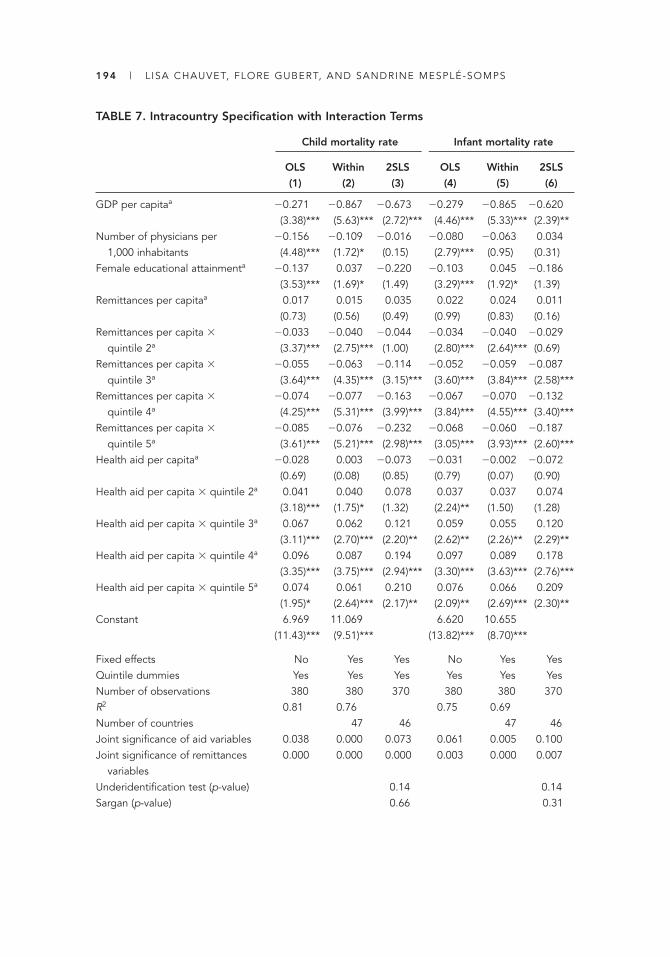
194 | L ISA CHAUVET, FLORE GUBERT, AND SANDRINE MESPLÉ-SOMPS
TABLE 7. Intracountry Specification with Interaction Terms
Child mortality rate Infant mortality rate
OLS Within 2SLS OLS Within 2SLS
(1) (2) (3) (4) (5) (6)
GDP per capitaa �0.271 �0.867 �0.673 �0.279 �0.865 �0.620(3.38)*** (5.63)*** (2.72)*** (4.46)*** (5.33)*** (2.39)**
Number of physicians per �0.156 �0.109 �0.016 �0.080 �0.063 0.0341,000 inhabitants (4.48)*** (1.72)* (0.15) (2.79)*** (0.95) (0.31)
Female educational attainmenta �0.137 0.037 �0.220 �0.103 0.045 �0.186(3.53)*** (1.69)* (1.49) (3.29)*** (1.92)* (1.39)
Remittances per capitaa 0.017 0.015 0.035 0.022 0.024 0.011(0.73) (0.56) (0.49) (0.99) (0.83) (0.16)
Remittances per capita � �0.033 �0.040 �0.044 �0.034 �0.040 �0.029quintile 2a (3.37)*** (2.75)*** (1.00) (2.80)*** (2.64)*** (0.69)
Remittances per capita � �0.055 �0.063 �0.114 �0.052 �0.059 �0.087quintile 3a (3.64)*** (4.35)*** (3.15)*** (3.60)*** (3.84)*** (2.58)***
Remittances per capita � �0.074 �0.077 �0.163 �0.067 �0.070 �0.132quintile 4a (4.25)*** (5.31)*** (3.99)*** (3.84)*** (4.55)*** (3.40)***
Remittances per capita � �0.085 �0.076 �0.232 �0.068 �0.060 �0.187quintile 5a (3.61)*** (5.21)*** (2.98)*** (3.05)*** (3.93)*** (2.60)***
Health aid per capitaa �0.028 0.003 �0.073 �0.031 �0.002 �0.072(0.69) (0.08) (0.85) (0.79) (0.07) (0.90)
Health aid per capita � quintile 2a 0.041 0.040 0.078 0.037 0.037 0.074(3.18)*** (1.75)* (1.32) (2.24)** (1.50) (1.28)
Health aid per capita � quintile 3a 0.067 0.062 0.121 0.059 0.055 0.120(3.11)*** (2.70)*** (2.20)** (2.62)** (2.26)** (2.29)**
Health aid per capita � quintile 4a 0.096 0.087 0.194 0.097 0.089 0.178(3.35)*** (3.75)*** (2.94)*** (3.30)*** (3.63)*** (2.76)***
Health aid per capita � quintile 5a 0.074 0.061 0.210 0.076 0.066 0.209(1.95)* (2.64)*** (2.17)** (2.09)** (2.69)*** (2.30)**
Constant 6.969 11.069 6.620 10.655(11.43)*** (9.51)*** (13.82)*** (8.70)***
Fixed effects No Yes Yes No Yes YesQuintile dummies Yes Yes Yes Yes Yes YesNumber of observations 380 380 370 380 380 370R2 0.81 0.76 0.75 0.69Number of countries 47 46 47 46Joint significance of aid variables 0.038 0.000 0.073 0.061 0.005 0.100Joint significance of remittances 0.000 0.000 0.000 0.003 0.000 0.007
variablesUnderidentification test (p-value) 0.14 0.14Sargan (p-value) 0.66 0.31
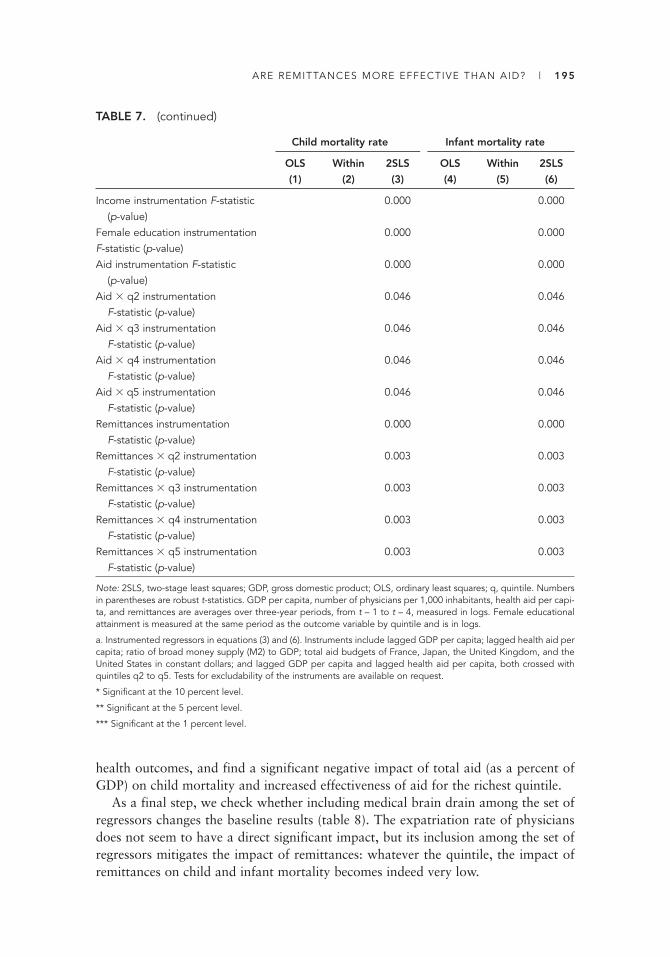
ARE REMITTANCES MORE EFFECTIVE THAN AID? | 195
health outcomes, and find a significant negative impact of total aid (as a percent ofGDP) on child mortality and increased effectiveness of aid for the richest quintile.
As a final step, we check whether including medical brain drain among the set ofregressors changes the baseline results (table 8). The expatriation rate of physiciansdoes not seem to have a direct significant impact, but its inclusion among the set ofregressors mitigates the impact of remittances: whatever the quintile, the impact ofremittances on child and infant mortality becomes indeed very low.
TABLE 7. (continued)
Child mortality rate Infant mortality rate
OLS Within 2SLS OLS Within 2SLS
(1) (2) (3) (4) (5) (6)
Income instrumentation F-statistic 0.000 0.000(p-value)
Female education instrumentation 0.000 0.000F-statistic (p-value)Aid instrumentation F-statistic 0.000 0.000
(p-value)Aid � q2 instrumentation 0.046 0.046
F-statistic (p-value)Aid � q3 instrumentation 0.046 0.046
F-statistic (p-value)Aid � q4 instrumentation 0.046 0.046
F-statistic (p-value)Aid � q5 instrumentation 0.046 0.046
F-statistic (p-value)Remittances instrumentation 0.000 0.000
F-statistic (p-value)Remittances � q2 instrumentation 0.003 0.003
F-statistic (p-value)Remittances � q3 instrumentation 0.003 0.003
F-statistic (p-value)Remittances � q4 instrumentation 0.003 0.003
F-statistic (p-value)Remittances � q5 instrumentation 0.003 0.003
F-statistic (p-value)
Note: 2SLS, two-stage least squares; GDP, gross domestic product; OLS, ordinary least squares; q, quintile. Numbersin parentheses are robust t-statistics. GDP per capita, number of physicians per 1,000 inhabitants, health aid per capi-ta, and remittances are averages over three-year periods, from t – 1 to t – 4, measured in logs. Female educationalattainment is measured at the same period as the outcome variable by quintile and is in logs.
a. Instrumented regressors in equations (3) and (6). Instruments include lagged GDP per capita; lagged health aid percapita; ratio of broad money supply (M2) to GDP; total aid budgets of France, Japan, the United Kingdom, and theUnited States in constant dollars; and lagged GDP per capita and lagged health aid per capita, both crossed withquintiles q2 to q5. Tests for excludability of the instruments are available on request.
* Significant at the 10 percent level.
** Significant at the 5 percent level.
*** Significant at the 1 percent level.

196 | L ISA CHAUVET, FLORE GUBERT, AND SANDRINE MESPLÉ-SOMPS
TABLE 8. Intracountry Specification with Medical Brain Drain, Two-Stage LeastSquares Estimations
Child mortality rate Infant mortality rate
(1) (2)
GDP per capitaa �0.823 �0.814(3.41)*** (2.71)***
Number of physicians per 1,000 inhabitants �0.913 �1.123(1.55) (1.56)
Female educational attainmenta 0.195 0.348(0.65) (0.95)
Medical brain draina �0.983 �1.268(1.50) (1.61)
Remittances per capitaa 0.115 0.114(1.52) (1.18)
Remittances per capita � quintile 2a �0.064 �0.055(1.81)* (1.35)
Remittances per capita � quintile 3a �0.126 �0.102(3.85)*** (2.67)***
Remittances per capita � quintile 4a �0.121 �0.077(2.78)*** (1.53)
Remittances per capita � quintile 5a �0.077 0.012(0.69) (0.09)
Health aid per capitaa �0.116 �0.127(1.54) (1.44)
Health aid per capita � quintile 2a 0.053 0.041(1.10) (0.68)
Health aid per capita � quintile 3a 0.061 0.043(0.98) (0.56)
Health aid per capita � quintile 4a 0.096 0.052(1.11) (0.49)
Health aid per capita � quintile 5a 0.068 0.026(0.57) (0.18)
Fixed effects Yes YesQuintile dummies Yes YesNumber of observations 370 370Number of countries 46 46Joint significance of aid variables 0.557 0.804Joint significance of remittances variables 0.001 0.080Underidentification test (p-value) 0.67 0.67Sargan (p-value) 0.87 0.66Income instrumentation F-statistic (p-value) 0.000 0.000Female education instrumentation F-statistic (p-value) 0.000 0.000Aid instrumentation F-statistic (p-value) 0.000 0.000Aid � q2 instrumentation F-statistic (p-value) 0.046 0.046Aid � q3 instrumentation F-statistic (p-value) 0.046 0.046Aid � q4 instrumentation F-statistic (p-value) 0.046 0.046Aid � q5 instrumentation F-statistic (p-value) 0.046 0.046
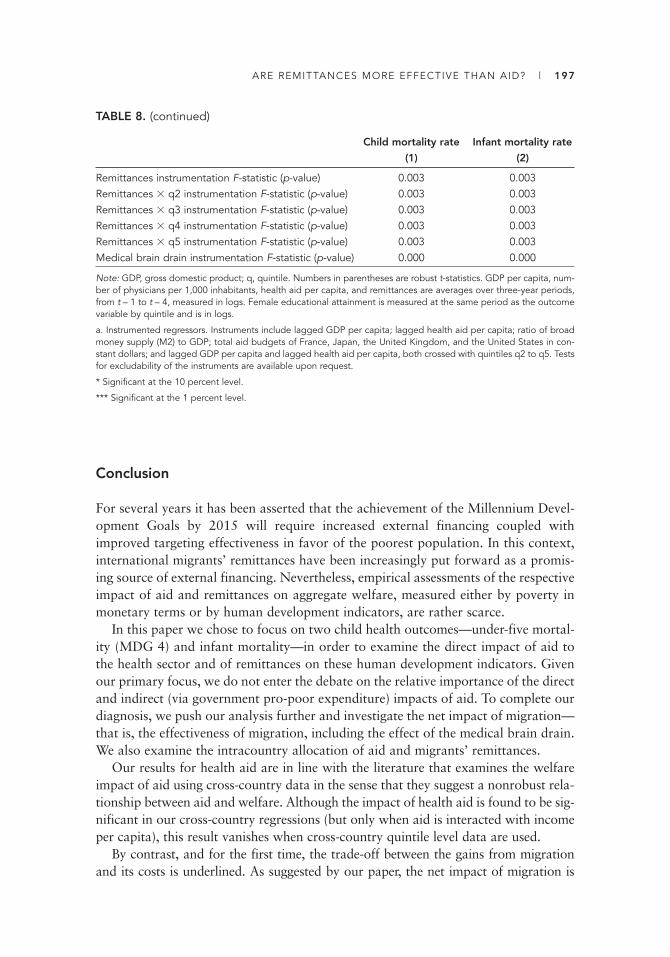
ARE REMITTANCES MORE EFFECTIVE THAN AID? | 197
Conclusion
For several years it has been asserted that the achievement of the Millennium Devel-opment Goals by 2015 will require increased external financing coupled withimproved targeting effectiveness in favor of the poorest population. In this context,international migrants’ remittances have been increasingly put forward as a promis-ing source of external financing. Nevertheless, empirical assessments of the respectiveimpact of aid and remittances on aggregate welfare, measured either by poverty inmonetary terms or by human development indicators, are rather scarce.
In this paper we chose to focus on two child health outcomes—under-five mortal-ity (MDG 4) and infant mortality—in order to examine the direct impact of aid tothe health sector and of remittances on these human development indicators. Givenour primary focus, we do not enter the debate on the relative importance of the directand indirect (via government pro-poor expenditure) impacts of aid. To complete ourdiagnosis, we push our analysis further and investigate the net impact of migration—that is, the effectiveness of migration, including the effect of the medical brain drain.We also examine the intracountry allocation of aid and migrants’ remittances.
Our results for health aid are in line with the literature that examines the welfareimpact of aid using cross-country data in the sense that they suggest a nonrobust rela-tionship between aid and welfare. Although the impact of health aid is found to be sig-nificant in our cross-country regressions (but only when aid is interacted with incomeper capita), this result vanishes when cross-country quintile level data are used.
By contrast, and for the first time, the trade-off between the gains from migrationand its costs is underlined. As suggested by our paper, the net impact of migration is
TABLE 8. (continued)
Child mortality rate Infant mortality rate
(1) (2)
Remittances instrumentation F-statistic (p-value) 0.003 0.003Remittances � q2 instrumentation F-statistic (p-value) 0.003 0.003Remittances � q3 instrumentation F-statistic (p-value) 0.003 0.003Remittances � q4 instrumentation F-statistic (p-value) 0.003 0.003Remittances � q5 instrumentation F-statistic (p-value) 0.003 0.003Medical brain drain instrumentation F-statistic (p-value) 0.000 0.000
Note: GDP, gross domestic product; q, quintile. Numbers in parentheses are robust t-statistics. GDP per capita, num-ber of physicians per 1,000 inhabitants, health aid per capita, and remittances are averages over three-year periods,from t – 1 to t – 4, measured in logs. Female educational attainment is measured at the same period as the outcomevariable by quintile and is in logs.
a. Instrumented regressors. Instruments include lagged GDP per capita; lagged health aid per capita; ratio of broadmoney supply (M2) to GDP; total aid budgets of France, Japan, the United Kingdom, and the United States in con-stant dollars; and lagged GDP per capita and lagged health aid per capita, both crossed with quintiles q2 to q5. Testsfor excludability of the instruments are available upon request.
* Significant at the 10 percent level.
*** Significant at the 1 percent level.

198 | L ISA CHAUVET, FLORE GUBERT, AND SANDRINE MESPLÉ-SOMPS
rather weak when the negative effect of medical brain drain is taken into account.Moreover, remittances are found to be more beneficial for children belonging to therichest households. This result is in line with other microeconomic evidence suggestingthat remittances may increase within-country inequality. It differs from the finding ofChauvet and Mesplé-Somps (2007) that remittances have a pro-poor impact.
The small estimated impact of health aid and remittances net of brain drain costsmight well explain why child mortality rates have not substantially improved forthree decades, as asserted by Murray et al. (2007), despite the growing volume ofhealth aid and migrants’ remittances. This does not imply that official assistance isinefficient, nor does it mean that private remittances should substitute for aid.Rather, it means that further investigation into the microlevel determinants of childmortality rates is needed to improve our understanding of the bad performance onchild health outcomes in most developing countries, and in Africa in particular.
ANNEX TABLE A.1 Cross-Country Regression Sample (109 countries)
Albania* Egypt, Arab Rep. Madagascar South AfricaAlgeria El Salvador Malawi Sri LankaArgentina Equatorial Guinea* Malaysia St. LuciaArmenia* Eritrea* Mali St. VincentAzerbaijan Ethiopia Mauritania SudanBangladesh Fiji Mauritius SwazilandBelize* Gabon Mexico Syrian Arab Republic*Benin Gambia, The Moldova* Tajikistan*Bolivia Georgia Mongolia TanzaniaBosnia and Herzegovina Ghana Morocco ThailandBotswana Grenada* Mozambique TogoBrazil Guatemala Namibia TongaBurkina Faso Guinea Nepal Trinidad and Tobago*Cambodia Guinea-Bissau Nicaragua TunisiaCameroon Guyana Niger TurkeyCape Verde Haiti Nigeria UgandaCentral African Republic* Honduras Oman* Uruguay*Chad* India Pakistan VanuatuChile* Indonesia Panama Venezuela, R. B. deChina Iran, Islamic Rep.* Papua New Guinea Vietnam*Colombia Jamaica Paraguay Yemen, RepublicComoros Jordan Peru Zimbabwe*Congo, Rep. Kazakhstan* PhilippinesCosta Rica Kenya RwandaCôte d’Ivoire Kyrgyz Republic* SamoaCroatia* Lao PDR SenegalDominica* Lebanon SeychellesDominican Republic Lesotho Sierra LeoneEcuador Macedonia, FYR* Solomon Islands
* Countries excluded from the 2SLS estimations.
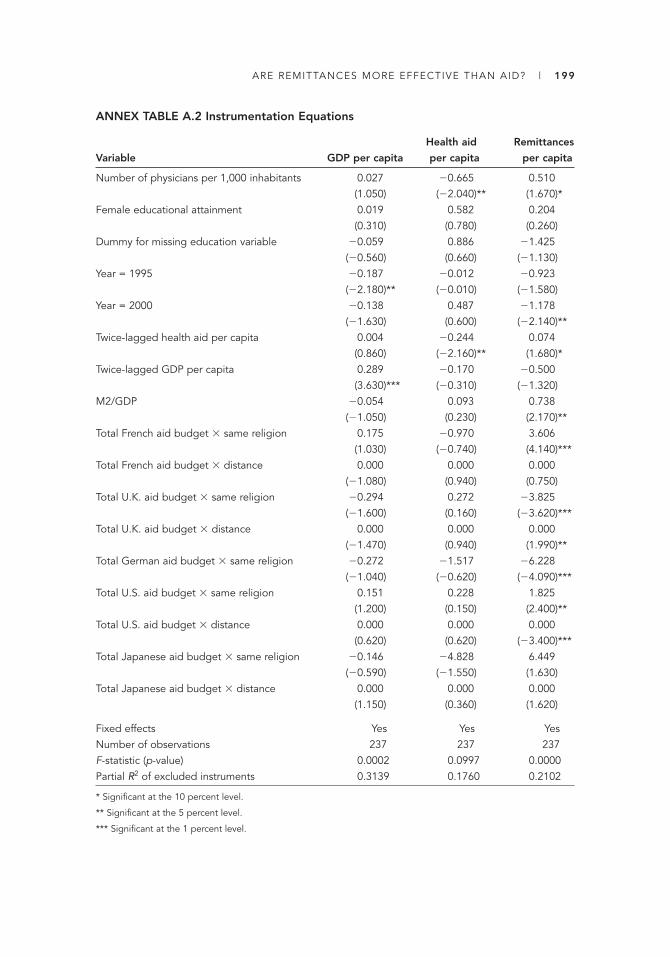
ARE REMITTANCES MORE EFFECTIVE THAN AID? | 199
ANNEX TABLE A.2 Instrumentation Equations
Health aid Remittances
Variable GDP per capita per capita per capita
Number of physicians per 1,000 inhabitants 0.027 �0.665 0.510(1.050) (�2.040)** (1.670)*
Female educational attainment 0.019 0.582 0.204(0.310) (0.780) (0.260)
Dummy for missing education variable �0.059 0.886 �1.425(�0.560) (0.660) (�1.130)
Year = 1995 �0.187 �0.012 �0.923(�2.180)** (�0.010) (�1.580)
Year = 2000 �0.138 0.487 �1.178(�1.630) (0.600) (�2.140)**
Twice-lagged health aid per capita 0.004 �0.244 0.074(0.860) (�2.160)** (1.680)*
Twice-lagged GDP per capita 0.289 �0.170 �0.500(3.630)*** (�0.310) (�1.320)
M2/GDP �0.054 0.093 0.738(�1.050) (0.230) (2.170)**
Total French aid budget � same religion 0.175 �0.970 3.606(1.030) (�0.740) (4.140)***
Total French aid budget � distance 0.000 0.000 0.000(�1.080) (0.940) (0.750)
Total U.K. aid budget � same religion �0.294 0.272 �3.825(�1.600) (0.160) (�3.620)***
Total U.K. aid budget � distance 0.000 0.000 0.000(�1.470) (0.940) (1.990)**
Total German aid budget � same religion �0.272 �1.517 �6.228(�1.040) (�0.620) (�4.090)***
Total U.S. aid budget � same religion 0.151 0.228 1.825(1.200) (0.150) (2.400)**
Total U.S. aid budget � distance 0.000 0.000 0.000(0.620) (0.620) (�3.400)***
Total Japanese aid budget � same religion �0.146 �4.828 6.449(�0.590) (�1.550) (1.630)
Total Japanese aid budget � distance 0.000 0.000 0.000(1.150) (0.360) (1.620)
Fixed effects Yes Yes YesNumber of observations 237 237 237F-statistic (p-value) 0.0002 0.0997 0.0000Partial R2 of excluded instruments 0.3139 0.1760 0.2102
* Significant at the 10 percent level.
** Significant at the 5 percent level.
*** Significant at the 1 percent level.

200 | L ISA CHAUVET, FLORE GUBERT, AND SANDRINE MESPLÉ-SOMPS
ANNEX TABLE A.3 Intracountry Regression Sample
Country name Year Country name Year
Armenia 2000 Kyrgyz Republic 1997Bangladesh 1996, 1999 Madagascar 1997Benin 1996, 2001 Malawi 1992Bolivia 1998, 2003 Mali 1995, 2001Brazil 1996 Mauritania 2000Burkina Faso 1993, 1999, 2003 Morocco 1992, 2003Cambodia 1997 Mozambique 1997, 2003Cameroon 1991, 1998, 2004 Namibia 1992, 2000Chad 1996, 2005 Nepal 1996Colombia 1995, 2000, 2005 Nicaragua 1997Comoros 1996 Niger 1998Côte d’Ivoire 1994 Nigeria 1990, 2003Dominican Republic 1996, 2002 Peru 1996Ethiopia 2000 Philippines 1998Gabon 2000 Rwanda 2000Ghana 1993, 1998, 2003 South Africa 1998Guatemala 1995, 1998 Tanzania 1996, 1999Guinea 1999 Togo 1998Haiti 1994, 2000 Turkey 1993, 1998India 1992, 1998 Uganda 1995, 2000Indonesia 1997 Vietnam 1997, 2002Jordan 1997 Yemen, Republic 1997Kazakhstan 1995 Zimbabwe 1994, 1999Kenya 1993, 1998, 2003
Notes
1. The eight Millennium Development Goals are, in brief: (1) to halve extreme income poverty;(2) to achieve universal primary education; (3) to promote gender equality; (4) to reducethe under-five mortality rate by two-thirds; (5) to reduce the maternal mortality rate bythree-quarters; (6) to reduce the incidence of AIDS; (7) to promote sustainable develop-ment and to halve the percentage of people without access to safe drinking water; and (8) to set up a global partnership for development involving more generous and morewidespread official development assistance.
2. CRS data are available at the OECD Web site http://www.oecd.org/document/0/0,2340,en_2649_34447_37679488_1_1_1_1,00.html.
3. Unlike us, Mishra and Newhouse (2007) include in their sample data on health commit-ments covering the 1960s and 1970s.
4. Note that the introduction of country fixed effects contributes to solving, although imper-fectly, the omitted variable bias.
ARE REMITTANCES MORE EFFECTIVE THAN AID? | 201
5. Tavares (2003) and Rajan and Subramanian (2005a, 2005b) use similar instruments foraid and remittances.
6. Tests of overidentification and underidentification are reported in each table. Tests forweak instruments, excludability, and partial R-squared are available on request.
7. Following the literature on the determinants of health, and contrary to Mishra and New-house (2007), we do not estimate a system of moment equations using generalized methodof moments (GMM) with a lagged dependent variable. The main reason is that the num-ber of time periods is too small.
8. The kind of nonlinearity is still debated. Some authors argue that the relationship is quad-ratic (Hansen and Tarp 2001; Lensink and White 2001). Others claim that the impact ofaid depends on economic policy (Burnside and Dollar 2000), on vulnerability to externalshocks (Guillaumont and Chauvet 2001), on export price shocks (Collier and Dehn 2001),or on whether the country is tropical (Dalgaard, Hansen, and Tarp 2004).
9. Results are available from the authors on request.
10. We reran all our regressions using aggregate aid disbursements instead of health aid dis-bursements, but the variable was never significant, suggesting that not all types of aidaffect health outcomes. Results are available on request.
11. The expatriation rate is also provided disaggregated by destination country.
12. Note that our estimations may underestimate the impact because the medical brain drainvariable provided by Docquier and Bhargava (2007) measures only emigration of physi-cians, not that of other medical personnel such as nurses and midwives.
13. In a recent paper, Fay et al. (2007) briefly reply to Ravallion’s comments.
14. We are not able to include time dummies because years vary from one country to the otherand we only have one year of observation for half the sample.
References
Acosta, Pablo A., Cesar A. Calderon, Pablo R. Fajnzylber, and Humberto Lopez. 2008. “WhatIs the Impact of International Remittances on Poverty and Inequality in Latin America?”World Development 36 (1): 89–114.
Adams, Richard H. 2004. “Remittances and Poverty in Guatemala.” Policy Research WorkingPaper 3418, World Bank, Washington, DC.
———. 2006. “Remittances and Poverty in Ghana.” Policy Research Working Paper 3838,World Bank, Washington, DC.
Adams, Richard H., and John Page. 2005. “Do International Migration and RemittancesReduce Poverty in Developing Countries?” World Development 33 (10): 1645–69.
Anand, S., and Till Bärnighausen. 2004. “Human Resources and Health Outcomes: Cross-Country Econometric Study.” Lancet 364: 1603–9.
Barro, Robert J., and Jong-Wha Lee. 2000. “International Data on Educational Attainment:Updates and Implications.” CID Working Paper 42, Center for International Develop-ment, Harvard University, Cambridge, MA.
Boone, Peter. 1996. “Politics and the Effectiveness of Foreign Aid.” European EconomicReview 40: 289–329.
Burnside, Craig, and David Dollar. 2000. “Aid, Policies, and Growth.” American EconomicReview 90 (4): 847–68.

Chauvet, Lisa, and Sandrine Mesplé-Somps. 2007. “Impact des financements internationauxsur les inégalités des pays en développement.” Revue Economique 58: 735–44.
Collier, Paul, and Jan Dehn. 2001. “Aid, Shocks, and Growth.” Policy Research WorkingPaper 2688, World Bank, Washington, DC.
Cox-Edwards, Alessandra, and Manuela Ureta. 2003. “International Migration, Remittancesand Schooling. Evidence from El Salvador.” Journal of Development Economics 72 (2):429–61.
Dalgaard, Carl-Johan, Henrik Hansen, and Finn Tarp. 2004. “On the Empirics of Foreign Aidand Growth.” Economic Journal 114 (496): F191–F217.
Docquier, Frédéric, and Alok Bhargava. 2007. “A New Panel Data Set on Physicians’ Emigra-tion Rates (1991–2004).” Economics School of Louvain, Louvain-la-Neuve, Belgium.http://perso.uclouvain.be/frederic.docquier/filePDF/MBD1_Description.pdf.
Dreher, Axel, Peter Nunnenkamp, and Rainer Thiele. 2008. “Does Aid for Education EducateChildren? Evidence from Panel Data.” World Bank Economic Review 22 (2): 291–314.
Fay, Marianne, Danny Leipziger, Quentin Wodon, and Tito Yepes. 2005. “Achieving Child-Health-Related Millennium Development Goals: The Role of Infrastructure.” WorldDevelopment 33 (8): 1267–84.
———. 2007. “‘Achieving Child-Health-Related Millennium Development Goals: The Role ofInfrastructure’—A Reply.” World Development 35 (5): 929–30.
Fielding, David, Mark McGillivray, and Sebastian Torres. 2008. “Achieving Health,Wealth and Wisdom: Links Between Aid and the Millennium Development Goals.” InAchieving the Millennium Development Goals, ed. Mark McGillivray. Studies in Devel-opment Economics and Policy. Houndsmill, Basingstoke, Hampshire, U.K.: PalgraveMacMillan.
Filmer, Deon, and Lant Pritchett. 1999. “The Impact of Public Spending on Health: DoesMoney Matter?” Social Science and Medicine 49: 1309–23.
———. 2001. “Estimating Wealth Effects without Expenditure Data or Tears: An Applicationto Educational Enrolments in States of India.” Demography 38 (1): 115–32.
Gomanee, Karuna, Sourafel Girma, and Oliver Morrissey. 2005. “Aid, Public Spending andHuman Welfare: Evidence from Quantile Regressions.” Journal of International Develop-ment 17: 299–309.
Gomanee, Karuna, Oliver Morrissey, Paul Mosley, and Arjan Verschoor. 2005. “Aid, GovernmentExpenditure, and Aggregate Welfare.” World Development 33 (3): 355–70.
Guillaumont, Patrick, and Lisa Chauvet. 2001. “Aid and Performance: A Reassessment.”Journal of Development Studies 37 (6): 66–92.
Gupta, Sanjeev, Catherine Pattillo, and Smita Wagh. 2007. “Impact of Remittances on Povertyand Financial Development in Sub-Saharan Africa.” IMF Working Paper 07/38, International Monetary Fund, Washington, DC.
Gwatkin, Davidson R., Shea Rutsein, Kiersten Johnson, Eldwan Suliman, Adam Wagstaff, andAgbessi Amouzou. 2007. Socio-Economic Differences in Health, Nutrition, and Populationwithin Developing Countries: An Overview. Produced by the World Bank in collaborationwith the government of the Netherlands and the Swedish International DevelopmentCooperation Agency, Washington, DC.
Hansen, Henrik, and Finn Tarp. 2001. “Aid and Growth Regressions.” Journal of Develop-ment Economics 64 (2): 547–70.
Hildebrandt, N., and David McKenzie. 2005. “The Effects of Migration on Child Health inMexico.” Policy Research Working Paper 3573, World Bank, Washington, DC.
202 | L ISA CHAUVET, FLORE GUBERT, AND SANDRINE MESPLÉ-SOMPS

ARE REMITTANCES MORE EFFECTIVE THAN AID? | 203
IMF (International Monetary Fund). 2005. World Economic Outlook, April 2005: Global-ization and External Imbalances. Washington, DC: IMF.
Kanaiaupuni, Shawn M., and Katharine M. Donato. 1999. “Migradollars and Mortality: TheEffects of Migration on Infant Survival in Mexico.” Demography 36: 339–53.
Lachaud, Jean-Pierre. 1999. “Envois de fonds, inégalité et pauvreté au Burkina Faso.” RevueTiers Monde 160: 793–827.
Leliveld, André. 1997. “The Effects of Restrictive South African Migrant Labor Policy on theSurvival of Rural Households in Southern Africa: A Case Study from Rural Swaziland.”World Development 25 (11): 1839–49.
Lensink, Robert, and Howard White. 2001. “Are There Negative Returns to Aid?” Journal ofDevelopment Studies 37 (6): 42–65.
Levine, Ruth, and the What Works Working Group. 2004. Millions Saved: Proven Successesin Global Health. Washington, DC: Center for Global Development.
Mansuri, Ghazala. 2007. “Migration, School Attainment and Child Labor: Evidence fromRural Pakistan.” Policy Research Working Paper 3945, World Bank, Washington, DC.
Masud, Nadia, and Boriana Yontcheva. 2005. “Does Foreign Aid Reduce Poverty? EmpiricalEvidence from Nongovernmental and Bilateral Aid.” IMF Working Paper 05/100, Inter-national Monetary Fund, Washington, DC.
McGuire, James W. 2006. “Basic Health Care Provision and Under-5 Mortality: A Cross-National Study of Developing Countries.” World Development 34 (3): 405–25.
Michaelowa, Katharina, and Anke Weber. 2007. “Aid Effectiveness in Primary, Secondary, andTertiary Education.” Background paper for the Education for All (EFA) Global Monitor-ing Report 2008, Education for All by 2015: Will We Make It? United Nations Educa-tional, Cultural, and Scientific Organization (UNESCO), New York. http://unesdoc.unesco.org/images/0015/001555/155559e.pdf.
Milanovic, Branco. 2005. “Can We Discern the Effect of Globalization on Income Distribu-tion? Evidence from Household Surveys.” World Bank Economic Review 19: 21–44.
Mishra, Prachi, and David L. Newhouse. 2007. “Health Aid and Infant Mortality.” IMFWorking Paper 07/100, International Monetary Fund, Washington, DC.
Mosley, Paul. 1987. Overseas Aid: Its Defence and Reform. Wheatsheaf Books, Brighton, U.K.
Mosley, Paul, John Hudson, and Arjan Verschoor. 2004. “Aid, Poverty Reduction and the‘New Conditionality.’” Economic Journal 114: F217–F243.
Murray, Christopher L., T. Laakso, K. Shibuya, K. Hill, and Alan D. Lopez. 2007. “Can WeAchieve Millennium Development Goal 4? New Analysis of Country Trends and Forecastsof Under-5 Mortality to 2015.” Lancet 370 (September 22): 1040–54.
Pritchett, Lant, and Larry Summers. 1996. “Wealthier Is Healthier.” Journal of HumanResources 31 (4): 841–68.
Rajan, Raghuram G., and Arvind Subramanian. 2005a. “Aid and Growth: What Does theCross-Country Evidence Really Show?” NBER Working Paper 11513, National Bureau ofEconomic Research, Cambridge, MA.
———. 2005b. “What Undermines Aid’s Impact on Growth?” IMF Working PaperWP/05/126, International Monetary Fund, Washington, DC.
Ratha, Dilip, Sanket Mohapatra, K. M. Vijayalakshmi, and Zhimei Xu. 2007. “RemittanceTrends 2007.” Migration and Development Brief 3, Development Prospects Group,Migration and Remittances Team, World Bank, Washington, DC. http://siteresources.worldbank.org/EXTDECPROSPECTS/Resources/476882-1157133580628/BriefingNote3.pdf.

Ravallion, Martin. 1993. “Human Development in Poor Countries: On the Role of PrivateIncomes and Public Services.” Journal of Economic Perspectives 7 (1): 133–50.
———. 2007. “‘Achieving Child-Health-Related Millennium Development Goals: The Role ofInfrastructure’—A Comment.” World Development 35 (5): 920–28.
Roodman, David. 2007. “Macro Aid Effectiveness Research: A Guide for the Perplexed.”Working Paper 135, Center for Global Development, Washington, DC.
Tavares, José. 2003. “Does Foreign Aid Corrupt?” Economics Letters 79 (1, April): 99–106.
World Bank. 2006. World Development Indicators 2006. Washington, DC: World Bank.
204 | L ISA CHAUVET, FLORE GUBERT, AND SANDRINE MESPLÉ-SOMPS

Comment on “Are Remittances More EffectiveThan Aid for Improving Child Health? An Empirical Assessment Using Inter- and Intracountry Data,” by Lisa Chauvet, FloreGubert, and Sandrine Mesplé-Somps
MELVIN D. AYOGU
In their paper, Chauvet, Gubert, and Mesplé-Somps investigate whether health aid orremittances matter for child health and, in particular, whether these help to reduceinfant mortality. In this respect, the paper qualifies as one more aid-ineffectivenessstudy. The deeper issues that the authors address, however, are related to those exam-ined in the paper by Jean-Paul Azam and Ruxanda Berlinschi, in this volume. Chau-vet, Gubert, and Mesplé-Somps take note of the call for a progressive substitution ofremittances for official aid. If, indeed, remittances from migrant workers prove, ingeneral, more effective than foreign aid in alleviating poverty, the obvious next stepis to promote more migration flows from poor to rich countries. The policy advicewould be, do not offer aid in lieu of migration; instead, allow more migration inreturn for less aid—at least, those types of aid for which remittances have been foundto be a superior remedy. For this reason alone, and given that the paper by Azam andBerlinschi suggests that rich countries have a hidden agenda of trading more aid forless migration (the opposite tack), this line of inquiry should be enthusiastically wel-comed. The excitement of the topic, however, may have also led the authors toattempt too much with a dataset that is arguably dirty. (On the general state of aiddata, see Easterly and Pfutze 2008, 30, 51.)
What the Authors Attempt to Do
Looking within and across countries, the authors investigate two key issues andattempt to tackle related interesting questions. The two main issues are (a) whetherforeign aid targeted to the health care sector reduces infant (below age 1) and child(under age 5) mortality rates, and (b) whether remittances from migrant workersreduce child and infant mortality rates. Other questions concern the circumstancesunder which one form of intervention may be more effective than the other. If
205
Melvin D. Ayogu is professor of economics and dean, Faculty of Commerce, University of Cape Town, South Africa.
Annual World Bank Conference on Development Economics 2009, Global © 2010 The International Bank for Reconstruction and Development / The World Bank

206 | MELVIN D. AYOGU
remittances are beneficial, does it matter that they come at the expense of loss ofskilled labor from migrant-sending countries? To examine this issue, the authorsfocus on physician expatriation and its impact. The premise is that if expatriation isharmful, the negative consequences could be set against the perceived benefits ofremittances, even though not all the measured remittances accrue from expatriatedphysicians alone. (The latter observation would, if correct, result in an underestima-tion of the net effect of brain drain, if such leakages do in fact occur.) The authorsalso look at the impact of aid and remittances across income deciles within a countryand examine the issue of absorptive capacity that has been frequently raised as a serious negative consequence of poor donor aid delivery practices. In rankings ofdonor best practices, excessive fragmentation and overhead costs are key factors inthe rating criteria (Easterly and Pfutze 2008).
What the Authors Find
Using a panel of developing countries, the authors determine that remittances pro-mote child health care but that health aid matters only when the relationships amongchild health indicators, aid, remittances, and income are taken into account. Ofcourse, this endogeneity effect runs deeper than can be addressed by tinkering withinstrumental variables. Here the authors could be picking up the consequences ofexisting aid practices, perhaps the effect of aid conditionality. It has been argued thatthe persistence of conditionality is partly attributable to its usefulness as an instru-ment for the pursuit of donor multiple objectives, of which only a few may be, in fact,altruistic (see Ayogu 2006 for a discussion). Recipient countries understand this larger game. One dimension of the game is the Samaritan’s dilemma elaborated inSvensson (2000), according to which a quandary for the do-gooder arises becauserecipients behave strategically; they have no incentives for implementing povertyreduction strategies when an increasing proportion of aid is conditioned on poverty.Overall, after all the econometric adjustments, the authors find that both types of inter-vention (foreign aid and remittances from abroad) improve health care outcomes.
Their indirect test of absorptive capacity constraints was not so fruitful, in that itwas not supported by the data. Brain drain of doctors was, however, found to beharmful to child health. Medical personnel and health aid are complementary; thelack of one depresses the other. Brain drain therefore reduces the effectiveness of aidas well as the net benefit of remittances. Remittances are found to be more effectivethan health aid in improving health outcomes for children from richer households.The finding of higher marginal productivity of remittances for higher-income groupsmay be picking up several issues, such as the fact that remittances are fungible,whereas targeted health aid is not. Remittances have the capacity to improve overallfamily welfare in a way that targeted health aid is unable to match. Among poorcommunities, remittances carry a positive feedback and a selection bias. Families thatreceive remittances are big fish in a small pond—even if their relatives residing over-seas are little fish in a humongous pond. Therefore, selectivity bias could be
COMMENT ON CHAUVET, GUBERT, AND MESPLÉ-SOMPS | 207
confounding the interpretation of the finding that the revealed positive impact ofremittances on child health discriminates with respect to income. Wealth is good fornutrition and other complementary ingredients for a healthy child, and the incomeflow from remittances may well add to household wealth over time.
What to Make of the Findings?
Although the authors are careful not to draw any hard recommendations fromtheir study, they have nonetheless made clear that there are no implications herefor a migration-aid trade-off. That is a prudent view; the whole question of braindrain, remittances, undocumented workers, and immigration policies in the con-text of a globalizing world has yet to be addressed adequately. For instance, arecent study (Clemens 2007) finds no evidence of the harmful effects of the exter-nal migration of health professionals. The more deleterious effect seems to be inter-nal migration across sectors by professionals anxious to avoid “leaving the brainin the drain.” According to the Southern African Migration Project (Crush 2008),working conditions emerge as the single most important predisposing factor forhealth professional emigration. Particularly influential are (a) the inequitable dis-tribution of personnel across the public versus private and primary versus second-ary health sectors, and (b) the urban-rural divide. With regard to the expatriationof physicians, analysts argue that many of the public health issues surroundinginfant mortality—such as immunization and hygiene, diarrhea and dehydration,access to clean water, and other basic public health care issues—do not actuallymake huge demands of a physician’s expertise.1 Physicians do not appear to be ascrucial as this study would seem to suggest. Drawing from the experiences ofMédecins Sans Frontières (Doctors without Borders) in South Africa, it could beargued that even if the expatriation of physicians is assumed to be less than benign,the core of the primary health care problem lies in governance and in governmentunderinvestment in clinics (Steinberg 2008, 273), rather than in the likely impactof brain drain on child health. Our view on governance is corroborated by a recentfinding by Rajkumar and Swaroop (2008).
Finally there are some results that are difficult to reconcile, such as the finding thataid raises infant mortality in some African countries. Clearly, given the HIV/AIDSpandemic, it would have been advisable to control for HIV prevalence (see Deaton2008). I am equally sympathetic regarding the data problems confronting theauthors, including the problematic instrumental variables deployed. Nonetheless, aidpractices such as timing of disbursements, conditionality, and the use of bilateralagencies are much more important than cultural distance and should have been usedin constructing the proxy for health aid disbursements.
Note
1. I am grateful to Dr. Max Price for this insight.

208 | MELVIN D. AYOGU
References
Ayogu, Melvin. 2006. “Can Africa Absorb More Aid?” In Aid, Debt Relief and Developmentin Africa: African Development Report 2006, 25–40. New York: Oxford University Press.
Clemens, Michael. 2007. “Do Visas Kill? Health Effects of African Health Professional Emi-gration.” Working Paper 114, Center for Global Development, Washington, DC.
Crush, Jonathan. 2008. “Southern African Migration Project SAMP. Migration Resources:Brain Drain Resources.” Queen’s University, Kingston, ON, Canada. http://www.queensu.ca/samp/migrationresources/braindrain/ (accessed June 8, 2008).
Deaton, Angus. 2008. “Income, Health, and Well-Being around the World: Evidence from aGallup World Poll.” Journal of Economic Perspectives 22 (2): 53–72.
Easterly, William, and Tobias Pfutze. 2008. “Where Does the Money Go? Best and Worst Prac-tices in Foreign Aid.” Journal of Economic Perspectives 22 (2): 29–52.
Rajkumar, Andrew Sunil, and Vinaya Swaroop. 2008. “Public Spending and Outcomes: DoesGovernance Matter?” Journal of Development Economics 86 (1): 96–111.
Steinberg, Johnny. 2008. Three-Letter Plague: A Young Man’s Journey through a Great Epi-demic. Johannesburg: Jonathan Ball.
Svensson, Jakob. 2000. “When Is Foreign Aid Credible? Aid Dependence and Conditionality.”Journal of Development Economics 61: 61–84.

The Role of Emigration and EmigrantNetworks in Labor Market Decisionsof NonmigrantsJINU KOOLA AND ÇAGLAR ÖZDEN
The Indian state of Kerala is an ideal place to explore a question that is prominent inthe migration literature: what role does the existence of migrant networks have in thelabor market participation decisions of nonmigrant household members? Two linkedstatewide representative surveys in 1998 and 2003 that collected individual informa-tion about each member of 10,000 households, including members who had migrated,are used for this purpose. The analysis of the labor market participation of young menreveals interesting patterns. In cross-sectional data, young men in households withmigrant members are found to be less likely to be employed, indicating that migrationdiscourages labor market participation by nonmigrants. When, however, panel dataare analyzed and individuals are followed over time, those males under age 30 arefound to be more likely to migrate in the second period, taking advantage of theirmigrant networks. This result goes counter to the claim that migration induces unem-ployment or withdrawal from the labor market among family members. Rather, it sug-gests that young men in migrant households have a higher expectation of emigrationand that they are less likely to take a job in Kerala while they prepare to emigrate.
Almost 10 percent of the labor force of Kerala State—close to 2 million people—livesand works in a Persian Gulf country. These numbers make Kerala one of the largestmigrant-sending regions in the world, and an interesting place to study various aspectsof emigration. This paper focuses on a paradox, created by migration, in the employ-ment patterns seen in Kerala. Emigration there increased by around 35 percentagepoints between 1998 and 2003, and the unemployment rate for young males increasedto 17.4 percent. Given the high unemployment rate in the face of massive emigration,the question arises: why has the exit rate of Kerala’s labor force not decreased unem-ployment among nonmigrants in the state? More specifically, what influence does emigration have on the labor supply decisions of nonmigrant household members?
209
Jinu Koola and Çaglar Özden are with the Development Research Group of the World Bank.
Annual World Bank Conference on Development Economics 2009, Global © 2010 The International Bank for Reconstruction and Development / The World Bank

210 | J INU KOOLA AND ÇAGLAR ÖZDEN
Massive communal emigration rates are likely to have diverse effects on young menas they enter the labor market. The cross-sectional data show that young men inhouseholds that include migrant members and that are part of significant migrant net-works are less likely to be employed. The implication is that the presence of migrantsin the household or the community decreases labor market participation and supplyamong nonmigrant members, mainly through a higher income effect from remit-tances. This point has been raised many times in the literature as an undesirable con-sequence of migration. However, panel data that follow individuals over time indicatethat these same young males are likely to migrate in the second period, taking advan-tage of the migration networks their families or communities have established. Thisfinding goes counter to the previous result and indicates a more complex decision-making process by nonmigrant household members. More specifically, young men inmigrant households or communities seem to have higher thresholds of entry into theKerala labor market, since they have higher opportunity costs. And if they fail toobtain the right labor market outcomes, they simply use the network to migrate.
A unique feature of this paper is that it looks at the roles of both family networksand social networks in migration and labor market decisions. The network theory ofmigration states that an individual’s probability of emigration increases with the sizeof that person’s network in his or her locality (see Massey et al. 1998). Kerala’smigrants, however, do not depend on the emigration experience of all the people intheir panchayat (local jurisdiction); rather, they rely on the people they know—family,friends, and acquaintances.1 The common characteristics of their networks are notnecessarily geographic, but religious. Social contacts are determined by religion, andin Kerala, as in the rest of India, religion is a community identity that distinguishessocial groups. Furthermore, the support and services provided by the network seemto be excludable and rivalrous, in that they are provided only to network memberswithin the same geographic location.
Using religion to define a community’s network, as in this paper, confers severalmain advantages. First and foremost, religion exogenously identifies a well-defined andwell-established social group, overcoming the problem of peer effects. Religion alsoaddresses the issue of self-selection because members of a religious group do not“choose” their religion today.2 Another benefit of using religion and geography toidentify a social group is that these variables allow for variation within localities andreligious groups. Finally, religious networks provide social support and many otherexcludable services that are especially valuable in labor market and migration contexts.
Most of the empirical studies that have explored the relationship between migra-tion and labor market participation by nonmigrants have focused on the role ofremittances (see Hanson 2005; Amuedo-Dorantes and Pozo 2006; Kim 2007). Yetthere is a gap in our understanding of how the expectation of emigration, facilitatedby emigration networks and the emigration of other household members, affects thehousehold’s labor supply and demand.
One of the main determinants of migration is the social and communal networkthat influences the decision to migrate and helps lower migration costs. Identificationof the influence of the family and the community is a key issue in this paper. The economic literature that studies migrant networks faces several empirical difficulties.

EMIGRATION AND EMIGRANT NETWORKS IN LABOR MARKET DECISION | 211
The main econometric challenge for network analysis is to identify the direction ofthe causal relationship between migrant networks and the migration decision, whichis complicated by peer effects. Peer effects confound the interpretation of the networkeffect because shared community characteristics can influence the migration decisionbut may be unobservable (Boyd 1989; Massey, Goldring, and Durnad 1994). Manski(1993) terms this the reflection problem.
Another concern for an econometric analysis is that access to the migrant networkmay be endogenous to the household’s own emigration experience (Taylor 1987;Orrenius 1999; McKenzie and Rapoport 2005). One way to isolate the networkeffect is to limit our analysis to new migrants who are temporarily exogenous to thenetwork (Orrenius 1999; Zhao 2001).
Empirical studies of migration have attempted to address these serious econo metricchallenges of endogeneity in other ways, by using community fixed effects, individual-level fixed effects, or instrumental variables such as rainfall data and historical state-level migration rates (Orrenius 1999; Winters, de Janvry, and Sadoulet 2001; Munshi2003; McKenzie and Rapoport 2005; Giles and Yoo 2007; Woodruff and Zenteno2007). In this study, the variation afforded by religion and geography is used to helpidentify the relationship between migrant networks and migration.
The results in this paper have important implications for policies regarding migra-tion and labor markets. A common view, as mentioned above, is that emigrationreduces the labor market participation and supply of the family members left behind.They rely on the remittances sent by family members abroad and make the optimalleisure-labor trade-off. This is viewed as a negative outcome because lower labor supply indicates lower income levels. This paper, however, shows that the decision-making process is more complicated and intertemporal in nature. It demonstrates thatalthough the presence of migrants in the household or the community increases thelikelihood of absence from the labor market because of higher opportunity costs,the outside option turns out to be migration for the nonmigrants, not reliance on remit-tances indefinitely. These results imply that policies should be designed accordingly.
In the next section, the institutional setting and context for the study are outlined.Subsequent sections present the data and provide basic summary statistics for thesample population, describe the conceptual framework and empirical methodology,and set out the estimation results. The final section contains conclusions.
Linkages between Kerala and the Persian Gulf
In 2003, 1.84 million people from Kerala, or close to 10 percent of the state’s totallabor force, were living and working in a Persian Gulf country (Zachariah and Rajan2004).3 Migration is almost all temporary because of the rather restrictive immigra-tion policies enacted by the countries of the Gulf Cooperation Council (GCC), whichprohibit permanent resettlement of foreign nationals (Massey et al. 1998).
Economic linkages between Kerala and the Persian Gulf have a very long history,but the current migration began to surge in 1973 with the sudden increase in oilprices.4 The Gulf countries, which faced a shortage of qualified local labor, sought

212 | J INU KOOLA AND ÇAGLAR ÖZDEN
foreign labor to satisfy their construction boom and other labor market demands.Kerala’s history of trade with the region and its large surplus labor force motivatedmigration (Zachariah, Mathew, and Rajan 2001; see also Weiner 1982; Massey et al.1998). By 1998, migrants from Kerala represented over 50 percent of India’s totalemigration to the Gulf countries (Prakash 1998). The state’s geographic position, atthe southwestern tip of India, with 580 kilometers of coastline, gives it privilegedaccess to the Gulf. Its population density and literacy rates are also very high by Indi-an standards.5 Thus, Kerala’s unemployed but relatively well-educated labor forcewas attracted to the employment opportunities that the Gulf countries offered.
In a country with a Hindu-majority population (80.5 percent), Kerala is unique inthat it has sizable Muslim and Christian populations (India 2001). The shares of totalpopulation are Hindu, 56.1 percent; Muslim, 24.7 percent; and Christian, 19 per-cent. Sufficient ethnographic data exist to suggest that social networks in Kerala havebeen created and are maintained within religious circles (Osella and Osella 2000;Kurien 2002). A distinguishing characteristic of Kerala’s Gulf migration is its religious dimension; although Muslims make up only one-fourth of the state’s totalpopulation, they represent close to half of the total emigrant population.6 In otherwords, current emigrants made up 13 percent of the total Muslim population in 1998,as against only 3 percent of the Hindu population and 6 percent of the Christian population. This is the main fact used to identify migrant networks in the paper.
Data
This study uses data from two linked household surveys conducted by the Centre forDevelopment Studies in Thiruvananthapuram, Kerala, and covering a statewide rep-resentative household sample: they are the Kerala Migration Survey (KMS) and theSouth Asia Migration Study (SMS). A principal advantage of this paper is that itexploits the panel nature of the survey data; half of the households canvassed in 1998were resurveyed in 2003.
The KMS was administered to the residents of 9,995 households selected from 200 panchayats in each of Kerala’s 14 districts between March and December 1998(Zachariah, Mathew, and Rajan 2001, 64). Fifty households were selected at randomfrom each panchayat.7 The survey collected individual information about each memberof the household, including members who had migrated, from the head of the house-hold at the time of the household visit.
The SMS survey, conducted in 2003, was designed to replicate the KMS and usedthe same questionnaire and a similar sampling methodology. The primary data for theSMS were collected from 10,012 households in 225 panchayats (rather than 200 panchayats, as in 1998) in the state’s 14 districts (Zachariah and Rajan 2004, 12).
Emigrant Characteristics
In the survey, current emigrants (EMIs) are categorized as those members of thehousehold who had emigrated from Kerala and who had been living abroad at the
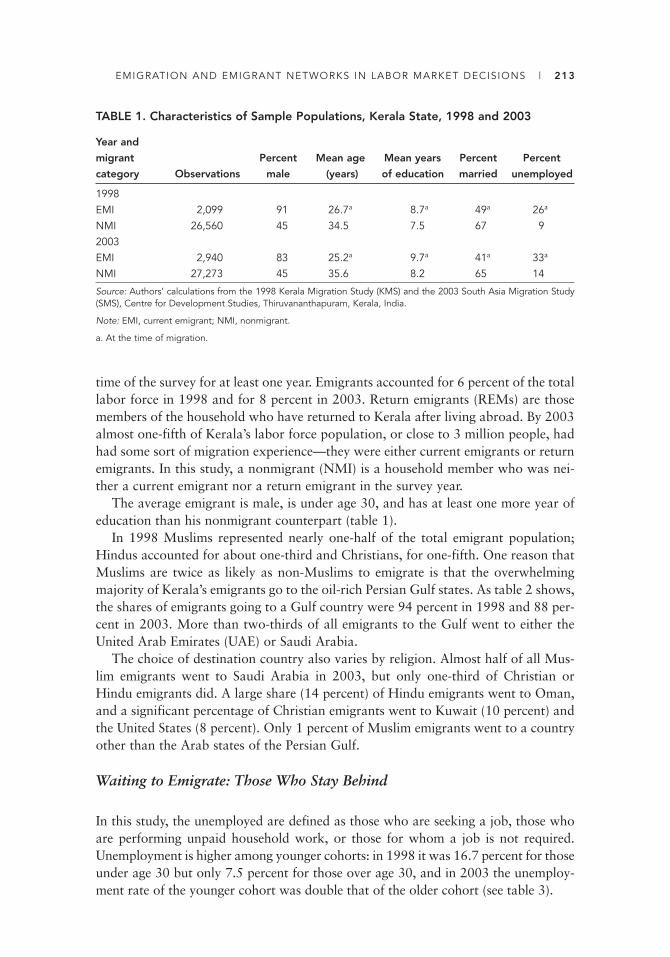
EMIGRATION AND EMIGRANT NETWORKS IN LABOR MARKET DECISIONS | 213
time of the survey for at least one year. Emigrants accounted for 6 percent of the totallabor force in 1998 and for 8 percent in 2003. Return emigrants (REMs) are thosemembers of the household who have returned to Kerala after living abroad. By 2003almost one-fifth of Kerala’s labor force population, or close to 3 million people, hadhad some sort of migration experience—they were either current emigrants or returnemigrants. In this study, a nonmigrant (NMI) is a household member who was nei-ther a current emigrant nor a return emigrant in the survey year.
The average emigrant is male, is under age 30, and has at least one more year ofeducation than his nonmigrant counterpart (table 1).
In 1998 Muslims represented nearly one-half of the total emigrant population;Hindus accounted for about one-third and Christians, for one-fifth. One reason thatMuslims are twice as likely as non-Muslims to emigrate is that the overwhelmingmajority of Kerala’s emigrants go to the oil-rich Persian Gulf states. As table 2 shows,the shares of emigrants going to a Gulf country were 94 percent in 1998 and 88 per-cent in 2003. More than two-thirds of all emigrants to the Gulf went to either theUnited Arab Emirates (UAE) or Saudi Arabia.
The choice of destination country also varies by religion. Almost half of all Mus-lim emigrants went to Saudi Arabia in 2003, but only one-third of Christian orHindu emigrants did. A large share (14 percent) of Hindu emigrants went to Oman,and a significant percentage of Christian emigrants went to Kuwait (10 percent) andthe United States (8 percent). Only 1 percent of Muslim emigrants went to a countryother than the Arab states of the Persian Gulf.
Waiting to Emigrate: Those Who Stay Behind
In this study, the unemployed are defined as those who are seeking a job, those whoare performing unpaid household work, or those for whom a job is not required.Unemployment is higher among younger cohorts: in 1998 it was 16.7 percent for thoseunder age 30 but only 7.5 percent for those over age 30, and in 2003 the unemploy-ment rate of the younger cohort was double that of the older cohort (see table 3).
TABLE 1. Characteristics of Sample Populations, Kerala State, 1998 and 2003
Year and
migrant Percent Mean age Mean years Percent Percent
category Observations male (years) of education married unemployed
1998EMI 2,099 91 26.7a 8.7a 49a 26a
NMI 26,560 45 34.5 7.5 67 92003EMI 2,940 83 25.2a 9.7a 41a 33a
NMI 27,273 45 35.6 8.2 65 14
Source: Authors’ calculations from the 1998 Kerala Migration Study (KMS) and the 2003 South Asia Migration Study(SMS), Centre for Development Studies, Thiruvananthapuram, Kerala, India.
Note: EMI, current emigrant; NMI, nonmigrant.
a. At the time of migration.
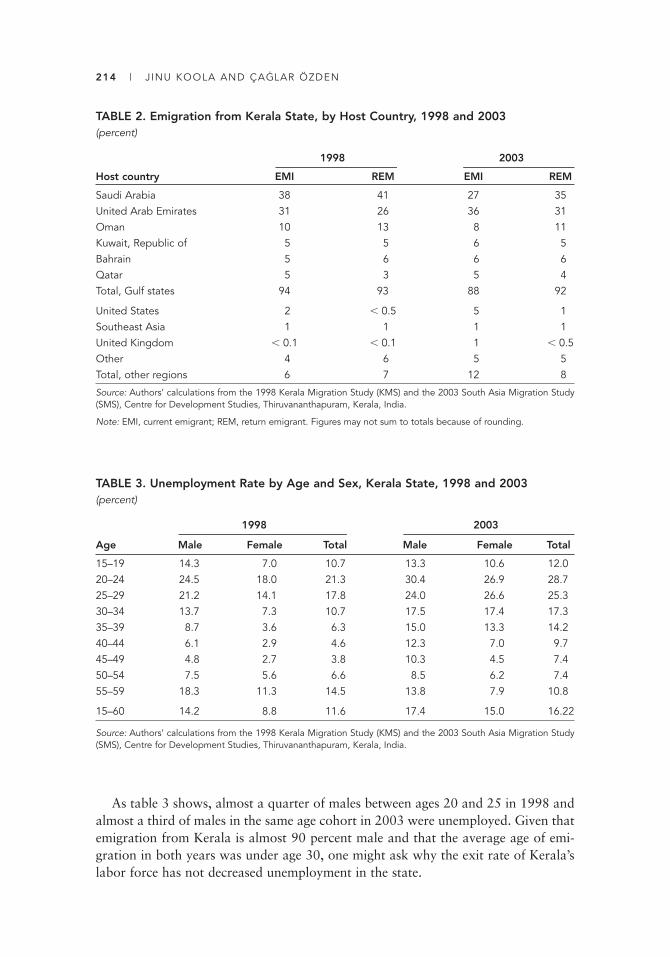
214 | J INU KOOLA AND ÇAGLAR ÖZDEN
TABLE 2. Emigration from Kerala State, by Host Country, 1998 and 2003(percent)
1998 2003
Host country EMI REM EMI REM
Saudi Arabia 38 41 27 35United Arab Emirates 31 26 36 31Oman 10 13 8 11Kuwait, Republic of 5 5 6 5Bahrain 5 6 6 6Qatar 5 3 5 4Total, Gulf states 94 93 88 92
United States 2 � 0.5 5 1Southeast Asia 1 1 1 1United Kingdom � 0.1 � 0.1 1 � 0.5 Other 4 6 5 5Total, other regions 6 7 12 8
Source: Authors’ calculations from the 1998 Kerala Migration Study (KMS) and the 2003 South Asia Migration Study(SMS), Centre for Development Studies, Thiruvananthapuram, Kerala, India.
Note: EMI, current emigrant; REM, return emigrant. Figures may not sum to totals because of rounding.
TABLE 3. Unemployment Rate by Age and Sex, Kerala State, 1998 and 2003(percent)
1998 2003
Age Male Female Total Male Female Total
15–19 14.3 7.0 10.7 13.3 10.6 12.020–24 24.5 18.0 21.3 30.4 26.9 28.725–29 21.2 14.1 17.8 24.0 26.6 25.330–34 13.7 7.3 10.7 17.5 17.4 17.335–39 8.7 3.6 6.3 15.0 13.3 14.240–44 6.1 2.9 4.6 12.3 7.0 9.745–49 4.8 2.7 3.8 10.3 4.5 7.450–54 7.5 5.6 6.6 8.5 6.2 7.455–59 18.3 11.3 14.5 13.8 7.9 10.8
15–60 14.2 8.8 11.6 17.4 15.0 16.22
Source: Authors’ calculations from the 1998 Kerala Migration Study (KMS) and the 2003 South Asia Migration Study(SMS), Centre for Development Studies, Thiruvananthapuram, Kerala, India.
As table 3 shows, almost a quarter of males between ages 20 and 25 in 1998 andalmost a third of males in the same age cohort in 2003 were unemployed. Given thatemigration from Kerala is almost 90 percent male and that the average age of emi-gration in both years was under age 30, one might ask why the exit rate of Kerala’slabor force has not decreased unemployment in the state.

EMIGRATION AND EMIGRANT NETWORKS IN LABOR MARKET DECISIONS | 215
One likely explanation for the high unemployment rate among young males is thatthey are waiting for the opportunity to emigrate and are unwilling to take a job inKerala in the meantime. As table 4 shows, the total unemployment rate is 40 percenthigher in emigrant households. Furthermore, the unemployment rate seems toincrease with the number of current emigrants from the household. Table 4 alsoshows that the unemployment gap between emigrant and nonmigrant households isat least 5 percentage points higher for the male population.
The figures in table 5 show that the unemployment rate is highest for malesbetween ages 15 and 29 in emigrant households. Table 6 presents the unemploymentrate among males according to whether the community is above or below the meannetwork size (or migration prevalence ratio).
TABLE 4. Unemployment Rate for Age Group 15–60, by Number of Emigrantsfrom the Household, Kerala State, 1998 and 2003 (percent)
Total population Male population
Number of emigrants 1998 2003 1998 2003
0 10.4 14.5 12.0 14.631 14.6 20.0 20.0 24.442 19.9 24.0 28.5 29.6
Source: Authors’ calculations from the 1998 Kerala Migration Study (KMS) and the 2003 South Asia Migration Study(SMS), Centre for Development Studies, Thiruvananthapuram, Kerala, India.
TABLE 5. Unemployment Rate, Males, by Age Cohort and Household EmigrationStatus, Kerala State, 1998 and 2003 (percent)
Age 15–29 Age 30–60
Household type 1998 2003 1998 2003
Nonmigrant household 14.5 23.0 9.6 13.5Current emigrant household 28.2 26.5 17.7 27.2
Source: Authors’ calculations from the 1998 Kerala Migration Study (KMS) and the 2003 South Asia Migration Study(SMS), Centre for Development Studies, Thiruvananthapuram, Kerala, India.
TABLE 6. Unemployment Rate, Males Age 15–60, byEmigrant Network Size, Kerala State, 1998 and 2003(percent)
Community type 1998 2003
Below mean network size 12.8 16.3Above mean network size 16.2 18.9
Source: Authors’ calculations from the 1998 Kerala Migration Study (KMS)and the 2003 South Asia Migration Study (SMS), Centre for DevelopmentStudies, Thiruvananthapuram, Kerala, India.

216 | J INU KOOLA AND ÇAGLAR ÖZDEN
One might assume from these findings that unemployed young males in emigranthouseholds are simply free riders without any intention of obtaining employment. Tothe contrary, 90 percent of emigrants in 1998 stated that their main reason for migra-tion was to seek employment. Indeed, the rate of job seeking is highest for youngmales in emigrant households. Table 7 shows that a quarter of males under age 30 inemigrant households was engaged in looking for a job at the time of the survey, asagainst 17 percent of young males in nonmigrant households in 1998 and 21 percentin 2003. The data do not specify whether job seekers are looking for jobs within oroutside Kerala, but it is most probable, given these findings, that young males in emi-grant households are likely to be seeking jobs outside the state.
Empirical Methodology
The methods used to model the behavior of those who stay behind are described inthis section. The panel dataset gives us the unique opportunity to examine the situa-tion in 2003 of those who were unemployed in 1998.
Cross-Sectional Regressions Using 1998 and 2003 Datasets
The hypothesis to be tested is that a household’s migration experience and the size ofthe emigrant network increase the probability of unemployment among nonmigrantmales. The following equation is estimated to predict whether individual i in panchayat p in time period t is employed, using a probit model:
Pr(Unemployedi) � b0 � b1EMI_hhi �b2EMI_Netwp
� b3EMI_Netwp2 � Zi � ei, (1)
where Unemployed is an indicator variable equal to 1 if the individual is unemployedin year t and 0 otherwise; EMI_hh is a dummy variable equal to 1 if the householdhas at least one emigrant in year t; and EMI_Netw refers to what we term the geo-graphic emigrant network and represents the proportion of adult males above age 16who are current emigrants in year t from panchayat p.
TABLE 7. Job-Seeking Rate, Males, by Age and by Emigration Status of Household, Kerala State, 1998 and 2003 (percent)
Age 15–29 Age 30–60
Household type 1998 2003 1998 2003
Nonmigrant household 16.9 21.6 5.6 10.3Current emigrant household 26.0 24.8 14.2 24.4
Source: Authors’ calculations from the 1998 Kerala Migration Study (KMS) and the 2003 South Asia Migration Study(SMS), Centre for Development Studies, Thiruvananthapuram, Kerala, India.

EMIGRATION AND EMIGRANT NETWORKS IN LABOR MARKET DECISIONS | 217
To test the hypothesis that males in emigrant households are more likely to be jobseekers, the following equation is estimated, using a probit model:
Pr(JobSeekeri) � b0 � b1EMI_hhi b2EMI_Netwp � b3EMI_Netwp2 � Z i � ei, (2)
where JobSeeker is an indicator variable equal to 1 if the individual is seeking a jobin the survey year and 0 otherwise, and all other variables are defined as before.
The sample of individuals included in these regressions is restricted to adult malesbetween ages 15 and 60. Current emigrants and students are omitted from the sam-ple. Equations (1) and (2) are estimated separately for males ages 15–29 and 30–60.All standard errors are clustered by household, since individuals in the same house-hold may share similar characteristics, and all regressions are weighted.
Panel Regressions
The main question is whether the young men who were unemployed in 1998 arewaiting for the opportunity to emigrate because they are seeking employment outsidethe state. To test this, the following regressions are estimated using panel data for thesample of males age 15–29 in 2003, excluding those who were migrants or studentsin 1998:
Pr(Employ_Statusi) � b0 � b1Unemployedi � b2EMI_hhi*Unemployedi
� b3EMI_hhi � b4EMI_Netwp � b5EMI_Netwp2
� Zi � ei. (3)
The dependent variable in this regression, Employ_Status, takes on three values: 1if the individual is unemployed in 2003; 2 if the individual is employed in 2003; or3 if the individual is an emigrant in 2003. Unemployed is a dummy variable equal to1 if the individual was unemployed in 1998. EMI_hh*Unemployed is the interactionterm if the individual was both unemployed in 1998 and a member of an emigranthousehold in 1998.
The following regression is then estimated for job seeking:
Pr(Jobseeking_Statusi) � b0 � b1Jobseekeri � b2EMI_hhi*Jobseekeri
� b3EMI_hhi � b4EMI_Netwp � b5EMI_Netwp2
� Zi � ei, (4)
where the dependent variable in this regression, Jobseeking_Status, takes on threevalues: 1 if the individual is a job seeker in 2003; 2 if the individual is employed in2003; or 3 if the individual is an emigrant in 2003. Jobseeker is a dummy variableequal to 1 if the individual was a job seeker in 1998, and EMI_hh*Jobseeker is aninteraction term if the individual was both a job seeker in 1998 and was living in anemigrant household in 1998.
In panel regressions, EMI_hh refers to the individual’s 1998 status. The networkvariables refer to the individual’s network in 2003. Control variables, described next,refer to the individual’s 1998 status, with an additional dummy variable equal to 1 ifthe individual was a return emigrant in either 1998 or 2003.

218 | J INU KOOLA AND ÇAGLAR ÖZDEN
Control Variables
Control variables are included in all regressions. The individual characteristics includethe individual’s years of schooling and years of schooling squared; age and agesquared; and a binary variable equal to 1 if the individual is married or unemployed.The household-level characteristics include (a) a binary variable equal to 1 if the house-hold has at least one return emigrant; (b) a binary variable equal to 1 if the householdhas at least one out-migrant; (c) a binary variable equal to 1 if there are multiple emi-grants in the household; (d) family size; and (e) the number of adult males (i.e., aboveage 18) in the household. Family characteristics (family size and the number of adultmales in the household) include the migrant, since the aim is to capture the household’s“pre-emigration” state. The data do not contain information on household income. Tocontrol for that household characteristic, an income proxy, the log of the total amountof land (wet and dry) owned by the household, is included.
The panchayat-level variables included are average cost of migration for allmigrants from the panchayat; average house quality of all households in the pan-chayat, rated on a scale of 1 to 5, with 1 being very poor and 5 being luxurious; anda binary variable equal to 1 if the panchayat is urban. The latter two variables mayalso proxy for the overall wealth and level of infrastructure in the panchayat.8
Empirical Results: Those Left Behind
The empirical results from the cross-sectional regressions described in equations (1)and (2) are presented in annex tables A.1 and A.2. The results show that the likeli-hood of unemployment increases for nonmigrant men between ages 15 and 60 if theylive in an emigrant household. The probability of unemployment increases with thesize of the emigrant network in the 1998 cross-section.
When equation (1) is estimated separately for males ages 15–29 and 30–60, the dis-incentive effect on employment of living in an emigrant household is found to be twotimes stronger for the younger cohort than for the older cohort of males in the 1998cross-section (see table 4). Unemployment also increases significantly with the size ofthe emigrant network for both cross-sections.
Males in emigrant households are also more likely to be job seekers in both years,as was shown in table 5. In addition, the probability of job seeking increases with theemigrant network in the 2003 cross-section. When equation (2) is estimated separate-ly by age cohort, the positive effect on job seeking of living in an emigrant householdis found to be much stronger for younger males than for their older counterparts.
One of the main advantages of this study is the panel structure of the data. Theresults of the panel analysis, presented in annex tables A.3 and A.4, support thehypothesis that unemployed males are waiting for emigration and are seeking jobsoutside Kerala. The probability of emigration increases for young males who wereliving in an emigrant household in 1998 and were also unemployed or seeking jobsin 1998. As expected, the probability of emigration increases with the size of the emi-grant network.
EMIGRATION AND EMIGRANT NETWORKS IN LABOR MARKET DECISIONS | 219
Consistent with the theoretical literature on the determinants of unemploymentand emigration, certain individual and household characteristics (years of schooling,age, marital status, employment status, family size, and number of adult males in thehousehold) also influence the probabilities of being unemployed, seeking jobs, andemigrating.
Conclusions
The findings in this paper support the hypothesis that young males in Kerala areunemployed because they are waiting for the opportunity to emigrate and are look-ing for jobs outside the state. These results indicate that young men who have a higherexpectation of emigration are less likely to take a job in Kerala while they prepare toemigrate. In other words, vast emigration from the state creates only “temporary”unemployment, not permanent unemployment in which nonmigrants simply rely onremittances without actively engaging in any productive activity.
One auxiliary effect from this stock of unemployed and ambitious young people isthat they add (in absolute terms) to the number of highly skilled, albeit unemployed,individuals in Kerala’s labor force. Emigrants are, on average, more educated thannonmigrants, and the proportion of emigrants or return emigrants with a secondaryeducation is higher than the proportion of those with secondary education in the general population. Aspiring emigrants need higher levels of education because newpolicies and an increasing demand for skilled and professional workers in the Gulfcountries require it. Since 1999, the United Arab Emirates no longer accepts applica-tions for visas for unskilled workers from Bangladesh, India, or Pakistan (Zachariahand Rajan 2004). Not surprisingly, the proportion of the population with secondaryor tertiary education increased by 3 percentage points between 1998 and 2003(Zachariah and Rajan 2004). Thus, those waiting to emigrate may be a potential“brain gain” for Kerala. Still, it is a matter of concern that in 2001 almost three-fourths of the unemployed had secondary or tertiary education (Zachariah, Mathew,and Rajan 2001). According to Zachariah and Rajan (2004) the total unemploymentrate in Kerala increased by 8 percentage points between 1998 and 2003, but the unem-ployment rate among those who had completed secondary schooling increased 15 per-centage points. It is vital that the state engage these highly skilled but unemployedyoung people in the labor market even while they wait to emigrate.
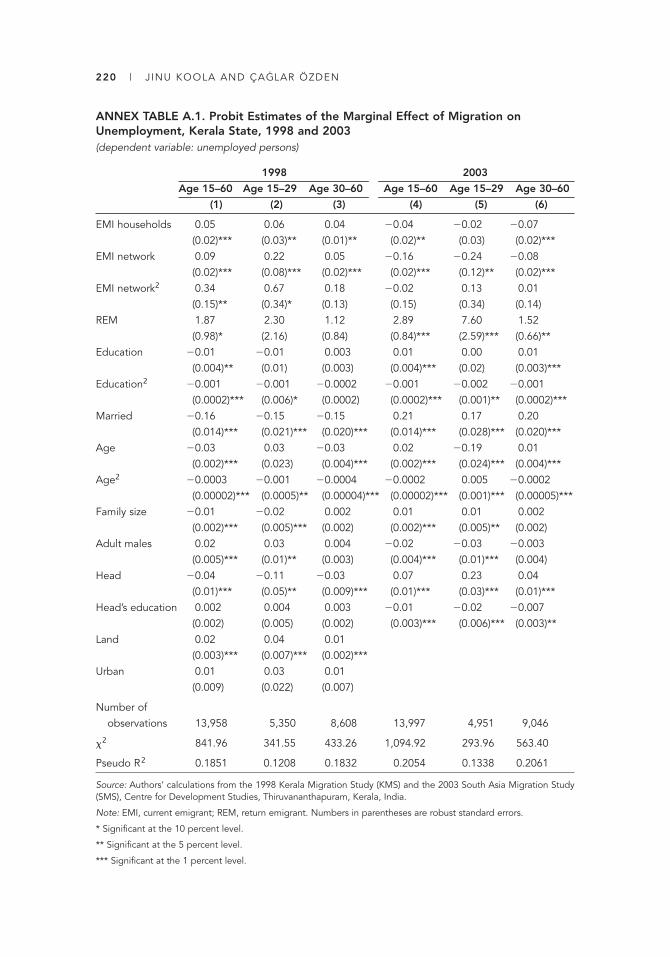
220 | J INU KOOLA AND ÇAGLAR ÖZDEN
ANNEX TABLE A.1. Probit Estimates of the Marginal Effect of Migration on Unemployment, Kerala State, 1998 and 2003 (dependent variable: unemployed persons)
1998 2003
Age 15–60 Age 15–29 Age 30–60 Age 15–60 Age 15–29 Age 30–60
(1) (2) (3) (4) (5) (6)
EMI households 0.05 0.06 0.04 �0.04 �0.02 �0.07(0.02)*** (0.03)** (0.01)** (0.02)** (0.03) (0.02)***
EMI network 0.09 0.22 0.05 �0.16 �0.24 �0.08(0.02)*** (0.08)*** (0.02)*** (0.02)*** (0.12)** (0.02)***
EMI network2 0.34 0.67 0.18 �0.02 0.13 0.01(0.15)** (0.34)* (0.13) (0.15) (0.34) (0.14)
REM 1.87 2.30 1.12 2.89 7.60 1.52(0.98)* (2.16) (0.84) (0.84)*** (2.59)*** (0.66)**
Education �0.01 �0.01 0.003 0.01 0.00 0.01(0.004)** (0.01) (0.003) (0.004)*** (0.02) (0.003)***
Education2 �0.001 �0.001 �0.0002 �0.001 �0.002 �0.001(0.0002)*** (0.006)* (0.0002) (0.0002)*** (0.001)** (0.0002)***
Married �0.16 �0.15 �0.15 0.21 0.17 0.20(0.014)*** (0.021)*** (0.020)*** (0.014)*** (0.028)*** (0.020)***
Age �0.03 0.03 �0.03 0.02 �0.19 0.01(0.002)*** (0.023) (0.004)*** (0.002)*** (0.024)*** (0.004)***
Age2 �0.0003 �0.001 �0.0004 �0.0002 0.005 �0.0002(0.00002)*** (0.0005)** (0.00004)*** (0.00002)*** (0.001)*** (0.00005)***
Family size �0.01 �0.02 0.002 0.01 0.01 0.002(0.002)*** (0.005)*** (0.002) (0.002)*** (0.005)** (0.002)
Adult males 0.02 0.03 0.004 �0.02 �0.03 �0.003(0.005)*** (0.01)** (0.003) (0.004)*** (0.01)*** (0.004)
Head �0.04 �0.11 �0.03 0.07 0.23 0.04(0.01)*** (0.05)** (0.009)*** (0.01)*** (0.03)*** (0.01)***
Head’s education 0.002 0.004 0.003 �0.01 �0.02 �0.007(0.002) (0.005) (0.002) (0.003)*** (0.006)*** (0.003)**
Land 0.02 0.04 0.01(0.003)*** (0.007)*** (0.002)***
Urban 0.01 0.03 0.01(0.009) (0.022) (0.007)
Number of observations 13,958 5,350 8,608 13,997 4,951 9,046
�2 841.96 341.55 433.26 1,094.92 293.96 563.40
Pseudo R2 0.1851 0.1208 0.1832 0.2054 0.1338 0.2061
Source: Authors’ calculations from the 1998 Kerala Migration Study (KMS) and the 2003 South Asia Migration Study(SMS), Centre for Development Studies, Thiruvananthapuram, Kerala, India.
Note: EMI, current emigrant; REM, return emigrant. Numbers in parentheses are robust standard errors.
* Significant at the 10 percent level.
** Significant at the 5 percent level.
*** Significant at the 1 percent level.
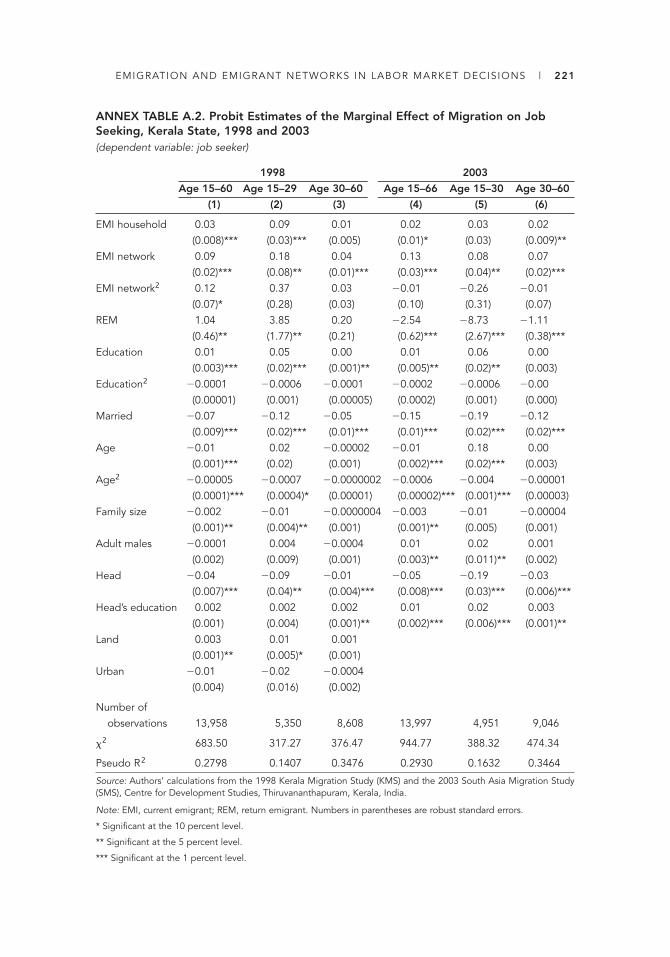
EMIGRATION AND EMIGRANT NETWORKS IN LABOR MARKET DECISIONS | 221
ANNEX TABLE A.2. Probit Estimates of the Marginal Effect of Migration on JobSeeking, Kerala State, 1998 and 2003 (dependent variable: job seeker)
1998 2003
Age 15–60 Age 15–29 Age 30–60 Age 15–66 Age 15–30 Age 30–60
(1) (2) (3) (4) (5) (6)
EMI household 0.03 0.09 0.01 0.02 0.03 0.02(0.008)*** (0.03)*** (0.005) (0.01)* (0.03) (0.009)**
EMI network 0.09 0.18 0.04 0.13 0.08 0.07(0.02)*** (0.08)** (0.01)*** (0.03)*** (0.04)** (0.02)***
EMI network2 0.12 0.37 0.03 �0.01 �0.26 �0.01(0.07)* (0.28) (0.03) (0.10) (0.31) (0.07)
REM 1.04 3.85 0.20 �2.54 �8.73 �1.11(0.46)** (1.77)** (0.21) (0.62)*** (2.67)*** (0.38)***
Education 0.01 0.05 0.00 0.01 0.06 0.00(0.003)*** (0.02)*** (0.001)** (0.005)** (0.02)** (0.003)
Education2 �0.0001 �0.0006 �0.0001 �0.0002 �0.0006 �0.00(0.00001) (0.001) (0.00005) (0.0002) (0.001) (0.000)
Married �0.07 �0.12 �0.05 �0.15 �0.19 �0.12(0.009)*** (0.02)*** (0.01)*** (0.01)*** (0.02)*** (0.02)***
Age �0.01 0.02 �0.00002 �0.01 0.18 0.00(0.001)*** (0.02) (0.001) (0.002)*** (0.02)*** (0.003)
Age2 �0.00005 �0.0007 �0.0000002 �0.0006 �0.004 �0.00001(0.0001)*** (0.0004)* (0.00001) (0.00002)*** (0.001)*** (0.00003)
Family size �0.002 �0.01 �0.0000004 �0.003 �0.01 �0.00004(0.001)** (0.004)** (0.001) (0.001)** (0.005) (0.001)
Adult males �0.0001 0.004 �0.0004 0.01 0.02 0.001(0.002) (0.009) (0.001) (0.003)** (0.011)** (0.002)
Head �0.04 �0.09 �0.01 �0.05 �0.19 �0.03(0.007)*** (0.04)** (0.004)*** (0.008)*** (0.03)*** (0.006)***
Head’s education 0.002 0.002 0.002 0.01 0.02 0.003(0.001) (0.004) (0.001)** (0.002)*** (0.006)*** (0.001)**
Land 0.003 0.01 0.001(0.001)** (0.005)* (0.001)
Urban �0.01 �0.02 �0.0004(0.004) (0.016) (0.002)
Number of observations 13,958 5,350 8,608 13,997 4,951 9,046
�2 683.50 317.27 376.47 944.77 388.32 474.34
Pseudo R2 0.2798 0.1407 0.3476 0.2930 0.1632 0.3464
Source: Authors’ calculations from the 1998 Kerala Migration Study (KMS) and the 2003 South Asia Migration Study(SMS), Centre for Development Studies, Thiruvananthapuram, Kerala, India.
Note: EMI, current emigrant; REM, return emigrant. Numbers in parentheses are robust standard errors.
* Significant at the 10 percent level.
** Significant at the 5 percent level.
*** Significant at the 1 percent level.

222 | J INU KOOLA AND ÇAGLAR ÖZDEN
ANNEX TABLE A.3. Panel Data: Multinomial Logit Estimates of the Impact of Previous Unemployment and Migration on Current Unemployment and Migrationfor Males Age 15–29, Kerala State, 1998 and 2003
Unemployed External emigrant Unemployed External or internal
in 2003 in 2003 in 2003 migrant in 2003
Dependent variable (1) (2) (3) (4)
Unemployed (1998) 0.61 (0.63 0.75 �0.23(0.228)*** (0.401) (0.260)*** (0.352)
EMI household (1998) �0.21 0.45 �0.15 0.15(0.350) (0.353) (0.353) (0.319)
Unemployed*EMI household 0.22 1.61 �0.11 1.29
(0.646) (0.635)** (0.743) (0.596)**EMI network 1.44 20.62 1.39 11.84
(4.182) (6.137)*** (4.420) (5.063)**EMI network2 �19.44 �45.42 �20.07 �23.95
(16.853) (19.047)** (17.720) (16.114)REM (1998 or 2003) �0.35 �0.04 �0.30 0.20
(0.626) (0.500) (0.658) (0.492)Education �0.27 0.71 �0.25 0.58
(0.103)** (0.327)** (0.107)** (0.246)**Education2 0.02 �0.03 0.02 �0.02
(0.006)*** (0.017)* (0.007)** (0.013)*Married �0.44 1.14 �0.40 1.19
(0.562) (0.394)*** (0.657) (0.350)***Age �0.09 0.95 �0.08 0.41
(0.089) (0.444)** (0.033)** (0.318)Age2 0.00 �0.02 0.00 �0.01
0.61 �0.63 0.75 �0.23
Number of observations 2,117 2,117 2,053 2,053�2 187.65 187.65 147.17 147.17Pseudo R2 0.1241 0.1241 0.1023 0.1023
Source: Authors’ calculations from the 1998 Kerala Migration Study (KMS) and the 2003 South Asia Migration Study(SMS), Centre for Development Studies, Thiruvananthapuram, Kerala, India.
Note: EMI, current emigrant; REM, return emigrant. Numbers in parentheses are robust standard errors. Columns (1)and (2) refer to the multinomial logit in which the dependent variable takes on three values: 1 if unemployed, 2 ifemployed, or 3 if external emigrant in 2003. Columns (3) and (4) refer to the multinomial logit regression in which thedependent variable takes on three values: 1 if unemployed, 2 if employed, or 3 if external emigrant in 2003. All estimates are relative to the base outcome of employed in 2003.
* Significant at the 10 percent level.
** Significant at the 5 percent level.
*** Significant at the 1 percent level.
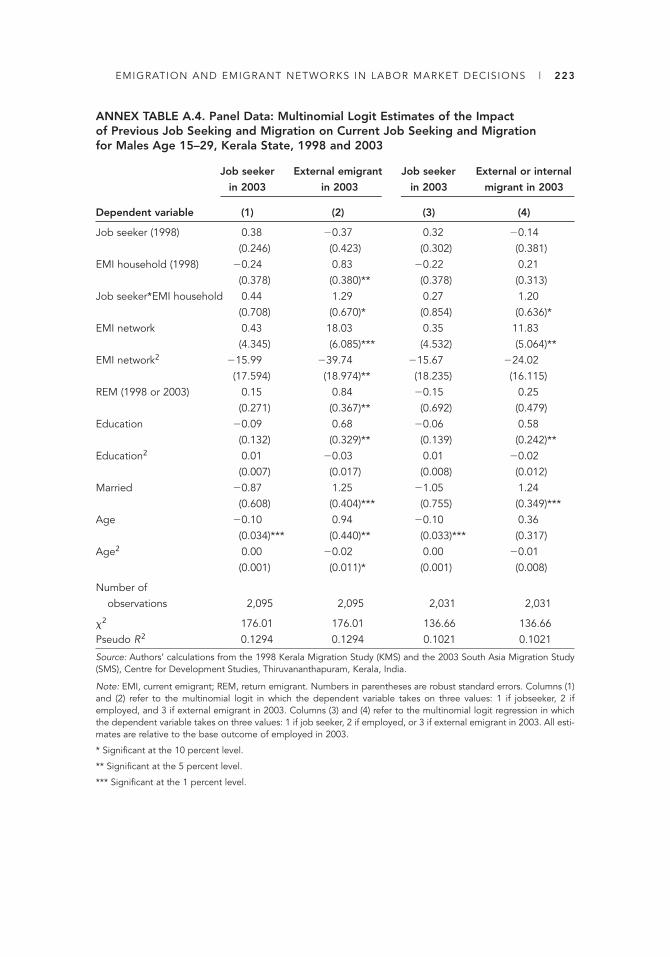
EMIGRATION AND EMIGRANT NETWORKS IN LABOR MARKET DECISIONS | 223
ANNEX TABLE A.4. Panel Data: Multinomial Logit Estimates of the Impact of Previous Job Seeking and Migration on Current Job Seeking and Migration for Males Age 15–29, Kerala State, 1998 and 2003
Job seeker External emigrant Job seeker External or internal
in 2003 in 2003 in 2003 migrant in 2003
Dependent variable (1) (2) (3) (4)
Job seeker (1998) 0.38 �0.37 0.32 �0.14(0.246) (0.423) (0.302) (0.381)
EMI household (1998) �0.24 0.83 �0.22 0.21(0.378) (0.380)** (0.378) (0.313)
Job seeker*EMI household 0.44 1.29 0.27 1.20(0.708) (0.670)* (0.854) (0.636)*
EMI network 0.43 18.03 0.35 11.83(4.345) (6.085)*** (4.532) (5.064)**
EMI network2 �15.99 �39.74 �15.67 �24.02(17.594) (18.974)** (18.235) (16.115)
REM (1998 or 2003) 0.15 0.84 �0.15 0.25(0.271) (0.367)** (0.692) (0.479)
Education �0.09 0.68 �0.06 0.58(0.132) (0.329)** (0.139) (0.242)**
Education2 0.01 �0.03 0.01 �0.02(0.007) (0.017) (0.008) (0.012)
Married �0.87 1.25 �1.05 1.24(0.608) (0.404)*** (0.755) (0.349)***
Age �0.10 0.94 �0.10 0.36(0.034)*** (0.440)** (0.033)*** (0.317)
Age2 0.00 �0.02 0.00 �0.01(0.001) (0.011)* (0.001) (0.008)
Number of observations 2,095 2,095 2,031 2,031
�2 176.01 176.01 136.66 136.66Pseudo R2 0.1294 0.1294 0.1021 0.1021
Source: Authors’ calculations from the 1998 Kerala Migration Study (KMS) and the 2003 South Asia Migration Study(SMS), Centre for Development Studies, Thiruvananthapuram, Kerala, India.
Note: EMI, current emigrant; REM, return emigrant. Numbers in parentheses are robust standard errors. Columns (1)and (2) refer to the multinomial logit in which the dependent variable takes on three values: 1 if jobseeker, 2 ifemployed, and 3 if external emigrant in 2003. Columns (3) and (4) refer to the multinomial logit regression in whichthe dependent variable takes on three values: 1 if job seeker, 2 if employed, or 3 if external emigrant in 2003. All esti-mates are relative to the base outcome of employed in 2003.
* Significant at the 10 percent level.
** Significant at the 5 percent level.
*** Significant at the 1 percent level.

Notes
1. Panchayats are often referred to as villages, but they are also found in cities.
2. Hinduism, Christianity, and Islam have all been established in Kerala for many centuries.Early Hinduism can be linked to the decline of Buddhism and a process of “Aryanization”in Kerala during the fifth and sixth centuries AD. The development of Islam can be tracedto contacts with Arab traders in the eighth century AD. And the beginnings of Christianityare traditionally credited to Saint Thomas the apostle, in the first century AD (see Kurien2002).
3. This figure is similar to estimations by the State Planning Board of Kerala, which deter-mined the number of emigrants in 1997 to be 1.6 million people. The estimates presentedin this section are the authors’ own calculations from the Kerala Migration Study (KMS)and the South Asia Migration Study (SMS), conducted in 1998 and 2003, respectively.
4. In 1973 a conference among GCC countries led to an agreement to form an oil cartel, theOrganization of the Petroleum Exporting Countries (OPEC), that drove up the price of oil.By 1974 the price of oil had quadrupled (Massey et al. 1998, 137).
5. Kerala’s literacy rate, at 91 percent according to the 2001 census, is the highest amongIndian states.
6. In 1998, 50 percent of Gulf emigrants were Muslim.
7. Because the number of households at the panchayat level in each sample was not adjust-ed to reflect the total number of households in the panchayat, observations are weightedby the percentage of the panchayat population represented by the sample households.
8. Panchayat fixed effects are not included in the probit models because inclusion of a set ofpanchayat dummies would induce an incidental parameters problem (see Greene 2002).An additional problem with including panchayat dummies is that the emigration preva-lence rates are all measured at the panchayat level, which would make these variables per-fectly collinear with the panchayat dummies.
References
Amuedo-Dorantes, Catalina, and Susan Pozo. 2006. “Migration, Remittances, and Male andFemale Employment Patterns.” American Economic Review 96 (2, May): 222–26.
Boyd, M. 1989. “Family and Personal Networks in International Migration: Recent Develop-ments and New Agendas.” International Migration Review 23 (3): 638–70.
Giles, John, and Kyeongwon Yoo. 2007. “Precautionary Behavior, Migrant Networks, andHousehold Consumption Decisions: An Empirical Analysis Using Household Panel Datafrom Rural China.” Review of Economics and Statistics 89 (3, August): 534–51.
Greene, William H. 2002. Econometric Analysis. 5th ed. Englewood Cliffs, NJ: Prentice Hall.
Hanson, Gordon H. 2005. Emigration, Remittances, and Labor Force Participation in Mexico. INTAL Working Paper 28, Institute for the Integration of Latin America andthe Caribbean, for the Inter-American Development Bank, Washington, DC.http://www.iadb.org/INTAL/aplicaciones/uploads/publicaciones/i_INTALITD_WP_28_2007_Hanson.pdf.
India. 2001. “Data on Religion,” Census of India 2001. New Delhi: Office of the RegistrarGeneral. http://www.censusindia.net/.
224 | J INU KOOLA AND ÇAGLAR ÖZDEN

EMIGRATION AND EMIGRANT NETWORKS IN LABOR MARKET DECISIONS | 225
Kim, Namsuk. 2007. “The Impact of Remittances on Labor Supply: The Case of Jamaica.”Policy Research Working Paper 4120, World Bank, Washington, DC. http://econ. worldbank.org/external/default/main?pagePK�64165259&theSitePK�469372&piPK�64165421&menuPK�64166093&entityID�000016406_20070126111038.
Kurien, P. A. 2002. Kaleidoscopic Ethnicity: International Migration and the Reconstructionof Community Identities in India. New Brunswick, NJ: Rutgers University Press.
Manski, Charles F. 1993. “Identification of Endogenous Social Effects: The Reflection Prob-lem.” Review of Economic Studies 60 (3): 531–42.
Massey, Douglas S., Luis Goldring, and Jorge Durnad. 1994. “Continuities in TransnationalMigration: An Analysis of Nineteen Mexican Communities.” American Journal of Sociology99 (6, May): 1492–1533.
Massey, Douglas S., Joaquin Arrango, Graeme Hugo, Ali Kouaouci, Adela Pellegrino, and J. Edward Taylor. 1998. Worlds in Motion: Understanding International Migration at theEnd of the Millennium. Oxford, U.K.: Clarendon Press.
McKenzie, D. J., and H. Rapoport. 2005. “Network Effects and the Dynamics of Migrationand Inequality: Theory and Evidence from Mexico.” Working Paper 063, Bureau forResearch in Economic Analysis of Development (BREAD), Cambridge, MA.
Munshi, K. 2003. “Networks in the Modern Economy: Mexican Migrants in the US LaborMarket.” Quarterly Journal of Economics 118 (2): 549–99.
Orrenius, Pia M. 1999. “The Role of Family Networks, Coyote Prices, and the Rural Economyin Migration from Western Mexico: 1965–1994.” Working Paper 9910, Federal ReserveBank of Dallas, Dallas, TX.
Osella, F., and C. Osella. 2000. Social Mobility in Kerala. London: Pluto Press.
Prakash, B. A. 1998. “Gulf Migration and Its Economic Impact: The Kerala Experience.” Economic and Political Weekly 33 (50, December 12): 3209–13.
Taylor, J. E. 1987. “Undocumented Mexico-U.S. Migration and the Returns to Households inRural Mexico.” American Journal of Agricultural Economics 69: 626–38.
Weiner, M. 1982. “International Migration and Development: Indians in the Persian Gulf.”Population and Development Review 8 (1): 1–36.
Winters, P., A. de Janvry, and E. Sadoulet. 2001. “Family and Community Networks in Mexico-U.S. Migration.” Journal of Human Resources 36 (1): 159–84.
Woodruff, C., and R. Zenteno. 2007. “Migration Networks and Microenterprises in Mexico.”Journal of Development Economics 82 (2): 509–28.
Zachariah, K. C., and S. Irudaya Rajan. 2004. “Gulf Revisited: Economic Consequences ofEmigration from Kerala; Emigration and Unemployment.” Working Paper 363, Centre forDevelopment Studies, Thiruvananthapuram, Kerala, India. http://cds.edu/download_ files/363.pdf.
Zachariah, K. C., E. T. Mathew, and S. I. Rajan. 2001. “Social, Economic, and DemographicConsequences of Migration on Kerala.” International Migration 39 (2): 43–71.
Zhao, Y. H. 2001. “The Role of Migrant Networks in Labour Migration: The Case of China.”Working Paper N20001012, China Economic Research Center, Beijing University, Beijing.
226
Comment on “The Role of Emigration and Emigrant Networks in Labor Market Decisionsof Nonmigrants,” by Jinu Koola and ÇaglarÖzden
JEAN-LUC DEMONSANT
The paper by Koola and Özden offers new insights on the functioning of migrant net-works and their impact on labor outcomes for those who stay behind. The authorspresent interesting empirical findings on the case of migrants from Kerala State,India, to the Arab states of the Persian Gulf. Because it is rooted in the cultural speci-ficities of the case study and is open to sociological approaches, the paper is particu-larly rich and relevant for development economists eager to avoid cultural blindnessin their own research. The role of networks in migration decisions offers many per-spectives for research, as their functioning is complex and it is difficult to identifyuniversal patterns.
Cultural Biases of Earlier Studies
The existing microeconomics literature on migration networks is a good example ofhow a focus on one geographic area can flaw the vision of development economists,in that it is clearly dominated by the case of Mexico-U.S. migration. For example, inthe references to the paper by Koola and Özden, of the 10 entries on migrant net-works that mention a specific destination country in the title, 8 are on Mexico. Ofcourse, since the United States and Mexico share the longest border between a devel-oped and a developing country, this emphasis does not come out of the blue and isperhaps legitimate. Nevertheless, the concentration on a particular case has adverseconsequences for research in the field. Because theoretical economists draw theirinspiration from empirical case studies, the tendency to infer general behaviors fromspecific cases where the context yields different outcomes is rather common. Proba-bly more dramatic, though, is the application by policy makers of “best practices” toinappropriate situations.
Jean-Luc Demonsant is assistant professor of economics at the University of Guanajuato, Mexico.
Annual World Bank Conference on Development Economics 2009, Global © 2010 The International Bank for Reconstruction and Development / The World Bank

COMMENT ON KOOLA AND ÖZDEN | 227
Earlier studies, working from homogenous village societies, have focused on the“quantity” rather than on the “quality” of networks. The paper by Koola and Özdenremedies this deficiency by uncovering new mechanisms in play in network forma-tion and functioning.
Religion as the Cement of Migration Networks
Departing from the existing literature on migration networks, the authors convinc-ingly show that religious networks are more efficient than geographic ones in increas-ing the probability of migration of Keralites to the Gulf. In other studies, networksare usually measured by assessing the proportion of migrants from a geographic com-munity to a given destination. By differentiating migrants according to their religion,Koola and Özden make an important point: geographic proximity is not sufficient tobond people, especially in heterogeneous societies. In Kerala, where three major reli-gions coexist, religion is a strong identity marker.
Religious communities are a central vehicle of socialization everywhere, but par-ticularly in poor countries, where social safety nets are incomplete or nonexistent andhouseholds must cope with a tough environment of severe poverty and shocks to eco-nomic and physical well-being. In order to face such an adverse situation, the house-hold cannot be isolated; it needs friends and relatives to count on. As a result, thereligious community is a place of exchange in the village, as it is in migration.
Indeed, economists working on networks of Mexican migrants in the UnitedStates may well become inspired by this breakthrough, as Catholicism is losing itsmonopoly in Mexico in favor of growing non-Catholic Christian movements. Witheven families now divided between Catholics and other Christians, the power of thesenew churches to mobilize community spirit is already indisputable.
How Do Networks Operate?
Koola and Özden find that the migration network has no spillover effect; having anetwork in country A increases the probability of migrating to that destination, butnot to others. They conclude that the network is purely informative and is not usedto finance migration; rather, experienced migrants provide referrals and circulateinformation about job offers, labor market conditions, and the like. The authors’main argument is that if the network financed migration, flows would not be desti-nation specific.
I must admit that I was not fully convinced by that reasoning. Probably the diffi-culty is a matter of vocabulary; if “financing migration” means “paying for the trip,”then it is true that migration would not be destination specific. But there are othermigration costs, linked with relocation. The authors note that networks can provide“social support,” and they do mention housing. For me, these kinds of support arealso “economic.” There are many accounts of established migrants paying the rentwhile the new migrant is getting settled. What about providing a safety net in case ofmisfortune such as unemployment or disease? The institution of rotating saving and

228 | JEAN-LUC DEMONSANT
credit associations (ROSCAs, or, in India, chit funds) has been well documented inpoor rural economies but also in migrant communities, where immigrants are morelikely to be at a disadvantage in the credit market. Srinivasan (1995) describesROSCAs in Oxford run by South Asian women. There are more studies in the Unit-ed States (where data availability is not such an issue) than elsewhere, but it may wellbe the case that there are Keralite ROSCAs in the Arab states of the Persian Gulf.Hence, without directly financing the migration, the migrant network finances thesettlement of the new migrant and provides him or her with informal social security.Because settled migrants will be more in a position to lend a hand, they will be themain providers and will therefore finance this informal insurance at the time the new-comers need it the most. In turn, the new migrants will finance the next newcomersand thus form a chain of reciprocity with subsequent waves of migrants.
Religious Clustering of Minorities
Another aspect of the authors’ findings is that Hindu networks have the highestimpacts on both the decision to migrate and the choice of location, followed byChristian and then Muslim networks. The authors suggest that Hindus are morereliant on their networks than are the other groups. They mention that Muslims aremore religiously compatible in the Arab Gulf states and that Christians have an educational advantage. I would suggest two further explanations. A first, noneco-nomic, one is that non-Muslims are clearly minorities in the Arab Gulf states. Religious practices are made easier when population is concentrated. The building ofchurches and Hindu temples, for instance, requires a minimum number of believers.Furthermore, some claim that freedom of religion would not be totally guaranteedfor non- Muslims in some areas of the Gulf. The channeling effect for non-Muslimswould then also be explained by the fact that a larger group is better able to defenditself.
The second, complementary, explanation stems from the network externalities.As depicted by the authors in their study on geographic network effects, the rela-tionship between the stock of migrants in a given place and the probability ofmigrating is nonlinear. There are, in fact, two opposite effects: the stock ofmigrants reduces the relocation cost, but it increases competition on the labor mar-ket and thus decreases the incentive for migration. When the stock of migrants isstill low, the positive network externality dominates; when the stock is high, thenegative wage effect dominates. The authors observe that although Muslims rep-resent only one-fourth of Kerala’s population, they make up close to half of thetotal emigrant population in the Gulf states. The proportion is not nearly as highfor Christians and Hindus, which would explain the difference in the effects: Mus-lim migration is at a stage at which the competition effect is very high, whereas thepositive network externality still strongly dominates for both Hindus and Chris-tians. Only longitudinal and historical data, since the 1970s, would allow us toascertain whether this is relevant. In the results presented, with the data at hand, itappears that “own religious network” effects diminished slightly between 1998
COMMENT ON KOOLA AND ÖZDEN | 229
and 2003, but the differences are not statistically significant, and five years is, anyway, too short a time to detect such a pattern.
Extended Family Networks
When one looks carefully at the regressions concerning the migration decision, itappears that for a Muslim, having relatives who are migrants is (at least) as impor-tant as having other Muslims from the same village on migration. This does not holdfor Christians or Hindus. This result could be interpreted as an indication that thefamily is taking over from the religious network among Muslims. If there is morecompetition on the labor market, it becomes more costly to help new migrantsbecause of the unemployment risk. When times are rough, family represents a saferresort. There is a large body of literature documenting how the extended family pro-vides all kinds of insurance and protection against external events; Cox andFafchamps (2007) offer a complete and up-to-date review. Additional information onthe functioning of Keralite households would have been required in order to investi-gate the role of family networks, and this is beyond the scope of the paper.
Unemployment of Potential Migrants?
The authors obtain noteworthy results on employment decisions of nonmigrants. Ina first econometric study, they show a standard outcome: young people are more like-ly to be unemployed in migrant households. Using the panel structure of the data,they show that the young unemployed in migrant households in 1998 had a higherprobability of being on migration abroad in 2003. There seems, however, to be aselection bias because of an attrition problem that could potentially dampen thisresult. Suppose a young man was unemployed in 1998 but got married and formeda new home by 2003. Recall that in the sample regressions, persons who werebetween ages 10 and 24 in 1998 were between ages 15 and 29 in 2003; indeed, sincestudents were excluded, the young persons were likely to have been between ages 14and 24 in 1998 and therefore between ages 19 and 29 in 2003. This seems to be areasonable marriage age range.
The bias would stem from the following issue: is this individual still present in thesample, since he cannot be traced in 2003, when he is no longer part of “the initialhousehold”? In the data presentation the authors mention that it is the householdsthat are resurveyed, not the household members. In reality, we do not know the sit-uation of this particular young man in 2003. Has he found a job? Has he migrated?Leaving the parents’ household and finding a job are likely to be linked. If it is thecase that this young man is no longer in the sample and that he has not migrated,then the link between “unemployed in 1998” and “on migration in 2003” is biasedupward. In other words, it is not to be taken for granted that unemployed young per-sons in migrant households are actually potential external migrants. They may stillbe in Kerala and may simply have left the initial household to form a new one.
230 | JEAN-LUC DEMONSANT
Perhaps this comment is not relevant, as the issue may have been taken intoaccount in the analysis. Nevertheless, it underscores the fact that I found no mentionof the definition of “households” or “household members” in the paper. Are house-holds mainly nuclear families, or extended ones? Concerns about change in house-hold composition between the two dates may be quite relevant and decisive in theformer case.
To conclude, research on migrant networks is a challenging field of investigationfor econometricians because it is data consuming. A first-best option would be tohave data on both sides: at home and for the destination country. Such a data col-lection process is extremely difficult to implement and is therefore expensive, but itis rewarding. I surmise that the authors would agree with me that it would definite-ly be of great help in better grasping the migration process. Facing a second-best sit-uation, as development economists are trained to do, the authors fared very well inconvincingly highlighting the importance of religious networks.
Finally, I have to say that this article is particularly useful and relevant for such aconference. Aimed at a large audience, from policy makers to professional and aca-demic economists, it shows that noneconomic factors often play an important partin individuals’ choices. A priori, religion has little to do with migration decisions, orat least it does not seem to be of such importance. Development economists have atendency to overlook those issues, though times may be changing; as a recent studyby Rao and Walton (2004) shows, interdisciplinarity is in the air in academia, as atthe World Bank.
References
Cox, Donald, and Marcel Fafchamps. 2007. “Extended Family and Kinship Networks: Economic Insights and Evolutionary Directions.” Handbook of Development Economics,vol. 4, ed. T. Paul Schulz and John Strauss, 3711–84. Amsterdam: North-Holland.
Rao, Vijayendra, and Michael Walton. 2004. Culture and Public Action. Stanford, CA: Stan-ford University Press.
Srinivasan, Shaila. 1995. “ROSCAs among South Asians in Oxford.” In Money-Go-Rounds:The Importance of Rotating Savings and Credit Associations for Women, ed. ShirleyArdener and Sandra Burman. Washington, DC: Berg Publishers.

Higher Education andHigh-Technology Industry

The Role of Higher Education in High-Technology Industrial Development: What Can International Experience Tell Us?
SACHI HATAKENAKA
An extraordinary level of policy attention is being accorded higher education today.The reason is clear: higher education is considered one of the key factors for thedevelopment of science-based high-technology industries. This paper shows that thevarious types of higher education institutions play significantly different roles,which can influence the shape and nature of high-tech industry. The study furtherproposes a classification framework for institutions to illuminate such a difference.Drawing on experience in a variety of economies (the United States; Japan; Finland;Taiwan, China; the Republic of Korea; Ireland; Israel; China; and India), three separate dimensions are proposed for differentiating institutional characteristics:responsiveness, fundamental science orientation, and selectivity. Finally, the paperexamines how the three dimensions developed in specific country contexts and suggests that early interventions for developing responsiveness may be particularlyimportant.
Higher education commands an extraordinary level of policy attention today. The reason is clear: with the rise of knowledge economies and science-based high- technology industries, higher education is considered crucial to economic development.Experience shows that high-tech industry can emerge in highly dissimilar countries,including those with limited industrial bases or low levels of economic developmentsuch as China, India, and Ireland. It is not surprising that innovation policies to create and support high-tech industries are a priority in almost all member countriesof the Organisation for Economic Co-operation and Development (OECD) and inmany developing countries. Development of an appropriate higher education sectoris becoming a critical component of such policies.
233
Sachi Hatakenaka is an independent researcher.
Annual World Bank Conference on Development Economics 2009, Global © 2010 The International Bank for Reconstruction and Development / The World Bank

234 | SACHI HATAKENAKA
Much has been written about the role of American universities in high-tech indus-tries and more generally in industrial development, and some studies compare theroles of U.S. institutions with those in Europe or Japan. Studies in other countriesconclude that the contributions of well-trained engineers and scientists—and, byimplication, higher education systems—are significant. The comparative literature onhigher education describes similarities and differences among national systems, butthere tends to be little emphasis on their roles in economic development.
Lester (2005), in a comparative study of several countries, argues that different typesof industrial transformation require different contributions by universities. There is alsoan emerging literature on university-industry relationships in developing countries(Chen and Kenney 2007; Ma 2007; Wu 2007; Yusuf and Nabeshima 2007; Kroll andLeifner 2008), and the role of universities in economic development is beginning to bediscussed in a more specific way (Mazzoleni and Nelson 2007; Leifner and Schiller2008). Mazzoleni and Nelson provide an in-depth analysis of the role of public researchin economic catch-up and argue for the increasing importance of such research, partic-ularly in application-oriented sciences and engineering. They also provide a helpfuloverview of the nature of American research universities and their economic roles.Leifner and Schiller contribute to the debate by introducing the notion of “academiccapabilities” to help with thinking about how universities contribute to the developmentof technological capacity. However, few studies examine how different types of highereducation institutions may contribute differently to the development of high-tech indus-try and how institutional characteristics influence the nature of their contribution.
The objective of the paper is to fill this gap in the literature by proposing a classi-fication framework for higher education institutions. More specifically, the paperseeks answers to three questions:
1. What are the characteristics of higher education institutions that define the natureof their contributions to high-tech industry?
2. What roles do these institutions play in the development of high-tech industry?
3. How do institutional characteristics develop?
The ultimate goal is to draw lessons for the future for higher education systems, par-ticularly in developing countries.
This paper is based on a review of experience in a range of countries. Whereverpossible, country-specific literature on higher education systems and their develop-ment is drawn on. The main emphasis is on two high-tech industrial sectors of relatively recent date: information and communications technology (ICT), both hard-ware and software, and biotechnology.
The point of this paper is not to fully contrast the paths taken or to examine allthe contributing factors in the development of high-tech industry. That a variety offactors was behind the take-off of high-tech industry is accepted as a given. The paperfocuses on the specific roles higher education has played within that context. It exam-ines differences in capabilities for high-tech industry among countries, but only to theextent that they are related to the roles of higher education systems.

HIGHER EDUCATION IN HIGH-TECH INDUSTRIAL DEVELOPMENT | 235
In order to explore the variety of roles played by higher education at differentstages of industrial development, four sets of economies are examined:
• The United States, which has held a leading position in both sectors—ICT andbiotechnology—from their very beginning
• Japan and Finland, which entered the global competition in high-tech products ona foundation of significant existing industrial capability
• A group of late developers, including the Republic of Korea and Taiwan, China,that were building industrial capability around the time these industries were born
• A group that developed high-tech industry from a much less developed industrialbase (China, India, Ireland, and Israel).
The paper attempts to draw on comparative historical data, to the extent they exist,so that comparisons can be made not only geographically but also over time.
Framework for Understanding Institutional Characteristics
In this section, a framework for classifying institutions is proposed, using threedimensions that measure institutional characteristics: responsiveness, basic scienceorientation, and selectivity (figure 1). Responsiveness refers to institutions’ abilityand inclination to respond to changing practical and industrial needs. Basic scienceorientation measures the level of commitment to fundamental science. Selectivity hasto do with the stringency of the criteria for recruiting students and staff and distin-guishes elite institutions from those that are open to people more widely.
These three dimensions emerged in the course of the review of the various cases,but also from prior academic work. The first two dimensions, responsiveness andbasic science orientation (shown in figure 2), owe much to the work of Stokes (1997),
basic scienceorientation
selectivity
responsiveness
FIGURE 1.Three Dimensions of a Higher Education Institution
Source: Author’s elaboration.

236 | SACHI HATAKENAKA
who proposed two similar dimensions to distinguish between four different types ofresearch orientation. Figure 2 shows the framework to differentiate between fourtypes of institutions using these two dimensions.
The top right-hand cell is occupied by relevant research universities, which con-duct fundamental research, but with an eye to its relevance to society. These institu-tions are committed to fundamental science but are also concerned about being useful, and they strive to remain responsive to socioeconomic needs. Surprisingly, notmany institutions fit this category. A primary example is a group of Americanresearch universities that in their development embraced the value of relevance(Rosenberg and Nelson 1994; Geiger 2004a; Mazzoleni and Nelson 2007). Whenthese universities became the envy of the world because of their contributions in high-tech industry such as biotechnology and ICT, the world initially looked to all Americanuniversities as if they were all the same. Over time, it became clear that even withinthe American system there were different types of university and that only certainresearch universities were proactive in industrial innovation in general and in thedevelopment of high-tech industry in particular. Some Israeli universities also appearto belong to this cell, although perhaps with less emphasis on basic science and moreon applied research.
The top left-hand cell is occupied by basic research universities, which are drivenprincipally by the core values of fundamental science, with little interest in or capac-ity for responding to external needs. This is where the classic ivory-tower universitieswith well-developed research capabilities belong; indeed, the great majority ofresearch universities in the world have belonged to this cell—at least until recently,when economic relevance became a global catchphrase. These institutions value cutting-edge science, reward scientific discoveries, and encourage their academics todefine actively the direction of scientific research. Scientific developments were to beindependent of practical requirements, which were regarded as a “corrupting” influ-ence on science. Indeed, until the 1990s, this cell represented what most higher education institutions aspired to be. Many Japanese national universities developedto fit into this category in spite of their origins as practically oriented universities, asis discussed next.
FIGURE 2.Institutional Characteristics: Responsiveness and Basic Science Orientation
Source: Adapted from Stokes (1997).
responsiveness to economic needs
NO YES
basic relevant research research
institutions institutions
teaching-focused practically institutions oriented
institutions
YES
basic science orientation
NO

HIGHER EDUCATION IN HIGH-TECH INDUSTRIAL DEVELOPMENT | 237
The bottom right-hand cell contains practically oriented institutions that aspire tomeet the economy’s needs for practical skills and knowledge. They offer courses rel-evant to employers and often conduct consulting and application-oriented researchwith and for employers. They have little interest in, or capacity for, furtherance ofgeneric scientific knowledge or fundamental research. Examples are diverse; theyrange from the grandes écoles in France, which were designed to provide elite pro-fessional education (although some have now begun to develop basic research capac-ity), and many polytechnic schools and their equivalents in other countries. Irelandand Finland reformed their higher education sectors by introducing this type of insti-tution. Historically, the Japanese national universities would have belonged to thiscell at their founding, as they were established to provide key technological skillsneeded for national modernization, but their commitment to bring science into prac-tice place them higher in the quadrant, in comparison with traditional trade schools,which focus on practical skills. Some Chinese universities have roots in this cell, andothers appear to have moved rightward toward this cell over the last 20 years,becoming much more economically relevant. Some institutions fit this cell naturallyby virtue of their emphasis on an application-oriented subject mix; engineering insti-tutions such as the Indian Institutes of Technology are good examples.
The bottom left-hand cell is occupied by teaching-focused institutions, which areneither practically oriented in their teaching nor research oriented. U.S. liberal arts col-leges are good examples because they are committed to offering broad curricula, withan emphasis on generic skills rather than vocational or professional content. Theydefine their identity in terms of their commitment to teaching and conduct hardly anyresearch. (Some teaching institutions, however, are more academically oriented.) Mostuniversities in developing countries fall into the teaching-focused category by defaultsimply because they do not have the resources to be active in research. In many suchcases their teaching is defined according to academic discipline.
The third dimension, selectivity, differentiates further the nature of the institutionsin each of the four cells. The more selective the institutions are in screening incomingstudents, the more elitist they are. Grandes écoles are differentiated from the bulk ofpolytechnics in that they are among the most highly selective institutions, which mostpolytechnics are not. Selectivity is often a system-level characteristic; some higher edu-cation systems are explicitly selective, characterized by highly competitive entranceexaminations to allocate talents across institutions, as in Japan and Korea. Other sys-tems are much less so and are based on the notion that all universities command equalstatus; this is the tradition in Germany and many other European countries.
As will be discussed later, selectivity appears to be an important characteristic thatstrengthens the roles institutions may play.
Roles of Different Types of Institution
This section describes how different types of institution contributed to the develop-ment of high-tech industry, drawing on the experiences of the countries listed above.One important observation is that none of the institutional categories appears to be

238 | SACHI HATAKENAKA
necessary for the development of high-tech industry; rather, they play different roles.The footprints of university roles are sometimes visible in the shape and nature of theresulting industry, but at other times industry developed while incorporating univer-sity contributions in a way that became almost invisible.
Relevant Research Universities
It is well established that some American research universities contributed significantlyto the birth and development of biotechnology and the computer industry. Forinstance, fundamental scientific discoveries in university laboratories and the resultingpatents (such as Cohen’s and Boyer’s discovery of recombinant DNA technique) led tothe development of biotechnology as a whole new industry with strong linkages with academic scientific research (Henderson, Orsenigo, and Pisano 1999). The early evo-lution of the biotechnology industry was characterized by the formation of new firms,many of which were academic spin-offs; usually, academics worked in conjunctionwith professional managers, backed by venture capital. The early academic inventorswere labeled “star scientists” because they were key players both in basic science andin its applications. They had a special role mainly because of the significant amountof tacit knowledge associated with the original scientific discoveries (Zucker andDarby 1996; Zucker, Darby, and Brewer 1998; Zucker, Darby, and Armstrong 2002).The norms in American universities that permitted academics to become deeplyengaged in commercialization—which had developed early, given their culture ofstriving to be useful—was crucial in this process (Henderson, Orsenigo, and Pisano1999; Etzkowitz 2002).
American universities were also important to the development of the computer hard-ware and software industries, although their visibility varied over time (Rosenberg andNelson 1994; Bresnahan and Malerba 1999; Mowery 1999). For instance, universitieswere actively engaged in the early development of computers in the 1940s. (During thisperiod, European universities such as those in Manchester, Cambridge, and Berlin wereas active as their American counterparts.) They were also important in the developmentof microcomputers, as exemplified by spin-offs from the Massachusetts Instituteof Technology, Stanford University, and the University of Texas. In Europe, only Cambridge University in the United Kingdom played a similar role in microcomputers.
There is evidence that industry values the more conventional channels of contri-butions made by universities. One survey found that industry regarded generalresearch findings, or instrumentation and techniques developed through research, asmore important university contributions than prototypes (Cohen, Nelson, and Walsh2002). The same survey found that publications, meetings and conferences, informalinteraction, and consulting were more important than patents as mechanisms throughwhich industry gained access to university knowledge. Furthermore, industry reportedthat university research was helpful in solving problems, rather than in inspiring and triggering new research. These results concern contributions made by all types ofAmerican universities, including basic research institutions. Nonetheless, it is importantto note that what is valued is not so much application capabilities in universities asrelevant research capability.
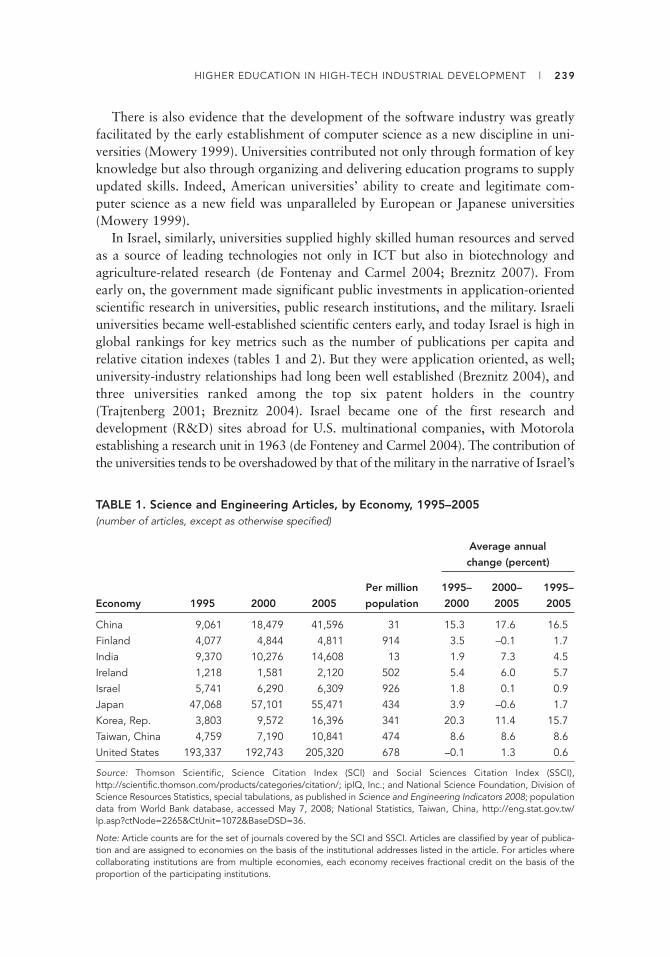
HIGHER EDUCATION IN HIGH-TECH INDUSTRIAL DEVELOPMENT | 239
There is also evidence that the development of the software industry was greatlyfacilitated by the early establishment of computer science as a new discipline in uni-versities (Mowery 1999). Universities contributed not only through formation of keyknowledge but also through organizing and delivering education programs to supplyupdated skills. Indeed, American universities’ ability to create and legitimate com-puter science as a new field was unparalleled by European or Japanese universities(Mowery 1999).
In Israel, similarly, universities supplied highly skilled human resources and servedas a source of leading technologies not only in ICT but also in biotechnology and agriculture-related research (de Fontenay and Carmel 2004; Breznitz 2007). Fromearly on, the government made significant public investments in application-orientedscientific research in universities, public research institutions, and the military. Israeli universities became well-established scientific centers early, and today Israel is high inglobal rankings for key metrics such as the number of publications per capita and relative citation indexes (tables 1 and 2). But they were application oriented, as well;university-industry relationships had long been well established (Breznitz 2004), andthree universities ranked among the top six patent holders in the country (Trajtenberg 2001; Breznitz 2004). Israel became one of the first research and development (R&D) sites abroad for U.S. multinational companies, with Motorolaestablishing a research unit in 1963 (de Fonteney and Carmel 2004). The contribution ofthe universities tends to be overshadowed by that of the military in the narrative of Israel’s
TABLE 1. Science and Engineering Articles, by Economy, 1995–2005(number of articles, except as otherwise specified)
Average annual
change (percent)
Per million 1995– 2000– 1995–
Economy 1995 2000 2005 population 2000 2005 2005
China 9,061 18,479 41,596 31 15.3 17.6 16.5Finland 4,077 4,844 4,811 914 3.5 –0.1 1.7India 9,370 10,276 14,608 13 1.9 7.3 4.5Ireland 1,218 1,581 2,120 502 5.4 6.0 5.7Israel 5,741 6,290 6,309 926 1.8 0.1 0.9Japan 47,068 57,101 55,471 434 3.9 –0.6 1.7Korea, Rep. 3,803 9,572 16,396 341 20.3 11.4 15.7Taiwan, China 4,759 7,190 10,841 474 8.6 8.6 8.6United States 193,337 192,743 205,320 678 –0.1 1.3 0.6
Source: Thomson Scientific, Science Citation Index (SCI) and Social Sciences Citation Index (SSCI),http://scientific.thomson.com/products/categories/citation/; ipIQ, Inc.; and National Science Foundation, Division ofScience Resources Statistics, special tabulations, as published in Science and Engineering Indicators 2008; populationdata from World Bank database, accessed May 7, 2008; National Statistics, Taiwan, China, http://eng.stat.gov.tw/lp.asp?ctNode=2265&CtUnit=1072&BaseDSD=36.
Note: Article counts are for the set of journals covered by the SCI and SSCI. Articles are classified by year of publica-tion and are assigned to economies on the basis of the institutional addresses listed in the article. For articles wherecollaborating institutions are from multiple economies, each economy receives fractional credit on the basis of theproportion of the participating institutions.

240 | SACHI HATAKENAKA
high-tech industry, but they have contributed to the emergence of an entrepreneurialsector, both directly and indirectly, through spin-offs and through science parks,some of which had been established as early as the 1960s (Roper and Grimes 2005).
It is no accident that the resulting high-tech industry in Israel was highly R&D-oriented and had cutting-edge technological content. This poses a sharp contrast to
TABLE 2. Relative Prominence in Scientific Literature, Selected Economies, 1995 and 2003(index: 1.00 indicates that an economy’s share of cited literature equals its world share of scientific literature)
Rank Economy or group 1995 2003
1 Switzerland 1.189 1.1522 United States 1.013 1.0265 United Kingdom 0.830 0.8648 Finland 0.755 0.826
12 Ireland 0.662 0.76414 Israel 0.682 0.74215 EU-15 0.681 0.73719 Hong Kong, China 0.438 0.67222 Japan 0.551 0.57524 Singapore 0.422 0.50926 Chile 0.343 0.47828 Korea, Rep. 0.320 0.43929 Thailand n.a. 0.43230 Czech Republic n.a. 0.41731 Argentina 0.304 0.41132 Slovenia n.a. 0.40933 South Africa 0.325 0.40434 Taiwan, China 0.321 0.40135 Mexico 0.349 0.38536 Poland 0.295 0.36037 Brazil 0.314 0.35938 Slovak Republic n.a. 0.33940 Bulgaria 0.166 0.32541 China 0.218 0.29342 India 0.182 0.28443 Croatia 0.257 0.28144 Turkey 0.214 0.27845 Saudi Arabia 0.220 0.256
Source: Thomson ISI, Science Citation Index (SCI) and Social Sciences Citation Index (SSCI), http://www.isinet.com/products/citation/; ipIQ, Inc.; National Science Foundation, Division of Science Resources Statistics, special tabula-tions, Science and Engineering Indicators 2006.
Note: n.a., not applicable; EU-15 refers to the 15 countries of the European Union before the expansion in member-ship of May 1, 2004. The relative prominence of scientific literature is measured on the basis of the relative citationindex of an economy, that is, the economy’s share of cited literature adjusted for its share of published literature. Theeconomy’s citation of its own literature is excluded. An index of 1.00 indicates that the economy’s share of cited liter-ature equals its world share of scientific literature. An index greater than 1.00 or less than 1.00 indicates that the econ-omy’s literature is cited relatively more or less, respectively, than its share of scientific literature. Economies with ashare of world publications in the cited field of less than 10 percent during the period are either excluded or are listedas n.a. In the case of cited articles with collaborating institutions from multiple economies, each economy receivesfractional credit on the basis of the proportion of its participating institutions.
HIGHER EDUCATION IN HIGH-TECH INDUSTRIAL DEVELOPMENT | 241
other emerging economies. Whereas the software industry in India and Ireland largelygrew by providing software services, Israel’s software industry developed on the basisof niche software products with global applications. Israel’s innovation capabilities,as gauged, for example, by its patenting performance, lags behind that of Japan and the United States but is comparable with that of Finland and Taiwan, China(Trajtenberg 2001). Israel’s ICT industry displays a marked concentration onupstream R&D, compared with the Finnish ICT industry, which covers a wider valuechain ranging from R&D and production to marketing and distribution, or with Ireland’s, which has hardly any R&D (Roper and Grimes 2005).
In summary, relevant research universities appear to contribute by
• Conducting basic research in fields pertinent to developments in industry and dis-seminating such knowledge through a variety of activities such as patenting andlicensing, academic spin-offs, consulting, and advising
• Providing updated skills in areas relevant to industry, both in undergraduate education and in advanced research training for masters and PhDs.
Basic Research Universities
Basic research universities are characterized by an academic ethos of scientific auton-omy, and it would not be surprising to find that they are less proactive than relevantresearch universities. Nonetheless, they are capable of supporting the development ofhigh-tech industry with high technological content, through both research and edu-cation. One example is postwar Japan, where a group of national and some privateuniversities developed to become basic research universities. Their contributions tothe development of high-tech industry have not been very visible, and Japanese pol-icy makers and industrialists were often critical of them because they were deemed tobe less responsive than their American peers. There is, however, consistent evidencethat Japanese universities’ contributions are underrated and that they have played adifferent but “important” role as compared with their American peers (Yoshiharaand Tamai 1999; Pechter and Kakinuma 1999; Kodama and Suzuki 2007). Someanalysts have coined the term “receiver-active paradigm” to describe this technologytransfer phenomenon; it was the technology-receiving industry, rather than the uni-versities, that actively defined how and when technology transfer took place(Kodama and Suzuki 2007).
Indeed, Japanese companies have been extremely active in using universities toacquire new scientific knowledge. An unusual mechanism that brought universityacademics and industry together was industries’ practice of sending their staff to uni-versities, not for any specific education programs but, more generally, to study, some-times for a whole year. This practice was often motivated by a desire to learn aboutfields of science in which industry had limited expertise (Hicks 1993; Darby andZucker 1996). Accordingly, in biotechnology, “star scientists” worked with companyemployees in their university laboratories, resulting in higher levels of coauthorshipthan in the United States (Darby and Zucker 1996). Other researchers also find
242 | SACHI HATAKENAKA
that Japanese academics’ relationships with companies are equivalent to those pre-vailing in the United Kingdom and the United States, at least as measured by coau-thorships (Pechter and Kakinuma 1999), but that companies had to be proactive ineliciting scientific and technological information from the universities (Kodama andSuzuki 2007).
Japanese universities have been much less active in directly engaging in the com-mercialization of science. In the early development of biotechnology, Japanese uni-versities played a negligible role in forming new companies in Japan, in striking contrast to the visibility and dominance of academic spin-offs in the United Kingdomand the United States (Henderson, Orsenigo, and Pisano 1999). This was partlybecause of the unevenness of Japanese science, at least at the outset; there were liter-ally no researchers in Japan working in genetic engineering at the time of the scien-tific breakthroughs (Darby and Zucker 1996). But even when they did catch up in science, universities as organizations did not permit their civil servant “star scientists” to work in the same way in new companies (Darby and Zucker 1996).
Similar passive, albeit important, roles are also evident in education. Japaneseuniversities made a significant contribution by supplying large numbers of engi-neers and scientists at the undergraduate and master’s levels, something that wasessential for the birth and development of the electronics industry. A group ofhighly selective Japanese national universities with large science and engineeringfaculties was particularly important in producing high-caliber scientists and engi-neers. Companies, however, had to develop significant capability for impartingthe necessary skills to graduates through extensive in-house training. A form ofdivision of labor developed whereby universities selected students and providedgeneral academic training, while companies carried out the necessary specialisttraining, even for R&D personnel.
Moreover, it was not universities that proposed massive expansion in scienceand engineering programs; it was government that, in response to industrialdemand, planned such an expansion through funding. Indeed, Japanese universi-ties were generally slow to respond to emerging needs for industrial skills in, forinstance, new areas such as software-related engineering, semiconductors, andbiotechnology (Baba, Takai, and Mizuta 1996; Darby and Zucker 1996; Mowery1999; Kobayashi 2001). They were also slow in establishing relevant researchtraining. Although master’s programs in engineering had become commonplace by the 1980s, doctoral programs in science and engineering remained small andunattractive for industry (Clark 1995; Shimizu and Mori 2001; see also table 3).PhDs from universities were too narrowly specialized and too academically ori-ented for industry. Instead, industry recruited bright potential researchers withless academic training and trained them in-house, using the unique Japanese systemin which doctorates were awarded by universities for dissertations that were writtenmainly in the companies, without detailed supervision by academics (Shimizu andMori 2001). The companies took the extreme route of developing in-house train-ing to cultivate doctoral-level researchers.
In summary, basic research universities can contribute to high-tech industry indeveloping scientific capacity and in providing scientific information, although in the

HIGHER EDUCATION IN HIGH-TECH INDUSTRIAL DEVELOPMENT | 243
case of Japan this required proactive work on the part of industry. Such universitiescan also provide large numbers of well-educated scientists and engineers, even thoughthe graduates’ training may not be fine-tuned to specific industrial technologicalneeds. The great selectivity of Japanese universities was helpful for industry, whichactively used such selectivity for identifying high-caliber talents.
Practically Oriented Institutions
Practically oriented institutions are unique in that they offer specialized engineeringand science skills that are directly relevant to industrial needs. In Finland and Irelandprofessional institutions were created as an alternative to conventional universityeducation, which was seen as unresponsive to industrial needs. Institutional respon-siveness was particularly important when new disciplines such as computer scienceemerged, and it appeared to give countries a competitive edge, as was clear in the caseof Ireland.
In Ireland, the government-led expansion of technically trained manpower in the1970s and 1980s was important in attracting multinational corporations (MNCs),including ICT enterprises. The starting point was a consensus that emerged earlyamong policy makers that technical education was essential but that universities wereoverly academic and that a different type of institution was needed to provide thecritically needed technical manpower (White 2001). Thirteen regional technical col-leges and two national institutes of higher education were established in the 1970sfor this purpose, representing the bulk of expansion in the tertiary sector. They wereestablished specifically to be responsive to economic needs, and they are knowntoday as having well-established practices in, for instance, assessing industrial needsand obtaining industrial inputs in curricular content (Breznitz 2007).
TABLE 3. Total Enrollment, Advanced Research (PhD) Programs, Selected Economiesand Selected Years, 1970–2006(numbers enrolled, except as otherwise specified)
Percent of
Economy 1970 1980 1990 2000 2003 2006 total, 2006
China — — — 54,038 108,737 — —Finland — — — 19,750 19,846 22,145 7.2India — — — 55,019 65,357 36,519 —Ireland — — — 2,904 3,816 5,146 2.8Israel — — — 6,647 7,944 9,715 3.1Japan 13,243 18,211 28,354 59,007 68,245 75,028 1.8Korea, Rep. — — — 28,924 34,712 41,055 1.3Taiwan, China 166 673 4,437 13,822 21,658 29,839 2.3United States — — — 293,002 306,889 388,685 2.2
Source: UNESCO database accessed May 7, 2008; Education Statistics, Ministry of Education, Science and Technology,Japan; Education Statistics, Ministry of Education, Taiwan, China.
Note: —, not available. UNESCO, United Nations Educational, Scientific, and Cultural Organization.

244 | SACHI HATAKENAKA
Finland also made a decisive move to create a set of responsive institutions whenit established 29 polytechnics in the 1990s. By 2000, nearly 60 percent of entrants tohigher education were going to polytechnics. Although it is still early to assess the fullimpact of polytechnics in Finland, their early performance reviews have been positive,and there are indications that their expansion coincided with the timing of majorindustrial needs, particularly in telecommunications (OECD 2003). In one survey ofhigh-tech industry in northern Finland, 47 percent of companies said that poly -technics were important, compared with 38 percent saying the same of a universitywith a known regional orientation, and with 10–20 percent for other universities inFinland (Juahiainen 2006).
Both Korea and Taiwan, China, invested in application-oriented research capacityin government research institutes, which had a significant part in developing domestictechnological capacity within high-tech industry. The fact that such capacity wasbuilt outside universities is perhaps not surprising, given that it is faster and easier toconcentrate resources in dedicated institutions. Such decisions did, however, have con-sequences, particularly in the case of Korea, in delaying the development of researchcapacity in universities, with the notable exception of the Korea Advanced Instituteof Science (KAIS), discussed below.
The experience of Taiwan, China, with high-tech industry cannot be describedwithout citing the story of the Electronic Research Service Organization (ERSO), apublic research institution. ERSO is a branch of the Industrial Technology ResearchInstitute (ITRI) and was at the heart of the economy’s acquisition of technologicalknow-how in semiconductors. ERSO orchestrated the first major technology trans-fer agreement, with RCA in the 1970s. It subsequently developed an integrated cir-cuit (IC) fabrication technology and established a spin-off company that in turn wasimportant in the diffusion of technological know-how (Wade 1990; Saxenian 2004).The industry in Taiwan, China (unlike the cases of Japan and Korea), included manysmall-to-medium-size enterprises that lacked the capability to undertake significantR&D in-house, and public investment in applied research was essential for their technological upgrading (Wade 1990).
The Korean experience of investing in application-oriented research capacity ingovernment research institutes is somewhat less visible, but it has been important inbuilding corporate research capacity. An example is the Korea Institute of Scienceand Technology (KIST), established in 1966 and staffed by Korean scientists andengineers brought back from abroad, one of the early efforts to reverse the braindrain. The institute was designed to undertake contract research with both industryand government and was particularly active in facilitating technology transfer fromforeign firms to local firms (Mazzoleni and Nelson 2007). KIST provides an inter-esting and exceptional example because it later became amalgamated with the KoreaAdvanced Institute of Science (KAIS), a graduate-level educational institution estab-lished in the 1970s specifically to fill an important gap in Korean higher educationby creating high-level skills of industrial relevance (Mazzoleni and Nelson 2007). Itis thus possible, even though not common, for research capacity developed in gov-ernment research institutes to contribute directly to the evolution of higher educationinstitutions.

HIGHER EDUCATION IN HIGH-TECH INDUSTRIAL DEVELOPMENT | 245
Teaching-Focused Institutions
In the early stage of development of high-tech industry, companies often recruitedgeneric science and engineering graduates who were not necessarily trained in a spe-cialization relevant to the industry. In China, India, Japan, Korea, and Taiwan,China, these graduates mainly came from teaching-focused institutions because manyinstitutions simply had not yet developed research capacity. All these governmentsemphasized science and engineering. Beyond this general statement, there is a signif-icant divergence in what happened in each case.
In Japan the government, in response to growing industrial demand in the late1950s through the early 1960s, aggressively promoted science and engineering under-graduate programs not only in national universities but also in private universities,which were largely teaching oriented (Nakayama 1995). Most private universities in Japan had limited resources for undertaking science and engineering programs orresearch. It was through special government subsidies, which provided up to half ofundergraduate student costs and two-thirds of the associated investment costs inscience and engineering, that private universities managed to establish programs inthese disciplines (Nakayama 1995). This push no doubt helped Japan produce a largenumber of scientists and engineers; students in these fields constituted 27–28 percentof all undergraduates in the late 1960s through the 1980s (table 4).
Korea and Taiwan, China, made earlier moves toward emphasizing science andengineering relative to their industrial development, which resulted in massive braindrains. In Korea more than a third of undergraduate enrollments were in scienceand engineering by the mid-1960s (table 4), and the proportion increased to over40 percent in the subsequent period in spite of the great expansion of the higher education sector that was taking place. Korea today has one of the world’s highest
TABLE 4. Undergraduate Science and Engineering Enrollments, Japan and theRepublic of Korea, Including Agriculture and Excluding Medicine, Selected Years,1960–2005
Country
and
indicator 1960 1965 1970 1975 1980 1985 1990 1995 2000 2005
Japan
Number
enrolled 136,818 238,596 375,598 443,180 451,904 463,336 524,201 611,351 625,371 590,549
Percent
of total
enrollment 23 27 28 27 26 27 26 26 25 24
Korea, Rep.
Number
enrolled — 37,099 59,264 74,410 166,137 337,624 419,891 523,002 — —
Percent
of total
enrollment — 35 34 36 41 36 40 44 — —
Source: Japan, MEXT, 2006; Weidman and Park 2000.

246 | SACHI HATAKENAKA
tertiary enrollment ratios, at 91 percent (table 5), and one of the highest proportionsof science and engineering students (table 6). In Taiwan, China, the proportion of sci-ence and engineering enrollments was about a quarter through the early 1970s andgradually increased from the mid-1970s through the 1990s to over 40 percent (table 7).In contrast, in 2005 India’s engineering students made up only 6 percent of total ter-tiary enrollments, and even when scientists are added, the proportion is significantlylower than for other economies, at 20 percent (see table 6). It is not that all thesecountries had high proportions of science and engineering in higher education.
TABLE 5. Tertiary Gross Enrollment Ratio, Selected Economies, Selected Years,1970–2006
Economy 1970 1975 1980 1985 1990 1995 2000 2005 2006
China 0 1 2 3 3 5 8 — 22Finland 13 28 32 34 48 70 83 92 93India 5 5 5 6 6 7 10 11 12Ireland 12 17 18 22 31 40 49 58 59Israel 18 23 29 33 36 41 50 58 58Japan 18 26 31 28 31 42 47 55 57Korea, Rep. 7 9 15 34 39 52 73 90 91Taiwan, China — — — — — 39 56 82 84United States 47 55 56 60 72 81 69 82 82
Source: UNESCO database; World Bank database accessed May 7, 2008; Education Indicators, Ministry of Education,Taiwan, China.
Note: UNESCO, United Nations Educational, Scientific, and Cultural Organization. The gross enrollment ratio is thetotal number of students in tertiary education, including graduate school, as a percentage of the population in thefive-year age group following on from secondary school–leaving age.
TABLE 6. Total Tertiary Enrollment in Science and Engineering, Selected Countries, 2005
Percent of total enrollment
Science Science/
Enrollment and engineering
Economy Science Engineering Total Science Engineering engineering ratio
Chinaa 1,443,129 5,536,123 18,352,821 8 30 38 0.3Finland 35,468 80,827 305,996 12 26 38 0.4Indiab 1,689,504 696,609 11,777,296 14 6 20 2.4Ireland 22,851 19,233 186,561 12 10 23 1.2Israel 29,967 56,812 310,937 10 18 28 0.5Japan 118,704 668,526 4,038,302 3 17 19 0.2Korea, Rep. 264,259 1,022,845 3,224,875 8 32 40 0.3UnitedStates 1,537,243 1,154,971 17,272,044 9 7 16 1.3
Source: UNESCO database, accessed May 7, 2008; for China, Zhou (2005).
Note: UNESCO, United Nations Educational, Scientific, and Cultural Organization.
a. 2004.b. 2001.

HIGHER EDUCATION IN HIGH-TECH INDUSTRIAL DEVELOPMENT | 247
One factor that appears to exert an influence going well beyond that of numbersis selectivity. China, India, Japan, Korea, and Taiwan, China, are alike in that theyhave highly selective institutions which recruit high-caliber students into engineeringnationally and which have set high quality standards in engineering schools. Fur-thermore, these institutions invariably have had a significant share of their institu-tional profile in engineering, and in that sense their origins were closer to practicallyoriented institutions than to generic teaching-focused ones. At the time of the eco-nomic take-off, there was little domestic demand for graduates from these selectiveschools. This meant that they were cheap, high-caliber resources with training in sci-ence and technology that emerging industries could readily tap into.
Roles of Higher Education Institutions Revisited
In this section, six different kinds of involvement by higher education institutions aresummarized, mainly to highlight the dependence of the nature of their participationin the economy on both institutional characteristics and the industrial context.
Education
Institutions have made diverse contributions in education. Generic teaching institu-tions and basic research universities produced generic scientists and engineers and leftthe companies to take the responsibility for developing specialized knowledge andskills. This role was particularly pronounced when the government intervened bypreferentially expanding science and engineering programs. Practically oriented insti-tutions were more proactive in keeping up with changing needs for industrial skillsand supplying specialized knowledge and skills as industry evolved. Relevantresearch universities were able to be similarly proactive at a higher level, in theirresearch training.
Research
Academics in relevant research universities were most proactive in conductingresearch and in working directly with research applications, assisted by universities’organizational capacity to promote and support consulting, patenting and licensing,and spin-offs. Basic research–oriented universities were less active in furtheringindustries’ commercialization goals but helped companies acquire better understand-ing of new scientific fields, provided advice, and conducted joint research, although
TABLE 7. Graduates in Science and Engineering, Including Agriculture and Excluding Medicine, Taiwan, China, Selected Years, 1960–95
Item 1960 1965 1970 1975 1980 1985 1990 1995
Number of graduates 1,655 2,689 7,987 19,716 25,672 37,965 50,490 82,938Percent of total graduates 27 25 24 33 36 42 44 46
Source: Lin 2004.
248 | SACHI HATAKENAKA
generally on the universities’ own terms. Other institutions, such as governmentresearch institutions and practically oriented universities, helped industry acquireexisting technologies through application-oriented research.
Spin-offs
University spin-offs appeared to play a visible role when there was a significantknowledge or capacity gap between universities and domestic industry. The gap couldtake very different forms, as demonstrated by the cases of biotechnology in the UnitedStates and ICT in China.
In the United States the knowledge gap had to do with fundamental scientific dis-coveries and with related tacit knowledge. In China the nature of the knowledge gapwas related to established technology, which was nonetheless new to China. Thehighly selective nature of Chinese universities also meant that they were better posi-tioned to assemble a group of high-caliber individuals to lead and work in new ven-tures than normal companies; universities in effect were able to exploit the widecapacity gap of available human resources.
Significant examples of academic spin-offs were associated with universities withrelevant research capabilities. Thus, in biotechnology in the United States, academicsfrom research universities became directly involved in spin-offs, and there were sim-ilar stories in various fields in Israel. In Ireland, where, because of lack of governmentfunding, universities did not develop research capacity until late (Sands 2005), aca-demic spin-offs were generally not common, but one computer science departmentdid develop an early research capacity, with European funding, and became knownfor its academic spin-offs (Breznitz 2007).
A very different experience was seen in China, where universities had becomeactive in creating enterprises since the late 1980s, even when they had little researchcapability. Although these enterprises are sometimes described as spin-offs, they aresignificantly different from the normal practice in that they are owned and managedby universities (Eun, Lee, and Wu 2006). Some of these companies have been spec-tacularly successful; they include three of the most successful personal computer (PC)companies, Lenovo, Founder, and Tongfang, which were created by the ChineseAcademy of Sciences, Beijing University, and Tsinghua University, respectively. About40 university enterprises are already listed on stock markets in China and HongKong, China (Eun, Lee, and Wu 2006).
Interestingly, the knowledge content of these spin-off companies does not oftenderive from significant scientific research; rather, the spin-off was the mechanismthrough which skilled personnel moved from universities to the commercial sector(Chen and Kenney 2007). These enterprises were a simple mechanism through whichuniversities could contribute to industrial capabilities in an environment of very lim-ited industrial capability (Eun, Lee, and Wu 2006). They resembled in this respectJapanese university start-ups in the early phase of industrial development (Odagiriand Goto 1996), when academics could behave as arbitragers of Western technologyand were in a good position to create companies, given the underdevelopedindustrial context.

HIGHER EDUCATION IN HIGH-TECH INDUSTRIAL DEVELOPMENT | 249
It is not clear how long this practice of university enterprises will continue inChina. Both the government and many universities may be going through a rethink-ing process, as many enterprises have not been successful and managerial responsi-bilities are increasingly demanding (Ma 2007; Kroll and Leifner 2008). It is likelythat China’s university enterprise experience was a phenomenon dictated by thespecific context of underdeveloped industry and a high concentration of talent in universities.
Science Parks
Taiwan, China, provides the most visible example of a highly successful science park,which had a critical part in the development of the semiconductor industry there. In1980 the government established a science park in Hsinchu, close to two of theisland’s best technical universities, and relocated ERSO to the park (Saxenian 2004).There was a certain division of labor, in that applied and relevant basic research wereundertaken by ERSO, while the universities largely appeared to supply graduates asmanpower to the park.
In China many high-tech zones, industrial parks, and science parks have been established close to universities by the central government and local authorities, as wellas by the universities themselves. The nature of their dynamic evolution is only begin-ning to be documented, but the diversity in approach is already evident (Chen and Kenney 2007). The park founded by local authorities in Zhongguancun in Beijing, closeto the Chinese Academy of Science as well as to Beijing and Tsinghua Universities, isconsidered one of the most successful in attracting multinational corporations’ R&Dinvestments. The park established by Tsinghua University on its campus has many suchR&D units, as well as spin-offs from the university. An interesting variant is Shenzhen,whose high-tech industrial park has been used to attract established universities to create a virtual campus.
Licensing
Licensing is one function that seems to be linked strongly to relevant research capacityin universities, as well as to the level of development of intellectual property– relatedinstitutions in the country. In the case of the United States, the patenting practiceevolved as one of many mechanisms for technology transfer from universities, predi-cated on huge government funding in relevant scientific research (Rosenberg and Nelson 1994; Mowery et al. 2004). An early development of professional support unitssuch as technology-licensing offices was also important for effective technology trans-fer through licensing. It is increasingly clear, however, that for most U.S. universities,patenting and licensing constitute a net drain rather than a source of additional income(Thursby and Thursby 2007).
The wider acceptance of the World Trade Organization (WTO) and other interna-tional regimes related to intellectual property will undoubtedly have consequencesfor the paths that future developing economies can take in catching up. Althoughit is important for developing countries and their universities to increase their

250 | SACHI HATAKENAKA
understanding of intellectual property, indiscriminate opening of technology transferoffices in universities with a view to patenting inventions may be unwarranted.
Brain Drain and Brain Circulation
Brain drain transformed into brain circulation appears to be more and more impor-tant to the introduction of high-tech industry in developing countries. This undoubt-edly reflects the increasingly global nature of higher education as well as labor markets in developed countries, many of which are actively recruiting professionalsfrom developing countries in areas of key skills shortages such as ICT. Such a braindrain can turn into brain circulation once appropriate domestic conditions are createdfor industrial development, when “brains” that are enriched with international expe-rience can return to their home countries.
Indeed, one feature of high-tech development in Taiwan, China, that distinguishesit from the cases of Japan and Korea, is the visible role played by the diaspora of engineers, particularly in Silicon Valley, and the transformation of the brain draininto brain circulation linked directly to the birth of high-tech industry (Saxenian1999, 2004, 2006; Saxenian, Motoyama, and Quan 2002). Almost 80 percent of thediaspora professionals in Silicon Valley had gone to the United States to study andremained there for work (Saxenian, Motoyama, and Quan 2002). Early generationsof the diaspora were instrumental in informing the home government about SiliconValley and its unusual dynamism, inspiring an early policy of building a similar cluster (Saxenian 2004). Hsinchu Science Park represents a Taiwanese attempt torecreate Silicon Valley, and indeed the park later became an active recipient of thereturning diaspora, with 40 percent of its companies started by returnees (Wade 1990;Saxenian 2004).
It is well known that Taiwan, China, suffered a huge brain drain that started in the1950s and lasted until the 1990s. Interestingly, the government nevertheless continuedorganizing programs of overseas study to complement the domestic education system.In 1975, 2,300 students were studying under government auspices; in 1986 the figurewas 7,000 (Wade 1990). This was happening in the midst of the massive brain drain,which was estimated at 20 percent of all engineering graduates in the late 1970s (Houand Gee 1993). Instead of ceasing to send students abroad, the government steppedup efforts to keep in touch with the diaspora community (Wade 1990). The benefitsof this policy were finally felt in the 1990s, when the brains started to return.
China and India, too, experienced brain drain to Silicon Valley. In the survey ofSilicon Valley professionals, over half of Indians and nearly 80 percent of mainlandChinese there had originally come to the United States for their education (Saxenian,Motoyama, and Quan 2002). China was able to benefit doubly from diasporas, asthe Hsinchu–Silicon Valley–Shanghai nexus developed through (broadly defined)overseas Chinese engineers, including those originally from Taiwan, China (Saxenian2006). In the early 2000s the Chinese government stepped up efforts to recruit backthe overseas Chinese.
The dominance of Indian entrepreneurs in U.S. high-tech companies, and notonly in Silicon Valley, is well documented (Saxenian, Motoyama, and Quan 2002;
HIGHER EDUCATION IN HIGH-TECH INDUSTRIAL DEVELOPMENT | 251
Wadhwa et al. 2007). This highly entrepreneurial diaspora was important as a “reputational intermediary” in connecting Indian firms to client U.S. firms and inbringing American multinationals to India (Kapur 2002; Kapur and McHale 2005; Saxenian 2006).
Even during the brain drain, selectivity appears to have played a role. The com-petitive entrance system for higher education meant that some engineering collegesand universities had elite status, and it was largely graduates from such institutionswho became critical members of the diaspora and formed vibrant alumni networks(Saxenian 2004). Such networks were important for solving technical problems, withformer teachers as well as former classmates serving as important sources of technicalinformation.
In China, India, and Taiwan, China, the brain drain was often triggered by prospectsof graduate education abroad. In all three cases, graduates from the most select institutions actively pursued opportunities in graduate education abroad and succeededin finding places, notably in good American research universities. It is easy to imaginethat in their search for the best U.S. graduate schools, these graduates would have benefited from having been at elite home institutions, with active peer interactions providing information about studying abroad and with letters of recommendation fromhome institutions that enjoyed credibility. It is almost as though graduate schools in theUnited States became a natural extension of the domestic education system.
It is also interesting to observe the differing approaches taken by governments.The government of Taiwan, China, offered fellowships for study abroad even at theheight of the brain drain, apparently in the belief that the economy would gain in theend. A decade later the Chinese government was doing something similar. Both valued foreign education sufficiently to send graduates abroad in the first place, butboth also worked hard to bring them back. It is as if, for both, foreign institutions,particularly in the United States, functioned as a critical component of the highereducation system, providing the kind of education that their domestic institutionscould not offer. India, which also suffered a severe brain drain, particularly of high-caliber graduates, was somewhat hostile to the idea of expatriate Indians until muchlater and was also slower in orchestrating the use of expatriate brains (Saxenian1999, 2006).
Evolution of the Universities
Although all four types of institution discussed above had some economic role in thedevelopment of high-tech industry, the “responsive” institutions in the right-handcells of figure 2 appear to have participated much more proactively and directly inhelping high-tech industry emerge and evolve. Yet such institutions do not seem toemerge naturally. In all cases government action was critical in founding them and ininfluencing their missions and orientations. In this section the evolution of the vari-ous types of institution in specific countries is examined to aid understanding of theunderlying dynamics.
252 | SACHI HATAKENAKA
Building Responsiveness
In the United States the emergence of a group of responsive institutions was no acci-dent. A whole group of American universities, the land grant colleges, was foundedin the late nineteenth century with the explicit objective of serving the practicalneeds of the community. The federal government supported their establishmentthrough special grants and continued to sustain their growth by funding some oftheir service activities, such as agricultural extension. This group was a wide mix,ranging from broad institutions such as Cornell and Purdue Universities to institu-tions oriented toward industrial training, such as the Massachusetts Institute ofTechnology. That universities could and should be useful to society became a beliefshared by government, the public, and universities broadly. The responsiveness ofAmerican universities in teaching was well established in those early days, and itwas their responsiveness that generated new subjects such as electrical, chemical,and aeronautical engineering (Rosenberg and Nelson 1994).
Before World War II, private foundations provided key support to some universi-ties, helping them undertake research that was relevant and useful to society (Geiger2004b). But it was the spectacular success with the use of science to develop key mil-itary technology during World War II that brought about a new level of commitmentto “useful scientific research” by government, universities, and the public alike. Post-war government research funding was massive but also mission oriented, comingfrom key agencies with application interests such as defense, health, and energy(Rosenberg and Nelson 1994; Geiger 2004a). The role of the Defense AdvancedResearch Projects Agency (DARPA) in funding application-oriented basic researchwas legendary—so much so that the U.S. National Academy of Sciences has recentlyrecommended the creation of a DARPA-like agency in energy to ensure the contin-ued competitiveness of American science (NAS 2005).
In Ireland and Finland universities moved toward the right-hand side of figure 2,becoming more responsive over the past decades. In both cases there had been concernthat universities were detached from industry and were unable to meet changing labormarket needs (White 2001; OECD 2003). Both governments invested in creating alarge group of practically oriented institutions, as described above, but also pushedtheir universities to become more economically relevant. Investments to create sizablealternatives to universities exerted pressure on universities to become more sensitive toeconomic needs. In Ireland the government funded the establishment of new technicalprograms at universities and technical institutions that were considered relevant toindustry. In Finland significant public investments were made in strategic areas ofR&D, with much emphasis on collaboration between companies and universities(OECD 2003; Dahlman, Routti, and Yla-Anttila 2007; Srinivas and Viljamaa 2008).
Today, Finland has a diverse university sector, with varying levels of universityinclination to work with industry. Some universities with a technological orientationor regional development missions are much more active in working with industry andreceive much larger shares of funding from the Finnish Funding Agency for Technol-ogy and Innovation (TEKES), which provides competitive grants for application- oriented research (Finland, Ministry of Education, 2005).

HIGHER EDUCATION IN HIGH-TECH INDUSTRIAL DEVELOPMENT | 253
The Oulu University of Applied Sciences was important in the transformation ofOulu Province from a sleepy backwater to a vibrant high-tech center (Donnelly andHyry 2004). Established in the 1950s with the specific mission of helping the regiondevelop, the university has been proactive in its choice of disciplinary coverage andresponsive in its educational program. An electrical engineering department wasestablished early, well before industrial needs emerged, but the university alsoresponded quickly to meet emerging skills shortages, for instance, in managementeducation (Donnelly and Hyry 2004). The university’s responsiveness led to thedevelopment of relevant research centers in which both basic and applied researchwere undertaken, often jointly with industry, and with some academic spin-offs.
In China the government has, since the 1980s, been taking steps to reform thehigher education system. In retrospect, the measures employed have been remarkablyconsistent in pushing key universities toward the American relevant research univer-sity model (Ma 2007). In the science and technology reform that began in the 1980s,the role of these fields in economic development was strongly emphasized. Publicresearch institutes were to reorient the content of their research to meet economicneeds, and universities were to develop research capacity relevant to society, for thefirst time. The official endorsement did not mean that government funding was forth-coming for research. Although the Chinese National Science Foundation was estab-lished in 1986 to provide competitive grants for basic research projects in publicresearch institutions, as well as in universities, university budgets had been cut andwere extremely tight. Universities had strong incentives to generate their ownincomes through industrial contracting (Ma 2007). This was the context in whichuniversities began to develop a certain responsiveness to industry, through contractresearch and consulting and by setting up their own enterprises.
The government has also supported the emergence of elite research universitiesthrough a series of special programs, from the key university and key laboratory pro-grams in the 1980s to the more famous Projects 211 and 985 in the 1990s, whichconcentrated government funding on the top 100 and top 9 universities, respectively(Ma 2007). Together with the gradual development of competitive funding forresearch, these initiatives resulted in strong incentives for universities to be researchoriented and compete globally to become world-class institutions (Ma 2007). It is noaccident that one of the first global rankings of universities was designed by a Chinese university; Chinese institutions were developing such indicators to gaugetheir positions in the world.
Moving away from Responsiveness
The path taken by Japanese universities provides an interesting contrast to that in theUnited States. The starting points in the two countries were similar in that Japan’s firstuniversity, the University of Tokyo, was developed in the late nineteenth century as acritical instrument for Japan’s modernization—specifically, to teach useful scientificknowledge. At the time, the university’s structure of having practically oriented facul-ties such as engineering, agriculture, medicine, and law, along with science and litera-ture, was highly unusual even in global terms (Bartholomew 1989). Other imperial

254 | SACHI HATAKENAKA
universities were established along the lines of the Tokyo University model, and collectively they helped introduce key technologies and knowledge essential forJapan’s early industrialization. University academics and graduates were critical in thebirth of many of Japan’s technology-oriented enterprises, such as Toyota, Toshiba, andsome pharmaceutical companies (Odagiri and Goto 1996). Indeed, Japanese versionsof university start-ups are visible in many corporate histories. Large companies habit-ually sponsored university facilities, and academics actively served as technical consultants (Hashimoto 1999). Even the largest industrial corporations had limitedresearch facilities or capabilities in those days, and university academics undertookapplication-oriented research that was relevant to the companies.
After World War II, Japanese universities embarked on an evolutionary pathtoward becoming basic research universities and began to be somewhat removedfrom industrial development (Hatakenaka forthcoming). In a striking contrast to theUnited States, where the successful role of science in military technology had reinforced public confidence, Japanese academics moved away from the military- industrial complex (Hatakenaka 2004). When industry began to acquire foreigntechnology in the 1950s, universities had a minimal role in the process (Hashimoto1999). In the 1960s, industries recruited their own researchers, often from universi-ties, to establish corporate laboratories (Nakayama 1991), marking the beginning ofa new era in which corporate research became a dominant force in industrial inno-vation (Nakayama 1995). In the late 1960s, student uprisings led to further criticismof university-industry relationships, and a strong sentiment for limiting such rela-tionships prevailed (Hashimoto 1999; Hatakenaka 2004). Institutional mechanismsfor working with industry remained underdeveloped under this culture of censorship;the bulk of scientists and engineers were civil servants in national universities, sub-ject to rules that forbade them to consult with industry, and universities lacked theautonomy to create their own rules.
Although individual academics did work with industry, their modes of engagementwere distinctly different from those of American universities. Relationships wereformed principally by industries doing the legwork of coming to individual academ-ics, extracting information, and making every effort to learn from the universities, ina receiver-active technical transfer model (Kodama and Suzuki 2007). There was sur-prisingly little interaction between universities and companies concerning the contentof education (Dore and Sako 1989), and universities made little organizational effortto work with industry, until recently. Rather, companies expected universities to be nomore than a selection mechanism, and they developed in-house capabilities and prac-tices to train graduates in the needed specializations. An important consequence of thissystem was that Japanese universities did not learn to respond to emerging needs forindustrial skills. This detachment increasingly became an issue for industry as it movedinto advanced-technology fields, particularly when new industries such as computersoftware, semiconductors, and biotechnology developed in the 1980s (Baba, Takai,and Mizuta 1996; Darby and Zucker 1996; Kobayashi 2001). In a comparative analy-sis of Stanford University and the Tokyo Institute of Technology (TIT), curricularchange was found to be infrequent and limited in scope at the TIT, whereas at Stanfordupdating took place organically and almost constantly (Harayama 2001; Hoshino,
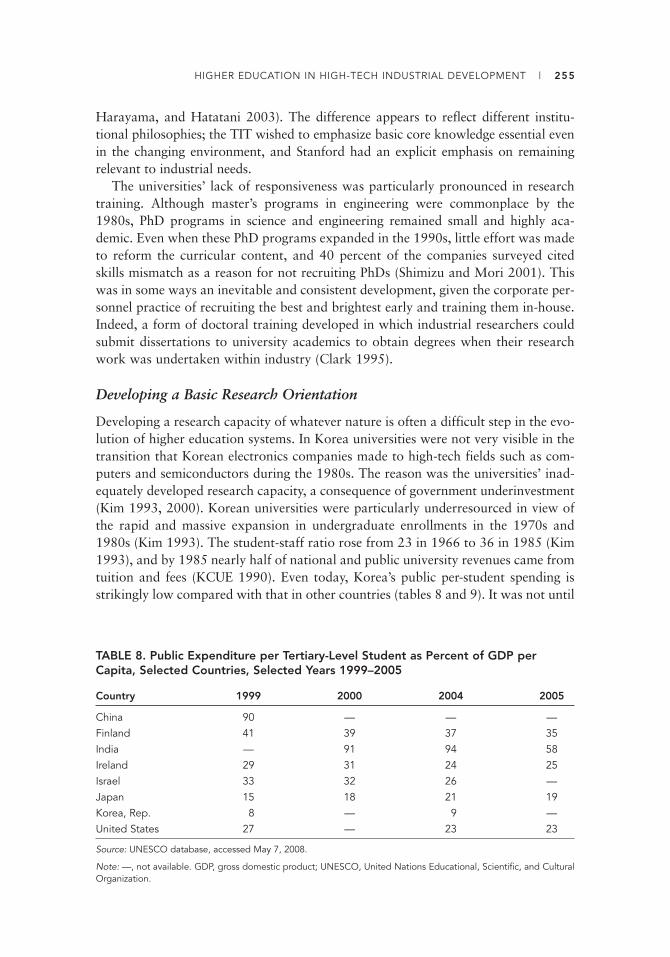
HIGHER EDUCATION IN HIGH-TECH INDUSTRIAL DEVELOPMENT | 255
Harayama, and Hatatani 2003). The difference appears to reflect different institu-tional philosophies; the TIT wished to emphasize basic core knowledge essential evenin the changing environment, and Stanford had an explicit emphasis on remaining relevant to industrial needs.
The universities’ lack of responsiveness was particularly pronounced in researchtraining. Although master’s programs in engineering were commonplace by the1980s, PhD programs in science and engineering remained small and highly aca-demic. Even when these PhD programs expanded in the 1990s, little effort was madeto reform the curricular content, and 40 percent of the companies surveyed citedskills mismatch as a reason for not recruiting PhDs (Shimizu and Mori 2001). Thiswas in some ways an inevitable and consistent development, given the corporate per-sonnel practice of recruiting the best and brightest early and training them in-house.Indeed, a form of doctoral training developed in which industrial researchers couldsubmit dissertations to university academics to obtain degrees when their researchwork was undertaken within industry (Clark 1995).
Developing a Basic Research Orientation
Developing a research capacity of whatever nature is often a difficult step in the evo-lution of higher education systems. In Korea universities were not very visible in thetransition that Korean electronics companies made to high-tech fields such as com-puters and semiconductors during the 1980s. The reason was the universities’ inad-equately developed research capacity, a consequence of government underinvestment(Kim 1993, 2000). Korean universities were particularly underresourced in view ofthe rapid and massive expansion in undergraduate enrollments in the 1970s and1980s (Kim 1993). The student-staff ratio rose from 23 in 1966 to 36 in 1985 (Kim1993), and by 1985 nearly half of national and public university revenues came fromtuition and fees (KCUE 1990). Even today, Korea’s public per-student spending isstrikingly low compared with that in other countries (tables 8 and 9). It was not until
TABLE 8. Public Expenditure per Tertiary-Level Student as Percent of GDP per Capita, Selected Countries, Selected Years 1999–2005
Country 1999 2000 2004 2005
China 90 — — —Finland 41 39 37 35India — 91 94 58Ireland 29 31 24 25Israel 33 32 26 —Japan 15 18 21 19Korea, Rep. 8 — 9 —United States 27 — 23 23
Source: UNESCO database, accessed May 7, 2008.
Note: —, not available. GDP, gross domestic product; UNESCO, United Nations Educational, Scientific, and CulturalOrganization.
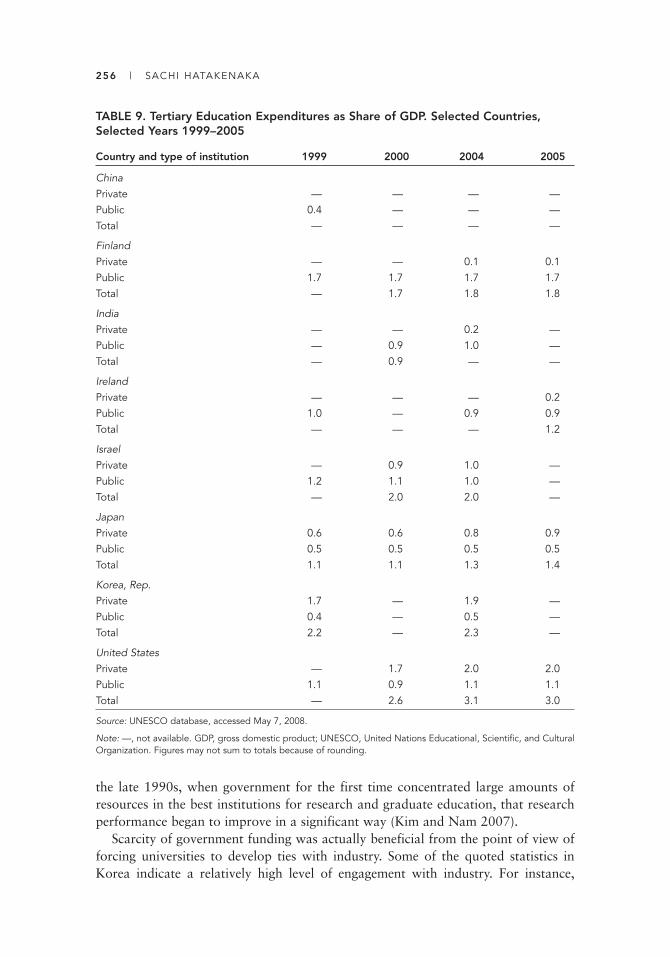
256 | SACHI HATAKENAKA
TABLE 9. Tertiary Education Expenditures as Share of GDP. Selected Countries,Selected Years 1999–2005
Country and type of institution 1999 2000 2004 2005
ChinaPrivate — — — —Public 0.4 — — —Total — — — —
FinlandPrivate — — 0.1 0.1Public 1.7 1.7 1.7 1.7Total — 1.7 1.8 1.8
IndiaPrivate — — 0.2 —Public — 0.9 1.0 —Total — 0.9 — —
IrelandPrivate — — — 0.2Public 1.0 — 0.9 0.9Total — — — 1.2
IsraelPrivate — 0.9 1.0 —Public 1.2 1.1 1.0 —Total — 2.0 2.0 —
JapanPrivate 0.6 0.6 0.8 0.9Public 0.5 0.5 0.5 0.5Total 1.1 1.1 1.3 1.4
Korea, Rep.Private 1.7 — 1.9 —Public 0.4 — 0.5 —Total 2.2 — 2.3 —
United StatesPrivate — 1.7 2.0 2.0Public 1.1 0.9 1.1 1.1Total — 2.6 3.1 3.0
Source: UNESCO database, accessed May 7, 2008.
Note: —, not available. GDP, gross domestic product; UNESCO, United Nations Educational, Scientific, and CulturalOrganization. Figures may not sum to totals because of rounding.
the late 1990s, when government for the first time concentrated large amounts ofresources in the best institutions for research and graduate education, that researchperformance began to improve in a significant way (Kim and Nam 2007).
Scarcity of government funding was actually beneficial from the point of view offorcing universities to develop ties with industry. Some of the quoted statistics inKorea indicate a relatively high level of engagement with industry. For instance,
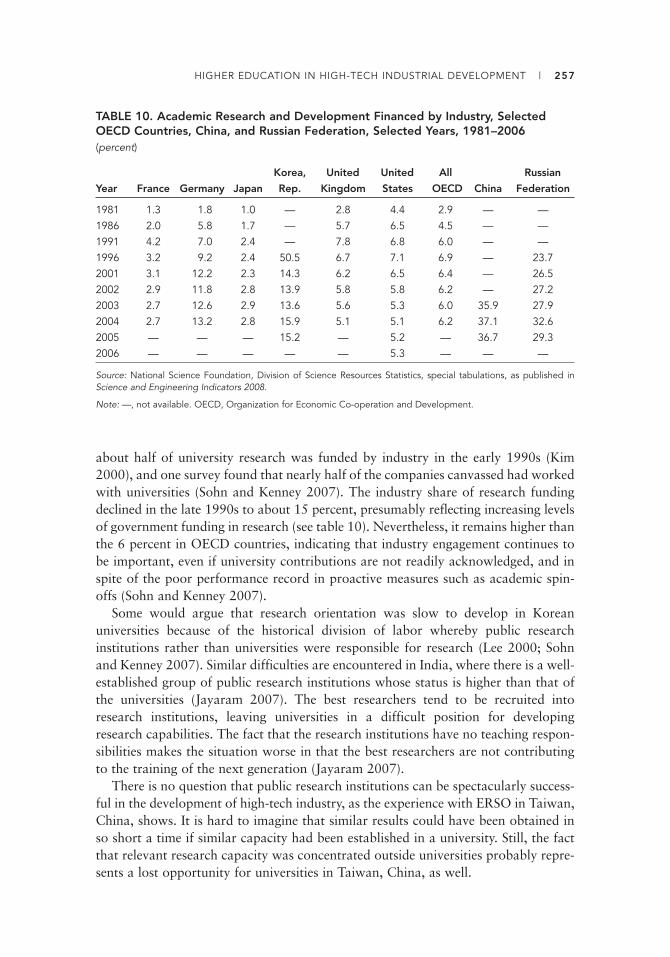
HIGHER EDUCATION IN HIGH-TECH INDUSTRIAL DEVELOPMENT | 257
about half of university research was funded by industry in the early 1990s (Kim2000), and one survey found that nearly half of the companies canvassed had workedwith universities (Sohn and Kenney 2007). The industry share of research fundingdeclined in the late 1990s to about 15 percent, presumably reflecting increasing levelsof government funding in research (see table 10). Nevertheless, it remains higher thanthe 6 percent in OECD countries, indicating that industry engagement continues tobe important, even if university contributions are not readily acknowledged, and inspite of the poor performance record in proactive measures such as academic spin-offs (Sohn and Kenney 2007).
Some would argue that research orientation was slow to develop in Korean universities because of the historical division of labor whereby public research institutions rather than universities were responsible for research (Lee 2000; Sohnand Kenney 2007). Similar difficulties are encountered in India, where there is a well-established group of public research institutions whose status is higher than that ofthe universities (Jayaram 2007). The best researchers tend to be recruited intoresearch institutions, leaving universities in a difficult position for developingresearch capabilities. The fact that the research institutions have no teaching respon-sibilities makes the situation worse in that the best researchers are not contributingto the training of the next generation (Jayaram 2007).
There is no question that public research institutions can be spectacularly success-ful in the development of high-tech industry, as the experience with ERSO in Taiwan,China, shows. It is hard to imagine that similar results could have been obtained inso short a time if similar capacity had been established in a university. Still, the factthat relevant research capacity was concentrated outside universities probably repre-sents a lost opportunity for universities in Taiwan, China, as well.
TABLE 10. Academic Research and Development Financed by Industry, SelectedOECD Countries, China, and Russian Federation, Selected Years, 1981–2006(percent)
Korea, United United All Russian
Year France Germany Japan Rep. Kingdom States OECD China Federation
1981 1.3 1.8 1.0 — 2.8 4.4 2.9 — —1986 2.0 5.8 1.7 — 5.7 6.5 4.5 — —1991 4.2 7.0 2.4 — 7.8 6.8 6.0 — —1996 3.2 9.2 2.4 50.5 6.7 7.1 6.9 — 23.72001 3.1 12.2 2.3 14.3 6.2 6.5 6.4 — 26.52002 2.9 11.8 2.8 13.9 5.8 5.8 6.2 — 27.22003 2.7 12.6 2.9 13.6 5.6 5.3 6.0 35.9 27.92004 2.7 13.2 2.8 15.9 5.1 5.1 6.2 37.1 32.62005 — — — 15.2 — 5.2 — 36.7 29.32006 — — — — — 5.3 — — —
Source: National Science Foundation, Division of Science Resources Statistics, special tabulations, as published in Science and Engineering Indicators 2008.
Note: —, not available. OECD, Organization for Economic Co-operation and Development.

258 | SACHI HATAKENAKA
Finland’s experience shows that it is possible to link applied research capacity inpublic research institutions to universities in a productive way. When Finland madeits bid to turn itself into a knowledge economy in the early 1990s, a key componentof its policies was large public investment in collaborative R&D among universities,public research institutions, and companies, orchestrated by TEKES (Dahlman,Routti, and Yla-Anttila 2007).
China promoted the research role of universities early on, despite the existence ofpublic research institutions. In the science and technology reform starting in the1980s, the Chinese government took action both to reorient government researchinstitutions toward becoming economically relevant and to recognize, for the firsttime, the research role of universities in economic development.
Concluding Remarks
This paper has argued that institutions contribute to the development of high-techindustry in different ways. It has also proposed that their roles are largely determinedby characteristics which can be defined on three dimensions: their responsiveness, theirbasic research orientation, and their selectivity. Enhancing university characteristicsalong any of these three dimensions can strengthen the nature of the contributions uni-versities make. The more responsive are the universities, the more companies candepend on universities in tailoring academia’s research and education contributions totheir specific needs. The more the institutions are oriented toward basic research, thebetter they are able to provide a sophisticated scientific base to enhance the high- technology content of industry. The more selective the universities, the less difficult it isfor companies to identify appropriate talents.
The paper also introduced four key types of institutions, using the first two dimen-sions, responsiveness and basic research orientation. The four are basic research uni-versities, relevant research universities, teaching-focused institutions, and practicallyoriented institutions. Interestingly, no single type of institution appeared to be essen-tial for starting up high-tech industry; every one of the four types of institution wasinstrumental in the establishment of high-tech industry in one setting or another. Infact, different university types appear to lead to different shapes and natures of high-tech industry. For instance, the production of high-quality scientists and engineers inlarge numbers by teaching-focused institutions was sufficient to ensure the availabil-ity of cheap, high-caliber labor in India, leading to key production advantages.
Basic research universities help companies equip themselves with key scientificknowledge and well-trained employees in generic science and engineering. But suc-cessful companies have to be sufficiently proactive to extract appropriate scientificknow-how from universities or to provide further specialized training to employeesto ensure their competitiveness.
Practically oriented institutions can provide application-oriented research assis-tance and specialist training, as needed by industry, and can help companies reducethe costs of in-house research or training. However, they are not able to assist com-panies in upgrading the scientific content of their work or to provide postgraduate

HIGHER EDUCATION IN HIGH-TECH INDUSTRIAL DEVELOPMENT | 259
training in emerging fields of science. They can provide institutional support forstart-ups, although these are unlikely to be characterized as science based.
Relevant research universities are characterized by their ability to be more directlyinvolved in commercialization of scientific knowledge. These universities can also pro-vide high-level postgraduate training in emerging fields to supply key skills for emerg-ing industry. They tend to develop and attract appropriate ecosystems (such as venturecapital and professional support services) for science-based start-ups over time.
Industrial demand for the contributions of universities is likely to become morestringent. Global competitive pressures will demand constant upgrading and redefi-nition of industry’s competitive advantage. Universities will need to provide “higher-order” contributions, and to do so, they will need to move along at least one of thethree dimensions. A good supply of cheap generic scientists and engineers may havebeen enough to start high-tech industry yesterday, but the growth of such industrywill lead to higher wages, which in turn will demand redefinition of its competitiveadvantage. By enhancing responsiveness, basic research orientation, or selectivity, thepower of university support to industry can be strengthened.
The paper has also proposed that moving universities along any of the dimensionsrequires nontrivial effort. Governments can be an important influence in orientingand guiding institutional development, in subtle or not so subtle ways.
Responsiveness does not appear to emerge naturally; in all the cases examined,some specific interventions had occurred to instill the culture of responsiveness, oftenat the time of founding, and often with government intervention. There is no simplerecipe for encouraging institutions to become responsive. The demand to which insti-tutions must be sensitive is often local, intangible, and ill defined. Governments mayrequire that institutions provide new educational programs or expand existing ones,but simply following a top-down requirement does not make an institution respon-sive. The Korean government’s central requirement of maintaining a quota for engi-neering programs may not have encouraged responsiveness. Indeed, it is possible thatthe more frequently a government interferes through regulations or even throughfinancial incentives, the less institutions learn to be creative and strategic about whatthey do. In Ireland and Finland new groups of institutions were established by gov-ernment from scratch in order to build responsiveness into the system.
Peer pressures and academic norms tend to push universities to become nonre-sponsive over time—toward becoming basic research universities or academically ori-ented teaching institutions. On the whole, there appear to be more cases in whichinstitutions developed responsiveness first and then evolved toward a fundamentalscience orientation than vice versa. (A good example is the Massachusetts Institute ofTechnology; see Etzkowitz 2002.) It is probably easier to develop in that order thanthe other way around.
Today, economic responsiveness on the part of universities has become a globalmantra. The last decade has seen an ever-increasing number of government policiesseeking to push universities to develop such a dimension, and this has led to changesin academic values. For instance, it would be unusual to meet an academic in anyOECD country who would contest the need for a university to be economically rel-evant. Notwithstanding this dynamic change, most institutions have a long way to

260 | SACHI HATAKENAKA
go toward developing a full set of internal and external mechanisms that are respon-sive and proactive. The Japanese national universities, for example, are as collaborativewith industry as are U.S, ones, but they still lag substantively in proactive commer-cialization as measured by metrics such as licensing and spin-offs. Indeed, in orderfor universities to become truly proactive, a whole new set of relationships is likelyto be needed, not only with industry but also with other players, ranging from venturecapital to proactive research funding bodies. It takes a full ecosystem to enhance theresponsiveness of universities. One advantage that developing countries have over oldeconomies may be the potential to develop new institutions that together can make upsuch a complete system.
Building a basic research orientation also requires serious commitment and invest-ment, usually from government. Investments are needed not only in human capital,in the form of advanced research training, but also in infrastructure such as librariesand laboratories, as well as for direct expenses associated with research. A researchorientation cannot be developed overnight, but it is difficult to change once intro-duced; PhD-trained academics usually gravitate toward research rather than teach-ing, and a sense of elitism is often associated with being research oriented—the morebasic, the more elite. Active intervention is usually needed to counter the academicdrift away from becoming responsive.
Selectivity is one dimension of higher education institutions that often emergesnaturally as the demand for higher education expands and the competition for placesincreases. However, it needs to be underpinned by robust selection systems that arefair but also provide good learning incentives for future students. This is not easy, butit merits considerable attention, as selection systems can directly influence the repu-tational hierarchy of institutions, as well as students’ learning incentives, for years tocome. Some examinations inadvertently encourage students to become orientedtoward test-taking tactics rather than learning, and some scoring systems give a spurious impression of accuracy.
The fact that all three dimensions are important in enabling institutions to playkey roles does not mean that all institutions must be the same. Because differentdimensions bring different advantages, there is a strong case for a variety of institu-tions, as the experience in the United States and Finland shows. It is reasonable for anational system of higher education to seek to have as much diversity as possible interms of types of institution.
A historical legacy that the case countries share is some form of national championof science and technology. The postwar United States was a special place in that pol-icy makers’ endorsement of the employment of science for societal benefit led to thedevelopment of a whole host of federal funding institutions that supported funda-mental science, for different reasons (Geiger 2004a). Similarly, without the highestcommitment from Jawaharlal Nehru, India’s first postindependence leader, the country’sinstitutes of technology would never have received the extraordinary technical assis-tance from the United States, the Soviet Union, and Germany that enabled them todevelop their high standards. Without the commitment of Deng Xiaoping, the Chinese government would not have devoted so many resources to science and tech-nology, which in turn helped attract the best and the brightest to the field. Such visible
HIGHER EDUCATION IN HIGH-TECH INDUSTRIAL DEVELOPMENT | 261
support of science and technology at the highest levels helped foster the commitmentto science and technology within the society that led students more readily to chooseto study these disciplines.
National championship of this kind is not easy to maintain. Science is expensive,and it takes a long time for its impact to be felt. It is easy for commitment to scienceto give way to fiscal pressures, particularly since it is never clear how much is needed.It is also not easy to cultivate and then maintain the high level of interest within thesociety that induces students to choose science and engineering. Many OECD countries, including Japan, the United Kingdom, and the United States, are increas-ingly concerned about the level of interest in science among students. Even in India,there is growing concern that fewer students are choosing a science track.
A final point for reflection is the role of governance arrangements at both the insti-tutional level and the national level. Quality assurance considerations often lead gov-ernment bodies to become overprescriptive about inputs, as well as being concernedabout outputs. This is a significant dilemma in developing countries, where there islittle tradition and culture concerning the quality of higher education. Attempts bygovernments to “control” quality on the basis of inputs can lead to institutions’becoming similar to each other and being passive in defining what they are. To makematters worse, some dimensions are easier to measure than others, which can thenresult in their being given undue prominence; publications and citations are estab-lished metrics for evaluating the productivity and quality of scientific research, butmetrics for responsiveness are only just emerging.
Moreover, tight regulatory control by government can be a serious impedimentwhen institutions need to respond to changing needs. Yet the desire for the system torespond to the needs of both labor markets and future students, particularly indynamically developing countries, often pushes governments to centralize key deci-sions about the size and direction of the higher education system.
Institutional capacity to respond to complex change is unlikely to develop if insti-tutions do not have autonomy in making strategic decisions. Furthermore, institu-tions are unlikely to be able to make good strategic decisions without appropriategovernance structures and internal processes. The key for the future is to ensure thatthere are governance arrangements at both the institutional and the system levels thatwill facilitate and even encourage further evolution of higher education.
References
Baba, Y., S. Takai, and Y. Mizuta. 1996. “The User Driven Evolution of the Japanese SoftwareIndustry: The Case of Customized Software for Mainframes.” In The International Com-puter Software Industry: A Comparative Study of Industry Evolution and Structure, ed. D. C. Mowery. New York: Oxford University Press.
Bartholomew, James R. 1989. The Formation of Science in Japan. New Haven, CT: Yale University Press.
Bresnahan, Timothy F., and Franco Malerba. 1999. “Industrial Dynamics and the Evolutionof Firms’ and Nations’ Competitive Capabilities in the World Computer Industry.” InSources of Industrial Leadership: Studies of Seven Industries, ed. David C. Mowery andRichard R. Nelson. Cambridge, U.K.: Cambridge University Press.

262 | SACHI HATAKENAKA
Breznitz, Dan. 2004. “The Israeli Software Industry.” In From Underdogs to Tigers: The Riseand Growth of the Software Industry in Brazil, China, India, Ireland, and Israel, ed.Ashish Arora and Alfonso Gambardella. Oxford, U.K.: Oxford University Press.
———. 2007. Innovation and the State: Political Choice and Strategies for Growth in Israel,Taiwan and Ireland. New Haven, CT: Yale University Press.
Chen, Kun, and Martin Kenney. 2007. “Universities/Research Institutes and Regional Inno-vation Systems: The Cases of Beijing and Schenzhen.” World Development 35 (6):1056–74.
Clark, Burton R. 1995. Places of Inquiry: Research and Advanced Education in Modern Universities. Berkeley and Los Angeles: University of California Press.
Cohen, W. M., R. R. Nelson, and J. P. Walsh. 2002. “Links and Impact: The Influence of Public Research on Industrial R&D.” Management Science 48 (1): 1–23.
Dahlman, Carl, Jorma Routti, and Pekka Yla-Anttila. 2007. Finland as a Knowledge Economy:Elements of Success and Lessons Learned. Washington, DC: World Bank Institute.
Darby, Michael R., and Lynne G. Zucker. 1996. “Star Scientists, Institutions and the Entry ofJapanese Biotechnology Enterprises.” NBER Working Paper 5795, National Bureau ofEconomic Research, Cambridge, MA.
de Fontaney, Catherine, and Erran Carmel. 2004. “Israel’s Silicon Wadi: The Forces behind Clus-ter Formation.” In Building High Tech Clusters: Silicon Valley and Beyond, ed. TimothyBresnahan and Alfonso Gambardella. Cambridge, U.K.: Cambridge University Press.
Donnelly, Tom, and Martti Hyry. 2004. “Urban and Regional High Technologies: The Case ofOulu.” Local Economy 19 (2): 134–49.
Dore, Ronald P., and Mari Sako. 1989. How the Japanese Learn to Work. London: Routledge.
Etzkowitz, Henry. 2002. MIT and the Rise of Entrepreneurial Science. London: Routledge.
Eun, Jong-Hak, Keun Lee, and Guisheng Wu. 2006. “Explaining University-Run Enterprisesin China: A Theoretical Framework for University-Industry Relationship in DevelopingCountries and Its Application to China.” Research Policy 35: 1329–46.
Finland, Ministry of Education. 2005. “OECD Thematic Review of Tertiary Education: CountryBackground Report for Finland.” Organisation for Economic Co-operation and Development, Paris.
Geiger, Roger. 2004a. Research and Relevant Knowledge: American Research Universitiessince World War II. New Brunswick, NJ: Transaction Publishers.
———. 2004b. To Advance Knowledge: The Growth of American Research Universities1900–1940. New Brunswick, NJ: Transaction Publishers.
Harayama, Yuko. 2001. “Silicon Valley no sangyo hatten to Stanford daigaku no curriculumhensen” [Silicon Valley’s Industrial Development and Curricular Change in Stanford Uni-versity]. In Daigaku kaikaku: kadai to souten, ed. Masahiko Aoki, Akihiko Sawa, andMichio Daito, 31–66. Tokyo: Toyo Keizai Shinposha.
Hashimoto, Takehiko. 1999. “The Hesitant Relationship Reconsidered: University-IndustryCooperation in Postwar Japan.” In Industrializing Knowledge: University-Industry Link-ages in Japan and the US, ed. Lewis Branscomb, Fumio Kodama, and Richard Florida.Cambridge, MA: MIT Press.
Hatakenaka, Sachi. 2004. University-Industry Partnerships in MIT, Cambridge and Tokyo:Storytelling across Boundaries. New York: Routledge.
———. Forthcoming. “What’s the Point of Universities? The Economic Role of Universities inJapan.” Japan Forum.
Henderson, Rebecca, Luigi Orsenigo, and Gary P. Pisano. 1999. “The Pharmaceutical Indus-try and the Revolution in Molecular Biology: Interactions among Scientific, Institutionaland Organizational Change.” In Sources of Industrial Leadership: Studies of Seven

HIGHER EDUCATION IN HIGH-TECH INDUSTRIAL DEVELOPMENT | 263
Industries, ed. David Mowery and Richard Nelson. Cambridge, U.K.: Cambridge University Press.
Hicks, Diana. 1993. “University-Industry Research Links in Japan.” Policy Sciences 26: 361–95.
Hoshino, Yu, Yuko Harayama, and Shigeo Hatatani. 2003. “Daigaku no gaibu henka henotaio sei” [Responsiveness of Universities to External Change]. In Sangaku Renkei, ed.Yuko Harayama. Tokyo: Toyo Keizai Shinposha.
Hou, Chi-Ming, and San Gee. 1993. “National Systems Supporting Technical Advance inIndustry: The Case of Taiwan.” In National Innovation Systems: A Comparative Analysis,ed. Richard R. Nelson. New York: Oxford University Press.
Japan, MEXT (Ministry of Education, Culture, Science, and Technology). 2006. Monbuka-gakutokeiyoran. Tokyo: Ministry of Finance Press.
Jayaram, N. 2007. “Beyond Retailing Knowledge: Prospects of Research-Oriented Universitiesin India.” In World Class Worldwide: Transforming Research Universities in Asia and LatinAmerica, ed. Philip G. Altbach and Jorge Balán. Baltimore, MD: Johns Hopkins UniversityPress.
Juahiainen, Jussi S. 2006. “Multipolis: High-Technology Network in Northern Finland.”European Planning Studies 14 (10): 1407–28.
Kapur, Devesh. 2002. “The Causes and Consequences of India’s IT Boom.” India Review1 (2): 91–110.
Kapur, Devesh, and John McHale. 2005. “Sojourns and Software: International MobileHuman Capital and High Tech Industry Development in India, Ireland and Israel.” InFrom Underdogs to Tigers: The Rise and Growth of the Software Industry in Brazil,China, India, Ireland, and Israel, ed. Ashish Arora and Alfonso Gambardella. Oxford,U.K.: Oxford University Press.
KCUE (Korean Council for University Education). 1990. Korean Higher Education: Its Development, Aspects and Prospects. Seoul: KCUE.
Kim, Ki-Seok, and Sunghee Nam. 2007. “The Making of a World-Class University at thePeriphery.” In World Class Worldwide: Transforming Research Universities in Asia andLatin America, ed. Philip G. Altbach and Jorge Balán. Baltimore, MD: Johns Hopkins University Press.
Kim, Limsu. 1993. “National System of Industrial Innovation: Dynamics of Capability Build-ing in Korea.” In National Innovation Systems: A Comparative Analysis, ed. Richard R.Nelson. New York: Oxford University Press.
———. 2000. “Korea’s National Innovation System in Transition.” In Technology, LearningAnd Innovation: Experiences of Newly Industrializing Economies, ed. Limsu Kim andRichard R. Nelson. Cambridge, U.K.: Cambridge University Press.
Kobayashi, Shinichi. 2001. “Daigaku kyoiku no shokugyoteki relevance to daigaku no soshikisekkei” [Relevance of University Education to Work and Organizational Design]. InDaigaku kaikaku: kadai to souten, ed. Masahiko Aoki, Akihiko Sawa, and Michio Daito.Tokyo: Toyo Keizai Shinposha.
Kodama, Fumio, and Jun Suzuki. 2007. “How Japanese Companies Have Used ScientificAdvances to Restructure Their Businesses: The Receiver-Active National System of Innovation.” World Development 35 (6): 976–90.
Kroll, Henning, and Ingo Leifner. 2008. “Spin-Off Enterprises as Means of Technology Com-mercialisation in a Transforming Economy—Evidence from Three Universities in China.”Technovation 28: 293–313.
Lee, Won-Young. 2000. “The Role of Science and Technology Policy in Korea’s IndustrialDevelopment.” In Technology, Learning and Innovation: Experiences of Newly Industri-alizing Economies, ed. Limsu Kim and Richard R. Nelson. Cambridge, U.K.: Cambridge University Press.

264 | SACHI HATAKENAKA
Leifner, Ingo, and Daniel Schiller. 2008. “Academic Capabilities in Developing Countries: AConceptual Framework with Empirical Illustrations from Thailand.” Research Policy 37:276–93.
Lester, Richard K. 2005. “Universities, Innovation, and the Competitiveness of LocalEconomies: Summary Report from the Local Innovation Systems Project—Phase I.” MITIPC Working Paper 05-010, Industrial Performance Center, Massachusetts Institute ofTechnology, Cambridge, MA.
Lin, Tin-Chun. 2004. “The Role of Higher Education in Economic Development: An Empiri-cal Study of Taiwan Case.” Journal of Asian Economics 15 (2): 355–71.
Ma, Wanhua. 2007. “The Flagship University and China’s Economic Reform.” In World ClassWorldwide: Transforming Research Universities in Asia and Latin America, ed. Philip G.Altbach and Jorge Balán. Baltimore, MD: Johns Hopkins University Press.
Mazzoleni, Roberto, and Richard R. Nelson. 2007. “Public Research Institutions and Economic Catch Up.” Research Policy 36 (10, December): 1512–28.
Mowery, David C. 1999. “The Computer Software Industry.” In Sources of Industrial Leadership:Studies of Seven Industries, ed. David C. Mowery and Richard R. Nelson. Cambridge, U.K.: Cambridge University Press.
Mowery, David, Richard R. Nelson, Bhaven N. Sampat, and Arvids A. Ziedonis. 2004. IvoryTower and Industrial Innovation: University-Industry Technology Transfer before andafter the Bayh-Dole Act. Stanford, CA: Stanford University Press.
Nakayama, Shigeru. 1991. Science, Technology and Society in Postwar Japan. Japanese StudiesSeries. London: Kegan Paul International.
———. 1995. Kagaku gijutsu no sengoshi. Tokyo: Iwanami Shoten.
NAS (National Academy of Sciences). 2005. Rising above the Gathering Storm: Energizingand Employing America for a Brighter Economic Future. Washington, DC: NationalAcademies Press.
Odagiri, Hiroyuki, and Akira Goto. 1996. Technology and Industrial Development in Japan:Building Capabilities by Learning, Innovation and Public Policy. Oxford, U.K.: Oxford University Press.
OECD (Organisation for Economic Co-operation and Development). 2003. Reviews ofNational Policies for Education: Polytechnic Education in Finland. Paris: OECD.
Pechter, Kenneth, and Sumio Kakinuma. 1999. “Co-authorship Linkages between UniversityResearch and Japanese Industry.” In Industrializing Knowledge: University-Industry Link-ages in Japan and the US, ed. Lewis Branscomb, Fumio Kodama, and Richard Florida,102–27. Cambridge, MA: MIT Press.
Roper, Stephen, and Seamus Grimes. 2005. “Wireless Valley, Silicon Wadi and Digital Island—Helsinki, Tel Aviv and Dublin and the ICT Global Production Network.” Geoforum 36:297–313.
Rosenberg, Nathan, and Richard Nelson. 1994. “American Universities and TechnicalAdvance in Industry.” Research Policy 23: 323–48.
Sands, Anita. 2005. “The Irish Software Industry.” In From Underdogs to Tigers: The Rise andGrowth of the Software Industry in Brazil, China, India, Ireland, and Israel, ed. AshishArora and Alfonso Gambardella. Oxford, U.K.: Oxford University Press.
Saxenian, AnnaLee. 1999. Silicon Valley’s New Immigrant Entrepreneurs. San Francisco: Public Policy Institute of California.
———. 2004. “Taiwan’s Hsinchu Region: Imitator and Partner for Silicon Valley.” In Build-ing High-Tech Clusters: Silicon Valley and Beyond, ed. Timothy Bresnahan and AlfonsoGambardella. Cambridge, U.K.: Cambridge University Press.
HIGHER EDUCATION IN HIGH-TECH INDUSTRIAL DEVELOPMENT | 265
———. 2006. The New Argonauts: Regional Advantage in a Global Economy. Cambridge,MA: Harvard University Press.
Saxenian, AnnaLee, Yasuyuki Motoyama, and Xiaohong Quan. 2002. Local and Global Net-works of Immigrant Professionals in Silicon Valley. San Francisco: Public Policy Instituteof California.
Shimizu, Kiyoyuki, and Kazuhiro Mori. 2001.”Nihon no rikokei daigakuinkyoiku no bap-ponteki kaikaku” [Fundamental Reform for Graduate Schools in Japan]. In Daigakukaikaku: kadai to souten, ed. Masahiko Aoki, Akihiro Sawa, and Michio Daito. Tokyo:Toyo Keizai Shinposha.
Sohn, Dong-Won, and Martin Kenney. 2007. “Universities, Clusters, Innovation Systems: TheCase of Seoul, Korea.” World Development 35 (6): 991–1004.
Srinivas, Smita, and Kimmo Viljamaa. 2008. “Emergence of Economic Institutions: Analysingthe Third Role of Universities in Turku, Finland.” Regional Studies 42 (3): 323–41.
Stokes, Donald E. 1997. Pasteur’s Quadrant: Basic Science and Technological Innovation.Washington, DC: Brookings Institution Press.
Thursby, Jerry G., and Marie C. Thursby. 2007. “University Licensing.” Oxford Review ofEconomic Policy 23 (4): 620–39.
Trajtenberg, Manuel. 2001. “Innovation in Israel 1968–1997: A Comparative Analysis UsingPatent Data.” Research Policy 30: 363–89.
Wade, Robert. 1990. Governing the Market: Economic Theory and the Role of Governmentin East Asian Industrialization. Princeton, NJ: Princeton University Press.
Wadhwa, Vivek, AnnaLee Saxenian, Ben Rissing, and Gary Gereffi. 2007. “America’s NewImmigrant Entrepreneurs: Part I.” Duke Science, Technology and Innovation Paper 23,Master of Engineering Management Program, Pratt School of Engineering, Duke Univer-sity, Durham, NC.
Weidman, John C., and Namgi Park. 2000. Higher Education in Korea: Tradition and Adaptation. New York: Falmer Press.
White, Tony. 2001. Investing in People: Higher Education in Ireland from 1960–2000.Dublin: Institute of Public Administration.
Wu, Weiping. 2007. “Cultivating Research Universities and Industrial Linkages in China: TheCase of Shanghai.” World Development 35 (6): 1075–93.
Yoshihara, Mariko, and Katsuya Tamai. 1999. “Lack of Incentives and Persisting Constraints:Factors Hindering Technology Transfer at Japanese Universities.” In IndustrializingKnowledge: University-Industry Linkages in Japan and the US, ed. Lewis Branscomb,Fumio Kodama, and Richard Florida, 348–64. Cambridge, MA: MIT Press.
Yusuf, Shahid, and Kaoru Nabeshima. 2007. How Universities Promote Economic Growth.Washington, DC: World Bank.
Zhou, Ji. 2005. Higher Education in China. Singapore: Thomson Learning.
Zucker, Lynn G., and Michael R. Darby. 1996. “Star Scientists and Institutional Transforma-tion: Patterns of Invention and Innovation in the Formation of the Biotechnology Industry.”Proceedings of the National Academy of Sciences 93 (23): 12709–116.
Zucker, Lynne G., Michael R. Darby, and Jeff S. Armstrong. 2002. “Commercializing Knowl-edge: University Science, Knowledge Capture and Firm Performance in Biotechnology.”Management Science 48 (1): 138–53.
Zucker, Lynne G., Michael R. Darby, and Marilyn B. Brewer. 1998. “Intellectual Human Capitaland the Birth of US Biotechnology Enterprises.” American Economic Review 88 (1):290–306.
266
Comment on “The Role of Higher Education inHigh-Technology Industrial Development:What Can International Experience Tell Us?”by Sachi Hatakenaka
ERIK SANDER
Over the last 20 years, technology-based multinational corporations (MNCs) andsmall and medium-size enterprises (SMEs) have increasingly looked to universities toundertake basic research that spawns breakthrough products for the future. This isresearch that companies are either not equipped to undertake themselves or are unableto fund internally, given their focus on near-term product development that has animpact on the bottom line. Concurrently, high-technology industry across the globecontinues to rely on universities to produce an employee population that can be drawnon to fill company pipelines with highly skilled professionals who can contribute tothe company’s profitability quickly and with less postrecruitment training.
In this paper, Hatakenaka provides a strong foundation for discussing the diversehistory of government-university-industry collaboration mechanisms across interna-tional borders and highlights the complex variables and key motivators affecting howthese groups work together. Essentially, the particular characteristics of each univer-sity, company, and government entity are crucial to how these collaborations havegrown (or have failed to grow substantially) in various settings. Whereas in somecountries, such as Japan, industries have focused on the academic role of screeningand providing foundational training for future long-term employees, in other countries, such as the United States, they have taken a broader viewpoint towardleveraging academic research and educational resources to build the company’s tech-nology and employee pipelines. Viewed globally, government-university-industry collaborations can be seen as a jumble of disjointed education, research, and outreach programs. Nevertheless, Hatakenaka clearly identifies the salient variables and moti-vational factors that determine how these collaborations have been birthed and havegrown in different countries.
The themes of organizational characteristics and responsiveness arise several timesin Hatakenaka’s discussion of global government-university-industry collaboration
Erik Sander is director of industry programs, University of Florida College of Engineering, Gainesville.
Annual World Bank Conference on Development Economics 2009, Global © 2010 The International Bank for Reconstruction and Development / The World Bank

COMMENT ON HATAKENAKA | 267
models. It can be instructive to extend and reframe these points through a brief discussion of such collaborations from the perspective of cultural barriers and issues,not only across geographic borders, but also across the cultural borders of the gov-ernment, academic, and private sectors.
Support for Higher Education
One could argue that a key to understanding what drives culture and motivationwithin higher education is a grasp of the support mechanisms for an institute’sresearch and education mission. In general, many U.S. universities are recognized ashaving built strong industrial relations through research and education programs,and so it is sensible to study the U.S. system as a baseline for understanding thebroader global environment for the effect of universities on high-technology indus-tries across borders.
As illustrated in figure 1 and discussed by Hatakenaka, U.S. university researchhas grown substantially since World War II, primarily in response to new governmentfunding programs established to advance the technological and manufacturing capa-bilities of U.S. industry. Beginning with relatively minuscule funding levels in the1950s, federal support of U.S. university research today spans myriad governmentagencies providing more than US$40 billion (in constant 2000 dollars) to assist vir-tually every field of scientific advancement. U.S. research-intensive universities havegrown reliant on federal support, which typically funds more than 60 percent of auniversity’s research base (NSF 2008).
Government funding agencies have their individual funding profiles; for example,whereas the Defense Advanced Research Projects Agency (DARPA) tends to fund laterstages of research and is, not surprisingly, oriented toward defense applications, theNational Institutes of Health (NIH) emphasizes the discovery phase. Nevertheless, thegreatest part of government support for university research is targeted toward basicresearch, which is focused on knowledge discovery rather than on specific, predeter-mined market applications. The government typically seeds next-generation discover-ies, some of which industry can ultimately take to market. This prevalence of govern-ment basic research funding dovetails well with university researchers’ quest for basicknowledge. The result is that 75 percent of U.S. university research is defined as basic.There is a stark contrast with the profile of high- technology industry research, only4 percent of which is categorized as basic (NSF 2008). High-technology industry isdriven by market economics to direct its internal resources toward applied researchand development; it is focused on meeting a specific market need through develop-ment of a product or service and its underlying technology.
As Hatakenaka rightly notes, the U.S. government funds basic research at highereducation institutions to provide the foundation for fundamental technology breakthroughs for next-generation corporate products—thus establishing a key rolefor U.S. universities in the overall advancement of technology today and in the future.Universities in several other countries draw a much greater proportion of their fundingfrom industry. For instance, Hatakenaka observes that industry supports more than

268 | ERIK SANDER
30 percent of university research in China and Russia, although one could questionwhether this is because of greater industry involvement or less government support.
Transitioning the Valley of Death
Industry’s own development of next-generation technology advances must ultimatelyspan the continuum of basic research to applied research and development, althoughcompanies in different societies have made conscious decisions as to where theychoose to focus in that spectrum. For example, Hatakenaka points out that industryin some countries, including China, has historically chosen to focus on developmentof new applications of existing technologies, whereas countries such as the UnitedStates have distributed resources across the entire spectrum. Whichever model ofindustrial product development is chosen, one common theme drives resource alloca-tion: a market pull for the technologies being developed. This market pull, entailing afocus on customer needs in research and in product and service design and develop-ment, can produce an efficient allocation of research and development (R&D)resources, but sometimes at the cost of discovery of next-generation technologies tounderpin future product lines—essentially, the basic research element.
Government-university-industry research collaborations provide an alternatemeans of technology development whereby the government funds next-generation,
0
5,000
10,000
15,000
20,000
25,000
30,000
35,000
40,000
45,000
mill
ions
of c
onst
ant
2000
U.S
. dol
lars
200520001995199019851980197519701965
other nonprofit industry university federal
FIGURE 1.Funding Sources for U.S. University Research
Source: NSF 2008.

COMMENT ON HATAKENAKA | 269
high-risk basic research in universities. Often, however, the greatest challenge is tofind a home for these technologies in industry. This transition point can be difficultto negotiate because the technology is sometimes too far along for further significantgovernment funding and university development but is not sufficiently developed andrisk mitigated to attract substantial industry interest in adoption or funding.
Successful government-university-industry research collaborations require thebridging of what has been commonly termed the Valley of Death—the point in atechnology’s life cycle at which the research is transitioning from an academic basicresearch program to an applied industrial development program (figure 2). The chal-lenge usually revolves around (a) the university’s further development, and thereforerisk mitigation, of the technology, perhaps to the point of a demonstrable prototypeor initial clinical trials, and (b) industry’s willingness to adopt earlier-stage technolo-gies through funding and licensing.
This analytical approach can also be applied to the educational mission of highereducation if one considers the output of the collaborative process to be university students/company recruits. Although most students do not fall into a true Valley ofDeath in the same way that university technologies may completely fail to make thetransition to the private sector, there is an analogous problem of how best to fill theeducational gap between the basic science knowledge of academia and the more specialized knowledge of industry. Kapur and Crowley (2008) raise an importantquestion: is the purpose of higher education to train people for a labor force, or totrain a labor force that is in turn trainable by employers? Hatakenaka points out that
Valley ofDeath
industry developmentindustry funding
market pulltechnological push
university researchgovernment funding
fund
ing
/int
eres
t
industry—product developmentuniversity—research commercialization
FIGURE 2.Bridging the Technological “Valley of Death”
Source: Author’s elaboration.
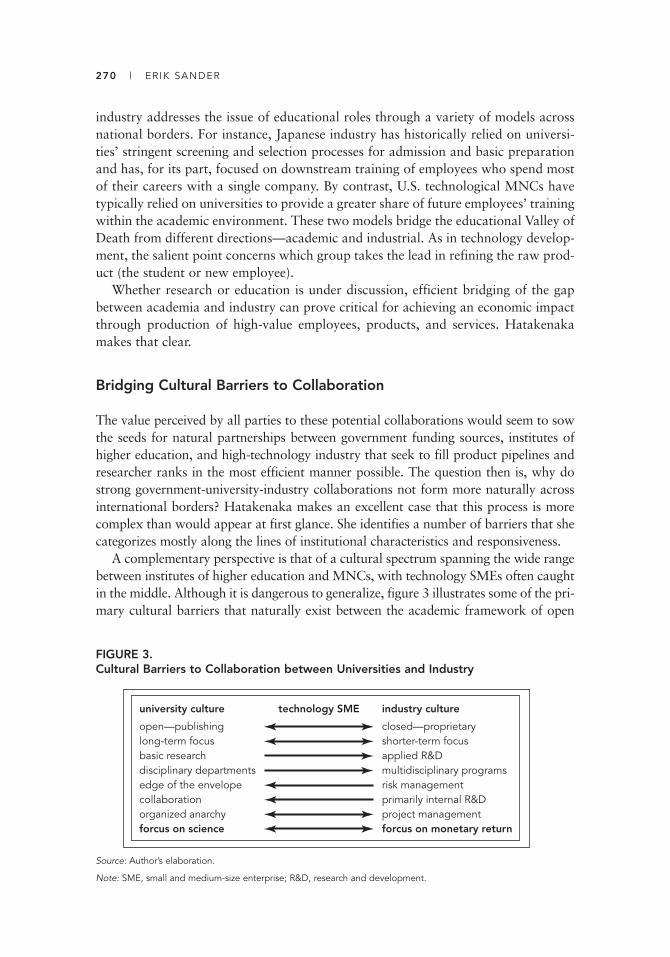
270 | ERIK SANDER
industry addresses the issue of educational roles through a variety of models acrossnational borders. For instance, Japanese industry has historically relied on universi-ties’ stringent screening and selection processes for admission and basic preparationand has, for its part, focused on downstream training of employees who spend mostof their careers with a single company. By contrast, U.S. technological MNCs havetypically relied on universities to provide a greater share of future employees’ trainingwithin the academic environment. These two models bridge the educational Valley ofDeath from different directions—academic and industrial. As in technology develop-ment, the salient point concerns which group takes the lead in refining the raw prod-uct (the student or new employee).
Whether research or education is under discussion, efficient bridging of the gapbetween academia and industry can prove critical for achieving an economic impactthrough production of high-value employees, products, and services. Hatakenakamakes that clear.
Bridging Cultural Barriers to Collaboration
The value perceived by all parties to these potential collaborations would seem to sowthe seeds for natural partnerships between government funding sources, institutes ofhigher education, and high-technology industry that seek to fill product pipelines andresearcher ranks in the most efficient manner possible. The question then is, why dostrong government-university-industry collaborations not form more naturally acrossinternational borders? Hatakenaka makes an excellent case that this process is morecomplex than would appear at first glance. She identifies a number of barriers that shecategorizes mostly along the lines of institutional characteristics and responsiveness.
A complementary perspective is that of a cultural spectrum spanning the wide rangebetween institutes of higher education and MNCs, with technology SMEs often caughtin the middle. Although it is dangerous to generalize, figure 3 illustrates some of the pri-mary cultural barriers that naturally exist between the academic framework of open
open—publishinglong-term focusbasic researchdisciplinary departmentsedge of the envelopecollaborationorganized anarchyforcus on science
closed—proprietaryshorter-term focusapplied R&Dmultidisciplinary programsrisk managementprimarily internal R&Dproject managementforcus on monetary return
university culture technology SME industry culture
FIGURE 3.Cultural Barriers to Collaboration between Universities and Industry
Source: Author’s elaboration.
Note: SME, small and medium-size enterprise; R&D, research and development.

COMMENT ON HATAKENAKA | 271
BOX 1. Pathways for Interaction between Higher Education and High-Technology Industry
Leveraging research assetsTechnology licensingIndustry-sponsored researchJoint researchFacility usage agreementsTechnology donations
Leveraging researcher assetsIndustrial advisory boardsFaculty sabbaticalsFaculty consultingVisiting industry researchers
Leveraging educational assetsPublicationsAlumni networksDistance educationLifelong learningShort courses, seminars, and conferences
Leveraging student assetsProactive student recruitmentStudent internships/cooperative educationStudent scholarships
Source: Author’s elaboration.
discourse and the more focused and proprietary company environment. It is readilyseen that the cultural gaps between universities, small technology-based companies, andlarge industry players can be manifested in definitive ways that affect collaborationpotential, such as timeframes (semesters versus weeks), focus (basic versus appliedresearch), management (decentralized versus hierarchical and project driven), and bottom-line emphasis (discovery versus profits and shareholder value). The challenge,many times, is to overcome these cultural barriers and make full use of university, private sector, and government resources to maximize ultimate economic impact.
There are multiple avenues for higher education-industry engagement, as describedby Hatakenaka, but not all universities and not all companies and governments areequipped to take advantage of them. Hatakenaka describes this relationship building interms of responsiveness to meeting industry needs and notes that it succeeds only if itserves the university, industry, and, ultimately, the government sources that provide sub-stantial support to the academic system. Box 1 surveys the numerous potential avenuesof interaction between the industrial and academic sectors. The list is not meant to be
272 | ERIK SANDER
all-inclusive, but the point is that there are myriad ways in which higher education andhigh-technology industry can establish mutually beneficial relationships.
As Hatakenaka discusses, across national borders, industry does not engage equal-ly with higher education institutions through all avenues, and not all academic unitsare equally equipped to respond fully to all high-technology companies. For instance,U.S. firms are more likely to have engaged in multiple avenues of collaboration,including technology licensing and industry-sponsored research; Japanese firms havehistorically not taken advantage of some of these university capabilities but havefocused on others, such as student recruitment and in-house training. Even this situation is changing, as Japan is now entering an era of university spin-offs and technology commercialization catalyzed by government programs.
Global Best Practices in Public-Private Partnerships
The U.S. Science and Technology Policy Institute, with funding from the NationalScience Foundation (NSF), recently conducted a best practices study of government-university-industry partnerships worldwide to aid understanding of the various col-laboration mechanisms (Lal et al. 2007). A team of institute personnel and variousdomain experts studied and visited more than 40 public-private partnerships in ninecountries. The study focused on five areas of inquiry: program-level vision; center-level organization; industry partnerships; international partnerships; and engineeringeducation. In the research domain, the study confirmed Hatakenaka’s broad modelof responsiveness. Even within a given country—for example, Germany—the basicresearch focus of, say, the Max Planck Institutes stands out in contrast to the Fraunhofer Institutes’ focus on applied research in close collaboration with industrypartners. In the United Kingdom, the Warwick University Manufacturing Group, whichis very industrially focused and does outstanding applied research, provides anotherexcellent example of Hatakenaka’s model of responsiveness to industrial R&D needs. Anoutstanding mixed model is Belgium’s International Microelectronics Center (IMEC),which has established a robust model of working closely with a large population ofMNCs and SMEs through a multitiered association model (see figure 4).
In each of these examples, it is important to point out that the technology devel-opment spectrum discussed earlier is not isolated from the student development spec-trum. Students in application-oriented academic centers typically work closely withindustrial researchers and are well prepared to make significant contributions asemployees of the company or industry. What is untested is whether those students arebetter prepared in the longer term for a broader spectrum of careers.
Conclusion
Hatakenaka provides an excellent foundation for exploring the myriad relationshipsamong government agencies, higher education institutions, and high-technology industry across national borders. Her parsing of higher education institutions andhigh-technology industry by their historical interactions is exemplary and provides a

COMMENT ON HATAKENAKA | 273
framework for an expanded discussion of the role of higher education and high- technology industry cultures in establishing collaborative relationships. Inherent cultureis a critical variable driving the influence of higher education on high-technology indus-try, and vice versa, and Hatakenaka rightly points out that collaborative mechanismsare varied and differ across borders. There is much that can be added to this discussion,and Hatakenaka has supplied an important first step in a field of study that has untilnow not gained the attention it deserves. Further studies can profoundly reshape thesemodels of collaboration between higher education and high-technology industry to thebenefit of the global economy, especially in the developing world.
References
Kapur, Devesh, and Megan Crowley. 2008. “Beyond the ABCs: Higher Education and Devel-oping Countries.” Working Paper 139, Center for Global Development, Washington, DC.
Lal, Bhavya, Craig Boardman, Nate Deshmukh Towery, Jamie Link, and Stephanie Shipp.2007. Designing the Next Generation of NSF Engineering Research Centers: Insights fromWorldwide Practice. Washington, DC: U.S. Science and Technology Policy Institute.
NSF (National Science Foundation). 2008. “NSF Science and Engineering Indicators.” NSF,Washington, DC.
focus on technology transfer and industry needs
ERC (U.S.)
SRC/ERC/NCRC (Korea, Rep. of)
SAIT (Korea, Rep. of)
INQIE (Japan)
IMEC (Belgium)
Global COE (Japan)MPI (Germany)
WTCC (Japan)
Key Labs (China)
CSET (Ireland)IMRC (U.K.)
Fraunhofer (Germany)
VUTC (U.K.)
WMG (U.K.)
FMTC (Belgium)
NERCs (China)
IAE (Korea, Rep. of)focu
s on
bas
ic a
nd c
urio
sity
-dri
ven
rese
arch
FIGURE 4.Differences in Focus among Public-Private Partnerships, Selected Countries: Findings from a Survey
Source: Lal et al. 2007.
Note: The institutions shown in the figure are research partnerships in the countries named. The partnerships men-tioned in the text are the International Microelectronics Center (IMEC), the Max Planck Institutes (MPI), the FraunhoferInstitutes (Fraunhofer), and the Warwick University Manufacturing Group (WMG).


African Higher Education and Industry: What Are the Linkages? AKILAGPA SAWYERR AND BOUBAKAR BARRY
Productive linkages between higher education and industry presuppose the existenceof institutions able to prepare skilled technical personnel and to produce and trans-fer innovative, industry-relevant research and technology. The necessary counterpartis industry hungry for new knowledge and technology and prepared to invest indeveloping or acquiring it.
Weaknesses on both sides are evident in Sub-Saharan Africa. Higher education hassuffered from years of neglect and underfunding and is generally considered to be ori-ented away from science and technology. Although there are signs of a revival, over-all, higher education, particularly as regards science and technology research, is notup to the task of lifting African industry to a globally competitive level.
On the other side, high-technology industry is largely absent in the region. Thispaper consequently focuses on small and medium-size industry, which is importantfor Africa’s immediate future. But given the lack of steady pressure to acquire newknowledge and technology so as to remain competitive, there is little demand fromthis sector for industry-relevant research by knowledge institutions.
Part of the solution to this impasse must lie in a policy framework and materialinterventions aimed at boosting research capacity and industrial development inpriority areas while at the same time providing appropriate bridging mechanisms andsupportive fiscal and other incentives. There is also scope for regional and continentalcollaboration to harvest economies of scale.
Massive transformations in global communication, production and managementin the second half of the twentieth century placed knowledge and its applicationsat the center of economic and social development in all parts of the world by
275
Akilagpa Sawyerr is a former secretary-general of the Association of African Universities. Boubakar Barry is coordina-tor of the Research and Education Networking Unit, Association of African Universities. Ransford Bekoe, assistant proj-ect officer in the Office of the Secretary-General, Association of African Universities, provided substantial research sup-port in the preparation of this paper.
Annual World Bank Conference on Development Economics 2009, Global © 2010 The International Bank for Reconstruction and Development / The World Bank
276 | AKILAGPA SAWYERR AND BOUBAKAR BARRY
integrating the generation and application of advanced knowledge into materialand cultural production to an extent unknown in history. This evolution hasgiven added significance to systems and institutions for knowledge production.The spectacular economic and social developments of recent decades, especiallyin the newly industrializing countries of Southeast Asia, have gone hand in handwith rapid and substantial expansion of higher education and skills training.Although the exact character of the nexus between knowledge production andeconomic and social development remains unclear, there is little doubt about itsexistence or about its reciprocal nature, with knowledge production and the con-ditions and operations of the productive sectors of economy and society influ-encing each other.
To introduce our examination of one aspect of this general question, we firstbriefly review the key features of linkages between higher education and industry andthe conditions for their success. This will set the background for the examination andassessment of the specific case of Africa.
Channels and Conditions of Interaction
Although there is no reason to expect all kinds of industry to interact with the knowl-edge production process in exactly the same way, even in the same country, the generalpathways of interaction are clear. On the side of knowledge production institutions, thecontribution to industry takes a variety of forms and moves through a variety of chan-nels (see Brennenraedts, Bekkers, and Verspagen 2006, 4).1 The main ones are
• Preparation of well-educated technical graduates, ensuring a cadre of skilled andtrainable personnel for industry, especially in the fields of science, engineering, andmanagement
• Pursuit of fundamental as well as applications-oriented research that producesindustrially relevant new knowledge, including management science
• Direct generalized transmission of research products through publications,patents, prototypes, and the like
• Direct targeted transmission through conferences, workshops, meetings, net-works, and other formal and informal interactions
• Indirect transmission in the course of collaborative ventures and exchanges of personnel
• Transmission under commercial arrangements such as research contracts, licenses,and consultancies.
With regard to the provision of skilled cadres, the outcome turns, in the firstinstance, on the number, variety, and quality of technical graduates produced bythe education and training system and available for absorption into industry asmanagers, skilled and semiskilled technical workers, and researchers. Equally sig-nificant for successful linkage, although often ignored, is the capacity (or other-wise) of industry to absorb the products of the universities and training institutionsand put them to productive use.
AFRICAN HIGHER EDUCATION AND INDUSTRY: WHAT ARE THE L INKAGES? | 277
For meaningful interaction around the production of knowledge and its injec-tion into industry, there needs to be (a) a basis for interaction, namely, relevantknowledge and awareness of the need for it; (b) a disposition for productiveengagement; and (c) a supportive policy framework.
Capable Knowledge Producers
In the absence of knowledge institutions with both the capability to produce usableknowledge and the orientation and ability to transfer it to industry, the supply sidewill be absent or weak. Thus, the higher education and training system must have thecapability and flexibility to produce and supply technical graduates on a suitablescale and in fields relevant to industry and its evolving needs. Such graduates willstaff the managerial and technical levels of industry and, in the case of small andmedium-size industry, even provide entrepreneurial leadership. To meet the specialneeds of high-technology industry, these graduates must include a substantial pro-portion of PhDs in mathematics and the various branches of engineering to ensurehigh-level appreciation of emerging technologies and the possibilities for innovation.
Even more than in the supply and absorption of graduates, the linkage betweenhigher education and industry is often perceived in the production of knowledge andits injection into production and management as a basis for technological and man-agerial innovation. A key condition for this is the capacity of the knowledge produc-tion centers, through cutting-edge as well as applications-oriented research, to pro-duce usable new knowledge and new applications. Institutions that lack high-qualityresearch capability thus have no part in such interactions. Yet the capacity to producethe relevant knowledge is not sufficient; it must be combined with the appropriateorientation and the ability to transmit knowledge to potential users. Academic insti-tutions, through the publication of research findings, through conference presenta-tions, and through the taking out of patents, do much of this in the normal course oftheir work. The critical factor is to go beyond this and engage in more deliberate andtargeted transmission to industry and other potential users of the research productor, indeed, to pursue coproduction of knowledge with users. Modes of targeted transmission include workshops, meetings, networks, and other formal and informalinteractions; collaborative ventures and exchanges of personnel between industryand knowledge centers; and commercial arrangements such as research contracts,licenses, and consultancies (Brennenraedts, Bekkers, and Verspagen 2006, 15–16). Tohelp discharge this extension function effectively, institutions frequently provide special incentives to their staffs and set up specific structures, such as consultancy orcommercialization units.
Receptive Industry
For its part, industry must adopt a posture of active receptiveness for there to be suc-cessful interaction. Where industry feels no need for new knowledge or technology,or is unwilling or unable to invest time or resources in its acquisition, there will be

278 | AKILAGPA SAWYERR AND BOUBAKAR BARRY
no effective demand for locally produced knowledge and technology. There must bea perception of need, recognition that the proffered or potential knowledge productswill meet that need, and preparedness to invest in the acquisition of such products.In the case of skilled technical and managerial cadres, this is usually not a problem—certainly not for high-technology and medium-size enterprises, which need suchcadres if they are to be minimally effective. In relation to the acquisition of knowl-edge, however, a distinction is usually drawn between, on the one hand, high- technology industries and enterprises engaged in the export of manufactures, whichneed such knowledge in order to raise their productivity and international competi-tiveness, and, on the other hand, small, low-technology enterprises, which do not per-ceive such a need. In the latter instance, the absence of a technology culture—whichdevelops out of the pressure for constant updating and deepening of technology inorder to survive competition—means that there is little disposition to invest in theacquisition of new knowledge for upgrading or adapting current technology beyondwhat is embodied in new machinery and equipment (World Bank 2009).
Even in the case of high-technology producers and export-oriented manufacturers,whether and under what conditions they will engage with local knowledge produc-ers for needed knowledge depends on several factors. For local branches of transna-tional enterprises, the primary source of research and new technology is the parentcompany and its branches and affiliates, rendering marginal any local knowledgeproduction capacity, a situation that often applies in Africa. In other instances, agood deal turns on the existence or otherwise of a technology culture, as well as thedegree to which local knowledge producers are perceived as credible partners fromwhom to procure knowledge or with whom to collaborate in the coproduction ofknowledge. As will be seen from the consideration of the case material, the lack ofthese preconditions constitutes a major barrier to higher education–industry linkages in Sub-Saharan Africa.
An element that runs through all discussion of higher education–industry linkagesis the importance of proactiveness on both sides. Universities and research centersmust provide incentives and set up structures aimed at promoting and facilitatinglinkages with industry, even as industry must be actively receptive. There is evidence,however, that, even though university interest is essential for engagement, successfullinkages have come into being and have survived principally through the commitmentof industry and its investment of time and resources in specific linkage arrangements,whether by seeking collaboration, commissioning research, setting up an incubatoror a research laboratory in a university or center, receiving student interns, or releas-ing staff as adjuncts to institutions. Indeed, it may be stated with some force thatwithout vibrant industry driven by the pressure to increase productivity and lowercosts in order to thrive in a fiercely competitive, usually export, market, the drive toinnovate through the application of new knowledge and new technology remainsweak, and recourse to knowledge institutions for support or collaboration is highlyunlikely.2 In such conditions, the response to overtures from the knowledge institu-tions is bound to be lukewarm, at best. This must go a long way toward explainingwhy the many university-initiated measures aimed at promoting and facilitatinglinkages with industry have not achieved long-term success (see box 1 and the accom-panying text).
AFRICAN HIGHER EDUCATION AND INDUSTRY: WHAT ARE THE L INKAGES? | 279
Supportive Policy Framework
A third general condition for the success of higher education–industry linkages is a sup-portive public policy framework. Experience shows that appropriate public policy inter-ventions are often necessary to strengthen both the supply and demand sides and tobridge the gap between knowledge producers and industry. Such interventions take avariety of forms: for example, creating the necessary competences on the supply side,mainly through support for graduate training and research in selected priority areas inuniversities and research centers; establishing official structures to facilitate collabora-tion and information flow; and offering direct incentives to stimulate industry demandand receptivity to local knowledge workers and products. In some instances, the statehas collaborated directly, in a variety of ways, with universities and industry.
BOX 1. Selected Examples of University-Industry Partnerships in Africa
Makerere University, Uganda
• The Uganda Gatsby Trust, based at Makerere’s Faculty of Technology, is a not-for profit entity established in 1994 with seed funding from the Gatsby Chari-table Foundation (GCF) in the United Kingdom. The trust seeks to supportmanufacturing and value-adding businesses with growth potential. Its activitiesinclude training courses, business development services, student internships,technology development and transfer, and a business park.
• The Makerere University Private Sector Forum serves as a platform for interac-tion between the university and the private sector, with the mission of encourag-ing support for university programs and promoting entrepreneurship training,joint research, curriculum review, technology innovation and transfer, and devel-opment of business clusters.
University of Dar es Salaam, TanzaniaThe Institute of Production Innovation was founded in 1981 to carry out productinnovation, transfer innovations to industry, and provide technical consultancyfor enterprises.
Kwame Nkrumah University of Science and Technology, GhanaThe Technology Consultancy Centre was originally established in 1972 as a pro-duction unit of the University of Science and Technology in Kumasi. It serves asa conduit through which university research is made available to industry. Mostof its clients are small and medium-size enterprises in the informal sector, and thetechnologies transferred are mainly in food processing, fabrication of small-scalemachinery and parts, and ceramics manufacture and foundry works.
Source: Tindimubona (2000, 18, 19); UNCTAD (2003, 57, 70). For further informationon the Uganda Gatsby Trust, see http://gatsbyuganda.com/; for information on the Tech-nology Consultancy Centre, see http://www.knust.edu.gh/tcc/index.htm.
280 | AKILAGPA SAWYERR AND BOUBAKAR BARRY
The African Scene: Background
Some clarification is necessary to help frame this review of the African situation.First, the discussion is essentially limited to Sub-Saharan Africa, excluding SouthAfrica. This is because the histories and levels of development of the Maghreb coun-tries and South Africa are sufficiently different from the rest of Africa to make mean-ingful generalizations across the continent difficult for the purposes of our topic. Onthe other hand, even though the rest of Africa is by no means homogenous, there isenough in common to allow for reasonable generalizations.
Second, an undertaking such as this is faced with the usual difficulties of lack ofadequate and consistent national and intercountry data. The problem is compound-ed in this instance by the virtual absence of literature dealing with the actual formsand structures of such university-industry interaction as there is, in contrast to theburgeoning literature elsewhere. In the circumstances, we have been fortunate tocome across a number of country case studies that provide us with useful, if limited,material on which to proceed.
Third, given the near-absence of high-technology industry (see “Industry inAfrica,” below), the prevalence of small and middle-size industry, and the critical roleof the latter in Africa’s development, our presentation will deal primarily with suchindustry, concentrating on pathways between industry and knowledge productioncenters and the extent and potential of such linkages.
Finally, although we recognize the contribution of university-based managementconsulting to organizational improvement and to productivity increases, the topicdoes not receive direct attention in our discussion. This is largely because it is sosparsely covered in the literature.
Higher Education in Africa
As indicated above, the key conditions for effective higher education–industry link-ages include (a) the capability of higher education to produce skilled technical andmanagerial cadres and usable knowledge and (b) the capacity and disposition ofhigher education institutions to transmit such knowledge to end users. To assess theseconditions, it is necessary to review briefly the state of African higher education andits relationship with industry.
Capability
Most African higher education institutions, from their colonial or immediate post-colonial beginnings, have been oriented toward the liberal arts and basic sciences.This orientation, which suited the immediate postcolonial agenda of providing acadre of leaders and workers to run the public and private sectors of the newly inde-pendent states, was, by and large, effective for the first decade or so of independence.Before the end of that period, however, a clamor arose to alter the mission of thealmost exclusively public universities and training institutions to make them more
AFRICAN HIGHER EDUCATION AND INDUSTRY: WHAT ARE THE L INKAGES? | 281
development oriented. This campaign culminated in a call by Africa’s higher educa-tion leaders for the transformation of the leading African universities into “develop-mental universities,” as voiced at two major events: a United Nations–sponsored1962 conference in Tananarive, and a workshop entitled “Creating the African University: Emerging Issues in the 1970s,” organized by the Association of AfricanUniversities in Accra in 1972 (see Sawyerr 2004).3
In response to the changing global environment and the increasing centrality ofknowledge to production and social development, the call for developmentalismbecame insistent, and steps were taken in many places to give it meaning. Universi-ties of science and technology and of agriculture were established; new emphasis wasplaced on polytechnics and technical training; and in the early 1990s technologyparks began to be set up around universities and other higher education institutions.These attempts to reorient higher education in Africa have to date met with very limited success, partly because of the persistence of the ingrained orientation andpractices of the leading universities but also because of lack of complementary trans-formations in economy and policy.
What did change by the end of the 1980s was the profile of the typical higher education system, reshaped by an explosion of enrollments, an aging faculty, andreduced research and graduate study programs. The resulting deterioration was com-pounded by a combination of neglect and underfunding, as well as policy errors atboth the system level and the institution level. By the late 1990s, most African uni-versities were in dire straits, even the region’s premier institutions, which had, in theirprime, vied with the best in the world. (For fuller discussion of these issues and rele-vant references, see Sawyerr 2004; World Bank 2009.)
The situation is perhaps best captured in a set of paradoxes:
• The number of universities expanded dramatically following the wave of politicalindependence, from 52 in 1960 to over 400 in 2000, and it continues to climbsteeply, especially on the private side. Yet many countries still have only one, two,or three universities, and there is little diversity in institutional forms and functions.
• University enrollments rose fourfold between 1975 and 1985, almost tripled againduring the next decade, and are still rising. Yet, with an average participation rateof barely 5 percent, pressure for expansion of enrollment is unrelenting.
• Expenditure per student as a proportion of gross national product (GNP)—that is,in relation to national wealth—is far higher in Africa than anywhere else in theworld. Yet, owing to a combination of difficult economic conditions in most coun-tries and the fact that most universities depend on public support, the provision ofresources has not kept pace with enrollment.
Another problem relevant to our discussion is the aging of the faculty in virtually alluniversities, as senior faculty retire without being replaced at the rate required tomaintain the appropriate levels of leadership of research and graduate programs. Thiscan be seen from the following selective figures:
• Since 1990, according to the International Organization for Migration, Africa hasbeen losing an estimated 20,000 professionals each year through migration, manyof them academics.

282 | AKILAGPA SAWYERR AND BOUBAKAR BARRY
• In 2003 Makerere University in Uganda had an estimated vacancy rate of about40 percent, as did the Ghanaian university system.
• In Nigeria 400 professors (45 percent of the top-level professoriate) were expect-ed to reach the mandatory retirement age in 2008.
• In South Africa 50 percent of the academic staff was over age 50 in 2004.• Only a third of the academic staff at Makerere University held doctoral degrees as
of December 2006.• In 2008, for the first time, teaching positions at the University of Dar es Salaam were
to be filled by staff with only a bachelor’s degree—about 91 positions were involved.
The overall effects include
• Heavy teaching loads resulting from hugely expanded enrollments, unmatched bycommensurate faculty increases or the benefit of modern teaching aids
• Involvement of academic staff in nonacademic activities as a means of supplement-ing low official incomes, cutting down on time for staff development and research
• The absence of mentoring by senior colleagues and the lack of a critical mass ofother researchers, heightening the isolation of young researchers and reducing thescope for learning on the job.
All these have obvious implications for the quality of teaching, learning, andresearch.
There have, of course, been remarkable instances of coping and pockets of signif-icant revitalization. Particularly in the last few years, there has also been a generalawakening at the institutional, national, and continental levels to the need for cor-rective action. Nevertheless, the general situation remains problematic. This is in partbecause the attempt at revival has coincided with the rise of the knowledge societyand the imperative of global competitiveness. The consequence is that Africa’s insti-tutions, unlike most others in the world, face a dual challenge:
• The old task of producing experts for managing the essentially primary-productioneconomy and developing-country social conditions, and
• The new task of providing cutting-edge knowledge, advanced management, andinnovation to develop and manage a modern society and economy in the contextof global competitiveness.
Although this picture of degeneration in the conditions for knowledge productionand innovation may appear unduly bleak, it highlights the challenges, the better toenable us to appreciate the limited capability of the higher education system torespond effectively to the needs of modern industry.
Turning directly to the matter of university-industry linkages, Sub-Saharan Africahas the lowest tertiary enrollment rate in the world, particularly in the scientific andtechnical fields (tables 1 and 2).
The world average gross tertiary enrollment rate is 24 percent, and that of NorthAmerica and Europe is 70 percent, but in Africa it is only 5 percent. In 1995 Sub-Saharan Africa had a tertiary-level enrollment rate of 0.28 percent in technical fields;the developing-country average was 0.82 percent, and that for developed countries
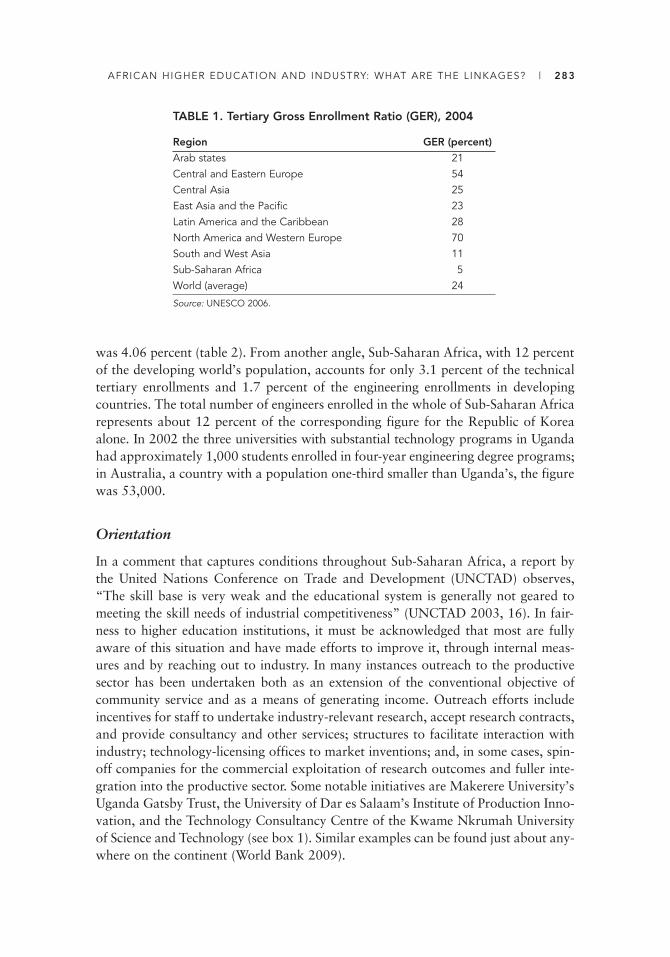
AFRICAN HIGHER EDUCATION AND INDUSTRY: WHAT ARE THE L INKAGES? | 283
was 4.06 percent (table 2). From another angle, Sub-Saharan Africa, with 12 percentof the developing world’s population, accounts for only 3.1 percent of the technicaltertiary enrollments and 1.7 percent of the engineering enrollments in developingcountries. The total number of engineers enrolled in the whole of Sub-Saharan Africarepresents about 12 percent of the corresponding figure for the Republic of Koreaalone. In 2002 the three universities with substantial technology programs in Ugandahad approximately 1,000 students enrolled in four-year engineering degree programs;in Australia, a country with a population one-third smaller than Uganda’s, the figurewas 53,000.
Orientation
In a comment that captures conditions throughout Sub-Saharan Africa, a report bythe United Nations Conference on Trade and Development (UNCTAD) observes,“The skill base is very weak and the educational system is generally not geared tomeeting the skill needs of industrial competitiveness” (UNCTAD 2003, 16). In fair-ness to higher education institutions, it must be acknowledged that most are fullyaware of this situation and have made efforts to improve it, through internal meas-ures and by reaching out to industry. In many instances outreach to the productivesector has been undertaken both as an extension of the conventional objective ofcommunity service and as a means of generating income. Outreach efforts includeincentives for staff to undertake industry-relevant research, accept research contracts,and provide consultancy and other services; structures to facilitate interaction withindustry; technology-licensing offices to market inventions; and, in some cases, spin-off companies for the commercial exploitation of research outcomes and fuller inte-gration into the productive sector. Some notable initiatives are Makerere University’sUganda Gatsby Trust, the University of Dar es Salaam’s Institute of Production Inno-vation, and the Technology Consultancy Centre of the Kwame Nkrumah Universityof Science and Technology (see box 1). Similar examples can be found just about any-where on the continent (World Bank 2009).
TABLE 1. Tertiary Gross Enrollment Ratio (GER), 2004
Region GER (percent)
Arab states 21Central and Eastern Europe 54Central Asia 25East Asia and the Pacific 23Latin America and the Caribbean 28North America and Western Europe 70South and West Asia 11Sub-Saharan Africa 5World (average) 24
Source: UNESCO 2006.

28
4
TABLE 2. Total Tertiary-Level Enrollment in Technical Subjects, 1995
Tertiary-level enrollment Technical subjects
Total Percent of All technical Natural Mathematics/
Country group/country students population subjects sciences computing Engineering
Developing countries 35,345,800 0.82 7,021,929 2,046,566 780,930 4,194,433Sub-Saharan Africa 1,542,700 0.28 220,660 111,500 39,330 69,830
Ghana 9,600 0.06 2,100 1,200 200 700Kenya 31,300 0.12 4,600 3,600 — 1,000Mauritius 5,500 0.49 500 100 100 300South Africa 617,900 1.49 72,200 21,700 30,500 20,000Tanzania 12,800 0.04 3,600 800 100 2,700Uganda 27,600 0.14 2,600 800 300 1,500Zimbabwe 45,600 0.41 9,700 2,200 800 6,700
Latin America 7,677,800 1.64 1,404,402 212,901 188,800 1,002,701Asia 21,553,400 0.72 4,584,300 1,513,100 438,600 2,632,600Transition economies 2,025,800 1.95 440,800 55,500 30,600 354,700Developed countries 33,774,800 4.06 5,754,419 1,509,334 1,053,913 3,191,172
Source: UNCTAD 2003.
Note: —, not available.
AFRICAN HIGHER EDUCATION AND INDUSTRY: WHAT ARE THE L INKAGES? | 285
In the end, these initiatives have proved neither substantial nor sustainable, forreasons to do partly with the histories and ways of work of the knowledge insti-tutions, which make it difficult to fully integrate such initiatives within the insti-tutions. Other factors are the state and orientation of industry, as will emergefrom the discussion that follows, and the overall policy framework within whichthe interaction takes place, especially dependence of research projects on donorfunding for survival.
Turning to the institutions, the problematic features relate to curriculum coverageand enrollment patterns, the extent and nature of research activities, and attitudestoward involvement with industry and commerce.
Curriculum and enrollment patterns. Enrollment is still heavily biased in favor of lib -eral arts courses, with not enough science students and even fewer in engineering andmathematics (see table 2). The roots of the problem lie largely outside the university,in that secondary schools do not turn out enough science-ready university entrants.Moreover, because the unit cost of producing science and technology (S&T) gradu-ates is so much higher than for liberal arts graduates, most public universities and virtually all the private universities, which account for a large part of the recent insti-tutional expansion, concentrate on non-S&T courses. The upshot is that the pool ofscience-trained graduates from which industry would draw its high-level technicalworkers is much shallower than in other regions of the world.
In addition, the teaching and learning process tends not to emphasize problem- solvingskills or exposure to real-life situations. There are notable exceptions, especially in themedical schools and in those institutions where problem-based learning, communitywork, and industrial attachment still form part of teaching and learning. The situationin most institutions which had these programs in the past is that they are no longeraffordable, especially in view of bloated enrollments, overcrowded classrooms and laboratories, and grossly inadequate staffing.
A particularly serious aspect of this situation is the absence or virtual collapse ofgraduate study in most universities. Although the issue affects all parts of the aca-demic enterprise and research culture, the relevant point here is that African coun-tries are turning out neither the numbers of PhDs in mathematics and engineeringrequired for high-technology take-off nor enough of the holders of master’s degreesneeded to provide leadership in small and medium-size enterprises if Africaneconomies and societies are to be globally competitive.
This is not to say that a shortage of science graduates with problem-solving skills orPhDs is currently handicapping local industry. There is evidence to the contrary, withthe arrival of the “unemployed science graduate.” Although the nub of the issue appearsto lie in the absorptive capacity of local industry (which we address later), the point tonote is that African institutions are currently in no position to provide the depth andrange of basic science and high-level problem-solving skills needed to support industrialdevelopment of the sort and at the levels required to move African societies out ofpoverty and into a solid competitive posture such as is demanded by the times.
Research. In the second place, there is not enough research, basic or applied, inAfrican universities, and what does exist is of neither the type nor the quality to

286 | AKILAGPA SAWYERR AND BOUBAKAR BARRY
attract the interest of industry or to lift it to a higher level (World Bank 2009). Theproblem is partly attributable to the quality of human resources available at the uni-versities and the incentives for undertaking industry-relevant research. Many facultymembers do not hold PhDs and—an especially serious shortcoming in technologicalfields—time for research is constricted by heavy teaching loads. Issues such as thedevelopment of new products and successful linkages with industry are rarely takeninto account for purposes of promotion and career advancement, creating a majordisincentive to engaging in research and development (R&D) activities that do notlead to scientific publication.
A further issue concerns the relevance of such research as is undertaken. Becauseof the “publish or perish” syndrome, research agendas tend to focus on purely aca-demic and narrowly scientific objectives so as to ensure publication in refereed jour-nals, with little regard for developmental needs. This situation is compounded byundue dependence on donor funding for research, which tends not to be industry oriented. Not surprisingly, the results of such research are rarely relevant to localentrepreneurs and industries, which, as a consequence, feel no inclination to forgepartnerships with local researchers or their institutions.
Attitudes. In the third place, and linked to some of the factors identified above, thereis little understanding in the university setting of the ways of work and the constraintsof industry, of what industry considers important, or of what it takes to prepare forand work effectively with it. In the absence of such understanding, it is virtuallyimpossible for the two sides to act proactively in planning and undertaking collabo-rative work (van Zyl, Amadi-Echendu, and Bothma 2007, 2). There are, of course,attempts to get around this problem by establishing structures, including special cen-ters, within the universities , for facilitating and promoting industrial outreach andinteraction (see box 1). But by and large, this is not enough to overcome the drag ofthe factors mentioned above.
Finally, there is a line of thinking, particularly within the leading public universi-ties, which holds that the role of universities is to develop knowledge throughresearch, publication of research results, and the training of students, not to solveroutine problems. In such circles, research commissioned by or targeted to industryis often regarded as “not real science.” This attitude is linked to the insistence on pub-lication in peer-reviewed journals as the basis for academic career advancement.
Industry in Africa
The basic unit of technological activity is the industrial firm, which is responsible forthe acquisition, development, adaptation, and use of technology (UNCTAD 2003, 1).The firm’s activities, particularly in a competitive setting, stimulate innovation in tech-nology and its applications, which usually drives the higher education and researchsector. Thus, the presence and activities of such firms are key to the technological andbroader development of any society in the contemporary world. Experience showsthat the factors driving technological development in such firms include competitionand trade policies, governing rules and regulations, physical infrastructure, skills, and

AFRICAN HIGHER EDUCATION AND INDUSTRY: WHAT ARE THE L INKAGES? | 287
financing (UNCTAD 2003, 2). Among these, skills acquired through high-level andspecialized training and knowledge generated from relevant research are major deter-minants of success in the new competition.
Against this background, what can we say about industrial firms and the conditionand structure of industry in general in Africa, in relation to technology develop-ment and knowledge acquisition? As previously noted, the relevant data and literatureare thin. We therefore rely heavily on country case studies of Kenya, Ghana, Uganda,and Tanzania published by UNCTAD in 2003. Although these four cases cannot represent the total situation on the continent, the main findings are confirmed by otherstudies (see, for example, World Bank 2009) and are sufficiently robust to form thebasis of comments on Africa outside South Africa and the Maghreb.
By and large, African manufacturing industry, as portrayed in the case study coun-tries, is dominated by low-level processing of natural resources and the production ofsimple consumer goods for local consumption. Describing a typical situation, theUNCTAD study observed,
[Ghana’s] industry structure consists mainly of a large refining industry and aluminumsmelting facility, with very limited manufacturing capacity. The modern sector, largelyowned by foreign companies, is concentrated on food processing and on industrial inter-mediaries manufactures. . . . Most of the semi-modern enterprises are relatively small-scale African-owned operations running on simple machinery and on low-level techni-cal and managerial skills. They generally produce lower-quality goods geared to thedomestic market. The informal sector is entirely African and operates on even simplertechnologies. (UNCTAD 2003, 43)
Thus, rather like Africa’s systems of higher education, Africa’s industry has remainedsubstantially untransformed—in this case, from its colonial raw material productionand export origins. At a time when world trade has shifted strongly from resource-based to technology-based commodities, Africa has the highest proportion ofresource-based exports, and its share of high-technology products is the lowest. Pri-mary products account for over three-quarters of all exports, with two-thirds ofexport revenues coming from petroleum alone. The shares of engineering, food, andgarment exports are relatively low, except for Mauritius (World Bank 2009). Further-more, there is hardly any high-technology (i.e., truly R&D intensive) industry such aswireless technology, advanced biotechnology, materials science, and so on.
What industry there is consists essentially of light manufacturing, often involvingsimple and relatively self-contained engineering activities and agroprocessing, bothlargely reliant on technology embodied in simple equipment, and requiring limitedskills. Not surprisingly, manufacturing value added in Sub-Saharan Africa, excludingSouth Africa, grew only 0.1 percent per year over the period 1990–97 and has stagnated at 0.4 percent as a share of global manufacturing value added, at a timewhen the developing-country share of global manufacturing exports had grown from9.6 percent in 1980 to 26.9 percent in 2000 (UNCTAD 2003, 2, 6).
Nevertheless, as long as these medium-technology enterprises remain the most sig-nificant forms of industry in Africa, their performance will be vital to the develop-ment and competitiveness of African economies. Improvements in their productivityand coverage through engagement with local and foreign knowledge and technology
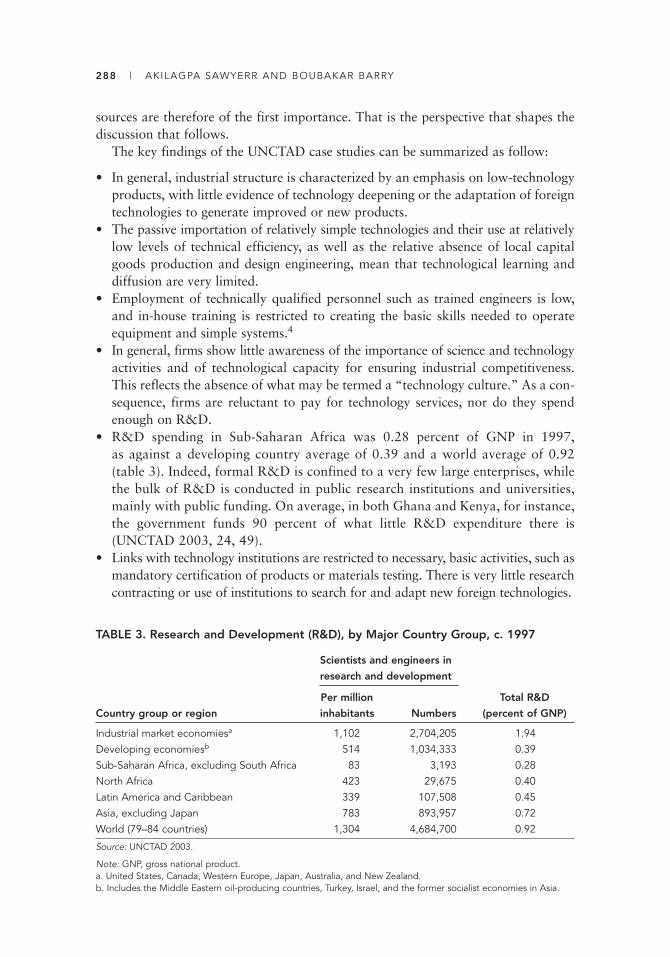
288 | AKILAGPA SAWYERR AND BOUBAKAR BARRY
sources are therefore of the first importance. That is the perspective that shapes thediscussion that follows.
The key findings of the UNCTAD case studies can be summarized as follow:
• In general, industrial structure is characterized by an emphasis on low-technologyproducts, with little evidence of technology deepening or the adaptation of foreigntechnologies to generate improved or new products.
• The passive importation of relatively simple technologies and their use at relativelylow levels of technical efficiency, as well as the relative absence of local capitalgoods production and design engineering, mean that technological learning anddiffusion are very limited.
• Employment of technically qualified personnel such as trained engineers is low,and in-house training is restricted to creating the basic skills needed to operateequipment and simple systems.4
• In general, firms show little awareness of the importance of science and technologyactivities and of technological capacity for ensuring industrial competitiveness.This reflects the absence of what may be termed a “technology culture.” As a con-sequence, firms are reluctant to pay for technology services, nor do they spendenough on R&D.
• R&D spending in Sub-Saharan Africa was 0.28 percent of GNP in 1997,as against a developing country average of 0.39 and a world average of 0.92(table 3). Indeed, formal R&D is confined to a very few large enterprises, whilethe bulk of R&D is conducted in public research institutions and universities,mainly with public funding. On average, in both Ghana and Kenya, for instance,the government funds 90 percent of what little R&D expenditure there is (UNCTAD 2003, 24, 49).
• Links with technology institutions are restricted to necessary, basic activities, such asmandatory certification of products or materials testing. There is very little researchcontracting or use of institutions to search for and adapt new foreign technologies.
TABLE 3. Research and Development (R&D), by Major Country Group, c. 1997
Scientists and engineers in
research and development
Per million Total R&D
Country group or region inhabitants Numbers (percent of GNP)
Industrial market economiesa 1,102 2,704,205 1.94Developing economiesb 514 1,034,333 0.39Sub-Saharan Africa, excluding South Africa 83 3,193 0.28North Africa 423 29,675 0.40Latin America and Caribbean 339 107,508 0.45Asia, excluding Japan 783 893,957 0.72World (79–84 countries) 1,304 4,684,700 0.92
Source: UNCTAD 2003.
Note: GNP, gross national product.a. United States, Canada, Western Europe, Japan, Australia, and New Zealand.b. Includes the Middle Eastern oil-producing countries, Turkey, Israel, and the former socialist economies in Asia.

AFRICAN HIGHER EDUCATION AND INDUSTRY: WHAT ARE THE L INKAGES? | 289
Considering its percentage of the world’s total population, it is estimated that Africaundertakes only about a tenth of the R&D it ought to be conducting. Where R&Ddoes occur, the research output is often prematurely abandoned and is rarely trans-formed into usable technologies (Massaquoi 2001, 6). Ironically, the low volume ofR&D and the low rate of transformation of research results into practical use lead tolow returns to R&D investment in Africa, compared with those in the developed andemerging countries, which in turn, leads to low investments, in a downward spiral.
This general absence of a technology culture is attributable, in part, to the lack ofcompetition that would spur demand for better and more efficient technology, whichin turn could stimulate science and technology institutions to create more advanced,useful, and affordable products.
Most countries have extensive public infrastructure devoted to the production ofindustrially useful knowledge and technology and their transmission to industrythrough research centers, industrial promotion units, and funding arrangements. Yetthe evidence from the case studies and other sources is that, by and large, firms inAfrica are unaware of the technological services or capabilities available within theofficial technology infrastructure and universities or regard them as irrelevant or inef-ficient. There are thus few links with those institutions and such facilities andresources as they have (UNCTAD 2003, 34).
For all these reasons—in particular, the generally weak skills base, the absence ofa technology culture, and the resulting low inflows of high technology—most indus-tries lack the ability to absorb sophisticated technologies, which constitute the cut-ting edge of industrial dynamism and competitiveness. Furthermore, especiallybecause of the low level of in-house technological activity, firms cannot always iden-tify their specific technological needs and so lack the necessary basis for seeking,acquiring, and absorbing essential knowledge and technology inputs throughresearch contracting, collaborative ventures, and the like.
This situation, together with the generally weak drive for technological innova-tion, constitute a formidable barrier to linkages with agencies that can conductresearch for or in collaboration with industry or that have the means to facilitate suchresearch. That, we would argue, constitutes the main constraint on the provision oftechnology support by research and development institutions. As succinctly put in theUNCTAD study,
Where such [in-house] capabilities are lacking, even good technology institutions can dolittle. (UNCTAD 2003, 33)
Without a more dynamic technology culture in private industry, an institution such asthe Kenya Industrial Research and Development Institute cannot provide much morethan mundane technical services. (UNCTAD 2003, 31)
A final feature of note is that the principal industries in Africa are for the most partaffiliates or subsidiaries of multinational companies established in developed coun-tries and operate mainly in the primary sector and in services. These affiliates andsubsidiaries carry out very little research on the continent, almost all the neededresearch being undertaken at headquarters or other locations of the parent compa-nies. In consequence, their presence has little impact on domestic technology devel-opment (World Bank 2009).
290 | AKILAGPA SAWYERR AND BOUBAKAR BARRY
Concluding Comment
It is difficult to bring such a wide-ranging discussion to a neat conclusion, and thereis not much point in offering “recommendations.” What we do instead is to suggestsome initial ideas aimed at encouraging a systematic approach to what ought to be aburning national and continental issue: the mobilization of Africa’s knowledgeresources in support of its sustained development in the current global dispensation.
Given the lack of data and of basic understanding on such a crucial issue, a firststep has to be the establishment, preferably in each country and certainly in eachregion, of a well-resourced “observatory” involving industry, government, the uni-versities, and the technology institutions. The primary task of this body should be thethorough study and proper observation and visioning of this phenomenon, namely,that of mobilizing and applying Africa’s knowledge resources, as it evolves over thecoming decade. Experience elsewhere should be carefully examined and adapted tothe changing African realities.
An obvious second thrust is the revitalization and strengthening of Africa’s uni-versities and the facilitation of their repositioning to provide the intellectual sinewsof a new drive for African development on all fronts. The case for such a revitaliza-tion drive is now generally accepted, nationally, continentally, and among Africa’sdonor partners. The principal gain will be the combination of expanded access withquality and lifelong learning skills, along with the general spread of the scientificapproach to all aspects of life. This will have immediate significance not only for theconditions of individual and social life but also for the quality of the labor force as awhole and, thus, for the productive sector, including industry.
The improvement of general education should be complemented by a special pro-gram for the strengthening of staff quality, research, and graduate study in carefullyselected priority areas aligned with specific national industrial development objec-tives. The determination of priority development areas should be approached as anissue of critical national policy, involving detailed technical and sociological studiesand wide consultation. In some circumstances, a subregional approach will offer thebest options. Necessary intermediary arrangements, including the provision of pub-licly supported laboratories and other facilities, should be made, both to support priority-area research and to promote linkages to targeted industrial activities.
A crucial factor will be the stimulation of a technology culture in industry in generaland especially in the targeted sectors. As appears from all that has been said above,without such a culture the demand side of the knowledge-industry interaction willremain so weak as to render the linkage anemic and unsustainable, providing no impe-tus to industrial innovation and competitiveness. Part of the answer will consist in themeasured exposure of industry to internal and external competition. But note shouldalso be taken of the lessons from the positive East Asian experience, as well as fromAfrica’s not-so-positive experience: at this stage of maturity, domestic industry, exposedto unrestrained foreign competition, faces the danger of decimation, and, therefore, apolicy of measured exposure must incorporate specific and targeted state support for local industry and enterprise if it is to elicit the appropriate responses (UNCTAD 2003, 4;

AFRICAN HIGHER EDUCATION AND INDUSTRY: WHAT ARE THE L INKAGES? | 291
World Bank 2009). What is needed, drawing on East Asian experience, is a regime ofcarefully considered and proactive state support and incentives, aimed at building upa strong technology culture in local industry, with special emphasis on priority areas,and at raising the capacity of industry to compete locally and internationally. State-supported apprenticeships for engineers and technologists, and encouragement offirms to develop active in-house and external staff training and upgrading, can makea major contribution. Industry should be facilitated increasingly to engage with andreinforce the local knowledge and technology infrastructure, in what was known inBrazil as the “Sabato Triangle,” involving close collaboration among government,universities, and industry.
To give this entire process the necessary weight and urgency, it must be champi-oned by the highest political levels. In other countries this has been achieved by fram-ing it as a special presidential or prime ministerial initiative. Something similar shouldbe done in Africa.
Although the primary locus of the effort must be national, the scale of the prob-lem, in terms of resources, skill pools, and markets, transcends national boundaries.In this connection, it is encouraging that the African Union is providing continentalleadership in the revitalization of higher education. The new Second Decade for Edu-cation in Africa (2006–15), declared in 2007, includes, for the first time, a compo-nent on higher education, signaling the African Union’s recognition of the vital rolethat higher education must play in the region’s development agenda. In relation,specifically, to science and technology, this new awareness is symbolized by the Scienceand Technology Consolidated Plan of Action launched in 2005 by the African Unionand the secretariat of the New Partnership for Africa’s Development (NEPAD).This plan (NEPAD 2006) is aimed at developing and using science and technologyfor the socioeconomic transformation of the continent and its integration into theworld economy. Although its implementation has been stalled by the failure, so far,of African leaders to reach a consensus on how to finance it, the plan is significantbecause, as with the declaration of the Second Decade of Education, it signals, finally,the engagement of Africa’s political leadership. For its part, the African DevelopmentBank has approved a Strategy for Higher Education, Science, and Technologyaimed, among other things, at helping member countries link higher education to the productive sector.
Supplemented by appropriate national-level policies and structures, such as thoseoutlined above, and combined with well-resourced regional nodes of strength inselected areas, these efforts provide a starting point for productive collaborationbetween higher education and industry nationally and across the continent.
Notes
1. We use the term “knowledge production institution,” which is more general than “highereducation” or “university,” to emphasize that relevant knowledge production occurs out-side the formal university system, although the latter remains the principal locus forresearch and knowledge generation.
292 | AKILAGPA SAWYERR AND BOUBAKAR BARRY
2. An exception must be made in the case of state-sponsored research or industrial drive, asfor the arms industry.
3. The Tananarive conference was sponsored by the United Nations Educational, Cultural,and Scientific Organization (UNESCO) and the United Nations Economic Commissionfor Africa.
4. Although the point about low employment of technically qualified personnel holds for thetypical medium-to-low-technology enterprise, the situation is significantly different in thelarger firms and major public enterprises and utilities, where the top engineers and managersare drawn from local graduates, occasionally with foreign postgraduate qualifications.
Bibliography
African Ministerial Council on Technology. n.d. “Flagship R&D Programmes: Building Engi-neering Capacity for Manufacturing.” http://www.nepadst.org/platforms/engcapacity.shtml.
Ajayi, J. F. Ade, Lameck K. H. Goma, and G. Ampah Johnson. 1996. The African Experiencewith Higher Education. Accra: Association of African Universities; London: James Currey;Athens, OH: Ohio University Press.
Breier, Mignonne, and Mahlubi Mabizela. 2008. “High-Skill Requirements in Advanced Man-ufacturing.” In Human Resources Development Review: Education, Employment andSkills in South Africa, ed. Andre Kraak and Karen Press, 300–21. Cape Town: HSRCPress.
Brennenraedts, Reginald, Rudi Bekkers, and Bart Verspagen. 2006. “The Different Channelsof University-Industry Knowledge Transfer: Empirical Evidence from Biomedical Engi-neering.” Working Paper 06.04, Eindhoven Centre for Innovation Studies, Eindhoven,Netherlands.
Engelhard, Rutger. 2000. National Policy Dialogue on Research and Technology for Development. Introduction to Assessment Reports Prepared in Ghana, Senegal, Ugandaand Vietnam. Maastricht, Netherlands: European Centre for Development Policy Management.
Lorentzen, Jo Angelique Wildschut. 2008. “High-Skill Requirements in Advanced Manufac-turing.” Human Resources Development Review: Education, Employment and Skills inSouth Africa, ed. Andre Kraak and Karen Press, 345–64. Cape Town: HSRC Press.
Lwakabamba, Silas, and Francis Mbuza. 2004. “African Centre for Engineering and Technol-ogy Education.” Global Journal of Engineering Education (Australia) 8 (1): 93–100.
Massaquoi, J. C. M., ed. 2001. University-Industry Partnership for Cooperative TechnologyDevelopment in Africa: Opportunities, Challenges, Strategies and Policy Issues. Nairobi:United Nations Educational, Scientific, and Cultural Organization (UNESCO).
NEPAD (New Partnership for Africa’s Development), Office of Science and Technology. 2006.Africa’s Science and Technology Consolidated Plan of Action. Midrand, South Africa:NEPAD.
Sawyerr, Akilagpa. 2004. “Challenges Facing African Universities: Selected Issues.” AfricanStudies Review 47 (1): 1–59.
Scott, Alister, et al. 2001. The Economic Returns to Basic Research and the Benefits of University-Industry Relationships: A Literature Review and Update of Findings. Science andTechnology Policy Research, Report for the U.K. Office of Science and Technology, London.
Tindimubona, Alex R. 2000. “National Policy Dialogue on Research and Technology forDevelopment in Uganda: An Assessment.” European Centre for Development Policy Man-agement, Maastricht, Netherlands.

AFRICAN HIGHER EDUCATION AND INDUSTRY: WHAT ARE THE L INKAGES? | 293
UNCTAD (United Nations Conference on Trade and Development). 2003. Africa’s Technolo-gy Gap: Case Studies on Kenya, Ghana, Uganda and Tanzania. UNCTAD/ITE/IPC/Misc.13. New York: United Nations.
UNESCO (United Nations Educational, Scientific, and Cultural Organization). 2006. “Glob-al Education Digest 2006: Comparing Education Statistics around the World.” UNESCOInstitute for Statistics, Montreal.
van Zyl, A., J. Amadi-Echendu, and T. J. D. Bothma. 2007. “Nine Drivers of KnowledgeTransfer between Universities and Industry R&D Partners in South Africa.” South AfricanJournal of Information Management 9 (1, March): 1–22.
World Bank. 2009. Accelerating Catch-up: Tertiary Education for Growth in Sub-SaharanAfrica. Directions in Development Series. Washington, DC: World Bank.
Yesufu, T. M. 1973. Creating the African University: Emerging Issues in the 1970s. Ibadan,Nigeria: Association of African Universities; Oxford University Press.
294
Comment on “African Higher Educationand Industry: What Are the Linkages?”by Akilagpa Sawyerr and Boubakar Barry
SHAHID YUSUF
The paper by Sawyerr and Barry is a model of balanced exposition. It rightly startsby underscoring the axial role of knowledge for development and the increasing con-tribution knowledge producers can make to the pace and technological content ofindustrial change and to gains in productivity. The authors enumerate the pathwaysthrough which knowledge finds its way into production processes, but they stress,again rightly, that the outcomes depend on the capability of the producers to gener-ate a stock of usable knowledge and on the efforts to disseminate this knowledge topotential users. Equally, those who can benefit from the knowledge must be active inseeking it out, and well prepared and entrepreneurial in putting it to the best possi-ble use. Fumio Kodama has labeled firms with absorptive capacity as “receiveractive” (Kodama and Suzuki 2007). The dynamism and growth of a knowledgeeconomy depend on the initiative of both parties. To what degree this interactionbetween producers and users results in a virtuous economic spiral depends, accord-ing to Sawyerr and Barry, on the emergence of a technology culture that stimulatesthe continual deepening of knowledge, as well as unceasing efforts by industry to har-ness knowledge effectively for the sake of survival in a unsparingly competitive worldeconomy.
An economy that induces the continuous production, borrowing, adaptation, andutilization of knowledge has been slow to emerge in African countries, for a varietyof reasons. African universities are struggling to rise to the challenge of graduatingenough engineers and scientists with skills of the requisite quality and to conductresearch that can be of practical relevance. African firms, by and large, evince littledesire to upgrade their technologies and diversify into areas of higher technology byfully exploiting the available supply of skills and seeking out technology from all pos-sible sources, domestic and foreign. They are behaving passively, preferring to remainin low-technology, niche areas. As a consequence, African firms too often forgo the
Shahid Yusuf is an economic adviser at the World Bank Institute.
Annual World Bank Conference on Development Economics 2009, Global© 2010 The International Bank for Reconstruction and Development / The World Bank

COMMENT ON SAWYERR AND BARRY | 295
opportunities that could be grasped through an upgrading of their workforces,through technology catch-up, and through strategies that give greater primacy toin-house applied research and to innovation.
Sawyerr and Barry conclude by calling for a determined political drive designed tostrengthen the technology culture by, for example, enhancing market competition; torevitalize the universities; and to create an “observatory” composed of key stake-holders to help chart the way forward. The authors’ diagnosis is balanced and well-rounded. But they never explain why African countries have been slow to evolve atechnology culture, why competitive pressures impinging on African economies havebeen relatively weak, and why industry in African countries has remained low tech-nology. A stab at each of these questions is surely the first step in arriving at solu-tions, however tentative. Absent such analysis of persistent shortcomings, theauthors’ recommendations, although sensible, do not go beyond the generic.
If one compares some of the Southeast Asian “tiger” economies with countries inSub-Saharan Africa, it is apparent that Malaysia and Thailand started out from aresource base that was not different from that of several of the coastal economies inAfrica. Neither of these countries had or even now possesses a technology culture.Neither has a strong tertiary education sector, and their universities are only nowbeginning to develop postgraduate and postdoctoral programs. Yet they haveacquired substantial manufacturing capability and have absorbed the expertise toproduce high-tech products. The question that arises is why Southeast Asian coun-tries have responded differently to global competition, have integrated with globalvalue chains, and have built an internationally competitive industrial base eventhough the technology culture was no stronger there than in a number of Africancountries. There are several possible explanations that Sawyerr and Barry could haveexamined. It could be, for example, that the African economies were (and remain),on balance, more closed and less politically stable than their Southeast Asian com-parators and therefore attracted little foreign direct investment in manufacturingactivities; that their market institutions were and are relatively weaker; that their pri-mary and secondary education systems did not impart the basic skills required of anindustrial workforce; and that the region has lacked role models such as Japan andthe Republic of Korea to generate a variety of spillover and neighborhood effects.And there are other reasons, as well.
Southeast Asian countries are now attempting to build technological capabilitiesand deepen embryonic innovation systems, much like the African countries that arethe focus of this paper. However, they have the advantage of starting from a solidmanufacturing base, and one that has absorbed the advances in technology in theelectronics, engineering, and transportation industries. They have also begun invest-ing substantially in tertiary education and research. Nevertheless, the deepening ofdomestic technological capabilities poses severe challenges, especially for latecomersstruggling to climb onto the first rung of the global market for manufactures.
The majority of countries in Sub-Saharan Africa lag far behind, and developing acompetitive knowledge economy will take years of effort and investment. Sawyerrand Barry identify a broad objective, the technology culture, and they point to some
296 | SHAHID YUSUF
of the weaknesses of African universities, which fail to emphasize problem-solvingskills and are struggling to enlarge the pool of graduates with mathematics, science,and engineering skills. The authors assert that a relatively protected domestic marketmight explain the small appetite for technology among firms and the low investmentin research and development. But all they offer by way of remedies is to call for activeinvolvement by the state and a pan-African effort to develop science and technologyskills. This is a small part of the answer that policy makers are seeking, not just inSub-Saharan Africa but also in Asia and elsewhere. How to make government inter-ventions more effective is the more compelling question the paper fails to address.Nor does the paper acknowledge and tackle another equally important policy ques-tion: what kinds of specific actions by firms and other nonstate actors are needed tocomplement the efforts of the state to embed a technology culture and to make it thefoundation of an economy that derives competitive strength from innovation? Deal-ing with these questions in any depth would go far beyond the authors’ remit, but astart at providing answers beyond the commonplace, grounded in their vast knowl-edge of the subject, would have augmented the contribution of the paper to policymaking.
Reference
Kodama, Fumio, and Jun Suzuki. 2007. “How Japanese Companies Have Used ScientificAdvances to Restructure Their Businesses: The Receiver-Active National System of Inno-vation.” World Development 35 (6): 976–90.
An Arrested Virtuous Circle? HigherEducation and High-TechnologyIndustries in IndiaRAKESH BASANT AND PARTHA MUKHOPADHYAY
The authors provide a brief but comprehensive overview of linkages between highereducation and the high-technology sector, followed by an analysis of the major link-ages in India. Links outside the labor market are found to be weak—a consequenceof a regulatory structure that separates research from the university and discouragesgood faculty from joining the university. The effect is to erode the quality of the intel-lectual capital necessary to generate new knowledge. In the labor market, the authorsfind a robust link between higher education and high-tech industry, but despite astrong private sector supply response to the growth of high-tech industry, the qualityleaves much to be desired. Poor university governance may be limiting both labor market and non–labor market linkages. Industry efforts to improve the quality ofgraduates are promising, but overreliance on industry may compromise workforceflexibility. Addressing governance failures in higher education is necessary in order tostrengthen the links between higher education and high-tech industry.
For late-industrializing countries, the creation of a high-technology industrial base iscritical for development. As the links between technology and development evolve,the potential role of higher education in contributing to the creation of a high-techindustrial base is becoming a major policy focus.1 In this context, the links betweenhigh-tech industries and higher education become crucial. The available literature hasnot explored these linkages adequately, especially in the context of developing coun-tries. The aim of this paper is to explore empirically such linkages in India.
297
Rakesh Basant is a professor at the Indian Institute of Management, Ahmedabad. Partha Mukhopadhyay is a seniorresearch fellow at the Center for Policy Research, Delhi. This is an extensively revised version of the paper presented atthe Annual World Bank Conference on Development Economics. Rakesh Basant would like to acknowledge the supportof the Observer Research Foundation, New Delhi, for part of the work reported here. The authors are also grateful toShobha Tekumalla and Rohan Mukherjee for excellent research assistance and to Pankaj Chandra and an anonymousreferee for useful comments.
Annual World Bank Conference on Development Economics 2009, Global © 2010 The International Bank for Reconstruction and Development / The World Bank
298 | RAKESH BASANT AND PARTHA MUKHOPADHYAY
The next section contains a brief but comprehensive overview of linkages betweenhigher education and the high-tech sector. This is followed by a survey of the structureof higher education in India. Empirical evidence on the major linkages in India is thenexamined in the context of the recent growth of high-tech industry there, and concreteexamples of labor market channels in the information technology, financial services,and high-end manufacturing sectors are presented. The response of the higher educa-tion sector to developments in the labor market, and the differences in this respectbetween Indian states, are examined, and we argue that the response has been restrictedby the nature of regulation in India. Some issues raised in earlier sections are then discussed in the context of other South Asian countries. The final sections identify policylessons and present conclusions.
Linkages between Higher Education and High-Technology Industry
Three broad conceptual frameworks inform the analysis of the linkages betweenhigher education and high-tech industry: the national innovation system (NIS); thetriple-helix paradigm; and university-industry linkages (UILs).
The concept of NIS was developed to explain the differences in the innovative per-formances of industrial countries. More recently, the framework has been applied to theanalysis of the experiences of developing countries, especially the newly industrializingeconomies of East Asia. NIS characterizes a system of interacting agents—firms, univer-sities (including research institutions), and government agencies—that are involved inthe development and commercialization of science and technology. These interactionsare undertaken within national borders and encompass technical, commercial, legal,financial, and social transactions. (See Metcalfe and Ramlogan 2008 for a succinct sum-mary of the NIS literature.) Differences in innovative performance among nation-statesare ascribed to differences in the way institutions combine and interact to generate,improve, and diffuse new technologies—that is, products, processes, and practices.
The initial applications of this framework focused on nation-states, but NIS isincreasingly being used to look at regional, local (cluster), and sectoral situations. Itis often also employed to contextualize case studies of specific institutions—firms, universities, and state agencies. It has been suggested that the literature in this traditionhas focused more on the “invention system” than on the “innovation system” and hasthus accorded less importance to understanding the complementary economic processesneeded to convert invention into innovation and then to diffuse the innovations (Metcalfe and Ramlogan 2008).
The triple-helix paradigm extends the NIS framework. In triple helix I, “the stateencompasses industry and academia and directs relations between them.” In triplehelix II, the three actors are in individual and separate domains “with strong bordersdividing them and highly circumscribed relations” among them. Triple helix III gen-erates a “knowledge infrastructure . . . with each taking the role of the other and withhybrid organizations at the interface” (Etzkowitz and Leydesdorff 2000, 111). Theframework thus develops a model of innovation that captures multiple reciprocalrelationships among industry, university, and government which help capitalizeknowledge at different stages of its development process (Etzkowitz 2003). In so
AN ARRESTED VIRTUOUS CIRCLE? | 299
doing, it focuses on the internal transformation of each of the helixes and the influ-ence of one helix on the other.
The recent literature on university-industry linkages appears at first glance to be bothan extension and a combination of these two frameworks, as it focuses on two of thethree components of NIS and two helixes of the triple-helix system. UIL studies, howev-er, are different, in three ways. First, UILs are typically analyzed in the context of geo-graphically bound clusters, related to the literature on regional or cluster-specificinnovation systems. In adopting this focus, they tend to deemphasize the macro linkagesbetween the education system and industry. Second, UIL studies focus on the variety ofindustry-academia linkages and their measurement. Third, these studies increasinglyexplore the complementary economic processes that are required in order to facilitateand even push the invention-innovation-diffusion process. This exploration has led tothe examination of various policy options that bring universities closer to the market andfacilitate commercialization of technology developed at the university, through licensingand start-ups. Thus, the emerging focus of this work is on understanding the factors thathelp “traditional universities” become “entrepreneurial universities.”2
Broadly, all three streams of literature encompass the linkages between higher edu-cation and high-tech industries, with the UIL framework giving these interactionsgreater attention. Nevertheless, the linkages remain largely underexplored in the con-text of developing countries. In particular, labor market linkages have received inad-equate attention, whether in local or national contexts. This is surprising because thelabor market connection between industry and academia remains the most promi-nent link even in developed countries, where universities contribute relatively little topatenting, licensing, and new enterprise creation except, probably, in life sciences(Hershberg, Nabeshima, and Yusuf 2007). In developing countries, such linkages areeven weaker.
Conversely, industries can influence higher education institutions through a vari-ety of channels. These relationships, again, have been little explored in developingcountries, where the relative capacities of the private sector and the state differ fromthose in a developed country. The ability of institutions to respond positively toindustry and create a virtuous feedback loop depends on the regulatory structure ofhigher education, especially the constraints on establishing new institutions, hiringfaculty, setting salaries, and making changes in curriculum—that is, it depends on thedegree of agency possessed by the institution.
The Developing-Country Context
It is useful to briefly describe the linkages between higher education and high-techindustries and how the nature of these interactions may differ in developing countries.
Linkages from Higher Education Institutions to High-Technology Industries
Consider first the links that operate from higher education institutions to high-techindustries.

300 | RAKESH BASANT AND PARTHA MUKHOPADHYAY
1. Higher education institutions provide a common and possibly neutral platform fordiscussions about the broader goals of innovation policy and a forum that permitsrelatively open interaction between industry and government.3 This feature maybe valuable in developing countries, where the relationship between the bureau-cracy and industry is often antagonistic or clientelist, either of which precludesproductive dialogue. Its function may be especially important when a country ismoving from one type of industry-government relationship toward another, forexample, during a liberalization. We do not explore this linkage here.
2. Another mundane link is through the institutions’ supply of services such as test-ing, training, certification, and prototype development.4 This is especially impor-tant in developing countries, where firms are typically small and their number is relatively large. Developing skills in-house is more difficult for a small firm thanfor a large one; furthermore, the country’s talent pool is relatively limited and isunable to meet the needs of the large number of firms. Higher education institu-tions such as universities can function as a common pool resource, aggregatingthe limited talent and making it available to all firms on a fee-for-service basis.This, again, is not an area we explore here.
3. The third link is through an ostensibly primary function of higher education, cre-ation of knowledge, through technology licensing, industry-institution researchand development (R&D) projects, and the like. Given the relatively poor state ofthe education infrastructure in developing countries, the predominance of statefunding for higher education, and the low levels of funding of R&D by industry,this is unlikely to be a strong channel.
4. A step beyond the creation of knowledge is its commercialization through the cre-ation of new enterprises that put to use technologies developed in the institutionsby students or faculty. Often, formation of new enterprises is facilitated by scienceparks, incubators, and the like that are established around research-based aca-demic institutions. The growth of high-technology industries, however, requiresinputs other than those from higher education institutions. For example, if a cityis to become a financial center, human skills have to be combined with urbaninfrastructure. Similarly, limited availability of risk capital may strongly inhibit thegrowth of high-tech firms.
5. Finally, and most important, higher education institutions supply talent for high-tech industries. Students trained at these institutions become part of the laborpool, which may or may not be restricted to the region. This is not true just forservice sectors commonly regarded as high-tech areas, such as information tech-nology (IT) and financial services; most types of manufacturing, too, need a cer-tain component of high-end skills. As the higher education sector evolves, itacquires the capacity to handle more complex technologies (“deepening”), and itsinfluence extends to more industries (“broadening”).
The focus of the UIL literature has been on the creation and commercialization ofknowledge and the creation of enterprises. The links through the supply of laborhave, in some sense, been considered too mundane. Yet, although the former types oflinkage are possibly more important in countries where growth is driven by pushing

AN ARRESTED VIRTUOUS CIRCLE? | 301
the technological frontier, the labor market link may be significant in developingcountries, where the growth of high-tech industry may depend more on how quicklyexisting technologies can be exploited. In industries such as software, this ability maywell be constrained by the supply of highly skilled labor, which will determine thecost and the pace of expansion.
Linkages from High-Technology Industries to Higher Education Institutions
The linkages that extend from high-tech industries to higher education can, again, begrouped under five broad types.
1. The first and most mundane is the supply of goods and services; for example, high-techindustry provides specialized equipment to institutions, as well as technicians to serv-ice the equipment. In developing countries, the servicing function is likely to be moreimportant because much of the equipment may be imported and may also see muchlonger usage periods than in developed countries. We do not explore this link here.
2. In developing countries, where teachers are often in short supply, industry profes-sionals may serve as teaching staff. Of course, industry also affects the supply ofteachers by offering an alternative career choice for students, which could influenceboth the quality and the compensation of the teaching pool. This is especially truefor technical and professional education, which is relevant to high-tech industries.
3. Industry can influence the curriculum by working with government or higher edu-cation institutions to effect changes in line with its own requirements. To theextent that industry is more outward-oriented than higher education institutionsin developing countries, this can be a source of new ideas, but it also carries a riskof making education narrower.
4. High-tech industries can be a source of funding for higher education. Because of thestronger links between educational inputs and success in industry, alumni in theseindustries may be more predisposed toward giving back to the institution. Industrymay also fund research projects. Given the low levels of government funding, bothin general and specifically for research, and the conditionalities that restrict the useof such funding, contributions from industry can be more important in developingthan in developed countries. In research, especially, the added funding from indus-try can be a sizable proportion of the overall research budget in universities.
5. Finally, demand for labor on the part of industry can lead to demand for new insti-tutions and expansion of the capacity of existing institutions. Depending on theresponse, this can affect the structure of the higher education sector. Concentra-tion of industry in a few areas, as is more likely in developing countries, may sim-ilarly concentrate the structure of higher education.
Higher Education in India
India has several types of higher education institutions: universities, “deemed to be uni-versities,” colleges, institutions of national importance, and postgraduate institutions
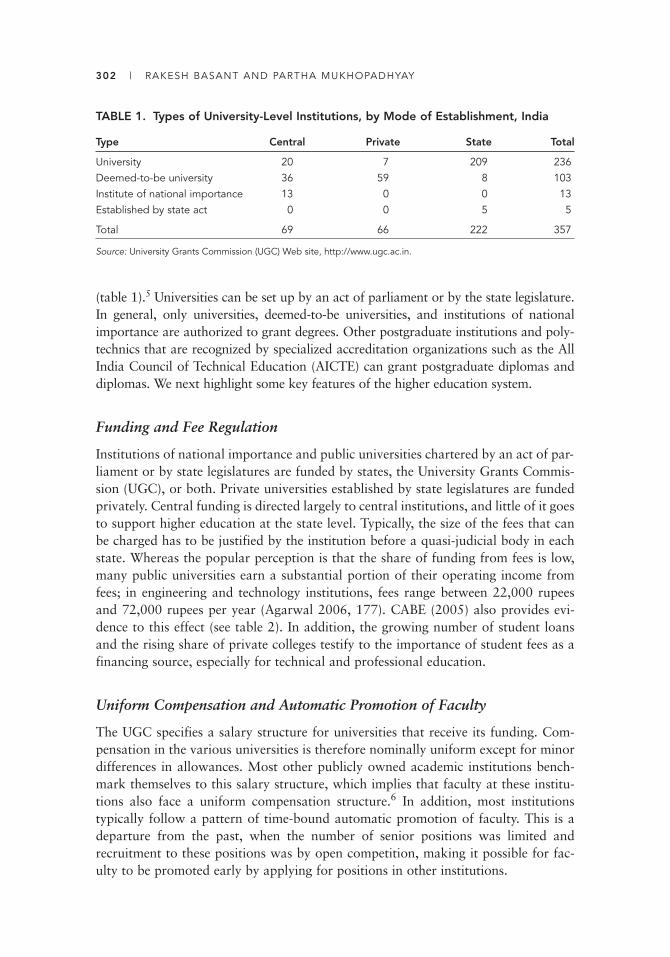
302 | RAKESH BASANT AND PARTHA MUKHOPADHYAY
(table 1).5 Universities can be set up by an act of parliament or by the state legislature.In general, only universities, deemed-to-be universities, and institutions of nationalimportance are authorized to grant degrees. Other postgraduate institutions and poly-technics that are recognized by specialized accreditation organizations such as the AllIndia Council of Technical Education (AICTE) can grant postgraduate diplomas anddiplomas. We next highlight some key features of the higher education system.
Funding and Fee Regulation
Institutions of national importance and public universities chartered by an act of par-liament or by state legislatures are funded by states, the University Grants Commis-sion (UGC), or both. Private universities established by state legislatures are fundedprivately. Central funding is directed largely to central institutions, and little of it goesto support higher education at the state level. Typically, the size of the fees that canbe charged has to be justified by the institution before a quasi-judicial body in eachstate. Whereas the popular perception is that the share of funding from fees is low,many public universities earn a substantial portion of their operating income fromfees; in engineering and technology institutions, fees range between 22,000 rupeesand 72,000 rupees per year (Agarwal 2006, 177). CABE (2005) also provides evi-dence to this effect (see table 2). In addition, the growing number of student loansand the rising share of private colleges testify to the importance of student fees as afinancing source, especially for technical and professional education.
Uniform Compensation and Automatic Promotion of Faculty
The UGC specifies a salary structure for universities that receive its funding. Com-pensation in the various universities is therefore nominally uniform except for minordifferences in allowances. Most other publicly owned academic institutions bench-mark themselves to this salary structure, which implies that faculty at these institu-tions also face a uniform compensation structure.6 In addition, most institutions typically follow a pattern of time-bound automatic promotion of faculty. This is adeparture from the past, when the number of senior positions was limited andrecruitment to these positions was by open competition, making it possible for fac-ulty to be promoted early by applying for positions in other institutions.
TABLE 1. Types of University-Level Institutions, by Mode of Establishment, India
Type Central Private State Total
University 20 7 209 236Deemed-to-be university 36 59 8 103Institute of national importance 13 0 0 13Established by state act 0 0 5 5
Total 69 66 222 357
Source: University Grants Commission (UGC) Web site, http://www.ugc.ac.in.
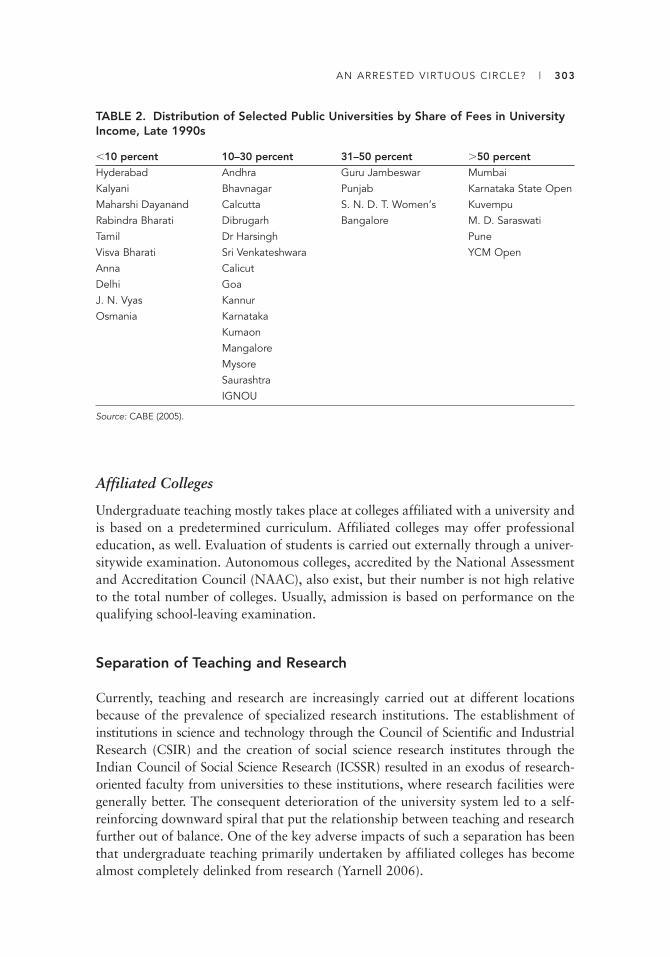
AN ARRESTED VIRTUOUS CIRCLE? | 303
Affiliated Colleges
Undergraduate teaching mostly takes place at colleges affiliated with a university andis based on a predetermined curriculum. Affiliated colleges may offer professionaleducation, as well. Evaluation of students is carried out externally through a univer-sitywide examination. Autonomous colleges, accredited by the National Assessmentand Accreditation Council (NAAC), also exist, but their number is not high relativeto the total number of colleges. Usually, admission is based on performance on thequalifying school-leaving examination.
Separation of Teaching and Research
Currently, teaching and research are increasingly carried out at different locationsbecause of the prevalence of specialized research institutions. The establishment ofinstitutions in science and technology through the Council of Scientific and IndustrialResearch (CSIR) and the creation of social science research institutes through theIndian Council of Social Science Research (ICSSR) resulted in an exodus of research-oriented faculty from universities to these institutions, where research facilities were generally better. The consequent deterioration of the university system led to a self-reinforcing downward spiral that put the relationship between teaching and researchfurther out of balance. One of the key adverse impacts of such a separation has beenthat undergraduate teaching primarily undertaken by affiliated colleges has becomealmost completely delinked from research (Yarnell 2006).
TABLE 2. Distribution of Selected Public Universities by Share of Fees in UniversityIncome, Late 1990s
�10 percent 10–30 percent 31–50 percent �50 percent
Hyderabad Andhra Guru Jambeswar MumbaiKalyani Bhavnagar Punjab Karnataka State OpenMaharshi Dayanand Calcutta S. N. D. T. Women’s KuvempuRabindra Bharati Dibrugarh Bangalore M. D. SaraswatiTamil Dr Harsingh PuneVisva Bharati Sri Venkateshwara YCM OpenAnna CalicutDelhi GoaJ. N. Vyas KannurOsmania Karnataka
KumaonMangaloreMysoreSaurashtraIGNOU
Source: CABE (2005).

304 | RAKESH BASANT AND PARTHA MUKHOPADHYAY
Specialized Institutes for Professional Education
Much professional education is provided through specialized institutes at both theundergraduate and postgraduate levels. These professional institutions may be affili-ated with a university but may be independently or, often, concomitantly approvedby the AICTE or other professional councils such as the Medical Council of India.They have flexibility in designing their curriculum, and student evaluation is per-formed in-house. Some of these entities are accredited by the National AccreditationBoard (NAB). Admissions are based on highly selective nationwide or statewide competitive examinations. In some states, the increasing number of institutions hasreduced the degree of selectivity overall, but the quality of the institutions varies considerably, and higher-quality institutions maintain a high level of selectivity.
Fees in private educational institutions are currently regulated through a com-mittee headed by a former high court judge. This mechanism allows considerablevariation across institutions. Some institutions, including a few that are not in theprivate sector, such as the Indian Institutes of Management (IIMs), are able tocharge market-related fees for professional education, and these have been risingrecently.7
Linkages between Higher Education and High-TechnologyIndustries in India
The high-tech industry in India has seen some growth, and the share of communica-tions and computer-related services has increased significantly in recent years (fig-ure 1). This growth may have led to an increase in demand for skilled workers; recentstudies have indicated the presence of output-skill complementarities (Berman,Somanathan, and Tan 2005; Chamarbagwala and Sharma 2008). There is some evi-dence for growing wage premiums for skilled workers, driven by growth in demandfor skills.8
Developments in science and technology, and changes in global production andR&D networks, are creating new opportunities for interaction between academicinstitutions and firms in India. The evidence reported in Basant and Chandra (2007)suggests that some academic institutions and other entities in the cities of Pune andBangalore have utilized these opportunities to build linkages and interact with thecity clusters in a rich variety of ways. Only a few institutions, however, have the relevant knowledge base needed to undertake high-end knowledge networking activ-ities with industrial entities. The survey data reveal a hierarchy of institutions accord-ing to the strengths of their linkages: those that undertake only teaching (linkagethrough the labor market); those that carry on research and teaching and provideservices such as testing (linkages of all the types mentioned earlier); and those thatfocus on specialized research (linkages predominantly driven by knowledge genera-tion and dissemination). Given the existence of this hierarchy, reflecting low institu-tional capabilities, academic institutions rarely come together to advance the linkagescollectively, but many are gearing up to participate in such linkages in a more sys-tematic manner. The experience of Pune and Bangalore broadly supports the idea
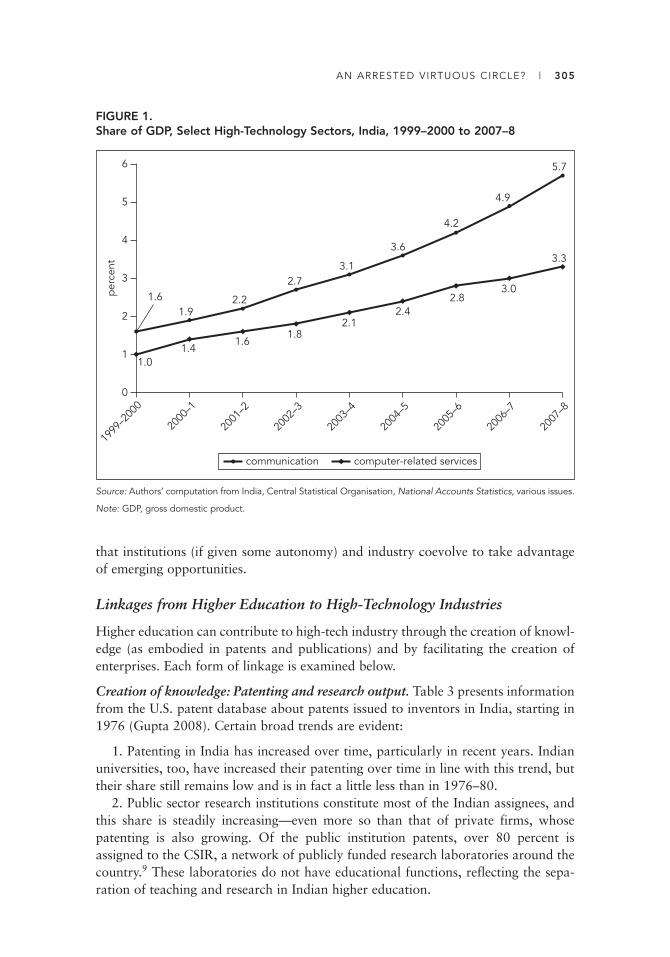
AN ARRESTED VIRTUOUS CIRCLE? | 305
that institutions (if given some autonomy) and industry coevolve to take advantageof emerging opportunities.
Linkages from Higher Education to High-Technology Industries
Higher education can contribute to high-tech industry through the creation of knowl-edge (as embodied in patents and publications) and by facilitating the creation ofenterprises. Each form of linkage is examined below.
Creation of knowledge: Patenting and research output. Table 3 presents informationfrom the U.S. patent database about patents issued to inventors in India, starting in1976 (Gupta 2008). Certain broad trends are evident:
1. Patenting in India has increased over time, particularly in recent years. Indianuniversities, too, have increased their patenting over time in line with this trend, buttheir share still remains low and is in fact a little less than in 1976–80.
2. Public sector research institutions constitute most of the Indian assignees, andthis share is steadily increasing—even more so than that of private firms, whosepatenting is also growing. Of the public institution patents, over 80 percent isassigned to the CSIR, a network of publicly funded research laboratories around thecountry.9 These laboratories do not have educational functions, reflecting the sepa-ration of teaching and research in Indian higher education.
FIGURE 1.Share of GDP, Select High-Technology Sectors, India, 1999–2000 to 2007–8
Source: Authors’ computation from India, Central Statistical Organisation, National Accounts Statistics, various issues.
Note: GDP, gross domestic product.
1.61.9
2.2
2.73.1
3.6
4.2
4.9
5.7
1.01.4
1.61.8
2.12.4
2.83.0
3.3
0
1
2
per
cent
3
4
5
6
1999
–200
0
2000
–1
2001
–2
2002
–3
2003
–4
2004
–5
2005
–6
2006
–7
2007
–8
communication computer-related services

TABLE 3. Patents Awarded to Inventors in India, by Type of Assignee, 1976–2005
Indian assignee Foreign assignee
University or University or
Individual Private firm Public sector institution NGO Private firm State institution
Number of patents1976–80 16 11 3 3 0 50 0 51981–85 15 10 3 1 0 34 9 41986–90 27 10 16 1 0 36 16 151991–95 31 20 35 2 0 114 8 121996–2000 70 90 167 13 0 272 12 202001–5 82 267 677 45 5 831 2 31
Total 241 408 901 65 5 1,337 47 87
Share of patents of a given assignee over time (percent)1976–80 6.6 2.7 0.3 4.6 0.0 3.7 0.0 5.71981–85 6.2 2.5 0.3 1.5 0.0 2.5 19.1 4.61986–90 11.2 2.5 1.8 1.5 0.0 2.7 34.0 17.21991–95 12.9 4.9 3.9 3.1 0.0 8.5 17.0 13.81996–2000 29.0 22.1 18.5 20.0 0.0 20.3 25.5 23.02001–5 34.0 65.4 75.1 69.2 100.0 62.2 4.3 35.6
Share of assignees as percent of total patents within a period1976–80 18.2 12.5 3.4 3.4 0.0 56.8 0.0 5.71981–85 19.7 13.2 3.9 1.3 0.0 44.7 11.8 5.31986–90 22.3 8.3 13.2 0.8 0.0 29.8 13.2 12.41991–95 14.0 9.0 15.8 0.9 0.0 51.4 3.6 5.41996–2000 10.9 14.0 25.9 2.0 0.0 42.2 1.9 3.12001–5 4.2 13.8 34.9 2.3 0.3 42.8 0.1 1.6Total 7.8 13.2 29.1 2.1 0.2 43.3 1.5 2.8
Source: Gupta 2008.
Note: NGO, nongovernmental organization.
30
6
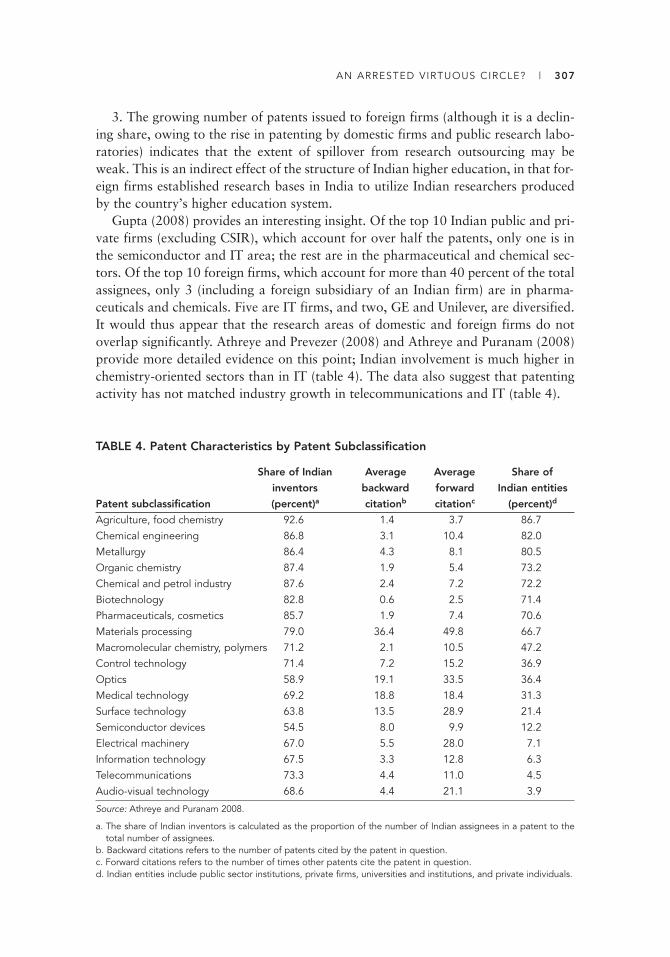
AN ARRESTED VIRTUOUS CIRCLE? | 307
3. The growing number of patents issued to foreign firms (although it is a declin-ing share, owing to the rise in patenting by domestic firms and public research labo-ratories) indicates that the extent of spillover from research outsourcing may beweak. This is an indirect effect of the structure of Indian higher education, in that for-eign firms established research bases in India to utilize Indian researchers producedby the country’s higher education system.
Gupta (2008) provides an interesting insight. Of the top 10 Indian public and pri-vate firms (excluding CSIR), which account for over half the patents, only one is inthe semiconductor and IT area; the rest are in the pharmaceutical and chemical sec-tors. Of the top 10 foreign firms, which account for more than 40 percent of the totalassignees, only 3 (including a foreign subsidiary of an Indian firm) are in pharma-ceuticals and chemicals. Five are IT firms, and two, GE and Unilever, are diversified.It would thus appear that the research areas of domestic and foreign firms do notoverlap significantly. Athreye and Prevezer (2008) and Athreye and Puranam (2008)provide more detailed evidence on this point; Indian involvement is much higher inchemistry-oriented sectors than in IT (table 4). The data also suggest that patentingactivity has not matched industry growth in telecommunications and IT (table 4).
TABLE 4. Patent Characteristics by Patent Subclassification
Share of Indian Average Average Share of
inventors backward forward Indian entities
Patent subclassification (percent)a citationb citationc (percent)d
Agriculture, food chemistry 92.6 1.4 3.7 86.7Chemical engineering 86.8 3.1 10.4 82.0Metallurgy 86.4 4.3 8.1 80.5Organic chemistry 87.4 1.9 5.4 73.2Chemical and petrol industry 87.6 2.4 7.2 72.2Biotechnology 82.8 0.6 2.5 71.4Pharmaceuticals, cosmetics 85.7 1.9 7.4 70.6Materials processing 79.0 36.4 49.8 66.7Macromolecular chemistry, polymers 71.2 2.1 10.5 47.2Control technology 71.4 7.2 15.2 36.9Optics 58.9 19.1 33.5 36.4Medical technology 69.2 18.8 18.4 31.3Surface technology 63.8 13.5 28.9 21.4Semiconductor devices 54.5 8.0 9.9 12.2Electrical machinery 67.0 5.5 28.0 7.1Information technology 67.5 3.3 12.8 6.3Telecommunications 73.3 4.4 11.0 4.5Audio-visual technology 68.6 4.4 21.1 3.9
Source: Athreye and Puranam 2008.
a. The share of Indian inventors is calculated as the proportion of the number of Indian assignees in a patent to thetotal number of assignees.
b. Backward citations refers to the number of patents cited by the patent in question.c. Forward citations refers to the number of times other patents cite the patent in question.d. Indian entities include public sector institutions, private firms, universities and institutions, and private individuals.

308 | RAKESH BASANT AND PARTHA MUKHOPADHYAY
This raises the question of the capacity of domestic industry to benefit fromspillovers, since it diminishes the likelihood that the domestic firm is receiver activein the sense described by Kodama, Kano, and Suzuki (2006). Thus, the direct gener-ation of knowledge can largely be attributed to public research labs instead of tohigher education institutions, and the indirect generation of knowledge, too, seems tobe in areas where linkages to domestic industry appear low. In the case of the phar-maceutical and biotechnology industry, however—consistent with Athreye and Pre-vezer (2008), Athreye and Puranam (2008), and Gupta (2008)—there seems to be anindication that linkages are beginning to form (see box 1), matching the pattern indeveloped countries, where such linkages are concentrated in the life sciences sector.
Creation of knowledge: Publications. Even in basic research, the capacity of uni-versities is limited and skewed. About 80 percent of the doctorates awarded inengineering were from 20 universities, and about two-thirds of the science doctor-ates were from 30 universities. Only about 20 universities have a fellow in one ofthe three science academies (Agarwal 2006). Even in social sciences, where infra-structural constraints are presumably less binding, just 26.2 percent of the 454 arti-cles published in a leading domestic social science journal between 1998 and 2000were from universities. Of that share, 13.9 percent came from three universities inDelhi and Mumbai, and the Indian Institutes of Management originated another4.4 percent; that is, 70 percent of the university total was from these few institu-tions. Specialized research institutes and organizations accounted for more thanuniversities, with 27.3 percent of all the articles (Chatterjee et al. 2002). Of thetotal publications from the 15 Indian universities most active in publishing in theareas of health and biotechnology in international peer-reviewed journals duringthe period 1991–2002, 20.5 percent came from one university, the Indian Instituteof Science (Kumar et al. 2004). As is shown below, that institution is also the dom-inant player in the linkages between academia and industry, especially in the fieldsof pharmaceuticals and biotechnology.
Research has moved out of Indian universities and other academic institutionsover the years. For many years now, the public sector research institutions have beenthe main centers of research activity, and universities have largely become teachinginstitutions.
Creation of enterprises. Apart from working in high-tech industries as employees,persons with higher education may set up enterprises in high-tech sectors. Enterprisecreation as a part of UILs is still at a nascent stage in India, and relationships outsidethe labor market are limited to research support through consulting and otherresearch projects. But the focus on enterprise creation is causing considerable excite-ment among research-oriented science, technology, and management institutions.
Conventional incubators are proliferating in India today. Virtually all the well-known technology institutions have one, and some management institutions areexperimenting with the concept. Basant and Chandra (2006) analyze the emergingenterprise-creation role of academic institutions in India and the incubation modelsused by them. It is too early to assess the impact of these enterprise creation efforts;most have begun only within the last five years. No outstanding success has come to

AN ARRESTED VIRTUOUS CIRCLE? | 309
light, but many incubators can boast of moderate success. Although precise numbersare not available, many companies from technology institutions have survived therigors of market competition after graduating from the incubators. At the moment,the most important contribution of such efforts has been to highlight the possibilityof creating enterprises based on technological innovation in educational institutions.Even moderate success generates a sharper focus on technology-based entrepreneur-ship as a career option.
BOX 1. University-Industry Linkages in the Biotechnology and Pharmaceutical Sectors
The Indian biotechnology and pharmaceutical industries have seen significantgrowth in recent years. There is ample evidence to show that links with academiahave also grown, helping to create “training opportunities for in-house staff,improve access to research facilities and expensive equipment, expand clinical trialcapabilities and provide access to government-sponsored research funds” (Frew et al. 2007, 408). The variety of linkages is large; partnerships may be focused onproduct development, drug delivery platforms, drug candidate screening, medicaldiagnostics, clinical trials, or data management. A few educational institutions suchas the Indian Institute of Science have created new enterprises on the basis of tech-nologies developed within the institution. Many partnerships are developing prod-ucts to address India’s local health needs, especially in the area of vaccines. (Fordescriptions of these partnerships, see, for example, Maria, Ruet, and Zerah 2003;Kumar et al. 2004; Yarnell 2006; Frew et al. 2007.)
A striking finding from a (nonexhaustive) survey of company linkages with uni-versities and public research institutes is that relatively few institutions and firmsare involved. The institutions most active in these alliances are the Indian Instituteof Science (IISc), the International Centre for Genetic Engineering and Biotechnol-ogy (ICGEB), the National Institute of Immunology (NII), the All Indian Instituteof Medical Sciences (AIIMS), the Indian Institute of Chemical Technology (IICT) inHyderabad, and the Centre for Cellular and Molecular Biology (CCMB). Only oneof these, the IISc, is a university; participation by other universities, which includethe Jawaharlal Nehru University and the Universities of Delhi, Madurai, andOsmania, is fairly limited. Shanta Biotech, Bharat Biotech, Bharat Biotech Interna-tional, Nicholas Piramal, Dr Reddy’s Laboratories, and Ranbaxy are among thefew firms that are active in these partnerships.
It thus appears that the linkages are still in their infancy, and it will take sometime before they deepen enough to make a significant impact on technologydevelopment and diffusion. Participation of only a select set of mainly specializedresearch institutions highlights the quality constraints that prevent most academicinstitutions from contributing to these alliances and also points to the adverseeffect that the separation of research and teaching may have had on the ability ofIndian universities to effectively participate in such collaborations.
310 | RAKESH BASANT AND PARTHA MUKHOPADHYAY
A small survey of 11 incubators (35 originally received questionnaires) reveals that9 are publicly funded; 1 incubator is supported by alumni and another by a venturecapital institution. Nine of these incubators are associated with educational institu-tions, but most of the incubatees are from outside the educational institution, and ineight of the incubators, all the incubatees but one are external to the institution. Thisis a form of UIL that is perhaps more akin to enterprise nurturing than creation. (Itcan be argued that this activity is part of the supply of services rather than enterprisecreation.) Many incubatees have sought intellectual property (IP) protection (espe-cially in the incubator funded by a venture capital institution), but many have not.Although in this sample most of the incubatees are “outsiders,” a large proportion ofthe incubators in the Indian Institutes of Technology (IITs) and other nationallyknown institutes of technology incubate their own faculty and students—an activitythat comes closer to enterprise creation in the conventional sense of the term. (SeeBasant and Chandra 2006 for details.)
An alternative model of enterprise creation through focused agenda-basedresearch—as is being pursued by the TeNet group at IIT Madras (http://www.tenet.res.in)—appears to offer an interesting alternative to the conventional model. How-ever, it requires considerable motivation on the part of the research group and theability to address the trade-off between publication and enterprise creation. SomeR&D institutions have just started to grapple with this dilemma, and the idea ofenterprise creation might further sharpen the trade-off.
Linkages from High-Technology Industry to Higher Education
As mentioned earlier, industry can support higher education by providing teachingtalent; pushing for curriculum reform; taking measures to improve the labor supplythrough assessment, certification, and registration of professionals; and directly fund-ing institutions. We look at these linkages in the Indian context.
Supply of teachers. The number of higher education institutions has shown stronggrowth. This is especially true of professional institutions, most of them in the pri-vate sector. The number of teachers has not kept pace with this growth, as the num-ber of PhDs produced indicates. Consequently, many of these institutions are staffedby part-time faculty or faculty whose experience has been more in industry than inacademia. Although it is mandatory for institutions to disclose the qualifications offaculty, this information is not collated.10 A quick survey of institution Web sitesreveals, however, that a number of faculty members lack PhD degrees and that faculty size is small. In fact, even at the National Institutes of Technology, a large proportion of faculty is without PhDs.11
The supply of faculty members from industry, both part-timers and those embark-ing on a second career, is therefore a significant source of linkage. Although this practicecan strengthen industry-academia links, it is possible that, given the differences in com-pensation, many of those who are choosing to enter academia from industry are notdoing so out of choice, and their links with their former organizations may be weakerthan would be initially evident.

AN ARRESTED VIRTUOUS CIRCLE? | 311
Modifications and enhancements to curriculum. The IT industry has been in theforefront of demands for changes in the educational curriculum in India as a resultof the industry perception that the quality of existing graduates is low. According tothe National Association of Software and Service Companies (NASSCOM), onlyabout 25 percent of technical graduates and 10 to 15 percent of general college grad-uates are currently suitable for employment in the offshore IT and business productoutsourcing (BPO) industries, respectively (NASSCOM 2005).12
NASSCOM has signed memorandums of understanding with the UGC and theAICTE to strengthen professional education in line with the IT industry’s require-ments for skilled professionals. A key component is a mentorship program betweena higher education institution and a firm. Some examples of these mentoring rela-tionships are those of Zensar with VIT; Pune XANSA with Jammu University; PixtelTechnologies with the ISB Engineering College, Ghaziabad; and Pixtel Technologieswith the Galgotia College of Engineering, Greater Noida. In addition, companiessuch as ITC InfoTech, Accenture, SUN, MindTree, Microsoft, and Patni are under-taking faculty training programs.
NASSCOM is also piloting a “finishing school” for engineering graduates who arestill seeking employment. One pilot was conducted during May and June 2007 for aperiod of eight weeks in eight institutions, including IIT Roorkee and seven NationalInstitutes of Technology (NITs): Khozikode, Durgapur, Kurushetra, Jaipur, Surathkal,Thiruchirapalli, and Warangal. The “finishing school” addresses both technicaland soft skills development and is staffed by trained faculty and practicing IT and IT-enabled services (ITES) industry consultants. The students receive an opportunityto reinforce key basic engineering skills and, in addition, acquire industry-specificknowledge, soft skills, and management and employment skills (NASSCOM2007).
Some NASSCOM members have intensively promoted training and supplemen-tary education for their recruits and employees. Wipro Technologies has had anAcademy of Software Excellence for over 10 years; the Infosys Campus Connect program (see box 2) is about 5 years old. The extent of remediation efforts beingundertaken by the IT industry is an indication of the inappropriate training of grad-uating engineers from higher education institutions, at least from the point of view ofthe IT sector.13 These industry initiatives are in addition to a private training industrythat began to develop along with the growth of the IT sector and has now diversifiedinto training for back-office operations, retail employment, and the like. The coursesdo not have a certification other than the brand name of the institute.14 The respon-sibility for quality assurance therefore rests with the student.
Some pharmaceutical firms have also developed linkages with universities, forexample, through continuing-education PhD programs with universities for their labresearchers.15 These linkages, however, are restricted to a few institutions. Bhat-tacharya and Arora (2007) find that of seven select universities, only three (IIT Delhi,Jawaharlal Nehru University, and Delhi University) interacted actively with industryin curriculum design across departments. In two (Pune and Jadavpur) such interac-tion was linked to a few departments, and Hyderabad University and the Indian Insti-tute of Science reported no such linkages. These limited relationships may become

312 | RAKESH BASANT AND PARTHA MUKHOPADHYAY
weaker if PhD programs begin to exit the university and move to specialized insti- tutions, as incipient trends indicate. National laboratories rather than universitiesare becoming the locus of PhD research; for example, the National Chemical Labora tory may well be the largest producer of PhDs in the chemical sciences (seeYarnell 2006).
Industry participation in the curriculum is now spreading to other areas, foremostof which is vocational training, where the private sector already has a strong
BOX 2. The Infosys Campus Connect Program
Infosys, a large Indian IT services provider with over 100,000 employees, annu-ally recruits more than 10,000 professionals. In May 2004 the companylaunched Campus Connect with 60 colleges, as an “industry-academia collabo-ration program to align engineering student competencies with industry needs”(see Infosys 2007). The program has grown rapidly, and as of March 2008, itextended to 500 colleges. It operates at present in nine cities in India and is nowexpanding to China, Malaysia, and Mexico. In its short history, Campus Connect has already trained 25,000 students and enhanced the skills of 2,000faculty members.
The core of Campus Connect is the Foundation Program, a 130-classroom-hour proprietary educational supplement for a batch size of 60–75 students thatis integrated with the college’s academic schedule and may include industrial vis-its to Infosys development centers. The course material is provided by Infosysand is based on resources it uses for its induction programs, including assign-ments, case studies, and a student project bank that simulates live project situa-tions adapted for academic environments. All other facilities are provided by theparticipating college. A companion soft skills program, delivered by alliancepartners, is intended to develop students’ proficiency in communications, team-work, corporate work culture, and so on. In contrast to the foundation program,there is a charge for the soft skills program.
The college is given incentives on the basis of the performance of the numberof graduates joining Infosys and is expected to pass on the cash benefits receivedfrom Infosys to faculty members and other individuals according to college-specific norms. Campus Connect also engages in such activities as facilitating faculty sabbaticals and sponsoring presentations of papers at conferences.
By aligning the skill needs of IT services with the college curriculum, CampusConnect reduces learning time and training cost after employment. Infosys doesnot guarantee that graduates of Campus Connect will be offered employment,nor is it incumbent on graduates to accept an offer from Infosys, should itchoose to make one. Infosys thus banks on its reputation as a superior employerand its large annual recruitment to ensure that a sufficient number of CampusConnect graduates accepts Infosys offers to make its investment in the programworthwhile.

AN ARRESTED VIRTUOUS CIRCLE? | 313
presence. India has many industrial training institutes (ITIs) that offer a variety ofcourses, including long-term courses ranging from two to three years, especially forthe manufacturing sector. As part of an ongoing reform program, many industriesand industry associations are now becoming involved in the management of theseinstitutions and in improving the relevance to industry of their instruction.16
Although the system can be commended for allowing the growth of such initia-tives by benignly neglecting to regulate them, their expansion does raise questionsabout the ability of the formal higher education system to respond to marketdemand, especially with respect to professional courses.17
Improvement in labor quality. In addition to modifications to curriculum, the ITindustry, through NASSCOM, has undertaken other initiatives to improve the qual-ity of the labor supply, especially for the ITES sector. The degree of selectivity in thebasic educational qualification for the ITES sector, which comprises university edu-cation in all disciplines, is less than that of engineering, which is the base qualifica-tion in the IT sector. The improvement initiatives can be grouped under the heads oftesting and verification.
The NASSCOM Assessment of Competence (NAC) is designed to address possi-ble talent shortages by creating a robust and continuous pipeline of talent for theITES industry through a standard assessment and certification program. The assess-ment program tests the aptitude of a candidate on seven skill sets.18 NASSCOM hasalso partnered with other organizations to develop customized certification programsfor frontline managers in this sector, for example, certified BPO quality analyst(CBQA) and certified BPO team leader, level 1 (CBTL-1). A test for the IT sector,NAC-Tech has also been developed. The need for such tests reflects the limited effec-tiveness of quality regulation with respect to educational institutions.
Labor quality is also affected by fraudulent reporting of qualifications. To facili-tate more accurate verification of credentials, NASSCOM has fostered a NationalSkills Registry (NSR) to ensure that there is a verified database of the skill sets andtalents of the human resources within the ITES industry. The NSR contains personal,academic, and employment details for IT professionals (ITPs), as entered by the indi-viduals themselves, with associated background check information. It covers ITPemployees and prospective employees in the IT and ITES industries. Every ITP regis-tered in the NSR is identified uniquely by fingerprints, and the database includes theITP’s photograph. As of September 2009, 79 major companies and over 485,551professionals have registered (see www.nationalskillsregistry.com).
Funding of higher education institutions. Although the government provides mostof the funding for public institutions, private funding has made noticeable contribu-tions to some. Much of this funding, however, is limited to marquee institutions suchas the IITs and IIMs. On occasion, Indian industry has contributed to institutionsabroad. It has been argued (for example, by Kapur and Mehta 2007) that a bur-geoning trend toward private contributions may have been nipped in the bud by thegovernment’s desire to control the flows by insisting that they be channeled througha central fund, the Bharat Shiksha Kosh (India Education Fund), whose use would bedetermined by the central Ministry of Education. There is, however, considerable
314 | RAKESH BASANT AND PARTHA MUKHOPADHYAY
private funding of higher education through the establishment of privately ownededucational institutions, which now constitute the majority of institutions in profes-sional and technical education.
Relative Importance of Different Linkages
The creation of knowledge and the creation of enterprises are, at this time, relativelyweak channels of interaction between industry and academia. The universities produce few patents, and even the generation of publications is limited and is con-centrated in a few universities. As for enterprise creation, the role of educational insti-tutions can better be described as nurturing rather than creative—facilitating existingentrepreneurs in pursuit of their goals. A select few academic institutions are collaborating with a limited number of pharmaceutical and biotechnology firms todevelop technologies. In this context, the growing interest of high-tech industry, especially IT, in remedial or supplementary education and in participating in theimprovement of educational institutions indicates that the strongest link at this timebetween higher education and high-tech industry in developing countries such asIndia is likely to be through the labor market.
Labor Market Linkages
To investigate the nature of the labor market linkage, we analyze unit-level data fromthe 61st round of the National Sample Survey (NSS) for 2004–5.19 If the labor mar-ket links between higher education and high-tech industry are strong, one wouldexpect that persons with higher education would have a higher propensity to beemployed in high-tech industry.
Defining High-Technology Industries
Following the classification by the Organisation for Economic Co-operation andDevelopment (OECD) of industries as low tech, medium tech, medium-high tech,and high tech, we grouped 60 manufacturing industries into three categories.20
Stehrer and Wörz (2003), in their analysis, use four categories, according to technologylevel: low, medium low, medium high, and high. This grouping is not as disaggregatedas the OECD’s, and a comparison of the two shows that several groups categorizedas medium tech by the OECD are under high tech in the other categorization. At thethree-digit industry group level, reclassification of the OECD high-tech designationinto medium high and high tech might be too arbitrary. Consequently, for our pur-poses all manufacturing industries categorized as medium-high tech in the OECDclassification are considered high tech.
The “high-tech equivalent” in the services sector is categorized as financial and IT-related services. Anecdotal evidence suggests that in recent years a large proportion ofpersons with higher education have joined these sectors, especially those who have

AN ARRESTED VIRTUOUS CIRCLE? | 315
technical degrees. Financial intermediation, which includes banking, insurance, pensionfunds, and the like (Standard Industrial Classification, or SIC, codes 65–67), is treatedas one of the high-tech services. The other is computer-related activities (SIC code 72),which includes software and hardware consulting. This category also captures IT outsourcing of various kinds. In accordance with this conceptualization of high-techindustry, our empirical exercise recognizes three types of high-tech industry:
• All high-tech industry (high-tech manufacturing, financial services, and IT)• High-tech manufacturing• High-tech services (financial intermediation and computer and computer-related
activities—mainly, IT services).
Defining Higher Education
The key purpose of the exercise is to ascertain whether higher education increases theprobability of being employed in the high-tech sectors. To do so, we need to definehigher education. The NSS 61st round data allow us to create the following cate-gories relating to higher education:
• All types of higher education: any graduate (or equivalent) qualification andabove. Included are persons with a general education level of graduate or post-graduate and above, or with a technical degree or a technical diploma or certifi-cate (graduate and above).
• Nontechnical higher education: graduate and above in the general education category.
• Technical higher education: technical degree, or graduate (and above) diploma or certificate courses.
• Nontechnical higher education with technical nongraduate diplomas: graduate(or above) in general education with below–graduate level technical diplomas or certificates.
Other Explanatory Variables
Apart from the level of education of the worker, several other factors may influencethe probability that a worker will be employed in high-tech industry. At the individ-ual level, we include age and gender as two control variables. At the regional or statelevel, apart from rural or urban place of residence, we introduce the following vari-ables to capture the importance of high-tech employment in the region and its infra-structural characteristics:
1. Importance of high-tech employment in the region. If a region has a large high-tech sector, the possibility that a worker located in that region will be employed inthat sector goes up. To capture this “demand” effect, we used the share of high-techemployment in total employment in the state as a variable.
2. Infrastructural facilities. Good infrastructure is often a prerequisite for theindustrialization of a region. This is especially true for high-tech industries, whichare typically infrastructure intensive. Availability of good infrastructure can facilitate

316 | RAKESH BASANT AND PARTHA MUKHOPADHYAY
the emergence and growth of high-tech industries in a region. In that sense, it canenhance the share of high-tech employment in the region, thereby increasing the valueof the high-tech employment variable defined above. However, infrastructure canhave another effect by facilitating participation of workers in such industries. Forexample, good transportation facilities can enlarge the spatial scope of the labor market, and good telecommunications facilities can facilitate participation of work-ers in the hinterland, especially in the area of IT services.
The state infrastructure indexes prepared by Mohanty (2004) are used to capturethis effect. The infrastructure index “reflects the degree to which a state is preparedin terms of its infrastructure to enable its population to take advantage of public services” and the associated industrial employment opportunities. The summaryinfrastructure index measures the overall levels of infrastructure development at thestate level. The aggregate measure is based on variables that measure the supply aswell as the use of infrastructural facilities in three sectors: communications, power,and transport.21 In order to capture the relative situation of states in each of theunderlying sectors, sector-specific indexes have also been used. Potentially, differentsegments of infrastructure can influence employment in high-tech industry differently.Thus, we have four indexes for infrastructure for each state: an aggregate summaryindex of infrastructure; a power infrastructure index; a telecommunications infra-structure index; and a transport infrastructure index. Both the supply and the use ofeach category of infrastructure have been captured in these subindexes.
Results
Table 5 shows that, on average, high-tech industries have a greater propensity to useworkers with higher education. The share of workers in high-tech industries withgraduate and postgraduate qualifications (both general and technical) is significantlyhigher than in other industries. Within high-tech sectors, high-tech services seem tobe using workers with higher education more intensively than does high-tech manu-facturing, especially in urban areas.22
TABLE 5. Share of Workers with Higher Education in High-Technology Industries(percent)
All high-
technology High-technology High-technology
industries manufacturing services All industries
Level of education Rural Urban Rural Urban Rural Urban Rural Urban
Graduate and postgraduateeducation 18.7 42.4 10.3 23.7 36.5 65.9 2.7 16.2
No technicaleducation 87.1 76.8 86.6 79.2 88.3 73.9 98.6 92.6
Source: Authors’ calculations based on individual-level data, National Sample Survey, Round 61.

AN ARRESTED VIRTUOUS CIRCLE? | 317
In order to explore the relationship between high-tech industries and higher edu-cation more systematically, we estimate the likelihood of being employed in high-techindustries, using a probit specification. These estimated relationships assess whetherthe likelihood of participation in high-tech industries increases with higher education,even after controlling for some other individual- and region-specific variables.
The results presented in table 6 show that higher education has a positive and significant effect on the likelihood of a worker’s participation in high-tech industries.Interestingly, nongraduate technical education also has a positive and significanteffect on participation in high-tech industries, although its impact is marginally lowerthan that of higher education.
Within high-tech industries there are some interesting differences. In high-techmanufacturing, although the impact of higher education is positive and significant, itis somewhat lower than the effect of nongraduate technical education. The situationis just the opposite in the case of high-tech services, where higher education has alarger impact on the likelihood of being employed in the industry than does non-graduate technical education.
As expected, male workers are more likely to be engaged in such industries, andrural location affects the likelihood of working in high-tech industry adversely, otherthings being equal. However, it also appears that the negative effect of rural locationis outweighed by the education effect. Local infrastructure does not seem to have any
TABLE 6. Determinants of Participation in High-Technology Industry, All Graduates
All high-technology High-technology High-technology
industry manufacturing services
Marginal Marginal Marginal
Variable effect P � |z | effect P � |z | effect P � |z|
Age �0.000124 0.00 �0.000106 0.00 �0.000009 0.24Rural dummy �0.024291 0.00 �0.015218 0.00 �0.006815 0.00Male dummy 0.005572 0.00 0.003227 0.00 0.001745 0.00Infrastructure index 0.000005 0.74 0.000005 0.68 0.000001 0.92State share of high-
technology employment 0.000950 0.06 0.000412 0.24 0.000342 0.13All graduates 0.045689 0.00 0.007687 0.00 0.034418 0.00Nongraduate
technical education 0.040615 0.00 0.026002 0.00 0.010265 0.00
Observed probability 0.019166 0.011349 0.007816Predicted probability 0.008276 0.005322 0.002101Number of observations 244,849 244,849 244,849Wald chi2 (29) 3958.68 1897.17 2865.62Prob � chi2 0.0000 0.0000 0.0000Pseudo R2 0.1978 0.1448 0.2606Log pseudolikelihood �18614.40 �13005.99 �8275.08
Source: Authors’ calculations.
Note: Estimates for state dummies have been suppressed.

318 | RAKESH BASANT AND PARTHA MUKHOPADHYAY
direct impact on a worker’s participation in high-tech industries. The share of high-tech employment in total state employment does have a positive impact but is some-what significant only when all high-tech industries are looked at together.
Disaggregation of higher education categories provides some interesting insights,as seen in table 7. The estimates suggest that the impact of technical higher educa-tion on participation in high-tech industries is higher than that of nontechnical higher education. Interestingly, when nontechnical higher education is combinedwith nongraduate technical education, their impact, taken together, is almost thesame as that of technical higher education. Nongraduate technical education alsohas a positive impact, but the magnitude is less, close to that of nontechnical highereducation. The impact of other variables is similar.
These results are not affected when we disaggregate the infrastructure index(results are available on request). No subsector index approaches significance, withthe possible exception of the effect of power on services. It is possible that part of theimpact is captured by the share of high-tech employment in total state employmentinsofar as good infrastructure facilitates the growth of such industries. The “com-mutation effect” through transport and the “local outsourcing” effect through com-munications are not yet visible.
TABLE 7. Determinants of Participation in High-Technology Industry, Disaggregated Education
All high-technology High-technology High-technology
industry manufacturing services
Marginal Marginal Marginal
Variable effect P � |z| effect P � |z| effect P � |z|
Age �0.000121 0.00 �0.000104 0.00 0.000008 0.30Rural dummy �0.024286 0.00 �0.015194 0.00 �0.006846 0.00Male dummy 0.005606 0.00 0.003201 0.00 0.001772 0.00Infrastructure index 0.000005 0.73 0.000005 0.65 0.000001 0.91State share of high-
technology employment 0.001037 0.04 0.000455 0.18 0.000369 0.11Nontechnical graduate 0.038146 0.00 0.003750 0.00 0.032824 0.00Technical graduate 0.086855 0.00 0.025713 0.00 0.049432 0.00Graduates with nongraduate
technical education 0.080286 0.00 0.018771 0.02 0.055741 0.00Nongraduate technical 0.041013 0.00 0.026084 0.00 0.010402 0.00
Observed probability 0.019166 0.011350 0.007816Predicted probability 0.008313 0.005296 0.002127Number of observations 244,849 244,849 244,849Wald chi2 (31) 4033.68 1934.39 2904.67Prob � chi2 0.0000 0.0000 0.0000Pseudo R2 0.2002 0.1488 0.2608Log pseudolikelihood �18560.63 �12945.36 �8271.93
Source: Authors’ calculations.
Note: Estimates for state dummies have been suppressed.

AN ARRESTED VIRTUOUS CIRCLE? | 319
Apart from highlighting the strong effect of higher education on the probability ofhigh-tech employment, these results provide some interesting insights. The observa-tion that graduates with nongraduate technical education are in a similar situation astechnical graduates indicates that firms may have some flexibility in combining tech-nical and nontechnical education. Furthermore, the links between higher educationand high-tech employment are stronger in services than in manufacturing across mostcategories. As expected, nongraduate technical education helps in obtaining manu-facturing jobs more than jobs in services, and nontechnical graduate education ismore of a help for employment in services than in manufacturing. Services also appearrelatively less gender biased than manufacturing.23
Response of the Higher Education Sector
The preceding analysis of the Indian labor market makes it clear that acquiring higher education, especially technical education, does help improve the chances ofemployment in the high-tech sector. Given the wage premium in this sector, it is natural that there will be increasing demand for higher education as the pool of theeligible population increases.24 How has the higher education sector responded tothis development?
Growth in Institutions
As figure 2 shows, the number of higher education institutions has exhibited sub-stantial growth in recent years. The number of universities shows a sharp upwardtrend in figure 3, and an even more rapid rise is seen in the number of deemed-to-beuniversities, as shown in figure 4, with the private sector accounting for an over-whelming number in recent years.25
Concentration in specific states. The stock of institutions is concentrated in a fewstates, most of which are rich and relatively urban (table 8). Five southern states—Tamil Nadu, Kerala, Karnataka, Andhra Pradesh, and Maharashtra—and two in thenorth, Haryana and Punjab, have a technical institution intensity index (the share oftechnical institutions divided by the share of population) greater than unity. Three ofthese states, Maharashtra, Haryana, and Punjab, are the top three states in per capitaincome, and the other four occupy the sixth to ninth ranks. Five of these seven statesare among the six most urbanized states in the country. (Andhra Pradesh is at thenational average, and Kerala is below the national average.) Although the seven stateshave only 35.5 percent of the national population and 36.4 percent of the universities,they account for 48.8 percent of all nonagricultural and nonhousehold workers. Exceptin Andhra Pradesh, the ratio of such workers is higher than the national average.
These states account for 53.4 percent of all deemed-to-be universities, 59.3 per-cent of all private deemed-to-be universities, and 61.9 percent of the applications fordeemed-to-be universities. They also have 74 percent of all engineering colleges and69 percent of all medical colleges.

320 | RAKESH BASANT AND PARTHA MUKHOPADHYAY
FIGURE 2.Number of Colleges for Professional Education, India, 1950–2005
Source: India, Ministry of Human Resource Development, “Selected Educational Statistics, 2004–05.”
Note: Data for the years 1975–76, 1980–81, and 1985–86 are not comparable because they include institutions otherthan professional colleges.
1,354
3,201
208
0
500
1,000
per
cent
1,500
2,000
2,500
3,000
3,500
886
2,223
992
770
852
218
1950
–51
1955
–56
1960
–61
1965
–66
1970
–71
1975
–76
1980
–81
1985
–86
1990
–91
1995
–96
2000
–200
1
2004
–5
FIGURE 3. Number of New Universities (Not Including Deemed-to-Be Universities), India,Pre-1950 and 1950–2005
Source: Calculated from dates of establishment provided in University Grants Commission, Annual Report 2005–06.
30
0
5
10
15
20
num
ber
25
30
35
40
6
12
19 18
10
19 20
28
37
Pre–
1950
1950
–55
1956
–60
1961
–65
1966
–70
1971
–75
1976
–80
1981
–85
1986
–90
1991
–95
1996
–200
0
2001
–5
18 19
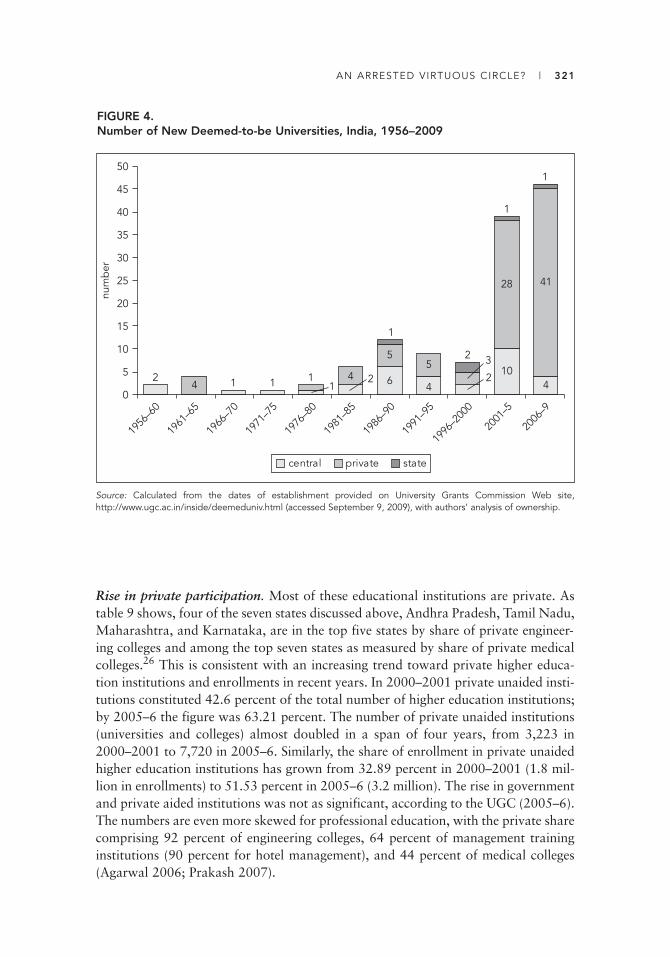
AN ARRESTED VIRTUOUS CIRCLE? | 321
Rise in private participation. Most of these educational institutions are private. Astable 9 shows, four of the seven states discussed above, Andhra Pradesh, Tamil Nadu,Maharashtra, and Karnataka, are in the top five states by share of private engineer-ing colleges and among the top seven states as measured by share of private medicalcolleges.26 This is consistent with an increasing trend toward private higher educa-tion institutions and enrollments in recent years. In 2000–2001 private unaided insti-tutions constituted 42.6 percent of the total number of higher education institutions;by 2005–6 the figure was 63.21 percent. The number of private unaided institutions(universities and colleges) almost doubled in a span of four years, from 3,223 in2000–2001 to 7,720 in 2005–6. Similarly, the share of enrollment in private unaidedhigher education institutions has grown from 32.89 percent in 2000–2001 (1.8 mil-lion in enrollments) to 51.53 percent in 2005–6 (3.2 million). The rise in governmentand private aided institutions was not as significant, according to the UGC (2005–6).The numbers are even more skewed for professional education, with the private sharecomprising 92 percent of engineering colleges, 64 percent of management traininginstitutions (90 percent for hotel management), and 44 percent of medical colleges(Agarwal 2006; Prakash 2007).
FIGURE 4. Number of New Deemed-to-be Universities, India, 1956–2009
Source: Calculated from the dates of establishment provided on University Grants Commission Web site,http://www.ugc.ac.in/inside/deemeduniv.html (accessed September 9, 2009), with authors’ analysis of ownership.
64
1044
55
28 41
1121
2 241
3
1
2
1
1
0
5
10
15
20
25
30
35
40
45
50
1956
–60
1961
–65
1966
–70
1971
–75
1981
–85
1986
–90
1991
–95
1996
–200
0
1976
–80
2001
–5
2006
–9
central private state
num
ber
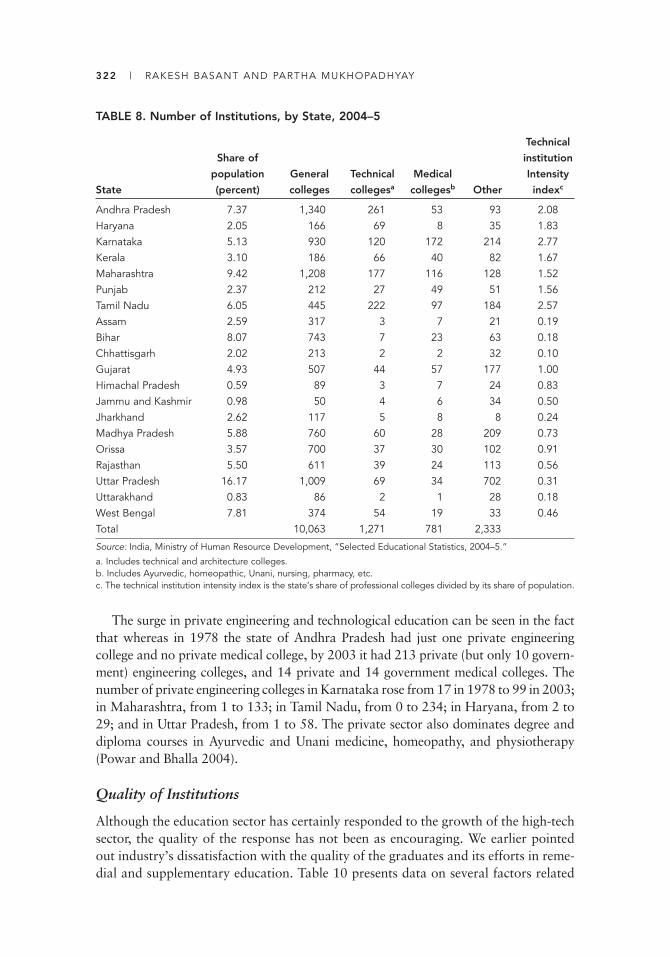
322 | RAKESH BASANT AND PARTHA MUKHOPADHYAY
The surge in private engineering and technological education can be seen in the factthat whereas in 1978 the state of Andhra Pradesh had just one private engineering college and no private medical college, by 2003 it had 213 private (but only 10 govern-ment) engineering colleges, and 14 private and 14 government medical colleges. Thenumber of private engineering colleges in Karnataka rose from 17 in 1978 to 99 in 2003;in Maharashtra, from 1 to 133; in Tamil Nadu, from 0 to 234; in Haryana, from 2 to29; and in Uttar Pradesh, from 1 to 58. The private sector also dominates degree anddiploma courses in Ayurvedic and Unani medicine, homeopathy, and physiotherapy(Powar and Bhalla 2004).
Quality of Institutions
Although the education sector has certainly responded to the growth of the high-techsector, the quality of the response has not been as encouraging. We earlier pointedout industry’s dissatisfaction with the quality of the graduates and its efforts in reme-dial and supplementary education. Table 10 presents data on several factors related
TABLE 8. Number of Institutions, by State, 2004–5
Technical
Share of institution
population General Technical Medical Intensity
State (percent) colleges collegesa collegesb Other indexc
Andhra Pradesh 7.37 1,340 261 53 93 2.08Haryana 2.05 166 69 8 35 1.83Karnataka 5.13 930 120 172 214 2.77Kerala 3.10 186 66 40 82 1.67Maharashtra 9.42 1,208 177 116 128 1.52Punjab 2.37 212 27 49 51 1.56Tamil Nadu 6.05 445 222 97 184 2.57Assam 2.59 317 3 7 21 0.19Bihar 8.07 743 7 23 63 0.18Chhattisgarh 2.02 213 2 2 32 0.10Gujarat 4.93 507 44 57 177 1.00Himachal Pradesh 0.59 89 3 7 24 0.83Jammu and Kashmir 0.98 50 4 6 34 0.50Jharkhand 2.62 117 5 8 8 0.24Madhya Pradesh 5.88 760 60 28 209 0.73Orissa 3.57 700 37 30 102 0.91Rajasthan 5.50 611 39 24 113 0.56Uttar Pradesh 16.17 1,009 69 34 702 0.31Uttarakhand 0.83 86 2 1 28 0.18West Bengal 7.81 374 54 19 33 0.46Total 10,063 1,271 781 2,333
Source: India, Ministry of Human Resource Development, “Selected Educational Statistics, 2004–5.”
a. Includes technical and architecture colleges.b. Includes Ayurvedic, homeopathic, Unani, nursing, pharmacy, etc.c. The technical institution intensity index is the state’s share of professional colleges divided by its share of population.
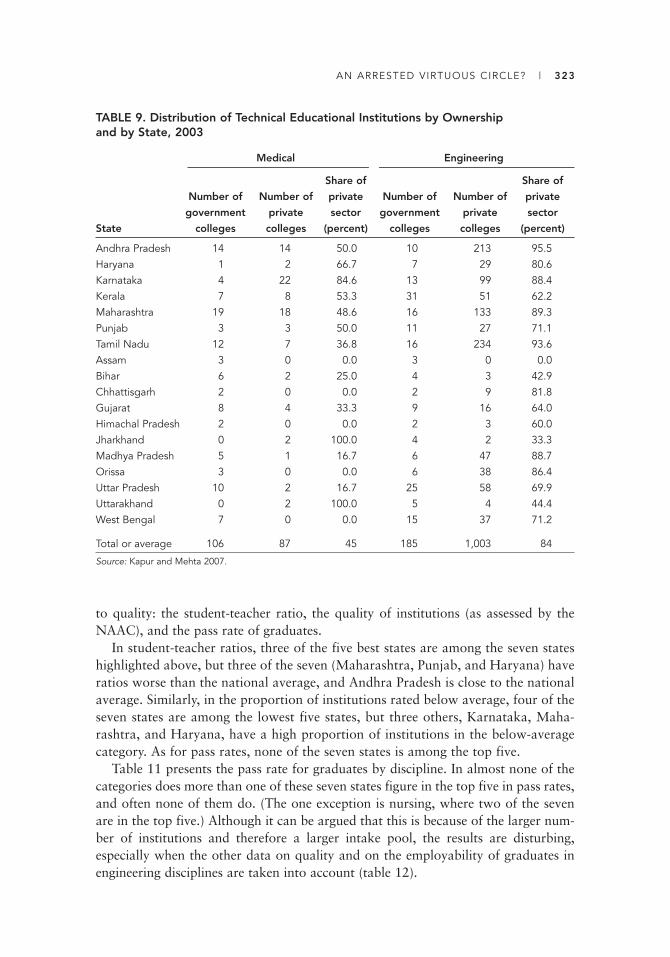
AN ARRESTED VIRTUOUS CIRCLE? | 323
TABLE 9. Distribution of Technical Educational Institutions by Ownership and by State, 2003
Medical Engineering
Share of Share of
Number of Number of private Number of Number of private
government private sector government private sector
State colleges colleges (percent) colleges colleges (percent)
Andhra Pradesh 14 14 50.0 10 213 95.5Haryana 1 2 66.7 7 29 80.6Karnataka 4 22 84.6 13 99 88.4Kerala 7 8 53.3 31 51 62.2Maharashtra 19 18 48.6 16 133 89.3Punjab 3 3 50.0 11 27 71.1Tamil Nadu 12 7 36.8 16 234 93.6Assam 3 0 0.0 3 0 0.0Bihar 6 2 25.0 4 3 42.9Chhattisgarh 2 0 0.0 2 9 81.8Gujarat 8 4 33.3 9 16 64.0Himachal Pradesh 2 0 0.0 2 3 60.0Jharkhand 0 2 100.0 4 2 33.3Madhya Pradesh 5 1 16.7 6 47 88.7Orissa 3 0 0.0 6 38 86.4Uttar Pradesh 10 2 16.7 25 58 69.9Uttarakhand 0 2 100.0 5 4 44.4West Bengal 7 0 0.0 15 37 71.2
Total or average 106 87 45 185 1,003 84
Source: Kapur and Mehta 2007.
to quality: the student-teacher ratio, the quality of institutions (as assessed by theNAAC), and the pass rate of graduates.
In student-teacher ratios, three of the five best states are among the seven stateshighlighted above, but three of the seven (Maharashtra, Punjab, and Haryana) haveratios worse than the national average, and Andhra Pradesh is close to the nationalaverage. Similarly, in the proportion of institutions rated below average, four of theseven states are among the lowest five states, but three others, Karnataka, Maha-rashtra, and Haryana, have a high proportion of institutions in the below-averagecategory. As for pass rates, none of the seven states is among the top five.
Table 11 presents the pass rate for graduates by discipline. In almost none of thecategories does more than one of these seven states figure in the top five in pass rates,and often none of them do. (The one exception is nursing, where two of the sevenare in the top five.) Although it can be argued that this is because of the larger num-ber of institutions and therefore a larger intake pool, the results are disturbing, especially when the other data on quality and on the employability of graduates inengineering disciplines are taken into account (table 12).

324 | RAKESH BASANT AND PARTHA MUKHOPADHYAY
Discussion
The institutional response has been one of significant growth in recent years. The pri-vate sector is not just establishing professional colleges; it is also founding universi-ties. Given the low number of private universities created by state acts and the muchlarger number of deemed-to-be universities, the preferred entry mode of the privatesector appears to be by the latter route, presumably because of the considerable regulatory constraints involved in establishing a university by state act. With theapproval of a large number of private deemed-to-be universities, the mix of universi-ties is changing. If all 128 pending proposals for deemed-to-be universities were to beapproved, the number of universities and deemed-to-be universities would be almostequal. The outcome, however, may not be any greater variety in curriculum andcourse offerings, since a number of the deemed-to-be universities are specialized institutions or engineering and technology institutions. Moreover, the UGC can be
TABLE 10. Quality Indicators for Higher Education, by State
Percent of Percent gainfullyPercent of students employed within
Student-teacher colleges rated passing final two years afterState ratioa below averageb examsc graduatingd
Andhra Pradesh 21 29 48 48.8Haryana 27 59 71Karnataka 14 47 64 64.0Kerala 16 11 66 94.3Maharashtra 26 55 62 75.5Punjab 25 17 74 54.5Tamil Nadu 16 21 46 33.5Assam 16 76 60 76.8Bihar 19 64 73 62.8Chhattisgarh 34 45 76Gujarat 41 34 75 62.0Himachal Pradesh 29 42 69Jammu and Kashmir 18 8 79 41.2Jharkhand 25 47 71Madhya Pradesh 35 55 76 52.8Orissa 18 74 75 39.5Rajasthan 30 61 76 74.5Uttar Pradesh 46 52 63 87.0Uttarakhand 40 43 77West Bengal 29 47 71 82.7
India 23 47 63 51.2
Source: See notes below.
a. University Grants Commission, Annual Report 2005-06; India, Ministry of Human Resource Development, “SelectedEducational Statistics, 2004-05.” b. Quality categories used in this table are adapted from National Assessment and Accreditation Council (NAAC)grading; http://www.naacindia.org.c. University Grants Commission, “University Development in India, Basic Facts and Figures, Examination Results—2002.”d. Institute of Applied Manpower Research (IAMR), Manpower Profile India 2005.
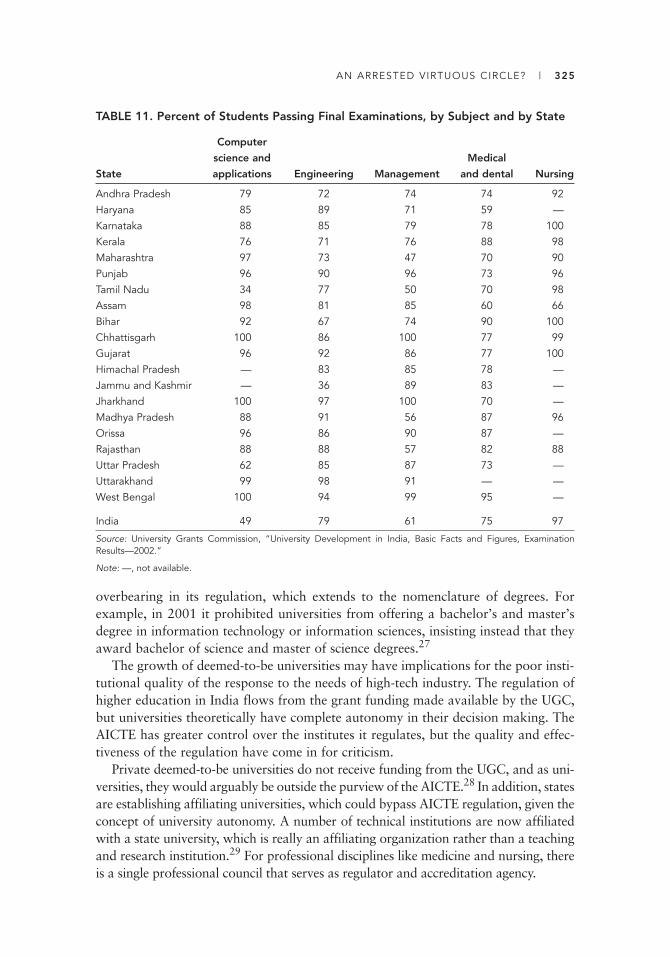
AN ARRESTED VIRTUOUS CIRCLE? | 325
overbearing in its regulation, which extends to the nomenclature of degrees. Forexample, in 2001 it prohibited universities from offering a bachelor’s and master’sdegree in information technology or information sciences, insisting instead that theyaward bachelor of science and master of science degrees.27
The growth of deemed-to-be universities may have implications for the poor insti-tutional quality of the response to the needs of high-tech industry. The regulation ofhigher education in India flows from the grant funding made available by the UGC,but universities theoretically have complete autonomy in their decision making. TheAICTE has greater control over the institutes it regulates, but the quality and effec-tiveness of the regulation have come in for criticism.
Private deemed-to-be universities do not receive funding from the UGC, and as uni-versities, they would arguably be outside the purview of the AICTE.28 In addition, statesare establishing affiliating universities, which could bypass AICTE regulation, given theconcept of university autonomy. A number of technical institutions are now affiliatedwith a state university, which is really an affiliating organization rather than a teachingand research institution.29 For professional disciplines like medicine and nursing, thereis a single professional council that serves as regulator and accreditation agency.
TABLE 11. Percent of Students Passing Final Examinations, by Subject and by State
Computer
science and Medical
State applications Engineering Management and dental Nursing
Andhra Pradesh 79 72 74 74 92Haryana 85 89 71 59 —Karnataka 88 85 79 78 100Kerala 76 71 76 88 98Maharashtra 97 73 47 70 90Punjab 96 90 96 73 96Tamil Nadu 34 77 50 70 98Assam 98 81 85 60 66Bihar 92 67 74 90 100Chhattisgarh 100 86 100 77 99Gujarat 96 92 86 77 100Himachal Pradesh — 83 85 78 —Jammu and Kashmir — 36 89 83 —Jharkhand 100 97 100 70 —Madhya Pradesh 88 91 56 87 96Orissa 96 86 90 87 —Rajasthan 88 88 57 82 88Uttar Pradesh 62 85 87 73 —Uttarakhand 99 98 91 — —West Bengal 100 94 99 95 —
India 49 79 61 75 97
Source: University Grants Commission, “University Development in India, Basic Facts and Figures, ExaminationResults—2002.”
Note: —, not available.
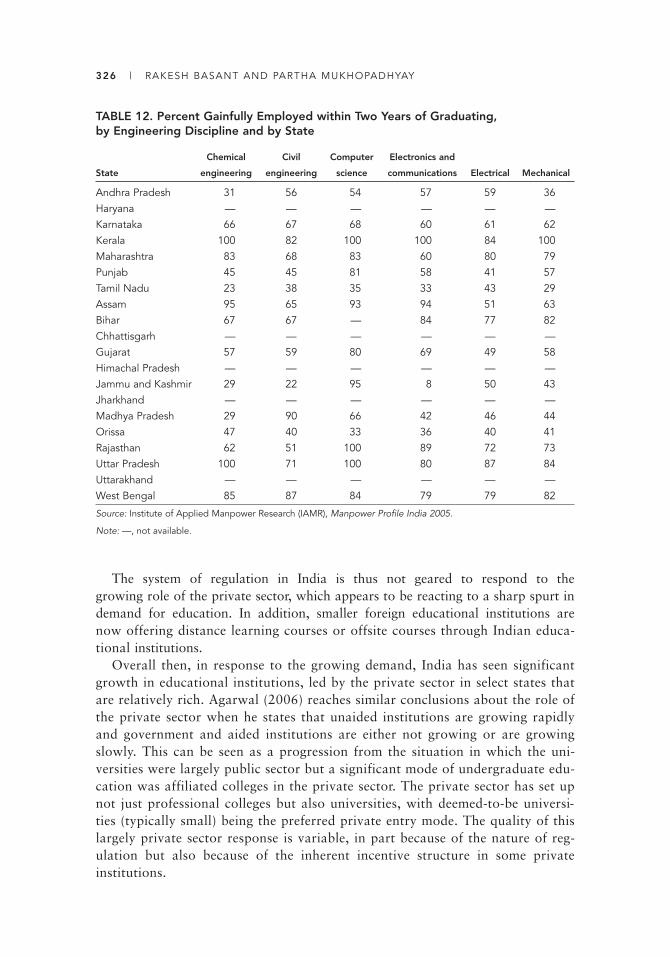
326 | RAKESH BASANT AND PARTHA MUKHOPADHYAY
The system of regulation in India is thus not geared to respond to thegrowing role of the private sector, which appears to be reacting to a sharp spurt indemand for education. In addition, smaller foreign educational institutions arenow offering distance learning courses or offsite courses through Indian educa -tional institutions.
Overall then, in response to the growing demand, India has seen significantgrowth in educational institutions, led by the private sector in select states thatare relatively rich. Agarwal (2006) reaches similar conclusions about the role ofthe private sector when he states that unaided institutions are growing rapidlyand government and aided institutions are either not growing or are growingslowly. This can be seen as a progression from the situation in which the uni-versities were largely public sector but a significant mode of undergraduate edu-cation was affiliated colleges in the private sector. The private sector has set upnot just professional colleges but also universities, with deemed-to-be universi-ties (typically small) being the preferred private entry mode. The quality of thislargely private sector response is variable, in part because of the nature of reg-ulation but also because of the inherent incentive structure in some private institutions.
TABLE 12. Percent Gainfully Employed within Two Years of Graduating, by Engineering Discipline and by State
Chemical Civil Computer Electronics and
State engineering engineering science communications Electrical Mechanical
Andhra Pradesh 31 56 54 57 59 36Haryana — — — — — —Karnataka 66 67 68 60 61 62Kerala 100 82 100 100 84 100Maharashtra 83 68 83 60 80 79Punjab 45 45 81 58 41 57Tamil Nadu 23 38 35 33 43 29Assam 95 65 93 94 51 63Bihar 67 67 — 84 77 82Chhattisgarh — — — — — —Gujarat 57 59 80 69 49 58Himachal Pradesh — — — — — —Jammu and Kashmir 29 22 95 8 50 43Jharkhand — — — — — —Madhya Pradesh 29 90 66 42 46 44Orissa 47 40 33 36 40 41Rajasthan 62 51 100 89 72 73Uttar Pradesh 100 71 100 80 87 84Uttarakhand — — — — — —West Bengal 85 87 84 79 79 82
Source: Institute of Applied Manpower Research (IAMR), Manpower Profile India 2005.
Note: —, not available.

AN ARRESTED VIRTUOUS CIRCLE? | 327
Higher Education Response in Other South Asian Countries
A number of the features described above are common to other South Asian countries,such as Bangladesh, Pakistan, and Sri Lanka. The role of the government in these countries is still large, especially in Sri Lanka, but there is strong private sector growthwherever it is permitted or tolerated. Much of this growth is directed to meeting theimmediate labor supply needs of the high-tech industrial and service sectors, as in India,but because of the limited size of the sectors in these countries, we do not observe thekind of feedback loop in those countries that we are beginning to see in India.
Bangladesh
At present, Bangladesh has 80 universities, of which 53 are private and 27 are public.There are 1,400 colleges providing tertiary-level education, all of which are affiliatedwith National University.30 Students in these affiliated colleges make up 80 percentof all enrollment. After the enactment of the Private University Act in 1992, enroll-ment in private universities grew rapidly, from 8,718 students in 1998 to 35,968in 2001 and 91,648 in 2005—nearly half of the enrollment outside National University. In public universities, the comparable figures were 67,531 students in1998, 92,562 in 2001, and more than 115,929 in 2005. In that year there were 6,852teachers, 5,498 officers, and 14,643 employees in public universities, and 3,487
FIGURE 5 .Distribution of Private Universities by Enrollment, Bangladesh, 2005
Source: BANBEIS 2006.
Note: Data are not available for all 53 private universities.
1
1415
11
6
3
1 10
0
2
4
6
8
10
12
14
16
less t
han
100
7,501
–10,0
00
more th
an
15,00
0
number of students enrolled
num
ber
of u
nive
rsiti
es
101–
500
501–
1,000
1,001
–2,50
0
2,501
–5,00
0
5,001
–7,50
0
10,00
1–15
,000

328 | RAKESH BASANT AND PARTHA MUKHOPADHYAY
teachers, 1,299 officers, and 2,356 employees in private universities.31 The privateuniversities are small (see figure 5), and 46 of the total of 53 are located in the Dhakametropolitan area. Private affiliated colleges account for more than 80 percent ofenrollment in general undergraduate degree courses but for only 25 percent of theenrollment in honors courses and 17 percent in postgraduate courses. Similarly, intechnical and vocational education, private offerings have been limited to the sec-ondary and higher-secondary school levels. This indicates that the private sector iscurrently serving the lower end of the market.
Aminuzzaman (2007) avers that quality evaluation processes, diagnostic review,and evaluation of quality are generally absent in higher education institutions, exceptfor administrative reviews by departmental chairmen or deans of the faculties in thepublic universities. Private universities do, however, have to seek mandatory approvalfrom Bangladesh’s University Grants Commission. Aminuzzaman also states thatindustry and corporate support, which plays an important role in research in thefields of business, science, and technology, is absent in Bangladesh. He contends thatresearch activities in higher education are constrained by inadequate financial support and by lack of a clear research program; of facilities such as laboratories,equipment, libraries, and journals; and of faculty incentives for research, such astime-bound promotion rules. In public universities, both revenue and expenditure perstudent are low; 70 percent of the budget is spent on salaries, and research expendi-ture accounts for less than 1 percent.32
Pakistan
The small size of private universities is also characteristic of Pakistan, although notto as large a degree as in Bangladesh. As shown in figure 6, 36 of Pakistan’s 111 universities have fewer than 1,000 students, and only 16 have more than 5,000 stu-dents. At least in principle, their university status enables them to decide their curriculum, which is more than can be said for the many private affiliated colleges inBangladesh and India.
As in Bangladesh, private participation in Pakistan is more intensive at lower lev-els of education. Private institutions’ share of PhD students is minuscule (3 percentof male and 2 percent of female enrollments). As shown in table 13, enrollments inprivate institutions are concentrated according to gender and in undergraduate edu-cation (which accounts for 18 percent of men and 9 percent of women) and post-graduate diplomas (21 percent of men and 9 percent of women). Private institutionshave a large share of enrollment of postgraduate diplomas, usually in professionalcourses. Private participation varies regionally. In Sindh, where private institutionshave the strongest presence, they account for 45 percent of the men and for 35 per-cent of the women enrolled.
If one excludes the Islamabad Capital Territory (ICT), 37 percent of faculty inprivate institutions is part time, compared with 20 percent of faculty in publicinstitutions, as expected. In the ICT, however, the position is remarkably reversed.In private institutions, 90 percent of the faculty is full time, compared with only

AN ARRESTED VIRTUOUS CIRCLE? | 329
Table 13. Share of Private Enrollment by Educational Level, Pakistan, 2006–7(percent of total enrollment)
Student Postgraduate Postgraduate
category Undergraduate Postgraduate (16+ years) PhD diploma
MalePercent 18 21 8 3 34Number 239,274 83,264 16,433 6,659 4,560FemalePercent 9 9 3 2 14Number 183,963 58,145 8,523 2,584 2,480AveragePercent 14 16 7 3 27Total number 423,237 141,409 24,956 9,243 7,040
Source: Pakistan, Higher Education Commission, “Statistical Booklet on Higher Education.”
FIGURE 6.Distribution of Universities by Enrollment, Pakistan
Source: Calculated from data available at Higher Education Commission, Pakistan, Web site, http://www.hec.gov.pk/QualityAssurance/download/1319_Enrollment-in-UniversitiesDAIs-2001-06-7-2-08-websie-7-07.xls.
number of students enrolled
0
5
10
15
num
ber
of u
nive
rsiti
es
20
25
30
35
20
13
3
31
28
75
1 2 1
less t
han
100
101–
500
1,001
–2,50
0
2,501
–5,00
0
5,001
–7,50
0
7,501
–10,0
00
10,00
1–15
,000
15,00
1–20
,000
20,00
1–25
,000
501–
1,000
11 percent in public institutions. For Pakistan as a whole, therefore, only 34 per-cent of the faculty in public institutions is full time, as against 68 percent in private institutions. The quality of faculty, however, varies for public and privateinstitutions. As is shown in table 14, even among full-time faculty in private insti-tutions, only 21 percent have a master of philosophy or a PhD degree, but 36 per-cent in public institutions do.

330 | RAKESH BASANT AND PARTHA MUKHOPADHYAY
Sri Lanka
In Sri Lanka the National Policy on Education is rooted in Ordinance 31 of 1939(significantly amended, 1945 through 1953) and in the Education Code. The SriLanka University Grants Commission was established in 1979 to oversee the func-tioning of universities. The system has gradually expanded; student intakeincreased from 4,950 in 1980 to 16,635 in 2006, and the country has 15 universi-ties consisting of 78 faculties and 425 departments, with academic staff numbering3,818. The universities are almost entirely funded by the government. Control bythe national government limits the scope for experimentation and autonomy.33
Annual enrollment in universities is about 2.4 percent of the age cohort. In addi-tion, many professional institutes and cross-border higher education institutionsoffer diploma- and degree-level courses (Gamage 2007). Taking all these studentstogether, gross enrollment in higher education in Sri Lanka is more than 12 percentof the age cohort.
Stephen (2007) identifies 19 private foreign education providers that offer74 courses. Five sectors account for 84 percent of these course offerings: informationtechnology (28 courses); engineering (10); business administration (10); accounting,finance, and banking (9); and tourism and hospitality (5). There are 23 representa-tives of universities from 12 countries. The most numerous are from Australia, theUnited Kingdom, New Zealand, Malaysia, and Singapore, in that order. Currently,there is no formal system of quality assurance or accreditation of diplomas anddegrees awarded by cross-border educational institutions.
Given this environment, Esham (2008) finds that the common types of UIL in SriLanka are limited to consultancies and training programs, student internships, andinformal interactions at third-party meetings such as conferences. Among departments,
TABLE 14. Qualifications (Highest Degree) of Full-Time Faculty Members, Pakistan, 2003–4
Master Master of
Sector Bachelor Master (16+ years) philosophy PhD Total
Number of faculty membersDistance learning 9 110 0 22 41 182Public 1,059 4,525 1,319 1,019 2,549 10,471Private 1,151 1,480 508 284 540 3,963Total 2,219 6,115 1,827 1,325 3,130 14,616Share of sector total (percent)Distance learning 4.9 60.4 0.0 12.1 22.5 100.0Public 10.1 43.2 12.6 9.7 24.3 100.0Private 29.0 37.3 12.8 7.2 13.6 100.0Total 15.2 41.8 12.5 9.1 21.4 100.0
Source: Pakistan, Higher Education Commission, “Statistical Booklet on Higher Education.”
Note: Percentages may not sum to 100 because of rounding.

AN ARRESTED VIRTUOUS CIRCLE? | 331
engineering had relatively more and humanities relatively fewer interactions. Academ-ics and industrialists agree that the lack of established mechanisms is a key obstacle.Heavy workloads and lack of research facilities limit university capabilities, and indus-try continues to hold a dim view of the commercialization potential of universityresearch and of interest among academics. In 2000, just 6 percent of patents went topublic institutions, including universities, whereas individual inventors claimed 72 per-cent and private institutions accounted for 22 percent.
Discussion
The review of experience in Bangladesh, Sri Lanka, and Pakistan brings out a fewcommon features. First, the extent of UIL in all three countries is low, even in Pak-istan, which has demonstrated high-tech capabilities as a nation (e.g., in the nuclearindustry). This finding, however, does not fully apply in certain sections of the labormarket, as discussed below. Second, extensive government control of the sector persists, most so perhaps in Sri Lanka. Third, the private sector finds its niche in avariety of environments. It is reasonably quick to respond to labor market demands,as is evidenced by its behavior in the three countries, but it focuses mostly on the low-hanging fruit—for example, pass degrees and secondary professional education inBangladesh, professional and cross-border higher education in Sri Lanka, and undergraduate and postgraduate diplomas in Pakistan. Quality is an issue in all threecountries, with faculty constituting a critical constraint.
We have argued that the growth of the private education sector in India has beena response to the growth of the high-tech industry, especially the IT and ITES sectors.Arguably, the initial establishment of these industries was facilitated by the avail-ability of high-quality skills in sufficient numbers, produced for the most part by thepublic education system. At the time these industries were established, in the 1990s,India may have been the preferred business location in the region for many reasons,in addition to education. The subsequent rapid increase in demand by high-tech sec-tors has been partly satisfied by the growth of private educational institutions of vari-able quality. The combination of first-mover advantages and agglomerationeconomies could imply that as long as the Indian supply chain continues to producereasonably and relatively (in the context of the region) employable graduates, itwould be difficult for other countries in the region to develop similar industries.Prospective investors, many of which are now domestic Indian companies, wouldlook at the thick labor markets in Indian cities such as Bangalore, Chennai, Delhi,Hyderabad, Mumbai, Pune, and now even Kolkata and would find being therepreferable to being among the initial investors in places like Dhaka, Karachi, andColombo. Given that none of these regional countries can, at least at the moment,ensure that the supply of high-tech graduates can be maintained as the industry scalesup, or that the quality of graduates will be substantially better than in India, thestrength of the labor market linkage between high-tech industry and the higher education sector in India may almost act as an entry barrier for other countries in theregion.34

332 | RAKESH BASANT AND PARTHA MUKHOPADHYAY
Policy Implications
Our examination of the linkages between the higher education sector and high-techindustry in India (with a brief look at other countries in South Asia) indicates thatlinks outside the labor market are rather weak, although they may be growing withthe increased interest of high-tech industry in research (for example, in the pharma-ceutical and biotechnology sectors in India). The linkages are more with specializedresearch institutions than with universities. This is not a desirable state of affairs, butit is only to be expected. The reasons, we argue, lie primarily in certain regulatoryfeatures of the system, as discussed next.
Separation of Teaching and Research
Fundamentally, Indian universities are not involved in research, which is conducted byspecialized science, technology, and even social science institutions. This divorce ofresearch from teaching is evident in our findings. The low supply of research-inclinedfaculty is also apparent; Banerjee and Muley (2008) put the ratio of PhDs to graduateengineers at less than 1 percent. Even within the public sector, the separation of teach-ing and research embodied in the establishment of specialized research institutions is“slowly depleting research-driven universities of their best faculty,” according to Pad-manabhan Balaram, director of IISc, Bangalore (quoted in Yarnell 2006).
Inappropriate Faculty Incentives
Universities in India have very limited autonomy with respect to faculty compen-sation, which is largely uniform across universities. Private universities and somespecialized institutions can offer differential compensation, either in direct salaryor in research support. Research-inclined students self-select into public or privatelaboratories (industry) or go abroad, essentially because of differences in compen-sation (Banerjee and Muley 2008). In addition to the level of compensation, thelack of facilities and the practice of automatic promotion undermine the faculty’sresearch orientation. In addition, automatic promotion blunts incentives to movebetween universities, so that a critical mass of good faculty cannot agglomerate,leading to a suboptimal dispersion of capable faculty and adversely affecting thenext generation of faculty. The absence of research-oriented, internationally visiblefaculty groups results in a low level of interest among researchers looking for post-doctoral opportunities. This hampers the development of the kind of researchecosystem that is critical for productive research all over the world.35 If facultycompensation and the work environment are unattractive, quality erodes overtime, affecting the very intellectual resources and capacity needed to generate newindustry-relevant knowledge.
Thus, more than willingness (which could, in principle, be addressed by incentives;see box 3), it is ability that is increasingly becoming rare in universities. Given thegrowing opportunities available elsewhere, this has meant that good faculty is inshort supply, especially in professional disciplines.36 It is noteworthy in this context

AN ARRESTED VIRTUOUS CIRCLE? | 333
BOX 3. Legislation to Protect and Utilize Publicly Funded Intellectual Property
Among the many shortcomings of the Indian faculty reward system is the lowweight accorded to industry interfaces, except perhaps in management education.Even though it remains debatable whether the creation of new commercial knowl-edge and ventures should be an important objective of academic institutions, theIndian government is taking some intermediate measures to change this situation.The Protection and Utilization of Public Funded Intellectual Property (PUPFIP)Bill, a counterpart of the U.S. Bayh-Dole Act (University and Small BusinessPatent Procedures Act, 1980), was introduced in the Indian parliament on Decem-ber 15, 2008. Under this legislation, universities and research institutions maypatent the results of publicly funded research, and inventors as well as institutionswill be able to receive a share of royalties and licensing fees. The researcher (inven-tor) is to receive a minimum of 30 percent of the royalties from the publicly fundedintellectual property (PFIP), but he or she is restricted from publishing or disclos-ing the PFIP without a prior 30-day notice to the government. A violation willdeprive the institution of future public funding and make it liable for repaying thegrant with interest. This is seen as a way of supplementing the limited public budget for research and development.
A number of concerns have been raised about the effectiveness of this strategy.As Mowery et al. (2001) show, it is not clear that Bayh-Dole had a significanteffect on the content of research in American universities. Data on patenting,licensing, and other types of commercialization show that the act did not facilitatetechnology transfer and commercialization (So et al. 2008). Furthermore, the abil-ity of publicly funded research to address questions of limited commercial valuebut significant public good may be compromised if the difference between privateand public research is reduced. This is especially the case in developing countries,where public benefits and commercial advantage may diverge significantlybecause of the low incomes of large sections of the population. As So et al. (2008,2082) argue, “the focus on royalty returns at the expense of public goods may bemisplaced.”
The reason for the limited effectiveness of Bayh-Dole may be that incentivesmay not always act in the manner anticipated. University faculty are self-selectedand are not driven primarily by monetary incentives. If increasing the commer-cial value of research requires limitation of its benefits, the incentives of theresearcher may be adversely affected if he or she is motivated by the public ben-efits of the research. Here, it is the design of the incentives under the U.S. typeof legislation that is called into question. Monetary incentives may, however, bemore effective in developing countries. If so, the PUPFIP bill may well be moresuccessful in India than Bayh-Dole was in the United States. Yet that successmay not be in the social interest, which may be better served by an expansionof the public budget for competitively awarded research grants (see Aghion et al.2009).

334 | RAKESH BASANT AND PARTHA MUKHOPADHYAY
that many firms which have tried to build linkages with academia have been dissat-isfied because of quality-related issues (Frew et al. 2007).37 The result has been adownward spiral of less interaction of firms with academia and diminished ability orrelevance of academia vis-à-vis industry’s expectations.
Limited Autonomy of Universities
We have already stated that labor market linkages are the strongest and most wide-spread UIL in India. Yet, despite a vigorous response by the private sector to growthin the high-tech industry, the quality of the average graduate remains poor. This out-come is significantly driven by various problems of governance. Some of the key issuesrelating to the autonomy of universities are discussed next.
Reluctance to treat professional education as a commercial activity. There is extremeunwillingness to recognize even professional education as a commercial activity, andas Kapur and Mehta (2007) note, this position has been buttressed by a series of courtjudgments. The effort to preserve access to higher education has focused on keepingfees low rather than on expanding access to educational finance and scholarships. Theinability of universities to decide their fees increases the dependence of the universityon the UGC and the state government and consequentially constrains its autonomy,compromises its work environment, and limits diversity within the system.
Standardization of curriculum and affiliation of colleges. The affiliating system,under which colleges prepare students for a university-administered examinationbased on a uniform curriculum at the university level, fosters the existence of very largeuniversities, reduces the colleges to teaching institutions, and limits innovation in cur-riculum, except to the extent allowed in autonomous colleges. To add to this, regula-tory institutions such as the UGC appear to be involved in exercises to standardize thecurriculum.38 It is difficult to introduce innovations in curriculum because there are fartoo many colleges whose faculties would have to be retooled. Consequently, many col-leges continue offering ossified content. The effect of this situation is worse when technology is changing rapidly. In such a scenario, it is nearly impossible to think ofinnovative multidisciplinary courses that can induce greater research orientation andleverage increasing convergence across scientific and engineering disciplines.39
Poor accreditation capacity. The lack of a robust accreditation system adds to theproblem. The incipient accreditation bodies are all in the government sector and havelimited capacity to accredit the growing number of institutions. As Agarwal (2006,113) remarks, the current system of accreditation “serves little purpose.” The repu-tation of institutions depends more on their selectivity in intake of students than ontheir curriculum and pedagogy. This makes the role of industry in signaling the qual-ity of higher education ambiguous. Most of the courses in professional disciplinessuch as engineering, medicine, and management rely on entrance exams that are inde-pendent from school-leaving exams. Companies can simply leverage the stringentselection process of technical higher education and deemphasize the quality ofinstruction. This is especially true when the employees would have to be reskilled

AN ARRESTED VIRTUOUS CIRCLE? | 335
after recruitment—for example, in IT, where engineers from different streams enterthe software sector. Such a perspective implies that the choice of employees is notoverly dependent on quality and academic discipline, thereby muting industry’sresponse to indifferent quality.
Lack of a credit and qualification framework. Credible accreditation that wouldallow for transferable credits, enabling students to choose their institution and paceof learning, is not yet available in India. The acquisition and especially the upgrad-ing of skills are affected by the near-absence of a system of transferable credits, whichretards the acquisition of qualifications by persons who are already employed andwho do not have the opportunity for full-time study or are not continuously in onelocation, as would be required by the part-time courses that are currently on offer.40
In summary, the ability of institutions to respond positively to industry and createa virtuous feedback loop depends on the regulatory structure. Most of our findingsrelating to the poor state of UIL can be linked to regulatory features or to their second-order impact (see table 15). As Kapur and Mehta note:
The most acute weakness plaguing India’s higher education system is a crisis of governance. Its most visible manifestation is a crisis of faculty. The generation thatwas inspired by a broad commitment to the public good has retired or will do so soon.There is little likelihood of sufficient replenishment, given entrenched mediocrity ininstitutions with lifetime appointments, few competitive pressures and abysmal governance. The result has been the academic equivalent of Gresham’s law—the baddrives out the good. The prevailing political ideological climate in which elite institutions are seen as anti-democratic, finds its natural response in political control toinfluence admissions policies, internal organization, and the structure of courses andfunding. As quality deteriorates, students are less and less willing to pay the veryresources without which quality cannot be improved. (Kapur and Mehta 2007, 49)
The solutions to enhancing both labor market and non–labor market linkages thusappear to intersect at the core issue of faculty quality. Although the indifferent qual-ity of the private response may indicate a bigger role for regulation, the current struc-ture of regulation has resulted in restriction of the private response at the high endwhile neglecting its growth at the lower end. It will be necessary to address these regulatory failures in higher education in order to strengthen the links between highereducation and high-tech industry.
Concluding Observations
In this paper, we have adopted an eclectic approach to the linkages between high-techindustries and the higher education sector. Our analysis draws on the national inno-vation system (NIS), triple helix, and university-industry linkages (UIL) frameworksbut does not situate itself solely within any one of the discourses. In the context ofour initial discussion on NIS, and ignoring the financial aspects for the moment, it isuseful to think of four entities: the government, industry, specialized research institu-tions, and universities.41 Initially, industry, specialized institutions, and universitieswere embedded within the state. The first of these three to become relatively

336 | RAKESH BASANT AND PARTHA MUKHOPADHYAY
independent was industry, through a gradual liberalization. Since then, specializedinstitutions have become somewhat more autonomous, but universities havearguably become less so. Meanwhile, a new class of relatively autonomous privateinstitutions offering technical and professional education has emerged. Even the lim-ited degree of autonomy in research and educational institutions, coupled with a rel-atively high degree of agency in industry, has led to many linkages between these twosectors, especially in externally oriented service and industrial sectors such as IT andpharmaceuticals, despite the difficult regulatory environment. The size of the high-tech private sector in India, particularly the IT industry, has permitted that sector totry to evolve a compensating response to regulatory obstacles. Industry associationsand individual firms are working with educational institutions to provide supple-mentary educational inputs customized to the needs of the industry or, in the case ofvocational training, of particular firms. In a research-intensive sector such as phar-maceuticals, we observe higher-level linkages between select firms and elite institu-tions supported by government funds such as the New Millennium Indian Technol -ogy Leadership Initiative (NMITLI). The limitations of relying on such a responsecan be seen in the muted participation of sectors other than IT, ITES, and pharma-ceuticals. It is also evident in other countries of the region, where such a response is
TABLE 15. Summary of Key Findings
Feature related to regulation
Finding of higher education Other features
Low knowledge creation Separation of teaching and research Poor facilitiesInappropriate faculty incentives,such as low compensation and automatic promotion, leading topoor quality of faculty
Low enterprise creation Second-order effect of low Lack of venture financingknowledge creation
Concentration of private Differential entry regulation and state- Agglomeration of industrialresponse in a few states level fee regulation across states activity in a few states
Indifferent quality Second-order effect of poor quality Highly selective entranceof graduates of faculty examination, making it
Ability to change curriculum restricted easier for industry to by system of college affiliation tolerate poor instructionPoor accreditation system
Lack of transferable credits, limitinglifelong learning
Low involvement of industry Second-order response to indifferent Limited need in currentcompetitive environment(but this is becoming lessrelevant)
Growing ability to link with foreign research
Source: Authors’ compilation.

AN ARRESTED VIRTUOUS CIRCLE? | 337
lacking in the absence of a large high-tech sector. Beyond this limited intersection, itis difficult to find the requisite autonomy or intellectual capability in the research andeducational institutions, or even the demand from firms. In this sense, the currentrelationship can be seen as being at an intermediate stage between triple helix I andtriple helix II, although some portions of the relationship have elements of triplehelix III. It is this variegated nature of UIL that makes it difficult to adopt a singleanalytical metric.
Other features of the NIS can affect the linkage decisions of the actors. For exam-ple, a significant constraint in India is the absence of early-stage funding for start-ups.Most of the so-called venture capital activity in India is actually “growth funding” andtakes the form of private equity. As Dhingra (2007) notes, a limited amount of trueventure capital funding has just begun, but its expansion beyond well- established sec-tors such as IT is as yet limited. In such a situation, some firms may choose to link notto domestic educational and research institutions but to external institutions. One rea-son may be that external institutions come with their own linkages into the broaderfinancial system, which are necessary for commercializing innovations.
Any success that such industry-led initiatives may have should not distract fromthe underlying failure in the regulation of higher education that has led to the emer-gence of these initiatives.42 Not only are such responses limiting, but they may alsobe deeply inequitable, as industry picks the few cherries in the education system andconcentrates its resources on them. There is also a risk that the production of skillswill become too tailored to the current industrial structure, hindering the flexibilitythat is necessary for any workforce in today’s globalized environment.43
Measured against the criterion of the need to broaden and deepen UIL, this ten-dency of the higher education system to narrow its focus is disturbing and may beaffecting the growth of many industries. Nor does the industry engagement, exceptfor a few instances in biotechnology and pharmaceuticals, lead to the depth of knowl-edge that would be needed to assimilate more complex technologies. Liberalizationhas made industry much more nimble in effecting structural change, but the same isnot true for universities. The larger challenge is to design appropriate work environ-ments and compensation packages that will attract talented young people to acade-mia. This will do much to alleviate the existing constraints on the availability ofresearch-inclined faculty in academic institutions, the effect of which is to limit theaddition of value from a more intensive exchange with industry. As a consequence ofthe lack of appropriate faculty, the industry initiative may remain restricted to theimportant but still shallow level of enhancing the quality of entry-level employees.The creation of a virtuous circle seems to have been arrested by an archaic regulatorystructure, with constraints on the establishment of viable new institutions, facultyrecruitment and salaries, and changes in the curriculum. Many of these governanceproblems also permeate other South Asian countries, including Bangladesh, Pakistan,and Sri Lanka.
It is useful to benchmark the current situation to the three qualities of a world-class university proposed by Salmi (2009): (a) a “high concentration of talent” in theform of faculty, students, and researchers from around the world; (b)“abundantresources” from endowments, public resources, tuition, and competitive research
338 | RAKESH BASANT AND PARTHA MUKHOPADHYAY
funding, which enhances the pedagogy and enables advanced research to be con-ducted; and (c) ”favorable governance features” that encourage innovation and aca-demic freedom, foster strategic vision, and enable flexibility to allow the universityto make decisions autonomously and manage resources without bureaucratic inter-ference such as restrictions on faculty compensation.
In a separate study of European and U.S. universities, Aghion et al. (2009) findthat it is extremely important to avoid endogamy in faculty—that is, recruitment ofone’s own graduates. Internationalization of faculty is therefore an important ele-ment of a world-class university. University autonomy and merit-based competitionfor research funding are also positively linked to university research output. By pro-viding more generous stakes for research competitions, governments can induceresearch universities to employ their funding better, make better use of their autono-my, and respond more productively to local competition.44 These findings broadlysupport the analysis in Salmi (2009), who relies on an earlier study by Aghion et al.(2008).
Each pair of the three attributes named by Salmi (2009) can produce high-qualitygraduates (attributes a and b), significant research (a and c), or transfer of technology(b and c), but in order to achieve all three outcomes, it is necessary that all three characteristics be present in the university. In our review, we describe a situation inIndia in which there are elements of (a), primarily in student quality, and elements of(b) at institutes of national importance such as the IITs, the IISc, and the IIMs, butrarely any element of (c). Consequently, India manages to produce a certain numberof outstanding graduates but falls short on the goals of significant research and trans-fer of technology.
In conclusion, it is perhaps better to focus on how far UIL has traveled in India thanon where it is currently situated. Until recently, the lack of competitive pressure in aprotected, inward-looking market with government licensing meant that the privatesector in India was not proactive in seeking out linkages to advance research capabil-ities. The bulk of research was conducted in public institutions, again with little regardfor market demand. Two broad trends are combining to alter this picture. First, risingcompetition in recent years seems to be leading to a growing number of alliancesamong firms and between higher education institutions and industry, especially inglobally oriented, research-intensive industries such as pharmaceuticals and biotech-nology. Concomitantly, the increasing fiscal reticence of government and the pushtoward commercial orientation of education has meant that academic institutions areno longer financially protected. Although this trend can have deleterious conse-quences, especially if it is carried too far and is married to a stifling governance envi-ronment, as is the case in India, it does push some of these institutions to become moreoriented toward industry, alleviating a key mindset constraint that has restricted UILin the past.45 As both these trends play out in the future, one can expect, in a positivescenario, more demand for UIL and, consequently, a derived demand for relief of theregulatory constraints (for example, in faculty compensation and university autono-my) that currently limit the capacity of universities to undertake cutting-edge research.To some extent, the recent suggested increase in faculty compensation addresses thisproblem, but it still seems unlikely that faculty compensation will be individualized to
AN ARRESTED VIRTUOUS CIRCLE? | 339
any degree. More critically, university autonomy appears to show little progress. Onthe other hand, in a negative scenario, industry, which is now relatively free of restric-tions, may choose to cope with governance failures by exiting, perhaps to foreign aca-demic and research institutions—a move that can have other collateral benefits suchas venture funding—or by self-providing, which would usually be suboptimal. In thefinal analysis, research activities in industry and university are complementary andmutually reinforcing, and the success of industry-academia linkages lies in the intel-lectual exploitation of these complementarities.
Notes
1. This paper is confined to an instrumental view of education. Such a view is limiting; inprinciple, higher education must address much larger goals relating to the human condi-tion. That project, however, seems remote, given the inability of the system to address eventhe instrumental issues described here.
2. For recent work in the area of UILs, see Yusuf and Nabeshima (2006) and a special issueof World Development on this topic (Hershberg, Nabeshima, and Yusuf 2007).
3. For example, in addition to many workshops, the Indian Institutes of Management con-duct short-term management development programs for senior civil servants and offer amaster’s program in public policy that is well attended by civil servants.
4. One of the more commercially remunerative services supplied by higher education insti-tutions is training, especially for management institutions. For many institutions, man-agement education programs account for a substantial part of their revenue.
5. Deemed universities are a novel feature in India. The central government may, on theadvice of the University Grants Commission (UGC), declare that any institution forhigher education shall be deemed to be a university, following which all the provisionsof the UGC Act (enacted with the objective of making provision for the coordinationand determination of standards in universities) shall apply to that institution as if it werea university. Usually, to be a deemed university, an institution would be innovative, of avery high standard, and engaged in teaching and conducting research in chosen fields ofspecialization, but recently there has been a proliferation of such deemed universities. Fora more detailed description of higher education in India, see Basant and Mukhopadhyay(2009).
6. The Indian Institutes of Technology (IIT), the Indian Institutes of Management (IIM), anda few other designated institutions have a slightly higher salary structure than the normalUGC scale. There are also some differences in benefits between universities funded fromthe central (federal) budget and those funded at the state level. In any case, nominallyequivalent compensation implies variations in real compensation because differences incosts of living among locations are not fully adjusted.
7. Current fees at the more expensive Indian Institutes of Management are aroundUS$25,000 per year.
8. For estimates, see Chamarbagwala (2006); Kijima (2006); Azam (2008); Bargain et al.(2008); and Unni and Rani (2008).
9. The data also show that within the U.S. patent database, CSIR was the dominant assigneefor the health-biotechnology field, as well (Kumar et al. 2004).
10. On the disclosure requirement, see the Proforma for Mandatory Disclosure of Informationabout Accredited Programmes by Institutions, issued by the AICTE.

340 | RAKESH BASANT AND PARTHA MUKHOPADHYAY
11. Some estimates, such as those by Banerjee and Muley (2008), show high percentages offaculty without PhDs at the National Institutes of Technology at Warangal (55 percent),Hamirpur (52 percent), Durgapur (44 percent), and Surat (34 percent).
12. NASSCOM is a major trade body of the IT software and services industry in India. It hasabout 900 members, of which nearly 150 are global companies from the United States, theUnited Kingdom, the European Union, Japan, China, and elsewhere. NASSCOM’s mem-ber companies are in the businesses of software development, software services, and IT-enabled and business product outsourcing (BPO) services.
13. Part of the impetus for remediation programs may be the IT sector’s efforts to reskill forthe software industry engineers who have been trained for other specializations such asmechanical and chemical engineering.
14. Similarly, one of India’s newest, better-known business schools, the Indian School of Busi-ness, is not accredited by the AICTE.
15. For example, employees at Avesthagen are encouraged to pursue doctoral studies througha collaborative program at Mysore University (Frew et al. 2007). Dr Reddy’s Laborato-ries, Ranbaxy, and Nicholas Piramal have similar arrangements with universities for theiremployees (Yarnell 2006).
16. A proposal by the Confederation of Indian Industry (see CII 2007) involves the creationof institute management committees (IMCs) chaired by a person from industry who willbe given financial and academic autonomy by the state governments to manage the ITIs.The central government will provide a 10-year interest-free loan of up to 25 million rupeeson the basis of an institute development plan prepared by the IMC. The state governmentwill continue to regulate admissions and fees. See also Nichenametla (2007); Mukhopad-hyay (2008).
17. Sometimes even the private response is deemed inadequate by private sector clients.Reliance ADAG recently purchased NIS-Sparta, a training institution, in an effort to bet-ter control the training of its employees.
18. The skills tested by the NAC include listening and keyboard skills, verbal ability, spokenEnglish, comprehension and writing ability, office software usage, numerical and analyti-cal skills, and concentration and accuracy. For further details, see http://nac.nasscom.in/.
19. The analysis covers usual-status workers who report being engaged in economic activityeither for the greatest part of the year (principal status) or for only part of the year (sec-ondary status).
20. The OECD classification is based on R&D intensity in 12 OECD countries: Canada, Den-mark, Finland, France, Germany, Ireland, Italy, Japan, Spain, Sweden, the United King-dom, and the United States. The OECD high and medium-high groups have been aggre-gated into the high category. The detailed classification in this paper may be obtained onrequest from the authors.
21. In constructing the overall index, the principal-component method has been used to esti-mate the relative weights of the variables and the sectors. See Mohanty (2004) for detailsof each index.
22. It needs to be emphasized that 98.6 percent of rural workers and 92.6 percent of urbanworkers in all industries have no technical education.
23. A specific example is that over the period 1999–2000 to 2004–5, the NSS data show thatthe share of women among system analysts and programmers, which is the category of IToccupations showing the highest growth rate, rose from 6.8 to 29.7 percent.
24. For some estimates of the wage premium, see Chamarbagwala (2006); Kijima (2006);Azam (2008); Bargain et al. (2008); and Unni and Rani (2008).
AN ARRESTED VIRTUOUS CIRCLE? | 341
25. There was a spurt in 2002, when 26 deemed-to-be-universities came into being, of which9 were private institutions.
26. That ranking ignores two states, Jharkhand and Uttarakhand, that have 100 percent pri-vate medical colleges, but for the reason that they each have two private medical collegesbut no public medical college.
27. See India, Ministry of Human Resources, Department of Higher Education, “UGC Clari-fication on the Recognition of BIS, BIT, MIS, MIT Degrees,” http://education.nic .in/technicaledu/ugc_bis.asp.
28. In 2001, in Bharathidasan University v. AICTE, India’s Supreme Court held that the“power to grant approval for starting new technical institutions and for introduction ofnew courses or programmes in consultation with the agencies concerned . . . would notcover a ‘University’ but only a ‘technical institution.’” It is not entirely clear whether thereis a distinction between universities established by state acts, such as Bharathidasan Uni-versity, and deemed-to-be universities.
29. For example, the West Bengal University of Technology has 156 affiliated colleges but nofaculty of its own. All appointments to the university are through deputation. The univer-sity has 17 staff members, including 4 statutory officers and support staff. Seehttp://www.wbut.net/ (accessed September 4, 2009).
30. National University serves as an affiliating university for degree and postgraduate degreeeducation at various colleges and institutes. Three other public universities have no regu-lar classroom instruction. They are Bangabandhu Sheikh Mujibur Rahman AgricultureUniversity; Bangabandhu Sheikh Mujib Medical University, the sole medical university;and Bangladesh Open University (BOU). BOU conducts 18 formal and 19 nonformal education courses. It has 12 regional centers for its 6 faculties and schools, as well as80 local centers and 1,000 tutorials throughout the country. (Data in this section are from BANBEIS 2006.)
31. Monem (2007) finds that regular faculty in public institutions work as part-time facultyin private institutions. This could be a device used by private institutions to signal qualityby emphasizing the parent institutions of the faculty.
32. Revenue and expenditure per student in public universities amount to 1,970 taka and2,520 taka per year, respectively; the comparable figures for private universities are 16,450taka and 15,970 taka.
33. Government policy in Sri Lanka is not to charge any fees to undergraduate and diploma-level students. The government has, however, allowed institutions to charge students forthe cost of postgraduate programs, short-term training programs, contract research, andconsultancy and other services. About 95 percent of the university budgets still comesfrom treasury funds.
34. In the case of Sri Lanka, prospects for a sufficient supply of graduates are constrained bythe size of the country’s labor market, but in Pakistan and Bangladesh the number of tech-nical graduates is also limited, even though the overall size of the education sector is muchlarger.
35. The authors are grateful to Pratap B. Mehta for suggesting this implication. Salmi (2009)has a similar discussion on the negative effects of the separation of higher education intospecialized grande écoles and universities in France. See also Yarnell (2006).
36. As noted in Agarwal (2006), the March 2004 report of the Board on Faculty Developmentof the AICTE projects a serious shortage in faculty, given the growth in the number ofinstitutions and the increase in student intake. In fact, shortage of faculty is cited as a rea-son for reduction of intake in 1,346 approved engineering institutions and for the prohi-bition of intake in 7 institutions.

342 | RAKESH BASANT AND PARTHA MUKHOPADHYAY
37. Maria, Ruet, and Zerah (2003) describe cases in which such partnerships were discontin-ued because of failure to deliver what was promised. Lack of mutual trust and low- qualityinfrastructure have been suggested as other constraints on linkages (Bhattacharya andArora 2007).
38. The UGC has reiterated its belief in universities’ freedom in designing the curriculum,which it describes as “fundamental” to its policies. It has said that the “impression . . .that the UGC has undertaken an exercise to design a nationally uniform curriculum . . . isnot correct.” It has, however, formed a committee to evolve a framework to help ensureand enhance the quality and relevance of curriculums. When this framework becomesavailable, it will be shared with universities, which would be free to adopt or adapt thecurriculum framework (Tribune 2008).
39. This argument has less relevance for the AICTE and other council-approved institutions,deemed-to-be universities, or state-act universities. Efforts are being made in a few institu-tions, including the National Center for Biological Sciences (NCBS), the Indian Institute ofScience (IISc), and the National Chemical Laboratories (NCL), to develop multidisciplinaryresearch programs (Yarnell 2006). Given the difficulties in developing interdisciplinarycourses and research programs in existing institutions, the government is experimentingwith new Indian Institutes of Science Education and Research, which have a multidiscipli-nary curriculum at the undergraduate level, but these institutions will be limited to a minus-cule number of students.
40. In 2003 the Association of Indian Universities did hold a seminar on this issue, “Threatsand Opportunities in Higher Education in Context of GATS and Networking among Indi-an Universities and Credit Transfer with Universities in India.” CABE (2005) also men-tions the need for a credit system.
41. Specialized research institutions include the CSIR laboratories, the IITs and IIMs, the IISc,and the like.
42. Such coping behavior as a response to a failure of public services is common in many othersectors in India, including water, electricity, and health.
43. Wolf (2002) suggests that that investment in basic skills such as mathematics and writingmay be much more relevant than investment in domain-specific skills.
44. Even external funding was found to be more efficacious if universities enjoyed autonomyand faced competition from other institutions.
45. Universities need to be autonomous not just from the government but also from industryif a critical part of their research agenda is to be self-driven and pioneering. They shouldtherefore not become too financially dependent on either source.
References
Agarwal, Pawan. 2006. “Higher Education in India: The Need for Change.” ICRIER WorkingPaper 180, Indian Council for Research on International Economic Relations, New Delhi.
Aghion, Philippe, Mathias Dewatripont, Caroline Hoxby, Andreu Mas-Colell, and AndréSapir. 2008. Higher Aspirations: An Agenda for Reforming European Universities. BruegelBlueprint Series vol. 5. Brussels: Bruegel.
———. 2009. “The Governance and Performance of Research Universities: Evidence fromEurope and the U.S.” NBER Working Paper 14851, National Bureau of EconomicResearch, Cambridge, MA.
Aminuzzaman, Salahuddin. 2007. “Overview of Quality Assurance in the Context ofBangladesh.” Presented at the International Workshop on the Development of Measurements

AN ARRESTED VIRTUOUS CIRCLE? | 343
for Higher Education Quality Assurance in Bangladesh, organized by the American International University–Bangladesh (AIUB) and the Asia Pacific Quality Network(APQN), Dhaka, May 30–31. http://www.aiub.edu/StaticPages/APQN2007/Papers/ aminuzzaman%20paper.doc.
Athreye, Suma, and Martha Prevezer. 2008. “R&D Offshoring and the Domestic Science Base inIndia and China.” Working Paper 26, Centre for Globalization Research, School of Businessand Management, Queen Mary University of London. http://webspace.qmul.ac.uk/pmartins/CGRWP26.pdf.
Athreye, Suma, and Phanish Puranam. 2008. “India and China: Their Role in the Global R&DEconomy.” Presented at the Maastricht Economic and Social Research and Training Cen-tre on Innovation and Technology (MEIDE) Conference, Renmin University, Beijing, April21–22. http://www.merit.unu.edu/MEIDE/papers/2008/1202480444_SA.pdf.
Azam, Mehtabul. 2008. “India’s Rising Skill Premium: Role of Demand and Supply.” SouthernMethodist University, Dallas, TX. http://people.smu.edu/mazam/Azam-01.pdf.
BANBEIS (Bangladesh Bureau of Educational Information and Statistics). 2006. “NationalEducation Survey (Post Primary) 2005.” BANBEIS, Ministry of Education, Dhaka.
Banerjee, Rangan, and Vinayak Muley. 2008. Engineering Education in India. ObserverResearch Foundation, Delhi.
Bargain, Olivier, Sumon K. Bhaumik, Manisha Chakrabarty, and Zhong Zhao. 2008. “Earn-ings Differences between Chinese and Indian Wage Earners, 1987–2004.” IZA DiscussionPaper 3284, Institute for the Study of Labor (IZA), Bonn, Germany.
Basant, Rakesh, and Pankaj Chandra. 2006. “University-Industry Link and Enterprise Creation in India—Some Strategic and Policy Issues.” In How Universities Promote Economic Growth, ed. Shahid Yusuf and Kaoru Nabeshima, 209–26. Directions in Devel-opment Series. Washington, DC: World Bank.
———. 2007. “Role of Educational and R&D Institutions in City Clusters: An ExploratoryStudy of Bangalore and Pune Regions in India.” World Development 35 (6, June): 1037–55.
Basant, Rakesh, and Partha Mukhopadhyay. 2009. “An Arrested Virtuous Circle? Higher Education and High-Tech Industries in India.” Working Paper 2009-05-01, Indian Insti-tute of Management, Ahmedabad. http://www.iimahd.ernet.in/publications/data/2009-05-01Basant.pdf.
Berman, Eli, Rohini Somanathan, and Hong W. Tan. 2005. “Is Skill-Biased TechnologicalChange Here Yet? Evidence from Indian Manufacturing in the 1990s.” Policy ResearchWorking Paper 3761, World Bank, Washington, DC.
Bhattacharya, S., and P. Arora. 2007. “Industrial Linkages in Indian Universities: What TheyReveal and What They Imply?” Scientometrics 70 (2): 277–300.
CABE (Central Advisory Board of Education). 2005. “Report of the CABE Committee onFinancing of Higher and Technical Education.” National Institute of Educational Planningand Administration, New Delhi.
Chamarbagwala, Rubiana. 2006. “Economic Liberalization and Wage Inequality in India.”World Development 34 (12, December): 1997–2015.
Chamarbagwala, Rubiana, and Gunjan Sharma. 2008. “Industrial Deregulation, Skill Upgrad-ing, and Wage Inequality in India.” CAEPR Working Paper 2008-002, Center for AppliedEconomics and Policy Research, Indiana University, Bloomington, IN.
Chatterjee, Partha, et al. 2002. “Social Science Research Capacity in South Asia.” SSRC Work-ing Paper 6, Social Science Research Council, New York. http://southasia.ssrc.org/ publications/southasiareport.pdf.

344 | RAKESH BASANT AND PARTHA MUKHOPADHYAY
CII (Confederation of Indian Industry). 2007. “Public Private Partnership for ITI Upgrada-tion.” CII Communique, July, CII, New Delhi.
Dhingra, Inderbir S. 2007. “Enhancing Innovation Finance.” In Unleashing India’s Innova-tion: Toward Sustainable and Inclusive Growth, ed. Mark A. Dutz. Washington, DC:World Bank.
Esham, M. 2008. “Strategies to Develop University-Industry Linkages in Sri Lanka.” ResearchStudies on Tertiary Education Sector Study Series 4 (2007/2008), National EducationCommission, Colombo.
Etzkowitz, Henry. 2003. “Innovation in Innovation: The Triple Helix of University-Industry-Government Relations.” Social Science Information 42 (3): 293–337.
Etzkowitz, Henry, and Loet Leydesdorff. 2000. “The Dynamics of Innovation from NationalSystems and Mode 2 to a Triple Helix University-Industry-Government Relationship.”Research Policy 29 (2): 109–23.
Frew, Sarah E., Rahim Rezaie, Stephen M. Sammut, Monali Ray, Abdallah S. Daar, and PeterA. Singer. 2007. “India’s Health Biotech Sector at a Crossroads.” Nature Biotechnology25 (4, April): 403–17.
Gamage, Sujata, ed. 2007. “Linking Knowledge to Innovation in the Economy and Society:The Role of Universities in Asia.” International Development Research Centre (IDRC),Ottawa.
Gupta, Anil. 2008. “Do Patents Matter: IP in Indian R&D Institutions and Universities.” Pres-entation at the Intellectual Property Rights (IPR) Management Development Program,Indian Institute of Management, Ahmedabad.
Hershberg, Eric, Kaoru Nabeshima, and Shahid Yusuf, eds. 2007. “University-Industry Link-ages and the Development of Knowledge-Intensive Clusters in Asian Cities.” World Devel-opment 35 (6, June): 931–1098.
Infosys. 2007. “Campus Connect Program Overview.” Infosys Web site, http://campusconnect.infosys.com.
Kapur, Devesh, and Pratap B. Mehta. 2007. “Indian Higher Education Reform: From Half-Baked Socialism to Half-Baked Capitalism.” Presented at the Brookings–National Coun-cil on Applied Economic Research (NCAER) India Policy Forum, New Delhi, July 17–18.http://www.ncaer.org/downloads/IPF2007/kapur-mehta.pdf.
Kijima, Yoko. 2006. “Why Did Wage Inequality Increase? Evidence from Urban India 1983–99.” Journal of Development Economics 81 (1, October): 97–117.
Kodama, Fumio, Shingo Kano, and Jun Suzuki. 2006. “Beyond Absorptive Capacity: TheManagement of Technology for a Proactive Corporate Strategy toward University- IndustryLinks.” In How Universities Promote Economic Growth, ed. Shahid Yusuf and KaoruNabeshima, 241–54. Directions in Development Series. Washington, DC: World Bank.
Kumar, N. K., U. Quach, H. Thorsteinsdottir, H. Somsekhar, A. S. Daar, and P. Singer. 2004.“Indian Bio-technology—Rapidly Evolving and Industry Led.” Nature Biotechnology 22(December, Suppl.): 31–36.
Maria, A., J. Ruet, and M. H. Zerah. 2003. “Biotechnology in India.” Centre de SciencesHumaines (CSH) and CERNA, New Delhi.
Metcalfe, Stan, and Ronnie Ramlogan. 2008. “Innovation Systems and the CompetitiveProcess in Developing Economies.” Quarterly Review of Economics and Finance 48(2, May): 433–46.
Mohanty, Nirmal. 2004. “Study on State Infrastructure.” Report to the 12th Finance Com-mission, New Delhi. http://fincomindia.nic.in/writereaddata/html_en_files/fincomnet/rpt_intra/st_infrast.doc.

AN ARRESTED VIRTUOUS CIRCLE? | 345
Monem, Mobasser. 2007. “Higher Education in Bangladesh: Status, Issues and Prospects.”Presented at seminar on “Knowledge for Development (K4D): The Role of Universities,”Colombo, January 25.
Mowery, David C., Richard R. Nelson, Bhaven N. Sampat, and Arvids A. Ziedonis. 2001.“The Growth of Patenting and Licensing by U.S. Universities: An Assessment of the Effectsof the Bayh-Dole Act of 1980.” Research Policy 30 (1, January): 99–119.
Mukhopadhyay, Partha. 2008. “A PPP Model for Vocational Education: Upgrading the ITIsin India.” In India Infrastructure Report 2008: Business Models of the Future, 3iNetwork.Delhi: Oxford University Press.
NASSCOM (National Association of Software and Service Companies). 2005. NASSCOM-McKinsey Report: Extending India’s Leadership in the Global IT and BPO Industries.Mumbai, India: NASSCOM. http://www.nasscom.in/Nasscom/templates/NormalPage.aspx?id=4969.
———. 2007. “Finishing School for Engineering Students—NASSCOM Education Initiative.”NASSCOM, Mumbai, India.
Nichenametla, Prasad. 2007. “ITI Upgrade Plan a Non-Starter.” Business Standard (NewDelhi), December 8. http:// www.rediff.com/money/2007/dec/08iti.htm.
Powar, K. B., and V. Bhalla. 2004. “Private Professional Higher Education in India.” NewFrontiers in Education 34 (2): 126–27.
Prakash, Ved. 2007. “Trends in Growth and Financing of Higher Education in India.” Eco-nomic and Political Weekly 42 (31, August 4).
Salmi, Jamil. 2009. “The Challenge of Establishing World-Class Universities.” World Bank,Washington, DC. http://portal.unesco.org/education/en/files/55825/12017990845Salmi.pdf/Salmi.pdf.
So, Anthony D., Bhaven N. Sampath, Arti K. Rai, Robert Cook-Deegan, Jerome H. Reichman,Robert Weissman, and Amy Kapczynski. 2008. “Is Bayh-Dole Good for Developing Coun-tries? Lessons from the US Experience.” PLoS Biology 6 (10): e262, 2078–84.http://www.plosbiology.org/article/info%3Adoi%2F10.1371%2Fjournal.pbio.0060262.
Stehrer, Robert, and Julia Wörz. 2003. “Industrial Diversity, Trade Patterns, and ProductivityConvergence.” WIIW Working Paper 23, Vienna Institute for International EconomicStudies, Vienna. http://www.wiiw.ac.at/pdf/WP23.pdf.
Stephen. Francis M. 2007. “Relevance of Foreign Degrees, Offered Locally, and Their Contri-bution to the Socio-Economic Development in Sri Lanka.” Research Studies on TertiaryEducation Sector, Study Series 1 (2007/2008), National Education Commission, Colombo.http://www.nec.gov.lk/content/admin/-%20Rel_101.pdf.
Tribune (Chandigarh, India). 2008. “UGC Not for Uniform Curriculum.” January 9.http://www.tribuneindia.com/2008/20080109/delhi.htm.
Unni, Jeemol, and Uma Rani. 2008. Flexibility of Labour in Globalizing India: The Challengeof Skills and Technology. New Delhi: Tulika Books.
Wolf, Alison. 2002. Does Education Matter? London: Penguin.
Yarnell, Amanda. 2006. “Indian Science Rising.” Chemical Engineering News 84 (12, March20): 12–20. http://pubs.acs.org/cen/coverstory/84/8412India.html.
Yusuf, Shahid, and Kaoru Nabeshima, eds. 2006. How Universities Promote EconomicGrowth. Directions in Development Series. Washington, DC: World Bank.

346
Comment on “An Arrested Virtuous Circle?Higher Education and High-Technology Industries in India,” by Rakesh Basantand Partha Mukhopadhyay
PANKAJ CHANDRA
Basant and Mukhopadhyay present an interesting and important view on what ishappening in the higher education sector in India and its role in building and grow-ing the high-technology industry. The authors have pieced together a story based ona variety of secondary data sources and evidence from literature. My comments onthe paper will be in the form of a few questions that will, I hope, promote furtherunderstanding of the issues raised by the authors, complement their analysis, andseek a process explanation of some of their findings. The authors rue the poor link-ages between higher education and high-technology industry and hold improper regulation of higher education responsible for it. They argue that among the manylinkages that may exist between the higher education sector and high-technologyindustry, the link relating to the labor market is the most active in India, while othersare weak. They note that young, male, urban graduates (and nongraduates with tech-nical diplomas) are more likely to be working in the high-technology sector.
The paper prompts one to ask the following questions:
• Is there a hierarchy in the linkages between higher education and high technol-ogy, and does it explain the extent of linkages?
• What have been the reasons behind poor linkages?
• Is there something about the structure of higher education in India that inhibitslinkages?
• Can we say something about the quality of these linkages, and does quality varyfrom public to private institutions?
It would indeed be interesting to know the extent of engagement in other types oflinkages, independent of their strengths or weaknesses, in order to understand their
Pankaj Chandra is a professor of operations and technology management and director at the Indian Institute of Management Bangalore.
Annual World Bank Conference on Development Economics 2009, Global© 2010 The International Bank for Reconstruction and Development / The World Bank
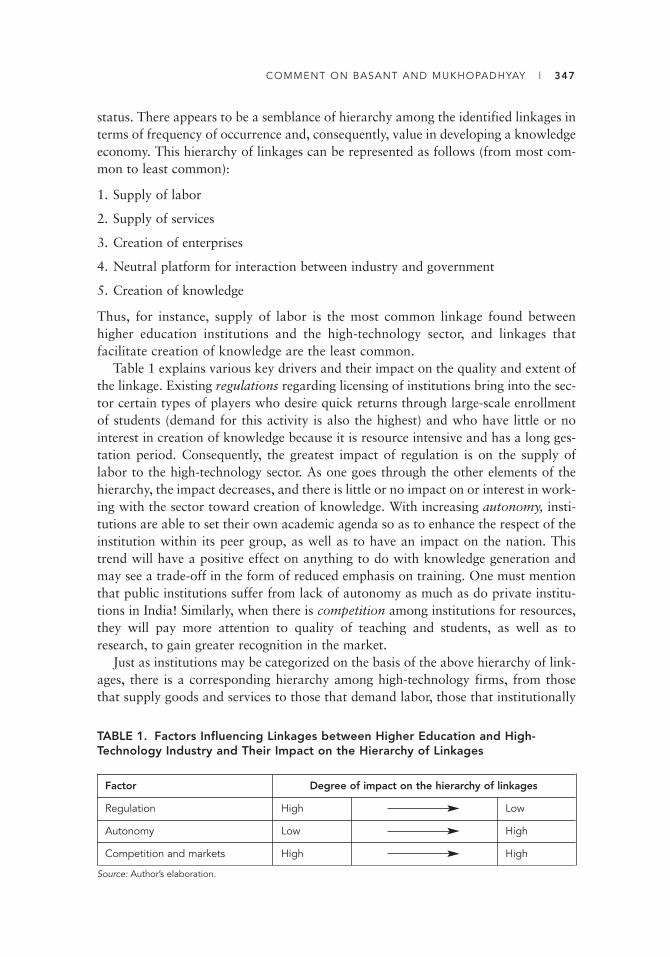
COMMENT ON BASANT AND MUKHOPADHYAY | 347
status. There appears to be a semblance of hierarchy among the identified linkages interms of frequency of occurrence and, consequently, value in developing a knowledgeeconomy. This hierarchy of linkages can be represented as follows (from most com-mon to least common):
1. Supply of labor
2. Supply of services
3. Creation of enterprises
4. Neutral platform for interaction between industry and government
5. Creation of knowledge
Thus, for instance, supply of labor is the most common linkage found betweenhigher education institutions and the high-technology sector, and linkages thatfacilitate creation of knowledge are the least common.
Table 1 explains various key drivers and their impact on the quality and extent ofthe linkage. Existing regulations regarding licensing of institutions bring into the sec-tor certain types of players who desire quick returns through large-scale enrollmentof students (demand for this activity is also the highest) and who have little or nointerest in creation of knowledge because it is resource intensive and has a long ges-tation period. Consequently, the greatest impact of regulation is on the supply oflabor to the high-technology sector. As one goes through the other elements of thehierarchy, the impact decreases, and there is little or no impact on or interest in work-ing with the sector toward creation of knowledge. With increasing autonomy, insti-tutions are able to set their own academic agenda so as to enhance the respect of theinstitution within its peer group, as well as to have an impact on the nation. Thistrend will have a positive effect on anything to do with knowledge generation andmay see a trade-off in the form of reduced emphasis on training. One must mentionthat public institutions suffer from lack of autonomy as much as do private institu-tions in India! Similarly, when there is competition among institutions for resources,they will pay more attention to quality of teaching and students, as well as toresearch, to gain greater recognition in the market.
Just as institutions may be categorized on the basis of the above hierarchy of link-ages, there is a corresponding hierarchy among high-technology firms, from thosethat supply goods and services to those that demand labor, those that institutionally
TABLE 1. Factors Influencing Linkages between Higher Education and High- Technology Industry and Their Impact on the Hierarchy of Linkages
Factor Degree of impact on the hierarchy of linkages
Regulation High Low
Autonomy Low High
Competition and markets High High
Source: Author’s elaboration.

348 | PANKAJ CHANDRA
supply teachers, and, finally, those that supply funds for research and other activities.Thus, higher education institutions and high-technology firms are not homogenous,and it may be worthwhile to segment them appropriately and study the behavior ofeach segment and its performance vis-à-vis others before designing any policy inter-vention, as these entities’ response to a common policy may vary considerably.
If we explore the linkages described in the paper further and recognize the exis-tence of this hierarchy, a few interesting observations can be made about the linkages.The linkages may not always be as weak, but the size of the segments of differenttypes of institution, as defined by the hierarchy, may vary. We first make a few com-ments on some of the observations in the paper regarding the linkages in order toexplain why some may not be strong enough in India. We will examine three of thelinkages identified: labor market linkages, creation of enterprises, and creation ofknowledge.
Labor Market Linkages
The findings on high-technology manufacturing appear to be intuitive. From theanalysis, it is apparent that high-technology services seem to dominate within allhigh-technology industries in terms of their propensity to hire graduates of all kinds,including nontechnical graduates. This makes one wonder if many of the industriesidentified as high-technology services are indeed high technology. For example, bank-ing in India is quite manual and has low research and development (R&D) intensity.In addition, the deployment of general graduates is largely in functions that are non-technical. Perhaps inclusion of sectors such as engineering design, animation art, andhealth care delivery would lead to differing findings. One may also have to segregategraduates and postgraduates to see the above effect more sharply. That may be help-ful in explaining the perspective of high-technology industry, as well, in terms of thevalue it places on knowledge generation, as most postgraduate degrees are researchoriented, especially in technical disciplines. Finally, with respect to colocation of thehigh-technology sector and the highly educated worker, it may be recognized thatcausality may be bidirectional in this case.
Creation of Enterprises
Enterprise formation through incubators is but a small fraction of all start-ups glob-ally, and the same is true in India, where formal incubation is a rather recent phe-nomenon. Older incubators are to be found in technology institutions such as theIndian Institute of Technology (IIT) Bombay and the Indian Institute of Science (IISc)Bangalore. Interestingly, both these incubators support only their own students andfaculty for incubation services and have had significant successes. By contrast, incu-batees at the management institutions are primarily from outside the institutions.It may be worth noting that whereas incubators at management institutions focus
COMMENT ON BASANT AND MUKHOPADHYAY | 349
on technology-based entrepreneurship, students and faculty at these institutionsfocus on innovative business models rather than technology for developing theirenterprises—a clear mismatch of objectives. Another interesting hypothesis is thatone of the reasons Indian incubators do not find fresh graduates may have less todo with lack of innovation in institutions than with the behavior of the middle class;most entrepreneurs who come from nonentrepreneurial families tend first to securethemselves economically through a high-paying job and then enter the world ofentrepreneurship. It is no mystery, then, that many of these incubatees are not recentgraduates.
Two other factors have adversely affected the formation of student- and faculty-led enterprises in the high-technology sector. First, an enterprise requires formationof a team with diverse skills—technology, marketing, finance, and so on. In India,however, science and technology institutions (as well as management institutions) arestand-alone entities, not part of a comprehensive university. As a consequence, stu-dent or faculty start-up teams remain incomplete, reducing the chances of venturefunding and of success. Second, the ecosystem for nurturing high-technology entre-preneurship is not sufficiently developed. Uncertain support in the following areasadversely affects enterprise creation:
• Early financing
• Mentoring support
• Fast prototyping
• Prototyping funds
• Early market linkages
Funds made available to technical graduates to start an enterprise, and matchinggrants from the government, would go a long way toward promoting enterprise cre-ation. It appears that incubation activity may be best suited for comprehensive uni-versities that can help create an integrated support environment and provide sourcesof innovation. However, research parks on the campuses of stand-alone institutionsmay be more appropriate because they may attract slightly mature firms that mightbe seeking only complementary skills from such institutions.
Creation of Knowledge
Some comments are in place about the observations in the paper on the creation ofknowledge as a key linkage between institutions and high-technology industry. First,an overemphasis on patents as a comprehensive indicator of knowledge creation dis-torts the picture for India, where patenting costs and cumbersome procedures aremajor deterrents to seeking a patent. On a related note, it may not be possible toassess the extent and quality of research spillovers in an industry by the share ofpatents awarded to foreign firms. The chemical and pharmaceutical industry, forexample, is one of the largest sectors, as measured by the number of firms in the
350 | PANKAJ CHANDRA
country. It should not be a surprise that it has the highest share of patents, comparedwith semiconductors, where the number of firms is very small. Indian firms in thesesectors have been known to be working with higher education institutions to developadvanced knowledge through joint PhD programs, and they are forging strongresearch partnerships with select institutions, including the University Institute ofChemical Technology (UDCT), IIT Bombay, and the National Institute of Pharma-ceutical Education and Research (NIPER). This is also a sector in which foreignenterprises encounter significant competition from domestic firms, explaining theirlow participation in institutional R&D in India (perhaps to prevent any spilloverbenefits to Indian firms). Research spillover occurs through movement of personnel,suppliers, and so on and may be helping domestic firms develop capabilities.
Second, it would be worthwhile to measure other indicators of the generation andquality of knowledge—for example, research contracts from industry, the value ofthese grants, utilization of research by industry, citation of the research in patents,joint publication, and so on, to gauge whether there has been any change in thisdomain over the years.
Third, without claiming that research output through the academia-industry link-age is adequate, one can argue that the mechanisms needed to translate academicresearch into a patent application are largely absent. For example, each year a largenumber of students complete dissertations, often with industry support, yet the like-lihood that one of these dissertations will become the basis of a patent or industrialapplication is low.
Fourth, it would be useful to understand the context of knowledge creationthrough linkages by delineating the stage of industrial development and understand-ing the demand pull for research by Indian industry. This might be true for non-industry-specific knowledge, as well.
Fifth, equity and access considerations have led to the establishment of institutionsin locations that are often far away from industrial clusters, providing little oppor-tunity for linkages with high-technology industry.
In summary, observations from patenting must be seen, at best, as intermediateobservations on a transiting economy that is trying to get its macro principles right!Measurement of change might be a better indicator in such a situation.
Finally, we explore whether there is something about the structure of higher education in India that inhibits linkages. Two key factors have significantly impededformation of linkages:
1. Restrictive regulation, manifested in several areas
• Rules governing institutions—centralization of curriculum, low compensation,licensing of institutions, and the like, leading to a weak research environment
• Caps on endowments, resulting in low motivation to seek linkages withindustry
• High student-teacher ratios, which motivate institutions to focus more on train-ing and less on research.
2. Proliferation of stand-alone institutions.

COMMENT ON BASANT AND MUKHOPADHYAY | 351
The aim of the underlying policies has been to improve labor-related linkages, butthey may have slowed the formation of other types.
In conclusion, data-based evidence would help explain whether other linkages areweak or are simply in early stages. Two issues call for careful study: the demand pullfor various linkages from the industry, and the comparison of linkages between private and public institutions. Interestingly, much of the linkage thus far has beendriven by public institutions through public funds. As private industry and privateinstitutions grow in India, their participation both in funding and in seeking innova-tion funds for developing new enterprises or new knowledge will become crucial forthe growth of the economy.


Human Development

Health and Socioeconomic Status:The Importance of Causal Pathways
DUNCAN THOMAS
The poor tend to be in poor health. A positive association between socioeconomicstatus (SES) and health has been established worldwide, within specific societies, overthe life course, and for a broad array of indicators of both health and SES. Experi-mental and nonexperimental evidence on the causal pathways that underlie this association suggests that fetal health and health in early life likely affect health andeconomic prosperity in later life. Some evidence suggests that changes in health dur-ing adulthood also affect work outcomes. Overall, the strongest evidence for a causalimpact of health on economic success is reflected in the effect of improved nutritionon economic productivity. The evidence on other dimensions of health is more limited. Very little attention has been paid to the dynamic interplay between healthand behavioral choices that shapes economic outcomes over the longer term. Recentinnovations provide unparalleled opportunities for making major contributions toknowledge that could have a lasting impact on the well-being of populations aroundthe world.
The poor tend to be in poor health. A positive association between socioeconomicstatus (SES) and health has been established across the globe, within specific societies,over the life course, and for a broad array of indicators of both health and SES. Inter-pretation of the association is at the center of a large and contentious debate.
A key issue in this debate has been isolation of the causal pathways that link healthand economic prosperity. Pinning down causal pathways at the individual level is crit-ically important from both a scientific and a policy standpoint. For example, if incomegrowth leads to improvements in health, policy makers should take health benefitsinto account when allocating resources to programs that promote economic growth.
355
Duncan Thomas is a professor of economics at Duke University, Durham, NC, and a faculty affiliate at the Duke GlobalHealth Institute. This paper draws extensively on collaborative work with Elizabeth Frankenberg and John Strauss, towhom the author acknowledges an enormous debt for guiding his thinking. The paper benefited from comments byT. Paul Schultz and by an anonymous reviewer.
Annual World Bank Conference on Development Economics 2009, Global © 2010 The International Bank for Reconstruction and Development / The World Bank

356 | DUNCAN THOMAS
If, conversely, health contributes to economic prosperity, these benefits ought to beincluded in evaluations of the impact of resources allocated to the health sector—including, for example, provision of public health services, immunization, maternaland child health programs, subsidized medical care, and health insurance programs,as well as public health information campaigns and training of health personnel.
Causality likely runs in both directions. On the one hand, a family with moreincome is likely to invest more in its members’ human capital, including health. Inlow-resource populations, as income increases, individuals typically invest in betterdiets and improved sanitation and devote more resources to health care. On the otherhand, if a healthier worker is less susceptible to disease, more alert, and more ener-getic, he or she will probably be more productive and may work longer hours. As aresult, the worker will command higher earnings. In contrast, individuals in poorerhealth may reduce their hours or be unable to work at all, and they may have to dipinto their savings to pay for costly treatments or care.
Other, unobserved factors probably drive both health and economic prosperity.For example, part of health is inherited, as are other attributes related to economicprosperity. The role of genes, and the role the environment plays in their expression,are not fully understood. Moreover, families that choose to invest in the health oftheir children may also value other investments that would improve their own andtheir children’s lives. They may make investments in other dimensions of their chil-dren’s human capital, working more effectively, or saving more.
It is important to take into account factors that are not readily observed (or, moreprecisely, not treated as observed, in most models), for at least two reasons. First, ademonstration that health does not have a causal impact on income cannot be inter-preted as indicating that the correlation between income and health should be attrib-uted to a causal effect of income on health. The association may be attributed to theseother, unobserved factors.
Second, the literature has typically referred to unobserved factors, including, forexample, tastes, information, and the like. Some of these, such as information abouthealth practices or propensities to save for the future, are amenable to measurement.Accumulation of scientific evidence on their role, if any, in behavioral choices thatexplain the association between health and economic prosperity is a potentiallyimportant new line of research. Moreover, some of these factors can be influenced bypolicy. For example, campaigns that provide information about health and the healthconsequences of behaviors have been successful in effecting lifestyle changes that pro-mote better health, such as policies that discourage tobacco use.
This paper focuses on key issues involved in isolating causal pathways that linkhealth and SES at the micro level. Rather than attempt exhaustively to describe themethods and evidence, we focus on a small number of studies to illustrate the meth-ods that have been used in the literature and assess their contributions to knowledge.The conclusion highlights some of the lines of future inquiry in this literature that arelikely to be especially profitable and describes some methodological advances thathave the potential to yield new evidence that will substantially influence both scienceand policy design. (For more comprehensive reviews of the literature on health anddevelopment, see Strauss and Thomas 1995, 2008; Jack and Lewis 2008.)

HEALTH AND SOCIOECONOMIC STATUS | 357
Measurement of Health and Socioeconomic Status
The relationship between health and SES is not unidimensional. The magnitude anddirection of the correlation vary with the measures of health and of SES. For exam-ple, short-term episodes of illness that have no longer-term ramifications for healthor functioning may result in changes in how time is allocated (to rest and recupera-tion, say) and thus perhaps to earnings during the period of illness, although even thiswill depend on the nature of the work and the payment mechanisms. Workers paidby the piece or on an hourly or daily basis are likely to have lower earnings whensick, whereas workers with paid sick leave may not. Reallocations of time in responseto episodes of illness may be temporary, and the individual may make up for lostearnings by spending more time on activities such as work when his or her healthimproves.
More persistent or chronic health conditions may have broader effects on SES.These conditions may result in permanent changes in earnings because of changes intime allocation or productivity, or both. The health conditions may also result inchanges in consumption, savings, and wealth as individuals draw on resources fortreatment or in response to reduced earnings. Conditions that affect life expectancylikely affect intertemporal preferences and therefore decisions about savings andwealth accumulation.
In practice, in many instances, whether a specific health event will turn into achronic condition may not be immediately obvious, and the path from short-term tolonger-term health difficulties may be complex. Moreover, the cumulative effect ofmultiple health insults may turn an apparently short-term health problem into achronic condition. For example, the literature suggests that the deleterious conse-quences for day-to-day functioning of a traumatic event such as an earthquake orexposure to a violent attack are dramatically magnified when an individual has hadprior exposure to traumatic events.
The impact of a health condition may also have long-reaching effects on economicand social success if the condition results in a shift in the individual’s lifetime tra-jectory. For example, a health condition during early childhood may affect school performance, which, in turn, has lasting effects on academic achievement and economicsuccess in later life. In other instances, behavioral responses to chronic conditions, suchas change of occupation or life style, may mitigate the negative consequences for economic prosperity. Health innovations in later life can have yet other impacts onthe economic security of the individual.
It is important to keep in mind that there is likely to be considerable heterogene-ity not only in the magnitude and direction of the association between health and SESbut also in its interpretation. These issues have received inadequate attention in theliterature, partly because relatively few health measures have been used in studiesrelating health to SES, a shortcoming that reflects data constraints.
In recent years, the quality and quantity of data for exploring these questions havedramatically improved. There have been, and continue to be, exciting innovations inthe technology for measuring a broad array of health markers, using noninvasive andminimally invasive methods that can be implemented in the field at low cost. These

358 | DUNCAN THOMAS
technologies include, for example, in-home monitors and assays of blood drops(dried on filter paper), cheek swabs, saliva, and hair, for measuring short-term andlonger-term health conditions as well as DNA. These health measures have been integrated with rich administrative data, as well as with population-based socioeco-nomic data, many of which involve long-term longitudinal surveys that follow individuals over the life course.
In combination, these integrated data sources provide opportunities to makemajor advances in understanding the complex interplay between different dimen-sions of health and SES over the life course. In the next sections, variation over thelife course will be used as an organizing principle in an assessment of the state of thefield regarding the causal impact of health on socioeconomic prosperity.
Health in Early Life and Later Outcomes
Investigation of the links between health in early life, including fetal health, and laterlife outcomes is an active area of scientific inquiry. Research by Barker and his col-leagues has highlighted the key role of maternal nutrition during pregnancy. It isthought that inadequate nutrients and oxygen during fetal development may result inadaptions in organ development to ensure survival while a fetus and possibly imme-diately after birth. This fetal “programming” appears to result in elevated risk ofhealth problems throughout the entire life course (Barker 1994; Victora et al. 2008).
For example, low birthweight may result in reduced growth during infancybecause the body is programmed as a fetus to survive on low levels of nutrients. This“thrifty phenotype,” which develops as an adaption to adverse nutrition in utero,results in permanent metabolic and endocrine changes. These changes would be ben-eficial if food continued to be scarce after birth, but if food is plentiful, the samemetabolic changes may be disadvantageous; they have been associated with elevatedrisks of obesity, dyslipidemia, and glucose intolerance in later life (Hales and Barker1992). Thus, it is thought that being born small and thin but becoming overweightduring adolescence or adulthood put an individual at greatest risk of heart diseaseand type 2 diabetes in later life. Furthermore, the biological literature suggests thatnot only does the overall nutritional status of the mother affect fetal health; the tim-ing of nutrition and health insults also affect the growth and development of thechild. For example, inadequate nutrients during the period when arteries are formedare associated with elevated risk of heart disease because of hardened arteries inmidlife and later (Godfrey and Barker 2000).
Much of the experimental evidence on the longer-term effects of maternal nutri-tion deprivation relies on animal models. There are, however, several innovative stud-ies that exploit quasi-experimental designs to measure the effects on humans. Forexample, Roseboom et al. (2001) summarize a rich body of work that examines theimpact of the Dutch famine in the Netherlands on the health and mortality of prime-age adults. Toward the end of World War II, several Dutch cities that were thoughtto be supporting the Resistance were subjected to severe food rationing for about sixmonths. People who were in utero during that period constitute a “treatment group”
HEALTH AND SOCIOECONOMIC STATUS | 359
whose health in later life can be compared with that of a “control group” of peoplewho were born at the same time in other Dutch cities and were not subjected to thesame food rationing. The authors find that nutritional deprivation early in the fetalperiod results in an elevated risk of glucose intolerance and heart disease among adultmales and females.
It is likely that maternal nutritional status is not the only factor that affects fetaloutcomes. Finch and Crimmins (2004) highlight the importance of infection duringthe fetal period. They argue that maternal infection and stress result in inflammationthat has detrimental consequences for the development of the fetus, which affects thehealth and well-being of the offspring through the entire life course. For example, itis thought that inflammation in utero is implicated in the development of plaque inthe arteries and therefore in heart disease and that these effects are independent ofdiet and lifestyle choices.
Quantification of the magnitude of these effects is particularly salient for developingcountries because of the coexistence of infectious diseases with the onset of the nutri-tion transition. On the one hand, the obesity epidemic is reaching beyond the developedcountries and is spreading throughout the globe (Popkin 1993). On the other hand, levels of infection and, thus, of inflammation are much higher in poorer societies, sug-gesting that these populations may be carrying a particularly heavy burden of diseasein the future.
A key implication of this research is that the long arm of fetal and early childhoodhealth may extend not only to health in later life but also to economic and socialprosperity through the life course. Studies have documented that low birthweight ispredictive of lower school attainment and less success in the labor market. Althoughlow birthweight likely reflects poor intrauterine growth, it is not clear that these asso-ciations can be given a causal interpretation. Low birthweight is the outcome ofmany factors, including low resource levels, inadequate access to health services, andmaternal behaviors, all of which may be related to other investments in infants andchildren. To establish that variation in fetal health causes variation in economic suc-cess, it is necessary to identify changes in fetal health that are arguably exogenousand not under the direct control of parents.
This concern is addressed in some recent studies. Almond (2006) examines thelonger-term effects of being conceived in late 1918, during the Spanish flu pandemic.The Spanish flu, caused by an unusually severe strain of the H1N1 virus, resulted invery high levels of morbidity and mortality. It is estimated that more than half a million people died in the United States and that about one in four people sufferedfrom the virus (Crosby 1989). The virus was first detected in March 1918, andalthough the pandemic persisted to the middle of 1920, its impact on the health of theU.S. population was concentrated in the last half of 1918. Whereas influenza usuallykills the youngest and oldest, the Spanish flu killed prime-age adults and fell particu-larly heavily on males. It has been conjectured that undetected tuberculosis amongthese men rendered them particularly vulnerable (Noymer and Garenne 2000).
Using data from the 1960 United States census, Almond compares the health,schooling, and labor market outcomes of people who were born in 1919 with thoseborn before the onset of the pandemic and those born at least nine months after the
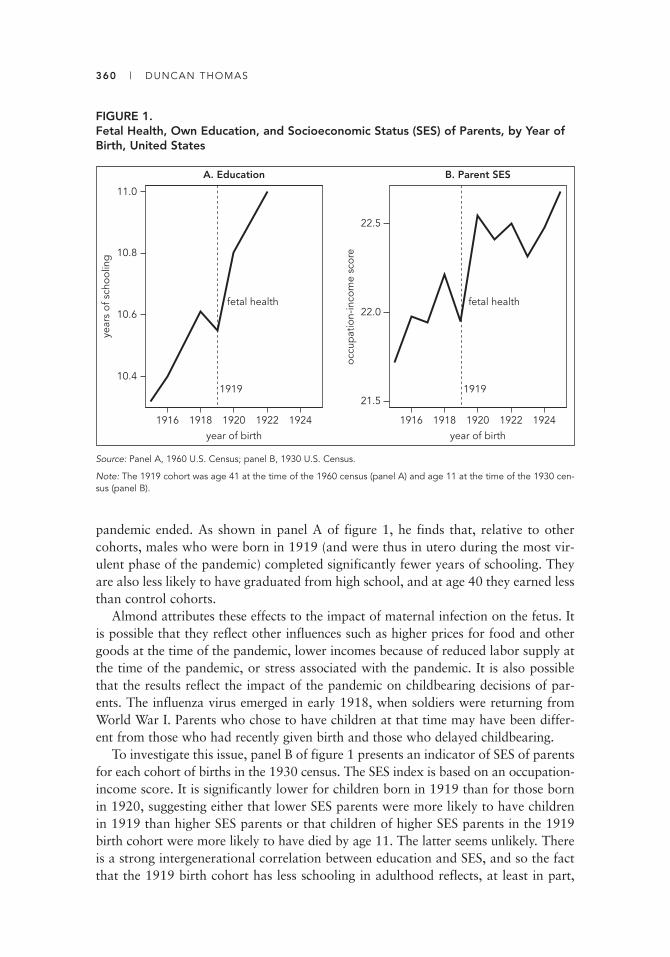
360 | DUNCAN THOMAS
pandemic ended. As shown in panel A of figure 1, he finds that, relative to othercohorts, males who were born in 1919 (and were thus in utero during the most vir-ulent phase of the pandemic) completed significantly fewer years of schooling. Theyare also less likely to have graduated from high school, and at age 40 they earned lessthan control cohorts.
Almond attributes these effects to the impact of maternal infection on the fetus. Itis possible that they reflect other influences such as higher prices for food and othergoods at the time of the pandemic, lower incomes because of reduced labor supply atthe time of the pandemic, or stress associated with the pandemic. It is also possiblethat the results reflect the impact of the pandemic on childbearing decisions of par-ents. The influenza virus emerged in early 1918, when soldiers were returning fromWorld War I. Parents who chose to have children at that time may have been differ-ent from those who had recently given birth and those who delayed childbearing.
To investigate this issue, panel B of figure 1 presents an indicator of SES of parentsfor each cohort of births in the 1930 census. The SES index is based on an occupation-income score. It is significantly lower for children born in 1919 than for those bornin 1920, suggesting either that lower SES parents were more likely to have childrenin 1919 than higher SES parents or that children of higher SES parents in the 1919birth cohort were more likely to have died by age 11. The latter seems unlikely. Thereis a strong intergenerational correlation between education and SES, and so the factthat the 1919 birth cohort has less schooling in adulthood reflects, at least in part,
FIGURE 1. Fetal Health, Own Education, and Socioeconomic Status (SES) of Parents, by Year ofBirth, United States
10.4
11.0
10.6
10.8
1916 1920 1922 19241918 1916 1920 1922 19241918
21.5
22.0
22.5
year of birth year of birth
1919
year
s of
sch
oolin
g
1919
A. Education B. Parent SES
occu
pat
ion-
inco
me
scor
e
fetal health fetal health
Source: Panel A, 1960 U.S. Census; panel B, 1930 U.S. Census.
Note: The 1919 cohort was age 41 at the time of the 1960 census (panel A) and age 11 at the time of the 1930 cen-sus (panel B).

HEALTH AND SOCIOECONOMIC STATUS | 361
differences in family background. It would seem premature to attribute the entiregap between the 1919 and other birth cohorts in economic prosperity as an adult tothe impact of health insults during the fetal period resulting from the influenza pandemic. Almond also exploits variation across states in mortality attributed to thepandemic, but those estimates are potentially contaminated by behavioral responsesto the pandemic. (See Thomas 2008 for a discussion.)
Related work examines the impact on human capital and economic prosperity inmidlife of being born during the 1959–61 Chinese famine. Using the 1991 wave ofthe China Health and Nutrition Survey (CHNS), Chen and Zhou (2007) compareoutcomes for cohorts born in the 1950s and 1960s. The impact of the famine is iden-tified by using regional variation in the 1960 death rate that is attributed to thefamine. The authors find that adults who were born in 1959 or 1960 and survivedto 1991 would have been 3 centimeters taller if they had not been exposed to thefamine. They also report reduced hours of work by individuals in this cohort. Familyincome per capita is lower, but the magnitude and significance of these effects differacross the cohort, depending on the specific measure of income. It is unclear how tointerpret evidence on family earnings, which reflect the contributions of family members from other birth cohorts.
As with the influenza pandemic, it is possible that the estimated effects of the Chinese famine reflect the impact of income and price variation resulting from thefamine. As the authors note, interpretation of the estimates is complicated by at leasttwo additional concerns. First, location of birth is not known in the CHNS, and sothe authors assume that respondents were born in the same location where they wereinterviewed 40 years later. This, they conjecture, is a reasonable assumption in Chinaduring the period. This concern highlights an important advantage of Almond’swork, which uses census data that include information on location of birth.
Second, survivors of the famine may be selected on health and human capital. Onthe one hand, it is likely that the frailest individuals would have died in the harshenvironment at the time of the famine—in which case the estimated effects are prob-ably downward biased. On the other hand, there is evidence that fertility respondedto the famine and that birth rates declined substantially soon after the onset of thefamine. The direction of bias in this case is unclear.
One assessment of the empirical magnitude of these influences comes from a com-parison of birth cohorts born around the time of the 1974 floods in Bangladesh withcohorts born before and after the floods. Flooding is commonplace in the GangesDelta, but there had been no parallel to the severity of the 1974 floods for almost20 years, and it is estimated that more than 20,000 people were killed by them. Table 1presents data from the 1996 Matlab Health and Socioeconomic Survey (MHSS),which collected population-representative information on individuals living inBangladesh’s Matlab District. The fraction of the population born between 1970 and1978 is reported in the first column for each year of birth. The substantially reducedsize of the 1975 birth cohort is consistent with the idea that fetal health was affectedby the floods. The second column reports differences in the fractions of males in eachbirth cohort who are unable to read, relative to the 1970 birth cohort. Cohorts bornin 1975 are nearly 10 percentage points less likely to be illiterate than those born in
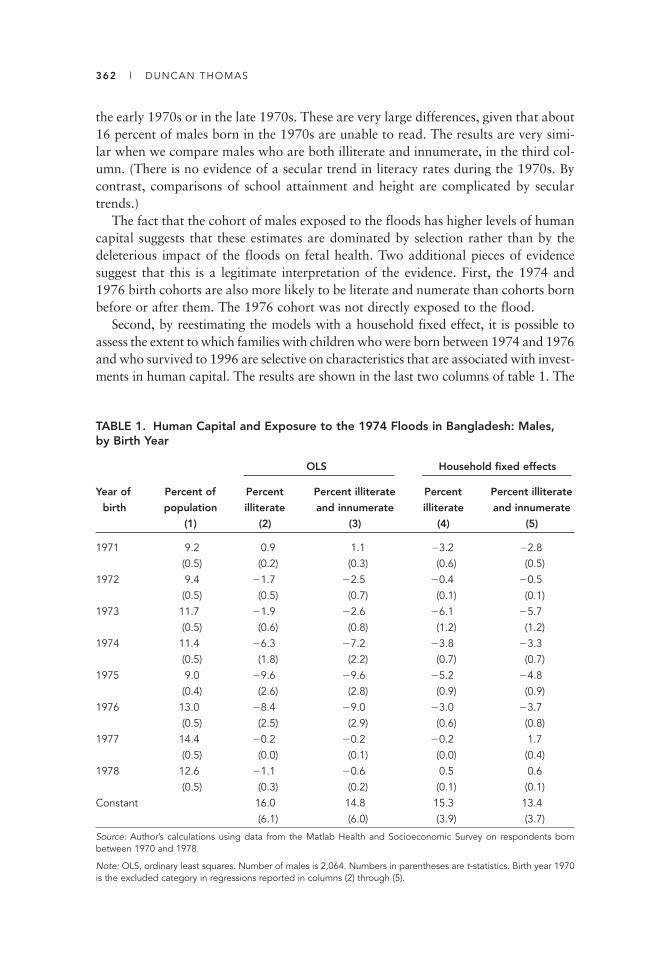
362 | DUNCAN THOMAS
the early 1970s or in the late 1970s. These are very large differences, given that about16 percent of males born in the 1970s are unable to read. The results are very simi-lar when we compare males who are both illiterate and innumerate, in the third col-umn. (There is no evidence of a secular trend in literacy rates during the 1970s. Bycontrast, comparisons of school attainment and height are complicated by seculartrends.)
The fact that the cohort of males exposed to the floods has higher levels of humancapital suggests that these estimates are dominated by selection rather than by thedeleterious impact of the floods on fetal health. Two additional pieces of evidencesuggest that this is a legitimate interpretation of the evidence. First, the 1974 and1976 birth cohorts are also more likely to be literate and numerate than cohorts bornbefore or after them. The 1976 cohort was not directly exposed to the flood.
Second, by reestimating the models with a household fixed effect, it is possible toassess the extent to which families with children who were born between 1974 and 1976and who survived to 1996 are selective on characteristics that are associated with invest-ments in human capital. The results are shown in the last two columns of table 1. The
TABLE 1. Human Capital and Exposure to the 1974 Floods in Bangladesh: Males,by Birth Year
OLS Household fixed effects
Year of Percent of Percent Percent illiterate Percent Percent illiterate
birth population illiterate and innumerate illiterate and innumerate
(1) (2) (3) (4) (5)
1971 9.2 0.9 1.1 �3.2 �2.8(0.5) (0.2) (0.3) (0.6) (0.5)
1972 9.4 �1.7 �2.5 �0.4 �0.5(0.5) (0.5) (0.7) (0.1) (0.1)
1973 11.7 �1.9 �2.6 �6.1 �5.7(0.5) (0.6) (0.8) (1.2) (1.2)
1974 11.4 �6.3 �7.2 �3.8 �3.3(0.5) (1.8) (2.2) (0.7) (0.7)
1975 9.0 �9.6 �9.6 �5.2 �4.8(0.4) (2.6) (2.8) (0.9) (0.9)
1976 13.0 �8.4 �9.0 �3.0 �3.7(0.5) (2.5) (2.9) (0.6) (0.8)
1977 14.4 �0.2 �0.2 �0.2 1.7(0.5) (0.0) (0.1) (0.0) (0.4)
1978 12.6 �1.1 �0.6 0.5 0.6(0.5) (0.3) (0.2) (0.1) (0.1)
Constant 16.0 14.8 15.3 13.4(6.1) (6.0) (3.9) (3.7)
Source: Author’s calculations using data from the Matlab Health and Socioeconomic Survey on respondents bornbetween 1970 and 1978.
Note: OLS, ordinary least squares. Number of males is 2,064. Numbers in parentheses are t-statistics. Birth year 1970is the excluded category in regressions reported in columns (2) through (5).

HEALTH AND SOCIOECONOMIC STATUS | 363
differences in human capital across birth-year cohorts are substantially reduced, andthere is no evidence that the 1974–76 cohorts are different from the others. We concludethat at least in the case of the Bangladesh floods, inferences about the causal effect ofhealth insults during the fetal period need to take into account behavioral responses byparents to the floods and their aftermath.
Selective fertility, and fetal or infant mortality that is selective on characteristicsrelated to investments in health and human capital, are potential concerns for theinterpretation of results based on comparisons across cohorts. In the Chinese case,there is evidence that the number of live births declined dramatically soon after theonset of the famine. Evidence based on children born in the United States in 1919 isalso potentially contaminated by selective fertility. The general point is that individ-uals, couples, and families are likely to take into account changes in the environment,including changes in the disease environment, when making decisions about thefuture.
The emerging body of literature on the health and economic impact of insults inutero is extremely important. A related line of inquiry assesses the extent to whichinvestments in the health and well-being of reproductive-age women, especially preg-nant women, contribute to the health and economic well-being of the next genera-tion. There are other potential benefits from investments in the reproductive healthof women. Greater control over fertility typically leads to fewer children ever bornand, possibly, to greater investments in each child (Schultz 2008). Moreover, theremay be benefits in the form of better health of reproductive-age women. Greater con-trol over timing of births and improved health potentially improve labor marketopportunities for women and the resources available to them. To the extent that thesefactors also elevate women’s control over resources within a family, the literature sug-gests that further investments in the health and well-being of children, as well as inthe accumulation of wealth, may result (Thomas 1990; Rubalcava, Teruel, andThomas 2009).
These issues are explored in a series of studies that use observational data andexploit variation in the availability of reproductive health services across Indonesia.The bidan desa, or village midwife program, inaugurated in the mid-1990s, seeks toplace a trained nurse in every village in Indonesia in an effort to reduce maternal mortality and improve birth outcomes. The cost of the midwife is absorbed by thegovernment for the first three years, as long as the midwife remains working inthe village to which she is assigned. During this time, she is encouraged to develop aprivate practice.
Evaluation of the program is not straightforward. Comparisons of the health ofwomen before and after a midwife joins a community would reflect both the impactof the midwife and any other changes over time. From the outset, midwives wereallocated to the poorest communities that did not already have a midwife. Compar-isons of the health of females in a community that had a midwife with the health offemales in a community without a midwife would therefore reflect the combinedinfluence of the presence of the midwife and differences between the communities.
To identify the effects of the midwives, Frankenberg and Thomas (2001) suggestthat if midwives focused on the health of reproductive-age females and had no direct

364 | DUNCAN THOMAS
influence on the health of males, differences between communities would be reflectedin the health of males. Drawing on two waves of the Indonesia Family Life Survey(IFLS), they estimate the change in health of females in communities that did not havea midwife by the second wave and compare this change with the change among malesin the same communities. This method provides an estimate of health changes inthose “control communities.” The difference in changes in health of females and ofmales in communities in which a midwife joined the community between the surveywaves provides an estimate of the differential health changes in “treatment commu-nities.” Comparison of the differences in treatment communities with the differencesin the control communities yields an estimate of the impact of the village midwife onthe health of reproductive-age females. This estimation strategy takes into accountthe fact that midwives are allocated purposively to communities where they are like-ly to have their biggest impact. The strategy also takes into account secular changesin health within each community, as long as those changes are common for males andfemales. Frankenberg and Thomas (2001) focus on body mass index (BMI), an indicator of general health and nutritional status, and report a large and significantbeneficial impact on the BMI of females from the introduction of a midwife into acommunity.
The strategy assumes that the midwife has no direct or indirect impact on the healthof males. Indirect benefits may arise if women learn about better health care practicesthat affect other family members or if women seek advice from the midwife about thehealth of others in their families. If these benefits are positive, the estimated effects ofthe midwife will be biased downward. If, however, the presence of a midwife results inreduced resources being allocated to improving the health of males and children, thestrategy would yield upward-biased estimates.
Frankenberg, Suriastini, and Thomas (2005) address this concern by examiningthe impact of a midwife on child health. In this case, the identification strategy com-bines the advantages of the longitudinal design of the IFLS with insights from thenutrition literature on the biology of linear growth. Specifically, health and nutritioninterventions have their greatest impact on the length of children during the first fewyears of life. Eventual adult height is largely determined by around age 3 or 4. Thus,if a midwife joins a community when a child is age 5 or 6, the services provided bythe midwife are unlikely to have much effect on the child’s growth trajectory. In con-trast, if the midwife is present from the time the child is conceived, the child will befully exposed to the potential benefits from the midwife.
Consider a treatment community in which a midwife joins the community imme-diately after the first wave of the survey. Comparison of the height of children age 8in the first wave with children the same age in the second wave provides an estimateof the changes in height that can be attributed to secular improvements and areunlikely to be associated with the presence of the midwife. In contrast, the differencesbetween the heights of children age 3 and younger in the second wave and of chil-dren of the same age in the first wave provide an estimate of the impact of being fullyexposed to the midwife relative to having no exposure to her. This difference, how-ever, is contaminated by secular changes that might have occurred during this period.Thus, comparison of the differences in heights of young children between the waves
HEALTH AND SOCIOECONOMIC STATUS | 365
with the differences in heights of older children between the waves (which capturesecular changes) yields an estimate of the impact of the midwife on the longer-termnutritional status of young children.
It is possible that there are cohort-specific growth trajectories. To assess whetherthis is an important concern, an alternative strategy compares changes in heights ofyoung children, relative to older children, in treatment communities with similarchanges in heights of young and older children in control communities that never hada midwife. Furthermore, by comparing changes in the heights of older children intreatment and control communities, it is possible to evaluate the validity of theassumptions in the model. A child who is fully exposed to a midwife is almost half astandard deviation taller than a similar child who is not so exposed—a difference thatis not only significant but is larger than the urban-rural gap in heights of Indonesianchildren. Related research shows that midwives are associated with improved birthoutcomes, including increased birthweight and fewer complications at birth(Frankenberg et al. 2009). Taken as a whole, this research indicates that the intro-duction of improved reproductive health services in rural Indonesia has resulted inimproved health of women and children.
These studies, based on observational data, are able to estimate effects that can beinterpreted as causal because of the research designs, which develop credible controlgroups with which treatments are compared. Assessment of the impact of improvedreproductive health services on economic outcomes is more tenuous with this strategy,although the evidence suggests that improved reproductive health services are associatedwith elevated rates of labor force participation in the market and with higher earningsamong females in Indonesia.
Joshi and Schultz (2007) make further progress on this front by examining theimpact of a family planning intervention that was assigned to some villages in MatlabDistrict, Bangladesh, and not to others. Starting in 1977, family planning services, inconjunction with maternal and child health services, were provided on a door-to-door basis in treatment villages. Control villages continued to receive services at localclinics. Studies have documented large and significant declines in fertility (ICDDR,B2004). Joshi and Schultz exploit this design to assess the impact on the health andeconomic prosperity of women exposed to the treatment and to measure the effectsof exposure to the program on the women’s children.
Drawing on survey data collected by the Matlab Health and Socioeconomic Survey (MHSS) 20 years after the initiation of the program, Joshi and Schultz reportsignificant improvements in the health of exposed women, higher rates of employmentout of the home, and greater economic productivity in those activities. The householdsin which these women reside are wealthier and are more likely to have access to waterwithin the family compound. The children of exposed women are more likely to sur-vive to age 5, and they are more likely to be immunized. There is some evidence ofimproved nutritional status among these children, although there are only modest gainsin schooling relative to children of women in control areas.
Frankenberg and Thomas (2007) highlight the potential impact of exposure to theprogram on female savings and empowerment. Specifically, they exploit a feature ofthe MHSS, which, following the IFLS, collects information on assets at the individual
366 | DUNCAN THOMAS
level within each household. Reduced fertility associated with exposure to the familyplanning outreach will reduce the number of children that a woman can call on forassistance at older ages, and so there is a greater incentive to accumulate wealth overthe life course to draw on in later life. Moreover, if control over assets translates intocontrol over decisions about resource allocations, as women gain control over fertilitythey may also be empowered to assert themselves in other domains of the familyeconomy. Women who were exposed to the family planning outreach treatment havesignificantly higher asset levels than women not in the treatment areas. Treatedwomen tend to accumulate gold and goats—assets that are traditionally controlledby women. This is not because couples in treatment areas accumulated more assets,since males in the treatment communities did not save more than males in controlcommunities.
The combination of data from experiments and from observational sources paintsa picture in which reproductive health programs yield benefits measured not only inincreased control over fertility but also in improved health and economic outcomesfor women and greater accumulation of resources for the future. Furthermore, thereis some evidence that the programs yield benefits in terms of improved child health.We turn next to a discussion of the evidence on the influence of child health on eco-nomic prosperity.
Child Health and Economic Success
A substantial body of literature has documented that adult height is correlated notonly with improved health but also with economic prosperity, as indicated by higherrates of participation in the labor force and, among those who work, higher hourlyearnings. These relationships have been established in the historical literature fol-lowing pioneering work by Fogel (2004) and his collaborators, and they have alsobeen documented in the literature on developing countries (Strauss and Thomas1998). Adult height is largely determined during early childhood, and clearly, eco-nomic prosperity during adulthood cannot have a causal impact on linear growthduring childhood. It is therefore tempting to interpret these associations as indicatinga causal effect of early childhood nutrition on economic prosperity during adulthood.
That would be premature. Factors that affect early childhood growth, such asgenes, parental resources, and parents’ tastes for investing in the human capital oftheir children, might also affect economic prosperity during adulthood. In that case,height and educational attainment, and possibly cognitive achievement, would bepositively correlated (Case and Paxson 2008). Genetic influences, cognition, andtastes are seldom included in empirical models that relate adult height to economicprosperity, but without taking them into account, it is difficult to interpret the asso-ciations between attained adult height and economic prosperity.
Observational studies that relate height or weight of children to school perform-ance suffer from similar problems, although attempts have been made to treat thejoint determination of child health and child schooling through an instrumental vari-ables approach or by including family fixed effects in the models. Prices of inputs into

HEALTH AND SOCIOECONOMIC STATUS | 367
the production of height are potential instruments; they may include (implicit orexplicit) prices of local health services and prices of specific foods, relative to otherprices. Estimation is complicated because child nutrition reflects both a stock and aflow component, and so the instruments necessarily capture variation in the envi-ronment to which the person was exposed during the fetal period and in the first fewyears of life. As noted above, the use of local variation in prices and services is com-plicated if allocation of programs and subsidies takes into account child health or ifpeople move to areas because of improved services (Schultz 2002).
Alderman, Hoddinott, and Kinsey (2006) use variation in resources during thefirst years of life to measure the impact of early childhood nutrition on adult statureand schooling attainment. They exploit variation in resources resulting fromdroughts and civil war in Zimbabwe, treating this variation as a result of unantici-pated shocks. It is not clear, however, that this variation is entirely unanticipated andthat parents do not respond to it by, for example, moving.
The authors find that early childhood nutrition has a large and significant impacton years of completed schooling, indicating that public health interventions thatensure that infants and young children are well nourished are likely to have a directimpact on the human capital and economic prosperity of a population. (See Glewweand Miguel 2008 for a review of this literature.)
Numerous animal experiments and some small-scale randomized interventionswith children have implicated both macronutrients and several micronutrients suchas iron and zinc in cognitive functioning. Some of these studies have linked supple-mentation to school performance or economic outcomes. (See Pollitt et al. 1993 fora review.)
Among the most influential studies of the impact of child nutrition on economicwell-being is a randomized intervention conducted by the Instituto de Nutrición deCentro América y Panamá (INCAP) in four villages in rural Guatemala between1969 and 1977. Two villages were randomly assigned to receive a treatment of a for-tified drink, Atole, which was high in energy and protein and contained iron andniacin. The other two villages were provided with sugared water, Fresco. Childrenfrom birth to age 7, along with pregnant and lactating mothers, were eligible toreceive the drink daily at a community center in each village. The study populationwas poor and undernourished. Prior to the intervention, about four of every five chil-dren age 2 in the villages were stunted (height for age z-score � 2), and about one-third exhibited wasting (weight for age z-score � 2).
Children exposed to the treatment are taller at 36 months than children in thesame villages who did not receive the treatment during their first few years of life. Toisolate the impact of the supplementation, these differences across cohorts are con-trasted with differences across the same cohorts in control villages. This is an impor-tant result because it establishes that a nutrition intervention in early life can havelong-lasting effects on the health and well-being of a population (Martorell et al.2005).
Maluccio et al. (2006) use a similar approach to measure the impact of nutritionsupplementation on cognitive achievement. In a follow-up study conducted in2002–04, when the study subjects were adults, abstract reasoning skills were measured

368 | DUNCAN THOMAS
with a Raven’s Colored Progressive Matrices test. Subjects who were exposed to thetreatment during the first three years of life performed better on the test than thosenot exposed in early life. There is a small impact on females’ completed schooling andlanguage skills.
Related research explores the impact of the nutrition supplementation on eco-nomic productivity in adulthood. Using the same follow-up survey, Hoddinott et al.(2008) apply the same empirical strategy of comparing the cohort that was fullyexposed to the supplement with earlier birth cohorts in the treatment villages andcontrasting the difference in economic outcomes with the difference between thesame cohorts in the control villages. They find that among males who were workingand were fully exposed to the supplementation as a child, hourly earnings were 40 to60 percent higher than they would otherwise have been. This is an extremely largeeffect. Elevated productivity was largely offset by reduced hours of work. Annualearnings are estimated to be about 7 percent higher among treated males relative tocontrols, although this difference is not significant (which may reflect inadequatepower because of small sample sizes). Among females, the authors find that treatedindividuals tend to earn less per hour, work fewer hours, and have lower annual earn-ings than controls but that none of these differences is significant.
In sum, females benefit more in terms of school performance than males. Amongthose males who earn income, however, there is a 50 percent premium in hourlyearnings for those in the treatment group relative to controls. Compensating reduc-tions in hours of work among these males result in much smaller effects on annualearnings. There are no effects on the labor market outcomes of females. Takentogether, the results are puzzling. It is possible that they reflect a complex set ofchoices related to schooling, marriage, and labor market participation that differsbetween males and females. It is also possible that the estimated effects are con-taminated by attrition that differs between treatments and controls and alsobetween males and females in ways that are related to labor market and schoolingoutcomes. The authors conclude that this is an unlikely explanation because theyfind little evidence of systematic differences between those who attrited and thosewho did not. These comparisons are based on observed characteristics whenthe respondents were young children. It is possible that there are differences between thetwo groups that are not observed at baseline, either because they were not measuredat that time or because of changes that occurred in the lives of the respondents afterthe baseline.
Putting attrition aside, the results on the longer-term impact of this early childnutrition intervention suggest that improvements in the nutritional status of childrenin the first few years of life lead to improved human capital outcomes (as indicatedby better health in later life, improved cognitive functioning, and, among females,more schooling) and elevated economic productivity among males in the labor force.Since, however, there is little evidence that annual earnings are higher among treatedcohorts, the benefits of improved childhood nutrition do not appear to translate intogreater economic prosperity at the aggregate level.
The bulk of the literature on the link between childhood nutrition and economicprosperity in developing countries has, appropriately, focused on undernutrition.
HEALTH AND SOCIOECONOMIC STATUS | 369
However, in advanced countries, rates of pediatric obesity are high, and the evidenceindicates that obesity among young children is an emerging concern in developingcountries passing through the nutrition transition (Popkin 1993; de Onis and Blossner2000). Rapid changes in nutrition levels across cohorts in these countries maypresage serious health problems as these children enter midlife. As noted above, thethrifty-gene hypothesis suggests that it is children who are low weight at birth butoverweight in adolescence who are at greatest risk of cardiovascular disease and dia-betes in later life. Low birthweight is far more common in lower-income countriesand is more likely among children whose mothers were poorly nourished as children,as indicated by their height as adults (Victora et al. 2008). There is very little scien-tific evidence on whether and how childhood obesity affects social and economic suc-cess in later life. This is an important gap in the literature.
Although nutrition has played a central role in the literature on health and devel-opment, communicable diseases remain a leading cause of death in many low-incomesettings. Putting aside HIV, many of these diseases are preventable at modest cost. Asan example, intestinal helminth infections, or worms, are prevalent in many parts ofthe developing world and can be effectively treated with readily available anti-helminthic drugs. High worm loads result in iron-deficient anemia and protein-energydeficiency, which have, in turn, been associated with reduced cognitive development.The evidence from randomized trials that measure the impact on the cognitive performance of subjects receiving pharmacological interventions to treat helminthinfections is inconclusive (Dickson et al. 2000).
Success in treating infectious diseases in a community is likely to have significantexternality benefits. Miguel and Kremer (2004) take this as their starting point inestimating the causal effect of treating worms among school-age children, using arandom assignment treatment-control design in rural Kenya. In the first year of thestudy, 25 primary schools were randomly assigned to receive an orally administeredantihelminthic drug; those schools and an additional 25 schools received the treat-ment in the second year, and all 75 primary schools received the treatment in the thirdyear. There are externality benefits: children who were not treated but who lived inthe treated areas benefited from the reduced worm loads in those communities.School attendance increased substantially, as indicated by a 25 percent reduction inabsenteeism after treatment in treatment areas, relative to controls. Performance onschool tests, however, did not respond to the treatment. The authors conjecture thatthis may reflect the effects of congestion. It may also have to do with what is learnedin school and what is tested in examinations—which may itself explain the high lev-els of absenteeism among primary school children. It is also consistent with therebeing little effect of helminth infection on cognition (Dickson et al. 2000).
Adult Health and Economic Success
The evidence discussed thus far suggests that health in early life likely affects school-ing and economic productivity in later life. We next assess whether changes in healthduring adulthood affect economic prosperity.
370 | DUNCAN THOMAS
A temporary bout of poor health is likely to be accompanied by reduced timespent working and, possibly, by lower productivity over the short run. Whether theseeffects translate into longer-term impacts on earnings is less clear. Individuals maycompensate by allocating additional time to work when they are in better health.Family members may substitute for a member when he or she is in poor health(Thirumurthy, Graff Zivin, and Goldstein 2008). Chronic diseases and longer boutsof illness are more likely to have permanent effects on economic resources. For exam-ple, studies have documented declines in the productivity of individuals working ontea estates in Kenya during the 18 months prior to AIDS-related death or exit fromthe labor force (Fox et al. 2004).
Determining whether changes in adult health have a causal impact on economicand social success is a substantial challenge. Identification of the health domains thatare most important and the magnitudes of their impacts on different dimensions ofeconomic prosperity poses even greater challenges. Convincing evidence will befounded on a model of behavior that takes into account investments in health overthe entire life course, expectations about future health and labor market prospects,time allocation in the short and longer runs, and the broader role of family membersin these decisions.
Whereas energy supplementation during the first two or three years of life haslong-term benefits, experimental studies that involve calorie supplementation of maleadults indicate only modest effects on worker productivity. For example, sugarcanecutters in some villages in Guatemala were randomly assigned to receive calorie sup-plements, while similar workers in other villages were not. There were no differencesbetween the productivity of the workers from the two villages (Immink and Viteri1981). In contrast, construction workers in Kenya who were randomly given energysupplements were slightly more productive in road digging than the controls (Wolgemuth et al. 1982).
The nutrition literature has highlighted the important role that specific micronu-trients play in the etiology of disease and the functioning of the human body. Iron isa good example. Iron deficiency is prevalent throughout the developing world, par-ticularly in South and Southeast Asia, and studies have shown a causal effect of irondeficiency on reduced work capacity, suggesting that there may be a direct linkbetween iron deficiency and economic productivity (Haas and Brownlie 2001).
Iron plays an essential role in oxidative energy production. Iron-deficiency anemiaaffects physical activity through two main pathways: (a) as hemoglobin levelsdecline, the maximum amount of oxygen the body can use (aerobic capacity)declines, and (b) as iron stores are depleted, the amount of oxygen available to mus-cles falls, reducing endurance and causing the heart to work harder for the sameactivity. Iron deficiency is also associated with, among other effects, greater suscepti-bility to disease, fatigue, and reduced cognitive development.
Rigorous clinical trials with animals and humans demonstrate a causal relation-ship between iron deficiency and reduced maximal aerobic capacity (VO2max),which changes by about 25–30 percent as subjects are made anemic or receive ade-quate iron supplementation. Iron-deficient anemia is also associated with reducedendurance at below maximal work rates.
HEALTH AND SOCIOECONOMIC STATUS | 371
Demonstrating that iron deficiency impedes maximal capacity and endurance doesnot reveal the economic consequences of iron deficiency in daily life. Those conse-quences may be more closely aligned with energy efficiency—the amount of physio-logical energy required to perform a given task. In fact, evidence from randomizedtreatment-control studies of Chinese female cotton mill workers and Sri Lankanfemale tea plantation workers suggest that elevated productivity resulted in changesin time allocation. Specifically, neither study found evidence of greater productivityper hour among iron-deficient subjects who received iron supplements relative tosubjects who were not supplemented, but in both cases, treated women reallocatedtime away from work and toward nonwork activities (Edgerton et al. 1979; Li et al.1994). Results from a random assignment treatment-control iron supplementationstudy of male rubber workers, however, indicates that treated individuals who wereanemic at the initiation of the study were able to tap about 20 percent more rubberafter supplementation, compared with anemic controls (Basta et al. 1979). Interpre-tation of this result is complicated by the fact that attrition from the study exceeded50 percent; if those subjects who did not benefit from the study were more likely toattrit, the estimated benefits would be biased upward.
The Work and Iron Status Evaluation (WISE) is designed to examine the immedi-ate and longer-term impact of providing iron supplements to older adults in CentralJava, Indonesia (Thomas et al. 2006). In this population, about one-quarter of oldermen and one-third of older women are iron deficient, as indicated by low hemoglo-bin. Older males are randomly assigned to receive a weekly iron supplement, or anidentical-appearing placebo, for slightly more than a year. Everyone in the man’shousehold is similarly assigned to treatment or control. (In the small fraction ofhouseholds with more than one older male, a random male is selected to determineassignment to treatment or control for the entire household.)
Respondents who were iron deficient prior to the intervention and who wereassigned to the treatment have higher levels of iron in their blood and are able tocycle longer on an ergocycle at the end of the intervention, relative to comparablecontrol subjects. Relative to similar controls, treated subjects are more likely to beworking, lose less work time to illness, are more energetic, are better able to conductphysically arduous activities, and enjoy better psychosocial health.
About half the male workers in the study are self-employed (primarily as ricefarmers), and the other half are paid a time wage. There is no evidence that hours ofwork were affected by the treatment, for either time-wage workers or the self-employed. Among males who earned a time wage, there is no evidence of changes inproductivity as indicated by hourly earnings. Of course, if their wages are set by anemployer, it is not obvious that the worker will reap the benefits of greater produc-tivity. This is not true for the self-employed; males who were iron deficient and self-employed at baseline reported 20 percent higher hourly earnings after six months ofsupplementation relative to similar controls. Since there was no change in their hoursof work, this translates into 20 percent higher income from labor.
Wage workers who received the treatment reduced their amount of time spentsleeping by about 40 minutes per day and reallocated this time to leisure. Self-employed workers made no such adjustments. A picture emerges of iron deficiency

372 | DUNCAN THOMAS
having a causal impact on work capacity and energy needed to complete tasks. Theself-employed who benefited from the treatment allocate the additional energy totheir fields; they work harder, produce more, and earn more per hour of work. Incontrast, wage workers were able to channel their greater energy toward reducedsleep and more time for leisure. After 12 months of supplementation, there is evi-dence that some of the treated iron-deficient males who were working for a timewage at baseline had shifted to self-employment or had taken an additional job.
WISE demonstrates that iron deficiency has a causal impact on time allocation andeconomic productivity. It also highlights the importance of taking into accountbehavioral responses to the experiment itself in assessing the impact of the treatment.Results from the Chinese and Sri Lankan studies reinforce this point; they indicatethat iron deficiency had little impact on productivity but did affect how individualsallocated their time.
If iron supplementation improves the health and well-being of individuals, weexpect that these people will be more productive not only at work but also in otherdomains of their lives. Furthermore, they may respond to these improvements inmany ways, such as changing the nature of their work and the time spent on work.The results echo the evidence from the INCAP study indicating that treated subjectscompensated for increased hourly earnings by allocating less time to work. It is critically important that all these responses are taken into account if we are to under-stand the impact of health improvements on economic growth. This limits the contributions to the literature of experiments that are designed to isolate specificinputs and outputs in the health and productivity relationship and do not capture thebroader ramifications of the health intervention.
Health care costs have skyrocketed and have far outpaced inflation in many coun-tries in recent decades. Much of the increase in advanced economies has been attrib-uted to the development of technologies that improve health and extend life (Cutler2004). At the same time, calories have become inexpensive relative to other goods(although food prices are subject to considerable variation from year to year andhave increased dramatically in recent months). These changes in prices, along withdifferences in prices across space, provide potentially powerful sources of variationfor identifying the impact of changes in the health of adults on social and economicsuccess.
The assumptions under which identification will be valid are not obviously satis-fied, at least in general. First, the relative price changes should have no direct impacton the economic prosperity of an individual. In the case of food prices, this rules outthe agricultural sector, including all farmers, along with workers in food-relatedindustries. Workers in the health sector and allied industries are similarly affected.Second, variation in prices reflects a combination of a number of factors that con-spire to bring demand into line with supply in a general equilibrium. To the extentthat those factors also influence economic prosperity, it will be difficult to pin downtheir impact on health status. This is a special challenge when relying only on temporal or spatial variation in prices. Third, measurement of markers of health in sur-vey data that are affected by variation in prices and also affect economic success raisesadditional difficulties.
HEALTH AND SOCIOECONOMIC STATUS | 373
These issues may be sidestepped by relying on experimental or quasi-experimentalvariation in prices. For example, starting in 1974, subjects enrolled in the RANDHealth Insurance Experiment (HIE) were randomly assigned to 1 of 14 fee-for-servicehealth plans. About 1,800 subjects were assigned to a plan that provided free care,and 2,800 subjects were assigned to plans that varied in terms of copayments (from25 to 95 percent of fees) and total out-of-pocket expenses. Almost three-quarters ofthe subjects were enrolled in the experiment for three years; the rest participated forfive years.
Newhouse and the Insurance Experiment Group (1993) describe the experimentand the main results. Use of health care declined as the price increased, with subjectsin the free-care group using health care services most intensively. The evidence onhealth outcomes is mixed. Newhouse and colleagues conclude that the health of theaverage person enrolled in the HIE was not adversely affected by reduced use ofhealth services. They note, however, that the health of the poor who were sick wasmore improved among those who faced lower prices. For example, among the poorwho were enrolled in the free-care plan, relative to other plans, mortality was lower,blood pressure improved more, vision was corrected more often, dental health wasbetter, and the incidence of anemia was reduced more. All these indicators weremeasured through clinical testing or from blood samples.
In stark contrast, the self-reported general health of this group deteriorated dur-ing the period! Specifically, of 11 self-reported health indicators, 9 were reported tohave worsened among those who received free care relative to those who incurredsome cost when seeking health care, although only one of these differences is signif-icant. The clinical and biomarker evidence indicates that these people were, if any-thing, in better health. One might suspect that, as a result of their greater exposureto the health care system, these people learned more about their health than theywould have if they had used services less frequently, and it is this information that isreflected in the worse self-assessed health outcomes. These results provide a practicalexample of some of the difficulties associated with health measurement in population-based surveys.
Dow et al. (2008) sidestep these problems with measurement of health and exam-ine the impact on labor outcomes of randomly assigned variation in the price ofhealth care. They find that females who received free health care are significantlymore likely to be working at the end of the intervention than females who had to payfor health services. The difference in participation rates is about 4 percentage points.Males who had not completed high school are about 8 percentage points more likelyto be working if they received free care than if they paid for care (although this effectis only significant at a 10 percent size of test).
A similar experiment conducted in Indonesia involved changes in the prices ofhealth services. To measure the impact of increased user fees, prices of basic servicesat public health centers were raised in randomly selected treatment districts, whileprices were held constant (in real terms) in neighboring control districts. Subjectswere interviewed before prices were increased in 1991 and again two years later. Par-alleling the results for the HIE, respondents in the areas where prices had increasedused less health care and also reported their general health as having improved
374 | DUNCAN THOMAS
relative to subjects in the control areas where prices had not been changed. However,more specific indicators of health indicated that higher prices resulted in worsehealth. Specifically, respondents in areas where prices increased reported that theyhad more difficulty doing physically demanding tasks, spent more days away fromwork, and had more days in bed because of illness. These results further underscorethe challenges associated with health measurement.
Turning to work outcomes, in areas where health care prices increased, employ-ment rates rose among males and females relative to those in areas where healthprices did not change. These effects are largest among the least educated. The mostplausible interpretation of both the HIE and Indonesian results is that the averagetreatment effects on labor supply indicate a causal effect of improved health on theallocation of time to the labor market.
Evidence regarding the impact of health on economic productivity in the Indonesiastudy is less clear. Wage growth was lower among workers in the market sector wholived in areas where health care prices were raised, relative to the control areas. Theestimated effects are large (about 15 percent) but are only significant at a 10 percentsize of test.
Quasi-experimental evidence supports the conclusion that health affects employ-ment outcomes. During the 1960s and early 1970s, Canada introduced nationalhealth insurance. Taking advantage of the phased introduction of the system acrossprovinces and occupations, Gruber and Hanratty (1995) find that employment andwages increased as workers were covered by national health insurance. The authorsconclude that labor demand rose because workers were more productive, eitherbecause of increased job mobility and better matching of skills or because their healthimproved as a result of being covered by health insurance.
Although the introduction of national health insurance was not designed as anexperiment, this study exploits the fact that some people were covered by the systemearlier than others. The plausibility of the results rests crucially on the extent towhich this “natural experiment” approximates random assignment. The authorsprovide a compelling argument in favor of this interpretation.
Designing health policy innovations so that they are phased in and rigorously eval-uated during the phase-in period will not only contribute to improved policy designand implementation; it also has the potential to facilitate identification of the broaderimpacts of the policy innovations, beyond health care and health outcomes to eco-nomic and social indicators. It is unfortunate that this design is relatively rare.
Turning to the literature based on observational data, the challenge is to identifyinstruments that are, first, predictive of health status and, second, valid in the senseof not being correlated with unobserved factors that affect the economic or socialoutcome of interest in the model. The experimental results suggest that prices ofhealth inputs (including foods) may satisfy the first condition for measures of pro-ductivity. Labor supply effects are harder to identify in this context because healthinputs affect real wages and thus the value of time.
Studies have explored the relationship between body mass index (BMI) and labormarket outcomes. BMI, which depends on net energy intake and varies over the lifecourse, captures both longer- and shorter-run dimensions of nutrition. It is related to
HEALTH AND SOCIOECONOMIC STATUS | 375
VO2max and thus to aerobic capacity and endurance independent of energy intake(Spurr 1983). Whether this pathway is one through which health influences produc-tivity in an important way is not obvious, since many jobs do not require sustainedphysical effort. Treadmill tests suggest that excess (fat) weight affects the efficiency atwhich energy is transferred to work output (Cureton 1992).
Drawing on data on workers in the rural Philippines, Haddad and Bouis (1991)find no effect of BMI on earnings of agricultural workers. Using the same sample,however, Foster and Rosenzweig (1993, 1994) highlight the difficulties of observinghealth and argue that employers use BMI as a marker for health. They contrast work-ers paid by time with those paid on a piece-rate basis and find that BMI affects thewages of only time-rate workers. This suggests that it is not health (or at least robust-ness) that is rewarded in the labor market; rather, there is a benefit from conveyingthe impression of being in good health. It is not clear why employers would be con-sistently fooled into paying a worker more because he is heavier (but not more pro-ductive) or why employers would not learn about the productivity of workers.
Thomas and Strauss (1997) explore this issue among male and female workers inurban Brazil. With relative food prices as instruments, BMI has a positive impact onthe hourly earnings of both employees and the self-employed, suggesting that BMI ismore than just an easily observed marker of health used by employers. Since theeffect of BMI on hourly earnings is largest among the least educated, who are themost likely to do manual labor, the authors conjecture that BMI may be a marker forstrength. Similar evidence is reported for African workers by Glick and Sahn (1998)and Croppenstedt and Muller (2000). There is little empirical evidence relating BMIto labor supply, although BMI has been shown to affect the proportion of workingtime that is spent on very physically demanding activities by men (Pitt, Rosenzweig,and Hassan 1990; Bhargava 1994; Fafchamps and Quisumbing 1999).
Adams et al. (2003) take a different approach to evaluating the direction of causal-ity underlying the associations between health and SES. They examine whether priorSES predicts current health status, conditional on an extensive set of information onhealth histories. Under the assumptions of their model, if prior SES does not predicthealth innovations, then a direct causal pathway from SES to health can be rejected.This is essentially a test for Granger causality. Using data for older adults in the UnitedStates, they conclude there is little evidence that SES has a causal impact on healthexcept perhaps in the case of psychosocial health. The authors attribute the latter tothe fact that Medicare does not cover mental health services. Their conclusions onthe impact of health on SES are more tentative, although they generally find little evi-dence that health affects wealth of older adults.
The assumptions underlying these tests are not innocuous. The models include abattery of prior health indicators, each of which is the outcome of choices made overthe life course. If those choices are correlated with SES, the assumptions underlyingthe empirical strategy will be violated. In addition, there are legitimate questionsabout whether the testing strategy has sufficient power to detect causal effects of SESon health in a broader class of models.
In an effort to assess the importance of this concern, Adda, Chandola, and Marmot (2003) conduct a replication using the same empirical methods with data

376 | DUNCAN THOMAS
from the United Kingdom and Sweden. They find results that are remarkably similarto those for the United States, including the evidence on psychosocial health. This istroubling because in the United Kingdom and Sweden, all health services—includingmental health services—are available free of charge. The authors conclude that thetesting strategy adopted by Adams et al. (2003) lacks power against plausible alter-native models.
It is likely that the dynamics underlying observed health and observed SES are verycomplex. For example, a person’s health may be in decline prior to a diagnosis of,say, heart disease, and the decline in health may result in decreased earnings becauseof reduced hours or lower hourly earnings. Attempts to link the diagnosis to reducedwealth are unlikely to be fruitful. Similarly, a person who perceives that his or herhealth is in decline and anticipates having reduced earnings in the future may chooseto increase his or her labor supply and thus current earnings.
More generally, the dynamic links between health and economic prosperity havebeen little studied. This is an important gap in the scientific literature, for several rea-sons. Health is a stock that evolves over time, and prior health behaviors—and healthshocks—likely influence current economic status. Virtually nothing is known aboutthe speed with which the effects of health transitions at the individual level are trans-mitted to the labor market in low-income settings. Does a period of poor health (or anegative health shock) put a worker on a permanently lower wage trajectory, or dothe negative consequences of ill health dissipate as health subsequently improves? Theextent of catch-up likely depends on the nature of the health problem, the structure ofthe labor market, and the worker’s characteristics, including age, education, and theextent to which the individual has a buffer of resources on which to draw in bad times.
Development of a better understanding of the dynamic interplay between healthand economic prosperity is likely to shed new light on some of the mechanismsthrough which the two covary. Apart from the econometric advantages associatedwith analyses based on repeated observations of the same person over time, “naturalexperiments” arising from unanticipated variation in a respondent’s life are likely toprove a powerful resource in this literature.
Thomas and Frankenberg (2000) provide an example. The first column of table 2,using data on males age 18–68 interviewed in the 1997 wave of the IFLS, indicatesthat the elasticity of wages with respect to BMI is 2.0. The results in the second col-umn control for height, age, education, and location of residence: the elasticity isreduced to 1.0, indicating that current weight reflects, in substantial part, humancapital and background characteristics. Prior BMI might serve as a control for thesecharacteristics, and accordingly, exploiting the repeat-observation dimension of theIFLS, BMI measured in 1993 is added in column 3. Prior BMI does predict currentwages, and it soaks up some of the correlation with current BMI. Controlling 1993BMI, 1997 BMI can be interpreted as the weight gain since 1993; its effect is alsopositive. It is not obvious what to make of this correlation. It is possible thatincreased wages were spent on more energy intake (or less energy output) or thatchanges in both wages and weight arise because of some other unobserved factor.
To explore this further, we turn to wages measured in 1993. Column 4 essentiallyreplicates the 1997 results reported in column 2. Wages in 1993 are related to BMI

HEALTH AND SOCIOECONOMIC STATUS | 377
in 1993 and to BMI in 1997 (column 5). BMI in 1993 remains significant. However,weight gained between 1993 and 1997 is a significant predictor of wages measuredin 1993, prior to that weight change. This is compelling evidence that BMI and wagesare jointly determined (or are influenced by other unobserved factors) and that theregressions in table 1 cannot be given a causal interpretation.
This evidence raises further doubts regarding the validity of the approach to iden-tifying causal effects taken by Adams et al. (2003). We conclude that modeling thedynamics underlying the evolution of health and economic prosperity remains animportant scientific endeavor.
Conclusions
The weight of the evidence indicates that fetal health and early childhood nutritionhave a causal impact on human capital accumulation and economic productivity.There is some evidence indicating that changes in adult health affect labor outcomes,particularly productivity. Although the exact mechanisms underlying these relation-ships are not entirely clear, the most convincing evidence is distinguished by the coex-istence of carefully conducted experimental studies and observational studies that
TABLE 2. Dynamic Relationship between Body Mass Index (BMI) and Hourly Earnings of Adult Males, Indonesia Family Life Survey, 1993 and 1997
ln(hourly earnings), 1997 ln(hourly earnings), 1993
Plus height and BMI97and BMI97 and
BMI97 only education BMI93 BMI93 BMI93
Covariates (1) (2) (3) (4) (5)
ln(BMI) in 1997 2.03 1.03 0.82 0.35(0.12) (0.10) (0.16) (0.17)
ln(BMI) in 1993 0.34 0.96 0.78(0.17) (0.14) (0.18)
ln(height) 2.36 2.40 2.27 2.52(0.34) (0.44) (0.40) (0.44)
Years of education (spline)0–5 0.05 0.04 0.05 0.05
(0.01) (0.01) (0.01) (0.01)6–11 0.09 0.10 0.09 0.10
(0.01) (0.01) (0.01) (0.01)�11 0.11 0.10 0.14 0.14
(0.01) (0.01) (0.01) (0.01)Age and location controls No Yes Yes Yes YesR2 0.06 0.29 0.30 0.30 0.30
Source: Thomas and Frankenberg 2000.
Note: Sample includes adult males age 18–68. Earnings and BMI are measured at time of each survey. Height andeducation are measured at baseline. Earnings, BMI, and height are specified in logarithms. Numbers in parenthesesare standard errors robust to arbitrary forms of heteroskedasticity and take into account correlations resulting fromsurvey clustering. Models 2–5 include age, specified as a linear spline, and location measured by indicators for eachprovince and for urban sector.

378 | DUNCAN THOMAS
have documented sizable effects of nutrition on productivity indicators. Explanationsthat are founded on an understanding of the underlying biological mechanisms haveproved to be a powerful force in support of these conclusions.
Little attention has been paid to the behavioral response to longer-term improvementsin health and productivity. The limited evidence suggests that short-term increases inproductivity have little immediate impact on time allocation but that if the productivitygains persist over the longer term, individuals reduce their hours at work, as would besuggested by theory. If this turns out to be a general result, it is important.
Studies that focus exclusively on productivity and studies that focus solely onannual earnings will provide incomplete descriptions of the relationships betweenhealth and labor outcomes. By ignoring the fact that individuals choose to substitutetime away from work, these studies will tend to understate the welfare gains associ-ated with health improvements, which are not reflected in aggregate statistics of eco-nomic growth. In general, scaling estimated productivity effects to the aggregate levellikely will overstate the extent to which the macro association between health andincome can be attributed to a causal effect of health on economic prosperity.
A plausible argument can be, and has been, made that other dimensions of healthlikely affect economic prosperity. These links, however, have not been established asreliably as the links between reducing nutritional deficiencies and productivity. Thereis little evidence on the impact on socioeconomic success of obesity and related healthconditions, of infection and inflammation, or of stress and injuries, despite the preva-lence of these health concerns around the globe. And, remarkably little is knownabout the impact on economic prosperity of psychosocial health problems.
The cumulative effect of multiple health insults on health outcomes in later life hasbeen highlighted in the literature on older adults in advanced economies (McEwen2000). It has received little attention in the developing-country literature even thoughhealth insults are more frequent and potentially more damaging in lower-incomesocieties and may take their toll in early life or midlife. It remains unclear whetherwear and tear on the body resulting from health insults have implications for eco-nomic prosperity.
More generally, there is a paucity of evidence on the dynamics linking innovationsin health and innovations in economic prosperity, particularly over the longer term.Studies that take into account the shorter-term and longer-term behavioral responsesthat accompany health innovations are few and far between.
In the literature relating health to SES, inadequate attention has been paid to thevarious domains of SES. The evidence discussed above suggests that the impact ofparticular health markers on productivity at work and on time allocation may bequite different and that these differences may only emerge over the medium or longerterm. Similarly, there are likely to be distinct effects of health on education and cog-nition in early life and on cognitive performance in later life. The impact of health onproductivity in home production, choices between consumption and savings, andintertemporal preferences are also likely to differ.
These are all critical gaps in our knowledge. The task of filling them calls for a sus-tained program of research that integrates the advantages of randomized treatment-control designs, phased policy interventions, and broad-purpose, longitudinal social
HEALTH AND SOCIOECONOMIC STATUS | 379
surveys. Each of these tools, on its own, is unlikely to provide the scientific evidencenecessary to make progress in the field and thereby influence policy design.
Sustained longitudinal studies that collect repeated observations on the same indi-vidual will be necessary for understanding the dynamic aspects of the links betweenhealth and SES over the short and longer terms. Broad-purpose panel surveys, incombination with the changes that will occur in the global economy, have the poten-tial to provide a rich laboratory for understanding the links between health and economic success. Financial crises, the collapse of markets, price spikes, and naturaldisasters are all candidates for this research. It is often difficult, however, to separateshocks from events that might have been predicted, in which case the estimatedeffects of the observed change will be contaminated by behavioral responses thatanticipate the change. The task of separately identifying the effects of multiple, relatedchanges is very complex, and the level of complexity is likely to increase as the magnitude of the shock increases.
Reliance on these natural experiments alone is unlikely to suffice. Pilot studies ofthe impact of policy changes have the potential to yield important new insights thatwill improve policy design and affect the state of science. Coordination of longitudi-nal health and socioeconomic surveys with phased policy changes and health inter-ventions provides opportunities for more planning in the study design and greatercontrol over the variation that people confront.
There are good reasons for expanding the horizons of experimental studies.Specifically, measuring broader socioeconomic outcomes than is typically the case,examining behavioral responses to the treatment, and following subjects for anextended period will substantially increase the contributions of these studies. Forexample, an intervention that seeks to eradicate malaria in an area might not onlymeasure its incidence before and after the intervention but also track changes in eco-nomic productivity and behavioral responses to the intervention, such as changes inwork status, hours of work, time allocation, migration, expectations about thefuture, planning horizons, and investments. Since economic and social changes willprobably take some time to emerge, subjects will need to be tracked beyond the inter-vention period. Taking account of the medium-term and longer-term impacts on bothhealth and economic outcomes will provide a more comprehensive assessment of theintervention.
Randomized interventions or phased trials in parallel with large-scale panel stud-ies have the potential to significantly affect science and policy design in cost-effectiveways. A quantum leap in the breadth and quality of research in this area can beachieved by exploiting rapidly evolving technologies for health measurement in afield setting, in conjunction with innovative techniques for combining state-of-the-artsurvey data and administrative records on individuals, their families, and their communities.
Developing the knowledge base necessary to understand the complex linkagesbetween health and economic prosperity is far from straightforward. Yet the chal-lenges provide an extraordinary opportunity for health scientists, social scientists,and practitioners to collaborate to generate new knowledge that may have a lastingimpact on the well-being of populations across the globe.

380 | DUNCAN THOMAS
References
Adams, P., M. Hurd, A. Merrill, D. McFadden, and T. Ribeiro. 2003. “Healthy, Wealthy, andWise? Tests for Direct Causal Paths between Health and Socioeconomic Status.” Journalof Econometrics 112 (1): 3–56.
Adda, J., T. Chandola, and M. Marmot. 2003. “Socio-Economic Status and Health: Causalityand Pathways.” Journal of Econometrics 112 (1): 57–63.
Alderman, Harold, John Hoddinott, and Bill Kinsey. 2006. “Long-Term Consequences ofEarly Childhood Malnutrition.” Oxford Economic Papers 58 (3): 450–74.
Almond, Douglas. 2006. “Is the 1918 Influenza Pandemic Over? Long-Term Effects of in uteroExposure in the Post-1940 US Population.” Journal of Political Economy 114 (4): 672–71.
Barker, David J. P. 1994. Mothers, Babies and Health in Later Life. London: BMJ PublishingGroup.
Basta, S. S., D. Soekirman, D. Karayadi, and N. Scrimshaw. 1979. “Iron Deficiency Anemiaand the Productivity of Adult Males in Indonesia.” American Journal of Clinical Nutrition32: 916–25.
Bhargava, Alok. 1994. “Modeling the Health of Filipino Children.” Journal of the Royal Sta-tistical Society, Series A 157: 417–32.
Case, Anne, and Christina Paxson. 2008. “Stature and Status: Height, Ability and Labor Mar-ket Outcomes.” Journal of Political Economy 116 (3, June): 499–532.
Chen, Yuyu, and Li-An Zhou. 2007. “The Long-Term Health and Economic Consequences ofthe 1959–61 Famine in China.” Journal of Health Economics 26 (4): 659–81.
Croppenstedt, Andre, and Christophe Muller. 2000. “The Impact of Farmers’ Health andNutritional Status on Their Productivity and Efficiency: Evidence from Ethiopia.” Eco-nomic Development and Cultural Change 48 (3): 475–502.
Crosby, Alfred. 1989. America’s Forgotten Pandemic: The Influenza of 1918. Cambridge,U.K.: Cambridge University Press.
Cureton, Kirk J. 1992. “Effects of Experimental Alterations in Excess Weight on Physiologi-cal Responses to Exercise and Physical Performance.” In Body Composition and PhysicalPerformance: Applications to the Military, ed. B. M. Mariott and J. Grumstrup-Scott,71–88. Washington, DC: National Academy Press.
Cutler, David. 2004. Your Money or Your Life: Strong Medicine for America’s Health CareSystem. Oxford, U.K.: Oxford University Press.
de Onis, Mercedes, and Monika Blossner. 2000. “Prevalence and Trends of Overweight amongPreschool Children in Developing Countries.” American Journal of Clinical Nutrition 72(4, October): 1032–39.
Dickson, Rumona, Shally Awasthi, Paula Williamson, Colin Demellweek, and Paul Garner.2000. “Effects of Treatment for Intestinal Helminth Infection on Growth and CognitivePerformance in Children: Systematic Review of Randomized Trials.” British MedicalJournal 320 (June): 1697–701.
Dow, William, Paul Gertler, Robert Schoeni, John Strauss, and Duncan Thomas. 2008.“Health Care Prices, Health and Labor Outcomes: Experimental Evidence.” PopulationStudies Center at the Institute for Social Research, University of Michigan, Ann Arbor.
Edgerton, V. R., G. W. Gardner, Y. Ohira, K. A. Gunawardena, and B. Senewiratne. 1979.“Iron-Deficiency Anemia and Its Effect on Worker Productivity and Activity Patterns.”British Medical Journal 2: 1546–49.
Fafchamps, Marcel, and Agnes Quisumbing. 1999. “Human Capital, Productivity and LaborAllocation in Rural Pakistan.” Journal of Human Resources 34 (2): 369–406.

HEALTH AND SOCIOECONOMIC STATUS | 381
Finch, Caleb, and Eileen Crimmins. 2004. “Inflammatory Exposure and Historical Changes inHuman Life Spans.” Science 305: 1736–39.
Fogel, Robert W. 2004. The Escape from Hunger and Premature Death, 1700–2100. Cambridge, U.K: Cambridge University Press.
Foster, Andrew, and Mark Rosenzweig. 1993. “Information Flows and Discrimination in LaborMarkets in Rural Areas in Developing Countries.” In Proceedings of the World Bank AnnualConference on Development Economics, 1992: Supplement to the World Bank EconomicReview and the World Bank Research Observer, ed. Lawrence H. Summers and ShekharShah, 173–203. Washington, DC: World Bank.
———. 1994. “A Test for Moral Hazard in the Labor Market: Contractual Arrangements,Effort, and Health.” Review of Economics and Statistics 76 (2): 213–27.
Fox, Matthew, Sydney Rosen, William MacLeod, Monique Wasunna, Margaret Bii, GinamarieFoglia, and Jonathon Simon. 2004. “The Impact of HIV/AIDS on Labour Productivity inKenya.” Tropical Medicine and International Health 9 (3): 318–24.
Frankenberg, Elizabeth, and Duncan Thomas. 2001. “Women’s Health and Pregnancy Out-comes: Do Services Make a Difference?” Demography 38 (2): 253–65.
————. 2007. “Family Planning, Old Age Security and Savings by Women: ExperimentalEvidence.” Duke University, Durham, NC.
Frankenberg, Elizabeth, Wayan Suriastini, and Duncan Thomas. 2005. “Can ExpandingAccess to Basic Health Care Improve Children’s Health Status? Lessons from Indonesia’s‘Midwife in the Village’ Programme.” Population Studies 59 (1): 5–19.
Frankenberg, Elizabeth, Alison Buttenheim, Bondan Sikoki, and Wayan Suriastini. 2009. “DoWomen Increase Their Use of Reproductive Health Care When It Becomes More Avail-able? Evidence from Indonesia.” Studies in Family Planning 40 (1, March): 27–38.
Glewwe, Paul, and Edward Miguel. 2008. “The Impact of Child Health and Nutrition on Edu-cation in Less Developed Countries.” In Handbook of Development Economics, vol. 4,ed. T. Paul Schultz and John Strauss, 3561–846. Amsterdam: North-Holland.
Glick, Paul, and David E. Sahn. 1998. “Health and Productivity in a Heterogeneous UrbanLabour Market.” Applied Economics 30 (2): 203–16.
Godfrey, Keith, and David Barker. 2000. “Fetal Nutrition and Adult Disease.” American Jour-nal of Clinical Nutrition 71 (Suppl.): 1344S–52S.
Gruber, Jonathan, and Maria Hanratty. 1995. “The Labor-Market Effects of IntroducingNational Health Insurance: Evidence from Canada.” Journal of Business and EconomicStatistics 13 (2): 163–73.
Haas, Jere D., and Thomas Brownlie. 2001. “Iron Deficiency and Reduced Work Capacity: ACritical Review of the Research to Determine a Causal Relationship.” Journal of Nutrition131 (Suppl. 2): 676S–88S.
Haddad, Lawrence J., and Howarth E. Bouis. 1991. “The Impact of Nutritional Status onAgricultural Productivity: Wage Evidence from the Philippines.” Oxford Bulletin of Eco-nomics and Statistics 53 (1, February): 45–68.
Hales, C. Nicholas, and David J. Barker. 1992. “Type 2 (Non-Insulin-Dependent) DiabetesMellitus: The Thrifty Phenotype Hypothesis.” Diabetologia 35: 595–601.
Hoddinott, John, John Maluccio, Jere Behrman, Rafael Flores, and Reynaldo Martorell. 2008.“Effect of a Nutrition Intervention during Early Childhood on Economic Productivity inGuatemalan Adults.” Lancet 381: 411–16.
ICDDR,B (International Centre for Diarrhoeal Disease Research, Bangladesh), Centre forHealth and Population Research. 2004. Health and Demographic Surveillance System–Matlab, vol. 35. Dhaka: ICDDR,B.

382 | DUNCAN THOMAS
Immink, Maarten D. C., and Fernando E. Viteri. 1981. “Energy Intake and Productivityof Guatemalan Sugarcane Cutters: An Empirical Test of the Efficiency Wage Hypothesis,Part 1.” Journal of Development Economics 9 (2): 251–87.
Jack, William, and Maureen Lewis. 2008. “Health Investments and Economic Growth: AnOverview.” Prepared for the Commission on Growth and Development. http://www.growthcommission.org/storage/cgdev/documents/ThemesPapers/jacklewis.pdf.
Joshi, Shareen, and T. Paul Schultz. 2007. “Family Planning as an Investment in Development:Evaluation of a Program’s Consequences in Matlab, Bangladesh.” Yale University Eco-nomic Growth Center Discussion Paper 951, New Haven, CT. http://www.econ.yale.edu/growth_pdf/cdp951.pdf.
Li, R., X. Chen, H. Yan, P. Deurenberg, L. Garby, and J. Hautvast. 1994. “Functional Conse-quences of Iron Supplementation in Iron-Deficient Female Cotton Workers in Beijing,China.” American Journal of Clinical Nutrition 59 (4): 906–13.
Maluccio, John, John Hoddinott, Jere R. Behrman, Agnes Quisumbing, Reynaldo Martorell,and Aryeh D. Stein. 2006. “The Impact of Nutrition during Early Childhood on Educa-tion among Guatemalan Adults.” International Food Policy Research Institute (IFPRI),Washington, DC.
Martorell, Reynaldo, Jere R. Behrman, Rafael Flores, and Aryeh Stein. 2005. “Rationale for aFollow-up Study Focusing on Economic Productivity.” Food and Nutrition Bulletin 26 (2,Suppl. 1): S5–S14.
McEwen, Bruce. 2000. “Allostasis and Allostatic Load: Implications for Neuropsychophar-mocology.” Neuropsychopharmacology 22 (2): 108–24.
Miguel, Edward, and Michael Kremer. 2004. “Worms: Identifying Impacts on Education andHealth in the Presence of Treatment Externalities.” Econometrica 72 (1): 159–217.
Newhouse, Joseph, and the Insurance Experiment Group. 1993. Free for All? Lessons fromthe RAND Health Insurance Experiment. Cambridge, MA: Harvard University Press.
Noymer, Andrew, and Michel Garenne. 2000. “The 1918 Influenza Epidemic’s Effects on SexDifferentials in Mortality in the United States.” Population and Development Review 26(3, September): 565–81.
Pitt, Mark, Mark Rosenzweig, and Mohammed Nasmul Hassan. 1990. “Productivity, Health,and Inequality in the Intrahousehold Distribution of Food in Low-Income Countries.”American Economic Review 80 (December): 1139–56.
Pollitt, Ernesto, Kathleen Gorman, Patrice Engle, Raynaldo Martorell, and Juan Rivera. 1993.Early Supplemental Feeding and Cognition. Monographs of the Society for Research inChild Development, vol. 235. Chicago: University of Chicago Press.
Popkin, Barry M. 1993. “Nutrition Patterns and Transitions.” Population and DevelopmentReview 19 (1): 138–57.
Roseboom, Tessa J., Jan H. P. van der Meulen, Anita Ravelli, Clive Osmond, David J. Barker,and Otto P. Blecker. 2001. “Effects of Prenatal Exposure to the Dutch Famine on AdultDisease in Later Life: An Overview.” Twin Research 4 (5): 293–98.
Rubalcava, Luis, Graciela Teruel, and Duncan Thomas. 2009. “Investments, Time Preferences,and Public Transfers Paid to Women.” Economic Development and Cultural Change 37(3, April): 507–38.
Schultz, T. Paul. 2002. “Wage Gains Associated with Height as a Form of Health Human Capital.” American Economic Review 92 (2): 349–53.
———. 2008. “Population Policies, Fertility, Women’s Human Capital and Child Quality.”In Handbook of Development Economics, vol. 4, ed. T. Paul Schultz and John Strauss.Amsterdam: North-Holland.

HEALTH AND SOCIOECONOMIC STATUS | 383
Spurr, G. B. 1983. “Nutritional Status and Physical Work Capacity.” Yearbook of PhysicalAnthropology, 26: 1–53.
Strauss, John, and Duncan Thomas. 1995. “Human Resources: Empirical Modeling of House-hold and Family Decisions.” In Handbook of Development Economics, vol. 3A, ed. J. R.Behrman and T. N. Srinivasan. Amsterdam: North-Holland.
———. 1998. “Health, Nutrition and Economic Development.” Journal of Economic Litera-ture 36 (2): 766–817.
———. 2008. “Health over the Life Course.” In Handbook of Development Economics, vol. 4,ed. T. Paul Schultz and John Strauss. Amsterdam: North-Holland.
Thirumurthy, Harsha, Joshua Graff Zivin, and Marcus Goldstein. 2008. “The Economic Impactof AIDS Treatment: Labor Supply in Western Kenya.” Journal of Human Resources 43 (3):511–52.
Thomas, Duncan. 1990. “Intra-Household Resource Allocation: An Inferential Approach.”Journal of Human Resources 25 (4): 635–64.
———. 2008. “The 1918 Influenza Pandemic: Longer Term Impacts.” Duke University,Durham, NC.
Thomas, Duncan, and Elizabeth Frankenberg. 2000. “Dynamics of Health and Labor MarketOutcomes.” Duke University, Durham, NC.
Thomas, Duncan, and John Strauss. 1997. “Health and Wages: Evidence on Men and Womenin Urban Brazil.” Journal of Econometrics 77 (1, March): 159–85.
Thomas, Duncan, Elizabeth Frankenberg, Jed Friedman, Jean-Pierre Habicht, MohammedHakimi, Nicholas Ingwersen, Jaswadi, Nathan Jones, Christopher McKelvey, GretelPelto, Bondan Sikoki, Teresa Seeman, James P. Smith, Cecep Sumantri, Wayan Suriastini,and Siswanto Wilopo. 2006. “Causal Effect of Health on Labor Market Outcomes:Experimental Evidence.” California Center for Population Research, Working Paper2006-07, University of California, Los Angeles. http://papers.ccpr.ucla.edu/papers/PWP-CCPR-2006-070/PWP-CCPR-2006-070.pdf.
Victora, Cesar, Linda Adair, Caroline Fall, Pedro Hallal, Reynaldo Martorell, Linda Richter,and Hashapal Singh Sachdev. 2008. “Maternal and Child Undernutrition: Consequencesfor Adult Health and Human Capital.” Lancet 371 (9609): 340–57.
Wolgemuth, June, Michael Latham, Andrew Hall, Andrew Chesher, and D. W. T. Crompton.1982. “Worker Productivity and the Nutritional Status of Kenyan Road ConstructionLaborers.” American Journal of Clinical Nutrition 36 (7): 68–78.


The Household Impacts of TreatingHIV/AIDS in Developing Countries
MARKUS GOLDSTEIN, JOSHUA GRAFF ZIVIN,AND HARSHA THIRUMURTHY
Recent data on the household impacts of providing antiretroviral therapy to HIV-infected adults permit a much fuller assessment of the economic footprint of treatmentthan was previously possible. Drawing on evidence from treatment programs in western Kenya and several countries of Sub-Saharan Africa, the authors discuss a rangeof benefits to the households of patients receiving treatment. These benefits begin withthe labor market outcomes of treated patients, who are able to significantly increasetheir work hours within six months after they initiate treatment. In the same time period, substantial improvements take place in the nutritional status and school atten-dance of children in patients’ households, which in turn can improve the future well-being of these children. The results demonstrate that treatment can mitigate the negativesocioeconomic consequences of HIV/AIDS. The authors argue that the findings providean added rationale for the continued scaling up of treatment programs, which shouldbe viewed as investments that offer large, long-term economic returns to society.
Since the advent of highly active antiretroviral therapy (ART) in 1996, morbidityand mortality from HIV/AIDS have declined substantially in industrial countries.1
Owing to the widespread availability of such treatment, HIV/AIDS is often dealtwith as a chronic disease in these countries. In developing nations, access to anti-retroviral therapy is growing but is still limited. In Sub-Saharan Africa, the regionmost affected by HIV/AIDS, the number of HIV-positive people receiving treat-ment rose from 100,000 in the late 1990s to nearly 2 million in 2003. Despite this
385
Markus Goldstein is a senior economist with the World Bank. Joshua Graff Zivin is an associate professor of economics atthe University of California, San Diego, and a research associate at the National Bureau of Economic Research. HarshaThirumurthy is an assistant professor of health economics at the University of North Carolina at Chapel Hill and a facultyfellow at the Carolina Population Center. The authors thank T. Paul Schultz, Duncan Thomas, and an anonymous refereefor useful comments. This paper has also benefited from invaluable comments and suggestions by John Strauss. For the workunderlying much of this paper, we are grateful for the support of the AMPATH program and the Indiana University–MoiUniversity Partnership. Financial support for this project was received from the Economic and Social Research Council inthe United Kingdom; Pfizer, Inc.; the World Bank; PEPFAR– Kenya; the Yale University Center for Interdisciplinary Researchon AIDS (CIRA), through a grant from the National Institute of Mental Health to Michael Merson, MD (P30 MH 62294);the Social Science Research Council; and the Calderone Program at Columbia University.
Annual World Bank Conference on Development Economics 2009, Global © 2010 The International Bank for Reconstruction and Development / The World Bank
386 | MARKUS GOLDSTEIN, JOSHUA GRAFF ZIVIN, AND HARSHA THIRUMURTHY
progress, only about 30 percent of the people in need of treatment currently haveaccess to it. Since public provision of treatment remains the primary channelthrough which people in developing countries can access ART, expansion ofdonor support remains critical to achieve the international community’s goal ofuniversal access to HIV treatment (as well as prevention, care, and support) by2010 for all who need it (Group of 8 communiqué, July 2008). According to estimates by the Joint United Nations Programme on HIV/AIDS (UNAIDS), theannual cost of achieving universal access to treatment by 2010 will be approxi-mately US$15 billion per year—an amount much larger than current expenditureson treatment (UNAIDS 2007).
Greater support for the scaling up of treatment programs has been lacking, fora number of reasons. These include skepticism as to whether ART will generatehealth and economic benefits that are sizable enough to offset its costs and a relateddebate about how best to allocate scarce resources in developing countries (see,for example, Canning 2006). Since treatment, once initiated, must be continuedfor the entire duration of a person’s life, there has also been concern about thewisdom and sustainability of current expenditures on ART. According to theEconomist (2006), people who begin receiving ART today will become tomor-row’s “medical pensioners” whose treatment costs will become the responsibilityof the countries in which they live and the organizations that support these coun-tries. Because evidence on the impacts of providing ART has been slow to emerge,until recently it has been impossible to evaluate treatment programs properly andassess whether expenditures on such programs may be justified on economic, asopposed to humanitarian, grounds.
In this paper we draw on recent research to describe the short-term impact of treat-ment on the socioeconomic outcomes of patients and households in Sub-SaharanAfrica. Since the scaling up of treatment programs is a recent phenomenon, the evidence on household impacts that we present here has been largely absent in discussions of the costs and benefits of treatment. These household impacts are animportant component of the benefits that stem from treatment programs, and whenthey are taken into consideration, it is difficult not to view treatment expenditures asinvestments that offer longer-term economic returns to households.
To see why treatment could induce a variety of positive changes in the well-beingof households in low-income settings, it is instructive to consider how these house-holds generally respond to health setbacks. Households in low-income settings facea great deal of health and economic risk, and their ability to cope with such risk andensure minimum levels of food consumption and well-being is often limited. Becauseaccess to formal or informal credit and insurance against large setbacks may be lack-ing, some households may have to resort to extreme measures, including partial orfull withdrawal of children from school, increased employment of children’s labor infamily farms or business enterprises, and reductions in food consumption for someor all household members. Coping with AIDS-related adult morbidity, rather than atemporary illness, is especially challenging. Individuals can expect to recover fromtemporary illnesses and so might be able to rely at least partially on informal creditand insurance from friends and relatives. For chronic illnesses, however, finding
THE HOUSEHOLD IMPACTS OF TREATING HIV/AIDS | 387
individuals who are willing to provide support is more difficult. Furthermore, sinceAIDS invariably ends in death when no treatment is available, the disease may haveeven larger effects on the well-being of household members, particularly childrenwho will be left without a parent.
Longitudinal household survey data that we have collected in collaboration witha treatment program in western Kenya, along with limited evidence from other coun-tries in Sub-Saharan Africa, suggests that ART reverses and mitigates many of theeffects of HIV on the socioeconomic well-being of infected adults and their house-holds. The starting point for these household impacts lies in the employment out-comes of adult patients who receive ART. Evidence from rural Kenya shows thatafter ART is initiated there is a large and immediate increase in the amount of workperformed by treated patients. These increases are in contrast to the well-documenteddecline in productivity for HIV-infected individuals who do not have access to treat-ment (Fox et al. 2004). Although it is encouraging that these labor supply increasesare observed in the first 6 to 12 months after initiation of treatment, we emphasizethat more evidence is needed about the long-term effects of ART on the labor supplyand other outcomes.
Our analysis of data from Kenya suggests that as adult patients become healthierand more productive thanks to ART, the burden on children to provide substitutelabor decreases substantially. Boys work significantly less in income-generating activ-ities, and the amount of household chores that girls perform decreases considerably.These reductions in time allocated to labor are accompanied by increased school atten-dance, which is likely to result in higher wages and improved health for these childrenin the future. ART also leads to large improvements in the nutritional status of veryyoung children in treated patients’ households—another indicator that the short-termimpacts of treatment may have long-term effects on health and economic outcomes.
Although the positive effects of ART that we document here are largely private ben-efits realized by patients and their households, we argue that under certain conditionsthis evidence can provide a rationale for public support for ART. Such conditionsinclude the existence of borrowing constraints for households in low-income settingsand the externalities that may result from improved schooling outcomes. The broadersocioeconomic view of the impact of ART—particularly its intergenerational effects—also suggests that cost-effectiveness analyses of ART (which typically focus on thenumber of patient life-years saved) may substantially underestimate the benefits oftreatment. Our findings also call into question the argument that resources should beallocated to HIV prevention at the expense of treatment (Canning 2006).
The next section reviews the evidence on the clinical and immunological impactsof ART and provides an overview of existing efforts to scale up treatment programs.The empirical strategy for estimating the impact of treatment when randomized con-trolled trials are not feasible is then discussed. There follows a survey of unique evi-dence from western Kenya on socioeconomic impacts on households of patientsreceiving ART—from employment outcomes for treated patients, to schooling andemployment outcomes for children and the nutritional status of very young children.The issue of generalizability is then examined, with reference to evidence from othersettings such as South Africa and Botswana, and areas where additional research is

388 | MARKUS GOLDSTEIN, JOSHUA GRAFF ZIVIN, AND HARSHA THIRUMURTHY
needed are identified. The final section summarizes the policy implications that flowfrom these household impacts of treatment.
Effectiveness and Availability of Antiretroviral Therapy
As HIV weakens the immune system, it inevitably causes AIDS and, eventually,death, if treatment is not provided. According to a prominent study conducted inUganda, progression to AIDS—the last stage of HIV infection—takes about nineyears from the time of HIV seroconversion (Morgan et al. 2002).2 During much ofthis period, most HIV-infected individuals may be unaware of their status and can bephysically capable of performing all normal activities. Progression to AIDS is usuallyassociated with substantial weight loss (wasting) and with opportunistic infectionssuch as P. carinii pneumonia, Kaposi’s sarcoma, and tuberculosis. In the absence ofantiretroviral therapy, death usually occurs rapidly after progression to AIDS. TheUgandan study reports a median survival time of 9.2 months (Morgan et al. 2002),and an older study in Brazil documents a median survival time of 5.1 months (Chequer et al. 1992).
Highly active antiretroviral therapy (ART) has been proved to reduce the likelihoodof opportunistic infections and prolong the life of HIV-infected individuals. In accor-dance with World Health Organization (WHO) guidelines, antiretroviral therapy isoften initiated about the time that an HIV-infected individual develops AIDS (WHO2006). After several months of treatment, patients generally become asymptomaticand have improved functional capacity. Numerous studies have shown that antiretro-viral therapy dramatically reduces morbidity and mortality among HIV-infected indi-viduals, both in industrial countries (Hammer et al. 1997; Hogg et al. 1998; Palellaet al. 1998) and in developing countries (Laurent et al. 2002; Marins et al. 2003; Coetzee et al. 2004; Koenig, Leandre, and Farmer 2004; Wools-Kaloustian et al. 2006).
In Haiti patients experienced weight gain and improved functional capacity withinone year after the initiation of ART (Koenig, Leandre, and Farmer 2004). A study con-ducted in the township of Khayelitsha, South Africa, showed that among 287 adultswho received ART, 86.3 percent were still alive 24 months after treatment began(Coetzee et al. 2004). Large and significant improvements were also observed in clin-ical outcomes. The median weight gain was 5.0 kilograms after six months of treat-ment, and 9.0 kilograms after a year. CD4 cell counts—an important indicator of disease progression, with lower counts indicating weaker immune systems—increasedby a median of 134 and 288 cells per microliter after 6 and 24 months of treatment,respectively. In western Kenya, where we conducted our socioeconomic study, otherresearchers have reported results that are strikingly similar to those from South Africa.In particular, mean increases in CD4 cell counts of 109 and 297 cells per microliterwere observed at 6 weeks and 36 months, respectively, after initiation of treatment.Mortality rates in the first two to three years of ART have been low for patients whoseCD4 cell counts were not too low (i.e., not less than 50) at the time of treatment ini-tiation. Without ART, these mortality rates would undoubtedly be extremely high.
The compelling evidence that ART is effective in developing countries has accumu-lated just since 2003, during which time access to treatment in Sub-Saharan Africa and

THE HOUSEHOLD IMPACTS OF TREATING HIV/AIDS | 389
other HIV-affected regions of the world has grown substantially. The price of ART indeveloping countries is an important consideration in debates about treatment provi-sion and in cost-benefit analyses, but that price has been falling. In 2000 first-line ARTregimens cost more than US$10,000 per patient per year, and differential pricing wasrarely employed by pharmaceutical companies. Beginning in 2001, widespread gener-ic production of some antiretrovirals reduced these prices significantly, to as low asUS$99 per patient-year for a commonly used first-line regimen (Medicins Sans Frontieres 2007). It should be noted, however, that the costs of improved first-line regimens (less toxic ones that have been recently recommended by the WHO), as wellas second-line regimens, which are used when first-line regimens fail, are considerablymore expensive. Expenditures on laboratory tests and HIV clinic operations can alsobe sizable. The level of such nondrug costs depends on the treatment setting and on avariety of factors that include the nature of the existing infrastructure in the areawhere an HIV clinic is being established and the cost of hiring additional staff.
Much like the price reductions, growth in donor support for the provision of ARThas also been important in scaling up treatment to current levels. By the end of 2007,resources from the Global Fund to Fight AIDS, Tuberculosis, and Malaria; the U.S.Global AIDS Program (known as the President’s Emergency Plan for AIDS Relief);and nongovernmental organizations (NGOs), as well as in-country government sup-port, had helped nearly 2 million individuals receive ART in Sub-Saharan Africaalone. Progress, however, has been uneven among and within countries, and existingfunds fall short of what is required in order to serve the nearly 5 million people whoneed ART. The experience with scaling up treatment in South Africa illustrates manyof these issues. (For a discussion, see Nattrass 2006.)
Household Impacts of Treatment in Kenya
In collaboration with a treatment program that was among the first to scale up HIVcare in Sub-Saharan Africa, we examined a cohort of patients receiving ART at a ruralHIV clinic managed by the Academic Model for the Prevention and Treatment ofHIV/AIDS (AMPATH). Founded in 2001 through collaboration between the Moi Uni-versity School of Medicine, the Moi Teaching and Referral Hospital, and the IndianaUniversity School of Medicine (Mamlin et al. 2004), AMPATH has been expandingHIV care and treatment at government health facilities in western Kenya. As of early2008, more than 58,000 individuals at 21 health facilities were receiving HIV care fromAMPATH, with approximately 23,000 persons clinically eligible for ART and receiv-ing it free of charge. Details about our survey and the sample selection criteria are dis-cussed at greater length in Thirumurthy, Graff Zivin, and Goldstein (2008). Here, weprovide an overview of the survey and summarize the empirical strategy and results.
Survey Data
Our study was based at an AMPATH HIV clinic that operates within a government-run primary health care center in the town of Mosoriot. The clinic provides freeHIV/AIDS medical care, including all relevant tests and ART, to infected individualswho enroll in care. The rural region that is served by the health center has a population

390 | MARKUS GOLDSTEIN, JOSHUA GRAFF ZIVIN, AND HARSHA THIRUMURTHY
of 35,383 individuals living in 6,643 households (Kenya 1999). Crop farming and ani-mal husbandry are the primary economic activities of households in the survey area.
We conducted three waves of household surveys between 2004 and 2006. Thedata from these surveys allow us to examine how a variety of measures of socio -economic well-being change because of ART.3 There was an interval of roughly6 months between the first two waves and an interval of 18 months between the sec-ond and third waves.4 The survey questionnaires collected a range of comprehensivesocioeconomic information on households and resembled those used by the WorldBank’s Living Standards Measurement Surveys. Questions covered demographiccharacteristics, health, agriculture, assets, income and employment, children’s schoolenrollment and attendance, and time allocation to household chores. Teams of maleand female enumerators interviewed the household head and spouse, and anthropo-metric measurements were taken of children under age 5. For in-clinic interviews, allinformation was obtained from the AMPATH patient.
The survey sample consists of two groups of households. The first group com-prises 503 households chosen randomly from a census of all households in the cliniccatchment area that did not contain an AMPATH patient (census sample house-holds). In this sample, the HIV status of respondents is usually unknown unless therespondent self-reports having gone for an HIV test and tested HIV-positive or HIV-negative. The second group consists of 260 households enrolled in the study at theHIV clinic because they contained at least one adult HIV-positive AMPATH patient(at various stages of HIV disease). Of these 260 households, we focus here on the 200in which, prior to wave 2, the HIV-positive patient was at a sufficiently advancedstage of the disease to begin receiving ART. (We refer to these as ART households.)5
On completion of the first two waves of the survey, we used the AMPATH MedicalRecords System (AMRS), which contains electronic records of clinical and treatment-related information on all patients, to establish which patients in our sample werereceiving ART and when they began receiving it. When examining the labor marketoutcomes of treated patients, we focus on the 191 adult ART recipients who appearin both of the first two waves of the survey. For other household-level outcomes, wefocus on the children living in the patients’ households.
Empirical Strategy
Estimating the effect of any intervention ideally requires experimental informationfrom groups that do and do not receive the treatment of interest. In the absence ofsuch data, a variety of nonexperimental techniques can be used to assess the impactof the intervention and, at the very least, determine whether the estimated impactsare likely to underestimate or overestimate the actual impacts. Since the strong evidence on the clinical effectiveness of ART makes randomized controlled trials ofART unethical, we use our longitudinal data from the cohort of ART recipients andcensus sample individuals to establish the household impacts of treatment.
When observing changes over time in socioeconomic outcomes for the ART recip-ients, an overarching concern in attributing these changes to the medical treatment isthat the changes may be driven by omitted (i.e., confounding) variables that would
THE HOUSEHOLD IMPACTS OF TREATING HIV/AIDS | 391
bias estimates. Given the nature of the outcomes we study here, seasonal change asso-ciated with weather and the agricultural season is a key concern. For example, com-parison of employment levels measured during the middle of the growing season witha later observation that may have occurred during harvest might suggest large laborincreases as a result of treatment, whereas these effects would simply be an artifactof survey timing. For this reason, we make use of data from the census sample to con-trol for secular trends in outcome variables within the survey region. Furthermore, toadjust for individual-specific characteristics that may be associated with average out-come levels for each individual, the regressions we estimate include individual fixedeffects. This method can thus be described as a difference-in-difference strategy, inwhich the changes over time in the outcome variable for the ART sample (which rep-resents the “treatment” group) are compared with changes over time for the censussample (which serves as the “comparison” group).6
Since clinical evidence on the impacts of ART suggest that the largest and most sig-nificant health improvements occur shortly after initiation of ART, we divide theART sample into two groups of patients: those who were just beginning treatment atthe time of the wave 1 interview (the treatment-naïve group), and those who hadalready been in treatment for more than 100 days as of wave 1 (treatment-nonnaïvegroup). In the results that follow, we document how temporal patterns in key out-comes differ for these two groups of ART recipients and their households.
Impact of ART on Treated Patients’ Employment Outcomes
In many ways, the impact of ART on the employment outcomes of patients is thestarting point for household impacts, since the ability of an adult to work and con-tribute income to the household has both income and substitution effects that maydrive many decisions regarding children’s employment and schooling, as well foodconsumption levels. Before beginning ART, adult patients at AMPATH’s HIV clinicare significantly less likely to engage in income-earning activities than other adults inthe clinic’s catchment area. Their households are also poorer than households in thecatchment area. Such comparisons are supported by the literature on the economicimpacts of AIDS. Fox et al. (2004), in their study of workers at a Kenyan tea plan-tation, show that the onset of AIDS leads to significant reductions in productivity.As we discuss in this section, our findings suggest that treatment can substantially mitigate the employment effects of HIV/AIDS.
Our survey recorded information on two outcomes that measure an individual’semployment status: (a) an indicator of participation in any economic activities duringthe week preceding each interview, and (b) the total number of hours worked in thatweek. The survey recorded this information in each wave for all household membersolder than age 8 and for three types of activities: wage and salaried jobs, farming onthe household’s owned or rented land, and nonfarm self-employed work. Our measureof market labor supply is defined as the total hours devoted to all these activities.7
The first indications that both the health and the employment status of patientsare influenced by ART are provided in figure 1, showing the relationship between theduration of time on ART and patients’ CD4 cell counts, and figure 2, showing time

FIGURE 2.Weekly Hours Worked before and after Initiation of Antiretroviral Therapy (ART)
Source: Authors’ survey data.
Note: The dashed lines indicate the 95 percent confidence intervals obtained from estimating a linear regression of indi-viduals’ hours worked on dummy variables for each interval, with the omitted interval being the eight weeks prior to treat-ment initiation. The sample consists of the 191 ART recipients who appear in both waves of the household survey data.
FIGURE 1.CD4 Count before and after Initiation of Antiretroviral Therapy (ART)
Source: AMPATH Medical Records System.
Note: The figure is generated using CD4 count data for all patients receiving ART at the Mosoriot HIV Clinic. The dashedlines indicate the 95 percent confidence intervals obtained by estimating a linear regression of individuals’ CD4 countson dummy variables for each interval, with the omitted interval being the 10 weeks prior to treatment initiation.
0
50
350
400
100
150
200
250
300
CD
4 co
unt
–40 –20–30 –10 0weeks before and after ART initiation
2010 30 40 50 60 70 80 90
average CD4 count 95 percent confidence interval
0
5
50
10
15
20
25
35
30
45
40
tota
l hou
rs w
orke
d in
wee
kp
rece
din
g t
he in
terv
iew
–8 80 16 24weeks before and after ART initiation
4032 48 56
average hours/week 95 percent confidence interval
392

THE HOUSEHOLD IMPACTS OF TREATING HIV/AIDS | 393
on ART and hours worked in the week preceding the interview. The response of CD4cell count is highly nonlinear: at 10–20 weeks, the median count has risen to levelsat which patients are generally asymptomatic (CD4 > 200). Subsequent changes aresmaller and less consistent. A similar nonlinear relationship is found for patients’body mass index (not shown). The resemblance between the curves for CD4 andhours worked in the figures is striking, suggesting that the two outcomes are closelyrelated.
When we examine the link between ART and labor market outcomes in regressionsthat better adjust for omitted variables, we find that ART does indeed lead to a largeand significant increase in employment outcomes (table 1). These changes can beobserved in just the six months between waves 1 and 2 of the survey. Controlling forvarious seasonal factors that are evident in both the ART sample and the census sam-ple, adults receiving treatment are 8.5 percentage points more likely to participate inthe labor force in wave 2 than in wave 1 (column 1).8 The number of hours workedin the preceding week also increases significantly in the six months between surveywaves, by 4.6 hours (column 2). In relation to the levels in wave 1, this implies a largeincrease in labor supply for the entire sample of ART patients: labor force participa-tion rates rise by almost 11 percent, and weekly hours worked rise by 19 percent.
Treatment duration. As noted above, ART recipients can be divided into treatment-naïve and treatment-nonnaïve groups according to how long they have been on
TABLE 1. Impact of Antiretroviral Therapy (ART) on Labor Supply, IndividualFixed Effects(dependent variables: labor force participation; hours worked)
LFP Hours LFP Hours
(1) (2) (3) (4)
Patient on ART * wave 2 0.085 4.575(2.42)** (1.88)*
Treatment-naïve patient on ART * wave 2 0.170 7.860(3.07)*** (2.44)**
Treatment nonnaïve patient on ART * wave 2 0.015 1.920(0.38) (0.69)
Constant 0.879 35.976 0.879 35.979(38.68)*** (16.96)*** (39.28)*** (16.98)***
Observations 2,954 2,954 2,954 2,954R2 0.69 0.75 0.69 0.75
Source: Authors’ calculations.
Note: LFP, labor force participation. Errors are clustered at the household level for each wave. Numbers in parenthe-ses are robust t-statistics. The dependent variable LFP indicates whether the individual was engaged in any labor market activity in the week preceding the interview. The dependent variable Hours is total number of hours devotedto labor market activities in the week preceding the interview. All regressions include individual fixed effects, awave 2 indicator, and 10 month-of-interview indicators, with one month from each wave omitted to avoid collinearitywith the wave 2 indicator.
*Significant at the 10 percent level.
**Significant at the 5 percent level.
***Significant at the 1 percent level.
394 | MARKUS GOLDSTEIN, JOSHUA GRAFF ZIVIN, AND HARSHA THIRUMURTHY
treatment at the time of wave 1. Columns 3 and 4 of table 1 show a stronger andeven more striking result. The individuals with by far the largest increase in employ-ment outcomes between the two waves are the treatment-naïve patients who beganreceiving ART less than 100 days prior to the wave 1 interview. The size of theseincreases is substantial: over the course of six months, patients who have just initiatedART show a 17 percentage point increase in labor force participation rates and work7.9 hours more per week. Given wave 1 employment levels of a 65.1 percent partic-ipation rate and 20.3 hours worked for this group, the estimates imply a 26 percentincrease in participation rates and a 39 percent increase in number of hours worked.In contrast, the other ART recipients in our sample show no statistically significantchange in outcomes between waves, suggesting that earlier employment gains aremaintained through continued treatment. Thus, the story that emerges from these datais that in the first six months of ART there are large increases in labor supply, and inthe second six months of ART there are no additional changes in labor supply. Thistemporal pattern in the labor supply response among treated patients closely resem-bles the health responses, as measured by body mass index (BMI) and CD4 count,reported in the next section. As is discussed there, additional follow-up is necessary inorder to establish the longer-term effects of ART. The third wave of data we have col-lected represents one opportunity to estimate such effects (analysis is ongoing), butadditional long-term studies of patients receiving ART are also necessary.
Gender differences in labor supply impacts. The survey data from each wave ofthe survey show that men are more likely to be engaged in market labor market activ-ities than women. (Summary statistics are available in Thirumurthy, Graff Zivin, andGoldstein 2008.) We also find gender differences for some components of marketlabor supply: women are much less likely to work for a wage but are equally likelyto work in a nonfarm business. This raises the question of whether the labor marketimpacts of ART differ according to the gender of the patient being treated. To test forsuch differences, we estimate the impacts separately for men and women.
Importantly, we find that for male patients in the early stages of treatment (treatmentnaïve in wave 1), there is no significant increase in labor force participation rates, butthere is a large and significant increase of 12.7 hours in weekly labor supply betweenrounds (a 43 percent increase relative to average weekly hours worked in wave 1).Among male patients, therefore, those already working prior to initiation of ART arethe ones who increase their labor supply after treatment. For women in the early stagesof treatment, there is a large and significant increase of 21.8 percentage points in thelabor force participation rate between rounds (a 35 percent increase relative to theiraverage participation rate in round 1), but no significant increase in weekly hoursworked. This is consistent with our intuition, since men have high levels of labor mar-ket participation to begin with, and most of their response to improved health takes theform of additional hours worked. For women, initial labor market participation is low,so labor supply is the natural margin for change.
It should be emphasized again that none of the results outlined above are basedon a comparison of a treatment group consisting of ART recipients with a control
THE HOUSEHOLD IMPACTS OF TREATING HIV/AIDS | 395
group consisting of HIV-positive patients who require ART but do not get it. Themedical literature clearly indicates that the latter group will experience continueddeclines in health and possibly death within 6 to 12 months. Our estimated employ-ment impacts are likely to be underestimates of the full impact of treatment. Thismakes the size of the employment impacts described above even more striking.
Household Impacts
Households in which an adult member falls ill and becomes less able to work may beforced to rely on children to cope with the loss of income and the need for caregiv-ing. Our research addresses whether ART, when given to adults after they developAIDS, improves children’s welfare in a manner consistent with the dramatic improve-ments in adult patient health. Focusing on several important aspects of children’slives, the household survey data from Kenya provide a unique opportunity to answerthis question. Many of our results are discussed in greater detail in Graff Zivin,Thirumurthy, and Goldstein (2006), but we provide an overview of them here. Inparticular, we examine the impact of ART on the amount of time children spendworking, on the amount of time they spend in school, and on measures of currentnutritional status of very young children.
Information on the amount of time children spent on various activities was gen-erally obtained from the adult respondent in each household. In order to make acomparison across activities and obtain accurate information, a recall period of sevendays was chosen.
Impacts on school attendance. Turning first to the school attendance of childrenbetween ages 8 and 18, we find that between the first two waves of the study, therewere large and significant increases in hours of school attended in the precedingweek. The first three columns of table 2 examine the impact of ART for all children,for boys, and for girls. Children in the census sample serve as a control for other fac-tors that may be influencing labor and schooling outcomes.
The largest increases in hours of school attended occur for children of ART recip-ients who were treatment naïve in wave 1. As column 1 shows, the increase in weeklyhours of school attendance in the six months between waves 1 and 2 is 6.4 hours forthese children, representing a 21 percent increase relative to their average attendancelevel in wave 1.9 For children in households including an adult who was not treat-ment naïve, there is no significant change in weekly hours attended. This suggeststhat significant increases in attendance occur in the first six months after ART is initiated for an adult household member and remain at higher levels after six months.In columns 2 and 3, our findings indicate that there are significant increases in hoursof attendance for both boys and girls in households of ART recipients who weretreatment naïve in wave 1. The increase in school attendance of 8.7 hours for boysis especially large, representing a 29 percent increase relative to their average atten-dance level in wave 1.10 Girls also experience a large and significant increase of6.5 hours of school attended in the preceding week. In both cases, the increase in

39
6
TABLE 2. Impact of Antiretroviral Therapy (ART) on Children’s School Attendance and Market Labor Supply, Individual Fixed Effects(dependent variables; hours of school attended; hours worked in preceding week)
Hours of school attended Hours worked in preceding week
All children Boys Girls All children Boys Girls
(1) (2) (3) (4) (5) (6)
ART household (treatment naïve) * wave 2 6.393 8.673 6.513 �4.475 �7.452 �0.812(2.792)** (3.854)** (3.241)** (2.046)** (3.185)** (2.740)
ART household (treatment nonnaïve) * wave 2 1.893 4.902 �1.035 �3.276 �7.473 1.192(2.548) (2.770)* (3.941) (1.996) (2.897)** (2.833)
Constant 23.649 23.527 22.643 21.776 27.513 13.159(3.097)*** (3.885)*** (4.144)*** (2.978)*** (4.019)*** (4.595)***
Observations 960 518 442 916 502 414R2 0.83 0.83 0.85 0.78 0.82 0.68
Source: Authors’ calculations.
Note: Errors are clustered at the household level for each wave. Numbers in parentheses are robust t-statistics. The dependent variables are total number of hours of school attended in the weekpreceding the interview and total number of hours devoted to income-generating activities in that week. Observations for which school attendance was reported to be below normal because ofschool holidays during the week preceding the interview are excluded from the sample. The number of observations in columns 4–6 is smaller than in columns 1–3 because labor supply informationis missing for 44 children. All regressions include individual fixed effects, a wave 2 indicator, and 10 month-of-interview indicators, with one month from each wave omitted to avoid collinearity withthe wave 2 indicator.
*Significant at the 10 percent level.
**Significant at the 5 percent level.
***Significant at the 1 percent level.

THE HOUSEHOLD IMPACTS OF TREATING HIV/AIDS | 397
hours of attendance occurs within roughly six months after ART initiation. There isalso some evidence of prolonged increases in boys’ school attendance, as those inhouseholds of ART recipients who were not treatment naïve in wave 1 experience asignificant additional increase between waves 1 and 2. This more persistent effectmay be attributable to the fact that boys’ reductions in labor activities show a moredrawn-out response to treatment, as is discussed below.
Ideally, the schooling trends of children in ART households would be comparedwith those of children in households where ART is needed but is not available(a counterfactual group). As we discussed for the case of patients’ employment outcomes, such a comparison would reveal the “full” impact of ART on children’sschooling. In the absence of such a comparison group, we rely on the literature toreveal what might happen to children’s school outcomes in the absence of ART (i.e.,if adult morbidity and mortality were to occur). Using longitudinal data fromKwaZulu-Natal, South Africa, Case and Ardington (2006) show that children wholose a mother are significantly less likely to remain in school and complete signifi-cantly fewer years of schooling than similar-age children whose mothers are alive.The impact of paternal death on children’s schooling is considerably weaker. Beegle,De Weerdt, and Dercon (2006) examine the long-term consequences drawing on lon-gitudinal data (spanning 13 years) from the Kagera region of Tanzania. They findthat maternal death results in a significant reduction in the number of years ofschooling completed, as well as in lower height. There is also evidence from Kenyathat children’s outcomes begin to worsen even in the years prior to a parent’s death,when the parent may be sick with AIDS (Evans and Miguel 2007). In light of theseresults, it seems likely that the impact of ART on the schooling outcomes of treatedadults’ children would be larger if we compared the children with a counterfactualgroup rather than the census sample.
These effects on school attendance imply that expenditures on ART today canyield benefits to families for years to come. Given the substantial returns to educa-tion in developing countries, these findings highlight the “investment” aspect ofexpenditures on ART and underscore the importance of paying attention not just tothe clinical outcomes and productivity of adult patients who receive ART but also toa broader set of outcomes pertaining to the children of treated patients. They suggestthat the future economic prospects of societies can be brighter if adults who are sicktoday are treated.
Impacts on child labor. A natural explanation for the higher school attendance lev-els in ART households is that these households have a lower demand for children’slabor after adult patients become healthier and more productive. It therefore standsto reason that we should observe reductions in the number of hours worked by chil-dren once ART is provided. Indeed, there is strong evidence in favor of such aresponse within the ART households in our study.
In columns 4, 5, and 6 of table 2, we examine the responses in hours worked inlabor market activities (farm, business, or wage labor). There is a large and signifi-cant reduction of 4.5 hours in the weekly hours worked for all children in households
398 | MARKUS GOLDSTEIN, JOSHUA GRAFF ZIVIN, AND HARSHA THIRUMURTHY
of ART recipients who were treatment naïve as of wave 1. For boys in such house-holds, the average decrease in market labor supply (7.5 hours) in the six monthsbetween waves 1 and 2 is remarkably similar to the estimated increase in weeklyhours of school attendance (8.7 hours). The continued decline between waves 1 and2 in the labor supply of boys in households of patients who were not treatment naïvein wave 1 is also accompanied by a corresponding increase in hours of school atten-dance. Thus, labor reductions for boys associated with improvements in adult patienthealth closely track increases in their school attendance over the corresponding timeperiod.
The lack of any treatment effect on the market labor supply of girls should beinterpreted with caution. Girls in the survey area spend significantly more time innonmarket labor activities such as household chores and caregiving than in marketactivities. If girls experience decreases in their nonmarket labor supply when an adulthousehold member becomes healthier thanks to ART, this will not be captured in themarket labor supply measures reported in table 2. Indeed, in a recent paper thatexamines richer time allocation data from waves 1 and 3 of the survey, we find evi-dence of significant declines in the number of hours girls spend performing house-hold chores such as water and firewood collection (d’Adda et al. 2009). This resultpoints to the importance of gathering information on multiple activities to whichtime is allocated, not just market labor activities.
Impacts on early childhood nutrition. As the productivity and income of treatedadults increase, their households may be able to consume more food. Such a devel-opment is especially likely to affect the welfare of very young children, whose nutri-tional status is highly sensitive to changes in food consumption. Our research indicates that these children experience large and significant improvements in theirnutritional status, as measured by the z-score of their weight-for-height. This is ameasure of nutritional status that is sensitive to short-term growth disturbancescaused by factors such as inadequate food intake (WHO 1995). Prior to the initia-tion of ART for adult patients, their children are more malnourished than other chil-dren in the clinic’s catchment area. Yet this difference is completely erased within sixmonths after ART begins, with the weight-for-height measures of children increasingby more than 0.5 standard deviations (Graff Zivin, Thirumurthy, and Goldstein2006). The children in ART households who benefit the most are in fact those whodisplay wasting (z-score < −2) prior to ART initiation. Such nutritional improvementsat early ages have significant implications for these children’s cognitive development,future school performance, and employment outcomes (Thomas and Strauss 1997;Glewwe and King 2001). These may well represent the most long-lasting gains tosociety from providing treatment to HIV-infected adults today.
Impacts on the elderly. The impacts of ART on the labor supply of adultpatients could also have implications for the time allocation patterns of the elderly.During the periods when HIV-infected adults become sick, it is possible that elderly household members adjust their own labor supply or other activities suchas caregiving. For example, in Cambodia and Thailand, Knodel (2008) has found
THE HOUSEHOLD IMPACTS OF TREATING HIV/AIDS | 399
that parents of adults who die from AIDS are more likely to provide shelter andgive care to children orphaned by the adult death. An important omission fromthe labor supply questionnaires used in Kenya is that no information was recordedon the market labor supply of the elderly. Data were collected on the nonmarketlabor supply of the elderly, and analysis of these data is ongoing. One hypothesisthat remains to be tested is whether ART results in reduced labor demand for theelderly who reside in the households of treated adults. On this note, we turn to awide range of other questions regarding the impact of ART that have yet to beaddressed.
Evidence from Elsewhere and Directions for Future Research
Much of the evidence presented so far has been from a single clinic in western Kenya.Moreover, the data focus on what happens to ART recipients and their householdsduring the short-term horizon of the first 6 to 12 months of ART. Nevertheless, addi-tional research from other ART programs suggests that the Kenyan findings of largesocioeconomic benefits from ART provision are generalizable. Two studies fromsouthern Africa indicate that the employment effects of ART on treated patients aresubstantial. Studying a cohort of patients in the township of Khayelitsha, Coetzeeand Nattrass (2004) find evidence of significant improvements in the labor force par-ticipation rates of ART recipients. Habyarimana, Mbakile, and Pop-Eleches (2007)examine human resource data from two mines in Botswana operated by the Debswana Diamond Company, which provides free, firm-based ART to its employ-ees. Using data on workers’ absenteeism rates, the authors find large increases inabsenteeism of HIV-infected workers in the year before beginning ART. Subsequently,absenteeism rates decline rapidly. In the period from two to four years after ART ini-tiation, treated workers have low absenteeism rates that are similar to those of othermining workers at the company. Similar evidence has been obtained from SouthAfrica, albeit over a short time horizon of 6 to 12 months after ART initiation. Judg-ing from the evidence from Botswana, then, it appears that the short-term impacts ofART are sustained in the medium term, as well, at least for the case of treatedpatients’ employment. Studies that collect richer household-level information fromART recipients are greatly needed in order to learn more about the long-run impactsof ART and the generalizability of those results, particularly regarding children’shealth and education.
Thus far, we have viewed most of the impacts of ART through the lens of thepatient’s labor supply. At the same time, ART for people with AIDS (and the prospectof obtaining ART for those in the early stages of HIV infection), through its tremen-dous capacity to extend life, may also change people’s planning horizons and leadthem to undertake larger investments in the future. Indeed, such a change in per-spective may be partly responsible for the human capital investments we documentedearlier. Additional work on planning responses could highlight some of the other benefits of ART. For example, those who live longer may invest more in physical capital, exercise greater environmental stewardship, and engage in additional pre-ventive health behaviors.

400 | MARKUS GOLDSTEIN, JOSHUA GRAFF ZIVIN, AND HARSHA THIRUMURTHY
Many of the impacts of ART that we have documented are welfare improving, butchanges in sexual behavior in response to treatment availability have the potential toerode some of these benefits. The concern is that for those individuals not in treatment(especially currently uninfected individuals), the availability of ART could result in alower perceived cost of engaging in risky sexual behavior.11 If this were the case, scal-ing up ART could pose a challenge to HIV prevention efforts. Empirical research on thistopic is crucial, as the magnitude of these effects will help assess the need for compan-ion interventions when ART is scaled up. It is reassuring that the evidence to date on thesexual behavior of ART recipients themselves indicates that ART results in reducedrisky behavior and HIV transmission (Bunnell et al. 2006). In the absence of more directevidence on community behavior, the increased provision of information and counsel-ing to HIV-negative individuals and those of unknown status seems prudent.
In the long run, for ART to be effective and household impacts to persist, a high rateof adherence to medications is essential. Given that many treatment programs haveonly been functioning for a limited number of years, evidence on long-term adherencelevels and household impacts is, by definition, lacking. Early evidence indicates thatpatients are highly adherent to ART (Orrell et al. 2003), but research on barriers toadherence is necessary (Mills et al. 2006). Similar, longitudinal studies of patients onART are needed in order to understand the long-term household impacts of treatment.
Proper estimation of the costs of ART is another area where further work wouldbe of value. The US$99 annual cost of first-line treatment regimens cited earlier isonly one part of the overall costs; other expenditures, such as facility construction,staffing, and laboratory tests, are associated with treatment programs. These costsare likely to vary according to the locations and the socioeconomic settings in whichtreatment programs operate. Moreover, the sustainability of the foreign donor sup-port that enables the establishment of some treatment programs is an important issuein light of the fact that an interruption in drug supplies for patients receiving ARTcould result in treatment failure and the development of drug resistance.
The Economic Rationale for Scaling Up ART
Antiretroviral therapy provides large and significant socioeconomic benefits to treat-ed patients and their households. Although the gains from the labor productivityimpacts alone outweigh the current costs of treatment (Thirumurthy, Graff Zivin, andGoldstein 2008), a more comprehensive assessment of the costs and benefits of ARTis needed to underpin a thorough economic evaluation of the intervention.12 Addi-tional evidence from large treatment programs and over the long term is also neces-sary before stronger policy conclusions can be drawn. However, the improvement inpatients’ employment outcomes over the short term is clearly a first step in quantify-ing the benefits of ART, and one that is particularly large in light of the “no ART”counterfactual scenario in which rapid death would occur. The increase in patients’employment frees up children’s time, and the children are then able to attend schoolmore. In addition, some of the income derived from patients’ employment paysfor food that leads to improvements in child nutrition. Thus, a second step in the
THE HOUSEHOLD IMPACTS OF TREATING HIV/AIDS | 401
assessment of benefits from ART should account for the long-run investment effectsof improvements in education and nutrition at this critical juncture in children’s lives.
It is illuminating to consider the long-run effects, for example, of improvements inchild nutrition within ART households. Without the provision of ART, children aremore likely to remain malnourished, entailing costs that are highlighted by Behrman,Alderman, and Hoddinott (2004). First, malnourished children are less likely to sur-vive into adulthood. Second, malnourished children are more likely to be susceptibleto disease, which implies societal costs, given that primary health care is generallysubsidized. Third, malnutrition is associated with lower educational attainment for arange of reasons, including an inability to concentrate in class. It is striking that inthe absence of ART, children may be doubly cursed, as malnutrition and labor bur-dens will reduce both the quality and the quantity of their schooling experience.Finally, poor early childhood nutrition affects labor productivity in adulthood.Thomas and Strauss (1997), for example, show that in Brazil the height of adults,which can proxy for early childhood nutrition, is associated with higher wages. Sincethe provision of ART to adults improves children’s nutritional status and therebyavoids these future consequences of malnutrition, the long-term benefits of ART gowell beyond the increase in treated patients’ incomes.
Additionally, emerging work on early childhood development drawing on neuro-science and economics may show that ART affects several outcomes for childrenbeyond those of nutrition and schooling. In a review of early childhood developmentprograms, Knudsen and colleagues extrapolate from animal studies to argue that“these findings, that both differences in, and disruptions of, close affinitive bondsearly in life can have lifelong effects on the development of social behaviors, raiseimportant concerns regarding the extent to which analogous early life experiencesinfluence human development” (Knudsen et al. 2006, 10157). A growing body ofneurobiological studies of children shows that severe stress, including parental death,particularly when not offset by professional assistance, can lead to long-term physi-cal and mental health problems. (For a review, see Center on the Developing Child2007.) Such effects are suggestive of other benefits from the provision of ART, andthey deserve further investigation.
It is important to note that the impacts discussed thus far are predominantly pri-vate benefits realized by treated individuals and their immediate family members.Although our analysis suggests that treatment is a worthwhile investment for indi-viduals and their families (uncertainty regarding the long term notwithstanding), thecase for public subsidies and thus for international involvement in treatment is lessobvious and is a matter for further theoretical and empirical investigation. There arefour main issues that would provide justification for public support. First, borrow-ing constraints, which are a significant concern in low-income settings, may pose ahindrance to privatizing the market for ART, since the flows of costs and benefitsoccur on different time scales. (Costs are incurred during a period of sickness, andbenefits are realized at least 6 to 12 months later.) Second, the provision of treatmentmay generate social externalities that will not factor into the decisions of privateactors in the health care marketplace. For example, ART is known to reduce thetransmission of HIV, and it thus imparts important benefits to the sexual partners of

402 | MARKUS GOLDSTEIN, JOSHUA GRAFF ZIVIN, AND HARSHA THIRUMURTHY
those receiving treatment, but by lowering the perceived costs of infection, treatmentmay lead to more sexually promiscuous behavior. Third, incomplete adherence toART can lead to virologic failure and drug resistance. If a poorly adherent patient ismore likely to spread a resistant strain of the disease, the social costs of such behav-ior are higher. Finally, in an extension of the human capital discussion above, thesocial returns to education may exceed private returns, and hence any interventionthat improves children’s education (directly, through the education effect of ART, orindirectly, through improved nutrition leading to improved educational outcomes)could provide some justification for a subsidy. This paper does not delineate the mag-nitude of all these factors; rather, it suggests issues for further research.
The potentially large macroeconomic impacts associated with the effects of ARTthat we have documented here are worth considering, particularly in countries withhigh HIV prevalence. The model developed by Bell, Devarajan, and Gersbach (2006)predicts drastic economic declines (e.g., a halving of household incomes in three gen-erations’ time) in the absence of interventions to address the problem of HIV/AIDS.The key to this model is the hollowing out of the human capital core that would havesustained growth. Indeed, the important assumptions of the model are supportedindirectly by our evidence on the household impacts of ART. The provision of ARTcan thus be one of the critical tools for avoiding the potentially large intergenera-tional economic effects of HIV/AIDS. This consideration is a powerful argument forpublic support for ART, in combination with other interventions, with the aim ofensuring economic growth and efficiency (Devarajan and Goldstein 2007).
We have shown, on the basis of studies in Kenya and elsewhere, that in the firsttwo to three years after beginning ART, patients receiving the treatment realize largesocioeconomic benefits. But ART alone is not enough to stop the scourge ofHIV/AIDS. The development of interventions that can effectively stem the spread ofHIV/AIDS is certainly necessary, and these interventions should be scaled up whenthey become available. Nonetheless, short of a cure, many countries will still be facedwith millions of infected individuals, many of them adults. The experience of severaltreatment programs in Africa indicates that ART can not only prevent the loss of thiscurrent generation of workers but can also restore their economic productivity andhelp prevent negative effects on the health and education of the next generation.
Notes
1. In this paper we use the terms “ART” and “treatment” to refer to highly active anti-retroviral therapy (HAART), which was introduced in 1996. HAART always consists ofthree antiretroviral medications. Treatment for most patients begins with a first-line reg-imen that is usually modified over time. Generic medications that combine three med-ications in one pill (such as Triomune) have recently become available.
2. Conversion to HIV-positive serology normally occurs 4 to 10 weeks after transmission.The duration of the clinical latent period has been found to vary considerably, dependingon the mode of transmission and age at transmission (Collaborative Group 2000). Indeveloping countries, limited access to health care and a greater burden of other infectiousdiseases may expedite the progression of HIV.

THE HOUSEHOLD IMPACTS OF TREATING HIV/AIDS | 403
3. Patients who came to the clinic from outside the clinic’s catchment area were interviewedat the clinic rather than at home.
4. Our analysis of the third wave of data is ongoing, and so this paper primarily emphasizesresults based on the first two waves.
5. The analysis here excludes the 60 households containing HIV-positive AMPATH patientswho were in the early stages of HIV disease and were not yet sick enough to require ART,according to WHO treatment guidelines. These households are excluded because theuntreated HIV-positive patients would not have experienced significant health changesduring the survey period. The small sample size of these HIV households also limits ourability to use them as a control group in the data analysis. All analysis in the paper is thusrestricted to the 200 households containing ART recipients and to households from thecensus sample.
Included in the sample are two adults (and their household members) who were origi-nally part of the census sample but enrolled in the AMPATH clinic and began receivingART between waves. As is discussed in the text, several other patients in the ART sampleinitiated ART between waves.
6. A key assumption of the difference-in-difference approach is that there are no time- varyingcharacteristics that differ between the ART sample and the census sample and that are alsocorrelated with trends in the outcome variables of interest.
7. Information on labor supply of household members was typically provided by the house-hold head, except in the case of clinic interviews at which the patient provided all infor-mation about the household.
8. The coefficient of the variable “Patient on ART * wave 2” indicates how much the out-come variable changed between wave 1 and wave 2 for patients on ART, after controllingfor time trends with data from the census sample.
9. Average hours attended are 30.47 for children in households with adult ART recipientswho were treatment naïve in wave 1 or who began treatment shortly after wave 1.
10. Average hours attended are 30.15 for boys in households with adult ART recipients whowere treatment naïve in wave 1 or who began treatment shortly after wave 1.
11. This is considerably less of a concern for those on ART, since the drugs significantly reduceinfectivity.
12. It should be noted that calculating the impact of ART on household income using the esti-mated impacts on labor supply is difficult because it is not obvious which is the appro-priate wage rate to use. Those with HIV may not be able to obtain average local wagerates if they are less productive (if their health has not been fully restored, or even aftertheir health has been restored) or if they encounter HIV-related stigma and discrimination.
References
Beegle, Kathleen, Joachim De Weerdt, and Stefan Dercon. 2006. “Orphanhood and the Long-Run Impact on Children.” American Journal of Agricultural Economics 88: 1266–72.
Behrman, Jere, Harold Alderman, and John Hoddinott. 2004. “Hunger and Malnutrition.”Challenge Paper Summary prepared for the Copenhagen Consensus, Copenhagen. May 24. http://www.copenhagenconsensus.com/Admin/Public/DWSDownload.aspx?File=Files%2FFiler%2FCC%2FPress%2FUK%2FCPHunger%5B1%5D.pdf.
Bell, Clive, Shantayanan Devarajan, and Hans Gersbach. 2006. “The Long-Run EconomicCosts of AIDS: A Model with an Application to South Africa.” World Bank EconomicReview 20: 55–89.

404 | MARKUS GOLDSTEIN, JOSHUA GRAFF ZIVIN, AND HARSHA THIRUMURTHY
Bunnell, Rebecca, et al. 2006. “Changes in Sexual Behavior and Risk of HIV Transmission afterAntiretroviral Therapy and Prevention Interventions in Rural Uganda.” AIDS 20: 85–92.
Canning, David. 2006. “The Economics of HIV/AIDS in Low-Income Countries: The Case forPrevention.” Journal of Economic Perspectives 20: 121–42.
Case, Anne, and Cally Ardington. 2006. “The Impact of Parental Death on School Outcomes:Longitudinal Evidence from South Africa.” Demography 43: 401–20.
Center on the Developing Child. 2007. “A Science-Based Framework for Early Childhood Policy: Using Evidence to Improve Outcomes in Learning, Behavior, and Health for Vulnerable Children.” Center on the Developing Child, Harvard University, Cambridge,MA. http://www.developingchild.harvard.edu/content/publications.html.
Chequer, P., et al. 1992. “Determinants of Survival in Adult Brazilian AIDS Patients,1982–1989.” AIDS 6: 483–87.
Coetzee, Celeste, and Nicoli Nattrass. 2004. “Living on AIDS Treatment: A Socio-EconomicProfile of Africans Receiving Antiretroviral Therapy in Khayelitsha, Cape Town.” CSSRWorking Paper 04/71, Centre for Social Science Research, Cape Town.
Coetzee, David, et al. 2004. “Outcomes after Two Years of Providing Antiretroviral Treatmentin Khayelitsha, South Africa.” AIDS 18: 887–95.
Collaborative Group (Collaborative Group on AIDS Incubation and HIV Survival Includingthe CASCADE EU Concerted Action). 2000. “Time From HIV-1 Seroconversion to AIDSand Death before Widespread Use of Highly-Active Antiretroviral Therapy: A Collabora-tive Re-Analysis.” Lancet 355: 1131–37.
d’Adda, Giovanna, Markus Goldstein, Joshua Graff Zivin, Mabel Nangami, and HarshaThirumurthy. 2009. “ARV Treatment and Time Allocation to Household Tasks: Evidencefrom Kenya.” African Development Review 21 (1): 180–208.
Devarajan, Shantayanan, and Markus Goldstein. 2007. “The Case for Public Action on AIDSOrphans.” Paper prepared for the Joint Learning Initiative on Children and AIDS, WorldBank, Washington, DC.
Economist. 2006. “Look to the Future: The War against AIDS.” August 19.
Evans, David, and Edward A. Miguel. 2007. “Orphans and Schooling: A Longitudinal Analysis.” Demography 44: 35–57.
Fox, Matthew P., et al. 2004. “The Impact of HIV/AIDS on Labour Productivity in Kenya.”Tropical Medicine and International Health 9: 318–24.
Glewwe, Paul, and Elizabeth M. King. 2001. “The Impact of Early Childhood Nutritional Status on Cognitive Development: Does the Timing of Malnutrition Matter?” World BankEconomic Review 15 (1): 81–113.
Graff Zivin, Joshua S., Harsha Thirumurthy, and Markus Goldstein. 2006. “AIDS Treatmentand Intrahousehold Resource Allocations: Children’s Nutrition and Schooling in Kenya.”NBER Working Paper 12689, National Bureau of Economic Research, Cambridge, MA.
Habyarimana, James, Bekezela Mbakile, and Cristian Pop-Eleches. 2007. “HIV/AIDS, ARVTreatment and Worker Absenteeism: Evidence from a Large African Firm.” Columbia University, New York.
Hammer, Scott M., et al. 1997. “A Controlled Trial of Two Nucleoside Analogues plus Indinavir in Persons with Human Immunodeficiency Virus Infection and CD4 Cell Countsof 200 per Cubic Millimeter or Less.” New England Journal of Medicine 337: 725–33.
Hogg, Robert S., et al. 1998. “Improved Survival among HIV-Infected Individuals FollowingInitiation of Antiretroviral Therapy.” Journal of the American Medical Association 279:450–54.
Kenya, Central Bureau of Statistics. 1999. Kenya 1999 Population and Housing Census.Nairobi: Central Bureau of Statistics.
THE HOUSEHOLD IMPACTS OF TREATING HIV/AIDS | 405
Knodel, John E. 2008. “Poverty and the Impact of AIDS on Older Persons: Evidence fromCambodia and Thailand.” Economic Development and Cultural Change 56 (2): 441–75.
Knudsen, Eric, James Heckman, Judy Cameron, and Jack Shonkoff. 2006. “Economic, Neurobiological, and Behavioral Perspectives on Building America’s Future Workforce.”Proceedings of the National Academy of Sciences 103 (27): 10155–62.
Koenig, Serena P., Fernet Leandre, and Paul E. Farmer. 2004. “Scaling-up HIV Treatment Pro-grammes in Resource-Limited Settings: The Rural Haiti Experience.” AIDS 18: S21–S25.
Laurent, Christian, et al. 2002. “The Senegalese Government’s Highly Active AntiretroviralTherapy Initiative: An 18-Month Follow-up Study.” AIDS 16: 1363–70.
Mamlin, Joe, Sylvester Kimaiyo, Winstone Nyandiko, and William Tierney. 2004. AcademicInstitutions Linking Access to Treatment and Prevention: Case Study. Geneva: WorldHealth Organization.
Marins, Jose Ricardo P., et al. 2003. “Dramatic Improvement in Survival among Adult Brazilian AIDS Patients.” AIDS 17: 1675–82.
Medicins Sans Frontieres. 2007. Untangling the Web of Price Reductions. Geneva: MedicinsSans Frontieres.
Mills, Edward J., et al. 2006. “Adherence to HAART: A Systematic Review of Developed andDeveloping Nation Patient-Reported Barriers and Facilitators.” PloS Med 3 (11): e438.
Morgan, Dilys, et al. 2002. “HIV-1 Infection in Rural Africa: Is There a Difference in MedianTime to AIDS and Survival Compared with That in Industrialized Countries?” AIDS 16:597–603.
Nattrass, Nicoli. 2006. “South Africa’s ‘Rollout’ of Highly Active Antiretroviral Therapy: ACritical Assessment.” Journal of Acquired Immune Deficiency Syndrome 43 (5): 618–23.
Orrell, C., D. R. Bangsberg, M. Badri, and R. Wood. 2003. “Adherence Is Not a Barrier toSuccessful Antiretroviral Therapy in South Africa.” AIDS 17: 1369–75.
Palella, Frank J., et al. 1998. “Declining Morbidity and Mortality among Patients with AdvancedHuman Immunodeficiency Virus Infection.” New England Journal of Medicine 338:853–60.
Thirumurthy, Harsha, Joshua Graff Zivin, and Markus Goldstein. 2008. “The EconomicImpact of AIDS Treatment: Labor Supply in Western Kenya.” Journal of HumanResources 43 (3, Summer): 511–52.
Thomas, Duncan, and John Strauss. 1997. “Health and Wages: Evidence on Men and Womenin Urban Brazil.” Journal of Econometrics 77 (1, March): 159–85.
UNAIDS (Joint United Nations Programme on HIV/AIDS). 2007. Financial ResourcesRequired to Achieve Universal Access to HIV Prevention, Treatment, Care and Support.Geneva: UNAIDS.
WHO (World Health Organization). 1995. Physical Status: The Use and Interpretation ofAnthropometry—Report of a WHO Expert Committee. World Health Organization Technical Report 854. Geneva: WHO. http://whqlibdoc.who.int/trs/WHO_TRS_854.pdf.
———. 2006. Antiretroviral Therapy for HIV Infection in Adults and Adolescents: Recom-mendations for a Public Health Approach—2006 Revision. Geneva: WHO.
Wools-Kaloustian, Kara, et al. 2006. “Viability and Effectiveness of Large-Scale HIV TreatmentInitiatives in Sub-Saharan Africa: Experience from Western Kenya.” AIDS 20: 41–48.

406
Comment on “Health and Socioeconomic Status:The Importance of Causal Pathways,” byDuncan Thomas, and “The Household Impactsof Treating HIV/AIDS in Developing Countries,”by Markus Goldstein, Joshua Graff Zivin,and Harsha Thirumurthy
T. PAUL SCHULTZ
One goal of health economics is to clarify how to achieve improvements in healthat the least private and social cost. But several issues arise. The first is that deter-mining how to measure health status is not a simple task. Health has many facets.The common indicators of mortality and morbidity are generally measured poorlyand with much systematic error in low-income countries. Furthermore, they can-not be decomposed reliably by cause or disease or readily linked to individuals whoexhibit different biological and economic endowments, opportunities, and health-related behaviors.
The second problem is to evaluate how public policies affect health outcomes overtime. Health production functions are difficult to estimate in high-income countriesand are rarely assessed in low-income countries unless the policy inputs or healthtreatments are administered in a social experiment—in which case the inputs are notassociated with the confounding biological and economic endowments of individu-als and their lifetime health-related behaviors.
The third challenge is to estimate the social value of the measured health outcomeand the social cost of delivery of the health policy inputs. Needless to say, assignmentof social values to health and to its distribution in the population involves issues ofethics, as well as of economics and politics, that go far beyond our discussion here.One among many methods for assigning a private economic value to health measuresis to assess the effect of a health outcome on individuals’ productive potential. Thisapproach is parallel to the human capital framework that has been employed to clar-ify the economic consequences of education as a factor raising individual productiv-ity. The increasing availability of multipurpose household surveys and censuses thatcollect the socioeconomic and health characteristics of a representative populationprovides a basis for estimating in some contexts the effect of health human capital onindividual productivity or observed wage rates. There are many reasons to expect
T. Paul Schultz is Malcolm K. Brachman Professor Emeritus of Economics at Yale University, New Haven, CT.
Annual World Bank Conference on Development Economics 2009, Global © 2010 The International Bank for Reconstruction and Development / The World Bank.

COMMENT | 407
that health policy variations affecting the accumulation of health human capital willbe associated with the individual’s endowments before the policy treatment and withthe persisting patterns of health-related behaviors. Given these sources of individualheterogeneity, such as genetic diversity and variation in socioeconomic status—whichare likely to be associated with who receives heath policy treatments—little can belearned about the causal effect of the policy treatment on health outcomes from thedirect association of the two unless the policy is prescribed in a random experimentor unless strong assumptions are maintained regarding the functioning of programinstitutions and individual and family behavior.
This is the dilemma that faces applied health economics, and it appears to me evenmore serious in developing countries than in developed ones, although conceptuallysimilar. We tend to be guided by medical knowledge derived from clinical experi-ments in carefully monitored situations that do not allow an economic assessment ofthe cost of scaling up the specified medical treatment to a field program at a regionalor national level. Nor do these clinical experiments provide the economist with abasis on which to evaluate the economic productivity effects of the health improve-ments and, hence, their private income effects.
Another dilemma for public health policy evaluations is that interventions arebelieved to have social externalities on the health of other individuals who do notexperience the policy treatment.1 It is generally believed that preventive health carefor infectious and parasitic diseases creates such spillover social benefits, which partlyjustifies the production of such goods in the public sector.
The papers in the session on human development provide insights into the issuesdescribed above. Duncan Thomas draws attention to areas in which knowledgeabout what produces health and about the consequences of health for incomegrowth, or, as he terms it, “prosperity,” has been mounting rapidly. Let me summa-rize some of his observations and then note where our perspectives differ slightly.First, evidence has recently accumulated showing that the nutritional and physicalcondition and development of the pregnant woman and her fetus set into motionlong-lasting effects on the child, related not only to lifespan but also to the child’scognition, school attainment, earnings, and disability-free years of life that may bepotentially applied to productive work. These life-course outcomes are likely to addup to greater productive potential and tend to be associated with higher marketincome—although, as Thomas notes, this did not necessarily hold in his iron supple-ment social experiment.
This body of evidence on health and development is generated by research con-ducted in many disciplines, using disparate data and methods and creating plenty ofpuzzling paradoxes and loose ends. The types of research, with the associated prob-lems, include the following:
1. Historical accidents or natural experiments, in which a treatment appears to occurat a specific time or location or to a specific group and the effects can be followedas the members of relevant cohort live out their lives. Examples include the Spanishflu epidemic and the radioactive rainfall on Sweden after the Chernobyl nuclearreactor accident.

408 | T. PAUL SCHULTZ
2. Social experiments, in which treatments are randomly allocated among people,households, or communities. The treated and comparison populations are fol-lowed to minimize attrition and to document consequences accumulating overtime.
3. Assessment of technical and behavioral relationships between, on the one hand,preconditions or risk factors and, on the other hand, outcomes affected by familyand institutional behavior and constrained by biology and technology. Inferenceof causal effects typically requires the researcher to impose debatable identifyingassumptions.
4. Findings from randomized animal studies, which may be arguably relevant tohuman development.
Because studies linking health to outcomes are complicated, and many mechanismsmay be consistent with observed empirical regularities, it is generally desirable to dis-tinguish how specific pathways relate socioeconomic characteristics to health and tosubsequent individual and family outcomes. New biological markers are helping toquantify some of these biological indicators in large representative household surveys.Thomas cites several examples to illustrate what can be learned from these data andmethods, and what the limitations are of even well-designed research programs:
1. The experience of survivors from the cohort born in China during the famine of1959–60 may show how malnutrition stunts and scars a cohort and affects itsmembers’ capacities as adults. But some of the cohort—probably individuals whowere less healthy, on average—die as a result of the stress of the famine, and thisculling changes the composition of the surviving cohort and should be taken intoaccount. Thomas also notes that fertility tends to decline during a famine, whichmay further change the socioeconomic composition of those born because fertilityis a choice—as is migration to mitigate the conditions of the famine.
2. A parallel behavioral change in fertility associated with the flood in Bangladesh in1974 makes it difficult to ascertain how the health crisis caused by the flood affectedthe educational attainment of the cohort born near the time of the flood.
3. Social programs in rural Indonesia stationed midwives in poor villages in the1990s, but evaluation of the local health effects of the program requires carefulcomparisons among suitable groups. Because midwives’ presence directly benefitsonly the health of women and children, not men, a comparison of how gender dif-ferences in health evolve in communities that receive midwives and those that donot offers Thomas a convincing basis for evaluating this health intervention.
A similar approach in Matlab District, Bangladesh, followed a family planning andchild and maternal health social experiment that began in 1977. By 1996, programvillages exhibited much lower fertility, lower child mortality, and improved healthamong women of childbearing age, compared with the control villages, but the healthof men was not affected (Schultz 2009). The benefits of the Matlab program forhealth and productivity are therefore expected to be specific by age and sex. Themonthly earnings of women working in the paid labor force are indeed shown to beone-third higher for women age 25–54 in the program treatment villages in 1996,

COMMENT | 409
whereas wages are no different for men, controlling for their schooling and age. Norare there distinguishable program effects on wages of males or females age 15–24,even when adjusted for sample selection bias of wage earners, where household landholdings are specified to raise home productivity and thereby identify the modelof selection into the paid labor force.
The increased wage rate of women in the program villages in Matlab comes aboutbecause women who presumably have been enabled to avoid unwanted childbearingare more productive in paid jobs. But because the households in the program villagesalso accumulate more household assets and have fewer children to perform house-hold chores, the women actually choose to increase their participation in householdproduction, even though their wage opportunities in the market are now greater. Aneconomist might hypothesize that the value of home productivity of women musthave increased even more than their market wages, to dominate the attractiveness ofthe higher wage rates women receive in the paid labor force.
Foster and Rosenzweig (2007) note a similar pattern in rural India, where theGreen Revolution increased agricultural yields differentially across the countrybetween 1970 and 2000. Household incomes have consequently increased, andwomen’s wages have risen since 1982, during a period when birthrates declined andschooling increased. But the adult women who are reducing their birthrates are notturning to the paid labor force; rather, they may be reallocating their time from childcare to home production. In the longer run, I would expect the labor productivity ofwomen in market employment in rural South Asia to increase more rapidly thanlabor productivity in home production, but this will not necessarily occur immedi-ately or in all countries experiencing the common features of the demographic tran-sition, even when the aggregate economy experiences robust growth, as has India’ssince the 1990s.
Thomas argues that it is important, in evaluating how health affects prosperity, tounderstand how long-term gains in health and productivity affect labor supply. Econ-omists have conceptualized workers’ labor supply response to an increase in theirwages as a combination of an income effect, which favors the demand for leisure orless work, and a substitution effect associated with the increased opportunity cost ofleisure, which favors a reduction in the demand for leisure or a tendency to workmore.2 When individual labor supply is embedded in a family model of coordinatedlabor supply, the wages of other family members also enter the equation with theirown combinations of income and cross-substitution effects. In the rural Indian andBangladesh studies, it is likely that the increasing wages of husbands have con-tributed to wives’ reallocation of time from child care to home production, as thehusbands’ cross-wage effects tend to have a negative influence on wives’ supply oftime for working in the labor market.
Another of Thomas’s arguments regarding health is also reflected in the labor supply literature. A short-run fluctuation in health and productivity as a result ofcontrol of an acute infectious illness is expected to exert a more positive effect on current labor supply than would a long-term or permanent change in health—forexample, reduction of the disabling effects of chronic illness, which brings with it a

410 | T. PAUL SCHULTZ
lifetime improvement in wage opportunities and hence a larger gain in lifetime wealththat encourages workers to consume more leisure and work fewer hours.
The Work and Iron Status Evaluation (WISE), a social experiment Thomas andhis colleagues planned and implemented in central Java, illustrates how increasedhealth and productivity resulting from provision of a randomized iron supplementbrought about improvements in objective and subjective health status and ledmale wage earners to reallocate time from sleep to leisure—perhaps because theywere paid on an hourly basis and thus did not receive increased wages from theiremployers. Self-employed males, who realized financial gains of 15 percent fromtheir enhanced productivity, received more income but still worked about thesame amount of time as before. Wage earners who received the iron supplementswere more likely to shift over time to self-employment, where they could expectto realize the financial benefit from their decreased anemia and increased produc-tivity per hour worked.3
Further study of family labor supply behavior in developing countries is needed,especially that of women as they adjust their time allocation to the declining levels offertility observed worldwide and to what I expect to be a period of improving healthstatus of women relative to men. Design of public policies in the labor market andsocial welfare systems that assist women in their reallocation of time could be signif-icant factors in reducing poverty and increasing total income. Targeting family plan-ning and reproductive health programs to those women and young children whohave the most to gain from this package of information, services, and supplies mightrepresent a form of health human capital investment with relatively high long-terminternal rates of return, as documented in Matlab. But more prospective experimen-tal and pilot programs must be evaluated before any generalizations can be drawn inthis regard. Conversely, there are probably many parts of the world where the fertil-ity of the upper and middle classes does not respond substantially to family planningsubsidies or does not suggest that a market failure is being mitigated by this publicintervention. The challenge is to define the context in which returns are suitably highfor publicly subsidized social welfare programs.
In their paper, Goldstein, Graff Zivin, and Thirumurthy estimate the benefits froman antiretroviral (ARV) drug therapy that was prescribed to HIV/AIDS patients inwestern Kenya when their CD4 counts collapsed to levels at which their immune sys-tems were unlikely to sustain their capacity to work. With the recent drop in the costof these drugs and the increase in donor funding for ARV treatment programs, it isappropriate to ask, what are the health and economic consequences of these pro-grams for those treated, under the conditions prevailing in rural Africa? It is not eth-ically acceptable to provide therapy for a random sample of AIDS patients. An alter-native approach to evaluation is to collect representative data on the population fromwhich the patients come and then to construct a comparison of how patients’ CD4count and their labor supply and other household behaviors change over time forindividuals after they enter ARV therapy, as well as how this change compares withthat occurring at the same time in the same community within the representativesample (that is, to control for variation by age, sex, and season). Using relatively
COMMENT | 411
small samples, the authors are able to document that the medical indicator of diseaseremission improves within two months; patients’ work hours increase 39 percent;and work hours by children in patients’ households decrease (significantly, in the caseof boys), while children of both genders reallocate more hours to attending school.Although the concluding claims of the authors to have evaluated the economic costsand benefits of ARV programs are somewhat overstated, their evaluation methodol-ogy is promising and deserves to be replicated in other settings where the costs ofscaling up the program can be more thoroughly assessed.
Notes
1. Thus, provision of deworming medicine in randomly selected schools in Kenya led toreduced burdens of these parasites on children from neighboring school districts and onother children within the district who did not undergo the treatment (because they did notattend school the day the medicine was available or because their families did not com-plete the permission form allowing them to participate in the medical treatment).
2. The balance of the offsetting income and substitution effects allows a labor economist toaccount for own-wage responses in either sign within this framework: a positive labor sup-ply response to a rise in wages by women results when the substitution effect dominatesthe income effect, whereas a negative (uncompensated) labor supply response for menoccurs because the income effect weighted by initial hours worked by the man dominateshis substitution effect, accounting in the extreme case for a backward-bending labor sup-ply relationship with respect to male wages.
3. One might argue that the value of home production is largely omitted from nationalincome and product accounts because of the difficulty of valuing the product, and thesame is, of course, true of leisure. But the welfare gains from the increased value of leisure,efficiency of sleep, and productivity at work are nonetheless clear, even if national incomeand product accounts do not capture all of them.
References
Foster, Andrew D., and Mark R. Rosenzweig. 2007. “Does Economic Growth Reduce Fertility?Rural India, 1971–1999.” In India Policy Forum, 2006–07, ed. Suman Bery, BarryBosworth, and Arvind Panagariya. New Delhi: National Council of Applied EconomicResearch (NCAER); Washington, DC: Brookings Institution Press; New Delhi: Sage Publi-cations India.
Schultz, T. Paul. 2009. “How Does Family Planning Promote Development? Evidence from aSocial Experiment in Matlab Bangladesh—1977–1996.” Presented at the annual meetingof the Population Association of America, Detroit, MI, April 30. http://paa2009.princeton.edu/download.aspx?submissionId=90065.

412
Comment on “The Household Impacts of Treating HIV/AIDS in Developing Countries,”by Markus Goldstein, Joshua Graff Zivin, andHarsha Thirumurthy
JOHN STRAUSS
In this paper, Goldstein, Graff Zivin, and Thirumurthy summarize their excellentarticle published in the Journal of Human Resources (Thirumurthy, Graff Zivin, andGoldstein 2008). That work is quite important because it represents the best scien-tific study to date of the impact of antiretroviral (ARV) therapy on HIV patients’labor supply and the spillover effects on the labor supply of other household mem-bers, notably children. The authors find that the therapy has a large effect on HIVpatients’ hours worked, which rise back toward what they were before the patientsbecame so ill. The impacts are much larger for patients in the first six months of ARVtreatment. The authors also find a large effect on increased blood CD4 counts, indi-cating that the ARV medication is working. An important finding is that theseimpacts on CD4 counts and on labor supply occur almost immediately after treat-ment has begun and last for the six months’ portion of the study that is reported.Also of importance are the spillover effects—the increased time at school anddecreased labor time of children who had been taking care of HIV-infected parents.
In addition to providing a simplified summary of their journal article, the authorsadvocate the scaling up of ARV treatment programs such as the one they study inrural Kenya. Here, important issues of public economics arise that the authors havenot considered carefully enough, as discussed below.
To begin with, I summarize the scientific issues in the conference paper. Ade-quately assessing the impacts of ARV on labor supply poses a challenge. Experimentsare not possible in this case because of ethical concerns about controls not receivingtreatment. The authors use hospital data from the Academic Model for the Preven-tion and Treatment of HIV/AIDS (AMPATH), an organization in western Kenya, onHIV-positive patients undergoing ARV treatment. In addition, they conduct severalwaves of surveys of these patients to obtain information on the labor supply of therespondents and others in their households. Unfortunately, they do not have available
John Strauss is professor of economics at the University of Southern California.
Annual World Bank Conference on Development Economics 2009, Global© 2010 The International Bank for Reconstruction and Development / The World Bank

COMMENT ON GOLDSTEIN, Z IVIN, AND THIRUMURTHY | 413
data on these patients prior to treatment, but they do know how long the treatmentshave been going on.
Of course, those persons who seek treatment constitute a very select group of theHIV-positive population, which would lead to bias if their characteristics were simplycompared with a control group. The authors recognize this and instead use first dif-ferences over a six-month period during which they collected data prospectively. Thefirst difference eliminates additive, unobserved, time-invariant individual characteris-tics that may be responsible for those patients’ seeking care in the first place.
The difficult part is to find a plausible treatment group. The authors use a sam-ple made up of individuals in the area who are not registered in the AMPATH med-ical system. Of course, some of these persons will be HIV positive, while most willbe HIV negative. They will differ in their underlying characteristics, since the HIV-positive persons are not yet receiving treatment. These controls, too, were inter-viewed over time, and a difference over a six-month time period is taken for themas well. The authors then use a difference-in-difference specification to examine theimpact on labor supply of being on ARV treatment. As mentioned, the difference-in-difference specification will eliminate time-invariant unobservables that maycause selection bias, but it will not eliminate time-varying unobservables. If, forinstance, there are differential trends over time between treatments and controls, orthere exist time-varying shocks that affect both treatment status and labor supply(say, from unanticipated side effects of the ARV drugs), this would not be accountedfor by the difference-in-difference estimator. Overall, though, the results in thisstudy seem quite plausible and are certainly far more reliable than those from otherstudies to date.
One of the important results reported in the paper is the existence of gender dif-ferentials associated with treatment. (These differences are explored in much moredetail in the longer Journal of Human Resources version.) The results on labor forceparticipation show up only for women, not men—perhaps not surprisingly, since itis female labor force attachment that is usually suspect, more than men’s. The impacton hours is greater for men, although part of the reason is probably that female workin home production is not taken into account. Schooling hours rise for both boys andgirls, but work declines only for boys (again, perhaps because home production workis not counted).
Finally, the Journal of Human Resources version reports on impacts on earnings,which are also strong and positive. These estimates are probably biased upward,however, because the value of labor hours is evaluated at mean market wages,whereas the market wages of these still-sick workers are likely to be below meanwages. In addition, it may be the more productive workers in the population whocontract HIV, or it may be the less productive ones; the authors provide no data onthis, and evidence from other studies is mixed on this point (see Strauss and Thomas2008). In addition, household income will not rise as much as does the treated indi-vidual’s income if the labor supply of other members falls, as the authors demon-strate happens, at least for boys. What is more useful to think about than laborincome is full income, which should rise by the value of the increase in nonsick time
414 | JOHN STRAUSS
for the treated respondents. The paper claims that the rise in full income is equal toUS$350 per year, about the same as the current costs for first-line ARV drugs pluslaboratory tests (although less than the costs of second-line drugs, should they beneeded). But, as explained below, the stated costs are not complete, and so a properbenefit-cost calculation is not performed in this research.
One drawback of the results is that people are followed for only six months. Thestudy went on for two years, but the authors do not use the extra 18 months of data.Indeed, it would be extremely useful if the authors could go back and reinterview therespondents after more time has elapsed.
The science in the study is good, in my view, and the micro results are plausibleand convincing. However, the public economics in the second part of the paper areproblematic.
The first issue, which the authors now realize but did not in an earlier version ofthis paper, is that the benefits they calculate are private benefits. There are no socialexternalities in these results. That is not to say that social externalities may not exist;they may indeed. Examples that come to mind are the possibilities that transmissionrates of HIV may slow because some HIV-positive persons are taking ARVs (ofcourse, their sexual behavior may respond in perverse ways to the treatment, offset-ting any such benefit) and that more people may decide to be tested for HIV becauseof treatment being available. Unfortunately the science behind both scenarios is lim-ited, and the authors’ results say nothing about these mechanisms. (See Glick 2005for a nice survey on HIV testing.)
The real issue is that in practice, ARV drugs are being given free of charge byorganizations such as AMPATH, yet the fact that the benefits are in large part pri-vate indicates that there should be scope to charge patients, at least in the interestsof economic efficiency. Goldstein, Graff Zivin, and Thirumurthy argue againstsuch a policy on grounds of potential credit market constraints, but their ownresults belie this rationale because the impacts occur so rapidly after the start oftreatment—within the first six months. One might assert that there should be aprice schedule that increases with time from the initiation of treatment, but toargue for continued free access seems extreme in light of the authors’ results. It isstill possible, and perhaps likely, that an optimal pricing schedule would not recoverthe full cost—certainly not, if positive externalities do exist—but the optimal pricewill surely not be zero. Although it may not be interpreted in this way, this pricingargument is really good news for equity if implemented carefully because a limitedARV budget can extend to more HIV-positive patients if existing patients can suc-cessfully begin to pay part of the costs.
A second key issue that must be considered before thinking of scaling up the ARVeffort is the ability to scale up while maintaining the same level (or even close to thesame level) of service quality. In western Kenya, the group that runs the hospitals pro-viding the ARV treatments, AMPATH, is a collaboration by the medical schools ofthe University of Indiana and the University of Nairobi. Hence, the quality of theadministrative staff running the programs is very high—much higher than would pre-sumably be the case if the Kenyan Ministry of Health were operating the system.
COMMENT ON GOLDSTEIN, Z IVIN, AND THIRUMURTHY | 415
Issues of corruption, of waste, and of favoritism of treatment that would likelyhave to be dealt with in a publicly run system may not have to be consideredfor AMPATH, or at least to a much smaller degree. Presumably, it is much easier forAMPATH to staff the system with high-quality medical staff than it would be for thegovernment. To illustrate the problem, during my recent visit to a hospital verymuch like the AMPATH system in rural southeastern Uganda, a manager explainedthat a key difficulty was in attracting high-quality medical staff, even though thehospital was private and foreign run. One reason was that the area was so isolated.The hospital had set up and was supplying free satellite Internet access for staff, tomake living in that area more agreeable. In this regard AMPATH may have someadvantages because population densities are higher in rural Kenya than in otherparts of rural Sub-Saharan Africa and there are towns and cities in the area thatoffer some amenities.
The ability of AMPATH to deliver services and attain high rates of proper intakesof medicine may be high. (It is claimed to be more than 80 percent, but the data onwhich that claim is based are not absolutely accurate.) Whether a publicly run sys-tem would be able to achieve the same level is unclear. If not, then of course the wor-ries about emerging ARV-resistant types of HIV would be at issue.
These private-public distinctions are important because where delivery is in pri-vate or nongovernmental organization hands, as with AMPATH, the full costs areundoubtedly far higher than they would be under a public system. It is highly doubt-ful that the authors have data on all the costs, many of which would originate inBloomington, Indiana. As an aside, in the case of the Ugandan hospital I visited, 100percent of capital costs and more than 80 percent of operating costs, including allthe costs of the ARV drugs, were borne by foreign sources. Continued foreign aid iscertainly essential to the sustainability of AMPATH-like centers.
Concerning the evaluation of the social benefits and costs of ARV, the best dis-cussion is still found in the World Bank report Confronting AIDS (World Bank1997). Although the costs of ARV have dropped phenomenally since 1997, whenConfronting AIDS was published, the economic arguments contained in that volumeare still the starting place for any serious economic evaluation of the trade-offsinvolved.
Nevertheless, Goldstein, Graff Zivin, and Thirumurthy have made an essentialcontribution to the evaluation of ARV treatment. As noted, the analysis is not com-plete as a benefit-cost study or as an assessment of the ability to scale up this inter-vention and pass a benefit-cost test. The study does, however, raise interesting andvaluable issues of the pricing of ARV treatment and thus of the ability to perhapsreach many more HIV-infected patients than might have been thought possible.
References
Glick, Peter. 2005. “Scaling Up HIV Voluntary Counseling and Testing in Africa: What CanEvaluation Studies Tell Us about Potential Prevention Impacts?” Evaluation Review29 (4): 331–57.

416 | JOHN STRAUSS
Strauss, John, and Duncan Thomas. 2008. “Health over the Life Course.” In Handbook ofDevelopment Economics, vol. 4, ed. T. Paul Schultz and John Strauss. Amsterdam: North-Holland.
Thirumurthy, Harsha, Joshua Graff Zivin, and Markus Goldstein. 2008. “The EconomicImpact of AIDS Treatment: Labor Supply in Western Kenya.” Journal of HumanResources 43 (3, Summer): 511–52.
World Bank. 1997. Confronting AIDS: Public Policies in a Global Epidemic. World Bank Policy Research Report. New York: Oxford University Press.
Political Economy


When Is Public Expenditure Pro-Poor?
FRANCISCO RODRÍGUEZ
Studies of the progressivity of government spending often assume that certain typesof expenditure (e.g., for education and health) deliver the largest benefits to the poor.But the extent to which different types of expenditure can be pro-poor is likely to varysignificantly for countries at different levels of development. To deal with that issue,this paper develops a new indicator of the progressivity of fiscal policies. The meas-ure is obtained by empirically assessing the effect of different types of expenditure onpoverty and on the income elasticity of poverty reduction, using a panel of 387growth spells derived from the World Bank’s PovcalNet database. It is then used toevaluate the extent to which countries’ fiscal policies are pro-poor and to test differ-ent political-economy theories of the determination of fiscal policies. The results indi-cate that whereas richer economies have more pro-poor fiscal policies, policies inmore unequal, less financially developed, and more open economies are likely to beless pro-poor.
What makes for shared growth? How do some countries develop arrangements inwhich the poor benefit from and contribute to the growth process? Why are somedevelopment processes inclusive, while others appear to be driven by the actions andself-interest of particular groups?
Providing an answer to these questions requires that two distinct sets of issues beaddressed. One concerns the conditions under which the poor can contribute to eco-nomic growth. A well-established strand of the political-economy literature consid-ers that participation by the poor in the political process tends to increase the pres-sures on governments to enact distortionary policies that end up harming growthprospects (Alesina and Rodrik 1994; Persson and Tabellini 1994). However, the linksbetween political-economy models, redistribution, and growth are complex, and
419
Francisco Rodríguez is head of research at the Human Development Report Office of the United Nations DevelopmentProgramme. The author thanks Maria Eugenia Boza, Robert Bates, Andrew Donaldson, and Eduardo Zambrano forhelpful discussions and Madalina Ursu and Mark Purser for superb research assistance.
Annual World Bank Conference on Development Economics 2009, Global© 2010 The International Bank for Reconstruction and Development / The World Bank
420 | FRANCISCO RODRÍGUEZ
the exact effect of greater political participation is likely to depend on the preciseworkings of the political system, including the role that economic resources play ininfluencing politics (Bénabou 1996; Rodríguez 2004). The existence of credit con-straints may imply that the poor have unexploited high-productivity investmentopportunities, so that redistributing resources to them can generate high rates ofgrowth as the returns from these investments are realized (Galor and Zeira 1993).Furthermore, the participation of the poor in the political process may be necessaryto stave off the emergence of radical revolutionary movements, the effects of whichcan be much more harmful to an economy than those of the moderate redistributionlikely to emerge under voting in a democratic system (Acemoglu and Robinson2006).
A second set of issues has to do with the conditions under which the poor can ben-efit from growth. Several theories of political economy, going back at least to Meltzerand Richard (1981), have studied the conditions under which the political equili -brium will deliver high amounts of redistribution. The classic prediction is that moreunequal societies will tend to have higher redistribution. Other theories have stressed,as alternative determinants of redistribution, the role of economic development infostering the growth of the state and the need for social insurance, as a result of aneconomy’s integration into world markets.
Empirically, both of these literatures are hampered by lack of clarity as to theappropriate measure of pro-poor policies. The standard approach is to regress a setof public policies, such as government expenditures, on a set of demographic andpolitical determinants that stand in for different political-economy theories (see, e.g.,Shelton 2007). It is assumed that government expenditures, or certain types of government expenditure, are inherently redistributive and that the predictions ofpolitical-economy models can therefore be evaluated by studying the effect of certainvariables (e.g., inequality and openness) on these expenditures.
The relationship between public policies and redistribution, however, is likely todiffer significantly from country to country. European countries tend to carry out sig-nificant amounts of redistribution through their social security systems. In contrast,in many developing countries the social security system covers only the formal sec-tor, which tends to be made up of relatively better off individuals. Similarly, govern-ment action is likely to affect not only the level of poverty but also the responsive-ness of poverty to economic growth. A government that heavily invests in publicredistributive spending but finances that spending with the fiscal dividends of an eco-nomic expansion may be able to reduce poverty substantially while the expansionlasts. If, however, the economy enters a contraction and fiscal resources dry up, theensuing contraction in public programs may end up significantly harming the poor.To understand how the poor can share in economic growth, one must accordinglyevaluate not only the effects of spending levels on the poor but also how these effectsare linked to the economy’s growth rate.
This paper tackles these issues by developing a new measure of the benefits thatthe poor derive from social policies. The measure is derived directly from an assess-ment of the effects of different fiscal policies on the level of poverty. By regressingthe change in poverty on the levels, differences, and interactions of various types of

WHEN IS PUBLIC EXPENDITURE PRO-POOR? | 421
government expenditure, we can construct an empirically grounded estimate of howthe actions of the state affect the poor under different economic conditions. Usingthese results, we develop an index of the extent to which a government’s policies benefit the poor. The index is based not on a priori assumptions but, rather, on theobserved relationships between public spending and the evolution of poverty. Thismeasure can then be used to evaluate key questions in the shared growth debate, suchas: To what extent are pro-poor policies consistent with economic growth? How relevant are existing political-economy theories to an understanding of the determi-nants of pro-poor policies?
Government action on poverty reduction does not operate only through govern-ment expenditure. Governments can impose regulations that make it more or less dif-ficult for the poor to access credit or enter markets; they can design social programsefficiently or in ways that invite rent-seeking; and they can allow or attempt tochange conditions that lead to discrimination against disadvantaged groups. Thepaper does not attempt to characterize the stance of the whole of government poli-cies; instead, it centers on the effects that two key variables, the level and the com-position of government expenditures, have on poverty reduction and its associationwith growth.
In the next section, we introduce our theoretical framework and present our keyestimating equations. We then discuss our data and results. The final section presentsconcluding comments and discusses possible directions for further research.
Estimation Framework
The basis for our estimation exercise will be a set of regressions of the form:
�pt � �1 � �2�yt � �Xt, (1)
where pt is the logarithm of the poverty rate, yt is the logarithm of mean income, andXt is a set of control variables. The estimate of �2 in this regression is known as theincome elasticity of poverty reduction; it captures the percentage change in povertyrates resulting from a 1 percent change in mean income. Bourguignon (2003) hasshown that this elasticity is governed by an identity linking the poverty rate, the levelof income, and the degree of income inequality. He suggests that this can be con-trolled for by adding the change in income inequality as a right-hand-side variable:
�pt � �1 � �2�yt � �3�Gt ��Xt, (2)
where Gt is an indicator of inequality, such as the Gini coefficient. Our interest lies in understanding the effect that public expenditures have on this
relationship. A number of natural possibilities come to mind. The first is simply tointroduce the level of public expenditures in this regression. Thus, for example, onecould hypothesize that for every percentage point of gross domestic product (GDP)devoted to public expenditures, one would expect to see a decline of �4 percent in thepoverty rate, yielding the specification:
�pt � �1 � �2�yt � �3�Gt � �4Et, (3)

422 | FRANCISCO RODRÍGUEZ
where Et denotes the ratio of government expenditures to GDP. Note that since it isnatural to expect that expenditures may also affect inequality, it may make sense tosupplement estimation of this relationship with a separate equation for the determi-nation of inequality. Perhaps a more natural hypothesis would be that increases inpublic expenditures would lead to declines in poverty:
�pt � �1 � �2�yt � �3�Gt � �4Et � �5�Et. (4)
An additional class of hypotheses would explore the determinants of heterogene-ity across countries in the responsiveness of poverty reduction to growth. For exam-ple, we may be interested in evaluating the sensitivity of the income elasticity ofpoverty to the level of public expenditure. This hypothesis would capture the idea,for example, that if a country devotes x percent of GDP to government spending, thepoor will benefit more from economic growth than if it did not do so. In that case,equation (4) would become:
�pt � �1 � �2�yt � �3�Gt � �4Et � �5�Et � �6Et�yt. (5)
These specifications are motivated purely by intuitive concerns: it seems reason-able to expect that at a given level of income and inequality, higher levels of pro-poorspending would lead to faster declines in the poverty rate. Only some of these speci-fications, however, will map neatly into a theory of the determination of poverty. Forexample, if � � 0, equation (2) will easily integrate out to:
pt � c � �1t � �2yt � �3Gt. (6)
If, in addition, we set �1 � 0, we have a linear version of the identity between poverty,income, and inequality derived by Bourguignon (2003) and Kraay (2004). Similarly, ifwe believe that there is a complementarity between government spending and meanincome in the determination of poverty such that poverty is a decreasing function ofthe product of yt and Et, our natural representation of poverty would be:
pt � c � �1t � �2yt � �3Gt � �4Et � �5Etyt, (7)
which would generate the following equation in differences:
�pt � �1 � �2�yt � �3�Gt � �4�Et � �5�(Etyt). (8)
Note the contrast between equation (8) and equation (5): if expenditures and out-put are multiplicative complements in the poverty function, then the appropriate con-trol in a regression in differences is �(Etyt) and not Et�yt. The reason is simple: ifexpenditures increase the effect of output on poverty, it must be the case that outputincreases the effect of expenditures on poverty by the same magnitude.1 Thus, it isincorrect to control only for the interaction between the levels of one variable andthe changes in the other—at least, if what one has in mind is a theory such as equation (7).
Given that equations (7) and (8) are simply different expressions of the same theory,one may ask why it makes sense to estimate the equation in differences instead of inlevels. Put another way, why concentrate on estimating the effect of changes inincome on changes in poverty (and suffer the inevitable loss in information that
WHEN IS PUBLIC EXPENDITURE PRO-POOR? | 423
comes from first-differencing), if one can simply estimate the relationship betweenlevels of poverty and levels of income in the cross-country data? To a certain extent,this question parallels the discussion of whether to evaluate theories of developmentby studying growth rates or levels of GDP. In this paper, we follow the conventionalapproach of concentrating on the equation in differences. An argument in favor of thisapproach comes from the belief that there is a large component of time-invariantcountry-specific factors that help determine poverty levels and that will drop out onfirst-differencing. Another consideration is that the change in poverty as a result ofeconomic growth is the focus of considerable attention by policy makers—muchmore so than the existence of differences in poverty levels between poorer and richereconomies.2 Nevertheless, it is useful to remember that some equations in differenceswill have corresponding tractable formulations in levels, a fact that we appeal tobelow.
We close with a caveat. It is common to find estimates in the literature of equation (1)and its variants that are given a causal interpretation. There is nothing in the specifi-cation of poverty elasticity estimates to ensure that they are not contaminated byreverse causation or omitted variable bias. Indeed, it is not hard to come up with astory in which the reduction of poverty generates the necessary social conditions toenable high economic growth, so that �2 fails to capture the effect of growth onpoverty. One school of thought treats estimation of these equations as cross-nationalextensions of an accounting relationship in which causality is not as important as thestrength of the association. It is essential to bear these points in mind as we discussthe role that social expenditures play in this relationship.
Data and Evidence
The analysis employs data on income distributions, poverty rates, and mean incometaken from the World Bank’s PovcalNet database, which contains 548 country-yearestimates for 100 countries. Most of these estimates are national, although in somecases they correspond to only urban or rural areas. The national estimates are usedexcept for three cases (Argentina, China, and India) for which there are no national-level estimates available: in those cases, urban data are used. For 13 countries there isjust one observation, and these cases are lost on first-differencing, leaving 387 spellsof growth for 87 economies. The purchasing power parity (PPP)–adjusted US$2 perday poverty rate is used to construct the dependent variable.
The data on expenditures come from the Government Finance Statistics (GFS)database of the International Monetary Fund (IMF 2006a, 2006b), and the data onoutput are from the IMF’s International Financial Statistics (IFS) database (IMF2006c). Building this series (as well as the other expenditure series in the database)requires that data from the GFS Historical Statistics, which cover the 1972–90 period,be linked with those for the 1990–2006 period. This is done using the guidelines setout in Wickens (2002); the post-1990 expenditure series is combined with the sum ofthe pre-1990 current expenditure and capital transfer series. All series are expressednet of interest payments. A set of analogous linking rules is employed to construct
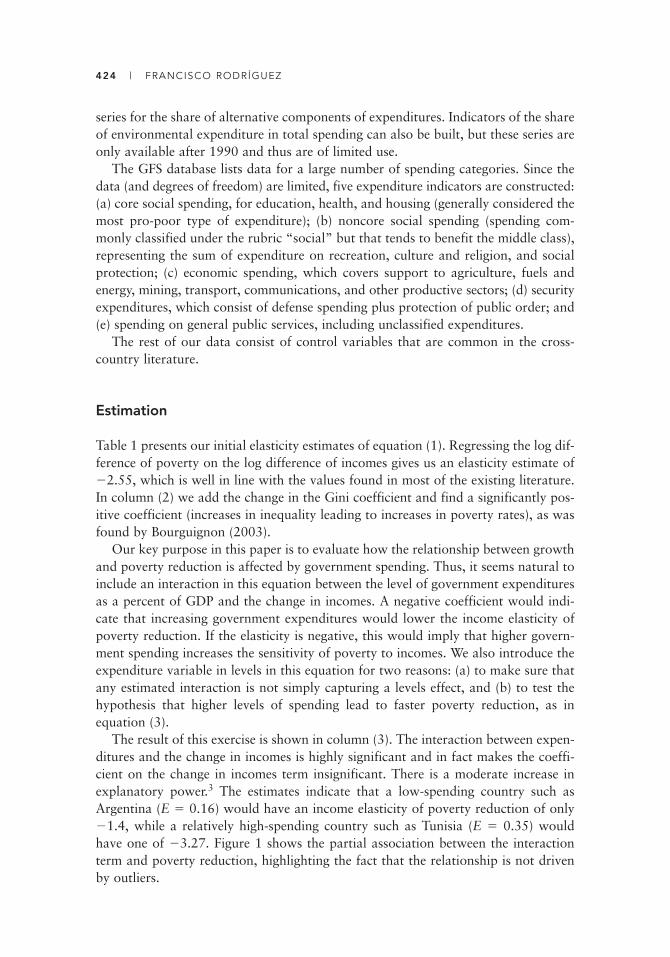
424 | FRANCISCO RODRÍGUEZ
series for the share of alternative components of expenditures. Indicators of the shareof environmental expenditure in total spending can also be built, but these series areonly available after 1990 and thus are of limited use.
The GFS database lists data for a large number of spending categories. Since thedata (and degrees of freedom) are limited, five expenditure indicators are constructed:(a) core social spending, for education, health, and housing (generally considered themost pro-poor type of expenditure); (b) noncore social spending (spending com-monly classified under the rubric “social” but that tends to benefit the middle class),representing the sum of expenditure on recreation, culture and religion, and socialprotection; (c) economic spending, which covers support to agriculture, fuels andenergy, mining, transport, communications, and other productive sectors; (d) securityexpenditures, which consist of defense spending plus protection of public order; and(e) spending on general public services, including unclassified expenditures.
The rest of our data consist of control variables that are common in the cross-country literature.
Estimation
Table 1 presents our initial elasticity estimates of equation (1). Regressing the log dif-ference of poverty on the log difference of incomes gives us an elasticity estimate of�2.55, which is well in line with the values found in most of the existing literature.In column (2) we add the change in the Gini coefficient and find a significantly pos-itive coefficient (increases in inequality leading to increases in poverty rates), as wasfound by Bourguignon (2003).
Our key purpose in this paper is to evaluate how the relationship between growthand poverty reduction is affected by government spending. Thus, it seems natural toinclude an interaction in this equation between the level of government expendituresas a percent of GDP and the change in incomes. A negative coefficient would indi-cate that increasing government expenditures would lower the income elasticity ofpoverty reduction. If the elasticity is negative, this would imply that higher govern-ment spending increases the sensitivity of poverty to incomes. We also introduce theexpenditure variable in levels in this equation for two reasons: (a) to make sure thatany estimated interaction is not simply capturing a levels effect, and (b) to test thehypothesis that higher levels of spending lead to faster poverty reduction, as in equation (3).
The result of this exercise is shown in column (3). The interaction between expen-ditures and the change in incomes is highly significant and in fact makes the coeffi-cient on the change in incomes term insignificant. There is a moderate increase inexplanatory power.3 The estimates indicate that a low-spending country such asArgentina (E � 0.16) would have an income elasticity of poverty reduction of only�1.4, while a relatively high-spending country such as Tunisia (E � 0.35) wouldhave one of �3.27. Figure 1 shows the partial association between the interactionterm and poverty reduction, highlighting the fact that the relationship is not drivenby outliers.
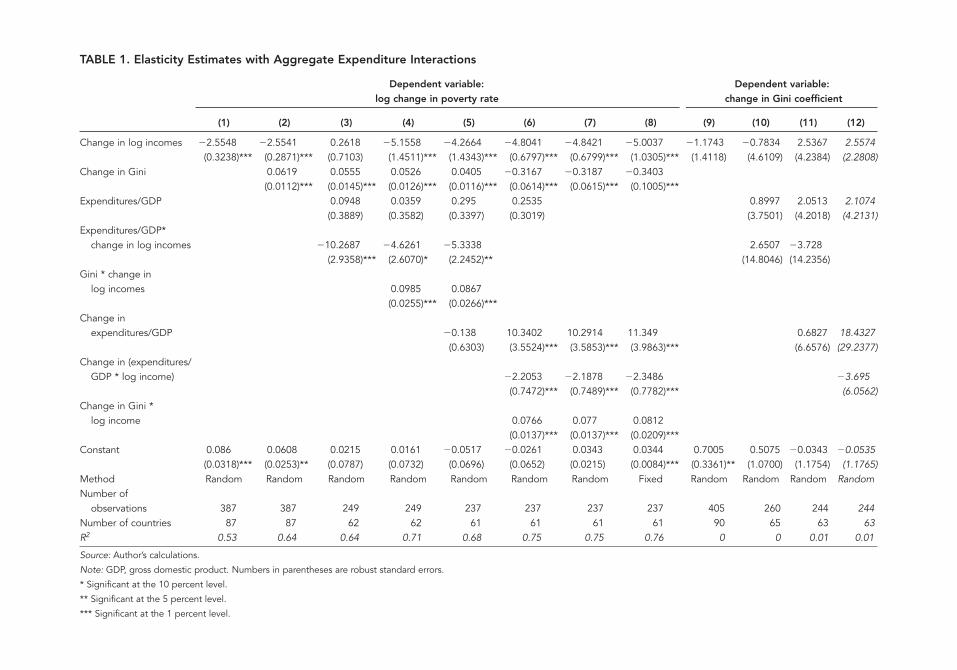
TABLE 1. Elasticity Estimates with Aggregate Expenditure Interactions
Dependent variable: Dependent variable:log change in poverty rate change in Gini coefficient
(1) (2) (3) (4) (5) (6) (7) (8) (9) (10) (11) (12)
Change in log incomes �2.5548 �2.5541 0.2618 �5.1558 �4.2664 �4.8041 �4.8421 �5.0037 �1.1743 �0.7834 2.5367 2.5574(0.3238)*** (0.2871)*** (0.7103) (1.4511)*** (1.4343)*** (0.6797)*** (0.6799)*** (1.0305)*** (1.4118) (4.6109) (4.2384) (2.2808)
Change in Gini 0.0619 0.0555 0.0526 0.0405 �0.3167 �0.3187 �0.3403(0.0112)*** (0.0145)*** (0.0126)*** (0.0116)*** (0.0614)*** (0.0615)*** (0.1005)***
Expenditures/GDP 0.0948 0.0359 0.295 0.2535 0.8997 2.0513 2.1074(0.3889) (0.3582) (0.3397) (0.3019) (3.7501) (4.2018) (4.2131)
Expenditures/GDP*change in log incomes �10.2687 �4.6261 �5.3338 2.6507 �3.728
(2.9358)*** (2.6070)* (2.2452)** (14.8046) (14.2356)Gini * change in
log incomes 0.0985 0.0867(0.0255)*** (0.0266)***
Change inexpenditures/GDP �0.138 10.3402 10.2914 11.349 0.6827 18.4327
(0.6303) (3.5524)*** (3.5853)*** (3.9863)*** (6.6576) (29.2377)Change in (expenditures/
GDP * log income) �2.2053 �2.1878 �2.3486 �3.695(0.7472)*** (0.7489)*** (0.7782)*** (6.0562)
Change in Gini *log income 0.0766 0.077 0.0812
(0.0137)*** (0.0137)*** (0.0209)***Constant 0.086 0.0608 0.0215 0.0161 �0.0517 �0.0261 0.0343 0.0344 0.7005 0.5075 �0.0343 �0.0535
(0.0318)*** (0.0253)** (0.0787) (0.0732) (0.0696) (0.0652) (0.0215) (0.0084)*** (0.3361)** (1.0700) (1.1754) (1.1765)Method Random Random Random Random Random Random Random Fixed Random Random Random RandomNumber of
observations 387 387 249 249 237 237 237 237 405 260 244 244Number of countries 87 87 62 62 61 61 61 61 90 65 63 63R2 0.53 0.64 0.64 0.71 0.68 0.75 0.75 0.76 0 0 0.01 0.01
Source: Author’s calculations.
Note: GDP, gross domestic product. Numbers in parentheses are robust standard errors.
* Significant at the 10 percent level.
** Significant at the 5 percent level.
*** Significant at the 1 percent level.
426 | FRANCISCO RODRÍGUEZ
Does this mean that high government spending is unequivocally good for thepoor? Not necessarily. What this result shows is that government spending will leadgrowth to translate into a faster rate of poverty reduction and thus make sharedgrowth more likely. But the greater responsiveness of poverty to growth is a double-edged sword, as it also implies that poverty will increase more rapidly during an economic contraction. To continue with the above examples, Tunisia’s high level ofgovernment spending has enabled it to share the benefits of its high growth morebroadly, but the fact that poverty is less responsive to growth in Argentina has para-doxically diminished the increase in poverty that could result from that country’s negative growth.
A reasonable alternative hypothesis is that exogenous reductions in poverty allowfor the empowerment of poor individuals, thus permitting the generation of a polit-ical coalition that supports expansion of expenditure. The existence of such a chan-nel of causation could contaminate the estimates in table 1 and offer a reasonablealternative interpretation of the estimated relationship. Note, however, that it is moredifficult—although certainly not impossible—to come up with a reverse causationstory to account for the significance of the nonlinear interaction terms. Findingappropriate instruments for the composition of government expenditures in cross-national data that are exogenous and have no direct effect on poverty is a worthwhileyet daunting task that we will not attempt to carry out here. It is therefore importantto keep in mind that the estimated relationship is best interpreted as an empiricalassociation that may embody a causal effect.
FIGURE 1. Poverty Reduction and the Interaction between Growth and Government Expenditures
log
cha
nge
in p
over
ty (u
nexp
lain
ed p
art)
4
–0.1 –0.05 0log change in mean incomes*in government expenditures (unexplained part)
0.05
2
0
–2
–1
–3
3
1
Source: Author’s elaboration.
Note: Coefficient � �10.268702; standard error � 2.9358033; t � 3.5.

WHEN IS PUBLIC EXPENDITURE PRO-POOR? | 427
Ravallion (1997) has suggested that high-inequality countries have a lower incomeelasticity of poverty reduction. This implies that there is an additional interactionbetween inequality and the change in incomes that is absent from our current speci-fication, and it may be that the interaction between expenditures and income changesis really proxying for the inequality-growth interaction. In column (4), we introducethe interaction suggested by Ravallion and find that it is indeed significant. Theexpenditure-growth interaction does remain significant (at 10 percent), although thecoefficient falls by more than half.
If the level of poverty depends on the level of spending, it may be more natural toexpect that the change in poverty would depend on the change in spending levels, asin equation (8). Column (5) adds a term for the change in the ratio of expendituresto GDP. The term is not significant, although the significance of the expenditure-growth interaction increases somewhat. But remember also that equation (8) suggeststhat the correct specification corresponding to a theory of a multiplicative comple-mentarity between income levels and expenditure would include a control for �(Etyt)and not just for Et�yt. The same reasoning applies to the inequality-growth interac-tion: if poverty depends on Gtyt, the change in poverty over time will depend on�Gtyt and not just on Gt�yt. Column (6) corrects our specification to include bothof these terms. They are now highly significant, as is the change in expenditures. Thelevel of expenditures is insignificant and can be dropped with little consequence forthe explanatory value of the model (column 7).
We adopt the equation in column (7)—which is simply equation (8)—as our pre-ferred specification for the calculations below. We estimate it using a random-effectsspecification to make the fullest available use of limited data, but in fact the random-effects and fixed-effects specifications do not differ much, as is seen in column (8).
The effects of spending on poverty may not be limited, however, to those capturedby the coefficients of this equation. As was pointed out in the preceding section,expenditure levels could also have a direct effect on inequality. Since equation (8)shows that the change in poverty depends on the change in inequality, one could rea-sonably expect expenditures to have an effect on inequality that would thus turn intoan indirect effect on poverty. The last four columns of table 1 evaluate this hypothe-sis. Somewhat surprisingly, we find little evidence of an effect of government spend-ing on inequality, whether through the level of spending, an interaction with growth,or the change in spending. We conclude that for the purposes of studying the effectsof spending on poverty reduction, we may reasonably treat the evolution of inequal-ity as given.
Although our results are interesting, they arise from the use of a very gross aggre-gate variable, the ratio of total government expenditures to GDP. One would expectthe results of these exercises to vary considerably once one splits spending into itsdiverse categories. Intuitively, one might expect certain categories of spending to bevery pro-poor and thus to have significant effects on the level of poverty. Thus, intable 2 we repeat the same exercise as in table 1 but now disaggregate spending intothe five broad categories outlined above.
Using the more disaggregated category certainly has a cost in terms of data, cuttingthe number of countries in our baseline estimation from 87 to 35 and the number of
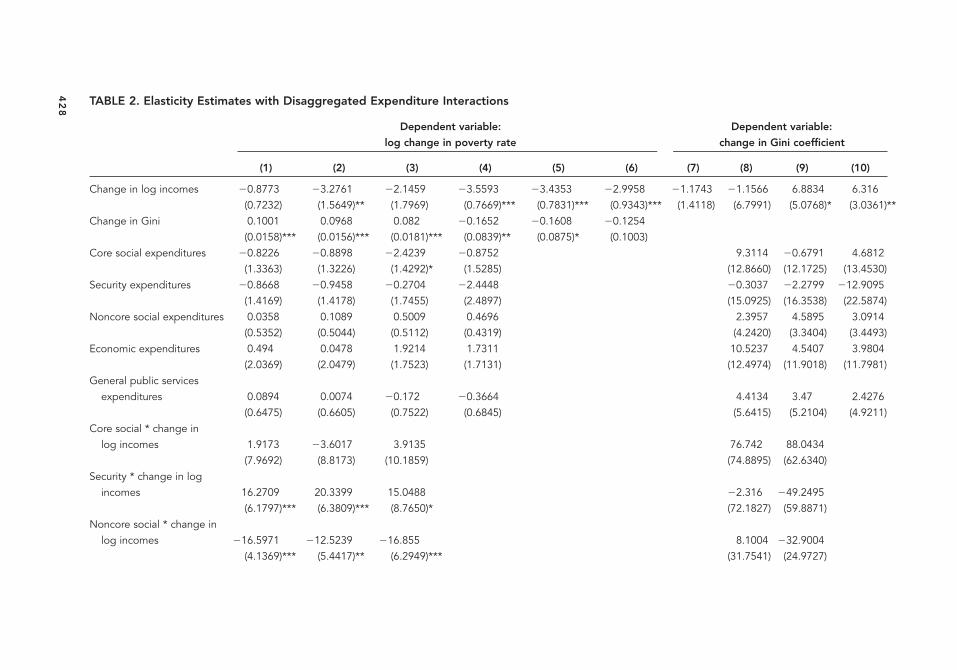
TABLE 2. Elasticity Estimates with Disaggregated Expenditure Interactions
Dependent variable: Dependent variable:
log change in poverty rate change in Gini coefficient
(1) (2) (3) (4) (5) (6) (7) (8) (9) (10)
Change in log incomes �0.8773 �3.2761 �2.1459 �3.5593 �3.4353 �2.9958 �1.1743 �1.1566 6.8834 6.316(0.7232) (1.5649)** (1.7969) (0.7669)*** (0.7831)*** (0.9343)*** (1.4118) (6.7991) (5.0768)* (3.0361)
Change in Gini 0.1001 0.0968 0.082 �0.1652 �0.1608 �0.1254(0.0158)*** (0.0156)*** (0.0181)*** (0.0839)** (0.0875)* (0.1003)
Core social expenditures �0.8226 �0.8898 �2.4239 �0.8752 9.3114 �0.6791 4.6812(1.3363) (1.3226) (1.4292)* (1.5285) (12.8660) (12.1725) (13.4530)
Security expenditures �0.8668 �0.9458 �0.2704 �2.4448 �0.3037 �2.2799 �12.9095(1.4169) (1.4178) (1.7455) (2.4897) (15.0925) (16.3538) (22.5874)
Noncore social expenditures 0.0358 0.1089 0.5009 0.4696 2.3957 4.5895 3.0914(0.5352) (0.5044) (0.5112) (0.4319) (4.2420) (3.3404) (3.4493)
Economic expenditures 0.494 0.0478 1.9214 1.7311 10.5237 4.5407 3.9804(2.0369) (2.0479) (1.7523) (1.7131) (12.4974) (11.9018) (11.7981)
General public services expenditures 0.0894 0.0074 �0.172 �0.3664 4.4134 3.47 2.4276
(0.6475) (0.6605) (0.7522) (0.6845) (5.6415) (5.2104) (4.9211)Core social * change in
log incomes 1.9173 �3.6017 3.9135 76.742 88.0434(7.9692) (8.8173) (10.1859) (74.8895) (62.6340)
Security * change in log incomes 16.2709 20.3399 15.0488 �2.316 �49.2495
(6.1797)*** (6.3809)*** (8.7650)* (72.1827) (59.8871)Noncore social * change in
log incomes �16.5971 �12.5239 �16.855 8.1004 �32.9004(4.1369)*** (5.4417)** (6.2949)*** (31.7541) (24.9727)
42
8
**
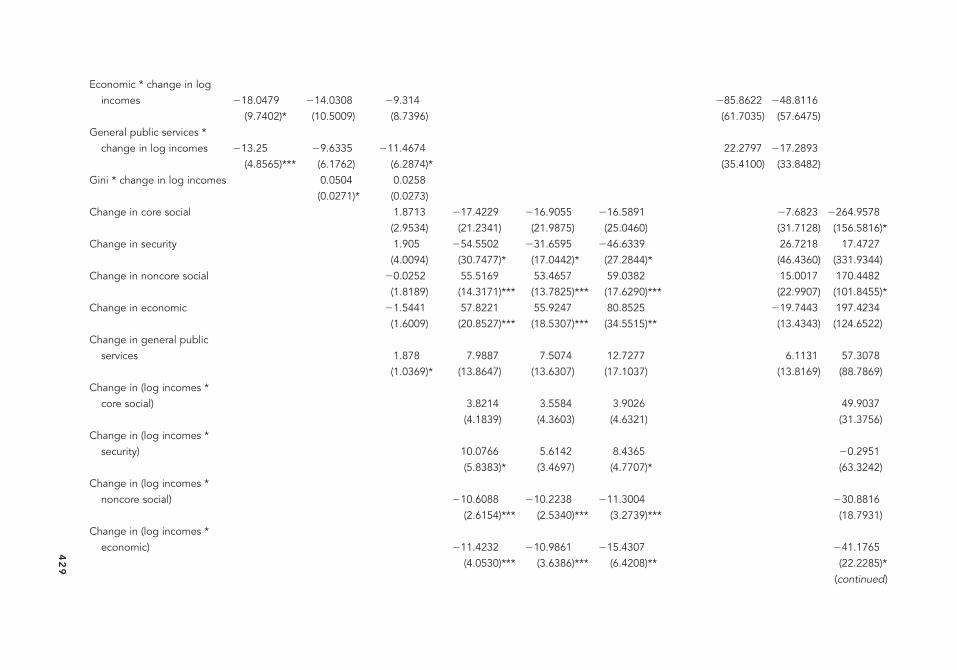
Economic * change in log incomes �18.0479 �14.0308 �9.314 �85.8622 �48.8116
(9.7402)* (10.5009) (8.7396) (61.7035) (57.6475)General public services *
change in log incomes �13.25 �9.6335 �11.4674 22.2797 �17.2893(4.8565)*** (6.1762) (6.2874)* (35.4100) (33.8482)
Gini * change in log incomes 0.0504 0.0258(0.0271)* (0.0273)
Change in core social 1.8713 �17.4229 �16.9055 �16.5891 �7.6823 �264.9578(2.9534) (21.2341) (21.9875) (25.0460) (31.7128) (156.5816)*
Change in security 1.905 �54.5502 �31.6595 �46.6339 26.7218 17.4727(4.0094) (30.7477)* (17.0442)* (27.2844)* (46.4360) (331.9344)
Change in noncore social �0.0252 55.5169 53.4657 59.0382 15.0017 170.4482(1.8189) (14.3171)*** (13.7825)*** (17.6290)*** (22.9907) (101.8455)*
Change in economic �1.5441 57.8221 55.9247 80.8525 �19.7443 197.4234(1.6009) (20.8527)*** (18.5307)*** (34.5515)** (13.4343) (124.6522)
Change in general public services 1.878 7.9887 7.5074 12.7277 6.1131 57.3078
(1.0369)* (13.8647) (13.6307) (17.1037) (13.8169) (88.7869)Change in (log incomes *
core social) 3.8214 3.5584 3.9026 49.9037(4.1839) (4.3603) (4.6321) (31.3756)
Change in (log incomes * security) 10.0766 5.6142 8.4365 �0.2951
(5.8383)* (3.4697) (4.7707)* (63.3242)Change in (log incomes *
noncore social) �10.6088 �10.2238 �11.3004 �30.8816(2.6154)*** (2.5340)*** (3.2739)*** (18.7931)
Change in (log incomes * economic) �11.4232 �10.9861 �15.4307 �41.1765
(4.0530)*** (3.6386)*** (6.4208)** (22.2285)*
42
9
(continued)
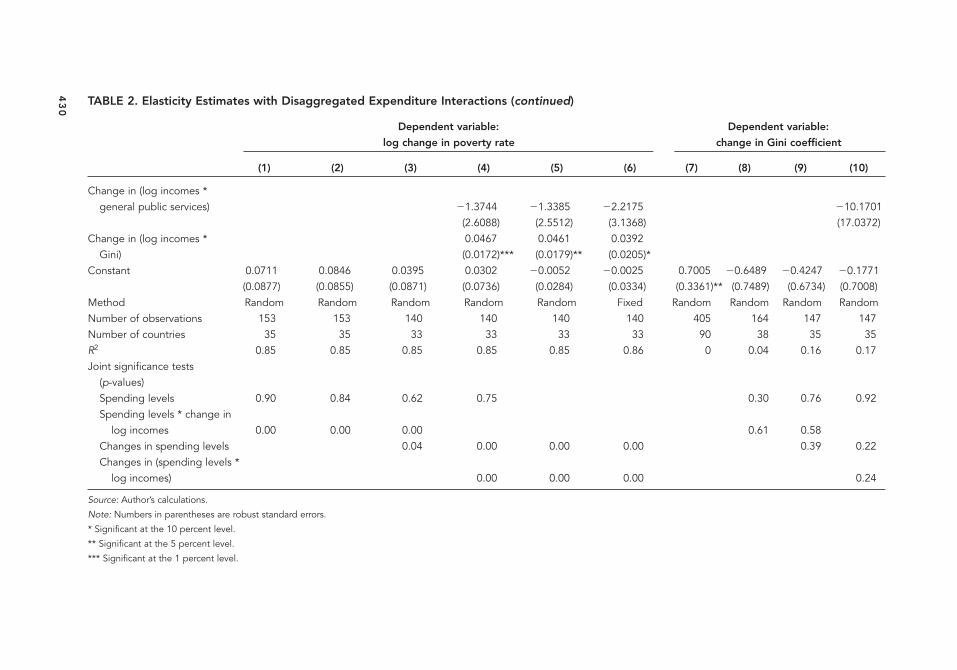
Change in (log incomes * general public services) �1.3744 �1.3385 �2.2175 �10.1701
(2.6088) (2.5512) (3.1368) (17.0372)Change in (log incomes * 0.0467 0.0461 0.0392
Gini) (0.0172)*** (0.0179)** (0.0205)*Constant 0.0711 0.0846 0.0395 0.0302 �0.0052 �0.0025 0.7005 �0.6489 �0.4247 �0.1771
(0.0877) (0.0855) (0.0871) (0.0736) (0.0284) (0.0334) (0.3361)** (0.7489) (0.6734) (0.7008)Method Random Random Random Random Random Fixed Random Random Random RandomNumber of observations 153 153 140 140 140 140 405 164 147 147Number of countries 35 35 33 33 33 33 90 38 35 35R2 0.85 0.85 0.85 0.85 0.85 0.86 0 0.04 0.16 0.17Joint significance tests
(p-values)Spending levels 0.90 0.84 0.62 0.75 0.30 0.76 0.92Spending levels * change in
log incomes 0.00 0.00 0.00 0.61 0.58Changes in spending levels 0.04 0.00 0.00 0.00 0.39 0.22Changes in (spending levels *
log incomes) 0.00 0.00 0.00 0.24
Source: Author’s calculations.
Note: Numbers in parentheses are robust standard errors.
* Significant at the 10 percent level.
** Significant at the 5 percent level.
*** Significant at the 1 percent level.
TABLE 2. Elasticity Estimates with Disaggregated Expenditure Interactions (continued)
Dependent variable: Dependent variable:
log change in poverty rate change in Gini coefficient
(1) (2) (3) (4) (5) (6) (7) (8) (9) (10)
43
0
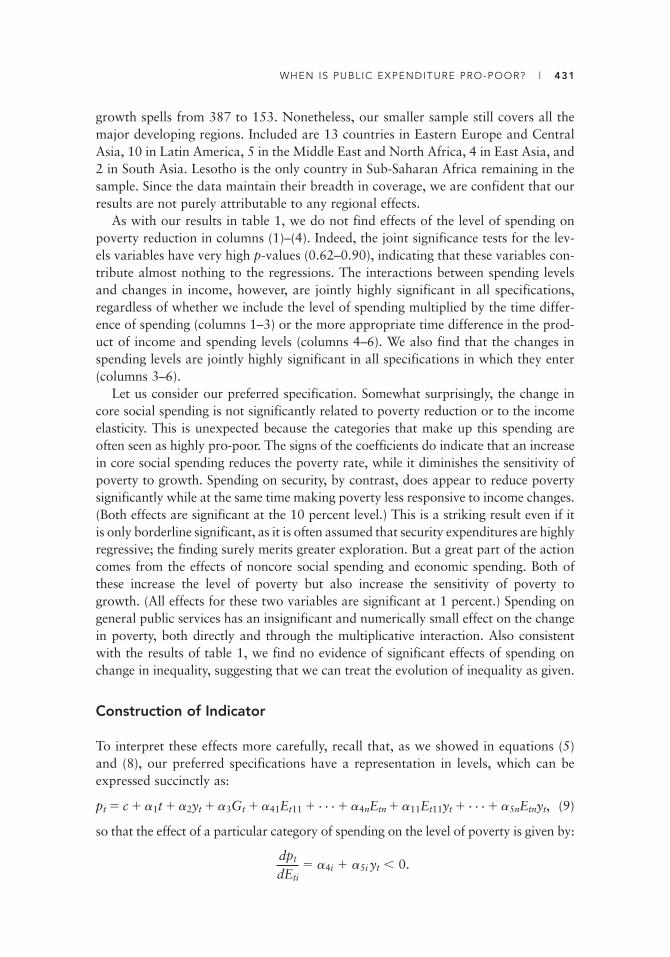
WHEN IS PUBLIC EXPENDITURE PRO-POOR? | 431
growth spells from 387 to 153. Nonetheless, our smaller sample still covers all themajor developing regions. Included are 13 countries in Eastern Europe and CentralAsia, 10 in Latin America, 5 in the Middle East and North Africa, 4 in East Asia, and2 in South Asia. Lesotho is the only country in Sub-Saharan Africa remaining in thesample. Since the data maintain their breadth in coverage, we are confident that ourresults are not purely attributable to any regional effects.
As with our results in table 1, we do not find effects of the level of spending onpoverty reduction in columns (1)–(4). Indeed, the joint significance tests for the lev-els variables have very high p-values (0.62–0.90), indicating that these variables con-tribute almost nothing to the regressions. The interactions between spending levelsand changes in income, however, are jointly highly significant in all specifications,regardless of whether we include the level of spending multiplied by the time differ-ence of spending (columns 1–3) or the more appropriate time difference in the prod-uct of income and spending levels (columns 4–6). We also find that the changes inspending levels are jointly highly significant in all specifications in which they enter(columns 3–6).
Let us consider our preferred specification. Somewhat surprisingly, the change incore social spending is not significantly related to poverty reduction or to the incomeelasticity. This is unexpected because the categories that make up this spending areoften seen as highly pro-poor. The signs of the coefficients do indicate that an increasein core social spending reduces the poverty rate, while it diminishes the sensitivity ofpoverty to growth. Spending on security, by contrast, does appear to reduce povertysignificantly while at the same time making poverty less responsive to income changes.(Both effects are significant at the 10 percent level.) This is a striking result even if itis only borderline significant, as it is often assumed that security expenditures are highlyregressive; the finding surely merits greater exploration. But a great part of the actioncomes from the effects of noncore social spending and economic spending. Both ofthese increase the level of poverty but also increase the sensitivity of poverty togrowth. (All effects for these two variables are significant at 1 percent.) Spending ongeneral public services has an insignificant and numerically small effect on the changein poverty, both directly and through the multiplicative interaction. Also consistentwith the results of table 1, we find no evidence of significant effects of spending onchange in inequality, suggesting that we can treat the evolution of inequality as given.
Construction of Indicator
To interpret these effects more carefully, recall that, as we showed in equations (5)and (8), our preferred specifications have a representation in levels, which can beexpressed succinctly as:
pt � c � �1t � �2yt � �3Gt � �41Et11 � . . . � �4nEtn � �11Et11yt � . . . � �5nEtnyt, (9)
so that the effect of a particular category of spending on the level of poverty is given by:
� �4i � �5i yt � 0.dpt
dEti

432 | FRANCISCO RODRÍGUEZ
In the case of core social and security spending, where �5i � 0, this implies:
� � yt.
For both categories, the threshold levels of log income correspond, respectively, tomonthly incomes of US$116 and US$281 (in 1993 PPP-adjusted dollars). Thus, coresocial spending is pro-poor only in the poorest 44.9 percent of countries, while secu-rity is pro-poor in the poorest 86.7 percent of countries. Note, however, that only thecoefficient on security spending is estimated with a reasonable degree of precision, sothat the other estimate must be interpreted with caution.
In the case of the remaining three categories—noncore social, economic, and gen-eral public services spending—a similar logic shows that they will be pro-poor onlywhen:
� � yt.
For these three categories, the threshold levels of income correspond to US$187,US$162, and US$273, or, respectively, the richest 32.7, 37.8, and 13.3 percent ofcountries. The coefficient of general public services spending, however, is not signif-icant and should be interpreted cautiously.
Using these coefficients, we can now go on to evaluate the appropriateness of fis-cal policies in different countries by estimating the contribution that governmentspending makes to poverty reduction. Applying equation (9), we can calculate thecontribution of government expenditure to poverty reduction as the differencebetween the predicted level of poverty given the country’s level of expenditure andthe predicted level of poverty that the model would yield if all its expenditure valueswere set to zero:
�pt � �pt � �dpt�Et1. . .
� Etn � 0 � �41Et1 � . . . � �4nEtn � �51Et1yt � . . . � �5nEtnyt.
(10)
Table 3 shows the result of this exercise, which we have carried out using both theresults of table 1 (aggregate expenditures) and those of table 2 (disaggregated expen-ditures). The former has the advantage of being available for a larger number ofcountries, while the latter has the benefit of using the full information on spendingon diverse categories. Fortunately, we find that the correlation between the twoindexes is reasonably high (0.76). Figure 2 illustrates how, although some differencesexist, both indexes seem to be telling a consistent story.
Although the results shown in table 3 are not unexpected, there are some surprises.The countries with the highest amounts of poverty reduction attributable to fiscalpolicy tend to be in Eastern Europe. To a large extent, this is a result of these coun-tries’ high levels of government expenditure, coupled with the fact that they are rel-atively wealthy (among developing nations) and spend significantly on the types ofexpenditure that are good for relatively rich countries, such as social security. Indeed,the estimates suggest that for Slovenia, government expenditures lowered the level of
�4i
�5i
�4i
�5i

WHEN IS PUBLIC EXPENDITURE PRO-POOR? | 433
poverty by a whopping 129 log points. In contrast, in almost half of the sample wefind that government expenditures do not contribute to poverty reduction.4
Although the most pro-poor countries tend to be in Eastern Europe, while the lesspro-poor tend to be in Africa, there are some notable exceptions. Uruguay, Panama,and Brazil are among the 10 countries with most pro-poor fiscal policies, while
TABLE 3. Poverty Reduction Impact of Expenditures, by Country, Average 1977–2005
Aggregate Disaggregated Aggregate Disaggregated
Country expenditures expenditures Country expenditures expenditures
Slovenia 1.2886 1.7656Czech Republic 0.8960 0.6049Hungary 0.8399 0.7725Slovak Republic 0.7972 0.4698Uruguay 0.7969 1.4173Croatia 0.7616 0.6486Poland 0.6355 0.6160Panama 0.5869 0.0931Brazil 0.5811 0.8151Bulgaria 0.5425 0.3288Chile 0.5249 0.4398Belarus 0.5200 0.4417Jordan 0.4867Namibia 0.4798Malaysia 0.4687 0.2694Tunisia 0.4500 0.1097Iran, Islamic Rep. of 0.4090 0.2105Estonia 0.4076 0.0929Colombia 0.3715Latvia 0.3558 0.0522Argentina 0.3542 0.5404Trinidad and Tobago 0.3532 �0.0614Turkey 0.3286 �0.0134Morocco 0.3109 0.0566Romania 0.3091 0.0057Costa Rica 0.2801 0.0114Algeria 0.2679Dominican Republic 0.2396 0.1337Venezuela, R.B. de 0.2373 �0.1187Lithuania 0.2021 �0.2044Paraguay 0.1861Albania 0.1735 �0.2490Bolivia 0.1709 �0.1381Yemen, Republic of �0.0004Peru 0.1661Kazakhstan 0.1541 �0.2005
Georgia 0.1099 �0.0276Guatemala 0.0465Thailand 0.0455 �0.0626Honduras 0.0401Ukraine �0.0386 �0.9320Philippines �0.0554Moldova �0.0665 �0.9410Botswana �0.0778Vietnam �0.1050Côte d’Ivoire �0.1128Lesotho �0.1148 �0.5922Azerbaijan �0.1216 �0.2316Haiti �0.1391Cameroon �0.1411Bangladesh �0.1452Sri Lanka �0.1458 �0.9879Egypt, Arab Rep. of �0.1507 �0.4199Kenya �0.1551Indonesia �0.1796 �0.4030Nepal �0.1819India �0.2115Sierra Leone �0.2259Mongolia �0.2316 �0.9227Burkina Faso �0.2744Ghana �0.3058Pakistan �0.3404 0.7553Madagascar �0.3545Gambia, The �0.3715Rwanda �0.3777Nicaragua �0.3883 �0.5844Nigeria �0.4221Mali �0.4445Swaziland �0.5302Uganda �0.5649Burundi �0.6152 �1.1004Zambia �0.8489
Source: Author’s calculations.
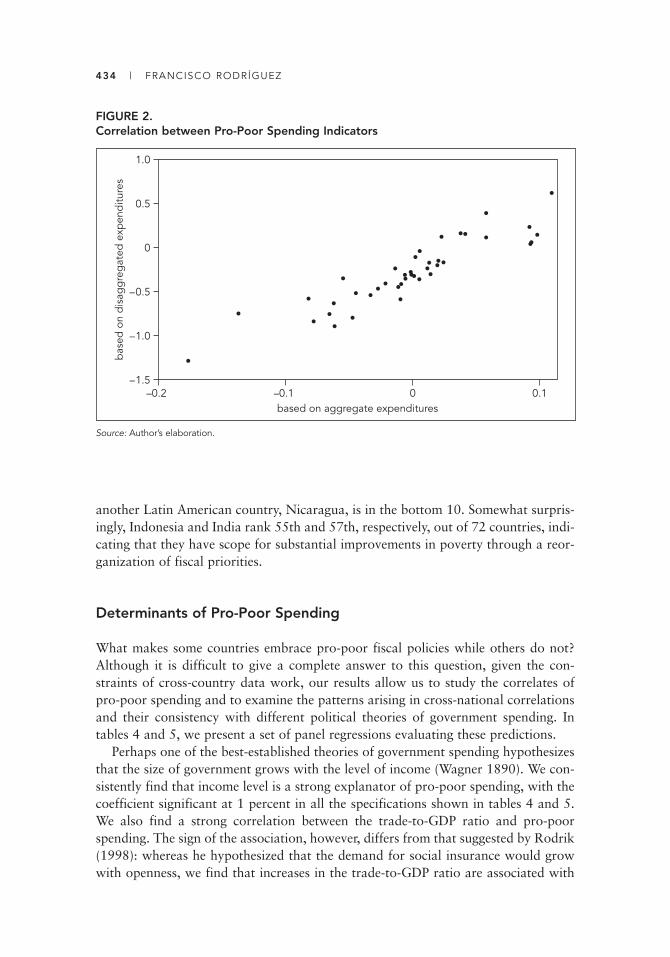
434 | FRANCISCO RODRÍGUEZ
another Latin American country, Nicaragua, is in the bottom 10. Somewhat surpris-ingly, Indonesia and India rank 55th and 57th, respectively, out of 72 countries, indi-cating that they have scope for substantial improvements in poverty through a reor-ganization of fiscal priorities.
Determinants of Pro-Poor Spending
What makes some countries embrace pro-poor fiscal policies while others do not?Although it is difficult to give a complete answer to this question, given the con-straints of cross-country data work, our results allow us to study the correlates ofpro-poor spending and to examine the patterns arising in cross-national correlationsand their consistency with different political theories of government spending. Intables 4 and 5, we present a set of panel regressions evaluating these predictions.
Perhaps one of the best-established theories of government spending hypothesizesthat the size of government grows with the level of income (Wagner 1890). We con-sistently find that income level is a strong explanator of pro-poor spending, with thecoefficient significant at 1 percent in all the specifications shown in tables 4 and 5.We also find a strong correlation between the trade-to-GDP ratio and pro-poorspending. The sign of the association, however, differs from that suggested by Rodrik(1998): whereas he hypothesized that the demand for social insurance would growwith openness, we find that increases in the trade-to-GDP ratio are associated with
FIGURE 2. Correlation between Pro-Poor Spending Indicators
bas
ed o
n d
isag
gre
gat
ed e
xpen
ditu
res
1.0
–0.2 –0.1 0based on aggregate expenditures
0.1
0
–0.5
–1.5
–1.0
0.5
Source: Author’s elaboration.

TABLE 4. Determinants of Pro-Poor Policies, Random-Effects Regressions(dependent variable: expected decline in poverty attributable to spending policies)
(1) (2) (3) (4) (5) (6) (7) (8) (9) (10) (11) (12) (13) (14) (15)
Mean income �0.5507 �0.5566 �0.5331 �0.5324 �0.552 �0.5337 �0.4812 �0.492 �0.4779 �0.4901 �0.5281 �0.5184 �0.4862 �0.5396 �0.5468
(0.0272)*** (0.0286)*** (0.0268)*** (0.0258)*** (0.0335)*** (0.0257)*** (0.0310)*** (0.0293)*** (0.0308)*** (0.0293)*** (0.0242)*** (0.0282)*** (0.0280)*** (0.0289)*** (0.0287)***
Trade/GDP 0.0009 0.0011 0.001 0.001 0.001 0.0014 0.0014 0.0015 0.0014 0.0011 0.0012 0.0012 0.0014 0.0011
(0.0003)*** (0.0003)*** (0.0003)*** (0.0003)*** (0.0003)*** (0.0003)*** (0.0003)*** (0.0004)*** (0.0003)*** (0.0003)*** (0.0003)*** (0.0003)*** (0.0003)*** (0.0003)***
Liquid liabilities/
GDP �0.0007 �0.0007 �0.0007 �0.0007 �0.0007 �0.0007 �0.0007 �0.0007 �0.0007 �0.0009 �0.0006 �0.001 �0.0011
(0.0004)* (0.0003)** (0.0004)* (0.0004)** (0.0004)* (0.0004)* (0.0004)* (0.0004)* (0.0004)** (0.0004)** (0.0004) (0.0004)** (0.0004)**
Gini coefficient 0.0031 0.0031 0.0029 0.0022 0.0021 0.0023 0.0023 0.0028 0.0022 0.0015 0.0002 0.0001
(0.0014)** (0.0013)** (0.0013)** (0.0017) (0.0017) (0.0019) (0.0018) (0.0013)** (0.0014) (0.0016) (0.0013) (0.0012)
Percent of urban
population 0.0013
(0.0008)
Democracy
(polity) 0.0013
(0.0008)
Economic
freedom 0.0434
(0.0364)
Executive
constraints 0.003
(0.0080)
Expropriation
risk �0.0197
(0.0166)
Degree of
capitalism �0.0056
(0.0157)
(continued)
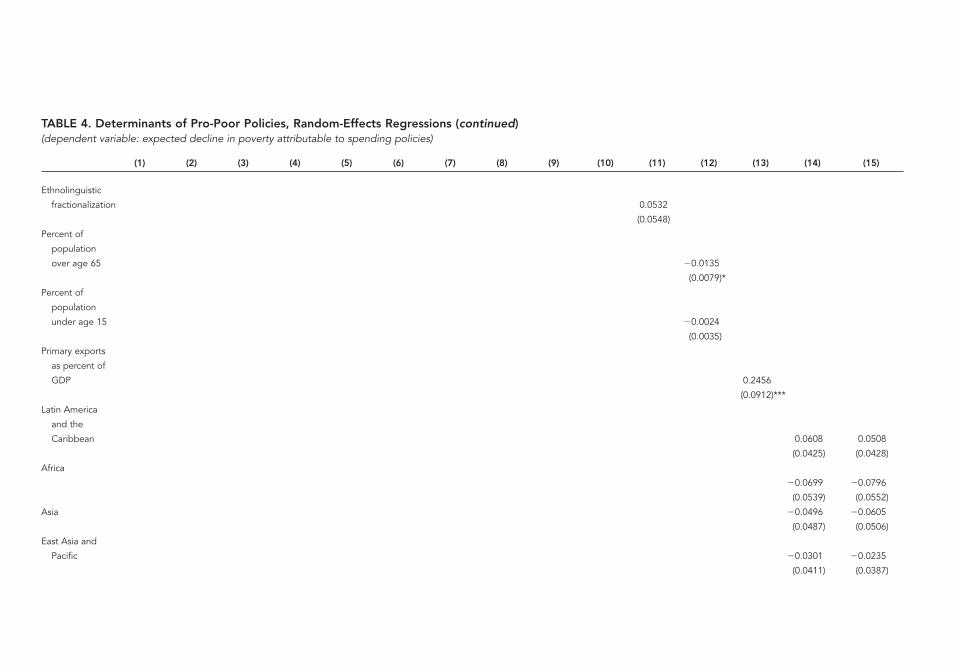
Ethnolinguistic
fractionalization 0.0532
(0.0548)
Percent of
population
over age 65 �0.0135
(0.0079)*
Percent of
population
under age 15 �0.0024
(0.0035)
Primary exports
as percent of
GDP 0.2456
(0.0912)***
Latin America
and the
Caribbean 0.0608 0.0508
(0.0425) (0.0428)
Africa
�0.0699 �0.0796
(0.0539) (0.0552)
Asia �0.0496 �0.0605
(0.0487) (0.0506)
East Asia and
Pacific �0.0301 �0.0235
(0.0411) (0.0387)
TABLE 4. Determinants of Pro-Poor Policies, Random-Effects Regressions (continued)(dependent variable: expected decline in poverty attributable to spending policies)
(1) (2) (3) (4) (5) (6) (7) (8) (9) (10) (11) (12) (13) (14) (15)
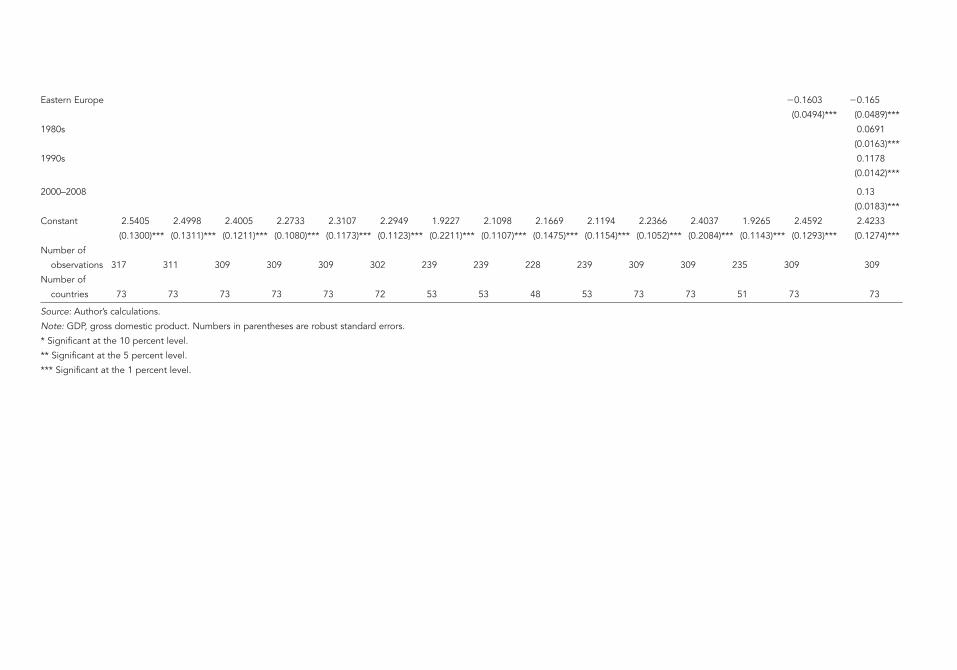
Eastern Europe �0.1603 �0.165
(0.0494)*** (0.0489)***
1980s 0.0691
(0.0163)***
1990s 0.1178
(0.0142)***
2000–2008 0.13
(0.0183)***
Constant 2.5405 2.4998 2.4005 2.2733 2.3107 2.2949 1.9227 2.1098 2.1669 2.1194 2.2366 2.4037 1.9265 2.4592 2.4233
(0.1300)*** (0.1311)*** (0.1211)*** (0.1080)*** (0.1173)*** (0.1123)*** (0.2211)*** (0.1107)*** (0.1475)*** (0.1154)*** (0.1052)*** (0.2084)*** (0.1143)*** (0.1293)*** (0.1274)***
Number of
observations 317 311 309 309 309 302 239 239 228 239 309 309 235 309 309
Number of
countries 73 73 73 73 73 72 53 53 48 53 73 73 51 73 73
Source: Author’s calculations.
Note: GDP, gross domestic product. Numbers in parentheses are robust standard errors.
* Significant at the 10 percent level.
** Significant at the 5 percent level.
*** Significant at the 1 percent level.
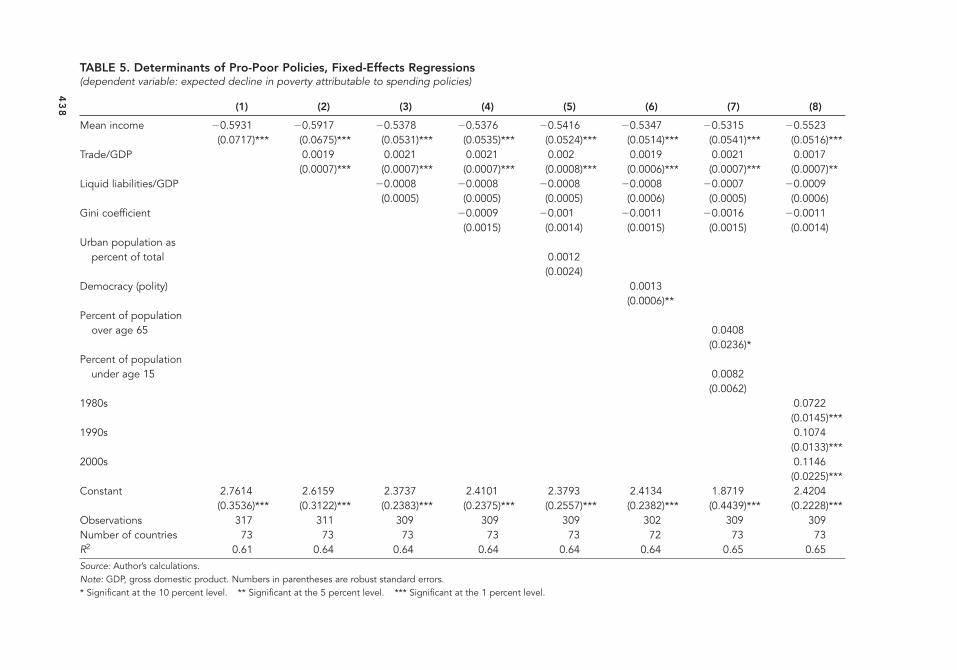
43
8
TABLE 5. Determinants of Pro-Poor Policies, Fixed-Effects Regressions(dependent variable: expected decline in poverty attributable to spending policies)
(1) (2) (3) (4) (5) (6) (7) (8)
Mean income �0.5931 �0.5917 �0.5378 �0.5376 �0.5416 �0.5347 �0.5315 �0.5523(0.0717)*** (0.0675)*** (0.0531)*** (0.0535)*** (0.0524)*** (0.0514)*** (0.0541)*** (0.0516)***
Trade/GDP 0.0019 0.0021 0.0021 0.002 0.0019 0.0021 0.0017(0.0007)*** (0.0007)*** (0.0007)*** (0.0008)*** (0.0006)*** (0.0007)*** (0.0007)**
Liquid liabilities/GDP �0.0008 �0.0008 �0.0008 �0.0008 �0.0007 �0.0009(0.0005) (0.0005) (0.0005) (0.0006) (0.0005) (0.0006)
Gini coefficient �0.0009 �0.001 �0.0011 �0.0016 �0.0011(0.0015) (0.0014) (0.0015) (0.0015) (0.0014)
Urban population as percent of total 0.0012
(0.0024)Democracy (polity) 0.0013
(0.0006)** Percent of population
over age 65 0.0408(0.0236)*
Percent of population under age 15 0.0082
(0.0062)1980s 0.0722
(0.0145)*** 1990s 0.1074
(0.0133)*** 2000s 0.1146
(0.0225)*** Constant 2.7614 2.6159 2.3737 2.4101 2.3793 2.4134 1.8719 2.4204
(0.3536)*** (0.3122)*** (0.2383)*** (0.2375)*** (0.2557)*** (0.2382)*** (0.4439)*** (0.2228)*** Observations 317 311 309 309 309 302 309 309Number of countries 73 73 73 73 73 72 73 73R2 0.61 0.64 0.64 0.64 0.64 0.64 0.65 0.65Source: Author’s calculations.Note: GDP, gross domestic product. Numbers in parentheses are robust standard errors.* Significant at the 10 percent level. ** Significant at the 5 percent level. *** Significant at the 1 percent level.
WHEN IS PUBLIC EXPENDITURE PRO-POOR? | 439
lower levels of pro-poor spending. In column (3) we add a measure of financial devel-opment, capturing the idea that there may be complementarities between the actionof the public sector to help the poor and the availability of well-functioning creditmarkets. Here, indeed, we do find that the level of financial development is associat-ed with poverty reduction, although the coefficient is generally significant only at 10 percent. In column (4) we introduce one of the classic explanatory variables:median-voter theories of politics predict a positive association between inequalityand redistribution (Meltzer and Richard 1981). In contrast, we find a negative asso-ciation between inequality and pro-poor spending, in line with the predictions ofBénabou (1996, 2005) and Rodríguez (2004).
A number of variables that are commonly used in the political-economy literatureappear not to enter significantly. One could expect that more urbanized economieswould have more extensive working-class organizations and would thus be able topressure for more pro-poor spending, but this prediction is not borne out in our data.Similarly, median-voter theories tend to predict that democracy should be associatedwith more redistribution (Boix 2003), but we fail to find an effect. Nor do we find anassociation between our measure of pro-poor spending and institutional measuressuch as the degree of economic freedom, executive constraints, the degree of capital-ism, expropriation risk, or ethnolinguistic fractionalization. We do find some weakevidence that the age composition of the population is associated with pro-poorspending, with older populations spending less on redistribution. We also find some-what stronger evidence of an association between the share of primary exports inGDP and redistribution, although other controls for resource abundance (not shown)do not deliver consistent results. Our last two columns show that the inequality effectseems to disappear once we control for regional dummies, although the openness,financial development, and income effects survive. We find that Eastern Europeancountries, after taking into account their level of income, openness, financial depth,and inequality, exhibit higher levels of redistribution than other countries. (The omit-ted region is the Middle East and North Africa.) Our last column shows that thedegree of progressivity of spending appears to be declining over time (the omittedperiod is the 1970s). Table 5 shows that similar results are present in fixed-effectsregressions (although some of the variables in table 4 are time invariant and thusdrop out of this specification), but the only effects that seem to consistently surviveare the income and openness effects.
Conclusions
This paper has explored the determinants of pro-poor spending. In contrast to otherworks, which assume a priori that some types of expenditures are pro-poor and oth-ers are not, we empirically derive our measure of progressivity of spending from theempirical identification of the effect of different fiscal policies on the poor. Our spec-ification takes into account the fact that the level of expenditures should not justaffect poverty but should also influence the responsiveness of poverty to growth,thereby affecting the extent to which growth is shared. Our results show that theoptimal mix of polices will depend on a country’s level of income and that certain

440 | FRANCISCO RODRÍGUEZ
policies that protect the poor under some conditions (e.g., high economic growth)may end up being harmful to the poor if those conditions change. Some of our resultsare close to what one would reasonably expect. Social spending is beneficial to thepoor in the poorest countries, while noncore social spending such as social securityand recreation seems to benefit the poor only in countries that are well above theaverage level of income. However, we also find the association between core socialspending and poverty to be statistically weak, an effect that is surprising and thatmay reflect the need for further examination of subdivisions of this category. (Forexample, spending on higher education, which is included, is rarely pro-poor.) Thefact that some of the results do not accord with received notions about the progres-sivity of expenditure categories suggests that it is necessary to explore further themicroeconomic evidence on the links between these categories and poverty reduction.
We find that Eastern European countries tend to be following the most pro-poorstrategies. Being relatively rich, they can redistribute using mechanisms such as socialsecurity systems, to which they indeed devote significant resources. We find that themix of government expenditures in African countries tends to be detrimental to thewelfare of the poor. Countries such as Brazil, Panama, and Uruguay are strong per-formers in terms of poverty reduction, but other countries whose poverty reductionrecord is generally considered strong, such as India and Indonesia, do not come outwell in our indicator.
Our indicator also provides new evidence as to the necessary political conditionsfor sharing growth. We find that richer countries tend to be more pro-poor, eventhough the poor make up a smaller group of the population in these countries. Wealso find that openness and inequality are negatively associated with pro-poor poli-cies, contrary to the conventional wisdom. Financial development, by contrast, seemsto be positively correlated with pro-poor fiscal policies.
Notes
1. This is simply a consequence of Young’s theorem, which states that for any twice differ-entiable function f (x, y), it must be that fxy � fyx.
2. If the poverty rate is a nonlinear function of y, then the average effect in equation (7) ofyt may be very different from the marginal effect of an increment in y, and policy makersmay be much more interested in the latter than in the former.
3. If we run the same regression as in column (2) but restrict it to the sample in column (3),we get an R2 of 0.58, so that adding in the level and interaction expression increases theR2 by 0.06.
4. This does not mean that they should be zero. As we saw above, there are always sometypes of expenditure that will be poverty reducing even for very poor countries.
References
Acemoglu, Daron, and James Robinson. 2006. Economic Origins of Dictatorship and Democ-racy. Cambridge, U.K.: Cambridge University Press.

WHEN IS PUBLIC EXPENDITURE PRO-POOR? | 441
Alesina, Alberto, and Dani Rodrik. 1994. “Distributive Politics and Economic Growth.”Quarterly Journal of Economics 109 (2, May): 465–90.
Bénabou, Roland. 1996. “Inequality and Growth.” NBER Macroeconomics Annual, ed.Ben S. Bernanke and Julio J. Rotemberg, 11–92. Cambridge, MA: National Bureau of Eco-nomic Research.
———. 2005. “Inequality, Technology and the Social Contract.” In Handbook of EconomicGrowth, ed. Philippe Aghion and Steven Durlauf, vol. 1, 1595–1638. Amsterdam: North-Holland.
Boix, Carles. 2003. Democracy and Redistribution. Cambridge, U.K.: Cambridge UniversityPress.
Bourguignon, Francois. 2003. “The Growth Elasticity of Poverty Reduction: Explaining Het-erogeneity across Countries and Time Periods.” In Inequality and Growth: Theory andPolicy Implications, ed. Theo S. Eicher and Stephen J. Turnovsky. Cambridge, MA: MITPress.
Galor, Oded, and Joseph Zeira. 1993. “Income Distribution and Macroeconomics.” Reviewof Economic Studies 60 (1): 35–52.
IMF (International Monetary Fund). 2006a. “Government Finance Statistics Database andBrowser.” CD-ROM. International Monetary Fund, Washington, DC.
———. 2006b. “Historical Government Finance Statistics Database and Browser.” CD-ROM.International Monetary Fund, Washington, DC.
———. 2006c. “International Financial Statistics Database.” International Monetary Fund,Washington, DC.
Kraay, Aart. 2004. “When Is Growth Pro-Poor? Cross-Country Evidence.” IMF WorkingPaper 04/47, International Monetary Fund, Washington, DC.
Meltzer, Allan, and Scott Richard. 1981. “A Rational Theory of the Size of Government.”Journal of Political Economy 89: 914–27.
Persson, Torsten, and Guido Tabellini. 1994. “Is Inequality Harmful for Growth?” AmericanEconomic Review 84 (3, June): 600–21.
Ravallion, Martin. 1997. “Can High Inequality Developing Countries Escape Absolute Poverty?” Economics Letters 56 (1): 51–57.
Rodríguez, Francisco. 2004. “Inequality, Redistribution, and Rent-Seeking.” Economics andPolitics 16 (3, November): 287–320.
Rodrik, Dani. 1998. “Why Do More Open Economies Have Bigger Governments?” Journalof Political Economy 106 (5): 997–1032.
Shelton, Cameron A. 2007. “The Size and Composition of Government Expenditure.” Journalof Public Economics 91 (11–12): 2230–60.
Wagner, Adolph. 1890. Finanzwissenschaft. Leipzig.
Wickens, Tobias. 2002. Classification of GFSM 1986 Data to the GFSM 2001 Framework.Washington, DC: International Monetary Fund.


The Political Economy of Public Service Provision in South AsiaLAKSHMI IYER
Access to education and health facilities varies considerably across the countriesand regions of South Asia. This paper surveys the theoretical and empirical litera-ture on collective action and public goods provision. The role of group influence,heterogeneity within groups, and group size is explored in detail. The paper thendiscusses the impact of committed leaders on public goods provision, together withthe factors involved in sustaining that impact, and examines how these insights canbe applied in analyzing issues related to the quality of public goods provision. Thegrowing role of the private sector in providing basic education services in SouthAsia is briefly surveyed.
Basic health and education remain remarkably scarce in developing countries. In2007 more than one-third of the children in developing countries were not enrolledin school, and a quarter of the children were not immunized. South Asia laggedbehind the developing-country average, with a combined gross enrollment ratio of60 percent and an immunization rate of 65 percent (UNDP 2007, tables 1 and 6).The situation varies by country—primary school enrollment rates in South Asiarange from 97 percent in Sri Lanka to 68 percent in Pakistan—and considerableregional differences exist within countries. In India nearly every village in KeralaState has access to a school, but only 39 percent of villages in Bihar do. In 2005,57 percent of children in Pakistan’s Punjab Province were enrolled in primary school;the figure for Balochistan was 34 percent. Rates of full immunization varied from76 percent in Punjab to 48 percent in Balochistan (Pakistan 2007). In Nepal access toschools is tenfold better in the best districts than in the worst. (See Banerjee, Iyer, andSomanathan 2008 for a broader range of within-country comparisons of the avail-ability of public goods.) By contrast, Sri Lanka presents a case of relative equality in
443
Lakshmi Iyer is an assistant professor of business administration at the Harvard Business School. The author thanksShanta Devarajan, Asim Khwaja, Karthik Muralidharan, and participants at the ABCDE, Cape Town, for helpful com-ments and suggestions.
Annual World Bank Conference on Development Economics 2009, Global © 2010 The International Bank for Reconstruction and Development / The World Bank

444 | LAKSHMI IYER
educational attainment: the fraction of the population completing secondary schoolvaries across districts from 35 to 41 percent (Sri Lanka 2006, table 14.2b).
We should note that simply providing access to a school or enrolling a child inschool is not enough to ensure an educated population. The quality of the servicesprovided at these physical facilities is quite low in many South Asian countries andregions. A nationally representative survey found that 25 percent of primary schoolteachers in India and 16 percent of those in Bangladesh are likely to be absent on anygiven day and that 40 percent of health workers in India and 35 percent of those inBangladesh are likely to be absent (Chaudhury et al. 2006). In Pakistan a detailedstudy of schools in Punjab found that teachers in government schools are absentapproximately four days a month and that by the end of the third class (grade), justover 50 percent of children had mastered the mathematics curriculum for class 1(Andrabi et al. 2007). The quality of service provision also varies considerably with-in countries: teacher absenteeism in India ranges from 15 percent in Maharashtra to42 percent in Jharkhand (Kremer et al. 2005, table 2).
Interestingly, the quality of service provision appears to be correlated with physi-cal access. For instance, states in India where fewer villages have access to schoolshave worse rates of teacher attendance (figure 1). Furthermore, the variation in phys-ical access to health and education facilities is not simply a matter of different pref -erences; data from India again show that the same places have worse access to bothhealth and education facilities (figure 2). In all South Asian countries, governments
FIGURE 1.Quality and Quantity of Education Services across Indian States
Source: India 2001; Kremer et al. 2005.
Note: Dots represent individual states.
percent of villages having a primary school
fitted valuespercent of primary school teachers absent
0
5
10
15
20
per
cent
of t
each
ers
abse
nt
25
30
35
40
45
50
40 50 60 70 80 90 100

THE POLITICAL ECONOMY OF PUBLIC SERVICE PROVISION IN SOUTH ASIA | 445
have the primary responsibility for providing these services to their citizens. Why,then, are some regions relatively more successful in obtaining these services for theirresidents, while other areas within the same country lag behind?
In this paper, I review theoretical models of physical public goods provision, as wellas the empirical evidence for the channels hypothesized in this literature. Most of thesemodels focus on the physical provision of health and education facilities. I considertwo classes of explanations: “bottom-up” accounts that concentrate on the ability oflocal communities to successfully obtain public goods from the state, and “top-down”factors emphasizing unilateral policy interventions undertaken by committed leaders.In this sense, I abstract away from the policy maker–provider relationship discussedin detail in World Development Report 2004 (World Bank 2004), subsuming theprovider-type decision under the second class of factors. The analysis in this paper canbe applied both to the relationship between citizens and service providers and to therelationship between citizens and policy makers, as long as the electoral process doesnot automatically result in better service provision. The analysis takes a purely posi-tive point of view; that is, it describes which factors matter in practice rather thanattempting to suggest specific types of public service delivery for specific contexts.
I then consider whether similar factors can explain the variations in the quality ofpublic goods, highlighting some recent field experiments aimed at improving healthand education outcomes. In the final section, I turn to the issue of whether purely pri-vate provision of these goods can be the solution to failures of public provision.
FIGURE 2.Access to Health and Educational Facilities across Indian States
Source: India 2001.
Note: Dots represent individual states.
per
cent
of v
illag
es h
avin
g a
med
ical
faci
lity
percent of villages having an educational facility
10
0
20
30
40
50
60
70
80
90
100
50 55 60 65 70 75 80 85 90 95 100
fitted valuespercent of villages having a medical facility
446 | LAKSHMI IYER
Theories of Collective Action
Citizens in South Asia value education and health services. The Public Report onBasic Education in India (PROBE Team 1999) surveyed parents in the four states ofIndia with the lowest enrollment ratios. Virtually all parents (98 percent) felt that itwas important for a boy to be educated, and 89 percent of parents also felt that it wasimportant for a girl to be educated. A survey of 10,000 voters in 1996 revealed thatpublic amenities were listed as the “main problem faced by people like you” by one-fifth of the respondents—the second biggest concern after poverty (Center for theStudy of Developing Societies 1996). Surveys in Pakistan confirm that parents caredeeply about their children’s education (Andrabi et al. 2007, 6). Why do some com-munities manage to articulate these demands well enough to obtain these public services from the state, while others do not succeed in doing so?
The standard model of public goods provision assumes that the provision of apublic good depends on the total effort exerted by all the individuals in a group butthat an individual’s costs of participating in group activities are privately incurred.This model has been traditionally applied to the analysis of the provision of localschools or health facilities funded by local taxes. In such cases, the benefit is havinga local school for the children, and the private cost is the tax paid to obtain it.
This model is also appropriate where such infrastructure is financed by the gov-ernment but local communities have to coordinate to extract resources from the stateand to make sure these resources are then used to build the relevant infrastructure.The benefit is, again, the building of a local school, and the private cost is the cost ofparticipating in community actions such as organizing local meetings, writing to stateofficials, monitoring the spending of local funds, meeting with the local elected rep-resentative, and publicizing the activities of state officials.1 Such efforts are necessarybecause the electoral process may not automatically result in better access to healthand education. Keefer and Khemani (2005) survey three major sources of politicalmarket imperfections: lack of information among voters about the performance ofpoliticians; lack of credibility of political promises to citizens; and social polarizationthat leads to resources being targeted toward specific social groups. The evidencefrom several countries shows that there is at most a weak link between expenditureson public services and the actual level of services received by the local community(World Bank 2004, 35–38), suggesting that “public goods” such as information gath-ering and monitoring are underprovided at the local level.
In this theoretical framework, individuals in a community first decide on the levelof effort (or the costs) they would be willing to incur toward getting a local school.The probability of obtaining the school depends on the overall effort mobilized bythe community relative to a preset threshold (in the local financing model) or relativeto the effort mobilized by other communities (in a setting in which several commu-nities are competing for limited state resources). Undertaking individual effort iscostly and entails rising marginal costs for the agent. Each person in the group makeshis or her choice independent of the others, and therefore there is an incentive to freeride on other people’s effort. For instance, if I expect others in my community to bear

THE POLITICAL ECONOMY OF PUBLIC SERVICE PROVISION IN SOUTH ASIA | 447
the fixed cost of setting up a school, I have every incentive to contribute zero effortor cost toward the project.
This simple framework generates several comparative statics predictions for theimpact of community characteristics on the provision of education and health facili-ties. The main implications involve the role of group influence, heterogeneity withingroups, and group size.
Group Influence
Communities that are inherently more powerful in demanding public goods are morelikely to get them. This difference in political influence usually arises because certaingroups have historically been advantaged in terms of income or political connections.Examples of such privileged groups include whites in South Africa during theapartheid years, high castes in India through most of its history, and large landown-ers in Brazil. A corollary is that institutional changes which increase the politicalinfluence of certain groups should result in members of that group having greateraccess to public goods.
Heterogeneity within Groups
The theory generates ambiguous predictions, depending on the type of heterogeneitythat is present within the group. First, members of a group might have heterogeneouspreferences concerning the type or nature of the public good, depending on theirdemographic or locational characteristics. In the local school example, one can easilyimagine individuals within a community having considerably different preferencesabout the provision of a primary versus a high school (depending on the age of theindividual’s child); choice of the language of instruction; whether the school shouldprovide a school bus (which would depend on the location of the individual’s resi-dence); whether the students should have school uniforms; the length of the schoolday; and other details of the curriculum. The theory implies that groups with veryheterogeneous preferences concerning public goods will typically make lower indi-vidual contributions toward those public goods.
If land and labor markets are well functioning, rational economic behavior wouldimply that households would migrate to form more homogeneous communitieswhere all members share the same tastes concerning public good provision. This isthe insight of a classic paper implying that citizens have the option to “vote with theirfeet” to obtain better public goods (Tiebout 1956). Such migration results in betterprovision of public goods through two channels. First, it generates competitionacross jurisdictions to retain residents and hence creates better incentives for localgovernments. Second, free riding is likely to be minimized in a completely homoge -nous community, since each resident has migrated to a community that provides hisor her desired level or type of public good.
In most developing countries, migration rates are typically low, and hence we donot expect the Tiebout mechanism to be a significant channel for obtaining public

448 | LAKSHMI IYER
goods. Migration rates in South Asia are particularly low: the Indian census of 2001reveals that 96 percent of India’s people live in the state of their birth.2 Some reasonsfor these extremely low migration rates may be differences in language and cultureacross state boundaries, the costs involved in leaving established social networks, therelative paucity of infrastructure such as roads, and dysfunctional land markets thatmight make it difficult to buy or sell property.
A second type of heterogeneity could lie in the benefits the public good confers onresidents. For instance, farmers with large plots of land have more to gain from anirrigation canal; families with several children have more to gain from a local publicschool than single-child families; and people with preexisting medical conditionsmight derive more benefit from a local health center. In many cases the rich will haveless to gain from public provision of education and health, since they are the oneswho can best access private provision of such services. Analyzing the theoreticalimplications of such inequality can become quite complicated, especially if a private“exit option” is available to some households (see, among others, Bardhan, Ghatak,and Karaivanov 2007; Das and Khwaja 2005). Greater inequality of benefits canmake people less likely to contribute toward a public good, but this effect can bereversed at high levels of inequality: if one person expects to gain almost all the bene -fits (e.g., if there is only one farmer in the whole area), he will be motivated to bearthe whole cost.
Third, a group can be socially heterogeneous in terms of religion, language, caste,or ethnicity, and this can lead to differences in preferences concerning public goods.(For example, each person may want the medium of instruction in the school to behis or her mother tongue.) It can also lead directly to less effective collective actionbecause of increased communication costs across social categories, less trust, or alower degree of altruism toward members of a different social category. Conversely,socially homogeneous groups may also be able to monitor their members’ contribu-tions toward the public good and use social sanctions to achieve high contributions.Channels such as these predict worse outcomes when society is divided into severaldifferent social groups. An alternative possibility is that social tensions are maxi-mized when there are two large groups rather than several small groups, in whichcase increasing heterogeneity might even help achieve greater social cohesion.
In sum, the theoretical framework predicts that groups with heterogeneous pref-erences will make lower contributions toward the public good. The predictions forthe impact of economic and social heterogeneity are more nuanced.
Group Size
Larger group size has two possible effects. First, although having a large number ofpeople in the group does exacerbate the free-rider problem, a large group has thepotential to mobilize more effort at a lower cost (since the costs for each individualare convex). The net effect is therefore uncertain and depends on whether theincrease in the free-rider problem outweighs the resource advantage of large groups.If the public good does not deteriorate with a large number of users (i.e., if congestion

THE POLITICAL ECONOMY OF PUBLIC SERVICE PROVISION IN SOUTH ASIA | 449
effects are small), the resource advantage effect is likely to dominate. Examples ofsuch public goods include public health campaigns such as malaria eradication andAIDS awareness. Second, if the large number of users means that individual benefitsfrom the public good are reduced (e.g., if the same irrigation canal is to be used by alarger number of farmers), the free-rider effect is exacerbated, and so larger groupsare likely to generate lower contributions. These comparisons assume that the scaleof the project being considered remains the same, but larger communities mightchoose projects of a different scale or scope. Extending the analysis to incorporatethese factors would bring an added layer of complexity to the model.
Empirical Evidence on Collective Action and Public Goods
In this section, I survey the empirical evidence on the determinants of collectiveaction postulated by the theoretical framework: the power of certain groups, groupheterogeneity, and group size.
Group Influence
There is considerable evidence from South Asia that groups with historical politicaladvantages are able to obtain better public goods for themselves. Banerjee andSomanathan (2007) conducted an analysis on the availability of education, health,and other infrastructure across all the states of India, using census data at the levelof the parliamentary constituency. They found that areas with a higher population ofBrahmans, the elite priestly caste in India’s caste system, have better access to pri-mary, middle, and secondary schools, post offices, and piped water. These are, in fact,exactly the goods we would expect the Brahman caste to value most, given the caste’straditional deep involvement in education and written knowledge and the caste pol-lution norms that prohibit Brahmans from sharing water with lower castes. In thecase of infrastructure for which Brahmans would not be expected to have a specialpreference, such as electricity connections, health centers, and roads, the study doesnot find any significant correlation between the presence of Brahmans and the pro-vision of such services.3 On a more local level, village-level surveys found that house-holds that belong to the same community as the village head are more likely to obtainaccess to public housing funds, public toilets, and water and electricity connections(Besley, Pande, and Rao 2005).
Do institutional reforms that affect the political advantage of different groupsresult in corresponding changes in access to public services? To illustrate, the IndianConstitution provides for the reservation of a number of electoral constituencies formembers of the Scheduled Castes and Scheduled Tribes.4 In these constituencies, onlymembers of the targeted communities are allowed to contest elections, and so thisprovision significantly increases the political influence of these communities. It turnsout that reserving electoral constituencies for Scheduled Caste candidates results ingreater access to primary schools for members of that community. Such an impact is

450 | LAKSHMI IYER
not observed for Scheduled Tribe communities (Krishnan 2007). Between 1971 and1991, areas with higher Scheduled Castes populations experienced a rapid expansionin access to various types of infrastructure, while areas with higher Scheduled Tribepopulations do not show such increases (Banerjee and Somanathan 2007).
One reason for this difference may be that Scheduled Castes have been able tomobilize politically, creating parties such as the Bahujan Samaj Party (BSP) that caterspecifically to their interests. Another possibility is that Scheduled Tribes tend to livein remote isolated areas where it is costly to provide infrastructure. There is some evi -dence that such political reservations work well only if the context is conducive. Adetailed survey of teacher attendance in the schools of Uttar Pradesh found that hav-ing a Scheduled Caste village head in fact reduces teacher attendance (Pandey 2006).This is probably because most teachers are not from the Scheduled Caste communi-ties, and, hence, teacher absence is a type of “noncooperation” in heterogeneouscommunities. I explore further evidence on the impact of social heterogeneity below.
Another major political reform in India has been the decentralization of power tovillage-level panchayats following the 73rd Amendment to the Constitution in 1992.Reservations for village-head positions for Scheduled Castes and Scheduled Tribeswere put in place, similar to the reservation policies for state and national electoralconstituencies. The amendment also required that a certain fraction of the village-headpositions be reserved for women; the villages that are reserved under this scheme arechosen at random in each election, providing an excellent natural experiment settingfor evaluating the impact of strengthening women’s political voice.
Increasing the political voice of women does help them gain access to the goodsthey most value. A detailed survey of villages in the Birbhum District of West BengalState found that having a woman head increased the provision of goods whichwomen valued, such as drinking water and roads (Chattopadhyay and Duflo 2004).Some of the results again sound a cautionary note regarding the importance of thesocial context. For instance, female village heads were widely perceived by village res-idents as less competent, even though they did no worse than men on any objectivemeasure of performance. Results from further studies indicate that such social biasmay be decreasing as voters are more exposed to women leaders (Beaman et al. forth-coming).
Heterogeneity within Groups
Several studies find that social or ethnic heterogeneity is associated with reduced con-tributions for public projects and lower levels of access. The pioneering study in thisempirical literature was an analysis of expenditure patterns across cities in the UnitedStates that found that cities with racially diverse populations spent a lower shareof their budget on schools, roads, and garbage collection and a greater share onhealth services and police (Alesina, Baqir, and Easterly 1999). It is in fact not clearwhether this reflects different preferences, difficulties of collective action in heteroge-neous communities, or perhaps the fact that cities which provide more health andpolice services attract a more diverse population. A related paper finds some evidencefor the Tiebout migration hypothesis. The United States witnessed a dramatic
THE POLITICAL ECONOMY OF PUBLIC SERVICE PROVISION IN SOUTH ASIA | 451
consolidation of school districts (jurisdictions) over the course of the twentieth century: the number of jurisdictions decreased by a factor of 12. This decline, how-ever, was much more marked in areas where the population became more raciallyhomogeneous, suggesting strong support for the notion that people migrate to formhomogeneous communities. Where the population is not homogeneous, people prefer to retain separate communities providing their own preferred type of school(Alesina, Baqir, and Hoxby 2004).
Direct evidence on the role of social heterogeneity in public goods contributionscomes from experimental results, where subjects participate in a variety of publicgoods “games” that simulate real-life situations. Interestingly, subjects in most ofthese experiments display a much lower level of free riding than is predicted by eco-nomic theory. (For a detailed survey of the experimental literature, see Ledyard1995.) There is no consensus on the impact of introducing heterogeneity acrossagents. Heterogeneity in the distribution of benefits across agents raises contributionlevels (Cardenas, Stranlund, and Willis 2002), while introducing heterogeneity in theperceived status of participants tends to decrease contribution levels (Anderson, Mellor, and Milyo 2008).
Real-life results are similar to the experimental ones, suggesting that differenttypes of heterogeneity matter in different ways. Asim Khwaja conducted a detailedsurvey of project maintenance across communities in Baltistan, northwest Pakistan,and found that inequality of benefits has a very nonlinear relationship with projectmaintenance undertaken by the community; residents with more assets (land) bene-fit more from these project maintenance expenditures. At low levels of asset inequal-ity, project maintenance decreases with increasing inequality, while at high levels ofinequality, further increases in inequality actually lead to better maintenance (Khwaja2009). This is consistent with the theoretical prediction outlined earlier. A similarnonlinear relationship is seen in the operation of sugar cooperatives in Maharashtra,with high prices more likely to be maintained when the number of big farmers iseither very small or very large (Banerjee et al. 2001).
Several papers have documented the long-run impact of historical patterns ofinequality and lack of social cohesion. In a comparative study of New Worldeconomies, Stanley Engerman and Kenneth Sokoloff found that places where the cli-mate was suited to the cultivation of plantation crops such as sugar (e.g., Brazil andHaiti) or places which had extractive industries (e.g., Mexico and Peru) had colonialinstitutions under which a small elite owned most of the productive resources. Theelite in these high-inequality areas managed to capture a disproportionate share ofpolitical power, as well. These countries ended up having much lower investments inpublic education, as well as a delayed transition to democracy and universal suffragecompared with initially more equal places such as the United States and Canada, pre-cisely because policy moves such as democratization or widespread public educationwould likely threaten the economic and political dominance of the elites (Engermanand Sokoloff 2000, 2005).
In the context of South Asia, we find a similar perpetuation of colonial-era heterogeneity. Abhijit Banerjee and Lakshmi Iyer compared development pathsacross the districts of India according to whether they had a historically unequal
452 | LAKSHMI IYER
distribution of land. This variation stems from the differing land tenure systemsimplemented by the British colonial rulers: areas in which a small number of land-lords was assigned the primary responsibility for land revenue collection ended uphaving an economically and politically powerful elite class, compared with nonland-lord areas where taxes were effectively collected directly from the peasant. Eventhough landlords were formally abolished in the 1950s, the study found that the for-merly landlord-controlled areas lag behind the nonlandlord areas in the provision ofeducation and health facilities. The authors’ explanation is that in landlord areasthere is a much greater social and economic distance between the elites and the masses,making it difficult to effectively coordinate public action to obtain public goods(Banerjee and Iyer 2005). Some evidence for this noncooperation hypothesis is seenin the greater incidence of violent crimes, such as murder and armed robbery, in landlord areas. Preliminary results from Pakistan also suggest a similar pattern oflandlord-dominated areas having worse outcomes in terms of public service provi-sion (Cheema and Siddiqui 2008).
Many studies document a negative effect of social heterogeneity on public goodsprovision. Parents whose children attended ethnically heterogeneous schools inKenya contributed less to school fund-raising drives (Miguel and Gugerty 2005). InIndia areas with a higher degree of caste and religious heterogeneity had significantlylower levels of access to schools, transport services, wells, health services, and elec-tricity connections (Banerjee, Iyer, and Somanathan 2005). In Nepal social hetero-geneity is associated with increased firewood collection (and, consequently, worsemaintenance of common forest resources), while economic inequality is positivelyassociated with forest maintenance (Baland et al. forthcoming).
Why does social heterogeneity have a negative effect on collective action? As dis-cussed earlier, there are three potential mechanisms: social heterogeneity may reducethe degree of altruism or trust among members of the community, increase the costsof communication, or lessen the ability of members to enforce social contributionnorms. A series of public goods experiments in Uganda explicitly tested these variouschannels (Habyarimana et al. 2007). The authors found that the impact of social het-erogeneity mainly works through the third channel; that is, members of the samesocial group are more likely to be able to find each other through their social net-works, which gives them an edge in monitoring social contributions.
Group Size
Relatively little empirical evidence exists on the effect of group size on the provisionof public goods. Theoretically, the impact is ambiguous, depending on how much thefree-riding problem increases with group size. Experimental evidence by Isaac andWalker (1988) suggests that free riding increases in large groups mainly because themarginal benefits of the group activity diminish, specifically because of congestioneffects in the public project. Once these congestion effects are controlled for, free rid-ing does not increase appreciably with group size.
Larger villages in India were significantly more likely, in 1971, to have access toalmost every type of infrastructure, and they were more likely to increase their access
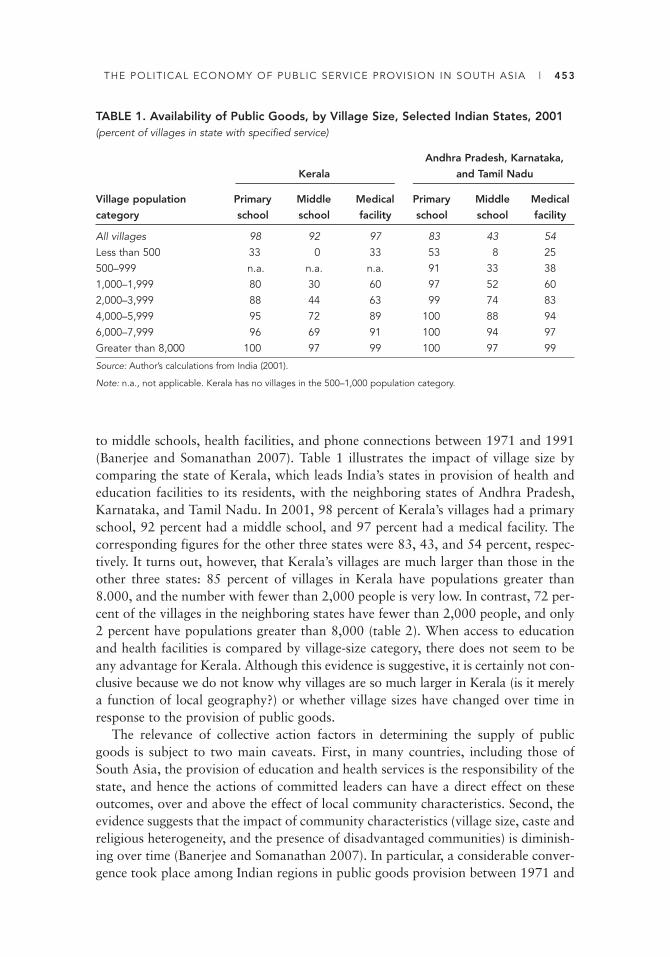
THE POLITICAL ECONOMY OF PUBLIC SERVICE PROVISION IN SOUTH ASIA | 453
TABLE 1. Availability of Public Goods, by Village Size, Selected Indian States, 2001(percent of villages in state with specified service)
Andhra Pradesh, Karnataka,
Kerala and Tamil Nadu
Village population Primary Middle Medical Primary Middle Medical
category school school facility school school facility
All villages 98 92 97 83 43 54Less than 500 33 0 33 53 8 25500–999 n.a. n.a. n.a. 91 33 381,000–1,999 80 30 60 97 52 602,000–3,999 88 44 63 99 74 834,000–5,999 95 72 89 100 88 946,000–7,999 96 69 91 100 94 97Greater than 8,000 100 97 99 100 97 99
Source: Author’s calculations from India (2001).
Note: n.a., not applicable. Kerala has no villages in the 500–1,000 population category.
to middle schools, health facilities, and phone connections between 1971 and 1991(Banerjee and Somanathan 2007). Table 1 illustrates the impact of village size bycomparing the state of Kerala, which leads India’s states in provision of health andeducation facilities to its residents, with the neighboring states of Andhra Pradesh,Karnataka, and Tamil Nadu. In 2001, 98 percent of Kerala’s villages had a primaryschool, 92 percent had a middle school, and 97 percent had a medical facility. Thecorresponding figures for the other three states were 83, 43, and 54 percent, respec-tively. It turns out, however, that Kerala’s villages are much larger than those in theother three states: 85 percent of villages in Kerala have populations greater than8.000, and the number with fewer than 2,000 people is very low. In contrast, 72 per-cent of the villages in the neighboring states have fewer than 2,000 people, and only2 percent have populations greater than 8,000 (table 2). When access to educationand health facilities is compared by village-size category, there does not seem to beany advantage for Kerala. Although this evidence is suggestive, it is certainly not con-clusive because we do not know why villages are so much larger in Kerala (is it merelya function of local geography?) or whether village sizes have changed over time inresponse to the provision of public goods.
The relevance of collective action factors in determining the supply of publicgoods is subject to two main caveats. First, in many countries, including those ofSouth Asia, the provision of education and health services is the responsibility of thestate, and hence the actions of committed leaders can have a direct effect on theseoutcomes, over and above the effect of local community characteristics. Second, theevidence suggests that the impact of community characteristics (village size, caste andreligious heterogeneity, and the presence of disadvantaged communities) is diminish-ing over time (Banerjee and Somanathan 2007). In particular, a considerable conver-gence took place among Indian regions in public goods provision between 1971 and

454 | LAKSHMI IYER
1991, a development that Banerjee and Somanathan attribute to specific policies ofthe Indian government aimed at equalizing access. Can top-down interventions byparticular leaders make a difference?
The Role of the State: Ideology, History, and Sustainability
When asked how Kerala had succeeded in ensuring widespread literacy, the state’sminister of education cited several reasons aside from local collective action: “A longtradition of public action, strong support for Leftist political movements, benevolentrulers such as the royal family of Travancore, and strong social reform movementsagainst practices such as untouchability.”5
This comment highlights three key factors: commitment by leaders, policy com-petition, and conditions for long-term sustainability.
1. Committed leaders matter. As early as 1817, Regent Gauri Parvathi Bai of Travancore State declared, “The state should defray the entire cost of the educationof its people in order that there might be no backwardness in the spread of enlight-enment among them, that by diffusion of education they might become better sub-jects and public servants and that the reputation of the state might be enhancedthereby.” This remarkable announcement was followed by the setting up of schoolsin each district of Travancore State over the next few decades and by state commit-ments to health care. The Travancore Administrative Report for 1901 records 809students in the Maharaja’s High School, of whom 800 had received vaccinations. Thestudents came from both the priestly Brahman caste and the lower castes and from awide range of occupational groups, suggesting that the state was also active in remov-ing barriers to social cohesion. In contrast, the British colonial state set up the first English school in British Malabar (the northern region of the modern Kerala State)only in 1848.
Travancore was not the only place with a committed ruler. Sayajirao III, the rulerof Baroda (in present-day Gujarat State) from 1875 to 1939, declared that education
TABLE 2. Village Size Categories, Selected Indian States, 2001(percent of villages in each size category)
Andhra Pradesh, Karnataka,
Village population Kerala and Tamil Nadu
Less than 500 0.4 29.2500–999 0.0 19.81,000–1,999 0.7 23.52,000–3,999 3.5 17.84,000–5,999 4.8 5.66,000–7,999 5.0 2.1Greater than 8,000 85.6 2.0Total 100.0 100.0
Source: Author’s calculations from India (2001).
THE POLITICAL ECONOMY OF PUBLIC SERVICE PROVISION IN SOUTH ASIA | 455
was “absolutely necessary for the realization of my ambitions and wishes for thefuture of my people.” The state ordered that schools be provided in all villages whichcould produce 16 children willing to attend; Sayajirao was also the first to introducecompulsory education in certain areas, in 1892. It took the British more than20 years to introduce a similar law in the neighboring Central Provinces. It is impor-tant to note that the rulers mentioned here were hereditary kings with little directpressure from their subjects for the provision of such facilities. This effect is also notlimited to the specific rulers mentioned here: in general, areas of India that were ruledby native rulers have better access to schools and health centers than areas ruled byBritish administrators (Iyer 2007).
2. The presence of committed actors can help spur policy competition. In additionto keeping social reform on the political agenda, it is possible that the strong pres-ence of Communist parties in Kerala forced competing parties to make a similar com-mitment to public services.
The history of education in Sri Lanka (known as Ceylon until 1972) is illustrativein this regard. (The discussion here is based on Sri Lanka, Ministry of Education,2004.) Before the colonial period, education had traditionally been provided by Bud-dhist monks. The arrival of the Portuguese and then the Dutch led to the setting upof several missionary schools during the sixteenth, seventeenth, and eighteenth cen-turies. During the period of direct British colonial rule (1796–1931), the colonialgovernment also established a few schools. In the mid-nineteenth century, Buddhist,Hindu, and Muslim communities started their own religious schools to give theirchildren an alternative to the Christian schools. This increase in the number ofschools led to a 42 percent literacy rate for men as early as 1901. By comparison, theliteracy rate for men in the state of Travancore, the highest in India, was only 21 per-cent at that time. Thus, competing (religious) ideologies appear to have advanced thecause of access to education. A cross-country analysis finds a similar result: compe-tition among missionaries resulted in better education outcomes across formercolonies in Africa, irrespective of the religious denomination of the missionariesthemselves (Gallego and Woodberry 2006).
Following the end of direct British colonial rule and the institution of universalsuffrage in 1931, Sri Lanka adopted several major education initiatives, in 1942.These were heavily influenced by the views of C. W. W. Kannangara, the country’sfirst minister of education. They included free education from kindergarten throughuniversity, instruction in the mother tongue of the student, the setting up of 53 high-quality central schools for secondary education throughout the country, the institu-tion of a scholarship program, and the establishment of the University of Ceylon. Itshould be noted that Kannangara faced considerable opposition from the elitesbefore the measures were passed. These initiatives have contributed to a literacy rateof over 90 percent in Sri Lanka and to a secondary school completion rate of 40 per-cent in 2001.
3. The long-term sustainability of the original initiative is a critical factor, but lit-tle is known about what determines it. Did education continue to receive prominencein Kerala because of the commitment of successive rulers in the states of Travancoreand Cochin, or because of the influence of social reform movements in Kerala that
456 | LAKSHMI IYER
were specifically aimed at increasing the access of lower castes to public facilities(Ramachandran 1997)? Why is Gujarat not among the leading states of India in pub-lic goods provision, even though it had had an extremely committed ruler in the past?What factors prompted the Sri Lankan state to continue its long-term commitmentto education after the colonial period and the 1942 reforms?
One possibility is that a higher initial level of literacy might change the effective-ness of local collective action, by lowering the costs of demanding public goods orby increasing social cohesion. In this context, it is interesting to note that literacyrates across Indian districts in 1961 are significant predictors of access to a range of public goods in 1991 (Banerjee and Iyer 2008). By contrast, an initial provision ofdeworming drugs in Kenya proved extremely difficult to sustain over the longerterm. This suggests that specific measures are needed to galvanize local collectiveaction; simply providing a public good is not sufficient for sustainability (Kremerand Miguel 2007).
Can governments undertake measures to increase social cohesion and hence makecollective action more effective? Some indications are provided by comparing thecontrasting experiences of Kenya and Tanzania: local ethnic heterogeneity is nega-tively correlated with the quality of schools in Kenya’s Busia, but the two are posi-tively correlated in the nearby Meatu region in Tanzania (Miguel 2004). A plausiblereason is that whereas after independence, the Kenyan leadership played up triballoyalties for political reasons, and little effort was put into building a Kenyan identity,Tanzania’s leadership laid considerable emphasis on creating a single Tanzanian iden-tity. The importance of such feedback mechanisms between initial top-down initia-tives and later bottom-up processes has not yet been explored in much detail, ineither the theoretical or the empirical literature.
Quality of Public Services
The theoretical framework described earlier can also be applied to analysis of the fac-tors affecting the quality of public services. As long as some private cost is incurredby the user in verifying or enforcing the quality of service (e.g., going to the healthcenter to check whether the nurse is present, or filing a complaint with school author-ities if the teacher is not doing a good job), the same insights would apply. The impli-cations of the framework would be that people who have political advantages willenjoy a higher quality of public goods provision but that the impact of group size andgroup heterogeneity is ambiguous.
The empirical evidence has highlighted many of the same factors as importantdeterminants of public goods quality. For instance, schools located in areas of Indiathat were under the landlord-based land tenure system are much more likely to havehigher rates of teacher absenteeism (Pandey 2006). The importance of bottom-upfactors is highlighted by the observation that teacher absence is lower in schools inwhich the Parent Teacher Association (PTA) has met in the preceding three months(Kremer et al. 2005). It is important to note that this result is not driven solely by
THE POLITICAL ECONOMY OF PUBLIC SERVICE PROVISION IN SOUTH ASIA | 457
links between the teacher and the local community: teachers from the local commu-nity are not less likely to be absent, and the mere existence of a PTA does not help toreduce absenteeism. This evidence clearly suggests a role for the kind of communityaction modeled earlier.
Given the failures of community action to ensure service delivery in many cases,what means can be used to rectify the situation? Duflo, Hanna, and Ryan (2008)report the results of an experiment in which teachers in a randomly chosen subset ofschools in Rajasthan were offered a bonus if they proved their presence in school byphotographing themselves with their students. This scheme reduced teacher absencein those schools by half—a huge improvement. Increased teacher presence also led toimproved student learning outcomes. It should be noted that this approach does notfocus on improving local collective action, and in this sense, it is a top-down methodof intervention. Olken (2007) found a similar result in Indonesia, where increasedcentralized auditing dramatically improved the quality of roads built by local villagecommittees.
The latter study is unusual because it included an explicit comparison of top-downauditing with more bottom-up community monitoring. The study found that makingit easier for citizens to monitor local road building had very little effect on the qual-ity of roads. A similar result was found in a study in Rajasthan (Banerjee, Deaton,and Duflo 2004). Members of the local community were given strong incentives tomonitor the presence of nurses at the local health center. They did keep track ofwhether the nurse was present, but in the absence of any effective sanctioning mechanism, there was no impact on absence of service providers.6 An innovativeexperiment in Andhra Pradesh was explicitly designed to improve teacher accounta-bility: public school teachers were given bonuses if their students improved their testscores. This initiative significantly improved student learning outcomes, mainly byinducing greater instructional effort on the part of the teacher (Muralidharan and Sundararaman 2006).
Is Private Provision the Solution?
In recent years, many countries of South Asia have witnessed a dramatic rise inthe number of private schools in rural areas. In Pakistan the number of privateschools increased from 32,000 to 47,000 between 2000 and 2005; in 2005 one inthree primary school students was enrolled in a private school (Andrabi et al.2007). In India 28 percent of the rural population had access to a private schoolin 2003, and 15 percent of all students were estimated to be studying in privateschools (Muralidharan and Kremer 2008). In Bangladesh a nongovernmentalorganization (NGO), BRAC, is one of the biggest suppliers of primary schooling:its nonformal primary education program, which covers the same competencies asthe government schools, grew from 22 one-room schools in 1985 to 49,000schools in 2004, accounting for about 11 percent of the primary school childrenin the country. By contrast, in Sri Lanka, where the public school system is

458 | LAKSHMI IYER
working well, only 4 percent of all students are enrolled in private or religiousschools (Sri Lanka, Ministry of Education, 2007).
Private schools perform better than public schools on many dimensions. Teacherabsence is considerably less, and student learning outcomes are significantly better(Muralidharan and Kremer 2008; Andrabi et al. 2007). Can the entry of such non-state actors into the education sector be the answer to the substantial failings in thepublic education system that were documented earlier, as well as to the difficulties inimproving local collective action?
There are three reasons why the state still needs to be a major force in the provi-sion of health and education services on a large scale. First, private schools do notprovide universal service: they are more likely to be located in larger villages, as inIndia, or in richer villages and richer settlements within villages, as in Pakistan. Inboth India and Pakistan, they are much more likely to exist when teacher absenteeismin the public school system is high. Second, private schools are more expensive forthe students than are public schools. In Pakistan, the average annual cost of a privateprimary school is 3,563 rupees, more than seven times the public school cost of 479 rupees. The cost of schooling is a significant deterrent to enrollment: 25 percentof boys and 22 percent of girls cite the cost of schooling as their reason for not goingto school, and 18 percent of boys and 15 percent of girls cite it as their reason fordropping out of primary school (Pakistan 2007, tables 2.20, 2.23, and 2.24). Boththe location and the cost of private schools limit the access of the poorest householdsto such facilities. We should note, however, that the total social costs of privateschools are in fact lower than those of public schools (Andrabi et al. 2007). This sug-gests that increasing the ability of households to access these schools—for instancethrough education vouchers—can be an effective policy tool for improving learningoutcomes. In general, such combinations of public and private action in providing education and health services deserve more detailed attention, both in the academicliterature and in policy making.
Third, an intriguing study from Pakistan suggests that an initial investment by thestate may be needed for private schools to be viable. The main advantage of privateschools is that they are able to hire local teachers for much lower wages than thosepaid to government schoolteachers, who typically enjoy civil service protection.Where do private schools find teachers with at least minimal levels of education?Andrabi, Das, and Khwaja (2007) find that these teachers are the products of priorinvestments by the state in expanding access to public education in rural areas. Thisis consistent with the timing of the recent rise in private schools. Over time, it maybe possible for the private school system to generate its own teachers and thusbecome self-sustaining.
Conclusions
This paper has documented the shortfalls in the delivery of health and education serv-ices across South Asia. A key feature of the data is that there are large gaps in serv-ice delivery even within specific countries. I surveyed two classes of explanations forsuch underprovision. The first broad class focuses on the factors that might make
THE POLITICAL ECONOMY OF PUBLIC SERVICE PROVISION IN SOUTH ASIA | 459
local demand insufficient or ineffective in ensuring provision of services. These arethe factors that make collective action more or less difficult; they include the influ-ence of certain politically advantaged groups, group heterogeneity, and group size.We saw that in many cases the theoretical framework yielded ambiguous predictions.The empirical evidence, on the whole, suggests that (a) the political influence of thegroup matters significantly in obtaining the group’s preferred goods; (b) groupswhich are socially heterogeneous are less effective in obtaining public goods, andresults for groups which are economically heterogeneous vary; and (c) larger groupsare likely to be more effective in obtaining desired public goods.
The second class of explanations focused on factors that might affect the supply ofpublic goods, irrespective of demand conditions. Several experiences suggest that com-mitted leaders can make a big difference in providing public goods, that competitionamong motivated agents can be a significant force, and that top-down interventionsmay not be self-sustaining. We know relatively little about how to effectively promotecollective action or about other channels for making an initial intervention sustain-able. These remain fruitful avenues for theoretical and, especially, empirical work.
Notes
1. This framework is based on the theoretical model in Banerjee, Iyer, and Somanathan(2008).
2. The Indian migration rate contrasts with the figures in developed countries. For instance,40 percent of the U.S. population resides in a state other than the birth state.
3. Although caste pollution norms might apply to contact in health centers as well, it is verylikely that the service providers (e.g., doctors) would be from the upper castes.
4. The Scheduled Castes are communities that have historically been at the bottom of theHindu caste hierarchy; Scheduled Tribes include communities that have traditionallybeen outside the Hindu caste system.
5. Author’s interview with M.A. Baby, minister of education and culture, Kerala, September2006.
6. Banerjee and Duflo (2006) survey a number of other studies aimed at reducing absencesof service providers.
References
Alesina, Alberto, Reza Baqir, and William Easterly. 1999. “Public Goods and Ethnic Divi-sions.” Quarterly Journal of Economics 114 (4): 1243–84.
Alesina, Alberto, Reza Baqir, and Caroline Hoxby. 2004. “Political Jurisdictions in Heteroge-neous Communities.” Journal of Political Economy 112: 348–96.
Anderson, Lisa R., Jennifer M. Mellor, and Jeffrey Milyo. 2008. “Inequality and Public GoodProvision: An Experimental Analysis.” Journal of Socio-Economics 37 (3, June): 1010–28.
Andrabi, Tahir, Jishnu Das, and Asim Ijaz Khwaja. 2007. “Students Today, Teachers Tomor-row? Identifying Constraints on the Provision of Education.” Working Paper, KennedySchool of Government, Harvard University, Cambridge, MA. http://ksghome.harvard.edu/~akhwaja/papers/teachersstudentssept07.pdf.

460 | LAKSHMI IYER
Andrabi, Tahir, Jishnu Das, Asim Ijaz Khwaja, Tara Vishwanath, Tristan Zajonc, and theLEAPS Team. 2007. “Pakistan—Learning and Educational Achievements in Punjab Schools(LEAPS): Insights to Inform the Education Policy Debate.” World Bank, Washington, DC.http://leapsproject.org/assets/publications/LEAPS_report.pdf.
Baland, Jean Marie, Pranab Bardhan, Sanghamitra Das, Dilip Mookherjee, and Rinki Sarkar.Forthcoming. “The Environmental Impact of Poverty: Evidence from Firewood Collectionin Rural Nepal.” Economic Development and Cultural Change. http://people.bu.edu/dilipm/publications/nepaledccsept083.pdf.
Banerjee, Abhijit, and Esther Duflo. 2006. “Addressing Absence.” Journal of Economic Perspectives 20 (1, Winter): 117–32.
Banerjee, Abhijit, and Lakshmi Iyer. 2005. “History, Institutions and Economic Performance:The Legacy of Colonial Land Tenure Systems in India.” American Economic Review95 (4): 1190–1213.
———. 2008. “Colonial Land Tenure, Electoral Competition and Public Goods in India.”Harvard Business School Working Paper 08-062, Cambridge, MA.
Banerjee, Abhijit, and Rohini Somanathan. 2007. “The Political Economy of Public Goods:Some Evidence from India.” Journal of Development Economics 82 (2): 287–314.
Banerjee, Abhijit, Angus Deaton, and Esther Duflo. 2004. “Health Care Delivery in RuralRajasthan.” Economic and Political Weekly 39 (9): 944–49.
Banerjee, Abhijit, Lakshmi Iyer, and Rohini Somanathan. 2005. “History, Social Divisions andPublic Goods in Rural India.” Journal of the European Economic Association 3 (2–3):639–47.
———. 2008. “Public Action for Public Goods.” In Handbook of Development Economics,vol. 4, ed. T. Paul Schultz and John Strauss. Amsterdam: North-Holland.
Banerjee, Abhijit, Dilip Mookherjee, Kaivan Munshi, and Debraj Ray. 2001. “Inequality, Con-trol Rights and Rent Seeking: Sugar Cooperatives in Maharashtra.” Journal of PoliticalEconomy 109 (1): 138–90.
Bardhan, Pranab, Maitreesh Ghatak, and Alexander Karaivanov. 2007. “Wealth Inequalityand Collective Action.” Journal of Public Economics 91 (9): 1843–74.
Beaman, Lori, Raghabendra Chattopadhyay, Esther Duflo, Rohini Pande, and Petia Topalova.Forthcoming. “Powerful Women: Does Exposure Reduce Bias?” Quarterly Journal of Economics 124 (4). Draft available at http://ksghome.harvard.edu/~rpande/Research,%20Working%20Papers.htm.
Besley, Timothy, Rohini Pande, and Vijayendra Rao. 2005. “Participatory Democracy inAction: Survey Evidence from South India.” Journal of the European Economic Associa-tion 3 (2–3): 648–57.
Cardenas, Juan Camilo, John Stanlund, and Cleve Willis. 2002. “Economic Inequality andBurden-Sharing in the Provision of Local Environmental Quality.” Ecological Economics40 (3): 379–95.
Center for the Study of Developing Societies. 1996. “National Election Studies.” Center forthe Study of Developing Societies, New Delhi. http://www.lokniti.org/dataunit.htm.
Chattopadhyay, Raghbendra, and Esther Duflo. 2004. “Women as Policy Makers: Evidencefrom a Randomized Policy Experiment in India.” Econometrica 72 (5): 1409–43.
Chaudhury, Nazmul, Jeffrey Hammer, Michael Kremer, Karthik Muralidharan, and F. HalseyRogers. 2006. “Missing in Action: Teacher and Health Worker Absence in DevelopingCountries.” Journal of Economic Perspectives 20 (1): 91–116.
Cheema, Ali, and Bilal Siddiqui. 2008. “Colonial Village Institutions, Path Dependence andPublic Good Provision: Do Peasant Republics Serve Better than Feudal Estates?” Work inprogress, Lahore University of Management Sciences, Lahore, Pakistan.
THE POLITICAL ECONOMY OF PUBLIC SERVICE PROVISION IN SOUTH ASIA | 461
Das, Jishnu, and Asim Khwaja. 2005. “Bunching and Heterogeneity: Characterizing theMonopolistic Provision of Excludable Public Goods.” Working Paper, Kennedy School ofGovernment, Harvard University, Cambridge, MA.
Duflo, Esther, Rema Hanna, and Stephen Ryan. 2008. “Monitoring Works: Getting Teachersto Come to School.” CEPR Discussion Paper DP6682, Centre for Economic PolicyResearch, London.
Engerman, Stanley L., and Kenneth L. Sokoloff. 2000. “Institutions, Factor Endowments, andPaths of Development in the New World.” Journal of Economic Perspectives 14 (3):217–32.
———. 2005. “Colonialism, Inequality and the Long-Run Paths to Development.” NBERWorking Paper 11057, National Bureau of Economic Research, Cambridge, MA.
Gallego, Francisco A., and Robert Woodberry. 2006. “Christian Missionaries and Educa-tion in Former Colonies: An Early Example of the Economics of School Choice?” Working Paper, MIT, Cambridge, MA. http://www.economia.puc.cl/ archivos_profes/63/ missionaries_jun13.pdf.
Habyarimana, James, Macartan Humphreys, Daniel Posner, and Jeremy Weinstein. 2007.“Why Does Ethnic Diversity Undermine Public Good Provision?” American Political Sci-ence Review 101 (4): 709–25.
India. 2001. Census of India 2001: Village Directory Data, Electronic Data Files. New Delhi:Office of the Registrar General.
Isaac, R. Mark., and James M. Walker. 1988. “Group Size Effects in Public Goods Provision: TheVoluntary Contributions Mechanism.” Quarterly Journal of Economics 103 (1): 179–99.
Iyer, Lakshmi. 2007. “Direct versus Indirect Colonial Rule in India: Long-Term Conse-quences.” Working Paper, Harvard Business School, Cambridge, MA. http://www.people.hbs.edu/liyer/Iyer_colonial_dec2007.pdf.
Keefer, Philip, and Stuti Khemani. 2005. “Democracy, Public Expenditures, and the Poor:Understanding Political Incentives for Providing Public Services.” World Bank ResearchObserver 20 (1): 1–27.
Khwaja, Asim Ijaz. 2009. “Can Good Projects Succeed in Bad Communities?” Journal of Pub-lic Economics 93 (7–8, August): 899–916.
Kremer, Michael, and Edward Miguel. 2007. “The Illusion of Sustainability.” Quarterly Jour-nal of Economics 112 (3): 1007–65.
Kremer, Michael, Nazmul Chaudhury, Jeffrey Hammer, Karthik Muralidharan, and F. HalseyRogers. 2005. “Teacher Absence in India: A Snapshot.” Journal of the European Eco-nomic Association 3 (2–3): 658–67.
Krishnan, Nandini. 2007. “Political Reservations and Rural Public Good Provision in India.”Working Paper, Boston University, Boston. http://www.bu.edu/econ/ied/dp/papers/ Political%20Reservations%20and%20Rural%20Public%20Good%20Provision%20in%20India.pdf.
Ledyard, J. 1995. “Public Goods: A Survey of Experimental Research.” In Handbook ofExperimental Economics, ed. J. H. Kagel and A. Roth. Princeton, NJ: Princeton UniversityPress.
Miguel, Edward. 2004. “Tribe or Nation? Nation-Building and Public Goods in Kenya versusTanzania.” World Politics 56 (3): 327–62.
Miguel, Edward, and Mary Kay Gugerty. 2005. “Ethnic Diversity, Social Sanctions and PublicGoods in Kenya.” Journal of Public Economics 89 (11–12): 2325–68.
Muralidharan, Karthik, and Michael Kremer. 2008. “Private-Public Schools in Rural India.”In School Choice International: Exploring Private Public Partnerships, ed. RajashriChakrabarti and Paul E. Peterson. Cambridge, MA: MIT Press.

462 | LAKSHMI IYER
Muralidharan, Karthik, and Venkatesh Sundararaman. 2006. “Teacher Incentives in Develop-ing Countries: Experimental Evidence from India.” Working Paper, Harvard University,Cambridge, MA.
Olken, Benjamin. 2007. “Monitoring Corruption: Evidence from a Field Experiment inIndonesia.” Journal of Political Economy 115 (2): 200–49.
Pakistan. 2007. Pakistan Social and Living Standards Measurement Survey 2005–06. Islam-abad: Statistics Division.
Pandey, Priyanka. 2006. “Service Delivery and Capture in Public Schools: How Does History Matter and Can Mandated Political Representation Reverse the Effects of History?” Working Paper, South Asia Human Development Department, World Bank,Washington, DC.
PROBE Team. 1999. Public Report on Basic Education in India. New Delhi: Oxford Univer-sity Press.
Ramachandran, V. K. 1997. “On Kerala’s Development Achievements.” In Indian Develop-ment: Selected Regional Perspectives, ed. Jean Drèze and Amartya Sen. New Delhi: OxfordUniversity Press.
Sri Lanka. 2006. Statistical Abstract 2005. Colombo: Department of Census and Statistics.
Sri Lanka, Ministry of Education. 2004. “Historical Overview of Education in Sri Lanka.”Ministry of Education, Colombo. http://www.moe.gov.lk/modules.php?name=Content&pa=showpage&pid=2.
———. 2007. School Census 2006: Preliminary Report. Colombo: Department of Census andStatistics.
Tiebout, Charles M. 1956. “A Pure Theory of Local Expenditures.” Journal of Political Economy 64 (5): 416–24.
Travancore State. 1901. Travancore Administrative Report. Travancore, India.
UNDP (United Nations Development Programme). 2007. Human Development Report2007/2008: Fighting Climate Change: Human Solidarity in a Divided World. New York:UNDP.
World Bank. 2004. World Development Report 2004: Making Services Work for Poor People.Washington, DC: World Bank and Oxford University Press.
Comment on “The Political Economy of Public Service Provision in South Asia,” by Lakshmi Iyer
ASHUTOSH VARSHNEY
Until the late 1980s, political economy was a subfield primarily populated by politi-cal scientists, with occasional participation by economists such as Mancur Olson(1965, 1982), on the one hand, and Kenneth Arrow (1970) and Amartya Sen (1981),on the other. Over the past decade or so, participation by economists has been muchmore vigorous. By now, the field of political economy has become a joint enterpriseof the two disciplines of political science and economics.
Does that mean that the two fields agree on how to define, or identify, what ispolitical? Although it would be too much to say that all political scientists (or, for thatmatter, all economists) define what is political, or identify the determinants of poli-tics, in the same way, I as a political scientist, using Iyer’s paper, would like to sug-gest how conceptions and determinants of politics can be quite different across disci-plines. As a consequence, the explanations, too, might vary.
The central question in Iyer’s paper is, why do some regions of a country succeedin obtaining public goods for their residents, while other areas within the same coun-try lag behind? The public goods she primarily focuses on are education and health,although there are brief references to “public amenities” in general. In effect, her cen-tral question takes the following form: why, in India, do states like Kerala have aschool for every village (and a literacy rate of more than 90 percent), while states likeBihar have provided schools to only 39 percent of their villages?
Before we examine Iyer’s argument, let us ask, at what level should we examinevariation in the provision of public goods? There are three easily identifiable units ofanalysis: states (or provinces), districts, and villages. With meticulous care and bal-ance, Iyer has surveyed the literature explaining variation at the village level, and tosome extent her analysis can be leveraged at the district level, but the paper does notadequately deal with variation at the state level. Her independent variables—groupsize, group influence, and group heterogeneity—can work well at the village level,
463
Ashutosh Varshney is a professor of political science at Brown University, Providence, RI.
Annual World Bank Conference on Development Economics 2009, Global © 2010 The International Bank for Reconstruction and Development / The World Bank

464 | ASHUTOSH VARSHNEY
and also potentially at the district level, but their explanatory power weakens whenwe go up to the state level.
Is this simply a theoretical point, or one with actual empirical and explanatory sig-nificance? Health and education in India are state-level subjects. It is the state gov-ernment that is primarily responsible for fiscal allocations for, and the administrationof, primary and secondary education and primary health. The central governmentcan be a partner, but it is not a decision maker. It follows that state-level variation inliteracy and health will depend substantially, if not entirely, on how much the stategovernment spends on education and health and on whether, and why, differentstates have different public expenditure profiles.
Indeed, if we examine the patterns of literacy and health in India, something moreinteresting than the state-level variation stands out. The four southern Indian states aresystematically ahead of the northern part of the country (with the exception of a smallnorthern state, Himachal Pradesh). One of the most interesting political-economyquestions in India is why the South is so far ahead of the North in literacy and health.
To answer this question, one would have to survey two facets of political- economyliterature that are not the focus of Iyer’s analytical gaze: historical political economy andwhat might be called, for want of a better term, institutional political economy. Historical political economy deals with the long legacies of some transformative eras,or critical junctures, in politics. Institutional political economy deals with issues such asthe impact of party systems. Let me turn to each briefly.
Historical Caste Dynamics in India’s North and South
The historical political economy of India makes it very clear that caste dynamics constitute one of the most dramatic differences between India’s South and North(Varshney 2000). Like race in the United States, caste is the dark underbelly of Indianpolitics, economy, and society. Skin color is not its primary basis, but the caste systemresembles racial stratification in several other ways. Traditionally, castes were birth-based groups organized in a vertical hierarchy. The upper castes had the higher pro-fessions; the lower castes—now called the other backward classes (OBCs)—werepeasants, service providers, and artisans; and the Dalits, the ex-untouchables, were atthe bottom of the social scale and were restricted to menial jobs.
Caste differences were not simply professional. Lower castes also historically suf-fered humiliation and discrimination at the hands of the upper castes in a verticalHindu social order. For centuries, they were looked down on; they were not allowedaccess to upper-caste temples, wells, schools, or village commons; their styles of dressand the architectural patterns of their homes had to be in keeping with their “stationin life”; their children were viewed as fit only for menial jobs and not worthy of edu-cation; and their women were treated with disrespect. Upward mobility in the castesystem was highly limited. Tradition, if violated, was enforced by coercion.
In southern India, the lower castes had already been mobilized into social move-ments during the last decades of British rule. In the 1950s and 1960s, they rose in politics, as well. By the late 1960s, all over southern India, upper-caste hegemony had

COMMENT ON IYER | 465
been undermined, leading to a new political equilibrium in the 1970s. In this newequilibrium, the OBCs held the upper hand, and the upper castes accepted their jun-ior role. In the North, such political reversal has of late been under way in two of thelargest states, Uttar Pradesh and Bihar.
In short, the South went through a lower-caste revolution decades ago. Does thathave an impact on health and literacy? As regards literacy, the impact is very clear.The lower-caste movements emphasized, among other things, two objectives—toquote a major southern leader of the movement, “respect yourself,” and “educateyourself.” (For a detailed discussion, see Rajendran 1974.) As a result, the rise of thelower castes, which constituted anywhere from 80 to 90 percent of the southern Indian population, lifted the average literacy rates for the southern Indian states enor-mously. (See Varshney 2005 on the further implications.) The rise of the lower castesbegan several decades later in northern India.
Party Politics, Health, and Education
Shall we conclude that caste dynamics is all that we need to look at—that states arelocked into equilibria struck decades ago? Let me briefly turn to the institutionalpolitical-economy literature that is beginning to emerge and ask if party politics hasa public goods impact. On the basis of a study of all states of India, Chhibber andNooruddin (2004) note that the delivery of public goods varies significantly acrossIndian states, and they show that states with two-party competition provide morepublic goods than states with multiparty competition. This is so because in two-partysystems political parties need the support of large social groups, whereas in multi-party systems the social base of the parties is smaller and political parties provide“club goods” to these smaller groups rather than public goods to larger social coali-tions. I am not absolutely certain that the argument is correct, but at any rate Chhibberand Nooruddin have proposed an intriguing idea for further exploration.
Conclusion
To sum up, Iyer’s remarkable survey of political-economy literature is confined to thevillage or to district-level variation. For state-level variation, which is an importantaspect of public goods variation in India, we need to turn to a very different kind ofpolitical economy that conceptualizes politics not only in terms of historical driversof politics but perhaps also in view of the nature of party politics in India.
References
Arrow, Kenneth. 1970. Social Choice and Individual Values. 2nd ed. New Haven, CT: YaleUniversity Press.
Chhibber, Pradeep, and Irfan Nooruddin. 2004. “Do Party Systems Count? The Number ofParties and Government Performance in the Indian States.” Comparative Political Studies37 (2, March): 152–87.

466 | ASHUTOSH VARSHNEY
Olson, Mancur. 1965. The Logic of Collective Action. Cambridge, MA: Harvard UniversityPress.
———. 1982. The Rise and Decline of Nations. New Haven, CT: Yale University Press.
Rajendran, G. 1974. The Ezhava Community and Kerala Politics. Trivandrum, India: Academyof Political Science.
Sen, Amartya. 1981. Poverty and Famines. Oxford, UK. Oxford University Press.
Varshney, Ashutosh. 2000. “Is India Becoming More Democratic?” Journal of Asian Studies59 (1, February): 3–25.
———. 2005. “Democracy and Poverty.” In Measuring Empowerment, ed. Deepa Narayan.Washington, DC: World Bank.

Closing Remarks
ALAN GELB
This Annual World Bank Conference on Development Economics (ABCDE) is ahistoric one. It is a first for the African continent, and it combines the global andregional ABCDE conferences. It has brought together more than 500 participants toshare insights about the process of development. We come from more than 60 coun-tries, and 228 of us live in Africa and 61 in Asia, so we are very widely distributed.
Before proceeding, I would like again to thank the South African government,especially Treasury, for the wonderful support and fantastic organization that youhave provided for this conference. I think that even if we forget some of the papers,presentations, and debates, we are going to remember the dinner last night, and themusic, the dancing, and the poetry, for a very long time. It was really a great experi-ence. Thank you very much, for all of us.
Actually, it was so good that I am sorry that we rotate the ABCDE—I would loveto come back to Cape Town next year.
The conference, as you know, has been about people, politics, and globalization.As we convened here, South Africa’s minister of finance, Trevor Manuel, observedthat the global and continental commitments expressed in recent years have actuallyhelped developing countries enter a higher growth path and that these countries havebegun to reap the benefits of difficult economic policy decisions and of globalization.But he also pointed to the near-term impediments, including rapidly rising food andfuel prices and global economic turmoil, and he emphasized that new conditionsrequire dynamic and innovative solutions from development economists. Indeed,such solutions have been a central feature of our discussions.
The World Bank’s chief economist, Justin Lin, noted in the opening session thatAfrica has demonstrated robust growth in recent years—it is no longer a “hopelesscontinent,” as the Economist labeled it back in 2000. The challenge will be to
467
Alan Gelb is a senior fellow at the Center for Global Development, Washington, DC. At the time of the conference, hewas the director, Development Economics, World Bank.
Annual World Bank Conference on Development Economics 2009, Global © 2010 The International Bank for Reconstruction and Development / The World Bank

468 | ALAN GELB
maintain and strengthen this growth. The chief economist stressed that people arenot simply the end of development; they are also the means of development, and it isimportant that they be given opportunities to work and to contribute to develop-ment. He pointed out that globalization provides very good examples of this—forexample, in East Asia and China—but that it also poses new challenges for develop-ing countries.
President Thabo Mbeki reminded us, on the first day of the conference, thatrumors of the death of development economics are very premature, and he asked theconference to consider a number of questions that concern policy makers in Africaand elsewhere in the developing world. These questions include what steps to take inresponse to rising food and fuel prices, how Africa can take advantage of the com-modity boom, what can be done to strengthen the development of human capital inthe event of a global turndown that curtails exports and inward investment, andwhat measures to take to sustain the rhythm of development. During the past twoand a half days, we have had 43 sessions, some 90 speakers in all, plus discussions,and a wonderful essay competition. It is not possible to cover all this in a single summary—unless, of course, you would like to stay another week in Cape Town,which many of us would. So I am going to be very brief in summarizing as best I cansome of the themes that came up surrounding the first topic of the conference—people.
It is clear that human capital development is central to development, and thisaspect was covered in sessions that included Minister Trevor Manuel; MichaelSpence, the chair of the Growth and Development Commission; and Paul Schultz.Among other events, there was a comparative session on human capital development,which demonstrated that public health interventions can have positive effects on thelives of the poor and can lead to positive impacts on the economy. We heard someinteresting reports about antiretroviral therapy, vitamin supplementation, and otherexamples that came up in the discussion, such as the successful HIV/AIDS programin Thailand. We need to learn from these cases and to share experiences.
Michael Spence’s address on rethinking growth emphasized that health is not onlya basic human right, but also a critical input for economic growth. There is, clearly,growing evidence, including at the micro level, that especially among the young, poorhealth and malnutrition have a detrimental effect on productivity and economicgrowth. This effect occurs through the channel of labor supply reduction but alsothrough damage to cognitive development, which has a lasting effect on skills acqui-sition that cannot be easily reversed.
The challenge of measuring the impact of public health investments was also discussed. It might seem obvious that public health investment provides support foreconomic growth, but the devil is in the details. Costly investments in health todaymay yield improvements in growth only in 20 or 30 years’ time, making it difficultto estimate the overall returns and, therefore, to budget accurately. Maximizing thegains from health investment and identifying appropriate interventions require afocus on equity, efficiency, and service delivery. (Failures in the last area are, unfor-tunately, all too common in the health sector.) The conference also examined therole of health policy concerning HIV/AIDS and its effect on economic growth. The
CLOSING REMARKS | 469
interaction on this topic included a range of views on the relationship between poverty, wealth, and HIV infection. Some presentations dealt with the educationalimpact on children who lose their parents to HIV/AIDS. Understanding these aspectsof the HIV/AIDS tragedy is important for ensuring effective policy.
A session on higher education and high-technology industries, organized byDevesh Kapur, was motivated in part by emerging evidence that the spectacular economic and social development that has taken place—particularly, perhaps, in theFar East—has occurred simultaneously with the rapid development and expansionof higher education. The session highlighted the important links between higher education and the development of high-technology industries. From an African per-spective, it was agreed that poor outcomes in this area, which persist despite anexpansion of university enrollment, relate in part to a lack of focus on science andtechnology. The difficulties in many developing regions, including Africa, in sustain-ing high-level academic communities—the core of the science and technology community—and the related issues were also noted.
One particular aspect of employment that received attention was the high inci-dence of youth unemployment in developing countries, especially in the countries ofNorth Africa and in South Africa. It is interesting that at these two extremes of thecontinent, the issue of youth unemployment seems to be a particularly salient ques-tion. Clearly, if youth unemployment can be addressed, a source of tremendous economic growth and dynamism can be tapped. Alternatively, youth unemploymentcan be a source of social tension and conflict. Appropriate education and trainingpolicies are critical, especially for advanced education and vocational training. Theyouth employment issue was also brought up in the context of a global dichotomy:the average age of the population in advanced countries is increasing, and the devel-oping world is becoming younger. The Commission on Growth and Developmentargued that the potential for work-related migration and labor mobility to addressthese issues deserves careful consideration in the years ahead.
Philanthropy and development share a long history, but the importance of this linkhas been mounting because of the growing size of private foundations. There was adebate on the roles of philanthropy, government, and nonprofit organizations. Oneview was that development is helped most when companies get involved and con-tribute their technical expertise rather than simply make donations.
We all know that politics is a key driver of development and that it can help orhinder inclusive economic growth and the policies that support economic activity.Indeed, the issue of politics pervaded many sessions that were not explicitly aboutthat topic. The findings of the Commission on Growth and Development also high-lighted the critical importance of the political leadership’s taking a long view andacting in the interests of all citizens rather than of a small, select group.
A comparative session organized by Robert Bates addressed many interestingpolitical-economy questions, such as whether government spending is really redistri-butional. That discussion brought up some interesting differences between rich andpoor countries—for example, that social spending is more likely to be redistributivein rich than in poor countries.

470 | ALAN GELB
Who receives public goods? What have we learned from experience in India? Atthe micro level, the village level, group size, group interests, and group influenceappear to be important. But it was also suggested that at the provincial level there isa historical and an institutional dynamic and that, in certain respects, the North ofIndia lags the South by 50 years. Some very interesting thoughts emerged about therelationship between transfers of political power and implications for development.
The session also considered the analytics of political transitions—for example, inSouth Africa and Sri Lanka—and the trade-offs for elites between productivity gainsfrom empowering the poor and the loss of potential power. A clear understanding ofwhen these transitions are going to be productive and when they are going to bedestructive is important from many points of view. This exchange was supplementedby a focus on crime and poverty that included a discussion of the negative conse-quences associated with police corruption, an assessment of job creation issues innorthern and southern Africa, and, again, an emphasis on the importance of politicsin ensuring that public expenditures are allocated in ways that maximize benefits forthe poor. This issue was discussed in the context of poverty reduction strategies andHeavily Indebted Poor Countries (HIPCs).
Bassma Kodmani of the Arab Reform Initiative underlined the political challengesand new opportunities for democracy in the Middle East. Her plea for a politicalapproach to reform in the Arab states highlighted that grassroots movements arebecoming more confident about expressing discontent around social and politicalissues such as water, land, and food and that their interest in democratic reform isconverging with the concerns of more elite social strata seeking parliamentary andjudicial reform.
India—the other major low-income part of the world, in addition to Africa—offers a remarkable reform story. Sunil Kant Munjal, the chairman of Hero Corpo-rate Services, spoke about India’s reforms and the role played by political consensusin this success. India provides a very concrete example of the importance of sharedand balanced growth, labor market reform, and balanced government intervention.Reaffirming the presentation of the Commission on Growth and Development, wenote that the call is for better government rather than for less government. We alsolooked at the role of governments and the public sector in the Southern AfricanDevelopment Community (SADC) and in Africa more broadly. In this area, as in others, this ABCDE helps us to learn from comparative experience.
Closing Remarks
FUNDI TSHAZIBANA
There is no question that the reality of the world that we will all leave to our childrenwill be vastly different as a result of processes that we have come to identify as globalization—in particular, the integration of the world in a way that would haveseemed impossible a couple of decades ago. At the beginning of this conference, someone asked me whether globalization was a topic that was worth exploring further.In fact, one of the things we have noted is that there are always new facets to global-ization and that new opportunities—and new threats—present themselves all the time.
The three Fs—food prices, fuel prices, and financial market turmoil—were strongthemes from the opening session and have remained at the center of the conference andof many of our deliberations. These factors threaten to undermine global growth andstability. There is a clear need for national policies in these areas, supported by multi-lateral factors. Food prices and food security were addressed throughout the confer-ence, and there was a parallelization that focused on the importance of national, regional, and international responses to offset the effects on welfare and to supportincreased productivity in agriculture and bolster food supply. There was also quite adynamic debate on financial market turmoil, which emphasized that the financial crisiswe face at the moment is different in that it originated in the developed world. Givenstrong economic growth and resilience, emerging markets are a vital part of the solu-tion to the prevailing financial market crisis. Economic growth in developing economiesis projected to be four times that of high-income economies in 2008. Globalization isalso evidenced by the internationalization of banking, which heightens the risk of trans-mitting financial shocks worldwide. Some 40 percent of domestic banking assets arenow owned by foreign banks, and the number of banks from the south is growing.
Several factors have helped improve emerging-market resilience to financial crises.These include prudent macroeconomic policies, as practiced in a number of countries,
471
Fundi Tshazibana is director for economic policy at the National Treasury of South Africa.
Annual World Bank Conference on Development Economics 2009, Global © 2010 The International Bank for Reconstruction and Development / The World Bank.

472 | FUNDI TSHAZIBANA
including countries in Sub-Saharan Africa; a reduction in public debt; and accumula-tion of foreign reserves.
Despite the challenges, globalization provides significant opportunities for further-ing human development. Indeed, accessing high external demand and maximizing theimport of knowledge are among the commonalities linking the 13 countries identifiedin the Commission on Growth and Development as experiencing high and sustainablegrowth in the post–World War II period. It is perhaps in this context that the advan-tages of globalization are best considered.
There was also robust discussion in the area of trade and investment. In a sessionorganized by Anthony Venables of Oxford University, we looked at how trade andinvestment affect economic development. It was argued that part of the divergence ineconomic performance between Africa and Asia over the past several decades reflectsAfrica’s fragmentation into many economies, which imposes a wide range of costs onAfrican citizens by limiting the benefits of spillovers, preventing manufacturing fromexploiting the potential for large-scale economies, and skewing production towardsmall-scale manufacturing and agriculture.
The topic of deep integration raises questions concerning how regional integrationis best used to achieve economic development. Southern African economic integrationwould be supported by greater attention to harmonization of institutions and policiesacross the region. There was also a supposition put forward that the relatively disap-pointing performance of African manufacturing trade stemmed from the fact thatAfrican indigenous firms tend to be less productive than nonindigenous ones. Thisraised the question of how to accelerate the growth of indigenous African firms. It wasargued that substantial growth in trade flows would likely follow trade liberalization ifaccompanied by complementary policies to lower costs associated with trade-relatedinfrastructure and institutions.
The underperformance of Sub-Saharan African export-oriented manufacturing wasa recurring theme in the trade discussion and was taken up in a session on industrial-ization in least-developed countries. A discussion on infrastructure, productivity, andgrowth concluded that although infrastructure enhances growth, public infrastructurepriorities should be country specific and complemented by sound economic policy.Perspectives on foreign direct investment (FDI) included a discussion of whether thedeterminants of FDI and the benefits for host economies differ according to whethersuch investment comes from the North or the South. We also had a robust discussionof migration, which is a highly visible aspect of globalization. In a comparative ses-sion, it was argued that both remittances and foreign aid support developmentthrough improvement of child health outcomes but that the overall effect is weak oncemedical brain drain is taken into account. Jean-Paul Azam suggested that one moti-vation for foreign aid was to reduce migration pressures. The threat that brain drainposes to human capital development in developing countries was also flagged as a limitation on reaping the benefits of globalization.
The conference, finally, took up the interlinkages of issues related to climatechange, which touched on our themes of people, politics, and globalization.


ECO-AUDIT
Environmental Benefits Statement
The World Bank is committed to preservingendangered forests and natural resources.People, Politics, and Globalization is printedon recycled paper made with 50-percent postconsumer fiber. The Office of the Publisherfollows the recommended standards forpaper usage set by the Green Press Initiative,a nonprofit program supporting publishers inusing fiber that is not sourced from endan-gered forests. For more information, visitwww.greenpressinitiative.org.
Saved:• 16 trees• 5 million BTUs of total
energy• 1,537 pounds of net
greenhouse gases• 7,404 gallons of
waste water• 450 pounds of
solid waste
Themes and Participants for the
ANNUAL WORLD BANK CONFERENCE ON
DEVELOPMENT ECONOMICS
Seoul, Republic of Korea
“ LESSONS FROM EAST ASIA AND THE GLOBAL FINANCIAL CRISIS”
June 22–24, 2009
Industrial Policy and DevelopmentSocial Capital, Institutions, and DevelopmentFinancial Crisis and RegulationThe Road Ahead to a Sustainable Global Economic SystemInnovation and Competition
Jeung-Hyun Yoon • Justin Lin • Il Sakong • Anne O. Krueger • Simon Johnson • Olivier Blanchard • James Robinson • Ha-Joon Chang • Karen R. Polenske • Bert Hofman • Partha Dasgupta • Masahiko Aoki • Wonhyuk Lim • Mariano Tommasi • Yung Chul Park • Joshua Aizenman • Jaime Jaramillo-Vallejo • Jong-Wha Lee • Stijn Claessens • Giovanni Zanalda • Yoon Je Cho • Jeromin Zettelmeyer • Philip Lane • Sungchul Chung • Jan Svejnar • Jean-Jacques Dethier • Alan Gelb • Young Geol Lee
Look for publication of the proceedings from this conference in November 2010 under the title Annual World Bank Conference on Development Economics 2010, Global: Lessons from East Asia and the Global Financial Crisis (ISBN 978-0-8213-8060-4).

The Annual World Bank Conference on Development Economics (ABCDE) is one of the world’s best-known series of conferences for the presentation and discussion of new knowledge on development. The conference provides a forum for the
world’s leading development thinkers to share new knowledge and ideas. “People, Politics, and Globalization” was the theme of the ABCDE held in Cape Town, South Africa, on June 9–11, 2008. The conference was co-organized by the Government of South Africa and the World Bank.
IN THIS VOLUME:Introduction by Justin Yifu Lin and Boris Pleskovic. Opening addresses by Trevor Manuel, Justin Yifu Lin, and Thabo Mbeki. Keynote addresses by Michael Spence, Bassma Kodmani, and Sunil Kant Munjal. Papers by Paul Collier and Anthony J. Venables; Lawrence Edwards; Aaditya Mattoo and Arvind Subramanian; Jean-Paul Azam and Ruxanda Berlinschi; Lisa Chauvet, Flore Gubert, and Sandrine Mesplé-Somps; Jinu Koola and Çaglar Özden; Sachi Hatakenaka; Akilagpa Sawyerr and Boubakar Barry; Rakesh Basant and Partha Mukhopadhyay; Duncan Thomas; Markus Goldstein, Joshua Graff Zivin, and Harsha Thirumurthy; Francisco Rodríguez; and Lakshmi Iyer. Comments by Beata Smarzynska Javorcik, Melvin D. Ayogu, Jean-Luc Demonsant, Erik Sander, Shahid Yusuf, Pankaj Chandra, T. Paul Schultz, John Strauss, and Ashutosh Varshney. Closing remarks by Alan Gelb and Fundi Tshazibana.
ISBN 978-0-8213-7722-2
SKU 17722